Exhibit 99.1

The following presentations contain "forward-looking statements" within the meaning of
federal securities laws, including estimates of REVPAR, profit margins, earnings and the
number of lodging properties to be added in future years; expected investment spending;
anticipated results from synthetic fuel operations; and similar statements concerning future
events and expectations that are not historical facts. We caution you that these statements
are not guarantees of future performance and are subject to numerous risks and
uncertainties, including whether early indications of an economic recovery will continue;
supply and demand changes for hotel rooms, vacation ownership intervals, and corporate
housing; competitive conditions in the lodging industry; relationships with clients and
property owners; the availability of capital to finance growth and owner refurbishment of
existing hotels; the impact of recent privacy initiatives on our marketing of timeshares and
other products; and the risk that the Internal Revenue Service may not issue a satisfactory
private letter ruling in connection with the sale of the interest in our synthetic fuel business
or reject any of the tax credits produced; any of which could cause actual results to differ
materially from those expressed in or implied by the following. You can find more detailed
information about these and other risks and uncertainties in our periodic filings with the
SEC. These statements are made as of November 11, 2003, and we undertake no obligation
to publicly update or revise any forward-looking statement, whether as a result of new
information, future events or otherwise.
These presentations also include certain non-GAAP financial measures as defined by SEC
rules. As required by SEC rules, we have provided a reconciliation of those measures to the
most directly comparable GAAP measures at the end of the presentations and which is also
available on our investor relations website at www.marriott.com/investor and clicking on
"Reconciliations Required by Sarbanes Oxley."

Arne M. Sorenson
Executive Vice President
Chief Financial Officer
and President - Continental
European Lodging
Marriott International, Inc.

J.W. Marriott, Jr.
Chairman of the Board
and Chief Executive Officer
Marriott International, Inc.
Michael E. Jannini
Executive Vice President
Lodging Brand Management
Marriott International, Inc.

Marriott Lodging
2600+ Properties
First Choice Brand Preference
Distribution Channel Mastery
69 Countries
Broadest Portfolio
Largest Frequency Program
#1 Web Site
Deep Hospitality Culture
Premium Market Share
Largest Hotel Management Company
18 Lodging Brands
6

1995
2000
2005
2010
Operational
Excellence
Loyalty
Experience
Marriott Leadership
7

Operational Excellence
Brand Standards
Balanced Scorecard
Quality Assurance
At Your Service
Sleep Well Bed
High Speed Internet Access
8

Associates
Investors
Guests
Loyalty
9

Experience
TIME
Agriculture
Manufacturing
Service
Experience
10

FULL Service
High Room Rates
High Profit Margins
High REVPAR Premiums
System Obligations
High Value Travelers
More Complex
Well Differentiated
Defensible
Competence Requirements
Asset Appreciation
11

12

Simon F. Cooper
President and
Chief Operating Officer
The Ritz-Carlton
Hotel Company, L.L.C.
The Ritz-Carlton Hotel Company
Security Analyst
Meeting
November, 2003
14

Best in Class Service
J.D. Power Satisfaction Scores
Ritz-Carlton
Four Seasons
Luxury Average
Fairmont
Inter-Continental
880
839
835
823
778
Source: 2003 J.D. Power
15

Effects of Stay Elements on Ritz-Carlton Loyalty
Logistic Regression for Resort Hotels
Ritz –
Carlton
Loyalty
Provided Sense of Well-Being
Cleanliness of Hotel
18.5
12.4
17.9
Very Satisfied
Odds Ratio
Staff Genuinely Cares For You
10.6
Ability of Staff to Anticipate Needs
Feeling Wanted As Guest
7.8
Feel As If Guest In RC Home
7.3
16

Customer Engagement Levels
Rate Paid
= $246
Rate Paid
= $234
Rate Paid
= $227
Actively
Disengaged
11%
Not Engaged
15%
Engaged
29%
Fully
Engaged
45%
17

Employee Satisfaction
(1) “Satisfaction with Ritz-Carlton Hotel Company” from the Global Employee Satisfaction Survey.
Employee
Satisfaction (1)
Recognition
“Best Employer in Asia” (by the Asian Wall Street
Journal):
#1 The Portman Ritz-Carlton, Shanghai (#1 in China – second
consecutive win)
#3 The Ritz-Carlton Millenia Singapore (#2 in Singapore)
#8 The Ritz-Carlton Hong Kong (#1 in Hong Kong)
18
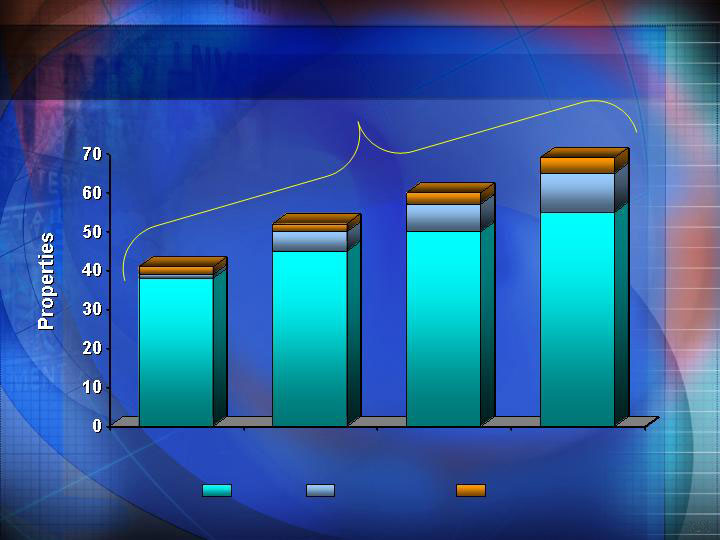
Worldwide Distribution
77% Growth
Hotels
Clubs
Residences
2000
2001
2002
2003E
41
52
60
69
19

Average Rates
Ritz-Carlton Domestic Hotels
12003 estimate as of 10/8/03
$250
$237
$233
$255
$231
$296
Comparable
Non-Comp
1
20

Average Cost per Key
Existing Hotels
New Development
Investment
per Room
$276K
Number
of Rooms
408
Investment
per Room
$391K
Number
of Rooms
302
21

Comparison to Four Seasons
U.S. Comparable House Profit Margin
= Ritz-Carlton
= Four Seasons
22
23

24

Sid S. Yu
Senior Vice President
Brand Management
Marriott International, Inc.

Marriott
Hotels & Resorts
Renaissance
Hotels & Resorts
New Heights
26

Marriott…Culture of Change
“Companies that don’t risk anything will
inevitably find themselves falling behind.
You can lead change or it can lead you.
The key is to manage risk productively.”
J.W. Marriott, Jr.
27

Takeaways
Business Clarity
… attract more consumers
... complementary values
Winning Brands
… shining star & getting
brighter
… emerging star

Business Clarity - - Consumer Needs
ACHIEVEMENT CONSUMER
peace of mind / trust
familiarity
comfort / dependability
ENJOYMENT/ STYLE CONSUMER
unique hotels
design / style
status
45% spending
55% spending
“ENJOYMENT” BRANDS
25% revenue
Renaissance
Westin
Hyatt
“ACHIEVEMENT” BRANDS
75% revenue
Marriott
Hilton

Business Clarity - Complementary Value
Achievement Oriented
Enjoyment Oriented
MARRIOTT
Hotels & Resorts
RENAISSANCE
Hotels & Resorts
NEW CONSUMERS … NOT CANNIBALIZATION
CROSS SELL UPSIDE
BUSINESS SYNERGIES
CONSUMER DIFFERENTIATION
> 50% did not use Marriott
> 70 % did not use RHR

Winning Brands
31
Marriott Hotels & Resorts
DEPARTURE POINT
…50 Years of Leadership
…Knowledge Leader
#1 Preference – Consumers
#1 Preference - Meeting
Planners
#1 Preference - Owners
REVPAR Premium
# 1 Distribution
Baltimore Waterfront
Source: Global Brand Tracking Study

(2003 Global Brand Tracking Study)
1st-Choice Preference
1st-Mention
Unaided Awareness
#1 Preference Leader - Consumers

(2002 Meeting Planner Satisfaction)
MHR
Hilton
RHR
Hyatt
Sheraton
#1
#1
#1
= Significant Improvement
= Significant Decline
= No change since 2001
Scale:
Penetration (U.S.)
Penetration (Int’l)
#1
1st Choice Preference
Provide Best Value
Provide Best Meeting
Services
#1
#1
Effective Promotion
of Meeting Services
#1 Meeting Planner Preference

Marriott #1 Among Owners As Managers for Future Hotels
(2003 Owner & Franchise Satisfaction Study)
What Manager would Owner Choose Tomorrow for Future Hotels?
#1 Preference Leader - Owners

Marriott
REVPAR
Index
REVPAR (Revenue per available room) index is for September 2003 YTD, for total
comparable U.S. hotels; data from Smith Travel
Consistent REVPAR Index Leader

Park Lane, UK
Next 50 Years of Leadership
DESTINATION
Take Industry Leadership to
New Heights
…Keep Brand Fresh
…Take Knowledge
to New Heights
…Further Expand & Grow

Keep Brand Fresh
warm & rich
Emphasize
Modern & Classic Sophistication
range of familiarity
progressive
residence

Keep Brand Fresh
MODERN COMFORTS
… amenities
… food & beverage
… consumer technology

Take Knowledge Leadership to New Heights
… expand definition of
service & relationships
… expand definition of
meeting excellence

5 YR CAGR % of Brand % Pipeline*
North America
International
Marriott Brand
* Rooms as of third quarter 2003, except for Pipeline, which is measured in units
Expand Marriott - Geography
42%
58%
100%
72%
28%
100%
+3%
+14%
+6%

DOWNTOWN
18% of Brand pipeline
CONVENTIONS
26% of Brand pipeline
Seattle Marriott Waterfront
Expand Marriott – Primary Locations

Expand Marriott – Line Extensions
JW MARRIOTT
4% of Brand pipeline
RESORTS
29% of Brand pipeline
JW Marriott Desert Ridge Resort

Drive Pricing Upside …
Line Extensions / Primary Locations
2003 Average Daily Rate*
JW Marriott
$176
Resorts
$165
Conventions
$158
Other Marriott Hotels
$120
*Estimated 2003, United States

Expanding The Leadership
“# 1
By Wide Margin”
… Business Week
October 2003
JW Marriott
Orlando Grande Lakes
Marriott
Miami South Beach

This Is Renaissance
46

This Is Renaissance
$2 billion
systemwide
sales
126 hotels
104% REVPAR
index
Strong guest
satisfaction
47

Strong Guest Satisfaction
Among users, RHR leads over other Enjoyment brands …
for Overall Opinion of Brands, Quality of Staff Service, and Distinctive.
Overall
Opinion
Quality of
Staff Service
Distinctive
2003 Global Brand Tracking
48

Renaissance
Top Upper Upscale Brand
Consumer Reports
Renaissance
#2 Upper Upscale Brand
JD Power
Top 5 Brands
Zagats
Strong Guest Satisfaction
49

Renaissance REVPAR Index
Renaissance
REVPAR
Index
Note: 2003 REVPAR Index for total comparable U.S. properties through September

savvy service
street f & b
expressive design
Three Pillars
Priorities For 2004 … Beyond
#2 REVPAR Index Leader
3 Pillars
Quality Growth

Renaissance Arts Hotel

Renaissance Hollywood

London Chancery Court
Renaissance Clubsport

2003 Zagats Survey
Renaissance Hotels & Resorts
“ Rapid expansion, well – liked, high – end
brand from Marriott
Pleasantly surprised … well appointed
room, conference facilities & dependable,
personal services
This chain gives a lot …”

Takeaways
Business Clarity
… attract more consumers
... complementary values
Winning Brands
… shining star &
getting brighter
… emerging star

Sid S. Yu
Senior Vice President
Brand Management
Simon F. Cooper
President and
Chief Operating Officer
The Ritz-Carlton Hotel
Company, L.L.C.
Brand Strategy Q&A
Michael E. Jannini
Executive Vice President
Lodging Brand Management
Moderator: Leeny K. Oberg
Vice President
Investor Relations

Amy C. McPherson
Senior Vice President
Global Revenue Management
Marriott International, Inc.
Global Rate
Integrity & Single
Image Inventory

Why & Why Now...
Changing and Complex Business
Environment
Eroding Customer Confidence in Rates
Inadequate Industry Response

Sources of Roomnights
Roomnights by Channel
All Marriott Brands Worldwide
Year To Date 2003
Property
49%
Worldwide
Reservations/800#
14%
10%
Marriott.com
7%
Other Internet
1%
Major Travel Management
Companies-GDS
13%
Travel
Agents-GDS
6%
Area Reservation
Sales Offices

Global Rate Integrity and Single Image Inventory
Across All Channels
Single Image
Brand Standard
& Customer
Guarantee
Travel
Management
Company Pricing
Strategy
eChannel
Strategy
Our Vision...
Sources of Roomnights
Property
49%
10%
Marriott.com/
Brand Site
7%
Other Internet
1%
13%
Major Travel Management
Companies-GDS
Roomnights by Channel
All Marriott Brands Worldwide
Year To Date 2003
Worldwide
Reservations/800#
14%
Travel
Agents-GDS
6%
Area Reservation
Sales Offices

Sources of Roomnights
Property
49%
10%
Marriott.com
7%
Other Internet
1%
13%
Single Image
Brand Standard
Major Travel Management
Companies-GDS
Roomnights by Channel
All Marriott Brands Worldwide
Year To Date 2003
Worldwide
Reservations/800#
14%
Travel
Agents-GDS
6%
Area Reservation
Sales Offices

Sources of Roomnights
Property
49%
Marriott.com
7%
Other Internet
1%
13%
Major Travel Management
Companies-GDS
Roomnights by Channel
All Marriott Brands Worldwide
Year To Date 2003
Worldwide
Reservations/800#
14%
Travel
Agents-GDS
6%
10%
Area Reservation
Sales Offices

Sources of Roomnights
Property
49%
10%
Marriott.com
7%
Other Internet
1%
13%
Major Travel Management
Companies-GDS
Roomnights by Channel
All Marriott Brands Worldwide
Year To Date 2003
Worldwide
Reservations/800#
14%
Travel
Agents-GDS
6%
Area Reservation
Sales Offices

Sources of Roomnights
Property
49%
10%
7%
Other Internet
1%
13%
Area Reservation
Sales Offices
Marriott.com
Major Travel Management
Companies-GDS
Roomnights by Channel
All Marriott Brands Worldwide
Year To Date 2003
Worldwide
Reservations/800#
14%
Travel
Agents-GDS
6%

Sources of Roomnights
Property
49%
10%
7%
Other Internet
1%
13%
Marriott.com
Major Travel Management
Companies-GDS
Roomnights by Channel
All Marriott Brands Worldwide
Year To Date 2003
Worldwide
Reservations/800#
14%
Travel
Agents-GDS
6%
Area Reservation
Sales Offices
Marriott’s
Guarantee

Sources of Roomnights
Property
49%
10%
7%
Other Internet
1%
13%
Marriott.com
Major Travel Management
Companies-GDS
Roomnights by Channel
All Marriott Brands Worldwide
Year To Date 2003
Worldwide
Reservations/800#
14%
Travel
Agents-GDS
6%
Marriott’s
Guarantee
Area Reservation
Sales Offices

Mandates single image
inventory standard
“Sells the way the customer
wants to buy”
Strengthens customer
confidence and trust
Enhances competitive
advantage
Single Image
Brand Standard
& Customer
Guarantee
Travel
Management
Company Pricing
Strategy
eChannel
Strategy

Enables Marriott’s Look No
Further Best Rate Guarantee
Strengthens relationship and
fosters travel program compliance
Drives incremental revenue/profit
Enhances status as a preferred
supplier
Single Image Brand
Standard
& Customer
Guarantee
Travel
Management
Company Pricing
Strategy
eChannel
Strategy

Enables Marriott’s Look No
Further Best Rate Guarantee
Drives incremental revenue
Provides additional distribution
of rates
“Sells the way the customer
wants to buy”
Single Image Brand
Standard
& Customer
Guarantee
Travel
Management
Company Pricing
Strategy
eChannel
Strategy

Global Rate Integrity and Single Image Inventory
Across All Channels
Single Image
Brand Standard
& Customer
Guarantee
Travel
Management
Company Pricing
Strategy
eChannel
Strategy

Bruce W. Wolff
Senior Vice President
Distribution Sales and Strategy
Marriott International, Inc.

Internet/Marriott.com
Opportunities
Marketer’s dream
Strengthens customer relationships
Powerful sales channel
Supports other Marriott International needs

Internet Concerns . . . . . .
Price transparency
Good for consumer
What are we doing?
Marriott’s rational pricing
Marriott’s Look No Further Best Rate Guarantee

Internet Concerns . . . . . .
Commoditization
Marriott product is not a commodity
Buying patterns demonstrate lodging not
commoditized
Information supports superior products
What are we doing?
Focus on brand equity
product, pricing, promotion, sales efforts
Enhance Marriott.com
Support customer buying patterns
reservations, Marriott.com, travel agents

Internet Concerns . . . . . .
Expensive intermediaries appearing
Rate integrity
Inventory integrity
Cost
What are we doing?
Enhance all channels, particularly Marriott.com
Travelweb
Best Rate Guarantee
Win-Win deals with e-intermediaries

Rita M. Cuddihy
Senior Vice President
Marketing
Marriott International, Inc.

Marriott Rewards
The world’s longest running and most
popular loyalty program
Over 19 million members
Recent accolades – top hotel loyalty program
Business Week
Business Travelers Magazine
7th consecutive year

Marriott Rewards Members are
Loyal to the Brand
% of Trip Share Given to Marriott Brands
12%
32%
54%
64%
79%
Non-
members
Members
Silver
Gold
Platinum

Marriott Rewards Active Members
Continue to Grow…
2000
2001
2002
2003E
Active members have made a paid stay within the past 12 months.
14% increase
1% increase
5% increase

And The Number Of Elite Members Has
Grown Even Faster
2000
2001
2002
2003E
Elite members have stayed at least 10 paid nights within a calendar year
23% increase
13% decrease
17% increase

Results in Strong Growth in Member Activity
2000
2001
2002
2003E
14% increase
4% increase
10% increase
Paid Nights

Marriott Rewards Service
Enhancements in 2003
Elite benefits applicable at all brands
Distinct 800 lines for Silver, Gold and
Platinum Elite members
Easy redemption with electronic certificates
Faster track to achieve Silver Elite status

Marriott Rewards Offers More…
Resorts
Onsite golf
Spas
… than any other program

November 20, 2003
20th Anniversary

Where Do We Go From Here?
Strengthening relationships
Focus on end-to-end customer experience
Guest recognition through enhanced
segmentation

Strengthening Relationships
Recognize “Our associates have the right
information at the right touchpoint so they
can recognize our guest.”
Differentiate “We understand our customers
and the value of our relationship.”
Anticipate “They don’t have to ask.”
Rewards “Rewards inspire repurchase and
increase share.”

Robert J. McCarthy
Executive Vice President
North American
Lodging Operations
Marriott International, Inc.

Operational Excellence
Our Associates…
…Are Our Most
VALUED ASSET!
100

Quality Assurance Program
Audits Performed by Certified
Third Party
Hotels Audited Twice a Year
Enforce Standards Compliance
at Every Hotel
101

Guest Satisfaction Survey
Reinforces Quality and
Consistency
Respond Quickly to Guest
Concerns
High Performers are Recognized
and Rewarded
Survey for Event Customers
102

Innovation in Products and Services
Piloting Check-in Check-out Kiosks
Wired for Business Survey Results:
83% would purchase Wired for Business
on additional stays
49% have purchased Wired for Business
on 5 or more stays
Wired for Business buyers would give
Marriott 16% more of their trips
103

Daily Basics Meetings
Global Communication Platform
Guests Feel Welcomed and
Appreciated
Associates are Recognized
and Acknowledged
for Contributions
104

At Your Service
Guest
At Your Service
Agent
105

At Your Service
Facilitates Guest Recognition
Identifies Guest Issues/Trends
Enables Issue Resolution
Creates Repeat Guest Profile
106

At Your Service
Intent to Return
Overall Satisfaction
Satisfaction with
Problem Resolution
Compared to
Brand Average
5.1% Better
Guest Satisfaction
Survey Questions
4.5% Better
2.5% Better
107

Hallmarks of Consistency
Setting High Brand Standards
Rigorous Quality Assurance
Program
Timely Guest Feedback
Innovation in Products and Services
Respect for the Individual
108

Amy C. McPherson
Senior Vice President
Global Revenue Management
Robert J. McCarthy
Executive Vice President
North American
Lodging Operations
Bruce W. Wolff
Senior Vice President
Distribution Sales
and Strategy
Rita M. Cuddihy
Senior Vice President
Marketing
Sales, Marketing & Operations Q&A
Moderator: Leeny K. Oberg
Vice President Investor Relations

Stephen P. Weisz
President
Marriott Vacation Club International
Marriott International, Inc.
Vacation Ownership
The Marriott Way

Ritz Carlton Aspen Member Lounge
1Source: American Resort Development Association
Vacation Ownership Industry
Began 40 years ago in Europe1
5,400 Vacation Ownership resorts in
over 100 countries1
Vacation Ownership is the purchase of
an interval of time in a resort or points
in a resort system.
Product ownership typically based on –
Deeded Real Estate (forever)
Right-to-use (specified number of years)
Points in a trust (trust owns real estate)
Typically sold in 1 week intervals (“timeshare”)
May be multiple weeks (“fractional” up to “quartershare”)
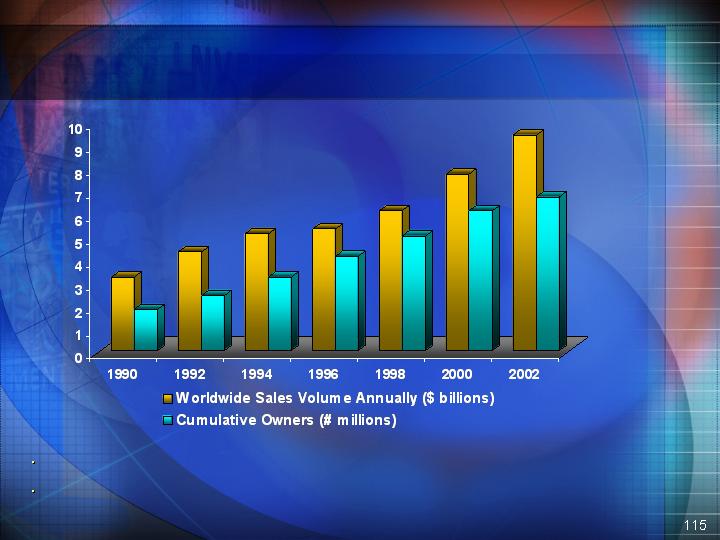
Vacation Ownership Industry
In 2002 $9.4 billion annual sales, 6.7 million cumulative owners
Since 1990, vacation ownership sales CAGR of 9.3%.
1 Source: ARDA - The Vacation Ownership Industry: Selected Characteristics 2003

Brands affiliated with Lodging companies
taking market share from other pure
Vacation Ownership brands
Improving consumer acceptance driving
industry growth
Continued market segmentation
More flexibility to use options and more “club”
benefits
Relationship marketing replacing telemarketing
Industry Trends

Average Price
$10K - $60K/
Week
$10K - $15K/
Week
$100K - $400K/
3 - 4 week
membership
$100K - $300K/
Fraction
Typical Customer
$75K - $200K+
household income
$50K - $90K
household income;
value conscious
$200K+ household
income; $3M+
net worth
$125K+ household
income; $1M+
net worth
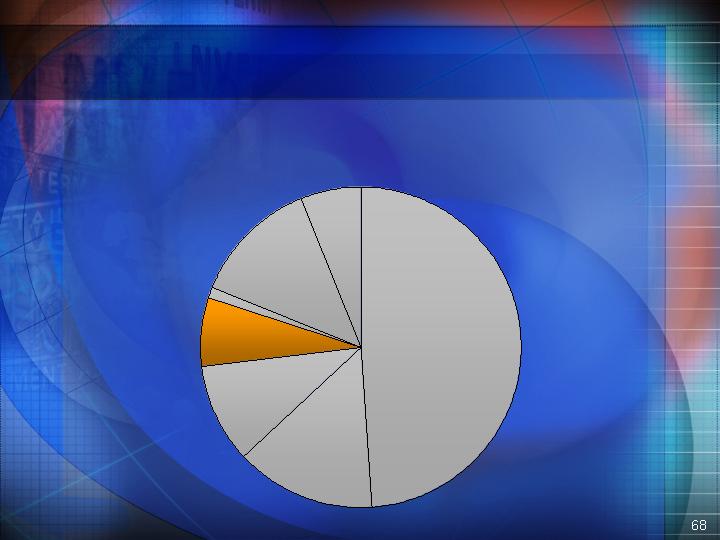
Portfolio of Brands
% of Total 2002
Contract Sales
4%
11%
5%
80%

2002
1997
Source: Vacation Ownership World Magazine
(1) U. S. headquartered companies with Sales of $20 million or more in timeshares and/or fractional ownership interests
Marriott Vacation Ownership Brands
Remaining Industry
Marriott Vacation Ownership Sales
Market Share of US Based Companies1

What Does Marriott Vacation
Ownership Do for Marriott Lodging?
Increases MI brand loyalty as measured in
average roomnights per year from MVCI owners
Improves overall value of Marriott Rewards
system by providing highly-desirable
redemption locations
Drives improved results at hotels co-located
with Marriott Vacation Ownership projects, (ex.
Aruba, Kauai, Palm Springs, Orlando, Phuket)
Provides flexibility in deal negotiations

Marriott Vacation Ownership Priorities
Customer relationship management
Profitability and margins
Return on invested capital

How We Sell
Counselor sales approach
Marketing focus on:
In market leads
Affinity leads (Marriott Rewards)
Owner referrals
Prepared for do-not-call environment
Invested over $40 million in customer
relationship management (CRM) systems
CRM will enable us to learn from each
customer interaction and customize sales
approaches

*Excludes gain on sale of Interval International of $44M.
$60
$94
$138
$147
$139
$146 to
$148
$123
Marriott Vacation Ownership Results
$165 to
$175
($ in Millions)
122

Financing
Profit Drivers
Sale of Vacation
Ownership Interests
Financing and Sales
of Vacation
Ownership Mortgages
Management Fees,
Rental Commissions
Development
Services

Profit Drivers
Development
40%
Financing
45%
Services
15%
Percentage of total timeshare profit in 2002
Note: Administrative costs are allocated pro-rata based on operating profit

Product costs
40% of sales price
Number of units:
Construction:
Sales life:
Project life sale
Project costs:
Typical MVCI Development Project
300 - 500
Phased units (30 – 60 units per phase)
7 years – 10 years
$300 - $500M
Marketing & sales costs
Commence approximately
12-18 months prior to first occupancy
Sales:
Development margin
45% of sales price
15% of sales price

Marriott Vacation Ownership
Consumer Financing
Propensity to finance is 45% to 48% of MVCI sales
Typical MVCI borrowing amount is $17,000
Typical borrowing rate is 12.5% to 12.8%
Credit guideline is credit score of over 600 for
automatic approval
Best-in-class servicing
Recycle defaulted inventory

Marriott Vacation Ownership
Mortgage Notes Sales
Normal part of capital recycle program
(2 note sales planned for 2003)
MVCI gets face amount of loan and splits
interest with investor
Gain represents present value of expected
future interest cash flows
Limited Marriott credit enhancement

Marriott Vacation Ownership
Services Income
Management fees of approximately $20M
in 2003; fee is typically 10% of annual
condo owners dues
Rental commissions
Ancillary business (food and beverage,
golf, spa)

2Excludes Interval International gain
Marriott Vacation Ownership ROIC1
1Earnings before interest and taxes divided by average invested capital

Typical MVCI Project
Year 1
Year 2
Year 3
Year 4
Year 5
Year 6
Year 7
Year 8
Year 9
Year 10
Year 11
Year 12
Invested capital project life to date
Annual contract sales
($ in Millions)
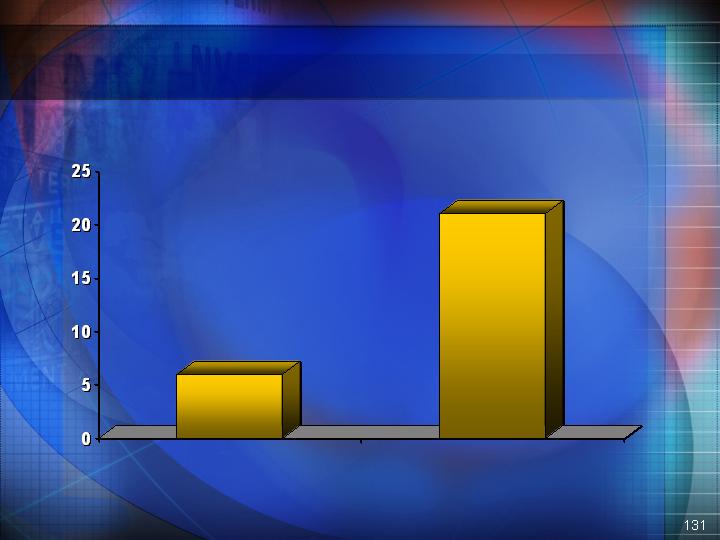
Marriott Vacation Ownership
Number of Projects With 5+ Years of Sales
2003
2006E
6
21

Marriott Vacation Ownership
ROIC Improvement
Maturing of long term inventory
Increase number of joint ventures. Joint venture
terms typically include:
Split of development risks and profits
Retention by MVCI of financing and
management profits
Non recourse financing
Increase number of marketing & sales agreements
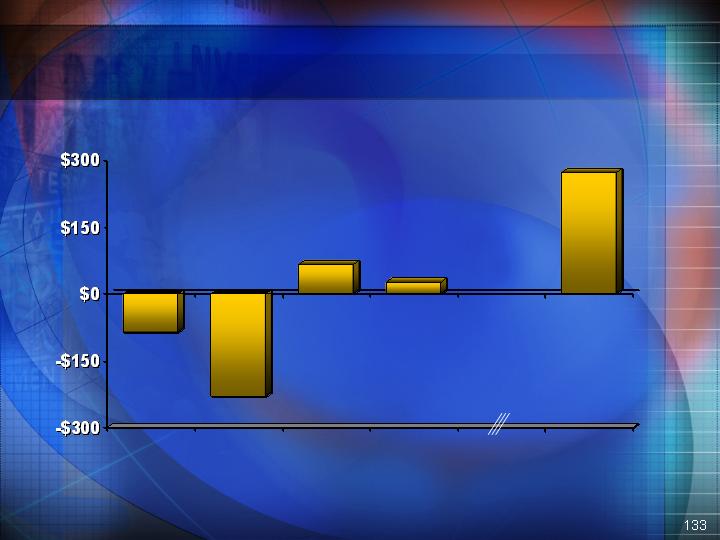
Marriott Vacation Ownership
Cash From Operations1
2000
$66
2001
2002
2003E
2006E
$26
$(86)
$(230)
$270
1Timeshare cash flow defined as after tax timeshare profit plus timeshare activity, net,
and depreciation and amortization.
($ in Millions)

Marriott Vacation Ownership
Profit Outlook
2000
$1391
2001
2003E
2004E
2006E
$146 to
$148
$138
$147
1Excluding gain on sale of Interval International investment
($ in Millions)
$165 to
$175
$280 to
$290
2002

Stephen P. Weisz
President
Marriott Vacation Club International
Marriott International, Inc.
Marriott Vacation Club Ownership Q&A
Moderator: Leeny K. Oberg
Vice President
Investor Relations

Joseph V. Cozza
Executive Director of Catering
New York Marriott Marquis
Marriott International, Inc.

George McNeill, CMC
Executive Chef
New York Marriott Marquis
Marriott International, Inc.

Kevin M. Kimball
Executive Vice President
Lodging Finance
Marriott International, Inc.

Lodging Growth
Sources of revenue
Property level margins
Worldwide rooms growth
Outlook
142
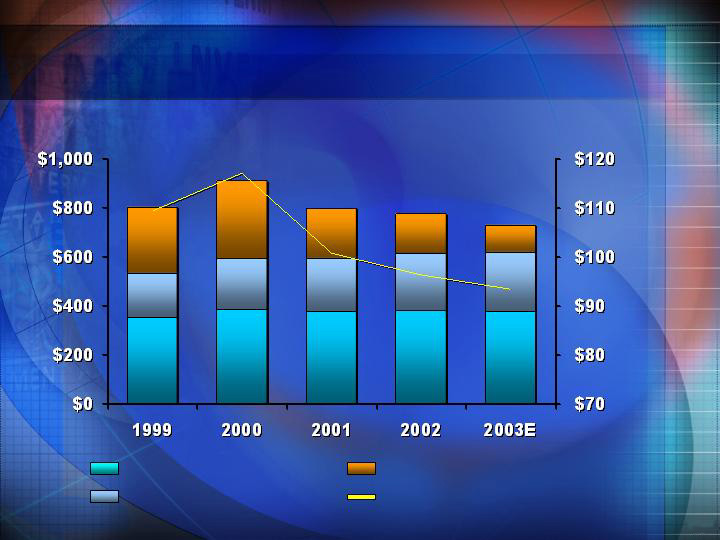
Lodging Fee Revenue
$800M
$907M
$794M
$773M
$725 to
$735M
Marriott Hotels & Resorts
REVPAR
Base Management Fees
Franchise Fees
Incentive Management Fees
143
($ in Millions)
Marriott Hotels & Resorts REVPAR
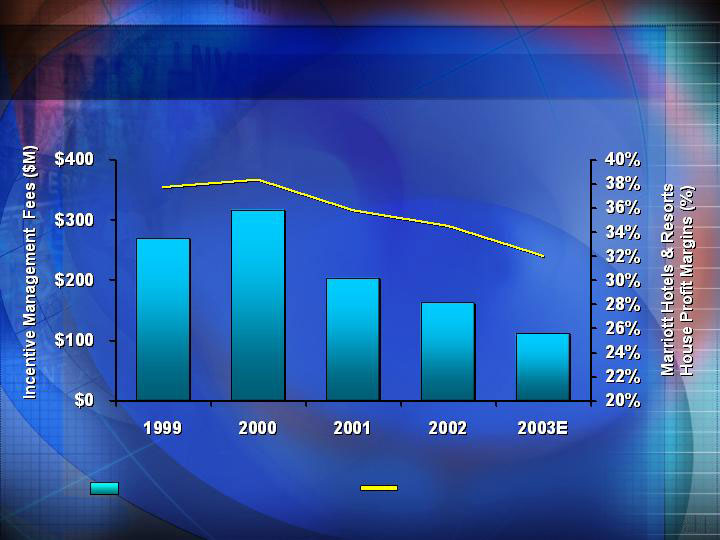
Incentive Fees have fallen with Margins
Incentive management fees vs house profit margins
Incentive management fees
MHR house profit margin
144

U.S. Lodging Profit Contribution1
West
20%
South East
18%
South Central
13%
Mid Atlantic
18%
North East
14%
Mid West
17%
12003 YTD; full service, extended stay and select service segments.
Does not include MVCI or allocation of overhead
145

International Lodging Profit Contribution1
Central America
13%
Latin America
6%
Middle East &
Africa
11%
Continental Europe
29%
Asia Pacific
30%
United Kingdom
11%
12003 YTD; full service, extended stay and select service segments.
Does not include MVCI or allocation of overhead
146

Management and Franchise Contracts
Long-term
High renewal rates
147

International
U.S.
$100
Varies based on part of the world
3% of revenue
Current Typical Management Contract
35% House Profit
22% Net House Profit
3% of revenue in Europe &
Mideast; 1% to 3% of revenue
in Asia
10% to 11% of capital
Characteristics
Revenue per room
Base fee
Margins
Owners priority
15% to 25% of
Net House Profit
20 to 40 years
(including renewals)
Incentive fees
Term
Same or slightly lower in Europe;
Significantly higher in Asia
Similar in Europe;
Usually none in Asia
Similar in Europe;
Typically 8% of House Profit in Asia
Slightly less in Europe; 15 to
30 years (including renewals)
in Asia
148

Significant REVPAR Premiums1
1Smith Travel Research, September 2003 YTD; managed U.S. comparable hotels
Marriott
Renaissance
Residence
Inn
Courtyard
TownePlace
Suites
SpringHill
Suites
Ritz-Carlton
114
115
104
132
125
117
107
149

Property Level Revenue Sources
Marriott Hotels & Resorts1
Rooms
Food & beverage
Other
Total
2003 YTD
150
61%
32
7
100%
1As of Sept. year to date; 145 comparable managed North American hotels. “Other”
includes telephone, garage, gift shops, rents & commissions, golf & spa revenues

2003 YTD
% of Sales
Expenses
Wages & benefits
33%
Cost of sales & controllables
17
5
Utilities, repair and maintenance
Sales & marketing
Insurance, accidents, G&A and other
5
House Profit
5
35%
Base fee
Furniture, fixtures & equipment escrow
Real estate insurance, taxes & other
Net House Profit
3
5
5
22%
Property Level Margins
Marriott Hotels & Resorts
1As of Sept. year to date; 145 comparable managed North American hotels. “Other” includes telephone, garage,
gift shops, rents & commissions, golf & spa revenues
151

Focus on Profitability
Expense Items
Labor & benefits
Food & beverage
Telephone
Insurance
Labor scheduling
Procurement program
Wired for business
Systemwide insurance program
REVPAR increase of approximately 3% annually
should hold hotel margins flat from 2003 to 2006
Competitive Advantage
152

Labor Scheduling
Automated
Cross training
Citywide access
Highly skilled labor force
Higher associate satisfaction
Hours optimized
153

Procurement
154

Marriott Hotels & Resorts Occupancy Level Sensitivity
(1989-2000 for comparable managed properties)
3.0%
2.0%
6.8%
6.1%
Avg. REVPAR Growth
Avg. ADR Growth
Years when occupancy
was 72% to 75%
Years when occupancy
was above 75%
155

Marriott Hotels & Resorts
REVPAR versus House Profit Margin
MHR Comparable U.S. REVPAR
MHR House Profit Margin
156
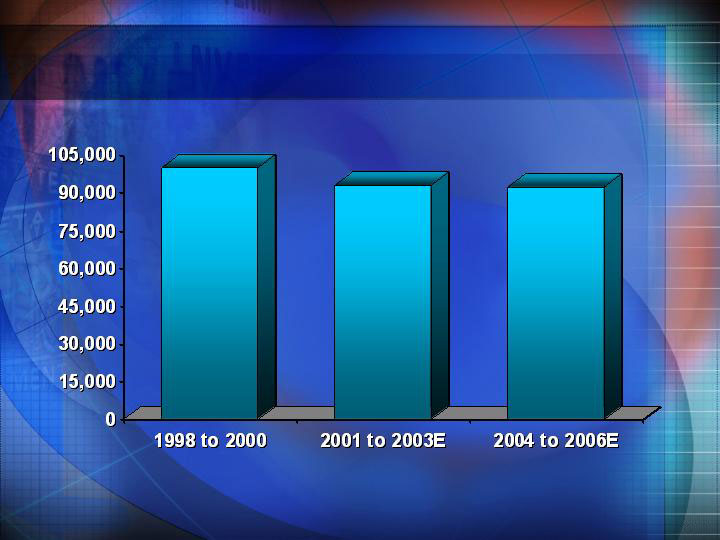
Gross Room Additions1
100,000
93,000
90,000 to
95,000
1Includes worldwide room additions for all lodging brands; does not include MVCI,
Ramada International or hotel deletions.
157

Gross Room Additions1
International
New Builds
15%
International
Conversions
5%
North
American
Conversions
21%
North
American
New Builds
59%
International
New Builds
17%
International
Conversions
10%
North
American
Conversions
20%
North
American
New Builds
53%
2001 to 2003E
2004 to 2006E
93,000
rooms opening
90,000 to 95,000
rooms opening
1Does not include Ramada International or MVCI
158

Increased Room Additions Outside The U.S.1
2001 to 2003E
2004 to 2006E
International
Full Service
New Builds
15%
International
Conversions
5%
North American
Full Service
Conversions
11%
North American
Full Service New Builds
20%
North
American
Limited Service
New Builds
39%
North American
Limited Service
Conversions
10%
International
Full Service
New Builds
17%
International
Conversions
10%
North American
Full Service
Conversions
16%
North American
Full Service New Builds
14%
North
American
Limited Service
New Builds
39%
North American
Limited Service
Conversions
4%
1Does not include Ramada International or MVCI
93,000 rooms opening
90,000 to 95,000
rooms opening
159
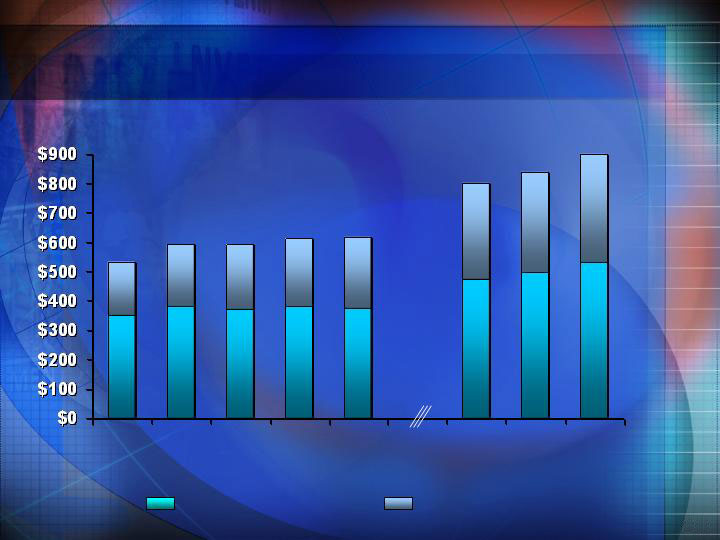
Base and Franchise Fee Recovery Scenarios
Base Management Fees
Franchise Fees
($ in Millions)
1999
2000
2001
2002
2003E
$532
$591
$592
$611
$617
$800
$840
$900
2006E
3% Annual
REVPAR
Growth
2006E
5% Annual
REVPAR
Growth
2006E
8% Annual
REVPAR
Growth
160

Incentive Management Fee Recovery Sensitivity
(based on 2003 year to date)
NHP More Than
30% Below
Owners Priority
Hotels Earning Incentive
Management Fees in 2003
845 Managed
Hotels
22%
13%
3%
8%
4%
50%
Net House Profit (NHP)
Less Than 5% Below
Owners Priority
NHP 5% to 10% Below
Owners Priority
NHP 10% to 20% Below
Owners Priority
NHP 20% to 30% Below
Owners Priority
161
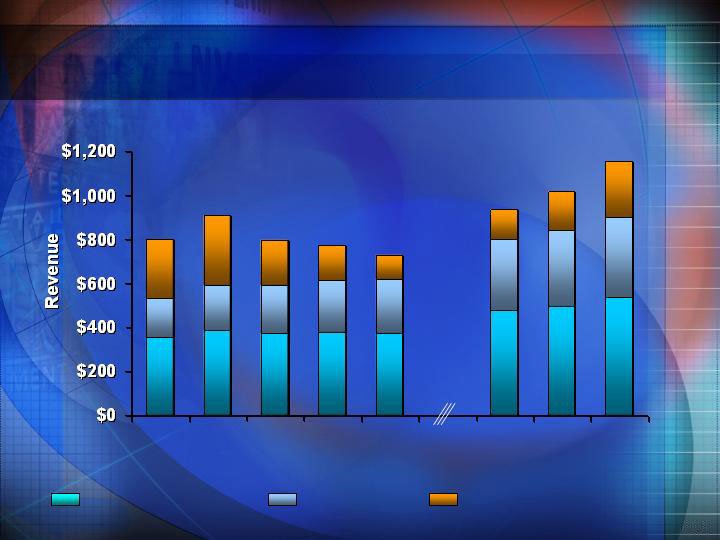
Lodging Fee Revenue Recovery Scenarios
Base Management Fees
Franchise Fees
Incentive Management Fees
($ in Millions)
1999
2000
2001
2002
2003E
$725 to
$735
$800
$907
$794
$773
$935
$1,015
$1,150
2006E
3% Annual
REVPAR
Growth
2006E
5% Annual
REVPAR
Growth
2006E
8% Annual
REVPAR
Growth
162

Core Lodging Results REVPAR Sensitivities
(Full Service, Select Service and Extended Stay segments)
($ in Millions)
Note: 2001 – 2002 adjusted for normalized operations
2000
2001
2002
2003E
2006E
3% Annual
REVPAR
Growth
2006E
5% Annual
REVPAR
Growth
2006E
8% Annual
REVPAR
Growth
$798
$607
$574
$545
$765
$845
$980
163

164

Carolyn B. Handlon
Executive Vice President
and Global Treasurer
Marriott International, Inc.

Discussion Topics
Marriott’s financial strengths
How we invest our capital
Improving return on invested capital
Meaningful earnings per share growth
166

REVPAR
premium
Strong returns
to owners &
franchisees
Capital
recycling
Financial
flexibility
Increased
distribution/
market share
Brand
equity
Strong
Cash flow
Growing
Earnings
Higher
Return on
Invested
Capital
Our Business Model
167

Financial Strength and Stability
Broad geographic distribution
Brand diversification
Length of contracts
Strong balance sheet and cash flow
Management/franchise business model
168

Solid Investment Grade
Income from continuing
operations
EBITDA1
Debt at 9/12/03
2003 Latest
4 Quarters
($ in Millions)
1Includes pre-tax operating losses of $127 million from our synthetic fuel operations, before syn-fuel
depreciation expense of $10 million. The operating losses are more than offset by the tax credits
generated by this business, which reduce our income tax expense
$422
$648
$1,678
169

Investment Philosophy
Focus on management and franchise contracts
Invest where expected returns exceed cost of capital
Minimal real estate ownership
Selective real estate development or temporary
ownership to enhance management agreement
Recycle capital
170

Investment Process
Set aggregate commitment levels through
budget and long range planning process
Evaluate investments using rigorous criteria;
net present value, earnings per share and
return on invested capital
Remain investment grade credit
Monitor and analyze post audit results
171

Marriott International Capital Recycling
Typical Holding Time
Timeshare resort units
3 years
Timeshare consumer notes
6 months or less
Lodging senior and
mezzanine debt
5 years
Lodging new build
Lodging acquisitions
12 to 18 months for Limited Service;
2 to 3 years Full Service
3 to 12 months
Lodging new build
172

Lodging Notes Receivable and Guarantees1
Lodging notes receivable
Lodging guarantees in effect
Total
$915
503
$1,418
At 9/12/03
$944
549
$1,493
($ in Millions)
1The above numbers do not include $800 million and $200 million of loans and
guarantees primarily related to timeshare mortgage notes and Senior Living
Services at 9/12/03 and 1/03/03, respectively.
At 1/03/03
173

Guarantee and Loan Loss Provisions
Guarantee and loan loss
provisions
$90
2001
2002
$30
2003
$10
3Q YTD
($ in Millions)
174

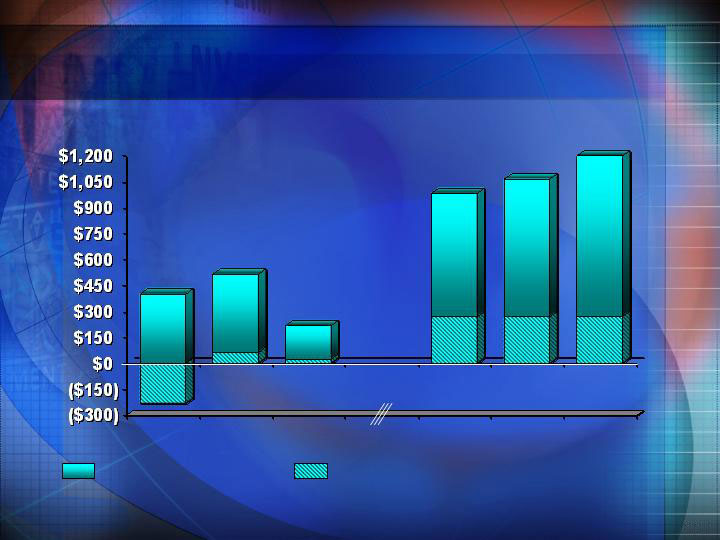
Lodging Results Provide Attractive Upside1
($ in Millions)
1Adjusted to reflect normalized operations
2000
2001
2002
2003E
2006E
3% Annual
REVPAR
Growth
$936
$690 to
$700
Approx.
$1,050
Approx.
$1,130
Approx.
$1,270
$7561
$7131
2006E
5% Annual
REVPAR
Growth
2006E
8% Annual
REVPAR
Growth
Core lodging
Timeshare
175
Cash From Operations1
2001
$403
$516
$220
2002
2003E
$990
2006E
3% Annual
REVPAR
Growth
2006E
5% Annual
REVPAR
Growth
2006E
8% Annual
REVPAR
Growth
$1,070
$1,200
($ in Millions)
1Timeshare business’s impact on cash flow defined as after tax timeshare profit plus timeshare activity, net, and depreciation and
amortization.
Core lodging and other
Timeshare
176

Estimated Free Cash Flow
Net cash flow from operations1
2004E to 2006E
2004E investment spending
2005E to 2006E
investment spending
2004E to 2006E dispositions,
note sales & collections
Free cash flow
$2,700
($500)
$1,500 to $2,000
$1,000 to $1,500
1Assumes average of 3%, 5% & 8% annual REVPAR growth scenarios and includes
MVCI timeshare development
($1,000 to $2,000)
($ in Millions)
177
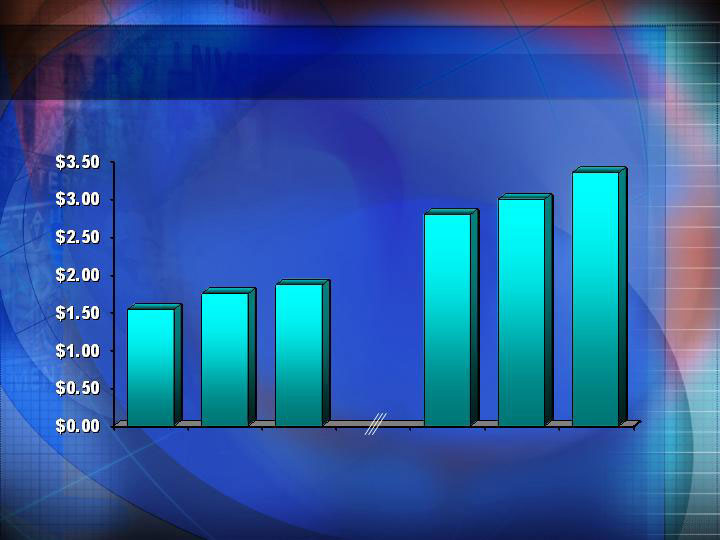
EPS Sensitivity to REVPAR1
($ per share)
1From continuing operations and normalized for 2001 and 2002; assumes contribution from synthetic
fuel of $0.40 in 2003 and $0.38 in 2006
2001
2002
2003E
$2.80
$3.00
$3.35
$1.75
$1.86 to
$1.88
$1.54
2006E
3% Annual
REVPAR
Growth
2006E
5% Annual
REVPAR
Growth
2006E
8% Annual
REVPAR
Growth
178

EPS Growth Drivers 2003E to 2006E1
Assuming 3% to 6% REVPAR Growth Annually
Base and
Franchise
Fees
9% to 11%
5%
17% to 22%
Incentive
Management
Fees
Operating
Leverage and
Net Interest Income
Total
EPS
MVCI
2%
1% to 4%
1Does not include earnings from synthetic fuel
179

180

Edwin D. Fuller
President and
Managing Director
Marriott Lodging - International
William J. Shaw
President and
Chief Operating Officer
John W. Marriott III
Executive Vice President
Lodging
James M. Sullivan
Executive Vice President
Lodging Development
Arne M. Sorenson
Executive Vice President,
Chief Financial Officer and President
Continental European Lodging
Leadership Q&A
Moderator: Laura E. Paugh
Senior Vice President
Investor Relations