The right choice for the long term¨
Washington Mutual
Investors Fund
Annual report for the year ended April 30, 2010
Washington Mutual Investors FundSM seeks to provide income and growth of principal through investments in quality common stocks.
This Fund is one of the 30 American Funds. American Funds is one of the nation’s largest mutual fund families. For nearly 80 years, Capital Research and Management Company,SM the American Funds adviser, has invested with a long-term focus based on thorough research and attention to risk.
On the cover: west front aerial view of Mount Vernon Estate. On page 11: Upper Garden at Mount Vernon. Both photographs are courtesy of the Mount Vernon Ladies’ Association.
| In this report |
| | | |
| | | Special feature |
| | | |
| 6 | | What makes your Fund different? A well-marked path and a seasoned guide. |
| | | |
| | | Contents |
| | | |
| 1 | | Letter to shareholders |
| | | |
| 3 | | The value of a long-term perspective |
| | | |
| 12 | | Investment portfolio |
| | | |
| 16 | | Financial statements |
| | | |
| 30 | | Board of directors, directors emeriti, advisory board and other officers |
| | | |
Fund results shown in this report, unless otherwise indicated, are for Class A shares at net asset value. If a sales charge (maximum 5.75%) had been deducted, the results would have been lower. Results are for past periods and are not predictive of results for future periods. Current and future results may be lower or higher than those shown. Share prices and returns will vary, so investors may lose money. Investing for short periods makes losses more likely. Investments are not FDIC-insured, nor are they deposits of or guaranteed by a bank or any other entity, so they may lose value. For current information and month-end results, visit americanfunds.com.
Here are the average annual total returns on a $1,000 investment with all distributions reinvested for periods ended March 31, 2010 (the most recent calendar quarter-end):
| Class A shares | 1 year | 5 years | 10 years |
| Reflecting 5.75% maximum sales charge | 34.35% | 0.11% | 2.68% |
The total annual Fund operating expense ratio was 0.70% for Class A shares as of April 30, 2010.
Investment results assume all distributions are reinvested and reflect applicable fees and expenses. The Fund’s investment adviser and business manager waived a portion of their management fees from September 1, 2004 through December 31, 2008. Applicable Fund results shown reflect the waiver, without which they would have been lower. See the Financial Highlights table on pages 24 and 25 for details.
Results for other share classes can be found on page 27.
Equity investments are subject to market fluctuations. See the prospectus and the Risk Factors section of this report for more information on these and other risks associated with investing in the Fund.
Fellow shareholders:
The U.S. stock market, anticipating the now-evident signs of economic improvement, climbed steadily during Washington Mutual Investors Fund’s fiscal year ended April 30, 2010. The Fund’s total return for this period was 34.3%, with income dividends of 67½ cents per share reinvested. The Fund did not make a capital gain distribution during the year.
The U.S. economy has now produced three consecutive quarters of positive growth in the gross domestic product, aided by federal government stimulus and spending programs and supported by accommodative Federal Reserve monetary policy, with a near-zero federal funds interest rate.
To replenish inventories and respond to new orders, industrial production has been increasing since last June. Corporate profits have picked up. Since January 2010, over 100 Standard & Poor’s 500 Composite Index companies have either raised their dividends or started paying them and only two have either decreased or suspended them. Although unemployment remains very high at 9.7%, the economy is now creating more jobs than it loses. Consumer spending is leading the growth in the gross domestic product. While we expect the economy to continue to grow, it still faces headwinds. Home prices are stabilizing, but foreclosures and unsold homes still have a depressing effect on the real estate market. Commercial real estate projects continue to decline, and joblessness in the construction industry remains very high. State and local gove rnments are being forced to trim spending because of lower tax receipts. Our own federal government deficits are a long-term worry for the economy. Notwithstanding these headwinds, we do expect the economy to continue to expand, and we think this environment should continue to be positive for the large-capitalization, dividend-paying stocks in which the Fund invests.
Since October 31, 2009, when we last reported to you, 11 new companies appeared in the Fund’s portfolio: Nucor, Tenaris, Diamond Offshore Drilling, Potash Corp. of Saskatchewan, W.W. Grainger, Stanley Black & Decker, Walt Disney, Colgate-Palmolive, M&T Bank, Bank of Montreal and Toronto-Dominion Bank. Eight companies have been eliminated: 3M, Avery Dennison, Burlington Northern Santa Fe, Gannett, Limited Brands, Nordstrom, Sysco and Clorox.
The Investment Adviser’s Report on page 2 provides more information on the Fund’s results, which appear below.
Average annual total returns for periods ended April 30, 2010, with all distributions reinvested | | 1 year | 5 years | 10 years | Lifetime (Since 7/31/52) |
Washington Mutual Investors Fund (Class A shares) | | 34.3% | 1.8% | 3.5% | 11.8% |
| Standard & Poor’s 500 Composite Index* | | 38.8 | 2.6 | –0.2 | 10.5 |
*The S&P 500 is unmanaged and does not reflect the effect of sales charges, commissions or expenses. |
| Cordially, | |  |
| | James H. Lemon, Jr. Vice Chairman of the Board | Jeffrey L. Steele President of the Fund |
June 7, 2010
For current information about the Fund, visit americanfunds.com.
Investment adviser’s report
As the recovery in both the consumer and industrial sectors of the U.S. economy continued to progress, stocks have advanced sharply. Key economic indicators improved from a year ago, and retail sales, industrial production, exports and company earnings showed solid growth. Gross domestic product expanded at a 3.0% annualized rate in the first quarter of 2010, although over half of that expansion was due to the restocking of inventories. Adding support to equity markets, inflation and interest rates continue at low levels.
In this positive environment, Washington Mutual Investors Fund posted a total return of 34.3% for the past 12 months. Even though the Fund’s results were strong on an absolute basis, Washington Mutual trailed the unmanaged Standard & Poor’s 500 Composite Index, which gained 38.8%.
Over the past five years, Washington Mutual provided an average annual total return of 1.8%, compared with 2.6% by the S&P 500. However, the Fund continued to outpace the S&P 500 by significant margins over longer periods. As the chart on page 1 shows, for the 10-year period ended April 30, 2010, the Fund had an average annual return of 3.5%, compared with –0.2% by the S&P 500. Over its nearly 58-year lifetime, Washington Mutual Investors Fund has had an average annual return of 11.8%, compared with 10.5% by the S&P 500.
Dividends have resumed their upswing since last autumn. One of the Fund’s larger holdings, IBM, increased its dividend by 18%. Companies built liquidity in the face of the recession, and now balance sheets are among the strongest we have ever seen. The industrial companies in the S&P 500 have an average cash-to-assets ratio of about 12% and can also profitably take advantage of current low interest rates to meet additional borrowing requirements.
The Fund’s investments
The Fund’s five largest investment sectors at fiscal year-end as a percentage of net assets were Industrials (17.1%), Energy (13.3%), Health care (12.7%), Utilities (9.7%) and Consumer discretionary (9.2%). Industrials, energy and health care made large contributions to the Fund over the past 12 months, while telecommunications and utilities detracted from results.
Often in rapidly recovering stock markets like the past 12 months, the lesser quality, smaller companies, which fell the most during the decline, experience a stronger recovery than the larger, well-financed companies that pay dividends. It has often been the case that after a year to 18 months of recovery, the next wave of stock market gains incorporates the larger income-oriented companies. Should this happen, the Fund could benefit from this new wave of market expansion. In addition, growing worries about debt problems in Greece and the concern that the troubles may spread to other European countries may cause investors to favor U.S. stocks.
Despite the advances of the U.S. economy and stock markets so far, there are some signs that hint that this could be a longer and more drawn-out process than usual. Companies are only tentatively replenishing their inventories and haven’t returned to normal hiring levels. State and federal governments are grappling with fiscal crises. Commercial real estate remains troubled, and there has been very little recovery in housing starts.
We will continue to monitor these developments closely. As always, we will focus our investments in quality companies that meet strict financial standards that include a consistent record of paying dividends. This approach has served the Fund well in all kinds of markets, and we believe it will continue to do so in the years ahead.
— Capital Research and Management Company
For current information about the Fund, visit americanfunds.com
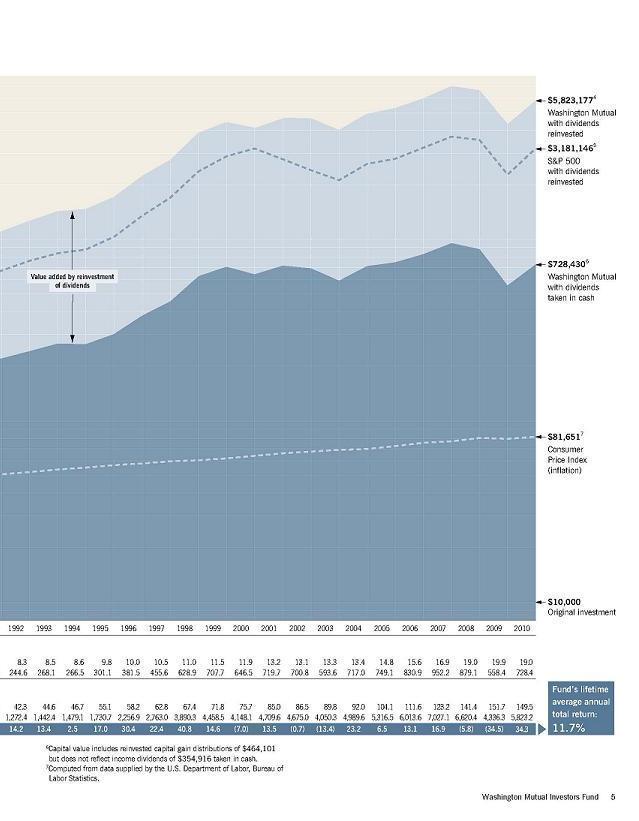
The value of a long-term perspective
Below are the plot points for the mountain chart image featured above.
| WASHINGTON MUTUAL INVESTORS FUND | | | | | |
| MOUNTAIN CHART AND INDEX PLOT POINTS | | | | | |
| | | | | | | | |
| Results of a $10,000 investment in WMIF, the S&P500, and the CPI. | | | | |
| July 31, 1952 through April 30, 2010 | | | | | | |
| | | | | | | | |
| Year | CAPITAL VALUE | TOTAL VALUE | | | |
| ended | Dividends in | | Dividends | | TOTAL | | |
| April 30 | Cash | WMIF6 | Reinvested | WMIF4 | RETURN | S&P500 | CPI7 |
| | | | | | | | |
| 07/31/52 | | $9,425 | | $9,425 | | $10,000 | $10,000 |
19533 | $170 | 9,161 | $170 | 9,330 | -6.7% | 10,094 | 9,963 |
| 1954 | 434 | 10,773 | 449 | 11,494 | 23.2 | 12,282 | 10,037 |
| 1955 | 500 | 14,665 | 542 | 16,288 | 41.7 | 17,295 | 10,000 |
| 1956 | 580 | 17,851 | 654 | 20,565 | 26.3 | 22,938 | 10,075 |
| 1957 | 647 | 18,304 | 756 | 21,877 | 6.4 | 22,520 | 10,449 |
| 1958 | 680 | 16,928 | 825 | 21,055 | -3.8 | 22,269 | 10,824 |
| 1959 | 701 | 24,125 | 885 | 31,071 | 47.6 | 30,569 | 10,861 |
| 1960 | 728 | 21,871 | 948 | 29,041 | -6.5 | 29,850 | 11,049 |
| 1961 | 815 | 26,300 | 1,097 | 36,167 | 24.5 | 37,071 | 11,161 |
| 1962 | 824 | 26,592 | 1,146 | 37,654 | 4.1 | 38,158 | 11,311 |
| 1963 | 891 | 28,838 | 1,279 | 42,278 | 12.3 | 42,296 | 11,423 |
| 1964 | 923 | 31,149 | 1,369 | 47,109 | 11.4 | 49,698 | 11,573 |
| 1965 | 956 | 36,940 | 1,462 | 57,490 | 22.0 | 57,450 | 11,760 |
| 1966 | 1,048 | 38,487 | 1,648 | 61,603 | 7.2 | 60,563 | 12,097 |
| 1967 | 1,176 | 39,424 | 1,906 | 65,270 | 6.0 | 64,731 | 12,397 |
| 1968 | 1,331 | 42,481 | 2,231 | 72,692 | 11.4 | 69,365 | 12,884 |
| 1969 | 1,516 | 48,408 | 2,627 | 85,576 | 17.7 | 75,988 | 13,596 |
| 1970 | 1,605 | 39,049 | 2,874 | 71,603 | -16.3 | 61,834 | 14,419 |
| 1971 | 1,711 | 48,769 | 3,193 | 93,387 | 30.4 | 81,718 | 15,019 |
| 1972 | 1,779 | 47,991 | 3,455 | 95,521 | 2.3 | 87,267 | 15,543 |
| 1973 | 1,818 | 43,290 | 3,671 | 89,522 | -6.3 | 89,214 | 16,330 |
| 1974 | 1,858 | 40,682 | 3,907 | 87,956 | -1.7 | 77,959 | 17,978 |
| 1975 | 2,185 | 42,855 | 4,828 | 98,315 | 11.8 | 79,061 | 19,813 |
| 1976 | 2,350 | 53,771 | 5,498 | 129,949 | 32.2 | 95,785 | 21,011 |
| 1977 | 2,510 | 55,449 | 6,171 | 140,348 | 8.0 | 96,702 | 22,472 |
| 1978 | 2,658 | 54,228 | 6,849 | 144,340 | 2.8 | 100,121 | 23,933 |
| 1979 | 2,870 | 58,180 | 7,785 | 163,075 | 13.0 | 110,959 | 26,442 |
| 1980 | 3,203 | 56,032 | 9,167 | 165,848 | 1.7 | 122,446 | 30,337 |
| 1981 | 4,784 | 72,410 | 14,603 | 230,424 | 38.9 | 160,796 | 33,371 |
| 1982 | 4,097 | 69,851 | 13,327 | 235,768 | 2.3 | 148,977 | 35,543 |
| 1983 | 4,497 | 101,855 | 15,517 | 362,293 | 53.7 | 221,825 | 36,929 |
| 1984 | 4,840 | 100,116 | 17,527 | 373,509 | 3.1 | 225,698 | 38,614 |
| 1985 | 5,465 | 115,473 | 20,783 | 452,498 | 21.1 | 265,541 | 40,037 |
| 1986 | 6,110 | 152,209 | 24,380 | 623,768 | 37.9 | 361,778 | 40,674 |
| 1987 | 6,781 | 180,960 | 28,228 | 771,949 | 23.8 | 457,672 | 42,210 |
| 1988 | 7,116 | 167,083 | 30,815 | 742,856 | -3.8 | 427,911 | 43,858 |
| 1989 | 6,183 | 198,139 | 27,838 | 911,609 | 22.7 | 525,847 | 46,105 |
| 1990 | 8,920 | 202,429 | 41,689 | 971,051 | 6.5 | 581,168 | 48,277 |
| 1991 | 9,136 | 222,016 | 44,574 | 1,113,747 | 14.7 | 683,361 | 50,637 |
| 1992 | 8,319 | 244,607 | 42,315 | 1,272,372 | 14.2 | 779,015 | 52,247 |
| 1993 | 8,468 | 268,131 | 44,625 | 1,442,389 | 13.4 | 850,855 | 53,933 |
| 1994 | 8,583 | 266,513 | 46,719 | 1,479,112 | 2.5 | 896,027 | 55,206 |
| 1995 | 9,790 | 301,054 | 55,060 | 1,730,694 | 17.0 | 1,052,264 | 56,891 |
| 1996 | 10,008 | 381,514 | 58,187 | 2,256,894 | 30.4 | 1,369,880 | 58,539 |
| 1997 | 10,506 | 455,551 | 62,763 | 2,763,032 | 22.4 | 1,714,024 | 60,000 |
| 1998 | 11,033 | 628,864 | 67,443 | 3,890,253 | 40.8 | 2,417,442 | 60,861 |
| 1999 | 11,527 | 707,654 | 71,812 | 4,458,483 | 14.6 | 2,945,129 | 62,247 |
| 2000 | 11,935 | 646,507 | 75,684 | 4,148,130 | -7.0 | 3,243,332 | 64,157 |
| 2001 | 13,153 | 719,687 | 85,030 | 4,709,580 | 13.5 | 2,822,817 | 66,255 |
| 2002 | 13,116 | 700,823 | 86,458 | 4,674,962 | -0.7 | 2,466,687 | 67,341 |
| 2003 | 13,345 | 593,597 | 89,753 | 4,050,310 | -13.4 | 2,138,513 | 68,839 |
| 2004 | 13,383 | 717,050 | 92,016 | 4,989,599 | 23.2 | 2,627,509 | 70,412 |
| 2005 | 14,846 | 749,077 | 104,079 | 5,316,457 | 6.5 | 2,793,876 | 72,884 |
| 2006 | 15,614 | 830,885 | 111,648 | 6,013,586 | 13.1 | 3,224,286 | 75,468 |
| 2007 | 16,895 | 952,250 | 123,209 | 7,027,094 | 16.9 | 3,715,238 | 77,410 |
| 2008 | 19,026 | 879,074 | 141,440 | 6,620,450 | -5.8 | 3,541,391 | 80,458 |
| 2009 | 19,946 | 558,444 | 151,683 | 4,336,342 | -34.5 | 2,291,662 | 79,865 |
| 2010 | 19,028 | 728,430 | 149,470 | 5,823,177 | 34.3 | 3,181,146 | 81,651 |
| | 354,916 | | 2,016,066 | | | | |
| | | | | | | | |
| | | | | | | Fund's lifetime | |
| | | | | | | average annual | |
| | | | | | | compound | |
| | | | | | | return: | |
| | | | | | | 11.7% | |
| | | | | | | 57.7479 | |
| | | | | | | | |
3 For the period July 31, 1952 (when the Fund began operations) through April 30, 1953. | | | |
| | | | | | | | |
4 Total value includes reinvested dividends of $2,016,066 and reinvested capital gain distributions of $2,747,465. | | |
| | | | | | | | |
5 The S&P 500 cannot be invested in directly. | | | | | |
| | | | | | | | |
6 Capital value includes reinvested capital gain distributions of $464,101 but does not reflect income dividends of | | |
| $354,916 taken in cash. | | | | | | |
| | | | | | | | |
7 Computed from data supplied by the U.S. Department of Labor, Bureau of Labor Statistics. | | | |

A well-marked path and a seasoned guide
Long before he was the father of our country, George Washington was a surveyor — licensed at the age of seventeen. It is difficult to imagine today the skills needed to map uncharted territories on our colonial frontiers. It is quite possible that the lessons George Washington learned as a mapmaker helped him in making important decisions later in life. One of those lessons, surely, was that shortcuts often lead to dead ends. In the investment world, many people make mistakes by following short-term investment trends or by investing in what is fashionable. Of course, recent events reminded everyone that all investments involve risks, but there is much to recommend prudence and a good compass.
Since 1952, Washington Mutual Investors Fund has been providing investors with a unique and well-tested approach to help them reach their financial goals with as few setbacks as possible.
The Fund has consistently focused on an exclusive group of well-established companies with good long-term records and dividend histories. What’s more, it has never backtracked by being less than fully invested in the stock market.
These characteristics have made it easy for shareholders and their financial advisers to determine the role the Fund plays in an overall asset-allocation plan. As a result, the Fund is a popular choice for investors in retirement plans (more than one million personal tax-deferred accounts) and for use by fiduciaries (nearly half a million accounts are held by trustees, guardians and custodians).
Let’s take a closer look at what makes Washington Mutual Investors Fund different.
Higher standards The Fund’s eligible list of investments is based on standards created after the Great Depression to ensure prudent choices by fiduciaries. The standards emphasize companies with long histories of paying dividends and those that have fully earned the dividends they pay (rather than those that borrow money for that purpose), as well as companies with very strong balance sheets. These strict qualifications eliminate all but a small percentage of companies. Because new, untested or unsteady companies do not meet these eligibility standards, Washington Mutual Investors Fund’s portfolio tends to include many familiar names — companies whose products or services you might know well. "On any given day, shareholders are likely to use dozens of products or services provided by companies that are among the Fund’s holdings," says Jim Lemon, vice chairman of the board. "When you fill your gas tank, use a computer, make a phone call, drink a soda or even reach for a paper towel, chances are, you’re doing business with a company in which you’re a part owner through Washington Mutual Investors Fund." Nearly all companies whose stocks are held must be based in the United States — by far the world’s largest single-country economy and home to 15 of the world’s 20 largest companies* — although the Fund may invest up to 5% of its assets in companies based outside the U.S., provided that they are listed on the New York Stock Exchange and meet certain additional criteria. *Source: Market capitalizations, Morgan Stanley Capital International All Country World Index, 12/31/09. | | 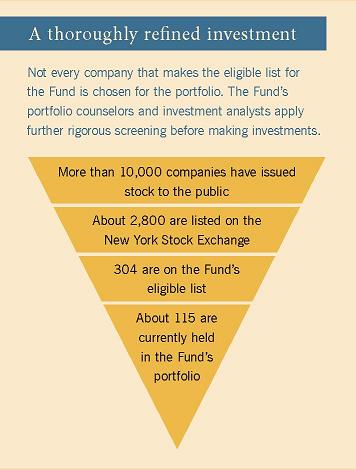 |
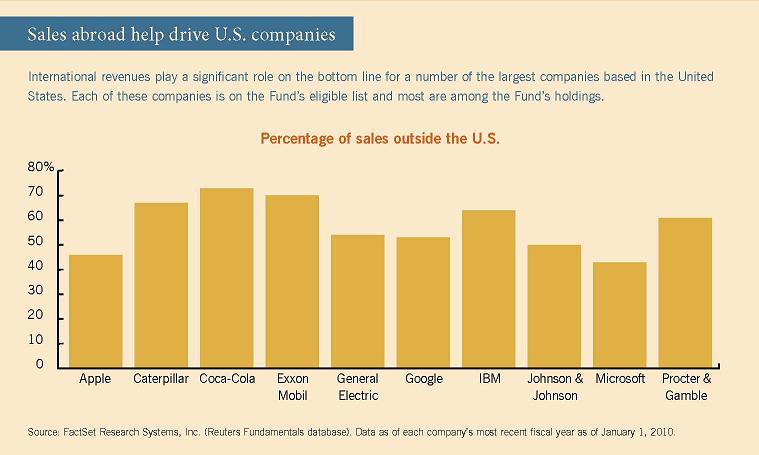
Yet even U.S.-based companies can do significant business outside the U.S. Over 40% of all sales by large U.S. companies are abroad, according to Standard & Poor’s Index Services. In some cases, the percentage is considerably higher.
An experienced board of directors regularly monitors the Fund’s investment standards and, occasionally, makes adjustments to reflect economic, market or corporate changes seen as permanent. Among the directors are business executives, academics and former U.S. government officials, all dedicated to ensuring that shareholders are well-served.
"To keep an eye on things from a shareholder’s point of view, it’s important to actually be a shareholder," says Jim Miller, former director of the U.S. Office of Management and Budget and a member of the Fund’s board since 1992. "So, directors typically have invested in Washington Mutual Investors Fund."
As a policy, the Fund remains fully invested at all times, with 95% or more of assets invested in common stocks. Investors can benefit from owning large, high-quality companies over long periods without trying to time the stock market. The more volatile, less-capitalized stocks — those most likely to go up (or down) the most and the fastest — are not as likely to be among those held by the Fund.
"When the market as a whole goes down dramatically, smaller companies often fare the worst," explains Jim Dunton, who has served as one of the Fund’s portfolio counselors for 31 years. "As these stocks have a much deeper hole to climb out of, they initially reflect outsized gains in the first stage of the market’s recovery. The larger, high-quality companies have typically not fallen as far and recover a bit more slowly; however, investors often appreciate this less-volatile experience."
More experience Washington Mutual Investors Fund began operations in 1952. Slightly more than 1% of all U.S. equity mutual funds in existence today (less than 50 of nearly 4,000) have been around that long — and that number doesn’t even take into account those that did not survive the entire period. The Fund’s investment manager is one of the world’s oldest and largest. Founded in 1931, Capital Research and Management Company has offices in Los Angeles; San Francisco; New York; Washington, D.C.; London; Geneva; Hong Kong; Singapore and Tokyo. From these offices, hundreds of investment professionals study companies all over the world. This global presence allows global insights and perspectives that influence how investment professionals think about U.S.-based companies. Seven portfolio counselors, with a total of 248 years of invesment experience, each independently manage a slice of the Fund’s assets in accordance with the Fund’s investment objective and guidelines. This multiple portfolio counselor system means that success isn’t all up to one person (as it is in most mutual funds) and it helps ensure continuity because only a small portion of responsibility is likely to change hands at any one time. Analysts also manage a portion of the Fund’s assets. This is rarely seen in the mutual fund world, where serving as an analyst is often viewed as just a step on the career path toward portfolio management. In the Capital organization, it is a career option by itself, enabling investment analysts to develop the understanding and perspective that comes with experience and to make the most of knowing company executives over many years. | |  |
Fund results shown are for Class A shares at net asset value. If a sales charge (maximum 5.75%) had been deducted, the results would have been lower. Results are for past periods and are not predictive of results for future periods. Current and future results may be lower or higher than those shown. Share prices and returns will vary, so investors may lose money. For current information and month-end results, visit americanfunds.com.
Superior long-term results There have been 48 rolling 10-year periods (such as 1953–1962, 1954–1963) in Washington Mutual Investors Fund’s lifetime. The Fund outpaced the stock market (as measured by the unmanaged Standard & Poor’s 500 Composite Index) during 39 of those periods. Meanwhile, the value of an investment in the Fund at least doubled during 40 of the periods (83.3% of the time), at least tripled during 26 of the periods (54.2% of the time) and at least quadrupled in 13 of the periods (27.1% of the time). The Fund has always held up better than the market (S&P 500) during market declines of approximately 15% or more. Of course, there have been periods when the Fund has not done as well as the market. The Fund’s results have been negative in just 12 of the 57 years in its history. In all but three of these instances, Fund share-holders who reinvested dividends — which have been paid quarterly throughout the Fund’s lifetime — were back in the black if they held on to their investment through the following year. Generally, the Fund has achieved these results and has done so by avoiding dramatic ups and downs. It has been less volatile than the S&P 500 over the 10 years through calendar 2009, as well as over its entire history. (Volatility is calculated using annualized standard deviation, a measure of how monthly total returns over time have varied from the mean.) Indeed, over the past 10 calendar years — a period some have called a "lost decade" — the Fund showed its stamina and shareholders came out ahead. | | 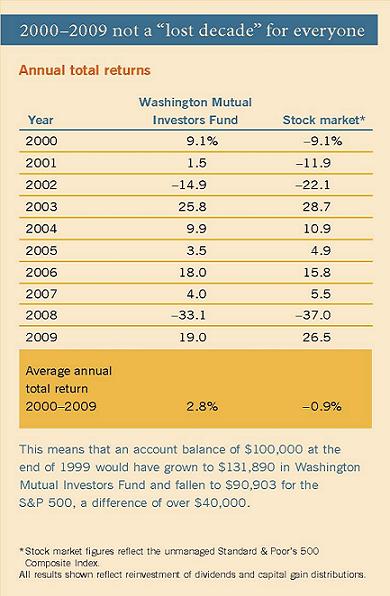 |
The Fund’s portfolio counselors emphasize investing in companies for the long term, which helps keep portfolio turnover low — 21% a year, on average, over the past five calendar years. The five-year average for similar funds (growth and income funds tracked by Lipper) was 63%. Lower turnover means lower Fund expenses — less money spent buying and selling portfolio securities.
Similarly, Washington Mutual Investors Fund’s management fees have been low. As of April 30, 2010, they were just 0.29% for A shares, compared with 0.59% for similar funds, according to Lipper.
Compensation paid to the Fund’s portfolio counselors is heavily influenced by investment results over rolling four- and eight-year periods to encourage a long-term investment approach.
Moreover, each portfolio counselor is an investor in Washington Mutual Investors Fund. So, our seasoned investment professionals, using the Fund’s investment standards to seek superior long-term results, are on the same path as the Fund’s shareholders.
Investment portfolio April 30, 2010
| Industry sector diversification | Percent of net assets | | | Ten largest holdings | Percent of net assets | |
| Industrials | 17.13% | | | Chevron | 5.28% | |
| Energy | 13.31 | | | Verizon | 3.57 | |
| Health care | 12.72 | | | McDonald’s | 3.19 | |
| Utilities | 9.66 | | | Royal Dutch Shell | 3.19 | |
| Consumer discretionary | 9.19 | | | Merck | 2.90 | |
| Financials | 8.53 | | | AT&T | 2.83 | |
| Consumer staples | 8.15 | | | Boeing | 2.49 | |
| Information technology | 7.71 | | | United Technologies | 2.44 | |
| Telecommunication services | 6.40 | | | Coca-Cola | 2.25 | |
| Materials | 3.11 | | | Wells Fargo | 1.97 | |
| Miscellaneous | 1.97 | | | | | |
| Short-term securities & other assets less liabilities | 2.12 | | | | | |
| | | | | | | |
| Common stocks — 97.88% | Shares | Value (000) | | Percent of net assets |
| Energy — 13.31% | | | | |
| Baker Hughes Inc. | 2,000,000 | $ 99,520 | | .19% |
| Chevron Corp. | 33,016,800 | 2,688,888 | | 5.28 |
| ConocoPhillips | 12,350,000 | 730,997 | | 1.43 |
| Diamond Offshore Drilling, Inc. | 1,920,000 | 151,872 | | .30 |
| Exxon Mobil Corp. | 5,015,000 | 340,268 | | .67 |
| Halliburton Co. | 7,000,000 | 214,550 | | .42 |
| Hess Corp. | 2,140,000 | 135,997 | | .27 |
| Marathon Oil Corp. | 6,000,000 | 192,900 | | .38 |
| Occidental Petroleum Corp. | 1,700,000 | 150,722 | | .30 |
| Royal Dutch Shell PLC, Class A (ADR) | 886,700 | 55,640 | | |
| Royal Dutch Shell PLC, Class B (ADR) | 25,880,000 | 1,570,398 | | 3.19 |
| Schlumberger Ltd. | 6,250,000 | 446,375 | | .88 |
| | | 6,778,127 | | 13.31 |
| | | | | |
| Materials — 3.11% | | | | |
| Air Products and Chemicals, Inc. | 2,500,000 | 191,950 | | .38 |
| Alcoa Inc. | 8,500,000 | 114,240 | | .22 |
| Dow Chemical Co. | 15,032,826 | 463,462 | | .91 |
| E.I. du Pont de Nemours and Co. | 6,800,000 | 270,912 | | .53 |
| Monsanto Co. | 880,000 | 55,493 | | .11 |
| Potash Corp. of Saskatchewan Inc. | 425,000 | 46,962 | | .09 |
| PPG Industries, Inc. | 1,600,000 | 112,592 | | .22 |
| Praxair, Inc. | 2,900,000 | 242,933 | | .48 |
| Weyerhaeuser Co. | 1,690,000 | 83,689 | | .17 |
| | | 1,582,233 | | 3.11 |
| | | | | |
| Industrials — 17.13% | | | | |
| Boeing Co. | 17,510,000 | 1,268,249 | | 2.49 |
| Caterpillar Inc. | 2,000,000 | 136,180 | | .27 |
| Deere & Co. | 2,250,000 | 134,595 | | .27 |
| Eaton Corp. | 1,200,000 | 92,592 | | .18 |
| Emerson Electric Co. | 15,750,000 | 822,622 | | 1.62 |
| General Dynamics Corp. | 2,950,000 | 225,262 | | .44 |
| General Electric Co. | 17,500,000 | 330,050 | | .65 |
| Honeywell International Inc. | 9,300,000 | 441,471 | | .87% |
| Illinois Tool Works Inc. | 5,620,000 | 287,182 | | .56 |
| Lockheed Martin Corp. | 7,700,000 | 653,653 | | 1.28 |
| Masco Corp. | 9,227,813 | 149,767 | | .29 |
| Norfolk Southern Corp. | 2,000,000 | 118,660 | | .23 |
| Northrop Grumman Corp. | 13,400,000 | 908,922 | | 1.79 |
| Pitney Bowes Inc. | 10,274,000 | 260,960 | | .51 |
| Rockwell Automation | 3,000,000 | 182,160 | | .36 |
| Southwest Airlines Co. | 5,500,000 | 72,490 | | .14 |
| Tyco International Ltd. | 8,000,000 | 310,320 | | .61 |
| United Parcel Service, Inc., Class B | 12,175,900 | 841,842 | | 1.65 |
| United Technologies Corp. | 16,565,000 | 1,241,547 | | 2.44 |
| Waste Management, Inc. | 7,000,000 | 242,760 | | .48 |
| | | 8,721,284 | | 17.13 |
| | | | | |
| Consumer discretionary — 9.19% | | | | |
| Best Buy Co., Inc. | 1,750,000 | 79,800 | | .16 |
| Darden Restaurants, Inc. | 2,000,000 | 89,500 | | .18 |
| Harley-Davidson, Inc. | 3,950,000 | 133,628 | | .26 |
| Home Depot, Inc. | 22,980,300 | 810,056 | | 1.59 |
| J.C. Penney Co., Inc. | 1,600,000 | 46,672 | | .09 |
| Johnson Controls, Inc. | 21,698,200 | 728,842 | | 1.43 |
| Leggett & Platt, Inc. | 5,000,000 | 122,650 | | .24 |
| Lowe’s Companies, Inc. | 6,400,000 | 173,568 | | .34 |
| Mattel, Inc. | 3,000,000 | 69,150 | | .14 |
| McDonald’s Corp. | 23,040,000 | 1,626,394 | | 3.19 |
| McGraw-Hill Companies, Inc. | 11,300,000 | 381,036 | | .75 |
| News Corp., Class A | 7,060,000 | 108,865 | | .21 |
| VF Corp. | 2,800,000 | 241,976 | | .47 |
| Walt Disney Co. | 1,900,000 | 69,996 | | .14 |
| | | 4,682,133 | | 9.19 |
| | | | | |
| Consumer staples — 8.15% | | | | |
| Avon Products, Inc. | 7,330,400 | 236,992 | | .47 |
| Coca-Cola Co. | 21,439,589 | 1,145,946 | | 2.25 |
| Colgate-Palmolive Co. | 1,300,000 | 109,330 | | .21 |
| H.J. Heinz Co. | 3,700,000 | 173,419 | | .34 |
| Kimberly-Clark Corp. | 2,700,000 | 165,402 | | .32 |
| Kraft Foods Inc., Class A | 26,390,000 | 781,144 | | 1.53 |
| PepsiCo, Inc. | 8,250,000 | 538,065 | | 1.06 |
| Procter & Gamble Co. | 8,650,800 | 537,734 | | 1.06 |
| Walgreen Co. | 2,500,000 | 87,875 | | .17 |
| Wal-Mart Stores, Inc. | 7,000,000 | 375,550 | | .74 |
| | | 4,151,457 | | 8.15 |
| | | | | |
| Health care — 12.72% | | | | |
| Abbott Laboratories | 18,440,400 | 943,411 | | 1.85 |
| Aetna Inc. | 7,400,000 | 218,670 | | .43 |
| Baxter International Inc. | 3,810,000 | 179,908 | | .35 |
| Becton, Dickinson and Co. | 1,000,000 | 76,370 | | .15 |
| Bristol-Myers Squibb Co. | 20,500,000 | 518,445 | | 1.02 |
| Cardinal Health, Inc. | 13,823,700 | 479,544 | | .94 |
| Eli Lilly and Co. | 24,000,000 | 839,280 | | 1.65 |
| Health care (continued) | | | | |
| Johnson & Johnson | 12,865,000 | 827,220 | | 1.63 |
| Medtronic, Inc. | 12,015,000 | 524,935 | | 1.03 |
| Merck & Co., Inc. | 42,190,000 | 1,478,338 | | 2.90 |
| Pfizer Inc | 13,578,250 | 227,028 | | .45 |
| Stryker Corp. | 1,650,000 | 94,776 | | .19 |
| UnitedHealth Group Inc. | 2,250,000 | 68,198 | | .13 |
| | | 6,476,123 | | 12.72 |
| | | | | |
| Financials — 8.53% | | | | |
| Allstate Corp. | 10,500,000 | 343,035 | | .67 |
| American Express Co. | 10,000,000 | 461,200 | | .91 |
| BB&T Corp. | 5,665,000 | 188,305 | | .37 |
| Chubb Corp. | 5,000,000 | 264,350 | | .52 |
| HSBC Holdings PLC (ADR) | 3,900,000 | 198,471 | | .39 |
| JPMorgan Chase & Co. | 6,349,100 | 270,345 | | .53 |
| KeyCorp | 7,000,000 | 63,140 | | .12 |
| Marsh & McLennan Companies, Inc. | 25,516,900 | 618,019 | | 1.21 |
| Moody’s Corp. | 2,450,000 | 60,564 | | .12 |
| PNC Financial Services Group, Inc. | 1,645,000 | 110,560 | | .22 |
| Toronto-Dominion Bank | 1,300,000 | 96,798 | | .19 |
| U.S. Bancorp | 24,825,600 | 664,581 | | 1.31 |
| Wells Fargo & Co. | 30,270,000 | 1,002,240 | | 1.97 |
| | | 4,341,608 | | 8.53 |
| | | | | |
| Information technology — 7.71% | | | | |
| Automatic Data Processing, Inc. | 5,395,000 | 233,927 | | .46 |
Google Inc., Class A1 | 450,000 | 236,448 | | .47 |
| Hewlett-Packard Co. | 10,810,000 | 561,796 | | 1.10 |
| Intel Corp. | 19,700,000 | 449,751 | | .88 |
| International Business Machines Corp. | 3,935,000 | 507,615 | | 1.00 |
| Linear Technology Corp. | 7,790,000 | 234,168 | | .46 |
| Microsoft Corp. | 21,730,000 | 663,634 | | 1.30 |
| Oracle Corp. | 12,213,300 | 315,592 | | .62 |
| Paychex, Inc. | 10,950,000 | 335,070 | | .66 |
| Texas Instruments Inc. | 14,825,000 | 385,598 | | .76 |
| | | 3,923,599 | | 7.71 |
| | | | | |
| Telecommunication services — 6.40% | | | | |
| AT&T Inc. | 55,215,000 | 1,438,903 | | 2.83 |
| Verizon Communications Inc. | 62,950,000 | 1,818,625 | | 3.57 |
| | | 3,257,528 | | 6.40 |
| | | | | |
| Utilities — 9.66% | | | | |
| Ameren Corp. | 1,400,000 | 36,344 | | .07 |
| American Electric Power Co., Inc. | 3,800,000 | 130,340 | | .25 |
| Consolidated Edison, Inc. | 2,800,000 | 126,560 | | .25 |
| Dominion Resources, Inc. | 8,550,000 | 357,390 | | .70 |
| Duke Energy Corp. | 45,100,000 | 756,778 | | 1.49 |
| Entergy Corp. | 7,380,000 | 599,920 | | 1.18 |
| Exelon Corp. | 18,660,000 | 813,389 | | 1.60 |
| FirstEnergy Corp. | 15,200,000 | 575,624 | | 1.13 |
| FPL Group, Inc. | 5,550,000 | 288,878 | | .57 |
| NiSource Inc. | 2,500,000 | 40,750 | | .08 |
| PPL Corp. | 14,917,904 | 369,367 | | .72 |
| Southern Co. | 17,300,000 | 597,888 | | 1.17 |
| Xcel Energy Inc. | 10,500,000 | 228,375 | | .45 |
| | | 4,921,603 | | 9.66 |
| | | | | |
| Miscellaneous — 1.97% | | | | |
| Other common stocks in initial period of acquisition | | 1,003,092 | | 1.97 |
| | | | | |
Total common stocks (cost: $41,048,669,000) | | 49,838,787 | | 97.88 |
| | | | | |
| | | | | |
| | | | | |
| Short-term securities — 2.17% | Principal amount (000) | | | |
| | | | | |
Colgate-Palmolive Co. 0.18% due 5/10/20102 | $ 21,700 | 21,699 | | .04 |
Fannie Mae 0.18%–0.25% due 6/14–8/16/2010 | 167,400 | 167,312 | | .33 |
Federal Farm Credit Banks 0.17% due 5/27/2010 | 12,500 | 12,499 | | .02 |
Federal Home Loan Bank 0.17%–0.19% due 6/9–7/28/2010 | 100,000 | 99,968 | | .20 |
Freddie Mac 0.16%–0.18% due 6/28–6/29/2010 | 82,124 | 82,101 | | .16 |
General Electric Co. 0.18% due 5/3/2010 | 71,500 | 71,499 | | .14 |
Jupiter Securitization Co., LLC 0.22% due 5/11/20102 | 32,000 | 31,998 | | .06 |
Merck & Co. Inc. 0.19% due 5/24/20102 | 64,900 | 64,892 | | .13 |
NetJets Inc. 0.21% due 6/30/20102 | 55,000 | 54,976 | | .11 |
Paccar Financial Corp. 0.16% due 5/13/2010 | 23,400 | 23,398 | | .05 |
PepsiCo Inc. 0.19%–0.20% due 6/15–6/16/20102 | 90,000 | 89,978 | | .18 |
Pfizer Inc 0.18% due 6/21/20102 | 27,600 | 27,593 | | .05 |
Procter & Gamble International Funding S.C.A. 0.18%–0.19% due 5/14–6/4/20102 | 134,700 | 134,684 | | .26 |
Straight-A Funding LLC 0.17%–0.26% due 5/5–7/21/20102 | 129,582 | 129,555 | | .25 |
U.S. Treasury Bills 0.155%–0.161% due 5/27–6/24/2010 | 95,800 | 95,780 | | .19 |
| | | | | |
Total short-term securities (cost: $1,107,922,000) | | 1,107,932 | | 2.17 |
| | | | | |
Total investment securities (cost: $42,156,591,000) | | 50,946,719 | | 100.05 |
| Other assets less liabilities | | (26,848) | | (.05) |
| | | | | |
| Net assets | | $50,919,871 | | 100.00% |
| | | | | |
| | | | | |
| "Miscellaneous" securities include holdings in their initial period of acquisition that have not previously been publicly disclosed. |
| | | | | |
1 Security did not produce income during the last 12 months. 2 Purchased in a transaction exempt from registration under the Securities Act of 1933. May be resold in the U.S. in transactions exempt from registration, normally to qualified institutional buyers. The total value of all such securities was $555,375,000, which represented 1.09% of the net assets of the Fund. |
| |
| | | | | |
| Key to abbreviation | | | | |
| ADR = American Depositary Receipts | | | | |
| | | | | |
| | | | | |
| See Notes to financial statements | | | | |
Financial statements
Statement of assets and liabilities at April 30, 2010 | (dollars in thousands) |
| Assets: | | | | | | |
| Investment securities, at value (cost: $42,156,591) | | | | | $ | 50,946,719 | |
| Cash | | | | | | 1,803 | |
| Receivables for: | | | | | | | |
| Sales of investments | | $ | 121,657 | | | | | |
| Sales of Fund’s shares | | | 47,311 | | | | | |
| Dividends | | | 112,587 | | | | 281,555 | |
| | | | | | | | 51,230,077 | |
| Liabilities: | | | | | | | | |
| Payables for: | | | | | | | | |
| Purchases of investments | | | 180,831 | | | | | |
| Repurchases of Fund’s shares | | | 87,438 | | | | | |
| Management services | | | 12,041 | | | | | |
| Services provided by affiliates | | | 26,643 | | | | | |
| Directors’ and advisory board’s deferred compensation | | | 2,385 | | | | | |
| Other | | | 868 | | | | 310,206 | |
| Net assets at April 30, 2010 | | | | | | $ | 50,919,871 | |
| | | | | | | | | |
| Net assets consist of: | | | | | | | | |
| Capital paid in on shares of capital stock | | | | | | $ | 48,364,370 | |
| Undistributed net investment income | | | | | | | 300,340 | |
| Accumulated net realized loss | | | | | | | (6,534,956 | ) |
| Net unrealized appreciation | | | | | | | 8,790,117 | |
| Net assets at April 30, 2010 | | | | | | $ | 50,919,871 | |
| |
| (dollars and shares in thousands, except per-share amounts) |
| |
Total authorized capital stock — 4,000,000 shares, $.001 par value (1,972,765 total shares outstanding) |
| | Net assets | Shares outstanding | Net asset value per share* |
| Class A | $39,349,284 | 1,522,919 | $25.84 |
| Class B | 1,249,015 | 48,681 | 25.66 |
| Class C | 1,829,809 | 71,487 | 25.60 |
| Class F-1 | 1,770,442 | 68,689 | 25.77 |
| Class F-2 | 415,858 | 16,094 | 25.84 |
| Class 529-A | 932,374 | 36,132 | 25.80 |
| Class 529-B | 144,592 | 5,630 | 25.68 |
| Class 529-C | 287,911 | 11,217 | 25.67 |
| Class 529-E | 52,643 | 2,048 | 25.70 |
| Class 529-F-1 | 51,215 | 1,988 | 25.77 |
| Class R-1 | 66,709 | 2,600 | 25.65 |
| Class R-2 | 694,004 | 27,125 | 25.59 |
| Class R-3 | 1,280,555 | 49,840 | 25.69 |
| Class R-4 | 1,120,816 | 43,516 | 25.76 |
| Class R-5 | 867,869 | 33,593 | 25.83 |
| Class R-6 | 806,775 | 31,206 | 25.85 |
*Maximum offering price and redemption price per share were equal to the net asset value per share for all share classes, except for Classes A and 529-A, for which the maximum offering prices per share were $27.42 and $27.37, respectively.
See Notes to financial statements
Statement of operations for the year ended April 30, 2010 | (dollars in thousands) |
| Investment income: | | | | | | |
| Income: | | | | | | |
| Dividends (net of non-U.S. taxes of $808) | | $ | 1,687,241 | | | | |
| Interest | | | 1,803 | | | $ | 1,689,044 | |
| | | | | | | | | |
| Fees and expenses*: | | | | | | | | |
| Investment advisory services | | | 95,872 | | | | | |
| Business management services | | | 43,565 | | | | | |
| Distribution services | | | 143,302 | | | | | |
| Transfer agent services | | | 54,327 | | | | | |
| Administrative services | | | 17,151 | | | | | |
| Reports to shareholders | | | 3,026 | | | | | |
| Registration statement and prospectus | | | 8,775 | | | | | |
| Directors’ and advisory board’s compensation | | | 2,140 | | | | | |
| Auditing and legal | | | 305 | | | | | |
| Custodian | | | 301 | | | | | |
| State and local taxes | | —† | | | | | |
| Other | | | 2,632 | | | | 371,396 | |
| Net investment income | | | | | | | 1,317,648 | |
| | | | | | | | | |
| Net realized gain and unrealized appreciation on investments: | | | | | | | | |
| Net realized gain on investments | | | | | | | 2,207,034 | |
| Net unrealized appreciation on investments | | | | | | | 10,515,745 | |
| Net realized gain and unrealized appreciation on investments | | | | | | | 12,722,779 | |
| Net increase in net assets resulting from operations | | | | | | $ | 14,040,427 | |
*Additional information related to class-specific fees and expenses is included in the Notes to financial statements.
†Amount less than one thousand.
| Statements of changes in net assets | (dollars in thousands) |
| | Year ended April 30 | |
| Operations: | 2010 | | 2009 | |
| Net investment income | $ 1,317,648 | | $ 1,424,548 | |
| Net realized gain (loss) on investments | 2,207,034 | | (8,718,989) | |
| Net unrealized appreciation (depreciation) on investments | 10,515,745 | | (18,332,108) | |
| Net increase (decrease) in net assets resulting from operations | 14,040,427 | | (25,626,549) | |
| | | | | |
| Dividends and distributions paid to shareholders: | | | | |
| Dividends from net investment income | (1,367,940) | | (1,596,849) | |
| Distributions from net realized gain on investments | — | | (1,101,866) | |
| Total dividends and distributions paid to shareholders | (1,367,940) | | (2,698,715) | |
| | | | | |
| Net capital share transactions | (5,069,126) | | (4,761,319) | |
| | | | | |
| Total increase (decrease) in net assets | 7,603,361 | | (33,086,583) | |
| | | | | |
| Net assets: | | | | |
| Beginning of year | 43,316,510 | | 76,403,093 | |
| End of year (including undistributed net investment income: $300,340 and $351,063, respectively) | $50,919,871 | | $ 43,316,510 | |
See Notes to financial statements
Notes to financial statements
Washington Mutual Investors Fund (the "Fund") is registered under the Investment Company Act of 1940 as an open-end, diversified management investment company. The Fund’s investment objective is to produce current income and to provide an opportunity for growth of principal consistent with sound common stock investing.
On November 24, 2009, shareholders approved a proposal to reorganize the Fund from a Maryland corporation to a Delaware statutory trust. The reorganization is anticipated to be completed on July 1, 2010; however, the Fund reserves the right to delay the implementation. Shareholders also approved amendments to the Fund’s Investment Advisory Agreement and amendments to and elimination of certain fundamental investment policies of the Fund.
The Fund has 16 share classes consisting of five retail share classes, five 529 college savings plan share classes and six retirement plan share classes. The 529 college savings plan share classes (529-A, 529-B, 529-C, 529-E and 529-F-1) may be used to save for college education. The six retirement plan share classes (R-1, R-2, R-3, R-4, R-5 and R-6) are generally offered only through eligible employer-sponsored retirement plans. The Fund’s share classes are described below:
| Share class | | Initial sales charge | Contingent deferred sales charge upon redemption | Conversion feature |
| Classes A and 529-A | | Up to 5.75% | None (except 1% for certain redemptions within one year of purchase without an initial sales charge) | None |
| Classes B and 529-B* | | None | Declines from 5% to 0% for redemptions within six years of purchase | Classes B and 529-B convert to Classes A and 529-A, respectively, after eight years |
| Class C | | None | 1% for redemptions within one year of purchase | Class C converts to Class F-1 after 10 years |
| Class 529-C | | None | 1% for redemptions within one year of purchase | None |
| Class 529-E | | None | None | None |
| Classes F-1, F-2 and 529-F-1 | | None | None | None |
| Classes R-1, R-2, R-3, R-4, R-5 and R-6 | | None | None | None |
*Class B and 529-B shares of the Fund are not available for purchase. |
On May 1, 2009, the Fund made an additional retirement plan share class (Class R-6) available for sale pursuant to an amendment to its registration statement filed with the Securities and Exchange Commission (SEC). Refer to the Fund’s retirement plan prospectus for more details.
Holders of all share classes have equal pro rata rights to assets, dividends and liquidation proceeds. Each share class has identical voting rights, except for the exclusive right to vote on matters affecting only its class. Share classes have different fees and expenses ("class-specific fees and expenses"), primarily due to different arrangements for distribution, administrative and shareholder services. Differences in class-specific fees and expenses will result in differences in net investment income and, therefore, the payment of different per-share dividends by each class.
| 2. Significant accounting policies |
The financial statements have been prepared to comply with accounting principles generally accepted in the United States of America. These principles require management to make estimates and assumptions that affect reported amounts and disclosures. Actual results could differ from those estimates. The Fund follows the significant accounting policies described below, as well as the valuation policies described in the next section on valuation.
Security transactions and related investment income — Security transactions are recorded by the Fund as of the date the trades are executed with brokers. Realized gains and losses from security transactions are determined based on the specific identified cost of the securities. Dividend income is recognized on the ex-dividend date and interest income is recognized on an accrual basis. Market discounts, premiums and original issue discounts on fixed-income securities are amortized daily over the expected life of the security.
Class allocations — Income, fees and expenses (other than class-specific fees and expenses) and realized and unrealized gains and losses are allocated daily among the various share classes based on their relative net assets. Class-specific fees and expenses, such as distribution, administrative and shareholder services, are charged directly to the respective share class.
Dividends and distributions to shareholders — Dividends and distributions paid to shareholders are recorded on the ex-dividend date.
The Fund’s investments are reported at fair value as defined by accounting principles generally accepted in the United States of America. The Fund generally determines its net asset value as of approximately 4:00 p.m. New York time each day the New York Stock Exchange is open.
Methods and inputs — The Fund uses the following methods and inputs to establish the fair value of its assets and liabilities. Use of particular methods and inputs may vary over time based on availability and relevance as market and economic conditions evolve.
Equity securities are generally valued at the official closing price of, or the last reported sale price on, the exchange or market on which such securities are traded, as of the close of business on the day the securities are being valued or, lacking any sales, at the last available bid price. Prices for each security are taken from the principal exchange or market in which the security trades.
Fixed-income securities, including short-term securities purchased with more than 60 days left to maturity, are generally valued at prices obtained as of approximately 3:00 p.m. New York time from one or more pricing vendors. Vendors value such securities based on one or more of the following inputs: benchmark yields, transactions, bids, offers, quotations from dealers and trading systems, new issues, spreads, interest rate volatilities, and other relationships observed in the markets among comparable securities; and proprietary pricing models such as yield measures calculated using factors such as cash flows, financial or collateral performance and other reference data.
Where the investment adviser deems it appropriate to do so (such as when vendor prices are unavailable or not deemed to be representative), fixed-income securities will be valued in good faith at the mean quoted bid and asked prices that are reasonably and timely available (or bid prices, if asked prices are not available) or at prices for securities of comparable maturity, quality and type.
Securities with both fixed-income and equity characteristics, or equity securities traded principally among fixed-income dealers, are generally valued in the manner described above for either equity or fixed-income securities, depending on which method is deemed most appropriate by the investment adviser. Short-term securities purchased within 60 days to maturity are valued at amortized cost, which approximates fair value. The value of short-term securities originally purchased with maturities greater than 60 days is determined based on an amortized value to par when they reach 60 days or less remaining to maturity.
Securities and other assets for which representative market quotations are not readily available or are considered unreliable by the investment adviser are fair valued as determined in good faith under guidelines adopted by authority of the Fund’s board of directors. Various inputs may be reviewed in order to make a good faith determination of a security’s fair value. These inputs include, but are not limited to, the type and cost of the security; contractual or legal restrictions on resale of the security; relevant financial or business developments of the issuer; actively traded similar or related securities; conversion or exchange rights on the security; related corporate actions; significant events occurring after the close of trading in the security; and changes in overall market conditions. Fair valuations and valuations of investments that are not actively trading involve judgment and may differ materially from valuations that would have been used had greater market activity occurred.
Classifications — The Fund classifies its assets and liabilities into three levels based on the inputs used to value the assets or liabilities. Level 1 values are based on quoted prices in active markets for identical securities. Level 2 values are based on significant observable market inputs, such as quoted prices for similar securities and quoted prices in inactive markets. Level 3 values are based on significant unobservable inputs that reflect the Fund’s determination of assumptions that market participants might reasonably use in valuing the securities. The valuation levels are not necessarily an indication of the risk or liquidity associated with the underlying investment. For example, U.S. government securities are reflected as Level 2 because the inputs used to determine fair value may not always be quoted prices in an active market.
The following table presents the Fund’s valuation levels as of April 30, 2010 (dollars in thousands):
| Investment securities: | | Level 1 | | Level 2 | | Level 3 | | Total | |
| Common stocks: | | | | | | | | | |
| Energy | | $ | 6,778,127 | | $ | — | | $ | — | | $ | 6,778,127 | |
| Materials | | | 1,582,233 | | | — | | | — | | | 1,582,233 | |
| Industrials | | | 8,721,284 | | | — | | | — | | | 8,721,284 | |
| Consumer discretionary | | | 4,682,133 | | | — | | | — | | | 4,682,133 | |
| Consumer staples | | | 4,151,457 | | | — | | | — | | | 4,151,457 | |
| Health care | | | 6,476,123 | | | — | | | — | | | 6,476,123 | |
| Financials | | | 4,341,608 | | | — | | | — | | | 4,341,608 | |
| Information technology | | | 3,923,599 | | | — | | | — | | | 3,923,599 | |
| Telecommunication services | | | 3,257,528 | | | — | | | — | | | 3,257,528 | |
| Utilities | | | 4,921,603 | | | — | | | — | | | 4,921,603 | |
| Miscellaneous | | | 1,003,092 | | | — | | | — | | | 1,003,092 | |
| Short-term securities | | | — | | | 1,107,932 | | | — | | | 1,107,932 | |
| Total | | $ | 49,838,787 | | $ | 1,107,932 | | $ | — | | $ | 50,946,719 | |
Investing in the Fund may involve certain risks including, but not limited to, those described below.
The prices of, and the income generated by, the common stocks and other securities held by the Fund may decline in response to certain events taking place around the world, including those directly involving the issuers whose securities are owned by the Fund; conditions affecting the general economy; overall market changes; local, regional or global political, social or economic instability; governmental or governmental agency responses to economic conditions; and currency, interest rate and commodity price fluctuations.
| 5. Taxation and distributions |
Federal income taxation — The Fund complies with the requirements under Subchapter M of the Internal Revenue Code applicable to mutual funds and intends to distribute substantially all of its net taxable income and net capital gains each year. The Fund is not subject to income taxes to the extent such distributions are made. Therefore, no federal income tax provision is required.
As of and during the period ended April 30, 2010, the Fund did not have a liability for any unrecognized tax benefits. The Fund recognizes interest and penalties, if any, related to unrecognized tax benefits as income tax expense in the statement of operations. During the period, the Fund did not incur any interest or penalties.
The Fund is not subject to examination by U.S. federal tax authorities or state tax authorities for tax years before 2006.
Non-U.S. taxation — Dividend income is recorded net of non-U.S. taxes paid.
Distributions — Distributions paid to shareholders are based on net investment income and net realized gains determined on a tax basis, which may differ from net investment income and net realized gains for financial reporting purposes. These differences are due primarily to different treatment for items such as short-term capital gains and losses; capital losses related to sales of certain securities within 30 days of purchase; and cost of investments sold. The fiscal year in which amounts are distributed may differ from the year in which the net investment income and net realized gains are recorded by the Fund for financial reporting purposes.
During the year ended April 30, 2010, the Fund reclassified $436,000 from undistributed net investment income to capital paid in on shares of capital stock and $5,000 from accumulated net realized loss to undistributed net investment income to align financial reporting with tax reporting.
As of April 30, 2010, the tax basis components of distributable earnings, unrealized appreciation (depreciation) and cost of investment securities were as follows:
| | (dollars in thousands) |
| Undistributed ordinary income | $ 302,725 |
Capital loss carryforwards*:Expiring 2017 | $(2,944,294) | |
Expiring 2018 | (3,493,853) | (6,438,147) |
| Gross unrealized appreciation on investment securities | 10,334,419 |
| Gross unrealized depreciation on investment securities | (1,641,100) |
| Net unrealized appreciation on investment securities | 8,693,319 |
| Cost of investment securities | 42,253,400 |
*The capital loss carryforwards will be used to offset any capital gains realized by the Fund in future years through the expiration dates. The Fund will not make distributions from capital gains while capital loss carryforwards remain. |
The tax character of distributions paid to shareholders was as follows (dollars in thousands):
| | Year ended April 30, 2010 | | Year ended April 30, 2009 |
Share class | Ordinary income | | Long-term capital gains | | Total distributions paid | | Ordinary income | | Long-term capital gains | | Total distributions paid |
| Class A | $1,087,747 | | $— | | $1,087,747 | | $1,297,249 | | $870,934 | | $2,168,183 |
| Class B | 30,048 | | — | | 30,048 | | 41,064 | | 37,205 | | 78,269 |
| Class C | 37,528 | | — | | 37,528 | | 45,521 | | 42,136 | | 87,657 |
| Class F-1 | 48,281 | | — | | 48,281 | | 61,223 | | 40,201 | | 101,424 |
| Class F-2* | 11,112 | | — | | 11,112 | | 2,328 | | 2,274 | | 4,602 |
| Class 529-A | 23,609 | | — | | 23,609 | | 24,494 | | 17,169 | | 41,663 |
| Class 529-B | 2,911 | | — | | 2,911 | | 3,214 | | 3,124 | | 6,338 |
| Class 529-C | 5,438 | | — | | 5,438 | | 5,743 | | 5,563 | | 11,306 |
| Class 529-E | 1,231 | | — | | 1,231 | | 1,245 | | 971 | | 2,216 |
| Class 529-F-1 | 1,318 | | — | | 1,318 | | 1,255 | | 819 | | 2,074 |
| Class R-1 | 1,209 | | — | | 1,209 | | 1,145 | | 1,062 | | 2,207 |
| Class R-2 | 13,491 | | — | | 13,491 | | 13,966 | | 13,255 | | 27,221 |
| Class R-3 | 30,591 | | — | | 30,591 | | 33,432 | | 24,518 | | 57,950 |
| Class R-4 | 30,825 | | — | | 30,825 | | 26,156 | | 17,866 | | 44,022 |
| Class R-5 | 25,387 | | — | | 25,387 | | 38,814 | | 24,769 | | 63,583 |
Class R-6† | 17,214 | | — | | 17,214 | | — | | — | | — |
| Total | $1,367,940 | | $— | | $1,367,940 | | $1,596,849 | | $1,101,866 | | $2,698,715 |
*Class F-2 was offered beginning August 1, 2008. †Class R-6 was offered beginning May 1, 2009. |
| 6. Fees and transactions with related parties |
Business management services — The Fund has a Business Management Agreement with Washington Management Corporation (WMC). Under this agreement, WMC provides services necessary to carry on the Fund’s general administrative and corporate affairs. These services encompass matters relating to general corporate governance, regulatory compliance and monitoring of the Fund’s contractual service providers, including custodian operations, shareholder services and Fund share distribution functions. Under the agreement, all expenses chargeable to the Class A shares of the Fund, including compensation to the business manager, shall not exceed 1% of the Class A average net assets of the Fund on an annual basis. The agreement provides for monthly fee s, accrued daily, based on a series of decreasing annual rates beginning with 0.175% on the first $3 billion of daily net assets and decreasing to 0.030% on such assets in excess of $77 billion. For the year ended April 30, 2010, the business management services fee was $43,565,000, which was equivalent to an annualized rate of 0.09% of average daily net assets. During the year ended April 30, 2010, WMC paid the Fund’s investment adviser $2,072,000 for performing various fund accounting services for the Fund and for The American Funds Tax-Exempt Series I, another registered investment company for which WMC serves as business manager. Johnston, Lemon & Co. Incorporated (JLC), a wholly owned subsidiary of The Johnston-Lemon Group, Incorporated (parent company of WMC), earned $359,000 on its retail sales of shares, including payments under the distribution plans of the Fund. JLC received no brokerage commissions resulting from the purchases and sales of securities for the investment account of the Fun d.
Investment advisory services — Capital Research and Management Company (CRMC), the Fund’s investment adviser, is the parent company of American Funds Distributors,¨ Inc. (AFD), the principal underwriter of the Fund’s shares, and American Funds Service Company¨ (AFS), the Fund’s transfer agent. The Investment Advisory Agreement with CRMC provides for monthly fees accrued daily. These fees are based on a series of decreasing annual rates beginning with 0.225% on the first $3 billion of daily net assets and decreasing to 0.177% on such assets in excess of $89 billion. For the year ended April 30, 2010, the investment advisory services fee was $95,872,000, which was equivalent to an annualized rate of 0.198% of average daily net assets.
Class-specific fees and expenses — Expenses that are specific to individual share classes are accrued directly to the respective share class. The principal class-specific fees and expenses are described below:
Distribution services — The Fund has adopted plans of distribution for all share classes, except Classes F-2, R-5 and R-6. Under the plans, the board of directors approves certain categories of expenses that are used to finance activities primarily intended to sell Fund shares and service existing accounts. The plans provide for payments, based on an annualized percentage of average daily net assets, ranging from 0.25% to 1.00% as noted on the following page. In some cases, the board of directors has limited the amounts that may be paid to less than the maximum allowed by the plans. All share classes with a plan may use up to 0.25% of averag e daily net assets to pay service fees, or to compensate AFD for paying service fees, to firms that have entered into agreements with AFD to provide certain shareholder services. The remaining amounts available to be paid under each plan are paid to dealers to compensate them for their sales activities.
For Classes A and 529-A, the board of directors has also approved the reimbursement of dealer and wholesaler commissions paid by AFD for certain shares sold without a sales charge. These classes reimburse AFD for amounts billed within the prior 15 months but only to the extent that the overall annual expense limit of 0.25% is not exceeded. As of April 30, 2010, there were no unreimbursed expenses subject to reimbursement for Classes A or 529-A.
| Share class | Currently approved limits | Plan limits |
| Class A | 0.25% | 0.25% |
| Class 529-A | 0.25 | 0.50 |
| Classes B and 529-B | 1.00 | 1.00 |
| Classes C, 529-C and R-1 | 1.00 | 1.00 |
| Class R-2 | 0.75 | 1.00 |
| Classes 529-E and R-3 | 0.50 | 0.75 |
| Classes F-1, 529-F-1 and R-4 | 0.25 | 0.50 |
Transfer agent services — The Fund has a transfer agent agreement with AFS for Classes A and B. Under this agreement, these share classes compensate AFS for transfer agent services including shareholder recordkeeping, communications and transaction processing. AFS is also compensated for certain transfer agent services provided to all other share classes from the administrative services fees paid to CRMC as described below.
Administrative services — The Fund has an administrative services agreement with CRMC to provide transfer agent and other related shareholder services for all share classes other than Classes A and B. Each relevant share class pays CRMC annual fees up to 0.15% (0.10% for Class R-5 and 0.05% for Class R-6) based on its respective average daily net assets. Each relevant share class also pays AFS additional amounts for certain transfer agent services. CRMC and AFS may use these fees to compensate third parties for performing these services. Each 529 share class is subject to an additional administrative services fee payable to the Commonwealth of Virginia for the maintenance of the 529 college savings plan. The quarterly fee is based on a series of d ecreasing annual rates beginning with 0.10% on the first $30 billion of the net assets invested in Class 529 shares of the American Funds and decreasing to 0.06% on such assets between $120 billion and $150 billion. The fee for any given calendar quarter is accrued and calculated on the basis of the average net assets of Class 529 shares of the American Funds for the last month of the prior calendar quarter. Although these amounts are included with administrative services fees on the accompanying financial statements, the Commonwealth of Virginia is not considered a related party.
Expenses under the agreements described above for the year ended April 30, 2010, were as follows (dollars in thousands):
| | | | | | Administrative services |
Share class | Distribution services | | Transfer agent services | | CRMC administrative services | | Transfer agent services | | Commonwealth of Virginia administrative services |
| Class A | $ 87,873 | | $52,443 | | Not applicable | | Not applicable | | Not applicable |
| Class B | 13,864 | | 1,884 | | Not applicable | | Not applicable | | Not applicable |
| Class C | 17,608 | | | | $ 2,617 | | $ 442 | | Not applicable |
| Class F-1 | 4,038 | | | | 2,315 | | 183 | | Not applicable |
| Class F-2 | Not applicable | | | | 440 | | 23 | | Not applicable |
| Class 529-A | 1,794 | | | | 882 | | 160 | | $ 834 |
| Class 529-B | 1,408 | | | | 150 | | 48 | | 141 |
| Class 529-C | 2,605 | | Included in | | 278 | | 80 | | 263 |
| Class 529-E | 239 | | administrative | | 51 | | 9 | | 48 |
| Class 529-F-1 | — | | services | | 46 | | 8 | | 43 |
| Class R-1 | 556 | | | | 69 | | 23 | | Not applicable |
| Class R-2 | 4,780 | | | | 940 | | 1,936 | | Not applicable |
| Class R-3 | 5,907 | | | | 1,738 | | 764 | | Not applicable |
| Class R-4 | 2,630 | | | | 1,518 | | 32 | | Not applicable |
| Class R-5 | Not applicable | | | | 784 | | 12 | | Not applicable |
| Class R-6* | Not applicable | | | | 273 | | 1 | | Not applicable |
| Total | $143,302 | | $54,327 | | $12,101 | | $3,721 | | $1,329 |
*Class R-6 was offered beginning May 1, 2009. |
Directors’ and advisory board’s deferred compensation — Since the adoption of the deferred compensation plan in 1994, independent directors and advisory board members may elect to defer the cash payment of part or all of their compensation. These deferred amounts, which remain as liabilities of the Fund, are treated as if invested in shares of the Fund or other American Funds. These amounts represent general, unsecured liabilities of the Fund and vary according to the total returns of the selected funds. Directors’ and advisory board’s compensation of $2,140,000, shown on the accompanying financial statements, include s $1,554,000 in current fees (either paid in cash or deferred) and a net increase of $586,000 in the value of the deferred amounts.
Affiliated officers and directors — All officers and all interested directors of the Fund are affiliated with WMC. Officers and interested directors do not receive compensation directly from the Fund.
| 7. Capital share transactions |
Capital share transactions in the Fund were as follows (dollars and shares in thousands):
| | Sales1 | | Reinvestments of dividends and distributions | | Repurchases1 | | Net (decrease) increase |
| Share class | Amount | | Shares | | Amount | | Shares | | Amount | | Shares | | Amount | | Shares |
Year ended April 30, 2010 |
| Class A | $2,486,219 | | 106,597 | | $1,024,913 | | 44,448 | | $(8,038,118) | | (345,221) | | $(4,526,986) | | (194,176) |
| Class B | 16,401 | | 710 | | 28,940 | | 1,272 | | (557,876) | | (23,895) | | (512,535) | | (21,913) |
| Class C | 140,939 | | 6,067 | | 34,660 | | 1,524 | | (421,724) | | (18,262) | | (246,125) | | (10,671) |
| Class F-1 | 414,949 | | 18,079 | | 44,048 | | 1,914 | | (635,809) | | (27,514) | | (176,812) | | (7,521) |
| Class F-2 | 329,604 | | 14,828 | | 7,742 | | 335 | | (145,891) | | (6,474) | | 191,455 | | 8,689 |
| Class 529-A | 103,987 | | 4,425 | | 23,602 | | 1,022 | | (120,413) | | (5,156) | | 7,176 | | 291 |
| Class 529-B | 2,213 | | 96 | | 2,910 | | 127 | | (23,459) | | (990) | | (18,336) | | (767) |
| Class 529-C | 32,742 | | 1,413 | | 5,434 | | 237 | | (44,944) | | (1,938) | | (6,768) | | (288) |
| Class 529-E | 6,479 | | 279 | | 1,230 | | 54 | | (8,345) | | (356) | | (636) | | (23) |
| Class 529-F-1 | 13,323 | | 566 | | 1,318 | | 57 | | (9,564) | | (411) | | 5,077 | | 212 |
| Class R-1 | 20,780 | | 901 | | 1,203 | | 52 | | (13,796) | | (596) | | 8,187 | | 357 |
| Class R-2 | 151,347 | | 6,570 | | 13,441 | | 589 | | (184,408) | | (7,957) | | (19,620) | | (798) |
| Class R-3 | 284,344 | | 12,266 | | 30,382 | | 1,324 | | (351,198) | | (15,007) | | (36,472) | | (1,417) |
| Class R-4 | 437,215 | | 19,673 | | 30,780 | | 1,341 | | (402,058) | | (17,087) | | 65,937 | | 3,927 |
| Class R-5 | 394,213 | | 17,200 | | 25,304 | | 1,093 | | (893,179) | | (41,701) | | (473,662) | | (23,408) |
Class R-62 | 698,432 | | 32,285 | | 17,062 | | 725 | | (44,500) | | (1,804) | | 670,994 | | 31,206 |
Total net increase (decrease) | $5,533,187 | | 241,955 | | $1,292,969 | | 56,114 | | $(11,895,282) | | (514,369) | | $(5,069,126) | | (216,300) |
Year ended April 30, 2009 |
| Class A | $4,200,504 | | 180,201 | | $2,058,558 | | 91,881 | | $(10,541,874) | | (458,944) | | $(4,282,812) | | (186,862) |
| Class B | 92,539 | | 4,019 | | 75,383 | | 3,435 | | (531,235) | | (22,802) | | (363,313) | | (15,348) |
| Class C | 244,752 | | 10,579 | | 83,430 | | 3,822 | | (605,517) | | (26,386) | | (277,335) | | (11,985) |
| Class F-1 | 578,188 | | 24,356 | | 90,468 | | 4,030 | | (1,023,594) | | (44,713) | | (354,938) | | (16,327) |
Class F-23 | 240,487 | | 10,436 | | 3,918 | | 194 | | (68,292) | | (3,225) | | 176,113 | | 7,405 |
| Class 529-A | 107,569 | | 4,506 | | 41,655 | | 1,877 | | (108,292) | | (4,685) | | 40,932 | | 1,698 |
| Class 529-B | 11,096 | | 464 | | 6,335 | | 291 | | (18,358) | | (792) | | (927) | | (37) |
| Class 529-C | 36,622 | | 1,551 | | 11,300 | | 520 | | (45,606) | | (1,951) | | 2,316 | | 120 |
| Class 529-E | 7,947 | | 341 | | 2,215 | | 101 | | (5,958) | | (264) | | 4,204 | | 178 |
| Class 529-F-1 | 8,609 | | 362 | | 2,074 | | 94 | | (8,049) | | (328) | | 2,634 | | 128 |
| Class R-1 | 18,248 | | 765 | | 2,194 | | 101 | | (17,362) | | (734) | | 3,080 | | 132 |
| Class R-2 | 187,302 | | 8,071 | | 27,194 | | 1,251 | | (205,867) | | (8,737) | | 8,629 | | 585 |
| Class R-3 | 306,695 | | 13,036 | | 57,913 | | 2,611 | | (552,239) | | (21,903) | | (187,631) | | (6,256) |
| Class R-4 | 330,062 | | 14,278 | | 43,973 | | 1,989 | | (287,409) | | (12,009) | | 86,626 | | 4,258 |
| Class R-5 | 650,276 | | 26,249 | | 62,999 | | 2,850 | | (332,172) | | (13,420) | | 381,103 | | 15,679 |
Total net increase (decrease) | $7,020,896 | | 299,214 | | $2,569,609 | | 115,047 | | $(14,351,824) | | (620,893) | | $(4,761,319) | | (206,632) |
1Includes exchanges between share classes of the Fund. 2Class R-6 was offered beginning May 1, 2009. 3Class F-2 was offered beginning August 1, 2008. | | | | | | | | | | |
| 8. Investment transactions |
The Fund made purchases and sales of investment securities, excluding short-term securities and U.S. government obligations, if any, of $10,616,729,000 and $15,681,714,000, respectively, during the year ended April 30, 2010.
Financial highlights1
| | | Income (loss) from investment operations2 | | Dividends and distributions | | | | | | |
| | Net asset value, beginning of period | Net investment income | Net gains (losses) on securities (both realized and unrealized) | Total from investment operations | | Dividends (from net investment income) | Distributions (from capital gains) | Total dividends and distributions | Net asset value, end of period | Total return3,4 | Net assets, end of period (in millions) | Ratio of expenses to average net assets before reimbursements/ waivers | Ratio of expenses to average net assets after reimbursements/ waivers4 | Ratio of net income to average net assets4 |
| Class A: | | | | | | | | | | | | | | |
| Year ended 4/30/2010 | $19.81 | $.65 | $ 6.06 | $ 6.71 | | $(.68) | $ — | $ (.68) | $25.84 | 34.29% | $39,349 | .70% | .70% | 2.80% |
| Year ended 4/30/2009 | 31.92 | .64 | (11.53) | (10.89) | | (.72) | (.50) | (1.22) | 19.81 | (34.50) | 34,012 | .67 | .65 | 2.60 |
| Year ended 4/30/2008 | 36.55 | .71 | (2.68) | (1.97) | | (.72) | (1.94) | (2.66) | 31.92 | (5.78) | 60,782 | .60 | .58 | 2.02 |
| Year ended 4/30/2007 | 32.66 | .68 | 4.71 | 5.39 | | (.66) | (.84) | (1.50) | 36.55 | 16.85 | 70,811 | .60 | .57 | 2.00 |
| Year ended 4/30/2006 | 29.85 | .66 | 3.20 | 3.86 | | (.62) | (.43) | (1.05) | 32.66 | 13.11 | 64,202 | .60 | .57 | 2.13 |
| Class B: | | | | | | | | | | | | | | |
| Year ended 4/30/2010 | 19.67 | .48 | 6.01 | 6.49 | | (.50) | — | (.50) | 25.66 | 33.31 | 1,249 | 1.46 | 1.46 | 2.07 |
| Year ended 4/30/2009 | 31.71 | .45 | (11.46) | (11.01) | | (.53) | (.50) | (1.03) | 19.67 | (35.01) | 1,389 | 1.42 | 1.40 | 1.85 |
| Year ended 4/30/2008 | 36.33 | .44 | (2.67) | (2.23) | | (.45) | (1.94) | (2.39) | 31.71 | (6.51) | 2,726 | 1.36 | 1.33 | 1.27 |
| Year ended 4/30/2007 | 32.47 | .42 | 4.69 | 5.11 | | (.41) | (.84) | (1.25) | 36.33 | 15.98 | 3,296 | 1.36 | 1.33 | 1.24 |
| Year ended 4/30/2006 | 29.69 | .42 | 3.17 | 3.59 | | (.38) | (.43) | (.81) | 32.47 | 12.24 | 3,053 | 1.37 | 1.34 | 1.37 |
| Class C: | | | | | | | | | | | | | | |
| Year ended 4/30/2010 | 19.63 | .46 | 6.00 | 6.46 | | (.49) | — | (.49) | 25.60 | 33.23 | 1,830 | 1.50 | 1.50 | 2.00 |
| Year ended 4/30/2009 | 31.65 | .44 | (11.44) | (11.00) | | (.52) | (.50) | (1.02) | 19.63 | (35.04) | 1,613 | 1.47 | 1.44 | 1.80 |
| Year ended 4/30/2008 | 36.26 | .42 | (2.66) | (2.24) | | (.43) | (1.94) | (2.37) | 31.65 | (6.54) | 2,979 | 1.41 | 1.38 | 1.22 |
| Year ended 4/30/2007 | 32.41 | .39 | 4.68 | 5.07 | | (.38) | (.84) | (1.22) | 36.26 | 15.91 | 3,481 | 1.42 | 1.40 | 1.17 |
| Year ended 4/30/2006 | 29.64 | .40 | 3.16 | 3.56 | | (.36) | (.43) | (.79) | 32.41 | 12.15 | 3,113 | 1.43 | 1.41 | 1.30 |
| Class F-1: | | | | | | | | | | | | | | |
| Year ended 4/30/2010 | 19.76 | .64 | 6.04 | 6.68 | | (.67) | — | (.67) | 25.77 | 34.26 | 1,770 | .71 | .71 | 2.78 |
| Year ended 4/30/2009 | 31.85 | .64 | (11.51) | (10.87) | | (.72) | (.50) | (1.22) | 19.76 | (34.52) | 1,506 | .67 | .65 | 2.59 |
| Year ended 4/30/2008 | 36.48 | .70 | (2.68) | (1.98) | | (.71) | (1.94) | (2.65) | 31.85 | (5.82) | 2,947 | .63 | .61 | 1.99 |
| Year ended 4/30/2007 | 32.60 | .67 | 4.70 | 5.37 | | (.65) | (.84) | (1.49) | 36.48 | 16.83 | 3,179 | .62 | .59 | 1.97 |
| Year ended 4/30/2006 | 29.80 | .65 | 3.19 | 3.84 | | (.61) | (.43) | (1.04) | 32.60 | 13.06 | 2,646 | .63 | .61 | 2.10 |
| Class F-2: | | | | | | | | | | | | | | |
| Year ended 4/30/2010 | 19.81 | .68 | 6.09 | 6.77 | | (.74) | — | (.74) | 25.84 | 34.65 | 416 | .46 | .46 | 2.91 |
Period from 8/5/2008 to 4/30/2009 | 29.64 | .46 | (9.22) | (8.76) | | (.57) | (.50) | (1.07) | 19.81 | (29.77) | 147 | .445 | .435 | 3.105 |
| Class 529-A: | | | | | | | | | | | | | | |
| Year ended 4/30/2010 | 19.78 | .63 | 6.05 | 6.68 | | (.66) | — | (.66) | 25.80 | 34.20 | 932 | .76 | .76 | 2.71 |
| Year ended 4/30/2009 | 31.89 | .62 | (11.52) | (10.90) | | (.71) | (.50) | (1.21) | 19.78 | (34.57) | 709 | .73 | .71 | 2.55 |
| Year ended 4/30/2008 | 36.51 | .67 | (2.66) | (1.99) | | (.69) | (1.94) | (2.63) | 31.89 | (5.85) | 1,089 | .69 | .66 | 1.93 |
| Year ended 4/30/2007 | 32.63 | .65 | 4.71 | 5.36 | | (.64) | (.84) | (1.48) | 36.51 | 16.75 | 1,094 | .67 | .65 | 1.91 |
| Year ended 4/30/2006 | 29.83 | .64 | 3.19 | 3.83 | | (.60) | (.43) | (1.03) | 32.63 | 13.01 | 833 | .68 | .65 | 2.05 |
| Class 529-B: | | | | | | | | | | | | | | |
| Year ended 4/30/2010 | 19.69 | .45 | 6.02 | 6.47 | | (.48) | — | (.48) | 25.68 | 33.15 | 145 | 1.56 | 1.56 | 1.93 |
| Year ended 4/30/2009 | 31.74 | .42 | (11.47) | (11.05) | | (.50) | (.50) | (1.00) | 19.69 | (35.08) | 126 | 1.53 | 1.51 | 1.74 |
| Year ended 4/30/2008 | 36.36 | .39 | (2.66) | (2.27) | | (.41) | (1.94) | (2.35) | 31.74 | (6.62) | 204 | 1.49 | 1.46 | 1.13 |
| Year ended 4/30/2007 | 32.50 | .38 | 4.68 | 5.06 | | (.36) | (.84) | (1.20) | 36.36 | 15.82 | 218 | 1.48 | 1.46 | 1.11 |
| Year ended 4/30/2006 | 29.72 | .38 | 3.17 | 3.55 | | (.34) | (.43) | (.77) | 32.50 | 12.07 | 180 | 1.51 | 1.48 | 1.22 |
| Class 529-C: | | | | | | | | | | | | | | |
| Year ended 4/30/2010 | 19.68 | .45 | 6.02 | 6.47 | | (.48) | — | (.48) | 25.67 | 33.19 | 288 | 1.55 | 1.55 | 1.93 |
| Year ended 4/30/2009 | 31.73 | .43 | (11.47) | (11.04) | | (.51) | (.50) | (1.01) | 19.68 | (35.08) | 226 | 1.52 | 1.50 | 1.75 |
| Year ended 4/30/2008 | 36.35 | .39 | (2.66) | (2.27) | | (.41) | (1.94) | (2.35) | 31.73 | (6.62) | 361 | 1.49 | 1.46 | 1.13 |
| Year ended 4/30/2007 | 32.49 | .38 | 4.69 | 5.07 | | (.37) | (.84) | (1.21) | 36.35 | 15.84 | 374 | 1.48 | 1.45 | 1.11 |
| Year ended 4/30/2006 | 29.71 | .38 | 3.18 | 3.56 | | (.35) | (.43) | (.78) | 32.49 | 12.10 | 295 | 1.50 | 1.47 | 1.23 |
| Class 529-E: | | | | | | | | | | | | | | |
| Year ended 4/30/2010 | 19.71 | .56 | 6.03 | 6.59 | | (.60) | — | (.60) | 25.70 | 33.80 | 53 | 1.05 | 1.05 | 2.43 |
| Year ended 4/30/2009 | 31.77 | .55 | (11.48) | (10.93) | | (.63) | (.50) | (1.13) | 19.71 | (34.74) | 41 | 1.02 | 1.00 | 2.26 |
| Year ended 4/30/2008 | 36.39 | .57 | (2.66) | (2.09) | | (.59) | (1.94) | (2.53) | 31.77 | (6.14) | 60 | .98 | .95 | 1.64 |
| Year ended 4/30/2007 | 32.52 | .55 | 4.70 | 5.25 | | (.54) | (.84) | (1.38) | 36.39 | 16.44 | 61 | .97 | .94 | 1.62 |
| Year ended 4/30/2006 | 29.74 | .54 | 3.17 | 3.71 | | (.50) | (.43) | (.93) | 32.52 | 12.64 | 46 | .98 | .96 | 1.74 |
| | | | | | | | | | | | | | | |
| | | Income (loss) from investment operations2 | | Dividends and distributions | | | | | | |
| | Net asset value, beginning of period | Net investment income | Net gains (losses) on securities (both realized and unrealized) | Total from investment operations | | Dividends (from net investment income) | Distributions (from capital gains) | Total dividends and distributions | Net asset value, end of period | Total return4 | Net assets, end of period (in millions) | Ratio of expenses to average net assets before reimbursements/ waivers | Ratio of expenses to average net assets after reimbursements/ waivers4 | Ratio of net income to average net assets4 |
| Class 529-F-1: | | | | | | | | | | | | | | |
| Year ended 4/30/2010 | $19.76 | $.68 | $ 6.04 | $ 6.72 | | $(.71) | $ — | $ (.71) | $25.77 | 34.48% | $ 51 | .55% | .55% | 2.91% |
| Year ended 4/30/2009 | 31.85 | .67 | (11.50) | (10.83) | | (.76) | (.50) | (1.26) | 19.76 | (34.41) | 35 | .52 | .50 | 2.77 |
| Year ended 4/30/2008 | 36.47 | .74 | (2.66) | (1.92) | | (.76) | (1.94) | (2.70) | 31.85 | (5.65) | 52 | .48 | .45 | 2.14 |
| Year ended 4/30/2007 | 32.59 | .72 | 4.70 | 5.42 | | (.70) | (.84) | (1.54) | 36.47 | 17.01 | 47 | .47 | .44 | 2.11 |
| Year ended 4/30/2006 | 29.79 | .70 | 3.18 | 3.88 | | (.65) | (.43) | (1.08) | 32.59 | 13.20 | 32 | .49 | .46 | 2.24 |
| Class R-1: | | | | | | | | | | | | | | |
| Year ended 4/30/2010 | 19.68 | .46 | 6.01 | 6.47 | | (.50) | — | (.50) | 25.65 | 33.21 | 67 | 1.47 | 1.47 | 1.98 |
| Year ended 4/30/2009 | 31.72 | .45 | (11.46) | (11.01) | | (.53) | (.50) | (1.03) | 19.68 | (34.99) | 44 | 1.43 | 1.41 | 1.85 |
| Year ended 4/30/2008 | 36.33 | .42 | (2.66) | (2.24) | | (.43) | (1.94) | (2.37) | 31.72 | (6.55) | 67 | 1.42 | 1.40 | 1.20 |
| Year ended 4/30/2007 | 32.48 | .39 | 4.68 | 5.07 | | (.38) | (.84) | (1.22) | 36.33 | 15.86 | 69 | 1.43 | 1.41 | 1.15 |
| Year ended 4/30/2006 | 29.71 | .39 | 3.17 | 3.56 | | (.36) | (.43) | (.79) | 32.48 | 12.10 | 47 | 1.47 | 1.44 | 1.26 |
| Class R-2: | | | | | | | | | | | | | | |
| Year ended 4/30/2010 | 19.62 | .45 | 6.01 | 6.46 | | (.49) | — | (.49) | 25.59 | 33.23 | 694 | 1.52 | 1.52 | 1.96 |
| Year ended 4/30/2009 | 31.64 | .43 | (11.44) | (11.01) | | (.51) | (.50) | (1.01) | 19.62 | (35.07) | 548 | 1.50 | 1.48 | 1.77 |
| Year ended 4/30/2008 | 36.25 | .41 | (2.66) | (2.25) | | (.42) | (1.94) | (2.36) | 31.64 | (6.57) | 865 | 1.44 | 1.41 | 1.19 |
| Year ended 4/30/2007 | 32.40 | .39 | 4.68 | 5.07 | | (.38) | (.84) | (1.22) | 36.25 | 15.91 | 985 | 1.47 | 1.41 | 1.15 |
| Year ended 4/30/2006 | 29.64 | .40 | 3.16 | 3.56 | | (.37) | (.43) | (.80) | 32.40 | 12.13 | 812 | 1.53 | 1.41 | 1.29 |
| Class R-3: | | | | | | | | | | | | | | |
| Year ended 4/30/2010 | 19.70 | .57 | 6.02 | 6.59 | | (.60) | — | (.60) | 25.69 | 33.85 | 1,280 | 1.03 | 1.03 | 2.45 |
| Year ended 4/30/2009 | 31.76 | .56 | (11.48) | (10.92) | | (.64) | (.50) | (1.14) | 19.70 | (34.72) | 1,010 | .97 | .95 | 2.29 |
| Year ended 4/30/2008 | 36.38 | .58 | (2.67) | (2.09) | | (.59) | (1.94) | (2.53) | 31.76 | (6.13) | 1,827 | .95 | .93 | 1.67 |
| Year ended 4/30/2007 | 32.51 | .55 | 4.70 | 5.25 | | (.54) | (.84) | (1.38) | 36.38 | 16.45 | 2,199 | .96 | .93 | 1.63 |
| Year ended 4/30/2006 | 29.73 | .54 | 3.18 | 3.72 | | (.51) | (.43) | (.94) | 32.51 | 12.68 | 1,878 | .97 | .94 | 1.75 |
| Class R-4: | | | | | | | | | | | | | | |
| Year ended 4/30/2010 | 19.75 | .64 | 6.04 | 6.68 | | (.67) | — | (.67) | 25.76 | 34.29 | 1,121 | .72 | .72 | 2.75 |
| Year ended 4/30/2009 | 31.83 | .63 | (11.50) | (10.87) | | (.71) | (.50) | (1.21) | 19.75 | (34.52) | 782 | .69 | .67 | 2.59 |
| Year ended 4/30/2008 | 36.46 | .68 | (2.68) | (2.00) | | (.69) | (1.94) | (2.63) | 31.83 | (5.87) | 1,125 | .67 | .65 | 1.95 |
| Year ended 4/30/2007 | 32.57 | .65 | 4.72 | 5.37 | | (.64) | (.84) | (1.48) | 36.46 | 16.82 | 1,213 | .67 | .64 | 1.92 |
| Year ended 4/30/2006 | 29.78 | .64 | 3.18 | 3.82 | | (.60) | (.43) | (1.03) | 32.57 | 13.00 | 1,013 | .68 | .65 | 2.06 |
| Class R-5: | | | | | | | | | | | | | | |
| Year ended 4/30/2010 | 19.80 | .72 | 6.05 | 6.77 | | (.74) | — | (.74) | 25.83 | 34.62 | 868 | .42 | .42 | 3.08 |
| Year ended 4/30/2009 | 31.92 | .70 | (11.53) | (10.83) | | (.79) | (.50) | (1.29) | 19.80 | (34.31) | 1,129 | .39 | .37 | 2.91 |
| Year ended 4/30/2008 | 36.55 | .78 | (2.67) | (1.89) | | (.80) | (1.94) | (2.74) | 31.92 | (5.57) | 1,319 | .37 | .35 | 2.24 |
| Year ended 4/30/2007 | 32.65 | .76 | 4.72 | 5.48 | | (.74) | (.84) | (1.58) | 36.55 | 17.15 | 1,154 | .37 | .35 | 2.22 |
| Year ended 4/30/2006 | 29.85 | .73 | 3.19 | 3.92 | | (.69) | (.43) | (1.12) | 32.65 | 13.34 | 883 | .38 | .35 | 2.34 |
| Class R-6: | | | | | | | | | | | | | | |
| Year ended 4/30/2010 | 19.95 | .71 | 5.93 | 6.64 | | (.74) | — | (.74) | 25.85 | 33.79 | 807 | .37 | .37 | 3.03 |
| | | | | | | | | | | | | | | |
| | | | | Year ended April 30 |
| | | | | 2010 | 2009 | 2008 | 2007 | 2006 |
| Portfolio turnover rate for all classes of shares | 22% | 39% | 18% | 19% | 13% |
1 Based on operations for the periods shown (unless otherwise noted) and, accordingly, may not be representative of a full year.
2 Based on average shares outstanding.
3 Total returns exclude any applicable sales charges, including contingent deferred sales charges.
4 This column reflects the impact, if any, of certain reimbursements/waivers from CRMC and WMC. During some of the periods shown, CRMC and WMC reduced fees for investment advisory services and business management services. In addition, during some of the periods shown, CRMC paid a portion of the Fund’s transfer agent fees for certain retirement plan share classes.
5 Annualized.
See Notes to financial statements
Report of Independent Registered Public Accounting Firm
| To the Board of Directors and Shareholders of Washington Mutual Investors Fund, Inc.: |
In our opinion, the accompanying statement of assets and liabilities, including the investment portfolio, and the related statements of operations and of changes in net assets and the financial highlights present fairly, in all material respects, the financial position of Washington Mutual Investors Fund, Inc. (the "Fund") at April 30, 2010, the results of its operations for the year then ended, the changes in its net assets for each of the two years in the period then ended and its financial highlights for each of the periods presented, in conformity with accounting principles generally accepted in the United States of America. These financial statements and financial highlights (hereafter referred to as "financial statements") are the responsibility of the Fund’s management; our responsibility is to express an opinion on these fin ancial statements based on our audits. We conducted our audits of these financial statements in accordance with the standards of the Public Company Accounting Oversight Board (United States). Those standards require that we plan and perform the audit to obtain reasonable assurance about whether the financial statements are free of material misstatement. An audit includes examining, on a test basis, evidence supporting the amounts and disclosures in the financial statements, assessing the accounting principles used and significant estimates made by management, and evaluating the overall financial statement presentation. We believe that our audits, which included confirmation of securities owned at April 30, 2010 by correspondence with the custodian and brokers, provide a reasonable basis for our opinion.
PricewaterhouseCoopers LLP
Los Angeles, California
June 9, 2010
| Other share class results | unaudited |
| Classes B, C, F and 529 | |
Fund results shown are for past periods and are not predictive of results for future periods. Current and future results may be lower or higher than those shown. Share prices and returns will vary, so investors may lose money. For current information and month-end results, visit americanfunds.com.
Average annual total returns for periods ended March 31, 2010 (the most recent calendar quarter-end):
| | | 1 year | 5 years | 10 years1/ Life of class |
Class B shares2 | | | | |
Reflecting applicable contingent deferred sales charge (CDSC), maximum of 5%, payable only if shares are sold within six years of purchase | | 36.38% | 0.20% | 2.66% |
| Not reflecting CDSC | | 41.38 | 0.53 | 2.66 |
Class C shares — first sold 3/15/01 | | | | |
Reflecting CDSC, maximum of 1%, payable only if shares are sold within one year of purchase | | 40.31 | 0.47 | 1.90 |
| Not reflecting CDSC | | 41.31 | 0.47 | 1.90 |
Class F-1 shares3 — first sold 3/15/01 | | | | |
Not reflecting annual asset-based fee charged by sponsoring firm | | 42.45 | 1.27 | 2.70 |
Class F-2 shares3 — first sold 8/5/08 | | | | |
Not reflecting annual asset-based fee charged by sponsoring firm | | 42.78 | — | –4.22 |
Class 529-A shares4 — first sold 2/15/02 | | | | |
Reflecting 5.75% maximum sales charge | | 34.19 | 0.03 | 2.08 |
| Not reflecting maximum sales charge | | 42.38 | 1.22 | 2.83 |
Class 529-B shares2,4 — first sold 2/19/02 | | | | |
Reflecting applicable CDSC, maximum of 5%, payable only if shares are sold within six years of purchase | | 36.26 | 0.07 | 2.20 |
| Not reflecting CDSC | | 41.26 | 0.41 | 2.20 |
Class 529-C shares4 — first sold 2/15/02 | | | | |
Reflecting CDSC, maximum of 1%, payable only if shares are sold within one year of purchase | | 40.25 | 0.41 | 1.98 |
| Not reflecting CDSC | | 41.25 | 0.41 | 1.98 |
Class 529-E shares3,4 — first sold 3/1/02 | | 41.96 | 0.93 | 2.12 |
Class 529-F-1 shares3,4 — first sold 9/16/02 | | | | |
Not reflecting annual asset-based fee charged by sponsoring firm | | 42.70 | 1.42 | 5.02 |
1 Applicable to Class B shares only. All other share classes reflect results for the life of the class. 2 These shares are not available for purchase. 3 These shares are sold without any initial or contingent deferred sales charge. 4 Results shown do not reflect the $10 account setup fee and an annual $10 account maintenance fee. | | |
Investment results assume all distributions are reinvested and reflect applicable fees and expenses. The Fund’s investment adviser and business manager waived a portion of their management fees from September 1, 2004 through December 31, 2008. Applicable Fund results shown reflect the waiver, without which they would have been lower. See the Financial Highlights table on pages 24 and 25 for details that include expense ratios for all share classes.
For information regarding the differences among the various share classes, refer to the Fund’s prospectus.
| Expense example | unaudited |
As a shareholder of the Fund, you incur two types of costs: (1) transaction costs, such as initial sales charges on purchase payments and contingent deferred sales charges on redemptions (loads), and (2) ongoing costs, including management fees, distribution and service (12b-1) fees, and other expenses. This example is intended to help you understand your ongoing costs (in dollars) of investing in the Fund so you can compare these costs with the ongoing costs of investing in other mutual funds. The example is based on an investment of $1,000 invested at the beginning of the period and held for the entire period (November 1, 2009 through April 30, 2010).
Actual expenses:
The first line of each share class in the table on the next page provides information about actual account values and actual expenses. You may use the information in this line, together with the amount you invested, to estimate the expenses that you paid over the period. Simply divide your account value by $1,000 (for example, an $8,600 account value divided by $1,000 = 8.6), then multiply the result by the number in the first line under the heading entitled "Expenses paid during period" to estimate the expenses you paid on your account during this period.
Hypothetical example for comparison purposes:
The second line of each share class in the table on the next page provides information about hypothetical account values and hypothetical expenses based on the actual expense ratio for the share class and an assumed rate of return of 5.00% per year before expenses, which is not the actual return of the share class. The hypothetical account values and expenses may not be used to estimate the actual ending account balance or expenses you paid for the period. You may use this information to compare the ongoing costs of investing in the fund and other funds. To do so, compare this 5.00% hypothetical example with the 5.00% hypothetical examples that appear in the shareholder reports of the other funds.
Notes:
There are some account fees that are charged to certain types of accounts, such as individual retirement accounts and 529 college savings plan accounts (generally, a $10 fee is charged to set up the account and an additional $10 fee is charged to the account annually), that would increase the amount of expenses paid on your account. In addition, retirement plan participants may be subject to certain fees charged by the plan sponsor, and Class F-1, F-2 and 529-F-1 shareholders may be subject to fees charged by financial intermediaries, typically ranging from 0.75% to 1.50% of assets annually depending on services offered. You can estimate the impact of these fees by adding the amount of the fees to the total estimated expenses you paid on your accoun t during the period as calculated above. In addition, your ending account value would be lower by the amount of these fees.
Note that the expenses shown in the table are meant to highlight your ongoing costs only and do not reflect any transactional costs, such as sales charges (loads). Therefore, the second line of each share class in the table is useful in comparing ongoing costs only and will not help you determine the relative total costs of owning different funds. In addition, if these transactional costs were included, your costs would have been higher.
| | Beginning account value 11/1/2009 | Ending account value 4/30/2010 | Expenses paid during period* | Annualized expense ratio |
| Class A — actual return | $1,000.00 | $1,140.19 | $3.56 | .67% |
| Class A — assumed 5% return | 1,000.00 | 1,021.47 | 3.36 | .67 |
| Class B — actual return | 1,000.00 | 1,135.97 | 7.63 | 1.44 |
| Class B — assumed 5% return | 1,000.00 | 1,017.65 | 7.20 | 1.44 |
| Class C — actual return | 1,000.00 | 1,135.59 | 7.84 | 1.48 |
| Class C — assumed 5% return | 1,000.00 | 1,017.46 | 7.40 | 1.48 |
| Class F-1 — actual return | 1,000.00 | 1,139.94 | 3.71 | .70 |
| Class F-1 — assumed 5% return | 1,000.00 | 1,021.32 | 3.51 | .70 |
| Class F-2 — actual return | 1,000.00 | 1,141.40 | 2.39 | .45 |
| Class F-2 — assumed 5% return | 1,000.00 | 1,022.56 | 2.26 | .45 |
| Class 529-A — actual return | 1,000.00 | 1,139.51 | 3.93 | .74 |
| Class 529-A — assumed 5% return | 1,000.00 | 1,021.12 | 3.71 | .74 |
| Class 529-B — actual return | 1,000.00 | 1,135.29 | 8.15 | 1.54 |
| Class 529-B — assumed 5% return | 1,000.00 | 1,017.16 | 7.70 | 1.54 |
| Class 529-C — actual return | 1,000.00 | 1,135.41 | 8.10 | 1.53 |
| Class 529-C — assumed 5% return | 1,000.00 | 1,017.21 | 7.65 | 1.53 |
| Class 529-E — actual return | 1,000.00 | 1,138.02 | 5.46 | 1.03 |
| Class 529-E — assumed 5% return | 1,000.00 | 1,019.69 | 5.16 | 1.03 |
| Class 529-F-1 — actual return | 1,000.00 | 1,141.38 | 2.81 | .53 |
| Class 529-F-1 — assumed 5% return | 1,000.00 | 1,022.17 | 2.66 | .53 |
| Class R-1 — actual return | 1,000.00 | 1,135.45 | 7.73 | 1.46 |
| Class R-1 — assumed 5% return | 1,000.00 | 1,017.55 | 7.30 | 1.46 |
| Class R-2 — actual return | 1,000.00 | 1,135.61 | 7.89 | 1.49 |
| Class R-2 — assumed 5% return | 1,000.00 | 1,017.41 | 7.45 | 1.49 |
| Class R-3 — actual return | 1,000.00 | 1,138.14 | 5.41 | 1.02 |
| Class R-3 — assumed 5% return | 1,000.00 | 1,019.74 | 5.11 | 1.02 |
| Class R-4 — actual return | 1,000.00 | 1,140.37 | 3.71 | .70 |
| Class R-4 — assumed 5% return | 1,000.00 | 1,021.32 | 3.51 | .70 |
| Class R-5 — actual return | 1,000.00 | 1,141.71 | 2.18 | .41 |
| Class R-5 — assumed 5% return | 1,000.00 | 1,022.76 | 2.06 | .41 |
| Class R-6 — actual return | 1,000.00 | 1,141.82 | 1.91 | .36 |
| Class R-6 — assumed 5% return | 1,000.00 | 1,023.01 | 1.81 | .36 |
| *The "expenses paid during period" are equal to the "annualized expense ratio," multiplied by the average account value over the period, multiplied by the number of days in he period, and divided by 365 (to reflect the one-half year period). |
| Tax information | unaudited |
We are required to advise you within 60 days of the Fund’s fiscal year-end regarding the federal tax status of certain distributions received by shareholders during such fiscal year. The Fund hereby designates the following amounts for the Fund’s fiscal year ended April 30, 2010:
| Qualified dividend income | 100% |
| Corporate dividends received deduction | 100% |
| U.S. government income that may be exempt from state taxation | $247,000 |
Individual shareholders should refer to their Form 1099 or other tax information, which will be mailed in January 2011, to determine the calendar year amounts to be included on their 2010 tax returns. Shareholders should consult their tax advisers.
Board of directors and directors emeriti
| Independent directors |
Name and age | Year first elected a director of the Fund1 | Principal occupation(s) during past five years | Number of portfolios in Fund complex2 overseen by director | Other directorships3 held |
Nariman Farvardin, 53 | 2007 | Senior Vice President for Academic Affairs & Provost, University of Maryland; former Dean, The A. James Clark School of Engineering, University of Maryland | 3 | JPMorgan Value Opportunities Fund |
Barbara Hackman Franklin, 70 | 2005 | President and CEO, Barbara Franklin Enterprises (international business and corporate governance consulting); former U.S. Secretary of Commerce (1992–1993) | 3 | Aetna, Inc.; The Dow Chemical Company; JPMorgan Value Opportunities Fund |
Mary Davis Holt, 59 | 2010 | Partner, Flynn Heath Holt Leadership, LLC (leadership consulting firm); former Chief Operating Officer, Time Life, Inc. | 1 | None |
R. Clark Hooper, 63 | 2003 | Private investor; former President, Dumbarton Group LLC (securities industry consulting); former Executive Vice President — Policy and Oversight, National Association of Securities Dealers (NASD) (1970–2003) | 44 | JPMorgan Value Opportunities Fund; The Swiss Helvetia Fund, Inc. |
James C. Miller III, 67 | 1992 | Senior Advisor, Husch Blackwell Sanders LLP (economic, financial and regulatory consulting); former Chairman, The CapAnalysis Group, LLC (economic, financial and regulatory consulting); former Director, U.S. Office of Management and Budget (1985–1988) | 3 | Clean Energy Fuels Corporation; JPMorgan Value Opportunities Fund |
Donald L. Nickles, 61 | 2007 | Chairman and CEO, The Nickles Group (consulting and business venture firm); former United States Senator | 3 | Chesapeake Energy Corporation; JPMorgan Value Opportunities Fund; Valero Energy Corporation |
William J. Shaw, 64 | 2009 | Vice Chairman; former President and Chief Operating Officer (1997–April 2009), Marriott International, Inc. | 1 | Marriott International, Inc. |
J. Knox Singleton, 61 Chairman of the Board (Independent and Non-Executive) | 2001 | President and CEO, INOVA Health System | 3 | Healthcare Realty Trust, Inc.; JPMorgan Value Opportunities Fund |
Lydia W. Thomas, Ph.D., 65 | 2010 | Corporate director; former President and CEO, Noblis, Inc. (nonprofit science, technology and strategy organization) | 1 | Cabot Corporation; Mueller Water Products, Inc. |
Interested directors4 |
Name, age and position with Fund | Year first elected a director or officer of the Fund1 | Principal occupation(s) during past five years | Number of portfolios in Fund complex2 overseen by director | Other directorships3 held |
James H. Lemon, Jr., 74 Vice Chairman of the Board | 1971 | Chairman of the Board and CEO, The Johnston-Lemon Group, Incorporated (financial services holding company) | 3 | JPMorgan Value Opportunities Fund |
Harry J. Lister, 74 | 1972 | Director, Washington Management Corporation | 1 | None |
Jeffrey L. Steele, 64 President | 2000 | President and Director, Washington Management Corporation | 3 | JPMorgan Value Opportunities Fund |
| Directors emeriti |
Stephen Hartwell, Chairman Emeritus |
| Cyrus A. Ansary | Charles A. Bowsher | Fred J. Brinkman | Daniel J. Callahan III | Edward W. Kelley, Jr. | Katherine D. Ortega | T. Eugene Smith |
The Fund’s statement of additional information includes additional information about the Fund’s directors and is available without charge upon request by calling American Funds Service Company at 800/421-0180. The address for all directors, advisory board members and officers of the Fund is 1101 Vermont Avenue, NW, Washington, DC 20005, Attention: Fund Secretary.
Advisory board and other officers
| Advisory board members |
Name and age | Year first elected to advisory board1 | Principal occupation(s) during past five years | Number of portfolios in Fund complex on which advisory board member serves | Other directorships3 held |
Louise M. Cromwell, 65 | 2001 | Retired Partner, Shaw Pittman LLP | 1 | None |
Jeffrey A. Eisenach, 52 | 2008 | Managing Director, Navigant Economics LLC (economic and financial consulting); former Chairman and Managing Partner, Empiris LLC (economic consulting); former Chairman, Criterion Economics, LLC (economic, litigation, regulation and legislation consulting); former Chairman and President, The CapAnalysis Group, LLC (economic, financial and regulatory consulting) | 1 | None |
Linda D. Rabbitt, 61 | 2001 | Chairman and CEO, Rand Construction Corporation | 1 | Brookfield Properties Corporation; Towers Watson & Co. |
Robert G. Templin, Jr., 62 | 2008 | President, Northern Virginia Community College | 1 | None |
R. Clark Wadlow, 63 | 2005 | Retired Partner, Sidley Austin, LLP | 1 | None |
| Other officers |
Name, age and position with Fund | Year first elected an officer of the Fund1 | Principal occupation(s) during past five years |
Michael W. Stockton, 43 Senior Vice President, Treasurer and Assistant Secretary | 1995 | Senior Vice President, Secretary, Treasurer and Director; Washington Management Corporation |
Lois A. Erhard, 57 Vice President | 1983 | Vice President, Washington Management Corporation |
J. Lanier Frank, 49 Assistant Vice President | 1997 | Assistant Vice President, Washington Management Corporation |
Jennifer L. Butler, 44 Secretary | 2005 | Vice President and Assistant Secretary, Washington Management Corporation |
Stephanie L. Pfromer, 41 Assistant Secretary | 2007 | Vice President and General Counsel, Washington Management Corporation; former Vice President and Senior Counsel, The BISYS Group, Inc. (now Citigroup, Inc.) |
Curt M. Scott, 31 Assistant Treasurer | 2006 | Assistant Vice President and Assistant Treasurer, Washington Management Corporation; former Financial Analyst, The BISYS Group, Inc. (now Citigroup, Inc.) |
1 Directors, advisory board members and officers of the Fund serve until their resignation, removal or retirement.
2 Capital Research and Management Company manages the American Funds, consisting of 30 funds. Capital Research and Management Company also manages American Funds Insurance Series,¨ which is composed of 16 funds and serves as the underlying investment vehicle for certain variable insurance contracts; American Funds Target Date Retirement Series,¨ Inc., which is composed of 10 funds and is available through tax-deferred retirement plans and IRAs; and Endowments, w hich is available to certain nonprofit organizations.
3 This includes all directorships other than those in the American Funds that are held by each director or advisory board member as a director of a public company or a registered investment company.
4 "Interested persons" within the meaning of the 1940 Act, as amended, on the basis of their affiliation with the Fund’s business manager, Washington Management Corporation.
Offices of the Fund and of the
business manager
Washington Management Corporation
1101 Vermont Avenue, NW
Washington, DC 20005-3521
202/842-5665
Investment adviser
Capital Research and Management Company
333 South Hope Street
Los Angeles, CA 90071-1406
6455 Irvine Center Drive
Irvine, CA 92618
Transfer agent
American Funds Service Company
(Write to the address near you.)
P.O. Box 6007
Indianapolis, IN 46206-6007
P.O. Box 2280
Norfolk, VA 23501-2280
Custodian of assets
JPMorgan Chase Bank
270 Park Avenue
New York, NY 10017-2070
Counsel
Dechert LLP
1775 I Street, NW
Washington, DC 20006-2401
Independent registered public accounting firm
PricewaterhouseCoopers LLP
350 South Grand Avenue
Los Angeles, CA 90071-2889
Principal underwriter
American Funds Distributors, Inc.
333 South Hope Street
Los Angeles, CA 90071-1406
| Investors should carefully consider the investment objectives, risks, charges and expenses of the American Funds. This and other important information is contained in the Fund’s summary prospectus and prospectus, which can be obtained from your financial professional and should be read carefully before investing. You may also call American Funds Service Company (AFS) at 800/421-0180 or visit the American Funds website at americanfunds.com. |
"American Funds Proxy Voting Procedures and Principles" — which describes how we vote proxies relating to portfolio securities — is available on the American Funds website or upon request by calling AFS. The Fund files its proxy voting record with the U.S. Securities and Exchange Commission (SEC) for the 12 months ended June 30 by August 31. The proxy voting record is available free of charge on the SEC website at sec.gov and on the American Funds website.
Washington Mutual Investors Fund files a complete list of its portfolio holdings with the SEC for the first and third quarters of each fiscal year on Form N-Q. This filing is available free of charge on the SEC website. You may also review or, for a fee, copy this filing at the SEC’s Public Reference Room in Washington, DC. Additional information regarding the operation of the Public Reference Room may be obtained by calling the SEC’s Office of Investor Education and Advocacy at 800/SEC-0330. Additionally, the list of portfolio holdings is available on the American Funds website or by calling AFS.
This report is for the information of shareholders of Washington Mutual Investors Fund, but it may also be used as sales literature when preceded or accompanied by the current summary prospectus or prospectus, which gives details about charges, expenses, investment objectives and operating policies of the Fund. If used as sales material after June 30, 2010, this report must be accompanied by an American Funds statistical update for the most recently completed calendar quarter.
Lit. No. MFGEAR-901-0610P (S20686)
Printed on paper containing 10% post-consumer waste Printed with inks containing soy and/or vegetable oil
The Capital Group Companies
American FundsCapital Research and ManagementCapital InternationalCapital GuardianCapital Bank and Trust
Washington Mutual Investors Fund, Inc.
1101 Vermont Avenue, NW
Washington, DC 20005
202/842-5665
ITEM 2. Code of Ethics.
The Registrant has adopted a code of ethics that applies to its Principal Executive Officer and Principal Financial Officer. The Registrant undertakes to provide to any person without charge, upon request, a copy of the Code of Ethics. Such request can be made to American Funds Service Company at 800/421-0180 or to the Secretary of the Registrant, 1101 Vermont Avenue, NW, Suite 600, Washington, DC 20005.
ITEM 3. Audit Committee Financial Expert.
The Registrant’s Board has determined that James C. Miller, a member of the Registrant’s Audit Committee, is an “audit committee financial expert” and “independent,” as such terms are defined in this Item. This designation will not increase the designee’s duties, obligations or liability as compared to her duties, obligations and liability as a member of the Audit Committee and of the Board; nor will it reduce the responsibility of the other Audit Committee members. There may be other individuals who, through education or experience, would qualify as “audit committee financial experts” if the Board had designated them as such. Most importantly, the Board believes each member of the Audit Committee contributes significantly to the effective oversight of the Registrant’s financial statements and condition.
ITEM 4. Principal Accountant Fees and Services.
Registrant:
2009 $98,000
2010 $75,000
2009 none
2010 none
2009 $7,000
2010 $7,000
The tax fees consist of professional services relating to the preparation of the Registrant’s tax returns.
2009 none
2010 none
ITEM 4. Principal Accountant Fees and Services. (continued)
Adviser and affiliates (includes only fees for non-audit services billed to the adviser and affiliates for engagements that relate directly to the operations and financial reporting of the Registrant and were subject to the pre-approval policies described below):
Not Applicable
2009 none
2010 none
2009 $6,000
2010 $15,000
The tax fees consist of consulting services relating to the Registrant’s investments.
2009 none
2010 $4,000
All audit and permissible non-audit services that the Registrant’s audit committee considers compatible with maintaining the independent registered public accounting firm’s independence are required to be pre-approved by the committee. The pre-approval requirement will extend to all non-audit services provided to the Registrant, the business manager, the investment adviser, and any entity controlling, controlled by, or under common control with the business manager or investment adviser that provides ongoing services to the Registrant, if the engagement relates directly to the operations and financial reporting of the Registrant. The committee will not delegate its responsibility to pre-approve these services to the business manager or investment adviser. The committee may delegate to one or more committee member s the authority to review and pre-approve audit and permissible non-audit services. Actions taken under any such delegation will be reported to the full committee at its next meeting. The pre-approval requirement is waived with respect to non-audit services if certain conditions are met. The pre-approval requirement was not waived for any of the non-audit services listed above provided to the Registrant, adviser and affiliates.
Aggregate non-audit fees paid to the Registrant’s auditors, including fees for all services billed to the Registrant, adviser and affiliates that provide ongoing services to the Registrant, were $13,000 for fiscal year 2009 and $26,000 for fiscal year 2010. The non-audit services represented by these amounts were brought to the attention of the committee and considered to be compatible with maintaining the auditors’ independence.
ITEM 5. Audit Committee of Listed Registrants.
Not applicable to this Registrant, insofar as the Registrant is not a listed issuer as defined in Rule 10A-3 under the Securities Exchange Act of 1934.
ITEM 6. Schedule of Investments.
The full schedule of investments for the Fund is included as part of the report to shareholders filed under Item 1 of this Form.
ITEM 7. Disclosure of Proxy Voting Policies and Procedures for Closed-End Management Investment Companies.
Not applicable to this Registrant, insofar as the Registrant is not a closed-end management investment company.
ITEM 8. Portfolio Managers of Closed-End Management Investment Companies.
Not applicable to this Registrant, insofar as the Registrant is not a closed-end management investment company.
ITEM 9. Purchases of Equity Securities by Closed-End Management Investment Company and Affiliated Purchasers.
Not applicable to this Registrant, insofar as the Registrant is not a closed-end management investment company.
ITEM 10. Submission of Matters to a Vote of Security Holders.
There have been no material changes to the procedures by which shareholders may recommend nominees to the Registrant’s Board of Directors since the Registrant last submitted a proxy statement to its shareholders. The procedures are as follows. The Registrant has a Governance Committee comprised solely of persons who are not considered “interested persons” of the Registrant within the meaning of the Investment Company Act of 1940. The committee periodically reviews such issues as the Board’s composition, responsibilities, committees, compensation and other relevant issues, and recommends any appropriate changes to the full Board of Directors. While the committee normally is able to identify from its own resources an ample number of qualified candidates, it will consider shareholder suggestions of persons to be considered as nominees to fill future vacancies on the Board. Such suggestions must be sent in writing to the Governance Committee of the Registrant, c/o the Registrant’s Secretary, and should be accompanied by complete biographical and occupational data on the prospective nominee, along with a written consent of the prospective nominee for consideration of his or her name by the Governance Committee.
ITEM 11. Controls and Procedures.
| (a) | The Registrant’s Principal Executive Officer and Principal Financial Officer have concluded, based on their evaluation of the Registrant’s disclosure controls and procedures (as such term is defined in Rule 30a-3(c) under the Investment Company Act of 1940), that such controls and procedures are adequate and reasonably designed to achieve the purposes described in paragraph (c) of such rule. |
| (b) | There were no changes in the Registrant’s internal controls over financial reporting (as defined in Rule 30a-3(d) under the Investment Company Act of 1940) that occurred during the Registrant’s second fiscal quarter of the period covered by this report that have materially affected, or are reasonably likely to materially affect, the Registrant’s internal control over financial reporting. |
ITEM 12. Exhibits.
| (a) | The Code of Ethics that is the subject of the disclosure required by Item 2 is attached as an exhibit hereto. |
| (b) | The certifications required by Rule 30a-2 of the Investment Company Act of 1940, as amended, and Sections 302 and 906 of the Sarbanes-Oxley Act of 2002 are attached as exhibits hereto. |
SIGNATURES
Pursuant to the requirements of the Securities Exchange Act of 1934 and the Investment Company Act of 1940, the Registrant has duly caused this report to be signed on its behalf by the undersigned, thereunto duly authorized.
Washington Mutual Investors Fund, Inc.
By /s/Jeffrey L. Steele
Jeffrey L. Steele, President and Principal Executive Officer
Date: June 29, 2010
Pursuant to the requirements of the Securities Exchange Act of 1934 and the Investment Company Act of 1940, this report has been signed below by the following persons on behalf of the Registrant and in the capacities and on the dates indicated.
By /s/ Jeffrey L. Steele
Jeffrey L. Steele, President and Principal Executive Officer
By /s/Michael W. Stockton
Michael W. Stockton, Principal Financial Officer,
Senior Vice President and Treasurer
Date: June 29, 2010