UNITED STATES
SECURITIES AND EXCHANGE COMMISSION
Washington, D.C. 20549
FORM N-CSR
Certified Shareholder Report of Registered
Management Investment Companies
Investment Company Act File Number: 811-604
Washington Mutual Investors Fund
(Exact name of registrant as specified in charter)
1101 Vermont Avenue, NW
Washington, DC 20005
(Address of principal executive offices)
Jennifer L. Butler
Secretary
Washington Mutual Investors Fund
1101 Vermont Avenue, NW
Washington, DC 20005
(Name and address of agent for service)
Registrant's telephone number, including area code: (202) 842-5665
Date of fiscal year end: April 30, 2011
Date of reporting period: April 30, 2011
ITEM 1. Reports to Stockholders.
Annual report dated April 30, 2011
The right choice for the long term¨
Washington Mutual
Investors FundSM
Annual report for the year ended April 30, 2011
Washington Mutual Investors Fund seeks to produce income and to provide an opportunity for growth of principal consistent with sound common stock investing.
This Fund is one of the 33 American Funds. American Funds is one of the nation’s largest mutual fund families. For 80 years, Capital Research and Management Company,SM the American Funds adviser, has invested with a long-term focus based on thorough research and attention to risk.
On the cover: the National Mall, viewed from Capitol Hill.
| In this report |
| | |
| | Special feature |
| | |
| 6 | U.S. companies, global businesses |
| | Contents |
| | |
| 1 | Letter to shareholders |
| | |
| 3 | The value of a long-term perspective |
| | |
| 12 | Investment portfolio |
| | |
| 16 | Financial statements |
| | |
| 30 | Board of trustees, trustees emeriti, advisory board and other officers |
| | |
Fund results shown in this report, unless otherwise indicated, are for Class A shares at net asset value. If a sales charge (maximum 5.75%) had been deducted, the results would have been lower. Results are for past periods and are not predictive of results for future periods. Current and future results may be lower or higher than those shown. Share prices and returns will vary, so investors may lose money. Investing for short periods makes losses more likely. Investments are not FDIC-insured, nor are they deposits of or guaranteed by a bank or any other entity, so they may lose value. For current information and month-end results, visit americanfunds.com.
Here are the average annual total returns on a $1,000 investment with all distributions reinvested for periods ended March 31, 2011 (the most recent calendar quarter-end):
| Class A shares | 1 year | 5 years | 10 years |
| Reflecting 5.75% maximum sales charge | 9.25% | 1.21% | 3.38% |
The total annual Fund operating expense ratio was 0.63% for Class A shares as of April 30, 2011.
Investment results assume all distributions are reinvested and reflect applicable fees and expenses. The Fund’s investment adviser and business manager each waived a portion of their management fees from September 1, 2004, through December 31, 2008. Applicable Fund results shown reflect the waivers, without which they would have been lower. See the Financial Highlights table on pages 24 and 25 for details.
Results for other share classes can be found on page 27.
See the prospectus and the Risk Factors section of this report for more information on risks associated with investing in the Fund.
Fellow shareholders:
For the second consecutive year, your Fund has achieved strong results. For the fiscal year ended April 30, 2011, the Fund’s total return was 17.8%, with regular income dividends of 60.5 cents per share (and a special dividend of 7 cents per share) reinvested. The Fund did not make a capital gain distribution during the year. The unmanaged Standard & Poor’s 500 Composite Index returned 17.2% in the same period.
The U.S. economy has been growing for approximately two years. Extreme weather, Middle Eastern turmoil and higher oil prices have not been helpful in recent months, but the economy and the stock market continue to do better. The stock market has recovered significantly since the decline in 2008, and generally, U.S. stocks continue to have better results than bond investments. During the past year, energy and natural resource stocks generally produced the best results, while financials and utilities had the lowest returns. The financial sector and the automotive industry — the chief beneficiaries of government assistance — have stabilized and are returning to profitability. Consumer and business spending has been on the increase, raising the U.S. economic growth rate as well as corporate profits, particularly for larger U.S. companies. The housing and construction industries, however, continue to struggle.
Although the economic growth rate remains lower than hoped for, and the month-by-month economic data does not always indicate improvement, the private sector is creating new jobs. Even so, the unemployment rate remains stubbornly high at 9.1%. Since the end of the recession, employment has increased by about 2 million; however, 8.8 million jobs were lost in the decline.
Budget woes at both the federal and state government levels make it quite difficult for governments to use fiscal stimulus to boost the economy. The expected long-term ill effects of high federal deficits are now triggering efforts to constrain the growth in federal spending. In addition, total government employment is falling, particularly as state and local governments lay off employees in order to balance budgets. The Federal Reserve does continue to hold short-term interest rates low, and the core inflation rate also remains low. Higher food and energy prices, however, are putting upward pressure on the Consumer Price Index, contributing to fears that interest rates and inflation may increase.
In this improving, but unsteady, economic climate, we think your Fund, with its emphasis on strong, dividend-paying, large U.S.-based companies, remains well positioned. Since October 31, 2010, when we last reported to you, three new companies appeared in the Fund’s portfolio: Apple, Goldman Sachs and Union Pacific. Twelve companies have been eliminated: Alcoa, Baker Hughes, Bank of Montreal, Best Buy, Cisco Systems, Diamond Offshore Drilling, Hewlett-Packard, KeyCorp, Mattel, Medtronic, Wal-Mart and Weyerhaeuser.
The Investment Adviser’s Report on page 2 provides more information on the Fund’s results, which appear below.
Average annual total returns for periods ended April 30, 2011, with all distributions reinvested | | 1 year | 5 years | 10 years | Lifetime (Since 7/31/52) |
| Washington Mutual Investors Fund (Class A shares) | | 17.8% | 2.7% | 3.8% | 11.9% |
| Standard & Poor’s 500 Composite Index* | | 17.2 | 3.0 | 2.8 | 10.6 |
*The S&P 500 is unmanaged and its results do not reflect the effect of sales charges, commissions, account fees, expenses or taxes. |
| Sincerely, | | |
| |  |  |
| | James H. Lemon, Jr. Vice Chairman of the Board | Jeffrey L. Steele President of the Fund |
June 3, 2011
For current information about the Fund, visit americanfunds.com.
Investment adviser’s report
Investment results were encouraging for the fiscal year ended April 30, 2011, as Washington Mutual Investors Fund modestly outdistanced the unmanaged Standard & Poor’s 500 Composite Index, its traditional benchmark. The Fund held no more than about 4% in cash and equivalents at most times during the year, participating in the market surge. The Fund’s requirement to be fully invested paid off in a year when the markets were up strongly.
A widely diversified list of companies, highlighted by energy and industrial firms, helped the Fund. They included Marathon Oil (+68.1%); Chevron (+34.4%), the Fund’s largest holding; and Royal Dutch Shell (+28.9%), the Fund’s second-largest holding. These securities benefited from the sharp rise in oil prices during the fiscal year. Other companies that helped included Dow Chemical (+33.0%), IBM (+32.2%) and Verizon (+30.8%). Companies that had below-market returns included Home Depot (+5.4%), Procter & Gamble (+4.4%) and Merck (+2.6%).
It’s important to recognize that these solid results were achieved during a year that was marked by an unusual number of weather disruptions and natural disasters, as well as business challenges. They included severe snowstorms, record floods in the Midwest and South and supply disruptions caused by the Japanese earthquake and tsunami. In addition, rising oil and gasoline prices as a result of political unrest in the Middle East affected consumer spending. Another negative influence on the economy was layoffs of state and local employees due to the high debt levels of U.S. cities, states and the Federal Government.
Over the long term, Washington Mutual Investors Fund has continued to outpace the S&P 500. As the chart on page 1 shows, for the 10-year period ended April 30, 2011, the Fund had an average annual total return of 3.8%, compared with 2.8% by the S&P 500. Over its nearly 59-year lifetime, Washington Mutual Investors Fund had an average annual return of 11.9%, compared with 10.6% by the S&P 500.
Dividends are once again on the rise. Of the 500 companies in the S&P 500, 386 issued dividends in the first four months of the calendar 2011 year. Of those, 137 increased their dividend and 12 initiated paying dividends. Of the stocks held in Washington Mutual Investors Fund for the full fiscal year, about 81% increased their dividend. At the last meeting of the board of directors in March, Washington Mutual Investors Fund’s dividend was increased to 15.5 cents a share from 15 cents, reflecting the growth of dividends in the marketplace.
The Fund’s five largest investment sectors at fiscal year-end as a percentage of net assets were: industrials (17.0%), energy (15.6%), health care (12.2%), consumer staples (9.3%) and financials (9.0%).
After seven consecutive quarters of double-digit earnings gains in the S&P 500, it would not be surprising if the growth rate of the S&P 500 companies began to taper off as we go forward. We continue to believe this could occur in a context of a long, slow recovery in equities and the economy. Slow is not necessarily bad. Slowness of recovery itself could result in an extended time frame for the economic expansion and we think that this is a constructive possibility. With much of the lost ground in the market already regained, future prospects could be more muted than they were in recent months after the 2008–2009 market decline.
Our team of portfolio counselors and investment analysts will continue to follow the negative and positive developments closely during the year ahead.
— Capital Research and Management Company
The value of a long-term perspective

| WASHINGTON MUTUAL INVESTORS FUND | | | | | | |
| MOUNTAIN CHART AND INDEX PLOT POINTS | | | | |
| | | | | | | | |
| Results of a $10,000 investment in WMIF, the S&P500, and the CPI. | | |
| July 31, 1952 through April 30, 2011 | | | | | |
| | | | | | | | |
| Year | CAPITAL VALUE | TOTAL VALUE | | | |
| ended | Dividends in | | Dividends | | TOTAL | | |
| April 30 | Cash | WMIF6 | Reinvested | WMIF4 | RETURN | S&P500 | CPI7 |
| | | | | | | | |
| 07/31/52 | | $9,425 | | $9,425 | | $10,000 | $10,000 |
19533 | $170 | 9,161 | $170 | 9,330 | -6.7% | 10,094 | 9,963 |
| 1954 | 434 | 10,773 | 449 | 11,494 | 23.2 | 12,282 | 10,037 |
| 1955 | 500 | 14,665 | 542 | 16,288 | 41.7 | 17,295 | 10,000 |
| 1956 | 580 | 17,851 | 654 | 20,565 | 26.3 | 22,938 | 10,075 |
| 1957 | 647 | 18,304 | 756 | 21,877 | 6.4 | 22,520 | 10,449 |
| 1958 | 680 | 16,928 | 825 | 21,055 | -3.8 | 22,269 | 10,824 |
| 1959 | 701 | 24,125 | 885 | 31,071 | 47.6 | 30,569 | 10,861 |
| 1960 | 728 | 21,871 | 948 | 29,041 | -6.5 | 29,850 | 11,049 |
| 1961 | 815 | 26,300 | 1,097 | 36,167 | 24.5 | 37,071 | 11,161 |
| 1962 | 824 | 26,592 | 1,146 | 37,654 | 4.1 | 38,158 | 11,311 |
| 1963 | 891 | 28,838 | 1,279 | 42,278 | 12.3 | 42,296 | 11,423 |
| 1964 | 923 | 31,149 | 1,369 | 47,109 | 11.4 | 49,698 | 11,573 |
| 1965 | 956 | 36,940 | 1,462 | 57,490 | 22.0 | 57,450 | 11,760 |
| 1966 | 1,048 | 38,487 | 1,648 | 61,603 | 7.2 | 60,563 | 12,097 |
| 1967 | 1,176 | 39,424 | 1,906 | 65,270 | 6.0 | 64,731 | 12,397 |
| 1968 | 1,331 | 42,481 | 2,231 | 72,692 | 11.4 | 69,365 | 12,884 |
| 1969 | 1,516 | 48,408 | 2,627 | 85,576 | 17.7 | 75,988 | 13,596 |
| 1970 | 1,605 | 39,049 | 2,874 | 71,603 | -16.3 | 61,834 | 14,419 |
| 1971 | 1,711 | 48,769 | 3,193 | 93,387 | 30.4 | 81,718 | 15,019 |
| 1972 | 1,779 | 47,991 | 3,455 | 95,521 | 2.3 | 87,267 | 15,543 |
| 1973 | 1,818 | 43,290 | 3,671 | 89,522 | -6.3 | 89,214 | 16,330 |
| 1974 | 1,858 | 40,682 | 3,907 | 87,956 | -1.7 | 77,959 | 17,978 |
| 1975 | 2,185 | 42,855 | 4,828 | 98,315 | 11.8 | 79,061 | 19,813 |
| 1976 | 2,350 | 53,771 | 5,498 | 129,949 | 32.2 | 95,785 | 21,011 |
| 1977 | 2,510 | 55,449 | 6,171 | 140,348 | 8.0 | 96,702 | 22,472 |
| 1978 | 2,658 | 54,228 | 6,849 | 144,340 | 2.8 | 100,121 | 23,933 |
| 1979 | 2,870 | 58,180 | 7,785 | 163,075 | 13.0 | 110,959 | 26,442 |
| 1980 | 3,203 | 56,032 | 9,167 | 165,848 | 1.7 | 122,446 | 30,337 |
| 1981 | 4,784 | 72,410 | 14,603 | 230,424 | 38.9 | 160,796 | 33,371 |
| 1982 | 4,097 | 69,851 | 13,327 | 235,768 | 2.3 | 148,977 | 35,543 |
| 1983 | 4,497 | 101,855 | 15,517 | 362,293 | 53.7 | 221,825 | 36,929 |
| 1984 | 4,840 | 100,116 | 17,527 | 373,509 | 3.1 | 225,698 | 38,614 |
| 1985 | 5,465 | 115,473 | 20,783 | 452,498 | 21.1 | 265,541 | 40,037 |
| 1986 | 6,110 | 152,209 | 24,380 | 623,768 | 37.9 | 361,778 | 40,674 |
| 1987 | 6,781 | 180,960 | 28,228 | 771,949 | 23.8 | 457,672 | 42,210 |
| 1988 | 7,116 | 167,083 | 30,815 | 742,856 | -3.8 | 427,911 | 43,858 |
| 1989 | 6,183 | 198,139 | 27,838 | 911,609 | 22.7 | 525,847 | 46,105 |
| 1990 | 8,920 | 202,429 | 41,689 | 971,051 | 6.5 | 581,168 | 48,277 |
| 1991 | 9,136 | 222,016 | 44,574 | 1,113,747 | 14.7 | 683,361 | 50,637 |
| 1992 | 8,319 | 244,607 | 42,315 | 1,272,372 | 14.2 | 779,015 | 52,247 |
| 1993 | 8,468 | 268,131 | 44,625 | 1,442,389 | 13.4 | 850,855 | 53,933 |
| 1994 | 8,583 | 266,513 | 46,719 | 1,479,112 | 2.5 | 896,027 | 55,206 |
| 1995 | 9,790 | 301,054 | 55,060 | 1,730,694 | 17.0 | 1,052,264 | 56,891 |
| 1996 | 10,008 | 381,514 | 58,187 | 2,256,894 | 30.4 | 1,369,880 | 58,539 |
| 1997 | 10,506 | 455,551 | 62,763 | 2,763,032 | 22.4 | 1,714,024 | 60,000 |
| 1998 | 11,033 | 628,864 | 67,443 | 3,890,253 | 40.8 | 2,417,442 | 60,861 |
| 1999 | 11,527 | 707,654 | 71,812 | 4,458,483 | 14.6 | 2,945,129 | 62,247 |
| 2000 | 11,935 | 646,507 | 75,684 | 4,148,130 | -7.0 | 3,243,332 | 64,157 |
| 2001 | 13,153 | 719,687 | 85,030 | 4,709,580 | 13.5 | 2,822,817 | 66,255 |
| 2002 | 13,116 | 700,823 | 86,458 | 4,674,962 | -0.7 | 2,466,687 | 67,341 |
| 2003 | 13,345 | 593,597 | 89,753 | 4,050,310 | -13.4 | 2,138,513 | 68,839 |
| 2004 | 13,383 | 717,050 | 92,016 | 4,989,599 | 23.2 | 2,627,509 | 70,412 |
| 2005 | 14,846 | 749,077 | 104,079 | 5,316,457 | 6.5 | 2,793,876 | 72,884 |
| 2006 | 15,614 | 830,885 | 111,648 | 6,013,586 | 13.1 | 3,224,286 | 75,468 |
| 2007 | 16,895 | 952,250 | 123,209 | 7,027,094 | 16.9 | 3,715,238 | 77,410 |
| 2008 | 19,026 | 879,074 | 141,440 | 6,620,450 | -5.8 | 3,541,391 | 80,458 |
| 2009 | 19,946 | 558,444 | 151,683 | 4,336,342 | -34.5 | 2,291,662 | 79,865 |
| 2010 | 19,028 | 728,430 | 149,470 | 5,823,177 | 34.3 | 3,181,146 | 81,651 |
| 2011 | 19,028 | 836,115 | 153,634 | 6,858,187 | 17.8 | 3,729,400 | 84,234 |
| | 373,944 | | 2,169,700 | | | | |
| | | | | | | | |
| | | | | | | Fund's lifetime | |
| | | | | | | average annual | |
| | | | | | | compound | |
| | | | | | | return: | |
| | | | | | | 11.8% | |
| | | | | | | 58.7479 | |
| | | | | | | | |
| |
| The results shown are before taxes on Fund distributions and sale of Fund shares. |
| |
| The market indexes are unmanaged and their results do not reflect the effect of sales charges, commissions, account fees, expenses or taxes. |
| |
| 1 As outlined in the prospectus, the sales charge is reduced for accounts (and aggregaed investments) of $25,000 or more and is eliminated for purchases of $1 million or more. There is no sales charge on dividends or capital gain distributions that are reinvested in additional shares. |
| |
| 2 The maximum initial sales charge was 8.5% prior to July 1, 1988. |
| |
3 For the period July 31, 1952 (when the Fund began operations) through April 30, 1953. |
| | | | | | | | |
4 Total value includes reinvested dividends of $2,169,700 and reinvested capital gain distributions of $2,747,465. |
| | | | | | | | |
5 The S&P 500 cannot be invested in directly. | | | | |
| | | | | | | | |
6 Capital value includes reinvested capital gain distributions of $464,101 but does not reflect income dividends of |
| $373,944 taken in cash. | | | | | | |
| | | | | | | | |
7 Computed from data supplied by the U.S. Department of Labor, Bureau of Labor Statistics. |
| | | | | | | | |

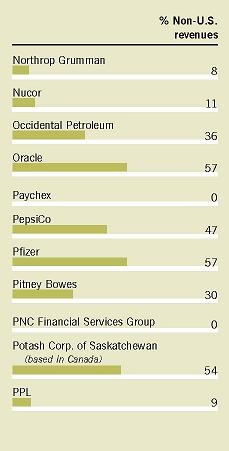
| During the past few years, nearly half the revenues of large U.S. companies reporting foreign sales have come from other countries — up from less than a third in 2001, according to Standard & Poor’s. "With economies in many Asian and Latin American countries growing more rapidly than ours, it’s possible that 2011 could be the first year when non-U.S. revenues account for more than half the total," says Alan Berro, who has served Capital Research and Management Company as a portfolio counselor or investment analyst for the past 20 years. The column alongside this article on the next five pages shows how important revenues from outside the U.S. have become to each of the Fund’s holdings.
Large companies, like those in which you have an investment through Washington Mutual Investors Fund, tend to be global wherever they’re based. Not surprisingly, most of the Fund’s holdings are industry world leaders. To cite just a few examples:
▪ United Parcel Service delivers the most packages3
▪ Boeing, the largest U.S. exporter, built three-quarters of commercial jetliners currently in service
▪ American Express is the largest credit card issuer
▪ Pfizer is the leading pharmaceuticals manufacturer ▪ Colgate-Palmolive holds a global market share of over 40% with its toothpaste line
Many of the holdings have customers in more than 100 countries. Procter & Gamble, for instance, sells everything from Pantene to Prilosec to Pampers all over the world, while Avon representatives call on clients from Albania to Zambia. The familiar golden arches of McDonald’s rise over more than 32,000 locations in 117 countries, and Big Mac sandwich prices in various countries are often used by The Economist magazine to illustrate relative currency values.
"Much of McDonald’s menu is the same elsewhere as it is here, but several products have been adapted or developed to meet local culture and tastes," says Anne-Marie Peterson, an investment analyst who studies the hotel and restaurant sector. "Indians enjoy Chicken Maharaja Macs or McAloo Tikki veggie burgers. In China, Egg McMuffins feature a spicy red sauce. Other examples include blinis and deep-fried brie on menus in Russia, strawberry pies in Lebanon, corn in South Africa and even beer in Europe." | 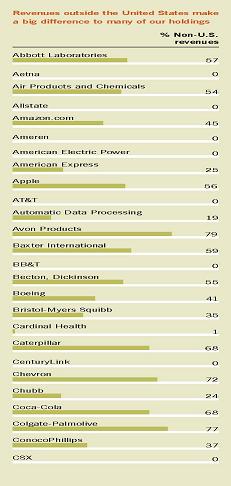 |
 |
Coca-Cola’s namesake soda can be found almost everywhere (its logo is the world’s most recognized), but the company also sells a long list of other beverages adapted for specific markets, including a "super-pulpy" Minute Maid orange juice in China. "Interestingly, Coke’s biggest seller in China is Sprite," observes David Carpenter, an investment analyst who has been following consumer staples for more than a decade. "That’s because up until recently refrigeration in stores and homes wasn’t something you could count on, and while Sprite tastes reasonably good warm, Coca-Cola’s flavor suffers. I think the Chinese market for Coke is just getting started. Only about 25% of Chinese consumers — that’s about 300 million people — drink Coke even once a week, so far. The company’s preparing for plenty of growth there. Beverages are heavy to ship, so it’s best to locate bottling operations close to the ultimate consumer. Coke already has almost 40 bottlers in China and plans to add 10 more in the next five years."
Rival PepsiCo has a huge international presence, too — in part because of its Frito-Lay subsidiary. "Unlike sweets, salty snacks translate to every culture," says David, "and there’s no significant competition." One of the rapidly growing markets where PepsiCo dominates is the Middle East, where David observes that "consumers divorce Western ideals and politics from Western brands."
Telecommunications giant AT&T doesn’t reveal foreign revenues, but says it provides wireless coverage to more than 200 countries on all seven continents plus more than 130 cruise ships at sea. Google, with offices in over 40 countries, can also claim users on all seven continents, and its "Street View" map feature added Antarctica in 2010.
Technology companies are often the most global of all. A whopping 85% of revenues at microchip maker Intel come from outside the U.S., and more than half the employees at Texas Instruments and more than a third of those at Microsoft are based overseas.
"Big economies of scale and low distribution costs make it easy for many technology companies to operate around the world," says Jeff Lager, who has 14 years of experience with Capital Research and Management Company as a portfolio counselor or investment analyst. "U.S. technology companies tend to be the industry leaders, thanks to the historic strength of the U.S. educational system combined with a vibrant venture capital community that encourages new ventures and a culture that rewards innovation." Talented individuals from all over the world flock to places like California’s Silicon Valley, Research Triangle Park in North Carolina and Boston’s Route 128 corridor, helping U.S. companies continue to discover and develop advancements that are embraced globally. |
| |  |
| Most technology companies are relatively young, but some U.S. companies have been making their mark all over the globe for many years. Almost a century ago, General Electric helped build the Panama Canal, as well as the first hydroelectric dam in India. More recently, United Technologies’ elevator subsidiary, Otis, makes it possible to get to the top of the world’s tallest building — the half-mile tall Burj Khalifa, in Dubai — in just one minute. Otis has a 25% market share in China, which currently accounts for half of the world’s elevator installations.
Here in the U.S. (and many other parts of the Western world), our infrastructures are mature. The companies that helped build them — Caterpillar, for instance — were market darlings back when the Fund was getting started in the 1950s and 1960s because they were instrumental in creating highways and commercial centers in this country.
"Now, China, India, the Middle East and Latin America are all in the early phases of developing their infrastructures, and it may be a whole new morning for those companies, which are ideally positioned to benefit on a scale several times larger than what we experienced in this country," says investment analyst Martin Jacobs, who has followed the industrial manufacturing sector for more than 15 years.
The Fund, of course, maintains some holdings with little to no exposure outside the U.S. — typically insurers, utilities, railroads and banks. UnitedHealth Group, for example, only supplies health insurance for U.S. companies and individuals.
Beginning in 1952, when Washington Mutual Investors Fund began operations, until about a decade ago, all holdings had to be based in the U.S. That sometimes forced sales of companies involved in mergers with companies based overseas — for example, in the mid-1980s, when Shell Oil became part of Shell Transport, based in the United Kingdom, which later merged with Royal Dutch Petroleum, based in the Netherlands. Indeed, more than 20 of the 78 holdings shown as the portfolio in the Fund’s 1953 annual report are now (or once were) parts of companies based outside the U.S. | 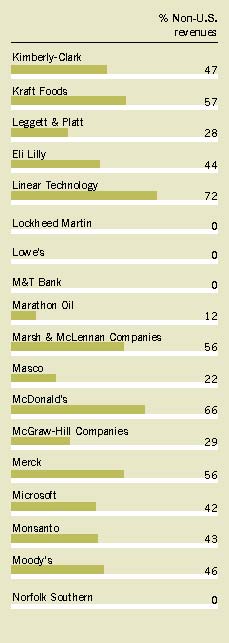 |
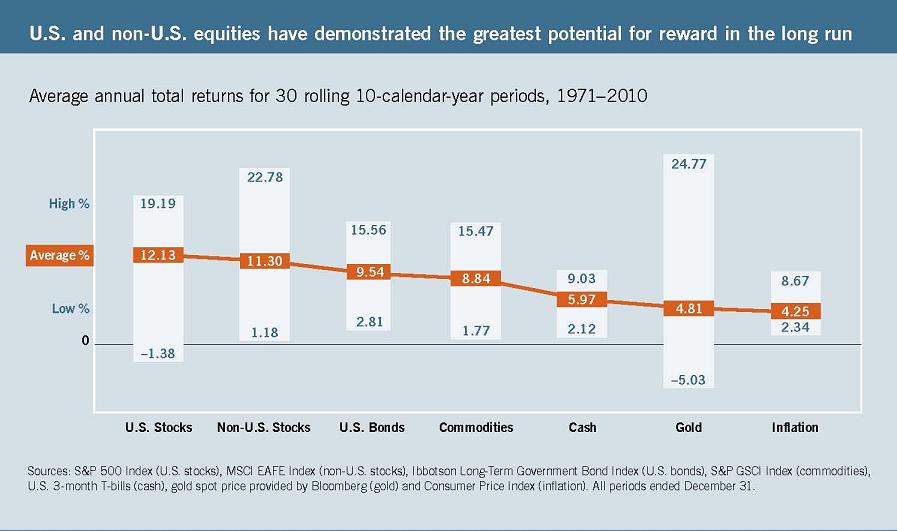
 | "That’s why, in 2000, the Fund’s board decided to allow up to five percent of assets to be invested in companies based outside the U.S. — subject to the Fund’s tough eligibility tests," says J. Knox Singleton, current chairman of the board. "Earlier this year, the board raised the limit to 10%, reflecting increased cross-border mergers and the growth of blue-chip foreign companies doing business in the U.S." Next to U.S. equities, non-U.S. stocks have demonstrated the greatest potential for reward in the long run, as measured over the last 30 rolling 10-year periods. Of course, investing outside the U.S. involves certain additional risks.
In addition to the limitation on non-U.S. holdings, the Fund’s eligibility standards — based on rules established by a District of Columbia court after the Great Depression, to ensure prudent management of trust funds — require that all companies considered for the portfolio must meet the financial listing requirements of the New York Stock Exchange.
The NYSE itself has become an increasingly global operation. American Depositary Shares, representing ownership in stocks of numerous companies based outside the United States, are listed for trading on the NYSE. In 2007, the NYSE merged with Euronext (the combined exchanges in Brussels, Paris and Amsterdam), and this year the Frankfurt-based Deutsche Bšrse is in the process of purchasing a majority stake in NYSE Euronext. |
| Not surprisingly, several U.S.-based companies in the financial industry are capitalizing on global opportunities. Marsh & McLennan Companies, for instance, has offices in over 100 countries which provide insurance and risk management solutions as well as consulting services to businesses. JPMorgan Chase is the custodian for American Depositary Shares for companies based in more than 100 different countries.
The Fund’s current non-U.S. holdings include two financial firms — Toronto-Dominion Bank (based in Canada) and HSBC Holdings (based in the United Kingdom). Other non-U.S. holdings include Potash Corp. of Saskatchewan (the world’s leading producer of fertilizer, based in Canada), Tenaris (an Argentinean steelmaker) and Royal Dutch Shell (originally a British store that sold painted seashells but now the operator of more than 44,000 service stations in over 30 countries).
The Fund’s investment adviser, Capital Research and Management Company, has looked at companies from a global perspective for many years and established its first research office outside the U.S. — in Geneva, Switzerland — nearly five decades ago, in 1962. It has since added research offices in London, Singapore, Hong Kong, Tokyo, and most recently, Mumbai. From these locations, as well as Los Angeles, San Francisco, New York and Washington, D.C., more than 200 investment professionals — who collectively speak more than two dozen languages — study companies and industries worldwide. They meet with company executives, as well as lower level employees, customers, suppliers and competitors, seeking insights others might miss.
"Over the past few years, I’ve been to China, Mexico, Central Europe and India to see the local facilities for companies I cover," says Martin Jacobs. "By looking at companies’ operations all over the world, I can see if their standards and processes are consistent, and at the same time get perspective on differences among local markets."
These efforts, combined with those of eight experienced portfolio counselors and dozens of other investment professionals, are dedicated to helping your Fund seek to take advantage of an increasingly global economy.▪ | 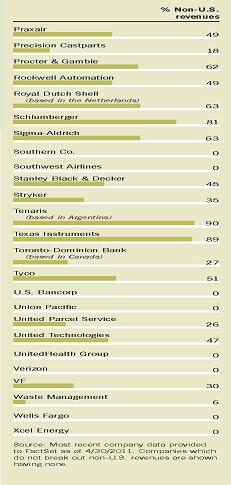 |
Investment portfolio April 30, 2011
| Industry sector diversification | Percent of net assets | | | Ten largest holdings | Percent of net assets | |
| Industrials | 16.97% | | | Chevron | 6.39% | |
| Energy | 15.57 | | | Royal Dutch Shell | 4.22 | |
| Health care | 12.18 | | | Merck | 3.71 | |
| Consumer staples | 9.27 | | | Verizon | 3.63 | |
| Financials | 8.99 | | | Procter & Gamble | 2.96 | |
| Consumer discretionary | 8.99 | | | Boeing | 2.34 | |
| Information technology | 7.28 | | | Home Depot | 2.29 | |
| Telecommunication services | 6.02 | | | Coca-Cola | 2.21 | |
| Materials | 5.06 | | | Dow Chemical | 2.11 | |
| Utilities | 4.48 | | | AT&T | 2.09 | |
| Miscellaneous | 2.49 | | | | | |
| Short-term securities & other assets less liabilities | 2.70 | | | | | |
| | | | | | | |
| | | | | | | Value | | | Percent of |
| Common stocks — 97.30% | | | | Shares | | | (000) | | | net assets |
| Energy — 15.57% | | | | | | | | | |
| Chevron Corp. | | | 31,881,800 | | $ | 3,489,144 | | | 6.39% |
| ConocoPhillips | | | 11,840,000 | | | 934,531 | | | 1.71 |
| Exxon Mobil Corp. | | | 3,997,500 | | | 351,780 | | | 0.64 |
| Hess Corp. | | | | 2,140,000 | | | 183,954 | | | 0.34 |
| Marathon Oil Corp. | | | 4,100,000 | | | 221,564 | | | 0.41 |
| Occidental Petroleum Corp. | | 1,900,000 | | | 217,151 | | | 0.4 |
| Royal Dutch Shell PLC, Class A (ADR) | | 886,700 | | | 68,702 | | | |
| Royal Dutch Shell PLC, Class B (ADR) | 28,568,600 | | | 2,238,635 | | | 4.22 |
| Schlumberger Ltd. | | | 8,233,300 | | | 738,939 | | | 1.35 |
| Tenaris SA (ADR) | | | 1,220,000 | | | 61,964 | | | 0.11 |
| | | | | | | | 8,506,364 | | | 15.57 |
| | | | | | | | | | | |
| Materials — 5.06% | | | | | | | | |
| Air Products and Chemicals, Inc. | 2,500,000 | | | 238,800 | | | 0.44 |
| Dow Chemical Co. | | | 28,097,826 | | | 1,151,730 | | | 2.11 |
| E.I. du Pont de Nemours and Co. | | 6,260,000 | | | 355,506 | | | 0.65 |
| Monsanto Co. | | | 100,000 | | | 6,804 | | | 0.01 |
| Nucor Corp. | | | | 12,250,000 | | | 575,260 | | | 1.05 |
| Potash Corp. of Saskatchewan Inc. | | 2,130,000 | | | 120,089 | | | 0.22 |
| Praxair, Inc. | | | | 2,822,000 | | | 300,317 | | | 0.55 |
| Sigma-Aldrich Corp. | | | 200,000 | | | 14,116 | | | 0.03 |
| | | | | | | | 2,762,622 | | | 5.06 |
| | | | | | | | | | | |
| Industrials — 16.97% | | | | | | | | |
| Boeing Co. | | | 16,010,000 | | | 1,277,278 | | | 2.34 |
| Caterpillar Inc. | | | 2,800,000 | | | 323,148 | | | 0.59 |
| CSX Corp. | | | | 5,915,000 | | | 465,451 | | | 0.85 |
| Deere & Co. | | | | 2,200,000 | | | 214,500 | | | 0.39 |
| Eaton Corp. | | | | 5,800,000 | | | 310,474 | | | 0.57 |
| Emerson Electric Co. | | | 10,420,000 | | | 633,119 | | | 1.16 |
| General Dynamics Corp. | | | 2,950,000 | | | 214,819 | | | 0.39 |
| General Electric Co. | | | 22,500,000 | | | 460,125 | | | 0.84 |
| Honeywell International Inc. | | 4,471,100 | | | 273,765 | | | 0.5 |
| Illinois Tool Works Inc. | | | 5,020,000 | | | 293,218 | | | 0.54 |
| Lockheed Martin Corp. | | | 10,590,000 | | | 839,258 | | | 1.54 |
| Masco Corp. | | | 8,000,000 | | | 107,360 | | | 0.20 |
| Norfolk Southern Corp. | | | 3,600,000 | | | 268,848 | | | 0.49 |
| Northrop Grumman Corp. | | | 13,650,000 | | | 868,276 | | | 1.59 |
| Pitney Bowes Inc. | | | 4,000,000 | | | 98,240 | | | 0.18 |
| Precision Castparts Corp. | | | 90,000 | | | 13,907 | | | 0.02 |
| Rockwell Automation | | | 2,000,000 | | | 174,260 | | | 0.32 |
| Southwest Airlines Co. | | | 5,500,000 | | | 64,625 | | | 0.12 |
| Tyco International Ltd. | | | 2,190,000 | | | 106,741 | | | 0.19 |
| Union Pacific Corp. | | | 5,080,000 | | | 525,628 | | | 0.96 |
| United Parcel Service, Inc., Class B | | 5,160,900 | | | 386,913 | | | 0.71 |
| United Technologies Corp. | | | 11,305,000 | | | 1,012,702 | | | 1.85 |
| W.W. Grainger, Inc. | | | 425,000 | | | 64,430 | | | 0.12 |
| Waste Management, Inc. | | | 7,000,000 | | | 276,220 | | | 0.51 |
| | | | | | | | 9,273,305 | | | 16.97 |
| | | | | | | | | | | |
| Consumer discretionary — 8.99% | | | | | | | |
Amazon.com, Inc.1 | | 1,644,000 | | | 323,046 | | | 0.59 |
| Harley-Davidson, Inc. | | | 2,000,000 | | | 74,520 | | | 0.14 |
| Home Depot, Inc. | | | 33,671,000 | | | 1,250,541 | | | 2.29 |
| Johnson Controls, Inc. | | | 17,335,000 | | | 710,735 | | | 1.3 |
| Leggett & Platt, Inc. | | | 2,800,000 | | | 73,612 | | | 0.13 |
| Lowe’s Companies, Inc. | | | 6,400,000 | | | 168,000 | | | 0.31 |
| McDonald’s Corp. | | | 12,100,000 | | | 947,551 | | | 1.73 |
| McGraw-Hill Companies, Inc. | | 12,919,100 | | | 522,836 | | | 0.96 |
| Stanley Black & Decker, Inc. | | 3,250,000 | | | 236,112 | | | 0.43 |
| VF Corp. | | | | 5,200,000 | | | 522,912 | | | 0.96 |
| Walt Disney Co. | | | 1,840,000 | | | 79,304 | | | 0.15 |
| | | | | | | | 4,909,169 | | | 8.99 |
| | | | | | | | | | | |
| Consumer staples — 9.27% | | | | | | | |
| Avon Products, Inc. | | 7,330,400 | | | 215,367 | | | 0.39 |
| Coca-Cola Co. | | | 17,885,000 | | | 1,206,522 | | | 2.21 |
| Colgate-Palmolive Co. | | | 1,860,000 | | | 156,891 | | | 0.29 |
| Kimberly-Clark Corp. | | | 300,000 | | | 19,818 | | | 0.04 |
| Kraft Foods Inc., Class A | | | 34,015,000 | | | 1,142,224 | | | 2.09 |
| PepsiCo, Inc. | | | | 10,250,000 | | | 706,122 | | | 1.29 |
| Procter & Gamble Co. | | | 24,960,800 | | | 1,619,956 | | | 2.96 |
| | | | | | | | 5,066,900 | | | 9.27 |
| | | | | | | | | | | |
| Health care — 12.18% | | | | | | | | |
| Abbott Laboratories | | 3,800,000 | | | 197,752 | | | 0.36 |
| Aetna Inc. | | | | 7,400,000 | | | 306,212 | | | 0.56 |
| Baxter International Inc. | | | 12,110,000 | | | 689,059 | | | 1.26 |
| Becton, Dickinson and Co. | | | 1,000,000 | | | 85,940 | | | 0.16 |
| Bristol-Myers Squibb Co. | | | 27,580,000 | | | 774,998 | | | 1.42 |
| Cardinal Health, Inc. | | | 14,913,279 | | | 651,561 | | | 1.19 |
| Eli Lilly and Co. | | | 9,250,000 | | | 342,342 | | | 0.63 |
| Johnson & Johnson | | | 16,230,000 | | | 1,066,636 | | | 1.95 |
| Merck & Co., Inc. | | | 56,450,000 | | | 2,029,377 | | | 3.71 |
| Pfizer Inc | | | | 14,250,000 | | | 298,680 | | | 0.55 |
| Stryker Corp. | | | | 1,300,000 | | | 76,700 | | | 0.14 |
| UnitedHealth Group Inc. | | | 2,750,000 | | | 135,383 | | | 0.25 |
| | | | | | | | 6,654,640 | | | 12.18 |
| | | | | | | | | | | |
| Financials — 8.99% | | | | | | | | | |
| Allstate Corp. | | | 5,050,000 | | | 170,892 | | | 0.31 |
| American Express Co. | | | 18,950,000 | | | 930,066 | | | 1.7 |
| BB&T Corp. | | | | 3,515,000 | | | 94,624 | | | 0.17 |
| Chubb Corp. | | | | 2,900,000 | | | 189,051 | | | 0.35 |
| Goldman Sachs Group, Inc. | | 513,000 | | | 77,468 | | | 0.14 |
| HSBC Holdings PLC (ADR) | | | 5,200,000 | | | 283,244 | | | 0.52 |
| JPMorgan Chase & Co. | | | 6,349,100 | | | 289,710 | | | 0.53 |
| M&T Bank Corp. | | | 4,124,491 | | | 364,481 | | | 0.67 |
| Marsh & McLennan Companies, Inc. | | 23,366,900 | | | 707,550 | | | 1.29 |
| Moody’s Corp. | | | 2,450,000 | | | 95,893 | | | 0.18 |
| PNC Financial Services Group, Inc. | | 1,645,000 | | | 102,549 | | | 0.19 |
| Toronto-Dominion Bank | | | 1,300,000 | | | 112,619 | | | 0.21 |
| U.S. Bancorp | | | | 15,345,600 | | | 396,223 | | | 0.72 |
| Wells Fargo & Co. | | | 37,653,100 | | | 1,096,082 | | | 2.01 |
| | | | | | | | 4,910,452 | | | 8.99 |
| | | | | | | | | | | |
| Information technology — 7.28% | | | | | | | |
Apple Inc.1 | | | 435,000 | | | 151,480 | | | 0.28 |
| Automatic Data Processing, Inc. | | 5,695,000 | | | 309,523 | | | 0.57 |
Google Inc., Class A1 | | | 450,000 | | | 244,845 | | | 0.45 |
| Intel Corp. | | | | 4,500,000 | | | 104,355 | | | 0.19 |
| International Business Machines Corp. | | 4,640,000 | | | 791,491 | | | 1.45 |
| Linear Technology Corp. | | | 8,913,000 | | | 310,173 | | | 0.57 |
| Microsoft Corp. | | | 15,195,000 | | | 395,374 | | | 0.72 |
| Oracle Corp. | | | | 13,943,300 | | | 502,656 | | | 0.92 |
| Paychex, Inc. | | | 15,118,827 | | | 494,537 | | | 0.9 |
| Texas Instruments Inc. | | | 18,867,500 | | | 670,362 | | | 1.23 |
| | | | | | | | 3,974,796 | | | 7.28 |
| | | | | | | | | | | |
| Telecommunication services — 6.02% | | | | | | |
| AT&T Inc. | | | 36,715,000 | | | 1,142,571 | | | 2.09 |
| CenturyLink, Inc. | | | 4,040,000 | | | 164,751 | | | 0.3 |
| Verizon Communications Inc. | | 52,450,000 | | | 1,981,561 | | | 3.63 |
| | | | | | | | 3,288,883 | | | 6.02 |
| | | | | | | | | | | |
| Utilities — 4.48% | | | | | | | | | |
| Ameren Corp. | | | 1,400,000 | | | 41,034 | | | 0.07 |
| American Electric Power Co., Inc. | | 4,175,000 | | | 152,304 | | | 0.28 |
| Dominion Resources, Inc. | | | 10,550,000 | | | 489,731 | | | 0.9 |
| Duke Energy Corp. | | | 31,875,000 | | | 594,469 | | | 1.09 |
| Entergy Corp. | | | 1,000,000 | | | 69,720 | | | 0.13 |
| Exelon Corp. | | | | 5,375,000 | | | 226,556 | | | 0.41 |
| FirstEnergy Corp. | | | 7,000,000 | | | 279,720 | | | 0.51 |
| PPL Corp. | | | | 2,500,000 | | | 68,575 | | | 0.13 |
| Southern Co. | | | | 7,800,000 | | | 304,512 | | | 0.56 |
| Xcel Energy Inc. | | | 9,000,000 | | | 218,970 | | | 0.4 |
| | | | | | | | 2,445,591 | | | 4.48 |
| | | | | | | | | | | |
| Miscellaneous — 2.49% | | | | | | | | |
| Other common stocks in initial period of acquisition | | 1,358,817 | | | 2.49 |
| | | | | | | | | | | |
Total common stocks (cost: $39,709,511,000) | | | 53,151,539 | | | 97.3 |
| | | | | | | | |
| | | | | Principal amount | | | Value | | | Percent of |
| Short-term securities — 3.06% | | | | (000) | | | (000) | | | net assets |
| | | | | | | | | | | |
Coca-Cola Co. 0.14%–0.21% due 5/13–5/27/20112 | $98,000 | | | 97,991 | | | 0.18 |
Fannie Mae 0.07%–0.20% due 6/20/2011–1/3/2012 | 267,371 | | | 267,280 | | | 0.49 |
Federal Home Loan Bank 0.08%–0.115% due 5/6–6/8/2011 | 71,223 | | | 71,220 | | | 0.13 |
Freddie Mac 0.05%–0.23% due 5/2–10/19/2011 | 266,850 | | | 266,769 | | | 0.49 |
General Electric Co. 0.05% due 5/2/2011 | 63,300 | | | 63,300 | | | 0.11 |
Google Inc. 0.13% due 5/25/20112 | | 26,500 | | | 26,498 | | | 0.05 |
Hewlett-Packard Co. 0.12% due 5/2–5/11/20112 | 59,500 | | | 59,498 | | | 0.11 |
IBM Corp. 0.08% due 5/2/20112 | | 67,800 | | | 67,800 | | | 0.12 |
Johnson & Johnson 0.16%–0.19% due 5/19–7/14/20112 | 67,000 | | | 66,984 | | | 0.12 |
Jupiter Securitization Co., LLC 0.16%–0.18% due 5/6–5/25/20112 | 75,300 | | | 75,296 | | | 0.14 |
Medtronic Inc. 0.17% due 7/19/20112 | | 50,000 | | | 49,975 | | | 0.09 |
NetJets Inc. 0.15% due 6/21/20112 | | 43,500 | | | 43,487 | | | 0.08 |
PepsiCo Inc. 0.16%–0.17% due 5/17–6/13/20112 | 55,000 | | | 54,992 | | | 0.1 |
Private Export Funding Corp. 0.22% due 6/7/20112 | 39,200 | | | 39,193 | | | 0.07 |
Procter & Gamble Co. 0.15%–0.18% due 6/9–6/15/20112 | 86,000 | | | 85,983 | | | 0.16 |
Straight-A Funding LLC 0.19%–0.25% due 5/10–6/24/20112 | 123,454 | | | 123,426 | | | 0.23 |
U.S. Treasury Bills 0.07%–0.155% due 5/5–8/18/2011 | 213,600 | | | 213,581 | | | 0.39 |
| | | | | | | | | | | |
Total short-term securities (cost: $1,673,180,000) | | 1,673,273 | | | 3.06 |
| | | | | | | | | | | |
Total investment securities (cost: $41,382,691,000) | | 54,824,812 | | | 100.36 |
| Other assets less liabilities | | | | | | (198,236) | | | (0.36) |
| | | | | | | | | | | |
| Net assets | | | | | | $54,626,576 | | | 100.00% |
| | | | �� | | | | | | | |
| | | | | | | | | | | |
| “Miscellaneous” securities include holdings in their initial period of acquisition that have not previously been publicly disclosed. |
| | | | | | | | | | | |
| Investments in affiliates | | | | | |
| A company is considered to be an affiliate of the Fund under the Investment Company Act of 1940 if the Fund’s holdings in that company represent 5% or more of the outstanding voting shares. Further details on such holdings and related transactions during the year ended April 30, 2011, appear below. |
| | | | | | Dividend | Value of affiliate |
| | | | | | income | at 4/30/2011 |
| | Beginning shares | Additions | Reductions | Ending shares | (000) | (000) |
McGraw-Hill Companies, Inc.3 | 11,300,000 | 4,119,100 | 2,500,000 | 12,919,100 | $13,217 | $— |
| | | | | | | |
1 Security did not produce income during the last 12 months. | |
2 Acquired in a transaction exempt from registration under the Securities Act of 1933. May be resold in the U.S. in transactions exempt from registration, normally to qualified institutional buyers. The total value of all such securities was $791,123,000, which represented 1.45% of the net assets of the Fund. |
3 Unaffiliated issuer at 4/30/2011. | | | | | |
| | | | | | | |
| | | | | | | |
| Key to abbreviation | | | | |
| ADR = American Depositary Receipts | | |
| | | | | | | |
| See Notes to financial statements | | | |
Financial statements
| Statement of assets and liabilities at April 30, 2011 | | | (dollars in thousands) |
| Assets: | | | |
| Investment securities, at value (cost: $41,382,691) | | | $54,824,812 |
| Cash | | | 1,140 |
| Receivables for: | | | |
| Sales of investments | $176,872 | | |
| Sales of Fund’s shares | 42,364 | | |
| Dividends | 106,444 | | 325,680 |
| | | | 55,151,632 |
| Liabilities: | | | |
| Payables for: | | | |
| Purchases of investments | 407,373 | | |
| Repurchases of Fund’s shares | 77,513 | | |
| Management services | 10,681 | | |
| Services provided by related parties | 26,241 | | |
| Trustees’ and advisory board’s deferred compensation | 3,077 | | |
| Other | 171 | | 525,056 |
| Net assets at April 30, 2011 | | | $54,626,576 |
| | | | |
| Net assets consist of: | | | |
| Capital paid in on shares of beneficial interest | | | $45,087,630 |
| Undistributed net investment income | | | 342,771 |
| Accumulated net realized loss | | | (4,245,964) |
| Net unrealized appreciation | | | 13,442,139 |
| Net assets at April 30, 2011 | | | $54,626,576 |
| | (dollars and shares in thousands, except per-share amounts) |
| Shares of beneficial interest issued and outstanding (no stated par value) — unlimited shares authorized (1,843,560 total shares outstanding) |
| | Net assets | Shares outstanding | Net asset value per share |
| Class A | $41,374,956 | 1,394,909 | $29.66 |
| Class B | 888,722 | 30,173 | 29.45 |
| Class C | 1,933,976 | 65,840 | 29.37 |
| Class F-1 | 2,066,872 | 69,862 | 29.59 |
| Class F-2 | 630,165 | 21,246 | 29.66 |
| Class 529-A | 1,137,714 | 38,411 | 29.62 |
| Class 529-B | 117,000 | 3,969 | 29.48 |
| Class 529-C | 329,922 | 11,201 | 29.46 |
| Class 529-E | 61,826 | 2,096 | 29.50 |
| Class 529-F-1 | 63,336 | 2,142 | 29.58 |
| Class R-1 | 80,982 | 2,751 | 29.44 |
| Class R-2 | 745,188 | 25,380 | 29.36 |
| Class R-3 | 1,367,025 | 46,358 | 29.49 |
| Class R-4 | 1,406,681 | 47,583 | 29.56 |
| Class R-5 | 1,020,927 | 34,424 | 29.66 |
| Class R-6 | 1,401,284 | 47,215 | 29.68 |
See Notes to financial statements
Statement of operations for the year ended April 30, 2011 | | | (dollars in thousands) |
| Investment income: | | | |
| Income: | | | |
| Dividends (net of non-U.S. taxes of $2,141; also includes $13,217 from affiliate) | $1,625,374 | | |
| Interest | 2,595 | | $1,627,969 |
| | | | |
| Fees and expenses*: | | | |
| Investment advisory services | 97,775 | | |
| Business management services | 26,449 | | |
| Distribution services | 144,182 | | |
| Transfer agent services | 47,303 | | |
| Administrative services | 18,130 | | |
| Reports to shareholders | 2,560 | | |
| Registration statement and prospectus | 694 | | |
| Trustees’ and advisory board’s compensation | 2,046 | | |
| Auditing and legal | 352 | | |
| Custodian | 213 | | |
| State and local taxes | —† | | |
| Other | 2,298 | | 342,002 |
| Net investment income | | | 1,285,967 |
| | | | |
| Net realized gain and unrealized appreciation on investments: | | | |
| Net realized gain on investments (includes $9,765 net gain from affiliate) | | | 2,288,945 |
| Net unrealized appreciation on investments | | | 4,652,022 |
| Net realized gain and unrealized appreciation on investments | | | 6,940,967 |
| Net increase in net assets resulting from operations | | | $8,226,934 |
*Additional information related to class-specific fees and expenses is included in the Notes to financial statements.
†Amount less than one thousand.
| Statements of changes in net assets | | | (dollars in thousands) | |
| | Year ended April 30 | |
| | 2011 | | 2010 | |
| Operations: | | | | |
| Net investment income | $ 1,285,967 | | $ 1,317,648 | |
| Net realized gain on investments | 2,288,945 | | 2,207,034 | |
| Net unrealized appreciation on investments | 4,652,022 | | 10,515,745 | |
| Net increase in net assets resulting from operations | 8,226,934 | | 14,040,427 | |
| | | | | |
| Dividends paid to shareholders from net investment income | (1,243,402) | | (1,367,940) | |
| | | | | |
| Net capital share transactions | (3,276,827) | | (5,069,126) | |
| | | | | |
| Total increase in net assets | 3,706,705 | | 7,603,361 | |
| | | | | |
| Net assets: | | | | |
| Beginning of year | 50,919,871 | | 43,316,510 | |
| End of year (including undistributed net investment income: $342,771 and $300,340, respectively) | $54,626,576 | | $50,919,871 | |
See Notes to financial statements
Notes to financial statements
Washington Mutual Investors Fund (the "Fund") is registered under the Investment Company Act of 1940 as an open-end, diversified management investment company. The Fund’s investment objective is to produce income and to provide an opportunity for growth of principal consistent with sound common stock investing. Effective July 1, 2010, the Fund reorganized from a Maryland corporation to a Delaware statutory trust in accordance with a proposal approved by shareholders on November 24, 2009.
The Fund has 16 share classes consisting of five retail share classes, five 529 college savings plan share classes and six retirement plan share classes. The 529 college savings plan share classes (529-A, 529-B, 529-C, 529-E and 529-F-1) may be used to save for college education. The six retirement plan share classes (R-1, R-2, R-3, R-4, R-5 and R-6) are generally offered only through eligible employer-sponsored retirement plans. The Fund’s share classes are described below:
| Share class | | Initial sales charge | Contingent deferred sales charge upon redemption | Conversion feature |
| Classes A and 529-A | | Up to 5.75% | None (except 1% for certain redemptions within one year of purchase without an initial sales charge) | None |
| Classes B and 529-B* | | None | Declines from 5% to 0% for redemptions within six years of purchase | Classes B and 529-B convert to Classes A and 529-A, respectively, after eight years |
| Class C | | None | 1% for redemptions within one year of purchase | Class C converts to Class F-1 after 10 years |
| Class 529-C | | None | 1% for redemptions within one year of purchase | None |
| Class 529-E | | None | None | None |
| Classes F-1, F-2 and 529-F-1 | | None | None | None |
| Classes R-1, R-2, R-3, R-4, R-5 and R-6 | | None | None | None |
| |
*Class B and 529-B shares of the Fund are not available for purchase. |
Holders of all share classes have equal pro rata rights to assets, dividends and liquidation proceeds. Each share class has identical voting rights, except for the exclusive right to vote on matters affecting only its class. Share classes have different fees and expenses ("class-specific fees and expenses"), primarily due to different arrangements for distribution, administrative and shareholder services. Differences in class-specific fees and expenses will result in differences in net investment income and, therefore, the payment of different per-share dividends by each class.
| 2. Significant accounting policies |
The financial statements have been prepared to comply with accounting principles generally accepted in the United States of America. These principles require management to make estimates and assumptions that affect reported amounts and disclosures. Actual results could differ from those estimates. The Fund follows the significant accounting policies described below, as well as the valuation policies described in the next section on valuation.
Security transactions and related investment income — Security transactions are recorded by the Fund as of the date the trades are executed with brokers. Realized gains and losses from security transactions are determined based on the specific identified cost of the securities. Dividend income is recognized on the ex-dividend date and interest income is recognized on an accrual basis. Market discounts, premiums and original issue discounts on fixed-income securities are amortized daily over the expected life of the security.
Class allocations — Income, fees and expenses (other than class-specific fees and expenses) and realized and unrealized gains and losses are allocated daily among the various share classes based on their relative net assets. Class-specific fees and expenses, such as distribution, administrative and shareholder services, are charged directly to the respective share class.
Dividends and distributions to shareholders — Dividends and distributions paid to shareholders are recorded on the ex-dividend date.
The Fund’s investments are reported at fair value as defined by accounting principles generally accepted in the United States of America. The Fund generally determines the net asset value of each share class as of approximately 4:00 p.m. New York time each day the New York Stock Exchange is open.
Methods and inputs — The Fund uses the following methods and inputs to establish the fair value of its assets and liabilities. Use of particular methods and inputs may vary over time based on availability and relevance as market and economic conditions evolve.
Equity securities are generally valued at the official closing price of, or the last reported sale price on, the exchange or market on which such securities are traded, as of the close of business on the day the securities are being valued or, lacking any sales, at the last available bid price. Prices for each security are taken from the principal exchange or market in which the security trades.
Fixed-income securities, including short-term securities purchased with more than 60 days left to maturity, are generally valued at prices obtained as of approximately 3:00 p.m. New York time, or relevant local time for securities trading outside U.S. time zones, from one or more pricing vendors. Vendors value such securities based on one or more of the following inputs: benchmark yields, transactions, bids, offers, quotations from dealers and trading systems, new issues, spreads, interest rate volatilities, and other relationships observed in the markets among comparable securities; and proprietary pricing models such as yield measures calculated using factors such as cash flows, financial or collateral performance and other reference data.
Where the investment adviser deems it appropriate to do so (such as when vendor prices are unavailable or not deemed to be representative), fixed-income securities will be valued in good faith at the mean quoted bid and asked prices that are reasonably and timely available (or bid prices, if asked prices are not available) or at prices for securities of comparable maturity, quality and type.
Securities with both fixed-income and equity characteristics, or equity securities traded principally among fixed-income dealers, are generally valued in the manner described above for either equity or fixed-income securities, depending on which method is deemed most appropriate by the investment adviser. Short-term securities purchased within 60 days to maturity are valued at amortized cost, which approximates fair value. The value of short-term securities originally purchased with maturities greater than 60 days is determined based on an amortized value to par when they reach 60 days.
Securities and other assets for which representative market quotations are not readily available or are considered unreliable by the investment adviser are fair valued as determined in good faith under guidelines adopted by authority of the Fund’s board of trustees. Various inputs may be reviewed in order to make a good faith determination of a security’s fair value. These inputs include, but are not limited to, the type and cost of the security; contractual or legal restrictions on resale of the security; relevant financial or business developments of the issuer; actively traded similar or related securities; conversion or exchange rights on the security; related corporate actions; significant events occurring after the close of trading in the security; and changes in overall market conditions. Fair valuations and valuations of investments that are not actively trading involve judgment and may differ materially from valuations that would have been used had greater market activity occurred.
Classifications — The Fund classifies its assets and liabilities into three levels based on the inputs used to value the assets or liabilities. Level 1 values are based on quoted prices in active markets for identical securities. Level 2 values are based on significant observable market inputs, such as quoted prices for similar securities and quoted prices in inactive markets. Level 3 values are based on significant unobservable inputs that reflect the Fund’s determination of assumptions that market participants might reasonably use in valuing the securities. The valuation levels are not necessarily an indication of the risk or liquidity associated with the underlying investment. For example, U.S. government securities are reflected as Level 2 because the inputs used to determine fair value may not always be quoted prices in an active market. The following table presents the Fund’s valuation levels as of April 30, 2011 (dollars in thousands):
| Investment securities: | Level 1 | | Level 2 | | Level 3 | | Total |
| Common stocks: | | | | | | | |
| Energy | $ 8,506,364 | | $ — | | $— | | $ 8,506,364 |
| Materials | 2,762,622 | | — | | — | | 2,762,622 |
| Industrials | 9,273,305 | | — | | — | | 9,273,305 |
| Consumer discretionary | 4,909,169 | | — | | — | | 4,909,169 |
| Consumer staples | 5,066,900 | | — | | — | | 5,066,900 |
| Health care | 6,654,640 | | — | | — | | 6,654,640 |
| Financials | 4,910,452 | | — | | — | | 4,910,452 |
| Information technology | 3,974,796 | | — | | — | | 3,974,796 |
| Telecommunication services | 3,288,883 | | — | | — | | 3,288,883 |
| Utilities | 2,445,591 | | — | | — | | 2,445,591 |
| Miscellaneous | 1,358,817 | | — | | — | | 1,358,817 |
| Short-term securities | — | | 1,673,273 | | — | | 1,673,273 |
| Total | $53,151,539 | | $1,673,273 | | $— | | $54,824,812 |
Investing in the Fund may involve certain risks including, but not limited to, those described below.
Market conditions — The prices of, and the income generated by, the common stocks and other securities held by the Fund may decline due to market conditions and other factors, including those directly involving the issuers of securities held by the Fund.
Investing in income-oriented stocks — Income provided by the Fund may be reduced by changes in the dividend policies of, and the capital resources available at, the companies in which the Fund invests.
Investing in growth-oriented stocks — Growth-oriented stocks may involve larger price swings and greater potential for loss than other types of investments.
Management — The investment adviser to the Fund actively manages the Fund’s investments. Consequently, the Fund is subject to the risk that the methods and analyses employed by the investment adviser in this process may not produce the desired results. This could cause the Fund to lose value or its results to lag relevant benchmarks or other funds with similar objectives.
| 5. Taxation and distributions |
Federal income taxation — The Fund complies with the requirements under Subchapter M of the Internal Revenue Code applicable to mutual funds and intends to distribute substantially all of its net taxable income and net capital gains each year. The Fund is not subject to income taxes to the extent such distributions are made. Therefore, no federal income tax provision is required.
As of and during the period ended April 30, 2011, the Fund did not have a liability for any unrecognized tax benefits. The Fund recognizes interest and penalties, if any, related to unrecognized tax benefits as income tax expense in the statement of operations. During the period, the Fund did not incur any interest or penalties.
The Fund is not subject to examination by U.S. federal tax authorities or state tax authorities for tax years before 2007.
Non-U.S. taxation — Dividend income is recorded net of non-U.S. taxes paid.
Distributions — Distributions paid to shareholders are based on net investment income and net realized gains determined on a tax basis, which may differ from net investment income and net realized gains for financial reporting purposes. These differences are due primarily to different treatment for items such as currency gains and losses; short-term capital gains and losses; capital losses related to sales of certain securities within 30 days of purchase; and net capital losses. The fiscal year in which amounts are distributed may differ from the year in which the net investment income and net realized gains are recorded by the Fund for financial reporting purposes.
During the year ended April 30, 2011, the Fund reclassified $47,000 from undistributed net investment income to accumulated net realized loss and $87,000 from undistributed net investment income to capital paid in on shares of beneficial interest to align financial reporting with tax reporting.
As of April 30, 2011, the tax basis components of distributable earnings, unrealized appreciation (depreciation) and cost of investment securities were as follows:
| | (dollars in thousands) |
| Undistributed ordinary income | $ 345,848 |
Capital loss carryforwards*:Expiring 2017 | $ (691,448) | |
Expiring 2018 | (3,493,853) | (4,185,301) |
| Gross unrealized appreciation on investment securities | 13,827,809 |
| Gross unrealized depreciation on investment securities | (446,351) |
| Net unrealized appreciation on investment securities | 13,381,458 |
| Cost of investment securities | 41,443,354 |
*Reflects the utilization of capital loss carryforwards of $2,252,846,000. The capital loss carryforwards will be used to offset any capital gains realized by the Fund in future years through the expiration dates. The Fund will not make distributions from capital gains while capital loss carryforwards remain. |
Under the Regulated Investment Company Modernization Act of 2010 (the "Act"), net capital losses recognized after April 30, 2011, may be carried forward indefinitely, and their character is retained as short-term and/or long-term losses. Previously, net capital losses were carried forward for eight years and treated as short-term losses. As a transition rule, the Act requires that post-enactment net capital losses be used before pre-enactment net capital losses.
Tax-basis distributions paid to shareholders from ordinary income were as follows (dollars in thousands):
| | Year ended April 30 | | |
| Share Class | 2011 | | 2010 | | |
| Class A | $973,632 | | $1,087,747 | | |
| Class B | 17,996 | | 30,048 | | |
| Class C | 31,980 | | 37,528 | | |
| Class F-1 | 45,199 | | 48,281 | | |
| Class F-2 | 13,696 | | 11,112 | | |
| Class 529-A | 24,426 | | 23,609 | | |
| Class 529-B | 2,077 | | 2,911 | | |
| Class 529-C | 5,071 | | 5,438 | | |
| Class 529-E | 1,209 | | 1,231 | | |
| Class 529-F-1 | 1,488 | | 1,318 | | |
| Class R-1 | 1,288 | | 1,209 | | |
| Class R-2 | 12,373 | | 13,491 | | |
| Class R-3 | 27,915 | | 30,591 | | |
| Class R-4 | 30,535 | | 30,825 | | |
| Class R-5 | 25,113 | | 25,387 | | |
| Class R-6 | 29,404 | | 17,214 | | |
| Total | $1,243,402 | | $1,367,940 | | |
| 6. Fees and transactions with related parties |
Business management services — The Fund has a business management agreement with Washington Management Corporation (WMC). Under this agreement, WMC provides services necessary to carry on the Fund’s general administrative and corporate affairs. These services encompass matters relating to general corporate governance, regulatory compliance and monitoring of the Fund’s contractual service providers, including custodian operations, shareholder services and Fund share distribution functions. Under the agreement, all expenses chargeable to the Class A shares of the Fund, including compensation to the business manager, shall not exceed 1% of the Class A average net assets of the Fund on an annual basis. The agreement provides for monthly fees, accrued daily, based on a series of decreasing annual rates. For the period May 1, 2010 through June 30, 2010, the annual rates began at 0.175% on the first $3 billion of daily net assets and decreased to 0.030% on such assets in excess of $77 billion. Effective July 1, 2010, annual rates were initiated at 0.117% on the first $3 billion of daily net assets decreasing to 0.0375% on such assets in excess of $44 billion. For the year ended April 30, 2011, the business management services fee was $26,449,000, which was equivalent to an annualized rate of 0.054% of average daily net assets. During the year ended April 30, 2011, WMC paid the Fund’s investment adviser $1,821,000 for performing various fund accounting services for the Fund and for The American Funds Tax-Exempt Series I, another registered investment company for which WMC serves as business manager. Johnston, Lemon & Co. Incorporated (JLC), a wholly owned subsidiary of The Johnston-Lemon Group, Incorporated (parent company of WMC), earned $431,000 on its retail sales of shares, including payments under the distribution plans of the Fund. JLC received no brokerage commissions resulting from the purchases and sales of securities for the investment account of the Fund.
Investment advisory services — Capital Research and Management Company (CRMC), the Fund’s investment adviser, is the parent company of American Funds Distributors,¨ Inc. (AFD), the principal underwriter of the Fund’s shares, and American Funds Service Company¨ (AFS), the Fund’s transfer agent. The Fund has an investment advisory agreement with CRMC that provides for monthly fees accrued daily. These fees are based on a series of decreasing annual rates beginning with 0.225% on the first $3 billion of daily net assets and decreasing to 0.177% on such assets in excess of $89 billion. For the year ended April 30, 2011, the investment advisory services fee was $97,775,000, which was equivalent to an annualized rate of 0.198% of average daily net assets.
Class-specific fees and expenses — Expenses that are specific to individual share classes are accrued directly to the respective share class. The principal class-specific fees and expenses are described below:
Distribution services — The Fund has plans of distribution for all share classes, except Classes F-2, R-5 and R-6. Under the plans, the board of trustees approves certain categories of expenses that are used to finance activities primarily intended to sell Fund shares and service existing accounts. The plans provide for payments, based on an annualized percentage of average daily net assets, ranging from 0.25% to 1.00% as noted on the following page. In some cases, the board of trustees has limited the amounts that may be paid to less than the maximum allowed by the plans. All share classes with a plan may use up to 0.25% of average daily net assets to pay service fees, or to compensate AFD for paying service fees, to firms that have entered into agreements with AFD to provide certain shareholder services. The remaining amounts available to be paid under each plan are paid to dealers to compensate them for their sales activities.
For Classes A and 529-A, distribution-related expenses include the reimbursement of dealer and wholesaler commissions paid by AFD for certain shares sold without a sales charge. These classes reimburse AFD for amounts billed within the prior 15 months but only to the extent that the overall annual expense limit of 0.25% is not exceeded. As of April 30, 2011, there were no unreimbursed expenses subject to reimbursement for Classes A or 529-A.
| Share class | Currently approved limits | Plan limits |
| Class A | 0.25% | 0.25% |
| Class 529-A | 0.25 | 0.50 |
| Classes B and 529-B | 1.00 | 1.00 |
| Classes C, 529-C and R-1 | 1.00 | 1.00 |
| Class R-2 | 0.75 | 1.00 |
| Classes 529-E and R-3 | 0.50 | 0.75 |
| Classes F-1, 529-F-1 and R-4 | 0.25 | 0.50 |
Transfer agent services — The Fund has a transfer agent agreement with AFS for Classes A and B. Under this agreement, these share classes compensate AFS for transfer agent services including shareholder recordkeeping, communications and transaction processing. AFS is also compensated for certain transfer agent services provided to all other share classes from the administrative services fees paid to CRMC as described below.
Administrative services — The Fund has an administrative services agreement with CRMC for all share classes, except Classes A and B, to provide certain services, including transfer agent and recordkeeping services; coordinating, monitoring, assisting and overseeing third-party service providers; and educating advisers and shareholders about the impact of market-related events, tax laws affecting investments, retirement plan restrictions, exchange limitations and other related matters. Each relevant share class pays CRMC annual fees up to 0.15% (0.10% for Class R-5 and 0.05% for Class R-6) based on its respective average daily net assets. Each relevant share class also pays AFS additional amounts for certain transfer agent services. CRMC and AFS may use these fees to compensate third
parties for performing these services.
Each 529 share class is subject to an additional administrative services fee payable to the Commonwealth of Virginia for the maintenance of the 529 college savings plan. The quarterly fee is based on a series of decreasing annual rates beginning with 0.10% on the first $30 billion of the net assets invested in Class 529 shares of the American Funds and decreasing to 0.06% on such assets between $120 billion and $150 billion. The fee for any given calendar quarter is accrued and calculated on the basis of the average net assets of Class 529 shares of the American Funds for the last month of the prior calendar quarter. Although these amounts are included with administrative services fees on the accompanying financial statements, the Commonwealth of Virginia is not considered a related party.
Expenses under the agreements described above for the year ended April 30, 2011, were as follows (dollars in thousands):
| | | | | | Administrative services |
Share class | Distribution services | | Transfer agent services | | CRMC administrative services | | Transfer agent services | | Commonwealth of Virginia administrative services |
| Class A | $ 90,910 | | $46,141 | | Not applicable | | Not applicable | | Not applicable |
| Class B | 9,959 | | 1,162 | | Not applicable | | Not applicable | | Not applicable |
| Class C | 17,667 | | | | $ 2,573 | | $ 411 | | Not applicable |
| Class F-1 | 4,389 | | | | 2,517 | | 147 | | Not applicable |
| Class F-2 | Not applicable | | | | 679 | | 28 | | Not applicable |
| Class 529-A | 2,106 | | | | 953 | | 168 | | $ 968 |
| Class 529-B | 1,211 | | | | 120 | | 40 | | 121 |
| Class 529-C | 2,870 | | Included in | | 284 | | 80 | | 289 |
| Class 529-E | 267 | | administrative | | 53 | | 9 | | 54 |
| Class 529-F-1 | — | | services | | 53 | | 9 | | 54 |
| Class R-1 | 690 | | | | 90 | | 20 | | Not applicable |
| Class R-2 | 5,020 | | | | 1,002 | | 1,690 | | Not applicable |
| Class R-3 | 6,114 | | | | 1,818 | | 717 | | Not applicable |
| Class R-4 | 2,979 | | | | 1,765 | | 29 | | Not applicable |
| Class R-5 | Not applicable | | | | 870 | | 9 | | Not applicable |
| Class R-6 | Not applicable | | | | 507 | | 3 | | Not applicable |
| Total | $144,182 | | $47,303 | | $13,284 | | $3,360 | | $1,486 |
| |
Trustees’ and advisory board’s deferred compensation — Independent trustees and advisory board members may elect to defer the cash payment of part or all of their compensation. These deferred amounts, which remain as liabilities of the Fund, are treated as if invested in shares of the Fund or other American Funds. These amounts represent general, unsecured liabilities of the Fund and vary according to the total returns of the selected funds. Trustees’ and advisory board’s compensation of $2,046,000, shown on the accompanying financial statements, includes $1,664,000 in current fees (either paid in cash or deferred) and a net increase of $382,000 in the value of the deferred amounts.
Affiliated officers and trustees — All officers and all interested trustees of the Fund are affiliated with WMC. Officers and interested trustees do not receive compensation directly from the Fund.
| 7. Capital share transactions |
Capital share transactions in the Fund were as follows (dollars and shares in thousands):
| | Sales* | | Reinvestments of dividends and distributions | | Repurchases* | | Net (decrease) increase | |
| Share class | Amount | | Shares | | Amount | | Shares | | Amount | | Shares | | Amount | | Shares | |
| Year ended April 30, 2011 | |
| Class A | $2,865,061 | | 108,757 | | $ 928,726 | | 35,548 | | $(7,066,688) | | (272,315) | | $(3,272,901) | | (128,010) | |
| Class B | 20,213 | | 771 | | 17,496 | | 677 | | (515,859) | | (19,956) | | (478,150) | | (18,508) | |
| Class C | 196,421 | | 7,528 | | 30,539 | | 1,178 | | (371,712) | | (14,353) | | (144,752) | | (5,647) | |
| Class F-1 | 556,359 | | 21,243 | | 42,538 | | 1,631 | | (560,045) | | (21,701) | | 38,852 | | 1,173 | |
| Class F-2 | 263,570 | | 10,018 | | 10,963 | | 418 | | (138,781) | | (5,284) | | 135,752 | | 5,152 | |
| Class 529-A | 148,141 | | 5,653 | | 24,419 | | 935 | | (111,715) | | (4,309) | | 60,845 | | 2,279 | |
| Class 529-B | 2,073 | | 80 | | 2,077 | | 80 | | (46,983) | | (1,821) | | (42,833) | | (1,661) | |
| Class 529-C | 36,490 | | 1,399 | | 5,070 | | 195 | | (41,566) | | (1,610) | | (6) | | (16) | |
| Class 529-E | 6,911 | | 265 | | 1,209 | | 46 | | (6,841) | | (263) | | 1,279 | | 48 | |
| Class 529-F-1 | 13,793 | | 522 | | 1,487 | | 57 | | (11,355) | | (425) | | 3,925 | | 154 | |
| Class R-1 | 19,759 | | 764 | | 1,287 | | 49 | | (17,317) | | (662) | | 3,729 | | 151 | |
| Class R-2 | 148,851 | | 5,717 | | 12,363 | | 477 | | (204,924) | | (7,939) | | (43,710) | | (1,745) | |
| Class R-3 | 253,537 | | 9,668 | | 27,902 | | 1,073 | | (367,185) | | (14,223) | | (85,746) | | (3,482) | |
| Class R-4 | 402,289 | | 15,463 | | 30,529 | | 1,170 | | (330,684) | | (12,566) | | 102,134 | | 4,067 | |
| Class R-5 | 241,982 | | 9,164 | | 25,066 | | 959 | | (243,889) | | (9,292) | | 23,159 | | 831 | |
| Class R-6 | 474,750 | | 18,062 | | 29,396 | | 1,116 | | (82,550) | | (3,169) | | 421,596 | | 16,009 | |
Total net increase (decrease) | $5,650,200 | | 215,074 | | $1,191,067 | | 45,609 | | $(10,118,094) | | (389,888) | | $(3,276,827) | | (129,205) | |
| Year ended April 30, 2010 | |
| Class A | $2,486,219 | | 106,597 | | $1,024,913 | | 44,448 | | $(8,038,118) | | (345,221) | | $(4,526,986) | | (194,176) | |
| Class B | 16,401 | | 710 | | 28,940 | | 1,272 | | (557,876) | | (23,895) | | (512,535) | | (21,913) | |
| Class C | 140,939 | | 6,067 | | 34,660 | | 1,524 | | (421,724) | | (18,262) | | (246,125) | | (10,671) | |
| Class F-1 | 414,949 | | 18,079 | | 44,048 | | 1,914 | | (635,809) | | (27,514) | | (176,812) | | (7,521) | |
| Class F-2 | 329,604 | | 14,828 | | 7,742 | | 335 | | (145,891) | | (6,474) | | 191,455 | | 8,689 | |
| Class 529-A | 103,987 | | 4,425 | | 23,602 | | 1,022 | | (120,413) | | (5,156) | | 7,176 | | 291 | |
| Class 529-B | 2,213 | | 96 | | 2,910 | | 127 | | (23,459) | | (990) | | (18,336) | | (767) | |
| Class 529-C | 32,742 | | 1,413 | | 5,434 | | 237 | | (44,944) | | (1,938) | | (6,768) | | (288) | |
| Class 529-E | 6,479 | | 279 | | 1,230 | | 54 | | (8,345) | | (356) | | (636) | | (23) | |
| Class 529-F-1 | 13,323 | | 566 | | 1,318 | | 57 | | (9,564) | | (411) | | 5,077 | | 212 | |
| Class R-1 | 20,780 | | 901 | | 1,203 | | 52 | | (13,796) | | (596) | | 8,187 | | 357 | |
| Class R-2 | 151,347 | | 6,570 | | 13,441 | | 589 | | (184,408) | | (7,957) | | (19,620) | | (798) | |
| Class R-3 | 284,344 | | 12,266 | | 30,382 | | 1,324 | | (351,198) | | (15,007) | | (36,472) | | (1,417) | |
| Class R-4 | 437,215 | | 19,673 | | 30,780 | | 1,341 | | (402,058) | | (17,087) | | 65,937 | | 3,927 | |
| Class R-5 | 394,213 | | 17,200 | | 25,304 | | 1,093 | | (893,179) | | (41,701) | | (473,662) | | (23,408) | |
| Class R-6 | 698,432 | | 32,285 | | 17,062 | | 725 | | (44,500) | | (1,804) | | 670,994 | | 31,206 | |
Total net increase (decrease) | $5,533,187 | | 241,955 | | $1,292,969 | | 56,114 | | $(11,895,282) | | (514,369) | | $(5,069,126) | | (216,300) | |
*Includes exchanges between share classes of the Fund. |
| 8. Investment transactions |
The Fund made purchases and sales of investment securities, excluding short-term securities and U.S. government obligations, if any, of $12,121,250,000 and $15,731,650,000, respectively, during the year ended April 30, 2011.
Financial highlights1
| | | Income (loss) from investment operations2 | | Dividends and distributions | | | | | | |
| | Net asset value, beginning of period | Net investment income | Net gains (losses) on securities (both realized and unrealized) | Total from investment operations | | Dividends (from net investment income) | Distributions (from capital gains) | Total dividends and distributions | Net asset value, end of period | Total return3,4 | Net assets, end of period (in millions | Ratio of expenses to average net assets before reimbursements/ waivers | Ratio of expenses to average net assets after reimbursements/ waivers4 | Ratio of net income to average net assets4 |
| Class A: | | | | | | | | | | | | | | |
| Year ended 4/30/2011 | $25.84 | $.70 | $ 3.80 | $ 4.50 | | $(.68) | $ — | $ (.68) | $29.66 | 17.77% | $41,375 | .63% | .63% | 2.67% |
| Year ended 4/30/2010 | 19.81 | .65 | 6.06 | 6.71 | | (.68) | — | (.68) | 25.84 | 34.29 | 39,349 | .70 | .70 | 2.80 |
| Year ended 4/30/2009 | 31.92 | .64 | (11.53) | (10.89) | | (.72) | (.50) | (1.22) | 19.81 | (34.50) | 34,012 | .67 | .65 | 2.60 |
| Year ended 4/30/2008 | 36.55 | .71 | (2.68) | (1.97) | | (.72) | (1.94) | (2.66) | 31.92 | (5.78) | 60,782 | .60 | .58 | 2.02 |
| Year ended 4/30/2007 | 32.66 | .68 | 4.71 | 5.39 | | (.66) | (.84) | (1.50) | 36.55 | 16.85 | 70,811 | .60 | .57 | 2.00 |
| Class B: | | | | | | | | | | | | | | |
| Year ended 4/30/2011 | 25.66 | .51 | 3.75 | 4.26 | | (.47) | — | (.47) | 29.45 | 16.88 | 889 | 1.39 | 1.39 | 1.98 |
| Year ended 4/30/2010 | 19.67 | .48 | 6.01 | 6.49 | | (.50) | — | (.50) | 25.66 | 33.31 | 1,249 | 1.46 | 1.46 | 2.07 |
| Year ended 4/30/2009 | 31.71 | .45 | (11.46) | (11.01) | | (.53) | (.50) | (1.03) | 19.67 | (35.01) | 1,389 | 1.42 | 1.40 | 1.85 |
| Year ended 4/30/2008 | 36.33 | .44 | (2.67) | (2.23) | | (.45) | (1.94) | (2.39) | 31.71 | (6.51) | 2,726 | 1.36 | 1.33 | 1.27 |
| Year ended 4/30/2007 | 32.47 | .42 | 4.69 | 5.11 | | (.41) | (.84) | (1.25) | 36.33 | 15.98 | 3,296 | 1.36 | 1.33 | 1.24 |
| Class C: | | | | | | | | | | | | | | |
| Year ended 4/30/2011 | 25.60 | .48 | 3.76 | 4.24 | | (.47) | — | (.47) | 29.37 | 16.82 | 1,934 | 1.44 | 1.44 | 1.86 |
| Year ended 4/30/2010 | 19.63 | .46 | 6.00 | 6.46 | | (.49) | — | (.49) | 25.60 | 33.23 | 1,830 | 1.50 | 1.50 | 2.00 |
| Year ended 4/30/2009 | 31.65 | .44 | (11.44) | (11.00) | | (.52) | (.50) | (1.02) | 19.63 | (35.04) | 1,613 | 1.47 | 1.44 | 1.80 |
| Year ended 4/30/2008 | 36.26 | .42 | (2.66) | (2.24) | | (.43) | (1.94) | (2.37) | 31.65 | (6.54) | 2,979 | 1.41 | 1.38 | 1.22 |
| Year ended 4/30/2007 | 32.41 | .39 | 4.68 | 5.07 | | (.38) | (.84) | (1.22) | 36.26 | 15.91 | 3,481 | 1.42 | 1.40 | 1.17 |
| Class F-1: | | | | | | | | | | | | | | |
| Year ended 4/30/2011 | 25.77 | .68 | 3.81 | 4.49 | | (.67) | — | (.67) | 29.59 | 17.79 | 2,067 | .66 | .66 | 2.62 |
| Year ended 4/30/2010 | 19.76 | .64 | 6.04 | 6.68 | | (.67) | — | (.67) | 25.77 | 34.26 | 1,770 | .71 | .71 | 2.78 |
| Year ended 4/30/2009 | 31.85 | .64 | (11.51) | (10.87) | | (.72) | (.50) | (1.22) | 19.76 | (34.52) | 1,506 | .67 | .65 | 2.59 |
| Year ended 4/30/2008 | 36.48 | .70 | (2.68) | (1.98) | | (.71) | (1.94) | (2.65) | 31.85 | (5.82) | 2,947 | .63 | .61 | 1.99 |
| Year ended 4/30/2007 | 32.60 | .67 | 4.70 | 5.37 | | (.65) | (.84) | (1.49) | 36.48 | 16.83 | 3,179 | .62 | .59 | 1.97 |
| Class F-2: | | | | | | | | | | | | | | |
| Year ended 4/30/2011 | 25.84 | .74 | 3.81 | 4.55 | | (.73) | — | (.73) | 29.66 | 18.05 | 630 | .41 | .41 | 2.83 |
| Year ended 4/30/2010 | 19.81 | .68 | 6.09 | 6.77 | | (.74) | — | (.74) | 25.84 | 34.65 | 416 | .46 | .46 | 2.91 |
Period from 8/5/2008 to 4/30/2009 | 29.64 | .46 | (9.22) | (8.76) | | (.57) | (.50) | (1.07) | 19.81 | (29.77) | 147 | .445 | .435 | 3.105 |
| Class 529-A: | | | | | | | | | | | | | | |
| Year ended 4/30/2011 | 25.80 | .67 | 3.81 | 4.48 | | (.66) | — | (.66) | 29.62 | 17.73 | 1,138 | .70 | .70 | 2.58 |
| Year ended 4/30/2010 | 19.78 | .63 | 6.05 | 6.68 | | (.66) | — | (.66) | 25.80 | 34.20 | 932 | .76 | .76 | 2.71 |
| Year ended 4/30/2009 | 31.89 | .62 | (11.52) | (10.90) | | (.71) | (.50) | (1.21) | 19.78 | (34.57) | 709 | .73 | .71 | 2.55 |
| Year ended 4/30/2008 | 36.51 | .67 | (2.66) | (1.99) | | (.69) | (1.94) | (2.63) | 31.89 | (5.85) | 1,089 | .69 | .66 | 1.93 |
| Year ended 4/30/2007 | 32.63 | .65 | 4.71 | 5.36 | | (.64) | (.84) | (1.48) | 36.51 | 16.75 | 1,094 | .67 | .65 | 1.91 |
| Class 529-B: | | | | | | | | | | | | | | |
| Year ended 4/30/2011 | 25.68 | .48 | 3.77 | 4.25 | | (.45) | — | (.45) | 29.48 | 16.79 | 117 | 1.50 | 1.50 | 1.85 |
| Year ended 4/30/2010 | 19.69 | .45 | 6.02 | 6.47 | | (.48) | — | (.48) | 25.68 | 33.15 | 145 | 1.56 | 1.56 | 1.93 |
| Year ended 4/30/2009 | 31.74 | .42 | (11.47) | (11.05) | | (.50) | (.50) | (1.00) | 19.69 | (35.08) | 126 | 1.53 | 1.51 | 1.74 |
| Year ended 4/30/2008 | 36.36 | .39 | (2.66) | (2.27) | | (.41) | (1.94) | (2.35) | 31.74 | (6.62) | 204 | 1.49 | 1.46 | 1.13 |
| Year ended 4/30/2007 | 32.50 | .38 | 4.68 | 5.06 | | (.36) | (.84) | (1.20) | 36.36 | 15.82 | 218 | 1.48 | 1.46 | 1.11 |
| Class 529-C: | | | | | | | | | | | | | | |
| Year ended 4/30/2011 | 25.67 | .47 | 3.78 | 4.25 | | (.46) | — | (.46) | 29.46 | 16.79 | 330 | 1.49 | 1.49 | 1.80 |
| Year ended 4/30/2010 | 19.68 | .45 | 6.02 | 6.47 | | (.48) | — | (.48) | 25.67 | 33.19 | 288 | 1.55 | 1.55 | 1.93 |
| Year ended 4/30/2009 | 31.73 | .43 | (11.47) | (11.04) | | (.51) | (.50) | (1.01) | 19.68 | (35.08) | 226 | 1.52 | 1.50 | 1.75 |
| Year ended 4/30/2008 | 36.35 | .39 | (2.66) | (2.27) | | (.41) | (1.94) | (2.35) | 31.73 | (6.62) | 361 | 1.49 | 1.46 | 1.13 |
| Year ended 4/30/2007 | 32.49 | .38 | 4.69 | 5.07 | | (.37) | (.84) | (1.21) | 36.35 | 15.84 | 374 | 1.48 | 1.45 | 1.11 |
| Class 529-E: | | | | | | | | | | | | | | |
| Year ended 4/30/2011 | 25.70 | .60 | 3.79 | 4.39 | | (.59) | — | (.59) | 29.50 | 17.40 | 62 | .98 | .98 | 2.30 |
| Year ended 4/30/2010 | 19.71 | .56 | 6.03 | 6.59 | | (.60) | — | (.60) | 25.70 | 33.80 | 53 | 1.05 | 1.05 | 2.43 |
| Year ended 4/30/2009 | 31.77 | .55 | (11.48) | (10.93) | | (.63) | (.50) | (1.13) | 19.71 | (34.74) | 41 | 1.02 | 1.00 | 2.26 |
| Year ended 4/30/2008 | 36.39 | .57 | (2.66) | (2.09) | | (.59) | (1.94) | (2.53) | 31.77 | (6.14) | 60 | .98 | .95 | 1.64 |
| Year ended 4/30/2007 | 32.52 | .55 | 4.70 | 5.25 | | (.54) | (.84) | (1.38) | 36.39 | 16.44 | 61 | .97 | .94 | 1.62 |
| | | | | | | | | | | | | | | |
| See page 25 for footnotes. | | | | | | | | | | | | | |
| | | | | | | | | | | | | | | |
| | | Income (loss) from investment operations2 | | Dividends and distributions | | | | | | |
| | Net asset value, beginning of period | Net investment income | Net gains (losses) on securities (both realized and unrealized) | Total from investment operations | | Dividends (from net investment income) | Distributions (from capital gains) | Total dividends and distributions | Net asset value, end of period | Total return4 | Net assets, end of period (in millions) | Ratio of expenses to average net assets before reimbursements/ waivers | Ratio of expenses to average net assets after reimbursements/ waivers4 | Ratio of net income to average net assets4 |
| Class 529-F-1: | | | | | | | | | | | | | | |
| Year ended 4/30/2011 | $25.77 | $.73 | $ 3.79 | $ 4.52 | | $(.71) | $ — | $ (.71) | $29.58 | 17.96% | $ 63 | .48% | .48% | 2.79% |
| Year ended 4/30/2010 | 19.76 | .68 | 6.04 | 6.72 | | (.71) | — | (.71) | 25.77 | 34.48 | 51 | .55 | .55 | 2.91 |
| Year ended 4/30/2009 | 31.85 | .67 | (11.50) | (10.83) | | (.76) | (.50) | (1.26) | 19.76 | (34.41) | 35 | .52 | .50 | 2.77 |
| Year ended 4/30/2008 | 36.47 | .74 | (2.66) | (1.92) | | (.76) | (1.94) | (2.70) | 31.85 | (5.65) | 52 | .48 | .45 | 2.14 |
| Year ended 4/30/2007 | 32.59 | .72 | 4.70 | 5.42 | | (.70) | (.84) | (1.54) | 36.47 | 17.01 | 47 | .47 | .44 | 2.11 |
| Class R-1: | | | | | | | | | | | | | | |
| Year ended 4/30/2011 | 25.65 | .48 | 3.79 | 4.27 | | (.48) | — | (.48) | 29.44 | 16.90 | 81 | 1.41 | 1.41 | 1.86 |
| Year ended 4/30/2010 | 19.68 | .46 | 6.01 | 6.47 | | (.50) | — | (.50) | 25.65 | 33.21 | 67 | 1.47 | 1.47 | 1.98 |
| Year ended 4/30/2009 | 31.72 | .45 | (11.46) | (11.01) | | (.53) | (.50) | (1.03) | 19.68 | (34.99) | 44 | 1.43 | 1.41 | 1.85 |
| Year ended 4/30/2008 | 36.33 | .42 | (2.66) | (2.24) | | (.43) | (1.94) | (2.37) | 31.72 | (6.55) | 67 | 1.42 | 1.40 | 1.20 |
| Year ended 4/30/2007 | 32.48 | .39 | 4.68 | 5.07 | | (.38) | (.84) | (1.22) | 36.33 | 15.86 | 69 | 1.43 | 1.41 | 1.15 |
| Class R-2: | | | | | | | | | | | | | | |
| Year ended 4/30/2011 | 25.59 | .49 | 3.76 | 4.25 | | (.48) | — | (.48) | 29.36 | 16.85 | 745 | 1.41 | 1.41 | 1.89 |
| Year ended 4/30/2010 | 19.62 | .45 | 6.01 | 6.46 | | (.49) | — | (.49) | 25.59 | 33.23 | 694 | 1.52 | 1.52 | 1.96 |
| Year ended 4/30/2009 | 31.64 | .43 | (11.44) | (11.01) | | (.51) | (.50) | (1.01) | 19.62 | (35.07) | 548 | 1.50 | 1.48 | 1.77 |
| Year ended 4/30/2008 | 36.25 | .41 | (2.66) | (2.25) | | (.42) | (1.94) | (2.36) | 31.64 | (6.57) | 865 | 1.44 | 1.41 | 1.19 |
| Year ended 4/30/2007 | 32.40 | .39 | 4.68 | 5.07 | | (.38) | (.84) | (1.22) | 36.25 | 15.91 | 985 | 1.47 | 1.41 | 1.15 |
| Class R-3: | | | | | | | | | | | | | | |
| Year ended 4/30/2011 | 25.69 | .60 | 3.79 | 4.39 | | (.59) | — | (.59) | 29.49 | 17.41 | 1,367 | .97 | .97 | 2.33 |
| Year ended 4/30/2010 | 19.70 | .57 | 6.02 | 6.59 | | (.60) | — | (.60) | 25.69 | 33.85 | 1,280 | 1.03 | 1.03 | 2.45 |
| Year ended 4/30/2009 | 31.76 | .56 | (11.48) | (10.92) | | (.64) | (.50) | (1.14) | 19.70 | (34.72) | 1,010 | .97 | .95 | 2.29 |
| Year ended 4/30/2008 | 36.38 | .58 | (2.67) | (2.09) | | (.59) | (1.94) | (2.53) | 31.76 | (6.13) | 1,827 | .95 | .93 | 1.67 |
| Year ended 4/30/2007 | 32.51 | .55 | 4.70 | 5.25 | | (.54) | (.84) | (1.38) | 36.38 | 16.45 | 2,199 | .96 | .93 | 1.63 |
| Class R-4: | | | | | | | | | | | | | | |
| Year ended 4/30/2011 | 25.76 | .68 | 3.79 | 4.47 | | (.67) | — | (.67) | 29.56 | 17.73 | 1,407 | .66 | .66 | 2.61 |
| Year ended 4/30/2010 | 19.75 | .64 | 6.04 | 6.68 | | (.67) | — | (.67) | 25.76 | 34.29 | 1,121 | .72 | .72 | 2.75 |
| Year ended 4/30/2009 | 31.83 | .63 | (11.50) | (10.87) | | (.71) | (.50) | (1.21) | 19.75 | (34.52) | 782 | .69 | .67 | 2.59 |
| Year ended 4/30/2008 | 36.46 | .68 | (2.68) | (2.00) | | (.69) | (1.94) | (2.63) | 31.83 | (5.87) | 1,125 | .67 | .65 | 1.95 |
| Year ended 4/30/2007 | 32.57 | .65 | 4.72 | 5.37 | | (.64) | (.84) | (1.48) | 36.46 | 16.82 | 1,213 | .67 | .64 | 1.92 |
| Class R-5: | | | | | | | | | | | | | | |
| Year ended 4/30/2011 | 25.83 | .76 | 3.82 | 4.58 | | (.75) | — | (.75) | 29.66 | 18.14 | 1,021 | .36 | .36 | 2.92 |
| Year ended 4/30/2010 | 19.80 | .72 | 6.05 | 6.77 | | (.74) | — | (.74) | 25.83 | 34.62 | 868 | .42 | .42 | 3.08 |
| Year ended 4/30/2009 | 31.92 | .70 | (11.53) | (10.83) | | (.79) | (.50) | (1.29) | 19.80 | (34.31) | 1,129 | .39 | .37 | 2.91 |
| Year ended 4/30/2008 | 36.55 | .78 | (2.67) | (1.89) | | (.80) | (1.94) | (2.74) | 31.92 | (5.57) | 1,319 | .37 | .35 | 2.24 |
| Year ended 4/30/2007 | 32.65 | .76 | 4.72 | 5.48 | | (.74) | (.84) | (1.58) | 36.55 | 17.15 | 1,154 | .37 | .35 | 2.22 |
| Class R-6: | | | | | | | | | | | | | | |
| Year ended 4/30/2011 | 25.85 | .77 | 3.82 | 4.59 | | (.76) | — | (.76) | 29.68 | 18.18 | 1,401 | .31 | .31 | 2.91 |
| Year ended 4/30/2010 | 19.95 | .71 | 5.93 | 6.64 | | (.74) | — | (.74) | 25.85 | 33.79 | 807 | .37 | .37 | 3.03 |
| | | | | | | | | | | | | | | |
| | | | | Year ended April 30 |
| | | | | 2011 | 2010 | 2009 | 2008 | 2007 |
| Portfolio turnover rate for all share classes | 25% | 22% | 39% | 18% | 19% |
1 Based on operations for the periods shown (unless otherwise noted) and, accordingly, may not be representative of a full year.
2 Based on average shares outstanding.
3 Total returns exclude any applicable sales charges, including contingent deferred sales charges.
4 This column reflects the impact, if any, of certain reimbursements/waivers from CRMC and WMC. During some of the periods shown, CRMC and WMC reduced fees for investment advisory services and business management services. In addition, during some of the periods shown, CRMC paid a portion of the Fund’s transfer agent fees for certain retirement plan share classes.
5 Annualized.
See Notes to financial statements
Report of Independent Registered Public Accounting Firm
| To the Board of Trustees and Shareholders of Washington Mutual Investors Fund: |
In our opinion, the accompanying statement of assets and liabilities, including the investment portfolio, and the related statements of operations and of changes in net assets and the financial highlights present fairly, in all material respects, the financial position of Washington Mutual Investors Fund (the "Fund") at April 30, 2011, the results of its operations for the year then ended, the changes in its net assets for each of the two years in the period then ended and its financial highlights for each of the periods presented, in conformity with accounting principles generally accepted in the United States of America. These financial statements and financial highlights (hereafter referred to as "financial statements") are the responsibility of the Fund’s management. Our responsibility is to express an opinion on these financial statements based on our audits. We conducted our audits of these financial statements in accordance with the standards of the Public Company Accounting Oversight Board (United States). Those standards require that we plan and perform the audit to obtain reasonable assurance about whether the financial statements are free of material misstatement. An audit includes examining, on a test basis, evidence supporting the amounts and disclosures in the financial statements, assessing the accounting principles used and significant estimates made by management, and evaluating the overall financial statement presentation. We believe that our audit, which included confirmation of securities owned at April 30, 2011, by correspondence with the custodian and brokers, provides a reasonable basis for our opinion.
PricewaterhouseCoopers LLP
Los Angeles, California
June 9, 2011
| Other share class results | unaudited | |
Fund results shown are for past periods and are not predictive of results for future periods. Current and future results may be lower or higher than those shown. Share prices and returns will vary, so investors may lose money. For current information and month-end results, visit americanfunds.com.
Average annual total returns for periods ended March 31, 2011 (the most recent calendar quarter-end):
| | | 1 year | 5 years | 10 years1/ Life of class |
Class B shares2 | | | | |
Reflecting applicable contingent deferred sales charge (CDSC), maximum of 5%, payable only if shares are sold within six years of purchase | | 10.08% | 1.31% | 3.37% |
| Not reflecting CDSC | | 15.08 | 1.65 | 3.37 |
| Class C shares | | | | |
Reflecting CDSC, maximum of 1%, payable only if shares are sold within one year of purchase | | 14.01 | 1.60 | 3.13 |
| Not reflecting CDSC | | 15.01 | 1.60 | 3.13 |
Class F-1 shares3 | | | | |
Not reflecting annual asset-based fee charged by sponsoring firm | | 15.92 | 2.40 | 3.94 |
Class F-2 shares3 — first sold 8/5/08 | | | | |
Not reflecting annual asset-based fee charged by sponsoring firm | | 16.18 | — | 3.01 |
Class 529-A shares4 — first sold 2/15/02 | | | | |
Reflecting 5.75% maximum sales charge | | 9.20 | 1.14 | 3.51 |
| Not reflecting maximum sales charge | | 15.85 | 2.34 | 4.18 |
Class 529-B shares2,4 — first sold 2/19/02 | | | | |
Reflecting applicable CDSC, maximum of 5%, payable only if shares are sold within six years of purchase | | 9.91 | 1.19 | 3.61 |
| Not reflecting CDSC | | 14.91 | 1.53 | 3.61 |
Class 529-C shares4 — first sold 2/15/02 | | | | |
Reflecting CDSC, maximum of 1%, payable only if shares are sold within one year of purchase | | 13.96 | 1.54 | 3.33 |
| Not reflecting CDSC | | 14.96 | 1.54 | 3.33 |
Class 529-E shares3,4 — first sold 3/1/02 | | 15.52 | 2.05 | 3.51 |
Class 529-F-1 shares3,4 — first sold 9/16/02 | | | | |
Not reflecting annual asset-based fee charged by sponsoring firm | | 16.09 | 2.56 | 6.26 |
| | | |
1 Applicable to Classes B, C and F-1 shares only. All other share classes reflect results for the life of the class. 2 These shares are not available for purchase. 3 These shares are sold without any initial or contingent deferred sales charge. 4 Results shown do not reflect the $10 account setup fee and an annual $10 account maintenance fee. | | |
Investment results assume all distributions are reinvested and reflect applicable fees and expenses. The Fund’s investment adviser and business manager each waived a portion of their management fees from September 1, 2004, through December 31, 2008. Applicable Fund results shown reflect the waivers, without which they would have been lower. See the Financial Highlights table on pages 24 and 25 for details that include expense ratios for all share classes.
For information regarding the differences among the various share classes, refer to the Fund’s prospectus.
| Expense example | unaudited | |
As a shareholder of the Fund, you incur two types of costs: (1) transaction costs, such as initial sales charges on purchase payments and contingent deferred sales charges on redemptions (loads), and (2) ongoing costs, including management fees, distribution and service (12b-1) fees, and other expenses. This example is intended to help you understand your ongoing costs (in dollars) of investing in the Fund so you can compare these costs with the ongoing costs of investing in other mutual funds. The example is based on an investment of $1,000 invested at the beginning of the period and held for the entire six-month period (November 1, 2010, through April 30, 2011).
Actual expenses:
The first line of each share class in the table on the next page provides information about actual account values and actual expenses. You may use the information in this line, together with the amount you invested, to estimate the expenses that you paid over the period. Simply divide your account value by $1,000 (for example, an $8,600 account value divided by $1,000 = 8.6), then multiply the result by the number in the first line under the heading entitled "Expenses paid during period" to estimate the expenses you paid on your account during this period.
Hypothetical example for comparison purposes:
The second line of each share class in the table on the next page provides information about hypothetical account values and hypothetical expenses based on the actual expense ratio for the share class and an assumed rate of return of 5.00% per year before expenses, which is not the actual return of the share class. The hypothetical account values and expenses may not be used to estimate the actual ending account balance or expenses you paid for the period. You may use this information to compare the ongoing costs of investing in the Fund and other funds. To do so, compare this 5.00% hypothetical example with the 5.00% hypothetical examples that appear in the shareholder reports of the other funds.
Notes:
There are some account fees that are charged to certain types of accounts, such as individual retirement accounts and 529 college savings plan accounts (generally, a $10 fee is charged to set up the account and an additional $10 fee is charged to the account annually), that would increase the amount of expenses paid on your account. In addition, retirement plan participants may be subject to certain fees charged by the plan sponsor, and Class F-1, F-2 and 529-F-1 shareholders may be subject to fees charged by financial intermediaries, typically ranging from 0.75% to 1.50% of assets annually depending on services offered. You can estimate the impact of these fees by adding the amount of the fees to the total estimated expenses you paid on your account during the period as calculated above. In addition, your ending account value would be lower by the amount of these fees.
Note that the expenses shown in the table are meant to highlight your ongoing costs only and do not reflect any transactional costs, such as sales charges (loads). Therefore, the second line of each share class in the table is useful in comparing ongoing costs only and will not help you determine the relative total costs of owning different funds. In addition, if these transactional costs were included, your costs would have been higher.
| | Beginning account value 11/1/2010 | Ending account value 4/30/2011 | Expenses paid during period* | Annualized expense ratio |
Class A — actual return | $1,000.00 | $1,154.31 | $3.31 | .62% |
Class A — assumed 5% return | 1,000.00 | 1,021.72 | 3.11 | .62 |
Class B — actual return | 1,000.00 | 1,149.67 | 7.36 | 1.38 |
Class B — assumed 5% return | 1,000.00 | 1,017.95 | 6.90 | 1.38 |
Class C — actual return | 1,000.00 | 1,149.60 | 7.57 | 1.42 |
Class C — assumed 5% return | 1,000.00 | 1,017.75 | 7.10 | 1.42 |
Class F-1 — actual return | 1,000.00 | 1,154.07 | 3.47 | .65 |
Class F-1 — assumed 5% return | 1,000.00 | 1,021.57 | 3.26 | .65 |
Class F-2 — actual return | 1,000.00 | 1,155.55 | 2.14 | .40 |
Class F-2 — assumed 5% return | 1,000.00 | 1,022.81 | 2.01 | .40 |
Class 529-A — actual return | 1,000.00 | 1,153.64 | 3.68 | .69 |
Class 529-A — assumed 5% return | 1,000.00 | 1,021.37 | 3.46 | .69 |
Class 529-B — actual return | 1,000.00 | 1,149.40 | 7.89 | 1.48 |
Class 529-B — assumed 5% return | 1,000.00 | 1,017.46 | 7.40 | 1.48 |
Class 529-C — actual return | 1,000.00 | 1,149.71 | 7.89 | 1.48 |
Class 529-C — assumed 5% return | 1,000.00 | 1,017.46 | 7.40 | 1.48 |
Class 529-E — actual return | 1,000.00 | 1,152.36 | 5.18 | .97 |
Class 529-E — assumed 5% return | 1,000.00 | 1,019.98 | 4.86 | .97 |
Class 529-F-1 — actual return | 1,000.00 | 1,155.13 | 2.51 | .47 |
Class 529-F-1 — assumed 5% return | 1,000.00 | 1,022.46 | 2.36 | .47 |
Class R-1 — actual return | 1,000.00 | 1,149.87 | 7.46 | 1.40 |
Class R-1 — assumed 5% return | 1,000.00 | 1,017.85 | 7.00 | 1.40 |
Class R-2 — actual return | 1,000.00 | 1,149.86 | 7.41 | 1.39 |
Class R-2 — assumed 5% return | 1,000.00 | 1,017.90 | 6.95 | 1.39 |
Class R-3 — actual return | 1,000.00 | 1,152.47 | 5.12 | .96 |
Class R-3 — assumed 5% return | 1,000.00 | 1,020.03 | 4.81 | .96 |
Class R-4 — actual return | 1,000.00 | 1,153.82 | 3.47 | .65 |
Class R-4 — assumed 5% return | 1,000.00 | 1,021.57 | 3.26 | .65 |
Class R-5 — actual return | 1,000.00 | 1,155.79 | 1.87 | .35 |
Class R-5 — assumed 5% return | 1,000.00 | 1,023.06 | 1.76 | .35 |
Class R-6 — actual return | 1,000.00 | 1,155.98 | 1.66 | .31 |
Class R-6 — assumed 5% return | 1,000.00 | 1,023.26 | 1.56 | .31 |
| *The "expenses paid during period" are equal to the "annualized expense ratio," multiplied by the average account value over the period, multiplied by the number of days in the period, and divided by 365 (to reflect the one-half year period). |
Tax information unaudited
We are required to advise you within 60 days of the Fund’s fiscal year-end regarding the federal tax status of certain distributions received by shareholders during such fiscal year. The Fund hereby designates the following amounts for the Fund’s fiscal year ended April 30, 2011:
| Qualified dividend income | 100% |
| Corporate dividends received deduction | 100% |
| U.S. government income that may be exempt from state taxation | $405,000 |
Individual shareholders should refer to their Form 1099 or other tax information, which will be mailed in January 2012, to determine the calendar year amounts to be included on their 2011 tax returns. Shareholders should consult their tax advisers.
Board of trustees and trustees emeriti
| Independent trustees | |
Name and age | Year first elected a trustee of the Fund1 | Principal occupation(s) during past five years | Number of portfolios in Fund complex2 overseen by trustee | Other directorships3 held | |
Nariman Farvardin, 54 | 2007 | President, Stevens Institute of Technology; former Senior Vice President for Academic Affairs & Provost, University of Maryland; former Dean, The A. James Clark School of Engineering, University of Maryland (2007-2011) | 3 | JPMorgan Value Opportunities Fund | |
Barbara Hackman Franklin, 71 | 2005 | President and CEO, Barbara Franklin Enterprises (international business and corporate governance consulting); former U.S. Secretary of Commerce (1992–1993) | 3 | Aetna, Inc.; The Dow Chemical Company; JPMorgan Value Opportunities Fund | |
Mary Davis Holt, 60 | 2010 | Partner, Flynn Heath Holt Leadership, LLC (leadership consulting firm); former Chief Operating Officer, Time Life, Inc. | 1 | None | |
R. Clark Hooper, 64 | 2003 | Private investor; former President, Dumbarton Group LLC (securities industry consulting); former Executive Vice President — Policy and Oversight, National Association of Securities Dealers (NASD) (1970–2003) | 48 | JPMorgan Value Opportunities Fund; The Swiss Helvetia Fund, Inc. | |
James C. Miller III, 68 | 1992 | Senior Advisor, Husch Blackwell LLP (economic, financial and regulatory consulting); former Chairman, The CapAnalysis Group, LLC (economic, financial and regulatory consulting); former Director, U.S. Office of Management and Budget (1985–1988) | 3 | Clean Energy Fuels Corporation; JPMorgan Value Opportunities Fund | |
Donald L. Nickles, 62 | 2007 | Chairman and CEO, The Nickles Group (consulting and business venture firm); former United States Senator | 3 | Chesapeake Energy Corporation; JPMorgan Value Opportunities Fund; Valero Energy Corporation | |
William J. Shaw, 65 | 2009 | Former Vice Chairman (1997-2011); former President and Chief Operating Officer (1997–2009), Marriott International, Inc. | 1 | None | |
J. Knox Singleton, 62 Chairman of the Board (Independent and Non-Executive) | 2001 | President and CEO, INOVA Health System | 3 | Healthcare Realty Trust, Inc.; JPMorgan Value Opportunities Fund | |
Lydia W. Thomas, 66 | 2010 | Corporate director; former President and CEO, Noblis, Inc. (nonprofit science, technology and strategy organization) | 1 | Cabot Corporation; Mueller Water Products, Inc. | |
Interested trustees4 | |
Name, age and position with Fund | Year first elected a trustee or officer of the Fund1 | Principal occupation(s) during past five years | Number of portfolios in Fund complex2 overseen by trustee | Other directorships3 held | |
James H. Lemon, Jr., 75 Vice Chairman of the Board | 1971 | Chairman of the Board and CEO, The Johnston-Lemon Group, Incorporated (financial services holding company) | 3 | JPMorgan Value Opportunities Fund | |
Harry J. Lister, 75 | 1972 | Director, Washington Management Corporation | 1 | None | |
Jeffrey L. Steele, 65 President | 2000 | President and Director, Washington Management Corporation | 3 | JPMorgan Value Opportunities Fund | |
| Trustees emeriti | |
Stephen Hartwell, Chairman Emeritus | |
| Cyrus A. Ansary | Charles A. Bowsher | Fred J. Brinkman | Daniel J. Callahan III | Edward W. Kelley, Jr. | Katherine D. Ortega | T. Eugene Smith | |
The Fund’s statement of additional information includes additional information about the Fund’s trustees and is available without charge upon request by calling American Funds Service Company at 800/421-0180. The address for all trustees, advisory board members and officers of the Fund is 1101 Vermont Avenue, NW, Washington, DC 20005, Attention: Fund Secretary.
Advisory board and other officers
| Advisory board members | |
Name and age | Year first elected to advisory board1 | Principal occupation(s) during past five years | Number of portfolios in Fund complex on which advisory board member serves | Other directorships3 held | |
Jeffrey A. Eisenach, 53 | 2008 | Managing Director, Navigant Economics LLC (economic and financial consulting); former Chairman and Managing Partner, Empiris LLC (economic consulting); former Chairman, Criterion Economics, LLC (economic, litigation, regulation and legislation consulting) | 1 | None | |
Linda D. Rabbitt, 62 | 2001 | Chairman and CEO, Rand Construction Corporation | 1 | Towers Watson & Co. | |
Robert G. Templin, Jr., 63 | 2008 | President, Northern Virginia Community College | 1 | None | |
R. Clark Wadlow, 64 | 2005 | Retired Partner, Sidley Austin, LLP | 1 | None | |
| Other officers | |
Name, age and position with Fund | Year first elected an officer of the Fund1 | Principal occupation(s) during past five years | |
Michael W. Stockton, 44 Senior Vice President, Treasurer and Assistant Secretary | 1995 | Executive Vice President, Secretary, Treasurer and Director; Washington Management Corporation | |
J. Lanier Frank, 50 Assistant Vice President | 1997 | Assistant Vice President, Washington Management Corporation | |
Jennifer L. Butler, 45 Secretary | 2005 | Vice President and Assistant Secretary, Washington Management Corporation | |
Stephanie L. Pfromer, 42 Assistant Secretary | 2007 | Vice President and General Counsel, Washington Management Corporation; former Vice President and Senior Counsel, The BISYS Group, Inc. (now Citigroup, Inc.) | |
Curt M. Scott, 32 Assistant Treasurer | 2006 | Assistant Vice President and Assistant Treasurer, Washington Management Corporation | |
1 Trustees, advisory board members and officers of the Fund serve until their resignation, removal or retirement.
2 Capital Research and Management Company manages the American Funds, consisting of 33 funds. Capital Research and Management Company also manages American
Funds Insurance Series,¨ which is composed of 18 funds and serves as the underlying investment vehicle for certain variable insurance contracts and American Funds
Target Date Retirement Series,¨ Inc., which is composed of 10 funds and is available through tax-deferred retirement plans and IRAs.
3 This includes all directorships other than those in the American Funds that are held by each trustee or advisory board member as a director of a public company or a
registered investment company.
4 "Interested persons" within the meaning of the Investment Company Act of 1940, as amended, on the basis of their affiliation with the Fund’s business manager,
Washington Management Corporation.
Offices of the Fund and of the
business manager
Washington Management Corporation
1101 Vermont Avenue, NW
Washington, DC 20005-3521
202/842-5665
Investment adviser
Capital Research and
Management Company
333 South Hope Street
Los Angeles, CA 90071-1406
6455 Irvine Center Drive
Irvine, CA 92618
Transfer agent
American Funds Service Company
(Write to the address near you.)
P.O. Box 6007
Indianapolis, IN 46206-6007
P.O. Box 2280
Norfolk, VA 23501-2280
Custodian of assets
JPMorgan Chase Bank
270 Park Avenue
New York, NY 10017-2070
Counsel
Dechert LLP
1775 I Street, NW
Washington, DC 20006-2401
Independent registered public
accounting firm
PricewaterhouseCoopers LLP
350 South Grand Avenue
Los Angeles, CA 90071-2889
Principal underwriter
American Funds Distributors, Inc.
333 South Hope Street
Los Angeles, CA 90071-1406
| Investors should carefully consider the investment objectives, risks, charges and expenses of the American Funds. This and other important information is contained in the Fund’s prospectus and summary prospectus, which can be obtained from your financial professional and should be read carefully before investing. You may also call American Funds Service Company (AFS) at 800/421-0180 or visit the American Funds website at americanfunds.com. |
The Fund’s proxy voting guidelines — which describe how proxies for portfolio securities are voted — are available upon request by calling the Fund’s business manager at 800/972-9274. The Fund files its proxy voting record with the U.S. Securities and Exchange Commission (SEC) for the 12 months ended June 30 by August 31. The proxy voting record is available free of charge on the SEC website at sec.gov and on the American Funds website.
Washington Mutual Investors Fund files a complete list of its portfolio holdings with the SEC for the first and third quarters of each fiscal year on Form N-Q. This filing is available free of charge on the SEC website. You may also review or, for a fee, copy this filing at the SEC’s Public Reference Room in Washington, D.C. Additional information regarding the operation of the Public Reference Room may be obtained by calling the SEC’s Office of Investor Education and Advocacy at 800/SEC-0330. Additionally, the list of portfolio holdings is available by calling AFS.
This report is for the information of shareholders of Washington Mutual Investors Fund, but it may also be used as sales literature when preceded or accompanied by the current prospectus or summary prospectus, which gives details about charges, expenses, investment objectives and operating policies of the Fund. If used as sales material after June 30, 2011, this report must be accompanied by an American Funds statistical update for the most recently completed calendar quarter.
The Capital Group Companies
American FundsCapital Research and ManagementCapital InternationalCapital GuardianCapital Bank and Trust
Lit. No. MFGEAR-901-0611P (S26176)
Printed on paper containing 10% post-consumer waste Printed with inks containing soy and/or vegetable oil
ITEM 2. Code of Ethics.
The Registrant has adopted a code of ethics that applies to its Principal Executive Officer and Principal Financial Officer. The Registrant undertakes to provide to any person without charge, upon request, a copy of the Code of Ethics. Such request can be made to American Funds Service Company at 800/421-0180 or to the Secretary of the Registrant, 1101 Vermont Avenue, NW, Suite 600, Washington, DC 20005.
ITEM 3. Audit Committee Financial Expert.
The Registrant’s Board has determined that James C. Miller, a member of the Registrant’s Audit Committee, is an “audit committee financial expert” and “independent,” as such terms are defined in this Item. This designation will not increase the designee’s duties, obligations or liability as compared to her duties, obligations and liability as a member of the Audit Committee and of the Board; nor will it reduce the responsibility of the other Audit Committee members. There may be other individuals who, through education or experience, would qualify as “audit committee financial experts” if the Board had designated them as such. Most importantly, the Board believes each member of the Audit Committee contributes significantly to the effective oversight of the Registrant’s financial statements and condition.
ITEM 4. Principal Accountant Fees and Services.
Registrant:
2010 $75,000
2011 $92,000
2010 none
2011 none
2010 $7,000
2011 $12,000
The tax fees consist of professional services relating to the preparation of the Registrant’s tax returns.
2010 none
2011 none
ITEM 4. Principal Accountant Fees and Services. (continued)
Adviser and affiliates (includes only fees for non-audit services billed to the adviser and affiliates for engagements that relate directly to the operations and financial reporting of the Registrant and were subject to the pre-approval policies described below):
Not Applicable
2010 none
2011 none
2010 $15,000
2011 $27,000
The tax fees consist of consulting services relating to the Registrant’s investments.
2010 $4,000
2011 $2,000
All audit and permissible non-audit services that the Registrant’s Audit Committee considers compatible with maintaining the independent registered public accounting firm’s independence are required to be pre-approved by the Committee. The pre-approval requirement will extend to all non-audit services provided to the Registrant, the business manager, the investment adviser, and any entity controlling, controlled by, or under common control with the business manager or investment adviser that provides ongoing services to the Registrant, if the engagement relates directly to the operations and financial reporting of the Registrant. The Committee will not delegate its responsibility to pre-approve these services to the business manager or investment adviser. The Committee may delegate to one or more Committee members the authority to review and pre-approve audit and permissible non-audit services. Actions taken under any such delegation will be reported to the full Committee at its next meeting. The pre-approval requirement is waived with respect to non-audit services if certain conditions are met. The pre-approval requirement was not waived for any of the non-audit services listed above provided to the Registrant, adviser and affiliates.
Aggregate non-audit fees paid to the Registrant’s auditors, including fees for all services billed to the Registrant, adviser and affiliates that provide ongoing services to the Registrant, were $26,000 for fiscal year 2010 and $41,000 for fiscal year 2011. The non-audit services represented by these amounts were brought to the attention of the Committee and considered to be compatible with maintaining the auditors’ independence.
ITEM 5. Audit Committee of Listed Registrants.
Not applicable to this Registrant, insofar as the Registrant is not a listed issuer as defined in Rule 10A-3 under the Securities Exchange Act of 1934.
ITEM 6. Schedule of Investments.
The full schedule of investments for the Fund is included as part of the report to shareholders filed under Item 1 of this Form.
ITEM 7. Disclosure of Proxy Voting Policies and Procedures for Closed-End Management Investment Companies.
Not applicable to this Registrant, insofar as the Registrant is not a closed-end management investment company.
ITEM 8. Portfolio Managers of Closed-End Management Investment Companies.
Not applicable to this Registrant, insofar as the Registrant is not a closed-end management investment company.
ITEM 9. Purchases of Equity Securities by Closed-End Management Investment Company and Affiliated Purchasers.
Not applicable to this Registrant, insofar as the Registrant is not a closed-end management investment company.
ITEM 10. Submission of Matters to a Vote of Security Holders.
There have been no material changes to the procedures by which shareholders may recommend nominees to the Registrant’s Board of Trustees since the Registrant last submitted a proxy statement to its shareholders. The procedures are as follows. The Registrant has a Governance Committee comprised solely of persons who are not considered “interested persons” of the Registrant within the meaning of the Investment Company Act of 1940. The committee periodically reviews such issues as the Board’s composition, responsibilities, committees, compensation and other relevant issues, and recommends any appropriate changes to the full Board of Trustees. While the committee normally is able to identify from its own resources an ample number of qualified candidates, it will consider shareholder suggestions of persons to be considered as nominees to fill future vacancies on the Board. Such suggestions must be sent in writing to the Governance Committee of the Registrant, c/o the Registrant’s Secretary, and should be accompanied by complete biographical and occupational data on the prospective nominee, along with a written consent of the prospective nominee for consideration of his or her name by the Governance Committee.
ITEM 11. Controls and Procedures.
| (a) | The Registrant’s Principal Executive Officer and Principal Financial Officer have concluded, based on their evaluation of the Registrant’s disclosure controls and procedures (as such term is defined in Rule 30a-3(c) under the Investment Company Act of 1940), that such controls and procedures are adequate and reasonably designed to achieve the purposes described in paragraph (c) of such rule. |
| (b) | There were no changes in the Registrant’s internal controls over financial reporting (as defined in Rule 30a-3(d) under the Investment Company Act of 1940) that occurred during the Registrant’s second fiscal quarter of the period covered by this report that have materially affected, or are reasonably likely to materially affect, the Registrant’s internal control over financial reporting. |
ITEM 12. Exhibits.
| (a) | The Code of Ethics that is the subject of the disclosure required by Item 2 is attached as an exhibit hereto. |
| (b) | The certifications required by Rule 30a-2 of the Investment Company Act of 1940, as amended, and Sections 302 and 906 of the Sarbanes-Oxley Act of 2002 are attached as exhibits hereto. |
SIGNATURES
Pursuant to the requirements of the Securities Exchange Act of 1934 and the Investment Company Act of 1940, the Registrant has duly caused this report to be signed on its behalf by the undersigned, thereunto duly authorized.
Washington Mutual Investors Fund
By /s/Jeffrey L. Steele
Jeffrey L. Steele, President and Principal Executive Officer
Date: June 29, 2011
Pursuant to the requirements of the Securities Exchange Act of 1934 and the Investment Company Act of 1940, this report has been signed below by the following persons on behalf of the Registrant and in the capacities and on the dates indicated.
Jeffrey L. Steele, President and Principal Executive Officer
| | By /s/Michael W. Stockton | |
Michael W. Stockton, Principal Financial Officer,
Senior Vice President and Treasurer