UNITED STATES
SECURITIES AND EXCHANGE COMMISSION
Washington, D.C. 20549
FORM N-CSR
Certified Shareholder Report of
Registered Management Investment Companies
Investment Company Act File Number: 811-00604
Washington Mutual Investors Fund
(Exact Name of Registrant as Specified in Charter)
6455 Irvine Center Drive
Irvine, California 92618
(Address of Principal Executive Offices)
Registrant's telephone number, including area code: (949) 975-5000
Date of fiscal year end: April 30
Date of reporting period: April 30, 2014
Jennifer L. Butler
Washington Mutual Investors Fund
6455 Irvine Center Drive
Irvine, California 92618
(Name and Address of Agent for Service)
Copies to:
Robert W. Helm
Dechert LLP
1900 K Street, NW
Washington, DC 20006
(Counsel for the Registrant)
ITEM 1 – Reports to Stockholders

High investment
standards
 | Washington Mutual
Investors FundSM Annual report
for the year ended
April 30, 2014 |
Washington Mutual Investors Fund seeks to produce income and to provide an opportunity for growth of principal consistent with sound common stock investing.
This fund is one of more than 40 offered by one of the nation’s largest mutual fund families, American Funds, from Capital Group. For more than 80 years, Capital has invested with a long-term focus based on thorough research and attention to risk.
Fund results shown in this report, unless otherwise indicated, are for Class A shares at net asset value. If a sales charge (maximum 5.75%) had been deducted, the results would have been lower. Results are for past periods and are not predictive of results for future periods. Current and future results may be lower or higher than those shown. Share prices and returns will vary, so investors may lose money. Investing for short periods makes losses more likely. Investments are not FDIC-insured, nor are they deposits of or guaranteed by a bank or any other entity, so they may lose value. For current information and month-end results, visit americanfunds.com.
Here are the average annual total returns on a $1,000 investment with all distributions reinvested for periods ended March 31, 2014 (the most recent calendar quarter-end):
| Class A shares | | 1 year | | | 5 years | | | 10 years | |
| | | | | | | | | | |
| Reflecting 5.75% maximum sales charge | | | 15.55% | | | | 18.85% | | | | 6.58% | |
For other share class results, visit americanfunds.com and americanfundsretirement.com.
The total annual fund operating expense ratio is 0.60% for Class A shares as of the prospectus dated July 1, 2014 (unaudited).
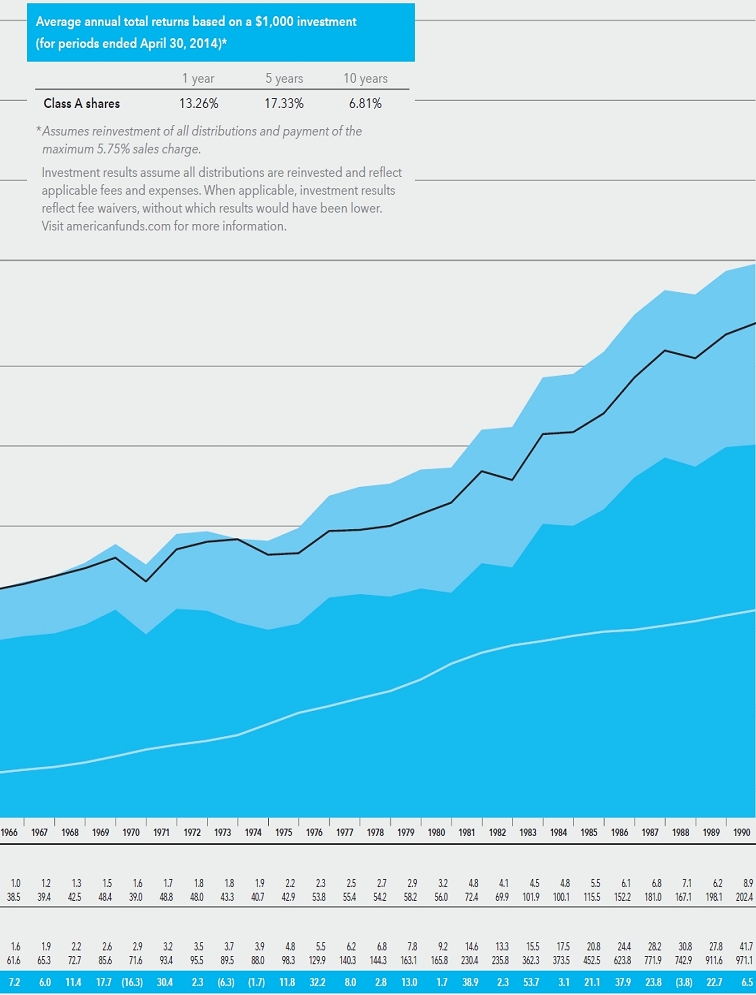
Investment results assume all distributions are reinvested and reflect applicable fees and expenses. When applicable, investment results reflect fee waivers, without which results would have been lower. Visit americanfunds.com for more information.
The fund’s 30-day yield for Class A shares as of May 31, 2014, reflecting the 5.75% maximum sales charge and calculated in accordance with the U.S. Securities and Exchange Commission formula, was 1.83%.
Refer to the fund prospectus and the Risk Factors section of this report for more information on risks associated with investing in the fund.

Fellow investors:
For the 12 months ended April 30, 2014, Washington Mutual Investors Fund reported a total return of 20.16%, compared with the 20.42% gain of the unmanaged Standard & Poor’s 500 Composite Index and the 16.22% rise of the Lipper Growth & Income Funds Index.
The fund paid four regular dividends totaling 71 cents per share and one special dividend of 15 cents per share. The payments represent an increase to 86 cents from 73 cents per share for the previous fiscal year. The fund also made a capital gains distribution of 78.5 cents per share.
We’re especially pleased with the fund’s three-year average annual total return of 14.25%, which outpaced the 13.81% gain of the S&P 500 and the 10.52% return of the Lipper Growth & Income Funds Index. Additionally, over its nearly 62-year lifetime, the fund has had an average annual total return of 11.99%, compared with 10.76% for the S&P 500.
U.S. economic and market overview The U.S. stock market continued its five-year runup, which included several all-time highs, during the fund’s fiscal year ended April 30, 2014. Gains during the 2013 calendar year were especially strong despite uncertainty as to when the Federal Reserve would begin to reduce its bond buying program, which was designed to stimulate the economy. In January 2014 the Fed finally started paring back the buybacks, which, to the markets, signaled its confidence in the U.S. recovery.
We believe that the outlook for the U.S. economy remains favorable. Interest rates are expected to rise gradually and inflation remains subdued.
The U.S. economy, as measured by the nation’s gross domestic product (GDP), contracted in the first quarter of 2014, a downward revision from the projected expansion of 0.1%. The Commerce Department attributed the slowdown — the first negative GDP rate in three years —
Results at a glance
Average annual total returns, with all distributions reinvested, for periods ended April 30, 2014
| | | 1 year | | 3 years | | 5 years | | 10 years | | Lifetime
(since 7/31/52) |
| | | | | | | | | | | |
| Washington Mutual Investors Fund (Class A shares) | | | 20.16 | % | | | 14.25 | % | | | 18.73 | % | | | 7.44 | % | | | 11.99 | % |
| Standard & Poor’s 500 Composite Index* | | | 20.42 | | | | 13.81 | | | | 19.12 | | | | 7.66 | | | | 10.76 | |
| Lipper Growth & Income Funds Index | | | 16.22 | | | | 10.52 | | | | 16.92 | | | | 6.82 | | | | — | † |
| * | The market index is unmanaged and, therefore, has no expenses. Investors cannot invest directly in an index. |
| † | This index was not in existence as of the date the fund’s Class A shares became available; therefore, lifetime results are not shown. |
| Washington Mutual Investors Fund | 1 |
to slower growth of business inventories, a larger-than-expected drop in net exports, a reduction in non-residential construction and, most important, the harsh winter weather. Most economists, however, consider this weak quarter to be a temporary event, their expectations buoyed by a number of positive indicators including a reduction in consumer debt, easing of state and federal government spending cuts, increases in business spending and the continuing housing recovery.
Global economic and market overview
Although the fund may only invest a maximum of 10% of its assets in companies domiciled outside the United States, the greater global economy certainly influences its results.
During the fund’s fiscal year, global stocks moved higher amid improvements in economic data in the U.S. and Europe. And while rising tensions between Russia and Ukraine dampened investor sentiment at times, energy stocks rallied on concerns that the Ukraine crisis might trigger an oil and gas shortage. Also, a burst of merger-and-acquisitions activity provided a boost to several industries, particularly pharmaceuticals.
Inside the portfolio
As of April 30, 2014, the fund’s 10 largest holdings were Microsoft (4.8%), Boeing (4.3%), Home Depot (3.8%), Merck (3.8%), Royal Dutch Shell (3.4%), Wells Fargo (3.4%), Chevron (2.9%), Lockheed Martin (2.8%), Union Pacific (2.8%) and American Express (2.6%).
During its fiscal year, the fund more than doubled its weighting in Microsoft (from 2.1%) and Comcast (to 1.4% from 0.4%). The fund also increased its positions in Wells Fargo (from 2.6%), Lockheed Martin (from 1.9%) and JPMorgan Chase (to 2.1% from 1.4%).
Shareholders benefited from the fund’s exposure to industrial and financial stocks, as returns for those sectors outpaced the index. Companies that helped lift relative fund results included aerospace and defense firms such as Boeing and Lockheed Martin, as well as select financials such as American Express, McGraw Hill Financial and Wells Fargo.
On a relative basis, the utilities, telecommunication services and consumer staples sectors were the top fund detractors. Detracting companies, on a relative basis, included Verizon Communications, FirstEnergy, Chevron and Home Depot. Stocks in these traditional dividend-paying sectors tend to lag in strong equity markets.
Looking ahead
Despite indications of mixed global economic growth, we believe the outlook is improving and is better than it has been over the past few years. With Europe no longer in recession and the United States on track to grow at a faster rate, the global economic recovery is moving forward at a measured pace. Washington Mutual Investors Fund’s experienced team of portfolio managers and investment analysts continues to search for companies with solid balance sheets, good earnings visibility and strong cash flow that can be used to support growing dividends high-quality companies that align with the fund’s objectives.
It’s important to note, however, that the recent period has been relatively exceptional for both the fund and the indexes. More precisely, this current rate of stock appreciation may not be sustainable over the intermediate term. At this point in the market cycle we’re paying even closer attention to potential risks in an effort to protect our shareholders’ assets.
Cordially,

Alan N. Berro
Vice Chairman and President
Washington Mutual Investors Fund
June 6, 2014
For current information about the fund, visit americanfunds.com.
| 2 | Washington Mutual Investors Fund |
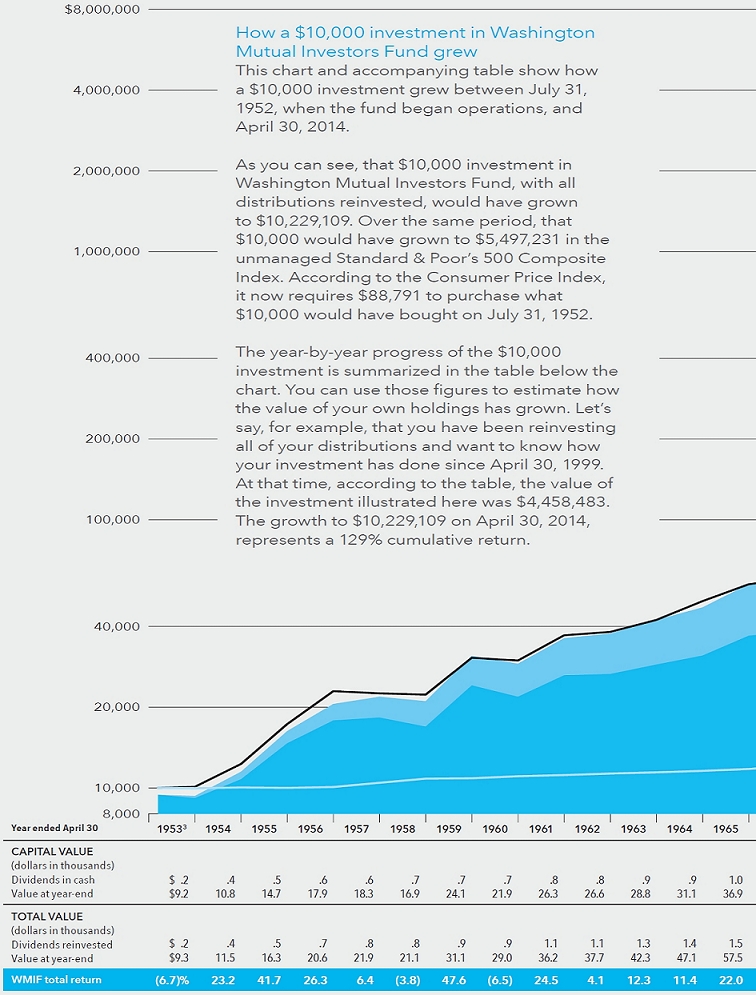
The value of a long-term perspective
Fund results shown are for Class A shares and reflect deduction of the maximum sales charge of 5.75% on the $10,000 investment.¹ Thus, the net amount invested was $9,425.² Results are for past periods and are not predictive of results for future periods. Current and future results may be lower or higher than those shown. Share prices and returns will vary, so investors may lose money. For current information and month-end results, visit americanfunds.com.
The results shown are before taxes on fund distributions and sale of fund shares.
| 1 | As outlined in the prospectus, the sales charge is reduced for accounts (and aggregated investments) of $25,000 or more and is eliminated for purchases of $1 million or more. There is no sales charge on dividends or capital gain distributions that are reinvested in additional shares. |
| 2 | The maximum initial sales charge was 8.5% prior to July 1, 1988. |
| 3 | For the period July 31, 1952 (when the fund began operations) through April 30, 1953. |
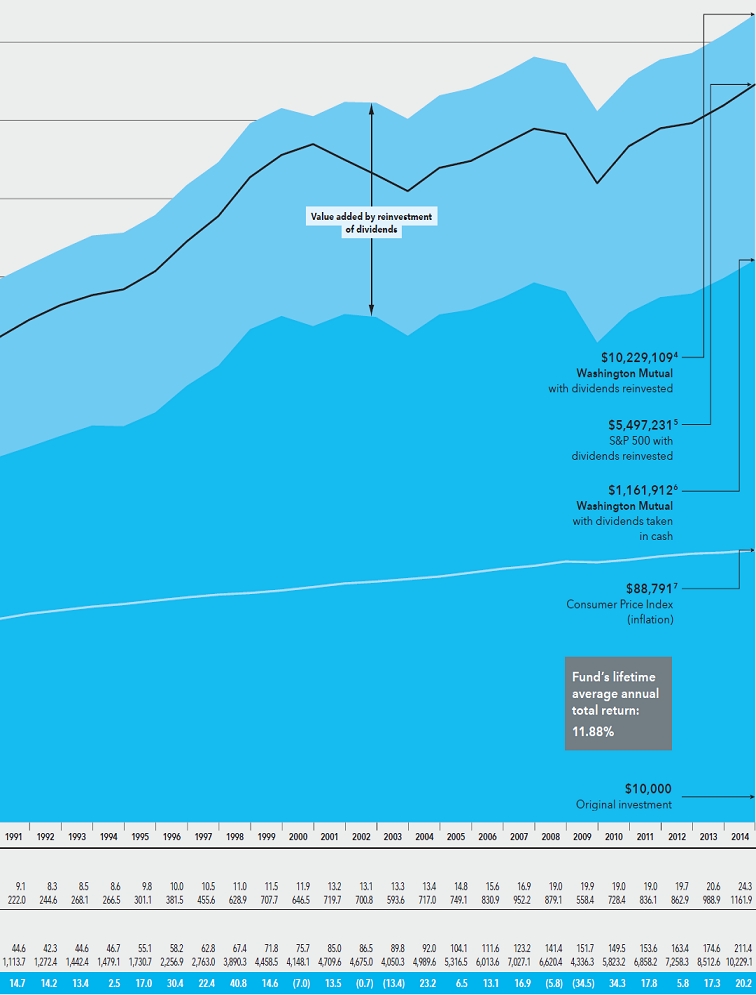
| 4 | Total value includes reinvested dividends of $2,719,135 and reinvested capital gain distributions of $2,939,800. |
| 5 | The market index is unmanaged and, therefore, has no expenses. Investors cannot invest directly in an index. |
| 6 | Capital value includes reinvested capital gain distributions of $486,230 but does not reflect income dividends of $438,602 taken in cash. |
| 7 | Computed from data supplied by the U.S. Department of Labor, Bureau of Labor Statistics. |
| 3 | Washington Mutual Investors Fund |
How a $10,000 investment has grown
While notable for their volatility in recent years, financial markets have tended to reward investors over the long term. Active management — bolstered by experience and careful research — can add even more value. As the chart shows, over its lifetime, Washington Mutual Investors Fund has done demonstrably better than its relevant benchmark.
| Washington Mutual Investors Fund | 5 |
Our dividend strategy strives for sustainable income, less volatile growth.

Alan Berro
Portfolio manager

Gene Stein
Portfolio manager
Designed to achieve a “magnitude and beauty as to be an object of pride to the American people,”* the Washington Monument is among our capital’s most recognizable architectural achievements. The elegant marble-and-granite obelisk continues to represent the clamorous ascendancy of a wholly American brand of democracy.
The idea behind another wholly American brand, Washington Mutual Investors Fund, also emerged from crisis — the Great Depression. To protect long-term investors after the speculation that caused the market to crash in 1929, the District of Columbia instituted strict investment quality standards. Subsequently, the fund was founded on these high standards and today can serve risk-averse long-term investors, who, among other challenges, must weather inevitable market downturns and save enough for a retirement that could last more than 30 years.
To address these most vital needs, the fund has strictly adhered to the high Investment Standards on which it was founded. (See sidebar on page 9.) Those standards were and continue to be based on a disciplined investment strategy emphasizing stocks that pay dividends.
Over the long term, these rigorous standards have generated above-average returns and have done so with less volatility than the unmanaged Standard & Poor’s 500 Composite Index. This says as much about the quality of companies in which the fund invests as it does the importance of dividends and the income they generate.
“The discipline of dividends has been a key component of Washington Mutual Investors Fund,” says Alan Berro, vice chair and president of the fund. “After all, this is a fund for which income is one of the primary objectives. The only aspect that changes over time is where we find that income.”
Fund portfolio manager Gene Stein points out, “The prospectus lists the fund’s objectives as income and growth — in that order: income first, growth second.”
Why dividends matter
More specifically, dividends are important for at least two key reasons.
Dividends are a significant part of total investment return
Over the 30-year period ended December 31, 2013, dividends contributed 54% of the total return of the unmanaged S&P 500 index. As the chart on page 8 demonstrates, the cumulative returns of the S&P 500 over the past 30 years vary greatly when considering dividends only. If we were to eliminate all dividends, the S&P 500
| * | Washington National Monument Society board of managers’ statement of expectations, September 23, 1835. |
| 6 | Washington Mutual Investors Fund |

“Dividends are the ultimate proof that stocks are not just pieces of paper. They represent ownership in real businesses.”
Bernie Nees, Founder
return would have been reduced by more than 50%. Alan puts it this way: “If investors in the fund receive more than half of their return up front from dividends, they’re not as dependent on market returns to meet their long-term investment goals.”
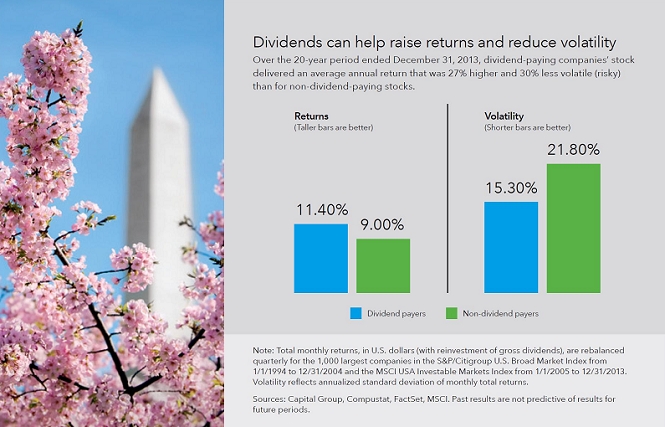
Dividends can help raise returns and reduce investment volatility
Financial professionals typically measure volatility by standard deviation. Put simply, investments with a low standard deviation historically have been less volatile than investments with a high standard deviation.
Analysis (see chart on page 10) reveals that for the 20-year period ended December 31, 2013, dividend-paying companies’ stock delivered an average annual return that was 27% higher (11.40% vs. 9.00%) and 30% less volatile (risky) than for non-dividend-paying stocks. Of course, it bears remembering that past results may not be predictive of results in future periods.
“What has differentiated this fund over time,” adds Alan, “is that in volatile down markets, the fund’s results tend to go down less. It’s the income from dividends that has provided some of that protection.”
What dividends can tell us about a company
A history of paying (or not paying) dividends can also tell us a great deal about a company. For example, companies that regularly pay dividends often are:
| Washington Mutual Investors Fund | 7 |

“Fifteen years ago you could never expect much in the way of dividends from some developing sectors like information technology. That’s no longer the case.”
Gene Stein
Aligned with shareholder interests
According to its founder, Bernie Nees, the fund is based on a sound premise:
“Dividends are the ultimate proof that stocks are not just pieces of paper. They represent ownership in real businesses.” Benjamin Graham, considered the father of value investing, and David Dodd took the idea further in their landmark book, Security Analysis: “The prime purpose of a business is to pay dividends to its owners.”
Managed with discipline
If a company is committed to paying a specific percentage of earnings or cash flow every year as a dividend, it has to sharpen its pencil whenever it gets new investment opportunities. That is, it requires the firm’s officers to be better stewards of capital.
Expressing management’s confidence in its future prospects
Paying dividends can send a powerful signal to the market. It suggests that a company has confidence in its earnings, balance sheet and cash flow.
Where we’re finding dividends today
Where do the fund’s five portfolio managers and more than 20 investment analysts currently find dividends? The simple answer is: in nearly every sector.
Dividend payments, cumulatively, are at record levels. On a per-share basis, dividend payments grew by 11.8% over the fund’s fiscal year, and since 2002, the number of S&P 500 companies paying dividends grew from 70% to 84%.2
| 2 | Source: FactSet Dividend Quarterly U.S., March 24, 2014. |
| 8 | Washington Mutual Investors Fund |
“Wherever the dividends are, we’ll find them,” says Alan. “Previously we got our dividends from a limited number of sectors, such as consumer staples, utilities, telecommunication services and energy. Today, we also get them from industrials, including aerospace and defense; health care, including pharmaceuticals; and information technology services.”
For example, 97% of the companies in the basic materials3 sector paid a dividend in 2013, up from a low of 85% in 2003. In industrial goods4, 95% paid a dividend, up from 79% in 2002. The equivalent percentages for financials5 and energy6 are 92% (up from 84% in 2009) and 83% (up from 78% in 2003), respectively.
Two reasons for the resurgence of dividends across sectors are an improving economy and maturing markets. Most banks have recovered from the recent recession, and the Federal Reserve has given them a green light to again pay dividends. As for maturing markets, “Fifteen years ago,” Gene notes, “you could never expect much in the way of dividends from some developing sectors like information technology. That’s no longer the case.”
| 3 | Basic materials: extraction and primary refinement of chemicals, metals, nonmetallic and construction materials; forest, wood and paper products; and containers and packaging products. |
| 4 | Industrial goods: production of goods used in construction and manufacturing, aerospace and defense, industrial machinery, tools, lumber production, construction, cement and metal fabrication. |
| 5 | Financials: banks, investment funds, insurance companies and real estate firms. |
| 6 | Energy: companies involved in the exploration and development of oil or gas reserves, or in oil and gas drilling, or integrated power firms. |
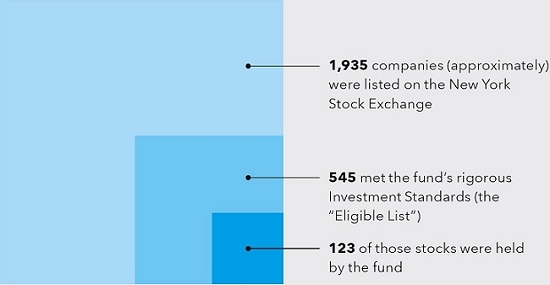
High standards seek to raise the investment bar
The Washington Mutual Investors Fund Investment Standards are based on criteria originally established after the Great Depression by the U.S. District Court for the District of Columbia. The fund continues to embrace those founding principles, which require a thorough and rigorous investment-screening process to arrive at a list of eligible stocks, from which fund holdings can be chosen. Currently, the fund:
| | Ÿ | Can invest only in companies that meet the fund’s strict Investment Standards. |
| | Ÿ | Seeks to be 95% invested in equities (stocks) at all times. |
| | Ÿ | May only invest up to 10% of its assets in companies based outside the United States. |
| | Ÿ | Can invest no more than 5% of the fund’s total assets in stock of non-dividend-paying companies; however, those non-dividend-paying companies must meet additional more-stringent requirements. |
| | Ÿ | May not invest in companies that derive the majority of their revenues from alcohol or tobacco products. |
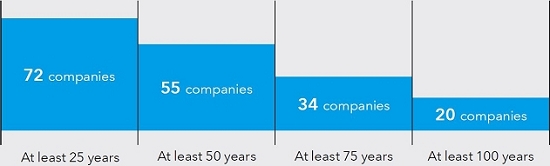
Many are called, few are chosen
As of December 31, 2013:
A focus on dividend-paying companies
Of the 123 stocks held by the fund, as of December 31, 2013, the following companies paid uninterrupted dividends over the periods cited:
| Washington Mutual Investors Fund | 9 |

Andrei Muresianu
Investment analyst
“Major semiconductor companies,” adds Gene, “like Intel and Texas Instruments, now pay a dividend that is well above average. Also, other large tech companies, like Cisco Systems, Microsoft, IBM and Apple, now have above-average dividend yields.”
The bottom line, says investment analyst Andrei Muresianu, is that “If you still think the only places to shop for dividends are in the telecommunications and utilities sectors, think again.”
A powerful combination
Well-researched and disciplined stock-picking, when combined with a dividend tailwind, can beat the market over the long term — and do so with lower volatility. This can be most beneficial to investors because, says Gene, “This often makes it easier for investors to stay in a fund during difficult periods. Remember, it’s unlikely that investors can benefit fully from any fund’s results if they sell or reduce their holdings in down markets.” For this reason, he adds, the fund “could serve as a core holding for any investor, by offering exposure to high-quality companies that have less downside risk during difficult markets.”
To put things in perspective, Andrei notes, “We’re five years into a bull market. Most bull markets last four to six years. History has shown that a fund with a high dividend yield and a curated universe of quality companies has been a good place to be at this point in the cycle.” ¢
| 10 | Washington Mutual Investors Fund |
Summary investment portfolio April 30, 2014
| Industry sector diversification | Percent of net assets |
| | |
 |
| Ten largest holdings | | Percent of
net assets |
| Microsoft | | | 4.81 | % |
| Boeing | | | 4.34 | |
| Home Depot | | | 3.81 | |
| Merck | | | 3.78 | |
| Royal Dutch Shell | | | 3.42 | |
| Wells Fargo | | | 3.40 | |
| Chevron | | | 2.88 | |
| Lockheed Martin | | | 2.82 | |
| Union Pacific | | | 2.81 | |
| American Express | | | 2.60 | |
| Common stocks 98.52% | | Shares | | | Value
(000) | | | Percent of
net assets | |
| Energy 11.33% | | | | | | | | | | | | |
| Chevron Corp. | | | 16,585,000 | | | $ | 2,081,749 | | | | 2.88 | % |
| ConocoPhillips | | | 10,945,100 | | | | 813,330 | | | | 1.12 | |
| Enbridge Inc. | | | 23,535,000 | | | | 1,136,505 | | | | 1.57 | |
| Pioneer Natural Resources Co. | | | 4,250,000 | | | | 821,398 | | | | 1.14 | |
| Royal Dutch Shell PLC, Class B (ADR) | | | 29,240,000 | | | | 2,475,166 | | | | 3.42 | |
| Other securities | | | | | | | 864,339 | | | | 1.20 | |
| | | | | | | | 8,192,487 | | | | 11.33 | |
| | | | | | | | | | | | | |
| Materials 4.15% | | | | | | | | | | | | |
| Dow Chemical Co. | | | 21,310,000 | | | | 1,063,369 | | | | 1.47 | |
| Nucor Corp. | | | 9,493,100 | | | | 491,268 | | | | .68 | |
| Praxair, Inc. | | | 3,370,000 | | | | 439,953 | | | | .61 | |
| Other securities | | | | | | | 1,009,292 | | | | 1.39 | |
| | | | | | | | 3,003,882 | | | | 4.15 | |
| | | | | | | | | | | | | |
| Industrials 18.95% | | | | | | | | | | | | |
| Boeing Co. | | | 24,320,000 | | | | 3,137,766 | | | | 4.34 | |
| Caterpillar Inc. | | | 10,260,000 | | | | 1,081,404 | | | | 1.50 | |
| General Electric Co. | | | 37,724,000 | | | | 1,014,398 | | | | 1.40 | |
| Lockheed Martin Corp. | | | 12,425,000 | | | | 2,039,440 | | | | 2.82 | |
| Northrop Grumman Corp. | | | 4,290,000 | | | | 521,278 | | | | .72 | |
| Rockwell Automation | | | 3,930,000 | | | | 468,377 | | | | .65 | |
| Rockwell Collins, Inc. | | | 5,994,600 | | | | 465,481 | | | | .64 | |
| Union Pacific Corp. | | | 10,660,000 | | | | 2,029,984 | | | | 2.81 | |
| United Technologies Corp. | | | 7,620,000 | | | | 901,675 | | | | 1.25 | |
| Waste Management, Inc. | | | 15,360,200 | | | | 682,761 | | | | .94 | |
| Other securities | | | | | | | 1,361,600 | | | | 1.88 | |
| | | | | | | | 13,704,164 | | | | 18.95 | |
| | | | | | | | | | | | | |
| Consumer discretionary 11.31% | | | | | | | | | | | | |
| Amazon.com, Inc.1 | | | 3,750,000 | | | | 1,140,487 | | | | 1.58 | |
| Comcast Corp., Class A | | | 20,132,739 | | | | 1,042,071 | | | | 1.44 | |
| Home Depot, Inc. | | | 34,661,000 | | | | 2,755,896 | | | | 3.81 | |
| Johnson Controls, Inc. | | | 10,863,800 | | | | 490,392 | | | | .68 | |
| VF Corp. | | | 12,250,000 | | | | 748,352 | | | | 1.03 | |
| Walt Disney Co. | | | 6,083,900 | | | | 482,697 | | | | .67 | |
| Other securities | | | | | | | 1,518,876 | | | | 2.10 | |
| | | | | | | | 8,178,771 | | | | 11.31 | |
| Washington Mutual Investors Fund | 11 |
| Common stocks (continued) | | Shares | | | Value
(000) | | | Percent of
net assets | |
| Consumer staples 9.00% | | | | | | | | | | | | |
| Coca-Cola Co. | | | 30,029,200 | | | $ | 1,224,891 | | | | 1.70 | % |
| Kimberly-Clark Corp. | | | 5,555,000 | | | | 623,549 | | | | .86 | |
| Nestlé SA (ADR) | | | 9,570,192 | | | | 738,627 | | | | 1.02 | |
| PepsiCo, Inc. | | | 12,060,000 | | | | 1,035,833 | | | | 1.43 | |
| Procter & Gamble Co. | | | 16,923,900 | | | | 1,397,068 | | | | 1.93 | |
| Unilever NV (New York registered) | | | 9,587,900 | | | | 410,554 | | | | .57 | |
| Other securities | | | | | | | 1,074,796 | | | | 1.49 | |
| | | | | | | | 6,505,318 | | | | 9.00 | |
| | | | | | | | | | | | | |
| Health care 10.30% | | | | | | | | | | | | |
| Bristol-Myers Squibb Co. | | | 16,436,200 | | | | 823,289 | | | | 1.14 | |
| Humana Inc. | | | 7,620,000 | | | | 836,295 | | | | 1.15 | |
| Johnson & Johnson | | | 13,930,000 | | | | 1,410,970 | | | | 1.95 | |
| Merck & Co., Inc. | | | 46,687,400 | | | | 2,734,014 | | | | 3.78 | |
| Pfizer Inc. | | | 24,070,000 | | | | 752,910 | | | | 1.04 | |
| Other securities | | | | | | | 894,428 | | | | 1.24 | |
| | | | | | | | 7,451,906 | | | | 10.30 | |
| | | | | | | | | | | | | |
| Financials 14.46% | | | | | | | | | | | | |
| ACE Ltd. | | | 3,860,000 | | | | 394,955 | | | | .55 | |
| American Express Co. | | | 21,550,000 | | | | 1,884,117 | | | | 2.60 | |
| CME Group Inc., Class A | | | 8,718,389 | | | | 613,687 | | | | .85 | |
| JPMorgan Chase & Co. | | | 27,682,400 | | | | 1,549,661 | | | | 2.14 | |
| McGraw Hill Financial, Inc. | | | 7,109,100 | | | | 525,576 | | | | .73 | |
| U.S. Bancorp | | | 12,355,000 | | | | 503,837 | | | | .70 | |
| Wells Fargo & Co. | | | 49,590,200 | | | | 2,461,658 | | | | 3.40 | |
| Other securities | | | | | | | 2,527,017 | | | | 3.49 | |
| | | | | | | | 10,460,508 | | | | 14.46 | |
| | | | | | | | | | | | | |
| Information technology 9.87% | | | | | | | | | | | | |
| Apple Inc. | | | 1,114,700 | | | | 657,773 | | | | .91 | |
| Microsoft Corp. | | | 86,071,800 | | | | 3,477,301 | | | | 4.81 | |
| QUALCOMM Inc. | | | 5,000,000 | | | | 393,550 | | | | .54 | |
| Texas Instruments Inc. | | | 19,370,700 | | | | 880,398 | | | | 1.22 | |
| Other securities | | | | | | | 1,726,747 | | | | 2.39 | |
| | | | | | | | 7,135,769 | | | | 9.87 | |
| | | | | | | | | | | | | |
| Telecommunication services 3.62% | | | | | | | | | | | | |
| AT&T Inc. | | | 23,090,000 | | | | 824,313 | | | | 1.14 | |
| Verizon Communications Inc. | | | 37,063,293 | | | | 1,731,968 | | | | 2.39 | |
| Other securities | | | | | | | 62,737 | | | | .09 | |
| | | | | | | | 2,619,018 | | | | 3.62 | |
| | | | | | | | | | | | | |
| Utilities 3.33% | | | | | | | | | | | | |
| Duke Energy Corp. | | | 5,695,700 | | | | 424,272 | | | | .58 | |
| PG&E Corp. | | | 19,957,300 | | | | 909,654 | | | | 1.26 | |
| Other securities | | | | | | | 1,076,819 | | | | 1.49 | |
| | | | | | | | 2,410,745 | | | | 3.33 | |
| | | | | | | | | | | | | |
| Miscellaneous 2.20% | | | | | | | | | | | | |
| Other common stocks in initial period of acquisition | | | | | | | 1,591,990 | | | | 2.20 | |
| | | | | | | | | | | | | |
| Total common stocks (cost: $45,111,192,000) | | | | | | | 71,254,558 | | | | 98.52 | |
| 12 | Washington Mutual Investors Fund |
| Short-term securities 1.42% | | Principal amount
(000) | | | Value
(000) | | | Percent of
net assets | |
| Chevron Corp. 0.09%–0.10% due 5/13–5/16/20142 | | $ | 72,100 | | | $ | 72,096 | | | | .10 | % |
| Coca-Cola Co. 0.10%–0.11% due 5/19–7/23/20142 | | | 93,000 | | | | 92,991 | | | | .13 | |
| Merck & Co. Inc. 0.08% due 5/23/20142 | | | 40,000 | | | | 39,998 | | | | .05 | |
| Procter & Gamble Co. 0.10%–0.14% due 5/14–6/19/20142 | | | 121,200 | | | | 121,195 | | | | .17 | |
| United Technologies Corp. 0.07% due 6/30/20142 | | | 13,300 | | | | 13,298 | | | | .02 | |
| Other securities | | | | | | | 688,553 | | | | .95 | |
| | | | | | | | | | | | | |
| Total short-term securities (cost: $1,028,088,000) | | | | | | | 1,028,131 | | | | 1.42 | |
| Total investment securities (cost: $46,139,280,000) | | | | | | | 72,282,689 | | | | 99.94 | |
| Other assets less liabilities | | | | | | | 45,912 | | | | .06 | |
| | | | | | | | | | | | | |
| Net assets | | | | | | $ | 72,328,601 | | | | 100.00 | % |
This summary investment portfolio is designed to streamline the report and help investors better focus on the fund’s principal holdings. See the inside back cover for details on how to obtain a complete schedule of portfolio holdings.
As permitted by U.S. Securities and Exchange Commission regulations, “Miscellaneous” securities include holdings in their first year of acquisition that have not previously been publicly disclosed.
“Other securities” includes all issues that are not disclosed separately in the summary investment portfolio.
The following footnotes apply to either the individual securities noted or one or more of the securities aggregated and listed as a single line item.
| 1 | Security did not produce income during the last 12 months. |
| 2 | Acquired in a transaction exempt from registration under section 4(2) of the Securities Act of 1933. May be resold in the U.S. in transactions exempt from registration, normally to qualified institutional buyers. The total value of all such securities, including those in “Other securities,” was $572,936,000, which represented .79% of the net assets of the fund. |
Key to abbreviation
ADR = American Depositary Receipts
See Notes to Financial Statements
| Washington Mutual Investors Fund | 13 |
Financial statements
| Statement of assets and liabilities | | | | | | |
| at April 30, 2014 | | (dollars in thousands) |
| | | | | | | | | |
| Assets: | | | | | | | | |
| Investment securities, at value (cost: $46,139,280) | | | | | | $ | 72,282,689 | |
| Cash | | | | | | | 606 | |
| Receivables for: | | | | | | | | |
| Sales of investments | | $ | 37,908 | | | | | |
| Sales of fund’s shares | | | 53,827 | | | | | |
| Dividends | | | 103,328 | | | | 195,063 | |
| | | | | | | | 72,478,358 | |
| Liabilities: | | | | | | | | |
| Payables for: | | | | | | | | |
| Purchases of investments | | | 42,219 | | | | | |
| Repurchases of fund’s shares | | | 59,755 | | | | | |
| Management services | | | 13,960 | | | | | |
| Services provided by related parties | | | 28,127 | | | | | |
| Board members’ deferred compensation | | | 5,507 | | | | | |
| Other | | | 189 | | | | 149,757 | |
| Net assets at April 30, 2014 | | | | | | $ | 72,328,601 | |
| | | | | | | | | |
| Net assets consist of: | | | | | | | | |
| Capital paid in on shares of beneficial interest | | | | | | $ | 44,022,317 | |
| Undistributed net investment income | | | | | | | 186,981 | |
| Undistributed net realized gain | | | | | | | 1,975,894 | |
| Net unrealized appreciation | | | | | | | 26,143,409 | |
| Net assets at April 30, 2014 | | | | | | $ | 72,328,601 | |
(dollars and shares in thousands, except per-share amounts)
Shares of beneficial interest issued and outstanding (no stated par value) —
unlimited shares authorized (1,791,923 total shares outstanding)
| | | Net assets | | | Shares
outstanding | | | Net asset value
per share | |
| Class A | | $ | 50,625,396 | | | | 1,253,060 | | | $ | 40.40 | |
| Class B | | | 235,907 | | | | 5,872 | | | | 40.17 | |
| Class C | | | 1,770,781 | | | | 44,284 | | | | 39.99 | |
| Class F-1 | | | 3,830,978 | | | | 95,110 | | | | 40.28 | |
| Class F-2 | | | 2,077,281 | | | | 51,431 | | | | 40.39 | |
| Class 529-A | | | 1,731,221 | | | | 42,922 | | | | 40.33 | |
| Class 529-B | | | 41,158 | | | | 1,024 | | | | 40.20 | |
| Class 529-C | | | 446,700 | | | | 11,143 | | | | 40.09 | |
| Class 529-E | | | 90,625 | | | | 2,257 | | | | 40.15 | |
| Class 529-F-1 | | | 100,191 | | | | 2,488 | | | | 40.27 | |
| Class R-1 | | | 100,383 | | | | 2,506 | | | | 40.06 | |
| Class R-2 | | | 808,123 | | | | 20,227 | | | | 39.95 | |
| Class R-3 | | | 1,856,727 | | | | 46,259 | | | | 40.14 | |
| Class R-4 | | | 2,138,735 | | | | 53,140 | | | | 40.25 | |
| Class R-5 | | | 1,893,031 | | | | 46,866 | | | | 40.39 | |
| Class R-6 | | | 4,581,364 | | | | 113,334 | | | | 40.42 | |
See Notes to Financial Statements
| 14 | Washington Mutual Investors Fund |
| Statement of operations | | | | | | |
| for the year ended April 30, 2014 | | (dollars in thousands) |
| | | | |
| Investment income: | | | | | | | | |
| Income: | | | | | | | | |
| Dividends (net of non-U.S. taxes of $12,549) | | $ | 1,783,408 | | | | | |
| Interest | | | 1,872 | | | $ | 1,785,280 | |
| Fees and expenses*: | | | | | | | | |
| Investment advisory services | | | 130,637 | | | | | |
| Business management services | | | 29,573 | | | | | |
| Distribution services | | | 171,066 | | | | | |
| Transfer agent services | | | 65,374 | | | | | |
| Administrative services | | | 14,312 | | | | | |
| Reports to shareholders | | | 2,264 | | | | | |
| Registration statement and prospectus | | | 712 | | | | | |
| Board members’ compensation | | | 2,565 | | | | | |
| Auditing and legal | | | 357 | | | | | |
| Custodian | | | 593 | | | | | |
| State and local taxes | | | — | † | | | | |
| Other | | | 2,609 | | | | 420,062 | |
| Net investment income | | | | | | | 1,365,218 | |
| | | | | | | | | |
| Net realized gain and unrealized appreciation on investments: | | | | | | | | |
| Net realized gain on investments | | | | | | | 3,225,369 | |
| Net unrealized appreciation on investments | | | | | | | 7,653,650 | |
| Net realized gain and unrealized appreciation on investments | | | | | | | 10,879,019 | |
| | | | | | | | | |
| Net increase in net assets resulting from operations | | | | | | $ | 12,244,237 | |
| * | Additional information related to class-specific fees and expenses is included in the Notes to Financial Statements. |
| † | Amount less than one thousand. |
See Notes to Financial Statements
| Washington Mutual Investors Fund | 15 |
Statements of changes in net assets
(dollars in thousands)
| | | Year ended April 30 | |
| | 2014 | | | 2013 | |
| | | | | | | |
| Operations: | | | | | | |
| Net investment income | | $ | 1,365,218 | | | $ | 1,273,155 | |
| Net realized gain on investments | | | 3,225,369 | | | | 2,442,031 | |
| Net unrealized appreciation on investments | | | 7,653,650 | | | | 5,415,758 | |
| Net increase in net assets resulting from operations | | | 12,244,237 | | | | 9,130,944 | |
| | | | | | | | | |
| Dividends and distributions paid to shareholders: | | | | | | | | |
| Dividends from net investment income | | | (1,491,580 | ) | | | (1,269,560 | ) |
| Distributions from net realized gain on investments | | | (1,372,808 | ) | | | — | |
| Total dividends and distributions paid to shareholders | | | (2,864,388 | ) | | | (1,269,560 | ) |
| | | | | | | | | |
| Net capital share transactions | | | 1,509,034 | | | | (1,521,502 | ) |
| | | | | | | | | |
| Total increase in net assets | | | 10,888,883 | | | | 6,339,882 | |
| | | | | | | | | |
| Net assets: | | | | | | | | |
| Beginning of year | | | 61,439,718 | | | | 55,099,836 | |
| End of year (including undistributed net investment income: $186,981 and $313,741, respectively) | | $ | 72,328,601 | | | $ | 61,439,718 | |
See Notes to Financial Statements
| 16 | Washington Mutual Investors Fund |
Notes to financial statements
1. Organization
Washington Mutual Investors Fund (the “fund”) is registered under the Investment Company Act of 1940 as an open-end, diversified management investment company. The fund’s investment objective is to produce income and to provide an opportunity for growth of principal consistent with sound common stock investing.
The fund has 16 share classes consisting of five retail share classes (Classes A, B and C, as well as two F share classes, F-1 and F-2), five 529 college savings plan share classes (Classes 529-A, 529-B, 529-C, 529-E and 529-F-1) and six retirement plan share classes (Classes R-1, R-2, R-3, R-4, R-5 and R-6). The 529 college savings plan share classes can be used to save for college education. The retirement plan share classes are generally offered only through eligible employer-sponsored retirement plans. The fund’s share classes are described further in the following table:
| Share class | | Initial sales charge | | Contingent deferred sales
charge upon redemption | | Conversion feature |
| Classes A and 529-A | | Up to 5.75% | | None (except 1% for certain redemptions within one year of purchase without an initial sales charge) | | None |
| Classes B and 529-B* | | None | | Declines from 5% to 0% for redemptions within six years of purchase | | Classes B and 529-B convert to Classes A and 529-A, respectively, after eight years |
| Class C | | None | | 1% for redemptions within one year of purchase | | Class C converts to Class F-1 after 10 years |
| Class 529-C | | None | | 1% for redemptions within one year of purchase | | None |
| Class 529-E | | None | | None | | None |
| Classes F-1, F-2 and 529-F-1 | | None | | None | | None |
| Classes R-1, R-2, R-3, R-4, R-5 and R-6 | | None | | None | | None |
| * | Class B and 529-B shares of the fund are not available for purchase. |
Holders of all share classes have equal pro rata rights to assets, dividends and liquidation proceeds. Each share class has identical voting rights, except for the exclusive right to vote on matters affecting only its class. Share classes have different fees and expenses (“class-specific fees and expenses”), primarily due to different arrangements for distribution, administrative and shareholder services. Differences in class-specific fees and expenses will result in differences in net investment income and, therefore, the payment of different per-share dividends by each share class.
2. Significant accounting policies
The financial statements have been prepared to comply with accounting principles generally accepted in the United States of America. These principles require management to make estimates and assumptions that affect reported amounts and disclosures. Actual results could differ from those estimates. The fund follows the significant accounting policies described in this section, as well as the valuation policies described in the next section on valuation.
Security transactions and related investment income — Security transactions are recorded by the fund as of the date the trades are executed with brokers. Realized gains and losses from security transactions are determined based on the specific identified cost of the securities. In the event a security is purchased with a delayed payment date, the fund will segregate liquid assets sufficient to meet its payment obligations. Dividend income is recognized on the ex-dividend date and interest income is recognized on an accrual basis. Market discounts, premiums and original issue discounts on fixed-income securities are amortized daily over the expected life of the security.
Class allocations — Income, fees and expenses (other than class-specific fees and expenses) and realized and unrealized gains and losses are allocated daily among the various share classes based on their relative net assets. Class-specific fees and expenses, such as distribution, administrative and shareholder services, are charged directly to the respective share class.
Dividends and distributions to shareholders — Dividends and distributions to shareholders are recorded on the ex-dividend date.
| Washington Mutual Investors Fund | 17 |
3. Valuation
Capital Research and Management Company (“CRMC”), the fund’s investment adviser, values the fund’s investments at fair value as defined by accounting principles generally accepted in the United States of America. The net asset value of each share class of the fund is generally determined as of approximately 4:00 p.m. New York time each day the New York Stock Exchange is open.
Methods and inputs — The fund’s investment adviser uses the following methods and inputs to establish the fair value of the fund’s assets and liabilities. Use of particular methods and inputs may vary over time based on availability and relevance as market and economic conditions evolve.
Equity securities are generally valued at the official closing price of, or the last reported sale price on, the exchange or market on which such securities are traded, as of the close of business on the day the securities are being valued or, lacking any sales, at the last available bid price. Prices for each security are taken from the principal exchange or market on which the security trades.
Fixed-income securities, including short-term securities purchased with more than 60 days left to maturity, are generally valued at prices obtained from one or more pricing vendors. Vendors value such securities based on one or more of the following inputs: benchmark yields, transactions, bids, offers, quotations from dealers and trading systems, new issues, spreads, interest rate volatilities, and other relationships observed in the markets among comparable securities; and proprietary pricing models such as yield measures calculated using factors such as cash flows, financial or collateral performance and other reference data.
When the fund’s investment adviser deems it appropriate to do so (such as when vendor prices are unavailable or not deemed to be representative), fixed-income securities will be valued in good faith at the mean quoted bid and ask prices that are reasonably and timely available (or bid prices, if ask prices are not available) or at prices for securities of comparable maturity, quality and type.
Securities with both fixed-income and equity characteristics, or equity securities traded principally among fixed-income dealers, are generally valued in the manner described for either equity or fixed-income securities, depending on which method is deemed most appropriate by the fund’s investment adviser. Short-term securities purchased within 60 days to maturity are valued at amortized cost, which approximates fair value. The value of short-term securities originally purchased with maturities greater than 60 days is determined based on an amortized value to par when they reach 60 days.
Securities and other assets for which representative market quotations are not readily available or are considered unreliable by the fund’s investment adviser are fair valued as determined in good faith under fair valuation guidelines adopted by authority of the fund’s board of trustees as further described. The investment adviser follows fair valuation guidelines, consistent with U.S. Securities and Exchange Commission rules and guidance, to consider relevant principles and factors when making fair value determinations. The investment adviser considers relevant indications of value that are reasonably and timely available to it in determining the fair value to be assigned to a particular security, such as the type and cost of the security; contractual or legal restrictions on resale of the security; relevant financial or business developments of the issuer; actively traded similar or related securities; conversion or exchange rights on the security; related corporate actions; significant events occurring after the close of trading in the security; and changes in overall market conditions. Fair valuations and valuations of investments that are not actively trading involve judgment and may differ materially from valuations that would have been used had greater market activity occurred.
Processes and structure — The fund’s board of trustees has delegated authority to the fund’s investment adviser to make fair value determinations, subject to board oversight. The investment adviser has established a Joint Fair Valuation Committee (the “Fair Valuation Committee”) to administer, implement and oversee the fair valuation process, and to make fair value decisions. The Fair Valuation Committee regularly reviews its own fair value decisions, as well as decisions made under its standing instructions to the investment adviser’s valuation teams. The Fair Valuation Committee reviews changes in fair value measurements from period to period and may, as deemed appropriate, update the fair valuation guidelines to better reflect the results of back testing and address new or evolving issues. The Fair Valuation Committee reports any changes to the fair valuation guidelines to the board of trustees with supplemental information to support the changes. The fund’s board and audit committee also regularly review reports that describe fair value determinations and methods.
The fund’s investment adviser has also established a Fixed-Income Pricing Review Group to administer and oversee the fixed-income valuation process, including the use of fixed-income pricing vendors. This group regularly reviews pricing vendor information and market data. Pricing decisions, processes and controls over security valuation are also subject to additional internal reviews, including an annual control self-evaluation program facilitated by the investment adviser’s compliance group.
| 18 | Washington Mutual Investors Fund |
Classifications — The fund’s investment adviser classifies the fund’s assets and liabilities into three levels based on the inputs used to value the assets or liabilities. Level 1 values are based on quoted prices in active markets for identical securities. Level 2 values are based on significant observable market inputs, such as quoted prices for similar securities and quoted prices in inactive markets. Level 3 values are based on significant unobservable inputs that reflect the investment adviser’s determination of assumptions that market participants might reasonably use in valuing the securities. The valuation levels are not necessarily an indication of the risk or liquidity associated with the underlying investment. For example, U.S. government securities are reflected as Level 2 because the inputs used to determine fair value may not always be quoted prices in an active market. The following table presents the fund’s valuation levels as of April 30, 2014 (dollars in thousands):
| | | Investment securities | |
| | | Level 1 | | | Level 2 | | | Level 3 | | | Total | |
| Assets: | | | | | | | | | | | | | | | | |
| Common stocks: | | | | | | | | | | | | | | | | |
| Energy | | $ | 8,192,487 | | | $ | — | | | $ | — | | | $ | 8,192,487 | |
| Materials | | | 3,003,882 | | | | — | | | | — | | | | 3,003,882 | |
| Industrials | | | 13,704,164 | | | | — | | | | — | | | | 13,704,164 | |
| Consumer discretionary | | | 8,178,771 | | | | — | | | | — | | | | 8,178,771 | |
| Consumer staples | | | 6,505,318 | | | | — | | | | — | | | | 6,505,318 | |
| Health care | | | 7,451,906 | | | | — | | | | — | | | | 7,451,906 | |
| Financials | | | 10,460,508 | | | | — | | | | — | | | | 10,460,508 | |
| Information technology | | | 7,135,769 | | | | — | | | | — | | | | 7,135,769 | |
| Telecommunication services | | | 2,619,018 | | | | — | | | | — | | | | 2,619,018 | |
| Utilities | | | 2,410,745 | | | | — | | | | — | | | | 2,410,745 | |
| Miscellaneous | | | 1,591,990 | | | | — | | | | — | | | | 1,591,990 | |
| Short-term securities | | | — | | | | 1,028,131 | | | | — | | | | 1,028,131 | |
| Total | | $ | 71,254,558 | | | $ | 1,028,131 | | | $ | — | | | $ | 72,282,689 | |
4. Risk factors
Investing in the fund may involve certain risks including, but not limited to, those described below.
Market conditions — The prices of, and the income generated by, the common stocks and other securities held by the fund may decline — sometimes rapidly or unpredictably — due to various factors, including events or conditions affecting the general economy or particular industries; overall market changes; local, regional or global political, social or economic instability; governmental or governmental agency responses to economic conditions; and currency, interest rate and commodity price fluctuations.
Issuer risks — The values of, and the income generated by, securities held by the fund may also decline in response to various factors directly related to the issuers of such securities, including reduced demand for an issuer’s goods or services, poor management performance and strategic initiatives such as mergers, acquisitions or dispositions and the market response to any such initiative.
Investing in income-oriented stocks — Income provided by the fund may be reduced by changes in the dividend policies of, and the capital resources available for dividend payments at, the companies in which the fund invests.
Investing in growth-oriented stocks — Growth-oriented common stocks and other equity-type securities (such as preferred stocks, convertible preferred stocks and convertible bonds) may involve larger price swings and greater potential for loss than other types of investments.
Management — The investment adviser to the fund actively manages the fund’s investments. Consequently, the fund is subject to the risk that the methods and analyses employed by the investment adviser in this process may not produce the desired results. This could cause the fund to lose value or its investment results to lag relevant benchmarks or other funds with similar objectives.
| Washington Mutual Investors Fund | 19 |
5. Taxation and distributions
Federal income taxation — The fund complies with the requirements under Subchapter M of the Internal Revenue Code applicable to mutual funds and intends to distribute substantially all of its net taxable income and net capital gains each year. The fund is not subject to income taxes to the extent such distributions are made. Therefore, no federal income tax provision is required.
As of and during the period ended April 30, 2014, the fund did not have a liability for any unrecognized tax benefits. The fund recognizes interest and penalties, if any, related to unrecognized tax benefits as income tax expense in the statement of operations. During the period, the fund did not incur any interest or penalties.
The fund is not subject to examination by U.S. federal tax authorities or state tax authorities for tax years before 2010.
Non-U.S. taxation — Dividend income is recorded net of non-U.S. taxes paid.
Distributions — Distributions paid to shareholders are based on net investment income and net realized gains determined on a tax basis, which may differ from net investment income and net realized gains for financial reporting purposes. These differences are due primarily to different treatment for items such as currency gains and losses; short-term capital gains and losses; capital losses related to sales of certain securities within 30 days of purchase; and deferred expenses. The fiscal year in which amounts are distributed may differ from the year in which the net investment income and net realized gains are recorded by the fund for financial reporting purposes. The fund may also designate a portion of the amount paid to redeeming shareholders as a distribution for tax purposes.
During the year ended April 30, 2014, the fund reclassified $338,000 from undistributed net investment income to undistributed net realized gain; and reclassified $60,000 from undistributed net investment income and $126,591,000 from undistributed net realized gain to capital paid in on shares of beneficial interest to align financial reporting with tax reporting.
As of April 30, 2014, the tax basis components of distributable earnings, unrealized appreciation (depreciation) and cost of investment securities were as follows (dollars in thousands):
| Undistributed ordinary income | | $ | 192,488 | |
| Undistributed long-term capital gains | | | 2,005,872 | |
| Gross unrealized appreciation on investment securities | | | 26,366,515 | |
| Gross unrealized depreciation on investment securities | | | (253,084 | ) |
| Net unrealized appreciation on investment securities | | | 26,113,431 | |
| Cost of investment securities | | | 46,169,258 | |
The tax character of distributions paid to shareholders was as follows (dollars in thousands):
| | | Year ended April 30, 2014 | | | Year ended April 30, 2013 | |
| Share class | | Ordinary
income | | | Long-term
capital gains | | | Total
distributions paid | | | Ordinary
income | | | Long-term
capital gains | | | Total
distributions paid | |
| Class A | | $ | 1,071,678 | | | $ | 971,329 | | | $ | 2,043,007 | | | $ | 937,751 | | | $ | — | | | $ | 937,751 | |
| Class B | | | 4,080 | | | | 5,481 | | | | 9,561 | | | | 5,901 | | | | — | | | | 5,901 | |
| Class C | | | 26,007 | | | | 35,898 | | | | 61,905 | | | | 25,966 | | | | — | | | | 25,966 | |
| Class F-1 | | | 74,613 | | | | 69,275 | | | | 143,888 | | | | 60,363 | | | | — | | | | 60,363 | |
| Class F-2 | | | 42,622 | | | | 37,921 | | | | 80,543 | | | | 27,203 | | | | — | | | | 27,203 | |
| Class 529-A | | | 34,631 | | | | 32,777 | | | | 67,408 | | | | 29,211 | | | | — | | | | 29,211 | |
| Class 529-B | | | 633 | | | | 930 | | | | 1,563 | | | | 873 | | | | — | | | | 873 | |
| Class 529-C | | | 5,894 | | | | 8,586 | | | | 14,480 | | | | 5,240 | | | | — | | | | 5,240 | |
| Class 529-E | | | 1,617 | | | | 1,722 | | | | 3,339 | | | | 1,377 | | | | — | | | | 1,377 | |
| Class 529-F-1 | | | 2,171 | | | | 1,860 | | | | 4,031 | | | | 1,764 | | | | — | | | | 1,764 | |
| Class R-1 | | | 1,408 | | | | 1,939 | | | | 3,347 | | | | 1,321 | | | | — | | | | 1,321 | |
| Class R-2 | | | 12,055 | | | | 16,103 | | | | 28,158 | | | | 11,237 | | | | — | | | | 11,237 | |
| Class R-3 | | | 34,078 | | | | 36,596 | | | | 70,674 | | | | 29,721 | | | | — | | | | 29,721 | |
| Class R-4 | | | 44,017 | | | | 40,223 | | | | 84,240 | | | | 37,388 | | | | — | | | | 37,388 | |
| Class R-5 | | | 41,517 | | | | 34,378 | | | | 75,895 | | | | 33,290 | | | | — | | | | 33,290 | |
| Class R-6 | | | 94,559 | | | | 77,790 | | | | 172,349 | | | | 60,954 | | | | — | | | | 60,954 | |
| Total | | $ | 1,491,580 | | | $ | 1,372,808 | | | $ | 2,864,388 | | | $ | 1,269,560 | | | $ | — | | | $ | 1,269,560 | |
| 20 | Washington Mutual Investors Fund |
6. Fees and transactions with related parties
CRMC, the fund’s investment adviser, is the parent company of American Funds Distributors,® Inc. (“AFD”), the principal underwriter of the fund’s shares, American Funds Service Company® (“AFS”), the fund’s transfer agent, and Washington Management Corporation (“WMC”), the fund’s business manager. CRMC, AFD, AFS and WMC are considered related parties to the fund.
Investment advisory services — The fund has an investment advisory agreement with CRMC that provides for monthly fees accrued daily. These fees are based on a series of decreasing annual rates beginning with 0.225% on the first $3 billion of daily net assets and decreasing to 0.177% on such assets in excess of $89 billion. For the year ended April 30, 2014, the investment advisory services fee was $130,637,000, which was equivalent to an annualized rate of 0.195% of average daily net assets.
Business management services — The fund has a business management agreement with WMC. Under this agreement, WMC provides services necessary to carry on the fund’s general administrative and corporate affairs. These services encompass matters relating to general corporate governance, regulatory compliance and monitoring of the fund’s contractual service providers, including custodian operations, shareholder services and fund share distribution functions. Under the agreement, all expenses chargeable to the Class A shares of the fund, including compensation to the business manager, shall not exceed 1% of the Class A average net assets of the fund on an annual basis. The agreement provides for monthly fees, accrued daily, based on a series of decreasing annual rates beginning with 0.117% on the first $3 billion of daily net assets and decreasing to 0.0375% on such assets in excess of $44 billion. For the year ended April 30, 2014, the business management services fee was $29,573,000, which was equivalent to an annualized rate of 0.044% of average daily net assets.
Class-specific fees and expenses — Expenses that are specific to individual share classes are accrued directly to the respective share class. The principal class-specific fees and expenses are described below:
Distribution services — The fund has plans of distribution for all share classes, except Class F-2, R-5 and R-6 shares. Under the plans, the board of trustees approves certain categories of expenses that are used to finance activities primarily intended to sell fund shares and service existing accounts. The plans provide for payments, based on an annualized percentage of average daily net assets, ranging from 0.25% to 1.00% as noted in this section. In some cases, the board of trustees has limited the amounts that may be paid to less than the maximum allowed by the plans. All share classes with a plan may use up to 0.25% of average daily net assets to pay service fees, or to compensate AFD for paying service fees, to firms that have entered into agreements with AFD to provide certain shareholder services. The remaining amounts available to be paid under each plan are paid to dealers to compensate them for their sales activities.
For Class A and 529-A shares, distribution-related expenses include the reimbursement of dealer and wholesaler commissions paid by AFD for certain shares sold without a sales charge. These share classes reimburse AFD for amounts billed within the prior 15 months but only to the extent that the overall annual expense limit of 0.25% is not exceeded. As of April 30, 2014, there were no unreimbursed expenses subject to reimbursement for Class A or 529-A shares.
| Share class | | Currently approved limits | | Plan limits | |
| Class A | | | 0.25 | % | | | 0.25 | % | |
| Class 529-A | | | 0.25 | | | | 0.50 | | |
| Classes B and 529-B | | | 1.00 | | | | 1.00 | | |
| Classes C, 529-C and R-1 | | | 1.00 | | | | 1.00 | | |
| Class R-2 | | | 0.75 | | | | 1.00 | | |
| Classes 529-E and R-3 | | | 0.50 | | | | 0.75 | | |
| Classes F-1, 529-F-1 and R-4 | | | 0.25 | | | | 0.50 | | |
Transfer agent services — The fund has a shareholder services agreement with AFS under which the fund compensates AFS for providing transfer agent services to each of the fund’s share classes. These services include recordkeeping, shareholder communications and transaction processing. In addition, the fund reimburses AFS for amounts paid to third parties for performing transfer agent services on behalf of fund shareholders.
| Washington Mutual Investors Fund | 21 |
Administrative services — The fund has an administrative services agreement with CRMC under which the fund compensates CRMC for providing administrative services to Class A, C, F, 529 and R shares. These services include, but are not limited to, coordinating, monitoring, assisting and overseeing third parties that provide services to fund shareholders. Under the agreement, Class A shares pay an annual fee of 0.01% and Class C, F, 529 and R shares pay an annual fee of 0.05% of their respective average daily net assets.
529 plan services — Each 529 share class is subject to service fees to compensate the Commonwealth of Virginia for the maintenance of the 529 college savings plan. During the period May 1, 2013, to March 31, 2014, the quarterly fee was based on a series of decreasing annual rates beginning with 0.10% on the first $30 billion of the net assets invested in Class 529 shares of the American Funds and decreasing to 0.06% on such assets between $120 billion and $150 billion. Effective April 1, 2014, the quarterly fee was amended to provide for reduced annual rates of 0.07%, 0.06% and 0.05% over $30 billion, $50 billion and $70 billion, respectively, of the net assets invested in Class 529 shares of the American Funds. The fee for any given calendar quarter is accrued and calculated on the basis of the average net assets of Class 529 shares of the American Funds for the last month of the prior calendar quarter. The fee is included in other expenses in the fund’s statement of operations. The Commonwealth of Virginia is not considered a related party.
For the year ended April 30, 2014, class-specific expenses under the agreements were as follows (dollars in thousands):
| Share class | | Distribution
services | | Transfer agent
services | | Administrative
services | | 529 plan
services |
| Class A | | | $112,918 | | | | $47,593 | | | | $4,758 | | | Not applicable |
| Class B | | | 2,813 | | | | 299 | | | | Not applicable | | | Not applicable |
| Class C | | | 17,725 | | | | 1,746 | | | | 889 | | | Not applicable |
| Class F-1 | | | 8,506 | | | | 4,186 | | | | 1,705 | | | Not applicable |
| Class F-2 | | | Not applicable | | | | 1,829 | | | | 851 | | | Not applicable |
| Class 529-A | | | 3,530 | | | | 1,178 | | | | 799 | | | $1,546 |
| Class 529-B | | | 480 | | | | 44 | | | | 24 | | | 47 |
| Class 529-C | | | 4,144 | | | | 335 | | | | 209 | | | 405 |
| Class 529-E | | | 416 | | | | 43 | | | | 42 | | | 81 |
| Class 529-F-1 | | | — | | | | 67 | | | | 45 | | | 88 |
| Class R-1 | | | 939 | | | | 96 | | | | 47 | | | Not applicable |
| Class R-2 | | | 5,823 | | | | 2,391 | | | | 392 | | | Not applicable |
| Class R-3 | | | 8,824 | | | | 2,753 | | | | 886 | | | Not applicable |
| Class R-4 | | | 4,948 | | | | 1,986 | | | | 992 | | | Not applicable |
| Class R-5 | | | Not applicable | | | | 813 | | | | 830 | | | Not applicable |
| Class R-6 | | | Not applicable | | | | 15 | | | | 1,843 | | | Not applicable |
| Total class-specific expenses | | | $171,066 | | | | $65,374 | | | | $14,312 | | | $2,167 |
Board members’ deferred compensation — Board members who are unaffiliated with CRMC may elect to defer the cash payment of part or all of their compensation. These deferred amounts, which remain as liabilities of the fund, are treated as if invested in shares of the fund or other American Funds. These amounts represent general, unsecured liabilities of the fund and vary according to the total returns of the selected funds. Board members’ compensation of $2,565,000 in the fund’s statement of operations includes $1,724,000 in current fees (either paid in cash or deferred) and a net increase of $841,000 in the value of the deferred amounts.
Affiliated officers and trustees — Officers and certain trustees of the fund are or may be considered to be affiliated with CRMC, WMC, AFD and AFS. No affiliated officers or trustees received any compensation directly from the fund.
| 22 | Washington Mutual Investors Fund |
7. Capital share transactions
Capital share transactions in the fund were as follows (dollars and shares in thousands):
| | | | | | | | | Reinvestments of | | | | | | | | | Net (decrease) | |
| | | Sales* | | | dividends and distributions | | | Repurchases* | | | increase | |
| Share class | | Amount | | | Shares | | | Amount | | | Shares | | | Amount | | | Shares | | | Amount | | | Shares | |
| |
| Year ended April 30, 2014 |
| | | | | | | | | | | | | | | | | | | | | | |
| Class A | | $ | 3,271,606 | | | | 86,398 | | | $ | 1,990,692 | | | | 51,944 | | | $ | (5,449,188 | ) | | | (143,425 | ) | | $ | (186,890 | ) | | | (5,083 | ) |
| Class B | | | 6,465 | | | | 173 | | | | 9,487 | | | | 248 | | | | (143,750 | ) | | | (3,819 | ) | | | (127,798 | ) | | | (3,398 | ) |
| Class C | | | 272,540 | | | | 7,270 | | | | 60,542 | | | | 1,590 | | | | (569,968 | ) | | | (15,165 | ) | | | (236,886 | ) | | | (6,305 | ) |
| Class F-1 | | | 1,050,454 | | | | 27,774 | | | | 141,977 | | | | 3,714 | | | | (847,572 | ) | | | (22,224 | ) | | | 344,859 | | | | 9,264 | |
| Class F-2 | | | 776,452 | | | | 20,228 | | | | 74,919 | | | | 1,952 | | | | (390,599 | ) | | | (10,283 | ) | | | 460,772 | | | | 11,897 | |
| Class 529-A | | | 162,963 | | | | 4,301 | | | | 67,395 | | | | 1,760 | | | | (188,242 | ) | | | (4,970 | ) | | | 42,116 | | | | 1,091 | |
| Class 529-B | | | 1,069 | | | | 29 | | | | 1,562 | | | | 41 | | | | (23,782 | ) | | | (631 | ) | | | (21,151 | ) | | | (561 | ) |
| Class 529-C | | | 42,112 | | | | 1,116 | | | | 14,470 | | | | 379 | | | | (58,675 | ) | | | (1,560 | ) | | | (2,093 | ) | | | (65 | ) |
| Class 529-E | | | 8,550 | | | | 226 | | | | 3,339 | | | | 88 | | | | (10,157 | ) | | | (269 | ) | | | 1,732 | | | | 45 | |
| Class 529-F-1 | | | 18,143 | | | | 479 | | | | 4,029 | | | | 106 | | | | (15,401 | ) | | | (405 | ) | | | 6,771 | | | | 180 | |
| Class R-1 | | | 18,903 | | | | 506 | | | | 3,344 | | | | 88 | | | | (22,511 | ) | | | (598 | ) | | | (264 | ) | | | (4 | ) |
| Class R-2 | | | 154,250 | | | | 4,121 | | | | 28,143 | | | | 740 | | | | (237,116 | ) | | | (6,334 | ) | | | (54,723 | ) | | | (1,473 | ) |
| Class R-3 | | | 372,596 | | | | 9,893 | | | | 70,637 | | | | 1,852 | | | | (480,924 | ) | | | (12,724 | ) | | | (37,691 | ) | | | (979 | ) |
| Class R-4 | | | 482,151 | | | | 12,776 | | | | 84,224 | | | | 2,206 | | | | (527,791 | ) | | | (13,995 | ) | | | 38,584 | | | | 987 | |
| Class R-5 | | | 435,442 | | | | 11,380 | | | | 75,751 | | | | 1,978 | | | | (353,506 | ) | | | (9,378 | ) | | | 157,687 | | | | 3,980 | |
| Class R-6 | | | 1,358,226 | | | | 35,719 | | | | 172,191 | | | | 4,488 | | | | (406,408 | ) | | | (10,719 | ) | | | 1,124,009 | | | | 29,488 | |
| Total net increase (decrease) | | $ | 8,431,922 | | | | 222,389 | | | $ | 2,802,702 | | | | 73,174 | | | $ | (9,725,590 | ) | | | (256,499 | ) | | $ | 1,509,034 | | | | 39,064 | |
| |
| Year ended April 30, 2013 |
| |
| Class A | | $ | 2,718,140 | | | | 86,247 | | | $ | 907,807 | | | | 28,837 | | | $ | (5,727,400 | ) | | | (182,287 | ) | | $ | (2,101,453 | ) | | | (67,203 | ) |
| Class B | | | 8,075 | | | | 261 | | | | 5,834 | | | | 188 | | | | (248,866 | ) | | | (7,996 | ) | | | (234,957 | ) | | | (7,547 | ) |
| Class C | | | 197,446 | | | | 6,315 | | | | 25,218 | | | | 810 | | | | (489,016 | ) | | | (15,709 | ) | | | (266,352 | ) | | | (8,584 | ) |
| Class F-1 | | | 776,912 | | | | 24,737 | | | | 59,530 | | | | 1,896 | | | | (781,041 | ) | | | (25,154 | ) | | | 55,401 | | | | 1,479 | |
| Class F-2 | | | 566,619 | | | | 18,058 | | | | 24,544 | | | | 776 | | | | (255,466 | ) | | | (8,077 | ) | | | 335,697 | | | | 10,757 | |
| Class 529-A | | | 159,275 | | | | 5,078 | | | | 29,203 | | | | 928 | | | | (171,460 | ) | | | (5,456 | ) | | | 17,018 | | | | 550 | |
| Class 529-B | | | 1,143 | | | | 36 | | | | 872 | | | | 28 | | | | (33,369 | ) | | | (1,073 | ) | | | (31,354 | ) | | | (1,009 | ) |
| Class 529-C | | | 42,641 | | | | 1,368 | | | | 5,238 | | | | 168 | | | | (56,827 | ) | | | (1,819 | ) | | | (8,948 | ) | | | (283 | ) |
| Class 529-E | | | 8,100 | | | | 258 | | | | 1,377 | | | | 44 | | | | (9,166 | ) | | | (293 | ) | | | 311 | | | | 9 | |
| Class 529-F-1 | | | 14,424 | | | | 461 | | | | 1,764 | | | | 56 | | | | (14,584 | ) | | | (465 | ) | | | 1,604 | | | | 52 | |
| Class R-1 | | | 17,401 | | | | 563 | | | | 1,318 | | | | 42 | | | | (28,528 | ) | | | (912 | ) | | | (9,809 | ) | | | (307 | ) |
| Class R-2 | | | 162,207 | | | | 5,197 | | | | 11,219 | | | | 360 | | | | (229,227 | ) | | | (7,348 | ) | | | (55,801 | ) | | | (1,791 | ) |
| Class R-3 | | | 392,939 | | | | 12,590 | | | | 29,708 | | | | 949 | | | | (429,524 | ) | | | (13,722 | ) | | | (6,877 | ) | | | (183 | ) |
| Class R-4 | | | 486,823 | | | | 15,604 | | | | 37,374 | | | | 1,191 | | | | (490,245 | ) | | | (15,660 | ) | | | 33,952 | | | | 1,135 | |
| Class R-5 | | | 389,129 | | | | 12,402 | | | | 33,153 | | | | 1,052 | | | | (341,760 | ) | | | (10,956 | ) | | | 80,522 | | | | 2,498 | |
| Class R-6 | | | 891,637 | | | | 28,351 | | | | 60,915 | | | | 1,926 | | | | (283,008 | ) | | | (8,941 | ) | | | 669,544 | | | | 21,336 | |
| Total net increase (decrease) | | $ | 6,832,911 | | | | 217,526 | | | $ | 1,235,074 | | | | 39,251 | | | $ | (9,589,487 | ) | | | (305,868 | ) | | $ | (1,521,502 | ) | | | (49,091 | ) |
| * | Includes exchanges between share classes of the fund. |
8. Investment transactions
The fund made purchases and sales of investment securities, excluding short-term securities and U.S. government obligations, if any, of $12,897,395,000 and $12,419,693,000, respectively, during the year ended April 30, 2014.
| Washington Mutual Investors Fund | 23 |
Financial highlights
| | | | | | Income from | | | | | | | | | | | | | | | | | | | | | | | | | |
| | | | | | investment operations1 | | | Dividends and distributions | | | | | | | | | | | | | | | | |
| | | | | | | | | Net gains on | | | | | | | | | | | | | | | | | | | | | | | | | | | | |
| | | Net asset | | | | | | securities | | | | | | Dividends | | | | | | Total | | | | | | | | | | | | Ratio of | | | Ratio of | |
| | | value, | | | Net | | | (both | | | Total from | | | (from net | | | Distributions | | | dividends | | | Net asset | | | | | | Net assets, | | | expenses | | | net income | |
| | | beginning | | | | investment | | | | realized and | | | investment | | | investment | | | (from capital | | | and | | | value, end | | | Total | | | end of year | | | to average | | | to average | |
| | | of year | | | income | | | unrealized) | | | operations | | | income) | | | gains) | | | distributions | | | of year | | | return2 | | | (in millions) | | | net assets | | | net assets | |
| Class A: | | | | | | | | | | | | | | | | | | | | | | | | | | | | | | | | | | | | | | | | | | | | | | | | |
| Year ended 4/30/2014 | | $ | 35.08 | | | $ | .79 | | | $ | 6.18 | | | $ | 6.97 | | | $ | (.86 | ) | | $ | (.79 | ) | | $ | (1.65 | ) | | $ | 40.40 | | | | 20.16 | % | | $ | 50,626 | | | | .60 | % | | | 2.07 | % |
| Year ended 4/30/2013 | | | 30.61 | | | | .73 | | | | 4.47 | | | | 5.20 | | | | (.73 | ) | | | — | | | | (.73 | ) | | | 35.08 | | | | 17.28 | | | | 44,142 | | | | .62 | | | | 2.32 | |
| Year ended 4/30/2012 | | | 29.66 | | | | .68 | | | | .97 | | | | 1.65 | | | | (.70 | ) | | | — | | | | (.70 | ) | | | 30.61 | | | | 5.83 | | | | 40,566 | | | | .62 | | | | 2.39 | |
| Year ended 4/30/2011 | | | 25.84 | | | | .70 | | | | 3.80 | | | | 4.50 | | | | (.68 | ) | | | — | | | | (.68 | ) | | | 29.66 | | | | 17.77 | | | | 41,375 | | | | .63 | | | | 2.67 | |
| Year ended 4/30/2010 | | | 19.81 | | | | .65 | | | | 6.06 | | | | 6.71 | | | | (.68 | ) | | | — | | | | (.68 | ) | | | 25.84 | | | | 34.29 | | | | 39,349 | | | | .70 | | | | 2.80 | |
| Class B: | | | | | | | | | | | | | | | | | | | | | | | | | | | | | | | | | | | | | | | | | | | | | | | | |
| Year ended 4/30/2014 | | | 34.88 | | | | .50 | | | | 6.14 | | | | 6.64 | | | | (.56 | ) | | | (.79 | ) | | | (1.35 | ) | | | 40.17 | | | | 19.24 | | | | 236 | | | | 1.35 | | | | 1.33 | |
| Year ended 4/30/2013 | | | 30.42 | | | | .50 | | | | 4.44 | | | | 4.94 | | | | (.48 | ) | | | — | | | | (.48 | ) | | | 34.88 | | | | 16.41 | | | | 323 | | | | 1.37 | | | | 1.61 | |
| Year ended 4/30/2012 | | | 29.45 | | | | .47 | | | | .97 | | | | 1.44 | | | | (.47 | ) | | | — | | | | (.47 | ) | | | 30.42 | | | | 5.06 | | | | 511 | | | | 1.38 | | | | 1.68 | |
| Year ended 4/30/2011 | | | 25.66 | | | | .51 | | | | 3.75 | | | | 4.26 | | | | (.47 | ) | | | — | | | | (.47 | ) | | | 29.45 | | | | 16.88 | | | | 889 | | | | 1.39 | | | | 1.98 | |
| Year ended 4/30/2010 | | | 19.67 | | | | .48 | | | | 6.01 | | | | 6.49 | | | | (.50 | ) | | | — | | | | (.50 | ) | | | 25.66 | | | | 33.31 | | | | 1,249 | | | | 1.46 | | | | 2.07 | |
| Class C: | | | | | | | | | | | | | | | | | | | | | | | | | | | | | | | | | | | | | | | | | | | | | | | | |
| Year ended 4/30/2014 | | | 34.74 | | | | .48 | | | | 6.12 | | | | 6.60 | | | | (.56 | ) | | | (.79 | ) | | | (1.35 | ) | | | 39.99 | | | | 19.19 | | | | 1,771 | | | | 1.39 | | | | 1.27 | |
| Year ended 4/30/2013 | | | 30.31 | | | | .48 | | | | 4.43 | | | | 4.91 | | | | (.48 | ) | | | — | | | | (.48 | ) | | | 34.74 | | | | 16.39 | | | | 1,757 | | | | 1.42 | | | | 1.53 | |
| Year ended 4/30/2012 | | | 29.37 | | | | .45 | | | | .96 | | | | 1.41 | | | | (.47 | ) | | | — | | | | (.47 | ) | | | 30.31 | | | | 4.99 | | | | 1,794 | | | | 1.42 | | | | 1.60 | |
| Year ended 4/30/2011 | | | 25.60 | | | | .48 | | | | 3.76 | | | | 4.24 | | | | (.47 | ) | | | — | | | | (.47 | ) | | | 29.37 | | | | 16.82 | | | | 1,934 | | | | 1.44 | | | | 1.86 | |
| Year ended 4/30/2010 | | | 19.63 | | | | .46 | | | | 6.00 | | | | 6.46 | | | | (.49 | ) | | | — | | | | (.49 | ) | | | 25.60 | | | | 33.23 | | | | 1,830 | | | | 1.50 | | | | 2.00 | |
| Class F-1: | | | | | | | | | | | | | | | | | | | | | | | | | | | | | | | | | | | | | | | | | | | | | | | | |
| Year ended 4/30/2014 | | | 34.99 | | | | .75 | | | | 6.16 | | | | 6.91 | | | | (.83 | ) | | | (.79 | ) | | | (1.62 | ) | | | 40.28 | | | | 20.05 | | | | 3,831 | | | | .67 | | | | 1.99 | |
| Year ended 4/30/2013 | | | 30.53 | | | | .71 | | | | 4.47 | | | | 5.18 | | | | (.72 | ) | | | — | | | | (.72 | ) | | | 34.99 | | | | 17.25 | | | | 3,004 | | | | .66 | | | | 2.27 | |
| Year ended 4/30/2012 | | | 29.59 | | | | .66 | | | | .97 | | | | 1.63 | | | | (.69 | ) | | | — | | | | (.69 | ) | | | 30.53 | | | | 5.78 | | | | 2,575 | | | | .66 | | | | 2.34 | |
| Year ended 4/30/2011 | | | 25.77 | | | | .68 | | | | 3.81 | | | | 4.49 | | | | (.67 | ) | | | — | | | | (.67 | ) | | | 29.59 | | | | 17.79 | | | | 2,067 | | | | .66 | | | | 2.62 | |
| Year ended 4/30/2010 | | | 19.76 | | | | .64 | | | | 6.04 | | | | 6.68 | | | | (.67 | ) | | | — | | | | (.67 | ) | | | 25.77 | | | | 34.26 | | | | 1,770 | | | | .71 | | | | 2.78 | |
| Class F-2: | | | | | | | | | | | | | | | | | | | | | | | | | | | | | | | | | | | | | | | | | | | | | | | | |
| Year ended 4/30/2014 | | | 35.08 | | | | .86 | | | | 6.18 | | | | 7.04 | | | | (.94 | ) | | | (.79 | ) | | | (1.73 | ) | | | 40.39 | | | | 20.38 | | | | 2,077 | | | | .41 | | | | 2.26 | |
| Year ended 4/30/2013 | | | 30.60 | | | | .79 | | | | 4.49 | | | | 5.28 | | | | (.80 | ) | | | — | | | | (.80 | ) | | | 35.08 | | | | 17.57 | | | | 1,387 | | | | .41 | | | | 2.51 | |
| Year ended 4/30/2012 | | | 29.66 | | | | .74 | | | | .96 | | | | 1.70 | | | | (.76 | ) | | | — | | | | (.76 | ) | | | 30.60 | | | | 6.04 | | | | 881 | | | | .40 | | | | 2.59 | |
| Year ended 4/30/2011 | | | 25.84 | | | | .74 | | | | 3.81 | | | | 4.55 | | | | (.73 | ) | | | — | | | | (.73 | ) | | | 29.66 | | | | 18.05 | | | | 630 | | | | .41 | | | | 2.83 | |
| Year ended 4/30/2010 | | | 19.81 | | | | .68 | | | | 6.09 | | | | 6.77 | | | | (.74 | ) | | | — | | | | (.74 | ) | | | 25.84 | | | | 34.65 | | | | 416 | | | | .46 | | | | 2.91 | |
| Class 529-A: | | | | | | | | | | | | | | | | | | | | | | | | | | | | | | | | | | | | | | | | | | | | | | | | |
| Year ended 4/30/2014 | | | 35.03 | | | | .75 | | | | 6.17 | | | | 6.92 | | | | (.83 | ) | | | (.79 | ) | | | (1.62 | ) | | | 40.33 | | | | 20.03 | | | | 1,731 | | | | .69 | | | | 1.97 | |
| Year ended 4/30/2013 | | | 30.56 | | | | .70 | | | | 4.47 | | | | 5.17 | | | | (.70 | ) | | | — | | | | (.70 | ) | | | 35.03 | | | | 17.21 | | | | 1,465 | | | | .71 | | | | 2.23 | |
| Year ended 4/30/2012 | | | 29.62 | | | | .65 | | | | .97 | | | | 1.62 | | | | (.68 | ) | | | — | | | | (.68 | ) | | | 30.56 | | | | 5.72 | | | | 1,262 | | | | .71 | | | | 2.30 | |
| Year ended 4/30/2011 | | | 25.80 | | | | .67 | | | | 3.81 | | | | 4.48 | | | | (.66 | ) | | | — | | | | (.66 | ) | | | 29.62 | | | | 17.73 | | | | 1,138 | | | | .70 | | | | 2.58 | |
| Year ended 4/30/2010 | | | 19.78 | | | | .63 | | | | 6.05 | | | | 6.68 | | | | (.66 | ) | | | — | | | | (.66 | ) | | | 25.80 | | | | 34.20 | | | | 932 | | | | .76 | | | | 2.71 | |
| Class 529-B: | | | | | | | | | | | | | | | | | | | | | | | | | | | | | | | | | | | | | | | | | | | | | | | | |
| Year ended 4/30/2014 | | | 34.90 | | | | .45 | | | | 6.15 | | | | 6.60 | | | | (.51 | ) | | | (.79 | ) | | | (1.30 | ) | | | 40.20 | | | | 19.10 | | | | 41 | | | | 1.48 | | | | 1.20 | |
| Year ended 4/30/2013 | | | 30.44 | | | | .46 | | | | 4.44 | | | | 4.90 | | | | (.44 | ) | | | — | | | | (.44 | ) | | | 34.90 | | | | 16.26 | | | | 56 | | | | 1.50 | | | | 1.48 | |
| Year ended 4/30/2012 | | | 29.48 | | | | .44 | | | | .96 | | | | 1.40 | | | | (.44 | ) | | | — | | | | (.44 | ) | | | 30.44 | | | | 4.90 | | | | 79 | | | | 1.50 | | | | 1.55 | |
| Year ended 4/30/2011 | | | 25.68 | | | | .48 | | | | 3.77 | | | | 4.25 | | | | (.45 | ) | | | — | | | | (.45 | ) | | | 29.48 | | | | 16.79 | | | | 117 | | | | 1.50 | | | | 1.85 | |
| Year ended 4/30/2010 | | | 19.69 | | | | .45 | | | | 6.02 | | | | 6.47 | | | | (.48 | ) | | | — | | | | (.48 | ) | | | 25.68 | | | | 33.15 | | | | 145 | | | | 1.56 | | | | 1.93 | |
| Class 529-C: | | | | | | | | | | | | | | | | | | | | | | | | | | | | | | | | | | | | | | | | | | | | | | | | |
| Year ended 4/30/2014 | | | 34.83 | | | | .45 | | | | 6.14 | | | | 6.59 | | | | (.54 | ) | | | (.79 | ) | | | (1.33 | ) | | | 40.09 | | | | 19.11 | | | | 447 | | | | 1.47 | | | | 1.20 | |
| Year ended 4/30/2013 | | | 30.39 | | | | .45 | | | | 4.45 | | | | 4.90 | | | | (.46 | ) | | | — | | | | (.46 | ) | | | 34.83 | | | | 16.31 | | | | 390 | | | | 1.49 | | | | 1.45 | |
| Year ended 4/30/2012 | | | 29.46 | | | | .43 | | | | .96 | | | | 1.39 | | | | (.46 | ) | | | — | | | | (.46 | ) | | | 30.39 | | | | 4.88 | | | | 349 | | | | 1.49 | | | | 1.52 | |
| Year ended 4/30/2011 | | | 25.67 | | | | .47 | | | | 3.78 | | | | 4.25 | | | | (.46 | ) | | | — | | | | (.46 | ) | | | 29.46 | | | | 16.79 | | | | 330 | | | | 1.49 | | | | 1.80 | |
| Year ended 4/30/2010 | | | 19.68 | | | | .45 | | | | 6.02 | | | | 6.47 | | | | (.48 | ) | | | — | | | | (.48 | ) | | | 25.67 | | | | 33.19 | | | | 288 | | | | 1.55 | | | | 1.93 | |
| Class 529-E: | | | | | | | | | | | | | | | | | | | | | | | | | | | | | | | | | | | | | | | | | | | | | | | | |
| Year ended 4/30/2014 | | | 34.88 | | | | .65 | | | | 6.14 | | | | 6.79 | | | | (.73 | ) | | | (.79 | ) | | | (1.52 | ) | | | 40.15 | | | | 19.73 | | | | 91 | | | | .94 | | | | 1.72 | |
| Year ended 4/30/2013 | | | 30.44 | | | | .62 | | | | 4.44 | | | | 5.06 | | | | (.62 | ) | | | — | | | | (.62 | ) | | | 34.88 | | | | 16.89 | | | | 77 | | | | .96 | | | | 1.97 | |
| Year ended 4/30/2012 | | | 29.50 | | | | .58 | | | | .96 | | | | 1.54 | | | | (.60 | ) | | | — | | | | (.60 | ) | | | 30.44 | | | | 5.46 | | | | 67 | | | | .97 | | | | 2.04 | |
| Year ended 4/30/2011 | | | 25.70 | | | | .60 | | | | 3.79 | | | | 4.39 | | | | (.59 | ) | | | — | | | | (.59 | ) | | | 29.50 | | | | 17.40 | | | | 62 | | | | .98 | | | | 2.30 | |
| Year ended 4/30/2010 | | | 19.71 | | | | .56 | | | | 6.03 | | | | 6.59 | | | | (.60 | ) | | | — | | | | (.60 | ) | | | 25.70 | | | | 33.80 | | | | 53 | | | | 1.05 | | | | 2.43 | |
| 24 | Washington Mutual Investors Fund |
| | | | | | Income from | | | | | | | | | | | | | | | | | | | | | | | | | |
| | | | | | investment operations1 | | | Dividends and distributions | | | | | | | | | | | | | | | | |
| | | | | | | | | Net gains on | | | | | | | | | | | | | | | | | | | | | | | | | | | | |
| | | Net asset | | | | | | securities | | | | | | Dividends | | | | | | Total | | | | | | | | | | | | Ratio of | | | Ratio of | |
| | | value, | | | Net | | | (both | | | Total from | | | (from net | | | Distributions | | | dividends | | | Net asset | | | | | | Net assets, | | | expenses | | | net income | |
| | | beginning | | | | investment | | | | realized and | | | investment | | | investment | | | (from capital | | | and | | | value, end | | | Total | | | end of year | | | to average | | | to average | |
| | | of year | | | income | | | unrealized) | | | operations | | | income) | | | gains) | | | distributions | | | of year | | | return2 | | | (in millions) | | | net assets | | | net assets | |
| Class 529-F-1: | | | | | | | | | | | | | | | | | | | | | | | | | | | | | | | | | | | | | | | | | | | | | | | | |
| Year ended 4/30/2014 | | $ | 34.98 | | | $ | .83 | | | $ | 6.16 | | | $ | 6.99 | | | $ | (.91 | ) | | $ | (.79 | ) | | $ | (1.70 | ) | | $ | 40.27 | | | | 20.29 | % | | $ | 100 | | | | .47 | % | | | 2.19 | % |
| Year ended 4/30/2013 | | | 30.51 | | | | .77 | | | | 4.47 | | | | 5.24 | | | | (.77 | ) | | | — | | | | (.77 | ) | | | 34.98 | | | | 17.49 | | | | 81 | | | | .49 | | | | 2.45 | |
| Year ended 4/30/2012 | | | 29.58 | | | | .71 | | | | .96 | | | | 1.67 | | | | (.74 | ) | | | — | | | | (.74 | ) | | | 30.51 | | | | 5.93 | | | | 69 | | | | .49 | | | | 2.52 | |
| Year ended 4/30/2011 | | | 25.77 | | | | .73 | | | | 3.79 | | | | 4.52 | | | | (.71 | ) | | | — | | | | (.71 | ) | | | 29.58 | | | | 17.96 | | | | 63 | | | | .48 | | | | 2.79 | |
| Year ended 4/30/2010 | | | 19.76 | | | | .68 | | | | 6.04 | | | | 6.72 | | | | (.71 | ) | | | — | | | | (.71 | ) | | | 25.77 | | | | 34.48 | | | | 51 | | | | .55 | | | | 2.91 | |
| Class R-1: | | | | | | | | | | | | | | | | | | | | | | | | | | | | | | | | | | | | | | | | | | | | | | | | |
| Year ended 4/30/2014 | | | 34.81 | | | | .48 | | | | 6.12 | | | | 6.60 | | | | (.56 | ) | | | (.79 | ) | | | (1.35 | ) | | | 40.06 | | | | 19.18 | | | | 100 | | | | 1.39 | | | | 1.27 | |
| Year ended 4/30/2013 | | | 30.37 | | | | .48 | | | | 4.45 | | | | 4.93 | | | | (.49 | ) | | | — | | | | (.49 | ) | | | 34.81 | | | | 16.42 | | | | 88 | | | | 1.40 | | | | 1.54 | |
| Year ended 4/30/2012 | | | 29.44 | | | | .45 | | | | .96 | | | | 1.41 | | | | (.48 | ) | | | — | | | | (.48 | ) | | | 30.37 | | | | 4.97 | | | | 86 | | | | 1.40 | | | | 1.60 | |
| Year ended 4/30/2011 | | | 25.65 | | | | .48 | | | | 3.79 | | | | 4.27 | | | | (.48 | ) | | | — | | | | (.48 | ) | | | 29.44 | | | | 16.90 | | | | 81 | | | | 1.41 | | | | 1.86 | |
| Year ended 4/30/2010 | | | 19.68 | | | | .46 | | | | 6.01 | | | | 6.47 | | | | (.50 | ) | | | — | | | | (.50 | ) | | | 25.65 | | | | 33.21 | | | | 67 | | | | 1.47 | | | | 1.98 | |
| Class R-2: | | | | | | | | | | | | | | | | | | | | | | | | | | | | | | | | | | | | | | | | | | | | | | | | |
| Year ended 4/30/2014 | | | 34.71 | | | | .49 | | | | 6.12 | | | | 6.61 | | | | (.58 | ) | | | (.79 | ) | | | (1.37 | ) | | | 39.95 | | | | 19.26 | | | | 808 | | | | 1.35 | | | | 1.32 | |
| Year ended 4/30/2013 | | | 30.30 | | | | .49 | | | | 4.42 | | | | 4.91 | | | | (.50 | ) | | | — | | | | (.50 | ) | | | 34.71 | | | | 16.39 | | | | 753 | | | | 1.37 | | | | 1.57 | |
| Year ended 4/30/2012 | | | 29.36 | | | | .46 | | | | .96 | | | | 1.42 | | | | (.48 | ) | | | — | | | | (.48 | ) | | | 30.30 | | | | 5.03 | | | | 712 | | | | 1.39 | | | | 1.63 | |
| Year ended 4/30/2011 | | | 25.59 | | | | .49 | | | | 3.76 | | | | 4.25 | | | | (.48 | ) | | | — | | | | (.48 | ) | | | 29.36 | | | | 16.85 | | | | 745 | | | | 1.41 | | | | 1.89 | |
| Year ended 4/30/2010 | | | 19.62 | | | | .45 | | | | 6.01 | | | | 6.46 | | | | (.49 | ) | | | — | | | | (.49 | ) | | | 25.59 | | | | 33.23 | | | | 694 | | | | 1.52 | | | | 1.96 | |
| Class R-3: | | | | | | | | | | | | | | | | | | | | | | | | | | | | | | | | | | | | | | | | | | | | | | | | |
| Year ended 4/30/2014 | | | 34.87 | | | | .65 | | | | 6.14 | | | | 6.79 | | | | (.73 | ) | | | (.79 | ) | | | (1.52 | ) | | | 40.14 | | | | 19.73 | | | | 1,857 | | | | .95 | | | | 1.71 | |
| Year ended 4/30/2013 | | | 30.43 | | | | .62 | | | | 4.45 | | | | 5.07 | | | | (.63 | ) | | | — | | | | (.63 | ) | | | 34.87 | | | | 16.90 | | | | 1,647 | | | | .97 | | | | 1.97 | |
| Year ended 4/30/2012 | | | 29.49 | | | | .58 | | | | .97 | | | | 1.55 | | | | (.61 | ) | | | — | | | | (.61 | ) | | | 30.43 | | | | 5.47 | | | | 1,443 | | | | .96 | | | | 2.05 | |
| Year ended 4/30/2011 | | | 25.69 | | | | .60 | | | | 3.79 | | | | 4.39 | | | | (.59 | ) | | | — | | | | (.59 | ) | | | 29.49 | | | | 17.41 | | | | 1,367 | | | | .97 | | | | 2.33 | |
| Year ended 4/30/2010 | | | 19.70 | | | | .57 | | | | 6.02 | | | | 6.59 | | | | (.60 | ) | | | — | | | | (.60 | ) | | | 25.69 | | | | 33.85 | | | | 1,280 | | | | 1.03 | | | | 2.45 | |
| Class R-4: | | | | | | | | | | | | | | | | | | | | | | | | | | | | | | | | | | | | | | | | | | | | | | | | |
| Year ended 4/30/2014 | | | 34.96 | | | | .76 | | | | 6.16 | | | | 6.92 | | | | (.84 | ) | | | (.79 | ) | | | (1.63 | ) | | | 40.25 | | | | 20.09 | | | | 2,139 | | | | .65 | | | | 2.02 | |
| Year ended 4/30/2013 | | | 30.50 | | | | .71 | | | | 4.47 | | | | 5.18 | | | | (.72 | ) | | | — | | | | (.72 | ) | | | 34.96 | | | | 17.28 | | | | 1,823 | | | | .65 | | | | 2.28 | |
| Year ended 4/30/2012 | | | 29.56 | | | | .67 | | | | .96 | | | | 1.63 | | | | (.69 | ) | | | — | | | | (.69 | ) | | | 30.50 | | | | 5.79 | | | | 1,556 | | | | .65 | | | | 2.35 | |
| Year ended 4/30/2011 | | | 25.76 | | | | .68 | | | | 3.79 | | | | 4.47 | | | | (.67 | ) | | | — | | | | (.67 | ) | | | 29.56 | | | | 17.73 | | | | 1,407 | | | | .66 | | | | 2.61 | |
| Year ended 4/30/2010 | | | 19.75 | | | | .64 | | | | 6.04 | | | | 6.68 | | | | (.67 | ) | | | — | | | | (.67 | ) | | | 25.76 | | | | 34.29 | | | | 1,121 | | | | .72 | | | | 2.75 | |
| Class R-5: | | | | | | | | | | | | | | | | | | | | | | | | | | | | | | | | | | | | | | | | | | | | | | | | |
| Year ended 4/30/2014 | | | 35.08 | | | | .88 | | | | 6.17 | | | | 7.05 | | | | (.95 | ) | | | (.79 | ) | | | (1.74 | ) | | | 40.39 | | | | 20.43 | | | | 1,893 | | | | .35 | | | | 2.32 | |
| Year ended 4/30/2013 | | | 30.60 | | | | .81 | | | | 4.48 | | | | 5.29 | | | | (.81 | ) | | | — | | | | (.81 | ) | | | 35.08 | | | | 17.63 | | | | 1,504 | | | | .35 | | | | 2.57 | |
| Year ended 4/30/2012 | | | 29.66 | | | | .75 | | | | .97 | | | | 1.72 | | | | (.78 | ) | | | — | | | | (.78 | ) | | | 30.60 | | | | 6.09 | | | | 1,236 | | | | .35 | | | | 2.65 | |
| Year ended 4/30/2011 | | | 25.83 | | | | .76 | | | | 3.82 | | | | 4.58 | | | | (.75 | ) | | | — | | | | (.75 | ) | | | 29.66 | | | | 18.14 | | | | 1,021 | | | | .36 | | | | 2.92 | |
| Year ended 4/30/2010 | | | 19.80 | | | | .72 | | | | 6.05 | | | | 6.77 | | | | (.74 | ) | | | — | | | | (.74 | ) | | | 25.83 | | | | 34.62 | | | | 868 | | | | .42 | | | | 3.08 | |
| Class R-6: | | | | | | | | | | | | | | | | | | | | | | | | | | | | | | | | | | | | | | | | | | | | | | | | |
| Year ended 4/30/2014 | | | 35.10 | | | | .90 | | | | 6.18 | | | | 7.08 | | | | (.97 | ) | | | (.79 | ) | | | (1.76 | ) | | | 40.42 | | | | 20.51 | | | | 4,581 | | | | .30 | | | | 2.36 | |
| Year ended 4/30/2013 | | | 30.62 | | | | .82 | | | | 4.49 | | | | 5.31 | | | | (.83 | ) | | | — | | | | (.83 | ) | | | 35.10 | | | | 17.68 | | | | 2,943 | | | | .30 | | | | 2.61 | |
| Year ended 4/30/2012 | | | 29.68 | | | | .76 | | | | .97 | | | | 1.73 | | | | (.79 | ) | | | — | | | | (.79 | ) | | | 30.62 | | | | 6.14 | | | | 1,914 | | | | .31 | | | | 2.68 | |
| Year ended 4/30/2011 | | | 25.85 | | | | .77 | | | | 3.82 | | | | 4.59 | | | | (.76 | ) | | | — | | | | (.76 | ) | | | 29.68 | | | | 18.18 | | | | 1,401 | | | | .31 | | | | 2.91 | |
| Year ended 4/30/2010 | | | 19.95 | | | | .71 | | | | 5.93 | | | | 6.64 | | | | (.74 | ) | | | — | | | | (.74 | ) | | | 25.85 | | | | 33.79 | | | | 807 | | | | .37 | | | | 3.03 | |
| | | Year ended April 30 |
| | | 2014 | | 2013 | | 2012 | | 2011 | | 2010 |
| Portfolio turnover rate for all share classes | | 19% | | 22% | | 22% | | 25% | | 22% |
| 1 | Based on average shares outstanding. |
| 2 | Total returns exclude any applicable sales charges, including contingent deferred sales charges. |
See Notes to Financial Statements
| Washington Mutual Investors Fund | 25 |
Report of Independent Registered Public Accounting Firm
To the Board of Trustees and Shareholders of Washington Mutual Investors Fund
In our opinion, the accompanying statement of assets and liabilities, including the summary investment portfolio, and the related statements of operations and of changes in net assets and the financial highlights present fairly, in all material respects, the financial position of Washington Mutual Investors Fund (the “Fund”) at April 30, 2014, the results of its operations for the year then ended, the changes in its net assets for each of the two years in the period then ended and the financial highlights for each of the five years in the period then ended, in conformity with accounting principles generally accepted in the United States of America. These financial statements and financial highlights (hereafter referred to as “financial statements”) are the responsibility of the Fund’s management. Our responsibility is to express an opinion on these financial statements based on our audits. We conducted our audits of these financial statements in accordance with the standards of the Public Company Accounting Oversight Board (United States). Those standards require that we plan and perform the audit to obtain reasonable assurance about whether the financial statements are free of material misstatement. An audit includes examining, on a test basis, evidence supporting the amounts and disclosures in the financial statements, assessing the accounting principles used and significant estimates made by management, and evaluating the overall financial statement presentation. We believe that our audits, which included confirmation of securities at April 30, 2014 by correspondence with the custodian and brokers, provide a reasonable basis for our opinion.
PricewaterhouseCoopers LLP
Los Angeles, California
June 6, 2014
| 26 | Washington Mutual Investors Fund |
As a fund shareholder, you incur two types of costs: (1) transaction costs, such as initial sales charges on purchase payments and contingent deferred sales charges on redemptions (loads), and (2) ongoing costs, including management fees, distribution and service (12b-1) fees, and other expenses. This example is intended to help you understand your ongoing costs (in dollars) of investing in the fund so you can compare these costs with the ongoing costs of investing in other mutual funds. The example is based on an investment of $1,000 invested at the beginning of the period and held for the entire six-month period (November 1, 2013, through April 30, 2014).
Actual expenses:
The first line of each share class in the table on the following page provides information about actual account values and actual expenses. You may use the information in this line, together with the amount you invested, to estimate the expenses that you paid over the period. Simply divide your account value by $1,000 (for example, an $8,600 account value divided by $1,000 = 8.6), then multiply the result by the number in the first line under the heading entitled “Expenses paid during period” to estimate the expenses you paid on your account during this period.
Hypothetical example for comparison purposes:
The second line of each share class in the table on the following page provides information about hypothetical account values and hypothetical expenses based on the actual expense ratio for the share class and an assumed rate of return of 5.00% per year before expenses, which is not the actual return of the share class. The hypothetical account values and expenses may not be used to estimate the actual ending account balance or expenses you paid for the period. You may use this information to compare the ongoing costs of investing in the fund and other funds. To do so, compare this 5.00% hypothetical example with the 5.00% hypothetical examples that appear in the shareholder reports of the other funds.
Notes:
There are some account fees that are charged to certain types of accounts, such as individual retirement accounts and 529 college savings plan accounts (generally, a $10 fee is charged to set up the account and an additional $10 fee is charged to the account annually), that would increase the amount of expenses paid on your account. In addition, retirement plan participants may be subject to certain fees charged by the plan sponsor, and Class F-1, F-2 and 529-F-1 shareholders may be subject to fees charged by financial intermediaries, typically ranging from 0.75% to 1.50% of assets annually depending on services offered. You can estimate the impact of these fees by adding the amount of the fees to the total estimated expenses you paid on your account during the period as calculated above. In addition, your ending account value would be lower by the amount of these fees.
Note that the expenses shown in the table on the following page are meant to highlight your ongoing costs only and do not reflect any transactional costs, such as sales charges (loads). Therefore, the second line of each share class in the table is useful in comparing ongoing costs only and will not help you determine the relative total costs of owning different funds. In addition, if these transactional costs were included, your costs would have been higher.
| Washington Mutual Investors Fund | 27 |
| | | Beginning
account value
11/1/2013 | | | Ending
account value
4/30/2014 | | | Expenses paid
during period* | | | Annualized
expense ratio | |
| Class A — actual return | | $ | 1,000.00 | | | $ | 1,084.70 | | | $ | 3.05 | | | | .59 | % |
| Class A — assumed 5% return | | | 1,000.00 | | | | 1,021.87 | | | | 2.96 | | | | .59 | |
| Class B — actual return | | | 1,000.00 | | | | 1,080.61 | | | | 6.91 | | | | 1.34 | |
| Class B — assumed 5% return | | | 1,000.00 | | | | 1,018.15 | | | | 6.71 | | | | 1.34 | |
| Class C — actual return | | | 1,000.00 | | | | 1,080.69 | | | | 7.17 | | | | 1.39 | |
| Class C — assumed 5% return | | | 1,000.00 | | | | 1,017.90 | | | | 6.95 | | | | 1.39 | |
| Class F-1 — actual return | | | 1,000.00 | | | | 1,084.26 | | | | 3.41 | | | | .66 | |
| Class F-1 — assumed 5% return | | | 1,000.00 | | | | 1,021.52 | | | | 3.31 | | | | .66 | |
| Class F-2 — actual return | | | 1,000.00 | | | | 1,085.72 | | | | 2.07 | | | | .40 | |
| Class F-2 — assumed 5% return | | | 1,000.00 | | | | 1,022.81 | | | | 2.01 | | | | .40 | |
| Class 529-A — actual return | | | 1,000.00 | | | | 1,083.99 | | | | 3.57 | | | | .69 | |
| Class 529-A — assumed 5% return | | | 1,000.00 | | | | 1,021.37 | | | | 3.46 | | | | .69 | |
| Class 529-B — actual return | | | 1,000.00 | | | | 1,080.01 | | | | 7.58 | | | | 1.47 | |
| Class 529-B — assumed 5% return | | | 1,000.00 | | | | 1,017.50 | | | | 7.35 | | | | 1.47 | |
| Class 529-C — actual return | | | 1,000.00 | | | | 1,080.14 | | | | 7.53 | | | | 1.46 | |
| Class 529-C — assumed 5% return | | | 1,000.00 | | | | 1,017.55 | | | | 7.30 | | | | 1.46 | |
| Class 529-E — actual return | | | 1,000.00 | | | | 1,082.81 | | | | 4.85 | | | | .94 | |
| Class 529-E — assumed 5% return | | | 1,000.00 | | | | 1,020.13 | | | | 4.71 | | | | .94 | |
| Class 529-F-1 — actual return | | | 1,000.00 | | | | 1,085.36 | | | | 2.38 | | | | .46 | |
| Class 529-F-1 — assumed 5% return | | | 1,000.00 | | | | 1,022.51 | | | | 2.31 | | | | .46 | |
| Class R-1 — actual return | | | 1,000.00 | | | | 1,080.30 | | | | 7.17 | | | | 1.39 | |
| Class R-1 — assumed 5% return | | | 1,000.00 | | | | 1,017.90 | | | | 6.95 | | | | 1.39 | |
| Class R-2 — actual return | | | 1,000.00 | | | | 1,080.49 | | | | 7.02 | | | | 1.36 | |
| Class R-2 — assumed 5% return | | | 1,000.00 | | | | 1,018.05 | | | | 6.80 | | | | 1.36 | |
| Class R-3 — actual return | | | 1,000.00 | | | | 1,082.78 | | | | 4.91 | | | | .95 | |
| Class R-3 — assumed 5% return | | | 1,000.00 | | | | 1,020.08 | | | | 4.76 | | | | .95 | |
| Class R-4 — actual return | | | 1,000.00 | | | | 1,084.46 | | | | 3.36 | | | | .65 | |
| Class R-4 — assumed 5% return | | | 1,000.00 | | | | 1,021.57 | | | | 3.26 | | | | .65 | |
| Class R-5 — actual return | | | 1,000.00 | | | | 1,086.01 | | | | 1.81 | | | | .35 | |
| Class R-5 — assumed 5% return | | | 1,000.00 | | | | 1,023.06 | | | | 1.76 | | | | .35 | |
| Class R-6 — actual return | | | 1,000.00 | | | | 1,086.17 | | | | 1.55 | | | | .30 | |
| Class R-6 — assumed 5% return | | | 1,000.00 | | | | 1,023.31 | | | | 1.51 | | | | .30 | |
| * | The “expenses paid during period” are equal to the “annualized expense ratio,” multiplied by the average account value over the period, multiplied by the number of days in the period, and divided by 365 (to reflect the one-half year period). |
We are required to advise you of the federal tax status of certain distributions received by shareholders during the fiscal year. The fund hereby designates the following amounts for the fund’s fiscal year ended April 30, 2014:
| Long-term capital gains | | $1,413,246,000 |
| Qualified dividend income | | 100% |
| Corporate dividends received deduction | | 100% |
| U.S. government income that may be exempt from state taxation | | $339,000 |
Individual shareholders should refer to their Form 1099 or other tax information, which will be mailed in January 2015, to determine the calendar year amounts to be included on their 2014 tax returns. Shareholders should consult their tax advisors.
| 28 | Washington Mutual Investors Fund |
Board of trustees and other officers
“Independent” trustees1
| Name and age | | Year first
elected
a trustee
of the fund2 | | Principal occupation(s) during past five years | | Number of
portfolios in fund
complex overseen
by trustee | | Other directorships 3
held by trustee |
| Charles E. Andrews, 62 | | 2013 | | CEO, MorganFranklin Consulting (business consulting and technology solutions); Consultant and corporate director; former President, RSM McGladrey, Inc. (professional services) | | 1 | | Marriott Vacations Worldwide Corporation; NVR, Inc.; WashingtonFirst Bankshares, Inc. |
| Nariman Farvardin, Ph. D., 57 | | 2007 | | President, Stevens Institute of Technology; former Senior Vice President for Academic Affairs & Provost, University of Maryland, College Park | | 3 | | None |
| Barbara Hackman Franklin, 74 | | 2005 | | President and CEO, Barbara Franklin Enterprises (international business and corporate governance consulting); former U.S. Secretary of Commerce (1992–1993) | | 3 | | Aetna, Inc. |
| Mary Davis Holt, 63 | | 2010 | | Partner, Flynn Heath Holt Leadership, LLC (leadership consulting firm); former COO, Time Life Inc. (1993–2003) | | 1 | | None |
| R. Clark Hooper, 67 | | 2003 | | Private investor | | 72 | | The Swiss Helvetia Fund, Inc. |
| James C. Miller III, Ph.D., 71 | | 1992 | | Senior Advisor, Husch Blackwell LLP (economic, financial and regulatory consulting); former Chairman of the Board, The CapAnalysis Group, LLC (economic, financial and regulatory consulting) (2003–2006); former Director, U.S. Office of Management and Budget (1985–1988) | | 3 | | Clean Energy Fuels Corporation |
| Donald L. Nickles, 65 | | 2007 | | Chairman of the Board and CEO, The Nickles Group (consulting and business venture firm); former United States Senator (Oklahoma) (1981–2005) | | 1 | | Valero Energy Corporation |
| William J. Shaw, 68 | | 2009 | | Chairman of the Board, Marriott Vacations Worldwide Corporation; former Vice Chairman of the Board and former President and COO, Marriott International, Inc. | | 3 | | The Carlyle Group; Marriott Vacations Worldwide Corporation |
John Knox Singleton, 65
Chairman of the Board
(Independent and
Non-Executive) | | 2001 | | President and CEO, INOVA Health System | | 3 | | Healthcare Realty Trust, Inc. |
| Lydia Waters Thomas, Ph.D., 69 | | 2010 | | Corporate director; former President and CEO, Noblis, Inc. (nonprofit science, technology and strategy organization) (1996–2007) | | 1 | | Cabot Corporation; Mueller Water Products, Inc. |
“Interested” trustees4,5
Name, age and
position with fund | | Year first
elected
a trustee
or officer
of the fund2 | | Principal occupation(s) during past five years
and positions held with affiliated entities or
the principal underwriter of the fund | | Number of
portfolios in fund
complex overseen
by trustee | | Other directorships 3
held by trustee |
Alan N. Berro, 53
Vice Chairman of the Board
and President | | 2012 | | Senior Vice President — Capital World Investors, Capital Research and Management Company | | 1 | | None |
Paul F. Roye, 60
Executive Vice President | | 2012 | | Senior Vice President — Fund Business Management Group, Capital Research and Management Company; Chief Legal Officer, Capital Research and Management Company; Director, American Funds Service Company6 | | 12 | | None |
| Washington Mutual Investors Fund | 29 |
| Cyrus A. Ansary | Katherine D. Ortega | T. Eugene Smith |
The fund’s statement of additional information includes further details about fund trustees and is available without charge upon request by calling American Funds Service Company at (800) 421-4225 or by visiting the American Funds website at americanfunds.com. The address for all trustees and officers of the fund is 6455 Irvine Center Drive, Irvine, CA 92618, Attention: Secretary.
Other officers5
Name, age and
position with fund | | Year first
elected
an officer
of the fund2 | | Principal occupation(s) during past five years and positions held with affiliated entities
or the principal underwriter of the fund |
Jeffrey T. Lager, 46
Senior Vice President | | 2014 | | Senior Vice President — Capital World Investors, Capital Research and Management Company; Director, American Funds Service Company6 |
Michael W. Stockton, 47
Senior Vice President | | 1995 | | Vice President — Fund Business Management Group, Capital Research and Management Company |
Donald H. Rolfe, 42
Vice President | | 2013 | | Chief Compliance Officer, Capital Research Company;6 Chief Compliance Officer, Capital Research and Management Company; Vice President and Senior Counsel — Fund Business Management Group, Capital Research and Management Company |
Jennifer L. Butler, 48
Secretary | | 2005 | | Assistant Vice President — Fund Business Management Group, Capital Research and Management Company |
Brian D. Bullard, 44
Treasurer | | 2013 | | Senior Vice President — Fund Business Management Group, Capital Research and Management Company; former Chief Accountant — Division of Investment Management, United States Securities and Exchange Commission |
Dori Laskin, 62
Assistant Treasurer | | 2013 | | Vice President — Fund Business Management Group, Capital Research and Management Company |
Neal F. Wellons, 43
Assistant Treasurer | | 2013 | | Vice President — Fund Business Management Group, Capital Research and Management Company |
| 1 | The term “independent” trustee refers to a trustee who is not an “interested person” of the fund within the meaning of the Investment Company Act of 1940. |
| 2 | Trustees and officers of the fund serve until their resignation, removal or retirement. |
| 3 | This includes all directorships (other than those in the American Funds or other funds managed by Capital Research and Management Company or its affiliates) that are held by each trustee as a trustee or director of a public company or a registered investment company. |
| 4 | The term “interested” trustee refers to a trustee who is an “interested person” within the meaning of the Investment Company Act of 1940, on the basis of their affiliation with the fund’s investment adviser, Capital Research and Management Company, or affiliated entities (including the fund’s principal underwriter). |
| 5 | All of the officers listed are officers and/or directors/trustees of one or more of the other funds for which Capital Research and Management Company serves as investment adviser. |
| 6 | Company affiliated with Capital Research and Management Company. |
| 30 | Washington Mutual Investors Fund |
Office of the fund
6455 Irvine Center Drive
Irvine, CA 92618-4518
Investment adviser
Capital Research and Management Company
333 South Hope Street
Los Angeles, CA 90071-1406
Transfer agent for shareholder accounts
American Funds Service Company
(Write to the address near you.)
P.O. Box 6007
Indianapolis, IN 46206-6007
P.O. Box 2280
Norfolk, VA 23501-2280
Custodian of assets
JPMorgan Chase Bank
270 Park Avenue
New York, NY 10017-2070
Counsel
Dechert LLP
1775 I Street, NW
Washington, DC 20006-2401
Independent registered public accounting firm
PricewaterhouseCoopers LLP
601 South Figueroa Street
Los Angeles, CA 90017-3874
Principal underwriter
American Funds Distributors, Inc.
333 South Hope Street
Los Angeles, CA 90071-1406
Investors should carefully consider investment objectives, risks, charges and expenses. This and other important information is contained in the fund prospectus and summary prospectus, which can be obtained from your financial professional and should be read carefully before investing. You may also call American Funds Service Company (AFS) at (800) 421-4225 or visit the American Funds website at americanfunds.com.
“American Funds Proxy Voting Procedures and Principles” — which describes how we vote proxies relating to portfolio securities — is available on the American Funds website or upon request by calling AFS. The fund files its proxy voting record with the U.S. Securities and Exchange Commission (SEC) for the 12 months ended June 30 by August 31. The proxy voting record is available free of charge on the SEC website at sec.gov and on the American Funds website.
A complete April 30, 2014, portfolio of Washington Mutual Investors Fund’s investments is available free of charge by calling AFS or visiting the SEC website (where it is part of Form N-CSR).
Washington Mutual Investors Fund files a complete list of its portfolio holdings with the SEC for the first and third quarters of each fiscal year on Form N-Q. This filing is available free of charge on the SEC website. You may also review or, for a fee, copy this filing at the SEC’s Public Reference Room in Washington, D.C. Additional information regarding the operation of the Public Reference Room may be obtained by calling the SEC’s Office of Investor Education and Advocacy at (800) SEC-0330. Additionally, the list of portfolio holdings is available by calling AFS.
This report is for the information of shareholders of Washington Mutual Investors Fund, but it also may be used as sales literature when preceded or accompanied by the current prospectus or summary prospectus, which gives details about charges, expenses, investment objectives and operating policies of the fund. If used as sales material after June 30, 2014, this report must be accompanied by an American Funds statistical update for the most recently completed calendar quarter.
The American Funds Advantage
Since 1931, American Funds, part of Capital Group, has helped investors pursue long-term investment success. Our consistent approach — in combination with The Capital SystemSM — has resulted in a superior long-term track record.
| | Aligned with investor success |
| | We base our decisions on a long-term perspective, which we believe aligns our goals with the interests of our clients. Our portfolio managers average 26 years of investment experience, including 21 years at our company, reflecting a career commitment to our long-term approach.1 |
| | |
| | The Capital SystemSM |
| | Our investment process, The Capital System, combines individual accountability with teamwork. Each fund is divided into portions that are managed independently by investment professionals with diverse backgrounds, ages and investment approaches. An extensive global research effort is the backbone of our system. |
| | |
| | Superior long-term track record |
| | Our equity funds have beaten their Lipper peer indexes in 90% of 10-year periods and 96% of 20-year periods. Our fixed-income funds have beaten their Lipper indexes in 56% of 10-year periods and 57% of 20-year periods.2 Our fund management fees have been among the lowest in the industry.3 |
| | 1 | Portfolio manager experience as of December 31, 2013. |
| | 2 | Based on Class A share results for rolling periods through December 31, 2013. Periods covered are the shorter of the fund’s lifetime or since the comparable Lipper index inception date (except SMALLCAP World Fund, for which the Lipper average was used). |
| | 3 | Based on management fees for the 20-year period ended December 31, 2013, versus comparable Lipper categories, excluding funds of funds. |

ITEM 2 – Code of Ethics
The Registrant has adopted a Code of Ethics that applies to its Principal Executive Officer and Principal Financial Officer. The Registrant undertakes to provide to any person without charge, upon request, a copy of the Code of Ethics. Such request can be made to American Funds Service Company at 800/421-9225 or to the Secretary of the Registrant, 6455 Irvine Center Drive, Irvine, California 92618.
ITEM 3 – Audit Committee Financial Expert
The Registrant’s board has determined that James C. Miller III, a member of the Registrant’s audit committee, is an “audit committee financial expert” and "independent," as such terms are defined in this Item. This designation will not increase the designee’s duties, obligations or liability as compared to his or her duties, obligations and liability as a member of the audit committee and of the board, nor will it reduce the responsibility of the other audit committee members. There may be other individuals who, through education or experience, would qualify as "audit committee financial experts" if the board had designated them as such. Most importantly, the board believes each member of the audit committee contributes significantly to the effective oversight of the Registrant’s financial statements and condition.
ITEM 4 – Principal Accountant Fees and Services
| | Registrant: |
| | | a) Audit Fees: |
| | | | 2013 | $97,000 |
| | | | 2014 | $95,000 |
| | | | |
| | | b) Audit-Related Fees: |
| | | | 2013 | None |
| | | | 2014 | None |
| | | | |
| | | c) Tax Fees: |
| | | | 2013 | $8,000 |
| | | | 2014 | $8,000 |
| | | | The tax fees consist of professional services relating to the preparation of the Registrant’s tax returns. |
| | | | |
| | | d) All Other Fees: |
| | | | 2013 | None |
| | | | 2014 | None |
| | | | |
| | Adviser and affiliates (includes only fees for non-audit services billed to the adviser and affiliates for engagements that relate directly to the operations and financial reporting of the Registrant and were subject to the pre-approval policies described below): |
| | | a) Audit Fees: |
| | | | Not Applicable |
| | | | |
| | | b) Audit-Related Fees: |
| | | | 2013 | None |
| | | | 2014 | None |
| | | | |
| | | c) Tax Fees: |
| | | | 2013 | $11,000 |
| | | | 2014 | $27,000 |
| | | | The tax fees consist of consulting services relating to the Registrant’s investments. |
| | | | |
| | | d) All Other Fees: |
| | | | 2013 | $2,000 |
| | | | 2014 | $2,000 |
| | | | The other fees consist of subscription services related to an accounting research tool. |
All audit and permissible non-audit services that the Registrant’s audit committee considers compatible with maintaining the independent registered public accounting firm’s independence are required to be pre-approved by the committee. The pre-approval requirement will extend to all non-audit services provided to the Registrant, the investment adviser, and any entity controlling, controlled by, or under common control with the investment adviser that provides ongoing services to the Registrant, if the engagement relates directly to the operations and financial reporting of the Registrant. The committee will not delegate its responsibility to pre-approve these services to the investment adviser. The committee may delegate to one or more committee members the authority to review and pre-approve audit and permissible non-audit services. Actions taken under any such delegation will be reported to the full committee at its next meeting. The pre-approval requirement is waived with respect to non-audit services if certain conditions are met. The pre-approval requirement was not waived for any of the non-audit services listed above provided to the Registrant, adviser and affiliates.
Aggregate non-audit fees paid to the Registrant’s auditors, including fees for all services billed to the Registrant, adviser and affiliates that provide ongoing services to the Registrant, were $20,000 for fiscal year 2013 and $37,000 for fiscal year 2014. The non-audit services represented by these amounts were brought to the attention of the committee and considered to be compatible with maintaining the auditors’ independence.
ITEM 5 – Audit Committee of Listed Registrants
Not applicable to this Registrant, insofar as the Registrant is not a listed issuer as defined in Rule 10A-3 under the Securities Exchange Act of 1934.
ITEM 6 – Schedule of Investments
 | Washington Mutual Investors Fund® Investment portfolio April 30, 2014 |
| Common stocks 98.52% | | |
| | | Value |
| Energy 11.33% | Shares | (000) |
| | | |
| Chevron Corp. | 16,585,000 | $ 2,081,749 |
| ConocoPhillips | 10,945,100 | 813,330 |
| Enbridge Inc. | 23,535,000 | 1,136,505 |
| FMC Technologies, Inc.1 | 2,755,000 | 156,209 |
| Hess Corp. | 2,140,000 | 190,802 |
| Occidental Petroleum Corp. | 1,140,000 | 109,155 |
| Pioneer Natural Resources Co. | 4,250,000 | 821,398 |
| Royal Dutch Shell PLC, Class B (ADR) | 29,240,000 | 2,475,166 |
| Schlumberger Ltd. | 2,842,400 | 288,646 |
| Spectra Energy Corp | 3,010,000 | 119,527 |
| | | 8,192,487 |
| Materials 4.15% | | |
| | | |
| Air Products and Chemicals, Inc. | 1,800,000 | 211,536 |
| Dow Chemical Co. | 21,310,000 | 1,063,369 |
| E.I. du Pont de Nemours and Co. | 1,220,000 | 82,130 |
| MeadWestvaco Corp. | 3,995,000 | 156,085 |
| Mosaic Co. | 3,796,400 | 189,972 |
| Nucor Corp. | 9,493,100 | 491,268 |
| Potash Corp. of Saskatchewan Inc. | 9,462,500 | 342,164 |
| Praxair, Inc. | 3,370,000 | 439,953 |
| Steel Dynamics, Inc. | 1,500,000 | 27,405 |
| | | 3,003,882 |
| Industrials 18.95% | | |
| | | |
| Boeing Co. | 24,320,000 | 3,137,766 |
| Caterpillar Inc. | 10,260,000 | 1,081,404 |
| Cummins Inc. | 1,120,000 | 168,952 |
| Emerson Electric Co. | 4,574,700 | 311,903 |
| General Dynamics Corp. | 3,188,400 | 348,970 |
| General Electric Co. | 37,724,000 | 1,014,398 |
| Honeywell International Inc. | 600,000 | 55,740 |
| Lockheed Martin Corp. | 12,425,000 | 2,039,440 |
| Northrop Grumman Corp. | 4,290,000 | 521,278 |
| Parker-Hannifin Corp. | 2,400,000 | 304,512 |
| Precision Castparts Corp. | 150,000 | 37,963 |
| Rockwell Automation | 3,930,000 | 468,377 |
| Rockwell Collins, Inc. | 5,994,600 | 465,481 |
| Union Pacific Corp. | 10,660,000 | 2,029,984 |
| United Technologies Corp. | 7,620,000 | 901,675 |
| W.W. Grainger, Inc. | 525,000 | 133,560 |
| Waste Management, Inc. | 15,360,200 | 682,761 |
| | | 13,704,164 |
| | | |
| Common stocks | | |
| | | Value |
| Consumer discretionary 11.31% | Shares | (000) |
| | | |
| Amazon.com, Inc.1 | 3,750,000 | $ 1,140,487 |
| Carnival Corp., units | 6,861,938 | 269,743 |
| CBS Corp., Class B | 4,280,000 | 247,213 |
| Comcast Corp., Class A | 20,132,739 | 1,042,071 |
| Home Depot, Inc. | 34,661,000 | 2,755,896 |
| Honda Motor Co., Ltd. (ADR) | 550,000 | 18,315 |
| Johnson Controls, Inc. | 10,863,800 | 490,392 |
| Lowe's Companies, Inc. | 5,500,000 | 252,505 |
| Ralph Lauren Corp., Class A | 892,994 | 135,173 |
| Tiffany & Co. | 970,000 | 84,865 |
| Time Warner Inc. | 2,800,000 | 186,088 |
| Twenty-First Century Fox, Inc., Class A | 10,149,100 | 324,974 |
| VF Corp. | 12,250,000 | 748,352 |
| Walt Disney Co. | 6,083,900 | 482,697 |
| | | 8,178,771 |
| Consumer staples 9.00% | | |
| | | |
| Avon Products, Inc. | 20,000,000 | 305,600 |
| Coca-Cola Co. | 30,029,200 | 1,224,891 |
| Colgate-Palmolive Co. | 3,720,000 | 250,356 |
| Costco Wholesale Corp. | 1,660,000 | 192,029 |
| Kimberly-Clark Corp. | 5,555,000 | 623,549 |
| Nestlé SA (ADR) | 9,570,192 | 738,627 |
| PepsiCo, Inc. | 12,060,000 | 1,035,833 |
| Procter & Gamble Co. | 16,923,900 | 1,397,068 |
| Unilever NV (New York registered) | 9,587,900 | 410,554 |
| Wal-Mart Stores, Inc. | 4,100,000 | 326,811 |
| | | 6,505,318 |
| Health care 10.30% | | |
| | | |
| AbbVie Inc. | 3,723,600 | 193,925 |
| AstraZeneca PLC (ADR) | 310,000 | 24,506 |
| Bristol-Myers Squibb Co. | 16,436,200 | 823,289 |
| Edwards Lifesciences Corp.1 | 994,000 | 80,981 |
| Gilead Sciences, Inc.1 | 3,603,000 | 282,800 |
| Humana Inc. | 7,620,000 | 836,295 |
| Johnson & Johnson | 13,930,000 | 1,410,970 |
| Merck & Co., Inc. | 46,687,400 | 2,734,014 |
| Pfizer Inc. | 24,070,000 | 752,910 |
| Quest Diagnostics Inc. | 1,443,200 | 80,718 |
| UnitedHealth Group Inc. | 3,085,000 | 231,498 |
| | | 7,451,906 |
| Financials 14.46% | | |
| | | |
| ACE Ltd. | 3,860,000 | 394,955 |
| Allstate Corp. | 4,000,000 | 227,800 |
| American Express Co. | 21,550,000 | 1,884,117 |
| Capital One Financial Corp. | 4,450,000 | 328,855 |
| Charles Schwab Corp. | 7,260,000 | 192,753 |
| Chubb Corp. | 2,750,000 | 253,220 |
| Citigroup Inc. | 5,000,000 | 239,550 |
| CME Group Inc., Class A | 8,718,389 | 613,687 |
| Deutsche Bank AG | 210,000 | 9,246 |
| Common stocks | | |
| | | Value |
| Financials (continued) | Shares | (000) |
| | | |
| Goldman Sachs Group, Inc. | 2,214,900 | $ 353,985 |
| JPMorgan Chase & Co. | 27,682,400 | 1,549,661 |
| KeyCorp | 19,160,000 | 261,342 |
| Marsh & McLennan Companies, Inc. | 6,398,700 | 315,520 |
| McGraw Hill Financial, Inc. | 7,109,100 | 525,576 |
| Moody's Corp. | 2,420,000 | 189,970 |
| Sumitomo Mitsui Financial Group, Inc. (ADR) | 11,000,000 | 87,450 |
| Toronto-Dominion Bank | 1,400,000 | 67,326 |
| U.S. Bancorp | 12,355,000 | 503,837 |
| Wells Fargo & Co. | 49,590,200 | 2,461,658 |
| | | 10,460,508 |
| Information technology 9.87% | | |
| | | |
| Amphenol Corp., Class A | 2,300,000 | 219,305 |
| Analog Devices, Inc. | 1,200,000 | 61,548 |
| Apple Inc. | 1,114,700 | 657,773 |
| Automatic Data Processing, Inc. | 3,742,700 | 291,781 |
| Cisco Systems, Inc. | 14,795,000 | 341,912 |
| Google Inc., Class A1 | 531,600 | 284,342 |
| Google Inc., Class C1 | 531,600 | 279,973 |
| Linear Technology Corp. | 3,635,000 | 161,758 |
| Microsoft Corp. | 86,071,800 | 3,477,301 |
| Oracle Corp. | 900,000 | 36,792 |
| Paychex, Inc. | 1,180,000 | 49,336 |
| QUALCOMM Inc. | 5,000,000 | 393,550 |
| Texas Instruments Inc. | 19,370,700 | 880,398 |
| | | 7,135,769 |
| Telecommunication services 3.62% | | |
| | | |
| AT&T Inc. | 23,090,000 | 824,313 |
| Verizon Communications Inc. | 37,063,293 | 1,731,968 |
| Vodafone Group PLC (ADR) | 1,652,727 | 62,737 |
| | | 2,619,018 |
| Utilities 3.33% | | |
| | | |
| Dominion Resources, Inc. | 3,930,000 | 285,082 |
| Duke Energy Corp. | 5,695,700 | 424,272 |
| Edison International | 409,000 | 23,133 |
| Exelon Corp. | 6,625,000 | 232,074 |
| FirstEnergy Corp. | 10,486,100 | 353,906 |
| National Grid PLC (ADR) | 2,570,000 | 182,624 |
| PG&E Corp. | 19,957,300 | 909,654 |
| | | 2,410,745 |
| Miscellaneous 2.20% | | |
| | | |
| Other common stocks in initial period of acquisition | | 1,591,990 |
| Total common stocks (cost: $45,111,192,000) | | 71,254,558 |
| | | |
| | Principal amount | Value |
| Short-term securities 1.42% | (000) | (000) |
| | | |
| Abbott Laboratories 0.10% due 5/19–6/24/20142 | $127,600 | $ 127,592 |
| Chevron Corp. 0.09%–0.10% due 5/13–5/16/20142 | 72,100 | 72,096 |
| Coca-Cola Co. 0.10%–0.11% due 5/19–7/23/20142 | 93,000 | 92,991 |
| Emerson Electric Co. 0.08%–0.11% due 5/14–5/27/20142 | 65,800 | 65,797 |
| Federal Farm Credit Banks 0.12% due 12/19/2014 | 30,000 | 29,980 |
| Federal Home Loan Bank 0.05%–0.14% due 5/2–12/23/2014 | 218,200 | 218,177 |
| Freddie Mac 0.095%–0.135% due 5/5/2014–1/26/2015 | 59,100 | 59,050 |
| Merck & Co. Inc. 0.08% due 5/23/20142 | 40,000 | 39,998 |
| Paccar Financial Corp. 0.10%–0.11% due 5/15–6/5/2014 | 71,200 | 71,191 |
| Private Export Funding Corp. 0.23% due 10/9/20142 | 40,000 | 39,969 |
| Procter & Gamble Co. 0.10%–0.14% due 5/14–6/19/20142 | 121,200 | 121,195 |
| Regents of the University of California 0.13% due 5/12/2014 | 76,800 | 76,797 |
| United Technologies Corp. 0.07% due 6/30/20142 | 13,300 | 13,298 |
| Total short-term securities (cost: $1,028,088,000) | | 1,028,131 |
| Total investment securities (cost: $46,139,280,000) | | 72,282,689 |
| Other assets less liabilities | | 45,912 |
| Net assets | | $72,328,601 |
As permitted by U.S. Securities and Exchange Commission regulations, “Miscellaneous” securities include holdings in their first year of acquisition that have not previously been publicly disclosed.
1 Security did not produce income during the last 12 months.
2 Acquired in a transaction exempt from registration under section 4(2) of the Securities Act of 1933. May be resold in the U.S. in transactions exempt from registration, normally to qualified institutional buyers. The total value of all such securities was $572,936,000, which represented .79% of the net assets of the fund.
Key to abbreviation
ADR = American Depositary Receipts
Investments are not FDIC-insured, nor are they deposits of or guaranteed by a bank or any other entity, so they may lose value.
Investors should carefully consider investment objectives, risks, charges and expenses. This and other important information is contained in the fund prospectus and summary prospectus, which can be obtained from your financial professional and should be read carefully before investing. You may also call American Funds Service Company (AFS) at (800) 421-4225 or visit the American Funds website at americanfunds.com.
MFGEFPX-001-0614O-S44291
Report of Independent Registered Public Accounting Firm
To the Board of Trustees and Shareholders of Washington Mutual Investors Fund
We have audited the accompanying statement of assets and liabilities of Washington Mutual Investors Fund (the “Fund”), including the summary investment portfolio, as of April 30, 2014, and the related statement of operations for the year then ended, the statements of changes in net assets for each of the two years in the period then ended (collectively, the “financial statements”), the financial highlights for each of the five years in the period then ended (the financial statements and financial highlights are included in Item 1 of this Form N-CSR), and the investment portfolio as of April 30, 2014 (included in Item 6 of this Form N-CSR). These financial statements, financial highlights, and investment portfolio are the responsibility of the Fund’s management. Our responsibility is to express an opinion on these financial statements, financial highlights, and investment portfolio based on our audits.
We conducted our audits in accordance with the standards of the Public Company Accounting Oversight Board (United States). Those standards require that we plan and perform the audit to obtain reasonable assurance about whether the financial statements, financial highlights, and investment portfolio are free of material misstatement. An audit includes examining, on a test basis, evidence supporting the amounts and disclosures in the financial statements and investment portfolio. Our procedures included confirmation of securities owned as of April 30, 2014, by correspondence with the custodian and brokers. An audit also includes assessing the accounting principles used and significant estimates made by management, as well as evaluating the overall financial statement presentation. We believe that our audits provide a reasonable basis for our opinion.
In our opinion, the financial statements, financial highlights, and investment portfolio referred to above present fairly, in all material respects, the financial position of Washington Mutual Investors Fund as of April 30, 2014, and the results of its operations for the year then ended, the changes in its net assets for each of the two years in the period then ended, and the financial highlights for each of the five years in the period then ended, in conformity with accounting principles generally accepted in the United States of America.
PricewaterhouseCoopers LLP
Los Angeles, California
June 6, 2014
ITEM 7 – Disclosure of Proxy Voting Policies and Procedures for Closed-End Management Investment Companies
Not applicable to this Registrant, insofar as the Registrant is not a closed-end management investment company.
ITEM 8 – Portfolio Managers of Closed-End Management Investment Companies
Not applicable to this Registrant, insofar as the Registrant is not a closed-end management investment company.
ITEM 9 – Purchases of Equity Securities by Closed-End Management Investment Company and Affiliated Purchasers
Not applicable to this Registrant, insofar as the Registrant is not a closed-end management investment company.
ITEM 10 – Submission of Matters to a Vote of Security Holders
There have been no material changes to the procedures by which shareholders may recommend nominees to the Registrant’s board of trustees since the Registrant last submitted a proxy statement to its shareholders. The procedures are as follows. The Registrant has a nominating and governance committee comprised solely of persons who are not considered ‘‘interested persons’’ of the Registrant within the meaning of the Investment Company Act of 1940, as amended. The committee periodically reviews such issues as the board’s composition, responsibilities, committees, compensation and other relevant issues, and recommends any appropriate changes to the full board of trustees. While the committee normally is able to identify from its own resources an ample number of qualified candidates, it will consider shareholder suggestions of persons to be considered as nominees to fill future vacancies on the board. Such suggestions must be sent in writing to the nominating and governance committee of the Registrant, c/o the Registrant’s Secretary, and must be accompanied by complete biographical and occupational data on the prospective nominee, along with a written consent of the prospective nominee for consideration of his or her name by the nominating and governance committee.
ITEM 11 – Controls and Procedures
| (a) | The Registrant’s Principal Executive Officer and Principal Financial Officer have concluded, based on their evaluation of the Registrant’s disclosure controls and procedures (as such term is defined in Rule 30a-3 under the Investment Company Act of 1940), that such controls and procedures are adequate and reasonably designed to achieve the purposes described in paragraph (c) of such rule. |
| | |
| (b) | There were no changes in the Registrant’s internal controls over financial reporting (as defined in Rule 30a-3(d) under the Investment Company Act of 1940) that occurred during the Registrant’s second fiscal quarter of the period covered by this report that has materially affected, or is reasonably likely to materially affect, the Registrant’s internal control over financial reporting. |
ITEM 12 – Exhibits
| (a)(1) | The Code of Ethics that is the subject of the disclosure required by Item 2 is attached as an exhibit hereto. |
| | |
| (a)(2) | The certifications required by Rule 30a-2 of the Investment Company Act of 1940 and Sections 302 and 906 of the Sarbanes-Oxley Act of 2002 are attached as exhibits hereto. |
SIGNATURES
Pursuant to the requirements of the Securities Exchange Act of 1934 and the Investment Company Act of 1940, the Registrant has duly caused this report to be signed on its behalf by the undersigned, thereunto duly authorized.
| | WASHINGTON MUTUAL INVESTORS FUND |
| | |
| | By /s/ Paul F. Roye |
| | Paul F. Roye, Executive Vice President and Principal Executive Officer |
| | |
| | Date: June 30, 2014 |
Pursuant to the requirements of the Securities Exchange Act of 1934 and the Investment Company Act of 1940, this report has been signed below by the following persons on behalf of the Registrant and in the capacities and on the dates indicated.
| By /s/ Paul F. Roye |
Paul F. Roye, Executive Vice President and Principal Executive Officer |
| |
| Date: June 30, 2014 |
| By /s/ Brian D. Bullard |
Brian D. Bullard, Treasurer and Principal Financial Officer |
| |
| Date: June 30, 2014 |