UNITED STATES
SECURITIES AND EXCHANGE COMMISSION
Washington, D.C. 20549
FORM N-CSR
Certified Shareholder Report of
Registered Management Investment Companies
Investment Company Act File Number: 811-00604
Washington Mutual Investors Fund
(Exact Name of Registrant as Specified in Charter)
6455 Irvine Center Drive
Irvine, California 92618
(Address of Principal Executive Offices)
Registrant's telephone number, including area code: (213) 486-9200
Date of fiscal year end: April 30
Date of reporting period: April 30, 2017
Jennifer L. Butler
Washington Mutual Investors Fund
333 South Hope Street
Los Angeles, California 90071
(Name and Address of Agent for Service)
ITEM 1 – Reports to Stockholders
 | Washington Mutual
Investors FundSM |
| |
Annual report
for the year ended
April 30, 2017 |

We believe high-
conviction investing
and diverse
perspectives lead
to better results.
Washington Mutual Investors Fund seeks to produce income and to provide an opportunity for growth of principal consistent with sound common stock investing.
This fund is one of more than 40 offered by one of the nation’s largest mutual fund families, American Funds, from Capital Group. For more than 85 years, Capital has invested with a long-term focus based on thorough research and attention to risk.
Fund results shown in this report, unless otherwise indicated, are for Class A shares at net asset value. If a sales charge (maximum 5.75%) had been deducted, the results would have been lower. Results are for past periods and are not predictive of results for future periods. Current and future results may be lower or higher than those shown. Share prices and returns will vary, so investors may lose money. Investing for short periods makes losses more likely. Investments are not FDIC-insured, nor are they deposits of or guaranteed by a bank or any other entity, so they may lose value. For current information and month-end results, visit americanfunds.com.
Here are the average annual total returns on a $1,000 investment with all distributions reinvested for periods ended March 31, 2017 (the most recent calendar quarter-end):
| Class A shares | | 1 year | | | 5 years | | | 10 years | |
| | | | | | | | | | |
| Reflecting 5.75% maximum sales charge | | | 9.50% | | | | 11.27% | | | | 6.21% | |
The total annual fund operating expense ratio is 0.58% for Class A shares as of the prospectus dated July 1, 2017 (unaudited).
Investment results assume all distributions are reinvested and reflect applicable fees and expenses. When applicable, investment results reflect fee waivers, without which results would have been lower. Visit americanfunds.com for more information.
The fund’s 30-day yield for Class A shares as of May 31, 2017, reflecting the 5.75% maximum sales charge and calculated in accordance with the U.S. Securities and Exchange Commission formula, was 1.75%.
Refer to the fund prospectus and the Risk Factors section of this report for more information on risks associated with investing in the fund.
Contents
Fellow investors:
For the 12 months ended April 30, 2017, Washington Mutual Investors Fund reported a total return of 15.91%, which compares to the 17.92% gain of the unmanaged Standard & Poor’s 500 Composite Index (benchmark) and 15.66% for the Lipper Growth & Income Funds Index (peers).
Over the past fiscal year, the fund paid four regular dividends totaling 77 cents per share, and one special dividend of 2 cents. The fund also made a capital gains distribution of $1.83 per share in December 2016.
We’re pleased that the fund’s one-, three-, five- and 10-year average annual total returns outpaced the Lipper index over those same periods of time. Additionally, over its nearly 65-year lifetime, the fund’s average annual return has led the S&P 500.
Market, economy and sectors
The S&P 500 gained nearly 18% over the past 12 months, and, on March 1, set an all-time intraday trading record of above 2,400. Moreover, between November 9 and December 9, the benchmark delivered a significant one-month rally, rising nearly 5%.
The Dow Jones Industrial Average, for the first time, finally broke through the 20,000 ceiling in January. At the close of business in April, the Dow was nudging 21,000. For the fund’s fiscal year, President Trump’s
Results at a glance
Total returns for periods ended April 30, 2017, with all distributions reinvested.
| | | Cumulative | | Average annual total returns |
| | | total return | | | | | | | | | | | Lifetime |
| | | 1 year | | 3 years | | 5 years | | 10 years | | (since 7/31/52) |
| | | | | | | | | | | |
| Washington Mutual Investors Fund (Class A shares) | | | 15.91 | % | | | 8.78 | % | | | 12.65 | % | | | 6.48 | % | | | 11.83 | % |
| Standard & Poor’s 500 Composite Index* | | | 17.92 | | | | 10.47 | | | | 13.68 | | | | 7.15 | | | | 10.75 | |
| Lipper Growth & Income Funds Index | | | 15.66 | | | | 7.33 | | | | 10.83 | | | | 5.15 | | | | — | † |
| | |
| * | The market index is unmanaged and, therefore, has no expenses. Investors cannot invest directly in an index. |
| † | This index was not in existence as of the date the fund’s Class A shares became available; therefore, lifetime results are not shown. |
| | |
| Washington Mutual Investors Fund | 1 |
The New Geography of Investing®
Where a company does business can be more important than where it’s located. Here’s a look at Washington Mutual Investors Fund’s portfolio in terms of where its equity holdings earn their revenue. The charts below show the countries and regions in which the fund’s equity investments are located, and where the revenue comes from.
Equity portion breakdown by domicile (%)

Equity portion breakdown by revenue (%)
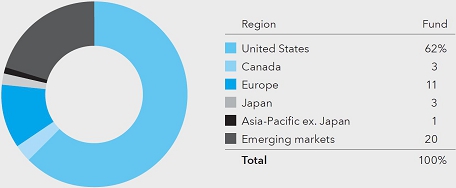
Source: Capital Group (as of April 30, 2017).
Compared with the MSCI ACWI ex USA as a percent of net assets.
election helped lift investors’ outlooks, driven by their expectation that the administration would pursue fiscal policy reforms that could usher in lower tax rates, more spending on infrastructure projects, and less business and investor regulation.
Economy. The U.S. unemployment rate fell to 4.4% in April, the lowest since May 2007. We have not yet seen this market optimism in the backward-looking metrics of economic growth. For example, the economy, as measured by real Gross Domestic Product, is off to a slow start in 2017. The 1.2% annual growth rate for the first quarter is the lowest in three years.
The Federal Reserve decided to hold short-term rates steady in mid-May, but the market believes it will make good on its stated expectation to proceed with several gradual rate increases this year. Also, more to the point, the Fed noted that these signs of slow growth were “likely to be transitory.” The Fed raised the federal funds rate twice in the last six months — 25 basis points in mid-December and 25 basis points in mid-March — to a target range of 0.75% to 1.00%.
Sectors. Over the fund’s fiscal year, the strongest sectors in the benchmark were information technology (+35.36%), financials (+27.32%) and industrials (+19.40%). The only retreating sector was real estate (–2.24%).
| 2 | Washington Mutual Investors Fund |
Inside the portfolio
Sector summary. Contributors to the fund’s returns, as compared to the index, came from industrials, health care, consumer discretionary and utilities sectors.
Top fund sector detractors, on a relative basis, were information technology, energy, financials, and telecommunication services and consumer staples.
Stock summary. As of April 30, 2017, the fund’s 10 largest holdings were Microsoft (5.9%), Home Depot (4.0%), Boeing Company (3.2%), Comcast (3.1%), Lockheed Martin (2.6%), Royal Dutch Shell (2.2%), Verizon Communications (2.2%), Coca-Cola (2.1%), Merck (2.1%), and JPMorgan Chase (2.0%).
Companies that helped lift relative fund results included Microsoft, Boeing, and Texas Instruments. Companies that detracted from relative returns included Bank of America, Verizon Communications, Schlumberger and Apple.
Looking ahead
Through its investment in high-quality large-cap stocks, the fund aims to protect on the downside while participating in a large part of the upside. The fund’s characteristics can vary depending on valuations, market opportunities, longer term industry trends, and the interest-rate environment.
We always have a keen eye on the fund’s income objectives. Specifically, even in a changing market, we continue to focus on delivering consistent income and competitive results with less volatility over the long term, as proven by a comparison with the fund’s peers.
We thank our current investors for the trust and confidence they’ve placed in American Funds and Washington Mutual Investors Fund and look forward to reporting to you again in six months.
Cordially,

Alan N. Berro
Vice Chairman and President
Washington Mutual Investors Fund
June 8, 2017
For current information about the fund, visit americanfunds.com.
Why your annual report has a different look
You have probably noticed that this annual report doesn’t look like the glossier reports of the past. After surveying a large, representative sample of our investors, we have decided to make a few key changes to these documents and have adjusted the look and feel of our reports (e.g., paper stock and design standards) to reflect the prevailing industry norm. These changes will reduce costs and the amount of paper we consume.
You also told us that we should be considering ways to deliver the valuable perspective of our investment professionals to you digitally. We are in the process of building our digital investor education content on our website, which will provide a platform for investment professionals to communicate with investors using the channels that you access more often.
If you have not already done so, you can elect to receive your annual reports electronically. Once you do, you will receive an email notification as soon as the documents are available. To learn more, visit americanfunds.com/gopaperless. ■
| Washington Mutual Investors Fund | 3 |
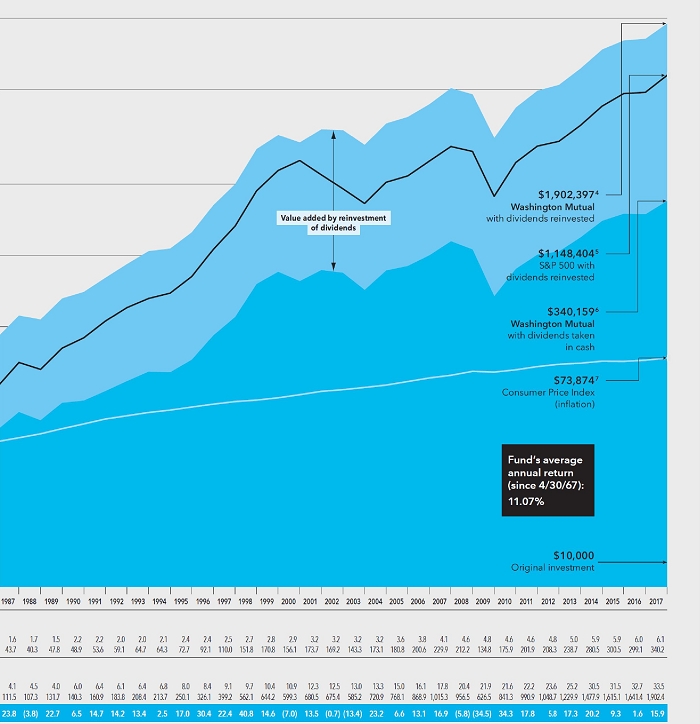
The value of a long-term perspective
Fund results shown are for Class A shares and reflect deduction of the maximum sales charge of 5.75% on the $10,000 investment.¹ Thus, the net amount invested was $9,425.² Results are for past periods and are not predictive of results for future periods. Current and future results may be lower or higher than those shown. Share prices and returns will vary, so investors may lose money. For current information and month-end results, visit americanfunds.com.
The results shown are before taxes on fund distributions and sale of fund shares.
| 1 | As outlined in the prospectus, the sales charge is reduced for accounts (and aggregated investments) of $25,000 or more and is eliminated for purchases of $1 million or more. There is no sales charge on dividends or capital gain distributions that are reinvested in additional shares. |
| 2 | The maximum initial sales charge was 8.50% prior to July 1, 1988. |
| 3 | Assumes a $10,000 investment made in the fund on April 30, 1967. |
| 4 | Total value includes reinvested dividends of $488,296 and reinvested capital gain distributions of $637,139. |
| 5 | Source: S&P Dow Jones Indices LLC. The market index is unmanaged and, therefore, has no expenses. Investors cannot invest directly in an index. |
| 6 | Capital value includes reinvested capital gain distributions of $153,999 but does not reflect income dividends of $121,160 taken in cash. |
| 7 | Computed from data supplied by the U.S. Department of Labor, Bureau of Labor Statistics. |

| 4 | Washington Mutual Investors Fund |
How a $10,000 investment has grown over 50 years
While notable for their volatility in recent years, financial markets have tended to reward investors over the long term. Investment management — bolstered by experience and careful research — can add even more value. As the chart shows, over the past 50 years, Washington Mutual Investors Fund has done demonstrably better than its relevant benchmark.
| Washington Mutual Investors Fund | 5 |
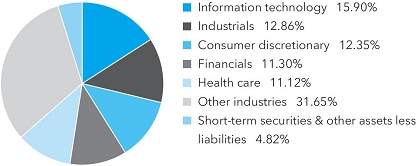
Summary investment portfolio April 30, 2017
| Industry sector diversification | Percent of net assets |
| Largest equity holdings | | Percent of
net assets |
| Microsoft | | | 5.90 | % |
| Home Depot | | | 4.04 | |
| Boeing | | | 3.16 | |
| Comcast | | | 3.13 | |
| Lockheed Martin | | | 2.58 | |
| Royal Dutch Shell | | | 2.24 | |
| Verizon Communications | | | 2.16 | |
| Coca-Cola | | | 2.10 | |
| Merck | | | 2.07 | |
| JPMorgan Chase | | | 2.04 | |
| Common stocks 95.18% | | Shares | | | Value
(000) | |
| Energy 9.34% | | | | | | | | |
| Chevron Corp. | | | 12,257,694 | | | $ | 1,307,896 | |
| Enbridge Inc. | | | 37,584,659 | | | | 1,557,884 | |
| Royal Dutch Shell PLC, Class B (ADR) | | | 37,350,400 | | | | 2,021,404 | |
| Schlumberger Ltd. | | | 24,654,300 | | | | 1,789,655 | |
| Other securities | | | | | | | 1,755,144 | |
| | | | | | | | 8,431,983 | |
| | | | | | | | | |
| Materials 4.72% | | | | | | | | |
| E.I. du Pont de Nemours and Co. | | | 19,611,991 | | | | 1,564,056 | |
| Praxair, Inc. | | | 5,411,600 | | | | 676,342 | |
| Other securities | | | | | | | 2,022,027 | |
| | | | | | | | 4,262,425 | |
| Industrials 12.86% | | | | | | | | |
| Boeing Co. | | | 15,436,200 | | | | 2,853,073 | |
| Caterpillar Inc. | | | 7,028,707 | | | | 718,756 | |
| Lockheed Martin Corp. | | | 8,639,300 | | | | 2,327,859 | |
| Northrop Grumman Corp. | | | 5,131,300 | | | | 1,262,095 | |
| Waste Management, Inc. | | | 12,453,100 | | | | 906,337 | |
| Other securities | | | | | | | 3,542,209 | |
| | | | | | | | 11,610,329 | |
| | | | | | | | | |
| Consumer discretionary 12.35% | | | | | | | | |
| Comcast Corp., Class A | | | 72,076,378 | | | | 2,824,673 | |
| Home Depot, Inc. | | | 23,392,800 | | | | 3,651,616 | |
| Newell Brands Inc. | | | 14,044,100 | | | | 670,465 | |
| Starbucks Corp. | | | 11,140,400 | | | | 669,092 | |
| Other securities | | | | | | | 3,331,540 | |
| | | | | | | | 11,147,386 | |
| | | | | | | | | |
| Consumer staples 7.91% | | | | | | | | |
| Coca-Cola Co. | | | 43,911,000 | | | | 1,894,760 | |
| Costco Wholesale Corp. | | | 5,579,500 | | | | 990,473 | |
| CVS Health Corp. | | | 7,120,000 | | | | 586,973 | |
| Kraft Heinz Co. | | | 9,265,000 | | | | 837,463 | |
| Procter & Gamble Co. | | | 14,587,500 | | | | 1,273,926 | |
| Other securities | | | | | | | 1,554,017 | |
| | | | | | | | 7,137,612 | |
| | | | | | | | | |
| Health care 11.12% | | | | | | | | |
| Aetna Inc. | | | 6,462,700 | | | | 872,917 | |
| Bristol-Myers Squibb Co. | | | 14,606,500 | | | | 818,694 | |
| Humana Inc.1 | | | 7,506,000 | | | | 1,666,182 | |
| Johnson & Johnson | | | 14,855,300 | | | | 1,834,184 | |
| Medtronic PLC | | | 8,060,800 | | | | 669,772 | |
| 6 | Washington Mutual Investors Fund |
| | | Shares | | | Value
(000) | |
| Merck & Co., Inc. | | | 30,055,000 | | | $ | 1,873,328 | |
| UnitedHealth Group Inc. | | | 5,268,351 | | | | 921,329 | |
| Other securities | | | | | | | 1,384,668 | |
| | | | | | | | 10,041,074 | |
| | | | | | | | | |
| Financials 11.30% | | | | | | | | |
| Capital One Financial Corp. | | | 10,208,000 | | | | 820,519 | |
| Chubb Ltd. | | | 7,878,900 | | | | 1,081,379 | |
| CME Group Inc., Class A | | | 10,072,136 | | | | 1,170,281 | |
| JPMorgan Chase & Co. | | | 21,206,500 | | | | 1,844,966 | |
| Marsh & McLennan Companies, Inc. | | | 8,726,800 | | | | 646,918 | |
| PNC Financial Services Group, Inc. | | | 6,231,800 | | | | 746,258 | |
| Wells Fargo & Co. | | | 29,117,100 | | | | 1,567,665 | |
| Other securities | | | | | | | 2,320,031 | |
| | | | | | | | 10,198,017 | |
| | | | | | | | | |
| Information technology 15.90% | | | | | | | | |
| Alphabet Inc., Class A2 | | | 794,200 | | | | 734,254 | |
| Alphabet Inc., Class C2 | | | 268,350 | | | | 243,114 | |
| Amphenol Corp., Class A | | | 8,642,500 | | | | 624,939 | |
| Analog Devices, Inc. | | | 7,957,083 | | | | 606,330 | |
| Apple Inc. | | | 9,067,000 | | | | 1,302,474 | |
| Broadcom Ltd. | | | 4,590,499 | | | | 1,013,628 | |
| Intel Corp. | | | 42,116,000 | | | | 1,522,493 | |
| Microsoft Corp. | | | 77,713,800 | | | | 5,320,287 | |
| Texas Instruments Inc. | | | 11,568,600 | | | | 916,002 | |
| Visa Inc., Class A | | | 6,656,100 | | | | 607,169 | |
| Other securities | | | | | | | 1,464,341 | |
| | | �� | | | | | 14,355,031 | |
| | | | | | | | | |
| Telecommunication services 3.14% | | | | | | | | |
| AT&T Inc. | | | 22,279,200 | | | | 882,925 | |
| Verizon Communications Inc. | | | 42,537,901 | | | | 1,952,915 | |
| | | | | | | | 2,835,840 | |
| | | | | | | | | |
| Utilities 2.57% | | | | | | | | |
| Dominion Resources, Inc. | | | 7,985,000 | | | | 618,279 | |
| PG&E Corp. | | | 8,698,500 | | | | 583,234 | |
| Other securities | | | | | | | 1,115,020 | |
| | | | | | | | 2,316,533 | |
| | | | | | | | | |
| Miscellaneous 3.97% | | | | | | | | |
| Other common stocks in initial period of acquisition | | | | | | | 3,580,114 | |
| | | | | | | | | |
| Total common stocks (cost: $55,118,909,000) | | | | | | | 85,916,344 | |
| | | | | | | | | |
| Short-term securities 4.74% | | Principal amount
(000) | | | | | |
| Apple Inc. 0.88% due 5/3/2017–5/8/20173 | | $ | 125,000 | | | | 124,982 | |
| Chariot Funding, LLC 0.87% due 5/1/20173 | | | 50,000 | | | | 49,996 | |
| Chevron Corp. 0.87% due 5/22/20173 | | | 50,000 | | | | 49,973 | |
| Coca-Cola Co. 0.95% due 7/6/20173 | | | 50,000 | | | | 49,918 | |
| Federal Home Loan Bank 0.54%–0.85% due 5/4/2017–8/2/2017 | | | 1,729,900 | | | | 1,728,455 | |
| Johnson & Johnson 0.85% due 6/1/20173 | | | 45,000 | | | | 44,966 | |
| Merck & Co. Inc. 0.84%–0.86% due 5/8/2017–6/5/20173 | | | 75,000 | | | | 74,968 | |
| Procter & Gamble Co. 0.82%–0.83% due 5/18/2017–6/1/20173 | | | 203,391 | | | | 203,254 | |
| U.S. Treasury Bills 0.50%–0.90% due 5/4/2017–10/5/2017 | | | 630,900 | | | | 630,239 | |
| Other securities | | | | | | | 1,324,997 | |
| | | | | | | | | |
| Total short-term securities (cost: $4,281,810,000) | | | | | | | 4,281,748 | |
| | | | | | | | | |
| Total investment securities 99.92% (cost: $59,400,719,000) | | | | | | | 90,198,092 | |
| Other assets less liabilities 0.08% | | | | | | | 71,849 | |
| | | | | | | | | |
| Net assets 100.00% | | | | | | $ | 90,269,941 | |
| Washington Mutual Investors Fund | 7 |
This summary investment portfolio is designed to streamline the report and help investors better focus on the fund’s principal holdings. See the inside back cover for details on how to obtain a complete schedule of portfolio holdings.
As permitted by U.S. Securities and Exchange Commission regulations, “Miscellaneous” securities include holdings in their first year of acquisition that have not previously been publicly disclosed.
“Other securities” includes all issues that are not disclosed separately in the summary investment portfolio.
Investments in affiliates
A company is an affiliate of the fund under the Investment Company Act of 1940 if the fund’s holdings in that company represent 5% or more of the outstanding voting shares. The value of the fund’s affiliated-company holdings is shown in the summary investment portfolio. Further details on such holdings and related transactions during the year ended April 30, 2017, appear below.
| | | Beginning
shares | | | Additions | | | Reductions | | | Ending
shares | | | Net realized
gain
(000) | | | Net unrealized
appreciation
(000) | | | Dividend
income
(000) | | | Value of
affiliates at
4/30/2017
(000) | |
| Humana Inc. | | | 7,620,000 | | | | — | | | | 114,000 | | | | 7,506,000 | | | $ | 15,948 | | | $ | 326,212 | | | $ | 9,677 | | | $ | 1,666,182 | |
The following footnotes apply to either the individual securities noted or one or more of the securities aggregated and listed as a single line item.
| 1 | Represents an affiliated company as defined under the Investment Company Act of 1940. |
| 2 | Security did not produce income during the last 12 months. |
| 3 | Acquired in a transaction exempt from registration under Section 4(2) of the Securities Act of 1933. May be resold in the U.S. in transactions exempt from registration, normally to qualified institutional buyers. The total value of all such securities, including those in “Other securities,” was $1,423,195,000, which represented 1.58% of the net assets of the fund. |
Key to abbreviation
ADR = American Depositary Receipts
See Notes to Financial Statements
| 8 | Washington Mutual Investors Fund |
Financial statements
Statement of assets and liabilities
at April 30, 2017 | (dollars in thousands) |
| Assets: | | | | | | | | |
| Investment securities, at value: | | | | | | | | |
| Unaffiliated issuers (cost: $58,856,996) | | $ | 88,531,910 | | | | | |
| Affiliated issuers (cost: $543,723) | | | 1,666,182 | | | $ | 90,198,092 | |
| Cash | | | | | | | 243 | |
| Receivables for: | | | | | | | | |
| Sales of investments | | | 92,884 | | | | | |
| Sales of fund’s shares | | | 114,653 | | | | | |
| Dividends | | | 122,375 | | | | 329,912 | |
| | | | | | | | 90,528,247 | |
| Liabilities: | | | | | | | | |
| Payables for: | | | | | | | | |
| Purchases of investments | | | 99,497 | | | | | |
| Repurchases of fund’s shares | | | 106,855 | | | | | |
| Investment advisory services | | | 17,214 | | | | | |
| Services provided by related parties | | | 22,737 | | | | | |
| Board members’ deferred compensation | | | 8,092 | | | | | |
| Other | | | 3,911 | | | | 258,306 | |
| Net assets at April 30, 2017 | | | | | | $ | 90,269,941 | |
| | | | | | | | | |
| Net assets consist of: | | | | | | | | |
| Capital paid in on shares of beneficial interest | | | | | | $ | 57,135,141 | |
| Undistributed net investment income | | | | | | | 165,094 | |
| Undistributed net realized gain | | | | | | | 2,172,333 | |
| Net unrealized appreciation | | | | | | | 30,797,373 | |
| Net assets at April 30, 2017 | | | | | | $ | 90,269,941 | |
(dollars and shares in thousands, except per-share amounts)
Shares of beneficial interest issued and outstanding (no stated par value) —
unlimited shares authorized (2,106,668 total shares outstanding)
| | | | | | Shares | | | Net asset value | |
| | | Net assets | | | outstanding | | | per share | |
| Class A | | $ | 53,976,231 | | | | 1,258,545 | | | $ | 42.89 | |
| Class B | | | 1 | | | | — | * | | | 42.82 | |
| Class C | | | 1,643,277 | | | | 38,796 | | | | 42.36 | |
| Class T | | | 10 | | | | — | * | | | 42.89 | |
| Class F-1 | | | 2,998,606 | | | | 70,162 | | | | 42.74 | |
| Class F-2 | | | 9,462,974 | | | | 220,790 | | | | 42.86 | |
| Class F-3 | | | 248,488 | | | | 5,794 | | | | 42.88 | |
| Class 529-A | | | 1,982,006 | | | | 46,309 | | | | 42.80 | |
| Class 529-B | | | 1 | | | | — | * | | | 42.95 | |
| Class 529-C | | | 470,186 | | | | 11,068 | | | | 42.48 | |
| Class 529-E | | | 99,901 | | | | 2,347 | | | | 42.57 | |
| Class 529-T | | | 10 | | | | — | * | | | 42.89 | |
| Class 529-F-1 | | | 125,873 | | | | 2,947 | | | | 42.71 | |
| Class R-1 | | | 92,513 | | | | 2,180 | | | | 42.45 | |
| Class R-2 | | | 736,219 | | | | 17,402 | | | | 42.31 | |
| Class R-2E | | | 30,883 | | | | 723 | | | | 42.71 | |
| Class R-3 | | | 1,889,723 | | | | 44,419 | | | | 42.54 | |
| Class R-4 | | | 2,683,354 | | | | 62,869 | | | | 42.68 | |
| Class R-5E | | | 406 | | | | 9 | | | | 42.86 | |
| Class R-5 | | | 2,137,146 | | | | 49,846 | | | | 42.87 | |
| Class R-6 | | | 11,692,133 | | | | 272,462 | | | | 42.91 | |
*Amount less than one thousand.
See Notes to Financial Statements
| Washington Mutual Investors Fund | 9 |
Statement of operations
for the year ended April 30, 2017 | (dollars in thousands) |
| | | | | | | | | |
| Investment income: | | | | | | | | |
| Income: | | | | | | | | |
| Dividends (net of non-U.S. taxes of $13,196; also includes $9,677 from affiliates) | | $ | 2,100,803 | | | | | |
| Interest | | | 18,086 | | | $ | 2,118,889 | |
| Fees and expenses*: | | | | | | | | |
| Investment advisory services | | | 197,540 | | | | | |
| Distribution services | | | 179,479 | | | | | |
| Transfer agent services | | | 69,866 | | | | | |
| Administrative services | | | 21,079 | | | | | |
| Reports to shareholders | | | 2,595 | | | | | |
| Registration statement and prospectus | | | 1,900 | | | | | |
| Board members’ compensation | | | 2,619 | | | | | |
| Auditing and legal | | | 401 | | | | | |
| Custodian | | | 721 | | | | | |
| Other | | | 2,038 | | | | 478,238 | |
| Net investment income | | | | | | | 1,640,651 | |
| | | | | | | | | |
| Net realized gain and unrealized appreciation: | | | | | | | | |
| Net realized gain (loss) on: | | | | | | | | |
| Investments: | | | | | | | | |
| Unaffiliated issuers | | | 3,327,022 | | | | | |
| Affiliated issuers | | | 15,948 | | | | | |
| Currency transactions | | | (606 | ) | | | 3,342,364 | |
| Net unrealized appreciation on: | | | | | | | 7,478,527 | |
| Investments: | | | | | | | | |
| Unffiliated issuers | | | 7,152,315 | | | | | |
| Affiliated issuers | | | 326,212 | | | | | |
| Net realized gain and unrealized appreciation | | | | | | | 10,820,891 | |
| Net increase in net assets resulting from operations | | | | | | $ | 12,461,542 | |
*Additional information related to class-specific fees and expenses is included in the Notes to Financial Statements.
Statements of changes in net assets
(dollars in thousands)
| | | Year ended April 30 | |
| | | 2017 | | | 2016 | |
| Operations: | | | | | | | | |
| Net investment income | | $ | 1,640,651 | | | $ | 1,532,787 | |
| Net realized gain | | | 3,342,364 | | | | 3,041,981 | |
| Net unrealized appreciation (depreciation) | | | 7,478,527 | | | | (3,338,626 | ) |
| Net increase in net assets resulting from operations | | | 12,461,542 | | | | 1,236,142 | |
| Dividends and distributions paid to shareholders: | | | | | | | | |
| Dividends from net investment income | | | (1,613,391 | ) | | | (1,569,346 | ) |
| Distributions from net realized gain on investments | | | (3,662,644 | ) | | | (3,006,010 | ) |
| Total dividends and distributions paid to shareholders | | | (5,276,035 | ) | | | (4,575,356 | ) |
| Net capital share transactions | | | 4,638,201 | | | | 3,175,152 | |
| | | | | | | | | |
| Total increase (decrease) in net assets | | | 11,823,708 | | | | (164,062 | ) |
| Net assets: | | | | | | | | |
| Beginning of year | | | 78,446,233 | | | | 78,610,295 | |
| End of year (including undistributed net investment income: $165,094 and $138,349, respectively) | | $ | 90,269,941 | | | $ | 78,446,233 | |
See Notes to Financial Statements
| 10 | Washington Mutual Investors Fund |
Notes to financial statements
1. Organization
Washington Mutual Investors Fund (the “fund”) is registered under the Investment Company Act of 1940 as an open-end, diversified management investment company. The fund’s investment objective is to produce income and to provide an opportunity for growth of principal consistent with sound common stock investing.
The fund has 21 share classes consisting of seven retail share classes (Classes A, B, C, T, F-1, F-2 and F-3), six 529 college savings plan share classes (Classes 529-A, 529-B, 529-C, 529-E, 529-T and 529-F-1) and eight retirement plan share classes (Classes R-1, R-2, R-2E, R-3, R-4, R-5E, R-5 and R-6). The 529 college savings plan share classes can be used to save for college education. The retirement plan share classes are generally offered only through eligible employer-sponsored retirement plans. The fund’s share classes are described further in the following table:
| Share class | | Initial sales charge | | Contingent deferred sales charge upon
redemption | | Conversion feature |
| Classes A and 529-A | | Up to 5.75% | | None (except 1% for certain redemptions within one year of purchase without an initial sales charge) | | None |
| Classes B and 529-B* | | None | | Declines from 5% to 0% for redemptions within six years of purchase | | Classes B and 529-B convert to Classes A and 529-A, respectively, after eight years |
| Class C | | None | | 1% for redemptions within one year of purchase | | Class C converts to Class F-1 after 10 years |
| Class 529-C | | None | | 1% for redemptions within one year of purchase | | None |
| Class 529-E | | None | | None | | None |
| Classes T and 529-T* | | Up to 2.50% | | None | | None |
| Classes F-1, F-2, F-3 and 529-F-1 | | None | | None | | None |
| Classes R-1, R-2, R-2E, R-3, R-4, R-5E, R-5 and R-6 | | None | | None | | None |
| * | Class B, T, 529-B and 529-T shares of the fund are not available for purchase. Final conversion of Class B and 529-B shares to Class A and 529-A shares, respectively, occurred on April 28, 2017. These share classes were fully liquidated on May 5, 2017, upon the removal of seed capital invested by the fund’s investment adviser. |
Holders of all share classes have equal pro rata rights to the assets, dividends and liquidation proceeds of the fund. Each share class has identical voting rights, except for the exclusive right to vote on matters affecting only its class. Share classes have different fees and expenses (“class-specific fees and expenses”), primarily due to different arrangements for distribution, transfer agent and administrative services. Differences in class-specific fees and expenses will result in differences in net investment income and, therefore, the payment of different per-share dividends by each share class.
2. Significant accounting policies
The fund is an investment company that applies the accounting and reporting guidance issued in Topic 946 by the U.S. Financial Accounting Standards Board. The fund’s financial statements have been prepared to comply with U.S. generally accepted accounting principles (“U.S. GAAP”). These principles require the fund’s investment adviser to make estimates and assumptions that affect reported amounts and disclosures. Actual results could differ from those estimates. Subsequent events, if any, have been evaluated through the date of issuance in the preparation of the financial statements. The fund follows the significant accounting policies described in this section, as well as the valuation policies described in the next section on valuation.
Security transactions and related investment income — Security transactions are recorded by the fund as of the date the trades are executed with brokers. Realized gains and losses from security transactions are determined based on the specific identified cost of the securities. In the event a security is purchased with a delayed payment date, the fund will segregate liquid assets sufficient to meet its payment obligations. Dividend income is recognized on the ex-dividend date and interest income is recognized on an accrual basis. Market discounts, premiums and original issue discounts on fixed-income securities are amortized daily over the expected life of the security.
| Washington Mutual Investors Fund | 11 |
Class allocations — Income, fees and expenses (other than class-specific fees and expenses) and realized and unrealized gains and losses are allocated daily among the various share classes based on their relative net assets. Class-specific fees and expenses, such as distribution, transfer agent and administrative services, are charged directly to the respective share class.
Dividends and distributions to shareholders — Dividends and distributions to shareholders are recorded on the ex-dividend date.
3. Valuation
Capital Research and Management Company (“CRMC”), the fund’s investment adviser, values the fund’s investments at fair value as defined by U.S. GAAP. The net asset value of each share class of the fund is generally determined as of approximately 4:00 p.m. New York time each day the New York Stock Exchange is open.
Methods and inputs — The fund’s investment adviser uses the following methods and inputs to establish the fair value of the fund’s assets and liabilities. Use of particular methods and inputs may vary over time based on availability and relevance as market and economic conditions evolve.
Equity securities are generally valued at the official closing price of, or the last reported sale price on, the exchange or market on which such securities are traded, as of the close of business on the day the securities are being valued or, lacking any sales, at the last available bid price. Prices for each security are taken from the principal exchange or market on which the security trades.
Fixed-income securities, including short-term securities, are generally valued at prices obtained from one or more pricing vendors. Vendors value such securities based on one or more of the following inputs: benchmark yields, transactions, bids, offers, quotations from dealers and trading systems, new issues, spreads, interest rate volatilities, and other relationships observed in the markets among comparable securities; and proprietary pricing models such as yield measures calculated using factors such as cash flows, financial or collateral performance and other reference data.
When the fund’s investment adviser deems it appropriate to do so (such as when vendor prices are unavailable or deemed to be not representative), fixed-income securities will be valued in good faith at the mean quoted bid and ask prices that are reasonably and timely available (or bid prices, if ask prices are not available) or at prices for securities of comparable maturity, quality and type.
Securities with both fixed-income and equity characteristics, or equity securities traded principally among fixed-income dealers, are generally valued in the manner described for either equity or fixed-income securities, depending on which method is deemed most appropriate by the fund’s investment adviser.
Securities and other assets for which representative market quotations are not readily available or are considered unreliable by the fund’s investment adviser are fair valued as determined in good faith under fair valuation guidelines adopted by authority of the fund’s board of trustees as further described. The investment adviser follows fair valuation guidelines, consistent with U.S. Securities and Exchange Commission rules and guidance, to consider relevant principles and factors when making fair value determinations. The investment adviser considers relevant indications of value that are reasonably and timely available to it in determining the fair value to be assigned to a particular security, such as the type and cost of the security; contractual or legal restrictions on resale of the security; relevant financial or business developments of the issuer; actively traded similar or related securities; conversion or exchange rights on the security; related corporate actions; significant events occurring after the close of trading in the security; and changes in overall market conditions. In addition, the closing prices of equity securities that trade in markets outside U.S. time zones may be adjusted to reflect significant events that occur after the close of local trading but before the net asset value of each share class of the fund is determined. Fair valuations and valuations of investments that are not actively trading involve judgment and may differ materially from valuations that would have been used had greater market activity occurred.
Processes and structure — The fund’s board of trustees has delegated authority to the fund’s investment adviser to make fair value determinations, subject to board oversight. The investment adviser has established a Joint Fair Valuation Committee (the “Fair Valuation Committee”) to administer, implement and oversee the fair valuation process, and to make fair value decisions. The Fair Valuation Committee regularly reviews its own fair value decisions, as well as decisions made under its standing instructions to the investment adviser’s valuation teams. The Fair Valuation Committee reviews changes in fair value measurements from period to period and may, as deemed appropriate, update the fair valuation guidelines to better reflect the results of back testing and address new or evolving issues. The Fair Valuation Committee reports any changes to the fair valuation guidelines to the board of trustees with supplemental information to support the changes. The fund’s board and audit committee also regularly review reports that describe fair value determinations and methods.
| 12 | Washington Mutual Investors Fund |
The fund’s investment adviser has also established a Fixed-Income Pricing Review Group to administer and oversee the fixed-income valuation process, including the use of fixed-income pricing vendors. This group regularly reviews pricing vendor information and market data. Pricing decisions, processes and controls over security valuation are also subject to additional internal reviews, including an annual control self-evaluation program facilitated by the investment adviser’s compliance group.
Classifications — The fund’s investment adviser classifies the fund’s assets and liabilities into three levels based on the inputs used to value the assets or liabilities. Level 1 values are based on quoted prices in active markets for identical securities. Level 2 values are based on significant observable market inputs, such as quoted prices for similar securities and quoted prices in inactive markets. Certain securities trading outside the U.S. may transfer between Level 1 and Level 2 due to valuation adjustments resulting from significant market movements following the close of local trading. Level 3 values are based on significant unobservable inputs that reflect the investment adviser’s determination of assumptions that market participants might reasonably use in valuing the securities. The valuation levels are not necessarily an indication of the risk or liquidity associated with the underlying investment. For example, U.S. government securities are reflected as Level 2 because the inputs used to determine fair value may not always be quoted prices in an active market. The following table presents the fund’s valuation levels as of April 30, 2017 (dollars in thousands):
| | | Investment securities |
| | | Level 1 | | | Level 2 | | | Level 3 | | | Total | |
| Assets: | | | | | | | | | | | | | | | | |
| Common stocks: | | | | | | | | | | | | | | | | |
| Energy | | $ | 8,431,983 | | | $ | — | | | $ | — | | | $ | 8,431,983 | |
| Materials | | | 4,262,425 | | | | — | | | | — | | | | 4,262,425 | |
| Industrials | | | 11,610,329 | | | | — | | | | — | | | | 11,610,329 | |
| Consumer discretionary | | | 11,147,386 | | | | — | | | | — | | | | 11,147,386 | |
| Consumer staples | | | 7,137,612 | | | | — | | | | — | | | | 7,137,612 | |
| Health care | | | 10,041,074 | | | | — | | | | — | | | | 10,041,074 | |
| Financials | | | 10,198,017 | | | | — | | | | — | | | | 10,198,017 | |
| Information technology | | | 14,355,031 | | | | — | | | | — | | | | 14,355,031 | |
| Telecommunication services | | | 2,835,840 | | | | — | | | | — | | | | 2,835,840 | |
| Utilities | | | 2,316,533 | | | | — | | | | — | | | | 2,316,533 | |
| Miscellaneous | | | 3,580,114 | | | | — | | | | — | | | | 3,580,114 | |
| Short-term securities | | | — | | | | 4,281,748 | | | | — | | | | 4,281,748 | |
| Total | | $ | 85,916,344 | | | $ | 4,281,748 | | | $ | — | | | $ | 90,198,092 | |
4. Risk factors
Investing in the fund may involve certain risks including, but not limited to, those described below.
Market conditions — The prices of, and the income generated by, the common stocks and other securities held by the fund may decline — sometimes rapidly or unpredictably — due to various factors, including events or conditions affecting the general economy or particular industries; overall market changes; local, regional or global political, social or economic instability; governmental or governmental agency responses to economic conditions; and currency exchange rate, interest rate and commodity price fluctuations.
Issuer risks — The prices of, and the income generated by, securities held by the fund may decline in response to various factors directly related to the issuers of such securities, including reduced demand for an issuer’s goods or services, poor management performance and strategic initiatives such as mergers, acquisitions or dispositions and the market response to any such initiatives.
Investing in income-oriented stocks — Income provided by the fund may be reduced by changes in the dividend policies of, and the capital resources available for dividend payments at, the companies in which the fund invests.
Investing in growth-oriented stocks — Growth-oriented common stocks and other equity-type securities (such as preferred stocks, convertible preferred stocks and convertible bonds) may involve larger price swings and greater potential for loss than other types of investments.
Management — The investment adviser to the fund actively manages the fund’s investments. Consequently, the fund is subject to the risk that the methods and analyses employed by the investment adviser in this process may not produce the desired results. This could cause the fund to lose value or its investment results to lag relevant benchmarks or other funds with similar objectives.
| Washington Mutual Investors Fund | 13 |
5. Taxation and distributions
Federal income taxation — The fund complies with the requirements under Subchapter M of the Internal Revenue Code applicable to mutual funds and intends to distribute substantially all of its net taxable income and net capital gains each year. The fund is not subject to income taxes to the extent such distributions are made. Therefore, no federal income tax provision is required.
As of and during the period ended April 30, 2017, the fund did not have a liability for any unrecognized tax benefits. The fund recognizes interest and penalties, if any, related to unrecognized tax benefits as income tax expense in the statement of operations. During the period, the fund did not incur any interest or penalties.
The fund is not subject to examination by U.S. federal tax authorities for tax years before 2013 and by state tax authorities for tax years before 2012.
Non-U.S. taxation — Dividend and interest income are recorded net of non-U.S. taxes paid. The fund may file withholding tax reclaims in certain jurisdictions to recover a portion of amounts previously withheld. As a result of rulings from European courts, the fund filed for additional reclaims related to prior years. These reclaims are recorded when the amount is known and there are no significant uncertainties on collectability.
Distributions — Distributions paid to shareholders are based on net investment income and net realized gains determined on a tax basis, which may differ from net investment income and net realized gains for financial reporting purposes. These differences are due primarily to different treatment for items such as currency gains and losses; short-term capital gains and losses; capital losses related to sales of certain securities within 30 days of purchase; and deferred expenses. The fiscal year in which amounts are distributed may differ from the year in which the net investment income and net realized gains are recorded by the fund for financial reporting purposes. The fund may also designate a portion of the amount paid to redeeming shareholders as a distribution for tax purposes.
During the year ended April 30, 2017, the fund reclassified $434,000 from undistributed net investment income to undistributed net realized gain, $81,000 from undistributed net investment income to capital paid in on shares of beneficial interest and $139,497,000 from undistributed net realized gain to capital paid in on shares of beneficial interest to align financial reporting with tax reporting.
As of April 30, 2017, the tax basis components of distributable earnings, unrealized appreciation (depreciation) and cost of investment securities were as follows (dollars in thousands):
| Undistributed ordinary income | | $ | 173,186 | |
| Undistributed long-term capital gains | | | 2,204,428 | |
| Gross unrealized appreciation on investment securities | | | 31,276,309 | |
| Gross unrealized depreciation on investment securities | | | (511,030 | ) |
| Net unrealized appreciation on investment securities | | | 30,765,279 | |
| Cost of investment securities | | | 59,432,813 | |
| 14 | Washington Mutual Investors Fund |
The tax character of distributions paid to shareholders was as follows (dollars in thousands):
| | | Year ended April 30, 2017 | | | Year ended April 30, 2016 |
| Share class | | Ordinary
income | | | Long-term
capital gains | | | Total
dividends and
distributions
paid | | | Ordinary
income | | | Long-term
capital gains | | | Total
dividends and
distributions
paid | |
| Class A | | $ | 995,600 | | | $ | 2,260,184 | | | $ | 3,255,784 | | | $ | 1,034,924 | | | $ | 1,974,246 | | | $ | 3,009,170 | |
| Class B | | | 297 | | | | 1,081 | | | | 1,378 | | | | 1,186 | | | | 3,597 | | | | 4,783 | |
| Class C | | | 18,386 | | | | 70,570 | | | | 88,956 | | | | 20,317 | | | | 62,909 | | | | 83,226 | |
| Class F-1 | | | 55,066 | | | | 130,757 | | | | 185,823 | | | | 55,906 | | | | 110,943 | | | | 166,849 | |
| Class F-2 | | | 161,393 | | | | 350,403 | | | | 511,796 | | | | 123,745 | | | | 221,315 | | | | 345,060 | |
| Class F-31 | | | 204 | | | | — | | | | 204 | | | | — | | | | — | | | | — | |
| Class 529-A | | | 34,117 | | | | 80,804 | | | | 114,921 | | | | 34,505 | | | | 68,984 | | | | 103,489 | |
| Class 529-B | | | 43 | | | | 175 | | | | 218 | | | | 177 | | | | 602 | | | | 779 | |
| Class 529-C | | | 4,900 | | | | 19,720 | | | | 24,620 | | | | 5,292 | | | | 17,375 | | | | 22,667 | |
| Class 529-E | | | 1,517 | | | | 4,110 | | | | 5,627 | | | | 1,572 | | | | 3,599 | | | | 5,171 | |
| Class 529-F-1 | | | 2,398 | | | | 5,104 | | | | 7,502 | | | | 2,288 | | | | 4,111 | | | | 6,399 | |
| Class R-1 | | | 1,069 | | | | 4,105 | | | | 5,174 | | | | 1,194 | | | | 3,682 | | | | 4,876 | |
| Class R-2 | | | 8,251 | | | | 31,871 | | | | 40,122 | | | | 9,642 | | | | 29,004 | | | | 38,646 | |
| Class R-2E | | | 230 | | | | 708 | | | | 938 | | | | 43 | | | | 105 | | | | 148 | |
| Class R-3 | | | 28,661 | | | | 80,038 | | | | 108,699 | | | | 30,965 | | | | 71,847 | | | | 102,812 | |
| Class R-4 | | | 46,079 | | | | 108,618 | | | | 154,697 | | | | 44,264 | | | | 87,910 | | | | 132,174 | |
| Class R-5E2 | | | 1 | | | | 3 | | | | 4 | | | | — | 3 | | | — | 3 | | | — | 3 |
| Class R-5 | | | 43,308 | | | | 88,310 | | | | 131,618 | | | | 43,448 | | | | 73,597 | | | | 117,045 | |
| Class R-6 | | | 211,871 | | | | 426,083 | | | | 637,954 | | | | 159,878 | | | | 272,184 | | | | 432,062 | |
| Total | | $ | 1,613,391 | | | $ | 3,662,644 | | | $ | 5,276,035 | | | $ | 1,569,346 | | | $ | 3,006,010 | | | $ | 4,575,356 | |
| 1 | Class F-3 shares began investment operations on January 27, 2017. |
| 2 | Class R-5E shares began investment operations on November 20, 2015. |
| 3 | Amount less than one thousand. |
6. Fees and transactions with related parties
CRMC, the fund’s investment adviser, is the parent company of American Funds Distributors,® Inc. (“AFD”), the principal underwriter of the fund’s shares, and American Funds Service Company® (“AFS”), the fund’s transfer agent. CRMC, AFD and AFS are considered related parties to the fund.
Investment advisory services — The fund has an investment advisory and service agreement with CRMC that provides for monthly fees accrued daily. These fees are based on a series of decreasing annual rates beginning with 0.342% on the first $3 billion of daily net assets and decreasing to 0.2115% on such assets in excess of $116 billion. For the year ended April 30, 2017, the investment advisory services fee was $197,540,000, which was equivalent to an annualized rate of 0.235% of average daily net assets.
Class-specific fees and expenses — Expenses that are specific to individual share classes are accrued directly to the respective share class. The principal class-specific fees and expenses are further described below:
Distribution services — The fund has plans of distribution for all share classes, except Class F-2, F-3, R-5E, R-5 and R-6 shares. Under the plans, the board of trustees approves certain categories of expenses that are used to finance activities primarily intended to sell fund shares and service existing accounts. The plans provide for payments, based on an annualized percentage of average daily net assets, ranging from 0.25% to 1.00% as noted in this section. In some cases, the board of trustees has limited the amounts that may be paid to less than the maximum allowed by the plans. All share classes with a plan may use up to 0.25% of average daily net assets to pay service fees, or to compensate AFD for paying service fees, to firms that have entered into agreements with AFD to provide certain shareholder services. The remaining amounts available to be paid under each plan are paid to dealers to compensate them for their sales activities.
For Class A and 529-A shares, distribution-related expenses include the reimbursement of dealer and wholesaler commissions paid by AFD for certain shares sold without a sales charge. These share classes reimburse AFD for amounts billed within the prior
| Washington Mutual Investors Fund | 15 |
15 months but only to the extent that the overall annual expense limit of 0.25% is not exceeded. As of April 30, 2017, there were no unreimbursed expenses subject to reimbursement for Class A or 529-A shares.
| | Share class | | Currently approved limits | | Plan limits | |
| | Class A | | | 0.25 | % | | | 0.25 | % | |
| | Class 529-A | | | 0.25 | | | | 0.50 | | |
| | Classes B and 529-B | | | 1.00 | | | | 1.00 | | |
| | Classes C, 529-C and R-1 | | | 1.00 | | | | 1.00 | | |
| | Class R-2 | | | 0.75 | | | | 1.00 | | |
| | Class R-2E | | | 0.60 | | | | 0.85 | | |
| | Classes 529-E and R-3 | | | 0.50 | | | | 0.75 | | |
| | Classes T, F-1, 529-T, 529-F-1 and R-4 | | | 0.25 | | | | 0.50 | | |
Transfer agent services — The fund has a shareholder services agreement with AFS under which the fund compensates AFS for providing transfer agent services to each of the fund’s share classes. These services include recordkeeping, shareholder communications and transaction processing. In addition, the fund reimburses AFS for amounts paid to third parties for performing transfer agent services on behalf of fund shareholders.
Administrative services — The fund has an administrative services agreement with CRMC under which the fund compensates CRMC for providing administrative services to Class A, C, T, F, 529 and R shares. These services include, but are not limited to, coordinating, monitoring, assisting and overseeing third parties that provide services to fund shareholders. Under the agreement, Class A shares pay an annual fee of 0.01% and Class C, T, F, 529 and R shares pay an annual fee of 0.05% of their respective average daily net assets.
529 plan services — Each 529 share class is subject to service fees to compensate the Virginia College Savings Plan (“Virginia529”) for its oversight and administration of the 529 college savings plan. From May 1, 2016 to June 30, 2016, the quarterly fee was based on a series of decreasing annual rates beginning with 0.10% on the first $30 billion of the net assets invested in Class 529 shares of the American Funds and decreasing to 0.05% on such assets in excess of $70 billion. Effective July 1, 2016, the quarterly fee was amended to annual rates of 0.10% on the first $20 billion of the net assets invested in the Class 529 shares of the American Funds, 0.05% on such assets between $20 billion and $100 billion, and 0.03% on such assets over $100 billion. The fee for any given calendar quarter is accrued and calculated on the basis of the average net assets of Class 529 shares of the American Funds for the last month of the prior calendar quarter. The fee is included in other expenses in the fund’s statement of operations. Virginia529 is not considered a related party to the fund.
| 16 | Washington Mutual Investors Fund |
For the year ended ended April 30, 2017, class-specific expenses under the agreements were as follows (dollars in thousands):
| | Share class | | Distribution
services | | Transfer agent
services | | Administrative
services | | 529 plan
services | |
| | Class A | | | $124,553 | | | | $45,386 | | | | $5,231 | | | Not applicable | |
| | Class B | | | 334 | | | | 38 | | | | Not applicable | | | Not applicable | |
| | Class C | | | 16,163 | | | | 1,393 | | | | 811 | | | Not applicable | |
| | Class T1 | | | — | | | | — | 2 | | | — | 2 | | Not applicable | |
| | Class F-1 | | | 7,463 | | | | 3,737 | | | | 1,503 | | | Not applicable | |
| | Class F-2 | | | Not applicable | | | | 8,468 | | | | 3,833 | | | Not applicable | |
| | Class F-33 | | | Not applicable | | | | — | 2 | | | 10 | | | Not applicable | |
| | Class 529-A | | | 4,183 | | | | 1,334 | | | | 934 | | | $1,349 | |
| | Class 529-B | | | 54 | | | | 7 | | | | 3 | | | 4 | |
| | Class 529-C | | | 4,477 | | | | 348 | | | | 227 | | | 328 | |
| | Class 529-E | | | 469 | | | | 39 | | | | 47 | | | 69 | |
| | Class 529-T1 | | | — | | | | — | 2 | | | — | 2 | | — | 2 |
| | Class 529-F-1 | | | — | | | | 83 | | | | 58 | | | 84 | |
| | Class R-1 | | | 936 | | | | 96 | | | | 47 | | | Not applicable | |
| | Class R-2 | | | 5,409 | | | | 2,583 | | | | 364 | | | Not applicable | |
| | Class R-2E | | | 97 | | | | 33 | | | | 8 | | | Not applicable | |
| | Class R-3 | | | 9,140 | | | | 2,787 | | | | 917 | | | Not applicable | |
| | Class R-4 | | | 6,201 | | | | 2,480 | | | | 1,242 | | | Not applicable | |
| | Class R-5E | | | Not applicable | | | | — | 2 | | | — | 2 | | Not applicable | |
| | Class R-5 | | | Not applicable | | | | 1,012 | | | | 1,005 | | | Not applicable | |
| | Class R-6 | | | Not applicable | | | | 42 | | | | 4,839 | | | Not applicable | |
| | Total class-specific expenses | | | $179,479 | | | | $69,866 | | | | $21,079 | | | $1,834 | |
| | 1 | Class T and 529-T shares began investment operations on April 7, 2017. |
| | 2 | Amount less than one thousand. |
| | 3 | Class F-3 shares began investment operations on January 27, 2017. |
Board members’ deferred compensation — Board members who are unaffiliated with CRMC may elect to defer the cash payment of part or all of their compensation. These deferred amounts, which remain as liabilities of the fund, are treated as if invested in shares of the fund or other American Funds. These amounts represent general, unsecured liabilities of the fund and vary according to the total returns of the selected funds. Board members’ compensation of $2,619,000 in the fund’s statement of operations reflects $1,537,000 in current fees (either paid in cash or deferred) and a net increase of $1,082,000 in the value of the deferred amounts.
Affiliated officers and trustees — Officers and certain trustees of the fund are or may be considered to be affiliated with CRMC, AFD and AFS. No affiliated officers or trustees received any compensation directly from the fund.
Security transactions with related funds — The fund may purchase from, or sell securities to, other funds managed by CRMC (or funds managed by certain affiliates of CRMC) under procedures adopted by the fund’s board of trustees. The funds involved in such transactions are considered related by virtue of having a common investment adviser (or affiliated investment advisers), common trustees and/or common officers. When such transactions occur, each transaction is executed at the current market price of the security and no brokerage commissions or fees are paid in accordance with Rule 17a-7 of the 1940 Act.
Interfund lending — Pursuant to an exemptive order issued by the SEC, the fund, along with other CRMC-managed funds (or funds managed by certain affiliates of CRMC), may participate in an interfund lending program. The program provides an alternate credit facility that permits the funds to lend or borrow cash for temporary purposes directly to or from one another, subject to the conditions of the exemptive order. The fund did not lend or borrow cash through the interfund lending program at any time during the year ended April 30, 2017.
| Washington Mutual Investors Fund | 17 |
7. Capital share transactions
Capital share transactions in the fund were as follows (dollars and shares in thousands):
| | | Sales1 | | Reinvestments of
dividends and distributions | | Repurchases1 | | Net (decrease)
increase |
| Share class | | Amount | | | Shares | | | Amount | | | Shares | | | Amount | | | Shares | | | Amount | | | Shares | |
| | | | | | | | | | | | | | | | | | | | | | | | | | | | | | | | | |
| Year ended April 30, 2017 | | | | | | | | | | |
| | | | | | | | | | | | | | | | | | | | | | | | | | | | | | | | | |
| Class A | | $ | 3,373,188 | | | | 81,653 | | | $ | 3,177,442 | | | | 77,057 | | | $ | (7,766,870 | ) | | | (188,128 | ) | | $ | (1,216,240 | ) | | | (29,418 | ) |
| Class B | | | 607 | | | | 15 | | | | 1,366 | | | | 34 | | | | (68,655 | ) | | | (1,664 | ) | | | (66,682 | ) | | | (1,615 | ) |
| Class C | | | 290,517 | | | | 7,122 | | | | 87,729 | | | | 2,150 | | | | (460,643 | ) | | | (11,267 | ) | | | (82,397 | ) | | | (1,995 | ) |
| Class T2 | | | 10 | | | | — | 3 | | | — | | | | — | | | | — | | | | — | | | | 10 | | | | — | 3 |
| Class F-1 | | | 522,739 | | | | 12,706 | | | | 182,228 | | | | 4,434 | | | | (859,613 | ) | | | (20,796 | ) | | | (154,646 | ) | | | (3,656 | ) |
| Class F-2 | | | 4,090,455 | | | | 99,156 | | | | 498,671 | | | | 12,093 | | | | (1,876,626 | ) | | | (45,381 | ) | | | 2,712,500 | | | | 65,868 | |
| Class F-34 | | | 248,431 | | | | 5,831 | | | | 197 | | | | 4 | | | | (1,754 | ) | | | (41 | ) | | | 246,874 | | | | 5,794 | |
| Class 529-A | | | 181,882 | | | | 4,413 | | | | 114,888 | | | | 2,791 | | | | (262,742 | ) | | | (6,386 | ) | | | 34,028 | | | | 818 | |
| Class 529-B | | | 183 | | | | 5 | | | | 218 | | | | 5 | | | | (12,040 | ) | | | (292 | ) | | | (11,639 | ) | | | (282 | ) |
| Class 529-C | | | 43,067 | | | | 1,054 | | | | 24,605 | | | | 601 | | | | (78,618 | ) | | | (1,922 | ) | | | (10,946 | ) | | | (267 | ) |
| Class 529-E | | | 8,883 | | | | 217 | | | | 5,626 | | | | 138 | | | | (14,589 | ) | | | (357 | ) | | | (80 | ) | | | (2 | ) |
| Class 529-T2 | | | 10 | | | | — | 3 | | | — | | | | — | | | | — | | | | — | | | | 10 | | | | — | 3 |
| Class 529-F-1 | | | 24,892 | | | | 603 | | | | 7,499 | | | | 183 | | | | (25,868 | ) | | | (630 | ) | | | 6,523 | | | | 156 | |
| Class R-1 | | | 15,844 | | | | 388 | | | | 5,163 | | | | 127 | | | | (28,942 | ) | | | (708 | ) | | | (7,935 | ) | | | (193 | ) |
| Class R-2 | | | 165,589 | | | | 4,053 | | | | 40,054 | | | | 983 | | | | (248,436 | ) | | | (6,094 | ) | | | (42,793 | ) | | | (1,058 | ) |
| Class R-2E | | | 22,404 | | | | 540 | | | | 938 | | | | 23 | | | | (2,082 | ) | | | (50 | ) | | | 21,260 | | | | 513 | |
| Class R-3 | | | 384,984 | | | | 9,390 | | | | 108,620 | | | | 2,653 | | | | (526,958 | ) | | | (12,845 | ) | | | (33,354 | ) | | | (802 | ) |
| Class R-4 | | | 652,934 | | | | 15,885 | | | | 154,669 | | | | 3,768 | | | | (641,447 | ) | | | (15,616 | ) | | | 166,156 | | | | 4,037 | |
| Class R-5E | | | 459 | | | | 11 | | | | 4 | | | | — | 3 | | | (74 | ) | | | (2 | ) | | | 389 | | | | 9 | |
| Class R-5 | | | 487,126 | | | | 11,786 | | | | 131,537 | | | | 3,192 | | | | (598,176 | ) | | | (14,639 | ) | | | 20,487 | | | | 339 | |
| Class R-6 | | | 3,664,443 | | | | 89,105 | | | | 637,388 | | | | 15,445 | | | | (1,245,155 | ) | | | (30,056 | ) | | | 3,056,676 | | | | 74,494 | |
| Total net increase (decrease) | | $ | 14,178,647 | | | | 343,933 | | | $ | 5,178,842 | | | | 125,681 | | | $ | (14,719,288 | ) | | | (356,874 | ) | | $ | 4,638,201 | | | | 112,740 | |
| | | | | | | | | | | | | | | | | | | | | | | | | | | | | | | | | |
| Year ended April 30, 2016 | | | | | | |
| | | | | | | | | | | | | | | | | | | | | | | | | | | | | | | | | |
| Class A | | $ | 3,065,605 | | | | 78,555 | | | $ | 2,938,274 | | | | 77,218 | | | $ | (5,582,343 | ) | | | (142,345 | ) | | $ | 421,536 | | | | 13,428 | |
| Class B | | | 1,290 | | | | 33 | | | | 4,749 | | | | 126 | | | | (77,004 | ) | | | (1,976 | ) | | | (70,965 | ) | | | (1,817 | ) |
| Class C | | | 258,731 | | | | 6,705 | | | | 82,025 | | | | 2,185 | | | | (386,720 | ) | | | (9,986 | ) | | | (45,964 | ) | | | (1,096 | ) |
| Class F-1 | | | 524,963 | | | | 13,493 | | | | 163,622 | | | | 4,315 | | | | (577,054 | ) | | | (14,731 | ) | | | 111,531 | | | | 3,077 | |
| Class F-2 | | | 1,720,604 | | | | 44,066 | | | | 335,004 | | | | 8,809 | | | | (1,085,666 | ) | | | (27,823 | ) | | | 969,942 | | | | 25,052 | |
| Class 529-A | | | 152,175 | | | | 3,893 | | | | 103,462 | | | | 2,725 | | | | (228,677 | ) | | | (5,817 | ) | | | 26,960 | | | | 801 | |
| Class 529-B | | | 295 | | | | 8 | | | | 779 | | | | 20 | | | | (14,082 | ) | | | (359 | ) | | | (13,008 | ) | | | (331 | ) |
| Class 529-C | | | 39,959 | | | | 1,031 | | | | 22,661 | | | | 602 | | | | (64,306 | ) | | | (1,651 | ) | | | (1,686 | ) | | | (18 | ) |
| Class 529-E | | | 7,842 | | | | 203 | | | | 5,169 | | | | 137 | | | | (12,035 | ) | | | (309 | ) | | | 976 | | | | 31 | |
| Class 529-F-1 | | | 17,551 | | | | 451 | | | | 6,399 | | | | 169 | | | | (17,916 | ) | | | (455 | ) | | | 6,034 | | | | 165 | |
| Class R-1 | | | 16,827 | | | | 435 | | | | 4,875 | | | | 130 | | | | (25,829 | ) | | | (665 | ) | | | (4,127 | ) | | | (100 | ) |
| Class R-2 | | | 140,196 | | | | 3,630 | | | | 38,616 | | | | 1,030 | | | | (228,844 | ) | | | (5,907 | ) | | | (50,032 | ) | | | (1,247 | ) |
| Class R-2E | | | 8,516 | | | | 219 | | | | 147 | | | | 4 | | | | (511 | ) | | | (13 | ) | | | 8,152 | | | | 210 | |
| Class R-3 | | | 372,731 | | | | 9,575 | | | | 102,664 | | | | 2,721 | | | | (559,656 | ) | | | (14,406 | ) | | | (84,261 | ) | | | (2,110 | ) |
| Class R-4 | | | 558,013 | | | | 14,307 | | | | 132,148 | | | | 3,489 | | | | (568,282 | ) | | | (14,575 | ) | | | 121,879 | | | | 3,221 | |
| Class R-5E5 | | | 10 | | | | — | 3 | | | — | | | | — | | | | — | | | | — | | | | 10 | | | | — | 3 |
| Class R-5 | | | 342,492 | | | | 8,735 | | | | 116,951 | | | | 3,072 | | | | (425,516 | ) | | | (10,784 | ) | | | 33,927 | | | | 1,023 | |
| Class R-6 | | | 2,131,499 | | | | 54,833 | | | | 431,579 | | | | 11,334 | | | | (818,830 | ) | | | (20,945 | ) | | | 1,744,248 | | | | 45,222 | |
| Total net increase (decrease) | | $ | 9,359,299 | | | | 240,172 | | | $ | 4,489,124 | | | | 118,086 | | | $ | (10,673,271 | ) | | | (272,747 | ) | | $ | 3,175,152 | | | | 85,511 | |
| 1 | Includes exchanges between share classes of the fund. |
| 2 | Class T and 529-T shares began investment operations on April 7, 2017. |
| 3 | Amount less than one thousand. |
| 4 | Class F-3 shares began investment operations on January 27, 2017. |
| 5 | Class R-5E shares began investment operations on November 20, 2015. |
8. Investment transactions
The fund made purchases and sales of investment securities, excluding short-term securities and U.S. government obligations, if any, of $17,275,239,000 and $18,143,153,000, respectively, during the year ended April 30, 2017.
| 18 | Washington Mutual Investors Fund |
Financial highlights
| | | | | | Income from
investment operations1 | | | Dividends and distributions | | | | | | | | | | | | | | | | |
| | | Net asset
value,
beginning
of period | | | Net
investment
income | | | Net gains
(losses) on
securities
(both
realized and
unrealized) | | | Total from
investment
operations | | | Dividends
(from net
investment
income) | | | Distributions
(from capital
gains) | | | Total
dividends
and
distributions | | | Net asset
value,
end
of period | | | Total
return2 | | | Net assets,
end of period
(in millions) | | | Ratio of
expenses to
average
net assets | | | Ratio of
net income
to average
net assets | |
| Class A: | | | | | | | | | | | | | | | | | | | | | | | | | | | | | | | | | | | | | | | | | | | | | | | | |
| Year ended 4/30/2017 | | $ | 39.38 | | | $ | .80 | | | $ | 5.33 | | | $ | 6.13 | | | $ | (.79 | ) | | $ | (1.83 | ) | | $ | (2.62 | ) | | $ | 42.89 | | | | 15.91 | % | | $ | 53,976 | | | | .58 | % | | | 1.95 | % |
| Year ended 4/30/2016 | | | 41.23 | | | | .80 | | | | (.24 | ) | | | .56 | | | | (.82 | ) | | | (1.59 | ) | | | (2.41 | ) | | | 39.38 | | | | 1.62 | | | | 50,717 | | | | .58 | | | | 2.02 | |
| Year ended 4/30/2015 | | | 40.40 | | | | .83 | | | | 2.89 | | | | 3.72 | | | | (.85 | ) | | | (2.04 | ) | | | (2.89 | ) | | | 41.23 | | | | 9.28 | | | | 52,547 | | | | .58 | | | | 2.01 | |
| Year ended 4/30/2014 | | | 35.08 | | | | .79 | | | | 6.18 | | | | 6.97 | | | | (.86 | ) | | | (.79 | ) | | | (1.65 | ) | | | 40.40 | | | | 20.16 | | | | 50,626 | | | | .60 | | | | 2.07 | |
| Year ended 4/30/2013 | | | 30.61 | | | | .73 | | | | 4.47 | | | | 5.20 | | | | (.73 | ) | | | — | | | | (.73 | ) | | | 35.08 | | | | 17.28 | | | | 44,142 | | | | .62 | | | | 2.32 | |
| Class B: | | | | | | | | | | | | | | | | | | | | | | | | | | | | | | | | | | | | | | | | | | | | | | | | |
| Year ended 4/30/2017 | | | 39.19 | | | | .53 | | | | 5.23 | | | | 5.76 | | | | (.30 | ) | | | (1.83 | ) | | | (2.13 | ) | | | 42.82 | | | | 14.93 | | | | — | 3 | | | 1.34 | | | | 1.31 | |
| Year ended 4/30/2016 | | | 41.00 | | | | .51 | | | | (.24 | ) | | | .27 | | | | (.49 | ) | | | (1.59 | ) | | | (2.08 | ) | | | 39.19 | | | | .87 | | | | 63 | | | | 1.33 | | | | 1.31 | |
| Year ended 4/30/2015 | | | 40.17 | | | | .53 | | | | 2.85 | | | | 3.38 | | | | (.51 | ) | | | (2.04 | ) | | | (2.55 | ) | | | 41.00 | | | | 8.46 | | | | 141 | | | | 1.33 | | | | 1.28 | |
| Year ended 4/30/2014 | | | 34.88 | | | | .50 | | | | 6.14 | | | | 6.64 | | | | (.56 | ) | | | (.79 | ) | | | (1.35 | ) | | | 40.17 | | | | 19.24 | | | | 236 | | | | 1.35 | | | | 1.33 | |
| Year ended 4/30/2013 | | | 30.42 | | | | .50 | | | | 4.44 | | | | 4.94 | | | | (.48 | ) | | | — | | | | (.48 | ) | | | 34.88 | | | | 16.41 | | | | 323 | | | | 1.37 | | | | 1.61 | |
| Class C: | | | | | | | | | | | | | | | | | | | | | | | | | | | | | | | | | | | | | | | | | | | | | | | | |
| Year ended 4/30/2017 | | | 38.92 | | | | .47 | | | | 5.27 | | | | 5.74 | | | | (.47 | ) | | | (1.83 | ) | | | (2.30 | ) | | | 42.36 | | | | 14.99 | | | | 1,643 | | | | 1.38 | | | | 1.15 | |
| Year ended 4/30/2016 | | | 40.77 | | | | .48 | | | | (.24 | ) | | | .24 | | | | (.50 | ) | | | (1.59 | ) | | | (2.09 | ) | | | 38.92 | | | | .82 | | | | 1,588 | | | | 1.38 | | | | 1.23 | |
| Year ended 4/30/2015 | | | 39.99 | | | | .50 | | | | 2.83 | | | | 3.33 | | | | (.51 | ) | | | (2.04 | ) | | | (2.55 | ) | | | 40.77 | | | | 8.39 | | | | 1,708 | | | | 1.38 | | | | 1.21 | |
| Year ended 4/30/2014 | | | 34.74 | | | | .48 | | | | 6.12 | | | | 6.60 | | | | (.56 | ) | | | (.79 | ) | | | (1.35 | ) | | | 39.99 | | | | 19.19 | | | | 1,771 | | | | 1.39 | | | | 1.27 | |
| Year ended 4/30/2013 | | | 30.31 | | | | .48 | | | | 4.43 | | | | 4.91 | | | | (.48 | ) | | | — | | | | (.48 | ) | | | 34.74 | | | | 16.39 | | | | 1,757 | | | | 1.42 | | | | 1.53 | |
| Class T: | | | | | | | | | | | | | | | | | | | | | | | | | | | | | | | | | | | | | | | | | | | | | | | | |
| Period from 4/7/2017 to 4/30/20174,5 | | | 42.53 | | | | .01 | | | | .35 | | | | .36 | | | | — | | | | — | | | | — | | | | 42.89 | | | | .85 | 6 | | | — | 3 | | | .02 | 6 | | | .03 | 6 |
| Class F-1: | | | | | | | | | | | | | | | | | | | | | | | | | | | | | | | | | | | | | | | | | | | | | | | | |
| Year ended 4/30/2017 | | | 39.25 | | | | .76 | | | | 5.32 | | | | 6.08 | | | | (.76 | ) | | | (1.83 | ) | | | (2.59 | ) | | | 42.74 | | | | 15.81 | | | | 2,999 | | | | .67 | | | | 1.86 | |
| Year ended 4/30/2016 | | | 41.10 | | | | .76 | | | | (.23 | ) | | | .53 | | | | (.79 | ) | | | (1.59 | ) | | | (2.38 | ) | | | 39.25 | | | | 1.55 | | | | 2,897 | | | | .66 | | | | 1.94 | |
| Year ended 4/30/2015 | | | 40.28 | | | | .81 | | | | 2.85 | | | | 3.66 | | | | (.80 | ) | | | (2.04 | ) | | | (2.84 | ) | | | 41.10 | | | | 9.18 | | | | 2,908 | | | | .66 | | | | 1.95 | |
| Year ended 4/30/2014 | | | 34.99 | | | | .75 | | | | 6.16 | | | | 6.91 | | | | (.83 | ) | | | (.79 | ) | | | (1.62 | ) | | | 40.28 | | | | 20.05 | | | | 3,831 | | | | .67 | | | | 1.99 | |
| Year ended 4/30/2013 | | | 30.53 | | | | .71 | | | | 4.47 | | | | 5.18 | | | | (.72 | ) | | | — | | | | (.72 | ) | | | 34.99 | | | | 17.25 | | | | 3,004 | | | | .66 | | | | 2.27 | |
| Class F-2: | | | | | | | | | | | | | | | | | | | | | | | | | | | | | | | | | | | | | | | | | | | | | | | | |
| Year ended 4/30/2017 | | | 39.36 | | | | .87 | | | | 5.33 | | | | 6.20 | | | | (.87 | ) | | | (1.83 | ) | | | (2.70 | ) | | | 42.86 | | | | 16.10 | | | | 9,463 | | | | .41 | | | | 2.10 | |
| Year ended 4/30/2016 | | | 41.21 | | | | .86 | | | | (.23 | ) | | | .63 | | | | (.89 | ) | | | (1.59 | ) | | | (2.48 | ) | | | 39.36 | | | | 1.81 | | | | 6,097 | | | | .41 | | | | 2.19 | |
| Year ended 4/30/2015 | | | 40.39 | | | | .89 | | | | 2.90 | | | | 3.79 | | | | (.93 | ) | | | (2.04 | ) | | | (2.97 | ) | | | 41.21 | | | | 9.48 | | | | 5,352 | | | | .40 | | | | 2.14 | |
| Year ended 4/30/2014 | | | 35.08 | | | | .86 | | | | 6.18 | | | | 7.04 | | | | (.94 | ) | | | (.79 | ) | | | (1.73 | ) | | | 40.39 | | | | 20.38 | | | | 2,077 | | | | .41 | | | | 2.26 | |
| Year ended 4/30/2013 | | | 30.60 | | | | .79 | | | | 4.49 | | | | 5.28 | | | | (.80 | ) | | | — | | | | (.80 | ) | | | 35.08 | | | | 17.57 | | | | 1,387 | | | | .41 | | | | 2.51 | |
| Class F-3: | | | | | | | | | | | | | | | | | | | | | | | | | | | | | | | | | | | | | | | | | | | | | | | | |
| Period from 1/27/2017 to 4/30/20174,7 | | | 41.86 | | | | .15 | | | | 1.10 | | | | 1.25 | | | | (.23 | ) | | | — | | | | (.23 | ) | | | 42.88 | | | | 2.98 | 6 | | | 249 | | | | .08 | 6 | | | .35 | 6 |
See page 22 for footnotes.
| Washington Mutual Investors Fund | 19 |
Financial highlights (continued)
| | | | | | Income from
investment operations1 | | | Dividends and distributions | | | | | | | | | | | | | | | | |
| | | Net asset
value,
beginning
of period | | | Net
investment
income | | | Net gains
(losses) on
securities
(both
realized and
unrealized) | | | Total from
investment
operations | | | Dividends
(from net
investment
income) | | | Distributions
(from capital
gains) | | | Total
dividends
and
distributions | | | Net asset
value,
end
of period | | | Total
return2 | | | Net assets,
end of period
(in millions) | | | Ratio of
expenses to
average
net assets | | | Ratio of
net income
to average
net assets | |
| Class 529-A: | | | | | | | | | | | | | | | | | | | | | | | | | | | | | | | | | | | | | | | | | | | | | | | | |
| Year ended 4/30/2017 | | $ | 39.30 | | | $ | .77 | | | $ | 5.32 | | | $ | 6.09 | | | $ | (.76 | ) | | $ | (1.83 | ) | | $ | (2.59 | ) | | $ | 42.80 | | | | 15.82 | % | | $ | 1,982 | | | | .66 | % | | | 1.86 | % |
| Year ended 4/30/2016 | | | 41.15 | | | | .76 | | | | (.24 | ) | | | .52 | | | | (.78 | ) | | | (1.59 | ) | | | (2.37 | ) | | | 39.30 | | | | 1.52 | | | | 1,788 | | | | .68 | | | | 1.93 | |
| Year ended 4/30/2015 | | | 40.33 | | | | .79 | | | | 2.88 | | | | 3.67 | | | | (.81 | ) | | | (2.04 | ) | | | (2.85 | ) | | | 41.15 | | | | 9.17 | | | | 1,839 | | | | .68 | | | | 1.91 | |
| Year ended 4/30/2014 | | | 35.03 | | | | .75 | | | | 6.17 | | | | 6.92 | | | | (.83 | ) | | | (.79 | ) | | | (1.62 | ) | | | 40.33 | | | | 20.03 | | | | 1,731 | | | | .69 | | | | 1.97 | |
| Year ended 4/30/2013 | | | 30.56 | | | | .70 | | | | 4.47 | | | | 5.17 | | | | (.70 | ) | | | — | | | | (.70 | ) | | | 35.03 | | | | 17.21 | | | | 1,465 | | | | .71 | | | | 2.23 | |
| Class 529-B: | | | | | | | | | | | | | | | | | | | | | | | | | | | | | | | | | | | | | | | | | | | | | | | | |
| Year ended 4/30/2017 | | | 39.23 | | | | .49 | | | | 5.31 | | | | 5.80 | | | | (.25 | ) | | | (1.83 | ) | | | (2.08 | ) | | | 42.95 | | | | 15.03 | | | | — | 3 | | | 1.45 | | | | 1.21 | |
| Year ended 4/30/2016 | | | 41.04 | | | | .47 | | | | (.26 | ) | | | .21 | | | | (.43 | ) | | | (1.59 | ) | | | (2.02 | ) | | | 39.23 | | | | .71 | | | | 11 | | | | 1.46 | | | | 1.18 | |
| Year ended 4/30/2015 | | | 40.20 | | | | .48 | | | | 2.85 | | | | 3.33 | | | | (.45 | ) | | | (2.04 | ) | | | (2.49 | ) | | | 41.04 | | | | 8.34 | | | | 25 | | | | 1.46 | | | | 1.15 | |
| Year ended 4/30/2014 | | | 34.90 | | | | .45 | | | | 6.15 | | | | 6.60 | | | | (.51 | ) | | | (.79 | ) | | | (1.30 | ) | | | 40.20 | | | | 19.10 | | | | 41 | | | | 1.48 | | | | 1.20 | |
| Year ended 4/30/2013 | | | 30.44 | | | | .46 | | | | 4.44 | | | | 4.90 | | | | (.44 | ) | | | — | | | | (.44 | ) | | | 34.90 | | | | 16.26 | | | | 56 | | | | 1.50 | | | | 1.48 | |
| Class 529-C: | | | | | | | | | | | | | | | | | | | | | | | | | | | | | | | | | | | | | | | | | | | | | | | | |
| Year ended 4/30/2017 | | | 39.03 | | | | .45 | | | | 5.27 | | | | 5.72 | | | | (.44 | ) | | | (1.83 | ) | | | (2.27 | ) | | | 42.48 | | | | 14.91 | | | | 470 | | | | 1.43 | | | | 1.10 | |
| Year ended 4/30/2016 | | | 40.88 | | | | .45 | | | | (.23 | ) | | | .22 | | | | (.48 | ) | | | (1.59 | ) | | | (2.07 | ) | | | 39.03 | | | | .74 | | | | 442 | | | | 1.45 | | | | 1.15 | |
| Year ended 4/30/2015 | | | 40.09 | | | | .47 | | | | 2.85 | | | | 3.32 | | | | (.49 | ) | | | (2.04 | ) | | | (2.53 | ) | | | 40.88 | | | | 8.33 | | | | 464 | | | | 1.45 | | | | 1.14 | |
| Year ended 4/30/2014 | | | 34.83 | | | | .45 | | | | 6.14 | | | | 6.59 | | | | (.54 | ) | | | (.79 | ) | | | (1.33 | ) | | | 40.09 | | | | 19.11 | | | | 447 | | | | 1.47 | | | | 1.20 | |
| Year ended 4/30/2013 | | | 30.39 | | | | .45 | | | | 4.45 | | | | 4.90 | | | | (.46 | ) | | | — | | | | (.46 | ) | | | 34.83 | | | | 16.31 | | | | 390 | | | | 1.49 | | | | 1.45 | |
| Class 529-E: | | | | | | | | | | | | | | | | | | | | | | | | | | | | | | | | | | | | | | | | | | | | | | | | |
| Year ended 4/30/2017 | | | 39.10 | | | | .66 | | | | 5.30 | | | | 5.96 | | | | (.66 | ) | | | (1.83 | ) | | | (2.49 | ) | | | 42.57 | | | | 15.54 | | | | 100 | | | | .90 | | | | 1.62 | |
| Year ended 4/30/2016 | | | 40.95 | | | | .66 | | | | (.24 | ) | | | .42 | | | | (.68 | ) | | | (1.59 | ) | | | (2.27 | ) | | | 39.10 | | | | 1.29 | | | | 92 | | | | .92 | | | | 1.68 | |
| Year ended 4/30/2015 | | | 40.15 | | | | .69 | | | | 2.86 | | | | 3.55 | | | | (.71 | ) | | | (2.04 | ) | | | (2.75 | ) | | | 40.95 | | | | 8.90 | | | | 95 | | | | .92 | | | | 1.66 | |
| Year ended 4/30/2014 | | | 34.88 | | | | .65 | | | | 6.14 | | | | 6.79 | | | | (.73 | ) | | | (.79 | ) | | | (1.52 | ) | | | 40.15 | | | | 19.73 | | | | 91 | | | | .94 | | | | 1.72 | |
| Year ended 4/30/2013 | | | 30.44 | | | | .62 | | | | 4.44 | | | | 5.06 | | | | (.62 | ) | | | — | | | | (.62 | ) | | | 34.88 | | | | 16.89 | | | | 77 | | | | .96 | | | | 1.97 | |
| Class 529-T: | | | | | | | | | | | | | | | | | | | | | | | | | | | | | | | | | | | | | | | | | | | | | | | | |
| Period from 4/7/2017 to 4/30/20174,5 | | | 42.53 | | | | .01 | | | | .35 | | | | .36 | | | | — | | | | — | | | | — | | | | 42.89 | | | | .85 | 6 | | | — | 3 | | | .03 | 6 | | | .02 | 6 |
| Class 529-F-1: | | | | | | | | | | | | | | | | | | | | | | | | | | | | | | | | | | | | | | | | | | | | | | | | |
| Year ended 4/30/2017 | | | 39.23 | | | | .85 | | | | 5.31 | | | | 6.16 | | | | (.85 | ) | | | (1.83 | ) | | | (2.68 | ) | | | 42.71 | | | | 16.06 | | | | 126 | | | | .44 | | | | 2.08 | |
| Year ended 4/30/2016 | | | 41.08 | | | | .84 | | | | (.23 | ) | | | .61 | | | | (.87 | ) | | | (1.59 | ) | | | (2.46 | ) | | | 39.23 | | | | 1.76 | | | | 110 | | | | .46 | | | | 2.15 | |
| Year ended 4/30/2015 | | | 40.27 | | | | .88 | | | | 2.87 | | | | 3.75 | | | | (.90 | ) | | | (2.04 | ) | | | (2.94 | ) | | | 41.08 | | | | 9.40 | | | | 108 | | | | .45 | | | | 2.13 | |
| Year ended 4/30/2014 | | | 34.98 | | | | .83 | | | | 6.16 | | | | 6.99 | | | | (.91 | ) | | | (.79 | ) | | | (1.70 | ) | | | 40.27 | | | | 20.29 | | | | 100 | | | | .47 | | | | 2.19 | |
| Year ended 4/30/2013 | | | 30.51 | | | | .77 | | | | 4.47 | | | | 5.24 | | | | (.77 | ) | | | — | | | | (.77 | ) | | | 34.98 | | | | 17.49 | | | | 81 | | | | .49 | | | | 2.45 | |
| Class R-1: | | | | | | | | | | | | | | | | | | | | | | | | | | | | | | | | | | | | | | | | | | | | | | | | |
| Year ended 4/30/2017 | | | 39.00 | | | | .46 | | | | 5.28 | | | | 5.74 | | | | (.46 | ) | | | (1.83 | ) | | | (2.29 | ) | | | 42.45 | | | | 14.98 | | | | 93 | | | | 1.39 | | | | 1.14 | |
| Year ended 4/30/2016 | | | 40.85 | | | | .47 | | | | (.23 | ) | | | .24 | | | | (.50 | ) | | | (1.59 | ) | | | (2.09 | ) | | | 39.00 | | | | .81 | | | | 93 | | | | 1.39 | | | | 1.22 | |
| Year ended 4/30/2015 | | | 40.06 | | | | .50 | | | | 2.85 | | | | 3.35 | | | | (.52 | ) | | | (2.04 | ) | | | (2.56 | ) | | | 40.85 | | | | 8.41 | | | | 101 | | | | 1.38 | | | | 1.21 | |
| Year ended 4/30/2014 | | | 34.81 | | | | .48 | | | | 6.12 | | | | 6.60 | | | | (.56 | ) | | | (.79 | ) | | | (1.35 | ) | | | 40.06 | | | | 19.18 | | | | 100 | | | | 1.39 | | | | 1.27 | |
| Year ended 4/30/2013 | | | 30.37 | | | | .48 | | | | 4.45 | | | | 4.93 | | | | (.49 | ) | | | — | | | | (.49 | ) | | | 34.81 | | | | 16.42 | | | | 88 | | | | 1.40 | | | | 1.54 | |
| 20 | Washington Mutual Investors Fund |
| | | | | | Income from
investment operations1 | | | Dividends and distributions | | | | | | | | | | | | | | | | |
| | | Net asset
value,
beginning
of period | | | Net
investment
income | | | Net gains
(losses) on
securities
(both
realized and
unrealized) | | | Total from
investment
operations | | | Dividends
(from net
investment
income) | | | Distributions
(from capital
gains) | | | Total
dividends
and
distributions | | | Net asset
value,
end
of period | | | Total
return2 | | | Net assets,
end of period
(in millions) | | | Ratio of
expenses to
average
net assets | | | Ratio of
net income
to average
net assets | |
| Class R-2: | | | | | | | | | | | | | | | | | | | | | | | | | | | | | | | | | | | | | | | | | | | | | | | | |
| Year ended 4/30/2017 | | $ | 38.88 | | | $ | .46 | | | $ | 5.26 | | | $ | 5.72 | | | $ | (.46 | ) | | $ | (1.83 | ) | | $ | (2.29 | ) | | $ | 42.31 | | | | 14.97 | % | | $ | 736 | | | | 1.39 | % | | | 1.13 | % |
| Year ended 4/30/2016 | | | 40.73 | | | | .49 | | | | (.23 | ) | | | .26 | | | | (.52 | ) | | | (1.59 | ) | | | (2.11 | ) | | | 38.88 | | | | .85 | | | | 718 | | | | 1.36 | | | | 1.25 | |
| Year ended 4/30/2015 | | | 39.95 | | | | .51 | | | | 2.84 | | | | 3.35 | | | | (.53 | ) | | | (2.04 | ) | | | (2.57 | ) | | | 40.73 | | | | 8.46 | | | | 803 | | | | 1.34 | | | | 1.25 | |
| Year ended 4/30/2014 | | | 34.71 | | | | .49 | | | | 6.12 | | | | 6.61 | | | | (.58 | ) | | | (.79 | ) | | | (1.37 | ) | | | 39.95 | | | | 19.26 | | | | 808 | | | | 1.35 | | | | 1.32 | |
| Year ended 4/30/2013 | | | 30.30 | | | | .49 | | | | 4.42 | | | | 4.91 | | | | (.50 | ) | | | — | | | | (.50 | ) | | | 34.71 | | | | 16.39 | | | | 753 | | | | 1.37 | | | | 1.57 | |
| Class R-2E: | | | | | | | | | | | | | | | | | | | | | | | | | | | | | | | | | | | | | | | | | | | | | | | | |
| Year ended 4/30/2017 | | | 39.26 | | | | .55 | | | | 5.33 | | | | 5.88 | | | | (.60 | ) | | | (1.83 | ) | | | (2.43 | ) | | | 42.71 | | | | 15.27 | | | | 31 | | | | 1.10 | | | | 1.35 | |
| Year ended 4/30/2016 | | | 41.18 | | | | .52 | | | | (.07 | ) | | | .45 | | | | (.78 | ) | | | (1.59 | ) | | | (2.37 | ) | | | 39.26 | | | | 1.35 | | | | 8 | | | | 1.01 | | | | 1.40 | |
| Period from 8/29/2014 to 4/30/20154,8 | | | 42.40 | | | | .51 | | | | 1.01 | | | | 1.52 | | | | (.70 | ) | | | (2.04 | ) | | | (2.74 | ) | | | 41.18 | | | | 3.63 | 6,9 | | | — | 3 | | | .64 | 9,10 | | | 1.84 | 9,10 |
| Class R-3: | | | | | | | | | | | | | | | | | | | | | | | | | | | | | | | | | | | | | | | | | | | | | | | | |
| Year ended 4/30/2017 | | | 39.08 | | | | .65 | | | | 5.28 | | | | 5.93 | | | | (.64 | ) | | | (1.83 | ) | | | (2.47 | ) | | | 42.54 | | | | 15.49 | | | | 1,890 | | | | .95 | | | | 1.58 | |
| Year ended 4/30/2016 | | | 40.94 | | | | .65 | | | | (.25 | ) | | | .40 | | | | (.67 | ) | | | (1.59 | ) | | | (2.26 | ) | | | 39.08 | | | | 1.23 | | | | 1,767 | | | | .95 | | | | 1.66 | |
| Year ended 4/30/2015 | | | 40.14 | | | | .68 | | | | 2.86 | | | | 3.54 | | | | (.70 | ) | | | (2.04 | ) | | | (2.74 | ) | | | 40.94 | | | | 8.89 | | | | 1,937 | | | | .94 | | | | 1.65 | |
| Year ended 4/30/2014 | | | 34.87 | | | | .65 | | | | 6.14 | | | | 6.79 | | | | (.73 | ) | | | (.79 | ) | | | (1.52 | ) | | | 40.14 | | | | 19.73 | | | | 1,857 | | | | .95 | | | | 1.71 | |
| Year ended 4/30/2013 | | | 30.43 | | | | .62 | | | | 4.45 | | | | 5.07 | | | | (.63 | ) | | | — | | | | (.63 | ) | | | 34.87 | | | | 16.90 | | | | 1,647 | | | | .97 | | | | 1.97 | |
| Class R-4: | | | | | | | | | | | | | | | | | | | | | | | | | | | | | | | | | | | | | | | | | | | | | | | | |
| Year ended 4/30/2017 | | | 39.20 | | | | .77 | | | | 5.31 | | | | 6.08 | | | | (.77 | ) | | | (1.83 | ) | | | (2.60 | ) | | | 42.68 | | | | 15.83 | | | | 2,683 | | | | .64 | | | | 1.88 | |
| Year ended 4/30/2016 | | | 41.06 | | | | .77 | | | | (.25 | ) | | | .52 | | | | (.79 | ) | | | (1.59 | ) | | | (2.38 | ) | | | 39.20 | | | | 1.54 | | | | 2,306 | | | | .65 | | | | 1.96 | |
| Year ended 4/30/2015 | | | 40.25 | | | | .81 | | | | 2.86 | | | | 3.67 | | | | (.82 | ) | | | (2.04 | ) | | | (2.86 | ) | | | 41.06 | | | | 9.22 | | | | 2,283 | | | | .64 | | | | 1.95 | |
| Year ended 4/30/2014 | | | 34.96 | | | | .76 | | | | 6.16 | | | | 6.92 | | | | (.84 | ) | | | (.79 | ) | | | (1.63 | ) | | | 40.25 | | | | 20.09 | | | | 2,139 | | | | .65 | | | | 2.02 | |
| Year ended 4/30/2013 | | | 30.50 | | | | .71 | | | | 4.47 | | | | 5.18 | | | | (.72 | ) | | | — | | | | (.72 | ) | | | 34.96 | | | | 17.28 | | | | 1,823 | | | | .65 | | | | 2.28 | |
| Class R-5E: | | | | | | | | | | | | | | | | | | | | | | | | | | | | | | | | | | | | | | | | | | | | | | | | |
| Year ended 4/30/2017 | | | 39.36 | | | | .75 | | | | 5.42 | | | | 6.17 | | | | (.84 | ) | | | (1.83 | ) | | | (2.67 | ) | | | 42.86 | | | | 16.04 | | | | — | 3 | | | .48 | | | | 1.82 | |
| Period from 11/20/2015 to 4/30/20164,11 | | | 41.13 | | | | .33 | | | | (.03 | ) | | | .30 | | | | (.48 | ) | | | (1.59 | ) | | | (2.07 | ) | | | 39.36 | | | | .97 | 6 | | | — | 3 | | | .22 | 6 | | | .87 | 6 |
| Class R-5: | | | | | | | | | | | | | | | | | | | | | | | | | | | | | | | | | | | | | | | | | | | | | | | | |
| Year ended 4/30/2017 | | | 39.37 | | | | .90 | | | | 5.32 | | | | 6.22 | | | | (.89 | ) | | | (1.83 | ) | | | (2.72 | ) | | | 42.87 | | | | 16.16 | | | | 2,137 | | | | .35 | | | | 2.18 | |
| Year ended 4/30/2016 | | | 41.22 | | | | .89 | | | | (.24 | ) | | | .65 | | | | (.91 | ) | | | (1.59 | ) | | | (2.50 | ) | | | 39.37 | | | | 1.87 | | | | 1,949 | | | | .35 | | | | 2.26 | |
| Year ended 4/30/2015 | | | 40.39 | | | | .93 | | | | 2.89 | | | | 3.82 | | | | (.95 | ) | | | (2.04 | ) | | | (2.99 | ) | | | 41.22 | | | | 9.55 | | | | 1,998 | | | | .34 | | | | 2.24 | |
| Year ended 4/30/2014 | | | 35.08 | | | | .88 | | | | 6.17 | | | | 7.05 | | | | (.95 | ) | | | (.79 | ) | | | (1.74 | ) | | | 40.39 | | | | 20.43 | | | | 1,893 | | | | .35 | | | | 2.32 | |
| Year ended 4/30/2013 | | | 30.60 | | | | .81 | | | | 4.48 | | | | 5.29 | | | | (.81 | ) | | | — | | | | (.81 | ) | | | 35.08 | | | | 17.63 | | | | 1,504 | | | | .35 | | | | 2.57 | |
| Class R-6: | | | | | | | | | | | | | | | | | | | | | | | | | | | | | | | | | | | | | | | | | | | | | | | | |
| Year ended 4/30/2017 | | | 39.40 | | | | .91 | | | | 5.34 | | | | 6.25 | | | | (.91 | ) | | | (1.83 | ) | | | (2.74 | ) | | | 42.91 | | | | 16.23 | | | | 11,692 | | | | .30 | | | | 2.21 | |
| Year ended 4/30/2016 | | | 41.25 | | | | .90 | | | | (.23 | ) | | | .67 | | | | (.93 | ) | | | (1.59 | ) | | | (2.52 | ) | | | 39.40 | | | | 1.91 | | | | 7,800 | | | | .30 | | | | 2.30 | |
| Year ended 4/30/2015 | | | 40.42 | | | | .95 | | | | 2.89 | | | | 3.84 | | | | (.97 | ) | | | (2.04 | ) | | | (3.01 | ) | | | 41.25 | | | | 9.59 | | | | 6,301 | | | | .30 | | | | 2.28 | |
| Year ended 4/30/2014 | | | 35.10 | | | | .90 | | | | 6.18 | | | | 7.08 | | | | (.97 | ) | | | (.79 | ) | | | (1.76 | ) | | | 40.42 | | | | 20.51 | | | | 4,581 | | | | .30 | | | | 2.36 | |
| Year ended 4/30/2013 | | | 30.62 | | | | .82 | | | | 4.49 | | | | 5.31 | | | | (.83 | ) | | | — | | | | (.83 | ) | | | 35.10 | | | | 17.68 | | | | 2,943 | | | | .30 | | | | 2.61 | |
| | | Year ended April 30 |
| | | 2017 | | | 2016 | | | 2015 | | | 2014 | | | 2013 | |
| Portfolio turnover rate for all share classes | | | 21 | % | | | 30 | % | | | 24 | % | | | 19 | % | | | 22 | % |
| Washington Mutual Investors Fund | 21 |
Financial highlights (continued)
| 1 | Based on average shares outstanding. |
| 2 | Total returns exclude any applicable sales charges, including contingent deferred sales charges. |
| 3 | Amount less than $1 million. |
| 4 | Based on operations for the period shown and, accordingly, is not representative of a full year. |
| 5 | Class T and 529-T shares began investment operations on April 7, 2017. |
| 6 | Not annualized. |
| 7 | Class F-3 shares began investment operations on January 27, 2017. |
| 8 | Class R-2E shares began investment operations on August 29, 2014. |
| 9 | All or a significant portion of assets in this class consisted of seed capital invested by CRMC and/or its affiliates. Fees for distribution services are not charged or accrued on these seed capital assets. If such fees were paid by the fund on seed capital assets, fund expenses would have been higher and net income and total return would have been lower. |
| 10 | Annualized. |
| 11 | Class R-5E shares began investment operations on November 20, 2015. |
See Notes to Financial Statements
| 22 | Washington Mutual Investors Fund |
Report of Independent Registered Public Accounting Firm
To the Board of Trustees and Shareholders of Washington Mutual Investors Fund
In our opinion, the accompanying statement of assets and liabilities, including the summary investment portfolio, and the related statements of operations and of changes in net assets and the financial highlights present fairly, in all material respects, the financial position of Washington Mutual Investors Fund (the “Fund”) at April 30, 2017, the results of its operations for the year then ended, the changes in its net assets for each of the two years in the period then ended and the financial highlights for each of the periods presented, in conformity with accounting principles generally accepted in the United States of America. These financial statements and financial highlights (hereafter referred to as “financial statements”) are the responsibility of the Fund’s management. Our responsibility is to express an opinion on these financial statements based on our audits. We conducted our audits of these financial statements in accordance with the standards of the Public Company Accounting Oversight Board (United States). Those standards require that we plan and perform the audit to obtain reasonable assurance about whether the financial statements are free of material misstatement. An audit includes examining, on a test basis, evidence supporting the amounts and disclosures in the financial statements, assessing the accounting principles used and significant estimates made by management, and evaluating the overall financial statement presentation. We believe that our audits, which included confirmation of securities at April 30, 2017 by correspondence with the custodian and brokers, provide a reasonable basis for our opinion.
PricewaterhouseCoopers LLP
Los Angeles, California
June 8, 2017
| Washington Mutual Investors Fund | 23 |
As a fund shareholder, you incur two types of costs: (1) transaction costs, such as initial sales charges on purchase payments and contingent deferred sales charges on redemptions (loads), and (2) ongoing costs, including management fees, distribution and service (12b-1) fees, and other expenses. This example is intended to help you understand your ongoing costs (in dollars) of investing in the fund so you can compare these costs with the ongoing costs of investing in other mutual funds. The example is based on an investment of $1,000 invested at the beginning of the period and held for the entire six-month period (November 1, 2016, through April 30, 2017).
Actual expenses:
The first line of each share class in the table on the following page provides information about actual account values and actual expenses. You may use the information in this line, together with the amount you invested, to estimate the expenses that you paid over the period. Simply divide your account value by $1,000 (for example, an $8,600 account value divided by $1,000 = 8.6), then multiply the result by the number in the first line under the heading titled “Expenses paid during period” to estimate the expenses you paid on your account during this period.
Hypothetical example for comparison purposes:
The second line of each share class in the table on the following page provides information about hypothetical account values and hypothetical expenses based on the actual expense ratio for the share class and an assumed rate of return of 5.00% per year before expenses, which is not the actual return of the share class. The hypothetical account values and expenses may not be used to estimate the actual ending account balance or expenses you paid for the period. You may use this information to compare the ongoing costs of investing in the fund and other funds. To do so, compare this 5.00% hypothetical example with the 5.00% hypothetical examples that appear in the shareholder reports of the other funds.
Notes:
Retirement plan participants may be subject to certain fees charged by the plan sponsor, and Class F-1, F-2, F-3 and 529-F-1 shareholders may be subject to fees charged by financial intermediaries, typically ranging from 0.75% to 1.50% of assets annually depending on services offered. You can estimate the impact of these fees by adding the amount of the fees to the total estimated expenses you paid on your account during the period as calculated above. In addition, your ending account value would be lower by the amount of these fees.
Note that the expenses shown in the table on the following page are meant to highlight your ongoing costs only and do not reflect any transactional costs, such as sales charges (loads). Therefore, the second line of each share class in the table is useful in comparing ongoing costs only and will not help you determine the relative total costs of owning different funds. In addition, if these transactional costs were included, your costs would have been higher.
| 24 | Washington Mutual Investors Fund |
| | | Beginning | | | Ending | | | | | | | |
| | | account value | | | account value | | | Expenses paid | | | Annualized | |
| | | 11/1/2016 | | | 4/30/2017 | | | during period1 | | | expense ratio | |
| Class A - actual return | | $ | 1,000.00 | | | $ | 1,124.02 | | | $ | 3.00 | | | | .57 | % |
| Class A - assumed 5% return | | | 1,000.00 | | | | 1,021.97 | | | | 2.86 | | | | .57 | |
| Class B - actual return | | | 1,000.00 | | | | 1,119.06 | | | | 7.04 | | | | 1.34 | |
| Class B - assumed 5% return | | | 1,000.00 | | | | 1,018.15 | | | | 6.71 | | | | 1.34 | |
| Class C - actual return | | | 1,000.00 | | | | 1,119.91 | | | | 7.25 | | | | 1.38 | |
| Class C - assumed 5% return | | | 1,000.00 | | | | 1,017.95 | | | | 6.90 | | | | 1.38 | |
| Class T - actual return2 | | | 1,000.00 | | | | 1,008.47 | | | | .22 | | | | .34 | |
| Class T - assumed 5% return2 | | | 1,000.00 | | | | 1,023.11 | | | | 1.71 | | | | .34 | |
| Class F-1 - actual return | | | 1,000.00 | | | | 1,123.81 | | | | 3.53 | | | | .67 | |
| Class F-1 - assumed 5% return | | | 1,000.00 | | | | 1,021.47 | | | | 3.36 | | | | .67 | |
| Class F-2 - actual return | | | 1,000.00 | | | | 1,125.16 | | | | 2.16 | | | | .41 | |
| Class F-2 - assumed 5% return | | | 1,000.00 | | | | 1,022.76 | | | | 2.06 | | | | .41 | |
| Class F-3 - actual return3 | | | 1,000.00 | | | | 1,029.76 | | | | .78 | | | | .30 | |
| Class F-3 - assumed 5% return3 | | | 1,000.00 | | | | 1,023.31 | | | | 1.51 | | | | .30 | |
| Class 529-A - actual return | | | 1,000.00 | | | | 1,123.63 | | | | 3.48 | | | | .66 | |
| Class 529-A - assumed 5% return | | | 1,000.00 | | | | 1,021.52 | | | | 3.31 | | | | .66 | |
| Class 529-B - actual return | | | 1,000.00 | | | | 1,120.48 | | | | 7.57 | | | | 1.44 | |
| Class 529-B - assumed 5% return | | | 1,000.00 | | | | 1,017.65 | | | | 7.20 | | | | 1.44 | |
| Class 529-C - actual return | | | 1,000.00 | | | | 1,119.31 | | | | 7.51 | | | | 1.43 | |
| Class 529-C - assumed 5% return | | | 1,000.00 | | | | 1,017.70 | | | | 7.15 | | | | 1.43 | |
| Class 529-E - actual return | | | 1,000.00 | | | | 1,122.49 | | | | 4.74 | | | | .90 | |
| Class 529-E - assumed 5% return | | | 1,000.00 | | | | 1,020.33 | | | | 4.51 | | | | .90 | |
| Class 529-T - actual return2 | | | 1,000.00 | | | | 1,008.47 | | | | .27 | | | | .42 | |
| Class 529-T - assumed 5% return2 | | | 1,000.00 | | | | 1,022.71 | | | | 2.11 | | | | .42 | |
| Class 529-F-1 - actual return | | | 1,000.00 | | | | 1,124.94 | | | | 2.27 | | | | .43 | |
| Class 529-F-1 - assumed 5% return | | | 1,000.00 | | | | 1,022.66 | | | | 2.16 | | | | .43 | |
| Class R-1 - actual return | | | 1,000.00 | | | | 1,119.87 | | | | 7.25 | | | | 1.38 | |
| Class R-1 - assumed 5% return | | | 1,000.00 | | | | 1,017.95 | | | | 6.90 | | | | 1.38 | |
| Class R-2 - actual return | | | 1,000.00 | | | | 1,119.69 | | | | 7.31 | | | | 1.39 | |
| Class R-2 - assumed 5% return | | | 1,000.00 | | | | 1,017.90 | | | | 6.95 | | | | 1.39 | |
| Class R-2E - actual return | | | 1,000.00 | | | | 1,121.27 | | | | 5.79 | | | | 1.10 | |
| Class R-2E - assumed 5% return | | | 1,000.00 | | | | 1,019.34 | | | | 5.51 | | | | 1.10 | |
| Class R-3 - actual return | | | 1,000.00 | | | | 1,122.04 | | | | 4.89 | | | | .93 | |
| Class R-3 - assumed 5% return | | | 1,000.00 | | | | 1,020.18 | | | | 4.66 | | | | .93 | |
| Class R-4 - actual return | | | 1,000.00 | | | | 1,123.85 | | | | 3.32 | | | | .63 | |
| Class R-4 - assumed 5% return | | | 1,000.00 | | | | 1,021.67 | | | | 3.16 | | | | .63 | |
| Class R-5E - actual return | | | 1,000.00 | | | | 1,124.77 | | | | 2.48 | | | | .47 | |
| Class R-5E - assumed 5% return | | | 1,000.00 | | | | 1,022.46 | | | | 2.36 | | | | .47 | |
| Class R-5 - actual return | | | 1,000.00 | | | | 1,125.47 | | | | 1.79 | | | | .34 | |
| Class R-5 - assumed 5% return | | | 1,000.00 | | | | 1,023.11 | | | | 1.71 | | | | .34 | |
| Class R-6 - actual return | | | 1,000.00 | | | | 1,125.62 | | | | 1.53 | | | | .29 | |
| Class R-6 - assumed 5% return | | | 1,000.00 | | | | 1,023.36 | | | | 1.45 | | | | .29 | |
| | |
| 1 | The “expenses paid during period” are equal to the “annualized expense ratio,” multiplied by the average account value over the period, multiplied by the number of days in the period, and divided by 365 (to reflect the one-half year period). |
| 2 | The period for the “annualized expense ratio” and “actual return” line is based on the number of days since the share class began investment operations on April 7, 2017. The “assumed 5% return” line is based on 181 days. |
| 3 | The period for the “annualized expense ratio” and “actual return” line is based on the number of days since the share class began investment operations on January 27, 2017. The “assumed 5% return” line is based on 181 days. |
| | |
| Washington Mutual Investors Fund | 25 |
We are required to advise you of the federal tax status of certain distributions received by shareholders during the fiscal year. The fund hereby designates the following amounts for the fund’s fiscal year ended April 30, 2017:
| Long-term capital gains | $3,780,198,000 |
| Qualified dividend income | 100% |
| Corporate dividends received deduction | 100% |
| U.S. government income that may be exempt from state taxation | $7,222,000 |
Individual shareholders should refer to their Form 1099 or other tax information, which will be mailed in January 2018, to determine the calendar year amounts to be included on their 2017 tax returns. Shareholders should consult their tax advisors.
| 26 | Washington Mutual Investors Fund |
Board of trustees and other officers
Independent trustees1
| Name and year of birth | | Year first
elected
a trustee
of the fund2 | | Principal occupation(s) during past five years | | Number of
portfolios in fund
complex overseen
by trustee3 | | Other directorships4
held by trustee |
| Charles E. Andrews, 1952 | | 2013 | | Board member and Advisor, MorganFranklin Consulting (business consulting and technology solutions); former CEO, MorganFranklin Consulting; consultant and corporate director | | 1 | | Marriott Vacations Worldwide Corporation;
NVR, Inc.;
WashingtonFirst Bankshares, Inc. |
| Nariman Farvardin, PhD, 1956 | | 2007 | | President, Stevens Institute of Technology; former Senior Vice President for Academic Affairs and Provost, University of Maryland, College Park | | 1 | | None |
| Mary Davis Holt, 1950 | | 2010 | | Principal, Mary Davis Holt Enterprises, LLC (leadership development consulting); former Partner, Flynn Heath Holt Leadership, LLC (leadership consulting); former COO, Time Life Inc. (1993–2003) | | 1 | | None |
| R. Clark Hooper, 1946 | | 2003 | | Private investor | | 80 | | None |
| James C. Miller III, PhD, 1942 | | 1992 | | Senior Advisor, Husch Blackwell LLP (economic, financial and regulatory consulting); former Director, U.S. Office of Management and Budget (1985–1988) | | 1 | | Clean Energy Fuels Corporation |
| Donald L. Nickles, 1948 | | 2007 | | Chairman of the Board and CEO, The Nickles Group (consulting and business venture); former United States Senator (Oklahoma) (1981–2005) | | 1 | | Valero Energy Corporation |
| John Knox Singleton, 1948 Chairman of the Board (Independent and Non-Executive) | | 2001 | | President and CEO, INOVA Health System | | 1 | | Healthcare Realty Trust, Inc. |
| Margaret Spellings, 1957 | | 2015 | | President, The University of North Carolina; former President, George W. Bush Foundation; former President and CEO, Margaret Spellings & Company (public policy and strategic consulting); former President, U.S. Chamber Foundation and Senior Advisor to the President and CEO, U.S. Chamber of Commerce | | 81 | | ClubCorp Holdings, Inc. |
| Lydia Waters Thomas, PhD, 1944 | | 2010 | | Corporate director; former President and CEO, Noblis, Inc. (nonprofit science, technology and strategy organization) (1996–2007) | | 1 | | Mueller Water Products, Inc. |
Interested trustees5,6
Name, year of birth and
position with fund | | Year first
elected
a trustee
or officer
of the fund2 | | Principal occupation(s) during past five years
and positions held with affiliated entities or
the principal underwriter of the fund | | Number of
portfolios in fund
complex overseen
by trustee3 | | Other directorships4
held by trustee |
Alan N. Berro, 1960
Vice Chairman of the Board and President | | 2012 | | Partner — Capital World Investors, Capital Research and Management Company; Director, Capital Research and Management Company | | 1 | | None |
Paul F. Roye, 1953
Executive Vice President | | 2012 | | Director, Capital Research and Management Company; Senior Vice President and Senior Counsel — Fund Business Management Group, Capital Research and Management Company | | 11 | | None |
| Washington Mutual Investors Fund | 27 |
Trustees emeritus
| Cyrus A. Ansary | Katherine D. Ortega |
The fund’s statement of additional information includes further details about fund trustees and is available without charge upon request by calling American Funds Service Company at (800) 421-4225 or by visiting the American Funds website at americanfunds.com. The address for all trustees and officers of the fund is 6455 Irvine Center Drive, Irvine, CA 92618, Attention: Secretary.
Other officers6
Name, year of birth and
position with fund | | Year first
elected
an officer
of the fund2 | | Principal occupation(s) during past five years and positions held with affiliated entities
or the principal underwriter of the fund |
Jeffrey T. Lager, 1968
Senior Vice President | | 2014 | | Partner — Capital World Investors, Capital Research and Management Company |
Eric H. Stern, 1964
Senior Vice President | | 2014 | | Partner — Capital International Investors, Capital Research and Management Company;
Partner — Capital International Investors, Capital Guardian Trust Company;7
Partner — Capital International Investors, Capital Bank and Trust Company7 |
Michael W. Stockton, 1967
Senior Vice President | | 1995 | | Vice President — Fund Business Management Group, Capital Research and Management Company |
Donald H. Rolfe, 1972
Vice President | | 2013 | | Senior Vice President and Senior Counsel — Fund Business Management Group, Capital Research and Management Company |
Diana Wagner, 1973
Vice President | | 2015 | | Partner — Capital World Investors, Capital Research and Management Company;
Director, Capital Research and Management Company |
Jennifer L. Butler, 1966
Secretary | | 2005 | | Assistant Vice President — Fund Business Management Group, Capital Research and Management Company |
Brian C. Janssen, 1972
Treasurer | | 2016 | | Vice President — Investment Operations, Capital Research and Management Company |
Raymond F. Sullivan, Jr., 1957
Assistant Secretary | | 2014 | | Vice President — Fund Business Management Group, Capital Research and Management Company |
Dori Laskin, 1951
Assistant Treasurer | | 2013 | | Vice President — Investment Operations, Capital Research and Management Company |
Gregory F. Niland, 1971
Assistant Treasurer | | 2016 | | Vice President — Investment Operations, Capital Research and Management Company |
| 1 | The term independent trustee refers to a trustee who is not an “interested person” of the fund within the meaning of the Investment Company Act of 1940. |
| 2 | Trustees and officers of the fund serve until their resignation, removal or retirement. |
| 3 | Funds managed by Capital Research and Management Company or its affiliates. |
| 4 | This includes all directorships/trusteeships (other than those in the American Funds or other funds managed by Capital Research and Management Company or its affiliates) that are held by each trustee as a trustee or director of a public company or a registered investment company. |
| 5 | The term interested trustee refers to a trustee who is an “interested person” within the meaning of the Investment Company Act of 1940, on the basis of their affiliation with the fund’s investment adviser, Capital Research and Management Company, or affiliated entities (including the fund’s principal underwriter). |
| 6 | All of the directors/trustees and/or officers listed, with the exception of Eric H. Stern and Diana Wagner, are officers and/or directors/trustees of one or more of the other funds for which Capital Research and Management Company serves as investment adviser. |
| 7 | Company affiliated with Capital Research and Management Company. |
| 28 | Washington Mutual Investors Fund |
Office of the fund
6455 Irvine Center Drive
Irvine, CA 92618-4518
Investment adviser
Capital Research and Management Company
333 South Hope Street
Los Angeles, CA 90071-1406
Transfer agent for shareholder accounts
American Funds Service Company
(Write to the address near you.)
P.O. Box 6007
Indianapolis, IN 46206-6007
P.O. Box 2280
Norfolk, VA 23501-2280
Custodian of assets
JPMorgan Chase Bank
270 Park Avenue
New York, NY 10017-2070
Counsel
Dechert LLP
1900 K Street, NW
Washington, DC 20006-1110
Independent registered public accounting firm
PricewaterhouseCoopers LLP
601 South Figueroa Street
Los Angeles, CA 90017-3874
Principal underwriter
American Funds Distributors, Inc.
333 South Hope Street
Los Angeles, CA 90071-1406
Investors should carefully consider investment objectives, risks, charges and expenses. This and other important information is contained in the fund prospectus and summary prospectus, which can be obtained from your financial professional and should be read carefully before investing. You may also call American Funds Service Company (AFS) at (800) 421-4225 or visit the American Funds website at americanfunds.com.
“American Funds Proxy Voting Procedures and Principles” — which describes how we vote proxies relating to portfolio securities — is available on the American Funds website or upon request by calling AFS. The fund files its proxy voting record with the U.S. Securities and Exchange Commission (SEC) for the 12 months ended June 30 by August 31. The proxy voting record is available free of charge on the SEC website at sec.gov and on the American Funds website.
A complete April 30, 2017, portfolio of Washington Mutual Investors Fund’s investments is available free of charge by calling AFS or visiting the SEC website (where it is part of Form N-CSR).
Washington Mutual Investors Fund files a complete list of its portfolio holdings with the SEC for the first and third quarters of each fiscal year on Form N-Q. This filing is available free of charge on the SEC website. You may also review or, for a fee, copy this filing at the SEC’s Public Reference Room in Washington, D.C. Additional information regarding the operation of the Public Reference Room may be obtained by calling the SEC’s Office of Investor Education and Advocacy at (800) SEC-0330. Additionally, the list of portfolio holdings is available by calling AFS.
This report is for the information of shareholders of Washington Mutual Investors Fund, but it also may be used as sales literature when preceded or accompanied by the current prospectus or summary prospectus, which gives details about charges, expenses, investment objectives and operating policies of the fund. If used as sales material after June 30, 2017, this report must be accompanied by an American Funds statistical update for the most recently completed calendar quarter.
American Funds from Capital Group
The Capital AdvantageSM
Since 1931, American Funds, part of Capital Group, has helped investors pursue long-term investment success. Our consistent approach — in combination with The Capital SystemSM — has resulted in a superior long-term track record.
| | Aligned with investor success |
| | We base our decisions on a long-term perspective, which we believe aligns our goals with the interests of our clients. Our portfolio managers average 27 years of investment experience, including 21 years at our company, reflecting a career commitment to our long-term approach.1 |
| | |
| | The Capital SystemSM |
| | The Capital System combines individual accountability with teamwork. Funds using The Capital System are divided into portions that are managed independently by investment professionals with diverse backgrounds, ages and investment approaches. An extensive global research effort is the backbone of our system. |
| | |
| | American Funds’ superior long-term track record |
| | Equity funds have beaten their Lipper peer indexes in 93% of 10-year periods and 98% of 20-year periods. Fixed income funds have beaten their Lipper indexes in 80% of 10-year periods and 80% of 20-year periods.2 Fund management fees have been among the lowest in the industry.3 |
| | 1 | Portfolio manager experience as of December 31, 2016. |
| | 2 | Based on Class F-2 share results for rolling periods through December 31, 2016. Periods covered are the shorter of the fund’s lifetime or since the comparable Lipper index inception date (except Capital Income Builder and SMALLCAP World Fund, for which the Lipper average was used). Expenses differ for each share class, so results will vary. Class F-2 shares were first offered on August 1, 2008. Class F-2 share results prior to the date of first sale are hypothetical based on Class A share results without a sales charge, adjusted for typical estimated expenses. Results for certain funds with an inception date after August 1, 2008, also include hypothetical returns because those funds’ Class F-2 shares sold after the funds’ date of first offering. Please see americanfunds.com for more information on specific expense adjustments and the actual dates of first sale. |
| | 3 | On average, our management fees were in the lowest quintile 73% of the time, based on the 20-year period ended December 31, 2016, versus comparable Lipper categories, excluding funds of funds. |

ITEM 2 – Code of Ethics
The Registrant has adopted a Code of Ethics that applies to its Principal Executive Officer and Principal Financial Officer. The Registrant undertakes to provide to any person without charge, upon request, a copy of the Code of Ethics. Such request can be made to American Funds Service Company at 800/421-9225 or to the Secretary of the Registrant, 6455 Irvine Center Drive, Irvine, California 92618.
ITEM 3 – Audit Committee Financial Expert
The Registrant’s board has determined that James C. Miller III, a member of the Registrant’s audit committee, is an “audit committee financial expert” and "independent," as such terms are defined in this Item. This designation will not increase the designee’s duties, obligations or liability as compared to his or her duties, obligations and liability as a member of the audit committee and of the board, nor will it reduce the responsibility of the other audit committee members. There may be other individuals who, through education or experience, would qualify as "audit committee financial experts" if the board had designated them as such. Most importantly, the board believes each member of the audit committee contributes significantly to the effective oversight of the Registrant’s financial statements and condition.
| ITEM 4 – Principal Accountant Fees and Services | |
| | | |
| Registrant: | |
| a) Audit Fees: |
| | 2016 | $114,000 |
| | 2017 | $110,000 |
| | |
| b) Audit-Related Fees: |
| | 2016 | None |
| | 2017 | None |
| | |
| c) Tax Fees: |
| | 2016 | $8,000 |
| | 2017 | $9,000 |
| | The tax fees consist of professional services relating to the preparation of the Registrant’s tax returns. |
| d) All Other Fees: |
| | 2016 | None |
| | 2017 | None |
| | Adviser and affiliates (includes only fees for non-audit services billed to the adviser and affiliates for engagements that relate directly to the operations and financial reporting of the Registrant and were subject to the pre-approval policies described below): |
| a) Audit Fees: |
| | Not Applicable |
| | |
| b) Audit-Related Fees: |
| | 2016 | None |
| | 2017 | $17,000 |
| | The audit-related fees consist of assurance and related services relating to the examination of the Registrant’s transfer agent, principal underwriter and investment adviser conducted in accordance with Statement on Standards for Attestation Engagements Number 16 issued by the American Institute of Certified Public Accountants. |
| c) Tax Fees: |
| | 2016 | $17,000 |
| | 2017 | None |
| | The tax fees consist of consulting services relating to the Registrant’s investments. |
| | | |
| d) All Other Fees: |
| | 2016 | $2,000 |
| | 2017 | $2,000 |
| | The other fees consist of subscription services related to an accounting research tool. |
| | |
| | | |
| | All audit and permissible non-audit services that the Registrant’s audit committee considers compatible with maintaining the independent registered public accounting firm’s independence are required to be pre-approved by the committee. The pre-approval requirement will extend to all non-audit services provided to the Registrant, the investment adviser, and any entity controlling, controlled by, or under common control with the investment adviser that provides ongoing services to the Registrant, if the engagement relates directly to the operations and financial reporting of the Registrant. The committee will not delegate its responsibility to pre-approve these services to the investment adviser. The committee may delegate to one or more committee members the authority to review and pre-approve audit and permissible non-audit services. Actions taken under any such delegation will be reported to the full committee at its next meeting. The pre-approval requirement is waived with respect to non-audit services if certain conditions are met. The pre-approval requirement was not waived for any of the non-audit services listed above provided to the Registrant, adviser and affiliates. |
| | | |
| | Aggregate non-audit fees paid to the Registrant’s auditors, including fees for all services billed to the Registrant, adviser and affiliates that provide ongoing services to the Registrant, were $28,000 for fiscal year 2016 and $28,000 for fiscal year 2017. The non-audit services represented by these amounts were brought to the attention of the committee and considered to be compatible with maintaining the auditors’ independence. |
ITEM 5 – Audit Committee of Listed Registrants
Not applicable to this Registrant, insofar as the Registrant is not a listed issuer as defined in Rule 10A-3 under the Securities Exchange Act of 1934.
ITEM 6 – Schedule of Investments
Washington Mutual Investors FundSM
Investment portfolio
April 30, 2017
Common stocks 95.18%
Energy 9.34% | Shares | Value
(000) |
| Chevron Corp. | 12,257,694 | $1,307,896 |
| ConocoPhillips | 8,962,300 | 429,384 |
| Enbridge Inc. | 37,584,659 | 1,557,884 |
| EOG Resources, Inc. | 1,472,100 | 136,169 |
| Exxon Mobil Corp. | 1,641,600 | 134,037 |
| Halliburton Co. | 11,097,000 | 509,130 |
| Noble Energy, Inc. | 4,541,200 | 146,817 |
| Pioneer Natural Resources Co. | 2,310,000 | 399,607 |
| Royal Dutch Shell PLC, Class B (ADR) | 37,350,400 | 2,021,404 |
| Schlumberger Ltd. | 24,654,300 | 1,789,655 |
| | | 8,431,983 |
| Materials 4.72% | | |
| Air Products and Chemicals, Inc. | 2,790,000 | 391,995 |
| Dow Chemical Co. | 6,201,500 | 389,454 |
| E.I. du Pont de Nemours and Co. | 19,611,991 | 1,564,056 |
| International Flavors & Fragrances Inc. | 886,500 | 122,860 |
| LyondellBasell Industries NV | 1,500,000 | 127,140 |
| Monsanto Co. | 3,058,200 | 356,617 |
| Nucor Corp. | 6,142,600 | 376,726 |
| Potash Corp. of Saskatchewan Inc. | 1,712,200 | 28,902 |
| Praxair, Inc. | 5,411,600 | 676,342 |
| Rio Tinto PLC (ADR) | 1,216,800 | 48,453 |
| WestRock Co. | 3,358,486 | 179,880 |
| | | 4,262,425 |
| Industrials 12.86% | | |
| Boeing Co. | 15,436,200 | 2,853,073 |
| C.H. Robinson Worldwide, Inc. | 2,854,149 | 207,497 |
| Canadian National Railway Co. | 638,800 | 46,179 |
| Caterpillar Inc. | 7,028,707 | 718,756 |
| Cummins Inc. | 400,000 | 60,376 |
| Deere & Co. | 1,741,800 | 194,402 |
| General Dynamics Corp. | 390,600 | 75,694 |
| General Electric Co. | 18,212,600 | 527,983 |
| Honeywell International Inc. | 763,100 | 100,073 |
| IDEX Corp. | 527,400 | 55,250 |
| Ingersoll-Rand PLC | 5,000,000 | 443,750 |
| Johnson Controls International PLC | 9,421,000 | 391,631 |
| Lockheed Martin Corp. | 8,639,300 | 2,327,859 |
| Norfolk Southern Corp. | 2,981,500 | 350,296 |
| Northrop Grumman Corp. | 5,131,300 | 1,262,095 |
| PACCAR Inc | 5,600,000 | 373,688 |
| Parker-Hannifin Corp. | 600,000 | 96,480 |
| Republic Services, Inc. | 1,500,000 | 94,485 |
| Rockwell Automation | 950,000 | 149,482 |
Washington Mutual Investors Fund — Page 1 of 5
Common stocks
Industrials (continued) | Shares | Value
(000) |
| Union Pacific Corp. | 3,348,900 | $374,943 |
| Waste Management, Inc. | 12,453,100 | 906,337 |
| | | 11,610,329 |
| Consumer discretionary 12.35% | | |
| Carnival Corp., units | 985,800 | 60,893 |
| CBS Corp., Class B | 7,704,100 | 512,785 |
| Cinemark Holdings, Inc. | 5,700,000 | 246,240 |
| Comcast Corp., Class A | 72,076,378 | 2,824,673 |
| D.R. Horton, Inc. | 461,500 | 15,179 |
| General Motors Co. | 5,400,000 | 187,056 |
| Home Depot, Inc. | 23,392,800 | 3,651,616 |
| McDonald’s Corp. | 1,584,500 | 221,719 |
| Newell Brands Inc. | 14,044,100 | 670,465 |
| Priceline Group Inc.1 | 175,800 | 324,671 |
| Scripps Networks Interactive, Inc., Class A | 636,400 | 47,552 |
| Starbucks Corp. | 11,140,400 | 669,092 |
| Time Warner Inc. | 2,505,500 | 248,721 |
| Twenty-First Century Fox, Inc., Class A | 15,019,100 | 458,683 |
| VF Corp. | 8,860,000 | 484,022 |
| Viacom Inc., Class B | 1,772,121 | 75,422 |
| Walt Disney Co. | 2,534,600 | 293,000 |
| Whirlpool Corp. | 297,000 | 55,147 |
| Wynn Resorts, Ltd. | 816,600 | 100,450 |
| | | 11,147,386 |
| Consumer staples 7.91% | | |
| Coca-Cola Co. | 43,911,000 | 1,894,760 |
| Coca-Cola European Partners PLC | 3,352,000 | 129,454 |
| Colgate-Palmolive Co. | 2,000,000 | 144,080 |
| Costco Wholesale Corp. | 5,579,500 | 990,473 |
| CVS Health Corp. | 7,120,000 | 586,973 |
| Kraft Heinz Co. | 9,265,000 | 837,463 |
| Mondelez International, Inc. | 1,940,000 | 87,358 |
| Nestlé SA (ADR) | 6,660,900 | 512,883 |
| Procter & Gamble Co. | 14,587,500 | 1,273,926 |
| Sysco Corp. | 5,430,000 | 287,084 |
| Unilever NV | 1,691,500 | 88,364 |
| Walgreens Boots Alliance, Inc. | 3,522,000 | 304,794 |
| | | 7,137,612 |
| Health care 11.12% | | |
| AbbVie Inc. | 1,826,000 | 120,406 |
| Aetna Inc. | 6,462,700 | 872,917 |
| AmerisourceBergen Corp. | 74,000 | 6,072 |
| AstraZeneca PLC (ADR) | 5,297,100 | 160,237 |
| Bristol-Myers Squibb Co. | 14,606,500 | 818,694 |
| Danaher Corp. | 521,100 | 43,423 |
| Eli Lilly and Co. | 769,600 | 63,153 |
| Gilead Sciences, Inc. | 1,390,000 | 95,285 |
| Humana Inc.2 | 7,506,000 | 1,666,182 |
| Johnson & Johnson | 14,855,300 | 1,834,184 |
| Medtronic PLC | 8,060,800 | 669,772 |
| Merck & Co., Inc. | 30,055,000 | 1,873,328 |
| Novo Nordisk A/S, Class B (ADR) | 275,000 | 10,637 |
Washington Mutual Investors Fund — Page 2 of 5
Common stocks
Health care (continued) | Shares | Value
(000) |
| Pfizer Inc. | 11,786,000 | $399,781 |
| Regeneron Pharmaceuticals, Inc.1 | 27,500 | 10,684 |
| ResMed Inc. | 2,280,207 | 155,031 |
| Roche Holding AG (ADR) | 6,624,500 | 216,608 |
| Sanofi (ADR) | 2,185,000 | 103,351 |
| UnitedHealth Group Inc. | 5,268,351 | 921,329 |
| | | 10,041,074 |
| Financials 11.30% | | |
| American Express Co. | 779,000 | 61,736 |
| Ameriprise Financial, Inc. | 202,000 | 25,826 |
| Bank of America Corp. | 13,013,000 | 303,723 |
| BlackRock, Inc. | 1,005,000 | 386,493 |
| Capital One Financial Corp. | 10,208,000 | 820,519 |
| Charles Schwab Corp. | 1,365,600 | 53,054 |
| Chubb Ltd. | 7,878,900 | 1,081,379 |
| Citigroup Inc. | 5,500,000 | 325,160 |
| CME Group Inc., Class A | 10,072,136 | 1,170,281 |
| Discover Financial Services | 3,760,800 | 235,388 |
| Goldman Sachs Group, Inc. | 889,700 | 199,115 |
| Huntington Bancshares Inc. | 21,803,500 | 280,393 |
| Invesco Ltd. | 4,408,800 | 145,226 |
| JPMorgan Chase & Co. | 21,206,500 | 1,844,966 |
| Marsh & McLennan Companies, Inc. | 8,726,800 | 646,918 |
| Moody’s Corp. | 472,400 | 55,894 |
| PNC Financial Services Group, Inc. | 6,231,800 | 746,258 |
| S&P Global Inc. | 1,848,300 | 248,023 |
| Wells Fargo & Co. | 29,117,100 | 1,567,665 |
| | | 10,198,017 |
| Information technology 15.90% | | |
| Accenture PLC, Class A | 987,500 | 119,784 |
| Alphabet Inc., Class A1 | 794,200 | 734,254 |
| Alphabet Inc., Class C1 | 268,350 | 243,114 |
| Amphenol Corp., Class A | 8,642,500 | 624,939 |
| Analog Devices, Inc. | 7,957,083 | 606,330 |
| Apple Inc. | 9,067,000 | 1,302,474 |
| Automatic Data Processing, Inc. | 2,599,300 | 271,601 |
| Broadcom Ltd. | 4,590,499 | 1,013,628 |
| DXC Technology Co.1 | 132,721 | 9,999 |
| Hewlett Packard Enterprise Co. | 1,545,000 | 28,783 |
| HP Inc. | 2,668,000 | 50,212 |
| Intel Corp. | 42,116,000 | 1,522,493 |
| Intuit Inc. | 3,775,000 | 472,668 |
| Jack Henry & Associates, Inc. | 2,594,200 | 251,430 |
| MasterCard Inc., Class A | 1,658,500 | 192,917 |
| Microsoft Corp. | 77,713,800 | 5,320,287 |
| Texas Instruments Inc. | 11,568,600 | 916,002 |
| Visa Inc., Class A | 6,656,100 | 607,169 |
| Xilinx, Inc. | 1,060,800 | 66,947 |
| | | 14,355,031 |
Washington Mutual Investors Fund — Page 3 of 5
Common stocks
Telecommunication services 3.14% | Shares | Value
(000) |
| AT&T Inc. | 22,279,200 | $882,925 |
| Verizon Communications Inc. | 42,537,901 | 1,952,915 |
| | | 2,835,840 |
| Utilities 2.57% | | |
| CMS Energy Corp. | 1,591,000 | 72,231 |
| Dominion Resources, Inc. | 7,985,000 | 618,279 |
| Duke Energy Corp. | 900,000 | 74,250 |
| Exelon Corp. | 730,000 | 25,280 |
| National Grid PLC (ADR) | 730,000 | 47,355 |
| PG&E Corp. | 8,698,500 | 583,234 |
| Pinnacle West Capital Corp. | 1,750,000 | 148,908 |
| Sempra Energy | 4,034,700 | 456,002 |
| Southern Co. | 3,129,400 | 155,844 |
| Xcel Energy Inc. | 3,000,000 | 135,150 |
| | | 2,316,533 |
| Miscellaneous 3.97% | | |
| Other common stocks in initial period of acquisition | | 3,580,114 |
| Total common stocks (cost: $55,118,909,000) | | 85,916,344 |
| Short-term securities 4.74% | Principal amount
(000) | |
| 3M Co. 0.82% due 5/16/20173 | $49,400 | 49,380 |
| Apple Inc. 0.88% due 5/3/2017–5/8/20173 | 125,000 | 124,982 |
| Army and Air Force Exchange Service 0.85% due 6/2/20173 | 45,000 | 44,963 |
| Bank of New York Mellon Corp. 0.89% due 7/21/2017 | 50,000 | 49,887 |
| CAFCO, LLC 0.98%–1.00% due 5/23/2017–6/1/20173 | 75,000 | 74,949 |
| Chariot Funding, LLC 0.87% due 5/1/20173 | 50,000 | 49,996 |
| Chevron Corp. 0.87% due 5/22/20173 | 50,000 | 49,973 |
| Ciesco LLC 0.98% due 5/4/20173 | 40,000 | 39,994 |
| Cisco Systems, Inc. 0.83% due 5/24/20173 | 25,000 | 24,985 |
| Coca-Cola Co. 0.95% due 7/6/20173 | 50,000 | 49,918 |
| Danaher Corp. 0.90% due 5/17/2017 | 18,600 | 18,592 |
| Eli Lilly and Co. 0.83% due 5/19/20173 | 50,000 | 49,976 |
| Estée Lauder Companies Inc. 0.85% due 5/4/20173 | 20,000 | 19,997 |
| ExxonMobil Corp. 0.71%–0.74% due 5/16/2017–5/24/2017 | 100,000 | 99,951 |
| Fannie Mae 0.76%–0.80% due 6/19/2017–7/5/2017 | 128,966 | 128,806 |
| Federal Farm Credit Banks 0.54% due 5/3/2017 | 24,900 | 24,899 |
| Federal Home Loan Bank 0.54%–0.85% due 5/4/2017–8/2/2017 | 1,729,900 | 1,728,455 |
| GE Capital Treasury Services (U.S.) LLC 0.80% due 5/8/2017 | 50,000 | 49,989 |
| General Dynamics Corp. 0.84% due 6/5/20173 | 25,000 | 24,977 |
| Hershey Co. 0.85% due 5/22/20173 | 25,000 | 24,986 |
| Johnson & Johnson 0.85% due 6/1/20173 | 45,000 | 44,966 |
| Merck & Co. Inc. 0.84%–0.86% due 5/8/2017–6/5/20173 | 75,000 | 74,968 |
| Paccar Financial Corp. 0.85%–0.96% due 5/11/2017–7/27/2017 | 41,100 | 41,055 |
| PepsiCo Inc. 0.81%–0.84% due 5/22/2017–5/26/20173 | 76,000 | 75,955 |
| Pfizer Inc. 0.84%–0.92% due 5/15/2017–7/20/20173 | 100,000 | 99,878 |
| Private Export Funding Corp. 0.88%–0.97% due 5/15/2017–5/18/20173 | 100,000 | 99,956 |
| Procter & Gamble Co. 0.82%–0.83% due 5/18/2017–6/1/20173 | 203,391 | 203,254 |
| Prudential Funding, LLC 0.90% due 5/17/2017 | 25,000 | 24,989 |
| Qualcomm Inc. 0.74%–0.89% due 5/9/2017–6/22/20173 | 96,000 | 95,915 |
| Regents of the University of California 0.95% due 6/9/2017–7/12/2017 | 61,800 | 61,691 |
Washington Mutual Investors Fund — Page 4 of 5
| Short-term securities | Principal amount
(000) | Value
(000) |
| U.S. Treasury Bills 0.50%–0.90% due 5/4/2017–10/5/2017 | $630,900 | $630,239 |
| Walt Disney Co. 0.92% due 6/22/2017–7/21/20173 | 99,400 | 99,227 |
| Total short-term securities (cost: $4,281,810,000) | | 4,281,748 |
| Total investment securities 99.92% (cost: $59,400,719,000) | | 90,198,092 |
| Other assets less liabilities 0.08% | | 71,849 |
| Net assets 100.00% | | $90,269,941 |
As permitted by U.S. Securities and Exchange Commission regulations, “Miscellaneous” securities include holdings in their first year of acquisition that have not previously been publicly disclosed.
The following footnotes apply to either the individual securities noted or one or more of the securities aggregated and listed as a single line item.
| 1 | Security did not produce income during the last 12 months. |
| 2 | Represents an affiliated company as defined under the Investment Company Act of 1940. |
| 3 | Acquired in a transaction exempt from registration under Section 4(2) of the Securities Act of 1933. May be resold in the U.S. in transactions exempt from registration, normally to qualified institutional buyers. The total value of all such securities was $1,423,195,000, which represented 1.58% of the net assets of the fund. |
| Key to abbreviation |
| ADR = American Depositary Receipts |
Additional financial disclosures are included in the fund’s current shareholder report and should be read in conjunction with this report.
Investments are not FDIC-insured, nor are they deposits of or guaranteed by a bank or any other entity, so they may lose value.
Investors should carefully consider investment objectives, risks, charges and expenses. This and other important information is contained in the fund prospectus and summary prospectus, which can be obtained from your financial professional and should be read carefully before investing. You may also call American Funds Service Company (AFS) at (800) 421-4225 or visit the American Funds website at americanfunds.com.
| MFGEFPX-001-0617O-S54183 | Washington Mutual Investors Fund — Page 5 of 5 |
To the Board of Trustees and Shareholders of Washington Mutual Investors Fund
In our opinion, the accompanying statement of assets and liabilities, including the summary investment portfolio, and the related statements of operations and of changes in net assets and the financial highlights (included in Item 1 of this Form N-CSR) and the investment portfolio (included in Item 6 of this Form N-CSR) present fairly, in all material respects, the financial position of Washington Mutual Investors Fund (the "Fund") as of April 30, 2017, the results of its operations for the year then ended, the changes in its net assets for each of the two years in the period then ended and the financial highlights for each of the periods presented, in conformity with accounting principles generally accepted in the United States of America. These financial statements, financial highlights, and investment portfolio (hereafter referred to as "financial statements") are the responsibility of the Fund's management. Our responsibility is to express an opinion on these financial statements based on our audits. We conducted our audits of these financial statements in accordance with the standards of the Public Company Accounting Oversight Board (United States). Those standards require that we plan and perform the audit to obtain reasonable assurance about whether the financial statements are free of material misstatement. An audit includes examining, on a test basis, evidence supporting the amounts and disclosures in the financial statements, assessing the accounting principles used and significant estimates made by management, and evaluating the overall financial statement presentation. We believe that our audits, which included confirmation of securities as of April 30, 2017 by correspondence with the custodian and brokers, provide a reasonable basis for our opinion.
PricewaterhouseCoopers LLP
Los Angeles, California
June 8, 2017
ITEM 7 – Disclosure of Proxy Voting Policies and Procedures for Closed-End Management Investment Companies
Not applicable to this Registrant, insofar as the Registrant is not a closed-end management investment company.
ITEM 8 – Portfolio Managers of Closed-End Management Investment Companies
Not applicable to this Registrant, insofar as the Registrant is not a closed-end management investment company.
ITEM 9 – Purchases of Equity Securities by Closed-End Management Investment Company and Affiliated Purchasers
Not applicable to this Registrant, insofar as the Registrant is not a closed-end management investment company.
ITEM 10 – Submission of Matters to a Vote of Security Holders
There have been no material changes to the procedures by which shareholders may recommend nominees to the Registrant’s board of trustees since the Registrant last submitted a proxy statement to its shareholders. The procedures are as follows. The Registrant has a nominating and governance committee comprised solely of persons who are not considered ‘‘interested persons’’ of the Registrant within the meaning of the Investment Company Act of 1940, as amended. The committee periodically reviews such issues as the board’s composition, responsibilities, committees, compensation and other relevant issues, and recommends any appropriate changes to the full board of trustees. While the committee normally is able to identify from its own resources an ample number of qualified candidates, it will consider shareholder suggestions of persons to be considered as nominees to fill future vacancies on the board. Such suggestions must be sent in writing to the nominating and governance committee of the Registrant, c/o the Registrant’s Secretary, and must be accompanied by complete biographical and occupational data on the prospective nominee, along with a written consent of the prospective nominee for consideration of his or her name by the nominating and governance committee.
ITEM 11 – Controls and Procedures
| (a) | The Registrant’s Principal Executive Officer and Principal Financial Officer have concluded, based on their evaluation of the Registrant’s disclosure controls and procedures (as such term is defined in Rule 30a-3 under the Investment Company Act of 1940), that such controls and procedures are adequate and reasonably designed to achieve the purposes described in paragraph (c) of such rule. |
| | |
| (b) | There were no changes in the Registrant’s internal controls over financial reporting (as defined in Rule 30a-3(d) under the Investment Company Act of 1940) that occurred during the Registrant’s second fiscal quarter of the period covered by this report that has materially affected, or is reasonably likely to materially affect, the Registrant’s internal control over financial reporting. |
ITEM 12 – Exhibits
| (a)(1) | The Code of Ethics that is the subject of the disclosure required by Item 2 is attached as an exhibit hereto. |
| | |
| (a)(2) | The certifications required by Rule 30a-2 of the Investment Company Act of 1940 and Sections 302 and 906 of the Sarbanes-Oxley Act of 2002 are attached as exhibits hereto. |
SIGNATURES
Pursuant to the requirements of the Securities Exchange Act of 1934 and the Investment Company Act of 1940, the Registrant has duly caused this report to be signed on its behalf by the undersigned, thereunto duly authorized.
| | WASHINGTON MUTUAL INVESTORS FUND |
| | |
| | By /s/ Paul F. Roye |
| | Paul F. Roye, Executive Vice President and Principal Executive Officer |
| | |
| | Date: June 30, 2017 |
Pursuant to the requirements of the Securities Exchange Act of 1934 and the Investment Company Act of 1940, this report has been signed below by the following persons on behalf of the Registrant and in the capacities and on the dates indicated.
| By /s/ Paul F. Roye |
Paul F. Roye, Executive Vice President and Principal Executive Officer |
| |
| Date: June 30, 2017 |
| By /s/ Brian C. Janssen |
Brian C. Janssen, Treasurer and Principal Financial Officer |
| |
| Date: June 30, 2017 |