| OMB APPROVAL |
| OMB Number: 3235-0570 |
| Expires: October 31, 2006 |
| Estimated average burden |
| hours per response.......19.3 |
UNITED STATES
SECURITIES AND EXCHANGE COMMISSION
Washington, D.C. 20549
FORM N-CSR
CERTIFIED SHAREHOLDER REPORT OF REGISTERED
MANAGEMENT INVESTMENT COMPANIES
Investment Company Act File Number 811-0495
GARTMORE MUTUAL FUNDS
(Exact name of registrant as specified in charter)
1200 RIVER ROAD, SUITE 1000, CONSHOHOCKEN, PENNSYLVANIA 19428
(Address of principal executive offices) (Zip code)
ERIC E. MILLER, ESQ.
1200 RIVER ROAD
SUITE 1000
CONSHOHOCKEN, PA 19428
(Name and address of agent for service)
Registrant’s telephone number, including area code: (484) 530-1300
Date of fiscal year end: 10/31/2004
Date of reporting period: 10/31/2004
Form N-CSR is to be used by management investment companies to file reports with the Commission not later than 10 days after the transmission to stockholders of any report that is required to be transmitted to stockholders under Rule 30e-1 under the Investment Company Act of 1940 (17 CFR 270.30e-1). The Commission may use the information provided on Form N-CSR in its regulatory, disclosure review, inspection, and policymaking roles.
A registrant is required to disclose the information specified by Form N-CSR, and the Commission will make this information public. A registrant is not required to respond to the collection of information contained in Form N-CSR unless the Form displays a currently valid Office of Management and Budget (“OMB”) control number. Please direct comments concerning the accuracy of the information collection burden estimate and any suggestions for reducing the burden to Secretary, Securities and Exchange Commission, 450 Fifth Street, NW, Washington, DC 20549-0609. The OMB has reviewed this collection of information under the clearance requirements of 44 U.S.C. § 3507.
TABLE OF CONTENTS
Item 1. Reports to Stockholders.
Include a copy of the report transmitted to stockholders pursuant to Rule 30e-1 under the Act (17 CFR 270.30e-1).
Annual Report October 31, 2004 Sector Series Gartmore Global Financial Services Fund Gartmore Global Health Sciences Fund Gartmore Global Natural Resources Fund Gartmore Global Technology and Communications Fund Gartmore Global Utilities Fund Leadership Series
Gartmore Mid Cap Growth Leaders Fund (formerly “Gartmore Millennium Growth Fund”) Gartmore Nationwide Leaders Fund Gartmore U.S. Growth Leaders Fund Gartmore Worldwide Leaders Fund International Series Gartmore China Opportunities Fund Gartmore Emerging Markets Fund Gartmore International Growth Fund Concept Series Gartmore High Yield Bond Fund Gartmore Value Opportunities Fund Gartmore Micro Cap Equity Fund Gartmore U.S. Growth Leaders Long-Short Fund (formerly “Gartmore Long-Short Equity Plus Fund”) Gartmore Convertible Fund
Gartmore Small Cap Growth Fund www.gartmorefunds.com |
Solutions.

UNITED STATES | UNITED KINGDOM | JAPAN
Based in greater metropolitan Philadelphia, Gartmore is the global asset management arm of Nationwide®. Gartmore’s affiliated advisers* collectively manage more than $77 billion1 in assets through its global investment platform encompassing more than 185 investment management professionals supported by an 800-person staff.
We provide core and specialty equity, fixed-income and alternative investment solutions through mutual funds, separate accounts, commingled portfolios and wrap accounts to individual and institutional clients around the world.
This wide range of investment opportunities is built on sound investment management processes designed to increase the probability of delivering enhanced risk-adjusted returns over the long term.
Our investment management teams incorporate fundamental stock selection with the application of technology to help control risk and add to returns. Insightful stock selection is a function of the efforts of talented alpha-driven managers and analysts, working in an entrepreneurial environment, who are specialists in their respective investment disciplines.
www.gartmore.com
*Gartmore’s Affiliated Advisers
The following 10 asset management affiliates of Nationwide do business under the trade name “Gartmore Group”: Gartmore Capital Management Ltd2, Gartmore Fund Managers Ltd2, Gartmore Global Partners2, 3, Gartmore Investment Ltd2, Gartmore Japan Ltd2, Gartmore Morley Capital Management, Inc.3, Gartmore Mutual Fund Capital Trust3, 4, Gartmore SA Capital Trust3, 4, Gartmore Separate Accounts LLC3, and NorthPointe Capital® LLC3
| 1. | | As of Oct. 31, 2004. |
| |
| 2. | | These advisers are subsidiaries of Gartmore Investment Management plc, which ultimately reports to Nationwide®. |
| |
| 3. | | These are SEC-registered investment advisers based in the United States. Collectively, these advisers manage $40 billion as of Oct. 31, 2004. |
| |
| 4. | | Together, these advisers do business as Gartmore Global Investments, Inc. |
Gartmore Global Investments is the investment adviser to Gartmore Funds. NorthPointe Capital is a federally registered service mark of Gartmore Global Investments, Inc. Nationwide is a federally registered service mark of Nationwide Mutual Insurance Company.
Gartmore Funds distributed by Gartmore Distribution Services, Inc., Member NASD. 1200 River Road, Suite 1000, Conshohocken, PA 19428.
© 2004 Gartmore Global Investments, Inc. All rights reserved.

Annual Report
October 31, 2004
| | | | | |
| | | | | Contents |
| | | | | |
| | 2 | | | Message to Shareholders |
| | 3 | | | Market Perspectives |
| | | | | |
| | | | | Sector Series |
| | 9 | | | Gartmore Global Financial Services Fund |
| | 15 | | | Gartmore Global Health Sciences Fund |
| | 20 | | | Gartmore Global Natural Resources Fund |
| | 25 | | | Gartmore Global Technology and |
| | | | | Communications Fund |
| | 31 | | | Gartmore Global Utilities Fund |
| | | | | |
| | | | | Leadership Series |
| | 46 | | | Gartmore Mid Cap Growth Leaders Fund |
| | | | | (formerly “Gartmore Millennium Growth Fund”) |
| | 51 | | | Gartmore Nationwide Leaders Fund |
| | 56 | | | Gartmore U.S. Growth Leaders Fund |
| | 61 | | | Gartmore Worldwide Leaders Fund |
| | | | | |
| | | | | International Series |
| | 75 | | | Gartmore China Opportunities Fund |
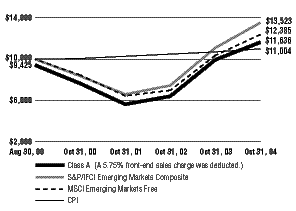
| | 80 | | | Gartmore Emerging Markets Fund |
| | 88 | | | Gartmore International Growth Fund |
| | | | | |
| | | | | Concept Series |
| | 101 | | | Gartmore High Yield Bond Fund |
| | 109 | | | Gartmore Value Opportunities Fund |
| | 117 | | | Gartmore Micro Cap Equity Fund |
| | 123 | | | Gartmore U.S. Growth Leaders Long-Short Fund |
| | | | | (formerly “Gartmore Long-Short Equity Plus Fund”) |
| | 131 | | | Gartmore Convertible Fund |
| | 137 | | | Gartmore Small Cap Growth Fund |
| | | | | |
| | 155 | | | Notes to Financial Statements |
Commentary provided by Gartmore Global Investments, investment adviser to Gartmore Funds. All opinions and estimates included in this report constitute Gartmore Global Investments’ judgment as of the date of this report and are subject to change without notice.
Statement Regarding Availability of Quarterly Portfolio Schedule.
The Gartmore Funds file complete schedules of portfolio holdings for each Fund with the Securities and Exchange Commission (the “Commission”) for the first and third quarters of each fiscal year on Form N-Q. The Funds’ Forms N-Q are available on the Commission’s website at http://www.sec.gov. The Funds’ Forms N-Q may be reviewed and copied at the Commission’s Public Reference Room in Washington, DC, and information on the operation of the Public Reference Room may be obtained by calling 1-800-SEC-0330; and the Funds make the information on Form N-Q available to shareholders on www.gartmorefunds.com or upon request without charge.
Statement Regarding Availability of Proxy Voting Record.
Information regarding how the Fund voted proxies relating to portfolio securities held during the most recent 12-month period ended June 30, 2004 is available without charge, upon request, by calling 800-848-0920, and on the Commission’s website at http://www.sec.gov.

Dear Fellow Shareholders,
Gazing in the rearview mirror may appear to be an exercise in 20/20 hindsight, but it isn’t. Investing is an active and engaged discipline that requires us to turn yesterday’s lessons into tomorrow’s insight. With that in mind, I’d like to share with you some of my thoughts on the investment landscape for the annual period that ended on October 31, 2004.
You probably began 2004 buoyed by the news of positive earnings reports, low interest rates and the market’s bullish bent that had carried over from late 2003. However, by February’s end, we all grew edgier as we watched our investments drawn into a vortex of volatility that persisted throughout the year. Beginning with the first 2004 U.S. employment reports, domestic and international markets1 began swinging to and fro. The gyrations were fueled by conflicting economic reports, dollar weakness, national debt, trade imbalances, spotty corporate spending, and America’s unsettling presidential race...not to mention the fallout from global terrorism and Middle East tensions.
Co-Global Chief Investment Officer of Equities Young Chin gives more detail on these developments in his accompanying Market Perspectives.
We believe that one of the best ways to manage risk is to employ global investment diversification2 coupled with skilled and disciplined active management. Our commitment is to offer you a diverse menu of products that include various asset classes and capture global investment opportunities in forms that you can use to diversify your portfolio. In response to complex, volatile markets, it’s imperative to have uncorrelated, well-performing funds that can populate a dynamic portfolio that helps to meet your specific investment objectives.
Several of our specialty sector funds, such as the Gartmore Global Financial Services Fund and the Gartmore Global Utilities Fund, were strong performers during the reporting period ended October 31, 2004. In the arena of international funds, we believe that China is—and will remain—a solid source of investment returns. This was amply illustrated by the performance of the Gartmore China Opportunities Fund, which commenced operations on June 29, 2004, vis-à-vis its benchmark and peer group.
Moving into the absolute return arena, the Gartmore U.S. Growth Leaders Long-Short Fund underscored the virtues derived from the ability to employ short selling in a mutual fund, a technique used to attempt to profit from falling stock prices. And, in terms of packaged asset allocation products, investments in the new Gartmore Optimal Allocations Funds edged ahead of benchmark returns since June 29, 2004, when this series commenced operations.
In keeping with our governance policies and unwavering commitment to placing the interests of shareholders first, we work closely with the independent Board of Trustees, and continue to closely assess fund performance, to design and deliver new products, and to address critical investment issues that matter to you.
One of the most surprising challenges we faced this year came in our $707 million3 stable value retirement product, the Gartmore Morley Capital Accumulation Fund. While stable value mutual funds have long been a popular investment option in IRAs and defined contribution plans, some of the long-accepted stable value mutual fund industry methods for stabilizing fund NAVs were placed under review by regulators in 2003. After 18 months, during which time we exhausted every avenue for resolving this issue, the Board of Trustees and the Gartmore management team concurred that it would be in our investors’ best interest to convert the Fund to a short-duration bond fund.
As of the writing of this letter, I’m pleased to report that the transition has gone smoothly. Moreover, every shareholder who redeemed his or her investment prior to the conversion of the fund received a per share value of $10, the net asset value that the fund had always sought to maintain.
All of us at Gartmore are looking forward to serving you for another year. As always, Gartmore values the confidence that you have placed in us as a steward of your investments, and we are firmly committed to helping you to protect and grow the assets you have entrusted to us.
Wishing you a very happy and prosperous 2005,

Paul J. Hondros
CEO
Gartmore
| 1. | | International investing involves additional risks, including currency fluctuations, differences in accounting standards, political instability, and foreign regulations, all of which are magnified in emerging markets. |
| |
| 2. | | Diversification is a risk management technique that mixes a wide variety of investments within a portfolio to minimize the impact of any one security on overall portfolio performance. There is no assurance that a diversified portfolio will produce better returns than a non-diversified portfolio. |
| |
| 3. | | As of 10/31/04. |
2 Annual Report 2004

Commentary by Young Chin
Co-Global Chief Investment Officer:Equities
During the first four months of this reporting period—from November 1, 2003, through February 29, 2004—the global economic recovery continued to gather momentum. The Morgan Stanley Capital International Europe, Australasia and Far East (MSCI EAFE®) Index, representing international markets, gained 14.38%.1 The S&P 500® Index, representing the U.S. market as a whole, gained 9.63%.1 All major sectors within both indexes posted positive returns.
In March and April of 2004, however, the markets were hit with an unusually long series of negative news events including rising oil prices, reports of lower-than-expected U.S. manufacturing activity and dampened investor sentiment. Weaker-than-expected U.S. job growth numbers and constant government revisions to the job reports also fueled concerns about the true status and health of employment.
In addition, from March through October 2004, investors’ attention turned to the potential negative impacts of the following events: 1) brutal hostage-taking episodes in the Middle East; 2) further threats of large-scale terrorism; 3) rising short-term interest rates; 4) inflation concerns; 5) large and growing U.S. current account and trade deficits; 6) a weakening dollar; and 7) a close and contentious U.S. presidential election.
Amid this global scenario, equity markets were very volatile, exhibiting huge swings in sector performance. From March 1, 2004, through October 31, 2004, two sectors within the MSCI EAFE Index delivered negative returns—consumer staples and information technology; however, the Index managed to advance 4.18% during this period.1 During the same period, four sectors within the S&P 500 Index—financial services, consumer staples, information technology and health care—posted negative returns. Fortunately, these negative returns did not offset the positive results from the other sectors and the S&P 500 Index managed to deliver nearly flat returns (-0.18%) during the last eight months of the period.
A 78% increase in oil prices (from $29.11 to $51.76)2 from November 1, 2003 to October 31, 2004 (the “reporting period”) led to robust profits for energy-related companies. This increase was attributable to several factors, including vigorous consumption from China, and politically motivated supply disruptions in Russia, Iraq, Nigeria, and Venezuela, as well as weather-related disruptions caused by hurricanes that pounded the United States and hampered production in the Gulf of Mexico.
During the reporting period, utility companies also gained from higher-than-expected energy prices. High dividends made telecommunications stocks attractive. Industrial stocks gained due to demand from the recovering global economy, particularly the robust growth occurring in China. Domestically, within the S&P 500 Index for the entire reporting period, sector performance ranged from a high of 44% for the energy sector (38% for the MSCI EAFE Index) to a low of -1% for the information technology sector (-1.35% for the MSCI EAFE Index). Stocks in the utilities, telecommunications services and industrials sectors delivered returns of 24%, 21% and 18% (29%, 20% and 16% for the MSCI EAFE Index), respectively, while stocks in healthcare and consumer staples delivered returns of only 2% and 4% (3% and 15% for the MSCI EAFE Index), respectively.1
In the United States, during the reporting period, health-care and consumer staples stocks, which typically are defensive in nature, delivered muted returns at a time when these stocks were expected to outperform. Health-care returns suffered from uncertainty regarding U.S. presidential candidate John Kerry’s reforms, as well as from investor concerns about the fundamental strength of major pharmaceutical companies, given their weak product pipelines. Consumer staples company margins were pressured by rising operating costs and managements’ inability to offset these costs by raising prices, due to the growing pricing power of discount retailers such as Wal-Mart Stores, Inc.
Information technology stocks during the reporting period posted negative returns due to cautious business spending. Despite an average of 22% profit growth for those companies in the S&P 500 Index during the reporting period,3 managers were intent on keeping costs down by limiting expenditures on labor and capital investments.
Fund reviews
Many investors struggled during the reporting period with the huge swings and wide range of returns in sector performance, as well as the many uncertainties that weighed on the global markets. Five of Gartmore’s specialty products, however, performed well during this reporting period, as noted in the table on page 4.
2004 Annual Report 3

Average Annual Total Returns
Nov. 1, 2003–Oct. 31, 2004
| | | | | | | | | |
| | | Class A | | | | |
| | | Average Annual | | | Benchmark | |
| Fund | | Total Returns* | | | Returns** | |
| |
| Gartmore Global Financial Services Fund** | | | 17.01 | % | | | 14.32 | % |
| |
| Gartmore Global Utilities Fund** | | | 31.81 | % | | | 24.49 | % |
| |
| Gartmore Micro Cap Equity Fund** | | | 22.96 | % | | | 9.26 | % |
| |
| Gartmore Small Cap Fund** | | | 15.33 | % | | | 11.73 | % |
| |
| Gartmore U.S. Growth Leaders Long-Short Fund** | | | 9.03 | % | | | 1.09 | % |
| |
Source: BISYS, as of Oct. 31, 2004
PAST PERFORMANCE DOES NOT GUARANTEE FUTURE RESULTS.
| * | | Performance is for Class A shares without sales charges and assumes that all distributions are reinvested. If these performance figures did include the load, results would have been lower. Total returns may reflect a waiver of part of the Fund’s fees for certain periods since inception, without which returns would have been lower. Standardized performance can be found in this report following the fund-specific commentaries. To obtain performance information current to the most recent month-end, which may be higher or lower than the performance shown above, please call 800-848-0920 or visit www.gartmorefunds.com. |
| |
| ** | | Please see all fund-specific and benchmark-specific disclosures at the end of this report. |
Benchmarks are for illustrative purposes only.
The Gartmore Global Financial Services Fund’s performance during this reporting period was bolstered by a generally favorable global economic and credit environment. Low interest rates aided consumers’ ability to manage their debt, evidenced by the fact that delinquency rates were relatively low, while businesses generated healthy cash flows. In addition, some of the Fund’s investments in Japan, where the economy rebounded after suffering through a decade-long depression, performed extremely well.
High electricity prices, as well as an emphasis on wireless telecommunications providers over fixed-line providers, helped the Gartmore Global Utilities Fund’s portfolio management team deliver stellar returns.
Particularly strong stock selection in the health-care, industrials and information technology sectors facilitated strong investment flow and returns for the Gartmore Micro Cap Equity Fund.
Concurrently, an overweighting in energy and materials, as well as flexibility in the information technology weighting, helped the Gartmore Small Cap Fund outperform its benchmark.
The Gartmore U.S. Growth Leaders Long-Short Fund produced above-average results. The Fund, which was put into the hands of a new management team on July 1, 2004, is employing a refined strategy designed to produce positive absolute returns and generate relatively low volatility as well as maintain a low correlation with the S&P 500 Index, while benchmarked against the Citigroup 3-Month T-Bill Index. The Fund also can help to reduce the overall risk of a portfolio because the Fund can short stocks and potentially outperform its peers during falling markets. With this new strategy, the Fund can be net long or short, and the manager typically will hold 70 to 100 positions. Under the previous management style, the Fund held somewhere between 400 and 500 securities.
Looking ahead
We expect economic and capital market conditions to improve during the upcoming reporting period as investors reposition for the long term. The number of adverse forces and political uncertainties weighing on the markets should decline. The U.S. economy should grow at a stable, trend rate of about 3% to 4%, and market volatility should decline.
Much of the uncertainty that had been weighing on the markets during the end of this reporting period was resolved with the U.S. presidential election results. Under President Bush’s administration, we expect the energy, utilities, financial services and defense industries to be well positioned for steady growth. In regard to the energy sector, the Republican-controlled Congress and the president appear to support U.S. policies that will make America less dependent on foreign energy supplies. The president is likely to promote the expansion of U.S. exploration activities and policies that will make it more beneficial for companies to explore alternative sources of energy, such as nuclear power. Proposed Republican tax policies should make those companies that pay high dividends, such as utility and financial services firms, more attractive. Financial services firms, in particular, should gain from President Bush’s efforts to partially privatize Social Security (the plan may be designed to divert some Social Security assets to private accounts). Defense companies should benefit from the high priority of the war on terror. The president’s plan for tort reform could help the health-care industry and other industries burdened by excessive litigation.
4 Annual Report 2004

Our investment management team believes that commodity prices should moderate somewhat as growth slows in response to rising interest rates across the globe. This rise should reduce some of the stimulus that has driven an extraordinarily robust increase in global demand. For example, we suspect that the price of oil will moderate somewhere in the $35 to $45 per barrel range, instead of hovering around the $50 mark. Moreover, prices for other materials such as copper and similar industrial metals also should moderate with a reduction in demand.
The strength of the U.S. dollar may continue to decline, which should prove to be a positive development for American manufacturers, because this decline makes their goods more attractive overseas. A decline in the U.S. dollar also may help to improve the U.S. current account deficit, due to improved trade balances.
So far, the slide in the dollar has been concentrated mainly against the European and Japanese currencies. Many Asian currencies, including China’s, have maintained a link to the dollar, which has actually caused their goods to gain in competitiveness, along with goods from the United States.
China, however, has been attempting to slow its robust economic growth, which over the past year has been gaining at a rate of 8% to 9%, in an effort to control its inflation rate.4 We would not be surprised to see China eventually remove its peg to the U.S. dollar, which would be a huge step toward a more market-based economy. A potential risk factor to the markets during 2005 is a continued or sharp drop in the value of the U.S. dollar, which would be disruptive to global markets since many Central Banks hold our currency. Another risk is a rapid decoupling of a major Asian economy’s peg to U.S. currency.
If all the above-mentioned positive factors come to pass, we should see U.S. job growth improve as corporate confidence is renewed in response to more stable and predictable economic conditions. There is a risk, however, that the pressures of global competition might dampen corporate flexibility to add resources. At present, though, companies have announced significant layoffs, which we see as another risk factor for 2005.
We believe that the Federal Reserve will continue to raise interest rates until the federal funds rate reaches a neutral (neither stimulative nor restrictive) level of 4%. Although this is not a net positive factor for the market, a 4% federal funds rate should permit the U.S. economy to solidify and continue to grow at a stable level. We expect no further short-term interest-rate increases in Japan or in Europe.
Outside the United States and within Europe, we believe that France and Italy have the most attractive valuations. We also believe that the macroeconomic outlook for the United Kingdom’s economy is very favorable.
Within the Pacific Rim we see good, but somewhat fragile, prospects in Japan. Japan’s economy has been heavily reliant upon China’s growth.
Japan will need a broader global recovery to offset an expected slight slowdown in 2005 for China. In addition, continued high oil prices are expected to pose greater challenges to the sustainability of Japan’s recent growth. We, however, believe that a sustained recovery in Japan is very possible, given the recent indications for greater domestic growth. Renewed investor sentiment and stronger consumer demand in Japan, as well as a continued favorable export environment, all support our view.
In summary, we expect that investors will react favorably to calmer market conditions and slowly increase their equity allocations. Instead of focusing on a plethora of negative events, investors can once again focus on fundamentals and opportunities.
A more certain U.S. political direction, more moderate commodity prices and a correction of some of the imbalances in the global economy brought about by a weaker U.S. dollar should create an environment of reduced volatility. In 2005, we believe that the biggest risks to the economy could be disruptive currency movements and weaker-than-anticipated job growth. Thus, we believe that investors should focus on diversification and asset allocation, based on their investment needs.

Young Chin
Co-Global Chief Investment Officer:Equities
Gartmore
Sources:
| 1. | | FactSet Research Systems Inc., Nov. 1, 2003–Feb. 24, 2004; March 1, 2004–Oct. 31, 2004; Oct. 31, 2003–Oct. 31, 2004 |
| |
| 2. | | Bloomberg Financial Services, Nov. 1, 2003–Oct. 31, 2004 |
| |
| 3. | | Baseline Financial Services, Inc., Dec. 5, 2004 |
2004 Annual Report 5
| 4. | Zheng Jingping, “Stable and Fast Economic Growth in the First Three Quarters of 2004,” National Bureau of Statistics of China, Oct. 22, 2004, <http://www.stats.gov.ch/ english/newsandcomingevents.htm> (Dec. 16, 2004). |
Investing in mutual funds involves risk, including possible loss of principal. There is no assurance that the investment objective of any fund will be achieved, or that a diversified portfolio will produce better returns than a nondiversified portfolio. Performance returns assume reinvestment of all distributions. The investment return and principal value of an investment will fluctuate, so that an investor’s shares, when redeemed, may be worth more or less than their original cost.
Index performance is provided for comparison purposes only; the indexes are unmanaged and no fees or expenses are reflected. Individuals cannot invest directly in market indexes.
Gartmore Global Financial Services Fund
Morgan Stanley Capital International (MSCI) World Financials IndexSM: An unmanaged index that is based on developed-market country indexes and is generally representative of the stocks in the global financial services sector.
Gartmore Global Utilities Fund
Morgan Stanley Capital International (MSCI) World Utilities IndexSM: An unmanaged index that is based on developed-market country indexes and is generally representative of the stocks in the utilities sector, which includes industry groups such as electric, gas, multi-utilities, and unregulated power and water. Morgan Stanley Capital International (MSCI) World Telecommunication Services IndexSM: An unmanaged index that is based on developed-market country indexes and is generally representative of the stocks in the global utilities sector. The Gartmore Global Utilities Fund uses a composite of 60% MSCI World Telecommunication Services Index and 40% MSCI World Utilities Index.
Gartmore Micro Cap Equity Fund
Wilshire Micro-Cap® Index: An unmanaged, market capitalization-weighted index that measures small-cap stocks in the bottom “half” of the Wilshire 5000 Total Market Index as of June 30 of each year; the Wilshire 5000 Total Market Index contains more than 6,500 stocks that trade and are based in the United States.
Gartmore Small Cap Fund
Russell 2000® Index: An unmanaged index that measures the performance of the stocks of small-capitalization U.S. companies; includes the smallest 2,000 U.S. companies in the Russell 3000® Index, which measures the performance of the largest 3,000 U.S. companies, based on market capitalization.
Gartmore U.S. Growth Leaders Long-Short Fund
Citigroup 3-Month T-Bill Index: An unmanaged index that is generally representative of 3-month Treasury bills; consists of an average of the last 3-month Treasury bill issues (excluding the current month-end bill).
Funds that concentrate on specific sectors or a relatively small number of securities may be subject to greater volatility than a more diversified investment.
International investing involves additional risks, including currency fluctuations, differences in accounting standards, political instability and foreign regulations, all of which are magnified in emerging markets.
Small-company stocks have higher risks than the stocks of larger, more established companies and have significant short-term price volatility.
In order to achieve the Gartmore U.S. Growth Leaders Long-Short Fund’s objective, the managers may use sophisticated investment strategies such as leverage, short selling, short-term trading, investing in derivatives and in smaller companies. These strategies may cause the Fund to have greater risk and volatility, and higher expenses, than those of other investments. The risks of investing in this Fund are more fully detailed within the Fund’s prospectus.
The opinions expressed herein are those of Gartmore Global Investments and may not actually come to pass. This information is current as of October 31, 2004, and is subject to change at any time, based on market and other conditions.
Investors should carefully consider a fund’s investment objectives, risks, fees, charges and expenses before investing any money. To obtain this and other information on Gartmore’s funds, please call 800-848-0920 to request a prospectus, or download a prospectus at www.gartmorefunds.com. Please read it carefully before investing any money.
Gartmore Funds distributed by Gartmore Distribution Services, Inc., Member NASD. 1200 River Road, Suite 1000, Conshohocken, PA 19428.
6 Annual Report 2004
Important Information
Small-company stocks have higher risks than the stocks of larger, more established companies and have significant short-term price volatility.
Funds that concentrate on specific sectors or a relatively small number of securities may be subject to greater volatility than a more diversified investment.
International investing involves additional risks, including currency fluctuations, differences in accounting standards, political instability and foreign regulations, all of which are magnified in emerging markets.
The Gartmore China Opportunities Fund invests in securities of companies that are located in, or derive a significant portion of their earnings or revenues from, China and/or Hong Kong. These securities may present substantially higher risks and greater volatility than those in most mutual funds. The Fund may not be appropriate for all investors. It also may purchase securities in initial public offerings, which can be very volatile and carry high transaction costs.
High-yield funds typically are subject to greater risk and price volatility than funds that invest in higher-rated debt securities.
In order to achieve the Gartmore U.S. Growth Leaders Long-Short Fund’s objective, the managers may use sophisticated investment strategies such as leverage, short selling, short-term trading, investing in derivatives and in smaller companies. These strategies may cause the Fund to have greater risk and volatility, and higher expenses, than those of other investments. The risks of investing in this Fund are more fully detailed within the Fund’s prospectus.
The Gartmore Small Cap Fund may purchase securities in initial public offerings, which can be very volatile and carry high transaction costs.
2004 Annual Report 7

Sector Series
| |
| | Gartmore Global Financial Services Fund |
For the annual period ended Oct. 31, 2004, the Gartmore Global Financial Services Fund returned 17.01% (Class A at NAV) versus 14.32% for its benchmark, the Morgan Stanley Capital International (MSCI) World Financials Index. For broader comparison, the average return for the Fund’s Lipper peer category of Financial Services Funds was 10.57%.
During the reporting period, financial services stocks were aided by a generally favorable global economic and credit environment. Low interest rates aided consumers’ ability to manage their debt, as delinquency rates were relatively low, while businesses generated healthy cash flows.
Factors that aided the Fund’s performance included the performance of some of the Fund’s investments in Japan, where the economy has been reviving after suffering through a decade-long depression. Orix Corp., a Japanese provider of financial services for small and mid-sized companies worldwide, performed well. In the United States, a number of our stock selections contributed positively to the Fund’s performance.
Credit-card issuer Capital One Financial Corp., for example, benefited from improving consumer credit and its exposure to auto and small business lending. Bank of America Corp.—the third-largest U.S. bank—continued to make progress in assimilating FleetBoston Financial Corp., a merger that already is exhibiting lowered costs of doing business. In addition, among smaller bank holdings, Colonial National Bank and Placer Sierra Bancshares merit mention as performance contributors for the Fund.
Underweighting the real estate segment was one factor that detracted from performance. Although many REITs (real estate investment trusts) did well, we thought that these REITs were richly valued and vulnerable to rising interest rates. Underperforming stocks held by the Fund included: New York Community Bancorp, Inc., –which we sold because of a deteriorating balance sheet– online brokerage firm Ameritrade Holding Corp. which was hampered by a decline in trading volumes during the summer.
Geographically, the Fund also suffered from being underweighted in stocks from Canada and Australia, which performed well in part because of currency appreciation in those countries.
We expect improving economic performance in the United States, as well as abroad, in 2005. Credit quality should remain strong, and perhaps even improve, during the first quarter and possibly into subsequent quarters. Mergers and acquisitions should continue, but at a slower pace amid richer valuations. Rising interest rates typically provide a challenging environment for financial services companies, but our approach is to limit the Fund’s exposure to pure lending plays. Instead, we will focus on companies with a significant component of fee-based income. In banking, we continue to favor smaller banks with good growth prospects and valuations that tend to make them attractive takeover candidates. We believe pricing in the property and casualty insurance industry could soften further. Consequently, we find few compelling values there at the moment. The Fund owns selected positions in asset managers and brokers, and we would consider raising our exposure if the financial markets show signs of breaking out of their recent trading ranges.
Portfolio Managers:
Douglas Burtnick, CFA And Stuart Quint, CFA
| |
| | Class A: GLFAX |
| | Class B: GLFBX |
| | Class C: GLFCX |
| | Class R: GLFRX |
| | Institutional Service Class: GFISX |
| | Institutional Class: GLFIX |
2004 Annual Report 9
Sector Series
Gartmore Global Financial Services Fund
Average Annual Total Return
(For periods ended October 31, 2004)
| | | | | | | | | | | |
| | | | One year | | | Inception1 | |
|
| |
| Class A | | without sales charge2 | | | 17.01% | | | | 12.00% | |
| | | with sales charge3 | | | 10.28% | | | | 9.72% | |
|
| Class B | | without sales charge2 | | | 16.15% | | | | 11.20% | |
| | | with sales charge4 | | | 11.15% | | | | 10.33% | |
|
| Class C | | without sales charge2 | | | 16.16% | | | | 11.20% | |
| | | with sales charge5 | | | 15.16% | | | | 11.20% | |
|
Class R 6,8 | | | | | 16.47% | | | | 11.30% | |
|
| Institutional Class7,8 | | | 17.25% | | | | 12.28% | |
|
| Institutional Service Class8 | | | 17.25% | | | | 12.28% | |
|
All figures showing the effect of a sales charge reflect the maximum charge possible, because it has the most dramatic effect on performance data.
| |
| 1 | Fund commenced operations on December 18, 2001. |
| |
| 2 | These returns do not reflect the effects of sales charges (SC). |
| |
| 3 | A 5.75% front-end sales charge was deducted. |
| |
| 4 | A 5.00% contingent deferred sales charge (CDSC) was deducted. The CDSC declines to 0% after 6 years. |
| |
| 5 | A CDSC of 1.00% was deducted because it is charged when you sell Class C shares within the first year after purchase. |
| |
| 6 | These returns until the creation of Class R shares (12/31/03) include the performance of the Fund’s Class B shares. The returns have been adjusted for the fact that Class R shares do not have any applicable sales charges but have not been adjusted for the lower expenses applicable to Class R shares. Excluding the effect of any fee waivers or reimbursements, such prior performance is similar to what Class R shares would have produced because the Class R shares invest in the same portfolio of securities as Class B shares. |
| |
| 7 | These returns until the creation of Institutional Class shares (6/29/04) include the performance of the Fund’s Institutional Service shares. The returns have not been adjusted for the lower expenses applicable to Institutional Class shares. Excluding the effect of any fee waivers or reimbursements, such prior performance is similar to what Institutional Class shares would have produced because the Institutional Class shares invest in the same portfolio of securities as Institutional Service shares. |
| |
| 8 | Not subject to any sales charges. |
Performance of a $10,000 Investment
Investment return and principal value will fluctuate, and when redeemed, shares may be worth more or less than original cost. Past performance is no guarantee of future results and does not reflect the deduction of taxes that a shareholder would pay on fund distributions or the redemption of fund shares. Investing in mutual funds involves market risk, including loss of principal. Performance returns assume the reinvestment of all distributions.
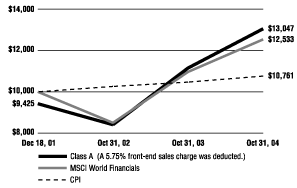
Comparative performance of $10,000 invested in Class A shares of the Gartmore Global Financial Services Fund, Morgan Stanley Capital International World Financials Index (MSCI World Financials)(a), and the Consumer Price Index (CPI)(b) since inception. Unlike the Fund, the returns for these unmanaged indexes do not reflect any fees, expenses, or sales charges. Investors cannot invest directly in market indexes.
| | |
| (a) | | The MSCI World Financials is an unmanaged index representative of the stocks in the global financial services sector and is based on 23 developed market country indices. |
| |
| (b) | | The CPI represents changes in prices of a basket of goods and services purchased for consumption by urban households. |
10 Annual Report 2004
Gartmore Global Financial Services Fund
Shareholder
Expense Example
As a shareholder of the Funds, you incur two types of costs: (1) transaction costs, including sales charges (loads) paid on purchase payments and redemption fees; and (2) ongoing costs, including investment advisory fees, administration fees, distribution fees and other Fund expenses. The examples below are intended to help you understand your ongoing costs (in dollars) of investing in the Funds and to compare these costs with the ongoing costs of investing in other mutual funds. The examples assume that you had a $1,000 investment in the Class at the beginning of the reporting period, May 1, 2004, and continued to hold your shares at the end of the reporting period, October 31, 2004. Per SEC requirements, the examples are based on an investment of $1,000 invested at the beginning of the period and held for the entire six-month period ended October 31, 2004.
Actual Expenses
For each Class of the Fund in the table below, the first line provides information about actual account values and actual expenses. You may use the information in this line, together with the amount you invested, to estimate the expenses that you paid over the period. Simply divide your account value by $1,000 (for example, an $8,600 account value divided by $1,000 = 8.6), then multiply the result by the number in the first line of each Class under the heading entitled “Expenses Paid During Period” to estimate the expenses you paid on your account during the period.
Hypothetical Example for Comparison Purposes
The second line of each Class in the table below provides information about hypothetical account values and hypothetical expenses based on the Class’ actual expense ratio and an assumed rate of return of 5% per year before expenses, which is not the Class’ actual return. The hypothetical account values and expenses may not be used to estimate the actual ending account balance or expenses you paid for the period. You may use this information to compare the ongoing costs of investing in the Class of the Fund and other funds. To do so, compare this 5% hypothetical example with the 5% hypothetical examples that appear in the shareholder reports of the other funds.
Please note that the expenses shown in the table are meant to highlight your ongoing costs only and do not reflect any transaction costs, such as sales charges (loads) or redemption fees. Therefore, the second line for each Class in the table is useful in comparing ongoing costs only, and will not help you determine the relative total costs of owning different funds. In addition, if these transaction costs were included, your costs would have been higher. The examples also assume all dividends and distributions have been reinvested.
Schedule of Shareholder Expenses
Expense Analysis of a $1,000 Investment
(October 31, 2004)
| | | | | | | | | | | | | | | | | | | | | | | |
| | | | Beginning | | | Ending | | | | | | | |
| | | | Account Value | | | Account Value | | | Expenses Paid | | | Annualized | | | |
| Global Financial Services Fund | | | | 5/1/04 | | | 10/31/04 | | | During Period* | | | Expense Ratio | | | |
|
|
| Class A | | | Actual | | | $ | 1,000 | | | $ | 1,049 | | | $ | 8.55 | | | | 1.66% | | | |
| | | | Hypothetical | 1 | | $ | 1,000 | | | $ | 1,017 | | | $ | 8.45 | | | | 1.66% | | | |
|
| Class B | | | Actual | | | $ | 1,000 | | | $ | 1,046 | | | $ | 12.34 | | | | 2.40% | | | |
| | | | Hypothetical | 1 | | $ | 1,000 | | | $ | 1,013 | | | $ | 12.22 | | | | 2.40% | | | |
|
| Class C | | | Actual | | | $ | 1,000 | | | $ | 1,046 | | | $ | 12.34 | | | | 2.40% | | | |
| | | | Hypothetical | 1 | | $ | 1,000 | | | $ | 1,013 | | | $ | 12.22 | | | | 2.40% | | | |
|
| Class R | | | Actual | | | $ | 1,000 | | | $ | 1,047 | | | $ | 9.88 | | | | 1.92% | | | |
| | | | Hypothetical | 1 | | $ | 1,000 | | | $ | 1,015 | | | $ | 9.77 | | | | 1.92% | | | |
|
| Institutional Service Class | | | Actual | | | $ | 1,000 | | | $ | 1,050 | | | $ | 7.21 | | | | 1.40% | | | |
| | | | Hypothetical | 1 | | $ | 1,000 | | | $ | 1,018 | | | $ | 7.13 | | | | 1.40% | | | |
|
| Institutional Class (a) | | | Actual | | | $ | 1,000 | | | $ | 1,030 | | | $ | 4.81 | (b) | | | 1.40% | | | |
| | | | Hypothetical | 1 | | $ | 1,000 | | | $ | 1,010 | | | $ | 4.78 | (b) | | | 1.40% | | | |
|
| | |
| (a) | | For the period from June 29, 2004 (commencement of operations) through October 31, 2004. |
| |
| (b) | | Expenses are equal to the Fund’s annualized expense ratio multiplied by the average account value over the period multiplied by 124/366 (to reflect the period). |
| |
| * | Expenses are equal to the Fund’s annualized expense ratio multiplied by the average account value over the period multiplied by 184/366 (to reflect the one-half year period). |
1 Represents the hypothetical 5% annual return before expenses.
2004 Annual Report 11
Gartmore Global Financial Services Fund
Sector Series
| |
| | Portfolio Summary |
| | (October 31, 2004) |
The SEC adopted a requirement that Funds present their portfolio holdings in a table, chart or graph format in their annual and semiannual reports to shareholders, whether or not a schedule of investments is utilized. The following tables, which present portfolio holdings as a percentage of net assets, are provided in compliance with this requirement.
| | | | | | | |
| Asset Allocation | | | | |
|
|
| Common Stocks | | | 94.6% | | | |
| Repurchase Agreements | | | 4.9% | | | |
| Other Assets in excess of Liabilities | | | 0.5% | | | |
| | |
| | | |
| | | | 100.0% | | | |
| | | | | | | |
| Top Countries | | | | |
|
|
| United States | | | 52.0% | | | |
| United Kingdom | | | 12.4% | | | |
| Japan | | | 6.3% | | | |
| Switzerland | | | 3.6% | | | |
| France | | | 3.5% | | | |
| Hong Kong | | | 2.9% | | | |
| Ireland | | | 2.5% | | | |
| Germany | | | 2.4% | | | |
| Spain | | | 2.2% | | | |
| Belgium | | | 1.9% | | | |
| Other Countries | | | 10.3% | | | |
| | |
| | | |
| | | | 100.0% | | | |
| | | | | | | |
| Top Holdings | | | | |
|
|
| Bank Of America Corp. | | | 4.2% | | | |
| Citigroup, Inc. | | | 4.1% | | | |
| Royal Bank of Scotland Group PLC | | | 3.6% | | | |
| U.S. Bancorp | | | 3.1% | | | |
| HSBC Holdings PLC | | | 3.1% | | | |
| Wachovia Corp. | | | 3.0% | | | |
| Hang Lung Group Ltd. | | | 2.9% | | | |
| BNP Paribas SA | | | 2.8% | | | |
| Allstate Corp. | | | 2.7% | | | |
| UBS AG | | | 2.6% | | | |
| Other Holdings | | | 67.9% | | | |
| | |
| | | |
| | | | 100.0% | | | |
12 Annual Report 2004
Gartmore Global Financial Services Fund
Statement of Investments
October 31, 2004
Gartmore Global Financial Services Fund
| | | | | | | | | | | |
|
| Common Stocks (94.6%) |
|
| | Shares or | | | |
| | Principal Amount | | | Value | | | |
|
| AUSTRALIA (1.1%) |
| Banking (1.1%) |
| Australia & New Zealand Banking Group Ltd. (c) | | | 4,403 | | | $ | 67,408 | | | |
| | | | | |
| | | |
| |
|
| BELGIUM (1.9%) |
| Financial Services (1.9%) |
| Fortis NV (c) | | | 4,690 | | | | 119,526 | | | |
| | | | | |
| | | |
| |
|
| FRANCE (3.5%) |
| Banking (2.8%) |
| BNP Paribas SA (c) | | | 2,620 | | | | 178,448 | | | |
| | | | | |
| | | |
| |
| Insurance (0.7%) |
| Axa (c) | | | 2,070 | | | | 44,649 | | | |
| | | | | |
| | | |
| |
| | | | | | | | 223,097 | | | |
| | | | | |
| | | |
| |
|
| GERMANY (2.4%) |
| Financial Services (2.4%) |
| Hypo Real Estate Holding AG (b) (c) | | | 4,090 | | | | 153,038 | | | |
| | | | | |
| | | |
| |
|
| HONG KONG (2.9%) |
| Financial Services (2.9%) |
| Hang Lung Group Ltd. (c) | | | 112,640 | | | | 184,684 | | | |
| | | | | |
| | | |
| |
|
| IRELAND (2.5%) |
| Banking (2.5%) |
| Bank of Ireland (c) | | | 11,610 | | | | 159,005 | | | |
| | | | | |
| | | |
| |
|
| ITALY (1.7%) |
| Banking (1.7%) |
| UniCredito Italiano SpA (c) | | | 20,570 | | | | 110,443 | | | |
| | | | | |
| | | |
| |
|
| JAPAN (6.3%) |
| Banking (0.4%) |
| UFJ Holdings, Inc. (c) | | | 6 | | | | 27,814 | | | |
| | | | | |
| | | |
| |
| Financial Services (5.5%) |
| Daito Trust Construction Co. Ltd. (c) | | | 1,100 | | | | 46,460 | | | |
| Mitsubishi Tokyo Financial Group, Inc. (c) | | | 8 | | | | 67,686 | | | |
| Mizuho Financial Group, Inc. (c) | | | 13 | | | | 50,105 | | | |
| Nomura Holdings, Inc. (c) | | | 3,000 | | | | 36,498 | | | |
| Orix Corp. (c) | | | 700 | | | | 81,801 | | | |
| Sumitomo Mitsui Financial Group, Inc. (c) | | | 10 | | | | 64,933 | | | |
| | | | | |
| | | |
| |
| | | | | | | | 347,483 | | | |
| | | | | |
| | | |
| |
| Insurance (0.4%) |
| Millea Holdings, Inc. (c) | | | 2 | | | | 26,335 | | | |
| | | | | |
| | | |
| |
| | | | | | | | 401,632 | | | |
| | | | | |
| | | |
| |
|
| PORTUGAL (0.5%) |
| Banking (0.5%) |
| Banco Commercial Portuguese S.A. (c) | | | 14,000 | | | | 32,997 | | | |
| | | | | |
| | | |
| |
|
| SPAIN (2.2%) |
| Banking (2.2%) |
| Banco Popular Espanol SA (c) | | | 1,020 | | | | 57,794 | | | |
| Banco Santander Central Hispano SA (c) | | | 7,470 | | | | 83,383 | | | |
| | | | | |
| | | |
| |
| | | | | | | | 141,177 | | | |
| | | | | |
| | | |
| |
|
| SWEDEN (1.6%) |
| Banking (1.6%) |
| Skandinaviska Enskilda Banken AB (c) | | | 5,970 | | | | 99,393 | | | |
| | | | | |
| | | |
| |
|
| SWITZERLAND (3.6%) |
| Financial Services (2.6%) |
| UBS AG (c) | | | 2,260 | | | | 163,132 | | | |
| | | | | |
| | | |
| |
| Insurance (1.0%) |
| Zurich Financial Services AG (c) | | | 460 | | | | 65,454 | | | |
| | | | | |
| | | |
| |
| | | | | | | | 228,586 | | | |
| | | | | |
| | | |
| |
|
| UNITED KINGDOM (12.4%) |
| Banking (11.7%) |
| Barclays PLC (c) | | | 12,691 | | | | 124,031 | | | |
| HBOS PLC (c) | | | 8,185 | | | | 109,613 | | | |
| HSBC Holdings PLC (c) | | | 12,210 | | | | 196,976 | | | |
| Lloyds TSB Group PLC (c) | | | 10,417 | | | | 82,299 | | | |
| Royal Bank of Scotland Group PLC (c) | | | 7,765 | | | | 228,570 | | | |
| | | | | |
| | | |
| |
| | | | | | | | 741,489 | | | |
| | | | | |
| | | |
| |
| Insurance (0.7%) |
| Royal & Sun Alliance Insurance Group PLC (c) | | | 32,430 | | | | 44,460 | | | |
| | | | | |
| | | |
| |
| | | | | | | | 785,949 | | | |
| | | | | |
| | | |
| |
|
| UNITED STATES (52.0%) |
| Banking (15.6%) |
| Bank Of America Corp. | | | 5,940 | | | | 266,053 | | | |
| Marshall & Ilsley Corp. | | | 780 | | | | 32,737 | | | |
| Northern Trust Corp. | | | 1,310 | | | | 55,727 | | | |
| Placer Sierra Bancshares (b) | | | 2,040 | | | | 48,960 | | | |
| U.S. Bancorp | | | 6,970 | | | | 199,412 | | | |
| Wachovia Corp. | | | 3,830 | | | | 188,474 | | | |
| Wells Fargo & Co. | | | 2,050 | | | | 122,426 | | | |
| Zions Bancorp | | | 1,140 | | | | 75,434 | | | |
| | | | | |
| | | |
| |
| | | | | | | | 989,223 | | | |
| | | | | |
| | | |
| |
| Financial Services (27.3%) |
| Accredited Home Lenders Holders Co. (b) | | | 690 | | | | 24,895 | | | |
| American Capital Strategies Ltd. | | | 2,511 | | | | 77,715 | | | |
| American Express Co. | | | 1,780 | | | | 94,465 | | | |
| Ameritrade Holding Corp. (b) | | | 2,300 | | | | 29,946 | | | |
| Calamos Asset Management, Inc., Class A (b) | | | 2,950 | | | | 57,525 | | | |
| Capital One Financial Corp. | | | 1,550 | | | | 114,328 | | | |
| CIT Group, Inc. | | | 1,880 | | | | 75,952 | | | |
| Citigroup, Inc. | | | 5,960 | | | | 264,445 | | | |
| Countrywide Financial Corp. | | | 3,076 | | | | 98,217 | | | |
2004 Annual Report 13
| |
| | Statement of Investments (Continued) |
| | October 31, 2004 |
Gartmore Global Financial Services Fund (Continued)
Sector Series
| | | | | | | | | | | |
|
| Common Stocks (continued) |
|
| | Shares or | | | |
| | Principal Amount | | | Value | | | |
|
UNITED STATES (continued)
Financial Services (continued) |
| E*TRADE Financial Corp. (b) | | | 5,170 | | | $ | 66,693 | | | |
| Eagle Hospitality Properties Trust, Inc. (b) | | | 3,410 | | | | 32,395 | | | |
| Fannie Mae | | | 1,366 | | | | 95,825 | | | |
| Franklin Resources, Inc. | | | 740 | | | | 44,859 | | | |
| Freddie Mac | | | 850 | | | | 56,610 | | | |
| Goldman Sachs Group, Inc. | | | 1,384 | | | | 136,158 | | | |
| Investors Financial Services Corp. | | | 1,960 | | | | 75,440 | | | |
| J.P. Morgan Chase & Co. | | | 3,159 | | | | 121,937 | | | |
| Knight Trading Group, Inc. (b) | | | 5,630 | | | | 58,496 | | | |
| Legg Mason, Inc. | | | 980 | | | | 62,436 | | | |
| MBNA Corp. | | | 1,510 | | | | 38,701 | | | |
| Saxon Capital, Inc. (b) | | | 2,500 | | | | 48,000 | | | |
| T. Rowe Price Group, Inc. | | | 860 | | | | 47,962 | | | |
| | | | | |
| | | |
| |
| | | | | | | | 1,723,000 | | | |
| | | | | |
| | | |
| |
| Insurance (9.1%) |
| Allstate Corp. | | | 3,570 | | | | 171,681 | | | |
| American International Group, Inc. | | | 2,660 | | | | 161,489 | | | |
| Assurant, Inc. | | | 1,230 | | | | 33,185 | | | |
| Hartford Financial Services Group | | | 780 | | | | 45,614 | | | |
| MGIC Investment Corp. | | | 600 | | | | 38,586 | | | |
| PartnerRe Ltd. | | | 2,220 | | | | 129,093 | | | |
| | | | | |
| | | |
| |
| | | | | | | | 579,648 | | | |
| | | | | |
| | | |
| |
| | | | | | | | 3,291,871 | | | |
| | | | | |
| | | |
| |
| Total Common Stocks | | | 5,998,806 | | | |
| | | | | |
| | | |
| | | | | | | | | | | |
|
| Repurchase Agreements (4.9%) |
|
| | Shares or | | | |
| | Principal Amount | | | Value | | | |
|
|
CS First Boston, 1.75%, dated 10/29/04, due 11/01/04, repurchase price $129,465
(Fully collateralized by U.S. Treasury Notes and U.S. Agency Securities) | | $ | 129,276 | | | | 129,276 | | | |
Nomura Securities, 1.75% dated 10/29/04, due 11/01/04, repurchase price $180,655
(Fully collateralized by AA Corporate Bonds and U.S. Agency Securities) | | | 180,629 | | | | 180,629 | | | |
| | | | | |
| | | |
| |
| | | | | |
| | | |
| |
| Total Repurchase Agreements | | | 309,905 | | | |
| | | | | |
| | | |
| |
| Total Investments (Cost $5,919,297) (a) — 99.5% | | | 6,308,711 | | | |
| Other assets in excess of liabilities — 0.5% | | | 29,064 | | | |
| | | | | |
| | | |
| |
| NET ASSETS — 100.0% | | $ | 6,337,775 | | | |
| | | | | |
| | | |
| | |
| (a) | | See notes to financial statements for tax unrealized appreciation (depreciation) of securities. |
| |
| (b) | | Denotes a non-income producing security. |
| |
| (c) | | Fair Valued Security. |
See notes to financial statements.
14 Annual Report 2004
Sector Series
| |
| | Gartmore Global Health Sciences Fund |
For the annual period ended Oct. 31, 2004, the Gartmore Global Health Sciences Fund returned 6.26% (Class A at NAV) versus 3.87% for its benchmark, the Goldman Sachs Healthcare Index. For broader comparison, the average return for the Fund’s Lipper peer category of Health/Biotechnology Funds was 5.93%.
In managing the Fund, we attempt to hold what we consider to be the best collection of health-care stocks in the portfolio each day, namely those companies that are experiencing positive and sustainable fundamental changes. We use quantitative techniques to guide the Fund’s industry and stock selection, but we rely most heavily on our proprietary research and new stock ideas as well as possible trends identified by our network of health-care industry contacts.
The Fund achieved solid gains during the annual period, though sector returns have been less robust than during the previous annual period. Both the Fund and the Index finished the period in positive territory, yet the Fund outperformed the Index due primarily to our stock selection decisions within the health-care providers and services sector as well as in pharmaceuticals. Within the health-care providers and services industry, which includes hospitals, long-term care facilities and other related companies, the Fund placed an emphasis on health maintenance organizations (HMOs); our research showed that many HMOs would benefit from strong revenue gains. Specifically, overweight positions HMOs, such as UnitedHealth Group Inc., and Magellan Health Services, Inc., contributed to the Fund’s outperformance in that industry. Fund holdings within the pharmaceuticals sector also performed well when compared to their counterparts in the Index. The best performer within this industry was the Fund’s position in Ireland-based Elan Corp., PLC. This company’s stock benefited from its management restructuring decisions, as well as the strength of the company’s product pipeline.
Unfortunately, several pharmaceutical holdings also held back the Fund’s return, most notably Merck & Co., Inc. Merck’s surprise decision to pull the anti-inflammatory drug, Vioxx, from the market sent the firm’s stock price plummeting immediately upon release of the news. As a result, added scrutiny also was given to other large pharmaceutical firms with comparable drugs, and whose stock was held by the Fund, such as Pfizer Inc., whose stock price also was hurt. Since Merck’s announcement, we have sold our position in the stock and trimmed the Fund’s position in other large U.S. pharmaceuticals.
Looking ahead, we believe that the health-care sector will remain largely a stock-picker’s market for the near term. Thus, we do not foresee any major themes emerging that would persuade us to significantly reposition the portfolio. We plan to maintain an underweight position in large U.S. pharmaceuticals, placing a greater emphasis on generic and European pharmaceutical companies. We also intend to continue to maintain significant positions in the HMO industry.
Portfolio Manager: Paul Cluskey
| |
| | Class A: GLSAX |
| | Class B: GLSBX |
| | Class C: GMSCX |
| | Class R: GGHRX |
| | Institutional Service Class: GLSIX |
| | Institutional Class: GGHIX |
2004 Annual Report 15
Sector Series
Gartmore Global Health Sciences Fund
Average Annual Total Return
(For periods ended October 31, 2004)
| | | | | | | | | | | |
| | | | One year | | | Inception1 | |
|
| |
| Class A | | without sales charge2 | | | 6.26% | | | | 2.25% | |
| | | with sales charge3 | | | 0.19% | | | | 0.68% | |
|
| Class B | | without sales charge2 | | | 5.52% | | | | 1.57% | |
| | | with sales charge4 | | | 0.66% | | | | 0.83% | |
|
Class C5 | | without sales charge2 | | | 5.52% | | | | 1.59% | |
| | | with sales charge6 | | | 4.55% | | | | 1.59% | |
|
Class R 7,8 | | | | | 5.84% | | | | 1.65% | |
|
| Institutional Class8,9 | | | 6.41% | | | | 2.51% | |
|
| Institutional Service Class8,9 | | | 6.30% | | | | 2.48% | |
|
All figures showing the effect of a sales charge reflect the maximum charge possible, because it has the most dramatic effect on performance data.
| |
| 1 | Fund commenced operations on December 29, 2000. |
| |
| 2 | These returns do not reflect the effects of sales charges (SC). |
| |
| 3 | A 5.75% front-end sales charge was deducted. |
| |
| 4 | A 5.00% contingent deferred sales charge (CDSC) was deducted. The CDSC declines to 0% after 6 years. |
| |
| 5 | These returns until the creation of Class C shares (9/23/02) include the performance of the Fund’s Class B shares. Excluding the effects of any fee waivers or reimbursements, such prior performance is substantially similar to what Class C shares would have produced because Class C shares invest in the same portfolio of securities as Class B shares and have the same expenses after any fee waivers or reimbursements. For Class C shares returns with sales charges, these returns have been restated for the applicable sales charges. |
| |
| 6 | A CDSC of 1.00% was deducted because it is charged when you sell Class C shares within the first year after purchase. |
| |
| 7 | These returns until the creation of Class R shares (12/31/03) include the performance of the Fund’s Class B shares. The returns have been adjusted for the fact that Class R shares do not have any applicable sales charges but have not been adjusted for the lower expenses applicable to Class R shares. Excluding the effect of any fee waivers or reimbursements, such prior performance is similar to what Class R shares would have produced because the Class R shares invest in the same portfolio of securities as Class B shares. |
| |
| 8 | These returns until the creation of Institutional Class shares (6/29/04) include the performance of the Fund’s Institutional Service shares. The returns have not been adjusted for the lower expenses applicable to Institutional Class shares. Excluding the effect of any fee waivers or reimbursements, such prior performance is similar to what Institutional Class shares would have produced because the Institutional Class shares invest in the same portfolio of securities as Institutional Service shares. |
| |
| 9 | Not subject to any sales charges. |
Performance of a $10,000 Investment
Investment return and principal value will fluctuate, and when redeemed, shares may be worth more or less than original cost. Past performance is no guarantee of future results and does not reflect the deduction of taxes that a shareholder would pay on fund distributions or the redemption of fund shares. Investing in mutual funds involves market risk, including loss of principal. Performance returns assume the reinvestment of all distributions.
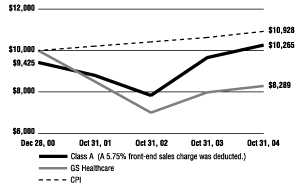
Comparative performance of $10,000 invested in Class A shares of the Gartmore Global Health Sciences Fund, the Goldman Sachs Healthcare Index (GS Healthcare)(a), and the Consumer Price Index (CPI)(b) since inception. Unlike the Fund, the returns for these unmanaged indexes do not reflect any fees, expenses, or sales charges. Investors cannot invest directly in market indexes.
| | |
| (a) | | The GS Healthcare is an unmanaged index representative of the stocks in the healthcare sector. |
| |
| (b) | | The CPI represents changes in prices of a basket of goods and services purchased for consumption by urban households. |
16 Annual Report 2004
Gartmore Global Health Sciences Fund
Shareholder
Expense Example
As a shareholder of the Funds, you incur two types of costs: (1) transaction costs, including sales charges (loads) paid on purchase payments and redemption fees; and (2) ongoing costs, including investment advisory fees, administration fees, distribution fees and other Fund expenses. The examples below are intended to help you understand your ongoing costs (in dollars) of investing in the Funds and to compare these costs with the ongoing costs of investing in other mutual funds. The examples assume that you had a $1,000 investment in the Class at the beginning of the reporting period, May 1, 2004, and continued to hold your shares at the end of the reporting period, October 31, 2004. Per SEC requirements, the examples are based on an investment of $1,000 invested at the beginning of the period and held for the entire six-month period ended October 31, 2004.
Actual Expenses
For each Class of the Fund in the table below, the first line provides information about actual account values and actual expenses. You may use the information in this line, together with the amount you invested, to estimate the expenses that you paid over the period. Simply divide your account value by $1,000 (for example, an $8,600 account value divided by $1,000 = 8.6), then multiply the result by the number in the first line of each Class under the heading entitled “Expenses Paid During Period” to estimate the expenses you paid on your account during the period.
Hypothetical Example for Comparison Purposes
The second line of each Class in the table below provides information about hypothetical account values and hypothetical expenses based on the Class’ actual expense ratio and an assumed rate of return of 5% per year before expenses, which is not the Class’ actual return. The hypothetical account values and expenses may not be used to estimate the actual ending account balance or expenses you paid for the period. You may use this information to compare the ongoing costs of investing in the Class of the Fund and other funds. To do so, compare this 5% hypothetical example with the 5% hypothetical examples that appear in the shareholder reports of the other funds.
Please note that the expenses shown in the table are meant to highlight your ongoing costs only and do not reflect any transaction costs, such as sales charges (loads) or redemption fees. Therefore, the second line for each Class in the table is useful in comparing ongoing costs only, and will not help you determine the relative total costs of owning different funds. In addition, if these transaction costs were included, your costs would have been higher. The examples also assume all dividends and distributions have been reinvested.
Schedule of Shareholder Expenses
Expense Analysis of a $1,000 Investment
(October 31, 2004)
| | | | | | | | | | | | | | | | | | | | | | | |
| | | | Beginning | | | Ending | | | | | | | |
| | | | Account Value | | | Account Value | | | Expenses Paid | | | Annualized | | | |
| Global Health Sciences Fund | | | | 5/1/04 | | | 10/31/04 | | | During Period* | | | Expense Ratio | | | |
|
|
| Class A | | | Actual | | | $ | 1,000 | | | $ | 916 | | | $ | 7.71 | | | | 1.60% | | | |
| | | | Hypothetical | 1 | | $ | 1,000 | | �� | $ | 1,017 | | | $ | 8.14 | | | | 1.60% | | | |
|
| Class B | | | Actual | | | $ | 1,000 | | | $ | 913 | | | $ | 10.82 | | | | 2.25% | | | |
| | | | Hypothetical | 1 | | $ | 1,000 | | | $ | 1,014 | | | $ | 11.45 | | | | 2.25% | | | |
|
| Class C | | | Actual | | | $ | 1,000 | | | $ | 913 | | | $ | 10.82 | | | | 2.25% | | | |
| | | | Hypothetical | 1 | | $ | 1,000 | | | $ | 1,014 | | | $ | 11.45 | | | | 2.25% | | | |
|
| Class R | | | Actual | | | $ | 1,000 | | | $ | 914 | | | $ | 8.57 | | | | 1.78% | | | |
| | | | Hypothetical | 1 | | $ | 1,000 | | | $ | 1,016 | | | $ | 9.06 | | | | 1.78% | | | |
|
| Institutional Service Class | | | Actual | | | $ | 1,000 | | | $ | 916 | | | $ | 7.03 | | | | 1.46% | | | |
| | | | Hypothetical | 1 | | $ | 1,000 | | | $ | 1,018 | | | $ | 7.43 | | | | 1.46% | | | |
|
| Institutional Class (a) | | | Actual | | | $ | 1,000 | | | $ | 929 | | | $ | 4.08 | (b) | | | 1.25% | | | |
| | | | Hypothetical | 1 | | $ | 1,000 | | | $ | 1,011 | | | $ | 4.27 | (b) | | | 1.25% | | | |
|
| | |
| (a) | | For the period from June 29, 2004 (commencement of operations) through October 31, 2004. |
| |
| (b) | | Expense are equal to the Fund’s annualized expense ratio multiplied by the average account value over the period multiplied by 124/366 (to reflect the period). |
| |
| * | Expenses are equal to the Fund’s annualized expense ratio multiplied by the average account value over the period multiplied by 182/366 (to reflect the one-half year period). |
1 Represents the hypothetical 5% annual return before expenses.
2004 Annual Report 17
Gartmore Global Health Sciences Fund
Sector Series
| |
| | Portfolio Summary |
| | (October 31, 2004) |
The SEC adopted a requirement that Funds present their portfolio holdings in a table, chart or graph format in their annual and semiannual reports to shareholders, whether or not a schedule of investments is utilized. The following tables, which present portfolio holdings as a percentage of net assets, are provided in compliance with this requirement.
| | | | | | | |
| Asset Allocation | | | | |
|
|
| Common Stocks | | | 88.2% | | | |
| Repurchase Agreements | | | 16.3% | | | |
| Other Investments* | | | 5.3% | | | |
| Other Liabilities in excess of Assets** | | | -9.8% | | | |
| | |
| | | |
| | | | 100.0% | | | |
| |
| * | Includes value of collateral received from securities lending. |
| |
| ** | Includes value of collateral owed from securities lending. |
| | | | | | | |
| Top Industries | | | | |
|
|
| Drugs | | | 28.3% | | | |
| Medical Products | | | 24.9% | | | |
| Medical Instruments | | | 9.1% | | | |
| Insurance | | | 7.1% | | | |
| Medical — Biomedical/ Genetic | | | 7.0% | | | |
| Medical Products & Services | | | 6.6% | | | |
| Therapeutics | | | 3.1% | | | |
| Hospitals | | | 1.5% | | | |
| Diagnostic Equipment | | | 0.6% | | | |
| Other Industries | | | 11.8% | | | |
| | |
| | | |
| | | | 100.0% | | | |
| | | | | | | |
| Top Holdings | | | | |
|
|
| Johnson & Johnson | | | 7.8% | | | |
| Abbott Laboratories | | | 5.7% | | | |
| Wyeth | | | 5.2% | | | |
| Medtronic, Inc. | | | 5.2% | | | |
| Bard (C.R.), Inc. | | | 4.0% | | | |
| UnitedHealth Group, Inc. | | | 4.0% | | | |
| Pfizer, Inc. | | | 3.4% | | | |
| Guidant Corp. | | | 3.2% | | | |
| InVitrogen Corp. | | | 3.1% | | | |
| Eli Lilly & Co. | | | 2.9% | | | |
| Other Holdings | | | 55.4% | | | |
| | |
| | | |
| | | | 100.0% | | | |
18 Annual Report 2004
Statement of Investments
October 31, 2004
Gartmore Global Health Sciences Fund
| | | | | | | | | | | |
|
| Common Stocks (88.2%) |
|
| | Shares or | | | |
| | Principal Amount | | | Value | | | |
|
| Diagnostic Equipment (0.6%) |
| Immucor, Inc. (b) | | | 2,780 | | | $ | 85,763 | | | |
| | | | | |
| | | |
| |
|
| Drugs (28.3%) |
| Abbott Laboratories | | | 19,770 | | | | 842,794 | | | |
| Andrx Corp. (b) | | | 6,900 | | | | 149,316 | | | |
| Eli Lilly & Co. | | | 7,860 | | | | 431,593 | | | |
| First Horizon Pharmaceutical Corp. (b) | | | 6,760 | | | | 166,161 | | | |
| GlaxoSmithKline PLC ADR - UK | | | 9,150 | | | | 387,960 | | | |
| Novartis AG ADR - CH | | | 8,650 | | | | 415,287 | | | |
| Pfizer, Inc. | | | 17,444 | | | | 505,004 | | | |
| Taro Pharmaceutical Industries Ltd. (b) | | | 11,910 | | | | 316,449 | | | |
| Valeant Pharmaceuticals International | | | 2,140 | | | | 51,360 | | | |
| Watson Pharmaceuticals, Inc. (b) | | | 5,130 | | | | 143,794 | | | |
| Wyeth | | | 19,235 | | | | 762,668 | | | |
| | | | | |
| | | |
| |
| | | | | | | | 4,172,386 | | | |
| | | | | |
| | | |
| |
|
| Hospitals (1.5%) |
| Community Health Systems, Inc. (b) | | | 5,450 | | | | 146,169 | | | |
| Symbion, Inc. (b) | | | 4,380 | | | | 68,065 | | | |
| | | | | |
| | | |
| |
| | | | | | | | 214,234 | | | |
| | | | | |
| | | |
| |
|
| Insurance (7.1%) |
| Aetna, Inc. | | | 2,005 | | | | 190,475 | | | |
| Molina Healthcare, Inc. (b) | | | 910 | | | | 33,506 | | | |
| UnitedHealth Group, Inc. | | | 8,100 | | | | 586,440 | | | |
| WellPoint Health Networks, Inc. (b) | | | 2,410 | | | | 235,361 | | | |
| | | | | |
| | | |
| |
| | | | | | | | 1,045,782 | | | |
| | | | | |
| | | |
| |
|
| Medical - Biomedical/Genetic (7.0%) |
| Charles River Laboratories International, Inc. (b) | | | 6,120 | | | | 286,355 | | | |
| Genzyme Corp. (b) | | | 5,550 | | | | 291,209 | | | |
| Incyte Corp. (b) | | | 28,470 | | | | 296,087 | | | |
| Protein Design Labs, Inc. (b) | | | 4,260 | | | | 81,579 | | | |
| Transkaryotic Therapies, Inc. (b) | | | 4,280 | | | | 74,087 | | | |
| | | | | |
| | | |
| |
| | | | | | | | 1,029,317 | | | |
| | | | | |
| | | |
| |
|
| Medical Instruments (9.1%) |
| Advanced Neuromodulation Systems, Inc. (b) | | | 4,850 | | | | 154,376 | | | |
| Beckman Coulter, Inc. | | | 5,080 | | | | 302,260 | | | |
| Boston Scientific Corp. (b) | | | 5,760 | | | | 203,328 | | | |
| Fisher Scientific International, Inc. (b) | | | 3,410 | | | | 195,598 | | | |
| Guidant Corp. | | | 7,160 | | | | 476,998 | | | |
| | | | | |
| | | |
| |
| | | | | | | | 1,332,560 | | | |
| | | | | |
| | | |
| |
|
| Medical Products (24.9%) |
| Advanced Medical Optics, Inc. (b) | | | 3,930 | | | | 153,663 | | | |
| Bard (C.R.), Inc. | | | 10,410 | | | | 591,288 | | | |
| Baxter International, Inc. | | | 7,890 | | | | 242,696 | | | |
| Cytyc Corp. (b) | | | 5,580 | | | | 145,582 | | | |
| Johnson & Johnson | | | 19,640 | | | | 1,146,584 | | | |
| Kinetic Concepts, Inc. (b) | | | 3,380 | | | | 168,425 | | | |
| Medtronic, Inc. | | | 14,880 | | | | 760,517 | | | |
| St. Jude Medical, Inc. (b) | | | 3,990 | | | | 305,514 | | | |
| Vnus Medical Technologies (b) | | | 9,750 | | | | 146,640 | | | |
| | | | | |
| | | |
| |
| | | | | | | | 3,660,909 | | | |
| | | | | |
| | | |
| |
|
| Medical Products & Services (6.6%) |
| Invitrogen Corp. (b) | | | 7,810 | | | | 452,199 | | | |
| Magellan Health Services, Inc. (b) | | | 4,060 | | | | 151,844 | | | |
| Medco Health Solutions, Inc. (b) | | | 6,900 | | | | 233,979 | | | |
| Pharmion Corp. (b) | | | 2,970 | | | | 136,472 | | | |
| | | | | |
| | | |
| |
| | | | | | | | 974,494 | | | |
| | | | | |
| | | |
| |
|
| Therapeutics (3.1%) |
| Eyetech Pharmaceuticals, Inc. (b) | | | 6,460 | | | | 274,162 | | | |
| Gilead Sciences, Inc. (b) | | | 5,200 | | | | 180,076 | | | |
| | | | | |
| | | |
| |
| | | | | | | | 454,238 | | | |
| | | | | |
| | | |
| |
| Total Common Stocks | | | 12,969,683 | | | |
| | | | | |
| | | |
| |
Repurchase Agreements (16.3%) |
CS First Boston, 1.75%, dated 10/29/04, due 11/01/04, repurchase price $998,867
(Fully collateralized by U.S. Treasury Notes and U.S. Agency Securities) | | $ | 998,721 | | | | 998,721 | | | |
Nomura Securities, 1.75% dated 10/29/04, due 11/01/04, repurchase price $1,395,655
(Fully collateralized by AA Corporate Bonds and U.S. Agency Securities) | | | 1,395,452 | | | | 1,395,452 | | | |
| | | | | |
| | | |
| |
| | | | | |
| | | |
| |
| Total Repurchase Agreements | | | 2,394,173 | | | |
| | | | | |
| | | |
| |
Short-Term Securities Held as Collateral for Securities Lending (5.3%) |
| Pool of short-term securities for Gartmore Mutual Funds - footnote 2 (Securities Lending) | | | 779,449 | | | | 779,449 | | | |
| | | | | |
| | | |
| |
| Total Short-Term Securities Held as Collateral for Securities Lending | | | 779,449 | | | |
| | | | | |
| | | |
| |
| Total Investments (Cost $16,034,658) (a) — 109.8% | | | 16,143,305 | | | |
| Liabilities in excess of other assets — (9.8)% | | | (1,447,527) | | | |
| | | | | |
| | | |
| |
| NET ASSETS — 100.0% | | $ | 14,695,778 | | | |
| | | | | |
| | | |
| | |
| (a) | | See notes to financial statements for tax unrealized appreciation (depreciation) of securities. |
| |
| (b) | | Denotes a non-income producing security. |
ADR American Depositary Receipt
CH Switzerland
UK United Kingdom
See notes to financial statements.
2004 Annual Report 19
Sector Series
| |
| | Gartmore Global Natural Resources Fund |
From its inception on June 29, 2004, through Oct. 31, 2004, the Gartmore Global Natural Resources Fund returned 12.58% (Class A at NAV) versus 10.39% for its benchmark, the Goldman Sachs Natural Resources Index. Due to its recent inception, the Fund has not yet been classified by Lipper.
Several factors contributed to the Fund’s performance during the period. Most notably, natural resources stocks were driven primarily by high energy prices, especially for crude oil, which surged above $50 per barrel near the end of the period. While the Organization of Petroleum Exporting Countries (OPEC) tried to increase production and keep a lid on oil prices, a number of factors combined to more than offset OPEC’s efforts. These included: (1) strong demand from China; (2) fears of supply disruptions due to various geopolitical developments in Russia, Iraq, Nigeria Norway, and Venezuala; (3) the worst hurricane season to hit the United States in 40 years; and (4) tight refining capacity. Also aiding the natural resources sector were strong prices for both industrial and precious metals.
Relative to the benchmark, the Fund was helped by an overweighting in energy services and drilling stocks. These stocks contributed positively to the Fund’s performance because the typical spending increases for energy services and drilling had been delayed due to the recent worldwide recession and the subsequent climate of generally cautious business spending. Given the persistent strength in energy prices, however, exploration companies are likely to ramp up spending in the near future. Among drillers, land drillers, such as Nabors Industries Ltd. also contributed to Fund performance during the period as a result of their greater exposure to natural gas and decreased sensitivity to overseas events. Among services stocks, Halliburton Co. and BJ Services Co. contributed to Fund performance.
The Fund also benefited from investing in companies that provide equipment and services for coal, copper and steel mining, as robust demand from China, as well as bottlenecks in the transportation industry, contributed to higher commodity prices in those markets. Machinery companies Bucyrus International, Inc. and Joy Global Inc. were noteworthy contributors to Fund performance. Bucyrus, a Milwaukee-based maker of excavation equipment, enjoyed a respectable advance following its initial public offering in late July, as a sizable backlog of orders attracted investors’ attention. Another contributor to Fund performance, International Steel Group Inc., surged late in the period due to a buyout offer from rival steel producer Ispat International N.V.
On the other hand, an underweighting versus the benchmark in large, integrated energy companies hurt Fund performance. An underweighting in precious metals also detracted from performance. With many gold mining companies trading at a premium to the value of their gold reserves, we found most precious metals stocks unappealing from a valuation standpoint. In the aluminum industry, Alcoa Inc. lagged, due in part to disappointment about the company’s first-quarter 2004 financial results.
We foresee that some short-term consolidation might occur in the natural resources sector, as share prices have had quick runups in many cases. Accordingly, we feel that a “buy the dips” strategy, or purchasing stocks that appear to exhibit short-term price reversals, is called for in the case of the sector’s more richly valued stocks. That said, the favorable fundamentals supporting this sector in the recent past—including a weak U.S. dollar and large budget and trade deficits, as well as rapidly growing demand from China and India—should make the sector an attractive place to invest for the foreseeable future.
Portfolio Managers: William Gerlach, CFA
| |
| | Class A: GGNAX |
| | Class B: GGNBX |
| | Class C: GGNCX |
| | Class R: GGNRX |
| | Institutional Service Class: GGNSX |
| | Institutional Class: GGNIX |
20 Annual Report 2004
Gartmore Global Natural Resources Fund
Fund Performance
Average Annual Total Return
(For Periods Ended October 31, 2004)
| | | | | | | |
| | | | Inception1 | |
|
| |
Class A1 | | without sales charge2 | | | 12.58% | |
| | | with sales charge3 | | | 6.11% | |
|
Class B1 | | without sales charge2 | | | 12.10% | |
| | | with sales charge4 | | | 7.10% | |
|
| Class C | | without sales charge2 | | | 12.20% | |
| | | with sales charge5 | | | 11.20% | |
|
Class R6 | | | | | 12.22% | |
|
| Institutional Class6 | | | 12.60% | |
|
| Institutional Service Class6 | | | 12.50% | |
|
All figures showing the effect of a sales charge reflect the maximum charge possible, because it has the most dramatic effect on performance data.
| |
| 1 | Fund commenced operations on June 29, 2004. |
| |
| 2 | These returns do not reflect the effects of sales charges (SC). |
| |
| 3 | A 5.75% front-end sales charge was deducted. |
| |
| 4 | A 5.00% contingent deferred sales charge (CDSC) was deducted. The CDSC declines to 1% after 6 years. |
| |
| 5 | A CDSC of 1.00% was deducted because it is charged when you sell Class C shares within the first year after purchase. |
| |
| 6 | Not subject to any sales charges. |
Performance of a $10,000 Investment
Investment return and principal value will fluctuate, and when redeemed, shares may be worth more or less than original cost. Past performance is no guarantee of future results and does not reflect the deduction of taxes that a shareholder would pay on fund distributions or the redemption of fund shares. Investing in mutual funds involves market risk, including loss of principal. Performance returns assume the reinvestment of all distributions.
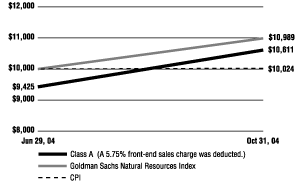
Comparative performance of $10,000 invested in Class A shares of the Gartmore Global Natural Resources Fund, Goldman Sachs Natural Resources Index (a), and the Consumer Price Index (CPI)(b) since inception. Unlike the Fund, the returns for these unmanaged indexes do not reflect any fees, expenses, or sales charges. Investors cannot invest directly in market indexes.
| | |
| (a) | | Goldman Sachs Natural Resources Index is an unmanaged, modified capitalization-weighted sector index of U.S.-traded natural resource-related stocks; includes companies in the categories of extractive industries, energy companies, owners and operators of timber tracts, forestry services, producers of pulp and paper, and owners of plantations. |
| |
| (b) | | The CPI represents changes in prices of a basket of goods and services purchased for consumption by urban households. |
| |
| * | The Shareholder Expense Example is not required for Funds that are operational less than six months. |
2004 Annual Report 21
Gartmore Global Natural Resources Fund
Sector Series
| |
| | Portfolio Summary |
| | (October 31, 2004) |
The SEC adopted a requirement that Funds present their portfolio holdings in a table, chart or graph format in their annual and semiannual reports to shareholders, whether or not a schedule of investments is utilized. The following tables, which present portfolio holdings as a percentage of net assets, are provided in compliance with this requirement.
| | | | | | | |
| Asset Allocation | | | | |
|
|
| Common Stocks | | | 95.0% | | | |
| Repurchase Agreement | | | 2.8% | | | |
| Other Assets in excess of Liabilities | | | 2.2% | | | |
| | |
| | | |
| | | | 100.0% | | | |
| | | | | | | |
| Top Industries | | | | |
|
|
| Oil Company — Integrated | | | 31.2% | | | |
| Oil Company — Exploration & Production | | | 17.5% | | | |
| Oil & Gas Drilling | | | 7.7% | | | |
| Oil Field Services | | | 7.4% | | | |
| Energy | | | 5.2% | | | |
| Raw Materials | | | 4.5% | | | |
| Paper and Related Products | | | 4.1% | | | |
| Pipelines — Domestic | | | 3.4% | | | |
| Gold Mining | | | 3.0% | | | |
| Machinery — Construction & Mining | | | 2.6% | | | |
| Other Industries | | | 13.4% | | | |
| | |
| | | |
| | | | 100.0% | | | |
| | | | | | | |
| Top Holdings | | | | |
|
|
| Exxon Mobil Corp. | | | 8.5% | | | |
| ChevronTexaco Corp. | | | 7.6% | | | |
| BP PLC - ADR - GB | | | 5.8% | | | |
| ConocoPhillips | | | 5.1% | | | |
| Royal Dutch Petroleum Co. | | | 4.3% | | | |
| Halliburton Co. | | | 3.7% | | | |
| Schlumberger Ltd. | | | 3.6% | | | |
| Nabors Industries, Ltd. | | | 3.4% | | | |
| Newmont Mining Corp. | | | 3.0% | | | |
| BJ Services Co. | | | 2.9% | | | |
| Other Holdings | | | 52.1% | | | |
| | |
| | | |
| | | | 100.0% | | | |
22 Annual Report 2004
Statement of Investments
October 31, 2004
Gartmore Global Natural Resources Fund
| | | | | | | | | | | |
|
| Common Stocks (95.0%) |
|
| | Shares or | | | |
| | Principal Amount | | | Value | | | |
|
| Chemicals Specialty (0.9%) |
| Ashland, Inc. | | | 570 | | | $ | 32,843 | | | |
| | | | | |
| | | |
| |
|
| Coal Mining (2.0%) |
| Peabody Energy Corp. | | | 1,100 | | | | 70,158 | | | |
| | | | | |
| | | |
| |
|
| Copper Production (1.5%) |
| Phelps Dodge Corp. | | | 607 | | | | 53,137 | | | |
| | | | | |
| | | |
| |
|
| Energy (5.2%) |
| Arch Coal, Inc. | | | 1,286 | | | | 41,821 | | | |
| BJ Services Co. | | | 2,000 | | | | 101,999 | | | |
| KFx, Inc. (b) | | | 2,305 | | | | 21,529 | | | |
| Murphy Oil Corp. | | | 200 | | | | 16,004 | | | |
| | | | | |
| | | |
| |
| | | | | | | | 181,353 | | | |
| | | | | |
| | | |
| |
|
| Gold Mining (3.0%) |
| Newmont Mining Corp. | | | 2,200 | | | | 104,544 | | | |
| | | | | |
| | | |
| |
|
| Industrial Gases (0.9%) |
| Praxair, Inc. | | | 770 | | | | 32,494 | | | |
| | | | | |
| | | |
| |
|
| Machinery - Construction & Mining (2.6%) |
| Bucyrus International, Inc., Class A | | | 1,400 | | | | 42,000 | | | |
| Joy Global, Inc. | | | 1,400 | | | | 47,306 | | | |
| | | | | |
| | | |
| |
| | | | | | | | 89,306 | | | |
| | | | | |
| | | |
| |
|
| Metal - Aluminum (0.5%) |
| Alcan, Inc. | | | 350 | | | | 16,212 | | | |
| | | | | |
| | | |
| |
|
| Oil & Gas Drilling (7.7%) |
| GlobalSantaFe Corp. | | | 2,350 | | | | 69,325 | | | |
| Grey Wolf, Inc. (b) | | | 4,950 | | | | 25,641 | | | |
| Nabors Industries, Ltd. (b) | | | 2,437 | | | | 119,705 | | | |
| Noble Corp. (b) | | | 800 | | | | 36,544 | | | |
| Patterson - UTI Energy, Inc. | | | 890 | | | | 17,115 | | | |
| | | | | |
| | | |
| |
| | | | | | | | 268,330 | | | |
| | | | | |
| | | |
| |
|
| Oil Company - Exploration & Production (17.5%) |
| Apache Corp. | | | 1,637 | | | | 82,996 | | | |
| Burlington Resources, Inc. | | | 1,670 | | | | 69,305 | | | |
| Chesapeake Energy Corp. | | | 1,100 | | | | 17,688 | | | |
| EnCana Corp. | | | 1,050 | | | | 51,870 | | | |
| EOG Resources, Inc. | | | 1,020 | | | | 67,891 | | | |
| Noble Energy, Inc. | | | 1,200 | | | | 69,600 | | | |
| Quicksilver Resources, Inc. (b) | | | 2,722 | | | | 86,097 | | | |
| Transocean Sedco Forex, Inc. (b) | | | 2,100 | | | | 74,025 | | | |
| Ultra Petroleum Corp. (b) | | | 790 | | | | 38,394 | | | |
| XTO Energy, Inc. | | | 1,633 | | | | 54,510 | | | |
| | | | | |
| | | |
| |
| | | | | | | | 612,376 | | | |
| | | | | |
| | | |
| |
|
| Oil Company - Integrated (31.2%) |
| BP PLC - ADR - GB | | | 3,472 | | | | 202,244 | | | |
| ChevronTexaco Corp. | | | 5,000 | | | | 265,300 | | | |
| ConocoPhillips | | | 2,100 | | | | 177,051 | | | |
| Exxon Mobil Corp. | | | 6,000 | | | | 295,319 | | | |
| Royal Dutch Petroleum Co. | | | 2,800 | | | | 151,872 | | | |
| | | | | |
| | | |
| |
| | | | | | | | 1,091,786 | | | |
| | | | | |
| | | |
| |
|
| Oil Field Services (7.4%) |
| Halliburton Co. | | | 3,500 | | | | 129,640 | | | |
| Schlumberger Ltd. | | | 2,025 | | | | 127,454 | | | |
| | | | | |
| | | |
| |
| | | | | | | | 257,094 | | | |
| | | | | |
| | | |
| |
|
| Oil Refining & Marketing (0.5%) |
| Sunoco, Inc. | | | 230 | | | | 17,103 | | | |
| | | | | |
| | | |
| |
|
| Paper & Related Products (4.1%) |
| Georgia-Pacific Corp. | | | 1,700 | | | | 58,803 | | | |
| International Paper Co. | | | 2,200 | | | | 84,722 | | | |
| | | | | |
| | | |
| |
| | | | | | | | 143,525 | | | |
| | | | | |
| | | |
| |
|
| Pipelines - Domestic (3.4%) |
| Enbridge, Inc. | | | 1,200 | | | | 52,093 | | | |
| Questar Corp. | | | 250 | | | | 12,000 | | | |
| The Williams Companies, Inc. | | | 4,500 | | | | 56,295 | | | |
| | | | | |
| | | |
| |
| | | | | | | | 120,388 | | | |
| | | | | |
| | | |
| |
|
| Raw Materials (4.5%) |
| Alcoa, Inc. | | | 2,700 | | | | 87,750 | | | |
| Vulcan Materials Co. | | | 1,400 | | | | 69,692 | | | |
| | | | | |
| | | |
| |
| | | | | | | | 157,442 | | | |
| | | | | |
| | | |
| |
|
| Steel Production (2.1%) |
| International Steel Group, Inc. (b) | | | 1,472 | | | | 54,361 | | | |
| United States Steel Corp. | | | 475 | | | | 17,442 | | | |
| | | | | |
| | | |
| |
| | | | | | | | 71,803 | | | |
| | | | | |
| | | |
| |
| Total Common Stocks | | | 3,319,894 | | | |
| | | | | |
| | | |
2004 Annual Report 23
| |
| | Statement of Investments (Continued) |
| | October 31, 2004 |
Gartmore Global Natural Resources Fund (Continued)
Sector Series
| | | | | | | | | | | |
|
| Repurchase Agreements (2.8%) |
|
| | Shares or | | | |
| | Principal Amount | | | Value | | | |
|
|
CS First Boston, 1.75%, dated 10/29/04, due 11/1/04, repurchase price $40,218
(Fully collateralized by AA Rated Corporate Bonds) | | $ | 40,216 | | | $ | 40,216 | | | |
Nomura Securities, 1.75%, dated 10/29/04, due 11/1/04, repurchase price $56,195
(Fully collateralized by U.S. Agency Securities) | | | 56,192 | | | | 56,192 | | | |
| | | | | |
| | | |
| |
| Total Repurchase Agreements | | | 96,408 | | | |
| | | | | |
| | | |
| |
| Total Investments (Cost $3,167,954) (a) — 97.8% | | | 3,416,302 | | | |
| Other assets in excess of liabilities — 2.2% | | | 77,490 | | | |
| | | | | |
| | | |
| |
| NET ASSETS — 100.0% | | $ | 3,493,792 | | | |
| | | | | |
| | | |
| | |
| (a) | | See notes to financial statements for tax unrealized appreciation (depreciation) of securities. |
| |
| (b) | | Non-income producing securities. |
ADR American Depositary Receipt
UK United Kingdom
See notes to financial statements.
24 Annual Report 2004
Sector Series
| |
| | Gartmore Global Technology and Communications Fund |
For the annual period ended Oct. 31, 2004, the Gartmore Global Technology and Communications Fund returned - -8.81% (Class A at NAV) versus -2.58% for its benchmark, the Goldman Sachs Technology Composite Index. For broader comparison, the average return for the Fund’s Lipper peer category of Science & Technology Funds was -3.14%.
Technology stocks began the reporting period in a bullish mode, building on a broad-based rally that began in March 2003. The U.S. economy, however, continued to decelerate and, as the period progressed, investors responded by rotating money out of technology stocks and into sectors considered to be more defensive, such as consumer staples and energy. Demand for technology products and services was limited by consumers’ considerable debt and by cautious business spending, which may have been a result of uncertainty about the U.S. presidential election and concerns about higher energy costs.
The Fund was helped by its investments in Internet stocks, including Yahoo! Inc. and eBay Inc. Yahoo!, the Fund’s largest holding at period-end, was particularly successful in attracting Internet users to its Web site, enabling the company to maintain favorable profit margins for its online advertising services. Apple Computer, Inc. was another contributor, as the stock more than doubled, mainly due to robust demand for the company’s iPod digital music player. Synaptics Inc., a maker of touchpad technologies for laptop computers, also was a standout, aided by strong demand for touch keypad, keyboards and other computer input devices.
On the negative side, performance suffered because of an underweighting in the computers and peripherals area, which held up better than most other technology subsectors. In addition, shares of SanDisk Corp., a maker of the flash memory cards used in digital cameras, multimedia cellular phones and other digital devices, fell sharply during the period. Although this holding fit well with our theme of investing in companies that support the growing digital communications area, this Fund holding was hurt by excessive capacities additions and weak pricing. In the software segment, PalmSource, Inc., a provider of operating systems for handheld devices, experienced a 41% decline in share price, resulting in - -0.71% loss to the Fund. Investors feared that PalmSource, recently spun off from handheld device maker palmOne, would have trouble competing with Microsoft and other rivals.
Although growth stocks and tech stocks in particular struggled during this period, we are moderately optimistic about their prospects in 2005. Many Wall Street analysts have scaled back their individual company forecasts, which could open the door for upside surprises. And, while interest rates are rising, we believe the Fed will do its tightening at a gradual pace which should not jeopardize the economic recovery. Energy prices are moderating which should help spending by individuals and businesses. We will be looking at the areas of broadband penetration, internet security, e-commerce, digital radio/satellite, India’s IT companies and online travel to include companies with strong end-user demand and growing markets.
Portfolio Managers: Aaron Harris and Chip Zhu
| |
| | Class A: GAGTX |
| | Class B: GBGTX |
| | Class C: GCGTX |
| | Class R: GGTRX |
| | Institutional Service Class: GIGTX |
| | Institutional Class: GGTIX |
2004 Annual Report 25
Sector Series
Gartmore Global Technology and Communications Fund
Average Annual Total Return
(For Periods Ended October 31, 2004)
| | | | | | | | | | | |
| | | | One year | | | Inception1 | |
|
| |
| Class A | | without sales charge2 | | | -8.81% | | | | -19.99% | |
| | | with sales charge3 | | | -14.15% | | | | -21.08% | |
|
| Class B | | without sales charge2 | | | -9.55% | | | | -20.57% | |
| | | with sales charge4 | | | -14.07% | | | | -20.91% | |
|
Class C5 | | without sales charge2 | | | -9.50% | | | | -20.46% | |
| | | with sales charge6 | | | -10.40% | | | | -20.46% | |
|
Class R 7,9 | | | | | -9.28% | | | | -20.52% | |
|
| Institutional Class8,9 | | | -8.67% | | | | -19.68% | |
|
| Institutional Service Class8,9 | | | -8.93% | | | | -19.73% | |
|
All figures showing the effect of a sales charge reflect the maximum charge possible, because it has the most dramatic effect on performance data.
| |
| 1 | Fund commenced operations on June 30, 2000. |
| |
| 2 | These returns do not reflect the effects of sales charges (SC). |
| |
| 3 | A 5.75% front-end sales charge was deducted. |
| |
| 4 | A 5.00% contingent deferred sales charge (CDSC) was deducted. The CDSC declines to 0% after 6 years. |
| |
| 5 | These returns until the creation of Class C shares (3/1/01) include the performance of the Fund’s Class B shares. Excluding the effects of any fee waivers or reimbursements, such prior performance is substantially similar to what Class C shares would have produced because Class C shares invest in the same portfolio of securities as Class B shares and have the same expenses after any fee waivers or reimbursements. For Class C shares returns with sales charges, these returns have been restated for the applicable sales charges. |
| |
| 6 | A CDSC of 1.00% was deducted because it is charged when you sell Class C shares within the first year after purchase. |
| |
| 7 | These returns until the creation of Class R shares (12/31/03) include the performance of the Fund’s Class B shares. The returns have been adjusted for the fact that Class R shares do not have any applicable sales charges but have not been adjusted for the lower expenses applicable to Class R shares. Excluding the effect of any fee waivers or reimbursements, such prior performance is similar to what Class R shares would have produced because the Class R shares invest in the same portfolio of securities as Class B shares. |
| |
| 8 | These returns until the creation of Institutional Class shares (6/29/04) include the performance of the Fund’s Institutional Service shares. The returns have not been adjusted for the lower expenses applicable to Institutional Class shares. Excluding the effect of any fee waivers or reimbursements, such prior performance is similar to what Institutional Class shares would have produced because the Institutional Class shares invest in the same portfolio of securities as Institutional Service shares. |
| |
| 9 | Not subject to any sales charges. |
Performance of a $10,000 Investment
Investment return and principal value will fluctuate, and when redeemed, shares may be worth more or less than original cost. Past performance is no guarantee of future results and does not reflect the deduction of taxes that a shareholder would pay on fund distributions or the redemption of fund shares. Investing in mutual funds involves market risk, including loss of principal. Performance returns assume the reinvestment of all distributions.
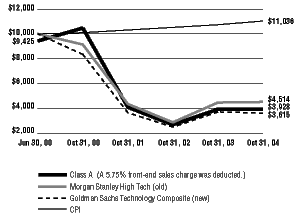
Comparative performance of $10,000 invested in Class A shares of the Gartmore Global Technology and Communications Fund, Morgan Stanley High-Tech 35 Index (Morgan Stanley High-Tech)(old)(a), Goldman Sachs Technology Composite Index(GSTI®)(new)(b) and the Consumer Price Index (CPI)(c) since inception. Unlike the Fund, the returns for these unmanaged indexes do not reflect any fees, expenses, or sales charges. Investors cannot invest directly in market indexes.
| | |
| (a) | | The Morgan Stanley High-Tech(old) is an equal dollar-weighted index of 35 stocks in nine different technology subsectors. |
| |
| (b) | | The GSTI®(new) is an unmanaged, modified, market capitalization-weighted index that is designed to measure the performance of companies in the technology sector. |
| |
| (c) | | The CPI represents changes in prices of a basket of goods and services purchased for consumption by urban households. |
26 Annual Report 2004
Gartmore Global Technology and Communications Fund
Shareholder
Expense Example
As a shareholder of the Funds, you incur two types of costs: (1) transaction costs, including sales charges (loads) paid on purchase payments and redemption fees; and (2) ongoing costs, including investment advisory fees, administration fees, distribution fees and other Fund expenses. The examples below are intended to help you understand your ongoing costs (in dollars) of investing in the Funds and to compare these costs with the ongoing costs of investing in other mutual funds. The examples assume that you had a $1,000 investment in the Class at the beginning of the reporting period, May 1, 2004, and continued to hold your shares at the end of the reporting period, October 31, 2004. Per SEC requirements, the examples are based on an investment of $1,000 invested at the beginning of the period and held for the entire six-month period ended October 31, 2004.
Actual Expenses
For each Class of the Fund in the table below, the first line provides information about actual account values and actual expenses. You may use the information in this line, together with the amount you invested, to estimate the expenses that you paid over the period. Simply divide your account value by $1,000 (for example, an $8,600 account value divided by $1,000 = 8.6), then multiply the result by the number in the first line of each Class under the heading entitled “Expenses Paid During Period” to estimate the expenses you paid on your account during the period.
Hypothetical Example for Comparison Purposes
The second line of each Class in the table below provides information about hypothetical account values and hypothetical expenses based on the Class’ actual expense ratio and an assumed rate of return of 5% per year before expenses, which is not the Class’ actual return. The hypothetical account values and expenses may not be used to estimate the actual ending account balance or expenses you paid for the period. You may use this information to compare the ongoing costs of investing in the Class of the Fund and other funds. To do so, compare this 5% hypothetical example with the 5% hypothetical examples that appear in the shareholder reports of the other funds.
Please note that the expenses shown in the table are meant to highlight your ongoing costs only and do not reflect any transaction costs, such as sales charges (loads) or redemption fees. Therefore, the second line for each Class in the table is useful in comparing ongoing costs only, and will not help you determine the relative total costs of owning different funds. In addition, if these transaction costs were included, your costs would have been higher. The examples also assume all dividends and distributions have been reinvested.
Schedule of Shareholder Expenses
Expense Analysis of a $1,000 Investment
(October 31, 2004)
| | | | | | | | | | | | | | | | | | | | | | | |
| | | | Beginning | | | Ending | | | | | | | |
| Global Technology and | | | | Account Value | | | Account Value | | | Expenses Paid | | | Annualized | | | |
| Communications Fund | | | | 5/1/04 | | | 10/31/04 | | | During Period* | | | Expense Ratio | | | |
|
|
| Class A | | | Actual | | | $ | 1,000 | | | $ | 994 | | | $ | 8.57 | | | | 1.71% | | | |
| | | | Hypothetical | 1 | | $ | 1,000 | | | $ | 1,016 | | | $ | 8.70 | | | | 1.71% | | | |
|
| Class B | | | Actual | | | $ | 1,000 | | | $ | 991 | | | $ | 12.01 | | | | 2.40% | | | |
| | | | Hypothetical | 1 | | $ | 1,000 | | | $ | 1,013 | | | $ | 12.22 | | | | 2.40% | | | |
|
| Class C | | | Actual | | | $ | 1,000 | | | $ | 991 | | | $ | 12.01 | | | | 2.40% | | | |
| | | | Hypothetical | 1 | | $ | 1,000 | | | $ | 1,013 | | | $ | 12.22 | | | | 2.40% | | | |
|
| Class R | | | Actual | | | $ | 1,000 | | | $ | 994 | | | $ | 9.62 | | | | 1.92% | | | |
| | | | Hypothetical | 1 | | $ | 1,000 | | | $ | 1,015 | | | $ | 9.77 | | | | 1.92% | | | |
|
| Institutional Service Class | | | Actual | | | $ | 1,000 | | | $ | 994 | | | $ | 8.12 | | | | 1.62% | | | |
| | | | Hypothetical | 1 | | $ | 1,000 | | | $ | 1,017 | | | $ | 8.25 | | | | 1.62% | | | |
|
| Institutional Class (a) | | | Actual | | | $ | 1,000 | | | $ | 940 | | | $ | 4.60 | (b) | | | 1.40% | | | |
| | | | Hypothetical | 1 | | $ | 1,000 | | | $ | 1,010 | | | $ | 4.78 | (b) | | | 1.40% | | | |
|
| | |
| (a) | | For the period from June 29, 2004 (commencement of operations) through October 31, 2004. |
| |
| (b) | | Expense are equal to the Fund’s annualized expense ratio multiplied by the average account value over the period multiplied by 124/366 (to reflect the period). |
| |
| * | Expenses are equal to the Fund’s annualized expense ratio multiplied by the average account value over the period multiplied by 184/366 (to reflect the one-half year period). |
1 Represents the hypothetical 5% annual return before expenses.
2004 Annual Report 27
Gartmore Global Technology and Communications Fund
Sector Series
| |
| | Portfolio Summary |
| | (October 31, 2004) |
The SEC adopted a requirement that Funds present their portfolio holdings in a table, chart or graph format in their annual and semiannual reports to shareholders, whether or not a schedule of investments is utilized. The following tables, which present portfolio holdings as a percentage of net assets, are provided in compliance with this requirement.
| | | | | | | |
| Asset Allocation | | | | |
|
|
| Common Stocks | | | 89.2% | | | |
| Repurchase Agreements | | | 2.1% | | | |
| Other Investments* | | | 10.2% | | | |
| Other Assets in excess of Liabilities** | | | -1.5% | | | |
| | |
| | | |
| | | | 100.0% | | | |
| |
| * | Includes value of collateral received form securities lending. |
| |
| ** | Includes value of collateral owed from securities lending. |
| | | | | | | |
| Top Industries | | | | |
|
|
| Computer Software | | | 28.2% | | | |
| Computer Services | | | 12.9% | | | |
| Internet Security | | | 6.1% | | | |
| Wireless Equipment | | | 5.9% | | | |
| Internet Services/Software | | | 5.9% | | | |
| Semiconductors | | | 4.1% | | | |
| Electronic Components | | | 3.7% | | | |
| Radio | | | 3.7% | | | |
| Applications Software | | | 3.6% | | | |
| Telecommunication Equipment | | | 3.5% | | | |
| Other Industries | | | 22.4% | | | |
| | |
| | | |
| | | | 100.0% | | | |
| | | | | | | |
| Top Holdings | | | | |
|
|
| Yahoo, Inc. | | | 4.8% | | | |
| XM Satellite Radio Holdings, Inc., Class A | | | 3.7% | | | |
| Apple Computer, Inc. | | | 3.4% | | | |
| Intel Corp. | | | 2.8% | | | |
| eBay, Inc. | | | 2.5% | | | |
| Intuit, Inc. | | | 2.5% | | | |
| Aladdin Knowledge Systems | | | 2.2% | | | |
| Jupitermedia Corp. | | | 2.2% | | | |
| Motorola, Inc. | | | 2.2% | | | |
| Infosys Technologies Ltd. ADR - IN | | | 2.2% | | | |
| Other Holdings | | | 71.5% | | | |
| | |
| | | |
| | | | 100.0% | | | |
28 Annual Report 2004
Statement of Investments
October 31, 2004
Gartmore Global Technology and Communications Fund
| | | | | | | | | | | |
|
| Common Stocks (89.2%) |
|
| | Shares or | | | |
| | Principal Amount | | | Value | | | |
|
| Applications Software (3.6%) |
| MICROS Systems, Inc. (b) | | | 2,400 | | | $ | 141,888 | | | |
| Satyam Computer Services Ltd. ADR - IN | | | 6,700 | | | | 176,009 | | | |
| | | | | |
| | | |
| |
| | | | | | | | 317,897 | | | |
| | | | | |
| | | |
| |
|
| Computer Hardware (3.4%) |
| Apple Computer, Inc. (b) | | | 5,600 | | | | 294,168 | | | |
| | | | | |
| | | |
| |
|
| Computer Services (12.9%) |
| Cognizant Technology Solutions Corp., Class A (b) | | | 5,400 | | | | 183,600 | | | |
| Jupitermedia Corp. (b) | | | 9,800 | | | | 194,383 | | | |
| Kanbay International, Inc. (b) | | | 3,700 | | | | 88,393 | | | |
| Radware Ltd. (b) | | | 2,700 | | | | 66,690 | | | |
| Research in Motion Ltd. (b) | | | 2,000 | | | | 176,400 | | | |
| Yahoo, Inc. (b) | | | 11,500 | | | | 416,185 | | | |
| | | | | |
| | | |
| |
| | | | | | | | 1,125,651 | | | |
| | | | | |
| | | |
| |
|
| Computer Software (28.2%) |
| Adobe Systems, Inc. | | | 2,000 | | | | 112,060 | | | |
| AutoDesk, Inc. | | | 2,400 | | | | 126,600 | | | |
| Business Objects S.A. ADR - FR (b) | | | 5,000 | | | | 127,600 | | | |
| Computer Associates International, Inc. | | | 4,600 | | | | 127,466 | | | |
| Compuware Corp. (b) | | | 18,900 | | | | 109,431 | | | |
| Infosys Technologies Ltd. ADR - IN | | | 2,900 | | | | 192,850 | | | |
| Intuit, Inc. (b) | | | 4,800 | | | | 217,727 | | | |
| Kronos, Inc. (b) | | | 3,200 | | | | 156,960 | | | |
| McAfee, Inc. (b) | | | 5,900 | | | | 142,780 | | | |
| McDATA Corp., Class B (b) | | | 29,000 | | | | 174,000 | | | |
| Micromuse, Inc. (b) | | | 9,200 | | | | 39,468 | | | |
| Microsoft Corp. | | | 5,600 | | | | 156,744 | | | |
| Open Solutions, Inc. (b) | | | 6,700 | | | | 188,706 | | | |
| Oracle Corp. (b) | | | 13,400 | | | | 169,644 | | | |
| PalmSource, Inc. (b) | | | 4,000 | | | | 89,680 | | | |
| Sun Microsystems, Inc. (b) | | | 11,300 | | | | 51,189 | | | |
| Synaptics, Inc. (b) | | | 4,400 | | | | 139,216 | | | |
| Wind River Systems, Inc. (b) | | | 9,500 | | | | 127,205 | | | |
| | | | | |
| | | |
| |
| | | | | | | | 2,449,326 | | | |
| | | | | |
| | | |
| |
|
| E-Commerce (3.4%) |
| eBay, Inc. (b) | | | 2,200 | | | | 214,742 | | | |
| eLong, Inc. (b) | | | 6,000 | | | | 81,600 | | | |
| | | | | |
| | | |
| |
| | | | | | | | 296,342 | | | |
| | | | | |
| | | |
| |
|
| Electronic Components (3.7%) |
| AMX Corp. (b) | | | 4,100 | | | | 79,827 | | | |
| Intel Corp. | | | 11,100 | | | | 247,086 | | | |
| | | | | |
| | | |
| |
| | | | | | | | 326,913 | | | |
| | | | | |
| | | |
| |
|
| Internet Security (6.1%) |
| Aladdin Knowledge Systems (b) | | | 7,800 | | | | 196,170 | | | |
| Symantec Corp. (b) | | | 2,800 | | | | 159,432 | | | |
| VeriSign, Inc. (b) | | | 6,600 | | | | 177,078 | | | |
| | | | | |
| | | |
| |
| | | | | | | | 532,680 | | | |
| | | | | |
| | | |
| |
|
| Internet Services/ Software (5.9%) |
| Akamai Technologies, Inc. (b) | | | 5,200 | | | | 72,020 | | | |
| Ask Jeeves, Inc. (b) | | | 2,300 | | | | 59,294 | | | |
| F5 Networks, Inc. (b) | | | 3,500 | | | | 139,825 | | | |
| J2 Global Communications, Inc. (b) | | | 4,800 | | | | 144,720 | | | |
| Sapient Corp. (b) | | | 6,900 | | | | 55,545 | | | |
| Shanda Interactive Entertainment Ltd. (b) | | | 1,300 | | | | 39,506 | | | |
| | | | | |
| | | |
| |
| | | | | | | | 510,910 | | | |
| | | | | |
| | | |
| |
|
| Investment Companies (1.0%) |
| Harris & Harris Group, Inc. (b) | | | 7,600 | | | | 90,364 | | | |
| | | | | |
| | | |
| |
|
| Radio (3.7%) |
| XM Satellite Radio Holdings, Inc., Class A (b) | | | 10,000 | | | | 323,200 | | | |
| | | | | |
| | | |
| |
|
| Semiconductors (4.1%) |
| Freescale Semiconductor, Inc. (b) | | | 8,000 | | | | 124,320 | | | |
| Marvel Technology Group Ltd. (b) | | | 6,100 | | | | 174,277 | | | |
| National Semiconductor Corp. | | | 3,600 | | | | 60,120 | | | |
| | | | | |
| | | |
| |
| | | | | | | | 358,717 | | | |
| | | | | |
| | | |
| |
|
| Telecom Equipment (2.7%) |
| Digi International, Inc. (b) | | | 9,500 | | | | 130,055 | | | |
| SBA Communications Corp. (b) | | | 12,900 | | | | 107,973 | | | |
| | | | | |
| | | |
| |
| | | | | | | | 238,028 | | | |
| | | | | |
| | | |
| |
|
| Telecom Services (1.1%) |
| Ubiquitel, Inc. (b) | | | 17,200 | | | | 97,524 | | | |
| | | | | |
| | | |
| |
|
| Telecommunication Equipment (3.5%) |
| Comverse Technology, Inc. (b) | | | 5,200 | | | | 107,328 | | | |
| NII Holdings, Inc., Class B (b) | | | 1,900 | | | | 84,113 | | | |
| Telefonaktiebolaget LM Ericsson ADR - SE (b) | | | 3,800 | | | | 109,858 | | | |
| | | | | |
| | | |
| |
| | | | | | | | 301,299 | | | |
| | | | | |
| | | |
| |
|
| Wireless Equipment (5.9%) |
| American Tower Corp. (b) | | | 9,100 | | | | 156,429 | | | |
| Motorola, Inc. | | | 11,200 | | | | 193,312 | | | |
| QUALCOMM, Inc. | | | 4,000 | | | | 167,240 | | | |
| | | | | |
| | | |
| |
| | | | | | | | 516,981 | | | |
| | | | | |
| | | |
| |
| Total Common Stocks | | | 7,780,000 | | | |
| | | | | |
| | | |
2004 Annual Report 29
| |
| | Statement of Investments (Continued) |
| | October 31, 2004 |
Gartmore Global Technology and Communications Fund (Continued)
Sector Series
| | | | | | | | | | | |
|
| Repurchase Agreements (2.1%) |
|
| | Shares or | | | |
| | Principal Amount | | | Value | | | |
|
|
CS First Boston, 1.75%, dated 10/29/04, due 11/01/04, repurchase price $76,202
(Fully collateralized by Treasury Notes and U.S. Agency Securities) | | $ | 76,191 | | | $ | 76,191 | | | |
Nomura Securities, 1.75% dated 10/29/04, due 11/01/04, repurchase price $106,472
(Fully collateralized by AA Corporate Bonds and U.S. Agency Securities) | | | 106,456 | | | | 106,456 | | | |
| | | | | |
| | | |
| |
| Total Repurchase Agreements | | | 182,647 | | | |
| | | | | |
| | | |
| |
Short-Term Securities Held as Collateral for Securities Lending (10.2%) |
| Pool of short-term securities for Gartmore Mutual Funds — footnote 2 (Securities Lending) | | | 889,381 | | | | 889,381 | | | |
| | | | | |
| | | |
| |
| Total Short-Term Securities Held as Collateral for Securities Lending | | | 889,381 | | | |
| | | | | |
| | | |
| |
| Total Investments (Cost $8,283,406) (a) — 101.5% | | | 8,852,028 | | | |
| Liabilities in excess of other assets — (1.5%) | | | (128,118) | | | |
| | | | | |
| | | |
| |
| NET ASSETS — 100.0% | | $ | 8,723,910 | | | |
| | | | | |
| | | |
| | |
| (a) | | See notes to financial statements for tax unrealized appreciation (depreciation) of securities. |
| |
| (b) | | Denotes a non-income producing security. |
ADR American Depositary Receipt
FR France
IN India
SE Sweden
See notes to financial statements.
30 Annual Report 2004
Sector Series
| |
| | Gartmore Global Utilities Fund |
For the annual period ended Oct. 31, 2004, the Gartmore Global Utilities Fund returned 31.81% (Class A at NAV) versus 24.49% for its benchmark, 60% Morgan Stanley Capital International (MSCI) World Telecommunication Services Index/40% MSCI World Utilities Index. For broader comparison, the average return for the Fund’s Lipper peer category of Utility Funds was 22.78%.
The Fund invests in equities whose primary business operations are in the utility sector or related industries. These include companies that provide services to the public in areas such as telecommunications, cable television, radio, transportation, water and energy. Utility companies have traditionally paid above-average dividends, but the Fund also focuses on companies that have strong growth potential.
High electricity prices—caused mainly by high prices for input materials such as gas, oil and coal—drove strong revenue growth for many companies in the utilities sector. Fund performance benefited from this environment, yet the Fund outperformed its benchmark primarily because sector allocation and stock selection decisions succeeded in adding alpha (risk-adjusted returns largely attributed to the manager’s stock and/or sector selection) to the portfolio. In particular, we increased the Fund’s utilities and wireless telecommunications holdings while decreasing positions in traditional telecommunications companies, an area that experienced more moderate growth rates.
Within the utilities sector, electric utilities contributed most to Fund returns, followed by oil and gas, multi-utilities and unregulated power companies. Texas-based TXU Corp. and Scandinavia-based Fortum—both of which benefited from high electricity prices—were notable contributors to the Fund’s performance. TXU also brought in a new management team and embarked on a program to pay down company debt and increase payouts to shareholders, while Fortum performed well due to its announcement that it would spin off its oil refinery business.
We chose to purchase the stocks of wireless telecommunications providers over fixed-line providers because we believe that the area offers higher growth potential. This decision added to Fund returns as several wireless providers made strong contributions to the Fund’s performance. Vodafone Group PLC and Verizon Communications Inc., for example, added more than 5% to returns. Within this sector, however, the Fund’s underweight position in France Telecom detracted from returns relative to the blended index.
Both the utilities and telecommunications sectors appear well positioned to maintain their strong growth into 2005. In general, management teams within these sectors are showing discipline, paying dividends and repurchasing company stock—three positive indicators for stock prices. We also believe that the high energy prices that have boosted utilities’ revenues during the past year will continue to provide a tailwind for these companies throughout the year to come. Within the telecommunications services sector, we plan to remain focused on wireless providers because new third-generation handsets as well as further expansion into developing markets should provide new revenue sources for those companies.
Portfolio Manager: Ben Walker
| |
| | Class A: GGUAX |
| | Class B: GGUBX |
| | Class C: GGUCX |
| | Class R: GLURX |
| | Institutional Service Class: GUISX |
| | Institutional Class: GLUIX |
2004 Annual Report 31
Sector Series
Gartmore Global Utilities Fund
Average Annual Total Return
(For periods ended October 31, 2004)
| | | | | | | | | | | |
| | | | One year | | | Inception1 | |
|
| |
| Class A | | without sales charge2 | | | 31.81% | | | | 3.61% | |
| | | with sales charge3 | | | 24.16% | | | | 1.50% | |
|
| Class B | | without sales charge2 | | | 30.86% | | | | 2.85% | |
| | | with sales charge4 | | | 25.86% | | | | 1.85% | |
|
| Class C | | without sales charge2 | | | 30.90% | | | | 2.86% | |
| | | with sales charge5 | | | 29.90% | | | | 2.86% | |
|
Class R 6,8 | | | | | 31.46% | | | | 3.01% | |
|
| Institutional Class7,8 | | | 32.13% | | | | 3.89% | |
|
| Institutional Service Class8 | | | 32.13% | | | | 3.89% | |
|
All figures showing the effect of a sales charge reflect the maximum charge possible, because it has the most dramatic effect on performance data.
| |
| 1 | Fund commenced operations on December 18, 2001. |
| |
| 2 | These returns do not reflect the effects of sales charges (SC). |
| |
| 3 | A 5.75% front-end sales charge was deducted. |
| |
| 4 | A 5.00% contingent deferred sales charge (CDSC) was deducted. The CDSC declines to 0% after 6 years. |
| |
| 5 | A CDSC of 1.00% was deducted because it is charged when you sell Class C shares within the first year after purchase. |
| |
| 6 | These returns until the creation of Class R shares (12/31/03) include the performance of the Fund’s Class B shares. The returns have been adjusted for the fact that Class R shares do not have any applicable sales charges but have not been adjusted for the lower expenses applicable to Class R shares. Excluding the effect of any fee waivers or reimbursements, such prior performance is similar to what Class R shares would have produced because the Class R shares invest in the same portfolio of securities as Class B shares. |
| |
| 7 | These returns until the creation of Institutional Class shares (6/29/04) include the performance of the Fund’s Institutional Service shares. The returns have not been adjusted for the lower expenses applicable to Institutional Class shares. Excluding the effect of any fee waivers or reimbursements, such prior performance is similar to what Institutional Class shares would have produced because the Institutional Class shares invest in the same portfolio of securities as Institutional Service shares. |
| |
| 8 | Not subject to any sales charges. |
Performance of a $10,000 Investment
Investment return and principal value will fluctuate, and when redeemed, shares may be worth more or less than original cost. Past performance is no guarantee of future results and does not reflect the deduction of taxes that a shareholder would pay on fund distributions or the redemption of fund shares. Investing in mutual funds involves market risk, including loss of principal. Performance returns assume the reinvestment of all distributions.
Comparative performance of $10,000 invested in Class A shares of the Gartmore Global Utilities Fund, Morgan Stanley Capital International World Telecommunications Services Index (MSCI World Telecom)(a), Morgan Stanley Capital International World Utilities Index (MSCI World Utilities)(b), Composite Index (Composite)(c) and the Consumer Price Index (CPI)(d) since inception. Unlike the Fund, the returns for these unmanaged indexes do not reflect any fees, expenses, or sales charges. Investors cannot invest directly in market indexes.
| | |
| (a) | | The MSCI World Telecom is an unmanaged index representative of the stocks in the global utilities sector and is based on 23 developed market country indices. |
| |
| (b) | | The MSCI World Utilities is made up of industry groups such as electric, gas, multi utilities and unregulated power and water. |
| |
| (c) | | The Composite is a combination of 60% MSCI World Telecom and 40% MSCI World Utilities Indices. |
| |
| (d) | | The CPI represents changes in prices of a basket of goods and services purchased for consumption by urban households. |
32 Annual Report 2004
Gartmore Global Utilities Fund
Shareholder
Expense Example
As a shareholder of the Funds, you incur two types of costs: (1) transaction costs, including sales charges (loads) paid on purchase payments and redemption fees; and (2) ongoing costs, including investment advisory fees, administration fees, distribution fees and other Fund expenses. The examples below are intended to help you understand your ongoing costs (in dollars) of investing in the Funds and to compare these costs with the ongoing costs of investing in other mutual funds. The examples assume that you had a $1,000 investment in the Class at the beginning of the reporting period, May 1, 2004, and continued to hold your shares at the end of the reporting period, October 31, 2004. Per SEC requirements, the examples are based on an investment of $1,000 invested at the beginning of the period and held for the entire six-month period ended October 31, 2004.
Actual Expenses
For each Class of the Fund in the table below, the first line provides information about actual account values and actual expenses. You may use the information in this line, together with the amount you invested, to estimate the expenses that you paid over the period. Simply divide your account value by $1,000 (for example, an $8,600 account value divided by $1,000 = 8.6), then multiply the result by the number in the first line of each Class under the heading entitled “Expenses Paid During Period” to estimate the expenses you paid on your account during the period.
Hypothetical Example for Comparison Purposes
The second line of each Class in the table below provides information about hypothetical account values and hypothetical expenses based on the Class’ actual expense ratio and an assumed rate of return of 5% per year before expenses, which is not the Class’ actual return. The hypothetical account values and expenses may not be used to estimate the actual ending account balance or expenses you paid for the period. You may use this information to compare the ongoing costs of investing in the Class of the Fund and other funds. To do so, compare this 5% hypothetical example with the 5% hypothetical examples that appear in the shareholder reports of the other funds.
Please note that the expenses shown in the table are meant to highlight your ongoing costs only and do not reflect any transaction costs, such as sales charges (loads) or redemption fees. Therefore, the second line for each Class in the table is useful in comparing ongoing costs only, and will not help you determine the relative total costs of owning different funds. In addition, if these transaction costs were included, your costs would have been higher. The examples also assume all dividends and distributions have been reinvested.
Schedule of Shareholder Expenses
Expense Analysis of a $1,000 Investment
(October 31, 2004)
| | | | | | | | | | | | | | | | | | | | | | | |
| | | | Beginning | | | Ending | | | | | | | |
| | | | Account Value | | | Account Value | | | Expenses Paid | | | Annualized | | | |
| Global Utilities Fund | | | | 5/1/04 | | | 10/31/04 | | | During Period* | | | Expense Ratio | | | |
|
|
| Class A | | | Actual | | | $ | 1,000 | | | $ | 1,157 | | | $ | 7.86 | | | | 1.45% | | | |
| | | | Hypothetical | 1 | | $ | 1,000 | | | $ | 1,018 | | | $ | 7.38 | | | | 1.45% | | | |
|
| Class B | | | Actual | | | $ | 1,000 | | | $ | 1,153 | | | $ | 11.91 | | | | 2.20% | | | |
| | | | Hypothetical | 1 | | $ | 1,000 | | | $ | 1,014 | | | $ | 11.20 | | | | 2.20% | | | |
|
| Class C | | | Actual | | | $ | 1,000 | | | $ | 1,153 | | | $ | 11.91 | | | | 2.20% | | | |
| | | | Hypothetical | 1 | | $ | 1,000 | | | $ | 1,014 | | | $ | 11.20 | | | | 2.20% | | | |
|
| Class R | | | Actual | | | $ | 1,000 | | | $ | 1,156 | | | $ | 9.27 | | | | 1.71% | | | |
| | | | Hypothetical | 1 | | $ | 1,000 | | | $ | 1,016 | | | $ | 8.70 | | | | 1.71% | | | |
|
| Institutional Service Class | | | Actual | | | $ | 1,000 | | | $ | 1,159 | | | $ | 6.51 | | | | 1.20% | | | |
| | | | Hypothetical | 1 | | $ | 1,000 | | | $ | 1,019 | | | $ | 6.11 | | | | 1.20% | | | |
|
| Institutional Class (a) | | | Actual | | | $ | 1,000 | | | $ | 1,122 | | | $ | 4.31 | (b) | | | 1.20% | | | |
| | | | Hypothetical | 1 | | $ | 1,000 | | | $ | 1,011 | | | $ | 4.10 | (b) | | | 1.20% | | | |
|
| | |
| (a) | | For the period from June 29, 2004 (commencement of operations) through October 31, 2004. |
| |
| (b) | | Expense are equal to the Fund’s annualized expense ratio multiplied by the average account value over the period multiplied by 124/366 (to reflect the period). |
| |
| * | Expenses are equal to the Fund’s annualized expense ratio multiplied by the average account value over the period multiplied by 184/366 (to reflect the one-half year period). |
1 Represents the hypothetical 5% annual return before expenses.
2004 Annual Report 33
Gartmore Global Utilities Fund
Sector Series
| |
| | Portfolio Summary |
| | (October 31, 2004) |
The SEC adopted a requirement that Funds present their portfolio holdings in a table, chart or graph format in their annual and semiannual reports to shareholders, whether or not a schedule of investments is utilized. The following tables, which present portfolio holdings as a percentage of net assets, are provided in compliance with this requirement.
| | | | | | | |
| Asset Allocation | | | | |
|
|
| Common Stocks | | | 99.3% | | | |
| Participation Notes | | | 0.3% | | | |
| Other Assets in excess of Liabilities | | | 0.4% | | | |
| | |
| | | |
| | | | 100.0% | | | |
| | | | | | | |
| Top Countries | | | | |
|
|
| United States | | | 34.5% | | | |
| United Kingdom | | | 25.5% | | | |
| Spain | | | 7.8% | | | |
| Japan | | | 5.8% | | | |
| Italy | | | 5.8% | | | |
| Germany | | | 5.2% | | | |
| France | | | 3.5% | | | |
| Finland | | | 3.0% | | | |
| Austria | | | 2.4% | | | |
| Portugal | | | 1.8% | | | |
| Other Countries | | | 4.7% | | | |
| | |
| | | |
| | | | 100.0% | | | |
| | | | | | | |
| Top Holdings | | | | |
|
|
| Vodafone Group PLC | | | 10.0% | | | |
| Telefonica SA | | | 6.0% | | | |
| Verizon Communications, Inc. | | | 5.9% | | | |
| E. ON AG | | | 3.6% | | | |
| TXU Corp. | | | 3.6% | | | |
| Telecom Italia SpA | | | 3.5% | | | |
| Exelon Corp. | | | 3.3% | | | |
| Suez SA | | | 3.0% | | | |
| Fortum Oyj | | | 3.0% | | | |
| SBC Communications, Inc. | | | 2.7% | | | |
| Other Holdings | | | 55.4% | | | |
| | |
| | | |
| | | | 100.0% | | | |
34 Annual Report 2004
Statement of Investments
October 31, 2004
Gartmore Global Utilities Fund
| | | | | | | | | | | |
|
| Common Stocks (99.3%) |
|
| | Shares or | | | |
| | Principal Amount | | | Value | | | |
|
| AUSTRIA (2.4%) |
| Oil & Gas Utility (2.0%) |
| OMV AG (c) | | | 552 | | | $ | 132,491 | | | |
| | | | | |
| | | |
| |
| Telecommunications (0.4%) |
| Telekom Austria AG (c) | | | 1,965 | | | | 29,803 | | | |
| | | | | |
| | | |
| |
| | | | | | | | 162,294 | | | |
| | | | | |
| | | |
| |
|
| CANADA (1.6%) |
| Telecommunications (1.6%) |
| BCE, Inc. | | | 4,576 | | | | 106,132 | | | |
| | | | | |
| | | |
| |
|
| FINLAND (3.0%) |
| Oil & Gas Utility (3.0%) |
| Fortum Oyj (c) | | | 13,061 | | | | 199,731 | | | |
| | | | | |
| | | |
| |
|
| FRANCE (3.5%) |
| Oil & Gas Utility (0.5%) |
| Total SA (c) | | | 156 | | | | 32,465 | | | |
| | | | | |
| | | |
| |
| Water Utility (3.0%) |
| Suez SA (c) | | | 8,753 | | | | 204,478 | | | |
| | | | | |
| | | |
| |
| | | | | | | | 236,943 | | | |
| | | | | |
| | | |
| |
|
| GERMANY (5.2%) |
| Gas & Electric Utility (5.2%) |
| E. ON AG (c) | | | 2,975 | | | | 242,635 | | | |
| Rwe AG (c) | | | 2,080 | | | | 110,081 | | | |
| | | | | |
| | | |
| |
| | | | | | | | 352,716 | | | |
| | | | | |
| | | |
| |
|
| HONG KONG (0.3%) |
| Electric Utility (0.3%) |
| CLP Holdings Ltd. (c) | | | 3,000 | | | | 17,226 | | | |
| | | | | |
| | | |
| |
|
| ITALY (5.8%) |
| Electric Utility (1.3%) |
| Enel SpA (c) | | | 9,369 | | | | 84,603 | | | |
| | | | | |
| | | |
| |
| Gas Utility (0.3%) |
| Snam Rete Gas SpA (c) | | | 4,491 | | | | 22,775 | | | |
| | | | | |
| | | |
| |
| Oil & Gas Drilling (0.5%) |
| Saipem SpA (c) | | | 3,149 | | | | 36,266 | | | |
| | | | | |
| | | |
| |
| Telecommunications (3.7%) |
| Telecom Italia SpA (c) | | | 70,280 | | | | 233,951 | | | |
| Telecom Italia Di RISP (c) | | | 5,060 | | | | 12,584 | | | |
| | | | | |
| | | |
| |
| | | | | | | | 246,535 | | | |
| | | | | |
| | | |
| |
| | | | | | | | 390,179 | | | |
| | | | | |
| | | |
| |
|
| JAPAN (5.8%) |
| Electric Utility (3.8%) |
| Chubu Electric Power Co., Inc. (c) | | | 2,600 | | | | 56,437 | | | |
| Kansai Electric Power Co., Inc. (c) | | | 2,200 | | | | 41,162 | | | |
| Kyushu Electric Power Co., Inc. (c) | | | 1,800 | | | | 35,597 | | | |
| Tohoku Electric Power Co., Inc. (c) | | | 1,800 | | | | 30,664 | | | |
| Tokyo Electric Power Co., Inc. (c) | | | 4,300 | | | | 97,202 | | | |
| | | | | |
| | | |
| |
| | | | | | | | 261,062 | | | |
| | | | | |
| | | |
| |
| Gas Utility (0.8%) |
| Osaka Gas Co. Ltd. (c) | | | 10,000 | | | | 28,910 | | | |
| Tokyo Gas Co. Ltd. (c) | | | 6,000 | | | | 22,336 | | | |
| | | | | |
| | | |
| |
| | | | | | | | 51,246 | | | |
| | | | | |
| | | |
| |
| Telecommunications (1.2%) |
| Nippon Telegraph & Telephone Corp. (c) | | | 19 | | | | 80,639 | | | |
| | | | | |
| | | |
| |
| | | | | | | | 392,947 | | | |
| | | | | |
| | | |
| |
|
| LUXEMBOURG (1.2%) |
| Oil & Gas Utility (1.2%) |
| Stolt Offshore SA (b) (c) | | | 15,891 | | | | 80,097 | | | |
| | | | | |
| | | |
| |
|
| NORWAY (0.4%) |
| Telecommunications (0.4%) |
| Telenor ASA (c) | | | 3,079 | | | | 24,525 | | | |
| | | | | |
| | | |
| |
|
| PORTUGAL (1.8%) |
| Telecommunications (1.8%) |
| Portugal Telecom SA (c) | | | 10,784 | | | | 121,559 | | | |
| | | | | |
| | | |
| |
|
| SINGAPORE (0.5%) |
| Telecommunications (0.5%) |
| Singapore Telecommunications Ltd. (c) | | | 22,285 | | | | 32,414 | | | |
| | | | | |
| | | |
| |
|
| SPAIN (7.8%) |
| Gas & Electric Utility (1.8%) |
| Union Fenosa SA (c) | | | 5,033 | | | | 122,512 | | | |
| | | | | |
| | | |
| |
| Telecommunications (6.0%) |
| Telefonica SA (c) | | | 24,264 | | | | 401,572 | | | |
| | | | | |
| | | |
| |
| Television (0.0%) |
| Antena 3 Television SA (b) (c) | | | 34 | | | | 2,179 | | | |
| | | | | |
| | | |
| |
| | | | | | | | 526,263 | | | |
| | | | | |
| | | |
| |
|
| UNITED KINGDOM (25.5%) |
| Electric Utility (6.3%) |
| International Power PLC (b) (c) | | | 44,735 | | | | 132,086 | | | |
| National Grid Transco PLC (c) | | | 8,820 | | | | 76,781 | | | |
| Scottish & Southern Energy PLC (c) | | | 7,416 | | | | 113,523 | | | |
| Scottish Power PLC (c) | | | 12,220 | | | | 98,764 | | | |
| | | | | |
| | | |
| |
| | | | | | | | 421,154 | | | |
| | | | | |
| | | |
2004 Annual Report 35
| |
| | Statement of Investments (Continued) |
| | October 31, 2004 |
Gartmore Global Utilities Fund (Continued)
Sector Series
| | | | | | | | | | | |
|
| Common Stocks (continued) |
|
| | Shares or | | | |
| | Principal Amount | | | Value | | | |
|
| UNITED KINGDOM (continued) |
| Gas & Electric Utility (0.5%) |
| Centrica PLC (c) | | | 7,009 | | | $ | 30,979 | | | |
| | | | | |
| | | |
| |
| Telecommunications (9.9%) |
| Vodafone Group PLC (c) | | | 262,405 | | | | 673,449 | | | |
| | | | | |
| | | |
| |
| Transportation (1.2%) |
| Peninsular and Oriental Steam Navigation Co. (c) | | | 16,380 | | | | 80,469 | | | |
| | | | | |
| | | |
| |
| Water Utility (7.6%) |
| AWG PLC (b) (c) | | | 5,135 | | | | 68,593 | | | |
| Northumbrian Water Group PLC (c) | | | 40,932 | | | | 113,102 | | | |
| Pennon Group PLC (c) | | | 8,505 | | | | 143,535 | | | |
| Severn Trent PLC (c) | | | 1,653 | | | | 27,756 | | | |
| United Utilities PLC (c) | | | 7,179 | | | | 75,689 | | | |
| United Utilities PLC, Class A (c) | | | 11,165 | | | | 79,580 | | | |
| | | | | |
| | | |
| |
| | | | | | | | 508,255 | | | |
| | | | | |
| | | |
| |
| | | | | | | | 1,714,306 | | | |
| | | | | |
| | | |
| |
|
| UNITED STATES (34.5%) |
| Electric Utility (7.7%) |
| AES Corp. (b) | | | 2,220 | | | | 24,198 | | | |
| Dominion Resources, Inc. | | | 1,191 | | | | 76,605 | | | |
| Duke Energy Corp. | | | 6,950 | | | | 170,484 | | | |
| Edison International | | | 921 | | | | 28,091 | | | |
| Entergy Corp. | | | 862 | | | | 56,340 | | | |
| PPL Corp. | | | 2,872 | | | | 149,344 | | | |
| Southern Co. (The) | | | 374 | | | | 11,815 | | | |
| | | | | |
| | | |
| |
| | | | | | | | 516,877 | | | |
| | | | | |
| | | |
| |
| Gas & Electric Utility (9.0%) |
| Exelon Corp. | | | 5,582 | | | | 221,159 | | | |
| Questar Corp. | | | 2,948 | | | | 141,504 | | | |
| TXU Corp. | | | 3,918 | | | | 239,860 | | | |
| | | | | |
| | | |
| |
| | | | | | | | 602,523 | | | |
| | | | | |
| | | |
| |
| Gas Utility (0.8%) |
| FirstEnergy Corp. | | | 1,285 | | | | 53,109 | | | |
| | | | | |
| | | |
| |
| Oil & Gas Utility (3.8%) |
| ConocoPhillips | | | 1,494 | | | | 125,959 | | | |
| EOG Resources, Inc. | | | 1,959 | | | | 130,391 | | | |
| | | | | |
| | | |
| |
| | | | | | | | 256,350 | | | |
| | | | | |
| | | |
| |
| Telecommunications (13.2%) |
| AT&T Corp. | | | 2,939 | | | | 50,286 | | | |
| BellSouth Corp. | | | 3,401 | | | | 90,705 | | | |
| Nextel Communications, Inc., Class A (b) | | | 4,273 | | | | 113,192 | | | |
| SBC Communications, Inc. | | | 7,153 | | | | 180,685 | | | |
| Sprint Corp. | | | 2,499 | | | | 52,354 | | | |
| Verizon Communications, Inc. | | | 10,150 | | | | 396,864 | | | |
| | | | | |
| | | |
| |
| | | | | | | | 884,086 | | | |
| | | | | |
| | | |
| |
| | | | | | | | 2,312,945 | | | |
| | | | | |
| | | |
| |
| Total Common Stocks | | | 6,670,277 | | | |
| | | | | |
| | | |
| |
Participation Notes (0.3%) |
| United States (0.3%) |
| Tobacco (0.3%) |
| National Thermal (b) (c) | | $ | 15,300 | | | | 20,655 | | | |
| | | | | |
| | | |
| |
| Total Participation Notes | | | 20,655 | | | |
| | | | | |
| | | |
| |
| Total Investments (Cost $6,148,096) (a) — 99.6% | | | 6,690,932 | | | |
| Other assets in excess of liabilities — 0.4% | | | 28,331 | | | |
| | | | | |
| | | |
| |
| NET ASSETS — 100.0% | | $ | 6,719,263 | | | |
| | | | | |
| | | |
| | |
| (a) | | See notes to financial statements for tax unrealized appreciation (depreciation) of securities. |
| |
| (b) | | Non-income producing securities. |
| |
| (c) | | Fair Valued Security. |
See notes to financial statements.
36 Annual Report 2004
Statements of Assets and Liabilities
October 31, 2004
| | | | | | | | | | | | | | | | | | | |
| | Gartmore Global | | | Gartmore Global | | | Gartmore Global | | | Gartmore Global | |
| | Financial | | | Health | | | Natural | | | Technology and | |
| | Services Fund | | | Sciences Fund | | | Resources Fund | | | Communications Fund | |
|
|
| |
Assets: | | | | | | | | | | | | | | | | |
| Investments, at value (cost $5,609,392; $13,640,485; $3,071,546; $8,100,759; and $6,148,096; respectively) | | $ | 5,998,806 | | | $ | 13,749,132 | | | $ | 3,319,894 | | | $ | 8,669,381 | |
| Repurchase agreements, at cost | | | 309,905 | | | | 2,394,173 | | | | 96,408 | | | | 182,647 | |
| | |
|
| |
| | | Total Investments | | | 6,308,711 | | | | 16,143,305 | | | | 3,416,302 | | | | 8,852,028 | |
| | |
|
| |
| Foreign currency, at value (cost $2; $0; $0; $176,570 and $13; respectively) | | | 2 | | | | — | | | | — | | | | 176,384 | |
| Interest and dividends receivable | | | 7,236 | | | | 8,021 | | | | 1,513 | | | | 2,139 | |
| Receivable for investments sold | | | 206,910 | | | | 1,586,550 | | | | 236,896 | | | | 1,302,504 | |
| Receivable from adviser | | | 6,615 | | | | 4,923 | | | | 8,042 | | | | 5,916 | |
| Reclaims receivable | | | 2,253 | | | | — | | | | — | | | | — | |
| Prepaid expenses and other assets | | | 12,790 | | | | 11,766 | | | | 40,125 | | | | 28,672 | |
| | |
|
| |
| | | Total Assets | | | 6,544,517 | | | | 17,754,565 | | | | 3,702,878 | | | | 9,478,262 | |
| | |
|
Liabilities: | | | | | | | | | | | | | | | | |
| Payable to custodian | | | — | | | | — | | | | — | | | | — | |
| Payable for investments purchased | | | 195,597 | | | | 2,258,385 | | | | 199,528 | | | | 741,805 | |
| Unrealized depreciation on forward foreign currency contracts | | | — | | | | — | | | | — | | | | — | |
| Payable for return of collateral received for securities on loan | | | — | | | | 779,449 | | | | — | | | | 889,381 | |
| Accrued expenses and other payables | | | | | | | | | | | | | | | | |
| | Investment advisory fees | | | 4,761 | | | | 11,359 | | | | 2,636 | | | | 6,292 | |
| | Fund administration and transfer agent fees | | | 3,610 | | | | 2,957 | | | | 1,929 | | | | 2,206 | |
| | Distribution fees | | | 2,316 | | | | 3,981 | | | | 23 | | | | 1,581 | |
| | Administrative servicing fees | | | 11 | | | | 1,983 | | | | 6 | | | | 668 | |
| | Other | | | 447 | | | | 673 | | | | 4,964 | | | | 1,800 | |
| | |
|
| |
| | | Total Liabilities | | | 206,742 | | | | 3,058,787 | | | | 209,086 | | | | 1,643,733 | |
| | |
|
| |
Net Assets | | $ | 6,337,775 | | | $ | 14,695,778 | | | $ | 3,493,792 | | | $ | 8,723,910 | |
| | |
|
Represented by: | | | | | | | | | | | | | | | | |
| Capital | | $ | 5,507,978 | | | $ | 14,711,824 | | | $ | 3,114,692 | | | $ | 15,064,701 | |
| Accumulated net investment income (loss) | | | 3,066 | | | | — | | | | 1,052 | | | | — | |
| Accumulated net realized gains (losses) from investment and foreign currency transactions | | | 437,062 | | | | (124,693 | ) | | | 129,700 | | | | (6,909,227 | ) |
| Net unrealized appreciation (depreciation) on investments and translation of assets and liabilities denominated in foreign currencies | | | 389,669 | | | | 108,647 | | | | 248,348 | | | | 568,436 | |
| | |
|
| |
Net Assets | | $ | 6,337,775 | | | $ | 14,695,778 | | | $ | 3,493,792 | | | $ | 8,723,910 | |
| | |
|
Net Assets: | | | | | | | | | | | | | | | | |
| Class A Shares | | $ | 2,456,561 | | | $ | 6,143,564 | | | $ | 107,371 | | | $ | 2,991,296 | |
| Class B Shares | | | 1,071,922 | | | | 1,076,058 | | | | 1,121 | | | | 1,063,754 | |
| Class C Shares | | | 1,087,941 | | | | 2,092,232 | | | | 6,128 | | | | 78,682 | |
| Class R Shares | | | 1,079 | | | | 977 | | | | 1,123 | | | | 923 | |
| Institutional Service Class Shares | | | 1,045,800 | | | | 4,978,656 | | | | 1,125 | | | | 4,357,906 | |
| Institutional Class Shares | | | 674,472 | | | | 404,291 | | | | 3,376,924 | | | | 231,349 | |
| | |
|
| |
| Total | | $ | 6,337,775 | | | $ | 14,695,778 | | | $ | 3,493,792 | | | $ | 8,723,910 | |
| | |
|
Shares outstanding (unlimited number of shares authorized): | | | | | | | | | | | | | | | | |
| Class A Shares | | | 196,644 | | | | 612,196 | | | | 9,557 | | | | 850,683 | |
| Class B Shares | | | 87,117 | | | | 110,037 | | | | 100 | | | | 312,404 | |
| Class C Shares | | | 88,425 | | | | 213,838 | | | | 546 | | | | 22,934 | |
| Class R Shares | | | 88 | | | | 100 | | | | 100 | | | | 270 | |
| Institutional Service Class Shares | | | 83,312 | | | | 491,321 | | | | 100 | | | | 1,219,443 | |
| Institutional Class Shares | | | 53,739 | | | | 39,865 | | | | 300,526 | | | | 64,677 | |
| | |
|
| |
| Total | | | 509,325 | | | | 1,467,357 | | | | 310,929 | | | | 2,470,411 | |
| | |
|
Net asset value: | | | | | | | | | | | | | | | | |
| Class A Shares | | $ | 12.49 | | | $ | 10.04 | | | $ | 11.23 | | | $ | 3.52 | |
| Class B Shares (a) | | $ | 12.30 | | | $ | 9.78 | | | $ | 11.21 | | | $ | 3.41 | |
| Class C Shares (b) | | $ | 12.30 | | | $ | 9.78 | | | $ | 11.21 | | | $ | 3.43 | |
| Class R Shares | | $ | 12.31 | | | $ | 9.81 | | | $ | 11.22 | | | $ | 3.42 | |
| Institutional Service Class Shares | | $ | 12.55 | | | $ | 10.13 | | | $ | 11.23 | | | $ | 3.57 | |
| Institutional Class Shares | | $ | 12.55 | | | $ | 10.14 | | | $ | 11.24 | | | $ | 3.58 | |
Maximum offering price per share
(100%/(100%-maximum sales charge) of net asset value adjusted to the nearest cent): | | | | | | | | | | | | | | | | |
| Class A Shares | | $ | 13.25 | | | $ | 10.65 | | | $ | 11.92 | | | $ | 3.73 | |
| | |
|
| |
| Maximum Sales Charge — Class A Shares | | | 5.75 | % | | | 5.75 | % | | | 5.75 | % | | | 5.75 | % |
| | |
|
|
[Additional columns below]
[Continued from above table, first column(s) repeated]
| | | | | | | |
| | Gartmore Global | |
| | Utilities Fund | |
| | |
| | |
| |
| |
Assets: | | | | |
| Investments, at value (cost $5,609,392; $13,640,485; $3,071,546; $8,100,759; and $6,148,096; respectively) | | $ | 6,690,932 | |
| Repurchase agreements, at cost | | | — | |
| | |
| |
| | | Total Investments | | | 6,690,932 | |
| | |
| |
| Foreign currency, at value (cost $2; $0; $0; $176,570 and $13; respectively) | | | 13 | |
| Interest and dividends receivable | | | 17,251 | |
| Receivable for investments sold | | | 338,896 | |
| Receivable from adviser | | | 6,361 | |
| Reclaims receivable | | | 527 | |
| Prepaid expenses and other assets | | | 12,389 | |
| | |
| |
| | | Total Assets | | | 7,066,369 | |
| | |
| |
Liabilities: | | | | |
| Payable to custodian | | | 55,897 | |
| Payable for investments purchased | | | 278,581 | |
| Unrealized depreciation on forward foreign currency contracts | | | 699 | |
| Payable for return of collateral received for securities on loan | | | — | |
| Accrued expenses and other payables | | | | |
| | Investment advisory fees | | | 3,842 | |
| | Fund administration and transfer agent fees | | | 3,563 | |
| | Distribution fees | | | 3,896 | |
| | Administrative servicing fees | | | 6 | |
| | Other | | | 622 | |
| | |
| |
| | | Total Liabilities | | | 347,106 | |
| | |
| |
Net Assets | | $ | 6,719,263 | |
| | |
| |
Represented by: | | | | |
| Capital | | $ | 6,047,417 | |
| Accumulated net investment income (loss) | | | 9,746 | |
| Accumulated net realized gains (losses) from investment and foreign currency transactions | | | 119,535 | |
| Net unrealized appreciation (depreciation) on investments and translation of assets and liabilities denominated in foreign currencies | | | 542,565 | |
| | |
| |
Net Assets | | $ | 6,719,263 | |
| | |
| |
Net Assets: | | | | |
| Class A Shares | | $ | 1,190,423 | |
| Class B Shares | | | 885,344 | |
| Class C Shares | | | 3,555,898 | |
| Class R Shares | | | 1,182 | |
| Institutional Service Class Shares | | | 836,727 | |
| Institutional Class Shares | | | 249,689 | |
| | |
| |
| Total | | $ | 6,719,263 | |
| | |
| |
Shares outstanding (unlimited number of shares authorized): | | | | |
| Class A Shares | | | 109,481 | |
| Class B Shares | | | 82,330 | |
| Class C Shares | | | 331,011 | |
| Class R Shares | | | 110 | |
| Institutional Service Class Shares | | | 76,698 | |
| Institutional Class Shares | | | 22,885 | |
| | |
| |
| Total | | | 622,515 | |
| | |
| |
Net asset value: | | | | |
| Class A Shares | | $ | 10.87 | |
| Class B Shares (a) | | $ | 10.75 | |
| Class C Shares (b) | | $ | 10.74 | |
| Class R Shares | | $ | 10.78 | |
| Institutional Service Class Shares | | $ | 10.91 | |
| Institutional Class Shares | | $ | 10.91 | |
Maximum offering price per share
(100%/(100%-maximum sales charge) of net asset value adjusted to the nearest cent): | | | | |
| Class A Shares | | $ | 11.53 | |
| | |
| |
| Maximum Sales Charge — Class A Shares | | | 5.75 | % |
| | |
| |
| | | |
| | |
| (a) | | For Class B shares, the redemption price per share varies by length of time shares are held. |
| (b) | | For Class C shares, the redemption price per share is reduced by 1.00% for shares held less than one year. |
See notes to financial statements.
2004 Annual Report 37
Sector Series
| |
| | Statements of Operations |
| | For the Year Ended October 31, 2004 |
| | | | | | | | | | | | | | | | | | | | | | | |
| | Gartmore Global | | | Gartmore Global | | | Gartmore | | | Gartmore Global | | | Gartmore Global | |
| | Financial Services | | | Health Sciences | | | Global Natural | | | Technology and | | | Utilities | |
| | Fund | | | Fund | | | Resources Fund (a) | | | Communications Fund | | | Fund | |
|
|
| |
INVESTMENT INCOME: | | | | | | | | | | | | | | | | | | | | |
| Interest income | | $ | 2,892 | | | $ | 10,003 | | | $ | 855 | | | $ | 3,094 | | | $ | 1,015 | |
| Dividend income (net of foreign withholding tax of $10,582; $0; $0; $35 and $7,178; respectively) | | | 145,076 | | | | 102,307 | | | | 16,097 | | | | 21,537 | | | | 102,322 | |
| | Income from securities lending | | | — | | | | 62 | | | | — | | | | — | | | | — | |
| | |
| |
| |
| |
| | Total Income | | | 147,968 | | | | 112,372 | | | | 16,952 | | | | 24,631 | | | | 103,337 | |
| | |
| |
| |
Expenses: | | | | | | | | | | | | | | | | | | | | |
| Investment advisory fees | | | 54,371 | | | | 117,729 | | | | 9,752 | | | | 91,528 | | | | 29,771 | |
| Fund administration and transfer agent fees | | | 13,020 | | | | 17,434 | | | | 2,937 | | | | 15,818 | | | | 11,937 | |
| Distribution fees Class A | | | 5,961 | | | | 13,179 | | | | 26 | | | | 8,376 | | | | 2,054 | |
| Distribution fees Class B | | | 10,228 | | | | 10,609 | | | | 4 | | | | 11,262 | | | | 7,486 | |
| Distribution fees Class C | | | 10,131 | | | | 5,316 | | | | 7 | | | | 694 | | | | 15,719 | |
| Distribution fees Class R | | | 3 | | | | 3 | | | | 1 | | | | 3 | | | | 3 | |
| Administrative servicing fees Class A | | | 89 | | | | 4,908 | | | | 5 | | | | 1,991 | | | | 24 | |
| Administrative servicing fees Class R | | | 2 | | | | 2 | | | | 1 | | | | 2 | | | | 2 | |
| Administrative servicing fees Institutional Service Class | | | — | | | | 10,829 | | | | — | | | | 10,860 | | | | — | |
| Registration and filing fees | | | 50,441 | | | | 48,168 | | | | 11,635 | | | | 44,524 | | | | 49,546 | |
| Printing fees | | | 855 | | | | 2,025 | | | | 1,900 | | | | 4,806 | | | | 463 | |
| Other | | | 2,817 | | | | 5,377 | | | | 9,808 | | | | 8,112 | | | | 3,379 | |
| | |
| |
| |
| |
| | Total expenses before reimbursed expenses | | | 147,918 | | | | 235,579 | | | | 36,076 | | | | 197,976 | | | | 120,384 | |
| Expenses reimbursed | | | (42,529 | ) | | | (37,526 | ) | | | (21,945 | ) | | | (29,954 | ) | | | (47,596 | ) |
| | |
| |
| |
| |
| | | Total Expenses | | | 105,389 | | | | 198,053 | | | | 14,131 | | | | 168,022 | | | | 72,788 | |
| | |
| |
| |
| |
Net Investment Income (Loss) | | | 42,579 | | | | (85,681 | ) | | | 2,821 | | | | (143,391 | ) | | | 30,549 | |
| | |
| |
| |
| |
REALIZED/ UNREALIZED GAINS (LOSSES) FROM INVESTMENTS: | | | | | | | | | | | | | | | | | | | | |
| Net realized gains (losses) on investment transactions | | | 459,094 | | | | 43,803 | | | | 129,700 | | | | (1,128,733 | ) | | | 867,401 | |
| Net realized gains (losses) on foreign currency transactions | | | (3,489 | ) | | | (1,962 | ) | | | — | | | | (1,070 | ) | | | (7,922 | ) |
| | |
| |
| |
| |
| Net realized gains (losses) on investment and foreign currency transactions | | | 455,605 | | | | 41,841 | | | | 129,700 | | | | (1,129,803 | ) | | | 859,479 | |
| Net change in unrealized appreciation/depreciation on investments and translation of assets and liabilities denominated in foreign currencies | | | 203,356 | | | | 127,705 | | | | 248,348 | | | | 176,659 | | | | 302,803 | |
| | |
| |
| |
| |
| Net realized/unrealized gains (losses) on investments and foreign currencies | | | 658,961 | | | | 169,546 | | | | 378,048 | | | | (953,144 | ) | | | 1,162,282 | |
| | |
| |
| |
| |
CHANGE IN NET ASSETS RESULTING FROM OPERATIONS | | $ | 701,540 | | | $ | 83,865 | | | $ | 380,869 | | | $ | (1,096,535 | ) | | $ | 1,192,831 | |
| | |
| |
| |
|
| | |
| (a) | | For the period from June 29, 2004 (commencement of operations) through October 31, 2004. |
See notes to financial statements.
38 Annual Report 2004
Statements of Changes in Net Assets
| | | | | | | | | | | | | | | | | | | | | |
| | | | | | |
| | Gartmore Global | | | Gartmore Global | | | Gartmore Global | |
| | Financial Services Fund | | | Health Sciences Fund | | | Natural Resources Fund | |
| | Year Ended | | | Year Ended | | | Year Ended | | | Year Ended | | | Period Ended | |
| | October 31, 2004 | | | October 31, 2003 | | | October 31, 2004 | | | October 31, 2003 | | | October 31, 2004 (a) | |
|
|
| |
FROM INVESTMENT ACTIVITIES: | | | | | | | | | | | | | | | | | | | | |
Operations: | | | | | | | | | | | | | | | | | | | | |
| Net investment income (loss) | | $ | 42,579 | | | $ | 15,765 | | | $ | (85,681 | ) | | $ | (47,261 | ) | | $ | 2,821 | |
| Net realized gains (losses) on investment and foreign currency transactions | | | 455,605 | | | | 401,100 | | | | 41,841 | | | | 1,313,790 | | | | 129,700 | |
| Net change in unrealized appreciation/depreciation on investments and translation of assets and liabilities denominated in foreign currencies | | | 203,356 | | | | 475,644 | | | | 127,705 | | | | (129,330 | ) | | | 248,348 | |
| | |
| |
| |
| |
| Change in net assets resulting from operations | | | 701,540 | | | | 892,509 | | | | 83,865 | | | | 1,137,199 | | | | 380,869 | |
| | |
| |
| |
| |
Distributions to Class A Shareholders from: | | | | | | | | | | | | | | | | | | | | |
| Net investment income | | | (19,336 | ) | | | (1,596 | ) | | | — | | | | — | | | | (87 | ) |
| Net realized gains on investments | | | (148,606 | ) | | | — | | | | (318,186 | ) | | | — | | | | — | |
Distributions to Class B Shareholders from: | | | | | | | | | | | | | | | | | | | | |
| Net investment income | | | (2,631 | ) | | | (179 | ) | | | — | | | | — | | | | — | |
| Net realized gains on investments | | | (86,510 | ) | | | — | | | | (75,061 | ) | | | — | | | | — | |
Distributions to Class C Shareholders from: | | | | | | | | | | | | | | | | | | | | |
| Net investment income | | | (2,660 | ) | | | (177 | ) | | | — | | | | — | | | | — | |
| Net realized gains on investments | | | (83,988 | ) | | | — | | | | (13,473 | ) | | | — | | | | — | |
Distributions to Class R Shareholders from: | | | | | | | | | | | | | | | | | | | | |
| Net investment income | | | (6 | ) (b) | | | — | | | | — | | | | — | | | | — | |
Distributions to Institutional Service Class Shareholders from: | | | | | | | | | | | | | | | | | | | | |
| Net investment income | | | (9,744 | ) | | | (2,031 | ) | | | — | | | | — | | | | (2 | ) |
| Net realized gains on investments | | | (83,737 | ) | | | — | | | | (300,573 | ) | | | — | | | | — | |
Distributions to Institutional Class Shareholders from: | | | | | | | | | | | | | | | | | | | | |
| From net investment income | | | (1,601 | ) (a) | | | — | | | | — | | | | — | | | | (5,728 | ) |
| | |
| |
| |
| |
| Change in net assets from shareholder distributions | | | (438,819 | ) | | | (3,983 | ) | | | (707,293 | ) | | | — | | | | (5,817 | ) |
| | |
| |
| |
| |
| Change in net assets from capital transactions | | | 2,165,480 | | | | 337,681 | | | | 6,457,494 | | | | 3,994,720 | | | | 3,118,740 | |
| | |
| |
| |
| |
| Change in net assets | | | 2,428,201 | | | | 1,226,207 | | | | 5,834,066 | | | | 5,131,919 | | | | 3,493,792 | |
Net Assets: | | | | | | | | | | | | | | | | | | | | |
| Beginning of period | | | 3,909,574 | | | | 2,683,367 | | | | 8,861,712 | | | | 3,729,793 | | | | — | |
| | |
| |
| |
| |
| End of period | | $ | 6,337,775 | | | $ | 3,909,574 | | | $ | 14,695,778 | | | $ | 8,861,712 | | | $ | 3,493,792 | |
| | |
| |
| |
| |
|
| | |
| (a) | | For the period from June 29, 2004 (commencement of operations) through October 31, 2004. |
| (b) | | For the period from December 30, 2003 (commencement of operations) through October 31, 2004. |
See notes to financial statements.
2004 Annual Report 39
Sector Series
| |
| | Statements of Changes in Net Assets |
| | | | | | | | | | | | | | | | | |
| | | | | | |
| | Gartmore Global Technology and | | | |
| | Communications Fund | | | Gartmore Global Utilities Fund | |
| | Year Ended | | | Year Ended | | | Year Ended | | | Year Ended | |
| | October 31, 2004 | | | October 31, 2003 | | | October 31, 2004 | | | October 31, 2003 | |
|
|
| |
FROM INVESTMENT ACTIVITIES: | | | | | | | | | | | | | | | | |
Operations: | | | | | | | | | | | | | | | | |
| Net investment income (loss) | | $ | (143,391 | ) | | $ | (72,489 | ) | | $ | 30,549 | | | $ | 16,198 | |
| Net realized gains (losses) on investment and foreign currency transactions | | | (1,129,803 | ) | | | 1,780,381 | | | | 859,479 | | | | (26,745 | ) |
| Net change in unrealized appreciation/depreciation on investments and translation of assets and liabilities denominated in foreign currencies | | | 176,659 | | | | 348,683 | | | | 302,803 | | | | 350,425 | |
| | |
| |
| |
| |
| Change in net assets resulting from operations | | | (1,096,535 | ) | | | 2,056,575 | | | | 1,192,831 | | | | 339,878 | |
| | |
| |
| |
| |
Distributions to Class A Shareholders from: | | | | | | | | | | | | | | | | |
| Net investment income | | | — | | | | — | | | | (3,515 | ) | | | (4,041 | ) |
Distributions to Class B Shareholders from: | | | | | | | | | | | | | | | | |
| Net investment income | | | — | | | | — | | | | (480 | ) | | | (2,128 | ) |
Distributions to Class C Shareholders from: | | | | | | | | | | | | | | | | |
| Net investment income | | | — | | | | — | | | | (4,370 | ) | | | (2,116 | ) |
Distributions to Class R Shareholders from: | | | | | | | | | | | | | | | | |
| Net investment income | | | — | | | | — | | | | (3 | ) (a) | | | — | |
Distributions to Institutional Service Class Shareholders from: | | | | | | | | | | | | | | | | |
| Net investment income | | | — | | | | — | | | | (3,949 | ) | | | (4,846 | ) |
Distributions to Institutional Class Shareholders from: | | | | | | | | | | | | | | | | |
| From net investment income | | | — | | | | — | | | | (557 | ) (b) | | | — | |
| | |
| |
| |
| |
| Change in net assets from shareholder distributions | | | — | | | | — | | | | (12,874 | ) | | | (13,131 | ) |
| | |
| |
| |
| |
| Change in net assets from capital transactions | | | 275,909 | | | | 4,334,111 | | | | 2,923,928 | | | | 111,153 | |
| | |
| |
| |
| |
| Change in net assets | | | (820,626 | ) | | | 6,390,686 | | | | 4,103,885 | | | | 437,900 | |
Net Assets: | | | | | | | | | | | | | | | | |
| Beginning of period | | | 9,544,536 | | | | 3,153,850 | | | | 2,615,378 | | | | 2,177,478 | |
| | |
| |
| |
| |
| End of period | | $ | 8,723,910 | | | $ | 9,544,536 | | | $ | 6,719,263 | | | $ | 2,615,378 | |
| | |
| |
| |
| |
|
| | |
| (a) | | For the period from December 30, 2003 (commencement of operations) through October 31, 2004. |
| (b) | | For the period from June 29, 2004 (commencement of operations) through October 31, 2004. |
See notes to financial statements.
40 Annual Report 2004
Financial Highlights
Selected Data for Each Share of Capital Outstanding
Gartmore Global Financial Services Fund
| | | | | | | | | | | | | | | | | |
| | | | |
| | | | Investment Activities | |
| | | | | | Net Realized | | | |
| | | | | | and | | | |
| | Net Asset | | | Net | | | Unrealized | | | Total | |
| | Value, | | | Investment | | | Gains | | | from | |
| | Beginning of | | | Income | | | (Losses) on | | | Investment | |
| | Period | | | (Loss) | | | Investments | | | Activities | |
|
|
| |
Class A Shares | | | | | | | | | | | | | | | | |
| Period Ended October 31, 2002 (d) | | $ | 10.00 | | | | 0.04 | | | | (1.12 | ) | | | (1.08 | ) |
| Year Ended October 31, 2003 | | $ | 8.92 | | | | 0.07 | | | | 2.83 | | | | 2.90 | |
| Year Ended October 31, 2004 | | $ | 11.80 | | | | 0.12 | | | | 1.77 | | | | 1.89 | |
Class B Shares | | | | | | | | | | | | | | | | |
| Period Ended October 31, 2002 (d) | | $ | 10.00 | | | | (0.02 | ) | | | (1.11 | ) | | | (1.13 | ) |
| Year Ended October 31, 2003 | | $ | 8.87 | | | | 0.01 | | | | 2.79 | | | | 2.80 | |
| Year Ended October 31, 2004 | | $ | 11.67 | | | | 0.02 | | | | 1.75 | | | | 1.77 | |
Class C Shares | | | | | | | | | | | | | | | | |
| Period Ended October 31, 2002 (d) | | $ | 10.00 | | | | (0.02 | ) | | | (1.11 | ) | | | (1.13 | ) |
| Year Ended October 31, 2003 | | $ | 8.87 | | | | 0.01 | | | | 2.79 | | | | 2.80 | |
| Year Ended October 31, 2004 | | $ | 11.67 | | | | 0.02 | | | | 1.75 | | | | 1.77 | |
Class R Shares | | | | | | | | | | | | | | | | |
| Period Ended October 31, 2004 (g) | | $ | 11.47 | | | | 0.04 | | | | 0.86 | | | | 0.90 | |
Institutional Service Class Shares | | | | | | | | | | | | | | | | |
| Period Ended October 31, 2002 (d) | | $ | 10.00 | | | | 0.06 | | | | (1.12 | ) | | | (1.06 | ) |
| Year Ended October 31, 2003 | | $ | 8.94 | | | | 0.11 | | | | 2.83 | | | | 2.94 | |
| Year Ended October 31, 2004 | | $ | 11.85 | | | | 0.15 | | | | 1.78 | | | | 1.93 | |
Institutional Class Shares | | | | | | | | | | | | | | | | |
| Period Ended October 31, 2004 (h) | | $ | 12.22 | | | | 0.02 | | | | 0.34 | | | | 0.36 | |
|
[Additional columns below]
[Continued from above table, first column(s) repeated]
| | | | | | | | | | | | | | | | | | | | | |
| | | | | | |
| | Distributions | | | | | |
| | Net | | | Net | | | | | Net Asset | | | |
| | Investment | | | Realized | | | Total | | | Value, End | | | Total | |
| | Income | | | Gains | | | Distributions | | | of Period | | | Return (a) | |
| | |
| | |
| |
| |
Class A Shares | | | | | | | | | | | | | | | | | | | | |
| Period Ended October 31, 2002 (d) | | | — | | | | — | | | | — | | | $ | 8.92 | | | | (10.78% | ) (e) |
| Year Ended October 31, 2003 | | | (0.02 | ) | | | — | | | | (0.02 | ) | | $ | 11.80 | | | | 32.59% | |
| Year Ended October 31, 2004 | | | (0.09 | ) | | | (1.11 | ) | | | (1.20 | ) | | $ | 12.49 | | | | 17.01% | |
Class B Shares | | | | | | | | | | | | | | | | | | | | |
| Period Ended October 31, 2002 (d) | | | — | | | | — | | | | — | | | $ | 8.87 | | | | (11.30% | ) (e) |
| Year Ended October 31, 2003 | | | — | | | | — | | | | — | | | $ | 11.67 | | | | 31.60% | |
| Year Ended October 31, 2004 | | | (0.03 | ) | | | (1.11 | ) | | | (1.14 | ) | | $ | 12.30 | | | | 16.15% | |
Class C Shares | | | | | | | | | | | | | | | | | | | | |
| Period Ended October 31, 2002 (d) | | | — | | | | — | | | | — | | | $ | 8.87 | | | | (11.30% | ) (e) |
| Year Ended October 31, 2003 | | | — | | | | — | | | | — | | | $ | 11.67 | | | | 31.60% | |
| Year Ended October 31, 2004 | | | (0.03 | ) | | | (1.11 | ) | | | (1.14 | ) | | $ | 12.30 | | | | 16.16% | |
Class R Shares | | | | | | | | | | | | | | | | | | | | |
| Period Ended October 31, 2004 (g) | | | (0.06 | ) | | | — | | | | (0.06 | ) | | $ | 12.31 | | | | 7.89% | (e) |
Institutional Service Class Shares | | | | | | | | | | | | | | | | | | | | |
| Period Ended October 31, 2002 (d) | | | — | | | | — | | | | — | | | $ | 8.94 | | | | (10.57% | ) (e) |
| Year Ended October 31, 2003 | | | (0.03 | ) | | | — | | | | (0.03 | ) | | $ | 11.85 | | | | 32.95% | |
| Year Ended October 31, 2004 | | | (0.12 | ) | | | (1.11 | ) | | | (1.23 | ) | | $ | 12.55 | | | | 17.25% | |
Institutional Class Shares | | | | | | | | | | | | | | | | | | | | |
| Period Ended October 31, 2004 (h) | | | (0.03 | ) | | | — | | | | (0.03 | ) | | $ | 12.55 | | | | 2.96% | (e) |
| | |
[Additional columns below]
[Continued from above table, first column(s) repeated]
| | | | | | | | | | | | | | | | | | | | | | | | | | | |
| | | | |
| | Ratios / Supplemental Data | | | |
| | | | Ratio of Net | | | | | |
| | | | Ratio of Net | | | Ratio of | | | Investment | | | | | |
| | | | Investment | | | Expenses | | | Income (Loss) | | | | | |
| | Net Assets | | | Ratio of | | | Income | | | (Prior to | | | (Prior to | | | | | |
| | at End of | | | Expenses | | | (Loss) | | | Reimbursements) | | | Reimbursements) | | | | | |
| | Period | | | to Average | | | to Average | | | to Average | | | to Average | | | Portfolio | | | |
| | (000s) | | | Net Assets | | | Net Assets | | | Net Assets (b) | | | Net Assets (b) | | | Turnover (c) | | | |
| | | | |
| | | | |
| |
| | | |
Class A Shares | | | | | | | | | | | | | | | | | | | | | | | | | | |
| Period Ended October 31, 2002 (d) | | $ | 675 | | | | 1.66% | (f) | | | 0.47% | (f) | | | 3.76% | (f) | | | (1.63% | ) (f) | | | 102.39% | | | |
| Year Ended October 31, 2003 | | $ | 1,228 | | | | 1.65% | | | | 0.81% | | | | 2.78% | | | | (0.33% | ) | | | 256.82% | | | |
| Year Ended October 31, 2004 | | $ | 2,457 | | | | 1.65% | | | | 1.06% | | | | 2.41% | | | | 0.31% | | | | 129.61% | | | |
Class B Shares | | | | | | | | | | | | | | | | | | | | | | | | | | |
| Period Ended October 31, 2002 (d) | | $ | 672 | | | | 2.38% | (f) | | | (0.25% | ) (f) | | | 4.51% | (f) | | | (2.38% | ) (f) | | | 102.39% | | | |
| Year Ended October 31, 2003 | | $ | 906 | | | | 2.40% | | | | 0.08% | | | | 3.67% | | | | (1.20% | ) | | | 256.82% | | | |
| Year Ended October 31, 2004 | | $ | 1,072 | | | | 2.40% | | | | 0.20% | | | | 3.14% | | | | (0.54% | ) | | | 129.61% | | | |
Class C Shares | | | | | | | | | | | | | | | | | | | | | | | | | | |
| Period Ended October 31, 2002 (d) | | $ | 665 | | | | 2.38% | (f) | | | (0.25% | ) (f) | | | 4.51% | (f) | | | (2.38% | ) (f) | | | 102.39% | | | |
| Year Ended October 31, 2003 | | $ | 883 | | | | 2.40% | | | | 0.08% | | | | 3.68% | | | | (1.20% | ) | | | 256.82% | | | |
| Year Ended October 31, 2004 | | $ | 1,088 | | | | 2.40% | | | | 0.20% | | | | 3.15% | | | | (0.55% | ) | | | 129.61% | | | |
Class R Shares | | | | | | | | | | | | | | | | | | | | | | | | | | |
| Period Ended October 31, 2004 (g) | | $ | 1 | | | | 1.98% | (f) | | | 0.46% | (f) | | | 2.74% | (f) | | | (0.30% | ) (f) | | | 129.61% | | | |
Institutional Service Class Shares | | | | | | | | | | | | | | | | | | | | | | | | | | |
| Period Ended October 31, 2002 (d) | | $ | 671 | | | | 1.40% | (f) | | | 0.73% | (f) | | | 3.51% | (f) | | | (1.38% | ) (f) | | | 102.39% | | | |
| Year Ended October 31, 2003 | | $ | 892 | | | | 1.40% | | | | 1.08% | | | | 2.68% | | | | (0.20% | ) | | | 256.82% | | | |
| Year Ended October 31, 2004 | | $ | 1,046 | | | | 1.40% | | | | 1.20% | | | | 2.14% | | | | 0.46% | | | | 129.61% | | | |
Institutional Class Shares | | | | | | | | | | | | | | | | | | | | | | | | | | |
| Period Ended October 31, 2004 (h) | | $ | 674 | | | | 1.40% | (f) | | | 0.53% | (f) | | | 2.30% | (f) | | | (0.37% | ) (f) | | | 129.61% | | | |
| | | | |
| | |
| (a) | | Excludes sales charge. |
| (b) | | During the period certain fees were waived and/or reimbursed. If such waivers/reimbursements had not occurred, the ratio would have been as indicated. |
| (c) | | Portfolio turnover is calculated on the basis of the Fund as a whole without distinguishing among the classes of shares. |
| (d) | | For the period from December 18, 2001 (commencement of operations) through October 31, 2002. |
| (e) | | Not annualized. |
| (f) | | Annualized. |
| (g) | | For the period from December 30, 2003 (commencement of operations) through October 31, 2004. |
| (h) | | For the period from June 29, 2004 (commencement of operations) through October 31, 2004. |
See notes to financial statements.
2004 Annual Report 41
| |
| | Financial Highlights |
| | Selected Data for Each Share of Capital Outstanding |
Sector Series
Gartmore Global Health Sciences Fund
| | | | | | | | | | | | | | | | | |
| | | | |
| | | | Investment Activities | |
| | | | | | Net Realized | | | |
| | | | | | and | | | |
| | Net Asset | | | Net | | | Unrealized | | | Total | |
| | Value, | | | Investment | | | Gains | | | from | |
| | Beginning | | | Income | | | (Losses) on | | | Investment | |
| | of Period | | | (Loss) | | | Investments | | | Activities | |
|
|
| |
Class A Shares | | | | | | | | | | | | | | | | |
| Period Ended October 31, 2001 (d) | | $ | 10.00 | | | | (0.03 | ) | | | (0.63 | ) | | | (0.66 | ) |
| Year Ended October 31, 2002 | | $ | 9.33 | | | | (0.06 | ) | | | (0.97 | ) | | | (1.03 | ) |
| Year Ended October 31, 2003 | | $ | 8.30 | | | | (0.05 | ) | | | 1.99 | | | | 1.94 | |
| Year Ended October 31, 2004 | | $ | 10.24 | | | | (0.06 | ) | | | 0.70 | | | | 0.64 | |
Class B Shares | | | | | | | | | | | | | | | | |
| Period Ended October 31, 2001 (d) | | $ | 10.00 | | | | (0.09 | ) | | | (0.62 | ) | | | (0.71 | ) |
| Year Ended October 31, 2002 | | $ | 9.29 | | | | (0.15 | ) | | | (0.93 | ) | | | (1.08 | ) |
| Year Ended October 31, 2003 | | $ | 8.21 | | | | (0.13 | ) | | | 1.98 | | | | 1.85 | |
| Year Ended October 31, 2004 | | $ | 10.06 | | | | (0.13 | ) | | | 0.69 | | | | 0.56 | |
Class C Shares | | | | | | | | | | | | | | | | |
| Period Ended October 31, 2002 (e) | | $ | 7.92 | | | | (0.01 | ) | | | 0.30 | | | | 0.29 | |
| Year Ended October 31, 2003 | | $ | 8.21 | | | | (0.12 | ) | | | 1.98 | | | | 1.86 | |
| Year Ended October 31, 2004 | | $ | 10.07 | | | | (0.04 | ) | | | 0.59 | | | | 0.55 | |
Class R Shares | | | | | | | | | | | | | | | | |
| Period Ended October 31, 2004 (h) | | $ | 10.04 | | | | (0.09 | ) | | | (0.14 | ) | | | (0.23 | ) |
Institutional Service Class Shares | | | | | | | | | | | | | | | | |
| Period Ended October 31, 2001 (d) | | $ | 10.00 | | | | (0.01 | ) | | | (0.62 | ) | | | (0.63 | ) |
| Year Ended October 31, 2002 | | $ | 9.36 | | | | (0.04 | ) | | | (0.97 | ) | | | (1.01 | ) |
| Year Ended October 31, 2003 | | $ | 8.35 | | | | (0.04 | ) | | | 2.01 | | | | 1.97 | |
| Year Ended October 31, 2004 | | $ | 10.32 | | | | (0.06 | ) | | | 0.71 | | | | 0.65 | |
Institutional Class Shares | | | | | | | | | | | | | | | | |
| Period Ended October 31, 2004 (i) | | $ | 10.92 | | | | (0.01 | ) | | | (0.77 | ) | | | (0.78 | ) |
|
[Additional columns below]
[Continued from above table, first column(s) repeated]
| | | | | | | | | | | | | | | | | | | | | |
| | | | | | |
| | Distributions | | | | | |
| | Net | | | | | Net Asset | | | |
| | Realized | | | Return of | | | Total | | | Value, End | | | Total | |
| | Gains | | | Capital | | | Distributions | | | of Period | | | Return (a) | |
| | |
| | |
| |
| |
Class A Shares | | | | | | | | | | | | | | | | | | | | |
| Period Ended October 31, 2001 (d) | | | — | | | | (0.01 | ) | | | (0.01 | ) | | $ | 9.33 | | | | (6.61% | ) (f) |
| Year Ended October 31, 2002 | | | — | | | | — | | | | — | | | $ | 8.30 | | | | (11.04% | ) |
| Year Ended October 31, 2003 | | | — | | | | — | | | | — | | | $ | 10.24 | | | | 23.37% | |
| Year Ended October 31, 2004 | | | (0.84 | ) | | | — | | | | (0.84 | ) | | $ | 10.04 | | | | 6.26% | |
Class B Shares | | | | | | | | | | | | | | | | | | | | |
| Period Ended October 31, 2001 (d) | | | — | | | | — | | | | — | | | $ | 9.29 | | | | (7.10% | ) (f) |
| Year Ended October 31, 2002 | | | — | | | | — | | | | — | | | $ | 8.21 | | | | (11.63% | ) |
| Year Ended October 31, 2003 | | | — | | | | — | | | | — | | | $ | 10.06 | | | | 22.53% | |
| Year Ended October 31, 2004 | | | (0.84 | ) | | | — | | | | (0.84 | ) | | $ | 9.78 | | | | 5.52% | |
Class C Shares | | | | | | | | | | | | | | | | | | | | |
| Period Ended October 31, 2002 (e) | | | — | | | | — | | | | — | | | $ | 8.21 | | | | 3.66% | (f) |
| Year Ended October 31, 2003 | | | — | | | | — | | | | — | | | $ | 10.07 | | | | 22.66% | |
| Year Ended October 31, 2004 | | | (0.84 | ) | | | — | | | | (0.84 | ) | | $ | 9.78 | | | | 5.52% | |
Class R Shares | | | | | | | | | | | | | | | | | | | | |
| Period Ended October 31, 2004 (h) | | | — | | | | — | | | | — | | | $ | 9.81 | | | | (2.29% | ) (f) |
Institutional Service Class Shares | | | | | | | | | | | | | | | | | | | | |
| Period Ended October 31, 2001 (d) | | | — | | | | (0.01 | ) | | | (0.01 | ) | | $ | 9.36 | | | | (6.25% | ) (f) |
| Year Ended October 31, 2002 | | | — | | | | — | | | | — | | | $ | 8.35 | | | | (10.79% | ) |
| Year Ended October 31, 2003 | | | — | | | | — | | | | — | | | $ | 10.32 | | | | 23.59% | |
| Year Ended October 31, 2004 | | | (0.84 | ) | | | — | | | | (0.84 | ) | | $ | 10.13 | | | | 6.30% | |
Institutional Class Shares | | | | | | | | | | | | | | | | | | | | |
| Period Ended October 31, 2004 (i) | | | — | | | | — | | | | — | | | $ | 10.14 | | | | (7.14% | ) (f) |
| | |
[Additional columns below]
[Continued from above table, first column(s) repeated]
| | | | | | | | | | | | | | | | | | | | | | | | | | | |
| | | | |
| | Ratios / Supplemental Data | | | |
| | | | Ratio of Net | | | | | |
| | | | Ratio of Net | | | Ratio of | | | Investment | | | | | |
| | | | Investment | | | Expenses | | | Income (Loss) | | | | | |
| | Net Assets | | | Ratio of | | | Income | | | (Prior to | | | (Prior to | | | | | |
| | at End of | | | Expenses | | | (Loss) | | | Reimbursements) | | | Reimbursements) | | | | | |
| | Period | | | to Average | | | to Average | | | to Average | | | to Average | | | Portfolio | | | |
| | (000s) | | | Net Assets | | | Net Assets | | | Net Assets (b) | | | Net Assets (b) | | | Turnover (c) | | | |
| | | | |
| | | | |
| |
| | | |
Class A Shares | | | | | | | | | | | | | | | | | | | | | | | | | | |
| Period Ended October 31, 2001 (d) | | $ | 779 | | | | 1.53% | (g) | | | (0.55% | ) (g) | | | 6.84% | (g) | | | (5.86% | ) (g) | | | 754.05% | | | |
| Year Ended October 31, 2002 | | $ | 1,538 | | | | 1.60% | | | | (0.99% | ) | | | 3.10% | | | | (2.49% | ) | | | 893.80% | | | |
| Year Ended October 31, 2003 | | $ | 4,087 | | | | 1.57% | | | | (0.75% | ) | | | 2.29% | | | | (1.47% | ) | | | 570.16% | | | |
| Year Ended October 31, 2004 | | $ | 6,144 | | | | 1.59% | | | | (0.67% | ) | | | 1.90% | | | | (0.98% | ) | | | 388.52% | | | |
Class B Shares | | | | | | | | | | | | | | | | | | | | | | | | | | |
| Period Ended October 31, 2001 (d) | | $ | 774 | | | | 2.13% | (g) | | | (1.15% | ) (g) | | | 7.61% | (g) | | | (6.63% | ) (g) | | | 754.05% | | | |
| Year Ended October 31, 2002 | | $ | 730 | | | | 2.28% | | | | (1.71% | ) | | | 4.00% | | | | (3.43% | ) | | | 893.80% | | | |
| Year Ended October 31, 2003 | | $ | 899 | | | | 2.25% | | | | (1.41% | ) | | | 3.06% | | | | (2.22% | ) | | | 570.16% | | | |
| Year Ended October 31, 2004 | | $ | 1,076 | | | | 2.25% | | | | (1.32% | ) | | | 2.56% | | | | (1.63% | ) | | | 388.52% | | | |
Class C Shares | | | | | | | | | | | | | | | | | | | | | | | | | | |
| Period Ended October 31, 2002 (e) | | $ | 58 | | | | 2.25% | (g) | | | (1.69% | ) (g) | | | 2.80% | (g) | | | (2.24% | ) (g) | | | 893.80% | | | |
| Year Ended October 31, 2003 | | $ | 130 | | | | 2.25% | | | | (1.45% | ) | | | 2.96% | | | | (2.16% | ) | | | 570.16% | | | |
| Year Ended October 31, 2004 | | $ | 2,092 | | | | 2.25% | | | | (1.44% | ) | | | 2.57% | | | | (1.76% | ) | | | 388.52% | | | |
Class R Shares | | | | | | | | | | | | | | | | | | | | | | | | | | |
| Period Ended October 31, 2004 (h) | | $ | 1 | | | | 1.88% | (g) | | | (1.03% | ) (g) | | | 2.22% | (g) | | | (1.37% | ) (g) | | | 388.52% | | | |
Institutional Service Class Shares | | | | | | | | | | | | | | | | | | | | | | | | | | |
| Period Ended October 31, 2001 (d) | | $ | 781 | | | | 1.10% | (g) | | | (0.13% | ) (g) | | | 6.59% | (g) | | | (5.62% | ) (g) | | | 754.05% | | | |
| Year Ended October 31, 2002 | | $ | 1,403 | | | | 1.27% | | | | (0.66% | ) | | | 2.85% | | | | (2.24% | ) | | | 893.80% | | | |
| Year Ended October 31, 2003 | | $ | 3,746 | | | | 1.42% | | | | (0.61% | ) | | | 2.12% | | | | (1.31% | ) | | | 570.16% | | | |
| Year Ended October 31, 2004 | | $ | 4,979 | | | | 1.46% | | | | (0.54% | ) | | | 1.76% | | | | (0.84% | ) | | | 388.52% | | | |
Institutional Class Shares | | | | | | | | | | | | | | | | | | | | | | | | | | |
| Period Ended October 31, 2004 (i) | | $ | 404 | | | | 1.25% | (g) | | | (0.25% | ) (g) | | | 1.54% | (g) | | | (0.54% | ) (g) | | | 388.52% | | | |
| | | | |
| | |
| (a) | | Excludes sales charge. |
| (b) | | During the period certain fees were waived and/or reimbursed. If such waivers/reimbursements had not occurred, the ratio would have been as indicated. |
| (c) | | Portfolio turnover is calculated on the basis of the Fund as a whole without distinguishing among the classes of shares. |
| (d) | | For the period from December 29, 2000 (commencement of operations) through October 31, 2001. |
| (e) | | For the period from September 23, 2002 (commencement of operations) through October 31, 2002. |
| (f) | | Not annualized. |
| (g) | | Annualized. |
| (h) | | For the period from December 30, 2003 (commencement of operations) through October 31, 2004. |
| (i) | | For the period from June 29, 2004 (commencement of operations) through October 31, 2004. |
See notes to financial statements.
42 Annual Report 2004
Gartmore Global Natural Resources Fund
| | | | | | | | | | | | | | | | | |
| | | | |
| | | | Investment Activities | |
| | | | | | Net Realized | | | |
| | | | | | and | | | |
| | Net Asset | | | Net | | | Unrealized | | | Total | |
| | Value, | | | Investment | | | Gains | | | from | |
| | Beginning | | | Income | | | (Losses) on | | | Investment | |
| | of Period | | | (Loss) | | | Investments | | | Activities | |
|
|
| |
Class A Shares | | | | | | | | | | | | | | | | |
| Period Ended October 31, 2004 (d) | | $ | 10.00 | | | | — | | | | 1.25 | | | | 1.25 | |
Class B Shares | | | | | | | | | | | | | | | | |
| Period Ended October 31, 2004 (d) | | $ | 10.00 | | | | (0.03 | ) | | | 1.24 | | | | 1.21 | |
Class C Shares | | | | | | | | | | | | | | | | |
| Period Ended October 31, 2004 (d) | | $ | 10.00 | | | | (0.02 | ) | | | 1.23 | | | | 1.21 | |
Class R Shares | | | | | | | | | | | | | | | | |
| Period Ended October 31, 2004 (d) | | $ | 10.00 | | | | (0.02 | ) | | | 1.24 | | | | 1.22 | |
Institutional Service Class Shares | | | | | | | | | | | | | | | | |
| Period Ended October 31, 2004 (d) | | $ | 10.00 | | | | 0.02 | | | | 1.23 | | | | 1.25 | |
Institutional Class Shares | | | | | | | | | | | | | | | | |
| Period Ended October 31, 2004 (d) | | $ | 10.00 | | | | 0.01 | | | | 1.25 | | | | 1.26 | |
|
[Additional columns below]
[Continued from above table, first column(s) repeated]
| | | | | | | | | | | | | | | | | |
| | | | | | |
| | Distributions | | | | | |
| | Net | | | | | Net Asset | | | |
| | Investment | | | Total | | | Value, End | | | Total | |
| | Income | | | Distributions | | | of Period | | | Return (a) | |
| | |
| | |
| |
| |
Class A Shares | | | | | | | | | | | | | | | | |
| Period Ended October 31, 2004 (d) | | | (0.02 | ) | | | (0.02 | ) | | $ | 11.23 | | | | 12.58% | (e) |
Class B Shares | | | | | | | | | | | | | | | | |
| Period Ended October 31, 2004 (d) | | | — | | | | — | | | $ | 11.21 | | | | 12.10% | (e) |
Class C Shares | | | | | | | | | | | | | | | | |
| Period Ended October 31, 2004 (d) | | | — | | | | — | | | $ | 11.21 | | | | 12.20% | (e) |
Class R Shares | | | | | | | | | | | | | | | | |
| Period Ended October 31, 2004 (d) | | | — | (g) | | | — | | | $ | 11.22 | | | | 12.22% | (e) |
Institutional Service Class Shares | | | | | | | | | | | | | | | | |
| Period Ended October 31, 2004 (d) | | | (0.02 | ) | | | (0.02 | ) | | $ | 11.23 | | | | 12.50% | (e) |
Institutional Class Shares | | | | | | | | | | | | | | | | |
| Period Ended October 31, 2004 (d) | | | (0.02 | ) | | | (0.02 | ) | | $ | 11.24 | | | | 12.60% | (e) |
| | |
[Additional columns below]
[Continued from above table, first column(s) repeated]
| | | | | | | | | | | | | | | | | | | | | | | | | | | |
| | | | |
| | Ratios / Supplemental Data | | | |
| | | | Ratio of Net | | | | | |
| | | | Ratio of Net | | | Ratio of | | | Investment | | | | | |
| | | | Investment | | | Expenses | | | Income (Loss) | | | | | |
| | Net Assets | | | Ratio of | | | Income | | | (Prior to | | | (Prior to | | | | | |
| | at End of | | | Expenses to | | | (Loss) | | | Reimbursements) | | | Reimbursements) | | | | | |
| | Period | | | Average | | | to Average | | | to Average | | | to Average | | | Portfolio | | | |
| | (000s) | | | Net Assets | | | Net Assets | | | Net Assets (b) | | | Net Assets (b) | | | Turnover (c) | | | |
| | | | |
| | | | |
| |
| | | |
Class A Shares | | | | | | | | | | | | | | | | | | | | | | | | | | |
| Period Ended October 31, 2004 (d) | | $ | 107 | | | | 1.58% | (f) | | | (1.05% | ) (f) | | | 4.11% | (f) | | | (3.59% | ) (f) | | | 48.29% | | | |
Class B Shares | | | | | | | | | | | | | | | | | | | | | | | | | | |
| Period Ended October 31, 2004 (d) | | $ | 1 | | | | 2.30% | (f) | | | (0.88% | ) (f) | | | 4.44% | (f) | | | (3.02% | ) (f) | | | 48.29% | | | |
Class C Shares | | | | | | | | | | | | | | | | | | | | | | | | | | |
| Period Ended October 31, 2004 (d) | | $ | 6 | | | | 2.30% | (f) | | | (1.29% | ) (f) | | | 4.77% | (f) | | | (3.76% | ) (f) | | | 48.29% | | | |
Class R Shares | | | | | | | | | | | | | | | | | | | | | | | | | | |
| Period Ended October 31, 2004 (d) | | $ | 1 | | | | 1.94% | (f) | | | (0.53% | ) (f) | | | 3.91% | (f) | | | (2.51% | ) (f) | | | 48.29% | | | |
Institutional Service Class Shares | | | | | | | | | | | | | | | | | | | | | | | | | | |
| Period Ended October 31, 2004 (d) | | $ | 1 | | | | 1.39% | (f) | | | 0.17% | (f) | | | 3.56% | (f) | | | (2.00% | ) (f) | | | 48.29% | | | |
Institutional Class Shares | | | | | | | | | | | | | | | | | | | | | | | | | | |
| Period Ended October 31, 2004 (d) | | $ | 3,377 | | | | 1.30% | (f) | | | 0.27% | (f) | | | 3.32% | (f) | | | (1.74% | ) (f) | | | 48.29% | | | |
| | | | |
| | |
| (a) | | Excludes sales charge. |
| (b) | | During the period certain fees were waived and/or reimbursed. If such waivers/reimbursements had not occurred, the ratio would have been as indicated. |
| (c) | | Portfolio turnover is calculated on the basis of the Fund as a whole without distinguishing among the classes of shares. |
| (d) | | For the period from June 29, 2004 (commencement of operations) through October 31, 2004. |
| (e) | | Not annualized. |
| (f) | | Annualized. |
| (g) | | Amount is less than $0.005. |
See notes to financial statements.
2004 Annual Report 43
| |
| | Financial Highlights |
| | Selected Data for Each Share of Capital Outstanding |
Sector Series
Gartmore Global Technology and Communications Fund
| | | | | | | | | | | | | | | | | |
| | | | |
| | | | Investment Activities | |
| | | | | | Net Realized | | | |
| | | | | | and | | | |
| | Net Asset | | | Net | | | Unrealized | | | |
| | Value, | | | Investment | | | Gains | | | Total from | |
| | Beginning of | | | Income | | | (Losses) on | | | Investment | |
| | Period | | | (Loss) | | | Investments | | | Activities | |
|
|
| |
Class A Shares | | | | | | | | | | | | | | | | |
| Period Ended October 31, 2000 (d) | | $ | 10.00 | | | | (0.02 | ) | | | 1.14 | | | | 1.12 | |
| Year Ended October 31, 2001 | | $ | 11.12 | | | | (0.06 | ) | | | (6.41 | ) | | | (6.47 | ) |
| Year Ended October 31, 2002 | | $ | 4.02 | | | | (0.04 | ) | | | (1.35 | ) | | | (1.39 | ) |
| Year Ended October 31, 2003 | | $ | 2.63 | | | | (0.04 | ) | | | 1.27 | | | | 1.23 | |
| Year Ended October 31, 2004 | | $ | 3.86 | | | | (0.06 | ) | | | (0.28 | ) | | | (0.34 | ) |
Class B Shares | | | | | | | | | | | | | | | | |
| Period Ended October 31, 2000 (d) | | $ | 10.00 | | | | (0.06 | ) | | | 1.15 | | | | 1.09 | |
| Year Ended October 31, 2001 | | $ | 11.09 | | | | (0.09 | ) | | | (6.40 | ) | | | (6.49 | ) |
| Year Ended October 31, 2002 | | $ | 3.97 | | | | (0.07 | ) | | | (1.32 | ) | | | (1.39 | ) |
| Year Ended October 31, 2003 | | $ | 2.58 | | | | (0.06 | ) | | | 1.25 | | | | 1.19 | |
| Year Ended October 31, 2004 | | $ | 3.77 | | | | (0.08 | ) | | | (0.28 | ) | | | (0.36 | ) |
Class C Shares | | | | | | | | | | | | | | | | |
| Period Ended October 31, 2001 (e) | | $ | 5.37 | | | | (0.02 | ) | | | (1.36 | ) | | | (1.38 | ) |
| Year Ended October 31, 2002 | | $ | 3.99 | | | | (0.08 | ) | | | (1.31 | ) | | | (1.39 | ) |
| Year Ended October 31, 2003 | | $ | 2.60 | | | | (0.06 | ) | | | 1.25 | | | | 1.19 | |
| Year Ended October 31, 2004 | | $ | 3.79 | | | | (0.06 | ) | | | (0.30 | ) | | | (0.36 | ) |
Class R Shares | | | | | | | | | | | | | | | | |
| Period Ended October 31, 2004 (i) | | $ | 3.70 | | | | (0.05 | ) | | | (0.23 | ) | | | (0.28 | ) |
Institutional Service Class Shares | | | | | | | | | | | | | | | | |
| Period Ended October 31, 2000 (d) | | $ | 10.00 | | | | (0.03 | ) | | | 1.15 | | | | 1.12 | |
| Year Ended October 31, 2001 | | $ | 11.12 | | | | (0.04 | ) | | | (6.39 | ) | | | (6.43 | ) |
| Year Ended October 31, 2002 | | $ | 4.06 | | | | (0.03 | ) | | | (1.37 | ) | | | (1.40 | ) |
| Year Ended October 31, 2003 | | $ | 2.66 | | | | (0.04 | ) | | | 1.30 | | | | 1.26 | |
| Year Ended October 31, 2004 | | $ | 3.92 | | | | (0.06 | ) | | | (0.29 | ) | | | (0.35 | ) |
Institutional Class Shares | | | | | | | | | | | | | | | | |
| Period Ended October 31, 2004 (j) | | $ | 3.81 | | | | (0.01 | ) | | | (0.22 | ) | | | (0.23 | ) |
|
[Additional columns below]
[Continued from above table, first column(s) repeated]
| | | | | | | | | | | | | | | | | |
| | | | | | |
| | Distributions | | | | | |
| | Net | | | | | Net Asset | | | |
| | Realized | | | Total | | | Value, End | | | Total | |
| | Gains | | | Distributions | | | of Period | | | Return (a) | |
| | |
| | |
| |
| |
Class A Shares | | | | | | | | | | | | | | | | |
| Period Ended October 31, 2000 (d) | | | — | | | | — | | | $ | 11.12 | | | | 11.20% | (f) |
| Year Ended October 31, 2001 | | | (0.63 | ) | | | (0.63 | ) | | $ | 4.02 | | | | (60.93% | ) |
| Year Ended October 31, 2002 | | | — | | | | — | | | $ | 2.63 | | | | (34.58% | ) (h) |
| Year Ended October 31, 2003 | | | — | | | | — | | | $ | 3.86 | | | | 46.77% | |
| Year Ended October 31, 2004 | | | — | | | | — | | | $ | 3.52 | | | | (8.81% | ) |
Class B Shares | | | | | | | | | | | | | | | | |
| Period Ended October 31, 2000 (d) | | | — | | | | — | | | $ | 11.09 | | | | 10.90% | (f) |
| Year Ended October 31, 2001 | | | (0.63 | ) | | | (0.63 | ) | | $ | 3.97 | | | | (61.30% | ) |
| Year Ended October 31, 2002 | | | — | | | | — | | | $ | 2.58 | | | | (35.01% | ) (h) |
| Year Ended October 31, 2003 | | | — | | | | — | | | $ | 3.77 | | | | 46.12% | |
| Year Ended October 31, 2004 | | | — | | | | — | | | $ | 3.41 | | | | (9.55% | ) |
Class C Shares | | | | | | | | | | | | | | | | |
| Period Ended October 31, 2001 (e) | | | — | | | | — | | | $ | 3.99 | | | | (25.70% | ) (f) |
| Year Ended October 31, 2002 | | | — | | | | — | | | $ | 2.60 | | | | (34.84% | ) (h) |
| Year Ended October 31, 2003 | | | — | | | | — | | | $ | 3.79 | | | | 45.77% | |
| Year Ended October 31, 2004 | | | — | | | | — | | | $ | 3.43 | | | | (9.50% | ) |
Class R Shares | | | | | | | | | | | | | | | | |
| Period Ended October 31, 2004 (i) | | | — | | | | — | | | $ | 3.42 | | | | (7.57% | ) (f) |
Institutional Service Class Shares | | | | | | | | | | | | | | | | |
| Period Ended October 31, 2000 (d) | | | — | | | | — | | | $ | 11.12 | | | | 11.20% | (f) |
| Year Ended October 31, 2001 | | | (0.63 | ) | | | (0.63 | ) | | $ | 4.06 | | | | (60.58% | ) |
| Year Ended October 31, 2002 | | | — | | | | — | | | $ | 2.66 | | | | (34.48% | ) (h) |
| Year Ended October 31, 2003 | | | — | | | | — | | | $ | 3.92 | | | | 47.37% | |
| Year Ended October 31, 2004 | | | — | | | | — | | | $ | 3.57 | | | | (8.93% | ) |
Institutional Class Shares | | | | | | | | | | | | | | | | |
| Period Ended October 31, 2004 (j) | | | — | | | | — | | | $ | 3.58 | | | | (6.04% | ) (f) |
| | |
[Additional columns below]
[Continued from above table, first column(s) repeated]
| | | | | | | | | | | | | | | | | | | | | | | | | | | |
| | | | |
| | Ratios / Supplemental Data | | | |
| | | | Ratio of Net | | | | | |
| | | | Ratio of Net | | | Ratio of | | | Investment | | | | | |
| | | | Investment | | | Expenses | | | Income | | | | | |
| | Net Assets | | | Ratio of | | | Income | | | (Prior to | | | (Prior to | | | | | |
| | at End of | | | Expenses | | | (Loss) to | | | Reimbursements) | | | Reimbursements) | | | | | |
| | Period | | | to Average | | | Average | | | to Average | | | to Average | | | Portfolio | | | |
| | (000s) | | | Net Assets | | | Net Assets | | | Net Assets (b) | | | Net Assets (b) | | | Turnover (c) | | | |
| | | | |
| | | | |
| |
| | | |
Class A Shares | | | | | | | | | | | | | | | | | | | | | | | | | | |
| Period Ended October 31, 2000 (d) | | $ | 4,602 | | | | 1.73% | (g) | | | (1.07% | ) (g) | | | 4.43% | (g) | | | (3.77% | ) (g) | | | 149.08% | | | |
| Year Ended October 31, 2001 | | $ | 2,038 | | | | 1.73% | | | | (1.05% | ) | | | 6.38% | | | | (5.70% | ) | | | 922.33% | | | |
| Year Ended October 31, 2002 | | $ | 1,514 | | | | 1.69% | | | | (1.37% | ) | | | 2.56% | | | | (2.24% | ) | | | 944.01% | | | |
| Year Ended October 31, 2003 | | $ | 3,303 | | | | 1.69% | | | | (1.38% | ) | | | 2.96% | | | | (2.64% | ) | | | 1136.72% | | | |
| Year Ended October 31, 2004 | | $ | 2,991 | | | | 1.71% | | | | (1.45% | ) | | | 2.02% | | | | (1.76% | ) | | | 722.91% | | | |
Class B Shares | | | | | | | | | | | | | | | | | | | | | | | | | | |
| Period Ended October 31, 2000 (d) | | $ | 2,275 | | | | 2.33% | (g) | | | (1.69% | ) (g) | | | 5.18% | (g) | | | (4.54% | ) (g) | | | 149.08% | | | |
| Year Ended October 31, 2001 | | $ | 1,137 | | | | 2.33% | | | | (1.66% | ) | | | 7.21% | | | | (6.54% | ) | | | 922.33% | | | |
| Year Ended October 31, 2002 | | $ | 780 | | | | 2.38% | | | | (2.02% | ) | | | 3.32% | | | | (2.96% | ) | | | 944.01% | | | |
| Year Ended October 31, 2003 | | $ | 1,196 | | | | 2.40% | | | | (2.07% | ) | | | 3.73% | | | | (3.40% | ) | | | 1136.72% | | | |
| Year Ended October 31, 2004 | | $ | 1,064 | | | | 2.40% | | | | (2.14% | ) | | | 2.72% | | | | (2.46% | ) | | | 722.91% | | | |
Class C Shares | | | | | | | | | | | | | | | | | | | | | | | | | | |
| Period Ended October 31, 2001 (e) | | $ | 29 | | | | 2.33% | (g) | | | (1.79% | ) (g) | | | 9.94% | (g) | | | (9.40% | ) (g) | | | 922.33% | | | |
| Year Ended October 31, 2002 | | $ | 17 | | | | 2.38% | | | | (1.83% | ) | | | 3.40% | | | | (2.85% | ) | | | 944.01% | | | |
| Year Ended October 31, 2003 | | $ | 39 | | | | 2.40% | | | | (2.10% | ) | | | 3.65% | | | | (3.35% | ) | | | 1136.72% | | | |
| Year Ended October 31, 2004 | | $ | 79 | | | | 2.40% | | | | (2.14% | ) | | | 2.73% | | | | (2.47% | ) | | | 722.91% | | | |
Class R Shares | | | | | | | | | | | | | | | | | | | | | | | | | | |
| Period Ended October 31, 2004 (i) | | $ | 1 | | | | 1.99% | (g) | | | (1.75% | ) (g) | | | 2.28% | (g) | | | (2.04% | ) (g) | | | 722.91% | | | |
Institutional Service Class Shares | | | | | | | | | | | | | | | | | | | | | | | | | | |
| Period Ended October 31, 2000 (d) | | $ | 1,854 | | | | 1.40% | (g) | | | (0.76% | ) (g) | | | 4.17% | (g) | | | (3.53% | ) (g) | | | 149.08% | | | |
| Year Ended October 31, 2001 | | $ | 730 | | | | 1.40% | | | | (0.70% | ) | | | 5.70% | | | | (5.00% | ) | | | 922.33% | | | |
| Year Ended October 31, 2002 | | $ | 843 | | | | 1.41% | | | | (1.37% | ) | | | 2.08% | | | | (2.04% | ) | | | 944.01% | | | |
| Year Ended October 31, 2003 | | $ | 5,006 | | | | 1.58% | | | | (1.29% | ) | | | 2.65% | | | | (2.36% | ) | | | 1136.72% | | | |
| Year Ended October 31, 2004 | | $ | 4,358 | | | | 1.62% | | | | (1.36% | ) | | | 1.92% | | | | (1.67% | ) | | | 722.91% | | | |
Institutional Class Shares | | | | | | | | | | | | | | | | | | | | | | | | | | |
| Period Ended October 31, 2004 (j) | | $ | 231 | | | | 1.40% | (g) | | | (1.05% | ) (g) | | | 1.92% | (g) | | | (1.57% | ) (g) | | | 722.91% | | | |
| | | | |
| | |
| (a) | | Excludes sales charge. |
| (b) | | During the period certain fees were waived and/or reimbursed. If such waivers/reimbursements had not occurred, the ratio would have been as indicated. |
| (c) | | Portfolio turnover is calculated on the basis of the Fund as a whole without distinguishing among the classes of shares. |
| (d) | | For the period from June 30, 2000 (commencement of operations) through October 31, 2000. |
| (e) | | For the period from March 1, 2001 (commencement of operations) through October 31, 2001. |
| (f) | | Not annualized. |
| (g) | | Annualized. |
| (h) | | The total returns shown include losses realized on the disposal of investments that were reimbursed by the adviser, which otherwise would have reduced total returns by 0.54%, 0.60%, 0.89%, and 0.38% for Class A, Class B, Class C and
Institutional Service Class shares, respectively. |
| (i) | | For the period from December 30, 2003 (commencement of operations) through October 31, 2004. |
| (j) | | For the period from June 29, 2004 (commencement of operations) through October 31, 2004. |
See notes to financial statements.
44 Annual Report 2004
Gartmore Global Utilities Fund
| | | | | | | | | | | | | | | | | |
| | | | |
| | | | Investment Activities | |
| | | | | | Net Realized | | | |
| | | | | | and | | | |
| | Net Asset | | | Net | | | Unrealized | | | Total | |
| | Value, | | | Investment | | | Gains | | | from | |
| | Beginning of | | | Income | | | (Losses) on | | | Investment | |
| | Period | | | (Loss) | | | Investments | | | Activities | |
|
|
| |
Class A Shares | | | | | | | | | | | | | | | | |
| Period Ended October 31, 2002 (d) | | $ | 10.00 | | | | 0.11 | | | | (2.85 | ) | | | (2.74 | ) |
| Year Ended October 31, 2003 | | $ | 7.20 | | | | 0.07 | | | | 1.06 | | | | 1.13 | |
| Year Ended October 31, 2004 | | $ | 8.28 | | | | 0.09 | | | | 2.54 | | | | 2.63 | |
Class B Shares | | | | | | | | | | | | | | | | |
| Period Ended October 31, 2002 (d) | | $ | 10.00 | | | | 0.05 | | | | (2.84 | ) | | | (2.79 | ) |
| Year Ended October 31, 2003 | | $ | 7.18 | | | | 0.02 | | | | 1.05 | | | | 1.07 | |
| Year Ended October 31, 2004 | | $ | 8.22 | | | | 0.04 | | | | 2.50 | | | | 2.54 | |
Class C Shares | | | | | | | | | | | | | | | | |
| Period Ended October 31, 2002 (d) | | $ | 10.00 | | | | 0.05 | | | | (2.84 | ) | | | (2.79 | ) |
| Year Ended October 31, 2003 | | $ | 7.18 | | | | 0.02 | | | | 1.05 | | | | 1.07 | |
| Year Ended October 31, 2004 | | $ | 8.22 | | | | 0.03 | | | | 2.51 | | | | 2.54 | |
Class R Shares | | | | | | | | | | | | | | | | |
| Period Ended October 31, 2004 (g) | | $ | 9.14 | | | | 0.08 | | | | 1.58 | | | | 1.66 | |
Institutional Service Class Shares | | | | | | | | | | | | | | | | |
| Period Ended October 31, 2002 (d) | | $ | 10.00 | | | | 0.13 | | | | (2.85 | ) | | | (2.72 | ) |
| Year Ended October 31, 2003 | | $ | 7.21 | | | | 0.09 | | | | 1.06 | | | | 1.15 | |
| Year Ended October 31, 2004 | | $ | 8.30 | | | | 0.13 | | | | 2.53 | | | | 2.66 | |
Institutional Class Shares | | | | | | | | | | | | | | | | |
| Period Ended October 31, 2004 (h) | | $ | 9.75 | | | | 0.03 | | | | 1.15 | | | | 1.18 | |
|
[Additional columns below]
[Continued from above table, first column(s) repeated]
| | | | | | | | | | | | | | | | | |
| | | | | | |
| | Distributions | | | | | |
| | Net | | | | | Net Asset | | | |
| | Investment | | | Total | | | Value, End | | | Total | |
| | Income | | | Distributions | | | of Period | | | Return (a) | |
| | |
| | |
| |
| |
Class A Shares | | | | | | | | | | | | | | | | |
| Period Ended October 31, 2002 (d) | | | (0.06 | ) | | | (0.06 | ) | | $ | 7.20 | | | | (27.46% | ) (e) |
| Year Ended October 31, 2003 | | | (0.05 | ) | | | (0.05 | ) | | $ | 8.28 | | | | 15.80% | |
| Year Ended October 31, 2004 | | | (0.04 | ) | | | (0.04 | ) | | $ | 10.87 | | | | 31.81% | |
Class B Shares | | | | | | | | | | | | | | | | |
| Period Ended October 31, 2002 (d) | | | (0.03 | ) | | | (0.03 | ) | | $ | 7.18 | | | | (27.93% | ) (e) |
| Year Ended October 31, 2003 | | | (0.03 | ) | | | (0.03 | ) | | $ | 8.22 | | | | 14.92% | |
| Year Ended October 31, 2004 | | | (0.01 | ) | | | (0.01 | ) | | $ | 10.75 | | | | 30.86% | |
Class C Shares | | | | | | | | | | | | | | | | |
| Period Ended October 31, 2002 (d) | | | (0.03 | ) | | | (0.03 | ) | | $ | 7.18 | | | | (27.93% | ) (e) |
| Year Ended October 31, 2003 | | | (0.03 | ) | | | (0.03 | ) | | $ | 8.22 | | | | 14.92% | |
| Year Ended October 31, 2004 | | | (0.02 | ) | | | (0.02 | ) | | $ | 10.74 | | | | 30.90% | |
Class R Shares | | | | | | | | | | | | | | | | |
| Period Ended October 31, 2004 (g) | | | (0.02 | ) | | | (0.02 | ) | | $ | 10.78 | | | | 18.23% | (e) |
Institutional Service Class Shares | | | | | | | | | | | | | | | | |
| Period Ended October 31, 2002 (d) | | | (0.07 | ) | | | (0.07 | ) | | $ | 7.21 | | | | (27.27% | ) (e) |
| Year Ended October 31, 2003 | | | (0.06 | ) | | | (0.06 | ) | | $ | 8.30 | | | | 16.10% | |
| Year Ended October 31, 2004 | | | (0.05 | ) | | | (0.05 | ) | | $ | 10.91 | | | | 32.13% | |
Institutional Class Shares | | | | | | | | | | | | | | | | |
| Period Ended October 31, 2004 (h) | | | (0.02 | ) | | | (0.02 | ) | | $ | 10.91 | | | | 12.15% | (e) |
| | |
[Additional columns below]
[Continued from above table, first column(s) repeated]
| | | | | | | | | | | | | | | | | | | | | | | | | | | |
| | | | |
| | Ratios / Supplemental Data | | | |
| | | | Ratio of Net | | | | | |
| | | | Ratio of Net | | | Ratio of | | | Investment | | | | | |
| | | | Investment | | | Expenses | | | Income (Loss) | | | | | |
| | Net Assets | | | Ratio of | | | Income | | | (Prior to | | | (Prior to | | | | | |
| | at End of | | | Expenses to | | | (Loss) | | | Reimbursements) | | | Reimbursements) | | | | | |
| | Period | | | Average Net | | | to Average | | | to Average | | | to Average | | | Portfolio | | | |
| | (000s) | | | Assets | | | Net Assets | | | Net Assets (b) | | | Net Assets (b) | | | Turnover (c) | | | |
| | | | |
| | | | |
| |
| | | |
Class A Shares | | | | | | | | | | | | | | | | | | | | | | | | | | |
| Period Ended October 31, 2002 (d) | | $ | 547 | | | | 1.46% | (f) | | | 1.46% | (f) | | | 3.96% | (f) | | | (1.04% | ) (f) | | | 146.88% | | | |
| Year Ended October 31, 2003 | | $ | 734 | | | | 1.45% | | | | 0.96% | | | | 3.06% | | | | (0.65% | ) | | | 112.34% | | | |
| Year Ended October 31, 2004 | | $ | 1,190 | | | | 1.45% | | | | 1.14% | | | | 2.70% | | | | (0.10% | ) | | | 391.22% | | | |
Class B Shares | | | | | | | | | | | | | | | | | | | | | | | | | | |
| Period Ended October 31, 2002 (d) | | $ | 544 | | | | 2.18% | (f) | | | 0.75% | (f) | | | 4.71% | (f) | | | (1.78% | ) (f) | | | 146.88% | | | |
| Year Ended October 31, 2003 | | $ | 625 | | | | 2.20% | | | | 0.25% | | | | 3.89% | | | | (1.44% | ) | | | 112.34% | | | |
| Year Ended October 31, 2004 | | $ | 885 | | | | 2.20% | | | | 0.41% | | | | 3.46% | | | | (0.84% | ) | | | 391.22% | | | |
Class C Shares | | | | | | | | | | | | | | | | | | | | | | | | | | |
| Period Ended October 31, 2002 (d) | | $ | 541 | | | | 2.18% | (f) | | | 0.75% | (f) | | | 4.71% | (f) | | | (1.78% | ) (f) | | | 146.88% | | | |
| Year Ended October 31, 2003 | | $ | 623 | | | | 2.20% | | | | 0.25% | | | | 3.89% | | | | (1.44% | ) | | | 112.34% | | | |
| Year Ended October 31, 2004 | | $ | 3,556 | | | | 2.20% | | | | 0.43% | | | | 3.33% | | | | (0.70% | ) | | | 391.22% | | | |
Class R Shares | | | | | | | | | | | | | | | | | | | | | | | | | | |
| Period Ended October 31, 2004 (g) | | $ | 1 | | | | 1.78% | (f) | | | 0.99% | (f) | | | 3.14% | (f) | | | (0.35% | ) (f) | | | 391.22% | | | |
Institutional Service Class Shares | | | | | | | | | | | | | | | | | | | | | | | | | | |
| Period Ended October 31, 2002 (d) | | $ | 545 | | | | 1.20% | (f) | | | 1.72% | (f) | | | 3.71% | (f) | | | (0.79% | ) (f) | | | 146.88% | | | |
| Year Ended October 31, 2003 | | $ | 633 | | | | 1.20% | | | | 1.25% | | | | 2.89% | | | | (0.44% | ) | | | 112.34% | | | |
| Year Ended October 31, 2004 | | $ | 837 | | | | 1.20% | | | | 1.41% | | | | 2.46% | | | | 0.15% | | | | 391.22% | | | |
Institutional Class Shares | | | | | | | | | | | | | | | | | | | | | | | | | | |
| Period Ended October 31, 2004 (h) | | $ | 250 | | | | 1.20% | (f) | | | 1.02% | (f) | | | 2.19% | (f) | | | 0.03% | (f) | | | 391.22% | | | |
| | | | |
| | |
| (a) | | Excludes sales charge. |
| (b) | | During the period certain fees were waived and/or reimbursed. If such waivers/ reimbursements had not occurred, the ratio would have been as indicated. |
| (c) | | Portfolio turnover is calculated on the basis of the Fund as a whole without distinguishing among the classes of shares. |
| (d) | | For the period from December 18, 2001 (commencement of operations) through October 31, 2002. |
| (e) | | Not annualized. |
| (f) | | Annualized. |
| (g) | | For the period from December 30, 2003 (commencement of operations) through April 30, 2004. |
| (h) | | For the period from June 29, 2004 (commencement of operations) through October 31, 2004. |
See notes to financial statements.
2004 Annual Report 45
Leadership Series
| |
| | Gartmore Mid Cap Growth Leaders Fund |
| | (formerly Gartmore Millennium Growth Fund) |
On Sept. 30, 2004, the Gartmore Millennium Growth Fund was renamed the “Gartmore Mid Cap Growth Leaders Fund.” At that point, Joseph C. O’Connor, a seasoned portfolio manager who brought 20 years experience and a focus on running mid-cap concentrated portfolios to the Fund, assumed day-to-day management of the Fund.
For the annual period ended Oct. 31, 2004, the Gartmore Mid Cap Growth Leaders Fund returned 1.95% (Class A at NAV) versus 8.77% for its benchmark, the Russell Midcap® Growth Index. For broader comparison, the average return for the Fund’s Lipper peer category of Mid-Cap Growth Funds was 5.26%.
Since assuming management duties, we have implemented a process that employs a “top-down/bottom-up” approach to identifying attractive companies with sustainable earnings growth in the industries best positioned, we believe, to benefit from the future economic environment. This process is geared to deliver a positive alpha (risk-adjusted returns largely attributed to the manager’s stock and/or sector selection) while assuming a beta—a measure of a fund’s volatility vis-à-vis its index, on average, that is not higher than the benchmark (Russell Mid Cap Growth Index).
For the full reporting period, the Fund underperformed its benchmark due to poor stock and sector selections in the telecommunications, consumer staples, consumer discretionary and, in particular, the information technology and health-care sectors. Of the Fund’s 20 worst-performing stocks, 15 were from the information technology sector and four were from the health-care sector, which, as sectors, negatively impacted the Fund’s return by -4.47% and -1.66%, respectively. The six worst-performing information technology stocks—Lexar Media, Inc.; Silicon Storage Technology, Inc.; Citadel Security Software, Inc.; PalmSource, Inc.; Digitas Inc.; and Brooks Automation, Inc., were the largest detractors to Fund performance overall.
Looking ahead, the Fund plans to achieve its investment objective of long-term capital appreciation by utilizing our process in constructing a portfolio of between 25 and 35 securities. These will be companies that the manager believes exhibit greater-than-average growth, given the economic environment. The top-down approach is a stock screening process that takes into account several macroeconomic factors and is designed to narrow the available number of investments in mid-cap stocks to several hundred potential ideas. The approach takes into consideration such macroeconomic factors as Federal Reserve policy, interest rates, inflation and the overall domestic economy. This discipline enables the manager to focus analysis on the most attractive business sectors within the overall market.
Once these “most attractive sectors” are determined, the bottom-up approach is performed on potential stock ideas by identifying individual companies with both attractive earnings potential and sustainable growth characteristics that may not be fully recognized by the market at large. Finally, a 12-month target price is established for all individual companies reviewed, with minimum hurdle rates of capital appreciation potential required before a stock will be added to the Fund.
Portfolio Manager: Joseph C. O’Connor
| |
| | Class A: NMGAX |
| | Class B: NMGBX |
| | Class C: GMGCX |
| | Class D: NMCGX |
| | Class R: GMGRX |
| | Institutional Class: GMGIX |
46 Annual Report 2004
Gartmore Mid Cap Growth Leaders Fund
Fund Performance
Average Annual Total Return
(For periods ended October 31, 2004)
| | | | | | | | | | | | | | | |
| | | | One | | | Five | | | Ten | |
| | | | year | | | years | | | years | |
|
| |
Class A 1 | | without sales charge2 | | | 1.95% | | | | -6.80% | | | | 4.17% | |
| | | with sales charge3 | | | -3.92% | | | | -7.90% | | | | 3.55% | |
|
Class B1 | | without sales charge2 | | | 1.23% | | | | -7.79% | | | | 3.48% | |
| | | with sales charge4 | | | -3.77% | | | | -8.09% | | | | 3.48% | |
|
Class C 1 | | without sales charge2 | | | 1.22% | | | | -7.33% | | | | 3.87% | |
| | | with sales charge5 | | | 0.22% | | | | -7.33% | | | | 3.87% | |
|
Class D 1,6 | | without sales charge2 | | | 2.27% | | | | -6.46% | | | | 4.35% | |
| | | with sales charge7 | | | -2.33% | | | | -7.32% | | | | 3.87% | |
|
Class R 1,8 | | | | | 1.83% | | | | -6.54% | | | | 4.31% | |
|
| Institutional Class8,9 | | | 2.27% | | | | -6.46% | | | | 4.35% | |
|
All figures showing the effect of a sales charge reflect the maximum charge possible, because it has the most dramatic effect on performance data.
| |
| 1 | These returns through May 11, 1998 include the performance of the Fund’s predecessor fund, and, for periods from May 11, 1998 to the creation of the class, include the performance of the Fund’s Class D shares. These returns were achieved prior to the creation of Class A and Class B shares (5/11/98), Class C shares (3/1/01), and Class R shares (12/31/03). Excluding the effect of any fee waivers or reimbursements, such prior performance is similar to what Class A, Class B, Class C, and Class R shares would have produced during those periods because all classes of the Fund’s shares invest in the same portfolio of securities. The performance for these classes has been restated to reflect differences in sales charges (where applicable), but does not reflect the differing levels of other fees (primarily Rule 12b-1 and/or administrative services fees) applicable to such classes. If these other fees were reflected, the performance for Class A, Class B, Class C and Class R shares would have been lower. |
| |
| 2 | These returns do not reflect the effects of sales charges (SC). |
| |
| 3 | A 5.75% front-end sales charge was deducted. |
| |
| 4 | A 5.00% contingent deferred sales charge (CDSC) was deducted. The CDSC declines to 0% after 6 years. |
| |
| 5 | A CDSC of 1.00% was deducted because it is charged when you sell Class C shares within the first year after purchase. |
| |
| 6 | These returns through May 11, 1998 include the performance of the Fund’s predecessor fund. |
| |
| 7 | A 4.50% front-end sales charge was deducted. |
| |
| 8 | Not subject to any sales charges. |
| |
| 9 | These returns until the creation of Institutional Class shares (6/30/04) include the performance of the Fund’s Class D shares. The returns have not been adjusted for the lower expenses applicable to Institutional Class shares. Excluding the effect of any fee waivers or reimbursements, such prior performance is similar to what Institutional Class shares would have produced because the Institutional Class shares invest in the same portfolio of securities as Institutional Service shares. |
Performance of a $10,000 Investment
Investment return and principal value will fluctuate, and when redeemed, shares may be worth more or less than original cost. Past performance is no guarantee of future results and does not reflect the deduction of taxes that a shareholder would pay on fund distributions or the redemption of fund shares. Investing in mutual funds involves market risk, including loss of principal. Performance returns assume the reinvestment of all distributions.
Comparative performance of $10,000 invested in Class D shares of the Gartmore MidCap Growth Leaders, the Russell MidCap Growth Index (Russell MidCap Growth)(a), and the Consumer Price Index (CPI)(b) over a 10-year period ended 10/31/04. Unlike the Fund, the returns for these unmanaged indexes do not reflect any fees, expenses, or sales charges. Investors cannot invest directly in market indexes.
| | |
| (a) | | The Russell MidCap Growth—an unmanaged index of the stock of medium-sized U.S. companies with a capitalization range of $1.2 billion to $9.8 billion as of June 30, 2003, gives a broad look at how the stock price of medium-sized U.S. companies have performed. |
| |
| (b) | | The CPI represents changes in prices of a basket of goods and services purchased for consumption by urban households. |
2004 Annual Report 47
Gartmore Mid Cap Growth Leaders Fund
Leadership Series
| |
| | Shareholder |
| | Expense Example |
As a shareholder of the Funds, you incur two types of costs: (1) transaction costs, including sales charges (loads) paid on purchase payments and redemption fees; and (2) ongoing costs, including investment advisory fees, administration fees, distribution fees and other Fund expenses. The examples below are intended to help you understand your ongoing costs (in dollars) of investing in the Funds and to compare these costs with the ongoing costs of investing in other mutual funds. The examples assume that you had a $1,000 investment in the Class at the beginning of the reporting period, May 1, 2004, and continued to hold your shares at the end of the reporting period, October 31, 2004. Per SEC requirements, the examples are based on an investment of $1,000 invested at the beginning of the period and held for the entire six-month period ended October 31, 2004.
Actual Expenses
For each Class of the Fund in the table below, the first line provides information about actual account values and actual expenses. You may use the information in this line, together with the amount you invested, to estimate the expenses that you paid over the period. Simply divide your account value by $1,000 (for example, an $8,600 account value divided by $1,000 = 8.6), then multiply the result by the number in the first line of each Class under the heading entitled “Expenses Paid During Period” to estimate the expenses you paid on your account during the period.
Hypothetical Example for Comparison Purposes
The second line of each Class in the table below provides information about hypothetical account values and hypothetical expenses based on the Class’ actual expense ratio and an assumed rate of return of 5% per year before expenses, which is not the Class’ actual return. The hypothetical account values and expenses may not be used to estimate the actual ending account balance or expenses you paid for the period. You may use this information to compare the ongoing costs of investing in the Class of the Fund and other funds. To do so, compare this 5% hypothetical example with the 5% hypothetical examples that appear in the shareholder reports of the other funds.
Please note that the expenses shown in the table are meant to highlight your ongoing costs only and do not reflect any transaction costs, such as sales charges (loads) or redemption fees. Therefore, the second line for each Class in the table is useful in comparing ongoing costs only, and will not help you determine the relative total costs of owning different funds. In addition, if these transaction costs were included, your costs would have been higher. The examples also assume all dividends and distributions have been reinvested.
Schedule of Shareholder Expenses
Expense Analysis of a $1,000 Investment
(October 31, 2004)
| | | | | | | | | | | | | | | | | | | | | | | |
| | | | Beginning | | | Ending | | | | | | | |
| | | | Account Value | | | Account Value | | | Expenses Paid | | | Annualized | | | |
| Mid Cap Growth Leaders Fund | | | | 5/1/04 | | | 10/31/04 | | | During Period* | | | Expense Ratio | | | |
|
|
| Class A | | | Actual | | | $ | 1,000 | | | $ | 1,038 | | | $ | 7.73 | | | | 1.51% | | | |
| | | | Hypothetical | 1 | | $ | 1,000 | | | $ | 1,017 | | | $ | 7.69 | | | | 1.51% | | | |
|
| Class B | | | Actual | | | $ | 1,000 | | | $ | 1,034 | | | $ | 11.25 | | | | 2.20% | | | |
| | | | Hypothetical | 1 | | $ | 1,000 | | | $ | 1,014 | | | $ | 11.20 | | | | 2.20% | | | |
|
| Class C | | | Actual | | | $ | 1,000 | | | $ | 1,034 | | | $ | 11.25 | | | | 2.20% | | | |
| | | | Hypothetical | 1 | | $ | 1,000 | | | $ | 1,014 | | | $ | 11.20 | | | | 2.20% | | | |
|
| Class D | | | Actual | | | $ | 1,000 | | | $ | 1,039 | | | $ | 6.15 | | | | 1.20% | | | |
| | | | Hypothetical | 1 | | $ | 1,000 | | | $ | 1,019 | | | $ | 6.11 | | | | 1.20% | | | |
|
| Class R | | | Actual | | | $ | 1,000 | | | $ | 1,036 | | | $ | 8.60 | | | | 1.68% | | | |
| | | | Hypothetical | 1 | | $ | 1,000 | | | $ | 1,017 | | | $ | 8.55 | | | | 1.68% | | | |
|
| Institutional Class (a) | | | Actual | | | $ | 1,000 | | | $ | 1,045 | | | $ | 1.00 | (b) | | | 1.08% | | | |
| | | | Hypothetical | 1 | | $ | 1,000 | | | $ | 999 | | | $ | 0.98 | (b) | | | 1.08% | | | |
|
| | |
| (a) | | For the period from September 28, 2004 (commencement of operations) through October 31, 2004. |
| |
| (b) | | Expense are equal to the Fund’s annualized expense ratio multiplied by the average account value over the period multiplied by 33/366 (to reflect the period). |
| |
| * | Expenses are equal to the Fund’s annualized expense ratio multiplied by the average account value over the period multiplied by 184/366 (to reflect the one-half year period). |
1 Represents the hypothetical 5% annual return before expenses.
48 Annual Report 2004
Gartmore Mid Cap Growth Leaders Fund
Portfolio Summary
(October 31, 2004)
The SEC adopted a requirement that Funds present their portfolio holdings in a table, chart or graph format in their annual and semiannual reports to shareholders, whether or not a schedule of investments is utilized. The following tables, which present portfolio holdings as a percentage of net assets, are provided in compliance with this requirement.
| | | | | | | |
| Asset Allocation | | | | |
|
|
| Common Stocks | | | 99.0% | | | |
| Commercial Paper | | | 2.2% | | | |
| Other Investments* | | | 3.6% | | | |
| Other Liabilities in excess of Assets** | | | -4.8% | | | |
| | |
| | | |
| | | | 100.0% | | | |
| |
| * | Includes value of collateral received from securities lending. |
| |
| ** | Includes value of collateral owed from securities lending. |
| | | | | | | |
| Top Industries | | | | |
|
|
| Computer Software & Services | | | 15.7% | | | |
| Medical Products & Services | | | 14.5% | | | |
| Semiconductors | | | 11.0% | | | |
| Financial | | | 9.9% | | | |
| Oil & Gas | | | 7.7% | | | |
| Retail | | | 6.7% | | | |
| Manufacturing | | | 6.2% | | | |
| Aerospace & Defense | | | 5.1% | | | |
| Industrial Gases | | | 3.8% | | | |
| Travel | | | 3.5% | | | |
| Other Industries | | | 15.9% | | | |
| | |
| | | |
| | | | 100.0% | | | |
| | | | | | | |
| Top Holdings | | | | |
|
|
| Cit Group, Inc. | | | 4.9% | | | |
| Quest Software, Inc. | | | 4.5% | | | |
| Gilead Sciences, Inc. | | | 4.0% | | | |
| Praxair, Inc. | | | 3.8% | | | |
| Teva Pharmaceutical Industries Ltd. ADR-IL | | | 3.8% | | | |
| Quiksilver, Inc. | | | 3.7% | | | |
| Manor Care, Inc. | | | 3.6% | | | |
| Royal Caribbean Cruises Ltd. | | | 3.5% | | | |
| Jabil Circuit, Inc. | | | 3.5% | | | |
| Hyperion Solutions Corp. | | | 3.4% | | | |
| Other Holdings | | | 61.3% | | | |
| | |
| | | |
| | | | 100.0% | | | |
2004 Annual Report 49
Leadership Series
| |
| | Statement of Investments |
| | October 31, 2004 |
Gartmore Mid Cap Growth Leaders Fund
| | | | | | | | | | | |
|
| Common Stocks (99.0%) |
|
| | Shares or | | | |
| | Principal Amount | | | Value | | | |
|
| Aerospace & Defense (5.1%) |
| L-3 Communications Holdings, Inc. | | | 6,100 | | | $ | 402,173 | | | |
| Rockwell Collins Corp. | | | 17,200 | | | | 610,084 | | | |
| | | | | |
| | | |
| |
| | | | | | | | 1,012,257 | | | |
| | | | | |
| | | |
| |
|
| Commercial Services (3.0%) |
| Cendant Corp. | | | 29,000 | | | | 597,110 | | | |
| | | | | |
| | | |
| |
|
| Computer Software & Services (15.7%) |
| Akamai Technologies (b) | | | 13,165 | | | | 182,335 | | | |
| Ask Jeeves, Inc. (b) | | | 6,095 | | | | 157,129 | | | |
| Business Objectives SA (b) | | | 25,600 | | | | 653,312 | | | |
| Hyperion Solutions Corp. (b) | | | 17,055 | | | | 684,417 | | | |
| Micros Systems, Inc. (b) | | | 9,625 | | | | 569,030 | | | |
| Quest Software, Inc. (b) | | | 61,810 | | | | 906,752 | | | |
| | | | | |
| | | |
| |
| | | | | | | | 3,152,975 | | | |
| | | | | |
| | | |
| |
|
| Financial (9.9%) |
| Cit Group, Inc. | | | 24,500 | | | | 989,800 | | | |
| Legg Mason, Inc. | | | 8,950 | | | | 570,205 | | | |
| T Rowe Price Group, Inc. | | | 7,725 | | | | 430,823 | | | |
| | | | | |
| | | |
| |
| | | | | | | | 1,990,828 | | | |
| | | | | |
| | | |
| |
|
| Food & Beverage (3.3%) |
| Dean Foods Co. (b) | | | 14,900 | | | | 444,765 | | | |
| Ralcorp Holding, Inc. | | | 5,900 | | | | 216,825 | | | |
| | | | | |
| | | |
| |
| | | | | | | | 661,590 | | | |
| | | | | |
| | | |
| |
|
| Hospitals (3.4%) |
| Triad Hospitals, Inc. (b) | | | 20,600 | | | | 680,418 | | | |
| | | | | |
| | | |
| |
|
| Hotels & Casinos (2.1%) |
| Station Casinos, Inc. | | | 8,170 | | | | 416,262 | | | |
| | | | | |
| | | |
| |
|
| Hotels & Motels (3.1%) |
| Starwood Hotels & Resorts Worldwide | | | 13,150 | | | | 627,650 | | | |
| | | | | |
| | | |
| |
|
| Industrial Gases (3.8%) |
| Praxair, Inc. | | | 18,000 | | | | 759,600 | | | |
| | | | | |
| | | |
| |
|
| Manufacturing (6.2%) |
| Fortune Brands, Inc. | | | 4,000 | | | | 291,280 | | | |
| Inco Ltd. (b) | | | 8,400 | | | | 297,360 | | | |
| Ingersoll Rand Co. | | | 9,560 | | | | 654,286 | | | |
| | | | | |
| | | |
| |
| | | | | | | | 1,242,926 | | | |
| | | | | |
| | | |
| |
|
| Medical Products & Services (14.5%) |
| Fisher Scientific International, Inc. (b) | | | 11,000 | | | | 630,960 | | | |
| Gilead Sciences, Inc. (b) | | | 23,300 | | | | 806,879 | | | |
| Manor Care, Inc. | | | 22,100 | | | | 723,554 | | | |
| Teva Pharmaceutical Industries Ltd. ADR-IL | | | 28,900 | | | | 751,400 | | | |
| | | | | |
| | | |
| |
| | | | | | | | 2,912,793 | | | |
| | | | | |
| | | |
| |
|
| Oil & Gas (7.7%) |
| Noble Corp. (b) | | | 8,800 | | | | 401,984 | | | |
| Patterson-UTI Energy, Inc. | | | 30,000 | | | | 576,900 | | | |
| The Williams Companies, Inc. | | | 44,700 | | | | 559,197 | | | |
| | | | | |
| | | |
| |
| | | | | | | | 1,538,081 | | | |
| | | | | |
| | | |
| |
|
| Retail (6.7%) |
| Dollar General Corp. | | | 30,900 | | | | 594,825 | | | |
| Quiksilver, Inc. (b) | | | 27,400 | | | | 746,650 | | | |
| | | | | |
| | | |
| |
| | | | | | | | 1,341,475 | | | |
| | | | | |
| | | |
| |
|
| Semiconductors (11.0%) |
| International Rectifier Corp. (b) | | | 11,414 | | | | 453,707 | | | |
| Jabil Circuit, Inc. (b) | | | 28,500 | | | | 692,835 | | | |
| Lam Research Corp. (b) | | | 21,900 | | | | 570,057 | | | |
| MEMC Electronic Materials, Inc. (b) | | | 51,210 | | | | 481,374 | | | |
| | | | | |
| | | |
| |
| | | | | | | | 2,197,973 | | | |
| | | | | |
| | | |
| |
|
| Travel (3.5%) |
| Royal Caribbean Cruises Ltd. | | | 15,000 | | | | 699,000 | | | |
| | | | | |
| | | |
| |
| Total Common Stocks | | | 19,830,938 | | | |
| | | | | |
| | | |
| |
Commercial Paper (2.2%) |
| Insurance (2.2%) |
| Allstate Corp. 1.85%, 11/01/04 | | $ | 445,000 | | | | 445,000 | | | |
| | | | | |
| | | |
| |
| Total Commercial Paper | | | 445,000 | | | |
| | | | | |
| | | |
| |
Short-Term Securities Held as Collateral for Securities Lending (3.6%) |
| Pool of short-term securities for Gartmore Mutual Funds - footnote 2 (Securities Lending) | | | 711,475 | | | | 711,475 | | | |
| | | | | |
| | | |
| |
| Total Short-Term Securities Held as Collateral for Securities Lending | | | 711,475 | | | |
| | | | | |
| | | |
| |
| Total Investments (Cost $20,148,835) (a) — 104.8% | | | 20,987,413 | �� | | |
| Liabilities in excess of other assets — (4.8)% | | | (959,243) | | | |
| | | | | |
| | | |
| |
| NET ASSETS — 100.0% | | $ | 20,028,170 | | | |
| | | | | |
| | | |
| | |
| (a) | | See notes to financial statements for tax unrealized appreciation (depreciation) of securities. |
| |
| (b) | | Non-income producing securities. |
ADR American Depositary Receipt
IL Israel
See notes to financial statements.
50 Annual Report 2004
Leadership Series
| |
| | Gartmore Nationwide Leaders Fund |
Gary Haubold assumed responsibility for the management of this Fund on Sept. 30, 2004. Mr. Haubold has 20 years of investment experience, with a flexible investment management style that favors value over growth. The Fund will now reflect this value emphasis, focusing on stocks with market capitalizations of between $10 billion and $50 billion.
For the annual period ended Oct. 31, 2004, the Gartmore Nationwide Leaders Fund returned 10.00% (Class A at NAV) versus 9.42% for its benchmark, the S&P 500 Index. For broader comparison, the average return for the Fund’s Lipper peer category of Multi-Cap Core Funds was 8.25%.
This Fund is a “best ideas” portfolio, focused on only 20 to 30 companies with competitively strong positions in their respective industries where we believe the near-term investment outlook is very attractive. A small portion of the Fund is reserved to take advantage of shorter-term opportunities within the marketplace. Given the concentrated number of securities, this Fund can exhibit large performance deviations from those of the Index.
During the annual reporting period, the Fund outperformed its benchmark due to both sector and stock selections. Overweight positions relative to the benchmark in energy and materials stocks contributed to these results, since these sectors returned 44% and 17%, respectively. The political situation in the Middle East and the resulting concerns about supply disruptions kept oil prices high, while low inventory levels drove commodity prices higher. Lack of capital investment during the past five years, coupled with rising demand from China and Asia, has pushed commodity inventory levels to record lows, and prices to new highs.
Most of the Fund’s significant performance came from its top holdings. These stocks included Elan Corp., plc, an Ireland-based biotechnology company that focuses on neurology, autoimmune diseases and the treatment of pain, which contributed 2.96% to the Fund’s performance. The stock earned positive returns due to the company’s ongoing corporate restructuring, improved prospects for the firm’s multiple sclerosis drug Antegren and the company’s successful drug development technology, which Elan Corp. licensed to the Roche Group during the period. Royal Caribbean Cruises Ltd. was another top-performing holding of the Fund, contributing 2.43% to annual performance. It benefited from a cyclical increase in consumer spending on leisure and travel-related activities.
Stock selection in the information technology sector was the biggest detractor from Fund performance with semiconductor stocks such as Intel Corp. and Applied Materials, Inc. posting negative returns. These stocks suffered from substantial pricing pressures, as production ramped faster than demand increased, producing temporary inventory glut.
Looking ahead to the new fiscal year, there is much to be optimistic about. The contentious U.S. presidential election is now behind us, and the political direction of the country is now more certain. We continue to anticipate a recovering economy, stronger corporate profits and interest rates at historically low levels. China’s acceleration in growth has created meaningful and persistent shortages of such raw materials as coking coal, steel, copper and energy. Our portfolio strategy has evolved in response to the dynamic global market for commodities, and we will continue to carefully analyze the fortunes of the energy and raw materials sectors.
Portfolio Manager: Gary Haubold, CFA
| |
| | Class A: GULAX |
| | Class B: GULBX |
| | Class C: GULCX |
| | Class R: GNLRX |
| | Institutional Service Class: GULIX |
| | Institutional Class: GNLIX |
2004 Annual Report 51
Leadership Series
Gartmore Nationwide Leaders Fund
Average Annual Total Return
(For periods ended October 31, 2004)
| | | | | | | | | | | |
| | | | One year | | | Inception1 | |
|
| |
| Class A | | without sales charge2 | | | 10.00% | | | | 8.05% | |
| | | with sales charge3 | | | 3.64% | | | | 5.81% | |
|
| Class B | | without sales charge2 | | | 9.32% | | | | 7.26% | |
| | | with sales charge4 | | | 4.32% | | | | 6.33% | |
|
| Class C | | without sales charge2 | | | 9.32% | | | | 7.26% | |
| | | with sales charge5 | | | 8.32% | | | | 7.26% | |
|
Class R 6,7 | | | | | 9.66% | | | | 7.42% | |
|
| Institutional Class6,8 | | | 10.16% | | | | 8.19% | |
|
| Institutional Service Class6 | | | 10.07% | | | | 8.16% | |
|
All figures showing the effect of a sales charge reflect the maximum charge possible, because it has the most dramatic effect on performance data.
| |
| 1 | Fund commenced operations on December 28, 2001. |
| |
| 2 | These returns do not reflect the effects of sales charges (SC). |
| |
| 3 | A 5.75% front-end sales charge was deducted. |
| |
| 4 | A 5.00% contingent deferred sales charge (CDSC) was deducted. The CDSC declines to 0% after 6 years. |
| |
| 5 | A CDSC of 1.00% was deducted because it is charged when you sell Class C shares within the first year after purchase. |
| |
| 6 | Not subject to any sales charges. |
| |
| 7 | These returns until the creation of Class R shares (10/1/03) include the performance of the Fund’s Class B shares. The returns have been adjusted for the fact that Class R shares do not have any applicable sales charges but have not been adjusted for the lower expenses applicable to Class R shares. Excluding the effect of any fee waivers or reimbursements, such prior performance is similar to what Class R shares would have produced because the Class R shares invest in the same portfolio of securities as Class B shares. |
| |
| 8 | These returns until the creation of Institutional Class shares (6/29/04) include the performance of the Fund’s Institutional Service shares. The returns have not been adjusted for the lower expenses applicable to Institutional Class shares. Excluding the effect of any fee waivers or reimbursements, such prior performance is similar to what Institutional Class shares would have produced because the Institutional Class shares invest in the same portfolio of securities as Institutional Service shares. |
Performance of a $10,000 Investment
Investment return and principal value will fluctuate, and when redeemed, shares may be worth more or less than original cost. Past performance is no guarantee of future results and does not reflect the deduction of taxes that a shareholder would pay on fund distributions or the redemption of fund shares. Investing in mutual funds involves market risk, including loss of principal. Performance returns assume the reinvestment of all distributions.
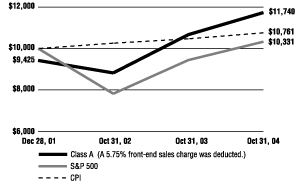
Comparative performance of $10,000 invested in Class A shares of the Gartmore Nationwide Leaders Fund, S&P 500 Index (S&P 500)(a) and the Consumer Price Index (CPI)(b) since inception. Unlike the Fund, the returns for these unmanaged indexes do not reflect any fees, expenses, or sales charges. Investors cannot invest directly in market indexes.
| | |
| (a) | | The S&P 500 is an unmanaged index of 500 widely held stocks of large U.S. companies that gives a broad look at how the stock prices of large U.S. companies have performed. |
| |
| (b) | | The CPI represents changes in prices of a basket of goods and services purchased for consumption by urban households. |
52 Annual Report 2004
Gartmore Nationwide Leaders Fund
Shareholder
Expense Example
As a shareholder of the Funds, you incur two types of costs: (1) transaction costs, including sales charges (loads) paid on purchase payments and redemption fees; and (2) ongoing costs, including investment advisory fees, administration fees, distribution fees and other Fund expenses. The examples below are intended to help you understand your ongoing costs (in dollars) of investing in the Funds and to compare these costs with the ongoing costs of investing in other mutual funds. The examples assume that you had a $1,000 investment in the Class at the beginning of the reporting period, May 1, 2004, and continued to hold your shares at the end of the reporting period, October 31, 2004. Per SEC requirements, the examples are based on an investment of $1,000 invested at the beginning of the period and held for the entire six-month period ended October 31, 2004.
Actual Expenses
For each Class of the Fund in the table below, the first line provides information about actual account values and actual expenses. You may use the information in this line, together with the amount you invested, to estimate the expenses that you paid over the period. Simply divide your account value by $1,000 (for example, an $8,600 account value divided by $1,000 = 8.6), then multiply the result by the number in the first line of each Class under the heading entitled “Expenses Paid During Period” to estimate the expenses you paid on your account during the period.
Hypothetical Example for Comparison Purposes
The second line of each Class in the table below provides information about hypothetical account values and hypothetical expenses based on the Class’ actual expense ratio and an assumed rate of return of 5% per year before expenses, which is not the Class’ actual return. The hypothetical account values and expenses may not be used to estimate the actual ending account balance or expenses you paid for the period. You may use this information to compare the ongoing costs of investing in the Class of the Fund and other funds. To do so, compare this 5% hypothetical example with the 5% hypothetical examples that appear in the shareholder reports of the other funds.
Please note that the expenses shown in the table are meant to highlight your ongoing costs only and do not reflect any transaction costs, such as sales charges (loads) or redemption fees. Therefore, the second line for each Class in the table is useful in comparing ongoing costs only, and will not help you determine the relative total costs of owning different funds. In addition, if these transaction costs were included, your costs would have been higher. The examples also assume all dividends and distributions have been reinvested.
Schedule of Shareholder Expenses
Expense Analysis of a $1,000 Investment
(October 31, 2004)
| | | | | | | | | | | | | | | | | | | | | | | |
| | | | Beginning | | | Ending | | | | | | | |
| | | | Account Value | | | Account Value | | | Expenses Paid | | | Annualized | | | |
| Nationwide Leaders Fund | | | | 5/1/04 | | | 10/31/04 | | | During Period* | | | Expense Ratio | | | |
|
|
| Class A | | | Actual | | | $ | 1,000 | | | $ | 1,073 | | | $ | 7.66 | | | | 1.47% | | | |
| | | | Hypothetical | 1 | | $ | 1,000 | | | $ | 1,018 | | | $ | 7.48 | | | | 1.47% | | | |
|
| Class B | | | Actual | | | $ | 1,000 | | | $ | 1,069 | | | $ | 11.44 | | | | 2.20% | | | |
| | | | Hypothetical | 1 | | $ | 1,000 | | | $ | 1,014 | | | $ | 11.20 | | | | 2.20% | | | |
|
| Class C | | | Actual | | | $ | 1,000 | | | $ | 1,069 | | | $ | 11.44 | | | | 2.20% | | | |
| | | | Hypothetical | 1 | | $ | 1,000 | | | $ | 1,014 | | | $ | 11.20 | | | | 2.20% | | | |
|
| Class R | | | Actual | | | $ | 1,000 | | | $ | 1,072 | | | $ | 8.96 | | | | 1.72% | | | |
| | | | Hypothetical | 1 | | $ | 1,000 | | | $ | 1,016 | | | $ | 8.76 | | | | 1.72% | | | |
|
| Institutional Service Class | | | Actual | | | $ | 1,000 | | | $ | 1,073 | | | $ | 7.40 | | | | 1.42% | | | |
| | | | Hypothetical | 1 | | $ | 1,000 | | | $ | 1,018 | | | $ | 7.23 | | | | 1.42% | | | |
|
| Institutional Class (a) | | | Actual | | | $ | 1,000 | | | $ | 1,030 | | | $ | 3.85 | (b) | | | 1.12% | | | |
| | | | Hypothetical | 1 | | $ | 1,000 | | | $ | 1,011 | | | $ | 3.83 | (b) | | | 1.12% | | | |
|
| | |
| (a) | | For the period from June 29, 2004 (commencement of operations) through October 31, 2004. |
| |
| (b) | | Expense are equal to the Fund’s annualized expense ratio multiplied by the average account value over the period multiplied by 124/366 (to reflect the period). |
| |
| * | Expenses are equal to the Fund’s annualized expense ratio multiplied by the average account value over the period multiplied by 184/366 (to reflect the one-half year period). |
1 Represents the hypothetical 5% annual return before expenses.
2004 Annual Report 53
Gartmore Nationwide Leaders Fund
Leadership Series
| |
| | Portfolio Summary |
| | (October 31, 2004) |
The SEC adopted a requirement that Funds present their portfolio holdings in a table, chart or graph format in their annual and semiannual reports to shareholders, whether or not a schedule of investments is utilized. The following tables, which present portfolio holdings as a percentage of net assets, are provided in compliance with this requirement.
| | | | | | | |
| Asset Allocation | | | | |
|
|
| Common Stock | | | 94.5% | | | |
| Repurchase Agreement | | | 5.5% | | | |
| | |
| | | |
| | | | 100.0% | | | |
| | | | | | | |
| Top Industries | | | | |
|
|
| Oil & Gas | | | 14.6% | | | |
| Financial Services | | | 12.3% | | | |
| Retail | | | 7.5% | | | |
| Computer Equipment | | | 6.6% | | | |
| Coal | | | 5.7% | | | |
| Capital Goods | | | 5.0% | | | |
| Drugs | | | 4.9% | | | |
| Telecommunications | | | 4.3% | | | |
| Food & Beverage | | | 4.2% | | | |
| Metals | | | 4.2% | | | |
| Other Industries | | | 30.7% | | | |
| | |
| | | |
| | | | 100.0% | | | |
| | | | | | | |
| Top Holdings | | | | |
|
|
| ConocoPhillips | | | 4.9% | | | |
| Pfizer, Inc. | | | 4.9% | | | |
| Goldman Sachs Group, Inc. | | | 4.6% | | | |
| Verizon Communications, Inc. | | | 4.3% | | | |
| Kraft Foods, Inc., Class A | | | 4.2% | | | |
| Phelps Dodge Corp. | | | 4.2% | | | |
| Royal Caribbean Cruises Ltd. | | | 4.1% | | | |
| Nike, Inc., Class B | | | 4.0% | | | |
| Wachovia Corp. | | | 4.0% | | | |
| Starwood Hotels & Resorts Worldwide, Inc. | | | 4.0% | | | |
| Other Holdings | | | 56.8% | | | |
| | |
| | | |
| | | | 100.0% | | | |
54 Annual Report 2004
Statement of Investments
October 31, 2004
Gartmore Nationwide Leaders Fund
| | | | | | | | | | | |
|
| Common Stocks (94.5%) |
|
| | Shares or | | | |
| | Principal Amount | | | Value | | | |
|
| Aerospace/Defense (3.7%) |
| General Dynamics Corp. | | | 1,700 | | | $ | 173,604 | | | |
| | | | | |
| | | |
| |
|
| Capital Goods (5.0%) |
| Cummins Engine, Inc. | | | 1,550 | | | | 108,624 | | | |
| PACCAR, Inc. | | | 1,800 | | | | 124,758 | | | |
| | | | | |
| | | |
| |
| | | | | | | | 233,382 | | | |
| | | | | |
| | | |
| |
|
| Coal (5.7%) |
| Arch Coal, Inc. | | | 4,420 | | | | 143,738 | | | |
| Peabody Energy Corp. | | | 1,900 | | | | 121,182 | | | |
| | | | | |
| | | |
| |
| | | | | | | | 264,920 | | | |
| | | | | |
| | | |
| |
|
| Computer Equipment (6.6%) |
| Apple Computer, Inc. (b) | | | 1,300 | | | | 68,289 | | | |
| Dell, Inc. (b) | | | 2,400 | | | | 84,144 | | | |
| International Business Machines Corp. | | | 1,700 | | | | 152,575 | | | |
| | | | | |
| | | |
| |
| | | | | | | | 305,008 | | | |
| | | | | |
| | | |
| |
|
| Computer Software & Services (3.1%) |
| Microsoft Corp. | | | 5,200 | | | | 145,548 | | | |
| | | | | |
| | | |
| |
|
| Drugs (4.9%) |
| Pfizer, Inc. | | | 7,800 | | | | 225,810 | | | |
| | | | | |
| | | |
| |
|
| Financial Services (12.3%) |
| CIT Group, Inc. | | | 4,200 | | | | 169,680 | | | |
| Goldman Sachs Group, Inc. | | | 2,175 | | | | 213,977 | | | |
| Wachovia Corp. | | | 3,800 | | | | 186,998 | | | |
| | | | | |
| | | |
| |
| | | | | | | | 570,655 | | | |
| | | | | |
| | | |
| |
|
| Food & Beverage (4.2%) |
| Kraft Foods, Inc., Class A | | | 5,900 | | | | 196,529 | | | |
| | | | | |
| | | |
| |
|
| Hotels / Motels (4.0%) |
| Starwood Hotels & Resorts Worldwide, Inc. | | | 3,900 | | | | 186,147 | | | |
| | | | | |
| | | |
| |
|
| Insurance (3.1%) |
| Allstate Corp. (The) | | | 3,000 | | | | 144,270 | | | |
| | | | | |
| | | |
| |
|
| Metals (4.2%) |
| Phelps Dodge Corp. | | | 2,200 | | | | 192,588 | | | |
| | | | | |
| | | |
| |
|
| Oil & Gas (14.6%) |
| Apache Corp. | | | 3,218 | | | | 163,153 | | | |
| BJ Services Co. | | | 3,400 | | | | 173,400 | | | |
| ConocoPhillips | | | 2,700 | | | | 227,637 | | | |
| Schlumberger Ltd. | | | 1,700 | | | | 106,998 | | | |
| | | | | |
| | | |
| |
| | | | | | | | 671,188 | | | |
| | | | | |
| | | |
| |
|
| Railroads (3.3%) |
| Canadian National Railway Co. ADR — CA | | | 500 | | | | 27,025 | | | |
| Norfolk Southern Corp. | | | 3,700 | | | | 125,615 | | | |
| | | | | |
| | | |
| |
| | | | | | | | 152,640 | | | |
| | | | | |
| | | |
| |
|
| Retail (7.5%) |
| Nike, Inc., Class B | | | 2,300 | | | | 187,013 | | | |
| Wal-Mart Stores, Inc. | | | 2,958 | | | | 159,495 | | | |
| | | | | |
| | | |
| |
| | | | | | | | 346,508 | | | |
| | | | | |
| | | |
| |
|
| Steel (1.8%) |
| Nucor Corp. | | | 2,000 | | | | 84,460 | | | |
| | | | | |
| | | |
| |
|
| Telecommunications (4.3%) |
| Verizon Communications, Inc. | | | 5,100 | | | | 199,410 | | | |
| | | | | |
| | | |
| |
|
| Tobacco (2.1%) |
| UST, Inc. | | | 2,400 | | | | 98,784 | | | |
| | | | | |
| | | |
| |
|
| Travel (4.1%) |
| Royal Caribbean Cruises Ltd. | | | 4,100 | | | | 191,060 | | | |
| | | | | |
| | | |
| |
| Total Common Stocks | | | 4,382,511 | | | |
| | | | | |
| | | |
| |
Repurchase Agreements (5.5%) |
CS First Boston, 1.75%, dated 10/29/04, due 11/01/04, repurchase price $106,616
(Fully collateralized by U.S. Agency Securities & U.S. Treasury Notes) | | $ | 106,600 | | | | 106,600 | | | |
| Nomura Securities, 1.75%, dated 10/29/04, due 11/01/04, repurchase price $148,968 (Fully collateralized by AA Rated Corporate Bonds & U.S. Agency Securities) | | | 148,947 | | | | 148,947 | | | |
| | | | | |
| | | |
| |
| Total Repurchase Agreements | | | 255,547 | | | |
| | | | | |
| | | |
| |
| Total Investments (Cost $4,325,445) (a) — 100.0% | | | 4,638,058 | | | |
| | | | | |
| | | |
| |
| Other assets in excess of liabilities — 0.0% | | | 519 | | | |
| | | | | |
| | | |
| |
| NET ASSETS — 100.0% | | $ | 4,638,577 | | | |
| | | | | |
| | | |
| | |
| (a) | | See notes to financial statements for tax unrealized appreciation (depreciation) of securities. |
| |
| (b) | | Denotes a non-income producing security. |
ADR American Depositary Receipt
CA Canada
See notes to financial statements.
2004 Annual Report 55
Leadership Series
| |
| | Gartmore U.S. Growth Leaders Fund |
For the annual period ended Oct. 31, 2004, the Gartmore U.S. Growth Leaders Fund returned 3.28% (Class A at NAV) versus 9.42% for the Fund’s benchmark, the S&P 500 Index. For broader comparison, the average return for the Fund’s Lipper peer category of Multi-Cap Growth Funds was 4.69%.
During the reporting period, growth stocks fared reasonably well, though these stocks lagged value stock shares by a considerable margin. While the U.S. economy continued to grow at a moderate pace, as measured by changes in gross domestic product (GDP), the rate of growth declined steadily with each passing quarter. Furthermore, beginning with the surprisingly strong March 2004 employment numbers, investors began to anticipate that the Federal Reserve Board would raise short-term interest rates sooner rather than later—a perception that turned out to be accurate. These factors served as negative influences on the technology sector and on growth stocks in general. In addition, technology stocks were hampered by weaker-than-expected end-user demand, soft pricing and rising inventories.
Despite the challenges faced by the technology sector, this sector provided some of the Fund’s top performance contributors for the period. Security software maker Symantec Corp. was a strong contributor to Fund performance—contributing 1.60%, as Symantec beat earnings estimates for the third quarter, announced a two-for-one stock split and increased its share buyback program. McAfee, Inc., a rival security software provider whose securities were held by the Fund, exceeded its third-quarter earnings forecasts and upped guidance for the fourth quarter as well. In the consumer discretionary space, the discount retailer Target Corp. contributed 0.56% to Fund performance, as Target reported strong same-store sales for September 2004, and investors appeared optimistic about prospects for a profitable 2004 holiday season.
While the Fund enjoyed success with some of its technology picks, the primary factors holding back Fund performance, relative to the S&P 500 Index, were an overweighting in technology stocks and an underweighting in energy stocks. High crude oil and natural gas prices increased the profitability of energy exploration and production companies, as well as the firms that provide drilling and other services. In May, we began to increase the Fund’s energy weighting while trimming the Fund’s technology exposure, but these moves were not sufficient to stem the underperformance. Among the Fund’s technology holdings, some of the largest detractors were Emulex Corp. (-1.33%), SanDisk Corp. (-1.20%) and VERITAS Software Corp. (-0.78). Emulex, a maker of hardware that connects storage networks, saw its market share decline and inventories rise. SanDisk faltered due to slack demand for its flash memory cards. Meanwhile, VERITAS Software fell sharply in July when it announced that lower-than-expected license sales due to weakness in its enterprise business would cause VERITAS to fall short of earnings estimates for the second quarter.
Although growth stocks struggled during the period, we are optimistic about their prospects for 2005. Most analysts have significantly scaled back their forecasts for growth in individual companies and in the nation’s GDP, opening the door for more upside surprises. Moreover, while interest rates are rising, we believe that the Fed will do its tightening at a measured, gradual pace that should not jeopardize the economic recovery. Finally, energy prices appear to be moderating, which should help support spending by both consumers and businesses.
Portfolio Managers: Christopher Baggini, CFA and Douglas Burtnick, CFA
On September 21, 2004, the Enforcement Staff of the Commission’s Fort Worth District Office (the “Staff”) contacted Gartmore Mutual Fund Capital Trust (the “Adviser”), the investment adviser to the Gartmore U.S. Growth Leaders Fund (the “Fund”), a series of Gartmore Mutual Funds (“GMF”). The Staff asserted that the methodology used to calculate the performance fee for the Fund did not comply with the requirements of Rule 205-2 under the Investment Advisers Act of 1940 (“Advisers Act”). The Adviser agreed temporarily to forego the collection of any performance fees pending an evaluation of the Staff’s assertion. Discussions with the Staff are ongoing, and the outcome of those discussions will determine the remedial steps, if any, to be taken.
| |
| | Class A: GXXAX |
| | Class B: GXXBX |
| | Class C: GXXCX |
| | Class R: GGLRX |
| | Institutional Service Class: GXXIX |
| | Institutional Class: GGLIX |
56 Annual Report 2004
Gartmore U.S. Growth Leaders Fund
Fund Performance
Average Annual Total Return
(For periods ended October 31, 2004)
| | | | | | | | | | | |
| | | | One year | | | Inception1 | |
|
| |
| Class A | | without sales charge2 | | | 3.28% | | | | -2.66% | |
| | | with sales charge3 | | | -2.64% | | | | -3.98% | |
|
| Class B | | without sales charge2 | | | 2.62% | | | | -3.33% | |
| | | with sales charge4 | | | -2.38% | | | | -3.76% | |
|
Class C5 | | without sales charge2 | | | 2.60% | | | | -3.19% | |
| | | with sales charge6 | | | 1.60% | | | | -3.19% | |
|
Class R 7,8 | | | | | 2.86% | | | | -3.25% | |
|
| Institutional Class7,9 | | | 3.37% | | | | -2.40% | |
|
| Institutional Service Class7 | | | 3.37% | | | | -2.40% | |
|
All figures showing the effect of a sales charge reflect the maximum charge possible, because it has the most dramatic effect on performance data.
| |
| 1 | Fund commenced operations on June 30, 2000. |
| |
| 2 | These returns do not reflect the effects of sales charges (SC). |
| |
| 3 | A 5.75% front-end sales charge was deducted. |
| |
| 4 | A 5.00% contingent deferred sales charge (CDSC) was deducted. The CDSC declines to 0% after 6 years. |
| |
| 5 | These returns until the creation of Class C shares (3/1/01) include the performance of the Fund’s Class B shares. Excluding the effects of any fee waivers or reimbursements, such prior performance is substantially similar to what Class C shares would have produced because Class C shares invest in the same portfolio of securities as Class B shares and have the same expenses after any fee waivers or reimbursements. For Class C shares returns with sales charges, these returns have been restated for the applicable sales charges. |
| |
| 6 | A CDSC of 1.00% was deducted because it is charged when you sell Class C shares within the first year after purchase. |
| |
| 7 | Not subject to any sales charges. |
| |
| 8 | These returns until the creation of Class R shares (10/1/03) include the performance of the Fund’s Class B shares. The returns have been adjusted for the fact that Class R shares do not have any applicable sales charges but have not been adjusted for the lower expenses applicable to Class R shares. Excluding the effect of any fee waivers or reimbursements, such prior performance is similar to what Class R shares would have produced because the Class R shares invest in the same portfolio of securities as Class B shares. |
| |
| 9 | These returns until the creation of Institutional Class shares (6/29/04) include the performance of the Fund’s Institutional Service shares. The returns have not been adjusted for the lower expenses applicable to Institutional Class shares. Excluding the effect of any fee waivers or reimbursements, such prior performance is similar to what Institutional Class shares would have produced because the Institutional Class shares invest in the same portfolio of securities as Institutional Service shares. |
Performance of a $10,000 Investment
Investment return and principal value will fluctuate, and when redeemed, shares may be worth more or less than original cost. Past performance is no guarantee of future results and does not reflect the deduction of taxes that a shareholder would pay on fund distributions or the redemption of fund shares. Investing in mutual funds involves market risk, including loss of principal. Performance returns assume the reinvestment of all distributions.
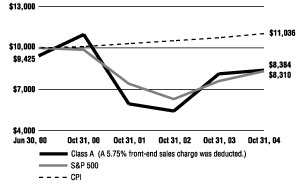
Comparative performance of $10,000 invested in Class A shares of the Gartmore U.S. Growth Leaders Fund, S&P 500 Index (S&P 500)(a), and the Consumer Price Index (CPI)(b) since inception. Unlike the Fund, the returns for these unmanaged indexes do not reflect any fees, expenses, or sales charges. Investors cannot invest directly in market indexes.
| | |
| (a) | | The S&P 500 is an unmanaged index of 500 widely held stocks of large U.S. companies that gives a broad look at how the stock prices of large U.S. companies have performed. |
| |
| (b) | | The CPI represents changes in prices of a basket of goods and services purchased for consumption by urban households. |
2004 Annual Report 57
Gartmore U.S. Growth Leaders Fund
Leadership Series
| |
| | Shareholder |
| | Expense Example |
As a shareholder of the Funds, you incur two types of costs: (1) transaction costs, including sales charges (loads) paid on purchase payments and redemption fees; and (2) ongoing costs, including investment advisory fees, administration fees, distribution fees and other Fund expenses. The examples below are intended to help you understand your ongoing costs (in dollars) of investing in the Funds and to compare these costs with the ongoing costs of investing in other mutual funds. The examples assume that you had a $1,000 investment in the Class at the beginning of the reporting period, May 1, 2004, and continued to hold your shares at the end of the reporting period, October 31, 2004. Per SEC requirements, the examples are based on an investment of $1,000 invested at the beginning of the period and held for the entire six-month period ended October 31, 2004.
Actual Expenses
For each Class of the Fund in the table below, the first line provides information about actual account values and actual expenses. You may use the information in this line, together with the amount you invested, to estimate the expenses that you paid over the period. Simply divide your account value by $1,000 (for example, an $8,600 account value divided by $1,000 = 8.6), then multiply the result by the number in the first line of each Class under the heading entitled ���Expenses Paid During Period” to estimate the expenses you paid on your account during the period.
Hypothetical Example for Comparison Purposes
The second line of each Class in the table below provides information about hypothetical account values and hypothetical expenses based on the Class’ actual expense ratio and an assumed rate of return of 5% per year before expenses, which is not the Class’ actual return. The hypothetical account values and expenses may not be used to estimate the actual ending account balance or expenses you paid for the period. You may use this information to compare the ongoing costs of investing in the Class of the Fund and other funds. To do so, compare this 5% hypothetical example with the 5% hypothetical examples that appear in the shareholder reports of the other funds.
Please note that the expenses shown in the table are meant to highlight your ongoing costs only and do not reflect any transaction costs, such as sales charges (loads) or redemption fees. Therefore, the second line for each Class in the table is useful in comparing ongoing costs only, and will not help you determine the relative total costs of owning different funds. In addition, if these transaction costs were included, your costs would have been higher. The examples also assume all dividends and distributions have been reinvested.
Schedule of Shareholder Expenses
Expense Analysis of a $1,000 Investment
(October 31, 2004)
| | | | | | | | | | | | | | | | | | | | | | | |
| | | | Beginning | | | Ending | | | | | | | |
| | | | Account Value | | | Account Value | | | Expenses Paid | | | Annualized | | | |
| U.S. Growth Leaders Fund | | | | 5/1/04 | | | 10/31/04 | | | During Period* | | | Expense Ratio | | | |
|
|
| Class A | | | Actual | | | $ | 1,000 | | | $ | 1,056 | | | $ | 8.48 | | | | 1.64% | | | |
| | | | Hypothetica | l 1 | | $ | 1,000 | | | $ | 1,017 | | | $ | 8.35 | | | | 1.64% | | | |
|
| Class B | | | Actual | | | $ | 1,000 | | | $ | 1,052 | | | $ | 11.87 | | | | 2.30% | | | |
| | | | Hypothetical | 1 | | $ | 1,000 | | | $ | 1,013 | | | $ | 11.71 | | | | 2.30% | | | |
|
| Class C | | | Actual | | | $ | 1,000 | | | $ | 1,052 | | | $ | 11.86 | | | | 2.30% | | | |
| | | | Hypothetical | 1 | | $ | 1,000 | | | $ | 1,013 | | | $ | 11.71 | | | | 2.30% | | | |
|
| Class R | | | Actual | | | $ | 1,000 | | | $ | 1,054 | | | $ | 9.08 | | | | 1.76% | | | |
| | | | Hypothetical | 1 | | $ | 1,000 | | | $ | 1,016 | | | $ | 8.96 | | | | 1.76% | | | |
|
| Institutional Service Class | | | Actual | | | $ | 1,000 | | | $ | 1,057 | | | $ | 7.91 | | | | 1.53% | | | |
| | | | Hypothetical | 1 | | $ | 1,000 | | | $ | 1,017 | | | $ | 7.79 | | | | 1.53% | | | |
|
| Institutional Class (a) | | | Actual | | | $ | 1,000 | | | $ | 997 | | | $ | 4.40 | (b) | | | 1.30% | | | |
| | | | Hypothetical | 1 | | $ | 1,000 | | | $ | 1,010 | | | $ | 4.44 | (b) | | | 1.30% | | | |
|
| | |
| (a) | | For the period from June 29, 2004 (commencement of operations) through October 31, 2004. |
| |
| (b) | | Expense are equal to the Fund’s annualized expense ratio multiplied by the average account value over the period multiplied by 124/366 (to reflect the period). |
| |
| * | Expenses are equal to the Fund’s annualized expense ratio multiplied by the average account value over the period multiplied by 184/366 (to reflect the one-half year period). |
1 Represents the hypothetical 5% annual return before expenses.
58 Annual Report 2004
Gartmore U.S. Growth Leaders Fund
Portfolio Summary
(October 31, 2004)
The SEC adopted a requirement that Funds present their portfolio holdings in a table, chart or graph format in their annual and semiannual reports to shareholders, whether or not a schedule of investments is utilized. The following tables, which present portfolio holdings as a percentage of net assets, are provided in compliance with this requirement.
| | | | | | | |
| Asset Allocation | | | | |
|
|
| Common Stock | | | 96.0% | | | |
| Repurchase Agreements | | | 4.4% | | | |
| Other Investments* | | | 8.5% | | | |
| Other Liabilities in excess of Assets** | | | -8.9% | | | |
| | |
| | | |
| | | | 100.0% | | | |
| |
| * | Includes value of collateral received from securities lending. |
| |
| ** | Includes value of collateral owed from securities lending. |
| | | | | | | |
| Top Industries | | | | |
|
|
| Computer Software & Services | | | 15.0% | | | |
| Financial Services | | | 11.6% | | | |
| Healthcare | | | 11.4% | | | |
| Manufacturing | | | 10.2% | | | |
| Retail | | | 10.1% | | | |
| Semiconductors | | | 9.1% | | | |
| Oil & Gas | | | 6.9% | | | |
| Computer Equipment | | | 5.9% | | | |
| Hotels & Casinos | | | 4.2% | | | |
| Telecommunications | | | 3.6% | | | |
| Other Industries | | | 12.0% | | | |
| | |
| | | |
| | | | 100.0% | | | |
| | | | | | | |
| Top Holdings | | | | |
|
|
| Capital One Financial Corp. | | | 5.7% | | | |
| Kohl’s Corp. | | | 4.3% | | | |
| Marriott International, Inc., Class A | | | 4.2% | | | |
| Franklin Resources, Inc. | | | 4.0% | | | |
| Yahoo, Inc. | | | 3.8% | | | |
| EMC Corp. | | | 3.8% | | | |
| Juniper Networks, Inc. | | | 3.6% | | | |
| St. Jude Medical, Inc. | | | 3.6% | | | |
| UnitedHealth Group, Inc. | | | 3.5% | | | |
| Danaher Corp. | | | 3.5% | | | |
| Other Holdings | | | 60.0% | | | |
| | |
| | | |
| | | | 100.0% | | | |
2004 Annual Report 59
Leadership Series
| |
| | Statement of Investments |
| | October 31, 2004 |
Gartmore U.S. Growth Leaders Fund
| | | | | | | | | | | |
|
| Common Stocks (96.0%) |
|
| | Shares or | | | |
| | Principal Amount | | | Value | | | |
|
| Computer Equipment (5.9%) |
| Apple Computer, Inc. (b) | | | 14,300 | | | $ | 751,179 | | | |
| EMC Corp. (b) | | | 102,590 | | | | 1,320,333 | | | |
| | | | | |
| | | |
| |
| | | | | | | | 2,071,512 | | | |
| | | | | |
| | | |
| |
|
| Computer Software & Services (15.0%) |
| Business Objects S.A. ADR - FR (b) | | | 42,290 | | | | 1,079,241 | | | |
| Citrix Systems, Inc. (b) | | | 40,650 | | | | 980,885 | | | |
| Macfee, Inc. (b) | | | 37,300 | | | | 902,660 | | | |
| Quest Software, Inc. (b) | | | 66,000 | | | | 968,220 | | | |
| Yahoo, Inc. (b) | | | 38,160 | | | | 1,381,010 | | | |
| | | | | |
| | | |
| |
| | | | | | | | 5,312,016 | | | |
| | | | | |
| | | |
| |
|
| Consumer Products (3.5%) |
| Gillette Co. (The) | | | 29,800 | | | | 1,236,104 | | | |
| | | | | |
| | | |
| |
|
| Financial Services (11.6%) |
| Ameritrade Holding Corp. (b) | | | 53,650 | | | | 698,523 | | | |
| Capital One Financial Corp. | | | 26,890 | | | | 1,983,407 | | | |
| Franklin Resources, Inc. | | | 23,560 | | | | 1,428,207 | | | |
| | | | | |
| | | |
| |
| | | | | | | | 4,110,137 | | | |
| | | | | |
| | | |
| |
|
| Healthcare (11.4%) |
| Eyetech Pharmaceuticals, Inc. (b) | | | 16,950 | | | | 719,358 | | | |
| Gilead Sciences, Inc. (b) | | | 22,710 | | | | 786,447 | | | |
| St. Jude Medical, Inc. (b) | | | 16,200 | | | | 1,240,434 | | | |
| UnitedHealth Group, Inc. | | | 17,130 | | | | 1,240,212 | | | |
| | | | | |
| | | |
| |
| | | | | | | | 3,986,451 | | | |
| | | | | |
| | | |
| |
|
| Hotels & Casinos (4.2%) |
| Marriott International, Inc., Class A | | | 27,060 | | | | 1,474,499 | | | |
| | | | | |
| | | |
| |
|
| Insurance (2.5%) |
| Allstate Corp. (The) | | | 18,190 | | | | 874,757 | | | |
| | | | | |
| | | |
| |
|
| Manufacturing (10.2%) |
| Danaher Corp. | | | 22,490 | | | | 1,239,873 | | | |
| Textron, Inc. | | | 16,650 | | | | 1,134,698 | | | |
| Tyco International Ltd. | | | 39,200 | | | | 1,221,080 | | | |
| | | | | |
| | | |
| |
| | | | | | | | 3,595,651 | | | |
| | | | | |
| | | |
| |
|
| Oil & Gas (6.9%) |
| Nabors Industries Ltd. (b) | | | 24,550 | | | | 1,205,896 | | | |
| Praxair, Inc. | | | 28,390 | | | | 1,198,058 | | | |
| | | | | |
| | | |
| |
| | | | | | | | 2,403,954 | | | |
| | | | | |
| | | |
| |
|
| Radio (2.0%) |
| XM Satellite Radio Holdings, Inc. (b) | | | 21,300 | | | | 688,416 | | | |
| | | | | |
| | | |
| |
|
| Retail (10.1%) |
| Best Buy Co., Inc. | | | 13,100 | | | | 775,782 | | | |
| Kohl’s Corp. (b) | | | 29,900 | | | | 1,517,724 | | | |
| Target Corp. | | | 24,670 | | | | 1,233,993 | | | |
| | | | | |
| | | |
| |
| | | | | | | | 3,527,499 | | | |
| | | | | |
| | | |
| |
|
| Semiconductors (9.1%) |
| Lam Research Corp. (b) | | | 34,400 | | | | 895,432 | | | |
| QLogic Corp. (b) | | | 37,020 | | | | 1,203,150 | | | |
| Texas Instruments, Inc. | | | 44,050 | | | | 1,077,023 | | | |
| | | | | |
| | | |
| |
| | | | | | | | 3,175,605 | | | |
| | | | | |
| | | |
| |
|
| Telecommunications (3.6%) |
| Juniper Networks, Inc. (b) | | | 47,280 | | | | 1,258,121 | | | |
| | | | | |
| | | |
| |
| Total Common Stocks | | | 33,714,722 | | | |
| | | | | |
| | | |
| |
Repurchase Agreements (4.4%) |
CS First Boston, 1.75%, dated 10/29/04, due 11/01/04, repurchase price $637,287
(Fully collateralized by U.S. Agency Securities & U.S. Treasury Notes) | | $ | 637,195 | | | | 637,195 | | | |
| Nomura Securities, 1.75%, dated 10/29/04, due 11/01/04, repurchase price $890,444 (Fully collateralized by AA Rated Corporate Bonds & U.S. Agency Securities) | | | 890,314 | | | | 890,314 | | | |
| | | | | |
| | | |
| |
| Total Repurchase Agreements | | | 1,527,509 | | | |
| | | | | |
| | | |
| |
Short-Term Securities Held as Collateral for Securities Lending (8.5%) |
| Pool of short-term securities for Gartmore Mutual Funds — footnote 2 (Securities Lending) | | | 2,999,835 | | | | 2,999,835 | | | |
| | | | | |
| | | |
| |
Total Short-Term Securities Held as Collateral
for Securities Lending | | | 2,999,835 | | | |
| | | | | |
| | | |
| |
| Total Investments (Cost $35,480,743) (a) — 108.9% | | | 38,242,066 | | | |
| Liabilities in excess of other assets — (8.9)% | | | (3,153,951) | | | |
| | | | | |
| | | |
| |
| NET ASSETS — 100.0% | | $ | 35,088,115 | | | |
| | | | | |
| | | |
| | |
| (a) | | See notes to financial statements for tax unrealized appreciation (depreciation) of securities. |
| |
| (b) | | Denotes a non-income producing security. |
ADR American Depositary Receipt
FR France
See notes to financial statements.
60 Annual Report 2004
Leadership Series
| |
| | Gartmore Worldwide Leaders Fund |
For the annual period ended Oct. 31, 2004, the Gartmore Worldwide Leaders Fund returned 7.28% (Class A at NAV) versus 13.76% for its benchmark, the Morgan Stanley Capital International (MSCI) World Index. For broader comparison, the average return for the Fund’s Lipper peer category of Global Large-Cap Core Funds was 9.85%.
Through the end of 2003 and the first quarter of 2004, the emerging equity markets continued to outperform the developed equity universe—particularly the Latin American region, which was bolstered by the improving global economic backdrop. An overweight position by the Fund in China and an underweight position in the United States benefited Fund performance. An overweight position by the Fund in Taiwan, however, hurt performance, because the Taiwanese market suffered as a result of a re-emergence of Severe Acute Respiratory Syndrome (SARS), an earthquake and growing political tension with the Chinese mainland.
A combination of surprisingly weak global markets, country allocations, and stock selections was responsible for the Fund’s underperformance during the period. In particular, underperformance in the last two months of 2003 was particularly pronounced, enough to offset the strong three-month run leading up to the close of the reporting period. March and April of 2004 witnessed a setback in the fortunes of global markets. U.S. employment data came in surprisingly weak, and the prospect of global monetary tightening weighed on the markets after the Chinese government implemented measures designed to cool economic growth. These developments particularly upset the emerging markets universe, which underperformed sharply during the second quarter of 2004. The rising oil prices also weighed on a number of markets during the latter half of the reporting period, not the least of which was Japan’s market. The Fund’s Japanese exposure was a major detractor from performance while the Fund’s overweighting of the relatively robust U.K. market added value.
The Fund’s U.S. exposure was markedly positive, not only due to our notable underweight position but also as a result of our particular stock picks. The Fund was underweight in Intel Corp. and Pfizer Inc., both of which lagged the wider market, while we were overweight in market leaders Apple Computer, Inc. and Hilton Hotels Corp., both of which outperformed the market.
At the country level, the Fund’s exposure to Japan had particularly negative impact on Fund performance. Overweighting Japan’s underperforming market detracted from Fund performance, as did our selection of the Japanese stocks, as reflected at the Fund’s stock level, where overweight positions in Kyorin Pharmaceutical Co., Ltd.; UFJ Holdings, Inc.; and Nissan Motor Co., Ltd. were among the weakest performing positions in the Fund.
In terms of sector allocation, the Fund’s underweighting of telecommunications was the biggest detractor from performance. Our selection of stocks in the consumer discretionary sector also was negative for Fund returns; U.S. retailers Netflix, Inc. and The Home Depot, Inc. were among the Fund’s bottom-performing stocks. Overweighting by the Fund to the energy sector, however, paid dividends, as the strengthening oil prices boosted Fund stocks such as ConocoPhillips and The “Shell” Transport and Trading Co., p.l.c., two of the Fund’s overweights.
As of the end of October 2004, the Fund had a reasonably cyclical bias, being notably overweight in the materials sector. This reflects the positive outlook for the sector, which is largely a function of still-buoyant Chinese demand for raw materials. The Fund also has an overweight stance in the energy sector, in a clear bid to leverage the high oil price. The cyclical effect of being overweight in materials, however, is tempered somewhat by an overweight in the more defensive health-care sector, though the Fund is underweight in the pharmaceuticals sub-sector due to concerns about competition.
Portfolio Manager: Neil Rogan
| |
| | Class A: GLLAX |
| | Class B: GLLBX |
| | Class C: GLLCX |
| | Class R: GWLRX |
| | Institutional Service Class: GLLSX |
| | Institutional Class: GWLIX |
2004 Annual Report 61
Leadership Series
Gartmore Worldwide Leaders Fund
Average Annual Total Return
(For periods ended October 31, 2004)
| | | | | | | | | | | |
| | | | One year | | | Inception1 | |
|
| |
| Class A | | without sales charge2 | | | 7.28% | | | | -6.61% | |
| | | with sales charge3 | | | 1.08% | | | | -7.92% | |
|
| Class B | | without sales charge2 | | | 6.57% | | | | -7.27% | |
| | | with sales charge4 | | | 1.57% | | | | -7.72% | |
|
Class C5 | | without sales charge2 | | | 6.39% | | | | -7.18% | |
| | | with sales charge6 | | | 5.39% | | | | -7.18% | |
|
Class R 7,8 | | | | | 7.00% | | | | -7.15% | |
|
| Institutional Class7,9 | | | 7.34% | | | | -6.37% | |
|
| Institutional Service Class7 | | | 7.34% | | | | -6.37% | |
|
All figures showing the effect of a sales charge reflect the maximum charge possible, because it has the most dramatic effect on performance data.
| |
| 1 | Fund commenced operations on August 30, 2000. |
| |
| 2 | These returns do not reflect the effects of sales charges (SC). |
| |
| 3 | A 5.75% front-end sales charge was deducted. |
| |
| 4 | A 5.00% contingent deferred sales charge (CDSC) was deducted. The CDSC declines to 0% after 6 years. |
| |
| 5 | These returns until the creation of Class C shares (3/1/01) include the performance of the Fund’s Class B shares. Excluding the effects of any fee waivers or reimbursements, such prior performance is substantially similar to what Class C shares would have produced because Class C shares invest in the same portfolio of securities as Class B shares and have the same expenses after any fee waivers or reimbursements. For Class C shares returns with sales charges, these returns have been restated for the applicable sales charges. |
| |
| 6 | A CDSC of 1.00% was deducted because it is charged when you sell Class C shares within the first year after purchase. |
| |
| 7 | Not subject to any sales charges. |
| |
| 8 | These returns until the creation of Class R shares (10/1/03) include the performance of the Fund’s Class B shares. The returns have been adjusted for the fact that Class R shares do not have any applicable sales charges but have not been adjusted for the lower expenses applicable to Class R shares. Excluding the effect of any fee waivers or reimbursements, such prior performance is similar to what Class R shares would have produced because the Class R shares invest in the same portfolio of securities as Class B shares. |
| |
| 9 | These returns until the creation of Institutional Class shares (6/29/04) include the performance of the Fund’s Institutional Service shares. The returns have not been adjusted for the lower expenses applicable to Institutional Class shares. Excluding the effect of any fee waivers or reimbursements, such prior performance is similar to what Institutional Class shares would have produced because the Institutional Class shares invest in the same portfolio of securities as Institutional Service shares. |
Performance of a $10,000 Investment
Investment return and principal value will fluctuate, and when redeemed, shares may be worth more or less than original cost. Past performance is no guarantee of future results and does not reflect the deduction of taxes that a shareholder would pay on fund distributions or the redemption of fund shares. Investing in mutual funds involves market risk, including loss of principal. Performance returns assume the reinvestment of all distributions.
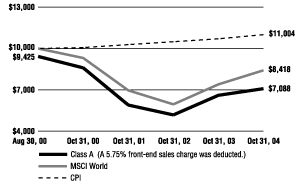
Comparative performance of $10,000 invested in Class A shares of the Gartmore Worldwide Leaders Fund, the Morgan Stanley Capital International World Index (MSCI World)(a), and the Consumer Price Index (CPI)(b) since inception. Unlike the Fund, the returns for these unmanaged indexes do not reflect any fees, expenses, or sales charges. Investors cannot invest directly in market indexes.
| | |
| (a) | | The MSCI World — an unmanaged index of companies whose securities are listed on the stock exchanges of the U.S., Europe, Canada, Australia and the Far East- gives a broad look at how the stock prices of these companies have performed. |
| |
| (b) | | The CPI represents changes in prices of a basket of goods and services purchased for consumption by urban households. |
62 Annual Report 2004
Gartmore Worldwide Leaders Fund
Shareholder
Expense Example
As a shareholder of the Funds, you incur two types of costs: (1) transaction costs, including sales charges (loads) paid on purchase payments and redemption fees; and (2) ongoing costs, including investment advisory fees, administration fees, distribution fees and other Fund expenses. The examples below are intended to help you understand your ongoing costs (in dollars) of investing in the Funds and to compare these costs with the ongoing costs of investing in other mutual funds. The examples assume that you had a $1,000 investment in the Class at the beginning of the reporting period, May 1, 2004, and continued to hold your shares at the end of the reporting period, October 31, 2004. Per SEC requirements, the examples are based on an investment of $1,000 invested at the beginning of the period and held for the entire six-month period ended October 31, 2004.
Actual Expenses
For each Class of the Fund in the table below, the first line provides information about actual account values and actual expenses. You may use the information in this line, together with the amount you invested, to estimate the expenses that you paid over the period. Simply divide your account value by $1,000 (for example, an $8,600 account value divided by $1,000 = 8.6), then multiply the result by the number in the first line of each Class under the heading entitled “Expenses Paid During Period” to estimate the expenses you paid on your account during the period.
Hypothetical Example for Comparison Purposes
The second line of each Class in the table below provides information about hypothetical account values and hypothetical expenses based on the Class’ actual expense ratio and an assumed rate of return of 5% per year before expenses, which is not the Class’ actual return. The hypothetical account values and expenses may not be used to estimate the actual ending account balance or expenses you paid for the period. You may use this information to compare the ongoing costs of investing in the Class of the Fund and other funds. To do so, compare this 5% hypothetical example with the 5% hypothetical examples that appear in the shareholder reports of the other funds.
Please note that the expenses shown in the table are meant to highlight your ongoing costs only and do not reflect any transaction costs, such as sales charges (loads) or redemption fees. Therefore, the second line for each Class in the table is useful in comparing ongoing costs only, and will not help you determine the relative total costs of owning different funds. In addition, if these transaction costs were included, your costs would have been higher. The examples also assume all dividends and distributions have been reinvested.
Schedule of Shareholder Expenses
Expense Analysis of a $1,000 Investment
(October 31, 2004)
| | | | | | | | | | | | | | | | | | | | | | | |
| | | | Beginning | | | Ending | | | | | | | |
| | | | Account Value | | | Account Value | | | Expenses Paid | | | Annualized | | | |
| Worldwide Leaders Fund | | | | 5/1/04 | | | 10/31/04 | | | During Period* | | | Expense Ratio | | | |
|
|
| Class A | | | Actual | | | $ | 1,000 | | | $ | 1,056 | | | $ | 8.79 | | | | 1.70% | | | |
| | | | Hypothetical | 1 | | $ | 1,000 | | | $ | 1,016 | | | $ | 8.65 | | | | 1.70% | | | |
|
| Class B | | | Actual | | | $ | 1,000 | | | $ | 1,052 | | | $ | 12.38 | | | | 2.40% | | | |
| | | | Hypothetical | 1 | | $ | 1,000 | | | $ | 1,013 | | | $ | 12.22 | | | | 2.40% | | | |
|
| Class C | | | Actual | | | $ | 1,000 | | | $ | 1,052 | | | $ | 12.38 | | | | 2.40% | | | |
| | | | Hypothetical | 1 | | $ | 1,000 | | | $ | 1,013 | | | $ | 12.22 | | | | 2.40% | | | |
|
| Class R | | | Actual | | | $ | 1,000 | | | $ | 1,055 | | | $ | 9.76 | | | | 1.89% | | | |
| | | | Hypothetical | 1 | | $ | 1,000 | | | $ | 1,015 | | | $ | 9.62 | | | | 1.89% | | | |
|
| Institutional Service Class | | | Actual | | | $ | 1,000 | | | $ | 1,056 | | | $ | 8.53 | | | | 1.65% | | | |
| | | | Hypothetical | 1 | | $ | 1,000 | | | $ | 1,017 | | | $ | 8.40 | | | | 1.65% | | | |
|
| Institutional Class (a) | | | Actual | | | $ | 1,000 | | | $ | 1,051 | | | $ | 4.86 | (b) | | | 1.40% | | | |
| | | | Hypothetical | 1 | | $ | 1,000 | | | $ | 1,010 | | | $ | 4.78 | (b) | | | 1.40% | | | |
|
| | |
| (a) | | For the period from June 29, 2004 (commencement of operations) through October 31, 2004. |
| |
| (b) | | Expense are equal to the Fund’s annualized expense ratio multiplied by the average account value over the period multiplied by 124/366 (to reflect the period). |
| |
| * | Expenses are equal to the Fund’s annualized expense ratio multiplied by the average account value over the period multiplied by 184/366 (to reflect the one-half year period). |
1 Represents the hypothetical 5% annual return before expenses.
2004 Annual Report 63
Gartmore Worldwide Leaders Fund
Leadership Series
| |
| | Portfolio Summary |
| | (October 31, 2004) |
The SEC adopted a requirement that Funds present their portfolio holdings in a table, chart or graph format in their annual and semiannual reports to shareholders, whether or not a schedule of investments is utilized. The following tables, which present portfolio holdings as a percentage of net assets, are provided in compliance with this requirement.
| | | | | | | |
| Asset Allocation | | | | |
|
|
| Common Stocks | | | 95.0% | | | |
| Repurchase Agreements | | | 9.4% | | | |
| Other Investments* | | | 4.2% | | | |
| Other Liabilities in excess of Assets** | | | -8.6% | | | |
| | |
| | | |
| | | | 100.0% | | | |
| |
| * | Includes value of collateral received from securities lending. |
| |
| ** | Includes value of collateral owed from securities lending. |
| | | | | | | |
| Top Countries | | | | |
|
|
| United States | | | 39.6% | | | |
| United Kingdom | | | 17.4% | | | |
| Japan | | | 10.7% | | | |
| Australia | | | 8.6% | | | |
| Germany | | | 6.0% | | | |
| Italy | | | 4.4% | | | |
| Switzerland | | | 3.8% | | | |
| South Korea | | | 2.9% | | | |
| Hong Kong | | | 1.6% | | | |
| Other Countries | | | 5.0% | | | |
| | |
| | | |
| | | | 100.0% | | | |
| | | | | | | |
| Top Holdings | | | | |
|
|
| ConocoPhillips | | | 4.4% | | | |
| Apple Computer, Inc. | | | 4.4% | | | |
| HSBC Holdings PLC | | | 4.3% | | | |
| Autostrade SPA | | | 4.2% | | | |
| Hilton Hotels Corp. | | | 4.1% | | | |
| Gillette Co. (The) | | | 4.0% | | | |
| Shell Transport & Trading Co. PLC | | | 3.9% | | | |
| BHP Billiton PLC | | | 3.8% | | | |
| Computershare Ltd. | | | 3.7% | | | |
| Roche Holding AG | | | 3.7% | | | |
| Other Holdings | | | 59.5% | | | |
| | |
| | | |
| | | | 100.0% | | | |
64 Annual Report 2004
Statement of Investments
October 31, 2004
Gartmore Worldwide Leaders Fund
| | | | | | | | | | | |
|
| Common Stocks (95.0%) |
|
| | Shares or | | | |
| | Principal Amount | | | Value | | | |
|
| AUSTRALIA (8.6%) |
| Computer Software & Services (3.8%) |
| Computershare Ltd. (c) | | | 319,400 | | | $ | 1,247,665 | | | |
| | | | | |
| | | |
| |
| Multimedia (1.3%) |
| News Corp. Ltd. (The) ADR | | | 13,000 | | | | 408,720 | | | |
| | | | | |
| | | |
| |
| Telecommunications (3.5%) |
| Telstra Corp. Ltd. (c) | | | 323,000 | | | | 1,125,305 | | | |
| | | | | |
| | | |
| |
| | | | | | | | 2,781,690 | | | |
| | | | | |
| | | |
| |
|
| GERMANY (6.0%) |
| Chemicals (3.1%) |
| BASF AG (c) | | | 15,600 | | | | 977,066 | | | |
| | | | | |
| | | |
| |
| Manufacturing (2.9%) |
| Siemens AG (c) | | | 12,700 | | | | 947,460 | | | |
| | | | | |
| | | |
| |
| | | | | | | | 1,924,526 | | | |
| | | | | |
| | | |
| |
|
| HONG KONG (1.6%) |
| Chemicals (0.6%) |
| Kingboard Chemical Holdings Ltd. (c) | | | 96,000 | | | | 201,383 | | | |
| | | | | |
| | | |
| |
| Textiles (1.0%) |
| Fountain Set Holdings Ltd. (c) | | | 422,000 | | | | 317,935 | | | |
| | | | | |
| | | |
| |
| | | | | | | | 519,318 | | | |
| | | | | |
| | | |
| |
|
| ITALY (4.4%) |
| Public Thoroughfares (4.4%) |
| Autostrade SPA (c) | | | 64,494 | | | | 1,408,966 | | | |
| | | | | |
| | | |
| |
|
| JAPAN (10.7%) |
| Electronics (2.0%) |
| Rohm Co. Ltd. (c) | | | 6,200 | | | | 634,568 | | | |
| | | | | |
| | | |
| |
| Financial Services (6.8%) |
| Credit Saison Co. Ltd. (c) | | | 25,900 | | | | 826,998 | | | |
| Shinsei Bank Ltd. (c) | | | 104,000 | | | | 677,585 | | | |
| Sumitomo Mitsui Financial Group, Inc. (c) | | | 104 | | | | 675,307 | | | |
| | | | | |
| | | |
| |
| | | | | | | | 2,179,890 | | | |
| | | | | |
| | | |
| |
| Real Estate (1.9%) |
| Mitsui Fudosan Co. Ltd. (c) | | | 59,000 | | | | 625,026 | | | |
| | | | | |
| | | |
| |
| | | | | | | | 3,439,484 | | | |
| | | | | |
| | | |
| |
|
| SOUTH KOREA (2.9%) |
| Electronics (2.9%) |
| Hynix Semiconductor, Inc. (b) (c) | | | 83,000 | | | | 941,945 | | | |
| | | | | |
| | | |
| |
|
| SWITZERLAND (3.8%) |
| Pharmaceuticals (3.8%) |
| Roche Holding AG (c) | | | 12,100 | | | | 1,234,865 | | | |
| | | | | |
| | | |
| |
|
| UNITED KINGDOM (17.4%) |
| Banking (4.5%) |
| HSBC Holdings PLC (c) | | | 89,000 | | | | 1,435,781 | | | |
| | | | | |
| | | |
| |
| Gas & Electric Utility (2.1%) |
| International Power PLC (b) (c) | | | 234,000 | | | | 690,916 | | | |
| | | | | |
| | | |
| |
| Mining (6.4%) |
| BHP Billiton PLC (c) | | | 125,000 | | | | 1,270,145 | | | |
| Rio Tinto PLC (c) | | | 30,000 | | | | 787,034 | | | |
| | | | | |
| | | |
| |
| | | | | | | | 2,057,179 | | | |
| | | | | |
| | | |
| |
| Oil & Gas (4.1%) |
| Shell Transport & Trading Co. PLC (c) | | | 168,000 | | | | 1,323,019 | | | |
| | | | | |
| | | |
| |
| Water & Sewerage Services (0.3%) |
| Pennon Group PLC (c) | | | 5,683 | | | | 95,909 | | | |
| | | | | |
| | | |
| |
| | | | | | | | 5,602,804 | | | |
| | | | | |
| | | |
| |
|
| UNITED STATES (39.6%) |
| Computer Software & Services (2.6%) |
| Adobe Systems, Inc. | | | 14,800 | | | | 829,244 | | | |
| | | | | |
| | | |
| |
| Computers (4.6%) |
| Apple Computer, Inc. (b) | | | 28,400 | | | | 1,491,852 | | | |
| | | | | |
| | | |
| |
| Cosmetics & Toiletries (9.3%) |
| Colgate-Palmolive Co. | | | 11,000 | | | | 490,820 | | | |
| Gillette Co. (The) | | | 32,000 | | | | 1,327,361 | | | |
| Procter & Gamble Co. | | | 23,700 | | | | 1,212,966 | | | |
| | | | | |
| | | |
| |
| | | | | | | | 3,031,147 | | | |
| | | | | |
| | | |
| |
| Financial Services (2.0%) |
| J.P. Morgan Chase & Co. | | | 16,600 | | | | 640,760 | | | |
| | | | | |
| | | |
| |
| Hotels & Motels (4.3%) |
| Hilton Hotels Corp. | | | 69,900 | | | | 1,391,010 | | | |
| | | | | |
| | | |
| |
| Investment Advisory Services (3.6%) |
| Franklin Resources, Inc. | | | 19,100 | | | | 1,157,842 | | | |
| | | | | |
| | | |
| |
| Motion Pictures & Services (0.3%) |
| Dreamworks Animation SKG, Inc. (b) | | | 2,640 | | | | 103,092 | | | |
| | | | | |
| | | |
| |
| Oil & Gas (6.7%) |
| ConocoPhillips | | | 17,800 | | | | 1,500,718 | | | |
| EOG Resources, Inc. | | | 9,900 | | | | 658,944 | | | |
| | | | | |
| | | |
| |
| | | | | | | | 2,159,662 | | | |
| | | | | |
| | | |
| |
| Retail (3.1%) |
| Target Corp. | | | 19,800 | | | | 990,396 | | | |
| | | | | |
| | | |
| |
| Telecommunications (3.1%) |
| Sprint Corp. | | | 47,400 | | | | 993,030 | | | |
| | | | | |
| | | |
| |
| | | | | | | | 12,788,035 | | | |
| | | | | |
| | | |
| |
| Total Common Stocks | | $ | 30,641,633 | | | |
| | | | | |
| | | |
2004 Annual Report 65
| |
| | Statement of Investments (Continued) |
| | October 31, 2004 |
Gartmore Worldwide Leaders Fund (Continued)
Leadership Series
| | | | | | | | | | | |
|
| Repurchase Agreements (9.4%) |
|
| | Shares or | | | |
| | Principal Amount | | | Value | | | |
|
| CS First Boston, 1.75%, dated 10/29/04, due 11/01/04, repurchase price $1,258,140 (Fully collateralized by U.S. Agencies and Treasury Notes) | | $ | 1,257,956 | | | $ | 1,257,956 | | | |
| Nomura Securities, 1.75%, dated 10/29/04, due 11/01/04, repurchase price $1,757,925 (Fully collateralized by AA Corporate Bonds and U.S. Agencies) | | | 1,757,669 | | | | 1,757,669 | | | |
| | | | | |
| | | |
| |
| Total Repurchase Agreements | | | 3,015,625 | | | |
| | | | | |
| | | |
| | | | | | | | | | | |
|
| Short-Term Securities Held as Collateral for Securities Lending (4.2%) |
|
| | Shares or | | | |
| | Principal Amount | | | Value | | | |
|
| Pool of short-term securities for Gartmore Mutual Funds - footnote 2 (Securities Lending) | | $ | 1,346,411 | | | | 1,346,411 | | | |
| | | | | |
| | | |
| |
| Total Short-Term Securities Held as Collateral for Securities Lending | | | 1,346,411 | | | |
| | | | | |
| | | |
| |
| Total Investments (Cost $33,015,401) (a) — 108.6% | | | 35,003,669 | | | |
| Liabilities in excess of other assets — (8.6)% | | | (2,774,591) | | | |
| | | | | |
| | | |
| |
| NET ASSETS — 100.0% | | $ | 32,229,078 | | | |
| | | | | |
| | | |
| | |
| (a) | | See notes to financial statements for tax unrealized appreciation (depreciation) of securities. |
| |
| (b) | | Denotes a non-income producing security. |
| |
| (c) | | Fair Valued security. |
ADR American Depositary Receipt
See notes to financial statements.
66 Annual Report 2004
Statements of Assets and Liabilities
October 31, 2004
| | | | | | | | | | | | | | | | | | | |
| | Gartmore | | | Gartmore | | | Gartmore | | | Gartmore | |
| | Mid Cap Growth | | | Nationwide | | | U.S. Growth | | | Worldwide | |
| | Leaders Fund | | | Leaders Fund | | | Leaders Fund | | | Leaders Fund | |
|
|
| |
Assets: | | | | | | | | | | | | | | | | |
| Investments, at value (cost $20,148,835; $4,069,898; $33,953,234; $29,999,776 respectively) | | $ | 20,987,413 | | | $ | 4,382,511 | | | $ | 36,714,557 | | | $ | 31,988,044 | |
| Repurchase agreements, at cost | | | — | | | | 255,547 | | | | 1,527,509 | | | | 3,015,625 | |
| | |
| |
| |
| |
| | | Total Investments | | | 20,987,413 | | | | 4,638,058 | | | | 38,242,066 | | | | 35,003,669 | |
| | |
| |
| |
| |
| Cash | | | 4,964 | | | | — | | | | — | | | | 772 | |
| Foreign currency, at value (cost $0; $0; $0 and $271; respectively) | | | — | | | | — | | | | — | | | | 270 | |
| Interest and dividends receivable | | | 551 | | | | 2,485 | | | | 9,340 | | | | 50,511 | |
| Receivable for investments sold | | | 866,616 | | | | 65,397 | | | | 2,705,682 | | | | 152,221 | |
| Unrealized appreciation on forward foreign currency contracts | | | — | | | | — | | | | — | | | | 1,939 | |
| Receivable from adviser | | | 22,644 | | | | 6,047 | | | | 5,087 | | | | 25,101 | |
| Reclaims receivable | | | — | | | | — | | | | — | | | | 15,351 | |
| Prepaid expenses and other assets | | | 12,857 | | | | 13,068 | | | | 28,849 | | | | 28,699 | |
| | |
| |
| |
| |
| | | Total Assets | | | 21,895,045 | | | | 4,725,055 | | | | 40,991,024 | | | | 35,278,533 | |
| | |
| |
| |
| |
Liabilities: | | | | | | | | | | | | | | | | |
| Payable for investments purchased | | | 1,111,468 | | | | 80,217 | | | | 2,828,476 | | | | 1,638,968 | |
| Payable for capital shares redeemed | | | — | | | | — | | | | 3,937 | | | | — | |
| Payable for return of collateral received for securities on loan | | | 711,475 | | | | — | | | | 2,999,835 | | | | 1,346,411 | |
| Accrued expenses and other payables | | | | | | | | | | | | | | | | |
| | Investment advisory fees | | | 13,364 | | | | 3,082 | | | | 42,911 | | | | 24,269 | |
| | Fund administration and transfer agent fees | | | 11,264 | | | | 1,247 | | | | 5,099 | | | | 14,471 | |
| | Distribution fees | | | 4,044 | | | | 975 | | | | 9,678 | | | | 6,551 | |
| | Administrative servicing fees | | | 285 | | | | 400 | | | | 11,739 | | | | 11,256 | |
| | Other | | | 14,975 | | | | 557 | | | | 1,234 | | | | 7,529 | |
| | |
| |
| |
| |
| | | Total Liabilities | | | 1,866,875 | | | | 86,478 | | | | 5,902,909 | | | | 3,049,455 | |
| | |
| |
| |
| |
Net Assets | | $ | 20,028,170 | | | $ | 4,638,577 | | | $ | 35,088,115 | | | $ | 32,229,078 | |
| | |
| |
| |
| |
Represented by: | | | | | | | | | | | | | | | | |
| Capital | | $ | 55,042,670 | | | $ | 4,029,578 | | | $ | 32,848,490 | | | $ | 74,892,732 | |
| Accumulated net investment income (loss) | | | — | | | | — | | | | — | | | | 118,314 | |
| Accumulated net realized gains (losses) from investment, futures, short sales, and foreign currency transactions | | | (35,853,078 | ) | | | 296,386 | | | | (521,698 | ) | | | (44,773,106 | ) |
| Net unrealized appreciation (depreciation) on investments and translation of assets and liabilities denominated in foreign currencies | | | 838,578 | | | | 312,613 | | | | 2,761,323 | | | | 1,991,138 | |
| | |
| |
| |
| |
Net Assets | | $ | 20,028,170 | | | $ | 4,638,577 | | | $ | 35,088,115 | | | $ | 32,229,078 | |
| | |
| |
| |
| |
Net Assets: | | | | | | | | | | | | | | | | |
| Class A Shares | | $ | 5,768,818 | | | $ | 1,445,458 | | | $ | 21,272,881 | | | $ | 30,706,545 | |
| Class B Shares | | | 3,323,805 | | | | 409,754 | | | | 2,572,272 | | | | 122,004 | |
| Class C Shares | | | 76,623 | | | | 403,818 | | | | 3,999,718 | | | | 24,896 | |
| Class D Shares | | | 10,856,861 | | | | — | | | | — | | | | — | |
| Class R Shares | | | 1,018 | | | | 1,126 | | | | 1,105 | | | | 1,120 | |
| Institutional Services Class Shares | | | — | | | | 2,377,392 | | | | 7,008,419 | | | | 1,373,462 | |
| Institutional Class Shares | | | 1,045 | | | | 1,029 | | | | 233,720 | | | | 1,051 | |
| | |
| |
| |
| |
| Total | | $ | 20,028,170 | | | $ | 4,638,577 | | | $ | 35,088,115 | | | $ | 32,229,078 | |
| | |
| |
| |
| |
Shares outstanding (unlimited number of shares authorized) | | | | | | | | | | | | | | | | |
| Class A Shares | | | 500,944 | | | | 115,248 | | | | 2,505,467 | | | | 4,085,370 | |
| Class B Shares | | | 309,447 | | | | 33,271 | | | | 312,239 | | | | 16,713 | |
| Class C Shares | | | 7,128 | | | | 32,792 | | | | 482,660 | | | | 3,395 | |
| Class D Shares | | | 925,456 | | | | — | | | | — | | | | — | |
| Class R Shares | | | 87 | | | | 91 | | | | 134 | | | | 153 | |
| Institutional Services Class Shares | | | — | | | | 189,152 | | | | 815,988 | | | | 180,814 | |
| Institutional Class Shares | | | 89 | | | | 82 | | | | 27,200 | | | | 138 | |
| | |
| |
| |
| |
| Total | | | 1,743,151 | | | | 370,636 | | | | 4,143,688 | | | | 4,286,583 | |
| | |
| |
| |
| |
Net asset value: | | | | | | | | | | | | | | | | |
| Class A Shares | | $ | 11.52 | | | $ | 12.54 | | | $ | 8.49 | | | $ | 7.52 | |
| Class B Shares (a) | | $ | 10.74 | | | $ | 12.32 | | | $ | 8.24 | | | $ | 7.30 | |
| Class C Shares (b) | | $ | 10.75 | | | $ | 12.31 | | | $ | 8.29 | | | $ | 7.33 | |
| Class D Shares | | $ | 11.73 | | | $ | — | | | $ | — | | | $ | — | |
| Class R Shares | | $ | 11.68 | | | $ | 12.37 | | | $ | 8.27 | | | $ | 7.33 | |
| Institutional Services Class Shares | | $ | — | | | $ | 12.57 | | | $ | 8.59 | | | $ | 7.60 | |
| Institutional Class Shares | | $ | 11.73 | | | $ | 12.58 | | | $ | 8.59 | | | $ | 7.60 | |
Maximum offering price per share (100%/(100%-maximum sales charge) of net asset value adjusted to the nearest cent) | | | | | | | | | | | | | | | | |
| Class A Shares | | $ | 12.22 | | | $ | 13.31 | | | $ | 9.01 | | | $ | 7.98 | |
| Class D Shares | | $ | 12.28 | | | $ | — | | | $ | — | | | $ | — | |
| | |
| |
| |
| |
| Maximum Sales Charge — Class A Shares | | | 5.75 | % | | | 5.75 | % | | | 5.75 | % | | | 5.75 | % |
| | |
| |
| |
| |
| Maximum Sales Charge — Class D Shares | | | 4.50 | % | | | — | | | | — | | | | — | |
| | |
| |
| |
| |
|
| | |
| (a) | | For Class B shares, the redemption price per share varies by length of time shares are held. |
| (b) | | For Class C shares, the redemption price per share is reduced by 1.00% for shares held less than one year. |
See notes to financial statements.
2004 Annual Report 67
Leadership Series
| |
| | Statements of Operations |
| | For the Year Ended October 31, 2004 |
| | | | | | | | | | | | | | | | | | |
| | Gartmore | | | Gartmore | | | Gartmore | | | Gartmore | |
| | Mid Cap Growth | | | Nationwide | | | U.S. Growth | | | Worldwide | |
| | Leaders Fund | | | Leaders Fund | | | Leaders Fund | | | Leaders Fund | |
|
|
| |
INVESTMENT INCOME: | | | | | | | | | | | | | | | | |
| Interest income | | $ | 4,251 | | | $ | 1,586 | | | $ | 12,903 | | | $ | 5,930 | |
| Dividend income (net of foreign withholding tax of $0; $0; $0 and $44,267; respectively) | | | 101,536 | | | | 48,051 | | | | 152,289 | | | | 748,925 | |
| Income from securities lending | | | 7,422 | | | | — | | | | 3,377 | | | | 4,505 | |
| | |
| |
| |
| |
| | Total Income | | | 113,209 | | | | 49,637 | | | | 168,569 | | | | 759,360 | |
| | |
| |
| |
| |
Expenses: | | | | | | | | | | | | | | | | |
| Investment advisory fees | | | 183,545 | | | | 37,513 | | | | 309,373 | | | | 330,068 | |
| Fund administration and transfer agent fees | | | 48,665 | | | | 8,563 | | | | 46,808 | | | | 92,537 | |
| Distribution fees Class A | | | 15,320 | | | | 3,680 | | | | 38,665 | | | | 81,273 | |
| Distribution fees Class B | | | 34,532 | | | | 3,815 | | | | 23,517 | | | | 1,068 | |
| Distribution fees Class C | | | 674 | | | | 3,760 | | | | 30,058 | | | | 229 | |
| Distribution fees Class R | | | 3 | | | | 4 | | | | 4 | | | | 4 | |
| Administrative servicing fees Class A | | | 3,816 | | | | 230 | | | | 13,654 | | | | 15,230 | |
| Administrative servicing fees Class R | | | 2 | | | | 3 | | | | 3 | | | | 3 | |
| Administrative servicing fees Institutional Service Class | | | — | | | | 4,420 | | | | 18,836 | | | | 3,573 | |
| Dividend expense for securities sold short | | | 2 | | | | — | | | | — | | | | — | |
| Registration and filing fees | | | 51,512 | | | | 49,753 | | | | 45,941 | | | | 45,964 | |
| Printing fees | | | 43,118 | | | | 3,328 | | | | 13,536 | | | | 41,291 | |
| Other | | | 21,528 | | | | 2,601 | | | | 6,496 | | | | 18,990 | |
| | |
| |
| |
| |
| | Total expenses before reimbursed expenses | | | 402,717 | | | | 117,670 | | | | 546,891 | | | | 630,230 | |
| Expenses reimbursed | | | (98,160 | ) | | | (49,762 | ) | | | (45,996 | ) | | | (51,866 | ) |
| | |
| |
| |
| |
| | Total Expenses | | | 304,557 | | | | 67,908 | | | | 500,895 | | | | 578,364 | |
| | |
| |
| |
| |
Net Investment Income (Loss) | | | (191,348 | ) | | | (18,271 | ) | | | (332,326 | ) | | | 180,996 | |
| | |
| |
| |
| |
REALIZED/ UNREALIZED GAINS (LOSSES) FROM INVESTMENTS: | | | | | | | | | | | | | | | | |
| Net realized gains (losses) on investment transactions | | | 2,720,348 | | | | 439,268 | | | | (217,369 | ) | | | 2,155,711 | |
| Net realized gains (losses) on short sale transactions | | | (260,103 | ) | | | — | | | | — | | | | — | |
| Net increase from payment by advisor for losses realized on the disposal of investments | | | 14,628 | | | | — | | | | — | | | | — | |
| Net realized gains (losses) on foreign currency transactions | | | — | | | | — | | | | — | | | | (86,054 | ) |
| | |
| |
| |
| |
| Net realized gains (losses) on investment, short sale and foreign currency transactions | | | 2,474,873 | | | | 439,268 | | | | (217,369 | ) | | | 2,069,657 | |
| Net change in unrealized appreciation/depreciation on investments and translation of assets and liabilities denominated in short sales and foreign currencies | | | (1,918,161 | ) | | | (59,891 | ) | | | 1,185,980 | | | | 122,533 | |
| | |
| |
| |
| |
| Net realized/unrealized gains (losses) on investments, short sales and foreign currencies | | | 556,712 | | | | 379,377 | | | | 968,611 | | | | 2,192,190 | |
| | |
| |
| |
| |
CHANGE IN NET ASSETS RESULTING FROM OPERATIONS | | $ | 365,364 | | | $ | 361,106 | | | $ | 636,285 | | | $ | 2,373,186 | |
| | |
| |
| |
| |
|
See notes to financial statements.
68 Annual Report 2004
Statements of Changes in Net Assets
| | | | | | | | | | | | | | | | | |
| | | | |
| | Gartmore Mid Cap Growth Leaders Fund | | | Gartmore Nationwide Leaders Fund | |
| | Year Ended | | | Year Ended | | | Year Ended | | | Year Ended | |
| | October 31, 2004 | | | October 31, 2003 | | | October 31, 2004 | | | October 31, 2003 | |
|
|
| |
| | | | |
FROM INVESTMENT ACTIVITIES: | | | | | | | | | | | | | | | | |
Operations: | | | | | | | | | | | | | | | | |
| Net investment income (loss) | | $ | (191,348 | ) | | $ | (227,519 | ) | | $ | (18,271 | ) | | $ | (5,050 | ) |
| Net realized gains (losses) on investment, short sales and foreign currency transactions | | | 2,474,873 | | | | 2,269,680 | | | | 439,268 | | | | (59,975 | ) |
| Net change in unrealized appreciation/depreciation on investments and translation of assets and liabilities denominated in foreign currencies and short sales | | | (1,918,161 | ) | | | 3,495,835 | | | | (59,891 | ) | | | 582,847 | |
| | |
| |
| |
| |
| Change in net assets resulting from operations | | | 365,364 | | | | 5,537,996 | | | | 361,106 | | | | 517,822 | |
| | |
| |
| |
| |
Distributions to Class A Shareholders from: | | | | | | | | | | | | | | | | |
| Net investment income | | | — | | | | — | | | | — | | | | (3,468 | ) |
Distributions to Class B Shareholders from: | | | | | | | | | | | | | | | | |
| Net investment income | | | — | | | | — | | | | — | | | | (477 | ) |
Distributions to Class C Shareholders from: | | | | | | | | | | | | | | | | |
| Net investment income | | | — | | | | — | | | | — | | | | (368 | ) |
Distributions to Institutional Service Class Shareholders from: | | | | | | | | | | | | | | | | |
| Net investment income | | | — | | | | — | | | | — | | | | (3,660 | ) |
| | |
| |
| |
| |
| Change in net assets from shareholder distributions | | | — | | | | — | | | | — | | | | (7,973 | ) |
| | |
| |
| |
| |
| Change in net assets from capital transactions | | | (2,227,976 | ) | | | (1,768,874 | ) | | | 822,402 | | | | 714,713 | |
| | |
| |
| |
| |
| Change in net assets | | | (1,862,612 | ) | | | 3,769,122 | | | | 1,183,508 | | | | 1,224,562 | |
Net Assets: | | | | | | | | | | | | | | | | |
| Beginning of period | | | 21,890,782 | | | | 18,121,660 | | | | 3,455,069 | | | | 2,230,507 | |
| | |
| |
| |
| |
| End of period | | $ | 20,028,170 | | | $ | 21,890,782 | | | $ | 4,638,577 | | | $ | 3,455,069 | |
| | |
| |
| |
| |
|
See notes to financial statements.
2004 Annual Report 69
Leadership Series
| |
| | Statements of Changes in Net Assets |
| | | | | | | | | | | | | | | | | |
| | | | |
| | Gartmore U.S. Growth Leaders Fund | | | Gartmore Worldwide Leaders Fund | |
| | Year Ended | | | Year Ended | | | Year Ended | | | Year Ended | |
| | October 31, 2004 | | | October 31, 2003 | | | October 31, 2004 | | | October 31, 2003 | |
|
|
| |
FROM INVESTMENT ACTIVITIES: | | | | | | | | | | | | | | | | |
Operations: | | | | | | | | | | | | | | | | |
| Net investment income (loss) | | $ | (332,326 | ) | | $ | (87,378 | ) | | $ | 180,996 | | | $ | (64,310 | ) |
| Net realized gains (losses) on investment and foreign currency transactions | | | (217,369 | ) | | | 2,057,741 | | | | 2,069,657 | | | | 8,003,840 | |
| Net change in unrealized appreciation/ depreciation on investments and translation of assets and liabilities denominated in foreign currencies | | | 1,185,980 | | | | 1,383,567 | | | | 122,533 | | | | (1,598,403 | ) |
| | |
| |
| |
| |
| Change in net assets resulting from operations | | | 636,285 | | | | 3,353,930 | | | | 2,373,186 | | | | 6,341,127 | |
| | |
| |
| |
| |
| Change in net assets from capital transactions | | | 15,543,896 | | | | 12,610,380 | | | | (6,548,427 | ) | | | 26,929,213 | |
| | |
| |
| |
| |
| Change in net assets | | | 16,180,181 | | | | 15,964,310 | | | | (4,175,241 | ) | | | 33,270,340 | |
Net Assets: | | | | | | | | | | | | | | | | |
| Beginning of period | | | 18,907,934 | | | | 2,943,624 | | | | 36,404,319 | | | | 3,133,979 | |
| | |
| |
| |
| |
| End of period | | $ | 35,088,115 | | | $ | 18,907,934 | | | $ | 32,229,078 | | | $ | 36,404,319 | |
| | |
| |
| |
| |
|
See notes to financial statements.
70 Annual Report 2004
Financial Highlights
Selected Data for Each Share of Capital Outstanding
Gartmore Mid Cap Growth Leaders Fund
| | | | | | | | | | | | | | | | | | | | | | | | | | | | | | | | | |
| | | | | | | | | | |
| | | | Investment Activities | | | Distributions | | | | | |
| | | | | | | | | | | | | | |
| | | | | | Net Realized | | | | | | | | | |
| | | | | | and | | | | | | | | | |
| | Net Asset | | | Net | | | Unrealized | | | Total | | | | | | | |
| | Value, | | | Investment | | | Gains | | | from | | | Net | | | | | Net Asset | | | |
| | Beginning | | | Income | | | (Losses) on | | | Investment | | | Investment | | | Total | | | Value, End | | | Total | |
| | of Period | | | (Loss) | | | Investments | | | Activities | | | Income | | | Distributions | | | of Period | | | Return (a) | |
|
|
| |
Class A Shares | | | | | | | | | | | | | | | | | | | | | | | | | | | | | | | | |
| Year Ended October 31, 2000 (d) | | $ | 19.70 | | | | (0.27 | ) | | | 10.63 | | | | 10.36 | | | | (1.37 | ) | | | (1.37 | ) | | $ | 28.69 | | | | 56.20% | |
| Year Ended October 31, 2001 | | $ | 28.69 | | | | (0.16 | ) | | | (15.19 | ) | | | (15.35 | ) | | | (2.41 | ) | | | (2.41 | ) | | $ | 10.93 | | | | (57.29% | ) |
| Year Ended October 31, 2002 | | $ | 10.93 | | | | (0.14 | ) | | | (2.29 | ) | | | (2.43 | ) | | | — | | | | — | | | $ | 8.50 | | | | (22.23% | ) |
| Year Ended October 31, 2003 | | $ | 8.50 | | | | (0.12 | ) | | | 2.92 | | | | 2.80 | | | | — | | | | — | | | $ | 11.30 | | | | 32.94% | |
| Year Ended October 31, 2004 | | $ | 11.30 | | | | (0.12 | ) | | | 0.34 | | | | 0.22 | | | | — | | | | — | | | $ | 11.52 | | | | 1.95% | |
Class B Shares | | | | | | | | | | | | | | | | | | | | | | | | | | | | | | | | |
| Year Ended October 31, 2000 (d) | | $ | 19.44 | | | | (0.42 | ) | | | 10.59 | | | | 10.17 | | | | (1.37 | ) | | | (1.37 | ) | | $ | 28.24 | | | | 55.97% | |
| Year Ended October 31, 2001 | | $ | 28.24 | | | | (0.22 | ) | | | (15.21 | ) | | | (15.43 | ) | | | (2.41 | ) | | | (2.41 | ) | | $ | 10.40 | | | | (58.60% | ) |
| Year Ended October 31, 2002 | | $ | 10.40 | | | | (0.19 | ) | | | (2.18 | ) | | | (2.37 | ) | | | — | | | | — | | | $ | 8.03 | | | | (22.79% | ) |
| Year Ended October 31, 2003 | | $ | 8.03 | | | | (0.18 | ) | | | 2.76 | | | | 2.58 | | | | — | | | | — | | | $ | 10.61 | | | | 32.13% | |
| Year Ended October 31, 2004 | | $ | 10.61 | | | | (0.18 | ) | | | 0.31 | | | | 0.13 | | | | — | | | | — | | | $ | 10.74 | | | | 1.23% | |
Class C Shares | | | | | | | | | | | | | | | | | | | | | | | | | | | | | | | | |
| Period Ended October 31, 2001 (e) | | $ | 13.46 | | | | (0.07 | ) | | | (2.98 | ) | | | (3.05 | ) | | | — | | | | — | | | $ | 10.41 | | | | (22.66% | ) (f) |
| Year Ended October 31, 2002 | | $ | 10.41 | | | | (0.19 | ) | | | (2.18 | ) | | | (2.37 | ) | | | — | | | | — | | | $ | 8.04 | | | | (22.77% | ) |
| Year Ended October 31, 2003 | | $ | 8.04 | | | | (0.16 | ) | | | 2.74 | | | | 2.58 | | | | — | | | | — | | | $ | 10.62 | | | | 32.09% | |
| Year Ended October 31, 2004 | | $ | 10.62 | | | | (0.16 | ) | | | 0.29 | | | | 0.13 | | | | — | | | | — | | | $ | 10.75 | | | | 1.22% | |
Class D Shares | | | | | | | | | | | | | | | | | | | | | | | | | | | | | | | | |
| Year Ended October 31, 2000 | | $ | 19.69 | | | | (0.14 | ) | | | 10.57 | | | | 10.43 | | | | (1.37 | ) | | | (1.37 | ) | | $ | 28.75 | | | | 56.61% | |
| Year Ended October 31, 2001 | | $ | 28.75 | | | | (0.11 | ) | | | (15.20 | ) | | | (15.31 | ) | | | (2.41 | ) | | | (2.41 | ) | | $ | 11.03 | | | | (57.00% | ) |
| Year Ended October 31, 2002 | | $ | 11.03 | | | | (0.11 | ) | | | (2.32 | ) | | | (2.43 | ) | | | — | | | | — | | | $ | 8.60 | | | | (22.03% | ) |
| Year Ended October 31, 2003 | | $ | 8.60 | | | | (0.10 | ) | | | 2.97 | | | | 2.87 | | | | — | | | | — | | | $ | 11.47 | | | | 33.37% | |
| Year Ended October 31, 2004 | | $ | 11.47 | | | | (0.08 | ) | | | 0.34 | | | | 0.26 | | | | — | | | | — | | | $ | 11.73 | | | | 2.27% | |
Class R Shares | | | | | | | | | | | | | | | | | | | | | | | | | | | | | | | | |
| Period Ended October 31, 2004 (h) | | $ | 11.47 | | | | (0.11 | ) | | | 0.32 | | | | 0.21 | | | | — | | | | — | | | $ | 11.68 | | | | 1.83% | (f) |
Institutional Class Shares | | | | | | | | | | | | | | | | | | | | | | | | | | | | | | | | |
| Period Ended October 31, 2004 (i) | | $ | 11.23 | | | | (0.01 | ) | | | 0.51 | | | | 0.50 | | | | — | | | | — | | | $ | 11.73 | | | | 4.45% | (f) |
|
[Additional columns below]
[Continued from above table, first column(s) repeated]
| | | | | | | | | | | | | | | | | | | | | | | | | | | |
| | | | |
| | Ratios / Supplemental Data | | | |
| | | | Ratio of Net | | | | | |
| | | | Ratio of Net | | | Ratio of | | | Investment | | | | | |
| | | | Investment | | | Expenses | | | Income (Loss) | | | | | |
| | Net Assets | | | Ratio of | | | Income | | | (Prior to | | | (Prior to | | | | | |
| | at End of | | | Expenses | | | (Loss) | | | Reimbursements) | | | Reimbursements) | | | | | |
| | Period | | | to Average | | | to Average | | | to Average | | | to Average | | | Portfolio | | | |
| | (000s) | | | Net Assets | | | Net Assets | | | Net Assets (b) | | | Net Assets (b) | | | Turnover (c) | | | |
| | | | |
| | | | |
| |
| | | |
Class A Shares | | | | | | | | | | | | | | | | | | | | | | | | | | |
| Year Ended October 31, 2000 (d) | | $ | 22,612 | | | | 1.47% | | | | (0.95% | ) | | | 1.67% | | | | (1.15% | ) | | | 330.32% | | | |
| Year Ended October 31, 2001 | | $ | 6,601 | | | | 1.63% | | | | (1.00% | ) | | | 2.75% | | | | (2.12% | ) | | | 698.74% | | | |
| Year Ended October 31, 2002 | | $ | 4,880 | | | | 1.59% | | | | (1.27% | ) | | | 2.20% | | | | (1.88% | ) | | | 432.60% | | | |
| Year Ended October 31, 2003 | | $ | 6,441 | | | | 1.55% | | | | (1.27% | ) | | | 1.99% | | | | (1.71% | ) | | | 365.45% | | | |
| Year Ended October 31, 2004 | | $ | 5,769 | | | | 1.50% | | | | (0.97% | ) | | | 1.98% | | | | (1.44% | ) | | | 405.85% | | | |
Class B Shares | | | | | | | | | | | | | | | | | | | | | | | | | | |
| Year Ended October 31, 2000 (d) | | $ | 7,608 | | | | 2.10% | | | | (1.57% | ) | | | 2.35% | | | | (1.82% | ) | | | 330.32% | | | |
| Year Ended October 31, 2001 | | $ | 3,985 | | | | 2.23% | | | | (1.60% | ) | | | 3.67% | | | | (3.04% | ) | | | 698.74% | | | |
| Year Ended October 31, 2002 | | $ | 3,005 | | | | 2.25% | | | | (1.94% | ) | | | 2.90% | | | | (2.59% | ) | | | 432.60% | | | |
| Year Ended October 31, 2003 | | $ | 3,663 | | | | 2.24% | | | | (1.96% | ) | | | 2.68% | | | | (2.40% | ) | | | 365.45% | | | |
| Year Ended October 31, 2004 | | $ | 3,324 | | | | 2.20% | | | | (1.66% | ) | | | 2.67% | | | | (2.13% | ) | | | 405.85% | | | |
Class C Shares | | | | | | | | | | | | | | | | | | | | | | | | | | |
| Period Ended October 31, 2001 (e) | | $ | 52 | | | | 2.23% | (g) | | | (1.76% | ) (g) | | | 4.38% | (g) | | | (3.91% | ) (g) | | | 698.74% | | | |
| Year Ended October 31, 2002 | | $ | 45 | | | | 2.25% | | | | (1.94% | ) | | | 2.90% | | | | (2.59% | ) | | | 432.60% | | | |
| Year Ended October 31, 2003 | | $ | 69 | | | | 2.24% | | | | (1.96% | ) | | | 2.69% | | | | (2.41% | ) | | | 365.45% | | | |
| Year Ended October 31, 2004 | | $ | 77 | | | | 2.20% | | | | (1.65% | ) | | | 2.69% | | | | (2.14% | ) | | | 405.85% | | | |
Class D Shares | | | | | | | | | | | | | | | | | | | | | | | | | | |
| Year Ended October 31, 2000 | | $ | 36,090 | | | | 1.10% | | | | (0.55% | ) | | | 1.30% | | | | (0.75% | ) | | | 330.32% | | | |
| Year Ended October 31, 2001 | | $ | 15,079 | | | | 1.30% | | | | (0.69% | ) | | | 2.51% | | | | (1.90% | ) | | | 698.74% | | | |
| Year Ended October 31, 2002 | | $ | 10,192 | | | | 1.27% | | | | (0.97% | ) | | | 1.90% | | | | (1.60% | ) | | | 432.60% | | | |
| Year Ended October 31, 2003 | | $ | 11,747 | | | | 1.24% | | | | (0.96% | ) | | | 1.69% | | | | (1.40% | ) | | | 365.45% | | | |
| Year Ended October 31, 2004 | | $ | 10,857 | | | | 1.20% | | | | (0.66% | ) | | | 1.67% | | | | (1.13% | ) | | | 405.85% | | | |
Class R Shares | | | | | | | | | | | | | | | | | | | | | | | | | | |
| Period Ended October 31, 2004 (h) | | $ | 1 | | | | 1.72% | (g) | | | (1.16% | ) (g) | | | 2.09% | (g) | | | (1.53% | ) (g) | | | 405.85% | | | |
Institutional Class Shares | | | | | | | | | | | | | | | | | | | | | | | | | | |
| Period Ended October 31, 2004 (i) | | $ | 1 | | | | 1.08% | (g) | | | (0.69% | ) (g) | | | 2.50% | (g) | | | (2.11% | ) (g) | | | 405.85% | | | |
| | | | |
| | |
| (a) | | Excludes sales charge. |
| (b) | | During the period certain fees were waived and/or reimbursed. If such waivers/reimbursements had not occurred, the ratios would have been as indicated. |
| (c) | | Portfolio turnover is calculated on the basis of the Fund as a whole without distinguishing among the classes of shares. |
| (d) | | Net investment income (losses) is based on average shares outstanding during the period. |
| (e) | | For the period from March 1, 2001 (commencement of operations) through October 31, 2001. |
| (f) | | Not annualized. |
| (g) | | Annualized. |
| (h) | | For the period from December 30, 2003 (commencement of operations) through October 31, 2004. |
| (i) | | For the period from September 28, 2004 (commencement of operations) through October 31, 2004. |
See notes to financial statements.
2004 Annual Report 71
| |
| | Financial Highlights |
| | Selected Data for Each Share of Capital Outstanding |
Leadership Series
Gartmore Nationwide Leaders Fund
| | | | | | | | | | | | | | | | | |
| | | | |
| | | | Investment Activities | |
| | | | | | Net Realized | | | |
| | | | | | and | | | |
| | Net Asset | | | Net | | | Unrealized | | | Total | |
| | Value, | | | Investment | | | Gains | | | from | |
| | Beginning | | | Income | | | (Losses) on | | | Investment | |
| | of Period | | | (Loss) | | | Investments | | | Activities | |
|
|
| |
Class A Shares | | | | | | | | | | | | | | | | |
| Period Ended October 31, 2002 (d) | | $ | 10.00 | | | | 0.02 | | | | (0.55 | ) | | | (0.53 | ) |
| Year Ended October 31, 2003 | | $ | 9.46 | | | | — | | | | 1.98 | | | | 1.98 | |
| Year Ended October 31, 2004 | | $ | 11.40 | | | | (0.04 | ) | | | 1.18 | | | | 1.14 | |
Class B Shares | | | | | | | | | | | | | | | | |
| Period Ended October 31, 2002 (d) | | $ | 10.00 | | | | (0.05 | ) | | | (0.55 | ) | | | (0.60 | ) |
| Year Ended October 31, 2003 | | $ | 9.40 | | | | (0.09 | ) | | | 1.97 | | | | 1.88 | |
| Year Ended October 31, 2004 | | $ | 11.27 | | | | (0.12 | ) | | | 1.17 | | | | 1.05 | |
Class C Shares | | | | | | | | | | | | | | | | |
| Period Ended October 31, 2002 (d) | | $ | 10.00 | | | | (0.05 | ) | | | (0.55 | ) | | | (0.60 | ) |
| Year Ended October 31, 2003 | | $ | 9.40 | | | | (0.08 | ) | | | 1.96 | | | | 1.88 | |
| Year Ended October 31, 2004 | | $ | 11.27 | | | | (0.12 | ) | | | 1.16 | | | | 1.04 | |
Class R Shares | | | | | | | | | | | | | | | | |
| Period Ended October 31, 2003 (e) | | $ | 10.98 | | | | (0.01 | ) | | | 0.31 | | | | 0.30 | |
| Year Ended October 31, 2004 | | $ | 11.28 | | | | (0.08 | ) | | | 1.17 | | | | 1.09 | |
Institutional Service Class Shares | | | | | | | | | | | | | | | | |
| Period Ended October 31, 2002 (d) | | $ | 10.00 | | | | 0.03 | | | | (0.55 | ) | | | (0.52 | ) |
| Year Ended October 31, 2003 | | $ | 9.47 | | | | — | | | | 1.99 | | | | 1.99 | |
| Year Ended October 31, 2004 | | $ | 11.42 | | | | (0.03 | ) | | | 1.18 | | | | 1.15 | |
Institutional Class Shares | | | | | | | | | | | | | | | | |
| Period Ended October 31, 2004 (h) | | $ | 12.22 | | | | (0.01 | ) | | | 0.37 | | | | 0.36 | |
|
[Additional columns below]
[Continued from above table, first column(s) repeated]
| | | | | | | | | | | | | | | | | |
| | | | | | |
| | Distributions | | | | | |
| | Net | | | | | Net Asset | | | |
| | Investment | | | Total | | | Value, End | | | Total | |
| | Income | | | Distributions | | | of Period | | | Return (a) | |
| | |
| | |
| |
| |
Class A Shares | | | | | | | | | | | | | | | | |
| Period Ended October 31, 2002 (d) | | | (0.01 | ) | | | (0.01 | ) | | $ | 9.46 | | | | (5.34% | ) (f) |
| Year Ended October 31, 2003 | | | (0.04 | ) | | | (0.04 | ) | | $ | 11.40 | | | | 20.97% | |
| Year Ended October 31, 2004 | | | — | | | | — | | | $ | 12.54 | | | | 10.00% | |
Class B Shares | | | | | | | | | | | | | | | | |
| Period Ended October 31, 2002 (d) | | | — | | | | — | | | $ | 9.40 | | | | (6.00% | ) (f) |
| Year Ended October 31, 2003 | | | (0.01 | ) | | | (0.01 | ) | | $ | 11.27 | | | | 20.08% | |
| Year Ended October 31, 2004 | | | — | | | | — | | | $ | 12.32 | | | | 9.32% | |
Class C Shares | | | | | | | | | | | | | | | | |
| Period Ended October 31, 2002 (d) | | | — | | | | — | | | $ | 9.40 | | | | (6.00% | ) (f) |
| Year Ended October 31, 2003 | | | (0.01 | ) | | | (0.01 | ) | | $ | 11.27 | | | | 20.08% | |
| Year Ended October 31, 2004 | | | — | | | | — | | | $ | 12.31 | | | | 9.32% | |
Class R Shares | | | | | | | | | | | | | | | | |
| Period Ended October 31, 2003 (e) | | | — | | | | — | | | $ | 11.28 | | | | 2.73% | (f) |
| Year Ended October 31, 2004 | | | — | | | | — | | | $ | 12.37 | | | | 9.66% | |
Institutional Service Class Shares | | | | | | | | | | | | | | | | |
| Period Ended October 31, 2002 (d) | | | (0.01 | ) | | | (0.01 | ) | | $ | 9.47 | | | | (5.23% | ) (f) |
| Year Ended October 31, 2003 | | | (0.04 | ) | | | (0.04 | ) | | $ | 11.42 | | | | 21.10% | |
| Year Ended October 31, 2004 | | | — | | | | — | | | $ | 12.57 | | | | 10.07% | |
Institutional Class Shares | | | | | | | | | | | | | | | | |
| Period Ended October 31, 2004 (h) | | | — | | | | — | | | $ | 12.58 | | | | 2.95% | (f) |
| | |
[Additional columns below]
[Continued from above table, first column(s) repeated]
| | | | | | | | | | | | | | | | | | | | | | | | | | | |
| | | | |
| | Ratios / Supplemental Data | | | |
| | | | Ratio of Net | | | | | |
| | | | Ratio of Net | | | Ratio of | | | Investment | | | | | |
| | | | Investment | | | Expenses | | | Income (Loss) | | | | | |
| | Net Assets | | | Ratio of | | | Income | | | (Prior to | | | (Prior to | | | | | |
| | at End of | | | Expenses | | | (Loss) | | | Reimbursements) | | | Reimbursements) | | | | | |
| | Period | | | to Average | | | to Average | | | to Average | | | to Average | | | Portfolio | | | |
| | (000s) | | | Net Assets | | | Net Assets | | | Net Assets (b) | | | Net Assets (b) | | | Turnover (c) | | | |
| | | | |
| | | | |
| |
| | | |
Class A Shares | | | | | | | | | | | | | | | | | | | | | | | | | | |
| Period Ended October 31, 2002 (d) | | $ | 891 | | | | 1.45% | (g) | | | 0.23% | (g) | | | 4.93% | (g) | | | (3.25% | ) (g) | | | 60.54% | | | |
| Year Ended October 31, 2003 | | $ | 1,351 | | | | 1.45% | | | | (0.04% | ) | | | 3.23% | | | | (1.82% | ) | | | 196.86% | | | |
| Year Ended October 31, 2004 | | $ | 1,445 | | | | 1.47% | | | | (0.31% | ) | | | 2.61% | | | | (1.46% | ) | | | 230.95% | | | |
Class B Shares | | | | | | | | | | | | | | | | | | | | | | | | | | |
| Period Ended October 31, 2002 (d) | | $ | 317 | | | | 2.20% | (g) | | | (0.58% | ) (g) | | | 5.78% | (g) | | | (4.16% | ) (g) | | | 60.54% | | | |
| Year Ended October 31, 2003 | | $ | 350 | | | | 2.20% | | | | (0.74% | ) | | | 4.11% | | | | (2.65% | ) | | | 196.86% | | | |
| Year Ended October 31, 2004 | | $ | 410 | | | | 2.20% | | | | (1.05% | ) | | | 3.34% | | | | (2.20% | ) | | | 230.95% | | | |
Class C Shares | | | | | | | | | | | | | | | | | | | | | | | | | | |
| Period Ended October 31, 2002 (d) | | $ | 243 | | | | 2.21% | (g) | | | (0.60% | ) (g) | | | 5.80% | (g) | | | (4.19% | ) (g) | | | 60.54% | | | |
| Year Ended October 31, 2003 | | $ | 358 | | | | 2.20% | | | | (0.82% | ) | | | 3.95% | | | | (2.57% | ) | | | 196.86% | | | |
| Year Ended October 31, 2004 | | $ | 404 | | | | 2.20% | | | | (1.05% | ) | | | 3.34% | | | | (2.20% | ) | | | 230.95% | | | |
Class R Shares | | | | | | | | | | | | | | | | | | | | | | | | | | |
| Period Ended October 31, 2003 (e) | | $ | 1 | | | | 1.80% | (g) | | | (1.11% | ) (g) | | | (1.90% | ) (g) | | | (1.21% | ) (g) | | | 196.86% | | | |
| Year Ended October 31, 2004 | | $ | 1 | | | | 1.81% | | | | (0.69% | ) | | | 2.91% | | | | (1.79% | ) | | | 230.95% | | | |
Institutional Service Class Shares | | | | | | | | | | | | | | | | | | | | | | | | | | |
| Period Ended October 31, 2002 (d) | | $ | 778 | | | | 1.32% | (g) | | | 0.39% | (g) | | | 4.74% | (g) | | | (3.03% | ) (g) | | | 60.54% | | | |
| Year Ended October 31, 2003 | | $ | 1,395 | | | | 1.38% | | | | 0.01% | | | | 3.06% | | | | (1.67% | ) | | | 196.86% | | | |
| Year Ended October 31, 2004 | | $ | 2,377 | | | | 1.41% | | | | (0.27% | ) | | | 2.56% | | | | (1.42% | ) | | | 230.95% | | | |
Institutional Class Shares | | | | | | | | | | | | | | | | | | | | | | | | | | |
| Period Ended October 31, 2004 (h) | | $ | 1 | | | | 1.12% | (g) | | | (0.17% | ) (g) | | | 2.44% | (g) | | | (1.50% | ) (g) | | | 230.95% | | | |
| | | | |
| | |
| (a) | | Excludes sales charge. |
| (b) | | During the period certain fees were waived and/or reimbursed. If such waivers/reimbursements had not occurred, the ratios would have been as indicated. |
| (c) | | Portfolio turnover is calculated on the basis of the Fund as a whole without distinguishing among the classes of shares. |
| (d) | | For the period from December 18, 2001 (commencement of operations) through October 31, 2002. Registration of shares effective with the Securities and Exchange Commission on December 28, 2001. |
| (e) | | For the period from October 1, 2003 (commencement of operations) through October 31, 2003. |
| (f) | | Not annualized. |
| (g) | | Annualized. |
| (h) | | For the period from June 29, 2004 (commencement of operations) through October 31, 2004. |
See notes to financial statements.
72 Annual Report 2004
Financial Highlights
Selected Data for Each Share of Capital Outstanding
Gartmore U.S. Growth Leaders Fund
| | | | | | | | | | | | | | | | | |
| | | | |
| | | | Investment Activities | |
| | | | | | Net Realized | | | |
| | | | | | and | | | |
| | Net Asset | | | Net | | | Unrealized | | | Total | |
| | Value, | | | Investment | | | Gains | | | from | |
| | Beginning | | | Income | | | (Losses) on | | | Investment | |
| | of Period | | | (Loss) | | | Investments | | | Activities | |
|
|
| |
Class A Shares | | | | | | | | | | | | | | | | |
| Period Ended October 31, 2000 (d) | | $ | 10.00 | | | | (0.01 | ) | | | 1.65 | | | | 1.64 | |
| Year Ended October 31, 2001 | | $ | 11.64 | | | | (0.08 | ) | | | (5.13 | ) | | | (5.21 | ) |
| Year Ended October 31, 2002 | | $ | 6.02 | | | | (0.07 | ) | | | (0.46 | ) | | | (0.53 | ) |
| Year Ended October 31, 2003 | | $ | 5.49 | | | | (0.03 | ) | | | 2.76 | | | | 2.73 | |
| Year Ended October 31, 2004 | | $ | 8.22 | | | | (0.07 | ) | | | 0.34 | | | | 0.27 | |
Class B Shares | | | | | | | | | | | | | | | | |
| Period Ended October 31, 2000 (d) | | $ | 10.00 | | | | (0.03 | ) | | | 1.65 | | | | 1.62 | |
| Year Ended October 31, 2001 | | $ | 11.62 | | | | (0.11 | ) | | | (5.14 | ) | | | (5.25 | ) |
| Year Ended October 31, 2002 | | $ | 5.96 | | | | (0.12 | ) | | | (0.44 | ) | | | (0.56 | ) |
| Year Ended October 31, 2003 (f) | | $ | 5.40 | | | | (0.11 | ) | | | 2.74 | | | | 2.63 | |
| Year Ended October 31, 2004 | | $ | 8.03 | | | | (0.13 | ) | | | 0.34 | | | | 0.21 | |
Class C Shares | | | | | | | | | | | | | | | | |
| Period Ended October 31, 2001 (e) | | $ | 6.45 | | | | (0.04 | ) | | | (0.41 | ) | | | (0.45 | ) |
| Year Ended October 31, 2002 (f) | | $ | 6.00 | | | | (0.12 | ) | | | (0.44 | ) | | | (0.56 | ) |
| Year Ended October 31, 2003 (f) | | $ | 5.44 | | | | (0.13 | ) | | | 2.77 | | | | 2.64 | |
| Year Ended October 31, 2004 | | $ | 8.08 | | | | (0.11 | ) | | | 0.32 | | | | 0.21 | |
Class R Shares | | | | | | | | | | | | | | | | |
| Period Ended October 31, 2003 (g) | | $ | 7.49 | | | | (0.01 | ) | | | 0.56 | | | | 0.55 | |
| Year Ended October 31, 2004 | | $ | 8.04 | | | | (0.11 | ) | | | 0.34 | | | | 0.23 | |
Institutional Service Class Shares | | | | | | | | | | | | | | | | |
| Period Ended October 31, 2000 (d) | | $ | 10.00 | | | | — | | | | 1.66 | | | | 1.66 | |
| Year Ended October 31, 2001 | | $ | 11.66 | | | | (0.06 | ) | | | (5.13 | ) | | | (5.19 | ) |
| Year Ended October 31, 2002 (f) | | $ | 6.06 | | | | (0.06 | ) | | | (0.46 | ) | | | (0.52 | ) |
| Year Ended October 31, 2003 | | $ | 5.54 | | | | (0.03 | ) | | | 2.80 | | | | 2.77 | |
| Year Ended October 31, 2004 | | $ | 8.31 | | | | (0.09 | ) | | | 0.37 | | | | 0.28 | |
Institutional Class Shares | | | | | | | | | | | | | | | | |
| Period Ended October 31, 2004 (j) | | $ | 8.62 | | | | (0.02 | ) | | | (0.01 | ) | | | (0.03 | ) |
|
[Additional columns below]
[Continued from above table, first column(s) repeated]
| | | | | | | | | | | | | | | | | |
| | | | | | |
| | Distributions | | | | | |
| | Net | | | | | Net Asset | | | |
| | Realized | | | Total | | | Value, End | | | Total | |
| | Gains | | | Distributions | | | of Period | | | Return (a) | |
| | |
| | |
| |
| |
Class A Shares | | | | | | | | | | | | | | | | |
| Period Ended October 31, 2000 (d) | | | — | | | | — | | | $ | 11.64 | | | | 16.40% | (h) |
| Year Ended October 31, 2001 | | | (0.41 | ) | | | (0.41 | ) | | $ | 6.02 | | | | (45.81% | ) |
| Year Ended October 31, 2002 | | | — | | | | — | | | $ | 5.49 | | | | (8.80% | ) |
| Year Ended October 31, 2003 | | | — | | | | — | | | $ | 8.22 | | | | 49.73% | |
| Year Ended October 31, 2004 | | | — | | | | — | | | $ | 8.49 | | | | 3.28% | |
Class B Shares | | | | | | | | | | | | | | | | |
| Period Ended October 31, 2000 (d) | | | — | | | | — | | | $ | 11.62 | | | | 16.20% | (h) |
| Year Ended October 31, 2001 | | | (0.41 | ) | | | (0.41 | ) | | $ | 5.96 | | | | (46.25% | ) |
| Year Ended October 31, 2002 | | | — | | | | — | | | $ | 5.40 | | | | (9.40% | ) |
| Year Ended October 31, 2003 (f) | | | — | | | | — | | | $ | 8.03 | | | | 48.70% | |
| Year Ended October 31, 2004 | | | — | | | | — | | | $ | 8.24 | | | | 2.62% | |
Class C Shares | | | | | | | | | | | | | | | | |
| Period Ended October 31, 2001 (e) | | | — | | | | — | | | $ | 6.00 | | | | (6.98% | ) (h) |
| Year Ended October 31, 2002 (f) | | | — | | | | — | | | $ | 5.44 | | | | (9.33% | ) |
| Year Ended October 31, 2003 (f) | | | — | | | | — | | | $ | 8.08 | | | | 48.53% | |
| Year Ended October 31, 2004 | | | — | | | | — | | | $ | 8.29 | | | | 2.60% | |
Class R Shares | | | | | | | | | | | | | | | | |
| Period Ended October 31, 2003 (g) | | | — | | | | — | | | $ | 8.04 | | | | 7.34% | (h) |
| Year Ended October 31, 2004 | | | — | | | | — | | | $ | 8.27 | | | | 2.86% | |
Institutional Service Class Shares | | | | | | | | | | | | | | | | |
| Period Ended October 31, 2000 (d) | | | — | | | | — | | | $ | 11.66 | | | | 16.60% | (h) |
| Year Ended October 31, 2001 | | | (0.41 | ) | | | (0.41 | ) | | $ | 6.06 | | | | (45.55% | ) |
| Year Ended October 31, 2002 (f) | | | — | | | | — | | | $ | 5.54 | | | | (8.58% | ) |
| Year Ended October 31, 2003 | | | — | | | | — | | | $ | 8.31 | | | | 50.00% | |
| Year Ended October 31, 2004 | | | — | | | | — | | | $ | 8.59 | | | | 3.37% | |
Institutional Class Shares | | | | | | | | | | | | | | | | |
| Period Ended October 31, 2004 (j) | | | — | | | | — | | | $ | 8.59 | | | | (0.35% | ) (h) |
| | |
[Additional columns below]
[Continued from above table, first column(s) repeated]
| | | | | | | | | | | | | | | | | | | | | | | | | | | |
| | | | |
| | Ratios / Supplemental Data | | | |
| | | | Ratio of Net | | | | | |
| | | | Ratio of Net | | | Ratio of | | | Investment | | | | | |
| | | | Investment | | | Expenses | | | Income (Loss) | | | | | |
| | Net Assets | | | Ratio of | | | Income | | | (Prior to | | | (Prior to | | | | | |
| | at End of | | | Expenses | | | (Loss) | | | Reimbursements) | | | Reimbursements) | | | | | |
| | Period | | | to Average | | | to Average | | | to Average | | | to Average | | | Portfolio | | | |
| | (000s) | | | Net Assets | | | Net Assets | | | Net Assets (b) | | | Net Assets (b) | | | Turnover (c) | | | |
| | | | |
| | | | |
| |
| | | |
Class A Shares | | | | | | | | | | | | | | | | | | | | | | | | | | |
| Period Ended October 31, 2000 (d) | | $ | 1,411 | | | | 1.20% | (i) | | | (0.30% | ) (i) | | | 8.29% | (i) | | | (7.39% | ) (i) | | | 124.62% | | | |
| Year Ended October 31, 2001 | | $ | 1,195 | | | | 1.60% | | | | (1.04% | ) | | | 7.91% | | | | (7.35% | ) | | | 944.67% | | | |
| Year Ended October 31, 2002 | | $ | 1,356 | | | | 1.57% | | | | (1.20% | ) | | | 3.04% | | | | (2.67% | ) | | | 773.95% | | | |
| Year Ended October 31, 2003 | | $ | 8,714 | | | | 1.59% | | | | (1.02% | ) | | | 2.10% | | | | (1.54% | ) | | | 637.45% | | | |
| Year Ended October 31, 2004 | | $ | 21,273 | | | | 1.64% | | | | (1.06% | ) | | | 1.80% | | | | (1.23% | ) | | | 510.91% | | | |
Class B Shares | | | | | | | | | | | | | | | | | | | | | | | | | | |
| Period Ended October 31, 2000 (d) | | $ | 804 | | | | 1.70% | (i) | | | (0.83% | ) (i) | | | 9.20% | (i) | | | (8.33% | ) (i) | | | 124.62% | | | |
| Year Ended October 31, 2001 | | $ | 772 | | | | 2.20% | | | | (1.66% | ) | | | 8.84% | | | | (8.30% | ) | | | 944.67% | | | |
| Year Ended October 31, 2002 | | $ | 719 | | | | 2.26% | | | | (1.89% | ) | | | 3.88% | | | | (3.51% | ) | | | 773.95% | | | |
| Year Ended October 31, 2003 (f) | | $ | 2,023 | | | | 2.30% | | | | (1.72% | ) | | | 2.96% | | | | (2.38% | ) | | | 637.45% | | | |
| Year Ended October 31, 2004 | | $ | 2,572 | | | | 2.30% | | | | (1.71% | ) | | | 2.45% | | | | (1.86% | ) | | | 510.91% | | | |
Class C Shares | | | | | | | | | | | | | | | | | | | | | | | | | | |
| Period Ended October 31, 2001 (e) | | $ | 9 | | | | 2.20% | (i) | | | (1.77% | ) (i) | | | 9.87% | (i) | | | (9.44% | ) (i) | | | 944.67% | | | |
| Year Ended October 31, 2002 (f) | | $ | 16 | | | | 2.27% | | | | (1.89% | ) | | | 3.69% | | | | (3.31% | ) | | | 773.95% | | | |
| Year Ended October 31, 2003 (f) | | $ | 1,606 | | | | 2.30% | | | | (1.76% | ) | | | 2.60% | | | | (2.07% | ) | | | 637.45% | | | |
| Year Ended October 31, 2004 | | $ | 4,000 | | | | 2.30% | | | | (1.74% | ) | | | 2.47% | | | | (1.91% | ) | | | 510.91% | | | |
Class R Shares | | | | | | | | | | | | | | | | | | | | | | | | | | |
| Period Ended October 31, 2003 (g) | | $ | 1 | | | | 1.90% | (i) | | | (1.64% | ) (i) | | | 2.00% | (i) | | | (1.74% | ) (i) | | | 637.45% | | | |
| Year Ended October 31, 2004 | | $ | 1 | | | | 1.89% | | | | (1.33% | ) | | | 2.20% | | | | (1.64% | ) | | | 510.91% | | | |
Institutional Service Class Shares | | | | | | | | | | | | | | | | | | | | | | | | | | |
| Period Ended October 31, 2000 (d) | | $ | 777 | | | | 0.75% | (i) | | | 0.12% | (i) | | | 8.14% | (i) | | | (7.27% | ) (i) | | | 124.62% | | | |
| Year Ended October 31, 2001 | | $ | 449 | | | | 1.30% | | | | (0.75% | ) | | | 7.39% | | | | (6.84% | ) | | | 944.67% | | | |
| Year Ended October 31, 2002 (f) | | $ | 853 | | | | 1.32% | | | | (0.95% | ) | | | 2.52% | | | | (2.15% | ) | | | 773.95% | | | |
| Year Ended October 31, 2003 | | $ | 6,563 | | | | 1.50% | | | | (0.94% | ) | | | 2.00% | | | | (1.44% | ) | | | 637.45% | | | |
| Year Ended October 31, 2004 | | $ | 7,008 | | | | 1.54% | | | | (0.93% | ) | | | 1.68% | | | | (1.08% | ) | | | 510.91% | | | |
Institutional Class Shares | | | | | | | | | | | | | | | | | | | | | | | | | | |
| Period Ended October 31, 2004 (j) | | $ | 234 | | | | 1.30% | (i) | | | (0.83% | ) (i) | | | 1.54% | (i) | | | (1.07% | ) (i) | | | 510.91% | | | |
| | | | |
| | |
| (a) | | Excludes sales charge. |
| (b) | | During the period certain fees were waived and/or reimbursed. If such waivers/reimbursements had not occurred, the ratios would have been as indicated. |
| (c) | | Portfolio turnover is calculated on the basis of the Fund as a whole without distinguishing among the classes of shares. |
| (d) | | For the period from June 30, 2000 (commencement of operations) through October 31, 2000. |
| (e) | | For the period from March 1, 2001 (commencement of operations) through October 31, 2001. |
| (f) | | Net investment income (loss) is based on average shares outstanding during the period. |
| (g) | | For the period from October 1, 2003 (commencement of operations) through October 31, 2003. |
| (h) | | Not annualized. |
| (i) | | Annualized. |
| (j) | | For the period from June 29, 2004 (commencement of operations) through October 31, 2004. |
See notes to financial statements.
2004 Annual Report 73
| |
| | Financial Highlights |
| | Selected Data for Each Share of Capital Outstanding |
Leadership Series
Gartmore Worldwide Leaders Fund
| | | | | | | | | | | | | | | | | |
| | | | |
| | | | Investment Activities | |
| | | | | | Net Realized | | | |
| | | | | | and | | | |
| | Net Asset | | | Net | | | Unrealized | | | Total | |
| | Value, | | | Investment | | | Gains | | | from | |
| | Beginning | | | Income | | | (Losses) on | | | Investment | |
| | of Period | | | (Loss) | | | Investments | | | Activities | |
|
|
| |
Class A Shares | | | | | | | | | | | | | | | | |
| Period Ended October 31, 2000 (d) | | $ | 10.00 | | | | — | | | | (0.88 | ) | | | (0.88 | ) |
| Year Ended October 31, 2001 | | $ | 9.12 | | | | (0.01 | ) | | | (2.85 | ) | | | (2.86 | ) |
| Year Ended October 31, 2002 | | $ | 6.26 | | | | — | | | | (0.76 | ) | | | (0.76 | ) |
| Year Ended October 31, 2003 | | $ | 5.50 | | | | (0.02 | ) | | | 1.53 | | | | 1.51 | |
| Year Ended October 31, 2004 | | $ | 7.01 | | | | 0.05 | | | | 0.46 | | | | 0.51 | |
Class B Shares | | | | | | | | | | | | | | | | |
| Period Ended October 31, 2000 (d) | | $ | 10.00 | | | | — | | | | (0.89 | ) | | | (0.89 | ) |
| Year Ended October 31, 2001 | | $ | 9.11 | | | | (0.06 | ) | | | (2.85 | ) | | | (2.91 | ) |
| Year Ended October 31, 2002 | | $ | 6.20 | | | | (0.04 | ) | | | (0.75 | ) | | | (0.79 | ) |
| Year Ended October 31, 2003 (e) | | $ | 5.41 | | | | (0.04 | ) | | | 1.48 | | | | 1.44 | |
| Year Ended October 31, 2004 | | $ | 6.85 | | | | — | | | | 0.45 | | | | 0.45 | |
Class C Shares | | | | | | | | | | | | | | | | |
| Period Ended October 31, 2001 (f) | | $ | 7.77 | | | | (0.02 | ) | | | (1.52 | ) | | | (1.54 | ) |
| Year Ended October 31, 2002 | | $ | 6.23 | | | | (0.04 | ) | | | (0.75 | ) | | | (0.79 | ) |
| Year Ended October 31, 2003 | | $ | 5.44 | | | | (0.06 | ) | | | 1.51 | | | | 1.45 | |
| Year Ended October 31, 2004 | | $ | 6.89 | | | | — | | | | 0.44 | | | | 0.44 | |
Class R Shares | | | | | | | | | | | | | | | | |
| Period Ended October 31, 2003 (i) | | $ | 6.55 | | | | (0.01 | ) | | | 0.32 | | | | 0.31 | |
| Year Ended October 31, 2004 | | $ | 6.86 | | | | 0.02 | | | | 0.45 | | | | 0.47 | |
Institutional Service Class Shares | | | | | | | | | | | | | | | | |
| Period Ended October 31, 2000 (d) | | $ | 10.00 | | | | 0.01 | | | | (0.89 | ) | | | (0.88 | ) |
| Year Ended October 31, 2001 | | $ | 9.12 | | | | 0.01 | | | | (2.84 | ) | | | (2.83 | ) |
| Year Ended October 31, 2002 | | $ | 6.29 | | | | 0.01 | | | | (0.76 | ) | | | (0.75 | ) |
| Year Ended October 31, 2003 | | $ | 5.54 | | | | — | | | | 1.54 | | | | 1.54 | |
| Year Ended October 31, 2004 | | $ | 7.08 | | | | 0.05 | | | | 0.47 | | | | 0.52 | |
Institutional Class Shares | | | | | | | | | | | | | | | | |
| Period Ended October 31, 2004 (j) | | $ | 7.23 | | | | 0.02 | | | | 0.35 | | | | 0.37 | |
|
[Additional columns below]
[Continued from above table, first column(s) repeated]
| | | | | | | | | |
| | Net Asset | | | |
| | Value, End | | | Total | |
| | of Period | | | Return (a) | |
| | |
| | |
| |
| |
Class A Shares | | | | | | | | |
| Period Ended October 31, 2000 (d) | | $ | 9.12 | | | | (8.80% | ) (g) |
| Year Ended October 31, 2001 | | $ | 6.26 | | | | (31.36% | ) |
| Year Ended October 31, 2002 | | $ | 5.50 | | | | (12.14% | ) |
| Year Ended October 31, 2003 | | $ | 7.01 | | | | 27.45% | |
| Year Ended October 31, 2004 | | $ | 7.52 | | | | 7.28% | |
Class B Shares | | | | | | | | |
| Period Ended October 31, 2000 (d) | | $ | 9.11 | | | | (8.90% | ) (g) |
| Year Ended October 31, 2001 | | $ | 6.20 | | | | (31.94% | ) |
| Year Ended October 31, 2002 | | $ | 5.41 | | | | (12.74% | ) |
| Year Ended October 31, 2003 (e) | | $ | 6.85 | | | | 26.62% | |
| Year Ended October 31, 2004 | | $ | 7.30 | | | | 6.57% | |
Class C Shares | | | | | | | | |
| Period Ended October 31, 2001 (f) | | $ | 6.23 | | | | (19.82% | ) (g) |
| Year Ended October 31, 2002 | | $ | 5.44 | | | | (12.68% | ) |
| Year Ended October 31, 2003 | | $ | 6.89 | | | | 26.65% | |
| Year Ended October 31, 2004 | | $ | 7.33 | | | | 6.39% | |
Class R Shares | | | | | | | | |
| Period Ended October 31, 2003 (i) | | $ | 6.86 | | | | 4.73% | (g) |
| Year Ended October 31, 2004 | | $ | 7.33 | | | | 7.00% | |
Institutional Service Class Shares | | | | | | | | |
| Period Ended October 31, 2000 (d) | | $ | 9.12 | | | | (8.80% | ) (g) |
| Year Ended October 31, 2001 | | $ | 6.29 | | | | (31.03% | ) |
| Year Ended October 31, 2002 | | $ | 5.54 | | | | (11.92% | ) |
| Year Ended October 31, 2003 | | $ | 7.08 | | | | 27.80% | |
| Year Ended October 31, 2004 | | $ | 7.60 | | | | 7.34% | |
Institutional Class Shares | | | | | | | | |
| Period Ended October 31, 2004 (j) | | $ | 7.60 | | | | 5.12% | (g) |
| | |
[Additional columns below]
[Continued from above table, first column(s) repeated]
| | | | | | | | | | | | | | | | | | | | | | | | | | | |
| | | | |
| | Ratios / Supplemental Data | | | |
| | | | Ratio of Net | | | | | |
| | | | Ratio of Net | | | Ratio of | | | Investment | | | | | |
| | | | Investment | | | Expenses | | | Income (Loss) | | | | | |
| | Net Assets | | | Ratio of | | | Income | | | (Prior to | | | (Prior to | | | | | |
| | at End of | | | Expenses | | | (Loss) | | | Reimbursements) | | | Reimbursements) | | | | | |
| | Period | | | to Average | | | to Average | | | to Average | | | to Average | | | Portfolio | | | |
| | (000s) | | | Net Assets | | | Net Assets | | | Net Assets (b) | | | Net Assets (b) | | | Turnover (c) | | | |
| | | | |
| | | | |
| |
| | | |
Class A Shares | | | | | | | | | | | | | | | | | | | | | | | | | | |
| Period Ended October 31, 2000 (d) | | $ | 1,542 | | | | 1.68% | (h) | | | 0.05% | (h) | | | 6.74% | (h) | | | (5.01% | ) (h) | | | 21.59% | | | |
| Year Ended October 31, 2001 | | $ | 1,096 | | | | 1.75% | | | | (0.19% | ) | | | 5.71% | | | | (4.15% | ) | | | 34.57% | | | |
| Year Ended October 31, 2002 | | $ | 1,046 | | | | 1.69% | | | | (0.03% | ) | | | 2.60% | | | | (0.94% | ) | | | 467.35% | | | |
| Year Ended October 31, 2003 | | $ | 34,889 | | | | 1.67% | | | | (0.47% | ) | | | (k) | | | | (k) | | | | 689.06% | | | |
| Year Ended October 31, 2004 | | $ | 30,707 | | | | 1.70% | | | | 0.53% | | | | 1.85% | | | | 0.38% | | | | 495.62% | | | |
Class B Shares | | | | | | | | | | | | | | | | | | | | | | | | | | |
| Period Ended October 31, 2000 (d) | | $ | 1,519 | | | | 2.26% | (h) | | | (0.53% | ) (h) | | | 7.47% | (h) | | | (5.74% | ) (h) | | | 21.59% | | | |
| Year Ended October 31, 2001 | | $ | 1,051 | | | | 2.35% | | | | (0.78% | ) | | | 6.47% | | | | (4.90% | ) | | | 34.57% | | | |
| Year Ended October 31, 2002 | | $ | 936 | | | | 2.39% | | | | (0.72% | ) | | | 3.36% | | | | (1.69% | ) | | | 467.35% | | | |
| Year Ended October 31, 2003 (e) | | $ | 96 | | | | 2.39% | | | | (0.72% | ) | | | (k) | | | | (k) | | | | 689.06% | | | |
| Year Ended October 31, 2004 | | $ | 122 | | | | 2.40% | | | | (0.13% | ) | | | 2.57% | | | | (0.30% | ) | | | 495.62% | | | |
Class C Shares | | | | | | | | | | | | | | | | | | | | | | | | | | |
| Period Ended October 31, 2001 (f) | | $ | 20 | | | | 2.35% | (h) | | | (1.04% | ) (h) | | | 7.40% | (h) | | | (6.09% | ) (h) | | | 34.57% | | | |
| Year Ended October 31, 2002 | | $ | 19 | | | | 2.39% | | | | (0.71% | ) | | | 3.41% | | | | (1.73% | ) | | | 467.35% | | | |
| Year Ended October 31, 2003 | | $ | 19 | | | | 2.38% | | | | (0.84% | ) | | | (k) | | | | (k) | | | | 689.06% | | | |
| Year Ended October 31, 2004 | | $ | 25 | | | | 2.40% | | | | (0.08% | ) | | | 2.57% | | | | (0.25% | ) | | | 495.62% | | | |
Class R Shares | | | | | | | | | | | | | | | | | | | | | | | | | | |
| Period Ended October 31, 2003 (i) | | $ | 1 | | | | 1.87% | (h) | | | (1.05% | ) (h) | | | 1.97% | (h) | | | (1.15% | ) (h) | | | 689.06% | | | |
| Year Ended October 31, 2004 | | $ | 1 | | | | 1.96% | | | | 0.28% | | | | 2.12% | | | | 0.12% | | | | 495.62% | | | |
Institutional Service Class Shares | | | | | | | | | | | | | | | | | | | | | | | | | | |
| Period Ended October 31, 2000 (d) | | $ | 1,521 | | | | 1.36% | (h) | | | 0.37% | (h) | | | 6.45% | (h) | | | (4.72% | ) (h) | | | 21.59% | | | |
| Year Ended October 31, 2001 | | $ | 1,048 | | | | 1.42% | | | | 0.13% | | | | 5.44% | | | | (3.89% | ) | | | 34.57% | | | |
| Year Ended October 31, 2002 | | $ | 1,133 | | | | 1.42% | | | | 0.25% | | | | 2.34% | | | | (0.67% | ) | | | 467.35% | | | |
| Year Ended October 31, 2003 | | $ | 1,400 | | | | 1.46% | | | | 0.12% | | | | (k) | | | | (k) | | | | 689.06% | | | |
| Year Ended October 31, 2004 | | $ | 1,373 | | | | 1.65% | | | | 0.61% | | | | 1.80% | | | | 0.46% | | | | 495.62% | | | |
Institutional Class Shares | | | | | | | | | | | | | | | | | | | | | | | | | | |
| Period Ended October 31, 2004 (j) | | $ | 1 | | | | 1.40% | (h) | | | 0.72% | (h) | | | 1.70% | (h) | | | 0.42% | (h) | | | 495.62% | | | |
| | | | |
| | |
| (a) | | Excludes sales charge. |
| (b) | | During the period certain fees were waived and/or reimbursed. If such waivers/reimbursements had not occurred, the ratios would have been as indicated. |
| (c) | | Portfolio turnover is calculated on the basis of the Fund as a whole without distinguishing among the classes of shares. |
| (d) | | For the period from August 30, 2000 (commencement of operations) through October 31, 2000. |
| (e) | | Net investment income (loss) is based on average shares outstanding during the period. |
| (f) | | For the period from March 1, 2001 (commencement of operations) through October 31, 2001. |
| (g) | | Not annualized. |
| (h) | | Annualized. |
| (i) | | For the period from October 1, 2003 (commencement of operations) through October 31, 2003. |
| (j) | | For the period from June 29, 2004 (commencement of operations) through October 31, 2004. |
| (k) | | There no fee reductions in this period. |
See notes to financial statements.
74 Annual Report 2004
International Series
| |
| | Gartmore China Opportunities Fund |
From its inception on June 29, 2004, through Oct. 31, 2004, the Gartmore China Opportunities Fund returned 12.61% (Class A at NAV) versus 10.08% for its benchmark, the Morgan Stanley Capital International (MSCI) Zhong Hua Index. For broader comparison, the average return for the Fund’s Lipper peer category of China Region Funds was 6.27%.
Equity markets in the Chinese region began the period strongly, thanks in part to China’s robust economic growth and the supportive global macroeconomic backdrop. However, March and April 2004 witnessed a change in market environment that generated a wave of profit-taking and outright selling. Monetary tightening in China, political uncertainty in Taiwan, jitters about the prospects for global growth and concerns that valuations had become over-extended combined to drive the markets sharply lower. By the time of the Fund’s June 2004 inception, Hong Kong’s market had more or less stabilized, performing strongly during the remaining months of the reporting period, helped by a recovery in the property sector. However, Taiwan’s market remained under pressure; rising oil prices and the poor performance of the technology sector caused problems. Later in the period, China’s market was boosted by evidence that the government had succeeded in slowing the economy without causing a hard landing, although the surprise announcement of an interest-rate hike late in October was something of an unpleasant surprise.
Stock selection was the main driver of the strong performance for the Fund during the reporting period, particularly in the financials sector. The Fund benefited from overweight positions in a number of outperforming Hong Kong real estate stocks as the Hong Kong property market benefited from reflation— the intentional reversal of deflation through a monetary action by a government. Most notably Midland Realty Group and New World Development Co. Ltd. Contributed 1.81% and 0.28% to the Fund’s performance, respectively. Stock selection in the industrials and consumer discretionary sectors also contributed positively to Fund performance, as did an overweight allocation to the materials sector. An overweight holding of Yanzhou Coal Mining Co. Ltd. was one of the best-performing positions in the portfolio, contributing 0.29% to the Fund’s performance.
The largest detractor from performance came from the Fund’s underweight allocation to the energy sector, given that the sector performed so well on the strong rise in oil prices. Consequently, our underweight positions in PetroChina Co. Ltd. (-0.31%), The Hong Kong and China Gas Co. Ltd. (-0.27%) and CNOOC Ltd. (-0.40%) were among the bottom five contributors to Fund performance.
The Fund continues to focus on consumer-related stocks on the basis that the strong gross domestic product levels of recent years will continue to fuel a rise in China’s consumerism. Stocks with strong brands, including Wumart Stores, Inc. and Convenience Retail Asia Ltd., are therefore allocated overweight positions in the Fund. We choose to avoid companies with relatively high debt levels as well as state-owned enterprises, feeling that they are more likely to suffer ill effects from any further monetary tightening, while consumer-related stocks may prove to be relatively resilient in the face of a broader market decline.
We continue to take a considerable underweight stance in telecommunications, viewing competition in the sector as damaging to profit margins. The largest underweight in the Fund is in the financials sector, where we take a highly selective approach. We are underweight in Hong Kong financials, expecting loan growth to disappoint.
Portfolio Manager: Philip Ehrmann
| |
| | Class A: GOPAX |
| | Class B: GOPBX |
| | Class C: GOPCX |
| | Class R: GOPRX |
| | Institutional Service Class: GOPSX |
| | Institutional Class: GOPIX |
2004 Annual Report 75
International Series
Gartmore China Opportunities Fund
Average Annual Total Return
(For periods ended October 31, 2004)
| | | | | | | |
| | | | Inception1 | |
|
| |
Class A1 | | without sales charge2 | | | 12.61% | |
| | | with sales charge3 | | | 6.14% | |
|
Class B1 | | without sales charge2 | | | 12.38% | |
| | | with sales charge4 | | | 7.38% | |
|
| Class C | | without sales charge2 | | | 12.30% | |
| | | with sales charge5 | | | 11.30% | |
|
Class R6 | | | | | 12.46% | |
|
| Institutional Class6 | | | 12.74% | |
|
| Institutional Service Class6 | | | 12.74% | |
|
All figures showing the effect of a sales charge reflect the maximum charge possible, because it has the most dramatic effect on performance data.
| |
| 1 | Fund commenced operations on June 29, 2004. |
| |
| 2 | These returns do not reflect the effects of sales charges (SC). |
| |
| 3 | A 5.75% front-end sales charge was deducted. |
| |
| 4 | A 5.00% contingent deferred sales charge (CDSC) was deducted. The CDSC declines to 1% after 6 years. |
| |
| 5 | A CDSC of 1.00% was deducted because it is charged when you sell Class C shares within the first year after purchase. |
| |
| 6 | Not subject to any sales charges. |
Performance of a $10,000 Investment
Investment return and principal value will fluctuate, and when redeemed, shares may be worth more or less than original cost. Past performance is no guarantee of future results and does not reflect the deduction of taxes that a shareholder would pay on fund distributions or the redemption of fund shares. Investing in mutual funds involves market risk, including loss of principal. Performance returns assume the reinvestment of all distributions.
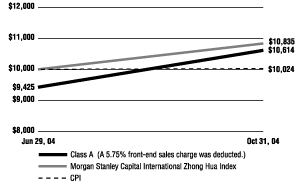
Comparative performance of $10,000 invested in Class A shares of the Gartmore China Opportunities Fund, Morgan Stanley Capital International (MSCI) Zhong Hua Index (a) and the Consumer Price Index (CPI)(b) since inception. Unlike the Fund, the returns for these unmanaged indexes do not reflect any fees, expenses, or sales charges. Investors cannot invest directly in market indexes.
| | |
| (a) | | MSCI Zhong Hua Index is an unmanaged, free float-adjusted market capitalization-weighted index that is designed to measure the performance of stocks in the developed markets of China and Hong Kong; the Index gives one-third of its weightings to China stocks and the remainder to Hong Kong stocks. |
| |
| (b) | | The CPI represents changes in prices of a basket of goods and services purchased for consumption by urban households. |
| |
| * | The Shareholder Expense Example is not required for Funds operational less than six months. |
76 Annual Report 2004
Gartmore China Opportunities Fund
Portfolio Summary
(October 31, 2004)
The SEC adopted a requirement that Funds present their portfolio holdings in a table, chart or graph format in their annual and semiannual reports to shareholders, whether or not a schedule of investments is utilized. The following tables, which present portfolio holdings as a percentage of net assets, are provided in compliance with this requirement.
| | | | | | | |
| Asset Allocation | | | | |
|
|
| Common Stocks | | | 96.3% | | | |
| Repurchase Agreements | | | 3.7% | | | |
| | |
| | | |
| | | | 100.0% | | | |
| | | | | | | |
| Top Countries | | | | |
|
|
| Hong Kong | | | 82.5% | | | |
| China | | | 13.8% | | | |
| Other Countries | | | 3.7% | | | |
| | |
| | | |
| | | | 100.0% | | | |
| | | | | | | |
| Top Holdings | | | | |
|
|
| Asia Aluminum Holdings Ltd. | | | 2.8% | | | |
| Lianhua Supermarket Holdings Ltd. | | | 2.7% | | | |
| China Mobile Ltd. | | | 2.6% | | | |
| Lenovo Group Ltd. | | | 2.5% | | | |
| China Resources Power Holdings Co. Ltd. | | | 2.5% | | | |
| Global Bio-chem Technology Group Co. Ltd. | | | 2.5% | | | |
| Kingboard Chemical Holdings Ltd. | | | 2.4% | | | |
| Lee & Man Paper Manufacturing Ltd. | | | 2.4% | | | |
| Weichai Power Co. Ltd. | | | 2.4% | | | |
| New World Development | | | 2.3% | | | |
| Other Countries | | | 74.9% | | | |
| | |
| | | |
| | | | 100.0% | | | |
2004 Annual Report 77
International Series
| |
| | Statement of Investments |
| | October 31, 2004 |
Gartmore China Opportunities Fund
| | | | | | | | | | | |
|
| Common Stocks (96.3%) |
|
| | Shares or | | | |
| | Principal Amount | | | Value | | | |
| | | | | | |
|
| CHINA (13.8%) |
| Building & Construction (3.4%) |
| Baoye Group Co. Ltd. (c) | | | 238,000 | | | $ | 129,192 | | | |
| Zhejiang Expressway Co. Ltd. (c) | | | 142,000 | | | | 96,041 | | | |
| | | | | |
| | | |
| |
| | | | | | | | 225,233 | | | |
| | | | | |
| | | |
| |
| Electric Utility (1.7%) |
| Datang International Power Generation Co. Ltd. (c) | | | 140,000 | | | | 111,751 | | | |
| | | | | |
| | | |
| |
| Electronics (1.7%) |
| TPV Technology Ltd. (c) | | | 192,000 | | | | 115,382 | | | |
| | | | | |
| | | |
| |
| Metals & Mining (1.7%) |
| Jiangxi Copper Co. Ltd. (c) | | | 221,000 | | | | 117,303 | | | |
| | | | | |
| | | |
| |
| Mining (1.4%) |
| Yanzhou Coal Mining Co. Ltd. (c) | | | 70,000 | | | | 92,925 | | | |
| | | | | |
| | | |
| |
| Oil & Gas (2.0%) |
| China Oilfield Services Ltd. (c) | | | 458,000 | | | | 133,880 | | | |
| | | | | |
| | | |
| |
| Transportation (1.9%) |
| Hainan Meilan International Airport Co. Ltd. (c) | | | 158,000 | | | | 129,119 | | | |
| | | | | |
| | | |
| |
| | | | | | | | 925,593 | | | |
| | | | | |
| | | |
| |
|
| HONG KONG (82.5%) |
| Building & Construction (2.8%) |
| Asia Aluminum Holdings Ltd. (c) | | | 1,688,000 | | | | 191,068 | | | |
| | | | | |
| | | |
| |
| Building - Residential & Commercial (2.2%) |
| Shanghai Forte Land Co. Ltd. | | | 474,000 | | | | 146,224 | | | |
| | | | | |
| | | |
| |
| Chemicals (2.4%) |
| Kingboard Chemical Holdings Ltd. (c) | | | 78,000 | | | | 163,624 | | | |
| | | | | |
| | | |
| |
| Commercial Services (0.8%) |
| Linmark Group Ltd. (c) | | | 154,000 | | | | 51,820 | | | |
| | | | | |
| | | |
| |
| Computers (2.5%) |
| Lenovo Group Ltd. (c) | | | 472,000 | | | | 169,908 | | | |
| | | | | |
| | | |
| |
| Diversified Operations (0.8%) |
| Melco International Development Ltd. (c) | | | 48,000 | | | | 53,653 | | | |
| | | | | |
| | | |
| |
| Electric Utility (2.5%) |
| China Resources Power Holdings Co. Ltd. (c) | | | 292,000 | | | | 167,207 | | | |
| | | | | |
| | | |
| |
| Electrical & Electronic (1.5%) |
| Johnson Electric Holdings Ltd. (c) | | | 103,500 | | | | 103,191 | | | |
| | | | | |
| | | |
| |
| Electronic Equipment (2.1%) |
| GOME Electrical Appliances Holdings Ltd. (c) | | | 174,600 | | | | 140,202 | | | |
| | | | | |
| | | |
| |
| Electronics (2.2%) |
| Solomon Systech International Ltd. | | | 590,000 | | | | 149,331 | | | |
| | | | | |
| | | |
| |
| Engine Manufacturing (2.4%) |
| Weichai Power Co. Ltd. | | | 78,000 | | | | 160,842 | | | |
| | | | | |
| | | |
| |
| Finance (1.3%) |
| Hong Kong Exchanges & Clearing Ltd. (c) | | | 38,000 | | | | 86,526 | | | |
| | | | | |
| | | |
| |
| Food Products (4.5%) |
| Global Bio-chem Technology Group Co. Ltd. (c) | | | 210,000 | | | | 165,029 | | | |
| Heng Tai Consumables Group Ltd. (c) | | | 1,030,000 | | | | 138,913 | | | |
| | | | | |
| | | |
| |
| | | | | | | | 303,942 | | | |
| | | | | |
| | | |
| |
| Health Care Products (2.1%) |
| Hengan International Group Co. Ltd. (c) | | | 264,000 | | | | 140,838 | | | |
| | | | | |
| | | |
| |
| Hotels, Restaurants & Leisure (3.4%) |
| Cafe De Coral Holdings Ltd. (c) | | | 90,000 | | | | 97,143 | | | |
| Hong Kong and Shanghai Hotels Ltd. (c) (The) | | | 172,500 | | | | 130,763 | | | |
| | | | | |
| | | |
| |
| | | | | | | | 227,906 | | | |
| | | | | |
| | | |
| |
| Information Services (1.2%) |
| HC International, Inc. (c) | | | 330,000 | | | | 80,536 | | | |
| | | | | |
| | | |
| |
| Insurance (2.0%) |
| Ping AN Insurance (Group) Co. of China Ltd. (b) | | | 87,000 | | | | 136,926 | | | |
| | | | | |
| | | |
| |
| Machinery & Machine Tools (1.7%) |
| Techtronic Industries Co. Ltd. (c) | | | 56,000 | | | | 111,732 | | | |
| | | | | |
| | | |
| |
| Medical Products (1.2%) |
Shandong Weigao Group Medical
Polymer Co. Ltd. | | | 832,000 | | | | 79,102 | | | |
| | | | | |
| | | |
| |
| Oil & Gas (3.2%) |
| PetroChina Co. Ltd. (c) | | | 174,000 | | | | 91,485 | | | |
| Xinao Gas Holdings Ltd. (c) | | | 216,000 | | | | 120,718 | | | |
| | | | | |
| | | |
| |
| | | | | | | | 212,203 | | | |
| | | | | |
| | | |
| |
| Paper Products (2.4%) |
| Lee & Man Paper Manufacturing Ltd. (c) | | | 222,000 | | | | 162,597 | | | |
| | | | | |
| | | |
| |
| Publishing (2.5%) |
| Culturecom Holdings Ltd. (c) | | | 1,414,000 | | | | 90,149 | | | |
| Oriental Press Group Ltd. (c) | | | 216,000 | | | | 79,793 | | | |
| | | | | |
| | | |
| |
| | | | | | | | 169,942 | | | |
| | | | | |
| | | |
78 Annual Report 2004
| | | | | | | | | | | |
|
| Common Stocks (continued) |
|
| | Shares or | | | |
| | Principal Amount | | | Value | | | |
| | | | | | |
|
| HONG KONG (continued) |
| Real Estate (17.8%) |
| Cheung Kong (Holdings) Ltd. (c) | | | 18,000 | | | $ | 149,086 | | | |
| China Overseas Land and Investment Ltd. (c) | | | 636,000 | | | | 138,991 | | | |
| Henderson Land Development Co. Ltd. (c) | | | 22,000 | | | | 102,088 | | | |
| Hongkong Land Holdings Ltd. (c) | | | 75,000 | | | | 154,772 | | | |
| Hopewell Holdings Ltd. (c) | | | 69,000 | | | | 148,498 | | | |
| Midland Realty Holdings Ltd. (c) | | | 314,000 | | | | 139,593 | | | |
| New World Development Co. Ltd. (c) | | | 178,000 | | | | 155,789 | | | |
| Sino Land Co. Ltd. (c) | | | 116,000 | | | | 99,185 | | | |
| Sun Hung Kai Properties Ltd. (c) | | | 12,000 | | | | 111,073 | | | |
| | | | | |
| | | |
| |
| | | | | | | | 1,199,075 | | | |
| | | | | |
| | | |
| |
| Retail (9.3%) |
| Convenience Retail Asia Ltd. (c) | | | 300,000 | | | | 101,177 | | | |
| Lianhua Supermarket Holdings Ltd. (c) | | | 156,000 | | | | 182,578 | | | |
| Lifestyle International Holdings Ltd. | | | 100,000 | | | | 141,326 | | | |
| Sa Sa International Holdings Ltd. (c) | | | 220,000 | | | | 91,925 | | | |
| Wumart Stores, Inc. (b) (c) | | | 65,000 | | | | 111,070 | | | |
| | | | | |
| | | |
| |
| | | | | | | | 628,076 | | | |
| | | | | |
| | | |
| |
| Telecommunications (2.6%) |
| China Mobile Ltd. (c) | | | 60,000 | | | | 174,580 | | | |
| | | | | |
| | | |
| |
| Textiles (3.1%) |
| Fountain Set Holdings Ltd. (c) | | | 108,000 | | | | 81,367 | | | |
| Texwinca Holdings Ltd. (c) | | | 140,000 | | | | 126,923 | | | |
| | | | | |
| | | |
| |
| | | | | | | | 208,290 | | | |
| | | | | |
| | | |
| |
| Transportation (2.0%) |
| Cosco Pacific Ltd. (c) | | | 76,000 | | | | 131,368 | | | |
| | | | | |
| | | |
| |
| | | | | | | | 5,550,709 | | | |
| | | | | |
| | | |
| |
| Total Common Stocks | | | 6,476,302 | | | |
| | | | | |
| | | |
| |
Repurchase Agreements (3.7%) |
| | | | | | | | | | | |
|
| Repurchase Agreements (3.7%) |
|
| | Shares or | | | |
| | Principal Amount | | | Value | | | |
| | | | | | |
|
|
CS First Boston, 1.75%, dated 10/29/04, due 11/01/04, repurchase price $103,744
(Fully collateralized by Treasury Notes and U.S. Agency Securities) | | $ | 103,729 | | | | 103,729 | | | |
Nomura Securities, 1.75% dated 10/29/04, due 11/01/04, repurchase price $144,954
(Fully collateralized by AA Corporate Bonds and U.S. Agency Securities) | | | 144,933 | | | | 144,933 | | | |
| | | | | |
| | | |
| |
| Total Repurchase Agreements | | | 248,662 | | | |
| | | | | |
| | | |
| |
| Total Investments (Cost $6,278,797) (a) — 100.0% | | | 6,724,964 | | | |
| | | | | |
| | | |
| |
| Liabilities in excess of other assets — 0.0% | | | (78) | | | |
| | | | | |
| | | |
| |
| NET ASSETS — 100.0% | | $ | 6,724,886 | | | |
| | | | | |
| | | |
| | |
| (a) | | See notes to financial statements for tax unrealized appreciation (depreciation) of securities. |
| |
| (b) | | Denotes a non-income producing security. |
| |
| (c) | | Fair Valued Security. |
See notes to financial statements.
2004 Annual Report 79
International Series
| |
| | Gartmore Emerging Markets Fund |
For the annual period ended Oct. 31, 2004, the Gartmore Emerging Markets Fund returned 16.97% (Class A at NAV) versus 19.40% for its benchmark, the Morgan Stanley Capital International Emerging Markets Free (MSCI EMF) Index. For broader comparison, the average return for the Fund’s Lipper peer category of Emerging Markets Funds was 19.50%.
During the first five months of the reporting period, emerging equity markets strongly outperformed relative to the markets of the developed world, supported by a background of improving global economic growth, low/declining interest rates and rising demandas well as pricesfor raw materials. During this period, the Fund performed very strongly relative to its benchmark. Overweight positions in Thailand, Indonesia, and Mexico added to performance. In addition, stock selection was very strong, particularly in the financials and materials sectors, and in South Korea and Hong Kong.
Early in the second quarter of 2004, the asset class sold off sharply as China’s government took measures to cool runaway economic growth. In addition, fears surfaced that an imminent rise in U.S. interest rates would put the brakes on global economic recovery. Particularly hard hit were the Asian region markets and the more cyclical sectors, such as materials and industrials. The Fund’s exposure to the materials and industrial sectors therefore detracted from performance as did overweights in the more cyclical Asian markets (e.g., Taiwan and South Korea).
For the full reporting period, strong stock selection contributed positively to Fund performance. The Fund’s exposure to South Korea and Russia was particularly beneficial, due largely to stock selection in both countries’ markets. The top three performers in the Fund’s portfolio were holdings in South Korea (an underweight in both LG Card Co., Ltd. and Samsung Electronics Co. Ltd. plus an overweight in Dongkuk Steel Mill Co., Ltd.—contributing 2.55%, 1.13%, 0.78%, respectively, to the Fund’s performance), while an underweight by the Fund in troubled Russian oil giant OAO NK YUKOS was the fifth-largest contributor to Fund performance. The Fund’s stock selection in the information technology and consumer discretionary sectors, however, made a negative contribution to Fund performance. The Fund’s selection of underperforming technology stocks in Taiwan, such as Accton Technology Corp. (-0.88%) and Taiwan Semiconductor Manufacturing Co. Ltd. (-0.59%) contributed to the negative performance.
At the other end of the scale, underweights by the Fund in South Africa proved to be detrimental, as this market outperformed despite our concerns that the South African currency was significantly overvalued. The Fund’s overweight exposure to the Latin American region is the result of its holdings in Brazil and Mexico, where we maintain overweight and off-index positions in a small number of conviction stocks. Strong retail sales growth in Mexico supports our view that the country continues to benefit from improving economic conditions globally.
Fund positions in the financials and materials sectors added value. Among the Fund’s top contributors to performance were the off-index positions in South African bank Absa Group Ltd. (0.68%) and mining stocks Yanzhou Coal Mining Co. Ltd. (0.51%), Gerdau S.A. (0.49%) and Grupo México S.A. de C.V. (0.40%). Fund performance was hindered by overweight positions in a number of (particularly Taiwanese) information technology stocks. The information technology sector lagged as a result of profits downgrades and weak pricing power.
We remain selective within the Emerging Europe, Middle East and Asia (EMEA) region; in our opinion, positive sentiment attached to the European Union convergence is an overstretched theme. We are therefore comfortable with our underweights in markets such as Hungry and the Czech Republic.
Portfolio Managers: Philip Ehrmann and Peter Dalgliesh
| |
| | Class A: GEGAX |
| | Class B: GEGBX |
| | Class C: GEGCX |
| | Class R: GEMRX |
| | Institutional Service Class: GEGSX |
| | Institutional Class: GEGIX |
80 Annual Report 2004
Gartmore Emerging Markets Fund
Fund Performance
Average Annual Total Return
(For periods ended October 31, 2004)
| | | | | | | | | | | |
| | | | One year | | | Inception1 | |
|
| |
| Class A | | without sales charge2 | | | 16.97% | | | | 5.18% | |
| | | with sales charge3 | | | 10.27% | | | | 3.70% | |
|
| Class B | | without sales charge2 | | | 16.14% | | | | 4.48% | |
| | | with sales charge4 | | | 11.14% | | | | 4.06% | |
|
Class C5 | | without sales charge2 | | | 16.21% | | | | 4.83% | |
| | | with sales charge6 | | | 15.21% | | | | 4.83% | |
|
Class R 7,9 | | | | | 16.56% | | | | 4.57% | |
|
| Institutional Class8,9 | | | 17.25% | | | | 5.56% | |
|
| Institutional Service Class9 | | | 17.25% | | | | 5.56% | |
|
All figures showing the effect of a sales charge reflect the maximum charge possible, because it has the most dramatic effect on performance data.
| |
| 1 | Fund commenced operations on August 30, 2000. |
| |
| 2 | These returns do not reflect the effects of sales charges (SC). |
| |
| 3 | A 5.75% front-end sales charge was deducted. |
| |
| 4 | A 5.00% contingent deferred sales charge (CDSC) was deducted. The CDSC declines to 0% after 6 years. |
| |
| 5 | These returns until the creation of Class C shares (3/1/01) include the performance of the Fund’s Class B shares. Excluding the effects of any fee waivers or reimbursements, such prior performance is substantially similar to what Class C shares would have produced because Class C shares invest in the same portfolio of securities as Class B shares and have the same expenses after any fee waivers or reimbursements. For Class C shares returns with sales charges, these returns have been restated for the applicable sales charges. |
| |
| 6 | A CDSC of 1.00% was deducted because it is charged when you sell Class C shares within the first year after purchase. |
| |
| 7 | These returns until the creation of Class R shares (12/31/03) include the performance of the Fund’s Class B shares. The returns have been adjusted for the fact that Class R shares do not have any applicable sales charges but have not been adjusted for the lower expenses applicable to Class R shares. Excluding the effect of any fee waivers or reimbursements, such prior performance is similar to what Class R shares would have produced because the Class R shares invest in the same portfolio of securities as Class B shares. |
| |
| 8 | These returns until the creation of Institutional Class shares (6/29/04) include the performance of the Fund’s Institutional Service shares. The returns have not been adjusted for the lower expenses applicable to Institutional Class shares. Excluding the effect of any fee waivers or reimbursements, such prior performance is similar to what Institutional Class shares would have produced because the Institutional Class shares invest in the same portfolio of securities as Institutional Service shares. |
| |
| 9 | Not subject to any sales charges. |
Performance of a $10,000 Investment
Investment return and principal value will fluctuate, and when redeemed, shares may be worth more or less than original cost. Past performance is no guarantee of future results and does not reflect the deduction of taxes that a shareholder would pay on fund distributions or the redemption of fund shares. Investing in mutual funds involves market risk, including loss of principal. Performance returns assume the reinvestment of all distributions.
Comparative performance of $10,000 invested in Class A shares of the Gartmore Emerging Markets Fund, S&P/ IFCI Emerging Markets Composite Index(a), Morgan Stanley Capital International Emerging Markets Free Index (MSCI Emerging Markets)(b), and the Consumer Price Index (CPI)(c) since inception. Unlike the Fund, the returns for these unmanaged indexes do not reflect any fees, expenses, or sales charges. Investors cannot invest directly in market indexes.
| | |
| (a) | | The S&P/ IFCI Emerging Markets Composite Index is an unmanaged index that aims to represent the performance of the stocks in emerging stock markets that are available to foreign institutional investors. |
| |
| (b) | | The MSCI Emerging Markets is a free float-adjusted market capitalization index that is designed to measure equity market performance in the global emerging markets. |
| |
| (c) | | The CPI represents changes in prices of a basket of goods and services purchased for consumption by urban households. |
2004 Annual Report 81
Gartmore Emerging Markets Fund
International Series
| |
| | Shareholder |
| | Expense Example |
As a shareholder of the Funds, you incur two types of costs: (1) transaction costs, including sales charges (loads) paid on purchase payments and redemption fees; and (2) ongoing costs, including investment advisory fees, administration fees, distribution fees and other Fund expenses. The examples below are intended to help you understand your ongoing costs (in dollars) of investing in the Funds and to compare these costs with the ongoing costs of investing in other mutual funds. The examples assume that you had a $1,000 investment in the Class at the beginning of the reporting period, May 1, 2004, and continued to hold your shares at the end of the reporting period, October 31, 2004. Per SEC requirements, the examples are based on an investment of $1,000 invested at the beginning of the period and held for the entire six-month period ended October 31, 2004.
Actual Expenses
For each Class of the Fund in the table below, the first line provides information about actual account values and actual expenses. You may use the information in this line, together with the amount you invested, to estimate the expenses that you paid over the period. Simply divide your account value by $1,000 (for example, an $8,600 account value divided by $1,000 = 8.6), then multiply the result by the number in the first line of each Class under the heading entitled “Expenses Paid During Period” to estimate the expenses you paid on your account during the period.
Hypothetical Example for Comparison Purposes
The second line of each Class in the table below provides information about hypothetical account values and hypothetical expenses based on the Class’ actual expense ratio and an assumed rate of return of 5% per year before expenses, which is not the Class’ actual return. The hypothetical account values and expenses may not be used to estimate the actual ending account balance or expenses you paid for the period. You may use this information to compare the ongoing costs of investing in the Class of the Fund and other funds. To do so, compare this 5% hypothetical example with the 5% hypothetical examples that appear in the shareholder reports of the other funds.
Please note that the expenses shown in the table are meant to highlight your ongoing costs only and do not reflect any transaction costs, such as sales charges (loads) or redemption fees. Therefore, the second line for each Class in the table is useful in comparing ongoing costs only, and will not help you determine the relative total costs of owning different funds. In addition, if these transaction costs were included, your costs would have been higher. The examples also assume all dividends and distributions have been reinvested.
Schedule of Shareholder Expenses
Expense Analysis of a $1,000 Investment
(October 31, 2004)
| | | | | | | | | | | | | | | | | | | | | | | |
| | | | Beginning | | | Ending | | | | | | | |
| | | | Account Value | | | Account Value | | | Expenses Paid | | | Annualized | | | |
| Emerging Markets Fund | | | | 5/1/04 | | | 10/31/04 | | | During Period* | | | Expense Ratio | | | |
|
|
| Class A | | | Actual | | | $ | 1,000 | | | $ | 1,061 | | | $ | 9.74 | | | | 1.88% | | | |
| | | | Hypothetical | 1 | | $ | 1,000 | | | $ | 1,016 | | | $ | 9.57 | | | | 1.88% | | | |
|
| Class B | | | Actual | | | $ | 1,000 | | | $ | 1,056 | | | $ | 13.18 | | | | 2.55% | | | |
| | | | Hypothetical | 1 | | $ | 1,000 | | | $ | 1,012 | | | $ | 12.98 | | | | 2.55% | | | |
|
| Class C | | | Actual | | | $ | 1,000 | | | $ | 1,057 | | | $ | 13.19 | | | | 2.55% | | | |
| | | | Hypothetical | 1 | | $ | 1,000 | | | $ | 1,012 | | | $ | 12.98 | | | | 2.55% | | | |
|
| Class R | | | Actual | | | $ | 1,000 | | | $ | 1,059 | | | $ | 10.61 | | | | 2.05% | | | |
| | | | Hypothetical | 1 | | $ | 1,000 | | | $ | 1,015 | | | $ | 10.43 | | | | 2.05% | | | |
|
| Institutional Service Class | | | Actual | | | $ | 1,000 | | | $ | 1,062 | | | $ | 8.03 | | | | 1.55% | | | |
| | | | Hypothetical | 1 | | $ | 1,000 | | | $ | 1,017 | | | $ | 7.89 | | | | 1.55% | | | |
|
| Institutional Class (a) | | | Actual | | | $ | 1,000 | | | $ | 1,108 | | | $ | 5.53 | (b) | | | 1.55% | | | |
| | | | Hypothetical | 1 | | $ | 1,000 | | | $ | 1,009 | | | $ | 5.30 | (b) | | | 1.55% | | | |
|
| | |
| (a) | | For the period from June 29, 2004 (commencement of operations) through October 31, 2004. |
| |
| (b) | | Expense are equal to the Fund’s annualized expense ratio multiplied by the average account value over the period multiplied by 124/366 (to reflect the period). |
| |
| * | Expenses are equal to the Fund’s annualized expense ratio multiplied by the average account value over the period multiplied by 184/366 (to reflect the one-half year period). |
1 Represents the hypothetical 5% annual return before expenses.
82 Annual Report 2004
Gartmore Emerging Markets Fund
Portfolio Summary
(October 31, 2004)
The SEC adopted a requirement that Funds present their portfolio holdings in a table, chart or graph format in their annual and semiannual reports to shareholders, whether or not a schedule of investments is utilized. The following tables, which present portfolio holdings as a percentage of net assets, are provided in compliance with this requirement.
| | | | | | | |
| Asset Allocation | | | | |
|
|
| Common Stocks | | | 93.6% | | | |
| Participation Notes | | | 3.8% | | | |
| Repurchase Agreements | | | 1.6% | | | |
| Warrants | | | 0.2% | | | |
| Other Assets in excess of Liabilities | | | 0.8% | | | |
| | |
| | | |
| | | | 100.0% | | | |
| | | | | | | |
| Top Countries | | | | |
|
|
| Korea | | | 20.0% | | | |
| Brazil | | | 11.2% | | | |
| South Africa | | | 10.8% | | | |
| Taiwan | | | 9.7% | | | |
| Mexico | | | 7.0% | | | |
| Russia | | | 6.7% | | | |
| Malaysia | | | 5.1% | | | |
| Thailand | | | 4.9% | | | |
| Hong Kong | | | 4.0% | | | |
| China | | | 3.0% | | | |
| Other Countries | | | 17.6% | | | |
| | |
| | | |
| | | | 100.0% | | | |
| | | | | | | |
| Top Holdings | | | | |
|
|
| Samsung Electronics GDR | | | 4.1% | | | |
| Anglo American PLC | | | 2.4% | | | |
| Petroleo Brasileiro SA ADR | | | 2.2% | | | |
| Surgutneftegaz ADR | | | 1.9% | | | |
| America Movil SA de CV ADR | | | 1.8% | | | |
| Klabin SA | | | 1.6% | | | |
| Taiwan Semiconductor Manufacturing Co. Ltd. | | | 1.6% | | | |
| INI Steel Co. | | | 1.5% | | | |
| Sasol Ltd. | | | 1.5% | | | |
| LUKOIL ADR | | | 1.5% | | | |
| Other Holdings | | | 79.9% | | | |
| | |
| | | |
| | | | 100.0% | | | |
2004 Annual Report 83
International Series
| |
| | Statement of Investments |
| | October 31, 2004 |
Gartmore Emerging Markets Fund
| | | | | | | | | | | |
|
| Common Stocks (93.6%) |
|
| | Shares or | | | |
| | Principal Amount | | | Value | | | |
|
| ARGENTINA (0.8%) |
| Oil & Gas (0.8%) |
| Tenaris SA ADR | | | 4,100 | | | $ | 183,557 | | | |
| | | | | |
| | | |
| |
|
| BRAZIL (11.2%) |
| Banking (2.1%) |
| Banco Itau Holding Financeira SA ADR | | | 4,000 | | | | 242,000 | | | |
| Uniao de Bancos Brasileiros SA GDR | | | 9,200 | | | | 243,340 | | | |
| | | | | |
| | | |
| |
| | | | | | | | 485,340 | | | |
| | | | | |
| | | |
| |
| Beverages (0.7%) |
| Companhia de Bebidas das Americas ADR | | | 6,400 | | | | 158,720 | | | |
| | | | | |
| | | |
| |
| Electric Utility (1.4%) |
| Companhia Energetica de Minas Gerais | | | 14,290,500 | | | | 330,243 | | | |
| | | | | |
| | | |
| |
| Mining (0.6%) |
| Companhia Vale do Rio Doce, Class A | | | 7,300 | | | | 132,402 | | | |
| | | | | |
| | | |
| |
| Oil & Gas (3.1%) |
| Petroleo Brasileiro SA ADR | | | 14,550 | | | | 516,670 | | | |
| Petroleo Brasileiro SA ADR (c) | | | 5,400 | | | | 176,040 | | | |
| | | | | |
| | | |
| |
| | | | | | | | 692,710 | | | |
| | | | | |
| | | |
| |
| Paper Products (1.6%) |
| Klabin SA | | | 225,800 | | | | 371,590 | | | |
| | | | | |
| | | |
| |
| Retail - Food Products (0.3%) |
| Companhia Brasileira de Distribuicao | | | 3,100 | | | | 73,780 | | | |
| | | | | |
| | | |
| |
| Grupo Pao de Acucar ADR | | | | | | | | | | |
| Steel (0.6%) |
| Gerdau SA ADR | | | 8,600 | | | | 126,936 | | | |
| | | | | |
| | | |
| |
| Telecommunications (0.8%) |
| Tele Norte Leste Participacoes SA ADR | | | 13,800 | | | | 180,504 | | | |
| | | | | |
| | | |
| |
| | | | | | | | 2,552,225 | | | |
| | | | | |
| | | |
| |
|
| CHILE (0.9%) |
| Food (0.9%) |
| Cencosud SA ADR (b) | | | 9,800 | | | | 217,778 | | | |
| | | | | |
| | | |
| |
|
| CHINA (3.0%) |
| Mining (1.0%) |
| Yanzhou Coal Mining Co. Ltd. (d) | | | 174,000 | | | | 230,984 | | | |
| | | | | |
| | | |
| |
| Oil & Gas (0.7%) |
| CNOOC Ltd. (d) | | | 308,500 | | | | 158,931 | | | |
| | | | | |
| | | |
| |
| Telecommunications (1.3%) |
| China Telecom Corp. Ltd. (d) | | | 960,000 | | | | 308,905 | | | |
| | | | | |
| | | |
| |
| | | | | | | | 698,820 | | | |
| | | | | |
| | | |
| |
|
| HONG KONG (4.0%) |
| Agriculture (0.7%) |
| Global Bio-chem Technology Group Co Ltd. (d) | | | 208,000 | | | | 163,457 | | | |
| | | | | |
| | | |
| |
| Computer Services (0.6%) |
| Lenovo Group Ltd. (d) | | | 390,000 | | | | 140,390 | | | |
| | | | | |
| | | |
| |
| Electric Utility (1.1%) |
| China Resources Power Holdings Co Ltd. (d) | | | 434,000 | | | | 248,520 | | | |
| | | | | |
| | | |
| |
| Insurance (0.9%) |
| Ping An Insurance (Group) Co. oF | | | 128,000 | | | | 201,454 | | | |
| | | | | |
| | | |
| |
| China Ltd. (b) | | | | | | | | | | |
| Semiconductors (0.7%) |
| Solomon Systech International Ltd. | | | 632,000 | | | | 159,961 | | | |
| | | | | |
| | | |
| |
| | | | | | | | 913,782 | | | |
| | | | | |
| | | |
| |
|
| HUNGARY (0.4%) |
| Chemicals (0.4%) |
| BorsodChem Rt | | | 8,700 | | | | 86,449 | | | |
| | | | | |
| | | |
| |
|
| INDIA (0.9%) |
| Financial Services (0.9%) |
| ICICI Bank Ltd. ADR | | | 12,450 | | | | 196,212 | | | |
| | | | | |
| | | |
| |
|
| INDONESIA (2.9%) |
| Banking (0.9%) |
| PT Bank Mandiri (d) | | | 1,250,500 | | | | 216,190 | | | |
| | | | | |
| | | |
| |
| Mining (1.3%) |
| PT Bumi Resources Tbk (b) (d) | | | 3,675,500 | | | | 294,058 | | | |
| | | | | |
| | | |
| |
| Telecommunication Services (0.7%) |
| PT Telekomunikasi Indonesia (d) | | | 336,000 | | | | 160,776 | | | |
| | | | | |
| | | |
| |
| | | | | | | | 671,024 | | | |
| | | | | |
| | | |
| |
|
| ISRAEL (1.6%) |
| Computer Software (1.0%) |
| Retalix Ltd. ADR (b) | | | 12,200 | | | | 216,428 | | | |
| | | | | |
| | | |
| |
| Electronics (0.6%) |
| Orbotech Ltd. (b) | | | 8,600 | | | | 145,426 | | | |
| | | | | |
| | | |
| |
| | | | | | | | 361,854 | | | |
| | | | | |
| | | |
| |
|
| KOREA (20.0%) |
| Automobile (0.7%) |
| Ssangyong Motor Co. (b) (d) | | | 24,700 | | | | 151,830 | | | |
| | | | | |
| | | |
| |
| Banking (1.2%) |
| Hana Bank (d) | | | 10,940 | | | | 273,555 | | | |
| | | | | |
| | | |
84 Annual Report 2004
| | | | | | | | | | | |
|
| Common Stocks (continued) |
|
| | Shares or | | | |
| | Principal Amount | | | Value | | | |
|
| KOREA (continued) |
| Building - Residential/ Commercial (1.4%) |
| Hyundai Development Co. (d) | | | 23,600 | | | $ | 317,056 | | | |
| | | | | |
| | | |
| |
| Communications Equipment (0.8%) |
| KH Vatec Co. Ltd. (d) | | | 6,900 | | | | 184,863 | | | |
| | | | | |
| | | |
| |
| Diversified Operations (1.0%) |
| GS Holdings Corp. (b) | | | 10,550 | | | | 224,288 | | | |
| | | | | |
| | | |
| |
| Electronics (5.1%) |
| Samsung Electronics Co. Ltd. (d) | | | 500 | | | | 196,602 | | | |
| Samsung Electronics GDR | | | 7,200 | | | | 952,199 | | | |
| | | | | |
| | | |
| |
| | | | | | | | 1,148,801 | | | |
| | | | | |
| | | |
| |
| Financial (1.1%) |
| Woori Finance Holdings Co. Ltd. (d) | | | 36,380 | | | | 262,169 | | | |
| | | | | |
| | | |
| |
| Financial Services (0.6%) |
| Daishin Securities Co. Ltd. | | | 16,700 | | | | 127,169 | | | |
| | | | | |
| | | |
| |
| Household Durables (1.8%) |
| LG Electronics, Inc. (d) | | | 5,100 | | | | 288,271 | | | |
| LG Electronics, Inc. (d) | | | 4,100 | | | | 131,523 | | | |
| | | | | |
| | | |
| |
| | | | | | | | 419,794 | | | |
| | | | | |
| | | |
| |
| Industrials (0.4%) |
| Hanjin Shipping Co. Ltd. (d) | | | 5,000 | | | | 96,567 | | | |
| | | | | |
| | | |
| |
| Retail (1.0%) |
| Shinsegae Co. Ltd. (d) | | | 800 | | | | 225,241 | | | |
| | | | | |
| | | |
| |
| Steel (1.5%) |
| INI Steel Co. (d) | | | 33,000 | | | | 350,526 | | | |
| | | | | |
| | | |
| |
| Telecommunications (1.5%) |
| SK Telecom Co. Ltd. (d) | | | 1,780 | | | | 280,233 | | | |
| SK Telecom Co. Ltd. ADR | | | 3,800 | | | | 74,974 | | | |
| | | | | |
| | | |
| |
| | | | | | | | 355,207 | | | |
| | | | | |
| | | |
| |
| Tobacco (0.9%) |
| KT&G Corp. | | | 7,500 | | | | 207,682 | | | |
| | | | | |
| | | |
| |
| Transportation (1.0%) |
| Korean Air Lines Co. Ltd. (d) | | | 15,500 | | | | 237,834 | | | |
| | | | | |
| | | |
| |
| | | | | | | | 4,582,582 | | | |
| | | | | |
| | | |
| |
|
| MALAYSIA (5.1%) |
| Banking (2.0%) |
| CIMB Berhad (d) | | | 161,400 | | | | 208,069 | | | |
| Public Bank Berhad (d) | | | 147,600 | | | | 270,019 | | | |
| | | | | |
| | | |
| |
| | | | | | | | 478,088 | | | |
| | | | | |
| | | |
| |
| Electronics (1.0%) |
| Tenega Nasional (d) | | | 75,000 | | | | 219,147 | | | |
| | | | | |
| | | |
| |
| Telecommunications (1.3%) |
| Telekom Malaysia Berhad (d) | | | 99,800 | | | | 302,197 | | | |
| | | | | |
| | | |
| |
| Transportation (0.8%) |
| Malaysia International Shipping Corp. Berhad (d) | | | 50,800 | | | | 178,024 | | | |
| | | | | |
| | | |
| |
| | | | | | | | 1,177,456 | | | |
| | | | | |
| | | |
| |
|
| MEXICO (7.0%) |
| Construction (0.5%) |
| Urbi Desarrolloas Urbanos, SA de CV (b) | | | 28,500 | | | | 106,238 | | | |
| | | | | |
| | | |
| |
| Diversified Operations (0.9%) |
| Grupo Carso S.A. de CV | | | 42,458 | | | | 202,042 | | | |
| | | | | |
| | | |
| |
| Financial Services (1.3%) |
| Grupo Financiero Banorte SA de CV | | | 61,700 | | | | 289,969 | | | |
| | | | | |
| | | |
| |
| Media (1.1%) |
| TV Azteca SA de CV ADR | | | 26,000 | | | | 260,520 | | | |
| | | | | |
| | | |
| |
| Retail (1.5%) |
| Organizacion Soriana SA de CV | | | 37,861 | | | | 121,501 | | | |
| Wal-Mart de Mexico SA de CV | | | 71,300 | | | | 233,323 | | | |
| | | | | |
| | | |
| |
| | | | | | | | 354,824 | | | |
| | | | | |
| | | |
| |
| Telecommunications (1.7%) |
| America Movil SA de CV ADR | | | 9,200 | | | | 404,800 | | | |
| | | | | |
| | | |
| |
| | | | | | | | 1,618,393 | | | |
| | | | | |
| | | |
| |
|
| POLAND (1.6%) |
| Banking (1.3%) |
| Bank Pekao SA (d) | | | 7,900 | | | | 300,754 | | | |
| | | | | |
| | | |
| |
| Construction (0.3%) |
| Globe Trade Centre SA (b) | | | 2,200 | | | | 77,676 | | | |
| | | | | |
| | | |
| |
| | | | | | | | 378,430 | | | |
| | | | | |
| | | |
| |
|
| RUSSIA (6.7%) |
| Brewery (0.7%) |
| Efes Breweries International GDR (b) | | | 5,700 | | | | 158,916 | | | |
| | | | | |
| | | |
| |
| Oil & Gas (4.5%) |
| LUKOIL ADR (d) | | | 2,700 | | | | 337,608 | | | |
| OAO Gazprom ADR (d) | | | 6,800 | | | | 254,490 | | | |
| Surgutneftegaz ADR | | | 11,021 | | | | 439,738 | | | |
| | | | | |
| | | |
| |
| | | | | | | | 1,031,836 | | | |
| | | | | |
| | | |
| |
| Steel (0.6%) |
| Mechel ADR (b) | | | 6,800 | | | | 139,400 | | | |
| | | | | |
| | | |
| |
| Telecommunications (0.9%) |
| AO VimpelCom ADR (b) | | | 1,850 | | | | 210,900 | | | |
| | | | | |
| | | |
| |
| | | | | | | | 1,541,052 | | | |
| | | | | |
| | | |
| |
|
| SOUTH AFRICA (10.8%) |
| Banking (1.5%) |
| ABSA Group Ltd. | | | 30,800 | | | | 335,136 | | | |
| | | | | |
| | | |
2004 Annual Report 85
| |
| | Statement of Investments (Continued) |
| | October 31, 2004 |
Gartmore Emerging Markets Fund (Continued)
International Series
| | | | | | | | | | | |
|
| Common Stocks (continued) |
|
| | Shares or | | | |
| | Principal Amount | | | Value | | | |
|
| SOUTH AFRICA (continued) |
| Diversified Operations (0.6%) |
| Barloworld Ltd. (d) | | | 10,700 | | | $ | 148,753 | | | |
| | | | | |
| | | |
| |
| Financial Services (0.7%) |
| African Bank Investments Ltd. (d) | | | 70,400 | | | | 163,785 | | | |
| | | | | |
| | | |
| |
| Home Furnishings (1.0%) |
| Lewis Group Ltd. (b) | | | 43,800 | | | | 227,269 | | | |
| | | | | |
| | | |
| |
| Mining (3.4%) |
| Anglo American PLC (d) | | | 24,900 | | | | 541,337 | | | |
| Impala Platinum Holdings Ltd. (d) | | | 3,000 | | | | 239,913 | | | |
| | | | | |
| | | |
| |
| | | | | | | | 781,250 | | | |
| | | | | |
| | | |
| |
| Oil & Gas (1.5%) |
| Sasol Ltd. (d) | | | 17,100 | | | | 338,426 | | | |
| | | | | |
| | | |
| |
| Paper Products (1.0%) |
| Sappi Ltd (d) | | | 15,500 | | | | 223,137 | | | |
| | | | | |
| | | |
| |
| Retail (1.1%) |
| Massmart Holdings Ltd. | | | 37,900 | | | | 263,438 | | | |
| | | | | |
| | | |
| |
| | | | | | | | 2,481,194 | | | |
| | | | | |
| | | |
| |
|
| TAIWAN (9.7%) |
| Banking (1.4%) |
| E.Sun Financial Holding Co. Ltd. (d) | | | 470,000 | | | | 321,372 | | | |
| | | | | |
| | | |
| |
| Computer Services (1.3%) |
| Acer, Inc. (d) | | | 198,000 | | | | 290,397 | | | |
| | | | | |
| | | |
| |
| Electronics (0.9%) |
| Ichia Technologies, Inc. (d) | | | 130,449 | | | | 199,074 | | | |
| | | | | |
| | | |
| |
| Insurance (0.9%) |
| Cathay Financial Holding Co. Ltd. (d) | | | 105,000 | | | | 201,327 | | | |
| | | | | |
| | | |
| |
| Networking Products (0.5%) |
| Accton Technology Corp. (d) | | | 273,000 | | | | 112,141 | | | |
| | | | | |
| | | |
| |
| Petrochemicals (0.8%) |
| Fomosa Chemicals & Fibre Corp. (d) | | | 109,000 | | | | 184,700 | | | |
| | | | | |
| | | |
| |
| Semiconductors (2.1%) |
| Taiwan Semiconductor Manufacturing Co. Ltd. (d) | | | 273,397 | | | | 363,134 | | | |
| Taiwan Semiconductor Manufacturing Co. Ltd. ADR | | | 19,166 | | | | 145,087 | | | |
| | | | | |
| | | |
| |
| | | | | | | | 508,221 | | | |
| | | | | |
| | | |
| |
| Steel (0.7%) |
| China Steel Corp. (d) | | | 166,000 | | | | 167,152 | | | |
| | | | | |
| | | |
| |
| Textiles (1.1%) |
| Far Eastern Textile Ltd. (d) | | | 372,599 | | | | 248,790 | | | |
| | | | | |
| | | |
| |
| | | | | | | | 2,233,174 | | | |
| | | | | |
| | | |
| |
|
| THAILAND (4.9%) |
| Banking (0.7%) |
| Kasikornbank Public Co. Ltd. (b) (d) | | | 139,900 | | | | 160,360 | | | |
| | | | | |
| | | |
| |
| Electric Utility (0.5%) |
| Ratchaburi Electricity | | | 138,600 | | | | 125,008 | | | |
| | | | | |
| | | |
| |
| Financial Services (0.8%) |
| TISCO Finance Public Co. Ltd. (b) | | | 342,800 | | | | 189,122 | | | |
| | | | | |
| | | |
| |
| Petrochemicals (0.9%) |
| Aromatics PC (b) | | | 134,700 | | | | 208,524 | | | |
| | | | | |
| | | |
| |
| Telecommunications (1.2%) |
| Shin Corporation Public Co. Ltd. | | | 281,100 | | | | 248,132 | | | |
| | | | | |
| | | |
| |
| Transportation (0.8%) |
| Thai Airways International Public Co Ltd. (d) | | | 159,900 | | | | 188,516 | | | |
| | | | | |
| | | |
| |
| | | | | | | | 1,119,662 | | | |
| | | | | |
| | | |
| |
|
| TURKEY (2.1%) |
| Automotive (0.9%) |
| Ford Otomotiv Sanayi AS | | | 26,029,500 | | | | 206,541 | | | |
| | | | | |
| | | |
| |
| Commercial Banks (1.2%) |
| Denizbank A.S. (b) | | | 146,136,000 | | | | 285,434 | | | |
| | | | | |
| | | |
| |
| | | | | | | | 491,975 | | | |
| | | | | |
| | | |
| |
| Total Common Stocks | | | 21,505,619 | | | |
| | | | | |
| | | |
| |
Participation Notes (3.8%) |
| INDIA (3.8%) |
| Banking (0.1%) |
| ICICI Bank Ltd., expiring 03/30/07 (d) | | $ | 3,700 | | | | 24,383 | | | |
| | | | | |
| | | |
| |
| Diversified Operations (1.1%) |
| Larsen & Toubro Ltd. (d) | | | 11,000 | | | | 201,300 | | | |
| National Thermal (b) (d) | | | 40,600 | | | | 54,810 | | | |
| | | | | |
| | | |
| |
| | | | | | | | 256,110 | | | |
| | | | | |
| | | |
| |
| Oil & Gas (1.3%) |
| Oil and Natural Gas Corp. Ltd., 10/31/05 (d) | | | 17,200 | | | | 299,280 | | | |
| | | | | |
| | | |
| |
| Software & Computer Services (0.6%) |
| Satyam Computer Services Ltd., 03/07/23 (d) | | | 17,700 | | | | 146,025 | | | |
| | | | | |
| | | |
| |
| Tobacco (0.7%) |
| ITC Ltd., 04/07/30 (d) | | | 6,300 | | | | 151,074 | | | |
| | | | | |
| | | |
| |
| Total Participation Notes | | | 876,872 | | | |
| | | | | |
| | | |
86 Annual Report 2004
| | | | | | | | | | | |
|
| Repurchase Agreements (1.6%) |
|
| | Shares or | | | |
| | Principal Amount | | | Value | | | |
|
|
CS First Boston, 1.75%, dated 10/29/04, due 11/01/04, repurchase price $153,626
(Fully collateralized by Treasury Notes and U.S. Agency Securities) | | $ | 153,604 | | | $ | 153,604 | | | |
Nomura Securities, 1.75% dated 10/29/04, due 11/01/04, repurchase price $214,651
(Fully collateralized by AA Corporate Bonds and U.S. Agency Securities) | | | 214,620 | | | | 214,620 | | | |
| | | | | |
| | | |
| |
| Total Repurchase Agreements | | | 368,224 | | | |
| | | | | |
| | | |
| |
Warrants (0.2%) |
| THAILAND (0.2%) |
| Financial Services (0.2%) |
| Kiatnakin Finance Public Co. Ltd., 01/18/11 | | | 129,900 | | | | 43,938 | | | |
| | | | | |
| | | |
| |
| Total Warrants | | | 43,938 | | | |
| | | | | |
| | | |
| |
| Total Investments (Cost $20,825,864) (a) — 99.2% | | | 22,794,653 | | | |
| Other assets in excess of liabilities — 0.8% | | | 194,559 | | | |
| | | | | |
| | | |
| |
| NET ASSETS — 100.0% | | $ | 22,989,212 | | | |
| | | | | |
| | | |
| | |
| (a) | | See notes to financial statements for tax unrealized appreciation (depreciation) of securities. |
| |
| (b) | | Denotes a non-income producing security. |
| |
| (c) | | Preferred Stock. |
| |
| (d) | | Fair Valued Security. |
ADR American Depositary Receipt
GDR Global Depositary Receipt
See notes to financial statements.
2004 Annual Report 87
International Series
| |
| | Gartmore International Growth Fund |
For the annual period ended Oct. 31, 2004, the Gartmore International Growth Fund returned 11.60% (Class A at NAV) versus 19.67% for its benchmark, the Morgan Stanley Capital International (MSCI) All Country World Free excluding U.S. Index. For broader comparison, the average return for the Fund’s Lipper peer category of International Multi-Cap Core Funds was 17.06%.
Through the end of 2003 and the first quarter of 2004, the global economic recovery continued to gather momentum, enhanced by the relatively accommodative global interest-rate environment. During that time, the emerging equity markets continued to outperform the developed equity universe— particularly the Latin American region, which was bolstered by the improving global economic backdrop. Overweight positions in both Japan and China benefited Fund performance; however, an overweight position in Hong Kong hurt the Fund.
March and April of 2004 witnessed a turnaround in the fortunes of global markets. U.S. employment data came in surprisingly weak, and the prospect of global monetary tightening weighed on the markets after the Chinese government implemented measures designed to cool economic growth. These developments particularly upset the emerging markets universe, which underperformed sharply during the second quarter of 2004. Stock selection in Japan detracted from Fund performance during the latter half of the period.
A combination of country allocation and stock selection was responsible for the Fund’s underperformance during the overall period. On the one hand, exposure to China was most beneficial for Fund performance, both in terms of country allocation and stock selection. This positive factor, however, was more than offset by negative stock selection in Japan. A number of Japanese holdings were among the worst-performing positions in the Fund, including UMC JAPAN, NEC Electronics Corp., Nissan Motor Co., Ltd. and Kyorin Pharmaceutica Co., Ltd., which, respectively, detracted -0.58%, - -0.53% and -0.47% from the Fund’s performance. Nonetheless, our position in Japanese financial services firm UFJ Holdings, Inc. was the strongest-performing position in the Fund’s portfolio during the annual period with a 0.51% performance contribution.
At the sector level, our consumer discretionary exposure was the most detrimental to Fund performance, due to overweights in Nissan Motor, and, News Corp plus an underweight in Toyota Motor Corp. The Fund’s information technology exposure similarly contributed to negative performance, as a result of overweights in a number of semiconductor-related stocks, including Taiwan Semiconductor Manufacturing Co. Ltd., Samsung Electronics Co. Ltd. and UMC JAPAN. The Fund’s overweight exposure to the materials sector added value. BHP Billiton, Companhia Vale do Rio Doce and Rio Tinto Ltd. were all among the top 20 contributors to relative performance with contributions of, respectively, 0.36%, 0.24%, and 0.21%.
In terms of country bias, the United Kingdom is the largest country overweight in the Fund, reflecting our positive macroeconomic outlook for the region. We also hold overweights in a few European countries, such as Germany, because of its attractive valuation as compared to the United States and the United Kingdom. We have markedly scaled back our exposure to Japan and now hold a considerable underweight in the country, on indications that the economic picture is deteriorating somewhat, while the high oil price also adds to concerns about Japan’s economic growth.
The Fund is now considerably overweight in the more cyclical materials sector, reflecting the positive outlook for the sector, which is largely a function of still-buoyant Chinese demand for raw materials. This positioning also ties in with our overweight country allocation to China, where we believe that overheating will be prevented by the government without an economic “hard landing.” The Fund also has taken an overweight stance in the energy sector, in a clear bid to leverage the high oil price.
Portfolio Manager: Team
| |
| | Class A: GIGAX |
| | Class B: GIGBX |
| | Class C: GIGCX |
| | Class R: GIRRX |
| | Institutional Service Class: GIGSX |
| | Institutional Class: GIGIX |
88 Annual Report 2004
Gartmore International Growth Fund
Fund Performance
Average Annual Total Return
(For periods ended October 31, 2004)
| | | | | | | | | | | |
| | | | One year | | | Inception1 | |
|
| |
| Class A | | without sales charge2 | | | 11.60% | | | | -5.81% | |
| | | with sales charge3 | | | 5.13% | | | | -7.14% | |
|
| Class B | | without sales charge2 | | | 10.85% | | | | -6.49% | |
| | | with sales charge4 | | | 5.85% | | | | -6.94% | |
|
Class C5 | | without sales charge2 | | | 10.79% | | | | -6.37% | |
| | | with sales charge6 | | | 9.79% | | | | -6.37% | |
|
Class R 7,9 | | | | | 11.14% | | | | -6.43% | |
|
| Institutional Class8,9 | | | 11.91% | | | | -5.52% | |
|
| Institutional Service Class9 | | | 11.91% | | | | -5.52% | |
|
All figures showing the effect of a sales charge reflect the maximum charge possible, because it has the most dramatic effect on performance data.
| |
| 1 | Fund commenced operations on August 30, 2000. |
| |
| 2 | These returns do not reflect the effects of sales charges (SC). |
| |
| 3 | A 5.75% front-end sales charge was deducted. |
| |
| 4 | A 5.00% contingent deferred sales charge (CDSC) was deducted. The CDSC declines to 0% after 6 years. |
| |
| 5 | These returns until the creation of Class C shares (3/1/01) include the performance of the Fund’s Class B shares. Excluding the effects of any fee waivers or reimbursements, such prior performance is substantially similar to what Class C shares would have produced because Class C shares invest in the same portfolio of securities as Class B shares and have the same expenses after any fee waivers or reimbursements. For Class C shares returns with sales charges, these returns have been restated for the applicable sales charges. |
| |
| 6 | A CDSC of 1.00% was deducted because it is charged when you sell Class C shares within the first year after purchase. |
| |
| 7 | These returns until the creation of Class R shares (12/31/03) include the performance of the Fund’s Class B shares. The returns have been adjusted for the fact that Class R shares do not have any applicable sales charges but have not been adjusted for the lower expenses applicable to Class R shares. Excluding the effect of any fee waivers or reimbursements, such prior performance is similar to what Class R shares would have produced because the Class R shares invest in the same portfolio of securities as Class B shares. |
| |
| 8 | These returns until the creation of Institutional Class shares (6/29/04) include the performance of the Fund’s Institutional Service shares. The returns have not been adjusted for the lower expenses applicable to Institutional Class shares. Excluding the effect of any fee waivers or reimbursements, such prior performance is similar to what Institutional Class shares would have produced because the Institutional Class shares invest in the same portfolio of securities as Institutional Service shares. |
| |
| 9 | Not subject to any sales charges. |
Performance of a $10,000 Investment
Investment return and principal value will fluctuate, and when redeemed, shares may be worth more or less than original cost. Past performance is no guarantee of future results and does not reflect the deduction of taxes that a shareholder would pay on fund distributions or the redemption of fund shares. Investing in mutual funds involves market risk, including loss of principal. Performance returns assume the reinvestment of all distributions.
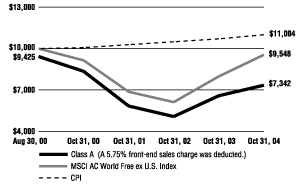
Comparative performance of $10,000 invested in Class A shares of the Gartmore International Growth Fund, Morgan Stanley Capital International All Country World Free ex U.S. Index (MSCI AC World ex U.S.)(a), and the Consumer Price Index (CPI)(b) since inception. Unlike the Fund, the returns for these unmanaged indexes do not reflect any fees, expenses, or sales charges. Investors cannot invest directly in market indexes.
| | |
| (a) | | The MSCI AC World Free ex U.S. is an index that contains companies that are replicas of their local markets not including any securities in the United States. |
| |
| (b) | | The CPI represents changes in prices of a basket of goods and services purchased for consumption by urban households. |
2004 Annual Report 89
Gartmore International Growth Fund
International Series
| |
| | Shareholder |
| | Expense Example |
As a shareholder of the Funds, you incur two types of costs: (1) transaction costs, including sales charges (loads) paid on purchase payments and redemption fees; and (2) ongoing costs, including investment advisory fees, administration fees, distribution fees and other Fund expenses. The examples below are intended to help you understand your ongoing costs (in dollars) of investing in the Funds and to compare these costs with the ongoing costs of investing in other mutual funds. The examples assume that you had a $1,000 investment in the Class at the beginning of the reporting period, May 1, 2004, and continued to hold your shares at the end of the reporting period, October 31, 2004. Per SEC requirements, the examples are based on an investment of $1,000 invested at the beginning of the period and held for the entire six-month period ended October 31, 2004.
Actual Expenses
For each Class of the Fund in the table below, the first line provides information about actual account values and actual expenses. You may use the information in this line, together with the amount you invested, to estimate the expenses that you paid over the period. Simply divide your account value by $1,000 (for example, an $8,600 account value divided by $1,000 = 8.6), then multiply the result by the number in the first line of each Class under the heading entitled “Expenses Paid During Period” to estimate the expenses you paid on your account during the period.
Hypothetical Example for Comparison Purposes
The second line of each Class in the table below provides information about hypothetical account values and hypothetical expenses based on the Class’ actual expense ratio and an assumed rate of return of 5% per year before expenses, which is not the Class’ actual return. The hypothetical account values and expenses may not be used to estimate the actual ending account balance or expenses you paid for the period. You may use this information to compare the ongoing costs of investing in the Class of the Fund and other funds. To do so, compare this 5% hypothetical example with the 5% hypothetical examples that appear in the shareholder reports of the other funds.
Please note that the expenses shown in the table are meant to highlight your ongoing costs only and do not reflect any transaction costs, such as sales charges (loads) or redemption fees. Therefore, the second line for each Class in the table is useful in comparing ongoing costs only, and will not help you determine the relative total costs of owning different funds. In addition, if these transaction costs were included, your costs would have been higher. The examples also assume all dividends and distributions have been reinvested.
Schedule of Shareholder Expenses
Expense Analysis of a $1,000 Investment
(October 31, 2004)
| | | | | | | | | | | | | | | | | | | | | | | |
| | | | Beginning | | | Ending | | | | | | | |
| | | | Account Value | | | Account Value | | | Expenses Paid | | | Annualized | | | |
| International Growth Fund | | | | 5/1/04 | | | 10/31/04 | | | During Period* | | | Expense Ratio | | | |
|
|
| Class A | | | Actual | | | $ | 1,000 | | | $ | 1,039 | | | $ | 8.51 | | | | 1.66% | | | |
| | | | Hypothetical | 1 | | $ | 1,000 | | | $ | 1,017 | | | $ | 8.45 | | | | 1.66% | | | |
|
| Class B | | | Actual | | | $ | 1,000 | | | $ | 1,036 | | | $ | 12.28 | | | | 2.40% | | | |
| | | | Hypothetical | 1 | | $ | 1,000 | | | $ | 1,013 | | | $ | 12.22 | | | | 2.40% | | | |
|
| Class C | | | Actual | | | $ | 1,000 | | | $ | 1,035 | | | $ | 12.28 | | | | 2.40% | | | |
| | | | Hypothetical | 1 | | $ | 1,000 | | | $ | 1,013 | | | $ | 12.22 | | | | 2.40% | | | |
|
| Class R | | | Actual | | | $ | 1,000 | | | $ | 1,037 | | | $ | 9.88 | | | | 1.93% | | | |
| | | | Hypothetical | 1 | | $ | 1,000 | | | $ | 1,015 | | | $ | 9.82 | | | | 1.93% | | | |
|
| Institutional Service Class | | | Actual | | | $ | 1,000 | | | $ | 1,041 | | | $ | 7.18 | | | | 1.40% | | | |
| | | | Hypothetical | 1 | | $ | 1,000 | | | $ | 1,018 | | | $ | 7.13 | | | | 1.40% | | | |
|
| Institutional Class (a) | | | Actual | | | $ | 1,000 | | | $ | 1,051 | | | $ | 4.86 | (b) | | | 1.40% | | | |
| | | | Hypothetical | 1 | | $ | 1,000 | | | $ | 1,010 | | | $ | 4.78 | (b) | | | 1.40% | | | |
|
| | |
| (a) | | For the period from June 29, 2004 (commencement of operations) through October 31, 2004. |
| |
| (b) | | Expense are equal to the Fund’s annualized expense ratio multiplied by the average account value over the period multiplied by 124/366 (to reflect the period). |
| |
| * | Expenses are equal to the Fund’s annualized expense ratio multiplied by the average account value over the period multiplied by 184/366 (to reflect the one-half year period). |
1 Represents the hypothetical 5% annual return before expenses.
90 Annual Report 2004
Gartmore International Growth Fund
Portfolio Summary
(October 31, 2004)
The SEC adopted a requirement that Funds present their portfolio holdings in a table, chart or graph format in their annual and semiannual reports to shareholders, whether or not a schedule of investments is utilized. The following tables, which present portfolio holdings as a percentage of net assets, are provided in compliance with this requirement.
| | | | | | | |
| Asset Allocation | | | | |
|
|
| Common Stocks | | | 94.3% | | | |
| Repurchase Agreements | | | 5.1% | | | |
| Other Assets in excess of Liabilities | | | 0.6% | | | |
| | |
| | | |
| | | | 100.0% | | | |
| | | | | | | |
| Top Countries | | | | |
|
|
| United Kingdom | | | 31.9% | | | |
| Japan | | | 11.4% | | | |
| France | | | 8.8% | | | |
| Germany | | | 6.8% | | | |
| Italy | | | 6.4% | | | |
| Switzerland | | | 4.0% | | | |
| Canada | | | 3.8% | | | |
| Spain | | | 3.1% | | | |
| Australia | | | 2.9% | | | |
| Norway | | | 2.8% | | | |
| Other Countries | | | 18.1% | | | |
| | |
| | | |
| | | | 100.0% | | | |
| | | | | | | |
| Top Holdings | | | | |
|
|
| BP PLC | | | 3.4% | | | |
| Telefonica SA | | | 3.1% | | | |
| E. ON AG | | | 2.2% | | | |
| HSBC Holdings PLC | | | 2.2% | | | |
| Sun Hung Kai Properties Ltd. | | | 2.1% | | | |
| Suncor Energy, Inc. | | | 2.1% | | | |
| Peninsular & Oriental Steam Navigation Co. | | | 2.1% | | | |
| Vedanta Resources PLC | | | 2.0% | | | |
| Banca Intesa SPA | | | 2.0% | | | |
| Rolls-Royce Group | | | 2.0% | | | |
| Other Holdings | | | 76.8% | | | |
| | |
| | | |
| | | | 100.0% | | | |
2004 Annual Report 91
International Series
| |
| | Statement of Investments |
| | October 31, 2004 |
Gartmore International Growth Fund
| | | | | | | | | | | |
|
| Common Stocks (94.3%) |
|
| | Shares or | | | |
| | Principal Amount | | | Value | | | |
|
| AUSTRALIA (2.9%) |
| Coal (0.7%) |
| Excel Coal Ltd. | | | 18,019 | | | $ | 59,221 | | | |
| | | | | |
| | | |
| |
| Minerals (1.2%) |
| BHP Billiton Ltd. (c) | | | 10,709 | | | | 110,747 | | | |
| | | | | |
| | | |
| |
| Multimedia (1.0%) |
| News Corp., Ltd. (The) (c) | | | 10,570 | | | | 84,903 | | | |
| | | | | |
| | | |
| |
| | | | | | | | 254,871 | | | |
| | | | | |
| | | |
| |
|
| AUSTRIA (0.5%) |
| Oil & Gas (0.5%) |
| OMV AG (c) | | | 194 | | | | 46,564 | | | |
| | | | | |
| | | |
| |
|
| BRAZIL (1.0%) |
| Mining (1.0%) |
| Companhia Vale de Rio Doce ADR | | | 4,704 | | | | 85,613 | | | |
| | | | | |
| | | |
| |
|
| CANADA (3.8%) |
| Oil & Gas (3.8%) |
| Encana Corp. | | | 1,688 | | | | 83,587 | | | |
| Petro-Canada | | | 1,109 | | | | 60,444 | | | |
| Suncor Energy, Inc. | | | 5,386 | | | | 183,912 | | | |
| | | | | |
| | | |
| |
| | | | | | | | 327,943 | | | |
| | | | | |
| | | |
| |
|
| CHINA (1.5%) |
| Mining (1.5%) |
| Yanzhou Coal Mining Co. Ltd. (c) | | | 98,000 | | | | 130,095 | | | |
| | | | | |
| | | |
| |
|
| FINLAND (1.1%) |
| Oil & Gas (1.1%) |
| Fortum Oyj (c) | | | 6,239 | | | | 95,408 | | | |
| | | | | |
| | | |
| |
|
| FRANCE (8.8%) |
| Banking (5.0%) |
| BNP Paribas SA (c) | | | 2,560 | | | | 174,361 | | | |
| Credit Agricole SA (c) | | | 4,480 | | | | 131,372 | | | |
| Societe Generale (c) | | | 1,410 | | | | 130,906 | | | |
| | | | | |
| | | |
| |
| | | | | | | | 436,639 | | | |
| | | | | |
| | | |
| |
| Beverages (0.9%) |
| Pernod — Richard SA (c) | | | 588 | | | | 81,414 | | | |
| | | | | |
| | | |
| |
| Health & Personal Care (0.5%) |
| Sanofi-Aventis SA (c) | | | 595 | | | | 43,397 | | | |
| | | | | |
| | | |
| |
| Oil & Gas (1.8%) |
| Total Fina Elf SA (c) | | | 750 | | | | 156,081 | | | |
| | | | | |
| | | |
| |
| Utilities (0.6%) |
| Suez SA (c) | | | 2,280 | | | | 53,263 | | | |
| | | | | |
| | | |
| |
| | | | | | | | 770,794 | | | |
| | | | | |
| | | |
| |
|
| GERMANY (6.8%) |
| Chemicals (1.6%) |
| BASF AG (c) | | | 2,255 | | | | 141,235 | | | |
| | | | | |
| | | |
| |
| Computer Software & Services (1.0%) |
| SAP AG (c) | | | 525 | | | | 89,428 | | | |
| | | | | |
| | | |
| |
| Electric (2.3%) |
| E. ON AG (c) | | | 2,306 | | | | 188,072 | | | |
| | | | | |
| | | |
| |
| Gas & Electric Utility (0.4%) |
| RWE AG (c) | | | 710 | | | | 37,576 | | | |
| | | | | |
| | | |
| |
| Manufacturing (1.0%) |
| Siemens AG (c) | | | 1,178 | | | | 87,883 | | | |
| | | | | |
| | | |
| |
| Telecommunications (0.5%) |
| Deutsche Telekom AG (b) (c) | | | 2,364 | | | | 45,419 | | | |
| | | | | |
| | | |
| |
| | | | | | | | 589,613 | | | |
| | | | | |
| | | |
| |
|
| HONG KONG (2.1%) |
| Real Estate (2.1%) |
| Sun Hung Kai Properties Ltd. (c) | | | 20,000 | | | | 185,122 | | | |
| | | | | |
| | | |
| |
|
| ITALY (6.4%) |
| Banking (2.0%) |
| Banca Intesa SPA (c) | | | 42,876 | | | | 175,648 | | | |
| | | | | |
| | | |
| |
| Oil & Gas (1.9%) |
| ENI SPA (c) | | | 7,144 | | | | 162,972 | | | |
| | | | | |
| | | |
| |
| Public Thoroughfares (1.0%) |
| Autostrade SPA (c) | | | 4,076 | | | | 89,046 | | | |
| | | | | |
| | | |
| |
| Telecommunications (1.5%) |
| Telecom Italia SPA (c) | | | 40,070 | | | | 133,386 | | | |
| | | | | |
| | | |
| |
| | | | | | | | 561,052 | | | |
| | | | | |
| | | |
| |
|
| JAPAN (11.4%) |
| Automotive (1.6%) |
| Honda Motor Co. Ltd. (c) | | | 700 | | | | 33,936 | | | |
| Toyota Motor Corp. (c) | | | 2,700 | | | | 104,546 | | | |
| | | | | |
| | | |
| |
| | | | | | | | 138,482 | | | |
| | | | | |
| | | |
| |
| Building & Construction (0.8%) |
| Daiwa House Industry Co. Ltd. (c) | | | 7,000 | | | | 71,427 | | | |
| | | | | |
| | | |
| |
| Financial Services (3.2%) |
| Credit Saison Co. Ltd. (c) | | | 3,700 | | | | 118,142 | | | |
| Mitsubishi Tokyo Financial Group, Inc. (c) | | | 10 | | | | 84,607 | | | |
| Sumitomo Mitsui Financial Group, Inc. (c) | | | 11 | | | | 71,427 | | | |
| | | | | |
| | | |
| |
| | | | | | | | 274,176 | | | |
| | | | | |
| | | |
| |
| Import/ Export (0.6%) |
| Mitsubishi Corp. (c) | | | 5,000 | | | | 55,132 | | | |
| | | | | |
| | | |
92 Annual Report 2004
| | | | | | | | | | | |
|
| Common Stocks (continued) |
|
| | Shares or | | | |
| | Principal Amount | | | Value | | | |
|
| JAPAN (continued) |
| Mining (0.9%) |
| Sumitomo Metal & Mining Co. Ltd. (c) | | | 12,000 | | | $ | 80,999 | | | |
| | | | | |
| | | |
| |
| Pharmaceuticals (0.9%) |
| Takeda Chemical Industries Ltd. (c) | | | 1,600 | | | | 77,128 | | | |
| | | | | |
| | | |
| |
| Real Estate (1.8%) |
| Mitsui Fudosan Co. Ltd. (c) | | | 15,000 | | | | 158,904 | | | |
| | | | | |
| | | |
| |
| Steel (0.5%) |
| Nippon Steel Corp. (c) | | | 19,000 | | | | 44,358 | | | |
| | | | | |
| | | |
| |
| Transportation (0.5%) |
| West Japan Railway Co. (c) | | | 10 | | | | 39,842 | | | |
| | | | | |
| | | |
| |
| Transportation-Marine (0.6%) |
| Nippon Yusen Kabushiki Kaisha (c) | | | 10,000 | | | | 50,245 | | | |
| | | | | |
| | | |
| |
| | | | | | | | 990,693 | | | |
| | | | | |
| | | |
| |
|
| NETHERLANDS (2.7%) |
| Food (0.8%) |
| Koninlijke Numico NV (b) (c) | | | 1,952 | | | | 65,770 | | | |
| | | | | |
| | | |
| |
| Oil & Gas (1.9%) |
| Royal Dutch Petroleum Co. (c) | | | 3,146 | | | | 170,595 | | | |
| | | | | |
| | | |
| |
| | | | | | | | 236,365 | | | |
| | | | | |
| | | |
| |
|
| NORWAY (2.8%) |
| Oil & Gas (1.5%) |
| Norsk Hydro ASA (c) | | | 1,850 | | | | 136,063 | | | |
| | | | | |
| | | |
| |
| Oil — Field Services (1.3%) |
| Stolt Offshore SA (b) (c) | | | 21,897 | | | | 110,370 | | | |
| | | | | |
| | | |
| |
| | | | | | | | 246,433 | | | |
| | | | | |
| | | |
| |
|
| PORTUGAL (2.0%) |
| Telecommunications (2.0%) |
| Portugal Telecom, SGPS, SA (c) | | | 15,324 | | | | 172,734 | | | |
| | | | | |
| | | |
| |
|
| SOUTH KOREA (1.5%) |
| Electronics (1.5%) |
| Hynix Semiconductor, Inc. (b) (c) | | | 11,280 | | | | 128,014 | | | |
| | | | | |
| | | |
| |
|
| SPAIN (3.1%) |
| Telecommunications (3.1%) |
| Telefonica SA (c) | | | 16,478 | | | | 272,713 | | | |
| | | | | |
| | | |
| |
| Television (0.0%) |
| Antena 3 Television SA (b) (c) | | | 18 | | | | 1,154 | | | |
| | | | | |
| | | |
| |
| | | | | | | | 273,867 | | | |
| | | | | |
| | | |
| |
|
| SWITZERLAND (4.0%) |
| Banking (1.2%) |
| UBS AG (c) | | | 1,500 | | | | 108,274 | | | |
| | | | | |
| | | |
| |
| Chemicals (1.4%) |
| Syngenta AG (c) | | | 1,310 | | | | 124,622 | | | |
| | | | | |
| | | |
| |
| Pharmaceuticals (1.4%) |
| Novartis AG (c) | | | 1,850 | | | | 88,388 | | | |
| Roche Holding AG (c) | | | 290 | | | | 29,596 | | | |
| | | | | |
| | | |
| |
| | | | | | | | 117,984 | | | |
| | | | | |
| | | |
| |
| | | | | | | | 350,880 | | | |
| | | | | |
| | | |
| |
|
| UNITED KINGDOM (31.9%) |
| Aerospace & Defense (2.0%) |
| Rolls- Royce Group, B Shares (b) | | | 1,171,830 | | | | 2,147 | | | |
| Rolls-Royce Group PLC (c) | | | 36,850 | | | | 175,359 | | | |
| | | | | |
| | | |
| |
| | | | | | | | 177,506 | | | |
| | | | | |
| | | |
| |
| Banking (3.5%) |
| HSBC Holdings PLC (c) | | | 11,646 | | | | 187,877 | | | |
| Royal Bank of Scotland Group PLC (c) | | | 4,100 | | | | 120,687 | | | |
| | | | | |
| | | |
| |
| | | | | | | | 308,564 | | | |
| | | | | |
| | | |
| |
| Beverages (2.0%) |
| Diageo PLC (c) | | | 3,000 | | | | 40,123 | | | |
| SABMiller PLC (c) | | | 9,284 | | | | 133,725 | | | |
| | | | | |
| | | |
| |
| | | | | | | | 173,848 | | | |
| | | | | |
| | | |
| |
| Building & Construction (1.0%) |
| CRH PLC (c) | | | 3,627 | | | | 86,539 | | | |
| | | | | |
| | | |
| |
| Cruise Lines (0.9%) |
| Carnival PLC (c) | | | 1,530 | | | | 80,933 | | | |
| | | | | |
| | | |
| |
| Food & Household Products (1.5%) |
| Cadbury Schweppes PLC (c) | | | 15,860 | | | | 131,970 | | | |
| | | | | |
| | | |
| |
| Gas & Electric Utility (2.4%) |
| International Power PLC (b) (c) | | | 40,230 | | | | 118,784 | | | |
| Scottish Power PLC (c) | | | 11,155 | | | | 90,157 | | | |
| | | | | |
| | | |
| |
| | | | | | | | 208,941 | | | |
| | | | | |
| | | |
| |
| Hotels & Motels (1.5%) |
| Hilton Group PLC (c) | | | 26,939 | | | | 127,368 | | | |
| | | | | |
| | | |
| |
| Household Products (1.0%) |
| Reckitt Benckiser PLC (c) | | | 3,094 | | | | 84,752 | | | |
| | | | | |
| | | |
| |
| Metals (2.0%) |
| Vedanta Resources PLC (c) | | | 26,887 | | | | 176,329 | | | |
| | | | | |
| | | |
2004 Annual Report 93
| |
| | Statement of Investments (Continued) |
| | October 31, 2004 |
Gartmore International Growth Fund (Continued)
International Series
| | | | | | | | | | | |
|
| Common Stocks (continued) |
|
| | Shares or | | | |
| | Principal Amount | | | Value | | | |
|
| UNITED KINGDOM (continued) |
| Mining (2.7%) |
| Anglo American PLC (c) | | | 4,200 | | | $ | 92,269 | | | |
| Rio Tinto PLC (c) | | | 5,429 | | | | 142,427 | | | |
| | | | | |
| | | |
| |
| | | | | | | | 234,696 | | | |
| | | | | |
| | | |
| |
| Oil & Gas (4.2%) |
| BP PLC (c) | | | 30,574 | | | | 296,383 | | | |
| Shell Transport & Trading Co. PLC (c) | | | 8,734 | | | | 68,781 | | | |
| | | | | |
| | | |
| |
| | | | | | | | 365,164 | | | |
| | | | | |
| | | |
| |
| Pharmaceuticals (0.8%) |
| AstraZeneca PLC (c) | | | 1,650 | | | | 67,566 | | | |
| | | | | |
| | | |
| |
| Telecommunications (1.8%) |
| Vodafone Group PLC (c) | | | 60,981 | | | | 156,504 | | | |
| | | | | |
| | | |
| |
| Transportation (2.1%) |
| Peninsular & Oriental Steam Navigation Co. (c) | | | 36,670 | | | | 180,147 | | | |
| | | | | |
| | | |
| |
| Water Utility (2.5%) |
| United Utilities PLC (c) | | | 8,227 | | | | 86,738 | | | |
| United Utilities PLC, A Shares | | | 18,450 | | | | 131,505 | | | |
| | | | | |
| | | |
| |
| | | | | | | | 218,243 | | | |
| | | | | |
| | | |
| |
| | | | | | | | 2,779,070 | | | |
| | | | | |
| | | |
| |
| Total Common Stocks | | | 8,225,131 | | | |
| | | | | |
| | | |
| |
Repurchase Agreements (5.1%) |
| | | | | | | | | | | |
|
| Repurchase Agreements (5.1%) |
|
| | Shares or | | | |
| | Principal Amount | | | Value | | | |
|
CS First Boston, 1.75%, dated 10/29/04, due 11/01/04, repurchase price $186,655
(Fully collateralized by U.S. Agency Securities & U.S. Treasury Notes) | | $ | 186,627 | | | | 186,627 | | | |
Nomura Securities, 1.75%, dated 10/29/04, due 11/01/04, repurchase price $260,802
(Fully collateralized by AA Rated Corporate Bonds & U.S. Agency Securities) | | | 260,764 | | | | 260,764 | | | |
| | | | | |
| | | |
| |
| Total Repurchase Agreements | | | 447,391 | | | |
| | | | | |
| | | |
| |
| Total Investments (Cost $8,035,505) (a) — 99.4% | | | 8,672,522 | | | |
| Other assets in excess of liabilities — 0.6% | | | 49,436 | | | |
| | | | | |
| | | |
| |
| NET ASSETS — 100.0% | | $ | 8,721,958 | | | |
| | | | | |
| | | |
| | |
| (a) | | See notes to financial statements for tax unrealized appreciation (depreciation) of securities. |
| |
| (b) | | Denotes a non-income producing security. |
| |
| (c) | | Fair Valued Security. |
ADR American Depositary Receipt
See notes to financial statements.
94 Annual Report 2004
Statements of Assets and Liabilities
October 31, 2004
| | | | | | | | | | | | | | | |
| | Gartmore | | | Gartmore | | | Gartmore | |
| | China Opportunities | | | Emerging Markets | | | International Growth | |
| | Fund | | | Fund | | | Fund | |
| | | | | | |
|
|
| |
Assets: | | | | | | | | | | | | |
| Investments, at value (cost $6,030,135; $20,457,640 and $7,588,114; respectively) | | $ | 6,476,302 | | | $ | 22,426,429 | | | $ | 8,225,131 | |
| Repurchase agreements, at cost | | | 248,662 | | | | 368,224 | | | | 447,391 | |
| | |
| |
| |
| |
| | Total Investment | | | 6,724,964 | | | | 22,794,653 | | | | 8,672,522 | |
| | |
| |
| |
| |
| Foreign currency, at value (cost $38,339; $255,117 and $75,947; respectively) | | | 38,314 | | | | 258,200 | | | | 76,693 | |
| Interest and dividends receivable | | | 3,460 | | | | 53,786 | | | | 9,862 | |
| Receivable for capital shares issued | | | 4,995 | | | | 13,984 | | | | — | |
| Receivable for investments sold | | | 29,918 | | | | 85,082 | | | | 227,136 | |
| Unrealized appreciation on forward foreign currency contracts | | | 1 | | | | 95 | | | | 172 | |
| Receivable from adviser | | | 23,475 | | | | 6,668 | | | | 6,369 | |
| Reclaims receivable | | | — | | | | — | | | | 6,959 | |
| Prepaid expenses and other assets | | | 40,998 | | | | 29,831 | | | | 28,790 | |
| | |
| |
| |
| |
| | | Total Assets | | | 6,866,125 | | | | 23,242,299 | | | | 9,028,503 | |
| | |
| |
| |
| |
Liabilities: | | | | | | | | | | | | |
| Payable for investments purchased | | | 127,569 | | | | 215,482 | | | | 290,010 | |
| Unrealized depreciation on forward foreign currency contracts | | | 7 | | | | — | | | | 868 | |
| Payable for capital shares redeemed | | | — | | | | 500 | | | | — | |
| Accrued expenses and other payables | | | | | | | | | | | | |
| | Investment advisory fees | | | 6,895 | | | | 20,017 | | | | 6,579 | |
| | Fund administration and transfer agent fees | | | 5,729 | | | | 6,984 | | | | 4,773 | |
| | Distribution fees | | | 216 | | | | 7,143 | | | | 3,006 | |
| | Administrative servicing fees | | | 68 | | | | 1,327 | | | | 63 | |
| | Other | | | 755 | | | | 1,634 | | | | 1,246 | |
| | |
| |
| |
| |
| | | Total Liabilities | | | 141,239 | | | | 253,087 | | | | 306,545 | |
| | |
| |
| |
| |
Net Assets | | $ | 6,724,886 | | | $ | 22,989,212 | | | $ | 8,721,958 | |
| | |
| |
| |
| |
Represented by: | | | | | | | | | | | | |
| Capital | | $ | 6,042,582 | | | $ | 19,410,306 | | | $ | 10,570,296 | |
| Accumulated net investment income (loss) | | | (2,049 | ) | | | (95 | ) | | | 695 | |
| Accumulated net realized gains (losses) from investment, futures, and foreign currency transactions | | | 238,171 | | | | 1,606,444 | | | | (2,493,923 | ) |
| Net unrealized appreciation (depreciation) on investments, futures, and translation of assets and liabilities denominated in foreign currencies | | | 446,182 | | | | 1,972,557 | | | | 644,890 | |
| | |
| |
| |
| |
Net Assets | | $ | 6,724,886 | | | $ | 22,989,212 | | �� | $ | 8,721,958 | |
| | |
| |
| |
| |
Net Assets: | | | | | | | | | | | | |
| Class A Shares | | $ | 1,028,535 | | | $ | 13,897,922 | | | $ | 3,095,984 | |
| Class B Shares | | | 19,086 | | | | 2,899,503 | | | | 2,694,971 | |
| Class C Shares | | | 38,125 | | | | 2,217,270 | | | | 111,827 | |
| Class R Shares | | | 1,124 | | | | 1,075 | | | | 1,046 | |
| Institutional Service Class Shares | | | 1,127 | | | | 3,737,323 | | | | 2,628,984 | |
| Institutional Class Shares | | | 5,636,889 | | | | 236,119 | | | | 189,146 | |
| | |
| |
| |
| |
| Total | | $ | 6,724,886 | | | $ | 22,989,212 | | | $ | 8,721,958 | |
| | |
| |
| |
| |
Shares Outstanding (unlimited number of shares authorized): | | | | | | | | | | | | |
| Class A Shares | | | 91,493 | | | | 1,132,227 | | | | 397,409 | |
| Class B Shares | | | 1,700 | | | | 241,985 | | | | 356,700 | |
| Class C Shares | | | 3,395 | | | | 182,568 | | | | 14,709 | |
| Class R Shares | | | 100 | | | | 89 | | | | 138 | |
| Institutional Service Class Shares | | | 100 | | | | 300,620 | | | | 333,333 | |
| Institutional Class Shares | | | 501,062 | | | | 18,991 | | | | 23,983 | |
| | |
| |
| |
| |
| Total | | | 597,850 | | | | 1,876,480 | | | | 1,126,272 | |
| | |
| |
| |
| |
Net Asset Value: | | | | | | | | | | | | |
| Class A Shares | | $ | 11.24 | | | $ | 12.27 | | | $ | 7.79 | |
| Class B Shares (a) | | $ | 11.23 | | | $ | 11.98 | | | $ | 7.56 | |
| Class C Shares (b) | | $ | 11.23 | | | $ | 12.14 | | | $ | 7.60 | |
| Class R Shares | | $ | 11.24 | | | $ | 12.01 | | | $ | 7.58 | |
| Institutional Service Class Shares | | $ | 11.25 | | | $ | 12.43 | | | $ | 7.89 | |
| Institutional Class Shares | | $ | 11.25 | | | $ | 12.43 | | | $ | 7.89 | |
Maximum Offering Price Per Share (100%/100%-maximum sales charge) of net asset value adjusted to the nearest cent): | | | | | | | | | | | | |
| Class A Shares | | $ | 11.93 | | | $ | 13.02 | | | $ | 8.27 | |
| | |
| |
| |
| Maximum Sales Charge — Class A Shares | | | 5.75 | % | | | 5.75 | % | | | 5.75 | % |
| | |
| |
| |
| |
|
| | |
| (a) | | For Class B shares, the redemption price per share varies by length of time shares are held. |
| (b) | | For Class C shares, the redemption price per share is reduced by 1.00% for shares held less than one year. |
See notes to financial statements.
2004 Annual Report 95
International Series
| |
| | Statements of Operations |
| | For the Year Ended October 31, 2004 |
| | | | | | | | | | | | | | |
| | Gartmore China | | | Gartmore | | | Gartmore | |
| | Opportunities | | | Emerging | | | International | |
| | Fund (a) | | | Markets Fund | | | Growth Fund | |
|
|
| |
INVESTMENT INCOME: | | | | | | | | | | | | |
| Interest income | | $ | 1,734 | | | $ | 8,253 | | | $ | — | |
| Dividend income (net of foreign withholding tax $0; $51,054 and $21,929; respectively) | | | 41,494 | | | | 437,279 | | | | 138,488 | |
| | |
| |
| |
| |
| | Total Income | | | 43,228 | | | | 445,532 | | | | 138,488 | |
| | |
| |
| |
Expenses: | | | | | | | | | | | | |
| Investment advisory fees | | | 24,092 | | | | 214,405 | | | | 78,402 | |
| Fund administration and transfer agent fees | | | 7,535 | | | | 38,320 | | | | 18,401 | |
| Distribution fees Class A | | | 334 | | | | 28,813 | | | | 7,245 | |
| Distribution fees Class B | | | 20 | | | | 25,735 | | | | 25,684 | |
| Distribution fees Class C | | | 26 | | | | 22,579 | | | | 768 | |
| Distribution fees Class R | | | 1 | | | | 3 | | | | 3 | |
| Administrative servicing fees Class A | | | 67 | | | | 9,928 | | | | 172 | |
| Administrative servicing fees Class R | | | 1 | | | | 2 | | | | 2 | |
| Professional fees | | | 27,826 | | | | 4,573 | | | | 1,870 | |
| Registration and filing fees | | | 16,488 | | | | 45,918 | | | | 45,220 | |
| Other | | | 5,958 | | | | 14,496 | | | | 5,710 | |
| | |
| |
| |
| |
| | Total expenses before reimbursed expenses | | | 82,348 | | | | 404,772 | | | | 183,477 | |
| Expenses reimbursed | | | (50,098 | ) | | | (19,484 | ) | | | (35,945 | ) |
| | |
| |
| |
| |
| | Total Expenses | | | 32,250 | | | | 385,288 | | | | 147,532 | |
| | |
| |
| |
| |
Net Investment Income (Loss) | | | 10,978 | | | | 60,244 | | | | (9,044 | ) |
| | |
| |
| |
| |
REALIZED/ UNREALIZED GAINS (LOSSES) FROM INVESTMENTS: | | | | | | | | | | | | |
| Net realized gains (losses) on investment transactions | | | 238,171 | | | | 2,279,971 | | | | 873,916 | |
| Net realized gains (losses) on futures transactions | | | — | | | | — | | | | (22,329 | ) |
| Net realized gains (losses) on foreign currency transactions | | | (342 | ) | | | (18,184 | ) | | | 5,754 | |
| | |
| |
| |
| |
| Net realized gains (losses) on investment, futures, and foreign currency transactions | | | 237,829 | | | | 2,261,787 | | | | 857,341 | |
| Net change in unrealized appreciation/depreciation on investments, futures, and translation of assets and liabilities denominated in foreign currencies | | | 446,182 | | | | (553,350 | ) | | | (22,049 | ) |
| | |
| |
| |
| |
| Net realized/unrealized gains (losses) on investments, futures, and foreign currencies | | | 684,011 | | | | 1,708,437 | | | | 835,292 | |
| | |
| |
| |
| |
CHANGE IN NET ASSETS RESULTING FROM OPERATIONS | | $ | 694,989 | | | $ | 1,768,681 | | | $ | 826,248 | |
| | |
| |
| |
| |
|
| | |
| (a) | | For the period from June 29, 2004 (commencement of operations) through October 31, 2004. |
See notes to financial statements.
96 Annual Report 2004
Statements of Changes in Net Assets
| | | | | | | | | | | | | | | | | | | | | | |
| | | | | | | | |
| | | | | | Gartmore | |
| | Gartmore Fund | | | Gartmore | | | International Growth Fund | |
| | China Opportunities | | | Emerging Markets Fund | | | |
| | Period Ended | | | Year Ended | | | Year Ended | | | Year Ended | | | Year Ended | |
| | October 31, 2004 (a) | | | October 31, 2004 | | | October 31, 2003 | | | October 31, 2004 | | | October 31, 2003 | |
|
|
| |
| | | | |
FROM INVESTMENT ACTIVITIES: | | | | | | | | | | | | | | | | | | | | |
Operations: | | | | | | | | | | | | | | | | | | | | |
| Net investment income (loss) | | $ | 10,978 | | | $ | 60,244 | | | $ | 41,277 | | | $ | (9,044 | ) | | $ | 13,570 | |
| Net realized gains (losses) on investment, futures, and foreign currency transactions | | | 237,829 | | | | 2,261,787 | | | | 824,505 | | | | 857,341 | | | | 745,468 | |
| Net change in unrealized appreciation/ depreciation on investments, futures, and translation of assets and liabilities denominated in foreign currencies | | | 446,182 | | | | (553,350 | ) | | | 2,771,822 | | | | (22,049 | ) | | | 928,479 | |
| | |
| |
| |
| |
| Change in net assets resulting from operations | | | 694,989 | | | | 1,768,681 | | | | 3,637,604 | | | | 826,248 | | | | 1,687,517 | |
| | |
| |
| |
Distributions to Class A Shareholders from: | | | | | | | | | | | | | | | | | | | | |
| Net investment income | | | (1,204 | ) | | | (48,254 | ) | | | — | | | | — | | | | — | |
Distributions to Class B Shareholders from: | | | | | | | | | | | | | | | | | | | | |
| Net investment income | | | (5 | ) | | | (3,983 | ) | | | — | | | | — | | | | — | |
Distributions to Class C Shareholders from: | | | | | | | | | | | | | | | | | | | | |
| Net investment income | | | — | | | | (3,008 | ) | | | — | | | | — | | | | — | |
Distributions to Class R Shareholders from: | | | | | | | | | | | | | | | | | | | | |
| | From net investment income | | | (1 | ) | | | (3 | ) (b) | | | — | | | | — | | | | — | |
Distributions to Institutional Service Class Shareholders from: | | | | | | | | | | | | | | | | | | | | |
| Net investment income | | | (2 | ) | | | (16,749 | ) | | | — | | | | — | | | | — | |
Distributions to Institutional Class Shareholders from: | | | | | | | | | | | | | | | | | | | | |
| Net investment income | | | (11,473 | ) | | | (831 | ) (a) | | | — | | | | — | | | | — | |
| | |
| |
| |
| |
| Change in net assets from shareholder distributions | | | (12,685 | ) | | | (72,828 | ) | | | — | | | | — | | | | — | |
| | |
| |
| |
| |
| Change in net assets from capital transactions | | | 6,042,582 | | | | 7,033,976 | | | | 6,022,767 | | | | 541,965 | | | | 44,605 | |
| | |
| |
| |
| |
| Change in net assets | | | 6,724,886 | | | | 8,729,829 | | | | 9,660,371 | | | | 1,368,213 | | | | 1,732,122 | |
Net Assets: | | | | | | | | | | | | | | | | | | | | |
| Beginning of period | | | — | | | | 14,259,383 | | | | 4,599,012 | | | | 7,353,745 | | | | 5,621,623 | |
| | |
| |
| |
| |
| End of period | | $ | 6,724,886 | | | $ | 22,989,212 | | | $ | 14,259,383 | | | $ | 8,721,958 | | | $ | 7,353,745 | |
| | |
| |
| |
|
| | |
| (a) | | For the period from June 29, 2004 (commencement of operations) through October 31, 2004. |
| (b) | | For the period from December 30, 2003 (commencement of operations) through October 31, 2004. |
See notes to financial statements.
2004 Annual Report 97
| |
| | Financial Highlights |
| | Selected Data for Each Share of Capital Outstanding |
International Series
Gartmore China Opportunities Fund
| | | | | | | | | | | | | | | | | |
| | | | |
| | | | Investment Activities | |
| | | | | | Net Realized | | | |
| | | | | | and | | | |
| | Net Asset | | | Net | | | Unrealized | | | Total | |
| | Value, | | | Investment | | | Gains | | | from | |
| | Beginning | | | Income | | | (Losses) on | | | Investment | |
| | of Period | | | (Loss) | | | Investments | | | Activities | |
|
|
| |
Class A Shares | | | | | | | | | | | | | | | | |
| Period Ended October 31, 2004 (d) | | $ | 10.00 | | | | 0.01 | | | | 1.25 | | | | 1.26 | |
Class B Shares | | | | | | | | | | | | | | | | |
| Period Ended October 31, 2004 (d) | | $ | 10.00 | | | | 0.01 | | | | 1.23 | | | | 1.24 | |
Class C Shares | | | | | | | | | | | | | | | | |
| Period Ended October 31, 2004 (d) | | $ | 10.00 | | | | (0.01 | ) | | | 1.24 | | | | 1.23 | |
Class R Shares | | | | | | | | | | | | | | | | |
| Period Ended October 31, 2004 (d) | | $ | 10.00 | | | | 0.01 | | | | 1.24 | | | | 1.25 | |
Institutional Service Class Shares | | | | | | | | | | | | | | | | |
| Period Ended October 31, 2004 (d) | | $ | 10.00 | | | | 0.02 | | | | 1.25 | | | | 1.27 | |
Institutional Class Shares | | | | | | | | | | | | | | | | |
| Period Ended October 31, 2004 (d) | | $ | 10.00 | | | | 0.02 | | | | 1.25 | | | | 1.27 | |
|
[Additional columns below]
[Continued from above table, first column(s) repeated]
| | | | | | | | | | | | | | | | | |
| | | | | | |
| | Distributions | | | | | |
| | Net | | | | | Net Asset | | | |
| | Investment | | | Total | | | Value, End | | | Total | |
| | Income | | | Distributions | | | of Period | | | Return (a) | |
| | |
| | |
| |
| |
Class A Shares | | | | | | | | | | | | | | | | |
| Period Ended October 31, 2004 (d) | | | (0.02 | ) | | | (0.02 | ) | | $ | 11.24 | | | | 12.61% | (f) |
Class B Shares | | | | | | | | | | | | | | | | |
| Period Ended October 31, 2004 (d) | | | (0.01 | ) | | | (0.01 | ) | | $ | 11.23 | | | | 12.38% | (f) |
Class C Shares | | | | | | | | | | | | | | | | |
| Period Ended October 31, 2004 (d) | | | — | | | | — | | | $ | 11.23 | | | | 12.30% | (f) |
Class R Shares | | | | | | | | | | | | | | | | |
| Period Ended October 31, 2004 (d) | | | (0.01 | ) | | | (0.01 | ) | | $ | 11.24 | | | | 12.46% | (f) |
Institutional Service Class Shares | | | | | | | | | | | | | | | | |
| Period Ended October 31, 2004 (d) | | | (0.02 | ) | | | (0.02 | ) | | $ | 11.25 | | | | 12.74% | (f) |
Institutional Class Shares | | | | | | | | | | | | | | | | |
| Period Ended October 31, 2004 (d) | | | (0.02 | ) | | | (0.02 | ) | | $ | 11.25 | | | | 12.74% | (f) |
| | |
[Additional columns below]
[Continued from above table, first column(s) repeated]
| | | | | | | | | | | | | | | | | | | | | | | | | | | |
| | | | |
| | Ratios / Supplemental Data | | | |
| | | | Ratio of Net | | | | | |
| | | | Ratio of Net | | | Ratio of | | | Investment | | | | | |
| | | | Investment | | | Expenses | | | Income (Loss) | | | | | |
| | Net | | | Ratio of | | | Income | | | (Prior to | | | (Prior to | | | | | |
| | Assets at End of | | | Expenses | | | (Loss) | | | Reimbursements) | | | Reimbursements) | | | | | |
| | Period | | | to Average | | | to Average | | | to Average | | | to Average | | | Portfolio | | | |
| | (000s) | | | Net Assets | | | Net Assets | | | Net Assets (b) | | | Net Assets (b) | | | Turnover (c) | | | |
| | | | |
| | | | |
| |
| | | |
Class A Shares | | | | | | | | | | | | | | | | | | | | | | | | | | |
| Period Ended October 31, 2004 (d) | | $ | 1,029 | | | | 1.95% | (g) | | | 0.37% | (g) | | | 5.57% | (g) | | | (3.25% | ) (g) | | | 50.76% | | | |
Class B Shares | | | | | | | | | | | | | | | | | | | | | | | | | | |
| Period Ended October 31, 2004 (d) | | $ | 19 | | | | 2.65% | (g) | | | (0.14% | ) (g) | | | 6.09% | (g) | | | (3.57% | ) (g) | | | 50.76% | | | |
Class C Shares | | | | | | | | | | | | | | | | | | | | | | | | | | |
| Period Ended October 31, 2004 (d) | | $ | 38 | | | | 2.65% | (g) | | | (1.42% | ) (g) | | | 6.93% | (g) | | | (5.69% | ) (g) | | | 50.76% | | | |
Class R Shares | | | | | | | | | | | | | | | | | | | | | | | | | | |
| Period Ended October 31, 2004 (d) | | $ | 1 | | | | 2.40% | (g) | | | (0.18% | ) (g) | | | 4.86% | (g) | | | (2.64% | ) (g) | | | 50.76% | | | |
Institutional Service Class Shares | | | | | | | | | | | | | | | | | | | | | | | | | | |
| Period Ended October 31, 2004 (d) | | $ | 1 | | | | 1.70% | (g) | | | 0.51% | (g) | | | 3.97% | (g) | | | (1.75% | ) (g) | | | 50.76% | | | |
Institutional Class Shares | | | | | | | | | | | | | | | | | | | | | | | | | | |
| Period Ended October 31, 2004 (d) | | $ | 5,637 | | | | 1.65% | (g) | | | 0.59% | (g) | | | 4.17% | (g) | | | (1.93% | ) (g) | | | 50.76% | | | |
| | | | |
| | |
| (a) | | Excludes sales charge. |
| (b) | | During the period certain fees were waived and/or reimbursed. If such waivers/reimbursements had not occurred, the ratios would have been as indicated. |
| (c) | | Portfolio turnover is calculated on the basis of the Fund as a whole without distinguishing among the classes of shares. |
| (d) | | For period from June 29, 2004 (commencement of operations) through October 31, 2004. |
| (f) | | Not annualized. |
| (g) | | Annualized. |
See notes to financial statements.
98 Annual Report 2004
Financial Highlights
Selected Data for Each Share of Capital Outstanding
Gartmore Emerging Markets Fund
| | | | | | | | | | | | | | | | | | | | | | | | | | | | | | | | | | | | | |
| | | | | | | | | | |
| | | | Investment Activities | | | Distributions | | | | | |
| | | | | | | | | | | | | | |
| | | | | | Net Realized | | | | | | | | | |
| | | | | | and | | | | | | | | | |
| | Net Asset | | | Net | | | | | Unrealized | | | Total | | | | | | | |
| | Value, | | | Investment | | | | | Gains | | | from | | | Net | | | | | Net Asset | | | |
| | Beginning | | | Income | | | Redemption | | | (Losses) on | | | Investment | | | Investment | | | Total | | | Value, End | | | Total | |
| | of Period | | | (Loss) | | | Fees | | | Investments | | | Activities | | | Income | | | Distributions | | | of Period | | | Return (a) | |
|
|
| |
Class A Shares | | | | | | | | | | | | | | | | | | | | | | | | | | | | | | | | | | | | |
| Period Ended October 31, 2000 (d) | | $ | 10.00 | | | | (0.01 | ) | | | — | | | | (1.87 | ) | | | (1.88 | ) | | | (0.01 | ) | | | (0.01 | ) | | $ | 8.11 | | | | (18.90% | ) (h) |
| Year Ended October 31, 2001 | | $ | 8.11 | | | | 0.01 | | | | — | | | | (2.14 | ) | | | (2.13 | ) | | | — | | | | — | | | $ | 5.98 | | | | (26.24% | ) |
| Year Ended October 31, 2002 | | $ | 5.98 | | | | (0.03 | ) | | | — | | | | 0.85 | | | | 0.82 | | | | — | | | | — | | | $ | 6.80 | | | | 13.71% | |
| Year Ended October 31, 2003 | | $ | 6.80 | | | | 0.03 | | | | — | | | | 3.71 | | | | 3.74 | | | | — | | | | — | | | $ | 10.54 | | | | 55.00% | |
| Year Ended October 31, 2004 | | $ | 10.54 | | | | 0.05 | | | | 0.03 | | | | 1.70 | | | | 1.78 | | | | (0.05 | ) | | | (0.05 | ) | | $ | 12.27 | | | | 16.97% | |
Class B Shares | | | | | | | | | | | | | | | | | | | | | | | | | | | | | | | | | | | | |
| Period Ended October 31, 2000 (d) | | $ | 10.00 | | | | (0.01 | ) | | | — | | | | (1.88 | ) | | | (1.89 | ) | | | (0.01 | ) | | | (0.01 | ) | | $ | 8.10 | | | | (19.00% | ) (h) |
| Year Ended October 31, 2001 | | $ | 8.10 | | | | (0.03 | ) | | | — | | | | (2.13 | ) | | | (2.16 | ) | | | — | | | | — | | | $ | 5.94 | | | | (26.67% | ) |
| Year Ended October 31, 2002 | | $ | 5.94 | | | | (0.08 | ) | | | — | | | | 0.85 | | | | 0.77 | | | | — | | | | — | | | $ | 6.71 | | | | 12.96% | |
| Year Ended October 31, 2003 | | $ | 6.71 | | | | — | | | | — | | | | 3.62 | | | | 3.62 | | | | — | | | | — | | | $ | 10.33 | | | | 53.95% | |
| Year Ended October 31, 2004 | | $ | 10.33 | | | | (0.03 | ) | | | 0.03 | | | | 1.67 | | | | 1.67 | | | | (0.02 | ) | | | (0.02 | ) | | $ | 11.98 | | | | 16.14% | |
Class C Shares | | | | | | | | | | | | | | | | | | | | | | | | | | | | | | | | | | | | |
| Period Ended October 31, 2001 (e) | | $ | 7.57 | | | | (0.01 | ) | | | — | | | | (1.54 | ) | | | (1.55 | ) | | | — | | | | — | | | $ | 6.02 | | | | (20.48% | ) (h) |
| Year Ended October 31, 2002 | | $ | 6.02 | | | | (0.08 | ) | | | — | | | | 0.86 | | | | 0.78 | | | | — | | | | — | | | $ | 6.80 | | | | 12.96% | |
| Year Ended October 31, 2003 | | $ | 6.80 | | | | — | | | | — | | | | 3.67 | | | | 3.67 | | | | — | | | | — | | | $ | 10.47 | | | | 53.97% | |
| Year Ended October 31, 2004 | | $ | 10.47 | | | | (0.02 | ) | | | 0.03 | | | | 1.68 | | | | 1.69 | | | | (0.02 | ) | | | (0.02 | ) | | $ | 12.14 | | | | 16.21% | |
Class R Shares | | | | | | | | | | | | | | | | | | | | | | | | | | | | | | | | | | | | |
| Period Ended October 31, 2004 (f) | | $ | 11.20 | | | | 0.03 | | | | 0.03 | | | | 0.78 | | | | 0.84 | | | | (0.03 | ) | | | (0.03 | ) | | $ | 12.01 | | | | 7.50% | (h) |
Institutional Service Class Shares | | | | | | | | | | | | | | | | | | | | | | | | | | | | | | | | | | | | |
| Period Ended October 31, 2000 (d) | | $ | 10.00 | | | | — | | | | — | | | | (1.88 | ) | | | (1.88 | ) | | | (0.01 | ) | | | (0.01 | ) | | $ | 8.11 | | | | (18.90% | ) (h) |
| Year Ended October 31, 2001 | | $ | 8.11 | | | | 0.04 | | | | — | | | | (2.13 | ) | | | (2.09 | ) | | | (0.01 | ) | | | (0.01 | ) | | $ | 6.01 | | | | (25.81% | ) |
| Year Ended October 31, 2002 | | $ | 6.01 | | | | (0.02 | ) | | | — | | | | 0.87 | | | | 0.85 | | | | — | | | | — | | | $ | 6.86 | | | | 14.14% | |
| Year Ended October 31, 2003 | | $ | 6.86 | | | | 0.08 | | | | — | | | | 3.72 | | | | 3.80 | | | | — | | | | — | | | $ | 10.66 | | | | 55.39% | |
| Year Ended October 31, 2004 | | $ | 10.66 | | | | 0.09 | | | | 0.03 | | | | 1.72 | | | | 1.84 | | | | (0.07 | ) | | | (0.07 | ) | | $ | 12.43 | | | | 17.25% | |
Institutional Class Shares | | | | | | | | | | | | | | | | | | | | | | | | | | | | | | | | | | | | |
| Period Ended October 31, 2004 (g) | | $ | 11.26 | | | | 0.03 | | | | 0.03 | | | | 1.15 | | | | 1.21 | | | | (0.04 | ) | | | (0.04 | ) | | $ | 12.43 | | | | 10.79% | (h) |
|
[Additional columns below]
[Continued from above table, first column(s) repeated]
| | | | | | | | | | | | | | | | | | | | | | | | | | | |
| | | | |
| | Ratios / Supplemental Data | | | |
| | | | Ratio of Net | | | | | |
| | | | Ratio of Net | | | Ratio of | | | Investment | | | | | |
| | | | Investment | | | Expenses | | | Income (Loss) | | | | | |
| | Net Assets | | | Ratio of | | | Income | | | (Prior to | | | (Prior to | | | | | |
| | at End of | | | Expenses | | | (Loss) | | | Reimbursements) | | | Reimbursements) | | | | | |
| | Period | | | to Average | | | to Average | | | to Average | | | to Average | | | Portfolio | | | |
| | (000s) | | | Net Assets | | | Net Assets | | | Net Assets (b) | | | Net Assets (b) | | | Turnover (c) | | | |
| | | | |
| | | | |
| |
| | | |
Class A Shares | | | | | | | | | | | | | | | | | | | | | | | | | | |
| Period Ended October 31, 2000 (d) | | $ | 1,366 | | | | 2.15% | (i) | | | (0.35% | ) (i) | | | 7.24% | (i) | | | (5.44% | ) (i) | | | 10.88% | | | |
| Year Ended October 31, 2001 | | $ | 1,066 | | | | 2.15% | | | | 0.18% | | | | 5.93% | | | | (3.60% | ) | | | 97.85% | | | |
| Year Ended October 31, 2002 | | $ | 1,996 | | | | 2.01% | | | | (0.49% | ) | | | 2.41% | | | | (0.89% | ) | | | 57.86% | | | |
| Year Ended October 31, 2003 | | $ | 9,070 | | | | 1.88% | | | | 0.61% | | | | 2.45% | | | | 0.05% | | | | 146.04% | | | |
| Year Ended October 31, 2004 | | $ | 13,898 | | | | 1.88% | | | | 0.41% | | | | 1.99% | | | | 0.31% | | | | 134.11% | | | |
Class B Shares | | | | | | | | | | | | | | | | | | | | | | | | | | |
| Period Ended October 31, 2000 (d) | | $ | 1,353 | | | | 2.75% | (i) | | | (0.95% | ) (i) | | | 7.96% | (i) | | | (6.16% | ) (i) | | | 10.88% | | | |
| Year Ended October 31, 2001 | | $ | 1,164 | | | | 2.75% | | | | (0.40% | ) | | | 6.67% | | | | (4.32% | ) | | | 97.85% | | | |
| Year Ended October 31, 2002 | | $ | 1,443 | | | | 2.71% | | | | (1.18% | ) | | | 3.22% | | | | (1.69% | ) | | | 57.86% | | | |
| Year Ended October 31, 2003 | | $ | 2,010 | | | | 2.55% | | | | 0.07% | | | | 3.18% | | | | (0.56% | ) | | | 146.04% | | | |
| Year Ended October 31, 2004 | | $ | 2,900 | | | | 2.55% | | | | (0.27% | ) | | | 2.65% | | | | (0.37% | ) | | | 134.11% | | | |
Class C Shares | | | | | | | | | | | | | | | | | | | | | | | | | | |
| Period Ended October 31, 2001 (e) | | $ | 10 | | | | 2.75% | (i) | | | (0.85% | ) (i) | | | 8.68% | (i) | | | (6.78% | ) (i) | | | 97.85% | | | |
| Year Ended October 31, 2002 | | $ | 15 | | | | 2.72% | | | | (1.12% | ) | | | 3.28% | | | | (1.68% | ) | | | 57.86% | | | |
| Year Ended October 31, 2003 | | $ | 1,398 | | | | 2.55% | | | | (0.12% | ) | | | 2.95% | | | | (0.52% | ) | | | 146.04% | | | |
| Year Ended October 31, 2004 | | $ | 2,217 | | | | 2.55% | | | | (0.16% | ) | | | 2.64% | | | | (0.25% | ) | | | 134.11% | | | |
Class R Shares | | | | | | | | | | | | | | | | | | | | | | | | | | |
| Period Ended October 31, 2004 (f) | | $ | 1 | | | | 2.15% | (i) | | | 0.26% | (i) | | | 2.28% | (i) | | | 0.13% | (i) | | | 134.11% | | | |
Institutional Service Class Shares | | | | | | | | | | | | | | | | | | | | | | | | | | |
| Period Ended October 31, 2000 (d) | | $ | 1,354 | | | | 1.82% | (i) | | | (0.02% | ) (i) | | | 6.95% | (i) | | | (5.15% | ) (i) | | | 10.88% | | | |
| Year Ended October 31, 2001 | | $ | 1,004 | | | | 1.82% | | | | 0.49% | | | | 5.60% | | | | (3.29% | ) | | | 97.85% | | | |
| Year Ended October 31, 2002 | | $ | 1,145 | | | | 1.73% | | | | (0.21% | ) | | | 2.24% | | | | (0.72% | ) | | | 57.86% | | | |
| Year Ended October 31, 2003 | | $ | 1,781 | | | | 1.55% | | | | 1.07% | | | | 2.18% | | | | 0.44% | | | | 146.04% | | | |
| Year Ended October 31, 2004 | | $ | 3,737 | | | | 1.55% | | | | 0.81% | | | | 1.66% | | | | 0.70% | | | | 134.11% | | | |
Institutional Class Shares | | | | | | | | | | | | | | | | | | | | | | | | | | |
| Period Ended October 31, 2004 (g) | | $ | 236 | | | | 1.55% | (i) | | | 0.81% | (i) | | | 1.71% | (i) | | | 0.65% | (i) | | | 134.11% | | | |
| | | | |
| | |
| (a) | | Excludes sales charge. |
| (b) | | During the period certain fees were waived and/or reimbursed. If such waivers/reimbursements had not occurred, the ratios would have been as indicated. |
| (c) | | Portfolio turnover is calculated on the basis of the Fund as a whole without distinguishing among the classes of shares. |
| (d) | | For period from August 30, 2000 (commencement of operations) through October 31, 2000. |
| (e) | | For the period from March 1, 2001 (commencement of operations) through October 31, 2001. |
| (f) | | For the period from December 30, 2003 (commencement of operations) through October 31, 2004. |
| (g) | | For period from June 29, 2004 (commencement of operations) through October 31, 2004. |
| (h) | | Not annualized. |
| (i) | | Annualized. |
See notes to financial statements.
2004 Annual Report 99
| |
| | Financial Highlights |
| | Selected Data for Each Share of Capital Outstanding |
International Series
Gartmore International Growth Fund
| | | | | | | | | | | | | | | | | | | | | | | | | | | | | |
| | | | | | | | | | |
| | | | Investment Activities | | | | | | | |
| | | | | | Net Realized | | | | | | | |
| | | | | | and | | | | | | | |
| | Net Asset | | | Net | | | | | Unrealized | | | Total | | | | | |
| | Value, | | | Investment | | | | | Gains | | | from | | | Net Asset | | | |
| | Beginning | | | Income | | | Redemption | | | (Losses) on | | | Investment | | | Value, End | | | Total | |
| | of Period | | | (Loss) | | | Fees | | | Investments | | | Activities | | | of Period | | | Return (a) | |
|
|
| |
Class A Shares | | | | | | | | | | | | | | | | | | | | | | | | | | | | |
| Period Ended October 31, 2000 (d) | | $ | 10.00 | | | | — | | | | — | | | | (1.14 | ) | | | (1.14 | ) | | $ | 8.86 | | | | (11.40% | ) (h) |
| Year Ended October 31, 2001 | | $ | 8.86 | | | | (0.02 | ) | | | — | | | | (2.65 | ) | | | (2.67 | ) | | $ | 6.19 | | | | (30.14% | ) |
| Year Ended October 31, 2002 | | $ | 6.19 | | | | 0.01 | | | | — | | | | (0.82 | ) | | | (0.81 | ) | | $ | 5.38 | | | | (13.09% | ) |
| Year Ended October 31, 2003 | | $ | 5.38 | | | | (0.01 | ) | | | 0.03 | | | | 1.58 | | | | 1.60 | | | $ | 6.98 | | | | 29.74% | |
| Year Ended October 31, 2004 | | $ | 6.98 | | | | 0.01 | | | | 0.01 | | | | 0.79 | | | | 0.81 | | | $ | 7.79 | | | | 11.60% | |
Class B Shares | | | | | | | | | | | | | | | | | | | | | | | | | | | | |
| Period Ended October 31, 2000 (d) | | $ | 10.00 | | | | (0.01 | ) | | | — | | | | (1.14 | ) | | | (1.15 | ) | | $ | 8.85 | | | | (11.50% | ) (h) |
| Year Ended October 31, 2001 | | $ | 8.85 | | | | (0.07 | ) | | | — | | | | (2.64 | ) | | | (2.71 | ) | | $ | 6.14 | | | | (30.62% | ) |
| Year Ended October 31, 2002 | | $ | 6.14 | | | | (0.03 | ) | | | — | | | | (0.81 | ) | | | (0.84 | ) | | $ | 5.30 | | | | (13.68% | ) |
| Year Ended October 31, 2003 | | $ | 5.30 | | | | (0.05 | ) | | | 0.03 | | | | 1.54 | | | | 1.52 | | | $ | 6.82 | | | | 28.68% | |
| Year Ended October 31, 2004 | | $ | 6.82 | | | | (0.05 | ) | | | 0.01 | | | | 0.78 | | | | 0.74 | | | $ | 7.56 | | | | 10.85% | |
Class C Shares | | | | | | | | | | | | | | | | | | | | | | | | | | | | |
| Period Ended October 31, 2001 (e) | | $ | 7.72 | | | | (0.02 | ) | | | — | | | | (1.53 | ) | | | (1.55 | ) | | $ | 6.17 | | | | (20.08% | ) (h) |
| Year Ended October 31, 2002 | | $ | 6.17 | | | | (0.03 | ) | | | — | | | | (0.81 | ) | | | (0.84 | ) | | $ | 5.33 | | | | (13.61% | ) |
| Year Ended October 31, 2003 | | $ | 5.33 | | | | (0.05 | ) | | | 0.03 | | | | 1.55 | | | | 1.53 | | | $ | 6.86 | | | | 28.71% | |
| Year Ended October 31, 2004 | | $ | 6.86 | | | | (0.01 | ) | | | 0.01 | | | | 0.74 | | | | 0.74 | | | $ | 7.60 | | | | 10.79% | |
Class R Shares | | | | | | | | | | | | | | | | | | | | | | | | | | | | |
| Period Ended October 31, 2004 (f) | | $ | 7.25 | | | | 0.02 | | | | 0.01 | | | | 0.30 | | | | 0.33 | | | $ | 7.58 | | | | 4.55% | (h) |
Institutional Service Class Shares | | | | | | | | | | | | | | | | | | | | | | | | | | | | |
| Period Ended October 31, 2000 (d) | | $ | 10.00 | | | | 0.01 | | | | — | | | | (1.15 | ) | | | (1.14 | ) | | $ | 8.86 | | | | (11.40% | ) (h) |
| Year Ended October 31, 2001 | | $ | 8.86 | | | | — | | | | — | | | | (2.64 | ) | | | (2.64 | ) | | $ | 6.22 | | | | (29.80% | ) |
| Year Ended October 31, 2002 | | $ | 6.22 | | | | 0.03 | | | | — | | | | (0.83 | ) | | | (0.80 | ) | | $ | 5.42 | | | | (12.86% | ) |
| Year Ended October 31, 2003 | | $ | 5.42 | | | | 0.01 | | | | 0.03 | | | | 1.59 | | | | 1.63 | | | $ | 7.05 | | | | 30.07% | |
| Year Ended October 31, 2004 | | $ | 7.05 | | | | 0.02 | | | | 0.01 | | | | 0.81 | | | | 0.84 | | | $ | 7.89 | | | | 11.91% | |
Institutional Class Shares | | | | | | | | | | | | | | | | | | | | | | | | | | | | |
| Period Ended October 31, 2004 (g) | | $ | 7.51 | | | | — | | | | 0.01 | | | | 0.37 | | | | 0.38 | | | $ | 7.89 | | | | 5.06% | (h) |
|
[Additional columns below]
[Continued from above table, first column(s) repeated]
| | | | | | | | | | | | | | | | | | | | | | | | | | | |
| | | | |
| | Ratios / Supplemental Data | | | |
| | | | Ratio of Net | | | | | |
| | | | Ratio of Net | | | Ratio of | | | Investment | | | | | |
| | | | Investment | | | Expenses | | | Income (Loss) | | | | | |
| | Net Assets | | | Ratio of | | | Income | | | (Prior to | | | (Prior to | | | | | |
| | at End of | | | Expenses | | | (Loss) | | | Reimbursements) | | | Reimbursements) | | | | | |
| | Period | | | to Average | | | to Average | | | to Average | | | to Average | | | Portfolio | | | |
| | (000s) | | | Net Assets | | | Net Assets | | | Net Assets (b) | | | Net Assets (b) | | | Turnover (c) | | | |
| | | | |
| | | | |
| |
| | | |
Class A Shares | | | | | | | | | | | | | | | | | | | | | | | | | | |
| Period Ended October 31, 2000 (d) | | $ | 2,975 | | | | 1.85% | (i) | | | 0.05% | (i) | | | 4.01% | (i) | | | (2.11% | ) (i) | | | 46.31% | | | |
| Year Ended October 31, 2001 | | $ | 2,156 | | | | 1.85% | | | | (0.30% | ) | | | 4.01% | | | | (2.46% | ) | | | 236.28% | | | |
| Year Ended October 31, 2002 | | $ | 1,965 | | | | 1.76% | | | | 0.20% | | | | 2.10% | | | | (0.14% | ) | | | 226.70% | | | |
| Year Ended October 31, 2003 | | $ | 2,592 | | | | 1.65% | | | | 0.39% | | | | 2.37% | | | | (0.33% | ) | | | 304.72% | | | |
| Year Ended October 31, 2004 | | $ | 3,096 | | | | 1.65% | | | | 0.06 % | | | | 2.10% | | | | (0.38% | ) | | | 262.09% | | | |
Class B Shares | | | | | | | | | | | | | | | | | | | | | | | | | | |
| Period Ended October 31, 2000 (d) | | $ | 2,950 | | | | 2.45% | (i) | | | (0.54% | ) (i) | | | 4.75% | (i) | | | (2.84% | ) (i) | | | 46.31% | | | |
| Year Ended October 31, 2001 | | $ | 2,078 | | | | 2.45% | | | | (0.89% | ) | | | 4.75% | | | | (3.19% | ) | | | 236.28% | | | |
| Year Ended October 31, 2002 | | $ | 1,840 | | | | 2.46% | | | | (0.50% | ) | | | 2.85% | | | | (0.89% | ) | | | 226.70% | | | |
| Year Ended October 31, 2003 | | $ | 2,395 | | | | 2.40% | | | | (0.36% | ) | | | 3.12% | | | | (1.08% | ) | | | 304.72% | | | |
| Year Ended October 31, 2004 | | $ | 2,695 | | | | 2.40% | | | | (0.70% | ) | | | 2.84% | | | | (1.14% | ) | | | 262.09% | | | |
Class C Shares | | | | | | | | | | | | | | | | | | | | | | | | | | |
| Period Ended October 31, 2001 (e) | | $ | 10 | | | | 2.45% | (i) | | | (1.10% | ) (i) | | | 6.72% | (i) | | | (5.37% | ) (i) | | | 236.28% | | | |
| Year Ended October 31, 2002 | | $ | 10 | | | | 2.46% | | | | (0.53% | ) | | | 2.95% | | | | (1.02% | ) | | | 226.70% | | | |
| Year Ended October 31, 2003 | | $ | 16 | | | | 2.40% | | | | (0.37% | ) | | | 3.12% | | | | (1.09% | ) | | | 304.72% | | | |
| Year Ended October 31, 2004 | | $ | 112 | | | | 2.40% | | | | (0.23% | ) | | | 2.87% | | | | (0.70% | ) | | | 262.09% | | | |
Class R Shares | | | | | | | | | | | | | | | | | | | | | | | | | | |
| Period Ended October 31, 2004 (f) | | $ | 1 | | | | 2.00% | (i) | | | 0.31% | (i) | | | 2.65% | (i) | | | (0.33% | ) (i) | | | 262.09% | | | |
Institutional Service Class Shares | | | | | | | | | | | | | | | | | | | | | | | | | | |
| Period Ended October 31, 2000 (d) | | $ | 2,954 | | | | 1.52 % | (i) | | | 0.39% | (i) | | | 3.75% | (i) | | | (1.84% | ) (i) | | | 46.31% | | | |
| Year Ended October 31, 2001 | | $ | 2,073 | | | | 1.52% | | | | 0.03% | | | | 3.72% | | | | (2.17% | ) | | | 236.28% | | | |
| Year Ended October 31, 2002 | | $ | 1,807 | | | | 1.48% | | | | 0.48% | | | | 1.85% | | | | 0.11% | | | | 226.70% | | | |
| Year Ended October 31, 2003 | | $ | 2,350 | | | | 1.40% | | | | 0.64% | | | | 2.12% | | | | (0.08% | ) | | | 304.72% | | | |
| Year Ended October 31, 2004 | | $ | 2,629 | | | | 1.40% | | | | 0.30 % | | | | 1.84% | | | | (0.14% | ) | | | 262.09% | | | |
Institutional Class Shares | | | | | | | | | | | | | | | | | | | | | | | | | | |
| Period Ended October 31, 2004 (g) | | $ | 189 | | | | 1.40% | (i) | | | 0.03% | (i) | | | 1.94% | (i) | | | (0.52% | ) (i) | | | 262.09% | | | |
| | | | |
| | |
| (a) | | Excludes sales charge. |
| (b) | | During the period certain fees were waived and/or reimbursed. If such waivers/reimbursements had not occurred, the ratios would have been as indicated. |
| (c) | | Portfolio turnover is calculated on the basis of the Fund as a whole without distinguishing among the classes of shares. |
| (d) | | For period from August 30, 2000 (commencement of operations) through October 31, 2000. |
| (e) | | For the period from March 1, 2001 (commencement of operations) through October 31, 2001. |
| (f) | | For the period from December 30, 2003 (commencement of operations) through October 31, 2004. |
| (g) | | For period from June 29, 2004 (commencement of operations) through October 31, 2004. |
| (h) | | Not annualized. |
| (i) | | Annualized. |
See notes to financial statements.
100 Annual Report 2004
Concept Series
| |
| | Gartmore High Yield Bond Fund |
For the annual period ended Oct. 31, 2004, the Gartmore High Yield Bond Fund returned 10.65% (Class A at NAV) versus 12.30% for its benchmark, the Citigroup High-Yield Market Index. For broader comparison, the average return for this Fund’s Lipper peer category of High Current Yield Funds was 11.03%.
High-yield bonds rode a wave of positive conditions—strong economic growth, low inflation, and relatively low default rates—and finished the second straight year with double-digit positive returns. Lower-rated credit issues such as CCC-rated bonds led performance, while some of the higher-rated areas such as BBB- and Split BBB-rated issues finished slightly in negative territory. Early in the period, the Fund held an underweight position within the riskier areas of the market—those that outperformed—yet we increased the Fund’s position in that space as the year progressed; the move to lower-rated issues helped Fund performance.
On a sector level, credit selection generally contributed to Fund performance more than sector or industry allocation. For example, the health-care sector added nicely to Fund returns returning 5.8% even though the sector as a whole lagged because investors shunned more traditionally defensive areas such as health care. The metals/mining sector added 0.60% to Fund performance, in part because strong demand from China kept revenues strong for those companies. In an example of a positive sector allocation decision, the Fund held no exposure to airlines issues during a time when these issues detracted heavily from performance for the Index, a downturn that began around July 30 and continued to the end of the reporting period.
The Fund’s holdings within the wireless sector performed well relative to the Index, also due to positive credit selection, yet the wireless sector generally turned in weak performance for the Fund and the overall Index. Among wireless holdings, Triton PCS Holdings, Inc., a wireless communications company, detracted 0.25% from Fund returns. This issue was hurt because investors had expected the company to be involved in merger activity, yet no suitors arrived. Electric utility company Calpine Corp. also detracted from Fund returns, partly because the company was burdened with too much debt. Calpine detracted 0.16% from the Fund’s overall return.
We are optimistic about the high-yield sector’s growth prospects. We believe that many companies are in good financial shape and have seen the ratio of credit upgrades to downgrades stabilize a bit. The economy also appears to be in a position to continue moderate-to-strong growth, allowing us to maintain a comfortable overweight position in lower-rated bonds, an area that we believe will outperform. Overall, we do not expect any broad sector themes that would require us to reposition the Fund’s portfolio. We plan to continue emphasizing quality credit selection within a range of sectors. The chemicals, containers, technology and cable sectors are all areas that we believe could outperform in the coming year.
Portfolio Manager: Karen Bater
| |
| | Class A: NYBAX |
| | Class B: NYBBX |
| | Class C: NYBCX |
| | Class R: GHYRX |
| | Institutional Service Class: NHYSX |
| | Institutional Class: GHBIX |
2004 Annual Report 101
Concept Series
Gartmore High Yield Bond Fund
Average Annual Total Return
(For periods ended October 31, 2004)
| | | | | | | | | | | |
| | | | One year | | | Inception1 | |
|
| |
| Class A | | without sales charge2 | | | 10.65% | | | | 2.35% | |
| | | with sales charge3 | | | 5.44% | | | | 1.32% | |
|
| Class B | | without sales charge2 | | | 9.92% | | | | 1.60% | |
| | | with sales charge4 | | | 4.92% | | | | 1.32% | |
|
Class C5 | | without sales charge2 | | | 9.92% | | | | 1.37% | |
| | | with sales charge6 | | | 8.92% | | | | 1.37% | |
|
Class R 7,9 | | | | | 10.25% | | | | 1.66% | |
|
| Institutional Class8,9 | | | 10.92% | | | | 2.74% | |
|
| Institutional Service Class9 | | | 10.90% | | | | 2.73% | |
|
All figures showing the effect of a sales charge reflect the maximum charge possible, because it has the most dramatic effect on performance data.
| |
| 1 | Fund commenced operations on December 29, 1999. |
| |
| 2 | These returns do not reflect the effects of sales charges (SC). |
| |
| 3 | A 4.75% front-end sales charge was deducted. |
| |
| 4 | A 5.00% contingent deferred sales charge (CDSC) was deducted. The CDSC declines to 0% after 6 years. |
| |
| 5 | These returns until the creation of Class C shares (3/1/01) include the performance of the Fund’s Class B shares. Excluding the effects of any fee waivers or reimbursements, such prior performance is substantially similar to what Class C shares would have produced because Class C shares invest in the same portfolio of securities as Class B shares and have the same expenses after any fee waivers or reimbursements. For Class C shares returns with sales charges, these returns have been restated for the applicable sales charges. |
| |
| 6 | A CDSC of 1.00% was deducted because it is charged when you sell Class C shares within the first year after purchase. |
| |
| 7 | These returns until the creation of Class R shares (12/31/03) include the performance of the Fund’s Class B shares. The returns have been adjusted for the fact that Class R shares do not have any applicable sales charges but have not been adjusted for the lower expenses applicable to Class R shares. Excluding the effect of any fee waivers or reimbursements, such prior performance is similar to what Class R shares would have produced because the Class R shares invest in the same portfolio of securities as Class B shares. |
| |
| 8 | These returns until the creation of Institutional Class shares (6/29/04) include the performance of the Fund’s Institutional Service shares. The returns have not been adjusted for the lower expenses applicable to Institutional Class shares. Excluding the effect of any fee waivers or reimbursements, such prior performance is similar to what Institutional Class shares would have produced because the Institutional Class shares invest in the same portfolio of securities as Institutional Service shares. |
| |
| 9 | Not subject to any sales charges. |
Performance of a $10,000 Investment
Investment return and principal value will fluctuate, and when redeemed, shares may be worth more or less than original cost. Past performance is no guarantee of future results and does not reflect the deduction of taxes that a shareholder would pay on fund distributions or the redemption of fund shares. Investing in mutual funds involves market risk, including loss of principal. Performance returns assume the reinvestment of all distributions.
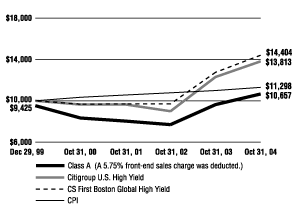
Comparative performance of $10,000 invested in Class A shares of the Gartmore High Yield Bond Fund, Citigroup U.S. High-Yield Market Index (a), CS First Boston Global High Yield Corporate Bond Index (b), and the Consumer Price Index (CPI)(c) since inception. Unlike the Fund, the returns for these unmanaged indexes do not reflect any fees, expenses, or sales charges. Investors cannot invest directly in market indexes.
| | |
| (a) | | The Citigroup U.S. High-Yield Market Index is an unmanaged index of high-yield debt securities and is a broad market measure. The Fund is changing the index to which it is compared from the CS First Boston Global High Yield Corporate Bond Index to the Citigroup U.S. High-Yield Market Index because the latter index more accurately reflects trends in the high-yield debt marketplace. |
| |
| (b) | | The CS First Boston Global High Yield Corporate Bond Index is an unmanaged index of high-yield debt securities which gives a broad look at the public high yield debt market. |
| |
| (c) | | The CPI represents changes in prices of a basket of goods and services purchased for consumption by urban households. |
102 Annual Report 2004
Gartmore High Yield Bond Fund
Shareholder
Expense Example
As a shareholder of the Funds, you incur two types of costs: (1) transaction costs, including sales charges (loads) paid on purchase payments and redemption fees; and (2) ongoing costs, including investment advisory fees, administration fees, distribution fees and other Fund expenses. The examples below are intended to help you understand your ongoing costs (in dollars) of investing in the Funds and to compare these costs with the ongoing costs of investing in other mutual funds. The examples assume that you had a $1,000 investment in the Class at the beginning of the reporting period, May 1, 2004, and continued to hold your shares at the end of the reporting period, October 31, 2004. Per SEC requirements, the examples are based on an investment of $1,000 invested at the beginning of the period and held for the entire six-month period ended October 31, 2004.
Actual Expenses
For each Class of the Fund in the table below, the first line provides information about actual account values and actual expenses. You may use the information in this line, together with the amount you invested, to estimate the expenses that you paid over the period. Simply divide your account value by $1,000 (for example, an $8,600 account value divided by $1,000 = 8.6), then multiply the result by the number in the first line of each Class under the heading entitled “Expenses Paid During Period” to estimate the expenses you paid on your account during the period.
Hypothetical Example for Comparison Purposes
The second line of each Class in the table below provides information about hypothetical account values and hypothetical expenses based on the Class’ actual expense ratio and an assumed rate of return of 5% per year before expenses, which is not the Class’ actual return. The hypothetical account values and expenses may not be used to estimate the actual ending account balance or expenses you paid for the period. You may use this information to compare the ongoing costs of investing in the Class of the Fund and other funds. To do so, compare this 5% hypothetical example with the 5% hypothetical examples that appear in the shareholder reports of the other funds.
Please note that the expenses shown in the table are meant to highlight your ongoing costs only and do not reflect any transaction costs, such as sales charges (loads) or redemption fees. Therefore, the second line for each Class in the table is useful in comparing ongoing costs only, and will not help you determine the relative total costs of owning different funds. In addition, if these transaction costs were included, your costs would have been higher. The examples also assume all dividends and distributions have been reinvested.
Schedule of Shareholder Expenses
Expense Analysis of a $1,000 Investment
(October 31, 2004)
| | | | | | | | | | | | | | | | | | | | | | | |
| | | | Beginning | | | Ending | | | | | | | |
| | | | Account Value | | | Account Value | | | Expenses Paid | | | Annualized | | | |
| High Yield Bond Fund | | | | 5/1/04 | | | 10/31/04 | | | During Period* | | | Expense Ratio | | | |
|
|
| Class A | | | Actual | | | $ | 1,000 | | | $ | 1,057 | | | $ | 5.22 | | | | 1.01% | | | |
| | | | Hypothetical | 1 | | $ | 1,000 | | | $ | 1,020 | | | $ | 5.14 | | | | 1.01% | | | |
|
| Class B | | | Actual | | | $ | 1,000 | | | $ | 1,054 | | | $ | 8.78 | | | | 1.70% | | | |
| | | | Hypothetical | 1 | | $ | 1,000 | | | $ | 1,016 | | | $ | 8.65 | | | | 1.70% | | | |
|
| Class C | | | Actual | | | $ | 1,000 | | | $ | 1,054 | | | $ | 8.83 | | | | 1.71% | | | |
| | | | Hypothetical | 1 | | $ | 1,000 | | | $ | 1,016 | | | $ | 8.70 | | | | 1.71% | | | |
|
| Class R | | | Actual | | | $ | 1,000 | | | $ | 1,056 | | | $ | 6.51 | | | | 1.26% | | | |
| | | | Hypothetical | 1 | | $ | 1,000 | | | $ | 1,019 | | | $ | 6.41 | | | | 1.26% | | | |
|
| Institutional Service Class | | | Actual | | | $ | 1,000 | | | $ | 1,058 | | | $ | 3.67 | | | | 0.71% | | | |
| | | | Hypothetical | 1 | | $ | 1,000 | | | $ | 1,021 | | | $ | 3.61 | | | | 0.71% | | | |
|
| Institutional Class (a) | | | Actual | | | $ | 1,000 | | | $ | 1,061 | | | $ | 2.48 | (b) | | | 0.71% | | | |
| | | | Hypothetical | 1 | | $ | 1,000 | | | $ | 1,013 | | | $ | 2.43 | (b) | | | 0.71% | | | |
|
| | |
| (a) | | For the period from June 29, 2004 (commencement of operations) through October 31, 2004. |
| |
| (b) | | Expense are equal to the Fund’s annualized expense ratio multiplied by the average account value over the period multiplied by 124/366 (to reflect the period). |
| |
| * | Expenses are equal to the Fund’s annualized expense ratio multiplied by the average account value over the period multiplied by 184/366 (to reflect the one-half year period). |
1 Represents the hypothetical 5% annual return before expenses.
2004 Annual Report 103
Gartmore High Yield Bond Fund
Concept Series
| |
| | Portfolio Summary |
| | (October 31, 2004) |
The SEC adopted a requirement that Funds present their portfolio holdings in a table, chart or graph format in their annual and semiannual reports to shareholders, whether or not a schedule of investments is utilized. The following tables, which present portfolio holdings as a percentage of net assets, are provided in compliance with this requirement.
| | | | | | | |
| Asset Allocation | | | | |
|
|
| Corporate Bonds | | | 88.1% | | | |
| Repurchase Agreement | | | 9.3% | | | |
| Preferred Stocks | | | 1.2% | | | |
| Yankee Dollar | | | 0.8% | | | |
| Yankee Bond | | | 0.7% | | | |
| Common Stock | | | 0.1% | | | |
| Other Liabilities in excess of Assets | | | -0.2% | | | |
| | |
| | | |
| | | | 100.0% | | | |
| | | | | | | |
| Top Industries | | | | |
|
|
| Utilities | | | 7.6% | | | |
| Oil & Gas | | | 7.3% | | | |
| Telecommunication Services | | | 7.0% | | | |
| Cable & Satellite | | | 6.4% | | | |
| Chemicals | | | 5.7% | | | |
| Healthcare | | | 5.7% | | | |
| Communication/ Mobile | | | 4.8% | | | |
| Gaming | | | 4.6% | | | |
| Containers | | | 4.5% | | | |
| Auto Parts & Equipment | | | 4.0% | | | |
| Other Industries | | | 42.4% | | | |
| | |
| | | |
| | | | 100.0% | | | |
| | | | | | | |
| Top Holdings | | | | |
|
|
| Cablevision System Corp. | | | 1.5% | | | |
| EL Paso Corp. | | | 1.5% | | | |
| Williams Cos., Inc. Series A | | | 1.3% | | | |
| Edison Mission Energy | | | 1.2% | | | |
| Georgia Pacific Corp. | | | 1.2% | | | |
| Qwest Corp. (c) | | | 1.2% | | | |
| Charter Communications Holdings LLC | | | 1.2% | | | |
| Triton PCS, Inc. | | | 1.1% | | | |
| AES Corp. (c) | | | 1.1% | | | |
| Great Atlantic & Pacific Tea Co. | | | 1.1% | | | |
| Other Companies | | | 87.6% | | | |
| | |
| | | |
| | | | 100.0% | | | |
104 Annual Report 2004
Statement of Investments
October 31, 2004
Gartmore High Yield Bond Fund
| | | | | | | | | | | |
|
| Corporate Bonds (88.1%) |
|
| | Shares or | | | |
| | Principal Amount | | | Value | | | |
|
| Aerospace/ Defense Equipment (1.2%) |
| BE Aerospace, Inc., 8.00%, 03/01/08 | | $ | 85,000 | | | $ | 85,850 | | | |
| Sequa Corp., 9.00%, 08/01/09 | | | 125,000 | | | | 139,688 | | | |
Vought Aircraft Industries, Inc.,
8.00%, 07/15/11 | | | 60,000 | | | | 58,500 | | | |
| | | | | |
| | | |
| |
| | | | | | | | 284,038 | | | |
| | | | | |
| | | |
| |
|
| Auto Manufacturing (0.2%) |
| Goodyear Tire & Rubber, 7.86%, 08/15/11 | | | 60,000 | | | | 56,850 | | | |
| | | | | |
| | | |
| |
|
| Auto Parts & Equipment (4.0%) |
| Accuride Corp., Series B, 9.25%, 02/01/08 | | | 85,000 | | | | 86,913 | | | |
Advanced Accessory Systems,
10.75%, 06/15/11 | | | 85,000 | | | | 77,350 | | | |
Collins & Aikman Products Corp.,
10.75%, 12/31/11 | | | 80,000 | | | | 79,800 | | | |
Delco Remy International, Inc.,
9.38%, 04/15/12 | | | 40,000 | | | | 39,700 | | | |
| Dura Operating Corp., 9.00%, 05/01/09 | | | 40,000 | | | | 38,300 | | | |
| Metaldyne Corp., 10.00%, 11/01/13 (c) | | | 75,000 | | | | 71,625 | | | |
| Rexnord Corp., 10.13%, 12/15/12 | | | 150,000 | | | | 169,499 | | | |
| Tenneco Automotive, Inc., 11.63%, 10/15/09 | | | 85,000 | | | | 90,313 | | | |
| TRW Automotive, Inc., 9.38%, 02/15/13 | | | 92,000 | | | | 105,800 | | | |
| TRW Automotive, Inc., 11.00%, 02/15/13 | | | 35,000 | | | | 41,650 | | | |
United Rentals North America, Inc.,
7.00%, 02/15/14 | | | 85,000 | | | | 78,413 | | | |
| Williams Scotsman, Inc., 9.88%, 06/01/07 | | | 105,000 | | | | 100,800 | | | |
| | | | | |
| | | |
| |
| | | | | | | | 980,163 | | | |
| | | | | |
| | | |
| |
|
| Building & Construction (2.3%) |
| Building Materials Corp., 7.75%, 08/01/14 (c) | | | 25,000 | | | | 24,813 | | | |
| D.R. Horton, Inc., 8.50%, 04/15/12 | | | 110,000 | | | | 124,025 | | | |
| K. Hovnanian Enterprises, 7.75%, 05/15/13 | | | 55,000 | | | | 59,400 | | | |
| Texas Industries, Inc., 10.25%, 06/15/11 | | | 100,000 | | | | 115,000 | | | |
| THL Buildco (Nortek Inc.), 8.50%, 09/01/14 (c) | | | 50,000 | | | | 53,000 | | | |
| WCI Communities, Inc., 9.13%, 05/01/12 | | | 170,000 | | | | 188,700 | | | |
| | | | | |
| | | |
| |
| | | | | | | | 564,938 | | | |
| | | | | |
| | | |
| |
|
| Building Products (1.0%) |
| Euramax International PLC, 8.50%, 08/15/11 | | | 85,000 | | | | 90,525 | | | |
| U.S. Concrete, Inc., 8.38%, 04/01/14 | | | 50,000 | | | | 53,438 | | | |
| RMCC Acquisition Co., 9.50%, 11/01/12 (c) | | | 90,000 | | | | 91,125 | | | |
| | | | | |
| | | |
| |
| | | | | | | | 235,088 | | | |
| | | | | |
| | | |
| |
|
| Cable & Satellite (6.4%) |
Adelphia Communications,
10.88%, 10/01/10 (b) | | | 85,000 | | | | 74,163 | | | |
Atlantic Broadband Finance LLC,
9.38%, 01/15/14 (c) | | | 175,000 | | | | 163,844 | | | |
| Cablevision System Corp., 8.00%, 04/15/12 (c) | | | 350,000 | | | | 376,249 | | | |
Charter Communications Holdings LLC,
8.63%, 04/01/09 | | | 350,000 | | | | 281,749 | | | |
Charter Communications Holdings LLC,
8.38%, 04/30/14 (c) | | | 85,000 | | | | 85,744 | | | |
| Echostar DBS Corp., 9.13%, 01/15/09 | | | 164,000 | | | | 182,860 | | | |
| Mediacom LLC, 9.50%, 01/15/13 | | | 100,000 | | | | 98,000 | | | |
| Panamsat Corp., 9.00%, 08/15/14 (c) | | | 155,000 | | | | 164,300 | | | |
| Young Broadcasting, Inc., 10.00%, 03/01/11 | | | 125,000 | | | | 131,250 | | | |
| | | | | |
| | | |
| |
| | | | | | | | 1,558,159 | | | |
| | | | | |
| | | |
| |
|
| Chemicals (5.7%) |
| BCP Caylux Holding SCA, 9.63%, 06/15/14 (c) | | | 125,000 | | | | 140,000 | | | |
| Crompton Corp., 9.88%, 08/01/12 (c) | | | 55,000 | | | | 60,638 | | | |
| Equistar Chemical Funding, 10.13%, 09/01/08 | | | 105,000 | | | | 120,619 | | | |
| Huntsman LLC, 11.63%, 10/15/10 | | | 105,000 | | | | 123,769 | | | |
| IMC Global, Inc., 11.25%, 06/01/11 | | | 70,000 | | | | 82,250 | | | |
| Lyondell Chemical Co., 9.50%, 12/15/08 | | | 190,000 | | | | 207,099 | | | |
| Millennium America, Inc., 9.25%, 06/15/08 | | | 85,000 | | | | 94,775 | | | |
| Nalco Co., 7.75%, 11/15/11 | | | 80,000 | | | | 86,600 | | | |
| Polyone Corp., 10.63%, 05/15/10 | | | 110,000 | | | | 122,100 | | | |
Resolution Performance Products,
8.00%, 12/15/09 | | | 55,000 | | | | 56,925 | | | |
| Rhodia SA, 8.88%, 06/01/11 | | | 175,000 | | | | 163,624 | | | |
| Solutia, Inc., 11.25%, 07/15/09 (b) | | | 85,000 | | | | 82,450 | | | |
United Agriculture Products,
8.25%, 12/15/11 (c) | | | 50,000 | | | | 54,000 | | | |
| | | | | |
| | | |
| |
| | | | | | | | 1,394,849 | | | |
| | | | | |
| | | |
| |
|
| Communication/Mobile (4.8%) |
| American Tower Corp., 9.38%, 02/01/09 | | | 167,000 | | | | 176,603 | | | |
| American Tower Corp., 7.13%, 10/15/12 (c) | | | 175,000 | | | | 178,063 | | | |
| Dobson Cellular Systems, 8.38%, 11/01/11 (c) | | | 45,000 | | | | 46,406 | | | |
| Triton PCS, Inc., 9.38%, 02/01/11 | | | 175,000 | | | | 128,625 | | | |
| Triton PCS, Inc., 8.50%, 06/01/13 | | | 300,000 | | | | 275,249 | | | |
| Ubiquitel Operating Co., 9.88%, 03/01/11 (c) | | | 85,000 | | | | 92,013 | | | |
| Ubiquitel Operating Co., 9.88%, 03/01/11 | | | 85,000 | | | | 92,013 | | | |
| Western Wireless Corp., 9.25%, 07/15/13 | | | 170,000 | | | | 181,049 | | | |
| | | | | |
| | | |
| |
| | | | | | | | 1,170,021 | | | |
| | | | | |
| | | |
| |
|
| Consumer Products/Services (1.8%) |
| Doane Pet Care Co., 10.75%, 03/01/10 | | | 85,000 | | | | 91,800 | | | |
| Iron Mountain, Inc., 7.75%, 01/15/15 | | | 85,000 | | | | 91,800 | | | |
| Reddy Ice Holdings, Inc, 10.50%, 11/01/12 (c) | | | 260,000 | | | | 175,500 | | | |
| Sealy Mattress Co., 8.25%, 06/15/14 | | | 85,000 | | | | 89,888 | | | |
| | | | | |
| | | |
| |
| | | | | | | | 448,988 | | | |
| | | | | |
| | | |
| |
|
| Containers (4.5%) |
| AEP Industries, Inc., 9.88%, 11/15/07 | | | 105,000 | | | | 106,838 | | | |
| Constar International, 11.00%, 12/01/12 | | | 85,000 | | | | 81,175 | | | |
| Crown Cork & Seal, 8.00%, 04/15/23 | | | 175,000 | | | | 169,313 | | | |
| Owens-Illinois, Inc., 7.50%, 05/15/10 | | | 105,000 | | | | 109,725 | | | |
| Pliant Corp., 11.13%, 06/15/09 | | | 30,000 | | | | 26,700 | | | |
| Pliant Corp., 11.13%, 09/01/09 | | | 50,000 | | | | 53,750 | | | |
2004 Annual Report 105
| |
| | Statement of Investments (Continued) |
| | October 31, 2004 |
Gartmore High Yield Bond Fund (Continued)
Concept Series
| | | | | | | | | | | |
|
| Corporate Bonds (continued) |
|
| | Shares or | | | |
| | Principal Amount | | | Value | | | |
|
| Containers (continued) |
| Pliant Corp., 13.00%, 06/01/10 | | $ | 225,000 | | | $ | 209,812 | | | |
| Silgan Holdings, Inc., 6.75%, 11/15/13 | | | 50,000 | | | | 51,500 | | | |
| Solo Cup Co., 8.50%, 02/15/14 | | | 215,000 | | | | 211,237 | | | |
| Tekni-Plex, Inc., 8.75%, 11/15/13 (c) | | | 80,000 | | | | 76,300 | | | |
| | | | | |
| | | |
| |
| | | | | | | | 1,096,350 | | | |
| | | | | |
| | | |
| |
|
| Cosmetics/ Toiletries (1.0%) |
| Armkel LLC, 9.50%, 08/15/09 | | | 110,000 | | | | 119,762 | | | |
| Elizabeth Arden, Inc., 7.75%, 01/15/14 | | | 110,000 | | | | 117,288 | | | |
| | | | | |
| | | |
| |
| | | | | | | | 237,050 | | | |
| | | | | |
| | | |
| |
|
| Distribution/ Wholesale (0.7%) |
| Aviall, Inc., 7.63%, 07/01/11 | | | 80,000 | | | | 86,400 | | | |
| Buhrmann U.S., Inc., 8.25%, 07/01/14 (c) | | | 90,000 | | | | 89,325 | | | |
| | | | | |
| | | |
| |
| | | | | | | | 175,725 | | | |
| | | | | |
| | | |
| |
|
| Diversified Manufacturing Operations (0.9%) |
| Blount Inc, 8.88%, 08/01/12 | | | 55,000 | | | | 59,881 | | | |
| Invensys PLC, 9.88%, 03/15/11 (c) | | | 25,000 | | | | 26,125 | | | |
| Koppers Industry, Inc., 9.88%, 10/15/13 | | | 125,000 | | | | 141,250 | | | |
| | | | | |
| | | |
| |
| | | | | | | | 227,256 | | | |
| | | | | |
| | | |
| |
|
| E-Commerce (0.3%) |
| FTD, Inc., 7.75%, 02/15/14 | | | 75,000 | | | | 75,188 | | | |
| | | | | |
| | | |
| |
|
| Electronics (0.2%) |
| Itron, Inc., 7.75%, 05/15/12 (c) | | | 50,000 | | | | 50,625 | | | |
| | | | | |
| | | |
| |
|
| Finance (1.5%) |
Global Cash Accounting & Finance,
8.75%, 03/15/12 | | | 85,000 | | | | 92,225 | | | |
| Labranche & Co., 9.50%, 05/15/09 (c) | | | 60,000 | | | | 60,000 | | | |
| Metris Cos., Inc., 10.13%, 07/15/06 | | | 90,000 | | | | 90,900 | | | |
| Refco Finance Holdings, 9.00%, 08/01/12 (c) | | | 110,000 | | | | 118,800 | | | |
| | | | | |
| | | |
| |
| | | | | | | | 361,925 | | | |
| | | | | |
| | | |
| |
|
| Food & Beverage (2.0%) |
Great Atlantic & Pacific Tea Co.,
7.75%, 04/15/07 | | | 275,000 | | | | 258,500 | | | |
Great Atlantic & Pacific Tea Co.,
9.13%, 12/15/11 | | | 25,000 | | | | 21,500 | | | |
| Pilgrims Pride Corp., 9.25%, 11/15/13 | | | 50,000 | | | | 55,750 | | | |
| Pinnacle Foods Holdings, 8.25%, 12/01/13 (c) | | | 50,000 | | | | 47,250 | | | |
| Stater Brothers Holdings, 8.13%, 06/15/12 | | | 75,000 | | | | 79,500 | | | |
| WH Holdings, 9.50%, 04/01/11 | | | 25,000 | | | | 27,375 | | | |
| | | | | |
| | | |
| |
| | | | | | | | 489,875 | | | |
| | | | | |
| | | |
| |
|
| Gaming (4.6%) |
American Casino & Entertainment,
7.85%, 02/01/12 (c) | | | 55,000 | | | | 59,125 | | | |
| Boyd Gaming Corp., 6.75%, 04/15/14 | | | 105,000 | | | | 110,119 | | | |
| Circus & Eldorado, 10.13%, 03/01/12 | | | 55,000 | | | | 59,675 | | | |
| Hard Rock Hotel, Inc., 8.88%, 06/01/13 | | | 110,000 | | | | 119,900 | | | |
| Herbst Gaming, Inc., 8.13%, 06/01/12 (c) | | | 110,000 | | | | 115,225 | | | |
| MGM Mirage, Inc., 9.75%, 06/01/07 | | | 170,000 | | | | 191,250 | | | |
Park Place Entertainment Corp.,
8.13%, 05/15/11 | | | 210,000 | | | | 245,437 | | | |
| Premier Entertainment Biloxi, 10.75%, 02/01/12 | | | 80,000 | | | | 85,200 | | | |
| Station Casinos, Inc., 6.00%, 04/01/12 | | | 130,000 | | | | 135,850 | | | |
| | | | | |
| | | |
| |
| | | | | | | | 1,121,781 | | | |
| | | | | |
| | | |
| |
|
| Healthcare (5.7%) |
| Ameripath, Inc., 10.50%, 04/01/13 | | | 85,000 | | | | 83,300 | | | |
| Ardent Health Services, 10.00%, 08/15/13 | | | 125,000 | | | | 127,813 | | | |
| Beverly Enterprises, Inc., 7.88%, 06/15/14 (c) | | | 55,000 | | | | 58,919 | | | |
| Curative Health Services, 10.75%, 05/01/11 | | | 50,000 | | | | 44,500 | | | |
| Healthsouth Corp., 10.75%, 10/01/08 | | | 85,000 | | | | 88,613 | | | |
| Healthsouth Corp., 7.63%, 06/01/12 | | | 125,000 | | | | 121,250 | | | |
| Iasis Healthcare Corp., 8.75%, 06/15/14 (c) | | | 50,000 | | | | 53,750 | | | |
| Omnicare, Inc., 8.13%, 03/15/11 | | | 170,000 | | | | 184,449 | | | |
| PacifiCare Health Systems, 10.75%, 06/01/09 | | | 109,000 | | | | 125,623 | | | |
| Res-Care, Inc., 10.63%, 11/15/08 | | | 105,000 | | | | 113,400 | | | |
| Team Health, Inc., 9.00%, 04/01/12 (c) | | | 50,000 | | | | 49,500 | | | |
| Tenet Healthcare Corp., 9.88%, 07/01/14 (c) | | | 210,000 | | | | 219,974 | | | |
| VWR International, Inc., 6.88%, 04/15/12 (c) | | | 105,000 | | | | 111,300 | | | |
| | | | | |
| | | |
| |
| | | | | | | | 1,382,391 | | | |
| | | | | |
| | | |
| |
|
| Insurance (0.7%) |
Crum & Forster Holding Corp.,
10.38%, 06/15/13 | | | 70,000 | | | | 74,900 | | | |
| Fairfax Financial Holdings, 7.75%, 04/26/12 | | | 100,000 | | | | 97,000 | | | |
| | | | | |
| | | |
| |
| | | | | | | | 171,900 | | | |
| | | | | |
| | | |
| |
|
| Leisure (1.9%) |
| Carmike Cinemas, 7.50%, 02/15/14 | | | 40,000 | | | | 41,050 | | | |
| Cinemark Inc., 9.75%, 03/15/14 | | | 85,000 | | | | 60,138 | | | |
| Gaylord Entertainment Co., 8.00%, 11/15/13 | | | 50,000 | | | | 53,875 | | | |
| Host Marriott LP, 7.13%, 11/01/13 | | | 100,000 | | | | 107,999 | | | |
| Regal Cinemas, Inc., 9.38%, 02/01/12 | | | 75,000 | | | | 88,875 | | | |
| Vail Resorts, Inc., 6.75%, 02/15/14 | | | 105,000 | | | | 107,888 | | | |
| | | | | |
| | | |
| |
| | | | | | | | 459,825 | | | |
| | | | | |
| | | |
| |
|
| Machinery/Equipment (1.2%) |
| Case New Holland, Inc., 9.25%, 08/01/11 (c) | | | 85,000 | | | | 96,900 | | | |
| NMHG Holdings Co., 10.00%, 05/15/09 | | | 170,000 | | | | 188,063 | | | |
| | | | | |
| | | |
| |
| | | | | | | | 284,963 | | | |
| | | | | |
| | | |
| |
|
| Media (1.3%) |
| LBI Media, Inc., 10.13%, 07/15/12 | | | 170,000 | | | | 189,125 | | | |
| LBI Media, Inc., 11.00%, 10/15/13 | | | 170,000 | | | | 123,463 | | | |
| | | | | |
| | | |
| |
| | | | | | | | 312,588 | | | |
| | | | | |
| | | |
106 Annual Report 2004
| | | | | | | | | | | |
|
| Corporate Bonds (continued) |
|
| | Shares or | | | |
| | Principal Amount | | | Value | | | |
|
| Metals & Mining (0.6%) |
| AK Steel Corp., 7.88%, 02/15/09 | | $ | 85,000 | | | $ | 86,275 | | | |
| Ispat Inland ULC, 9.75%, 04/01/14 | | | 40,000 | | | | 48,600 | | | |
| | | | | |
| | | |
| |
| | | | | | | | 134,875 | | | |
| | | | | |
| | | |
| |
|
| Oil & Gas (7.3%) |
| ANR Pipeline Co., 8.88%, 03/15/10 | | | 150,000 | | | | 168,375 | | | |
| Belden & Blake Corp., 8.75%, 07/15/12 (c) | | | 30,000 | | | | 32,400 | | | |
| EL Paso Corp., 7.88%, 06/15/12 | | | 340,000 | | | | 354,449 | | | |
| EL Paso Production Holdings, 7.75%, 06/01/13 | | | 200,000 | | | | 208,500 | | | |
| Forest Oil Corp., 8.00%, 06/15/08 | | | 40,000 | | | | 44,400 | | | |
| Giant Industries, 11.00%, 05/15/12 | | | 80,000 | | | | 94,200 | | | |
Petrobras International Finance,
9.13%, 07/02/13 | | | 85,000 | | | | 92,650 | | | |
| Petroleum Geo-Services, 10.00%, 11/05/10 | | | 185,000 | | | | 210,900 | | | |
| Premcor Refining Group, 6.13%, 05/01/11 (c) | | | 40,000 | | | | 42,200 | | | |
| Southern Natural Gas, 8.88%, 03/15/10 | | | 125,000 | | | | 140,781 | | | |
| Williams Cos., Inc., 8.13%, 03/15/12 | | | 85,000 | | | | 99,875 | | | |
| Williams Cos., Inc., Series A, 7.50%, 01/15/31 | | | 320,000 | | | | 328,000 | | | |
| | | | | |
| | | |
| |
| | | | | | | | 1,816,730 | | | |
| | | | | |
| | | |
| |
|
| Paper & Forest Products (2.1%) |
Appleton Papers, Inc. Series B,
9.75%, 06/15/14 | | | 50,000 | | | | 52,250 | | | |
| Boise Cascade LLC, 7.13%, 10/15/14 (c) | | | 45,000 | | | | 46,971 | | | |
| Georgia Pacific Corp., 8.88%, 02/01/10 | | | 255,000 | | | | 300,262 | | | |
| Georgia Pacific Corp., 8.00%, 01/15/24 | | | 75,000 | | | | 86,813 | | | |
| Stone Container Corp., 7.38%, 07/15/14 (c) | | | 25,000 | | | | 26,688 | | | |
| | | | | |
| | | |
| |
| | | | | | | | 512,984 | | | |
| | | | | |
| | | |
| |
|
| Publishing (1.3%) |
Advertising Directory Solutions,
9.25%, 11/15/12 (c) | | | 90,000 | | | | 93,938 | | | |
| CBD Media Holdings, 9.25%, 07/15/12 (c) | | | 175,000 | | | | 175,875 | | | |
| Liberty Group Publishing, 9.38%, 02/01/08 | | | 40,000 | | | | 40,300 | | | |
| | | | | |
| | | |
| |
| | | | | | | | 310,113 | | | |
| | | | | |
| | | |
| |
|
| Recreational Centers (0.6%) |
| Bally Total Fitness, 10.50%, 07/15/11 | | | 100,000 | | | | 97,250 | | | |
| Town Sports International, 9.63%, 04/15/11 | | | 55,000 | | | | 58,025 | | | |
| | | | | |
| | | |
| |
| | | | | | | | 155,275 | | | |
| | | | | |
| | | |
| |
|
| Retail (2.0%) |
| Cole National Group, Inc., 8.88%, 05/15/12 | | | 160,000 | | | | 187,000 | | | |
| Duane Reade, Inc., 9.75%, 08/01/11 (c) | | | 55,000 | | | | 52,800 | | | |
| Finlay Fine Jewelry Corp., 8.38%, 06/01/12 | | | 50,000 | | | | 54,625 | | | |
Jean Coutu Group PJC, Inc.,
8.50%, 08/01/14 (c) | | | 110,000 | | | | 112,200 | | | |
| Remington Arms Co., 10.50%, 02/01/11 | | | 85,000 | | | | 75,225 | | | |
| | | | | |
| | | |
| |
| | | | | | | | 481,850 | | | |
| | | | | |
| | | |
| |
|
| Services (0.4%) |
| Great Lakes Dredge & Dock, 7.75%, 12/15/13 | | | 105,000 | | | | 93,975 | | | |
| | | | | |
| | | |
| |
|
| Technology (3.5%) |
| AMI Semiconductors, Inc., 10.75%, 02/01/13 | | | 75,000 | | | | 87,938 | | | |
| Amkor Technology, Inc., 9.25%, 02/15/08 | | | 110,000 | | | | 105,600 | | | |
| Lucent Technologies, 6.45%, 03/15/29 | | | 85,000 | | | | 72,994 | | | |
| Nortel Networks Ltd., 6.13%, 02/15/06 | | | 125,000 | | | | 127,813 | | | |
| Sanmina Corp., 10.38%, 01/15/10 | | | 170,000 | | | | 199,324 | | | |
| UGS Corp., 10.00%, 06/01/12 (c) | | | 110,000 | | | | 123,200 | | | |
| Xerox Corp., 7.63%, 06/15/13 | | | 125,000 | | | | 137,500 | | | |
| | | | | |
| | | |
| |
| | | | | | | | 854,369 | | | |
| | | | | |
| | | |
| |
|
| Telecommunications Services (7.0%) |
| Alamosa Delaware, Inc., 12.00%, 07/31/09 | | | 85,000 | | | | 90,525 | | | |
Centennial Communications Corp.,
8.13%, 02/01/14 (c) | | | 125,000 | | | | 126,250 | | | |
| Insight Midwest, 10.50%, 11/01/10 | | | 125,000 | | | | 138,438 | | | |
| Level 3 Financing, Inc., 10.75%, 10/15/11 (c) | | | 105,000 | | | | 90,300 | | | |
| MCI, Inc., 5.91%, 05/01/07 | | | 9,000 | | | | 8,978 | | | |
| MCI, Inc., 6.69%, 05/01/09 | | | 9,000 | | | | 8,876 | | | |
| MCI, Inc., 7.74%, 05/01/14 | | | 11,000 | | | | 10,601 | | | |
| Nextel Communications, 8.13%, 07/01/11 | | | 40,000 | | | | 43,800 | | | |
| Nextel Communications, 5.95%, 03/15/14 | | | 170,000 | | | | 173,825 | | | |
| Nextel Partners, Inc., 12.50%, 11/15/09 | | | 113,000 | | | | 129,244 | | | |
Qwest Communications International,
7.25%, 02/15/11 (c) | | | 250,000 | | | | 248,124 | | | |
| Qwest Corp., 9.13%, 03/15/12 (c) | | | 255,000 | | | | 287,512 | | | |
| Rural Cellular Corp., Series B, 9.63%, 05/15/08 | | | 260,000 | | | | 244,400 | | | |
| SBA Telecommunications, 9.75%, 12/15/11 | | | 170,000 | | | | 143,225 | | | |
| | | | | |
| | | |
| |
| | | | | | | | 1,744,098 | | | |
| | | | | |
| | | |
| |
|
| Transportation Services (1.4%) |
| CHC Helicopter Corp., 7.38%, 05/01/14 | | | 105,000 | | | | 111,825 | | | |
| Horizon Lines LLC, 9.00%, 11/01/12 (c) | | | 80,000 | | | | 86,500 | | | |
| Quality Distribution, 9.00%, 11/15/10 (c) | | | 55,000 | | | | 51,219 | | | |
| Sea Containers Ltd., 10.50%, 05/15/12 | | | 80,000 | | | | 82,500 | | | |
| | | | | |
| | | |
| |
| | | | | | | | 332,044 | | | |
| | | | | |
| | | |
| |
|
| Utilities (7.6%) |
| AES Corp., 8.75%, 05/15/13 (c) | | | 235,000 | | | | 271,424 | | | |
| Allegheny Energy Supply, 8.25%, 04/15/12 (c) | | | 85,000 | | | | 95,838 | | | |
| Aquila, Inc., 7.63%, 11/15/09 | | | 105,000 | | | | 109,200 | | | |
Calpine Canada Energy Financing,
8.50%, 05/01/08 | | | 170,000 | | | | 104,550 | | | |
| Calpine Corp., 8.50%, 07/15/10 (c) | | | 175,000 | | | | 128,625 | | | |
| CMS Energy Corp., 9.88%, 10/15/07 | | | 170,000 | | | | 190,825 | | | |
| Dynegy Holdings, Inc., 8.75%, 02/15/12 | | | 170,000 | | | | 179,350 | | | |
| Dynegy Holdings, Inc., 9.88%, 07/15/10 (c) | | | 105,000 | | | | 119,306 | | | |
| Edison Mission Energy, 7.73%, 06/15/09 | | | 70,000 | | | | 74,550 | | | |
| Edison Mission Energy, 9.88%, 04/15/11 | | | 255,000 | | | | 301,537 | | | |
| Mission Energy Holding, 13.50%, 07/15/08 | | | 85,000 | | | | 107,738 | | | |
2004 Annual Report 107
| |
| | Statement of Investments (Continued) |
| | October 31, 2004 |
Gartmore High Yield Bond Fund (Continued)
Concept Series
| | | | | | | | | | | |
|
| Corporate Bonds (continued) |
|
| | Shares or | | | |
| | Principal Amount | | | Value | | | |
|
| Utilities (continued) |
| NRG Energy, Inc., 8.00%, 12/15/13 (c) | | $ | 105,000 | | | $ | 115,631 | | | |
| Reliant Resources, Inc., 9.25%, 07/15/10 | | | 50,000 | | | | 55,500 | | | |
| TNP Enterprises, Inc., 10.25%, 04/01/10 | | | 15,000 | | | | 16,125 | | | |
| | | | | |
| | | |
| |
| | | | | | | | 1,870,199 | | | |
| | | | | |
| | | |
| |
|
| Waste Management (0.4%) |
| Allied Waste North America, 7.38%, 04/15/14 | | | 105,000 | | | | 97,125 | | | |
| | | | | |
| | | |
| |
| Total Corporate Bonds | | | 21,544,173 | | | |
| | | | | |
| | | |
| |
Repurchase Agreements (9.3%) |
Nomura Securities, 1.75% dated 10/29/04, due 11/01/04, repurchase price $1,320,720
(Fully collateralized by U.S. Agency Securities and AA Rated Corporate Bonds) | | | 1,320,528 | | | | 1,320,528 | | | |
CS First Boston, 1.75% dated 10/29/04, due 11/01/04, repurchase price $945,234
(Fully collateralized by U.S. Treasury Notes and U.S. Agency Securities) | | | 945,096 | | | | 945,096 | | | |
| | | | | |
| | | |
| |
| Total Repurchase Agreements | | | 2,265,624 | | | |
| | | | | |
| | | |
| |
Preferred Stocks (1.2%) |
| Broadcasting (0.4%) |
| Spanish Broadcasting Systems, Inc., 10.75%, 10/15/13 | | | 91 | | | | 99,702 | | | |
| | | | | |
| | | |
| |
|
| Communication/ISP (0.0%) |
| Rhythms Netconnections, Inc., 6.75%, 03/03/12 (c) (d) (e) (f) | | | 1,691 | | | | 0 | | | |
| | | | | |
| | | |
| |
|
| Media (0.6%) |
| Paxson Communications, 13.25%, 11/15/06 | | | 18 | | | | 137,750 | | | |
| | | | | |
| | | |
| |
|
| Real Estate Investment Trusts (0.2%) |
| Istar Financial, Inc., 7.80%, 09/29/08 | | | 2,215 | | | | 57,369 | | | |
| | | | | |
| | | |
| |
| Total Preferred Stocks | | | 294,821 | | | |
| | | | | |
| | | |
| |
Yankee Dollar (0.8%) |
| Containers (0.8%) |
| Crown Euro Holdings SA, 10.88%, 03/01/13 | | | 170,000 | | | | 201,875 | | | |
| | | | | |
| | | |
| |
| Total Yankee Dollar | | | 201,875 | | | |
| | | | | |
| | | |
| |
Yankee Dollar (0.7%) |
| | | | | | | | | | | |
|
| Yankee Bonds (0.7%) |
|
| | Shares or | | | |
| | Principal Amount | | | Value | | | |
|
| Paper & Forest Products (0.7%) |
| Abitibi Consolidated, Inc., 7.75%, 06/15/11 | | | 75,000 | | | | 79,500 | | | |
| Abitibi Consolidated, Inc., 6.00%, 06/20/13 | | | 85,000 | | | | 81,388 | | | |
| | | | | |
| | | |
| |
| Total Yankee Bonds | | | 160,888 | | | |
| | | | | |
| | | |
| |
Common Stocks (0.1%) |
| Telecommunication Services (0.1%) |
| MCI, Inc. | | | 1,303 | | | | 22,477 | | | |
| | | | | |
| | | |
| |
| Total Common Stocks | | | 22,477 | | | |
| | | | | |
| | | |
| |
Warrants (0.0%) |
| Communication/Fixed (0.0%) |
| Maxcom Telecommunications SA, 04/01/07 (b) (c) (d) (e) (f) | | | 46 | | | | 0 | | | |
| | | | | |
| | | |
| |
| Communication/ISP (0.0%) | | | | | | |
| Metricom, Inc., 02/15/10 (b) (d) (e) (f) | | | 676 | | | | 0 | | | |
| | | | | |
| | | |
| |
| Total Warrants | | | 0 | | | |
| | | | | |
| | | |
| |
| Total Investments (Cost $23,310,483) (a) — 100.2% | | | 24,489,858 | | | |
| Liabilities in excess of other assets — (0.2)% | | | (51,868) | | | |
| | | | | |
| | | |
| |
| NET ASSETS — 100.0% | | $ | 24,437,990 | | | |
| | | | | |
| | | |
| | |
| (a) | | See notes to financial statements for tax unrealized appreciation (depreciation) of securities. |
| |
| (b) | | Security in default. |
| |
| (c) | | Represents a restricted security acquired and eligible for resale under rule 144A, which limits the resale to certain qualified buyers. These securities were deemed liquid pursuant to procedures approved by the Board of Trustees. |
| |
| (d) | | Fair Valued Security. |
| |
| (e) | | Denotes a non-income producing security. |
| |
| (f) | | Security has been deemed illiquid. The pricing committee has deemed the security to have zero value based upon procedures adopted by the Board of Trustees. |
See notes to financial statements.
108 Annual Report 2004
Concept Series
| |
| | Gartmore Value Opportunities Fund |
For the annual period ended Oct. 31, 2004, the Gartmore Value Opportunities Fund returned 10.72% (Class A at NAV) versus 11.73% for its benchmark, the Russell 2000® Index. For broader comparison, the average return for this Fund’s Lipper peer category of Small-Cap Core Funds was 12.93%.
Historically, we have sought to add value to the Fund through stock selection. For the annual period, stock selection was strong in the technology and producer durables sectors. Two technology names held by the Fund, Harris Corp. and Parametric Technology Corp., were particularly strong performers. Harris made an acquisition in the third quarter of 2004 that strengthened the company’s leading market position in the broadcast segment. Harris had an average weight in the portfolio of 0.70% for the period, and Parametric Technology had an average weight of 0.51%. Conversely, stock selection by the Fund was weaker in the health-care and consumer discretionary sectors. Consumer discretionary name Integrated Alarm Services Group, Inc. had a tough year as the company faced a challenging acquisition environment in the security alarm industry, yet the company still remains well positioned in many important geographic regions. Integrated Alarm Services Group had an average weighting of 0.60% during the period.
The market environment during the reporting period was challenging for “core value” investors, or those seeking to invest in the securities of companies that we deem to be undervalued. Only one other period stands out as similar—near the end of 1999 when the financial press unanimously heralded the death of “value” investing. During that time, we managed to outperform the value benchmark, given our portfolio’s bias to companies with improving earnings. We quickly passed through the speculation of the “tech bubble”—which burst in 2000, however, and headed to the other extreme, a deep value market that, for the past several years, has generally rewarded cheap stocks with little or no fundamental progress.
Except for brief, unsustainable rallies in the highly speculative areas of the market, “value” investing has made a dramatic comeback from its near death. Yet the move we have seen to deep or distressed value has been an even rarer occurrence. In such an environment, at times the Fund has struggled to outperform the benchmark. We believe that the move to “deep” value investing is coming to an end, as evidence suggests that investors are again paying attention to fundamental progress and not solely valuation. It is in this environment where we would expect greater rewards for our style and our disciplined approach to investing.
The Fund’s objective remains the same: to buy, at attractive valuations, well-positioned companies in which we see tangible evidence of fundamental improvement. The Fund’s portfolio continues to be characterized by stocks with favorable cash flow, earnings improvement and broad sector diversification. It seems just a matter of time before investors return to a more fundamentally focused investment discipline. As the next year unfolds, we expect that investors will pay closer attention to the fundamentals that we think are important for long-term investing success and that our discipline and style will yield favorable results.
Portfolio Managers:
Jeffery Petherick, CFA and Mary Champagne, CFA
| |
| | Class A: GVOAX |
| | Class B: GVOBX |
| | Class C: GVOCX |
| | Class R: GVORX |
| | Institutional Service Class: GVOIX |
| | Institutional Class: GVAIX |
2004 Annual Report 109
Concept Series
Gartmore Value Opportunities Fund
Average Annual Total Return
(For periods ended October 31, 2004)
| | | | | | | | | | | |
| | | | One year | | | Inception1 | |
|
| |
| Class A | | without sales charge2 | | | 10.72% | | | | 10.95% | |
| | | with sales charge3 | | | 4.37% | | | | 9.60% | |
|
| Class B | | without sales charge2 | | | 10.04% | | | | 10.25% | |
| | | with sales charge4 | | | 5.04% | | | | 9.96% | |
|
Class C5 | | without sales charge2 | | | 10.06% | | | | 10.25% | |
| | | with sales charge6 | | | 9.06% | | | | 10.25% | |
|
Class R 7,9 | | | | | 10.39% | | | | 10.32% | |
|
| Institutional Class8,9 | | | 11.05% | | | | 11.23% | |
|
| Institutional Service Class9 | | | 10.91% | | | | 11.20% | |
|
All figures showing the effect of a sales charge reflect the maximum charge possible, because it has the most dramatic effect on performance data.
| |
| 1 | Fund commenced operations on December 29, 1999. |
| |
| 2 | These returns do not reflect the effects of sales charges (SC). |
| |
| 3 | A 5.75% front-end sales charge was deducted. |
| |
| 4 | A 5.00% contingent deferred sales charge (CDSC) was deducted. The CDSC declines to 0% after 6 years. |
| |
| 5 | These returns until the creation of Class C shares (3/1/01) include the performance of the Fund’s Class B shares. Excluding the effects of any fee waivers or reimbursements, such prior performance is substantially similar to what Class C shares would have produced because Class C shares invest in the same portfolio of securities as Class B shares and have the same expenses after any fee waivers or reimbursements. For Class C shares returns with sales charges, these returns have been restated for the applicable sales charges. |
| |
| 6 | A CDSC of 1.00% was deducted because it is charged when you sell Class C shares within the first year after purchase. |
| |
| 7 | These returns until the creation of Class R shares (12/31/03) include the performance of the Fund’s Class B shares. The returns have been adjusted for the fact that Class R shares do not have any applicable sales charges but have not been adjusted for the lower expenses applicable to Class R shares. Excluding the effect of any fee waivers or reimbursements, such prior performance is similar to what Class R shares would have produced because the Class R shares invest in the same portfolio of securities as Class B shares. |
| |
| 8 | These returns until the creation of Institutional Class shares (6/29/04) include the performance of the Fund’s Institutional Service shares. The returns have not been adjusted for the lower expenses applicable to Institutional Class shares. Excluding the effect of any fee waivers or reimbursements, such prior performance is similar to what Institutional Class shares would have produced because the Institutional Class shares invest in the same portfolio of securities as Institutional Service shares. |
| |
| 9 | Not subject to any sales charges. |
Performance of a $10,000 Investment
Investment return and principal value will fluctuate, and when redeemed, shares may be worth more or less than original cost. Past performance is no guarantee of future results and does not reflect the deduction of taxes that a shareholder would pay on fund distributions or the redemption of fund shares. Investing in mutual funds involves market risk, including loss of principal. Performance returns assume the reinvestment of all distributions.
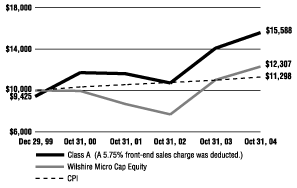
Comparative performance of $10,000 invested in Class A shares of the Gartmore Value Opportunities Fund, Russell 2000 Index (Russell 2000)(a), and the Consumer Price Index (CPI)(b) since inception. Unlike the Fund, the returns for these unmanaged indexes do not reflect any fees, expenses, or sales charges. Investors cannot invest directly in market indexes.
| | |
| (a) | | The Russell 2000 is an unmanaged index of securities of small capitalization U.S. companies. |
| |
| (b) | | The CPI represents changes in prices of a basket of goods and services purchased for consumption by urban households. |
110 Annual Report 2004
Gartmore Value Opportunities Fund
Shareholder
Expense Example
As a shareholder of the Funds, you incur two types of costs: (1) transaction costs, including sales charges (loads) paid on purchase payments and redemption fees; and (2) ongoing costs, including investment advisory fees, administration fees, distribution fees and other Fund expenses. The examples below are intended to help you understand your ongoing costs (in dollars) of investing in the Funds and to compare these costs with the ongoing costs of investing in other mutual funds. The examples assume that you had a $1,000 investment in the Class at the beginning of the reporting period, May 1, 2004, and continued to hold your shares at the end of the reporting period, October 31, 2004. Per SEC requirements, the examples are based on an investment of $1,000 invested at the beginning of the period and held for the entire six-month period ended October 31, 2004.
Actual Expenses
For each Class of the Fund in the table below, the first line provides information about actual account values and actual expenses. You may use the information in this line, together with the amount you invested, to estimate the expenses that you paid over the period. Simply divide your account value by $1,000 (for example, an $8,600 account value divided by $1,000 = 8.6), then multiply the result by the number in the first line of each Class under the heading entitled “Expenses Paid During Period” to estimate the expenses you paid on your account during the period.
Hypothetical Example for Comparison Purposes
The second line of each Class in the table below provides information about hypothetical account values and hypothetical expenses based on the Class’ actual expense ratio and an assumed rate of return of 5% per year before expenses, which is not the Class’ actual return. The hypothetical account values and expenses may not be used to estimate the actual ending account balance or expenses you paid for the period. You may use this information to compare the ongoing costs of investing in the Class of the Fund and other funds. To do so, compare this 5% hypothetical example with the 5% hypothetical examples that appear in the shareholder reports of the other funds.
Please note that the expenses shown in the table are meant to highlight your ongoing costs only and do not reflect any transaction costs, such as sales charges (loads) or redemption fees. Therefore, the second line for each Class in the table is useful in comparing ongoing costs only, and will not help you determine the relative total costs of owning different funds. In addition, if these transaction costs were included, your costs would have been higher. The examples also assume all dividends and distributions have been reinvested.
Schedule of Shareholder Expenses
Expense Analysis of a $1,000 Investment
(October 31, 2004)
| | | | | | | | | | | | | | | | | | | | | | | |
| | | | Beginning | | | Ending | | | | | | | |
| | | | Account Value | | | Account Value | | | Expenses Paid | | | Annualized | | | |
| Value Opportunities Fund | | | | 5/1/04 | | | 10/31/04 | | | During Period* | | | Expense Ratio | | | |
|
|
| Class A | | | Actual | | | $ | 1,000 | | | $ | 1,021 | | | $ | 7.11 | | | | 1.40% | | | |
| | | | Hypothetical | 1 | | $ | 1,000 | | | $ | 1,018 | | | $ | 7.13 | | | | 1.40% | | | |
|
| Class B | | | Actual | | | $ | 1,000 | | | $ | 1,017 | | | $ | 10.34 | | | | 2.04% | | | |
| | | | Hypothetical | 1 | | $ | 1,000 | | | $ | 1,015 | | | $ | 10.38 | | | | 2.04% | | | |
|
| Class C | | | Actual | | | $ | 1,000 | | | $ | 1,018 | | | $ | 10.35 | | | | 2.04% | | | |
| | | | Hypothetical | 1 | | $ | 1,000 | | | $ | 1,015 | | | $ | 10.38 | | | | 2.04% | | | |
|
| Class R | | | Actual | | | $ | 1,000 | | | $ | 1,019 | | | $ | 8.17 | | | | 1.61% | | | |
| | | | Hypothetical | 1 | | $ | 1,000 | | | $ | 1,017 | | | $ | 8.20 | | | | 1.61% | | | |
|
| Institutional Service Class | | | Actual | | | $ | 1,000 | | | $ | 1,021 | | | $ | 6.25 | | | | 1.23% | | | |
| | | | Hypothetical | 1 | | $ | 1,000 | | | $ | 1,019 | | | $ | 6.26 | | | | 1.23% | | | |
|
| Institutional Class (a) | | | Actual | | | $ | 1,000 | | | $ | 998 | | | $ | 3.69 | (b) | | | 1.09% | | | |
| | | | Hypothetical | 1 | | $ | 1,000 | | | $ | 1,011 | | | $ | 3.72 | (b) | | | 1.09% | | | |
|
| | |
| (a) | | For the period from June 29, 2004 (commencement of operations) through October 31, 2004. |
| |
| (b) | | Expense are equal to the Fund’s annualized expense ratio multiplied by the average account value over the period multiplied by 124/366 (to reflect the period). |
| |
| * | Expenses are equal to the Fund’s annualized expense ratio multiplied by the average account value over the period multiplied by 184/366 (to reflect the one-half year period). |
1 Represents the hypothetical 5% annual return before expenses.
2004 Annual Report 111
Gartmore Value Opportunities Fund
Concept Series
| |
| | Portfolio Summary |
| | (October 31, 2004) |
The SEC adopted a requirement that Funds present their portfolio holdings in a table, chart or graph format in their annual and semiannual reports to shareholders, whether or not a schedule of investments is utilized. The following tables, which present portfolio holdings as a percentage of net assets, are provided in compliance with this requirement.
| | | | | | | |
| Asset Allocation | | | | |
|
|
| Common Stocks | | | 98.1% | | | |
| Repurchase Agreements | | | 0.6% | | | |
| Other Investments* | | | 18.4% | | | |
| Other Liabilities in excess of Assets** | | | -17.1% | | | |
| | |
| | | |
| | | | 100.0% | | | |
| |
| * | Includes value of collateral received from securities lending. |
| |
| ** | Includes value of collateral owed from securities lending. |
| | | | | | | |
| Top Industries | | | | |
|
|
| Real Estate Investment Trusts (REIT) | | | 9.6% | | | |
| Banks: Outside New York City | | | 7.1% | | | |
| Utilities: Electrical | | | 3.9% | | | |
| Savings & Loan | | | 3.8% | | | |
| Retail | | | 3.4% | | | |
| Services: Commercial | | | 3.2% | | | |
| Production Technology Equipment | | | 2.9% | | | |
| Metal Fabricating | | | 2.7% | | | |
| Insurance: Multi-Line | | | 2.7% | | | |
| Communications Technology | | | 2.6% | | | |
| Other Industries | | | 58.1% | | | |
| | |
| | | |
| | | | 100.0% | | | |
| | | | | | | |
| Top Holdings | | | | |
|
|
| Colonial Bancgroup, Inc. (The) | | | 1.3% | | | |
| NCO Group, Inc. | | | 1.3% | | | |
| Questar Corp. | | | 1.3% | | | |
| Nationwide Health Properties, Inc. | | | 1.3% | | | |
| Affiliated Managers Group, Inc. | | | 1.2% | | | |
| Cullen/ Frost Bankers, Inc. | | | 1.2% | | | |
| Wisconsin Energy Corp. | | | 1.2% | | | |
| Westar Energy, Inc. | | | 1.2% | | | |
| Oshkosh Truck Corp. | | | 1.2% | | | |
| Bank Atlantic Bancorp, Inc., Class A | | | 1.2% | | | |
| Other Holdings | | | 87.6% | | | |
| | |
| | | |
| | | | 100.0% | | | |
112 Annual Report 2004
Statement of Investments
October 31, 2004
Gartmore Value Opportunities Fund
| | | | | | | | | | | |
|
| Common Stocks (98.1%) |
|
| | Shares or | | | |
| | Principal Amount | | | Value | | | |
|
| Aerospace (1.6%) |
| Alliant Techsystems, Inc. (b) | | | 2,200 | | | $ | 126,478 | | | |
| Orbital Sciences Corp. (b) | | | 20,500 | | | | 212,175 | | | |
| Teledyne Technologies, Inc. (b) | | | 6,600 | | | | 168,762 | | | |
| | | | | |
| | | |
| |
| | | | | | | | 507,415 | | | |
| | | | | |
| | | |
| |
|
| Air Transport (1.1%) |
| Offshore Logistics, Inc. (b) | | | 9,300 | | | | 336,288 | | | |
| | | | | |
| | | |
| |
|
| Auto Parts-After Market (0.1%) |
| TBC Corp. (b) | | | 1,400 | | | | 31,122 | | | |
| | | | | |
| | | |
| |
|
| Auto Parts: Original Equipment (0.7%) |
| Autoliv, Inc. | | | 5,100 | | | | 218,025 | | | |
| | | | | |
| | | |
| |
|
| Auto Trucks & Parts (1.2%) |
| Oshkosh Truck Corp. | | | 6,310 | | | | 371,659 | | | |
| | | | | |
| | | |
| |
|
| Banks: Outside New York City (7.1%) |
| AmericanWest Bancorp. (b) | | | 1,500 | | | | 29,775 | | | |
| Banner Corp. | | | 1,600 | | | | 47,840 | | | |
| BOK Financial Corp. (b) | | | 3,532 | | | | 160,741 | | | |
| Colonial Bancgroup, Inc. (The) | | | 19,800 | | | | 428,670 | | | |
| Cullen/ Frost Bankers, Inc. | | | 8,100 | | | | 396,900 | | | |
| First State Bancorp. | | | 2,000 | | | | 70,600 | | | |
| FirstMerit Corp. | | | 13,600 | | | | 355,368 | | | |
| Franklin Bank Corp. (b) | | | 14,000 | | | | 231,000 | | | |
| MBT Financial Corp. | | | 2,100 | | | | 42,399 | | | |
| Mercantile Bank Corp. | | | 1,385 | | | | 52,104 | | | |
| Nara Bankcorp., Inc. | | | 4,000 | | | | 76,440 | | | |
| Piper Jaffray Co. (b) | | | 5,600 | | | | 244,888 | | | |
| Southwest Bancorp., Inc. | | | 4,000 | | | | 93,920 | | | |
| | | | | |
| | | |
| |
| | | | | | | | 2,230,645 | | | |
| | | | | |
| | | |
| |
|
| Biotechnology Research & Production (0.5%) |
| Protein Design Labs, Inc. (b) | | | 8,600 | | | | 164,690 | | | |
| | | | | |
| | | |
| |
|
| Building: Heating & Plumbing (0.5%) |
| Jacuzzi Brands, Inc. (b) | | | 20,200 | | | | 174,730 | | | |
| | | | | |
| | | |
| |
|
| Building: Roofing & Wallboard (0.8%) |
| ElkCorp | | | 9,000 | | | | 253,350 | | | |
| | | | | |
| | | |
| |
|
| Chemicals (2.3%) |
| Airgas, Inc. | | | 10,100 | | | | 248,460 | | | |
| Georgia Gulf Corp. | | | 4,100 | | | | 185,607 | | | |
| Millennium Chemicals, Inc. (b) | | | 10,000 | | | | 214,800 | | | |
| Octel Corp. | | | 1,700 | | | | 32,810 | | | |
| OM Group, Inc. (b) | | | 2,100 | | | | 69,279 | | | |
| | | | | |
| | | |
| |
| | | | | | | | 750,956 | | | |
| | | | | |
| | | |
| |
|
| Coal (0.7%) |
| Peabody Energy Corp. | | | 3,400 | | | | 216,852 | | | |
| | | | | |
| | | |
| |
|
| Commercial Information Services (0.1%) |
| SOURCECORP, Inc. (b) | | | 1,800 | | | | 30,204 | | | |
| | | | | |
| | | |
| |
|
| Communications Technology (2.6%) |
| CommScope, Inc. (b) | | | 10,260 | | | | 184,783 | | | |
| Harris Corp. | | | 3,900 | | | | 239,967 | | | |
| Inter-Tel, Inc. | | | 7,587 | | | | 204,849 | | | |
| Standard Microsystems Corp. (b) | | | 9,700 | | | | 213,594 | | | |
| | | | | |
| | | |
| |
| | | | | | | | 843,193 | | | |
| | | | | |
| | | |
| |
|
| Computer Services, Software & Systems (2.5%) |
| BEA Systems, Inc. (b) | | | 18,900 | | | | 153,468 | | | |
| Digital River, Inc. (b) | | | 5,100 | | | | 169,830 | | | |
| Macromedia, Inc. (b) | | | 10,000 | | | | 271,400 | | | |
| Parametric Technology Corp. (b) | | | 26,200 | | | | 135,978 | | | |
| SS&C Technologies, Inc. | | | 2,650 | | | | 62,646 | | | |
| | | | | |
| | | |
| |
| | | | | | | | 793,322 | | | |
| | | | | |
| | | |
| |
|
| Computer Technology (1.6%) |
| Intergraph Corp. (b) | | | 4,700 | | | | 117,195 | | | |
| Komag, Inc. (b) | | | 17,800 | | | | 302,155 | | | |
| RadiSys Corp. (b) | | | 2,300 | | | | 30,544 | | | |
| Western Digital Corp. (b) | | | 8,800 | | | | 73,304 | | | |
| | | | | |
| | | |
| |
| | | | | | | | 523,198 | | | |
| | | | | |
| | | |
| |
|
| Consumer Electronics (0.5%) |
| CNET Networks, Inc. (b) | | | 21,400 | | | | 174,838 | | | |
| | | | | |
| | | |
| |
|
| Cosmetics (1.0%) |
| Elizabeth Arden, Inc. (b) | | | 13,900 | | | | 333,322 | | | |
| | | | | |
| | | |
| |
|
| Diversified Materials & Processing (0.8%) |
| Olin Corp. | | | 14,000 | | | | 261,800 | | | |
| | | | | |
| | | |
| |
|
| Diversified Production (1.3%) |
| Pentair, Inc. | | | 4,500 | | | | 168,210 | | | |
| Thomas & Betts Corp. | | | 8,800 | | | | 249,392 | | | |
| | | | | |
| | | |
| |
| | | | | | | | 417,602 | | | |
| | | | | |
| | | |
| |
|
| Drugs & Pharmaceuticals (1.5%) |
| Endo Pharmaceuticals Holdings, Inc. (b) | | | 9,500 | | | | 207,100 | | | |
| K-V Pharmaceutical Co. (b) | | | 11,700 | | | | 233,064 | | | |
| Sciclone Pharmaceuticals, Inc. (b) | | | 5,000 | | | | 22,750 | | | |
| Supergen, Inc. (b) | | | 2,900 | | | | 17,690 | | | |
| | | | | |
| | | |
| |
| | | | | | | | 480,604 | | | |
| | | | | |
| | | |
| |
|
| Electrical & Electronic (0.6%) |
| Benchmark Electronics, Inc. (b) | | | 6,000 | | | | 203,820 | | | |
| | | | | |
| | | |
2004 Annual Report 113
| |
| | Statement of Investments (Continued) |
| | October 31, 2004 |
Gartmore Value Opportunities Fund (Continued)
Concept Series
| | | | | | | | | | | |
|
| Common Stocks (continued) |
|
| | Shares or | | | |
| | Principal Amount | | | Value | | | |
|
| Electronics (1.1%) |
| Amphenol Corp., Class A (b) | | | 3,600 | | | $ | 123,588 | | | |
| Avid Technology, Inc. (b) | | | 4,500 | | | | 238,410 | | | |
| | | | | |
| | | |
| |
| | | | | | | | 361,998 | | | |
| | | | | |
| | | |
| |
|
| Electronics: Medical Systems (0.1%) |
| Luminex Corp. (b) | | | 2,800 | | | | 21,840 | | | |
| | | | | |
| | | |
| |
|
| Electronics: Semi-Conductors & Components (0.7%) |
| Atmel Corp. (b) | | | 64,102 | | | | 203,844 | | | |
| SIPEX Corp. (b) | | | 5,600 | | | | 32,088 | | | |
| | | | | |
| | | |
| |
| | | | | | | | 235,932 | | | |
| | | | | |
| | | |
| |
|
| Electronics: Technology (1.1%) |
| Gerber Scientific, Inc. (b) | | | 6,900 | | | | 53,958 | | | |
| PerkinElmer, Inc. | | | 15,200 | | | | 312,208 | | | |
| | | | | |
| | | |
| |
| | | | | | | | 366,166 | | | |
| | | | | |
| | | |
| |
|
| Energy Equipment (0.1%) |
| Global Power Equipment Group, Inc. (b) | | | 2,700 | | | | 21,762 | | | |
| | | | | |
| | | |
| |
|
| Fertilizers (0.7%) |
| Mosaic Co. (The) (b) | | | 14,400 | | | | 216,576 | | | |
| | | | | |
| | | |
| |
|
| Finance Companies (0.7%) |
| Saxon Capital, Inc. (b) | | | 11,700 | | | | 224,640 | | | |
| | | | | |
| | | |
| |
|
| Finance-Small Loan (0.7%) |
| Collegiate Funding Services, Inc. (b) | | | 19,070 | | | | 235,515 | | | |
| | | | | |
| | | |
| |
|
| Financial Data Processing Services & Systems (0.9%) |
| CCC Information Services Group, Inc. (b) | | | 8,600 | | | | 157,552 | | | |
| Hypercom Corp. (b) | | | 18,600 | | | | 120,528 | | | |
| | | | | |
| | | |
| |
| | | | | | | | 278,080 | | | |
| | | | | |
| | | |
| |
|
| Financial Miscellaneous (0.7%) |
| Triad Guaranty, Inc. (b) | | | 4,022 | | | | 219,239 | | | |
| | | | | |
| | | |
| |
|
| Foods (0.9%) |
| Del Monte Foods Co. (b) | | | 15,100 | | | | 161,268 | | | |
| Ralcorp Holding, Inc. | | | 3,600 | | | | 132,300 | | | |
| | | | | |
| | | |
| |
| | | | | | | | 293,568 | | | |
| | | | | |
| | | |
| |
|
| Forest Products (0.5%) |
| Universal Forest Products, Inc. | | | 4,500 | | | | 165,038 | | | |
| | | | | |
| | | |
| |
|
| Health Care Management Services (1.3%) |
| Community Health Systems, Inc. (b) | | | 4,900 | | | | 131,418 | | | |
| Per-Se Technologies, Inc. (b) | | | 20,400 | | | | 297,636 | | | |
| | | | | |
| | | |
| |
| | | | | | | | 429,054 | | | |
| | | | | |
| | | |
| |
|
| Homebuilding (0.5%) |
| Standard Pacific Corp | | | 2,800 | | | | 157,220 | | | |
| | | | | |
| | | |
| |
|
| Household Furnishings (0.6%) |
| American Woodmark Corp | | | 1,600 | | | | 59,488 | | | |
| Tempur-Pedic International, Inc. (b) | | | 8,000 | | | | 129,920 | | | |
| | | | | |
| | | |
| |
| | | | | | | | 189,408 | | | |
| | | | | |
| | | |
| |
|
| Identification Control & Filter Devices (0.6%) |
| Artesyn Technologies, Inc. (b) | | | 7,100 | | | | 68,870 | | | |
| Hubbell, Inc. | | | 2,900 | | | | 132,588 | | | |
| | | | | |
| | | |
| |
| | | | | | | | 201,458 | | | |
| | | | | |
| | | |
| |
|
| Insurance: Multi-Line (2.7%) |
| Allmerica Financial Corp. (b) | | | 1,400 | | | | 42,140 | | | |
| Assurant, Inc. | | | 7,860 | | | | 212,063 | | | |
| Reinsurance Group of America, Inc. | | | 8,100 | | | | 348,948 | | | |
| Wellchoice, Inc. (b) | | | 6,400 | | | | 267,264 | | | |
| | | | | |
| | | |
| |
| | | | | | | | 870,415 | | | |
| | | | | |
| | | |
| |
|
| Insurance: Property & Casualty (2.3%) |
| Aspen Insurance Holdings Ltd. | | | 11,557 | | | | 265,811 | | | |
| ProAssurance Corp. (b) | | | 8,200 | | | | 292,658 | | | |
| Tower Group, Inc. (b) | | | 20,000 | | | | 178,200 | | | |
| | | | | |
| | | |
| |
| | | | | | | | 736,669 | | | |
| | | | | |
| | | |
| |
|
| Investment Management Companies (2.0%) |
| Affiliated Managers Group, Inc. (b) | | | 7,150 | | | | 399,256 | | | |
| National Financial Partners Corp. | | | 7,400 | | | | 227,476 | | | |
| | | | | |
| | | |
| |
| | | | | | | | 626,732 | | | |
| | | | | |
| | | |
| |
|
| Leisure Time (0.9%) |
| K2, Inc. (b) | | | 15,000 | | | | 243,300 | | | |
| West Marine, Inc. (b) | | | 2,200 | | | | 53,966 | | | |
| | | | | |
| | | |
| |
| | | | | | | | 297,266 | | | |
| | | | | |
| | | |
| |
|
| Machinery: Agricultural (0.5%) |
| AGCO Corp. (b) | | | 8,100 | | | | 157,302 | | | |
| | | | | |
| | | |
| |
|
| Machinery: Industrial/ Specialty (0.3%) |
| Joy Global, Inc. | | | 2,600 | | | | 87,854 | | | |
| | | | | |
| | | |
| |
|
| Machinery: Oil Well Equipment & Services (1.9%) |
| Key Energy Services, Inc. (b) | | | 22,000 | | | | 253,000 | | | |
| Lufkin Industries, Inc. | | | 1,000 | | | | 35,410 | | | |
| National-OilWell, Inc. (b) | | | 9,800 | | | | 330,358 | | | |
| | | | | |
| | | |
| |
| | | | | | | | 618,768 | | | |
| | | | | |
| | | |
| |
|
| Machinery: Specialty (0.1%) |
| Cascade Corp | | | 1,400 | | | | 41,580 | | | |
| | | | | |
| | | |
114 Annual Report 2004
| | | | | | | | | | | |
|
| Common Stocks (continued) |
|
| | Shares or | | | |
| | Principal Amount | | | Value | | | |
|
| Medical and Dental Instruments & Supplies (0.6%) |
| Bio-Rad Laboratories, Inc., Class A (b) | | | 3,400 | | | $ | 176,868 | | | |
| | | | | |
| | | |
| |
|
| Metal Fabricating (2.7%) |
| Commercial Metals Co | | | 5,800 | | | | 209,670 | | | |
| Kaydon Corp. | | | 7,600 | | | | 224,960 | | | |
| Maverick Tube Corp. (b) | | | 7,100 | | | | 187,227 | | | |
| RTI International Metals, Inc. (b) | | | 2,800 | | | | 56,084 | | | |
| Timken Co. | | | 8,200 | | | | 196,800 | | | |
| | | | | |
| | | |
| |
| | | | | | | | 874,741 | | | |
| | | | | |
| | | |
| |
|
| Multi-Sector Companies (1.5%) |
| Carlisle Cos., Inc | | | 5,700 | | | | 331,341 | | | |
| Teleflex, Inc. | | | 3,700 | | | | 162,023 | | | |
| | | | | |
| | | |
| |
| | | | | | | | 493,364 | | | |
| | | | | |
| | | |
| |
|
| Oil: Crude Producers (2.1%) |
| Newfield Exploration Co. (b) | | | 5,000 | | | | 291,000 | | | |
| Swift Energy Co. (b) | | | 2,200 | | | | 53,350 | | | |
| The Meridian Resource Corp. (b) | | | 39,500 | | | | 317,975 | | | |
| | | | | |
| | | |
| |
| | | | | | | | 662,325 | | | |
| | | | | |
| | | |
| |
|
| Oil: Integrated Domestic (1.0%) |
| KCS Energy, Inc. (b) | | | 22,500 | | | | 306,225 | | | |
| | | | | |
| | | |
| |
|
| Paper (0.9%) |
| Chesapeake Corp. | | | 2,000 | | | | 46,420 | | | |
| Glatfelter Co. | | | 19,400 | | | | 241,142 | | | |
| | | | | |
| | | |
| |
| | | | | | | | 287,562 | | | |
| | | | | |
| | | |
| |
|
| Pollution Control & Environmental Services (0.2%) |
| Ionics, Inc. (b) | | | 1,700 | | | | 48,450 | | | |
| | | | | |
| | | |
| |
|
| Production Technology Equipment (2.9%) |
| ATMI, Inc. (b) | | | 9,461 | | | | 220,914 | | | |
| August Technology Corp. (b) | | | 13,800 | | | | 107,571 | | | |
| Axcelis Technologies, Inc. (b) | | | 36,000 | | | | 309,601 | | | |
| Cymer, Inc. (b) | | | 6,400 | | | | 182,528 | | | |
| Photon Dynamics, Inc. (b) | | | 5,564 | | | | 101,821 | | | |
| | | | | |
| | | |
| |
| | | | | | | | 922,435 | | | |
| | | | | |
| | | |
| |
|
| Publishing: Miscellaneous (0.2%) |
| Consolidated Graphics, Inc. (b) | | | 1,300 | | | | 55,510 | | | |
| | | | | |
| | | |
| |
|
| Railroad Equipment (0.9%) |
| Wabtec Corp. | | | 14,000 | | | | 283,780 | | | |
| | | | | |
| | | |
| |
|
| Railroads (0.4%) |
| RailAmerica, Inc. (b) | | | 12,800 | | | | 141,952 | | | |
| | | | | |
| | | |
| |
|
| Real Estate Investment Trusts (REITs) (9.6%) |
| AMB Property Corp | | | 9,400 | | | | 352,500 | | | |
| American Financial Realty Trust | | | 24,400 | | | | 358,680 | | | |
| Ashford Hospitality Trust | | | 37,200 | | | | 360,468 | | | |
| Associated Estates Realty Corp. | | | 4,000 | | | | 38,040 | | | |
| CBL & Associates Properties, Inc. | | | 5,300 | | | | 347,415 | | | |
| Developers Diversified Realty Corp. | | | 6,700 | | | | 280,060 | | | |
| Eagle Hospitality Properties Trust, Inc. (b) | | | 19,840 | | | | 188,480 | | | |
| Equity Inns, Inc. | | | 5,300 | | | | 50,350 | | | |
| Friedman, Billings, Ramsey Group, Inc. | | | 18,400 | | | | 315,376 | | | |
| Nationwide Health Properties, Inc. | | | 18,000 | | | | 406,259 | | | |
| New Century Financial Corp. | | | 5,400 | | | | 297,810 | | | |
| Winston Hotels, Inc. | | | 4,500 | | | | 49,725 | | | |
| | | | | |
| | | |
| |
| | | | | | | | 3,045,163 | | | |
| | | | | |
| | | |
| |
|
| Retail (3.4%) |
| Abercrombie & Fitch Co. | | | 3,200 | | | | 125,376 | | | |
| Fisher Scientific International, Inc. (b) | | | 3,500 | | | | 200,760 | | | |
| Genesco, Inc. (b) | | | 9,800 | | | | 250,880 | | | |
| Handleman Co. | | | 1,300 | | | | 27,963 | | | |
| Jos. A. Bank Clothiers, Inc. (b) | | | 6,937 | | | | 220,180 | | | |
| Mothers Work, Inc. (b) | | | 292 | | | | 3,781 | | | |
| Zale Corp. (b) | | | 9,100 | | | | 259,533 | | | |
| | | | | |
| | | |
| |
| | | | | | | | 1,088,473 | | | |
| | | | | |
| | | |
| |
|
| Savings & Loan (3.8%) |
| BankAtlantic Bancorp, Inc., Class A | | | 21,060 | | | | 368,339 | | | |
| BankUnited Financial Corp., Class A (b) | | | 8,140 | | | | 242,165 | | | |
| Hudson River Bancorp., Inc. | | | 2,700 | | | | 52,947 | | | |
| Independence Community Bank Corp. | | | 7,200 | | | | 270,936 | | | |
| Webster Financial Corp. | | | 6,000 | | | | 286,800 | | | |
| | | | | |
| | | |
| |
| | | | | | | | 1,221,187 | | | |
| | | | | |
| | | |
| |
|
| Securities Brokerage & Services (2.4%) |
| American Capital Strategies Ltd. | | | 11,200 | | | | 346,640 | | | |
| NCO Group, Inc. (b) | | | 15,600 | | | | 417,300 | | | |
| | | | | |
| | | |
| |
| | | | | | | | 763,940 | | | |
| | | | | |
| | | |
| |
|
| Services: Commercial (3.2%) |
| 4Kids Entertainment, Inc. (b) | | | 1,800 | | | | 32,922 | | | |
| Angelica Corp. | | | 1,900 | | | | 45,600 | | | |
| Chemed Corp. | | | 5,100 | | | | 308,295 | | | |
| Coinstar, Inc. (b) | | | 2,400 | | | | 61,992 | | | |
| Integrated Alarm Services Group, Inc. (b) | | | 14,700 | | | | 65,121 | | | |
| Manpower, Inc. | | | 2,300 | | | | 104,075 | | | |
| Pegasus Systems, Inc. (b) | | | 9,000 | | | | 93,690 | | | |
| Waste Connections, Inc. (b) | | | 10,150 | | | | 319,928 | | | |
| | | | | |
| | | |
| |
| | | | | | | | 1,031,623 | | | |
| | | | | |
| | | |
| |
|
| Shipping (1.1%) |
| Kirby Corp. (b) | | | 8,570 | | | | 359,940 | | | |
| | | | | |
| | | |
2004 Annual Report 115
| |
| | Statement of Investments (Continued) |
| | October 31, 2004 |
Gartmore Value Opportunities Fund (Continued)
Concept Series
| | | | | | | | | | | |
|
| Common Stocks (continued) |
|
| | Shares or | | | |
| | Principal Amount | | | Value | | | |
|
| Shoes (0.6%) |
| Finish Line, Inc., Class A (The) | | | 6,000 | | | $ | 207,780 | | | |
| | | | | |
| | | |
| |
|
| Steel (1.3%) |
| Harsco Corp. | | | 5,300 | | | | 256,785 | | | |
| Wheeling-Pittsburgh Corp. (b) | | | 5,500 | | | | 174,075 | | | |
| | | | | |
| | | |
| |
| | | | | | | | 430,860 | | | |
| | | | | |
| | | |
| |
|
| Telecommunications Equipment (1.0%) |
| Andrew Corp. (b) | | | 15,991 | | | | 223,554 | | | |
| C-COR, Inc. (b) | | | 11,000 | | | | 82,720 | | | |
| | | | | |
| | | |
| |
| | | | | | | | 306,274 | | | |
| | | | | |
| | | |
| |
|
| Tobacco (0.1%) |
| Standard Commercial Corp. | | | 1,200 | | | | 19,116 | | | |
| | | | | |
| | | |
| |
|
| Transportation Miscellaneous (0.2%) |
| SCS Transportation, Inc. (b) | | | 2,800 | | | | 50,596 | | | |
| | | | | |
| | | |
| |
|
| Utilities: Electrical (3.9%) |
| PNM Resources, Inc. | | | 8,900 | | | | 207,192 | | | |
| Westar Energy, Inc. | | | 18,400 | | | | 385,480 | | | |
| Wisconsin Energy Corp. | | | 12,000 | | | | 391,680 | | | |
| WPS Resources Corp. | | | 5,300 | | | | 251,750 | | | |
| | | | | |
| | | |
| |
| | | | | | | | 1,236,102 | | | |
| | | | | |
| | | |
| |
|
| Utilities: Gas Distributors (2.2%) |
| Cascade Natural Gas Corp. | | | 1,500 | | | | 30,390 | | | |
| Questar Corp. | | | 8,500 | | | | 408,000 | | | |
| Western Gas Resources, Inc. | | | 8,800 | | | | 257,752 | | | |
| | | | | |
| | | |
| |
| | | | | | | | 696,142 | | | |
| | | | | |
| | | |
| |
|
| Utilities: Telecommunications (0.8%) |
| NII Holdings, Inc. (b) | | | 6,000 | | | | 265,620 | | | |
| | | | | |
| | | |
| |
|
| Utilities: Water (0.1%) |
| California Water Service Group | | | 1,500 | | | | 44,235 | | | |
| | | | | |
| | | |
| |
| Total Common Stocks | | | 31,391,978 | | | |
| | | | | |
| | | |
| |
Repurchase Agreements (0.6%) |
| | | | | | | | | | | |
|
| Repurchase Agreements (0.6%) |
|
| | Shares or | | | |
| | Principal Amount | | | Value | | | |
|
|
CS First Boston, 1.75%, dated 10/29/04, due 11/1/04, repurchase price $84,551
(Fully collateralized by Treasury Notes and U.S. Agency Securities) | | $ | 84,538 | | | $ | 84,538 | | | |
Nomura Securities, 1.75%, dated 10/29/04, due 11/1/04, repurchase price $118,135
(Fully collateralized by U.S. Agency Securities and AA Rated Corporate Bonds) | | | 118,119 | | | | 118,119 | | | |
| | | | | |
| | | |
| |
| Total Repurchase Agreements | | | 202,657 | | | |
| | | | | |
| | | |
| |
Short-Term Securities Held as Collateral for Securities Lending (18.4%) |
| Pool of short-term securities for Gartmore Mutual Funds — footnote 2 (Securities Lending) | | | 5,895,220 | | | | 5,895,220 | | | |
| | | | | |
| | | |
| |
| Total Short-Term Securities Held as Collateral for Securities Lending | | | 5,895,220 | | | |
| | | | | |
| | | |
| |
| Total Investments (Cost $34,542,033) (a) — 117.1% | | | 37,489,855 | | | |
| Liabilities in excess of other assets — (17.1)% | | | (5,463,334) | | | |
| | | | | |
| | | |
| |
| NET ASSETS — 100.0% | | $ | 32,026,521 | | | |
| | | | | |
| | | |
| | |
| (a) | | See notes to financial statements for tax unrealized appreciation (depreciation) of securities. |
| |
| (b) | | Non-income producing securities. |
See notes to financial statements.
116 Annual Report 2004
Concept Series
| |
| | Gartmore Micro Cap Equity Fund |
As of Nov. 30, 2004, all share classes of the Gartmore Micro Cap Equity Fund have been closed to new accounts. The Fund’s managers have determined that, given the liquidity concerns inherent in the micro-cap area of the market, the Fund can most effectively seek to continue to fulfill its investment mandate by maintaining its current asset level.
For the annual period ended Oct. 31, 2004, the Gartmore Micro Cap Equity Fund returned 22.96% (Class A at NAV) versus 9.26% for its benchmark, the Wilshire Micro-Cap® Index. For broader comparison, the average return for the Fund’s Lipper peer category of Small-Cap Core Funds was 12.93%.
One overarching factor accounted for the Fund’s positive performance during the period: stock selection. There are two ways an investment manager can influence the value of a fund’s performance—sector allocation and stock selection decisions. Together, these factors determine the under- or outperformance of a fund relative to its benchmark. During the reporting period, stock selection by the Fund in every sector was positive except for consumer discretionary, with a loss of 0.10%, and consumer staples, with a loss of 0.01%.
Particularly strong results were achieved by the Fund in health care, adding 4.90%; industrials, adding 4.67%; and information technology, adding 4.82%. In fact, on a total-effect basis (adding sector allocation and stock selection), only one sector underperformed for the Fund—telecommunications, with a loss of 0.09%. We had no exposure to telecommunications during the period. Overall, it was an outstanding year for the Fund. We would have achieved even stronger returns for our shareholders if not for our underweights in financials, health care and materials. Factoring in stock selection, though, shows that we achieved positive returns in every sector where we actively made investment decisions.
The current investment environment continues to present problems and opportunities. From a macroeconomic perspective, the economy is slowing into a more normalized growth curve. Corporate profits, therefore, are not expected to be as strong during the next reporting period as these have been during this period. Furthermore, the markets continue to watch closely the war in Iraq, the effect of high energy prices on consumers, the uneven job picture and interest rates. With these factors constituting our working backdrop, we believe that the next reporting period will turn out to be a stock-picker’s market, because the major indexes are likely to produce modest gains. This type of environment works to our advantage, because micro-cap stocks tend to be overlooked and underfollowed, which creates opportunities for investors who are focused on the fundamentals and quality companies. Working against us, however, is the shift in investors’ preferred market cap range. During the past five years, small-cap stocks have outperformed large-cap stocks, but this leadership is changing as we are beginning to see signs of large-cap leadership.
Our investment philosophy has not changed: we continue to look for companies with sustainable competitive advantages, accelerating earnings and strong balance sheets. In short, we focus on stock selection. From time to time, we may consider our relative benchmark weightings and the weightings of particular stocks, but these issues are secondary to our primary objective of finding the best-in-class companies within their respective industries. We do not give in to the temptation to follow the latest trend or chase the hottest sector. We adhere to our investment philosophy of finding good companies that can perform well during a complete market cycle. We feel that maintaining this discipline is in the best interest of our shareholders.
Portfolio Manager: Carl Wilk
| |
| | Class A: GMEAX |
| | Class B: GMEBX |
| | Class C: GMECX |
| | Class R: GMERX |
| | Institutional Service Class: GMESX |
| | Institutional Class: GMEIX |
2004 Annual Report 117
Concept Series
Gartmore Micro Cap Equity Fund
Average Annual Total Return
(For periods ended October 31, 2004)
| | | | | | | | | | | |
| | | | One year | | | Inception1 | |
|
| |
| Class A | | without sales charge2 | | | 22.96% | | | | 33.13% | |
| | | with sales charge3 | | | 15.89% | | | | 29.81% | |
|
| Class B | | without sales charge2 | | | 22.13% | | | | 32.14% | |
| | | with sales charge4 | | | 17.13% | | | | 31.25% | |
|
| Class C | | without sales charge2 | | | 22.10% | | | | 32.19% | |
| | | with sales charge5 | | | 21.10% | | | | 32.19% | |
|
| Class R6,7 | | | 22.45% | | | | 32.28% | |
|
| Institutional Service Class7 | | | 23.26% | | | | 33.45% | |
|
| Institutional Class7 | | | 23.26% | | | | 33.45% | |
|
All figures showing the effect of a sales charge reflect the maximum charge possible, because it has the most dramatic effect on performance data.
| |
| 1 | Fund commenced operations on June 27, 2002. |
| |
| 2 | These returns do not reflect the effects of sales charges (SC). |
| |
| 3 | A 5.75% front-end sales charge was deducted. |
| |
| 4 | A 5.00% contingent deferred sales charge (CDSC) was deducted. The CDSC declines to 0% after 6 years. |
| |
| 5 | A CDSC of 1.00% was deducted because it is charged when you sell Class C shares within the first year after purchase. |
| |
| 6 | These returns until the creation of Class R shares (12/31/03) include the performance of the Fund’s Class B shares. The returns have been adjusted for the fact that Class R shares do not have any applicable sales charges but have not been adjusted for the lower expenses applicable to Class R shares. Excluding the effect of any fee waivers or reimbursements, such prior performance is similar to what Class R shares would have produced because the Class R shares invest in the same portfolio of securities as Class B shares. |
| |
| 7 | Not subject to any sales charges. |
Performance of a $10,000 Investment
Investment return and principal value will fluctuate, and when redeemed, shares may be worth more or less than original cost. Past performance is no guarantee of future results and does not reflect the deduction of taxes that a shareholder would pay on fund distributions or the redemption of fund shares. Investing in mutual funds involves market risk, including loss of principal. Performance returns assume the reinvestment of all distributions.
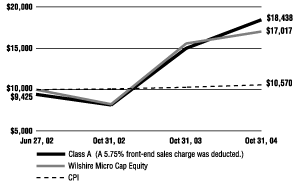
Comparative performance of $10,000 invested in Class A shares of the Gartmore Micro Cap Equity Fund, Wilshire Micro Cap Equity Index(a), and the Consumer Price Index (CPI)(b) since inception. Unlike the Fund, the returns for these unmanaged indexes do not reflect any fees, expenses, or sales charges. Investors cannot invest directly in market indexes.
| | |
| (a) | | The Wilshire Micro Cap Equity Index is a capitalization-weighted index that measures small-cap stocks in the bottom “half” of the Wilshire 5000 Index. |
| |
| (b) | | The CPI represents changes in prices of a basket of goods and services purchased for consumption by urban households. |
118 Annual Report 2004
Gartmore Micro Cap Equity Fund
Shareholder
Expense Example
As a shareholder of the Funds, you incur two types of costs: (1) transaction costs, including sales charges (loads) paid on purchase payments and redemption fees; and (2) ongoing costs, including investment advisory fees, administration fees, distribution fees and other Fund expenses. The examples below are intended to help you understand your ongoing costs (in dollars) of investing in the Funds and to compare these costs with the ongoing costs of investing in other mutual funds. The examples assume that you had a $1,000 investment in the Class at the beginning of the reporting period, May 1, 2004, and continued to hold your shares at the end of the reporting period, October 31, 2004. Per SEC requirements, the examples are based on an investment of $1,000 invested at the beginning of the period and held for the entire six-month period ended October 31, 2004.
Actual Expenses
For each Class of the Fund in the table below, the first line provides information about actual account values and actual expenses. You may use the information in this line, together with the amount you invested, to estimate the expenses that you paid over the period. Simply divide your account value by $1,000 (for example, an $8,600 account value divided by $1,000 = 8.6), then multiply the result by the number in the first line of each Class under the heading entitled “Expenses Paid During Period” to estimate the expenses you paid on your account during the period.
Hypothetical Example for Comparison Purposes
The second line of each Class in the table below provides information about hypothetical account values and hypothetical expenses based on the Class’ actual expense ratio and an assumed rate of return of 5% per year before expenses, which is not the Class’ actual return. The hypothetical account values and expenses may not be used to estimate the actual ending account balance or expenses you paid for the period. You may use this information to compare the ongoing costs of investing in the Class of the Fund and other funds. To do so, compare this 5% hypothetical example with the 5% hypothetical examples that appear in the shareholder reports of the other funds.
Please note that the expenses shown in the table are meant to highlight your ongoing costs only and do not reflect any transaction costs, such as sales charges (loads) or redemption fees. Therefore, the second line for each Class in the table is useful in comparing ongoing costs only, and will not help you determine the relative total costs of owning different funds. In addition, if these transaction costs were included, your costs would have been higher. The examples also assume all dividends and distributions have been reinvested.
Schedule of Shareholder Expenses
Expense Analysis of a $1,000 Investment
(October 31, 2004)
| | | | | | | | | | | | | | | | | | | | | | | |
| | | | Beginning | | | Ending | | | | | | | |
| | | | Account Value | | | Account Value | | | Expenses Paid | | | Annualized | | | |
| Micro Cap Equity Fund | | | | 5/1/04 | | | 10/31/04 | | | During Period* | | | Expense Ratio | | | |
|
|
| Class A | | | Actual | | | $ | 1,000 | | | $ | 1,036 | | | $ | 9.47 | | | | 1.85% | | | |
| | | | Hypothetical | 1 | | $ | 1,000 | | | $ | 1,016 | | | $ | 9.42 | | | | 1.85% | | | |
|
| Class B | | | Actual | | | $ | 1,000 | | | $ | 1,032 | | | $ | 13.28 | | | | 2.60% | | | |
| | | | Hypothetical | 1 | | $ | 1,000 | | | $ | 1,012 | | | $ | 13.23 | | | | 2.60% | | | |
|
| Class C | | | Actual | | | $ | 1,000 | | | $ | 1,032 | | | $ | 13.28 | | | | 2.60% | | | |
| | | | Hypothetical | 1 | | $ | 1,000 | | | $ | 1,012 | | | $ | 13.23 | | | | 2.60% | | | |
|
| Class R | | | Actual | | | $ | 1,000 | | | $ | 1,034 | | | $ | 11.45 | | | | 2.24% | | | |
| | | | Hypothetical | 1 | | $ | 1,000 | | | $ | 1,014 | | | $ | 11.40 | | | | 2.24% | | | |
|
| Institutional Service Class | | | Actual | | | $ | 1,000 | | | $ | 1,038 | | | $ | 8.19 | | | | 1.60% | | | |
| | | | Hypothetical | 1 | | $ | 1,000 | | | $ | 1,017 | | | $ | 8.14 | | | | 1.60% | | | |
|
| Institutional Class | | | Actual | | | $ | 1,000 | | | $ | 1,037 | | | $ | 8.24 | | | | 1.61% | | | |
| | | | Hypothetical | 1 | | $ | 1,000 | | | $ | 1,017 | | | $ | 8.20 | | | | 1.61% | | | |
|
| |
| * | Expenses are equal to the Fund’s annualized expense ratio multiplied by the average account value over the period multiplied by 184/366 (to reflect the one-half year period). |
| |
| 1 | Represents the hypothetical 5% annual return before expenses. |
2004 Annual Report 119
Gartmore Micro Cap Equity Fund
Concept Series
| |
| | Portfolio Summary |
| | (October 31, 2004) |
The SEC adopted a requirement that Funds present their portfolio holdings in a table, chart or graph format in their annual and semiannual reports to shareholders, whether or not a schedule of investments is utilized. The following tables, which present portfolio holdings as a percentage of net assets, are provided in compliance with this requirement.
| | | | | | | |
| Asset Allocation | | | | |
|
|
| Common Stocks | | | 90.0% | | | |
| Repurchase Agreements | | | 9.0% | | | |
| Other Investments* | | | 11.4% | | | |
| Other Liabilities in excess of Assets** | | | -10.4% | | | |
| | |
| | | |
| | | | 100.0% | | | |
| |
| * | Includes value of collateral received from securities lending. |
| |
| ** | Includes value of collateral owed from securities lending. |
| | | | | | | |
| Top Industries | | | | |
|
|
| Computer Software & Services | | | 10.2% | | | |
| Medical Equipment & Supplies | | | 9.7% | | | |
| Telecommunications | | | 5.4% | | | |
| Electronics | | | 5.1% | | | |
| Transportation | | | 4.9% | | | |
| Apparel | | | 4.6% | | | |
| Pharmaceuticals | | | 4.4% | | | |
| Healthcare | | | 4.0% | | | |
| Semiconductors | | | 3.9% | | | |
| Lasers | | | 3.6% | | | |
| Other Industries | | | 44.2% | | | |
| | |
| | | |
| | | | 100.0% | | | |
| | | | | | | |
| Top Holdings | | | | |
|
|
| Metrologic Instruments, Inc. | | | 2.2% | | | |
| Duratek, Inc. | | | 2.1% | | | |
| World Acceptance Corp. | | | 2.0% | | | |
| Dynamex, Inc. | | | 2.0% | | | |
| SS&C Technologies, Inc. | | | 1.9% | | | |
| Jos. A. Bank Clothiers, Inc. | | | 1.9% | | | |
| Kforce, Inc. | | | 1.8% | | | |
| American Medical Security Group, Inc. | | | 1.8% | | | |
| Mannatech, Inc. | | | 1.8% | | | |
| Lowrance Electronic Inc. | | | 1.8% | | | |
| Other Holdings | | | 80.7% | | | |
| | |
| | | |
| | | | 100.0% | | | |
120 Annual Report 2004
Statement of Investments
October 31, 2004
Gartmore Micro Cap Equity Fund
| | | | | | | | | | | |
|
| Common Stocks (90.0%) |
|
| | Shares or | | | |
| | Principal Amount | | | Value | | | |
| | | | | | |
|
| Apparel (4.6%) |
| Jos. A. Bank Clothiers, Inc. (b) | | | 70,000 | | | $ | 2,221,800 | | | |
| Lakeland Industries, Inc. (b) | | | 97,600 | | | | 1,600,640 | | | |
| Perry Ellis International, Inc. (b) | | | 70,000 | | | | 1,505,000 | | | |
| | | | | |
| | | |
| |
| | | | | | | | 5,327,440 | | | |
| | | | | |
| | | |
| |
|
| Audio/ Video Products (1.0%) |
| Digital Theater Systems, Inc. (b) | | | 65,000 | | | | 1,105,650 | | | |
| | | | | |
| | | |
| |
|
| Bank Holdings Companies (1.9%) |
| Pacific Premier Bancorp, Inc. (b) | | | 77,100 | | | | 905,925 | | | |
| Royal Bancshares of Pennsylvania, Inc., Class A | | | 46,954 | | | | 1,258,367 | | | |
| | | | | |
| | | |
| |
| | | | | | | | 2,164,292 | | | |
| | | | | |
| | | |
| |
|
| Casino Services (1.4%) |
| Mikohn Gaming Corp. (b) | | | 231,800 | | | | 1,645,780 | | | |
| | | | | |
| | | |
| |
|
| Chemicals (1.2%) |
| American Vanguard Corp. | | | 44,200 | | | | 1,430,754 | | | |
| | | | | |
| | | |
| |
|
| Computer Software & Services (10.2%) |
| Captiva Software Corp. (b) | | | 200,000 | | | | 1,968,000 | | | |
| Chordiant Software, Inc. (b) | | | 500,000 | | | | 1,230,000 | | | |
| ClickSoftware Co. (b) | | | 800,000 | | | | 1,624,000 | | | |
| Mobius Management Systems, Inc. (b) | | | 107,300 | | | | 733,932 | | | |
| QAD, Inc. | | | 39,500 | | | | 301,780 | | | |
| SBS Technologies, Inc. (b) | | | 56,200 | | | | 749,146 | | | |
| Smith Micro Software, Inc. (b) | | | 350,000 | | | | 2,012,500 | | | |
| SS&C Technologies, Inc. | | | 95,000 | | | | 2,245,800 | | | |
| Stratasys, Inc. (b) | | | 35,000 | | | | 1,024,800 | | | |
| | | | | |
| | | |
| |
| | | | | | | | 11,889,958 | | | |
| | | | | |
| | | |
| |
|
| Consulting Services (1.6%) |
| Perficient, Inc. (b) | | | 430,400 | | | | 1,885,152 | | | |
| | | | | |
| | | |
| |
|
| Containers & Packaging (0.8%) |
| Packaging Dynamics Corp. | | | 63,745 | | | | 879,681 | | | |
| | | | | |
| | | |
| |
|
| Cosmetics (1.2%) |
| CCA Industries, Inc. | | | 153,000 | | | | 1,436,670 | | | |
| | | | | |
| | | |
| |
|
| Data Processing (1.6%) |
| Innodata Isogen, Inc. (b) | | | 368,000 | | | | 1,795,840 | | | |
| | | | | |
| | | |
| |
|
| Electronic Forms (0.5%) |
| DataTRAK International, Inc. (b) | | | 49,698 | | | | 546,678 | | | |
| | | | | |
| | | |
| |
|
| Electronics (5.1%) |
| Cyberoptics Corp. (b) | | | 102,200 | | | | 1,155,400 | | | |
| Fargo Electronics (b) | | | 71,200 | | | | 933,432 | | | |
| LeCroy Corp. (b) | | | 94,250 | | | | 1,794,920 | | | |
| Lowrance Electronics, Inc. | | | 80,000 | | | | 2,036,800 | | | |
| | | | | |
| | | |
| |
| | | | | | | | 5,920,552 | | | |
| | | | | |
| | | |
| |
|
| Financial (2.0%) |
| World Acceptance Corp. (b) | | | 100,000 | | | | 2,340,000 | | | |
| | | | | |
| | | |
| |
|
| Food & Related (1.5%) |
| SunOpta, Inc. (b) | | | 275,000 | | | | 1,729,750 | | | |
| | | | | |
| | | |
| |
|
| Healthcare (4.0%) |
| America Service Group, Inc. (b) | | | 25,000 | | | | 894,250 | | | |
| American Medical Security Group, Inc. (b) | | | 65,000 | | | | 2,063,750 | | | |
| Option Care, Inc. | | | 125,000 | | | | 1,642,500 | | | |
| | | | | |
| | | |
| |
| | | | | | | | 4,600,500 | | | |
| | | | | |
| | | |
| |
|
| Human Resources (1.8%) |
| Kforce, Inc. (b) | | | 200,000 | | | | 2,118,000 | | | |
| | | | | |
| | | |
| |
|
| Internet (0.3%) |
| Aladdin Knowledge Systems (b) | | | 14,800 | | | | 372,220 | | | |
| | | | | |
| | | |
| |
|
| Lasers (3.6%) |
| Metrologic Instruments, Inc. (b) | | | 135,042 | | | | 2,518,533 | | | |
| Rofin-Sinar Technologies, Inc. (b) | | | 55,000 | | | | 1,648,350 | | | |
| | | | | |
| | | |
| |
| | | | | | | | 4,166,883 | | | |
| | | | | |
| | | |
| |
|
| Manufacturing (1.7%) |
| Raven Industries, Inc. | | | 86,000 | | | | 1,940,160 | | | |
| | | | | |
| | | |
| |
|
| Medical Equipment & Supplies (9.7%) |
| Angiodynamics, Inc. (b) | | | 142,576 | | | | 1,278,907 | | | |
| Encore Medical Corp. (b) | | | 39,500 | | | | 202,833 | | | |
| Hologic, Inc. (b) | | | 60,000 | | | | 1,204,800 | | | |
| I-Flow Corp. (b) | | | 120,000 | | | | 1,660,800 | | | |
| Lifeline Systems, Inc. (b) | | | 40,000 | | | | 962,000 | | | |
| Memry Corp. (b) | | | 500,000 | | | | 1,005,000 | | | |
| Microtek Medical Holdings, Inc. (b) | | | 400,000 | | | | 1,480,000 | | | |
| Quinton Cardiology Systems, Inc. (b) | | | 142,037 | | | | 1,384,861 | | | |
| ThermoGenesis Corp. (b) | | | 350,000 | | | | 1,954,749 | | | |
| | | | | |
| | | |
| |
| | | | | | | | 11,133,950 | | | |
| | | | | |
| | | |
| |
|
| Medical Laboratories (1.5%) |
| Bio-Reference Laboratories, Inc. (b) | | | 125,000 | | | | 1,758,750 | | | |
| | | | | |
| | | |
| |
|
| Medical Products (0.1%) |
| Vnus Medical Technologies (b) | | | 8,300 | | | | 124,832 | | | |
| | | | | |
| | | |
2004 Annual Report 121
| |
| | Statement of Investments (Continued) |
| | October 31, 2004 |
Gartmore Micro Cap Equity Fund (Continued)
Concept Series
| | | | | | | | | | | |
|
| Common Stocks (continued) |
|
| | Shares or | | | |
| | Principal Amount | | | Value | | | |
|
| Office Automation & Equipment (0.9%) |
| TRM Corp. (b) | | | 60,000 | | | $ | 1,052,400 | | | |
| | | | | |
| | | |
| |
|
| Oil & Gas (2.8%) |
| Lufkin Industries, Inc. | | | 55,800 | | | | 1,975,878 | | | |
| Mission Resources Corp. (b) | | | 200,000 | | | | 1,225,000 | | | |
| | | | | |
| | | |
| |
| | | | | | | | 3,200,878 | | | |
| | | | | |
| | | |
| |
|
| Pharmaceuticals (4.4%) |
| Bone Care International, Inc. (b) | | | 75,000 | | | | 1,722,375 | | | |
| Geopharma, Inc. (b) | | | 300,000 | | | | 1,260,000 | | | |
| Mannatech, Inc. | | | 120,000 | | | | 2,046,000 | | | |
| | | | | |
| | | |
| |
| | | | | | | | 5,028,375 | | | |
| | | | | |
| | | |
| |
|
| Pollution Control (2.1%) |
| Duratek, Inc. (b) | | | 120,000 | | | | 2,427,000 | | | |
| | | | | |
| | | |
| |
|
| Retail (1.8%) |
| Sportsman’s Guide, Inc. (The) (b) | | | 86,854 | | | | 2,028,041 | | | |
| | | | | |
| | | |
| |
|
| Semiconductors (3.9%) |
| Catalyst Semiconductor, Inc. (b) | | | 194,600 | | | | 1,165,654 | | | |
| Diodes, Inc. (b) | | | 64,500 | | | | 1,885,335 | | | |
| FSI International, Inc. (b) | | | 300,000 | | | | 1,399,500 | | | |
| | | | | |
| | | |
| |
| | | | | | | | 4,450,489 | | | |
| | | | | |
| | | |
| |
|
| Services (2.1%) |
| Labor Ready, Inc. (b) | | | 75,000 | | | | 1,076,250 | | | |
| Providence Service Corp. (b) | | | 60,000 | | | | 1,108,800 | | | |
| Team, Inc. (b) | | | 14,100 | | | | 222,780 | | | |
| | | | | |
| | | |
| |
| | | | | | | | 2,407,830 | | | |
| | | | | |
| | | |
| |
|
| Technology (2.5%) |
| Digi International, Inc. (b) | | | 100,000 | | | | 1,369,000 | | | |
| Excel Technology, Inc. (b) | | | 60,000 | | | | 1,513,200 | | | |
| | | | | |
| | | |
| |
| | | | | | | | 2,882,200 | | | |
| | | | | |
| | | |
| |
|
| Telecommunications (5.4%) |
| Comtech Telecommunications Corp. (b) | | | 55,000 | | | | 1,507,550 | | | |
| EFJ, Inc. (b) | | | 200,000 | | | | 1,180,000 | | | |
| Micronetics, Inc. (b) | | | 120,000 | | | | 966,000 | | | |
| Radyne ComStream, Inc. (b) | | | 121,400 | | | | 892,290 | | | |
| Westell Technologies, Inc., Class A (b) | | | 300,000 | | | | 1,683,000 | | | |
| | | | | |
| | | |
| |
| | | | | | | | 6,228,840 | | | |
| | | | | |
| | | |
| |
|
| Transportation (4.9%) |
| Celadon Group, Inc. (b) | | | 100,000 | | | | 1,945,000 | | | |
| Dynamex, Inc. (b) | | | 110,000 | | | | 2,277,000 | | | |
| HUB Group, Inc., Class A (b) | | | 35,000 | | | | 1,407,700 | | | |
| | | | | |
| | | |
| |
| | | | | | | | 5,629,700 | | | |
| | | | | |
| | | |
| |
|
| Veterinary Diagnostics (0.6%) |
| Neogen Corp. (b) | | | 40,000 | | | | 747,200 | | | |
| | | | | |
| | | |
| |
|
| Vitamins & Nutrition Products (1.3%) |
| Natural Alternatives International, Inc. (b) | | | 150,000 | | | | 1,470,000 | | | |
| | | | | |
| | | |
| |
| Total Common Stocks | | | 103,866,445 | | | |
| | | | | |
| | | |
| |
Repurchase Agreements (9.0%) |
| CS First Boston, 1.75%, dated 10/29/04, due 11/01/04, repurchase price $4,314,935 (Fully collateralized by U.S. Agency Securities and Treasury Notes) | | $ | 4,314,306 | | | | 4,314,306 | | | |
| | | | | |
| | | |
| |
| Nomura Securities, 1.75%, dated 10/29/04, due 11/01/04, repurchase price $6,029,006 (Fully collateralized by U.S. Agency Securities and AA Rated Corporate Bonds) | | | 6,028,127 | | | | 6,028,127 | | | |
| | | | | |
| | | |
| |
| Total Repurchase Agreements | | | 10,342,433 | | | |
| | | | | |
| | | |
| |
Short-Term Securities Held as Collateral for Securities Lending (11.4%) |
| Pool of short-term securities for Gartmore Mutual Funds - footnote 2 (Securities Lending) | | | 13,138,730 | | | | 13,138,730 | | | |
| | | | | |
| | | |
| |
| Total Short-Term Securities Held as Collateral for Securities Lending | | | 13,138,730 | | | |
| | | | | |
| | | |
| |
| Total Investments (Cost $118,187,734) (a) — 110.4% | | | 127,347,608 | | | |
| Other liabilities in excess of assets — (10.4%) | | | (12,039,438) | | | |
| | | | | |
| | | |
| |
| NET ASSETS — 100.0% | | $ | 115,308,170 | | | |
| | | | | |
| | | |
| | |
| (a) | | See notes to financial statements for tax unrealized appreciation (depreciation) of securities. |
| |
| (b) | | Denotes a non-income producing security. |
See notes to financial statements.
122 Annual Report 2004
Concept Series
| |
| | Gartmore U.S. Growth Leaders Long-Short Fund |
| | (Formerly Gartmore Long-Short Equity Plus Fund) |
For the annual period ended Oct. 31, 2004, the Gartmore U.S. Growth Leaders Long-Short Fund returned 9.03% (Class A at NAV) versus 9.42% for its benchmark, the S&P 500 Index. As of Nov. 1, 2004, the Fund will be compared to its new benchmark, the Citigroup 3-Month T-Bill Index, an unmanaged index that is an average of the last 3-month Treasury bill issues, excluding the current month-end bills. For the annual period ended Oct. 31, 2004, the Citigroup 3-Month T-Bill Index returned 1.09%. For broader comparison, the average return for the Fund’s Lipper peer category of Specialty Diversified Equity Funds was -1.98%.
The Fund’s name, managers and strategy changed as of July 1, 2004. The Fund now seeks to achieve absolute returns, regardless of market conditions, through the purchase and short sale of U.S. securities. This strategy is designed to produce relatively low volatility, more consistently positive returns than the overall market and a low correlation with the S&P 500 Index. The strategy is likely to underperform the S&P 500 Index when the market is rising, but should outperform during weak periods for the market. Because of the Fund’s anticipated low correlation with the overall market, we expect the Fund to appeal to investors who seek an additional tool for portfolio diversification through an asset allocation strategy.
Both long and short Fund positions are selected using bottom-up, fundamental analysis supplemented with quantitative filters. Some factors we look for in long positions include the likelihood of strong and accelerating earnings growth, solid market position, a strong balance sheet, capable management and reasonable valuation. For short Fund positions, the opposites of these qualities are sought: the likelihood of weak and decelerating earnings growth, vulnerable market position, a weak balance sheet, poor management and excessive valuation.
Sometimes Fund positions will be taken in pairs, with the Fund buying a more promising stock in an industry and selling short a weaker one. In such cases, the intent is for the Fund to profit on the “spread” or difference in the movement of the two stocks while minimizing the market and sector impact. At any particular time, the Fund may have a net long or a net short position, depending on market and other conditions. Near the end of the current period, the Fund had a small net long position—that is, slightly more of the Fund’s net assets were invested in long positions than in short ones.
Since July 1, 2004, Fund long positions that contributed to performance included McAfee, Inc. and Universal Health Services, Inc. On the short side, profitable Fund positions included Microstrategy Inc. and Coca-Cola Enterprises. Among the detractors to Fund performance were Checkpoint Technologies and Broadcom Corp., which held back performance on the long side, while short positions salesforce.com, inc. and Corning Inc. disappointed us.
While we are optimistic about the prospects for the U.S. economy and stock market in 2005, the hedged nature of the Fund makes the selection of individual positions more important than how the broader market performs. With that in mind, we will continue to apply our rigorous stock selection process for the Fund as diligently as possible in our effort to uncover the best long and short opportunities.
Portfolio Managers:
Christopher Baggini, CFA and Douglas Burtnick, CFA
| |
| | Class A: MLSAX |
| | Class B: MLSBX |
| | Class C: MLSCX |
| | Class R: GLSRX |
| | Institutional Class: GGUIX |
2004 Annual Report 123
Concept Series
Gartmore U.S. Growth Leaders Long-Short Fund
Average Annual Total Return
(For periods ended October 31, 2004)
| | | | | | | | | | | | | | | |
| | | | One | | | Five | | | |
| | | | year | | | years | | | Inception1 | |
|
| |
Class A2 | | without sales charge3 | | | 9.03% | | | | -1.02% | | | | 13.21% | |
| | | with sales charge4 | | | 2.78% | | | | -2.19% | | | | 12.23% | |
|
Class B2 | | without sales charge3 | | | 8.22% | | | | -1.37% | | | | 12.92% | |
| | | with sales charge5 | | | 4.27% | | | | -1.54% | | | | 12.92% | |
|
Class C6 | | without sales charge3 | | | 8.20% | | | | -1.83% | | | | 11.16% | |
| | | with sales charge7 | | | 7.47% | | | | -1.83% | | | | 11.16% | |
|
| Class R8,10 | | | 8.58% | | | | -1.11% | | | | 13.14% | |
|
| Institutional Class9,10 | | | 9.15% | | | | -1.00% | | | | 13.23% | |
|
All figures showing the effect of a sales charge reflect the maximum charge possible, because it has the most dramatic effect on performance data.
| |
| 1 | The Fund’s predecessor Fund, the Montgomery Partners Long-Short Equity Plus Fund, commenced operations for its Class C shares and Class R shares on December 31, 1997, and commenced operations for its Class A shares and Class B shares on October 31, 2001. As of June 23, 2003, the Gartmore Long-Short Equity Plus Fund (which previously had not commenced operations) acquired all the assets, subject to stated liabilities, of the Montgomery Partners Long-Short Equity Plus Fund. At that time the Gartmore Long-Short Equity Plus Fund took on the performance of the Montgomery Partners Long-Short Equity Plus Fund. |
| |
| 2 | These returns through October 31, 2001 include the performance of the Class R shares of the Fund’s predecessor fund, and, for periods from November 1, 2001 to June 22, 2003, the returns for the Class A and Class B shares include the performance of the Class A and Class B shares, respectively, of the Fund’s predecessor fund. Excluding the effect of any fee waivers or reimbursements, such prior performance is similar to what Class A and Class B shares would have produced because all classes of the Fund’s shares invest in the same portfolio of securities and Class A shares had the same expenses after waivers and reimbursements. The performance for these classes has been restated to reflect differences in sales charges (where applicable), but does not reflect the differing levels of other fees (primarily Rule 12b-1 and/or administrative services fees) applicable to Class B shares; if these fees were reflected, the performance for Class B shares would have been lower. |
| |
| 3 | These returns do not reflect the effects of sales charges (SC). |
| |
| 4 | A 5.75% front-end sales charge was deducted. |
| |
| 5 | A 5.00% contingent deferred sales charge (CDSC) was deducted. The CDSC declines to 0% after 6 years. |
| |
| 6 | These returns through June 22, 2003 include the performance of the Class C shares of the Fund’s predecessor fund. |
| |
| 7 | A CDSC of 1.00% was deducted because it is charged when you sell Class C shares within the first year after purchase. |
| |
| 8 | These returns for the period through October 31, 2001 include the performance of the Class R shares of the Fund’s predecessor fund, for the period from November 1, 2001 through June 22, 2003 include the performance of the Class B shares of the Fund’s predecessor fund and for the period from June 23, 2003 to December 31, 2003 (prior to the creation of the Fund’s Class R shares) include the performance of the Fund’s Class B shares. The returns have been adjusted for the fact that Class R shares do not have any applicable sales charges but have not been adjusted for the lower expenses applicable to Class R shares. Excluding the effect of any fee waivers or reimbursements, Class B shares’ average annual total returns are similar to what Class R shares would have produced because the Class R shares will invest in the same portfolio of securities as Class B shares. |
| |
| 9 | These returns for the period through October 31, 2001 include the performance of the Institutional Class shares of the Fund’s predecessor fund, for the period from November 1, 2001 through June 22, 2003 include the performance of the Class B shares of the Fund’s predecessor fund and for the period from June 23, 2003 to June 29, 2004 (prior to the creation of the Fund’s Institutional Class shares) include the performance of the Fund’s Class B shares. The returns have been adjusted for the fact that Institutional Class shares do not have any applicable sales charges but have not been adjusted for the lower expenses applicable to Institutional Class shares. Excluding the effect of any fee waivers or reimbursements, Class B shares’ average annual total returns are similar to what Institutional Class shares would have produced because the Institutional Class shares will invest in the same portfolio of securities as Class B shares. |
| |
| 10 | Not subject to any sales charges. |
Performance of a $10,000 Investment
Investment return and principal value will fluctuate, and when redeemed, shares may be worth more or less than original cost. Past performance is no guarantee of future results and does not reflect the deduction of taxes that a shareholder would pay on fund distributions or the redemption of fund shares. Investing in mutual funds involves market risk, including loss of principal. Performance returns assume the reinvestment of all distributions.
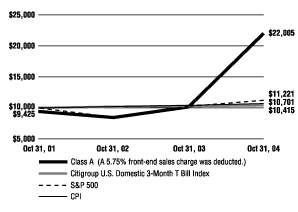
Comparative performance of $10,000 invested in Class A shares of the Gartmore U.S. Growth Leaders Long-Short Fund, the S&P 500 Index (S&P 500)(a), the Citigroup U.S. Domestic 3-Month T Bill Index(b), and the Consumer Price Index (CPI)(c) since inception. Unlike the Fund, the returns for these unmanaged indexes do not reflect any fees, expenses, or sales charges. Investors cannot invest directly in market indexes.
| | |
| (a) | | The S&P 500 is an unmanaged index of 500 widely held stocks of large U.S. companies that gives a broad look at how the stock prices of large U.S. companies have performed. |
| |
| (b) | | The Citigroup U.S. Domestic 3-Month T Bill Index is an average of the last 3-month treasury bill issues (excluding the current month-end bill). |
| |
| (c) | | The CPI represents changes in prices of a basket of goods and services purchased for consumption by urban households. |
124 Annual Report 2004
Gartmore U.S. Growth Leaders Long-Short Fund
Shareholder
Expense Example
As a shareholder of the Funds, you incur two types of costs: (1) transaction costs, including sales charges (loads) paid on purchase payments and redemption fees; and (2) ongoing costs, including investment advisory fees, administration fees, distribution fees and other Fund expenses. The examples below are intended to help you understand your ongoing costs (in dollars) of investing in the Funds and to compare these costs with the ongoing costs of investing in other mutual funds. The examples assume that you had a $1,000 investment in the Class at the beginning of the reporting period, May 1, 2004, and continued to hold your shares at the end of the reporting period, October 31, 2004. Per SEC requirements, the examples are based on an investment of $1,000 invested at the beginning of the period and held for the entire six-month period ended October 31, 2004.
Actual Expenses
For each Class of the Fund in the table below, the first line provides information about actual account values and actual expenses. You may use the information in this line, together with the amount you invested, to estimate the expenses that you paid over the period. Simply divide your account value by $1,000 (for example, an $8,600 account value divided by $1,000 = 8.6), then multiply the result by the number in the first line of each Class under the heading entitled “Expenses Paid During Period” to estimate the expenses you paid on your account during the period.
Hypothetical Example for Comparison Purposes
The second line of each Class in the table below provides information about hypothetical account values and hypothetical expenses based on the Class’ actual expense ratio and an assumed rate of return of 5% per year before expenses, which is not the Class’ actual return. The hypothetical account values and expenses may not be used to estimate the actual ending account balance or expenses you paid for the period. You may use this information to compare the ongoing costs of investing in the Class of the Fund and other funds. To do so, compare this 5% hypothetical example with the 5% hypothetical examples that appear in the shareholder reports of the other funds.
Please note that the expenses shown in the table are meant to highlight your ongoing costs only and do not reflect any transaction costs, such as sales charges (loads) or redemption fees. Therefore, the second line for each Class in the table is useful in comparing ongoing costs only, and will not help you determine the relative total costs of owning different funds. In addition, if these transaction costs were included, your costs would have been higher. The examples also assume all dividends and distributions have been reinvested.
Schedule of Shareholder Expenses
Expense Analysis of a $1,000 Investment
(October 31, 2004)
| | | | | | | | | | | | | | | | | | | | | | | |
| | | | Beginning | | | Ending | | | | | | | |
| | | | Account Value | | | Account Value | | | Expenses Paid | | | Annualized | | | |
| U.S. Growth Leaders Long-Short Fund | | | | 5/1/04 | | | 10/31/04 | | | During Period* | | | Expense Ratio | | | |
|
|
| Class A | | | Actual | | | $ | 1,000 | | | $ | 1,061 | | | $ | 16.99 | | | | 3.28% | | | |
| | | | Hypothetical | 1 | | $ | 1,000 | | | $ | 1,009 | | | $ | 16.70 | | | | 3.28% | | | |
|
| Class B | | | Actual | | | $ | 1,000 | | | $ | 1,058 | | | $ | 20.22 | | | | 3.91% | | | |
| | | | Hypothetical | 1 | | $ | 1,000 | | | $ | 1,005 | | | $ | 19.90 | | | | 3.91% | | | |
|
| Class C | | | Actual | | | $ | 1,000 | | | $ | 1,057 | | | $ | 19.81 | | | | 3.83% | | | |
| | | | Hypothetical | 1 | | $ | 1,000 | | | $ | 1,006 | | | $ | 19.50 | | | | 3.83% | | | |
|
| Class R | | | Actual | | | $ | 1,000 | | | $ | 1,060 | | | $ | 17.81 | | | | 3.44% | | | |
| | | | Hypothetical | 1 | | $ | 1,000 | | | $ | 1,008 | | | $ | 17.51 | | | | 3.44% | | | |
|
| Institutional Class (a) | | | Actual | | | $ | 1,000 | | | $ | 1,031 | | | $ | 6.54 | (b) | | | 1.90% | | | |
| | | | Hypothetical | 1 | | $ | 1,000 | | | $ | 1,007 | | | $ | 6.49 | (b) | | | 1.90% | | | |
|
| | |
| (a) | | For the period from June 29, 2004 (commencement of operations) through October 31, 2004. |
| |
| (b) | | Expense are equal to the Fund’s annualized expense ratio multiplied by the average account value over the period multiplied by 124/366 (to reflect the period). |
| |
| * | Expenses are equal to the Fund’s annualized expense ratio multiplied by the average account value over the period multiplied by 184/366 (to reflect the one-half year period). |
1 Represents the hypothetical 5% annual return before expenses.
2004 Annual Report 125
Gartmore U.S. Growth Leaders Long-Short Fund
Concept Series
| |
| (October 31, 2004) | Long Positions |
The SEC adopted a requirement that Funds present their portfolio holdings in a table, chart or graph format in their annual and semiannual reports to shareholders, whether or not a schedule of investments is utilized. The following tables, which present portfolio holdings as a percentage of net assets, are provided in compliance with this requirement.
| | | | | | | |
| Asset Allocation | | | | |
|
|
| Common Stocks | | | 58.8% | | | |
| Repurchase Agreement | | | 41.6% | | | |
| Other Liabilities in excess of Assets | | | -0.4% | | | |
| | |
| | | |
| | | | 100.0% | | | |
| | | | | | | |
| Top Industries | | | | |
|
|
| Technology | | | 13.2% | | | |
| Media/ Services | | | 9.1% | | | |
| Consumer Cyclical | | | 8.6% | | | |
| Health Care | | | 7.5% | | | |
| Finance | | | 6.4% | | | |
| Capital Goods/ Defense | | | 3.9% | | | |
| Consumer Staple | | | 2.8% | | | |
| Basic Industry/ Gold | | | 2.6% | | | |
| Transportation | | | 2.5% | | | |
| Energy | | | 1.2% | | | |
| Other Industries | | | 42.2% | | | |
| | |
| | | |
| | | | 100.0% | | | |
| | | | | | | |
| Top Holdings | | | | |
|
|
| PepsiCo, Inc. | | | 2.0% | | | |
| Kohl’s Corp. | | | 1.9% | | | |
| Capital One Financial Corp. | | | 1.6% | | | |
| Franklin Resources, Inc. | | | 1.6% | | | |
| Gillette Co. (The) | | | 1.5% | | | |
| Lam Research Corp. | | | 1.4% | | | |
| Apple Computer, Inc. | | | 1.3% | | | |
| Norfolk Southern Corp. | | | 1.3% | | | |
| Juniper Networks, Inc. | | | 1.3% | | | |
| EMC Corp. | | | 1.3% | | | |
| Other Holdings | | | 84.8% | | | |
| | |
| | | |
| | | | 100.0% | | | |
126 Annual Report 2004
Gartmore U.S. Growth Leaders Long-Short Fund
Portfolio Summary
| | |
| (October 31, 2004) | | Short Positions |
The SEC adopted a requirement that Funds present their portfolio holdings in a table, chart or graph format in their annual and semiannual reports to shareholders, whether or not a schedule of investments is utilized. The following tables, which present portfolio holdings as a percentage of net assets, are provided in compliance with this requirement.
| | | | | | | |
| Asset Allocation | | | | |
|
|
| Common Stocks | | | 44.3% | | | |
| | |
| | | |
| | | | | | | |
| Top Industries | | | | |
|
|
| Consumer Cyclical | | | 10.2% | | | |
| Technology | | | 6.3% | | | |
| Finance | | | 6.2% | | | |
| Health Care | | | 5.8% | | | |
| Capital Goods/Defense | | | 3.9% | | | |
| Media/Services | | | 2.9% | | | |
| Transportation | | | 2.5% | | | |
| Energy | | | 2.5% | | | |
| Consumer Staple | | | 2.3% | | | |
| Capital Goods | | | 0.9% | | | |
| Other Industries | | | 56.5% | | | |
| | |
| | | |
| | | | 100.0% | | | |
| | | | | | | |
| Top Holdings | | | | |
|
|
| AmSouth Bancorp | | | 1.6% | | | |
| Brinker International, Inc. | | | 1.5% | | | |
| Electronic Arts, Inc. | | | 1.5% | | | |
| Transocean, Inc. | | | 1.5% | | | |
| Expeditors International of Washington, Inc. | | | 1.5% | | | |
| International Paper Co. | | | 1.4% | | | |
| CarMax, Inc. | | | 1.4% | | | |
| Coca-Cola Enterprises, Inc. | | | 1.3% | | | |
| Aon Corp. | | | 1.3% | | | |
| Medtronic, Inc. | | | 1.2% | | | |
| Other Holdings | | | 85.8% | | | |
| | |
| | | |
| | | | 100.0% | | | |
2004 Annual Report 127
Concept Series
| |
| | Statement of Investments |
| | October 31, 2004 |
Gartmore U.S. Growth Leaders Long-Short Fund
| | | | | | | | | | | |
|
| Common Stocks — Long Positions (c) (58.8%) |
|
| | Shares or | | | |
| | Principal Amount | | | Value | | | |
|
| Basic Industry/ Gold (2.6%) |
| Fisher Scientific International, Inc. (b) | | | 2,990 | | | $ | 171,506 | | | |
| Praxair, Inc. | | | 6,450 | | | | 272,190 | | | |
| United States Steel Corp. | | | 7,550 | | | | 277,236 | | | |
| | | | | |
| | | |
| |
| | | | | | | | 720,932 | | | |
| | | | | |
| | | |
| |
|
| Capital Goods/ Defense (3.9%) |
| Danaher Corp. | | | 5,170 | | | | 285,022 | | | |
| PerkinElmer, Inc. | | | 11,200 | | | | 230,048 | | | |
| Textron, Inc. | | | 4,100 | | | | 279,415 | | | |
| Tyco International Ltd. | | | 9,440 | | | | 294,056 | | | |
| | | | | |
| | | |
| |
| | | | | | | | 1,088,541 | | | |
| | | | | |
| | | |
| |
|
| Consumer Cyclical (8.6%) |
| Abercrombie & Fitch Co. | | | 7,500 | | | | 293,850 | | | |
| Best Buy Co. | | | 3,710 | | | | 219,706 | | | |
| Gillette Co. (The) | | | 10,240 | | | | 424,755 | | | |
| Kohl’s Corp. (b) | | | 10,410 | | | | 528,412 | | | |
| Lowe’s Cos., Inc. | | | 6,040 | | | | 339,931 | | | |
| Pacific Sunwear of California, Inc. (b) | | | 10,300 | | | | 241,432 | | | |
| Target Corp. | | | 6,980 | | | | 349,140 | | | |
| | | | | |
| | | |
| |
| | | | | | | | 2,397,226 | | | |
| | | | | |
| | | |
| |
|
| Consumer Staple (2.8%) |
| PepsiCo, Inc. | | | 11,240 | | | | 557,279 | | | |
| Ralcorp Holding, Inc. | | | 5,820 | | | | 213,885 | | | |
| | | | | |
| | | |
| |
| | | | | | | | 771,164 | | | |
| | | | | |
| | | |
| |
|
| Energy (1.2%) |
| Nabors Industries Ltd. (b) | | | 6,950 | | | | 341,384 | | | |
| | | | | |
| | | |
| |
|
| Finance (6.4%) |
| Allstate Corp. | | | 5,920 | | | | 284,693 | | | |
| Capital One Financial Corp. | | | 6,230 | | | | 459,524 | | | |
| Franklin Resources, Inc. | | | 7,330 | | | | 444,344 | | | |
| Legg Mason, Inc. | | | 2,550 | | | | 162,461 | | | |
| North Fork Bancorporation, Inc. | | | 5,560 | | | | 245,196 | | | |
| T. Rowe Price Group, Inc. | | | 3,750 | | | | 209,138 | | | |
| | | | | |
| | | |
| |
| | | | | | | | 1,805,356 | | | |
| | | | | |
| | | |
| |
|
| Health Care (7.5%) |
| Eyetech Pharmaceuticals, Inc. (b) | | | 6,850 | | | | 290,714 | | | |
| Forest Laboratories, Inc., Class A (b) | | | 5,380 | | | | 239,948 | | | |
| Genzyme Corp. (b) | | | 5,850 | | | | 306,949 | | | |
| Gilead Sciences, Inc. (b) | | | 6,150 | | | | 212,975 | | | |
| Guidant Corp. | | | 3,400 | | | | 226,508 | | | |
| St. Jude Medical, Inc. (b) | | | 3,700 | | | | 283,309 | | | |
| UnitedHealth Group, Inc. | | | 3,990 | | | | 288,876 | | | |
| Wyeth | | | 6,150 | | | | 243,848 | | | |
| | | | | |
| | | |
| |
| | | | | | | | 2,093,127 | | | |
| | | | | |
| | | |
| |
|
| Media/ Services (9.1%) |
| Carnival Corp. | | | 4,500 | | | | 227,520 | | | |
| EMC Corp. (b) | | | 27,980 | | | | 360,103 | | | |
| Juniper Networks, Inc. (b) | | | 13,650 | | | | 363,226 | | | |
| Marriott International, Inc., Class A | | | 5,130 | | | | 279,534 | | | |
| Motorola, Inc. | | | 8,900 | | | | 153,614 | | | |
| Smith International, Inc. (b) | | | 3,550 | | | | 206,184 | | | |
| Starwood Hotels & Resorts Worldwide, Inc. | | | 7,000 | | | | 334,110 | | | |
| XM Satellite Radio Holdings, Class A (b) | | | 9,300 | | | | 300,576 | | | |
| Yahoo, Inc. (b) | | | 9,000 | | | | 325,710 | | | |
| | | | | |
| | | |
| |
| | | | | | | | 2,550,577 | | | |
| | | | | |
| | | |
| |
|
| Technology (13.2%) |
| Ameritrade Holdings Corp. (b) | | | 18,400 | | | | 239,568 | | | |
| Apple Computer, Inc. (b) | | | 7,100 | | | | 372,962 | | | |
| Business Objectives S.A. ADR - FR (b) | | | 13,530 | | | | 345,286 | | | |
| Citadel Security Software, Inc. (b) | | | 39,000 | | | | 129,831 | | | |
| Citrix Systems, Inc. (b) | | | 6,500 | | | | 156,845 | | | |
| Hyperion Solutions Corp. (b) | | | 3,700 | | | | 148,481 | | | |
| Lam Research Corp. (b) | | | 15,100 | | | | 393,052 | | | |
| McAfee, Inc. (b) | | | 12,500 | | | | 302,500 | | | |
| Micros Systems, Inc. (b) | | | 4,050 | | | | 239,436 | | | |
| National Semiconductor Corp. | | | 12,930 | | | | 215,931 | | | |
| QLogic Corp. (b) | | | 9,280 | | | | 301,600 | | | |
| Quest Software, Inc. (b) | | | 21,450 | | | | 314,672 | | | |
| Take-Two Interactive Software (b) | | | 8,150 | | | | 268,624 | | | |
| Texas Instruments, Inc. | | | 12,650 | | | | 309,293 | | | |
| | | | | |
| | | |
| |
| | | | | | | | 3,738,081 | | | |
| | | | | |
| | | |
| |
|
| Transportation (2.5%) |
| Forward Air Corp. (b) | | | 8,150 | | | | 335,536 | | | |
| Norfolk Southern Corp. | | | 10,980 | | | | 372,771 | | | |
| | | | | |
| | | |
| |
| | | | | | | | 708,307 | | | |
| | | | | |
| | | |
| |
|
| Utility (1.0%) |
| Questar Corp. | | | 5,800 | | | | 278,400 | | | |
| | | | | |
| | | |
| |
| Total Common Stocks — Long Positions (c) | | | 16,493,095 | | | |
| | | | | |
| | | |
128 Annual Report 2004
| | | | | | | | | | | |
|
| Repurchase Agreements (41.6%) |
|
|
| | Shares or | | | |
| | Principal Amount | | | Value | | | |
|
| CS First Boston, 1.75%, dated 10/29/04, due 11/01/04, repurchase price $4,862,466 (Fully collateralized by U.S. Agency Securities & U.S. Treasury Notes) | | $ | 4,861,757 | | | $ | 4,861,757 | | | |
| Nomura Securities, 1.75%, dated 10/29/04, due 11/01/04, repurchase price $6,794,038 (Fully collateralized by AA Rated Corporate Bonds & U.S. Agency Securities) | | | 6,793,048 | | | | 6,793,048 | | | |
| | | | | |
| | | |
| |
| Total Repurchase Agreements | | | 11,654,805 | | | |
| | | | | |
| | | |
| |
| Total Investments (Cost $26,991,662) (a) — 100.4% | | | 28,147,900 | | | |
| Liabilities in excess of other assets — (0.4)% | | | (110,802) | | | |
| | | | | |
| | | |
| |
| NET ASSETS — 100.0% | | $ | 28,037,098 | | | |
| | | | | |
| | | |
| | |
| (a) | | See notes to financial statements for tax unrealized appreciation (depreciation) of securities. |
| |
| (b) | | Denotes a non-income producing security. |
| |
| (c) | | All long positions held as collateral for securities sold short. |
ADR American Depositary Receipt
FR France
See notes to financial statements.
2004 Annual Report 129
Concept Series
| |
| | Statement of Investments |
| | October 31, 2004 |
Gartmore U.S. Growth Leaders Long-Short Fund
| | | | | | | | | | | |
|
| Common Stocks — Short Positions (44.3%) |
|
| | Shares | | | Value | | | |
|
| Basic Industry/Gold (0.8%) |
| Alcoa, Inc. | | | 7,100 | | | $ | 230,750 | | | |
| | | | | |
| | | |
| |
|
| Capital Goods (0.9%) |
| Avaya, Inc. (b) | | | 18,000 | | | | 259,200 | | | |
| | | | | |
| | | |
| |
|
| Capital Goods/Defense (3.9%) |
| Cooper Tire & Rubber Co. | | | 13,950 | | | | 271,746 | | | |
| Rockwell International Corp. | | | 5,950 | | | | 248,056 | | | |
| SPX Corp. | | | 7,430 | | | | 284,940 | | | |
| Tellabs, Inc. (b) | | | 35,500 | | | | 284,000 | | | |
| | | | | |
| | | |
| |
| | | | | | | | 1,088,742 | | | |
| | | | | |
| | | |
| |
|
| Consumer Cyclical (10.2%) |
| 99 Cents Only Stores (b) | | | 19,440 | | | | 299,570 | | | |
| Apollo Group, Inc. (b) | | | 4,140 | | | | 273,240 | | | |
| Avery-Dennison Corp. | | | 5,140 | | | | 312,717 | | | |
| Avon Products, Inc. | | | 6,600 | | | | 261,030 | | | |
| Bed Bath & Beyond, Inc. (b) | | | 6,850 | | | | 279,412 | | | |
| Harley-Davidson, Inc. | | | 5,240 | | | | 301,667 | | | |
| International Paper Co. | | | 10,600 | | | | 408,205 | | | |
| Saks, Inc. | | | 21,400 | | | | 261,508 | | | |
| Tiffany & Co. | | | 8,550 | | | | 250,772 | | | |
| Whole Foods Market, Inc. | | | 3,020 | | | | 245,919 | | | |
| | | | | |
| | | |
| |
| | | | | | | | 2,894,040 | | | |
| | | | | |
| | | |
| |
|
| Consumer Staple (2.3%) |
| Campbell Soup Co. | | | 9,970 | | | | 267,595 | | | |
| Coca-Cola Enterprises, Inc. | | | 18,260 | | | | 381,816 | | | |
| | | | | |
| | | |
| |
| | | | | | | | 649,411 | | | |
| | | | | |
| | | |
| |
|
| Energy (2.5%) |
| Marathon Oil Corp. | | | 7,300 | | | | 278,203 | | | |
| Transocean, Inc. (b) | | | 11,760 | | | | 414,540 | | | |
| | | | | |
| | | |
| |
| | | | | | | | 692,743 | | | |
| | | | | |
| | | |
| |
|
| Finance (6.2%) |
| AmSouth Bancorp | | | 16,500 | | | | 435,435 | | | |
| Janus Capital Group, Inc. | | | 22,030 | | | | 335,958 | | | |
| M & T Bank Corp. | | | 1,910 | | | | 196,730 | | | |
| St. Paul Cos., Inc. | | | 7,800 | | | | 264,888 | | | |
| Willis Group Holdings Ltd. | | | 5,860 | | | | 210,667 | | | |
| XL Capital Ltd. | | | 3,940 | | | | 285,650 | | | |
| | | | | |
| | | |
| |
| | | | | | | | 1,729,328 | | | |
| | | | | |
| | | |
| |
|
| Health Care (5.8%) |
| Aon Corp. | | | 17,490 | | | | 356,970 | | | |
| Caremark Rx, Inc. (b) | | | 7,850 | | | | 235,265 | | | |
| Conseco, Inc. (b) | | | 11,400 | | | | 191,064 | | | |
| HCA, Inc. | | | 7,250 | | | | 266,293 | | | |
| Medtronic, Inc. | | | 6,650 | | | | 339,881 | | | |
| Mylan Laboratories, Inc. | | | 13,750 | | | | 236,775 | | | |
| | | | | |
| | | |
| |
| | | | | | | | 1,626,248 | | | |
| | | | | |
| | | |
| |
|
| Media/Services (2.9%) |
| Brinker International, Inc. (b) | | | 13,050 | | | | 421,515 | | | |
| CarMax, Inc. (b) | | | 14,600 | | | | 384,564 | | | |
| | | | | |
| | | |
| |
| | | | | | | | 806,079 | | | |
| | | | | |
| | | |
| |
|
| Technology (6.3%) |
| Applied Materials, Inc. (b) | | | 17,110 | | | | 275,471 | | | |
| Brooks Automation, Inc. (b) | | | 18,510 | | | | 275,429 | | | |
| Electronic Arts, Inc. (b) | | | 9,250 | | | | 415,509 | | | |
| Micrel, Inc. (b) | | | 16,250 | | | | 182,488 | | | |
| Network Appliance, Inc. (b) | | | 13,580 | | | | 332,303 | | | |
| Solectron Corp. (b) | | | 52,740 | | | | 275,303 | | | |
| | | | | |
| | | |
| |
| | | | | | | | 1,756,503 | | | |
| | | | | |
| | | |
| |
|
| Transportation (2.5%) |
| Burlington Northern Santa Fe Corp. | | | 6,890 | | | | 288,071 | | | |
| Expeditors International of Washington, Inc. | | | 7,160 | | | | 408,836 | | | |
| | | | | |
| | | |
| |
| | | | | | | | 696,907 | | | |
| | | | | |
| | | |
| |
| Total Investments (Proceeds $11,923,722) (a) — 44.3% | | $ | 12,429,951 | | | |
| | | | | |
| | | |
| | |
| (a) | | See notes to financial statements for tax unrealized appreciation (depreciation) of securities. |
| |
| (b) | | Denotes a non-income producing security. |
See notes to financial statements.
130 Annual Report 2004
Concept Series
| |
| | Gartmore Convertible Fund |
From its inception on Jan. 20, 2004, through Oct. 31, 2004, the Gartmore Convertible Fund returned - -1.68% (Class A at NAV), versus 1.49% for its benchmark, the Goldman Sachs Convertible 100 Index. The Fund’s Lipper peer category is yet to be determined.
The Fund’s performance reflected the growing pains of a relatively new fund and the challenge of putting the associated uneven inflows of cash to work in an efficient and timely manner.
The Fund normally invests approximately 80% of its net assets in convertible securities, with roughly 60% of its holdings in investment-grade (BBB-/ Baa3 or better) convertibles. Fund returns come from two sources: interest income and potential appreciation of the underlying securities. In general, we would characterize this Fund as more conservative and somewhat less equity-sensitive than many convertible funds currently available. Throughout complete market cycles, our aim is to capture approximately 80% of the stock market’s movement when share prices advance, while keeping returns relatively flat when stocks are declining. To achieve this goal, we strive to buy securities at or below par value, and we generally do not supplement our convertible holdings with common stock. We believe that our investors value high risk-adjusted returns above all else, which is what we strive to deliver. Put another way, our primary goal is capital preservation, and we look for ways to generate income and capital gains that are consistent with that goal.
The Fund’s largest overweighting was in the energy sector, which aided Fund performance. Energy stocks were helped by rising prices for crude oil, which went beyond the $50-per-barrel threshold in October. Given the substantial free cash flows being generated by exploration and production companies and this business cycle’s still-modest spending on new projects, the Fund’s positions in services and drilling companies contributed to the Fund’s performance. Some of the better performers in this area included Schlumberger Ltd., Cooper Cameron Corp., BJ Services Co., Nabors Industries Ltd. and Grey Wolf, Inc.
Conversely, underweights by the Fund in the information technology and telecommunications sectors were somewhat detrimental to Fund performance. Many convertible securities offered by firms in these sectors, however, do not have sufficiently strong credit quality to meet our investing standards, so we looked elsewhere for suitable opportunities for the Fund. Over the long term, we believe that our high investing standards will benefit the Fund and its investors. In addition, information technology and telecommunications stocks appeared overvalued to us, which was another reason to be extremely selective in those sectors.
We are comfortable with the Fund’s positioning. Even if per-barrel crude oil prices drop back to the $30 to $40 range, energy services and drilling companies still could do extremely well. Moreover, with the economy in recovery, we believe that the broader trend of the stock market should be up, which would be favorable for convertible securities. We plan, however, to remain conservatively positioned and value-oriented, mindful of our primary objective of capital preservation.
Portfolio Managers:
Jeremiah O’Grady and Charles Wright
| |
| | Class A: GRVAX |
| | Class B: GRVBX |
| | Class C: GRVCX |
| | Institutional Service Class: GRVSX |
| | Institutional Class: GRVIX |
2004 Annual Report 131
Concept Series
Gartmore Convertible Fund
Aggregate Total Return
(For periods ended October 31, 2004)
| | | | | | | |
| | | | Inception1 | |
|
| |
Class A2 | | without sales charge3 | | | -0.80% | |
| | | with sales charge4 | | | -6.50% | |
|
Class B2 | | without sales charge3 | | | -1.58% | |
| | | with sales charge5 | | | -6.45% | |
|
Class C2 | | without sales charge3 | | | -1.53% | |
| | | with sales charge6 | | | -2.51% | |
|
Class R 7,8 | | | | | -0.97% | |
|
| Institutional Service Class2,8 | | | -0.68% | |
|
| Institutional Class8 | | | -0.68% | |
|
All figures showing the effect of a sales charge reflect the maximum charge possible, because it has the most dramatic effect on performance data.
| |
| 1 | Fund commenced operations on December 29, 2003. |
| |
| 2 | These returns until the creation of Class A, B, C and Institutional Service shares (1/20/04) include the performance of the Fund’s Institutional Class shares. Excluding the effects of any fee waivers or reimbursements, such prior performance is substantially similar to what Class A, B, C and Institutional Service shares would have produced because Class A, B, C and Institutional Service shares invest in the same portfolio of securities as Institutional Class shares. |
| |
| 3 | These returns do not reflect the effects of sales charges (SC). |
| |
| 4 | A 5.75% front-end sales charge was deducted. |
| |
| 5 | A 5.00% contingent deferred sales charge (CDSC) was deducted. The CDSC declines to 0% after 6 years. |
| |
| 6 | A CDSC of 1.00% was deducted because it is charged when you sell Class C shares within the first year after purchase. |
| |
| 7 | These returns until the creation of Class R shares (5/14/04) include the performance of the Fund’s Class B shares. Excluding the effects of any fee waivers or reimbursements, such prior performance is substantially similar to what Class R shares would have produced because Class R shares invest in the same portfolio of securities as Class B shares. |
| |
| 8 | Not subject to any sales charges. |
Performance of a $10,000 Investment
Investment return and principal value will fluctuate, and when redeemed, shares may be worth more or less than original cost. Past performance is no guarantee of future results and does not reflect the deduction of taxes that a shareholder would pay on fund distributions or the redemption of fund shares. Investing in mutual funds involves market risk, including loss of principal. Performance returns assume the reinvestment of all distributions.
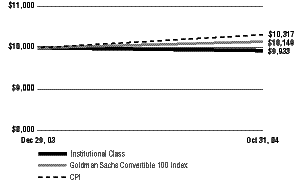
Comparative performance of $10,000 invested in Institutional Class shares of the Gartmore Convertible Fund, Goldman Sachs Convertible 100 Index(a), and the Consumer Price Index (CPI)(b) since inception. Unlike the Fund, the returns for these unmanaged indexes do not reflect any fees, expenses, or sales charges. Investors cannot invest directly in market indexes.
| | |
| (a) | | Goldman Sachs Convertible 100 Index is an unmanaged index with a target of 100 securities, including convertible bonds, preferreds, and mandatory convertible securities. |
| |
| (b) | | The CPI represents changes in prices of a basket of goods and services purchased for consumption by urban households. |
132 Annual Report 2004
Gartmore Convertible Fund
Shareholder
Expense Example
As a shareholder of the Funds, you incur two types of costs: (1) transaction costs, including sales charges (loads) paid on purchase payments and redemption fees; and (2) ongoing costs, including investment advisory fees, administration fees, distribution fees and other Fund expenses. The examples below are intended to help you understand your ongoing costs (in dollars) of investing in the Funds and to compare these costs with the ongoing costs of investing in other mutual funds. The examples assume that you had a $1,000 investment in the Class at the beginning of the reporting period, May 1, 2004, and continued to hold your shares at the end of the reporting period, October 31, 2004. Per SEC requirements, the examples are based on an investment of $1,000 invested at the beginning of the period and held for the entire six-month period ended October 31, 2004.
Actual Expenses
For each Class of the Fund in the table below, the first line provides information about actual account values and actual expenses. You may use the information in this line, together with the amount you invested, to estimate the expenses that you paid over the period. Simply divide your account value by $1,000 (for example, an $8,600 account value divided by $1,000 = 8.6), then multiply the result by the number in the first line of each Class under the heading entitled “Expenses Paid During Period” to estimate the expenses you paid on your account during the period.
Hypothetical Example for Comparison Purposes
The second line of each Class in the table below provides information about hypothetical account values and hypothetical expenses based on the Class’ actual expense ratio and an assumed rate of return of 5% per year before expenses, which is not the Class’ actual return. The hypothetical account values and expenses may not be used to estimate the actual ending account balance or expenses you paid for the period. You may use this information to compare the ongoing costs of investing in the Class of the Fund and other funds. To do so, compare this 5% hypothetical example with the 5% hypothetical examples that appear in the shareholder reports of the other funds.
Please note that the expenses shown in the table are meant to highlight your ongoing costs only and do not reflect any transaction costs, such as sales charges (loads) or redemption fees. Therefore, the second line for each Class in the table is useful in comparing ongoing costs only, and will not help you determine the relative total costs of owning different funds. In addition, if these transaction costs were included, your costs would have been higher. The examples also assume all dividends and distributions have been reinvested.
Schedule of Shareholder Expenses
Expense Analysis of a $1,000 Investment
(October 31, 2004)
| | | | | | | | | | | | | | | | | | | | | | | |
| | | | Beginning | | | Ending | | | | | | | |
| | | | Account Value | | | Account Value | | | Expenses Paid | | | Annualized | | | |
| Convertible Fund | | | | 5/1/04 | | | 10/31/04 | | | During Period* | | | Expense Ratio | | | |
|
|
| Class A | | | Actual | | | $ | 1,000 | | | $ | 999 | | | $ | 6.03 | | | | 1.20% | | | |
| | | | Hypothetical | 1 | | $ | 1,000 | | | $ | 1,019 | | | $ | 6.11 | | | | 1.20% | | | |
|
| Class B | | | Actual | | | $ | 1,000 | | | $ | 994 | | | $ | 9.78 | | | | 1.95% | | | |
| | | | Hypothetical | 1 | | $ | 1,000 | | | $ | 1,015 | | | $ | 9.93 | | | | 1.95% | | | |
|
| Class C | | | Actual | | | $ | 1,000 | | | $ | 996 | | | $ | 9.78 | | | | 1.95% | | | |
| | | | Hypothetical | 1 | | $ | 1,000 | | | $ | 1,015 | | | $ | 9.93 | | | | 1.95% | | | |
|
Class R(a) | | | Actual | | | $ | 1,000 | | | $ | 998 | | | $ | 7.33 | (b) | | | 1.46% | | | |
| | | | Hypothetical | 1 | | $ | 1,000 | | | $ | 1,018 | | | $ | 7.43 | (b) | | | 1.46% | | | |
|
| Institutional Service Class | | | Actual | | | $ | 1,000 | | | $ | 1,001 | | | $ | 4.78 | | | | 0.95% | | | |
| | | | Hypothetical | 1 | | $ | 1,000 | | | $ | 1,020 | | | $ | 4.84 | | | | 0.95% | | | |
|
| Institutional Class | | | Actual | | | $ | 1,000 | | | $ | 1,001 | | | $ | 4.78 | | | | 0.95% | | | |
| | | | Hypothetical | 1 | | $ | 1,000 | | | $ | 1,020 | | | $ | 4.84 | | | | 0.95% | | | |
|
| | |
| * | | Expenses are equal to the Fund’s annualized expense ratio multiplied by the average account value over the period multiplied by 182/366 (to reflect the one-half year period). |
| |
| 1 | Represents the hypothetical 5% annual return before expenses. |
| | |
| (a) | | For the period from May 14, 2004 (commencement of operations) through October 31, 2004. |
| |
| (b) | | Expenses are equal to the Fund’s annualized expense ratio multiplied by the average account value over the period multiplied by 170/366 (to reflect the period). |
2004 Annual Report 133
Gartmore Convertible Fund
Concept Series
| |
| | Portfolio Summary |
| | (October 31, 2004) |
The SEC adopted a requirement that Funds present their portfolio holdings in a table, chart or graph format in their annual and semiannual reports to shareholders, whether or not a schedule of investments is utilized. The following tables, which present portfolio holdings as a percentage of net assets, are provided in compliance with this requirement.
| | | | | | | |
| Asset Allocation | | | | |
|
|
| Convertible Bonds | | | 64.9% | | | |
| Convertible Preferred Stock | | | 27.6% | | | |
| Corporate Bonds | | | 2.3% | | | |
| Repurchase Agreement | | | 6.6% | | | |
| Other Liabilities in excess of Assets | | | -1.4% | | | |
| | |
| | | |
| | | | 100.0% | | | |
| | | | | | | |
| Top Industries | | | | |
|
|
| Oil & Gas | | | 12.3% | | | |
| Insurance | | | 9.2% | | | |
| Banks | | | 6.6% | | | |
| Retail | | | 5.7% | | | |
| Auto Parts & Equipment | | | 5.5% | | | |
| Paper & Related Products | | | 4.8% | | | |
| Pharmaceuticals | | | 4.1% | | | |
| Manufacturing | | | 3.3% | | | |
| Aerospace & Defense | | | 2.7% | | | |
| Hotels & Motels | | | 2.4% | | | |
| Other Industries | | | 43.4% | | | |
| | |
| | | |
| | | | 100.0% | | | |
| | | | | | | |
| Top Holdings | | | | |
|
|
| Sealed Air Corp. | | | 2.9% | | | |
| Cooper Cameron Corp. | | | 2.8% | | | |
| Sovereign Cap Trust IV | | | 2.6% | | | |
| Schlumberger Ltd. | | | 2.5% | | | |
| Titan International, Inc. | | | 2.5% | | | |
| Teva Pharmaceutical | | | 2.5% | | | |
| Hilton Hotels Corp. | | | 2.4% | | | |
| Centerpointe Energy, Inc. | | | 2.3% | | | |
| Simon Property Group LP | | | 2.3% | | | |
| General Motors Corp. | | | 2.3% | | | |
| Other Holdings | | | 74.9% | | | |
| | |
| | | |
| | | | 100.0% | | | |
134 Annual Report 2004
Gartmore Convertible Fund
Statement of Investments
October 31, 2004
Gartmore Convertible Fund
| | | | | | | | | | | |
|
| Convertible Bonds (64.9%) |
|
| | Shares or | | | |
| | Principal Amount | | | Value | | | |
|
| Aerospace/ Defense (1.0%) |
| Armor Holdings, Inc., 2.00%, 11/01/24 | | $ | 350,000 | | | $ | 345,188 | | | |
| | | | | |
| | | |
| |
|
| Apparel Manufacturing (1.8%) |
| Kellwood Co., 3.50%, 06/15/34 (b) | | | 650,000 | | | | 623,188 | | | |
| | | | | |
| | | |
| |
|
| Auto Parts & Equipment (5.5%) |
| Amer Axle & Manufacturing, Inc., 2.00%, 02/15/24 | | | 600,000 | | | | 529,500 | | | |
| Amer Axle & Manufacturing, Inc., 2.00%, 02/15/24 (b) | | | 300,000 | | | | 264,750 | | | |
| Titan International, Inc., 5.25%, 07/26/09 (b) | | | 850,000 | | | | 879,750 | | | |
| Tower Automotive, Inc., 5.75%, 07/26/09 (b) | | | 500,000 | | | | 241,875 | | | |
| | | | | |
| | | |
| |
| | | | | | | | 1,915,875 | | | |
| | | | | |
| | | |
| |
|
| Banks (2.3%) |
| Bankunited Capital Trust, 3.13%, 03/01/34 (b) | | | 400,000 | | | | 408,500 | | | |
| Bankunited Capital Trust, 3.13%, 03/01/34 | | | 400,000 | | | | 408,500 | | | |
| | | | | |
| | | |
| |
| | | | | | | | 817,000 | | | |
| | | | | |
| | | |
| |
|
| Batteries/ Battery Systems (1.8%) |
| Wilson Greatbatch Tech, 2.25%, 06/15/13 | | | 775,000 | | | | 639,375 | | | |
| | | | | |
| | | |
| |
|
| Broadcasting (1.9%) |
| Liberty Media Corp., 3.25%, 03/15/31 | | | 710,000 | | | | 661,188 | | | |
| | | | | |
| | | |
| |
|
| Computer Services (1.7%) |
| Electronic Data Systems, 3.88%, 07/15/23 | | | 580,000 | | | | 590,150 | | | |
| | | | | |
| | | |
| |
|
| Computer Software (1.5%) |
| Bell Microproducts, Inc., 3.75%, 03/05/24 | | | 500,000 | | | | 520,000 | | | |
| | | | | |
| | | |
| |
|
| Credit Card Services (1.5%) |
| American Express Credit Corp., 1.85%, 12/01/33 | | | 500,000 | | | | 531,875 | | | |
| | | | | |
| | | |
| |
|
| Electronic Components/ Semiconductors (1.5%) |
| Advanced Micro Devices, 4.75%, 02/01/22 | | | 500,000 | | | | 512,500 | | | |
| | | | | |
| | | |
| |
|
| Engineering (1.8%) |
| Fluor Corp., 1.50%, 02/15/24 | | | 600,000 | | | | 627,000 | | | |
| | | | | |
| | | |
| |
|
| Financial Services (1.1%) |
| Goldman Sachs Group, Inc., 1.50%, 07/23/09 | | | 400,000 | | | | 394,764 | | | |
| | | | | |
| | | |
| |
|
| Grocery Stores (0.9%) |
| Wild Oats Markets, Inc., 3.25%, 05/15/34 (b) | | | 380,000 | | | | 304,475 | | | |
| | | | | |
| | | |
| |
|
| Hotels & Motels (2.4%) |
| Hilton Hotels Corp., 3.38%, 04/15/23 | | $ | 750,000 | | | | 843,750 | | | |
| | | | | |
| | | |
| |
|
| Insurance (2.2%) |
| Leucadia National Corp., 3.75%, 04/15/14 (b) | | | 700,000 | | | | 778,750 | | | |
| | | | | |
| | | |
| |
|
| Machinery (1.9%) |
| Regal Beloit Corp., 2.75%, 03/15/24 (b) | | | 600,000 | | | | 663,750 | | | |
| | | | | |
| | | |
| |
|
| Manufacturing (3.3%) |
| 3M Company, 0.18%, 11/21/32 | | | 600,000 | | | | 532,500 | | | |
| Quanex Corp., 2.50%, 05/15/34 (b) | | | 570,000 | | | | 632,700 | | | |
| | | | | |
| | | |
| |
| | | | | | | | 1,165,200 | | | |
| | | | | |
| | | |
| |
|
| Multimedia (2.1%) |
| Walt Disney Co., 2.13%, 04/15/23 | | | 700,000 | | | | 749,000 | | | |
| | | | | |
| | | |
| |
|
| Oil & Gas (11.0%) |
| Cooper Cameron Corp., 1.50%, 05/15/24 | | | 980,000 | | | | 998,374 | | | |
| Grey Wolf, Inc., 3.75%, 05/07/23 | | | 300,000 | | | | 306,000 | | | |
| Nabors Industries, Inc., 1.03%, 06/15/23 | | | 700,000 | | | | 674,625 | | | |
| Pride International, Inc., 3.25%, 05/01/33 (b) | | | 450,000 | | | | 475,875 | | | |
| Pride International, Inc., 3.25%, 05/01/33 | | | 500,000 | | | | 528,750 | | | |
| Schlumberger Ltd., 2.13%, 06/01/23 | | | 840,000 | | | | 889,350 | | | |
| | | | | |
| | | |
| |
| | | | | | | | 3,872,974 | | | |
| | | | | |
| | | |
| |
|
| Paper & Related Products (2.9%) |
| Sealed Air Corp., 3.00%, 06/30/33 (b) | | | 1,000,000 | | | | 1,017,500 | | | |
| | | | | |
| | | |
| |
|
| Pharmaceuticals (4.1%) |
| Teva Pharmaceutical, 0.94%, 02/01/24 | | | 900,000 | | | | 868,500 | | | |
| Watson Pharmaceuticals, 1.75%, 03/15/23 | | | 600,000 | | | | 583,500 | | | |
| | | | | |
| | | |
| |
| | | | | | | | 1,452,000 | | | |
| | | | | |
| | | |
| |
|
| Retail (5.7%) |
| Mens Wearhouse, 3.13%, 10/15/23 | | | 700,000 | | | | 709,624 | | | |
| Reebok International Ltd., 2.00%, 05/01/24 (b) | | | 600,000 | | | | 611,250 | | | |
| Saks, Inc., 2.00%, 03/15/24 | | | 760,000 | | | | 668,800 | | | |
| | | | | |
| | | |
| |
| | | | | | | | 1,989,674 | | | |
| | | | | |
| | | |
| |
|
| Telecommunication Equipment (2.4%) |
| ADC Telecommunications, 2.24%, 06/15/13 (c) | | | 465,000 | | | | 441,169 | | | |
| Primus Telecom Group, 5.75%, 02/15/07 | | | 535,000 | | | | 414,625 | | | |
| | | | | |
| | | |
| |
| | | | | | | | 855,794 | | | |
| | | | | |
| | | |
| |
|
| Transportation Leasing & Trucking (1.6%) |
| United Rentals NA, Inc., 1.88%, 10/15/23 | | | 600,000 | | | | 545,250 | | | |
| | | | | |
| | | |
2004 Annual Report 135
| |
| | Statement of Investments (Continued) |
| | October 31, 2004 |
Gartmore Convertible Fund (Continued)
Concept Series
| | | | | | | | | | | |
|
| Convertible Bonds (continued) |
|
| | Shares or | | | |
| | Principal Amount | | | Value | | | |
|
| Wireless Equipment (1.0%) |
| American Tower Corp., 3.00%, 08/15/12 (b) | | $ | 330,000 | | | $ | 351,038 | | | |
| | | | | |
| | | |
| |
| Total Convertible Bonds | | | 22,767,258 | | | |
| | | | | |
| | | |
| |
Corporate Bonds (2.3%) |
| Auto Manufacturing (2.3%) |
| General Motors Corp., 6.25%, 07/15/33 | | | 30,000 | | | | 806,400 | | | |
| | | | | |
| | | |
| |
| Total Corporate Bonds | | | 806,400 | | | |
| | | | | |
| | | |
| |
Convertible Preferred Stocks (27.6%) |
| Aerospace & Defense (2.7%) |
| Northrop Grumman Corp, 7.00% | | | 3,300 | | | | 426,113 | | | |
| Northrop Grumman Corp, 7.25% | | | 5,000 | | | | 510,625 | | | |
| | | | | |
| | | |
| |
| | | | | | | | 936,738 | | | |
| | | | | |
| | | |
| |
|
| Banks (4.3%) |
| Sovereign Cap Trust IV, 4.38% | | | 18,900 | | | | 895,388 | | | |
| Washington Mutual, Inc, 5.38% | | | 11,000 | | | | 588,500 | | | |
| | | | | |
| | | |
| |
| | | | | | | | 1,483,888 | | | |
| | | | | |
| | | |
| |
|
| Energy (2.3%) |
| Centerpointe Energy, Inc, 2.00% | | | 24,400 | | | | 822,182 | | | |
| | | | | |
| | | |
| |
|
| Healthcare Services (2.0%) |
| McKesson Financing Trust, 5.00% | | | 14,500 | | | | 714,125 | | | |
| | | | | |
| | | |
| |
|
| Insurance (7.0%) |
| Genworth Financial, Inc, 6.00% | | | 11,000 | | | | 322,080 | | | |
| Platinum Underwriters, 7.00% | | | 25,000 | | | | 724,999 | | | |
| PMI Group, Inc., 5.88% | | | 28,400 | | | | 710,000 | | | |
| Reinsurance Group of America, Inc., 5.75% | | | 11,700 | | | | 677,138 | | | |
| | | | | |
| | | |
| |
| | | | | | | | 2,434,217 | | | |
| | | | | |
| | | |
| |
|
| Metals (1.3%) |
| Freeport Corp., 5.50% (b) | | | 480 | | | | 453,600 | | | |
| | | | | |
| | | |
| |
|
| Oil & Gas (1.3%) |
| Chesapeake Energy Corp., 5.00% | | | 4,000 | | | | 466,000 | | | |
| | | | | |
| | | |
| |
|
| Paper Products (1.9%) |
| International Paper Co., 5.25% | | $ | 13,000 | | | | 654,875 | | | |
| | | | | |
| | | |
| |
|
| Real Estate Investment Trusts (2.3%) |
| Simon Property Group LP, 6.00% | | | 15,000 | | | | 815,550 | | | |
| | | | | |
| | | |
| |
|
| Rental Auto/ Equipment (1.2%) |
| United Rentals Trust I, 6.50% | | | 10,900 | | | | 419,650 | | | |
| | | | | |
| | | |
| |
|
| Telecommunications (1.3%) |
| Centurytel, Inc, 6.88% | | | 18,600 | | | | 467,790 | | | |
| | | | | |
| | | |
| |
| Total Convertible Preferred Stocks | | | 9,668,615 | | | |
| | | | | |
| | | |
| |
Repurchase Agreements (6.6%) |
CS First Boston, 1.75%, dated 10/29/04, due 11/1/04, repurchase price $967,565
(Fully collateralized by AA Rated Treasury Notes and U.S. Agency Securities) | | | 967,515 | | | | 967,515 | | | |
Nomura Securities, 1.75%, dated 10/29/04, due 11/1/04, repurchase price $1,351,926
(Fully collateralized by U.S. Agency Securities and AA Rated Corporate Bonds) | | | 1,351,853 | | | | 1,351,853 | | | |
| | | | | |
| | | |
| |
| Total Repurchase Agreements | | | 2,319,368 | | | |
| | | | | |
| | | |
| |
| Total Investments (Cost $35,737,875) (a) — 101.4% | | | 35,561,641 | | | |
| Liabilities in excess of other assets — (1.4)% | | | (498,893) | | | |
| | | | | |
| | | |
| |
| NET ASSETS — 100.0% | | $ | 35,062,748 | | | |
| | | | | |
| | | |
| | |
| (a) | | See notes to financial statements for tax unrealized appreciation (depreciation) of securities. |
| |
| (b) | | Rule 144A, Section 4(2), or other security, which is restricted as to resale to institutional investors. The security has been deemed liquid pursuant to procedures approved by the Board of Trustees. |
| |
| (c) | | Variable rate security. The rate reflected in the Statement of Investments is the rate reflected in effect on October 31, 2004. |
See notes to financial statements.
136 Annual Report 2004
Concept Series
| |
| | Gartmore Small Cap Growth Fund |
From its inception on March 30, 2004, through Oct. 31, 2004, the Gartmore Small Cap Growth Fund returned –8.30% (Class A at NAV), versus –3.39% for the Fund’s benchmark, the Russell 2000® Growth Index. For broader comparison, the average return for the Fund’s Lipper peer category of Small-Cap Growth Funds was 0.21%.
During the reporting period, we were able to add value in the health-care and energy sectors. One of the Fund’s positive performing stocks was in health care sector- a biotechnology holding Pharmion Corp., whose stock surged higher on the news that the company’s drug for bone marrow disorders, Vidaza, was approved by the Food and Drug Administration. Cooper Companies, Inc. also aided performance, reporting strong earnings for its fiscal third quarter ended July 31, 2004; the company cited robust sales in its contact lens division as a driving force. An overweighting by the Fund in energy helped Fund performance, as rising crude oil and natural gas prices enabled many energy companies to generate healthy cash flows. Among the Fund’s contributors was Chesapeake Energy Corp., an oil and gas exploration and production company with major properties located primarily in the southern and midcontinental United States. Also boosting Fund performance was Tesoro Petroleum Corp., which benefited from favorable refining margins, as well as OMI Corp. and Teekay Shipping Corp. are two crude oil shipping companies that also performed well during the period.
Stock selection in the information technology sector was the main detractor from performance. With the economy in recovery mode and employment finally beginning to see meaningful growth in the spring, we believed that capital spending for semiconductors and software would soon accelerate. Capital spending, however, for both groups remained muted, allowing semiconductor inventories to build and driving chip prices lower. Amkor Technology, Inc., a maker of semiconductor capital equipment, was one stock in the group that hurt Fund performance. Another Fund holding, Maxtor Corp., a manufacturer of data storage equipment, encountered similar turbulence due to weak pricing and slack demand. Citadel Security Software, Inc., which markets software to the U.S. government’s Department of Defense, fell due to lower-than-expected orders for its products. Also, detracting from the Fund’s performance was stock selection in the financial sector; specifically Commercial Capital Bancorp, Inc. and Freemont General Corp.
Looking ahead, we think that the U.S. economy could grow at a modest but still healthy rate in 2005, which should benefit the market overall and technology in particular. Accordingly, in October we increased the Fund’s technology exposure to an overweighted position from a significant underweighting. Also contributing to our optimism—at least for the short term—is the fact that we are entering a seasonally favorable time of year for stocks overall and for small caps in particular. Conversely, we have trimmed the Fund’s energy exposure, because we think that many stocks in the sector have become richly valued, and crude oil prices could have some further downside risk. Finally, we have moderated the Fund’s underweighting in the consumer discretionary sector, adding a few names that we think could benefit from the holiday shopping season, such as Circuit City Stores, Inc.; Claire’s Stores, Inc.; and Pacific Sunwear of California, Inc.
Portfolio Manager: Gil Knight
| |
| | Class A: GTGAX |
| | Class B: GTGBX |
| | Class C: GTGCX |
| | Class R: GTGRX |
| | Institutional Service Class: GSSVX |
| | Institutional Class: GTGIX |
2004 Annual Report 137
Concept Series
Gartmore Small Cap Growth Fund
Aggregate Total Return
(For periods ended October 31, 2004)
| | | | | | | |
| | | | Inception1 | |
|
| |
| Class A | | without sales charge2 | | | -8.30% | |
| | | with sales charge3 | | | -13.57% | |
|
| Class B | | without sales charge2 | | | -8.60% | |
| | | with sales charge4 | | | -13.17% | |
|
| Class C | | without sales charge2 | | | -8.60% | |
| | | with sales charge5 | | | -9.51% | |
|
| Class R6 | | | -8.40% | |
|
| Institutional Service Class6 | | | -8.10% | |
|
| Institutional Class6 | | | -8.10% | |
|
All figures showing the effect of a sales charge reflect the maximum charge possible, because it has the most dramatic effect on performance data.
| |
| 1 | Fund commenced operations on March 30, 2004. |
| |
| 2 | These returns do not reflect the effects of sales charges (SC). |
| |
| 3 | A 5.75% front-end sales charge was deducted. |
| |
| 4 | A 5.00% contingent deferred sales charge (CDSC) was deducted. The CDSC declines to 0% after 6 years. |
| |
| 5 | A CDSC of 1.00% was deducted because it is charged when you sell Class C shares within the first year after purchase. |
| |
| 6 | Not subject to any sales charges. |
Performance of a $10,000 Investment
Investment return and principal value will fluctuate, and when redeemed, shares may be worth more or less than original cost. Past performance is no guarantee of future results and does not reflect the deduction of taxes that a shareholder would pay on fund distributions or the redemption of fund shares. Investing in mutual funds involves market risk, including loss of principal. Performance returns assume the reinvestment of all distributions.

Comparative performance of $10,000 invested in Class A shares of the Gartmore Small Cap Growth Fund, Russell 2000 Growth Index(a), and the Consumer Price Index (CPI)(b) since inception. Unlike the Fund, the returns for these unmanaged indexes do not reflect any fees, expenses, or sales charges. Investors cannot invest directly in market indexes.
| | |
| (a) | | The Russell 2000 Growth Index is an unmanaged index of securities of small capitalization companies. |
| |
| (b) | | The CPI represents changes in prices of a basket of goods and services purchased for consumption by urban households. |
138 Annual Report 2004
Gartmore Small Cap Growth Fund
Shareholder
Expense Example
As a shareholder of the Funds, you incur two types of costs: (1) transaction costs, including sales charges (loads) paid on purchase payments and redemption fees; and (2) ongoing costs, including investment advisory fees, administration fees, distribution fees and other Fund expenses. The examples below are intended to help you understand your ongoing costs (in dollars) of investing in the Funds and to compare these costs with the ongoing costs of investing in other mutual funds. The examples assume that you had a $1,000 investment in the Class at the beginning of the reporting period, May 1, 2004, and continued to hold your shares at the end of the reporting period, October 31, 2004. Per SEC requirements, the examples are based on an investment of $1,000 invested at the beginning of the period and held for the entire six-month period ended October 31, 2004.
Actual Expenses
For each Class of the Fund in the table below, the first line provides information about actual account values and actual expenses. You may use the information in this line, together with the amount you invested, to estimate the expenses that you paid over the period. Simply divide your account value by $1,000 (for example, an $8,600 account value divided by $1,000 = 8.6), then multiply the result by the number in the first line of each Class under the heading entitled “Expenses Paid During Period” to estimate the expenses you paid on your account during the period.
Hypothetical Example for Comparison Purposes
The second line of each Class in the table below provides information about hypothetical account values and hypothetical expenses based on the Class’ actual expense ratio and an assumed rate of return of 5% per year before expenses, which is not the Class’ actual return. The hypothetical account values and expenses may not be used to estimate the actual ending account balance or expenses you paid for the period. You may use this information to compare the ongoing costs of investing in the Class of the Fund and other funds. To do so, compare this 5% hypothetical example with the 5% hypothetical examples that appear in the shareholder reports of the other funds.
Please note that the expenses shown in the table are meant to highlight your ongoing costs only and do not reflect any transaction costs, such as sales charges (loads) or redemption fees. Therefore, the second line for each Class in the table is useful in comparing ongoing costs only, and will not help you determine the relative total costs of owning different funds. In addition, if these transaction costs were included, your costs would have been higher. The examples also assume all dividends and distributions have been reinvested.
Schedule of Shareholder Expenses
Expense Analysis of a $1,000 Investment
(October 31, 2004)
| | | | | | | | | | | | | | | | | | | | | | | |
| | | | Beginning | | | Ending | | | | | | | |
| | | | Account Value | | | Account Value | | | Expenses Paid | | | Annualized | | | |
| Small Cap Growth Fund | | | | 5/1/04 | | | 10/31/04 | | | During Period* | | | Expense Ratio | | | |
|
|
| Class A | | | Actual | | | $ | 1,000 | | | $ | 997 | | | $ | 8.48 | | | | 1.69% | | | |
| | | | Hypothetical | 1 | | $ | 1,000 | | | $ | 1,017 | | | $ | 8.60 | | | | 1.69% | | | |
|
| Class B | | | Actual | | | $ | 1,000 | | | $ | 995 | | | $ | 11.83 | | | | 2.36% | | | |
| | | | Hypothetical | 1 | | $ | 1,000 | | | $ | 1,013 | | | $ | 12.01 | | | | 2.36% | | | |
|
| Class C | | | Actual | | | $ | 1,000 | | | $ | 995 | | | $ | 11.73 | | | | 2.34% | | | |
| | | | Hypothetical | 1 | | $ | 1,000 | | | $ | 1,013 | | | $ | 11.91 | | | | 2.34% | | | |
|
| Class R | | | Actual | | | $ | 1,000 | | | $ | 996 | | | $ | 8.88 | | | | 1.77% | | | |
| | | | Hypothetical | 1 | | $ | 1,000 | | | $ | 1,016 | | | $ | 9.01 | | | | 1.77% | | | |
|
| Institutional Service Class | | | Actual | | | $ | 1,000 | | | $ | 999 | | | $ | 6.28 | | | | 1.25% | | | |
| | | | Hypothetical | 1 | | $ | 1,000 | | | $ | 1,019 | | | $ | 6.36 | | | | 1.25% | | | |
|
| Institutional Class | | | Actual | | | $ | 1,000 | | | $ | 999 | | | $ | 6.88 | | | | 1.37% | | | |
| | | | Hypothetical | 1 | | $ | 1,000 | | | $ | 1,018 | | | $ | 6.97 | | | | 1.37% | | | |
|
| |
| * | Expenses are equal to the Fund’s annualized expense ratio multiplied by the average account value over the period multiplied by 182/366 (to reflect the one-half year period). |
1 Represents the hypothetical 5% annual return before expenses.
2004 Annual Report 139
Gartmore Small Cap Growth Fund
Concept Series
| |
| | Portfolio Summary |
| | (October 31, 2004) |
The SEC adopted a requirement that Funds present their portfolio holdings in a table, chart or graph format in their annual and semiannual reports to shareholders, whether or not a schedule of investments is utilized. The following tables, which present portfolio holdings as a percentage of net assets, are provided in compliance with this requirement.
| | | | | | | |
| Asset Allocation | | | | |
|
|
| Common Stocks | | | 81.1% | | | |
| Repurchase Agreement | | | 17.5% | | | |
| Other Assets in excess of Liabilities | | | 1.4% | | | |
| | |
| | | |
| | | | 100.0% | | | |
| | | | | | | |
| Top Industries | | | | |
|
|
| Semiconductors | | | 11.6% | | | |
| Business Software & Services | | | 7.1% | | | |
| Wireless Equipment | | | 5.4% | | | |
| Pharmaceuticals | | | 5.2% | | | |
| Internet Services | | | 4.8% | | | |
| Medical Equipment & Supplies | | | 4.1% | | | |
| Retail | | | 4.0% | | | |
| Veterinary Diagnostics | | | 3.1% | | | |
| Manufacturing | | | 2.9% | | | |
| Transportation | | | 2.9% | | | |
| Other Industries | | | 48.9% | | | |
| | |
| | | |
| | | | 100.0% | | | |
| | | | | | | |
| Top Holdings | | | | |
|
|
| Genitope Corp. | | | 2.6% | | | |
| Charles River Associates, Inc. | | | 2.4% | | | |
| VCA Antech, Inc. | | | 1.9% | | | |
| Joy Global, Inc. | | | 1.8% | | | |
| Nobility Homes Inc. | | | 1.7% | | | |
| Gen-Probe, Inc. | | | 1.7% | | | |
| Lions Gate Entertainment Corp. | | | 1.7% | | | |
| Syneron Medical Ltd. | | | 1.7% | | | |
| Circuit City Stores, Inc. | | | 1.7% | | | |
| First Horizon Pharmaceutical Corp. | | | 1.7% | | | |
| Other Holdings | | | 81.1% | | | |
| | |
| | | |
| | | | 100.0% | | | |
140 Annual Report 2004
Statement of Investments
October 31, 2004
Gartmore Small Cap Growth Fund
| | | | | | | | | | | |
|
| Common Stocks (81.1%) |
|
| | Shares or | | | |
| | Principal Amount | | | Value | | | |
|
| Aerospace/ Defense (0.8%) |
| Curtiss-Wright Corp. | | | 400 | | | $ | 22,324 | | | |
| | | | | |
| | | |
| |
|
| Banking (1.4%) |
| Colonial BancGroup, Inc. | | | 1,800 | | | | 38,970 | | | |
| | | | | |
| | | |
| |
|
| Biological Products (2.6%) |
| Genitope Corp. (b) | | | 6,100 | | | | 72,346 | | | |
| | | | | |
| | | |
| |
|
| Building Products (1.5%) |
| Florida Rock Industries, Inc. | | | 800 | | | | 41,320 | | | |
| | | | | |
| | | |
| |
|
| Business Software & Services (7.1%) |
| Business Objectives SA-ADR - FR (b) | | | 1,400 | | | | 35,728 | | | |
| Extreme Networks, Inc. (b) | | | 6,200 | | | | 36,270 | | | |
| Marlin Business Services, Inc. (b) | | | 1,500 | | | | 26,438 | | | |
| Satyam Computer Services Ltd.-ADR - IN | | | 1,400 | | | | 36,778 | | | |
| Transaction Systems Architects, Inc., Class A (b) | | | 2,400 | | | | 39,347 | | | |
| Ultimate Software Group, Inc. (b) | | | 2,100 | | | | 27,017 | | | |
| | | | | |
| | | |
| |
| | | | | | | | 201,578 | | | |
| | | | | |
| | | |
| |
|
| Commercial Services (1.5%) |
| Jackson Hewitt Tax Service, Inc. | | | 2,000 | | | | 42,000 | | | |
| | | | | |
| | | |
| |
|
| Computer Software & Services (2.8%) |
| Compuware Corp. (b) | | | 6,700 | | | | 38,793 | | | |
| Novell, Inc. (b) | | | 5,600 | | | | 40,264 | | | |
| | | | | |
| | | |
| |
| | | | | | | | 79,057 | | | |
| | | | | |
| | | |
| |
|
| Electronics (1.5%) |
| Integrated Silicon Solution, Inc. (b) | | | 5,600 | | | | 42,056 | | | |
| | | | | |
| | | |
| |
|
| Entertainment (1.7%) |
| Lions Gate Entertainment Corp. (b) | | | 5,000 | | | | 49,050 | | | |
| | | | | |
| | | |
| |
|
| Identification Systems/ Devices (1.5%) |
| Cogent, Inc. (b) | | | 2,200 | | | | 42,095 | | | |
| | | | | |
| | | |
| |
|
| Industrial Supplies (1.3%) |
| MSC Industrial Direct Co., Class A | | | 1,100 | | | | 37,554 | | | |
| | | | | |
| | | |
| |
|
| Internet Services (4.8%) |
| Covansys Corp. (b) | | | 3,400 | | | | 39,168 | | | |
| FindWhat.com (b) | | | 1,600 | | | | 32,080 | | | |
| Jupiter Media Corp. (b) | | | 1,700 | | | | 33,720 | | | |
Shanda Interactive Entertainment
Ltd.-ADR - KY (b) | | | 1,000 | | | | 30,389 | | | |
| | | | | |
| | | |
| |
| | | | | | | | 135,357 | | | |
| | | | | |
| | | |
| |
|
| Management Services (2.4%) |
| Charles River Associates, Inc. (b) | | | 1,700 | | | | 68,306 | | | |
| | | | | |
| | | |
| |
|
| Manufactured Homes (1.7%) |
| Nobility Homes, Inc. | | | 2,500 | | | | 49,300 | | | |
| | | | | |
| | | |
| |
|
| Manufacturing (2.9%) |
| Engineered Support Systems, Inc. | | | 700 | | | | 33,628 | | | |
| Gen-Probe, Inc. (b) | | | 1,400 | | | | 49,056 | | | |
| | | | | |
| | | |
| |
| | | | | | | | 82,684 | | | |
| | | | | |
| | | |
| |
|
| Medical Equipment & Supplies (4.1%) |
| Intralase Corp. (b) | | | 1,400 | | | | 26,922 | | | |
| Intuitive Surgical, Inc. (b) | | | 1,400 | | | | 40,852 | | | |
| Syneron Medical Ltd. (b) | | | 2,500 | | | | 48,125 | | | |
| | | | | |
| | | |
| |
| | | | | | | | 115,899 | | | |
| | | | | |
| | | |
| |
|
| Mining Equipment (1.8%) |
| Joy Global, Inc. | | | 1,500 | | | | 50,685 | | | |
| | | | | |
| | | |
| |
|
| Oil & Gas (2.3%) |
| National-Oilwell, Inc. (b) | | | 1,200 | | | | 40,452 | | | |
| Ultra Petroleum Corp. (b) | | | 500 | | | | 24,300 | | | |
| | | | | |
| | | |
| |
| | | | | | | | 64,752 | | | |
| | | | | |
| | | |
| |
|
| Pharmaceuticals (5.2%) |
| First Horizon Pharmaceutical Corp. (b) | | | 1,900 | | | | 46,702 | | | |
| Medarex, Inc. (b) | | | 4,400 | | | | 33,484 | | | |
| Myogen, Inc. (b) | | | 3,500 | | | | 30,345 | | | |
| QLT, Inc. (b) | | | 2,200 | | | | 36,630 | | | |
| | | | | |
| | | |
| |
| | | | | | | | 147,161 | | | |
| | | | | |
| | | |
| |
|
| Physical Therapy & Rehabilitation Centers (1.0%) |
| U.S. Physical Therapy, Inc. (b) | | | 1,800 | | | | 27,180 | | | |
| | | | | |
| | | |
| |
|
| Real Estate Investment Trusts (0.9%) |
| Host Marriott Corp. (b) | | | 1,800 | | | | 26,190 | | | |
| | | | | |
| | | |
| |
|
| Retail (4.0%) |
| Circuit City Stores, Inc. | | | 2,900 | | | | 47,125 | | | |
| Hot Topic, Inc. (b) | | | 1,200 | | | | 24,672 | | | |
| Pacific Sunwear of California, Inc. (b) | | | 1,700 | | | | 39,848 | | | |
| | | | | |
| | | |
| |
| | | | | | | | 111,645 | | | |
| | | | | |
| | | |
| |
|
| Semiconductors (11.6%) |
| Axcelis Technologies, Inc. (b) | | | 2,900 | | | | 24,940 | | | |
| Broadcom Corp., Class A (b) | | | 1,300 | | | | 35,165 | | | |
| Fairchild Semiconductor International, Inc. (b) | | | 2,800 | | | | 40,235 | | | |
| Integrated Circuit Systems, Inc. (b) | | | 1,600 | | | | 36,080 | | | |
| Intersil Corp., Class A | | | 2,200 | | | | 35,904 | | | |
| Marvel Technology Group Ltd. (b) | | | 1,400 | | | | 39,998 | | | |
| Mykrolis Corp. (b) | | | 3,400 | | | | 35,734 | | | |
| Silicon Image, Inc. (b) | | | 2,700 | | | | 36,990 | | | |
| Stmicroelectronics NV-ADR - NL | | | 2,100 | | | | 38,871 | | | |
| | | | | |
| | | |
| |
| | | | | | | | 323,917 | | | |
| | | | | |
| | | |
2004 Annual Report 141
| |
| | Statement of Investments (Continued) |
| | October 31, 2004 |
Gartmore Small Cap Growth Fund (Continued)
Concept Series
| | | | | | | | | | | |
|
| Common Stocks (continued) |
|
| | Shares or | | | |
| | Principal Amount | | | Value | | | |
|
| Steel (1.3%) |
| Steel Dynamics, Inc. | | | 1,100 | | | $ | 36,520 | | | |
| | | | | |
| | | |
| |
|
| Technology (0.8%) |
| Plexus Corp. (b) | | | 1,900 | | | | 23,541 | | | |
| | | | | |
| | | |
| |
|
| Transportation (2.9%) |
| Overnite Corp. | | | 1,100 | | | | 35,596 | | | |
| Top Tankers, Inc (b) | | | 2,700 | | | | 46,170 | | | |
| | | | | |
| | | |
| |
| | | | | | | | 81,766 | | | |
| | | | | |
| | | |
| |
|
| Utilities (1.2%) |
| Sierra Pacific Resources (b) | | | 3,500 | | | | 33,600 | | | |
| | | | | |
| | | |
| |
|
| Veterinary Diagnostics (3.1%) |
| IDEXX Laboratories, Inc. (b) | | | 700 | | | | 34,888 | | | |
| VCA Antech, Inc. (b) | | | 2,400 | | | | 53,808 | | | |
| | | | | |
| | | |
| |
| | | | | | | | 88,696 | | | |
| | | | | |
| | | |
| |
|
| Wireless Equipment (5.4%) |
| Alvarion Ltd. (b) | | | 2,600 | | | | 34,840 | | | |
| American Tower Corp., Class A (b) | | | 2,100 | | | | 36,099 | | | |
| RF Micro Devices, Inc. (b) | | | 5,900 | | | | 38,409 | | | |
| Tessco Technologies, Inc. (b) | | | 3,400 | | | | 43,690 | | | |
| | | | | |
| | | |
| |
| | | | | | | | 153,038 | | | |
| | | | | |
| | | |
| |
| Total Common Stocks | | | 2,288,587 | | | |
| | | | | |
| | | |
| |
Repurchase Agreements (17.5%) |
| | | | | | | | | | | |
|
| Repurchase Agreements (17.5%) |
|
| | Shares or | | | |
| | Principal Amount | | | Value | | | |
|
|
CS First Boston, 1.75%, dated 10/29/04, due 11/1/04, repurchase price $205,493
(Fully collateralized by Treasury Notes and U.S. Agency Securities) | | $ | 205,482 | | | $ | 205,482 | | | |
Nomura Securities, 1.75%, dated 10/29/04, due 11/1/04, repurchase price $287,123
(Fully collateralized by U.S. Agency Securities and AA Rated Corporate Bonds) | | | 287,108 | | | | 287,108 | | | |
| | | | | |
| | | |
| |
| Total Repurchase Agreements | | | 492,590 | | | |
| | | | | |
| | | |
| |
| Total Investments (Cost $2,724,467) (a) — 98.6% | | | 2,781,177 | | | |
| Other assets in excess of liabilities — 1.4% | | | 39,697 | | | |
| | | | | |
| | | |
| |
| NET ASSETS — 100.0% | | $ | 2,820,874 | | | |
| | | | | |
| | | |
| | |
| (a) | | See notes to financial statements for tax unrealized appreciation (depreciation) of securities. |
| |
| (b) | | Non-income producing securities. |
ADR American Depositary Receipt
FR France
KY Cayman Islands
IN India
NL Netherlands
See notes to financial statements.
142 Annual Report 2004
Statements of Assets and Liabilities
October 31, 2004
| | | | | | | | | | | | | | | |
| | Gartmore High | | | Gartmore Value | | | Gartmore Micro | |
| | Yield Bond Fund | | | Opportunities Fund | | | Cap Equity Fund | |
|
|
| |
Assets: | | | | | | | | | | | | |
| Investments, at value (cost $21,044,859; $34,339,376 and $107,845,301; respectively) | | $ | 22,224,234 | | | $ | 37,287,198 | | | $ | 117,005,175 | |
| Repurchase agreements, at cost | | | 2,265,624 | | | | 202,657 | | | | 10,342,433 | |
| | |
| |
| |
| |
| | | Total Investments | | | 24,489,858 | | | | 37,489,855 | | | | 127,347,608 | |
| | |
| |
| |
| |
| Cash | | | — | | | | 175,018 | | | | 33,584 | |
| Interest and dividends receivable | | | 514,488 | | | | 14,746 | | | | 32,242 | |
| Receivable for capital shares issued | | | — | | | | — | | | | 590,801 | |
| Receivable for investments sold | | | 189,913 | | | | 771,158 | | | | 3,466,885 | |
| Receivable from adviser | | | 8,513 | | | | 8,649 | | | | 14,021 | |
| Prepaid expenses and other assets | | | 8,719 | | | | 13,261 | | | | 18,022 | |
| | |
| |
| |
| |
| | | Total Assets | | | 25,211,491 | | | | 38,472,687 | | | | 131,503,163 | |
| | |
| |
| |
| |
Liabilities: | | | | | | | | | | | | |
| Distributions payable | | | 141,942 | | | | — | | | | — | |
| Payable for investments purchased | | | 596,937 | | | | 504,320 | | | | 2,858,061 | |
| Payable for capital shares redeemed | | | — | | | | — | | | | 9,112 | |
| Payable for return of collateral received for securities on loan | | | — | | | | 5,895,220 | | | | 13,138,730 | |
| Accrued expenses and other payables | | | | | | | | | | | | |
| | Investment advisory fees | | | 11,137 | | | | 19,240 | | | | 115,702 | |
| | Fund administration and transfer agent fees | | | 7,908 | | | | 5,721 | | | | 21,484 | |
| | Distribution fees | | | 3,091 | | | | 5,423 | | | | 44,704 | |
| | Administrative servicing fees | | | 452 | | | | 8,719 | | | | 2 | |
| | Other | | | 12,034 | | | | 7,523 | | | | 7,198 | |
| | |
| |
| |
| |
| | | Total Liabilities | | | 773,501 | | | | 6,446,166 | | | | 16,194,993 | |
| | |
| |
| |
| |
Net Assets | | $ | 24,437,990 | | | $ | 32,026,521 | | | $ | 115,308,170 | |
| | |
| |
| |
| |
Represented by: | | | | | | | | | | | | |
| Capital | | $ | 55,534,533 | | | $ | 23,932,801 | | | $ | 103,247,497 | |
| Accumulated net investment income (loss) | | | 1 | | | | — | | | | — | |
| Accumulated net realized gains (losses) from investment, futures, and short sales | | | (32,275,919 | ) | | | 5,145,898 | | | | 2,900,798 | |
| Net unrealized appreciation (depreciation) on investments and futures | | | 1,179,375 | | | | 2,947,822 | | | | 9,159,875 | |
| | |
| |
| |
| |
Net Assets | | $ | 24,437,990 | | | $ | 32,026,521 | | | $ | 115,308,170 | |
| | |
| |
| |
| |
Net Assets: | | | | | | | | | | | | |
| Class A Shares | | $ | 4,027,232 | | | $ | 12,243,936 | | | $ | 74,982,778 | |
| Class B Shares | | | 734,074 | | | | 2,630,919 | | | | 6,403,117 | |
| Class C Shares | | | 1,836,030 | | | | 652,284 | | | | 30,377,105 | |
| Class R Shares | | | 1,051 | | | | 1,025 | | | | 1,109 | |
| Institutional Service Class Shares | | | 17,838,548 | | | | 16,497,359 | | | | 50,727 | |
| Institutional Class Shares | | | 1,055 | | | | 998 | | | | 3,493,334 | |
| | |
| |
| |
| |
| Total | | $ | 24,437,990 | | | $ | 32,026,521 | | | $ | 115,308,170 | |
| | |
| |
| |
| |
Shares outstanding (unlimited number of shares authorized) | | | | | | | | | | | | |
| Class A Shares | | | 568,552 | | | | 764,941 | | | | 3,832,869 | |
| Class B Shares | | | 103,776 | | | | 166,721 | | | | 333,219 | |
| Class C Shares | | | 259,398 | | | | 41,424 | | | | 1,579,210 | |
| Class R Shares | | | 149 | | | | 65 | | | | 58 | |
| Institutional Service Class Shares | | | 2,497,649 | | | | 1,022,550 | | | | 2,579 | |
| Institutional Class Shares | | | 148 | | | | 62 | | | | 177,608 | |
| | |
| |
| |
| |
| Total | | | 3,429,672 | | | | 1,995,763 | | | | 5,925,543 | |
| | |
| |
| |
| |
Net asset value: | | | | | | | | | | | | |
| Class A Shares | | $ | 7.08 | | | $ | 16.01 | | | $ | 19.56 | |
| Class B Shares (a) | | $ | 7.07 | | | $ | 15.78 | | | $ | 19.22 | |
| Class C Shares (b) | | $ | 7.08 | | | $ | 15.75 | | | $ | 19.24 | |
| Class R Shares | | $ | 7.07 | | | $ | 15.83 | | | $ | 19.27 | |
| Institutional Service Class Shares | | $ | 7.14 | | | $ | 16.13 | | | $ | 19.67 | |
| Institutional Class Shares | | $ | 7.14 | | | $ | 16.14 | | | $ | 19.67 | |
Maximum offering price per share (100%/(100%-maximum sales charge) of net asset value adjusted to the nearest cent | | | | | | | | | | | | |
| Class A Shares | | $ | 7.43 | | | $ | 16.99 | | | $ | 20.75 | |
| | |
| |
| |
| |
| Maximum Sales Charge — Class A Shares | | | 4.75 | % | | | 5.75 | % | | | 5.75 | % |
| | |
| |
| |
| |
| |
|
| | |
| (a) | | For Class B shares, the redemption price per share varies by the length of time shares are held. |
| (b) | | For Class C Shares, the redemption price per share is reduced by 1.00% for shares held less than one year. |
See notes to financial statements.
2004 Annual Report 143
Concept Series
| |
| | Statements of Assets and Liabilities |
| | October 31, 2004 |
| | | | | | | | | | | | | | | |
| | Gartmore U.S. | | | Gartmore | | | Gartmore | |
| | Growth Leaders | | | Convertible | | | Small Cap | |
| | Long-Short Fund | | | Fund | | | Growth Fund | |
|
|
| |
Assets: | | | | | | | | | | | | |
| Investments, at value (cost $15,336,857; $33,418,507 and $2,231,877; respectively) | | $ | 16,493,095 | | | $ | 33,242,273 | | | $ | 2,288,587 | |
| Repurchase agreements, at cost | | | 11,654,805 | | | | 2,319,368 | | | | 492,590 | |
| | |
| |
| |
| |
| | | Total Investments | | | 28,147,900 | | | | 35,561,641 | | | | 2,781,177 | |
| | |
| |
| |
| |
| Cash | | | 11,050,601 | | | | — | | | | 1,500 | |
| Interest and dividends receivable | | | 31,765 | | | | 192,277 | | | | 680 | |
| Receivable for capital shares issued | | | 368,575 | | | | 6,995 | | | | — | |
| Receivable for investments sold | | | 5,242,598 | | | | 116,054 | | | | 450,540 | |
| Receivable from adviser | | | 9,796 | | | | 3,652 | | | | 7,264 | |
| Prepaid expenses and other assets | | | 13,226 | | | | 6,219 | | | | 6,851 | |
| | |
| |
| |
| |
| | | Total Assets | | | 44,864,461 | | | | 35,886,838 | | | | 3,248,012 | |
| | |
| |
| |
| |
Liabilities: | | | | | | | | | | | | |
| Securities sold short, at value (proceeds $11,923,722; $0 and $0; respectively) | | | 12,429,951 | | | | — | | | | — | |
| Payable to custodian | | | — | | | | 380,767 | | | | — | |
| Payable for investments purchased | | | 4,336,613 | | | | 409,653 | | | | 422,206 | |
| Payable for capital shares redeemed | | | 1,505 | | | | 3,911 | | | | — | |
| Accrued expenses and other payables Investment advisory fees | | | 34,456 | | | | 18,864 | | | | 2,255 | |
| | Fund administration and transfer agent fees | | | 9,079 | | | | 4,311 | | | | 1,759 | |
| | Distribution fees | | | 7,538 | | | | 3,515 | | | | 41 | |
| | Administrative servicing fees | | | 2,545 | | | | 1 | | | | 1 | |
| | Other | | | 5,676 | | | | 3,068 | | | | 876 | |
| | |
| |
| |
| |
| | | Total Liabilities | | | 16,827,363 | | | | 824,090 | | | | 427,138 | |
| | |
| |
| |
| |
Net Assets | | $ | 28,037,098 | | | $ | 35,062,748 | | | $ | 2,820,874 | |
| | |
| |
| |
| |
Represented by: | | | | | | | | | | | | |
| Capital | | $ | 47,861,474 | | | $ | 35,569,201 | | | $ | 3,052,304 | |
| Accumulated net investment income (loss) | | | 914,137 | | | | 79,417 | | | | — | |
| Accumulated net realized gains (losses) from investment, futures, short sales and swaps | | | (21,366,849 | ) | | | (409,636 | ) | | | (288,140 | ) |
| Net unrealized appreciation (depreciation) on investments, futures and short sales | | | 628,336 | | | | (176,234 | ) | | | 56,710 | |
| | |
| |
| |
| |
Net Assets | | $ | 28,037,098 | | | $ | 35,062,748 | | | $ | 2,820,874 | |
| | |
| |
| |
| |
Net Assets: | | | | | | | | | | | | |
| Class A Shares | | $ | 24,411,098 | | | $ | 2,987,674 | | | $ | 14,055 | |
| Class B Shares | | | 653,363 | | | | 210,233 | | | | 12,648 | |
| Class C Shares | | | 2,640,764 | | | | 3,253,444 | | | | 40,104 | |
| Class R Shares | | | 1,022 | | | | 1,017 | | | | 916 | |
| Institutional Service Class Shares | | | — | | | | 311,455 | | | | 919 | |
| Institutional Class Shares | | | 330,851 | | | | 28,298,925 | | | | 2,752,232 | |
| | |
| |
| |
| |
| Total | | $ | 28,037,098 | | | $ | 35,062,748 | | | $ | 2,820,874 | |
| | |
| |
| |
| |
Shares outstanding (unlimited number of shares authorized) | | | | | | | | | | | | |
| Class A Shares | | | 2,553,958 | | | | 305,413 | | | | 1,532 | |
| Class B Shares | | | 69,660 | | | | 21,597 | | | | 1,384 | |
| Class C Shares | | | 366,269 | | | | 334,047 | | | | 4,391 | |
| Class R Shares | | | 109 | | | | 105 | | | | 100 | |
| Institutional Service Class Shares | | | — | | | | 31,856 | | | | 100 | |
| Institutional Class Shares | | | 34,581 | | | | 2,894,552 | | | | 299,500 | |
| | |
| |
| |
| |
| Total | | | 3,024,577 | | | | 3,587,570 | | | | 307,007 | |
| | |
| |
| |
| |
Net asset value: | | | | | | | | | | | | |
| Class A Shares | | $ | 9.56 | | | $ | 9.78 | | | $ | 9.17 | |
| Class B Shares (a) | | $ | 9.38 | | | $ | 9.73 | | | $ | 9.14 | |
| Class C Shares (b) | | $ | 7.21 | | | $ | 9.74 | | | $ | 9.13 | |
| Class R Shares | | $ | 9.41 | | | $ | 9.74 | | | $ | 9.16 | |
| Institutional Service Class Shares | | $ | — | | | $ | 9.78 | | | $ | 9.19 | |
| Institutional Class Shares | | $ | 9.57 | | | $ | 9.78 | | | $ | 9.19 | |
Maximum offering price per share (100%/(100%-maximum sales charge) of net asset value adjusted to the nearest cent | | | | | | | | | | | | |
| Class A Shares | | $ | 10.14 | | | $ | 10.38 | | | $ | 9.73 | |
| | |
| |
| |
| |
| Maximum Sales Charge — Class A Shares | | | 5.75 | % | | | 5.75 | % | | | 5.75 | % |
| | |
| |
| |
| |
|
| | |
| (a) | | For Class B shares, the redemption price per share varies by the length of time shares are held. |
| (b) | | For Class C Shares, the redemption price per share is reduced by 1.00% for shares held less than one year. |
See notes to financial statements.
144 Annual Report 2004
Statements of Operations
For the Year Ended October 31, 2004
| | | | | | | | | | | | | | |
| | Gartmore High | | | Gartmore Value | | | Gartmore Micro Cap | |
| | Yield Bond Fund | | | Opportunities Fund | | | Equity Fund | |
|
|
| |
INVESTMENT INCOME: | | | | | | | | | | | | |
| Interest income | | $ | 6,828,377 | | | $ | 18,763 | | | $ | 67,555 | |
| Dividend income | | | 25,649 | | | | 507,756 | | | | 236,532 | |
| Income from securities lending | | | 25,219 | | | | 20,231 | | | | 39,417 | |
| | |
| |
| |
| |
| | Total Income | | | 6,879,245 | | | | 546,750 | | | | 343,504 | |
| | |
| |
| |
Expenses: | | | | | | | | | | | | |
| Investment advisory fees | | | 455,436 | | | | 281,272 | | | | 958,951 | |
| Fund administration and transfer agent fees | | | 119,579 | | | | 61,708 | | | | 141,792 | |
| Distribution fees Class A | | | 10,866 | | | | 33,808 | | | | 130,255 | |
| Distribution fees Class B | | | 7,331 | | | | 27,188 | | | | 40,944 | |
| Distribution fees Class C | | | 27,687 | | | | 5,279 | | | | 178,786 | |
| Distribution fees Class R | | | 2 | | | | 3 | | | | 3 | |
| Administrative servicing fees Class A | | | 3,155 | | | | 13,743 | | | | 4,582 | |
| Administrative servicing fees Class R | | | 2 | | | | 2 | | | | 2 | |
| Administrative servicing fees Institutional Service Class | | | 5,378 | | | | 44,192 | | | | — | |
| Registration and filing fees | | | 40,999 | | | | 47,930 | | | | 62,248 | |
| Other | | | 27,077 | | | | 24,785 | | | | 39,010 | |
| | |
| |
| |
| | Total expenses before reimbursed expenses | | | 697,512 | | | | 539,910 | | | | 1,556,573 | |
| Expenses reimbursed | | | (63,445 | ) | | | (11,918 | ) | | | (14,021 | ) |
| | |
| |
| |
| |
| | Total Expenses | | | 634,067 | | | | 527,992 | | | | 1,542,552 | |
| | |
| |
| |
| |
Net Investment Income (Loss) | | | 6,245,178 | | | | 18,758 | | | | (1,199,048 | ) |
| | |
| |
| |
REALIZED/ UNREALIZED GAINS (LOSSES) FROM INVESTMENTS: | | | | | | | | | | | | |
| Net realized gains (losses) on investment transactions | | | 5,076,078 | | | | 5,404,162 | | | | 4,115,524 | |
| | |
| |
| |
| |
| Net realized gains (losses) on investment transactions | | | 5,076,078 | | | | 5,404,162 | | | | 4,115,524 | |
| Net change in unrealized appreciation/depreciation on investments | | | (5,990,113 | ) | | | (1,765,389 | ) | | | 5,816,745 | |
| | |
| |
| |
| |
| Net realized/unrealized gains (losses) on investments | | | (914,035 | ) | | | 3,638,773 | | | | 9,932,269 | |
| | |
| |
| |
| |
CHANGE IN NET ASSETS RESULTING FROM OPERATIONS | | $ | 5,331,143 | | | $ | 3,657,531 | | | $ | 8,733,221 | |
| | |
| |
| |
| |
|
See notes to financial statements.
2004 Annual Report 145
Concept Series
| |
| | Statements of Operations |
| | For the Year Ended October 31, 2004 |
| | | | | | | | | | | | | | |
| | Gartmore U.S. | | | Gartmore | | | Gartmore | |
| | Growth Leaders | | | Convertible | | | Small Cap | |
| | Long-Short Fund | | | Fund (a) | | | Growth Fund (b) | |
|
|
| |
INVESTMENT INCOME: | | | | | | | | | | | | |
| Interest income | | $ | 214,020 | | | $ | 321,730 | | | $ | 1,731 | |
| Dividend income (net of foreign withholding tax of $509; $0 and $0; respectively) | | | 223,279 | | | | 315,782 | | | | 8,311 | |
| | |
| |
| |
| |
| | Total Income | | | 437,299 | | | | 637,512 | | | | 10,042 | |
| | |
| |
| |
| |
Expenses: | | | | | | | | | | | | |
| Investment advisory fees | | | 404,155 | | | | 119,087 | | | | 15,425 | |
| Fund administration and transfer agent fees | | | 67,760 | | | | 25,132 | | | | 4,162 | |
| Distribution fees Class A | | | 62,350 | | | | 3,657 | | | | 7 | |
| Distribution fees Class B | | | 5,145 | | | | 581 | | | | 20 | |
| Distribution fees Class C | | | 13,786 | | | | 10,816 | | | | 42 | |
| Distribution fees Class R | | | 2 | | | | 2 | | | | 2 | |
| Administrative servicing fees Class A | | | 6,516 | | | | — | | | | — | |
| Administrative servicing fees Class R | | | 2 | | | | 1 | | | | 1 | |
| Dividend expense for securities sold short | | | 286,797 | | | | — | | | | — | |
| Registration and filing fees | | | 30,009 | | | | 44,676 | | | | 52,129 | |
| Other | | | 30,361 | | | | 15,484 | | | | 4,394 | |
| | |
| |
| |
| |
| | Total expenses before reimbursed expenses | | | 906,883 | | | | 219,436 | | | | 76,182 | |
| Expenses reimbursed | | | (14,723 | ) | | | (30,330 | ) | | | (53,910 | ) |
| | |
| |
| |
| |
| | Total Expenses | | | 892,160 | | | | 189,106 | | | | 22,272 | |
| | |
| |
| |
| |
Net Investment Income (Loss) | | | (454,861 | ) | | | 448,406 | | | | (12,230 | ) |
| | |
| |
| |
| |
REALIZED/ UNREALIZED GAINS (LOSSES) FROM INVESTMENTS: | | | | | | | | | | | | |
| Net realized gains (losses) on investment transactions | | | 4,916,186 | | | | (409,636 | ) | | | (288,140 | ) |
| Net realized gains (losses) on short sale transactions | | | (5,200,917 | ) | | | — | | | | — | |
| Net realized gains (losses) on swap transactions | | | 3,021,327 | | | | — | | | | — | |
| | |
| |
| |
| |
| Net realized gains (losses) on investment, short sale and swap transactions | | | 2,736,596 | | | | (409,636 | ) | | | (288,140 | ) |
| Net change in unrealized appreciation/depreciation on investments, short sales, and swaps | | | 154,329 | | | | (176,234 | ) | | | 56,710 | |
| | |
| |
| |
| |
| Net realized/unrealized gains (losses) on investments, short sales, and swaps | | | 2,890,925 | | | | (585,870 | ) | | | (231,430 | ) |
| | |
| |
| |
| |
CHANGE IN NET ASSETS RESULTING FROM OPERATIONS | | $ | 2,436,064 | | | $ | (137,464 | ) | | $ | (243,660 | ) |
| | |
| |
| |
| |
|
| | |
| (a) | | For the period from December 29, 2003 (commencement of operations) through October 31, 2004. |
| (b) | | For the period from March 30, 2004 (commencement of operations) through October 31, 2004. |
See notes to financial statements.
146 Annual Report 2004
Statements of Changes in Net Assets
| | | | | | | | | | | | | | | | | |
| | | | |
| | Gartmore High Yield | | | Gartmore Value | |
| | Bond Fund | | | Opportunities Fund | |
| | Year Ended | | | Year Ended | | | Year Ended | | | Year Ended | |
| | October 31, 2004 | | | October 31, 2003 | | | October 31, 2004 | | | October 31, 2003 | |
|
|
| |
| | | | |
FROM INVESTMENT ACTIVITIES: | | | | | | | | | | | | | | | | |
Operations: | | | | | | | | | | | | | | | | |
| Net investment income (loss) | | $ | 6,245,178 | | | $ | 9,009,509 | | | $ | 18,758 | | | $ | 46,607 | |
| Net realized gains (losses) on investment, future, foreign currency, short sale and swap transactions | | | 5,076,078 | | | | 2,372,104 | | | | 5,404,162 | | | | 903,791 | |
| Net change in unrealized appreciation/depreciation on investments, futures, translation of assets and liabilities denominated in foreign currencies, short sales and swaps | | | (5,990,113 | ) | | | 11,298,725 | | | | (1,765,389 | ) | | | 6,892,594 | |
| | |
|
| |
| Change in net assets resulting from operations | | | 5,331,143 | | | | 22,680,338 | | | | 3,657,531 | | | | 7,842,992 | |
| | |
|
Distributions to Class A Shareholders from: | | | | | | | | | | | | | | | | |
| Net investment income | | | (318,947 | ) | | | (321,724 | ) | | | (9,434 | ) | | | (28,121 | ) |
| Net realized gains on investments | | | — | | | | — | | | | — | | | | — | |
Distributions to Class B Shareholders from: | | | | | | | | | | | | | | | | |
| Net investment income | | | (48,620 | ) | | | (45,800 | ) | | | — | | | | (469 | ) |
| Net realized gains on investments | | | — | | | | — | | | | — | | | | — | |
Distributions to Class C Shareholders from: | | | | | | | | | | | | | | | | |
| Net investment income | | | (184,379 | ) | | | (95,475 | ) | | | — | | | | (19 | ) |
| Net realized gains on investments | | | — | | | | — | | | | — | | | | — | |
Distributions to Class R Shareholders from: | | | | | | | | | | | | | | | | |
| Net investment income | | | (46 | ) (a) | | | — | | | | — | | | | — | |
| Net realized gains on investments | | | — | | | | — | | | | — | | | | — | |
Distributions to Institutional Service Class Shareholders from: | | | | | | | | | | | | | | | | |
| Net investment income | | | (5,693,160 | ) | | | (8,546,510 | ) | | | (24,707 | ) | | | (43,596 | ) |
| Net realized gains on investments | | | — | | | | — | | | | — | | | | — | |
Distributions to Institutional Class Shareholders from: | | | | | | | | | | | | | | | | |
| Net investment income | | | (26 | ) (b) | | | — | | | | — | | | | — | |
| Net realized gains on investments | | | — | | | | — | | | | — | | | | — | |
| | |
|
| |
| Change in net assets from shareholder distributions | | | (6,245,178 | ) | | | (9,009,509 | ) | | | (34,141 | ) | | | (72,205 | ) |
| | |
|
| |
| Change in net assets from capital transactions | | | (88,703,708 | ) | | | 15,007,980 | | | | (8,405,689 | ) | | | 5,755,345 | |
| | |
|
| |
| Change in net assets | | | (89,617,743 | ) | | | 28,678,809 | | | | (4,782,299 | ) | | | 13,526,132 | |
Net Assets: | | | | | | | | | | | | | | | | |
| Beginning of period | | | 114,055,733 | | | | 85,376,924 | | | | 36,808,820 | | | | 23,282,688 | |
| | |
|
| |
| End of period | | $ | 24,437,990 | | | $ | 114,055,733 | | | $ | 32,026,521 | | | $ | 36,808,820 | |
| | |
|
|
[Additional columns below]
[Continued from above table, first column(s) repeated]
| | | | | | | | | |
| | |
| | Gartmore Micro Cap | |
| | Equity Fund | |
| | |
| | Year Ended | | | Year Ended | |
| | October 31, 2004 | | | October 31, 2003 | |
| | |
| | |
| |
| |
FROM INVESTMENT ACTIVITIES: | | | | | | | | |
Operations: | | | | | | | | |
| Net investment income (loss) | | $ | (1,199,048 | ) | | $ | (71,523 | ) |
| Net realized gains (losses) on investment, future, foreign currency, short sale and swap transactions | | | 4,115,524 | | | | 302,641 | |
| Net change in unrealized appreciation/depreciation on investments, futures, translation of assets and liabilities denominated in foreign currencies, short sales and swaps | | | 5,816,745 | | | | 3,360,291 | |
| | | |
| | | |
| |
| | | | | |
| |
| Change in net assets resulting from operations | | | 8,733,221 | | | | 3,591,409 | |
| | | |
| | | |
| |
| | | | | |
| |
Distributions to Class A Shareholders from: | | | | | | | | |
| Net investment income | | | — | | | | — | |
| Net realized gains on investments | | | (8,895 | ) | | | — | |
Distributions to Class B Shareholders from: | | | | | | | | |
| Net investment income | | | — | | | | — | |
| Net realized gains on investments | | | (889 | ) | | | — | |
Distributions to Class C Shareholders from: | | | | | | | | |
| Net investment income | | | — | | | | — | |
| Net realized gains on investments | | | (3,920 | ) | | | — | |
Distributions to Class R Shareholders from: | | | | | | | | |
| Net investment income | | | — | | | | — | |
| Net realized gains on investments | | | — | (a)(c) | | | — | |
Distributions to Institutional Service Class Shareholders from: | | | | | | | | |
| Net investment income | | | — | | | | — | |
| Net realized gains on investments | | | (7 | ) | | | — | |
Distributions to Institutional Class Shareholders from: | | | | | | | | |
| Net investment income | | | — | | | | — | |
| Net realized gains on investments | | | (506 | ) (b) | | | — | |
| | | |
| | | |
| |
| | | | | |
| |
| Change in net assets from shareholder distributions | | | (14,217 | ) | | | — | |
| | | |
| | | |
| |
| | | | | |
| |
| Change in net assets from capital transactions | | | 79,393,895 | | | | 21,609,219 | |
| | | |
| | | |
| |
| | | | | |
| |
| Change in net assets | | | 88,112,899 | | | | 25,200,628 | |
Net Assets: | | | | | | | | |
| Beginning of period | | | 27,195,271 | | | | 1,994,643 | |
| | | |
| | | |
| |
| | | | | |
| |
| End of period | | $ | 115,308,170 | | | $ | 27,195,271 | |
| | | |
| | | |
| |
| | | | | |
| |
| | |
| | |
| (a) | | For the period from December 30, 2003 (commencement of operations) through October 31, 2004. |
| (b) | | For the period from June 29, 2004 (commencement of operations) through October 31, 2004. |
| (c) | | Amount is less than a $1. |
See notes to financial statements.
2004 Annual Report 147
Concept Series
| |
| | Statements of Changes in Net Assets |
| | | | | | | | | | | | | | | |
| | |
| | Gartmore U.S. Growth Leaders Long-Short Fund | |
| | Year Ended | | | Period Ended | | | Year Ended | |
| | October 31, 2004 | | | October 31, 2003 (a) | | | June 30, 2003 | |
|
|
| |
| | | | |
FROM INVESTMENT ACTIVITIES: | | | | | | | | | | | | |
Operations: | | | | | | | | | | | | |
| Net investment income (loss) | | $ | (454,861 | ) | | $ | (191,261 | ) | | $ | (493,644 | ) |
| Net realized gains (losses) on investment, future, foreign currency, short sale and swap transactions | | | 2,736,596 | | | | 6,947,583 | | | | (8,027,305 | ) |
| Net change in unrealized appreciation/depreciation on investments, futures, translation of assets and liabilities denominated in foreign currencies, short sales and swaps | | | 154,329 | | | | (3,892,480 | ) | | | 7,620,932 | |
| | |
|
| |
| Change in net assets resulting from operations | | | (2,764,853 | ) | | | 2,863,842 | | | | (900,017 | ) |
| | |
|
| |
Distributions to Class A Shareholders from: | | | | | | | | | | | | |
| | Net investment income | | | (7,546,048 | ) | | | — | | | | — | |
| | Net realized gains on investments | | | — | | | | — | | | | — | |
Distributions to Class B Shareholders from: | | | | | | | | | | | | |
| | Net investment income | | | (119,661 | ) | | | — | | | | — | |
| | Net realized gains on investments | | | — | | | | — | | | | — | |
Distributions to Class C Shareholders from: | | | | | | | | | | | | |
| | Net investment income | | | (513,025 | ) | | | — | | | | — | |
| | Net realized gains on investments | | | — | | | | — | | | | — | |
Distributions to Class R Shareholders from: | | | | | | | | | | | | |
| | Net investment income | | | — | | | | — | | | | — | |
| | From net realized gain on investment | | | — | | | | — | | | | — | |
Distributions to Institutional Service Class Shareholders from: | | | | | | | | | | | | |
| | Net investment income | | | — | | | | — | | | | — | |
| | Net realized gains on investments | | | — | | | | — | | | | — | |
Distributions to Institutional Class Shareholders from: | | | | | | | | | | | | |
| | Net investment income | | | — | | | | — | | | | — | |
| | Net realized gains on investments | | | — | | | | — | | | | — | |
| | |
|
| |
| Change in net assets from shareholder distributions | | | (8,178,734 | ) | | | — | | | | — | |
| | |
|
| |
| Change in net assets from capital transactions | | | 2,411,514 | | | | (2,520,766 | ) | | | (14,651,576 | ) |
| | |
|
| |
| Change in net assets | | | (8,532,073 | ) | | | 343,076 | | | | (15,551,593 | ) |
Net Assets: | | | | | | | | | | | | |
| | | Beginning of period | | | 31,368,254 | | | | 31,025,178 | | | | 46,576,771 | |
| | |
|
| |
| | | End of period | | $ | 22,836,181 | | | $ | 31,368,254 | | | $ | 31,025,178 | |
| | |
|
| |
|
[Additional columns below]
[Continued from above table, first column(s) repeated]
| | | | | | | | | | | |
| | | | Gartmore Small Cap | |
| | Gartmore Convertible | | | Growth Fund | |
| | Fund | | | |
| | Period Ended | | | Period Ended | |
| | October 31, 2004 (b) | | | October 31, 2004 (c) | |
| | |
| | |
| |
| |
FROM INVESTMENT ACTIVITIES: | | | | | | | | |
Operations: | | | | | | | | |
| Net investment income (loss) | | $ | 448,406 | | | $ | (12,230 | ) |
| Net realized gains (losses) on investment, future, foreign currency, short sale and swap transactions | | | (409,636 | ) | | | (288,140 | ) |
| Net change in unrealized appreciation/depreciation on investments, futures, translation of assets and liabilities denominated in foreign currencies, short sales and swaps | | | (176,234 | ) | | | 56,710 | |
| | | |
| | | |
| |
| | | | | |
| |
| Change in net assets resulting from operations | | | (137,464 | ) | | | (243,660 | ) |
| | | |
| | | |
| |
| | | | | |
| |
Distributions to Class A Shareholders from: | | | | | | | | |
| | Net investment income | | | (31,238 | ) (d) | | | — | |
| | Net realized gains on investments | | | — | | | | — | |
Distributions to Class B Shareholders from: | | | | | | | | |
| | Net investment income | | | (1,215 | ) (d) | | | — | |
| | Net realized gains on investments | | | — | | | | — | |
Distributions to Class C Shareholders from: | | | | | | | | |
| | Net investment income | | | (20,050 | ) (d) | | | — | |
| | Net realized gains on investments | | | — | | | | — | |
Distributions to Class R Shareholders from: | | | | | | | | |
| | Net investment income | | | (9 | ) (e) | | | — | |
| | From net realized gain on investment | | | — | | | | — | |
Distributions to Institutional Service Class Shareholders from: | | | | | | | | |
| | Net investment income | | | (2,589 | ) (d) | | | — | |
| | Net realized gains on investments | | | — | | | | — | |
Distributions to Institutional Class Shareholders from: | | | | | | | | |
| | Net investment income | | | (323,490 | ) | | | — | |
| | Net realized gains on investments | | | — | | | | — | |
| | | |
| | | |
| |
| | | | | |
| |
| Change in net assets from shareholder distributions | | | (378,591 | ) | | | — | |
| | | |
| | | |
| |
| | | | | |
| |
| Change in net assets from capital transactions | | | 35,578,803 | | | | 3,064,534 | |
| | | |
| | | |
| |
| | | | | |
| |
| Change in net assets | | | 35,062,748 | | | | 2,820,874 | |
Net Assets: | | | | | | | | |
| | | Beginning of period | | | — | | | | — | |
| | | |
| | | |
| |
| | | | | |
| |
| | | End of period | | $ | 35,062,748 | | | $ | 2,820,874 | |
| | |
|
| | |
| | |
| (a) | | For the period from July 1, 2003 through October 31, 2003. The fund changed its fiscal year end from June 30 to October 31. |
| (b) | | For the period from December 29, 2003 (commencement of operations) through October 31, 2004. |
| (c) | | For the period from March 30, 2004 (commencement of operations) through October 31, 2004. |
| (d) | | For the period from January 20, 2004 (commencement of operations) through October 31, 2004. |
| (e) | | For the period from May 14, 2004 (commencement of operations) through October 31, 2004. |
See notes to financial statements.
148 Annual Report 2004
Financial Highlights
Selected Data for Each Share of Capital Outstanding
Gartmore High Yield Bond Fund
| | | | | | | | | | | | | | | | | |
| | | | |
| | | | Investment Activities | |
| | | | | | Net Realized | | | |
| | | | | | and | | | |
| | Net Asset | | | Net | | | Unrealized | | | Total | |
| | Value, | | | Investment | | | Gains | | | from | |
| | Beginning | | | Income | | | (Losses) on | | | Investment | |
| | of Period | | | (Loss) | | | Investments | | | Activities | |
|
|
| |
Class A Shares | | | | | | | | | | | | | | | | |
| Period Ended October 31, 2000 (d) | | $ | 10.00 | | | | 0.86 | | | | (2.04 | ) | | | (1.18 | ) |
| Year Ended October 31, 2001 | | $ | 7.96 | | | | 0.84 | | | | (1.10 | ) | | | (0.26 | ) |
| Year Ended October 31, 2002 | | $ | 6.86 | | | | 0.61 | | | | (0.87 | ) | | | (0.26 | ) |
| Year Ended October 31, 2003 | | $ | 5.99 | | | | 0.56 | | | | 0.89 | | | | 1.45 | |
| Year Ended October 31, 2004 | | $ | 6.88 | | | | 0.51 | | | | 0.20 | | | | 0.71 | |
Class B Shares | | | | | | | | | | | | | | | | |
| Period Ended October 31, 2000 (d) | | $ | 10.00 | | | | 0.80 | | | | (2.04 | ) | | | (1.24 | ) |
| Year Ended October 31, 2001 | | $ | 7.96 | | | | 0.78 | | | | (1.10 | ) | | | (0.32 | ) |
| Year Ended October 31, 2002 | | $ | 6.86 | | | | 0.56 | | | | (0.88 | ) | | | (0.32 | ) |
| Year Ended October 31, 2003 | | $ | 5.98 | | | | 0.52 | | | | 0.89 | | | | 1.41 | |
| Year Ended October 31, 2004 | | $ | 6.87 | | | | 0.46 | | | | 0.20 | | | | 0.66 | |
Class C Shares | | | | | | | | | | | | | | | | |
| Period Ended October 31, 2001 (e) | | $ | 8.07 | | | | 0.40 | | | | (1.21 | ) | | | (0.81 | ) |
| Year Ended October 31, 2002 | | $ | 6.86 | | | | 0.56 | | | | (0.87 | ) | | | (0.31 | ) |
| Year Ended October 31, 2003 | | $ | 5.99 | | | | 0.52 | | | | 0.89 | | | | 1.41 | |
| Year Ended October 31, 2004 | | $ | 6.88 | | | | 0.46 | | | | 0.20 | | | | 0.66 | |
Class R Shares | | | | | | | | | | | | | | | | |
| Period Ended October 31, 2004 (f) | | $ | 7.00 | | | | 0.32 | | | | 0.07 | | | | 0.39 | |
Institutional Service Class Shares | | | | | | | | | | | | | | | | |
| Period Ended October 31, 2000 (d) | | $ | 10.00 | | | | 0.87 | | | | (1.99 | ) | | | (1.12 | ) |
| Year Ended October 31, 2001 | | $ | 8.01 | | | | 0.87 | | | | (1.10 | ) | | | (0.23 | ) |
| Year Ended October 31, 2002 | | $ | 6.92 | | | | 0.63 | | | | (0.88 | ) | | | (0.25 | ) |
| Year Ended October 31, 2003 | | $ | 6.04 | | | | 0.58 | | | | 0.90 | | | | 1.48 | |
| Year Ended October 31, 2004 | | $ | 6.94 | | | | 0.53 | | | | 0.20 | | | | 0.73 | |
Institutional Class Shares | | | | | | | | | | | | | | | | |
| Period Ended October 31, 2004 (g) | | $ | 6.90 | | | | 0.18 | | | | 0.24 | | | | 0.42 | |
|
[Additional columns below]
[Continued from above table, first column(s) repeated]
| | | | | | | | | | | | | | | | | |
| | | | | | |
| | Distributions | | | | | |
| | Net | | | | | Net Asset | | | |
| | Investment | | | Total | | | Value, End | | | Total | |
| | Income | | | Distributions | | | of Period | | | Return (a) | |
| | |
| | |
| |
| |
Class A Shares | | | | | | | | | | | | | | | | |
| Period Ended October 31, 2000 (d) | | | (0.86 | ) | | | (0.86 | ) | | $ | 7.96 | | | | (12.48% | ) (h) |
| Year Ended October 31, 2001 | | | (0.84 | ) | | | (0.84 | ) | | $ | 6.86 | | | | (3.59% | ) |
| Year Ended October 31, 2002 | | | (0.61 | ) | | | (0.61 | ) | | $ | 5.99 | | | | (4.27% | ) |
| Year Ended October 31, 2003 | | | (0.56 | ) | | | (0.56 | ) | | $ | 6.88 | | | | 25.18% | |
| Year Ended October 31, 2004 | | | (0.51 | ) | | | (0.51 | ) | | $ | 7.08 | | | | 10.65% | |
Class B Shares | | | | | | | | | | | | | | | | |
| Period Ended October 31, 2000 (d) | | | (0.80 | ) | | | (0.80 | ) | | $ | 7.96 | | | | (13.02% | ) (h) |
| Year Ended October 31, 2001 | | | (0.78 | ) | | | (0.78 | ) | | $ | 6.86 | | | | (4.31% | ) |
| Year Ended October 31, 2002 | | | (0.56 | ) | | | (0.56 | ) | | $ | 5.98 | | | | (5.11% | ) |
| Year Ended October 31, 2003 | | | (0.52 | ) | | | (0.52 | ) | | $ | 6.87 | | | | 24.36% | |
| Year Ended October 31, 2004 | | | (0.46 | ) | | | (0.46 | ) | | $ | 7.07 | | | | 9.92% | |
Class C Shares | | | | | | | | | | | | | | | | |
| Period Ended October 31, 2001 (e) | | | (0.40 | ) | | | (0.40 | ) | | $ | 6.86 | | | | (10.15% | ) (h) |
| Year Ended October 31, 2002 | | | (0.56 | ) | | | (0.56 | ) | | $ | 5.99 | | | | (4.96% | ) |
| Year Ended October 31, 2003 | | | (0.52 | ) | | | (0.52 | ) | | $ | 6.88 | | | | 24.32% | |
| Year Ended October 31, 2004 | | | (0.46 | ) | | | (0.46 | ) | | $ | 7.08 | | | | 9.92% | |
Class R Shares | | | | | | | | | | | | | | | | |
| Period Ended October 31, 2004 (f) | | | (0.32 | ) | | | (0.32 | ) | | $ | 7.07 | | | | 5.73% | (h) |
Institutional Service Class Shares | | | | | | | | | | | | | | | | |
| Period Ended October 31, 2000 (d) | | | (0.87 | ) | | | (0.87 | ) | | $ | 8.01 | | | | (11.80% | ) (h) |
| Year Ended October 31, 2001 | | | (0.86 | ) | | | (0.86 | ) | | $ | 6.92 | | | | (3.19% | ) |
| Year Ended October 31, 2002 | | | (0.63 | ) | | | (0.63 | ) | | $ | 6.04 | | | | (4.12% | ) |
| Year Ended October 31, 2003 | | | (0.58 | ) | | | (0.58 | ) | | $ | 6.94 | | | | 25.51% | |
| Year Ended October 31, 2004 | | | (0.53 | ) | | | (0.53 | ) | | $ | 7.14 | | | | 10.90% | |
Institutional Class Shares | | | | | | | | | | | | | | | | |
| Period Ended October 31, 2004 (g) | | | (0.18 | ) | | | (0.18 | ) | | $ | 7.14 | | | | 6.10% | (h) |
| | |
[Additional columns below]
[Continued from above table, first column(s) repeated]
| | | | | | | | | | | | | | | | | | | | | | | | | | | |
| | | | |
| | Ratios / Supplemental Data | | | |
| | | | Ratio of Net | | | | | |
| | | | Ratio of Net | | | Ratio of | | | Investment | | | | | |
| | | | Investment | | | Expenses | | | Income (Loss) | | | | | |
| | Net Assets | | | Ratio of | | | Income | | | (Prior to | | | (Prior to | | | | | |
| | at End of | | | Expenses | | | (Loss) | | | Reimbursements) | | | Reimbursements) | | | | | |
| | Period | | | to Average | | | to Average | | | to Average | | | to Average | | | Portfolio | | | |
| | (000s) | | | Net Assets | | | Net Assets | | | Net Assets (b) | | | Net Assets (b) | | | Turnover (c) | | | |
| | | | |
| | | | |
| |
| | | |
Class A Shares | | | | | | | | | | | | | | | | | | | | | | | | | | |
| Period Ended October 31, 2000 (d) | | $ | 2,804 | | | | 0.95% | (i) | | | 12.35% | (i) | | | 1.15% | (i) | | | 12.15% | (i) | | | 76.93% | | | |
| Year Ended October 31, 2001 | | $ | 2,801 | | | | 0.95% | | | | 11.10% | | | | 1.11% | | | | 10.94% | | | | 83.79% | | | |
| Year Ended October 31, 2002 | | $ | 2,002 | | | | 0.97% | | | | 9.20% | | | | 1.09% | | | | 9.08% | | | | 93.27% | | | |
| Year Ended October 31, 2003 | | $ | 4,028 | | | | 1.02% | | | | 8.47% | | | | 1.10% | | | | 8.39% | | | | 104.54% | | | |
| Year Ended October 31, 2004 | | $ | 4,027 | | | | 1.03% | | | | 7.34% | | | | 1.20% | | | | 7.17% | | | | 77.13% | | | |
Class B Shares | | | | | | | | | | | | | | | | | | | | | | | | | | |
| Period Ended October 31, 2000 (d) | | $ | 188 | | | | 1.70% | (i) | | | 13.09% | (i) | | | 3.46% | (i) | | | 11.33% | (i) | | | 76.93% | | | |
| Year Ended October 31, 2001 | | $ | 244 | | | | 1.70% | | | | 10.35% | | | | 2.43% | | | | 9.62% | | | | 83.79% | | | |
| Year Ended October 31, 2002 | | $ | 355 | | | | 1.70% | | | | 8.46% | | | | 1.83% | | | | 8.33% | | | | 93.27% | | | |
| Year Ended October 31, 2003 | | $ | 764 | | | | 1.69% | | | | 7.81% | | | | 1.78% | | | | 7.73% | | | | 104.54% | | | |
| Year Ended October 31, 2004 | | $ | 734 | | | | 1.70% | | | | 6.63% | | | | 1.89% | | | | 6.45% | | | | 77.13% | | | |
Class C Shares | | | | | | | | | | | | | | | | | | | | | | | | | | |
| Period Ended October 31, 2001 (e) | | $ | 5 | | | | 1.70% | (i) | | | 10.05% | (i) | | | 8.58% | (i) | | | 3.17% | (i) | | | 83.79% | | | |
| Year Ended October 31, 2002 | | $ | 53 | | | | 1.70% | | | | 8.55% | | | | 1.97% | | | | 8.28% | | | | 93.27% | | | |
| Year Ended October 31, 2003 | | $ | 2,986 | | | | 1.71% | | | | 7.45% | | | | 1.77% | | | | 7.39% | | | | 104.54% | | | |
| Year Ended October 31, 2004 | | $ | 1,836 | | | | 1.71% | | | | 6.66% | | | | 1.86% | | | | 6.51% | | | | 77.13% | | | |
Class R Shares | | | | | | | | | | | | | | | | | | | | | | | | | | |
| Period Ended October 31, 2004 (f) | | $ | 1 | | | | 1.32% | (i) | | | 6.89% | (i) | | | 1.55% | (i) | | | 6.66% | (i) | | | 77.13% | | | |
Institutional Service Class Shares | | | | | | | | | | | | | | | | | | | | | | | | | | |
| Period Ended October 31, 2000 (d) | | $ | 88,639 | | | | 0.70% | (i) | | | 11.46% | (i) | | | 0.83% | (i) | | | 11.33% | (i) | | | 76.93% | | | |
| Year Ended October 31, 2001 | | $ | 85,885 | | | | 0.70% | | | | 11.30% | | | | 0.76% | | | | 11.24% | | | | 83.79% | | | |
| Year Ended October 31, 2002 | | $ | 82,967 | | | | 0.70% | | | | 9.38% | | | | 0.79% | | | | 9.29% | | | | 93.27% | | | |
| Year Ended October 31, 2003 | | $ | 106,278 | | | | 0.70% | | | | 8.87% | | | | 0.78% | | | | 8.79% | | | | 104.54% | | | |
| Year Ended October 31, 2004 | | $ | 17,839 | | | | 0.71% | | | | 7.60% | | | | 0.77% | | | | 7.53% | | | | 77.13% | | | |
Institutional Class Shares | | | | | | | | | | | | | | | | | | | | | | | | | | |
| Period Ended October 31, 2004 (g) | | $ | 1 | | | | 0.71% | (i) | | | 7.44% | (i) | | | 1.24% | (i) | | | 6.91% | (i) | | | 77.13% | | | |
| | | | |
| | |
| (a) | | Excludes sales charge. |
| (b) | | During the period certain fees were waived and/or reimbursed. If such waivers/reimbursements had not occurred, the ratios would have been as indicated. |
| (c) | | Portfolio turnover is calculated on the basis of the Fund as whole without distinguishing among the classes of shares. |
| (d) | | For the period from December 29, 1999 (commencement of operations) through October 31, 2000. |
| (e) | | For the period from March 1, 2001 (commencement of operations) through October 31, 2001. |
| (f) | | For the period from February 27, 2004 (commencement of operations) through October 31, 2004. |
| (g) | | For the period from June 29, 2004 (commencement of operations) through October 31, 2004. |
| (h) | | Not annualized. |
| (i) | | Annualized. |
See notes to financial statements.
2004 Annual Report 149
| |
| | Financial Highlights |
| | Selected Data for Each Share of Capital Outstanding |
Concept Series
Gartmore Value Opportunities Fund
| | | | | | | | | | | | | | | | | | | | | |
| | | | |
| | | | Investment Activities | |
| | | | | | Net Realized | | | |
| | | | | | and | | | |
| | Net Asset | | | Net | | | | | Unrealized | | | Total | |
| | Value, | | | Investment | | | | | Gains | | | from | |
| | Beginning | | | Income | | | Redemption | | | (Losses) on | | | Investment | |
| | of Period | | | (Loss) | | | Fees | | | Investments | | | Activities | |
|
|
| |
Class A Shares | | | | | | | | | | | | | | | | | | | | |
| Period Ended October 31, 2000 (d) | | $ | 10.00 | | | | 0.06 | | | | — | | | | 2.38 | | | | 2.44 | |
| Year Ended October 31, 2001 | | $ | 12.37 | | | | 0.10 | | | | — | | | | (0.20 | ) | | | (0.10 | ) |
| Year Ended October 31, 2002 | | $ | 12.17 | | | | 0.05 | | | | 0.01 | | | | (0.98 | ) | | | (0.92 | ) |
| Year Ended October 31, 2003 | | $ | 11.05 | | | | 0.03 | | | | — | | | | 3.42 | | | | 3.45 | |
| Year Ended October 31, 2004 | | $ | 14.47 | | | | — | | | | — | | | | 1.55 | | | | 1.55 | |
Class B Shares | | | | | | | | | | | | | | | | | | | | |
| Period Ended October 31, 2000 (d) | | $ | 10.00 | | | | 0.01 | | | | — | | | | 2.37 | | | | 2.38 | |
| Year Ended October 31, 2001 | | $ | 12.36 | | | | 0.02 | | | | — | | | | (0.20 | ) | | | (0.18 | ) |
| Year Ended October 31, 2002 | | $ | 12.16 | | | | (0.03 | ) | | | 0.01 | | | | (0.98 | ) | | | (1.00 | ) |
| Year Ended October 31, 2003 | | $ | 11.00 | | | | (0.06 | ) | | | — | | | | 3.40 | | | | 3.34 | |
| Year Ended October 31, 2004 | | $ | 14.34 | | | | (0.11 | ) | | | — | | | | 1.55 | | | | 1.44 | |
Class C Shares | | | | | | | | | | | | | | | | | | | | |
| Period Ended October 31, 2001 (e) | | $ | 13.08 | | | | 0.01 | | | | — | | | | (0.93 | ) | | | (0.92 | ) |
| Year Ended October 31, 2002 | | $ | 12.13 | | | | (0.03 | ) | | | 0.01 | | | | (0.97 | ) | | | (0.99 | ) |
| Year Ended October 31, 2003 | | $ | 10.98 | | | | (0.04 | ) | | | — | | | | 3.37 | | | | 3.33 | |
| Year Ended October 31, 2004 | | $ | 14.31 | | | | (0.09 | ) | | | — | | | | 1.53 | | | | 1.44 | |
Class R Shares | | | | | | | | | | | | | | | | | | | | |
| Period Ended October 31, 2004 (f) | | $ | 15.45 | | | | (0.05 | ) | | | — | | | | 0.43 | | | | 0.38 | |
Institutional Service Class Shares | | | | | | | | | | | | | | | | | | | | |
| Period Ended October 31, 2000 (d) | | $ | 10.00 | | | | 0.07 | | | | — | | | | 2.40 | | | | 2.47 | |
| Year Ended October 31, 2001 | | $ | 12.42 | | | | 0.13 | | | | — | | | | (0.19 | ) | | | (0.06 | ) |
| Year Ended October 31, 2002 | | $ | 12.24 | | | | 0.07 | | | | 0.01 | | | | (0.98 | ) | | | (0.90 | ) |
| Year Ended October 31, 2003 | | $ | 11.12 | | | | 0.04 | | | | — | | | | 3.44 | | | | 3.48 | |
| Year Ended October 31, 2004 | | $ | 14.56 | | | | 0.04 | | | | — | | | | 1.55 | | | | 1.59 | |
Institutional Class Shares | | | | | | | | | | | | | | | | | | | | |
| Year Ended October 31, 2004 (g) | | $ | 16.18 | | | | — | | | | — | | | | (0.04 | ) | | | (0.04 | ) |
|
[Additional columns below]
[Continued from above table, first column(s) repeated]
| | | | | | | | | | | | | | | | | | | | | |
| | | | | | |
| | Distributions | | | | | |
| | Net | | | Net | | | | | Net Asset | | | |
| | Investment | | | Realized | | | Total | | | Value, End | | | Total | |
| | Income | | | Gains | | | Distributions | | | of Period | | | Return (a) | |
| | |
| | |
| |
| |
Class A Shares | | | | | | | | | | | | | | | | | | | | |
| Period Ended October 31, 2000 (d) | | | (0.07 | ) | | | — | | | | (0.07 | ) | | $ | 12.37 | | | | 24.38% | (h) |
| Year Ended October 31, 2001 | | | (0.10 | ) | | | — | | | | (0.10 | ) | | $ | 12.17 | | | | (0.87% | ) |
| Year Ended October 31, 2002 | | | (0.05 | ) | | | (0.15 | ) | | | (0.20 | ) | | $ | 11.05 | | | | (7.75% | ) |
| Year Ended October 31, 2003 | | | (0.03 | ) | | | — | | | | (0.03 | ) | | $ | 14.47 | | | | 31.32% | |
| Year Ended October 31, 2004 | | | (0.01 | ) | | | — | | | | (0.01 | ) | | $ | 16.01 | | | | 10.72% | |
Class B Shares | | | | | | | | | | | | | | | | | | | | |
| Period Ended October 31, 2000 (d) | | | (0.02 | ) | | | — | | | | (0.02 | ) | | $ | 12.36 | | | | 23.79% | (h) |
| Year Ended October 31, 2001 | | | (0.02 | ) | | | — | | | | (0.02 | ) | | $ | 12.16 | | | | (1.45% | ) |
| Year Ended October 31, 2002 | | | (0.01 | ) | | | (0.15 | ) | | | (0.16 | ) | | $ | 11.00 | | | | (8.39% | ) |
| Year Ended October 31, 2003 | | | — | | | | — | | | | — | | | $ | 14.34 | | | | 30.39% | |
| Year Ended October 31, 2004 | | | — | | | | — | | | | — | | | $ | 15.78 | | | | 10.04% | |
Class C Shares | | | | | | | | | | | | | | | | | | | | |
| Period Ended October 31, 2001 (e) | | | (0.03 | ) | | | — | | | | (0.03 | ) | | $ | 12.13 | | | | (7.08% | ) (h) |
| Year Ended October 31, 2002 | | | (0.01 | ) | | | (0.15 | ) | | | (0.16 | ) | | $ | 10.98 | | | | (8.31% | ) |
| Year Ended October 31, 2003 | | | — | | | | — | | | | — | | | $ | 14.31 | | | | 30.35% | |
| Year Ended October 31, 2004 | | | — | | | | — | | | | — | | | $ | 15.75 | | | | 10.06% | |
Class R Shares | | | | | | | | | | | | | | | | | | | | |
| Period Ended October 31, 2004 (f) | | | — | | | | — | | | | — | | | $ | 15.83 | | | | 2.46% | (h) |
Institutional Service Class Shares | | | | | | | | | | | | | | | | | | | | |
| Period Ended October 31, 2000 (d) | | | (0.05 | ) | | | — | | | | (0.05 | ) | | $ | 12.42 | | | | 24.72% | (h) |
| Year Ended October 31, 2001 | | | (0.12 | ) | | | — | | | | (0.12 | ) | | $ | 12.24 | | | | (0.49% | ) |
| Year Ended October 31, 2002 | | | (0.07 | ) | | | (0.15 | ) | | | (0.22 | ) | | $ | 11.12 | | | | (7.56% | ) |
| Year Ended October 31, 2003 | | | (0.04 | ) | | | — | | | | (0.04 | ) | | $ | 14.56 | | | | 31.39% | |
| Year Ended October 31, 2004 | | | (0.02 | ) | | | — | | | | (0.02 | ) | | $ | 16.13 | | | | 10.91% | |
Institutional Class Shares | | | | | | | | | | | | | | | | | | | | |
| Year Ended October 31, 2004 (g) | | | — | | | | — | | | | — | | | $ | 16.14 | | | | (0.19% | ) (h) |
| | |
[Additional columns below]
[Continued from above table, first column(s) repeated]
| | | | | | | | | | | | | | | | | | | | | | | | | | | |
| | | | |
| | Ratios / Supplemental Data | | | |
| | | | Ratio of Net | | | | | |
| | | | Ratio of Net | | | Ratio of | | | Investment | | | | | |
| | | | Investment | | | Expenses | | | Income (Loss) | | | | | |
| | Net Assets | | | Ratio of | | | Income | | | (Prior to | | | (Prior to | | | | | |
| | at End of | | | Expenses | | | (Loss) | | | Reimbursements) | | | Reimbursements) | | | | | |
| | Period | | | to Average | | | to Average | | | to Average | | | to Average | | | Portfolio | | | |
| | (000s) | | | Net Assets | | | Net Assets | | | Net Assets (b) | | | Net Assets (b) | | | Turnover (c) | | | |
| | | | |
| | | | |
| |
| | | |
Class A Shares | | | | | | | | | | | | | | | | | | | | | | | | | | |
| Period Ended October 31, 2000 (d) | | $ | 2,460 | | | | 1.35% | (i) | | | 0.62% | (i) | | | 6.59% | (i) | | | (4.62% | ) (i) | | | 119.39% | | | |
| Year Ended October 31, 2001 | | $ | 10,789 | | | | 1.35% | | | | 0.69% | | | | 2.07% | | | | (0.03% | ) | | | 139.75% | | | |
| Year Ended October 31, 2002 | | $ | 9,766 | | | | 1.31% | | | | 0.39% | | | | 1.48% | | | | 0.22% | | | | 108.62% | | | |
| Year Ended October 31, 2003 | | $ | 12,156 | | | | 1.30% | | | | 0.20% | | | | 1.41% | | | | 0.09% | | | | 90.02% | | | |
| Year Ended October 31, 2004 | | $ | 12,244 | | | | 1.36% | | | | (0.01% | ) | | | 1.39% | | | | (0.04% | ) | | | 146.98% | | | |
Class B Shares | | | | | | | | | | | | | | | | | | | | | | | | | | |
| Period Ended October 31, 2000 (d) | | $ | 751 | | | | 1.95% | (i) | | | 0.10% | (i) | | | 7.70% | (i) | | | (5.65% | ) (i) | | | 119.39% | | | |
| Year Ended October 31, 2001 | | $ | 2,708 | | | | 1.95% | | | | 0.09% | | | | 3.06% | | | | (1.02% | ) | | | 139.75% | | | |
| Year Ended October 31, 2002 | | $ | 2,362 | | | | 1.98% | | | | (0.28% | ) | | | 2.22% | | | | (0.52% | ) | | | 108.62% | | | |
| Year Ended October 31, 2003 | | $ | 2,641 | | | | 2.00% | | | | (0.49% | ) | | | 2.12% | | | | (0.60% | ) | | | 90.02% | | | |
| Year Ended October 31, 2004 | | $ | 2,631 | | | | 2.01% | | | | (0.66% | ) | | | 2.04% | | | | (0.69% | ) | | | 146.98% | | | |
Class C Shares | | | | | | | | | | | | | | | | | | | | | | | | | | |
| Period Ended October 31, 2001 (e) | | $ | 108 | | | | 1.95% | (i) | | | (0.01% | ) (i) | | | 3.29% | (i) | | | (1.35% | ) (i) | | | 139.75% | | | |
| Year Ended October 31, 2002 | | $ | 133 | | | | 1.99% | | | | (0.30% | ) | | | 2.23% | | | | (0.54% | ) | | | 108.62% | | | |
| Year Ended October 31, 2003 | | $ | 342 | | | | 2.00% | | | | (0.56% | ) | | | 2.09% | | | | (0.65% | ) | | | 90.02% | | | |
| Year Ended October 31, 2004 | | $ | 652 | | | | 2.01% | | | | (0.67% | ) | | | 2.05% | | | | (0.71% | ) | | | 146.98% | | | |
Class R Shares | | | | | | | | | | | | | | | | | | | | | | | | | | |
| Period Ended October 31, 2004 (f) | | $ | 1 | | | | 1.60% | (i) | | | (0.35% | ) (i) | | | 1.64% | (i) | | | (0.39% | ) (i) | | | 146.98% | | | |
Institutional Service Class Shares | | | | | | | | | | | | | | | | | | | | | | | | | | |
| Period Ended October 31, 2000 (d) | | $ | 4,441 | | | | 1.00% | (i) | | | 0.98% | (i) | | | 5.99% | (i) | | | (4.01% | ) (i) | | | 119.39% | | | |
| Year Ended October 31, 2001 | | $ | 10,130 | | | | 1.00% | | | | 1.07% | | | | 1.81% | | | | 1.26% | | | | 139.75% | | | |
| Year Ended October 31, 2002 | | $ | 11,022 | | | | 1.16% | | | | 0.52% | | | | 1.40% | | | | 0.28% | | | | 108.62% | | | |
| Year Ended October 31, 2003 | | $ | 21,670 | | | | 1.20% | | | | 0.27% | | | | 1.30% | | | | 0.16% | | | | 90.02% | | | |
| Year Ended October 31, 2004 | | $ | 16,497 | | | | 1.19% | | | | 0.17% | | | | 1.22% | | | | 0.15% | | | | 146.98% | | | |
Institutional Class Shares | | | | | | | | | | | | | | | | | | | | | | | | | | |
| Year Ended October 31, 2004 (g) | | $ | 1 | | | | 1.09% | (i) | | | 0.09% | (i) | | | 1.17% | (i) | | | 0.01% | (i) | | | 146.98% | | | |
| | | | |
| | |
| (a) | | Excludes sales charge. |
| (b) | | During the period certain fees were waived and/or reimbursed. If such waivers/reimbursements had not occurred, the ratios would have been as indicated. |
| (c) | | Portfolio turnover is calculated on the basis of the Fund as whole without distinguishing among the classes of shares. |
| (d) | | For the period from December 29, 1999 (commencement of operations) through October 31, 2000. |
| (e) | | For the period from March 1, 2001 (commencement of operations) through October 31, 2001. |
| (f) | | For the period from December 30, 2003 (commencement of operations) through October 31, 2004. |
| (g) | | For the period from June 29, 2004 (commencement of operations) through October 31, 2004. |
| (h) | | Not annualized. |
| (i) | | Annualized. |
See notes to financial statements.
150 Annual Report 2004
Gartmore Micro Cap Equity Fund
| | | | | | | | | | | | | |
| | | | |
| | | | Investment Activities | |
| | Net Asset | | | Net | | | |
| | Value, | | | Investment | | | |
| | Beginning | | | Income | | | Redemption | |
| | of Period | | | (Loss) | | | Fees | |
|
|
| |
Class A Shares | | | | | | | | | | | | |
| Period Ended October 31, 2002 (d)(e) | | $ | 10.00 | | | | (0.04 | ) | | | — | |
| Year Ended October 31, 2003 | | $ | 8.64 | | | | (0.02 | ) | | | — | |
| Year Ended October 31, 2004 | | $ | 15.91 | | | | (0.18 | ) | | | 0.02 | |
Class B Shares | | | | | | | | | | | | |
| Period Ended October 31, 2002 (d) | | $ | 10.00 | | | | (0.06 | ) | | | — | |
| Year Ended October 31, 2003 | | $ | 8.61 | | | | (0.06 | ) | | | — | |
| Year Ended October 31, 2004 | | $ | 15.74 | | | | (0.26 | ) | | | 0.02 | |
Class C Shares | | | | | | | | | | | | |
| Period Ended October 31, 2002 (d) | | $ | 10.00 | | | | (0.06 | ) | | | — | |
| Year Ended October 31, 2003 | | $ | 8.61 | | | | (0.05 | ) | | | — | |
| Year Ended October 31, 2004 | | $ | 15.76 | | | | (0.24 | ) | | | 0.02 | |
Class R Shares | | | | | | | | | | | | |
| Period Ended October 31, 2004 (f) | | $ | 17.38 | | | | (0.27 | ) | | | 0.02 | |
Institutional Service Class Shares | | | | | | | | | | | | |
| Period Ended October 31, 2002 (d) | | $ | 10.00 | | | | (0.03 | ) | | | — | |
| Year Ended October 31, 2003 | | $ | 8.64 | | | | (0.13 | ) | | | — | |
| Year Ended October 31, 2004 | | $ | 15.96 | | | | (0.28 | ) | | | 0.02 | |
Institutional Class Shares | | | | | | | | | | | | |
| Period Ended October 31, 2002 (d) | | $ | 10.00 | | | | (0.03 | ) | | | — | |
| Year Ended October 31, 2003 | | $ | 8.64 | | | | (0.13 | ) | | | — | |
| Year Ended October 31, 2004 | | $ | 15.96 | | | | (0.16 | ) | | | 0.02 | |
|
[Additional columns below]
[Continued from above table, first column(s) repeated]
| | | | | | | | | | | | | |
| | | | Distributions | |
| | Investment Activities | | | |
| | Net Realized | | | | | |
| | and | | | | | |
| | Unrealized | | | Total | | | |
| | Gains | | | from | | | Net | |
| | (Losses) on | | | Investment | | | Realized | |
| | Investments | | | Activities | | | Gains | |
| | |
| | |
| |
| |
Class A Shares | | | | | | | | | | | | |
| Period Ended October 31, 2002 (d)(e) | | | (1.32 | ) | | | (1.36 | ) | | | — | |
| Year Ended October 31, 2003 | | | 7.29 | | | | 7.27 | | | | — | |
| Year Ended October 31, 2004 | | | 3.81 | | | | 3.65 | | | | — | (i) |
Class B Shares | | | | | | | | | | | | |
| Period Ended October 31, 2002 (d) | | | (1.33 | ) | | | (1.39 | ) | | | — | |
| Year Ended October 31, 2003 | | | 7.19 | | | | 7.13 | | | | — | |
| Year Ended October 31, 2004 | | | 3.72 | | | | 3.48 | | | | — | (i) |
Class C Shares | | | | | | | | | | | | |
| Period Ended October 31, 2002 (d) | | | (1.33 | ) | | | (1.39 | ) | | | — | |
| Year Ended October 31, 2003 | | | 7.20 | | | | 7.15 | | | | — | |
| Year Ended October 31, 2004 | | | 3.70 | | | | 3.48 | | | | — | (i) |
Class R Shares | | | | | | | | | | | | |
| Period Ended October 31, 2004 (f) | | | 2.14 | | | | 1.89 | | | | — | (i) |
Institutional Service Class Shares | | | | | | | | | | | | |
| Period Ended October 31, 2002 (d) | | | (1.33 | ) | | | (1.36 | ) | | | — | |
| Year Ended October 31, 2003 | | | 7.45 | | | | 7.32 | | | | — | |
| Year Ended October 31, 2004 | | | 3.97 | | | | 3.71 | | | | — | (i) |
Institutional Class Shares | | | | | | | | | | | | |
| Period Ended October 31, 2002 (d) | | | (1.33 | ) | | | (1.36 | ) | | | — | |
| Year Ended October 31, 2003 | | | 7.45 | | | | 7.32 | | | | — | |
| Year Ended October 31, 2004 | | | 3.85 | | | | 3.71 | | | | — | (i) |
| | |
[Additional columns below]
[Continued from above table, first column(s) repeated]
| | | | | | | | | |
| | Net Asset | | | |
| | Value, End | | | Total | |
| | of Period | | | Return (a) | |
| | |
| | |
| |
| |
Class A Shares | | | | | | | | |
| Period Ended October 31, 2002 (d)(e) | | $ | 8.64 | | | | (13.60% | ) (g) |
| Year Ended October 31, 2003 | | $ | 15.91 | | | | 84.14% | |
| Year Ended October 31, 2004 | | $ | 19.56 | | | | 22.96% | |
Class B Shares | | | | | | | | |
| Period Ended October 31, 2002 (d) | | $ | 8.61 | | | | (13.90% | ) (g) |
| Year Ended October 31, 2003 | | $ | 15.74 | | | | 82.81% | |
| Year Ended October 31, 2004 | | $ | 19.22 | | | | 22.13% | |
Class C Shares | | | | | | | | |
| Period Ended October 31, 2002 (d) | | $ | 8.61 | | | | (13.90% | ) (g) |
| Year Ended October 31, 2003 | | $ | 15.76 | | | | 83.04% | |
| Year Ended October 31, 2004 | | $ | 19.24 | | | | 22.10% | |
Class R Shares | | | | | | | | |
| Period Ended October 31, 2004 (f) | | $ | 19.27 | | | | 10.89% | (g) |
Institutional Service Class Shares | | | | | | | | |
| Period Ended October 31, 2002 (d) | | $ | 8.64 | | | | (13.60% | ) (g) |
| Year Ended October 31, 2003 | | $ | 15.96 | | | | 84.72% | |
| Year Ended October 31, 2004 | | $ | 19.67 | | | | 23.26% | |
Institutional Class Shares | | | | | | | | |
| Period Ended October 31, 2002 (d) | | $ | 8.64 | | | | (13.60% | ) (g) |
| Year Ended October 31, 2003 | | $ | 15.96 | | | | 84.72% | |
| Year Ended October 31, 2004 | | $ | 19.67 | | | | 23.26% | |
| | |
[Additional columns below]
[Continued from above table, first column(s) repeated]
| | | | | | | | | | | | | | | | | | | | | | | | | | | |
| | | | |
| | Ratios / Supplemental Data | | | |
| | | | Ratio of Net | | | | | |
| | | | Ratio of Net | | | Ratio of | | | Investment | | | | | |
| | | | Investment | | | Expenses | | | Income (Loss) | | | | | |
| | Net Assets | | | Ratio of | | | Income | | | (Prior to | | | (Prior to | | | | | |
| | at End of | | | Expenses | | | (Loss) | | | Reimbursements) | | | Reimbursements) | | | | | |
| | Period | | | to Average | | | to Average | | | to Average | | | to Average | | | Portfolio | | | |
| | (000s) | | | Net Assets | | | Net Assets | | | Net Assets (b) | | | Net Assets (b) | | | Turnover (c) | | | |
| | | | |
| | | | |
| |
| | | |
Class A Shares | | | | | | | | | | | | | | | | | | | | | | | | | | |
| Period Ended October 31, 2002 (d)(e) | | $ | 310 | | | | 1.80% | (h) | | | (1.32% | ) (h) | | | 8.73% | (h) | | | (8.25% | ) (h) | | | 56.08% | | | |
| Year Ended October 31, 2003 | | $ | 17,023 | | | | 1.82% | | | | (1.32% | ) | | | 2.26% | | | | (1.76% | ) | | | 104.50% | | | |
| Year Ended October 31, 2004 | | $ | 74,983 | | | | 1.81% | | | | (1.35% | ) | | | 1.82% | | | | (1.37% | ) | | | 107.36% | | | |
Class B Shares | | | | | | | | | | | | | | | | | | | | | | | | | | |
| Period Ended October 31, 2002 (d) | | $ | 43 | | | | 2.55% | (h) | | | (2.04% | ) (h) | | | 8.46% | (h) | | | (7.95% | ) (h) | | | 56.08% | | | |
| Year Ended October 31, 2003 | | $ | 1,611 | | | | 2.54% | | | | (2.08% | ) | | | 2.99% | | | | (2.52% | ) | | | 104.50% | | | |
| Year Ended October 31, 2004 | | $ | 6,403 | | | | 2.55% | | | | (2.11% | ) | | | 2.57% | | | | (2.13% | ) | | | 107.36% | | | |
Class C Shares | | | | | | | | | | | | | | | | | | | | | | | | | | |
| Period Ended October 31, 2002 (d) | | $ | 43 | | | | 2.55% | (h) | | | (2.04% | ) (h) | | | 8.46% | (h) | | | (7.95% | ) (h) | | | 56.08% | | | |
| Year Ended October 31, 2003 | | $ | 5,609 | | | | 2.54% | | | | (2.04% | ) | | | 2.90% | | | | (2.40% | ) | | | 104.50% | | | |
| Year Ended October 31, 2004 | | $ | 30,377 | | | | 2.55% | | | | (2.11% | ) | | | 2.57% | | | | (2.13% | ) | | | 107.36% | | | |
Class R Shares | | | | | | | | | | | | | | | | | | | | | | | | | | |
| Period Ended October 31, 2004 (f) | | $ | 1 | | | | 2.17% | (h) | | | (1.78% | ) (h) | | | 2.17% | (h) | | | (1.78% | ) (h) | | | 107.36% | | | |
Institutional Service Class Shares | | | | | | | | | | | | | | | | | | | | | | | | | | |
| Period Ended October 31, 2002 (d) | | $ | 43 | | | | 1.55% | (h) | | | (1.04% | ) (h) | | | 7.45% | (h) | | | (6.94% | ) (h) | | | 56.08% | | | |
| Year Ended October 31, 2003 | | $ | 80 | | | | 1.55% | | | | (1.15% | ) | | | 2.40% | | | | (2.00% | ) | | | 104.50% | | | |
| Year Ended October 31, 2004 | | $ | 51 | | | | 1.51% | | | | (1.10% | ) | | | 1.52% | | | | (1.11% | ) | | | 107.36% | | | |
Institutional Class Shares | | | | | | | | | | | | | | | | | | | | | | | | | | |
| Period Ended October 31, 2002 (d) | | $ | 1,556 | | | | 1.55% | (h) | | | (1.04% | ) (h) | | | 7.46% | (h) | | | (6.95% | ) (h) | | | 56.08% | | | |
| Year Ended October 31, 2003 | | $ | 2,873 | | | | 1.55% | | | | (1.15% | ) | | | 2.40% | | | | (2.00% | ) | | | 104.50% | | | |
| Year Ended October 31, 2004 | | $ | 3,493 | | | | 1.52% | | | | (1.14% | ) | | | 1.54% | | | | (1.15% | ) | | | 107.36% | | | |
| | | | |
| | |
| (a) | | Excludes sales charge. |
| (b) | | During the period certain fees were waived and/or reimbursed. If such waivers/reimbursements had not occurred, the ratios would have been as indicated. |
| (c) | | Portfolio turnover is calculated on the basis of the Fund as whole without distinguishing among the classes of shares. |
| (d) | | For the period from June 27, 2002 (commencement of operations) through October 31, 2002. |
| (e) | | Net investment income (loss) is based on average shares outstanding during the period. |
| (f) | | For the period from December 30, 2003 (commencement of operations) through October 31, 2004. |
| (g) | | Not annualized. |
| (h) | | Annualized. |
| (i) | | Amount is less than $0.005. |
See notes to financial statements.
2004 Annual Report 151
| |
| | Financial Highlights |
| | Selected Data for Each Share of Capital Outstanding |
Concept Series
Gartmore U.S. Growth Leaders Long-Short Fund
| | | | | | | | | | | | | | | | | |
| | | | |
| | | | Investment Activities | |
| | | | | | Net Realized | | | |
| | | | | | and | | | |
| | Net Asset | | | Net | | | Unrealized | | | Total | |
| | Value, | | | Investment | | | Gains | | | from | |
| | Beginning | | | Income | | | (Losses) on | | | Investment | |
| | of Period | | | (Loss) | | | Investments | | | Activities | |
|
|
| |
Class A Shares | | | | | | | | | | | | | | | | |
| Period Ended June 30, 2002 (d) | | $ | 11.14 | | | | 6.65 | | | | (6.90 | ) | | | (0.25 | ) |
| Year Ended June 30, 2003 (f) | | $ | 10.89 | | | | (0.08 | ) | | | 0.14 | | | | 0.06 | |
| Period Ended October 31, 2003 (e) | | $ | 10.95 | | | | (0.07 | ) | | | 1.12 | | | | 1.05 | |
| Year Ended October 31, 2004 | | $ | 12.00 | | | | 0.11 | | | | 0.77 | | | | 0.88 | |
Class B Shares | | | | | | | | | | | | | | | | |
| Period Ended June 30, 2002 (d) | | $ | 11.14 | | | | (0.07 | ) | | | (0.17 | ) | | | (0.24 | ) |
| Year Ended June 30, 2003 (f) | | $ | 10.90 | | | | (0.23 | ) | | | 0.19 | | | | (0.04 | ) |
| Period Ended October 31, 2003 (e)(f) | | $ | 10.86 | | | | (0.10 | ) | | | 1.12 | | | | 1.02 | |
| Year Ended October 31, 2004 | | $ | 11.88 | | | | 0.22 | | | | 0.58 | | | | 0.80 | |
Class C Shares | | | | | | | | | | | | | | | | |
| Year Ended June 30, 2000 | | $ | 18.01 | | | | (0.71 | ) | | | 12.41 | | | | 11.70 | |
| Year Ended June 30, 2001 | | $ | 27.72 | | | | (0.15 | ) | | | (8.43 | ) | | | (8.58 | ) |
| Year Ended June 30, 2002 | | $ | 10.02 | | | | (0.66 | ) | | | (0.31 | ) | | | (0.97 | ) |
| Year Ended June 30, 2003 | | $ | 9.05 | | | | (0.19 | ) | | | 0.17 | | | | (0.02 | ) |
| Period Ended October 31, 2003 (e) | | $ | 9.03 | | | | (0.08 | ) | | | 0.93 | | | | 0.85 | |
| Year Ended October 31, 2004 | | $ | 9.88 | | | | 0.64 | | | | (0.01 | ) | | | 0.63 | |
Class R Shares | | | | | | | | | | | | | | | | |
| Period Ended October 31, 2004 (g) | | $ | 9.21 | | | | (0.11 | ) | | | 0.31 | | | | 0.20 | |
Institutional Class Shares | | | | | | | | | | | | | | | | |
| Period Ended October 31, 2004 (h) | | $ | 9.28 | | | | (0.02 | ) | | | 0.31 | | | | 0.29 | |
|
[Additional columns below]
[Continued from above table, first column(s) repeated]
| | | | | | | | | | | | | | | | | | | | | |
| | | | | | |
| | Distributions | | | | | |
| | Net | | | Net | | | | | Net Asset | | | |
| | Investment | | | Realized | | | Total | | | Value, End | | | Total | |
| | Income | | | Gains | | | Distributions | | | of Period | | | Return (a) | |
| | |
| | |
| |
| |
Class A Shares | | | | | | | | | | | | | | | | | | | | |
| Period Ended June 30, 2002 (d) | | | — | | | | — | | | | — | | | $ | 10.89 | | | | (2.24% | ) (i) |
| Year Ended June 30, 2003 (f) | | | — | | | | — | | | | | | | $ | 10.95 | | | | 0.55% | |
| Period Ended October 31, 2003 (e) | | | — | | | | — | | | | — | | | $ | 12.00 | | | | 9.59% | (i) |
| Year Ended October 31, 2004 | | | (3.32 | ) | | | — | | | | (3.32 | ) | | $ | 9.56 | | | | 9.03% | |
Class B Shares | | | | | | | | | | | | | | | | | | | | |
| Period Ended June 30, 2002 (d) | | | — | | | | — | | | | — | | | $ | 10.90 | | | | (2.15% | ) (i) |
| Year Ended June 30, 2003 (f) | | | — | | | | — | | | | | | | $ | 10.86 | | | | (0.37% | ) |
| Period Ended October 31, 2003 (e)(f) | | | — | | | | — | | | | — | | | $ | 11.88 | | | | 9.39% | (i) |
| Year Ended October 31, 2004 | | | (3.30 | ) | | | — | | | | (3.30 | ) | | $ | 9.38 | | | | 8.22% | |
Class C Shares | | | | | | | | | | | | | | | | | | | | |
| Year Ended June 30, 2000 | | | — | | | | (1.99 | ) | | | (1.99 | ) | | $ | 27.72 | | | | 65.61% | |
| Year Ended June 30, 2001 | | | — | | | | (9.12 | ) | | | (9.12 | ) | | $ | 10.02 | | | | (40.62% | ) |
| Year Ended June 30, 2002 | | | — | | | | — | | | | — | | | $ | 9.05 | | | | (17.65% | ) |
| Year Ended June 30, 2003 | | | — | | | | — | | | | — | | | $ | 9.03 | | | | (0.22% | ) |
| Period Ended October 31, 2003 (e) | | | — | | | | — | | | | — | | | $ | 9.88 | | | | 9.41% | (i) |
| Year Ended October 31, 2004 | | | (3.30 | ) | | | — | | | | (3.30 | ) | | $ | 7.21 | | | | 8.20% | |
Class R Shares | | | | | | | | | | | | | | | | | | | | |
| Period Ended October 31, 2004 (g) | | | — | | | | — | | | | — | | | $ | 9.41 | | | | 2.17% | (i) |
Institutional Class Shares | | | | | | | | | | | | | | | | | | | | |
| Period Ended October 31, 2004 (h) | | | — | | | | — | | | | — | | | $ | 9.57 | | | | 3.12% | (i) |
| | |
[Additional columns below]
[Continued from above table, first column(s) repeated]
| | | | | | | | | | | | | | | | | | | | | | | | | | | |
| | | | |
| | Ratios / Supplemental Data | | | |
| | | | Ratio of Net | | | | | |
| | | | Ratio of Net | | | Ratio of | | | Investment | | | | | |
| | | | Investment | | | Expenses | | | Income (Loss) | | | | | |
| | Net Assets | | | Ratio of | | | Income | | | (Prior to | | | (Prior to | | | | | |
| | at End of | | | Expenses | | | (Loss) | | | Reimbursements) | | | Reimbursements) | | | | | |
| | Period | | | to Average | | | to Average | | | to Average | | | to Average | | | Portfolio | | | |
| | (000s) | | | Net Assets | | | Net Assets | | | Net Assets (b) | | | Net Assets (b) | | | Turnover (c) | | | |
| | | | |
| | | | |
| |
| | | |
Class A Shares | | | | | | | | | | | | | | | | | | | | | | | | | | |
| Period Ended June 30, 2002 (d) | | $ | 144 | | | | 1.95% | (j) | | | 122.95% | (j) | | | 2.26% | (j) | | | 122.64% | (j) | | | 425% | | | |
| Year Ended June 30, 2003 (f) | | $ | 29,561 | | | | 3.47% | | | | (2.04% | ) | | | 3.66% | | | | (2.23% | ) | | | 424% | | | |
| Period Ended October 31, 2003 (e) | | $ | 29,468 | | | | 3.23% | (j) | | �� | (1.77% | ) (j) | | | (k) | | | | (k) | | | | 126.69% | | | |
| Year Ended October 31, 2004 | | $ | 24,411 | | | | 2.20% | | | | (1.65% | ) | | | 2.25% | | | | (1.70% | ) | | | 577.36% | | | |
Class B Shares | | | | | | | | | | | | | | | | | | | | | | | | | | |
| Period Ended June 30, 2002 (d) | | $ | 121 | | | | 2.74% | (j) | | | (1.45% | ) (j) | | | 2.86% | (j) | | | (1.57% | ) (j) | | | 425% | | | |
| Year Ended June 30, 2003 (f) | | $ | 141 | | | | 3.73% | | | | (2.31% | ) | | | 4.54% | | | | (3.12% | ) | | | 424% | | | |
| Period Ended October 31, 2003 (e)(f) | | $ | 414 | | | | 3.98% | (j) | | | (2.54% | ) (j) | | | (k) | | | | (k) | | | | 126.69% | | | |
| Year Ended October 31, 2004 | | $ | 653 | | | | 2.93% | | | | (2.30% | ) | | | 3.00% | | | | (2.36% | ) | | | 577.36% | | | |
Class C Shares | | | | | | | | | | | | | | | | | | | | | | | | | | |
| Year Ended June 30, 2000 | | $ | 9,927 | | | | 2.82% | | | | (2.65% | ) | | | 4.67% | | | | (4.50% | ) | | | 204% | | | |
| Year Ended June 30, 2001 | | $ | 3,102 | | | | 3.04% | | | | (1.51% | ) | | | 3.82% | | | | (2.29% | ) | | | 143% | | | |
| Year Ended June 30, 2002 | | $ | 1,819 | | | | 3.28% | | | | (5.41% | ) | | | 3.71% | | | | (5.87% | ) | | | 425% | | | |
| Year Ended June 30, 2003 | | $ | 1,323 | | | | 3.72% | | | | (2.31% | ) | | | 4.54% | | | | (3.13% | ) | | | 424% | | | |
| Period Ended October 31, 2003 (e) | | $ | 1,487 | | | | 3.98% | (j) | | | (2.52% | ) (j) | | | (k) | | | | (k) | | | | 126.69% | | | |
| Year Ended October 31, 2004 | | $ | 2,641 | | | | 2.92% | | | | (2.29% | ) | | | 3.00% | | | | (2.37% | ) | | | 577.36% | | | |
Class R Shares | | | | | | | | | | | | | | | | | | | | | | | | | | |
| Period Ended October 31, 2004 (g) | | $ | 1 | | | | 2.45% | (j) | | | (1.74% | ) (j) | | | 2.49% | (j) | | | (1.78% | ) (j) | | | 577.36% | | | |
Institutional Class Shares | | | | | | | | | | | | | | | | | | | | | | | | | | |
| Period Ended October 31, 2004 (h) | | $ | 331 | | | | 1.90% | (j) | | | (0.52% | ) (j) | | | 2.09% | (j) | | | (0.72% | ) (j) | | | 577.36% | | | |
| | | | |
| | |
| (a) | | Excludes sales charge. |
| (b) | | During the period certain fees were waived and/or reimbursed. If such waivers/reimbursements had not occurred, the ratios would have been as indicated. |
| (c) | | Portfolio turnover is calculated on the basis of the Fund as whole without distinguishing among the classes of shares. |
| (d) | | For the period from October 31, 2001 (commencement of operations) through June 30, 2002. |
| (e) | | For the period from July 1, 2003 through October 31, 2003. |
| (f) | | Net investment income (loss) is based on average shares outstanding during the period. |
| (g) | | For the period from February 27, 2004 (commencement of operations) through October 31, 2004. |
| (h) | | For the period from June 29, 2004 (commencement of operations) through October 31, 2004. |
| (i) | | Not annualized. |
| (j) | | Annualized. |
| (k) | | There were no fee reductions in this period. |
See notes to financial statements.
152 Annual Report 2004
Gartmore Convertible Fund
| | | | | | | | | | | | | | | | | |
| | | | |
| | | | Investment Activities | |
| | | | | | Net Realized | | | |
| | | | | | and | | | |
| | Net Asset | | | Net | | | Unrealized | | | Total | |
| | Value, | | | Investment | | | Gains | | | from | |
| | Beginning | | | Income | | | (Losses) on | | | Investment | |
| | of Period | | | (Loss) | | | Investments | | | Activities | |
|
|
| |
Class A Shares | | | | | | | | | | | | | | | | |
| Period Ended October 31, 2004 (d) | | $ | 10.09 | | | | 0.15 | | | | (0.32 | ) | | | (0.17 | ) |
Class B Shares | | | | | | | | | | | | | | | | |
| Period Ended October 31, 2004 (d) | | $ | 10.09 | | | | 0.10 | | | | (0.35 | ) | | | (0.25 | ) |
Class C Shares | | | | | | | | | | | | | | | | |
| Period Ended October 31, 2004 (d) | | $ | 10.09 | | | | 0.10 | | | | (0.34 | ) | | | (0.24 | ) |
Class R Shares | | | | | | | | | | | | | | | | |
| Period Ended October 31, 2004 (e) | | $ | 9.66 | | | | 0.08 | | | | 0.09 | | | | 0.17 | |
Institutional Service Class Shares | | | | | | | | | | | | | | | | |
| Period Ended October 31, 2004 (d) | | $ | 10.09 | | | | 0.12 | | | | (0.28 | ) | | | (0.16 | ) |
Institutional Class Shares | | | | | | | | | | | | | | | | |
| Period Ended October 31, 2004 (f) | | $ | 10.00 | | | | 0.18 | | | | (0.25 | ) | | | (0.07 | ) |
|
[Additional columns below]
[Continued from above table, first column(s) repeated]
| | | | | | | | | | | | | | | | | |
| | | | | | |
| | Distributions | | | | | |
| | Net | | | | | Net Asset | | | |
| | Investment | | | Total | | | Value, End | | | Total | |
| | Income | | | Distributions | | | of Period | | | Return (a) | |
| | |
| | |
| |
| |
Class A Shares | | | | | | | | | | | | | | | | |
| Period Ended October 31, 2004 (d) | | | (0.14 | ) | | | (0.14 | ) | | $ | 9.78 | | | | (1.68% | ) (g) |
Class B Shares | | | | | | | | | | | | | | | | |
| Period Ended October 31, 2004 (d) | | | (0.11 | ) | | | (0.11 | ) | | $ | 9.73 | | | | (2.46% | ) (g) |
Class C Shares | | | | | | | | | | | | | | | | |
| Period Ended October 31, 2004 (d) | | | (0.11 | ) | | | (0.11 | ) | | $ | 9.74 | | | | (2.41% | ) (g) |
Class R Shares | | | | | | | | | | | | | | | | |
| Period Ended October 31, 2004 (e) | | | (0.09 | ) | | | (0.09 | ) | | $ | 9.74 | | | | 1.72% | (g) |
Institutional Service Class Shares | | | | | | | | | | | | | | | | |
| Period Ended October 31, 2004 (d) | | | (0.15 | ) | | | (0.15 | ) | | $ | 9.78 | | | | (0.68% | ) (g) |
Institutional Class Shares | | | | | | | | | | | | | | | | |
| Period Ended October 31, 2004 (f) | | | (0.15 | ) | | | (0.15 | ) | | $ | 9.78 | | | | (1.56% | ) (g) |
| | |
[Additional columns below]
[Continued from above table, first column(s) repeated]
| | | | | | | | | | | | | | | | | | | | | | | | | | | |
| | | | |
| | Ratios / Supplemental Data | | | |
| | | | Ratio of Net | | | | | |
| | | | Ratio of Net | | | Ratio of | | | Investment | | | | | |
| | | | Investment | | | Expenses | | | Income (Loss) | | | | | |
| | Net Assets | | | Ratio of | | | Income | | | (Prior to | | | (Prior to | | | | | |
| | at End of | | | Expenses | | | (Loss) | | | Reimbursements) | | | Reimbursements) | | | | | |
| | Period | | | to Average | | | to Average | | | to Average | | | to Average | | | Portfolio | | | |
| | (000s) | | | Net Assets | | | Net Assets | | | Net Assets (b) | | | Net Assets (b) | | | Turnover (c) | | | |
| | | | |
| | | | |
| |
| | | |
Class A Shares | | | | | | | | | | | | | | | | | | | | | | | | | | |
| Period Ended October 31, 2004 (d) | | $ | 2,988 | | | | 1.20% | (h) | | | 2.28% | (h) | | | 1.36% | (h) | | | 2.12% | (h) | | | 153.08% | | | |
Class B Shares | | | | | | | | | | | | | | | | | | | | | | | | | | |
| Period Ended October 31, 2004 (d) | | $ | 210 | | | | 1.95% | (h) | | | 1.55% | (h) | | | 2.08% | (h) | | | 1.42% | (h) | | | 153.08% | | | |
Class C Shares | | | | | | | | | | | | | | | | | | | | | | | | | | |
| Period Ended October 31, 2004 (d) | | $ | 3,253 | | | | 1.95% | (h) | | | 1.52% | (h) | | | 2.09% | (h) | | | 1.38% | (h) | | | 153.08% | | | |
Class R Shares | | | | | | | | | | | | | | | | | | | | | | | | | | |
| Period Ended October 31, 2004 (e) | | $ | 1 | | | | 1.58% | (h) | | | 1.75% | (h) | | | 1.59% | (h) | | | 1.75% | (h) | | | 153.08% | | | |
Institutional Service Class Shares | | | | | | | | | | | | | | | | | | | | | | | | | | |
| Period Ended October 31, 2004 (d) | | $ | 311 | | | | 0.95% | (h) | | | 2.28% | (h) | | | 1.10% | (h) | | | 2.13% | (h) | | | 153.08% | | | |
Institutional Class Shares | | | | | | | | | | | | | | | | | | | | | | | | | | |
| Period Ended October 31, 2004 (f) | | $ | 28,299 | | | | 0.95% | (h) | | | 2.53% | (h) | | | 1.12% | (h) | | | 2.36% | (h) | | | 153.08% | | | |
| | | | |
| | |
| (a) | | Excludes sales charge. |
| (b) | | During the period certain fees were waived and/or reimbursed. If such waivers/reimbursements had not occurred, the ratios would have been as indicated. |
| (c) | | Portfolio turnover is calculated on the basis of the Fund as a whole without distinguishing among the classes of shares. |
| (d) | | For the period from January 20, 2004 (commencement of operations) through October 31, 2004. |
| (e) | | For the period from May 14, 2004 (commencement of operations) through October 31, 2004. |
| (f) | | For the period from December 29, 2003 (commencement of operations) through October 31, 2004. |
| (g) | | Not annualized. |
| (h) | | Annualized. |
See notes to financial statements.
2004 Annual Report 153
| |
| | Financial Highlights |
| | Selected Data for Each Share of Capital Outstanding |
Concept Series
Gartmore Small Cap Growth Fund
| | | | | | | | | | | | | | | | | |
| | | | |
| | | | Investment Activities | |
| | | | | | Net Realized | | | |
| | | | | | and | | | |
| | Net Asset | | | Net | | | Unrealized | | | Total | |
| | Value, | | | Investment | | | Gains | | | from | |
| | Beginning | | | Income | | | (Losses) on | | | Investment | |
| | of Period | | | (Loss) | | | Investments | | | Activities | |
|
|
| |
Class A Shares | | | | | | | | | | | | | | | | |
| Period Ended October 31, 2004 (d) | | $ | 10.00 | | | | (0.01 | ) | | | (0.82 | ) | | | (0.83 | ) |
Class B Shares | | | | | | | | | | | | | | | | |
| Period Ended October 31, 2004 (d) | | $ | 10.00 | | | | (0.02 | ) | | | (0.84 | ) | | | (0.86 | ) |
Class C Shares | | | | | | | | | | | | | | | | |
| Period Ended October 31, 2004 (d) | | $ | 10.00 | | | | (0.02 | ) | | | (0.85 | ) | | | (0.87 | ) |
Class R Shares | | | | | | | | | | | | | | | | |
| Period Ended October 31, 2004 (d) | | $ | 10.00 | | | | (0.07 | ) | | | (0.77 | ) | | | (0.84 | ) |
Institutional Service Class Shares | | | | | | | | | | | | | | | | |
| Period Ended October 31, 2004 (d) | | $ | 10.00 | | | | (0.04 | ) | | | (0.77 | ) | | | (0.81 | ) |
Institutional Class Shares | | | | | | | | | | | | | | | | |
| Period Ended October 31, 2004 (d) | | $ | 10.00 | | | | (0.04 | ) | | | (0.77 | ) | | | (0.81 | ) |
|
[Additional columns below]
[Continued from above table, first column(s) repeated]
| | | | | | | | | |
| | Net Asset | | | |
| | Value, End | | | Total | |
| | of Period | | | Return (a) | |
| | |
| | |
| |
| |
Class A Shares | | | | | | | | |
| Period Ended October 31, 2004 (d) | | $ | 9.17 | | | | (8.30% | ) (e) |
Class B Shares | | | | | | | | |
| Period Ended October 31, 2004 (d) | | $ | 9.14 | | | | (8.60% | ) (e) |
Class C Shares | | | | | | | | |
| Period Ended October 31, 2004 (d) | | $ | 9.13 | | | | (8.60% | ) (e) |
Class R Shares | | | | | | | | |
| Period Ended October 31, 2004 (d) | | $ | 9.16 | | | | (8.40% | ) (e) |
Institutional Service Class Shares | | | | | | | | |
| Period Ended October 31, 2004 (d) | | $ | 9.19 | | | | (8.10% | ) (e) |
Institutional Class Shares | | | | | | | | |
| Period Ended October 31, 2004 (d) | | $ | 9.19 | | | | (8.10% | ) (e) |
| | |
[Additional columns below]
[Continued from above table, first column(s) repeated]
| | | | | | | | | | | | | | | | | | | | | | | | | | | |
| | | | |
| | Ratios / Supplemental Data | | | |
| | | | Ratio of Net | | | | | |
| | | | Ratio of Net | | | Ratio of | | | Investment | | | | | |
| | | | Investment | | | Expenses | | | Income (Loss) | | | | | |
| | Net Assets | | | Ratio of | | | Income | | | (Prior to | | | (Prior to | | | | | |
| | at End of | | | Expenses | | | (Loss) | | | Reimbursements) | | | Reimbursements) | | | | | |
| | Period | | | to Average | | | to Average | | | to Average | | | to Average | | | Portfolio | | | |
| | (000s) | | | Net Assets | | | Net Assets | | | Net Assets (b) | | | Net Assets (b) | | | Turnover (c) | | | |
| | | | |
| | | | |
| |
| | | |
Class A Shares | | | | | | | | | | | | | | | | | | | | | | | | | | |
| Period Ended October 31, 2004 (d) | | $ | 14 | | | | 1.67% | (f) | | | (0.81% | ) (f) | | | 4.98% | (f) | | | (4.12% | ) (f) | | | 633.92% | | | |
Class B Shares | | | | | | | | | | | | | | | | | | | | | | | | | | |
| Period Ended October 31, 2004 (d) | | $ | 13 | | | | 2.37% | (f) | | | (1.66% | ) (f) | | | 5.65% | (f) | | | (4.94% | ) (f) | | | 633.92% | | | |
Class C Shares | | | | | | | | | | | | | | | | | | | | | | | | | | |
| Period Ended October 31, 2004 (d) | | $ | 40 | | | | 2.35% | (f) | | | (1.68% | ) (f) | | | 5.42% | (f) | | | (4.76% | ) (f) | | | 633.92% | | | |
Class R Shares | | | | | | | | | | | | | | | | | | | | | | | | | | |
| Period Ended October 31, 2004 (d) | | $ | 1 | | | | 1.82% | (f) | | | (1.25% | ) (f) | | | 5.07% | (f) | | | (4.50% | ) (f) | | | 633.92% | | | |
Institutional Service Class Shares | | | | | | | | | | | | | | | | | | | | | | | | | | |
| Period Ended October 31, 2004 (d) | | $ | 1 | | | | 1.28% | (f) | | | (0.71% | ) (f) | | | 4.44% | (f) | | | (3.87% | ) (f) | | | 633.92% | | | |
Institutional Class Shares | | | | | | | | | | | | | | | | | | | | | | | | | | |
| Period Ended October 31, 2004 (d) | | $ | 2,752 | | | | 1.37% | (f) | | | (0.75% | ) (f) | | | 4.69% | (f) | | | (4.07% | ) (f) | | | 633.92% | | | |
| | | | |
| | |
| (a) | | Excludes sales charge. |
| (b) | | During the period certain fees were waived and/or reimbursed. If such waivers/reimbursements had not occurred, the ratios would have been as indicated. |
| (c) | | Portfolio turnover is calculated on the basis of the Fund as a whole without distinguishing among the classes of shares. |
| (d) | | For the period from March 30, 2004 (commencement of operations) through October 31, 2004. |
| (e) | | Not annualized. |
| (f) | | Annualized. |
See notes to financial statements.
154 Annual Report 2004
Notes to Financial Statements
October 31, 2004
1. Organization
Gartmore Mutual Funds (the “Trust”) is an open-end management investment company. Prior to January 25, 2002 the Trust was named Nationwide Mutual Funds. The Trust was created under the laws of Ohio as an Ohio business trust pursuant to a Declaration of Trust dated as of October 30, 1997, as subsequently amended, and is registered under the Investment Company Act of 1940, as amended (the “1940 Act”). As of October 31, 2004, the Trust had authorized an unlimited number of shares of beneficial interest (“shares”) without par value. The Trust operates forty-five (45) separate series, or mutual funds, each with its own investment objectives and strategies. This report contains the financial statements and financial highlights of the 18 funds listed below (individually a “Fund”, collectively the “Funds”):
| | |
| | - | Gartmore Global Financial Services Fund (“Global Financial Services”) |
| | - | Gartmore Global Health Sciences Fund (“Global Health Sciences”) |
| | - | Gartmore Global Natural Resources Fund (“Global Natural Resources”) |
| | - | Gartmore Global Technology and Communications Fund (“Global Technology and Communications”) |
| | - | Gartmore Global Utilities Fund (“Global Utilities”) |
| | - | Gartmore Mid Cap Growth Leaders Fund (“Mid Cap Growth Leaders”) (formerly Millennium Growth Fund) |
| | - | Gartmore Nationwide Leaders Fund (“Nationwide Leaders”) |
| | - | Gartmore U.S. Growth Leaders Fund (“U.S. Growth Leaders”) |
| | - | Gartmore Worldwide Leaders Fund (“Worldwide Leaders”) |
| | - | Gartmore China Opportunities Fund (“China Opportunities”) |
| | - | Gartmore Emerging Markets Fund (“Emerging Markets”) |
| | - | Gartmore International Growth Fund (“International Growth”) |
| | - | Gartmore High Yield Bond Fund (“High Yield Bond”) |
| | - | Gartmore Value Opportunities Fund (“Value Opportunities”) |
| | - | Gartmore Micro Cap Equity Fund (“Micro Cap Equity”) |
| | - | Gartmore U.S. Growth Leaders Long-Short Fund (“U.S. Growth Leaders Long-Short”) (formerly Gartmore Long-Short Equity Plus Fund) |
| | - | Gartmore Convertible Fund (“Convertible”) |
| | - | Gartmore Small Cap Growth Fund (“Small Cap Growth”) |
Under the Trust’s organizational documents, its officers and trustees are indemnified against certain liabilities arising out of the performance of their duties to the Trust. In addition, in the normal course of business, the Trust enters into contracts with its vendors and others that provide for general indemnifications. The Trust’s maximum liability under these arrangements is unknown, as this would involve future claims that may be made against the Trust. However, based on experience, the Trust expects that risk of loss to be remote.
Pursuant to a plan and agreement of redomestication and reorganization dated September 15, 2004, the shareholders of the Trust will be requested, at a special meeting to be held on December 23, 2004, to approve the redomestication of the Trust to a Delaware statutory trust; said Trust redomestication is expected to be effective as of March 1, 2005. The redomestication is a change in statutory status and will not affect the operations of the Trust.
2. Summary of Significant Accounting Policies
The following is a summary of significant accounting policies followed by the Funds in the preparation of their financial statements. The policies are in conformity with accounting principles generally accepted in the United States of America (“GAAP”). The preparation of financial statements requires management to make estimates and assumptions that affect the reported amounts of assets and liabilities, the disclosure of contingent assets and liabilities at the date of the financial statements, and the reported amounts of income and expenses for the period. Actual results could differ from those estimates.
2004 Annual Report 155
| |
| | Notes to Financial Statements (Continued) |
| | October 31, 2004 |

| |
| | Securities for which market quotations are readily available are valued at current market value as of “Valuation Time.” Valuation Time is as of the close of regular trading on the New York Stock Exchange (usually 4 p.m. Eastern time). Equity securities are valued at the last quoted sale price or, if there is no sale price, the last quoted bid price provided by an independent pricing service approved by the Trust’s Board of Trustees. Prices are taken from the primary market or exchange in which each security trades. Most securities listed on a foreign exchange to date have been valued at the last sale price at the close of the exchange on which the security is principally traded. Foreign securities, currencies, and other assets and liabilities denominated in foreign currencies are translated into U.S. dollars at the exchange rate of such currencies against the U.S. Dollar, as of Valuation Time, as provided by an independent pricing service approved by the Board of Trustees. |
| |
| | Debt and other Fixed income securities (other than short-term obligations) are valued at the last quoted bid price and/or by using a combination of daily quotes and matrix evaluations provided by an independent pricing service, the use of which has been approved by the Funds’ Board of Trustees. Short-term debt securities such as commercial paper and U.S. Treasury Bills having a remaining maturity of 60 days or less at the time of purchase are considered to be “short-term” and are valued at amortized cost which approximates market value. |
| |
| | Securities for which market quotations are not readily available, or for which an independent pricing service does not provide a value or provides a value that does not represent fair value in the judgment of the Funds’ investment adviser or designee, are valued at fair value under procedures approved by the Trust’s Board of Trustees. The “Fair Value” of such securities is determined in good faith by taking into account relevant factors and surrounding circumstances. Methods utilized to obtain a “Fair Value” may include the following non-exclusive list of SEC acceptable methods: (i) a multiple of earnings, (ii) the discount from market value of a similar, freely traded security, (iii) the yield-to-maturity for debt issues, or (iv) a consolidation of the methods. The Gartmore Fair Value Committee considers a non-exclusive list of factors to arrive at the appropriate method of determining “Fair Value.” For example, fair value determinations are required for securities whose value is affected by a “significant” event that materially affects the value of a domestic or foreign security which occurs subsequent to the time of the close of the principal market on which such domestic or foreign security trades and before the Valuation Time (i.e., a “subsequent event”). Typically, this will involve events occurring after the close of a foreign market on which a security trades and before the next Valuation Time. |
| |
| | Beginning July 1, 2004, the Funds holding foreign equity securities (the “Foreign Equity Funds”) began to value foreign securities at fair value in the circumstances described below. Generally, trading in foreign securities markets is completed each day at various times prior to the Valuation Time. Due to the time differences between the closings of the relevant foreign securities exchanges and the Valuation Time for the Foreign Equity Funds, the Foreign Equity Funds will fair value their foreign investments when it is determined that the market quotations for the foreign investments either are not readily available or are unreliable and, therefore, do not represent fair value. When the fair value prices are utilized, these prices will attempt to reflect the impact of the U.S. financial markets’ perceptions and trading activities on the Foreign Equity Funds’ foreign investments since the last closing prices of the foreign investments were calculated on their primary foreign securities markets or exchanges. For these purposes, the Board of Trustees of the Trust has determined that movements in relevant indices or other appropriate market indicators, after the close of the foreign securities exchanges, may demonstrate that market quotations are unreliable, and may trigger fair value pricing for certain securities. Consequently, fair valuation of portfolio securities may occur on a daily basis. In determining fair value prices, the Trust utilizes data furnished by an independent pricing service (and that data draws upon, among other information, the market values of foreign investments). The fair value prices of portfolio securities generally will be used when it is determined that the use of such prices will have a material impact on the net asset value of a Foreign Equity Fund. When a Foreign Equity Fund uses fair value pricing, the values assigned to the Foreign Equity Fund’s foreign investments may not be the quoted or published prices of the investments on their primary markets or exchanges. |
156 Annual Report 2004
| |
| | The Funds may enter into repurchase agreements with an entity which is a member of the Federal Reserve System or which is a “primary dealer” (as designated by the Federal Reserve Bank of New York) in U.S. Government obligations. The repurchase price generally equals the price paid by a Fund plus interest negotiated on the basis of current short-term rates, which may be more or less than the rate on the underlying portfolio securities. The seller under a repurchase agreement is required to maintain the value of the collateral held pursuant to the agreement at a market value equal to or greater than the repurchase price (including accrued interest). Collateral subject to repurchase agreements is held by the Funds’ custodian or another qualified sub-custodian or in the Federal Reserve/ Treasury book-entry system in a pooled cash account. If the counterparty defaults and the fair value of the collateral declines, realization of the collateral by the Funds may be delayed or limited. |
| |
| (c) | Foreign Currency Transactions |
| |
| | The accounting records of the Funds are maintained in U.S. dollars. Foreign currency amounts are translated into U.S. dollars at the current rate of exchange to determine the value of investments, assets and liabilities. Purchases and sales of securities, and income and expenses are translated at the prevailing rate of exchange on the respective date of such transactions. The Funds do not isolate that portion of the results of operations resulting from changes in foreign exchange rates on investments from fluctuations arising from changes in market prices of securities held. These fluctuations are included with the net realized and unrealized gain or loss from investments and foreign currencies. |
| |
| (d) | Risks Associated with Foreign Securities and Currencies |
| |
| | Investments in securities of foreign issuers carry certain risks not ordinarily associated with investments in securities of U.S. issuers. These risks include future political and economic developments, and the possible imposition of exchange controls or other foreign governmental laws and restrictions. In addition, with respect to certain countries, there is the possibility of expropriation of assets, confiscatory taxation, political or social instability or diplomatic developments, which could adversely affect investments in those countries. |
| |
| | Certain countries may also impose substantial restrictions on investments in their capital markets by foreign entities, including restrictions on investments in issuers of industries deemed sensitive to relevant national interests. These factors may limit the investment opportunities available and result in a lack of liquidity and a high price volatility with respect to securities of issuers from developing countries. |
| |
| (e) | Forward Foreign Currency Contracts |
| |
| | Certain Funds may enter into forward foreign currency exchange contracts in connection with planned purchases or sales of securities or to hedge the U.S. dollar value of portfolio securities denominated in a particular currency. The Funds could be exposed to risks if the counterparties to the contracts are unable to meet the terms of their contracts and from unanticipated movements in the value of a foreign currency relative to the U.S. dollar. Forward foreign currency contracts are valued at the current cost of covering these contracts, as provided by an independent pricing service approved by the Board of Trustees. The forward foreign currency contracts are adjusted by the daily exchange rate of the underlying currency and any gains or losses are recorded for financial statement purposes as unrealized gains or losses until the contract settlement date. |
| |
| | Certain Funds may invest in financial futures contracts (“futures contracts”) for the purpose of hedging their existing portfolio securities or securities they intend to purchase against fluctuations in value caused by changes in prevailing market interest rates or prices. Futures contracts may also be entered into for non-hedging purposes. |
| |
| | Upon entering into a futures contract, these Funds are required to pledge to the broker an amount of cash and/or other assets equal to a certain percentage of the contract amount (initial margin deposit). Subsequent payments, known as “variation margin”, are made each day, depending on the daily fluctuations in the fair value/market value |
2004 Annual Report 157
| |
| | Notes to Financial Statements (Continued) |
| | October 31, 2004 |
| |
| | of the underlying assets. A gain or loss equal to the daily variation margin is recognized on a daily basis. Futures contracts are valued daily at their last quoted sale price. |
| |
| | A “sale” of a futures contract means a contractual obligation to deliver the securities or foreign currency called for by the contract at a fixed price at a specified time in the future. A “purchase” of a futures contract means a contractual obligation to acquire the securities or foreign currency at a fixed price at a specified time in the future. |
| |
| | Should market conditions change unexpectedly, a Fund may not achieve the anticipated benefits of the futures contracts and may realize a loss. The use of futures transactions for hedging purposes involves the risk of imperfect correlation in movements in the price of futures contracts, interest rates, and the value/market value of the underlying hedged assets. |
| |
| | During the period, the U.S. Growth Leaders Long-Short Fund and the Mid-Cap Growth Leaders Fund each engaged in short-selling of portfolio securities. Each of these funds is authorized to engage in short-selling of portfolio securities which obligates the Funds to replace any security that the Funds have borrowed by purchasing the security at current market value sometime in the future. The Fund will incur a loss if the price of the security increases between the date of the short sale and the date on which the Fund replaces the borrowed security. The Fund generally will realize a gain if the price of the security declines between these dates. Until the Fund replaces the borrowed security, the Fund will maintain a segregated account with cash, U.S. government securities and/or securities held long to sufficiently cover the Fund’s short position on a daily basis. Dividends declared on securities sold short are recorded as an expense on the ex-dividend date and paid to the counterparty on the dividend pay date. The collateral for securities sold short includes the deposits with brokers and securities held long as shown in the Statement of Investments for each Fund. |
| |
| | To generate additional income, each of the Funds may lend up to 331/3% of the Fund’s total assets pursuant to agreements, requiring that the Fund receives cash or securities as collateral with respect to each loan of U.S. securities, equal to at least 102% of the value of the portfolio securities loaned, and with respect to each loan of non-U.S. securities, collateral of at least 105% of the value of the portfolio securities loaned, and at all times thereafter requiring the borrower to mark to market the collateral on a daily basis so that the market value of the collateral does not fall below 100% of the market value of the portfolio securities loaned. The Funds receive payments from borrowers equivalent to the dividends and interest that would have been earned on securities lent while simultaneously seeking to earn income on the investment of cash collateral. Collateral is marked to market daily to provide a level of collateral at least equal to the market value of securities lent. There may be risks of delay in recovery of the securities or even loss of rights in the collateral should the borrower of the securities fail financially. Loans will be made, however, only to borrowers deemed by the Funds’ investment adviser to be of good standing and creditworthy under guidelines established by the Board of Trustees and when, in the judgment of the adviser, the consideration which can be earned currently from these securities loans justifies the attendant risks. Loans are subject to termination by the Funds or the borrower at any time, and therefore, are not considered to be illiquid investments. JPMorgan Chase Bank serves as custodian for the securities lending program of the Funds. JPMorgan Chase Bank receives a custody fee based on the value of collateral received from borrowers. |
| |
| | The cash collateral received by the Funds at October 31, 2004, was pooled and invested in the following: |
| | | | | | | | | | | | | | | | | | | |
| Security Type | | Security Name | | | Market Value | | | Maturity Rate | | | Maturity Date | | | |
|
|
| Money Market Fund | | | JPM S/ L Collateral Investment | | | $ | 500,000 | | | | 1.81% | | | | 11/01/04 | | | |
|
| Repurchase Agreement | | | Barclays Capital | | | | 25,260,501 | | | | 1.91% | | | | 11/01/04 | | | |
|
| |
| | Information on the investment of cash collateral is shown in the Statement of Investments. |
158 Annual Report 2004
| |
| | As of October 31, 2004, the following Funds had securities with the following market values on loan: |
| | | | | | | | | | | |
| | Market Value | | | | | |
| | of Loaned | | | Market Value | | | |
| Fund | | Securities | | | of Collateral* | | | |
|
|
| Global Health Sciences | | $ | 761,830 | | | $ | 779,449 | | | |
|
| Global Technology and Communications | | | 862,380 | | | | 889,381 | | | |
|
| Mid Cap Growth Leaders | | | 686,700 | | | | 711,475 | | | |
|
| U.S. Growth Leaders | | | 2,926,617 | | | | 2,999,835 | | | |
|
| Worldwide Leaders | | | 1,282,918 | | | | 1,346,411 | | | |
|
| Value Opportunities | | | 5,769,743 | | | | 5,895,220 | | | |
|
| Micro Cap Equity | | | 12,656,142 | | | | 13,138,730 | | | |
|
| | |
| | * | Includes securities and cash collateral. |
| |
| (i) | Security Transactions and Investment Income |
| |
| | Security transactions are accounted for on the date the security is purchased or sold (“trade date”). Securities gains and losses are calculated on the identified cost basis. Interest income is recognized on the accrual basis and includes, where applicable, the amortization or accretion of premium or discount. Dividend income is recorded on the ex-dividend date. |
| |
| (j) | Distributions to Shareholders |
| |
| | Net investment income, if any, is declared daily and paid monthly for the High Yield Bond Fund and is declared and paid quarterly for all other Funds. For all Funds, distributable net realized capital gains, if any, are declared and distributed at least annually. |
| |
| | Dividends and distributions to shareholders are determined in accordance with federal income tax regulations, which may differ from GAAP. These “book/tax” differences are considered either permanent or temporary in nature. In accordance with AICPA (American Institute of Certified Public Accountants) Statement of Position 93-2, permanent differences (i.e., reclassification of market discounts, gain/ loss, paydowns, and distributions) are reclassified within the capital accounts based on their nature for federal income tax purposes; temporary differences do not require reclassification. These reclassifications have no effect upon the net asset value of the respective Funds. To the extent distributions exceed current and accumulated earnings and profits for federal income tax purposes, these distributions are reported as distributions of paid-in-capital. |
| |
| | It is the policy of each Fund to qualify or continue to qualify as a “regulated investment company” by complying with the provisions available to certain investment companies, as defined in applicable sections of the Internal Revenue Code, and to make distributions of net investment income and net realized capital gains sufficient to relieve the Fund from all, or substantially all, federal income taxes. |
| |
| (l) | Allocation of Expenses, Income, and Gains and Losses |
| |
| | Expenses directly attributable to a Fund are charged to that Fund. Expenses not directly attributable to a Fund are allocated proportionately among various or all Funds within the Trust. For the Equity Funds, the method for allocating income, fund level expenses, and realized and unrealized gains or losses is based on the fair value of shares outstanding relative to net assets. Under this method, each class of shares participates based on the total net asset value of that class’s shares in proportion to the total net assets of the Fund. For the Bond Funds, the allocation method used is based on the fair value of settled shares outstanding. Under this method, earnings are allocated based on the fair value of settled shares. Expenses specific to a class (such are 12b-1 and administrative services fees) are charged to that class. |
| |
| (m) | Capital Share Transactions |
| |
| | Transactions in capital shares of the Funds were as follows: |
2004 Annual Report 159
| |
| | Notes to Financial Statements (Continued) |
| | October 31, 2004 |
| | | | | | | | | | | | | | | | | | | | | | |
| | | | | | Global Natural | |
| | Global Financial Services | | | Global Health Sciences | | | Resources (a) | |
| | Year Ended | | | Year Ended | | | Year Ended | | | Year Ended | | | Period Ended | |
| | October 31, 2004 | | | October 31, 2003 | | | October 31, 2004 | | | October 31, 2003 | | | October 31, 2004 | |
|
|
| |
| | | | |
CAPITAL TRANSACTIONS: | | | | | | | | | | | | | | | | | | | | |
Class A Shares | | | | | | | | | | | | | | | | | | | | |
| | Proceeds from shares issued (b) | | $ | 2,120,548 | | | $ | 313,319 | | | $ | 6,977,872 | | | $ | 7,485,451 | | | $ | 103,923 | |
| | Dividends reinvested | | | 133,277 | | | | 1,596 | | | | 274,185 | | | | — | | | | 87 | |
| | Cost of shares redeemed | | | (1,097,974 | ) | | | (5,210 | ) | | | (4,950,075 | ) | | | (5,461,856 | ) | | | — | |
| | |
| |
| |
| |
| | | | 1,155,851 | | | | 309,705 | | | | 2,301,982 | | | | 2,023,595 | | | | 104,010 | |
| | |
| |
| |
| |
Class B Shares | | | | | | | | | | | | | | | | | | | | |
| | Proceeds from shares issued (b) | | | 27,905 | | | | 18,657 | | | | 165,325 | | | | 32,993 | | | | 1,000 | |
| | Dividends reinvested | | | 89,141 | | | | 179 | | | | 74,963 | | | | — | | | | — | |
| | Cost of shares redeemed | | | (8,388 | ) | | | (25 | ) | | | (27,500 | ) | | | (28,640 | ) | | | — | |
| | |
| |
| |
| |
| | | | 108,658 | | | | 18,811 | | | | 212,788 | | | | 4,353 | | | | 1,000 | |
| | |
| |
| |
| |
Class C Shares | | | | | | | | | | | | | | | | | | | | |
| | Proceeds from shares issued (b) | | | 70,192 | | | | 6,957 | | | | 2,138,361 | | | | 83,191 | | | | 6,000 | |
| | Dividends reinvested | | | 86,070 | | | | 177 | | | | 11,366 | | | | — | | | | — | |
| | Cost of shares redeemed | | | (6,719 | ) | | | — | | | | (74,108 | ) | | | (32,199 | ) | | | — | |
| | |
| |
| |
| |
| | | | 149,543 | | | | 7,134 | | | | 2,075,619 | | | | 50,992 | | | | 6,000 | |
| | |
| |
| |
| |
Class R Shares | | | | | | | | | | | | | | | | | | | | |
| | Proceeds from shares issued (b) | | | 1,000 | (c) | | | — | | | | 1,000 | (c) | | | — | | | | 1,000 | |
| | Dividends reinvested | | | 6 | (c) | | | — | | | | — | | | | — | | | | — | |
| | |
| |
| |
| |
| | | | 1,006 | | | | — | | | | 1,000 | | | | — | | | | 1,000 | |
| | |
| |
| |
| |
Institutional Service Class Shares | | | | | | | | | | | | | | | | | | | | |
| | Proceeds from shares issued (b) | | | 119 | | | | — | | | | 5,333,588 | | | | 3,997,278 | | | | 1,000 | |
| | Dividends reinvested | | | 93,480 | | | | 2,031 | | | | 300,573 | | | | — | | | | 2 | |
| | Cost of shares redeemed | | | — | | | | — | | | | (4,200,651 | ) | | | (2,081,498 | ) | | | — | |
| | |
| |
| |
| |
| | | | 93,599 | | | | 2,031 | | | | 1,433,510 | | | | 1,915,780 | | | | 1,002 | |
| | |
| |
| |
| |
Institutional Class Shares | | | | | | | | | | | | | | | | | | | | |
| | Proceeds from shares issued (b) | | | 707,404 | (a) | | | — | | | | 452,027 | (a) | | | — | | | | 3,000,000 | |
| | Dividends reinvested | | | 1,601 | (a) | | | — | | | | — | | | | — | | | | 5,728 | |
| | Cost of shares redeemed | | | (52,182 | ) (a) | | | — | | | | (19,432 | ) (a) | | | — | | | | — | |
| | |
| |
| |
| |
| | | | 656,823 | | | | — | | | | 432,595 | | | | — | | | | 3,005,728 | |
| | |
| |
| |
| |
| Change in net assets from capital transactions | | $ | 2,165,480 | | | $ | 337,681 | | | $ | 6,457,494 | | | $ | 3,994,720 | | | $ | 3,118,740 | |
| | |
| |
| |
| |
SHARE TRANSACTIONS: | | | | | | | | | | | | | | | | | | | | |
Class A Shares | | | | | | | | | | | | | | | | | | | | |
| | Issued | | | 171,290 | | | | 28,759 | | | | 656,551 | | | | 799,381 | | | | 9,549 | |
| | Reinvested | | | 11,537 | | | | 178 | | | | 27,255 | | | | — | | | | 8 | |
| | Redeemed | | | (90,241 | ) | | | (574 | ) | | | (470,608 | ) | | | (585,715 | ) | | | — | |
| | |
| |
| |
| |
| | | | 92,586 | | | | 28,363 | | | | 213,198 | | | | 213,666 | | | | 9,557 | |
| | |
| |
| |
| |
Class B Shares | | | | | | | | | | | | | | | | | | | | |
| | Issued | | | 2,283 | | | | 1,847 | | | | 15,742 | | | | 3,297 | | | | 100 | |
| | Reinvested | | | 7,867 | | | | 20 | | | | 7,603 | | | | — | | | | — | |
| | Redeemed | | | (695 | ) | | | (3 | ) | | | (2,656 | ) | | | (2,876 | ) | | | — | |
| | |
| |
| |
| |
| | | | 9,455 | | | | 1,864 | | | | 20,689 | | | | 421 | | | | 100 | |
| | |
| |
| |
| |
Class C Shares | | | | | | | | | | | | | | | | | | | | |
| | Issued | | | 5,711 | | | | 672 | | | | 207,003 | | | | 9,042 | | | | 546 | |
| | Reinvested | | | 7,596 | | | | 20 | | | | 1,153 | | | | — | | | | — | |
| | Redeemed | | | (574 | ) | | | — | | | | (7,242 | ) | | | (3,233 | ) | | | — | |
| | |
| |
| |
| |
| | | | 12,733 | | | | 692 | | | | 200,914 | | | | 5,809 | | | | 546 | |
| | |
| |
| |
| |
Class R Shares | | | | | | | | | | | | | | | | | | | | |
| | Issued | | | 88 | (c) | | | — | | | | 100 | (c) | | | — | | | | 100 | |
| | |
| |
| |
| |
| | | | 88 | | | | — | | | | 100 | | | | — | | | | 100 | |
| | |
| |
| |
| |
Institutional Service Class Shares | | | | | | | | | | | | | | | | | | | | |
| | Issued | | | — | | | | — | | | | 490,765 | | | | 414,766 | | | | 100 | |
| | Reinvested | | | 8,061 | | | | 226 | | | | 29,613 | | | | — | | | | — | |
| | Redeemed | | | — | | | | — | | | | (391,931 | ) | | | (219,947 | ) | | | — | |
| | |
| |
| |
| |
| | | | 8,061 | | | | 226 | | | | 128,447 | | | | 194,819 | | | | 100 | |
| | |
| |
| |
| |
Institutional Class Shares | | | | | | | | | | | | | | | | | | | | |
| | Issued | | | 57,838 | (a) | | | — | | | | 41,764 | (a) | | | — | | | | 300,001 | |
| | Reinvested | | | 130 | (a) | | | — | | | | — | | | | — | | | | 525 | |
| | Redeemed | | | (4,229 | ) (a) | | | — | | | | (1,899 | ) (a) | | | — | | | | — | |
| | |
| |
| |
| |
| | | | 53,739 | | | | — | | | | 39,865 | | | | — | | | | 300,526 | |
| | |
| |
| |
| |
| Total change in shares | | | 176,662 | | | | 31,145 | | | | 603,213 | | | | 414,715 | | | | 310,929 | |
| | |
| |
| |
| |
|
| | |
| (a) | | For the period from June 29, 2004 (commencement of operations) through October 31, 2004. |
| (b) | | Amount includes redemption fees, if any. |
| (c) | | For the period from December 30, 2003 (commencement of operations) through October 31, 2004. |
160 Annual Report 2004
| | | | | | | | | | | | | | | | | | |
| | | | |
| | Global Technology and Communications | | | Global Utilities | |
| | Year Ended | | | Year Ended | | | Year Ended | | | Year Ended | |
| | October 31, 2004 | | | October 31, 2003 | | | October 31, 2004 | | | October 31, 2003 | |
|
|
| |
| | | | |
CAPITAL TRANSACTIONS: | | | | | | | | | | | | | | | | |
Class A Shares | | | | | | | | | | | | | | | | |
| | Proceeds from shares issued (b) | | $ | 2,570,801 | | | $ | 4,342,520 | | | $ | 324,651 | | | $ | 98,663 | |
| | Dividends reinvested | | | — | | | | — | | | | 3,218 | | | | 3,978 | |
| | Cost of shares redeemed | | | (2,542,220 | ) | | | (3,448,988 | ) | | | (104,532 | ) | | | (2,073 | ) |
| | |
| |
| |
| |
| | | | 28,581 | | | | 893,532 | | | | 223,337 | | | | 100,568 | |
| | |
| |
| |
| |
Class B Shares | | | | | | | | | | | | | | | | |
| | Proceeds from shares issued (b) | | | 39,198 | | | | 101,745 | | | | 60,112 | | | | — | |
| | Dividends reinvested | | | — | | | | — | | | | 461 | | | | 2,128 | |
| | Cost of shares redeemed | | | (57,189 | ) | | | (50,117 | ) | | | (1,000 | ) | | | — | |
| | |
| |
| |
| |
| | | | (17,991 | ) | | | 51,628 | | | | 59,573 | | | | 2,128 | |
| | |
| |
| |
| |
Class C Shares | | | | | | | | | | | | | | | | |
| | Proceeds from shares issued (b) | | | 63,326 | | | | 18,314 | | | | 2,928,501 | | | | 1,495 | |
| | Dividends reinvested | | | — | | | | — | | | | 1,393 | | | | 2,116 | |
| | Cost of shares redeemed | | | (16,426 | ) | | | (4,819 | ) | | | (515,979 | ) | | | — | |
| | |
| |
| |
| |
| | | | 46,900 | | | | 13,495 | | | | 2,413,915 | | | | 3,611 | |
| | |
| |
| |
| |
Class R Shares | | | | | | | | | | | | | | | | |
| | Proceeds from shares issued (b) | | | 1,000 | (c) | | | — | | | | 1,000 | (c) | | | — | |
| | Dividends reinvested | | | — | | | | — | | | | 3 | (c) | | | — | |
| | |
| |
| |
| |
| | | | 1,000 | | | | — | | | | 1,003 | | | | — | |
| | |
| |
| |
| |
Institutional Service Class Shares | | | | | | | | | | | | | | | | |
| | Proceeds from shares issued (b) | | | 7,786,911 | | | | 8,252,349 | | | | 16 | | | | — | |
| | Dividends reinvested | | | — | | | | — | | | | 3,949 | | | | 4,846 | |
| | Cost of shares redeemed | | | (7,813,268 | ) | | | (4,876,893 | ) | | | — | | | | — | |
| | |
| |
| |
| |
| | | | (26,357 | ) | | | 3,375,456 | | | | 3,965 | | | | 4,846 | |
| | |
| |
| |
| |
Institutional Class Shares | | | | | | | | | | | | | | | | |
| | Proceeds from shares issued (b) | | | 271,151 | (a) | | | — | | | | 254,404 | (a) | | | — | |
| | Dividends reinvested | | | — | | | | — | | | | 557 | (a) | | | — | |
| | Cost of shares redeemed | | | (27,375 | ) (a) | | | — | | | | (32,826 | ) (a) | | | — | |
| | |
| |
| |
| |
| | | | 243,776 | | | | — | | | | 222,135 | | | | — | |
| | |
| |
| |
| |
| Change in net assets from capital transactions | | $ | 275,909 | | | $ | 4,334,111 | | | $ | 2,923,928 | | | $ | 111,153 | |
| | |
| |
| |
| |
SHARE TRANSACTIONS: | | | | | | | | | | | | | | | | |
Class A Shares | | | | | | | | | | | | | | | | |
| | Issued | | | 667,050 | | | | 1,392,736 | | | | 32,008 | | | | 12,398 | |
| | Reinvested | | | — | | | | — | | | | 324 | | | | 532 | |
| | Redeemed | | | (671,531 | ) | | | (1,112,232 | ) | | | (11,504 | ) | | | (287 | ) |
| | |
| |
| |
| |
| | | | (4,481 | ) | | | 280,504 | | | | 20,828 | | | | 12,643 | |
| | |
| |
| |
| |
Class B Shares | | | | | | | | | | | | | | | | |
| | Issued | | | 10,466 | | | | 32,977 | | | | 6,405 | | | | — | |
| | Reinvested | | | — | | | | — | | | | 48 | | | | 291 | |
| | Redeemed | | | (15,646 | ) | | | (17,304 | ) | | | (109 | ) | | | — | |
| | |
| |
| |
| |
| | | | (5,180 | ) | | | 15,673 | | | | 6,344 | | | | 291 | |
| | |
| |
| |
| |
Class C Shares | | | | | | | | | | | | | | | | |
| | Issued | | | 16,917 | | | | 5,484 | | | | 307,736 | | | | 186 | |
| | Reinvested | | | — | | | | — | | | | 143 | | | | 288 | |
| | Redeemed | | | (4,276 | ) | | | (1,637 | ) | | | (52,626 | ) | | | — | |
| | |
| |
| |
| |
| | | | 12,641 | | | | 3,847 | | | | 255,253 | | | | 474 | |
| | |
| |
| |
| |
Class R Shares | | | | | | | | | | | | | | | | |
| | Issued | | | 270 | (c) | | | — | | | | 110 | (c) | | | — | |
| | |
| |
| |
| |
| | | | 270 | | | | — | | | | 110 | | | | — | |
| | |
| |
| |
| |
Institutional Service Class Shares | | | | | | | | | | | | | | | | |
| | Issued | | | 2,042,497 | | | | 2,571,315 | | | | — | | | | — | |
| | Reinvested | | | — | | | | — | | | | 396 | | | | 642 | |
| | Redeemed | | | (2,100,008 | ) | | | (1,610,817 | ) | | | — | | | | — | |
| | |
| |
| |
| |
| | | | (57,511 | ) | | | 960,498 | | | | 396 | | | | 642 | |
| | |
| |
| |
| |
Institutional Class Shares | | | | | | | | | | | | | | | | |
| | Issued | | | 72,478 | (a) | | | — | | | | 25,982 | (a) | | | — | |
| | Reinvested | | | — | | | | — | | | | 55 | (a) | | | — | |
| | Redeemed | | | (7,801 | ) (a) | | | — | | | | (3,152 | ) (a) | | | — | |
| | |
| |
| |
| |
| | | | 64,677 | | | | — | | | | 22,885 | | | | — | |
| | |
| |
| |
| |
| Total change in shares | | | 10,416 | | | | 1,260,522 | | | | 305,816 | | | | 14,050 | |
| | |
| |
| |
| |
|
| | |
| (a) | | For the period from June 29, 2004 (commencement of operations) through October 31, 2004. |
| (b) | | Amount includes redemption fees, if any. |
| (c) | | For the period from December 30, 2003 (commencement of operations) through October 31, 2004. |
2004 Annual Report 161
| |
| | Notes to Financial Statements (Continued) |
| | October 31, 2004 |
| | | | | | | | | | | | | | | | | | |
| | | | |
| | Mid Cap Growth Leaders | | | Nationwide Leaders | |
| | Year Ended | | | Year Ended | | | Year Ended | | | Year Ended | |
| | October 31, 2004 | | | October 31, 2003 | | | October 31, 2004 | | | October 31, 2003 | |
|
|
| |
| | | | |
CAPITAL TRANSACTIONS: | | | | | | | | | | | | | | | | |
Class A Shares | | | | | | | | | | | | | | | | |
| | Proceeds from shares issued (a) | | $ | 1,770,984 | | | $ | 1,603,294 | | | $ | 354,697 | | | $ | 433,216 | |
| | Dividends reinvested | | | — | | | | — | | | | — | | | | 3,461 | |
| | Cost of shares redeemed | | | (2,551,054 | ) | | | (1,611,955 | ) | | | (378,856 | ) | | | (173,715 | ) |
| | |
| |
| |
| |
| | | | (780,070 | ) | | | (8,661 | ) | | | (24,159 | ) | | | 262,962 | |
| | |
| |
| |
| |
Class B Shares | | | | | | | | | | | | | | | | |
| | Proceeds from shares issued (a) | | | 271,598 | | | | 339,761 | | | | 46,866 | | | | 45,257 | |
| | Dividends reinvested | | | — | | | | — | | | | — | | | | 477 | |
| | Cost of shares redeemed | | | (619,738 | ) | | | (593,692 | ) | | | (20,483 | ) | | | (75,245 | ) |
| | |
| |
| |
| |
| | | | (348,140 | ) | | | (253,931 | ) | | | 26,383 | | | | (29,511 | ) |
| | |
| |
| |
| |
Class C Shares | | | | | | | | | | | | | | | | |
| | Proceeds from shares issued (a) | | | 22,951 | | | | 8,693 | | | | 30,791 | | | | 59,739 | |
| | Dividends reinvested | | | — | | | | — | | | | 2 | | | | 368 | |
| | Cost of shares redeemed | | | (16,234 | ) | | | (906 | ) | | | (17,259 | ) | | | (10 | ) |
| | |
| |
| |
| |
| | | | 6,717 | | | | 7,787 | | | | 13,534 | | | | 60,097 | |
| | |
| |
| |
| |
Class D Shares | | | | | | | | | | | | | | | | |
| | Proceeds from shares issued (a) | | | 951,537 | | | | 811,275 | | | | — | | | | — | |
| | Cost of shares redeemed | | | (2,060,020 | ) | | | (2,325,344 | ) | | | — | | | | — | |
| | |
| |
| |
| |
| | | | (1,108,483 | ) | | | (1,514,069 | ) | | | — | | | | — | |
| | |
| |
| |
| |
Class R Shares | | | | | | | | | | | | | | | | |
| | Proceeds from shares issued (a) | | | 1,000 | (c) | | | — | | | | — | | | | 1,000 | (b) |
| | |
| |
| |
| |
| | | | 1,000 | | | | — | | | | — | | | | 1,000 | |
| | |
| |
| |
| |
Institutional Service Class Shares | | | | | | | | | | | | | | | | |
| | Proceeds from shares issued (a) | | | — | | | | — | | | | 3,536,833 | | | | 1,879,229 | |
| | Dividends reinvested | | | — | | | | — | | | | — | | | | 3,660 | |
| | Cost of shares redeemed | | | — | | | | — | | | | (2,731,189 | ) | | | (1,462,724 | ) |
| | |
| |
| |
| |
| | | | — | | | | — | | | | 805,644 | | | | 420,165 | |
| | |
| |
| |
| |
Institutional Class Shares | | | | | | | | | | | | | | | | |
| | Proceeds from shares issued (a) | | | 1,000 | (d) | | | — | | | | 1,000 | (e) | | | — | |
| | |
| |
| |
| |
| | | | 1,000 | | | | — | | | | 1,000 | | | | — | |
| | |
| |
| |
| |
| Change in net assets from capital transactions | | $ | (2,227,976 | ) | | $ | (1,768,874 | ) | | $ | 822,402 | | | $ | 714,713 | |
| | |
| |
| |
| |
SHARE TRANSACTIONS: | | | | | | | | | | | | | | | | |
Class A Shares | | | | | | | | | | | | | | | | |
| | Issued | | | 155,883 | | | | 169,605 | | | | 29,076 | | | | 42,084 | |
| | Issued in connection with merger | | | — | | | | — | | | | — | | | | — | |
| | Reinvested | | | — | | | | — | | | | — | | | | 368 | |
| | Redeemed | | | (225,143 | ) | | | (173,645 | ) | | | (32,354 | ) | | | (18,160 | ) |
| | |
| |
| |
| |
| | | | (69,260 | ) | | | (4,040 | ) | | | (3,278 | ) | | | 24,292 | |
| | |
| |
| |
| |
Class B Shares | | | | | | | | | | | | | | | | |
| | Issued | | | 25,682 | | | | 39,893 | | | | 3,985 | | | | 4,730 | |
| | Reinvested | | | — | | | | — | | | | — | | | | 51 | |
| | Redeemed | | | (58,766 | ) | | | (71,353 | ) | | | (1,767 | ) | | | (7,481 | ) |
| | |
| |
| |
| |
| | | | (33,084 | ) | | | (31,460 | ) | | | 2,218 | | | | (2,700 | ) |
| | |
| |
| |
| |
Class C Shares | | | | | | | | | | | | | | | | |
| | Issued | | | 2,138 | | | | 1,056 | | | | 2,566 | | | | 5,840 | |
| | Reinvested | | | — | | | | — | | | | — | | | | 40 | |
| | Redeemed | | | (1,518 | ) | | | (100 | ) | | | (1,531 | ) | | | (1 | ) |
| | |
| |
| |
| |
| | | | 620 | | | | 956 | | | | 1,035 | | | | 5,879 | |
| | |
| |
| |
| |
Class D Shares | | | | | | | | | | | | | | | | |
| | Issued | | | 81,455 | | | | 84,823 | | | | — | | | | — | |
| | Reinvested | | | — | | | | — | | | | — | | | | — | |
| | Redeemed | | | (179,984 | ) | | | (245,490 | ) | | | — | | | | — | |
| | |
| |
| |
| |
| | | | (98,529 | ) | | | (160,667 | ) | | | — | | | | — | |
| | |
| |
| |
| |
Class R Shares | | | | | | | | | | | | | | | | |
| | Issued | | | 87 | (c) | | | — | | | | — | | | | 91 | (b) |
| | |
| |
| |
| |
| | | | 87 | | | | — | | | | — | | | | 91 | |
| | |
| |
| |
| |
Institutional Service Class Shares | | | | | | | | | | | | | | | | |
| | Issued | | | — | | | | — | | | | 294,832 | | | | 185,593 | |
| | Reinvested | | | — | | | | — | | | | — | | | | 388 | |
| | Redeemed | | | — | | | | — | | | | (227,885 | ) | | | (145,937 | ) |
| | |
| |
| |
| |
| | | | — | | | | — | | | | 66,947 | | | | 40,044 | |
| | |
| |
| |
| |
Institutional Class Shares | | | | | | | | | | | | | | | | |
| | Issued | | | 89 | (d) | | | — | | | | 82 | (e) | | | — | |
| | |
| |
| |
| |
| | | | 89 | | | | | | | | 82 | | | | | |
| | |
| |
| |
| |
| Total change in shares | | | (200,077 | ) | | | (195,211 | ) | | | 67,004 | | | | 67,606 | |
| | |
| |
| |
| |
|
| | |
| (a) | | Amount includes redemption fees, if any. |
| (b) | | For the period from October 1, 2003 (commencement of operations) through October 31, 2003. |
| (c) | | For the period from December 30, 2003 (commencement of operations) through October 31, 2004. |
| (d) | | For the period from September 28, 2004 (commencement of operations) through October 31, 2004. |
| (e) | | For the period from June 29, 2004 (commencement of operations) through October 31, 2004. |
162 Annual Report 2004
| | | | | | | | | | | | | | | | | | |
| | | | |
| | U.S. Growth Leaders | | | Worldwide Leaders | |
| | Year Ended | | | Year Ended | | | Year Ended | | | Year Ended | |
| | October 31, 2004 | | | October 31, 2003 | | | October 31, 2004 | | | October 31, 2003 | |
|
|
| |
| | | | |
CAPITAL TRANSACTIONS: | | | | | | | | | | | | | | | | |
Class A Shares | | | | | | | | | | | | | | | | |
| | Proceeds from shares issued (a) | | $ | 19,925,366 | | | $ | 6,936,056 | | | $ | 2,010,399 | | | $ | 6,147,549 | |
| | Proceeds from shares issued in connection with merger | | | — | | | | — | | | | — | | | | 31,318,617 | |
| | Cost of shares redeemed | | | (7,735,866 | ) | | | (1,060,629 | ) | | | (8,476,526 | ) | | | (9,640,424 | ) |
| | |
| |
| |
| |
| | | | 12,189,500 | | | | 5,875,427 | | | | (6,466,127 | ) | | | 27,825,742 | |
| | |
| |
| |
| |
Class B Shares | | | | | | | | | | | | | | | | |
| | Proceeds from shares issued (a) | | | 900,558 | | | | 912,810 | | | | 29,165 | | | | 37,766 | |
| | Cost of shares redeemed | | | (414,447 | ) | | | (104,738 | ) | | | (10,448 | ) | | | (998,210 | ) |
| | |
| |
| |
| |
| | | | 486,111 | | | | 808,072 | | | | 18,717 | | | | (960,444 | ) |
| | |
| |
| |
| |
Class C Shares | | | | | | | | | | | | | | | | |
| | Proceeds from shares issued (a) | | | 2,914,899 | | | | 1,442,894 | | | | 5,300 | | | | 296 | |
| | Cost of shares redeemed | | | (595,773 | ) | | | (94,121 | ) | | | (587 | ) | | | (4,172 | ) |
| | |
| |
| |
| |
| | | | 2,319,126 | | | | 1,348,773 | | | | 4,713 | | | | (3,876 | ) |
| | |
| |
| |
| |
Class R Shares | | | | | | | | | | | | | | | | |
| | Proceeds from shares issued (a) | | | — | | | | 1,000 | (b) | | | — | | | | 1,000 | (b) |
| | |
| |
| |
| |
| | | | — | | | | 1,000 | | | | — | | | | 1,000 | |
| | |
| |
| |
| |
Institutional Service Class Shares | | | | | | | | | | | | | | | | |
| | Proceeds from shares issued (a) | | | 7,443,652 | | | | 10,066,128 | | | | 2,362,333 | | | | 2,139,626 | |
| | Cost of shares redeemed | | | (7,128,734 | ) | | | (5,489,020 | ) | | | (2,469,063 | ) | | | (2,072,835 | ) |
| | |
| |
| |
| |
| | | | 314,918 | | | | 4,577,108 | | | | (106,730 | ) | | | 66,791 | |
| | |
| |
| |
| |
Institutional Class Shares | | | | | | | | | | | | | | | | |
| | Proceeds from shares issued (a) | | | 252,268 | (c) | | | — | | | | 1,000 | (c) | | | — | |
| | Cost of shares redeemed | | | (18,027 | ) (c) | | | — | | | | — | | | | — | |
| | |
| |
| |
| |
| | | | 234,241 | | | | — | | | | 1,000 | | | | | |
| | |
| |
| |
| |
| Change in net assets from capital transactions | | $ | 15,543,896 | | | $ | 12,610,380 | | | $ | (6,548,427 | ) | | $ | 26,929,213 | |
| | |
| |
| |
| |
SHARE TRANSACTIONS: | | | | | | | | | | | | | | | | |
Class A Shares | | | | | | | | | | | | | | | | |
| | Issued | | | 2,389,900 | | | | 964,028 | | | | 277,674 | | | | 1,028,937 | |
| | Issued in connection with merger | | | — | | | | — | | | | — | | | | 5,321,680 | |
| | Redeemed | | | (944,347 | ) | | | (151,289 | ) | | | (1,170,017 | ) | | | (1,563,239 | ) |
| | |
| |
| |
| |
| | | | 1,445,553 | | | | 812,739 | | | | (892,343 | ) | | | 4,787,378 | |
| | |
| |
| |
| |
Class B Shares | | | | | | | | | | | | | | | | |
| | Issued | | | 112,068 | | | | 135,874 | | | | 4,158 | | | | 7,747 | |
| | Redeemed | | | (51,717 | ) | | | (17,223 | ) | | | (1,433 | ) | | | (166,789 | ) |
| | |
| |
| |
| |
| | | | 60,351 | | | | 118,651 | | | | 2,725 | | | | (159,042 | ) |
| | |
| |
| |
| |
Class C Shares | | | | | | | | | | | | | | | | |
| | Issued | | | 357,925 | | | | 208,967 | | | | 727 | | | | 53 | |
| | Redeemed | | | (74,068 | ) | | | (13,043 | ) | | | (80 | ) | | | (710 | ) |
| | |
| |
| |
| |
| | | | 283,857 | | | | 195,924 | | | | 647 | | | | (657 | ) |
| | |
| |
| |
| |
Class R Shares | | | | | | | | | | | | | | | | |
| | Issued | | | — | | | | 134 | (b) | | | — | | | | 153 | (b) |
| | |
| |
| |
| |
| | | | — | | | | 134 | | | | — | | | | 153 | |
| | |
| |
| |
| |
Institutional Service Class Shares | | | | | | | | | | | | | | | | |
| | Issued | | | 878,553 | | | | 1,488,021 | | | | 324,332 | | | | 338,940 | |
| | Redeemed | | | (852,335 | ) | | | (852,214 | ) | | | (341,204 | ) | | | (345,851 | ) |
| | |
| |
| |
| |
| | | | 26,218 | | | | 635,807 | | | | (16,872 | ) | | | (6,911 | ) |
| | |
| |
| |
| |
Institutional Class Shares | | | | | | | | | | | | | | | | |
| | Issued | | | 29,370 | (c) | | | — | | | | 138 | (c) | | | — | |
| | Redeemed | | | (2,170 | ) (c) | | | — | | | | — | | | | — | |
| | |
| |
| |
| |
| | | | 27,200 | | | | | | | | 138 | | | | | |
| | |
| |
| |
| |
| Total change in shares | | | 1,843,179 | | | | 1,763,255 | | | | (905,705 | ) | | | 4,620,921 | |
| | |
| |
| |
| |
|
| | |
| (a) | | Amount includes redemption fees, if any. |
| (b) | | For the period from October 1, 2003 (commencement of operations) through October 31, 2003. |
| (c) | | For the period from June 29, 2004 (commencement of operations) through October 31, 2004. |
2004 Annual Report 163
| |
| | Notes to Financial Statements (Continued) |
| | October 31, 2004 |
| | | | | | | | | | | | | | | | | | | | | | |
| | | | | | |
| | China Opportunities | | | Emerging Markets | | | International Growth | |
| | Period Ended | | | Year Ended | | | Year Ended | | | Year Ended | | | Year Ended | |
| | October 31, 2004 (a) | | | October 31, 2004 | | | October 31, 2003 | | | October 31, 2004 | | | October 31, 2003 | |
|
|
| |
| | | | |
CAPITAL TRANSACTIONS: | | | | | | | | | | | | | | | | | | | | |
Class A Shares | | | | | | | | | | | | | | | | | | | | |
| | Proceeds from shares issued (b) | | $ | 972,446 | | | $ | 21,100,437 | | | $ | 20,248,675 | | | $ | 1,251,219 | | | $ | 7,760,900 | |
| | Dividends reinvested | | | 1,204 | | | | 40,819 | | | | — | | | | — | | | | — | |
| | Cost of shares redeemed | | | — | | | | (17,474,697 | ) | | | (15,372,126 | ) | | | (1,047,248 | ) | | | (7,765,342 | ) |
| | |
| |
| |
| |
| | | | 973,650 | | | | 3,666,559 | | | | 4,876,549 | | | | 203,971 | | | | (4,442 | ) |
| | |
| |
| |
| |
Class B Shares | | | | | | | | | | | | | | | | | | | | |
| | Proceeds from shares issued (b) | | | 18,290 | | | | 612,196 | | | | 125,863 | | | | 65,727 | | | | 43,830 | |
| | Dividends reinvested | | | 5 | | | | 3,397 | | | | — | | | | — | | | | — | |
| | Cost of shares redeemed | | | — | | | | (52,390 | ) | | | (281,246 | ) | | | (11,557 | ) | | | (7,305 | ) |
| | |
| |
| |
| |
| | | | 18,295 | | | | 563,203 | | | | (155,383 | ) | | | 54,170 | | | | 36,525 | |
| | |
| |
| |
| |
Class C Shares | | | | | | | | | | | | | | | | | | | | |
| | Proceeds from shares issued (b) | | | 37,312 | | | | 3,051,586 | | | | 1,302,297 | | | | 94,470 | | | | 2,468 | |
| | Dividends reinvested | | | — | | | | 923 | | | | — | | | | — | | | | — | |
| | Cost of shares redeemed | | | — | | | | (2,188,175 | ) | | | (866 | ) | | | (5,063 | ) | | | — | |
| | |
| |
| |
| |
| | | | 37,312 | | | | 864,334 | | | | 1,301,431 | | | | 89,407 | | | | 2,468 | |
| | |
| |
| |
| |
Class R Shares | | | | | | | | | | | | | | | | | | | | |
| | Proceeds from shares issued (b) | | | 1,000 | | | | 1,003 | (c) | | | — | | | | 1,001 | (c) | | | — | |
| | Dividends reinvested | | | 1 | | | | 3 | (c) | | | — | | | | — | | | | — | |
| | |
| |
| |
| |
| | | | 1,001 | | | | 1,006 | | | | — | | | | 1,001 | | | | — | |
| | |
| |
| |
| |
Institutional Service Class Shares | | | | | | | | | | | | | | | | | | | | |
| | Proceeds from shares issued (b) | | | 1,000 | | | | 1,717,456 | | | | 170 | | | | 13,535 | | | | 10,054 | |
| | Dividends reinvested | | | 2 | | | | 16,749 | | | | — | | | | — | | | | — | |
| | Cost of shares redeemed | | | — | | | | (9,154 | ) | | | — | | | | — | | | | — | |
| | |
| |
| |
| |
| | | | 1,002 | | | | 1,725,051 | | | | 170 | | | | 13,535 | | | | 10,054 | |
| | |
| |
| |
| |
Institutional Class Shares | | | | | | | | | | | | | | | | | | | | |
| | Proceeds from shares issued (b) | | | 4,999,850 | | | | 240,552 | (a) | | | — | | | | 199,054 | (a) | | | — | |
| | Dividends reinvested | | | 11,472 | | | | 831 | | | | — | | | | — | | | | — | |
| | Cost of shares redeemed | | | — | | | | (27,560 | ) (a) | | | — | | | | (19,173 | ) (a) | | | — | |
| | |
| |
| |
| |
| | | | 5,011,322 | | | | 213,823 | | | | — | | | | 179,881 | | | | — | |
| | |
| |
| |
| |
| Change in net assets from capital transactions | | $ | 6,042,582 | | | $ | 7,033,976 | | | $ | 6,022,767 | | | $ | 541,965 | | | $ | 44,605 | |
| | |
| |
| |
SHARE TRANSACTIONS: | | | | | | | | | | | | | | | | | | | | |
Class A Shares | | | | | | | | | | | | | | | | | | | | |
| | Issued | | | 91,381 | | | | 1,761,117 | | | | 2,506,014 | | | | 165,100 | | | | 1,360,357 | |
| | Reinvested | | | 112 | | | | 3,445 | | | | — | | | | — | | | | — | |
| | Redeemed | | | — | | | | (1,492,739 | ) | | | (1,939,080 | ) | | | (138,962 | ) | | | (1,354,133 | ) |
| | |
| |
| |
| |
| | | | 91,493 | | | | 271,823 | | | | 566,934 | | | | 26,138 | | | | 6,224 | |
| | |
| |
| |
| |
Class B Shares | | | | | | | | | | | | | | | | | | | | |
| | Issued | | | 1,700 | | | | 51,884 | | | | 16,278 | | | | 7,114 | | | | 5,129 | |
| | Reinvested | | | — | | | | 289 | | | | — | | | | — | | | | — | |
| | Redeemed | | | — | | | | (4,650 | ) | | | (36,740 | ) | | | (1,521 | ) | | | (1,271 | ) |
| | |
| |
| |
| |
| | | | 1,700 | | | | 47,523 | | | | (20,462 | ) | | | 5,593 | | | | 3,858 | |
| | |
| |
| |
| |
Class C Shares | | | | | | | | | | | | | | | | | | | | |
| | Issued | | | 3,395 | | | | 251,795 | | | | 131,404 | | | | 13,049 | | | | 459 | |
| | Reinvested | | | — | | | | 78 | | | | — | | | | — | | | | — | |
| | Redeemed | | | — | | | | (202,776 | ) | | | (95 | ) | | | (692 | ) | | | — | |
| | |
| |
| |
| |
| | | | 3,395 | | | | 49,097 | | | | 131,309 | | | | 12,357 | | | | 459 | |
| | |
| |
| |
| |
Class R Shares | | | | | | | | | | | | | | | | | | | | |
| | Issued | | | 100 | | | | 89 | (c) | | | — | | | | 138 | (c) | | | — | |
| | |
| |
| |
| |
| | | | 100 | | | | 89 | | | | — | | | | 138 | | | | — | |
| | |
| |
| |
| |
Institutional Service Class Shares | | | | | | | | | | | | | | | | | | | | |
| | Issued | | | 500,000 | | | | 132,149 | | | | — | | | | — | | | | — | |
| | Reinvested | | | 1,062 | | | | 1,399 | | | | — | | | | — | | | | — | |
| | |
| |
| |
| |
| | | | 501,062 | | | | 133,548 | | | | — | | | | — | | | | — | |
| | |
| |
| |
| |
Institutional Class Shares | | | | | | | | | | | | | | | | | | | | |
| | Issued | | | 100 | | | | 21,217 | (a) | | | — | | | | 26,463 | (a) | | | — | |
| | Reinvested | | | — | | | | 68 | (a) | | | — | | | | — | | | | — | |
| | Redeemed | | | — | | | | (2,294 | ) (a) | | | — | | | | (2,480 | ) (a) | | | — | |
| | |
| |
| |
| |
| | | | 100 | | | | 18,991 | | | | — | | | | 23,983 | | | | — | |
| | |
| |
| |
| |
| Total change in shares | | | 597,850 | | | | 521,071 | | | | 677,781 | | | | 68,209 | | | | 10,541 | |
| | |
| |
| |
|
| | |
| (a) | | For the period from June 29, 2004 (commencement of operations) through October 31, 2004. |
| (b) | | Amount includes redemption fees, if any. |
| (c) | | For the period from December 30, 2003 (commencement of operations) through October 31, 2004. |
164 Annual Report 2004
| | | | | | | | | | | | | | | | | | | | | | | | | | |
| | | | | | |
| | High Yield Bond | | | Value Opportunities | | | Micro Cap Equity | |
| | Year Ended | | | Year Ended | | | Year Ended | | | Year Ended | | | Year Ended | | | Year Ended | |
| | October 31, 2004 | | | October 31, 2003 | | | October 31, 2004 | | | October 31, 2003 | | | October 31, 2004 | | | October 31, 2003 | |
| | | | | | | | | | | | |
|
|
| |
| | | | |
CAPITAL TRANSACTIONS: | | | | | | | | | | | | | | | | | | | | | | | | |
Class A Shares | | | | | | | | | | | | | | | | | | | | | | | | |
| | Proceeds from shares issued (a) | | $ | 14,289,113 | | | $ | 20,150,839 | | | $ | 6,571,082 | | | $ | 3,846,532 | | | $ | 87,603,317 | | | $ | 15,652,025 | |
| | Dividends reinvested | | | 263,908 | | | | 262,786 | | | | 8,924 | | | | 27,722 | | | | 4,741 | | | | — | |
| | Cost of shares redeemed | | | (14,716,542 | ) | | | (18,892,092 | ) | | | (7,634,809 | ) | | | (4,341,259 | ) | | | (34,687,906 | ) | | | (343,521 | ) |
| | |
| |
| |
| |
| | | | (163,521 | ) | | | 1,521,533 | | | | (1,054,803 | ) | | | (467,005 | ) | | | 52,920,152 | | | | 15,308,504 | |
| | |
| |
| |
| |
Class B Shares | | | | | | | | | | | | | | | | | | | | | | | | |
| | Proceeds from shares issued (a) | | | 133,684 | | | | 544,178 | | | | 152,412 | | | | 275,847 | | | | 5,089,914 | | | | 1,396,507 | |
| | Dividends reinvested | | | 15,008 | | | | 21,301 | | | | — | | | | 458 | | | | 354 | | | | — | |
| | Cost of shares redeemed | | | (203,299 | ) | | | (229,910 | ) | | | (421,794 | ) | | | (660,706 | ) | | | (901,253 | ) | | | (55,546 | ) |
| | |
| |
| |
| |
| | | | (54,607 | ) | | | 335,569 | | | | (269,382 | ) | | | (384,401 | ) | | | 4,189,015 | | | | 1,340,961 | |
| | |
| |
| |
| |
Class C Shares | | | | | | | | | | | | | | | | | | | | | | | | |
| | Proceeds from shares issued (a) | | | 752,245 | | | | 2,818,010 | | | | 376,871 | | | | 189,360 | | | | 27,633,405 | | | | 5,118,281 | |
| | Dividends reinvested | | | 15,729 | | | | 7,868 | | | | — | | | | 18 | | | | 994 | | | | — | |
| | Cost of shares redeemed | | | (1,962,402 | ) | | | (13,918 | ) | | | (101,083 | ) | | | (26,002 | ) | | | (5,120,062 | ) | | | (158,950 | ) |
| | |
| |
| |
| |
| | | | (1,194,428 | ) | | | 2,811,960 | | | | 275,788 | | | | 163,376 | | | | 22,514,337 | | | | 4,959,331 | |
| | |
| |
| |
| |
Class R Shares | | | | | | | | | | | | | | | | | | | | | | | | |
| | Proceeds from shares issued (a) | | | 1,000 | (b) | | | — | | | | 1,000 | (d) | | | — | | | | 1,001 | (d) | | | — | |
| | Dividends reinvested | | | 40 | (b) | | | — | | | | — | | | | — | | | | — | | | | — | |
| | |
| |
| |
| |
| | | | 1,040 | | | | — | | | | 1,000 | | | | — | | | | 1,001 | | | | — | |
| | |
| |
| |
| |
Institutional Service Class Shares | | | | | | | | | | | | | | | | | | | | | | | | |
| | Proceeds from shares issued (a) | | | 17,216,382 | | | | 7,393,568 | | | | 12,107,929 | | | | 11,944,248 | | | | 50,384 | | | | 11 | |
| | Dividends reinvested | | | 6,331,095 | | | | 8,460,523 | | | | 24,708 | | | | 43,596 | | | | 7 | | | | — | |
| | Cost of shares redeemed | | | (110,840,689 | ) | | | (5,515,173 | ) | | | (19,491,929 | ) | | | (5,544,469 | ) | | | (97,410 | ) | | | — | |
| | |
| |
| |
| |
| | | | (87,293,212 | ) | | | 10,338,918 | | | | (7,359,292 | ) | | | 6,443,375 | | | | (47,019 | ) | | | 11 | |
| | |
| |
| |
| |
Institutional Class Shares | | | | | | | | | | | | | | | | | | | | | | | | |
| | Proceeds from shares issued (a) | | | 1,000 | (c) | | | — | | | | 1,000 | (c) | | | — | | | | 3,377,757 | | | | 412 | |
| | Dividends reinvested | | | 20 | (c) | | | — | | | | — | | | | — | | | | 506 | | | | | |
| | Cost of shares redeemed | | | — | | | | — | | | | — | | | | — | | | | (3,561,854 | ) | | | | |
| | |
| |
| |
| |
| | | | 1,020 | | | | — | | | | 1,000 | | | | — | | | | (183,591 | ) | | | 412 | |
| | |
| |
| |
| |
| Change in net assets from capital transactions | | $ | (88,703,708 | ) | | $ | 15,007,980 | | | $ | (8,405,689 | ) | | $ | 5,755,345 | | | $ | 79,393,895 | | | $ | 21,609,219 | |
| | |
| |
| |
SHARE TRANSACTIONS: | | | | | | | | | | | | | | | | | | | | | | | | |
Class A Shares | | | | | | | | | | | | | | | | | | | | | | | | |
| | Issued | | | 2,042,569 | | | | 3,035,167 | | | | 406,198 | | | | 323,886 | | | | 4,677,213 | | | | 1,058,159 | |
| | Reinvested | | | 37,914 | | | | 40,181 | | | | 563 | | | | 2,416 | | | | 251 | | | | — | |
| | Redeemed | | | (2,097,436 | ) | | | (2,824,204 | ) | | | (482,133 | ) | | | (370,127 | ) | | | (1,914,311 | ) | | | (24,274 | ) |
| | |
| |
| |
| |
| | | | (16,953 | ) | | | 251,144 | | | | (75,372 | ) | | | (43,825 | ) | | | 2,763,153 | | | | 1,033,885 | |
| | |
| |
| |
| |
Class B Shares | | | | | | | | | | | | | | | | | | | | | | | | |
| | Issued | | | 19,331 | | | | 83,397 | | | | 9,831 | | | | 23,221 | | | | 280,168 | | | | 100,860 | |
| | Reinvested | | | 2,163 | | | | 3,290 | | | | — | | | | 41 | | | | 19 | | | | — | |
| | Redeemed | | | (28,884 | ) | | | (34,834 | ) | | | (27,202 | ) | | | (53,894 | ) | | | (49,310 | ) | | | (3,518 | ) |
| | |
| |
| |
| |
| | | | (7,390 | ) | | | 51,853 | | | | (17,371 | ) | | | (30,632 | ) | | | 230,877 | | | | 97,342 | |
| | |
| |
| |
| |
Class C Shares | | | | | | | | | | | | | | | | | | | | | | | | |
| | Issued | | | 107,259 | | | | 426,195 | | | | 24,277 | | | | 13,971 | | | | 1,513,352 | | | | 362,018 | |
| | Reinvested | | | 2,263 | | | | 1,208 | | | | — | | | | 2 | | | | 54 | | | | — | |
| | Redeemed | | | (284,276 | ) | | | (2,105 | ) | | | (6,770 | ) | | | (2,175 | ) | | | (290,066 | ) | | | (11,148 | ) |
| | |
| |
| |
| |
| | | | (174,754 | ) | | | 425,298 | | | | 17,507 | | | | 11,798 | | | | 1,223,340 | | | | 350,870 | |
| | |
| |
| |
| |
Class R Shares | | | | | | | | | | | | | | | | | | | | | | | | |
| | Issued | | | 143 | (b) | | | — | | | | 65 | (d) | | | — | | | | 58 | (d) | | | — | |
| | Reinvested | | | 6 | (b) | | | — | | | | — | | | | — | | | | — | | | | — | |
| | |
| |
| |
| |
| | | | 149 | | | | — | | | | 65 | | | | — | | | | 58 | | | | — | |
| | |
| |
| |
| |
Institutional Service Class Shares | | | | | | | | | | | | | | | | | | | | | | | | |
| | Issued | | | 2,439,580 | | | | 1,103,878 | | | | 761,883 | | | | 931,522 | | | | 2,528 | | | | — | |
| | Reinvested | | | 902,593 | | | | 1,295,824 | | | | 1,571 | | | | 3,747 | | | | — | | | | — | |
| | Redeemed | | | (16,159,153 | ) | | | (816,958 | ) | | | (1,229,044 | ) | | | (438,518 | ) | | | (4,949 | ) | | | — | |
| | |
| |
| |
| |
| | | | (12,816,980 | ) | | | 1,582,744 | | | | (465,590 | ) | | | 496,751 | | | | (2,421 | ) | | | — | |
| | |
| |
| |
| |
Institutional Class Shares | | | | | | | | | | | | | | | | | | | | | | | | |
| | Issued | | | 145 | (c) | | | — | | | | 62 | (c) | | | — | | | | 178,566 | | | | — | |
| | Reinvested | | | 3 | (c) | | | — | | | | — | | | | — | | | | 27 | | | | — | |
| | Redeemed | | | — | | | | — | | | | — | | | | — | | | | (180,985 | ) | | | — | |
| | |
| |
| |
| |
| | | | 148 | | | | — | | | | 62 | | | | — | | | | (2,392 | ) | | | — | |
| | |
| |
| |
| |
| Total change in shares | | | (13,015,780 | ) | | | 2,311,039 | | | | (540,699 | ) | | | 434,092 | | | | 4,212,615 | | | | 1,482,097 | |
| | |
| |
| |
|
| | |
| (a) | | Amount includes redemption fees, if any. |
| (b) | | For the period from February 27, 2004 (commencement of operations) through October 31, 2004. |
| (c) | | For the period from June 29, 2004 (commencement of operations) through October 31, 2004. |
| (d) | | For the period from December 30, 2003 (commencement of operations) through October 31, 2004. |
2004 Annual Report 165
| |
| | Notes to Financial Statements (Continued) |
| | October 31, 2004 |
| | | | | | | | | | | | | | | | | | | | | | |
| | | | | | |
| | U.S. Growth Leaders Long-Short | | | Convertible | | | Small Cap Growth | |
| | Year Ended | | | Period Ended | | | Year Ended | | | Period Ended | | | Period Ended | |
| | October 31, 2004 | | | October 31, 2003 (g) | | | June 30, 2003 | | | October 31, 2004 | | | October 31, 2004 (d) | |
|
|
| |
|
CAPITAL TRANSACTIONS: | | | | | | | | | | | | | | | | | | | | |
Class A Shares | | | | | | | | | | | | | | | | | | | | |
| | Proceeds from shares issued (h) | | $ | 4,499,603 | | | $ | 726,070 | | | $ | 732,628 | | | $ | 3,480,288 | (e) | | $ | 13,629 | |
| | Proceeds from shares issued in connection with Class R Shares merger | | | — | | | | — | | | | 29,933,725 | | | | — | | | | — | |
| | Dividends reinvested | | | 5,979,998 | | | | — | | | | | | | | 21,236 | (e) | | | — | |
| | Cost of shares redeemed | | | (10,248,730 | ) | | | (3,540,842 | ) | | | (617,921 | ) | | | (480,135 | ) (e) | | | — | |
| | |
| |
| |
| |
| | | | 230,871 | | | | (2,814,772 | ) | | | 30,048,432 | | | | 3,021,389 | | | | 13,629 | |
| | |
| |
| |
| |
Class B Shares | | | | | | | | | | | | | | | | | | | | |
| | Proceeds from shares issued (h) | | | 446,346 | | | | 257,253 | | | | 64,983 | | | | 214,625 | (e) | | | 12,740 | |
| | Dividends reinvested | | | 1,465 | | | | — | | | | — | | | | 85 | (e) | | | — | |
| | Cost of shares redeemed | | | (128,952 | ) | | | — | | | | (42,167 | ) | | | (3,911 | ) (e) | | | — | |
| | |
| |
| |
| |
| | | | 318,859 | | | | 257,253 | | | | 22,816 | | | | 210,799 | | | | 12,740 | |
| | |
| |
| |
| |
Class C Shares | | | | | | | | | | | | | | | | | | | | |
| | Proceeds from shares issued (h) | | | 1,933,492 | | | | 216,954 | | | | 7,161 | | | | 3,337,486 | (e) | | | 40,782 | |
| | Dividends reinvested | | | 44,874 | | | | — | | | | — | | | | 2,057 | (e) | | | — | |
| | Cost of shares redeemed | | | (438,533 | ) | | | (180,203 | ) | | | (475,697 | ) | | | (86,362 | ) (e) | | | 55 | |
| | |
| |
| |
| |
| | | | 1,539,833 | | | | 36,751 | | | | (468,536 | ) | | | 3,253,181 | | | | 40,837 | |
| | |
| |
| |
| |
Class R Shares | | | | | | | | | | | | | | | | | | | | |
| | Proceeds from shares issued (h) | | | 1,000 | (a) | | | — | | | | 4,709,596 | (j | | | | )
1,000 (f) | | | 1,000 | |
| | Dividends reinvested | | | — | | | | — | | | | — | | | | 9 | (f) | | | — | |
| | Cost of shares redeemed | | | — | | | | — | | | | (14,736,279 | )(j | | | | ) — | | | — | |
| | Shares redeemed in connection with Class R Shares merger | | | — | | | | — | | | | (29,933,725 | )(j | | | | ) — | | | — | |
| | |
| |
| |
| |
| | | | 1,000 | | | | — | | | | (39,960,408 | ) | | | 1,009 | | | | 1,000 | |
| | |
| |
| |
| |
Institutional Service Class Shares | | | | | | | | | | | | | | | | | | | | |
| | Proceeds from shares issued (h) | | | — | | | | — | | | | — | | | | 316,000 | (e) | | | 1,000 | |
| | Dividends reinvested | | | — | | | | — | | | | — | | | | 1,161 | (e) | | | — | |
| | |
| |
| |
| |
| | | | | | | | — | | | | — | | | | 317,161 | | | | 1,000 | |
| | |
| |
| |
| |
Institutional Class Shares | | | | | | | | | | | | | | | | | | | | |
| | Proceeds from shares issued (h) | | | 343,762 | (b) | | | — | | | | — | | | | 30,065,920 | (c) | | | 2,995,383 | |
| | Dividends reinvested | | | — | | | | — | | | | — | | | | 290,722 | (c) | | | — | |
| | Cost of shares redeemed | | | (22,811 | ) (b) | | | — | | | | — | | | | (1,581,378 | ) (c) | | | (55 | ) |
| | |
| |
| |
| |
| | | | 320,951 | | | | — | | | | — | | | | 28,775,264 | | | | 2,995,328 | |
| | |
| |
| |
| |
Class ML Shares (i) | | | | | | | | | | | | | | | | | | | | |
| | Redeemed | | | — | | | | — | | | | (4,293,880 | ) | | | — | | | | — | |
| | |
| |
| |
| |
| | | | — | | | | — | | | | (4,293,880 | ) | | | — | | | | — | |
| | |
| |
| |
| |
| Change in net assets from capital transactions | | $ | 2,411,514 | | | $ | (2,520,768 | ) | | $ | (14,651,576 | ) | | $ | 35,578,803 | | | $ | 3,064,534 | |
| | |
| |
| |
SHARE TRANSACTIONS: | | | | | | | | | | | | | | | | | | | | |
Class A Shares | | | | | | | | | | | | | | | | | | | | |
| | Issued | | | 480,510 | | | | 62,860 | | | | 69,841 | | | | 352,634 | (e) | | | 1,532 | |
| | Shares issued in connection with Class R Shares merger | | | — | | | | — | | | | 2,675,377 | | | | — | | | | — | |
| | Reinvested | | | 663,707 | | | | — | | | | — | | | | 2,159 | (e) | | | — | |
| | Redeemed | | | (1,045,702 | ) | | | (308,151 | ) | | | (57,727 | ) | | | (49,380 | ) (e) | | | — | |
| | |
| |
| |
| |
| | | | 98,515 | | | | (245,291 | ) | | | 2,687,491 | | | | 305,413 | | | | 1,532 | |
| | |
| |
| |
| |
Class B Shares | | | | | | | | | | | | | | | | | | | | |
| | Issued | | | 48,887 | | | | 21,813 | | | | 5,911 | | | | 21,990 | (e) | | | 1,384 | |
| | Reinvested | | | 165 | | | | — | | | | — | | | | 9 | (e) | | | — | |
| | Redeemed | | | (14,223 | ) | | | — | | | | (4,003 | ) | | | (402 | ) (e) | | | — | |
| | |
| |
| |
| |
| | | | 34,829 | | | | 21,813 | | | | 1,908 | | | | 21,597 | | | | 1,384 | |
| | |
| |
| |
| |
Class C Shares | | | | | | | | | | | | | | | | | | | | |
| | Issued | | | 270,981 | | | | 22,939 | | | | 794 | | | | 342,677 | (e) | | | 4,391 | |
| | Reinvested | | | 6,560 | | | | — | | | | — | | | | 210 | (e) | | | — | |
| | Redeemed | | | (61,807 | ) | | | (18,936 | ) | | | (55,239 | ) | | | (8,840 | ) (e) | | | — | |
| | |
| |
| |
| |
| | | | 215,734 | | | | 4,003 | | | | (54,445 | ) | | | 334,047 | | | | 4,391 | |
| | |
| |
| |
| |
Class R Shares | | | | | | | | | | | | | | | | | | | | |
| | Issued | | | 109 | (a) | | | — | | | | 468,242 | (j) | | | 104 | (f) | | | 100 | |
| | Reinvested | | | — | | | | — | | | | — | | | | 1 | (f) | | | — | |
| | Redeemed | | | — | | | | — | | | | (1,455,328 | ) ( | | | j | ) — | | | — | |
| | Shares redeemed in connection with Class R Shares merger | | | — | | | | — | | | | (2,667,622 | ) ( | | | j | ) — | | | — | |
| | |
| |
| |
| |
| | | | 109 | | | | — | | | | (3,654,708 | ) | | | 105 | | | | 100 | |
| | |
| |
| |
| |
Institutional Service Class Shares | | | | | | | | | | | | | | | | | | | | |
| | Issued | | | — | | | | — | | | | — | | | | 31,738 | (e) | | | 100 | |
| | Reinvested | | | — | | | | — | | | | — | | | | 118 | (e) | | | — | |
| | |
| |
| |
| |
| | | | — | | | | — | | | | — | | | | 31,856 | | | | 100 | |
| | |
| |
| |
| |
Institutional Class Shares | | | | | | | | | | | | | | | | | | | | |
| | Issued | | | 36,989 | (b) | | | — | | | | — | | | | 3,026,263 | | | | 299,500 | |
| | Reinvested | | | — | | | | — | | | | — | | | | 29,579 | | | | — | |
| | Redeemed | | | (2,408 | ) (b) | | | — | | | | — | | | | (161,290 | ) | | | — | |
| | |
| |
| |
| |
| | | | 34,581 | | | | — | | | | — | | | | 2,894,552 | | | | 299,500 | |
| | |
| |
| |
| |
Class ML Shares (i) | | | | | | | | | | | | | | | | | | | | |
| | Redeemed | | | — | | | | — | | | | (455,374 | ) | | | — | | | | — | |
| | |
| |
| |
| |
| | | | — | | | | — | | | | (455,374 | ) | | | — | | | | — | |
| | |
| |
| |
| |
| Total change in shares | | | 383,768 | | | | (219,475 | ) | | | (1,475,128 | ) | | | 3,587,570 | | | | 307,007 | |
| | |
| |
| |
|
| | |
| (a) | | For the period from February 27, 2004 (commencement of operations) through October 31, 2004. |
| (b) | | For the period from June 29, 2004 (commencement of operations) through October 31, 2004. |
| (c) | | For the period from December 29, 2003 (commencement of operations) through October 31, 2004. |
| (d) | | For the period March 30, 2004 (commencement of operations) through October 31, 2004. |
| (e) | | For the period from January 20, 2004 (commencement of operations) through October 31, 2004. |
| (f) | | For the period from May 14, 2004 (commencement of operations) through October 31, 2004. |
| (g) | | For the period from July 1, 2003 (commencement of operations) through October 31, 2003. |
| (h) | | Amount includes redemption fees, if any. |
| (i) | | Class R shares were issued in exchange for Class ML shares on October 31, 2002. |
| (j) | | In conjunction with the Fund reorganization, R shares merged into Class A shares. |
166 Annual Report 2004
3. Transactions with Affiliates
Under the terms of the Trust’s Investment Advisory Agreements, Gartmore Global Asset Management Trust (“GGAMT”) or Gartmore Mutual Fund Capital Trust (“GMF”) manages the investment of the assets and supervises the daily business affairs of their respective Funds (as shown in table below). GMF is a wholly-owned subsidiary of Gartmore Global Investments, Inc. (“GGI”), a holding company. GGI is a majority-owned subsidiary of GGAMT. GGAMT is a wholly-owned subsidiary of Nationwide Corporation. All of the common stock of Nationwide Corporation is held by Nationwide Mutual Insurance Company (95.2%) and Nationwide Mutual Fire Insurance Company (4.8%), each of which is a mutual company owned by its policyholders. In addition, GMF and GGAMT each provide investment management evaluation services in initially selecting and monitoring on an ongoing basis the performance of the subadvisers, if applicable, for the Funds GMF or GGAMT advise. The subadvisers manage each of their respective Fund’s investments and have the responsibility for making all investment decisions for the applicable Funds. The adviser and subadviser, if applicable, for each Fund is as follows:
| | | | | | | | | |
| Fund | | Adviser | | | SubAdviser | |
|
| |
| Global Financial Services | | | GGAMT | | | | Gartmore Global Partners (a) | |
|
| Global Health Sciences | | | GMF | | | | n/a | |
|
| Global Natural Resources | | | GMF | | | | Gartmore Global Partners (a) | |
|
| Global Technology and Communications | | | GMF | | | | n/a | |
|
| Global Utilities | | | GGAMT | | | | Gartmore Global Partners (a) | |
|
| Mid Cap Growth Leaders | | | GMF | | | | n/a | |
|
| Nationwide Leaders | | | GMF | | | | n/a | |
|
| U.S. Growth Leaders | | | GMF | | | | n/a | |
|
| Worldwide Leaders | | | GGAMT | | | | Gartmore Global Partners (a) | |
|
| China Opportunities | | | GMF | | | | Gartmore Global Partners (a) | |
|
| Emerging Markets | | | GGAMT | | | | Gartmore Global Partners (a) | |
|
| International Growth | | | GGAMT | | | | Gartmore Global Partners (a) | |
|
| High Yield Bond | | | GMF | | | | n/a | |
|
| Value Opportunities | | | GMF | | | | NorthPointe Capital, LLC (a) | |
|
| Micro Cap Equity | | | GMF | | | | n/a | |
|
| U.S. Growth Leaders Long-Short | | | GMF | | | | n/a | |
|
| Convertible | | | GMF | | | | n/a | |
|
| Small Cap Growth | | | GMF | | | | n/a | |
|
| | |
| (a) | | Affiliate of GMF and GGAMT. |
Under the terms of the Investment Advisory Agreements, each Fund pays its respective adviser an investment advisory fee based on that Fund’s average daily net assets. From such fees, pursuant to the subadvisory agreements, the adviser pays fees to the applicable subadviser, if any. Additional information regarding the investment advisory fees and subadvisory fees for GGAMT, GMF and the subadvisers, where applicable, is as follows for the year ended October 31, 2004:
| | | | | | | | | | | | | | | | | |
| | | | Total | | | Fees | | | Paid to | | | |
| Fund | | Fee Schedule | | Fees | | | Retained | | | Subadviser | | | |
|
|
| Global Financial Services (a) | | Up to $500 million | | | 0.90% | | | | 0.45% | | | | 0.45% | | | |
| | | $500 million up to $2 billion | | | 0.85% | | | | 0.425% | | | | 0.425% | | | |
| | | On $2 billion and more | | | 0.80% | | | | 0.40% | | | | 0.40% | | | |
|
| Global Health Sciences (b) | | Up to $500 million | | | 0.90% | | | | 0.90% | | | | — | | | |
| | | $500 million up to $2 billion | | | 0.85% | | | | 0.85% | | | | — | | | |
| | | On $2 billion and more | | | 0.80% | | | | 0.80% | | | | — | | | |
|
| Global Natural Resources | | Up to $500 million | | | 0.90% | | | | 0.45% | | | | 0.45% | | | |
| | | $500 million up to $2 billion | | | 0.85% | | | | 0.425% | | | | 0.425% | | | |
| | | On $2 billion and more | | | 0.80% | | | | 0.40% | | | | 0.40% | | | |
|
2004 Annual Report 167
| |
| | Notes to Financial Statements (Continued) |
| | October 31, 2004 |
| | | | | | | | | | | | | | | | | |
| | | | Total | | | Fees | | | Paid to | | | |
| Fund | | Fee Schedule | | Fees | | | Retained | | | Subadviser | | | |
|
|
| Global Technology and Communications (c) | | Up to $500 million | | | 0.88% | | | | 0.88% | | | | — | | | |
| | | $500 million up to $2 billion | | | 0.83% | | | | 0.83% | | | | — | | | |
| | | On $2 billion and more | | | 0.78% | | | | 0.78% | | | | — | | | |
|
| Global Utilities (d) | | Up to $500 million | | | 0.70% | | | | 0.35% | | | | 0.35% | | | |
| | | $500 million up to $2 billion | | | 0.65% | | | | 0.325% | | | | 0.325% | | | |
| | | On $2 billion and more | | | 0.60% | | | | 0.30% | | | | 0.30% | | | |
|
| Mid Cap Growth Leaders (e) | | Up to $250 million | | | 0.80% | | | | 0.80% | | | | — | | | |
| | | $250 million up to $1 billion | | | 0.77% | | | | 0.77% | | | | — | | | |
| | | $1 billion up to $2 billion | | | 0.74% | | | | 0.74% | | | | — | | | |
| | | $2 billion up to $5 billion | | | 0.71% | | | | 0.71% | | | | — | | | |
| | | On $5 billion and more | | | 0.68% | | | | 0.68% | | | | — | | | |
|
| Nationwide Leaders (f) | | Up to $500 million | | | 0.80% | | | | 0.80% | | | | — | | | |
| | | $500 million up to $2 billion | | | 0.70% | | | | 0.70% | | | | — | | | |
| | | On $2 billion and more | | | 0.65% | | | | 0.65% | | | | — | | | |
|
| U.S. Growth Leaders (1) | | Up to $500 million | | | 0.90% | | | | 0.90% | | | | — | | | |
| | | $500 million up to $2 billion | | | 0.80% | | | | 0.80% | | | | — | | | |
| | | On $2 billion and more | | | 0.75% | | | | 0.75% | | | | — | | | |
|
| Worldwide Leaders (g) | | Up to $500 million | | | 0.90% | | | | 0.45% | | | | 0.45% | | | |
| | | $500 million up to $2 billion | | | 0.85% | | | | 0.425% | | | | 0.425% | | | |
| | | On $2 billion and more | | | 0.80% | | | | 0.40% | | | | 0.40% | | | |
|
| China Opportunities | | Up to $500 million | | | 1.25% | | | | 0.625% | | | | 0.625% | | | |
| | | $500 million up to $2 billion | | | 1.20% | | | | 0.60% | | | | 0.60% | | | |
| | | On $2 billion and more | | | 1.15% | | | | 0.575% | | | | 0.575% | | | |
|
| Emerging Markets (h) | | Up to $500 million | | | 1.05% | | | | 0.525% | | | | 0.525% | | | |
| | | $500 million up to $2 billion | | | 1.00% | | | | 0.500% | | | | 0.500% | | | |
| | | On $2 billion and more | | | 0.95% | | | | 0.475% | | | | 0.475% | | | |
|
| International Growth (i) | | Up to $500 million | | | 0.90% | | | | 0.45% | | | | 0.45% | | | |
| | | $500 million up to $2 billion | | | 0.85% | | | | 0.425% | | | | 0.425% | | | |
| | | On $2 billion and more | | | 0.80% | | | | 0.40% | | | | 0.40% | | | |
|
| High Yield Bond | | Up to $250 million | | | 0.55% | | | | 0.55% | | | | — | | | |
| | | On the next $750 million | | | 0.525% | | | | 0.525% | | | | — | | | |
| | | On the next $1 billion | | | 0.50% | | | | 0.50% | | | | — | | | |
| | | On the next $3 billion | | | 0.475% | | | | 0.475% | | | | — | | | |
| | | On $5 billion and more | | | 0.45% | | | | 0.45% | | | | — | | | |
|
| Value Opportunities | | Up to $250 million | | | 0.70% | | | | — | | | | 0.70% | | | |
| | | On the next $750 million | | | 0.675% | | | | — | | | | 0.675% | | | |
| | | On the next $1 billion | | | 0.65% | | | | — | | | | 0.65% | | | |
| | | On the next $3 billion | | | 0.625% | | | | — | | | | 0.625% | | | |
| | | On $5 billion and more | | | 0.60% | | | | — | | | | 0.60% | | | |
|
| Micro Cap Equity | | All Assets | | | 1.25% | | | | 1.25% | | | | — | | | |
|
| U.S. Growth Leaders Long-Short | | Up to $50 million | | | 1.50% | | | | 0.50% | | | | 1.00% | | | |
| | | On the next $200 million | | | 1.50% | | | | 0.75% | | | | 0.75% | | | |
| | | On $250 million and more | | | 1.25% | | | | 0.50% | | | | 0.75% | | | |
|
| Convertible | | Up to $500 million | | | 0.65% | | | | 0.65% | | | | — | | | |
| | | $500 million up to $1 billion | | | 0.60% | | | | 0.60% | | | | — | | | |
| | | On $1 billion and more | | | 0.55% | | | | 0.55% | | | | — | | | |
|
| Small Cap Growth | | All Assets | | | 0.95% | | | | 0.95% | | | | — | | | |
|
| | |
| (a) | | From March 1, 2004 to June 30, 2004, the advisory fee was 1.00% on assets up to $500 million, 0.95% on the next $500 million, and 0.90% on the assets over $2 billion. Prior to March 1, 2004, the advisory fee was 1.00% on all asset levels. |
| (b) | | From March 1, 2004 to June 30, 2004, the advisory fee was 1.00% on assets up to $500 million, 0.95% on the next $500 million, and 0.90% on the assets over $2 billion. Prior to March 1, 2004, the advisory fee was 1.00% on all asset levels. |
| (c) | | From March 1, 2004 to June 30, 2004, the advisory fee was 0.98% on assets up to $500 million, 0.93% on the next $500 million, and 0.88% on the assets over $2 billion. Prior to March 1, 2004, the advisory fee was 0.98% on all asset levels. |
| (d) | | From March 1, 2004 to June 30, 2004, the advisory fee was 0.80% on assets up to $500 million, 0.75% on the next $500 million, and 0.70% on the assets over $2 billion. Prior to March 1, 2004, the advisory fee was 0.80% on all asset levels. |
168 Annual Report 2004
| | |
| (e) | | Prior to March 1, 2004, the advisory fee was 1.03% on assets up to $250 million and 1.00% on the next $750 million and 0.97% on the next $1 billion and 0.94% on the next $3 billion and 0.91% on assets of $5 billion and more. |
| (f) | | Prior to July 1, 2004, the advisory fee was 0.80% on assets up to $500 million and 0.75% on the next $500 million and 0.70% on the assets over $2 billion. |
| (g) | | From March 1, 2004 to June 30, 2004, the advisory fee was 1.00% on assets up to $500 million, 0.95% on the next $500 million, and 0.90% on the assets over $2 billion. Prior to March 1, 2004, the advisory fee was 1.00% on all asset levels. |
| (h) | | From March 1, 2004 to June 30, 2004, the advisory fee was 1.15% on assets up to $500 million, 1.10% on the next $500 million, and 1.05% on the assets over $2 billion. Prior to March 1, 2004, the advisory fee was 1.15% on all asset levels. |
| (i) | | From March 1, 2004 to June 30, 2004, the advisory fee was 1.00% on assets up to $500 million, 0.95% on the next $500 million, and 0.90% on the assets over $2 billion. Prior to March 1, 2004, the advisory fee was 1.00% on all asset levels. |
| (1) | | The U.S. Growth Leaders Fund pays GMF a base management fee (as shown above) which may be adjusted upward or downward each quarter depending on the Fund’s performance relative to its benchmark. Thus, if the Fund outperforms its benchmark by 12% or more over a 36 month period, the Fund will pay higher management fees. Conversely, if the fund underperforms its benchmark by 12% or more over a 36 month period, the Fund will pay lower management fees. No adjustment will take place if the under or overperformance is less than 12% and GMF will receive the applicable base fee. The adjustment described above will be phased in over a 24 month period beginning after the first year of operations. The base fee is either increased or decreased by the following amounts at each breakpoint: |
| | | | | | | |
| | Fee | | | |
| Fee Schedule | | Adjustment | | | |
| | | | |
|
|
| Up to $500 million | | | +/- 0.22% | | | |
|
| $500 million up to $2 billion | | | +/- 0.18% | | | |
|
| On $2 billion and more | | | +/- 0.16% | | | |
|
On September 21, 2004, the Enforcement Staff of the Commission’s Fort Worth District Office (the “Staff”) contacted Gartmore Mutual Fund Capital Trust (the “Adviser”), the investment adviser to the Gartmore U.S. Growth Leaders Fund (the “Fund”), a series of Gartmore Mutual Funds (“GMF”). The Staff asserted that the methodology used to calculate the performance fee for the Fund did not comply with the requirements of Rule 205-2 under the Investment Advisers Act of 1940 (“Advisers Act”). The Adviser agreed temporarily to forego the collection of any performance fees pending an evaluation of the Staff’s assertion. Discussions with the Staff are ongoing, and the outcome of those discussions will determine the remedial steps, if any, to be taken.
GMF or GMCM, where applicable, and the Funds have entered into written contracts (“Expense Limitation Agreements”) limiting operating expenses (excluding any taxes, interest, brokerage fees, extraordinary expenses, short sale dividend expenses, Rule 12b-1 fees, and administrative services fees) from exceeding the amounts listed in the table below until February 28, 2005:
| | | | | | | | | |
| Fund | | Expense Caps | | | Amount | |
|
| |
| Global Financial Services | | | All Classes | | | | 1.40% | |
|
| Global Health Sciences | | | All Classes | | | | 1.25% | |
|
| Global Natural Resources | | | All Classes | | | | 1.30% | |
|
| Global Technology and Communications | | | All Classes | | | | 1.40% | |
|
| Global Utilities | | | All Classes | | | | 1.20% | |
|
| Mid Cap Growth Leaders | | | All Classes | | | | 1.20% | |
|
| Nationwide Leaders | | | All Classes | | | | 1.20% | |
|
| U.S. Growth Leaders | | | All Classes | | | | 1.30% | |
|
| Worldwide Leaders | | | All Classes | | | | 1.40% | |
|
| China Opportunities | | | All Classes | | | | 1.65% | |
|
| Emerging Markets | | | All Classes | | | | 1.55% | |
|
| International Growth | | | All Classes | | | | 1.40% | |
|
| High Yield Bond | | | All Classes | | | | 0.70% | |
|
| Value Opportunities | | | All Classes | | | | 1.00% | |
|
| Micro Cap Equity | | | All Classes | | | | 1.55% | |
|
| U.S. Growth Leaders Long-Short | | | All Classes | | | | 1.95% | |
|
| Convertible | | | All Classes | | | | 0.95% | |
|
| Small Cap Growth | | | All Classes | | | | 1.35% | |
|
GMF or GGAMT may request and receive reimbursement from a Fund of the advisory fees waived and other expenses reimbursed by GMF and GGAMT, respectively, pursuant to the Expense Limitation Agreements at a later date not to exceed (i) five fiscal years from commencement of operations or (ii) three years from the fiscal year in which the
2004 Annual Report 169
| |
| | Notes to Financial Statements (Continued) |
| | October 31, 2004 |
corresponding reimbursement to the Fund was made, depending on the Fund (as described below), if the Fund has reached a sufficient asset size to permit reimbursement to be made without causing the total annual operating expense ratio of the Fund to exceed the limits set forth above. No reimbursement will be made unless: (i) the Fund’s assets exceed $100 million; (ii) the total annual expense ratio of the Class making such reimbursement is less than the limit set forth above; and (iii) the payment of such reimbursement is approved by the Board of Trustees on a quarterly basis. Except as provided for in the Expense Limitation Agreements, reimbursement of amounts previously waived or assumed by GMF or GGAMT is not permitted. As of the year ended October 31, 2004, the cumulative potential reimbursements of the following Funds based on expenses reimbursed by GMF or GGAMT within five years from commencement of operations of the Fund would be:
| | | | | | | | | |
| Fund | | Amount | | | Expires | |
|
| |
| Global Financial Services | | $ | 133,863 | | | | December 18, 2006 | |
|
| Global Health Sciences | | | 227,987 | | | | December 29, 2005 | |
|
| Global Technology and Communications | | | 437,410 | | | | June 30, 2005 | |
|
| Global Utilities | | | 141,897 | | | | December 18, 2006 | |
|
| Nationwide Leaders | | | 157,383 | | | | December 28, 2006 | |
|
| U.S. Growth Leaders | | | 376,982 | | | | June 30, 2005 | |
|
| Worldwide Leaders | | | 278,538 | | | | August 30, 2005 | |
|
| Emerging Markets | | | 270,436 | | | | August 30, 2005 | |
|
| International Growth | | | 305,758 | | | | August 30, 2005 | |
|
| High Yield Bond | | | 392,732 | | | | December 29, 2004 | |
|
| Value Opportunities | | | 406,100 | | | | December 29, 2004 | |
|
| Micro Cap Equity | | | 83,592 | | | | June 27, 2007 | |
|
As of the year ended October 31, 2004, the cumulative potential reimbursements of the following Funds (unless otherwise indicated), based on reimbursements within three years from the fiscal year in which the corresponding reimbursement to the Fund was made for expenses reimbursed by GMF or GGAMT, would be:
| | | | | | | | | |
| | Amount | | | Amount | |
| | Fiscal Year | | | Fiscal Year | |
| Fund | | 2003 | | | 2004 | |
|
| |
| Global Natural Resources | | $ | — | | | $ | 21,945 | |
|
| Mid Cap Growth Leaders | | | 82,484 | | | | 98,160 | |
|
| China Opportunities | | | — | | | | 50,098 | |
|
| U.S. Growth Leaders Long-Short | | | — | | | | 14,723 | |
|
| Convertible | | | — | | | | 30,330 | |
|
| Small Cap Growth | | | — | | | | 53,910 | |
|
Under the terms of a Distribution Plan under Rule 12b-1 of the 1940 Act, Gartmore Distribution Services, Inc. (“GDSI”), the Funds’ distributor, is compensated by the Funds for expenses associated with the distribution of Class A, Class B, Class C, and Class R shares of the Funds. These fees are based on average daily net assets of the respective class of the Funds at an annual rate not to exceed 0.25% for Class A shares, 1.00% for Class B and Class C shares, and 0.50% for Class R shares.
Pursuant to an Underwriting Agreement, GDSI serves as principal underwriter of the Funds in the continuous distribution of their shares and receives commissions in the form of a front-end sales charge on the Class A, Class C (until April 1, 2004) and Class D shares. These fees are deducted from and are not included in proceeds from sales of Class A, Class C and Class D shares. From these fees, GDSI pays sales commissions, salaries, and other expenses in connection with generating new sales of Class A, Class C and Class D shares of the Funds. GDSI also receives fees for services as principal underwriter for Class B shares of the Funds. These fees are contingent deferred sales charges (“CDSCs”) ranging from 1% to 5% imposed on redemptions of Class B shares which may cause the current value of a shareholder’s account to fall below the total purchase payments. The CDSC, if applicable, will be imposed on redemptions made within six years of the purchase. In addition, Class C shares also have a CDSC of 1% imposed on redemptions of Class C shares
170 Annual Report 2004
made within one year of purchase. For the year ended October 31, 2004, GDSI received commissions of $968,520 from front-end sales charges of Class A, Class C and Class D shares and from CDSC fees from Class B and Class C shares of the Funds, of which $84,762 was reallowed to affiliated broker-dealers of the Funds.
The Funds assess a 2.00% redemption fee on all classes of shares that are purchased and are sold or exchanged within 90 days of purchase (within 30 days for the Nationwide Leaders and U.S. Growth Leaders Funds and within five days for the High Yield Bond and Convertible Funds). The redemption fee, if any, is paid directly to the applicable Fund and is designed to offset brokerage commissions, market impact and other costs associated with short-term trading of Fund shares. For purposes of determining whether the redemption fee applies, the shares that were held the longest will be redeemed first. This redemption fee is in addition to any CDSCs that may be applicable at the time of sale. The redemption fee may not apply in certain circumstances, such as redemptions or exchanges of shares held in certain omnibus accounts or retirement plans that cannot implement the redemption fee. The fee does not apply to shares purchased through reinvested dividends or capital gains.
For the year ended October 31, 2004, the following Funds had contributions to capital due to collection of redemption fees:
| | | | | | | |
| Fund | | Amount | | | |
|
|
| Emerging Markets | | $ | 56,404 | | | |
|
| International Growth | | | 11,890 | | | |
|
| Micro Cap Equity | | | 89,426 | | | |
|
Under the terms of a Fund Administration Agreement, Gartmore SA Capital Trust (“GSA”) provides various administrative and accounting services, and Gartmore Investors Services, Inc. (“GISI”), an indirect subsidiary of GSA, serves as Transfer Agent and Dividend Disbursing Agent for each of the Funds. The fees for the services provided under such agreement is calculated based on the Trust’s average daily net assets according to the fee schedule below. The fees are then allocated proportionately among all Funds within the Trust in relation to the average daily net assets of each Fund and are paid to GSA. GSA pays GISI from these fees for GISI’s services.
| | | | | |
| Combined Fee Schedule* | | | | |
|
|
| Up to $1 billion | | 0.25% | | |
|
| $1 billion and more up to $3 billion | | 0.18% | | |
|
| $3 billion and more up to $4 billion | | 0.14% | | |
|
| $4 billion and more up to $5 billion | | 0.07% | | |
|
| $5 billion and more up to $10 billion | | 0.04% | | |
|
| $10 billion and more up to $12 billion | | 0.02% | | |
|
| $12 billion or more | | 0.01% | | |
|
| |
| * | The assets of the Gartmore Investor Destinations Aggressive, Gartmore Investor Destinations Moderately Aggressive, Gartmore Investor Destinations Moderate, Gartmore Investor Destinations Moderately Conservative and Gartmore Investor Destinations Conservative Funds (collectively, the “Investor Destinations Funds”) and the Gartmore Optimal Allocations Fund: Aggressive, Gartmore Optimal Allocations Fund: Moderate, Gartmore Optimal Allocations Fund: Moderately Aggressive, and Gartmore Optimal Allocations Fund: Specialty (collectively, the “Optimal Funds”) are excluded from the Trust asset level amount in order to calculate this asset based fee. The Investor Destinations Funds and the Optimal Funds do not pay any part of this fee. |
GSA and GISI have entered into agreements with BISYS Fund Services Ohio, Inc., to provide sub-administration and sub-transfer agency services, respectively, to the Funds.
Under the terms of an Administrative Services Plan, the Funds may pay fees to servicing organizations, such as broker-dealers, including Nationwide Financial Services, and financial institutions, which agree to provide administrative support services to the shareholders of certain classes. These services include, but are not limited to, the following: establishing and maintaining shareholder accounts; processing purchase and redemption transactions; arranging bank wires; performing shareholder sub-accounting; answering inquiries regarding the Funds; and other such services. These fees are based on an annual rate of up to 0.25% of the average daily net assets of the Class A, Class D, Class R, and Institutional Service Class shares of each of the Funds.
2004 Annual Report 171
| |
| | Notes to Financial Statements (Continued) |
| | October 31, 2004 |
As of October 31, 2004 GMF, GGAMT or their affiliates directly held the percentage indicated below of the shares outstanding of the applicable Fund:
| | | | | |
| | % of | | |
| | Shares | | |
| | Outstanding | | |
| Fund | | Owned | | |
|
|
| Global Financial Services | | 65% | | |
|
| Global Health Sciences | | 21% | | |
|
| Global Natural Resources | | 97% | | |
|
| Global Technology and Communications | | 22% | | |
|
| Global Utilities | | 49% | | |
|
| Nationwide Leaders | | 27% | | |
|
| China Opportunities | | 84% | | |
|
| Emerging Markets | | 27% | | |
|
| International Growth | | 89% | | |
|
| High Yield Bond | | 40% | | |
|
| Value Opportunities | | 100% | | |
|
| Small Cap Growth | | 98% | | |
|
As a result of certain trading errors that occurred in August of 2004, the Mid Cap Growth Leaders Fund was reimbursed $14,628 by GMF to offset losses realized on the disposal of investments.
4. Bank Loans
The Trust has a credit agreement of $100,000,000. Borrowings under this arrangement bear interest at the Federal Funds rate plus 0.50%. The interest costs are included in custodian fees in the Statement of Operations. No compensation balances were required under the terms of the line of credit. There were no borrowings outstanding as of October 31, 2004.
172 Annual Report 2004
5. Investment Transactions
Purchases and sales of securities (excluding short-term securities) for the year ended October 31, 2004, are summarized as follows:
| | | | | | | | | | | |
| Fund | | Purchases | | | Sales | | | |
|
|
| Global Financial Services | | $ | 8,599,796 | | | $ | 6,916,273 | | | |
|
| Global Health Sciences | | | 48,577,833 | | | | 43,800,378 | | | |
|
| Global Natural Resources | | | 4,467,577 | | | | 1,525,732 | | | |
|
| Global Technology and Communications | | | 67,865,114 | | | | 68,714,224 | | | |
|
| Global Utilities | | | 18,291,081 | | | | 15,381,792 | | | |
|
| Mid Cap Growth Leaders | | | 83,568,441 | | | | 83,992,151 | | | |
|
| Nationwide Leaders | | | 10,350,366 | | | | 9,621,219 | | | |
|
| U.S. Growth Leaders | | | 156,228,315 | | | | 141,350,600 | | | |
|
| Worldwide Leaders | | | 165,367,672 | | | | 173,243,704 | | | |
|
| China Opportunities | | | 4,222,474 | | | | 2,764,816 | | | |
|
| Emerging Markets | | | 31,779,359 | | | | 25,173,810 | | | |
|
| International Growth | | | 20,824,425 | | | | 20,382,491 | | | |
|
| High Yield Bond | | | 74,479,725 | | | | 61,456,755 | | | |
|
| Value Opportunities | | | 55,923,656 | | | | 63,210,179 | | | |
|
| Micro Cap Equity | | | 145,740,925 | | | | 75,539,756 | | | |
|
| U.S. Growth Leaders Long-Short | | | 123,074,992 | | | | 137,493,303 | | | |
|
| Convertible | | | 61,443,073 | | | | 27,618,899 | | | |
|
| Small Cap Growth | | | 18,676,453 | | | | 16,156,436 | | | |
|
6. Portfolio Investment Risks
Credit and Market Risk. Funds that invest in high yield and emerging market instruments are subject to certain additional credit and market risks. The yields of high yield and emerging market debt obligations reflect, among other things, perceived credit risk. The Funds’ investment in securities rated below investment grade typically involve risks not associated with higher rated securities including, among others, greater risk of not receiving timely and/or ultimate payment of interest and principal, greater market price volatility, and less liquid secondary market trading. The consequences of political, social, economic, or diplomatic changes may have disruptive effects on the market prices of emerging markets investments held by the Funds.
2004 Annual Report 173
| |
| | Notes to Financial Statements (Continued) |
| | October 31, 2004 |
7. Federal Tax Information
The tax character of distributions paid during the fiscal year ended October 31, 2004, were as follows:
| | | | | | | | | | | | | | | | | | | | | |
| | | | | | | | |
| | Distributions paid from | | | | | | | |
| |
| | | | | | | |
| | | | Net Long | | | | | | | Total | |
| | Ordinary | | | Term Capital | | | Total Taxable | | | Return of | | Distributions | |
| Fund | | Income | | | Gains | | | Distributions | | | Capital | | Paid | |
|
| |
| Global Financial Services | | $ | 438,819 | | | $ | — | | | $ | 438,819 | | | $ | — | | | $ | 438,819 | |
|
| Global Health Sciences | | | 707,293 | | | | — | | | | 707,293 | | | | — | | | | 707,293 | |
|
| Global Natural Resources | | | 5,817 | | | | — | | | | 5,817 | | | | — | | | | 5,817 | |
|
| Global Technology and Communications | | | — | | | | — | | | | — | | | | — | | | | — | |
|
| Global Utilities | | | 12,874 | | | | — | | | | 12,874 | | | | — | | | | 12,874 | |
|
| Mid Cap Growth Leaders | | | — | | | | — | | | | — | | | | — | | | | — | |
|
| Nationwide Leaders | | | — | | | | — | | | | — | | | | — | | | | — | |
|
| U.S. Growth Leaders | | | — | | | | — | | | | — | | | | — | | | | — | |
|
| Worldwide Leaders | | | — | | | | — | | | | — | | | | — | | | | — | |
|
| China Opportunities | | | 12,685 | | | | — | | | | 12,685 | | | | — | | | | 12,685 | |
|
| Emerging Markets | | | 72,828 | | | | — | | | | 72,828 | | | | — | | | | 72,828 | |
|
| International Growth | | | — | | | | — | | | | — | | | | — | | | | — | |
|
| High Yield Bond | | | 6,900,084 | | | | — | | | | 6,900,084 | | | | — | | | | 6,900,084 | |
|
| Value Opportunities | | | 34,141 | | | | — | | | | 34,141 | | | | — | | | | 34,141 | |
|
| Micro Cap Equity | | | — | | | | 14,217 | | | | 14,217 | | | | — | | | | 14,217 | |
|
| U.S. Growth Leaders Long-Short | | | 8,178,734 | | | | — | | | | 8,178,734 | | | | — | | | | 8,178,734 | |
|
| Convertible | | | 378,591 | | | | — | | | | 378,591 | | | | — | | | | 378,591 | |
|
| Small Cap Growth | | | — | | | | — | | | | — | | | | — | | | | — | |
|
174 Annual Report 2004
The tax character of distributions paid during the fiscal year ended October 31, 2003 was as follows: (Total distributions paid differ from the Statement of Changes in Net Assets because for tax purposes dividends are recognized when actually paid.)
| | | | | | | | | | | | | | | | | | | | | |
| | | | | | | | |
| | Distributions paid from | | | | | | |
| |
| | | | | | |
| | | | Net Long | | | | | | Total | |
| | Ordinary | | | Term Capital | | Total Taxable | | | Return of | | | Distributions | |
| Fund | | Income | | | Gains | | Distributions | | | Capital | | | Paid | |
|
| |
| Global Financial Services | | $ | 3,983 | | | $ | — | | | $ | 3,983 | | | $ | — | | | $ | 3,983 | |
|
| Global Health Sciences | | | — | | | | — | | | | — | | | | — | | | | — | |
|
| Global Natural Resources | | | — | | | | — | | | | — | | | | — | | | | — | |
|
| Global Technology and Communications | | | — | | | | — | | | | — | | | | — | | | | — | |
|
| Global Utilities | | | 12,981 | | | | — | | | | 12,981 | | | | 150 | | | | 13,131 | |
|
| Mid Cap Growth Leaders | | | — | | | | — | | | | — | | | | — | | | | — | |
|
| Nationwide Leaders | | | 3,640 | | | | — | | | | 3,640 | | | | 4,333 | | | | 7,973 | |
|
| U.S. Growth Leaders | | | — | | | | — | | | | — | | | | — | | | | — | |
|
| Worldwide Leaders | | | — | | | | — | | | | — | | | | — | | | | — | |
|
| China Opportunities | | | — | | | | — | | | | — | | | | — | | | | — | |
|
| Emerging Markets | | | — | | | | — | | | | — | | | | — | | | | — | |
|
| International Growth | | | — | | | | — | | | | — | | | | — | | | | — | |
|
| High Yield Bond | | | 8,910,106 | | | | — | | | | 8,910,106 | | | | — | | | | 8,910,106 | |
|
| Value Opportunities | | | 72,205 | | | | — | | | | 72,205 | | | | — | | | | 72,205 | |
|
| Micro Cap Equity | | | — | | | | — | | | | — | | | | — | | | | — | |
|
| U.S. Growth Leaders Long-Short | | | — | | | | — | | | | — | | | | — | | | | — | |
|
| Convertible | | | — | | | | — | | | | — | | | | — | | | | — | |
|
| Small Cap Growth | | | — | | | | — | | | | — | | | | — | | | | — | |
|
2004 Annual Report 175
| |
| | Notes to Financial Statements (Continued) |
| | October 31, 2004 |
As of October 31, 2004, the components of accumulated earnings (deficit) on a tax basis was as follows: (Total distributions paid differ from the Statement of Changes in Net Assets because for tax purposes dividends are recognized when actually paid.)
| | | | | | | | | | | | | | | | | |
| | Undistributed | | Undistributed | | | Undistributed | | | |
| | Tax Exempt | | Ordinary | | | Long-Term | | | Accumulated | |
| Fund | | Income | | Income | | | Capital Gains | | | Earnings | |
|
| |
| Global Financial Services | | $ | — | | | $ | 444,602 | | | $ | 21,751 | | | $ | 466,353 | |
|
| Global Health Sciences | | | — | | | | 93,310 | | | | — | | | | 93,310 | |
|
| Global Natural Resources | | | — | | | | 132,318 | | | | — | | | | 132,318 | |
|
| Global Technology and Communications | | | — | | | | — | | | | — | | | | — | |
|
| Global Utilities | | | — | | | | 56,996 | | | | 111,801 | | | | 168,797 | |
|
| Mid Cap Growth Leaders | | | — | | | | — | | | | — | | | | — | |
|
| Nationwide Leaders | | | — | | | | 234,606 | | | | 68,858 | | | | 303,464 | |
|
| U.S. Growth Leaders | | | — | | | | — | | | | — | | | | — | |
|
| Worldwide Leaders | | | — | | | | 120,253 | | | | — | | | | 120,253 | |
|
| China Opportunities | | | — | | | | 244,471 | | | | — | | | | 244,471 | |
|
| Emerging Markets | | | — | | | | 572,362 | | | | 1,110,895 | | | | 1,683,257 | |
|
| International Growth | | | — | | | | — | | | | — | | | | — | |
|
| High Yield Bond | | | — | | | | 141,943 | | | | — | | | | 141,943 | |
|
| Value Opportunities | | | — | | | | 1,075,071 | | | | 4,162,428 | | | | 5,237,499 | |
|
| Micro Cap Equity | | | — | | | | 2,081,140 | | | | 900,920 | | | | 2,982,060 | |
|
| U.S. Growth Leaders Long-Short | | | — | | | | 919,954 | | | | — | | | | 919,954 | |
|
| Convertible | | | — | | | | 79,417 | | | | — | | | | 79,417 | |
|
| Small Cap Growth | | | — | | | | — | | | | — | | | | — | |
|
[Additional columns below]
[Continued from above table, first column(s) repeated]
| | | | | | | | | | | | | | | | | |
| | | | | | | | Total | |
| | | | Accumulated | | | Unrealized | | | Accumulated | |
| | Distributions | | | Capital and | | | Appreciation | | | Earnings | |
| Fund | | Payable | | | Other Losses | | | (Depreciation)* | | | (Deficit) | |
| | |
| | |
| Global Financial Services | | $ | — | | | $ | — | | | $ | 363,444 | | | $ | 829,797 | |
| | |
| Global Health Sciences | | | — | | | | — | | | | (109,356 | ) | | | (16,046 | ) |
| | |
| Global Natural Resources | | | — | | | | — | | | | 246,782 | | | | 379,100 | |
| | |
| Global Technology and Communications | | | — | | | | (6,752,941 | ) | | | 412,336 | | | | (6,340,605 | ) |
| | |
| Global Utilities | | | — | | | | — | | | | 503,049 | | | | 671,846 | |
| | |
| Mid Cap Growth Leaders | | | — | | | | (35,812,866 | ) | | | 798,366 | | | | (35,014,500 | ) |
| | |
| Nationwide Leaders | | | — | | | | — | | | | 305,535 | | | | 608,999 | |
| | |
| U.S. Growth Leaders | | | — | | | | (408,426 | ) | | | 2,648,051 | | | | 2,239,625 | |
| | |
| Worldwide Leaders | | | — | | | | (44,574,524 | ) | | | 1,790,616 | | | | (42,663,655 | ) |
| | |
| China Opportunities | | | — | | | | — | | | | 443,222 | | | | 687,693 | |
| | |
| Emerging Markets | | | — | | | | — | | | | 1,895,649 | | | | 3,578,906 | |
| | |
| International Growth | | | — | | | | (2,491,364 | ) | | | 643,026 | | | | (1,848,338 | ) |
| | |
| High Yield Bond | | | (141,942 | ) | | | (32,211,863 | ) | | | 1,115,319 | | | | (31,096,543 | ) |
| | |
| Value Opportunities | | | — | | | | — | | | | 2,856,220 | | | | 8,093,719 | |
| | |
| Micro Cap Equity | | | — | | | | — | | | | 9,078,612 | | | | 12,060,672 | |
| | |
| U.S. Growth Leaders Long-Short | | | — | | | | (21,185,720 | ) | | | 447,206 | | | | (19,818,560 | ) |
| | |
| Convertible | | | — | | | | (326,679 | ) | | | (259,191 | ) | | | (506,453 | ) |
| | |
| Small Cap Growth | | | — | | | | (277,820 | ) | | | 46,390 | | | | (231,430 | ) |
| | |
| |
| * | The differences between the book-basis and tax-basis unrealized appreciation (depreciation) is attributable primarily to: tax deferral of losses on wash sales; the difference between book and tax amortization methods for premium and market discount; and the return of capital adjustments from real estate investment trusts. |
As of October 31, 2004, the tax cost of securities and the breakdown of unrealized appreciation (depreciation) for each Fund were as follows:
| | | | | | | | | | | | | | | | | |
| | | | | | | | Net Unrealized | |
| | Tax Cost of | | | Unrealized | | | Unrealized | | | Appreciation | |
| Fund | | Securities | | | Appreciation | | | Depreciation | | | (Depreciation) | |
|
| |
| Global Financial Services | | $ | 5,945,522 | | | $ | 490,274 | | | $ | (127,086 | ) | | $ | 363,188 | |
|
| Global Health Sciences | | | 16,252,661 | | | | 400,888 | | | | (510,244 | ) | | | (109,356 | ) |
|
| Global Natural Resources | | | 3,169,520 | | | | 274,435 | | | | (27,653 | ) | | | 246,782 | |
|
| Global Technology and Communications | | | 8,439,692 | | | | 676,448 | | | | (264,412 | ) | | | 412,336 | |
|
| Global Utilities | | | 6,188,311 | | | | 568,730 | | | | (66,109 | ) | | | 502,621 | |
|
| Mid Cap Growth Leaders | | | 20,203,675 | | | | 1,076,176 | | | | (277,810 | ) | | | 798,366 | |
|
| Nationwide Leaders | | | 4,332,523 | | | | 357,815 | | | | (52,280 | ) | | | 305,535 | |
|
| U.S. Growth Leaders | | | 35,594,015 | | | | 2,823,830 | | | | (175,779 | ) | | | 2,648,051 | |
|
| Worldwide Leaders | | | 33,213,984 | | | | 2,115,787 | | | | (326,103 | ) | | | 1,789,684 | |
|
| China Opportunities | | | 6,281,757 | | | | 599,641 | | | | (156,434 | ) | | | 443,207 | |
|
| Emerging Markets | | | 20,904,676 | | | | 2,809,195 | | | | (917,314 | ) | | | 1,891,881 | |
|
| International Growth | | | 8,038,064 | | | | 697,254 | | | | (62,796 | ) | | | 634,458 | |
|
| High Yield Bond | | | 23,374,539 | | | | 1,547,031 | | | | (431,712 | ) | | | 1,115,319 | |
|
| Value Opportunities | | | 34,633,635 | | | | 3,732,694 | | | | (876,474 | ) | | | 2,856,220 | |
|
| Micro Cap Equity | | | 118,268,996 | | | | 14,197,195 | | | | (5,118,583 | ) | | | 9,078,612 | |
|
| U.S. Growth Leaders Long-Short | | | 39,096,514 | | | | 1,313,606 | | | | (866,400 | ) | | | 447,206 | |
|
| Convertible | | | 35,820,832 | | | | 648,034 | | | | (907,225 | ) | | | (259,191 | ) |
|
| Small Cap Growth | | | 2,734,787 | | | | 102,450 | | | | (56,060 | ) | | | 46,390 | |
|
176 Annual Report 2004
As of October 31, 2004, for Federal income tax purposes, the following Funds have capital loss carryforwards available to offset capital gains, if any, to the extent provided by the treasury regulations:
| | | | | | | | | |
| Fund | | Amount | | | Expires | |
| | | | |
|
| |
| Global Technology and Communications | | $ | 4,528,418 | | | | 2009 | |
|
| Global Technology and Communications | | | 1,182,126 | | | | 2010 | |
|
| Global Technology and Communications | | | 1,042,397 | | | | 2012 | |
|
| Mid Cap Growth Leaders | | | 31,043,487 | | | | 2009 | |
|
| Mid Cap Growth Leaders | | | 4,769,379 | | | | 2010 | |
|
| U.S. Growth Leaders | | | 257,332 | | | | 2010 | |
|
| U.S. Growth Leaders | | | 151,094 | | | | 2011 | |
|
| Worldwide Leaders | | | 32,481,540 | | | | 2009 | |
|
| Worldwide Leaders | | | 7,814,294 | | | | 2010 | |
|
| International Growth | | | 1,540,355 | | | | 2009 | |
|
| International Growth | | | 951,009 | | | | 2010 | |
|
| High Yield Bond | | | 13,413,036 | | | | 2009 | |
|
| High Yield Bond | | | 18,798,827 | | | | 2010 | |
|
| U.S. Growth Leaders Long-Short | | | 7,268,670 | | | | 2009 | |
|
| U.S. Growth Leaders Long-Short | | | 8,923,711 | | | | 2010 | |
|
| U.S. Growth Leaders Long-Short | | | 4,469,833 | | | | 2011 | |
|
| U.S. Growth Leaders Long-Short | | | 523,506 | | | | 2012 | |
|
| Convertible | | | 326,679 | | | | 2012 | |
|
| Small Cap Growth | | | 277,820 | | | | 2012 | |
|
As of October 31, 2004, the following Fund has additional capital loss carryforwards, subject to any applicable limitations on availability, to offset future capital gains, if any, as the successor of a merger with the Montgomery Global Focus Fund and Montgomery Global Opportunities Fund:
| | | | | | | | | |
| Fund | | Amount | | | Expires | |
|
| |
| Worldwide Leaders | | $ | 2,230,808 | | | | 2008 | |
|
| Worldwide Leaders | | | 1,121,464 | | | | 2009 | |
|
| Worldwide Leaders | | | 926,418 | | | | 2010 | |
|
8. Other Federal Tax Information (Unaudited):
For the period ended October 31, 2004, certain dividends paid by the Funds may be subject to a maximum tax rate of 15% as provided for by the Jobs and Growth Tax Relief Reconciliation Act of 2003. The Funds intend to designate the maximum amount allowable as taxed at a maximum rate of 15%. Complete information will be reported in conjunction with your 2004 Form 1099-DIV.
For the period ended October 31, 2004, the following Funds paid qualified dividend income:
| | | | | |
| | Qualified | |
| | Dividend | |
| Fund | | Income | |
| | |
|
| |
| Global Financial Services | | $ | 147,148 | |
|
| Global Natural Resources | | | 5,817 | |
|
| Global Utilities | | | 9,726 | |
|
| China Opportunities | | | 12,685 | |
|
| Emerging Markets | | | 72,828 | |
|
| High Yield Bond | | | 13,537 | |
|
| Value Opportunities | | | 34,141 | |
|
| U.S. Growth Leaders Long-Short | | | 172,187 | |
|
2004 Annual Report 177
| |
| | Notes to Financial Statements (Continued) |
| | October 31, 2004 |
For the taxable year ended October 31, 2004, the following percentage of income dividends paid by the Funds qualify for the dividends received deduction available to corporations:
| | | | | |
| | Dividends | |
| | Received | |
| Fund | | Deduction | |
|
| |
| Global Financial Services | | | 12 | % |
|
| Global Health Sciences | | | 5 | % |
|
| Global Natural Resources | | | 9 | % |
|
| Global Utilities | | | 52 | % |
|
| Value Opportunities | | | 46 | % |
|
| U.S. Growth Leaders Long-Short | | | 4 | % |
|
| Convertible | | | 43 | % |
|
178 Annual Report 2004
Report of Independent Registered Public Accounting Firm
To the Board of Trustees and Shareholders of Gartmore Mutual Funds:
In our opinion, the accompanying statements of assets and liabilities, including the statements of investments, and the related statements of operations and of changes in net assets and the financial highlights present fairly, in all material respects, the financial position of Gartmore Global Financial Services Fund, Gartmore Global Health Sciences Fund, Gartmore Global Natural Resources Fund, Gartmore Global Technology and Communications Fund, Gartmore Global Utilities Fund, Gartmore Mid Cap Growth Leaders Fund, Gartmore Nationwide Leaders Fund, Gartmore U.S. Growth Leaders Fund, Gartmore Worldwide Leaders Fund, Gartmore China Opportunities Fund, Gartmore Emerging Markets Fund, Gartmore International Growth Fund, Gartmore High Yield Bond Fund, Gartmore Value Opportunities Fund, Gartmore Micro Cap Equity Fund, Gartmore U.S. Growth Leaders Long-Short Fund, Gartmore Convertible Fund and Gartmore Small Cap Growth Fund (eighteen series of Gartmore Mutual Funds, hereafter referred to as the “Funds”) at October 31, 2004, the results of each of their operations for the year (or period) then ended, the changes in each of their net assets for each of the two years (or periods) then ended and the financial highlights for each of the three years (or periods) then ended in conformity with accounting principles generally accepted in the United States of America. These financial statements and financial highlights (hereafter referred to as “financial statements”) are the responsibility of the Funds’ management; our responsibility is to express an opinion on these financial statements based on our audits. We conducted our audits of these financial statements in accordance with the standards of the Public Company Accounting Oversight Board (United States.) Those standards require that we plan and perform the audit to obtain reasonable assurance about whether the financial statements are free of material misstatement. An audit includes examining, on a test basis, evidence supporting the amounts and disclosures in the financial statements, assessing the accounting principles used and significant estimates made by management, and evaluating the overall financial statement presentation. We believe that our audits, which included confirmation of securities at October 31, 2004 by correspondence with the custodian and brokers, provide a reasonable basis for our opinion. The financial highlights of Gartmore Global Health Sciences Fund, Gartmore Global Technology and Communications Fund, Gartmore Mid Cap Growth Leaders Fund, Gartmore U.S. Growth Leaders Fund, Gartmore Worldwide Leaders Fund, Gartmore Emerging Markets Fund, Gartmore International Growth Fund, Gartmore High Yield Bond Fund and Gartmore Value Opportunities Fund for the periods ended on or before October 31, 2001 were audited by other independent accountants whose report dated December 14, 2001 expressed an unqualified opinion on those financial statements.
PricewaterhouseCoopers LLP
Philadelphia, Pennsylvania
December 27, 2004
2004 Annual Report 179
| |
| | Management Information (Unaudited) |
Trustees who are not Interested Persons (as defined in the 1940 Act) and Officers of the Funds
October 31, 2004
| | | | | | | | | | | |
| | | | | | Number of Portfolios | | | |
| | Position(s) Held | | | | in the | | | Other |
| | with the Trust | | Principal Occupation(s) | | Gartmore Fund | | | Directorships |
| Name, Address | | and Length of | | During Past | | Complex Overseen | | | Held by Trustee |
| and Date of Birth | | Time Served1 | | Five Years | | by Trustee | | | or Nominee2 |
Charles E. Allen
c/o Gartmore Global
Investments, Inc.
1200 River Road,
Suite 1000
Conshohocken, PA 19428
1948 | | Trustee
since
July 2000 | | Mr. Allen is Chairman, Chief Executive Officer and President of the Graimark Realty Advisors, Inc. (real estate development, investment and asset management).3 | | | 84 | | | None |
|
Michael J. Baresich
c/o Gartmore Global
Investments, Inc.
1200 River Road,
Suite 1000,
Conshohocken, PA 19428
1954 | | Trustee
since
March 2004 | | Mr. Baresich has been Chairman of the Board of Cokinetic Systems Corp. (software company) since July 2004. Prior thereto and since 2001, Mr. Baresich served as its Chief Executive Officer. From June 1999 through August 2001, Mr. Baresich was a managing Director of Deutsche Bank. Prior to June 1999, Mr. Baresich was a Managing Director of Bankers Trust. | | | 84 | | | None |
|
Paula H.J. Cholmondeley
c/o Gartmore Global
Investments, Inc.
1200 River Road,
Suite 1000
Conshohocken, PA 19428
1947 | | Trustee
since
July 2000 | | Ms. Cholmondeley has been the Chairman and Chief Executive Officer of the Sorrel Group, a management consulting company, since January 2004. From March 2000 through December 2003, Ms. Cholmondeley was Vice President and General Manager of Sappi Fine Paper North America. Prior thereto, Ms. Cholmondeley was Vice President and General Manager of Residential Insulation of Owens Corning. | | | 84 | | | Director of Dentsply International, Inc., Ultralife Batteries, Inc., and Terex Corporation. |
|
C. Brent DeVore
c/o Gartmore Global
Investments, Inc.
1200 River Road,
Suite 1000
Conshohocken, PA 19428
1940 | | Trustee
since
1990 | | Dr. DeVore is President of Otterbein College. | | | 84 | | | None |
|
Phyllis K. Dryden
c/o Gartmore Global
Investments, Inc.
1200 River Road,
Suite 1000
Conshohocken, PA 19428
1947 | | Nominee | | Ms. Dryden was a former Managing Partner of marchFIRST, a global management consulting firm prior to 2002. | | | 84 | | | None |
|
180 Annual Report 2004
Trustees who are not Interested Persons (as defined in the 1940 Act) and Officers of the Funds
October 31, 2004 (Continued)
| | | | | | | | | | | |
| | | | | | Number of Portfolios | | | |
| | Position(s) Held | | | | in the | | | Other |
| | with the Trust | | Principal Occupation(s) | | Gartmore Fund | | | Directorships |
| Name, Address | | and Length of | | During Past | | Complex Overseen | | | Held by Trustee |
| and Date of Birth | | Time Served1 | | Five Years | | by Trustee | | | or Nominee2 |
Robert M. Duncan*
c/o Gartmore Global
Investments, Inc.
1200 River Road,
Suite 1000
Conshohocken, PA 19428
1927 | | Trustee
since
April 1987 | | Mr. Duncan is Vice President and Secretary Emeritus of The Ohio State University. | | | 84 | | | None |
|
Barbara L. Hennigar*
c/o Gartmore Global
Investments, Inc.
1200 River Road,
Suite 1000
Conshohocken, PA 19428
1935 | | Trustee
since
July 2000 | | Retired since June 2000. Prior thereto, Ms. Hennigar was the Chairman or President and Chief Executive Officer of OppenheimerFunds Services and a member of the Executive Committee of OppenheimerFunds. | | | 84 | | | None |
|
Barbara I. Jacobs
c/o Gartmore Global
Investments, Inc.
1200 River Road,
Suite 1000
Conshohocken, PA 19428
1951 | | Nominee | | Ms. Jacobs has served as Chairman of the Board of Directors of KICAP Network Fund, a European (United Kingdom) hedge fund, since December 2000. Prior to 2004, Ms. Jacobs was also a Managing Director and European Portfolio Manager with CREF Investments (Teacher Insurance Annuity Association — College Retirement Equity Funds). | | | 84 | | | None |
|
Thomas J. Kerr, IV*
c/o Gartmore Global
Investments, Inc.
1200 River Road,
Suite 1000
Conshohocken, PA 19428
1933 | | Trustee
since
October 1971 | | Dr. Kerr is President Emeritus of Kendall College. | | | 84 | | | None |
|
Douglas F. Kridler
c/o Gartmore Global
Investments, Inc.
1200 River Road,
Suite 1000
Conshohocken, PA 19428
1955 | | Trustee
since
September 1997 | | Mr. Kridler has served as the President and Chief Executive Officer of the Columbus Foundation (a Columbus, OH-based foundation which manages over 1,300 individual endowment funds) since February 2002. Mr. Kridler was the President of the Columbus Association for the Performing Arts prior thereto and Chairman of the Greater Columbus Convention and Visitors Bureau during 2000 and 2001. | | | 84 | | | None |
|
2004 Annual Report 181
| |
| | Management Information (Unaudited) |
Trustees who are not Interested Persons (as defined in the 1940 Act) and Officers of the Funds
October 31, 2004 (Continued)
| | | | | | | | | | | |
| | | | | | Number of Portfolios | | | |
| | Position(s) Held | | | | in the | | | Other |
| | with the Trust | | Principal Occupation(s) | | Gartmore Fund | | | Directorships |
| Name, Address | | and Length of | | During Past | | Complex Overseen | | | Held by Trustee |
| and Date of Birth | | Time Served1 | | Five Years | | by Trustee | | | or Nominee2 |
Michael D. McCarthy
c/o Gartmore Global
Investments, Inc.
1200 River Road,
Suite 1000
Conshohocken, PA 19428
1948 | | Nominee | | Mr. McCarthy serves as: the Founder and Chairman of The Eureka Foundation (which sponsors and funds the “Great Museums” series on PBS); and a Partner of Pineville Properties LLC (a commercial real estate development firm). | | | 844 | | | None |
|
David C. Wetmore
c/o Gartmore Global
Investments, Inc.
1200 River Road,
Suite 1000
Conshohocken, PA 19428
1948 | | Trustee
since
1995 | | Mr. Wetmore is a Managing Director of Updata Capital, an investment banking and venture capital firm. | | | 84 | | | None |
|
| | |
| * | | Pursuant to the Trust’s mandatory retirement policy, Mr. Duncan and Dr. Kerr are expected to retire on or about March 2, 2005, and Ms. Hennigar is expected to retire on or about October 12, 2005. |
| 1 | | The term of office length is until a trustee resigns or reaches a mandatory retirement age of 70. On March 2, 2000, the Board adopted a five-year implementation period for any Trustee 65 or older as of the adoption of this policy. |
| 2 | | Directorships held in (1) any other investment companies registered under the 1940 Act, (2) any company with a class of securities registered pursuant to Section 12 of the Securities Exchange Act of 1934, as amended (the “Exchange Act”), or (3) any company subject to the requirements of Section 15(d) of the Exchange Act. |
| 3 | | Mr. Allen owns a 51% interest in Graimark Realty Advisors, Inc., a 67% owner of G/ W Jefferson-St Jean LLC (“Jefferson-St”), a real estate development company. Until July 28, 2004, Jefferson-St had a construction loan, guaranteed by Mr. Allen, in the principal amount of $12.5 million (“Construction Loan”), from Bank One, NA, obtained in August, 2002. On July 1, 2004, Bank One Corporation merged with and into J.P. Morgan Chase & Co. (the “Merger”). Bank One Corporation was the parent company of Bank One, N.A. J.P. Morgan Chase & Co. is the parent company of J.P. Morgan Investment Management, Inc., subadviser of two of the Funds of the Trust. On July 28, 2004, the Construction Loan was refinanced with an unaffiliated permanent lender. Neither Mr. Allen nor the Trust’s management believes that the Construction Loan, secured well in advance of the Merger, and refinanced within 28 days following the completion of the Merger, should result in Mr. Allen’s being deemed to have a “material business relationship” with an investment adviser to the Trust. |
| 4 | | Messrs. McCarthy and Hondros (see table below) are also Administrative Committee Members for the Alphagen Arneb Fund, LLC , The Healthcare Fund LDC, The Leaders Long-Short Fund, LLC, and The Leaders Leaders Long-Short Fund LDC, four private investment companies (hedge funds) managed by GSA. |
| ** | | Trustees and Officers who are not Interested Persons (as defined in the 1940 Act) of the Funds received aggregate compensation of $384,292 from the Trust for the Year Ended October 31, 2004. Additional information regarding the Trustees and Officers may be found in the Trust’s statement of additional information, which is available without charge upon request, by calling 1-800-848-0920. Federal law requires the Trust, each of its investment advisers and sub-advisers to adopt procedures for voting proxies (“Proxy Voting Guidelines”) and to provide a summary of those Proxy Voting Guidelines used to vote the securities held by the Funds. The Funds’ proxy voting policies and procedures are available without charge (i) upon request, by calling 1-800-848-0920, (ii) on the Fund’s website at www.gartmorefunds.com, or (iii) on the Securities and Exchange Commission’s website at www.sec.gov. |
182 Annual Report 2004
Trustees and Officers who are Interested Persons (as defined in the 1940 Act) and Officers of the Funds
October 31, 2004
| | | | | | | | | | | |
| | | | | | Number of Portfolios | | | |
| | Position(s) Held | | | | in the | | | |
| Name, | | with the Trust | | Principal Occupation(s) | | Gartmore Fund | | | Other |
| Address | | and Length of | | During Past | | Complex Overseen | | | Directorships |
| and Age | | Time Served1 | | Five Years | | by Trustee | | | Held by Trustee2 |
Paul J. Hondros
Gartmore Global
Investments, Inc.
1200 River Road,
Suite 1000
Conshohocken, PA 19428
1948 | | Trustee and
Chairman
since
July 2000 | | Mr. Hondros has been President and Chief Executive Officer of various Gartmore entities, including Gartmore Distribution Services, Inc. (“GDSI”),3 Gartmore Investor Services, Inc. (“GISI”),3 Gartmore Morley Capital
Management, Inc. (“GMCM”),3 Gartmore Morley Financial Services, Inc. (“GMFS”),3 NorthPointe Capital, LLC (“NorthPointe”),3 Gartmore Global Asset Management Trust (“GGAMT”)3, Gartmore Global Investments, Inc. (“GGI”)3, Gartmore Mutual Fund Capital Trust (“GMFCT”) 3 and Gartmore SA Capital Trust (“GSA”)3 ; and a Director of Nationwide Securities, Inc.3, as well as several entities within Nationwide Financial Services, Inc. | | | 844 | | | None |
|
Arden L. Shisler
c/o Gartmore Global
Investments, Inc.
1200 River Road,
Suite 1000
Conshohocken, PA 19428
1941 | | Trustee
since
February 2000 | | Mr. Shisler has been a consultant since January 2003. Prior thereto, he was President and Chief Executive Officer of K&B Transport, Inc., a trucking firm. Since 1992, Mr. Shisler has also been Chairman of the Board for Nationwide Mutual Insurance Company. | | | 84 | | | Director of
Nationwide
Financial
Services, Inc. |
|
Gerald J. Holland
Gartmore Global
Investments, Inc.
1200 River Road,
Suite 1000
Conshohocken, PA 19428
1951 | | Treasurer
since
March 2001 | | Mr. Holland is Senior Vice President — Operations for GGI3, GMFCT3 , and GSA3. Prior to July 2000, Mr, Holland was Vice President for First Data Investor Services, an investment company service provider. | | | 84 | | | None |
|
Michael A. Krulikowski
Gartmore Global
Investments, Inc.
1200 River Road,
Suite 1000
Conshohocken, PA 19428
1959 | | Chief Compliance Officer
since
June 2004 | | Since November 1999, Mr. Krulikowski has served as a Vice President and Chief Compliance Officer of GGI. Prior thereto, Mr. Krulikowski served as Chief Compliance Officer of 1717 Capital Management Company/ Provident Mutual Insurance Company. | | | 84 | | | None |
|
2004 Annual Report 183
| |
| | Management Information (Unaudited) |
Trustees and Officers who are Interested Persons (as defined in the 1940 Act) and Officers of the Funds
October 31, 2004 (Continued)
| | | | | | | | | | | |
| | | | | | Number of Portfolios | | | |
| | Position(s) Held | | | | in the | | | |
| Name, | | with the Trust | | Principal Occupation(s) | | Gartmore Fund | | | Other |
| Address | | and Length of | | During Past | | Complex Overseen | | | Directorships |
| and Age | | Time Served1 | | Five Years | | by Trustee | | | Held by Trustee2 |
Eric E. Miller
Gartmore Global
Investments, Inc.
1200 River Road,
Suite 1000
Conshohocken, PA 19428
1954 | | Secretary
since
December 2002 | | Mr. Miller is Senior Vice President, Chief Counsel for GGI3, GMFCT3 and GSA3 since August 2002. From August 2000 to August 2002, Mr. Miller was a Partner with Stradley Ronan Stevens & Young, LLP. Prior to August 2000, Mr. Miller served as Senior Vice President and Deputy General Counsel at Delaware Investments. | | | 84 | | | None |
|
| | |
| 1 | | The term of office length is until a trustee resigns or reaches a mandatory retirement age of 70. On March 2, 2000, the Board adopted a five-year implementation period for any Trustee 65 or older as of the adoption of this policy. |
| 2 | | Directorships held in (1) any other investment companies registered under the 1940 Act, (2) any company with a class of securities registered pursuant to Section 12 of the Securities Exchange Act of 1934, as amended (the “Exchange Act”), or (3) any company subject to the requirements of Section 15(d) of the Exchange Act. |
| 3 | | This position is held with an affiliated person or principal underwriter of the Trust. |
| 4 | | Messrs. McCarthy and Hondros (see table below) are also Administrative Committee Members for the Alphagen Arneb Fund, LLC , The Healthcare Fund LDC, The Leaders Long-Short Fund, LLC, and The Leaders Long-Short Fund LDC, four private investment companies (hedge funds) managed by GSA. |
| * | | Trustees and Officers who are not Interested Persons (as defined in the 1940 Act) of the Funds received aggregate compensation of $384,292 from the Trust for the Year Ended October 31, 2004. Additional information regarding the Trustees and Officers may be found in the Trust’s statement of additional information, which is available without charge upon request, by calling 1-800-848-0920. Federal law requires the Trust, each of its investment advisers and sub-advisers to adopt procedures for voting proxies (“Proxy Voting Guidelines”) and to provide a summary of those Proxy Voting Guidelines used to vote the securities held by the Funds. The Funds’ proxy voting policies and procedures are available without charge (i) upon request, by calling 1-800-848-0920, (ii) on the Fund’s website at www.gartmorefunds.com, or (iii) on the Securities and Exchange Commission’s website at www.sec.gov. |
184 Annual Report 2004
Index Definitions
Citigroup 3-Month T-Bill Index: An unmanaged index that is generally representative of 3-month Treasury bills; consists of an average of the last 3-month Treasury bill issues (excluding the current month-end bill).
Citigroup High-Yield Market Index: An unmanaged index of high-yield debt securities that is a broad market measure.
Goldman Sachs Convertible 100 Index: An unmanaged index that tracks the performance of 100 equally weighted convertible issues, each with a market capitalization of at least $100 million. The index measures the performance of its components against that of their underlying common stocks as well as against other broad market indexes.
Goldman Sachs Healthcare Index: An unmanaged, market capitalization-weighted index that is generally representative of the stocks in the health-care sector.
Goldman Sachs Natural Resources Index: An unmanaged, modified capitalization-weighted sector index of U.S.-traded natural resource-related stocks; includes companies in the categories of extractive industries, energy companies, owners and operators of timber tracts, forestry services, producers of pulp and paper, and owners of plantations.
Goldman Sachs Technology Composite Index (GSTI®): An unmanaged, market capitalization-weighted index that is designed to measure the performance of companies in the technology sector.
Morgan Stanley Capital International (MSCI) All Country World excluding U.S. Index: An unmanaged, free float-adjusted, market-capitalization index that is designed to measure the performance of the stocks in companies in all countries except the United States.
Morgan Stanley Capital International (MSCI) Emerging Markets IndexSM: An unmanaged, free float-adjusted, market-capitalization index that is designed to measure the performance of the stocks in emerging-country markets.
Morgan Stanley Capital International (MSCI) World IndexSM: An unmanaged, free float-adjusted, market-capitalization index that is designed to measure the performance of global developed-market equities.
Morgan Stanley Capital International (MSCI) World Financials IndexSM: An unmanaged index that is based on developed-market country indexes and is generally representative of the stocks in the global financial services sector.
Morgan Stanley Capital International (MSCI) World Telecommunication Services IndexSM: An unmanaged index that is based on developed-market country indexes and is generally representative of the stocks in the global utilities sector.
Morgan Stanley Capital International (MSCI) World Utilities IndexSM: An unmanaged index that is based on developed-country indexes and is generally representative of the stocks in the utilities sector, which includes industry groups such electric, gas, multi-utilities, and unregulated power and water.
Morgan Stanley Capital International (MSCI) Zhong Hua Index: An unmanaged, free float-adjusted, market capitalization-weighted index that is designed to measure the performance of stocks in the developed markets of China and Hong Kong; the index gives one-third of its weightings to China stocks and the remainder to Hong Kong stocks.
Morgan Stanley High-Tech 35 Index: An unmanaged, equal dollar-weighted index of 35 stocks in nine different technology subsectors that represents the electronics-based technology industry.
Russell 2000® Index: An unmanaged index that measures the performance of the stocks of small-capitalization U.S. companies; includes the smallest 2,000 U.S. companies in the Russell 3000® Index, which measures the performance of the largest 3,000 U.S. companies, based on market capitalization.
Russell 2000® Growth Index: An unmanaged index that measures the performance of the stocks of U.S. companies in the Russell 2000® Index (the smallest 2,000 U.S. companies, based on market capitalization) with higher price-to-book ratios and higher forecasted growth values.
Russell Midcap® Growth Index: An unmanaged index of mid-capitalization growth stocks of U.S. companies; measures the performance of the stocks of those Russell Midcap® Index companies with higher price-to-book ratios and higher forecasted growth values, and gives a broad look at how the stock prices of medium-sized U.S. companies have performed.
Standard & Poor’s 500 (S&P 500) Index: An unmanaged, capitalization-weighted index of 500 widely held stocks of large-cap U.S. companies that gives a broad look at how the stock prices of those companies have performed.
Standard & Poor’s/International Finance Corporation Investable (S&P/IFCI) Composite Index: An unmanaged index that is designed to represent the performance of the stocks in emerging stock markets that are available to foreign institutional investors.
Wilshire Micro-Cap® Index: An unmanaged, capitalization-weighted index that measures small-cap stocks in the bottom “half” of the Wilshire 5000 Total Market Index as of June 30 of each year; the Wilshire 5000 Total Market Index contains more than 6,500 stocks that trade and are based in the United States.

Gartmore Funds
1200 River Road, Suite 1000
Conshohocken, PA 19428
www.gartmorefunds.com
Federal law requires the Trust, and each of its investment advisers and subadvisers, to adopt procedures for voting proxies (“Proxy Voting Guidelines”) and to provide a summary of those Proxy Voting Guidelines used to vote the securities held by the Funds. The Funds’ proxy voting policies and procedures are available without charge (i) upon request, by calling 800-848-0920, (ii) on the Funds’ Web site at www.gartmorefunds.com, or (iii) on the U.S. Securities and Exchange Commission’s Web site at www.sec.gov.
© 2004 Gartmore Global Investments, Inc.
All rights reserved.
Item 2. Code of Ethics.
| | Disclose whether, as of the end of the period covered by the report, the registrant has adopted a code of ethics that applies to the registrant’s principal executive officer, principal financial officer, principal accounting officer or controller, or persons performing similar functions, regardless of whether these individuals are employed by the registrant or a third party. If the registrant has not adopted such a code of ethics, explain why it has not done so. |
| |
| | The registrant has adopted a code of ethics that applies to the registrant’s principal executive officer, principal financial officer, principal accounting officer or controller, or persons performing similar functions. This code of ethics is included as Exhibit 11 (a)(1). |
| |
| | The registrant must briefly describe the nature of any amendment, during the period covered by the report, to a provision of its code of ethics that applies to the registrant’s principal executive officer, principal financial officer, principal accounting officer or controller, or persons performing similar functions, regardless of whether these individuals are employed by the registrant or a third party, and that relates to any element of the code of ethics definition enumerated in paragraph (b) of this Item. The registrant must file a copy of any such amendment as an exhibit pursuant to Item 11(a)(1), unless the registrant has elected to satisfy paragraph (f) of this Item by posting its code of ethics on its website pursuant to paragraph (f)(2) of this Item, or by undertaking to provide its code of ethics to any person without charge, upon request, pursuant to paragraph (f)(3) of this Item. |
| |
| | If the registrant has, during the period covered by the report, granted a waiver, including an implicit waiver, from a provision of the code of ethics that applies to the registrant’s principal executive officer, principal financial officer, principal accounting officer or controller, or persons performing similar functions, regardless of whether these individuals are employed by the registrant or a third party, that relates to one or more items set forth in paragraph (b) of this Item, the registrant must briefly describe the nature of the waiver, the name of the person to whom the waiver was granted, and the date of the waiver. |
| |
| | During the period covered by the report, with respect to the registrant’s code of ethics that applies to its principal executive officer, principal financial officer, principal accounting officer or controller, or persons performing similar functions, there have been no amendments to, nor any waivers granted from, a provision that relates to any element of the code of ethics definition enumerated in paragraph (b) of this Item 2. |
Item 3. Audit Committee Financial Expert.
| | (a) | (1) Disclose that the registrant’s board of directors has determined that the registrant either: |
| | (i) | Has at least one audit committee financial expert serving on its audit committee; or |
| |
| | (ii) | Does not have an audit committee financial expert serving on its audit committee. |
(2) If the registrant provides the disclosure required by paragraph (a)(1)(i) of this Item, it must disclose the name of the audit committee financial expert and whether that person is “independent.” In order to be considered “independent” for purposes of this Item, a member of an audit committee may not, other than in his or her capacity as a member of the audit committee, the board of directors, or any other board committee:
| | (i) | Accept directly or indirectly any consulting, advisory, or other compensatory fee from the issuer; or |
| |
| | (ii) | Be an “interested person” of the investment company as defined in Section 2(a)(19) of the Act (15 U.S.C. 80a- 2(a)(19)). |
(3) If the registrant provides the disclosure required by paragraph (a)(1)(ii) of this Item, it must explain why it does not
have an audit committee financial expert.
3(a)(1) The registrant’s board of directors has determined that the registrant has at least one audit committee financial expert serving on its audit committee.
3(a)(2) The audit committee financial expert is Paula H.J. Cholmondeley, who is “independent” for purposes of this Item 3 of Form N-CSR.
Item 4. Principal Accountant Fees and Services.
(a) through (d). The information in the table below is provided for services rendered to the registrant by its principal accountant, PricewaterhouseCoopers LLP (“PwC”), for its fiscal years ended October 31, 2003 and October 31, 2004.
| | | | | | | | | |
| | | 2003 | | | 2004 | |
| Audit Fees | | $ | 357,445 | | | $ | 396,045 | |
Audit-Related Fees1 | | $ | 74,900 | | | $ | 30,000 | |
Tax Fees2 | | $ | 94,800 | | | $ | 118,125 | |
| All Other Fees | | $ | 50,000 | | | $ | 0 | |
| | | | | | | |
| Total | | $ | 577,145 | | | $ | 544,170 | |
| | | | | | | |
| 1 | | Services include security counts performed under Rule 17f-2 of the 1940 Act. |
| |
| 2 | | Tax services in connection with the Funds’ excise tax calculations and review of the Funds’ applicable tax returns. |
The information in the table below is provided with respect to non-audit services that directly relate to the registrant’s operations and financial reporting and that were rendered by PwC to the registrant’s investment adviser, Gartmore Global Investors(“GGI”), and any service provider to the registrant controlling, controlled by or under common control with GGI that provided ongoing services to the registrant (“Covered Services Provider”), for the registrant’s fiscal years ended October 31, 2003 and October 31, 2004.
| | | | | | | | | |
| | | 2003 | | | 2004 | |
| Audit-Related Fees | | None. | | None. |
| Tax Fees | | None. | | None. |
| All Other Fees | | None | | None. |
| | | | | | | |
| Total | | None. | | None. |
| | | | | | | |
(e)(1) Pre-Approval Policies and Procedures. The Audit Committee (“Committee”) of the registrant is responsible for pre-approving (i) all audit and permissible non-audit services to be provided by the independent auditors to the registrant and (ii) all permissible non-audit services to be provided by the independent auditors to GGI and any Covered Services Provider if the engagement relates directly to the operations and financial reporting of the registrant. The Committee may delegate its responsibility to pre-approve any such audit and permissible non-audit services to the Chairperson of the Committee, and the Chairperson shall report to the Committee, at its next regularly scheduled meeting after the Chairperson’s pre-approval of such services, his or her decision(s). The Committee may also establish detailed pre-approval policies and procedures for pre-approval of such services in accordance with applicable laws, including the delegation of some or all of the Committee’s pre-approval responsibilities to other persons (other than GGI or the registrant’s officers). Pre-approval by the Committee of any permissible non-audit services shall not be required so long as: (i) the aggregate amount of all such permissible non-audit services provided to the registrant, GGI and any Covered Services Provider constitutes not more than 5% of the total amount of revenues paid by the registrant to its independent auditors during the fiscal year in which the permissible non-audit services are provided; (ii) the permissible non-audit services were not recognized by the registrant at the time of the engagement to be non-audit services; and (iii) such services are promptly brought to the attention of the Committee and approved by the Committee (or its delegate(s)) prior to the completion of the audit.
(e)(2) The information in the table below sets forth the percentages of fees for services (other than audit, review or attest services) rendered by PwC to the registrant for which the pre-approval requirement was waived pursuant to Rule 2-01(c)(7)(i)(C) of Regulation S-X: [indicate if percentages calculated with or without all audit fees for all funds] [or: Not Applicable]
Not Applicable.
| | | | | | | | | |
| | | 2003 | | | 2004 | |
| | | None. | | None. |
| Audit-Related Fees | | | | | | | | |
| Tax Fees | | | | | | | | |
| All Other Fees | | | | | | | | |
| | | | | | | |
| Total | | | | | | | | |
| | | | | | | |
The information in the table below sets forth the percentages of fees for services (other than audit, review or attest services) rendered by PwC to GGI and any Covered Services Provider required to be approved pursuant to Rule 2-01(c)(7)(ii)of Regulation S-X, for the registrant’s fiscal years ended October 31, 2003 and October 31, 2004: [indicate if percentages calculated with or without all audit fees for all funds] [or: Not Applicable]
| | | | | | | | | |
| | | 2003 | | | 2004 | |
| Audit-Related Fees | | | N/A | | | | N/A | |
| Tax Fees | | | N/A | | | | N/A | |
| All Other Fees | | | N/A | | | | N/A | |
| | | | | | | |
| Total | | | N/A | | | | N/A | |
| | | | | | | |
(f) The percentage of hours expended to audit the registrant’s financial statements for the fiscal year ended October 31, 2004 that were attributed to work performed by persons other than PwC’s full-time, permanent employees was ___%. [if over 50%] [or: Not Applicable]
Not applicable.
(g) The aggregate fees billed by PwC for non-audit services rendered to the registrant and service affiliates for the fiscal years ended October 31, 2003 and October 31, 2004 were $1,143,226 and $1,855,629 respectively.
(h) The registrant’s Audit Committee has considered whether the provision by PwC of non-audit services to GGI and Covered Services Providers that were not pre-approved pursuant to Rule 2-01(c)(7)(ii) of Regulation S-X because they did not directly relate to the registrant’s operations and financial reporting is compatible with maintaining PwC’s independence. [or: Not Applicable]
Not Applicable.
Item 5. Audit Committee of Listed Registrants.
| | (a) | If the registrant is a listed issuer as defined in Rule 10A-3 under the Exchange Act (17CFR 240.10A-3), state whether or not the registrant has a separately-designated standing audit committee established in accordance with Section 3(a)(58)(A) of the Exchange Act (15 U.S.C. 78c(a)(58)(A)). If the registrant has such a committee, however designated, identify each committee member. If the entire board of directors is acting as the registrant’s audit committee as specified in Section 3(a)(58)(B) of the Exchange Act (15 U.S.C. 78c(a)(58)(B)), so state. |
| |
| | (b) | If applicable, provide the disclosure required by Rule 10A-3(d) under the Exchange Act (17CFR 240.10A-3(d)) regarding an exemption from the listing standards for all audit committees. |
Not applicable.
Item 6. Schedule of Investments.
File Schedule I – Investments in securities of unaffiliated issuers as of the close of the reporting period as set forth in § 210.12-12 of Regulation S-X, unless the schedule is included as part of the report to shareholders filed under Item 1 of this Form.
This schedule is included as part of the report to shareholders filed under Item 1 of this Form.
Item 7. Disclosure of Proxy Voting Policies and Procedures for Closed-End Management Investment Companies.
A closed-end management investment company that is filing an annual report on this Form N-CSR must, unless it invests exclusively in non-voting securities, describe the policies and procedures that it uses to determine how to vote proxies relating to portfolio securities, including the procedures that the company uses when a vote presents a conflict between the interests of its shareholders, on the one hand, and those of the company’s investment adviser; principal underwriter; or any affiliated person (as defined in Section 2(a)(3) of the Investment Company Act of 1940 (15 U.S.C. 80a-2(a)(3)) and the rules thereunder) of the company, its investment adviser, or its principal underwriter, on the other. Include any policies and procedures of the company’s investment adviser, or any other third party, that the company uses, or that are used on the company’s behalf, to determine how to vote proxies relating to portfolio securities.
Not applicable.
Item 8. Purchases of Equity Securities by Closed-End Management Investment Company and Affiliated Purchasers.
If the registrant is a closed-end management investment company, provide the information specified in paragraph (b) of this Item with respect to any purchase made by or on behalf of the registrant or any “affiliated purchaser,” as defined in Rule 10b-18(a)(3) under the Exchange Act (17 CFR 240.10b-18(a)(3)), of shares or other units of any class of the registrant’s equity securities that is registered by the registrant pursuant to Section 12 of the Exchange Act (15 U.S.C. 781).
Not applicable
Item 9. Submission of Matters to a Vote of Security Holders.
Describe any material changes to the procedures by which shareholders may recommend nominees to the registrant’s board of directors, where those changes were implemented after the registrant last provided disclosure in response to the requirements of Item 7(d)(2)(ii)(G) of Schedule 14A (17 CFR 240.14a-101), or this Item.
There were no material changes in the registrant’s procedures by which shareholders may recommend nominees to the registrant’s board of directors.
Item 10. Controls and Procedures.
(a) Disclose the conclusions of the registrant’s principal executive and principal financial officers, or persons performing similar functions, regarding the effectiveness of the registrant’s disclosure controls and procedures (as defined in Rule 30a-3(c) under the Act (17 CFR 270.30a-3(c))) as of a date within 90 days of the filing date of the report that includes the disclosure required by this paragraph, based on the evaluation of these controls and procedures required by Rule 30a-3(b) under the Act (17 CFR 270.30a-3(b)) and Rules 13a-15(b) or 15d-15(b) under the Exchange Act (17 CFR 240.13a-15(b) or 240.15d-15(b)).
The registrant’s principal executive officer and principal financial officer have concluded, based on their evaluation of the registrant’s disclosure controls and procedures as conducted within 90 days of the filing date of this report, that these disclosure controls and procedures are adequately designed and are operating effectively to ensure that information required to be disclosed by the registrant on Form N-CSR is (i) accumulated and communicated to the investment company’s management, including the investment company’s certifying officers, to allow timely decisions regarding required disclosure; and (ii) recorded, processed, summarized and reported within the time periods specified in the Securities and Exchange Commission’s rules and forms.
(b) Disclose any change in the registrant’s internal control over financial reporting (as defined in Rule 30a-3(d) under the Act (17 CFR 270.30a-3(d)) that occurred during the registrant’s last fiscal half-year (the registrant’s second fiscal half-year in the case of an annual report) that has materially affected, or is reasonably likely to materially affect, the registrant’s internal control over financial reporting.
There were no changes in the registrant’s internal control over financial reporting that occurred during the registrant’s most recent fiscal half-year (the registrant’s second fiscal half-year in the case of an annual report) that have materially affected or are reasonably likely to materially affect, the registrant’s internal control over financial reporting.
Item 11. Exhibits.
(a) File the exhibits listed below as part of this Form. Letter or number the exhibits in the sequence indicated.
(a)(1) Any code of ethics, or amendment thereto, that is the subject of the disclosure required by Item 2, to the extent that the registrant intends to satisfy the Item 2 requirements through filing of an exhibit.
The code of ethics that is the subject of the disclosure required by Item 2 is attached hereto.
(a)(2) A separate certification for each principal executive officer and principal financial officer of the registrant as required by Rule 30a-2(a) under the Act (17 CFR 270.30a-2). Certifications pursuant to Rule 30a-2(a) are attached hereto.
(a)(3) Any written solicitation to purchase securities under Rule 23c-1 under the Act (17 CFR 270.23c-1) sent or given during the period covered by the report by or on behalf of the registrant to 10 or more persons. Not applicable.
(b) If the report is filed under Section 13(a) or 15(d) of the Exchange Act, provide the certifications required by rule 30a-2(b) under the Act as an exhibit. A certification furnished pursuant to this paragraph will not be deemed “filed” for purposes of Section 18 of the Exchange Act, or otherwise subject to the liability of that section. Such certification will not be deemed to be incorporated by reference into any filing under the Securities Act of 1933 or the Exchange Act, except to the extent that the registrant incorporates it by reference. Certifications pursuant to Rule 30a-2(b) are furnished herewith.
SIGNATURES
Pursuant to the requirements of the Securities Exchange Act of 1934 and the Investment Company Act of 1940, the registrant has duly caused this report to be signed on its behalf by the undersigned, thereunto duly authorized.
(Registrant) GARTMORE MUTUAL FUNDS
| | | |
| By (Signature and Title)* | | /s/ GERALD J. HOLLAND
Name: Gerald J. Holland
Title: Treasurer
Date: January 10, 2005 |
Pursuant to the requirements of the Securities Exchange Act of 1934 and the Investment Company Act of 1940, this report has been signed below by the following persons on behalf of the registrant and in the capacities and on the dates indicated.
| | | |
| By (Signature and Title)* | | /s/ PAUL J. HONDROS
Name: Paul J. Hondros
Title: President & Chairman of the Board
Date: January 10, 2005 |
| | | |
| By (Signature and Title)* | | /s/ GERALD J. HOLLAND
Name: Gerald J. Holland
Title: Treasurer
Date: January 10, 2005 |
* Print the name and title of each signing officer under his or her signature.