UNITED STATES
SECURITIES AND EXCHANGE COMMISSION
Washington, D.C. 20549
FORM N-CSR
CERTIFIED SHAREHOLDER REPORT OF REGISTERED
MANAGEMENT INVESTMENT COMPANIES
Investment Company Act File Number: 811-08495
GARTMORE MUTUAL FUNDS
|
| (Exact name of registrant as specified in charter) |
1200 RIVER ROAD, SUITE 1000, CONSHOHOCKEN, PENNSYLVANIA 19428
(Address of principal executive offices) (Zip code)
Eric Miller
1200 River Road
Suite 1000
Conshohocken, Pennsylvania 19428
|
| (Name and address of agent for service) |
Registrant’s telephone number, including area code: (484) 530-1300
Date of fiscal year end: October 31, 2005
Date of reporting period: October 31, 2005
Form N-CSR is to be used by management investment companies to file reports with the Commission not later than 10 days after the transmission to stockholders of any report that is required to be transmitted to stockholders under Rule 30e-1 under the Investment Company Act of 1940 (17 CFR 270.30e-1). The Commission may use the information provided on Form N-CSR in its regulatory, disclosure review, inspection, and policymaking roles.
A registrant is required to disclose the information specified by Form N-CSR, and the Commission will make this information public. A registrant is not required to respond to the collection of information contained in Form N-CSR unless the Form displays a currently valid Office of Management and Budget (“OMB”) control number. Please direct comments concerning the accuracy of the information collection burden estimate and any suggestions for reducing the burden to Secretary, Securities and Exchange Commission, 450 Fifth Street, NW, Washington, DC 20549-0609. The OMB has reviewed this collection of information under the clearance requirements of 44 U.S.C. § 3507.
| Item 1. | Reports to Stockholders. |
Include a copy of the report transmitted to stockholders pursuant to Rule 30e-1 under the Act (17 CFR 270.30e-1).
Annual Report
| | |
| | |

| | October 31, 2005 |
Core Equity Series
Gartmore Large Cap Value Fund
Gartmore Mid Cap Growth Fund
Gartmore Small Cap Fund
Core Fixed Income Series
Gartmore Bond Fund
Gartmore Government Bond Fund
Gartmore Morley Enhanced Income Fund
Gartmore Short Duration Bond Fund
Gartmore Tax-Free Income Fund
www.gartmorefunds.com

Solutions.

| | | | |
| UNITED STATES | | UNITED KINGDOM | | JAPAN |
Based in greater metropolitan Philadelphia, Gartmore is the global asset management arm of Nationwide®. Gartmore’s affiliated advisers* collectively manage more than $82 billion1 in assets through its global investment platform encompassing more than 185 investment management professionals supported by an 800-person staff.
We provide core and specialty equity, fixed-income and alternative investment solutions through mutual funds, separate accounts, commingled portfolios and wrap accounts to individual and institutional clients around the world.
This wide range of investment opportunities is built on sound investment management processes designed to increase the probability of delivering enhanced risk-adjusted returns over the long term.
Our investment management teams incorporate fundamental stock selection with the application of technology to help control risk and add to returns. Insightful stock selection is a function of the efforts of talented alpha-driven managers and analysts, working in an entrepreneurial environment, who are specialists in their respective investment disciplines.
www.gartmore.com
*Gartmore’s Affiliated Advisers
The following 11 asset management affiliates of Nationwide do business under the trade name “Gartmore Group”: Gartmore Capital Management Ltd2, Gartmore Fund Managers Ltd2, Gartmore Global Partners2, 3, Gartmore Investment Ltd2, Gartmore Japan Ltd2, Gartmore Morley Capital Management, Inc.3, Gartmore Mutual Fund Capital Trust3, 4, Gartmore Riverview, LLC, Gartmore SA Capital Trust3, 4, Gartmore Separate Accounts LLC3, and NorthPointe Capital® LLC3
| 2. | | These advisers are subsidiaries of Gartmore Investment Management plc, which ultimately reports to Nationwide®. |
| 3. | | These are SEC-registered investment advisers based in the United States. Collectively, these advisers manage $43 billion as of Oct. 31, 2005. |
| 4. | | Together, these advisers do business as Gartmore Global Investments, Inc. |
Gartmore Global Investments is the investment adviser to Gartmore Funds. NorthPointe Capital is a federally registered service mark of Gartmore Global Investments, Inc. Nationwide is a federally registered service mark of Nationwide Mutual Insurance Company.
Gartmore Funds distributed by Gartmore Distribution Services, Inc., Member NASD. 1200 River Road, Suite 1000, Conshohocken, PA 19428.
© 2005 Gartmore Global Investments, Inc. All rights reserved.
Annual Report
| | |
| | |
| | October 31, 2005 |
Commentary provided by Gartmore Global Investments, investment adviser to Gartmore Funds. All opinions and estimates included in this report constitute Gartmore Global Investments’ judgment as of the date of this report and are subject to change without notice.
Statement Regarding Availability of Quarterly Portfolio Schedule.
The Gartmore Funds file complete schedules of portfolio holdings for each Fund with the Securities and Exchange Commission (the “Commission”) for the first and third quarters of each fiscal year on Form N-Q. The Funds’ Forms N-Q are available on the Commission’s website at http://www.sec.gov. The Funds’ Forms N-Q may be reviewed and copied at the Commission’s Public Reference Room in Washington, DC, and information on the operation of the Public Reference Room may be obtained by calling 800-SEC-0330; and the Funds make the information on Form N-Q available to shareholders on www.gartmorefunds.com or upon request without charge.
Statement Regarding Availability of Proxy Voting Record.
Information regarding how the Fund voted proxies relating to portfolio securities held during the most recent 12-month period ended October 31, 2005 is available without charge, upon request, by calling 800-848-0920, and on the Commission’s website at http://www.sec.gov.
Message to Shareholders
October 31, 2005
Dear Shareholders,
At times during the annual reporting period ended Oct. 31, 2005, it seemed as though a host of uncertain and unpredictable events coalesced into a “perfect storm” of market volatility.
Hurricane Katrina is one example. This Category 5 storm not only bore down on a major American city and its environs, it also had one of the country’s largest energy-Producing regions in its sights. If that weren’t enough, the storm occurred just as oil and natural gas prices were spiraling to record levels, concurrent with fears of a great strain on global supply and capacity.
On another front, the intent to better integrate the member nations of the European Union (EU) was dealt a blow by France’s repudiation of a proposed EU constitution, a move that called into question the EU’s long-term effectiveness. Within a matter of weeks, France itself was rocked by what initially appeared to be youthful unrest in one section of Paris. As riots spread across the country, however, the situation revealed a disturbing and broad-based economic condition; unemployment among France’s immigrant population is five times the national average, and the segment’s per capita income is 40% below the national average. The lingering sense is that a number of European countries will have to deal with a long-overlooked social and economic issue at a time when the EU is struggling to retain its authority.
These are just two examples illustrating that market volatility can be a function of unexpected, and sometimes unrelated, global events. The accompanying “Market Perspectives” commentary provides a more detailed analysis of the various economic and social factors that influenced the market during the past year. I’d like to focus on Gartmore’s view on how best to navigate uncertain domestic and global markets in the pursuit of acceptable investment returns.
Risk, regardless of its source, is part and parcel of investing. The challenge is to mitigate risk as much as possible through sound portfolio diversification. Gartmore is committed to offering a diverse range of equity, fixed-income and alternative investment solutions designed to capture global investment opportunities. The informed investment response to complex, volatile markets is to configure a series of diverse, uncorrelated, well-performingfunds into a dynamic portfolio. At Gartmore, we seek to provide the core and satellite investments needed to construct a broadly diversified investment portfolio.
Moreover, Gartmore believes that seasoned investment experts employing well-articulated and tested processes and aided by global research form the path to acceptable risk-adjusted returns. We hold a core belief that the ideas and insights of talented investment professionals can add quantifiable investment returns. In that regard, we are pleased to report that the returns of 30 of our 47 retail mutual funds (Class A at NAV) exceeded their respective benchmarks for the annual period ended Oct. 31, 2005.
The performance of a number of Gartmore’s funds from a variety of sectors and regions strengthens the case for holding uncorrelated investments. For example, the performance of the Gartmore Global Natural Resources Fund, which during the reporting period returned 65.51% (Class A at NAV) versus the Goldman Sachs Natural Resources Index return of 34.75%, was driven by escalating energy prices derived from increased global demand coupled with concerns about supply shortages. Within the energy sector, the Fund concentrated on smaller companies with higher capacity for growth. It is widely believed that energy will be in great demand for an extended period of time; therefore, the Fund will remain focused on the energy services sector companies that acquire, develop, and exploit oil and natural gas properties. The Wall Street Journal cited the Fund as a “Category King” in the Mutual Fund Monthly Review of Sept. 6, 2005.
The Gartmore Small Cap Fund garnered above-average returns during the reporting period, posting a 31.51% return (Class A at NAV) versus the Russell 2000® Index return of 12.08%. Most of the Fund’s outperformance came from strong stock selection in the information technology and energy sectors, in addition to astute sector allocations. Shortly after the close of the period, the Fund was cited in The Wall Street Journal as a “Category King” and noted as the second-best-performing fund in its respective sector for October 2005.
In addition, during the reporting period, Gartmore’s small-cap investment team was enhanced by the hiring of senior portfolio manager Jayne Stevlingson, who has managed small-cap funds at both OppenheimerFunds, Inc. and Morgan Stanley.
The case for broad global diversification was made through the performance of several of our non-U.S. funds during the reporting period. In comparison to equity prices in Europe and Japan, those in the United States were more muted during the past year, reflecting stretched valuations and increasing uncertainty in the outlook for consumers. The emerging markets, however, outperformed all other regions. Though its performance slightly lagged that of its benchmark, the Gartmore Emerging Markets Fund posted very strong returns of 30.02% (Class A at NAV) for the reporting period. The Gartmore International Growth Fund, returning 26.13%
(Class A at NAV) versus the Morgan Stanley Capital International (MSCI) All Country World ex-U.S. Index return of 20.06%, also benefited from the impressive performance of emerging-market and Pacific Rim equities. In addition, Latin American securities delivered notably robust performance on the back of strong commodity prices.
The Gartmore Worldwide Leaders Fund, which returned 23.44% (Class A at NAV) versus 13.27% for the MSCI World IndexSM, benefited from both domestic and international developments. Overall, U.S. growth remained strong in the face of inflationary worries, while both Europe and Japan showed increasing signs of recovery. European export growth increased due to the weak euro at the same time that Japan experienced rising real incomes and increased capital expenditures. As a result, the Fund’s largest regional contributors were the United States, the United Kingdom and Japan. The Fund also benefited from strong stock selection within the technology, financial services, health-care and energy sectors.
Despite considerable volatility in both the U.S. economy and the U.S. equity markets during the past year, the Gartmore U.S. Growth Leaders Fund handily outperformed the Standard & Poor’s (S&P) 500® Index return of 8.72% with a return of 17.31% (Class A at NAV). The Fund’s performance was almost exclusively driven by strong stock selection, particularly in the technology and consumer goods areas. Concurrently, the Gartmore U.S. Growth Leaders Long-Short Fund returned 6.09% (Class A at NAV) versus 2.68% for its benchmark, the Citigroup 3-Month T-Bill Index. Again, adept stock selection, coupled with strong sector allocations, drove the Fund’s outperformance.
In addition to a suite of actively managed funds, Gartmore provides packaged asset allocation and diversification solutions. The Gartmore Optimal Allocations Funds, launched in June 2004, consist primarily of various proprietary Gartmore funds offered in four varieties, calibrated to different levels of risk: Moderate, Moderately Aggressive, Aggressive and Specialty. We are very pleased to report that each of these Funds, which serve as complements to actively managed holdings, outperformed their respective composite benchmarks for the reporting period.
| | | | | | |
| Fund Name | | Fund
Return* | | Benchmark Return | | Benchmark |
| Gartmore Optimal Allocations: Moderate | | 10.41% | | 7.56% | | S&P 500 (40%); MSCI EAFE (20%); Lehman Brothers U.S. Aggregate (40%) |
| Gartmore Optimal Allocations: Moderately Aggressive | | 12.77% | | 9.08% | | S&P 500 (60%); MSCI EAFE (20%); Lehman Brothers U.S. Aggregate (20%) |
| Gartmore Optimal Allocations: Aggressive | | 14.86% | | 10.67% | | S&P 500 (70%); MSCI EAFE (25%); Lehman Brothers U.S. Aggregate (5%) |
| Gartmore Optimal Allocations: Specialty | | 14.59% | | 11.50% | | S&P 500 (70%); MSCI EAFE (30%) |
| *All | Fund returns are Class A at NAV, as of Oct. 31, 2005. |
As we head into 2006, the only constant is uncertainty, which is a companion to opportunity. The informed and experienced investment manager, supported by broad-based research and analysis, can discern the investment opportunities associated with volatility. In today’s global investment landscape, a host of variables exist that impact investment returns, both positively and negatively. At Gartmore, we put all of our resources into our goal of achieving acceptable risk-adjusted returns on behalf of our investors. We measure our investment success by your performance standards. We appreciate the trust you have placed in us, and we will continue to strive to fulfill your investment objectives in the coming year.
Wishing you a very happy and prosperous 2006,

Young D. Chin
Co-Global Chief Investment Officer-Equities
President and CEO
Gartmore Global Investments
Market Perspectives
October 31, 2005
Market volatility continues, but with a positive trend
The one-year period ended Oct. 31, 2005, witnessed considerable quarter-to-quarter volatility. The past 12 months clearly have been rife with reasons to justify the wide swings in market pricing. Although the markets gave investors a bumpy ride, most of those who held on were rewarded, illustrated by the fact that, for the annual reporting period, the Morgan Stanley Capital International Europe, Australasia and Far East (MSCI EAFE®) Index returned 18.59% and the Standard & Poor’s (S&P) 500® Index was up 8.72%.
A broad rally in global equity markets took hold in the final two months of 2004. International stocks, as represented by the MSCI EAFE Index, advanced 11.55% during this period, while the S&P 500 Index, a broad measure of the U.S. equity market, gained 7.59%.
As 2005 began, however, concerns about slack economic growth, the onset of inflation, increasing interest rates and spiraling energy costs led to a far less favorable environment for stocks, leaving most markets on the defensive. To varying degrees, these concerns would continue to plague the equity markets for the remainder of the year. The overall global economy nonetheless proved resilient. In the United States, the economy grew at a faster pace during the fiscal third quarter than initially anticipated, signaling improving economic health. From July through September, gross domestic product, the broadest measure of U.S. economic activity, grew 4.3%.
The dominant topic in 2005, particularly during the latter half of the year, was the continued impact of rising energy costs. As Hurricane Katrina barreled down on the energy-intensive Louisiana coast, the futures price of crude oil rose to a high of $70 per barrel while natural gas prices doubled–a classic one-two economic punch. A confluence of increased global demand, particularly from China, and concerns about supply shortages also contributed to energy price hikes.
Meanwhile, the Federal Reserve Board continued its measured increases of short-term interest rates, despite speculation that the moves would halt amid spiking energy costs. Throughout the reporting period, the rate rose from 1.75% to 3.75% as a result of eight consecutive 0.25% increases. As September wound down, however, energy prices began to fall, though they still were far above their year-ago averages. Further, inflationary fears began to subside as the Fed displayed its confidence in the economy. Ben Bernanke was appointed the new Fed Chairman in October to replace Alan Greenspan, who retires at the end of his term in January 2006.
Toward the end of the reporting period, consumer sentiment began to lag. From August to September, the consumer confidence measure fell from 105.5 to 86.6. In August, wages and salaries increased by 6.6%, yet disposable income declined 0.1% along with personal spending, which fell 0.5%–the biggest drop in more than three years.
During the reporting period, energy and natural resource company profits surged alongside soaring energy costs and expanding global demand. In the telecommunications industry, on the other hand, the costs of consolidation muted returns. Domestically, within the S&P 500 Index for the entire reporting period, sector performance ranged from a high of 59% for health services (31% in the MSCI EAFE Index) to a low of –5% for consumer services (9% in the MSCI EAFE Index). Stocks in industrials, energy and distribution services delivered returns of 42%, 31% and 25% (43%, 24% and 46% in the MSCI EAFE Index), respectively, while stocks in consumer durables and communications delivered negative returns of –4% and –0.5% (14% and 5% in the MSCI EAFE Index), respectively.
Key trends for investors to watch
As we look toward the coming year, these are some of the key trends that we are paying particularly close attention to as we shape our investment strategies at Gartmore:
An aging population. During 2005, a landmark social milestone occurred when the leading edge of the baby boom generation reached 60 years of age. Since the early post-World War II years, the baby boomers, as one of the largest subsections of the U.S. population, have reshaped the social landscape in innumerable ways. This group’s retirement will continue the process. The country’s financial institutions, for example, will accelerate the re-engineering of their products and services toward wealth preservation, not just wealth generation. On the downside, though, the strain on many under-funded pension plans, in addition to the Social Security system, may reverberate through the markets in unexpected and unsettling ways.
Housing prices–up, down or sideways? The housing market remained strong during the reporting period, with 30-year fixed mortgage rates remaining below 6% for the
majority of the time. Confounding expectations amid Hurricanes Katrina and Rita and rising energy costs, existing home sales advanced to an all-time high of 2% in August. The robust housing market contributed much to the overall “wealth effect” for real estate investors. By the end of the reporting period, however, more pronounced signs of softening became evident.
One housing trend associated with the aging of the population: a wave of residential downsizing as retirees seek more practical, late-in-life living arrangements. Moreover, individuals are pulling back from the real estate speculation of the past few years as quick price appreciation has cooled in once-hot markets such as Las Vegas, Miami, Phoenix and San Diego.
The cost of socialization. During the past year, it has become even clearer that many corporations and countries must take a harder look at dealing with the burgeoning weight of socialization, which consists of, among other factors, health-care and retirement benefits. In fact, the future cost of socialization at both the corporate and country level will be of increasing concern in determining investment potential. Many longstanding business models and corporate policies will be revised in light of unsustainably heavy socialization costs.
France’s refusal to endorse the European Union (EU) constitution, for example, can be tied to the issue of socialization. Most observers believe that voters feared that a stronger EU would create an influx of cheap labor just as France was struggling to reduce high unemployment. In the United States, the issue of socialization was clearly evident in the United Auto Workers’ agreement with General Motors Corp. (GM) to cut health-care benefits for employees, retirees and their families. GM successfully argued that escalating pension and health-care benefits for a vast pool of retirees was forcing the enterprise into bankruptcy, which is a landmark shift in the auto industry’s historical model.
The international economic picture. In the latter part of 2005, the economies of Japan and Europe, including the United Kingdom, improved due to strong corporate profitability and expectations of higher levels of merger-and-acquisition activity. Europe was buoyed by export growth on the back of the weak euro. In Japan, meanwhile, rising real incomes and capital expenditure led to hopes of a sustainable recovery. Expectations rose when Prime Minister Junichiro Koizumi achieved a resounding victory in parliamentary elections, which gave his government a solid mandate for reform.
China’s economy grew rapidly during the reporting period. Despite ongoing criticism that governmental controls on the economy were overly rigid–particularly regarding commodity prices and imports/exports–China’s economy has largely stabilized and shows strong signs of continued growth. In fact, the government’s economic controls, once viewed as unduly prohibitive, are now credited with controlling what was becoming a dangerously overheated economy. For example, new factories were being developed in China at a rapid rate based on capital secured with minimal credit checks. Before long, some banks held portfolios with up to 45% nonperforming loans as a result of default. Government regulators subsequently mandated stricter credit rules and have even expressed a desire to improve China’s banks to such a degree that their credit quality would be attractive to foreign investors.
Throughout the first half of the year, the U.S. dollar continued its sustained, three-year decline versus benchmark currencies such as the euro. In mid-summer, however, the dollar reversed its multi-year trend. The dollar’s increase is due primarily to the strengthening U.S. economic outlook relative to the global platform and disappointment in European reform. In addition, two factors—the United Kingdom’s halting of interest-rate hikes and France’s vote against the EU constitution–have placed pressure on the euro, effectively bolstering the U.S. dollar.
The return of capital expenditures. As we look toward 2006, we are seeing a trend toward companies deploying large amounts of excess cash on their balance sheets. Since the 2000 market meltdown, many companies have relied on cash as their primary hedge against diminished revenues. Now, however, as the equity markets continue to recover, many of these firms are feeling the pressure either to put the money to work in various ways, such as toward acquisitions, or return the money to shareholders in the form of dividend payouts or share buybacks. The technology sector could be a notable beneficiary of this trend. Research and development as well as new product rollouts are key drivers in the technology industry, and both areas will be bolstered by increased spending.
Looking ahead
For the near term, investors will face a mixture of positive and negative factors. On the one hand, economic and corporate earnings growth is likely to slow in the coming months. Counterbalancing this slowdown could be positive sentiment surrounding the end of the Fed’s cycle of interest-rate hikes, which we anticipate will occur in the first half of 2006. If, as we expect, the peak in rates is accompanied by softening oil prices and a firm U.S. dollar, the investment environment should be favorable for equity markets.
Market Perspectives
Continued
PAST PERFORMANCE DOES NOT GUARANTEE FUTURE RESULTS.
To obtain performance information current to the most recent month-end, which may be higher or lower than the performance shown above, please call 800-848-0920 or go to www.gartmorefunds.com
The opinions expressed herein are those of Gartmore Global Investments and may not come to pass.
Investing in mutual funds involves risk, including possible loss of principal. There is no assurance that the investment objective of any fund will be achieved.
The Gartmore Optimal Allocations Funds are designed to provide diversification and asset allocation across several types of investments and asset classes, primarily by investing in underlying Gartmore funds.
There is no assurance that a diversified portfolio will produce better results than a nondiversified one.
Each Fund is subject to different levels of risk, based on the size of its asset class allocations.
Index performance is provided for comparison purposes only; indexes are unmanaged and no fees or expenses are reflected. Individuals cannot invest directly in an index. Market index performance is provided by a third party source that Gartmore deems reliable.
The Gartmore Small Cap Fund may purchase securities in initial public offerings, which can be very volatile and carry high transaction costs.
Small-company stocks have higher risks than the stocks of larger, more established companies and have significant short-term price volatility.
Funds that concentrate on specific sectors or a relatively small number of securities may be subject to greater volatility than that of other mutual funds. International investing involves additional risks, including currency fluctuations, differences in accounting standards, political instability and foreign regulations, all of which are magnified in emerging markets.
In order to achieve the Gartmore U.S. Growth Leaders Long-Short Fund’s objective, the managers may use sophisticated investment strategies such as short selling, short-term trading and investing in smaller companies. These strategies may cause the Fund to have greater risk and volatility, and higher expenses, than those of other investments. The risks of investing in this Fund are more fully detailed within the Fund’s prospectus.
The Gartmore Optimal Allocations Fund: Aggressive benchmark consists of 70% S&P 500 Index, 25% MSCI EAFE Index and 5% Lehman Brothers U.S. Aggregate Index.
The Gartmore Optimal Allocations Fund: Moderately Aggressive benchmark consists of 60% S&P 500 Index, 20% MSCI EAFE Index and 20% Lehman Brothers U.S. Aggregate Index.
The Gartmore Optimal Allocations Fund: Moderate benchmark consists of 40% S&P 500 Index, 20% MSCI EAFE Index and 40% Lehman Brothers U.S. Aggregate Index.
The Gartmore Optimal Allocations Fund: Specialty benchmark consists of 70& S&P 500 Index and 30% MSCI EAFE Index.
Standard & Poor’s 500® (S&P 500) Index: An unmanaged, market capitalization-weighted index of 500 widely held stocks of large-cap U.S. companies that gives a broad look at how the stock prices of those companies have performed.
Lehman Brothers U.S. Aggregate Index: An unmanaged, market value-weighted index of investment-grade, fixed-rate debt issues (including government, corporate, asset-backed, and mortgage-backed securities with maturities of one year or more) that is generally representative of the bond market as a whole.
Morgan Stanley Capital International Europe, Australasia and Far East (MSCI EAFE®) Index: An unmanaged, free float-adjusted, market capitalization-weighted index that is designed to measure the performance of stocks in developed markets outside the United States and Canada.
Goldman Sachs Natural Resources Index: An unmanaged, modified market capitalization-weighted sector index of U.S.-traded natural resource-related stocks; includes companies in the categories of extractive industries, energy companies, owners and operators of timber tracts, forestry services, producers of pulp and paper, and owners of plantations.
Citigroup 3-Month T-Bill Index: An unmanaged index that is generally representative of 3-month Treasury bills; consists of an average of the last 3-month Treasury bill issues (excluding the current month-end bill).
Morgan Stanley Capital International Emerging Markets (MSCI EM) IndexSM: An unmanaged, free float-adjusted, market capitalization-weighted index that is designed to measure the performance of the stocks in emerging-country markets.
Morgan Stanley Capital International (MSCI) All Country World excluding U.S. Index: An unmanaged, free float-adjusted, market-capitalization weighted index that is designed to measure the performance of the stocks in companies in all countries except the United States.
Morgan Stanley Capital International (MSCI) World IndexSM: An unmanaged, free float-adjusted, market capitalization-weighted index that is designed to measure the performance of global developed-market equities.
Russell 2000® Index: An unmanaged index that measures the performance of the stocks of small-capitalization U.S. companies; includes the smallest 2,000 U.S. companies in the Russell 3000® Index, which measures the performance of the largest 3,000 U.S. companies, based on market capitalization.
Each Fund’s underlying funds may be subject to specific investment risks such as those associated with a concentrated number of securities (such as REITs), small companies, international stocks, initial public offerings, short selling, short-term trading, bonds and short-term instruments.
Investors should carefully consider a fund’s investment objectives, risks, fees, charges and expenses before investing any money. To obtain this and other information on Gartmore’s funds, please call 800-848-0920 to request a prospectus, or download a prospectus at www.gartmorefunds.com. Please read it carefully before investing any money.
Gartmore Funds distributed by Gartmore Distribution Services, Inc., Member NASD. 1200 River Road, Suite 1000, Conshohocken, PA 19428.
Lipper Analytical Services, Inc. is an industry research firm whose rankings are based on total return performance and do not reflect the effect of sales charges. Each fund is ranked within a universe of funds similar in investment objective as determined by Lipper.
Market Perspectives
Continued
International investing involves additional risks, including currency fluctuations, differences in accounting standards, political instability and foreign regulations, all of which are magnified in emerging markets.
The Gartmore Small Cap Fund may purchase securities in initial public offerings, which can be volatile and carry high transaction costs.
While the Gartmore Bond Fund, the Gartmore Government Bond Fund, the Gartmore Short Duration Bond Fund and the Gartmore Morley Enhanced Income Fund invest primarily in securities of the U.S. government and its agencies, these Funds’ value is not guaranteed by these entities.
An investment in a money market fund is not insured or guaranteed by the FDIC or any other government agency. Although a money market fund seeks to preserve the value of your investment at $1.00 per share, it is possible to lose money by investing in the money market.
For some investors, income from the Gartmore Tax-Free Income Fund may be subject to state and local taxes, and the Federal Alternative Minimum Tax.
Investing in mutual funds involves risk, including possible loss of principal.
There is no assurance that the investment objective of any fund will be achieved.
Gartmore Global Investments, one of its affiliated advisers, or its employees, may have a position in the securities named in this report.
This report is for informational purposes only, and is not intended as an offer or recommendation with respect to the purchase or sale of any security, option, future or other derivatives in such securities.
A complete list of all transactions in the last 12-months is available upon request.
Although third party information has been obtained from and is based on sources the Firm believes to be reliable, the Firm does not guarantee the accuracy of the information, and it may be incomplete or condensed.
Commentary provided by Gartmore Global Investments, the investment adviser to Gartmore Funds. All opinions and estimates included in this report constitute Gartmore Global Investments’ judgment as of the date of this report and are subject to change without notice.
Gartmore Large Cap Value Fund
For the annual period ended Oct. 31, 2005, the Gartmore Large Cap Value Fund (Class A at NAV) returned 12.63% versus 11.86% for its benchmark, the Russell 1000® Value Index. For broader comparison, the average return for the Fund’s peer category of Large Cap-Value Funds was 9.75%.
The reporting period was strong for the U.S. large-cap equity market. As a result of several factors–lower oil prices, the conclusion of the U.S. presidential election, reasonably good economic and earnings news, reactions to the $32 billion Microsoft dividend and the beginning of the seasonally strong year-end period–the large-cap equity market experienced most of its gains for the reporting period in November and December of 2004. Large-cap value stocks, as measured by the Russell 1000® Value Index, outperformed large-cap growth stocks, as measured by the Russell 1000® Growth Index, returning 11.86% versus 8.81% respectively.
Our rigorous investment process helped us to deliver competitive investment returns. Stock selection continued to drive performance. Fund results were strongest in the energy, utilities and materials sectors. Among the Fund’s holdings in the energy sector, the overweighting of oil refining and marketing companies contributed to positive Fund performance. Monsanto Co., a leading provider of agricultural products and technology-based solutions to farmers, was the standout performer among the Fund’s materials holdings. Edison International and Texas Utilities (TXU Corp.) were the Fund’s stalwarts in the utilities sector.
Fund performance was challenged in the information technology, telecommunication, and consumer staples sectors. Lucent Technologies, Verizon Communications, and Sara Lee were three of the portfolio’s main detractors of performance.
The Fund is positioned to perform in a stock market that rewards investing in undervalued companies, those that are experiencing improving fundamentals. For the past 12 months, the market trend has been to reward individual issues whose fundamentals are improving more than expected. The best proxy for this trend in our process is our forecast earnings momentum factor. During the past fiscal year, this factor has been our strongest and most consistent model. As a result, we have begun to place more emphasis on estimate revisions in our investment process. It is our belief that a sound value investment philosophy coupled with a focus on earnings momentum should be the winning strategy in this environment.
We continue to focus on delivering competitive, active large-cap value performance through the consistent use of quantitative stock selection and portfolio construction techniques. Given the high-profile nature of large-cap value stocks, achieving outperformance can be a challenge. We believe that the best route to success is adherence to our investment decision making process.
Portfolio Manager:
Peter Cahill
| | |
Fund Performance | | Gartmore Large Cap Value Fund |
Average Annual Total Return
(For periods ended October 31, 2005)
| | | | | | | | |
| | | | | 1 Yr. | | 5 Yr. | | Inception1 |
| Class A | | w/o SC2 | | 12.63% | | 5.53% | | 5.65% |
| | | w/SC3 | | 6.15% | | 4.28% | | 4.76% |
| Class B | | w/o SC2 | | 11.97% | | 4.84% | | 4.87% |
| | | w/SC4 | | 6.97% | | 4.51% | | 4.87% |
| Class C5 | | w/o SC2 | | 11.98% | | 4.88% | | 4.90% |
| | | w/SC6 | | 10.98% | | 4.88% | | 4.90% |
| Class R7,8 | | | | 12.73% | | 5.09% | | 5.05% |
All figures showing the effect of a sales charge reflect the maximum charge possible, because it has the most dramatic effect on performance data.
| 1 | Fund commenced operations on November 2, 1998. |
| 2 | These returns do not reflect the effects of sales charges (SC). |
| 3 | A 5.75% front-end sales charge was deducted. |
| 4 | A 5.00% contingent deferred sales charge (CDSC) was deducted. The CDSC declines to 0% after 6 years. |
| 5 | These returns until the creation of Class C shares (3/1/01) include the performance of the Fund’s Class B shares. Excluding the effects of any fee waivers or reimbursements, such prior performance is substantially similar to what Class C shares would have produced because Class C shares invest in the same portfolio of securities as Class B shares and have the same expenses after fee waivers or reimbursements. For Class C shares returns with sales charges, these returns have been restated for the applicable sales charges. |
| 6 | A CDSC of 1.00% was deducted from the one year return because it is charged when you sell Class C shares within the first year after purchase. |
| 7 | These returns until the creation of Class R shares (10/1/03) include the performance of the Fund’s Class B shares. The returns have been adjusted for the fact that Class R shares do not have any applicable sales charges but have not been adjusted for the lower expenses applicable to Class R shares. Excluding the effect of any fee waivers or reimbursements, such prior performance is similar to what Class R shares would have produced because the Class R shares will invest in the same portfolio of securities as Class B shares. |
| 8 | Not subject to any sales charges. |
Performance of a $10,000 Investment
Investment return and principal value will fluctuate, and when redeemed, shares may be worth more or less than original cost. Past performance is no guarantee of future results and does not reflect the deduction of taxes that a shareholder would pay on fund distributions or the redemption of fund shares. Investing in mutual funds involves market risk, including loss of principal. Performance returns assume the reinvestment of all distributions.
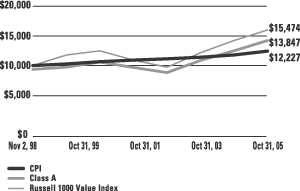
Comparative performance of $10,000 invested in Class A shares of the Gartmore Large Cap Value Fund, the Russell 1000 Value Index (Russell 1000 Value)(a), and the Consumer Price Index (CPI)(b) since inception. Unlike the Fund, the returns for these unmanaged indexes do not reflect any fees, expenses, or sales charges. Investors cannot invest directly in market indexes.
| (a) | The Russell 1000 Value is an unmanaged index of large capitalization value securities of U.S. companies included in the Russel 1000 Value Index. |
| (b) | The CPI represents changes in prices of a basket of goods and services purchased for consumption by urban households. |
| | |
Shareholder Expense Example | | Gartmore Large Cap Value Fund |
As a shareholder of the Fund, you incur two types of costs: (1) transaction costs, including sales charges (loads) paid on purchase payments and redemption fees; and (2) ongoing costs, including investment advisory fees, administration fees, distribution fees and other Fund expenses. The examples below are intended to help you understand your ongoing costs (in dollars) of investing in the Fund and to compare these costs with the ongoing costs of investing in other mutual funds. Per SEC requirements, the examples assume that you had a $1,000 investment in the Class at the beginning of the reporting period, May 1, 2005, and continued to hold your shares at the end of the reporting period, October 31, 2005.
Actual Expenses
For each Class of the Fund in the table below, the first line provides information about actual account values and actual expenses. You may use the information in this line, together with the amount you invested, to estimate the expenses that you paid over the period. Simply divide your account value by $1,000 (for example, an $8,600 account value divided by $1,000 = 8.6), then multiply the result by the number in the first line of each Class under the heading entitled “Expenses Paid During Period” to estimate the expenses you paid on your account during the period.
Hypothetical Example for Comparison Purposes
The second line of each Class in the table below provides information about hypothetical account values and hypothetical expenses based on the Class’ actual expense ratio and an assumed rate of return of 5% per year before expenses, which is not the Class’ actual return. The hypothetical account values and expenses may not be used to estimate the actual ending account balance or expenses you paid for the period. You may use this information to compare the ongoing costs of investing in the Class of the Fund and other funds. To do so, compare this 5% hypothetical example with the 5% hypothetical examples that appear in the shareholder reports of the other funds.
Please note that the expenses shown in the table are meant to highlight your ongoing costs only and do not reflect any transaction costs, such as sales charges (loads) or redemption fees. Therefore, the second line for each Class in the table is useful in comparing ongoing costs only, and will not help you determine the relative total costs of owning different funds. In addition, if these transaction costs were included, your costs would have been higher. The examples also assume all dividends and distributions have been reinvested.
Schedule of Shareholder Expenses
Expense Analysis of a $1,000 Investment
(October 31, 2005)
| | | | | | | | | | | | | | |
| Large Cap Value Fund | | | | | Beginning
Account Value,
May 1, 2005 | | Ending
Account Value,
October 31, 2005 | | Expenses Paid
During Period* | | Annualized
Expense Ratio* |
| Class A | | Actual | | | $ | 1,000.00 | | $ | 1,056.80 | | $ | 7.52 | | 1.45% |
| | | Hypothetical | 1 | | $ | 1,000.00 | | $ | 1,017.69 | | $ | 7.40 | | 1.45% |
| Class B | | Actual | | | $ | 1,000.00 | | $ | 1,054.50 | | $ | 10.67 | | 2.06% |
| | | Hypothetical | 1 | | $ | 1,000.00 | | $ | 1,014.62 | | $ | 10.51 | | 2.06% |
| Class C | | Actual | | | $ | 1,000.00 | | $ | 1,054.30 | | $ | 10.67 | | 2.06% |
| | | Hypothetical | 1 | | $ | 1,000.00 | | $ | 1,014.62 | | $ | 10.51 | | 2.06% |
| Class R | | Actual | | | $ | 1,000.00 | | $ | 1,058.10 | | $ | 6.95 | | 1.34% |
| | | Hypothetical | 1 | | $ | 1,000.00 | | $ | 1,018.24 | | $ | 6.84 | | 1.34% |
| * | Expenses are equal to the Fund’s annualized expense ratio multiplied by the average account value over the period multiplied by 184/365 (to reflect the one-half year period). The expense ratio presented represents a six month, annualized ratio in accordance with SEC guidelines. |
| 1 | Represents the hypothetical 5% return before expenses. |
| | |
Portfolio Summary | | Gartmore Large Cap Value Fund |
The SEC adopted a requirement that Funds present their portfolio holdings in a table, chart or graph format in their annual and semiannual reports to shareholders, whether or not a statement of investments is utilized. The following tables, which present portfolio holdings as a percentage of net assets, are provided in compliance with this requirement.
| | |
| Asset Allocation | | |
| Common Stocks | | 98.7% |
| Cash Equivalents | | 1.2% |
| Other Investments* | | 8.8% |
| Liabilities in excess of Other Assets** | | -8.7% |
| | |
|
| | | 100.0% |
| * | Includes value of collateral received from securities lending. |
| ** | Includes value of collateral owed from securities lending. |
| | |
| Top Industries | | |
| Oil & Gas | | 14.4% |
| Diversified Financials | | 13.3% |
| Banks | | 12.1% |
| Electric Utilities | | 6.6% |
| Insurance | | 6.2% |
| Diversified Telecommunication Services | | 5.4% |
| Pharmaceuticals | | 4.7% |
| Media | | 4.6% |
| Retail | | 3.1% |
| Real Estate | | 3.0% |
| Other Industries | | 26.6% |
| | |
|
| | | 100.0% |
| | |
| Top Holdings*** | | |
| Exxon Mobil Corp. | | 5.1% |
| Bank of America Corp. | | 4.5% |
| Citigroup, Inc. | | 4.5% |
| J.P. Morgan Chase & Co. | | 2.8% |
| ConocoPhillips | | 2.7% |
| ChevronTexaco Corp. | | 2.3% |
| Wachovia Corp. | | 2.1% |
| Wells Fargo Co. | | 2.1% |
| SBC Communications, Inc. | | 1.9% |
| Exelon Corp. | | 1.9% |
| Other Holdings | | 70.1% |
| | |
|
| | | 100.0% |
| *** | For purpose of listing top holdings, repurchase agreements are considered cash equivalents and are included as part of Other Holdings. |
Statement of Investments
October 31, 2005
Gartmore Large Cap Value Fund
| | | | | |
| | | Shares or
Principal Amount | | Value |
| | | | | | |
Aerospace & Defense (0.6%) | | | | | |
Northrop Grumman Corp. | | 4,100 | | $ | 219,965 |
| | | | |
|
|
Air Freight & Logistics (0.6%) | | | | | |
FedEx Corp. | | 2,400 | | | 220,632 |
| | | | |
|
|
Automobiles (0.5%) | | | | | |
Ford Motor Co. (c) | | 19,300 | | | 160,576 |
| | | | |
|
|
Banks (12.1%) | | | | | |
Bank of America Corp. | | 35,818 | | | 1,566,679 |
U.S. Bancorp | | 20,300 | | | 600,474 |
Wachovia Corp. | | 14,400 | | | 727,488 |
Washington Mutual, Inc. | | 14,748 | | | 584,003 |
Wells Fargo Co. | | 11,800 | | | 710,360 |
| | | | |
|
|
| | | | | | 4,189,004 |
| | | | |
|
|
Chemicals (2.1%) | | | | | |
Lyondell Chemical Co. | | 15,500 | | | 415,400 |
Monsanto Co. | | 5,000 | | | 315,050 |
| | | | |
|
|
| | | | | | 730,450 |
| | | | |
|
|
Communications Equipment (0.7%) | | | |
Lucent Technologies, Inc. (b) (c) | | 81,200 | | | 231,420 |
| | | | |
|
|
Computer Software & Services (0.6%) | | | |
Cognizant Technology Solutions Corp. (b) | | 4,600 | | | 202,308 |
| | | | |
|
|
Computers & Peripherals (2.0%) | | | |
Apple Computer, Inc. (b) | | 7,700 | | | 443,443 |
Hewlett-Packard Co. | | 8,700 | | | 243,948 |
| | | | |
|
|
| | | | | | 687,391 |
| | | | |
|
|
Diversified Financials (13.3%) | | | | | |
Citigroup, Inc. | | 33,960 | | | 1,554,689 |
Countrywide Credit Industries, Inc. | | 13,398 | | | 425,654 |
Fannie Mae | | 6,400 | | | 304,128 |
Goldman Sachs Group, Inc. | | 4,000 | | | 505,480 |
J.P. Morgan Chase & Co. | | 26,028 | | | 953,145 |
Merrill Lynch & Co., Inc. | | 7,500 | | | 485,550 |
Morgan Stanley Dean Witter & Co. | | 6,700 | | | 364,547 |
| | | | |
|
|
| | | | | | 4,593,193 |
| | | | |
|
|
Common Stocks (98.7%) Common Stocks (98.7%) |
| | | | | |
| | | Shares or
Principal Amount | | Value |
| | | | | | |
Diversified Telecommunication Services (5.4%) |
Bellsouth Corp. | | 23,500 | | $ | 611,470 |
SBC Communications, Inc. | | 28,100 | | | 670,185 |
Verizon Communications, Inc. | | 18,500 | | | 582,935 |
| | | | |
|
|
| | | | | | 1,864,590 |
| | | | |
|
|
Electric Utilities (6.6%) | | | | | |
Duke Power Co. (c) | | 8,000 | | | 211,840 |
Edison International | | 11,600 | | | 507,616 |
Emerson Electric Co. | | 2,700 | | | 187,785 |
Entergy Corp. | | 3,800 | | | 268,736 |
Exelon Corp. | | 12,600 | | | 655,578 |
TXU Corp. | | 4,400 | | | 443,300 |
| | | | |
|
|
| | | | | | 2,274,855 |
| | | | |
|
|
Electronics — Military (0.8%) | | | | | |
L-3 Communications Holdings,
Inc. (c) | | 3,600 | | | 280,152 |
| | | | |
|
|
Financial — Investment Banker/Broker (2.1%) | | | |
Lehman Brothers Holdings, Inc. | | 5,100 | | | 610,317 |
New Century Financial Corp. (c) | | 3,800 | | | 117,306 |
| | | | |
|
|
| | | | | | 727,623 |
| | | | |
|
|
Food & Beverages (2.7%) | | | | | |
Archer-Daniels-Midland Co. | | 16,500 | | | 402,105 |
Constellation Brands, Inc. (b) | | 16,700 | | | 393,118 |
Pilgrim’s Pride Corp. (c) | | 4,700 | | | 147,956 |
| | | | |
|
|
| | | | | | 943,179 |
| | | | |
|
|
Gas Utilities (1.0%) | | | | | |
Sempra Energy | | 7,900 | | | 349,970 |
| | | | |
|
|
Health Care Providers & Services (1.6%) | | | |
Aetna, Inc. | | 4,200 | | | 371,952 |
PacifiCare Health Systems, Inc. (b) | | 2,100 | | | 172,956 |
| | | | |
|
|
| | | | | | 544,908 |
| | | | |
|
|
Hotels & Motels (0.8%) | | | | | |
Marriott International, Inc., Class A | | 4,700 | | | 280,214 |
| | | | |
|
|
Household Products (0.6%) | | | | | |
Colgate-Palmolive Co. | | 3,600 | | | 190,656 |
| | | | |
|
|
Statement of Investments (Continued)
October 31, 2005
Gartmore Large Cap Value Fund (Continued)
| | Common Stocks (continued) |
| | | | | |
| | | Shares or
Principal Amount | | Value |
| | | | | | |
Insurance (6.2%) | | | | | |
Allstate Corp. (The) | | 7,900 | | $ | 417,041 |
American International Group, Inc. | | 5,250 | | | 340,200 |
Genworth Financial, Inc., Class A | | 6,600 | | | 209,154 |
Hartford Financial Services Group, Inc. | | 4,900 | | | 390,775 |
Prudential Financial, Inc. | | 4,700 | | | 342,113 |
St. Paul Travelers Cos., Inc. (The) | | 9,700 | | | 436,791 |
| | | | |
|
|
| | | | | | 2,136,074 |
| | | | |
|
|
Machinery (0.8%) | | | | | |
Paccar, Inc. | | 4,150 | | | 290,583 |
| | | | |
|
|
Media (4.6%) | | | | | |
Comcast Corp. (b) | | 19,600 | | | 545,468 |
Time Warner, Inc. | | 36,700 | | | 654,361 |
Walt Disney Co. (The) (c) | | 15,600 | | | 380,172 |
| | | | |
|
|
| | | | | | 1,580,001 |
| | | | |
|
|
Metals & Mining (0.5%) | | | | | |
United States Steel Corp. | | 5,000 | | | 182,650 |
| | | | |
|
|
Multi-Sector Companies (1.5%) | | | |
General Electric Co. | | 8,200 | | | 278,062 |
Textron, Inc. | | 3,300 | | | 237,732 |
| | | | |
|
|
| | | | | | 515,794 |
| | | | |
|
|
Oil & Gas (14.4%) | | | | | |
Anadarko Petroleum Corp. | | 3,600 | | | 326,556 |
ChevronTexaco Corp. | | 13,800 | | | 787,566 |
ConocoPhillips | | 14,200 | | | 928,396 |
Devon Energy Corp. | | 6,800 | | | 410,584 |
Exxon Mobil Corp. | | 31,600 | | | 1,774,025 |
Tesoro Petroleum Corp. | | 4,900 | | | 299,635 |
Valero Energy Corp. | | 4,000 | | | 420,960 |
| | | | |
|
|
| | | | | | 4,947,722 |
| | | | |
|
|
Packaging & Containers (0.4%) | | | |
Sonoco Products Co. (c) | | 5,200 | | | 147,160 |
| | | | |
|
|
Paper & Forest Products (1.0%) | | | |
Georgia Pacific Corp. | | 10,700 | | | 348,071 |
| | | | |
|
|
| | | | | |
| | | Shares or
Principal Amount | | Value |
| | | | | | |
Pharmaceuticals (4.7%) | | | | | |
Bristol-Myers Squibb Co. | | 8,300 | | $ | 175,711 |
Merck & Co., Inc. | | 12,200 | | | 344,284 |
Pfizer, Inc. | | 29,600 | | | 643,504 |
Wyeth | | 10,100 | | | 450,056 |
| | | | |
|
|
| | | | | | 1,613,555 |
| | | | |
|
|
Printing & Publishing (0.9%) | | | | | |
Donnelley (R.R.) & Sons Co. | | 8,600 | | | 301,172 |
| | | | |
|
|
Real Estate (3.0%) | | | | | |
General Growth Properties,
Inc. (c) | | 9,200 | | | 390,816 |
HRPT Properties Trust (c) | | 14,600 | | | 159,286 |
MDC Holdings, Inc. (c) | | 4,500 | | | 308,700 |
Vornado Realty Trust (c) | | 2,200 | | | 178,200 |
| | | | |
|
|
| | | | | | 1,037,002 |
| | | | |
|
|
Retail (3.1%) | | | | | |
Abercrombie & Fitch Co. | | 4,900 | | | 254,751 |
Costco Wholesale Corp. | | 7,500 | | | 362,700 |
Federated Department Stores, Inc. | | 4,000 | | | 245,480 |
V.F. Corp. | | 3,900 | | | 203,775 |
| | | | |
|
|
| | | | | | 1,066,706 |
| | | | |
|
|
Software (0.5%) | | | | | |
BEA Systems, Inc. (b) (c) | | 20,500 | | | 180,810 |
| | | | |
|
|
Telecommunications (0.4%) | | | | | |
Comverse Technology, Inc. (b) | | 5,500 | | | 138,050 |
| | | | |
|
|
Tobacco (1.5%) | | | | | |
Altria Group, Inc. | | 6,800 | | | 510,340 |
| | | | |
|
|
Transportation (1.1%) | | | | | |
Yellow Roadway Corp. (b) (c) | | 8,000 | | | 363,600 |
| | | | |
|
|
| | |
Total Common Stocks | | | | | 34,050,376 |
| | | | |
|
|
Cash Equivalents (1.2%)
| | | | | | |
| | | Shares or
Principal Amount | | Value |
| | | | | | | |
Investments in repurchase agreements (Collateralized by U.S. Government Agencies and U.S. Government Agency Mortgages, in a joint trading account at 3.90%, dated 10/31/05, due 11/01/05, repurchase price $397,007) | | $ | 396,964 | | $ | 396,964 |
| | | | | |
|
|
| | |
Total Cash Equivalents | | | | | | 396,964 |
| | | | | |
|
|
| |
Short-Term Securities Held as Collateral for Securities
Lending (8.8%)
| | | | | | | |
| | | Shares or
Principal Amount | | Value | |
Pool of short-term securities for Gartmore Mutual Funds —
note 2 (Securities Lending) | | $ | 3,026,092 | | $ | 3,026,092 | |
| | | | | |
|
|
|
| |
Total Short-Term Securities Held as Collateral for Securities Lending | | | 3,026,092 | |
| | | | | |
|
|
|
| |
Total Investments
(Cost $32,568,194) (a) — 108.7% | | | 37,473,432 | |
| |
Liabilities in excess of other assets — (8.7)% | | | (3,009,350 | ) |
| | | | | |
|
|
|
| |
NET ASSETS — 100.0% | | $ | 34,464,082 | |
| | | | | |
|
|
|
| | (a) | See notes to financial statements for tax unrealized appreciation (depreciation) of securities. |
| | (b) | Denotes a non-income producing security. |
| | (c) | All or part of the security was on loan as of October 31, 2005. |
See notes to financial statements.
Gartmore Mid Cap Growth Fund
For the annual period ended Oct. 31, 2005, the Gartmore Mid Cap Growth Fund (Class A at NAV) returned 14.42% versus 15.91% for its benchmark, the Russell Midcap® Growth Index. For broader comparison, the average return for the Fund’s Lipper peer category of Mid-Cap Growth Funds was 14.07%.
The year started with the markets facing headwinds of higher energy prices and higher interest rates. But later in the year, the markets turned decidedly positive, driven by good macro economic data and declining energy prices. Encouraged by this backdrop, investors put new money to work in the stock market. Mid Cap Growth Funds benefited as investors rotated from Large Cap and Small Cap stocks into Mid Cap stocks. The ensuing rally propelled the group to new highs for 2005.
The Fund’s investment objective continues to be to seek price appreciation and consistent investment returns by selecting high-quality, industry-leading companies that display strong growth potential at a reasonable valuation. We define high-quality stocks as those with the following characteristics: above market earnings growth, low debt-to-equity ratio and double-digit return on equity. In our experience, companies that exhibit sustainable competitive advantages and consistent earnings streams tend to perform well throughout a complete market cycle.
The Fund underperformed its benchmark during the period. This underperformance was largely a result of the Fund’s holdings in the Technology sector. Specifically, certain companies held in the portfolio experienced adverse operating conditions which pressured their shares in the market. These holdings included: Infospace, Mercury Interactive and Tibco, which were sold during the period.
Strong stock selection in the energy and health-care sectors contributed positively to the Fund’s return. Our selections in these sectors stemmed directly from our disciplined investment approach and our bottom-up stock selection process. Positive contributors included: EOG Resources, Inc.; XTO Energy Inc.; and Express Scripts, Inc.
We maintain a discipline of finding high-quality growth stocks, regardless of the prevailing market conditions. As we expected, during the past year cyclical and lower-quality company stocks performed very well, a typical occurrence in the first stage of an economic recovery. Looking forward, we feel that we are entering the second phase of an earnings recovery in which higher-quality companies with sustainable earnings growth tend to outperform. We continue to believe that we are protected on the downside by our careful attention to stock selection. Our core philosophy has not changed; therefore, the Fund remains relatively sector-neutral to the benchmark, since we prefer to let stock selections drive performance. We remain focused on high-quality companies with sustainable competitive advantages, strong balance sheets and industry-leading returns trading at reasonable multiples. We feel confident that our strategy will be rewarded throughout the complete market cycle.
Portfolio Manager:
Robert D. Glise
| | |
Fund Performance | | Gartmore Mid Cap Growth Fund |
Average Annual Total Return
(For periods ended October 31, 2005)
| | | | | | |
| | | | | 1 Yr. | | Inception1 |
| Class A2 | | w/o SC3 | | 14.42% | | 18.10% |
| | | w/SC4 | | 7.82% | | 15.85% |
| Class B2 | | w/o SC3 | | 13.65% | | 17.57% |
| | | w/SC5 | | 8.65% | | 16.87% |
| Class C2 | | w/o SC3 | | 13.65% | | 17.57% |
| | | w/SC6 | | 12.65% | | 17.57% |
| Class R2,7 | | | | 14.38% | | 18.00% |
| Institutional Class7 | | | | 14.79% | | 18.38% |
All figures showing the effect of a sales charge reflect the maximum charge possible, because it has the most dramatic effect on performance data.
| 1 | Fund commenced operations on October 1, 2002. |
| 2 | These returns included performance based on the Fund’s Institutional Class shares, which was achieved prior to the creation of Class A shares (3/5/03), Class B and Class C shares (8/21/03), and Class R shares (10/1/03). Excluding the effects of any fee waivers or reimbursements, such prior performance is similar to what Class A, Class B, Class C and Class R shares would have produced because all classes of the Fund’s shares invest in the same portfolio of securities. The performance for these classes has been restated to reflect differences in sales charges (where applicable), but does not reflect the differing levels of other fees (primarily Rule 12b-1 and/or administrative services fees) applicable to such classes; if these fees were reflected, the performance for Class A, Class B, Class C and Class R would have been lower. |
| 3 | These returns do not reflect the effects of sales charges (SC). |
| 4 | A 5.75% front-end sales charge was deducted. |
| 5 | A 5.00% contingent deferred sales charge (CDSC) was deducted. The CDSC declines to 0% after 6 years. |
| 6 | A CDSC of 1.00% was deducted from the one year return because it is charged when you sell Class C shares within the first year after purchase. |
| 7 | Not subject to any sales charges. |
Performance of a $10,000 Investment
Investment return and principal value will fluctuate, and when redeemed, shares may be worth more or less than original cost. Past performance is no guarantee of future results and does not reflect the deduction of taxes that a shareholder would pay on fund distributions or the redemption of fund shares. Investing in mutual funds involves market risk, including loss of principal. Performance returns assume the reinvestment of all distributions.
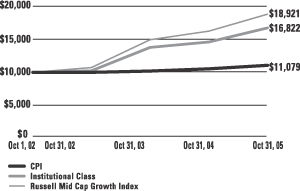
Comparative performance of $10,000 invested in the Institutional Class shares the Gartmore MidCap Growth Fund, Russell MidCap Growth Index (Russell MidCap Growth)(a), and the Consumer Price Index (CPI)(b) since inception. Unlike the Fund, the returns for these unmanaged indexes do not reflect any fees, expenses, or sales charges. Investors cannot invest directly in market indexes.
| (a) | The Russell MidCap Growth–an unmanaged index of the stock of medium-size U.S. companies with a capitalization range of $0.9 billion to $18.1 billion as of October 31, 2005, gives a broad look at how the stock price of medium-size U.S. companies have performed. |
| (b) | The CPI represents changes in prices of a basket of goods and services purchased for consumption by urban households. |
| | |
Shareholder Expense Example | | Gartmore Mid Cap Growth Fund |
As a shareholder of the Fund, you incur two types of costs: (1) transaction costs, including sales charges (loads) paid on purchase payments and redemption fees; and (2) ongoing costs, including investment advisory fees, administration fees, distribution fees and other Fund expenses. The examples below are intended to help you understand your ongoing costs (in dollars) of investing in the Fund and to compare these costs with the ongoing costs of investing in other mutual funds. Per SEC requirements, the examples assume that you had a $1,000 investment in the Class at the beginning of the reporting period, May 1, 2005, and continued to hold your shares at the end of the reporting period, October 31, 2005.
Actual Expenses
For each Class of the Fund in the table below, the first line provides information about actual account values and actual expenses. You may use the information in this line, together with the amount you invested, to estimate the expenses that you paid over the period. Simply divide your account value by $1,000 (for example, an $8,600 account value divided by $1,000 = 8.6), then multiply the result by the number in the first line of each Class under the heading entitled “Expenses Paid During Period” to estimate the expenses you paid on your account during the period.
Hypothetical Example for Comparison Purposes
The second line of each Class in the table below provides information about hypothetical account values and hypothetical expenses based on the Class’ actual expense ratio and an assumed rate of return of 5% per year before expenses, which is not the Class’ actual return. The hypothetical account values and expenses may not be used to estimate the actual ending account balance or expenses you paid for the period. You may use this information to compare the ongoing costs of investing in the Class of the Fund and other funds. To do so, compare this 5% hypothetical example with the 5% hypothetical examples that appear in the shareholder reports of the other funds.
Please note that the expenses shown in the table are meant to highlight your ongoing costs only and do not reflect any transaction costs, such as sales charges (loads) or redemption fees. Therefore, the second line for each Class in the table is useful in comparing ongoing costs only, and will not help you determine the relative total costs of owning different funds. In addition, if these transaction costs were included, your costs would have been higher. The examples also assume all dividends and distributions have been reinvested.
Schedule of Shareholder Expenses
Expense Analysis of a $1,000 Investment
(October 31, 2005)
| | | | | | | | | | | | | |
| Mid Cap Growth Fund | | | | Beginning
Account Value,
May 1, 2005 | | Ending
Account Value,
October 31, 2005 | | Expenses Paid
During Period* | | Annualized
Expense Ratio* |
| Class A | | Actual | | $ | 1,000.00 | | $ | 1,113.90 | | $ | 7.62 | | 1.43% |
| | | Hypothetical1 | | $ | 1,000.00 | | $ | 1,017.79 | | $ | 7.30 | | 1.43% |
| Class B | | Actual | | $ | 1,000.00 | | $ | 1,110.10 | | $ | 11.44 | | 2.15% |
| | | Hypothetical1 | | $ | 1,000.00 | | $ | 1,014.16 | | $ | 10.97 | | 2.15% |
| Class C | | Actual | | $ | 1,000.00 | | $ | 1,110.10 | | $ | 11.44 | | 2.15% |
| | | Hypothetical1 | | $ | 1,000.00 | | $ | 1,014.16 | | $ | 10.97 | | 2.15% |
| Class R | | Actual | | $ | 1,000.00 | | $ | 1,113.40 | | $ | 7.78 | | 1.46% |
| | | Hypothetical1 | | $ | 1,000.00 | | $ | 1,017.64 | | $ | 7.45 | | 1.46% |
| Institutional Class | | Actual | | $ | 1,000.00 | | $ | 1,115.30 | | $ | 6.13 | | 1.15% |
| | | Hypothetical1 | | $ | 1,000.00 | | $ | 1,019.20 | | $ | 5.87 | | 1.15% |
| * | Expenses are equal to the Fund’s annualized expense ratio multiplied by the average account value over the period multiplied by 184/365 (to reflect the one-half year period). The expense ratio presented represents a six month, annualized ratio in accordance with SEC guidelines. |
| 1 | Represents the hypothetical 5% return before expenses. |
| | |
Portfolio Summary | | Gartmore Mid Cap Growth Fund |
The SEC adopted a requirement that Funds present their portfolio holdings in a table, chart or graph format in their annual and semiannual reports to shareholders, whether or not a statement of investments is utilized. The following tables, which present portfolio holdings as a percentage of net assets, are provided in compliance with this requirement.
| | |
| Asset Allocation | | |
| Common Stock | | 97.6% |
| Cash Equivalents | | 8.4% |
| Liabilities in excess of Other Assets | | -6.0% |
| | |
|
| | | 100.0% |
| | |
| Top Industries | | |
| Computer Software & Services | | 11.2% |
| Oil & Gas | | 8.8% |
| Retail | | 8.1% |
| Telecommunications | | 7.6% |
| Consumer Products | | 6.1% |
| Electronics | | 5.2% |
| Consumer & Commercial Services | | 4.6% |
| Medical Products & Services | | 4.6% |
| Financial Services | | 4.4% |
| Semiconductors | | 4.1% |
| Other Industries | | 35.3% |
| | |
|
| | | 100.0% |
| | |
| Top Holdings* | | |
| L-3 Communications Holdings, Inc. | | 3.0% |
| XTO Energy, Inc. | | 2.5% |
| Marvel Technology Group Ltd. | | 2.4% |
| Patterson-UTI Energy, Inc. | | 2.1% |
| Investors Financial Services Corp. | | 2.0% |
| Jarden Corp. | | 2.0% |
| Business Objectives S.A. ADR–FR | | 2.0% |
| Neustar, Inc. | | 1.9% |
| Penn National Gaming, Inc. | | 1.9% |
| EOG Resources, Inc. | | 1.9% |
| Other Holdings | | 78.3% |
| | |
|
| | | 100.0% |
| * | For purpose of listing top holdings, repurchase agreements are considered cash equivalents and are included as part of Other Holdings. |
Statement of Investments
October 31, 2005
Gartmore Mid Cap Growth Fund
| | | | | |
| | | Shares or
Principal Amount | | Value |
| | | | | | |
Aerospace & Defense (3.0%) | | | | | |
L-3 Communications Holdings, Inc. | | 1,750 | | $ | 136,185 |
| | | | |
|
|
Banks (3.8%) | | | | | |
City National Corp. | | 880 | | | 64,574 |
North Fork Bancorp, Inc. | | 1,910 | | | 48,399 |
Zions Bancorp | | 850 | | | 62,450 |
| | | | |
|
|
| | | | | | 175,423 |
| | | | |
|
|
Business Services (3.1%) | | | | | |
ChoicePoint, Inc. (b) | | 1,480 | | | 62,545 |
Corporate Executive Board Co. (The) | | 990 | | | 81,813 |
| | | | |
|
|
| | | | | | 144,358 |
| | | | |
|
|
Computer Software & Services (11.2%) |
Business Objectives S.A. ADR — FR (b) | | 2,650 | | | 90,815 |
eResearch Technology, Inc. (b) | | 2,900 | | | 41,557 |
Factset Research Systems, Inc. | | 1,740 | | | 61,022 |
Fiserv, Inc. (b) | | 1,490 | | | 65,083 |
Henry (Jack) & Associates, Inc. | | 2,320 | | | 41,714 |
Intuit, Inc. (b) | | 1,310 | | | 60,168 |
Mercury Interactive Corp. (b) | | 1,460 | | | 50,793 |
Navteq Corp. (b) | | 1,190 | | | 46,553 |
Network Appliance, Inc. (b) | | 2,120 | | | 58,003 |
| | | | |
|
|
| | | | | | 515,708 |
| | | | |
|
|
Construction (2.3%) | | | | | |
Centex Corp. | | 880 | | | 56,628 |
D.R. Horton, Inc. | | 1,683 | | | 51,651 |
| | | | |
|
|
| | | | | | 108,279 |
| | | | |
|
|
Consumer & Commercial Services (4.6%) |
Alliance Data Systems Corp. (b) | | 1,880 | | | 66,853 |
Heartland Payment Systems, Inc. (b) | | 1,570 | | | 38,025 |
Rollins, Inc. | | 3,090 | | | 58,772 |
Total System Services, Inc. | | 2,280 | | | 48,587 |
| | | | |
|
|
| | | | | | 212,237 |
| | | | |
|
|
Consumer Products (6.1%) | | | | | |
Ball Corp. | | 990 | | | 38,976 |
Church & Dwight, Inc. | | 1,140 | | | 39,957 |
Fortune Brands, Inc. | | 500 | | | 37,985 |
| | | | | |
| | | Shares or
Principal Amount | | Value |
| | | | | | |
Consumer Products (continued) | | | | | |
Gildan Activewear, Inc., Class A (b) | | 2,030 | | $ | 70,786 |
Jarden Corp. (b) | | 2,725 | | | 92,078 |
| | | | |
|
|
| | | | | | 279,782 |
| | | | |
|
|
Diagnostic Kits (1.2%) | | | | | |
Dade Behring Holdings, Inc. | | 1,590 | | | 57,256 |
| | | | |
|
|
Electronics (5.2%) | | | | | |
Amphenol Corp., Class A | | 1,600 | | | 63,952 |
Cabot Microelectronics Corp. (b) | | 1,440 | | | 42,336 |
Jabil Circuit, Inc. (b) | | 2,400 | | | 71,640 |
Microchip Technology, Inc. | | 2,080 | | | 62,754 |
| | | | |
|
|
| | | | | | 240,682 |
| | | | |
|
|
Energy (2.3%) | | | | | |
Headwaters, Inc. (b) | | 1,410 | | | 44,894 |
MDU Resources Group, Inc. | | 1,830 | | | 60,336 |
| | | | |
|
|
| | | | | | 105,230 |
| | | | |
|
|
Financial Services (4.4%) | | | | | |
Ameritrade Holdings Corp. (b) | | 2,200 | | | 46,266 |
BlackRock, Inc. | | 690 | | | 65,412 |
Investors Financial Services Corp. | | 2,420 | | | 92,396 |
| | | | |
|
|
| | | | | | 204,074 |
| | | | |
|
|
Gaming & Leisure (2.9%) | | | | | |
Penn National Gaming, Inc. (b) | | 3,030 | | | 89,537 |
Scientific Games Corp. (b) | | 1,440 | | | 43,142 |
| | | | |
|
|
| | | | | | 132,679 |
| | | | |
|
|
Healthcare (3.2%) | | | | | |
Express Scripts, Inc. (b) | | 910 | | | 68,623 |
St. Jude Medical, Inc. (b) | | 1,620 | | | 77,874 |
| | | | |
|
|
| | | | | | 146,497 |
| | | | |
|
|
Insurance (1.3%) | | | | | |
W.R. Berkley Corp. | | 1,350 | | | 58,995 |
| | | | |
|
|
Medical Products & Services (4.6%) |
Biomet, Inc. | | 1,110 | | | 38,661 |
Fisher Scientific International, Inc. (b) | | 930 | | | 52,545 |
Kinetic Concept, Inc. (b) | | 1,001 | | | 35,936 |
ResMed, Inc. (b) | | 2,180 | | | 83,124 |
| | | | |
|
|
| | | | | | 210,266 |
| | | | |
|
|
| | Common Stocks (continued) |
| | | | | |
| | | Shares or
Principal Amount | | Value |
| | | | | | |
Oil & Gas (8.8%) | | | | | |
EOG Resources, Inc. | | 1,300 | | $ | 88,114 |
Kinder Morgan, Inc. | | 660 | | | 59,994 |
Patterson-UTI Energy, Inc. | | 2,840 | | | 96,929 |
World Fuel Services Corp. | | 1,460 | | | 46,574 |
XTO Energy, Inc. | | 2,650 | | | 115,169 |
| | | | |
|
|
| | | | | | 406,780 |
| | | | |
|
|
Pharmaceuticals (2.7%) | | | | | |
Barr Pharmaceuticals, Inc. (b) | | 1,080 | | | 62,046 |
IVAX Corp. (b) | | 2 | | | 57 |
Kos Pharmaceuticals, Inc. (b) | | 1,010 | | | 60,600 |
| | | | |
|
|
| | | | | | 122,703 |
| | | | |
|
|
Retail (8.1%) | | | | | |
Bed, Bath & Beyond, Inc. (b) | | 1,370 | | | 55,512 |
Coach, Inc. (b) | | 2,230 | | | 71,761 |
Copart, Inc. (b) | | 1,970 | | | 46,078 |
Office Depot, Inc. (b) | | 2,430 | | | 66,898 |
Staples, Inc. | | 2,660 | | | 60,462 |
Williams Sonoma, Inc. (b) | | 1,850 | | | 72,354 |
| | | | |
|
|
| | | | | | 373,065 |
| | | | |
|
|
Schools (1.2%) | | | | | |
Education Management Corp. (b) | | 1,820 | | | 56,129 |
| | | | |
|
|
Scientific Instruments (0.7%) | | | | | |
Waters Corp. (b) | | 950 | | | 34,390 |
| | | | |
|
|
Security & Commodity Exchanges (1.4%) |
Chicago Mercantile Exchange | | 180 | | | 65,727 |
| | | | |
|
|
Semiconductors (4.1%) | | | | | |
KLA-Tencor Corp. | | 1,440 | | | 66,658 |
Marvel Technology Group Ltd. (b) | | 2,370 | | | 109,991 |
Tessera Technologies, Inc. (b) | | 450 | | | 12,555 |
| | | | |
|
|
| | | | | | 189,204 |
| | | | |
|
|
Telecommunications (7.6%) | | | | | |
ADC Telecommunications, Inc. (b) | | 2,820 | | | 49,209 |
Amdocs Ltd. ADR (b) | | 1,810 | | | 47,911 |
Comverse Technology, Inc. (b) | | 2,320 | | | 58,232 |
Flir Systems, Inc. (b) | | 1,430 | | | 29,973 |
Neustar, Inc. (b) | | 2,930 | | | 89,658 |
NII Holdings, Inc. (b) | | 910 | | | 75,457 |
| | | | |
|
|
| | | | | | 350,440 |
| | | | |
|
|
| | | | | | | |
| | | Shares or
Principal Amount | | Value | |
| | | | | | | | |
Transportation (2.3%) | | | | | | | |
Knight Transportation, Inc. | | | 1,970 | | $ | 53,604 | |
Oshkosh Truck Corp. | | | 1,180 | | | 51,401 | |
| | | | | |
|
|
|
| | | | | | | 105,005 | |
| | | | | |
|
|
|
Waste Disposal (1.5%) | | | | | | | |
Stericycle, Inc. (b) | | | 1,190 | | | 68,496 | |
| | | | | |
|
|
|
| | |
Total Common Stocks | | | | | | 4,499,590 | |
| | | | | |
|
|
|
|
Cash Equivalents (8.4%) | |
Investments in repurchase agreements (Collateralized by U.S. Government Agencies and U.S. Government Agency Mortgages, in a joint trading account at 3.90%, dated 10/31/05, due 11/01/05, repurchase price $388,912) | | $ | 388,870 | | | 388,870 | |
| | | | | |
|
|
|
| | |
Total Cash Equivalents | | | | | | 388,870 | |
| | | | | |
|
|
|
| |
Total Investments
(Cost $4,230,989) (a) — 106.0% | | | 4,888,460 | |
| |
Liabilities in excess of other assets — (6.0)% | | | (275,270 | ) |
| | | | | |
|
|
|
| |
NET ASSETS — 100.0% | | $ | 4,613,190 | |
| | | | | |
|
|
|
| | (a) | See notes to financial statements for tax unrealized appreciation (depreciation) of securities. |
| | (b) | Denotes a non-income producing security. |
| | ADR | American Depositary Receipt |
See notes to financial statements.
Gartmore Small Cap Fund
For the annual period ended Oct. 31, 2005, the Gartmore Small Cap Fund (Class A at NAV) returned 31.51% versus 12.08% for its benchmark, the Russell 2000® Index. For broader comparison, the average return for the Fund’s Lipper peer category of Small-Cap Core Funds was 13.22%.
Equity markets rallied in the last fiscal quarter of 2004 before slowing in early 2005, as investors took profits amid growing concerns that the Federal Reserve Board’s measured increases in interest rates might slow economic growth. Small-cap stocks experienced a period of difficulty, given the circumstances, and the mindset of many market analysts shifted toward large caps.
Strong stock selection during the reporting period led the Fund to outperform its benchmark handily, while sector allocations added a modest amount of value. Market sentiment shifted considerably during the year, favoring our contrarian investment style. We took a more aggressive stance in the Fund at the close of 2004 and then in early 2005 moved toward companies offering stable growth. As the market weakened in April, we purchased beaten-down stocks, particularly within the technology industry.
Most of the Fund’s positive performance came from the information technology and energy sectors. Lightbridge, Inc. led the Fund’s technology sector holdings and has been a top-10 Fund performer throughout the reporting period. The company, which processes credit cards for Internet providers, initially focused on small, startup businesses but has since moved toward higher-growth businesses and has been rewarded for doing so. Of note in the Fund’s energy sector holdings was Parallel Petroleum Corp., a small energy and petroleum company with high growth potential that experienced significant gains as demand increased. We began investing in the stock as we saw strong value coming from operations in the Barnett Shale (a natural gas field) and Wolfcamp (an oil-producing zone), both located in Texas. Among the Fund’s health-care holdings, Alnylam Pharmaceuticals Inc. posted strong numbers following several research breakthroughs.
While no sectors generated negative returns for the Fund, a few individual stocks detracted, including DRYSHIPS INC. and Adolor Corp. DRYSHIPS, which transports coal and other mined minerals in aluminum cars, initially appeared attractive, but the market soon became saturated as rival manufacturers took advantage of cheap production costs, cutting into DRYSHIPS’ profitability. Adolor experienced a sharp drop in December 2004, following reports that trials of its new drug failed to produce significant improvement compared with a placebo.
As the end of 2005 approaches and we look toward 2006, two key issues surrounding small-cap stocks stand out. First, we believe that, when the Fed stops raising interest rates, we will see a significant market rally, and that rally will be led by small-cap stocks. Second, high levels of cash are sitting on corporate balance sheets, and plenty of private equity money is available. As companies and investors put this money to work, purchasing businesses and making other large-scale investments, we believe the first beneficiaries will be small- and mid-cap companies. While we wait for these situations to play out, we continue to apply our disciplined, bottom-up stock selection process, along with our dual strategy of buying into weakness that is not substantiated by our research, and selling into strength that is not accompanied by improvement in a company’s fundamentals.
Portfolio Managers:
William Gerlach, Charles Purcell and Gary Haubold, CFA
| | |
Fund Performance | | Gartmore Small Cap Fund |
Average Annual Total Return
(For periods ended October 31, 2005)
| | | | | | | | |
| | | | | 1 Yr. | | 5 Yr. | | Inception1 |
| Class A | | w/o SC2 | | 31.51% | | 11.57% | | 12.60% |
| | | w/SC3 | | 23.96% | | 10.26% | | 11.65% |
| Class B | | w/o SC2 | | 30.72% | | 10.83% | | 11.91% |
| | | w/SC4 | | 25.72% | | 10.57% | | 11.91% |
| Class C5 | | w/o SC2 | | 30.67% | | 10.87% | | 11.93% |
| | | w/SC6 | | 29.67% | | 10.87% | | 11.93% |
| Class R7,9 | | | | 31.47% | | 11.05% | | 12.06% |
| Institutional Class8,9 | | | | 31.93% | | 11.81% | | 12.82% |
| Institutional Service Class9 | | 31.91% | | 11.78% | | 12.80% |
All figures showing the effect of a sales charge reflect the maximum charge possible, because it has the most dramatic effect on performance data.
| 1 | Fund commenced operations on November 2, 1998. |
| 2 | These returns do not reflect the effects of sales charges (SC). |
| 3 | A 5.75% front-end sales charge was deducted. |
| 4 | A 5.00% contingent deferred sales charge (CDSC) was deducted. The CDSC declines to 0% after 6 years. |
| 5 | These returns until the creation of Class C shares (3/1/01) include the performance of the Fund’s Class B shares. Excluding the effect of any fee waivers or reimbursements, such prior performance is substantially similar to what Class C shares would have produced because Class C shares invest in the same portfolio of securities as Class B shares and have the same expenses after any fee waivers or reimbursements. For Class C shares returns with sales charges, these returns have been restated for the applicable sales charges. |
| 6 | A CDSC of 1.00% was deducted from the one year return because it is charged when you sell Class C shares within the first year after purchase. |
| 7 | These returns until the creation of Class R shares (12/30/03) include the performance of the Fund’s Class B shares. The returns have been adjusted for the fact that Class R shares do not have any applicable sales charges but have not been adjusted for the lower expenses applicable to Class R shares. Excluding the effect of any fee waivers or reimbursements, such prior performance is similar to what Class R shares would have produced because the Class R shares will invest in the same portfolio of securities as Class B shares. |
| 8 | These returns until the creation of Institutional Class shares (06/29/04) include the performance of the Fund’s Institutional Service Class shares. The returns have been adjusted for the fact that Institutional Class shares do not have any applicable sales charges but have not been adjusted for the lower expenses applicable to Institutional Class shares. Excluding the effect of any fee waivers or reimbursements, such prior performance is similar to what Institutional Class shares would have produced because the Institutional Class shares will invest in the same portfolio of securities as Institutional Service shares. |
| 9 | Not subject to any sales charges. |
Performance of a $10,000 Investment
Investment return and principal value will fluctuate, and when redeemed, shares may be worth more or less than original cost. Past performance is no guarantee of future results and does not reflect the deduction of taxes that a shareholder would pay on fund distributions or the redemption of fund shares. Investing in mutual funds involves market risk, including loss of principal. Performance returns assume the reinvestment of all distributions.
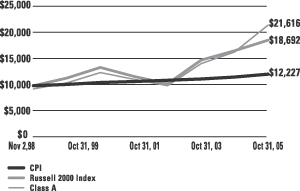
Comparative performance of $10,000 invested in Class A shares of the Gartmore Small Cap Fund, the Russell 2000 Index (Russell 2000)(a), and the Consumer Price Index (CPI)(b) since inception. Unlike the Fund, the returns for these unmanaged indexes do not reflect any fees, expenses, or sales charges. Investors cannot invest directly in market indexes.
| (a) | The Russell 2000 is an unmanaged index of approximately 2000 companies with small market capitalizations relative to the market capitalizations of other U.S. companies. |
| (b) | The CPI represents changes in prices of a basket of goods and services purchased for consumption by urban households. |
| | |
Shareholder Expense Example | | Gartmore Small Cap Fund |
As a shareholder of the Fund, you incur two types of costs: (1) transaction costs, including sales charges (loads) paid on purchase payments and redemption fees; and (2) ongoing costs, including investment advisory fees, administration fees, distribution fees and other Fund expenses. The examples below are intended to help you understand your ongoing costs (in dollars) of investing in the Fund and to compare these costs with the ongoing costs of investing in other mutual funds. Per SEC requirements, the examples assume that you had a $1,000 investment in the Class at the beginning of the reporting period, May 1, 2005, and continued to hold your shares at the end of the reporting period, October 31, 2005.
Actual Expenses
For each Class of the Fund in the table below, the first line provides information about actual account values and actual expenses. You may use the information in this line, together with the amount you invested, to estimate the expenses that you paid over the period. Simply divide your account value by $1,000 (for example, an $8,600 account value divided by $1,000 = 8.6), then multiply the result by the number in the first line of each Class under the heading entitled “Expenses Paid During Period” to estimate the expenses you paid on your account during the period.
Hypothetical Example for Comparison Purposes
The second line of each Class in the table below provides information about hypothetical account values and hypothetical expenses based on the Class’ actual expense ratio and an assumed rate of return of 5% per year before expenses, which is not the Class’ actual return. The hypothetical account values and expenses may not be used to estimate the actual ending account balance or expenses you paid for the period. You may use this information to compare the ongoing costs of investing in the Class of the Fund and other funds. To do so, compare this 5% hypothetical example with the 5% hypothetical examples that appear in the shareholder reports of the other funds.
Please note that the expenses shown in the table are meant to highlight your ongoing costs only and do not reflect any transaction costs, such as sales charges (loads) or redemption fees. Therefore, the second line for each Class in the table is useful in comparing ongoing costs only, and will not help you determine the relative total costs of owning different funds. In addition, if these transaction costs were included, your costs would have been higher. The examples also assume all dividends and distributions have been reinvested.
Schedule of Shareholder Expenses
Expense Analysis of a $1,000 Investment
(October 31, 2005)
| | | | | | | | | | | | | | |
| Small Cap Fund | | | | | Beginning
Account Value,
May 1, 2005 | | Ending
Account Value,
October 31, 2005 | | Expenses Paid
During Period* | | Annualized
Expense Ratio* |
| Class A | | Actual | | | $ | 1,000.00 | | $ | 1,217.90 | | $ | 9.62 | | 1.72% |
| | | Hypothetical | 1 | | $ | 1,000.00 | | $ | 1,016.33 | | $ | 8.78 | | 1.72% |
| Class B | | Actual | | | $ | 1,000.00 | | $ | 1,214.30 | | $ | 13.12 | | 2.35% |
| | | Hypothetical | 1 | | $ | 1,000.00 | | $ | 1,013.15 | | $ | 11.99 | | 2.35% |
| Class C | | Actual | | | $ | 1,000.00 | | $ | 1,213.90 | | $ | 13.11 | | 2.35% |
| | | Hypothetical | 1 | | $ | 1,000.00 | | $ | 1,013.15 | | $ | 11.99 | | 2.35% |
| Class R | | Actual | | | $ | 1,000.00 | | $ | 1,217.50 | | $ | 9.78 | | 1.75% |
| | | Hypothetical | 1 | | $ | 1,000.00 | | $ | 1,016.18 | | $ | 8.93 | | 1.75% |
| Institutional Service Class | | Actual | | | $ | 1,000.00 | | $ | 1,220.00 | | $ | 8.90 | | 1.59% |
| | | Hypothetical | 1 | | $ | 1,000.00 | | $ | 1,016.98 | | $ | 8.12 | | 1.59% |
| Institutional Class | | Actual | | | $ | 1,000.00 | | $ | 1,219.60 | | $ | 7.55 | | 1.35% |
| | | Hypothetical | 1 | | $ | 1,000.00 | | $ | 1,018.19 | | $ | 6.89 | | 1.35% |
| * | Expenses are equal to the Fund’s annualized expense ratio multiplied by the average account value over the period multiplied by 184/365 (to reflect the one-half year period). The expense ratio presented represents a six month, annualized ratio in accordance with SEC guidelines. |
| 1 | Represents the hypothetical 5% return before expenses. |
| | |
Portfolio Summary | | Gartmore Small Cap Fund |
October 31, 2005
The SEC adopted a requirement that Funds present their portfolio holdings in a table, chart or graph format in their annual and semiannual reports to shareholders, whether or not a statement of investments is utilized. The following tables, which present portfolio holdings as a percentage of net assets, are provided in compliance with this requirement.
| | |
| Asset Allocation | | |
| Common Stock | | 96.6% |
| Cash Equivalents | | 1.9% |
| Other Investments* | | 19.3% |
| Liabilities in excess of Other Assets** | | -17.8% |
| | |
|
| | | 100.0% |
| * | Includes value of collateral received from securities lending. |
| ** | Includes value of collateral owed from securities lending. |
| | |
| Top Industries | | |
| Oil & Gas | | 8.4% |
| Computer Software & Services | | 7.4% |
| Insurance | | 6.3% |
| Banking | | 5.6% |
| Real Estate Investment Trusts | | 5.6% |
| Financial Services | | 5.1% |
| Telecommunications | | 4.5% |
| Transportation | | 3.6% |
| Pharmaceuticals | | 3.4% |
| Retail | | 3.4% |
| Other Industries | | 46.7% |
| | |
|
| | | 100.0% |
| | |
| Top Holdings*** | | |
| Gevity HR, Inc. | | 1.6% |
| WebMethods, Inc. | | 1.5% |
| Interwoven, Inc. | | 1.5% |
| Integrated Device Technology, Inc. | | 1.5% |
| Ruby Tuesday, Inc. | | 1.4% |
| KKR Financial Corp. | | 1.3% |
| Consolidated Communications Holdings, Inc. | | 1.2% |
| Lightbridge, Inc. | | 1.2% |
| Platinum Underwriter Holdings Ltd. | | 1.2% |
| U.S.I. Holdings Corp. | | 1.1% |
| Other Holdings | | 86.5% |
| | |
|
| | | 100.0% |
| *** | For purpose of listing top holdings, repurchase agreements are considered cash equivalents and are included as part of Other Holdings. |
Statement of Investments
October 31, 2005
Gartmore Small Cap Fund
| | | | | |
| | | Shares or
Principal Amount | | Value |
| | | | | |
Advertising (0.6%) | | | | | |
Dex Media, Inc. | | 11,577 | | $ | 312,232 |
| | | | |
|
|
Aircraft Parts (0.3%) | | | | | |
Hexcel Corp. (b) (c) | | 9,680 | | | 153,137 |
K&F Industries Holdings, Inc. (b) | | 404 | | | 6,319 |
| | | | |
|
|
| | | | | | 159,456 |
| | | | |
|
|
Airlines (0.4%) | | | | | |
Frontier Airlines, Inc. (b) | | 21,103 | | | 199,423 |
| | | | |
|
|
Auto Parts & Equipment (0.7%) | | | |
Pep Boys-Manny, Moe & Jack, Inc. (c) | | 5,215 | | | 71,967 |
Wabash National Corp. (c) | | 15,029 | | | 276,684 |
| | | | |
|
|
| | | | | | 348,651 |
| | | | |
|
|
Banking (5.6%) | | | | | |
Centerstate Bank of Florida, Inc. | | 3,380 | | | 115,427 |
Colonial BancGroup, Inc. (The) | | 6,095 | | | 148,413 |
East West Bancorp, Inc. | | 1,842 | | | 70,530 |
First Commonwealth Financial Corp. | | 13,386 | | | 176,294 |
Mainsource Financial Group, Inc. (c) | | 19,732 | | | 358,530 |
National Penn Bancshares, Inc. | | 7,500 | | | 147,075 |
Placer Sierra Bankshares | | 15,457 | | | 416,103 |
S.Y. Bancorp, Inc. | | 6,020 | | | 142,915 |
Signature Bank (b) | | 8,648 | | | 250,792 |
State National Banchshares, Inc. (b) | | 9,700 | | | 237,650 |
Tompkins Trustco, Inc. | | 1,591 | | | 70,179 |
UCBH Holdings, Inc. | | 22,312 | | | 388,229 |
Wintrust Financial Corp. | | 4,505 | | | 241,828 |
| | | | |
|
|
| | | | | | 2,763,965 |
| | | | |
|
|
Beverages (0.6%) | | | | | |
Coca-Cola Bottling Co. Consolidated | | 6,545 | | | 298,517 |
| | | | |
|
|
Book Publishing (1.0%) | | | | | |
Readers Digest Association | | 33,827 | | | 518,230 |
| | | | |
|
|
Business Services & Equipment (2.4%) | | | |
Acxiom Corp. | | 16,819 | | | 358,917 |
Ariba, Inc. (b) (c) | | 33,902 | | | 264,775 |
Dexcom, Inc. (b) | | 11,084 | | | 144,203 |
| | | | | |
| | | Shares or
Principal Amount | | Value |
| | | | | |
Business Services & Equipment (continued) | | | |
Duratek, Inc. (b) (c) | | 27,747 | | $ | 395,950 |
Per-Se Technologies, Inc. (b) (c) | | 1,600 | | | 35,568 |
| | | | |
|
|
| | | | | | 1,199,413 |
| | | | |
|
|
Chemicals (1.5%) | | | | | |
Huntsman Corp. (b) | | 24,042 | | | 477,955 |
UAP Holding Corp. | | 15,210 | | | 290,511 |
| | | | |
|
|
| | | | | | 768,466 |
| | | | |
|
|
Coal (1.2%) | | | | | |
Alpha Natural Resources (b) | | 3,127 | | | 74,266 |
Arch Coal, Inc. (c) | | 2,644 | | | 203,773 |
Natural Resources Partners | | 6,503 | | | 330,743 |
| | | | |
|
|
| | | | | | 608,782 |
| | | | |
|
|
Communication Equipment (0.8%) | | | |
Polycom, Inc. (b) | | 25,699 | | | 393,195 |
| | | | |
|
|
Computer Software & Services (7.4%) |
Actuate Corp. (b) | | 123,808 | | | 352,853 |
Compuware Corp. (b) | | 22,738 | | | 183,950 |
eResearch Technology, Inc. (b) (c) | | 2,000 | | | 28,660 |
Extreme Networks, Inc. (b) | | 82,801 | | | 399,929 |
Kanbay International ,Inc. (b) | | 18,944 | | | 276,204 |
Mentor Graphics Corp. (b) | | 43,504 | | | 359,778 |
Mercury Interactive Corp. (b) (c) | | 7,011 | | | 243,913 |
Motive, Inc. (b) (c) | | 42,616 | | | 155,122 |
Omicell, Inc. (b) (c) | | 14,068 | | | 149,121 |
SSA Global Technologies, Inc. (b) | | 27,497 | | | 430,328 |
TIBCO Software, Inc. (b) | | 45,120 | | | 342,461 |
WebMethods, Inc. (b) (c) | | 107,632 | | | 749,118 |
| | | | |
|
|
| | | | | | 3,671,437 |
| | | | |
|
|
Construction & Building Materials (2.1%) |
Hughes Supply, Inc. | | 4,039 | | | 135,105 |
Interline Brands, Inc. (b) | | 11,404 | | | 222,720 |
Technical Olympic USA, Inc. (c) | | 15,520 | | | 328,093 |
Terex Corp. (b) | | 6,215 | | | 341,638 |
| | | | |
|
|
| | | | | | 1,027,556 |
| | | | |
|
|
Consumer Goods & Services (1.3%) |
Maidenform Brands, Inc. (b) | | 12,628 | | | 158,987 |
Nautilus Group, Inc. (c) | | 10,489 | | | 190,166 |
Tupperware Corp. | | 13,301 | | | 304,991 |
| | | | |
|
|
| | | | | | 654,144 |
| | | | |
|
|
| | Common Stocks (continued) |
| | | | | |
| | | Shares or
Principal Amount | | Value |
| | | | | |
Copper (0.1%) | | | | | |
Southern Copper Corp. (c) | | 1,275 | | $ | 70,304 |
| | | | |
|
|
Distribution (1.3%) | | | | | |
Bell Microproducts, Inc. (b) (c) | | 15,613 | | | 107,574 |
Nash Finch Co. (c) | | 5,427 | | | 168,562 |
Owens & Minor, Inc. | | 7,828 | | | 230,534 |
Spectrum Brands, Inc. (b) | | 5,521 | | | 114,285 |
| | | | |
|
|
| | | | | | 620,955 |
| | | | |
|
|
Electronics (2.6%) | | | | | |
Aeroflex, Inc. (b) | | 22,593 | | | 204,693 |
Celestica, Inc. (b) | | 46,905 | | | 448,411 |
Lipman Electronic Engineering Ltd. (b) | | 14,900 | | | 331,078 |
LTX Corp. (b) | | 80,741 | | | 277,749 |
Molecular Devices Corp. (b) | | 600 | | | 13,440 |
| | | | |
|
|
| | | | | | 1,275,371 |
| | | | |
|
|
Energy (0.8%) | | | | | |
Calpine Corp. (b) (c) | | 15,180 | | | 36,128 |
CMS Energy Corp. (b) | | 9,683 | | | 144,374 |
Headwaters, Inc. (b) (c) | | 561 | | | 17,862 |
NRG Energy, Inc. (b) (c) | | 4,180 | | | 179,782 |
| | | | |
|
|
| | | | | | 378,146 |
| | | | |
|
|
Engineering (0.8%) | | | | | |
URS Corp. (b) | | 9,550 | | | 386,107 |
| | | | |
|
|
Entertainment (0.7%) | | | | | |
4Kids Entertainment, Inc. (b) (c) | | 8,208 | | | 140,028 |
Carmike Cinemas, Inc. | | 9,509 | | | 209,959 |
| | | | |
|
|
| | | | | | 349,987 |
| | | | |
|
|
Financial Services (5.1%) | | | | | |
BankUnited Financial Corp. (c) | | 12,862 | | | 305,087 |
Calamos Asset Management, Inc. | | 5,600 | | | 136,024 |
Investors Financial Services Corp. (c) | | 6,410 | | | 244,734 |
iPayment Holdings, Inc. (b) | | 4,650 | | | 167,214 |
KKR Financial Corp. | | 29,095 | | | 649,401 |
Lazard Ltd., Class A (c) | | 8,838 | | | 228,462 |
MCG Capital Corp. (c) | | 10,588 | | | 174,914 |
NBC Capital Corp. | | 9,712 | | | 239,498 |
Waddell & Reed Financial | | 8,247 | | | 158,177 |
Wilmington Trust Corp. | | 5,842 | | | 221,470 |
| | | | |
|
|
| | | | | | 2,524,981 |
| | | | |
|
|
| | | | | |
| | | Shares or
Principal Amount | | Value |
| | | | | |
Food & Related (0.4%) | | | | | |
Lance, Inc. (c) | | 12,188 | | $ | 213,656 |
| | | | |
|
|
Gaming & Leisure (0.4%) | | | | | |
Boyd Gaming Corp. | | 4,881 | | | 201,341 |
| | | | |
|
|
Healthcare (1.3%) | | | | | |
Covance, Inc. (b) | | 3,552 | | | 172,805 |
Digene Corp. (b) (c) | | 2,500 | | | 75,500 |
Hythiam, Inc. (b) | | 10,387 | | | 58,167 |
PSS World Medical, Inc. (b) (c) | | 12,467 | | | 173,665 |
Sierra Health Services, Inc. (b) (c) | | 270 | | | 20,250 |
Symbion, Inc. (b) | | 3,000 | | | 67,890 |
WebMD Health Corp., Class A (b) | | 1,700 | | | 44,404 |
Wellcare Health Plans, Inc. (b) (c) | | 1,000 | | | 31,500 |
| | | | |
|
|
| | | | | | 644,181 |
| | | | |
|
|
Hospitals (0.2%) | | | | | |
Amedisys, Inc. (b) | | 1,805 | | | 68,969 |
Triad Hospitals, Inc. (b) | | 695 | | | 28,585 |
| | | | |
|
|
| | | | | | 97,554 |
| | | | |
|
|
Insurance (6.3%) | | | | | |
Aspen Insurance Holdings Ltd. | | 20,300 | | | 491,057 |
EMC Insurance Group, Inc. | | 17,404 | | | 321,974 |
Endurance Specialty Holdings Ltd. | | 7,850 | | | 260,306 |
KMG America Corp. (b) | | 5,000 | | | 43,000 |
PartnerRe Ltd. | | 3,094 | | | 197,150 |
Phoenix Companies, Inc. (The) (c) | | 21,324 | | | 276,146 |
Platinum Underwriter Holdings
Ltd. (c) | | 20,787 | | | 592,221 |
PMI Group, Inc. (The) (c) | | 9,870 | | | 393,616 |
U.S.I. Holdings Corp. (b) (c) | | 40,647 | | | 534,508 |
| | | | |
|
|
| | | | | | 3,109,978 |
| | | | |
|
|
Internet (3.2%) | | | | | |
Interwoven, Inc. (b) (c) | | 77,889 | | | 732,157 |
Matrix One, Inc. (b) (c) | | 72,832 | | | 367,073 |
RADWARE Ltd. (b) | | 25,389 | | | 467,411 |
| | | | |
|
|
| | | | | | 1,566,641 |
| | | | |
|
|
Machinery (2.6%) | | | | | |
Advanced Energy Industries, Inc. (b) | | 22,912 | | | 246,304 |
Blount International, Inc. (b) | | 11,989 | | | 190,146 |
Gorman-Rupp Co. | | 14,988 | | | 349,220 |
Statement of Investments (Continued)
October 31, 2005
Gartmore Small Cap Fund (Continued)
| | Common Stocks (continued) |
| | | | | |
| | | Shares or
Principal Amount | | Value |
| | | | | |
Machinery (continued) | | | | | |
Pentair, Inc. (c) | | 9,765 | | $ | 317,265 |
Regal-Beloit Corp. | | 5,659 | | | 180,126 |
| | | | |
|
|
| | | | | | 1,283,061 |
| | | | |
|
|
Manufacturing (1.8%) | | | | | |
Actuant Corp. (c) | | 6,485 | | | 315,820 |
Fleetwood Enterprises, Inc. (b) (c) | | 15,424 | | | 170,435 |
Grant Prideco, Inc. (b) | | 6,819 | | | 265,191 |
Packaging Corporation of America | | 6,207 | | | 125,940 |
| | | | |
|
|
| | | | | | 877,386 |
| | | | |
|
|
Medical (3.1%) | | | | | |
Adolor Corp. (b) | | 17,332 | | | 183,719 |
Advanced Medical Optics, Inc. (b) | | 1,595 | | | 56,910 |
Atricure, Inc. (b) | | 7,000 | | | 84,980 |
Cutera, Inc. (b) (c) | | 4,995 | | | 136,863 |
Immucor, Inc. (b) | | 15,706 | | | 407,099 |
Keryx Biopharmaceuticals, Inc. (b) (c) | | 4,900 | | | 70,805 |
LHC Group, Inc. (b) | | 17,687 | | | 286,529 |
Momenta Pharmaceuticals, Inc. (b) | | 5,498 | | | 118,372 |
Nektar Therapeutic (b) | | 1,481 | | | 22,304 |
Neurometrix, Inc. (b) (c) | | 2,200 | | | 81,906 |
Vnus Medical Technologies (b) (c) | | 8,725 | | | 89,257 |
| | | | |
|
|
| | | | | | 1,538,744 |
| | | | |
|
|
Oil & Gas (8.4%) | | | | | |
Airgas, Inc. | | 17,636 | | | 498,570 |
Alon USA Energy, Inc. (b) | | 8,412 | | | 164,034 |
Bronco Drilling Co., Inc. (b) | | 8,033 | | | 194,720 |
Carrizo Oil & Gas (b) (c) | | 4,930 | | | 127,884 |
CNX Gas Corp. (b) | | 11,000 | | | 228,250 |
Denbury Resources, Inc. (b) | | 4,440 | | | 193,717 |
Dresser-Rand Group, Inc. (b) | | 2,395 | | | 51,972 |
Energy Partners Ltd. (b) (c) | | 3,347 | | | 84,913 |
Enterprise GP Holdings LP | | 7,676 | | | 274,801 |
FMC Technologies, Inc. (b) | | 470 | | | 17,136 |
Global Industries Ltd. (b) | | 880 | | | 11,185 |
Grey Wolf, Inc. (b) | | 24,850 | | | 190,848 |
Hercules Offshore, Inc. (b) | | 24,460 | | | 532,493 |
Hydril Co. (b) | | 250 | | | 16,585 |
National-Oilwell, Inc. (b) | | 2,685 | | | 167,732 |
Noble Energy, Inc. | | 478 | | | 19,144 |
Parallel Petroleum (b) | | 12,262 | | | 162,226 |
| | | | | |
| | | Shares or
Principal Amount | | Value |
| | | | | |
Oil & Gas (continued) | | | | | |
Rossetta Resources, Inc. (b) | | 1,637 | | $ | 30,285 |
Rowan Cos., Inc. | | 5,018 | | | 165,544 |
Swift Energy Co. (b) (c) | | 2,960 | | | 129,234 |
Ultra Petroleum Corp. (b) (c) | | 3,315 | | | 174,004 |
Warren Resources, Inc. (b) (c) | | 18,241 | | | 282,188 |
Willbros Group, Inc. (b) (c) | | 7,850 | | | 122,539 |
Williams Scotsman International, Inc. (b) | | 18,682 | | | 284,901 |
| | | | |
|
|
| | | | | | 4,124,905 |
| | | | |
|
|
Paper & Related Products (1.5%) |
Bowater, Inc. (c) | | 4,303 | | | 114,030 |
Ennis, Inc. (c) | | 21,994 | | | 376,097 |
Smurfit-Stone Container Corp. (b) | | 23,894 | | | 252,321 |
| | | | |
|
|
| | | | | | 742,448 |
| | | | |
|
|
Pharmaceuticals (3.4%) | | | | | |
Acadia Pharmaceuticals, Inc. (b) | | 29,143 | | | 306,002 |
Alnylam Pharmaceuticals, Inc. (b) | | 22,373 | | | 215,005 |
Human Genome Sciences, Inc. (b) (c) | | 5,000 | | | 41,750 |
MGI Pharma, Inc. (b) (c) | | 2,867 | | | 53,785 |
NBTY, Inc. (b) | | 14,836 | | | 296,868 |
Nitromed, Inc. (b) (c) | | 2,773 | | | 45,117 |
NPS Pharmaceuticals, Inc. (b) | | 5,000 | | | 49,300 |
Nuvelo, Inc. (b) (c) | | 40,053 | | | 336,445 |
OSI Pharmaceuticals, Inc. (b) (c) | | 980 | | | 22,834 |
Panacos Pharmaceuticals, Inc. (b) | | 33,487 | | | 264,547 |
Perrigo Co. | | 4,300 | | | 57,491 |
| | | | |
|
|
| | | | | | 1,689,144 |
| | | | |
|
|
Radio (0.8%) | | | | | |
Radio One, Inc., Class D (b) | | 16,537 | | | 195,136 |
Westwood One, Inc. | | 9,771 | | | 180,764 |
| | | | |
|
|
| | | | | | 375,900 |
| | | | |
|
|
Real Estate Investment Trusts (5.6%) |
American Financial Realty Trust | | 20,080 | | | 247,185 |
Deerfield Triarc Capital Corp. (b) | | 28,831 | | | 373,938 |
Global Signal, Inc. (c) | | 7,796 | | | 323,144 |
Home Properties, Inc. | | 6,774 | | | 263,170 |
Hospitality Properties Trust | | 7,245 | | | 287,627 |
Lexington Corporate Properties Trust | | 12,776 | | | 278,261 |
| | Common Stocks (continued) |
| | | | | |
| | | Shares or
Principal Amount | | Value |
| | | | | |
Real Estate Investment Trusts (continued) |
Liberty Property Trust, Inc. | | 3,309 | | $ | 137,952 |
Strategic Hotel Capital, Inc. | | 3,786 | | | 64,324 |
United Dominion Realty Trust, Inc. | | 17,449 | | | 386,146 |
Universal Health Realty Income Trust | | 6,469 | | | 210,566 |
Washington Real Estate Investment Trust | | 7,348 | | | 219,338 |
| | | | |
|
|
| | | | | | 2,791,651 |
| | | | |
|
|
Restaurants (2.4%) | | | | | |
Lone Star Steakhouse & Saloon, Inc. | | 19,338 | | | 499,114 |
Ruby Tuesday, Inc. (c) | | 31,175 | | | 683,044 |
| | | | |
|
|
| | | | | | 1,182,158 |
| | | | |
|
|
Retail (3.4%) | | | | | |
1-800-FLOWERS.COM, Inc. (b) | | 52,189 | | | 354,363 |
AC Moore Arts & Crafts, Inc. (b) (c) | | 15,321 | | | 210,817 |
Dollar Tree Stores, Inc. (b) | | 8,126 | | | 175,197 |
DSW, Inc., Class A (b) | | 8,967 | | | 186,693 |
Linens ‘n Things, Inc. (b) | | 14,097 | | | 354,399 |
PETCO Animal Supplies, Inc. (b) | | 6,243 | | | 118,679 |
The Pantry, Inc. (b) | | 6,947 | | | 268,779 |
| | | | |
|
|
| | | | | | 1,668,927 |
| | | | |
|
|
Semiconductors (2.6%) | | | | | |
Integrated Device Technology, Inc. (b) (c) | | 73,473 | | | 725,913 |
Mattson Technology, Inc. (b) (c) | | 16,979 | | | 133,964 |
Novellus Systems, Inc. (b) | | 3,429 | | | 74,958 |
Semtech Corp. (b) (c) | | 24,537 | | | 370,018 |
| | | | |
|
|
| | | | | | 1,304,853 |
| | | | |
|
|
Services (2.2%) | | | | | |
Gevity HR, Inc. (c) | | 31,014 | | | 798,301 |
ServiceMaster Co. | | 22,597 | | | 284,270 |
| | | | |
|
|
| | | | | | 1,082,571 |
| | | | |
|
|
Steel (0.7%) | | | | | |
AK Steel Holding Corp. (b) (c) | | 18,013 | | | 125,911 |
L.B. Foster Co. (b) | | 700 | | | 9,030 |
NS Group, Inc. (b) | | 2,405 | | | 83,237 |
Steel Dynamics, Inc. (c) | | 4,389 | | | 135,927 |
| | | | |
|
|
| | | | | | 354,105 |
| | | | |
|
|
| | | | | |
| | | Shares or
Principal Amount | | Value |
| | | | | |
Telecommunications (4.5%) | | | | | |
Arris Group, Inc. (b) | | 17,388 | | $ | 143,799 |
Cincinnati Bell, Inc. (b) (c) | | 27,743 | | | 109,862 |
Consolidated Communications | | 46,545 | | | 617,187 |
Holdings, Inc. | | | | | |
Lightbridge, Inc. (b) | | 74,554 | | | 603,887 |
Tekelec (b) (c) | | 28,098 | | | 385,505 |
Valor Communications Group | | 29,932 | | | 381,034 |
| | | | |
|
|
| | | | | | 2,241,274 |
| | | | |
|
|
Tire & Rubber (0.1%) | | | | | |
Cooper Tire & Rubber Co. | | 4,082 | | | 55,760 |
| | | | |
|
|
Transportation (3.6%) | | | | | |
Arlington Tankers Ltd. (c) | | 3,843 | | | 85,584 |
Eagle Bulk Shipping, Inc. | | 3,070 | | | 45,497 |
Fairpoint Communications, Inc. | | 32,430 | | | 443,317 |
Genco Shipping & Trading Ltd. (b) | | 9,260 | | | 152,142 |
Greenbrier Cos., Inc. (The) (c) | | 6,446 | | | 177,587 |
Hornbeck Offshore Services, Inc. (b) | | 1,560 | | | 50,248 |
RailAmerica, Inc. (b) (c) | | 23,826 | | | 282,338 |
Rush Enterprises, Inc., Class A (b) | | 16,009 | | | 241,096 |
Seaspan Corp. (b) | | 2,970 | | | 55,717 |
StealthGas, Inc. (b) | | 19,220 | | | 251,397 |
| | | | |
|
|
| | | | | | 1,784,923 |
| | | | |
|
|
Utilities (0.1%) | | | | | |
Great Plains Energy, Inc. (c) | | 2,275 | | | 65,315 |
| | | | |
|
|
Waste Management (0.7%) | | | | | |
Allied Waste Industries, Inc. (b) (c) | | 14,301 | | | 116,410 |
WCA Waste Corp. (b) | | 25,713 | | | 228,846 |
| | | | |
|
|
| | | | | | 345,256 |
| | | | |
|
|
| | |
Total Common Stocks | | | | | 47,871,050 |
| | | | |
|
|
Statement of Investments (Continued)
October 31, 2005
Gartmore Small Cap Fund (Continued)
Cash Equivalents (1.9%)
| | | | | | |
| | | Shares or
Principal Amount | | Value |
| | | | | | | |
Investments in repurchase agreements (collateralized by U.S. Government Agencies and U.S. Government Agency Mortgages, in a joint trading account at 3.90%, dated 10/31/05, due 11/01/05, repurchase price $962,814) | | $ | 962,709 | | | $962,709 |
| | | | | |
|
|
| | |
Total Cash Equivalents | | | | | | 962,709 |
| | | | | |
|
|
Short-Term Securities Held as Collateral for Securities
Lending (19.3%)
| | | | | | | |
| | | Shares or
Principal Amount | | Value | |
| | | | | | |
Pool of short-term securities for Gartmore Mutual Funds —
note 2 (Securities Lending) | | $ | 9,567,168 | | $ | 9,567,168 | |
| | | | | |
|
|
|
| |
Total Short-Term Securities Held as Collateral for Securities Lending | | | 9,567,168 | |
| | | | | |
|
|
|
| |
Total Investments
(Cost $57,947,745) (a) — 117.8% | | | 58,400,927 | |
| |
Liabilities in excess of other
assets — (17.8)% | | | (8,820,849 | ) |
| | | | | |
|
|
|
| |
NET ASSETS — 100.0% | | $ | 49,580,078 | |
| | | | | |
|
|
|
| | (a) | See notes to financial statements for tax unrealized appreciation (depreciation) of securities. |
| | (b) | Non-income producing securities. |
| | (c) | All or part of the security was on loan as of October 31, 2005. |
See notes to financial statements.
Statements of Assets and Liabilities
October 31, 2005
| | | | | | | | | | | |
| | | Gartmore Large Cap
Value Fund | | Gartmore Mid Cap
Growth Fund | | Gartmore Small Cap Fund |
Assets: | | | | | | | | | | | |
Investments, at value (cost $32,171,230; $3,842,119; and $56,985,036; respectively) | | $ | 37,076,468 | | $ | 4,499,590 | | $ | 57,438,218 | | |
Repurchase agreements, at cost and value | | | 396,964 | | | 388,870 | | | 962,709 | | |
| | |
|
| |
|
| |
|
| | |
Total Investments | | | 37,473,432 | | | 4,888,460 | | | 58,400,927 | | |
| | |
|
| |
|
| |
|
| | |
Cash | | | — | | | — | | | — | | |
Interest and dividends receivable | | | 47,071 | | | 1,957 | | | 53,023 | | |
Receivable for capital shares issued | | | 54,058 | | | 2,707 | | | 1,613,896 | | |
Receivable for investments sold | | | — | | | 106,098 | | | 1,849,790 | | |
Prepaid expenses and other assets | | | 10,578 | | | 25,009 | | | 10,402 | | |
| | |
|
| |
|
| |
|
| | |
Total Assets | | | 37,585,139 | | | 5,024,231 | | | 61,928,038 | | |
| | |
|
| |
|
| |
|
| | |
| | | | |
Liabilities: | | | | | | | | | | | |
Payable to adviser | | | — | | | 14,345 | | | 9,831 | | |
Payable for investments purchased | | | — | | | 391,440 | | | 2,648,971 | | |
Payable for capital shares redeemed | | | 49,980 | | | — | | | 53,264 | | |
Payable for return of collateral received for securities on loan | | | 3,026,092 | | | — | | | 9,567,168 | | |
Accrued expenses and other payables | | | | | | | | | | | |
Investment advisory fees | | | 21,647 | | | 2,879 | | | 36,520 | | |
Fund administration and transfer agent fees | | | 2,963 | | | 916 | | | 5,723 | | |
Distribution fees | | | 11,136 | | | 691 | | | 13,642 | | |
Administrative servicing fees | | | 4,141 | | | 28 | | | 5,921 | | |
Trustee fees | | | 82 | | | 11 | | | 87 | | |
Other | | | 5,016 | | | 731 | | | 6,833 | | |
| | |
|
| |
|
| |
|
| | |
Total Liabilities | | | 3,121,057 | | | 411,041 | | | 12,347,960 | | |
| | |
|
| |
|
| |
|
| | |
Net Assets | | $ | 34,464,082 | | $ | 4,613,190 | | $ | 49,580,078 | | |
| | |
|
| |
|
| |
|
| | |
| | | | |
Represented by: | | | | | | | | | | | |
Capital | | $ | 28,146,007 | | $ | 3,689,697 | | $ | 41,910,348 | | |
Accumulated net investment income (loss) | | | 30,211 | | | — | | | — | | |
Accumulated net realized gains (losses) on investment transactions | | | 1,382,626 | | | 266,022 | | | 7,216,548 | | |
Net unrealized appreciation (depreciation) on investments | | | 4,905,238 | | | 657,471 | | | 453,182 | | |
| | |
|
| |
|
| |
|
| | |
Net Assets | | $ | 34,464,082 | | $ | 4,613,190 | | $ | 49,580,078 | | |
| | |
|
| |
|
| |
|
| | |
| | | | | | | | | | | | |
| | | | | | | | | | | | |
| | | | | | | | | | | | |
| | | | | | | | | | | | |
| | | | | | | | | | | | |
| | | | | | | | | | | | |
| | | | | | | | | | | | |
| | | | | | | | | | | | |
| | | | | | | | | | | | |
| | | | | | | | | | | | |
| | | | | | | | | | | | |
| | | | | | | | | | | | |
| | | | | | | | | | | | |
| | | | | | | | | | | | |
| | | | | | | | | | | | |
See notes to financial statements.
Statements of Assets and Liabilities (Continued)
October 31, 2005
| | | | | | | | | | | | | | |
| | | Gartmore Large Cap
Value Fund | | | Gartmore Mid Cap
Growth Fund | | | Gartmore Small Cap Fund |
Net Assets: | | | | | | | | | | | | | | |
Class A Shares | | $ | 28,231,989 | | | $ | 1,677,868 | | | $ | 40,538,644 | | | |
Class B Shares | | | 1,342,270 | | | | 173,088 | | | | 2,301,611 | | | |
Class C Shares | | | 4,888,490 | | | | 230,385 | | | | 5,468,216 | | | |
Class R Shares | | | 1,333 | | | | 1,274 | | | | 151,959 | | | |
Institutional Service Class Shares | | | — | | | | — | | | | 22 | | | |
Institutional Class Shares | | | — | | | | 2,530,575 | | | | 1,119,626 | | | |
| | |
|
|
| |
|
|
| |
|
|
| | |
Total | | $ | 34,464,082 | | | $ | 4,613,190 | | | $ | 49,580,078 | | | |
| | |
|
|
| |
|
|
| |
|
|
| | |
| | | | |
Shares outstanding (unlimited number of shares authorized) | | | | | | | | | | | | | | |
Class A Shares | | | 2,147,766 | | | | 107,874 | | | | 2,218,176 | | | |
Class B Shares | | | 103,562 | | | | 11,290 | | | | 131,921 | | | |
Class C Shares | | | 378,611 | | | | 15,028 | | | | 312,828 | | | |
Class R Shares | | | 103 | | | | 82 | | | | 8,619 | | | |
Institutional Service Class Shares | | | — | | | | — | | | | 1 | | | |
Institutional Class Shares | | | — | | | | 161,495 | | | | 60,346 | | | |
| | |
|
|
| |
|
|
| |
|
|
| | |
Total | | | 2,630,042 | | | | 295,769 | | | | 2,731,891 | | | |
| | |
|
|
| |
|
|
| |
|
|
| | |
| | | | |
Net asset value and redemption price per share: | | | | | | | | | | | | | | |
Class A Shares | | $ | 13.14 | | | $ | 15.55 | | | $ | 18.28 | | | |
Class B Shares (a) | | $ | 12.96 | | | $ | 15.33 | | | $ | 17.45 | | | |
Class C Shares (b) | | $ | 12.91 | | | $ | 15.33 | | | $ | 17.48 | | | |
Class R Shares | | $ | 12.97 | (c) | | $ | 15.51 | (c) | | $ | 17.63 | | | |
Institutional Service Class Shares | | $ | — | | | $ | — | | | $ | 18.52 | (c) | | |
Institutional Class Shares | | $ | — | | | $ | 15.67 | | | $ | 18.55 | | | |
| | | | |
Maximum offering price per share (100%/(100%-maximum sales charge) of net asset value adjusted to the nearest cent): | | | | | | | | | | | | | | |
Class A Shares | | $ | 13.94 | | | $ | 16.50 | | | $ | 19.40 | | | |
| | |
|
|
| |
|
|
| |
|
|
| | |
Maximum Sales Charge — Class A Shares | | | 5.75 | % | | | 5.75 | % | | | 5.75 | % | | |
| | |
|
|
| |
|
|
| |
|
|
| | |
| | | | | | | | | | | | | | | |
| | | | | | | | | | | | | | | |
| | | | | | | | | | | | | | | |
| | | | | | | | | | | | | | | |
| | | | | | | | | | | | | | | |
| | | | | | | | | | | | | | | |
| | | | | | | | | | | | | | | |
| | | | | | | | | | | | | | | |
| | | | | | | | | | | | | | | |
| | | | | | | | | | | | | | | |
| | | | | | | | | | | | | | | |
| | | | | | | | | | | | | | | |
| | | | | | | | | | | | | | | |
| | | | | | | | | | | | | | | |
| | | | | | | | | | | | | | | |
| (a) | For Class B shares, the redemption price per share varies by the length of time shares are held. |
| (b) | For Class C Shares, the redemption price per share is reduced by 1.00% for shares held less than one year. |
| (c) | Due to rounding, Net Assets divided by Shares Outstanding does not equal the NAV. |
See notes to financial statements.
Statements of Operations
For the Year Ended October 31, 2005
| | | | | | | | | | | | | | |
| | | Gartmore Large Cap
Value Fund | | | Gartmore Mid Cap
Growth Fund | | | Gartmore Small Cap Fund |
INVESTMENT INCOME: | | | | | | | | | | | | | | |
Interest income | | $ | 9,089 | | | $ | 5,550 | | | $ | 18,898 | | | |
Dividend income (net of foreign withholding tax of $0; $0; and $72; respectively) | | | 795,162 | | | | 16,349 | | | | 386,700 | | | |
Income from securities lending | | | 2,319 | | | | — | | | | 30,056 | | | |
| | |
|
|
| |
|
|
| |
|
|
| | |
Total Income | | | 806,570 | | | | 21,899 | | | | 435,654 | | | |
| | |
|
|
| |
|
|
| |
|
|
| | |
| | | | |
Expenses: | | | | | | | | | | | | | | |
Investment advisory fees | | | 240,514 | | | | 30,209 | | | | 301,067 | | | |
Fund administration and transfer agent fees | | | 42,524 | | | | 8,528 | | | | 42,812 | | | |
Distribution fees Class A | | | 69,441 | | | | 4,021 | | | | 68,947 | | | |
Distribution fees Class B | | | 12,182 | | | | 1,712 | | | | 17,723 | | | |
Distribution fees Class C | | | 30,725 | | | | 2,561 | | | | 12,025 | | | |
Distribution fees Class R | | | 4 | | | | 4 | | | | 396 | | | |
Administrative servicing fees Class A | | | 37,458 | | | | 289 | | | | 35,567 | | | |
Administrative servicing fees Institutional Service Class | | | — | | | | — | | | | 15 | | | |
Registration and filing fees | | | 42,572 | | | | 39,960 | | | | 45,536 | | | |
Trustee fees | | | 1,278 | | | | 149 | | | | 1,251 | | | |
Other | | | 20,791 | | | | 3,807 | | | | 21,883 | | | |
| | |
|
|
| |
|
|
| |
|
|
| | |
Total expenses before reimbursed expenses | | | 497,489 | | | | 91,240 | | | | 547,222 | | | |
Earnings credit (note 5) | | | (554 | ) | | | (72 | ) | | | (1,897 | ) | | |
Expenses reimbursed | | | (8,421 | ) | | | (36,261 | ) | | | (3,826 | ) | | |
| | |
|
|
| |
|
|
| |
|
|
| | |
Total Expenses | | | 488,514 | | | | 54,907 | | | | 541,499 | | | |
| | |
|
|
| |
|
|
| |
|
|
| | |
Net Investment Income (Loss) | | | 318,056 | | | | (33,008 | ) | | | (105,845 | ) | | |
| | |
|
|
| |
|
|
| |
|
|
| | |
| | | | |
REALIZED/UNREALIZED GAINS (LOSSES) FROM INVESTMENTS: | | | | | | | | | | | | | | |
Net realized gains (losses) on investment transactions | | | 2,593,142 | | | | 289,653 | | | | 7,924,590 | | | |
Net change in unrealized appreciation/depreciation on investments | | | 630,826 | | | | 257,619 | | | | (99,177 | ) | | |
| | |
|
|
| |
|
|
| |
|
|
| | |
Net realized/unrealized gains (losses) on investments | | | 3,223,968 | | | | 547,272 | | | | 7,825,413 | | | |
| | |
|
|
| |
|
|
| |
|
|
| | |
CHANGE IN NET ASSETS RESULTING FROM OPERATIONS | | $ | 3,542,024 | | | $ | 514,264 | | | $ | 7,719,568 | | | |
| | |
|
|
| |
|
|
| |
|
|
| | |
| | | | | | | | | | | | | | | |
| | | | | | | | | | | | | | | |
| | | | | | | | | | | | | | | |
| | | | | | | | | | | | | | | |
| | | | | | | | | | | | | | | |
| | | | | | | | | | | | | | | |
| | | | | | | | | | | | | | | |
| | | | | | | | | | | | | | | |
| | | | | | | | | | | | | | | |
| | | | | | | | | | | | | | | |
| | | | | | | | | | | | | | | |
| | | | | | | | | | | | | | | |
| | | | | | | | | | | | | | | |
| | | | | | | | | | | | | | | |
| | | | | | | | | | | | | | | |
See notes to financial statements.
Statements of Changes in Net Assets
October 31, 2005
| | | | | | | | | | | | | | | | | | |
| | | Gartmore Large Cap Value Fund | | | Gartmore Mid Cap Growth Fund |
| | | Year Ended
October 31, 2005 | | | Year Ended
October 31, 2004 | | | Year Ended
October 31, 2005 | | | Year Ended
October 31, 2004 |
FROM INVESTMENT ACTIVITIES: | | | | | | | | | | | | | | | | | | |
Operations: | | | | | | | | | | | | | | | | | | |
Net investment income (loss) | | $ | 318,056 | | | $ | 233,483 | | | $ | (33,008 | ) | | $ | (29,413 | ) | | |
Net realized gains (losses) on investment and futures transactions | | | 2,593,142 | | | | 2,132,903 | | | | 289,653 | | | | 165,111 | | | |
Net change in unrealized appreciation/depreciation on investment and futures transactions | | | 630,826 | | | | 1,107,554 | | | | 257,619 | | | | 39,576 | | | |
| | |
|
|
| |
|
|
| |
|
|
| |
|
|
| | |
Change in net assets resulting from operations | | | 3,542,024 | | | | 3,473,940 | | | | 514,264 | | | | 175,274 | | | |
| | |
|
|
| |
|
|
| |
|
|
| |
|
|
| | |
| | | | | |
Distributions to Class A Shareholders from: | | | | | | | | | | | | | | | | | | |
Net investment income | | | (292,757 | ) | | | (220,622 | ) | | | — | | | | — | | | |
Net realized gains on investments | | | — | | | | — | | | | (71,449 | ) | | | (32,733 | ) | | |
| | | | | |
Distributions to Class B Shareholders from: | | | | | | | | | | | | | | | | | | |
Net investment income | | | (5,475 | ) | | | (2,646 | ) | | | — | | | | — | | | |
Net realized gains on investments | | | — | | | | — | | | | (7,217 | ) | | | (3,048 | ) | | |
| | | | | |
Distributions to Class C Shareholders from: | | | | | | | | | | | | | | | | | | |
Net investment income | | | (15,770 | ) | | | (1,900 | ) | | | — | | | | — | | | |
Net realized gains on investments | | | — | | | | — | | | | (10,728 | ) | | | (10,833 | ) | | |
| | | | | |
Distributions to Class R Shareholders from: | | | | | | | | | | | | | | | | | | |
Net investment income | | | (15 | ) | | | (8 | ) | | | — | | | | — | | | |
Net realized gains on investments | | | — | | | | — | | | | (54 | ) | | | (28 | ) | | |
| | | | | |
Distributions to Institutional Class Shareholders from: | | | | | | | | | | | | | | | | | | |
Net realized gains on investments | | | — | | | | — | | | | (75,664 | ) | | | (36,735 | ) | | |
| | |
|
|
| |
|
|
| |
|
|
| |
|
|
| | |
Change in net assets from shareholder distributions | | | (314,017 | ) | | | (225,176 | ) | | | (165,112 | ) | | | (83,377 | ) | | |
| | |
|
|
| |
|
|
| |
|
|
| |
|
|
| | |
Change in net assets from capital transactions | | | 4,663,284 | | | | (2,476,365 | ) | | | 869,394 | | | | 1,376,384 | | | |
| | |
|
|
| |
|
|
| |
|
|
| |
|
|
| | |
Change in net assets | | | 7,891,291 | | | | 772,399 | | | | 1,218,546 | | | | 1,468,281 | | | |
| | | | | |
Net Assets: | | | | | | | | | | | | | | | | | | |
Beginning of period | | | 26,572,791 | | | | 25,800,392 | | | | 3,394,644 | | | | 1,926,363 | | | |
| | |
|
|
| |
|
|
| |
|
|
| |
|
|
| | |
End of period | | $ | 34,464,082 | | | $ | 26,572,791 | | | $ | 4,613,190 | | | $ | 3,394,644 | | | |
| | |
|
|
| |
|
|
| |
|
|
| |
|
|
| | |
Accumulated net investment income (loss) | | $ | 30,211 | | | $ | 26,172 | | | $ | — | | | $ | — | | | |
| | |
|
|
| |
|
|
| |
|
|
| |
|
|
| | |
| | | | | | | | | | | | | | | | | | | |
| | | | | | | | | | | | | | | | | | | |
| | | | | | | | | | | | �� | | | | | | | |
| | | | | | | | | | | | | | | | | | | |
| | | | | | | | | | | | | | | | | | | |
| | | | | | | | | | | | | | | | | | | |
| | | | | | | | | | | | | | | | | | | |
| | | | | | | | | | | | | | | | | | | |
| | | | | | | | | | | | | | | | | | | |
See notes to financial statements.
Statements of Changes in Net Assets
| | | | | | | | | | |
| | | Gartmore Small Cap Fund |
| | | Year Ended
October 31, 2005 | | | Year Ended
October 31, 2004 |
FROM INVESTMENT ACTIVITIES: | | | | | | | | | | |
Operations: | | | | | | | | | | |
Net investment income (loss) | | $ | (105,845 | ) | | $ | (232,437 | ) | | |
Net realized gains (losses) on investment and futures transactions | | | 7,924,590 | | | | 11,135,777 | | | |
Net change in unrealized appreciation/depreciation on investment and futures transactions | | | (99,177 | ) | | | (6,692,971 | ) | | |
| | |
|
|
| |
|
|
| | |
Change in net assets resulting from operations | | | 7,719,568 | | | | 4,210,369 | | | |
| | |
|
|
| |
|
|
| | |
| | | |
Distributions to Class A Shareholders from: | | | | | | | | | | |
Net realized gains on investments | | | (2,870,561 | ) | | | (260,898 | ) | | |
| | | |
Distributions to Class B Shareholders from: | | | | | | | | | | |
Net realized gains on investments | | | (192,097 | ) | | | (17,857 | ) | | |
| | | |
Distributions to Class C Shareholders from: | | | | | | | | | | |
Net realized gains on investments | | | (25,187 | ) | | | (1,102 | ) | | |
| | | |
Distributions to Class R Shareholders from: | | | | | | | | | | |
Net realized gains on investments | | | (138 | ) | | | — | | | |
| | | |
Distributions to Institutional Service Class Shareholders from: | | | | | | | | | | |
Net realized gains on investments | | | (894 | ) | | | (282,808 | ) | | |
| | | |
Distributions to Institutional Class Shareholders from: | | | | | | | | | | |
Net realized gains on investments | | | (18,313 | ) | | | — | | | |
| | |
|
|
| |
|
|
| | |
Change in net assets from shareholder distributions | | | (3,107,190 | ) | | | (562,665 | ) | | |
| | |
|
|
| |
|
|
| | |
Change in net assets from capital transactions | | | 20,140,520 | | | | (20,059,066 | ) | | |
| | |
|
|
| |
|
|
| | |
Change in net assets | | | 24,752,898 | | | | (16,411,362 | ) | | |
| | | |
Net Assets: | | | | | | | | | | |
Beginning of period | | | 24,827,180 | | | | 41,238,542 | | | |
| | |
|
|
| |
|
|
| | |
End of period | | $ | 49,580,078 | | | $ | 24,827,180 | | | |
| | |
|
|
| |
|
|
| | |
Accumulated net investment income (loss) | | $ | — | | | $ | — | | | |
| | |
|
|
| |
|
|
| | |
| | | | | | | | | | | |
| | | | | | | | | | | |
| | | | | | | | | | | |
| | | | | | | | | | | |
| | | | | | | | | | | |
| | | | | | | | | | | |
| | | | | | | | | | | |
| | | | | | | | | | | |
| | | | | | | | | | | |
| | | | | | | | | | | |
| | | | | | | | | | | |
| | | | | | | | | | | |
| | | | | | | | | | | |
See notes to financial statements.
Financial Highlights
Selected Data for Each Share of Capital Outstanding
Gartmore Large Cap Value Fund
| | | | | | | | | | | | | | | | | | | | | | | | | | | | | | | | | | | | | | | | | | | |
| | | | | Investment Activities | | | Distributions | | | | | | Ratios/Supplemental Data |
| | | Net Asset
Value,
Beginning
of Period | | Net
Investment
Income
(Loss) | | Net Realized
and
Unrealized
Gains
(Losses) on
Investments | | | Total
from
Investment
Activities | | | Net
Investment
Income | | | Net
Realized
Gains | | | Total
Distributions | | | Net
Asset
Value, End
of Period | | Total
Return (a) | | | Net Assets
at End of
Period
(000s) | | Ratio of
Expenses
to Average
Net Assets | | | Ratio of Net
Investment
Income
(Loss) to Average
Net Assets | | | Ratio of
Expenses
(Prior to
Reimbursements)
to Average
Net Assets (b) | | | Ratio of Net
Investment
Income (Loss)
(Prior to
Reimbursements)
to Average
Net Assets (b) | | | Portfolio
Turnover (c) |
| | | | | | | | | | | | | | | |
Class A Shares | | | | | | | | | | | | | | | | | | | | | | | | | | | | | | | | | | | | | | | | | | | |
Year Ended October 31, 2001 | | $ | 10.96 | | 0.10 | | (0.98 | ) | | (0.88 | ) | | (0.10 | ) | | — | | | (0.10 | ) | | $ | 9.98 | | (8.07% | ) | | $ | 27,824 | | 1.15% | | | 0.96% | | | 1.64% | | | 0.47% | | | 156.09% |
Year Ended October 31, 2002 | | $ | 9.98 | | 0.08 | | (0.82 | ) | | (0.74 | ) | | (0.08 | ) | | (0.41 | ) | | (0.49 | ) | | $ | 8.75 | | (7.98% | ) | | $ | 23,581 | | 1.36% | | | 0.81% | | | 1.48% | | | 0.69% | | | 91.03% |
Year Ended October 31, 2003 | | $ | 8.75 | | 0.10 | | 1.69 | | | 1.79 | | | (0.10 | ) | | — | | | (0.10 | ) | | $ | 10.44 | | 20.57% | | | $ | 24,800 | | 1.39% | | | 1.06% | | | 1.47% | | | 0.98% | | | 77.28% |
Year Ended October 31, 2004 | | $ | 10.44 | | 0.10 | | 1.35 | | | 1.45 | | | (0.10 | ) | | — | | | (0.10 | ) | | $ | 11.79 | | 13.92% | | | $ | 24,846 | | 1.39% | | | 0.91% | | | 1.45% | | | 0.84% | | | 58.61% |
Year Ended October 31, 2005 | | $ | 11.79 | | 0.15 | | 1.34 | | | 1.49 | | | (0.14 | ) | | — | | | (0.14 | ) | | $ | 13.14 | | 12.63% | | | $ | 28,232 | | 1.44% | | | 1.09% | | | 1.47% | | | 1.06% | | | 67.00% |
| | | | | | | | | | | | | | | |
Class B Shares | | | | | | | | | | | | | | | | | | | | | | | | | | | | | | | | | | | | | | | | | | | |
Year Ended October 31, 2001 (d) | | $ | 10.84 | | 0.02 | | (0.98 | ) | | (0.96 | ) | | (0.02 | ) | | — | | | (0.02 | ) | | $ | 9.86 | | (8.84% | ) | | $ | 528 | | 1.90% | | | 0.21% | | | 3.24% | | | (1.13% | ) | | 156.09% |
Year Ended October 31, 2002 | | $ | 9.86 | | 0.01 | | (0.80 | ) | | (0.79 | ) | | (0.02 | ) | | (0.41 | ) | | (0.43 | ) | | $ | 8.64 | | (8.53% | ) | | $ | 576 | | 2.02% | | | 0.14% | | | 2.17% | | | (0.01% | ) | | 91.03% |
Year Ended October 31, 2003 | | $ | 8.64 | | 0.03 | | 1.67 | | | 1.70 | | | (0.04 | ) | | — | | | (0.04 | ) | | $ | 10.30 | | 19.80% | | | $ | 751 | | 2.00% | | | 0.43% | | | 2.08% | | | 0.35% | | | 77.28% |
Year Ended October 31, 2004 | | $ | 10.30 | | 0.03 | | 1.33 | | | 1.36 | | | (0.03 | ) | | — | | | (0.03 | ) | | $ | 11.63 | | 13.25% | | | $ | 982 | | 2.00% | | | 0.29% | | | 2.06% | | | 0.22% | | | 58.61% |
Year Ended October 31, 2005 | | $ | 11.63 | | 0.06 | | 1.33 | | | 1.39 | | | (0.06 | ) | | — | | | (0.06 | ) | | $ | 12.96 | | 11.97% | | | $ | 1,342 | | 2.06% | | | 0.46% | | | 2.08% | | | 0.44% | | | 67.00% |
| | | | | | | | | | | | | | | |
Class C Shares | | | | | | | | | | | | | | | | | | | | | | | | | | | | | | | | | | | | | | | | | | | |
Period Ended October 31, 2001 (e) | | $ | 11.21 | | 0.02 | | (1.34 | ) | | (1.32 | ) | | (0.04 | ) | | — | | | (0.04 | ) | | $ | 9.85 | | (11.82% | )(g) | | $ | 58 | | 1.90% | (h) | | 0.11% | (h) | | 3.94% | (h) | | (1.93% | )(h) | | 156.09% |
Year Ended October 31, 2002 | | $ | 9.85 | | 0.01 | | (0.79 | ) | | (0.78 | ) | | (0.03 | ) | | (0.41 | ) | | (0.44 | ) | | $ | 8.63 | | (8.50% | ) | | $ | 80 | | 2.03% | | | 0.13% | | | 2.15% | | | 0.01% | | | 91.03% |
Year Ended October 31, 2003 | | $ | 8.63 | | 0.04 | | 1.66 | | | 1.70 | | | (0.05 | ) | | — | | | (0.05 | ) | | $ | 10.28 | | 19.77% | | | $ | 248 | | 2.00% | | | 0.38% | | | 2.08% | | | 0.30% | | | 77.28% |
Year Ended October 31, 2004 | | $ | 10.28 | | 0.03 | | 1.33 | | | 1.36 | | | (0.04 | ) | | — | | | (0.04 | ) | | $ | 11.60 | | 13.25% | | | $ | 743 | | 2.00% | | | 0.21% | | | 2.06% | | | 0.14% | | | 58.61% |
Year Ended October 31, 2005 | | $ | 11.60 | | 0.06 | | 1.33 | | | 1.39 | | | (0.08 | ) | | — | | | (0.08 | ) | | $ | 12.91 | | 11.98% | | | $ | 4,888 | | 2.06% | | | 0.34% | | | 2.07% | | | 0.34% | | | 67.00% |
| | | | | | | | | | | | | | | |
Class R Shares | | | | | | | | | | | | | | | | | | | | | | | | | | | | | | | | | | | | | | | | | | | |
Period Ended October 31, 2003 (f) | | $ | 9.92 | | — | | 0.39 | | | 0.39 | | | — | | | — | | | — | | | $ | 10.31 | | 3.93% | (g) | | $ | 1 | | 1.60% | (h) | | 0.48% | (h) | | 2.06% | (h) | | 0.02% | (h) | | 77.28% |
Year Ended October 31, 2004 | | $ | 10.31 | | 0.08 | | 1.33 | | | 1.41 | | | (0.08 | ) | | — | | | (0.08 | ) | | $ | 11.64 | | 13.71% | | | $ | 1 | | 1.54% | | | 0.75% | | | 1.86% | | | 0.42% | | | 58.61% |
Year Ended October 31, 2005 | | $ | 11.64 | | 0.15 | | 1.33 | | | 1.48 | | | (0.15 | ) | | — | | | (0.15 | ) | | $ | 12.97 | | 12.73% | | | $ | 1 | | 1.33% | | | 1.18% | | | 1.38% | | | 1.12% | | | 67.00% |
| | | | | | | | | | | | | | | | | | | | | | | | | | | | | | | | | | | | | | | | | | | | |
| | | | | | | | | | | | | | | | | | | | | | | | | | | | | | | | | | | | | | | | | | | | |
| | | | | | | | | | | | | | | | | | | | | | | | | | | | | | | | | | | | | | | | | | | | |
| | | | | | | | | | | | | | | | | | | | | | | | | | | | | | | | | | | | | | | | | | | | |
| | | | | | | | | | | | | | | | | | | | | | | | | | | | | | | | | | | | | | | | | | | | |
| | | | | | | | | | | | | | | | | | | | | | | | | | | | | | | | | | | | | | | | | | | | |
| | | | | | | | | | | | | | | | | | | | | | | | | | | | | | | | | | | | | | | | | | | | |
| | | | | | | | | | | | | | | | | | | | | | | | | | | | | | | | | | | | | | | | | | | | |
| (a) | Excludes sales charge. |
| (b) | During the period certain fees were waived and/or reimbursed. If such waivers/reimbursements had not occurred, the ratios would have been indicated. |
| (c) | Portfolio turnover is calculated on the basis of the Fund as a whole without distinguishing among the classes of shares. |
| (d) | Net investment income (loss) is based on average shares outstanding during the period. |
| (e) | For the period from March 1, 2001 (commencement of operations) through October 31, 2001. |
| (f) | For the period from October 1, 2003 (commencement of operations) through October 31, 2003. |
See notes to financial statements.
Financial Highlights
Selected Data for Each Share of Capital Outstanding
Gartmore Mid Cap Growth Fund
| | | | | | | | | | | | | | | | | | | | | | | | | | | | | | | | | | | | | | | |
| | | | | Investment Activities | | Distributions | | | | | | | | Ratios/Supplemental Data |
| | | Net Asset
Value,
Beginning
of Period | | Net
Investment
Income
(Loss) | | | Net Realized
and
Unrealized
Gains
(Losses) on
Investments | | Total
from
Investment
Activities | | Net
Realized
Gains | | | Total
Distributions | | | Net Asset
Value, End
of Period | | Total
Return (a) | | | Net Assets
at End of
Period
(000s) | | Ratio of
Expenses
to Average
Net Assets | | | Ratio of Net
Investment
Income
(Loss) to Average
Net Assets | | | Ratio of
Expenses
(Prior to
Reimbursements)
to Average
Net Assets (b) | | | Ratio of Net
Investment
Income (Loss)
(Prior to
Reimbursements)
to Average
Net Assets (b) | | | Portfolio
Turnover (c) |
| | | | | | | | | | | | | | |
Class A Shares | | | | | | | | | | | | | | | | | | | | | | | | | | | | | | | | | | | | | | | |
Period Ended October 31, 2003 (d) (e) | | $ | 9.88 | | (0.08 | ) | | 4.04 | | 3.96 | | — | | | — | | | $ | 13.84 | | 40.08% | (i) | | $ | 522 | | 1.40% | (j) | | (1.02% | )(j) | | 7.09% | (j) | | (6.71% | )(j) | | 74.46% |
Year Ended October 31, 2004 | | $ | 13.84 | | (0.13 | ) | | 0.87 | | 0.74 | | (0.37 | ) | | (0.37 | ) | | $ | 14.21 | | 5.44% | | | $ | 1,463 | | 1.40% | | | (0.98% | ) | | 2.51% | | | (2.08% | ) | | 94.56% |
Year Ended October 31, 2005 | | $ | 14.21 | | (0.13 | ) | | 2.16 | | 2.03 | | (0.69 | ) | | (0.69 | ) | | $ | 15.55 | | 14.42% | | | $ | 1,678 | | 1.42% | | | (0.87% | ) | | 2.38% | | | (1.84% | ) | | 68.86% |
| | | | | | | | | | | | | | |
Class B Shares | | | | | | | | | | | | | | | | | | | | | | | | | | | | | | | | | | | | | | | |
Period Ended October 31, 2003 (e) (f) | | $ | 13.17 | | (0.05 | ) | | 0.72 | | 0.67 | | — | | | — | | | $ | 13.84 | | 5.09% | (i) | | $ | 18 | | 2.15% | (j) | | (1.82% | )(j) | | 7.76% | (j) | | (7.43% | )(j) | | 74.46% |
Year Ended October 31, 2004 | | $ | 13.84 | | (0.20 | ) | | 0.84 | | 0.64 | | (0.37 | ) | | (0.37 | ) | | $ | 14.11 | | 4.70% | | | $ | 153 | | 2.15% | | | (1.74% | ) | | 3.27% | | | (2.86% | ) | | 94.56% |
Year Ended October 31, 2005 | | $ | 14.11 | | (0.24 | ) | | 2.15 | | 1.91 | | (0.69 | ) | | (0.69 | ) | | $ | 15.33 | | 13.65% | | | $ | 173 | | 2.15% | | | (1.61% | ) | | 3.11% | | | (2.56% | ) | | 68.86% |
| | | | | | | | | | | | | | |
Class C Shares | | | | | | | | | | | | | | | | | | | | | | | | | | | | | | | | | | | | | | | |
Period Ended October 31, 2003 (f) | | $ | 13.17 | | (0.05 | ) | | 0.72 | | 0.67 | | — | | | — | | | $ | 13.84 | | 5.09% | (i) | | $ | 1 | | 2.15% | (j) | | (1.87% | )(j) | | 7.55% | (j) | | (7.27% | )(j) | | 74.46% |
Year Ended October 31, 2004 | | $ | 13.84 | | (0.23 | ) | | 0.87 | | 0.64 | | (0.37 | ) | | (0.37 | ) | | $ | 14.11 | | 4.70% | | | $ | 224 | | 2.15% | | | (1.72% | ) | | 3.17% | | | (2.74% | ) | | 94.56% |
Year Ended October 31, 2005 | | $ | 14.11 | | (0.27 | ) | | 2.18 | | 1.91 | | (0.69 | ) | | (0.69 | ) | | $ | 15.33 | | 13.65% | | | $ | 230 | | 2.15% | | | (1.60% | ) | | 3.18% | | | (2.64% | ) | | 68.86% |
| | | | | | | | | | | | | | |
Class R Shares | | | | | | | | | | | | | | | | | | | | | | | | | | | | | | | | | | | | | | | |
Period Ended October 31, 2003 (g) | | $ | 13.08 | | (0.01 | ) | | 0.79 | | 0.78 | | — | | | — | | | $ | 13.86 | | 5.96% | (i) | | $ | 1 | | 1.75% | (j) | | (1.54% | )(j) | | 7.41% | (j) | | (7.20% | )(j) | | 74.46% |
Year Ended October 31, 2004 | | $ | 13.86 | | (0.17 | ) | | 0.86 | | 0.69 | | (0.37 | ) | | (0.37 | ) | | $ | 14.18 | | 5.06% | | | $ | 1 | | 1.66% | | | (1.27% | ) | | 2.63% | | | (2.24% | ) | | 94.56% |
Year Ended October 31, 2005 | | $ | 14.18 | | (0.15 | ) | | 2.17 | | 2.02 | | (0.69 | ) | | (0.69 | ) | | $ | 15.51 | | 14.38% | | | $ | 1 | | 1.49% | | | (0.97% | ) | | 2.53% | | | (2.00% | ) | | 68.86% |
| | | | | | | | | | | | | | |
Institutional Class Shares | | | | | | | | | | | | | | | | | | | | | | | | | | | | | | | | | | | | | | | |
Period Ended October 31, 2002 (h) | | $ | 10.00 | | (0.01 | ) | | 0.27 | | 0.26 | | — | | | — | | | $ | 10.26 | | 2.60% | (i) | | $ | 1,026 | | 1.15% | (j) | | (0.69% | )(j) | | 20.62% | (j) | | (20.16% | )(j) | | 3.74% |
Year Ended October 31, 2003 | | $ | 10.26 | | (0.09 | ) | | 3.69 | | 3.60 | | — | | | — | | | $ | 13.86 | | 35.09% | | | $ | 1,384 | | 1.15% | | | (0.76% | ) | | 5.96% | | | (5.56% | ) | | 74.46% |
Year Ended October 31, 2004 | | $ | 13.86 | | (0.10 | ) | | 0.88 | | 0.78 | | (0.37 | ) | | (0.37 | ) | | $ | 14.27 | | 5.73% | | | $ | 1,553 | | 1.15% | | | (0.72% | ) | | 2.26% | | | (1.83% | ) | | 94.56% |
Year Ended October 31, 2005 | | $ | 14.27 | | (0.07 | ) | | 2.16 | | 2.09 | | (0.69 | ) | | (0.69 | ) | | $ | 15.67 | | 14.79% | | | $ | 2,531 | | 1.15% | | | (0.61% | ) | | 1.98% | | | (1.43% | ) | | 68.86% |
| (a) | Excludes sales charge. |
| (b) | During the period certain fees were waived and/or reimbursed. If such waivers/reimbursements had not occurred, the ratios would have been as indicated. |
| (c) | Portfolio turnover is calculated on the basis of the Fund as a whole without distinguishing among the classes of shares. |
| (d) | For the period from March 5, 2003 (commencement of operations) through October 31, 2003. |
| (e) | Net investment income (loss) is based on average shares outstanding during the period. |
| (f) | For the period from August 21, 2003 (commencement of operations) through October 31, 2003. |
| (g) | For the period from October 1, 2003 (commencement of operations) through October 31, 2003. |
| (h) | For the period from October 1, 2002 (commencement of operations) through October 31, 2002. |
See notes to financial statements.
Financial Highlights
Selected Data for Each Share of Capital Outstanding
Gartmore Small Cap Fund
| | | | | | | | | | | | | | | | | | | | | | | | | | | | | | | | | | | | | | | | | | | | |
| | | | | Investment Activities | | | Distributions | | | | | | | | Ratios/Supplemental Data 
|
| | | Net Asset
Value,
Beginning
of Period | | Net
Investment
Income
(Loss) | | | Redemption
Fees | | Net Realized
and
Unrealized
Gains
(Losses) on
Investments | | | Total
from
Investment
Activities | | | Net
Realized
Gains | | | Total
Distributions | | | Net
Asset
Value, End
of Period | | Total
Return (a) | | | Net Assets
at End of
Period
(000s) | | | Ratio of
Expenses
to Average
Net Assets | | | Ratio of Net
Investment
Income
(Loss)
to Average
Net Assets | | | Ratio of
Expenses
(Prior to
Reimbursements)
to Average
Net Assets (b) | | | Ratio of Net
Investment
Income (Loss)
(Prior to
Reimbursements)
to Average
Net Assets (b) | | | Portfolio
Turnover (c) |
| | | | | | | | | | | | | | | |
Class A Shares | | | | | | | | | | | | | | | | | | | | | | | | | | | | | | | | | | | | | | | | | | | | |
Year Ended October 31, 2001 | | $ | 13.12 | | (0.02 | ) | | — | | (1.23 | ) | | (1.25 | ) | | (1.08 | ) | | (1.08 | ) | | $ | 10.79 | | (10.09% | ) | | $ | 21,190 | | | 1.35% | | | (0.17% | ) | | 2.00% | | | (0.82% | ) | | 119.03% |
Year Ended October 31, 2002 | | $ | 10.79 | | (0.02 | ) | | — | | (1.16 | ) | | (1.18 | ) | | — | | | — | | | $ | 9.61 | | (10.94% | ) | | $ | 20,290 | | | 1.51% | | | (0.24% | ) | | 1.72% | | | (0.45% | ) | | 111.00% |
Year Ended October 31, 2003 | | $ | 9.61 | | (0.05 | ) | | — | | 4.12 | | | 4.07 | | | — | | | — | | | $ | 13.68 | | 42.35% | | | $ | 21,198 | | | 1.59% | | | (0.37% | ) | | 1.70% | | | (0.48% | ) | | 100.05% |
Year Ended October 31, 2004 | | $ | 13.68 | | (0.09 | ) | | 0.05 | | 2.12 | | | 2.08 | | | (0.17 | ) | | (0.17 | ) | | $ | 15.59 | | 15.33% | | | $ | 23,023 | | | 1.59% | | | (0.55% | ) | | | (j) | | | (j) | | 341.57% |
Year Ended October 31, 2005 | | $ | 15.59 | | (0.03 | ) | | — | | 4.65 | | | 4.62 | | | (1.93 | ) | | (1.93 | ) | | $ | 18.28 | | 31.51% | | | $ | 40,539 | | | 1.67% | | | (0.27% | ) | | 1.69% | | | (0.28% | ) | | 292.46% |
| | | | | | | | | | | | | | | |
Class B Shares | | | | | | | | | | | | | | | | | | | | | | | | | | | | | | | | | | | | | | | | | | | | |
Year Ended October 31, 2001 | | $ | 13.02 | | (0.09 | ) | | — | | (1.24 | ) | | (1.33 | ) | | (1.08 | ) | | (1.08 | ) | | $ | 10.61 | | (10.84% | ) | | $ | 854 | | | 2.10% | | | (0.93% | ) | | 3.74% | | | (2.57% | ) | | 119.03% |
Year Ended October 31, 2002 | | $ | 10.61 | | (0.09 | ) | | — | | (1.13 | ) | | (1.22 | ) | | — | | | — | | | $ | 9.39 | | (11.50% | ) | | $ | 950 | | | 2.17% | | | (0.89% | ) | | 2.41% | | | (1.13% | ) | | 111.00% |
Year Ended October 31, 2003 | | $ | 9.39 | | (0.10 | ) | | — | | 4.00 | | | 3.90 | | | — | | | — | | | $ | 13.29 | | 41.53% | | | $ | 1,368 | | | 2.20% | | | (1.00% | ) | | 2.30% | | | (1.10% | ) | | 100.05% |
Year Ended October 31, 2004 | | $ | 13.29 | | (0.17 | ) | | 0.05 | | 2.04 | | | 1.92 | | | (0.17 | ) | | (0.17 | ) | | $ | 15.04 | | 14.57% | | | $ | 1,496 | | | 2.20% | | | (1.16% | ) | | | (j) | | | (j) | | 341.57% |
Year Ended October 31, 2005 | | $ | 15.04 | | (0.12 | ) | | — | | 4.46 | | | 4.34 | | | (1.93 | ) | | (1.93 | ) | | $ | 17.45 | | 30.72% | | | $ | 2,302 | | | 2.29% | | | (0.88% | ) | | 2.32% | | | (0.90% | ) | | 292.46% |
| | | | | | | | | | | | | | | |
Class C Shares | | | | | | | | | | | | | | | | | | | | | | | | | | | | | | | | | | | | | | | | | | | | |
Period Ended October 31, 2001 (d) | | $ | 11.33 | | (0.04 | ) | | — | | (0.66 | ) | | (0.70 | ) | | — | | | — | | | $ | 10.63 | | (6.18% | )(g) | | $ | 20 | | | 2.10% | (h) | | (1.26% | )(h) | | 5.62% | (h) | | (4.78% | )(h) | | 119.03% |
Year Ended October 31, 2002 | | $ | 10.63 | | (0.09 | ) | | — | | (1.13 | ) | | (1.22 | ) | | — | | | — | | | $ | 9.41 | | (11.48% | ) | | $ | 28 | | | 2.17% | | | (0.90% | ) | | 2.47% | | | (1.20% | ) | | 111.00% |
Year Ended October 31, 2003 | | $ | 9.41 | | (0.09 | ) | | — | | 3.99 | | | 3.90 | | | — | | | — | | | $ | 13.31 | | 41.45% | | | $ | 89 | | | 2.20% | | | (1.04% | ) | | 2.31% | | | (1.15% | ) | | 100.05% |
Year Ended October 31, 2004 | | $ | 13.31 | | (0.13 | ) | | 0.05 | | 2.01 | | | 1.93 | | | (0.17 | ) | | (0.17 | ) | | $ | 15.07 | | 14.62% | | | $ | 180 | | | 2.20% | | | (1.16% | ) | | | (j) | | | (j) | | 341.57% |
Year Ended October 31, 2005 (i) | | $ | 15.07 | | (0.17 | ) | | — | | 4.51 | | | 4.34 | | | (1.93 | ) | | (1.93 | ) | | $ | 17.48 | | 30.67% | | | $ | 5,468 | | | 2.33% | | | (1.00% | ) | | 2.33% | | | (1.00% | ) | | 292.46% |
| | | | | | | | | | | | | | | |
Class R Shares | | | | | | | | | | | | | | | | | | | | | | | | | | | | | | | | | | | | | | | | | | | | |
Period Ended October 31, 2004 (e) | | $ | 14.03 | | (0.09 | ) | | 0.05 | | 1.11 | | | 1.07 | | | — | | | — | | | $ | 15.10 | | 7.63% | (g) | | $ | 1 | | | 1.73% | (h) | | (0.63% | )(h) | | | (j) | | | (j) | | 341.57% |
Year Ended October 31, 2005 | | $ | 15.10 | | (0.03 | ) | | — | | 4.49 | | | 4.46 | | | (1.93 | ) | | (1.93 | ) | | $ | 17.63 | | 31.47% | | | $ | 152 | | | 1.74% | | | (0.25% | ) | | 1.74% | | | (0.25% | ) | | 292.46% |
| | | | | | | | | | | | | | | |
Institutional Service Class Shares | | | | | | | | | | | | | | | | | | | | | | | | | | | | | | | | | | | | | | | | | | | | |
Year Ended October 31, 2001 | | $ | 13.15 | | — | | | — | | (1.23 | ) | | (1.23 | ) | | (1.08 | ) | | (1.08 | ) | | $ | 10.84 | | (9.90% | ) | | $ | 4,485 | | | 1.20% | | | (0.04% | ) | | 1.79% | | | (0.63% | ) | | 119.03% |
Year Ended October 31, 2002 | | $ | 10.84 | | (0.01 | ) | | — | | (1.16 | ) | | (1.17 | ) | | — | | | — | | | $ | 9.67 | | (10.79% | ) | | $ | 5,856 | | | 1.38% | | | (0.11% | ) | | 1.57% | | | (0.30% | ) | | 111.00% |
Year Ended October 31, 2003 | | $ | 9.67 | | (0.02 | ) | | — | | 4.14 | | | 4.12 | | | — | | | — | | | $ | 13.79 | | 42.61% | | | $ | 18,584 | | | 1.45% | | | (0.35% | ) | | 1.54% | | | (0.44% | ) | | 100.05% |
Year Ended October 31, 2004 (i) | | $ | 13.79 | | (0.06 | ) | | 0.05 | | 2.11 | | | 2.10 | | | (0.17 | ) | | (0.17 | ) | | $ | 15.72 | | 15.43% | | | $ | 7 | | | 1.45% | | | (0.39% | ) | | | (j) | | | (j) | | 341.57% |
Year Ended October 31, 2005 | | $ | 15.72 | | 0.11 | | | — | | 4.62 | | | 4.73 | | | (1.93 | ) | | (1.93 | ) | | $ | 18.52 | | 31.91% | | | $ | — | (k) | | 1.49% | | | 0.76% | | | 1.58% | | | 0.68% | | | 292.46% |
| | | | | | | | | | | | | | | |
Institutional Class Shares | | | | | | | | | | | | | | | | | | | | | | | | | | | | | | | | | | | | | | | | | | | | |
Period Ended October 31, 2004 (f) | | $ | 15.64 | | (0.01 | ) | | 0.05 | | 0.07 | | | 0.11 | | | — | | | — | | | $ | 15.75 | | 0.70% | (g) | | $ | 120 | | | 1.20% | (h) | | (0.22% | )(h) | | | (j) | | | (j) | | 341.57% |
Year Ended October 31, 2005 | | $ | 15.75 | | 0.01 | | | — | | 4.72 | | | 4.73 | | | (1.93 | ) | | (1.93 | ) | | $ | 18.55 | | 31.93% | | | $ | 1,120 | | | 1.32% | | | 0.12% | | | 1.32% | | | 0.12% | | | 292.46% |
| | | | | | | | | | | | | | | | | | | | | | | | | | | | | | | | | | | | | | | | | | | | | |
| | |
(a) Excludes sales charge. | | (g) Not annualized. |
(b) During the period certain fees were waived and/or reimbursed. If such waivers/reimbursements had not occurred, the ratios would have been as indicated. | | (h)Annualized. (i) Net investment income (loss) is based on average shares outstanding during the period. (j) There were no fee reductions during the period. (k) The amount is less than $1,000. |
(c) Portfolio turnover is calculated on the basis of the Fund as a whole without distinguishing among the classes of shares. | |
(d) For the period from March 1, 2001 (commencement of operations) through October 31, 2001. | |
(e) For the period from December 30, 2003 (commencement of operations) through October 31, 2004. | |
(f) For the period from June 29, 2004 (commencement of operations) through October 31, 2004. | | |
See notes to financial statements.
For the annual period ended Oct. 31, 2005, the Gartmore Bond Fund (Class A at NAV) returned 1.87% versus 0.80% for its benchmark, the Lehman Brothers Government/Credit Bond Index. For broader comparison, the average return for the Fund’s Lipper peer category of Corporate Debt Funds A Rated was 0.98%.
The Federal Reserve Board continued to raise the federal funds rate during the past year, moving from 1.75% to 3.75%, as of Oct. 31, 2005. The Treasury yield curve flattened dramatically as compared to that of the previous year. During the past year, the two-year Treasury rose in yield by 179 basis points, while the 30-year Treasury fell in yield by 8 basis points.
Early in the reporting period, the Fund reduced its holdings in the intermediate part of the Treasury yield curve. The reduction of intermediate holdings aided Fund performance. As the Treasury yield curve flattens, intermediate bonds underperform. Toward the end of the reporting period, General Motors Acceptance Corp. bonds increased in value due to General Motors’ announcement that it planned to sell off a majority stake in the unit to regain investment-grade ratings. An overweight in General Motors Acceptance Corp. bonds relative to the benchmark Index added to Fund performance. The duration of the Fund was modestly shorter than that of the benchmark, which also aided Fund performance.
During the coming months, we will begin to evaluate moving back into intermediate bonds, because this typically is the time for the yield curve to begin to steepen once the Fed finishes raising interest rates. The Fund will remain adequately diversified to mitigate exposure to credit-specific risk.
We expect investment-grade corporate bonds to remain somewhat more volatile with the dislocation caused by U.S. automaker difficulties and leveraged buyout fears. We will carefully monitor the Fund’s corporate holdings and reduce those that we believe may be at risk of underperforming relative to the benchmark.
Portfolio Managers:
Gary S. Davis, CFA and Mabel C. Brown
| | |
Fund Performance | | Gartmore Bond Fund |
Average Annual Total Return
(For periods ended October 31, 2005)
| | | | | | | | |
| | | | | 1 Yr. | | 5 Yr. | | 10 Yr. |
| Class A1 | | w/o SC2 | | 1.87% | | 6.82% | | 5.72% |
| | | w/SC3 | | -3.01% | | 5.78% | | 5.21% |
| Class B4 | | w/o SC2 | | 1.18% | | 6.17% | | 5.24% |
| | | w/SC5 | | -3.70% | | 5.85% | | 5.24% |
| Class C6 | | w/o SC2 | | 1.18% | | 6.13% | | 5.45% |
| | | w/SC7 | | 0.20% | | 6.13% | | 5.45% |
| Class D8 | | w/o SC2 | | 2.15% | | 7.09% | | 5.93% |
| | | w/SC9 | | -2.45% | | 6.12% | | 5.44% |
| Class R1,10 | | | | 1.81% | | 6.87% | | 5.82% |
| Class X1 | | w/o SC2 | | 1.44% | | 6.26% | | 5.29% |
| | | w/SC5 | | -3.45% | | 5.94% | | 5.29% |
| Class Y1 | | w/o SC2 | | 1.44% | | 6.23% | | 5.50% |
| | | w/SC7 | | 0.46% | | 6.23% | | 5.50% |
| Institutional Class1,10 | | | | 2.30% | | 7.11% | | 5.93% |
All figures showing the effect of a sales charge reflect the maximum charge possible, because it has the most dramatic effect on performance data.
| 1 | These returns through May 11, 1998 include performance of the Fund’s predecessor fund, and, for periods from May 11, 1998 to the creation of the class, include the performance of the Fund’s Class D shares. These returns were achieved prior to the creation of Class A and Class X shares (5/11/98), Class Y shares (3/1/01), Class R shares (10/1/03), and Institutional Class shares (6/29/04) . Excluding the effect of any fee waivers or reimbursements, such prior performance is similar to what Class A, Class R, Class X Class Y and Institutional Class shares would have produced during those periods because all classes of the Fund’s shares invest in the same portfolio of securities. The performance for these classes has been restated to reflect differences in sales charges (where applicable), but does not reflect the differing levels of other fees (primarily Rule 12b-1 and/or administrative services fees) applicable to such classes. If these other fees were reflected, the performance for each of these classes of shares would have been lower. |
| 2 | These returns do not reflect the effects of sales charges (SC). |
| 3 | A 4.75% front-end sales charge was deducted. |
| 4 | These returns through May 11, 1998 include performance of the Fund’s predecessor fund, and for the period from May 11, 1998 to the creation of the Fund’s Class B shares on September 4, 2003, include the performance of the Fund’s Class X shares. Excluding the effect of any fee waivers or reimbursements, such prior performance is similar to what Class B shares would have produced during those periods because all classes of the Fund’s shares invest in the same portfolio of securities. The performance for these classes has been restated to reflect differences in sales charges (where applicable), but does not reflect the differing levels of other fees (primarily Rule 12b-1 and/or administrative services fees) applicable to such classes. If these other fees were reflected, the performance for the Class B shares would have been lower. |
| 5 | A 5.00% contingent deferred sales charge (CDSC) was deducted. The CDSC declines to 0% after 6 years. |
| 6 | These returns through May 11, 1998 include performance of the Fund’s predecessor fund, for the period from May 11, 1998 to March 1, 2001 include the performance of the Fund’s Class D shares and for the period from March 1, 2001 to the creation of the Fund’s Class C shares on September 4, 2003, include the performance of the Fund’s Class Y shares. Excluding the effect of any fee waivers or reimbursements, such prior performance is similar to what Class C shares would have produced during those periods because all classes of the Fund’s shares invest in the same portfolio of securities. The performance for these classes has been restated to reflect differences in sales charges (where applicable), but does not reflect the differing levels of other fees (primarily Rule 12b-1 and/or administrative services fees) applicable to such classes. If these other fees were reflected, the performance for Class C shares would have been lower. |
| 7 | A CDSC of 1.00% was deducted from the one year return because it is charged when you sell Class C shares within the first year after purchase. |
| 8 | These returns through May 11, 1998 include the performance of the fund’s predecessor fund. |
| 9 | A 4.50% front-end sales charge was deducted. |
| 10 | Not subject to any sales charges. |
Performance of a $10,000 Investment
Investment return and principal value will fluctuate, and when redeemed, shares may be worth more or less than original cost. Past performance is no guarantee of future results and does not reflect the deduction of taxes that a shareholder would pay on fund distributions or the redemption of fund shares. Investing in mutual funds involves market risk, including loss of principal. Performance returns assume the reinvestment of all distributions.
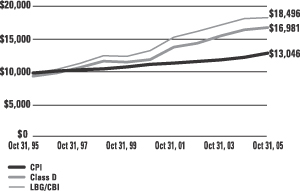
Comparative performance of $10,000 invested in Class D shares of the Gartmore Bond Fund, the Lehman Brothers Government/Credit Bond Index (LBG/CBI)(a), and the Consumer Price Index (CPI)(b) over a 10-year period ended 10/31/05. Unlike the Fund, the returns for these unmanaged indexes do not reflect any fees, expenses, or sales charges. Investors cannot invest directly in market indexes.
| (a) | The LBG/CBI is an unmanaged index of government and corporate bonds-gives a broad look at how the prices of U.S. government and corporate bonds have performed. |
| (b) | The CPI represents changes in prices of a basket of goods and services purchased for consumption by urban households. |
| | |
Shareholder Expense Example | | Gartmore Bond Fund |
As a shareholder of the Fund, you incur two types of costs: (1) transaction costs, including sales charges (loads) paid on purchase payments and redemption fees; and (2) ongoing costs, including investment advisory fees, administration fees, distribution fees and other Fund expenses. The examples below are intended to help you understand your ongoing costs (in dollars) of investing in the Fund and to compare these costs with the ongoing costs of investing in other mutual funds. Per SEC requirements, the examples assume that you had a $1,000 investment in the Class at the beginning of the reporting period, May 1, 2005, and continued to hold your shares at the end of the reporting period, October 31, 2005.
Actual Expenses
For each Class of the Fund in the table below, the first line provides information about actual account values and actual expenses. You may use the information in this line, together with the amount you invested, to estimate the expenses that you paid over the period. Simply divide your account value by $1,000 (for example, an $8,600 account value divided by $1,000 = 8.6), then multiply the result by the number in the first line of each Class under the heading entitled “Expenses Paid During Period” to estimate the expenses you paid on your account during the period.
Hypothetical Example for Comparison Purposes
The second line of each Class in the table below provides information about hypothetical account values and hypothetical expenses based on the Class’ actual expense ratio and an assumed rate of return of 5% per year before expenses, which is not the Class’ actual return. The hypothetical account values and expenses may not be used to estimate the actual ending account balance or expenses you paid for the period. You may use this information to compare the ongoing costs of investing in the Class of the Fund and other funds. To do so, compare this 5% hypothetical example with the 5% hypothetical examples that appear in the shareholder reports of the other funds.
Please note that the expenses shown in the table are meant to highlight your ongoing costs only and do not reflect any transaction costs, such as sales charges (loads) or redemption fees. Therefore, the second line for each Class in the table is useful in comparing ongoing costs only, and will not help you determine the relative total costs of owning different funds. In addition, if these transaction costs were included, your costs would have been higher. The examples also assume all dividends and distributions have been reinvested.
Schedule of Shareholder Expenses
Expense Analysis of a $1,000 Investment
(October 31, 2005)
| | | | | | | | | | | | | | |
| Bond Fund | | | | | Beginning
Account Value,
May 1, 2005 | | Ending
Account Value,
October 31, 2005 | | Expenses Paid
During Period* | | Annualized
Expense Ratio* |
| Class A | | Actual | | | $ | 1,000.00 | | $ | 1,004.10 | | $ | 5.61 | | 1.11% |
| | | Hypothetical | 1 | | $ | 1,000.00 | | $ | 1,019.40 | | $ | 5.67 | | 1.11% |
| Class B | | Actual | | | $ | 1,000.00 | | $ | 1,000.70 | | $ | 8.98 | | 1.78% |
| | | Hypothetical | 1 | | $ | 1,000.00 | | $ | 1,016.03 | | $ | 9.09 | | 1.78% |
| Class C | | Actual | | | $ | 1,000.00 | | $ | 1,000.70 | | $ | 8.93 | | 1.77% |
| | | Hypothetical | 1 | | $ | 1,000.00 | | $ | 1,016.08 | | $ | 9.03 | | 1.77% |
| Class D | | Actual | | | $ | 1,000.00 | | $ | 1,006.50 | | $ | 4.20 | | 0.83% |
| | | Hypothetical | 1 | | $ | 1,000.00 | | $ | 1,020.82 | | $ | 4.24 | | 0.83% |
| Class R | | Actual | | | $ | 1,000.00 | | $ | 1,004.80 | | $ | 5.76 | | 1.14% |
| | | Hypothetical | 1 | | $ | 1,000.00 | | $ | 1,019.25 | | $ | 5.82 | | 1.14% |
| Class X | | Actual | | | $ | 1,000.00 | | $ | 1,002.50 | | $ | 8.23 | | 1.63% |
| | | Hypothetical | 1 | | $ | 1,000.00 | | $ | 1,016.78 | | $ | 8.32 | | 1.63% |
| Class Y | | Actual | | | $ | 1,000.00 | | $ | 1,002.50 | | $ | 8.23 | | 1.63% |
| | | Hypothetical | 1 | | $ | 1,000.00 | | $ | 1,016.78 | | $ | 8.32 | | 1.63% |
| Institutional Class | | Actual | | | $ | 1,000.00 | | $ | 1,006.80 | | $ | 3.89 | | 0.77% |
| | | Hypothetical | 1 | | $ | 1,000.00 | | $ | 1,021.12 | | $ | 3.93 | | 0.77% |
| * | Expenses are equal to the Fund’s annualized expense ratio multiplied by the average account value over the period multiplied by 184/365 (to reflect the one-half year period). The expense ratio presented represents a six month, annualized ratio in accordance with SEC guidelines. |
| 1 | Represents the hypothetical 5% return before expenses. |
| | |
Portfolio Summary | | Gartmore Bond Fund |
The SEC adopted a requirement that Funds present their portfolio holdings in a table, chart or graph format in their annual and semiannual reports to shareholders, whether or not a statement of investments is utilized. The following tables, which present portfolio holdings as a percentage of net assets, are provided in compliance with this requirement.
| | |
| Asset Allocation | | |
| Corporate Bonds | | 46.4% |
U.S. Government Sponsored & Agency Obligations | | 24.6% |
| Commercial Paper | | 14.2% |
| Commercial Mortgage Backed Securities | | 8.0% |
| Asset Backed Securities | | 5.6% |
| Principal Only Bond | | 1.0% |
| Yankee Bond | | 0.9% |
| Taxable Municipal Bonds | | 0.5% |
| Other Investments* | | 1.4% |
| Liabilities in excess of Other Assets** | | -2.6% |
| | |
|
| | | 100.0% |
| * | Includes value of collateral received from securities lending. |
| ** | Includes value of collateral owed from securities lending. |
| | |
| Top Industries | | |
| Federal National Mortgage Association | | 8.2% |
| U.S. Treasury Bonds | | 8.0% |
| Financial / Miscellaneous | | 7.3% |
| Commercial Services | | 7.2% |
| U.S. Treasury Notes | | 4.9% |
| Utilities | | 3.4% |
| Airlines | | 3.4% |
| Federal Home Loan Mortgage Corporation | | 3.2% |
| Oil & Gas | | 3.0% |
| Paper & Forest Products | | 2.7% |
| Other Industries | | 48.7% |
| | |
|
| | | 100.0% |
| | |
| Top Holdings | | |
| U.S. Treasury Bonds, 5.50%, 08/15/28 | | 7.0% |
| Kitty Hawk, 4.05%, 11/01/05 | | 3.4% |
| U.S. Treasury Notes, 4.25%, 08/15/15 | | 3.3% |
Federal Home Loan Mortgage Corporation, 3.50%, 07/01/18 | | 3.2% |
| Bristol-Myers Squibb PP, 4.01%, 11/03/05 | | 3.0% |
| American General Finance Corp., 4.01%, 11/07/05 | | 2.9% |
Federal National Mortgage Association, 7.30%, 05/25/10 | | 2.8% |
| Countrywide Home Loans, 4.08%, 11/01/05 | | 2.7% |
| Becton, Dickinson & Co., 4.03%, 11/01/05 | | 2.2% |
| Willamette Industries, Inc., 7.35%, 07/01/26 | | 1.8% |
| Other Holdings | | 67.7% |
| | |
|
| | | 100.0% |
Statement of Investments
October 31, 2005
Asset Back Securities (5.6%)
| | | | | | |
| | | Principal
Amount | | Value |
| | | | | | | |
Ameriquest Mortgage Securities, Inc., 7.14%, 02/25/33 | | $ | 1,000,000 | | $ | 1,003,106 |
Chase Funding Mortgage Loan, 6.24%, 01/25/13 | | | 1,398,760 | | | 1,418,584 |
Residential Asset Mortgage Products, Inc., 2002-RSI-AI5, 5.91%, 01/25/32 | | | 1,180,302 | | | 1,179,261 |
Residential Funding Securities Corp. 2003-RM2-AI3, 4.50%, 05/25/33 | | | 1,000,000 | | | 964,456 |
Salomon Smith Barney Recreational Vehicle Trust, 6.30%, 04/15/16 | | | 1,000,000 | | | 1,012,829 |
Structured Asset Securities Corp., Series 2004-6XS, Class A6, 4.63%, 03/25/34 | | | 1,000,000 | | | 968,910 |
| | | | | |
|
|
| | |
Total Asset Backed Securities | | | | | | 6,547,146 |
| | | | | |
|
|
|
Commercial Mortgage Backed Securities (8.0%) |
Banks (0.8%) | | | |
ABN Amro Mortgage Corp., Class A23, 5.50%, 06/25/33 | | | 1,000,000 | | | 994,495 |
| | | | | |
|
|
Commercial Services (7.2%) | | | | | | |
Commercial Mortgage, Series 2001-J1A, Class B, 6.61%, 02/16/34 (b) | | | 1,000,000 | | | 1,062,557 |
Heller Financial Commercial Mortgage Asset, 6.85%, 05/15/31 | | | 2,000,000 | | | 2,096,967 |
JP Morgan Chase Commercial Mortgage Securities, 6.26%, 03/15/33 | | | 2,000,000 | | | 2,101,191 |
Merrill Lynch Mortgage Investors, Inc., 7.56%, 09/15/09 | | | 1,938,189 | | | 2,079,758 |
Nomura Asset Securities Corp., 6.69%, 03/15/30 | | | 1,000,000 | | | 1,077,637 |
| | | | | |
|
|
| | | | | | | 8,418,110 |
| | | | | |
|
|
| |
Total Commercial Mortgage Backed Securities | | | 9,412,605 |
| | | | | |
|
|
Corporate Bonds (46.4%)
| | | | | | |
| | | Principal
Amount | | Value |
| | | | | | | |
Air Freight & Couriers (0.9%) | | | |
Federal Express Corp., 7.63%, 01/01/15 | | $ | 1,000,000 | | $ | 1,064,130 |
| | | | | |
|
|
Airlines (3.4%) | | | |
America West Airlines, Series A, 6.85%, 07/02/09 | | | 339,309 | | | 334,868 |
Continental Airlines, Inc., Class A-2, Series 98-3, 6.32%, 11/01/08 | | | 1,000,000 | | | 988,599 |
Southwest Airlines Co., Class A-1, Series 01-1, 5.10%, 05/01/06 | | | 787,842 | | | 788,212 |
United Air Lines, Inc., 6.60%, 09/01/13 | | | 1,910,000 | | | 1,864,078 |
| | | | | |
|
|
| | | | | | | 3,975,757 |
| | | | | |
|
|
Automobiles (1.7%) | | | |
Daimlerchrysler, Inc., 7.30%, 01/15/12 | | | 1,000,000 | | | 1,070,827 |
Nissan Motor Acceptance,
4.63%, 03/8/10 (b) | | | 1,000,000 | | | 972,898 |
| | | | | |
|
|
| | | | | | | 2,043,725 |
| | | | | |
|
|
Banks (0.8%) | | | | | | |
Rabobank Cap III, 5.25%, 12/29/49 | | | 1,000,000 | | | 964,836 |
| | | | | |
|
|
Computers (0.6%) | | | | | | |
Digital Equipment Corp., 7.75%, 04/01/23 | | | 575,000 | | | 648,572 |
| | | | | |
|
|
Construction & Building Materials (1.4%) | | | |
Caterpillar, Inc., 9.38%, 08/15/11 | | | 500,000 | | | 602,174 |
Masco Corp., 6.75%, 03/15/06 | | | 1,000,000 | | | 1,007,528 |
| | | | | |
|
|
| | | | | | | 1,609,702 |
| | | | | |
|
|
Electronics (0.9%) | | | | | | |
Texas Instruments, Inc., 6.13%, 02/01/06 | | | 1,000,000 | | | 1,003,306 |
| | | | | |
|
|
Financial Leasing Company (0.4%) | | | |
Xtra, Inc., 6.88%, 03/15/06 | | | 430,000 | | | 432,543 |
| | | | | |
|
|
Gartmore Bond Fund
Statement of Investments (Continued)
October 31, 2005
Gartmore Bond Fund (Continued)
| | Corporate Bonds (Continued) |
| | | | | | |
| | | Principal
Amount | | Value |
| | | | | | | |
Financial Miscellaneous (7.3%) | | | | | | |
Block Financial Corp., 8.50%, 04/15/07 | | $ | 1,000,000 | | $ | 1,048,657 |
Countrywide Financial, 3.50%, 12/19/05 | | | 1,000,000 | | | 999,008 |
Ford Motor Credit Co., 7.38%, 02/01/11 | | | 500,000 | | | 469,599 |
General Motors Acceptance Corp., 6.75%, 12/01/14 | | | 500,000 | | | 478,118 |
International Lease Finance Corp., 5.75%, 10/15/06 | | | 1,000,000 | | | 1,006,302 |
John Deere Capital Corp., 4.50%, 08/25/08 | | | 1,000,000 | | | 989,317 |
OMX Timber Fin Inv LLC, Class A1, 5.42%, 01/29/20 | | | 1,000,000 | | | 990,370 |
Regions Financial Corp., 7.00%, 03/01/11 | | | 1,600,000 | | | 1,742,241 |
SLM Corp., 4.21%, 12/15/08 | | | 1,000,000 | | | 1,000,462 |
| | | | | |
|
|
| | | | | | | 8,724,074 |
| | | | | |
|
|
Food & Related (2.4%) | | | | | | |
McCormick & Co., Inc., 6.40%, 02/01/06 | | | 1,000,000 | | | 1,004,897 |
Whitman Corp., 7.29%, 09/15/26 | | | 1,500,000 | | | 1,771,365 |
| | | | | |
|
|
| | | | | | | 2,776,262 |
| | | | | |
|
|
Hotels & Casinos (1.9%) | | | | | | |
Harrah’s Operating Co., Inc., 7.88%, 12/15/05 | | | 1,200,000 | | | 1,204,500 |
MGM Mirage, Inc., 6.75%, 08/01/07 | | | 1,000,000 | | | 1,010,000 |
| | | | | |
|
|
| | | | | | | 2,214,500 |
| | | | | |
|
|
Insurance (1.9%) | | | | | | |
AMBAC, Inc., 9.38%, 08/01/11 | | | 1,000,000 | | | 1,196,537 |
Ohio Casualty Corp., 7.30%, 06/15/14 | | | 1,000,000 | | | 1,061,523 |
| | | | | |
|
|
| | | | | | | 2,258,060 |
| | | | | |
|
|
Machinery & Capital Goods (1.1%) | | | |
Clark Equipment Co.,
8.00%, 05/01/23 | | | 1,000,000 | | | 1,248,707 |
| | | | | |
|
|
Medical Equipment & Supplies (2.6%) | | | |
Bard (C.R.) Inc., 6.70%, 12/01/26 | | | 1,000,000 | | | 1,117,493 |
Baxter Finco BV, 4.75%, 10/15/10 | | | 1,000,000 | | | 981,963 |
Guidant Corp., 6.15%, 02/15/06 | | | 1,000,000 | | | 1,004,630 |
| | | | | |
|
|
| | | | | | | 3,104,086 |
| | | | | |
|
|
| | | | | | |
| | | Principal
Amount | | Value |
| | | | | | | |
Mortgage Bankers & Brokers (1.2%) | | | |
Enterprise Mortgage Acceptance Co., 6.63%, 01/15/25 | | $ | 2,000,000 | | $ | 1,364,137 |
| | | | | |
|
|
Motor Vehicle Parts & Accessories (2.5%) | | | |
Eaton Corp., 8.88%, 06/15/19 | | | 1,500,000 | | | 1,930,001 |
Pennzoil-Quaker State, 10.00%, 11/01/08 | | | 1,000,000 | | | 1,050,000 |
| | | | | |
|
|
| | | | | | | 2,980,001 |
| | | | | |
|
|
Natural Gas (2.6%) | | | |
Columbia Energy Group, 6.80%, 11/28/05 | | | 2,000,000 | | | 2,003,302 |
ONEOK, Inc., 7.75%, 08/15/06 | | | 1,000,000 | | | 1,019,701 |
| | | | | |
|
|
| | | | | | | 3,023,003 |
| | | | | |
|
|
Nuclear Energy (0.8%) | | | |
USEC, Inc., 6.63%, 01/20/06 | | | 1,000,000 | | | 992,500 |
| | | | | |
|
|
Office Furniture (0.9%) | | | |
Herman Miller, Inc., 7.13%, 03/15/11 | | | 1,000,000 | | | 1,073,835 |
| | | | | |
|
|
Oil & Gas (3.0%) | | | |
Kinder Morgan, Inc., 6.50%, 09/01/12 | | | 1,500,000 | | | 1,587,333 |
Pemex Project Funding Master Trust, 5.75%, 12/15/15 (b) | | | 1,000,000 | | | 971,000 |
Sempra Energy, 6.95%, 12/01/05 | | | 1,000,000 | | | 1,001,859 |
| | | | | |
|
|
| | | | | | | 3,560,192 |
| | | | | |
|
|
Paper & Forest Products (2.7%) | | | |
Temple-Inland, Inc., 7.88%, 05/01/12 | | | 1,000,000 | | | 1,090,386 |
Willamette Industries, Inc., 7.35%, 07/01/26 | | | 2,000,000 | | | 2,108,670 |
| | | | | |
|
|
| | | | | | | 3,199,056 |
| | | | | |
|
|
Security Brokers & Dealers (0.8%) | | | |
Nuveen Investments, 5.50%, 09/15/15 | | | 1,000,000 | | | 971,041 |
| | | | | |
|
|
Telecommunications (1.3%) | | | |
US West Communications, Inc., 6.88%, 09/15/33 | | | 1,750,000 | | | 1,548,750 |
| | | | | |
|
|
Utilities (3.4%) | | | |
Baltimore Gas & Electric, 7.50%, 01/15/07 | | | 1,200,000 | | | 1,237,417 |
Interstate P&L Co., 7.25%, 10/01/06 | | | 1,000,000 | | | 1,022,244 |
Corporate Bonds (continued)
| | | | | | |
| | | Principal
Amount | | Value |
| | | | | | | |
Utilities (continued) | | | |
Pacific Gas & Electric, 6.05%, 03/01/34 | | $ | 750,000 | | $ | 753,474 |
Southwestern Electric Power Co., 7.00%, 09/01/07 | | | 1,000,000 | | | 1,033,791 |
| | | | | |
|
|
| | | | | | | 4,046,926 |
| | | | | |
|
|
| | |
Total Corporate Bonds | | | | | | 54,827,701 |
| | | | | |
|
|
|
Principal Only Bond (1.0%) |
U.S. Treasury Strips (1.0%) | | | | | | |
4.75%, 08/15/20 | | | 2,500,000 | | | 1,221,855 |
| | | | | |
|
|
| | |
Total Principal Only Bond | | | | | | 1,221,855 |
| | | | | |
|
|
|
Taxable Municipal Bonds (0.5%) |
Louisiana (0.5%) | | | | | | |
Tobacco Settlement Financing Corp., 6.36%, 05/15/25 | | | 578,532 | | | 582,801 |
| | | | | |
|
|
| | |
Total Taxable Municipal Bonds | | | | | | 582,801 |
| | | | | |
|
|
|
U.S. Government Sponsored & Agency Obligations (24.6%) |
Federal Home Loan Mortgage Corporation (3.2%) | | | |
3.50%, 07/01/18, Gold Pool E01443 | | | 4,091,869 | | | 3,774,178 |
| | | | | |
|
|
Federal National Mortgage Association (8.2%) | | | |
7.02%, 09/01/07, Pool #323286 | | | 1,001,692 | | | 1,013,801 |
7.30%, 05/25/10, Series 00-T5 | | | 3,000,000 | | | 3,288,394 |
6.62%, 06/01/16, Pool #383661 | | | 1,900,571 | | | 2,100,733 |
5.00%, 04/01/19, Pool #386905 | | | 980,585 | | | 964,962 |
6.85%, 05/17/20, Series 97-M6 | | | 276,222 | | | 280,206 |
5.50%, 05/25/23, Series 03-33 | | | 2,000,000 | | | 2,020,191 |
| | | | | |
|
|
| | | | | | | 9,668,287 |
| | | | | |
|
|
U.S. Government Sponsored & Agency Obligations (continued)
| | | | | | |
| | | Principal
Amount | | Value |
| | | | | | | |
Sovereign Agency (0.3%) | | | |
AID-Israel, 0.00%, 05/15/24 | | $ | 1,000,000 | | $ | 386,781 |
| | | | | |
|
|
U.S. Treasury Bonds (8.0%) | | | |
5.50%, 08/15/28 | | | 7,500,000 | | | 8,201,663 |
5.375%, 02/15/31 (c) | | | 1,085,000 | | | 1,183,328 |
| | | | | |
|
|
| | | | | | | 9,384,991 |
| | | | | |
|
|
U.S. Treasury Notes (4.9%) | | | |
4.13%, 08/15/08 (c) | | | 1,000,000 | | | 992,578 |
4.13%, 05/15/15 (c) | | | 1,000,000 | | | 965,000 |
4.25%, 08/15/15 (c) | | | 3,950,000 | | | 3,854,335 |
| | | | | |
|
|
| | | | | | | 5,811,913 |
| | | | | |
|
|
| |
Total U.S. Government Sponsored & Agency Obligations | | | 29,026,150 |
| | | | | |
|
|
|
Yankee Bond (0.9%) |
Consumer Products (0.9%) | | | |
Tupperware Finance Co. BV, 7.25%, 10/01/06 | | | 1,000,000 | | | 1,008,202 |
| | | | | |
|
|
| |
Total Yankee Bond | | | 1,008,202 |
| | | | | |
|
|
|
Commercial Paper (14.2%) |
Countrywide Home Loans, 4.08%, 11/01/05 | | | 3,174,000 | | | 3,174,000 |
American General Finance Corp., 4.01%, 11/07/05 | | | 3,430,000 | | | 3,427,708 |
Bristol-Myers Squibb PP, 4.01%, 11/03/05 (b) | | | 3,500,000 | | | 3,499,220 |
Becton, Dickinson & Co., 4.03%, 11/01/05 | | | 2,612,000 | | | 2,612,000 |
Kitty Hawk,
4.05%, 11/01/05 | | | 4,000,000 | | | 4,000,000 |
| | | | | |
|
|
| |
Total Commercial Paper | | | 16,712,928 |
| | | | | |
|
|
Statement of Investments (Continued)
October 31, 2005
Gartmore Bond Fund (Continued)
Short Term Securities Held as Collateral for Securities Lending
| | | | | | | |
| | | Principal
Amount | | Value | |
| | | | | | | | |
Pool of short-term securities for Gartmore Mutual Funds — note 2 (Securities Lending) | | $ | 1,630,770 | | $ | 1,630,770 | |
| | | | | |
|
|
|
| |
Total Short-Term securities Held as Collateral for Securities Lending | | | 1,630,770 | |
| | | | | |
|
|
|
| |
Total Investments
(Cost $117,707,549) (a) — 102.6% | | | 120,970,158 | |
| | |
Liabilities in excess of other assets — (2.6%) | | | | | | (3,043,438 | ) |
| | | | | |
|
|
|
| |
NET ASSETS — 100.0% | | $ | 117,926,720 | |
| | | | | |
|
|
|
| | (a) | See notes to financial statements for tax unrealized appreciation (depreciation) of securities. |
| | (b) | Represents a restricted security acquired and eligible for resale under Rule 144A, which limits the resale to certain qualified buyers. These securities were deemed liquid pursuant to procedures approved by the Board of Trustees. |
| | (c) | All or part of the security was on loan as of October 31, 2005. |
See notes to financial statements.
| | |
Gartmore Government Bond Fund | | |
For the annual period ended Oct. 31, 2005, the Gartmore Government Bond Fund (Class A at NAV) returned 1.46% versus 0.99% for its benchmark, the Merrill Lynch Government Master Index. For broader comparison, the average return for the Fund’s Lipper peer category of Intermediate U.S. Government Funds was 0.56%.
The main driver of Fund returns was the price component. When yields rise, negative price action occurs and bond prices fall. The price return was negative due to the Federal Reserve Board’s continued increase of the federal funds rate during the reporting period; the two-year Treasury yield increased 1.79% while the 10-year Treasury yield rose 0.47%. Offsetting this downside effect, however, was the Fund’s large cash weighting, which benefited from increasing yields. Also, holdings on the longer end of the Treasury yield curve, where the price action was more favorable, contributed to returns. Fund returns also were helped by the Fund’s emphasis on earning additional income through holding a large weighting in U.S. Agency debentures and U.S. Agency mortgage-backed securities (MBS).
After being underweight in duration for most of the reporting period, the Fund is now just 0.25 year short in duration versus that of the Fund’s benchmark Index; we believe that the Fed’s interest-rate tightening soon will end. Also, the Fund’s maturity profile is being moved closer to that of the benchmark, based on our expectation that the next move by the Fed will be to lower interest rates on the front end of the Treasury curve in the coming months. In addition, an emphasis will be placed on MBS, as this sector has cheapened and looks attractive, given the high quality.
Portfolio Manager:
Gary Hunt, CFA
| | |
Fund Performance | | Gartmore Government Bond Fund |
Average Annual Total Return
(For periods ended October 31, 2005)
| | | | | | | | |
| | | | | 1 Yr. | | 5 Yr. | | 10 Yr. |
| Class A1 | | w/o SC2 | | 1.46% | | 5.70% | | 5.75% |
| | | w/SC3 | | -3.38% | | 4.67% | | 5.24% |
| Class B4 | | w/o SC2 | | 0.85% | | 5.10% | | 5.29% |
| | | w/SC5 | | -4.06% | | 4.77% | | 5.29% |
| Class C6 | | w/o SC2 | | 0.75% | | 5.01% | | 5.47% |
| | | w/SC7 | | -0.23% | | 5.01% | | 5.47% |
| Class D8 | | w/o SC2 | | 1.76% | | 5.96% | | 5.94% |
| | | w/SC9 | | -2.83% | | 4.99% | | 5.45% |
| Class R1,10 | | | | 1.34% | | 5.77% | | 5.85% |
| Class X1 | | w/o SC2 | | 1.00% | | 5.15% | | 5.31% |
| | | w/SC5 | | -3.91% | | 4.82% | | 5.31% |
| Class Y1 | | w/o SC2 | | 1.00% | | 5.09% | | 5.51% |
| | | w/SC7 | | 0.02% | | 5.09% | | 5.51% |
| Institutional Class1,10 | | | | 1.72% | | 5.98% | | 5.95% |
All figures showing the effect of a sales charge reflect the maximum charge possible, because it has the most dramatic effect on performance data.
| 1 | These returns through May 11, 1998 include performance of the Fund’s predecessor fund, and, for periods from May 11, 1998 to the creation of the class, include the performance of the Fund’s Class D shares. These returns were achieved prior to the creation of Class A and Class X shares (5/11/98), Class Y shares (3/1/01),Class R shares (10/1/03), and Institutional Class shares (6/29/04). Excluding the effect of any fee waivers or reimbursements, such prior performance is similar to what Class A, Class R, Class X, Class Y and Institutional Class shares would have produced during those periods because all classes of the Fund’s shares invest in the same portfolio of securities. The performance for these classes has been restated to reflect differences in sales charges (where applicable), but does not reflect the differing levels of other fees (primarily Rule 12b-1 and/or administrative services fees) applicable to such classes. If these other fees were reflected, the performance for each of these classes of shares would have been lower. |
| 2 | These returns do not reflect the effects of sales charges (SC). |
| 3 | A 4.75% front-end sales charge was deducted. |
| 4 | These returns through May 11, 1998 include performance of the Fund’s predecessor fund, and for the period from May 11, 1998 to the creation of the Fund’s Class B shares on September 4, 2003, include the performance of the Fund’s Class X shares. Excluding the effect of any fee waivers or reimbursements, such prior performance is similar to what Class B shares would have produced during those periods because all classes of the Fund’s shares invest in the same portfolio of securities. The performance for these classes has been restated to reflect differences in sales charges (where applicable), but does not reflect the differing levels of other fees (primarily Rule 12b-1 and/or administrative services fees) applicable to such classes. If these other fees were reflected, the performance for the Class B shares would have been lower. |
| 5 | A 5.00% contingent deferred sales charge (CDSC) was deducted. The CDSC declines to 0% after 6 years. |
| 6 | These returns through May 11, 1998 include performance of the Fund’s predecessor fund, for the period from May 11, 1998 to March 1, 2001 include the performance of the Fund’s Class D shares and for the period from March 1, 2001 to the creation of the Fund’s Class C shares on September 4, 2003, include the performance of the Fund’s Class Y shares. Excluding the effect of any fee waivers or reimbursements, such prior performance is similar to what Class C shares would have produced during those periods because all classes of the Fund’s shares invest in the same portfolio of securities. The performance for these classes has been restated to reflect differences in sales charges (where applicable), but does not reflect the differing levels of other fees (primarily Rule 12b-1 and/or administrative services fees) applicable to such classes. If these other fees were reflected, the performance for Class C shares would have been lower. |
| 7 | A CDSC of 1.00% was deducted from the one year return because it is charged when you sell Class C shares within the first year after purchase. |
| 8 | These returns through May 11, 1998 include the performance of the fund’s predecessor fund. |
| 9 | A 4.50% front-end sales charge was deducted. |
| 10 | Not subject to any sales charges. |
Performance of a $10,000 Investment
Investment return and principal value will fluctuate, and when redeemed, shares may be worth more or less than original cost. Past performance is no guarantee of future results and does not reflect the deduction of taxes that a shareholder would pay on fund distributions or the redemption of fund shares. Investing in mutual funds involves market risk, including loss of principal. Performance returns assume the reinvestment of all distributions.
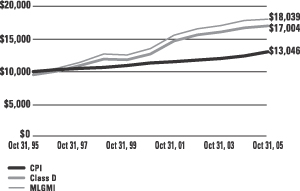
Comparative performance of $10,000 invested in Class D shares of the Gartmore Government Bond Fund, the Merrill Lynch Government Master Index (MLGMI)(a), and the Consumer Price Index (CPI)(b) over a 10-year period ended 10/31/05. Unlike the Fund, the returns for these unmanaged indexes do not reflect any fees, expenses, or sales charges. Investors cannot invest directly in market indexes.
| (a) | The MLGMI gives a broad look at how U.S. government bonds have performed. |
| (b) | The CPI represents changes in prices of a basket of goods and services purchased for consumption by urban households. |
| | |
Shareholder Expense Example | | Gartmore Government Bond Fund |
As a shareholder of the Fund, you incur two types of costs: (1) transaction costs, including sales charges (loads) paid on purchase payments and redemption fees; and (2) ongoing costs, including investment advisory fees, administration fees, distribution fees and other Fund expenses. The examples below are intended to help you understand your ongoing costs (in dollars) of investing in the Fund and to compare these costs with the ongoing costs of investing in other mutual funds. Per SEC requirements, the examples assume that you had a $1,000 investment in the Class at the beginning of the reporting period May 1, 2005, and continued to hold your shares at the end of the reporting period, October 31, 2005.
Actual Expenses
For each Class of the Fund in the table below, the first line provides information about actual account values and actual expenses. You may use the information in this line, together with the amount you invested, to estimate the expenses that you paid over the period. Simply divide your account value by $1,000 (for example, an $8,600 account value divided by $1,000 = 8.6), then multiply the result by the number in the first line of each Class under the heading entitled “Expenses Paid During Period” to estimate the expenses you paid on your account during the period.
Hypothetical Example for Comparison Purposes
The second line of each Class in the table below provides information about hypothetical account values and hypothetical expenses based on the Class’ actual expense ratio and an assumed rate of return of 5% per year before expenses, which is not the Class’ actual return. The hypothetical account values and expenses may not be used to estimate the actual ending account balance or expenses you paid for the period. You may use this information to compare the ongoing costs of investing in the Class of the Fund and other funds. To do so, compare this 5% hypothetical example with the 5% hypothetical examples that appear in the shareholder reports of the other funds.
Please note that the expenses shown in the table are meant to highlight your ongoing costs only and do not reflect any transaction costs, such as sales charges (loads) or redemption fees. Therefore, the second line for each Class in the table is useful in comparing ongoing costs only, and will not help you determine the relative total costs of owning different funds. In addition, if these transaction costs were included, your costs would have been higher. The examples also assume all dividends and distributions have been reinvested.
Schedule of Shareholder Expenses
Expense Analysis of a $1,000 Investment
(October 31, 2005)
| | | | | | | | | | | | | | |
| Government Bond Fund | | | | | Beginning
Account Value,
May 1, 2005 | | Ending
Account Value,
October 31, 2005 | | Expenses Paid
During Period* | | Annualized
Expense Ratio* |
| Class A | | Actual | | | $ | 1,000.00 | | $ | 1,000.80 | | $ | 5.60 | | 1.11% |
| | | Hypothetical | 1 | | $ | 1,000.00 | | $ | 1,019.40 | | $ | 5.67 | | 1.11% |
| Class B | | Actual | | | $ | 1,000.00 | | $ | 997.70 | | $ | 8.61 | | 1.71% |
| | | Hypothetical | 1 | | $ | 1,000.00 | | $ | 1,016.38 | | $ | 8.73 | | 1.71% |
| Class C | | Actual | | | $ | 1,000.00 | | $ | 997.70 | | $ | 8.61 | | 1.71% |
| | | Hypothetical | 1 | | $ | 1,000.00 | | $ | 1,016.38 | | $ | 8.73 | | 1.71% |
| Class D | | Actual | | | $ | 1,000.00 | | $ | 1,002.30 | | $ | 4.09 | | 0.81% |
| | | Hypothetical | 1 | | $ | 1,000.00 | | $ | 1,020.92 | | $ | 4.13 | | 0.81% |
| Class R | | Actual | | | $ | 1,000.00 | | $ | 1,000.60 | | $ | 5.29 | | 1.05% |
| | | Hypothetical | 1 | | $ | 1,000.00 | | $ | 1,019.71 | | $ | 5.36 | | 1.05% |
| Class X | | Actual | | | $ | 1,000.00 | | $ | 998.50 | | $ | 7.86 | | 1.56% |
| | | Hypothetical1 | | | $ | 1,000.00 | | $ | 1,017.14 | | $ | 7.96 | | 1.56% |
| Class Y | | Actual | | | $ | 1,000.00 | | $ | 998.50 | | $ | 7.86 | | 1.56% |
| | | Hypothetical | 1 | | $ | 1,000.00 | | $ | 1,017.14 | | $ | 7.96 | | 1.56% |
| Institutional Class | | Actual | | | $ | 1,000.00 | | $ | 1,002.40 | | $ | 3.63 | | 0.72% |
| | | Hypothetical | 1 | | $ | 1,000.00 | | $ | 1,021.37 | | $ | 3.67 | | 0.72% |
| * | Expenses are equal to the Fund’s annualized expense ratio multiplied by the average account value over the period multiplied by 184/365 (to reflect the one-half year period). The expense ratio presented represents a six month, annualized ratio in accordance with SEC guidelines. |
| 1 | Represents the hypothetical 5% return before expenses. |
| | |
Portfolio Summary | | Gartmore Government Bond Fund |
The SEC adopted a requirement that Funds present their portfolio holdings in a table, chart or graph format in their annual and semiannual reports to shareholders, whether or not a statement of investments is utilized. The following tables, which present portfolio holdings as a percentage of net assets, are provided in compliance with this requirement.
| | |
| Asset Allocation | | |
| U.S. Government Sponsored and Agency Obligations | | 98.8% |
| Cash Equivalents | | 0.3% |
| Other Investments* | | 0.6% |
| Other Assets in excess of Liabilities** | | 0.3% |
| | |
|
| | | 100.0% |
| * | Includes value of collateral received from securities lending. |
| ** | Includes value of collateral owed from securities lending. |
| | |
| Top Industries | | |
| Federal Home Loan Mortgage Corporation | | 32.5% |
| Federal National Mortgage Association | | 32.1% |
| Federal Home Loan Bank | | 23.0% |
| U.S. Treasury Inflation Protected Bonds | | 3.9% |
| U.S. Treasury Notes | | 3.7% |
| Sovereign Agency | | 3.6% |
| Other Industries | | 1.2% |
| | |
|
| | | 100.0% |
| | |
| Top Holdings*** | | |
Federal Home Loan Bank,
4.00%, 01/23/07 | | 15.1% |
Federal Home Loan Mortgage Corporation,
5.13%, 11/07/13 | | 6.1% |
Federal Home Loan Mortgage Corporation,
2.76%, 05/19/06 | | 6.0% |
Federal Home Loan Mortgage Corporation,
2.60%, 05/10/06 | | 6.0% |
Federal Home Loan Bank,
3.25%, 07/25/08 | | 6.0% |
Federal National Mortgage Association,
5.26%, 12/29/17 | | 5.9% |
U.S. Treasury Inflation Protected Bonds,
2.38%, 01/15/25 | | 3.9% |
U.S. Treasury Notes,
7.25%, 05/15/16 | | 3.7% |
Federal Home Loan Mortgage Corporation,
5.00%, 08/15/24 | | 3.5% |
Federal Home Loan Mortgage Corporation,
4.65%, 10/10/13 | | 2.9% |
| Other Holdings | | 40.9% |
| | |
|
| | | 100.0% |
| *** | For purpose of listing top holdings, repurchase agreements are considered cash equivalents and are included as part of Other Holdings. |
Statement of Investments
October 31, 2005
Gartmore Government Bond Fund
| | U.S. Government Sponsored & Agency Obligations (98.8%) |
| | | | | | |
| | | Principal
Amount | | Value |
| | | | | | | |
Federal Home Loan Bank (23.0%) | | | |
4.00%, 01/23/07 (b) | | $ | 25,000,000 | | $ | 24,821,751 |
6.02%, 01/09/08, Series AA-08 | | | 1,000,000 | | | 1,027,672 |
3.25%, 07/25/08, Series 1 | | | 10,000,000 | | | 9,834,760 |
5.99%, 04/15/13, Series BD-13 | | | 1,500,000 | | | 1,601,109 |
6.01%, 07/28/28, Series E-28 | | | 330,000 | | | 363,718 |
7.13%, 02/15/30, Series C-30 | | | 265,000 | | | 335,308 |
| | | | | |
|
|
| | | | | | | 37,984,318 |
| | | | | |
|
|
Federal Home Loan Mortgage Corporation (32.5%) | | | |
2.60%, 05/10/06, Series MTN | | | 10,000,000 | | | 9,907,130 |
2.76%, 05/19/06, Series MTN | | | 10,000,000 | | | 9,910,829 |
2.15%, 06/02/06, Series MTN | | | 1,000,000 | | | 986,929 |
5.50%, 04/01/07, Gold Pool #M90718 | | | 337,064 | | | 340,471 |
7.25%, 06/15/07, REMIC, Series 1313-G | | | 862 | | | 860 |
4.65%, 10/10/13, Series MTN | | | 5,000,000 | | | 4,807,245 |
5.13%, 11/07/13 | | | 10,000,000 | | | 10,000,869 |
5.50%, 11/15/20, REMIC, Series 2541-VL | | | 1,500,000 | | | 1,490,442 |
5.50%, 01/15/22, REMIC, Series 2666-OC | | | 1,500,000 | | | 1,512,202 |
5.50%, 12/15/22, Series 2533-PG | | | 2,500,000 | | | 2,485,472 |
5.00%, 02/15/23, Series 2960, Class BL | | | 3,916,728 | | | 3,811,712 |
6.50%, 03/15/24, REMIC, Series 1684-I | | | 2,000,000 | | | 2,076,253 |
5.00%, 08/15/24, Series 2943, Class VB | | | 6,044,000 | | | 5,754,279 |
6.50%, 03/15/31, REMIC, Series 2296-H | | | 403,950 | | | 420,052 |
| | | | | |
|
|
| | | | | | | 53,504,745 |
| | | | | |
|
|
Federal National Mortgage Association (32.1%) |
6.10%, 07/01/08, Pool #380488 | | | 899,087 | | | 917,352 |
6.00%, 11/25/08, REMIC, Series 94-48-E | | | 443,337 | | | 444,975 |
4.50%, 04/01/10, Pool #M80812 | | | 1,438,254 | | | 1,416,143 |
6.50%, 04/25/13, REMIC, Series 99-19-TD | | | 205,964 | | | 205,527 |
6.30%, 05/01/13, Pool #380311 | | | 1,806,406 | | | 1,848,985 |
6.30%, 04/01/14, Pool #381570 | | | 1,014,820 | | | 1,078,410 |
7.90%, 08/01/15, Pool #381190 | | | 1,577,788 | | | 1,843,380 |
7.11%, 10/01/15, Pool #383142 | | | 2,639,058 | | | 2,818,768 |
| | | | | | |
| | | Principal
Amount | | Value |
| | | | | | | |
Federal National Mortgage Association (continued) | | | |
8.20%, 03/10/16 | | $ | 1,500,000 | | $ | 1,887,339 |
5.50%, 04/25/16, REMIC, Series 02-55-QD | | | 3,000,000 | | | 3,020,308 |
6.68%, 05/01/16, Pool #383452 | | | 1,876,534 | | | 1,978,601 |
6.59%, 02/01/17 | | | 2,537,330 | | | 2,812,235 |
4.50%, 12/18/17 | | | 3,748,000 | | | 3,429,041 |
5.26%, 12/29/17 | | | 10,000,000 | | | 9,746,469 |
7.90%, 01/01/18, Pool #382229 | | | 3,031,432 | | | 3,592,031 |
9.25%, 10/25/18, REMIC, Series 88-25-B | | | 20,131 | | | 21,597 |
8.10%, 08/12/19 | | | 1,000,000 | | | 1,288,302 |
8.50%, 01/25/20, REMIC, Series 90-7-B | | | 55,928 | | | 58,363 |
6.85%, 05/17/20, Series 97-M6-C | | | 426,763 | | | 432,919 |
7.50%, 02/25/23, REMIC, Series 93-16-Z | | | 242,863 | | | 254,123 |
6.00%, 12/25/23, REMIC, Series 93-226-PK | | | 1,000,000 | | | 1,000,766 |
5.50%, 09/25/24, Series 2004-68-DY | | | 2,391,304 | | | 2,400,167 |
8.43%, 11/18/24, Series MTN | | | 500,000 | | | 689,221 |
5.65%, 02/22/28, Series MTN | | | 355,000 | | | 373,803 |
6.00%, 10/25/32, Series 2004-45-ZL | | | 2,073,775 | | | 2,090,577 |
3.50%, 11/25/32, REMIC, Series 03-66-AP | | | 4,779,299 | | | 4,512,465 |
6.27%, 02/25/35, REMIC, Series 98-M4-D | | | 2,500,000 | | | 2,661,259 |
| | | | | |
|
|
| | | | | | | 52,823,126 |
| | | | | |
|
|
Sovereign Agency (3.6%) | | | | | | |
AID — Israel, 6.80%, 02/15/12, Series 3-D | | | 1,000,000 | | | 1,078,636 |
AID — Israel, 5.50%, 09/18/23 | | | 2,525,000 | | | 2,656,053 |
AID — Panama, 7.15%, 04/01/27 | | | 2,000,000 | | | 2,149,200 |
| | | | | |
|
|
| | | | | | | 5,883,889 |
| | | | | |
|
|
U.S. Treasury Inflation Protected Bonds (3.9%) |
2.38%, 01/15/25 (b) | | | 6,250,560 | | | 6,505,307 |
| | | | | |
|
|
U.S. Treasury Notes (3.7%) | | | | | | |
7.25%, 05/15/16 (b) | | | 5,000,000 | | | 6,067,970 |
| | | | | |
|
|
| |
Total U.S. Government Sponsored & Agency Obligations | | | 162,769,355 |
| | | | | |
|
|
Statement of Investments (Continued)
October 31, 2005
Gartmore Government Bond Fund (Continued)
Cash Equivalents (0.3%)
| | | | | | |
| | | Principal
Amount | | Value |
| | | | | | | |
Investments in repurchase agreements (Collateralized by U.S. Government Agencies and U.S. Government Agency Mortgages, in a joint trading account at 3.90%, dated 10/31/05, due 11/01/05, repurchase price $569,562) | | $ | 569,501 | | $ | 569,501 |
| | | | | |
|
|
| | |
Total Cash Equivalents | | | | | | 569,501 |
| | | | | |
|
|
Short-Term Securities Held as Collateral for Securities
Lending (0.6%)
| | | | | | |
| | | Principal
Amount | | Value |
| | | | | | | |
Pool of short-term securities for Gartmore Mutual Funds —
note 2 (Securities Lending) | | $ | 1,025,900 | | $ | 1,025,900 |
| | | | | |
|
|
| |
Total Short-Term Securities Held as Collateral for Securities Lending | | | 1,025,900 |
| | | | | |
|
|
| |
Total Investments
(Cost $164,676,383) (a) — 99.7% | | | 164,364,756 |
| | |
Other assets in excess of liabilities — 0.3% | | | | | | 521,768 |
| | | | | |
|
|
| |
NET ASSETS — 100.0% | | $ | 164,886,524 |
| | | | | |
|
|
| | (a) | See notes to financial statements for tax unrealized appreciation (depreciation) of securities. |
| | (b) | All or part of the security was on loan as of October 31, 2005. |
| | REMIC | Real Estate Mortgage Investment Conduit |
See notes to financial statements.
Gartmore Morley Enhanced Income Fund
For the annual period ended Oct. 31, 2005, the Gartmore Morley Enhanced Income Fund (Class A at NAV) returned 1.66% versus 2.23% for its benchmark, the Lipper Ultra-Short Bond Fund Index. For broader comparison, the average return for the Fund’s Lipper peer category of Short Investment Grade Debt Funds was 1.09%.
Interest rates rose most steeply at the short end of the yield curve, a plotted graph line of the yields (or interest rates) on long-term and short-term maturity bonds, usually treasury securities, as the Federal Reserve Board stuck to its policy of incremental hikes at each meeting of the Federal Open Market Committee. Together, there were eight consecutive 0.25% increases during the reporting period, bringing the target federal funds rate from 1.75% to 3.75%. Although the core inflation rate, which excludes volatile food and energy prices, remained subdued, surging crude oil prices had a noticeable impact on the regular (non-core) Consumer Price Index, which in September 2005 posted its largest increase in the past 25 years. The yield curve flattened further during the reporting period, in part due to strong demand for intermediate- and longer-term Treasury securities, which moderated the increases in their yields. The spread between the two-year and 10-year Treasuries narrowed from 148 basis points on Oct. 31, 2004, to 18 basis points a year later.
For most of the reporting period, we kept the Fund’s duration roughly in line with that of the benchmark Index, allowing the Fund’s duration to fluctuate in a band from 0.65 to 0.75 years. The Index’s duration, however, shortened in the final few months, while the Fund’s duration remained near 0.70 years. This resulted in the Fund’s underperforming the Index during July and September, when interest rates spiked sharply higher. Rates continued to climb in October, but we shortened the Fund’s duration to bring it closer to that of the Index, which resulted in the Fund slightly outperforming the Index during the final month of the period.
The Fund had overweighted positions in the two strongest-performing spread sectors, commercial mortgage-backed securities (CMBS) and asset-backed securities (ABS), which helped Fund performance versus the Index. By the same token, the Fund benefited from an underweighting in corporate securities, the weakest spread sector during the period. Not holding Treasury or Agency securities also helped Fund performance, as these securities underperformed the spread sectors held by the Fund. The Fund’s overall credit quality remained high, with approximately 85% of its assets rated AAA/Aaa by Moody’s, Standard & Poor’s, or Fitch as of Oct. 31, 2005. The remaining assets carried A2/A ratings, and none of the Fund’s holdings were high-yield or convertible securities. The emphasis on AAA assets is consistent with the fund’s strategy of maintaining high overall credit quality.
Given our expectation that the Fed will push short-term interest rates a bit higher, we will try to maintain a slightly defensive duration positioning relative to the Fund’s benchmark Index. That means keeping the Fund’s duration modestly shorter than that of the Index. When the Fed finishes its series of credit-tightening moves, we will probably adjust the Fund’s duration to be more in line with that of the Index, and possibly even make it a bit longer than the benchmark’s to take advantage of higher yields and a stable interest-rate environment. In spread sectors, we anticipate keeping a focus on AAA-rated ABS and CMBS to take advantage of these securities’ incremental yield.
Portfolio Managers:
Perpetua M. Phillips and Shane Johnston
| | |
Fund Performance | | Gartmore Morley Enhanced Income Fund |
Average Annual Total Return
(For periods ended October 31, 2005)
| | | | | | | | |
| | | | | 1 Yr. | | 5 Yr. | | Inception1 |
| Class A | | w/o SC2 | | 1.66% | | 1.71% | | 2.12% |
| | | w/SC3 | | -2.18% | | 0.92% | | 1.45% |
| Class R4,5 | | | | 1.70% | | 1.68% | | 2.10% |
| Institutional Class4 | | | | 2.13% | | 1.85% | | 2.27% |
| Institutional Service Class4 | | 1.77% | | 2.12% | | 2.53% |
All figures showing the effect of a sales charge reflect the maximum charge possible, because it has the most dramatic effect on performance data.
| 1 | Fund commenced operations on December 29, 1999. |
| 2 | These returns do not reflect the effects of sales charges (SC). |
| 3 | A 3.75% front-end sales charge was deducted. |
| 4 | Not subject to any sales charges. |
| 5 | These returns until the creation of Class R shares (10/1/03) include the performance of the Fund’s Class A shares. Excluding the effects of any fee waivers or reimbursements, such prior performance is similar to what Class R shares would have produced because Class R shares invest in the same portfolio of securities as Class A shares. The performance for these classes has been restated to reflect the fact that Class R shares do not have any applicable sales charges, but does not reflect the differing levels of other fees (primarily Rule 12b-1 and/or administrative services fees) applicable to Class R shares; if these fees were reflected, the performance for Class R shares would have been lower. |
Performance of a $10,000 Investment
Investment return and principal value will fluctuate, and when redeemed, shares may be worth more or less than original cost. Past performance is no guarantee of future results and does not reflect the deduction of taxes that a shareholder would pay on fund distributions or the redemption of fund shares. Investing in mutual funds involves market risk, including loss of principal. Performance returns assume the reinvestment of all distributions.
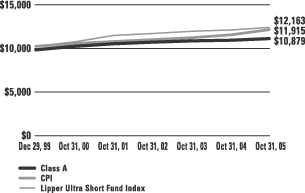
Comparative performance of $10,000 invested in Class A shares of the Gartmore Morley Enhanced Income Fund, Lipper Ultra Short Fund Index(a), and the Consumer Price Index (CPI)(b) since inception. Unlike the Fund, the returns for these unmanaged indexes do not reflect any fees, expenses, or sales charges. Investors cannot invest directly in market indexes.
| (a) | The Lipper Ultra-Short Bond Fund Index consists of funds with at least 65% of their assets in investment-grade debt instruments and maintains a portfolio with average maturity between 91 and 365 days. |
| (b) | The CPI represents changes in prices of a basket of goods and services purchased for consumption by urban households. |
| | |
Shareholder Expense Example | | Gartmore Morley Enhanced Income Fund |
As a shareholder of the Fund, you incur two types of costs: (1) transaction costs, including sales charges (loads) paid on purchase payments and redemption fees; and (2) ongoing costs, including investment advisory fees, administration fees, distribution fees and other Fund expenses. The examples below are intended to help you understand your ongoing costs (in dollars) of investing in the Fund and to compare these costs with the ongoing costs of investing in other mutual funds. Per SEC requirements, the examples assume that you had a $1,000 investment in the Class at the beginning of the reporting period, May 1, 2005, and continued to hold your shares at the end of the reporting period, October 31, 2005.
Actual Expenses
For each Class of the Fund in the table below, the first line provides information about actual account values and actual expenses. You may use the information in this line, together with the amount you invested, to estimate the expenses that you paid over the period. Simply divide your account value by $1,000 (for example, an $8,600 account value divided by $1,000 = 8.6), then multiply the result by the number in the first line of each Class under the heading entitled “Expenses Paid During Period” to estimate the expenses you paid on your account during the period.
Hypothetical Example for Comparison Purposes
The second line of each Class in the table below provides information about hypothetical account values and hypothetical expenses based on the Class’ actual expense ratio and an assumed rate of return of 5% per year before expenses, which is not the Class’ actual return. The hypothetical account values and expenses may not be used to estimate the actual ending account balance or expenses you paid for the period. You may use this information to compare the ongoing costs of investing in the Class of the Fund and other funds. To do so, compare this 5% hypothetical example with the 5% hypothetical examples that appear in the shareholder reports of the other funds.
Please note that the expenses shown in the table are meant to highlight your ongoing costs only and do not reflect any transaction costs, such as sales charges (loads) or redemption fees. Therefore, the second line for each Class in the table is useful in comparing ongoing costs only, and will not help you determine the relative total costs of owning different funds. In addition, if these transaction costs were included, your costs would have been higher. The examples also assume all dividends and distributions have been reinvested.
Schedule of Shareholder Expenses
Expense Analysis of a $1,000 Investment
(October 31, 2005)
| | | | | | | | | | | | | | |
| Morley Enhanced Income Fund | | | | | Beginning
Account Value,
May 1, 2005 | | Ending
Account Value,
October 31, 2005 | | Expenses Paid
During Period* | | Annualized
Expense Ratio* |
| Class A | | Actual | | | $ | 1,000.00 | | $ | 1,005.47 | | $ | 4.05 | | 0.80% |
| | | Hypothetical | 1 | | $ | 1,000.00 | | $ | 1,020.97 | | $ | 4.08 | | 0.80% |
| Class R | | Actual | | | $ | 1,000.00 | | $ | 1,007.37 | | $ | 3.65 | | 0.72% |
| | | Hypothetical | 1 | | $ | 1,000.00 | | $ | 1,021.37 | | $ | 3.67 | | 0.72% |
| Institutional Service Class | | Actual | | | $ | 1,000.00 | | $ | 1,007.67 | | $ | 3.55 | | 0.70% |
| | | Hypothetical | 1 | | $ | 1,000.00 | | $ | 1,021.47 | | $ | 3.57 | | 0.70% |
| Institutional Class | | Actual | | | $ | 1,000.00 | | $ | 1,010.13 | | $ | 2.28 | | 0.45% |
| | | Hypothetical | 1 | | $ | 1,000.00 | | $ | 1,022.73 | | $ | 2.30 | | 0.45% |
| * | Expenses are equal to the Fund’s annualized expense ratio multiplied by the average account value over the period multiplied by 184/365 (to reflect the one-half year period). The expense ratio presented represents a six month, annualized ratio in accordance with SEC guidelines. |
| 1 | Represents the hypothetical 5% return before expenses. |
| | |
Portfolio Summary | | Gartmore Morley Enhanced Income Fund |
The SEC adopted a requirement that Funds present their portfolio holdings in a table, chart or graph format in their annual and semiannual reports to shareholders, whether or not a statement of investments is utilized. The following tables, which present portfolio holdings as a percentage of net assets, are provided in compliance with this requirement.
| | |
| Asset Allocation | | |
| Asset Backed Securities | | 69.3% |
| Commercial Mortgage Backed Securities | | 14.8% |
| Collaterized Mortgage Obligations | | 9.0% |
| Cash Equivalents | | 3.9% |
| Sovereign Bonds | | 1.1% |
| U.S. Government Agencies–Mortgages | | 1.0% |
| Non-Agency Mortgage-Backed Bonds | | 0.4% |
| Other Investments* | | 0.4% |
| Other Assets in excess of Liabilities** | | 0.1% |
| | |
|
| | | 100.0% |
| * | Includes value of collateral owed from securities lending. |
| ** | Includes value of collateral received from securities lending. |
| | |
| Top Industries | | |
| Auto Loans | | 22.2% |
| Mortgage Backed | | 15.4% |
| Financial Services | | 15.1% |
| Credit Cards | | 14.5% |
| Federal Home Loan Mortgage Corporation | | 5.9% |
| Federal National Mortgage Association | | 4.1% |
| Equipment Loan | | 0.9% |
| Rate Reduction Bonds | | 0.8% |
| Other Industries | | 21.1% |
| | |
|
| | | 100.0% |
| | |
| Top Holdings*** | | |
| Discover Card Master Trust I 6.05%, 02/15/06 | | 2.3% |
| Wachovia Bank Commercial Mortgage Trust, 3.00%, 07/15/07 | | 1.9% |
| Onyx Acceptance Owner Trust, 4.07%, 03/15/06 | | 1.7% |
| Centex Home Equity, 5.04%, 09/25/07 | | 1.6% |
| Bank of America Corp. 5.25%, 02/01/07 | | 1.5% |
World Omni Auto Receivables Trust,
3.29%, 06/12/07 | | 1.5% |
| Capital One Master Trust, 4.60%, 10/15/06 | | 1.4% |
Federal National Mortgage Association,
3.00%, 10/25/06 | | 1.4% |
| Federal Home Loan Mortgage Corporation, 5.00%, 07/15/08 | | 1.4% |
| Capital One Auto Finance Trust, 2.96%, 03/15/07 | | 1.3% |
| Other Holdings | | 84.0% |
| | |
|
| | | 100.0% |
| *** | For purpose of listing top holdings, repurchase agreements are considered cash equivalents and are included as part of Other Holdings. |
Statement of Investments
October 31, 2005
Gartmore Morley Enhanced Income Fund

| Asset Backed Securities (69.3%) |
| | | | | | |
| | | Principal
Amount | | Value |
| | | | | | | |
Agency Wrapped (0.4%) | | | |
Federal Home Loan Mortgage Corporation | | | |
Series T-50, Class A7,
3.55%, 03/27/07 (c) | | $ | 2,000,000 | | $ | 1,928,019 |
| | | | | |
|
|
Auto Loans (22.2%) | | | |
Americredit Automobile Receivables Trust, 2.18%, 10/06/06 (c) | | | 4,962,616 | | | 4,928,207 |
Americredit Automobile Receivables Trust, 3.10%, 03/06/07 (c) | | | 4,577,681 | | | 4,524,344 |
Americredit Automobile Receivables Trust, 2.72%, 05/06/07 (c) | | | 4,862,026 | | | 4,788,541 |
BMW Vehicle Owner Trust,
2.67%, 01/25/07 (c) | | | 3,694,173 | | | 3,657,540 |
Capital Auto Receivables Asset Trust, Series 2003-2, Class A3A,
1.44%, 02/15/06 (c) | | | 437,178 | | | 435,262 |
Capital Auto Receivables Asset Trust, 3.12%, 08/15/06 (c) | | | 6,000,000 | | | 5,961,099 |
Capital Auto Receivables Asset Trust, 1.96%, 07/15/09 (c) | | | 3,500,000 | | | 3,431,736 |
Capital One Auto Finance Trust, 2.22%, 02/15/06 (c) | | | 829,689 | | | 826,690 |
Capital One Auto Finance Trust, 3.44%, 12/15/06 (c) | | | 4,000,000 | | | 3,967,958 |
Capital One Auto Finance Trust, 2.96%, 03/15/07 (c) | | | 6,270,000 | | | 6,176,885 |
Capital One Prime Auto Receivables Trust, 3.04%, 05/15/06 (c) | | | 1,937,949 | | | 1,930,242 |
Chase Manhattan Auto Owner Trust, Series 2003-A, Class A3,
1.52%, 02/15/06 (c) | | | 997,229 | | | 993,650 |
Chase Manhattan Auto Owner Trust, Series 2002-B, Class A4,
4.21%, 02/15/06 (c) | | | 2,051,745 | | | 2,050,674 |
Daimler Chrysler Auto Trust,
4.49%, 11/06/05 (c) | | | 2,040,938 | | | 2,040,771 |
Daimler Chrysler Auto Trust, Series 2003-A, Class A3,
2.12%, 12/08/05 (c) | | | 472,949 | | | 472,685 |
Ford Credit Auto Owner Trust,
3.48%, 08/15/07 (c) | | | 4,580,000 | | | 4,518,434 |
| | | | | | |
| | | Principal
Amount | | Value |
| | | | | | | |
Auto Loans (continued) | | | |
Honda Auto Receivables Owner Trust, Series 2004-3, Class A2,
2.48%, 05/18/06 (c) | | $ | 2,854,405 | | $ | 2,839,783 |
Honda Auto Receivables Owner Trust, 1.92%, 11/20/06 (c) | | | 22,254 | | | 22,226 |
Honda Auto Receivables Owner Trust, 2.77%, 01/21/08 (c) | | | 3,235,000 | | | 3,160,839 |
Nissan Auto Receivables Owner Trust, 3.75%, 11/15/06 (c) | | | 3,000,000 | | | 2,987,439 |
Onyx Acceptance Auto Trust, 3.10%, 06/15/06 (c) | | | 3,125,548 | | | 3,109,067 |
Onyx Acceptance Auto Trust, 2.94%, 05/15/08 (c) | | | 5,000,000 | | | 4,886,672 |
Onyx Acceptance Owner Trust, 4.07%, 03/15/06 (c) | | | 7,659,429 | | | 7,650,993 |
WFS Financial Owner Trust,
2.41%, 03/20/07 (c) | | | 5,000,000 | | | 4,913,349 |
WFS Financial Owner Trust,
2.19%, 08/20/06 (c) | | | 5,000,000 | | | 4,967,497 |
WFS Financial Owner Trust,
2.74%, 12/20/06 (c) | | | 4,924,254 | | | 4,869,790 |
World Omni Auto Receivables Trust, 4.30%, 11/20/06 (c) | | | 5,000,000 | | | 4,984,850 |
World Omni Auto Receivables Trust, 3.29%, 06/12/07 (c) | | | 6,770,000 | | | 6,683,961 |
| | | | | |
|
|
| | | | | | | 101,781,184 |
| | | | | |
|
|
Credit Cards (14.5%) | | | |
American Express Credit Account Master Trust, Series 01-2, Class A, 5.53%, 03/15/06 (c) | | | 5,000,000 | | | 5,018,471 |
American Express Credit Account Master Trust, 1.69%, 06/15/06 (c) | | | 4,000,000 | | | 3,928,539 |
Bank One Issuance Trust, Series 2003-A2, Class A2,
4.02%, 02/15/06 (c) | | | 3,100,000 | | | 3,100,470 |
Capital One Master Trust,
5.45%, 05/15/06 (c) | | | 4,500,000 | | | 4,522,520 |
Capital One Master Trust,
5.30%, 08/15/06 (c) | | | 3,000,000 | | | 3,013,311 |
Capital One Master Trust,
4.60%, 10/15/06 (c) | | | 6,581,000 | | | 6,571,331 |
Statement of Investments (Continued)
October 31, 2005
Gartmore Morley Enhanced Income Fund (Continued)
Asset Backed Securities (continued)
| |
| | | | | | |
| | | Principal
Amount | | Value |
| | | | | | | |
Credit Cards (continued) | | | |
Chase Credit Card Master Trust, Series 2003-1, Class A,
4.02%, 12/15/05 (c) | | $ | 4,000,000 | | $ | 4,000,140 |
Chase Credit Card Master Trust, Series 2001-6, Class A,
4.10%, 11/15/06 (c) | | | 4,000,000 | | | 4,005,104 |
Chemical Master Credit Card Trust I, Series 1996-2, Class A,
5.98%, 01/15/06 (c) | | | 4,000,000 | | | 4,011,749 |
Citibank Credit Card Issuance Trust, Series 2003-A5, Class A5,
2.50%, 04/07/06 (c) | | | 4,000,000 | | | 3,964,285 |
Citibank Credit Card Master Trust, Series 1999-5, Class A,
6.10%, 05/15/06 (c) | | | 3,000,000 | | | 3,022,793 |
Discover Card Master Trust I,
6.05%, 02/15/06 (c) | | | 10,565,000 | | | 10,611,262 |
Discover Master Card Trust, Series 2002-2, Class A,
5.15%, 04/15/07 (c) | | | 2,000,000 | | | 2,011,612 |
MBNA Master Credit Card Trust, 5.75%, 05/15/06 (c) | | | 5,000,000 | | | 5,030,362 |
Standard Credit Card Master Trust, Series 1994-2, Class A,
7.25%, 04/07/06 (c) | | | 4,000,000 | | | 4,044,764 |
| | | | | |
|
|
| | | | | | | 66,856,713 |
| | | | | |
|
|
Equipment Loan (0.9%) | | | |
MBNA Practice Solutions Owner Trust, 3.93%, 03/15/07 (c) | | | 4,299,244 | | | 4,267,700 |
| | | | | |
|
|
Financial Services (15.1%) | | | |
Bank of America Corp.,
5.25%, 02/01/07 (c) | | | 7,000,000 | | | 7,040,089 |
Caterpillar Financial Service Corp., 2.63%, 01/30/07 (c) | | | 5,000,000 | | | 4,872,275 |
Citigroup, Inc.,
6.75%, 12/01/05 (b) (c) | | | 3,000,000 | | | 3,005,766 |
Citigroup, Inc., 5.75%, 05/10/06 (c) | | | 5,000,000 | | | 5,030,815 |
General Electric Capital Corp., Series MTNA, 2.97%, 07/26/06 (c) | | | 4,000,000 | | | 3,954,916 |
General Electric Capital Corp.,
7.88%, 12/01/06 (c) | | | 4,000,000 | | | 4,124,204 |
John Hancock Global Funding II,
5.63%, 06/27/06 (c) | | | 5,000,000 | | | 5,028,525 |
| | | | | | |
| | | Principal
Amount | | Value |
| | | | | | | |
Financial Services (continued) | | | |
JP Morgan Chase & Co.,
5.63%, 08/15/06 (b) (c) | | $ | 5,000,000 | | $ | 5,033,115 |
Lehman Brothers Holdings,
6.25%, 05/15/06 (c) | | | 5,000,000 | | | 5,041,090 |
Merrill Lynch & Co., 2.47%, 03/10/06 (c) | | | 5,000,000 | | | 4,965,870 |
Morgan Stanley Dean Witter,
6.10%, 04/15/06 (b) (c) | | | 5,000,000 | | | 5,032,270 |
US Bank NA, 2.85%, 11/15/06 (b) (c) | | | 6,000,000 | | | 5,865,318 |
Wachovia Corp.,
4.95%, 11/01/06 (b) (c) | | | 5,000,000 | | | 5,004,840 |
Wells Fargo Co., 6.88%, 04/01/06 (c) | | | 5,310,000 | | | 5,357,280 |
| | | | | |
|
|
| | | | | | | 69,356,373 |
| | | | | |
|
|
Mortgage Backed (15.4%) | | | |
Centex Home Equity, Series 2004-C, Class AF1, 2.82%, 01/25/06 (c) | | | 432,987 | | | 431,184 |
Centex Home Equity,
2.98%, 04/25/06 (c) | | | 762,909 | | | 758,270 |
Centex Home Equity,
3.70%, 06/25/06 (c) | | | 911,325 | | | 904,261 |
Centex Home Equity,
3.26%, 10/25/06 (c) | | | 4,591,350 | | | 4,563,417 |
Centex Home Equity,
4.20%, 05/25/07 (c) | | | 4,071,851 | | | 4,049,236 |
Centex Home Equity,
5.04%, 09/25/07 (c) | | | 7,250,000 | | | 7,240,937 |
Chase Funding Mortgage Loan,
4.21%, 11/25/06 (c) | | | 5,000,000 | | | 4,949,788 |
Chase Funding Mortgage Loan,
2.98%, 02/25/07 (c) | | | 4,300,000 | | | 4,247,527 |
Chase Funding Mortgage Loan,
3.34%, 05/25/07 (c) | | | 5,000,000 | | | 4,903,238 |
Chase Funding Mortgage Loan,
3.30%, 11/25/08 (c) | | | 5,000,000 | | | 4,912,657 |
Countrywide, 4.32%, 08/25/08 (c) | | | 4,470,695 | | | 4,446,160 |
Countrywide, 4.28%, 01/25/21 (c) | | | 5,247,574 | | | 5,215,028 |
Popular ABS Mortgage Pass-Through Trust, 3.97%, 06/25/07 (c) | | | 4,821,848 | | | 4,821,824 |
Popular ABS Mortgage Pass-Through Trust, 4.07%, 01/25/08 (c) | | | 5,000,000 | | | 5,000,000 |
Residential Asset Mortgage Products, Inc., Series 2003-RS5, Class AI3, 2.59%, 11/25/05 (c) | | | 182,446 | | | 181,862 |
Asset Back Securities (continued)
| | | | | | |
| | | Principal
Amount | | Value |
| | | | | | | |
Mortgage Backed (continued) | | | |
Residential Asset Mortgage Products, Inc., Series 2003-RS9, Class AI3, 3.61%, 02/25/06 (c) | | $ | 1,774,753 | | $ | 1,766,406 |
Residential Asset Mortgage Products, Inc.,
5.00%, 07/25/06 (c) | | | 3,500,000 | | | 3,484,013 |
Residential Asset Mortgage Products, Inc.,
3.35%, 10/25/06 (c) | | | 3,371,755 | | | 3,335,016 |
Residential Asset Securities Corp., Series 2003-KS7, Class AI3,
3.37%, 03/25/06 (c) | | | 1,574,799 | | | 1,568,829 |
Residential Funding Mortgage Securities I, Series 2004-HS1,
Class AI3, 2.68%, 08/25/07 (c) | | | 3,900,000 | | | 3,800,837 |
| | | | | |
|
|
| | | | | | | 70,580,490 |
| | | | | |
|
|
Rate Reduction Bonds (0.8%) | | | |
PG&E Energy Recovery Funding LLC, 3.32%, 09/25/06 (c) | | | 3,570,044 | | | 3,552,169 |
| | | | | |
|
|
| | |
Total Asset Backed Securities | | | | | | 318,322,648 |
| | | | | |
|
|
|
Commercial Mortgage Backed Securities (14.8%) 
|
| | |
Asset Securitization Corp.,
7.40%, 04/13/09 (c) | | | 4,949,292 | | | 5,070,928 |
Banc of America Commercial Mortgage, Inc., Series 2004-3, Class A1, 2.98%, 12/10/06 (c) | | | 4,514,941 | | | 4,470,343 |
Banc of America Commercial Mortgage, Inc.,
4.04%, 01/10/08 (c) | | | 4,446,210 | | | 4,403,414 |
Banc of America Commercial Mortgage, Inc.,
4.36%, 01/10/08 (c) | | | 5,098,413 | | | 5,067,773 |
Bear Stearns Commercial Mortgage Securities, Inc., Series 2004-T16, Class A1, 2.62%, 08/13/06 (c) | | | 1,942,542 | | | 1,926,582 |
Bear Stearns Commercial Mortgage Securities, Inc., Series 2001-TOP2, Class A1,
6.08%, 05/15/10 (c) | | | 2,003,181 | | | 2,034,168 |
Commercial Mortgage Asset Trust, 6.59%, 05/17/07 (c) | | | 2,642,013 | | | 2,677,275 |
CS First Boston Mortgage Securities Corp., 2.08%, 01/15/08 (c) | | | 2,559,678 | | | 2,454,669 |
Commercial Mortgage Backed Securities (continued)
| | | | | | |
| | | Principal Amount | | Value |
| | | | | | | |
CS First Boston Mortgage Securities Corp., 2.61%, 06/15/08 (c) | | $ | 2,443,648 | | $ | 2,367,969 |
GMAC Commercial Mortgage Securities, Inc.,
3.11%, 12/10/06 (c) | | | 3,238,544 | | | 3,211,000 |
GS Mortgage Securities Corp. II, Series 2004-GG2, Class A1,
3.11%, 11/10/07 (c) | | | 3,113,676 | | | 3,086,118 |
JP Morgan Chase Commercial Mortgage Securities Corp., Series 2001-CIB3, Class A1,
4.47%, 02/15/06 (c) | | | 957,883 | | | 956,262 |
JP Morgan Chase Commercial Mortgage Securities Corp., Series 2004-PNC1, Class A1,
2.80%, 12/12/08 (c) | | | 2,983,649 | | | 2,884,329 |
LB-UBS Commercial Mortgage Trust, Series 2002-C7, Class A1,
3.17%, 10/15/07 (c) | | | 1,086,325 | | | 1,064,741 |
LB-UBS Commercial Mortgage Trust, 2.72%, 01/15/08 (c) | | | 5,464,914 | | | 5,284,781 |
Morgan Stanley Capital I, Series 2004-HQ4, 2.73%, 09/14/06 (c) | | | 2,374,477 | | | 2,352,216 |
Morgan Stanley Capital I,
3.39%, 01/13/07 (c) | | | 1,895,506 | | | 1,879,681 |
Morgan Stanley Dean Witter Capital I, Series 2001-TOP3, Class A1, 5.31%, 04/15/06 (c) | | | 381,129 | | | 381,213 |
Morgan Stanley Dean Witter Capital I, Series 2001-TOP5, Class A1, 5.02%, 11/15/06 (c) | | | 822,266 | | | 822,255 |
Morgan Stanley Dean Witter Capital I, Series 2003-T11, Class A1, 3.26%, 04/13/08 (c) | | | 2,285,183 | | | 2,216,362 |
Morgan Stanley Dean Witter Capital I, 6.46%, 07/15/09 (c) | | | 2,488,969 | | | 2,547,543 |
Nomura Asset Corp.,
6.28%, 04/15/07 (c) | | | 1,984,753 | | | 2,002,893 |
Salomon Brothers Mortgage,
6.34%, 04/18/09 (c) | | | 72,333 | | | 73,289 |
Wachovia Bank Commercial Mortgage Trust,
3.00%, 07/15/07 (c) | | | 9,082,508 | | | 8,895,873 |
| | | | | |
|
|
| |
Total Commercial Mortgage Backed Securities | | | 68,131,677 |
| | | | | |
|
|
Statement of Investments (Continued)
October 31, 2005
Gartmore Morley Enhanced Income Fund (Continued)
Collateralized Mortgage Obligations (9.0%)
| | | | | | |
| | | Principal Amount | | Value |
| | | | | | | |
Federal Home Loan Mortgage Corporation (5.8%) | | | |
Series 2791, Class KA,
4.00%, 08/15/06 | | $ | 1,408,821 | | $ | 1,403,667 |
Series 2691, Class MA,
4.00%, 02/15/07 | | | 1,995,713 | | | 1,984,667 |
Series 2700, Class PA,
4.50%, 02/15/07 | | | 2,002,709 | | | 1,996,833 |
3.00%, 02/15/08 | | | 4,000,000 | | | 3,906,471 |
Series 2726, Class AC,
3.75%, 06/15/08 | | | 3,590,236 | | | 3,549,339 |
5.00%, 07/15/08 | | | 6,335,850 | | | 6,343,370 |
Series 2630, Class JA,
3.00%, 08/15/11 | | | 2,016,986 | | | 1,923,890 |
Series 2611, Class KC,
3.50%, 07/15/12 | | | 1,858,319 | | | 1,792,001 |
Series 2664, Class GA,
4.50%, 11/15/12 | | | 1,998,440 | | | 1,968,414 |
Series 2613, Class PA,
3.25%, 11/15/14 | | | 1,929,754 | | | 1,801,148 |
| | | | | |
|
|
| | | | | | | 26,669,800 |
| | | | | |
|
|
Federal National Mortgage Association (3.2%) | | | |
3.00%, 10/25/06 | | | 6,450,644 | | | 6,385,903 |
3.50%, 05/25/09 | | | 4,330,457 | | | 4,240,057 |
Series 2003-75, Class NB,
3.25%, 02/25/12 | | | 1,360,711 | | | 1,302,781 |
Series 2003-57, Class NB,
3.00%, 12/25/17 | | | 1,795,773 | | | 1,691,096 |
Series 2003-14, Class AN,
3.50%, 06/25/22 | | | 1,359,504 | | | 1,302,412 |
| | | | | |
|
|
| | | | | | | 14,922,249 |
| | | | | |
|
|
| |
Total Collateralized Mortgage Obligations | | | 41,592,049 |
| | | | | |
|
|
|
Cash Equivalents (3.9%) |
Investments in repurchase agreements (Collateralized by U.S. Government Agencies and U.S. Government Agency Mortgages, in a joint trading account at 3.90%, dated 10/31/05, due 11/01/05, repurchase price $17,933,264) | | | 17,931,322 | | | 17,931,322 |
| | | | | |
|
|
| | |
Total Cash Equivalents | | | | | | 17,931,322 |
| | | | | |
|
|
Sovereign Bond (1.1%)
| | | | | | |
| | | Principal Amount | | Value |
| | | | | | | |
Canada (1.1%) | | | |
Ontario Province,
6.00%, 02/21/06 | | $ | 5,000,000 | | $ | 5,022,785 |
| | | | | |
|
|
| |
Total Sovereign Bond | | | 5,022,785 |
| | | | | |
|
|
|
U.S. Government Agencies — Mortgages (1.0%) |
Federal Home Loan Mortgage Corporation (0.1%) | | | |
Pool #E00678, 6.50%, 09/15/13 | | | 249,956 | | | 257,898 |
Pool #E00991, 6.00%, 11/15/15 | | | 297,873 | | | 304,435 |
| | | | | |
|
|
| | | | | | | 562,333 |
| | | | | |
|
|
Federal National Mortgage Association (0.9%) | | | |
Pool #190255, 6.50%, 09/25/08 | | | 174,726 | | | 178,765 |
Pool #254256, 5.50%, 02/25/09 | | | 99,434 | | | 99,962 |
Pool #253845, 6.00%, 10/25/15 | | | 377,915 | | | 386,696 |
Pool #545415, 6.00%, 03/25/16 | | | 511,736 | | | 523,625 |
Pool #625178, 5.50%, 05/25/16 | | | 1,101,957 | | | 1,110,212 |
Pool #254089, 6.00%, 05/25/16 | | | 568,540 | | | 581,749 |
Pool #254195, 5.50%, 07/25/16 | | | 1,130,129 | | | 1,138,595 |
| | | | | |
|
|
| | | | | | | 4,019,604 |
| | | | | |
|
|
| |
Total U.S. Government Agencies — Mortgages | | | 4,581,937 |
| | | | | |
|
|
|
Non-Agency Mortgage Backed Bond (0.4%) |
Residential Funding Mortgage Securities I, Series 2003-S11, Class A1, 2.50%, 03/25/10 | | | 1,844,836 | | | 1,764,225 |
| | | | | |
|
|
| |
Total Non-Agency Mortgage Backed Bond | | | 1,764,225 |
| | | | | |
|
|
Short-Term Securities Held as Collateral for Securities
Lending (0.4%)
| | | | | | |
| | | Principal Amount | | Value |
| | | | | | | |
Pool of short-term securities for Gartmore Mutual Funds —
note 2 (Securities Lending) | | $ | 2,072,073 | | $ | 2,072,073 |
| | | | | |
|
|
| |
Total Short-Term Securities Held as Collateral for Securities Lending | | | 2,072,073 |
| | | | | |
|
|
| |
Total Investments
(Cost $463,907,621) (a) — 99.9% | | | 459,418,716 |
| | |
Other assets in excess of liabilities — 0.1% | | | | | | 233,999 |
| | | | | |
|
|
| |
NET ASSETS — 100.0% | | $ | 459,652,715 |
| | | | | |
|
|
| | (a) | See notes to financial statements for tax unrealized appreciation (depreciation) of securities. |
| | (b) | All or part of the security was on loan as of October 31, 2005. |
| | (c) | Variable Rate Security. The rate presented in this report represents the rate that was in effect on October 31, 2005. The maturity date shown represents the last reset date. |
At October 31,2005, the Fund’s open short futures contracts were as follows:
| | | | | | | | | | |
Number of
Contracts
| | Short
Contract*
| | Expiration
| | Value
Covered by
Contracts
| | Unrealized
Appreciation
(Depreciation)
|
| 225 | | U.S. Treasury 2 Year Note | | 12/30/05 | | $ | 46,170,703 | | $ | 404,297 |
| | * | Cash pledged as collateral. |
See notes to financial statements.
Gartmore Short Duration Bond Fund
On Dec. 6, 2004, the Fund changed investment objectives, and the Fund’s name was changed from the “Gartmore Morley Capital Accumulation Fund” to the “Gartmore Short Duration Bond Fund.”
For the annual period ended Oct. 31, 2005, the Gartmore Short Duration Bond Fund (Class A at NAV) returned 0.98% versus 0.67% for its benchmark, the Merrill Lynch 1-3 year Treasury Index. For broader comparison, the average return for the Fund’s Lipper peer category of Short-Intermediate Investment Grade Debt Funds was 0.26%.
Interest rates rose most steeply at the short end of the yield curve, a plotted graph line of the yields (or interest rates) on long-term and short-term maturity bonds, usually treasury securities, as the Federal Reserve Board stuck to its policy of incremental hikes at each meeting of the Federal Open Market Committee. Together, there were eight consecutive 0.25% increases during the reporting period, bringing the target federal funds rate from 1.75% to 3.75%. Although the core inflation rate, which excludes volatile food and energy prices, remained subdued, surging crude oil prices had a noticeable impact on the regular (non-core) Consumer Price Index, which in September 2005 posted its largest increase in the past 25 years. The yield curve flattened further during the reporting period, in part due to strong demand for intermediate- and longer-term Treasury securities, which moderated the increases in their yields. The spread between the two-year and 10-year Treasuries narrowed from 148 basis points on Oct. 31, 2004, to 18 basis points a year later.
As part of the Fund’s conversion from a stable-value fund to a fixed-income mandate, there was a blackout period from Oct. 4, 2004, through Dec. 6, 2004. The Fund’s duration was much shorter than that of the benchmark Index during this period, which helped Fund performance significantly because interest rates rose.
Following the blackout period, we kept the Fund’s duration roughly in line with that of the benchmark Index, moving to a slightly shorter-than-benchmark duration from the end of the second quarter through the end of the third quarter. These decisions helped the Fund’s performance compared with that of the benchmark Index because short-term rates continued to increase. We emphasized maturities of less than one year to provide liquidity for the Fund. At the same time, we overweighted two- to three-year maturities so as to stay close to the Index’s average maturity.
The Fund had overweighted positions in a variety of spread sectors, including mortgage-backed securities, asset-backed securities and corporate securities, which helped Fund performance compared with that of the Index, whose components are all Treasury securities. The Fund’s overall credit quality remained high, with approximately 85% of its assets rated AAA/Aaa by Moody’s, Standard & Poor’s, or Fitch as of Oct. 31, 2005. The remaining assets carried AA, AA- or A+ ratings. The emphasis on AAA assets is consistent with the fund’s strategy of maintaining high overall credit quality.
Given our expectation that the Fed will push short-term interest rates a bit higher, we will try to maintain a slightly defensive Fund duration positioning relative to the Index’s duration. That means keeping the Fund’s duration modestly shorter than that of the Index. When the Fed finishes its series of credit-tightening moves, we likely will adjust the Fund’s duration to be more in line with that of the Index, and possibly even make it a bit longer to take advantage of higher yields and a stable interest-rate environment. In addition, we anticipate keeping a focus on high-quality spread sectors to take advantage of their incremental yield.
Portfolio Managers:
Perpetua M. Phillips and Shane Johnston
| | |
Fund Performance | | Gartmore Short Duration Bond Fund |
Average Annual Total Return
(For periods ended October 31, 2005)
| | | | | | | | |
| | | | | 1 Yr. | | 5 Yr. | | Inception1 |
| Class A2 | | w/o SC3 | | 0.98% | | 3.27% | | 3.77% |
| | | w/SC4 | | -2.05% | | 2.64% | | 3.30% |
| Class C6 | | w/o SC3 | | 0.60% | | 3.19% | | 3.71% |
| | | w/SC4 | | -0.14% | | 3.19% | | 3.71% |
| Service Class Shares5 | | | | 0.95% | | 3.25% | | 3.76% |
| Institutional Class Shares5 | | 1.24% | | 3.64% | | 4.15% |
| IRA Shares5 | | | | 0.90% | | 3.23% | | 3.75% |
| 1 | Fund commenced operations on February 1, 1999. |
| 2 | These returns until the creation of Class A shares (7/16/03) include the performance of the Fund’s IRA Class shares. Excluding the effects of any fee waivers or reimbursements, such performance is substantially similar to what Class A shares would have produced because Class A shares invest in the same portfolio of securities as IRA Class shares and have the same expenses after any fee waivers or reimbursements. For Class A returns including sales charges, these returns have been restated for the applicable sales charges. |
| 3 | These returns do not reflect the effects of sales charges (SC). |
| 4 | A 2.25% front-end sales charge was deducted. |
| 5 | Not subject to any sales charges. |
| 6 | These returns until the creation of Class C shares (2/28/05) include the performance of the Fund’s Class A shares. Excluding the effects of any fee waivers or reimbursements, such performance is substantially similar to what Class C shares would have produced because Class C shares invest in the same portfolio of securities as Class A shares. The performance for Class C has been restated to reflect differences in sales charges, but does not reflect the differing levels of other fees (primarily Rule 12b-1fees) applicable to the classes. If these other fees were reflected, the performance for each of these classes of shares would have been lower. |
Performance of a $10,000 Investment
Investment return and principal value will fluctuate, and when redeemed, shares may be worth more or less than original cost. Past performance is no guarantee of future results and does not reflect the deduction of taxes that a shareholder would pay on fund distributions or the redemption of fund shares. Investing in mutual funds involves market risk, including loss of principal. Performance returns assume the reinvestment of all distributions.
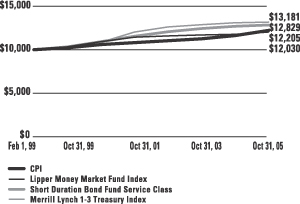
Comparative performance of $10,000 invested in the Gartmore Short Duration Bond Fund Service Class, the Lipper Money Market Fund Index(a), Merrill Lynch 1-3 Year Treasury Index(b), and the Consumer Price Index (CPI)(c) since inception. Unlike the Fund, the returns for these unmanaged indexes do not reflect any fees or expenses. Investors cannot invest directly in market indexes.
| (a) | The Lipper Money Market Fund Index generally reflects the return on selected money market mutual funds maintaining a constant price per share. |
| (b) | Merrill Lynch 1-3 Year Treasury Index which is an unmanaged index comprised of U.S. Treasury securities with maturities ranging from one to three years, which are guaranteed as to the timely payment of principal and interest by the U.S. government. |
| (c) | The CPI represents changes in prices of a basket of goods and services purchased for consumption by urban households. |
| | |
Shareholder Expense Example | | Gartmore Short Duration Bond Fund |
As a shareholder of the Fund, you incur two types of costs: (1) transaction costs, including sales charges (loads) paid on purchase payments and redemption fees; and (2) ongoing costs, including investment advisory fees, administration fees, distribution fees and other Fund expenses. The examples below are intended to help you understand your ongoing costs (in dollars) of investing in the Fund and to compare these costs with the ongoing costs of investing in other mutual funds. Per SEC requirements, the examples assume that you had a $1,000 investment in the Class at the beginning of the reporting period, May 1, 2005, and continued to hold your shares at the end of the reporting period, October 31, 2005.
Actual Expenses
For each Class of the Fund in the table below, the first line provides information about actual account values and actual expenses. You may use the information in this line, together with the amount you invested, to estimate the expenses that you paid over the period. Simply divide your account value by $1,000 (for example, an $8,600 account value divided by $1,000 = 8.6), then multiply the result by the number in the first line of each Class under the heading entitled “Expenses Paid During Period” to estimate the expenses you paid on your account during the period.
Hypothetical Example for Comparison Purposes
The second line of each Class in the table below provides information about hypothetical account values and hypothetical expenses based on the Class’ actual expense ratio and an assumed rate of return of 5% per year before expenses, which is not the Class’ actual return. The hypothetical account values and expenses may not be used to estimate the actual ending account balance or expenses you paid for the period. You may use this information to compare the ongoing costs of investing in the Class of the Fund and other funds. To do so, compare this 5% hypothetical example with the 5% hypothetical examples that appear in the shareholder reports of the other funds.
Please note that the expenses shown in the table are meant to highlight your ongoing costs only and do not reflect any transaction costs, such as sales charges (loads) or redemption fees. Therefore, the second line for each Class in the table is useful in comparing ongoing costs only, and will not help you determine the relative total costs of owning different funds. In addition, if these transaction costs were included, your costs would have been higher. The examples also assume all dividends and distributions have been reinvested.
Schedule of Shareholder Expenses
Expense Analysis of a $1,000 Investment
(October 31, 2005)
| | | | | | | | | | | | | | |
| Short Duration Bond Fund | | | | | Beginning
Account Value,
May 1, 2005 | | Ending
Account Value,
October 31, 2005 | | Expenses Paid
During Period* | | Annualized
Expense Ratio* |
| Class A | | Actual | | | $ | 1,000.00 | | $ | 1,006.60 | | $ | 4.20 | | 0.83% |
| | | Hypothetical | 1 | | $ | 1,000.00 | | $ | 1,020.82 | | $ | 4.24 | | 0.83% |
| Class C | | Actual | | | $ | 1,000.00 | | $ | 1,003.40 | | $ | 2.43 | | 1.45% |
| | | Hypothetical | 1 | | $ | 1,000.00 | | $ | 1,001.09 | | $ | 2.43 | | 1.45% |
| Institutional Class | | Actual | | | $ | 1,000.00 | | $ | 1,007.90 | | $ | 2.94 | | 0.58% |
| | | Hypothetical | 1 | | $ | 1,000.00 | | $ | 1,022.08 | | $ | 2.96 | | 0.58% |
| IRA Class | | Actual | | | $ | 1,000.00 | | $ | 1,006.20 | | $ | 4.60 | | 0.91% |
| | | Hypothetical | 1 | | $ | 1,000.00 | | $ | 1,020.41 | | $ | 4.64 | | 0.91% |
| Service Class | | Actual | | | $ | 1,000.00 | | $ | 1,006.60 | | $ | 4.20 | | 0.83% |
| | | Hypothetical | 1 | | $ | 1,000.00 | | $ | 1,020.82 | | $ | 4.24 | | 0.83% |
| * | Expenses are equal to the Fund’s annualized expense ratio multiplied by the average account value over the period multiplied by 184/365 (to reflect the one-half year period). The expense ratio presented represents a six month, annualized ratio in accordance with SEC guidelines. |
| 1 | Represents the hypothetical 5% return before expenses. |
| | |
Portfolio Summary | | Gartmore Short Duration Bond Fund |
The SEC adopted a requirement that Funds present their portfolio holdings in a table, chart or graph format in their annual and semiannual reports to shareholders, whether or not a statement of investments is utilized. The following tables, which present portfolio holdings as a percentage of net assets, are provided in compliance with this requirement.
| | |
| Asset Allocation | | |
| Asset Backed Securities | | 33.1% |
| Commercial Mortgage Backed Securities | | 18.3% |
| U.S. Government Sponsored Mortgage-Backed Obligations | | 18.1% |
| Corporate Bonds | | 16.1% |
| U.S. Treasury Notes | | 6.7% |
| Cash Equivalents | | 5.4% |
| U.S. Government Sponsored and Agency Obligations | | 2.1% |
| Other Assets in excess of Liabilities | | 0.2% |
| | |
|
| | | 100.0% |
| | |
| Top Industries | | |
| Home Equity Loans | | 14.1% |
| Automobiles | | 12.9% |
| Financial Services | | 11.3% |
| Federal National Mortgage Association | | 9.0% |
| Federal Home Loan Mortgage Corporation | | 7.6% |
| U.S. Treasury Notes | | 6.7% |
| Credit Cards | | 6.1% |
| Banks | | 4.8% |
| Government National Mortgage Association | | 3.6% |
| Other Industries | | 23.9% |
| | |
|
| | | 100.0% |
| | |
| Top Holdings* | | |
| U.S. Treasury Notes, 4.13%, 08/15/08 | | 6.7% |
| Federal National Mortgage Association, 4.00%, 10/25/13 | | 3.7% |
| Federal National Mortgage Association, 4.00%, 10/25/16 | | 3.7% |
| Onxyx Acceptance Auto Trust, 2.94%, 12/15/10 | | 3.2% |
| Centex Home Equity, 4.12%, 01/25/32 | | 2.9% |
| Morgan Stanley Dean Witter Capital I, 6.01%, 07/15/33 | | 2.7% |
| Bear Stearns Commercial Mortgage Securities, Inc., 5.06%, 11/15/16 | | 2.7% |
| Norwest Financial, Inc., 6.88%, 08/08/06 | | 2.6% |
| Morgan Stanley Dean Witter Capital I, 6.54%, 07/15/30 | | 2.4% |
| Bankboston, 7.38%, 09/15/06 | | 2.3% |
| Other Holdings | | 67.1% |
| | |
|
| | | 100.0% |
| * | For purpose of listing top holdings, repurchase agreements are considered cash equivalents and are included as part of Other Holdings. |
Statement of Investments
October 31, 2005
Gartmore Short Duration Bond Fund
| | Asset Backed Securities (33.1%) |
| | | | | | |
| | | Principal
Amount | | Value |
| | | | | | | |
Automobiles (12.9%) | | | | | | |
Americredit Automobile Receivables Trust 3.55%, 02/12/09, Series 2002-C, Class A4 | | $ | 2,797,269 | | $ | 2,774,835 |
Capital Auto Receivables Asset Trust, 3.35%, 02/15/08, Series 2004-2, Class A2 | | | 2,000,000 | | | 1,969,486 |
Chase Manhattan Auto Owner Trust, 2.06%, 12/15/09, Series 2003, Class A | | | 3,000,000 | | | 2,913,157 |
Onyx Acceptance Auto Trust,
2.94%, 12/15/10, Series 2004-A, Class A4 | | | 4,342,000 | | | 4,243,585 |
Volkswagen Auto Loan Enhanced Trust, 2.94%, 03/22/10, Series 2003-2 | | | 3,000,000 | | | 2,925,043 |
WFS Financial Owner Trust,
2.41%, 12/20/10, Series 2003-2, Class A4 | | | 2,275,000 | | | 2,235,574 |
| | | | | |
|
|
| | | | | | | 17,061,680 |
| | | | | |
|
|
Credit Cards (6.1%) | | | | | | |
Capital One Master Trust,
5.45%, 03/16/09, Series 2001-3A, Class A | | | 2,000,000 | | | 2,010,009 |
Capital One Master Trust,
5.30%, 06/15/09, Series 2001-5 | | | 2,999,000 | | | 3,012,306 |
Citibank Credit Card Master Trust, 6.10%, 05/15/08, Series 1999-5, Class A | | | 3,000,000 | | | 3,022,793 |
| | | | | |
|
|
| | | | | | | 8,045,108 |
| | | | | |
|
|
Home Equity Loans (14.1%) | | | | | | |
Centex Home Equity,
4.12%, 02/25/10, Series 2004-B, Class AF4 | | | 4,000,000 | | | 3,847,461 |
Chase Funding Mortgage Loan, 3.99%, 12/25/06, Series 2003-2, Class 1A4 | | | 3,000,000 | | | 2,975,450 |
Citi Financial Mortgage Securities, Inc., 4.43%, 05/25/08, Series 2003-4, Class AF4 | | | 3,000,000 | | | 2,956,249 |
Equity One, Inc., 4.27%, 04/25/08, Series 2004-3, Class AF3 | | | 3,000,000 | | | 2,978,747 |
| | | | | | |
| | | Principal Amount | | Value |
| | | | | | | |
Home Equity Loans (continued) | | | |
Residential Asset Mortgage Products, Inc., 4.86%, 07/25/07, Series 2003-R58 | | $ | 3,000,000 | | $ | 2,990,370 |
Residential Asset Mortgage Products, Inc., 4.47%, 09/25/08, Class 2003-KJ10 | | | 3,000,000 | | | 2,983,560 |
| | | | | |
|
|
| | | | | | | 18,731,837 |
| | | | | |
|
|
| |
Total Asset Backed Securities | | | 43,838,625 |
| | | | | |
|
|
|
Commercial Mortgage Backed Securities (18.3%) |
Bear Stearns Commercial Mortgage Securities, Inc., 5.06%, 11/29/07, Series 2001-TOP4 | | | 3,515,115 | | | 3,518,901 |
Bear Stearns Commercial Mortgage Securities, Inc., 6.08%, 07/17/07, Series 2001-TOP2 | | | 2,337,045 | | | 2,373,197 |
CS First Boston Mortgage Securities Corp., 7.33%, 06/15/08, Series 2000-C1, Class A1 | | | 2,420,551 | | | 2,514,008 |
Morgan Stanley Dean Witter Capital I, 6.54%, 05/15/09, Series 1998-WFS, Class A2 | | | 3,023,122 | | | 3,120,025 |
Morgan Stanley Dean Witter Capital I, 6.46%, 11/29/07,
Series 2001-TOP1 | | | 1,991,175 | | | 2,038,035 |
Morgan Stanley Dean Witter Capital I, 6.01%, 11/21/07,
Series 2001-TOP3 | | | 3,484,212 | | | 3,566,678 |
Nomura Asset Securities Corp., 6.59%, 02/16/07, Series 1998-D6 | | | 2,875,000 | | | 2,979,361 |
Salomon Brothers Mortgage Securites, 6.34%, 04/18/09 | | | 2,108,726 | | | 2,136,600 |
UBS Commercial Mortgage Trust, 2.72%, 01/15/06 | | | 2,049,343 | | | 1,981,793 |
| | | | | |
|
|
| |
Total Commercial Mortgage Backed Securities | | | 24,228,598 |
| | | | | |
|
|
Corporate Bonds (16.1%)
| | | | | | |
| | | Principal Amount | | Value |
| | | | | | | |
Banks (4.8%) | | | | | | |
Norwest Financial, Inc., 6.88%, 08/08/06 | | $ | 3,353,000 | | $ | 3,403,295 |
Wachovia Corp., 4.95%, 11/01/06 | | | 3,000,000 | | | 3,003,750 |
| | | | | |
|
|
| | | | | | | 6,407,045 |
| | | | | |
|
|
Financial Services (11.3%) | | | | | | |
Bankboston, 7.38%, 09/15/06 | | | 3,000,000 | | | 3,063,750 |
Merrill Lynch, 2.07%, 06/12/06 | | | 3,000,000 | | | 2,951,250 |
Monumental Global Funding, 6.05%, 01/19/06 (b) | | | 3,000,000 | | | 3,011,250 |
Principal Life Global, 6.13%, 03/01/06 (b) | | | 3,000,000 | | | 3,015,000 |
Province of Ontario, 3.38%, 01/15/08 | | | 3,000,000 | | | 2,917,500 |
| | | | | |
|
|
| | | | | | | 14,958,750 |
| | | | | |
|
|
| | |
Total Corporate Bonds | | | | | | 21,365,795 |
| | | | | |
|
|
|
U.S. Government Sponsored & Agency Obligations (2.1%)
|
Federal Home Loan Mortgage Corporation (2.1%) | | | |
3.61%, 09/27/12, Series T-50, Class A6 | | | 2,768,348 | | | 2,717,565 |
| | | | | |
|
|
| |
Total U.S. Government Sponsored & Agency Obligations | | | 2,717,565 |
| | | | | |
|
|
|
Obligations (18.1%)
U.S. Government Sponsored Mortgage Backed |
Federal Home Loan Mortgage Corporation (5.5%) | | | |
4.50%, 12/15/09, Series 2870,
Class BC | | | 3,000,000 | | | 2,958,990 |
4.00%, 05/15/12, Series 2676,
Class CV | | | 2,077,450 | | | 2,020,471 |
4.00%, 07/15/10, Series 2626,
Class UN | | | 2,384,406 | | | 2,337,433 |
| | | | | |
|
|
| | | | | | | 7,316,894 |
| | | | | |
|
|
Federal National Mortgage Association (9.0%) |
4.50%, 08/25/10, Series 2004-79, Class VE | | | 2,135,780 | | | 2,113,226 |
4.00%, 10/25/13, Series 2004-9, Class YJ | | | 5,000,000 | | | 4,901,151 |
4.00%, 10/25/16, Series 2004-80, Class LG | | | 5,000,000 | | | 4,874,710 |
| | | | | |
|
|
| | | | | | | 11,889,087 |
| | | | | |
|
|
U.S. Government Sponsored Mortgage Backed
Obligations (continued)
| | | | | | |
| | | Principal Amount | | Value |
| | | | | | | |
Government National Mortgage Association (3.6%) | | | |
4.00%, 05/20/13, Series 2004-76, Class QA | | $ | 2,487,393 | | $ | 2,404,247 |
3.47%, 07/20/07, Series 2004-22, Class BK | | | 2,460,070 | | | 2,371,901 |
| | | | | |
|
|
| | | | | | | 4,776,148 |
| | | | | |
|
|
| |
Total U.S. Government Sponsored Mortgage-Backed Obligations | | | 23,982,129 |
| | | | | |
|
|
|
U.S. Treasury Notes (6.7%)
|
U.S. Treasury Notes (6.7%) | | | | | | |
4.13%, 08/15/08 | | | 9,000,000 | | | 8,932,500 |
| | | | | |
|
|
| | |
Total U.S. Treasury Notes | | | | | | 8,932,500 |
| | | | | |
|
|
|
Cash Equivalents (5.4%)
|
Investments in repurchase agreements (collateralized by U.S. Government Agencies and U.S. Government Agency Mortgages, in a joint trading account at 3.90%, dated 10/31/05, due 11/01/05, repurchase price $7,140,264) | | | 7,139,492 | | | 7,139,492 |
| | | | | |
|
|
| | |
Total Cash Equivalents | | | | | | 7,139,492 |
| | | | | |
|
|
| |
Total Investments
(Cost $134,811,060) (a) — 99.8% | | | 132,204,704 |
| | |
Other assets in excess of liabilities — 0.2% | | | | | | 260,317 |
| | | | | |
|
|
| |
NET ASSETS — 100.0% | | $ | 132,465,021 |
| | | | | |
|
|
| | (a) | See Notes to Financial Statements for tax unrealized appreciation (depreciation) of securities. |
| | (b) | Represents a restricted security acquired and eligible for resale under Rule 144A, which limits the resale to certain qualified buyers. These securities were deemed liquid pursuant to procedures approved by the Board of Trustees. |
See notes to financial statements.
Gartmore Tax-Free Income Fund
For the annual period ended Oct. 31, 2005, the Gartmore Tax-Free Income Fund (Class A at NAV) returned 1.98% versus 2.56% for its benchmark, the Lehman Brothers Municipal Bond Index. For broader comparison, the average return for the Fund’s Lipper peer category of General Municipal Debt Funds was 2.07%.
During the reporting period, issuance of municipal bonds was steady; sales reached $391.0 billion, up 9.0% from the same period in 2004. The increase in supply was fueled by issuers taking advantage of lower interest rates to refinance or refund older, higher-costing debt. Higher tax receipts combined with better expense management resulted in a diminished need to issue bonds for new money purposes. Fortunately for the municipal bond market, the demand, though spotty from mutual fund and retail accounts, was solid from arbitraged accounts and insurance companies.
Despite the fact that 2005 has been the worst year on record for insured catastrophe losses at $55.7 billion–more than double the $27.5 billion incurred in 2004–the near-term impact on the industry appears to be manageable, and insurance investors remained active market participants. As for interest-rate moves, the Federal Reserve Board continued its gradual approach to raising the federal funds rate by increasing interest rates eight consecutive times by 25 basis points each to move from 1.75% to 3.75% during the reporting period. The Federal Open Market Committee believes that, even after these actions have been taken, monetary policy remains accommodative and, coupled with robust underlying productivity growth, is providing ongoing support to economic activity. The Fed observed that, despite the rise in energy prices, long–term inflation remains well contained. As a result, the Treasury yield curve, a plotted graph line of the yields (or interest rates) on long-term and short-term maturity bonds, usually treasury securities, continued to flatten; the spread is over 180 basis points through its five-year daily average. The municipal high-grade yield curve flattened as well and is 113 basis points through its five-year daily average.
The current duration of the Fund is 4.71 compared to its benchmark, which is 5.37. Fund underperformance is attributed to the shorter duration of the funds assets.
The bond market is concerned about rising interest rates and the resultant market volatility. Our strategy in response to prevailing economic conditions is to: 1) remain diversified on the yield curve; 2) purchase municipal bonds that become undervalued due to concerns about rising interest rates; 3) emphasize intermediate-term bonds bearing premium coupons (5% or higher); and 4) maintain bond portfolio quality.
Portfolio Manager:
Alpha Benson
| | |
Fund Performance | | Gartmore Tax-Free Income Fund |
Average Annual Total Return
(For periods ended October 31, 2005)
| | | | | | | | |
| | | | | 1 Yr. | | 5 Yr. | | 10 Yr. |
| Class A1 | | w/o SC2 | | 1.98% | | 5.23% | | 5.03% |
| | | w/SC3 | | -2.84% | | 4.21% | | 4.52% |
| Class B4 | | w/o SC2 | | 1.19% | | 4.56% | | 4.53% |
| | | w/SC5 | | -3.73% | | 4.22% | | 4.53% |
| Class C6 | | w/o SC2 | | 1.30% | | 4.47% | | 4.70% |
| | | w/SC7 | | 0.32% | | 4.47% | | 4.70% |
| Class D8 | | w/o SC2 | | 2.24% | | 5.52% | | 5.23% |
| | | w/SC9 | | -2.34% | | 4.56% | | 4.74% |
| Class X1 | | w/o SC2 | | 1.36% | | 4.63% | | 4.56% |
| | | w/SC5 | | -3.55% | | 4.29% | | 4.56% |
| Class Y1 | | w/o SC2 | | 1.37% | | 4.53% | | 4.73% |
| | | w/SC7 | | 0.39% | | 4.53% | | 4.73% |
All figures showing the effect of a sales charge reflect the maximum charge possible, because it has the most dramatic effect on performance data.
| 1 | These returns through May 11, 1998 include performance of the Fund’s predecessor fund, and, for periods from May 11, 1998 to the creation of the class, include the performance of the Fund’s Class D shares. These returns were achieved prior to the creation of Class A and Class X shares (5/11/98) and Class Y shares (3/1/01). Excluding the effect of any fee waivers or reimbursements, such prior performance is similar to what Class A, Class X and Class Y shares would have produced during those periods because all classes of the Fund’s shares invest in the same portfolio of securities. The performance for these classes has been restated to reflect differences in sales charges (where applicable), but does not reflect the differing levels of other fees (primarily Rule 12b-1 and/or administrative services fees) applicable to such classes. If these other fees were reflected, the performance for each of these classes of shares would have been lower. |
| 2 | These returns do not reflect the effects of sales charges (SC). |
| 3 | A 4.75% front-end sales charge was deducted. |
| 4 | These returns through May 11, 1998 include performance of the Fund’s predecessor fund, and for the period from May 11, 1998 to the creation of the Fund’s Class B shares on September 4, 2003, include the performance of the Fund’s Class X shares. Excluding the effect of any fee waivers or reimbursements, such prior performance is similar to what Class B shares would have produced during those periods because all classes of the Fund’s shares invest in the same portfolio of securities. The performance for these classes has been restated to reflect differences in sales charges (where applicable), but does not reflect the differing levels of other fees (primarily Rule 12b-1 and/or administrative services fees) applicable to such classes. If these other fees were reflected, the performance for the Class B shares would have been lower. |
| 5 | A 5.00% contingent deferred sales charge (CDSC) was deducted. The CDSC declines to 0% after 6 years. |
| 6 | These returns through May 11, 1998 include performance of the Fund’s predecessor fund, for the period from May 11, 1998 to March 1, 2001 include the performance of the Fund’s Class D shares and for the period from March 1, 2001 to the creation of the Fund’s Class C shares on September 4, 2003, include the performance of the Fund’s Class Y shares. Excluding the effect of any fee waivers or reimbursements, such prior performance is similar to what Class C shares would have produced during those periods because all classes of the Fund’s shares invest in the same portfolio of securities. The performance for these classes has been restated to reflect differences in sales charges (where applicable), but does not reflect the differing levels of other fees (primarily Rule 12b-1 and/or administrative services fees) applicable to such classes. If these other fees were reflected, the performance for Class C shares would have been lower. |
| 7 | A CDSC of 1.00% was deducted from the one year return because it is charged when you sell Class C shares within the first year after purchase. |
| 8 | These returns through May 11, 1998 include the performance of the fund’s predecessor fund. |
| 9 | A 4.50% front-end sales charge was deducted. |
Performance of a $10,000 Investment
Investment return and principal value will fluctuate, and when redeemed, shares may be worth more or less than original cost. Past performance is no guarantee of future results and does not reflect the deduction of taxes that a shareholder would pay on fund distributions or the redemption of fund shares. Investing in mutual funds involves market risk, including loss of principal. Performance returns assume the reinvestment of all distributions.
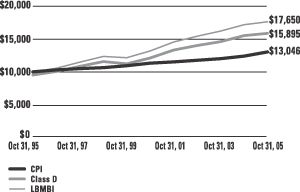
Comparative performance of $10,000 invested in Class D shares of the Gartmore Tax-Free Income Fund, the Lehman Brothers Municipal Bond Index (LBMBI)(a), and the Consumer Price Index (CPI)(b) over a 10-year period ended 10/31/05. Unlike the Fund, the returns for these unmanaged indexes do not reflect any fees, expenses, or sales charges. Investors cannot invest directly inmarket indexes.
| (a) | The LBMBI is an unmanaged index of municipal bonds-gives a broad look at how the bond prices on municipal bonds have performed. |
| (b) | The CPI represents changes in prices of a basket of goods and services purchased for consumption by urban households. |
| | |
Shareholder Expense Example | | Gartmore Tax-Free Income Fund |
As a shareholder of the Fund, you incur two types of costs: (1) transaction costs, including sales charges (loads) paid on purchase payments and redemption fees; and (2) ongoing costs, including investment advisory fees, administration fees, distribution fees and other Fund expenses. The examples below are intended to help you understand your ongoing costs (in dollars) of investing in the Fund and to compare these costs with the ongoing costs of investing in other mutual funds. Per SEC requirements, the examples assume that you had a $1,000 investment in the Class at the beginning of the reporting period, May 1, 2005, and continued to hold your shares at the end of the reporting period, October 31, 2005.
Actual Expenses
For each Class of the Fund in the table below, the first line provides information about actual account values and actual expenses. You may use the information in this line, together with the amount you invested, to estimate the expenses that you paid over the period. Simply divide your account value by $1,000 (for example, an $8,600 account value divided by $1,000 = 8.6), then multiply the result by the number in the first line of each Class under the heading entitled “Expenses Paid During Period” to estimate the expenses you paid on your account during the period.
Hypothetical Example for Comparison Purposes
The second line of each Class in the table below provides information about hypothetical account values and hypothetical expenses based on the Class’ actual expense ratio and an assumed rate of return of 5% per year before expenses, which is not the Class’ actual return. The hypothetical account values and expenses may not be used to estimate the actual ending account balance or expenses you paid for the period. You may use this information to compare the ongoing costs of investing in the Class of the Fund and other funds. To do so, compare this 5% hypothetical example with the 5% hypothetical examples that appear in the shareholder reports of the other funds.
Please note that the expenses shown in the table are meant to highlight your ongoing costs only and do not reflect any transaction costs, such as sales charges (loads) or redemption fees. Therefore, the second line for each Class in the table is useful in comparing ongoing costs only, and will not help you determine the relative total costs of owning different funds. In addition, if these transaction costs were included, your costs would have been higher. The examples also assume all dividends and distributions have been reinvested.
Schedule of Shareholder Expenses
Expense Analysis of a $1,000 Investment
(October 31, 2005)
| | | | | | | | | | | | | | |
| Tax Free Income Fund | | | | | Beginning
Account Value,
May 1, 2005 | | Ending
Account Value,
October 31, 2005 | | Expenses Paid
During Period* | | Annualized
Expense Ratio* |
| Class A | | Actual | | | $ | 1,000.00 | | $ | 1,004.90 | | $ | 4.90 | | 0.97% |
| | | Hypothetical | 1 | | $ | 1,000.00 | | $ | 1,020.11 | | $ | 4.95 | | 0.97% |
| Class B | | Actual | | | $ | 1,000.00 | | $ | 1,000.70 | | $ | 8.67 | | 1.72% |
| | | Hypothetical | 1 | | $ | 1,000.00 | | $ | 1,016.33 | | $ | 8.78 | | 1.72% |
| Class C | | Actual | | | $ | 1,000.00 | | $ | 1,001.80 | | $ | 8.68 | | 1.72% |
| | | Hypothetical | 1 | | $ | 1,000.00 | | $ | 1,016.33 | | $ | 8.78 | | 1.72% |
| Class D | | Actual | | | $ | 1,000.00 | | $ | 1,006.20 | | $ | 3.64 | | 0.72% |
| | | Hypothetical | 1 | | $ | 1,000.00 | | $ | 1,021.37 | | $ | 3.67 | | 0.72% |
| Class X | | Actual | | | $ | 1,000.00 | | $ | 1,001.70 | | $ | 7.92 | | 1.57% |
| | | Hypothetical | 1 | | $ | 1,000.00 | | $ | 1,017.09 | | $ | 8.01 | | 1.57% |
| Class Y | | Actual | | | $ | 1,000.00 | | $ | 1,001.80 | | $ | 7.92 | | 1.57% |
| | | Hypothetical | 1 | | $ | 1,000.00 | | $ | 1,017.09 | | $ | 8.01 | | 1.57% |
| * | Expenses are equal to the Fund’s annualized expense ratio multiplied by the average account value over the period multiplied by 184/365 (to reflect the one-half year period). The expense ratio presented represents a six month, annualized ratio in accordance with SEC guidelines. |
| 1 | Represents the hypothetical 5% return before expenses. |
| | |
Portfolio Summary | | Gartmore Tax-Free Income Fund |
October 31, 2005
The SEC adopted a requirement that Funds present their portfolio holdings in a table, chart or graph format in their annual and semiannual reports to shareholders, whether or not a statement of investments is utilized. The following tables, which present portfolio holdings as a percentage of net assets, are provided in compliance with this requirement.
| | |
| Asset Allocation | | |
| Municipal Bond | | 98.5% |
| Other Assets in excess of Liabilities | | 1.5% |
| | |
|
| | | 100.0% |
| | |
| Top States | | |
| Texas | | 16.7% |
| Illinois | | 12.2% |
| Alabama | | 8.0% |
| Massachusetts | | 4.9% |
| South Carolina | | 4.6% |
| Indiana | | 4.5% |
| Washington | | 4.4% |
| Ohio | | 4.3% |
| Michigan | | 4.3% |
| Georgia | | 3.8% |
| Other States | | 32.3% |
| | |
|
| | | 100.0% |
| | |
| Top Holdings | | |
| Indiana State Toll Road Commission East-West Toll Road Revenue Bonds, Series 1980, 9.00%, 01/01/15 | | 3.9% |
| Harris County, Texas Health Facilities Development Corporation Revenue School Health Care Systems, Series B, 5.75%, 07/01/27 | | 3.4% |
| Metropolitan Pier & Exposition Authority Illinois Dedicated State Tax Revenue Bonds (Mccormick Place Expansion Project), 5.50%, 12/15/24 | | 2.7% |
| Shelby County, Tennessee Educational & Housing Facilities Board Revenue Bonds (St. Judes Children’s Research), 5.38%, 07//01/24 | | 2.4% |
| Jefferson County, Alabama Sewer Capital Improvement Revenue Warrants, Series A, 5.13%, 02/01/29 | | 2.4% |
| Alabama 21st Century Authority Tobacco Settlement Revenue Bonds, 5.50%, 12/01/21 | | 2.3% |
| Michigan State General Obligation Unlimited Tax Bonds (Environmental Protection Program), Series 1992, 6.25%, 11/01/12 | | 2.2% |
| Illinois State General Obligation Unlimited Revenue Bonds, 5.25%, 05/01/23 | | 2.0% |
| Denver, Colorado City & County Airport Revenue Bonds, Series D, 5.50%, 11/15/25 | | 2.0% |
| Washington State Motor Vehicle Fuel Tax General Obligation Unlimited Tax Bonds, Series 1997-D, 5.38%, 01/01/22 | | 2.0% |
| Other Bonds | | 74.7% |
| | |
|
| | | 100.0% |
Statement of Investments
October 31, 2005
Gartmore Tax-Free Income Fund
| | | | | | |
| | | Principal Amount | | Value |
| | | | | | | |
Alabama (8.0%) | | | | | | |
Alabama 21st Century Authority Tobacco Settlement Revenue Bonds, 5.75%, 12/01/15 | | $ | 1,500,000 | | $ | 1,617,375 |
Alabama 21st Century Authority Tobacco Settlement Revenue Bonds, 5.50%, 12/01/21 | | | 4,000,000 | | | 4,089,040 |
Alabama Housing Finance Authority Single-Family Revenue Bonds, (Collateralized Home Mortgage Revenue Bond Program), Series 1996-D, 6.00%, 10/01/16 | | | 795,000 | | | 814,915 |
Auburn University Alabama General Fee Revenue Bonds, 5.50%, 06/01/18 | | | 1,685,000 | | | 1,808,443 |
Birmingham, Alabama Water & Sewer Revenue Warrants, Series 1998-A, 4.75%, 01/01/29 | | | 1,750,000 | | | 1,730,505 |
Jefferson County, Alabama Sewer Capital Improvement Revenue Warrants, Series A, 5.13%, 02/01/29 | | | 4,000,000 | | | 4,243,360 |
| | | | | |
|
|
| | | | | | | 14,303,638 |
| | | | | |
|
|
Arizona (1.1%) | | | | | | |
Mesa, Arizona Industrial Development Authority Revenue Bonds, (Discovery Health Systems), Series A, 5.63%, 01/01/29 | | | 1,800,000 | | | 1,962,414 |
| | | | | |
|
|
Colorado (2.0%) | | | | | | |
Denver, Colorado City & County Airport Revenue Bonds, Series D, 5.50%, 11/15/25 | | | 3,500,000 | | | 3,609,935 |
| | | | | |
|
|
District of Columbia (1.5%) | | | | | | |
District of Columbia General Obligation Unlimited Bonds, Series A, 5.50%, 06/01/29 | | | 1,775,000 | | | 1,855,727 |
District of Columbia Prerefunded General Obligation Unlimited, Series A, 5.50%, 06/01/29 | | | 725,000 | | | 784,327 |
| | | | | |
|
|
| | | | | | | 2,640,054 |
| | | | | |
|
|
| | | | | | |
| | | Principal Amount | | Value |
| | | | | | | |
Florida (3.4%) | | | | | | |
Florida State Board of Education Capital Outlay (Public Education), Series D, 5.75%, 06/01/22 | | $ | 1,050,000 | | $ | 1,140,857 |
Jacksonville, Florida Electric Authority Revenue Bonds, (St. John’s River), Series 9, 5.25%, 10/01/21 | | | 1,520,000 | | | 1,532,434 |
Tampa Bay Water Florida Utility System Revenue Bonds, 5.50%, 10/01/18 | | | 3,000,000 | | | 3,385,499 |
| | | | | |
|
|
| | | | | | | 6,058,790 |
| | | | | |
|
|
Georgia (3.8%) | | | | | | |
Atlanta, Georgia Airport General Obligation Refunding Revenue Bonds, Series A, 5.50%, 01/01/26 | | | 1,000,000 | | | 1,089,490 |
Georgia Local Government Certificates of Participation Grantor Trust, Series 1998-A, 4.75%, 06/01/28 | | | 1,000,000 | | | 1,008,270 |
Georgia Municipal Electric Power Authority Revenue Bonds, Prerefunded Series V, 6.60%, 01/01/18 | | | 465,000 | | | 570,894 |
Georgia Municipal Electric Power Authority Revenue Bonds, Prerefunded Series V, 6.60%, 01/01/18 | | | 55,000 | | | 65,578 |
Georgia Municipal Electric Power Authority Revenue Bonds, Unrefunded Series V, 6.60%, 01/01/18 | | | 2,230,000 | | | 2,658,874 |
Georgia Private College & Universities Authority, Refunding Revenue Bonds, (Mercer University Project), Series A, 5.25%, 10/01/25 | | | 1,500,000 | | | 1,520,445 |
| | | | | |
|
|
| | | | | | | 6,913,551 |
| | | | | |
|
|
Illinois (12.2%) | | | | | | |
Chicago Park District, Illinois General Obligation Unlimited Tax Park Bonds, Series 1996, 5.60%, 01/01/21 | | | 3,050,000 | | | 3,165,961 |
| | Municipal Bond (continued) |
| | | | | | |
| | | Principal Amount | | Value |
| | | | | | | |
Illinois (continued) | | | | | | |
Chicago, Illinois Prerefunded Project General Obligation Limited, Series A Series A, 5.38%, 01/01/24 | | $ | 1,995,000 | | $ | 2,098,361 |
Chicago, Illinois Unrefunded Project General Obligation Limited, Series A Series A, 5.38%, 01/01/24 | | | 935,000 | | | 983,442 |
Illinois Development Finance Authority Hospital Revenue Bonds, (Adventist Health Systems/Sunbelt Obligation), 5.50%, 11/15/20 | | | 1,750,000 | | | 1,830,465 |
Illinois Development Finance Authority Hospital Revenue Bonds, (Adventist Health Systems/Sunbelt Obligation), 5.65%, 11/15/24 | | | 3,000,000 | | | 3,127,290 |
Illinois State General Obligation Unlimited Revenue Bonds, 5.25%, 05/01/23 | | | 3,425,000 | | | 3,618,718 |
Illinois State Sales Tax Revenue Bonds, 5.00%, 06/15/19 | | | 2,000,000 | | | 2,109,220 |
Metropolitan Pier & Exposition Authority Illinois Dedicated State Tax Revenue Bonds (Mccormick Place Expansion Project), 5.50%, 12/15/24 | | | 4,500,000 | | | 4,841,595 |
| | | | | |
|
|
| | | | | | | 21,775,052 |
| | | | | |
|
|
Indiana (4.5%) | | | | | | |
Ball State University Student Fee Revenue Bonds, Series J, 6.20%, 07/01/2020 | | | 1,000,000 | | | 1,126,400 |
Indiana State Toll Road Commission East-West Toll Road Revenue Bonds, Series 1980, 9.00%, 01/01/15 | | | 5,335,000 | | | 6,960,788 |
| | | | | |
|
|
| | | | | | | 8,087,188 |
| | | | | |
|
|
Kansas (0.9%) | | | | | | |
Wichita, Kansas Hospital Revenue Refunding Bonds (Facilities Improvements Series 11), 6.75%, 11/15/19 | | | 1,500,000 | | | 1,693,095 |
| | | | | |
|
|
| | | | | | |
| | | Principal Amount | | Value |
| | | | | | | |
Louisiana (1.0%) | | | | | | |
Tobacco Settlement Financing Corp. (Louisiana Revenue Asset Backed), Series 2001B, 5.88%, 05/15/39 | | $ | 1,750,000 | | $ | 1,824,305 |
| | | | | |
|
|
Massachusetts (4.9%) | | | | | | |
Massachusetts Bay Transportation Authority Revenue Bonds, (General Transportation System), Series A, 5.38%, 03/01/19 | | | 2,000,000 | | | 2,035,040 |
Massachusetts State Consumer Loan General Obligation Limited, Series C, 5.50%, 11/01/2015 | | | 1,500,000 | | | 1,665,585 |
Massachusetts State Consumer Loan General Obligation Limited, Series D, 5.50%, 08/01/2019 | | | 1,000,000 | | | 1,123,490 |
Massachusetts State General Obligation Unlimited Bonds, Series D, 5.50%, 10/01/2018 | | | 2,000,000 | | | 2,242,140 |
Massachusetts State Prerefunded Consumer Loan General Obligation Limited, Series B, 5.25%, 03/01/2021 | | | 95,000 | | | 102,678 |
Massachusetts State Unrefunded Consumer Loan General Obligation Limited, Series B, 5.25%, 03/01/21 | | | 1,405,000 | | | 1,518,552 |
| | | | | |
|
|
| | | | | | | 8,687,485 |
| | | | | |
|
|
Michigan (4.3%) | | | | | | |
Michigan State General Obligation Unlimited Tax Bonds (Environmental Protection Program), Series 1992, 6.25%, 11/01/12 | | | 3,500,000 | | | 3,918,775 |
Michigan State Hospital Finance Authority Refunding Revenue Bonds, (Henry Ford Health), 6.00%, 11/15/24 | | | 1,500,000 | | | 1,586,700 |
Michigan State Hospital Finance Authority Revenue Bonds, (Ascension Health Credit), Series A, 5.75%, 11/15/18 | | | 2,000,000 | | | 2,186,840 |
| | | | | |
|
|
| | | | | | | 7,692,315 |
| | | | | |
|
|
Statement of Investments (Continued)
October 31, 2005
Gartmore Tax-Free Income Fund (Continued)
| | Municipal Bond (continued) |
| | | | | | |
| | | Principal Amount | | Value |
| | | | | | | |
Minnesota (0.9%) | | | | | | |
St. Louis Park, Minnesota Independent School District Number 283 General Obligation Unlimited Tax Bonds, 5.75%, 02/01/18 | | $ | 1,500,000 | | $ | 1,604,955 |
| | | | | |
|
|
Missouri (1.1%) | | | | | | |
Jackson County, Missouri Special Obligation Revenue Bonds, Series A, 5.50%, 12/01/12 | | | 1,415,000 | | | 1,553,811 |
Missouri State Environmental Improvement & Energy Resource Authority, State Revolving Fund-Multiple, Series A, Refunded Portion, 6.55%, 07/01/14 | | | 365,000 | | | 367,318 |
| | | | | |
|
|
| | | | | | | 1,921,129 |
| | | | | |
|
|
Nevada (1.3%) | | | | | | |
Nevada State Highway Impt. Revenue Bonds, 5.50%, 12/01/18 | | | 1,000,000 | | | 1,102,800 |
University of Nevada Community College Revenue Bonds, 5.38%, 07/01/20 | | | 1,200,000 | | | 1,261,644 |
| | | | | |
|
|
| | | | | | | 2,364,444 |
| | | | | |
|
|
New Jersey (2.5%) | | | | | | |
New Jersey State Transportation Trust Fund Authority, Transportation Systems Revenue Bonds, Series A, 5.75%, 06/15/17 | | | 1,000,000 | | | 1,119,770 |
New Jersey State Transportation Trust Fund Authority, Transportation Systems Revenue Bonds, Series B, 6.00%, 12/15/15 | | | 2,000,000 | | | 2,257,820 |
New Jersey State Turnpike Authority Revenue Bonds, Prerefunded Series 1991-C, 6.50%, 01/01/16 | | | 790,000 | | | 922,854 |
New Jersey State Turnpike Authority Revenue Bonds, Prerefunded Series 1991-C, 6.50%, 01/01/16 | | | 55,000 | | | 65,359 |
New Jersey State Turnpike Authority Revenue Bonds, Unrefunded Series 1991-C, 6.50%, 01/01/16 | | | 155,000 | | | 181,007 |
| | | | | |
|
|
| | | | | | | 4,546,810 |
| | | | | |
|
|
| | | | | | |
| | | Principal Amount | | Value |
| | | | | | | |
New Mexico (0.9%) | | | | | | |
Bernalillo County, New Mexico Gross Receipts Tax Revenue Bonds, 5.25%, 10/01/26 | | $ | 1,500,000 | | $ | 1,604,745 |
| | | | | |
|
|
New York (1.3%) | | | | | | |
New York State Local Government Assistance Corporation Revenue Refunding Bonds, Series 1993-E, 6.00%, 04/01/14 | | | 1,000,000 | | | 1,127,150 |
New York, New York City Transitional Finance Authority Future Tax Secured Revenue Bonds, 5.75%, 11/15/19 | | | 795,000 | | | 881,456 |
New York, New York City Transitional Finance Authority Future Tax Secured Revenue Bonds, 5.75%, 11/15/19 | | | 205,000 | | | 227,294 |
| | | | | |
|
|
| | | | | | | 2,235,900 |
| | | | | |
|
|
North Carolina (2.8%) | | | | | | |
North Carolina Housing Finance Agency, Single-Family Revenue Bonds, Series A, 6.25%, 03/01/17 | | | 735,000 | | | 741,336 |
North Carolina Medical Care Commission Hospital Revenue Bonds (Firsthealth of the Carolinas), 4.75%, 10/01/26 | | | 2,000,000 | | | 2,013,840 |
North Carolina Medical Care Commission Hospital Revenue Bonds, (Gaston Health Care), Prerefunded, 5.00%, 02/15/29 | | | 1,070,000 | | | 1,123,211 |
North Carolina Medical Care Commission Hospital Revenue Bonds, (Gaston Health Care), Unrefunded, 5.00%, 02/15/29 | | | 1,230,000 | | | 1,108,693 |
| | | | | |
|
|
| | | | | | | 4,987,080 |
| | | | | |
|
|
Ohio (4.3%) | | | | | | |
Cleveland, Ohio Waterworks Revenue Bonds, Series K, 5.25%, 01/01/20 | | | 1,000,000 | | | 1,087,520 |
Franklin County, Ohio Hospital Refunding & Improvement Revenue Bonds, (The Children’s Hospital Project), Series 1996-A, 5.75%, 11/01/20 | | | 1,100,000 | | | 1,128,941 |
| | Municipal Bond (continued) |
| | | | | | |
| | | Principal Amount | | Value |
| | | | | | | |
Ohio (continued) | | | | | | |
Hamilton, Ohio City School District General Obligation Bonds, Series A, 5.50%, 12/01/19 | | $ | 1,000,000 | | $ | 1,089,220 |
Montgomery County, Ohio Hospital Revenue Bonds (Kettering Medical Center), 6.75%, 04/01/18 | | | 2,500,000 | | | 2,723,300 |
Ohio State Building, Ohio Sales Tax Revenue Bonds, 5.00%, 04/01/17 | | | 1,655,000 | | | 1,742,814 |
| | | | | |
|
|
| | | | | | | 7,771,795 |
| | | | | |
|
|
Pennsylvania (0.6%) | | | | | | |
Pennsylvania State University General Obligation Unlimited Bonds, 5.25%, 03/01/16 | | | 1,000,000 | | | 1,074,060 |
| | | | | |
|
|
South Carolina (4.6%) | | | | | | |
Greenville, South Carolina Waterworks Revenue Bonds, 5.25%, 02/01/16 | | | 1,685,000 | | | 1,805,073 |
South Carolina State Public Service Authority Revenue Bonds, Series A, 5.50%, 01/01/22 | | | 1,000,000 | | | 1,065,400 |
South Carolina Transportation Infrastructure Revenue Bonds, 5.50%, 10/01/30 | | | 1,000,000 | | | 1,085,800 |
South Carolina Transportation Infrastructure Revenue Bonds, Series A, 5.38%, 10/01/24 | | | 3,000,000 | | | 3,243,780 |
Spartanburg, South Carolina Water System Revenue Bonds, Series 1996, 6.10%, 06/01/21 | | | 1,000,000 | | | 1,017,600 |
| | | | | |
|
|
| | | | | | | 8,217,653 |
| | | | | |
|
|
Tennessee (3.0%) | | | | | | |
Shelby County, Tennessee Educational & Housing Facilities Board Revenue Bonds (St. Judes Children’s Research), 5.38%, 07/01/24 | | | 4,200,000 | | | 4,364,598 |
Shelby County, Tennessee Health Educational & Housing Facilities Board Revenue Bonds (St. Judes Children’s Research), 6.00%, 07/01/14 | | | 1,000,000 | | | 1,081,160 |
| | | | | |
|
|
| | | | | | | 5,445,758 |
| | | | | |
|
|
| | | | | | |
| | | Principal Amount | | Value |
| | | | | | | |
Texas (16.7%) | | | | | | |
Beaumont Independent School District, Texas General Obligation Unlimited Tax School Building Bonds, Series 1996, 5.00%, 02/15/16 | | $ | 2,325,000 | | $ | 2,337,857 |
Collin County, Texas Permanent Improvement General Obligation Limited Tax Bonds, Series A, 5.50%, 02/15/19 | | | 1,300,000 | | | 1,387,399 |
Comal, Texas Independent School District General Obligation Unlimited Tax School Building and Refunding Bonds, 5.63%, 08/01/19 | | | 2,000,000 | | | 2,152,920 |
Fort Bend Independent School District, Texas General Obligation Unlimited Tax Bonds, Series 1996, 5.00%, 02/15/18 | | | 2,300,000 | | | 2,477,307 |
Fort Worth, Texas General Obligation Limited Tax Bonds, 5.63%, 03/01/17 | | | 1,350,000 | | | 1,393,227 |
Harris County, Texas Health Facilities Development Corporation Revenue School Health Care Systems, Series B, 5.75%, 07/01/27 | | | 5,325,000 | | | 6,132,216 |
Houston, Texas Independent School District General Obligation Limited Tax School House Refunding Bonds, Series 1997, 5.38%, 08/15/17 | | | 1,500,000 | | | 1,537,950 |
Houston, Texas Independent School District General Obligation Limited Tax School House Refunding Bonds, Series A, 4.75%, 02/15/26 | | | 2,000,000 | | | 2,010,120 |
Leander, Texas Independent School District General Obligation Unlimited Refunding Bonds, 5.00%, 08/15/22 | | | 1,000,000 | | | 1,038,360 |
Lower Colorado River Authority, Texas Junior Lien Refunding Revenue Bonds, Escrowed Series 1992, 6.00%, 01/01/17 | | | 1,245,000 | | | 1,451,433 |
Statement of Investments (Continued)
October 31, 2005
Gartmore Tax-Free Income Fund (Continued)
| | Municipal Bond (continued) |
| | | | | | |
| | | Principal Amount | | Value |
| | | | | | | |
Texas (continued) | | | | | | |
Montgomery County, Texas General Obligation Limited, 5.25%, 09/01/19 | | $ | 1,000,000 | | $ | 1,077,530 |
San Antonio, Texas Water Revenue Bonds, 5.00%, 05/15/25 | | | 1,000,000 | | | 1,028,590 |
Socorro, Texas Independent School District General Obligation Unlimited Tax Bonds, Series A, 5.75%, 02/15/14 | | | 1,000,000 | | | 1,054,760 |
Spring Branch, Texas Independent School District General Obligation Limited, 5.20%, 02/01/20 | | | 1,500,000 | | | 1,574,895 |
United Independent School District General Obligation Unlimited Tax Bonds, 5.38%, 08/15/25 | | | 1,000,000 | | | 1,070,240 |
Wichita Falls, Texas Water and Sewer Revenue Bonds (Priority Lien), 5.38%, 08/01/19 | | | 2,000,000 | | | 2,134,480 |
| | | | | |
|
|
| | | | | | | 29,859,284 |
| | | | | |
|
|
Vermont (1.2%) | | | | | | |
Vermont Educational & Health Buildings Financing Agency Revenue Bonds (Fletcher Allen Health), Series A, 6.00%, 12/01/23 | | | 2,000,000 | | | 2,193,620 |
| | | | | |
|
|
Virginia (3.8%) | | | | | | |
Fairfax County, Virginia Water Authority Refunding Revenue Bonds, Series 1992, 6.00%, 04/01/22 | | | 940,000 | | | 991,822 |
Henrico County, Virginia Water & Sewer System Refunding Revenue Bonds, Series 1994, 5.875%, 05/01/14 | | | 1,205,000 | | | 1,219,243 |
Virginia College Building Authority Educational Facilities Revenue Bonds, 5.00%, 02/01/18 | | | 2,955,000 | | | 3,101,687 |
Virginia Commonwealth Transportation Board Revenue Bonds, 5.00%, 04/01/18 | | | 1,435,000 | | | 1,507,941 |
| | | | | |
|
|
| | | | | | | 6,820,693 |
| | | | | |
|
|
| | | | | | |
| | | Principal Amount | | Value |
Washington (4.4%) | | | | | | |
Seattle, Washington Municipal Light & Power Revenue Improvement & Refunding Revenue Bonds, 5.13%, 03/01/26 | | $ | 1,000,000 | | $ | 1,029,730 |
Seattle, Washington Water Systems Revenue Bonds, 5.38%, 03/01/29 | | | 2,000,000 | | | 2,091,120 |
Washington State Motor Vehicle Fuel Tax General Obligation Unlimited Tax Bonds, Series 1997-D, 5.38%, 01/01/22 | | | 3,500,000 | | | 3,590,370 |
Washington State Motor Vehicle Fuel Tax General Obligation Unlimited Tax Bonds, Series C, 5.80%, 01/01/17 | | | 1,000,000 | | | 1,090,310 |
| | | | | |
|
|
| | | | | | | 7,801,530 |
| | | | | |
|
|
Wisconsin (1.5%) | | | | | | |
Wisconsin State General Obligation Unlimited, Series C, 5.55%, 05/01/21 | | | 1,000,000 | | | 1,086,740 |
Wisconsin State Transportation Revenue Bonds, Series A, 5.50%, 07/01/16 | | | 1,500,000 | | | 1,631,955 |
| | | | | |
|
|
| | | | | | | 2,718,695 |
| | | | | |
|
|
| | |
Total Municipal Bond | | | | | | 176,415,973 |
| | | | | |
|
|
| |
Total Investments
(Cost $164,290,329) (a) — 98.5% | | | 176,415,973 |
| |
Other assets in excess of
liabilities — 1.5% | | | 2,724,589 |
| | | | | |
|
|
| | |
NET ASSETS — 100.0% | | | | | $ | 179,140,562 |
| | | | | |
|
|
| | (a) | See Notes to Financial Statements for tax unrealized appreciation (depreciation) of securities. |
Distribution of investments, as a percentage of net assets in securities at value, is as follows:
| | | | | |
| Industry | | Percent | | Value |
Air, Water, and Solid Waste | | 1.19% | | $ | 2,134,480 |
Airports Flying Fields | | 2.62% | | | 4,699,425 |
Colleges and Universities | | 5.09% | | | 9,122,595 |
Educational Services | | 0.59% | | | 1,054,760 |
Electric and Other Services | | 0.86% | | | 1,532,434 |
Elementary and Secondary Schools | | 4.69% | | | 8,395,165 |
Environmental Quality | | 0.21% | | | 367,318 |
Facilities Support Services | | 4.25% | | | 7,612,999 |
Finance, Taxation, and Money | | 6.50% | | | 11,638,815 |
General Obligation | | 22.32% | | | 39,986,062 |
Health Services | | 7.69% | | | 13,771,595 |
Highway and Street Construction | | 1.46% | | | 2,610,741 |
Hospitals | | 11.44% | | | 20,484,789 |
Local and Surburban | | 1.14% | | | 2,035,040 |
Regulation, Administration of Transportation | | 1.56% | | | 2,801,394 |
Regulation, Administration of Utilities | | 0.57% | | | 1,029,730 |
Single Family Housing | | 0.87% | | | 1,556,250 |
Tobacco and Tobacco Products | | 4.20% | | | 7,530,720 |
Transportation Services | | 8.19% | | | 14,667,958 |
Water, sewer, and Utility | | 13.05% | | | 23,383,703 |
| | |
| |
|
|
| | | 98.48% | | | |
See notes to financial statements.
Statements of Assets and Liabilities
October 31, 2005
| | | | | | | | | | | | | | |
| | | Gartmore Bond Fund | | | Gartmore
Government Bond
Fund | | | Gartmore Morley 
Gartmore Morley Enhanced
Income Fund Enhanced Income Fund |
Assets: | | | | | | | | | | | | | | |
Investments, at value (cost $117,707,549; $164,106,882 and $445,976,299 respectively) | | $ | 120,970,158 | | | $ | 163,795,255 | | | $ | 441,487,394 | | | |
Repurchase agreements, at cost and value | | | — | | | | 569,501 | | | | 17,931,322 | | | |
| | |
|
|
| |
|
|
| |
|
|
| | |
Total Investments | | | 120,970,158 | | | | 164,364,756 | | | | 459,418,716 | | | |
| | |
|
|
| |
|
|
| |
|
|
| | |
Cash | | | — | | | | — | | | | 64,006 | | | |
Cash collateral pledged for futures | | | — | | | | — | | | | 90,000 | | | |
Interest and dividends receivable | | | 1,243,619 | | | | 1,758,548 | | | | 2,286,290 | | | |
Receivable for capital shares issued | | | 104,760 | | | | 88,543 | | | | 420,624 | | | |
Receivable from advisor | | | — | | | | — | | | | 5,747 | | | |
Net receivable for variation margin on futures contracts | | | — | | | | — | | | | 3,516 | | | |
Prepaid expenses and other assets | | | 19,465 | | | | 19,537 | | | | 19,485 | | | |
| | |
|
|
| |
|
|
| |
|
|
| | |
Total Assets | | | 122,338,002 | | | | 166,231,384 | | | | 462,308,384 | | | |
| | |
|
|
| |
|
|
| |
|
|
| | |
| | | | |
Liabilities: | | | | | | | | | | | | | | |
Payable to custodian | | | 2,472,407 | | | | — | | | | — | | | |
Distributions payable | | | 54,568 | | | | 44,305 | | | | 1,073 | | | |
Payable for return of collateral received for securities on loan | | | 1,630,770 | | | | 1,025,900 | | | | 2,072,073 | | | |
Payable for capital shares redeemed | | | 158,066 | | | | 140,832 | | | | 396,055 | | | |
Accrued expenses and other payables | | | | | | | | | | | | | | |
Investment advisory fees | | | 50,691 | | | | 70,317 | | | | 134,846 | | | |
Fund administration and transfer agent fees | | | 17,767 | | | | 21,008 | | | | 38,195 | | | |
Distribution fees | | | 5,143 | | | | 15,003 | | | | 264 | | | |
Administrative servicing fees | | | 7,913 | | | | 19,860 | | | | 2,969 | | | |
Trustee fees | | | 283 | | | | 399 | | | | 978 | | | |
Other | | | 13,674 | | | | 7,236 | | | | 9,216 | | | |
| | |
|
|
| |
|
|
| |
|
|
| | |
Total Liabilities | | | 4,411,282 | | | | 1,344,860 | | | | 2,655,669 | | | |
| | |
|
|
| |
|
|
| |
|
|
| | |
Net Assets | | $ | 117,926,720 | | | $ | 164,886,524 | | | $ | 459,652,715 | | | |
| | |
|
|
| |
|
|
| |
|
|
| | |
| | | | |
Represented by: | | | | | | | | | | | | | | |
Capital | | $ | 117,623,342 | | | $ | 165,089,677 | | | $ | 469,528,330 | | | |
Accumulated net investment income (loss) | | | (8,583 | ) | | | 18,760 | | | | 8,219 | | | |
Accumulated net realized gains (losses) on investment and futures transactions | | | (2,950,648 | ) | | | 89,714 | | | | (5,799,226 | ) | | |
Net unrealized appreciation (depreciation) on investments and futures | | | 3,262,609 | | | | (311,627 | ) | | | (4,084,608 | ) | | |
| | |
|
|
| |
|
|
| |
|
|
| | |
Net Assets | | $ | 117,926,720 | | | $ | 164,886,524 | | | $ | 459,652,715 | | | |
| | |
|
|
| |
|
|
| |
|
|
| | |
| | | | |
Net Assets: | | | | | | | | | | | | | | |
Class A Shares | | $ | 10,212,294 | | | $ | 54,165,868 | | | $ | 1,241,849 | | | |
Class B Shares | | | 223,027 | | | | 152,497 | | | | — | | | |
Class C Shares | | | 696,206 | | | | 330,619 | | | | — | | | |
Class D Shares | | | 99,133,387 | | | | 105,986,593 | | | | — | | | |
Class R Shares | | | 1,060 | | | | 1,037 | | | | 1,021 | | | |
Class X Shares | | | 2,821,337 | | | | 3,393,578 | | | | — | | | |
| | | | | | | | | | | | | | | |
See notes to financial statements.
| | | | | | | | | | | | | | |
| | | Gartmore Bond Fund | | | Gartmore
Government Bond
Fund | | | Gartmore Morley
Gartmore Morley Enhanced Income Fund Enhanced Income Fund |
Class Y Shares | | $ | 198,713 | | | $ | 855,336 | | | $ | — | | | |
Institutional Service Class Shares | | | — | | | | — | | | | 5,660,518 | | | |
Institutional Class Shares | | | 4,640,696 | | | | 996 | | | | 452,749,327 | | | |
| | |
|
|
| |
|
|
| |
|
|
| | |
Total | | $ | 117,926,720 | | | $ | 164,886,524 | | | $ | 459,652,715 | | | |
| | |
|
|
| |
|
|
| |
|
|
| | |
| | | | |
Shares outstanding (unlimited number of shares authorized): | | | | | | | | | | | | | | |
Class A Shares | | | 1,071,222 | | | | 5,327,430 | | | | 136,694 | | | |
Class B Shares | | | 23,393 | | | | 14,997 | | | | — | | | |
Class C Shares | | | 72,955 | | | | 32,532 | | | | — | | | |
Class D Shares | | | 10,382,894 | | | | 10,418,175 | | | | — | | | |
Class R Shares | | | 111 | | | | 102 | | | | 113 | | | |
Class X Shares | | | 295,845 | | | | 334,012 | | | | — | | | |
Class Y Shares | | | 20,816 | | | | 84,191 | | | | — | | | |
Institutional Service Class Shares | | | — | | | | — | | | | 622,762 | | | |
Institutional Class Shares | | | 486,022 | | | | 98 | | | | 49,832,644 | | | |
| | |
|
|
| |
|
|
| |
|
|
| | |
Total | | | 12,353,258 | | | | 16,211,537 | | | | 50,592,213 | | | |
| | |
|
|
| |
|
|
| |
|
|
| | |
| | | | |
Net asset value and redemption price per share: | | | | | | | | | | | | | | |
Class A Shares | | $ | 9.53 | | | $ | 10.17 | | | $ | 9.08 | | | |
Class B Shares (a) | | $ | 9.53 | | | $ | 10.17 | | | $ | — | | | |
Class C Shares (b) | | $ | 9.54 | | | $ | 10.16 | | | $ | — | | | |
Class D Shares | | $ | 9.55 | | | $ | 10.17 | | | $ | — | | | |
Class R Shares | | $ | 9.55 | | | $ | 10.17 | | | $ | 9.09 | (c) | | |
Class X Shares | | $ | 9.54 | | | $ | 10.16 | | | $ | — | | | |
Class Y Shares | | $ | 9.55 | | | $ | 10.16 | | | $ | — | | | |
Institutional Service Class Shares | | $ | — | | | $ | — | | | $ | 9.09 | | | |
Institutional Class Shares | | $ | 9.55 | | | $ | 10.17 | (c) | | $ | 9.09 | | | |
| | | | |
Maximum offering price per share (100%/(100%-maximum sales charge) of net asset value adjusted to the nearest cent): | | | | | | | | | | | | | | |
Class A Shares | | $ | 10.01 | | | $ | 10.68 | | | $ | 9.43 | | | |
Class D Shares | | $ | 10.00 | | | $ | 10.65 | | | $ | — | | | |
| | |
|
|
| |
|
|
| |
|
|
| | |
Maximum Sales Charge — Class A Shares | | | 4.75 | % | | | 4.75 | % | | | 3.75 | % | | |
| | |
|
|
| |
|
|
| |
|
|
| | |
Maximum Sales Charge — Class D Shares | | | 4.50 | % | | | 4.50 | % | | | — | | | |
| | |
|
|
| |
|
|
| |
|
|
| | |
| | | | | | | | | | | | | | | |
| | | | | | | | | | | | | | | |
| | | | | | | | | | | | | | | |
| | | | | | | | | | | | | | | |
| | | | | | | | | | | | | | | |
| | | | | | | | | | | | | | | |
| (a) | For Class B shares, the redemption price per share varies by the length of time shares are held. |
| (b) | For Class C Shares, the redemption price per share is reduced by 1.00% for shares held less than one year. |
| (c) | Due to rounding, Net Assets divided by Shares Outstanding does not equal the NAV. |
See notes to financial statements.
Statements of Assets and Liabilities
| | | | | | | | | | |
| | | Gartmore
Short Duration
Bond Fund | | |
Gartmore Tax-Free Income Fund Gartmore Tax-Free Income Fund |
Assets: | | | | | | | | | | |
Investments, at value (cost $127,671,568 and $164,290,329; respectively) | | $ | 125,065,212 | | | $ | 176,415,973 | | | |
Repurchase agreements, at cost and value | | | 7,139,492 | | | | — | | | |
| | |
|
|
| |
|
|
| | |
Total Investments | | | 132,204,704 | | | | 176,415,973 | | | |
| | |
|
|
| |
|
|
| | |
Cash | | | — | | | | 108,798 | | | |
Interest and dividends receivable | | | 776,487 | | | | 2,880,846 | | | |
Receivable for capital shares issued | | | 301,996 | | | | 46,958 | | | |
Prepaid expenses and other assets | | | 8,770 | | | | 4,822 | | | |
| | |
|
|
| |
|
|
| | |
Total Assets | | | 133,291,957 | | | | 179,457,397 | | | |
| | |
|
|
| |
|
|
| | |
| | | |
Liabilities: | | | | | | | | | | |
Payable to custodian | | | 343,890 | | | | — | | | |
Distributions payable | | | 15,544 | | | | 160,651 | | | |
Payable for capital shares redeemed | | | 330,331 | | | | 30,952 | | | |
Accrued expenses and other payables | | | | | | | | | | |
Investment advisory fees | | | 28,414 | | | | 76,022 | | | |
Fund administration and transfer agent fees | | | 21,173 | | | | 24,881 | | | |
Distribution fees | | | 27,213 | | | | 7,258 | | | |
Administrative servicing fees | | | 41,564 | | | | 610 | | | |
Trustee fees | | | 346 | | | | 427 | | | |
Other | | | 18,461 | | | | 16,034 | | | |
| | |
|
|
| |
|
|
| | |
Total Liabilities | | | 826,936 | | | | 316,835 | | | |
| | |
|
|
| |
|
|
| | |
Net Assets | | $ | 132,465,021 | | | $ | 179,140,562 | | | |
| | |
|
|
| |
|
|
| | |
| | | |
Represented by: | | | | | | | | | | |
Capital | | $ | 137,137,655 | | | $ | 167,495,373 | | | |
Accumulated net investment income (loss) | | | (50,356 | ) | | | (156,464 | ) | | |
Accumulated net realized gains (losses) on investment transactions | | | (2,015,922 | ) | | | (323,991 | ) | | |
Net unrealized appreciation (depreciation) on investments | | | (2,606,356 | ) | | | 12,125,644 | | | |
| | |
|
|
| |
|
|
| | |
Net Assets | | $ | 132,465,021 | | | $ | 179,140,562 | | | |
| | |
|
|
| |
|
|
| | |
| | | |
Net Assets: | | | | | | | | | | |
Class A Shares | | $ | 1,016,840 | | | $ | 10,053,960 | | | |
Class B Shares | | | — | | | | 602,104 | | | |
Class C Shares | | | 1,009 | | | | 1,210,553 | | | |
Class D Shares | | | — | | | | 162,138,937 | | | |
Class X Shares | | | — | | | | 4,903,186 | | | |
| | | | | | | | | | | |
| | | | | | | | | | | |
| | | | | | | | | | | |
| | | | | | | | | | | |
| | | | | | | | | | | |
| | | | | | | | | | | |
| | | | | | | | | | | |
See notes to financial statements.
| | | | | | | | | | |
| | | Gartmore
Short Duration
Bond Fund | | | Gartmore
Gartmore Tax-Free Income Fund Tax-Free Income Fund |
Class Y Shares | | $ | — | | | $ | 231,822 | | | |
Institutional Class Shares | | | 6,741,317 | | | | — | | | |
IRA Class Shares | | | 43,888,211 | | | | — | | | |
Service Class Shares | | | 80,817,644 | | | | — | | | |
| | |
|
|
| |
|
|
| | |
Total | | $ | 132,465,021 | | | $ | 179,140,562 | | | |
| | |
|
|
| |
|
|
| | |
| | | |
Shares outstanding (unlimited number of shares authorized): | | | | | | | | | | |
Class A Shares | | | 103,488 | | | | 958,844 | | | |
Class B Shares | | | — | | | | 57,442 | | | |
Class C Shares | | | 103 | | | | 115,725 | | | |
Class D Shares | | | — | | | | 15,465,843 | | | |
Class X Shares | | | — | | | | 467,647 | | | |
Class Y Shares | | | — | | | | 22,155 | | | |
Institutional Class Shares | | | 685,958 | | | | — | | | |
IRA Class Shares | | | 4,466,255 | | | | — | | | |
Service Class Shares | | | 8,225,041 | | | | — | | | |
| | |
|
|
| |
|
|
| | |
Total | | | 13,480,845 | | | | 17,087,656 | | | |
| | |
|
|
| |
|
|
| | |
| | | |
Net asset value and redemption price per share: | | | | | | | | | | |
Class A Shares | | $ | 9.83 | | | $ | 10.49 | | | |
Class B Shares (a) | | $ | — | | | $ | 10.48 | | | |
Class C Shares (b) | | $ | 9.83 | (c) | | $ | 10.46 | | | |
Class D Shares | | $ | — | | | $ | 10.48 | | | |
Class X Shares | | $ | — | | | $ | 10.48 | | | |
Class Y Shares | | $ | — | | | $ | 10.46 | | | |
Institutional Class Shares | | $ | 9.83 | | | $ | — | | | |
IRA Class Shares | | $ | 9.83 | | | $ | — | | | |
Service Class Shares | | $ | 9.83 | | | $ | — | | | |
| | | |
Maximum offering price per share (100%/(100%-maximum sales charge)
of net asset value adjusted to the nearest cent): | | | | | | | | | | |
Class A Shares | | $ | 10.06 | | | $ | 11.01 | | | |
Class D Shares | | $ | — | | | $ | 10.98 | | | |
| | |
|
|
| |
|
|
| | |
Maximum Sales Charge — Class A Shares | | | 2.25 | % | | | 4.75 | % | | |
| | |
|
|
| |
|
|
| | |
Maximum Sales Charge — Class D Shares | | | — | | | | 4.50 | % | | |
| | |
|
|
| |
|
|
| | |
| | | | | | | | | | | |
| | | | | | | | | | | |
| | | | | | | | | | | |
| | | | | | | | | | | |
| | | | | | | | | | | |
| (a) | For Class B shares, the redemption price per share varies by the length of time shares are held. |
| (b) | For Class C Shares, the redemption price per share is reduced by 1.00% for shares held less than one year. |
| (c) | Due to rounding, Net Assets divided by Shares Outstanding does not equal the NAV. |
See notes to financial statements.
Statements of Operations
For the Year Ended October 31, 2005
| | | | | | | | | | | | | | |
| | | Gartmore Bond
Fund | | | Gartmore
Government Bond
Fund | | | Fund Gartmore Morley Enhanced Income |
INVESTMENT INCOME: | | | | | | | | | | | | | | |
Interest income | | $ | 6,375,622 | | | $ | 7,781,793 | | | $ | 12,251,270 | | | |
Income from securities lending | | | 22,254 | | | | 13,185 | | | | 8,763 | | | |
| | |
|
|
| |
|
|
| |
|
|
| | |
Total Income | | | 6,397,876 | | | | 7,794,978 | | | | 12,260,033 | | | |
| | |
|
|
| |
|
|
| |
|
|
| | |
| | | | |
Expenses: | | | | | | | | | | | | | | |
Investment advisory fees | | | 611,058 | | | | 864,594 | | | | 1,337,985 | | | |
Fund administration and transfer agent fees | | | 158,706 | | | | 207,288 | | | | 427,947 | | | |
Distribution fees Class A | | | 24,151 | | | | 136,734 | | | | 3,191 | | | |
Distribution fees Class B | | | 1,506 | | | | 1,470 | | | | — | | | |
Distribution fees Class C | | | 5,175 | | | | 2,512 | | | | — | | | |
Distribution fees Class R | | | 4 | | | | 4 | | | | 4 | | | |
Distribution fees Class X | | | 27,421 | | | | 33,899 | | | | — | | | |
Distribution fees Class Y | | | 1,877 | | | | 7,698 | | | | — | | | |
Administrative servicing fees Class A | | | 7,493 | | | | 76,626 | | | | 1,227 | | | |
Administrative servicing fees Class D | | | 55,733 | | | | 104,659 | | | | — | | | |
Administrative servicing fees Institutional Service Class | | | — | | | | — | | | | 16,425 | | | |
Registration and filing fees | | | 59,219 | | | | 61,454 | | | | 53,328 | | | |
Trustee fees | | | 5,015 | | | | 7,070 | | | | 15,525 | | | |
Other | | | 111,977 | | | | 91,483 | | | | 94,619 | | | |
| | |
|
|
| |
|
|
| |
|
|
| | |
Total expenses before voluntary fee reductions | | | 1,069,335 | | | | 1,595,491 | | | | 1,950,251 | | | |
Earnings credit (Note 5) | | | (5,560 | ) | | | (4,862 | ) | | | (6,756 | ) | | |
Expenses reimbursed | | | — | | | | — | | | | (196,148 | ) | | |
| | |
|
|
| |
|
|
| |
|
|
| | |
Total Expenses | | | 1,063,775 | | | | 1,590,629 | | | | 1,747,347 | | | |
| | |
|
|
| |
|
|
| |
|
|
| | |
Net Investment Income | | | 5,334,101 | | | | 6,204,349 | | | | 10,512,686 | | | |
| | |
|
|
| |
|
|
| |
|
|
| | |
| | | | |
REALIZED/UNREALIZED GAINS (LOSSES) FROM INVESTMENTS: | | | | | | | | | | | | | | |
Net realized gains (losses) on investment transactions | | | 1,051,917 | | | | 1,115,473 | | | | (286,363 | ) | | |
Net realized gains (losses) on futures transactions | | | — | | | | — | | | | 536,890 | | | |
| | |
|
|
| |
|
|
| |
|
|
| | |
Net realized gains (losses) on investment and futures transactions | | | 1,051,917 | | | | 1,115,473 | | | | 250,527 | | | |
Net change in unrealized appreciation/depreciation on investments and futures | | | (3,797,729 | ) | | | (4,458,806 | ) | | | (2,909,779 | ) | | |
| | |
|
|
| |
|
|
| |
|
|
| | |
Net realized/unrealized gains (losses) on investments and futures | | | (2,745,812 | ) | | | (3,343,333 | ) | | | (2,659,252 | ) | | |
| | |
|
|
| |
|
|
| |
|
|
| | |
CHANGE IN NET ASSETS RESULTING FROM OPERATIONS | | $ | 2,588,289 | | | $ | 2,861,016 | | | $ | 7,853,434 | | | |
| | |
|
|
| |
|
|
| |
|
|
| | |
| | | | | | | | | | | | | | | |
| | | | | | | | | | | | | | | |
| | | | | | | | | | | | | | | |
| | | | | | | | | | | | | | | |
| | | | | | | | | | | | | | | |
| | | | | | | | | | | | | | | |
| | | | | | | | | | | | | | | |
| | | | | | | | | | | | | | | |
| | | | | | | | | | | | | | | |
| | | | | | | | | | | | | | | |
See notes to financial statements.
| | | | | | | | | | |
| | | Gartmore
Short Duration
Bond Fund | | | Gartmore
Gartmore Tax-Free Income Fund Tax-Free Income Fund |
INVESTMENT INCOME: | | | | | | | | | | |
Interest income | | $ | 7,361,823 | | | $ | 8,637,333 | | | |
| | |
|
|
| |
|
|
| | |
Total Income | | | 7,361,823 | | | | 8,637,333 | | | |
| | |
|
|
| |
|
|
| | |
| | | |
Expenses: | | | | | | | | | | |
Investment advisory fees | | | 836,301 | | | | 932,283 | | | |
Fund administration and transfer agent fees | | | 294,439 | | | | 235,524 | | | |
Distribution fees Class A | | | 2,137 | | | | 23,508 | | | |
Distribution fees Class B | | | — | | | | 5,446 | | | |
Distribution fees Class C | | | 5 | | | | 11,849 | | | |
Distribution fees Class X | | | — | | | | 49,286 | | | |
Distribution fees IRA Class | | | 252,520 | | | | — | | | |
Distribution fees Service Class | | | 298,231 | | | | — | | | |
Distribution fees Class Y | | | — | | | | 3,406 | | | |
Administrative servicing fees Class A | | | — | | | | 113 | | | |
Administrative servicing fees IRA Class | | | 75,698 | | | | — | | | |
Administrative servicing fees Service Class | | | 72,267 | | | | — | | | |
Registration and filing fees | | | 58,739 | | | | 55,051 | | | |
Trustee fees | | | 19,563 | | | | 7,664 | | | |
Other | | | 245,392 | | | | 119,448 | | | |
| | |
|
|
| |
|
|
| | |
Total expenses before voluntary fee reductions | | | 2,155,292 | | | | 1,443,578 | | | |
Expenses voluntarily reduced | | | (238,942 | ) | | | — | | | |
Earnings credit (Note 5) | | | (5,730 | ) | | | (20,623 | ) | | |
| | |
|
|
| |
|
|
| | |
Total Expenses | | | 1,910,620 | | | | 1,422,955 | | | |
| | |
|
|
| |
|
|
| | |
Net Investment Income | | | 5,451,203 | | | | 7,214,378 | | | |
| | |
|
|
| |
|
|
| | |
| | | |
REALIZED/UNREALIZED GAINS (LOSSES) FROM INVESTMENTS: | | | | | | | | | | |
Net realized gains (losses) on investment transactions | | | (1,216,116 | ) | | | 267,828 | | | |
| | |
|
|
| |
|
|
| | |
Net realized gains (losses) on investment | | | (1,216,116 | ) | | | 267,828 | | | |
Net change in unrealized appreciation/depreciation on investments | | | (2,606,356 | ) | | | (3,449,647 | ) | | |
| | |
|
|
| |
|
|
| | |
Net realized/unrealized gains (losses) on investments | | | (3,822,472 | ) | | | (3,181,819 | ) | | |
| | |
|
|
| |
|
|
| | |
CHANGE IN NET ASSETS RESULTING FROM OPERATIONS | | $ | 1,628,731 | | | $ | 4,032,559 | | | |
| | |
|
|
| |
|
|
| | |
| | | | | | | | | | | |
| | | | | | | | | | | |
| | | | | | | | | | | |
| | | | | | | | | | | |
| | | | | | | | | | | |
| | | | | | | | | | | |
| | | | | | | | | | | |
| | | | | | | | | | | |
| | | | | | | | | | | |
| | | | | | | | | | | |
| | | | | | | | | | | |
See notes to financial statements.
Statements of Changes in Net Assets
| | | | | | | | | | | | | | | | | | |
| | | Gartmore Bond Fund | | | Gartmore Government Bond Fund |
| | | Year Ended October 31, 2005 | | | Year Ended October 31, 2004 | | | Year Ended October 31, 2005 | | | Year Ended October 31, 2004 |
FROM INVESTMENT ACTIVITIES: | | | | | | | | | | | | | | | | | | |
Operations: | | | | | | | | | | | | | | | | | | |
Net investment income | | $ | 5,334,101 | | | $ | 6,071,125 | | | $ | 6,204,349 | | | $ | 6,919,961 | | | |
Net realized gains (losses) on investment transactions | | | 1,051,917 | | | | 3,939,111 | | | | 1,115,473 | | | | (858,692 | ) | | |
Net change in unrealized appreciation/depreciation on investments | | | (3,797,729 | ) | | | (2,757,638 | ) | | | (4,458,806 | ) | | | 1,007,897 | | | |
| | |
|
|
| |
|
|
| |
|
|
| |
|
|
| | |
Change in net assets from operations | | | 2,588,289 | | | | 7,252,598 | | | | 2,861,016 | | | | 7,069,166 | | | |
| | |
|
|
| |
|
|
| |
|
|
| |
|
|
| | |
| | | | | |
Distributions to Class A Shareholders from: | | | | | | | | | | | | | | | | | | |
Net investment income | | | (400,142 | ) | | | (449,448 | ) | | | (1,860,894 | ) | | | (1,912,956 | ) | | |
Net realized gains on investments | | | — | | | | — | | | | — | | | | (1,310,536 | ) | | |
| | | | | |
Distributions to Class B Shareholders from: | | | | | | | | | | | | | | | | | | |
Net investment income | | | (5,213 | ) | | | (2,334 | ) | | | (4,091 | ) | | | (2,899 | ) | | |
Net realized gains on investments | | | — | | | | — | | | | — | | | | (147 | ) | | |
| | | | | |
Distributions to Class C Shareholders from: | | | | | | | | | | | | | | | | | | |
Net investment income | | | (17,810 | ) | | | (2,007 | ) | | | (7,026 | ) | | | (7,117 | ) | | |
Net realized gains on investments | | | — | | | | — | | | | — | | | | (1,855 | ) | | |
| | | | | |
Distributions to Class D Shareholders from: | | | | | | | | | | | | | | | | | | |
Net investment income | | | (4,714,110 | ) | | | (5,518,021 | ) | | | (4,149,513 | ) | | | (4,979,167 | ) | | |
Net realized gains on investments | | | — | | | | — | | | | — | | | | (3,527,208 | ) | | |
| | | | | |
Distributions to Class R Shareholders from: | | | | | | | | | | | | | | | | | | |
Net investment income | | | (43 | ) | | | (41 | ) | | | (35 | ) | | | (32 | ) | | |
Net realized gains on investments | | | — | | | | — | | | | — | | | | (24 | ) | | |
| | | | | |
Distributions to Class X Shareholders from: | | | | | | | | | | | | | | | | | | |
Net investment income | | | (116,559 | ) | | | (137,402 | ) | | | (117,368 | ) | | | (155,711 | ) | | |
Net realized gains on investments | | | — | | | | — | | | | — | | | | (136,123 | ) | | |
| | | | | |
Distributions to Class Y Shareholders from: | | | | | | | | | | | | | | | | | | |
Net investment income | | | (7,971 | ) | | | (9,770 | ) | | | (26,680 | ) | | | (40,922 | ) | | |
Net realized gains on investments | | | — | | | | — | | | | — | | | | (46,030 | ) | | |
| | | | | |
Distributions to Intitutional Class Shareholders from: | | | | | | | | | | | | | | | | | | |
Net investment income | | | (64,941 | ) | | | (4,055 | ) (a) | | | (24,866 | ) | | | (1,969 | ) (a) | | |
| | |
|
|
| |
|
|
| |
|
|
| |
|
|
| | |
Change in net assets from shareholder distributions | | | (5,326,789 | ) | | | (6,123,078 | ) | | | (6,190,473 | ) | | | (12,122,696 | ) | | |
| | |
|
|
| |
|
|
| |
|
|
| |
|
|
| | |
Change in net assets from capital transactions | | | (6,874,780 | ) | | | (15,273,501 | ) | | | (14,723,998 | ) | | | (30,816,842 | ) | | |
| | |
|
|
| |
|
|
| |
|
|
| |
|
|
| | |
Change in net assets | | | (9,613,280 | ) | | | (14,143,981 | ) | | | (18,053,455 | ) | | | (35,870,372 | ) | | |
| | | | | |
Net Assets: | | | | | | | | | | | | | | | | | | |
Beginning of period | | | 127,540,000 | | | | 141,683,981 | | | | 182,939,979 | | | | 218,810,351 | | | |
| | |
|
|
| |
|
|
| |
|
|
| |
|
|
| | |
End of period | | $ | 117,926,720 | | | $ | 127,540,000 | | | $ | 164,886,524 | | | $ | 182,939,979 | | | |
| | |
|
|
| |
|
|
| |
|
|
| |
|
|
| | |
Accumulated net investment income (loss) | | $ | (8,583 | ) | | $ | (8,583 | ) | | $ | 18,760 | | | $ | 18,629 | | | |
| | |
|
|
| |
|
|
| |
|
|
| |
|
|
| | |
| | | | | | | | | | | | | | | | | | | |
| (a) | For the period from June 30, 2004 (commencement of operations) through October 31, 2004. |
See notes to financial statements.
Statements of Changes in Net Assets
| | | | | | | | | | | | | | | | | | |
| | | Gartmore Morley Enhanced Income Fund | | | Gartmore Short Duration Bond Fund 
|
| | | Year Ended
October 31, 2005 | | | Year Ended
October 31, 2004 | | | Year Ended
October 31, 2005 | | | Year Ended
October 31, 2004 |
FROM INVESTMENT ACTIVITIES: | | | | | | | | | | | | | | | | | | |
Operations: | | | | | | | | | | | | | | | | | | |
Net investment income | | $ | 10,512,686 | | | $ | 5,002,179 | | | $ | 5,451,203 | | | $ | 18,697,863 | | | |
Net realized gains (losses) on investment and futures transactions | | | 250,527 | | | | (2,344,773 | ) | | | (1,216,116 | ) | | | (1,826,324 | ) | | |
Net change in unrealized appreciation/depreciation on
investments and futures | | | (2,909,779 | ) | | | (97,688 | ) | | | (2,606,356 | ) | | | 1,372,707 | | | |
Net change in unrealized appreciation/depreciation on
wrapper contracts | | | — | | | | — | | | | — | | | | (550,681 | ) | | |
| | |
|
|
| |
|
|
| |
|
|
| |
|
|
| | |
Change in net assets from operations | | | 7,853,434 | | | | 2,559,718 | | | | 1,628,731 | | | | 17,693,565 | | | |
| | |
|
|
| |
|
|
| |
|
|
| |
|
|
| | |
| | | | | |
Distributions to Class A Shareholders from: | | | | | | | | | | | | | | | | | | |
Net investment income | | | (31,968 | ) | | | (38,436 | ) | | | (22,192 | ) | | | (14,701 | ) | | |
Net realized gains on investments | | | — | | | | — | | | | — | | | | (190 | ) | | |
| | | | | |
Distributions to Class C Shareholders from: | | | | | | | | | | | | | | | | | | |
Net investment income | | | — | | | | — | | | | (16 | ) (a) | | | — | | | |
| | | | | |
Distributions to Class R Shareholders from: | | | | | | | | | | | | | | | | | | |
Net investment income | | | (26 | ) | | | (16 | ) | | | — | | | | — | | | |
| | | | | |
Distributions to Institutional Class
Shareholders from: | | | | | | | | | | | | | | | | | | |
Net investment income | | | (10,887,612 | ) | | | (5,018,476 | ) | | | (450,062 | ) | | | (2,052,609 | ) | | |
Net realized gain on investments | | | — | | | | — | | | | — | | | | (46,583 | ) | | |
| | | | | |
Distributions to Institutional Service Class Shareholders from: | | | | | | | | | | | | | | | | | | |
Net investment income | | | (174,593 | ) | | | (152,442 | ) | | | — | | | | — | | | |
| | | | | |
Distributions to IRA Class Shareholders from: | | | | | | | | | | | | | | | | | | |
Net investment income | | | — | | | | — | | | | (2,313,572 | ) | | | (10,365,445 | ) | | |
Net realized gain on investments | | | — | | | | — | | | | — | | | | (289,512 | ) | | |
| | | | | |
Distributions to Service Class Shareholders from: | | | | | | | | | | | | | | | | | | |
Net investment income | | | — | | | | — | | | | (2,895,479 | ) | | | (5,233,773 | ) | | |
Net realized gain on investments | | | — | | | | — | | | | — | | | | (145,883 | ) | | |
| | |
|
|
| |
|
|
| |
|
|
| |
|
|
| | |
Change in net assets from shareholder distributions | | | (11,094,199 | ) | | | (5,209,370 | ) | | | (5,681,321 | ) | | | (18,148,696 | ) | | |
| | |
|
|
| |
|
|
| |
|
|
| |
|
|
| | |
Change in net assets from capital transactions | | | 153,943,037 | | | | 144,235,418 | | | | (570,977,333 | ) | | | 49,914,041 | | | |
| | |
|
|
| |
|
|
| |
|
|
| |
|
|
| | |
Change in net assets | | | 150,702,272 | | | | 141,585,766 | | | | (575,029,923 | ) | | | 49,458,910 | | | |
| | | | | |
Net Assets: | | | | | | | | | | | | | | | | | | |
Beginning of period | | | 308,950,443 | | | | 167,364,677 | | | | 707,494,944 | | | | 658,036,034 | | | |
| | |
|
|
| |
|
|
| |
|
|
| |
|
|
| | |
End of period | | $ | 459,652,715 | | | $ | 308,950,443 | | | $ | 132,465,021 | | | $ | 707,494,944 | | | |
| | |
|
|
| |
|
|
| |
|
|
| |
|
|
| | |
Accumulated net investment income (loss) | | $ | 8,219 | | | $ | 6,882 | | | $ | (50,356 | ) | | $ | (50,356 | ) | | |
| | |
|
|
| |
|
|
| |
|
|
| |
|
|
| | |
| | | | | | | | | | | | | | | | | | | |
| | | | | | | | | | | | | | | | | | | |
| | | | | | | | | | | | | | | | | | | |
| | | | | | | | | | | | | | | | | | | |
| | | | | | | | | | | | | | | | | | | |
| | | | | | | | | | | | | | | | | | | |
| | | | | | | | | | | | | | | | | | | |
| (a) | For the period from February 28, 2005 (commencement of operations) through October 31, 2005. |
See notes to financial statements.
Statements of Changes in Net Assets
| | | | | | | | | | |
| | | Gartmore Tax-Free Income Fund
|
| | | Year Ended October 31, 2005 | | | Year Ended October 31, 2004 |
FROM INVESTMENT ACTIVITIES: | | | | | | | | | | |
Operations: | | | | | | | | | | |
Net investment income | | $ | 7,214,378 | | | $ | 8,493,509 | | | |
Net realized gains (losses) on investment transactions | | | 267,828 | | | | 29,089 | | | |
Net change in unrealized appreciation/depreciation on investments | | | (3,449,647 | ) | | | 3,242,490 | | | |
| | |
|
|
| |
|
|
| | |
Change in net assets from operations | | | 4,032,559 | | | | 11,765,088 | | | |
| | |
|
|
| |
|
|
| | |
| | | |
Distributions to Class A Shareholders from: | | | | | | | | | | |
Net investment income | | | (345,087 | ) | | | (357,117 | ) | | |
| | | |
Distributions to Class B Shareholders from: | | | | | | | | | | |
Net investment income | | | (15,552 | ) | | | (7,762 | ) | | |
| | | |
Distributions to Class C Shareholders from: | | | | | | | | | | |
Net investment income | | | (34,172 | ) | | | (24,323 | ) | | |
| | | |
Distributions to Class D Shareholders from: | | | | | | | | | | |
Net investment income | | | (6,630,409 | ) | | | (7,852,219 | ) | | |
| | | |
Distributions to Class X Shareholders from: | | | | | | | | | | |
Net investment income | | | (177,039 | ) | | | (234,899 | ) | | |
| | | |
Distributions to Class Y Shareholders from: | | | | | | | | | | |
Net investment income | | | (12,197 | ) | | | (17,189 | ) | | |
| | |
|
|
| |
|
|
| | |
Change in net assets from shareholder distributions | | | (7,214,456 | ) | | | (8,493,509 | ) | | |
| | |
|
|
| |
|
|
| | |
Change in net assets from capital transactions | | | (9,916,817 | ) | | | (10,941,315 | ) | | |
| | |
|
|
| |
|
|
| | |
Change in net assets | | | (13,098,714 | ) | | | (7,669,736 | ) | | |
| | | |
Net Assets: | | | | | | | | | | |
Beginning of period | | | 192,239,276 | | | | 199,909,012 | | | |
| | |
|
|
| |
|
|
| | |
End of period | | $ | 179,140,562 | | | $ | 192,239,276 | | | |
| | |
|
|
| |
|
|
| | |
Accumulated net investment income (loss) | | $ | (156,464 | ) | | $ | (156,386 | ) | | |
| | |
|
|
| |
|
|
| | |
| | | | | | | | | | | |
| | | | | | | | | | | |
| | | | | | | | | | | |
| | | | | | | | | | | |
| | | | | | | | | | | |
| | | | | | | | | | | |
| | | | | | | | | | | |
| | | | | | | | | | | |
| | | | | | | | | | | |
| | | | | | | | | | | |
| | | | | | | | | | | |
| | | | | | | | | | | |
| | | | | | | | | | | |
| | | | | | | | | | | |
| | | | | | | | | | | |
| | | | | | | | | | | |
| | | | | | | | | | | |
See notes to financial statements.
Financial Highlights
Selected Data for Each Share of Capital Outstanding
Gartmore Bond Fund
| | | | | | | | | | | | | | | | | | | | | | | | | | | | | | | | | | | | | | | | | | |
| | | | | | | Investment Activities | | | Distributions | | | | | | | | Ratios/Supplemental Data
|
| | | | | Net Asset
Value,
Beginning
of Period | | Net
Investment
Income | | Net Realized
and
Unrealized
Gains
(Losses) on
Investments | | | Total
from
Investment
Activities | | | Net
Investment
Income | | | Total
Distributions | | | Net Asset
Value, End
of Period | | Total
Return (a) | | | Net Assets
at End of
Period
(000s) | | Ratio of
Expenses
to Average
Net Assets | | | Ratio of Net
Investment
Income to
Average
Net Assets | | | Ratio of
Expenses
(Prior to
Reimbursements)
to Average
Net Assets (b) | | | Ratio of
Investment
Income (Prior to
Reimbursements)
to Average
Net Assets (b) | | | Portfolio
Turnover (c) |
| | | | | | | | | | | | | | | |
Class A Shares | | | | | | | | | | | | | | | | | | | | | | | | | | | | | | | | | | | | | | | | | | |
Year Ended October 31, 2001 | | | | $ | 8.75 | | 0.52 | | 0.84 | | | 1.36 | | | (0.53 | ) | | (0.53 | ) | | $ | 9.58 | | 16.01% | | | $ | 4,775 | | 1.14% | | | 5.71% | | | (k | ) | | (k | ) | | 42.47% |
Year Ended October 31, 2002 | | | | $ | 9.58 | | 0.50 | | (0.15 | ) | | 0.35 | | | (0.50 | ) | | (0.50 | ) | | $ | 9.43 | | 3.84% | | | $ | 7,551 | | 1.06% | | | 5.34% | | | (k | ) | | (k | ) | | 27.66% |
Year Ended October 31, 2003 | | | | $ | 9.43 | | 0.46 | | 0.24 | | | 0.70 | | | (0.46 | ) | | (0.46 | ) | | $ | 9.67 | | 7.55% | | | $ | 10,128 | | 1.08% | | | 4.74% | | | (k | ) | | (k | ) | | 17.73% |
Year Ended October 31, 2004 | | | | $ | 9.67 | | 0.43 | | 0.08 | | | 0.51 | | | (0.43 | ) | | (0.43 | ) | | $ | 9.75 | | 5.37% | | | $ | 10,669 | | 1.04% | | | 4.38% | | | (k | ) | | (k | ) | | 17.20% |
Year Ended October 31, 2005 | | | | $ | 9.75 | | 0.40 | | (0.22 | ) | | 0.18 | | | (0.40 | ) | | (0.40 | ) | | $ | 9.53 | | 1.87% | | | $ | 10,212 | | 1.10% | | | 4.15% | | | (k | ) | | (k | ) | | 34.08% |
| | | | | | | | | | | | | | | |
Class B Shares | | | | | | | | | | | | | | | | | | | | | | | | | | | | | | | | | | | | | | | | | | |
Period Ended October 31, 2003 (d) | | | | $ | 9.49 | | 0.06 | | 0.18 | | | 0.24 | | | (0.06 | ) | | (0.06 | ) | | $ | 9.67 | | 2.50% | (i) | | $ | 24 | | 1.83% | (j) | | 3.62% | (j) | | (k | ) | | (k | ) | | 17.73% |
Year Ended October 31, 2004 | | | | $ | 9.67 | | 0.36 | | 0.08 | | | 0.44 | | | (0.36 | ) | | (0.36 | ) | | $ | 9.75 | | 4.66% | | | $ | 102 | | 1.72% | | | 3.64% | | | (k | ) | | (k | ) | | 17.20% |
Year Ended October 31, 2005 | | | | $ | 9.75 | | 0.34 | | (0.22 | ) | | 0.12 | | | (0.34 | ) | | (0.34 | ) | | $ | 9.53 | | 1.18% | | | $ | 223 | | 1.78% | | | 3.46% | | | (k | ) | | (k | ) | | 34.08% |
| | | | | | | | | | | | | | | |
Class C Shares | | | | | | | | | | | | | | | | | | | | | | | | | | | | | | | | | | | | | | | | | | |
Period Ended October 31, 2003 (d) | | | | $ | 9.50 | | 0.06 | | 0.18 | | | 0.24 | | | (0.06 | ) | | (0.06 | ) | | $ | 9.68 | | 2.49% | (i) | | $ | 9 | | 1.87% | (j) | | 3.60% | (j) | | (k | ) | | (k | ) | | 17.73% |
Year Ended October 31, 2004 | | | | $ | 9.68 | | 0.36 | | 0.08 | | | 0.44 | | | (0.36 | ) | | (0.36 | ) | | $ | 9.76 | | 4.63% | | | $ | 182 | | 1.72% | | | 3.48% | | | (k | ) | | (k | ) | | 17.20% |
Year Ended October 31, 2005 | | | | $ | 9.76 | | 0.34 | | (0.22 | ) | | 0.12 | | | (0.34 | ) | | (0.34 | ) | | $ | 9.54 | | 1.18% | | | $ | 696 | | 1.78% | | | 3.45% | | | (k | ) | | (k | ) | | 34.08% |
| | | | | | | | | | | | | | | |
Class D Shares | | | | | | | | | | | | | | | | | | | | | | | | | | | | | | | | | | | | | | | | | | |
Year Ended October 31, 2001 | | | | $ | 8.76 | | 0.54 | | 0.84 | | | 1.38 | | | (0.55 | ) | | (0.55 | ) | | $ | 9.59 | | 16.23% | | | $ | 132,034 | | 0.92% | | | 5.94% | | | (k | ) | | (k | ) | | 42.47% |
Year Ended October 31, 2002 | | | | $ | 9.59 | | 0.52 | | (0.15 | ) | | 0.37 | | | (0.52 | ) | | (0.52 | ) | | $ | 9.44 | | 4.07% | | | $ | 136,049 | | 0.83% | | | 5.58% | | | (k | ) | | (k | ) | | 27.66% |
Year Ended October 31, 2003 | | | | $ | 9.44 | | 0.49 | | 0.24 | | | 0.73 | | | (0.49 | ) | | (0.49 | ) | | $ | 9.68 | | 7.81% | | | $ | 127,591 | | 0.82% | | | 5.00% | | | (k | ) | | (k | ) | | 17.73% |
Year Ended October 31, 2004 | | | | $ | 9.68 | | 0.45 | | 0.09 | | | 0.54 | | | (0.45 | ) | | (0.45 | ) | | $ | 9.77 | | 5.75% | | | $ | 112,631 | | 0.78% | | | 4.64% | | | (k | ) | | (k | ) | | 17.20% |
Year Ended October 31, 2005 | | | | $ | 9.77 | | 0.43 | | (0.22 | ) | | 0.21 | | | (0.43 | ) | | (0.43 | ) | | $ | 9.55 | | 2.15% | | | $ | 99,133 | | 0.83% | | | 4.41% | | | (k | ) | | (k | ) | | 34.08% |
| | | | | | | | | | | | | | | |
Class R Shares | | | | | | | | | | | | | | | | | | | | | | | | | | | | | | | | | | | | | | | | | | |
Period Ended October 31, 2003 (e) | | | | $ | 9.80 | | 0.03 | | (0.12 | ) | | (0.09 | ) | | (0.03 | ) | | (0.03 | ) | | $ | 9.68 | | (0.92% | )(i) | | $ | 1 | | 1.85% | (j) | | 3.48% | (j) | | 1.95% | | | 3.38% | | | 17.73% |
Year Ended October 31, 2004 | | | | $ | 9.68 | | 0.39 | | 0.09 | | | 0.48 | | | (0.39 | ) | | (0.39 | ) | | $ | 9.77 | | 5.06% | | | $ | 1 | | 1.37% | | | 3.99% | | | (k | ) | | (k | ) | | 17.20% |
Year Ended October 31, 2005 | | | | $ | 9.77 | | 0.40 | | (0.22 | ) | | 0.18 | | | (0.40 | ) | | (0.40 | ) | | $ | 9.55 | | 1.81% | | | $ | 1 | | 1.14% | | | 4.08% | | | (k | ) | | (k | ) | | 34.08% |
| | | | | | | | | | | | | | | |
Class X Shares | | | | | | | | | | | | | | | | | | | | | | | | | | | | | | | | | | | | | | | | | | |
Year Ended October 31, 2001 | | | | $ | 8.75 | | 0.47 | | 0.84 | | | 1.31 | | | (0.48 | ) | | (0.48 | ) | | $ | 9.58 | | 15.33% | | | $ | 2,935 | | 1.72% | | | 5.10% | | | (k | ) | | (k | ) | | 42.47% |
Year Ended October 31, 2002 | | | | $ | 9.58 | | 0.45 | | (0.15 | ) | | 0.30 | | | (0.45 | ) | | (0.45 | ) | | $ | 9.43 | | 3.26% | | | $ | 3,548 | | 1.62% | | | 4.79% | | | (k | ) | | (k | ) | | 27.66% |
Year Ended October 31, 2003 (f) | | | | $ | 9.43 | | 0.41 | | 0.24 | | | 0.65 | | | (0.41 | ) | | (0.41 | ) | | $ | 9.67 | | 6.98% | | | $ | 3,674 | | 1.60% | | | 4.22% | | | (k | ) | | (k | ) | | 17.73% |
Year Ended October 31, 2004 | | | | $ | 9.67 | | 0.38 | | 0.08 | | | 0.46 | | | (0.38 | ) | | (0.38 | ) | | $ | 9.75 | | 4.82% | | | $ | 3,457 | | 1.57% | | | 3.85% | | | (k | ) | | (k | ) | | 17.20% |
Year Ended October 31, 2005 | | | | $ | 9.75 | | 0.35 | | (0.21 | ) | | 0.14 | | | (0.35 | ) | | (0.35 | ) | | $ | 9.54 | | 1.44% | | | $ | 2,821 | | 1.63% | | | 3.62% | | | (k | ) | | (k | ) | | 34.08% |
| | | | | | | | | | | | | | | |
Class Y Shares | | | | | | | | | | | | | | | | | | | | | | | | | | | | | | | | | | | | | | | | | | |
Period Ended October 31, 2001 (g) | | | | $ | 9.19 | | 0.25 | | 0.40 | | | 0.65 | | | (0.25 | ) | | (0.25 | ) | | $ | 9.59 | | 7.25% | (i) | | $ | 162 | | 1.74% | (j) | | 4.77% | (j) | | (k | ) | | (k | ) | | 42.47% |
Year Ended October 31, 2002 | | | | $ | 9.59 | | 0.45 | | (0.15 | ) | | 0.30 | | | (0.45 | ) | | (0.45 | ) | | $ | 9.44 | | 3.26% | | | $ | 272 | | 1.62% | | | 4.78% | | | (k | ) | | (k | ) | | 27.66% |
Year Ended October 31, 2003 (f) | | | | $ | 9.44 | | 0.41 | | 0.24 | | | 0.65 | | | (0.41 | ) | | (0.41 | ) | | $ | 9.68 | | 6.97% | | | $ | 256 | | 1.60% | | | 4.21% | | | (k | ) | | (k | ) | | 17.73% |
Year Ended October 31, 2004 | | | | $ | 9.68 | | 0.38 | | 0.08 | | | 0.46 | | | (0.38 | ) | | (0.38 | ) | | $ | 9.76 | | 4.81% | | | $ | 238 | | 1.57% | | | 3.85% | | | (k | ) | | (k | ) | | 17.20% |
Year Ended October 31, 2005 | | | | $ | 9.76 | | 0.35 | | (0.21 | ) | | 0.14 | | | (0.35 | ) | | (0.35 | ) | | $ | 9.55 | | 1.44% | | | $ | 199 | | 1.63% | | | 3.62% | | | (k | ) | | (k | ) | | 34.08% |
| | | | | | | | | | | | | | | |
Institutional Class Shares | | | | | | | | | | | | | | | | | | | | | | | | | | | | | | | | | | | | | | | | | | |
Period Ended October 31, 2004 (h) | | | | $ | 9.50 | | 0.15 | | 0.26 | | | 0.41 | | | (0.15 | ) | | (0.15 | ) | | $ | 9.76 | | 4.32% | (i) | | $ | 260 | | 0.73% | (j) | | 4.51% | (j) | | (k | ) | | (k | ) | | 17.20% |
Year Ended October 31, 2005 | | | | $ | 9.76 | | 0.43 | | (0.21 | ) | | 0.22 | | | (0.43 | ) | | (0.43 | ) | | $ | 9.55 | | 2.30% | | | $ | 4,641 | | 0.78% | | | 4.47% | | | (k | ) | | (k | ) | | 34.08% |
| | |
(a) Excludes sales charge. | | (g) For the period from March 1, 2001 (commencement of operations) through October 31, 2001. |
(b) During the period certain fees were waived and /or reimbursed. If such waivers/ reimbursements had not occurred, the ratios would have been as indicated. | | (h) For the period from June 29, 2004 (commencement of operations) through October 31, 2004. (i) Not annualized. (j) Annualized. (k) There were no fee reductions during the period. |
(c) Portfolio turnover is calculated on the basis of the Fund as a whole without distinguishing among the classes of shares. | |
(d) For the period from September 4, 2003 (commencement of operations) through October 31, 2003. | |
(e) For the period from October 1, 2003 (commencement of operations) through October 31, 2003. | |
(f) Effective September 1, 2003, Class B and Class C Shares were renamed renamed Class X and Class Y , respectively. | | |
See notes to financial statements.
Financial Highlights
Selected Data for Each Share of Capital Outstanding
Gartmore Government Bond Fund
| | | | | | | | | | | | | | | | | | | | | | | | | | | | | | | | | | | | | | | | | | | |
| | | | | Investment Activities | | | Distributions | | | | | | Ratios/Supplemental Data
|
| | | Net Asset
Value,
Beginning
of Period | | Net
Investment
Income | | Net Realized
and
Unrealized
Gains
(Losses) on
Investments | | | Total
from
Investment
Activities | | | Net
Investment
Income | | | Net
Realized
Gains | | | Total
Distributions | | | Net Asset
Value, End
of Period | | Total
Return (a) | | | Net Assets
at End of
Period
(000s) | | Ratio of
Expenses
to Average
Net Assets | | | Ratio of Net
Investment
Income
to Average
Net Assets | | | Ratio of
Expenses
(Prior to
Reimbursements)
to Average
Net Assets (b) | | | Ratio of
Investment
Income
(Prior to
Reimbursements)
to Average
Net Assets (b) | | | Portfolio
Turnover (c) |
| | | | | | | | | | | | | | | |
Class A Shares | | | | | | | | | | | | | | | | | | | | | | | | | | | | | | | | | | | | | | | | | | | |
Year Ended October 31, 2001 | | $ | 10.00 | | 0.53 | | 0.95 | | | 1.48 | | | (0.53 | ) | | — | | | (0.53 | ) | | $ | 10.95 | | 15.21% | | | $ | 57,336 | | 0.99% | | | 5.12% | | | 1.20% | | | 4.91% | | | 159.68% |
Year Ended October 31, 2002 | | $ | 10.95 | | 0.45 | | 0.20 | | | 0.65 | | | (0.45 | ) | | (0.20 | ) | | (0.65 | ) | | $ | 10.95 | | 6.42% | | | $ | 55,510 | | 1.07% | | | 4.28% | | | 1.11% | | | 4.24% | | | 99.42% |
Year Ended October 31, 2003 | | $ | 10.95 | | 0.41 | | (0.16 | ) | | 0.25 | | | (0.40 | ) | | (0.19 | ) | | (0.59 | ) | | $ | 10.61 | | 2.29% | | | $ | 56,589 | | 1.10% | | | 3.76% | | | (k | ) | | | (k) | | 106.65% |
Year Ended October 31, 2004 | | $ | 10.61 | | 0.35 | | 0.03 | | | 0.38 | | | (0.36 | ) | | (0.26 | ) | | (0.62 | ) | | $ | 10.37 | | 3.68% | | | $ | 55,481 | | 1.07% | | | 3.37% | | | (k | ) | | | (k) | | 110.72% |
Year Ended October 31, 2005 | | $ | 10.37 | | 0.35 | | (0.20 | ) | | 0.15 | | | (0.35 | ) | | — | | | (0.35 | ) | | $ | 10.17 | | 1.46% | | | $ | 54,166 | | 1.10% | | | 3.41% | | | (k | ) | | (k | ) | | 117.67% |
| | | | | | | | | | | | | | | |
Class B Shares | | | | | | | | | | | | | | | | | | | | | | | | | | | | | | | | | | | | | | | | | | | |
Period Ended October 31, 2003 (d) | | $ | 10.48 | | 0.06 | | 0.12 | | | 0.18 | | | (0.05 | ) | | — | | | (0.05 | ) | | $ | 10.61 | | 1.73% | (i) | | $ | 1 | | 1.80% | (j) | | 3.52% | (j) | | (k | ) | | | (k) | | 106.65% |
Year Ended October 31, 2004 | | $ | 10.61 | | 0.28 | | 0.03 | | | 0.31 | | | (0.29 | ) | | (0.26 | ) | | (0.55 | ) | | $ | 10.37 | | 3.04% | | | $ | 170 | | 1.69% | | | 2.75% | | | (k | ) | | | (k) | | 110.72% |
Year Ended October 31, 2005 | | $ | 10.37 | | 0.29 | | (0.20 | ) | | 0.09 | | | (0.29 | ) | | — | | | (0.29 | ) | | $ | 10.17 | | 0.85% | | | $ | 152 | | 1.71% | | | 2.79% | | | (k | ) | | (k | ) | | 117.67% |
| | | | | | | | | | | | | | | |
Class C Shares | | | | | | | | | | | | | | | | | | | | | | | | | | | | | | | | | | | | | | | | | | | |
Period Ended October 31, 2003 (d) | | $ | 10.48 | | 0.06 | | 0.12 | | | 0.18 | | | (0.05 | ) | | — | | | (0.05 | ) | | $ | 10.61 | | 1.73% | (i) | | $ | 65 | | 1.76% | (j) | | 4.11% | (j) | | (k | ) | | | (k) | | 106.65% |
Year Ended October 31, 2004 | | $ | 10.61 | | 0.28 | | 0.03 | | | 0.31 | | | (0.29 | ) | | (0.26 | ) | | (0.55 | ) | | $ | 10.37 | | 3.03% | | | $ | 296 | | 1.69% | | | 2.75% | | | (k | ) | | | (k) | | 110.72% |
Year Ended October 31, 2005 | | $ | 10.37 | | 0.29 | | (0.21 | ) | | 0.08 | | | (0.29 | ) | | — | | | (0.29 | ) | | $ | 10.16 | | 0.75% | | | $ | 331 | | 1.71% | | | 2.80% | | | (k | ) | | (k | ) | | 117.67% |
| | | | | | | | | | | | | | | |
Class D Shares | | | | | | | | | | | | | | | | | | | | | | | | | | | | | | | | | | | | | | | | | | | |
Year Ended October 31, 2001 | | $ | 10.01 | | 0.55 | | 0.95 | | | 1.50 | | | (0.55 | ) | | — | | | (0.55 | ) | | $ | 10.96 | | 15.43% | | | $ | 124,117 | | 0.79% | | | 5.24% | | | 0.90% | | | 5.13% | | | 159.68% |
Year Ended October 31, 2002 | | $ | 10.96 | | 0.48 | | 0.19 | | | 0.67 | | | (0.48 | ) | | (0.20 | ) | | (0.68 | ) | | $ | 10.95 | | 6.61% | | | $ | 174,637 | | 0.81% | | | 4.52% | | | 0.81% | | | 4.52% | | | 99.42% |
Year Ended October 31, 2003 | | $ | 10.95 | | 0.44 | | (0.15 | ) | | 0.29 | | | (0.43 | ) | | (0.19 | ) | | (0.62 | ) | | $ | 10.62 | | 2.67% | | | $ | 154,556 | | 0.82% | | | 4.03% | | | (k | ) | | | (k) | | 106.65% |
Year Ended October 31, 2004 | | $ | 10.62 | | 0.38 | | 0.02 | | | 0.40 | | | (0.39 | ) | | (0.26 | ) | | (0.65 | ) | | $ | 10.37 | | 3.87% | | | $ | 121,325 | | 0.78% | | | 3.66% | | | (k | ) | | | (k) | | 110.72% |
Year Ended October 31, 2005 | | $ | 10.37 | | 0.38 | | (0.20 | ) | | 0.18 | | | (0.38 | ) | | — | | | (0.38 | ) | | $ | 10.17 | | 1.76% | | | $ | 105,987 | | 0.81% | | | 3.70% | | | (k | ) | | (k | ) | | 117.67% |
| | | | | | | | | | | | | | | |
Class R Shares | | | | | | | | | | | | | | | | | | | | | | | | | | | | | | | | | | | | | | | | | | | |
Period Ended October 31, 2003 (e) | | $ | 10.77 | | 0.04 | | (0.16 | ) | | (0.12 | ) | | (0.03 | ) | | — | | | (0.03 | ) | | $ | 10.62 | | (1.12% | )(i) | | $ | 1 | | 1.48% | (j) | | 4.13% | (j) | | 1.58% | (j) | | 4.03% | (j) | | 106.65% |
Year Ended October 31, 2004 | | $ | 10.62 | | 0.32 | | 0.03 | | | 0.35 | | | (0.33 | ) | | (0.26 | ) | | (0.59 | ) | | $ | 10.38 | | 3.41% | | | $ | 1 | | 1.37% | | | 3.12% | | | (k | ) | | | (k) | | 110.72% |
Year Ended October 31, 2005 | | $ | 10.38 | | 0.35 | | (0.21 | ) | | 0.14 | | | (0.35 | ) | | — | | | (0.35 | ) | | $ | 10.17 | | 1.34% | | | $ | 1 | | 1.06% | | | 3.39% | | | (k | ) | | (k | ) | | 117.67% |
| | | | | | | | | | | | | | | |
Class X Shares | | | | | | | | | | | | | | | | | | | | | | | | | | | | | | | | | | | | | | | | | | | |
Year Ended October 31, 2001 | | $ | 10.00 | | 0.47 | | 0.94 | | | 1.41 | | | (0.47 | ) | | — | | | (0.47 | ) | | $ | 10.94 | | 14.41% | | | $ | 4,024 | | 1.64% | | | 4.27% | | | 1.68% | | | 4.23% | | | 159.68% |
Year Ended October 31, 2002 | | $ | 10.94 | | 0.40 | | 0.19 | | | 0.59 | | | (0.40 | ) | | (0.20 | ) | | (0.60 | ) | | $ | 10.93 | | 5.80% | | | $ | 6,067 | | 1.58% | | | 3.74% | | | 1.58% | | | 3.74% | | | 99.42% |
Year Ended October 31, 2003 (f) | | $ | 10.93 | | 0.36 | | (0.14 | ) | | 0.22 | | | (0.35 | ) | | (0.19 | ) | | (0.54 | ) | | $ | 10.61 | | 2.00% | | | $ | 5,689 | | 1.57% | | | 3.29% | | | (k | ) | | | (k) | | 106.65% |
Year Ended October 31, 2004 | | $ | 10.61 | | 0.30 | | 0.02 | | | 0.32 | | | (0.31 | ) | | (0.26 | ) | | (0.57 | ) | | $ | 10.36 | | 3.10% | | | $ | 4,557 | | 1.54% | | | 2.91% | | | (k | ) | | | (k) | | 110.72% |
Year Ended October 31, 2005 | | $ | 10.36 | | 0.30 | | (0.20 | ) | | 0.10 | | | (0.30 | ) | | — | | | (0.30 | ) | | $ | 10.16 | | 1.00% | | | $ | 3,394 | | 1.56% | | | 2.95% | | | (k | ) | | (k | ) | | 117.67% |
| | | | | | | | | | | | | | | |
Class Y Shares | | | | | | | | | | | | | | | | | | | | | | | | | | | | | | | | | | | | | | | | | | | |
Period Ended October 31, 2001 (g) | | $ | 10.47 | | 0.24 | | 0.47 | | | 0.71 | | | (0.24 | ) | | — | | | (0.24 | ) | | $ | 10.94 | | 6.89% | (i) | | $ | 449 | | 1.64% | (j) | | 4.20% | (j) | | 1.73% | (j) | | 4.11% | (j) | | 159.68% |
Year Ended October 31, 2002 | | $ | 10.94 | | 0.40 | | 0.19 | | | 0.59 | | | (0.40 | ) | | (0.20 | ) | | (0.60 | ) | | $ | 10.93 | | 5.80% | | | $ | 941 | | 1.58% | | | 3.72% | | | 1.58% | | | 3.72% | | | 99.42% |
Year Ended October 31, 2003 (f) | | $ | 10.93 | | 0.36 | | (0.14 | ) | | 0.22 | | | (0.35 | ) | | (0.19 | ) | | (0.54 | ) | | $ | 10.61 | | 2.00% | | | $ | 1,910 | | 1.57% | | | 3.28% | | | (k | ) | | | (k) | | 106.65% |
Year Ended October 31, 2004 | | $ | 10.61 | | 0.30 | | 0.02 | | | 0.32 | | | (0.31 | ) | | (0.26 | ) | | (0.57 | ) | | $ | 10.36 | | 3.10% | | | $ | 961 | | 1.54% | | | 2.93% | | | (k | ) | | | (k) | | 110.72% |
Year Ended October 31, 2005 | | $ | 10.36 | | 0.30 | | (0.20 | ) | | 0.10 | | | (0.30 | ) | | — | | | (0.30 | ) | | $ | 10.16 | | 1.00% | | | $ | 855 | | 1.56% | | | 2.95% | | | (k | ) | | (k | ) | | 117.67% |
| | | | | | | | | | | | | | | |
Institutional Class Shares | | | | | | | | | | | | | | | | | | | | | | | | | | | | | | | | | | | | | | | | | | | |
Period Ended October 31, 2004 (h) | | $ | 10.11 | | 0.12 | | 0.28 | | | 0.40 | | | (0.13 | ) | | — | | | (0.13 | ) | | $ | 10.38 | | 4.00% | (i) | | $ | 14 | | 0.69% | (j) | | 3.66% | (j) | | (k | ) | | | (k) | | 110.72% |
Year Ended October 31, 2005 (l) | | $ | 10.38 | | 0.39 | | (0.21 | ) | | 0.18 | | | (0.39 | ) | | — | | | (0.39 | ) | | $ | 10.17 | | 1.72% | | | $ | 1 | | 0.72% | | | 3.85% | | | (k | ) | | (k | ) | | 117.67% |
| | | | | | | | | | | | | | | | | | | | | | | | | | | | | | | | | | | | | | | | | | | | |
| | |
(a) Excludes sales charge. | | (g) For the period from March 1, 2001 (commencement of operations) through October 31, 2001. |
(b) During the period certain fees were waived and/or reimbursed. If such waivers/reimbursements had not occurred, the ratios would have been as indicated. | | (h) For the period from June 29, 2004 (commencement of operations) through October 31, 2004. (i) Not annualized. (j) Annualized. (k) There were no fee reductions during the period. (l) Net investment income (loss) is based on average shares outstanding during the period. |
(c) Portfolio turnover is calculated on the basis of the Fund as a whole without distinguishing among the classes of shares. | |
(d) For the period from September 4, 2003 (commencement of operations) through October 31, 2003. | |
(e) For the period from October 1, 2003 (commencement of operations) through October 31, 2003. | |
(f) Effective September 1, 2003, Class B and Class C shares were renamed Class X and Class Y shares, respectively. | |
See notes to financial statements.
Financial Highlights
Selected Data for Each Share of Capital Outstanding
Gartmore Morley Enhanced Income Fund
| | | | | | | | | | | | | | | | | | | | | | | | | | | | | | | | | | | | | | | | | | |
| | | | | | | Investment Activities | | | Distributions | | | | | | Ratios/Supplemental Data
|
| | | | | Net Asset
Value,
Beginning
of Period | | Net
Investment
Income | | Net Realized
and
Unrealized
Gains
(Losses) on
Investments | | | Total
from
Investment
Activities | | | Net
Investment
Income | | | Total
Distributions | | | Net Asset
Value, End
of Period | | Total Return (a) | | | Net Assets
at End of
Period
(000s) | | Ratio of
Expenses
to Average
Net Assets | | | Ratio of Net
Investment
Income
to Average
Net Assets | | | Ratio of
Expenses
(Prior to
Reimbursements)
to Average
Net Assets (b) | | | Ratio of Net
Investment
Income
(Prior to
Reimbursements)
to Average
Net Assets (b) | | | Portfolio
Turnover (c) |
| | | | | | | | | | | | | | | |
Class A Shares | | | | | | | | | | | | | | | | | | | | | | | | | | | | | | | | | | | | | | | | | | |
Year Ended October 31, 2001 | | | | $ | 9.90 | | 0.52 | | (0.20 | ) | | 0.32 | | | (0.52 | ) | | (0.52 | ) | | $ | 9.70 | | 3.26% | | | $ | 629 | | 0.90% | | | 5.18% | | | 1.51% | | | 4.57% | | | 46.50% |
Year Ended October 31, 2002 | | | | $ | 9.70 | | 0.41 | | (0.26 | ) | | 0.15 | | | (0.41 | ) | | (0.41 | ) | | $ | 9.44 | | 1.60% | | | $ | 1,691 | | 0.79% | | | 4.28% | | | 0.95% | | | 4.12% | | | 32.97% |
Year Ended October 31, 2003 | | | | $ | 9.44 | | 0.30 | | (0.18 | ) | | 0.12 | | | (0.30 | ) | | (0.30 | ) | | $ | 9.26 | | 1.31% | | | $ | 2,404 | | 0.78% | | | 3.11% | | | 0.88% | | | 3.01% | | | 29.97% |
Year Ended October 31, 2004 | | | | $ | 9.26 | | 0.16 | | (0.09 | ) | | 0.07 | | | (0.17 | ) | | (0.17 | ) | | $ | 9.16 | | 0.73% | | | $ | 1,575 | | 0.80% | | | 1.74% | | | 0.85% | | | 1.69% | | | 51.59% |
Year Ended October 31, 2005 | | | | $ | 9.16 | | 0.22 | | (0.07 | ) | | 0.15 | | | (0.23 | ) | | (0.23 | ) | | $ | 9.08 | | 1.66% | | | $ | 1,242 | | 0.80% | | | 2.36% | | | 0.85% | | | 2.31% | | | 60.80% |
| | | | | | | | | | | | | | | |
Class R Shares | | | | | | | | | | | | | | | | | | | | | | | | | | | | | | | | | | | | | | | | | | |
Period Ended October 31, 2003 (d) | | | | $ | 9.30 | | 0.02 | | (0.03 | ) | | (0.01 | ) | | (0.02 | ) | | (0.02 | ) | | $ | 9.27 | | (0.13% | )(e) | | $ | 1 | | 1.05% | (f) | | 2.01% | (f) | | 1.15% | (f) | | 1.91% | (f) | | 29.97% |
Year Ended October 31, 2004 | | | | $ | 9.27 | | 0.13 | | (0.09 | ) | | 0.04 | | | (0.14 | ) | | (0.14 | ) | | $ | 9.17 | | 0.48% | | | $ | 1 | | 1.00% | | | 1.49% | | | 1.00% | | | 1.49% | | | 51.59% |
Year Ended October 31, 2005 | | | | $ | 9.17 | | 0.22 | | (0.07 | ) | | 0.15 | | | (0.23 | ) | | (0.23 | ) | | $ | 9.09 | | 1.70% | | | $ | 1 | | 0.72% | | | 2.42% | | | 0.72% | | | 2.42% | | | 60.80% |
| | | | | | | | | | | | | | | |
Institutional Service Class Shares | | | | | | | | | | | | | | | | | | | | | | | | | | | | | | | | | | | | | | | | | | |
Year Ended October 31, 2001 | | | | $ | 9.90 | | 0.54 | | (0.19 | ) | | 0.35 | | | (0.54 | ) | | (0.54 | ) | | $ | 9.71 | | 3.57% | | | $ | 11,593 | | 0.70% | | | 5.45% | | | 1.44% | | | 4.71% | | | 46.50% |
Year Ended October 31, 2002 | | | | $ | 9.71 | | 0.42 | | (0.27 | ) | | 0.15 | | | (0.42 | ) | | (0.42 | ) | | $ | 9.44 | | 1.60% | | | $ | 10,093 | | 0.70% | | | 4.41% | | | 0.90% | | | 4.21% | | | 32.97% |
Year Ended October 31, 2003 | | | | $ | 9.44 | | 0.31 | | (0.17 | ) | | 0.14 | | | (0.31 | ) | | (0.31 | ) | | $ | 9.27 | | 1.50% | | | $ | 9,256 | | 0.70% | | | 3.25% | | | 0.80% | | | 3.15% | | | 29.97% |
Year Ended October 31, 2004 | | | | $ | 9.27 | | 0.17 | | (0.09 | ) | | 0.08 | | | (0.18 | ) | | (0.18 | ) | | $ | 9.17 | | 0.82% | | | $ | 7,476 | | 0.70% | | | 1.84% | | | 0.75% | | | 1.79% | | | 51.59% |
Year Ended October 31, 2005 | | | | $ | 9.17 | | 0.23 | | (0.07 | ) | | 0.16 | | | (0.24 | ) | | (0.24 | ) | | $ | 9.09 | | 1.77% | | | $ | 5,661 | | 0.70% | | | 2.47% | | | 0.75% | | | 2.42% | | | 60.80% |
| | | | | | | | | | | | | | | |
Institutional Class Shares | | | | | | | | | | | | | | | | | | | | | | | | | | | | | | | | | | | | | | | | | | |
Year Ended October 31, 2001 | | | | $ | 9.89 | | 0.56 | | (0.19 | ) | | 0.37 | | | (0.56 | ) | | (0.56 | ) | | $ | 9.70 | | 3.83% | | | $ | 10,144 | | 0.45% | | | 5.39% | | | 0.98% | | | 4.86% | | | 46.50% |
Year Ended October 31, 2002 | | | | $ | 9.70 | | 0.45 | | (0.26 | ) | | 0.19 | | | (0.45 | ) | | (0.45 | ) | | $ | 9.44 | | 1.96% | | | $ | 57,703 | | 0.45% | | | 4.57% | | | 0.64% | | | 4.38% | | | 32.97% |
Year Ended October 31, 2003 | | | | $ | 9.44 | | 0.33 | | (0.18 | ) | | 0.15 | | | (0.33 | ) | | (0.33 | ) | | $ | 9.26 | | 1.64% | | | $ | 155,704 | | 0.45% | | | 3.40% | | | 0.55% | | | 3.30% | | | 29.97% |
Year Ended October 31, 2004 | | | | $ | 9.26 | | 0.19 | | (0.08 | ) | | 0.11 | | | (0.20 | ) | | (0.20 | ) | | $ | 9.17 | | 1.07% | | | $ | 299,898 | | 0.45% | | | 2.05% | | | 0.50% | | | 2.00% | | | 51.59% |
Year Ended October 31, 2005 | | | | $ | 9.17 | | 0.25 | | (0.07 | ) | | 0.18 | | | (0.26 | ) | | (0.26 | ) | | $ | 9.09 | | 2.13% | | | $ | 452,749 | | 0.45% | | | 2.76% | | | 0.50% | | | 2.71% | | | 60.80% |
| | | | | | | | | | | | | | | | | | | | | | | | | | | | | | | | | | | | | | | | | | | |
| | | | | | | | | | | | | | | | | | | | | | | | | | | | | | | | | | | | | | | | | | | |
| | | | | | | | | | | | | | | | | | | | | | | | | | | | | | | | | | | | | | | | | | | |
| | | | | | | | | | | | | | | | | | | | | | | | | | | | | | | | | | | | | | | | | | | |
| | | | | | | | | | | | | | | | | | | | | | | | | | | | | | | | | | | | | | | | | | | |
| | | | | | | | | | | | | | | | | | | | | | | | | | | | | | | | | | | | | | | | | | | |
| | | | | | | | | | | | | | | | | | | | | | | | | | | | | | | | | | | | | | | | | | | |
| | | | | | | | | | | | | | | | | | | | | | | | | | | | | | | | | | | | | | | | | | | |
| | | | | | | | | | | | | | | | | | | | | | | | | | | | | | | | | | | | | | | | | | | |
| | | | | | | | | | | | | | | | | | | | | | | | | | | | | | | | | | | | | | | | | | | |
| | | | | | | | | | | | | | | | | | | | | | | | | | | | | | | | | | | | | | | | | | | |
| (a) | Excludes sales charge. |
| (b) | During the period certain fees were waived and/or reimbursed. If such waivers/reimbursements had not occurred, the ratios would have been as indicated. |
| (c) | Portfolio turnover is calculated on the basis of the Fund as a whole without distinguishing among the classes of shares. |
| (d) | For the period from October 1, 2003 (commencement of operations) through October 31, 2003. |
See notes to financial statements.
Financial Highlights
Selected Data for Each Share of Capital Outstanding
Gartmore Short Duration Bond Fund
| | | | | | | | | | | | | | | | | | | | | | | | | | | | | | | | | | | | | | | | | | | | | | | |
| | | | | Investment Activities | | Distributions | | | | | | | | | | | | | Ratios/Supplemental Data |
| | | Net Asset
Value,
Beginning
of Period | | Net
Investment
Income
(Loss) | | Net Realized
and
Unrealized
Gains
(Losses) on
Investments | | | Total
from
Investment
Activities | | Net
Investment
Income | | | Net
Realized
Gains | | | Total
Distributions | | | Reverse
Stock
Split | | | Capital
Contributions
from
Adviser | | Net Asset
Value, End
of Period | | Total
Return (a) | | | Net Assets
at End of
Period
(000s) | | Ratio of
Expenses
to Average
Net Assets | | | Ratio of
Net
Investment
Income
(Loss) to
Average
Net Assets | | | Ratio of
Expenses
(Prior to
Reimbursements)
to Average
Net Assets (b) | | | Ratio of Net
Investment
Income (Loss)
(Prior to
Reimbursements)
to Average
Net Assets (b) | | | Portfolio
Turnover (c) |
| | | | | | | | | | | | | | | | | |
Class A Shares | | | | | | | | | | | | | | | | | | | | | | | | | | | | | | | | | | | | | | | | | | | | | | | |
Period Ended October 31, 2003 (d) | | $ | 10.00 | | 0.08 | | — | | | 0.08 | | (0.08 | ) | | — | | | (0.08 | ) | | — | | | — | | $ | 10.00 | | 0.76% | (f) | | $ | 42 | | 0.95% | (g) | | 2.68% | (g) | | 1.05% | (g) | | 2.58% | (g) | | 16.61% |
Year Ended October 31, 2004 | | $ | 10.00 | | 0.23 | | (0.07 | ) | | 0.16 | | (0.23 | ) | | (0.01 | ) | | (0.24 | ) | | 0.01 | (i) | | 0.07 | | $ | 10.00 | | 2.35% | (j) | | $ | 1,585 | | 0.86% | | | 2.08% | | | 0.96% | | | 1.98% | | | 129.96% |
Year Ended October 31, 2005 | | $ | 10.00 | | 0.25 | | (0.15 | ) | | 0.10 | | (0.27 | ) | | — | | | (0.27 | ) | | — | | | — | | $ | 9.83 | | 0.98% | | | $ | 1,017 | | 0.78% | | | 2.40% | | | 0.88% | | | 2.30% | | | 292.03% |
| | | | | | | | | | | | | | | | | |
Class C Shares | | | | | | | | | | | | | | | | | | | | | | | | | | | | | | | | | | | | | | | | | | | | | | | |
Period Ended October 31, 2005 (e) | | $ | 9.91 | | 0.13 | | (0.06 | ) | | 0.07 | | (0.15 | ) | | — | | | (0.15 | ) | | — | | | — | | $ | 9.83 | | 0.76% | (f) | | $ | 1 | | 1.40% | (g) | | 2.08% | (g) | | 1.40% | (g) | | 2.08% | (g) | | 292.03% |
| | | | | | | | | | | | | | | | | |
Institutional Class Shares | | | | | | | | | | | | | | | | | | | | | | | | | | | | | | | | | | | | | | | | | | | | | | | |
Year Ended October 31, 2001 | | $ | 10.00 | | 0.59 | | — | | | 0.59 | | (0.59 | ) | | — | | | (0.59 | ) | | — | | | — | | $ | 10.00 | | 6.06% | | | $ | 15,531 | | 0.55% | | | 5.83% | | | 0.83% | | | 5.55% | | | 59.67% |
Year Ended October 31, 2002 | | $ | 10.00 | | 0.47 | | — | | | 0.47 | | (0.47 | ) | | (0.04 | ) | | (0.51 | ) | | 0.04 | (h) | | — | | $ | 10.00 | | 4.84% | | | $ | 19,239 | | 0.57% | | | 4.73% | | | 0.71% | | | 4.69% | | | 37.37% |
Year Ended October 31, 2003 | | $ | 10.00 | | 0.34 | | — | | | 0.34 | | (0.34 | ) | | — | | | (0.34 | ) | | — | | | — | | $ | 10.00 | | 3.41% | | | $ | 47,491 | | 0.60% | | | 3.40% | | | 0.70% | | | 3.30% | | | 16.61% |
Year Ended October 31, 2004 | | $ | 10.00 | | 0.27 | | (0.07 | ) | | 0.20 | | (0.27 | ) | | (0.01 | ) | | (0.28 | ) | | 0.01 | (i) | | 0.07 | | $ | 10.00 | | 2.69% | (k) | | $ | 72,996 | | 0.54% | | | 2.63% | | | 0.64% | | | 2.53% | | | 129.96% |
Year Ended October 31, 2005 | | $ | 10.00 | | 0.27 | | (0.15 | ) | | 0.12 | | (0.29 | ) | | — | | | (0.29 | ) | | — | | | — | | $ | 9.83 | | 1.24% | | | $ | 6,741 | | 0.49% | | | 2.46% | | | 0.59% | | | 2.36% | | | 292.03% |
| | | | | | | | | | | | | | | | | |
IRA Class Shares | | | | | | | | | | | | | | | | | | | | | | | | | | | | | | | | | | | | | | | | | | | | | | | |
Year Ended October 31, 2001 | | $ | 10.00 | | 0.55 | | — | | | 0.55 | | (0.55 | ) | | — | | | (0.55 | ) | | — | | | — | | $ | 10.00 | | 5.64% | | | $ | 2,073 | | 0.95% | | | 5.46% | | | 1.19% | | | 5.22% | | | 59.67% |
Year Ended October 31, 2002 | | $ | 10.00 | | 0.43 | | — | | | 0.43 | | (0.43 | ) | | (0.04 | ) | | (0.47 | ) | | 0.04 | (h) | | — | | $ | 10.00 | | 4.41% | | | $ | 38,001 | | 1.01% | | | 4.00% | | | 1.11% | | | 4.00% | | | 37.37% |
Year Ended October 31, 2003 | | $ | 10.00 | | 0.29 | | 0.01 | | | 0.30 | | (0.30 | ) | | — | | | (0.30 | ) | | — | | | — | | $ | 10.00 | | 2.99% | | | $ | 413,934 | | 1.01% | | | 2.90% | | | 1.11% | | | 2.80% | | | 16.61% |
Year Ended October 31, 2004 | | $ | 10.00 | | 0.23 | | (0.07 | ) | | 0.16 | | (0.23 | ) | | (0.01 | ) | | (0.24 | ) | | 0.01 | (i) | | 0.07 | | $ | 10.00 | | 2.30% | (l) | | $ | 369,014 | | 0.91% | | | 2.29% | | | 1.01% | | | 2.19% | | | 129.96% |
Year Ended October 31, 2005 | | $ | 10.00 | | 0.24 | | (0.15 | ) | | 0.09 | | (0.26 | ) | | — | | | (0.26 | ) | | — | | | — | | $ | 9.83 | | 0.90% | | | $ | 43,888 | | 0.83% | | | 2.21% | | | 0.93% | | | 2.11% | | | 292.03% |
| | | | | | | | | | | | | | | | | |
Service Class Shares | | | | | | | | | | | | | | | | | | | | | | | | | | | | | | | | | | | | | | | | | | | | | | | |
Year Ended October 31, 2001 | | $ | 10.00 | | 0.55 | | — | | | 0.55 | | (0.55 | ) | | — | | | (0.55 | ) | | — | | | — | | $ | 10.00 | | 5.64% | | | $ | 24,871 | | 0.95% | | | 5.45% | | | 1.23% | | | 5.17% | | | 59.67% |
Year Ended October 31, 2002 | | $ | 10.00 | | 0.44 | | — | | | 0.44 | | (0.44 | ) | | (0.04 | ) | | (0.48 | ) | | 0.04 | (h) | | — | | $ | 10.00 | | 4.44% | | | $ | 84,679 | | 0.96% | | | 4.23% | | | 1.08% | | | 4.21% | | | 37.37% |
Year Ended October 31, 2003 | | $ | 10.00 | | 0.30 | | — | | | 0.30 | | (0.30 | ) | | — | | | (0.30 | ) | | — | | | — | | $ | 10.00 | | 3.05% | | | $ | 196,569 | | 0.95% | | | 3.06% | | | 1.05% | | | 2.96% | | | 16.61% |
Year Ended October 31, 2004 | | $ | 10.00 | | 0.22 | | (0.07 | ) | | 0.15 | | (0.22 | ) | | (0.01 | ) | | (0.23 | ) | | 0.01 | (i) | | 0.07 | | $ | 10.00 | | 2.26% | (m) | | $ | 263,900 | | 0.97% | | | 2.20% | | | 1.07% | | | 2.10% | | | 129.96% |
Year Ended October 31, 2005 | | $ | 10.00 | | 0.24 | | (0.15 | ) | | 0.09 | | (0.26 | ) | | — | | | (0.26 | ) | | — | | | — | | $ | 9.83 | | 0.95% | | | $ | 80,818 | | 0.83% | | | 2.31% | | | 0.93% | | | 2.21% | | | 292.03% |
| | | | | | | | | | | | | | | | | | | | | | | | | | | | | | | | | | | | | | | | | | | | | | | | |
| | | | | | | | | | | | | | | | | | | | | | | | | | | | | | | | | | | | | | | | | | | | | | | | |
| | |
(a) Excludes sales charge. (b) During the period certain fees were waived and/or reimbursed. If such waivers/reimbursements had not occurred, the ratios would have been as indicated. (c) Portfolio turnover is calculated on the basis of the Fund as a whole without distinguishing among the classes of shares. (d) For the period from July 16, 2003 (commencement of operations) through October 31, 2003. (e) For the period from February 28, 2005 (commencement of operations) through October 31, 2005. (f) Not annualized. (g) Annualized. | | (h)Per share numbers prior to December 31, 2001 have been adjusted to reflect a 1.003633 for 1 reverse stock split. |
| | (i) Per share numbers prior to April 16, 2004 have been adjusted to reflect a 1.00620 for 1 reverse stock split. |
| | (j) The total return includes a contribution from adviser. If that contribution had not taken place, the total return would have been 1.63%. |
| | (k) The total return includes a contribution from adviser. If that contribution had not taken place, the total return would have been 1.97%. |
| | (l) The total return includes a contribution from adviser. If that contribution had not taken place, the total return would have been 1.58%. |
| | (m)The total return includes a contribution from adviser. If that contribution had not taken place, the total return would have been 1.54%. |
| | |
See notes to financial statements.
Financial Highlights
Selected Data for Each Share of Capital Outstanding
Gartmore Tax-Free Income Fund
| | | | | | | | | | | | | | | | | | | | | | | | | | | | | | | | | | | |
| | | | | | | Investment Activities | | Distributions | | | | | | | | Ratios/Supplemental Data |
| | | | | Net Asset
Value,
Beginning
of Period | | Net
Investment
Income | | Net Realized
and
Unrealized
Gains
(Losses) on
Investments | | | Total
from
Investment
Activities | | Net
Investment
Income | | | Total
Distributions | | | Net Asset
Value, End
of Period | | Total
Return (a) | | | Net Assets at End of
Period (000s) | | Ratio of Expenses to
Average Net Assets | | | Ratio of Net
Investment Income
to Average Net
Assets | | | Portfolio
Turnover (b) |
| | | | | | | | | | | | | |
Class A Shares | | | | | | | | | | | | | | | | | | | | | | | | | | | | | | | | | | | |
Year Ended October 31, 2001 | | | | $ | 10.04 | | 0.46 | | 0.49 | | | 0.95 | | (0.48 | ) | | (0.48 | ) | | $ | 10.51 | | 9.70% | | | $ | 5,837 | | 1.00% | | | 4.56% | | | 7.29% |
Year Ended October 31, 2002 | | | | $ | 10.51 | | 0.47 | | — | | | 0.47 | | (0.47 | ) | | (0.47 | ) | | $ | 10.51 | | 4.57% | | | $ | 7,586 | | 0.99% | | | 4.48% | | | 27.77% |
Year Ended October 31, 2003 | | | | $ | 10.51 | | 0.44 | | (0.02 | ) | | 0.42 | | (0.44 | ) | | (0.44 | ) | | $ | 10.49 | | 4.09% | | | $ | 7,580 | | 0.98% | | | 4.20% | | | 16.91% |
Year Ended October 31, 2004 | | | | $ | 10.49 | | 0.43 | | 0.18 | | | 0.61 | | (0.43 | ) | | (0.43 | ) | | $ | 10.67 | | 5.97% | | | $ | 9,599 | | 0.93% | | | 4.10% | | | 0.00% |
Year Ended October 31, 2005 | | | | $ | 10.67 | | 0.39 | | (0.18 | ) | | 0.21 | | (0.39 | ) | | (0.39 | ) | | $ | 10.49 | | 1.98% | | | $ | 10,054 | | 0.98% | | | 3.67% | | | 3.70% |
| | | | | | | | | | | | | |
Class B Shares | | | | | | | | | | | | | | | | | | | | | | | | | | | | | | | | | | | |
Period Ended October 31, 2003 (c) | | | | $ | 10.28 | | 0.06 | | 0.20 | | | 0.26 | | (0.06 | ) | | (0.06 | ) | | $ | 10.48 | | 2.48% | (f) | | $ | 41 | | 1.72% | (g) | | 3.54% | (g) | | 16.91% |
Year Ended October 31, 2004 | | | | $ | 10.48 | | 0.35 | | 0.19 | | | 0.54 | | (0.35 | ) | | (0.35 | ) | | $ | 10.67 | | 5.28% | | | $ | 370 | | 1.68% | | | 3.36% | | | 0.00% |
Year Ended October 31, 2005 | | | | $ | 10.67 | | 0.32 | | (0.20 | ) | | 0.12 | | (0.31 | ) | | (0.31 | ) | | $ | 10.48 | | 1.19% | | | $ | 602 | | 1.73% | | | 2.90% | | | 3.70% |
| | | | | | | | | | | | | |
Class C Shares | | | | | | | | | | | | | | | | | | | | | | | | | | | | | | | | | | | |
Period Ended October 31, 2003 (c) | | | | $ | 10.27 | | 0.06 | | 0.20 | | | 0.26 | | (0.06 | ) | | (0.06 | ) | | $ | 10.47 | | 2.48% | (f) | | $ | 1 | | 1.72% | (g) | | 3.65% | (g) | | 16.91% |
Year Ended October 31, 2004 | | | | $ | 10.47 | | 0.36 | | 0.17 | | | 0.53 | | (0.36 | ) | | (0.36 | ) | | $ | 10.64 | | 5.12% | | | $ | 984 | | 1.66% | | | 3.32% | | | 0.00% |
Year Ended October 31, 2005 | | | | $ | 10.64 | | 0.32 | | (0.19 | ) | | 0.13 | | (0.31 | ) | | (0.31 | ) | | $ | 10.46 | | 1.30% | | | $ | 1,211 | | 1.73% | | | 2.91% | | | 3.70% |
| | | | | | | | | | | | | |
Class D Shares | | | | | | | | | | | | | | | | | | | | | | | | | | | | | | | | | | | |
Year Ended October 31, 2001 | | | | $ | 10.03 | | 0.49 | | 0.49 | | | 0.98 | | (0.51 | ) | | (0.51 | ) | | $ | 10.50 | | 9.99% | | | $ | 202,942 | | 0.75% | | | 4.82% | | | 7.29% |
Year Ended October 31, 2002 | | | | $ | 10.50 | | 0.49 | | 0.01 | | | 0.50 | | (0.49 | ) | | (0.49 | ) | | $ | 10.51 | | 4.94% | | | $ | 195,601 | | 0.73% | | | 4.74% | | | 27.77% |
Year Ended October 31, 2003 | | | | $ | 10.51 | | 0.47 | | (0.02 | ) | | 0.45 | | (0.47 | ) | | (0.47 | ) | | $ | 10.49 | | 4.36% | | | $ | 184,774 | | 0.72% | | | 4.47% | | | 16.91% |
Year Ended October 31, 2004 | | | | $ | 10.49 | | 0.46 | | 0.18 | | | 0.64 | | (0.46 | ) | | (0.46 | ) | | $ | 10.67 | | 6.23% | | | $ | 174,451 | | 0.68% | | | 4.35% | | | 0.00% |
Year Ended October 31, 2005 | | | | $ | 10.67 | | 0.42 | | (0.19 | ) | | 0.23 | | (0.42 | ) | | (0.42 | ) | | $ | 10.48 | | 2.24% | | | $ | 162,139 | | 0.72% | | | 3.92% | | | 3.70% |
| | | | | | | | | | | | | |
Class X Shares | | | | | | | | | | | | | | | | | | | | | | | | | | | | | | | | | | | |
Year Ended October 31, 2001 | | | | $ | 10.03 | | 0.40 | | 0.49 | | | 0.89 | | (0.42 | ) | | (0.42 | ) | | $ | 10.50 | | 9.06% | | | $ | 5,592 | | 1.60% | | | 3.96% | | | 7.29% |
Year Ended October 31, 2002 | | | | $ | 10.50 | | 0.40 | | 0.01 | | | 0.41 | | (0.40 | ) | | (0.40 | ) | | $ | 10.51 | | 4.05% | | | $ | 6,445 | | 1.58% | | | 3.88% | | | 27.77% |
Year Ended October 31, 2003 (d) | | | | $ | 10.51 | | 0.38 | | (0.02 | ) | | 0.36 | | (0.38 | ) | | (0.38 | ) | | $ | 10.49 | | 3.48% | | | $ | 6,861 | | 1.57% | | | 3.61% | | | 16.91% |
Year Ended October 31, 2004 | | | | $ | 10.49 | | 0.37 | | 0.18 | | | 0.55 | | (0.37 | ) | | (0.37 | ) | | $ | 10.67 | | 5.34% | | | $ | 6,342 | | 1.53% | | | 3.50% | | | 0.00% |
Year Ended October 31, 2005 | | | | $ | 10.67 | | 0.32 | | (0.19 | ) | | 0.13 | | (0.32 | ) | | (0.32 | ) | | $ | 10.48 | | 1.36% | | | $ | 4,903 | | 1.57% | | | 3.06% | | | 3.70% |
| | | | | | | | | | | | | |
Class Y Shares | | | | | | | | | | | | | | | | | | | | | | | | | | | | | | | | | | | |
Period Ended October 31, 2001 (e) | | | | $ | 10.32 | | 0.22 | | 0.16 | | | 0.38 | | (0.22 | ) | | (0.22 | ) | | $ | 10.48 | | 3.73% | (f) | | $ | 115 | | 1.62% | (g) | | 3.98% | (g) | | 7.29% |
Year Ended October 31, 2002 | | | | $ | 10.48 | | 0.41 | | — | | | 0.41 | | (0.40 | ) | | (0.40 | ) | | $ | 10.49 | | 4.06% | | | $ | 221 | | 1.59% | | | 3.87% | | | 27.77% |
Year Ended October 31, 2003 (d) | | | | $ | 10.49 | | 0.39 | | (0.03 | ) | | 0.36 | | (0.38 | ) | | (0.38 | ) | | $ | 10.47 | | 3.49% | | | $ | 652 | | 1.57% | | | 3.61% | | | 16.91% |
Year Ended October 31, 2004 | | | | $ | 10.47 | | 0.38 | | 0.17 | | | 0.55 | | (0.37 | ) | | (0.37 | ) | | $ | 10.65 | | 5.35% | | | $ | 493 | | 1.54% | | | 3.51% | | | 0.00% |
Year Ended October 31, 2005 | | | | $ | 10.65 | | 0.32 | | (0.18 | ) | | 0.14 | | (0.33 | ) | | (0.33 | ) | | $ | 10.46 | | 1.37% | | | $ | 232 | | 1.58% | | | 3.05% | | | 3.70% |
| | | | | | | | | | | | | | | | | | | | | | | | | | | | | | | | | | | | |
| (a) | Excludes sales charge. |
| (b) | Portfolio turnover is calculated on the basis of the Fund as a whole without distinguishing among the classes of shares. |
| (c) | For the period from September 4, 2003 (commencement of operations) through October 31, 2003. |
| (d) | Effective September 1, 2003, Class B and Class C shares were renamed Class X and Class Y shares, respectively. |
| (e) | For the period from March 1, 2001 (commencement of operations) through October 31, 2001. |
See notes to financial statements.
Notes to Financial Statements
October 31, 2005
1. Organization
Gartmore Mutual Funds (the “Trust”) is an open-end management investment company, organized under the laws of Delaware by amended and restated Agreement and Declaration of Trust, dated October 28, 2004, as amended to date. Prior to January 25, 2002, the Trust was named “Nationwide Mutual Funds”. The Trust, originally created under the laws of Ohio as an Ohio business trust pursuant to a Declaration of Trust dated, as of October 30, 1997, as subsequently amended and redomesticated as a Delaware Statutory Trust on February 28, 2005, is registered under the Investment Company Act of 1940, as amended (the “1940 Act”). The redomestication was a change in statutory status and did not affect the operations of the Trust. As of October 31, 2005, the Trust had authorized an unlimited number of shares of beneficial interest (“shares”) without par value. The Trust operates forty-six (46) separate series, or mutual funds, each with its own investment objectives and strategies. This report contains the financial statements and financial highlights of the eight (8) funds listed below (individually, a “Fund”; collectively, the “Funds”):
- Gartmore Large Cap Value Fund (“Large Cap Value”)
- Gartmore Mid Cap Growth Fund (“Mid Cap Growth”)
- Gartmore Small Cap Fund (“Small Cap”)
- Gartmore Bond Fund (“Bond”)
- Gartmore Government Bond Fund (“Government Bond”)
- Gartmore Morley Enhanced Income Fund (“Morley Enhanced Income”)
- Gartmore Short Duration Bond Fund (“Short Duration Bond”) (formerly, Gartmore Morley Capital Accumulation Fund)
- Gartmore Tax-Free Income Fund (“Tax-Free Income”)
Under the Trust’s organizational documents, the Trust’s officers and trustees are indemnified against certain liabilities arising out of the performance of their duties to the Trust. In addition, the Trust has entered into Indemnification Agreements with its Trustees and certain of its Officers. Trust Officers receive no compensation from the Trust for serving as its Officers. In addition, in the normal course of business, the Trust enters into contracts with the Trust’s vendors and others that provide for general indemnifications. The Trust’s maximum liability under these arrangements is unknown, as this would involve future claims that may be made against the Trust. Based on experience, however, the Trust expects the risk of loss to be remote.
2. Summary of Significant Accounting Policies
The following is a summary of significant accounting policies followed by the Funds in the preparation of their financial statements. The policies are in conformity with accounting principles generally accepted in the United States of America (“GAAP”). The preparation of financial statements requires management to make estimates and assumptions that affect the reported amounts of assets and liabilities, the disclosure of contingent assets and liabilities at the date of the financial statements, and the reported amounts of income and expenses for the period. Actual results could differ from those estimates.
Securities for which market quotations are readily available are valued at current market value as of “Valuation Time.” Valuation Time is as of the close of regular trading on the New York Stock Exchange (usually 4 p.m. Eastern time). Equity securities are valued at the last quoted sale price or, if there is no sale price, the last quoted bid price provided by an independent pricing service approved by the Trust’s Board of Trustees. Securities traded on NASDAQ are valued at the NASDAQ official closing price. Prices are taken from the primary market or exchange in which each security trades. Most securities listed on a foreign exchange are valued either at fair value (see description below) or at the last sale price at the close of the exchange on which the security is principally traded. Foreign securities, currencies, and other assets and liabilities denominated in foreign currencies are translated into U.S. dollars at the exchange rate of said currencies against the U.S. Dollar, as of Valuation Time, as provided by an independent pricing service approved by the Board of Trustees.
Debt and other fixed income securities (other than short-term obligations) are valued at the last quoted bid price and/or by using a combination of daily quotes and matrix evaluations provided by an independent pricing service, the use of which has been approved by the Trust’s Board of Trustees. Short-term debt securities such as commercial paper and U.S. Treasury Bills, having a remaining maturity of 60 days or less at the time of purchase are considered to be “short-term” and are valued at amortized cost which approximates market value.
Securities for which market quotations are not readily available, or for which an independent pricing service does not provide a value or provides a value that does not represent fair value in the judgment of the Funds’ investment adviser or designee, are valued at fair value under procedures approved by the Trust’s Board of Trustees. The “Fair Value” of these securities is determined in good faith by taking into account relevant factors and surrounding circumstances. Methods utilized to obtain a “Fair Value” may include the following non-exclusive list of acceptable methods: (i) a multiple of earnings; (ii) the discount from market value of a similar, freely traded security; (iii) the yield-to-maturity for debt issues; or (iv) a consolidation of the methods. The Gartmore Fair Value Committee considers a non-exclusive list of factors to arrive at the appropriate method of determining “Fair Value.” For example, fair value determinations are required for securities whose value is affected by a “significant” event that materially affects the value of a domestic or foreign security which occurs subsequent to the time of the close of the principal market on which such domestic or foreign security trades and before the Valuation Time (i.e., a “subsequent event”). Typically, this will involve events occurring after the close of a foreign market on which a security trades and before the next Valuation Time.
The Funds holding foreign equity securities (the “Foreign Equity Funds”) value foreign securities at fair value in the circumstances described below. Generally, trading in foreign securities markets is completed each day at various times prior to the Valuation Time. Due to the time differences between the closings of the relevant foreign securities exchanges and the Valuation Time for the Foreign Equity Funds, the Foreign Equity Funds will fair value their foreign investments when it is determined that the market quotations for the foreign investments either are not readily available or are unreliable and, therefore, do not represent fair value. When the fair value prices are utilized, these prices will attempt to reflect the impact of the U.S. financial markets’ perceptions and trading activities on the Foreign Equity Funds’ foreign investments since the last closing prices of the foreign investments were calculated on their primary foreign securities markets or exchanges. For these purposes, the Board of Trustees of the Trust has determined that movements in relevant indices or other appropriate market indicators, after the close of the foreign securities exchanges, may demonstrate that market quotations are unreliable, and may trigger fair value pricing for certain securities. Consequently, fair valuation of portfolio securities may occur on a daily basis. As of October 31, 2005, the Funds did not hold any foreign equity securities.
In determining fair value prices, the Trust utilizes data furnished by an independent pricing service (and that data draws upon, among other information, the market values of foreign investments). The fair value prices of portfolio securities generally will be used when it is determined that the use of these prices will have a material impact on the net asset value of a Foreign Equity Fund. When a Foreign Equity Fund uses fair value pricing, the values assigned to the Foreign Equity Fund’s foreign investments may not be the quoted or published prices of the investments on their primary markets or exchanges.
For the Short Duration Bond Fund from October 4, 2004 through December 5, 2004, the Fund valued its securities using the amortized cost methodology in seeking to continue to maintain a stable NAV of $10.00 per share without the use of wrap contracts to stabilize the NAV. On December 6, 2004, upon the Fund’s change to a short duration bond fund with a fluctuating NAV, the Fund commenced valuation of its securities using the Fund’s valuation procedures.
| (b) | | Repurchase Agreements |
The Funds may enter into repurchase agreements with an entity which is a member of the Federal Reserve System or which is a “primary dealer” (as designated by the Federal Reserve Bank of New York) in U.S. Government obligations. The repurchase price generally equals the price paid by a Fund plus interest negotiated on the basis of current short-term rates, which may be more or less than the rate on the underlying portfolio securities. The seller
Notes to Financial Statements (Continued)
October 31, 2005
under a repurchase agreement is required to maintain the value of the collateral held pursuant to the agreement at a market value equal to or greater than the repurchase price (including accrued interest). Collateral subject to repurchase agreements is held by the Funds’ custodian or another qualified sub-custodian or in the Federal Reserve/ Treasury book-entry system. If the counterparty defaults and the fair value of the collateral declines, realization of the collateral by the Funds may be delayed or limited. The Funds may transfer uninvested cash balances into a pooled cash account. These balances are invested in one or more repurchase agreements, which are fully collateralized by U.S. Government Agencies and U.S. Government Agency Mortgages with the counterparties of CS First Boston and Nomura Securities.
Certain Funds may invest in financial futures contracts (“futures contracts”) for the purpose of hedging their existing portfolio securities or securities that the Funds intend to purchase against fluctuations in value caused by changes in prevailing market interest rates or prices. Futures contracts may also be entered into for non-hedging purposes. Upon entering into a futures contract, these Funds are required to pledge to the broker an amount of cash and/or other assets equal to a certain percentage of the contract amount (initial margin deposit). Subsequent payments, known as “variation margin”, are made each day, depending on the daily fluctuations in the fair value/market value of the underlying assets. A gain or loss equal to the daily variation margin is recognized on a daily basis. Future contracts are valued daily at their last quoted sale price.
A “sale” of a futures contract means a contractual obligation to deliver the securities or foreign currency called for by the contract at a fixed price at a specified time in the future. A “purchase” of a futures contract means a contractual obligation to acquire the securities or foreign currency at a fixed price at a specified time in the future.
Should market conditions change unexpectedly, the Funds may not achieve the anticipated benefits of the futures contracts and may realize a loss. The use of futures transactions for hedging purposes involves the risk of imperfect correlation in movements in the price of futures contracts, interest rates, and the value of the underlying hedged assets.
| (d) | | Security Transactions and Investment Income |
Security transactions are accounted for on the date the security is purchased or sold (i.e., the “trade date”). Securities gains and losses are calculated on the identified cost basis. Interest income is recognized on the accrual basis and includes, where applicable, the amortization or accretion of premium or discount. Dividend income is recorded on the ex-dividend date.
To generate additional income, each of the Funds may lend up to 33 1/3% of the Fund’s total assets pursuant to agreements, requiring that the borrower deliver cash or securities as collateral with respect to each new loan of U.S. securities, equal to at least 102% of the value of the portfolio securities loaned, and with respect to each new loan of non-U.S. securities, collateral of at least 105% of the value of the portfolio securities loaned, and thereafter requiring the borrower to mark to market the collateral on a daily basis and requiring the borrower to make up any shortfall of collateral. The Funds receive payments from borrowers of the dividends and interest that the Funds are entitled to for the positions on loan. These loan positions simultaneously earn income on the investment of cash collateral. Collateral is marked to market daily to provide a level of collateral at least equal to the market value of securities loaned. There may be risks of delay in recovery of the securities should the borrower of the securities fail financially. Loans will be made, however, only to borrowers deemed by the Funds’ investment adviser to be of good standing and creditworthy under guidelines established by the Board of Trustees and when, in the judgment of the adviser, the consideration which can be earned currently from these securities loans justifies the attendant risks. Loans are subject to termination by the Funds or the borrower at any time, and, therefore, are not considered to be illiquid investments. JPMorgan Chase Bank serves as custodian for the securities lending program of the Funds. JP Morgan Chase Bank receives a custody fee based on the value of collateral received from borrowers.
The cash collateral received by the Funds at October 31, 2005, was pooled and invested in the following:
| | | | | | | | | | |
| Security Type | | Issuer | | Value | | Maturity Rate | | | Maturity Date |
Master Note — Floating | | CDC Financial Product Inc. | | $ | 7,250,000 | | 4.16 | % | | 11/01/05 |
Master Note — Floating | | Merrill Lynch Mortgage Capital | | | 1,000,000 | | 4.16 | % | | 11/01/05 |
Repurchase Agreements — U.S. Government Agency Mortgages | | Nomura Securities | | | 9,072,003 | | 4.05 | % | | 11/01/05 |
Information on the investment of cash collateral is shown in the Statement of Investments.
As of October 31, 2005, the following Funds had securities with the following value on loan:
| | | | | | |
| Fund | | Value of
Loaned Securities | | Value of
Collateral* |
Large Cap Value | | $ | 3,005,544 | | $ | 3,026,092 |
Small Cap | | | 9,543,770 | | | 9,567,168 |
Bond | | | 6,292,792 | | | 6,423,329 |
Government Bond | | | 8,354,010 | | | 8,522,310 |
Morley Enhanced Income | | | 2,030,016 | | | 2,072,073 |
| | * | Includes securities and cash collateral |
| (f) | | Distributions to Shareholders |
Net investment income, if any, is declared and paid quarterly for the Large Cap Value, Mid Cap Growth, and Small Cap (the “Equity Funds”) and is declared daily and paid monthly for all other Funds. For all Funds, distributable net realized capital gains, if any, are declared and distributed at least annually.
Dividends and distributions to shareholders are determined in accordance with federal income tax regulations, which may differ from GAAP. These “book/tax” differences are considered either permanent or temporary in nature. In accordance with American Institute of Certified Public Accountants Statement of Position 93-2, permanent differences (i.e., reclassification of market discounts, gain/loss, paydowns and distributions) are reclassified within the capital accounts based on their nature for federal income tax purposes; temporary differences do not require reclassification. These reclassifications have no effect upon the net asset value of the respective Funds. To the extent distributions exceed current and accumulated earnings and profits for federal income tax purposes, these excesses are reported as distributions of paid-in-capital.
It is the policy of each Fund to qualify or continue to qualify as a “regulated investment company” by complying with the provisions available to certain investment companies, as defined in applicable sections of the Internal Revenue Code, and to make distributions of net investment income and net realized capital gains sufficient to relieve the Fund from all, or substantially all, federal income taxes.
| (h) | | Allocation of Expenses, Income, and Gains and Losses |
Expenses directly attributable to a Fund are charged to that Fund. Expenses not directly attributable to a Fund are allocated proportionately among various or all Funds within the Trust. For the Equity Funds, the method for allocating income, fund level expenses, and realized and unrealized gains or losses is based on the fair value of shares outstanding relative to net assets. Under this method, each class of shares participates based on the total net asset value of that class’s shares in proportion to the total net assets of the Fund. Expenses specific to a class (such as rule 12b-1 and administrative services fees) are charged to that class.
Notes to Financial Statements (Continued)
October 31, 2005
| (i) | | Capital Share Transactions |
| | | | | | | | | | | | | | | | | | |
| | | Large Cap Value | | | Mid Cap Growth |
| | | Year Ended
October 31, 2005 | | | Year Ended
October 31, 2004 | | | Year Ended
October 31, 2005 | | | Year Ended
October 31, 2004 |
CAPITAL TRANSACTIONS: | | | | | | | | | | | | | | | | | | |
Class A Shares | | | | | | | | | | | | | | | | | | |
Proceeds from shares issued (a) | | $ | 11,891,199 | | | $ | 9,618,899 | | | $ | 478,348 | | | $ | 1,321,580 | | | |
Dividends reinvested | | | 279,932 | | | | 217,672 | | | | 60,128 | | | | 25,656 | | | |
Cost of shares redeemed | | | (11,718,871 | ) | | | (12,838,218 | ) | | | (461,655 | ) | | | (448,690 | ) | | |
| | |
|
|
| |
|
|
| |
|
|
| |
|
|
| | |
| | | | 452,260 | | | | (3,001,647 | ) | | | 76,821 | | | | 898,546 | | | |
| | |
|
|
| |
|
|
| |
|
|
| |
|
|
| | |
| | | | | |
Class B Shares | | | | | | | | | | | | | | | | | | |
Proceeds from shares issued (a) | | | 436,577 | | | | 265,624 | | | | 30,647 | | | | 132,573 | | | |
Dividends reinvested | | | 4,640 | | | | 2,413 | | | | 5,636 | | | | 2,266 | | | |
Cost of shares redeemed | | | (202,227 | ) | | | (142,322 | ) | | | (30,774 | ) | | | (2,010 | ) | | |
| | |
|
|
| |
|
|
| |
|
|
| |
|
|
| | |
| | | | 238,990 | | | | 125,715 | | | | 5,509 | | | | 132,829 | | | |
| | |
|
|
| |
|
|
| |
|
|
| |
|
|
| | |
| | | | | |
Class C Shares | | | | | | | | | | | | | | | | | | |
Proceeds from shares issued (a) | | | 4,247,596 | | | | 1,899,004 | | | | 86,157 | | | | 1,002,064 | | | |
Dividends reinvested | | | 6,284 | | | | 408 | | | | 3,584 | | | | 28 | | | |
Cost of shares redeemed | | | (281,859 | ) | | | (1,499,853 | ) | | | (106,638 | ) | | | (784,671 | ) | | |
| | |
|
|
| |
|
|
| |
|
|
| |
|
|
| | |
| | | | 3,972,021 | | | | 399,559 | | | | (16,897 | ) | | | 217,421 | | | |
| | |
|
|
| |
|
|
| |
|
|
| |
|
|
| | |
| | | | | |
Class R Shares | | | | | | | | | | | | | | | | | | |
Proceeds from shares issued (a) | | | 175 | | | | — | | | | 175 | | | | — | | | |
Dividends reinvested | | | 15 | | | | 8 | | | | 54 | | | | 28 | | | |
Cost of shares redeemed | | | (177 | ) | | | — | | | | (176 | ) | | | — | | | |
| | |
|
|
| |
|
|
| |
|
|
| |
|
|
| | |
| | | | 13 | | | | 8 | | | | 53 | | | | 28 | | | |
| | |
|
|
| |
|
|
| |
|
|
| |
|
|
| | |
| | | | | |
Institutional Class Shares | | | | | | | | | | | | | | | | | | |
Proceeds from shares issued (a) | | | — | | | | — | | | | 890,194 | | | | 98,617 | | | |
Dividends reinvested | | | — | | | | — | | | | 75,664 | | | | 36,735 | | | |
Cost of shares redeemed | | | — | | | | — | | | | (161,950 | ) | | | (7,792 | ) | | |
| | |
|
|
| |
|
|
| |
|
|
| |
|
|
| | |
| | | | — | | | | — | | | | 803,908 | | | | 127,560 | | | |
| | |
|
|
| |
|
|
| |
|
|
| |
|
|
| | |
Change in net assets from capital transactions | | $ | 4,663,284 | | | $ | (2,476,365 | ) | | $ | 869,394 | | | $ | 1,376,384 | | | |
| | |
|
|
| |
|
|
| |
|
|
| |
|
|
| | |
| (a) | Includes redemption fees, if any. |
| | | | | | | | | | | | | | |
| | | Large Cap Value | | | Mid Cap Growth |
| | | Year Ended
October 31, 2005 | | | Year Ended
October 31, 2004 | | | Year Ended
October 31, 2005 | | | Year Ended
October 31, 2004 |
SHARE TRANSACTIONS: | | | | | | | | | | | | | | |
Class A Shares | | | | | | | | | | | | | | |
Issued | | 930,948 | | | 849,959 | | | 31,775 | | | 95,473 | | | |
Reinvested | | 21,733 | | | 19,268 | | | 4,003 | | | 1,881 | | | |
Redeemed | | (912,386 | ) | | (1,136,552 | ) | | (30,916 | ) | | (32,039 | ) | | |
| | |
|
| |
|
| |
|
| |
|
| | |
| | | 40,295 | | | (267,325 | ) | | 4,862 | | | 65,315 | | | |
| | |
|
| |
|
| |
|
| |
|
| | |
| | | | | |
Class B Shares | | | | | | | | | | | | | | |
Issued | | 34,557 | | | 23,967 | | | 2,104 | | | 9,505 | | | |
Reinvested | | 364 | | | 217 | | | 378 | | | 166 | | | |
Redeemed | | (15,833 | ) | | (12,584 | ) | | (2,042 | ) | | (145 | ) | | |
| | |
|
| |
|
| |
|
| |
|
| | |
| | | 19,088 | | | 11,600 | | | 440 | | | 9,526 | | | |
| | |
|
| |
|
| |
|
| |
|
| | |
| | | | | |
Class C Shares | | | | | | | | | | | | | | |
Issued | | 336,380 | | | 174,622 | | | 5,796 | | | 72,398 | | | |
Reinvested | | 493 | | | 37 | | | 241 | | | 2 | | | |
Redeemed | | (22,351 | ) | | (134,727 | ) | | (6,891 | ) | | (56,594 | ) | | |
| | |
|
| |
|
| |
|
| |
|
| | |
| | | 314,522 | | | 39,932 | | | (854 | ) | | 15,806 | | | |
| | |
|
| |
|
| |
|
| |
|
| | |
| | | | | |
Class R Shares | | | | | | | | | | | | | | |
Issued | | 14 | | | — | | | 11 | | | — | | | |
Reinvested | | 1 | | | 1 | | | 4 | | | 2 | | | |
Redeemed | | (14 | ) | | — | | | (11 | ) | | — | | | |
| | |
|
| |
|
| |
|
| |
|
| | |
| | | 1 | | | 1 | | | 4 | | | 2 | | | |
| | |
|
| |
|
| |
|
| |
|
| | |
| | | | | |
Institutional Class Shares | | | | | | | | | | | | | | |
Issued | | — | | | — | | | 57,744 | | | 6,864 | | | |
Reinvested | | — | | | — | | | 5,011 | | | 2,686 | | | |
Redeemed | | — | | | — | | | (10,098 | ) | | (560 | ) | | |
| | |
|
| |
|
| |
|
| |
|
| | |
| | | — | | | — | | | 52,657 | | | 8,990 | | | |
| | |
|
| |
|
| |
|
| |
|
| | |
Total change in shares | | 373,906 | | | (215,792 | ) | | 57,109 | | | 99,639 | | | |
| | |
|
| |
|
| |
|
| |
|
| | |
Notes to Financial Statements (Continued)
October 31, 2005
| | | | | | | | | | |
| | | Small Cap |
| | | Year Ended
October 31, 2005 | | | Year Ended
October 31, 2004 |
CAPITAL TRANSACTIONS: | | | | | | | | | | |
Class A Shares | | | | | | | | | | |
Proceeds from shares issued (a) | | $ | 23,584,972 | | | $ | 16,035,203 | | | |
Dividends reinvested | | | 2,851,134 | | | | 260,691 | | | |
Cost of shares redeemed | | | (13,022,021 | ) | | | (17,255,793 | ) | | |
| | |
|
|
| |
|
|
| | |
| | | | 13,414,085 | | | | (959,899 | ) | | |
| | |
|
|
| |
|
|
| | |
| | | |
Class B Shares | | | | | | | | | | |
Proceeds from shares issued (a) | | | 786,210 | | | | 149,084 | | | |
Dividends reinvested | | | 192,009 | | | | 17,840 | | | |
Cost of shares redeemed | | | (429,030 | ) | | | (214,488 | ) | | |
| | |
|
|
| |
|
|
| | |
| | | | 549,189 | | | | (47,564 | ) | | |
| | |
|
|
| |
|
|
| | |
| | | |
Class C Shares | | | | | | | | | | |
Proceeds from shares issued (a) | | | 5,235,353 | | | | 98,779 | | | |
Dividends reinvested | | | 20,926 | | | | 1,102 | | | |
Cost of shares redeemed | | | (113,838 | ) | | | (21,720 | ) | | |
| | |
|
|
| |
|
|
| | |
| | | | 5,142,441 | | | | 78,161 | | | |
| | |
|
|
| |
|
|
| | |
| | | |
Class R Shares | | | | | | | | | | |
Proceeds from shares issued (a) | | | 134,193 | | | | 1,003 | (c) | | |
Dividends reinvested | | | 138 | | | | — | | | |
Cost of shares redeemed | | | (2,155 | ) | | | — | | | |
| | |
|
|
| |
|
|
| | |
| | | | 132,176 | | | | 1,003 | | | |
| | |
|
|
| |
|
|
| | |
| | | |
Institutional Service Class Shares | | | | | | | | | | |
Proceeds from shares issued (a) | | | 122,388 | | | | 31,388,164 | | | |
Dividends reinvested | | | 894 | | | | 282,807 | | | |
Cost of shares redeemed | | | (132,819 | ) | | | (50,921,441 | ) | | |
| | |
|
|
| |
|
|
| | |
| | | | (9,537 | ) | | | (19,250,470 | ) | | |
| | |
|
|
| |
|
|
| | |
| | | |
Institutional Class Shares | | | | | | | | | | |
Proceeds from shares issued (a) | | | 1,140,758 | | | | 130,222 | (b) | | |
Dividends reinvested | | | 18,314 | | | | — | | | |
Cost of shares redeemed | | | (246,906 | ) | | | (10,519 | )(b) | | |
| | |
|
|
| |
|
|
| | |
| | | | 912,166 | | | | 119,703 | | | |
| | |
|
|
| |
|
|
| | |
Change in net assets from capital transactions | | $ | 20,140,520 | | | $ | (20,059,066 | ) | | |
| | |
|
|
| |
|
|
| | |
| (a) | Includes redemption fees, if any. |
| (b) | For the period from June 29, 2004 (commencement of operations) through October 31, 2004. |
| (c) | For the period from December 30, 2003 (commencement of operations) through October 31, 2004. |
| | | | | | | | |
| | | Small Cap |
| | | Year Ended
October 31, 2005 | | | Year Ended
October 31, 2004 |
SHARE TRANSACTIONS: | | | | | | | | |
Class A Shares | | | | | | | | |
Issued | | 1,345,613 | | | 1,087,993 | | | |
Reinvested | | 179,317 | | | 18,346 | | | |
Redeemed | | (783,370 | ) | | (1,178,894 | ) | | |
| | |
|
| |
|
| | |
| | | 741,560 | | | (72,555 | ) | | |
| | |
|
| |
|
| | |
| | | |
Class B Shares | | | | | | | | |
Issued | | 46,521 | | | 10,169 | | | |
Reinvested | | 12,583 | | | 1,295 | | | |
Redeemed | | (26,586 | ) | | (14,985 | ) | | |
| | |
|
| |
|
| | |
| | | 32,518 | | | (3,521 | ) | | |
| | |
|
| |
|
| | |
| | | |
Class C Shares | | | | | | | | |
Issued | | 306,215 | | | 6,689 | | | |
Reinvested | | 1,369 | | | 80 | | | |
Redeemed | | (6,697 | ) | | (1,540 | ) | | |
| | |
|
| |
|
| | |
| | | 300,887 | | | 5,229 | | | |
| | |
|
| |
|
| | |
| | | |
Class R Shares | | | | | | | | |
Issued | | 8,662 | | | 71 | (c) | | |
Reinvested | | 9 | | | — | | | |
Redeemed | | (123 | ) | | — | | | |
| | |
|
| |
|
| | |
| | | 8,548 | | | 71 | | | |
| | |
|
| |
|
| | |
| | | |
Institutional Service Class Shares | | | | | | | | |
Issued | | 7,182 | | | 2,083,984 | | | |
Reinvested | | 56 | | | 19,749 | | | |
Redeemed | | (7,699 | ) | | (3,451,255 | ) | | |
| | |
|
| |
|
| | |
| | | (461 | ) | | (1,347,522 | ) | | |
| | |
|
| |
|
| | |
| | | |
Institutional Class Shares | | | | | | | | |
Issued | | 65,027 | | | 8,320 | (b) | | |
Reinvested | | 1,138 | | | — | | | |
Redeemed | | (13,453 | ) | | (686 | )(b) | | |
| | |
|
| |
|
| | |
| | | 52,712 | | | 7,634 | | | |
| | |
|
| |
|
| | |
Total change in shares | | 1,135,764 | | | (1,410,664 | ) | | |
| | |
|
| |
|
| | |
| (a) | Includes redemption fees, if any. |
| (b) | For the period from June 29, 2004 (commencement of operations) through October 31, 2004. |
| (c) | For the period from December 30, 2003 (commencement of operations) through October 31, 2004. |
Notes to Financial Statements (Continued)
October 31, 2005
| | | | | | | | | | | | | | | | | | |
| | | Bond | | | Government Bond |
| | | Year Ended
October 31, 2005 | | | Year Ended
October 31, 2004 | | | Year Ended
October 31, 2005 | | | Year Ended
October 31, 2004 |
CAPITAL TRANSACTIONS: | | | | | | | | | | | | | | | | | | |
Class A Shares | | | | | | | | | | | | | | | | | | |
Proceeds from shares issued (a) | | $ | 4,055,723 | | | $ | 4,395,849 | | | $ | 19,047,496 | | | $ | 22,247,288 | | | |
Dividends reinvested | | | 406,101 | | | | 388,820 | | | | 1,997,849 | | | | 3,206,971 | | | |
Cost of shares redeemed | | | (4,685,722 | ) | | | (4,324,080 | ) | | | (21,290,605 | ) | | | (25,255,940 | ) | | |
| | |
|
|
| |
|
|
| |
|
|
| |
|
|
| | |
| | | | (223,898 | ) | | | 460,589 | | | | (245,260 | ) | | | 198,319 | | | |
| | |
|
|
| |
|
|
| |
|
|
| |
|
|
| | |
| | | | | |
Class B Shares | | | | | | | | | | | | | | | | | | |
Proceeds from shares issued (a) | | | 126,569 | | | | 82,988 | | | | 96,097 | | | | 379,377 | | | |
Dividends reinvested | | | 2,952 | | | | 984 | | | | 4,016 | | | | 2,659 | | | |
Cost of shares redeemed | | | (4,599 | ) | | | (7,476 | ) | | | (114,337 | ) | | | (213,355 | ) | | |
| | |
|
|
| |
|
|
| |
|
|
| |
|
|
| | |
| | | | 124,922 | | | | 76,496 | | | | (14,224 | ) | | | 168,681 | | | |
| | |
|
|
| |
|
|
| |
|
|
| |
|
|
| | |
| | | | | |
Class C Shares | | | | | | | | | | | | | | | | | | |
Proceeds from shares issued (a) | | | 713,393 | | | | 178,993 | | | | 256,951 | | | | 382,446 | | | |
Dividends reinvested | | | 1,578 | | | | 274 | | | | 3,301 | | | | 1,002 | | | |
Cost of shares redeemed | | | (186,808 | ) | | | (8,954 | ) | | | (219,601 | ) | | | (150,644 | ) | | |
| | |
|
|
| |
|
|
| |
|
|
| |
|
|
| | |
| | | | 528,163 | | | | 170,313 | | | | 40,651 | | | | 232,804 | | | |
| | |
|
|
| |
|
|
| |
|
|
| |
|
|
| | |
| | | | | |
Class D Shares | | | | | | | | | | | | | | | | | | |
Proceeds from shares issued (a) | | | 7,898,707 | | | | 8,622,722 | | | | 14,862,951 | | | | 19,942,178 | | | |
Dividends reinvested | | | 4,505,994 | | | | 4,990,110 | | | | 4,001,046 | | | | 7,911,363 | | | |
Cost of shares redeemed | | | (23,549,676 | ) | | | (29,578,633 | ) | | | (32,058,741 | ) | | | (57,516,442 | ) | | |
| | |
|
|
| |
|
|
| |
|
|
| |
|
|
| | |
| | | | (11,144,975 | ) | | | (15,965,801 | ) | | | (13,194,744 | ) | | | (29,662,901 | ) | | |
| | |
|
|
| |
|
|
| |
|
|
| |
|
|
| | |
| | | | | |
Class R Shares | | | | | | | | | | | | | | | | | | |
Proceeds from shares issued (a) | | | 175 | | | | — | | | | 175 | | | | — | | | |
Dividends reinvested | | | 46 | | | | 40 | | | | 38 | | | | 56 | | | |
Cost of shares redeemed | | | (175 | ) | | | — | | | | (175 | ) | | | — | | | |
| | |
|
|
| |
|
|
| |
|
|
| |
|
|
| | |
| | | | 46 | | | | 40 | | | | 38 | | | | 56 | | | |
| | |
|
|
| |
|
|
| |
|
|
| |
|
|
| | |
| | | | | |
Class X Shares | | | | | | | | | | | | | | | | | | |
Proceeds from shares issued (a) | | | 66,620 | | | | 122,993 | | | | 67,684 | | | | 107,014 | | | |
Dividends reinvested | | | 113,057 | | | | 120,618 | | | | 117,990 | | | | 270,999 | | | |
Cost of shares redeemed | | | (747,797 | ) | | | (491,500 | ) | | | (1,274,785 | ) | | | (1,370,259 | ) | | |
| | |
|
|
| |
|
|
| |
|
|
| |
|
|
| | |
| | | | (568,120 | ) | | | (247,889 | ) | | | (1,089,111 | ) | | | (992,246 | ) | | |
| | |
|
|
| |
|
|
| |
|
|
| |
|
|
| | |
| | | | | |
Class Y Shares | | | | | | | | | | | | | | | | | | |
Proceeds from shares issued (a) | | | 2,118 | | | | 9,565 | | | | 10,389 | | | | 38,141 | | | |
Dividends reinvested | | | 6,965 | | | | 7,632 | | | | 17,984 | | | | 38,511 | | | |
Cost of shares redeemed | | | (43,748 | ) | | | (37,097 | ) | | | (116,255 | ) | | | (983,441 | ) | | |
| | |
|
|
| |
|
|
| |
|
|
| |
|
|
| | |
| | | | (34,665 | ) | | | (19,900 | ) | | | (87,882 | ) | | | (906,789 | ) | | |
| | |
|
|
| |
|
|
| |
|
|
| |
|
|
| | |
| | | | | |
Intitutional Class Shares | | | | | | | | | | | | | | | | | | |
Proceeds from shares issued (a) | | | 4,489,496 | | | | 274,489 | (b) | | | 1,649,975 | | | | 157,722 | (b) | | |
Dividends reinvested | | | 65,905 | | | | 3,099 | (b) | | | 25,339 | | | | 1,495 | (b) | | |
Cost of shares redeemed | | | (111,654 | ) | | | (24,937 | )(b) | | | (1,808,780 | ) | | | (13,983 | )(b) | | |
| | |
|
|
| |
|
|
| |
|
|
| |
|
|
| | |
| | | | 4,443,747 | | | | 252,651 | | | | (133,466 | ) | | | 145,234 | | | |
| | |
|
|
| |
|
|
| |
|
|
| |
|
|
| | |
Change in net assets from capital transactions | | $ | (6,874,780 | ) | | $ | (15,273,501 | ) | | $ | (14,723,998 | ) | | $ | (30,816,842 | ) | | |
| | |
|
|
| |
|
|
| |
|
|
| |
|
|
| | |
| | | | | | | | | | | | | | |
| | | Bond | | | Government Bond |
| | | Year Ended
October 31, 2005 | | | Year Ended
October 31, 2004 | | | Year Ended
October 31, 2005 | | | Year Ended
October 31, 2004 |
SHARE TRANSACTIONS: | | | | | | | | | | | | | | |
Class A Shares | | | | | | | | | | | | | | |
Issued | | 418,178 | | | 452,327 | | | 1,848,683 | | | 2,145,208 | | | |
Reinvested | | 41,912 | | | 40,156 | | | 193,764 | | | 309,760 | | | |
Redeemed | | (483,142 | ) | | (445,874 | ) | | (2,066,139 | ) | | (2,435,334 | ) | | |
| | |
|
| |
|
| |
|
| |
|
| | |
| | | (23,052 | ) | | 46,609 | | | (23,692 | ) | | 19,634 | | | |
| | |
|
| |
|
| |
|
| |
|
| | |
| | | | | |
Class B Shares | | | | | | | | | | | | | | |
Issued | | 13,085 | | | 8,618 | | | 9,335 | | | 36,733 | | | |
Reinvested | | 305 | | | 102 | | | 390 | | | 259 | | | |
Redeemed | | (472 | ) | | (766 | ) | | (11,091 | ) | | (20,725 | ) | | |
| | |
|
| |
|
| |
|
| |
|
| | |
| | | 12,918 | | | 7,954 | | | (1,366 | ) | | 16,267 | | | |
| | |
|
| |
|
| |
|
| |
|
| | |
| | | | | |
Class C Shares | | | | | | | | | | | | | | |
Issued | | 73,390 | | | 18,625 | | | 25,046 | | | 36,914 | | | |
Reinvested | | 163 | | | 28 | | | 320 | | | 97 | | | |
Redeemed | | (19,292 | ) | | (919 | ) | | (21,375 | ) | | (14,581 | ) | | |
| | |
|
| |
|
| |
|
| |
|
| | |
| | | 54,261 | | | 17,734 | | | 3,991 | | | 22,430 | | | |
| | |
|
| |
|
| |
|
| |
|
| | |
| | | | | |
Class D Shares | | | | | | | | | | | | | | |
Issued | | 812,463 | | | 886,254 | | | 1,441,742 | | | 1,932,331 | | | |
Reinvested | | 464,200 | | | 514,563 | | | 387,899 | | | 763,040 | | | |
Redeemed | | (2,427,717 | ) | | (3,044,879 | ) | | (3,106,476 | ) | | (5,553,157 | ) | | |
| | |
|
| |
|
| |
|
| |
|
| | |
| | | (1,151,054 | ) | | (1,644,062 | ) | | (1,276,835 | ) | | (2,857,786 | ) | | |
| | |
|
| |
|
| |
|
| |
|
| | |
| | | | | |
Class R Shares | | | | | | | | | | | | | | |
Issued | | 18 | | | — | | | 17 | | | — | | | |
Reinvested | | 5 | | | 4 | | | 4 | | | 5 | | | |
Redeemed | | (18 | ) | | — | | | (17 | ) | | — | | | |
| | |
|
| |
|
| |
|
| |
|
| | |
| | | 5 | | | 4 | | | 4 | | | 5 | | | |
| | |
|
| |
|
| |
|
| |
|
| | |
| | | | | |
Class X Shares | | | | | | | | | | | | | | |
Issued | | 6,873 | | | 12,682 | | | 6,568 | | | 10,308 | | | |
Reinvested | | 11,661 | | | 12,455 | | | 11,452 | | | 26,189 | | | |
Redeemed | | (77,106 | ) | | (50,684 | ) | | (123,865 | ) | | (133,004 | ) | | |
| | |
|
| |
|
| |
|
| |
|
| | |
| | | (58,572 | ) | | (25,547 | ) | | (105,845 | ) | | (96,507 | ) | | |
| | |
|
| |
|
| |
|
| |
|
| | |
| | | | | |
Class Y Shares | | | | | | | | | | | | | | |
Issued | | 218 | | | 977 | | | 1,010 | | | 3,651 | | | |
Reinvested | | 718 | | | 787 | | | 1,746 | | | 3,722 | | | |
Redeemed | | (4,512 | ) | | (3,813 | ) | | (11,299 | ) | | (94,727 | ) | | |
| | |
|
| |
|
| |
|
| |
|
| | |
| | | (3,576 | ) | | (2,049 | ) | | (8,543 | ) | | (87,354 | ) | | |
| | |
|
| |
|
| |
|
| |
|
| | |
| | | | | |
Intitutional Class Shares | | | | | | | | | | | | | | |
Issued | | 464,108 | | | 28,858 | (b) | | 159,833 | | | 15,585 | (b) | | |
Reinvested | | 6,813 | | | 321 | (b) | | 2,453 | | | 145 | (b) | | |
Redeemed | | (11,518 | ) | | (2,560 | )(b) | | (176,569 | ) | | (1,349 | )(b) | | |
| | |
|
| |
|
| |
|
| |
|
| | |
| | | 459,403 | | | 26,619 | | | (14,283 | ) | | 14,381 | | | |
| | |
|
| |
|
| |
|
| |
|
| | |
Total change in shares | | (709,667 | ) | | (1,572,738 | ) | | (1,426,569 | ) | | (2,968,930 | ) | | |
| | |
|
| |
|
| |
|
| |
|
| | |
| (a) | Includes redemption fees, if any. |
| (b) | For the period from June 30, 2004 (commencement of operations) through October 31, 2004. |
Notes to Financial Statements (Continued)
October 31, 2005
| | | | | | | | | | | | | | | | | | |
| | | Morley Enhanced Income | | | Short Duration Bond |
| | | Year Ended
October 31, 2005 | | | Year Ended
October 31, 2004 | | | Year Ended
October 31, 2005 | | | Year Ended
October 31, 2004 |
CAPITAL TRANSACTIONS: | | | | | | | | | | | | | | | | | | |
Class A Shares | | | | | | | | | | | | | | | | | | |
Proceeds from shares issued (a) | | $ | 874,861 | | | $ | 1,625,575 | | | $ | 584,707 | | | $ | 1,930,508 | | | |
Dividends reinvested | | | 25,597 | | | | 26,520 | | | | 18,258 | | | | 12,775 | | | |
Cost of shares redeemed | | | (1,222,359 | ) | | | (2,456,275 | ) | | | (1,156,254 | ) | | | (400,935 | ) | | |
| | |
|
|
| |
|
|
| |
|
|
| |
|
|
| | |
| | | | (321,901 | ) | | | (804,180 | ) | | | (553,289 | ) | | | 1,542,348 | | | |
| | |
|
|
| |
|
|
| |
|
|
| |
|
|
| | |
| | | | | |
Class C Shares | | | | | | | | | | | | | | | | | | |
Proceeds from shares issued (a) | | | — | | | | — | | | | 1,000 | (b) | | | — | | | |
Dividends reinvested | | | — | | | | — | | | | 18 | (b) | | | — | | | |
Cost of shares redeemed | | | — | | | | — | | | | — | | | | — | | | |
| | |
|
|
| |
|
|
| |
|
|
| |
|
|
| | |
| | | | — | | | | — | | | | 1,018 | | | | — | | | |
| | |
|
|
| |
|
|
| |
|
|
| |
|
|
| | |
| | | | | |
Class R Shares | | | | | | | | | | | | | | | | | | |
Proceeds from shares issued (a) | | | 175 | | | | — | | | | — | | | | — | | | |
Dividends reinvested | | | 28 | | | | 16 | | | | — | | | | — | | | |
Cost of shares redeemed | | | (175 | ) | | | — | | | | — | | | | — | | | |
| | |
|
|
| |
|
|
| |
|
|
| |
|
|
| | |
| | | | 28 | | | | 16 | | | | — | | | | — | | | |
| | |
|
|
| |
|
|
| |
|
|
| |
|
|
| | |
Institutional Class Shares | | | | | | | | | | | | | | | | | | |
Proceeds from shares issued (a) | | | 167,884,563 | | | | 151,261,349 | | | | 3,811,812 | | | | 92,614,497 | | | |
Dividends reinvested | | | 11,483,917 | | | | 4,805,301 | | | | 505,967 | | | | 2,020,022 | | | |
Cost of shares redeemed | | | (23,347,403 | ) | | | (9,332,795 | ) | | | (70,241,568 | ) | | | (69,085,810 | ) | | |
| | |
|
|
| |
|
|
| |
|
|
| |
|
|
| | |
| | | | 156,021,077 | | | | 146,733,855 | | | | (65,923,789 | ) | | | 25,548,709 | | | |
| | |
|
|
| |
|
|
| |
|
|
| |
|
|
| | |
| | | | | |
Institutional Service Class Shares | | | | | | | | | | | | | | | | | | |
Proceeds from shares issued (a) | | | 1,621,939 | | | | 2,055,063 | | | | — | | | | — | | | |
Dividends reinvested | | | 188,032 | | | | 160,545 | | | | — | | | | — | | | |
Cost of shares redeemed | | | (3,566,138 | ) | | | (3,909,881 | ) | | | — | | | | — | | | |
| | |
|
|
| |
|
|
| |
|
|
| |
|
|
| | |
| | | | (1,756,167 | ) | | | (1,694,273 | ) | | | — | | | | — | | | |
| | |
|
|
| |
|
|
| |
|
|
| |
|
|
| | |
| | | | | |
IRA Class Shares | | | | | | | | | | | | | | | | | | |
Proceeds from shares issued (a) | | | — | | | | — | | | | 2,003,658 | | | | 412,997,999 | | | |
Dividends reinvested | | | — | | | | — | | | | 2,471,501 | | | | 10,308,892 | | | |
Cost of shares redeemed | | | — | | | | — | | | | (327,936,551 | ) | | | (467,952,756 | ) | | |
| | |
|
|
| |
|
|
| |
|
|
| |
|
|
| | |
| | | | — | | | | — | | | | (323,461,392 | ) | | | (44,645,865 | ) | | |
| | |
|
|
| |
|
|
| |
|
|
| |
|
|
| | |
| | | | | |
Service Class Shares | | | | | | | | | | | | | | | | | | |
Proceeds from shares issued (a) | | | — | | | | — | | | | 27,160,906 | | | | 234,707,875 | | | |
Dividends reinvested | | | — | | | | — | | | | 3,053,504 | | | | 5,513,973 | | | |
Cost of shares redeemed | | | — | | | | — | | | | (211,254,291 | ) | | | (172,752,999 | ) | | |
| | |
|
|
| |
|
|
| |
|
|
| |
|
|
| | |
| | | | — | | | | — | | | | (181,039,881 | ) | | | 67,468,849 | | | |
| | |
|
|
| |
|
|
| |
|
|
| |
|
|
| | |
Change in net assets from capital transactions | | $ | 153,943,037 | | | $ | 144,235,418 | | | $ | (570,977,333 | ) | | $ | 49,914,041 | | | |
| | |
|
|
| |
|
|
| |
|
|
| |
|
|
| | |
| (a) | Includes redemption fees, if any. |
| (b) | For the period from February 28, 2005 (commencement of operations) through October 31, 2005. |
| | | | | | | | | | | | | | |
| | | Morley Enhanced Income | | | Short Duration Bond |
| | | Year Ended
October 31, 2005 | | | Year Ended
October 31, 2004 | | | Year Ended
October 31, 2005 | | | Year Ended
October 31, 2004 |
SHARE TRANSACTIONS: | | | | | | | | | | | | | | |
Class A Shares | | | | | | | | | | | | | | |
Issued | | 95,994 | | | 176,384 | | | 59,186 | | | 193,030 | | | |
Reinvested | | 2,807 | | | 2,876 | | | 1,842 | | | 1,278 | | | |
Redeemed | | (133,975 | ) | | (266,872 | ) | | (116,000 | ) | | (40,093 | ) | | |
| | |
|
| |
|
| |
|
| |
|
| | |
| | | (35,174 | ) | | (87,612 | ) | | (54,972 | ) | | 154,215 | | | |
| | |
|
| |
|
| |
|
| |
|
| | |
| | | | | |
Class C Shares | | | | | | | | | | | | | | |
Issued | | — | | | — | | | 101 | (b) | | — | | | |
Reinvested | | — | | | — | | | 2 | (b) | | — | | | |
Redeemed | | — | | | — | | | — | | | — | | | |
| | |
|
| |
|
| |
|
| |
|
| | |
| | | — | | | — | | | 103 | | | — | | | |
| | |
|
| |
|
| |
|
| |
|
| | |
| | | | | |
Class R Shares | | | | | | | | | | | | | | |
Issued | | 19 | | | — | | | — | | | — | | | |
Reinvested | | 3 | | | 2 | | | — | | | — | | | |
Redeemed | | (19 | ) | | — | | | — | | | — | | | |
| | |
|
| |
|
| |
|
| |
|
| | |
| | | 3 | | | 2 | | | — | | | — | | | |
| | |
|
| |
|
| |
|
| |
|
| | |
| | | | | |
Institutional Class Shares | | | | | | | | | | | | | | |
Issued | | 18,412,038 | | | 16,406,509 | | | 383,565 | | | 9,256,793 | | | |
Reinvested | | 1,259,899 | | | 521,703 | | | 50,884 | | | 201,940 | | | |
Redeemed | | (2,561,322 | ) | | (1,013,943 | ) | | (7,047,742 | ) | | (6,908,581 | ) | | |
| | |
|
| |
|
| |
|
| |
|
| | |
| | | 17,110,615 | | | 15,914,269 | | | (6,613,293 | ) | | 2,550,152 | | | |
| | |
|
| |
|
| |
|
| |
|
| | |
| | | | | |
Institutional Service Class Shares | | | | | | | | | | | | | | |
Issued | | 177,656 | | | 222,791 | | | — | | | — | | | |
Reinvested | | 20,613 | | | 17,400 | | | — | | | — | | | |
Redeemed | | (390,867 | ) | | (423,504 | ) | | — | | | — | | | |
| | |
|
| |
|
| |
|
| |
|
| | |
| | | (192,598 | ) | | (183,313 | ) | | — | | | — | | | |
| | |
|
| |
|
| |
|
| |
|
| | |
| | | | | |
IRA Class Shares | | | | | | | | | | | | | | |
Issued | | — | | | — | | | 200,710 | | | 41,270,841 | | | |
Reinvested | | — | | | — | | | 248,790 | | | 1,030,950 | | | |
Redeemed | | — | | | — | | | (32,883,434 | ) | | (46,794,992 | ) | | |
| | |
|
| |
|
| |
|
| |
|
| | |
| | | — | | | — | | | (32,433,934 | ) | | (4,493,201 | ) | | |
| | |
|
| |
|
| |
|
| |
|
| | |
| | | | | |
Service Class Shares | | | | | | | | | | | | | | |
Issued | | — | | | — | | | 2,735,458 | | | 23,456,199 | | | |
Reinvested | | — | | | — | | | 307,860 | | | 551,397 | | | |
Redeemed | | — | | | — | | | (21,207,445 | ) | | (17,275,300 | ) | | |
| | |
|
| |
|
| |
|
| |
|
| | |
| | | — | | | — | | | (18,164,127 | ) | | 6,732,296 | | | |
| | |
|
| |
|
| |
|
| |
|
| | |
Total change in shares | | 16,882,846 | | | 15,643,346 | | | (57,266,223 | ) | | 4,943,462 | | | |
| | |
|
| |
|
| |
|
| |
|
| | |
| (a) | Includes redemption fees, if any. |
| (b) | For the period from February 28, 2005 (commencement of operations) through October 31, 2005. |
Notes to Financial Statements (Continued)
October 31, 2005
| | | | | | | | | | |
| | | Tax-Free Income |
| | | Year Ended
October 31, 2005 | | | Year Ended
October 31, 2004 |
CAPITAL TRANSACTIONS: | | | | | | | | | | |
Class A Shares | | | | | | | | | | |
Proceeds from shares issued (a) | | $ | 2,165,534 | | | $ | 3,319,010 | | | |
Dividends reinvested | | | 256,141 | | | | 249,559 | | | |
Cost of shares redeemed | | | (1,796,086 | ) | | | (1,711,258 | ) | | |
| | |
|
|
| |
|
|
| | |
| | | | 625,589 | | | | 1,857,311 | | | |
| | |
|
|
| |
|
|
| | |
| | | |
Class B Shares | | | | | | | | | | |
Proceeds from shares issued (a) | | | 360,216 | | | | 382,798 | | | |
Dividends reinvested | | | 12,588 | | | | 4,477 | | | |
Cost of shares redeemed | | | (132,372 | ) | | | (64,584 | ) | | |
| | |
|
|
| |
|
|
| | |
| | | | 240,432 | | | | 322,691 | | | |
| | |
|
|
| |
|
|
| | |
| | | |
Class C Shares | | | | | | | | | | |
Proceeds from shares issued (a) | | | 359,548 | | | | 1,001,038 | | | |
Dividends reinvested | | | 11,259 | | | | 1,899 | | | |
Cost of shares redeemed | | | (123,105 | ) | | | (24,538 | ) | | |
| | |
|
|
| |
|
|
| | |
| | | | 247,702 | | | | 978,399 | | | |
| | |
|
|
| |
|
|
| | |
| | | |
Class D Shares | | | | | | | | | | |
Proceeds from shares issued (a) | | | 5,686,108 | | | | 4,285,007 | | | |
Dividends reinvested | | | 5,464,894 | | | | 5,883,981 | | | |
Cost of shares redeemed | | | (20,573,357 | ) | | | (23,473,368 | ) | | |
| | |
|
|
| |
|
|
| | |
| | | | (9,422,355 | ) | | | (13,304,380 | ) | | |
| | |
|
|
| |
|
|
| | |
| | | |
Class X Shares | | | | | | | | | | |
Proceeds from shares issued (a) | | | 63,939 | | | | 188,611 | | | |
Dividends reinvested | | | 141,455 | | | | 169,798 | | | |
Cost of shares redeemed | | | (1,555,958 | ) | | | (984,657 | ) | | |
| | |
|
|
| |
|
|
| | |
| | | | (1,350,564 | ) | | | (626,248 | ) | | |
| | |
|
|
| |
|
|
| | |
| | | |
Class Y Shares | | | | | | | | | | |
Proceeds from shares issued (a) | | | 2 | | | | 117,769 | | | |
Dividends reinvested | | | 13,583 | | | | 17,040 | | | |
Cost of shares redeemed | | | (271,206 | ) | | | (303,897 | ) | | |
| | |
|
|
| |
|
|
| | |
| | | | (257,621 | ) | | | (169,088 | ) | | |
| | |
|
|
| |
|
|
| | |
Change in net assets from capital transactions | | $ | (9,916,817 | ) | | $ | (10,941,315 | ) | | |
| | |
|
|
| |
|
|
| | |
| (a) | Includes redemption fees, if any. |
| | | | | | | | |
| | | Tax-Free Income |
| | | Year Ended
October 31, 2005 | | | Year Ended
October 31, 2004 |
SHARE TRANSACTIONS: | | | | | | | | |
Class A Shares | | | | | | | | |
Issued | | 204,027 | | | 315,901 | | | |
Reinvested | | 24,122 | | | 23,670 | | | |
Redeemed | | (169,080 | ) | | (162,530 | ) | | |
| | |
|
| |
|
| | |
| | | 59,069 | | | 177,041 | | | |
| | |
|
| |
|
| | |
| | | |
Class B Shares | | | | | | | | |
Issued | | 33,977 | | | 36,654 | | | |
Reinvested | | 1,186 | | | 426 | | | |
Redeemed | | (12,438 | ) | | (6,270 | ) | | |
| | |
|
| |
|
| | |
| | | 22,725 | | | 30,810 | | | |
| | |
|
| |
|
| | |
| | | |
Class C Shares | | | | | | | | |
Issued | | 33,838 | | | 94,479 | | | |
Reinvested | | 1,063 | | | 181 | | | |
Redeemed | | (11,599 | ) | | (2,335 | ) | | |
| | |
|
| |
|
| | |
| | | 23,302 | | | 92,325 | | | |
| | |
|
| |
|
| | |
Class D Shares | | | | | | | | |
Issued | | 535,982 | | | 406,464 | | | |
Reinvested | | 514,654 | | | 557,872 | | | |
Redeemed | | (1,935,661 | ) | | (2,228,266 | ) | | |
| | |
|
| |
|
| | |
| | | (885,025 | ) | | (1,263,930 | ) | | |
| | |
|
| |
|
| | |
| | | |
Class X Shares | | | | | | | | |
Issued | | 6,023 | | | 17,828 | | | |
Reinvested | | 13,321 | | | 16,103 | | | |
Redeemed | | (146,276 | ) | | (93,604 | ) | | |
| | |
|
| |
|
| | |
| | | (126,932 | ) | | (59,673 | ) | | |
| | |
|
| |
|
| | |
| | | |
Class Y Shares | | | | | | | | |
Issued | | — | (b) | | 11,117 | | | |
Reinvested | | 1,281 | | | 1,619 | | | |
Redeemed | | (25,430 | ) | | (28,679 | ) | | |
| | |
|
| |
|
| | |
| | | (24,149 | ) | | (15,943 | ) | | |
| | |
|
| |
|
| | |
Total change in shares | | (931,010 | ) | | (1,039,370 | ) | | |
| | |
|
| |
|
| | |
| (a) | Includes redemption fees, if any. |
Notes to Financial Statements (Continued)
October 31, 2005
3. Transactions with Affiliates
Under the terms of the Trust’s Investment Advisory Agreements, Gartmore Mutual Fund Capital Trust (“GMF”) or Gartmore Morley Capital Management, Inc. (“GMCM”) manages the investment of the assets and supervises the daily business affairs of their respective Funds (as shown in the table below). GMF is a wholly-owned subsidiary of Gartmore Global Investments, Inc. (“GGI”), a holding company. GGI is a majority-owned subsidiary of Gartmore Global Asset Management Trust (“GGAMT”). GGAMT is a wholly-owned subsidiary of Nationwide Corporation. All of the common stock of Nationwide Corporation is held by Nationwide Mutual Insurance Company (95.2%) and Nationwide Mutual Fire Insurance Company (4.8%), each of which is a mutual company owned by its policyholders. GMCM is a wholly-owned subsidiary of Gartmore Morley Financial Services, Inc., an indirect subsidiary of GGI. With respect to the Large Cap Value Fund, GMF provides investment management evaluation services in initially selecting and monitoring on an ongoing basis, the performance of the subadvisers for such Fund. NorthPointe Capital, LLC (“NorthPointe”), an indirect, majority owned subsidiary of GGI, currently serves as the subadviser for the Large Cap Value Fund and as such, manages the Fund’s investments and has the responsibility for making all investment decisions for the Fund. The adviser and subadviser, if applicable, for each Fund is as follows:
| | | | |
| Fund | | Adviser | | Subadviser |
Large Cap Value | | GMF | | NorthPointe Capital, LLC(a) |
Mid Cap Growth | | GMF | | n/a |
Small Cap | | GMF | | n/a |
Bond | | GMF | | n/a |
Government Bond | | GMF | | n/a |
Morley Enhanced Income | | GMCM | | n/a |
Short Duration Bond | | GMCM | | n/a |
Tax-Free Income | | GMF | | n/a |
Under the terms of the Investment Advisory Agreements, each Fund pays GMF or GMCM, as applicable, an investment advisory fee based on that Fund’s average daily net assets. From these fees, pursuant to the subadvisory agreement, GMF pays fees to NorthPointe. Additional information regarding the investment advisory fees and subadvisory fees for GMF, GMCM and NorthPointe is as follows for the year ended October 31, 2005:
| | | | | | | | |
| Fund | | Fee Schedule | | Total
Fees | | Fees
Retained | | Paid to
Subadviser |
Large Cap Value | | Up to $100 million | | 0.75% | | 0.40% | | 0.35% |
| | | On $100 million and more | | 0.70% | | 0.40% | | 0.30% |
Mid Cap Growth | | Up to $250 million | | 0.75% | | 0.75% | | — |
| | | $250 million up to $1 billion | | 0.725% | | 0.725% | | — |
| | | $1 billion up to $2 billion | | 0.70% | | 0.70% | | — |
| | | $2 billion up to $5 billion | | 0.675% | | 0.675% | | — |
| | | On $5 billion and more | | 0.65% | | 0.65% | | — |
Small Cap | | Up to $100 million | | 0.95% | | 0.95% | | — |
| | | On $100 million and more | | 0.80% | | 0.80% | | — |
Morley Enhanced Income | | Up to $500 million | | 0.35% | | 0.35% | | — |
| | | $500 million up to $1 billion | | 0.34% | | 0.34% | | — |
| | | $1 billion up to $3 billion | | 0.325% | | 0.325% | | — |
| | | $3 billion up to $5 billion | | 0.30% | | 0.30% | | — |
| | | $5 billion up to $10 billion | | 0.285% | | 0.285% | | — |
| | | On $10 billion and more | | 0.275% | | 0.275% | | — |
| | | | | | | | |
| Fund | | Fee Schedule | | Total
Fees | | Fees
Retained | | Paid to
Subadviser |
| Short Duration Bond (a) | | Up to $500 million | | 0.35% | | 0.25% | | — |
| | | $500 million up to $1 billion | | 0.34% | | 0.24% | | — |
| | | $1 billion up to $3 billion | | 0.325% | | 0.225% | | — |
| | | $3 billion up to $5 billion | | 0.30% | | 0.20% | | — |
| | | $5 billion up to $10 billion | | 0.285% | | 0.185% | | — |
| | | $10 billion and more | | 0.275% | | 0.175% | | — |
| Bond, Government Bond and Tax-Free Income | | Up to $250 million | | 0.50% | | 0.50% | | — |
| | | On the next $750 million | | 0.475% | | 0.475% | | — |
| | | On the next $1 billion | | 0.45% | | 0.45% | | — |
| | | On the next $3 billion | | 0.425% | | 0.425% | | — |
| | | On $5 billion and more | | 0.40% | | 0.40% | | — |
| (a) | GMCM has agreed to voluntarily waive 0.10% of the advisory fee until further written notice to the shareholders. |
GMF or GMCM, where applicable, and the Funds have entered into written contracts (“Expense Limitation Agreements”) that limit operating expenses (excluding any taxes, interest, brokerage fees, extraordinary expenses, short sale dividend expenses, Rule 12b-1 fees, and administrative services fees) from exceeding the amounts listed in the table below until February 28, 2006.
| | | | | | | | | | | | | | | | | | | | | | | | |
| | | Expense Caps | | | | | | | | | | | | | |
| Fund | | Class A
Shares | | | Class B
Shares | | | Class C
Shares | | | Class R
Shares | | | Institutional
Class Shares | | | Institutional Service
Class Shares | | | Service
Class Shares | | | IRA
Class Shares | |
Large Cap Value | | 1.15 | % | | 1.15 | % | | 1.15 | % | | 1.15 | % | | 1.15 | % | | n/a | | | n/a | | | n/a | |
Mid Cap Growth | | 1.15 | % | | 1.15 | % | | 1.15 | % | | 1.15 | % | | 1.15 | % | | 1.15 | % | | n/a | | | n/a | |
Small Cap | | 1.35 | % | | 1.35 | % | | 1.35 | % | | 1.35 | % | | 1.35 | % | | 1.35 | % | | n/a | | | n/a | |
Morley Enhanced Income | | 0.45 | % | | n/a | | | n/a | | | 0.45 | % | | 0.45 | % | | 0.45 | % | | n/a | | | n/a | |
Short Duration Bond | | 0.55 | % | | n/a | | | 0.55 | % | | n/a | | | 0.55 | % | | n/a | | | 0.55 | % | | 0.55 | % |
GMF or GMCM may request and receive reimbursement from certain Funds of the advisory fees waived and other expenses reimbursed by GMF or GMCM, respectively, pursuant to the Expense Limitation Agreements at a later date not to exceed three years from the fiscal year in which the corresponding reimbursement to the Fund was made, depending on the Fund (as described below), if the Fund has reached a sufficient asset size to permit reimbursement to be made without causing the total annual operating expense ratio of the Fund to exceed the limits set forth above. No reimbursement will be made unless: (i) the Fund’s assets exceed $100 million; (ii) the total annual expense ratio of the Class making such reimbursement is at or less than the limit set forth above; and (iii) the payment of such reimbursement is approved by the Board of Trustees on a quarterly basis. Except as provided for in the Expense Limitation Agreements, reimbursement of amounts previously waived or assumed by GMF or GMCM is not permitted.
As of the ended October 31, 2005, the cumulative potential reimbursements of the following Funds (unless otherwise indicated), based on reimbursements which expire within three years from the fiscal year in which the corresponding reimbursements to the Fund was made for expenses reimbursed by GMF or GMCM, would be:
| | | | | | | | | |
| Fund | | Amount
Fiscal Year
2003 | | Amount
Fiscal Year
2004 | | Amount
Fiscal Year
2005 |
Large Cap Value | | $ | — | | $ | 17,394 | | $ | 8,421 |
Mid Cap Growth | | | 62,838 | | | 34,484 | | | 36,261 |
Small Cap | | | — | | | 13,994 | | | 3,826 |
Notes to Financial Statements (Continued)
October 31, 2005
Under the terms of a Distribution Plan under Rule 12b-1 of the 1940 Act, Gartmore Distribution Services, Inc. (“GDSI”), the Funds’ distributor, is compensated by the Funds for expenses associated with the distribution of certain classes of shares of the Funds. These fees are based on average daily net assets of the respective class of the Funds at an annual rate not to exceed the following:
| | | | | | | | | | | | | | | | | | | | | | | | |
| Fund | | Class A
Shares | | | Class B
Shares | | | Class C
Shares | | | Class R
Shares | | | Class X
Shares | | | Class Y
Shares | | | Service Class
Shares | | | IRA Class
Shares | |
Large Cap Value | | 0.25 | % | | 1.00 | % | | 1.00 | % | | 0.50 | % | | n/a | | | n/a | | | n/a | | | n/a | |
Mid Cap Growth | | 0.25 | % | | 1.00 | % | | 1.00 | % | | 0.50 | % | | n/a | | | n/a | | | n/a | | | n/a | |
Small Cap | | 0.25 | % | | 1.00 | % | | 1.00 | % | | 0.50 | % | | n/a | | | n/a | | | n/a | | | n/a | |
Bond | | 0.25 | % | | 1.00 | % | | 1.00 | % | | 0.50 | % | | 0.85 | % | | 0.85 | % | | n/a | | | n/a | |
Government Bond | | 0.25 | % | | 1.00 | % | | 1.00 | % | | 0.50 | % | | 0.85 | % | | 0.85 | % | | n/a | | | n/a | |
Morley Enhanced Income | | 0.25 | % | | n/a | | | n/a | | | 0.50 | % | | n/a | | | n/a | | | n/a | | | n/a | |
Short Duration Bond | | 0.25 | % | | n/a | | | 0.75 | % | | n/a | | | n/a | | | n/a | | | 0.25 | % | | 0.25 | % |
Tax-Free Income | | 0.25 | % | | 1.00 | % | | 1.00 | % | | n/a | | | 0.85 | % | | 0.85 | % | | n/a | | | n/a | |
Pursuant to an Underwriting Agreement, GDSI serves as principal underwriter of the Funds in the continuous distribution of their shares and receives commissions in the form of a front-end sales charge on the Class A and Class D shares. These fees are deducted from and are not included in proceeds from sales of Class A and Class D shares. From these fees, GDSI pays sales commissions, salaries, and other expenses in connection with generating new sales of Class A and Class D shares of the Funds. GDSI also receives fees for services as principal underwriter for Class B and Class X shares of the Funds. These fees are contingent deferred sales charges (“CDSCs”) ranging from 1% to 5% imposed on redemptions of Class B and Class X shares, which may cause the current value of a shareholder’s account to fall below the total purchase payments. The CDSC, if applicable, will be imposed on redemptions made within six years of the purchase. Class C and Class Y shares have a CDSC fee of 1% imposed on redemptions of Class C and Class Y shares made within one year of purchase. For the year ended October 31, 2005, GDSI received commissions of $292,556 from front-end sales charges of Class A and Class D shares and from CDSC fees from Class B, Class C, Class X, and Class Y shares of the Funds, of which $43,981 was re-allowed to affiliated broker-dealers of the Funds.
Under the terms of a Fund Administration and Transfer Agency Agreement, Gartmore SA Capital Trust (“GSA”) provides various administrative and accounting services for the Funds, and Gartmore Investors Services, Inc. (“GISI”), an indirect subsidiary of GSA, serves as Transfer Agent and Dividend Disbursing Agent for each of the Funds. For the period November 1, 2004 through December 31, 2004, the fees for the services provided under this agreement were calculated based on the Trust’s average daily net assets according to the fee schedule below. The fees were then allocated proportionately among all funds within the Trust in relation to the average daily net assets of each fund and are paid to GSA. GSA pays GISI from these fees for GISI’s services.
| | |
| Combined Fee Schedule* |
Up to $1 billion | | 0.25% |
$1 billion and more up to $3 billion | | 0.18% |
$3 billion and more up to $4 billion | | 0.14% |
$4 billion and more up to $5 billion | | 0.07% |
$5 billion and more up to $10 billion | | 0.04% |
$10 billion and more up to $12 billion | | 0.02% |
$12 billion or more | | 0.01% |
| * | The assets of the Gartmore Investor Destinations Aggressive, Gartmore Investor Destinations Moderately Aggressive, Gartmore Investor Destinations Moderate, Gartmore Investor Destinations Moderately Conservative and Gartmore Investor Destinations Conservative Funds (collectively, the “Investor Destinations Funds”) and the Gartmore Optimal Allocations Fund: Aggressive, Gartmore Optimal Allocations Fund: Moderate, Gartmore Optimal Allocations Fund: Moderately Aggressive, and Gartmore Optimal Allocations Fund: Specialty (collectively, the “Optimal Funds”) are excluded from the Trust asset level amount in order to calculate this asset based fee. The Investor Destinations Funds and the Optimal Funds do not pay any part of this fee. |
Effective January 1, 2005, the fee for the fund administration and transfer agency services increased as set forth below. The fees are calculated based on the Trust’s average daily net assets according to the fee schedule below. The fees are then allocated proportionately among all funds within the Trust in relation to the average daily net assets of each fund and are paid to GSA.
| | |
| Combined Fee Schedule* |
Up to $1 billion | | 0.26% |
$1 billion and more up to $3 billion | | 0.19% |
$3 billion and more up to $4 billion | | 0.15% |
$4 billion and more up to $5 billion | | 0.08% |
$5 billion and more up to $10 billion | | 0.05% |
$10 billion and more up to $12 billion | | 0.03% |
$12 billion or more | | 0.02% |
| * | The assets of the Investor Destinations Funds and the Optimal Funds are excluded from the Trust asset level amount in order to calculate this asset based fee. The Investor Destinations Funds and the Optimal Funds do not pay any part of this fee. |
GSA and GISI have entered into agreements with BISYS Fund Services Ohio, Inc.(“BISYS”), pursuant to which BISYS provides sub-administration and sub-transfer agency services, respectively, to the Funds.
Under the terms of an Administrative Services Plan, the Funds may pay fees to servicing organizations, such as broker-dealers, including Nationwide Financial Services, and financial institutions, which agree to provide administrative support services to the shareholders of certain classes. These services include, but are not limited, to the following: establishing and maintaining shareholder accounts; processing purchase and redemption transactions; arranging bank wires; performing shareholder sub-accounting; answering inquiries regarding the Funds; and other such services. These fees are based on an annual rate of up to 0.25% of the average daily net assets of the Class A, Class D, Class R, and Institutional Service Class shares of each of the Funds (except for the Short Duration Bond Fund). For the Short Duration Bond Fund, these fees are based on an annual rate of up to 0.25% of the average daily net assets of the IRA Class and Service Class shares.
As of October 31, 2005, the adviser or affiliates of the adviser directly held 36% of the shares outstanding of the Mid Cap Growth Fund.
4. Short-Term Trading Fees
The Funds (except the Morley Enhanced Income Fund) assess a 2.00% redemption fee on all classes of shares that are purchased and are sold or exchanged within 30 days of purchase (within 90 days for the Mid Cap Growth and Small Cap Funds and within five days for the Bond, Government Bond, and Tax- Free Income Funds). The redemption fee, if any, is paid directly to the applicable Fund and is designed to offset brokerage commissions, market impact, and other costs associated with short-term trading of Fund shares. For purposes of determining whether the redemption fee applies, the shares that were held the longest will be redeemed first. This redemption fee is in addition to any CDSCs that may be applicable at the time of sale. The redemption fee may not apply in certain circumstances, such as redemptions or exchanges of shares held in certain omnibus accounts or retirement plans that cannot implement the redemption fee. The fee does not apply to shares purchased through reinvested dividends or capital gains.
For the year ended October 31, 2005, the Funds had no contributions to capital due to collection of redemption fees.
The Short Duration Bond Fund waived its redemption fee from October 4, 2004, when the Fund’s wrap contracts terminated, through December 5, 2004, when the Fund converted to a short duration bond fund. Beginning on December 6, 2004, the Fund began to assess a 2% redemption fee on all classes of shares that are sold or exchanged within five business days of purchase.
Notes to Financial Statements (Continued)
October 31, 2005
5. Bank Loans and Earnings Credit
The Trust has a credit agreement of $100,000,000 with J.P. Morgan Chase & Co. Borrowings under this arrangement bear interest at the Federal Funds rate plus 0.50%. The interest costs are included in custodian fees in the Statement of Operations. No compensating balances were required under the terms of the line of credit. There were no borrowings outstanding as of October 31, 2005.
The Trust’s custodian bank has agreed to reduce its fees when the funds of the Trust maintain cash on deposit in non-interest-bearing custody and Demand Deposit Accounts.
6. Investment Transactions
Purchases and sales of securities (excluding short-term securities) for the year ended October 31, 2005, are summarized as follows:
| | | | | | |
| Fund | | Purchases | | Sales |
Large Cap Value | | $ | 25,738,522 | | $ | 21,222,692 |
Mid Cap Growth | | | 3,293,513 | | | 2,661,858 |
Small Cap | | | 106,869,897 | | | 91,304,815 |
Bond | | | 37,949,981 | | | 34,861,795 |
Government Bond | | | 180,289,097 | | | 189,009,582 |
Morley Enhanced Income | | | 368,769,017 | | | 218,469,090 |
Short Duration Bond | | | 648,611,804 | | | 518,639,447 |
Tax-Free Income | | | 6,826,750 | | | 16,167,869 |
Purchases and sales of U.S. Government securities for the year ended October 31, 2005, are summarized as follows:
| | | | | | |
| Fund | | Purchases | | Sales |
Bond | | $ | 23,590,047 | | $ | 11,045,450 |
Government Bond | | | 174,039,135 | | | 124,344,691 |
Morley Enhanced Income | | | 22,144,022 | | | — |
Short Duration Bond | | | 602,760,325 | | | 383,711,651 |
7. Federal Tax Information
The tax character of distributions paid during the fiscal year ended October 31, 2005, was as follows: (total distributions paid may differ from the Statement of Changes in Net Assets because for tax purposes dividends are recognized when paid.)
| | | | | | | | | | | | | | | |
| | | Distributions paid from
| | | | | | |
| Fund | | Ordinary
Income | | Net Long
Term Capital
Gains | | Total Taxable
Distributions | | Tax Exempt
Distributions | | Total
Distributions
Paid |
Large Cap Value | | $ | 314,017 | | $ | — | | $ | 314,017 | | $ | — | | $ | 314,017 |
Mid Cap Growth | | | — | | | 165,112 | | | 165,112 | | | — | | | 165,112 |
Small Cap | | | — | | | 3,107,190 | | | 3,107,190 | | | — | | | 3,107,190 |
Bond | | | 5,328,529 | | | — | | | 5,328,529 | | | — | | | 5,328,529 |
Government Bond | | | 6,209,349 | | | — | | | 6,209,349 | | | — | | | 6,209,349 |
Morley Enhanced Income | | | 10,386,236 | | | — | | | 10,386,236 | | | — | | | 10,386,236 |
Short Duration Bond | | | 6,123,024 | | | — | | | 6,123,024 | | | — | | | 6,123,024 |
Tax-Free Income | | | 17,078 | | | — | | | 17,078 | | | 7,237,912 | | | 7,254,990 |
The tax character of distributions paid during the fiscal year ended October 31, 2004 was as follows: (total distributions paid differ from the Statement of Changes in Net Assets because for tax purposes dividends are recognized when paid.)
| | | | | | | | | | | | | | | | | | |
| | | Distributions paid from
| | | | | | | | |
| Fund | | Ordinary
Income | | Net Long
Term Capital
Gains | | Total Taxable
Distributions | | Tax Exempt
Distributions | | Return of
Capital | | Total
Distributions
Paid |
Large Cap Value | | $ | 225,175 | | $ | — | | $ | 225,175 | | $ | — | | $ | — | | $ | 225,175 |
Mid Cap Growth | | | 66,870 | | | 16,507 | | | 83,377 | | | — | | | — | | | 83,377 |
Small Cap | | | — | | | 562,665 | | | 562,665 | | | — | | | — | | | 562,665 |
Bond | | | 6,219,460 | | | — | | | 6,219,460 | | | — | | | — | | | 6,219,460 |
Government Bond | | | 9,984,020 | | | 2,302,174 | | | 12,286,194 | | | — | | | — | | | 12,286,194 |
Morley Enhanced Income | | | 5,007,108 | | | — | | | 5,007,108 | | | — | | | — | | | 5,007,108 |
Short Duration Bond | | | 18,735,742 | | | 13,503 | | | 18,749,245 | | | — | | | — | | | 18,749,245 |
Tax-Free Income | | | 17,054 | | | — | | | 17,054 | | | 8,517,827 | | | — | | | 8,534,881 |
As of October 31, 2005, the components of accumulated earnings (deficit) on a tax basis were as follows:
| | | | | | | | | | | | | | | | | | | | | | | | | | | | |
| Fund | | Undistributed
Tax Exempt
Income | | Undistributed
Ordinary
Income | | Undistributed
Long-Term
Capital Gains | | Accumulated
Earnings | | Distributions
Payable | | | Accumulated
Capital and
Other Losses | | | Unrealized
Appreciation
(Depreciation)* | | | Total
Accumulated
Earnings
(Deficit) | |
Large Cap Value | | $ | — | | $ | 30,211 | | $ | 1,570,314 | | $ | 1,600,525 | | $ | — | | | $ | — | | | $ | 4,717,550 | | | $ | 6,318,075 | |
Mid Cap Growth | | | — | | | — | | | 267,532 | | | 267,532 | | | — | | | | — | | | | 655,961 | | | | 923,493 | |
Small Cap | | | — | | | 7,094,171 | | | 251,820 | | | 7,345,991 | | | — | | | | — | | | | 323,739 | | | | 7,669,730 | |
Bond | | | — | | | 448,919 | | | — | | | 448,919 | | | (457,502 | ) | | | (2,925,578 | ) | | | 3,237,539 | | | | 303,378 | |
Government Bond | | | — | | | 640,135 | | | 36,342 | | | 676,477 | | | (524,612 | ) | | | — | | | | (355,018 | ) | | | (203,153 | ) |
Morley Enhanced Income | | | — | | | 1,327,264 | | | — | | | 1,327,264 | | | (1,319,046 | ) | | | (5,394,928 | ) | | | (4,488,905 | ) | | | (9,875,615 | ) |
Short Duration Bond | | | — | | | 282,164 | | | — | | | 282,164 | | | (332,520 | ) | | | (2,015,922 | ) | | | (2,606,356 | ) | | | (4,672,634 | ) |
Tax-Free Income | | | 491,292 | | | — | | | — | | | 491,292 | | | (647,756 | ) | | | (323,991 | ) | | | 12,125,644 | | | | 11,645,189 | |
| * | The differences between the book-basis and tax-basis unrealized appreciation (depreciation) is attributable primarily to: tax deferral of losses on wash sales; the difference between book and tax amortization methods for premium and market discount; and the return of capital adjustments from real estate investment trusts. |
As of October 31, 2005, the tax cost of securities and the breakdown of unrealized appreciation (depreciation) for each Fund were as follows:
| | | | | | | | | | | | | | |
| Fund | | Tax Cost of
Securities | | Unrealized
Appreciation | | Unrealized
Depreciation | | | Net
Unrealized
Appreciation
(Depreciation) | |
Large Cap Value | | $ | 32,755,882 | | $ | 5,807,046 | | $ | (1,089,496 | ) | | $ | 4,717,550 | |
Mid Cap Growth | | | 4,232,499 | | | 780,376 | | | (124,415 | ) | | | 655,961 | |
Small Cap | | | 58,077,188 | | | 3,101,290 | | | (2,777,551 | ) | | | 323,739 | |
Bond | | | 117,732,619 | | | 3,992,172 | | | (754,633 | ) | | | 3,237,539 | |
Government Bond | | | 164,719,774 | | | 1,206,647 | | | (1,561,665 | ) | | | (355,018 | ) |
Morley Enhanced Income | | | 463,907,621 | | | 74,837 | | | (4,563,742 | ) | | | (4,488,905 | ) |
Short Duration Bond | | | 134,811,060 | | | — | | | (2,606,356 | ) | | | (2,606,356 | ) |
Tax-Free Income | | | 164,290,329 | | | 12,127,863 | | | (2,219 | ) | | | 12,125,644 | |
Notes to Financial Statements (Continued)
October 31, 2005
As of October 31, 2005, for Federal income tax purposes, the following Funds have capital loss carryforwards available to offset capital gains, if any, to the extent provided by the treasury regulations:
| | | | | |
| Fund | | Amount | | Expires |
Bond | | $ | 570,882 | | 2008 |
Bond | | | 813,853 | | 2009 |
Bond | | | 1,540,843 | | 2010 |
Morley Enhanced Income | | | 90,981 | | 2008 |
Morley Enhanced Income | | | 896,348 | | 2009 |
Morley Enhanced Income | | | 1,947,216 | | 2010 |
Morley Enhanced Income | | | 952,689 | | 2011 |
Morley Enhanced Income | | | 1,507,694 | | 2012 |
Short Duration Bond | | | 569,688 | | 2012 |
Short Duration Bond | | | 1,446,234 | | 2013 |
Tax-Free Income | | | 49,008 | | 2008 |
Tax-Free Income | | | 274,984 | | 2011 |
Report of Independent Registered Public
Accounting Firm
To the Board of Trustees and Shareholders of Gartmore Mutual Funds:
In our opinion, the accompanying statements of assets and liabilities, including the statements of investments, and the related statements of operations and of changes in net assets and the financial highlights present fairly, in all material respects, the financial position of Gartmore Large Cap Value Fund, Gartmore Mid Cap Growth Fund, Gartmore Small Cap Fund, Gartmore Bond Fund, Gartmore Government Bond Fund, Gartmore Morley Enhanced Income Fund, Gartmore Short Duration Bond Fund and Gartmore Tax-Free Income Fund (eight series of Gartmore Mutual Funds, hereafter referred to as the “Funds”) at October 31, 2005, the results of each of their operations for the year then ended, the changes in each of their net assets for each of the two years then ended and the financial highlights for each of the four years (or periods) then ended in conformity with accounting principles generally accepted in the United States of America. These financial statements and financial highlights (hereafter referred to as “financial statements”) are the responsibility of the Funds’ management; our responsibility is to express an opinion on these financial statements based on our audits. We conducted our audits of these financial statements in accordance with the standards of the Public Company Accounting Oversight Board (United States.) Those standards require that we plan and perform the audit to obtain reasonable assurance about whether the financial statements are free of material misstatement. An audit includes examining, on a test basis, evidence supporting the amounts and disclosures in the financial statements, assessing the accounting principles used and significant estimates made by management, and evaluating the overall financial statement presentation. We believe that our audits, which included confirmation of securities at October 31, 2005 by correspondence with the custodian and brokers, provide a reasonable basis for our opinion. The financial highlights of Gartmore Large Cap Value Fund, Gartmore Small Cap Fund, Gartmore Bond Fund, Gartmore Government Bond Fund, Gartmore Morley Enhanced Income Fund, Gartmore Short Duration Bond Fund and Gartmore Tax-Free Income Fund for the year (or period) ended October 31, 2001 were audited by other independent accountants whose report dated December 14, 2001 expressed an unqualified opinion on those financial statements.
PricewaterhouseCoopers LLP
Philadelphia, Pennsylvania
December 22, 2005
Supplemental Information (Unaudited)
1. Other Federal Tax Information (Unaudited):
For the period ended October 31, 2005, certain dividends paid by the Funds may be subject to a maximum tax rate of 15% as provided for by the Jobs and Growth Tax Relief Reconciliation Act of 2003. The Funds intend to designate the maximum amount allowable as taxed at a maximum rate of 15%. Complete information will be reported in conjunction with your 2005 Form 1099-DIV.
For the period ended October 31, 2005, the following Funds paid qualified dividend income:
| | | |
| Fund | | Qualified
Dividend
Income |
Large Cap Value | | $ | 785,438 |
Mid Cap Growth | | | 16,304 |
For the taxable year ended October 31, 2005, the following percentage of income dividends paid by the Funds qualify for the dividends received deduction available to corporations:
| | | |
| Fund | | Dividend
Received
Deduction | |
Large Cap Value | | 100 | % |
2. Shareholder Meeting
A separate shareholder meeting was held on Tuesday, December 23, 2004, for the shareholders of the Trust’s predecessor pursuant to a Proxy Statement on Schedule 14A, dated October 29, 2004, and mailed to the shareholders of the Trust’s predecessor on or around November 5, 2004.
Two Proposals: The purpose of the December 23, 2004 meeting was to allow the shareholders of the Trust’s predecessor to vote on:
i. Proposal One: The election of the Trust’s Predecessor’s Board of Trustees; and
ii. Proposal Two: The approval of an “Agreement and Plan of Reorganization” that provided for the reorganization of the Trust from an Ohio business trust into a Delaware statutory trust.
Proposal One: As set forth in the October 29, 2004 Proxy Statement, the nominees for election as Trustees of the Trust’s predecessor were: Charles E. Allen, Michael J. Baresich, Paula H.J. Cholmondeley, C. Brent DeVore, Phyllis Kay Dryden, Robert M. Duncan, Barbara L. Hennigar, Paul J. Hondros, Barbara I. Jacobs, Thomas J. Kerr, IV, Douglas F. Kridler, Michael D. McCarthy, Arden L. Shisler, and David C. Wetmore.
Proposal Two: As specifically set forth in the October 29, 2004 Proxy Statement, the Reorganization proposal requested the shareholders of the Trust’s predecessor to approve the proposed “Agreement and Plan of Reorganization” of the Trust’s predecessor (on behalf of each of the Trust’s funds) with and into a new Delaware-domiciled Trust, whereby the Funds of the new Delaware Trust would acquire all of the assets of the corresponding funds of the Trust’s predecessor subject to the liabilities, expenses, costs, charges, and reserves of the corresponding funds of the Trust’s predecessor (contingent or otherwise), in exchange for shares of the acquiring funds of the Trust to be distributed pro rata by the Trust to the holders of the shares of the funds of the Trust’s predecessor, in a complete liquidation of the Trust’s predecessor.
Voting Results:
The shareholders of the Trust’s predecessor voted to approve both Proposal One and Proposal Two, as follows:
| | |
| Proposal One: | | Election of a Board of Trustees of the Trust’s Predecessor |
Charles E. Allen: | | |
FOR | | 1,484,045,010.745 shares (96.963%) |
WITHHOLD | | 46,475,965.981 shares (3.037%) |
TOTAL | | 1,530,520,976.726 shares (100.000%) |
| |
Michael J. Baresich: | | |
FOR | | 1,479,546,876.136 shares (96.669%) |
WITHHOLD | | 50,974,100.590 shares (3.331%) |
TOTAL | | 1,530,520,976.726 shares (100.000%) |
| |
Paula H.J. Cholmondeley: | | |
FOR | | 1,483,986,754.474 shares (96.960%) |
WITHHOLD | | 46,534,222.252 shares (3.040%) |
TOTAL | | 1,530,520,976.726 shares (100.000%) |
| |
C. Brent DeVore: | | |
FOR | | 1,483,232,555.715 shares (96.910%) |
WITHHOLD | | 47,288,421.011 shares (3.090%) |
TOTAL | | 1,530,520,976.726 shares (100.000%) |
| |
Phyllis Kay Dryden: | | |
FOR | | 1,483,461,670.269 shares (96.925%) |
WITHHOLD | | 47,059,306.457 shares (3.075%) |
TOTAL | | 1,530,520,976.726 shares (100.000%) |
| |
Robert M. Duncan: | | |
FOR | | 1,478,518,553.740 shares (96.602%) |
WITHHOLD | | 52,002,422.986 shares (3.398%) |
TOTAL | | 1,530,520,976.726 shares (100.000%) |
| |
Barbara L. Hennigar: | | |
FOR | | 1,483,932,926.673 shares (96.956%) |
WITHHOLD | | 46,588,050.053 shares (3.044%) |
TOTAL | | 1,530,520,976.726 shares (100.000%) |
| |
Paul J. Hondros: | | |
FOR | | 1,483,799,576.741 shares (96.947%) |
WITHHOLD | | 46,721,399.985 shares (3.053%) |
TOTAL | | 1,530,520,976.726 shares (100.000%) |
| |
Barbara I. Jacobs: | | |
FOR | | 1,482,757,593.191 shares (96.879%) |
WITHHOLD | | 47,763,383.535 shares (3.121%) |
TOTAL | | 1,530,520,976.726 shares (100.000%) |
Supplemental Information (Unaudited) (Continued)
| | |
| Proposal One: | | Election of a Board of Trustees of the Trust’s Predecessor |
Thomas J. Kerr IV: | | |
FOR | | 1,477,143,243.388 shares (96.512%) |
WITHHOLD | | 53,377,733.338 shares (3.488%) |
TOTAL | | 1,530,520,976.726 shares (100.000%) |
| |
Douglas F. Kridler: | | |
FOR | | 1,484,100,191.103 shares (96.967%) |
WITHHOLD | | 46,420,785.623 shares (3.033%) |
TOTAL | | 1,530,520,976.726 shares (100.000%) |
| |
Michael D. McCarthy: | | |
FOR | | 1,483,352,898.255 shares (96.918%) |
WITHHOLD | | 47,168,078.471 shares (3.082%) |
TOTAL | | 1,530,520,976.726 shares (100.000%) |
| |
Arden L. Shisler: | | |
FOR | | 1,483,661,174.441 shares (96.938%) |
WITHHOLD | | 46,859,802.285 shares (3.062%) |
TOTAL | | 1,530,520,976.726 shares (100.000%) |
| |
David C. Wetmore: | | |
FOR | | 1,484,021,388.615 shares (96.962%) |
WITHHOLD | | 46,499,588.111 shares (3.038%) |
TOTAL | | 1,530,520,976.726 shares (100.000%) |
| |
| Proposal Two: | | Approval of the Agreement and Plan of Reorganization of the
Trust’s Predecessor: |
FOR | | 1,338,850,729.743 shares (87.477%) |
AGAINST | | 48,927,279.322 shares (3.197%) |
ABSTAIN | | 86,596,336.653 shares (5.658%) |
BROKER NON-VOTES | | 56,146,631.008 shares (3.668%) |
TOTAL | | 1,530,520,976.726 shares (100.000%) |
Management Information (Unaudited)
Trustees who are not Interested Persons (as defined in the 1940 Act) and Officers of the Funds as of October 31, 2005
| | | | | | | | |
Name, Address
and Year of Birth | | Position(s) Held
with the Trust
and Length of
Time Served1 | | Principal Occupation(s)
During Past
Five Years | | Number of Portfolios
in the
Gartmore Fund
Complex Overseen
by Trustee | | Other Directorships Held by Trustee or Nominee2 |
| | | | |
Charles E. Allen c/o Gartmore Global Investments, Inc. 1200 River Road,
Suite 1000 Conshohocken, PA 19428 1948 | | Trustee
since
July 2000 | | Mr. Allen is Chairman, Chief Executive Officer and President of the Graimark Realty Advisors, Inc. (real estate development, investment and asset management). | | 84 | | None |
| | | | |
Paula H.J. Cholmondeley c/o Gartmore Global Investments, Inc. 1200 River Road,
Suite 1000 Conshohocken, PA 19428 1947 | | Trustee
since
July 2000 | | Ms. Cholmondeley has been the Chairman and Chief Executive Officer of the Sorrel Group, a management consulting company, since January 2004. Prior thereto, Ms. Cholmondeley was Vice President and General Manager of Sappi Fine Paper North America. | | 84 | | Director of Dentsply International, Inc., Ultralife Batteries, Inc. , Terex Corporation, Minerals Technology, Inc. and Albany International Corp. |
| | | | |
C. Brent DeVore c/o Gartmore Global Investments, Inc. 1200 River Road,
Suite 1000 Conshohocken, PA 19428 1940 | | Trustee
since
1990 | | Dr. DeVore is President of Otterbein College. | | 84 | | None |
| | | | |
Phyllis K. Dryden c/o Gartmore Global Investments, Inc. 1200 River Road,
Suite 1000 Conshohocken, PA 19428 1947 | | Trustee
since
December 2004 | | Ms. Dryden was a former Managing Partner of marchFIRST, a global management consulting firm prior to February, 2001. | | 84 | | None |
| | | | |
Barbara L. Hennigar c/o Gartmore Global Investments, Inc. 1200 River Road,
Suite 1000 Conshohocken, PA 19428 1935 | | Trustee
since
July 2000 | | Retired. | | 84 | | None |
Management Information (Unaudited) (Continued)
Trustees who are not Interested Persons (as defined in the 1940 Act) and Officers of the Funds as of October 31, 2005 (Continued)
| | | | | | | | |
Name, Address
and Year of Birth | | Position(s) Held
with the Trust
and Length of
Time Served1 | | Principal Occupation(s)
During Past
Five Years | | Number of Portfolios
in the
Gartmore Fund
Complex Overseen
by Trustee | | Other Directorships Held by Trustee2 |
| | | | |
Barbara I. Jacobs c/o Gartmore Global Investments, Inc. 1200 River Road,
Suite 1000 Conshohocken, PA 19428 1950 | | Trustee
since
December 2004 | | Ms. Jacobs has served as Chairman of the Board of Directors of KICAP Network Fund, a European (United Kingdom) hedge fund, since December 2000. Prior to 2004, Ms. Jacobs was also a Managing Director and European Portfolio Manager with CREF Investments (Teachers Insurance Annuity Association–College Retirement Equity Fund). | | 84 | | None |
| | | | |
Douglas F. Kridler c/o Gartmore Global Investments, Inc. 1200 River Road,
Suite 1000 Conshohocken, PA 19428 1955 | | Trustee
since
September 1997 | | Mr. Kridler has served as the President and Chief Executive Officer of the Columbus Foundation (a Columbus, OH-based foundation which manages over 1,300 individual endowment funds) since February 2002. Mr. Kridler was the President of the Columbus Association for the Performing Arts prior thereto and Chairman of the Greater Columbus Convention and Visitors Bureau during 2000 and 2001. | | 84 | | None |
| | | | |
Michael D. McCarthy c/o Gartmore Global Investments, Inc. 1200 River Road,
Suite 1000 Conshohocken, PA 19428 1947 | | Trustee
since
December 2004 | | Mr. McCarthy serves as: the Founder and Chairman of The Eureka Foundation (which sponsors and funds the “Great Museums” series on PBS); and a Partner of Pineville Properties LLC (a commercial real estate development firm). | | 843 | | None |
| | | | |
David C. Wetmore c/o Gartmore Global Investments, Inc. 1200 River Road,
Suite 1000 Conshohocken, PA 19428 1948 | | Trustee
since 1995 and Chairman since
February 2005 | | Retired. | | 84 | | None |
| 1 | Length of time served includes time served with the Trust’s Predecessor. |
| 2 | Directorships held in (1) any other investment companies registered under the 1940 Act, (2) any company with a class of securities registered pursuant to Section 12 of the Securities Exchange Act of 1934, as amended (the “Exchange Act”), or (3) any company subject to the requirements of Section 15(d) of the Exchange Act. |
| 3 | Mr. McCarthy was also an Administrative Committee Member for the Alphagen Arneb Fund, LLC , The Healthcare Fund LDC, The Leaders Long-Short Fund, LLC, and The Leaders Long-Short Fund LDC, four private investment companies (hedge funds) managed by GSA. Mr. McCarthy resigned as an Administrative Committee Member effective June 30, 2005. |
Trustees and Officers who are not Interested Persons (as defined in the 1940 Act) of the Funds received aggregate compensation of $548,510 from the Trust for the year ended October 31, 2005. Additional information regarding the Trustees and Officers may be found in the Trust’s statement of additional information, which is available without charge upon request, by calling 800-848-0920.
Trustees who are Interested Persons (as defined in the 1940 Act) and/or Officers of the Funds as of October 31, 2005
| | | | | | | | |
Name, Address
and Year of Birth | | Position(s) Held
with the Trust
and Length of
Time Served1 | | Principal Occupation(s) During Past 5 Years | | Number of Portfolios
in the
Gartmore Fund
Complex Overseen
by Trustee | | Other Directorships Held by Trustee2 |
| | | | |
Paul J. Hondros Gartmore Global Investments, Inc. 1200 River Road,
Suite 1000 Conshohocken, PA 19428 1948 | | Trustee
since
July 2000 | | Mr. Hondros has been President and Chief Executive Officer of various Gartmore entities, including Gartmore Distribution Services, Inc. (“GDSI”),3 Gartmore Investor Services, Inc. (“GISI”),3 Gartmore Morley Capital Management, Inc. (“GMCM”),3 Gartmore Morley Financial Services, Inc. (“GMFS”), 3 NorthPointe Capital, LLC (“NorthPointe”),3 Gartmore Global Asset Management Trust (“GGAMT”)3,, Gartmore Global Investments, Inc. (“GGI”)3, Gartmore Mutual Fund Capital Trust (“GMFCT”)3 and Gartmore SA Capital Trust (“GSA”)3; and a Director of Nationwide Securities, Inc.3, as well as several entities within Nationwide Financial Services, Inc. | | 844 | | None |
| | | | |
Arden L. Shisler c/o Gartmore Global Investments, Inc. 1200 River Road,
Suite 1000 Conshohocken, PA 19428 1941 | | Trustee
since
February 2000 | | Mr. Shisler has been a consultant since January 2003. Prior thereto, he was President and Chief Executive Officer of K&B Transport, Inc., a trucking firm. Since 1992, Mr. Shisler has also been Chairman of the Board for Nationwide Mutual Insurance Company3. | | 84 | | Director of Nationwide Financial
Services, Inc. |
| | | | |
Gerald J. Holland Gartmore Global Investments, Inc.
1200 River Road,
Suite 1000 Conshohocken, PA 19428 1951 | | Treasurer
since
March 2001 | | Mr. Holland is Senior Vice President – Operations for GGI3, GMFCT3 , and GSA3. | | 84 | | None |
| | | | |
Michael A. Krulikowski Gartmore Global Investments, Inc.
1200 River Road,
Suite 1000 Conshohocken, PA 19428 1959 | | Chief Compliance Officer
since
June 2004 | | Since November 1999, Mr. Krulikowski has served as a Vice President and Chief Compliance Officer of GGI. Since June 2004, Mr. Krulikowski has also served as Chief Compliance Officer of the Trust. | | 84 | | None |
| | | | |
Eric E. Miller Gartmore Global Investments, Inc.
1200 River Road,
Suite 1000 Conshohocken, PA 19428 1953 | | Secretary
since December 2002 | | Mr. Miller is Senior Vice President, Chief Counsel for GGI3, GMFCT3 and GSA3 since August 2002. From August 2000 to August 2002, Mr. Miller was a Partner with Stradley Ronan Stevens & Young, LLP. | | 84 | | None |
Management Information (Unaudited) (Continued)
| 1 | Length of time served includes time served with the Trust’s Predecessor. |
| 2 | Directorships held in (1) any other investment companies registered under the 1940 Act, (2) any company with a class of securities registered pursuant to Section 12 of the Securities Exchange Act of 1934, as amended (the “Exchange Act”), or (3) any company subject to the requirements of Section 15(d) of the Exchange Act. |
| 3 | This position is held with an affiliated person or principal underwriter of the Trust. |
| 4 | Mr. Hondros was also an Administrative Committee Member for the Alphagen Arneb Fund, LLC , The Healthcare Fund LDC, The Leaders Long-Short Fund, LLC, and The Leaders Long-Short Fund LDC, four private investment companies (hedge funds) managed by GSA. Mr. Hondros resigned as an Administrative Committee Member effective June 30, 2005. |
Federal law requires the Trust, each of its investment advisers and sub-advisers to adopt procedures for voting proxies (“Proxy Voting Guidelines”) and to provide a summary of those Proxy Voting Guidelines used to vote the securities held by the Funds. The Funds’ proxy voting policies and procedures are available without charge (i) upon request, by calling 800-848-0920, (ii) on the Fund’s website at www.gartmorefunds.com, or (iii) on the Securities and Exchange Commission’s website at www.sec.gov.
Index Definitions
Lipper Analytical Services, Inc. is an industry research firm whose rankings are based on total return performance and do not reflect the effect of sales charges. Each fund is ranked within a universe of funds similar in investment objective as determined by Lipper.
Russell 1000® Value Index: An unmanaged index that measures the performance of the stocks of U.S. companies in the Russell 1000® Index (the largest 1,000 U.S. companies, based on market capitalization) with lower price-to-book ratios and lower forecasted growth values.
Russell Midcap® Growth Index: An unmanaged index of mid-capitalization growth stocks of U.S. companies; measures the performance of the stocks of those Russell Midcap® Index companies with higher price-to-book ratios and higher forecasted growth values, and gives a broad look at how the stock prices of medium-sized U.S. companies have performed.
Russell 2000® Index: An unmanaged index that measures the performance of the stocks of small-capitalization U.S. companies; includes the smallest 2,000 U.S. companies in the Russell 3000® Index, which measures the performance of the largest 3,000 U.S. companies, based on market capitalization.
Lehman Brothers Government/Credit Bond Index: An unmanaged index of U.S. government and investment-grade corporate bonds with at least one year to maturity; gives a broad look at how the prices of these securities have performed.
Merrill Lynch Government Master Index: An unmanaged index that gives a broad look at how U.S. government bonds have performed.
Lipper Ultra-Short Bond Fund Index: An unmanaged index that consists of fixed-income funds having very short durations (average maturity of between 91 and 365 days), relatively little market price sensitivity to changes in interest rates, and at least 65% of their assets in investment-grade debt instruments.
Lipper Money Market Fund Index: An unmanaged, equally weighted index that measures the performance of a broad group of taxable money market funds having a constant market price of $1 per share; consists of the largest 30 funds within the general money market funds investment objective as defined by Lipper Inc.
Merrill Lynch 1-3 Year Treasury Index: An unmanaged index that tracks short-term U.S. Treasury notes and bonds with maturities of one to three years.
Lehman Brothers Municipal Bond Index: An unmanaged index that gives a broad look at how the prices of municipal bonds have performed; includes approximately 15,000 municipal bonds that are rated Baa or better by Moody’s and have a maturity of at least two years.

Gartmore Funds
1200 River Road, Suite 1000
Conshohocken, PA 19428
www.gartmorefunds.com
Federal law requires the Fund, and the Fund’s investment advisers and subadvisers, to adopt procedures for voting proxies (“Proxy Voting Guidelines”) and to provide a summary of those Proxy Voting Guidelines used to vote the securities held by the Funds. The Fund’s proxy voting policies and procedures are available without charge (i) upon request, by calling 800-848-0920, (ii) on the Fund’s Web site at www.gartmorefunds.com, or (iii) on the U.S. Securities and Exchange Commission’s Web site at www.sec.gov.
© 2005 Gartmore Global Investments, Inc.
All rights reserved.
AR-Core 12/05
Annual Report
| | |
| | |

| | October 31, 2005 |
Gartmore Global Financial Services Fund
Gartmore Global Health Sciences Fund
Gartmore Global Natural Resources Fund
Gartmore Global Technology and Communications Fund
Gartmore Global Utilities Fund
Gartmore Mid Cap Growth Leaders Fund
Gartmore Nationwide Leaders Fund
Gartmore Small Cap Leaders Fund
Gartmore U.S. Growth Leaders Fund
Gartmore Worldwide Leaders Fund
Gartmore China Opportunities Fund
Gartmore Emerging Markets Fund
Gartmore International Growth Fund
Gartmore Convertible Fund
Gartmore High Yield Bond Fund
Gartmore Micro Cap Equity Fund
Gartmore Small Cap Growth Fund
Gartmore U.S. Growth Leaders Long-Short Fund
Gartmore Value Opportunities Fund
www.gartmorefunds.com

Solutions.

| | | | |
| UNITED STATES | | UNITED KINGDOM | | JAPAN |
Based in greater metropolitan Philadelphia, Gartmore is the global asset management arm of Nationwide®. Gartmore’s affiliated advisers* collectively manage more than $82 billion1 in assets through its global investment platform encompassing more than 185 investment management professionals supported by an 800-person staff.
We provide core and specialty equity, fixed-income and alternative investment solutions through mutual funds, separate accounts, commingled portfolios and wrap accounts to individual and institutional clients around the world.
This wide range of investment opportunities is built on sound investment management processes designed to increase the probability of delivering enhanced risk-adjusted returns over the long term.
Our investment management teams incorporate fundamental stock selection with the application of technology to help control risk and add to returns. Insightful stock selection is a function of the efforts of talented alpha-driven managers and analysts, working in an entrepreneurial environment, who are specialists in their respective investment disciplines.
www.gartmore.com
*Gartmore’s Affiliated Advisers
The following 11 asset management affiliates of Nationwide do business under the trade name “Gartmore Group”: Gartmore Capital Management Ltd2, Gartmore Fund Managers Ltd2, Gartmore Global Partners2, 3, Gartmore Investment Ltd2, Gartmore Japan Ltd2, Gartmore Morley Capital Management, Inc.3, Gartmore Mutual Fund Capital Trust3, 4, Gartmore Riverview, LLC3, Gartmore SA Capital Trust3, 4, Gartmore Separate Accounts LLC3, and NorthPointe Capital® LLC3
| 2. | | These advisers are subsidiaries of Gartmore Investment Management plc, which ultimately reports to Nationwide®. |
| 3. | | These are SEC-registered investment advisers based in the United States. Collectively, these advisers manage $43 billion as of Oct. 31, 2005. |
| 4. | | Together, these advisers do business as Gartmore Global Investments, Inc. |
Gartmore Global Investments is the investment adviser to Gartmore Funds. NorthPointe Capital is a federally registered service mark of Gartmore Global Investments, Inc. Nationwide is a federally registered service mark of Nationwide Mutual Insurance Company.
Gartmore Funds distributed by Gartmore Distribution Services, Inc., Member NASD. 1200 River Road, Suite 1000, Conshohocken, PA 19428.
© 2005 Gartmore Global Investments, Inc. All rights reserved.
Annual Report
| | |
| | |
| | October 31, 2005 |
Commentary provided by Gartmore Global Investments, investment adviser to Gartmore Funds. All opinions and estimates included in this report constitute Gartmore Global Investments’ judgment as of the date of this report and are subject to change without notice.
Statement Regarding Availability of Quarterly Portfolio Schedule.
The Gartmore Funds file complete schedules of portfolio holdings for each Fund with the Securities and Exchange Commission (the “Commission”) for the first and third quarters of each fiscal year on Form N-Q. The Funds’ Forms N-Q are available on the Commission’s website at http://www.sec.gov. The Funds’ Forms N-Q may be reviewed and copied at the Commission’s Public Reference Room in Washington, DC, and information on the operation of the Public Reference Room may be obtained by calling 800-SEC-0330; and the Funds make the information on Form N-Q available to shareholders on www.gartmorefunds.com or upon request without charge.
Statement Regarding Availability of Proxy Voting Record.
Information regarding how the Fund voted proxies relating to portfolio securities held during the most recent 12-month period ended June 30, 2005 is available without charge, upon request, by calling 800-848-0920, and on the Commission’s website at http://www.sec.gov.
Message to Shareholders
October 31, 2005
Dear Fellow Shareholders,
At times during the annual reporting period ended Oct. 31, 2005, it seemed as though a host of uncertain and unpredictable events coalesced into a “perfect storm” of market volatility.
Hurricane Katrina is one example. This Category 5 storm not only bore down on a major American city and its environs, it also had one of the country’s largest energy-producing regions in its sights. If that weren’t enough, the storm occurred just as oil and natural gas prices were spiraling to record levels, concurrent with fears of a great strain on global supply and capacity.
On another front, the intent to better integrate the member nations of the European Union (EU) was dealt a blow by France’s repudiation of a proposed EU constitution, a move that called into question the EU’s long-term effectiveness. Within a matter of weeks, France itself was rocked by what initially appeared to be youthful unrest in one section of Paris. As riots spread across the country, however, the situation revealed a disturbing and broad-based economic condition; unemployment among France’s immigrant population is five times the national average, and the segment’s per capita income is 40% below the national average. The lingering sense is that a number of European countries will have to deal with a long-overlooked social and economic issue at a time when the EU is struggling to retain its authority.
These are just two examples illustrating that market volatility can be a function of unexpected, and sometimes unrelated, global events. The accompanying “Market Perspectives” commentary provides a more detailed analysis of the various economic and social factors that influenced the market during the past year. I’d like to focus on Gartmore’s view on how best to navigate uncertain domestic and global markets in the pursuit of acceptable investment returns.
Risk, regardless of its source, is part and parcel of investing. The challenge is to mitigate risk as much as possible through sound portfolio diversification. Gartmore is committed to offering a diverse range of equity, fixed-income and alternative investment solutions designed to capture global investment opportunities. The informed investment response to complex, volatile markets is to configure a series of diverse, uncorrelated, well-performing funds into a dynamic portfolio. At Gartmore, we seek to provide the core and satellite investments needed to construct a broadly diversified investment portfolio.
Moreover, Gartmore believes that seasoned investment experts employing well-articulated and tested processes and aided by global research form the path to acceptable risk-adjusted returns. We hold a core belief that the ideas and insights of talented investment professionals can add quantifiable investment returns. In that regard, we are pleased to report that the returns of 30 of our 47 retail mutual funds (Class A at NAV) exceeded their respective benchmarks for the annual period ended Oct. 31, 2005.
The performance of a number of Gartmore’s funds from a variety of sectors and regions strengthens the case for holding uncorrelated investments. For example, the performance of the Gartmore Global Natural Resources Fund, which during the reporting period returned 65.51% (Class A at NAV) versus the Goldman Sachs Natural Resources Index return of 34.75%, was driven by escalating energy prices derived from increased global demand coupled with concerns about supply shortages. Within the energy sector, the Fund concentrated on smaller companies with higher capacity for growth. It is widely believed that energy will be in great demand for an extended period of time; therefore, the Fund will remain focused on the energy services sector companies that acquire, develop, and exploit oil and natural gas properties. The Wall Street Journal cited the Fund as a “Category King” in the Mutual Fund Monthly Review of Sept. 6, 2005.
The Gartmore Small Cap Fund garnered above-average returns during the reporting period, posting a 31.51% return (Class A at NAV) versus the Russell 2000® Index return of 12.08%. Most of the Fund’s outperformance came from strong stock selection in the information technology and energy sectors, in addition to astute sector allocations. Shortly after the close of the period, the Fund was cited in The Wall Street Journal as a “Category King” and noted as the second-best-performing fund in its respective sector for October 2005.
In addition, during the reporting period, Gartmore’s small-cap investment team was enhanced by the hiring of senior portfolio manager Jayne Stevlingson, who has managed small-cap funds at both OppenheimerFunds, Inc. and Morgan Stanley.
The case for broad global diversification was made through the performance of several of our non-U.S. funds during the reporting period. In comparison to equity prices in Europe and Japan, those in the United States were more muted during the past year, reflecting stretched valuations and increasing uncertainty in the outlook for consumers. The emerging markets, however, outperformed all other regions. Though its performance slightly lagged that of its benchmark, the Gartmore Emerging Markets Fund posted very strong returns of 30.02% (Class A at NAV) for the reporting period.
The Gartmore International Growth Fund, returning 26.13% (Class A at NAV) versus the Morgan Stanley Capital International (MSCI) All Country World ex-U.S. Index return of 20.06%, also benefited from the impressive performance of emerging-market and Pacific Rim equities. In addition, Latin American securities delivered notably robust performance on the back of strong commodity prices.
The Gartmore Worldwide Leaders Fund, which returned 23.44% (Class A at NAV) versus 13.27% for the MSCI World IndexSM, benefited from both domestic and international developments. Overall, U.S. growth remained strong in the face of inflationary worries, while both Europe and Japan showed increasing signs of recovery. European export growth increased due to the weak euro at the same time that Japan experienced rising real incomes and increased capital expenditures. As a result, the Fund’s largest regional contributors were the United States, the United Kingdom and Japan. The Fund also benefited from strong stock selection within the technology, financial services, health-care and energy sectors.
Despite considerable volatility in both the U.S. economy and the U.S. equity markets during the past year, the Gartmore U.S. Growth Leaders Fund handily outperformed the Standard & Poor’s (S&P) 500® Index return of 8.72% with a return of 17.31% (Class A at NAV). The Fund’s performance was almost exclusively driven by strong stock selection, particularly in the technology and consumer goods areas. Concurrently, the Gartmore U.S. Growth Leaders Long-Short Fund returned 6.09% (Class A at NAV) versus 2.68% for its benchmark, the Citigroup 3-Month T-Bill Index. Again, adept stock selection, coupled with strong sector allocations, drove the Fund’s outperformance.
In addition to a suite of actively managed funds, Gartmore provides packaged asset allocation and diversification solutions. The Gartmore Optimal Allocations Funds, launched in June 2004, consist primarily of various proprietary Gartmore funds offered in four varieties, calibrated to different levels of risk: Moderate, Moderately Aggressive, Aggressive and Specialty. We are very pleased to report that each of these Funds, which serve as complements to actively managed holdings, outperformed their respective composite benchmarks for the reporting period.
| | | | | | |
| Fund Name | | Fund
Return* | | Benchmark Return | | Benchmark |
Gartmore Optimal Allocations: | | | | | | |
| Moderate | | 10.41% | | 7.56% | | S&P 500 (40%); MSCI EAFE (20%); Lehman Brothers U.S. Aggregate (40%) |
Gartmore Optimal Allocations: | | | | | | |
| Moderately Aggressive | | 12.77% | | 9.08% | | S&P 500 (60%); MSCI EAFE (20%); Lehman Brothers U.S. Aggregate (20%) |
Gartmore Optimal Allocations: | | | | | | |
| Aggressive | | 14.86% | | 10.67% | | S&P 500 (70%); MSCI EAFE (25%); Lehman Brothers U.S. Aggregate (5%) |
Gartmore Optimal Allocations: | | | | | | |
| Specialty | | 14.59% | | 11.50% | | S&P 500 (70%); MSCI EAFE (30%) |
| * | All Fund returns are Class A at NAV, as of Oct. 31, 2005. |
As we head into 2006, the only constant is uncertainty, which is a companion to opportunity. The informed and experienced investment manager, supported by broad-based research and analysis, can discern the investment opportunities associated with volatility. In today’s global investment landscape, a host of variables exist that impact investment returns, both positively and negatively. At Gartmore, we put all of our resources into our goal of achieving acceptable risk-adjusted returns on behalf of our investors. We measure our investment success by your performance standards. We appreciate the trust you have placed in us, and we will continue to strive to fulfill your investment objectives in the coming year.
Wishing you a very happy and prosperous 2006,

Young D. Chin
Co-Global Chief Investment Officer – Equities
President and CEO
Gartmore Global Investments
Market Perspectives
October 31, 2005
Market volatility continues, but with a positive trend
The one-year period ended Oct. 31, 2005, witnessed considerable quarter-to-quarter volatility. The past 12 months clearly have been rife with reasons to justify the wide swings in market pricing. Although the markets gave investors a bumpy ride, most of those who held on were rewarded, illustrated by the fact that, for the annual reporting period, the Morgan Stanley Capital International Europe, Australasia and Far East (MSCI EAFE®) Index returned 18.59% and the Standard & Poor’s (S&P) 500® Index was up 8.72%.
A broad rally in global equity markets took hold in the final two months of 2004. International stocks, as represented by the MSCI EAFE Index, advanced 11.55% during this period, while the S&P 500 Index, a broad measure of the U.S. equity market, gained 7.59%.
As 2005 began, however, concerns about slack economic growth, the onset of inflation, increasing interest rates and spiraling energy costs led to a far less favorable environment for stocks, leaving most markets on the defensive. To varying degrees, these concerns would continue to plague the equity markets for the remainder of the year. The overall global economy nonetheless proved resilient. In the United States, the economy grew at a faster pace during the fiscal third quarter than initially anticipated, signaling improving economic health. From July through September, gross domestic product, the broadest measure of U.S. economic activity, grew 4.3%.
The dominant topic in 2005, particularly during the latter half of the year, was the continued impact of rising energy costs. As Hurricane Katrina barreled down on the energy-intensive Louisiana coast, the futures price of crude oil rose to a high of $70 per barrel while natural gas prices doubled—a classic one-two economic punch. A confluence of increased global demand, particularly from China, and concerns about supply shortages also contributed to energy price hikes.
Meanwhile, the Federal Reserve Board continued its measured increases of short-term interest rates, despite speculation that the moves would halt amid spiking energy costs. Throughout the reporting period, the rate rose from 1.75% to 3.75% as a result of eight consecutive 0.25% increases. As September wound down, however, energy prices began to fall, though they still were far above their year-ago averages. Further, inflationary fears began to subside as the Fed displayed its confidence in the economy. Ben Bernanke was appointed the new Fed Chairman in October to replace Alan Greenspan, who retires at the end of his term in January 2006.
Toward the end of the reporting period, consumer sentiment began to lag. From August to September, the consumer confidence measure fell from 105.5 to 86.6. In August, wages and salaries increased by 6.6%, yet disposable income declined 0.1% along with personal spending, which fell 0.5%—the biggest drop in more than three years.
During the reporting period, energy and natural resource company profits surged alongside soaring energy costs and expanding global demand. In the telecommunications industry, on the other hand, the costs of consolidation muted returns. Domestically, within the S&P 500 Index for the entire reporting period, sector performance ranged from a high of 59% for health services (31% in the MSCI EAFE Index) to a low of –5% for consumer services (9% in the MSCI EAFE Index). Stocks in industrials, energy and distribution services delivered returns of 42%, 31% and 25% (43%, 24% and 46% in the MSCI EAFE Index), respectively, while stocks in consumer durables and communications delivered negative returns of –4% and –0.5% (14% and 5% in the MSCI EAFE Index), respectively.
Key trends for investors to watch
As we look toward the coming year, these are some of the key trends that we are paying particularly close attention to as we shape our investment strategies at Gartmore:
An aging population. During 2005, a landmark social milestone occurred when the leading edge of the baby boom generation reached 60 years of age. Since the early post-World War II years, the baby boomers, as one of the largest subsections of the U.S. population, have reshaped the social landscape in innumerable ways. This group’s retirement will continue the process. The country’s financial institutions, for example, will accelerate the re-engineering of their products and services toward wealth preservation, not just wealth generation. On the downside, though, the strain on many under-funded pension plans, in addition to the Social Security system, may reverberate through the markets in unexpected and unsettling ways.
Housing prices—up, down or sideways? The housing market remained strong during the reporting period, with 30-year fixed mortgage rates remaining below 6% for the majority of the time. Confounding expectations amid Hurricanes Katrina and Rita and rising energy costs, existing home sales advanced to an all-time high of 2% in August. The robust housing market contributed much to the overall “wealth effect” for real estate investors. By the end of the reporting period, however, more pronounced signs of softening became evident.
One housing trend associated with the aging of the population: a wave of residential downsizing as retirees seek more practical, late-in-life living arrangements. Moreover, individuals are pulling back from the real estate
speculation of the past few years as quick price appreciation has cooled in once-hot markets such as Las Vegas, Miami, Phoenix and San Diego.
The cost of socialization. During the past year, it has become even clearer that many corporations and countries must take a harder look at dealing with the burgeoning weight of socialization, which consists of, among other factors, health-care and retirement benefits. In fact, the future cost of socialization at both the corporate and country level will be of increasing concern in determining investment potential. Many longstanding business models and corporate policies will be revised in light of unsustainably heavy socialization costs.
France’s refusal to endorse the European Union (EU) constitution, for example, can be tied to the issue of socialization. Most observers believe that voters feared that a stronger EU would create an influx of cheap labor just as France was struggling to reduce high unemployment. In the United States, the issue of socialization was clearly evident in the United Auto Workers’ agreement with General Motors Corp. (GM) to cut health-care benefits for employees, retirees and their families. GM successfully argued that escalating pension and health-care benefits for a vast pool of retirees was forcing the enterprise into bankruptcy, which is a landmark shift in the auto industry’s historical model.
The international economic picture. In the latter part of 2005, the economies of Japan and Europe, including the United Kingdom, improved due to strong corporate profitability and expectations of higher levels of merger-and-acquisition activity. Europe was buoyed by export growth on the back of the weak euro. In Japan, meanwhile, rising real incomes and capital expenditure led to hopes of a sustainable recovery. Expectations rose when Prime Minister Junichiro Koizumi achieved a resounding victory in parliamentary elections, which gave his government a solid mandate for reform.
China’s economy grew rapidly during the reporting period. Despite ongoing criticism that governmental controls on the economy were overly rigid—particularly regarding commodity prices and imports/exports—China’s economy has largely stabilized and shows strong signs of continued growth. In fact, the government’s economic controls, once viewed as unduly prohibitive, are now credited with controlling what was becoming a dangerously overheated economy. For example, new factories were being developed in China at a rapid rate based on capital secured with minimal credit checks. Before long, some banks held portfolios with up to 45% nonperforming loans as a result of default. Government regulators subsequently mandated stricter credit rules and have even expressed a desire to improve China’s banks to such a degree that their credit quality would be attractive to foreign investors.
Throughout the first half of the year, the U.S. dollar continued its sustained, three-year decline versus benchmark currencies such as the euro. In mid-summer, however, the dollar reversed its multi-year trend. The dollar’s increase is due primarily to the strengthening U.S. economic outlook relative to the global platform and disappointment in European reform. In addition, two factors—the United Kingdom’s halting of interest-rate hikes and France’s vote against the EU constitution—have placed pressure on the euro, effectively bolstering the U.S. dollar.
The return of capital expenditures. As we look toward 2006, we are seeing a trend toward companies deploying large amounts of excess cash on their balance sheets. Since the 2000 market meltdown, many companies have relied on cash as their primary hedge against diminished revenues. Now, however, as the equity markets continue to recover, many of these firms are feeling the pressure either to put the money to work in various ways, such as toward acquisitions, or return the money to shareholders in the form of dividend payouts or share buybacks. The technology sector could be a notable beneficiary of this trend. Research and development as well as new product rollouts are key drivers in the technology industry, and both areas will be bolstered by increased spending.
Looking ahead
For the near term, investors will face a mixture of positive and negative factors. On the one hand, economic and corporate earnings growth is likely to slow in the coming months. Counterbalancing this slowdown could be positive sentiment surrounding the end of the Fed’s cycle of interest-rate hikes, which we anticipate will occur in the first half of 2006. If, as we expect, the peak in rates is accompanied by softening oil prices and a firm U.S. dollar, the investment environment should be favorable for equity markets.
PAST PERFORMANCE DOES NOT GUARANTEE FUTURE RESULTS. To obtain performance information current to the most recent month-end, which may be higher or lower than the performance shown above, please call 800-848-0920 or go to www.gartmorefunds.com
Market Perspectives
Continued
The opinions expressed herein are those of Gartmore Global Investments and may not come to pass.
Investing in mutual funds involves risk, including possible loss of principal. There is no assurance that the investment objective of any fund will be achieved.
The Gartmore Optimal Allocations Funds are designed to provide diversification and asset allocation across several types of investments and asset classes, primarily by investing in underlying Gartmore funds.
There is no assurance that a diversified portfolio will produce better results than a nondiversified one.
Each Fund is subject to different levels of risk, based on the size of its asset class allocations.
Index performance is provided for comparison purposes only; indexes are unmanaged and no fees or expenses are reflected. Individuals cannot invest directly in an index. Market index performance is provided by a third party source that Gartmore deems reliable.
The Gartmore Small Cap Fund may purchase securities in initial public offerings, which can be very volatile and carry high transaction costs.
Small-company stocks have higher risks than the stocks of larger, more established companies and have significant short-term price volatility.
Funds that concentrate on specific sectors or a relatively small number of securities may be subject to greater volatility than that of other mutual funds. International investing involves additional risks, including currency fluctuations, differences in accounting standards, political instability and foreign regulations, all of which are magnified in emerging markets.
In order to achieve the Gartmore U.S. Growth Leaders Long-Short Fund’s objective, the managers may use sophisticated investment strategies such as short selling, short-term trading and investing in smaller companies. These strategies may cause the Fund to have greater risk and volatility, and higher expenses, than those of other investments. The risks of investing in this Fund are more fully detailed within the Fund’s prospectus.
The Gartmore Optimal Allocations Fund: Aggressive benchmark consists of 70% S&P 500 Index, 25% MSCI EAFE Index and 5% Lehman Brothers U.S. Aggregate Index.
The Gartmore Optimal Allocations Fund: Moderately Aggressive benchmark consists of 60% S&P 500 Index, 20% MSCI EAFE Index and 20% Lehman Brothers U.S. Aggregate Index.
The Gartmore Optimal Allocations Fund: Moderate benchmark consists of 40% S&P 500 Index, 20% MSCI EAFE Index and 40% Lehman Brothers U.S. Aggregate Index.
The Gartmore Optimal Allocations Fund: Specialty benchmark consists of 70& S&P 500 Index and 30% MSCI EAFE Index.
Standard & Poor’s 500® (S&P 500) Index: An unmanaged, market capitalization-weighted index of 500 widely held stocks of large-cap U.S. companies that gives a broad look at how the stock prices of those companies have performed.
Lehman Brothers U.S. Aggregate Index: An unmanaged, market value-weighted index of investment-grade, fixed-rate debt issues (including government, corporate, asset-backed, and mortgage-backed securities with maturities of one year or more) that is generally representative of the bond market as a whole.
Morgan Stanley Capital International Europe, Australasia and Far East (MSCI EAFE®) Index: An unmanaged, free float-adjusted, market capitalization-weighted index that is designed to measure the performance of stocks in developed markets outside the United States and Canada.
Goldman Sachs Natural Resources Index: An unmanaged, modified market capitalization-weighted sector index of U.S.-traded natural resource-related stocks; includes companies in the categories of extractive industries, energy companies, owners and operators of timber tracts, forestry services, producers of pulp and paper, and owners of plantations.
Citigroup 3-Month T-Bill Index: An unmanaged index that is generally representative of 3-month Treasury bills; consists of an average of the last 3-month Treasury bill issues (excluding the current month-end bill).
Morgan Stanley Capital International Emerging Markets (MSCI EM) IndexSM: An unmanaged, free float-adjusted, market capitalization-weighted index that is designed to measure the performance of the stocks in emerging-country markets.
Morgan Stanley Capital International (MSCI) All Country World excluding U.S. Index: An unmanaged, free float-adjusted, market-capitalization weighted index that is designed to measure the performance of the stocks in companies in all countries except the United States.
Morgan Stanley Capital International (MSCI) World IndexSM: An unmanaged, free float-adjusted, market capitalization-weighted index that is designed to measure the performance of global developed-market equities.
Russell 2000® Index: An unmanaged index that measures the performance of the stocks of small-capitalization U.S. companies; includes the smallest 2,000 U.S. companies in the Russell 3000® Index, which measures the performance of the largest 3,000 U.S. companies, based on market capitalization.
Each Fund’s underlying funds may be subject to specific investment risks such as those associated with a concentrated number of securities (such as REITs), small companies, international stocks, initial public offerings, short selling, short-term trading, bonds and short-term instruments.
Investors should carefully consider a fund’s investment objectives, risks, fees, charges and expenses before investing any money. To obtain this and other information on Gartmore’s funds, please call 800-848-0920 to request a prospectus, or download a prospectus at www.gartmorefunds.com. Please read it carefully before investing any money.
Gartmore Funds distributed by Gartmore Distribution Services, Inc., Member NASD. 1200 River Road, Suite 1000, Conshohocken, PA 19428.
Gartmore Global Investments, one of its affiliated advisers, or its employees, may have a position in the securities named in this report.
This report is for informational purposes only, and is not intended as an offer or recommendation with respect to the purchase or sale of any security, option, future or other derivatives in such securities.
A complete list of all transactions in the last 12-months is available upon request.
Although third party information has been obtained from and is based on sources the Firm believes to be reliable, the Firm does not guarantee the accuracy of the information, and it may be incomplete or condensed.
Lipper Analytical Services, Inc. is an industry research firm whose rankings are based on total return performance and do not reflect the effect of sales charges. Each fund is ranked within a universe of funds similar in investment objective as determined by Lipper.
Gartmore Global Financial Services Fund
For the annual period ended Oct. 31, 2005, the Gartmore Global Financial Services Fund returned 14.91% (Class A at NAV) versus 14.75% for its benchmark, the Morgan Stanley Capital International (MSCI) World Financials IndexSM. For broader comparison, the average return for the Fund’s Lipper peer category of Financial Services Funds was 8.95%.
Global economies remained strong over the past year. Even Japan rebounded from its long-lasting sluggishness. Several central banks raised interest rates through the year to reduce inflation risks caused by commodity and real estate price increases. Financial services stocks typically are affected by changes in the level of interest rates and the shape of the yield curve [a plotted graph line of the yields (or interest rates) on long-term and short-term maturity bonds, usually treasury securities]. This translated into downward pressure on earnings for banks in the United States and Europe, as most global yield curves have been relatively flat compared to the past few years.
The Fund’s portfolio benefited from strong stock selection through the past year. Fund performance was hindered versus the benchmark by negative contributions from industry allocations, including the Fund’s underweight position in real estate stocks.
The Fund benefited from strong performance in U.S. and Japanese stocks. Orix Corp. (U.S.) and Mitsubishi UFJ (Japan) were important holdings for the Fund and surged over 50% during the year. Orix, a diversified lender and real estate player, benefited from improving property values and credit quality and growth. Mitsubishi and UFJ completed their merger to form the world’s largest bank. Franklin Resources, the global asset manager, and American Capital Strategies, a lender to mid-sized companies, both rallied sharply and added to the Fund’s returns.
On a stock-specific level, futures brokerage firm Refco Inc. and Aspen Insurance Holdings, Ltd. detracted from Fund performance. Refco’s stock plummeted after revelations of accounting fraud and the CEO’s resignation. Aspen’s stock fell after the firm released higher loss estimates from Hurricanes Katrina and Rita.
While we are positive on the prospects for global economic growth, we are cautious about several factors, including credit quality and margin compression in the banking arena, as we head into 2006. The Fund is positioned to benefit from stronger reinsurance pricing, strong capital markets activity and continued growth around the globe. U.S. and Japanese stocks are overweight in the Fund as compared to the benchmark at the expense of Europe, where we see more limits on growth in 2006. On a sector basis, the Fund favors capital markets and insurance stocks over banks, where the Fund is underweight on a global basis.
Portfolio Managers:
Douglas Burtnick, CFA and Stuart Quint, CFA
| | |
Fund Performance | | Gartmore Global Financial Services Fund |
Average Annual Total Return
(For periods ended October 31, 2005)
| | | | | | |
| | | | | 1 Yr. | | Inception1 |
| Class A | | w/o SC2 | | 14.91% | | 12.75% |
| | | w/SC3 | | 8.32% | | 11.04% |
| Class B | | w/o SC2 | | 14.02% | | 11.92% |
| | | w/SC4 | | 9.02% | | 11.35% |
| Class C | | w/o SC2 | | 13.94% | | 11.90% |
| | | w/SC5 | | 12.94% | | 11.90% |
| Class R6,8 | | | | 14.82% | | 12.20% |
| Institutional Class7,8 | | | | 15.20% | | 13.03% |
| Institutional Service Class8 | | | | 15.20% | | 13.03% |
All figures showing the effect of a sales charge reflect the maximum charge possible, because it has the most dramatic effect on performance data.
| 1 | Fund commenced operations on December 18, 2001. |
| 2 | These returns do not reflect the effects of sales charges (SC). |
| 3 | A 5.75% front-end sales charge was deducted. |
| 4 | A 5.00% contingent deferred sales charge (CDSC) was deducted. The CDSC declines to 0% after 6 years. |
| 5 | A CDSC of 1.00% was deducted because it is charged when you sell Class C shares within the first year after purchase. |
| 6 | These returns until the creation of Class R shares (12/30/03) include the performance of the Fund’s Class B shares. The returns have been adjusted for the fact that Class R shares do not have any applicable sales charges but have not been adjusted for the lower expenses applicable to Class R shares. Excluding the effect of any fee waivers or reimbursements, such prior performance is similar to what Class R shares would have produced because the Class R shares invest in the same portfolio of securities as Class B shares. |
| 7 | These returns until the creation of Institutional Class shares (6/29/04) include the performance of the Fund’s Institutional Service shares. The returns have been adjusted for the fact that Institutional Class shares do not have any applicable sales charges but have not been adjusted for the lower expenses applicable to Institutional Class shares. Excluding the effect of any fee waivers or reimbursements, such prior performance is similar to what Institutional Class shares would have produced because the Institutional Class shares invest in the same portfolio of securities as Institutional Service shares. |
| 8 | Not subject to any sales charges. |
Performance of a $10,000 Investment
Investment return and principal value will fluctuate, and when redeemed, shares may be worth more or less than original cost. Past performance is no guarantee of future results and does not reflect the deduction of taxes that a shareholder would pay on fund distributions or the redemption of fund shares. Investing in mutual funds involves market risk, including loss of principal. Performance returns assume the reinvestment of all distributions.
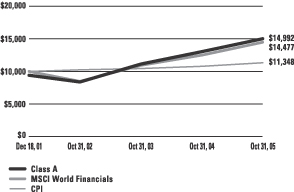
Comparative performance of $10,000 invested in Class A shares of the Gartmore Global Financial Services Fund, Morgan Stanley Capital International World Financials Index (MSCI World Financials)(a), and the Consumer Price Index (CPI)(b) since inception. Unlike the Fund, the returns for these unmanaged indexes do not reflect any fees, expenses, or sales charges. Investors cannot invest directly in market indexes.
| (a) | The MSCI World Financials is an unmanaged index representative of the stocks in the global financial services sector and is based on 23 developed market country indices. |
| (b) | The CPI represents changes in prices of a basket of goods and services purchased for consumption by urban households. |
| | |
Shareholder Expense Example | | Gartmore Global Financial Services Fund |
As a shareholder of the Fund, you incur two types of costs: (1) transaction costs, including sales charges (loads) paid on purchase payments and redemption fees; and (2) ongoing costs, including investment advisory fees, administration fees, distribution fees and other Fund expenses. The examples below are intended to help you understand your ongoing costs (in dollars) of investing in the Fund and to compare these costs with the ongoing costs of investing in other mutual funds. Per SEC requirements, the examples assume that you had a $1,000 investment in the Class at the beginning of the reporting period, May 1, 2005, and continued to hold your shares at the end of the reporting period, October 31, 2005.
Actual Expenses
For each Class of the Fund in the table below, the first line provides information about actual account values and actual expenses. You may use the information in this line, together with the amount you invested, to estimate the expenses that you paid over the period. Simply divide your account value by $1,000 (for example, an $8,600 account value divided by $1,000 = 8.6), then multiply the result by the number in the first line of each Class under the heading entitled “Expenses Paid During Period” to estimate the expenses you paid on your account during the period.
Hypothetical Example for Comparison Purposes
The second line of each Class in the table below provides information about hypothetical account values and hypothetical expenses based on the Class’ actual expense ratio and an assumed rate of return of 5% per year before expenses, which is not the Class’ actual return. The hypothetical account values and expenses may not be used to estimate the actual ending account balance or expenses you paid for the period. You may use this information to compare the ongoing costs of investing in the Class of the Fund and other funds. To do so, compare this 5% hypothetical example with the 5% hypothetical examples that appear in the shareholder reports of the other funds.
Please note that the expenses shown in the table are meant to highlight your ongoing costs only and do not reflect any transaction costs, such as sales charges (loads) or redemption fees. Therefore, the second line for each Class in the table is useful in comparing ongoing costs only, and will not help you determine the relative total costs of owning different funds. In addition, if these transaction costs were included, your costs would have been higher. The examples also assume all dividends and distributions have been reinvested.
Schedule of Shareholder Expenses
Expense Analysis of a $1,000 Investment
(October 31, 2005)
| | | | | | | | | | | | | | |
| Global Financial Services Fund | | | | | Beginning
Account Value,
5/1/05 | | Ending
Account Value,
10/31/05 | | Expenses Paid
During Period* | | Annualized
Expense Ratio* |
| Class A | | Actual | | | $ | 1,000.00 | | $ | 1,089.30 | | $ | 8.74 | | 1.66% |
| | | Hypothetical | 1 | | $ | 1,000.00 | | $ | 1,016.63 | | $ | 8.47 | | 1.66% |
| Class B | | Actual | | | $ | 1,000.00 | | $ | 1,086.10 | | $ | 12.62 | | 2.40% |
| | | Hypothetical | 1 | | $ | 1,000.00 | | $ | 1,012.90 | | $ | 12.25 | | 2.40% |
| Class C | | Actual | | | $ | 1,000.00 | | $ | 1,085.40 | | $ | 12.62 | | 2.40% |
| | | Hypothetical | 1 | | $ | 1,000.00 | | $ | 1,012.90 | | $ | 12.25 | | 2.40% |
| Class R | | Actual | | | $ | 1,000.00 | | $ | 1,089.60 | | $ | 9.11 | | 1.73% |
| | | Hypothetical | 1 | | $ | 1,000.00 | | $ | 1,016.28 | | $ | 8.83 | | 1.73% |
| Institutional Service Class | | Actual | | | $ | 1,000.00 | | $ | 1,091.00 | | $ | 7.38 | | 1.40% |
| | | Hypothetical | 1 | | $ | 1,000.00 | | $ | 1,017.94 | | $ | 7.15 | | 1.40% |
| Institutional Class | | Actual | | | $ | 1,000.00 | | $ | 1,091.00 | | $ | 7.38 | | 1.40% |
| | | Hypothetical | 1 | | $ | 1,000.00 | | $ | 1,017.94 | | $ | 7.15 | | 1.40% |
| * | Expenses are equal to the Fund’s annualized expense ratio multiplied by the average account value over the period multiplied by 184/365 (to reflect the one-half year period). The expense ratio presented represents a six month, annualized ratio in accordance with SEC guidelines. |
| 1 | Represents the hypothetical 5% return before expenses. |
| | |
Portfolio Summary | | Gartmore Global Financial Services Fund |
The SEC adopted a requirement that Funds present their portfolio holdings in a table, chart or graph format in their annual and semiannual reports to shareholders, whether or not a statement of investments is utilized. The following tables, which present portfolio holdings as a percentage of net assets, are provided in compliance with this requirement.
| | |
| Asset Allocation | | |
| Common Stocks | | 96.3% |
| Cash Equivalents | | 5.6% |
| Liabilities in excess of Other Assets | | -1.9% |
| | |
|
| | | 100.0% |
| | |
| Top Industries | | |
| Financial Services | | 40.0% |
| Banking | | 35.6% |
| Insurance | | 18.6% |
| Real Estate Investment Trusts | | 1.5% |
| Other | | 4.3% |
| | |
|
| | | 100.0% |
| | |
| Top Holdings* | | |
| Bank of America Corp. | | 3.8% |
| American International Group, Inc. | | 3.5% |
| Wachovia Corp. | | 3.1% |
| UBS AG | | 3.0% |
| Mitsubishi Tokyo Financial Group, Inc. | | 3.0% |
| Citigroup, Inc. | | 2.9% |
| HSBC Holdings PLC | | 2.6% |
| BNP Paribas SA | | 2.5% |
| Deutsche Bank AG | | 2.5% |
| American Express Co. | | 2.5% |
| Other Holdings | | 70.6% |
| | |
|
| | | 100.0% |
| * | For purpose of listing top holdings, repurchase agreements are considered cash equivalents and are included as part of Other Holdings. |
Statement of Investments
October 31, 2005
Gartmore Global Financial Services Fund
| | | | | |
| | | Shares or
Principal Amount | | Value |
| | | | | | |
AUSTRALIA (3.4%) | | | | | |
Banking (2.4%) | | | | | |
Australia & New Zealand Banking Group Ltd. (c) | | 10,960 | | $ | 193,431 |
National Australia Bank Ltd. (c) | | 6,530 | | | 161,479 |
| | | | |
|
|
| | | | | | 354,910 |
| | | | |
|
|
Financial Services (1.0%) | | | | | |
Australian Stock Exchange Ltd. (c) | | 6,690 | | | 144,185 |
| | | | |
|
|
| | | | | | 499,095 |
| | | | |
|
|
BELGIUM (0.8%) | | | | | |
Financial Services (0.8%) | | | | | |
Fortis NV (c) | | 3,900 | | | 111,011 |
| | | | |
|
|
BERMUDA (0.8%) | | | | | |
Insurance (0.8%) | | | | | |
ACE Ltd. | | 2,400 | | | 125,040 |
| | | | |
|
|
CANADA (1.9%) | | | | | |
Financial Services (1.9%) | | | | | |
Manulife Financial Corp. (c) | | 5,310 | | | 276,428 |
| | | | |
|
|
FRANCE (3.2%) | | | | | |
Banking (2.5%) | | | | | |
BNP Paribas SA (c) | | 4,840 | | | 367,052 |
| | | | |
|
|
Insurance (0.7%) | | | | | |
Axa (c) | | 3,560 | | | 103,105 |
| | | | |
|
|
| | | | | | 470,157 |
| | | | |
|
|
GERMANY (2.5%) | | | | | |
Financial Services (2.5%) | | | | | |
Deutsche Bank AG (c) | | 3,920 | | | 366,725 |
| | | | |
|
|
HONG KONG (0.8%) | | | | | |
Financial Services (0.8%) | | | | | |
Hang Lung Group Ltd. (c) | | 67,720 | | | 125,147 |
| | | | |
|
|
IRELAND (1.7%) | | | | | |
Banking (1.7%) | | | | | |
Bank of Ireland (c) | | 16,680 | | | 254,490 |
| | | | |
|
|
ITALY (1.4%) | | | | | |
Banking (1.4%) | | | | | |
UniCredito Italiano SpA (c) | | 37,020 | | | 206,706 |
| | | | |
|
|
| | | | | |
| | | Shares or
Principal Amount | | Value |
| | | | | | |
JAPAN (8.7%) | | | | | |
Banking (0.7%) | | | | | |
Sumitomo Trust & Banking (c) | | 13,000 | | $ | 110,692 |
| | | | |
|
|
Financial Services (8.0%) | | | | | |
Mitsubishi Tokyo Financial Group, Inc. (c) | | 35 | | | 439,971 |
Mizuho Financial Group, Inc. (c) | | 54 | | | 360,553 |
Orix Corp. (c) | | 1,200 | | | 225,048 |
Sumitomo Mitsui Financial Group, Inc. (c) | | 17 | | | 157,030 |
| | | | |
|
|
| | | | | | 1,182,602 |
| | | | |
|
|
| | | | | | 1,293,294 |
| | | | |
|
|
NETHERLANDS (2.8%) | | | | | |
Financial Services (0.8%) | | | | | |
ABN Amro Holding NV (c) | | 4,990 | | | 118,018 |
| | | | |
|
|
Insurance (2.0%) | | | | | |
ING Groep NV (c) | | 10,130 | | | 292,132 |
| | | | |
|
|
| | | | | | 410,150 |
| | | | |
|
|
SPAIN (2.1%) | | | | | |
Banking (2.1%) | | | | | |
Banco Bilbao Vizcaya Argentaria SA (c) | | 17,710 | | | 312,263 |
| | | | |
|
|
SWEDEN (0.9%) | | | | | |
Banking (0.9%) | | | | | |
Skandinaviska Enskilda Banken AB (c) | | 7,250 | | | 135,285 |
| | | | |
|
|
SWITZERLAND (3.0%) | | | | | |
Financial Services (3.0%) | | | | | |
UBS AG (c) | | 5,210 | | | 444,294 |
| | | | |
|
|
UNITED KINGDOM (9.4%) | | | | | |
Banking (7.8%) | | | | | |
HBOS PLC (c) | | 16,200 | | | 239,285 |
HSBC Holdings PLC (c) | | 24,563 | | | 385,891 |
Lloyds TSB Group PLC (c) | | 36,100 | | | 295,186 |
Royal Bank of Scotland Group PLC (c) | | 8,630 | | | 238,954 |
| | | | |
|
|
| | | | | | 1,159,316 |
| | | | |
|
|

| Common Stocks (continued) |
| | | | | |
| | | Shares or
Principal Amount | | Value |
| | | | | | |
UNITED KINGDOM (continued) | | | | | |
Insurance (1.6%) | | | | | |
Royal & Sun Alliance Insurance Group PLC (c) | | 75,660 | | $ | 128,789 |
Willis Group Holdings Ltd. | | 2,800 | | | 103,992 |
| | | | |
|
|
| | | | | | 232,781 |
| | | | |
|
|
| | | | | | 1,392,097 |
| | | | |
|
|
UNITED STATES (52.9%) | | | | | |
Banking (16.3%) | | | | | |
Bank of America Corp. | | 12,790 | | | 559,435 |
Centerstate Banks of Florida, Inc. | | 1,650 | | | 56,348 |
Colonial BancGroup, Inc. | | 9,330 | | | 227,186 |
Hudson City Bancorp, Inc. | | 25,120 | | | 297,421 |
Marshall & Ilsley Corp. | | 3,830 | | | 164,537 |
Northern Trust Corp. | | 3,370 | | | 180,632 |
SunTrust Banks, Inc. | | 2,600 | | | 188,448 |
UnionBanCal Corp. | | 1,550 | | | 106,144 |
Wachovia Corp. | | 9,030 | | | 456,196 |
Zions Bancorp | | 2,420 | | | 177,797 |
| | | | |
|
|
| | | | | | 2,414,144 |
| | | | |
|
|
Financial Services (21.4%) | | | | | |
American Express Co. | | 7,310 | | | 363,819 |
AmeriCredit Corp. (b) | | 3,690 | | | 82,472 |
Charles Schwab Corp. (The) | | 7,910 | | | 120,232 |
Citigroup, Inc. | | 9,390 | | | 429,873 |
E*TRADE Financial Corp. (b) | | 8,020 | | | 148,771 |
Franklin Resources, Inc. | | 1,650 | | | 145,811 |
Freddie Mac | | 1,900 | | | 116,565 |
Goldman Sachs Group, Inc. | | 2,870 | | | 362,682 |
Host Marriott Corp. | | 5,100 | | | 85,629 |
Investors Financial Services Corp. | | 1,960 | | | 74,833 |
J.P. Morgan Chase & Co. | | 9,800 | | | 358,876 |
Legg Mason, Inc. | | 2,220 | | | 238,228 |
Lehman Brothers Holding, Inc. | | 950 | | | 113,687 |
MBNA Corp. | | 4,720 | | | 120,690 |
Merrill Lynch & Co., Inc. | | 4,020 | | | 260,255 |
TAL International Group, Inc. (b) | | 2,580 | | | 46,724 |
Washington Mutual, Inc. | | 2,430 | | | 96,228 |
| | | | |
|
|
| | | | | | 3,165,375 |
| | | | |
|
|
Insurance (13.7%) | | | | | |
AFLAC, Inc. | | 2,390 | | | 114,194 |
Allstate Corp. | | 1,390 | | | 73,378 |
| | | | | | | |
| | | Shares or
Principal Amount | | Value | |
| | | | | | | | |
Insurance (continued) | | | | | | | |
American International Group, Inc. | | | 8,020 | | $ | 519,696 | |
Aspen Insurance Holdings Ltd. | | | 1,510 | | | 36,527 | |
Assurant, Inc. | | | 1,900 | | | 72,580 | |
Endurance Specialty Holdings Ltd. | | | 3,780 | | | 125,345 | |
Genworth Financial, Inc., Class A | | | 7,590 | | | 240,527 | |
Max Re Capital Ltd. | | | 7,380 | | | 176,456 | |
PartnerRe Ltd. | | | 3,910 | | | 249,145 | |
Safeco Corp. | | | 1,850 | | | 103,045 | |
St. Paul Travelers Cos. | | | 5,010 | | | 225,600 | |
UnumProvident Corp. | | | 4,340 | | | 88,059 | |
| | | | | |
|
|
|
| | | | | | | 2,024,552 | |
| | | | | |
|
|
|
Real Estate Investment Trusts (1.5%) | | | | |
Colonial Properties Trust | | | 1,690 | | | 73,870 | |
ProLogis | | | 3,620 | | | 155,660 | |
| | | | | |
|
|
|
| | | | | | | 229,530 | |
| | | | | |
|
|
|
| | | | | | | 7,833,601 | |
| | | | | |
|
|
|
| | |
Total Common Stocks | | | | | | 14,255,783 | |
| | | | | |
|
|
|
|
Cash Equivalents (5.6%) | |
Investments in repurchase agreements (Collateralized by U.S. Government Agencies and U.S. Government Agency Mortgages, in a joint trading account at 3.90%, dated 10/31/05, due 11/01/05, repurchase price $829,902) | | $ | 829,812 | | | 829,812 | |
| | | | | |
|
|
|
| | |
Total Cash Equivalents | | | | | | 829,812 | |
| | | | | |
|
|
|
| |
Total Investments
(Cost $14,262,616) (a) — 101.9% | | | 15,085,595 | |
| | |
Liabilities in excess of other
assets — (1.9)% | | | | | | (282,483 | ) |
| | | | | |
|
|
|
| | |
NET ASSETS — 100.0% | | | | | $ | 14,803,112 | |
| | | | | |
|
|
|
| | (a) | See notes to financial statements for tax unrealized appreciation (depreciation) of securities. |
| | (b) | Denotes a non-income producing security. |
See notes to financial statements.
Gartmore Global Health Sciences Fund
For the annual period ended Oct. 31, 2005, the Gartmore Global Health Sciences Fund (Class A at NAV) returned 16.47% versus 17.58% for its benchmark, the Goldman Sachs Healthcare Index. For broader comparison, the average return for the Fund’s Lipper peer category of Health/Biotechnology Funds was 15.03%.
The health-care market experienced a bumpy ride in late 2004, largely due to Eli Lilly and Co.’s attempt to overcome a strong patent challenge from makers of generic drugs. This case posed a potentially substantial risk to the pharmaceuticals industry, so Lilly’s victory served to smooth the way for positive performance in 2005. The tight U.S. presidential race led some investors to sideline their money in the event that the incumbent, George Bush, was unseated. President Bush’s re-election in November set the stage for a short-lived relief rally in the health-care market.
The health-care sector performed steadily during the early months of the year until Tysabri, a new Food and Drug Administration-approved treatment for multiple sclerosis, was taken off the market after several deaths were reported shortly after the drug’s rollout. Questions were raised about the FDA, and sentiment regarding the sector was generally poor in the middle of 2005. In the latter half of the year, however, the health-care market turned around and, for the reporting period overall, both the Fund and its Index posted positive gains.
Sector allocations significantly detracted from Fund performance, which in turn led to underperformance versus the benchmark. In particular, weak performance from the insurance industry bogged returns. Strong stock selection, however, had a positive effect on the portfolio during the reporting period.
On a stock-specific level, significant detractors from Fund performance included Genentech, Inc.; Biogen, Idec Inc.; and WellPoint, Inc. Although Genentech has performed well, especially since the rollout of its new prescription drug Avastin, the Fund held an underweight position in the stock. Biogen Idec was affected by the aforementioned fatality reports involving the drug Tysabri, and WellPoint detracted from Fund performance due to the timing of our purchase decision.
The Fund held positions in several health maintenance organizations (HMOs), which benefited Fund performance, including UnitedHealth Group Inc., PacifiCare Health Systems, Inc., and Aetna Inc. UnitedHealth and PacifiCare are strong players in the HMO space; recently, UnitedHealth set forth its plan to purchase PacifiCare in order to extend its reach in the changing HMO landscape.
As we round out the year and look toward 2006, we are slightly guarded about the HMO industry, a long-time staple in the Fund. Several large HMO companies will be managing government-run prescription drug plans in an effort to increase profits, leaving these companies in a position to bid for existing business. The potential risk involved in this scenario is that not all companies will acquire their targets, thus, potentially leading to disappointing earnings growth. We are maintaining the Fund’s underweight in large-cap pharmaceuticals, but we continue to monitor the sector closely as positive news resonates from several European pharmaceutical stocks.
Portfolio Manager:
Paul Cluskey
| | |
Fund Performance | | Gartmore Global Health Sciences Fund |
Average Annual Total Return
(For periods ended October 31, 2005)
| | | | | | |
| | | | | 1 Yr. | | Inception1 |
| Class A | | w/o SC2 | | 16.47% | | 5.04% |
| | | w/SC3 | | 9.80% | | 3.76% |
| Class B | | w/o SC2 | | 15.78% | | 4.35% |
| | | w/SC4 | | 10.78% | | 4.00% |
| Class C5 | | w/o SC2 | | 15.66% | | 4.35% |
| | | w/SC6 | | 14.66% | | 4.35% |
| Class R7,8 | | 16.55% | | 4.56% |
| Institutional Class8 | | 16.90% | | 5.33% |
| Institutional Service Class8 | | 16.72% | | 5.27% |
All figures showing the effect of a sales charge reflect the maximum charge possible, because it has the most dramatic effect on performance data.
| 1 | Fund commenced operations on December 29, 2000. |
| 2 | These returns do not reflect the effects of sales charges (SC). |
| 3 | A 5.75% front-end sales charge was deducted. |
| 4 | A 5.00% contingent deferred sales charge (CDSC) was deducted. The CDSC declines to 0% after 6 years. |
| 5 | These returns until the creation of Class C shares (9/23/02) include the performance of the Fund’s Class B shares. Excluding the effects of any fee waivers or reimbursements, such prior performance is substantially similar to what Class C shares would have produced because Class C shares invest in the same portfolio of securities as Class B shares and have the same expenses after any fee waivers or reimbursements. For Class C shares returns with sales charges, these returns have been restated for the applicable sales charges. |
| 6 | A CDSC of 1.00% was deducted because it is charged when you sell Class C shares within the first year after purchase. |
| 7 | These returns until the creation of Class R shares (12/30/03) include the performance of the Fund’s Class B shares. The returns have been adjusted for the fact that Class R shares do not have any applicable sales charges but have not been adjusted for the lower expenses applicable to Class R shares. Excluding the effect of any fee waivers or reimbursements, such prior performance is similar to what Class R shares would have produced because the Class R shares invest in the same portfolio of securities as Class B shares. |
| 8 | These returns until the creation of Institutional Class shares (6/29/04) include the performance of the Fund’s Institutional Service shares. The returns have been adjusted for the fact that Institutional Class shares do not have any applicable sales charges but have not been adjusted for the lower expenses applicable to Institutional Class shares. Excluding the effect of any fee waivers or reimbursements, such prior performance is similar to what Institutional Class shares would have produced because the Institutional Class shares invest in the same portfolio of securities as Institutional Service shares. |
| 9 | Not subject to any sales charges. |
Performance of a $10,000 Investment
Investment return and principal value will fluctuate, and when redeemed, shares may be worth more or less than original cost. Past performance is no guarantee of future results and does not reflect the deduction of taxes that a shareholder would pay on fund distributions or the redemption of fund shares. Investing in mutual funds involves market risk, including loss of principal. Performance returns assume the reinvestment of all distributions.
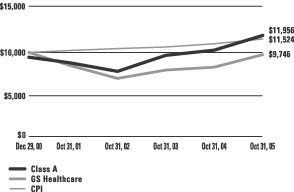
Comparative performance of $10,000 invested in Class A shares of the Gartmore Global Health Sciences Fund, the Goldman Sachs Healthcare Index (GS Healthcare)(a), and the Consumer Price Index (CPI)(b) since inception. Unlike the Fund, the returns for these unmanaged indexes do not reflect any fees, expenses, or sales charges. Investors cannot invest directly in market indexes.
| (a) | The GS Healthcare is an unmanaged index representative of the stocks in the healthcare sector. |
| (b) | The CPI represents changes in prices of a basket of goods and services purchased for consumption by urban households. |
| | |
Shareholder Expense Example | | Gartmore Global Health Sciences Fund |
As a shareholder of the Fund, you incur two types of costs: (1) transaction costs, including sales charges (loads) paid on purchase payments and redemption fees; and (2) ongoing costs, including investment advisory fees, administration fees, distribution fees and other Fund expenses. The examples below are intended to help you understand your ongoing costs (in dollars) of investing in the Fund and to compare these costs with the ongoing costs of investing in other mutual funds. Per SEC requirements, the examples assume that you had a $1,000 investment in the Class at the beginning of the reporting period, May 1, 2005, and continued to hold your shares at the end of the reporting period, October 31, 2005.
Actual Expenses
For each Class of the Fund in the table below, the first line provides information about actual account values and actual expenses. You may use the information in this line, together with the amount you invested, to estimate the expenses that you paid over the period. Simply divide your account value by $1,000 (for example, an $8,600 account value divided by $1,000 = 8.6), then multiply the result by the number in the first line of each Class under the heading entitled “Expenses Paid During Period” to estimate the expenses you paid on your account during the period.
Hypothetical Example for Comparison Purposes
The second line of each Class in the table below provides information about hypothetical account values and hypothetical expenses based on the Class’ actual expense ratio and an assumed rate of return of 5% per year before expenses, which is not the Class’ actual return. The hypothetical account values and expenses may not be used to estimate the actual ending account balance or expenses you paid for the period. You may use this information to compare the ongoing costs of investing in the Class of the Fund and other funds. To do so, compare this 5% hypothetical example with the 5% hypothetical examples that appear in the shareholder reports of the other funds.
Please note that the expenses shown in the table are meant to highlight your ongoing costs only and do not reflect any transaction costs, such as sales charges (loads) or redemption fees. Therefore, the second line for each Class in the table is useful in comparing ongoing costs only, and will not help you determine the relative total costs of owning different funds. In addition, if these transaction costs were included, your costs would have been higher. The examples also assume all dividends and distributions have been reinvested.
Schedule of Shareholder Expenses
Expense Analysis of a $1,000 Investment
(October 31, 2005)
| | | | | | | | | | | | | |
| Global Health Sciences Fund | | | | Beginning
Account Value,
5/1/05 | | Ending
Account Value,
10/31/05 | | Expenses Paid
During Period* | | Annualized
Expense Ratio* |
| Class A | | Actual | | $ | 1,000.00 | | $ | 1,047.70 | | $ | 8.41 | | 1.63% |
| | | Hypothetical1 | | $ | 1,000.00 | | $ | 1,016.78 | | $ | 8.32 | | 1.63% |
| Class B | | Actual | | $ | 1,000.00 | | $ | 1,044.50 | | $ | 11.80 | | 2.29% |
| | | Hypothetical1 | | $ | 1,000.00 | | $ | 1,013.46 | | $ | 11.69 | | 2.29% |
| Class C | | Actual | | $ | 1,000.00 | | $ | 1,043.60 | | $ | 11.80 | | 2.29% |
| | | Hypothetical1 | | $ | 1,000.00 | | $ | 1,013.46 | | $ | 11.69 | | 2.29% |
| Class R | | Actual | | $ | 1,000.00 | | $ | 1,047.90 | | $ | 7.90 | | 1.53% |
| | | Hypothetical1 | | $ | 1,000.00 | | $ | 1,017.29 | | $ | 7.81 | | 1.53% |
| Institutional Service Class | | Actual | | $ | 1,000.00 | | $ | 1,048.10 | | $ | 7.74 | | 1.50% |
| | | Hypothetical1 | | $ | 1,000.00 | | $ | 1,017.44 | | $ | 7.66 | | 1.50% |
| Institutional Class | | Actual | | $ | 1,000.00 | | $ | 1,048.90 | | $ | 6.61 | | 1.28% |
| | | Hypothetical1 | | $ | 1,000.00 | | $ | 1,018.55 | | $ | 6.53 | | 1.28% |
| * | Expenses are equal to the Fund’s annualized expense ratio multiplied by the average account value over the period multiplied by 184/365 (to reflect the one-half year period). The expense ratio presented represents a six month, annualized ratio in accordance with SEC guidelines. |
| 1 | Represents the hypothetical 5% return before expenses. |
| | |
Portfolio Summary | | Gartmore Global Health Sciences Fund |
The SEC adopted a requirement that Funds present their portfolio holdings in a table, chart or graph format in their annual and semiannual reports to shareholders, whether or not a statement of investments is utilized. The following tables, which present portfolio holdings as a percentage of net assets, are provided in compliance with this requirement.
| | |
| Asset Allocation | | |
| Common Stocks | | 93.7% |
| Cash Equivalents | | 12.4% |
| Other Investments* | | 9.6% |
| Liabilities in excess of Other Assets** | | -15.7% |
| | |
|
| | | 100.0% |
| * | Includes value of collateral received from securities lending. |
| ** | Includes value of collateral owed from securities lending. |
| | |
| Top Industries | | |
| Drugs | | 32.4% |
| Medical Products | | 17.2% |
| Insurance | | 9.4% |
| Therapeutics | | 7.6% |
| Medical Instruments | | 5.8% |
| Medical — Biomedical/Genetic | | 5.6% |
| Medical Products & Services | | 4.5% |
| Medical Services | | 4.0% |
| Healthcare Services | | 2.3% |
| Medical Laboratories | | 1.5% |
| Other Industries | | 9.7% |
| | |
|
| | | 100% |
| | |
| Top Holdings*** | | |
| Amgen, Inc. | | 6.6% |
| Wyeth | | 6.4% |
| Johnson & Johnson | | 6.1% |
| Pfizer, Inc. | | 5.0% |
| Medtronic, Inc. | | 4.5% |
| Cardinal Health, Inc. | | 4.5% |
| Genentech, Inc. | | 3.9% |
| UnitedHealth Group, Inc | | 3.7% |
| PacifiCare Health Systems, Inc. | | 3.3% |
| GlaxoSmithKline PLC ADR | | 3.2% |
| Other Holdings | | 52.8% |
| | |
|
| | | 100.0% |
| *** | For purpose of listing top holdings, repurchase agreements are considered cash equivalents and are included as part of Other Holdings. |
Statement of Investments
October 31, 2005
Gartmore Global Health Sciences Fund
| | U.S. Common Stocks (93.7%) |
| | | | | |
| | | Shares or
Principal Amount | | Value |
| | | | | | |
Distribution & Wholesale (0.6%) | | | |
MWI Veterinary Supply, Inc. (b) | | 7,327 | | $ | 164,271 |
| | | | |
|
|
Drugs (32.4%) | | | | | |
Amgen, Inc. (b) | | 22,689 | | | 1,718,919 |
GlaxoSmithKline PLC ADR — UK | | 16,120 | | | 838,079 |
Medicis Pharmaceutical Corp.,
Class A (c) | | 15,219 | | | 448,961 |
Novartis AG ADR — CH | | 9,858 | | | 530,558 |
Pfizer, Inc. | | 59,237 | | | 1,287,812 |
Roche Holding AG (d) | | 5,534 | | | 827,025 |
Schering-Plough Corp. | | 21,417 | | | 435,622 |
Shire Pharmaceuticals Group PLC (c) | | 17,977 | | | 644,296 |
Wyeth | | 37,259 | | | 1,660,261 |
| | | | |
|
|
| | | | | | 8,391,533 |
| | | | |
|
|
Healthcare Services (2.3%) | | | | | |
WebMD Health Corp., Class A (b) (c) | | 22,499 | | | 587,674 |
| | | | |
|
|
Hospitals (1.3%) | | | | | |
Community Health Systems, Inc. (b) (c) | | 9,374 | | | 347,869 |
| | | | |
|
|
Insurance (9.4%) | | | | | |
Coventry Health Care, Inc. (b) | | 11,814 | | | 637,838 |
PacifiCare Health Systems, Inc. (b) | | 10,284 | | | 846,990 |
UnitedHealth Group, Inc. | | 16,505 | | | 955,475 |
| | | | |
|
|
| | | | | | 2,440,303 |
| | | | |
|
|
Medical – Biomedical/Genetic (5.6%) | | | |
Encysive Pharmaceuticals, Inc. (b) | | 26,192 | | | 275,016 |
Keryx Biopharmaceuticals, Inc. (b) (c) | | 21,247 | | | 307,019 |
MedImmune, Inc. (b) | | 17,027 | | | 595,604 |
Myogen, Inc. (b) | | 13,897 | | | 278,635 |
| | | | |
|
|
| | | | | | 1,456,274 |
| | | | |
|
|
Medical Instruments (5.8%) | | | | | |
Guidant Corp. | | 12,781 | | | 805,203 |
St. Jude Medical, Inc. (b) | | 14,547 | | | 699,274 |
| | | | |
|
|
| | | | | | 1,504,477 |
| | | | |
|
|
| | | | | | |
| | | Shares or
Principal Amount | | Value |
| | | | | | | |
Medical Laboratories (1.5%) | | | | | | |
Covance, Inc. (b) | | | 8,172 | | $ | 397,568 |
| | | | | |
|
|
Medical Products (17.2%) | | | | | | |
Cytyc Corp. (b) | | | 12,978 | | | 328,992 |
Haemonetics Corp. (b) (c) | | | 7,387 | | | 357,900 |
Johnson & Johnson | | | 25,123 | | | 1,573,203 |
Medtronic, Inc. | | | 20,534 | | | 1,163,457 |
NxStage Medical, Inc. (b) | | | 12,984 | | | 147,368 |
Panacos Pharmaceuticals, Inc. (b) | | | 52,066 | | | 411,321 |
ResMed, Inc. (b) (c) | | | 12,626 | | | 481,429 |
| | | | | |
|
|
| | | | | | | 4,463,670 |
| | | | | |
|
|
Medical Products & Services (4.5%) | | | |
Cardinal Health, Inc. | | | 18,488 | | | 1,155,685 |
| | | | | |
|
|
Medical Services (4.0%) | | | | | | |
McKesson Corp. | | | 11,398 | | | 517,811 |
Medco Health Solutions, Inc. (b) | | | 9,321 | | | 526,637 |
| | | | | |
|
|
| | | | | | | 1,044,448 |
| | | | | |
|
|
Medical Supplies (1.5%) | | | | | | |
PRA International (b) | | | 14,229 | | | 377,922 |
| | | | | |
|
|
Therapeutics (7.6%) | | | | | | |
Genentech, Inc. (b) | | | 11,150 | | | 1,010,190 |
Genzyme Corp. (b) | | | 9,234 | | | 667,618 |
Gilead Sciences, Inc. (b) | | | 5,857 | | | 276,743 |
| | | | | |
|
|
| | | | | | | 1,954,551 |
| | | | | |
|
|
| | |
Total Common Stocks | | | | | | 24,286,245 |
| | | | | |
|
|
|
Cash Equivalents (12.4%) |
| | |
Investments in repurchase agreements (Collateralized by U.S. Government Agencies and U.S. Government Agency Mortgages, in a joint trading account at 3.90%, dated 10/31/05, due 11/01/05, repurchase price $3,221,474) | | $ | 3,221,125 | | | 3,221,125 |
| | | | | |
|
|
| | |
Total Cash Equivalents | | | | | | 3,221,125 |
| | | | | |
|
|
Short-Term Securities Held as Collateral for Securities
Lending (9.6%)
| | | | | | | |
| | | Shares or
Principal Amount | | Value | |
| | | | | | | | |
Pool of short-term securities for Gartmore Mutual Funds — note 2 (Securities Lending) | | $ | 2,497,502 | | $ | 2,497,502 | |
| | | | | |
|
|
|
| |
Total Short-Term Securities Held as Collateral for Securities Lending | | | 2,497,502 | |
| | | | | |
|
|
|
| |
Total Investments
(Cost $29,689,779) (a) — 115.7% | | | 30,004,872 | |
| |
Liabilities in excess of other
assets — (15.7)% | | | (4,066,901 | ) |
| | | | | |
|
|
|
| | |
NET ASSETS — 100.0% | | | | | $ | 25,937,971 | |
| | | | | |
|
|
|
| | (a) | See notes to financial statements for tax unrealized appreciation (depreciation) of securities. |
| | (b) | Denotes a non-income producing security. |
| | (c) | All or part of the security was on loan as of October 31, 2005. |
| | ADR | American Depositary Receipt |
See notes to financial statements.
Gartmore Global Natural Resources Fund
For the annual period ended Oct. 31, 2005, the Gartmore Global Natural Resources Fund (Class A at NAV) returned 65.51% versus 34.75% for its benchmark, the Goldman Sachs Natural Resources Index. For broader comparison, the average return for the Fund’s Lipper peer category of Natural Resources Funds was 40.78%.
During the reporting period, the per-barrel price of oil was extremely volatile, peaking at more than $70 in September 2005. Gasoline prices reached record highs of more than $3.50 per gallon in the United States, while natural gas prices doubled as the hurricane season began. Observers were unsure if economic growth could be sustained in the face of these price increases. Fortunately, the economy proved resilient as investors and consumers continually adapted to the series of shocks. The Fund was aided by strong stock selection, particularly in the energy and materials sectors, relative to the Fund’s benchmark. Sector allocations also were positive, though slightly hampered by the Fund’s somewhat large cash holding.
Smaller companies with higher capacity for growth benefited most from the increases in energy prices during the reporting period. Among these smaller companies that were additive to Fund performance were Parallel Petroleum Corp. and Peabody Energy Corp. As one of the largest U.S.-based coal-mining companies, Peabody benefited from rising coal prices and a strong management team whose efficient use of capital added to the company’s growth. In the industrials sector, FreightCar America, Inc., a producer of aluminum railcars primarily for coal transport, also was additive to performance.
Among the stocks that detracted from Fund performance was dry bulk carrier DRYSHIPS INC. Initially the company appeared attractive, but the market soon became saturated as rival manufacturers took advantage of cheap production costs, cutting into the company’s profitability.
Also detracting from Fund performance was the Fund’s large cash position, which was held in anticipation of a market correction. As a strong correction did not materialize, this strategy hurt the Fund, preventing investment in other opportunities.
We believe that energy will still be in relatively short supply over the long term. During the past three years, the United States has made little to no headway toward settling disputes in the Middle East in an effort to increase oil production. Further, demand from China, Japan and India shows no signs of slowing. Because we believe that energy will be in great demand for an extended period of time, we will maintain the Fund’s overweight in the energy services sector, whose companies acquire, develop and exploit oil and natural gas properties. In addition, due to volume constraints, we will maintain the Fund’s underweight in the energy sector.
Portfolio Manager:
William Gerlach, CFA and Jason Kotik, CFA
| | |
Fund Performance | | Gartmore Global Natural Resources Fund |
Average Annual Total Return
(For periods ended October 31, 2005)
| | | | | | |
| | | | | 1 Yr. | | Inception1 |
| Class A | | w/o SC2 | | 65.51% | | 59.13% |
| | | w/SC3 | | 55.94% | | 52.25% |
| Class B | | w/o SC2 | | 64.49% | | 57.89% |
| | | w/SC4 | | 59.49% | | 55.33% |
| Class C | | w/o SC2 | | 64.42% | | 57.95% |
| | | w/SC5 | | 63.42% | | 57.95% |
| Class R6 | | 65.15% | | 58.49% |
| Institutional Class6 | | 66.02% | | 59.51% |
| Institutional Service Class6 | | 65.89% | | 59.31% |
All figures showing the effect of a sales charge reflect the maximum charge possible, because it has the most dramatic effect on performance data.
| 1 | Fund commenced operations on June 29, 2004. |
| 2 | These returns do not reflect the effects of sales charges (SC). |
| 3 | A 5.75% front-end sales charge was deducted. |
| 4 | A 5.00% contingent deferred sales charge (CDSC) was deducted. The CDSC declines to 1% after 6 years. |
| 5 | A CDSC of 1.00% was deducted because it is charged when you sell Class C shares within the first year after purchase. |
| 6 | Not subject to any sales charges. |
Performance of a $10,000 Investment
Investment return and principal value will fluctuate, and when redeemed, shares may be worth more or less than original cost. Past performance is no guarantee of future results and does not reflect the deduction of taxes that a shareholder would pay on fund distributions or the redemption of fund shares. Investing in mutual funds involves market risk, including loss of principal. Performance returns assume the reinvestment of all distributions.
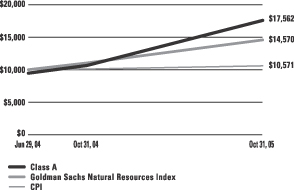
Comparative performance of $10,000 invested in Class A shares of the Gartmore Global Natural Resources Fund, Goldman Sachs Natural Resources Index (a), and the Consumer Price Index (CPI)(b) since inception. Unlike the Fund, the returns for these unmanaged indexes do not reflect any fees, expenses, or sales charges. Investors cannot invest directly in market indexes.
| (a) | Goldman Sachs Natural Resources is an unmanaged, modified market capitalization-weighted sector index of U.S.-traded natural resource-related stocks; includes companies in the categories of extractive industries, energy companies, owners and operators of timber tracts, forestry services, producers of pulp and paper, and owners of plantations. |
| (b) | The CPI represents changes in prices of a basket of goods and services purchased for consumption by urban households. |
| | |
Shareholder Expense Example | | Gartmore Global Natural Resources Fund |
As a shareholder of the Fund, you incur two types of costs: (1) transaction costs, including sales charges (loads) paid on purchase payments and redemption fees; and (2) ongoing costs, including investment advisory fees, administration fees, distribution fees and other Fund expenses. The examples below are intended to help you understand your ongoing costs (in dollars) of investing in the Fund and to compare these costs with the ongoing costs of investing in other mutual funds. Per SEC requirements, the examples assume that you had a $1,000 investment in the Class at the beginning of the reporting period, May 1, 2005, and continued to hold your shares at the end of the reporting period, October 31, 2005.
Actual Expenses
For each Class of the Fund in the table below, the first line provides information about actual account values and actual expenses. You may use the information in this line, together with the amount you invested, to estimate the expenses that you paid over the period. Simply divide your account value by $1,000 (for example, an $8,600 account value divided by $1,000 = 8.6), then multiply the result by the number in the first line of each Class under the heading entitled “Expenses Paid During Period” to estimate the expenses you paid on your account during the period.
Hypothetical Example for Comparison Purposes
The second line of each Class in the table below provides information about hypothetical account values and hypothetical expenses based on the Class’ actual expense ratio and an assumed rate of return of 5% per year before expenses, which is not the Class’ actual return. The hypothetical account values and expenses may not be used to estimate the actual ending account balance or expenses you paid for the period. You may use this information to compare the ongoing costs of investing in the Class of the Fund and other funds. To do so, compare this 5% hypothetical example with the 5% hypothetical examples that appear in the shareholder reports of the other funds.
Please note that the expenses shown in the table are meant to highlight your ongoing costs only and do not reflect any transaction costs, such as sales charges (loads) or redemption fees. Therefore, the second line for each Class in the table is useful in comparing ongoing costs only, and will not help you determine the relative total costs of owning different funds. In addition, if these transaction costs were included, your costs would have been higher. The examples also assume all dividends and distributions have been reinvested.
Schedule of Shareholder Expenses
Expense Analysis of a $1,000 Investment
(October 31, 2005)
| | | | | | | | | | | | | | |
| Global Natural Resources Fund | | | | | Beginning
Account Value,
5/1/05 | | Ending
Account Value,
10/31/05 | | Expenses Paid
During Period* | | Annualized
Expense Ratio* |
| Class A | | Actual | | | $ | 1,000 | | $ | 1,413 | | $ | 8.88 | | 1.46% |
| | | Hypothetical | 1 | | $ | 1,000 | | $ | 1,018 | | $ | 7.45 | | 1.46% |
| Class B | | Actual | | | $ | 1,000 | | $ | 1,408 | | $ | 13.35 | | 2.20% |
| | | Hypothetical | 1 | | $ | 1,000 | | $ | 1,014 | | $ | 11.23 | | 2.20% |
| Class C | | Actual | | | $ | 1,000 | | $ | 1,407 | | $ | 13.35 | | 2.20% |
| | | Hypothetical | 1 | | $ | 1,000 | | $ | 1,014 | | $ | 11.23 | | 2.20% |
| Class R | | Actual | | | $ | 1,000 | | $ | 1,410 | | $ | 10.08 | | 1.66% |
| | | Hypothetical | 1 | | $ | 1,000 | | $ | 1,017 | | $ | 8.47 | | 1.66% |
| Institutional Service Class | | Actual | | | $ | 1,000 | | $ | 1,413 | | $ | 7.36 | | 1.21% |
| | | Hypothetical | 1 | | $ | 1,000 | | $ | 1,019 | | $ | 6.18 | | 1.21% |
| Institutional Class | | Actual | | | $ | 1,000 | | $ | 1,414 | | $ | 7.30 | | 1.20% |
| | | Hypothetical | 1 | | $ | 1,000 | | $ | 1,019 | | $ | 6.12 | | 1.20% |
| * | Expenses are equal to the Fund’s annualized expense ratio multiplied by the average account value over the period multiplied by 184/365 (to reflect the one-half year period). The expense ratio presented represents a six month, annualized ratio in accordance with SEC guidelines. |
| 1 | Represents the hypothetical 5% return before expenses. |
| | |
Portfolio Summary | | Gartmore Global Natural Resources Fund |
The SEC adopted a requirement that Funds present their portfolio holdings in a table, chart or graph format in their annual and semiannual reports to shareholders, whether or not a statement of investments is utilized. The following tables, which present portfolio holdings as a percentage of net assets, are provided in compliance with this requirement.
| | |
| Asset Allocation | | |
| Common Stocks | | 90.6% |
| Cash Equivalents | | 13.2% |
| Liabilities in excess of Other Assets | | -3.8% |
| | |
|
| | | 100.0% |
| | |
| Top Industries | | |
| Oil Company-Exploration & Production | | 24.2% |
| Oil Company-Integrated | | 13.7% |
| Oil Field Services | | 12.5% |
| Oil & Gas Drilling | | 11.4% |
| Pipelines | | 5.7% |
| Coal Mining | | 4.2% |
| Energy | | 4.1% |
| Transport Services | | 2.5% |
| Raw Materials | | 2.0% |
| Steel Production | | 1.7% |
| Other Industries | | 18.0% |
| | |
|
| | | 100.0% |
| | |
| Top Holdings* | | |
| Halliburton Co. | | 5.8% |
| Exxon Mobil Corp. | | 4.7% |
| ConocoPhillips | | 4.2% |
| Burlington Resources, Inc. | | 4.0% |
| Newfield Exploration Co. | | 3.6% |
| The Williams Cos., Inc. | | 3.3% |
| ENSCO International, Inc. | | 3.1% |
| Hercules Offshore, Inc. | | 3.1% |
| ChevronTexaco Corp. | | 2.5% |
| Bronco Drilling Co., Inc. | | 2.3% |
| Other Holdings | | 63.4% |
| | |
|
| | | 100.0% |
| * | For purpose of listing top holdings, repurchase agreements are considered cash equivalents and are included as part of Other Holdings. |
Statement of Investments
October 31, 2005
Gartmore Global Natural Resources Fund
| | U.S. Common Stocks (90.6%) |
| | | | | |
| | | Shares or
Principal Amount | | Value |
| | | | | | |
Agriculture (1.1%) | | | | | |
Cadiz, Inc. (b) | | 2,700 | | $ | 54,000 |
The Mosaic Co. (b) | | 16,000 | | | 211,200 |
| | | | |
|
|
| | | | | | 265,200 |
| | | | |
|
|
Coal Mining (4.2%) | | | | | |
Arch Coal, Inc. | | 4,301 | | | 331,478 |
Natural Resource Partners LP | | 5,964 | | | 303,329 |
Peabody Energy Corp. | | 5,219 | | | 407,917 |
| | | | |
|
|
| | | | | | 1,042,724 |
| | | | |
|
|
Copper Production (1.5%) | | | | | |
Phelps Dodge Corp. | | 2,641 | | | 318,161 |
Southern Copper Corp. | | 900 | | | 49,626 |
| | | | |
|
|
| | | | | | 367,787 |
| | | | |
|
|
Energy (4.1%) | | | | | |
BJ Services Co. | | 15,406 | | | 535,358 |
Calpine Corp. (b) | | 7,968 | | | 18,964 |
CMS Energy Corp. (b) | | 2,059 | | | 30,700 |
ITC Holdings Corp. | | 1,000 | | | 27,500 |
Murphy Oil Corp. | | 1,974 | | | 92,482 |
NRG Energy, Inc. (b) | | 1,340 | | | 57,633 |
TXU Corp. | | 2,500 | | | 251,875 |
| | | | |
|
|
| | | | | | 1,014,512 |
| | | | |
|
|
Gold Mining (1.3%) | | | | | |
Barrick Gold Corp. | | 2,000 | | | 50,500 |
Newmont Mining Corp. | | 6,500 | | | 276,900 |
| | | | |
|
|
| | | | | | 327,400 |
| | | | |
|
|
Industrial Gases (0.6%) | | | | | |
Praxair, Inc. | | 3,200 | | | 158,112 |
| | | | |
|
|
Metal (0.7%) | | | | | |
Rio Tinto PLC — ADR GB | | 1,200 | | | 183,144 |
| | | | |
|
|
Minerals (0.9%) | | | | | |
BHP Billiton Ltd. — ADR AU | | 7,300 | | | 226,665 |
| | | | |
|
|
Oil & Gas Drilling (11.4%) | | | | | |
Bronco Drilling Co., Inc. (b) | | 23,858 | | | 578,318 |
ENSCO International, Inc. | | 16,783 | | | 765,137 |
Grey Wolf, Inc. (b) | | 28,650 | | | 220,032 |
Hydril (b) | | 250 | | | 16,585 |
Nabors Industries Ltd. (b) | | 5,500 | | | 377,465 |
| | | | | |
| | | Shares or
Principal Amount | | Value |
| | | | | | |
Oil & Gas Drilling (continued) | | | | | |
Noble Corp. | | 3,956 | | $ | 254,687 |
Pioneer Drilling Co. (b) | | 8,500 | | | 145,605 |
Precision Drilling Corp. (b) | | 1,000 | | | 46,000 |
Pride International, Inc. (b) | | 1,468 | | | 41,207 |
Rowan Cos., Inc. | | 11,612 | | | 383,080 |
| | | | |
|
|
| | | | | | 2,828,116 |
| | | | |
|
|
Oil Company Exploration & Production (24.2%) |
Anadarko Petroleum Corp. | | 2,000 | | | 181,420 |
Apache Corp. | | 2,603 | | | 166,149 |
Burlington Resources, Inc. | | 13,834 | | | 999,092 |
Canadian Natural Resources Ltd. | | 3,900 | | | 160,719 |
Carrizo Oil & Gas, Inc. (b) | | 3,070 | | | 79,636 |
Chesapeake Energy Corp. | | 1,400 | | | 44,940 |
CNX Gas Corp. (b) | | 9,000 | | | 186,750 |
Denbury Resources, Inc. (b) | | 10,091 | | | 440,271 |
Devon Energy Corp. | | 563 | | | 33,994 |
EnCana Corp. | | 7,200 | | | 330,192 |
Energy Partners Ltd. (b) | | 2,757 | | | 69,945 |
EOG Resources, Inc. | | 6,145 | | | 416,508 |
InterOil Corp. (b) | | 1,300 | | | 24,999 |
Newfield Exploration Co. (b) | | 19,416 | | | 880,128 |
Noble Energy, Inc. | | 4,004 | | | 160,360 |
Parallel Petroleum Corp. (b) | | 13,833 | | | 183,011 |
Quest Resource Corp. (b) | | 800 | | | 10,400 |
Rossetta Resources, Inc. (b) | | 863 | | | 15,966 |
Southwestern Energy Co. (b) | | 585 | | | 42,436 |
Swift Energy Co. (b) | | 3,040 | | | 132,726 |
Talisman Energy, Inc. | | 4,791 | | | 212,193 |
Transocean Sedco Forex, Inc. (b) | | 5,009 | | | 287,967 |
Ultra Petroleum Corp. (b) | | 4,705 | | | 246,965 |
Vintage Petroleum, Inc. | | 4,357 | | | 226,085 |
Warren Resources, Inc. (b) | | 27,829 | | | 430,515 |
XTO Energy, Inc. | | 600 | | | 26,076 |
| | | | |
|
|
| | | | | | 5,989,443 |
| | | | |
|
|
Oil Company Integrated (13.7%) | | | |
BP PLC ADR — GB | | 7,272 | | | 482,861 |
ChevronTexaco Corp. | | 10,937 | | | 624,175 |
ConocoPhillips | | 16,066 | | | 1,050,395 |
Exxon Mobil Corp. | | 20,815 | | | 1,168,554 |
Marathon Oil Corp. | | 94 | | | 5,655 |
Suncor Energy, Inc. | | 1,000 | | | 53,630 |
| | | | |
|
|
| | | | | | 3,385,270 |
| | | | |
|
|
U.S. Common Stocks (continued)
| |
| | | | | |
| | | Shares or
Principal Amount | | Value |
| | | | | | |
Oil Field Services (12.5%) | | | | | |
Dresser-Rand Group, Inc. (b) | | 1,022 | | $ | 22,177 |
Enterprise GP Holdings LP | | 10,495 | | | 375,721 |
FMC Technologies Inc. (b) | | 530 | | | 19,324 |
Global Industries, Ltd. (b) | | 1,120 | | | 14,235 |
Grand Prideco, Inc. (b) | | 5,967 | | | 232,057 |
Halliburton Co. | | 24,112 | | | 1,425,020 |
Hercules Offshore, Inc. (b) | | 35,020 | | | 762,385 |
National-Oilwell Varco, Inc. (b) | | 3,905 | | | 243,945 |
| | | | |
|
|
| | | | | | 3,094,864 |
| | | | |
|
|
Oil Refining & Marketing (1.7%) | | | |
Alon USA Energy, Inc. (b) | | 6,126 | | | 119,457 |
Ashland, Inc. | | 300 | | | 16,053 |
Headwaters, Inc. (b) | | 323 | | | 10,284 |
Valero Energy | | 2,600 | | | 273,624 |
| | | | |
|
|
| | | | | | 419,418 |
| | | | |
|
|
Paper & Related Products (0.3%) | | | |
Bowater, Inc. | | 200 | | | 5,300 |
Smurfit-Stone Container Corp. (b) | | 1,000 | | | 10,560 |
Upm-Kymmene Oyj Corp. | | 3,400 | | | 65,756 |
| | | | |
|
|
| | | | | | 81,616 |
| | | | |
|
|
Pipelines (5.7%) | | | | | |
El Paso Corp. | | 2,000 | | | 23,720 |
Enbridge, Inc. | | 1,200 | | | 36,828 |
Questar Corp. | | 5,321 | | | 419,029 |
The Williams Cos., Inc. | | 36,890 | | | 822,646 |
Western Gas Resources, Inc. | | 2,649 | | | 114,702 |
| | | | |
|
|
| | | | | | 1,416,925 |
| | | | |
|
|
Plastics (0.5%) | | | | | |
PolyOne Corp. (b) | | 20,000 | | | 115,400 |
| | | | |
|
|
Raw Materials (2.0%) | | | | | |
Alcoa, Inc. | | 4,800 | | | 116,592 |
Cameco Corp. | | 7,640 | | | 365,192 |
| | | | |
|
|
| | | | | | 481,784 |
| | | | |
|
|
Steel Production (1.7%) | | | | | |
L.B. Foster (b) | | 300 | | | 3,870 |
NS Group, Inc. (b) | | 7,709 | | | 266,808 |
Nucor Corp. | | 2,600 | | | 155,610 |
| | | | |
|
|
| | | | | | 426,288 |
| | | | |
|
|
| | | | | | | |
| | | Shares or
Principal Amount | | Value | |
| | | | | | | | |
Transport Services (2.5%) | | | | | | | |
Arlington Tankers Ltd. | | | 434 | | $ | 9,665 | |
Eagle Bulk Shipping, Inc. | | | 1,287 | | | 19,073 | |
Freightcar America, Inc. | | | 4,027 | | | 176,141 | |
Genco Shipping & Trading Ltd. (b) | | | 4,544 | | | 74,658 | |
Hornbeck Offshore Services, Inc. (b) | | | 1,440 | | | 46,382 | |
OMI Corp. | | | 1,000 | | | 18,080 | |
StealthGas, Inc. (b) | | | 21,080 | | | 275,727 | |
| | | | | |
|
|
|
| | | | | | | 619,726 | |
| | | | | |
|
|
|
| | |
Total Common Stocks | | | | | | 22,444,394 | |
| | | | | |
|
|
|
|
Cash Equivalents (13.2%) | |
| | | | | |
|
|
|
| | |
Investments in repurchase agreements (collateralized by U.S. Government Agencies and U.S. Government Agency Mortgages, in a joint trading account at 3.90%, dated 10/31/05, due 11/01/05, repurchase price $3,271,525) | | $ | 3,271,171 | | | 3,271,171 | |
| | | | | |
|
|
|
| | |
Total Cash Equivalents | | | | | | 3,271,171 | |
| | | | | |
|
|
|
| |
Total Investments
(Cost $24,484,736) (a) — 103.8% | | | 25,715,565 | |
| | |
Liabilities in excess of other assets — (3.8)% | | | | | | (943,068 | ) |
| | | | | |
|
|
|
| | |
NET ASSETS — 100.0% | | | | | $ | 24,772,497 | |
| | | | | |
|
|
|
| | (a) | See notes to financial statements for tax unrealized appreciation (depreciation) of securities. |
| | (b) | Non-income producing securities. |
| | ADR | American Depositary Receipt |
See notes to financial statements.
Gartmore Global Technology and Communications Fund
For the annual period ended Oct. 31, 2005, the Gartmore Global Technology and Communications Fund (Class A at NAV) returned 5.40% versus 6.03% for its benchmark, the Goldman Sachs Technology Composite Index. For broader comparison, the average return for the Fund’s Lipper peer category of Science and Technology Funds was 8.47%.
Considerable volatility occurred in the technology and communications space as we entered 2005. Consolidation in the telecommunications industry, particularly within the United States, was cause for turmoil in the telecom market; the fate of many telecommunications equipment providers and related industries was uncertain. Spiraling energy costs and questions about global gross domestic product growth muted consumer tech spending, and few sectors emerged as standout performers during the reporting period.
While strong stock selection had a positive effect on the Fund–as opposed to sector allocations, which were mostly flat–there were several names that contributed to the Fund’s underperformance, including eBay Inc., Sonus Networks, Inc. and TIBCO Software Inc. Historically a strong earner, eBay hit a soft spot during the reporting period; the company’s rapid growth appears to have caught up with it. The company’s stock was very expensive to purchase, and, when e-Bay’s growth rates began to slow, many investors lost confidence, which drove the stock’s price down. Management issues continued to plague Sonus Networks, namely high turnover in the chief executive officer position; also, the company has yet to realize substantial revenue. TIBCO suffered setbacks as the company experienced unforeseen difficulty entering the European market.
ARRIS Group, which provides cable for use in delivering voice, Internet and television for several large carriers, was among a number of stocks that added value to the Fund during the period. Business momentum has been strong for ARRIS; the company has performed well and was the leading contributor to Fund performance. Also providing strong returns for the Fund were Internet infrastructure company 24/7 Real Media, Inc. and Sonic Solutions, a leading provider of CD and DVD burning software.
Taken as a whole, industry performance has been volatile during the period. For example, the semiconductor industry performed well early in the reporting period. Though demand was not particularly high, well-managed inventories helped lead the industry higher. In the second part of the year, however, poor inventory management worked against the industry, pulling it back substantially and allowing equipment stocks to take the driver’s seat. We began the year with an overweight in the semiconductor industry and an underweight in equipment stocks, later reversing the two as we saw changes occurring in each industry. Both industries represented gains for the Fund as each was carefully positioned at the appropriate time.
While no clear single driver for growth in the technology and communications industries is evident, the macroeconomic picture remains positive. As we have done throughout 2005, we will continue to focus on individual stock selection as the key driver to Fund performance.
Portfolio Manager:
Chip Zhu
| | |
Fund Performance | | Gartmore Global Technology and Communications Fund |
Average Annual Total Return
(For periods ended October 31, 2005)
| | | | | | | | |
| | | | | 1 Yr. | | 5 Yr. | | Inception1 |
| Class A | | w/o SC2 | | 5.40% | | -18.46% | | -15.75% |
| | | w/SC3 | | -0.54% | | -19.42% | | -16.68% |
| Class B | | w/o SC2 | | 4.69% | | -19.03% | | -16.35% |
| | | w/SC4 | | -0.31% | | -19.33% | | -16.50% |
| Class C5 | | w/o SC2 | | 4.96% | | -18.90% | | -16.22% |
| | | w/SC6 | | 3.96% | | -18.90% | | -16.22% |
| Class R7,8 | | 5.26% | | -18.90% | | -16.22% |
| Institutional Class8 | | 5.87% | | -18.12% | | -15.42% |
| Institutional Service Class8 | | 5.88% | | -18.17% | | -15.46% |
All figures showing the effect of a sales charge reflect the maximum charge possible, because it has the most dramatic effect on performance data.
| 1 | Fund commenced operations on June 30, 2000. |
| 2 | These returns do not reflect the effects of sales charges (SC). |
| 3 | A 5.75% front-end sales charge was deducted. |
| 4 | A 5.00% contingent deferred sales charge (CDSC) was deducted. The CDSC declines to 0% after 6 years. |
| 5 | These returns until the creation of Class C shares (3/1/01) include the performance of the Fund’s Class B shares. Excluding the effects of any fee waivers or reimbursements, such prior performance is substantially similar to what Class C shares would have produced because Class C shares invest in the same portfolio of securities as Class B shares and have the same expenses after any fee waivers or reimbursements. For Class C shares returns with sales charges, these returns have been restated for the applicable sales charges. |
| 6 | A CDSC of 1.00% was deducted because it is charged when you sell Class C shares within the first year after purchase. |
| 7 | These returns until the creation of Class R shares (12/30/03) include the performance of the Fund’s Class B shares. The returns have been adjusted for the fact that Class R shares do not have any applicable sales charges but have not been adjusted for the lower expenses applicable to Class R shares. Excluding the effect of any fee waivers or reimbursements, such prior performance is similar to what Class R shares would have produced because the Class R shares invest in the same portfolio of securities as Class B shares. |
| 8 | These returns until the creation of Institutional Class shares (6/29/04) include the performance of the Fund’s Institutional Service shares. The returns have been adjusted for the fact that Institutional Class shares do not have any applicable sales charges but have not been adjusted for the lower expenses applicable to Institutional Class shares. Excluding the effect of any fee waivers or reimbursements, such prior performance is similar to what Institutional Class shares would have produced because the Institutional Class shares invest in the same portfolio of securities as Institutional Service shares. |
| 9 | Not subject to any sales charges. |
Performance of a $10,000 Investment
Investment return and principal value will fluctuate, and when redeemed, shares may be worth more or less than original cost. Past performance is no guarantee of future results and does not reflect the deduction of taxes that a shareholder would pay on fund distributions or the redemption of fund shares. Investing in mutual funds involves market risk, including loss of principal. Performance returns assume the reinvestment of all distributions.
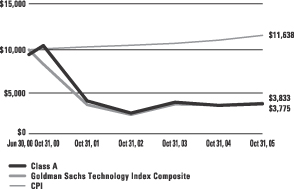
Comparative performance of $10,000 invested in Class A shares of the Gartmore Global Technology and Communications Fund, Goldman Sachs Technology Composite Index(GSTI®(a), and the Consumer Price Index (CPI)(b) since inception. Unlike the Fund, the returns for these unmanaged indexes do not reflect any fees, expenses, or sales charges. Investors cannot invest directly in market indexes.
| (a) | The GSTI® is an unmanaged, modified, market capitalization-weighted index that is designed to measure performance of companies in the technology sector. |
| (b) | The CPI represents changes in prices of a basket of goods and services purchased for consumption by urban households. |
| | |
Shareholder Expense Example | | Gartmore Global Technology and Communications Fund |
As a shareholder of the Fund, you incur two types of costs: (1) transaction costs, including sales charges (loads) paid on purchase payments and redemption fees; and (2) ongoing costs, including investment advisory fees, administration fees, distribution fees and other Fund expenses. The examples below are intended to help you understand your ongoing costs (in dollars) of investing in the Fund and to compare these costs with the ongoing costs of investing in other mutual funds. Per SEC requirements, the examples assume that you had a $1,000 investment in the Class at the beginning of the reporting period, May 1, 2005, and continued to hold your shares at the end of the reporting period, October 31, 2005.
Actual Expenses
For each Class of the Fund in the table below, the first line provides information about actual account values and actual expenses. You may use the information in this line, together with the amount you invested, to estimate the expenses that you paid over the period. Simply divide your account value by $1,000 (for example, an $8,600 account value divided by $1,000 = 8.6), then multiply the result by the number in the first line of each Class under the heading entitled “Expenses Paid During Period” to estimate the expenses you paid on your account during the period.
Hypothetical Example for Comparison Purposes
The second line of each Class in the table below provides information about hypothetical account values and hypothetical expenses based on the Class’ actual expense ratio and an assumed rate of return of 5% per year before expenses, which is not the Class’ actual return. The hypothetical account values and expenses may not be used to estimate the actual ending account balance or expenses you paid for the period. You may use this information to compare the ongoing costs of investing in the Class of the Fund and other funds. To do so, compare this 5% hypothetical example with the 5% hypothetical examples that appear in the shareholder reports of the other funds.
Please note that the expenses shown in the table are meant to highlight your ongoing costs only and do not reflect any transaction costs, such as sales charges (loads) or redemption fees. Therefore, the second line for each Class in the table is useful in comparing ongoing costs only, and will not help you determine the relative total costs of owning different funds. In addition, if these transaction costs were included, your costs would have been higher. The examples also assume all dividends and distributions have been reinvested.
Schedule of Shareholder Expenses
Expense Analysis of a $1,000 Investment
(October 31, 2005)
| | | | | | | | | | | | | |
Global Technology and Communications
Fund | | | | Beginning
Account Value,
5/1/05 | | Ending
Account Value,
10/31/05 | | Expenses Paid
During Period* | | Annualized
Expense Ratio* |
| Class A | | Actual | | $ | 1,000.00 | | $ | 1,163.00 | | $ | 9.27 | | 1.70% |
| | | Hypothetical1 | | $ | 1,000.00 | | $ | 1,016.43 | | $ | 8.68 | | 1.70% |
| Class B | | Actual | | $ | 1,000.00 | | $ | 1,159.10 | | $ | 12.95 | | 2.38% |
| | | Hypothetical1 | | $ | 1,000.00 | | $ | 1,013.00 | | $ | 12.15 | | 2.38% |
| Class C | | Actual | | $ | 1,000.00 | | $ | 1,161.30 | | $ | 12.97 | | 2.38% |
| | | Hypothetical1 | | $ | 1,000.00 | | $ | 1,013.00 | | $ | 12.15 | | 2.38% |
| Class R | | Actual | | $ | 1,000.00 | | $ | 1,161.30 | | $ | 9.86 | | 1.81% |
| | | Hypothetical1 | | $ | 1,000.00 | | $ | 1,015.88 | | $ | 9.24 | | 1.81% |
| Institutional Service Class | | Actual | | $ | 1,000.00 | | $ | 1,163.10 | | $ | 8.67 | | 1.59% |
| | | Hypothetical1 | | $ | 1,000.00 | | $ | 1,016.98 | | $ | 8.12 | | 1.59% |
| Institutional Class | | Actual | | $ | 1,000.00 | | $ | 1,166.20 | | $ | 7.53 | | 1.38% |
| | | Hypothetical1 | | $ | 1,000.00 | | $ | 1,018.04 | | $ | 7.04 | | 1.38% |
| * | Expenses are equal to the Fund’s annualized expense ratio multiplied by the average account value over the period multiplied by 184/365 (to reflect the one-half year period). The expense ratio presented represents a six month, annualized ratio in accordance with SEC guidelines. |
| 1 | Represents the hypothetical 5% return before expenses. |
| | |
Portfolio Summary | | Gartmore Global Technology and Communications Fund |
The SEC adopted a requirement that Funds present their portfolio holdings in a table, chart or graph format in their annual and semiannual reports to shareholders, whether or not a statement of investments is utilized. The following tables, which present portfolio holdings as a percentage of net assets, are provided in compliance with this requirement.
| | |
| Asset Allocation | | |
| Common Stocks | | 94.8% |
| Cash Equivalents | | 3.6% |
| Other Investments* | | 8.9% |
| Liabilities in excess of Other Assets** | | -7.3% |
| | |
|
| | | 100.0% |
| * | Includes value of collateral received from securities lending. |
| ** | Includes value of collateral owed from securities lending. |
| | |
| Top Industries | | |
| Computer Hardware | | 17.9% |
| Semiconductors | | 16.0% |
| Computer Software | | 15.2% |
| Electronic Components | | 10.9% |
| Networking | | 9.0% |
| Computer Services | | 7.5% |
| Wireless Equipment | | 7.1% |
| E-Commerce & Services | | 4.3% |
| Internet Software & Services | | 3.6% |
| Telecommunication Equipment | | 3.3% |
| Other Industries | | 5.2% |
| | |
|
| | | 100.0% |
| | |
| Top Holdings*** | | |
| Intel Corp. | | 7.4% |
| International Business Machines Corp. | | 6.0% |
| Microsoft Corp. | | 5.3% |
| Cisco Systems, Inc. | | 4.6% |
| Hewlett Packard Co. | | 3.6% |
| F5 Networks, Inc. | | 3.3% |
| Dell, Inc. | | 3.1% |
| Ingram Micro, Inc. | | 2.8% |
| eBay, Inc. | | 2.6% |
| Texas Instruments, Inc. | | 2.6% |
| Other Holdings | | 58.7% |
| | |
|
| | | 100.0% |
| *** | For purpose of listing top holdings, repurchase agreements are considered cash equivalents and are included as part of Other Holdings. |
Statement of Investments
October 31, 2005
Gartmore Global Technology and Communications Fund
| | U.S. Common Stocks (94.8%) |
| | | | | |
| | | Shares or
Principal Amount | | Value |
| | | | | | |
Computer Hardware (17.9%) | | | | | |
Dell, Inc. (b) | | 9,700 | | $ | 309,236 |
EMC Corp. (b) | | 17,800 | | | 248,488 |
Hewlett Packard Co. | | 12,800 | | | 358,912 |
Ingram Micro, Inc. (b) | | 15,250 | | | 276,025 |
International Business Machines Corp. | | 7,350 | | | 601,817 |
| | | | |
|
|
| | | | | | 1,794,478 |
| | | | |
|
|
Computer Services (7.5%) | | | | | |
Affiliated Computer Services, Inc. (b) | | 4,100 | | | 221,851 |
Cognizant Technology Solutions Corp. (b) | | 5,200 | | | 228,696 |
Sun Microsystems, Inc. (b) | | 11,800 | | | 47,200 |
Yahoo, Inc. (b) | | 6,850 | | | 253,245 |
| | | | |
|
|
| | | | | | 750,992 |
| | | | |
|
|
Computer Software (15.2%) | | | | | |
@Road, Inc. (b) | | 21,550 | | | 99,130 |
Agile Software Corp. (b) | | 13,050 | | | 92,655 |
F5 Networks, Inc. (b) | | 6,330 | | | 329,350 |
Hyperion Solutions Corp. (b) | | 2,750 | | | 132,990 |
Macromedia, Inc. (b) | | 2,300 | | | 101,016 |
McAfee, Inc. (b) | | 2,400 | | | 72,072 |
Microsoft Corp. | | 20,600 | | | 529,420 |
Oracle Corp. (b) | | 7,600 | | | 96,368 |
RealNetworks, Inc. (b) | | 7,950 | | | 62,010 |
| | | | |
|
|
| | | | | | 1,515,011 |
| | | | |
|
|
E-Commerce & Services (4.3%) | | | | | |
Ariba, Inc. (b) (c) | | 13,950 | | | 108,950 |
eBay, Inc. (b) | | 6,680 | | | 264,528 |
West Corp. (b) | | 1,500 | | | 59,175 |
| | | | |
|
|
| | | | | | 432,653 |
| | | | |
|
|
Electronic Components (10.9%) | | | | | |
Intel Corp. | | 31,630 | | | 743,305 |
Ionatron, Inc. (b) (c) | | 18,350 | | | 192,492 |
Sonic Solutions (b) | | 7,800 | | | 149,292 |
| | | | |
|
|
| | | | | | 1,085,089 |
| | | | |
|
|
| | | | | |
| | | Shares or
Principal Amount | | Value |
| | | | | | |
Internet Software & Services (3.6%) | | | |
Google, Inc., Class A (b) | | 610 | | $ | 227,005 |
Symantec Corp. (b) | | 5,370 | | | 128,075 |
| | | | |
|
|
| | | | | | 355,080 |
| | | | |
|
|
Networking (9.0%) | | | | | |
24/7 Real Media, Inc. (b) | | 32,870 | | | 210,039 |
Cisco Systems, Inc. (b) | | 26,500 | | | 462,425 |
Extreme Networks, Inc. (b) | | 9,800 | | | 47,334 |
Foundry Networks, Inc. (b) | | 7,950 | | | 94,844 |
Juniper Networks, Inc. (b) | | 3,800 | | | 88,654 |
| | | | |
|
|
| | | | | | 903,296 |
| | | | |
|
|
Semiconductors (16.0%) | | | | | |
Analog Devices, Inc. | | 4,450 | | | 154,771 |
Applied Materials, Inc. | | 8,550 | | | 140,049 |
ASML Holding N.V. ADR — NL (b) | | 11,350 | | | 192,723 |
Cypress Semiconductor Corp. (b) (c) | | 5,830 | | | 79,288 |
Emulex Corp. (b) (c) | | 5,950 | | | 110,135 |
Fairchild Semiconductor International, Inc. (b) | | 12,000 | | | 184,800 |
Integrated Device Technology, Inc. (b) (c) | | 22,550 | | | 222,793 |
Linear Technology Corp. | | 2,600 | | | 86,346 |
Marvell Technology Group Ltd. (b) | | 2,100 | | | 97,461 |
Teradyne, Inc. (b) | | 5,150 | | | 69,731 |
Texas Instruments, Inc. | | 9,250 | | | 264,087 |
| | | | |
|
|
| | | | | | 1,602,184 |
| | | | |
|
|
Telecommunication Equipment (3.3%) | | | |
AudioCodes Ltd. (b) (c) | | 12,250 | | | 138,058 |
Avaya, Inc. (b) | | 7,850 | | | 90,432 |
Tellabs, Inc. (b) | | 4,600 | | | 43,976 |
Westell Technologies, Inc. (b) | | 11,590 | | | 54,473 |
| | | | |
|
|
| | | | | | 326,939 |
| | | | |
|
|
Wireless Equipment (7.1%) | | | | | |
Motorola, Inc. | | 10,550 | | | 233,788 |
Qualcomm, Inc. | | 6,600 | | | 262,416 |
RF Micro Devices, Inc. (b) (c) | | 42,100 | | | 220,604 |
| | | | |
|
|
| | | | | | 716,808 |
| | | | |
|
|
| | |
Total Common Stocks | | | | | 9,482,530 |
| | | | |
|
|
Cash Equivalents (3.6%)
| | | | | | | |
| | | Principal
Amount | | Value | |
| | | | | | | | |
Investments in repurchase agreements (Collateralized by U.S. Government Agencies and U.S. Government Agency Mortgages, in a joint trading account at 3.90%, dated 10/31/05, due 11/01/05, repurchase price $363,245) | | $ | 363,206 | | $ | 363,206 | |
| | | | | |
|
|
|
| | |
Total Cash Equivalents | | | | | | 363,206 | |
| | | | | |
|
|
|
|
Lending (8.9%) Short-Term Securities Held as Collateral for Securities | |
Pool of short-term securities for Gartmore Mutual Funds — note 2 (Securities Lending) | | | 888,600 | | | 888,600 | |
| | | | | |
|
|
|
| | |
Total Short-Term Securities Held as Collateral for Securities Lending | | | | | | 888,600 | |
| | | | | |
|
|
|
| |
Total Investments
(Cost $10,496,760) (a) — 107.3% | | | 10,734,336 | |
| | |
Liabilities in excess of other assets — (7.3)% | | | | | | (734,670 | ) |
| | | | | |
|
|
|
| | |
NET ASSETS — 100.0% | | | | | $ | 9,999,666 | |
| | | | | |
|
|
|
| | (a) | See notes to financial statements for tax unrealized appreciation (depreciation) of securities. |
| | (b) | Denotes a non-income producing security. |
| | (c) | All or part of the security was on loan as of October 31, 2005. |
| | ADR | American Depositary Receipt |
See notes to financial statements.
Gartmore Global Utilities Fund
For the annual period ended Oct. 31, 2005, the Gartmore Global Utilities Fund returned 17.73% (Class A at NAV) versus 9.14% for its benchmark, a blend of 60% Morgan Stanley Capital International (MSCI) World Telecommunication Services IndexSM and 40% MSCI World Utilities Index SM. For broader comparison, the average return for the Fund’s Lipper peer category of Utility Funds was 20.93%.
Global utilities benefited from a favorable investment environment, as many of the conditions that prevailed during the first six months of the reporting period persisted in the second half. Energy prices continued to advance, with crude oil briefly exceeding $70 per barrel at the end of August, as Hurricane Katrina punished the Gulf Coast region. Long-term interest rates remained favorable, which helped utility stocks, since share prices in that sector tend to move in tandem with bond prices and inversely to long-term rates. Finally, with interest rates still low by historical standards, the high dividend yields of the utilities group appealed to investors.
The factor that proved to be most beneficial to Fund performance in comparison to that of the blended benchmark index was an overweighting in energy, where we reduced the Fund’s exposure in order to take profits as the period progressed. One of the Fund’s top stock performers in that sector was EOG Resources, Inc., an oil and gas producer with substantial reserves in Texas. Investors viewed the company’s onshore reserves as a distinct advantage, given the recent weather damage sustained by offshore producers. Also boosting Fund performance was ConocoPhillips, an integrated energy company with substantial refining operations that serves as a major supplier of natural gas to the utility industry. In utilities, our overweighting of water utilities was particularly beneficial, with Northumbrian Water Group plc and AWG plc–both U.K. companies–helping Fund performance.
Elsewhere, the Fund benefited from an underweighting in telecommunications services, a sector that comprises more than half of the Fund’s blended benchmark. Unlike the Fund, many utility funds tracked by Lipper have a minimal exposure to telecom services, which helped their performance but limited the Fund’s return during the period. That said, we correctly overweighted wireless telecoms and underweighted wireline stocks. In the wireless category, nonbenchmark holding O2 plc merits mention as a contributor. Our underweighting of such poorly performing wireline stocks as Telecom Italia S.p.A., SBC Communications Inc. and Spain-based Telefónica S.A. proved to be timely.
Wireless stock Sprint Nextel Corp., not part of the Fund’s blended benchmark, had the most negative impact on Fund performance; uncertainty about the buyout of Nextel affiliates following the company’s merger with Sprint caused many investors to sell. In the telecom services sector, overweighted positions in Germany-based Deutsche Telekom AG and France Telecom SA were counterproductive.
Since energy prices should continue to be a key driver of electricity prices, we anticipate maintaining the Fund’s emphasis on companies that are capable of passing along energy costs, and avoiding or limiting exposure to those companies that are not. The fate of utility stocks also will be determined to some extent by the regulatory environment, which we will monitor closely for clues to guide our investment strategy. In telecom services, we remain interested in wireless companies, particularly in emerging countries, where we believe the growth prospects are most dynamic.
Portfolio Manager:
Ben Walker
| | |
Fund Performance | | Gartmore Global Utilities Fund |
Average Annual Total Return
(For periods ended October 31, 2005)
| | | | | | |
| | | | | 1 Yr. | | Inception1 |
| Class A | | w/o SC2 | | 17.73% | | 7.09% |
| | | w/SC3 | | 10.99% | | 5.46% |
| Class B | | w/o SC2 | | 16.93% | | 6.32% |
| | | w/SC4 | | 11.93% | | 5.66% |
| Class C | | w/o SC2 | | 16.88% | | 6.31% |
| | | w/SC5 | | 15.88% | | 6.31% |
| Class R6,8 | | | | 17.61% | | 6.60% |
| Institutional Class7 | | | | 18.05% | | 7.38% |
| Institutional Service Class8 | | | | 18.05% | | 7.38% |
All figures showing the effect of a sales charge reflect the maximum charge possible, because it has the most dramatic effect on performance data.
| 1 | Fund commenced operations on December 18, 2001. |
| 2 | These returns do not reflect the effects of sales charges (SC). |
| 3 | A 5.75% front-end sales charge was deducted. |
| 4 | A 5.00% contingent deferred sales charge (CDSC) was deducted. The CDSC declines to 0% after 6 years. |
| 5 | A CDSC of 1.00% was deducted because it is charged when you sell Class C shares within the first year after purchase. |
| 6 | These returns until the creation of Class R shares (12/30/03) include the performance of the Fund’s Class B shares. The returns have been adjusted for the fact that Class R shares do not have any applicable sales charges but have not been adjusted for the lower expenses applicable to Class R shares. Excluding the effect of any fee waivers or reimbursements, such prior performance is similar to what Class R shares would have produced because the Class R shares invest in the same portfolio of securities as Class B shares. |
| 7 | These returns until the creation of Institutional Class shares (6/29/04) include the performance of the Fund’s Institutional Service shares. The returns have been adjusted for the fact that Institutional Class shares do not have any applicable sales charges but have not been adjusted for the lower expenses applicable to Institutional Class shares. Excluding the effect of any fee waivers or reimbursements, such prior performance is similar to what Institutional Class shares would have produced because the Institutional Class shares invest in the same portfolio of securities as Institutional Service shares. |
| 8 | Not subject to any sales charges. |
Performance of a $10,000 Investment
Investment return and principal value will fluctuate, and when redeemed, shares may be worth more or less than original cost. Past performance is no guarantee of future results and does not reflect the deduction of taxes that a shareholder would pay on fund distributions or the redemption of fund shares. Investing in mutual funds involves market risk, including loss of principal. Performance returns assume the reinvestment of all distributions.
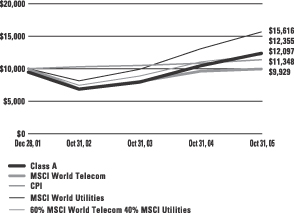
Comparative performance of $10,000 invested in Class A shares of the Gartmore Global Utilities Fund, Morgan Stanley Capital International World Telecommunications Services Index (MSCI World Telecom)(a), Morgan Stanley Capital International World Utilities Index (MSCI World Utilities)(b), Composite Index (Composite)(c), and the Consumer Price Index (CPI)(d) since inception. Unlike the Fund, the returns for these unmanaged indexes do not reflect any fees, expenses, or sales charges. Investors cannot invest directly in market indexes.
| (a) | The MSCI World Telecom is an unmanaged index representative of the stocks in the global utilities sector and is based on 23 developed market country indices. |
| (b) | The MSCI World Utilities is made up of industry groups such as electric, gas, multi utilities and unregulated power and water. |
| (c) | The Composite is a combination of 60% MSCI World Telecom and 40% MSCI World Utilities. |
| (d) | The CPI represents changes in prices of a basket of goods and services purchased for consumption by urban households. |
| | |
Shareholder Expense Example | | Gartmore Global Utilities Fund |
As a shareholder of the Fund, you incur two types of costs: (1) transaction costs, including sales charges (loads) paid on purchase payments and redemption fees; and (2) ongoing costs, including investment advisory fees, administration fees, distribution fees and other Fund expenses. The examples below are intended to help you understand your ongoing costs (in dollars) of investing in the Fund and to compare these costs with the ongoing costs of investing in other mutual funds. Per SEC requirements, the examples assume that you had a $1,000 investment in the Class at the beginning of the reporting period, May 1, 2005, and continued to hold your shares at the end of the reporting period, October 31, 2005.
Actual Expenses
For each Class of the Fund in the table below, the first line provides information about actual account values and actual expenses. You may use the information in this line, together with the amount you invested, to estimate the expenses that you paid over the period. Simply divide your account value by $1,000 (for example, an $8,600 account value divided by $1,000 = 8.6), then multiply the result by the number in the first line of each Class under the heading entitled “Expenses Paid During Period” to estimate the expenses you paid on your account during the period.
Hypothetical Example for Comparison Purposes
The second line of each Class in the table below provides information about hypothetical account values and hypothetical expenses based on the Class’ actual expense ratio and an assumed rate of return of 5% per year before expenses, which is not the Class’ actual return. The hypothetical account values and expenses may not be used to estimate the actual ending account balance or expenses you paid for the period. You may use this information to compare the ongoing costs of investing in the Class of the Fund and other funds. To do so, compare this 5% hypothetical example with the 5% hypothetical examples that appear in the shareholder reports of the other funds.
Please note that the expenses shown in the table are meant to highlight your ongoing costs only and do not reflect any transaction costs, such as sales charges (loads) or redemption fees. Therefore, the second line for each Class in the table is useful in comparing ongoing costs only, and will not help you determine the relative total costs of owning different funds. In addition, if these transaction costs were included, your costs would have been higher. The examples also assume all dividends and distributions have been reinvested.
Schedule of Shareholder Expenses
Expense Analysis of a $1,000 Investment
(October 31, 2005)
| | | | | | | | | | | | | |
| Global Utilities Fund | | | | Beginning
Account Value,
5/1/05 | | Ending
Account Value,
10/31/05 | | Expenses Paid
During Period* | | Annualized
Expense Ratio* |
| Class A | | Actual | | $ | 1,000.00 | | $ | 1,063.70 | | $ | 7.65 | | 1.47% |
| | | Hypothetical1 | | $ | 1,000.00 | | $ | 1,017.59 | | $ | 7.50 | | 1.47% |
| Class B | | Actual | | $ | 1,000.00 | | $ | 1,059.00 | | $ | 11.42 | | 2.20% |
| | | Hypothetical1 | | $ | 1,000.00 | | $ | 1,013.91 | | $ | 11.23 | | 2.20% |
| Class C | | Actual | | $ | 1,000.00 | | $ | 1,058.70 | | $ | 11.42 | | 2.20% |
| | | Hypothetical1 | | $ | 1,000.00 | | $ | 1,013.91 | | $ | 11.23 | | 2.20% |
| Class R | | Actual | | $ | 1,000.00 | | $ | 1,063.00 | | $ | 8.27 | | 1.59% |
| | | Hypothetical1 | | $ | 1,000.00 | | $ | 1,016.98 | | $ | 8.12 | | 1.59% |
| Institutional Service Class | | Actual | | $ | 1,000.00 | | $ | 1,064.00 | | $ | 6.24 | | 1.20% |
| | | Hypothetical1 | | $ | 1,000.00 | | $ | 1,018.95 | | $ | 6.12 | | 1.20% |
| Institutional Class | | Actual | | $ | 1,000.00 | | $ | 1,064.00 | | $ | 6.24 | | 1.20% |
| | | Hypothetical1 | | $ | 1,000.00 | | $ | 1,018.95 | | $ | 6.12 | | 1.20% |
| * | Expenses are equal to the Fund’s annualized expense ratio multiplied by the average account value over the period multiplied by 184/365 (to reflect the one-half year period). The expense ratio presented represents a six month, annualized ratio in accordance with SEC guidelines. |
| 1 | Represents the hypothetical 5% return before expenses. |
| | |
Portfolio Summary | | Gartmore Global Utilities Fund |
The SEC adopted a requirement that Funds present their portfolio holdings in a table, chart or graph format in their annual and semiannual reports to shareholders, whether or not a statement of investments is utilized. The following tables, which present portfolio holdings as a percentage of net assets, are provided in compliance with this requirement.
| | |
| Asset Allocation | | |
| Common Stocks | | 96.2% |
| Cash Equivalents | | 4.0% |
| Liabilities in excess of Other Assets | | -0.2% |
| | |
|
| | | 100.0% |
| | |
| Top Industries | | |
| Telecommunications | | 42.1% |
| Gas & Electric Utility | | 17.9% |
| Electric Utility | | 16.4% |
| Oil & Gas Utility | | 11.0% |
| Water Utility | | 6.6% |
| Energy | | 0.9% |
| Building & Construction | | 0.7% |
| Gas Utility | | 0.7% |
| Other Industries | | 3.7% |
| | |
|
| | | 100.0% |
| | |
| Top Holdings* | | |
| Vodafone Group PLC | | 9.9% |
| Verizon Communications, Inc. | | 5.9% |
| SBC Communications, Inc. | | 4.8% |
| Sprint Nextel Corp. | | 3.9% |
| Scottish Power PLC | | 3.4% |
| NTT DoCoMo, Inc. | | 3.1% |
| TXU Corp. | | 3.1% |
| Nippon Telegraph & Telephone Corp. | | 2.9% |
| ConocoPhillips | | 2.9% |
| RWE AG | | 2.6% |
| Other Holdings | | 57.5% |
| | |
|
| | | 100.0% |
| * | For purpose of listing top holdings, repurchase agreements are considered cash equivalents and are included as part of Other Holdings. |
Statement of Investments
October 31, 2005
Gartmore Global Utilities Fund
| | | | | |
| | | Shares or
Principal Amount | | Value |
| | | | | | |
AUSTRIA (0.6%) | | | | | |
Telecommunications (0.6%) | | | | | |
Telekom Austria AG (c) | | 2,730 | | $ | 56,497 |
| | | | |
|
|
BELGIUM (0.3%) | | | | | |
Electric Utility (0.2%) | | | | | |
Elia System Operator SA (b) (c) | | 500 | | | 19,052 |
| | | | |
|
|
Telecommunications (0.1%) | | | | | |
Mobistar SA (c) | | 120 | | | 9,715 |
| | | | |
|
|
| | | | | | 28,767 |
| | | | |
|
|
CANADA (1.1%) | | | | | |
Oil & Gas Utility (1.1%) | | | | | |
Suncor Energy, Inc. (c) | | 1,900 | | | 101,694 |
| | | | |
|
|
DENMARK (0.6%) | | | | | |
Telecommunications (0.6%) | | | | | |
TDC (c) | | 1,020 | | | 57,169 |
| | | | |
|
|
FINLAND (1.0%) | | | | | |
Oil & Gas Utility (1.0%) | | | | | |
Fortum Oyj (c) | | 4,931 | | | 87,265 |
| | | | |
|
|
FRANCE (4.3%) | | | | | |
Building & Construction (0.7%) | | | | | |
Bouygues SA (c) | | 1,210 | | | 59,713 |
| | | | |
|
|
Gas Utility (0.2%) | | | | | |
Gaz de France (b) (c) | | 588 | | | 18,073 |
| | | | |
|
|
Telecommunications (1.1%) | | | | | |
France Telecom SA (c) | | 3,703 | | | 96,259 |
| | | | |
|
|
Water Utility (2.3%) | | | | | |
Suez SA (c) | | 7,783 | | | 210,852 |
| | | | |
|
|
| | | | | | 384,897 |
| | | | |
|
|
GERMANY (5.5%) | | | | | |
Gas & Electric Utility (5.0%) | | | | | |
E. ON AG (c) | | 2,413 | | | 218,623 |
RWE AG (c) | | 3,600 | | | 229,113 |
| | | | |
|
|
| | | | | | 447,736 |
| | | | |
|
|
Telecommunications (0.5%) | | | | | |
Deutsche Telekom AG (c) | | 2,404 | | | 42,510 |
| | | | |
|
|
| | | | | | 490,246 |
| | | | |
|
|
| | | | | |
| | | Shares or
Principal Amount | | Value |
| | | | | | |
GREECE (1.4%) | | | | | |
Telecommunications (1.4%) | | | | | |
Hellenic Telecommunications Organization SA (b) (c) | | 5,187 | | $ | 107,035 |
Tim Hellas Telecommunications SA ADR | | 934 | | | 18,250 |
| | | | |
|
|
| | | | | | 125,285 |
| | | | |
|
|
HONG KONG (0.1%) | | | | | |
Electric Utility (0.1%) | | | | | |
CLP Holdings Ltd. (c) | | 1,500 | | | 8,612 |
| | | | |
|
|
ITALY (1.4%) | | | | | |
Electric Utility (1.2%) | | | | | |
Enel SPA (c) | | 12,742 | | | 102,618 |
| | | | |
|
|
Oil & Gas Utility (0.1%) | | | | | |
Snam Rete Gas SPA (c) | | 2,251 | | | 12,358 |
| | | | |
|
|
Telecommunications (0.1%) | | | | | |
Telecom Italia SPA (c) | | 2,836 | | | 8,207 |
| | | | |
|
|
| | | | | | 123,183 |
| | | | |
|
|
JAPAN (10.1%) | | | | | |
Electric Utility (2.0%) | | | | | |
Chubu Electric Power Co., Inc. (c) | | 1,600 | | | 39,657 |
Kansai Electric Power Co., Inc. (c) | | 1,300 | | | 28,595 |
Kyushu Electric Power Co., Inc. (c) | | 1,000 | | | 21,460 |
Tohoku Electric Power Co., Inc. (c) | | 1,000 | | | 20,405 |
Tokyo Electric Power Co., Inc. (c) | | 2,600 | | | 64,659 |
| | | | |
|
|
| | | | | | 174,776 |
| | | | |
|
|
Gas Utility (0.5%) | | | | | |
Osaka Gas Co., Ltd. (c) | | 6,000 | | | 21,942 |
Tokyo Gas Co., Ltd. (c) | | 5,000 | | | 19,666 |
| | | | |
|
|
| | | | | | 41,608 |
| | | | |
|
|
Telecommunications (7.6%) | | | | | |
KDDI Corp. (c) | | 25 | | | 143,297 |
Nippon Telegraph & Telephone Corp. (c) | | 54 | | | 258,165 |
NTT DoCoMo, Inc. (c) | | 161 | | | 278,085 |
| | | | |
|
|
| | | | | | 679,547 |
| | | | |
|
|
| | | | | | 895,931 |
| | | | |
|
|
| | Common Stocks (continued) |
| | | | | |
| | | Shares or
Principal Amount | | Value |
| | | | | | |
SPAIN (4.5%) | | | | | |
Electric Utility (1.6%) | | | | | |
Iberdrola SA (c) | | 5,360 | | $ | 143,510 |
| | | | |
|
|
Gas & Electric Utility (2.0%) | | | | | |
Endesa SA (c) | | 6,020 | | | 149,457 |
Union Fenosa SA (c) | | 962 | | | 31,825 |
| | | | |
|
|
| | | | | | 181,282 |
| | | | |
|
|
Telecommunications (0.9%) | | | | | |
Telefonica SA (c) | | 4,877 | | | 77,838 |
| | | | |
|
|
| | | | | | 402,630 |
| | | | |
|
|
UNITED KINGDOM (25.3%) | | | | | |
Electric Utility (5.8%) | | | | | |
International Power PLC (c) | | 30,160 | | | 123,842 |
Scottish & Southern Energy PLC (c) | | 4,996 | | | 86,678 |
Scottish Power PLC (c) | | 30,790 | | | 301,307 |
| | | | |
|
|
| | | | | | 511,827 |
| | | | |
|
|
Gas & Electric Utility (1.8%) | | | | | |
Centrica PLC (c) | | 19,970 | | | 84,402 |
National Grid PLC (c) | | 8,684 | | | 79,420 |
| | | | |
|
|
| | | | | | 163,822 |
| | | | |
|
|
Telecommunications (13.5%) | | | | | |
O2 PLC (c) | | 47,120 | | | 171,628 |
Virgin Mobile Holdings PLC (c) | | 26,520 | | | 140,844 |
Vodafone Group PLC (c) | | 334,500 | | | 878,129 |
| | | | |
|
|
| | | | | | 1,190,601 |
| | | | |
|
|
Water Utility (4.2%) | | | | | |
AWG PLC (c) | | 7,795 | | | 132,676 |
Northumbrian Water Group PLC (c) | | 24,192 | | | 101,710 |
Pennon Group PLC (c) | | 7,451 | | | 141,132 |
| | | | |
|
|
| | | | | | 375,518 |
| | | | |
|
|
| | | | | | 2,241,768 |
| | | | |
|
|
| | | | | |
| | | Shares or
Principal Amount | | Value |
| | | | | | |
UNITED STATES (40.0%) | | | | | |
Electric Utility (5.6%) | | | | | |
Allegheny Energy, Inc. (b) | | 2,190 | | $ | 61,889 |
Dominion Resources, Inc. | | 1,101 | | | 83,764 |
DPL, Inc. | | 3,070 | | | 79,114 |
Edison International | | 3,251 | | | 142,264 |
PPL Corp. | | 4,264 | | | 133,634 |
| | | | |
|
|
| | | | | | 500,665 |
| | | | |
|
|
Energy (0.9%) | | | | | |
NRG Energy, Inc. (b) | | 1,940 | | | 83,439 |
| | | | |
|
|
Gas & Electric Utility (9.0%) | | | | | |
Centerpoint Energy, Inc. | | 1,564 | | | 20,707 |
Duke Energy Corp. | | 415 | | | 10,989 |
Exelon Corp. | | 3,170 | | | 164,935 |
FirstEnergy Corp. | | 3,600 | | | 171,000 |
PG&E Corp. | | 3,210 | | | 116,780 |
TXU Corp. | | 2,708 | | | 272,832 |
Wisconsin Energy Corp. | | 1,160 | | | 43,883 |
| | | | |
|
|
| | | | | | 801,126 |
| | | | |
|
|
Oil & Gas Utility (8.7%) | | | | | |
Cimarex Energy Co. (b) | | 4,300 | | | 168,818 |
ConocoPhillips | | 3,848 | | | 251,583 |
EOG Resources, Inc. | | 2,857 | | | 193,647 |
The Williams Cos., Inc. | | 7,290 | | | 162,567 |
| | | | |
|
|
| | | | | | 776,615 |
| | | | |
|
|
Telecommunications (15.8%) | | | | | |
BellSouth Corp. | | 3,421 | | | 89,014 |
SBC Communications, Inc. | | 17,963 | | | 428,418 |
Sprint Nextel Corp. | | 14,945 | | | 348,368 |
Verizon Communications, Inc. | | 16,740 | | | 527,479 |
| | | | |
|
|
| | | | | | 1,393,279 |
| | | | |
|
|
| | | | | | 3,555,124 |
| | | | |
|
|
| | |
Total Common Stocks | | | | | 8,559,068 |
| | | | |
|
|
Statement of Investments (Continued)
October 31, 2005
Gartmore Global Utilities Fund (Continued)
Cash Equivalents (4.0%)
| | | | | | | |
| | | Principal
Amount | | Value | |
| | | | | | | | |
| | | | | | | | |
Investments in repurchase agreements (collateralized by U.S. Government Agencies and U.S. Government Agency Mortgages, in a joint trading account at 3.90%, dated 10/31/05, due 11/01/05, repurchase price $354,950) | | $ | 354,912 | | $ | 354,912 | |
| | | | | |
|
|
|
| | |
Total Cash Equivalents | | | | | | 354,912 | |
| | | | | |
|
|
|
| |
Total Investments
(Cost $8,646,882) (a) — 100.2% | | | 8,913,980 | |
| | |
Liabilities in excess of other assets — (0.2%) | | | | | | (15,675 | ) |
| | | | | |
|
|
|
| | |
NET ASSETS — 100.0% | | | | | $ | 8,898,305 | |
| | | | | |
|
|
|
| | (a) | See notes to financial statements for tax unrealized appreciation (depreciation) of securities. |
| | (b) | Non-income producing securities. |
| | ADR | American Depositary Receipt |
At October 31, 2005, the Fund’s open forward foreign currency contracts were as follows:
| | | | | | | | | | | | | | |
Currency
| | Delivery
Date
| | Contract
Value
| | | Market
Value
| | | Unrealized
Appreciation
(Depreciation)
| |
| Short Contracts: | | | | | | | | | | | | | | |
| Euro | | 11/01/05 | | $ | (129,671 | ) | | $ | (127,752 | ) | | $ | 1,919 | |
South African
Rand | | 11/07/05 | | | (44,185 | ) | | | (44,255 | ) | | | (70 | ) |
| | | | |
|
|
| |
|
|
| |
|
|
|
Total Short
Contracts: | | | | $ | (173,856 | ) | | $ | (172,007 | ) | | $ | 1,849 | |
| | | | |
|
|
| |
|
|
| |
|
|
|
| Long Contracts: | | | | | | | | | | | | | | |
| U.S. Dollar | | 11/02/05 | | $ | 40,229 | | | $ | 39,968 | | | $ | (261 | ) |
| | | | |
|
|
| |
|
|
| |
|
|
|
Total Long
Contracts: | | | | $ | 40,229 | | | $ | 39,968 | | | $ | (261 | ) |
| | | | |
|
|
| |
|
|
| |
|
|
|
See notes to financial statements.
Statements of Assets and Liabilities
October 31, 2005
| | | | | | | | | | | | | | | | | | | |
| | | Gartmore Global
Financial Services
Fund | | Gartmore Global
Health Sciences
Fund | | Gartmore Global
Natural Resources
Fund | | Gartmore Global
Technology and
Communications Fund | | | Gartmore Global Utilities Fund |
Assets: | | | | | | | | | | | | | | | | | | | |
Investments, at value (cost $13,432,804; $26,468,654; $21,213,565; $10,133,554; and $8,291,970; respectively) | | $ | 14,255,783 | | $ | 26,783,747 | | $ | 22,444,394 | | $ | 10,371,130 | | | $ | 8,559,068 | | | |
Repurchase agreements, at cost and value | | | 829,812 | | | 3,221,125 | | | 3,271,171 | | | 363,206 | | | | 354,912 | | | |
| | |
|
| |
|
| |
|
| |
|
|
| |
|
|
| | |
Total Investments | | | 15,085,595 | | | 30,004,872 | | | 25,715,565 | | | 10,734,336 | | | | 8,913,980 | | | |
| | |
|
| |
|
| |
|
| |
|
|
| |
|
|
| | |
Foreign currency, at value (cost $2; $0; $0; $176,686 and $14,406; respectively) | | | 2 | | | — | | | — | | | 175,971 | | | | 14,177 | | | |
Interest and dividends receivable | | | 13,992 | | | 5,806 | | | 26,750 | | | 2,300 | | | | 12,911 | | | |
Receivable for capital shares issued | | | 217,605 | | | 239,843 | | | 78,793 | | | 12,260 | | | | 6,397 | | | |
Receivable for investments sold | | | 271,363 | | | — | | | 1,553,975 | | | 58,535 | | | | 211,999 | | | |
Unrealized appreciation on forward foreign currency contracts | | | — | | | — | | | — | | | — | | | | 1,588 | | | |
Receivable from adviser | | | — | | | 1,211 | | | — | | | — | | | | — | | | |
Reclaims receivable | | | 5,061 | | | — | | | — | | | — | | | | 2,721 | | | |
Prepaid expenses and other assets | | | 4,529 | | | 5,622 | | | 23,342 | | | 17,934 | | | | 3,311 | | | |
| | |
|
| |
|
| |
|
| |
|
|
| |
|
|
| | |
Total Assets | | | 15,598,147 | | | 30,257,354 | | | 27,398,425 | | | 11,001,336 | | | | 9,167,084 | | | |
| | |
|
| |
|
| |
|
| |
|
|
| |
|
|
| | |
| | | | | | |
Liabilities: | | | | | | | | | | | | | | | | | | | |
Payable to custodian | | | — | | | — | | | — | | | — | | | | 292 | | | |
Payable to investment adviser | | | 12,615 | | | — | | | 16,168 | | | 15,157 | | | | 7,964 | | | |
Payable for investments purchased | | | 750,978 | | | 1,773,685 | | | 2,582,528 | | | — | | | | 249,846 | | | |
Payable for capital shares redeemed | | | 14,125 | | | 13,769 | | | 2,000 | | | 85,921 | | | | 17 | | | |
Payable for return of collateral received for securities on loan | | | — | | | 2,497,502 | | | — | | | 888,600 | | | | — | | | |
Accrued expenses and other payables | | | | | | | | | | | | | | | | | | | |
Investment advisory fees | | | 11,323 | | | 20,999 | | | 14,093 | | | 7,793 | | | | 5,823 | | | |
Fund administration and transfer agent fees | | | 2,014 | | | 1,754 | | | 3,015 | | | 1,458 | | | | 947 | | | |
Distribution fees | | | 3,122 | | | 6,645 | | | 6,632 | | | 1,528 | | | | 3,594 | | | |
Administrative servicing fees | | | 79 | | | 3,318 | | | 468 | | | 646 | | | | 187 | | | |
Trustee fees | | | 31 | | | 61 | | | 28 | | | 22 | | | | 22 | | | |
Other | | | 748 | | | 1,650 | | | 996 | | | 545 | | | | 87 | | | |
| | |
|
| |
|
| |
|
| |
|
|
| |
|
|
| | |
Total Liabilities | | | 795,035 | | | 4,319,383 | | | 2,625,928 | | | 1,001,670 | | | | 268,779 | | | |
| | |
|
| |
|
| |
|
| |
|
|
| |
|
|
| | |
Net Assets | | $ | 14,803,112 | | $ | 25,937,971 | | $ | 24,772,497 | | $ | 9,999,666 | | | $ | 8,898,305 | | | |
| | |
|
| |
|
| |
|
| |
|
|
| |
|
|
| | |
| | | | | | |
Represented by: | | | | | | | | | | | | | | | | | | | |
Capital | | $ | 13,230,776 | | $ | 23,290,399 | | $ | 20,868,390 | | $ | 15,729,818 | | | $ | 7,254,208 | | | |
Accumulated net investment
income (loss) | | | 34,572 | | | — | | | — | | | — | | | | (1,849 | ) | | |
Accumulated net realized gains (losses) from investment and foreign currency transactions | | | 715,000 | | | 2,332,479 | | | 2,673,278 | | | (5,967,013 | ) | | | 1,379,647 | | | |
Net unrealized appreciation (depreciation) on investments and translation of assets and liabilities denominated in foreign currencies | | | 822,764 | | | 315,093 | | | 1,230,829 | | | 236,861 | | | | 266,299 | | | |
| | |
|
| |
|
| |
|
| |
|
|
| |
|
|
| | |
Net Assets | | $ | 14,803,112 | | $ | 25,937,971 | | $ | 24,772,497 | | $ | 9,999,666 | | | $ | 8,898,305 | | | |
| | |
|
| |
|
| |
|
| |
|
|
| |
|
|
| | |
See notes to financial statements.
Statements of Assets and Liabilities (Continued)
October 31, 2005
| | | | | | | | | | | | | | | | | | | | | | |
| | | Gartmore Global
Financial Services
Fund | | | Gartmore Global
Health Sciences
Fund | | | Gartmore Global
Natural Resources
Fund | | | Gartmore Global
Technology and
Communications Fund | | | Gartmore Global Utilities Fund |
Net Assets: | | | | | | | | | | | | | | | | | | | | | | |
Class A Shares | | $ | 4,546,016 | | | $ | 11,130,704 | | | $ | 10,915,289 | | | $ | 3,070,594 | | | $ | 2,376,796 | | | |
Class B Shares | | | 1,242,751 | | | | 1,302,241 | | | | 647,906 | | | | 1,038,244 | | | | 1,201,930 | | | |
Class C Shares | | | 1,589,668 | | | | 3,899,331 | | | | 4,938,161 | | | | 32,890 | | | | 2,434,935 | | | |
Class R Shares | | | 1,239 | | | | 1,139 | | | | 22,952 | | | | 974 | | | | 1,389 | | | |
Institutional Service Class Shares | | | 1,204,591 | | | | 5,828,479 | | | | 170,132 | | | | 3,512,911 | | | | 987,279 | | | |
Institutional Class Shares | | | 6,218,847 | | | | 3,776,077 | | | | 8,078,057 | | | | 2,344,053 | | | | 1,895,976 | | | |
| | |
|
|
| |
|
|
| |
|
|
| |
|
|
| |
|
|
| | |
Total | | $ | 14,803,112 | | | $ | 25,937,971 | | | $ | 24,772,497 | | | $ | 9,999,666 | | | $ | 8,898,305 | | | |
| | |
|
|
| |
|
|
| |
|
|
| |
|
|
| |
|
|
| | |
| | | | | | |
Shares outstanding (unlimited number of shares authorized): | | | | | | | | | | | | | | | | | | | | | | |
Class A Shares | | | 338,999 | | | | 957,168 | | | | 607,362 | | | | 826,641 | | | | 193,179 | | | |
Class B Shares | | | 94,387 | | | | 115,676 | | | | 36,361 | | | | 290,647 | | | | 98,894 | | | |
Class C Shares | | | 120,763 | | | | 346,242 | | | | 276,987 | | | | 9,138 | | | | 200,346 | | | |
Class R Shares | | | 94 | | | | 100 | | | | 1,281 | | | | 270 | | | | 114 | | | |
Institutional Service Class Shares | | | 89,356 | | | | 495,603 | | | | 9,456 | | | | 929,599 | | | | 79,918 | | | |
Institutional Class Shares | | | 461,393 | | | | 320,194 | | | | 448,421 | | | | 618,287 | | | | 153,474 | | | |
| | |
|
|
| |
|
|
| |
|
|
| |
|
|
| |
|
|
| | |
Total | | | 1,104,992 | | | | 2,234,983 | | | | 1,379,868 | | | | 2,674,582 | | | | 725,925 | | | |
| | |
|
|
| |
|
|
| |
|
|
| |
|
|
| |
|
|
| | |
| | | | | | |
Net asset value and redemption price per share: | | | | | | | | | | | | | | | | | | | | | | |
Class A Shares | | $ | 13.41 | | | $ | 11.63 | | | $ | 17.97 | | | $ | 3.71 | | | $ | 12.30 | | | |
Class B Shares (a) | | $ | 13.17 | | | $ | 11.26 | | | $ | 17.82 | | | $ | 3.57 | | | $ | 12.15 | | | |
Class C Shares (b) | | $ | 13.16 | | | $ | 11.26 | | | $ | 17.83 | | | $ | 3.60 | | | $ | 12.15 | | | |
Class R Shares | | $ | 13.19 | (c) | | $ | 11.37 | (c) | | $ | 17.91 | | | $ | 3.60 | | | $ | 12.20 | (c) | | |
Institutional Service Class Shares | | $ | 13.48 | | | $ | 11.76 | | | $ | 17.99 | | | $ | 3.78 | | | $ | 12.35 | | | |
Institutional Class Shares | | $ | 13.48 | | | $ | 11.79 | | | $ | 18.01 | | | $ | 3.79 | | | $ | 12.35 | | | |
| | | | | | |
Maximum offering price per share (100%/(100%-maximum sales charge) of net asset value adjusted to the nearest cent): | | | | | | | | | | | | | | | | | | | | | | |
Class A Shares | | $ | 14.23 | | | $ | 12.34 | | | $ | 19.07 | | | $ | 3.94 | | | $ | 13.06 | | | |
| | |
|
|
| |
|
|
| |
|
|
| |
|
|
| |
|
|
| | |
Maximum Sales Charge — Class A Shares | | | 5.75 | % | | | 5.75 | % | | | 5.75 | % | | | 5.75 | % | | | 5.75 | % | | |
| | |
|
|
| |
|
|
| |
|
|
| |
|
|
| |
|
|
| | |
| | | | | | | | | | | | | | | | | | | | | | | |
| | | | | | | | | | | | | | | | | | | | | | | |
| | | | | | | | | | | | | | | | | | | | | | | |
| | | | | | | | | | | | | | | | | | | | | | | |
| | | | | | | | | | | | | | | | | | | | | | | |
| | | | | | | | | | | | | | | | | | | | | | | |
| | | | | | | | | | | | | | | | | | | | | | | |
| (a) | For Class B Shares, the redemption price per share varies by length of time shares are held. |
| (b) | For Class C Shares, the redemption price per share is reduced by 1.00% for shares held less than one year. |
| (c) | Due to rounding, Net Assets divided by shares outstanding does not equal the NAV. |
See notes to financial statements.
Statements of Operations
October 31, 2005
| | | | | | | | | | | | | | | | | | | | | | |
| | | Gartmore Global
Financial Services
Fund | | | Gartmore Global
Health Sciences
Fund | | | Gartmore Global
Natural Resources
Fund | | | Gartmore Global
Technology and
Communications Fund | | | Gartmore Global Utilities Fund |
INVESTMENT INCOME: | | | | | | | | | | | | | | | | | | | | | | |
Interest income | | $ | 17,136 | | | $ | 39,682 | | | $ | 31,178 | | | $ | 7,434 | | | $ | 5,443 | | | |
Dividend income (net of foreign withholding tax of $15,469; $0; $372; $0 and $23,885; respectively) | | | 265,982 | | | | 161,818 | | | | 88,842 | | | | 58,305 | | | | 279,757 | | | |
Income from securities lending | | | — | | | | 5,563 | | | | — | | | | 7,760 | | | | — | | | |
| | |
|
|
| |
|
|
| |
|
|
| |
|
|
| |
|
|
| | |
Total Income | | | 283,118 | | | | 207,063 | | | | 120,020 | | | | 73,499 | | | | 285,200 | | | |
| | |
|
|
| |
|
|
| |
|
|
| |
|
|
| |
|
|
| | |
| | | | | | |
Expenses: | | | | | | | | | | | | | | | | | | | | | | |
Investment advisory fees | | | 95,422 | | | | 188,722 | | | | 63,141 | | | | 80,707 | | | | 65,245 | | | |
Fund administration and transfer agent fees | | | 25,060 | | | | 29,644 | | | | 13,185 | | | | 12,147 | | | | 28,213 | | | |
Distribution fees Class A | | | 8,152 | | | | 21,735 | | | | 6,179 | | | | 7,496 | | | | 5,126 | | | |
Distribution fees Class B | | | 11,664 | | | | 12,222 | | | | 1,698 | | | | 10,153 | | | | 11,095 | | | |
Distribution fees Class C | | | 13,441 | | | | 31,633 | | | | 12,678 | | | | 654 | | | | 33,396 | | | |
Distribution fees Class R | | | 4 | | | | 4 | | | | 10 | | | | 4 | | | | 5 | | | |
Administrative servicing fees Class A | | | 360 | | | | 8,561 | | | | 455 | | | | 1,875 | | | | 389 | | | |
Administrative servicing fees Class R | | | — | | | | — | | | | 3 | | | | — | | | | — | | | |
Administrative servicing fees Institutional Service Class | | | — | | | | 11,066 | | | | 4 | | | | 7,833 | | | | — | | | |
Registration and filing fees | | | 55,010 | | | | 50,464 | | | | 55,890 | | | | 60,783 | | | | 55,088 | | | |
Printing fees | | | 3,902 | | | | 9,687 | | | | 3,109 | | | | 15,339 | | | | 3,207 | | | |
Trustee fee | | | 404 | | | | 826 | | | | 204 | | | | 342 | | | | 373 | | | |
Other | | | 3,254 | | | | 7,693 | | | | 5,450 | | | | 3,565 | | | | 5,029 | | | |
| | |
|
|
| |
|
|
| |
|
|
| |
|
|
| |
|
|
| | |
Total expenses before reimbursed expenses | | | 216,673 | | | | 372,257 | | | | 162,006 | | | | 200,898 | | | | 207,166 | | | |
Earnings credit (Note 5) | | | (193 | ) | | | — | | | | — | | | | (1,805 | ) | | | — | | | |
Expenses reimbursed | | | (33,642 | ) | | | (16,979 | ) | | | (37,587 | ) | | | (45,576 | ) | | | (50,361 | ) | | |
| | |
|
|
| |
|
|
| |
|
|
| |
|
|
| |
|
|
| | |
Total Expenses | | | 182,838 | | | | 355,278 | | | | 124,419 | | | | 153,517 | | | | 156,805 | | | |
| | |
|
|
| |
|
|
| |
|
|
| |
|
|
| |
|
|
| | |
Net Investment Income (Loss) | | | 100,280 | | | | (148,215 | ) | | | (4,399 | ) | | | (80,018 | ) | | | 128,395 | | | |
| | |
|
|
| |
|
|
| |
|
|
| |
|
|
| |
|
|
| | |
| | | | | | |
REALIZED/UNREALIZED GAINS (LOSSES) FROM INVESTMENTS: | | | | | | | | | | | | | | | | | | | | | | |
Net realized gains (losses) on investment transactions | | | 791,295 | | | | 2,701,931 | | | | 2,685,498 | | | | 942,214 | | | | 1,421,007 | | | |
Net realized gains (losses) on foreign currency transactions | | | (631 | ) | | | (3,234 | ) | | | (1,266 | ) | | | 24 | | | | (3,116 | ) | | |
| | |
|
|
| |
|
|
| |
|
|
| |
|
|
| |
|
|
| | |
Net realized gains (losses) on investment and foreign currency transactions | | | 790,664 | | | | 2,698,697 | | | | 2,684,232 | | | | 942,238 | | | | 1,417,891 | | | |
Net change in unrealized appreciation/depreciation on investments and translation of assets and liabilities denominated in foreign currencies | | | 433,095 | | | | 206,446 | | | | 982,481 | | | | (331,575 | ) | | | (276,266 | ) | | |
| | |
|
|
| |
|
|
| |
|
|
| |
|
|
| |
|
|
| | |
Net realized/unrealized gains (losses) on investments and foreign currencies | | | 1,223,759 | | | | 2,905,143 | | | | 3,666,713 | | | | 610,663 | | | | 1,141,625 | | | |
| | |
|
|
| |
|
|
| |
|
|
| |
|
|
| |
|
|
| | |
CHANGE IN NET ASSETS RESULTING FROM OPERATIONS | | $ | 1,324,039 | | | $ | 2,756,928 | | | $ | 3,662,314 | | | $ | 530,645 | | | $ | 1,270,020 | | | |
| | |
|
|
| |
|
|
| |
|
|
| |
|
|
| |
|
|
| | |
See notes to financial statements.
Statements of Changes in Net Assets
| | | | | | | | | | | | | | | | | | |
| | | Gartmore Global Financial Services Fund | | | Gartmore Global Health Sciences Fund |
| | | Year Ended
October 31, 2005 | | | Year Ended
October 31, 2004 | | | Year Ended
October 31, 2005 | | | Year Ended
October 31, 2004 |
FROM INVESTMENT ACTIVITIES: | | | | | | | | | | | | | | | | | | |
Operations: | | | | | | | | | | | | | | | | | | |
Net investment income (loss) | | $ | 100,280 | | | $ | 42,579 | | | $ | (148,215 | ) | | $ | (85,681 | ) | | |
Net realized gains (losses) on investment and foreign currency transactions | | | 790,664 | | | | 455,605 | | | | 2,698,697 | | | | 41,841 | | | |
Net change in unrealized appreciation/depreciation on investments and translation of assets and liabilities denominated in foreign currencies | | | 433,095 | | | | 203,356 | | | | 206,446 | | | | 127,705 | | | |
| | |
|
|
| |
|
|
| |
|
|
| |
|
|
| | |
Change in net assets resulting from operations | | | 1,324,039 | | | | 701,540 | | | | 2,756,928 | | | | 83,865 | | | |
| | |
|
|
| |
|
|
| |
|
|
| |
|
|
| | |
| | | | | |
Distributions to Class A Shareholders from: | | | | | | | | | | | | | | | | | | |
Net investment income | | | (30,875 | ) | | | (19,336 | ) | | | — | | | | — | | | |
Net realized gains on investments | | | (164,040 | ) | | | (148,606 | ) | | | (38,890 | ) | | | (318,186 | ) | | |
| | | | | |
Distributions to Class B Shareholders from: | | | | | | | | | | | | | | | | | | |
Net investment income | | | (4,210 | ) | | | (2,631 | ) | | | — | | | | — | | | |
Net realized gains on investments | | | (69,765 | ) | | | (86,510 | ) | | | (6,466 | ) | | | (75,061 | ) | | |
| | | | | |
Distributions to Class C Shareholders from: | | | | | | | | | | | | | | | | | | |
Net investment income | | | (5,299 | ) | | | (2,660 | ) | | | — | | | | — | | | |
Net realized gains on investments | | | (72,404 | ) | | | (83,988 | ) | | | (13,651 | ) | | | (13,473 | ) | | |
| | | | | |
Distributions to Class R Shareholders from: | | | | | | | | | | | | | | | | | | |
Net investment income | | | (10 | ) | | | (6 | )(b) | | | — | | | | — | | | |
Net realized gains on investments | | | (70 | ) | | | — | | | | (6 | ) | | | — | | | |
| | | | | |
Distributions to Institutional Service Class Shareholders from: | | | | | | | | | | | | | | | | | | |
Net investment income | | | (12,933 | ) | | | (9,744 | ) | | | — | | | | — | | | |
Net realized gains on investments | | | (66,565 | ) | | | (83,737 | ) | | | (28,114 | ) | | | (300,573 | ) | | |
| | | | | |
Distributions to Institutional Class Shareholders from: | | | | | | | | | | | | | | | | | | |
Net investment income | | | (53,869 | ) | | | (1,601 | )(a) | | | — | | | | — | | | |
Net realized gains on investments | | | (101,460 | ) | | | — | | | | (6,183 | ) | | | — | | | |
| | |
|
|
| |
|
|
| |
|
|
| |
|
|
| | |
Change in net assets from shareholder distributions | | | (581,500 | ) | | | (438,819 | ) | | | (93,310 | ) | | | (707,293 | ) | | |
| | |
|
|
| |
|
|
| |
|
|
| |
|
|
| | |
Change in net assets from capital transactions | | | 7,722,798 | | | | 2,165,480 | | | | 8,578,575 | | | | 6,457,494 | | | |
| | |
|
|
| |
|
|
| |
|
|
| |
|
|
| | |
Change in net assets | | | 8,465,337 | | | | 2,428,201 | | | | 11,242,193 | | | | 5,834,066 | | | |
| | | | | |
Net Assets: | | | | | | | | | | | | | | | | | | |
Beginning of period | | | 6,337,775 | | | | 3,909,574 | | | | 14,695,778 | | | | 8,861,712 | | | |
| | |
|
|
| |
|
|
| |
|
|
| |
|
|
| | |
End of period | | $ | 14,803,112 | | | $ | 6,337,775 | | | $ | 25,937,971 | | | $ | 14,695,778 | | | |
| | |
|
|
| |
|
|
| |
|
|
| |
|
|
| | |
Accumulated net investment income (loss) | | | 34,572 | | | | 3,066 | | | | — | | | | — | | | |
| | |
|
|
| |
|
|
| |
|
|
| |
|
|
| | |
| | | | | | | | | | | | | | | | | | | |
| (a) | For the period from June 29, 2004 (commencement of operations) through October 31, 2004. |
| (b) | For the period from December 30, 2003 (commencement of operations) through October 31, 2004. |
See notes to financial statements.
Statements of Changes in Net Assets
| | | | | | | | | | |
| | | Gartmore Global Natural Resources Fund |
| | | Year Ended
October 31, 2005 | | | Period Ended
October 31, 2004 (a) |
FROM INVESTMENT ACTIVITIES: | | | | | | | | | | |
Operations: | | | | | | | | | | |
Net investment income (loss) | | $ | (4,399 | ) | | $ | 2,821 | | | |
Net realized gains (losses) on investment and foreign currency transactions | | | 2,684,232 | | | | 129,700 | | | |
Net change in unrealized appreciation/depreciation on investments and translation of assets and liabilities denominated in foreign currencies | | | 982,481 | | | | 248,348 | | | |
| | |
|
|
| |
|
|
| | |
Change in net assets resulting from operations | | | 3,662,314 | | | | 380,869 | | | |
| | |
|
|
| |
|
|
| | |
| | | |
Distributions to Class A Shareholders from: | | | | | | | | | | |
Net investment income | | | (326 | ) | | | (87 | ) | | |
Net realized gains on investments | | | (9,325 | ) | | | — | | | |
| | | |
Distributions to Class B Shareholders from: | | | | | | | | | | |
Net investment income | | | (11 | ) | | | — | | | |
Net realized gains on investments | | | (116 | ) | | | — | | | |
| | | |
Distributions to Class C Shareholders from: | | | | | | | | | | |
Net realized gains on investments | | | (221 | ) | | | — | | | |
| | | |
Distributions to Class R Shareholders from: | | | | | | | | | | |
Net realized gains on investments | | | (43 | ) | | | — | | | |
| | | |
Distributions to Institutional Service Class Shareholders from: | | | | | | | | | | |
Net investment income | | | (1 | ) | | | (2 | ) | | |
Net realized gains on investments | | | (41 | ) | | | — | | | |
| | | |
Distributions to Institutional Class Shareholders from: | | | | | | | | | | |
Net investment income | | | (5,702 | ) | | | (5,728 | ) | | |
Net realized gains on investments | | | (121,521 | ) | | | — | | | |
| | |
|
|
| |
|
|
| | |
Change in net assets from shareholder distributions | | | (137,307 | ) | | | (5,817 | ) | | |
| | |
|
|
| |
|
|
| | |
Change in net assets from capital transactions | | | 17,753,698 | | | | 3,118,740 | | | |
| | |
|
|
| |
|
|
| | |
Change in net assets | | | 21,278,705 | | | | 3,493,792 | | | |
| | | |
Net Assets: | | | | | | | | | | |
Beginning of period | | | 3,493,792 | | | | — | | | |
| | |
|
|
| |
|
|
| | |
End of period | | $ | 24,772,497 | | | $ | 3,493,792 | | | |
| | |
|
|
| |
|
|
| | |
Accumulated net investment income (loss) | | | — | | | | 1,052 | | | |
| | |
|
|
| |
|
|
| | |
| | | | | | | | | | | |
| | | | | | | | | | | |
| | | | | | | | | | | |
| | | | | | | | | | | |
| | | | | | | | | | | |
| | | | | | | | | | | |
| | | | | | | | | | | |
| (a) | For the period from June 29, 2004 (commencement of operations) through October 31, 2004. |
See notes to financial statements.
Statements of Changes in Net Assets
| | | | | | | | | | | | | | | | | | |
| | | Gartmore Global Technology and
Communications Fund | | | Gartmore Global Utilities Fund |
| | | Year Ended
October 31, 2005 | | | Year Ended
October 31, 2004 | | | Year Ended
October 31, 2005 | | | Year Ended
October 31, 2004 |
FROM INVESTMENT ACTIVITIES: | | | | | | | | | | | | | | | | | | |
Operations: | | | | | | | | | | | | | | | | | | |
Net investment income (loss) | | $ | (80,018 | ) | | $ | (143,391 | ) | | $ | 128,395 | | | $ | 30,549 | | | |
Net realized gains (losses) on investment and foreign currency transactions | | | 942,238 | | | | (1,129,803 | ) | | | 1,417,891 | | | | 859,479 | | | |
Net change in unrealized appreciation/depreciation on investments and translation of assets and liabilities denominated in foreign currencies | | | (331,575 | ) | | | 176,659 | | | | (276,266 | ) | | | 302,803 | | | |
| | |
|
|
| |
|
|
| |
|
|
| |
|
|
| | |
Change in net assets resulting from operations | | | 530,645 | | | | (1,096,535 | ) | | | 1,270,020 | | | | 1,192,831 | | | |
| | |
|
|
| |
|
|
| |
|
|
| |
|
|
| | |
| | | | | |
Distributions to Class A Shareholders from: | | | | | | | | | | | | | | | | | | |
Net investment income | | | — | | | | — | | | | (37,306 | ) | | | (3,515 | ) | | |
Net realized gains on investments | | | — | | | | — | | | | (35,442 | ) | | | — | | | |
| | | | | |
Distributions to Class B Shareholders from: | | | | | | | | | | | | | | | | | | |
Net investment income | | | — | | | | — | | | | (13,834 | ) | | | (480 | ) | | |
Net realized gains on investments | | | — | | | | — | | | | (21,341 | ) | | | — | | | |
| | | | | |
Distributions to Class C Shareholders from: | | | | | | | | | | | | | | | | | | |
Net investment income | | | — | | | | — | | | | (30,306 | ) | | | (4,370 | ) | | |
Net realized gains on investments | | | — | | | | — | | | | (70,568 | ) | | | — | | | |
| | | | | |
Distributions to Class R Shareholders from: | | | | | | | | | | | | | | | | | | |
Net investment income | | | — | | | | — | | | | (23 | ) | | | (3 | )(a) | | |
Net realized gains on investments | | | — | | | | — | | | | (27 | ) | | | — | | | |
| | | | | |
Distributions to Institutional Service Class Shareholders from: | | | | | | | | | | | | | | | | | | |
Net investment income | | | — | | | | — | | | | (19,292 | ) | | | (3,949 | ) | | |
Net realized gains on investments | | | — | | | | — | | | | (19,154 | ) | | | — | | | |
| | | | | |
Distributions to Institutional Class Shareholders from: | | | | | | | | | | | | | | | | | | |
Net investment income | | | — | | | | — | | | | (37,552 | ) | | | (557 | )(b) | | |
Net realized gains on investments | | | — | | | | — | | | | (13,216 | ) | | | — | | | |
| | |
|
|
| |
|
|
| |
|
|
| |
|
|
| | |
Change in net assets from shareholder distributions | | | — | | | | — | | | | (298,061 | ) | | | (12,874 | ) | | |
| | |
|
|
| |
|
|
| |
|
|
| |
|
|
| | |
Change in net assets from capital transactions | | | 745,111 | | | | 275,909 | | | | 1,207,083 | | | | 2,923,928 | | | |
| | |
|
|
| |
|
|
| |
|
|
| |
|
|
| | |
Change in net assets | | | 1,275,756 | | | | (820,626 | ) | | | 2,179,042 | | | | 4,103,885 | | | |
| | | | | |
Net Assets: | | | | | | | | | | | | | | | | | | |
Beginning of period | | | 8,723,910 | | | | 9,544,536 | | | | 6,719,263 | | | | 2,615,378 | | | |
| | |
|
|
| |
|
|
| |
|
|
| |
|
|
| | |
End of period | | $ | 9,999,666 | | | $ | 8,723,910 | | | $ | 8,898,305 | | | $ | 6,719,263 | | | |
| | |
|
|
| |
|
|
| |
|
|
| |
|
|
| | |
Accumulated net investment income (loss) | | | 715 | | | | — | | | | (1,849 | ) | | | 9,746 | | | |
| | |
|
|
| |
|
|
| |
|
|
| |
|
|
| | |
| | | | | | | | | | | | | | | | | | | |
| | |
|
|
| |
|
|
| |
|
|
| |
|
|
| |
|
| (a) | For the period from December 30, 2003 (commencement of operations) through October 31, 2004. |
| (b) | For the period from June 29, 2004 (commencement of operations) through October 31, 2004. |
See notes to financial statements.
Financial Highlights
Selected Data for Each Share of Capital Outstanding
Gartmore Global Financial Services Fund
| | | | | | | | | | | | | | | | | | | | | | | | | | | | | | | | | | | | | | | | | | | | |
| | | | | Investment Activities | | | Distributions | | | | | | Ratios/Supplemental Data |
| | | Net Asset
Value,
Beginning
of Period | | Net
Investment
Income
(Loss) | | | Net Realized
and
Unrealized
Gains
(Losses) on
Investments | | | Total
from
Investment
Activities | | | Net
Investment
Income | | | Net
Realized
Gains | | | Total
Distributions | | | Net Asset
Value, End
of Period | | Total
Return (a) | | | Net Assets
at End of
Period
(000s) | | Ratio of
Expenses
to Average
Net Assets | | | Ratio of Net
Investment
Income
(Loss) to Average
Net Assets | | | Ratio of
Expenses
(Prior to
Reimbursements)
to Average
Net Assets (b) | | | Ratio of Net
Investment
Income (Loss)
(Prior to
Reimbursements)
to Average
Net Assets (b) | | | Portfolio
Turnover (c) |
| | | | | | | | | | | | | | | |
Class A Shares | | | | | | | | | | | | | | | | | | | | | | | | | | | | | | | | | | | | | | | | | | | | |
Period Ended October 31, 2002 (d) | | $ | 10.00 | | 0.04 | | | (1.12 | ) | | (1.08 | ) | | — | | | — | | | — | | | $ | 8.92 | | (10.78% | )(e) | | $ | 675 | | 1.66% | (f) | | 0.47% | (f) | | 3.76% | (f) | | (1.63% | )(f) | | 102.39% |
Year Ended October 31, 2003 | | $ | 8.92 | | 0.07 | | | 2.83 | | | 2.90 | | | (0.02 | ) | | — | | | (0.02 | ) | | $ | 11.80 | | 32.59% | | | $ | 1,228 | | 1.65% | | | 0.81% | | | 2.78% | | | (0.33% | ) | | 256.82% |
Year Ended October 31, 2004 | | $ | 11.80 | | 0.12 | | | 1.77 | | | 1.89 | | | (0.09 | ) | | (1.11 | ) | | (1.20 | ) | | $ | 12.49 | | 17.01% | | | $ | 2,457 | | 1.65% | | | 1.06% | | | 2.41% | | | 0.31% | | | 129.61% |
Year Ended October 31, 2005 | | $ | 12.49 | | 0.11 | | | 1.72 | | | 1.84 | | | (0.11 | ) | | (0.80 | ) | | (0.91 | ) | | $ | 13.41 | | 14.91% | | | $ | 4,546 | | 1.66% | | | 1.00% | | | 2.00% | | | 0.66% | | | 213.88% |
| | | | | | | | | | | | | | | |
Class B Shares | | | | | | | | | | | | | | | | | | | | | | | | | | | | | | | | | | | | | | | | | | | | |
Period Ended October 31, 2002 (d) | | $ | 10.00 | | (0.02 | ) | | (1.11 | ) | | (1.13 | ) | | — | | | — | | | — | | | $ | 8.87 | | (11.30% | )(e) | | $ | 672 | | 2.38% | (f) | | (0.25% | )(f) | | 4.51% | (f) | | (2.38% | )(f) | | 102.39% |
Year Ended October 31, 2003 | | $ | 8.87 | | 0.01 | | | 2.79 | | | 2.80 | | | — | | | — | | | — | | | $ | 11.67 | | 31.60% | | | $ | 906 | | 2.40% | | | 0.08% | | | 3.67% | | | (1.20% | ) | | 256.82% |
Year Ended October 31, 2004 | | $ | 11.67 | | 0.02 | | | 1.75 | | | 1.77 | | | (0.03 | ) | | (1.11 | ) | | (1.14 | ) | | $ | 12.30 | | 16.15% | | | $ | 1,072 | | 2.40% | | | 0.20% | | | 3.14% | | | (0.54% | ) | | 129.61% |
Year Ended October 31, 2005 | | $ | 12.30 | | 0.04 | | | 1.68 | | | 1.73 | | | (0.05 | ) | | (0.80 | ) | | (0.85 | ) | | $ | 13.17 | | 14.02% | | | $ | 1,243 | | 2.40% | | | 0.28% | | | 2.80% | | | (0.12% | ) | | 213.88% |
| | | | | | | | | | | | | | | |
Class C Shares | | | | | | | | | | | | | | | | | | | | | | | | | | | | | | | | | | | | | | | | | | | | |
Period Ended October 31, 2002 (d) | | $ | 10.00 | | (0.02 | ) | | (1.11 | ) | | (1.13 | ) | | — | | | — | | | — | | | $ | 8.87 | | (11.30% | )(e) | | $ | 665 | | 2.38% | (f) | | (0.25% | )(f) | | 4.51% | (f) | | (2.38% | )(f) | | 102.39% |
Year Ended October 31, 2003 | | $ | 8.87 | | 0.01 | | | 2.79 | | | 2.80 | | | — | | | — | | | — | | | $ | 11.67 | | 31.60% | | | $ | 883 | | 2.40% | | | 0.08% | | | 3.68% | | | (1.20% | ) | | 256.82% |
Year Ended October 31, 2004 | | $ | 11.67 | | 0.02 | | | 1.75 | | | 1.77 | | | (0.03 | ) | | (1.11 | ) | | (1.14 | ) | | $ | 12.30 | | 16.16% | | | $ | 1,088 | | 2.40% | | | 0.20% | | | 3.15% | | | (0.55% | ) | | 129.61% |
Year Ended October 31, 2005 | | $ | 12.30 | | 0.03 | | | 1.68 | | | 1.72 | | | (0.05 | ) | | (0.80 | ) | | (0.85 | ) | | $ | 13.16 | | 13.94% | | | $ | 1,590 | | 2.40% | | | 0.30% | | | 2.77% | | | (0.08% | ) | | 213.88% |
| | | | | | | | | | | | | | | |
Class R Shares | | | | | | | | | | | | | | | | | | | | | | | | | | | | | | | | | | | | | | | | | | | | |
Period Ended October 31, 2004 (g) | | $ | 11.47 | | 0.04 | | | 0.86 | | | 0.90 | | | (0.06 | ) | | — | | | (0.06 | ) | | $ | 12.31 | | 7.89% | (e) | | $ | 1 | | 1.98% | (f) | | 0.46% | (f) | | 2.74% | (f) | | (0.30% | )(f) | | 129.61% |
Year Ended October 31, 2005 | | $ | 12.31 | | 0.12 | | | 1.67 | | | 1.80 | | | (0.11 | ) | | (0.80 | ) | | (0.91 | ) | | $ | 13.19 | | 14.82% | | | $ | 1 | | 1.71% | | | 0.96% | | | 2.27% | | | 0.41% | | | 213.88% |
| | | | | | | | | | | | | | | |
Institutional Service Class Shares | | | | | | | | | | | | | | | | | | | | | | | | | | | | | | | | | | | | | | | | | | | | |
Period Ended October 31, 2002 (d) | | $ | 10.00 | | 0.06 | | | (1.12 | ) | | (1.06 | ) | | — | | | — | | | — | | | $ | 8.94 | | (10.57% | )(e) | | $ | 671 | | 1.40% | (f) | | 0.73% | (f) | | 3.51% | (f) | | (1.38% | )(f) | | 102.39% |
Year Ended October 31, 2003 | | $ | 8.94 | | 0.11 | | | 2.83 | | | 2.94 | | | (0.03 | ) | | — | | | (0.03 | ) | | $ | 11.85 | | 32.95% | | | $ | 892 | | 1.40% | | | 1.08% | | | 2.68% | | | (0.20% | ) | | 256.82% |
Year Ended October 31, 2004 | | $ | 11.85 | | 0.15 | | | 1.78 | | | 1.93 | | | (0.12 | ) | | (1.11 | ) | | (1.23 | ) | | $ | 12.55 | | 17.25% | | | $ | 1,046 | | 1.40% | | | 1.20% | | | 2.14% | | | 0.46% | | | 129.61% |
Year Ended October 31, 2005 | | $ | 12.55 | | 0.16 | | | 1.72 | | | 1.89 | | | (0.15 | ) | | (0.80 | ) | | (0.95 | ) | | $ | 13.48 | | 15.20% | | | $ | 1,205 | | 1.40% | | | 1.27% | | | 1.79% | | | 0.88% | | | 213.88% |
| | | | | | | | | | | | | | | |
Institutional Class Shares | | | | | | | | | | | | | | | | | | | | | | | | | | | | | | | | | | | | | | | | | | | | |
Period Ended October 31, 2004 (h) | | $ | 12.22 | | 0.02 | | | 0.34 | | | 0.36 | | | (0.03 | ) | | — | | | (0.03 | ) | | $ | 12.55 | | 2.96% | (e) | | $ | 674 | | 1.40% | (f) | | 0.53% | (f) | | 2.30% | (f) | | (0.37% | )(f) | | 129.61% |
Year Ended October 31, 2005 | | $ | 12.55 | | 0.12 | | | 1.76 | | | 1.89 | | | (0.15 | ) | | (0.80 | ) | | (0.95 | ) | | $ | 13.48 | | 15.20% | | | $ | 6,219 | | 1.40% | | | 1.22% | | | 1.62% | | | 1.00% | | | 213.88% |
| | | | | | | | | | | | | | | | | | | | | | | | | | | | | | | | | | | | | | | | | | | | | |
| | | | | | | | | | | | | | | | | | | | | | | | | | | | | | | | | | | | | | | | | | | | | |
| | | | | | | | | | | | | | | | | | | | | | | | | | | | | | | | | | | | | | | | | | | | | |
| | | | | | | | | | | | | | | | | | | | | | | | | | | | | | | | | | | | | | | | | | | | | |
| | | | | | | | | | | | | | | | | | | | | | | | | | | | | | | | | | | | | | | | | | | | | |
| (a) | Excludes sales charge. |
| (b) | During the period certain fees were waived and/or reimbursed. If such waivers/reimbursements had not occurred, the ratio would have been as indicated. |
| (c) | Portfolio turnover is calculated on the basis of the Fund as a whole without distinguishing among the classes of shares. |
| (d) | For the period from December 18, 2001 (commencement of operations) through October 31, 2002. |
| (g) | For the period from December 30, 2003 (commencement of operations) through October 31, 2004. |
| (h) | For the period from June 29, 2004 (commencement of operations) through October 31, 2004. |
See notes to financial statements.
Financial Highlights
Selected Data for Each Share of Capital Outstanding
Gartmore Global Health Sciences Fund
| | | | | | | | | | | | | | | | | | | | | | | | | | | | | | | | | | | | | | | | | | | | |
| | | | | Investment Activities | | | Distributions | | | | | | Ratios/Supplemental Data |
| | | Net Asset
Value,
Beginning
of Period | | Net
Investment
Income
(Loss) | | | Net Realized
and
Unrealized
Gains
(Losses) on
Investments | | | Total
from
Investment
Activities | | | Net
Realized
Gains | | | Return
of
Capital | | | Total
Distributions | | | Net
Asset
Value, End
of Period | | Total
Return (a) | | | Net Assets
at End of
Period
(000s) | | Ratio of
Expenses
to Average
Net Assets | | | Ratio of Net
Investment
Income
(Loss)
to Average
Net Assets | | | Ratio of
Expenses
(Prior to
Reimbursements)
to Average
Net Assets (b) | | | Ratio of Net
Investment
Income (Loss)
(Prior to
Reimbursements)
to Average
Net Assets (b) | | | Portfolio
Turnover (c) |
| | | | | | | | | | | | | | | |
Class A Shares | | | | | | | | | | | | | | | | | | | | | | | | | | | | | | | | | | | | | | | | | | | | |
Period Ended October 31, 2001 (d) | | $ | 10.00 | | (0.03 | ) | | (0.63 | ) | | (0.66 | ) | | — | | | (0.01 | ) | | (0.01 | ) | | $ | 9.33 | | (6.61% | )(f) | | $ | 779 | | 1.53% | (g) | | (0.55% | )(g) | | 6.84% | (g) | | (5.86% | )(g) | | 754.05% |
Year Ended October 31, 2002 | | $ | 9.33 | | (0.06 | ) | | (0.97 | ) | | (1.03 | ) | | — | | | — | | | — | | | $ | 8.30 | | (11.04% | ) | | $ | 1,538 | | 1.60% | | | (0.99% | ) | | 3.10% | | | (2.49% | ) | | 893.80% |
Year Ended October 31, 2003 | | $ | 8.30 | | (0.05 | ) | | 1.99 | | | 1.94 | | | — | | | — | | | — | | | $ | 10.24 | | 23.37% | | | $ | 4,087 | | 1.57% | | | (0.75% | ) | | 2.29% | | | (1.47% | ) | | 570.16% |
Year Ended October 31, 2004 | | $ | 10.24 | | (0.06 | ) | | 0.70 | | | 0.64 | | | (0.84 | ) | | — | | | (0.84 | ) | | $ | 10.04 | | 6.26% | | | $ | 6,144 | | 1.59% | | | (0.67% | ) | | 1.90% | | | (0.98% | ) | | 388.52% |
Year Ended October 31, 2005 | | $ | 10.04 | | (0.06 | ) | | 1.71 | | | 1.65 | | | (0.06 | ) | | — | | | (0.06 | ) | | $ | 11.63 | | 16.47% | | | $ | 11,131 | | 1.64% | | | (0.66% | ) | | 1.72% | | | (0.74% | ) | | 401.37% |
| | | | | | | | | | | | | | | |
Class B Shares | | | | | | | | | | | | | | | | | | | | | | | | | | | | | | | | | | | | | | | | | | | | |
Period Ended October 31, 2001 (d) | | $ | 10.00 | | (0.09 | ) | | (0.62 | ) | | (0.71 | ) | | — | | | — | | | — | | | $ | 9.29 | | (7.10% | )(f) | | $ | 774 | | 2.13% | (g) | | (1.15% | )(g) | | 7.61% | (g) | | (6.63% | )(g) | | 754.05% |
Year Ended October 31, 2002 | | $ | 9.29 | | (0.15 | ) | | (0.93 | ) | | (1.08 | ) | | — | | | — | | | — | | | $ | 8.21 | | (11.63% | ) | | $ | 730 | | 2.28% | | | (1.71% | ) | | 4.00% | | | (3.43% | ) | | 893.80% |
Year Ended October 31, 2003 | | $ | 8.21 | | (0.13 | ) | | 1.98 | | | 1.85 | | | — | | | — | | | — | | | $ | 10.06 | | 22.53% | | | $ | 899 | | 2.25% | | | (1.41% | ) | | 3.06% | | | (2.22% | ) | | 570.16% |
Year Ended October 31, 2004 | | $ | 10.06 | | (0.13 | ) | | 0.69 | | | 0.56 | | | (0.84 | ) | | — | | | (0.84 | ) | | $ | 9.78 | | 5.52% | | | $ | 1,076 | | 2.25% | | | (1.32% | ) | | 2.56% | | | (1.63% | ) | | 388.52% |
Year Ended October 31, 2005 | | $ | 9.78 | | (0.13 | ) | | 1.67 | | | 1.54 | | | (0.06 | ) | | — | | | (0.06 | ) | | $ | 11.26 | | 15.78% | | | $ | 1,302 | | 2.29% | | | (1.27% | ) | | 2.39% | | | (1.37% | ) | | 401.37% |
| | | | | | | | | | | | | | | |
Class C Shares | | | | | | | | | | | | | | | | | | | | | | | | | | | | | | | | | | | | | | | | | | | | |
Period Ended October 31, 2002 (e) | | $ | 7.92 | | (0.01 | ) | | 0.30 | | | 0.29 | | | — | | | — | | | — | | | $ | 8.21 | | 3.66% | (f) | | $ | 58 | | 2.25% | (g) | | (1.69% | )(g) | | 2.80% | (g) | | (2.24% | )(g) | | 893.80% |
Year Ended October 31, 2003 | | $ | 8.21 | | (0.12 | ) | | 1.98 | | | 1.86 | | | — | | | — | | | — | | | $ | 10.07 | | 22.66% | | | $ | 130 | | 2.25% | | | (1.45% | ) | | 2.96% | | | (2.16% | ) | | 570.16% |
Year Ended October 31, 2004 | | $ | 10.07 | | (0.04 | ) | | 0.59 | | | 0.55 | | | (0.84 | ) | | — | | | (0.84 | ) | | $ | 9.78 | | 5.52% | | | $ | 2,092 | | 2.25% | | | (1.44% | ) | | 2.57% | | | (1.76% | ) | | 388.52% |
Year Ended October 31, 2005 | | $ | 9.78 | | (0.12 | ) | | 1.66 | | | 1.54 | | | (0.06 | ) | | — | | | (0.06 | ) | | $ | 11.26 | | 15.66% | | | $ | 3,899 | | 2.30% | | | (1.30% | ) | | 2.37% | | | (1.37% | ) | | 401.37% |
| | | | | | | | | | | | | | | |
Class R Shares | | | | | | | | | | | | | | | | | | | | | | | | | | | | | | | | | | | | | | | | | | | | |
Period Ended October 31, 2004 (h) | | $ | 10.04 | | (0.09 | ) | | (0.14 | ) | | (0.23 | ) | | — | | | — | | | — | | | $ | 9.81 | | (2.29% | )(f) | | $ | 1 | | 1.88% | (g) | | (1.03% | )(g) | | 2.22% | (g) | | (1.37% | )(g) | | 388.52% |
Year Ended October 31, 2005 | | $ | 9.81 | | (0.06 | ) | | 1.68 | | | 1.62 | | | (0.06 | ) | | — | | | (0.06 | ) | | $ | 11.37 | | 16.55% | | | $ | 1 | | 1.60% | | | (0.59% | ) | | 1.67% | | | (0.65% | ) | | 401.37% |
| | | | | | | | | | | | | | | |
Institutional Service Class Shares | | | | | | | | | | | | | | | | | | | | | | | | | | | | | | | | | | | | | | | | | | | | |
Period Ended October 31, 2001 (d) | | $ | 10.00 | | (0.01 | ) | | (0.62 | ) | | (0.63 | ) | | — | | | (0.01 | ) | | (0.01 | ) | | $ | 9.36 | | (6.25% | )(f) | | $ | 781 | | 1.10% | (g) | | (0.13% | )(g) | | 6.59% | (g) | | (5.62% | )(g) | | 754.05% |
Year Ended October 31, 2002 | | $ | 9.36 | | (0.04 | ) | | (0.97 | ) | | (1.01 | ) | | — | | | — | | | — | | | $ | 8.35 | | (10.79% | ) | | $ | 1,403 | | 1.27% | | | (0.66% | ) | | 2.85% | | | (2.24% | ) | | 893.80% |
Year Ended October 31, 2003 | | $ | 8.35 | | (0.04 | ) | | 2.01 | | | 1.97 | | | — | | | — | | | — | | | $ | 10.32 | | 23.59% | | | $ | 3,746 | | 1.42% | | | (0.61% | ) | | 2.12% | | | (1.31% | ) | | 570.16% |
Year Ended October 31, 2004 | | $ | 10.32 | | (0.06 | ) | | 0.71 | | | 0.65 | | | (0.84 | ) | | — | | | (0.84 | ) | | $ | 10.13 | | 6.30% | | | $ | 4,979 | | 1.46% | | | (0.54% | ) | | 1.76% | | | (0.84% | ) | | 388.52% |
Year Ended October 31, 2005 | | $ | 10.13 | | (0.05 | ) | | 1.74 | | | 1.69 | | | (0.06 | ) | | — | | | (0.06 | ) | | $ | 11.76 | | 16.72% | | | $ | 5,828 | | 1.50% | | | (0.47% | ) | | 1.59% | | | (0.57% | ) | | 401.37% |
| | | | | | | | | | | | | | | |
Institutional Class Shares | | | | | | | | | | | | | | | | | | | | | | | | | | | | | | | | | | | | | | | | | | | | |
Period Ended October 31, 2004 (i) | | $ | 10.92 | | (0.01 | ) | | (0.77 | ) | | (0.78 | ) | | — | | | — | | | — | | | $ | 10.14 | | (7.14% | )(f) | | $ | 404 | | 1.25% | (g) | | (0.25% | )(g) | | 1.54% | (g) | | (0.54% | )(g) | | 388.52% |
Year Ended October 31, 2005 | | $ | 10.14 | | (0.03 | ) | | 1.74 | | | 1.71 | | | (0.06 | ) | | — | | | (0.06 | ) | | $ | 11.79 | | 16.90% | | | $ | 3,776 | | 1.29% | | | (0.35% | ) | | 1.34% | | | (0.41% | ) | | 401.37% |
| | | | | | | | | | | | | | | | | | | | | | | | | | | | | | | | | | | | | | | | | | | | | |
| | | | | | | | | | | | | | | | | | | | | | | | | | | | | | | | | | | | | | | | | | | | | |
| | | | | | | | | | | | | | | | | | | | | | | | | | | | | | | | | | | | | | | | | | | | | |
| (a) | Excludes sales charge. |
| (b) | During the period certain fees were waived and/or reimbursed. If such waivers/reimbursements had not occurred, the ratio would have been as indicated. |
| (c) | Portfolio turnover is calculated on the basis of the Fund as a whole without distinguishing among the classes of shares. |
| (d) | For the period from December 29, 2000 (commencement of operations) through October 31, 2001. |
| (e) | For the period from September 23, 2002 (commencement of operations) through October 31, 2002. |
| (h) | For the period from December 30, 2003 (commencement of operations) through October 31, 2004. |
| (i) | For the period from June 29, 2004 (commencement of operations) through October 31, 2004. |
See notes to financial statements.
Financial Highlights
Selected Data for Each Share of Capital Outstanding
Gartmore Global Natural Resources Fund
| | | | | | | | | | | | | | | | | | | | | | | | | | | | | | | | | | | | | | | | | | | | |
| | | | | Investment Activities | | Distributions | | | | | | | | Ratios/Supplemental Data |
| | | Net Asset
Value,
Beginning
of Period | | Net
Investment
Income
(Loss) | | | Redemption
Fees | | Net Realized
and
Unrealized
Gains
(Losses) on
Investments | | Total
from
Investment
Activities | | Net
Investment
Income | | | Net
Realized
Gains | | | Total
Distributions | | | Net
Asset
Value, End
of Period | | Total
Return (a) | | | Net
Assets at
End of
Period
(000s) | | Ratio of
Expenses
to Average
Net Assets | | | Ratio of Net
Investment
Income
(Loss)
to Average
Net Assets | | | Ratio of
Expenses
(Prior to
Reimbursements)
to Average
Net Assets (b) | | | Ratio of Net
Investment
Income (Loss)
(Prior to
Reimbursements)
to Average
Net Assets (b) | | | Portfolio
Turnover (c) |
| | | | | | | | | | | | | | | | |
Class A Shares | | | | | | | | | | | | | | | | | | | | | | | | | | | | | | | | | | | | | | | | | | | | |
Period Ended October 31, 2004 (d) | | $ | 10.00 | | — | | | — | | 1.25 | | 1.25 | | (0.02 | ) | | — | | | (0.02 | ) | | $ | 11.23 | | 12.58% | (e) | | $ | 107 | | 1.58% | (f) | | (1.05% | )(f) | | 4.11% | (f) | | (3.59% | )(f) | | 48.29% |
Year Ended October 31, 2005 | | $ | 11.23 | | — | (g) | | 0.01 | | 7.14 | | 7.15 | | (0.01 | ) | | (0.40 | ) | | (0.41 | ) | | $ | 17.97 | | 65.51% | | | $ | 10,915 | | 1.47% | | | (0.13% | ) | | 1.59% | | | (0.25% | ) | | 313.92% |
| | | | | | | | | | | | | | | | |
Class B Shares | | | | | | | | | | | | | | | | | | | | | | | | | | | | | | | | | | | | | | | | | | | | |
Period Ended October 31, 2004 (d) | | $ | 10.00 | | (0.03 | ) | | — | | 1.24 | | 1.21 | | — | | | — | | | — | | | $ | 11.21 | | 12.10% | (e) | | $ | 1 | | 2.30% | (f) | | (0.88% | )(f) | | 4.44% | (f) | | (3.02% | )(f) | | 48.29% |
Year Ended October 31, 2005 | | $ | 11.21 | | (0.04 | ) | | 0.01 | | 7.04 | | 7.01 | | — | | | (0.40 | ) | | (0.40 | ) | | $ | 17.82 | | 64.49% | | | $ | 648 | | 2.20% | | | (0.83% | ) | | 2.54% | | | (1.18% | ) | | 313.92% |
| | | | | | | | | | | | | | | | |
Class C Shares | | | | | | | | | | | | | | | | | | | | | | | | | | | | | | | | | | | | | | | | | | | | |
Period Ended October 31, 2004 (d) | | $ | 10.00 | | (0.02 | ) | | — | | 1.23 | | 1.21 | | — | | | — | | | — | | | $ | 11.21 | | 12.20% | (e) | | $ | 6 | | 2.30% | (f) | | (1.29% | )(f) | | 4.77% | (f) | | (3.76% | )(f) | | 48.29% |
Year Ended October 31, 2005 | | $ | 11.21 | | (0.04 | ) | | 0.01 | | 7.05 | | 7.02 | | — | | | (0.40 | ) | | (0.40 | ) | | $ | 17.83 | | 64.42% | | | $ | 4,938 | | 2.20% | | | (0.87% | ) | | 2.27% | | | (0.94% | ) | | 313.92% |
| | | | | | | | | | | | | | | | |
Class R Shares | | | | | | | | | | | | | | | | | | | | | | | | | | | | | | | | | | | | | | | | | | | | |
Period Ended October 31, 2004 (d) | | $ | 10.00 | | (0.02 | ) | | — | | 1.24 | | 1.22 | | — | | | — | (g) | | — | | | $ | 11.22 | | 12.22% | (e) | | $ | 1 | | 1.94% | (f) | | (0.53% | )(f) | | 3.91% | (f) | | (2.51% | )(f) | | 48.29% |
Year Ended October 31, 2005 | | $ | 11.22 | | — | (g) | | 0.01 | | 7.08 | | 7.09 | | — | | | (0.40 | ) | | (0.40 | ) | | $ | 17.91 | | 65.15% | | | $ | 23 | | 1.73% | | | (0.14% | ) | | 1.94% | | | (0.36% | ) | | 313.92% |
| | | | | | | | | | | | | | | | |
Institutional Service Class Shares | | | | | | | | | | | | | | | | | | | | | | | | | | | | | | | | | | | | | | | | | | | | |
Period Ended October 31, 2004 (d) | | $ | 10.00 | | 0.02 | | | — | | 1.23 | | 1.25 | | (0.02 | ) | | — | | | (0.02 | ) | | $ | 11.23 | | 12.50% | (e) | | $ | 1 | | 1.39% | (f) | | 0.17% | (f) | | 3.56% | (f) | | (2.00% | )(f) | | 48.29% |
Year Ended October 31, 2005 | | $ | 11.23 | | 0.01 | | | 0.01 | | 7.15 | | 7.17 | | (0.01 | ) | | (0.40 | ) | | (0.41 | ) | | $ | 17.99 | | 65.89% | | | $ | 170 | | 1.22% | | | 0.03% | | | 0.80% | | | 0.45% | | | 313.92% |
| | | | | | | | | | | | | | | | |
Institutional Class Shares | | | | | | | | | | | | | | | | | | | | | | | | | | | | | | | | | | | | | | | | | | | | |
Period Ended October 31, 2004 (d) | | $ | 10.00 | | 0.01 | | | — | | 1.25 | | 1.26 | | (0.02 | ) | | — | | | (0.02 | ) | | $ | 11.24 | | 12.60% | (e) | | $ | 3,377 | | 1.30% | (f) | | 0.27% | (f) | | 3.32% | (f) | | (1.74% | )(f) | | 48.29% |
Year Ended October 31, 2005 | | $ | 11.24 | | 0.03 | | | 0.01 | | 7.15 | | 7.19 | | (0.02 | ) | | (0.40 | ) | | (0.42 | ) | | $ | 18.01 | | 66.02% | | | $ | 8,078 | | 1.23% | | | 0.25% | | | 1.95% | | | (0.48% | ) | | 313.92% |
| | | | | | | | | | | | | | | | | | | | | | | | | | | | | | | | | | | | | | | | | | | | | |
| | | | | | | | | | | | | | | | | | | | | | | | | | | | | | | | | | | | | | | | | | | | | |
| | | | | | | | | | | | | | | | | | | | | | | | | | | | | | | | | | | | | | | | | | | | | |
| | | | | | | | | | | | | | | | | | | | | | | | | | | | | | | | | | | | | | | | | | | | | |
| | | | | | | | | | | | | | | | | | | | | | | | | | | | | | | | | | | | | | | | | | | | | |
| | | | | | | | | | | | | | | | | | | | | | | | | | | | | | | | | | | | | | | | | | | | | |
| | | | | | | | | | | | | | | | | | | | | | | | | | | | | | | | | | | | | | | | | | | | | |
| | | | | | | | | | | | | | | | | | | | | | | | | | | | | | | | | | | | | | | | | | | | | |
| | | | | | | | | | | | | | | | | | | | | | | | | | | | | | | | | | | | | | | | | | | | | |
| | | | | | | | | | | | | | | | | | | | | | | | | | | | | | | | | | | | | | | | | | | | | |
| | | | | | | | | | | | | | | | | | | | | | | | | | | | | | | | | | | | | | | | | | | | | |
| (a) | Excludes sales charge. |
| (b) | During the period certain fees were waived and/or reimbursed. If such waivers/reimbursements had not occurred, the ratio would have been as indicated. |
| (c) | Portfolio turnover is calculated on the basis of the Fund as a whole without distinguishing among the classes of shares. |
| (d) | For the period from June 29, 2004 (commencement of operations) through October 31, 2004. |
| (g) | Amount is less than $0.005. |
See notes to financial statements.
Financial Highlights
Selected Data for Each Share of Capital Outstanding
Gartmore Global Technology and Communications Fund
| | | | | | | | | | | | | | | | | | | | | | | | | | | | | | | | | | | | | | | | | |
| | | | | Investment Activities | | | Distributions | | | | | | Ratios/Supplemental Data |
| | | Net Asset
Value,
Beginning
of Period | | Net
Investment
Income
(Loss) | | | Net Realized
and
Unrealized
Gains
(Losses) on
Investments | | | Total
from
Investment
Activities | | | Net
Realized
Gains | | | Total
Distributions | | | Net
Asset
Value, End
of Period | | Total
Return (a) | | | Net Assets
at End of
Period
(000s) | | Ratio of
Expenses
to Average
Net Assets | | | Ratio of Net
Investment
Income
(Loss)
to Average
Net Assets | | | Ratio of
Expenses
(Prior to
Reimbursements)
to Average
Net Assets (b) | | | Ratio of Net
Investment
Income
(Prior to
Reimbursements)
to Average
Net Assets (b) | | | Portfolio
Turnover (c) |
| | | | | | | | | | | | | | |
Class A Shares | | | | | | | | | | | | | | | | | | | | | | | | | | | | | | | | | | | | | | | | | |
Year Ended October 31, 2001 | | $ | 11.12 | | (0.06 | ) | | (6.41 | ) | | (6.47 | ) | | (0.63 | ) | | (0.63 | ) | | $ | 4.02 | | (60.93% | ) | | $ | 2,038 | | 1.73% | | | (1.05% | ) | | 6.38% | | | (5.70% | ) | | 922.33% |
Year Ended October 31, 2002 | | $ | 4.02 | | (0.04 | ) | | (1.35 | ) | | (1.39 | ) | | — | | | — | | | $ | 2.63 | | (34.58% | )(g) | | $ | 1,514 | | 1.69% | | | (1.37% | ) | | 2.56% | | | (2.24% | ) | | 944.01% |
Year Ended October 31, 2003 | | $ | 2.63 | | (0.04 | ) | | 1.27 | | | 1.23 | | | — | | | — | | | $ | 3.86 | | 46.77% | | | $ | 3,303 | | 1.69% | | | (1.38% | ) | | 2.96% | | | (2.64% | ) | | 1136.72% |
Year Ended October 31, 2004 | | $ | 3.86 | | (0.06 | ) | | (0.28 | ) | | (0.34 | ) | | — | | | — | | | $ | 3.52 | | (8.81% | ) | | $ | 2,991 | | 1.71% | | | (1.45% | ) | | 2.02% | | | (1.76% | ) | | 722.91% |
Year Ended October 31, 2005 | | $ | 3.52 | | (0.03 | ) | | 0.22 | | | 0.19 | | | — | | | — | | | $ | 3.71 | | 5.40% | | | $ | 3,071 | | 1.72% | | | (0.87% | ) | | 2.23% | | | (1.38% | ) | | 654.64% |
| | | | | | | | | | | | | | |
Class B Shares | | | | | | | | | | | | | | | | | | | | | | | | | | | | | | | | | | | | | | | | | |
Year Ended October 31, 2001 | | $ | 11.09 | | (0.09 | ) | | (6.40 | ) | | (6.49 | ) | | (0.63 | ) | | (0.63 | ) | | $ | 3.97 | | (61.30% | ) | | $ | 1,137 | | 2.33% | | | (1.66% | ) | | 7.21% | | | (6.54% | ) | | 922.33% |
Year Ended October 31, 2002 | | $ | 3.97 | | (0.07 | ) | | (1.32 | ) | | (1.39 | ) | | — | | | — | | | $ | 2.58 | | (35.01% | )(g) | | $ | 780 | | 2.38% | | | (2.02% | ) | | 3.32% | | | (2.96% | ) | | 944.01% |
Year Ended October 31, 2003 | | $ | 2.58 | | (0.06 | ) | | 1.25 | | | 1.19 | | | — | | | — | | | $ | 3.77 | | 46.12% | | | $ | 1,196 | | 2.40% | | | (2.07% | ) | | 3.73% | | | (3.40% | ) | | 1136.72% |
Year Ended October 31, 2004 | | $ | 3.77 | | (0.08 | ) | | (0.28 | ) | | (0.36 | ) | | — | | | — | | | $ | 3.41 | | (9.55% | ) | | $ | 1,064 | | 2.40% | | | (2.14% | ) | | 2.72% | | | (2.46% | ) | | 722.91% |
Year Ended October 31, 2005 | | $ | 3.41 | | (0.05 | ) | | 0.21 | | | 0.16 | | | — | | | — | | | $ | 3.57 | | 4.69% | | | $ | 1,038 | | 2.41% | | | (1.55% | ) | | 2.93% | | | (2.07% | ) | | 654.64% |
| | | | | | | | | | | | | | |
Class C Shares | | | | | | | | | | | | | | | | | | | | | | | | | | | | | | | | | | | | | | | | | |
Period Ended October 31, 2001 (d) | | $ | 5.37 | | (0.02 | ) | | (1.36 | ) | | (1.38 | ) | | — | | | — | | | $ | 3.99 | | (25.70% | )(e) | | $ | 29 | | 2.33% | (f) | | (1.79% | )(f) | | 9.94% | (f) | | (9.40% | )(f) | | 922.33% |
Year Ended October 31, 2002 | | $ | 3.99 | | (0.08 | ) | | (1.31 | ) | | (1.39 | ) | | — | | | — | | | $ | 2.60 | | (34.84% | )(g) | | $ | 17 | | 2.38% | | | (1.83% | ) | | 3.40% | | | (2.85% | ) | | 944.01% |
Year Ended October 31, 2003 | | $ | 2.60 | | (0.06 | ) | | 1.25 | | | 1.19 | | | — | | | — | | | $ | 3.79 | | 45.77% | | | $ | 39 | | 2.40% | | | (2.10% | ) | | 3.65% | | | (3.35% | ) | | 1136.72% |
Year Ended October 31, 2004 | | $ | 3.79 | | (0.06 | ) | | (0.30 | ) | | (0.36 | ) | | — | | | — | | | $ | 3.43 | | (9.50% | ) | | $ | 79 | | 2.40% | | | (2.14% | ) | | 2.73% | | | (2.47% | ) | | 722.91% |
Year Ended October 31, 2005 (j) | | $ | 3.43 | | (0.05 | ) | | 0.22 | | | 0.17 | | | — | | | — | | | $ | 3.60 | | 4.96% | | | $ | 33 | | 2.41% | | | (1.51% | ) | | 3.06% | | | (2.16% | ) | | 654.64% |
| | | | | | | | | | | | | | |
Class R Shares | | | | | | | | | | | | | | | | | | | | | | | | | | | | | | | | | | | | | | | | | |
Period Ended October 31, 2004 (h) | | $ | 3.70 | | (0.05 | ) | | (0.23 | ) | | (0.28 | ) | | — | | | — | | | $ | 3.42 | | (7.57% | )(e) | | $ | 1 | | 1.99% | (f) | | (1.75% | )(f) | | 2.28% | (f) | | (2.04% | )(f) | | 722.91% |
Year Ended October 31, 2005 | | $ | 3.42 | | (0.03 | ) | | 0.21 | | | 0.18 | | | — | | | — | | | $ | 3.60 | | 5.26% | | | $ | 1 | | 1.83% | | | (1.01% | ) | | 2.33% | | | (1.51% | ) | | 654.64% |
| | | | | | | | | | | | | | |
Institutional Service Class Shares | | | | | | | | | | | | | | | | | | | | | | | | | | | | | | | | | | | | | | | | | |
Year Ended October 31, 2001 | | $ | 11.12 | | (0.04 | ) | | (6.39 | ) | | (6.43 | ) | | (0.63 | ) | | (0.63 | ) | | $ | 4.06 | | (60.58% | ) | | $ | 730 | | 1.40% | | | (0.70% | ) | | 5.70% | | | (5.00% | ) | | 922.33% |
Year Ended October 31, 2002 | | $ | 4.06 | | (0.03 | ) | | (1.37 | ) | | (1.40 | ) | | — | | | — | | | $ | 2.66 | | (34.48% | )(g) | | $ | 843 | | 1.41% | | | (1.37% | ) | | 2.08% | | | (2.04% | ) | | 944.01% |
Year Ended October 31, 2003 | | $ | 2.66 | | (0.04 | ) | | 1.30 | | | 1.26 | | | — | | | — | | | $ | 3.92 | | 47.37% | | | $ | 5,006 | | 1.58% | | | (1.29% | ) | | 2.65% | | | (2.36% | ) | | 1136.72% |
Year Ended October 31, 2004 | | $ | 3.92 | | (0.06 | ) | | (0.29 | ) | | (0.35 | ) | | — | | | — | | | $ | 3.57 | | (8.93% | ) | | $ | 4,358 | | 1.62% | | | (1.36% | ) | | 1.92% | | | (1.67% | ) | | 722.91% |
Year Ended October 31, 2005 | | $ | 3.57 | | (0.03 | ) | | 0.24 | | | 0.21 | | | — | | | — | | | $ | 3.78 | | 5.88% | | | $ | 3,513 | | 1.62% | | | (0.74% | ) | | 2.17% | | | (1.30% | ) | | 654.64% |
| | | | | | | | | | | | | | |
Institutional Class Shares | | | | | | | | | | | | | | | | | | | | | | | | | | | | | | | | | | | | | | | | | |
Period Ended October 31, 2004 (i) | | $ | 3.81 | | (0.01 | ) | | (0.22 | ) | | (0.23 | ) | | — | | | — | | | $ | 3.58 | | (6.04% | )(e) | | $ | 231 | | 1.40% | (f) | | (1.05% | )(f) | | 1.92% | (f) | | (1.57% | )(f) | | 722.91% |
Year Ended October 31, 2005 | | $ | 3.58 | | (0.02 | ) | | 0.23 | | | 0.21 | | | — | | | — | | | $ | 3.79 | | 5.87% | | | $ | 2,344 | | 1.40% | | | (0.77% | ) | | 1.68% | | | (1.05% | ) | | 654.64% |
| | | | | | | | | | | | | | | | | | | | | | | | | | | | | | | | | | | | | | | | | | |
| | | | | | | | | | | | | | | | | | | | | | | | | | | | | | | | | | | | | | | | | | |
| | |
(a) Excludes sales charge. (b) During the period certain fees were waived and/or reimbursed. If such waivers/reimbursements had not occurred, the ratio would have been as indicated. (c) Portfolio turnover is calculated on the basis of the Fund as a whole without distinguishing among the classes of shares. (d) For the period from March 1, 2001 (commencement of operations) through October 31, 2001. (e) Not annualized. (f) Annualized. | | (g) The total returns shown include losses realized on the disposal of investments that were reimbursed by the adviser, which otherwise would have reduced total returns by 0.54%, 0.60%, 0.89%, and 0.38% for Class A, Class B, Class C and Institutional Service Class shares, respectively. (h)For the period from December 30, 2003 (commencement of operations) through October 31, 2004. (i) For the period from June 29, 2004 (commencement of operations) through October 31, 2004. (j) Net investment income (loss) is based on average shares outstanding during the period. |
See notes to financial statements.
Financial Highlights
Selected Data for Each Share of Capital Outstanding
Gartmore Global Utilities Fund
| | | | | | | | | | | | | | | | | | | | | | | | | | | | | | | | | | | | | | | | | | | | | |
| | | | | Investment Activities | | | Distributions | | | | | | Ratios/Supplemental Data |
| | | Net Asset
Value,
Beginning
of Period | | Net
Investment
Income
(Loss) | | Redemption
Fees | | Net Realized
and
Unrealized
Gains
(Losses) on
Investments | | | Total
from
Investment
Activities | | | Net
Investment
Income | | | Net
Realized
Gains | | | Total
Distributions | | | Net
Asset
Value, End
of Period | | Total
Return (a) | | | Net Assets
at End of
Period
(000s) | | Ratio of
Expenses
to Average
Net Assets | | | Ratio of Net
Investment
Income
(Loss) to Average
Net Assets | | | Ratio of
Expenses
(Prior to
Reimbursements)
to Average Net
Assets (b) | | | Ratio of Net
Investment
Income (Loss)
(Prior to
Reimbursements)
to Average Net
Assets (b) | | | Portfolio
Turnover (c) |
| | | | | | | | | | | | | | | | |
Class A Shares | | | | | | | | | | | | | | | | | | | | | | | | | | | | | | | | | | | | | | | | | | | | | |
Period Ended October 31, 2002 (d) | | $ | 10.00 | | 0.11 | | | | (2.85 | ) | | (2.74 | ) | | (0.06 | ) | | — | | | (0.06 | ) | | $ | 7.20 | | (27.46% | )(e) | | $ | 547 | | 1.46% | (f) | | 1.46% | (f) | | 3.96% | (f) | | (1.04% | )(f) | | 146.88% |
Year Ended October 31, 2003 | | $ | 7.20 | | 0.07 | | | | 1.06 | | | 1.13 | | | (0.05 | ) | | — | | | (0.05 | ) | | $ | 8.28 | | 15.80% | | | $ | 734 | | 1.45% | | | 0.96% | | | 3.06% | | | (0.65% | ) | | 112.34% |
Year Ended October 31, 2004 | | $ | 8.28 | | 0.09 | | — | | 2.54 | | | 2.63 | | | (0.04 | ) | | — | | | (0.04 | ) | | $ | 10.87 | | 31.81% | | | $ | 1,190 | | 1.45% | | | 1.14% | | | 2.70% | | | (0.10% | ) | | 391.22% |
Year Ended October 31, 2005 | | $ | 10.87 | | 0.19 | | 0.02 | | 1.69 | | | 1.90 | | | (0.22 | ) | | (0.25 | ) | | (0.47 | ) | | $ | 12.30 | | 17.73% | | | $ | 2,377 | | 1.47% | | | 1.70% | | | 2.02% | | | 1.15% | | | 295.27% |
| | | | | | | | | | | | | | | | |
Class B Shares | | | | | | | | | | | | | | | | | | | | | | | | | | | | | | | | | | | | | | | | | | | | | |
Period Ended October 31, 2002 (d) | | $ | 10.00 | | 0.05 | | | | (2.84 | ) | | (2.79 | ) | | (0.03 | ) | | — | | | (0.03 | ) | | $ | 7.18 | | (27.93% | )(e) | | $ | 544 | | 2.18% | (f) | | 0.75% | (f) | | 4.71% | (f) | | (1.78% | )(f) | | 146.88% |
Year Ended October 31, 2003 | | $ | 7.18 | | 0.02 | | | | 1.05 | | | 1.07 | | | (0.03 | ) | | — | | | (0.03 | ) | | $ | 8.22 | | 14.92% | | | $ | 625 | | 2.20% | | | 0.25% | | | 3.89% | | | (1.44% | ) | | 112.34% |
Year Ended October 31, 2004 | | $ | 8.22 | | 0.04 | | — | | 2.50 | | | 2.54 | | | (0.01 | ) | | — | | | (0.01 | ) | | $ | 10.75 | | 30.86% | | | $ | 885 | | 2.20% | | | 0.41% | | | 3.46% | | | (0.84% | ) | | 391.22% |
Year Ended October 31, 2005 | | $ | 10.75 | | 0.09 | | 0.02 | | 1.59 | | | 1.79 | | | (0.14 | ) | | (0.25 | ) | | (0.39 | ) | | $ | 12.15 | | 16.93% | | | $ | 1,202 | | 2.20% | | | 0.96% | | | 2.76% | | | 0.40% | | | 295.27% |
| | | | | | | | | | | | | | | | |
Class C Shares | | | | | | | | | | | | | | | | | | | | | | | | | | | | | | | | | | | | | | | | | | | | | |
Period Ended October 31, 2002 (d) | | $ | 10.00 | | 0.05 | | | | (2.84 | ) | | (2.79 | ) | | (0.03 | ) | | — | | | (0.03 | ) | | $ | 7.18 | | (27.93% | )(e) | | $ | 541 | | 2.18% | (f) | | 0.75% | (f) | | 4.71% | (f) | | (1.78% | )(f) | | 146.88% |
Year Ended October 31, 2003 | | $ | 7.18 | | 0.02 | | | | 1.05 | | | 1.07 | | | (0.03 | ) | | — | | | (0.03 | ) | | $ | 8.22 | | 14.92% | | | $ | 623 | | 2.20% | | | 0.25% | | | 3.89% | | | (1.44% | ) | | 112.34% |
Year Ended October 31, 2004 | | $ | 8.22 | | 0.03 | | — | | 2.51 | | | 2.54 | | | (0.02 | ) | | — | | | (0.02 | ) | | $ | 10.74 | | 30.90% | | | $ | 3,556 | | 2.20% | | | 0.43% | | | 3.33% | | | (0.70% | ) | | 391.22% |
Year Ended October 31, 2005 (i) | | $ | 10.74 | | 0.15 | | 0.02 | | 1.62 | | | 1.79 | | | (0.13 | ) | | (0.25 | ) | | (0.38 | ) | | $ | 12.15 | | 16.88% | | | $ | 2,435 | | 2.20% | | | 1.25% | | | 2.81% | | | 0.63% | | | 295.27% |
| | | | | | | | | | | | | | | | |
Class R Shares | | | | | | | | | | | | | | | | | | | | | | | | | | | | | | | | | | | | | | | | | | | | | |
Period Ended October 31, 2004 (g) | | $ | 9.14 | | 0.08 | | — | | 1.58 | | | 1.66 | | | (0.02 | ) | | — | | | (0.02 | ) | | $ | 10.78 | | 18.23% | (e) | | $ | 1 | | 1.78% | (f) | | 0.99% | (f) | | 3.14% | (f) | | (0.35% | )(f) | | 391.22% |
Year Ended October 31, 2005 | | $ | 10.78 | | 0.20 | | 0.02 | | 1.66 | | | 1.88 | | | (0.21 | ) | | (0.25 | ) | | (0.46 | ) | | $ | 12.20 | | 17.61% | | | $ | 1 | | 1.51% | | | 1.64% | | | 2.31% | | | 0.84% | | | 295.27% |
| | | | | | | | | | | | | | | | |
Institutional Service Class Shares | | | | | | | | | | | | | | | | | | | | | | | | | | | | | | | | | | | | | | | | | | | | | |
Period Ended October 31, 2002 (d) | | $ | 10.00 | | 0.13 | | | | (2.85 | ) | | (2.72 | ) | | (0.07 | ) | | — | | | (0.07 | ) | | $ | 7.21 | | (27.27% | )(e) | | $ | 545 | | 1.20% | (f) | | 1.72% | (f) | | 3.71% | (f) | | (0.79% | )(f) | | 146.88% |
Year Ended October 31, 2003 | | $ | 7.21 | | 0.09 | | | | 1.06 | | | 1.15 | | | (0.06 | ) | | — | | | (0.06 | ) | | $ | 8.30 | | 16.10% | | | $ | 633 | | 1.20% | | | 1.25% | | | 2.89% | | | (0.44% | ) | | 112.34% |
Year Ended October 31, 2004 | | $ | 8.30 | | 0.13 | | — | | 2.53 | | | 2.66 | | | (0.05 | ) | | — | | | (0.05 | ) | | $ | 10.91 | | 32.13% | | | $ | 837 | | 1.20% | | | 1.41% | | | 2.46% | | | 0.15% | | | 391.22% |
Year Ended October 31, 2005 | | $ | 10.91 | | 0.23 | | 0.02 | | 1.69 | | | 1.94 | | | (0.25 | ) | | (0.25 | ) | | (0.50 | ) | | $ | 12.35 | | 18.05% | | | $ | 987 | | 1.20% | | | 1.97% | | | 1.78% | | | 1.39% | | | 295.27% |
| | | | | | | | | | | | | | | | |
Institutional Class Shares | | | | | | | | | | | | | | | | | | | | | | | | | | | | | | | | | | | | | | | | | | | | | |
Period Ended October 31, 2004 (h) | | $ | 9.75 | | 0.03 | | — | | 1.15 | | | 1.18 | | | (0.02 | ) | | — | | | (0.02 | ) | | $ | 10.91 | | 12.15% | (e) | | $ | 250 | | 1.20% | (f) | | 1.02% | (f) | | 2.19% | (f) | | 0.03% | (f) | | 391.22% |
Year Ended October 31, 2005 | | $ | 10.91 | | 0.17 | | 0.02 | | 1.75 | | | 1.94 | | | (0.25 | ) | | (0.25 | ) | | (0.50 | ) | | $ | 12.35 | | 18.05% | | | $ | 1,896 | | 1.20% | | | 1.85% | | | 1.67% | | | 1.38% | | | 295.27% |
| | | | | | | | | | | | | | | | | | | | | | | | | | | | | | | | | | | | | | | | | | | | | | |
| | | | | | | | | | | | | | | | | | | | | | | | | | | | | | | | | | | | | | | | | | | | | | |
| | | | | | | | | | | | | | | | | | | | | | | | | | | | | | | | | | | | | | | | | | | | | | |
| | | | | | | | | | | | | | | | | | | | | | | | | | | | | | | | | | | | | | | | | | | | | | |
| | | | | | | | | | | | | | | | | | | | | | | | | | | | | | | | | | | | | | | | | | | | | | |
| | | | | | | | | | | | | | | | | | | | | | | | | | | | | | | | | | | | | | | | | | | | | | |
| (a) | Excludes sales charge. |
| (b) | During the period certain fees were waived and/or reimbursed. If such waivers/reimbursements had not occurred, the ratio would have been as indicated. |
| (c) | Portfolio turnover is calculated on the basis of the Fund as a whole without distinguishing among the classes of shares. |
| (d) | For the period from December 18, 2001 (commencement of operations) through October 31, 2002. |
| (g) | For the period from December 30, 2003 (commencement of operations) through April 30, 2004. |
| (h) | For the period from June 29, 2004 (commencement of operations) through October 31, 2004. |
| (i) | Net investment income (loss) is based on average shares outstanding during the period. |
See notes to financial statements.
Gartmore Mid Cap Growth Leaders Fund
For the annual period ended Oct. 31, 2005, the Gartmore Mid Cap Growth Leaders Fund (Class A at NAV) returned 19.36% versus 15.91% for its benchmark, the Russell Midcap® Growth Index. For broader comparison, the average return for the Fund’s Lipper peer category of Mid-Cap Growth Funds was 14.07%.
Mid-cap stocks turned in a strong performance during the reporting period, finishing ahead of the large-cap and small-cap groups. Against a backdrop of adequate but not outstanding economic growth, investors looked to mid-cap securities for more dynamic earnings growth than that offered by large-cap securities, many of which grow at a pace close to that of the overall economy. At the same time, mid-cap securities were seen as providing greater protection against the challenges of rising interest rates and energy prices than their counterparts in the small-cap sector.
Stock selection in the information technology and consumer discretionary sectors was particularly helpful to Fund performance. MICROS Systems, Inc. was one standout technology performer for the Fund. The company, which provides point-of-sale hardware and software to hotels, restaurants and related operations, benefited from robust demand from companies that had deferred investing in technology infrastructure following the 9/11 terrorist attacks. Also contributing to Fund performance was semiconductor holding MEMC Electronic Materials, Inc., which more than doubled in price as the company experienced growing demand for its polysilicon chips from the manufacturers of solar panels. In the consumer discretionary sector, Station Casinos, Inc. was a strong performer for the Fund. Unlike other casinos in the area, Station is used primarily by Las Vegas locals. Rather than functioning as a tourism play, therefore, Station stock offers investors a way to benefit from the rapidly growing local economy. Another outperformer for the Fund was Starwood Hotels & Resorts Worldwide, Inc., owner of the St. Regis, Sheraton and Westin hotel chains, among others. The company’s high occupancy rates reflected the continuing strength in business travel and conference spending.
Detractors for the Fund included cosmetics holding The Estée Lauder Cos. Inc. Despite what seemed to us an inexpensive valuation, Estée Lauder stock weakened due to poor execution by management, and we sold the stock. Also detracting from performance was TIBCO Software Inc., a provider of business integration and optimization software. Although we liked TIBCO’s products, management overestimated the company’s growth potential, and there were some key departures among senior personnel. Also holding back the Fund’s performance was WMS Industries Inc., which provides gaming machines to the casino industry. After a strong run from May through July, concerns about overvaluation and the ability of WMS to ramp up production quickly enough to meet demand sidetracked its stock.
We believe one of the primary determinants of the market’s progress for the near term could be the core inflation rate, which excludes volatile items such as energy and food. From 1994 through 2002, the core consumer price index (CPI) rose at an annual rate of roughly 2.5%. If future readings stay within that limit, the Federal Reserve Board probably will not feel pressured to raise interest rates further than its current federal funds rate target, which is believed to be somewhere in the area of 4.5%. Economic factors aside, we believe the mid-cap market should continue to offer investors an attractive combination of advantages in a moderately growing economy.
Portfolio Managers:
Joseph C. O’Connor
| | |
Fund Performance | | Gartmore Mid Cap Growth Leaders Fund |
Average Annual Total Return
(For periods ended October 31, 2005)
| | | | | | | | |
| | | | | 1 Yr. | | 5 Yr. | | 10 Yr.1 |
| Class A | | w/o SC2 | | 19.36% | | -11.68% | | 3.98% |
| | | w/SC3 | | 12.52% | | -12.72% | | 3.36% |
| Class B | | w/o SC2 | | 18.62% | | -12.70% | | 3.22% |
| | | w/SC4 | | 13.62% | | -13.01% | | 3.22% |
| Class C | | w/o SC2 | | 18.60% | | -12.34% | | 3.61% |
| | | w/SC5 | | 17.60% | | -12.34% | | 3.61% |
| Class D | | w/o SC2 | | 19.78% | | -11.34% | | 4.20% |
| | | w/SC6 | | 14.41% | | -12.15% | | 3.72% |
| Class R7 | | | | 19.26% | | -11.50% | | 4.11% |
| Institutional Class7,8 | | 19.69% | | -11.36% | | 4.19% |
All figures showing the effect of a sales charge reflect the maximum charge possible, because it has the most dramatic effect on performance data.
| 1 | These returns through May 11, 1998 include the performance of the Fund’s predecessor fund, and, for periods from May 11, 1998 to the creation of the class, include the performance of the Fund’s Class D shares. These returns were achieved prior to the creation of Class A and Class B shares (5/11/98), Class C shares (3/1/01), and Class R shares (12/30/03). Excluding the effect of any fee waivers or reimbursements, such prior performance is similar to what Class A, Class B, Class C, and Class R shares would have produced during those periods because all classes of the Fund’s shares invest in the same portfolio of securities. The performance for these classes has been restated to reflect differences in sales charges (where applicable), but does not reflect the differing levels of other fees (primarily Rule 12b-1 and/or administrative services fees) applicable to such classes. If these other fees were reflected, the performance for Class A, Class B, Class C and Class R shares would have been lower. |
| 2 | These returns do not reflect the effects of sales charges (SC). |
| 3 | A 5.75% front-end sales charge was deducted. |
| 4 | A 5.00% contingent deferred sales charge (CDSC) was deducted. The CDSC declines to 0% after 6 years. |
| 5 | A CDSC of 1.00% was deducted because it is charged when you sell Class C shares within the first year after purchase. |
| 6 | A 4.50% front-end sales charge was deducted. |
| 7 | Not subject to any sales charges. |
| 8 | These returns until the creation of Institutional Class shares (6/30/04) include the performance of the Fund’s Institutional Service shares. The returns have been adjusted for the fact that Institutional Class shares do not have any applicable sales charges but have not been adjusted for the lower expenses applicable to Institutional Class shares. Excluding the effect of any fee waivers or reimbursements, such prior performance is similar to what Institutional Class shares would have produced because the Institutional Class shares invest in the same portfolio of securities as Institutional Service shares. |
Performance of a $10,000 Investment
Investment return and principal value will fluctuate, and when redeemed, shares may be worth more or less than original cost. Past performance is no guarantee of future results and does not reflect the deduction of taxes that a shareholder would pay on fund distributions or the redemption of fund shares. Investing in mutual funds involves market risk, including loss of principal. Performance returns assume the reinvestment of all distributions.
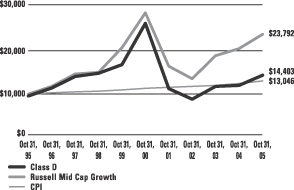
Comparative performance of $10,000 invested in Class D shares of the Gartmore MidCap Growth Leaders Fund, the Russell Mid Cap Growth Index (Russell Mid Cap Growth)(a), and the Consumer Price Index (CPI)(b) over a 10-year period ended 10/31/05. Unlike the Fund, the returns for these unmanaged indexes do not reflect any fees, expenses, or sales charges. Investors cannot invest directly in market indexes.
| (a) | The Russell Midcap Growth is an unmanaged index of mid-capitalization growth stocks of U.S. companies with a capitalization range of $492 million to $37 billion as of April 30, 2005. |
| (b) | The CPI represents changes in prices of a basket of goods and services purchased for consumption by urban households. |
| | |
Shareholder Expense Example | | Gartmore Mid Cap Growth Leaders Fund |
As a shareholder of the Fund, you incur two types of costs: (1) transaction costs, including sales charges (loads) paid on purchase payments and redemption fees; and (2) ongoing costs, including investment advisory fees, administration fees, distribution fees and other Fund expenses. The examples below are intended to help you understand your ongoing costs (in dollars) of investing in the Fund and to compare these costs with the ongoing costs of investing in other mutual funds. Per SEC requirements, the examples assume that you had a $1,000 investment in the Class at the beginning of the reporting period, May 1, 2005, and continued to hold your shares at the end of the reporting period, October 31, 2005.
Actual Expenses
For each Class of the Fund in the table below, the first line provides information about actual account values and actual expenses. You may use the information in this line, together with the amount you invested, to estimate the expenses that you paid over the period. Simply divide your account value by $1,000 (for example, an $8,600 account value divided by $1,000 = 8.6), then multiply the result by the number in the first line of each Class under the heading entitled “Expenses Paid During Period” to estimate the expenses you paid on your account during the period.
Hypothetical Example for Comparison Purposes
The second line of each Class in the table below provides information about hypothetical account values and hypothetical expenses based on the Class’ actual expense ratio and an assumed rate of return of 5% per year before expenses, which is not the Class’ actual return. The hypothetical account values and expenses may not be used to estimate the actual ending account balance or expenses you paid for the period. You may use this information to compare the ongoing costs of investing in the Class of the Fund and other funds. To do so, compare this 5% hypothetical example with the 5% hypothetical examples that appear in the shareholder reports of the other funds.
Please note that the expenses shown in the table are meant to highlight your ongoing costs only and do not reflect any transaction costs, such as sales charges (loads) or redemption fees. Therefore, the second line for each Class in the table is useful in comparing ongoing costs only, and will not help you determine the relative total costs of owning different funds. In addition, if these transaction costs were included, your costs would have been higher. The examples also assume all dividends and distributions have been reinvested.
Schedule of Shareholder Expenses
Expense Analysis of a $1,000 Investment
(October 31, 2005)
| | | | | | | | | | | | | | |
| Mid Cap Growth Leaders | | | | | Beginning
Account Value,
5/1/05 | | Ending
Account Value,
10/31/05 | | Expenses Paid
During Period* | | Annualized
Expense Ratio* |
| Class A | | Actual | | | $ | 1,000.00 | | $ | 1,122.40 | | $ | 8.08 | | 1.51% |
| | | Hypothetical | 1 | | $ | 1,000.00 | | $ | 1,017.39 | | $ | 7.71 | | 1.51% |
| Class B | | Actual | | | $ | 1,000.00 | | $ | 1,118.50 | | $ | 11.75 | | 2.20% |
| | | Hypothetical | 1 | | $ | 1,000.00 | | $ | 1,013.91 | | $ | 11.23 | | 2.20% |
| Class C | | Actual | | | $ | 1,000.00 | | $ | 1,118.40 | | $ | 11.75 | | 2.20% |
| | | Hypothetical | 1 | | $ | 1,000.00 | | $ | 1,013.91 | | $ | 11.23 | | 2.20% |
| Class D | | Actual | | | $ | 1,000.00 | | $ | 1,124.00 | | $ | 6.42 | | 1.20% |
| | | Hypothetical | 1 | | $ | 1,000.00 | | $ | 1,018.95 | | $ | 6.12 | | 1.20% |
| Class R | | Actual | | | $ | 1,000.00 | | $ | 1,122.50 | | $ | 8.13 | | 1.52% |
| | | Hypothetical | 1 | | $ | 1,000.00 | | $ | 1,017.34 | | $ | 7.76 | | 1.52% |
| Institutional Class | | Actual | | | $ | 1,000.00 | | $ | 1,124.10 | | $ | 6.42 | | 1.20% |
| | | Hypothetical | 1 | | $ | 1,000.00 | | $ | 1,018.95 | | $ | 6.12 | | 1.20% |
| * | Expenses are equal to the Fund’s annualized expense ratio multiplied by the average account value over the period multiplied by 184/365 (to reflect the one-half year period). The expense ratio presented represents a six month, annualized ratio in accordance with SEC guidelines. |
| 1 | Represents the hypothetical 5% return before expenses. |
| | |
Portfolio Summary | | Gartmore Mid Cap Growth Leaders Fund |
The SEC adopted a requirement that Funds present their portfolio holdings in a table, chart or graph format in their annual and semiannual reports to shareholders, whether or not a statement of investments is utilized. The following tables, which present portfolio holdings as a percentage of net assets, are provided in compliance with this requirement.
| | |
| Asset Allocation | | |
| Common Stocks | | 92.1% |
| Commercial Paper | | 8.1% |
| Other Investments* | | 5.6% |
| Liabilities in excess of Other Assets** | | -5.8 % |
| | |
|
| | | 100.0% |
| * | Includes value of collateral received from securities lending. |
| ** | Includes value of collateral owed from securities lending. |
| | |
| Top Industries | | |
| Computer Software & Services | | 15.0% |
| Retail | | 10.4% |
| Oil & Gas | | 8.5% |
| Mortgage bankers & correspondents | | 8.1% |
| Medical Services | | 7.8% |
| Manufacturing | | 7.7% |
| Semiconductors | | 6.8% |
| Telecommunications | | 5.3% |
| Hospitals | | 4.4% |
| Hotels & Motels | | 3.8% |
| Other Industries | | 22.2% |
| | |
|
| | | 100.0% |
| | |
| Top Holdings | | |
| Countrywide Home Loans, 4.08%, 11/1/05 | | 8.1% |
| Community Health Systems, Inc. | | 4.4% |
| Precision Castparts Corp. | | 4.2% |
| Broadcom Corp., Class A | | 4.1% |
| Starwood Hotels & Resorts Worldwide, Inc. | | 3.8% |
| T Rowe Price Group, Inc. | | 3.8% |
| Praxair, Inc. | | 3.6% |
| Micros Systems, Inc. | | 3.6% |
| J.C. Penney Company, Inc. | | 3.2% |
| Satyam Computer Services Ltd. — ADR IN | | 3.2% |
| Other Holdings | | 58.0% |
| | |
|
| | | 100.0% |
Statement of Investments
October 31, 2005
Gartmore Mid Cap Growth Leaders Fund
| Common Stocks (92.1%) |
| | | | | |
| | | Shares or
Principal Amount | | Value |
| | | | | | |
Aerospace & Defence (2.7%) | | | | | |
Rockwell Collins, Inc. | | 22,455 | | $ | 1,028,888 |
| | | | |
|
|
Amusement & Recreation Services (1.4%) | | | |
WMS Industries, Inc. (b) (c) | | 21,010 | | | 527,981 |
| | | | |
|
|
Commercial Services (1.6%) | | | | | |
Cendant Corp. | | 35,385 | | | 616,407 |
| | | | |
|
|
Computer Software & Services (15.0%) | | | |
AutoDesk, Inc. | | 21,910 | | | 988,798 |
Cognizant Technology Solutions Corp. (b) | | 17,200 | | | 756,456 |
Hyperion Solutions Corp. (b) | | 12,645 | | | 611,512 |
Micros Systems, Inc. (b) (c) | | 29,790 | | | 1,367,958 |
Quest Software, Inc. (b) | | 49,770 | | | 692,301 |
Satyam Computer Services Ltd. — ADR IN | | 35,640 | | | 1,218,175 |
| | | | |
|
|
| | | | | | 5,635,200 |
| | | | |
|
|
Financial (3.8%) | | | | | |
T Rowe Price Group, Inc. | | 21,950 | | | 1,438,164 |
| | | | |
|
|
Hospitals (4.4%) | | | | | |
Community Health Systems, Inc. (b) (c) | | 44,565 | | | 1,653,807 |
| | | | |
|
|
Hotels & Casinos (1.8%) | | | | | |
Station Casinos, Inc. | | 10,870 | | | 696,767 |
| | | | |
|
|
Hotels & Motels (3.8%) | | | | | |
Starwood Hotels & Resorts Worldwide, Inc. | | 24,770 | | | 1,447,311 |
| | | | |
|
|
Industrial Gases (3.6%) | | | | | |
Praxair, Inc. | | 27,800 | | | 1,373,598 |
| | | | |
|
|
Insurance (2.5%) | | | | | |
PartnerRe Ltd. | | 15,100 | | | 962,172 |
| | | | |
|
|
Machinery (2.2%) | | | | | |
W.W. Grainger, Inc. | | 12,610 | | | 844,618 |
| | | | |
|
|
Manufacturing (7.7%) | | | | | |
Fortune Brands, Inc. | | 6,200 | | | 471,014 |
Ingersoll Rand Co. | | 22,980 | | | 868,414 |
Precision Castparts Corp. | | 33,630 | | | 1,592,717 |
| | | | |
|
|
| | | | | | 2,932,145 |
| | | | |
|
|
| | | | | | |
| | | Shares or
Principal Amount | | Value |
| | | | | | | |
Medical Services (7.8%) | | | | | | |
Fisher Scientific International,
Inc. (b) | | | 16,745 | | $ | 946,093 |
Gilead Sciences, Inc. (b) | | | 22,280 | | | 1,052,730 |
Manor Care, Inc. | | | 26,285 | | | 979,116 |
| | | | | |
|
|
| | | | | | | 2,977,939 |
| | | | | |
|
|
Oil & Gas (8.5%) | | | | | | |
BJ Services Co. | | | 29,940 | | | 1,040,415 |
Noble Corp. | | | 7,565 | | | 487,035 |
Patterson-UTI Energy, Inc. | | | 23,355 | | | 797,106 |
The Williams Cos., Inc. | | | 40,760 | | | 908,948 |
| | | | | |
|
|
| | | | | | | 3,233,504 |
| | | | | |
|
|
Restaurants (2.8%) | | | | | | |
Darden Restaurants, Inc. | | | 32,820 | | | 1,064,024 |
| | | | | |
|
|
Retail (10.4%) | | | | | | |
Abercrombie & Fitch Co. | | | 15,670 | | | 814,683 |
Coach, Inc. (b) | | | 24,255 | | | 780,526 |
J.C. Penney Co., Inc. | | | 23,985 | | | 1,228,032 |
Staples, Inc. | | | 48,075 | | | 1,092,745 |
| | | | | |
|
|
| | | | | | | 3,915,986 |
| | | | | |
|
|
Semiconductors (6.8%) | | | | | | |
Broadcom Corp., Class A (b) | | | 36,240 | | | 1,538,750 |
Fairchild Semiconductor International, Inc. (b) | | | 67,595 | | | 1,040,963 |
| | | | | |
|
|
| | | | | | | 2,579,713 |
| | | | | |
|
|
Telecommunications (5.3%) | | | | | | |
Comverse Technology, Inc. (b) | | | 41,265 | | | 1,035,751 |
Juniper Networks, Inc. (b) | | | 41,420 | | | 966,329 |
| | | | | |
|
|
| | | | | | | 2,002,080 |
| | | | | |
|
|
| | |
Total Common Stocks | | | | | | 34,930,304 |
| | | | | |
|
|
|
Commercial Paper (8.1%) |
Mortgage Bankers & Correspondents (8.1%) | | | |
Countrywide Home Loans, 4.08%, 11/1/05 | | $ | 3,072,000 | | | 3,072,000 |
| | | | | |
|
|
| | |
Total Commercial Paper | | | | | | 3,072,000 |
| | | | | |
|
|
Short-Term Securities Held as Collateral for Securities
Lending (5.6%)
| | | | | | | |
| | | Principal
Amount | | Value | |
| | | | | | | | |
Pool of short-term securities for Gartmore Mutual Funds — note 2 (Securities Lending) | | $ | 2,121,265 | | $ | 2,121,265 | |
| | | | | |
|
|
|
| |
Total Short-Term Securities Held as Collateral for Securities Lending | | | 2,121,265 | |
| | | | | |
|
|
|
| |
Total Investments
(Cost $37,080,587) (a) — 105.8% | | | 40,123,569 | |
| | |
Liabilities in excess of other
assets — (5.8)% | | | | | | (2,185,398 | ) |
| | | | | |
|
|
|
| | |
NET ASSETS — 100.0% | | | | | $ | 37,938,171 | |
| | | | | |
|
|
|
| | (a) | See notes to financial statements for tax unrealized appreciation (depreciation) of securities. |
| | (b) | Non-income producing securities. |
| | (c) | All or part of the security was on loan as of October 31, 2005. |
| | ADR | American Depositary Receipt |
See notes to financial statements.
XXXXXXXX
Gartmore Nationwide Leaders Fund
For the annual period ended Oct. 31, 2005, the Gartmore Nationwide Leaders Fund (Class A at NAV) returned 18.12% versus 8.72% for its benchmark, the S&P 500® Index. For broader comparison, the average return for the Fund’s Lipper peer category of Multi-Cap Core Funds was 10.50%.
U.S. stocks seesawed in their performance during the reporting period, but they finished with respectable gains, primarily due to a rally that occurred in the late spring and early summer. First-quarter earnings reports were stronger than had been expected, and investors grew more confident about the U.S. economy’s ability to grow despite rising interest rates and surging crude oil prices. The rally was cut short in August, however, as oil made a run at the $70-per-barrel level and Hurricane Katrina ravaged the Gulf Coast. For the balance of the reporting period, uncertainty about the economic impact of two more hurricanes, Rita and Wilma, kept investors off balance. Large-cap securities underperformed small-cap securities as well as mid-cap securities for the full year under review but actually outperformed their smaller counterparts during the final three months.
The sectors that contributed most to Fund performance were consumer discretionary and information technology, although every sector except telecommunications services and utilities helped Fund performance to some degree. Stock selection was the primary driver of this outperformance, with Staples, Inc., Starwood Hotels & Resorts Worldwide, Inc., and Lennar Corp. meriting mention in the consumer discretionary sector. Fund holdings in office supplies retailer Staples benefited from an economy in which small businesses flourished, and we helped our cause by making timely purchases on temporary weakness in Staples stock. Starwood Hotels enjoyed robust occupancy numbers fueled by strong consumer and business travel. Homebuilder Lennar was aided by a housing market that, despite showing signs of tiring, was still fairly robust.
Information technology Fund holdings Seagate Technology and Advanced Micro Devices, Inc. both boosted the Fund’s return. Hard disk drive maker Seagate reported solid earnings growth as demand for its products continued to grow in markets for items such as portable digital music players and television set-top boxes. However, the company’s prospects dimmed, in our opinion, when Apple Computer, Inc. began transitioning from hard drives to Flash memory for its iPod line of products, and we sold our Seagate position. Advanced Micro Devices has existed in the shadow of Intel Corp. for years but manages to stay six months to a year ahead of its larger rival in rolling out new, more sophisticated microprocessors. We especially liked the prospects for Advanced Micro Devices’ recently introduced dual-core chips.
QLogic Corp. was the biggest detractor from Fund performance. QLogic, the provider of hardware and software for storage area networks (SANs), fell victim to tepid demand and reported disappointing quarterly results; we sold the stock. New York Community Bancorp, Inc. (NYCB) was another detractor from Fund performance. Poor management of NYCB’s balance sheet hurt the share price of this savings and loan, as did concerns that the real estate cycle may have peaked. Despite these challenges, we maintained the Fund’s position in NYCB because we thought investors had overreacted to the balance sheet issues, and NYCB stock offered a generous dividend yield of roughly 6% at the end of the reporting period.
For the near term, investors will face a mixture of positive and negative factors. On the one hand, growth in the economy and in corporate earnings is likely to slow in the coming months. Counterbalancing this slowdown could be positive sentiment surrounding the end of the Federal Reserve Board’s cycle of interest-rate hikes, which we anticipate will occur in the first half of 2006. If, as we expect, the peak in rates is accompanied by softening oil prices and a firm U.S. dollar, the investment environment should be favorable for employing our disciplined process of stock selection.
Portfolio Manager:
Gary Haubold, CFA
| | |
Fund Performance | | Gartmore Nationwide Leaders Fund |
Average Annual Total Return
(For periods ended October 31, 2005)
| | | | | | |
| | | | | 1 Yr. | | Inception1 |
| Class A | | w/o SC2 | | 18.12% | | 10.58% |
| | | w/SC3 | | 11.29% | | 8.88% |
| Class B | | w/o SC2 | | 17.25% | | 9.78% |
| | | w/SC4 | | 12.25% | | 9.18% |
| Class C | | w/o SC2 | | 17.30% | | 9.79% |
| | | w/SC5 | | 16.30% | | 9.79% |
| Class R6,7 | | 18.19% | | 10.12% |
| Institutional Class6,8 | | 18.37% | | 10.75% |
| Institutional Service Class6 | | 18.23% | | 10.69% |
All figures showing the effect of a sales charge reflect the maximum charge possible, because it has the most dramatic effect on performance data.
| 1 | Fund commenced operations on December 28, 2001. |
| 2 | These returns do not reflect the effects of sales charges (SC). |
| 3 | A 5.75% front-end sales charge was deducted. |
| 4 | A 5.00% contingent deferred sales charge (CDSC) was deducted. The CDSC declines to 0% after 6 years. |
| 5 | A CDSC of 1.00% was deducted because it is charged when you sell Class C shares within the first year after purchase. |
| 6 | Not subject to any sales charges. |
| 7 | These returns until the creation of Class R shares (10/1/03) include the performance of the Fund’s Class B shares. The returns have been adjusted for the fact that Class R shares do not have any applicable sales charges but have not been adjusted for the lower expenses applicable to Class R shares. Excluding the effect of any fee waivers or reimbursements, such prior performance is similar to what Class R shares would have produced because the Class R shares invest in the same portfolio of securities as Class B shares. |
| 8 | These returns until the creation of Institutional Class shares (6/29/04) include the performance of the Fund’s Institutional Service shares. The returns have been adjusted for the fact that Institutional Class shares do not have any applicable sales charges but have not been adjusted for the lower expenses applicable to Institutional Class shares. Excluding the effect of any fee waivers or reimbursements, such prior performance is similar to what Institutional Class shares would have produced because the Institutional Class shares invest in the same portfolio of securities as Institutional Service shares. |
Performance of a $10,000 Investment
Investment return and principal value will fluctuate, and when redeemed, shares may be worth more or less than original cost. Past performance is no guarantee of future results and does not reflect the deduction of taxes that a shareholder would pay on fund distributions or the redemption of fund shares. Investing in mutual funds involves market risk, including loss of principal. Performance returns assume the reinvestment of all distributions.
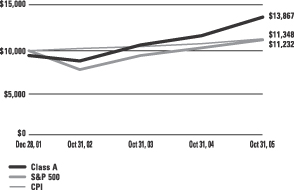
Comparative performance of $10,000 invested in Class A shares of the Gartmore Nationwide Leaders Fund, S&P 500 Index (S&P 500)(a) and the Consumer Price Index (CPI)(b) since inception. Unlike the Fund, the returns for these unmanaged indexes do not reflect any fees, expenses, or sales charges. Investors cannot invest directly in market indexes.
| (a) | The S&P 500 is an unmanaged index of 500 widely held stocks of large U.S. companies that gives a broad look at how the stock prices of large U.S. companies have performed. |
| (b) | The CPI represents changes in prices of a basket of goods and services purchased for consumption by urban households. |
| | |
Shareholder Expense Example | | Gartmore Nationwide Leaders Fund |
As a shareholder of the Fund, you incur two types of costs: (1) transaction costs, including sales charges (loads) paid on purchase payments and redemption fees; and (2) ongoing costs, including investment advisory fees, administration fees, distribution fees and other Fund expenses. The examples below are intended to help you understand your ongoing costs (in dollars) of investing in the Fund and to compare these costs with the ongoing costs of investing in other mutual funds. Per SEC requirements, the examples assume that you had a $1,000 investment in the Class at the beginning of the reporting period, May 1, 2005, and continued to hold your shares at the end of the reporting period, October 31, 2005.
Actual Expenses
For each Class of the Fund in the table below, the first line provides information about actual account values and actual expenses. You may use the information in this line, together with the amount you invested, to estimate the expenses that you paid over the period. Simply divide your account value by $1,000 (for example, an $8,600 account value divided by $1,000 = 8.6), then multiply the result by the number in the first line of each Class under the heading entitled “Expenses Paid During Period” to estimate the expenses you paid on your account during the period.
Hypothetical Example for Comparison Purposes
The second line of each Class in the table below provides information about hypothetical account values and hypothetical expenses based on the Class’ actual expense ratio and an assumed rate of return of 5% per year before expenses, which is not the Class’ actual return. The hypothetical account values and expenses may not be used to estimate the actual ending account balance or expenses you paid for the period. You may use this information to compare the ongoing costs of investing in the Class of the Fund and other funds. To do so, compare this 5% hypothetical example with the 5% hypothetical examples that appear in the shareholder reports of the other funds.
Please note that the expenses shown in the table are meant to highlight your ongoing costs only and do not reflect any transaction costs, such as sales charges (loads) or redemption fees. Therefore, the second line for each Class in the table is useful in comparing ongoing costs only, and will not help you determine the relative total costs of owning different funds. In addition, if these transaction costs were included, your costs would have been higher. The examples also assume all dividends and distributions have been reinvested.
Schedule of Shareholder Expenses
Expense Analysis of a $1,000 Investment
(October 31, 2005)
| | | | | | | | | | | | | | |
| Nationwide Leaders Fund | | | | | Beginning
Account Value,
5/1/05 | | Ending
Account Value,
10/31/05 | | Expenses Paid
During Period* | | Annualized
Expense Ratio* |
| Class A | | Actual | | | $ | 1,000.00 | | $ | 1,101.60 | | $ | 8.00 | | 1.51% |
| | | Hypothetical | 1 | | $ | 1,000.00 | | $ | 1,017.39 | | $ | 7.71 | | 1.51% |
| Class B | | Actual | | | $ | 1,000.00 | | $ | 1,097.40 | | $ | 11.63 | | 2.20% |
| | | Hypothetical | 1 | | $ | 1,000.00 | | $ | 1,013.91 | | $ | 11.23 | | 2.20% |
| Class C | | Actual | | | $ | 1,000.00 | | $ | 1,097.80 | | $ | 11.63 | | 2.20% |
| | | Hypothetical | 1 | | $ | 1,000.00 | | $ | 1,013.91 | | $ | 11.23 | | 2.20% |
| Class R | | Actual | | | $ | 1,000.00 | | $ | 1,102.30 | | $ | 7.47 | | 1.41% |
| | | Hypothetical | 1 | | $ | 1,000.00 | | $ | 1,017.89 | | $ | 7.20 | | 1.41% |
| Institutional Service Class | | Actual | | | $ | 1,000.00 | | $ | 1,102.50 | | $ | 7.58 | | 1.43% |
| | | Hypothetical | 1 | | $ | 1,000.00 | | $ | 1,017.79 | | $ | 7.30 | | 1.43% |
| Institutional Class | | Actual | | | $ | 1,000.00 | | $ | 1,102.90 | | $ | 6.52 | | 1.23% |
| | | Hypothetical | 1 | | $ | 1,000.00 | | $ | 1,018.80 | | $ | 6.28 | | 1.23% |
| * | Expenses are equal to the Fund’s annualized expense ratio multiplied by the average account value over the period multiplied by 184/365 (to reflect the one-half year period). The expense ratio presented represents a six month, annualized ratio in accordance with SEC guidelines. |
| 1 | Represents the hypothetical 5% return before expenses. |
| | |
Portfolio Summary | | Gartmore Nationwide Leaders Fund |
October 31, 2005
The SEC adopted a requirement that Funds present their portfolio holdings in a table, chart or graph format in their annual and semiannual reports to shareholders, whether or not a statement of investments is utilized. The following tables, which present portfolio holdings as a percentage of net assets, are provided in compliance with this requirement.
| | |
| Asset Allocation | | |
| Common Stocks | | 96.4% |
| Cash Equivalents | | 6.9% |
| Liabilities in excess of Other Assets | | -3.3% |
| | |
|
| | | 100.0% |
| | |
| Top Industries | | |
| Banks | | 15.7% |
| Tobacco | | 14.7% |
| Medical Products | | 11.2% |
| Oil & Gas | | 10.2% |
| Telecommunications | | 8.8% |
| Retail | | 5.7% |
| Semiconductors | | 4.5% |
| Insurance | | 3.9% |
| Construction & Building Materials | | 3.8% |
| Utilities | | 3.7% |
| Other Industries | | 17.8% |
| | |
|
| | | 100.0% |
| | |
| Top Holdings* | | |
| Reynolds American, Inc. | | 9.8% |
| Bank of America Corp. | | 7.1% |
| Bristol-Myers Squibb Co. | | 6.5% |
| Altria Group, Inc. | | 4.8% |
| Johnson & Johnson | | 4.7% |
| New York Community Bancorp, Inc. | | 4.7% |
| SBC Communications, Inc. | | 4.5% |
| Advanced Micro Devices, Inc. | | 4.5% |
| Citizens Communications Co. | | 4.3% |
| TJX Cos., Inc. (The) | | 3.9% |
| Other Holdings | | 45.2% |
| | |
|
| | | 100.0% |
| * | For purpose of listing top holdings, repurchase agreements are considered cash equivalents and are included as part of Other Holdings. |
Statement of Investments
October 31, 2005
Gartmore Nationwide Leaders Fund
| Common Stocks (96.4%) |
| | | | | |
| | | Shares or
Principal Amount | | Value |
| | | | | | |
Banks (15.7%) | | | | | |
Bank of America Corp. | | 23,900 | | $ | 1,045,386 |
Barclays PLC ADR — GB | | 14,700 | | | 582,414 |
New York Community Bancorp, Inc. | | 43,200 | | | 698,544 |
| | | | |
|
|
| | | | | | 2,326,344 |
| | | | |
|
|
Computer Software & Services (2.4%) | | | |
Oracle Corp. (b) | | 28,500 | | | 361,380 |
| | | | |
|
|
Construction & Building Materials (3.8%) | | | |
Lafarge North America, Inc. | | 9,300 | | | 562,743 |
| | | | |
|
|
Healthcare (2.6%) | | | | | |
Aetna, Inc. | | 4,400 | | | 389,664 |
| | | | |
|
|
Insurance (3.9%) | | | | | |
Old Republic International Corp. | | 22,100 | | | 572,611 |
| | | | |
|
|
Medical Products (11.2%) | | | | | |
Bristol-Myers Squibb Co. | | 45,200 | | | 956,884 |
Johnson & Johnson | | 11,200 | | | 701,344 |
| | | | |
|
|
| | | | | | 1,658,228 |
| | | | |
|
|
Oil & Gas (10.2%) | | | | | |
ConocoPhillips | | 7,600 | | | 496,888 |
Exxon Mobil Corp. | | 8,200 | | | 460,348 |
Newfield Exploration Co. | | 12,200 | | | 553,026 |
| | | | |
|
|
| | | | | | 1,510,262 |
| | | | |
|
|
Radio (3.3%) | | | | | |
Westwood One, Inc. | | 26,600 | | | 492,100 |
| | | | |
|
|
Railroads (1.0%) | | | | | |
Norfolk Southern Corp. | | 3,800 | | | 152,760 |
| | | | |
|
|
Real Estate Investment Trusts (3.1%) | | | |
First Industrial Realty Trust, Inc. | | 11,300 | | | 459,119 |
| | | | |
|
|
Retail (5.7%) | | | | | |
Staples, Inc. | | 11,400 | | | 259,122 |
TJX Cos., Inc. (The) | | 27,100 | | | 583,463 |
| | | | |
|
|
| | | | | | 842,585 |
| | | | |
|
|
Semiconductors (4.5%) | | | | | |
Advanced Micro Devices, Inc. (b) | | 28,400 | | | 659,448 |
| | | | |
|
|
| | | | | | | |
| | | Shares or
Principal Amount | | Value | |
| | | | | | | | |
Telecommunications (8.8%) | | | | | | | |
Citizens Communications Co. | | | 52,200 | | $ | 638,928 | |
SBC Communications, Inc. | | | 28,000 | | | 667,800 | |
| | | | | |
|
|
|
| | | | | | | 1,306,728 | |
| | | | | |
|
|
|
Tobacco (14.7%) | | | | | | | |
Altria Group, Inc. | | | 9,400 | | | 705,470 | |
Reynolds American, Inc. | | | 17,100 | | | 1,453,500 | |
| | | | | |
|
|
|
| | | | | | | 2,158,970 | |
| | | | | |
|
|
|
Utilities (3.7%) | | | | | | | |
Progress Energy, Inc. | | | 12,400 | | | 540,516 | |
| | | | | |
|
|
|
Wireless Equipment (1.8%) | | | | | | | |
Motorola, Inc. | | | 12,000 | | | 265,920 | |
| | | | | |
|
|
|
| | |
Total Common Stocks | | | | | | 14,259,378 | |
| | | | | |
|
|
|
|
Cash Equivalents (6.9%) | |
| | |
Investments in repurchase agreements (Collateralized by U.S. Government Agencies and U.S. Government Agency Mortgages, in a joint trading account at 3.90%, dated 10/31/05, due 11/01/05, repurchase price $1,025,662) | | $ | 1,025,551 | | | 1,025,551 | |
| | | | | |
|
|
|
| | |
Total Cash Equivalents | | | | | | 1,025,551 | |
| | | | | |
|
|
|
| |
Total Investments
(Cost $15,361,248) (a) — 103.3% | | | 15,284,929 | |
| | |
Liabilities in excess of other
assets — (3.3)% | | | | | | (484,211 | ) |
| | | | | |
|
|
|
| | |
NET ASSETS — 100.0% | | | | | $ | 14,800,718 | |
| | | | | |
|
|
|
| | (a) | See notes to financial statements for tax unrealized appreciation (depreciation) of securities. |
| | (b) | Denotes a non-income producing security. |
| | ADR | American Depositary Receipt |
See notes to financial statements.
Gartmore Small Cap Leaders Fund
From its inception on Dec. 29, 2004, through Oct. 31, 2005, the Gartmore Small Cap Leaders Fund (Class A at NAV) returned 0.80% versus 0.17% for its benchmark, the Russell 2000® Index. For broader comparison, the average return for the Fund’s Lipper peer category of Small-Cap Core Funds was 1.82%.
Early weakness in the small-cap market gave way to a rally during the May–July period, as first-quarter earnings reports were stronger than expected and investors grew more confident about the U.S. economy’s ability to grow despite rising interest rates and surging crude oil prices. The rally was cut short in August, however, as the price of oil made a run at the $70-per-barrel level and Hurricane Katrina ravaged the Gulf Coast. For the balance of the period, uncertainty about the economic impact of two more hurricanes, Rita and Wilma, kept investors off balance. Small-cap growth stocks underperformed their value counterparts during the reporting period.
The growth portion of the Fund was hampered by a significant underweighting in the energy sector. We generally try to purchase stocks at discounted prices and sell stocks when the securities reach what we consider full value. Based on our criteria, energy stocks were fully valued at the beginning of 2005, and we reduced the Fund’s exposure accordingly. In retrospect that was a mistake, but we have found that, over time, we are well served by sticking with our buy and sell disciplines rather than trying to forecast the behavior of commodity prices, interest rates, or other factors that can affect the market. Stock selection in health care was problematic, with generic drugmaker First Horizon Pharmaceutical Corp. detracting from performance despite continued strong financial results. Other detractors included DHB Industries, Inc., a supplier of anti-shrapnel vests to the military. The company began 2005 in fine shape, but suffered from a shortfall of contracts as the year progressed. Also struggling was Trex Co., Inc., a maker of composite decking material whose stock price was hurt by rising raw material costs due to the product’s petroleum base.
On the positive side, the Fund’s growth portfolio was aided by stock picking in information technology and financials. In technology, performance was helped by out-of-index holding Imergent, Inc., a provider of software and e-commerce services to small businesses. The stock rallied strongly at the beginning of the reporting period and we sold Imergent in September which was a timely decision since the stock’s price declined sharply soon thereafter. Also boosting the Fund’s return was ARRIS Group, Inc., which supplies equipment for broadband voice and data transmission. Despite a sharp sell-off in the final month of the reporting period, the stock performed well, as the voice-over-Internet protocol (VoIP) market continued to experience strong growth. In the financial sector, consumer finance holding World Acceptance Corp. also aided Fund performance, boosted by healthy loan demand.
While the choppiness of stock prices made the first 10 months of 2005 a difficult time to invest, earnings trends in most small-cap sectors continue to be constructive. If interest rates level off soon and energy prices continue to moderate, the outlook for small-cap growth stocks could be quite positive. One cautionary development is that the real estate market appears to be slowing, which could limit consumer spending at some point. As long as the economy can maintain its rate of growth close to recent levels, however, plenty of attractive opportunities should be available in the small-cap growth space.
The value portion of the Fund benefited from solid stock picking, particularly in the industrials, financials, and consumer discretionary sectors. In industrials, the Fund enjoyed strong performances from Accuride Corp. and Columbus McKinnon Corp. Accuride, a maker of long-haul truck components, was boosted by an attractive valuation and healthy truck demand in advance of tighter pollution standards due to be phased in during the next few years. Columbus McKinnon, a maker of hoists, lifts, and other equipment, performed well in the first quarter of 2005, and we liquidated the position June to take profits.
In financials, the Fund’s value portfolio was aided by two health-care REITs, Omega Healthcare Investors, Inc. and LTC Properties, Inc. Both stocks benefited from inexpensive valuations amid concerns about changes in the laws governing Medicare reimbursement of nursing homes and long-term care facilities; these concerns were subsequently proven to be overblown. In the consumer discretionary sector, the shares of specialty women’s retailer The J. Jill Group, Inc. rebounded nicely after selling off early in the period on concerns about the company’s business prospects. We sold the J. Jill Group stock in August amid takeover rumors that we thought were unlikely to be realized.
Detractors from Fund performance included intimate apparel maker Maidenform, Inc., which failed to live up to
Gartmore Small Cap Leaders Fund (Continued)
our expectations following Maidenform’s initial public offering in July. Because we thought that the stock’s risk/reward profile remained favorable, we maintained the Fund’s position in Maidenform. Also holding back Fund performance was Carmike Cinemas, Inc., owner of a chain of cinemas located in rural areas. We had hoped that the most recent Star Wars movie and other highly-publicized new films might boost overall theater attendance, but the film industry was a commercial disappointment. Consequently, we sold the stock in September.
For the near term, we believe that investors will consider several factors. On the negative side, share prices could be held in check by the likelihood of a slowing economy and weaker corporate earnings. On the positive side, stocks could get a boost as the peak in short-term interest rates approaches, especially if energy prices continue their recent easing trend. Furthermore, although valuations in the small-cap space are no longer cheap, diligent research should continue to be rewarded, as stocks in the group are not as well known as their larger counterparts.
Portfolio Managers:
Carl Wilk, CFP (growth sleeve) and Gary Haubold, CFA (value sleeve)
| | |
Fund Performance | | Gartmore Small Cap Leaders Fund |
Average Annual Total Return
(For periods ended October 31, 2005)
| | | | |
| | | | | Inception1 |
| Class A | | w/o SC2 | | 0.80% |
| | | w/SC3 | | -4.27% |
| Class B | | w/o SC2 | | 0.30% |
| | | w/SC4 | | -4.70% |
| Class C | | w/o SC2 | | 0.40% |
| | | w/SC5 | | -0.60% |
| Class R6 | | 0.50% |
| Institutional Class6 | | 1.10% |
| Institutional Service Class6 | | 1.00% |
All figures showing the effect of a sales charge reflect the maximum charge possible, because it has the most dramatic effect on performance data.
| 1 | Fund commenced operations on December 29, 2004. |
| 2 | These returns do not reflect the effects of sales charges (SC). |
| 3 | A 5.75% front-end sales charge was deducted. |
| 4 | A 5.00% contingent deferred sales charge (CDSC) was deducted. The CDSC declines to 1% after 6 years. |
| 5 | A CDSC of 1.00% was deducted because it is charged when you sell Class C shares within the first year after purchase. |
| 6 | Not subject to any sales charges. |
Performance of a $10,000 Investment
Investment return and principal value will fluctuate, and when redeemed, shares may be worth more or less than original cost. Past performance is no guarantee of future results and does not reflect the deduction of taxes that a shareholder would pay on fund distributions or the redemption of fund shares. Investing in mutual funds involves market risk, including loss of principal. Performance returns assume the reinvestment of all distributions.
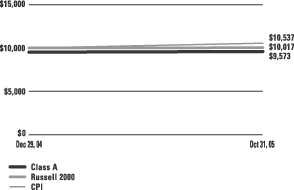
Comparative performance of $10,000 invested in Class A shares of the Gartmore Small Cap Leaders Fund, Russell 2000 Index(a), and the Consumer Price Index (CPI)(b) since inception. Unlike the Fund, the returns for these unmanaged indexes do not reflect any fees, expenses, or sales charges. Investors cannot invest directly in market indexes.
| (a) | The Russell 2000 is an unmanaged index of securities of small capitalization U.S. companies. |
| (b) | The CPI represents changes in prices of a basket of goods and services purchased for consumption by urban households. |
| | |
Shareholder Expense Example | | Gartmore Small Cap Leaders Fund |
As a shareholder of the Fund, you incur two types of costs: (1) transaction costs, including sales charges (loads) paid on purchase payments and redemption fees; and (2) ongoing costs, including investment advisory fees, administration fees, distribution fees and other Fund expenses. The examples below are intended to help you understand your ongoing costs (in dollars) of investing in the Fund and to compare these costs with the ongoing costs of investing in other mutual funds. Per SEC requirements, the examples assume that you had a $1,000 investment in the Class at the beginning of the reporting period, May 1, 2005, and continued to hold your shares at the end of the reporting period, October 31, 2005.
Actual Expenses
For each Class of the Fund in the table below, the first line provides information about actual account values and actual expenses. You may use the information in this line, together with the amount you invested, to estimate the expenses that you paid over the period. Simply divide your account value by $1,000 (for example, an $8,600 account value divided by $1,000 = 8.6), then multiply the result by the number in the first line of each Class under the heading entitled “Expenses Paid During Period” to estimate the expenses you paid on your account during the period.
Hypothetical Example for Comparison Purposes
The second line of each Class in the table below provides information about hypothetical account values and hypothetical expenses based on the Class’ actual expense ratio and an assumed rate of return of 5% per year before expenses, which is not the Class’ actual return. The hypothetical account values and expenses may not be used to estimate the actual ending account balance or expenses you paid for the period. You may use this information to compare the ongoing costs of investing in the Class of the Fund and other funds. To do so, compare this 5% hypothetical example with the 5% hypothetical examples that appear in the shareholder reports of the other funds.
Please note that the expenses shown in the table are meant to highlight your ongoing costs only and do not reflect any transaction costs, such as sales charges (loads) or redemption fees. Therefore, the second line for each Class in the table is useful in comparing ongoing costs only, and will not help you determine the relative total costs of owning different funds. In addition, if these transaction costs were included, your costs would have been higher. The examples also assume all dividends and distributions have been reinvested.
Schedule of Shareholder Expenses
Expense Analysis of a $1,000 Investment
(October 31, 2005)
| | | | | | | | | | | | | | |
| Small Cap Leaders | | | | | Beginning
Account Value,
5/1/05 | | Ending
Account Value,
10/31/05 | | Expenses Paid
During Period* | | Annualized
Expense Ratio* |
| Class A | | Actual | | | $ | 1,000.00 | | $ | 1,088.60 | | $ | 8.63 | | 1.64% |
| | | Hypothetical | 1 | | $ | 1,000.00 | | $ | 1,016.73 | | $ | 8.37 | | 1.64% |
| Class B | | Actual | | | $ | 1,000.00 | | $ | 1,086.70 | | $ | 12.36 | | 2.35% |
| | | Hypothetical | 1 | | $ | 1,000.00 | | $ | 1,013.15 | | $ | 11.99 | | 2.35% |
| Class C | | Actual | | | $ | 1,000.00 | | $ | 1,085.40 | | $ | 12.35 | | 2.35% |
| | | Hypothetical | 1 | | $ | 1,000.00 | | $ | 1,013.15 | | $ | 11.99 | | 2.35% |
| Class R | | Actual | | | $ | 1,000.00 | | $ | 1,087.70 | | $ | 10.95 | | 2.08% |
| | | Hypothetical | 1 | | $ | 1,000.00 | | $ | 1,014.51 | | $ | 10.62 | | 2.08% |
| Institutional Service Class | | Actual | | | $ | 1,000.00 | | $ | 1,089.50 | | $ | 7.43 | | 1.41% |
| | | Hypothetical | 1 | | $ | 1,000.00 | | $ | 1,017.89 | | $ | 7.20 | | 1.41% |
| Institutional Class | | Actual | | | $ | 1,000.00 | | $ | 1,090.60 | | $ | 7.11 | | 1.35% |
| | | Hypothetical | 1 | | $ | 1,000.00 | | $ | 1,018.19 | | $ | 6.89 | | 1.35% |
| * | Expenses are equal to the Fund’s annualized expense ratio multiplied by the average account value over the period multiplied by 184/365 (to reflect the one-half year period). The expense ratio presented represents a six month, annualized ratio in accordance with SEC guidelines. |
| 1 | Represents the hypothetical 5% return before expenses. |
| | |
Portfolio Summary | | Gartmore Small Cap Leaders Fund |
October 31, 2005
The SEC adopted a requirement that Funds present their portfolio holdings in a table, chart or graph format in their annual and semiannual reports to shareholders, whether or not a statement of investments is utilized. The following tables, which present portfolio holdings as a percentage of net assets, are provided in compliance with this requirement.
| | |
| Asset Allocation | | |
| Common Stock | | 93.3% |
| Other Assets in excess of Liabilities | | 6.7% |
| | |
|
| | | 100.0% |
| | |
| Top Industries | | |
| Computer Software & Services | | 11.9% |
| Real Estate Investment Trusts | | 11.6% |
| Financial & Miscellaneous | | 9.4% |
| Manufacturing | | 9.0% |
| Apparel & Accessories | | 7.0% |
| Consumer Goods & Services | | 5.5% |
| Retail | | 4.9% |
| Telecommunications | | 4.5% |
| Transportation | | 3.6% |
| Marketing Services | | 3.3% |
| Other Industries | | 29.3% |
| | |
|
| | | 100.0% |
| | |
| Top Holdings | | |
| Rush Enterprises Inc., Class A | | 2.8% |
| Valor Communications Group, Inc. | | 2.7% |
| Black Box Corp. | | 2.6% |
| Aspen Insurance Holdings Ltd. | | 2.5% |
| Weis Markets, Inc. | | 2.5% |
| Interwoven Software, Inc. | | 2.4% |
| KKR Financial Corp. | | 2.3% |
| Equity Inns, Inc. | | 2.3% |
| Smith Micro Software, Inc. | | 2.2% |
| Universal Health Realty Income Trust | | 2.2% |
| Other Holdings | | 75.5% |
| | |
|
| | | 100.0% |
Statement of Investments
October 31, 2005
Gartmore Small Cap Leaders Fund
| Common Stocks (93.3%) |
| | | | | |
| | | Shares | | Value |
| | | | | | |
Apparel & Accessories (7.0%) | | | | | |
Maidenform Brands, Inc. (b) | | 22,800 | | $ | 287,052 |
Men’s Warehouse, Inc. (The) (b) | | 12,400 | | | 306,280 |
Oxford Industries, Inc. | | 4,700 | | | 231,475 |
Volcom, Inc. (b) | | 10,000 | | | 305,800 |
| | | | |
|
|
| | | | | | 1,130,607 |
| | | | |
|
|
Computer Software & Services (11.9%) | | | | | |
Black Box Corp. | | 10,200 | | | 409,224 |
Interwoven Software, Inc. (b) | | 41,300 | | | 388,220 |
Merge Technologies, Inc. (b) | | 11,200 | | | 258,384 |
Parametric Technology Corp. (b) | | 49,100 | | | 319,641 |
Smith Micro Software, Inc. (b) | | 50,000 | | | 360,000 |
Tumbleweed Communications Corp. (b) | | 50,900 | | | 174,078 |
| | | | |
|
|
| | | | | | 1,909,547 |
| | | | |
|
|
Consumer Goods & Services (5.5%) | | | | | |
Coca-Cola Bottling Co. | | 6,200 | | | 282,782 |
Jarden Corp. (b) | | 9,000 | | | 304,110 |
Parlux Fragrances, Inc. (b) | | 12,500 | | | 289,500 |
| | | | |
|
|
| | | | | | 876,392 |
| | | | |
|
|
Electronics (2.0%) | | | | | |
Multi-Fineline Electronix, Inc. (b) | | 12,000 | | | 319,440 |
| | | | |
|
|
Energy – Alternate Sources (1.6%) | | | | | |
Headwaters, Inc. (b) | | 7,900 | | | 251,536 |
| | | | |
|
|
Financial & Miscellaneous (9.4%) | | | | | |
Centerstate Bank of Florida, Inc. | | 4,500 | | | 153,675 |
CVB Financial Corp. | | 16,500 | | | 325,215 |
KKR Financial Corp. | | 16,400 | | | 366,048 |
Wilmington Trust Corp. | | 8,700 | | | 329,817 |
World Acceptance Corp. (b) | | 12,000 | | | 337,680 |
| | | | |
|
|
| | | | | | 1,512,435 |
| | | | |
|
|
Food & Related (2.5%) | | | | | |
Weis Markets, Inc. | | 10,400 | | | 396,760 |
| | | | |
|
|
Gambling (1.8%) | | | | | |
Scientific Games Corp. (b) | | 9,900 | | | 296,604 |
| | | | |
|
|
Human Resources (1.7%) | | | | | |
Kforce, Inc. (b) | | 25,000 | | | 270,000 |
| | | | |
|
|
| | | | | |
| | | Shares | | Value |
| | | | | | |
Machinery, Equipment, & Supplies (1.2%) | | | |
Drew Industries, Inc. (b) | | 6,700 | | $ | 193,295 |
| | | | |
|
|
Manufacturing (9.0%) | | | | | |
Armor Holdings, Inc. (b) | | 7,200 | | | 321,912 |
Belden CDT, Inc. | | 9,000 | | | 179,370 |
Blount International, Inc. (b) | | 13,900 | | | 220,454 |
Ennis, Inc. | | 16,000 | | | 273,600 |
Rudolph Technologies, Inc. (b) | | 19,000 | | | 231,420 |
Simpson Manufacturing Co., Inc. | | 5,600 | | | 220,976 |
| | | | |
|
|
| | | | | | 1,447,732 |
| | | | |
|
|
Marketing Services (3.3%) | | | | | |
24/7 Real Media, Inc. (b) | | 41,300 | | | 263,907 |
Ventiv Health, Inc. (b) | | 10,600 | | | 267,544 |
| | | | |
|
|
| | | | | | 531,451 |
| | | | |
|
|
Media (1.7%) | | | | | |
Jupitermedia Corp. (b) | | 15,900 | | | 270,300 |
| | | | |
|
|
Medical (3.1%) | | | | | |
First Horizon Pharmaceutical Corp. (b) | | 16,800 | | | 242,424 |
West Pharmaceutical Services, Inc. | | 10,500 | | | 251,790 |
| | | | |
|
|
| | | | | | 494,214 |
| | | | |
|
|
Oil & Gas (3.2%) | | | | | |
Hanover Compressor Co. (b) | | 6,000 | | | 77,160 |
Lufkin Industries, Inc. | | 4,400 | | | 204,600 |
TETRA Technologies, Inc. (b) | | 8,400 | | | 234,948 |
| | | | |
|
|
| | | | | | 516,708 |
| | | | |
|
|
Real Estate Investment Trusts (11.6%) | | | | | |
Ashford Hospitality Trust | | 33,120 | | | 347,760 |
Equity Inns, Inc. | | 28,000 | | | 365,120 |
HouseValues, Inc. (b) | | 15,300 | | | 225,216 |
Inland Real Estate Corp. | | 17,400 | | | 247,950 |
Lexington Corporate Properties Trust | | 14,800 | | | 322,344 |
Universal Health Realty Income Trust | | 10,700 | | | 348,285 |
| | | | |
|
|
| | | | | | 1,856,675 |
| | | | |
|
|
Reinsurance (2.5%) | | | | | |
Aspen Insurance Holdings Ltd. | | 16,600 | | | 401,554 |
| | | | |
|
|
Retail (4.9%) | | | | | |
Jos. A. Bank Clothiers, Inc. (b) | | 8,000 | | | 326,480 |
Rush Enterprises Inc., Class A (b) | | 30,100 | | | 453,306 |
| | | | |
|
|
| | | | | | 779,786 |
| | | | |
|
|
Common Stocks (93.3%) (continued)
| | | | | |
| | | Shares | | Value |
| | | | | | |
Semiconductors (1.3%) | | | | | |
Varian Semiconductor Equipment Associates, Inc. (b) | | 5,600 | | $ | 211,792 |
| | | | |
|
|
Telecommunications (4.5%) | | | | | |
Arris Group, Inc. (b) | | 35,200 | | | 291,104 |
Valor Communications Group, Inc. | | 34,300 | | | 436,639 |
| | | | |
|
|
| | | | | | 727,743 |
| | | | |
|
|
Transportation (3.6%) | | | | | |
Celadon Group, Inc. (b) | | 13,500 | | | 312,660 |
Marten Transport Ltd. (b) | | 10,000 | | | 265,700 |
| | | | |
|
|
| | | | | | 578,360 |
| | | | |
|
|
| |
Total Common Stocks | | | 14,972,931 |
| | | | |
|
|
| |
Total Investments
(Cost $15,015,506) (a) — 93.3% | | | 14,972,931 |
| | |
Other assets in excess of
liabilities — 6.7% | | | | | 1,068,844 |
| | | | |
|
|
| |
NET ASSETS — 100.0% | | $ | 16,041,775 |
| | | | |
|
|
| | (a) | See Notes to Financial Statements for tax unrealized appreciation (depreciation) of securities. |
| | (b) | Denotes a non-income producing security. |
See notes to financial statements.
Gartmore U.S. Growth Leaders Fund
For the annual period ended Oct. 31, 2005, the Gartmore U.S. Growth Leaders Fund (Class A at NAV) returned 17.31% versus 8.72% for its benchmark, the S&P 500® Index. For broader comparison, the average return for the Fund’s Lipper peer category of Multi-Cap Growth Funds was 12.95%.
During the reporting period, the U.S. economy and the equity markets experienced a considerable amount of volatility. Late in the first calendar quarter of 2005, and into the second quarter, the fear of inflation heightened as the Federal Reserve Board continued to raise short-term interest rates; as a result, the market began trending downward. Toward the end of the second quarter, however, it became evident that the Fed’s philosophy of increasing rates at a “measured pace” would not stave off economic growth at the level initially anticipated. Confounding expectations, particularly in light of the devastation brought to the Gulf Coast by Hurricanes Katrina and Rita, gross domestic product growth accelerated from July through September.
Strong stock selection had a positive effect on the Fund’s portfolio during the period in contrast to sector allocations, which detracted from Fund performance.
On a stock-specific level, Google Inc. added significant value to the portfolio. Our philosophy states that we prefer companies that exhibit a faster rate of growth than that of the market, and Google is a prime example of such a candidate. Due to an increase in market share, Google’s earnings have risen more than 40% higher than anticipated at the start of the year. With a superior business model intact, nearly 70% of every revenue dollar goes directly to Google’s bottom line. Also adding value to the Fund was retailer Nordstrom, Inc. The company is well-positioned in the high-end retail market, and as a result of extending its growth margins has seen positive earnings revisions.
Among significant detractors from Fund performance, was Fund holding VeriSign, Inc., a premiere Internet security vendor and domain distributor that saw significant declines as its wireless ring tone market dropped off faster than expected in the second and third quarters of 2005. Also of note, Fund holding Investors Financial Services Corp., a trust bank, declined as the yield curve [a plotted graph line of the yields (or interest rates) on long-term and short-term maturity bonds, usually treasury securities] compressed during the spring, putting pressure on the company’s earnings.
The economy has shown a high degree of resiliency during the past 12 months; despite having to face many obstacles, the economy has continued to grow, leaving us with a positive outlook on the market. We believe that the Fed will soon ease up on interest rates, and when that happens we expect to see price/earnings multiples expand, signaling a positive event for the Fund. As always, we maintain our strategy of investing in growth companies that have the potential to generate positive earnings revisions and positive growth rates relative to the market.
Portfolio Managers:
Christopher Baggini, CFA and Douglas Burtnick, CFA
| | |
Fund Performance | | Gartmore U.S. Growth Leaders Fund |
Average Annual Total Return
(For periods ended October 31, 2005)
| | | | | | | | |
| | | | | 1 Yr. | | 5 Yr. | | Inception1 |
| Class A | | w/o SC2 | | 17.31% | | -2.16% | | 0.80% |
| | | w/SC3 | | 10.54% | | -3.31% | | -0.31% |
| Class B | | w/o SC2 | | 16.38% | | -2.86% | | 0.09% |
| | | w/SC4 | | 11.38% | | -3.23% | | -0.09% |
| Class C5 | | w/o SC2 | | 16.41% | | -2.74% | | 0.21% |
| | | w/SC6 | | 15.41% | | -2.74% | | 0.21% |
| Class R7,8 | | 17.41% | | -2.62% | | 0.33% |
| Institutional Class7,9 | | 17.69% | | -1.90% | | 1.08% |
| Institutional Service Class7 | | 17.35% | | -1.96% | | 1.03% |
All figures showing the effect of a sales charge reflect the maximum charge possible, because it has the most dramatic effect on performance data.
| 1 | Fund commenced operations on June 30, 2000. |
| 2 | These returns do not reflect the effects of sales charges (SC). |
| 3 | A 5.75% front-end sales charge was deducted. |
| 4 | A 5.00% contingent deferred sales charge (CDSC) was deducted. The CDSC declines to 0% after 6 years. |
| 5 | These returns until the creation of Class C shares (3/1/01) include the performance of the Fund’s Class B shares. Excluding the effects of any fee waivers or reimbursements, such prior performance is substantially similar to what Class C shares would have produced because Class C shares invest in the same portfolio of securities as Class B shares and have the same expenses after any fee waivers or reimbursements. For Class C shares returns with sales charges, these returns have been restated for the applicable sales charges. |
| 6 | A CDSC of 1.00% was deducted because it is charged when you sell Class C shares within the first year after purchase. |
| 7 | Not subject to any sales charges. |
| 8 | These returns until the creation of Class R shares (10/1/03) include the performance of the Fund’s Class B shares. The returns have been adjusted for the fact that Class R shares do not have any applicable sales charges but have not been adjusted for the lower expenses applicable to Class R shares. Excluding the effect of any fee waivers or reimbursements, such prior performance is similar to what Class R shares would have produced because the Class R shares invest in the same portfolio of securities as Class B shares. |
| 9 | These returns until the creation of Institutional Class shares (6/29/04) include the performance of the Fund’s Institutional Service shares. The returns have been adjusted for the fact that Institutional Class shares do not have any applicable sales charges but have not been adjusted for the lower expenses applicable to Institutional Class shares. Excluding the effect of any fee waivers or reimbursements, such prior performance is similar to what Institutional Class shares would have produced because the Institutional Class shares invest in the same portfolio of securities as Institutional Service shares. |
Performance of a $10,000 Investment
Investment return and principal value will fluctuate, and when redeemed, shares may be worth more or less than original cost. Past performance is no guarantee of future results and does not reflect the deduction of taxes that a shareholder would pay on fund distributions or the redemption of fund shares. Investing in mutual funds involves market risk, including loss of principal. Performance returns assume the reinvestment of all distributions.
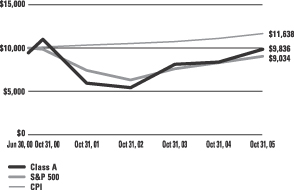
Comparative performance of $10,000 invested in Class A shares of the Gartmore U.S. Growth Leaders Fund, S&P 500 Index (S&P 500)(a), and the Consumer Price Index (CPI)(b) since inception. Unlike the Fund, the returns for these unmanaged indexes do not reflect any fees, expenses, or sales charges. Investors cannot invest directly in market indexes.
| (a) | The S&P 500 is an unmanaged index of 500 widely held stocks of large U.S. companies that gives a broad look at how the stock prices of large U.S. companies have performed. |
| (b) | The CPI represents changes in prices of a basket of goods and services purchased for consumption by urban households. |
| | |
Shareholder Expense Example | | Gartmore U.S. Growth Leaders Fund |
As a shareholder of the Fund, you incur two types of costs: (1) transaction costs, including sales charges (loads) paid on purchase payments and redemption fees; and (2) ongoing costs, including investment advisory fees, administration fees, distribution fees and other Fund expenses. The examples below are intended to help you understand your ongoing costs (in dollars) of investing in the Fund and to compare these costs with the ongoing costs of investing in other mutual funds. Per SEC requirements, the examples assume that you had a $1,000 investment in the Class at the beginning of the reporting period, May 1, 2005, and continued to hold your shares at the end of the reporting period, October 31, 2005.
Actual Expenses
For each Class of the Fund in the table below, the first line provides information about actual account values and actual expenses. You may use the information in this line, together with the amount you invested, to estimate the expenses that you paid over the period. Simply divide your account value by $1,000 (for example, an $8,600 account value divided by $1,000 = 8.6), then multiply the result by the number in the first line of each Class under the heading entitled “Expenses Paid During Period” to estimate the expenses you paid on your account during the period.
Hypothetical Example for Comparison Purposes
The second line of each Class in the table below provides information about hypothetical account values and hypothetical expenses based on the Class’ actual expense ratio and an assumed rate of return of 5% per year before expenses, which is not the Class’ actual return. The hypothetical account values and expenses may not be used to estimate the actual ending account balance or expenses you paid for the period. You may use this information to compare the ongoing costs of investing in the Class of the Fund and other funds. To do so, compare this 5% hypothetical example with the 5% hypothetical examples that appear in the shareholder reports of the other funds.
Please note that the expenses shown in the table are meant to highlight your ongoing costs only and do not reflect any transaction costs, such as sales charges (loads) or redemption fees. Therefore, the second line for each Class in the table is useful in comparing ongoing costs only, and will not help you determine the relative total costs of owning different funds. In addition, if these transaction costs were included, your costs would have been higher. The examples also assume all dividends and distributions have been reinvested.
Schedule of Shareholder Expenses
Expense Analysis of a $1,000 Investment
(October 31, 2005)
| | | | | | | | | | | | | | |
| U.S. Growth Leaders Fund | | | | | Beginning
Account Value,
5/1/05 | | Ending
Account Value,
10/31/05 | | Expenses Paid
During Period* | | Annualized
Expense Ratio* |
| Class A | | Actual | | | $ | 1,000.00 | | $ | 1,119.10 | | $ | 8.12 | | 1.52% |
| | | Hypothetical | 1 | | $ | 1,000.00 | | $ | 1,017.34 | | $ | 7.76 | | 1.52% |
| Class B | | Actual | | | $ | 1,000.00 | | $ | 1,113.80 | | $ | 11.67 | | 2.19% |
| | | Hypothetical | 1 | | $ | 1,000.00 | | $ | 1,013.96 | | $ | 11.18 | | 2.19% |
| Class C | | Actual | | | $ | 1,000.00 | | $ | 1,114.30 | | $ | 11.72 | | 2.20% |
| | | Hypothetical | 1 | | $ | 1,000.00 | | $ | 1,013.91 | | $ | 11.23 | | 2.20% |
| Class R | | Actual | | | $ | 1,000.00 | | $ | 1,118.70 | | $ | 9.88 | | 1.85% |
| | | Hypothetical | 1 | | $ | 1,000.00 | | $ | 1,015.67 | | $ | 9.44 | | 1.85% |
| Institutional Service Class | | Actual | | | $ | 1,000.00 | | $ | 1,118.80 | | $ | 7.64 | | 1.43% |
| | | Hypothetical | 1 | | $ | 1,000.00 | | $ | 1,017.79 | | $ | 7.30 | | 1.43% |
| Institutional Class | | Actual | | | $ | 1,000.00 | | $ | 1,119.60 | | $ | 6.41 | | 1.20% |
| | | Hypothetical | 1 | | $ | 1,000.00 | | $ | 1,018.95 | | $ | 6.12 | | 1.20% |
| * | Expenses are equal to the Fund’s annualized expense ratio multiplied by the average account value over the period multiplied by 184/365 (to reflect the one-half year period). The expense ratio presented represents a six month, annualized ratio in accordance with SEC guidelines. |
| 1 | Represents the hypothetical 5% return before expenses. |
| | |
Portfolio Summary | | Gartmore U.S. Growth Leaders Fund |
October 31, 2005
The SEC adopted a requirement that Funds present their portfolio holdings in a table, chart or graph format in their annual and semiannual reports to shareholders, whether or not a statement of investments is utilized. The following tables, which present portfolio holdings as a percentage of net assets, are provided in compliance with this requirement.
| | |
| Asset Allocation | | |
| Common Stock | | 99.2% |
| Cash Equivalents | | 3.1% |
| Other Investments* | | 11.2% |
| Liabilities in excess of Other Assets** | | -13.5% |
| | |
|
| | | 100.0% |
| * | Includes value of collateral received from securities lending. |
| ** | Includes value of collateral owed from securities lending. |
| | |
| Top Industries | | |
| Computer Software & Services | | 18.7% |
| Healthcare | | 16.6% |
| Retail | | 13.5% |
| Financial Services | | 8.6% |
| Telecommunications | | 8.0% |
| Oil & Gas | | 7.6% |
| Semiconductors | | 5.9% |
| Hotels/Casinos | | 3.7% |
| E-Commerce/Services | | 3.4% |
| Aerospace & Defense | | 3.4% |
| Other Industries | | 10.6% |
| | |
|
| | | 100.0% |
| | |
| Top Holdings*** | | |
| UnitedHealth Group, Inc. | | 5.9% |
| Amgen, Inc. | | 4.9% |
| Google, Inc. | | 4.3% |
| McAfee, Inc. | | 3.9% |
| Brinker International, Inc. | | 3.7% |
| Starwood Hotels & Resorts Worldwide, Inc. | | 3.7% |
| Home Depot, Inc. | | 3.7% |
| T. Rowe Price Group, Inc. | | 3.5% |
| Kohl’s Corp. | | 3.4% |
| Monster Worldwide, Inc. | | 3.4% |
| Other Holdings | | 59.6% |
| | |
|
| | | 100.0% |
| *** | For purpose of listing top holdings, repurchase agreements are considered cash equivalents and are included as part of Other Holdings. |
Statement of Investments
October 31, 2005
Gartmore U.S. Growth Leaders Fund
| Common Stocks (99.2%) |
| | | | | |
| | | Shares or
Principal Amount | | Value |
| | | | | | |
Aerospace & Defense (3.4%) | | | | | |
Boeing Co. (The) | | 59,900 | | $ | 3,871,936 |
| | | | |
|
|
Banks (2.2%) | | | | | |
Marshall & Ilsley Corp. | | 60,060 | | | 2,580,178 |
| | | | |
|
|
Computer Software & Services (18.6%) | | | |
Business Objects S.A. ADR — FR (b) (c) | | 64,970 | | | 2,226,522 |
Cognizant Technology Solutions Corp., Class A (b) | | 70,140 | | | 3,084,757 |
F5 Networks, Inc. (b) (c) | | 72,480 | | | 3,771,134 |
Google, Inc. (b) | | 13,330 | | | 4,960,626 |
Hyperion Solutions Corp. (b) | | 61,640 | | | 2,980,910 |
McAfee, Inc. (b) | | 147,500 | | | 4,429,425 |
| | | | |
|
|
| | | | | | 21,453,374 |
| | | | |
|
|
Consumer Products (3.2%) | | | | | |
Colgate-Palmolive Co. | | 70,300 | | | 3,723,088 |
| | | | |
|
|
E-Commerce/Services (3.4%) | | | | | |
Monster Worldwide, Inc. (b) | | 118,880 | | | 3,900,453 |
| | | | |
|
|
Financial Services (8.6%) | | | | | |
E*TRADE Financial Corp. (b) | | 124,300 | | | 2,305,765 |
Goldman Sachs Group, Inc. | | 28,050 | | | 3,544,679 |
T. Rowe Price Group, Inc. | | 61,540 | | | 4,032,100 |
| | | | |
|
|
| | | | | | 9,882,544 |
| | | | |
|
|
Healthcare (16.6%) | | | | | |
Amgen, Inc. (b) | | 73,610 | | | 5,576,694 |
Medco Health Solutions, Inc. (b) | | 60,150 | | | 3,398,475 |
St. Jude Medical, Inc. (b) | | 69,270 | | | 3,329,809 |
UnitedHealth Group, Inc. | | 116,660 | | | 6,753,448 |
| | | | |
|
|
| | | | | | 19,058,426 |
| | | | |
|
|
Hotels/Casinos (3.7%) | | | | | |
Starwood Hotels & Resorts Worldwide, Inc. | | 72,360 | | | 4,227,995 |
| | | | |
|
|
Insurance (2.3%) | | | | | |
PartnerRe Ltd. | | 41,420 | | | 2,639,282 |
| | | | |
|
|
| | | | | | |
| | | Shares or
Principal Amount | | Value |
| | | | | | | |
Machinery (2.2%) | | | | | | |
Cymer, Inc. (b) (c) | | | 72,200 | | $ | 2,516,170 |
| | | | | |
|
|
Oil & Gas (7.6%) | | | | | | |
ENSCO International, Inc. | | | 58,640 | | | 2,673,398 |
Halliburton Co. | | | 38,830 | | | 2,294,853 |
Praxair, Inc. | | | 76,280 | | | 3,768,994 |
| | | | | |
|
|
| | | | | | | 8,737,245 |
| | | | | |
|
|
Retail (13.5%) | | | | | | |
Abercrombie & Fitch Co. | | | 58,990 | | | 3,066,890 |
Brinker International, Inc. (b) (c) | | | 111,580 | | | 4,253,430 |
Home Depot, Inc. | | | 102,720 | | | 4,215,629 |
Kohl’s Corp. (b) | | | 82,180 | | | 3,955,323 |
| | | | | |
|
|
| | | | | | | 15,491,272 |
| | | | | |
|
|
Semiconductors (5.9%) | | | | | | |
Broadcom Corp., Class A (b) | | | 67,850 | | | 2,880,911 |
National Semiconductor Corp. | | | 171,960 | | | 3,891,455 |
| | | | | |
|
|
| | | | | | | 6,772,366 |
| | | | | |
|
|
Telecommunications (8.0%) | | | | | | |
Comverse Technology, Inc. (b) | | | 128,700 | | | 3,230,370 |
Corning, Inc. (b) | | | 124,770 | | | 2,506,629 |
QUALCOMM, Inc. | | | 88,690 | | | 3,526,315 |
| | | | | |
|
|
| | | | | | | 9,263,314 |
| | | | | |
|
|
| | |
Total Common Stocks | | | | | | 114,117,643 |
| | | | | |
|
|
|
Cash Equivalents (3.1%) |
Investments in repurchase agreements (Collateralized by U.S. Government Agencies and U.S. Government Agency Mortgages, in a joint trading account at 3.90%, dated 10/31/05, due 11/01/05, repurchase price $3,511,370) | | $ | 3,510,990 | | | 3,510,990 |
| | | | | |
|
|
| | |
Total Cash Equivalents | | | | | | 3,510,990 |
| | | | | |
|
|
Short-Term Securities Held as Collateral for Securities
Lending (11.2%)
| | | | | | | |
| | | Shares or
Principal Amount | | Value | |
| | | | | | | | |
Pool of short-term securities for Gartmore Mutual Funds — note 2 (Securities Lending) | | $ | 12,814,285 | | $ | 12,814,285 | |
| | | | | |
|
|
|
| |
Total Short-Term Securities Held as Collateral for Securities Lending | | | 12,814,285 | |
| | | | | |
|
|
|
| |
Total Investments
(Cost $127,645,430) (a) — 113.5% | | | 130,442,918 | |
| |
Liabilities in excess of other
assets — (13.5)% | | | (15,473,210 | ) |
| | | | | |
|
|
|
| | |
NET ASSETS — 100.0% | | | | | $ | 114,969,708 | |
| | | | | |
|
|
|
| | (a) | See notes to financial statements for tax unrealized appreciation (depreciation) of securities. |
| | (b) | Denotes a non-income producing security. |
| | (c) | All or part of the security was on loan as of October 31, 2005. |
| | ADR | American Depositary Receipt |
See notes to financial statements.
Gartmore Worldwide Leaders Fund
For the annual period ended Oct. 31, 2005, the Gartmore Worldwide Leaders Fund (Class A at NAV) returned 23.44% versus 13.27% for its benchmark, the Morgan Stanley Capital International (MSCI) World Index. For broader comparison, the average return for the Fund’s Lipper peer category of Global Large-Cap Core Funds was 12.98%.
In economic terms, the reporting period was characterized by all-time nominal highs for oil prices, with inflation creeping upward, as well as strong U.S. growth. Most notable was the record oil price, which peaked at about $70 per barrel at the end of August. Nevertheless, extreme oil prices did not stoke inflation to the extent expected, partly due to the widespread use of modern, energy-efficient products and partly due to the deflationary effects of cheaper exports from emerging markets, notably China.
In this environment, U.S. growth remained strong, job creation and rising housing prices supported consumption but gave rise to fears of higher prices pervading the economy. As a result, the Federal Reserve Board tightened monetary policy such that interest rates stood at 3.75% at the end of September. In the latter part of the year, both Europe and Japan showed increasing signs of recovery. Europe was buoyed by export growth on the back of the weak euro, with business confidence and investment on the increase. In Japan, meanwhile, rising real incomes and capital expenditure led to hopes of a recovery. Expectations rose when Prime Minister Junichiro Koizumi achieved a resounding victory in parliamentary elections, which gave his government a solid mandate for reform.
Equity prices appeared disconnected from underlying fundamentals during the reporting period but in fact represented a forward-looking view. The most notable laggard remained the United States, which advanced 8.7% according to the S&P 500® Index. This compared to an overall performance for the MSCI World Index of around 13% and reflected expensive valuations relative to those of other international markets. Emerging-market and Pacific equities performed the strongest, with Latin American markets delivering a notably robust performance on the back of strong commodity prices. Elsewhere, Japan and Europe (including the United Kingdom) also were strong, driven by hopes of economic recovery, strong corporate profitability and expectations of higher levels of merger-and-acquisition activity.
Drilling down to the stock level, U.S. firms Apple Computer, Inc. and ConocoPhillips contributed most to Fund performance. Apple has been resurgent due to the design quality of its products, not the least of which is its iPod music player. Meanwhile, oil firm ConocoPhillips has benefited from bottlenecks in refinery capacity that were brought to light by the aftermath of Hurricane Katrina but which were longstanding issues. Other contributors to Fund performance in the commodities arena included Japanese firm Sumitomo Metal Industries, Ltd. and BHP Billiton. Meanwhile another contributor to Fund performance, O2 PLC, made gains on subscriber growth and a bid by Spain’s Telefónica S.A.
On the downside, our exposure to media stocks ITV PLC and The News Corp. Ltd. detracted most from Fund performance. We opened holdings in The News Corp. after the company’s listing was shifted from Australia to the United States. The expected bounce from greater analyst coverage, however, did not occur, while a long-running dispute with a major shareholder went unresolved. In the case of the Fund holdings in U.K. terrestrial television firm ITV, advertising revenues disappointed on greater satellite and cable competition. We had also expected a bid for ITV, but none materialized. Elsewhere, our holding in sportswear firm Adidas-Salomon AG also was disappointing. The firm gained ground at the time of its bid for Reebok International Ltd. but has been weak since the middle of the summer as investors anticipate a slowdown in U.S. consumer spending.
We remain positive in our outlook for global growth, retaining our general strategy. Our country and sector stances are built from the bottom up and tend to reflect our views in aggregate. We remain underweight in the United States, where valuations appear stretched, notwithstanding the resilience of corporate profitability. Meanwhile, we are now underweight in Europe holdings, believing that essential structural reforms are unlikely to be enacted at present. We prefer the Asia Pacific region, having an overweight position in South Korea as well as Australia. Our most significant overweight remains in Japan, which we believe can continue to recover, given the current emphasis on growth driven by domestic demand. Overall valuations in the region do not appear stretched and should support equity prices.
Portfolio Manager:
Neil Rogan
| | |
Fund Performance | | Gartmore Worldwide Leaders Fund |
Average Annual Total Return
(For periods ended October 31, 2005)
| | | | | | | | |
| | | | | 1 Yr. | | 5 Yr. | | Inception1 |
| Class A | | w/o SC2 | | 23.44% | | 0.35% | | -1.43% |
| | | w/SC3 | | 16.32% | | -0.84% | | -2.55% |
| Class B | | w/o SC2 | | 22.70% | | -0.34% | | -2.11% |
| | | w/SC4 | | 17.70% | | -0.74% | | -2.30% |
| Class C5 | | w/o SC2 | | 22.81% | | -0.24% | | -2.01% |
| | | w/SC6 | | 21.81% | | -0.24% | | -2.01% |
| Class R7,8 | | 23.33% | | -0.13% | | -1.91% |
| Institutional Class7,9 | | 23.81% | | 0.63% | | -1.17% |
| Institutional Service Class7 | | 23.48% | | 0.57% | | -1.22% |
All figures showing the effect of a sales charge reflect the maximum charge possible, because it has the most dramatic effect on performance data.
| 1 | Fund commenced operations on August 30, 2000. |
| 2 | These returns do not reflect the effects of sales charges (SC). |
| 3 | A 5.75% front-end sales charge was deducted. |
| 4 | A 5.00% contingent deferred sales charge (CDSC) was deducted. The CDSC declines to 0% after 6 years. |
| 5 | These returns until the creation of Class C shares (3/1/01) include the performance of the Fund’s Class B shares. Excluding the effects of any fee waivers or reimbursements, such prior performance is substantially similar to what Class C shares would have produced because Class C shares invest in the same portfolio of securities as Class B shares and have the same expenses after any fee waivers or reimbursements. For Class C shares returns with sales charges, these returns have been restated for the applicable sales charges. |
| 6 | A CDSC of 1.00% was deducted because it is charged when you sell Class C shares within the first year after purchase. |
| 7 | Not subject to any sales charges. |
| 8 | These returns until the creation of Class R shares (10/1/03) include the performance of the Fund’s Class B shares. The returns have been adjusted for the fact that Class R shares do not have any applicable sales charges but have not been adjusted for the lower expenses applicable to Class R shares. Excluding the effect of any fee waivers or reimbursements, such prior performance is similar to what Class R shares would have produced because the Class R shares invest in the same portfolio of securities as Class B shares. |
| 9 | These returns until the creation of Institutional Class shares (6/29/04) include the performance of the Fund’s Institutional Service shares. The returns have been adjusted for the fact that Institutional Class shares do not have any applicable sales charges but have not been adjusted for the lower expenses applicable to Institutional Class shares. Excluding the effect of any fee waivers or reimbursements, such prior performance is similar to what Institutional Class shares would have produced because the Institutional Class shares invest in the same portfolio of securities as Institutional Service shares. |
Performance of a $10,000 Investment
Investment return and principal value will fluctuate, and when redeemed, shares may be worth more or less than original cost. Past performance is no guarantee of future results and does not reflect the deduction of taxes that a shareholder would pay on fund distributions or the redemption of fund shares. Investing in mutual funds involves market risk, including loss of principal. Performance returns assume the reinvestment of all distributions.
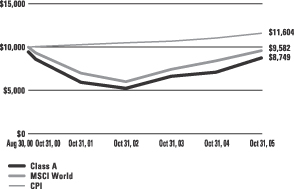
Comparative performance of $10,000 invested in Class A shares of the Gartmore Worldwide Leaders Fund, the Morgan Stanley Capital International World Index (MSCI World)(a), and the Consumer Price Index (CPI)(b) since inception. Unlike the Fund, the returns for these unmanaged indexes do not reflect any fees, expenses, or sales charges. Investors cannot invest directly in market indexes.
| (a) | The MSCI World- an unmanaged index of companies whose securities are listed on the stock exchanges of the U.S., Europe, Canada, Australia and the Far East- gives a broad look at how the stock prices of these companies have performed. |
| (b) | The CPI represents changes in prices of a basket of goods and services purchased for consumption by urban households. |
| | |
Shareholder Expense Example | | Gartmore Worldwide Leaders Fund |
As a shareholder of the Fund, you incur two types of costs: (1) transaction costs, including sales charges (loads) paid on purchase payments and redemption fees; and (2) ongoing costs, including investment advisory fees, administration fees, distribution fees and other Fund expenses. The examples below are intended to help you understand your ongoing costs (in dollars) of investing in the Fund and to compare these costs with the ongoing costs of investing in other mutual funds. Per SEC requirements, the examples assume that you had a $1,000 investment in the Class at the beginning of the reporting period, May 1, 2005, and continued to hold your shares at the end of the reporting period, October 31, 2005.
Actual Expenses
For each Class of the Fund in the table below, the first line provides information about actual account values and actual expenses. You may use the information in this line, together with the amount you invested, to estimate the expenses that you paid over the period. Simply divide your account value by $1,000 (for example, an $8,600 account value divided by $1,000 = 8.6), then multiply the result by the number in the first line of each Class under the heading entitled “Expenses Paid During Period” to estimate the expenses you paid on your account during the period.
Hypothetical Example for Comparison Purposes
The second line of each Class in the table below provides information about hypothetical account values and hypothetical expenses based on the Class’ actual expense ratio and an assumed rate of return of 5% per year before expenses, which is not the Class’ actual return. The hypothetical account values and expenses may not be used to estimate the actual ending account balance or expenses you paid for the period. You may use this information to compare the ongoing costs of investing in the Class of the Fund and other funds. To do so, compare this 5% hypothetical example with the 5% hypothetical examples that appear in the shareholder reports of the other funds.
Please note that the expenses shown in the table are meant to highlight your ongoing costs only and do not reflect any transaction costs, such as sales charges (loads) or redemption fees. Therefore, the second line for each Class in the table is useful in comparing ongoing costs only, and will not help you determine the relative total costs of owning different funds. In addition, if these transaction costs were included, your costs would have been higher. The examples also assume all dividends and distributions have been reinvested.
Schedule of Shareholder Expenses
Expense Analysis of a $1,000 Investment
(October 31, 2005)
| | | | | | | | | | | | | | |
| Worldwide Leaders Fund | | | | | Beginning
Account Value,
5/1/05 | | Ending
Account Value,
10/31/05 | | Expenses Paid
During Period* | | Annualized
Expense Ratio* |
| Class A | | Actual | | | $ | 1,000.00 | | $ | 1,151.90 | | $ | 9.17 | | 1.69% |
| | | Hypothetical | 1 | | $ | 1,000.00 | | $ | 1,016.48 | | $ | 8.63 | | 1.69% |
| Class B | | Actual | | | $ | 1,000.00 | | $ | 1,147.60 | | $ | 12.99 | | 2.40% |
| | | Hypothetical | 1 | | $ | 1,000.00 | | $ | 1,012.90 | | $ | 12.25 | | 2.40% |
| Class C | | Actual | | | $ | 1,000.00 | | $ | 1,148.30 | | $ | 13.00 | | 2.40% |
| | | Hypothetical | 1 | | $ | 1,000.00 | | $ | 1,012.90 | | $ | 12.25 | | 2.40% |
| Class R | | Actual | | | $ | 1,000.00 | | $ | 1,150.50 | | $ | 9.54 | | 1.76% |
| | | Hypothetical | 1 | | $ | 1,000.00 | | $ | 1,016.13 | | $ | 8.98 | | 1.76% |
| Institutional Service Class | | Actual | | | $ | 1,000.00 | | $ | 1,151.50 | | $ | 8.95 | | 1.65% |
| | | Hypothetical | 1 | | $ | 1,000.00 | | $ | 1,016.68 | | $ | 8.42 | | 1.65% |
| Institutional Class | | Actual | | | $ | 1,000.00 | | $ | 1,152.50 | | $ | 7.60 | | 1.40% |
| | | Hypothetical | 1 | | $ | 1,000.00 | | $ | 1,017.94 | | $ | 7.15 | | 1.40% |
| * | Expenses are equal to the Fund’s annualized expense ratio multiplied by the average account value over the period multiplied by 184/365 (to reflect the one-half year period). The expense ratio presented represents a six month, annualized ratio in accordance with SEC guidelines. |
| 1 | Represents the hypothetical 5% return before expenses. |
| | |
Portfolio Summary | | Gartmore Worldwide Leaders Fund |
October 31, 2005
The SEC adopted a requirement that Funds present their portfolio holdings in a table, chart or graph format in their annual and semiannual reports to shareholders, whether or not a statement of investments is utilized. The following tables, which present portfolio holdings as a percentage of net assets, are provided in compliance with this requirement.
| | |
| Asset Allocation | | |
| Common Stocks | | 96.0% |
| Cash Equivalents | | 4.8% |
| Other Investments* | | 11.9% |
| Liabilities in excess of Other Assets** | | –12.7% |
| | |
|
| | | 100.0% |
| * | Includes value of collateral received from securities lending. |
| ** | Includes value of collateral owed from securities lending. |
| | |
| Top Industries | | |
| Telecommunications | | 10.8% |
| Oil & Gas | | 10.7% |
| Financial Services | | 10.1% |
| Retail | | 8.0% |
| Computer Software & Services | | 6.2% |
| Consumer Goods | | 5.6% |
| Electronics | | 4.6% |
| Banking | | 4.5% |
| Semiconductors | | 4.4% |
| Restaurants | | 4.1% |
| Other Industries | | 31.0% |
| | |
|
| | | 100.0% |
| | |
| Top Holdings*** | | |
| ConocoPhillips | | 4.7% |
| UniCredito Italiano SPA | | 4.6% |
| McDonald’s Corp. | | 4.2% |
| Tiffany & Co. | | 4.2% |
| Mitsui Fudosan Co. Ltd. | | 4.1% |
| O2 PLC | | 3.9% |
| The Procter & Gamble Co. | | 3.9% |
| Apple Computer, Inc. | | 3.8% |
| Suncor Energy, Inc. | | 3.6% |
| Groupe Danone | | 3.3% |
| Other Holdings | | 59.7% |
| | |
|
| | | 100.0% |
| *** | For purpose of listing top holdings, repurchase agreements are considered cash equivalents and are included as part of Other Holdings. |
Statement of Investments
October 31, 2005
Gartmore Worldwide Leaders Fund
| Common Stocks (96.0%) |
| | | | | |
| | | Shares or Principal Amount | | Value |
| | | | | | |
AUSTRALIA (3.8%) | | | | | |
Coal (1.4%) | | | | | |
Excel Coal Ltd. (c) | | 104,729 | | $ | 528,772 |
| | | | |
|
|
Computer Software & Services (2.4%) | | | |
Computershare Ltd. (c) | | 183,980 | | | 905,675 |
| | | | |
|
|
| | | | | | 1,434,447 |
| | | | |
|
|
CANADA (3.6%) | | | | | |
Oil & Gas (3.6%) | | | | | |
Suncor Energy, Inc. | | 25,200 | | | 1,348,780 |
| | | | |
|
|
FRANCE (3.3%) | | | | | |
Food Products & Services (3.3%) | | | |
Groupe Danone (c) | | 12,100 | | | 1,229,784 |
| | | | |
|
|
GERMANY (1.8%) | | | | | |
Consumer Goods (1.8%) | | | | | |
Adidas-Salomon AG (c) | | 4,000 | | | 671,091 |
| | | | |
|
|
GREECE (1.5%) | | | | | |
Telecommunications (1.5%) | | | | | |
Hellenic Telecommunications Organization SA (b) (c) | | 26,900 | | | 555,088 |
| | | | |
|
|
ITALY (4.5%) | | | | | |
Banking (4.5%) | | | | | |
UniCredito Italiano SPA (c) | | 305,000 | | | 1,703,009 |
| | | | |
|
|
JAPAN (18.1%) | | | | | |
Airlines (2.4%) | | | | | |
Japan Airlines System Corp (c) | | 341,000 | | | 896,013 |
| | | | |
|
|
Electronics (2.0%) | | | | | |
Nippon Electric Glass Co. Ltd. (c) | | 40,000 | | | 765,846 |
| | | | |
|
|
Financial Services (5.1%) | | | | | |
Matsui Securities Co. Ltd. (c) | | 71,200 | | | 791,260 |
Mitsubishi UFJ Financial Group, Inc. (c) | | 89 | | | 1,118,784 |
| | | | |
|
|
| | | | | | 1,910,044 |
| | | | |
|
|
Oil & Gas (2.5%) | | | | | |
Nippon Oil Corp. (c) | | 108,000 | | | 922,469 |
| | | | |
|
|
Real Estate (4.1%) | | | | | |
Mitsui Fudosan Co. Ltd. (c) | | 94,000 | | | 1,539,056 |
| | | | |
|
|
| | | | | |
| | | Shares or Principal Amount | | Value |
| | | | | | |
JAPAN (continued) | | | | | |
Retail (2.0%) | | | | | |
The Daiei, Inc. (b) (c) | | 29,050 | | $ | 731,814 |
| | | | |
|
|
| | | | | | 6,765,242 |
| | | | |
|
|
SOUTH KOREA (4.4%) | | | | | |
Semiconductors (4.4%) | | | | | |
Hynix Semiconductor, Inc. (b) (c) | | 32,700 | | | 602,067 |
Samsung Electronics Co. Ltd. (c) | | 1,290 | | | 687,159 |
Samsung Electronics Co. Ltd. — GDR | | 1,300 | | | 349,375 |
| | | | |
|
|
| | | | | | 1,638,601 |
| | | | |
|
|
SWITZERLAND (2.0%) | | | | | |
Financial Services (2.0%) | | | | | |
Julius Baer Holding Ltd. (b) (c) | | 9,700 | | | 753,021 |
| | | | |
|
|
UNITED KINGDOM (12.0%) | | | | | |
Aerospace & Defense (2.1%) | | | | | |
BAE Systems PLC (c) | | 136,000 | | | 795,714 |
| | | | |
|
|
Mining (2.0%) | | | | | |
BHP Billiton PLC (c) | | 50,400 | | | 741,580 |
| | | | |
|
|
Telecommunications (6.4%) | | | | | |
O2 PLC (c) | | 400,200 | | | 1,457,674 |
Vodafone Group PLC (c) | | 356,000 | | | 934,571 |
| | | | |
|
|
| | | | | | 2,392,245 |
| | | | |
|
|
Water & Sewage Services (1.5%) | | | |
Pennon Group PLC (c) | | 28,498 | | | 539,791 |
| | | | |
|
|
| | | | | | 4,469,330 |
| | | | |
|
|
UNITED STATES (40.9%) | | | | | |
Computer Software & Services (3.8%) | | | |
Apple Computer, Inc. (b) | | 24,400 | | | 1,405,196 |
| | | | |
|
|
Consumer Goods (3.8%) | | | | | |
The Procter & Gamble Co. | | 25.638 | | | 1,435,444 |
| | | | |
|
|
Electronics (2.6%) | | | | | |
Advanced Micro Devices, Inc. (b) | | 42,400 | | | 984,528 |
| | | | |
|
|
Entertainment (0.6%) | | | | | |
CKX, Inc. (b) | | 17,800 | | | 223,212 |
| | | | |
|
|
Financial Services (2.9%) | | | | | |
JP Morgan Chase & Co. | | 30,100 | | | 1,102,262 |
| | | | |
|
|
Healthcare Services (2.0%) | | | | | |
Health Net, Inc. (b) | | 15,900 | | | 744,756 |
| | | | |
|
|
Common Stocks (continued)
| | | | | | |
| | | Shares or Principal Amount | | Value |
| | | | | | | |
UNITED STATES (continued) | | | | | | |
Machinery & Equipment (2.8%) | | | |
Caterpillar, Inc. | | | 19,900 | | $ | 1,046,541 |
| | | | | |
|
|
Medical Systems (2.1%) | | | | | | |
Davita, Inc. (b) | | | 15,700 | | | 772,126 |
| | | | | |
|
|
Oil & Gas (4.7%) | | | | | | |
ConocoPhillips | | | 26,700 | | | 1,745,646 |
| | | | | |
|
|
Pharmaceuticals (2.6%) | | | | | | |
Pfizer, Inc. | | | 44,000 | | | 956,560 |
| | | | | |
|
|
Restaurants (4.1%) | | | | | | |
McDonald’s Corp. | | | 49,100 | | | 1,551,560 |
| | | | | |
|
|
Retail (6.0%) | | | | | | |
J.C. Penney, Inc. | | | 13,300 | | | 680,960 |
Tiffany & Co. | | | 39,300 | | | 1,548,420 |
| | | | | |
|
|
| | | | | | | 2,229,380 |
| | | | | |
|
|
Telecommunications (2.9%) | | | | | | |
Alltel Corp. | | | 17,300 | | | 1,070,178 |
| | | | | |
|
|
| | | | | | | 15,267,389 |
| | | | | |
|
|
| | |
Total Common Stocks | | | | | | 35,835,782 |
| | | | | |
|
|
|
Cash Equivalents (4.8%) |
Investments in repurchase agreements (Collateralized by U.S. Government Agencies and U.S. Government Agency Mortgages, in a joint trading account at 3.90%, dated 10/31/05, due 11/01/05, repurchase price $1,798,797) | | $ | 1,798,605 | | | 1,798,605 |
| | | | | |
|
|
| | |
Total Cash Equivalents | | | | | | 1,798,605 |
| | | | | |
|
|
Short-Term Securities Held as Collateral for Securities
Lending (11.9%)
| | | | | | | |
| | | Shares or Principal Amount | | Value | |
Pool of short-term securities for Gartmore Mutual Funds — note 2 (Securities Lending) | | $ | 4,426,550 | | $ | 4,426,550 | |
| | | | | |
|
|
|
| |
Total Short-Term Securities Held as Collateral for Securities Lending | | | 4,426,550 | |
| | | | | |
|
|
|
| |
Total Investments
(Cost $39,648,914) (a) — 112.7% | | | 42,060,937 | |
| | |
Liabilities in excess of other assets — (12.7%) | | | | | | (4,752,133 | ) |
| | | | | |
|
|
|
| | |
NET ASSETS — 100.0% | | | | | $ | 37,308,804 | |
| | | | | |
|
|
|
| | (a) | See notes to financial statements for tax unrealized appreciation (depreciation) of securities. |
| | (b) | Denotes a non-income producing security. |
| | GDR | Global Depositary Receipt |
At October 31, 2005, the Fund’s open forward currency contracts were as follows:
| | | | | | | | | | | | | | |
Currency
| | Delivery Date
| | Contract
Value
| | | Market
Value
| | | Unrealized
Appreciation/
(Depreciation)
| |
| Short Contracts: | | | | | | | | | | | | | | |
| British Pound | | 11/01/05 | | $ | (497,755 | ) | | $ | (493,678 | ) | | $ | 4,077 | |
| | | | |
|
|
| |
|
|
| |
|
|
|
| Total Short Contracts | | | | $ | (497,755 | ) | | $ | (493,678 | ) | | $ | 4,077 | |
| | | | |
|
|
| |
|
|
| |
|
|
|
| | | | |
| Long Contracts: | | | | | | | | | | | | | | |
| Japanese Yen | | 11/02/05 | | $ | 303,151 | | | $ | 300,122 | | | $ | (3,029 | ) |
| Japanese Yen | | 11/04/05 | | | 100,376 | | | | 99,932 | | | | (444 | ) |
| | | | |
|
|
| |
|
|
| |
|
|
|
| Total Long Contracts | | | | | $403,527 | | | $ | 400,053 | | | $ | (3,473 | ) |
| | | | |
|
|
| |
|
|
| |
|
|
|
See notes to financial statements.
Statements of Assets and Liabilities
October 31, 2005
| | | | | | | | | | | | | | | | | | | | | |
| | | Gartmore
Mid Cap Growth
Leaders Fund | | | Gartmore
Nationwide
Leaders Fund | | | Gartmore
Small Cap
Leaders Fund | | | Gartmore
U.S. Growth
Leaders Fund | | Gartmore Worldwide Leaders Fund |
Assets: | | | | | | | | | | | | | | | | | | | | | |
Investments, at value (cost $37,080,587; $14,335,697; $15,015,506; $124,134,440; and $37,850,309, respectively) | | $ | 40,123,569 | | | $ | 14,259,378 | | | $ | 14,972,931 | | | $ | 126,931,928 | | $ | 40,262,332 | | | |
Repurchase agreements, at cost and value | | | — | | | | 1,025,551 | | | | — | | | | 3,510,990 | | | 1,798,605 | | | |
| | |
|
|
| |
|
|
| |
|
|
| |
|
| |
|
|
| | |
Total Investments | | | 40,123,569 | | | | 15,284,929 | | | | 14,972,931 | | | | 130,442,918 | | | 42,060,937 | | | |
| | |
|
|
| |
|
|
| |
|
|
| |
|
| |
|
|
| | |
Cash | | | 1,142 | | | | — | | | | 844,463 | | | | — | | | — | | | |
Foreign currency, at value (cost $0; $0; $0; $0 and $772; respectively) | | | — | | | | — | | | | — | | | | — | | | 761 | | | |
Interest and dividends receivable | | | 9,314 | | | | 37,320 | | | | 17,670 | | | | 58,346 | | | 52,436 | | | |
Receivable for capital shares issued | | | 5,237 | | | | 40,621 | | | | 5,115 | | | | 1,307,679 | | | 225,769 | | | |
Receivable for investments sold | | | — | | | | 360,490 | | | | 1,173,425 | | | | 4,844,471 | | | 3,001,307 | | | |
Unrealized appreciation on forward foreign currency contracts | | | — | | | | — | | | | — | | | | — | | | 604 | | | |
Receivable from adviser | | | 5,551 | | | | — | | | | 6,939 | | | | — | | | — | | | |
Reclaims receivable | | | — | | | | — | | | | — | | | | — | | | 11,883 | | | |
Prepaid expenses and other assets | | | 14,940 | | | | 15,132 | | | | 2,102 | | | | 22,665 | | | 25,753 | | | |
| | |
|
|
| |
|
|
| |
|
|
| |
|
| |
|
|
| | |
Total Assets | | | 40,159,753 | | | | 15,738,492 | | | | 17,022,645 | | | | 136,676,079 | | | 45,379,450 | | | |
| | |
|
|
| |
|
|
| |
|
|
| |
|
| |
|
|
| | |
| | | | | | |
Liabilities: | | | | | | | | | | | | | | | | | | | | | |
Payable to adviser | | | — | | | | 9,474 | | | | — | | | | 31,509 | | | 70 | | | |
Payable for investments purchased | | | — | | | | 886,899 | | | | 946,992 | | | | 8,607,137 | | | 3,523,343 | | | |
Payable for capital shares redeemed | | | 46,944 | | | | 24,618 | | | | 6,306 | | | | 73,010 | | | 33,439 | | | |
Payable for return of collateral received for securities on loan | | | 2,121,265 | | | | — | | | | — | | | | 12,814,285 | | | 4,426,550 | | | |
Accrued expenses and other payables | | | | | | | | | | | | | | | | | | | | | |
Investment advisory fees | | | 25,806 | | | | 8,173 | | | | 12,867 | | | | 101,120 | | | 29,821 | | | |
Fund administration and transfer agent fees | | | 6,799 | | | | 1,915 | | | | 1,911 | | | | 9,347 | | | 12,634 | | | |
Distribution fees | | | 4,630 | | | | 3,361 | | | | 6,642 | | | | 37,472 | | | 7,550 | | | |
Administrative servicing fees | | | 240 | | | | 2,000 | | | | 1,882 | | | | 20,833 | | | 12,859 | | | |
Trustee fees | | | 91 | | | | 32 | | | | 35 | | | | 219 | | | 82 | | | |
Other | | | 15,807 | | | | 1,302 | | | | 4,235 | | | | 11,439 | | | 24,298 | | | |
| | |
|
|
| |
|
|
| |
|
|
| |
|
| |
|
|
| | |
Total Liabilities | | | 2,221,582 | | | | 937,774 | | | | 980,870 | | | | 21,706,371 | | | 8,070,646 | | | |
| | |
|
|
| |
|
|
| |
|
|
| |
|
| |
|
|
| | |
Net Assets | | $ | 37,938,171 | | | $ | 14,800,718 | | | $ | 16,041,775 | | | $ | 114,969,708 | | $ | 37,308,804 | | | |
| | |
|
|
| |
|
|
| |
|
|
| |
|
| |
|
|
| | |
| | | | | | |
Represented by: | | | | | | | | | | | | | | | | | | | | | |
Capital | | $ | 67,804,040 | | | $ | 13,264,785 | | | $ | 15,838,275 | | | $ | 104,339,503 | | $ | 72,908,016 | | | |
Accumulated net investment income (loss) | | | 2,390 | | | | 22,283 | | | | — | | | | — | | | (601 | ) | | |
Accumulated net realized gains (losses) from investment and foreign currency transactions | | | (32,911,241 | ) | | | 1,589,969 | | | | 246,075 | | | | 7,832,717 | | | (38,011,791 | ) | | |
Net unrealized appreciation (depreciation) on investments and translation of assets and liabilities denominated in foreign currencies | | | 3,042,982 | | | | (76,319 | ) | | | (42,575 | ) | | | 2,797,488 | | | 2,413,180 | | | |
| | |
|
|
| |
|
|
| |
|
|
| |
|
| |
|
|
| | |
Net Assets | | $ | 37,938,171 | | | $ | 14,800,718 | | | $ | 16,041,775 | | | $ | 114,969,708 | | $ | 37,308,804 | | | |
| | |
|
|
| |
|
|
| |
|
|
| |
|
| |
|
|
| | |
See notes to financial statements.
Statements of Assets and Liabilities (Continued)
October 31, 2005
| | | | | | | | | | | | | | | | | | | | | | |
| | | Gartmore
Mid Cap Growth
Leaders Fund | | | Gartmore
Nationwide
Leaders Fund | | | Gartmore
Small Cap
Leaders Fund | | | Gartmore
U.S. Growth
Leaders Fund | | | Gartmore Worldwide Leaders Fund |
Net Assets: | | | | | | | | | | | | | | | | | | | | | | |
Class A Shares | | $ | 6,624,366 | | | $ | 5,309,305 | | | $ | 5,449,080 | | | $ | 76,762,137 | | | $ | 32,404,054 | | | |
Class B Shares | | | 3,387,447 | | | | 768,673 | | | | 888,213 | | | | 4,253,347 | | | | 342,939 | | | |
Class C Shares | | | 429,339 | | | | 2,046,127 | | | | 5,657,446 | | | | 22,773,566 | | | | 675,885 | | | |
Class D Shares | | | 11,232,482 | | | | — | | | | — | | | | — | | | | — | | | |
Class R Shares | | | 1,214 | | | | 1,331 | | | | 1,005 | | | | 637,175 | | | | 1,382 | | | |
Institutional Service Class Shares | | | — | | | | 6,674,063 | | | | 1,010 | | | | 8,806,211 | | | | 3,883,244 | | | |
Institutional Class Shares | | | 16,263,323 | | | | 1,219 | | | | 4,045,021 | | | | 1,737,272 | | | | 1,302 | | | |
| | |
|
|
| |
|
|
| |
|
|
| |
|
|
| |
|
|
| | |
Total | | $ | 37,938,171 | | | $ | 14,800,718 | | | $ | 16,041,775 | | | $ | 114,969,708 | | | $ | 37,308,804 | | | |
| | |
|
|
| |
|
|
| |
|
|
| |
|
|
| |
|
|
| | |
Shares outstanding (unlimited number of shares authorized): | | | | | | | | | | | | | | | | | | | | | | |
Class A Shares | | | 481,857 | | | | 381,441 | | | | 540,365 | | | | 7,710,174 | | | | 3,503,470 | | | |
Class B Shares | | | 265,952 | | | | 56,421 | | | | 88,598 | | | | 443,321 | | | | 38,381 | | | |
Class C Shares | | | 33,682 | | | | 150,268 | | | | 563,637 | | | | 2,359,611 | | | | 75,309 | | | |
Class D Shares | | | 799,516 | | | | — | | | | — | | | | — | | | | — | | | |
Class R Shares | | | 87 | | | | 97 | | | | 100 | | | | 65,622 | | | | 154 | | | |
Institutional Service Class Shares | | | — | | | | 478,118 | | | | 100 | | | | 873,519 | | | | 415,514 | | | |
Institutional Class Shares | | | 1,158,390 | | | | 87 | | | | 400,000 | | | | 171,890 | | | | 139 | | | |
| | |
|
|
| |
|
|
| |
|
|
| |
|
|
| |
|
|
| | |
Total | | | 2,739,484 | | | | 1,066,432 | | | | 1,592,800 | | | | 11,624,137 | | | | 4,032,967 | | | |
| | |
|
|
| |
|
|
| |
|
|
| |
|
|
| |
|
|
| | |
Net asset value and redemption price per share: | | | | | | | | | | | | | | | | | | | | | | |
Class A Shares | | $ | 13.75 | | | $ | 13.92 | | | $ | 10.08 | | | $ | 9.96 | | | $ | 9.25 | | | |
Class B Shares (a) | | $ | 12.74 | | | $ | 13.62 | | | $ | 10.03 | | | $ | 9.59 | | | $ | 8.94 | | | |
Class C Shares (b) | | $ | 12.75 | | | $ | 13.62 | | | $ | 10.04 | | | $ | 9.65 | | | $ | 8.97 | | | |
Class D Shares | | $ | 14.05 | | | $ | — | | | $ | — | | | $ | — | | | $ | — | | | |
Class R Shares | | $ | 13.93 | | | $ | 13.73 | (c) | | $ | 10.05 | | | $ | 9.71 | | | $ | 9.02 | (c) | | |
Institutional Service Class Shares | | $ | — | | | $ | 13.96 | | | $ | 10.10 | | | $ | 10.08 | | | $ | 9.35 | | | |
Institutional Class Shares | | $ | 14.04 | | | $ | 13.96 | (c) | | $ | 10.11 | | | $ | 10.11 | | | $ | 9.37 | (c) | | |
| | | | | | |
Maximum offering price per share (100%/(100%-maximum sales charge) of net asset value adjusted to the nearest cent): | | | | | | | | | | | | | | | | | | | | | | |
Class A Shares | | $ | 14.59 | | | $ | 14.77 | | | $ | 10.69 | | | $ | 10.57 | | | $ | 9.81 | | | |
Class D Shares | | $ | 14.71 | | | $ | — | | | $ | — | | | $ | — | | | $ | — | | | |
| | |
|
|
| |
|
|
| |
|
|
| |
|
|
| |
|
|
| | |
Maximum Sales Charge — Class A Shares | | | 5.75 | % | | | 5.75 | % | | | 5.75 | % | | | 5.75 | % | | | 5.75 | % | | |
| | |
|
|
| |
|
|
| |
|
|
| |
|
|
| |
|
|
| | |
Maximum Sales Charge — Class D Shares | | | 4.50 | % | | | — | | | | — | | | | — | | | | — | | | |
| | |
|
|
| |
|
|
| |
|
|
| |
|
|
| |
|
|
| | |
| | | | | | |
| | | | | | | | | | | | | | | | | | | | | | | |
| (a) | For Class B shares, the redemption price per share varies by length of time shares are held. |
| (b) | For Class C shares, the redemption price per share is reduced by 1.00% for shares held less than one year. |
| (c) | Due to rounding, Net Assets divided by shares outstanding does not equal the NAV. |
See notes to financial statements.
Statements of Operations
October 31, 2005
| | | | | | | | | | | | | | | | | | | | | | |
| | | Gartmore
Mid Cap Growth
Leaders Fund | | | Gartmore
Nationwide
Leaders Fund | | | Gartmore
Small Cap
Leaders Fund (a) | | | Gartmore
U.S. Growth
Leaders Fund | | | Gartmore Worldwide Leaders Fund |
INVESTMENT INCOME: | | | | | | | | | | | | | | | | | | | | | | |
Interest income | | $ | 63,113 | | | $ | 22,369 | | | $ | 1,385 | | | $ | 96,748 | | | $ | 22,536 | | | |
Dividend income (net of foreign withholding tax of $0; $0; $0; $0; and $61,617; respectively) | | | 165,743 | | | | 229,741 | | | | 133,431 | | | | 324,549 | | | | 447,800 | | | |
Income from securities lending | | | 7,112 | | | | — | | | | 5,946 | | | | 8,271 | | | | 13,859 | | | |
| | |
|
|
| |
|
|
| |
|
|
| |
|
|
| |
|
|
| | |
Total Income | | | 235,968 | | | | 252,110 | | | | 140,762 | | | | 429,568 | | | | 484,195 | | | |
| | |
|
|
| |
|
|
| |
|
|
| |
|
|
| |
|
|
| | |
| | | | | | |
Expenses: | | | | | | | | | | | | | | | | | | | | | | |
Investment advisory fees | | | 253,442 | | | | 85,651 | | | | 92,899 | | | | 574,027 | | | | 318,285 | | | |
Fund administration and transfer agent fees | | | 52,342 | | | | 15,321 | | | | 16,711 | | | | 96,852 | | | | 68,428 | | | |
Distribution fees Class A | | | 15,334 | | | | 8,947 | | | | 7,193 | | | | 103,886 | | | | 78,545 | | | |
Distribution fees Class B | | | 34,643 | | | | 5,874 | | | | 3,131 | | | | 33,719 | | | | 1,692 | | | |
Distribution fees Class C | | | 1,479 | | | | 10,051 | | | | 32,350 | | | | 101,246 | | | | 2,430 | | | |
Distribution fees Class R | | | 4 | | | | 4 | | | | 3 | | | | 99 | | | | 4 | | | |
Administrative servicing fees Class A | | | 3,631 | | | | 1,879 | | | | 1,900 | | | | 31,799 | | | | 14,580 | | | |
Administrative servicing fees Class R | | | — | | | | — | | | | 3 | | | | — | | | | — | | | |
Administrative servicing fees Institutional Service Class | | | — | | | | 11,716 | | | | — | | | | 17,946 | | | | 5,562 | | | |
Custodian fees | | | 33,416 | | | | 2,113 | | | | 13,560 | | | | 12,841 | | | | 46,381 | | | |
Legal fees | | | 3,234 | | | | 1,018 | | | | 23,969 | | | | 7,063 | | | | 4,390 | | | |
Registration and filing fees | | | 53,958 | | | | 44,935 | | | | 55,096 | | | | 58,464 | | | | 49,788 | | | |
Printing fees | | | 71,441 | | | | 4,621 | | | | 2,273 | | | | 27,626 | | | | 68,668 | | | |
Trustee fees | | | 1,156 | | | | 383 | | | | 355 | | | | 2,382 | | | | 1,360 | | | |
Other | | | 3,091 | | | | 1,057 | | | | 2,941 | | | | 7,835 | | | | 4,688 | | | |
| | |
|
|
| |
|
|
| |
|
|
| |
|
|
| |
|
|
| | |
Total expenses before reimbursed expenses | | | 527,171 | | | | 193,570 | | | | 252,384 | | | | 1,075,785 | | | | 664,801 | | | |
Earnings credit (Note 5) | | | (8,104 | ) | | | (288 | ) | | | (13,474 | ) | | | (489 | ) | | | (592 | ) | | |
Expenses reimbursed | | | (83,813 | ) | | | (31,180 | ) | | | (62,315 | ) | | | — | | | | (84,058 | ) | | |
| | |
|
|
| |
|
|
| |
|
|
| |
|
|
| |
|
|
| | |
Total Expenses | | | 435,254 | | | | 162,102 | | | | 176,595 | | | | 1,075,296 | | | | 580,151 | | | |
| | |
|
|
| |
|
|
| |
|
|
| |
|
|
| |
|
|
| | |
Net Investment Income (Loss) | | | (199,286 | ) | | | 90,008 | | | | (35,833 | ) | | | (645,728 | ) | | | (95,956 | ) | | |
| | |
|
|
| |
|
|
| |
|
|
| |
|
|
| |
|
|
| | |
| | | | | | |
REALIZED/UNREALIZED GAINS (LOSSES) FROM INVESTMENTS: | | | | | | | | | | | | | | | | | | | | | | |
Net realized gains (losses) on investment transactions | | | 2,941,837 | | | | 1,615,318 | | | | 263,061 | | | | 9,000,143 | | | | 6,761,315 | | | |
Net realized gains (losses) on foreign currency transactions | | | — | | | | — | | | | — | | | | — | | | | 5,168 | | | |
| | |
|
|
| |
|
|
| |
|
|
| |
|
|
| |
|
|
| | |
Net realized gains (losses) on investment and foreign currency transactions | | | 2,941,837 | | | | 1,615,318 | | | | 263,061 | | | | 9,000,143 | | | | 6,766,483 | | | |
Net change in unrealized appreciation/depreciation on investments and translation of assets and liabilities denominated in foreign currencies | | | 2,204,404 | | | | (388,932 | ) | | | (42,575 | ) | | | 36,165 | | | | 422,042 | | | |
| | |
|
|
| |
|
|
| |
|
|
| |
|
|
| |
|
|
| | |
Net realized/unrealized gains (losses) on investments and foreign currencies | | | 5,146,241 | | | | 1,226,386 | | | | 220,486 | | | | 9,036,308 | | | | 7,188,525 | | | |
| | |
|
|
| |
|
|
| |
|
|
| |
|
|
| |
|
|
| | |
CHANGE IN NET ASSETS RESULTING FROM OPERATIONS | | $ | 4,946,955 | | | $ | 1,316,394 | | | $ | 184,653 | | | $ | 8,390,580 | | | $ | 7,092,569 | | | |
| | |
|
|
| |
|
|
| |
|
|
| |
|
|
| |
|
|
| | |
| | | | | | | | | | | | | | | | | | | | | | | |
| (a) | For the period from December 29, 2004 (commencement of operations) through October 31, 2005. |
See notes to financial statements.
Statements of Changes in Net Assets
| | | | | | | | | | | | | | | | | | | | | | |
| | | Gartmore Mid Cap Growth
Leaders Fund | | | Gartmore Nationwide Leaders Fund | | | Gartmore Small Cap Leaders Fund |
| | | Year Ended
October 31, 2005 | | | Year Ended
October 31, 2004 | | | Year Ended
October 31, 2005 | | | Year Ended
October 31, 2004 | | | Period Ended
October 31, 2005 (a) |
FROM INVESTMENT ACTIVITIES: | | | | | | | | | | | | | | | | | | | | | | |
Operations: | | | | | | | | | | | | | | | | | | | | | | |
Net investment income (loss) | | $ | (199,286 | ) | | $ | (191,348 | ) | | $ | 90,008 | | | $ | (18,271 | ) | | $ | (35,833 | ) | | |
Net realized gains (losses) on investment transactions | | | 2,941,837 | | | | 2,474,873 | | | | 1,615,318 | | | | 439,268 | | | | 263,061 | | | |
Net change in unrealized appreciation/depreciation on investments | | | 2,204,404 | | | | (1,918,161 | ) | | | (388,932 | ) | | | (59,891 | ) | | | (42,575 | ) | | |
| | |
|
|
| |
|
|
| |
|
|
| |
|
|
| |
|
|
| | |
Change in net assets resulting from operations | | | 4,946,955 | | | | 365,364 | | | | 1,316,394 | | | | 361,106 | | | | 184,653 | | | |
| | |
|
|
| |
|
|
| |
|
|
| |
|
|
| |
|
|
| | |
| | | | | | |
Distributions to Class A Shareholders from: | | | | | | | | | | | | | | | | | | | | | | |
Net investment income | | | — | | | | — | | | | (24,752 | ) | | | — | | | | — | | | |
Net realized gains on investments | | | — | | | | — | | | | (106,882 | ) | | | — | | | | — | | | |
| | | | | | |
Distributions to Class B Shareholders from: | | | | | | | | | | | | | | | | | | | | | | |
Net investment income | | | — | | | | — | | | | (1,131 | ) | | | — | | | | — | | | |
Net realized gains on investments | | | — | | | | — | | | | (25,551 | ) | | | — | | | | — | | | |
| | | | | | |
Distributions to Class C Shareholders from: | | | | | | | | | | | | | | | | | | | | | | |
Net investment income | | | — | | | | — | | | | (3,506 | ) | | | — | | | | — | | | |
Net realized gains on investments | | | — | | | | — | | | | (25,053 | ) | | | — | | | | — | | | |
| | | | | | |
Distributions to Class R Shareholders from: | | | | | | | | | | | | | | | | | | | | | | |
Net investment income | | | — | | | | — | | | | (7 | ) | | | — | | | | — | | | |
Net realized gain on investment | | | — | | | | — | | | | (70 | ) | | | — | | | | — | | | |
| | | | | | |
Distributions to Institutional Service Class Shareholders from: | | | | | | | | | | | | | | | | | | | | | | |
Net investment income | | | — | | | | — | | | | (37,310 | ) | | | — | | | | — | | | |
Net realized gains on investments | | | — | | | | — | | | | (164,117 | ) | | | — | | | | — | | | |
| | | | | | |
Distributions to Institutional Class Shareholders from: | | | | | | | | | | | | | | | | | | | | | | |
Net investment income | | | — | | | | — | | | | (10 | ) | | | — | | | | — | | | |
Net realized gains on investment | | | — | | | | — | | | | (62 | ) | | | — | | | | — | | | |
| | |
|
|
| |
|
|
| |
|
|
| |
|
|
| |
|
|
| | |
Change in net assets from shareholder distributions | | | — | | | | — | | | | (388,451 | ) | | | — | | | | — | | | |
| | |
|
|
| |
|
|
| |
|
|
| |
|
|
| |
|
|
| | |
Change in net assets from capital transactions | | | 12,963,046 | | | | (2,227,976 | ) | | | 9,234,198 | | | | 822,402 | | | | 15,857,122 | | | |
| | |
|
|
| |
|
|
| |
|
|
| |
|
|
| |
|
|
| | |
Change in net assets | | | 17,910,001 | | | | (1,862,612 | ) | | | 10,162,141 | | | | 1,183,508 | | | | 16,041,775 | | | |
| | | | | | |
Net Assets: | | | | | | | | | | | | | | | | | | | | | | |
Beginning of period | | | 20,028,170 | | | | 21,890,782 | | | | 4,638,577 | | | | 3,455,069 | | | | — | | | |
| | |
|
|
| |
|
|
| |
|
|
| |
|
|
| |
|
|
| | |
End of period | | $ | 37,938,171 | | | $ | 20,028,170 | | | $ | 14,800,718 | | | $ | 4,638,577 | | | $ | 16,041,775 | | | |
| | |
|
|
| |
|
|
| |
|
|
| |
|
|
| |
|
|
| | |
Accumulated net investment income (loss) | | $ | 2,390 | | | $ | — | | | $ | 22,283 | | | $ | — | | | $ | — | | | |
| | |
|
|
| |
|
|
| |
|
|
| |
|
|
| |
|
|
| | |
| (a) | For the period from December 29, 2004 (commencement of operations) through October 31, 2005. |
See notes to financial statements.
Statements of Changes in Net Assets
| | | | | | | | | | | | | | | | | | |
| | | Gartmore U.S. Growth Leaders Fund | | | Gartmore Worldwide Leaders Fund |
| | | Year Ended
October 31, 2005 | | | Year Ended
October 31, 2004 | | | Year Ended
October 31, 2005 | | | Year Ended
October 31, 2004 |
FROM INVESTMENT ACTIVITIES: | | | | | | | | | | | | | | | | | | |
Operations: | | | | | | | | | | | | | | | | | | |
Net investment income (loss) | | $ | (645,728 | ) | | $ | (332,326 | ) | | $ | (95,956 | ) | | $ | 180,996 | | | |
Net realized gains (losses) on investment and foreign currency transactions | | | 9,000,143 | | | | (217,369 | ) | | | 6,766,483 | | | | 2,069,657 | | | |
Net change in unrealized appreciation/depreciation on investments and translation of assets and liabilities denominated in foreign currencies | | | 36,165 | | | | 1,185,980 | | | | 422,042 | | | | 122,533 | | | |
| | |
|
|
| |
|
|
| |
|
|
| |
|
|
| | |
Change in net assets resulting from operations | | | 8,390,580 | | | | 636,285 | | | | 7,092,569 | | | | 2,373,186 | | | |
| | |
|
|
| |
|
|
| |
|
|
| |
|
|
| | |
| | | | | |
Distributions to Class A Shareholders from: | | | | | | | | | | | | | | | | | | |
Net investment income | | | — | | | | — | | | | (112,974 | ) | | | — | | | |
| | | | | |
Distributions to Class B Shareholders from: | | | | | | | | | | | | | | | | | | |
Net investment income | | | — | | | | — | | | | (259 | ) | | | — | | | |
| | | | | |
Distributions to Class C Shareholders from: | | | | | | | | | | | | | | | | | | |
Net investment income | | | — | | | | — | | | | (106 | ) | | | — | | | |
| | | | | |
Distributions to Class R Shareholders from: | | | | | | | | | | | | | | | | | | |
Net investment income | | | — | | | | — | | | | (4 | ) | | | — | | | |
| | | | | |
Distributions to Institutional Service Class Shareholders from: | | | | | | | | | | | | | | | | | | |
Net investment income | | | — | | | | — | | | | (6,902 | ) | | | — | | | |
| | | | | |
Distributions to Institutional Class Shareholders from: | | | | | | | | | | | | | | | | | | |
Net investment income | | | — | | | | — | | | | (5 | ) | | | — | | | |
| | |
|
|
| |
|
|
| |
|
|
| |
|
|
| | |
Change in net assets from shareholder distributions | | | — | | | | — | | | | (120,250 | ) | | | — | | | |
| | |
|
|
| |
|
|
| |
|
|
| |
|
|
| | |
Change in net assets from capital transactions | | | 71,491,013 | | | | 15,543,896 | | | | (1,892,593 | ) | | | (6,548,427 | ) | | |
| | |
|
|
| |
|
|
| |
|
|
| |
|
|
| | |
Change in net assets | | | 79,881,593 | | | | 16,180,181 | | | | 5,079,726 | | | | (4,175,241 | ) | | |
| | | | | |
Net Assets: | | | | | | | | | | | | | | | | | | |
Beginning of period | | | 35,088,115 | | | | 18,907,934 | | | | 32,229,078 | | | | 36,404,319 | | | |
| | |
|
|
| |
|
|
| |
|
|
| |
|
|
| | |
End of period | | $ | 114,969,708 | | | $ | 35,088,115 | | | $ | 37,308,804 | | | $ | 32,229,078 | | | |
| | |
|
|
| |
|
|
| |
|
|
| |
|
|
| | |
Accumulated net investment income (loss) | | $ | — | | | $ | — | | | $ | (601 | ) | | $ | 118,314 | | | |
| | |
|
|
| |
|
|
| |
|
|
| |
|
|
| | |
| | | | | |
| | | | | | | | | | | | | | | | | | | |
| | | | | |
| | | | | | | | | | | | | | | | | | | |
| | | | | |
| | | | | | | | | | | | | | | | | | | |
| | | | | | | | | | | | | | | | | | | |
See notes to financial statements.
Financial Highlights
Selected Data for Each Share of Capital Outstanding
Gartmore Mid Cap Growth Leaders
| | | | | | | | | | | | | | | | | | | | | | | | | | | | | | | | | | | | | | | | | |
| | | | | Investment Activities | | | Distributions | | | | | | Ratios/Supplemental Data |
| | | Net Asset
Value,
Beginning
of Period | | Net
Investment
Income
(Loss) | | | Net Realized
and
Unrealized
Gains
(Losses) on
Investments | | | Total
from
Investment
Activities | | | Net
Investment
Income | | | Total
Distributions | | | Net
Asset
Value, End
of Period | | Total
Return (a) | | | Net
Assets at
End of
Period
(000s) | | Ratio of
Expenses
to
Average
Net
Assets | | | Ratio of Net
Investment
Income
(Loss)
to Average
Net Assets | | | Ratio of
Expenses
(Prior to
Reimbursements)
to Average
Net Assets (b) | | | Ratio of Net
Investment
Income (Loss)
(Prior to
Reimbursements)
to Average
Net Assets (b) | | | Portfolio
Turnover (c) |
| | | | | | | | | | | | | | |
Class A Shares | | | | | | | | | | | | | | | | | | | | | | | | | | | | | | | | | | | | | | | | | |
Year Ended October 31, 2001 | | $ | 28.69 | | (0.16 | ) | | (15.19 | ) | | (15.35 | ) | | (2.41 | ) | | (2.41 | ) | | $ | 10.93 | | (57.29% | ) | | $ | 6,601 | | 1.63% | | | (1.00% | ) | | 2.75% | | | (2.12% | ) | | 698.74% |
Year Ended October 31, 2002 | | $ | 10.93 | | (0.14 | ) | | (2.29 | ) | | (2.43 | ) | | — | | | — | | | $ | 8.50 | | (22.23% | ) | | $ | 4,880 | | 1.59% | | | (1.27% | ) | | 2.20% | | | (1.88% | ) | | 432.60% |
Year Ended October 31, 2003 | | $ | 8.50 | | (0.12 | ) | | 2.92 | | | 2.80 | | | — | | | — | | | $ | 11.30 | | 32.94% | | | $ | 6,441 | | 1.55% | | | (1.27% | ) | | 1.99% | | | (1.71% | ) | | 365.45% |
Year Ended October 31, 2004 | | $ | 11.30 | | (0.12 | ) | | 0.34 | | | 0.22 | | | — | | | — | | | $ | 11.52 | | 1.95% | | | $ | 5,769 | | 1.50% | | | (0.97% | ) | | 1.98% | | | (1.44% | ) | | 405.85% |
Year Ended October 31, 2005 | | $ | 11.52 | | (0.09 | ) | | 2.32 | | | 2.23 | | | — | | | — | | | $ | 13.75 | | 19.36% | | | $ | 6,624 | | 1.52% | | | (0.74% | ) | | 1.82% | | | (1.03% | ) | | 149.29% |
| | | | | | | | | | | | | | |
Class B Shares | | | | | | | | | | | | | | | | | | | | | | | | | | | | | | | | | | | | | | | | | |
Year Ended October 31, 2001 | | $ | 28.24 | | (0.22 | ) | | (15.21 | ) | | (15.43 | ) | | (2.41 | ) | | (2.41 | ) | | $ | 10.40 | | (58.60% | ) | | $ | 3,985 | | 2.23% | | | (1.60% | ) | | 3.67% | | | (3.04% | ) | | 698.74% |
Year Ended October 31, 2002 | | $ | 10.40 | | (0.19 | ) | | (2.18 | ) | | (2.37 | ) | | — | | | — | | | $ | 8.03 | | (22.79% | ) | | $ | 3,005 | | 2.25% | | | (1.94% | ) | | 2.90% | | | (2.59% | ) | | 432.60% |
Year Ended October 31, 2003 | | $ | 8.03 | | (0.18 | ) | | 2.76 | | | 2.58 | | | — | | | — | | | $ | 10.61 | | 32.13% | | | $ | 3,663 | | 2.24% | | | (1.96% | ) | | 2.68% | | | (2.40% | ) | | 365.45% |
Year Ended October 31, 2004 | | $ | 10.61 | | (0.18 | ) | | 0.31 | | | 0.13 | | | — | | | — | | | $ | 10.74 | | 1.23% | | | $ | 3,324 | | 2.20% | | | (1.66% | ) | | 2.67% | | | (2.13% | ) | | 405.85% |
Year Ended October 31, 2005 | | $ | 10.74 | | (0.19 | ) | | 2.19 | | | 2.00 | | | — | | | — | | | $ | 12.74 | | 18.62% | | | $ | 3,387 | | 2.22% | | | (1.43% | ) | | 2.52% | | | (1.72% | ) | | 149.29% |
| | | | | | | | | | | | | | |
Class C Shares | | | | | | | | | | | | | | | | | | | | | | | | | | | | | | | | | | | | | | | | | |
Period Ended October 31, 2001 (d) | | $ | 13.46 | | (0.07 | ) | | (2.98 | ) | | (3.05 | ) | | — | | | — | | | $ | 10.41 | | (22.66% | )(e) | | $ | 52 | | 2.23% | (f) | | (1.76% | )(f) | | 4.38% | (f) | | (3.91% | )(f) | | 698.74% |
Year Ended October 31, 2002 | | $ | 10.41 | | (0.19 | ) | | (2.18 | ) | | (2.37 | ) | | — | | | — | | | $ | 8.04 | | (22.77% | ) | | $ | 45 | | 2.25% | | | (1.94% | ) | | 2.90% | | | (2.59% | ) | | 432.60% |
Year Ended October 31, 2003 | | $ | 8.04 | | (0.16 | ) | | 2.74 | | | 2.58 | | | — | | | — | | | $ | 10.62 | | 32.09% | | | $ | 69 | | 2.24% | | | (1.96% | ) | | 2.69% | | | (2.41% | ) | | 365.45% |
Year Ended October 31, 2004 | | $ | 10.62 | | (0.16 | ) | | 0.29 | | | 0.13 | | | — | | | — | | | $ | 10.75 | | 1.22% | | | $ | 77 | | 2.20% | | | (1.65% | ) | | 2.69% | | | (2.14% | ) | | 405.85% |
Year Ended October 31, 2005 (i) | | $ | 10.75 | | (0.18 | ) | | 2.18 | | | 2.00 | | | — | | | — | | | $ | 12.75 | | 18.60% | | | $ | 429 | | 2.23% | | | (1.45% | ) | | 2.46% | | | (1.69% | ) | | 149.29% |
| | | | | | | | | | | | | | |
Class D Shares | | | | | | | | | | | | | | | | | | | | | | | | | | | | | | | | | | | | | | | | | |
Year Ended October 31, 2001 | | $ | 28.75 | | (0.11 | ) | | (15.20 | ) | | (15.31 | ) | | (2.41 | ) | | (2.41 | ) | | $ | 11.03 | | (57.00% | ) | | $ | 15,079 | | 1.30% | | | (0.69% | ) | | 2.51% | | | (1.90% | ) | | 698.74% |
Year Ended October 31, 2002 | | $ | 11.03 | | (0.11 | ) | | (2.32 | ) | | (2.43 | ) | | — | | | — | | | $ | 8.60 | | (22.03% | ) | | $ | 10,192 | | 1.27% | | | (0.97% | ) | | 1.90% | | | (1.60% | ) | | 432.60% |
Year Ended October 31, 2003 | | $ | 8.60 | | (0.10 | ) | | 2.97 | | | 2.87 | | | — | | | — | | | $ | 11.47 | | 33.37% | | | $ | 11,747 | | 1.24% | | | (0.96% | ) | | 1.69% | | | (1.40% | ) | | 365.45% |
Year Ended October 31, 2004 | | $ | 11.47 | | (0.08 | ) | | 0.34 | | | 0.26 | | | — | | | — | | | $ | 11.73 | | 2.27% | | | $ | 10,857 | | 1.20% | | | (0.66% | ) | | 1.67% | | | (1.13% | ) | | 405.85% |
Year Ended October 31, 2005 | | $ | 11.73 | | (0.06 | ) | | 2.38 | | | 2.32 | | | — | | | — | | | $ | 14.05 | | 19.78% | | | $ | 11,232 | | 1.22% | | | (0.43% | ) | | 1.52% | | | (0.72% | ) | | 149.29% |
| | | | | | | | | | | | | | |
Class R Shares | | | | | | | | | | | | | | | | | | | | | | | | | | | | | | | | | | | | | | | | | |
Period Ended October 31, 2004 (g) | | $ | 11.47 | | (0.11 | ) | | 0.32 | | | 0.21 | | | — | | | — | | | $ | 11.68 | | 1.83% | (e) | | $ | 1 | | 1.72% | (f) | | (1.16% | )(f) | | 2.09% | (f) | | (1.53% | )(f) | | 405.85% |
Year Ended October 31, 2005 | | $ | 11.68 | | (0.11 | ) | | 2.36 | | | 2.25 | | | — | | | — | | | $ | 13.93 | | 19.26% | | | $ | 1 | | 1.60% | | | (0.83% | ) | | 1.90% | | | (1.13% | ) | | 149.29% |
| | | | | | | | | | | | | | |
Institutional Class Shares | | | | | | | | | | | | | | | | | | | | | | | | | | | | | | | | | | | | | | | | | |
Period Ended October 31, 2004 (h) | | $ | 11.23 | | (0.01 | ) | | 0.51 | | | 0.50 | | | — | | | — | | | $ | 11.73 | | 4.45% | (e) | | $ | 1 | | 1.08% | (f) | | (0.69% | )(f) | | 2.50% | (f) | | (2.11% | )(f) | | 405.85% |
Year Ended October 31, 2005 | | $ | 11.73 | | (0.05 | ) | | 2.36 | | | 2.31 | | | — | | | — | | | $ | 14.04 | | 19.69% | | | $ | 16,263 | | 1.23% | | | (0.51% | ) | | 1.43% | | | (0.71% | ) | | 149.29% |
| | | | | | | | | | | | | | | | | | | | | | | | | | | | | | | | | | | | | | | | | | |
| | | | | | | | | | | | | | | | | | | | | | | | | | | | | | | | | | | | | | | | | | |
| (a) | Excludes sales charge. |
| (b) | During the period certain fees were waived and/or reimbursed. If such waivers/reimbursements had not occurred, the ratios would have been as indicated. |
| (c) | Portfolio turnover is calculated on the basis of the Fund as a whole without distinguishing among the classes of shares. |
| (d) | For the period from March 1, 2001 (commencement of operations) through October 31, 2001. |
| (g) | For the period from December 30, 2003 (commencement of operations) through October 31, 2004. |
| (h) | For the period from September 28, 2004 (commencement of operations) through October 31, 2004. |
| (i) | Net investment income (loss) is based on average shares outstanding during the period. |
See notes to financial statements.
Financial Highlights
Selected Data for Each Share of Capital Outstanding
Gartmore Nationwide Leaders Fund
| | | | | | | | | | | | | | | | | | | | | | | | | | | | | | | | | | | | | | | | | | | | |
| | | | | Investment Activities | | | Distributions | | | | | | | | Ratios/Supplemental Data |
| | | Net Asset
Value,
Beginning
of Period | | Net
Investment
Income
(Loss) | | | Net Realized
and
Unrealized
Gains
(Losses) on
Investments | | | Total
from
Investment
Activities | | | Net
Investment
Income | | | Net
Realized
Gains | | | Total
Distributions | | | Net
Asset
Value, End
of Period | | Total
Return (a) | | | Net
Assets at
End of
Period
(000s) | | Ratio of
Expenses
to
Average
Net
Assets | | | Ratio of Net
Investment
Income
(Loss) to
Average
Net Assets | | | Ratio of
Expenses
(Prior to
Reimbursements)
to Average Net
Assets (b) | | | Ratio of Net
Investment
Income (Loss)
(Prior to
Reimbursements)
to Average Net
Assets (b) | | | Portfolio
Turnover (c) |
| | | | | | | | | | | | | | | |
Class A Shares | | | | | | | | | | | | | | | | | | | | | | | | | | | | | | | | | | | | | | | | | | | | |
Period Ended October 31, 2002 (d) | | $ | 10.00 | | 0.02 | | | (0.55 | ) | | (0.53 | ) | | (0.01 | ) | | — | | | (0.01 | ) | | $ | 9.46 | | (5.34% | )(f) | | $ | 891 | | 1.45% | (g) | | 0.23% | (g) | | 4.93% | (g) | | (3.25% | )(g) | | 60.54% |
Year Ended October 31, 2003 | | $ | 9.46 | | — | | | 1.98 | | | 1.98 | | | (0.04 | ) | | — | | | (0.04 | ) | | $ | 11.40 | | 20.97% | | | $ | 1,351 | | 1.45% | | | (0.04% | ) | | 3.23% | | | (1.82% | ) | | 196.86% |
Year Ended October 31, 2004 | | $ | 11.40 | | (0.04 | ) | | 1.18 | | | 1.14 | | | — | | | — | | | — | | | $ | 12.54 | | 10.00% | | | $ | 1,445 | | 1.47% | | | (0.31% | ) | | 2.61% | | | (1.46% | ) | | 230.95% |
Year Ended October 31, 2005 | | $ | 12.54 | | 0.10 | | | 2.12 | | | 2.22 | | | (0.08 | ) | | (0.76 | ) | | (0.84 | ) | | $ | 13.92 | | 18.12% | | | $ | 5,309 | | 1.51% | | | 0.94% | | | 1.80% | | | 0.65% | | | 522.67% |
| | | | | | | | | | | | | | | |
Class B Shares | | | | | | | | | | | | | | | | | | | | | | | | | | | | | | | | | | | | | | | | | | | | |
Period Ended October 31, 2002 (d) | | $ | 10.00 | | (0.05 | ) | | (0.55 | ) | | (0.60 | ) | | — | | | — | | | — | | | $ | 9.40 | | (6.00% | )(f) | | $ | 317 | | 2.20% | (g) | | (0.58% | )(g) | | 5.78% | (g) | | (4.16% | )(g) | | 60.54% |
Year Ended October 31, 2003 | | $ | 9.40 | | (0.09 | ) | | 1.97 | | | 1.88 | | | (0.01 | ) | | — | | | (0.01 | ) | | $ | 11.27 | | 20.08% | | | $ | 350 | | 2.20% | | | (0.74% | ) | | 4.11% | | | (2.65% | ) | | 196.86% |
Year Ended October 31, 2004 | | $ | 11.27 | | (0.12 | ) | | 1.17 | | | 1.05 | | | — | | | — | | | — | | | $ | 12.32 | | 9.32% | | | $ | 410 | | 2.20% | | | (1.05% | ) | | 3.34% | | | (2.20% | ) | | 230.95% |
Year Ended October 31, 2005 | | $ | 12.32 | | 0.03 | | | 2.05 | | | 2.08 | | | (0.02 | ) | | (0.76 | ) | | (0.78 | ) | | $ | 13.62 | | 17.25% | | | $ | 769 | | 2.20% | | | 0.32% | | | 2.55% | | | (0.04% | ) | | 522.67% |
| | | | | | | | | | | | | | | |
Class C Shares | | | | | | | | | | | | | | | | | | | | | | | | | | | | | | | | | | | | | | | | | | | | |
Period Ended October 31, 2002 (d) | | $ | 10.00 | | (0.05 | ) | | (0.55 | ) | | (0.60 | ) | | — | | | — | | | — | | | $ | 9.40 | | (6.00% | )(f) | | $ | 243 | | 2.21% | (g) | | (0.60% | )(g) | | 5.80% | (g) | | (4.19% | )(g) | | 60.54% |
Year Ended October 31, 2003 | | $ | 9.40 | | (0.08 | ) | | 1.96 | | | 1.88 | | | (0.01 | ) | | — | | | (0.01 | ) | | $ | 11.27 | | 20.08% | | | $ | 358 | | 2.20% | | | (0.82% | ) | | 3.95% | | | (2.57% | ) | | 196.86% |
Year Ended October 31, 2004 | | $ | 11.27 | | (0.12 | ) | | 1.16 | | | 1.04 | | | — | | | — | | | — | | | $ | 12.31 | | 9.32% | | | $ | 404 | | 2.20% | | | (1.05% | ) | | 3.34% | | | (2.20% | ) | | 230.95% |
Year Ended October 31, 2005 | | $ | 12.31 | | 0.03 | | | 2.07 | | | 2.10 | | | (0.03 | ) | | (0.76 | ) | | (0.79 | ) | | $ | 13.62 | | 17.30% | | | $ | 2,046 | | 2.20% | | | 0.40% | | | 2.43% | | | 0.18% | | | 522.67% |
| | | | | | | | | | | | | | | |
Class R Shares | | | | | | | | | | | | | | | | | | | | | | | | | | | | | | | | | | | | | | | | | | | | |
Period Ended October 31, 2003 (e) | | $ | 10.98 | | (0.01 | ) | | 0.31 | | | 0.30 | | | — | | | — | | | — | | | $ | 11.28 | | 2.73% | (f) | | $ | 1 | | 1.80% | (g) | | (1.11% | )(g) | | 1.90% | (g) | | (1.21% | )(g) | | 196.86% |
Year Ended October 31, 2004 | | $ | 11.28 | | (0.08 | ) | | 1.17 | | | 1.09 | | | — | | | — | | | — | | | $ | 12.37 | | 9.66% | | | $ | 1 | | 1.81% | | | (0.69% | ) | | 2.91% | | | (1.79% | ) | | 230.95% |
Year Ended October 31, 2005 | | $ | 12.37 | | 0.14 | | | 2.06 | | | 2.20 | | | (0.08 | ) | | (0.76 | ) | | (0.84 | ) | | $ | 13.73 | | 18.19% | | | $ | 1 | | 1.45% | | | 1.04% | | | 1.79% | | | 0.70% | | | 522.67% |
| | | | | | | | | | | | | | | |
Institutional Service Class Shares | | | | | | | | | | | | | | | | | | | | | | | | | | | | | | | | | | | | | | | | | | | | |
Period Ended October 31, 2002 (d) | | $ | 10.00 | | 0.03 | | | (0.55 | ) | | (0.52 | ) | | (0.01 | ) | | — | | | (0.01 | ) | | $ | 9.47 | | (5.23% | )(f) | | $ | 778 | | 1.32% | (g) | | 0.39% | (g) | | 4.74% | (g) | | (3.03% | )(g) | | 60.54% |
Year Ended October 31, 2003 | | $ | 9.47 | | — | | | 1.99 | | | 1.99 | | | (0.04 | ) | | — | | | (0.04 | ) | | $ | 11.42 | | 21.10% | | | $ | 1,395 | | 1.38% | | | 0.01% | | | 3.06% | | | (1.67% | ) | | 196.86% |
Year Ended October 31, 2004 | | $ | 11.42 | | (0.03 | ) | | 1.18 | | | 1.15 | | | — | | | — | | | — | | | $ | 12.57 | | 10.07% | | | $ | 2,377 | | 1.41% | | | (0.27% | ) | | 2.56% | | | (1.42% | ) | | 230.95% |
Year Ended October 31, 2005 | | $ | 12.57 | | 0.12 | | | 2.12 | | | 2.24 | | | (0.09 | ) | | (0.76 | ) | | (0.85 | ) | | $ | 13.96 | | 18.23% | | | $ | 6,674 | | 1.43% | | | 0.98% | | | 1.75% | | | 0.66% | | | 522.67% |
| | | | | | | | | | | | | | | |
Institutional Class Shares | | | | | | | | | | | | | | | | | | | | | | | | | | | | | | | | | | | | | | | | | | | | |
Period Ended October 31, 2004 (h) | | $ | 12.22 | | (0.01 | ) | | 0.37 | | | 0.36 | | | — | | | — | | | — | | | $ | 12.58 | | 2.95% | (f) | | $ | 1 | | 1.12% | (g) | | (0.17% | )(g) | | 2.44% | (g) | | (1.50% | )(g) | | 230.95% |
Year Ended October 31, 2005 | | $ | 12.58 | | 0.17 | | | 2.09 | | | 2.26 | | | (0.12 | ) | | (0.76 | ) | | (0.88 | ) | | $ | 13.96 | | 18.37% | | | $ | 1 | | 1.20% | | | 1.23% | | | 1.77% | | | 0.72% | | | 522.67% |
| | | | | | | | | | | | | | | | | | | | | | | | | | | | | | | | | | | | | | | | | | | | | |
| | | | | | | | | | | | | | | | | | | | | | | | | | | | | | | | | | | | | | | | | | | | | |
| (a) | Excludes sales charge. |
| (b) | During the period certain fees were waived and/or reimbursed. If such waivers/reimbursements had not occurred, the ratios would have been as indicated. |
| (c) | Portfolio turnover is calculated on the basis of the Fund as a whole without distinguishing among the classes of shares. |
| (d) | For the period from December 18, 2001 (commencement of operations) through October 31, 2002. Registration of shares effective with the Securities and Exchange Commission on December 28, 2001. |
| (e) | For the period from October 1, 2003 (commencement of operations) through October 31, 2003. |
| (h) | For the period from June 29, 2004 (commencement of operations) through October 31, 2004. |
See notes to financial statements.
Financial Highlights
Selected Data for Each Share of Capital Outstanding
Gartmore Small Cap Leaders Fund
| | | | | | | | | | | | | | | | | | | | | | | | | | | | | | | | | |
| | | | | Investment Activities | | | | | | | Ratios/Supplemental Data |
| | | Net Asset
Value,
Beginning
of Period | | Net
Investment
Income
(Loss) | | | Net Realized
and
Unrealized
Gains
(Losses) on
Investments | | Total
from
Investment
Activities | | Net
Asset
Value, End
of Period | | Total
Return (a) | | | Net Assets
at End of
Period
(000s) | | Ratio of
Expenses
to Average
Net Assets | | | Ratio of Net
Investment
Income
(Loss)
to Average
Net Assets | | | Ratio of
Expenses
(Prior to
Reimbursements)
to Average
Net Assets (b) | | | Ratio of Net
Investment
Income (Loss)
(Prior to
Reimbursements)
to Average
Net Assets (b) | | | Portfolio
Turnover (c) |
| | | | | | | | | | | | |
Class A Shares | | | | | | | | | | | | | | | | | | | | | | | | | | | | | | | | | |
Period Ended October 31, 2005 (d) | | $ | 10.00 | | (0.01 | ) | | 0.09 | | 0.08 | | $ | 10.08 | | 0.80% | (e) | | $ | 5,449 | | 1.80% | (f) | | (0.20% | )(f) | | 2.36% | (f) | | (0.76% | )(f) | | 372.55% |
| | | | | | | | | | | | |
Class B Shares | | | | | | | | | | | | | | | | | | | | | | | | | | | | | | | | | |
Period Ended October 31, 2005 (d) | | $ | 10.00 | | (0.02 | ) | | 0.05 | | 0.03 | | $ | 10.03 | | 0.30% | (e) | | $ | 888 | | 2.49% | (f) | | (0.88% | )(f) | | 3.00% | (f) | | (1.39% | )(f) | | 372.55% |
| | | | | | | | | | | | |
Class C Shares | | | | | | | | | | | | | | | | | | | | | | | | | | | | | | | | | |
Period Ended October 31, 2005 (d) | | $ | 10.00 | | (0.04 | ) | | 0.08 | | 0.04 | | $ | 10.04 | | 0.40% | (e) | | $ | 5,657 | | 2.49% | (f) | | (0.90% | )(f) | | 3.04% | (f) | | (1.45% | )(f) | | 372.55% |
| | | | | | | | | | | | |
Class R Shares | | | | | | | | | | | | | | | | | | | | | | | | | | | | | | | | | |
Period Ended October 31, 2005 (d) | | $ | 10.00 | | (0.06 | ) | | 0.11 | | 0.05 | | $ | 10.05 | | 0.50% | (e) | | $ | 1 | | 2.26% | (f) | | (0.74% | )(f) | | 3.03% | (f) | | (1.51% | )(f) | | 372.55% |
| | | | | | | | | | | | |
Institutional Service Class Shares | | | | | | | | | | | | | | | | | | | | | | | | | | | | | | | | | |
Period Ended October 31, 2005 (d) | | $ | 10.00 | | — | | | 0.10 | | 0.10 | | $ | 10.10 | | 1.00% | (e) | | $ | 1 | | 1.57% | (f) | | (0.04% | )(f) | | 2.21% | (f) | | (0.69% | )(f) | | 372.55% |
| | | | | | | | | | | | |
Institutional Class Shares | | | | | | | | | | | | | | | | | | | | | | | | | | | | | | | | | |
Period Ended October 31, 2005 (d) | | $ | 10.00 | | (0.01 | ) | | 0.12 | | 0.11 | | $ | 10.11 | | 1.10% | (e) | | $ | 4,045 | | 1.49% | (f) | | 0.05% | (f) | | 2.29% | (f) | | (0.89% | )(f) | | 372.55% |
| | | | | | | | | | | | | | | | | | | | | | | | | | | | | | | | | | |
| | | | | | | | | | | | | | | | | | | | | | | | | | | | | | | | | | |
| | | | | | | | | | | | | | | | | | | | | | | | | | | | | | | | | | |
| | | | | | | | | | | | | | | | | | | | | | | | | | | | | | | | | | |
| | | | | | | | | | | | | | | | | | | | | | | | | | | | | | | | | | |
| | | | | | | | | | | | | | | | | | | | | | | | | | | | | | | | | | |
| | | | | | | | | | | | | | | | | | | | | | | | | | | | | | | | | | |
| | | | | | | | | | | | | | | | | | | | | | | | | | | | | | | | | | |
| | | | | | | | | | | | | | | | | | | | | | | | | | | | | | | | | | |
| | | | | | | | | | | | | | | | | | | | | | | | | | | | | | | | | | |
| | | | | | | | | | | | | | | | | | | | | | | | | | | | | | | | | | |
| | | | | | | | | | | | | | | | | | | | | | | | | | | | | | | | | | |
| | | | | | | | | | | | | | | | | | | | | | | | | | | | | | | | | | |
| | | | | | | | | | | | | | | | | | | | | | | | | | | | | | | | | | |
| | | | | | | | | | | | | | | | | | | | | | | | | | | | | | | | | | |
| | | | | | | | | | | | | | | | | | | | | | | | | | | | | | | | | | |
| (a) | Excludes sales charge. |
| (b) | During the period certain fees were waived and/or reimbursed. If such waivers/reimbursements had not occurred, the ratios would have been as indicated. |
| (c) | Portfolio turnover is calculated on the basis of the Fund as a whole without distinguishing among the classes of shares. |
| (d) | For the period from December 29, 2004 (commencement of operations) through October 31, 2005. |
See notes to financial statements.
Financial Highlights
Selected Data for Each Share of Capital Outstanding
Gartmore U.S. Growth Leaders Fund
| | | | | | | | | | | | | | | | | | | | | | | | | | | | | | | | | | | | | | | | | | | |
| | | | | Investment Activities | | | Distributions | | | | | | Ratios/Supplemental Data | | |
| | | Net Asset
Value,
Beginning
of Period | | Net
Investment
Income
(Loss) | | | Net Realized
and
Unrealized
Gains
(Losses) on
Investments | | | Total
from
Investment
Activities | | | Net
Realized
Gains | | | Total
Distributions | | | Net
Asset
Value, End
of Period | | Total
Return (a) | | | Net Assets
at End of
Period
(000s) | | Ratio of
Expenses
to Average
Net Assets | | | Ratio of Net
Investment
Income
(Loss)
to Average
Net Assets | | | Ratio of
Expenses
(Prior to
Reimbursements)
to Average
Net Assets (b) | | | Ratio of Net
Investment
Income (Loss)
(Prior to
Reimbursements)
to Average
Net Assets (b) | | | Portfolio
Turnover (c) | | |
| | | | | | | | | | | | | | | |
Class A Shares | | | | | | | | | | | | | | | | | | | | | | | | | | | | | | | | | | | | | | | | | | | |
Year Ended October 31, 2001 | | $ | 11.64 | | (0.08 | ) | | (5.13 | ) | | (5.21 | ) | | (0.41 | ) | | (0.41 | ) | | $ | 6.02 | | (45.81% | ) | | $ | 1,195 | | 1.60% | | | (1.04% | ) | | 7.91% | | | (7.35% | ) | | 944.67% | | |
Year Ended October 31, 2002 | | $ | 6.02 | | (0.07 | ) | | (0.46 | ) | | (0.53 | ) | | — | | | — | | | $ | 5.49 | | (8.80% | ) | | $ | 1,356 | | 1.57% | | | (1.20% | ) | | 3.04% | | | (2.67% | ) | | 773.95% | | |
Year Ended October 31, 2003 | | $ | 5.49 | | (0.03 | ) | | 2.76 | | | 2.73 | | | — | | | — | | | $ | 8.22 | | 49.73% | | | $ | 8,714 | | 1.59% | | | (1.02% | ) | | 2.10% | | | (1.54% | ) | | 637.45% | | |
Year Ended October 31, 2004 | | $ | 8.22 | | (0.07 | ) | | 0.34 | | | 0.27 | | | — | | | — | | | $ | 8.49 | | 3.28% | | | $ | 21,273 | | 1.64% | | | (1.06% | ) | | 1.80% | | | (1.23% | ) | | 510.91% | | |
Year Ended October 31, 2005 | | $ | 8.49 | | (0.05 | ) | | 1.52 | | | 1.47 | | | — | | | — | | | $ | 9.96 | | 17.31% | | | $ | 76,762 | | 1.56% | | | (0.89% | ) | | | (j) | | | (j) | | 442.04% | | |
| | | | | | | | | | | | | | | |
Class B Shares | | | | | | | | | | | | | | | | | | | | | | | | | | | | | | | | | | | | | | | | | | | |
Year Ended October 31, 2001 | | $ | 11.62 | | (0.11 | ) | | (5.14 | ) | | (5.25 | ) | | (0.41 | ) | | (0.41 | ) | | $ | 5.96 | | (46.25% | ) | | $ | 772 | | 2.20% | | | (1.66% | ) | | 8.84% | | | (8.30% | ) | | 944.67% | | |
Year Ended October 31, 2002 | | $ | 5.96 | | (0.12 | ) | | (0.44 | ) | | (0.56 | ) | | — | | | — | | | $ | 5.40 | | (9.40% | ) | | $ | 719 | | 2.26% | | | (1.89% | ) | | 3.88% | | | (3.51% | ) | | 773.95% | | |
Year Ended October 31, 2003 (e) | | $ | 5.40 | | (0.11 | ) | | 2.74 | | | 2.63 | | | — | | | — | | | $ | 8.03 | | 48.70% | | | $ | 2,023 | | 2.30% | | | (1.72% | ) | | 2.96% | | | (2.38% | ) | | 637.45% | | |
Year Ended October 31, 2004 | | $ | 8.03 | | (0.13 | ) | | 0.34 | | | 0.21 | | | — | | | — | | | $ | 8.24 | | 2.62% | | | $ | 2,572 | | 2.30% | | | (1.71% | ) | | 2.45% | | | (1.86% | ) | | 510.91% | | |
Year Ended October 31, 2005 | | $ | 8.24 | | (0.12 | ) | | 1.47 | | | 1.35 | | | — | | | — | | | $ | 9.59 | | 16.38% | | | $ | 4,253 | | 2.24% | | | (1.53% | ) | | | (j) | | | (j) | | 442.04% | | |
| | | | | | | | | | | | | | | |
Class C Shares | | | | | | | | | | | | | | | | | | | | | | | | | | | | | | | | | | | | | | | | | | | |
Period Ended October 31, 2001 (d) | | $ | 6.45 | | (0.04 | ) | | (0.41 | ) | | (0.45 | ) | | — | | | — | | | $ | 6.00 | | (6.98% | )(g) | | $ | 9 | | 2.20% | (h) | | (1.77% | )(h) | | 9.87% | (h) | | (9.44% | )(h) | | 944.67% | | |
Year Ended October 31, 2002 (e) | | $ | 6.00 | | (0.12 | ) | | (0.44 | ) | | (0.56 | ) | | — | | | — | | | $ | 5.44 | | (9.33% | ) | | $ | 16 | | 2.27% | | | (1.89% | ) | | 3.69% | | | (3.31% | ) | | 773.95% | | |
Year Ended October 31, 2003 (e) | | $ | 5.44 | | (0.13 | ) | | 2.77 | | | 2.64 | | | — | | | — | | | $ | 8.08 | | 48.53% | | | $ | 1,606 | | 2.30% | | | (1.76% | ) | | 2.60% | | | (2.07% | ) | | 637.45% | | |
Year Ended October 31, 2004 | | $ | 8.08 | | (0.11 | ) | | 0.32 | | | 0.21 | | | — | | | — | | | $ | 8.29 | | 2.60% | | | $ | 4,000 | | 2.30% | | | (1.74% | ) | | 2.47% | | | (1.91% | ) | | 510.91% | | |
Year Ended October 31, 2005 (e) | | $ | 8.29 | | (0.15 | ) | | 1.51 | | | 1.36 | | | — | | | — | | | $ | 9.65 | | 16.41% | | | $ | 22,774 | | 2.22% | | | (1.56% | ) | | | (j) | | | (j) | | 442.04% | | |
| | | | | | | | | | | | | | | |
Class R Shares | | | | | | | | | | | | | | | | | | | | | | | | | | | | | | | | | | | | | | | | | | | |
Period Ended October 31, 2003 (f) | | $ | 7.49 | | (0.01 | ) | | 0.56 | | | 0.55 | | | — | | | — | | | $ | 8.04 | | 7.34% | (g) | | $ | 1 | | 1.90% | (h) | | (1.64% | )(h) | | 2.00% | (h) | | (1.74% | )(h) | | 637.45% | | |
Year Ended October 31, 2004 | | $ | 8.04 | | (0.11 | ) | | 0.34 | | | 0.23 | | | — | | | — | | | $ | 8.27 | | 2.86% | | | $ | 1 | | 1.89% | | | (1.33% | ) | | 2.20% | | | (1.64% | ) | | 510.91% | | |
Year Ended October 31, 2005 | | $ | 8.27 | | — | | | 1.44 | | | 1.44 | | | — | | | — | | | $ | 9.71 | | 17.41% | | | $ | 637 | | 1.54% | | | (0.93% | ) | | | (j) | | | (j) | | 442.04% | | |
| | | | | | | | | | | | | | | |
Institutional Service Class Shares | | | | | | | | | | | | | | | | | | | | | | | | | | | | | | | | | | | | | | | | | | | |
Year Ended October 31, 2001 | | $ | 11.66 | | (0.06 | ) | | (5.13 | ) | | (5.19 | ) | | (0.41 | ) | | (0.41 | ) | | $ | 6.06 | | (45.55% | ) | | $ | 449 | | 1.30% | | | (0.75% | ) | | 7.39% | | | (6.84% | ) | | 944.67% | | |
Year Ended October 31, 2002 (e) | | $ | 6.06 | | (0.06 | ) | | (0.46 | ) | | (0.52 | ) | | — | | | — | | | $ | 5.54 | | (8.58% | ) | | $ | 853 | | 1.32% | | | (0.95% | ) | | 2.52% | | | (2.15% | ) | | 773.95% | | |
Year Ended October 31, 2003 | | $ | 5.54 | | (0.03 | ) | | 2.80 | | | 2.77 | | | — | | | — | | | $ | 8.31 | | 50.00% | | | $ | 6,563 | | 1.50% | | | (0.94% | ) | | 2.00% | | | (1.44% | ) | | 637.45% | | |
Year Ended October 31, 2004 | | $ | 8.31 | | (0.09 | ) | | 0.37 | | | 0.28 | | | — | | | — | | | $ | 8.59 | | 3.37% | | | $ | 7,008 | | 1.54% | | | (0.93% | ) | | 1.68% | | | (1.08% | ) | | 510.91% | | |
Year Ended October 31, 2005 | | $ | 8.59 | | (0.07 | ) | | 1.56 | | | 1.49 | | | — | | | — | | | $ | 10.08 | | 17.35% | | | $ | 8,806 | | 1.48% | | | (0.77% | ) | | | (j) | | | (j) | | 442.04% | | |
| | | | | | | | | | | | | | | |
Institutional Class Shares | | | | | | | | | | | | | | | | | | | | | | | | | | | | | | | | | | | | | | | | | | | |
Period Ended October 31, 2004 (i) | | $ | 8.62 | | (0.02 | ) | | (0.01 | ) | | (0.03 | ) | | — | | | — | | | $ | 8.59 | | (0.35% | )(g) | | $ | 234 | | 1.30% | (h) | | (0.83% | )(h) | | 1.54% | (h) | | (1.07% | )(h) | | 510.91% | | |
Year Ended October 31, 2005 | | $ | 8.59 | | (0.03 | ) | | 1.55 | | | 1.52 | | | — | | | — | | | $ | 10.11 | | 17.69% | | | $ | 1,737 | | 1.23% | | | (0.55% | ) | | | (j) | | | (j) | | 442.04% | | |
| | | | | | | | | | | | | | | | | | | | | | | | | | | | | | | | | | | | | | | | | | | | |
| (a) | Excludes sales charge. |
| (b) | During the period certain fees were waived and/or reimbursed. If such waivers/reimbursements had not occurred, the ratios would have been as indicated. |
| (c) | Portfolio turnover is calculated on the basis of the Fund as a whole without distinguishing among the classes of shares. |
| (d) | For the period from March 1, 2001 (commencement of operations) through October 31, 2001. |
| (e) | Net investment income (loss) is based on average shares outstanding during the period. |
| (f) | For the period from October 1, 2003 (commencement of operations) through October 31, 2003. |
| (i) | For the period from June 29, 2004 (commencement of operations) through October 31, 2004. |
| (j) | There were no fee reductions in this period. |
See notes to financial statements.
Financial Highlights
Selected Data for Each Share of Capital Outstanding
Gartmore Worldwide Leaders Fund
| | | | | | | | | | | | | | | | | | | | | | | | | | | | | | | | | | | | | | | | | |
| | | | | Investment Activities | | | Distributions | | | | | | Ratios/Supplemental Data |
| | | Net Asset
Value,
Beginning
of Period | | Net
Investment
Income
(Loss) | | | Net Realized
and
Unrealized
Gains
(Losses) on
Investments | | | Total
from
Investment
Activities | | | Net
Investment
Income | | | Total
Distributions | | | Net Asset
Value,
End of
Period | | Total
Return (a) | | | Net Assets
at End of
Period
(000s) | | Ratio of
Expenses to
Average
Net Assets | | | Ratio of Net
Investment
Income
(Loss) to Average
Net Assets | | | Ratio of
Expenses
(Prior to
Reimbursements)
to Average
Net Assets (b) | | | Ratio of Net
Investment
Income (Loss)
(Prior to
Reimbursements)
to Average
Net Assets (b) | | | Portfolio
Turnover (c) |
| | | | | | | | | | | | | | |
Class A Shares | | | | | | | | | | | | | | | | | | | | | | | | | | | | | | | | | | | | | | | | | |
Year Ended October 31, 2001 | | $ | 9.12 | | (0.01 | ) | | (2.85 | ) | | (2.86 | ) | | — | | | — | | | $ | 6.26 | | (31.36% | ) | | $ | 1,096 | | 1.75% | | | (0.19% | ) | | 5.71% | | | (4.15% | ) | | 34.57% |
Year Ended October 31, 2002 | | $ | 6.26 | | — | | | (0.76 | ) | | (0.76 | ) | | — | | | — | | | $ | 5.50 | | (12.14% | ) | | $ | 1,046 | | 1.69% | | | (0.03% | ) | | 2.60% | | | (0.94% | ) | | 467.35% |
Year Ended October 31, 2003 | | $ | 5.50 | | (0.02 | ) | | 1.53 | | | 1.51 | | | — | | | — | | | $ | 7.01 | | 27.45% | | | $ | 34,889 | | 1.67% | | | (0.47% | ) | | | (j) | | | (j) | | 689.06% |
Year Ended October 31, 2004 | | $ | 7.01 | | 0.05 | | | 0.46 | | | 0.51 | | | — | | | — | | | $ | 7.52 | | 7.28% | | | $ | 30,707 | | 1.70% | | | 0.53% | | | 1.85% | | | 0.38% | | | 495.62% |
Year Ended October 31, 2005 | | $ | 7.52 | | (0.02 | ) | | 1.78 | | | 1.76 | | | (0.03 | ) | | (0.03 | ) | | $ | 9.25 | | 23.44% | | | $ | 32,404 | | 1.69% | | | (0.26% | ) | | 1.94% | | | (0.50% | ) | | 352.57% |
| | | | | | | | | | | | | | |
Class B Shares | | | | | | | | | | | | | | | | | | | | | | | | | | | | | | | | | | | | | | | | | |
Year Ended October 31, 2001 | | $ | 9.11 | | (0.06 | ) | | (2.85 | ) | | (2.91 | ) | | — | | | — | | | $ | 6.20 | | (31.94% | ) | | $ | 1,051 | | 2.35% | | | (0.78% | ) | | 6.47% | | | (4.90% | ) | | 34.57% |
Year Ended October 31, 2002 | | $ | 6.20 | | (0.04 | ) | | (0.75 | ) | | (0.79 | ) | | — | | | — | | | $ | 5.41 | | (12.74% | ) | | $ | 936 | | 2.39% | | | (0.72% | ) | | 3.36% | | | (1.69% | ) | | 467.35% |
Year Ended October 31, 2003 (d) | | $ | 5.41 | | (0.04 | ) | | 1.48 | | | 1.44 | | | — | | | — | | | $ | 6.85 | | 26.62% | | | $ | 96 | | 2.39% | | | (0.72% | ) | | | (j) | | | (j) | | 689.06% |
Year Ended October 31, 2004 | | $ | 6.85 | | — | | | 0.45 | | | 0.45 | | | — | | | — | | | $ | 7.30 | | 6.57% | | | $ | 122 | | 2.40% | | | (0.13% | ) | | 2.57% | | | (0.30% | ) | | 495.62% |
Year Ended October 31, 2005 | | $ | 7.30 | | (0.05 | ) | | 1.71 | | | 1.66 | | | (0.02 | ) | | (0.02 | ) | | $ | 8.94 | | 22.70% | | | $ | 343 | | 2.41% | | | (0.94% | ) | | 2.64% | | | (1.18% | ) | | 352.57% |
| | | | | | | | | | | | | | |
Class C Shares | | | | | | | | | | | | | | | | | | | | | | | | | | | | | | | | | | | | | | | | | |
Period Ended October 31, 2001 (e) | | $ | 7.77 | | (0.02 | ) | | (1.52 | ) | | (1.54 | ) | | — | | | — | | | $ | 6.23 | | (19.82% | )(f) | | $ | 20 | | 2.35% | (g) | | (1.04% | )(g) | | 7.40% | (g) | | (6.09% | )(g) | | 34.57% |
Year Ended October 31, 2002 | | $ | 6.23 | | (0.04 | ) | | (0.75 | ) | | (0.79 | ) | | — | | | — | | | $ | 5.44 | | (12.68% | ) | | $ | 19 | | 2.39% | | | (0.71% | ) | | 3.41% | | | (1.73% | ) | | 467.35% |
Year Ended October 31, 2003 | | $ | 5.44 | | (0.06 | ) | | 1.51 | | | 1.45 | | | — | | | — | | | $ | 6.89 | | 26.65% | | | $ | 19 | | 2.38% | | | (0.84% | ) | | | (j) | | | (j) | | 689.06% |
Year Ended October 31, 2004 | | $ | 6.89 | | — | | | 0.44 | | | 0.44 | | | — | | | — | | | $ | 7.33 | | 6.39% | | | $ | 25 | | 2.40% | | | (0.08% | ) | | 2.57% | | | (0.25% | ) | | 495.62% |
Year Ended October 31, 2005 | | $ | 7.33 | | (0.05 | ) | | 1.71 | | | 1.66 | | | (0.02 | ) | | (0.02 | ) | | $ | 8.97 | | 22.81% | | | $ | 676 | | 2.41% | | | (0.90% | ) | | 2.65% | | | (1.15% | ) | | 352.57% |
| | | | | | | | | | | | | | |
Class R Shares | | | | | | | | | | | | | | | | | | | | | | | | | | | | | | | | | | | | | | | | | |
Period Ended October 31, 2003 (h) | | $ | 6.55 | | (0.01 | ) | | 0.32 | | | 0.31 | | | — | | | — | | | $ | 6.86 | | 4.73% | (f) | | $ | 1 | | 1.87% | (g) | | (1.05% | )(g) | | 1.97% | (g) | | (1.15% | )(g) | | 689.06% |
Year Ended October 31, 2004 | | $ | 6.86 | | 0.02 | | | 0.45 | | | 0.47 | | | — | | | — | | | $ | 7.33 | | 7.00% | | | $ | 1 | | 1.96% | | | 0.28% | | | 2.12% | | | 0.12% | | | 495.62% |
Year Ended October 31, 2005 | | $ | 7.33 | | (0.03 | ) | | 1.75 | | | 1.72 | | | (0.03 | ) | | (0.03 | ) | | $ | 9.02 | | 23.33% | | | $ | 1 | | 1.75% | | | (0.33% | ) | | 1.75% | | | (0.34% | ) | | 352.57% |
| | | | | | | | | | | | | | |
Institutional Service Class Shares | | | | | | | | | | | | | | | | | | | | | | | | | | | | | | | | | | | | | | | | | |
Year Ended October 31, 2001 | | $ | 9.12 | | 0.01 | | | (2.84 | ) | | (2.83 | ) | | — | | | — | | | $ | 6.29 | | (31.03% | ) | | $ | 1,048 | | 1.42% | | | 0.13% | | | 5.44% | | | (3.89% | ) | | 34.57% |
Year Ended October 31, 2002 | | $ | 6.29 | | 0.01 | | | (0.76 | ) | | (0.75 | ) | | — | | | — | | | $ | 5.54 | | (11.92% | ) | | $ | 1,133 | | 1.42% | | | 0.25% | | | 2.34% | | | (0.67% | ) | | 467.35% |
Year Ended October 31, 2003 | | $ | 5.54 | | — | | | 1.54 | | | 1.54 | | | — | | | — | | | $ | 7.08 | | 27.80% | | | $ | 1,400 | | 1.46% | | | 0.12% | | | | (j) | | | (j) | | 689.06% |
Year Ended October 31, 2004 | | $ | 7.08 | | 0.05 | | | 0.47 | | | 0.52 | | | — | | | — | | | $ | 7.60 | | 7.34% | | | $ | 1,373 | | 1.65% | | | 0.61% | | | 1.80% | | | 0.46% | | | 495.62% |
Year Ended October 31, 2005 | | $ | 7.60 | | (0.01 | ) | | 1.79 | | | 1.78 | | | (0.03 | ) | | (0.03 | ) | | $ | 9.35 | | 23.48% | | | $ | 3,883 | | 1.64% | | | (0.15% | ) | | 1.89% | | | (0.40% | ) | | 352.57% |
| | | | | | | | | | | | | | |
Institutional Class Shares | | | | | | | | | | | | | | | | | | | | | | | | | | | | | | | | | | | | | | | | | |
Period Ended October 31, 2004 (i) | | $ | 7.23 | | 0.02 | | | 0.35 | | | 0.37 | | | — | | | — | | | $ | 7.60 | | 5.12% | (f) | | $ | 1 | | 1.40% | (g) | | 0.72% | (g) | | 1.70% | (g) | | 0.42% | (g) | | 495.62% |
Year Ended October 31, 2005 | | $ | 7.60 | | 0.01 | | | 1.80 | | | 1.81 | | | (0.04 | ) | | (0.04 | ) | | $ | 9.37 | | 23.81% | | | $ | 1 | | 1.40% | | | 0.04% | | | 1.73% | | | (0.32% | ) | | 352.57% |
| | | | | | | | | | | | | | | | | | | | | | | | | | | | | | | | | | | | | | | | | | |
| | | | | | | | | | | | | | | | | | | | | | | | | | | | | | | | | | | | | | | | | | |
| | | | | | | | | | | | | | | | | | | | | | | | | | | | | | | | | | | | | | | | | | |
| | |
(a) Excludes sales charge. | | (f) Not annualized. |
(b) During the period certain fees were waived and/or reimbursed. If such waivers/reimbursements had not occurred, the ratios would have been as indicated. (c) Portfolio turnover is calculated on the basis of the Fund as a whole without distinguishing among the classes of shares. | | (g) Annualized. (h)For the period from October 1, 2003 (commencement of operations) through October 31, 2003. |
| | (i) For the period from June 29, 2004 (commencement of operations) through October 31, 2004. |
(d) Net investment income (loss) is based on average shares outstanding during the period. | | (j) There were no fee reductions in this period. |
(e) For the period from March 1, 2001 (commencement of operations) through October 31, 2001. | | |
See notes to financial statements.
Gartmore China Opportunities Fund
For the annual period ended Oct. 31, 2005, the Gartmore China Opportunities Fund returned 3.58% (Class A at NAV) versus 16.85% for its benchmark, the Morgan Stanley Capital International (MSCI) Zhong Hua Index. For broader comparison, the average return for the Fund’s Lipper peer category of China Region Funds was 7.55%.
In economic terms, the reporting period was characterized by strong global growth, with the United States leading the developed world, and China continuing to surprise investors with the resilience of its economy. Also notable was the record nominal oil price, which peaked at $70.50 at the end of August. Nevertheless, extreme oil prices did not stoke inflation to the extent expected, partly due to the widespread use of modern, energy-efficient products and partly due to the deflationary effects of cheaper exports from emerging markets, notably China. Finally succumbing to global pressure, Chinese authorities revalued the yuan by 2.1% in July, the first step in what promises to be a long period of currency adjustment. The underlying weakness of the yuan contributed to record current account surpluses and ensured that Chinese growth remained above 9% annualized for the entire period. Surprisingly, inflation in China was relatively muted, probably reflecting a lack of upward pressure on wages in an economy with a seemingly inexhaustible supply of labor.
The Chinese equity market lagged regional markets, with equities appearing to become increasingly cheap. However, it is possible that investors do not expect future earnings growth to keep pace with that of the past. Within the Fund, we maintained our tilt toward smaller-cap companies, particularly those with a strong management, a focus on shareholder interests and the possibility of building strong brands. As it turned out, the market preferred larger-cap stocks, given their more attractive defensive characteristics in a market which tended to underperform the region.
Overall, sector allocation for the Fund was poor. Our overweights in consumer staples and consumer discretionary stocks, as well as materials and health-care stocks, disappointed. Similarly, telecoms outperformed at a time when the Fund was underweight in that area.
In terms of stock selection, most of the damage to Fund performance derived from the underweight in telecoms; other detractors from performance were in industrials, energy and consumer discretionary stocks. In general, the Fund’s positions reflected expectations that rising consumption in China would be reflected in the emergence of a Western-style, brand-led culture. In actuality, our expectations did not come to pass during the year under review. In terms of specific stocks, our underweight in China Mobile Communications Corp., a telecoms firm, detracted most from Fund performance. We believed there was excessive uncertainty surrounding the authorities’ plan to nationalize China’s main telecoms firms, and we preferred to avoid that sector. In the meantime, China Mobile continued to build its business and grow its earnings, a fact which was reflected in strong stock price performance. Furthermore, our overweight in Global Bio-chem Technology Group Co. Ltd. also detracted from the Fund’s returns. The firm, which produces chemicals from corn, consistently failed to deliver shareholder returns. Despite being positively rated by many analysts and included in some MSCI indexes, Global Bio-chem’s stock remained weak throughout the reporting period.
On the positive side, the Fund’s underweight in utilities, relative to its benchmark, added value; we correctly anticipated margin pressure as input costs rose while costs to consumers were regulated. Our holding of personal hygiene product manufacturer Hengan International Group Co. added value. The firm has built a recognizable brand and has wide margins on its products, delivering strong earnings growth. Other significant contributors to Fund performance were Hang Seng Bank Ltd. and utility CLP Holdings Ltd., both of which delivered poor earnings growth and in which we were underweight.
Although the Fund produced poor performance during the reporting period, we would remind investors of our strong, long-term track record in the sector. This record has been built on investing in conviction stocks for many years, a process we believe remains robust. We continue to favor consumer stocks above all else, given our expectation of strong growth in this sector fueled by rising real incomes and an increasingly urbanized population. Furthermore, we believe that health-care firms, often specializing in traditional medicine, as well as some materials and technology firms can outperform during the medium term.
Our most significant underweight remains in financials. We believe that the extent of nonperforming loans is poorly understood, while the ability of firms to exploit capital, currency and other market reforms is uncertain. While certain sectors warrant a discount, we believe that a wide range of opportunities exists among smaller, growth-oriented firms. We will continue to align the Fund accordingly.
Portfolio Manager:
Philip Ehrmann
| | |
Fund Performance | | Gartmore China Opportunities Fund |
Average Annual Total Return
(For periods ended October 31, 2005)
| | | | | | |
| | | | | 1 Yr. | | Inception1 |
| Class A | | w/o SC2 | | 3.58% | | 12.18% |
| | | w/SC3 | | -2.41% | | 7.33% |
| Class B | | w/o SC2 | | 2.82% | | 11.39% |
| | | w/SC4 | | -2.17% | | 8.50% |
| Class C | | w/o SC2 | | 2.79% | | 11.31% |
| | | w/SC5 | | 1.79% | | 11.31% |
| Class R6 | | 3.29% | | 11.84% |
| Institutional Class6 | | 3.86% | | 12.50% |
| Institutional Service Class6 | | 3.63% | | 12.32% |
All figures showing the effect of a sales charge reflect the maximum charge possible, because it has the most dramatic effect on performance data.
| 1 | Fund commenced operations on June 29, 2004. |
| 2 | These returns do not reflect the effects of sales charges (SC). |
| 3 | A 5.75% front-end sales charge was deducted. |
| 4 | A 5.00% contingent deferred sales charge (CDSC) was deducted. The CDSC declines to 1% after 6 years. |
| 5 | A CDSC of 1.00% was deducted because it is charged when you sell Class C shares within the first year after purchase. |
| 6 | Not subject to any sales charges. |
Performance of a $10,000 Investment
Investment return and principal value will fluctuate, and when redeemed, shares may be worth more or less than original cost. Past performance is no guarantee of future results and does not reflect the deduction of taxes that a shareholder would pay on fund distributions or the redemption of fund shares. Investing in mutual funds involves market risk, including loss of principal. Performance returns assume the reinvestment of all distributions.
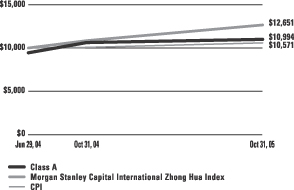
Comparative performance of $10,000 invested in Class A shares of the Gartmore China Opportunities Fund, Morgan Stanley Capital International (MSCI) Zhong Hua Index(a), and the Consumer Price Index (CPI)(b) since inception. Unlike the Fund, the returns for these unmanaged indexes do not reflect any fees, expenses, or sales charges. Investors cannot invest directly in market indexes.
| (a) | MSCI Zhong Hua is an unmanaged, free float-adjusted market capitalization-weighted index that is designed to measure the performance of stocks in the developed markets of China and Hong Kong; the index gives one- third of its weightings to China stocks and the remainder to Hong Kong Stocks. |
| (b) | The CPI represents changes in prices of a basket of goods and services purchased for consumption by urban households. |
| | |
Shareholder Expense Example | | Gartmore China Opportunities Fund |
As a shareholder of the Fund, you incur two types of costs: (1) transaction costs, including sales charges (loads) paid on purchase payments and redemption fees; and (2) ongoing costs, including investment advisory fees, administration fees, distribution fees and other Fund expenses. The examples below are intended to help you understand your ongoing costs (in dollars) of investing in the Fund and to compare these costs with the ongoing costs of investing in other mutual funds. Per SEC requirements, the examples assume that you had a $1,000 investment in the Class at the beginning of the reporting period, May 1, 2005, and continued to hold your shares at the end of the reporting period, October 31, 2005.
Actual Expenses
For each Class of the Fund in the table below, the first line provides information about actual account values and actual expenses. You may use the information in this line, together with the amount you invested, to estimate the expenses that you paid over the period. Simply divide your account value by $1,000 (for example, an $8,600 account value divided by $1,000 = 8.6), then multiply the result by the number in the first line of each Class under the heading entitled “Expenses Paid During Period” to estimate the expenses you paid on your account during the period.
Hypothetical Example for Comparison Purposes
The second line of each Class in the table below provides information about hypothetical account values and hypothetical expenses based on the Class’ actual expense ratio and an assumed rate of return of 5% per year before expenses, which is not the Class’ actual return. The hypothetical account values and expenses may not be used to estimate the actual ending account balance or expenses you paid for the period. You may use this information to compare the ongoing costs of investing in the Class of the Fund and other funds. To do so, compare this 5% hypothetical example with the 5% hypothetical examples that appear in the shareholder reports of the other funds.
Please note that the expenses shown in the table are meant to highlight your ongoing costs only and do not reflect any transaction costs, such as sales charges (loads) or redemption fees. Therefore, the second line for each Class in the table is useful in comparing ongoing costs only, and will not help you determine the relative total costs of owning different funds. In addition, if these transaction costs were included, your costs would have been higher. The examples also assume all dividends and distributions have been reinvested.
Schedule of Shareholder Expenses
Expense Analysis of a $1,000 Investment
(October 31, 2005)
| | | | | | | | | | | | | | |
| China Opportunities Fund | | | | | Beginning
Account Value,
5/1/05 | | Ending
Account Value,
10/31/05 | | Expenses Paid
During Period* | | Annualized
Expense Ratio* |
| Class A | | Actual | | | $ | 1,000 | | $ | 964 | | $ | 10.00 | | 2.02% |
| | | Hypothetical | 1 | | $ | 1,000 | | $ | 1,015 | | $ | 10.31 | | 2.02% |
| Class B | | Actual | | | $ | 1,000 | | $ | 960 | | $ | 13.59 | | 2.75% |
| | | Hypothetical | 1 | | $ | 1,000 | | $ | 1,011 | | $ | 14.04 | | 2.75% |
| Class C | | Actual | | | $ | 1,000 | | $ | 960 | | $ | 13.59 | | 2.75% |
| | | Hypothetical | 1 | | $ | 1,000 | | $ | 1,011 | | $ | 14.04 | | 2.75% |
| Class R | | Actual | | | $ | 1,000 | | $ | 964 | | $ | 10.45 | | 2.11% |
| | | Hypothetical | 1 | | $ | 1,000 | | $ | 1,014 | | $ | 10.77 | | 2.11% |
| Institutional Service Class | | Actual | | | $ | 1,000 | | $ | 964 | | $ | 8.96 | | 1.81% |
| | | Hypothetical | 1 | | $ | 1,000 | | $ | 1,016 | | $ | 9.24 | | 1.81% |
| Institutional Class | | Actual | | | $ | 1,000 | | $ | 966 | | $ | 8.67 | | 1.75% |
| | | Hypothetical | 1 | | $ | 1,000 | | $ | 1,016 | | $ | 8.93 | | 1.75% |
| * | Expenses are equal to the Fund’s annualized expense ratio multiplied by the average account value over the period multiplied by 184/365 (to reflect the one-half year period). The expense ratio presented represents a six month, annualized ratio in accordance with SEC guidelines. |
| 1 | Represents the hypothetical 5% return before expenses. |
| | |
Portfolio Summary | | Gartmore China Opportunities Fund |
October 31, 2005
The SEC adopted a requirement that Funds present their portfolio holdings in a table, chart or graph format in their annual and semiannual reports to shareholders, whether or not a statement of investments is utilized. The following tables, which present portfolio holdings as a percentage of net assets, are provided in compliance with this requirement.
| | |
| Asset Allocation | | |
| Common Stocks | | 98.7% |
| Other Assets in excess of Liabilities | | 1.3% |
| | |
|
| | | 100.0% |
| | |
| Top Industries | | |
| Real Estate | | 11.6% |
| Retail | | 11.0% |
| Oil & Gas | | 9.3% |
| Diversified Operations | | 7.6% |
| Food Products | | 6.5% |
| Transportation | | 6.5% |
| Building & Construction | | 5.6% |
| Telecommunications | | 4.1% |
| Paper Products | | 3.7% |
| Medical Products | | 3.4% |
| Other Industries | | 30.7% |
| | |
|
| | | 100.0% |
| | |
| Top Holdings | | |
| Wumart Stores, Inc. | | 3.6% |
| PetroChina Co. Ltd. | | 3.4% |
| Hopewell Holdings Ltd. | | 3.3% |
| Hengan International Group Co. Ltd. | | 3.1% |
| Cheung Kong Ltd. | | 3.1% |
| Lee & Man Paper Manufacturing Ltd. | | 2.9% |
| Baoye Group Co. Ltd. | | 2.9% |
| Kingboard Chemical Holdings Ltd. | | 2.6% |
| Techtronic Industries Co. Ltd. | | 2.6% |
| LI Ning Co. Ltd. | | 2.5% |
| Other Holdings | | 70.0% |
| | |
|
| | | 100.0% |
\
Statement of Investments
October 31, 2005
Gartmore China Opportunities Fund
| Common Stocks (98.7%) |
| | | | | |
| | | Shares | | Value |
| | | | | | |
CHINA (16.4%) | | | | | |
Banking (2.0%) |
China Construction Bank, Class H (b) (c) | | 681,000 | | $ | 206,454 |
| | | | |
|
|
Building & Construction (4.9%) |
Baoye Group Co. Ltd. (c) | | 416,000 | | | 293,029 |
Zhejiang Expressway Co. Ltd. (c) | | 340,000 | | | 202,495 |
| | | | |
|
|
| | | | | | 495,524 |
| | | | |
|
|
Electronics (1.2%) |
TPV Technology Ltd. (c) | | 164,000 | | | 125,399 |
| | | | |
|
|
Oil & Gas (4.2%) |
China Oilfield Servies Ltd. (c) | | 700,000 | | | 258,549 |
CNOOC Ltd. (c) | | 270,000 | | | 177,538 |
| | | | |
|
|
| | | | | | 436,087 |
| | | | |
|
|
Telecommunications (4.1%) |
China Telecom Co. Ltd. (c) | | 584,000 | | | 191,154 |
ZTE Corp. (c) | | 79,200 | | | 234,405 |
| | | | |
|
|
| | | | | | 425,559 |
| | | | |
|
|
| | | | | | 1,689,023 |
| | | | |
|
|
HONG KONG (82.3%) | | | | | |
Apparel (1.7%) |
Prime Success International Group Ltd. (c) | | 480,000 | | | 170,522 |
| | | | |
|
|
Banks (1.5%) |
Wing Hang Bank Ltd. (c) | | 22,000 | | | 150,601 |
| | | | |
|
|
Building & Construction (0.7%) |
Asia Aluminum Holdings Ltd. (c) | | 876,000 | | | 71,382 |
| | | | |
|
|
Chemicals (2.6%) |
Kingboard Chemical Holdings Ltd. (c) | | 128,000 | | | 271,399 |
| | | | |
|
|
Clothing & Textiles (2.5%) |
LI Ning Co. Ltd. (c) | | 426,000 | | | 258,851 |
| | | | |
|
|
Commercial Services (1.3%) |
Linmark Group Ltd. (c) | | 424,000 | | | 129,222 |
| | | | |
|
|
Diversified Operations (7.6%) |
Beijing Enterprises Holdings Ltd. (c) | | 92,000 | | | 141,178 |
Hutchison Whampoa Ltd. (c) | | 22,000 | | | 209,352 |
Li & Fung Ltd. (c) | | 98,000 | | | 210,309 |
Melco International Development
Ltd. (c) | | 228,000 | | | 220,515 |
| | | | |
|
|
| | | | | | 781,354 |
| | | | |
|
|
Engine Manufacturing (1.3%) |
Weichai Power Co. Ltd. (c) | | 70,000 | | | 133,937 |
| | | | |
|
|
| | | | | |
| | | Shares | | Value |
| | | | | | |
HONG KONG (continued) | | | | | |
Food Products (6.5%) |
China Yurun Food Group Ltd. (b) (c) | | 570,000 | | $ | 251,851 |
COFCO International Ltd. (c) | | 630,000 | | | 234,344 |
Global Bio-chem Technology Group Co. Ltd. (c) | | 454,000 | | | 180,880 |
| | | | |
|
|
| | | | | | 667,075 |
| | | | |
|
|
Healthcare Products (3.1%) |
Hengan International Group Co. Ltd. (c) | | 346,000 | | | 322,282 |
| | | | |
|
|
Hotels, Restaurants & Leisure (1.8%) |
Regal Hotels International Holdings Ltd. (c) | | 2,684,000 | | | 181,124 |
| | | | |
|
|
Information Services (1.3%) |
HC International, Inc. (b) (c) | | 700,000 | | | 135,836 |
| | | | |
|
|
Insurance (2.5%) |
China Life Insurance Co. Ltd. (b) (c) | | 352,000 | | | 257,954 |
| | | | |
|
|
Machinery & Machine Tools (2.6%) |
Techtronic Industries Co. Ltd. (c) | | 109,000 | | | 268,298 |
| | | | |
|
|
Medical Products (3.4%) |
China Shineway Pharmaceutical Group Ltd. (c) | | 368,000 | | | 154,291 |
Shandong Weigao Group Medical Polymer Co. Ltd. (c) | | 1,164,000 | | | 199,716 |
| | | | |
|
|
| | | | | | 354,007 |
| | | | |
|
|
Metal Frames (0.7%) |
Moulin Global Eyecare Holdings Ltd. (b) (c) | | 272,000 | | | 70,179 |
| | | | |
|
|
Motion Pictures & Services (0.8%) |
Richie Multi-Media Holdings Ltd. (b) (c) | | 3,230,000 | | | 83,338 |
| | | | |
|
|
Oil & Gas (5.1%) |
China Gas Holdings Ltd. (b) (c) | | 1,138,000 | | | 180,691 |
PetroChina Co. Ltd. (c) | | 450,000 | | | 345,121 |
| | | | |
|
|
| | | | | | 525,812 |
| | | | |
|
|
Paper Products (3.7%) |
Lee & Man Paper Manufacturing Ltd. (c) | | 314,000 | | | 294,442 |
Vision Grande Group Holdings Ltd. (c) | | 126,000 | | | 82,026 |
| | | | |
|
|
| | | | | | 376,468 |
| | | | |
|
|
Real Estate (11.6%) |
Cheung Kong Ltd. (c) | | 30,000 | | | 313,392 |
Hongkong Land Holdings Ltd. (c) | | 85,000 | | | 243,481 |
Hopewell Holdings Ltd. (c) | | 137,000 | | | 335,097 |
Common Stocks (continued)
| | | | | |
| | | Shares | | Value |
HONG KONG (continued) | | | | | |
Real Estate (continued) |
Hysan Development Co. (c) | | 82,000 | | $ | 178,688 |
Sinochem Hong Kong Holdings Ltd. (b) (c) | | 756,000 | | | 122,158 |
| | | | |
|
|
| | | | | | 1,192,816 |
| | | | |
|
|
Retail (11.0%) |
Giordano International Ltd. (c) | | 268,000 | | | 154,247 |
GOME Electrical Appliances Holdings Ltd. (c) | | 229,600 | | | 133,639 |
Lianhua Supermarket Holdings Ltd. (c) | | 214,000 | | | 232,228 |
Lifestyle International Holdings Ltd. (c) | | 168,000 | | | 242,889 |
Wumart Stores, Inc. (c) | | 179,000 | | | 369,472 |
| | | | |
|
|
| | | | | | 1,132,475 |
| | | | |
|
|
Steel (2.5%) |
Maanshan Iron & Steel Co., Class H (c) | | 848,000 | | | 255,724 |
| | | | |
|
|
Transportation (6.5%) |
China Travel International Investment | | 978,000 | | | 203,973 |
Hong Kong Ltd. (c) | | | | | |
Cosco Pacific Ltd. (c) | | 126,000 | | | 207,563 |
Pacific Basin Shipping Ltd. (c) | | 544,000 | | | 251,520 |
| | | | |
|
|
| | | | | | 663,056 |
| | | | |
|
|
| | | | | | 8,453,712 |
| | | | |
|
|
| | |
Total Common Stocks | | | | | 10,142,735 |
| | | | |
|
|
| | |
Total Investments
(Cost $10,497,091) (a) — 98.7% | | | | | 10,142,735 |
| | |
Other assets in excess of
liabilities — 1.3% | | | | | 133,329 |
| | | | |
|
|
| | |
NET ASSETS — 100.0% | | | | $ | 10,276,064 |
| | | | |
|
|
| | (a) | See notes to financial statements for tax unrealized appreciation (depreciation) of securities. |
| | (b) | Denotes a non-income producing security. |
At October 31, 2005, the Fund’s open forward foreign currency contracts were as follows:
| | | | | | | | | | | | |
Currency
| | Delivery
Date
| | Contract
Value
| | Market
Value
| | Unrealized
Appreciation/
(Depreciation)
| |
| Short Contracts: | | | | | | | | | | | | |
| Hong Kong Dollar | | 11/01/05 | | $ | 28,510 | | $ | 28,516 | | $ | (6 | ) |
| | | | |
|
| |
|
| |
|
|
|
| Total Short Contracts | | | | $ | 28,510 | | $ | 28,516 | | $ | (6 | ) |
| | | | |
|
| |
|
| |
|
|
|
| Long Contracts: | | | | | | | | | | | | |
| Hong Kong Dollar | | 11/02/05 | | $ | 32,550 | | $ | 32,553 | | $ | 3 | |
| | | | |
|
| |
|
| |
|
|
|
| Total Long Contracts | | | | $ | 32,550 | | $ | 32,553 | | $ | 3 | |
| | | | |
|
| |
|
| |
|
|
|
See notes to financial statements.
Gartmore Emerging Markets Fund
For the annual period ended Oct. 31, 2005, the Gartmore Emerging Markets Fund returned 30.02% (Class A at NAV) versus 33.80% for its benchmark, the Morgan Stanley Capital International Emerging Markets (MSCI EM) Index. For broader comparison, the average return for the Fund’s Lipper peer category of Emerging Markets Funds was 32.14%.
In economic terms, the reporting period was characterized by all-time nominal highs for oil prices, with inflation creeping upward, as well as strong U.S. growth. Most notable was the record oil price, which peaked at $70.50 per barrel at the end of August. Nevertheless, extreme oil prices did not stoke inflation to the extent expected, partly due to the widespread use of modern, energy-efficient products and partly due to the deflationary effects of cheaper exports from emerging markets, notably China.
In this environment, U.S. growth remained strong. As a result, the Federal Reserve Board raised interest rates repeatedly; these rates reached 3.75% by the end of the reporting period. In the latter part of the year, the markets in both Europe and Japan showed increasing signs of recovery. Europe was buoyed by export growth on the back of the weak euro, with business confidence and investment on the increase. In Japan, meanwhile, rising real incomes and capital expenditure led to hopes of a recovery. The overall background remained extremely positive for emerging-market economies, with rising domestic demand in the developed world fueling export growth. Furthermore, the asset class’s exposure to commodities proved positive, as prices for goods from zinc to crude oil to palm oil remained firm during the reporting period.
Equity prices in the United States disappointed, reflecting stretched valuations and increasing uncertainty in the outlook for consumers. Europe and Japan delivered stronger performance, but emerging markets outdid all other regions. Most notable was resource-rich Latin America, which performed very strongly. Elsewhere, the markets in Europe, the Middle East and Africa also saw encouraging returns, buoyed by the accession of a number of Eastern European countries to the European Union. Asian markets lagged other emerging markets, mainly due to the region’s dependence on oil imports, as well as disappointing levels of private consumption, but Asia still managed to outperform the developed world.
Unfortunately for the Fund, the effect of the strong U.S. dollar made worse a modestly disappointing outcome in local terms. In local terms, country allocation and sector allocation detracted from Fund performance. Our overweights in Russia and Brazil, and timely reduction in exposure to Indonesia, contributed to Fund performance. On the other hand, our lack of exposure to the smaller Egyptian market as well as our avoidance of the Eastern European markets of Hungary, Poland and the Czech Republic detracted most from Fund returns. Considering our sector exposure, our cash position detracted considerably from Fund returns, although we try to remain fully invested as much as possible. Furthermore, our lack of exposure to the energy sector detracted significantly from Fund performance.
On the other hand, stock selection contributed positively to overall Fund returns, with a wide range of firms adding value. The Fund’s top performer was Turkey’s DenizBank, which has a strong, focused management team, and is the subject of takeover rumors as Western European banks seek growth markets away from home. Elsewhere, Korea Investment Holdings Co. delivered strong performance. The firm’s exposure to fund flows toward equity mutual funds among domestic retail investors supported earnings, while its diverse underlying business ensured stability. Our exposure to Brazilian index heavyweight Petrobras also added value as the firm maintained strong cost control in an environment of regulated output prices.
On the downside, our holding in Ichia Technologies was disappointing, as the manufacturer of parts for mobile phone handsets faced increasing competition as well as eroding revenue and margins. Elsewhere, our lack of exposure, versus the Fund’s benchmark, to OAO LUKOIL also detracted from Fund performance, given the strength of the energy sector, most notably in Russia.
We retain our base case for a positive outlook for emerging-market equities. This argument is predicated on three main observations. First, a high degree of structural change has occurred in the sector since the Asian crisis of 1997. Second, most emerging-market countries now run current account surpluses with more-or-less free-floating exchange rates. Finally, the degree of fiscal rectitude in emerging markets has also been impressive. As a result, it is easier to contemplate equity investment in emerging markets. Moreover, returns in the emerging-market asset class have recently been extremely attractive. At present, the Fund is overweight in Brazil, Russia and Korea, preferring stocks in the energy, financials and industrials sectors, as well as some consumer names.
Portfolio Manager:
Philip Ehrmann
| | |
Fund Performance | | Gartmore Emerging Markets Fund |
Average Annual Total Return
(For periods ended October 31, 2005)
| | | | | | | | |
| | | | | 1 Yr. | | 5 Yr. | | Inception1 |
| Class A | | w/o SC2 | | 30.02% | | 14.61% | | 9.59% |
| | | w/SC3 | | 22.54% | | 13.27% | | 8.34% |
| Class B | | w/o SC2 | | 29.30% | | 13.88% | | 8.88% |
| | | w/SC4 | | 24.30% | | 13.64% | | 8.74% |
| Class C5 | | w/o SC2 | | 29.20% | | 14.18% | | 9.16% |
| | | w/SC6 | | 28.20% | | 14.18% | | 9.16% |
| Class R7,9 | | 30.11% | | 14.10% | | 9.08% |
| Institutional Class8,9 | | 30.60% | | 15.04% | | 9.99% |
| Institutional Service Class9 | | 30.60% | | 15.04% | | 9.99% |
All figures showing the effect of a sales charge reflect the maximum charge possible, because it has the most dramatic effect on performance data.
| 1 | Fund commenced operations on August 30, 2000. |
| 2 | These returns do not reflect the effects of sales charges (SC). |
| 3 | A 5.75% front-end sales charge was deducted. |
| 4 | A 5.00% contingent deferred sales charge (CDSC) was deducted. The CDSC declines to 0% after 6 years. |
| 5 | These returns until the creation of Class C shares (3/1/01) include the performance of the Fund’s Class B shares. Excluding the effects of any fee waivers or reimbursements, such prior performance is substantially similar to what Class C shares would have produced because Class C shares invest in the same portfolio of securities as Class B shares and have the same expenses after any fee waivers or reimbursements. For Class C shares returns with sales charges, these returns have been restated for the applicable sales charges. |
| 6 | A CDSC of 1.00% was deducted because it is charged when you sell Class C shares within the first year after purchase. |
| 7 | These returns until the creation of Class R shares (12/30/03) include the performance of the Fund’s Class B shares. The returns have been adjusted for the fact that Class R shares do not have any applicable sales charges but have not been adjusted for the lower expenses applicable to Class R shares. Excluding the effect of any fee waivers or reimbursements, such prior performance is similar to what Class R shares would have produced because the Class R shares invest in the same portfolio of securities as Class B shares. |
| 8 | These returns until the creation of Institutional Class shares (6/29/04) include the performance of the Fund’s Institutional Service shares. The returns have been adjusted for the fact that Institutional Class shares do not have any applicable sales charges but have not been adjusted for the lower expenses applicable to Institutional Class shares. Excluding the effect of any fee waivers or reimbursements, such prior performance is similar to what Institutional Class shares would have produced because the Institutional Class shares invest in the same portfolio of securities as Institutional Service shares. |
| 9 | Not subject to any sales charges. |
Performance of a $10,000 Investment
Investment return and principal value will fluctuate, and when redeemed, shares may be worth more or less than original cost. Past performance is no guarantee of future results and does not reflect the deduction of taxes that a shareholder would pay on fund distributions or the redemption of fund shares. Investing in mutual funds involves market risk, including loss of principal. Performance returns assume the reinvestment of all distributions.

Comparative performance of $10,000 invested in Class A shares of the Gartmore Emerging Markets Fund, Morgan Stanley Capital International Emerging Markets Index (MSCI Emerging Markets)(a), and the Consumer Price Index (CPI)(b) since inception. Unlike the Fund, the returns for these unmanaged indexes do not reflect any fees, expenses, or sales charges. Investors cannot invest directly in market indexes.
| (a) | The MSCI Emerging Markets is a free float-adjusted market capitalization index that is designed to measure equity market performance in the global emerging markets. |
| (b) | The CPI represents changes in prices of a basket of goods and services purchased for consumption by urban households. |
| | |
Shareholder Expense Example | | Gartmore Emerging Markets Fund |
As a shareholder of the Fund, you incur two types of costs: (1) transaction costs, including sales charges (loads) paid on purchase payments and redemption fees; and (2) ongoing costs, including investment advisory fees, administration fees, distribution fees and other Fund expenses. The examples below are intended to help you understand your ongoing costs (in dollars) of investing in the Fund and to compare these costs with the ongoing costs of investing in other mutual funds. Per SEC requirements, the examples assume that you had a $1,000 investment in the Class at the beginning of the reporting period, May 1, 2005, and continued to hold your shares at the end of the reporting period, October 31, 2005.
Actual Expenses
For each Class of the Fund in the table below, the first line provides information about actual account values and actual expenses. You may use the information in this line, together with the amount you invested, to estimate the expenses that you paid over the period. Simply divide your account value by $1,000 (for example, an $8,600 account value divided by $1,000 = 8.6), then multiply the result by the number in the first line of each Class under the heading entitled “Expenses Paid During Period” to estimate the expenses you paid on your account during the period.
Hypothetical Example for Comparison Purposes
The second line of each Class in the table below provides information about hypothetical account values and hypothetical expenses based on the Class’ actual expense ratio and an assumed rate of return of 5% per year before expenses, which is not the Class’ actual return. The hypothetical account values and expenses may not be used to estimate the actual ending account balance or expenses you paid for the period. You may use this information to compare the ongoing costs of investing in the Class of the Fund and other funds. To do so, compare this 5% hypothetical example with the 5% hypothetical examples that appear in the shareholder reports of the other funds.
Please note that the expenses shown in the table are meant to highlight your ongoing costs only and do not reflect any transaction costs, such as sales charges (loads) or redemption fees. Therefore, the second line for each Class in the table is useful in comparing ongoing costs only, and will not help you determine the relative total costs of owning different funds. In addition, if these transaction costs were included, your costs would have been higher. The examples also assume all dividends and distributions have been reinvested.
Schedule of Shareholder Expenses
Expense Analysis of a $1,000 Investment
(October 31, 2005)
| | | | | | | | | | | | | | |
| Emerging Markets Fund | | | | | Beginning
Account Value,
5/1/05 | | Ending
Account Value,
10/31/05 | | Expenses Paid
During Period* | | Annualized
Expense Ratio* |
| Class A | | Actual | | | $ | 1,000.00 | | $ | 1,176.20 | | $ | 10.31 | | 1.88% |
| | | Hypothetical | 1 | | $ | 1,000.00 | | $ | 1,015.52 | | $ | 9.60 | | 1.88% |
| Class B | | Actual | | | $ | 1,000.00 | | $ | 1,172.10 | | $ | 13.96 | | 2.55% |
| | | Hypothetical | 1 | | $ | 1,000.00 | | $ | 1,012.15 | | $ | 13.02 | | 2.55% |
| Class C | | Actual | | | $ | 1,000.00 | | $ | 1,171.90 | | $ | 13.96 | | 2.55% |
| | | Hypothetical | 1 | | $ | 1,000.00 | | $ | 1,012.15 | | $ | 13.02 | | 2.55% |
| Class R | | Actual | | | $ | 1,000.00 | | $ | 1,176.10 | | $ | 10.59 | | 1.93% |
| | | Hypothetical | 1 | | $ | 1,000.00 | | $ | 1,015.27 | | $ | 9.85 | | 1.93% |
| Institutional Service Class | | Actual | | | $ | 1,000.00 | | $ | 1,178.50 | | $ | 8.51 | | 1.55% |
| | | Hypothetical | 1 | | $ | 1,000.00 | | $ | 1,017.19 | | $ | 7.91 | | 1.55% |
| Institutional Class | | Actual | | | $ | 1,000.00 | | $ | 1,178.50 | | $ | 8.51 | | 1.55% |
| | | Hypothetical | 1 | | $ | 1,000.00 | | $ | 1,017.19 | | $ | 7.91 | | 1.55% |
| * | Expenses are equal to the Fund’s annualized expense ratio multiplied by the average account value over the period multiplied by 184/365 (to reflect the one-half year period). The expense ratio presented represents a six month, annualized ratio in accordance with SEC guidelines. |
| 1 | Represents the hypothetical 5% return before expenses. |
| | |
Portfolio Summary | | Gartmore Emerging Markets Fund |
October 31, 2005
The SEC adopted a requirement that Funds present their portfolio holdings in a table, chart or graph format in their annual and semiannual reports to shareholders, whether or not a statement of investments is utilized. The following tables, which present portfolio holdings as a percentage of net assets, are provided in compliance with this requirement.
| | |
| Asset Allocation | | |
| Common Stocks | | 89.4% |
| Participation Notes | | 3.9% |
| Cash Equivalents | | 2.0% |
| Warrants | | 0.5% |
| Other Assets in excess of Liabilities | | 4.2% |
| | |
|
| | | 100.0% |
| | |
| Top Industries | | |
| Oil & Gas | | 14.8% |
| Banking | | 14.4% |
| Telecommunications | | 10.7% |
| Electronics | | 7.1% |
| Retail | | 6.7% |
| Financial Services | | 4.3% |
| Mining | | 4.1% |
| Automobile | | 3.1% |
| Computer Hardware | | 3.0% |
| Steel | | 2.9% |
| Other Industries | | 28.9% |
| | |
|
| | | 100.0% |
| | |
| Top Holdings* | | |
| Companhia Vale do Rio Doce, Class A | | 2.7% |
| Petroleo Brasileiro SA ADR | | 2.7% |
| Samsung Electronics GDR | | 2.6% |
| Pyaterochka Holding NV | | 2.3% |
| Samsung Electronics Co. Ltd. | | 2.1% |
| MTN Group Ltd. | | 2.1% |
| Hana Bank | | 2.0% |
| SK Corp. | | 1.9% |
| Denizbank AS | | 1.7% |
| Sasol Ltd. | | 1.7% |
| Other Holdings | | 78.2% |
| | |
|
| | | 100.0% |
| * | For purpose of listing top holdings, repurchase agreements are considered cash equivalents and are included as part of Other Holdings. |
Statement of Investments
October 31, 2005
Gartmore Emerging Markets Fund
| Common Stocks (89.4%) |
| | | | | |
| | | Shares or
Principal Amount | | Value |
| | | | | | |
ARGENTINA (0.7%) | | | | | |
Oil & Gas (0.7%) | | | | | |
Tenaris SA ADR | | 2,858 | | $ | 313,951 |
| | | | |
|
|
BRAZIL (15.7%) | | | | | |
Banking (2.5%) | | | | | |
Banco Bradesco SA (d) | | 12,300 | | | 633,502 |
Unibanco Holdings GDR | | 8,200 | | | 428,860 |
| | | | |
|
|
| | | | | | 1,062,362 |
| | | | |
|
|
Electric Utility (0.8%) | | | | | |
Companhia Energetica de Minas Gerais (d) | | 9,593,118 | | | 349,569 |
| | | | |
|
|
Food & Beverage (1.1%) | | | | | |
CIA Brasiqeira BEB (d) | | 183,800 | | | 51,866 |
CIA Brasiqeira BEB (d) | | 1,138,600 | | | 406,299 |
| | | | |
|
|
| | | | | | 458,165 |
| | | | |
|
|
Insurance (0.7%) | | | | | |
Porto Seguro SA (b) (d) | | 28,700 | | | 285,686 |
| | | | |
|
|
Mining (2.7%) | | | | | |
Companhia Vale do Rio Doce, Class A (d) | | 30,766 | | | 1,133,268 |
| | | | |
|
|
Oil & Gas (3.5%) | | | | | |
Petroleo Brasileiro SA (d) | | 9,600 | | | 137,411 |
Petroleo Brasileiro SA ADR | | 17,400 | | | 1,111,861 |
Petroleo Brasileiro SA ADR (c) | | 3,400 | | | 195,058 |
| | | | |
|
|
| | | | | | 1,444,330 |
| | | | |
|
|
Retail (1.5%) | | | | | |
Lojas Renner SA (b) (d) | | 23,400 | | | 623,917 |
| | | | |
|
|
Steel (1.6%) | | | | | |
Usinas Siderurgicas de Minas Gerais SA (d) | | 33,200 | | | 671,141 |
| | | | |
|
|
Telecommunications (1.3%) | | | | | |
Tele Norte Leste Participacoes SA ADR | | 31,900 | | | 564,630 |
| | | | |
|
|
| | | | | | 6,593,068 |
| | | | |
|
|
CHINA (5.9%) | | | | | |
Banking (1.4%) | | | | | |
China Construction Bank (b) (d) | | 1,980,000 | | | 600,263 |
| | | | |
|
|
Manufacturing (1.0%) | | | | | |
Shanghai Electric Group Co. Ltd. (b) (d) | | 1,276,000 | | | 404,559 |
| | | | |
|
|
| | | | | |
| | | Shares or
Principal Amount | | Value |
| | | | | | |
CHINA (continued) | | | | | |
Oil & Gas (1.9%) | | | | | |
China Oilfield Services Ltd. (d) | | 1,128,000 | | $ | 416,633 |
Petrochina Co. Ltd. (d) | | 514,000 | | | 394,205 |
| | | | |
|
|
| | | | | | 810,838 |
| | | | |
|
|
Steel (0.8%) | | | | | |
Maanshan Iron & Steel Co. Ltd. (d) | | 1,078,000 | | | 325,084 |
| | | | |
|
|
Telecommunications (0.8%) | | | | | |
China Telecom Corp. Ltd. (d) | | 898,000 | | | 293,932 |
Foxconn International Holdings Ltd. (b) (d) | | 32,000 | | | 34,391 |
| | | | |
|
|
| | | | | | 328,323 |
| | | | |
|
|
| | | | | | 2,469,067 |
| | | | |
|
|
CZECH REPUBLIC (1.2%) | | | | | |
Multi-Media (1.2%) | | | | | |
Central European Media Enterprises Ltd., Class A (b) (d) | | 11,500 | | | 534,635 |
| | | | |
|
|
HUNGARY (0.8%) | | | | | |
Oil & Gas (0.8%) | | | | | |
MOL Magyar Olaj-es Gazipari Rt. (d) | | 3,658 | | | 339,122 |
| | | | |
|
|
INDIA (0.5%) | | | | | |
Financial Services (0.5%) | | | | | |
ICICI Bank Ltd. ADR | | 9,070 | | | 214,506 |
| | | | |
|
|
ISRAEL (2.6%) | | | | | |
Banking (1.0%) | | | | | |
Bank Leumi Le-Israel (b) (d) | | 128,100 | | | 417,689 |
| | | | |
|
|
Computer Software (0.9%) | | | | | |
Retalix Ltd. (b) (d) | | 16,100 | | | 394,450 |
| | | | |
|
|
Electronics (0.7%) | | | | | |
Orbotech Ltd. (b) (d) | | 9,001 | | | 195,592 |
| | | | |
|
|
| | | | | | 1,007,731 |
| | | | |
|
|
KOREA (18.8%) | | | | | |
Automobile (1.7%) | | | | | |
Hyundai Motor Co. Ltd. (d) | | 5,430 | | | 401,515 |
Ssangyong Motor Co. (b) (d) | | 41,100 | | | 321,893 |
| | | | |
|
|
| | | | | | 723,408 |
| | | | |
|
|
Banking (2.0%) | | | | | |
Hana Bank (d) | | 23,200 | | | 838,431 |
| | | | |
|
|
| Common Stocks (continued) |
| | | | | |
| | | Shares or
Principal Amount | | Value |
| | | | | | |
KOREA (continued) | | | | | |
Building – Residential & Commercial (1.3%) |
Hyundai Development Co. (d) | | 15,400 | | $ | 563,404 |
| | | | |
|
|
Communications Equipment (0.6%) | | | |
KH Vatec Co. Ltd. (d) | | 11,000 | | | 244,119 |
| | | | |
|
|
Diversified Operations (0.8%) | | | | | |
LG Corp. (d) | | 13,100 | | | 323,138 |
| | | | |
|
|
Electrical Equipment (1.6%) | | | | | |
Kumho Electric, Inc. (d) | | 11,250 | | | 671,409 |
| | | | |
|
|
Electronics (4.6%) | | | | | |
Samsung Electronics Co. Ltd. (d) | | 1,682 | | | 895,970 |
Samsung Electronics GDR | | 5,279 | | | 1,079,557 |
| | | | |
|
|
| | | | | | 1,975,527 |
| | | | |
|
|
Financial Services (1.2%) | | | | | |
LG Card Co. Ltd. (b) (d) | | 13,600 | | | 496,367 |
| | | | |
|
|
Oil & Gas (1.8%) | | | | | |
SK Corp. (d) | | 15,100 | | | 775,532 |
| | | | |
|
|
Retail (1.7%) | | | | | |
Hyundai Department Store Co. Ltd. (d) | | 10,400 | | | 693,513 |
| | | | |
|
|
Semiconductors (0.9%) | | | | | |
Hynix Semiconductor, Inc. (b) (d) | | 19,700 | | | 362,713 |
| | | | |
|
|
Telecommunications (0.6%) | | | | | |
KT Freetel Co. Ltd. (d) | | 11,400 | | | 245,729 |
| | | | |
|
|
| | | | | | 7,913,290 |
| | | | |
|
|
LEBANON (0.5%) | | | | | |
Telecommunications (0.5%) | | | | | |
Investcom LLC GDR (b) | | 16,400 | | | 221,564 |
| | | | |
|
|
MALAYSIA (2.3%) | | | | | |
Banking (0.9%) | | | | | |
Bumiputra-Commerce Holdings Bhd (d) | | 261,200 | | | 380,606 |
| | | | |
|
|
Electric (0.7%) | | | | | |
Tenega Nasional Berhad (d) | | 103,200 | | | 273,478 |
| | | | |
|
|
Real Estate (0.7%) | | | | | |
SP Setia Berhad (d) | | 321,100 | | | 313,061 |
| | | | |
|
|
| | | | | | 967,145 |
| | | | |
|
|
| | | | | |
| | | Shares or
Principal Amount | | Value |
| | | | | | |
MEXICO (7.2%) | | | | | |
Building Products (1.5%) | | | | | |
Cemex SA de CV ADR | | 12,300 | | $ | 640,461 |
| | | | |
|
|
Construction (0.2%) | | | | | |
Urbi Desarrolloas Urbanos, SA de CV (b) (d) | | 14,020 | | | 88,511 |
| | | | |
|
|
Diversified Operations (0.7%) | | | | | |
Grupo Carso SA de CV (d) | | 147,174 | | | 312,628 |
| | | | |
|
|
Financial Services (1.4%) | | | | | |
Grupo Financiero Banorte SA de CV (d) | | 68,100 | | | 580,845 |
| | | | |
|
|
Retail (1.2%) | | | | | |
Wal-Mart de Mexico SA de CV (d) | | 102,500 | | | 499,165 |
| | | | |
|
|
Steel (0.5%) | | | | | |
Industrias CH SA (b) (d) | | 100,000 | | | 208,710 |
| | | | |
|
|
Telecommunications (1.7%) | | | | | |
America Movil SA de CV ADR | | 27,300 | | | 716,625 |
| | | | |
|
|
| | | | | | 3,046,945 |
| | | | |
|
|
RUSSIA (9.1%) | | | | | |
Automobile (0.6%) | | | | | |
JSC Severstal — Avto (b) (d) | | 14,800 | | | 260,480 |
| | | | |
|
|
Brewery (0.5%) | | | | | |
Efes Breweries International GDR (b) | | 6,350 | | | 200,851 |
| | | | |
|
|
Electric (1.0%) | | | | | |
RAO Unified Energy System GDR (b) | | 11,400 | | | 403,560 |
| | | | |
|
|
Oil & Gas (3.3%) | | | | | |
LUKOIL ADR | | 10,200 | | | 560,489 |
OAO Gazprom GDR | | 8,800 | | | 521,840 |
Surgutneftegaz ADR | | 6,900 | | | 324,300 |
| | | | |
|
|
| | | | | | 1,406,629 |
| | | | |
|
|
Retail (2.3%) | | | | | |
Pyaterochka Holding NV (b) (d) | | 48,893 | | | 952,436 |
| | | | |
|
|
Telecommunications (1.4%) | | | | | |
AO VimpelCom ADR (b) | | 14,650 | | | 586,000 |
| | | | |
|
|
| | | | | | 3,809,956 |
| | | | |
|
|
Statement of Investments (Continued)
October 31, 2005
Gartmore Emerging Markets Fund (Continued)
| Common Stocks (continued) |
| | | | | |
| | | Shares or
Principal Amount | | Value |
| | | | | | |
SOUTH AFRICA (8.5%) | | | | | |
Banking (1.7%) | | | | | |
ABSA Group Ltd. (d) | | 52,877 | | $ | 702,085 |
| | | | |
|
|
Diversified Operations (0.9%) | | | | | |
Barloworld Ltd. (d) | | 25,100 | | | 393,609 |
| | | | |
|
|
Home Furnishing (0.6%) | | | | | |
Lewis Group Ltd. (d) | | 45,382 | | | 272,265 |
| | | | |
|
|
Mining (1.4%) | | | | | |
Anglo American PLC (d) | | 10,600 | | | 311,708 |
AngloGold Ltd. (d) | | 7,100 | | | 279,491 |
| | | | |
|
|
| | | | | | 591,199 |
| | | | |
|
|
Oil & Gas (1.7%) | | | | | |
Sasol Ltd. (d) | | 22,700 | | | 717,716 |
| | | | |
|
|
Telecommunications (2.2%) | | | | | |
MTN Group Ltd. (d) | | 117,952 | | | 879,134 |
| | | | |
|
|
| | | | | | 3,556,008 |
| | | | |
|
|
TAIWAN (9.9%) | | | | | |
Agricultural Production – Crops (0.9%) | | | |
Taiwan Fertilizer Co. Ltd. (d) | | 374,000 | | | 362,750 |
| | | | |
|
|
Banking (1.3%) | | | | | |
E.Sun Financial Holding Co. Ltd. (d) | | 464,120 | | | 279,489 |
TA Chong Bank Ltd. (b) (d) | | 944,820 | | | 259,282 |
| | | | |
|
|
| | | | | | 538,771 |
| | | | |
|
|
Building Products (1.0%) | | | | | |
Taiwan Cement Corp. (d) | | 648,700 | | | 399,165 |
| | | | |
|
|
Computer Hardware (3.0%) | | | | | |
Compal Electronics, Inc. (d) | | 797,709 | | | 708,401 |
Foxconn Technology Co. Ltd. (d) | | 135,300 | | | 528,916 |
| | | | |
|
|
| | | | | | 1,237,317 |
| | | | |
|
|
Electronics (1.8%) | | | | | |
AU Optronics Corp. (d) | | 338,000 | | | 431,266 |
Delta Electronics, Inc. (d) | | 201,000 | | | 340,472 |
| | | | |
|
|
| | | | | | 771,738 |
| | | | |
|
|
Financial Services (1.2%) | | | | | |
Shin Kong Financial Holding Co. Ltd. (d) | | 715,389 | | | 517,243 |
| | | | |
|
|
Semiconductors (0.7%) | | | | | |
United Microelectronics Corp. ADR | | 102,928 | | | 300,550 |
| | | | |
|
|
| | | | | | |
| | | Shares or
Principal Amount | | Value |
| | | | | | | |
TAIWAN (continued) | | | | | | |
Textiles (0.0%) | | | | | | |
Far Eastern Textile Ltd. (d) | | | 32,529 | | $ | 19,035 |
| | | | | |
|
|
| | | | | | | 4,146,569 |
| | | | | |
|
|
THAILAND (3.2%) | | | | | | |
Banking (0.8%) | | | | | | |
Kasikornbank Public Co. Ltd. (d) | | | 209,100 | | | 324,521 |
| | | | | |
|
|
Oil & Gas (1.1%) | | | | | | |
Thai Oil Public Co. Ltd. (b) (d) | | | 257,400 | | | 446,921 |
| | | | | |
|
|
Telecommunications (1.3%) | | | | | | |
Shin Corporation Public Co. Ltd. (d) | | | 597,900 | | | 559,883 |
| | | | | |
|
|
| | | | | | | 1,331,325 |
| | | | | |
|
|
TURKEY (2.5%) | | | | | | |
Banking (2.5%) | | | | | | |
Denizbank AS (b) (d) | | | 127,528 | | | 720,262 |
Turkiye Is Bankasi (d) | | | 47,100 | | | 329,026 |
| | | | | |
|
|
| | | | | | | 1,049,288 |
| | | | | |
|
|
| | |
Total Common Stocks | | | | | | 37,514,170 |
| | | | | |
|
|
|
Participation Notes (3.9%) |
INDIA (3.9%) | | | | | | |
Automobile (0.8%) | | | | | | |
Tata Motors Ltd., 0.00% (d) | | $ | 32,800 | | | 343,416 |
| | | | | |
|
|
Banking (0.3%) | | | | | | |
ICICI Bank Ltd., 0.00%, 03/30/07 (d) | | | 4,047 | | | 44,760 |
ICICI Bank Ltd., 0.00%, 12/21/07 (d) | | | 5,775 | | | 63,871 |
| | | | | |
|
|
| | | | | | | 108,631 |
| | | | | |
|
|
Technology (0.8%) | | | | | | |
Tata Consultancy Services Ltd., 0.00%, 08/20/07 (d) | | | 11,200 | | | 348,096 |
| | | | | |
|
|
Telecommunications (0.9%) | | | | | | |
Bharti Tele-Ventures Ltd., 0.00%, 04//27/07 (b) (d) | | | 53,231 | | | 381,134 |
| | | | | |
|
|
Tobacco (1.1%) | | | | | | |
ITC Ltd., 0.00%, 04/30/07 (d) | | | 170,500 | | | 455,235 |
| | | | | |
|
|
| | |
Total Participation Notes | | | | | | 1,636,512 |
| | | | | |
|
|
Cash Equivalents (2.0%)
| | | | | | |
| | | Shares or
Principal Amount | | Value |
| | | | | | | |
Investments in repurchase agreements (Collateralized by U.S. Government Agencies and U.S. Government Agency Mortgages, in a joint trading account at 3.90%, dated 10/31/05, due 11/01/05, repurchase price $848,931) | | $ | 848,839 | | $ | 848,839 |
| | | | | |
|
|
| | |
Total Cash Equivalents | | | | | | 848,839 |
| | | | | |
|
|
|
Warrants (0.5%) |
INDIA (0.5%) | | | | | | |
Bharti Televen, expiring 04/27/07 (b) | | | 23,500 | | | 168,236 |
Tata Consultancy, expiring 08/20/07 (b) | | | 1,400 | | | 43,527 |
| | | | | |
|
|
| | | | | | | 211,763 |
| | | | | |
|
|
| | |
Total Warrants | | | | | | 211,763 |
| | | | | |
|
|
| |
Total Investments
(Cost $35,358,034) (a) — 95.8% | | | 40,211,284 |
| | |
Other assets in excess of liabilities — 4.2% | | | | | | 1,755,748 |
| | | | | |
|
|
| | |
NET ASSETS — 100.0% | | | | | $ | 41,967,032 |
| | | | | |
|
|
| | (a) | See notes to financial statements for tax unrealized appreciation (depreciation) of securities. |
| | (b) | Denotes a non-income producing security. |
| | ADR | American Depositary Receipt |
| | GDR | Global Depositary Receipt |
At October 31, 2005, the Fund’s open forward foreign currency contracts were as follows:
| | | | | | | | | | | | |
Currency
| | Delivery
Date
| | Contract
Value
| | Value
| | Unrealized
Appreciation/
(Depreciation)
| |
| Short Contracts: | | | | | | | | | | | | |
| South African Rand | | 11/02/05 | | $ | 3,322 | | $ | 3,328 | | $ | (6 | ) |
| South African Rand | | 11/03/05 | | | 8,710 | | | 8,704 | | | 6 | |
| South African Rand | | 11/04/05 | | | 18,557 | | | 18,593 | | | (36 | ) |
| | | | |
|
| |
|
| |
|
|
|
| Total Short Contracts | | | | $ | 30,589 | | $ | 30,625 | | $ | (36 | ) |
| | | | |
|
| |
|
| |
|
|
|
| Long Contracts: | | | | | | | | | | | | |
| Hong Kong Dollar | | 11/02/05 | | $ | 34,148 | | $ | 34,153 | | $ | 5 | |
| | | | |
|
| |
|
| |
|
|
|
| Total Long Contracts | | | | $ | 34,148 | | $ | 34,153 | | $ | 5 | |
| | | | |
|
| |
|
| |
|
|
|
See notes to financial statements.
Gartmore International Growth Fund
For the annual period ended Oct. 31, 2005, the Gartmore International Growth Fund returned 25.49% (Class A at NAV) versus 20.06% for its benchmark, the Morgan Stanley Capital International (MSCI) All Country World Free excluding U.S. Index. For broader comparison, the average return for the Fund’s Lipper peer category of International Multi-Cap Core Funds was 18.11%.
In economic terms, the reporting period was characterized by all-time nominal highs for oil prices, with inflation creeping upward, as well as strong global growth. Most notable was the record oil price, which peaked at $70.50 per barrel at the end of August. Nevertheless, extreme oil prices did not stoke inflation to the extent expected, partly due to the widespread use of modern, energy-efficient products and partly due to the deflationary effects of cheaper exports from emerging markets, notably China.
Emerging market and Pacific equities performed most impressively during the reporting period, with Latin America delivering a notably robust performance on the back of strong commodity prices. Elsewhere, Japan and Europe (including the United Kingdom) were positive driven by hopes of economic recovery, strong corporate profitability and expectations of higher levels of merger-and-acquisition activity.
We began the period primarily with a large overweight versus the Fund’s benchmark in European securities (including the United Kingdom) at the expense of the Pacific region, although we were also underweight in emerging Europe. As the year progressed, however, we began to scale back our European positions, particularly in the United Kingdom, as growth faded. We are now slightly overweight in the United Kingdom and underweight in the rest of Europe. Our increasingly positive outlook for Japan led us to increase Fund exposure there, and we moved to an overweight Fund position in that country. In fact, Japan is now the Fund’s largest position as well as the Fund’s largest overweight, reflecting our degree of confidence. Our strategy was largely successful, producing a positive effect from country and sector allocation. Canada, Spain, the United Kingdom, and Japan were the largest contributors on this basis. In terms of sectors, selection in telecoms, energy, financials and consumer staples contributed most to Fund performance.
Drilling down to the stock level, our best-performing stocks were primarily concentrated in the energy sector: Suncor Energy Inc., Sasol Ltd., services firm Stolt Offshore S.A. and European refiner OMV AG. In addition, Finnish utility Fortum Corp. also performed strongly. We preferred energy firms since we believed analysts had consistently underestimated the short- to medium-term oil prices. Furthermore, refinery bottlenecks were likely to ensure that downstream product margins would remain strong. We preferred Fortum since the interest-rate outlook for Europe remained benign, supporting equity prices for the sector, which has bond-like qualities due to steady cash flows. Stocks that detracted from overall Fund performance included British airports operator BAA PLC, which has a monopoly on larger U.K. airports. Weakness in the airline sector, primarily through higher fuel costs, weighed on the BAA. Elsewhere, our position in Hynix Semiconductor Inc. detracted from Fund performance. Hynix’s share price was strong during the first half of 2005 but has been weaker since that time. The company left administration by it’s creditors in October 2005, which was well-received, but another global glut in DRAM memory chips in August weighed on Hynix’s share prices in the sector.
We remain positive in our outlook for global growth, retaining our general strategy. Our country and sector stances are built from the bottom up, and, as such, tend to reflect our views in aggregate. We remain overweight in Sweden, Switzerland, the United Kingdom and Ireland, where valuations appear attractive relative to the earnings outlook. Our major underweights include Spain and Germany, where growth is expected to be slower, notwithstanding the resilience of corporate profitability.
The Fund also is underweight in emerging markets, with the notable exception of Korea. The largest overweight, however, remains in Japan, which we believe will benefit from a significant re-rating as global investors rediscover that market’s attractions. In terms of sectors, we prefer textiles and luxury goods, given the undiminished spending power of high-net-worth individuals, and are also overweight in real estate and consumer financials, particularly in Japan, in expectation of a recovery in consumption. The Fund also holds overweight positions in European utilities and airlines, aerospace and defense.
Portfolio Managers:
Brian O’Neill and Ben Walker, CFA
| | |
Fund Performance | | Gartmore International Growth Fund |
Average Annual Total Return
(For periods ended October 31, 2005)
| | | | | | | | |
| | | | | 1 Yr. | | 5 Yr. | | Inception1 |
| Class A | | w/o SC2 | | 25.49% | | 1.99% | | -0.44% |
| | | w/SC3 | | 18.20% | | 0.79% | | -1.57% |
| Class B | | w/o SC2 | | 24.49% | | 1.24% | | -1.17% |
| | | w/SC4 | | 19.49% | | 0.85% | | -1.36% |
| Class C5 | | w/o SC2 | | 24.45% | | 1.34% | | -1.07% |
| | | w/SC6 | | 23.45% | | 1.34% | | -1.07% |
| Class R7,9 | | 25.37% | | 1.43% | | -0.98% |
| Institutional Class8,9 | | 25.72% | | 2.28% | | -0.16% |
| Institutional Service Class9 | | 25.72% | | 2.28% | | -0.16% |
All figures showing the effect of a sales charge reflect the maximum charge possible, because it has the most dramatic effect on performance data.
| 1 | Fund commenced operations on August 30, 2000. |
| 2 | These returns do not reflect the effects of sales charges (SC). |
| 3 | A 5.75% front-end sales charge was deducted. |
| 4 | A 5.00% contingent deferred sales charge (CDSC) was deducted. The CDSC declines to 0% after 6 years. |
| 5 | These returns until the creation of Class C shares (3/1/01) include the performance of the Fund’s Class B shares. Excluding the effects of any fee waivers or reimbursements, such prior performance is substantially similar to what Class C shares would have produced because Class C shares invest in the same portfolio of securities as Class B shares and have the same expenses after any fee waivers or reimbursements. For Class C shares returns with sales charges, these returns have been restated for the applicable sales charges. |
| 6 | A CDSC of 1.00% was deducted because it is charged when you sell Class C shares within the first year after purchase. |
| 7 | These returns until the creation of Class R shares (12/30/03) include the performance of the Fund’s Class B shares. The returns have been adjusted for the fact that Class R shares do not have any applicable sales charges but have not been adjusted for the lower expenses applicable to Class R shares. Excluding the effect of any fee waivers or reimbursements, such prior performance is similar to what Class R shares would have produced because the Class R shares invest in the same portfolio of securities as Class B shares. |
| 8 | These returns until the creation of Institutional Class shares (6/29/04) include the performance of the Fund’s Institutional Service shares. The returns have been adjusted for the fact that Institutional Class shares do not have any applicable sales charges but have not been adjusted for the lower expenses applicable to Institutional Class shares. Excluding the effect of any fee waivers or reimbursements, such prior performance is similar to what Institutional Class shares would have produced because the Institutional Class shares invest in the same portfolio of securities as Institutional Service shares. |
| 9 | Not subject to any sales charges. |
Performance of a $10,000 Investment
Investment return and principal value will fluctuate, and when redeemed, shares may be worth more or less than original cost. Past performance is no guarantee of future results and does not reflect the deduction of taxes that a shareholder would pay on fund distributions or the redemption of fund shares. Investing in mutual funds involves market risk, including loss of principal. Performance returns assume the reinvestment of all distributions.
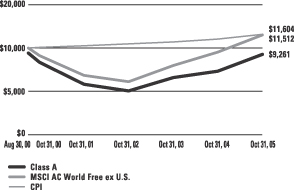
Comparative performance of $10,000 invested in Class A shares of the Gartmore International Growth Fund, Morgan Stanley Capital International All Country World Free ex U.S. Index (MSCI AC World ex U.S.)(a), and the Consumer Price Index (CPI)(b) since inception. Unlike the Fund, the returns for these unmanaged indexes do not reflect any fees, expenses, or sales charges. Investors cannot invest directly in market indexes.
| (a) | The MSCI AC World Free ex U.S. is an index that contains companies that are replicas of their local markets not including any securities in the United States. |
| (b) | The CPI represents changes in prices of a basket of goods and services purchased for consumption by urban households. |
| | |
Shareholder Expense Example | | Gartmore International Growth Fund |
As a shareholder of the Fund, you incur two types of costs: (1) transaction costs, including sales charges (loads) paid on purchase payments and redemption fees; and (2) ongoing costs, including investment advisory fees, administration fees, distribution fees and other Fund expenses. The examples below are intended to help you understand your ongoing costs (in dollars) of investing in the Fund and to compare these costs with the ongoing costs of investing in other mutual funds. Per SEC requirements, the examples assume that you had a $1,000 investment in the Class at the beginning of the reporting period, May 1, 2005, and continued to hold your shares at the end of the reporting period, October 31, 2005.
Actual Expenses
For each Class of the Fund in the table below, the first line provides information about actual account values and actual expenses. You may use the information in this line, together with the amount you invested, to estimate the expenses that you paid over the period. Simply divide your account value by $1,000 (for example, an $8,600 account value divided by $1,000 = 8.6), then multiply the result by the number in the first line of each Class under the heading entitled “Expenses Paid During Period” to estimate the expenses you paid on your account during the period.
Hypothetical Example for Comparison Purposes
The second line of each Class in the table below provides information about hypothetical account values and hypothetical expenses based on the Class’ actual expense ratio and an assumed rate of return of 5% per year before expenses, which is not the Class’ actual return. The hypothetical account values and expenses may not be used to estimate the actual ending account balance or expenses you paid for the period. You may use this information to compare the ongoing costs of investing in the Class of the Fund and other funds. To do so, compare this 5% hypothetical example with the 5% hypothetical examples that appear in the shareholder reports of the other funds.
Please note that the expenses shown in the table are meant to highlight your ongoing costs only and do not reflect any transaction costs, such as sales charges (loads) or redemption fees. Therefore, the second line for each Class in the table is useful in comparing ongoing costs only, and will not help you determine the relative total costs of owning different funds. In addition, if these transaction costs were included, your costs would have been higher. The examples also assume all dividends and distributions have been reinvested.
Schedule of Shareholder Expenses
Expense Analysis of a $1,000 Investment
(October 31, 2005)
| | | | | | | | | | | | | |
| International Growth Fund | | | | Beginning
Account Value,
5/1/05 | | Ending
Account Value,
10/31/05 | | Expenses Paid
During Period* | | Annualized
Expense Ratio* |
| Class A | | Actual | | $ | 1,000.00 | | $ | 1,154.20 | | $ | 9.01 | | 1.66% |
| | | Hypothetical1 | | $ | 1,000.00 | | $ | 1,016.63 | | $ | 8.47 | | 1.66% |
| Class B | | Actual | | $ | 1,000.00 | | $ | 1,150.10 | | $ | 13.01 | | 2.40% |
| | | Hypothetical1 | | $ | 1,000.00 | | $ | 1,012.90 | | $ | 12.25 | | 2.40% |
| Class C | | Actual | | $ | 1,000.00 | | $ | 1,149.10 | | $ | 13.00 | | 2.40% |
| | | Hypothetical1 | | $ | 1,000.00 | | $ | 1,012.90 | | $ | 12.25 | | 2.40% |
| Class R | | Actual | | $ | 1,000.00 | | $ | 1,152.30 | | $ | 9.17 | | 1.69% |
| | | Hypothetical1 | | $ | 1,000.00 | | $ | 1,016.48 | | $ | 8.63 | | 1.69% |
| Institutional Service Class | | Actual | | $ | 1,000.00 | | $ | 1,154.10 | | $ | 7.60 | | 1.40% |
| | | Hypothetical1 | | $ | 1,000.00 | | $ | 1,017.94 | | $ | 7.15 | | 1.40% |
| Institutional Class | | Actual | | $ | 1,000.00 | | $ | 1,154.10 | | $ | 7.60 | | 1.40% |
| | | Hypothetical1 | | $ | 1,000.00 | | $ | 1,017.94 | | $ | 7.15 | | 1.40% |
| * | Expenses are equal to the Fund’s annualized expense ratio multiplied by the average account value over the period multiplied by 184/365 (to reflect the one-half year period). The expense ratio presented represents a six month, annualized ratio in accordance with SEC guidelines. |
| 1 | Represents the hypothetical 5% return before expenses. |
| | |
Portfolio Summary | | Gartmore International Growth Fund |
The SEC adopted a requirement that Funds present their portfolio holdings in a table, chart or graph format in their annual and semiannual reports to shareholders, whether or not a statement of investments is utilized. The following tables, which present portfolio holdings as a percentage of net assets, are provided in compliance with this requirement.
| | |
| Asset Allocation | | |
| Common Stocks | | 96.5% |
| Cash Equivalents | | 2.1% |
| Other Assets in excess of Liabilities | | 1.4% |
| | |
|
| | | 100.0% |
| | |
| Top Industries | | |
| Financial Services | | 12.0% |
| Banking | | 10.6% |
| Oil & Gas | | 10.2% |
| Utilities | | 5.8% |
| Telecommunications | | 5.6% |
| Mining | | 4.3% |
| Aerospace & Defense | | 3.8% |
| Real Estate | | 3.8% |
| Electronics | | 3.7% |
| Chemicals | | 3.5% |
| Other Industries | | 36.7% |
| | |
|
| | | 100.0% |
| | |
| Top Holdings* | | |
| Mitsubishi UFJ Financial Group, Inc. | | 3.5% |
| Scottish Power PLC | | 2.8% |
| Orix Corp. | | 2.5% |
| O2 PLC | | 2.4% |
| Samsung Electronics Co. Ltd.- GDR | | 2.3% |
| Mitsui Fudosan Co. Ltd. | | 2.2% |
| Novartis AG | | 2.2% |
| Credit Saison Co. Ltd. | | 2.1% |
| UBS AG | | 2.0% |
| Sumitomo Mitsui Financial Group, Inc. | | 2.0% |
| Other Holdings | | 76.0% |
| | |
|
| | | 100.0% |
| * | For purpose of listing top holdings, repurchase agreements are considered cash equivalents and are included as part of Other Holdings. |
Statement of Investments
October 31, 2005
Gartmore International Growth Fund
| Common Stocks (96.5%) |
| | | | | |
| | | Shares | | Value |
| | | | | | |
AUSTRALIA (3.4%) | | | | | |
Coal (2.3%) | | | | | |
Excel Coal Ltd. (c) | | 47,699 | | $ | 240,831 |
Felix Resources Ltd. (c) | | 74,057 | | | 141,734 |
| | | | |
|
|
| | | | | | 382,565 |
| | | | |
|
|
Pharmaceuticals (1.1%) | | | | | |
CSL Ltd. (c) | | 6,470 | | | 181,981 |
| | | | |
|
|
| | | | | | 564,546 |
| | | | |
|
|
AUSTRIA (1.6%) | | | | | |
Oil & Gas (1.6%) | | | | | |
OMV AG (c) | | 4,870 | | | 262,730 |
| | | | |
|
|
BRAZIL (1.5%) | | | | | |
Banking (1.5%) | | | | | |
Banco Bradesco S.A. | | 4,650 | | | 241,289 |
| | | | |
|
|
CANADA (3.1%) | | | | | |
Mining (1.3%) | | | | | |
Inco Ltd. | | 5,410 | | | 217,590 |
| | | | |
|
|
Oil & Gas (1.8%) | | | | | |
Suncor Energy, Inc. | | 5,376 | | | 287,740 |
| | | | |
|
|
| | | | | | 505,330 |
| | | | |
|
|
FINLAND (1.4%) | | | | | |
Oil & Gas (1.4%) | | | | | |
Neste Oil (b) (c) | | 7,539 | | | 233,326 |
| | | | |
|
|
FRANCE (6.7%) | | | | | |
Banking (1.6%) | | | | | |
BNP Paribas SA (c) | | 3,530 | | | 267,705 |
| | | | |
|
|
Diversified Operations (1.6%) | | | | | |
LVMH Moet Hennessy SA (c) | | 3,320 | | | 268,866 |
| | | | |
|
|
Food Products & Services (2.1%) | | | | | |
Groupe Danone (c) | | 3,240 | | | 329,298 |
| | | | |
|
|
Utilities (1.4%) | | | | | |
Suez SA (c) | | 8,640 | | | 234,070 |
| | | | |
|
|
| | | | | | 1,099,939 |
| | | | |
|
|
GERMANY (3.4%) | | | | | |
Consumer Goods (1.8%) | | | | | |
Adidas-Salomon AG (c) | | 1,760 | | | 295,280 |
| | | | |
|
|
Utilities (1.6%) | | | | | |
RWE AG (c) | | 4,100 | | | 260,935 |
| | | | |
|
|
| | | | | | 556,215 |
| | | | |
|
|
| | | | | |
| | | Shares | | Value |
| | | | | | |
HONG KONG (1.6%) | | | | | |
Real Estate (1.6%) | | | | | |
Cheung Kong (Holdings) Ltd. (c) | | 25,000 | | $ | 261,160 |
| | | | |
|
|
IRELAND (3.5%) | | | | | |
Airlines (1.8%) | | | | | |
Ryanair Holdings PLC ADR (b) | | 5,940 | | | 294,445 |
| | | | |
|
|
Beverages (1.7%) | | | | | |
C&C Group PLC (c) | | 44,690 | | | 276,767 |
| | | | |
|
|
| | | | | | 571,212 |
| | | | |
|
|
ITALY (2.5%) | | | | | |
Banking (1.8%) | | | | | |
UniCredito Italiano SPA (c) | | 52,900 | | | 295,374 |
| | | | |
|
|
Oil & Gas (0.7%) | | | | | |
Eni SPA (c) | | 4,234 | | | 113,322 |
| | | | |
|
|
| | | | | | 408,696 |
| | | | |
|
|
JAPAN (25.5%) | | | | | |
Automotive (3.1%) | | | | | |
Suzuki Motor Corp. (c) | | 14,000 | | | 240,766 |
Toyota Motor Corp. (c) | | 5,700 | | | 264,357 |
| | | | |
|
|
| | | | | | 505,123 |
| | | | |
|
|
Financial Services (12.0%) | | | | | |
Credit Saison Co. Ltd. (c) | | 7,500 | | | 340,338 |
Matsui Securities Co. Ltd. (c) | | 28,000 | | | 311,170 |
Mitsubishi UFJ Financial Group, Inc. (c) | | 45 | | | 565,677 |
Orix Corp. (c) | | 2,200 | | | 412,588 |
Sumitomo Mitsui Financial Group, Inc. (c) | | 36 | | | 332,533 |
| | | | |
|
|
| | | | | | 1,962,306 |
| | | | |
|
|
Import & Export (1.8%) | | | | | |
Mitsubishi Corp. (c) | | 14,900 | | | 289,799 |
| | | | |
|
|
Internet Security (1.4%) | | | | | |
Nippon Electric Glass Co. Ltd. (c) | | 12,000 | | | 229,754 |
| | | | |
|
|
Mining (1.5%) | | | | | |
Nippon Minings Holdings, Inc. (c) | | 32,500 | | | 241,335 |
| | | | |
|
|
Real Estate (2.2%) | | | | | |
Mitsui Fudosan Co. Ltd. (c) | | 22,000 | | | 360,205 |
| | | | |
|
|
Textile Products (1.7%) | | | | | |
Toray Industries, Inc. (c) | | 50,000 | | | 277,469 |
| | | | |
|
|
Tobacco (1.8%) | | | | | |
Japan Tobacco, Inc. (c) | | 19 | | | 300,426 |
| | | | |
|
|
| | | | | | 4,166,417 |
| | | | |
|
|
| | Common Stocks (continued) |
| | | | | |
| | | Shares | | Value |
| | | | | | |
KOREA (5.4%) | | | | | |
Banking (1.7%) | | | | | |
Kookmin Bank ADR | | 4,740 | | $ | 276,911 |
| | | | |
|
|
Electronics (3.7%) | | | | | |
Hynix Semiconductor, Inc. (b) (c) | | 12,580 | | | 231,621 |
Samsung Electronics Co. Ltd. — GDR | | 1,420 | | | 381,625 |
| | | | |
|
|
| | | | | | 613,246 |
| | | | |
|
|
| | | | | | 890,157 |
| | | | |
|
|
NETHERLANDS (1.3%) | | | | | |
Food (1.3%) | | | | | |
Koninlijke Numico NV (b) (c) | | 5,232 | | | 211,885 |
| | | | |
|
|
NORWAY (1.5%) | | | | | |
Oil & Gas (1.5%) | | | | | |
Statoil ASA (c) | | 11,080 | | | 246,037 |
| | | | |
|
|
SOUTH AFRICA (1.5%) | | | | | |
Oil & Gas (1.5%) | | | | | |
Sasol Ltd. (c) | | 7,610 | | | 240,609 |
| | | | |
|
|
SWEDEN (3.6%) | | | | | |
Banking (2.0%) | | | | | |
Skandiaviska Enskilda Banken AB, Series A (c) | | 17,690 | | | 330,096 |
| | | | |
|
|
Telecommunications (1.6%) | | | | | |
LM Ericsson, Class B (c) | | 81,470 | | | 267,044 |
| | | | |
|
|
| | | | | | 597,140 |
| | | | |
|
|
SWITZERLAND (7.9%) | | | | | |
Banking (2.0%) | | | | | |
UBS AG (c) | | 3,900 | | | 332,583 |
| | | | |
|
|
Chemicals (2.0%) | | | | | |
Syngenta AG (c) | | 3,070 | | | 329,782 |
| | | | |
|
|
Luxury Goods (1.7%) | | | | | |
Compagnie Financiere Richemont AG (c) | | 7,510 | | | 285,779 |
| | | | |
|
|
Pharmaceuticals (2.2%) | | | | | |
Novartis AG (c) | | 6,640 | | | 357,223 |
| | | | |
|
|
| | | | | | 1,305,367 |
| | | | |
|
|
| | | | | | |
| | | Shares or
Principal Amount | | Value |
| | | | | | | |
UNITED KINGDOM (21.1%) | | | | | | |
Aerospace & Defense (3.8%) | | | | | | |
BAE Systems PLC (c) | | | 52,010 | | $ | 304,302 |
Rolls-Royce Group PLC (c) | | | 50,170 | | | 324,238 |
| | | | | |
|
|
| | | | | | | 628,540 |
| | | | | |
|
|
Chemicals (1.5%) | | | | | | |
Filtrona PLC (c) | | | 51,510 | | | 245,929 |
| | | | | |
|
|
Metals (1.5%) | | | | | | |
Vedanta Resources PLC (c) | | | 23,720 | | | 238,216 |
| | | | | |
|
|
Mining (1.5%) | | | | | | |
Rio Tinto PLC (c) | | | 6,450 | | | 245,717 |
| | | | | |
|
|
Oil & Gas (1.7%) | | | | | | |
BP PLC (c) | | | 25,144 | | | 278,508 |
| | | | | |
|
|
Telecommunications (4.0%) | | | | | | |
O2 PLC (c) | | | 109,510 | | | 398,876 |
Virgin Mobile Holdings PLC (c) | | | 45,340 | | | 240,795 |
| | | | | |
|
|
| | | | | | | 639,671 |
| | | | | |
|
|
Transportation (2.8%) | | | | | | |
BAA PLC (c) | | | 15,310 | | | 166,315 |
British Airways PLC (b) (c) | | | 53,030 | | | 283,317 |
| | | | | |
|
|
| | | | | | | 449,632 |
| | | | | |
|
|
Utilities (2.8%) | | | | | | |
Scottish Power PLC (c) | | | 47,080 | | | 460,720 |
| | | | | |
|
|
Water & Sewage Services (1.5%) | | | | | | |
Pennon Group PLC (c) | | | 13,404 | | | 253,890 |
| | | | | |
|
|
| | | | | | | 3,440,825 |
| | | | | |
|
|
| | |
Total Common Stocks | | | | | | 15,802,878 |
| | | | | |
|
|
|
Cash Equivalents (2.1%) |
Investments in repurchase agreements (Collateralized by U.S. Government Agencies and U.S. Government Agency Mortgages, in a joint trading account at 3.90%, dated 10/31/05, due 11/01/05, repurchase price $335,106) | | $ | 335,069 | | | 335,069 |
| | | | | |
|
|
| | |
Total Cash Equivalents | | | | | | 335,069 |
| | | | | |
|
|
Statement of Investments (Continued)
October 31, 2005
Gartmore International Growth Fund (Continued)
Cash Equivalents (continued)
| | | | | |
| | | | | Value |
Total Investments
(Cost $15,006,658) (a) — 98.6% | | | | $ | 16,137,947 |
| | |
Other assets in excess of
liabilities — 1.4% | | | | | 236,803 |
| | | | |
|
|
| | |
NET ASSETS — 100.0% | | | | $ | 16,374,750 |
| | | | |
|
|
| | (a) | See notes to financial statements for tax unrealized appreciation (depreciation) of securities. |
| | (b) | Denotes a non-income producing security. |
| | ADR | American Depositary Receipt |
| | GDR | Global Depositary Receipt |
See notes to financial statements.
Statement of Assets and Liabilities
October 31, 2005
| | | | | | | | | | | | | |
| | | Gartmore China
Opportunities Fund | | | Gartmore Emerging
Markets Fund | | Gartmore International Growth Fund |
Assets: | | | | | | | | | | | | | |
Investments, at value (cost $10,497,091; $34,509,195; and $14,671,589;
respectively) | | $ | 10,142,735 | | | $ | 39,362,445 | | $ | 15,802,878 | | | |
Repurchase agreements, at cost and value | | | — | | | | 848,839 | | | 335,069 | | | |
| | |
|
|
| |
|
| |
|
|
| | |
Total Investment | | | 10,142,735 | | | | 40,221,284 | | | 16,137,947 | | | |
| | |
|
|
| |
|
| |
|
|
| | |
Foreign currency, at value (cost $291,438; $1,167,212 and $25,689; respectively) | | | 291,522 | | | | 1,163,275 | | | 25,376 | | | |
Interest and dividends receivable | | | 6,439 | | | | 88,354 | | | 20,421 | | | |
Receivable for capital shares issued | | | 11,595 | | | | 113,129 | | | 4,397 | | | |
Receivable for investments sold | | | 976,050 | | | | 921,529 | | | 216,537 | | | |
Unrealized appreciation on forward foreign currency contracts | | | — | | | | 37 | | | 2,994 | | | |
Reclaims receivable | | | — | | | | 63 | | | 7,011 | | | |
Prepaid expenses and other assets | | | 16,059 | | | | 21,973 | | | 23,472 | | | |
| | |
|
|
| |
|
| |
|
|
| | |
Total Assets | | | 11,444,400 | | | | 42,519,644 | | | 16,438,155 | | | |
| | |
|
|
| |
|
| |
|
|
| | |
| | | | |
Liabilities: | | | | | | | | | | | | | |
Payable to custodian | | | 1,058,880 | | | | 193,595 | | | 20,554 | | | |
Payable to adviser | | | 3,624 | | | | 19,216 | | | 20,404 | | | |
Payable for investments purchased | | | 76,690 | | | | 238,433 | | | — | | | |
Unrealized depreciation on forward foreign currency contracts | | | 7 | | | | 83 | | | — | | | |
Payable for capital shares redeemed | | | 9,626 | | | | 38,872 | | | 498 | | | |
Accrued expenses and other payables | | | | | | | | | | | | | |
Investment advisory fees | | | 13,259 | | | | 41,089 | | | 12,502 | | | |
Fund administration and transfer agent fees | | | 2,531 | | | | 4,462 | | | 3,825 | | | |
Distribution fees | | | 2,055 | | | | 11,648 | | | 4,796 | | | |
Administrative servicing fees | | | 821 | | | | 2,908 | | | 326 | | | |
Trustee fees | | | 26 | | | | 90 | | | 28 | | | |
Other | | | 817 | | | | 2,216 | | | 472 | | | |
| | |
|
|
| |
|
| |
|
|
| | |
Total Liabilities | | | 1,168,336 | | | | 552,612 | | | 63,405 | | | |
| | |
|
|
| |
|
| |
|
|
| | |
Net Assets | | $ | 10,276,064 | | | $ | 41,967,032 | | $ | 16,374,750 | | | |
| | |
|
|
| |
|
| |
|
|
| | |
| | | | |
Represented by: | | | | | | | | | | | | | |
Capital | | $ | 9,794,993 | | | $ | 32,264,498 | | $ | 15,911,775 | | | |
Accumulated net investment income (loss) | | | 13,173 | | | | 79 | | | (2,346 | ) | | |
Accumulated net realized gains (losses) from investment and foreign currency transactions | | | 822,163 | | | | 4,850,818 | | | (672,173 | ) | | |
Net unrealized appreciation (depreciation) on investments and translation of assets and liabilities denominated in foreign currencies | | | (354,265 | ) | | | 4,851,637 | | | 1,137,494 | | | |
| | |
|
|
| |
|
| |
|
|
| | |
Net Assets | | $ | 10,276,064 | | | $ | 41,967,032 | | $ | 16,374,750 | | | |
| | |
|
|
| |
|
| |
|
|
| | |
| | | | | | | | | | | | | | |
| | | | | | | | | | | | | | |
| | | | | | | | | | | | | | |
| | | | | | | | | | | | | | |
See notes to financial statements.
Statements of Assets and Liabilities (Continued)
October 31, 2005
| | | | | | | | | | | | | | |
| | | Gartmore China
Opportunities Fund | | | Gartmore Emerging
Markets Fund | | | Gartmore International Growth Fund |
Net Assets: | | | | | | | | | | | | | | |
Class A Shares | | $ | 2,846,588 | | | $ | 22,008,897 | | | $ | 7,979,358 | | | |
Class B Shares | | | 315,014 | | | | 4,062,377 | | | | 3,443,741 | | | |
Class C Shares | | | 1,258,055 | | | | 4,301,890 | | | | 272,228 | | | |
Class R Shares | | | 1,172 | | | | 9,295 | | | | 1,311 | | | |
Institutional Service Class Shares | | | 1,169 | | | | 8,953,766 | | | | 3,305,878 | | | |
Institutional Class Shares | | | 5,854,066 | | | | 2,630,806 | | | | 1,372,234 | | | |
| | |
|
|
| |
|
|
| |
|
|
| | |
Total | | $ | 10,276,064 | | | $ | 41,967,032 | | | $ | 16,374,750 | | | |
| | |
|
|
| |
|
|
| |
|
|
| | |
| | | | |
Shares outstanding (unlimited number of shares authorized): | | | | | | | | | | | | | | |
Class A Shares | | | 252,986 | | | | 1,475,602 | | | | 823,572 | | | |
Class B Shares | | | 28,146 | | | | 280,598 | | | | 368,365 | | | |
Class C Shares | | | 112,379 | | | | 292,845 | | | | 28,963 | | | |
Class R Shares | | | 104 | | | | 638 | | | | 139 | | | |
Institutional Service Class Shares | | | 104 | | | | 591,462 | | | | 337,035 | | | |
Institutional Class Shares | | | 519,494 | | | | 173,783 | | | | 139,897 | | | |
| | |
|
|
| |
|
|
| |
|
|
| | |
Total | | | 913,213 | | | | 2,814,928 | | | | 1,697,971 | | | |
| | |
|
|
| |
|
|
| |
|
|
| | |
| | | | |
Net asset value and redemption price per share: | | | | | | | | | | | | | | |
Class A Shares | | $ | 11.25 | | | $ | 14.92 | | | $ | 9.69 | | | |
Class B Shares (a) | | $ | 11.19 | | | $ | 14.48 | | | $ | 9.35 | | | |
Class C Shares (b) | | $ | 11.19 | | | $ | 14.69 | | | $ | 9.40 | | | |
Class R Shares | | $ | 11.23 | (c) | | $ | 14.57 | | | $ | 9.41 | (c) | | |
Institutional Service Class Shares | | $ | 11.25 | (c) | | $ | 15.14 | | | $ | 9.81 | | | |
Institutional Class Shares | | $ | 11.27 | | | $ | 15.14 | | | $ | 9.81 | | | |
| | | | |
Maximum offering price per share (100%/(100%-maximum sales charge) of net asset value adjusted to the nearest cent): | | | | | | | | | | | | | | |
Class A Shares | | $ | 11.94 | | | $ | 15.82 | | | $ | 10.28 | | | |
| | |
|
|
| |
|
|
| |
|
|
| | |
Maximum Sales Charge — Class A Shares | | | 5.75 | % | | | 5.75 | % | | | 5.75 | % | | |
| | |
|
|
| |
|
|
| |
|
|
| | |
| | | | | | | | | | | | | | | |
| | | | | | | | | | | | | | | |
| | | | | | | | | | | | | | | |
| | | | | | | | | | | | | | | |
| | | | | | | | | | | | | | | |
| | | | | | | | | | | | | | | |
| | | | | | | | | | | | | | | |
| | | | | | | | | | | | | | | |
| | | | | | | | | | | | | | | |
| | | | | | | | | | | | | | | |
| | | | | | | | | | | | | | | |
| (a) | For Class B shares, the redemption price per share varies by length of time shares are held. |
| (b) | For Class C shares, the redemption price per share is reduced by 1.00% for shares held less than one year. |
| (c) | Due to rounding, Net Assets divided by shares outstanding does not equal the NAV. |
See notes to financial statements.
Statements of Operations
For the Year Ended October 31, 2005
| | | | | | | | | | | | | | |
| | | Gartmore China Opportunities Fund | | | Gartmore Emerging Markets Fund | | | Gartmore International Growth Fund |
INVESTMENT INCOME: | | | | | | | | | | | | | | |
Interest income | | $ | 4,781 | | | $ | 15,855 | | | $ | 10,079 | | | |
Dividend income (net of foreign withholding tax $0; $67,070; and $29,418; respectively) | | | 265,569 | | | | 761,378 | | | | 270,109 | | | |
| | |
|
|
| |
|
|
| |
|
|
| | |
Total Income | | | 270,350 | | | | 777,233 | | | | 280,188 | | | |
| | |
|
|
| |
|
|
| |
|
|
| | |
| | | | |
Expenses: | | | | | | | | | | | | | | |
Investment advisory fees | | | 119,186 | | | | 334,734 | | | | 104,734 | | | |
Fund administration and transfer agent fees | | | 33,542 | | | | 56,788 | | | | 30,230 | | | |
Distribution fees Class A | | | 5,654 | | | | 42,699 | | | | 10,778 | | | |
Distribution fees Class B | | | 2,252 | | | | 35,327 | | | | 30,952 | | | |
Distribution fees Class C | | | 10,698 | | | | 31,804 | | | | 1,445 | | | |
Distribution fees Class R | | | 4 | | | | 6 | | | | 4 | | | |
Administrative servicing fees Class A | | | 749 | | | | 13,108 | | | | 650 | | | |
Administrative servicing fees Class R | | | 2 | | | | — | | | | — | | | |
Administrative servicing fees Institutional Service Class | | | 1 | | | | — | | | | — | | | |
Registration and filing fees | | | 62,975 | | | | 61,232 | | | | 54,818 | | | |
Trustee fees | | | 348 | | | | 1,207 | | | | 427 | | | |
Other | | | 16,361 | | | | 44,290 | | | | 6,339 | | | |
| | |
|
|
| |
|
|
| |
|
|
| | |
Total expenses before reimbursed expenses | | | 251,772 | | | | 621,195 | | | | 240,377 | | | |
Earnings credit (Note 5) | | | (36 | ) | | | (1,201 | ) | | | (346 | ) | | |
Expenses reimbursed | | | (66,130 | ) | | | — | | | | (37,930 | ) | | |
| | |
|
|
| |
|
|
| |
|
|
| | |
Total Expenses | | | 185,606 | | | | 619,994 | | | | 202,101 | | | |
| | |
|
|
| |
|
|
| |
|
|
| | |
Net Investment Income (Loss) | | | 84,744 | | | | 157,239 | | | | 78,087 | | | |
| | |
|
|
| |
|
|
| |
|
|
| | |
| | | | |
REALIZED/UNREALIZED GAINS (LOSSES) FROM INVESTMENTS: | | | | | | | | | | | | | | |
Net realized gains (losses) on investment transactions | | | 825,122 | | | | 4,974,024 | | | | 1,819,563 | | | |
Net realized gains (losses) on foreign currency transactions | | | (4,876 | ) | | | (94,823 | ) | | | 9,505 | | | |
| | |
|
|
| |
|
|
| |
|
|
| | |
Net realized gains (losses) on investment and foreign currency transactions | | | 820,246 | | | | 4,879,201 | | | | 1,829,068 | | | |
Net change in unrealized appreciation/depreciation on investments and translation of assets and liabilities denominated in foreign currencies | | | (800,447 | ) | | | 2,879,080 | | | | 492,604 | | | |
| | |
|
|
| |
|
|
| |
|
|
| | |
Net realized/unrealized gains (losses) on investments and foreign currencies | | | 19,799 | | | | 7,758,281 | | | | 2,321,672 | | | |
| | |
|
|
| |
|
|
| |
|
|
| | |
CHANGE IN NET ASSETS RESULTING FROM OPERATIONS | | $ | 104,543 | | | $ | 7,915,520 | | | $ | 2,399,759 | | | |
| | |
|
|
| |
|
|
| |
|
|
| | |
| | | | | | | | | | | | | | | |
| | | | | | | | | | | | | | | |
| | | | | | | | | | | | | | | |
| | | | | | | | | | | | | | | |
| | | | | | | | | | | | | | | |
| | | | | | | | | | | | | | | |
| | | | | | | | | | | | | | | |
| | | | | | | | | | | | | | | |
| | | | | | | | | | | | | | | |
| | | | | | | | | | | | | | | |
| | | | | | | | | | | | | | | |
See notes to financial statements.
Statements of Changes in Net Assets
| | | | | | | | | | | | | | | | | | |
| | | Gartmore China Opportunities Fund | | | Gartmore Emerging Markets Fund |
| | | Year Ended
October 31, 2005 | | | Period Ended
October 31, 2004 (a) | | | Year Ended
October 31, 2005 | | | Year Ended
October 31, 2004 |
FROM INVESTMENT ACTIVITIES: | | | | | | | | | | | | | | | | | | |
Operations: | | | | | | | | | | | | | | | | | | |
Net investment income (loss) | | $ | 84,744 | | | $ | 10,978 | | | $ | 157,239 | | | $ | 60,244 | | | |
Net realized gains (losses) on investment and foreign currency transactions | | | 820,246 | | | | 237,829 | | | | 4,879,201 | | | | 2,261,787 | | | |
Net change in unrealized appreciation/depreciation on investments and translation of assets and liabilities denominated in foreign currencies | | | (800,447 | ) | | | 446,182 | | | | 2,879,080 | | | | (553,350 | ) | | |
| | |
|
|
| |
|
|
| |
|
|
| |
|
|
| | |
Change in net assets resulting from operations | | | 104,543 | | | | 694,989 | | | | 7,915,520 | | | | 1,768,681 | | | |
| | |
|
|
| |
|
|
| |
|
|
| |
|
|
| | |
| | | | | |
Distributions to Class A Shareholders from: | | | | | | | | | | | | | | | | | | |
Net investment income | | | (15,757 | ) | | | (1,204 | ) | | | (56,787 | ) | | | (48,254 | ) | | |
Net realized gain on investments | | | (44,331 | ) | | | — | | | | (975,437 | ) | | | — | | | |
| | | | | |
Distributions to Class B Shareholders from: | | | | | | | | | | | | | | | | | | |
Net investment income | | | (1,010 | ) | | | (5 | ) | | | (1,826 | ) | | | (3,983 | ) | | |
Net realized gain on investments | | | (3,240 | ) | | | — | | | | (207,463 | ) | | | — | | | |
| | | | | |
Distributions to Class C Shareholders from: | | | | | | | | | | | | | | | | | | |
Net investment income | | | (3,793 | ) | | | — | | | | (1,199 | ) | | | (3,008 | ) | | |
Net realized gain on investments | | | (23,795 | ) | | | — | | | | (173,966 | ) | | | — | | | |
| | | | | |
Distributions to Class R Shareholders from: | | | | | | | | | | | | | | | | | | |
Net investment income | | | (7 | ) | | | (1 | ) | | | (4 | ) | | | (3 | )(b) | | |
Net realized gain on investments | | | (36 | ) | | | — | | | | (76 | ) | | | — | | | |
| | | | | |
Distributions to Institutional Service Class Shareholders from: | | | | | | | | | | | | | | | | | | |
Net investment income | | | (9 | ) | | | (2 | ) | | | (41,434 | ) | | | (16,749 | ) | | |
Net realized gain on investments | | | (34 | ) | | | — | | | | (267,430 | ) | | | — | | | |
| | | | | |
Distributions to Institutional Class Shareholders from: | | | | | | | | | | | | | | | | | | |
Net investment income | | | (49,459 | ) | | | (11,473 | ) | | | (12,375 | ) | | | (831 | )(a) | | |
Net realized gain on investments | | | (169,694 | ) | | | — | | | | (58,885 | ) | | | — | | | |
| | |
|
|
| |
|
|
| |
|
|
| |
|
|
| | |
Change in net assets from shareholder distributions | | | (311,165 | ) | | | (12,685 | ) | | | (1,796,882 | ) | | | (72,828 | ) | | |
| | |
|
|
| |
|
|
| |
|
|
| |
|
|
| | |
Change in net assets from capital transactions | | | 3,757,800 | | | | 6,042,582 | | | | 12,859,182 | | | | 7,033,976 | | | |
| | |
|
|
| |
|
|
| |
|
|
| |
|
|
| | |
Change in net assets | | | 3,551,178 | | | | 6,724,886 | | | | 18,977,820 | | | | 8,729,829 | | | |
| | | | | |
Net Assets: | | | | | | | | | | | | | | | | | | |
Beginning of period | | | 6,724,886 | | | | — | | | | 22,989,212 | | | | 14,259,383 | | | |
| | |
|
|
| |
|
|
| |
|
|
| |
|
|
| | |
End of period | | $ | 10,276,064 | | | $ | 6,724,886 | | | $ | 41,967,032 | | | $ | 22,989,212 | | | |
| | |
|
|
| |
|
|
| |
|
|
| |
|
|
| | |
Accumulated net investment income (loss) | | $ | 13,173 | | | $ | (2,049 | ) | | $ | 79 | | | $ | (95 | ) | | |
| | |
|
|
| |
|
|
| |
|
|
| |
|
|
| | |
| | | | | | | | | | | | | | | | | | | |
| (a) | For the period from June 29, 2004 (commencement of operations) through October 31, 2004. |
| (b) | For the period from December 30, 2003 (commencement of operations) through October 31, 2004. |
See notes to financial statements.
Statements of Changes in Net Assets
| | | | | | | | | | |
| | | Gartmore International Growth Fund |
| | | Year Ended
October 31, 2005 | | | Year Ended
October 31, 2004 |
FROM INVESTMENT ACTIVITIES: | | | | | | | | | | |
Operations: | | | | | | | | | | |
Net investment income (loss) | | $ | 78,087 | | | $ | (9,044 | ) | | |
Net realized gains (losses) on investment and foreign currency transactions | | | 1,829,068 | | | | 857,341 | | | |
Net change in unrealized appreciation/depreciation on investments and translation of assets and liabilities denominated in foreign currencies | | | 492,604 | | | | (22,049 | ) | | |
| | |
|
|
| |
|
|
| | |
Change in net assets resulting from operations | | | 2,399,759 | | | | 826,248 | | | |
| | |
|
|
| |
|
|
| | |
| | | |
Distributions to Class A Shareholders from: | | | | | | | | | | |
Net investment income | | | (31,300 | ) | | | — | | | |
| | | |
Distributions to Class B Shareholders from: | | | | | | | | | | |
Net investment income | | | (19,754 | ) | | | — | | | |
| | | |
Distributions to Class C Shareholders from: | | | | | | | | | | |
Net investment income | | | (735 | ) | | | — | | | |
| | | |
Distributions to Class R Shareholders from: | | | | | | | | | | |
Net investment income | | | (11 | ) | | | — | | | |
| | | |
Distributions to Institutional Service Class Shareholders from: | | | | | | | | | | |
Net investment income | | | (32,202 | ) | | | — | | | |
| | | |
Distributions to Institutional Class Shareholders from: | | | | | | | | | | |
Net investment income | | | (6,631 | ) | | | — | | | |
| | |
|
|
| |
|
|
| | |
Change in net assets from shareholder distributions | | | (90,633 | ) | | | — | | | |
| | |
|
|
| |
|
|
| | |
Change in net assets from capital transactions | | | 5,343,666 | | | | 541,965 | | | |
| | |
|
|
| |
|
|
| | |
Change in net assets | | | 7,652,792 | | | | 1,368,213 | | | |
| | | |
Net Assets: | | | | | | | | | | |
Beginning of period | | | 8,721,958 | | | | 7,353,745 | | | |
| | |
|
|
| |
|
|
| | |
End of period | | $ | 16,374,750 | | | $ | 8,721,958 | | | |
| | |
|
|
| |
|
|
| | |
Accumulated net investment income (loss) | | $ | (2,346 | ) | | $ | 695 | | | |
| | |
|
|
| |
|
|
| | |
| | | | | | | | | | | |
| | | | | | | | | | | |
| | | | | | | | | | | |
| | | | | | | | | | | |
| | | | | | | | | | | |
| | | | | | | | | | | |
| | | | | | | | | | | |
| | | | | | | | | | | |
| | | | | | | | | | | |
| | | | | | | | | | | |
| | | | | | | | | | | |
| | | | | | | | | | | |
| | | | | | | | | | | |
See notes to financial statements.
Financial Highlights
Selected Data for Each Share of Capital Outstanding
Gartmore China Opportunities Fund
| | | | | | | | | | | | | | | | | | | | | | | | | | | | | | | | | | | | | | | | | | |
| | | | | Investment Activities | | Distributions | | | | | | Ratios/Supplemental Data |
| | | Net Asset
Value,
Beginning
of Period | | Net
Investment
Income
(Loss) | | | Net Realized
and
Unrealized
Gains
(Losses) on
Investments | | Total
from
Investment
Activities | | Net
Investment
Income | | | Net
Realized
Gains | | | Total
Distributions | | | Net
Asset
Value, End
of Period | | Total
Return (a) | | | Net Assets
at End of
Period
(000s) | | Ratio of
Expenses
to Average
Net Assets | | | Ratio of Net
Investment
Income
(Loss)
to Average
Net Assets | | | Ratio of
Expenses
(Prior to
Reimbursements)
to Average
Net Assets (b) | | | Ratio of Net
Investment
Income (Loss)
(Prior to
Reimbursements)
to Average
Net Assets (b) | | | Portfolio
Turnover (c) |
| | | | | | | | | | | | | | | |
Class A Shares | | | | | | | | | | | | | | | | | | | | | | | | | | | | | | | | | | | | | | | | | | |
Period Ended October 31, 2004 (d) | | $ | 10.00 | | 0.01 | | | 1.25 | | 1.26 | | (0.02 | ) | | – | | | (0.02 | ) | | $ | 11.24 | | 12.61% | (e) | | $ | 1,029 | | 1.95% | (f) | | 0.37% | (f) | | 5.57% | (f) | | (3.25% | )(f) | | 50.76% |
Year Ended October 31, 2005 | | $ | 11.24 | | 0.09 | | | 0.33 | | 0.42 | | (0.07 | ) | | (0.34 | ) | | (0.41 | ) | | $ | 11.25 | | 3.58% | | | $ | 2,847 | | 2.01% | | | 0.95% | | | 2.68% | | | 0.28% | | | 130.48% |
| | | | | | | | | | | | | | | |
Class B Shares | | | | | | | | | | | | | | | | | | | | | | | | | | | | | | | | | | | | | | | | | | |
Period Ended October 31, 2004 (d) | | $ | 10.00 | | 0.01 | | | 1.23 | | 1.24 | | (0.01 | ) | | – | | | (0.01 | ) | | $ | 11.23 | | 12.38% | (e) | | $ | 19 | | 2.65% | (f) | | (0.14% | )(f) | | 6.09% | (f) | | (3.57% | )(f) | | 50.76% |
Year Ended October 31, 2005 | | $ | 11.23 | | 0.03 | | | 0.31 | | 0.34 | | (0.04 | ) | | (0.34 | ) | | (0.38 | ) | | $ | 11.19 | | 2.82% | | | $ | 315 | | 2.74% | | | 0.33% | | | 3.41% | | | (0.34% | ) | | 130.48% |
| | | | | | | | | | | | | | | |
Class C Shares | | | | | | | | | | | | | | | | | | | | | | | | | | | | | | | | | | | | | | | | | | |
Period Ended October 31, 2004 (d) | | $ | 10.00 | | (0.01 | ) | | 1.24 | | 1.23 | | – | | | – | | | – | | | $ | 11.23 | | 12.30% | (e) | | $ | 38 | | 2.65% | (f) | | (1.42% | )(f) | | 6.93% | (f) | | (5.69% | )(f) | | 50.76% |
Year Ended October 31, 2005 | | $ | 11.23 | | 0.02 | | | 0.31 | | 0.33 | | (0.03 | ) | | (0.34 | ) | | (0.37 | ) | | $ | 11.19 | | 2.79% | | | $ | 1,258 | | 2.73% | | | 0.24% | | | 3.42% | | | (0.45% | ) | | 130.48% |
| | | | | | | | | | | | | | | |
Class R Shares | | | | | | | | | | | | | | | | | | | | | | | | | | | | | | | | | | | | | | | | | | |
Period Ended October 31, 2004 (d) | | $ | 10.00 | | 0.01 | | | 1.24 | | 1.25 | | (0.01 | ) | | – | | | (0.01 | ) | | $ | 11.24 | | 12.46% | (e) | | $ | 1 | | 2.40% | (f) | | (0.18% | )(f) | | 4.86% | (f) | | (2.64% | )(f) | | 50.76% |
Year Ended October 31, 2005 | | $ | 11.24 | | 0.06 | | | 0.33 | | 0.39 | | (0.06 | ) | | (0.34 | ) | | (0.40 | ) | | $ | 11.23 | | 3.29% | | | $ | 1 | | 2.22% | | | 0.49% | | | 2.87% | | | (0.16% | ) | | 130.48% |
| | | | | | | | | | | | | | | |
Institutional Sevice Class Shares | | | | | | | | | | | | | | | | | | | | | | | | | | | | | | | | | | | | | | | | | | |
Period Ended October 31, 2004 (d) | | $ | 10.00 | | 0.02 | | | 1.25 | | 1.27 | | (0.02 | ) | | – | | | (0.02 | ) | | $ | 11.25 | | 12.74% | (e) | | $ | 1 | | 1.70% | (f) | | 0.51% | (f) | | 3.97% | (f) | | (1.75% | )(f) | | 50.76% |
Year Ended October 31, 2005 | | $ | 11.25 | | 0.09 | | | 0.34 | | 0.43 | | (0.09 | ) | | (0.34 | ) | | (0.43 | ) | | $ | 11.25 | | 3.63% | | | $ | 1 | | 1.82% | | | 0.84% | | | 2.48% | | | 0.18% | | | 130.48% |
| | | | | | | | | | | | | | | |
Institutional Class Shares | | | | | | | | | | | | | | | | | | | | | | | | | | | | | | | | | | | | | | | | | | |
Period Ended October 31, 2004 (d) | | $ | 10.00 | | 0.02 | | | 1.25 | | 1.27 | | (0.02 | ) | | – | | | (0.02 | ) | | $ | 11.25 | | 12.74% | (e) | | $ | 5,637 | | 1.65% | (f) | | 0.59% | (f) | | 4.17% | (f) | | (1.93% | )(f) | | 50.76% |
Year Ended October 31, 2005 | | $ | 11.25 | | 0.12 | | | 0.34 | | 0.46 | | (0.10 | ) | | (0.34 | ) | | (0.44 | ) | | $ | 11.27 | | 3.86% | | | $ | 5,854 | | 1.72% | | | 0.98% | | | 2.41% | | | 0.29% | | | 130.48% |
| | | | | | | | | | | | | | | | | | | | | | | | | | | | | | | | | | | | | | | | | | | |
| | | | | | | | | | | | | | | | | | | | | | | | | | | | | | | | | | | | | | | | | | | |
| | | | | | | | | | | | | | | | | | | | | | | | | | | | | | | | | | | | | | | | | | | |
| | | | | | | | | | | | | | | | | | | | | | | | | | | | | | | | | | | | | | | | | | | |
| | | | | | | | | | | | | | | | | | | | | | | | | | | | | | | | | | | | | | | | | | | |
| | | | | | | | | | | | | | | | | | | | | | | | | | | | | | | | | | | | | | | | | | | |
| | | | | | | | | | | | | | | | | | | | | | | | | | | | | | | | | | | | | | | | | | | |
| | | | | | | | | | | | | | | | | | | | | | | | | | | | | | | | | | | | | | | | | | | |
| | | | | | | | | | | | | | | | | | | | | | | | | | | | | | | | | | | | | | | | | | | |
| | | | | | | | | | | | | | | | | | | | | | | | | | | | | | | | | | | | | | | | | | | |
| | | | | | | | | | | | | | | | | | | | | | | | | | | | | | | | | | | | | | | | | | | |
| | | | | | | | | | | | | | | | | | | | | | | | | | | | | | | | | | | | | | | | | | | |
| (a) | Excludes sales charge. |
| (b) | During the period certain fees were waived and/or reimbursed. If such waivers/reimbursements had not occurred, the ratios would have been as indicated. |
| (c) | Portfolio turnover is calculated on the basis of the Fund as a whole without distinguishing among the classes of shares. |
| (d) | For period from June 29, 2004 (commencement of operations) through October 31, 2004. |
See notes to financial statements.
Financial Highlights
Selected Data for Each Share of Capital Outstanding
Gartmore Emerging Markets Fund
| | | | | | | | | | | | | | | | | | | | | | | | | | | | | | | | | | | | | | | | | | | | | | |
| | | | | Investment Activities | | | Distributions | | | | | | Ratios/Supplemental Data |
| | | Net Asset
Value,
Beginning
of Period | | Net
Investment
Income
(Loss) | | | Redemption
Fees | | Net Realized
and
Unrealized
Gains
(Losses) on
Investments | | | Total
from
Investment
Activities | | | Net
Investment
Income | | | Net
Realized
Gains | | | Total
Distributions | | | Net Asset
Value, End
of Period | | Total
Return (a) | | | Net Assets
at End of
Period
(000s) | | Ratio of
Expenses
to Average
Net Assets | | | Ratio of Net
Investment
Income
(Loss) to Average
Net Assets | | | Ratio of
Expenses
(Prior to
Reimbursements)
to Average
Net Assets (b) | | | Ratio of Net
Investment
Income (Loss)
(Prior to
Reimbursements)
to Average
Net Assets (b) | | | Portfolio
Turnover (c) |
| | | | | | | | | | | | | | | | |
Class A Shares | | | | | | | | | | | | | | | | | | | | | | | | | | | | | | | | | | | | | | | | | | | | | | |
Year Ended October 31, 2001 | | $ | 8.11 | | 0.01 | | | — | | (2.14 | ) | | (2.13 | ) | | — | | | — | | | — | | | $ | 5.98 | | (26.24% | ) | | $ | 1,066 | | 2.15% | | | 0.18% | | | 5.93% | | | (3.60% | ) | | 97.85% |
Year Ended October 31, 2002 | | $ | 5.98 | | (0.03 | ) | | — | | 0.85 | | | 0.82 | | | — | | | — | | | — | | | $ | 6.80 | | 13.71% | | | $ | 1,996 | | 2.01% | | | (0.49% | ) | | 2.41% | | | (0.89% | ) | | 57.86% |
Year Ended October 31, 2003 | | $ | 6.80 | | 0.03 | | | — | | 3.71 | | | 3.74 | | | — | | | — | | | — | | | $ | 10.54 | | 55.00% | | | $ | 9,070 | | 1.88% | | | 0.61% | | | 2.45% | | | 0.05% | | | 146.04% |
Year Ended October 31, 2004 | | $ | 10.54 | | 0.05 | | | 0.03 | | 1.70 | | | 1.78 | | | (0.05 | ) | | — | | | (0.05 | ) | | $ | 12.27 | | 16.97% | | | $ | 13,898 | | 1.88% | | | 0.41% | | | 1.99% | | | 0.31% | | | 134.11% |
Year Ended October 31, 2005 | | $ | 12.27 | | 0.08 | | | — | | 3.47 | | | 3.54 | | | (0.05 | ) | | (0.85 | ) | | (0.90 | ) | | $ | 14.92 | | 30.02% | | | $ | 22,012 | | 1.84% | | | 0.55% | (i) | | | (i) | | | (i) | | 135.40% |
| | | | | | | | | | | | | | | | |
Class B Shares | | | | | | | | | | | | | | | | | | | | | | | | | | | | | | | | | | | | | | | | | | | | | | |
Year Ended October 31, 2001 | | $ | 8.10 | | (0.03 | ) | | — | | (2.13 | ) | | (2.16 | ) | | — | | | — | | | — | | | $ | 5.94 | | (26.67% | ) | | $ | 1,164 | | 2.75% | | | (0.40% | ) | | 6.67% | | | (4.32% | ) | | 97.85% |
Year Ended October 31, 2002 | | $ | 5.94 | | (0.08 | ) | | — | | 0.85 | | | 0.77 | | | — | | | — | | | — | | | $ | 6.71 | | 12.96% | | | $ | 1,443 | | 2.71% | | | (1.18% | ) | | 3.22% | | | (1.69% | ) | | 57.86% |
Year Ended October 31, 2003 | | $ | 6.71 | | — | | | — | | 3.62 | | | 3.62 | | | — | | | — | | | — | | | $ | 10.33 | | 53.95% | | | $ | 2,010 | | 2.55% | | | 0.07% | | | 3.18% | | | (0.56% | ) | | 146.04% |
Year Ended October 31, 2004 | | $ | 10.33 | | (0.03 | ) | | 0.03 | | 1.67 | | | 1.67 | | | (0.02 | ) | | — | | | (0.02 | ) | | $ | 11.98 | | 16.14% | | | $ | 2,900 | | 2.55% | | | (0.27% | ) | | 2.65% | | | (0.37% | ) | | 134.11% |
Year Ended October 31, 2005 | | $ | 11.98 | | (0.01 | ) | | — | | 3.37 | | | 3.36 | | | (0.01 | ) | | (0.85 | ) | | (0.86 | ) | | $ | 14.48 | | 29.30% | | | $ | 4,063 | | 2.52% | | | (0.11% | )(i) | | | (i) | | | (i) | | 135.40% |
| | | | | | | | | | | | | | | | |
Class C Shares | | | | | | | | | | | | | | | | | | | | | | | | | | | | | | | | | | | | | | | | | | | | | | |
Period Ended October 31, 2001 (d) | | $ | 7.57 | | (0.01 | ) | | — | | (1.54 | ) | | (1.55 | ) | | — | | | — | | | — | | | $ | 6.02 | | (20.48% | )(g) | | $ | 10 | | 2.75% | (h) | | (0.85% | )(h) | | 8.68% | (h) | | (6.78% | )(h) | | 97.85% |
Year Ended October 31, 2002 | | $ | 6.02 | | (0.08 | ) | | — | | 0.86 | | | 0.78 | | | — | | | — | | | — | | | $ | 6.80 | | 12.96% | | | $ | 15 | | 2.72% | | | (1.12% | ) | | 3.28% | | | (1.68% | ) | | 57.86% |
Year Ended October 31, 2003 | | $ | 6.80 | | — | | | — | | 3.67 | | | 3.67 | | | — | | | — | | | — | | | $ | 10.47 | | 53.97% | | | $ | 1,398 | | 2.55% | | | (0.12% | ) | | 2.95% | | | (0.52% | ) | | 146.04% |
Year Ended October 31, 2004 | | $ | 10.47 | | (0.02 | ) | | 0.03 | | 1.68 | | | 1.69 | | | (0.02 | ) | | — | | | (0.02 | ) | | $ | 12.14 | | 16.21% | | | $ | 2,217 | | 2.55% | | | (0.16% | ) | | 2.64% | | | (0.25% | ) | | 134.11% |
Year Ended October 31, 2005 | | $ | 12.14 | | (0.01 | ) | | — | | 3.42 | | | 3.41 | | | (0.01 | ) | | (0.85 | ) | | (0.86 | ) | | $ | 14.69 | | 29.20% | | | $ | 4,302 | | 2.51% | | | (0.11% | )(i) | | | (i) | | | (i) | | 135.40% |
| | | | | | | | | | | | | | | | |
Class R Shares | | | | | | | | | | | | | | | | | | | | | | | | | | | | | | | | | | | | | | | | | | | | | | |
Period Ended October 31, 2004 (e) | | $ | 11.20 | | 0.03 | | | 0.03 | | 0.78 | | | 0.84 | | | (0.03 | ) | | — | | | (0.03 | ) | | $ | 12.01 | | 7.50% | (g) | | $ | 1 | | 2.15% | (h) | | 0.26% | (h) | | 2.28% | (h) | | 0.13% | (h) | | 134.11% |
Year Ended October 31, 2005 | | $ | 12.01 | | 0.04 | | | — | | 3.41 | | | 3.45 | | | (0.04 | ) | | (0.85 | ) | | (0.89 | ) | | $ | 14.57 | | 30.11% | | | $ | 9 | | 1.82% | | | 0.16% | (i) | | | (i) | | | (i) | | 135.40% |
| | | | | | | | | | | | | | | | |
Institutional Service Class Shares | | | | | | | | | | | | | | | | | | | | | | | | | | | | | | | | | | | | | | | | | | | | | | |
Year Ended October 31, 2001 | | $ | 8.11 | | 0.04 | | | — | | (2.13 | ) | | (2.09 | ) | | (0.01 | ) | | — | | | (0.01 | ) | | $ | 6.01 | | (25.81% | ) | | $ | 1,004 | | 1.82% | | | 0.49% | | | 5.60% | | | (3.29% | ) | | 97.85% |
Year Ended October 31, 2002 | | $ | 6.01 | | (0.02 | ) | | — | | 0.87 | | | 0.85 | | | — | | | — | | | — | | | $ | 6.86 | | 14.14% | | | $ | 1,145 | | 1.73% | | | (0.21% | ) | | 2.24% | | | (0.72% | ) | | 57.86% |
Year Ended October 31, 2003 | | $ | 6.86 | | 0.08 | | | — | | 3.72 | | | 3.80 | | | — | | | — | | | — | | | $ | 10.66 | | 55.39% | | | $ | 1,781 | | 1.55% | | | 1.07% | | | 2.18% | | | 0.44% | | | 146.04% |
Year Ended October 31, 2004 | | $ | 10.66 | | 0.09 | | | 0.03 | | 1.72 | | | 1.84 | | | (0.07 | ) | | — | | | (0.07 | ) | | $ | 12.43 | | 17.25% | | | $ | 3,737 | | 1.55% | | | 0.81% | | | 1.66% | | | 0.70% | | | 134.11% |
Year Ended October 31, 2005 | | $ | 12.43 | | 0.10 | | | — | | 3.54 | | | 3.64 | | | (0.08 | ) | | (0.85 | ) | | (0.93 | ) | | $ | 15.14 | | 30.60% | | | $ | 8,955 | | 1.50% | | | 0.83% | (i) | | | (i) | | | (i) | | 135.40% |
| | | | | | | | | | | | | | | | |
Institutional Class Shares | | | | | | | | | | | | | | | | | | | | | | | | | | | | | | | | | | | | | | | | | | | | | | |
Period Ended October 31, 2004 (f) | | $ | 11.26 | | 0.03 | | | 0.03 | | 1.15 | | | 1.21 | | | (0.04 | ) | | — | | | (0.04 | ) | | $ | 12.43 | | 10.79% | (g) | | $ | 236 | | 1.55% | (h) | | 0.81% | (h) | | 1.71% | (h) | | 0.65% | (h) | | 134.11% |
Year Ended October 31, 2005 | | $ | 12.43 | | 0.11 | | | — | | 3.53 | | | 3.64 | | | (0.08 | ) | | (0.85 | ) | | (0.93 | ) | | $ | 15.14 | | 30.60% | | | $ | 2,631 | | 1.49% | | | 0.92% | (i) | | | (i) | | | (i) | | 135.40% |
| | | | | | | | | | | | | | | | | | | | | | | | | | | | | | | | | | | | | | | | | | | | | | | |
| | | | | | | | | | | | | | | | | | | | | | | | | | | | | | | | | | | | | | | | | | | | | | | |
| | | | | | | | | | | | | | | | | | | | | | | | | | | | | | | | | | | | | | | | | | | | | | | |
| | |
(a) Excludes sales charge. |
(b) During the period certain fees were waived and/or reimbursed. If such waivers/ reimbursements had not occurred, the ratios would have been as indicated. |
(c) Portfolio turnover is calculated on the basis of the Fund as a whole without distinguishing among the classes of shares. |
(d) For the period from March 1, 2001 (commencement of operations) through October 31, 2001. |
(e) For the period from December 30, 2003 (commencement of operations) through October 31, 2004. |
(f) For period from June 29, 2004 (commencement of operations) through October 31, 2004. |
(g) Not annualized. |
(h)Annualized. |
(i) There were no fee reductions during the period. | | |
See notes to financial statements.
Financial Highlights
Selected Data for Each Share of Capital Outstanding
Gartmore International Growth Fund
| | | | | | | | | | | | | | | | | | | | | | | | | | | | | | | | | | | | | | | | | | | |
| | | | | Investment Activities | | | Distributions | | | | | | Ratios/Supplemental Data |
| | | Net Asset
Value,
Beginning
of Period | | Net
Investment
Income
(Loss) | | | Redemption
Fees | | Net Realized
and
Unrealized
Gains
(Losses) on
Investments | | | Total
from
Investment
Activities | | | Net
Investment
Income | | | Total
Distributions | | | Net
Asset
Value, End
of Period | | Total
Return (a) | | | Net Assets
at End of
Period
(000s) | | Ratio of
Expenses
to Average
Net Assets | | | Ratio of Net
Investment
Income
(Loss)
to Average
Net Assets | | | Ratio of
Expenses
(Prior to
Reimbursements)
to Average
Net Assets (b) | | | Ratio of Net
Investment
Income (Loss)
(Prior to
Reimbursements)
to Average
Net Assets (b) | | | Portfolio
Turnover (c) |
| | | | | | | | | | | | | | | |
Class A Shares | | | | | | | | | | | | | | | | | | | | | | | | | | | | | | | | | | | | | | | | | | | |
Year Ended October 31, 2001 | | $ | 8.86 | | (0.02 | ) | | — | | (2.65 | ) | | (2.67 | ) | | — | | | — | | | $ | 6.19 | | (30.14% | ) | | $ | 2,156 | | 1.85% | | | (0.30% | ) | | 4.01% | | | (2.46% | ) | | 236.28% |
Year Ended October 31, 2002 | | $ | 6.19 | | 0.01 | | | — | | (0.82 | ) | | (0.81 | ) | | — | | | — | | | $ | 5.38 | | (13.09% | ) | | $ | 1,965 | | 1.76% | | | 0.20% | | | 2.10% | | | (0.14% | ) | | 226.70% |
Year Ended October 31, 2003 | | $ | 5.38 | | (0.01 | ) | | 0.03 | | 1.58 | | | 1.60 | | | — | | | — | | | $ | 6.98 | | 29.74% | | | $ | 2,592 | | 1.65% | | | 0.39% | | | 2.37% | | | (0.33% | ) | | 304.72% |
Year Ended October 31, 2004 | | $ | 6.98 | | 0.01 | | | 0.01 | | 0.79 | | | 0.81 | | | — | | | — | | | $ | 7.79 | | 11.60% | | | $ | 3,096 | | 1.65% | | | 0.06% | | | 2.10% | | | (0.38% | ) | | 262.09% |
Year Ended October 31, 2005 | | $ | 7.79 | | 0.08 | | | — | | 1.90 | | | 1.98 | | | (0.08 | ) | | (0.08 | ) | | $ | 9.69 | | 25.49% | | | $ | 7,980 | | 1.65% | | | 0.74% | | | 1.90% | | | 0.50% | | | 247.22% |
| | | | | | | | | | | | | | | |
Class B Shares | | | | | | | | | | | | | | | | | | | | | | | | | | | | | | | | | | | | | | | | | | | |
Year Ended October 31, 2001 | | $ | 8.85 | | (0.07 | ) | | — | | (2.64 | ) | | (2.71 | ) | | — | | | — | | | $ | 6.14 | | (30.62% | ) | | $ | 2,078 | | 2.45% | | | (0.89% | ) | | 4.75% | | | (3.19% | ) | | 236.28% |
Year Ended October 31, 2002 | | $ | 6.14 | | (0.03 | ) | | — | | (0.81 | ) | | (0.84 | ) | | — | | | — | | | $ | 5.30 | | (13.68% | ) | | $ | 1,840 | | 2.46% | | | (0.50% | ) | | 2.85% | | | (0.89% | ) | | 226.70% |
Year Ended October 31, 2003 | | $ | 5.30 | | (0.05 | ) | | 0.03 | | 1.54 | | | 1.52 | | | — | | | — | | | $ | 6.82 | | 28.68% | | | $ | 2,395 | | 2.40% | | | (0.36% | ) | | 3.12% | | | (1.08% | ) | | 304.72% |
Year Ended October 31, 2004 | | $ | 6.82 | | (0.05 | ) | | 0.01 | | 0.78 | | | 0.74 | | | — | | | — | | | $ | 7.56 | | 10.85% | | | $ | 2,695 | | 2.40% | | | (0.70% | ) | | 2.84% | | | (1.14% | ) | | 262.09% |
Year Ended October 31, 2005 | | $ | 7.56 | | 0.01 | | | — | | 1.83 | | | 1.84 | | | (0.05 | ) | | (0.05 | ) | | $ | 9.35 | | 24.49% | | | $ | 3,444 | | 2.40% | | | 0.12% | | | 2.81% | | | (0.30% | ) | | 247.22% |
| | | | | | | | | | | | | | | |
Class C Shares | | | | | | | | | | | | | | | | | | | | | | | | | | | | | | | | | | | | | | | | | | | |
Period Ended October 31, 2001 (d) | | $ | 7.72 | | (0.02 | ) | | — | | (1.53 | ) | | (1.55 | ) | | — | | | — | | | $ | 6.17 | | (20.08% | )(g) | | $ | 10 | | 2.45% | (h) | | (1.10% | )(h) | | 6.72% | (h) | | (5.37% | )(h) | | 236.28% |
Year Ended October 31, 2002 | | $ | 6.17 | | (0.03 | ) | | — | | (0.81 | ) | | (0.84 | ) | | — | | | — | | | $ | 5.33 | | (13.61% | ) | | $ | 10 | | 2.46% | | | (0.53% | ) | | 2.95% | | | (1.02% | ) | | 226.70% |
Year Ended October 31, 2003 | | $ | 5.33 | | (0.05 | ) | | 0.03 | | 1.55 | | | 1.53 | | | — | | | — | | | $ | 6.86 | | 28.71% | | | $ | 16 | | 2.40% | | | (0.37% | ) | | 3.12% | | | (1.09% | ) | | 304.72% |
Year Ended October 31, 2004 | | $ | 6.86 | | (0.01 | ) | | 0.01 | | 0.74 | | | 0.74 | | | — | | | — | | | $ | 7.60 | | 10.79% | | | $ | 112 | | 2.40% | | | (0.23% | ) | | 2.87% | | | (0.70% | ) | | 262.09% |
Year Ended October 31, 2005 | | $ | 7.60 | | 0.03 | | | — | | 1.82 | | | 1.85 | | | (0.05 | ) | | (0.05 | ) | | $ | 9.40 | | 24.45% | | | $ | 272 | | 2.40% | | | 0.10% | | | 2.69% | | | (0.19% | ) | | 247.22% |
| | | | | | | | | | | | | | | |
Class R Shares | | | | | | | | | | | | | | | | | | | | | | | | | | | | | | | | | | | | | | | | | | | |
Period Ended October 31, 2004 (e) | | $ | 7.25 | | 0.02 | | | 0.01 | | 0.30 | | | 0.33 | | | — | | | — | | | $ | 7.58 | | 4.55% | (g) | | $ | 1 | | 2.00% | (h) | | 0.31% | (h) | | 2.65% | (h) | | (0.33% | )(h) | | 262.09% |
Year Ended October 31, 2005 | | $ | 7.58 | | 0.07 | | | — | | 1.86 | | | 1.93 | | | (0.10 | ) | | (0.10 | ) | | $ | 9.41 | | 25.37% | | | $ | 1 | | 1.68% | | | 0.81% | | | 2.31% | | | 0.18% | | | 247.22% |
| | | | | | | | | | | | | | | |
Institutional Service Class Shares | | | | | | | | | | | | | | | | | | | | | | | | | | | | | | | | | | | | | | | | | | | |
Year Ended October 31, 2001 | | $ | 8.86 | | — | | | — | | (2.64 | ) | | (2.64 | ) | | — | | | — | | | $ | 6.22 | | (29.80% | ) | | $ | 2,073 | | 1.52% | | | 0.03% | | | 3.72% | | | (2.17% | ) | | 236.28% |
Year Ended October 31, 2002 | | $ | 6.22 | | 0.03 | | | — | | (0.83 | ) | | (0.80 | ) | | — | | | — | | | $ | 5.42 | | (12.86% | ) | | $ | 1,807 | | 1.48% | | | 0.48% | | | 1.85% | | | 0.11% | | | 226.70% |
Year Ended October 31, 2003 | | $ | 5.42 | | 0.01 | | | 0.03 | | 1.59 | | | 1.63 | | | — | | | — | | | $ | 7.05 | | 30.07% | | | $ | 2,350 | | 1.40% | | | 0.64% | | | 2.12% | | | (0.08% | ) | | 304.72% |
Year Ended October 31, 2004 | | $ | 7.05 | | 0.02 | | | 0.01 | | 0.81 | | | 0.84 | | | — | | | — | | | $ | 7.89 | | 11.91% | | | $ | 2,629 | | 1.40% | | | 0.30% | | | 1.84% | | | (0.14% | ) | | 262.09% |
Year Ended October 31, 2005 | | $ | 7.89 | | 0.11 | | | — | | 1.91 | | | 2.02 | | | (0.10 | ) | | (0.10 | ) | | $ | 9.81 | | 25.72% | | | $ | 3,306 | | 1.40% | | | 1.12% | | | 1.82% | | | 0.70% | | | 247.22% |
| | | | | | | | | | | | | | | |
Institutional Class Shares | | | | | | | | | | | | | | | | | | | | | | | | | | | | | | | | | | | | | | | | | | | |
Period Ended October 31, 2004 (f) | | $ | 7.51 | | — | | | 0.01 | | 0.37 | | | 0.38 | | | — | | | — | | | $ | 7.89 | | 5.06% | (g) | | $ | 189 | | 1.40% | (h) | | 0.03% | (h) | | 1.94% | (h) | | (0.52% | )(h) | | 262.09% |
Year Ended October 31, 2005 | | $ | 7.89 | | 0.11 | | | — | | 1.91 | | | 2.02 | | | (0.10 | ) | | (0.10 | ) | | $ | 9.81 | | 25.72% | | | $ | 1,372 | | 1.40% | | | 1.11% | | | 1.61% | | | 0.90% | | | 247.22% |
| | | | | | | | | | | | | | | | | | | | | | | | | | | | | | | | | | | | | | | | | | | | |
| | | | | | | | | | | | | | | | | | | | | | | | | | | | | | | | | | | | | | | | | | | | |
| (a) | Excludes sales charge. |
| (b) | During the period certain fees were waived and/or reimbursed. If such waivers/reimbursements had not occurred, the ratios would have been as indicated. |
| (c) | Portfolio turnover is calculated on the basis of the Fund as a whole without distinguishing among the classes of shares. |
| (d) | For the period from March 1, 2001 (commencement of operations) through October 31, 2001. |
| (e) | For the period from December 30, 2003 (commencement of operations) through October 31, 2004. |
| (f) | For period from June 29, 2004 (commencement of operations) through October 31, 2004. |
See notes to financial statements.
Gartmore Convertible Fund
For the annual period ended Oct. 31, 2005, the Gartmore Convertible Fund (Class A at NAV) returned 6.32% versus 2.57% for its benchmark, the Goldman Sachs Convertible 100 Index. For broader comparison, the average return for the Fund’s Lipper peer category of Convertible Security Funds was 6.76%.
After getting off to a strong start at the end of 2004, convertible securities struggled through the middle of May 2005. Some of the weakness for convertibles in absolute returns during this period was due to the selling of convertibles by funds unwinding arbitrage positions. A tapering off of this selling, along with an advancing stock market, provided a favorable backdrop for convertibles from mid-May through the end of July. Convertibles weakened again in August, as the price of crude oil made a run at the $70-per-barrel level and Hurricane Katrina swept through the Gulf Coast. The market remained on the defensive through September and October, as hurricanes Rita and Wilma made landfall. These events simultaneously prompted heightened concerns about slowing economic growth and fears of worsening inflation because of energy supply disruptions. Although convertibles generally lost ground in October, the Fund’s performance held up better than that of the benchmark Index due primarily to the Fund’s more-conservative positioning.
Relative to the benchmark Index, the Fund was helped by our security selection in information technology and industrials. In technology, the Fund’s holdings in Corning Inc. and Motorola, Inc. both turned in strong performances for the Fund, with Corning experiencing strong demand for its glass products from the makers of flat-panel displays. Meanwhile, Motorola posted healthy sales and earnings growth driven by brisk sales of its sleek Razr wireless handset. In industrials, our positions in Regal-Beloit Corp., a manufacturer of electric motors, and Fluor Corp., a construction and engineering services provider, were beneficial to Fund performance.
The consumer discretionary sector was the biggest detractor from Fund performance. Within that sector, the Fund’s holdings in Tower Automotive, Inc. hurt Fund results. Fortunately, we liquidated this position well before the auto parts maker filed for Chapter 11 bankruptcy protection for its U.S. operations in February 2005. The financials sector also held back Fund performance as reinsurer Platinum Underwriters Holdings, Ltd. struggled due to weaker-than-expected financial results stemming from 2005’s severe hurricane season. In addition, the Fund’s relative performance in the financials sector was hurt by the fact that the Fund held no position in two equity-sensitive issues that were part of the benchmark and performed well. We had avoided these two issues due to their unfavorable risk/reward profile.
We look for a reasonably favorable environment for convertible securities for the near term. Investments in a number of asset classes, including convertibles, could get a boost as we approach the end of the Federal Reserve Board’s period of “measured” interest-rate hikes, an event expected to occur at some point during the first half of 2006. Ben Bernanke, who is taking over the Fed after current chairman Alan Greenspan retires at the end of January 2006, is a highly regarded economist who should command considerable respect from investors. Energy prices, of course, will continue to be an important wild card, and we will be vigilant about protecting the Fund from damage by companies sensitive to high energy costs. Over complete market cycles, we are confident that our conservative, value-oriented strategy should add value for our shareholders.
Portfolio Managers:
Jeremiah O’Grady and Charles Wright
| | |
Fund Performance | | Gartmore Convertible Fund |
Average Annual Total Return
(For periods ended October 31, 2005)
| | | | | | |
| | | | | 1 Yr. | | Inception1 |
| Class A2 | | w/o SC3 | | 6.32% | | 2.94% |
| | | w/SC4 | | 0.18% | | -0.32% |
| Class B2 | | w/o SC3 | | 5.52% | | 2.07% |
| | | w/SC5 | | 0.52% | | -0.08% |
| Class C2 | | w/o SC3 | | 5.48% | | 2.08% |
| | | w/SC6 | | 5.48% | | 2.08% |
| Class R7,8 | | 6.16% | | 2.47% |
| Institutional Service Class2,8 | | 6.50% | | 3.10% |
| Institutional Class8 | | 6.50% | | 3.10% |
All figures showing the effect of a sales charge reflect the maximum charge possible, because it has the most dramatic effect on performance data.
| 1 | Fund commenced operations on December 29, 2003. |
| 2 | These returns until the creation of Class A, B, C and Institutional Service shares (1/20/04) include the performance of the Fund’s Institutional Class shares. Excluding the effects of any fee waivers or reimbursements, such prior performance is substantially similar to what Class A, B, C and Institutional Service shares would have produced because Class A, B, C and Institutional Service shares invest in the same portfolio of securities as Institutional Class shares. |
| 3 | These returns do not reflect the effects of sales charges (SC). |
| 4 | A 5.75% front-end sales charge was deducted. |
| 5 | A 5.00% contingent deferred sales charge (CDSC) was deducted. The CDSC declines to 0% after 6 years. |
| 6 | A CDSC of 1.00% was deducted because it is charged when you sell Class C shares within the first year after purchase. |
| 7 | These returns until the creation of Class R shares (5/14/04) include the performance of the Fund’s Class B shares. Excluding the effects of any fee waivers or reimbursements, such prior performance is substantially similar to what Class R shares would have produced because Class R shares invest in the same portfolio of securities as Class B shares. |
| 8 | Not subject to any sales charges. |
Performance of a $10,000 Investment
Investment return and principal value will fluctuate, and when redeemed, shares may be worth more or less than original cost. Past performance is no guarantee of future results and does not reflect the deduction of taxes that a shareholder would pay on fund distributions or the redemption of fund shares. Investing in mutual funds involves market risk, including loss of principal. Performance returns assume the reinvestment of all distributions.
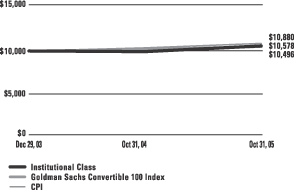
Comparative performance of $10,000 invested in Institutional Class shares of the Gartmore Convertible Fund, Goldman Sachs Convertible 100 Index(a), and the Consumer Price Index (CPI)(b) since inception. Unlike the Fund, the returns for these unmanaged indexes do not reflect any fees, expenses, or sales charges. Investors cannot invest directly in market indexes.
| (a) | The Goldman Sachs Convertible 100 Index is an unmanaged index with a target of 100 securities, including convertible bonds, preferreds, and mandatory convertible securities. |
| (b) | The CPI represents changes in prices of a basket of goods and services purchased for consumption by urban households. |
| | |
Shareholder Expense Example | | Gartmore Convertible Fund |
As a shareholder of the Fund, you incur two types of costs: (1) transaction costs, including sales charges (loads) paid on purchase payments and redemption fees; and (2) ongoing costs, including investment advisory fees, administration fees, distribution fees and other Fund expenses. The examples below are intended to help you understand your ongoing costs (in dollars) of investing in the Fund and to compare these costs with the ongoing costs of investing in other mutual funds. Per SEC requirements, the examples assume that you had a $1,000 investment in the Class at the beginning of the reporting period, May 1, 2005, and continued to hold your shares at the end of the reporting period, October 31, 2005.
Actual Expenses
For each Class of the Fund in the table below, the first line provides information about actual account values and actual expenses. You may use the information in this line, together with the amount you invested, to estimate the expenses that you paid over the period. Simply divide your account value by $1,000 (for example, an $8,600 account value divided by $1,000 = 8.6), then multiply the result by the number in the first line of each Class under the heading entitled “Expenses Paid During Period” to estimate the expenses you paid on your account during the period.
Hypothetical Example for Comparison Purposes
The second line of each Class in the table below provides information about hypothetical account values and hypothetical expenses based on the Class’ actual expense ratio and an assumed rate of return of 5% per year before expenses, which is not the Class’ actual return. The hypothetical account values and expenses may not be used to estimate the actual ending account balance or expenses you paid for the period. You may use this information to compare the ongoing costs of investing in the Class of the Fund and other funds. To do so, compare this 5% hypothetical example with the 5% hypothetical examples that appear in the shareholder reports of the other funds.
Please note that the expenses shown in the table are meant to highlight your ongoing costs only and do not reflect any transaction costs, such as sales charges (loads) or redemption fees. Therefore, the second line for each Class in the table is useful in comparing ongoing costs only, and will not help you determine the relative total costs of owning different funds. In addition, if these transaction costs were included, your costs would have been higher. The examples also assume all dividends and distributions have been reinvested.
Schedule of Shareholder Expenses
Expense Analysis of a $1,000 Investment
(October 31, 2005)
| | | | | | | | | | | | | | |
| Convertible Bond Fund | | | | | Beginning
Account Value,
5/1/05 | | Ending
Account Value,
10/31/05 | | Expenses Paid
During Period* | | Annualized
Expense Ratio* |
| Class A | | Actual | | | $ | 1,000.00 | | $ | 1,064.40 | | $ | 6.30 | | 1.21% |
| | | Hypothetical | 1 | | $ | 1,000.00 | | $ | 1,018.90 | | $ | 6.18 | | 1.21% |
| Class B | | Actual | | | $ | 1,000.00 | | $ | 1,060.90 | | $ | 10.18 | | 1.96% |
| | | Hypothetical | 1 | | $ | 1,000.00 | | $ | 1,015.12 | | $ | 10.00 | | 1.96% |
| Class C | | Actual | | | $ | 1,000.00 | | $ | 1,060.60 | | $ | 10.18 | | 1.96% |
| | | Hypothetical | 1 | | $ | 1,000.00 | | $ | 1,015.12 | | $ | 10.00 | | 1.96% |
| Class R | | Actual | | | $ | 1,000.00 | | $ | 1,064.40 | | $ | 7.08 | | 1.36% |
| | | Hypothetical | 1 | | $ | 1,000.00 | | $ | 1,018.14 | | $ | 6.94 | | 1.36% |
| Institutional Service Class | | Actual | | | $ | 1,000.00 | | $ | 1,065.90 | | $ | 5.00 | | 0.96% |
| | | Hypothetical | 1 | | $ | 1,000.00 | | $ | 1,020.16 | | $ | 4.90 | | 0.96% |
| Institutional Class | | Actual | | | $ | 1,000.00 | | $ | 1,065.90 | | $ | 5.00 | | 0.96% |
| | | Hypothetical | 1 | | $ | 1,000.00 | | $ | 1,020.16 | | $ | 4.90 | | 0.96% |
| * | Expenses are equal to the Fund’s annualized expense ratio multiplied by the average account value over the period multiplied by 184/365 (to reflect the one-half year period). The expense ratio presented represents a six month, annualized ratio in accordance with SEC guidelines. |
| 1 | Represents the hypothetical 5% return before expenses. |
| | |
Portfolio Summary | | Gartmore Convertible Fund |
October 31, 2005
The SEC adopted a requirement that Funds present their portfolio holdings in a table, chart or graph format in their annual and semiannual reports to shareholders, whether or not a statement of investments is utilized. The following tables, which present portfolio holdings as a percentage of net assets, are provided in compliance with this requirement.
| | |
| Asset Allocation | | |
| Convertible Bonds | | 57.4% |
| Convertible Preferred Stock | | 32.4% |
| Cash Equivalents | | 13.9% |
| Liabilities in excess of Other Assets | | -3.7% |
| | |
|
| | | 100.0% |
| | |
| Top Industries | | |
| Insurance | | 12.7% |
| Diversified Financial Services | | 7.9% |
| Pharmaceuticals | | 7.9% |
| Aerospace & Defense | | 7.5% |
| Computers | | 5.0% |
| Medical | | 4.2% |
| Gold Mining | | 4.2% |
| Savings & Loans | | 3.8% |
| Semiconductors | | 3.4% |
| Broadcast Media | | 2.8% |
| Other Industries | | 40.6% |
| | |
|
| | | 100.0% |
| | |
| Top Holdings* | | |
| EMC Corp., 4.50%, 04/01/07 | | 5.0% |
| Wyeth, 3.32%, 01/15/24 | | 3.9% |
| Placer Dome, Inc., 2.75%, 10/15/23 | | 3.6% |
| Lockheed Martin Corp., 3.54%, 08/15/33 | | 3.3% |
| American Express Credit Corp., 1.85%, 12/01/33 | | 3.2% |
| Travelers Property Casualty | | 3.0% |
| Sovereign Cap Trust IV | | 2.9% |
| Liberty Media Corp., 3.50%, 01/15/31 | | 2.8% |
| Centerpointe Energy, Inc. | | 2.8% |
| SLM Corp., 3.60%, 07/25/35 | | 2.6% |
| Other Holdings | | 66.9% |
| | |
|
| | | 100.0% |
| * | For purpose of listing top holdings, repurchase agreements are considered cash equivalents and are included as part of Other Holdings. |
Statement of Investments
October 31, 2005
Gartmore Convertible Fund
| | Convertible Bonds (57.4%) |
| | | | | | |
| | | Principal
Amount | | Value |
| | | | | | | |
Aerospace & Defense (5.7%) | | | | | | |
EDO Corp., 5.25%, 04/15/07 | | $ | 1,105,000 | | $ | 1,142,294 |
Lockheed Martin Corp., 3.54%, 08/15/33 | | | 1,485,000 | | | 1,558,269 |
| | | | | |
|
|
| | | | | | | 2,700,563 |
| | | | | |
|
|
Apparel (1.9%) | | | | | | |
Reebok International Ltd., 2.00%, 05/01/24 | | | 795,000 | | | 890,400 |
| | | | | |
|
|
Banking (1.9%) | | | | | | |
Euronet Worldwide, Inc., 3.50%, 10/15/25 (b) | | | 940,000 | | | 917,675 |
| | | | | |
|
|
Broadcast Media (2.8%) | | | | | | |
Liberty Media Corp., 3.50%, 01/15/31 | | | 1,395,000 | | | 1,353,150 |
| | | | | |
|
|
Computer Equipment (1.7%) | | | | | | |
Maxtor Corp., 6.80%, 04/30/10 | | | 835,000 | | | 808,906 |
| | | | | |
|
|
Computers (5.0%) | | | | | | |
EMC Corp., 4.50%, 04/01/07 | | | 2,260,000 | | | 2,387,125 |
| | | | | |
|
|
Consulting Services (1.5%) | | | | | | |
FTI Consulting, 3.75%, 07/15/12 (b) | | | 630,000 | | | 700,088 |
| | | | | |
|
|
Diversified Financial Services (5.8%) | | | |
American Express Credit Corp., 1.85%, 12/01/33 | | | 1,440,000 | | | 1,517,399 |
SLM Corp., 3.60%, 07/25/35 | | | 1,195,000 | | | 1,238,379 |
| | | | | |
|
|
| | | | | | | 2,755,778 |
| | | | | |
|
|
Gold Mining (4.2%) | | | | | | |
Agnico Eagle Mines, 4.50%, 02/15/12 | | | 310,000 | | | 322,400 |
Placer Dome, Inc., 2.75%, 10/15/23 | | | 1,530,000 | | | 1,704,038 |
| | | | | |
|
|
| | | | | | | 2,026,438 |
| | | | | |
|
|
Hotels & Motels (1.0%) | | | | | | |
Hilton Hotels Corp., 3.38%, 04/15/23 | | | 430,000 | | | 457,950 |
| | | | | |
|
|
Insurance (3.7%) | | | | | | |
Conseco, Inc., 3.50%, 09/30/35 (b) | | | 645,000 | | | 639,356 |
PMI Group, Inc., 2.50%, 07/15/21 | | | 1,110,000 | | | 1,137,750 |
| | | | | |
|
|
| | | | | | | 1,777,106 |
| | | | | |
|
|
| | | | | | |
| | | Principal
Amount | | Value |
| | | | | | | |
Manufacturing (1.7%) | | | | | | |
Danaher Corp., 1.71%, 01/22/21 | | $ | 1,045,000 | | $ | 824,244 |
| | | | | |
|
|
Medical (4.2%) | | | | | | |
Health Management Association, 1.50%, 08/01/23 | | | 800,000 | | | 805,000 |
Manor Care, Inc., 2.13%, 08/01/35 (b) | | | 1,215,000 | | | 1,224,113 |
| | | | | |
|
|
| | | | | | | 2,029,113 |
| | | | | |
|
|
Pharmaceuticals (7.9%) | | | | | | |
Axcan Pharma, Inc., 4.25%, 04/15/08 | | | 660,000 | | | 715,275 |
Ivax Corp., 4.50%, 05/15/08 | | | 1,180,000 | | | 1,180,000 |
Wyeth, 3.32%, 01/15/24 | | | 1,800,000 | | | 1,845,161 |
| | | | | |
|
|
| | | | | | | 3,740,436 |
| | | | | |
|
|
Semiconductors (3.4%) | | | | | | |
Advanced Micro Devices, 4.75%, 02/01/22 | | | 400,000 | | | 438,000 |
LSI Logic, 4.00%, 05/15/10 | | | 615,000 | | | 597,319 |
Skyworks Solutions, 4.75%, 11/15/07 | | | 625,000 | | | 609,375 |
| | | | | |
|
|
| | | | | | | 1,644,694 |
| | | | | |
|
|
Software (1.1%) | | | | | | |
Open Solutions, Inc., 1.47%, 02/02/35 (b) | | | 250,000 | | | 129,375 |
Open Solutions, Inc., 1.47%, 02/02/35 | | | 784,000 | | | 405,720 |
| | | | | |
|
|
| | | | | | | 535,095 |
| | | | | |
|
|
Telecommunication Equipment (2.5%) | | | |
Lucent Technologies, 2.75%, 06/15/23 | | | 530,000 | | | 555,175 |
Lucent Technologies, 8.00%, 08/01/31 | | | 635,000 | | | 653,256 |
| | | | | |
|
|
| | | | | | | 1,208,431 |
| | | | | |
|
|
Telecommunications (1.4%) | | | | | | |
ADC Telecommunications, 2.24%, 06/15/13 | | | 740,000 | | | 692,825 |
| | | | | |
|
|
| | |
Total Convertible Bonds | | | | | | 27,450,017 |
| | | | | |
|
|
Statement of Investments (Continued)
October 31, 2005
Gartmore Convertible Fund (Continued)
Convertible Preferred Stocks (32.4%)
| |
| | | | | |
| | | Shares or
Principal Amount | | Value |
| | | | | | |
Aerospace & Defense (1.8%) | | | | | |
Northrop Grumman Corp.,
7.00%, 04/04/21 | | 7,200 | | $ | 855,000 |
| | | | |
|
|
Building Materials (2.5%) | | | | | |
TXI Capital Trust I,
5.50%, 06/30/28 | | 23,140 | | | 1,209,065 |
| | | | |
|
|
Chemicals (2.7%) | | | | | |
Celanese Corp., 4.25%, 12/31/49 | | 22,905 | | | 604,119 |
Huntsman Corp., 5.00%, 02/16/06 | | 16,075 | | | 709,310 |
| | | | |
|
|
| | | | | | 1,313,429 |
| | | | |
|
|
Crude Petroleum & Natural Gas (1.5%) | | | |
Chesapeake Energy Corp.,
4.50%, 12/31/49 | | 6,900 | | | 708,113 |
| | | | |
|
|
Diversified Financial Services (2.1%) | | | |
Marshall & Ilsley Corp.,
6.50%, 08/15/07 | | 38,300 | | | 1,009,205 |
| | | | |
|
|
Energy (2.8%) | | | | | |
Centerpointe Energy, Inc.,
2.00%, 09/15/29 | | 38,300 | | | 1,323,495 |
| | | | |
|
|
Healthcare Products (1.7%) | | | | | |
Baxter International, Inc.,
7.00%, 02/16/06 | | 14,850 | | | 803,756 |
| | | | |
|
|
Insurance (9.0%) | | | | | |
Genworth Financial, Inc.,
6.00%, 05/16/07 | | 31,350 | | | 1,098,190 |
Reinsurance Group of America, Inc., 5.75%, 12/15/50 | | 11,250 | | | 666,563 |
Scottish RE Group Ltd.,
5.88%, 05/21/07 | | 21,250 | | | 597,975 |
Travelers Property Casualty,
4.50%, 04/15/32 | | 57,415 | | | 1,432,503 |
XL Capital Ltd., 6.50%, 05/15/07 | | 23,000 | | | 492,660 |
| | | | |
|
|
| | | | | | 4,287,891 |
| | | | |
|
|
Mining (0.8%) | | | | | |
Freeport — MC Corp.,
5.50%, 12/31/49 | | 360 | | | 395,775 |
| | | | |
|
|
Real Estate Investment Trusts (1.3%) | | | |
Simon Property Group LP,
6.00%, 12/31/49 | | 10,300 | | | 638,600 |
| | | | |
|
|
| | | | |
| | | Shares or
Principal Amount | | Value |
Rental & Leasing (2.4%) | | | | |
Hanover Compress Cap Trust, 7.25%, 12/14/29 | | 23,925 | | 1,136,438 |
| | | | |
|
Savings & Loans (3.8%) | | | | |
Sovereign Cap Trust IV,
4.38%, 03/01/34 | | 30,750 | | 1,372,219 |
Washington Mutual Capital Trust I, 5.38%, 05/21/07 | | 8,370 | | 426,661 |
| | | | |
|
| | | | | 1,798,880 |
| | | | |
|
| |
Total Convertible Preferred Stocks | | 15,479,647 |
| | | | |
|
| | | | | | | |
|
Cash Equivalents (13.9%) | |
| | | Principal
Amount | | Value | |
| | | | | | | | |
Investments in repurchase agreements (collateralized by U.S. Government Agencies and U.S. Government Agency Mortgages, in a joint trading account at 3.90%, dated 10/31/05, due 11/01/05, repurchase price $6,619,608) | | $ | 6,618,892 | | $ | 6,618,892 | |
| | | | | |
|
|
|
| |
Total Cash Equivalents | | | 6,618,892 | |
| | | | | |
|
|
|
| |
Total Investments
(Cost $49,253,331) (a) — 103.7% | | | 49,548,556 | |
| |
Liabilities in excess of other
assets — (3.7)% | | | (1,766,801 | ) |
| | | | | |
|
|
|
| | |
NET ASSETS — 100.0% | | | | | $ | 47,781,755 | |
| | | | | |
|
|
|
| | (a) | See notes to financial statements for tax unrealized appreciation (depreciation) of securities. |
| | (b) | Represents a restricted security acquired and eligible for resale under Rule 144A, which limits the resale to certain qualified buyers. These securities were deemed liquid pursuant to procedures approved by the Board of Trustees. |
See notes to financial statements.
Gartmore High Yield Bond Fund
For the annual period ended Oct. 31, 2005, the Gartmore High Yield Bond Fund (Class A at NAV) returned 2.23% versus 3.54% for its benchmark, the Citigroup High-Yield Market Index. For broader comparison, the average return for the Fund’s Lipper peer category of High Current Yield Funds was 3.25%.
The high-yield market struggled during the period, with both the Fund and its benchmark Index posting a negative principal return that offset a significant part of the average coupon rate of approximately 8%. Challenges for the market included upward pressure on yields due to ample supply of high-yield securities, stretched valuations at the end of 2004 and the well-publicized problems of issuers in the auto industry.
The container industry had the most negative impact on Fund performance. Most of the Fund’s underperformance was caused by holdings in Pliant Corp., a manufacturer of flexible packaging made from resin, a petroleum product. Hurricane damage to Gulf Coast crude oil production and refinery facilities led to skyrocketing resin prices, and Pliant was unable to pass along the higher cost to its customers. An underweighting in the broadband industry also hurt Fund performance, as did unfavorable security selection in the paper and forest segment. In the finance sector, the Fund unfortunately owned securities in Refco Finance Holdings when Refco’s chief executive officer was arrested for fraud; we subsequently liquidated the position at a loss. Other detractors from the Fund included Lifecare Holdings Inc., Solo Cup Co. and Adelphia Communications Corp.
Conversely, the Fund was aided by an underweighting in auto manufacturing, along with solid security selection in the group. Not owning the debt of General Motors Corp. or Ford Motor Co.–or any of their related entities–was an important positive factor that added to the Fund’s performance. The Fund’s largest sector weighting was in wireless, the benchmark’s best-performing industry and another group that added to Fund performance. Our significant overweighting in the sector more than made up for the fact that the Fund’s wireless securities underperformed those in the Index. Rural Cellular Corp. was one Fund holding that did particularly well. Other holdings in various sectors that helped Fund performance included Charter Communications Holdings, Llc; El Paso Corp.; Qwest Communications International Inc.; and Edison Mission Energy.
Looking at quality sectors, the Fund benefited from our strategy of overweighting securities with split BBB and B ratings while underweighting BB-rated paper. We favored this strategy, given the factors of the greater sensitivity of BB-rated securities to changes in interest rates and the Federal Reserve Board’s campaign of steadily raising rates. Our BB- rated holdings were especially helpful to Fund performance; we correctly anticipated that these holdings would underperform, and our picks outperformed their counterparts in the benchmark.
Looking ahead, we anticipate a relatively favorable backdrop for high-yield securities. Interest rates should remain relatively stable compared with those of the period under review; the Fed probably is close to the end of its current cycle of tightening. Although some minor differences of emphasis might occur, we look for the new Federal Reserve Board leadership to maintain continuity with Alan Greenspan’s policies. Moreover, we believe that economic growth should continue at roughly the same pace as has been maintained recently, providing a positive, though not outstanding, environment for corporate earnings growth. The default rate, a key measurement of the high-yield market, could rise slightly but should remain low by historical standards. Likewise, the ratio of credit quality upgrades to downgrades should decline slightly but remain at favorable levels, providing a reasonably positive environment in which to practice our disciplined brand of security selection.
Portfolio Manager:
Karen Bater
| | |
Fund Performance | | Gartmore High Yield Bond Fund |
Average Annual Total Return
(For periods ended October 31, 2005)
| | | | | | | | |
| | | | | 1 Yr. | | 5 Yr. | | Inception1 |
| Class A | | w/o SC2 | | 2.23% | | 5.50% | | 2.33% |
| | | w/SC3 | | -2.58% | | 4.47% | | 1.48% |
| Class B | | w/o SC2 | | 1.55% | | 4.74% | | 1.59% |
| | | w/SC4 | | -3.21% | | 4.46% | | 1.48% |
| Class C5 | | w/o SC2 | | 1.40% | | 4.48% | | 1.38% |
| | | w/SC6 | | 0.45% | | 4.48% | | 1.38% |
| Class R7,9 | | 2.05% | | 4.90% | | 1.72% |
| Institutional Class8,9 | | 2.54% | | 5.79% | | 2.70% |
| Institutional Service Class9 | | 2.34% | | 5.74% | | 2.67% |
All figures showing the effect of a sales charge reflect the maximum charge possible, because it has the most dramatic effect on performance data.
| 1 | Fund commenced operations on December 29, 1999. |
| 2 | These returns do not reflect the effects of sales charges (SC). |
| 3 | A 4.75% front-end sales charge was deducted. |
| 4 | A 5.00% contingent deferred sales charge (CDSC) was deducted. The CDSC declines to 0% after 6 years. |
| 5 | These returns until the creation of Class C shares (3/1/01) include the performance of the Fund’s Class B shares. Excluding the effects of any fee waivers or reimbursements, such prior performance is substantially similar to what Class C shares would have produced because Class C shares invest in the same portfolio of securities as Class B shares and have the same expenses after any fee waivers or reimbursements. For Class C shares returns with sales charges, these returns have been restated for the applicable sales charges. |
| 6 | A CDSC of 1.00% was deducted because it is charged when you sell Class C shares within the first year after purchase. |
| 7 | These returns until the creation of Class R shares (12/27/04) include the performance of the Fund’s Class B shares. The returns have been adjusted for the fact that Class R shares do not have any applicable sales charges but have not been adjusted for the lower expenses applicable to Class R shares. Excluding the effect of any fee waivers or reimbursements, such prior performance is similar to what Class R shares would have produced because the Class R shares invest in the same portfolio of securities as Class B shares. |
| 8 | These returns until the creation of Institutional Class shares (6/29/04) include the performance of the Fund’s Institutional Service shares. The returns have been adjusted for the fact that Institutional Class shares do not have any applicable sales charges but have not been adjusted for the lower expenses applicable to Institutional Class shares. Excluding the effect of any fee waivers or reimbursements, such prior performance is similar to what Institutional Class shares would have produced because the Institutional Class shares invest in the same portfolio of securities as Institutional Service shares. |
| 9 | Not subject to any sales charges. |
Performance of a $10,000 Investment
Investment return and principal value will fluctuate, and when redeemed, shares may be worth more or less than original cost. Past performance is no guarantee of future results and does not reflect the deduction of taxes that a shareholder would pay on fund distributions or the redemption of fund shares. Investing in mutual funds involves market risk, including loss of principal. Performance returns assume the reinvestment of all distributions.
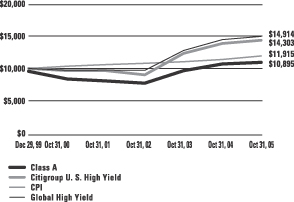
Comparative performance of $10,000 invested in Class A shares of the Gartmore High Yield Bond Fund, Citigroup U.S. High-Yield Market Index (a), and the Consumer Price Index (CPI)(b) since inception. Unlike the Fund, the returns for these unmanaged indexes do not reflect any fees, expenses, or sales charges. Investors cannot invest directly in market indexes.
| (a) | The Citigroup U.S. High-Yield Market is an unmanaged index of high-yield debt securities and is a broad market measure. |
| (b) | The CPI represents changes in prices of a basket of goods and services purchased for consumption by urban households. |
| | |
Shareholder Expense Example | | Gartmore High Yield Bond Fund |
As a shareholder of the Fund, you incur two types of costs: (1) transaction costs, including sales charges (loads) paid on purchase payments and redemption fees; and (2) ongoing costs, including investment advisory fees, administration fees, distribution fees and other Fund expenses. The examples below are intended to help you understand your ongoing costs (in dollars) of investing in the Fund and to compare these costs with the ongoing costs of investing in other mutual funds. Per SEC requirements, the examples assume that you had a $1,000 investment in the Class at the beginning of the reporting period, May 1, 2005, and continued to hold your shares at the end of the reporting period, October 31, 2005.
Actual Expenses
For each Class of the Fund in the table below, the first line provides information about actual account values and actual expenses. You may use the information in this line, together with the amount you invested, to estimate the expenses that you paid over the period. Simply divide your account value by $1,000 (for example, an $8,600 account value divided by $1,000 = 8.6), then multiply the result by the number in the first line of each Class under the heading entitled “Expenses Paid During Period” to estimate the expenses you paid on your account during the period.
Hypothetical Example for Comparison Purposes
The second line of each Class in the table below provides information about hypothetical account values and hypothetical expenses based on the Class’ actual expense ratio and an assumed rate of return of 5% per year before expenses, which is not the Class’ actual return. The hypothetical account values and expenses may not be used to estimate the actual ending account balance or expenses you paid for the period. You may use this information to compare the ongoing costs of investing in the Class of the Fund and other funds. To do so, compare this 5% hypothetical example with the 5% hypothetical examples that appear in the shareholder reports of the other funds.
Please note that the expenses shown in the table are meant to highlight your ongoing costs only and do not reflect any transaction costs, such as sales charges (loads) or redemption fees. Therefore, the second line for each Class in the table is useful in comparing ongoing costs only, and will not help you determine the relative total costs of owning different funds. In addition, if these transaction costs were included, your costs would have been higher. The examples also assume all dividends and distributions have been reinvested.
Schedule of Shareholder Expenses
Expense Analysis of a $1,000 Investment
(October 31, 2005)
| | | | | | | | | | | | | | |
| High Yield Bond | | | | | Beginning
Account Value,
5/1/05 | | Ending
Account Value,
10/31/05 | | Expenses Paid
During Period* | | Annualized
Expense Ratio* |
| Class A | | Actual | | | $ | 1,000.00 | | $ | 1,021.40 | | $ | 5.96 | | 1.17% |
| | | Hypothetical | 1 | | $ | 1,000.00 | | $ | 1,019.10 | | $ | 5.97 | | 1.17% |
| Class B | | Actual | | | $ | 1,000.00 | | $ | 1,017.90 | | $ | 9.46 | | 1.86% |
| | | Hypothetical | 1 | | $ | 1,000.00 | | $ | 1,015.62 | | $ | 9.49 | | 1.86% |
| Class C | | Actual | | | $ | 1,000.00 | | $ | 1,016.40 | | $ | 9.45 | | 1.86% |
| | | Hypothetical | 1 | | $ | 1,000.00 | | $ | 1,015.62 | | $ | 9.49 | | 1.86% |
| Class R | | Actual | | | $ | 1,000.00 | | $ | 1,019.50 | | $ | 6.57 | | 1.29% |
| | | Hypothetical | 1 | | $ | 1,000.00 | | $ | 1,018.50 | | $ | 6.58 | | 1.29% |
| Institutional Service Class | | Actual | | | $ | 1,000.00 | | $ | 1,021.00 | | $ | 4.64 | | 0.91% |
| | | Hypothetical | 1 | | $ | 1,000.00 | | $ | 1,020.41 | | $ | 4.64 | | 0.91% |
| Institutional Class | | Actual | | | $ | 1,000.00 | | $ | 1,022.60 | | $ | 4.33 | | 0.85% |
| | | Hypothetical | 1 | | $ | 1,000.00 | | $ | 1,020.72 | | $ | 4.34 | | 0.85% |
| * | Expenses are equal to the Fund’s annualized expense ratio multiplied by the average account value over the period multiplied by 184/365 (to reflect the one-half year period). The expense ratio presented represents a six month, annualized ratio in accordance with SEC guidelines. |
| 1 | Represents the hypothetical 5% return before expenses. |
| | |
Portfolio Summary | | Gartmore High Yield Bond Fund |
The SEC adopted a requirement that Funds present their portfolio holdings in a table, chart or graph format in their annual and semiannual reports to shareholders, whether or not a statement of investments is utilized. The following tables, which present portfolio holdings as a percentage of net assets, are provided in compliance with this requirement.
| | |
| Asset Allocation | | |
| Corporate Bonds | | 87.0% |
| Cash Equivalents | | 9.8% |
| Yankee Bonds | | 1.4% |
| Preferred Stocks | | 1.3% |
| Common Stock | | 0.1% |
| Warrants | | 0.0% |
| Other Assets in excess of Liabilities | | 0.4% |
| | |
|
| | | 100.0% |
| | |
| Top Industries | | |
| Telecommunication Services | | 8.4% |
| Oil & Gas | | 7.7% |
| Cable & Satellite | | 6.8% |
| Utilities | | 6.3% |
| Chemicals | | 5.2% |
| Healthcare | | 5.2% |
| Gaming | | 5.0% |
| Auto Parts & Equipment | | 3.7% |
| Containers | | 3.3% |
| Communication & Mobile | | 3.0% |
| Paper & Forest Products | | 2.3% |
| Other Industries | | 43.1% |
| | |
|
| | | 100.0% |
| | |
| Top Holdings* | | |
| Cablevision Systems Corp., 8.00%, 04/15/12 | | 1.4% |
| El Paso Group Co., 7.75%, 06/15/10 | | 1.4% |
| Edison Mission Energy, 9.88%, 04/15/11 | | 1.2% |
| Triton PCS, Inc., 8.50%, 06/01/13 | | 1.2% |
| Qwest Corp., 8.88%, 03/15/12 | | 1.2% |
| Georgia Pacific Corp., 8.88%, 02/01/10 | | 1.2% |
| Charter Communications Holdings LLC, 8.63%, 04/01/09 | | 1.1% |
| LBI Media, Inc., 10.13%, 07/15/12 | | 1.1% |
| Rural Cellular Corp., 9.88%, 02/01/10 | | 1.1% |
| AES Corp., 8.75%, 05/15/13 | | 1.1% |
| Other Companies | | 88.0% |
| | |
|
| | | 100.0% |
| * | For purpose of listing top holdings, repurchase agreements are considered cash equivalents and are included as part of Other Holdings. |
Statement of Investments
October 31, 2005
Gartmore High Yield Bond Fund
| Corporate Bonds (87.0%) |
| | | | | | |
| | | Principal
Amount | | Value |
| | | | | | | |
Advertising Services (0.8%) | | | |
WDAC Subsidiary Corp.,
8.38%, 12/01/14 (c) | | $ | 200,000 | | $ | 188,500 |
| | | | | |
|
|
Aerospace & Defense Equipment (1.2%) | | | |
K&F Acquisition, Inc., 7.75%, 11/15/14 (c) | | | 45,000 | | | 45,000 |
Sequa Corp., 9.00%, 08/01/09 | | | 125,000 | | | 129,688 |
Vought Aircraft Industries, Inc., 8.00%, 07/15/11 | | | 125,000 | | | 118,125 |
| | | | | |
|
|
| | | | | | | 292,813 |
| | | | | |
|
|
Apparel (1.1%) | | | |
Broder Bros Co.,
11.25%, 10/15/10 (c) | | | 120,000 | | | 111,000 |
Levi Strauss & Co., 9.75%, 01/15/15 | | | 165,000 | | | 166,650 |
| | | | | |
|
|
| | | | | | | 277,650 |
| | | | | |
|
|
Auto Parts & Equipment (3.7%) | | | |
Commercial Vehicle Group,
8.00%, 07/01/13 | | | 55,000 | | | 53,900 |
Dura Operating Corp.,
8.63%, 04/15/12 | | | 40,000 | | | 33,900 |
General Motors Acceptance Corp., 7.00%, 02/01/12 | | | 210,000 | | | 203,713 |
General Motors Acceptance Corp., 8.00%, 11/01/31 | | | 105,000 | | | 108,396 |
Rexnord Corp., 10.13%, 12/15/12 | | | 150,000 | | | 164,250 |
Tenneco Automotive, Inc.,
8.63%, 11/15/14 | | | 110,000 | | | 105,050 |
TRW Automotive, Inc.,
9.38%, 02/15/13 | | | 92,000 | | | 98,900 |
TRW Automotive, Inc.,
11.00%, 02/15/13 | | | 35,000 | | | 39,113 |
United Rentals North America, Inc., 7.00%, 02/15/14 | | | 85,000 | | | 78,200 |
| | | | | |
|
|
| | | | | | | 885,422 |
| | | | | |
|
|
Building & Construction (2.0%) | | | |
D.R. Horton, Inc., 8.50%, 04/15/12 | | | 110,000 | | | 117,987 |
K. Hovnanian Enterprises,
7.75%, 05/15/13 | | | 55,000 | | | 54,450 |
Ply Gem Industries, Inc.,
9.00%, 02/15/12 | | | 175,000 | | | 141,750 |
| | | | | | |
| | | Principal
Amount | | Value |
| | | | | | | |
Building & Construction (continued) | | | |
WCI Communities, Inc.,
9.13%, 05/01/12 | | $ | 170,000 | | $ | 170,850 |
| | | | | |
|
|
| | | | | | | 485,037 |
| | | | | |
|
|
Building Products (0.8%) | | | |
Goodman Global Holdings,
7.88%, 12/15/12 (c) | | | 175,000 | | | 164,500 |
Maax Holdings, Inc.,
0.00%, 12/15/12 | | | 75,000 | | | 29,625 |
| | | | | |
|
|
| | | | | | | 194,125 |
| | | | | |
|
|
Cable & Satellite (6.8%) | | | |
Adelphia Communications,
8.88%, 01/15/07 | | | 40,000 | | | 42,600 |
Adelphia Communications, 10.88%, 10/01/10 (b) | | | 125,000 | | | 81,250 |
Atlantic Broadband Finance, 9.38%, 01/15/14 | | | 175,000 | | | 158,375 |
Cablevision Systems Corp.,
8.00%, 04/15/12 (c) | | | 350,000 | | | 334,249 |
Charter Communications Holdings LLC, 8.63%, 04/01/09 | | | 325,000 | | | 266,499 |
Charter Communications Holdings LLC, 8.38%, 04/30/14 (c) | | | 85,000 | | | 85,213 |
Charter Communications Holdings, Series B, 10.25%, 01/15/10 | | | 175,000 | | | 136,500 |
Echostar DBS Corp.,
9.13%, 01/15/09 | | | 164,000 | | | 172,200 |
Intelsat Bermuda Ltd.,
8.25%, 01/15/13 | | | 85,000 | | | 84,788 |
Intelsat Ltd., 7.63%, 04/15/12 | | | 185,000 | | | 148,925 |
Young Broadcasting, Inc.,
10.00%, 03/01/11 | | | 125,000 | | | 116,250 |
| | | | | |
|
|
| | | | | | | 1,626,849 |
| | | | | |
|
|
Chemicals (5.2%) | | | |
BCP Crystal Holdings Corp.,
9.63%, 06/15/14 | | | 81,000 | | | 89,100 |
Crompton Corp., 9.88%, 08/01/12 | | | 55,000 | | | 61,600 |
Equistar Chemical Funding, 10.13%, 09/01/08 | | | 105,000 | | | 113,138 |
Huntsman Corp., 10.13%, 07/01/09 | | | 100,000 | | | 102,875 |
Huntsman International LLC, 11.50%, 07/15/12 | | | 100,000 | | | 113,125 |
Statement of Investments (Continued)
October 31, 2005
Gartmore High Yield Bond Fund (Continued)
| | Corporate Bonds (continued) |
| | | | | | |
| | | Principal
Amount | | Value |
| | | | | | | |
Chemicals (continued) | | | |
Huntsman International LLC, 7.38%, 01/01/15 | | $ | 115,000 | | $ | 109,250 |
IMC Global, Inc., 11.25%, 06/01/11 | | | 70,000 | | | 75,950 |
Koppers Industry, Inc.,
9.88%, 10/15/13 | | | 125,000 | | | 136,249 |
Lyondell Chemical Co.,
9.50%, 12/15/08 | | | 190,000 | | | 199,024 |
Millennium America, Inc.,
9.25%, 06/15/08 | | | 85,000 | | | 91,163 |
Polyone Corp., 10.63%, 05/15/10 | | | 110,000 | | | 107,800 |
Resolution Performance Products, 8.00%, 12/15/09 | | | 55,000 | | | 55,963 |
| | | | | |
|
|
| | | | | | | 1,255,237 |
| | | | | |
|
|
Communication & Mobile (3.0%) | | | |
American Tower Corp.,
7.13%, 10/15/12 | | | 175,000 | | | 180,469 |
Rogers Wireless, Inc.,
8.00%, 12/15/12 | | | 60,000 | | | 63,450 |
Triton PCS, Inc., 8.50%, 06/01/13 | | | 300,000 | | | 280,500 |
Ubiquitel Operating Co.,
9.88%, 03/01/11 (c) | | | 170,000 | | | 185,725 |
| | | | | |
|
|
| | | | | | | 710,144 |
| | | | | |
|
|
Computer Services (0.9%) | | | |
Sungard Data Systems, Inc.,
9.13%, 08/15/13 | | | 50,000 | | | 50,750 |
Sungard Data Systems, Inc., 10.25%, 08/15/15 | | | 40,000 | | | 39,650 |
Unigraphics Solutions, Inc., 10.00%, 06/01/12 | | | 110,000 | | | 120,175 |
| | | | | |
|
|
| | | | | | | 210,575 |
| | | | | |
|
|
Construction Machinery (0.4%) | | | |
Case New Holland, Inc.,
9.25%, 08/01/11 | | | 85,000 | | | 89,463 |
| | | | | |
|
|
Consumer Products & Services (1.3%) | | | |
Doane Pet Care Co.,
10.75%, 03/01/10 | | | 85,000 | | | 91,588 |
Doane Pet Care Co.,
10.63%, 11/15/15 | | | 50,000 | | | 50,625 |
Iron Mountain, Inc.,
7.75%, 01/15/15 | | | 85,000 | | | 84,575 |
| | | | | | |
| | | Principal
Amount | | Value |
| | | | | | | |
Consumer Products & Services (continued) | | | |
Sealy Mattress Co.,
8.25%, 06/15/14 | | $ | 85,000 | | $ | 86,275 |
| | | | | |
|
|
| | | | | | | 313,063 |
| | | | | |
|
|
Containers (3.3%) | | | |
Constar International,
11.00%, 12/01/12 (b) | | | 85,000 | | | 48,450 |
Crown Cork & Seal,
8.00%, 04/15/23 | | | 175,000 | | | 168,000 |
Owens-Brockway Glass Containers, 6.75%, 12/01/14 (c) | | | 60,000 | | | 56,400 |
Owens-Illinois, Inc.,
7.50%, 05/15/10 | | | 105,000 | | | 103,950 |
Pliant Corp., 11.63%, 06/15/09 | | | 25,529 | | | 27,571 |
Pliant Corp., 11.13%, 09/01/09 | | | 50,000 | | | 40,750 |
Pliant Corp., 13.00%, 06/01/10 (b) | | | 240,000 | | | 34,800 |
Silgan Holdings, Inc.,
6.75%, 11/15/13 | | | 50,000 | | | 49,750 |
Solo Cup Co., 8.50%, 02/15/14 | | | 265,000 | | | 217,300 |
Tekni-Plex, Inc., 10.88%, 08/15/12 | | | 40,000 | | | 42,700 |
| | | | | |
|
|
| | | | | | | 789,671 |
| | | | | |
|
|
Cosmetics & Toiletries (0.6%) | | | |
Del Laboratories, Inc.,
8.00%, 02/01/12 (c) | | | 45,000 | | | 33,750 |
Elizabeth Arden, Inc.,
7.75%, 01/15/14 | | | 110,000 | | | 109,313 |
| | | | | |
|
|
| | | | | | | 143,063 |
| | | | | |
|
|
Diversified Manufacturing Operations (0.3%) |
Blount Inc, 8.88%, 08/01/12 | | | 55,000 | | | 57,888 |
Invensys PLC, 9.88%, 03/15/11 (c) | | | 25,000 | | | 24,000 |
| | | | | |
|
|
| | | | | | | 81,888 |
| | | | | |
|
|
Drugs (0.8%) | | | |
Alpharma, Inc., 8.63%, 05/01/11 | | | 175,000 | | | 187,250 |
| | | | | |
|
|
E-Commerce (0.3%) | | | | | | |
FTD, Inc., 7.75%, 02/15/14 | | | 73,000 | | | 72,270 |
| | | | | |
|
|
Electronics (0.2%) | | | | | | |
Itron, Inc., 7.75%, 05/15/12 | | | 50,000 | | | 51,000 |
| | | | | |
|
|
| | Corporate Bonds (continued) |
| | | | | | |
| | | Principal
Amount | | Value |
| | | | | | | |
Finance (1.8%) | | | | | | |
Chukchansi Eco Dev Auth,
8.00%, 11/15/13 | | $ | 250,000 | | $ | 249,999 |
Global Cash Accounting & Finance, 8.75%, 03/15/12 | | | 110,000 | | | 117,013 |
Labranche & Co., 9.50%, 05/15/09 | | | 60,000 | | | 63,150 |
| | | | | |
|
|
| | | | | | | 430,162 |
| | | | | |
|
|
Food & Beverage (0.6%) | | | |
Pilgrims Pride Corp.,
9.25%, 11/15/13 | | | 50,000 | | | 54,875 |
Stater Bros. Holdings,
8.13%, 06/15/12 | | | 75,000 | | | 73,313 |
WH Holdings, 9.50%, 04/01/11 | | | 15,000 | | | 16,275 |
| | | | | |
|
|
| | | | | | | 144,463 |
| | | | | |
|
|
Forestry (0.6%) | | | |
Tembec Industries, Inc.,
8.50%, 02/01/11 | | | 220,000 | | | 139,700 |
| | | | | |
|
|
Gaming (5.0%) | | | |
American Casino & Entertainment, 7.85%, 02/01/12 | | | 55,000 | | | 56,375 |
Boyd Gaming Corp.,
6.75%, 04/15/14 | | | 105,000 | | | 103,556 |
Circus & Eldorado,
10.13%, 03/01/12 | | | 55,000 | | | 57,475 |
Hard Rock Hotel, Inc.,
8.88%, 06/01/13 | | | 110,000 | | | 117,150 |
Herbst Gaming, Inc.,
8.13%, 06/01/12 | | | 200,000 | | | 206,500 |
MGM Mirage, Inc.,
9.75%, 06/01/07 | | | 170,000 | | | 178,500 |
Park Place Entertainment Corp., 8.13%, 05/15/11 | | | 210,000 | | | 229,425 |
Poster Financial Group,
8.75%, 12/01/11 | | | 60,000 | | | 61,200 |
Premier Entertainment Biloxi, 10.75%, 02/01/12 | | | 80,000 | | | 70,400 |
Station Casinos, Inc.,
6.00%, 04/01/12 | | | 130,000 | | | 127,725 |
| | | | | |
|
|
| | | | | | | 1,208,306 |
| | | | | |
|
|
| | | | | | |
| | | Principal
Amount | | Value |
| | | | | | | |
Healthcare (5.2%) | | | |
Ameripath, Inc., 10.50%, 04/01/13 | | $ | 110,000 | | $ | 114,400 |
Beverly Enterprises, Inc.,
7.88%, 06/15/14 | | | 55,000 | | | 60,225 |
Iasis Healthcare Corp.,
8.75%, 06/15/14 | | | 50,000 | | | 51,250 |
Lifecare Holdings. Inc.,
9.25%, 08/15/13 | | | 315,000 | | | 233,099 |
Omnicare, Inc., 8.13%, 03/15/11 | | | 170,000 | | | 177,438 |
PacifiCare Health Systems,
10.75%, 06/01/09 | | | 109,000 | | | 117,448 |
Team Health, Inc., 9.00%, 04/01/12 | | | 50,000 | | | 56,250 |
Tenet Healthcare Corp.,
9.88%, 07/01/14 | | | 210,000 | | | 203,175 |
Warner Chilcott Corp.,
8.75%, 02/01/15 | | | 250,000 | | | 229,999 |
| | | | | |
|
|
| | | | | | | 1,243,284 |
| | | | | |
|
|
Insurance (0.7%) | | | |
Crum & Forster Holding Corp., 10.38%, 06/15/13 | | | 70,000 | | | 74,900 |
Fairfax Financial Holdings,
7.75%, 04/26/12 | | | 100,000 | | | 92,005 |
| | | | | |
|
|
| | | | | | | 166,905 |
| | | | | |
|
|
Leisure (1.5%) | | | |
Gaylord Entertainment Co.,
8.00%, 11/15/13 | | | 50,000 | | | 52,125 |
Host Marriott LP, 7.13%, 11/01/13 | | | 100,000 | | | 101,375 |
Universal City Florida,
8.38%, 05/01/10 (c) | | | 100,000 | | | 102,500 |
Vail Resorts, Inc., 6.75%, 02/15/14 | | | 105,000 | | | 104,475 |
| | | | | |
|
|
| | | | | | | 360,475 |
| | | | | |
|
|
Machinery & Equipment (1.8%) | | | |
Columbus McKinnon Corp.,
8.88%, 11/01/13 | | | 250,000 | | | 251,250 |
NMHG Holdings Co.,
10.00%, 05/15/09 | | | 170,000 | | | 181,475 |
| | | | | |
|
|
| | | | | | | 432,725 |
| | | | | |
|
|
Manufacturing (1.1%) | | | |
Maax Corp, 9.75%, 06/15/12 | | | 80,000 | | | 63,200 |
Reddy Ice Holdings, Inc.,
10.50%, 11/01/12 | | | 260,000 | | | 200,850 |
| | | | | |
|
|
| | | | | | | 264,050 |
| | | | | |
|
|
Statement of Investments (Continued)
October 31, 2005
Gartmore High Yield Bond Fund (Continued)
| | Corporate Bonds (continued) |
| | | | | | |
| | | Principal
Amount | | Value |
| | | | | | | |
Media (1.9%) | | | |
Canwest Media, Inc.,
8.00%, 09/15/12 | | $ | 115,000 | | $ | 120,463 |
LBI Media, Inc., 10.13%, 07/15/12 | | | 250,000 | | | 265,624 |
LBI Media, Inc., 12.13%, 10/15/13 | | | 85,000 | | | 62,263 |
| | | | | |
|
|
| | | | | | | 448,350 |
| | | | | |
|
|
Metals & Mining (0.1%) | | | |
Ispat Inland ULC, 9.75%, 04/01/14 | | | 26,000 | | | 29,380 |
| | | | | |
|
|
Oil & Gas (7.7%) | | | |
ANR Pipeline Co., 8.88%, 03/15/10 | | | 150,000 | | | 160,984 |
Chesapeake Energy Corp.,
6.25%, 01/15/18 | | | 80,000 | | | 77,600 |
El Paso Group Co., 7.75%, 06/15/10 | | | 325,000 | | | 329,875 |
EL Paso Production Holdings, 7.75%, 06/01/13 | | | 200,000 | | | 206,000 |
Forest Oil Corp., 8.00%, 06/15/08 | | | 40,000 | | | 41,900 |
Giant Industries, 11.00%, 05/15/12 | | | 70,000 | | | 77,875 |
Ocean Rig Norway AS,
8.38%, 07/01/13 | | | 115,000 | | | 123,481 |
Petrobras International Finance, 9.13%, 07/02/13 | | | 85,000 | | | 96,900 |
Petroleum Geo-Services,
10.00%, 11/05/10 | | | 185,000 | | | 204,425 |
Premcor Refining Group,
6.13%, 05/01/11 | | | 40,000 | | | 41,050 |
Southern Natural Gas,
8.88%, 03/15/10 | | | 125,000 | | | 134,153 |
Whiting Petroleum Corp.,
7.00%, 02/01/14 | | | 50,000 | | | 50,125 |
Williams Cos., Inc., 8.13%, 03/15/12 | | | 85,000 | | | 91,800 |
Williams Cos., Inc. Series A,
7.50%, 01/15/31 | | | 210,000 | | | 218,400 |
| | | | | |
|
|
| | | | | | | 1,854,568 |
| | | | | |
|
|
Paper & Forest Products (2.3%) | | | |
Boise Cascade LLC,
7.13%, 10/15/14 (c) | | | 45,000 | | | 40,050 |
Georgia Pacific Corp.,
8.88%, 02/01/10 | | | 255,000 | | | 279,225 |
Georgia Pacific Corp.,
8.00%, 01/15/24 | | | 75,000 | | | 79,875 |
JSG Funding PLC, 7.75%, 04/01/15 | | | 85,000 | | | 68,000 |
| | | | | | |
| | | Principal
Amount | | Value |
| | | | | | | |
Paper & Forest Products (continued) | | | |
Newpage Corp, 12.00%, 05/01/13 | | $ | 80,000 | | $ | 67,200 |
Stone Container Corp.,
7.38%, 07/15/14 | | | 25,000 | | | 22,188 |
| | | | | |
|
|
| | | | | | | 556,538 |
| | | | | |
|
|
Pharmaceuticals (0.1%) | | | |
Leiner Health Products,
11.00%, 06/01/12 | | | 40,000 | | | 33,200 |
| | | | | |
|
|
Publishing (0.7%) | | | |
CBD Media Holdings,
9.25%, 07/15/12 | | | 175,000 | | | 173,250 |
| | | | | |
|
|
Real Estate Development (0.2%) | | | |
Ashton Woods Usa/Finance,
9.50%, 10/01/15 | | | 50,000 | | | 46,750 |
| | | | | |
|
|
Retail (1.1%) | | | |
Finlay Fine Jewerly Corp.,
8.38%, 06/01/12 | | | 50,000 | | | 42,500 |
Jean Coutu Group PJC, Inc.,
8.50%, 08/01/14 | | | 160,000 | | | 148,400 |
Remington Arms Co.,
10.50%, 02/01/11 | | | 85,000 | | | 73,525 |
| | | | | |
|
|
| | | | | | | 264,425 |
| | | | | |
|
|
Rubber & Tires (0.5%) | | | |
Goodyear Tire & Rubber,
9.00%, 07/01/15 | | | 125,000 | | | 120,625 |
| | | | | |
|
|
Steel (0.2%) | | | |
Chaparral Steel Co.,
10.00%, 07/15/13 | | | 55,000 | | | 56,925 |
| | | | | |
|
|
Technology (2.8%) | | | |
Amkor Technology, Inc.,
9.25%, 02/15/08 | | | 80,000 | | | 76,400 |
Lucent Technologies,
6.45%, 03/15/29 | | | 185,000 | | | 158,175 |
Nortel Networks Ltd.,
6.13%, 02/15/06 | | | 125,000 | | | 124,688 |
Sanmina Corp., 10.38%, 01/15/10 | | | 170,000 | | | 186,150 |
Xerox Corp., 7.63%, 06/15/13 | | | 125,000 | | | 131,250 |
| | | | | |
|
|
| | | | | | | 676,663 |
| | | | | |
|
|
| | Corporate Bonds (continued) |
| | | | | | |
| | | Principal
Amount | | Value |
| | | | | | | |
Telecommunication Services (8.4%) | | | |
Alamosa Delaware, Inc.,
12.00%, 07/31/09 | | $ | 85,000 | | $ | 93,075 |
Digicel Ltd., 9.25%, 09/01/12 | | | 225,000 | | | 231,750 |
Insight Midwest, 10.50%, 11/01/10 | | | 125,000 | | | 131,250 |
Iwo Holdings, Inc.,
10.75%, 01/15/15 | | | 100,000 | | | 71,500 |
Level 3 Financing, Inc.,
10.75%, 10/15/11 (c) | | | 105,000 | | | 89,250 |
MCI, Inc., 6.91%, 05/01/07 | | | 9,000 | | | 9,090 |
MCI, Inc., 7.69%, 05/01/09 | | | 9,000 | | | 9,326 |
MCI, Inc., 8.74%, 05/01/14 | | | 111,000 | | | 122,933 |
Nextel Communications,
8.13%, 07/01/11 | | | 40,000 | | | 42,700 |
Nextel Communications,
5.95%, 03/15/14 | | | 170,000 | | | 170,530 |
Nextel Partners, Inc.,
12.50%, 11/15/09 | | | 113,000 | | | 120,628 |
Qwest Communication International,
7.25%, 02/15/11 (c) | | | 250,000 | | | 243,124 |
Qwest Corp., 8.88%, 03/15/12 (c) | | | 255,000 | | | 279,862 |
Rural Cellular Corp.,
9.75%, 01/15/10 | | | 160,000 | | | 159,200 |
Rural Cellular Corp.,
9.88%, 02/01/10 | | | 250,000 | | | 259,999 |
| | | | | |
|
|
| | | | | | | 2,034,217 |
| | | | | |
|
|
Transportation Services (2.2%) | | | |
American Commercial Lines, 9.50%, 02/15/15 (c) | | | 75,000 | | | 81,750 |
CHC Helicopter Corp.,
7.38%, 05/01/14 | | | 105,000 | | | 105,262 |
Greenbrier Companies, Inc.,
8.38%, 05/15/15 | | | 55,000 | | | 56,513 |
H-Lines Finance Holding,
11.00%, 04/01/13 (c) | | | 75,000 | | | 61,688 |
Horizon Lines LLC, 9.00%, 11/01/12 | | | 80,000 | | | 84,899 |
Quality Distribution,
9.00%, 11/15/10 | | | 55,000 | | | 50,119 |
Sea Containers Ltd.,
10.50%, 05/15/12 | | | 80,000 | | | 79,000 |
| | | | | |
|
|
| | | | | | | 519,231 |
| | | | | |
|
|
| | | | | | |
| | | Principal
Amount | | Value |
| | | | | | | |
Utilities (6.3%) | | | | | | |
AES Corp., 8.75%, 05/15/13 (c) | | $ | 235,000 | | $ | 253,800 |
Allegheny Energy Supply,
8.25%, 04/15/12 (c) | | | 85,000 | | | 93,925 |
Aquila, Inc., 7.63%, 11/15/09 | | | 105,000 | | | 107,625 |
Calpine Canada Energy Financing, 8.50%, 05/01/08 | | | 80,000 | | | 43,200 |
Calpine Corp., 8.50%, 07/15/10 (c) | | | 125,000 | | | 87,500 |
CMS Energy Corp.,
9.88%, 10/15/07 | | | 170,000 | | | 182,750 |
Dynegy Holdings, Inc.,
9.88%, 07/15/10 (c) | | | 105,000 | | | 112,875 |
Edison Mission Energy,
7.73%, 06/15/09 | | | 70,000 | | | 72,625 |
Edison Mission Energy,
9.88%, 04/15/11 | | | 255,000 | | | 297,074 |
Mission Energy Holding,
13.50%, 07/15/08 | | | 175,000 | | | 202,563 |
Reliant Resources, Inc.,
9.25%, 07/15/10 | | | 50,000 | | | 52,500 |
| | | | | |
|
|
| | | | | | | 1,506,437 |
| | | | | |
|
|
Waste Management (0.9%) | | | |
Allied Waste North America,
7.38%, 04/15/14 | | | 105,000 | | | 98,438 |
Allied Waste North America,
7.25%, 03/15/15 | | | 110,000 | | | 108,900 |
| | | | | |
|
|
| | | | | | | 207,338 |
| | | | | |
|
|
Wholesale Distribution (0.7%) | | | |
Aviall, Inc., 7.63%, 07/01/11 | | | 80,000 | | | 81,200 |
Buhrmann U.S., Inc.,
8.25%, 07/01/14 | | | 90,000 | | | 90,225 |
| | | | | |
|
|
| | | | | | | 171,425 |
| | | | | |
|
|
| | |
Total Corporate Bonds | | | | | | 21,007,237 |
| | | | | |
|
|
|
Yankee Bonds (1.4%) |
Containers (0.8%) | | | |
Crown Euro Holdings SA,
10.88%, 03/01/13 | | | 170,000 | | | 200,175 |
| | | | | |
|
|
Statement of Investments (Continued)
October 31, 2005
Gartmore High Yield Bond Fund (Continued)
Yankee Bonds (continued)
| | | | | | |
| | | Shares or
Principal Amount | | Value |
| | | | | | | |
Paper & Forest Products (0.6%) | | | |
Abitibi Consolidated, Inc.,
7.75%, 06/15/11 | | $ | 75,000 | | $ | 69,564 |
Abitibi Consolidated, Inc.,
6.00%, 06/20/13 | | | 85,000 | | | 70,337 |
| | | | | |
|
|
| | | | | | | 139,901 |
| | | | | |
|
|
| | |
Total Yankee Bonds | | | | | | 340,076 |
| | | | | |
|
|
|
Preferred Stocks (1.3%) |
Broadcasting (0.5%) | | | |
Spanish Broadcasting Systems, Inc., 10.75%, 10/15/13 | | | 102 | | | 108,787 |
| | | | | |
|
|
ISP Communication (0.0%) | | | | | | |
Rhythms Netconnections, Inc., 6.75%, 03/03/12 (d) (e) (f) | | | 1,691 | | | 0 |
| | | | | |
|
|
Media (0.6%) | | | |
Paxson Communications, 13.25%, 11/15/06 | | | 20 | | | 136,500 |
| | | | | |
|
|
Real Estate Investment Trusts (0.2%) | | | |
Istar Financial, Inc.,
7.80%, 09/29/08 | | | 2,215 | | | 56,261 |
| | | | | |
|
|
| | |
Total Preferred Stocks | | | | | | 301,548 |
| | | | | |
|
|
|
Common Stock (0.1%) |
Telecommunication Services (0.1%) | | | |
MCI, Inc. | | | 1,303 | | | 25,930 |
| | | | | |
|
|
| | |
Total Common Stock | | | | | | 25,930 |
| | | | | |
|
|
|
Warrants (0.0%) |
Fixed Communication (0.0%) | | | |
Maxcom Telecommunications SA, 04/01/07 (b) (d) (e) (f) | | | 46 | | | 0 |
| | | | | |
|
|
Warrants (continued)

| | | | | | |
| | | Shares or
Principal Amount | | Value |
| | | | | | | |
ISP Communication (0.0%) | | | |
Metricom, Inc.
02/15/10 (b) (d) (e) (f) | | $ | 676 | | $ | 0 |
| | | | | |
|
|
| | |
Total Warrants | | | | | | 0 |
| | | | | |
|
|
|
Cash Equivalents (9.8%) |
Investments in repurchase agreements (Collateralized by U.S. Government Agencies and U.S. Government Agency Mortgages, in a joint trading account at 3.90%, dated 10/31/05, due 11/01/05, repurchase price $2,347,464) | | | 2,347,214 | | | 2,347,214 |
| | | | | |
|
|
| | |
Total Cash Equivalents | | | | | | 2,347,214 |
| | | | | |
|
|
| |
Total Investments
(Cost $24,181,824) (a) — 99.6% | | | 23,958,180 |
| |
Other assets in excess of
liabilities — 0.4% | | | 94,828 |
| | | | | |
|
|
| |
NET ASSETS — 100.0% | | $ | 24,053,008 |
| | | | | |
|
|
| | (a) | See notes to financial statements for tax unrealized appreciation (depreciation) of securities. |
| | (c) | Represents a restricted security acquired and eligible for resale under rule 144A, which limits the resale to certain qualified buyers. These securities were deemed liquid pursuant to procedures approved by the Board of Trustees. |
| | (e) | Denotes a non-income producing security. |
| | (f) | Security has been deemed illiquid. The pricing committee has deemed the security have zero value based upon procedures adopted by the Board of Trustees. |
See notes to financial statements.
Gartmore Micro Cap Equity Fund
For the annual period ended Oct. 31, 2005, the Gartmore Micro Cap Equity Fund (Class A at NAV) returned 11.69% versus 13.92% for the Fund’s benchmark, the Wilshire Micro-Cap® Index. For broader comparison, the average return for the Fund’s Lipper peer category of Small-Cap Core Funds was 13.22%.
Micro-cap stocks performed roughly in line with their small-cap counterparts, finishing ahead of large-cap stocks but trailing mid-cap stocks during the reporting period. While market action was choppy for most of the period, a late spring/early summer rally enabled the benchmark to finish with a healthy gain. During the final three months of the reporting period, however, smaller stocks were weaker than mid-cap and large-cap stocks, as uncertainty related to rising interest rates and high energy prices caused investors to favor the relative safety of larger companies.
Our decision to underweight significantly the energy sector versus the benchmark hurt Fund performance. We thought that energy stocks were expensive early in the period, but they became even more so as the period progressed. Fortunately, solid stock selection by the Fund in energy names offset many of the negative effects of underweighting the sector as a whole. Several of the largest individual detractors from Fund performance were information technology holdings. One of these was Metrologic Instruments, Inc., a manufacturer and marketer of bar code scanning and automated data capturing solutions. Metrologic posted disappointing earnings growth due to lower-than-anticipated market growth as a result of challenging market conditions. We subsequently sold our position in the company. Another detractor from Fund performance was Sirenza Microdevices, Inc., a maker of antennas, amplifiers and other radio-frequency products. Sirenza missed an earnings target due to lackluster order growth. We continue to hold our position in the company, however, as the disappointment appears to be one time in nature.
Favorable stock selection by the Fund, particularly in the health-care and consumer discretionary sectors, helped Fund performance versus the benchmark. In health care, most of our Fund positions were in the equipment and supplies group and the services area, because we thought these firms offered more stable growth than pharmaceuticals and biotechnology firms. Two equipment holdings that performed well for the Fund were AngioDynamics, Inc. and Meridian Bioscience, Inc., both suppliers of diagnostic devices. We continue to hold Meridian Bioscience, anticipating additional upside; however we sold AngioDynamics based on valuation reasons. In the consumer discretionary sector, several specialty retailers boosted the Fund’s return. For example, men’s clothing retailer Jos. A. Bank Clothiers, Inc. was a standout for the Fund, because the company was able to manage its inventory effectively, opportunistically buying selected perennially popular items at deep discounts. Overall, the Fund’s top contributor to performance was energy holding Lufkin Industries, Inc., a provider of pumping units and other oil field equipment and services.
In our view, micro-cap stocks truly have come into their own during the past year or two. The asset class has attracted more interest with the introduction of two micro-cap indexes and a micro-cap exchange-traded fund (ETF). This increased attention, which has come not only from retail investors but also from the institutional side, should help increase the liquidity of the asset class and reduce volatility. Representing the smallest publicly traded companies, micro-cap securities can offer many dynamic growth opportunities that often depend more on company-specific factors than on overall economic conditions. We look forward to applying our disciplined stock selection skills as this exciting asset class continues to gain popularity.
Portfolio Manager:
Carl P. Wilk
| | |
Fund Performance | | Gartmore Micro Cap Equity Fund |
Average Annual Total Return
(For periods ended October 31, 2005)
| | | | | | |
| | | | | 1 Yr. | | Inception1 |
| Class A | | w/o SC2 | | 11.69% | | 26.32% |
| | | w/SC3 | | 5.28% | | 24.10% |
| Class B | | w/o SC2 | | 10.84% | | 25.37% |
| | | w/SC4 | | 5.84% | | 24.84% |
| Class C | | w/o SC2 | | 10.83% | | 25.41% |
| | | w/SC5 | | 9.83% | | 25.41% |
| Class R6,7 | | 11.61% | | 25.73% |
| Institutional Class7 | | 11.98% | | 26.63% |
| Institutional Service Class7 | | 11.93% | | 26.61% |
All figures showing the effect of a sales charge reflect the maximum charge possible, because it has the most dramatic effect on performance data.
| 1 | Fund commenced operations on June 27, 2002. |
| 2 | These returns do not reflect the effects of sales charges (SC). |
| 3 | A 5.75% front-end sales charge was deducted. |
| 4 | A 5.00% contingent deferred sales charge (CDSC) was deducted. The CDSC declines to 0% after 6 years. |
| 5 | A CDSC of 1.00% was deducted because it is charged when you sell Class C shares within the first year after purchase. |
| 6 | These returns until the creation of Class R shares (12/31/03) include the performance of the Fund’s Class B shares. The returns have been adjusted for the fact that Class R shares do not have any applicable sales charges but have not been adjusted for the lower expenses applicable to Class R shares. Excluding the effect of any fee waivers or reimbursements, such prior performance is similar to what Class R shares would have produced because the Class R shares invest in the same portfolio of securities as Class B shares. |
| 7 | Not subject to any sales charges. |
Performance of a $10,000 Investment
Investment return and principal value will fluctuate, and when redeemed, shares may be worth more or less than original cost. Past performance is no guarantee of future results and does not reflect the deduction of taxes that a shareholder would pay on fund distributions or the redemption of fund shares. Investing in mutual funds involves market risk, including loss of principal. Performance returns assume the reinvestment of all distributions.
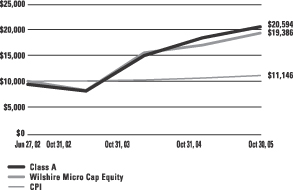
Comparative performance of $10,000 invested in Class A shares of the Gartmore Micro Cap Equity Fund, Wilshire Micro Cap Equity Index(a), and the Consumer Price Index (CPI)(b) since inception. Unlike the Fund, the returns for these unmanaged indexes do not reflect any fees, expenses, or sales charges. Investors cannot invest directly in market indexes.
| (a) | The Wilshire Micro Cap Equity Index is a capitalization-weighted index that measures small-cap stocks in the bottom “half” of the Wilshire 5000 Index. |
| (b) | The CPI represents changes in prices of a basket of goods and services purchased for consumption by urban households. |
| | |
Shareholder Expense Example | | Gartmore Micro Cap Equity Fund |
As a shareholder of the Fund, you incur two types of costs: (1) transaction costs, including sales charges (loads) paid on purchase payments and redemption fees; and (2) ongoing costs, including investment advisory fees, administration fees, distribution fees and other Fund expenses. The examples below are intended to help you understand your ongoing costs (in dollars) of investing in the Fund and to compare these costs with the ongoing costs of investing in other mutual funds. Per SEC requirements, the examples assume that you had a $1,000 investment in the Class at the beginning of the reporting period, May 1, 2005, and continued to hold your shares at the end of the reporting period, October 31, 2005.
Actual Expenses
For each Class of the Fund in the table below, the first line provides information about actual account values and actual expenses. You may use the information in this line, together with the amount you invested, to estimate the expenses that you paid over the period. Simply divide your account value by $1,000 (for example, an $8,600 account value divided by $1,000 = 8.6), then multiply the result by the number in the first line of each Class under the heading entitled “Expenses Paid During Period” to estimate the expenses you paid on your account during the period.
Hypothetical Example for Comparison Purposes
The second line of each Class in the table below provides information about hypothetical account values and hypothetical expenses based on the Class’ actual expense ratio and an assumed rate of return of 5% per year before expenses, which is not the Class’ actual return. The hypothetical account values and expenses may not be used to estimate the actual ending account balance or expenses you paid for the period. You may use this information to compare the ongoing costs of investing in the Class of the Fund and other funds. To do so, compare this 5% hypothetical example with the 5% hypothetical examples that appear in the shareholder reports of the other funds.
Please note that the expenses shown in the table are meant to highlight your ongoing costs only and do not reflect any transaction costs, such as sales charges (loads) or redemption fees. Therefore, the second line for each Class in the table is useful in comparing ongoing costs only, and will not help you determine the relative total costs of owning different funds. In addition, if these transaction costs were included, your costs would have been higher. The examples also assume all dividends and distributions have been reinvested.
Schedule of Shareholder Expenses
Expense Analysis of a $1,000 Investment
(October 31, 2005)
| | | | | | | | | | | | | | |
| Micro Cap Equity Fund | | | | | Beginning
Account Value,
5/1/05 | | Ending
Account Value,
10/31/05 | | Expenses Paid
During Period* | | Annualized
Expense Ratio* |
| Class A | | Actual | | | $ | 1,000.00 | | $ | 1,117.60 | | $ | 10.30 | | 1.93% |
| | | Hypothetical | 1 | | $ | 1,000.00 | | $ | 1,015.27 | | $ | 9.85 | | 1.93% |
| Class B | | Actual | | | $ | 1,000.00 | | $ | 1,113.30 | | $ | 14.17 | | 2.66% |
| | | Hypothetical | 1 | | $ | 1,000.00 | | $ | 1,011.59 | | $ | 13.58 | | 2.66% |
| Class C | | Actual | | | $ | 1,000.00 | | $ | 1,113.20 | | $ | 14.17 | | 2.66% |
| | | Hypothetical | 1 | | $ | 1,000.00 | | $ | 1,011.59 | | $ | 13.58 | | 2.66% |
| Class R | | Actual | | | $ | 1,000.00 | | $ | 1,117.40 | | $ | 10.57 | | 1.98% |
| | | Hypothetical | 1 | | $ | 1,000.00 | | $ | 1,015.02 | | $ | 10.11 | | 1.98% |
| Institutional Service Class | | Actual | | | $ | 1,000.00 | | $ | 1,118.90 | | $ | 8.87 | | 1.66% |
| | | Hypothetical | 1 | | $ | 1,000.00 | | $ | 1,016.63 | | $ | 8.47 | | 1.66% |
| Institutional Class | | Actual | | | $ | 1,000.00 | | $ | 1,119.40 | | $ | 8.87 | | 1.66% |
| | | Hypothetical | 1 | | $ | 1,000.00 | | $ | 1,016.63 | | $ | 8.47 | | 1.66% |
| * | Expenses are equal to the Fund’s annualized expense ratio multiplied by the average account value over the period multiplied by 184/365 (to reflect the one-half year period). The expense ratio presented represents a six month, annualized ratio in accordance with SEC guidelines. |
| 1 | Represents the hypothetical 5% return before expenses. |
| | |
Portfolio Summary | | Gartmore Micro Cap Equity Fund |
The SEC adopted a requirement that Funds present their portfolio holdings in a table, chart or graph format in their annual and semiannual reports to shareholders, whether or not a statement of investments is utilized. The following tables, which present portfolio holdings as a percentage of net assets, are provided in compliance with this requirement.
| | |
| Asset Allocation | | |
| Common Stocks | | 87.3% |
| Cash Equivalents | | 12.6% |
| Other Investments* | | 22.7% |
| Liabilities in excess of Other Assets** | | -22.6% |
| | |
|
| | | 100.0% |
| * | Includes value of collateral received from securities lending. |
| ** | Includes value of collateral owed from securities lending. |
| | |
| Top Industries | | |
| Computer Software & Services | | 9.4% |
| Telecommunications | | 6.3% |
| Medical Equipment & Supplies | | 5.4% |
| Electronics | | 4.9% |
| Retail | | 4.3% |
| Transportation | | 4.0% |
| Semiconductors | | 3.5% |
| Transportation Services | | 3.3% |
| Financial | | 3.0% |
| Restaurants | | 2.8% |
| Other Industries | | 53.1% |
| | |
|
| | | 100.0% |
| | |
| Top Holdings*** | | |
| Smith Micro Software, Inc. | | 2.7% |
| Radyne ComStream, Inc. | | 2.3% |
| Celadon Group, Inc. | | 2.3% |
| Marten Transport Ltd. | | 2.2% |
| Meridian Bioscience, Inc. | | 2.1% |
| EFJ, Inc. | | 2.0% |
| Indus International, Inc. | | 2.0% |
| Sun Hydraulics Corp. | | 2.0% |
| Kforce, Inc. | | 2.0% |
| Multi-Fineline Electronix, Inc. | | 1.9% |
| Other Holdings | | 78.5% |
| | |
|
| | | 100.0% |
| *** | For purpose of listing top holdings, repurchase agreements are considered cash equivalents and are included as part of Other Holdings. |
Statement of Investments
October 31, 2005
Gartmore Micro Cap Equity Fund
| Common Stocks (87.3%) |
| | | | | |
| | | Shares or
Principal Amount | | Value |
| | | | | | |
Advertising Services (1.6%) | | | | | |
24/7 Real Media, Inc. (b) | | 300,000 | | $ | 1,917,000 |
| | | | |
|
|
Apparel & Accessories (1.8%) | | | | | |
Jos. A. Bank Clothiers, Inc. (b) (c) | | 55,000 | | | 2,244,550 |
| | | | |
|
|
Auto Parts & Equipment (1.6%) | | | |
Impco Technologies, Inc. (b) (c) | | 380,000 | | | 1,972,200 |
| | | | |
|
|
Bank Holdings Companies (2.5%) | | | |
Pacific Premier Bancorp, Inc. (b) | | 145,000 | | | 1,754,500 |
Royal Bancshares of Pennsylvania, Inc., Class A (c) | | 53,366 | | | 1,257,839 |
| | | | |
|
|
| | | | | | 3,012,339 |
| | | | |
|
|
Capital Goods (1.9%) | | | | | |
Parlux Fragrances, Inc. (b) (c) | | 100,000 | | | 2,316,000 |
| | | | |
|
|
Chemicals (1.5%) | | | | | |
American Vanguard Corp. (c) | | 89,900 | | | 1,867,223 |
| | | | |
|
|
Commercial Services (0.3%) | | | | | |
Cash Systems, Inc. (b) | | 73,174 | | | 425,141 |
| | | | |
|
|
Computer Software & Services (9.4%) | | | |
Captiva Software Corp. (b) (c) | | 73,200 | | | 1,597,224 |
Indus International, Inc. (b) | | 850,000 | | | 2,459,900 |
MapInfo Corp. (b) (c) | | 122,400 | | | 1,504,296 |
Smith Micro Software, Inc. (b) (c) | | 453,500 | | | 3,265,200 |
Tumbleweed Communications Corp. (b) | | 425,000 | | | 1,453,500 |
WebSideStory, Inc. (b) (c) | | 69,400 | | | 1,206,866 |
| | | | |
|
|
| | | | | | 11,486,986 |
| | | | |
|
|
Consulting Services (1.6%) | | | | | |
Perficient, Inc. (b) (c) | | 250,000 | | | 1,935,000 |
| | | | |
|
|
Containers & Packaging (0.4%) | | | |
Packaging Dynamics Corp. | | 53,057 | | | 540,120 |
| | | | |
|
|
Cosmetics (1.0%) | | | | | |
CCA Industries, Inc. | | 150,000 | | | 1,188,000 |
| | | | |
|
|
Electronic Components (1.4%) | | | | | |
NVE Corp. (b) (c) | | 122,700 | | | 1,677,309 |
| | | | |
|
|
| | | | | |
| | | Shares or
Principal Amount | | Value |
| | | | | | |
Electronics (4.9%) | | | | | |
Cyberoptics Corp. (b) (c) | | 127,000 | | $ | 1,681,480 |
Fargo Electronics (b) | | 101,100 | | | 1,904,724 |
Multi-Fineline Electronix, Inc. (b) (c) | | 90,000 | | | 2,395,800 |
| | | | |
|
|
| | | | | | 5,982,004 |
| | | | |
|
|
Financial (3.0%) | | | | | |
FirstCity Financial Corp. (b) | | 120,000 | | | 1,380,000 |
World Acceptance Corp. (b) (c) | | 83,100 | | | 2,338,434 |
| | | | |
|
|
| | | | | | 3,718,434 |
| | | | |
|
|
Gambling (Non-Hotel Casinos) (1.2%) | | | |
Mikohn Gaming Corp. (b) (c) | | 141,200 | | | 1,481,188 |
| | | | |
|
|
Healthcare (2.1%) | | | | | |
Allied Healthcare International, Inc. (b) | | 240,300 | | | 1,463,427 |
Option Care, Inc. (c) | | 85,000 | | | 1,059,950 |
| | | | |
|
|
| | | | | | 2,523,377 |
| | | | |
|
|
Hotels & Motels (0.9%) | | | | | |
Jameson Inns, Inc. (b) | | 500,000 | | | 1,040,000 |
| | | | |
|
|
Human Resources (2.0%) | | | | | |
Kforce, Inc. (b) (c) | | 225,000 | | | 2,430,000 |
| | | | |
|
|
Insurance Brokers (1.1%) | | | | | |
James River Group, Inc. (b) (c) | | 70,000 | | | 1,323,000 |
| | | | |
|
|
Internet (1.3%) | | | | | |
Youbet.com, Inc. (b) | | 263,803 | | | 1,601,284 |
| | | | |
|
|
Machinery (1.1%) | | | | | |
Gehl Co. (b) (c) | | 60,738 | | | 1,395,152 |
| | | | |
|
|
Medical Equipment & Supplies (5.4%) | | | |
Encore Medical Corp. (b) | | 16,600 | | | 83,166 |
Lifeline Systems, Inc. (b) (c) | | 50,000 | | | 1,650,000 |
Memry Corp. (b) | | 54,720 | | | 92,477 |
Meridian Bioscience, Inc. (c) | | 120,000 | | | 2,512,800 |
ThermoGenesis Corp. (b) | | 450,000 | | | 2,241,000 |
| | | | |
|
|
| | | | | | 6,579,443 |
| | | | |
|
|
Medical Services (1.2%) | | | | | |
Metropolitan Health Networks, Inc. (b) | | 650,000 | | | 1,527,500 |
| | | | |
|
|
Statement of Investments (Continued)
October 31, 2005
Gartmore Micro Cap Equity Fund (Continued)
| Common Stocks (continued) |
| | | | | |
| | | Shares or
Principal Amount | | Value |
| | | | | | |
Metal Processors (2.0%) | | | | | |
Sun Hydraulics Corp. (c) | | 110,000 | | $ | 2,437,600 |
| | | | |
|
|
Oil & Gas (1.9%) | | | | | |
Lufkin Industries, Inc. | | 49,786 | | | 2,315,049 |
| | | | |
|
|
Printing (1.8%) | | | | | |
Multi-Color Corp. (c) | | 90,000 | | | 2,147,409 |
| | | | |
|
|
Real Estate Services (0.5%) | | | | | |
HouseValues, Inc. (b) (c) | | 40,099 | | | 590,257 |
| | | | |
|
|
Research & Development (1.7%) | | | |
Kendle International, Inc. (b) | | 87,700 | | | 2,111,816 |
| | | | |
|
|
Restaurants (2.8%) | | | | | |
Buffalo Wild Wings, Inc. (b) (c) | | 50,000 | | | 1,372,000 |
Famous Dave’s of America, Inc. (b) | | 175,000 | | | 2,094,750 |
| | | | |
|
|
| | | | | | 3,466,750 |
| | | | |
|
|
Retail (4.3%) | | | | | |
Collegiate Pacific, Inc. (c) | | 140,000 | | | 1,603,000 |
Sportsman’s Guide, Inc. (The) (b) | | 80,000 | | | 2,106,400 |
Zumiez, Inc. (b) (c) | | 45,000 | | | 1,536,300 |
| | | | |
|
|
| | | | | | 5,245,700 |
| | | | |
|
|
Semiconductors (3.5%) | | | | | |
FSI International, Inc. (b) | | 305,571 | | | 1,176,448 |
Kopin Corp. (b) (c) | | 290,000 | | | 1,638,500 |
Nanometrics, Inc. (b) | | 115,400 | | | 1,194,390 |
Rudolph Technologies, Inc. (b) (c) | | 25,000 | | | 304,500 |
| | | | |
|
|
| | | | | | 4,313,838 |
| | | | |
|
|
Services (1.6%) | | | | | |
Providence Service Corp. (b) (c) | | 65,000 | | | 2,006,550 |
| | | | |
|
|
Technology (0.7%) | | | | | |
Digi International, Inc. (b) (c) | | 80,000 | | | 848,800 |
| | | | |
|
|
Telecommunication Equipment (0.4%) | | | |
Sirenza Microdevices, Inc. (b) | | 150,000 | | | 480,000 |
| | | | |
|
|
Telecommunications (6.3%) | | | | | |
Airspan Networks, Inc. (b) (c) | | 289,832 | | | 1,443,363 |
EFJ, Inc. (b) | | 250,000 | | | 2,485,000 |
| | | | | | |
| | | Shares or
Principal Amount | | Value |
| | | | | | | |
Telecommunications (continued) | | | |
NMS Communications Corp. (b) (c) | | | 272,533 | | $ | 953,866 |
Radyne ComStream, Inc. (b) | | | 240,000 | | | 2,803,200 |
| | | | | |
|
|
| | | | | | | 7,685,429 |
| | | | | |
|
|
Transportation (4.0%) | | | | | | |
Celadon Group, Inc. (b) (c) | | | 120,000 | | | 2,779,200 |
MC Shipping, Inc. | | | 215,800 | | | 2,082,470 |
| | | | | |
|
|
| | | | | | | 4,861,670 |
| | | | | |
|
|
Transportation Services (3.3%) | | | |
Dynamex, Inc. (b) (c) | | | 84,400 | | | 1,385,848 |
Marten Transport Ltd. (b) (c) | | | 100,000 | | | 2,657,000 |
| | | | | |
|
|
| | | | | | | 4,042,848 |
| | | | | |
|
|
Veterinary Diagnostics (1.1%) | | | | | | |
Neogen Corp. (b) | | | 70,343 | | | 1,295,015 |
| | | | | |
|
|
Veterinary Services (1.6%) | | | | | | |
PetMed Express, Inc. (b) (c) | | | 180,000 | | | 1,999,800 |
| | | | | |
|
|
Wireless Equipment (0.6%) | | | | | | |
Globecomm Systems, Inc. (b) (c) | | | 97,700 | | | 714,187 |
| | | | | |
|
|
| | |
Total Common Stocks | | | | | | 106,745,968 |
| | | | | |
|
|
|
Cash Equivalents (12.6%) |
Investments in repurchase agreements (Collateralized by U.S. Government Agencies and U.S. Government Agency Mortgages, in a joint trading account at 3.90%, dated 10/31/05, due 11/01/05, repurchase price $15,376,806) | | $ | 15,375,163 | | | 15,375,163 |
| | | | | |
|
|
| | |
Total Cash Equivalents | | | | | | 15,375,163 |
| | | | | |
|
|
Short-Term Securities Held as Collateral for Securities
Lending (22.7%)
| | | | | | | |
| | | Shares or
Principal Amount | | Value | |
Pool of short-term securities for Gartmore Mutual Funds — note 2 (Securities Lending) | | $ | 27,810,992 | | $ | 27,810,992 | |
| | | | | |
|
|
|
| |
Total Short-Term Securities Held as Collateral for Securities Lending | | | 27,810,992 | |
| | | | | |
|
|
|
| |
Total Investments
(Cost $133,972,733) (a) — 122.6% | | | 149,932,123 | |
| | |
Liabilities in excess of other
assets — (22.6%) | | | | | | (27,590,279 | ) |
| | | | | |
|
|
|
| | |
NET ASSETS — 100.0% | | | | | $ | 122,341,844 | |
| | | | | |
|
|
|
| | (a) | See notes to financial statements for unrealized appreciation (depreciation) of securities. |
| | (b) | Denotes a non-income producing security. |
| | (c) | All or part of the security was on loan as of October 31, 2005. |
See notes to financial statements.
Gartmore Small Cap Growth Fund
On Aug. 22, 2005, Jayne Stevlingson, CFA, Vice President and Senior Portfolio Manager assumed portfolio co-management responsibilities for the Fund.
For the annual period ended Oct. 31, 2005, the Gartmore Small Cap Growth Fund returned -0.22% (Class A at NAV), versus 10.91% for its benchmark, the Russell 2000® Growth Index. For broader comparison, the average return for the Fund’s Lipper peer category of Small-Cap Core Funds was 13.22%.
The gains in small-cap growth stocks were due in large part to a strong rally that occurred in May, June and July on the heels of better-than-expected first-quarter earnings reports. Market action was choppy before and after that three-month period, as rising interest rates and surging crude oil prices combined to keep investors on the defensive. Small-cap shares turned in better performances than large caps but trailed the mid-cap group. Meanwhile, value stocks had a clear edge over growth stocks during the 12 months under review.
Unfavorable stock selection in the information technology and health care sectors was primarily responsible for the Fund’s underperformance. Within technology, our Internet software and services holdings were particularly disappointing, along with our picks in the semiconductors and semiconductor equipment segment. Although many stocks in these groups managed short bursts of appreciation during the period, there was a lack of follow-through, in most cases due to poor earnings growth. Axcelis Technologies, Inc. and SigmaTel, Inc. were two of the Fund’s semiconductor holdings that had a negative impact on performance, while VeriSign, Inc., whose share price was hurt by several downward revisions in its third-quarter sales forecast, was a detractor in the Internet software and services group. In health care, HMO Centene Corp. was a weak performer. Meanwhile, the share price of the Fund’s holdings in the educational loan-servicing company The First Marblehead Corp. sagged in connection with the resignation of its CEO following allegations of improper gift-giving.
On the positive side, Fund performance was helped by solid stock picking in industrials and utilities, and by an overweighting in the latter sector. Top Fund-performance contributors included medical device holding Syneron Medical Ltd., which gained on the news of favorable test results for its VelaSmooth cellulite reduction system. Southeastern Energy was another outperformer for the Fund as high crude oil prices boosted demand for the company’s drilling services. The share price of another Fund holding, Florida Rock Industries, Inc., a provider of construction materials, posted a large gain due to a healthy regional economy and expectations of strong demand driven by rebuilding efforts to repair damage sustained during the hurricane season. In recent months, we scaled back the Fund’s exposure to the volatile semiconductor group and looked for opportunities in other technology subsectors. Two of those picks were The Nasdaq Stock Market, Inc. and Shanda Interactive Entertainment Ltd., an Internet gaming company. Both of these stocks helped Fund performance.
In an effort to improve returns, we have brought the Fund’s sector weightings closer to those of the Fund’s benchmark Index. Our focus will be on trying to add value through stock picking within sectors. Looking ahead, we foresee the market receiving a boost in the coming year as investors begin to anticipate a topping out of the current interest-rate cycle. What’s more, although energy prices have likely entered a new era of higher levels by historical standards, we think crude oil could see further declines from recent price levels of about $70 per barrel toward the end of the reporting period. These positive factors, however, likely will be tempered somewhat by decelerating corporate earnings growth. We are comfortable with the companies currently in the Fund’s portfolio and will continue our search for the market’s highest-quality small-cap growth companies.
Portfolio Managers:
Gil Knight and Jayne Stevlingson, CFA
| | |
Fund Performance | | Gartmore Small Cap Growth Fund |
Aggregate Total Return
(For periods ended October 31, 2005)
| | | | | | |
| | | | | 1 Yr. | | Inception1 |
| Class A | | w/o SC2 | | -0.22% | | -5.44% |
| | | w/SC3 | | -5.96% | | -8.90% |
| Class B | | w/o SC2 | | -1.09% | | -6.15% |
| | | w/SC4 | | -6.04% | | -8.53% |
| Class C | | w/o SC2 | | -0.98% | | -6.09% |
| | | w/SC5 | | -1.97% | | -6.68% |
| Class R6 | | | | -0.33% | | -5.57% |
| Institutional Service Class6 | | 0.00% | | -5.18% |
| Institutional Class6 | | 0.00% | | -5.18% |
All figures showing the effect of a sales charge reflect the maximum charge possible, because it has the most dramatic effect on performance data.
| 1 | Fund commenced operations on March 30, 2004. |
| 2 | These returns do not reflect the effects of sales charges (SC). |
| 3 | A 5.75% front-end sales charge was deducted. |
| 4 | A 5.00% contingent deferred sales charge (CDSC) was deducted. The CDSC declines to 0% after 6 years. |
| 5 | A CDSC of 1.00% was deducted because it is charged when you sell Class C shares within the first year after purchase. |
| 6 | Not subject to any sales charges. |
Performance of a $10,000 Investment
Investment return and principal value will fluctuate, and when redeemed, shares may be worth more or less than original cost. Past performance is no guarantee of future results and does not reflect the deduction of taxes that a shareholder would pay on fund distributions or the redemption of fund shares. Investing in mutual funds involves market risk, including loss of principal. Performance returns assume the reinvestment of all distributions.
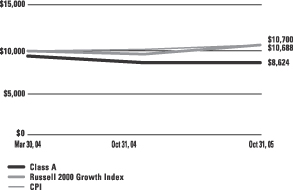
Comparative performance of $10,000 invested in Class A shares of the Gartmore Small Cap Growth Fund, Russell 2000 Growth Index(a), and the Consumer Price Index (CPI)(b) since inception. Unlike the Fund, the returns for these unmanaged indexes do not reflect any fees, expenses, or sales charges. Investors cannot invest directly in market indexes.
| (a) | The Russell 2000 Growth Index is an unmanaged index of securities of small capitalization companies. |
| (b) | The CPI represents changes in prices of a basket of goods and services purchased for consumption by urban households. |
| | |
Shareholder Expense Example | | Gartmore Small Cap Growth Fund |
As a shareholder of the Fund, you incur two types of costs: (1) transaction costs, including sales charges (loads) paid on purchase payments and redemption fees; and (2) ongoing costs, including investment advisory fees, administration fees, distribution fees and other Fund expenses. The examples below are intended to help you understand your ongoing costs (in dollars) of investing in the Fund and to compare these costs with the ongoing costs of investing in other mutual funds. Per SEC requirements, the examples assume that you had a $1,000 investment in the Class at the beginning of the reporting period, May 1, 2005, and continued to hold your shares at the end of the reporting period, October 31, 2005.
Actual Expenses
For each Class of the Fund in the table below, the first line provides information about actual account values and actual expenses. You may use the information in this line, together with the amount you invested, to estimate the expenses that you paid over the period. Simply divide your account value by $1,000 (for example, an $8,600 account value divided by $1,000 = 8.6), then multiply the result by the number in the first line of each Class under the heading entitled “Expenses Paid During Period” to estimate the expenses you paid on your account during the period.
Hypothetical Example for Comparison Purposes
The second line of each Class in the table below provides information about hypothetical account values and hypothetical expenses based on the Class’ actual expense ratio and an assumed rate of return of 5% per year before expenses, which is not the Class’ actual return. The hypothetical account values and expenses may not be used to estimate the actual ending account balance or expenses you paid for the period. You may use this information to compare the ongoing costs of investing in the Class of the Fund and other funds. To do so, compare this 5% hypothetical example with the 5% hypothetical examples that appear in the shareholder reports of the other funds.
Please note that the expenses shown in the table are meant to highlight your ongoing costs only and do not reflect any transaction costs, such as sales charges (loads) or redemption fees. Therefore, the second line for each Class in the table is useful in comparing ongoing costs only, and will not help you determine the relative total costs of owning different funds. In addition, if these transaction costs were included, your costs would have been higher. The examples also assume all dividends and distributions have been reinvested.
Schedule of Shareholder Expenses
Expense Analysis of a $1,000 Investment
(October 31, 2005)
| | | | | | | | | | | | | | |
| Small Cap Growth Fund | | | | | Beginning
Account Value,
5/1/ 05 | | Ending
Account Value,
10/31/05 | | Expenses Paid
During Period* | | Annualized
Expense Ratio* |
| Class A | | Actual | | | $ | 1,000.00 | | $ | 1,073.90 | | $ | 8.36 | | 1.60% |
| | | Hypothetical | 1 | | $ | 1,000.00 | | $ | 1,016.93 | | $ | 8.17 | | 1.60% |
| Class B | | Actual | | | $ | 1,000.00 | | $ | 1,068.60 | | $ | 12.25 | | 2.35% |
| | | Hypothetical | 1 | | $ | 1,000.00 | | $ | 1,013.15 | | $ | 11.99 | | 2.35% |
| Class C | | Actual | | | $ | 1,000.00 | | $ | 1,069.70 | | $ | 12.26 | | 2.35% |
| | | Hypothetical | 1 | | $ | 1,000.00 | | $ | 1,013.15 | | $ | 11.99 | | 2.35% |
| Class R | | Actual | | | $ | 1,000.00 | | $ | 1,072.90 | | $ | 8.93 | | 1.71% |
| | | Hypothetical | 1 | | $ | 1,000.00 | | $ | 1,016.38 | | $ | 8.73 | | 1.71% |
| Institutional Service Class | | Actual | | | $ | 1,000.00 | | $ | 1,074.90 | | $ | 7.01 | | 1.34% |
| | | Hypothetical | 1 | | $ | 1,000.00 | | $ | 1,018.24 | | $ | 6.84 | | 1.34% |
| Institutional Class | | Actual | | | $ | 1,000.00 | | $ | 1,074.90 | | $ | 7.06 | | 1.35% |
| | | Hypothetical | 1 | | $ | 1,000.00 | | $ | 1,018.19 | | $ | 6.89 | | 1.35% |
| * | Expenses are equal to the Fund’s annualized expense ratio multiplied by the average account value over the period multiplied by 184/365 (to reflect the one-half year period). The expense ratio presented represents a six month, annualized ratio in accordance with SEC guidelines. |
| 1 | Represents the hypothetical 5% return before expenses. |
| | |
Portfolio Summary | | Gartmore Small Cap Growth Fund |
The SEC adopted a requirement that Funds present their portfolio holdings in a table, chart or graph format in their annual and semiannual reports to shareholders, whether or not a statement of investments is utilized. The following tables, which present portfolio holdings as a percentage of net assets, are provided in compliance with this requirement.
| | |
| Asset Allocation | | |
| Common Stocks | | 96.6% |
| Cash Equivalents | | 1.7% |
| Other Assets in excess of Liabilities | | 1.7% |
| | |
|
| | | 100.0% |
| | |
| Top Industries | | |
| Medical | | 8.8% |
| Energy | | 5.7% |
| Building | | 5.3% |
| Computer Products | | 4.0% |
| Health Services | | 3.9% |
| Oil & Gas | | 3.5% |
| Machinery, Equipment, & Supplies | | 3.3% |
| Electronic Components | | 3.1% |
| Casino Hotels | | 3.1% |
| Retail | | 3.1% |
| Other Industries | | 56.2% |
| | |
|
| | | 100.0% |
| | |
| Top Holdings* | | |
| Healthcare Services Group, Inc. | | 1.8% |
| Webex Communications, Inc. | | 1.6% |
| Grand Prideco, Inc. | | 1.5% |
| Extreme Networks, Inc. | | 1.4% |
| Thermo Electron Corp. | | 1.4% |
| Airtran Holdings, Inc. | | 1.4% |
| Hurco Co. | | 1.4% |
| Life Time Fitness, Inc. | | 1.4% |
| Glenayre Technologies, Inc. | | 1.4% |
| Aspen Technologies, Inc. | | 1.4% |
| Other Holdings | | 85.3% |
| | |
|
| | | 100.0% |
| * | For purpose of listing top holdings, repurchase agreements are considered cash equivalents and are included as part of Other Holdings. |
Statement of Investments
October 31, 2005
Gartmore Small Cap Growth Fund
| Common Stocks (96.6%) |
| | | | | |
| | | Shares or
Principal Amount | | Value |
| | | | | | |
Advertising Agencies (0.9%) | | | | | |
Monster Worldwide, Inc. (b) | | 800 | | $ | 26,248 |
| | | | |
|
|
Aerospace & Defense (0.5%) | | | | | |
Armor Holdings, Inc. (b) | | 300 | | | 13,413 |
| | | | |
|
|
Amusement & Recreation (2.0%) | | | |
Boyd Gaming Corp. | | 700 | | | 28,875 |
Magna Entertainment (b) | | 4,590 | | | 30,661 |
| | | | |
|
|
| | | | | | 59,536 |
| | | | |
|
|
Applications Software (0.7%) | | | | | |
American Reprographics (b) | | 1,300 | | | 21,905 |
| | | | |
|
|
Banking (1.0%) | | | | | |
Prosperity Bancshares, Inc. | | 1,000 | | | 30,490 |
| | | | |
|
|
Beverages (1.0%) | | | | | |
Hansen Natural Corp. (b) | | 600 | | | 30,312 |
| | | | |
|
|
Biological Products (2.1%) | | | | | |
Cotherix, Inc. (b) | | 2,200 | | | 31,350 |
Protein Design Labs (b) | | 1,100 | | | 30,822 |
| | | | |
|
|
| | | | | | 62,172 |
| | | | |
|
|
Blankbooks & Looseleaf Binders (0.3%) | | | |
Efunds Corp. (b) | | 400 | | | 8,252 |
| | | | |
|
|
Building (5.3%) | | | | | |
Chicago Bridge and Iron Co. | | 1,800 | | | 40,140 |
Florida Rock Industries, Inc. | | 600 | | | 34,140 |
Granite Construction, Inc. | | 800 | | | 27,288 |
Simpson Manufacturing Co., Inc. | | 500 | | | 19,730 |
Washington Group International (b) | | 700 | | | 34,790 |
| | | | |
|
|
| | | | | | 156,088 |
| | | | |
|
|
Business Services (2.2%) | | | | | |
Extreme Networks, Inc. (b) | | 8,800 | | | 42,504 |
Internet Capital Group, Inc. (b) | | 2,700 | | | 23,058 |
| | | | |
|
|
| | | | | | 65,562 |
| | | | |
|
|
Casino Hotels (3.1%) | | | | | |
Scientific Games Corp. (b) | | 1,100 | | | 32,956 |
Shuffle Master, Inc. (b) | | 1,200 | | | 30,432 |
Sunstone Hotel Investors, Inc. | | 1,200 | | | 26,880 |
| | | | |
|
|
| | | | | | 90,268 |
| | | | |
|
|
| | | | | |
| | | Shares or
Principal Amount | | Value |
| | | | | | |
Communication (1.1%) | | | | | |
Crown Castle International Corp. (b) | | 1,300 | | $ | 31,876 |
| | | | |
|
|
Computer Products (4.0%) | | | | | |
Alloy Online, Inc. (b) | | 6,100 | | | 28,060 |
Micros Systems, Inc. (b) | | 500 | | | 22,960 |
Mro Software, Inc. (b) | | 1,200 | | | 19,656 |
Webex Communications, Inc. (b) | | 2,100 | | | 48,111 |
| | | | |
|
|
| | | | | | 118,787 |
| | | | |
|
|
Computer Services (1.6%) | | | | | |
Metasolv Inc. (b) | | 4,040 | | | 11,150 |
Sra Intl, Inc. (b) | | 1,100 | | | 36,102 |
| | | | |
|
|
| | | | | | 47,252 |
| | | | |
|
|
Computer Software (2.4%) | | | | | |
Aspen Technologies, Inc. (b) | | 6,700 | | | 40,535 |
F5 Networks, Inc. (b) | | 600 | | | 31,218 |
| | | | |
|
|
| | | | | | 71,753 |
| | | | |
|
|
Consulting Services (2.1%) | | | | | |
Corporate Executive Board | | 400 | | | 33,056 |
The Advisory Board Co. (b) | | 600 | | | 28,950 |
| | | | |
|
|
| | | | | | 62,006 |
| | | | |
|
|
Distribution (1.3%) | | | | | |
Keystone Automotive Industries, Inc. (b) | | 50 | | | 1,431 |
LKQ Corp. (b) | | 1,200 | | | 36,360 |
| | | | |
|
|
| | | | | | 37,791 |
| | | | |
|
|
Electric & Electronic Equipment (1.4%) | | | |
Hurco Co. (b) | | 2,300 | | | 41,009 |
| | | | |
|
|
Electronic Components (3.1%) | | | | | |
Mercury Computer Systems Inc. (b) | | 1,700 | | | 32,283 |
Micrel, Inc. (b) | | 2,800 | | | 28,000 |
Provide Commerce (b) | | 1,300 | | | 31,629 |
| | | | |
|
|
| | | | | | 91,912 |
| | | | |
|
|
Energy (5.7%) | | | | | |
Grand Prideco, Inc. (b) | | 1,100 | | | 42,779 |
Headwaters, Inc. (b) | | 800 | | | 25,472 |
Newfield Exploration Co. (b) | | 700 | | | 31,731 |
Ormat Technologies Inc | | 1,000 | | | 20,380 |
Southwestern Energy Co. (b) | | 200 | | | 14,508 |
Tidewater, Inc. | | 700 | | | 32,172 |
| | | | |
|
|
| | | | | | 167,042 |
| | | | |
|
|
| | | | | | |
Common Stocks (continued)
| |
| | | | | |
| | | Shares or
Principal Amount | | Value |
| | | | | | |
Engineering (1.2%) | | | | | |
Foster Wheeler Ltd. (b) | | 1,300 | | $ | 36,764 |
| | | | |
|
|
Equipment Rental & Leasing (1.0%) | | | |
Tal International Group Inc. (b) | | 1,600 | | | 28,976 |
| | | | |
|
|
Finance Services (2.0%) | | | | | |
NASDAQ Stock Market, Inc. (b) | | 900 | | | 27,801 |
Portfolio Recovery Associates, Inc. (b) | | 800 | | | 31,120 |
| | | | |
|
|
| | | | | | 58,921 |
| | | | |
|
|
Health Services (3.9%) | | | | | |
Allscripts Healthcare Solution, Inc. (b) | | 1,100 | | | 17,600 |
Arthrocare Corp. (b) | | 400 | | | 14,692 |
Immucor, Inc. (b) | | 1,200 | | | 31,104 |
Orasure Technologies Inc. (b) | | 2,500 | | | 27,525 |
Sierra Health Services, Inc. (b) | | 300 | | | 22,500 |
| | | | |
|
|
| | | | | | 113,421 |
| | | | |
|
|
Insurance (1.5%) | | | | | |
Aspen Insurance Holdings Ltd | | 700 | | | 16,933 |
Max Re Capital Ltd. | | 600 | | | 14,346 |
Partnerre Ltd. | | 200 | | | 12,744 |
| | | | |
|
|
| | | | | | 44,023 |
| | | | |
|
|
Machinery, Equipment, & Supplies (3.3%) | | | |
Advanced Energy Industries (b) | | 2,200 | | | 23,650 |
ASM Lithography Holding NV (b) | | 1,800 | | | 30,564 |
Thermo Electron Corp. (b) | | 1,400 | | | 42,266 |
| | | | |
|
|
| | | | | | 96,480 |
| | | | |
|
|
Management Consulting Services (0.6%) | | | |
Omnicell Inc. (b) | | 1,600 | | | 16,960 |
| | | | |
|
|
Manufacturing (1.9%) | | | | | |
Clarcor, Inc. | | 1,100 | | | 30,250 |
Ixia (b) | | 2,100 | | | 26,502 |
| | | | |
|
|
| | | | | | 56,752 |
| | | | |
|
|
Medical (8.8%) | | | | | |
Amicas, Inc. (b) | | 5,500 | | | 24,145 |
Arena Pharmaceuticals, Inc. (b) | | 700 | | | 7,280 |
Aspect Medical Systems, Inc. (b) | | 500 | | | 16,310 |
Cerner Corp. (b) | | 300 | | | 25,335 |
| | | | | |
| | | Shares or
Principal Amount | | Value |
| | | | | | |
| | | | | | |
Medical (continued) | | | |
Healthcare Services Group, Inc. | | 2,850 | | $ | 53,124 |
Lifeline Systems (b) | | 1,100 | | | 36,300 |
Pediatrix Medical Group, Inc. (b) | | 400 | | | 30,824 |
Psychiatric Solutions, Inc. (b) | | 700 | | | 38,290 |
Symbion Inc., Co. (b) | | 1,300 | | | 29,419 |
| | | | |
|
|
| | | | | | 261,027 |
| | | | |
|
|
Metal Forgings & Stampings (0.5%) | | | |
Commercial Metals Co. | | 500 | | | 15,895 |
| | | | |
|
|
Metal Mining (0.7%) | | | | | |
Inco, Ltd. | | 500 | | | 20,110 |
| | | | |
|
|
Newspapers (1.0%) | | | | | |
HARTE-HANKS, Inc. | | 1,100 | | | 28,160 |
| | | | |
|
|
Oil & Gas (3.5%) | | | | | |
Frontier Oil Corp. | | 400 | | | 14,752 |
Grey Wolf, Inc. (b) | | 3,600 | | | 27,648 |
Helmerich & Payne, Inc. | | 400 | | | 22,160 |
RPC Energy Services, Inc. | | 1,400 | | | 38,444 |
| | | | |
|
|
| | | | | | 103,004 |
| | | | |
|
|
Pharmaceuticals (1.8%) | | | | | |
Abgenix, Inc. (b) | | 2,600 | | | 27,040 |
Adams Respiratory Therapeutics Inc. (b) | | 700 | | | 26,180 |
| | | | |
|
|
| | | | | | 53,220 |
| | | | |
|
|
Prepackaged Software (2.8%) | | | | | |
Interwoven Software, Inc. (b) | | 1,700 | | | 15,980 |
Sumtotal Systems, Inc. (b) | | 7,700 | | | 34,881 |
Webmethods, Inc. (b) | | 4,500 | | | 31,320 |
| | | | |
|
|
| | | | | | 82,181 |
| | | | |
|
|
Raw Materials (1.1%) | | | | | |
Vulcan Materials Company | | 500 | | | 32,500 |
| | | | |
|
|
Real Estate (0.6%) | | | | | |
Trammell Crow Co. (b) | | 700 | | | 17,899 |
| | | | |
|
|
Real Estate Investment Trusts (2.5%) | | | |
Colonial Properties Trust | | 800 | | | 34,968 |
Equity Office Properties | | 900 | | | 27,720 |
Federal Realty Investment Trust | | 200 | | | 12,130 |
| | | | |
|
|
| | | | | | 74,818 |
| | | | |
|
|
Statement of Investments (Continued)
October 31, 2005
Gartmore Small Cap Growth Fund (Continued)
Common Stocks (continued)
| | | | | |
| | | Shares or
Principal Amount | | Value |
| | | | | | |
Recreational Centers (1.4%) | | | | | |
Life Time Fitness, Inc. (b) | | 1,100 | | $ | 40,854 |
| | | | |
|
|
Restaurants (0.5%) | | | | | |
P.F. Chang’s China Bistro, Inc. (b) | | 300 | | | 13,722 |
| | | | |
|
|
Retail (3.1%) | | | | | |
Abercrombie & Fitch Co. | | 600 | | | 31,194 |
Hibbet Sporting Goods, Inc. (b) | | 900 | | | 23,607 |
Hot Topic, Inc. (b) | | 1,400 | | | 20,846 |
Tractor Supply Co. (b) | | 300 | | | 14,550 |
| | | | |
|
|
| | | | | | 90,197 |
| | | | |
|
|
Security & Commodity Brokers (0.4%) | | | |
Cbot Holding Inc. (b) | | 100 | | | 10,650 |
| | | | |
|
|
Semiconductors & Related Devices (1.7%) | | | |
MEMC Electronic Materials, Inc. (b) | | 1,700 | | | 30,498 |
Microtune, Inc. (b) | | 4,000 | | | 15,440 |
Netlogic Microsystems, Inc. (b) | | 190 | | | 3,716 |
| | | | |
|
|
| | | | | | 49,654 |
| | | | |
|
|
Surgical & Medical Instruments (0.8%) | | | |
I-FLOW Corp. (b) | | 2,000 | | | 24,140 |
| | | | |
|
|
Telecom Equipment (2.5%) | | | | | |
Ditech Communications Corp. (b) | | 2,300 | | | 14,651 |
SBA Communications Corp. (b) | | 2,400 | | | 35,448 |
Westell Technologies, Inc. (b) | | 4,700 | | | 22,090 |
| | | | |
|
|
| | | | | | 72,189 |
| | | | |
|
|
Telephone Communication (1.4%) | | | |
Glenayre Technologies, Inc. (b) | | 10,700 | | | 40,339 |
| | | | |
|
|
Textile Goods (0.4%) | | | | | |
Deckers Outdoor (b) | | 700 | | | 12,005 |
| | | | |
|
|
Transportation (2.8%) | | | | | |
Airtran Holdings, Inc. (b) | | 2,800 | | | 41,888 |
AMR Corp. (b) | | 1,900 | | | 25,669 |
EGL, Inc. (b) | | 500 | | | 14,015 |
| | | | |
|
|
| | | | | | 81,572 |
| | | | |
|
|
Veterinary Services, Specialties (0.3%) | | | |
MWI Veterinary Supply, Inc. (b) | | 400 | | | 8,968 |
| | | | |
|
|
Wood Containers (0.8%) | | | | | |
Mobile Mini, Inc. (b) | | 500 | | | 23,340 |
| | | | |
|
|
| | |
Total Common Stocks | | | | | 2,842,415 |
| | | | |
|
|
Cash Equivalents (1.7%)
| | | | | | |
| | | Principal
Amount | | Value |
| | | | | | | |
Investments in repurchase agreements (collateralized by U.S. Government Agencies and U.S. Government Agency Mortgages, in a joint trading account at 3.90%, dated 10/31/05, due 11/01/05, repurchase price $49,981) | | $ | 49,976 | | $ | 49,976 |
| | | | | |
|
|
| | |
Total Cash Equivalents | | | | | | 49,796 |
| | | | | |
|
|
| |
Total Investments
(Cost $2,837,396) (a) — 98.3% | | | 2,892,391 |
| | |
Other assets in excess of liabilities — 1.7% | | | | | | 49,379 |
| | | | | |
|
|
| | |
NET ASSETS — 100.0% | | | | | $ | 2,941,770 |
| | | | | |
|
|
| | (a) | See notes to financial statements for tax unrealized appreciation (depreciation) of securities. |
| | (b) | Non-income producing securities. |
See notes to financial statements.
Gartmore U.S. Growth Leaders Long-Short Fund
For the annual period ended Oct. 31, 2005, the Gartmore U.S. Growth Leaders Long-Short Fund returned 6.09% (Class A at NAV) versus 2.68% for its benchmark, the Citigroup 3-Month T-Bill Index.
During the reporting period, the U.S. economy and equity markets experienced a considerable amount of volatility. Late in the first calendar quarter of 2005, and into the second quarter, the fear of inflation heightened as the Federal Reserve Board continued to raise short-term interest rates; as a result, the market began trending downward. Toward the end of the second quarter, however, it became evident that the Fed’s philosophy of increasing rates at a “measured pace” would not stave off economic growth at the level initially anticipated. Confounding expectations, particularly in light of the devastation brought to the Gulf Coast by Hurricanes Katrina and Rita, gross domestic product growth accelerated from July through September.
Strong stock selection, and sector allocations in particular, had a positive effect on the portfolio during the reporting period. On a stock-specific level, among the Fund’s best performers were Panera Bread Co.; Transkaryotic Therapies, Inc; and Google Inc. Panera Bread has been a highly volatile stock, but by re-evaluating its strategy and addressing overexpansion issues, the company has reaccelerated its earnings growth. Due to a premium placed on Transkaryotic Therapies’ stock price, the company added value to the portfolio. Google Inc. did well on higher-than-expected earnings and significant bottom-line revenue.
Drug manufacturer Elan Corp., plc was among significant performance detractors for the Fund. Elan experienced significant losses as its multiple-sclerosis drug, Tysabri, was reportedly found to cause fatal side effects in three patients during the drug’s initial six-month rollout. VeriSign, Inc., a premiere Internet security vendor and domain distributor, also detracted from Fund performance. VeriSign saw significant declines as its wireless ring tone market dropped off faster than expected in the second and third quarters of 2005.
The economy has shown a high degree of resiliency during the past 12 months; despite having to face many obstacles, the economy has continued to grow, leaving us with a positive outlook on the market. We believe that the Federal Reserve will soon ease up on interest rates. When that happens, we expect to see price/earnings multiples expand, signaling a positive event for the Fund. As always, we maintain our strategy of investing in growth companies that generate positive earnings revisions and positive growth rates relative to the market.
Portfolio Managers:
Christopher Baggini, CFA, and Douglas Burtnick, CFA
| | |
Fund Performance | | Gartmore U.S. Growth Leaders Long-Short Fund |
Average Annual Total Return
(For periods ended October 31, 2005)
| | | | | | | | |
| | | | | 1 Yr. | | 5 Yr. | | Inception1 |
| Class A2 | | w/o SC3 | | 6.09% | | -5.17% | | 12.28% |
| | | w/SC4 | | 0.02% | | -6.28% | | 11.43% |
| Class B2 | | w/o SC3 | | 5.33% | | -5.64% | | 11.92% |
| | | w/SC5 | | 0.33% | | -5.81% | | 11.92% |
| Class C6 | | w/o SC3 | | 5.35% | | -5.87% | | 10.40% |
| | | w/SC7 | | 4.35% | | -5.87% | | 10.40% |
| Class R8,10 | | 6.16% | | -5.24% | | 12.22% |
| Institutional Class9 | | 6.27% | | -5.12% | | 12.32% |
All figures showing the effect of a sales charge reflect the maximum charge possible, because it has the most dramatic effect on performance data.
| 1 | The Fund’s predecessor Fund, the Montgomery Partners Long-Short Equity Plus Fund, commenced operations for its Class C shares and Class R shares on December 31, 1997, and commenced operations for its Class A shares and Class B shares on October 31, 2001. As of June 23, 2003, the Gartmore Long-Short Equity Plus Fund (which previously had not commenced operations) acquired all the assets, subject to stated liabilities, of the Montgomery Partners Long-Short Equity Plus Fund. At that time the Gartmore Long-Short Equity Plus Fund took on the performance of the Montgomery Partners Long-Short Equity Plus Fund. |
| 2 | These returns through October 31, 2001 include the performance of the Class R shares of the Fund’s predecessor fund, and, for periods from November 1, 2001 to June 22, 2003, the returns for the Class A and Class B shares include the performance of the Class A and Class B shares, respectively, of the Fund’s predecessor fund. Excluding the effect of any fee waivers or reimbursements, such prior performance is similar to what Class A and Class B shares would have produced because all classes of the Fund’s shares invest in the same portfolio of securities and Class A shares had the same expenses after waivers and reimbursements. The performance for these classes has been restated to reflect differences in sales charges (where applicable), but does not reflect the differing levels of other fees (primarily Rule 12b-1 and/or administrative services fees) applicable to Class B shares; if these fees were reflected, the performance for Class B shares would have been lower. |
| 3 | These returns do not reflect the effects of sales charges (SC). |
| 4 | A 5.75% front-end sales charge was deducted. |
| 5 | A 5.00% contingent deferred sales charge (CDSC) was deducted. The CDSC declines to 0% after 6 years. |
| 6 | These returns through June 22, 2003 include the performance of the Class C shares of the Fund’s predecessor fund. |
| 7 | A CDSC of 1.00% was deducted because it is charged when you sell Class C shares within the first year after purchase. |
| 8 | These returns for the period through October 31, 2001 include the performance of the Class R shares of the Fund’s predecessor fund, for the period from November 1, 2001 through June 22, 2003 include the performance of the Class B shares of the Fund’s predecessor fund and for the period from June 23, 2003 to December 31, 2003 (prior to the creation of the Fund’s Class R shares on February 27, 2004) include the performance of the Fund’s Class B shares. The returns have been adjusted for the fact that Class R shares do not have any applicable sales charges but have not been adjusted for the lower expenses applicable to Class R shares. Excluding the effect of any fee waivers or reimbursements, Class B shares’ average annual total returns are similar to what Class R shares would have produced because the Class R shares will invest in the same portfolio of securities as Class B shares. |
| 9 | These returns for the period through October 31, 2001 include the performance of the Institutional Class shares of the Fund’s predecessor fund, for the period from November 1, 2001 through June 22, 2003 include the performance of the Class B shares of the Fund’s predecessor fund and for the period from June 23, 2003 to December 31, 2003 (prior to the creation of the Fund’s Institutional Class shares on June 29, 2004) include the performance of the Fund’s Class B shares. The returns have been adjusted for the fact that Institutional Class shares do not have any applicable sales charges but have not been adjusted for the lower expenses applicable to Institutional Class shares. Excluding the effect of any fee waivers or reimbursements, Class B shares’ average annual total returns are similar to what Institutional Class shares would have produced because the Institutional Class shares will invest in the same portfolio of securities as Class B shares. |
| 10 | Not subject to any sales charges. |
Performance of a $10,000 Investment
Investment return and principal value will fluctuate, and when redeemed, shares may be worth more or less than original cost. Past performance is no guarantee of future results and does not reflect the deduction of taxes that a shareholder would pay on fund distributions or the redemption of fund shares. Investing in mutual funds involves market risk, including loss of principal. Performance returns assume the reinvestment of all distributions.
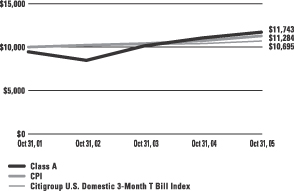
Comparative performance of $10,000 invested in Class A shares of the Gartmore U.S. Growth Leaders Long-Short Fund, the Citigroup U.S. Domestic 3-Month T Bill Index(a), and the Consumer Price Index (CPI)(b) since inception. Unlike the Fund, the returns for these unmanaged indexes do not reflect any fees, expenses, or sales charges. Investors cannot invest directly in market indexes.
| (a) | The Citigroup U.S. Domestic 3-Month T Bill Index is an average of the last 3-month treasury bill issues (excluding the current month-end bill). |
| (b) | The CPI represents changes in prices of a basket of goods and services purchased for consumption by urban households. |
| | |
Shareholder Expense Example | | Gartmore U.S. Growth Leaders Long-Short Fund |
As a shareholder of the Fund, you incur two types of costs: (1) transaction costs, including sales charges (loads) paid on purchase payments and redemption fees; and (2) ongoing costs, including investment advisory fees, administration fees, distribution fees and other Fund expenses. The examples below are intended to help you understand your ongoing costs (in dollars) of investing in the Fund and to compare these costs with the ongoing costs of investing in other mutual funds. Per SEC requirements, the examples assume that you had a $1,000 investment in the Class at the beginning of the reporting period, May 1, 2005, and continued to hold your shares at the end of the reporting period, October 31, 2005.
Actual Expenses
For each Class of the Fund in the table below, the first line provides information about actual account values and actual expenses. You may use the information in this line, together with the amount you invested, to estimate the expenses that you paid over the period. Simply divide your account value by $1,000 (for example, an $8,600 account value divided by $1,000 = 8.6), then multiply the result by the number in the first line of each Class under the heading entitled “Expenses Paid During Period” to estimate the expenses you paid on your account during the period.
Hypothetical Example for Comparison Purposes
The second line of each Class in the table below provides information about hypothetical account values and hypothetical expenses based on the Class’ actual expense ratio and an assumed rate of return of 5% per year before expenses, which is not the Class’ actual return. The hypothetical account values and expenses may not be used to estimate the actual ending account balance or expenses you paid for the period. You may use this information to compare the ongoing costs of investing in the Class of the Fund and other funds. To do so, compare this 5% hypothetical example with the 5% hypothetical examples that appear in the shareholder reports of the other funds.
Please note that the expenses shown in the table are meant to highlight your ongoing costs only and do not reflect any transaction costs, such as sales charges (loads) or redemption fees. Therefore, the second line for each Class in the table is useful in comparing ongoing costs only, and will not help you determine the relative total costs of owning different funds. In addition, if these transaction costs were included, your costs would have been higher. The examples also assume all dividends and distributions have been reinvested.
Schedule of Shareholder Expenses
Expense Analysis of a $1,000 Investment
(October 31, 2005)
| | | | | | | | | | | | | | |
| U.S Growth Leaders Long-Short Fund | | | | | Beginning
Account Value,
5/1/05 | | Ending
Account Value,
10/31/05 | | Expenses Paid
During Period* | | Annualized
Expense Ratio* |
| Class A | | Actual | | | $ | 1,000.00 | | $ | 1,075.50 | | $ | 15.07 | | 2.88% |
| | | Hypothetical | 1 | | $ | 1,000.00 | | $ | 1,010.48 | | $ | 14.70 | | 2.88% |
| Class B | | Actual | | | $ | 1,000.00 | | $ | 1,071.50 | | $ | 18.74 | | 3.59% |
| | | Hypothetical | 1 | | $ | 1,000.00 | | $ | 1,006.90 | | $ | 18.32 | | 3.59% |
| Class C | | Actual | | | $ | 1,000.00 | | $ | 1,072.10 | | $ | 18.80 | | 3.60% |
| | | Hypothetical | 1 | | $ | 1,000.00 | | $ | 1,006.85 | | $ | 18.37 | | 3.60% |
| Class R | | Actual | | | $ | 1,000.00 | | $ | 1,075.60 | | $ | 15.38 | | 2.94% |
| | | Hypothetical | 1 | | $ | 1,000.00 | | $ | 1,010.18 | | $ | 15.01 | | 2.94% |
| Institutional Class | | Actual | | | $ | 1,000.00 | | $ | 1,076.50 | | $ | 13.61 | | 2.60% |
| | | Hypothetical | 1 | | $ | 1,000.00 | | $ | 1,011.89 | | $ | 13.27 | | 2.60% |
| * | Expenses are equal to the Fund’s annualized expense ratio multiplied by the average account value over the period multiplied by 184/365 (to reflect the one-half year period). The expense ratio presented represents a six month, annualized ratio in accordance with SEC guidelines. |
| 1 | Represents the hypothetical 5% return before expenses. |
| | |
Portfolio Summary | | Gartmore U.S. Growth Leaders Long-Short Fund |
October 31, 2005 | Long Positions |
The SEC adopted a requirement that Funds present their portfolio holdings in a table, chart or graph format in their annual and semiannual reports to shareholders, whether or not a statement of investments is utilized. The following tables, which present portfolio holdings as a percentage of net assets, are provided in compliance with this requirement.
| | |
| Asset Allocation | | |
| Common Stocks | | 68.1% |
| Cash Equivalents | | 29.2% |
| Other Assets in excess of Liabilities | | 2.7% |
| | |
|
| | | 100.0% |
| | |
| Top Industries | | |
| Technology | | 11.5% |
| Media & Services | | 11.1% |
| Finance | | 8.0% |
| Consumer Cyclical | | 7.4% |
| Health Care | | 6.8% |
| Capital Goods & Defense | | 4.9% |
| Consumer Staple | | 3.7% |
| Energy | | 3.2% |
| Computer Software | | 2.7% |
| Transportation | | 2.2% |
| Other Industries | | 38.5% |
| | |
|
| | | 100.0% |
| | |
| Top Holdings* | | |
| UnitedHealth Group, Inc. | | 2.2% |
| Home Depot, Inc. | | 2.1% |
| Brinker International, Inc. | | 2.0% |
| McAfee, Inc. | | 2.0% |
| Colgate-Palmolive Co. | | 2.0% |
| Amgen, Inc. | | 1.8% |
| PepsiCo, Inc. | | 1.8% |
| Google, Inc. | | 1.6% |
| Hyperion Solutions Corp. | | 1.6% |
| Carnival Corp. | | 1.6% |
| Other Holdings | | 81.3% |
| | |
|
| | | 100.0% |
| * | For purpose of listing top holdings, repurchase agreements are considered cash equivalents and are included as part of Other Holdings. |
| | |
Portfolio Summary | | Gartmore U.S. Growth Leaders Long-Short Fund |
October 31, 2005 | Short Positions |
The SEC adopted a requirement that Funds present their portfolio holdings in a table, chart or graph format in their annual and semiannual reports to shareholders, whether or not a statement of investments is utilized. The following tables, which present portfolio holdings as a percentage of net assets, are provided in compliance with this requirement.
| | |
| Asset Allocation | | |
| Common Stocks | | 35.5% |
| Mutual Funds | | 10.0% |
| | |
|
| | | 45.5% |
| | |
| Top Industries | | |
| Equity Funds | | 10.0% |
| Consumer Staple | | 6.0% |
| Technology | | 5.3% |
| Media & Services | | 4.8% |
| Consumer Cyclical | | 3.7% |
| Capital Goods & Defense | | 3.6% |
| Computer Software | | 2.5% |
| Energy | | 2.3% |
| Healthcare | | 2.3% |
| Business Services | | 2.3% |
| Other Industries | | 57.2% |
| | |
|
| | | 100.0% |
| | |
| Top Holdings | | |
| iShares Russell 1000 Index | | 3.0% |
| Semiconductor HOLDRs Trust | | 2.5% |
| Computer Associates International, Inc. | | 2.3% |
| Anheuser Busch Cos., Inc. | | 1.8% |
| United Stationers, Inc. | | 1.5% |
| Limited, Inc. | | 1.5% |
| Amex Energy Select SPDR | | 1.5% |
| Infosys Technologies Ltd. ADR — IN | | 1.5% |
| Nasdaq Biotech Index | | 1.5% |
| iShares Russell 2000 Growth | | 1.5% |
| Other Holdings | | 81.4% |
| | |
|
| | | 100.0% |
Statement of Investments
October 31, 2005
Gartmore U.S. Growth Leaders Long-Short Fund
Common Stocks - Long Positions (c) (68.1%)
| |
| | | | | |
| | | Shares or
Principal Amount | | Value |
| | | | | | |
Basic Industry & Gold (1.3%) | | | |
Praxair, Inc. | | 14,950 | | $ | 738,680 |
| | | | |
|
|
Capital Goods & Defense (4.9%) | | | |
Boeing Co. | | 13,110 | | | 847,431 |
Fisher Scientific International, Inc. (b) | | 5,250 | | | 296,625 |
Tellabs, Inc. (b) | | 59,650 | | | 570,254 |
Textron, Inc. | | 7,700 | | | 554,708 |
Thermo Electron Corp. (b) | | 18,660 | | | 563,345 |
| | | | |
|
|
| | | | | | 2,832,363 |
| | | | |
|
|
Computer Software (2.7%) | | | |
F5 Networks, Inc. (b) | | 12,310 | | | 640,489 |
Satyam Computer Services Ltd. ADR — IN | | 26,260 | | | 897,567 |
| | | | |
|
|
| | | | | | 1,538,056 |
| | | | |
|
|
Consumer Cyclical (7.4%) | | | |
Abercrombie & Fitch Co. | | 12,230 | | | 635,838 |
Coach, Inc. (b) | | 22,650 | | | 728,877 |
Home Depot, Inc. | | 29,620 | | | 1,215,605 |
Kohl’s Corp. (b) | | 16,390 | | | 788,851 |
Staples, Inc. | | 39,010 | | | 886,697 |
| | | | |
|
|
| | | | | | 4,255,868 |
| | | | |
|
|
Consumer Staple (3.7%) | | | |
Colgate-Palmolive Co. | | 21,550 | | | 1,141,288 |
PepsiCo, Inc. | | 17,520 | | | 1,035,082 |
| | | | |
|
|
| | | | | | 2,176,370 |
| | | | |
|
|
Energy (3.2%) | | | |
ENSCO International, Inc. | | 14,000 | | | 638,260 |
Nabors Industries Ltd. (b) | | 6,450 | | | 442,664 |
Peabody Energy Corp. | | 10,110 | | | 790,197 |
| | | | |
|
|
| | | | | | 1,871,121 |
| | | | |
|
|
Environmental Services (1.0%) | | | |
Republic Services, Inc. | | 16,920 | | | 598,122 |
| | | | |
|
|
Finance (8.0%) | | | |
E*Trade Group, Inc. (b) | | 25,400 | | | 471,170 |
Goldman Sachs Group, Inc. | | 4,130 | | | 521,908 |
Legg Mason, Inc. | | 4,900 | | | 525,819 |
Marshall & Ilsley Corp. | | 13,760 | | | 591,130 |
Partnerre Ltd. | | 11,770 | | | 749,984 |
| | | | | |
| | | Shares or
Principal Amount | | Value |
| | | | | | |
Finance (continued) | | | | | |
State Street Corp. | | 10,530 | | $ | 581,572 |
T. Rowe Price Group, Inc. | | 9,200 | | | 602,784 |
Zions Bancorp | | 8,260 | | | 606,862 |
| | | | |
|
|
| | | | | | 4,651,229 |
| | | | |
|
|
Healthcare (6.8%) | | | |
Abgenix, Inc. (b) | | 37,280 | | | 387,712 |
Amgen, Inc. (b) | | 13,750 | | | 1,041,700 |
Medcohealth Solutions, Inc. (b) | | 11,950 | | | 675,175 |
St. Jude Medical, Inc. (b) | | 11,470 | | | 551,363 |
UnitedHealth Group, Inc. | | 22,090 | | | 1,278,790 |
| | | | |
|
|
| | | | | | 3,934,740 |
| | | | |
|
|
Insurance (2.1%) | | | |
Genworth Financial, Inc. | | 25,140 | | | 796,686 |
Max Re Capital Ltd. | | 18,050 | | | 431,576 |
| | | | |
|
|
| | | | | | 1,228,262 |
| | | | |
|
|
Media & Services (11.1%) | | | |
Brinker International, Inc. (b) | | 30,830 | | | 1,175,240 |
Carnival Corp. | | 18,170 | | | 902,504 |
Google, Inc. (b) | | 2,480 | | | 922,907 |
McGraw-Hill Cos., Inc. (The) | | 12,300 | | | 601,962 |
Panera Bread Co. (b) | | 11,280 | | | 667,663 |
Qualcomm, Inc. | | 17,720 | | | 704,547 |
Sprint Corp. | | 24,810 | | | 578,321 |
Starwood Hotels & Resorts Worldwide, Inc. | | 15,010 | | | 877,034 |
| | | | |
|
|
| | | | | | 6,430,178 |
| | | | |
|
|
Technology (11.5%) | | | |
Broadcom Corp. (b) | | 13,850 | | | 588,071 |
Business Objectives S.A.
ADR – FR (b) | | 16,240 | | | 556,545 |
Cognizant Technology Solutions Corp. (b) | | 13,040 | | | 573,499 |
Cymer, Inc. (b) | | 16,590 | | | 578,162 |
Hyperion Solutions Corp. (b) | | 18,920 | | | 914,971 |
Interwoven Software, Inc. (b) | | 30,880 | | | 290,272 |
Marvel Technology Group Ltd. (b) | | 15,820 | | | 734,206 |
McAfee, Inc. (b) | | 38,990 | | | 1,170,869 |
Monster Worldwide, Inc. (b) | | 19,020 | | | 624,046 |
National Semiconductor Corp. | | 26,480 | | | 599,242 |
| | | | |
|
|
| | | | | | 6,629,883 |
| | | | |
|
|
Gartmore U.S. Growth Leaders Long-Short Fund (Continued)
Common Stocks - Long Positions (c) (continued)
| | | | | | |
| | | Shares or
Principal Amount | | Value |
Telecommunications (1.2%) | | | |
Comverse Technology, Inc. (b) | | | 26,950 | | $ | 676,445 |
| | | | | |
|
|
Transportation (2.2%) | | | | | | |
CNF, Inc. | | | 10,900 | | | 613,343 |
Forward Air Corp. | | | 19,200 | | | 680,640 |
| | | | | |
|
|
| | | | | | | 1,293,983 |
| | | | | |
|
|
Utilities (1.0%) | | | | | | |
Questar Corp. | | | 7,270 | | | 572,513 |
| | | | | |
|
|
| |
Total Common Stocks – Long Positions (c) | | | 39,427,813 |
| | | | | |
|
|
|
Cash Equivalents (29.2%) |
| | |
Investments in repurchase agreements (Collateralized by U.S. Government Agencies, in a joint trading account at 3.90%, dated 10/31/05, due 11/01/05, repurchase price $16,919,472) | | $ | 16,917,639 | | | 16,917,639 |
| | | | | |
|
|
| |
Total Cash Equivalents | | | 16,917,639 |
| | | | | |
|
|
| |
Total Investments
(Cost $55,240,198) (a) — 97.3% | | | 56,345,452 |
| |
Other assets in excess of
liabilities — 2.7% | | | 1,546,405 |
| | | | | |
|
|
| | |
NET ASSETS — 100.0% | | | | | $ | 57,891,857 |
| | | | | |
|
|
| | (a) | See notes to financial statements for tax unrealized appreciation (depreciation) of securities. |
| | (b) | Denotes a non-income producing security. |
| | (c) | All long positions held as collateral for securities sold short. |
| | ADR | American Depositary Receipt |
See notes to financial statements.
Statement of Investments (Continued)
October 31, 2005
| Common Stocks - Short Positions (35.5%) |
| | | | | |
| | | Shares | | Value |
| | | | | | |
Business Services (2.3%) | | | | | |
United Stationers, Inc. (b) | | 19,600 | | $ | 889,252 |
Zebra Technologies Corp. Class A (b) | | 9,870 | | | 425,496 |
| | | | |
|
|
| | | | | | 1,314,748 |
| | | | |
|
|
Capital Goods & Defense (3.6%) | | | | | |
Amphenol Corp., Class A | | 10,400 | | | 415,688 |
Lear Corp. | | 18,540 | | | 564,728 |
Snap-On, Inc. | | 15,650 | | | 563,713 |
Tyco International Ltd. | | 20,150 | | | 531,759 |
| | | | |
|
|
| | | | | | 2,075,888 |
| | | | |
|
|
Casinos & Gambling (0.8%) | | | | | |
Wynn Resorts Ltd. (b) | | 10,300 | | | 480,804 |
| | | | |
|
|
Computer Software (2.5%) | | | | | |
BMC Software, Inc. (b) | | 29,090 | | | 569,873 |
Infosys Technologies Ltd. ADR — IN | | 12,730 | | | 865,640 |
| | | | |
|
|
| | | | | | 1,435,513 |
| | | | |
|
|
Consumer Cyclical (3.7%) | | | | | |
Garmin Ltd. | | 8,250 | | | 473,798 |
Limited, Inc. | | 44,310 | | | 886,642 |
UST, Inc. | | 18,450 | | | 763,646 |
| | | | |
|
|
| | | | | | 2,124,086 |
| | | | |
|
|
Consumer Staple (6.0%) | | | | | |
Anheuser Busch Cos., Inc. | | 24,840 | | | 1,024,898 |
ConAgra, Inc. | | 36,880 | | | 858,198 |
Kimberly — Clark Corp. | | 7,500 | | | 426,300 |
Performance Food Group Co. (b) | | 22,750 | | | 627,673 |
Yum! Brands, Inc. | | 11,600 | | | 590,092 |
| | | | |
|
|
| | | | | | 3,527,161 |
| | | | |
|
|
Energy (2.3%) | | | | | |
Schlumberger Ltd. | | 6,410 | | | 581,836 |
Valero Energy Corp. | | 7,190 | | | 756,675 |
| | | | |
|
|
| | | | | | 1,338,511 |
| | | | |
|
|
Finance (1.9%) | | | | | |
Commerce Bancorp, Inc. | | 24,910 | | | 759,008 |
Nelnet, Inc. (b) | | 9,360 | | | 347,256 |
| | | | |
|
|
| | | | | | 1,106,264 |
| | | | |
|
|
Healthcare (2.3%) | | | | | |
HCA, Inc. | | 11,680 | | | 562,859 |
Health Management Associates, Inc., Class A | | 35,600 | | | 762,196 |
| | | | |
|
|
| | | | | | 1,325,055 |
| | | | |
|
|
| | | | | |
| | | Shares | | Value |
| | | | | | |
Media & Services (4.8%) | | | | | |
Amazon.com, Inc. (b) | | 13,200 | | $ | 526,416 |
Knight-Ridder, Inc. | | 15,120 | | | 807,106 |
New York Times Co. | | 21,180 | | | 576,943 |
Salesforce.com, Inc. (b) | | 34,360 | | | 858,656 |
| | | | |
|
|
| | | | | | 2,769,121 |
| | | | |
|
|
Technology (5.3%) | | | | | |
02Micro International Ltd. (b) | | 22,890 | | | 299,859 |
Belden CDT, Inc. | | 14,640 | | | 291,775 |
Cognos, Inc. ADR — CA (b) | | 14,680 | | | 550,940 |
Computer Associates International, Inc. | | 48,440 | | | 1,354,867 |
Micron Technology, Inc. (b) | | 41,600 | | | 540,384 |
| | | | |
|
|
| | | | | | 3,037,825 |
| | | | |
|
|
| |
Total Common Stocks — Short Positions | | | 20,534,976 |
| | | | |
|
|
|
Mutual Funds - Short Positions (10.0%) |
Equity Funds (10.0%) | | | | | |
Amex Energy Select SPDR | | 17,880 | | | 872,544 |
iShares Russell 1000 Index | | 26,440 | | | 1,729,704 |
iShares Russell 2000 Growth | | 13,080 | | | 861,580 |
Nasdaq Biotech Index | | 11,670 | | | 862,530 |
Semiconductor HOLDRs Trust | | 43,050 | | | 1,444,328 |
| | | | |
|
|
| | |
Total Mutual Funds — Short Positions | | | | | 5,770,686 |
| | | | |
|
|
| | |
Total Investments
(Cost $26,339,352) (a) — 45.5% | | | | $ | 26,305,662 |
| | | | |
|
|
| | (a) | See notes to financial statements for tax unrealized appreciation (depreciation) of securities. |
| | (b) | Denotes a non-income producing security. |
| | ADR | American Depositary Receipt |
| | HOLDR | Holding Company Depositary Receipt |
| | SPDR | Standard & Poor’s Depositary Receipts |
See notes to financial statements.
Gartmore Value Opportunities Fund
For the annual period ended Oct. 31, 2005, the Gartmore Value Opportunities Fund (Class A at NAV) returned 13.59% versus 12.08% for its benchmark, the Russell 2000® Index. For broader comparison, the average return for the Fund’s Lipper peer category of Small-Cap Core Funds was 13.22%.
Equity markets rallied in the last fiscal quarter of 2004 before slowing in early 2005, as investors took profits amid growing concerns that the Federal Reserve Board’s measured increases in interest rates might slow economic growth. Small-cap stocks experienced a period of difficulty, given the circumstances, and the mindset of many market analysts shifted toward large caps.
The current investing environment is a welcome change from the frustrating situation of one year ago. At that time, the stock market was rewarding speculative companies and seemed to ignore those with strong and/or improving fundamentals. Typically, these speculative periods are unsustainable. The Fund’s solid performance in 2005 is evidence that the stock market has regained its “value” investing style (i.e., rewarding stocks with strong fundamentals). Within a value-style environment, the Fund has outperformed the benchmark.
Historically, we have sought to add value for the Fund through stock selection. It, therefore, is our goal to have the vast majority of our return derived from stock selection and not extraneous influences. During the reporting period, stock selection was strongest in the technology and financials sectors. Technology name Komag, Inc. and financials name Tower Group, Inc. were particularly strong performers for the Fund. Komag benefited from a recovery in the disk drive market, while Tower Group, a specialized property and casualty insurance provider, achieved robust earnings growth in part due to rising insurance premiums.
Conversely, stock selection was weaker in the energy and health-care sectors. Fund holding and energy name The Meridian Resource Corp. had a tough year as the company faced continued difficulty with production results at one location. Further, Meridian Resource’s primary production facilities were rendered inoperable as a result of hurricanes in the Gulf of Mexico during August and September.
Our objective for the Fund remains the same: to buy, at attractive valuations, well-positioned companies in which we see tangible evidence of fundamental improvement.
Despite the economic disruption caused by Hurricanes Katrina and Rita toward the end of the reporting period, our outlook remains unchanged. We expect those sectors that have exhibited improving fundamentals–particularly industrials and financials–to continue to be rewarded in the stock market, and we have positioned the Fund to benefit from such moves.
The Fund’s portfolio continues to be characterized by stocks with favorable cash flow characteristics, earnings improvement and broad sector diversification. As 2006 unfolds, we believe that: 1) investors will continue to pay attention to the fundamentals that we think are important for long-term investing success; and 2) our investment discipline and style will yield favorable results.
Portfolio Managers:
Jeffrey Petherick, CFA and Mary Champagne, CFA
| | |
Fund Performance | | Gartmore Value Opportunities Fund |
Average Annual Total Return
(For periods ended October 31, 2005)
| | | | | | | | |
| | | | | 1 Yr. | | 5 Yr. | | Inception1 |
| Class A | | w/o SC2 | | 13.59% | | 8.60% | | 11.40% |
| | | w/SC3 | | 7.04% | | 7.33% | | 10.28% |
| Class B | | w/o SC2 | | 12.90% | | 7.90% | | 10.70% |
| | | w/SC4 | | 8.19% | | 7.60% | | 10.59% |
| Class C5 | | w/o SC2 | | 12.86% | | 7.90% | | 10.69% |
| | | w/SC6 | | 11.92% | | 7.90% | | 10.69% |
| Class R7,9 | | 13.71% | | 8.12% | | 10.89% |
| Institutional Class8,9 | | 13.96% | | 8.87% | | 11.69% |
All figures showing the effect of a sales charge reflect the maximum charge possible, because it has the most dramatic effect on performance data.
| 1 | Fund commenced operations on December 29, 1999. |
| 2 | These returns do not reflect the effects of sales charges (SC). |
| 3 | A 5.75% front-end sales charge was deducted. |
| 4 | A 5.00% contingent deferred sales charge (CDSC) was deducted. The CDSC declines to 0% after 6 years. |
| 5 | These returns until the creation of Class C shares (3/1/01) include the performance of the Fund’s Class B shares. Excluding the effects of any fee waivers or reimbursements, such prior performance is substantially similar to what Class C shares would have produced because Class C shares invest in the same portfolio of securities as Class B shares and have the same expenses after any fee waivers or reimbursements. For Class C shares returns with sales charges, these returns have been restated for the applicable sales charges. |
| 6 | A CDSC of 1.00% was deducted because it is charged when you sell Class C shares within the first year after purchase. |
| 7 | These returns until the creation of Class R shares (12/30/03) include the performance of the Fund’s Class B shares. The returns have been adjusted for the fact that Class R shares do not have any applicable sales charges but have not been adjusted for the lower expenses applicable to Class R shares. Excluding the effect of any fee waivers or reimbursements, such prior performance is similar to what Class R shares would have produced because the Class R shares invest in the same portfolio of securities as Class B shares. |
| 8 | These returns until the creation of Institutional Class shares (6/29/04) include the performance of the Fund’s Institutional Service shares. The returns have been adjusted for the fact that Institutional Class shares do not have any applicable sales charges but have not been adjusted for the lower expenses applicable to Institutional Class shares. Excluding the effect of any fee waivers or reimbursements, such prior performance is similar to what Institutional Class shares would have produced because the Institutional Class shares invest in the same portfolio of securities as Institutional Service shares. |
| 9 | Not subject to any sales charges. |
Performance of a $10,000 Investment
Investment return and principal value will fluctuate, and when redeemed, shares may be worth more or less than original cost. Past performance is no guarantee of future results and does not reflect the deduction of taxes that a shareholder would pay on fund distributions or the redemption of fund shares. Investing in mutual funds involves market risk, including loss of principal. Performance returns assume the reinvestment of all distributions.
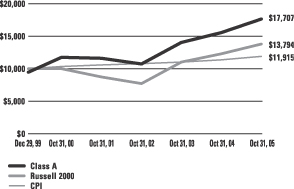
Comparative performance of $10,000 invested in Class A shares of the Gartmore Value Opportunities Fund, Russell 2000 Index (Russell 2000)(a), and the Consumer Price Index (CPI)(b) since inception. Unlike the Fund, the returns for these unmanaged indexes do not reflect any fees, expenses, or sales charges. Investors cannot invest directly in market indexes.
| (a) | The Russell 2000 is an unmanaged index of securities of small capitalization U.S. companies. |
| (b) | The CPI represents changes in prices of a basket of goods and services purchased for consumption by urban households. |
| | |
Shareholder Expense Example | | Gartmore Value Opportunities Fund |
As a shareholder of the Fund, you incur two types of costs: (1) transaction costs, including sales charges (loads) paid on purchase payments and redemption fees; and (2) ongoing costs, including investment advisory fees, administration fees, distribution fees and other Fund expenses. The examples below are intended to help you understand your ongoing costs (in dollars) of investing in the Fund and to compare these costs with the ongoing costs of investing in other mutual funds. Per SEC requirements, the examples assume that you had a $1,000 investment in the Class at the beginning of the reporting period, May 1, 2005, and continued to hold your shares at the end of the reporting period, October 31, 2005.
Actual Expenses
For each Class of the Fund in the table below, the first line provides information about actual account values and actual expenses. You may use the information in this line, together with the amount you invested, to estimate the expenses that you paid over the period. Simply divide your account value by $1,000 (for example, an $8,600 account value divided by $1,000 = 8.6), then multiply the result by the number in the first line of each Class under the heading entitled “Expenses Paid During Period” to estimate the expenses you paid on your account during the period.
Hypothetical Example for Comparison Purposes
The second line of each Class in the table below provides information about hypothetical account values and hypothetical expenses based on the Class’ actual expense ratio and an assumed rate of return of 5% per year before expenses, which is not the Class’ actual return. The hypothetical account values and expenses may not be used to estimate the actual ending account balance or expenses you paid for the period. You may use this information to compare the ongoing costs of investing in the Class of the Fund and other funds. To do so, compare this 5% hypothetical example with the 5% hypothetical examples that appear in the shareholder reports of the other funds.
Please note that the expenses shown in the table are meant to highlight your ongoing costs only and do not reflect any transaction costs, such as sales charges (loads) or redemption fees. Therefore, the second line for each Class in the table is useful in comparing ongoing costs only, and will not help you determine the relative total costs of owning different funds. In addition, if these transaction costs were included, your costs would have been higher. The examples also assume all dividends and distributions have been reinvested.
Schedule of Shareholder Expenses
Expense Analysis of a $1,000 Investment
(October 31, 2005)
| | | | | | | | | | | | | | |
| Value Opportunities Fund | | | | | Beginning
Account Value,
5/1/05 | | Ending
Account Value,
10/31/05 | | Expenses Paid
During Period* | | Annualized
Expense Ratio* |
| Class A | | Actual | | | $ | 1,000.00 | | $ | 1,117.20 | | $ | 7.74 | | 1.45% |
| | | Hypothetical | 1 | | $ | 1,000.00 | | $ | 1,017.69 | | $ | 7.40 | | 1.45% |
| Class B | | Actual | | | $ | 1,000.00 | | $ | 1,114.10 | | $ | 11.19 | | 2.10% |
| | | Hypothetical | 1 | | $ | 1,000.00 | | $ | 1,014.41 | | $ | 10.72 | | 2.10% |
| Class C | | Actual | | | $ | 1,000.00 | | $ | 1,113.60 | | $ | 11.19 | | 2.10% |
| | | Hypothetical | 1 | | $ | 1,000.00 | | $ | 1,014.41 | | $ | 10.72 | | 2.10% |
| Class R | | Actual | | | $ | 1,000.00 | | $ | 1,117.20 | | $ | 7.63 | | 1.43% |
| | | Hypothetical | 1 | | $ | 1,000.00 | | $ | 1,017.79 | | $ | 7.30 | | 1.43% |
| Institutional Class | | Actual | | | $ | 1,000.00 | | $ | 1,119.00 | | $ | 5.71 | | 1.07% |
| | | Hypothetical | 1 | | $ | 1,000.00 | | $ | 1,019.61 | | $ | 5.46 | | 1.07% |
| * | Expenses are equal to the Fund’s annualized expense ratio multiplied by the average account value over the period multiplied by 184/365 (to reflect the one-half year period). The expense ratio presented represents a six month, annualized ratio in accordance with SEC guidelines. |
| 1 | Represents the hypothetical 5% return before expenses. |
| | |
Portfolio Summary | | Gartmore Value Opportunities Fund |
The SEC adopted a requirement that Funds present their portfolio holdings in a table, chart or graph format in their annual and semiannual reports to shareholders, whether or not a statement of investments is utilized. The following tables, which present portfolio holdings as a percentage of net assets, are provided in compliance with this requirement.
| | |
| Asset Allocation | | |
| Common Stocks | | 94.8% |
| Cash Equivalents | | 4.5% |
| Other Investments* | | 20.2% |
| Liabilities in excess of Other Assets** | | -19.5% |
| | |
|
| | | 100.0% |
| * | Includes value of collateral received from securities lending. |
| ** | Includes value of collateral owed from securities lending. |
| | |
| Top Industries | | |
| Real Estate | | 9.8% |
| Commercial Banks | | 8.2% |
| Insurance | | 6.0% |
| Machinery | | 5.0% |
| Software | | 4.0% |
| Electrical Equipment | | 3.6% |
| Chemicals | | 3.4% |
| Specialty Retail | | 3.3% |
| Health Care Equipment & Supplies | | 2.9% |
| Semiconductors & Semiconductor Equipment | | 2.8% |
| Other Industries | | 51.0% |
| | |
|
| | | 100.0% |
| | |
| Top Holdings*** | | |
| Allmerica Financial Corp. | | 1.5% |
| Tower Group, Inc. | | 1.5% |
| First Industrial Realty Trust | | 1.3% |
| Ashford Hospitality Trust | | 1.3% |
| Avista Corp. | | 1.3% |
| El Paso Electric Co. | | 1.3% |
| Franklin Bank Corp. | | 1.2% |
| National Financial Partners Corp. | | 1.2% |
| Thomas & Betts Corp. | | 1.2% |
| Regal-Beloit Corp. | | 1.2% |
| Other Holdings | | 87.0% |
| | |
|
| | | 100.0% |
| *** | For purpose of listing top holdings, repurchase agreements are considered cash equivalents and are included as part of Other Holdings. |
Statement of Investments
October 31, 2005
Gartmore Value Opportunities Fund
| Common Stocks (94.8%) |
| | | | | |
| | | Shares or
Principal Amount | | Value |
| | | | | | |
Aerospace & Defense (1.7%) | | | |
Teledyne Technologies, Inc. (b) | | 3,500 | | $ | 123,410 |
United Industrial Corp. (c) | | 3,700 | | | 130,573 |
| | | | |
|
|
| | | | | | 253,983 |
| | | | |
|
|
Airlines (1.1%) | | | |
Alaska Air Group, Inc. (b) (c) | | 5,100 | | | 160,803 |
| | | | |
|
|
Auto Components (0.5%) | | | |
Drew Industries, Inc. (b) | | 2,300 | | | 66,355 |
| | | | |
|
|
Biotechnology (0.7%) | | | |
Serologicals Corp. (b) (c) | | 4,900 | | | 95,452 |
| | | | |
|
|
Building Products (0.1%) | | | |
ElkCorp. | | 600 | | | 18,978 |
| | | | |
|
|
Capital Markets (1.2%) | | | |
Affiliated Managers Group,
Inc. (b) (c) | | 2,250 | | | 172,688 |
| | | | |
|
|
Chemicals (3.4%) | | | |
Airgas, Inc. | | 4,600 | | | 130,042 |
Olin Corp. (c) | | 8,400 | | | 150,192 |
Omnova Solutions, Inc. (b) | | 20,398 | | | 91,791 |
RPM International, Inc. | | 6,200 | | | 115,444 |
| | | | |
|
|
| | | | | | 487,469 |
| | | | |
|
|
Commercial Banks (8.2%) | | | |
Capital Corp. of the West (c) | | 4,674 | | | 154,242 |
Columbia Banking System, Inc. | | 4,900 | | | 141,659 |
East West Bancorp, Inc. | | 4,600 | | | 176,134 |
Greene County Bancshares, Inc. | | 5,200 | | | 138,112 |
Midwest Banc Holding, Inc. (c) | | 4,500 | | | 100,980 |
Placer Sierra Bancshares | | 6,193 | | | 166,716 |
Security Bank Corp. (c) | | 6,436 | | | 158,840 |
Vineyard National Bancorp Co. (c) | | 4,700 | | | 137,616 |
| | | | |
|
|
| | | | | | 1,174,299 |
| | | | |
|
|
Commercial Services & Supplies (0.4%) | | | |
Steelcase, Inc., Class A | | 4,200 | | | 60,144 |
| | | | |
|
|
Communications Equipment (1.6%) | | | |
3Com Corp. (b) | | 22,600 | | | 87,010 |
Polycom, Inc. (b) | | 9,400 | | | 143,820 |
| | | | |
|
|
| | | | | | 230,830 |
| | | | |
|
|
| | | | | |
| | | Shares or
Principal Amount | | Value |
| | | | | | |
Computers & Peripherals (1.1%) | | | |
Dot Hill Systems Corp. (b) | | 14,100 | | $ | 97,713 |
Intergraph Corp. (b) (c) | | 1,400 | | | 67,732 |
| | | | |
|
|
| | | | | | 165,445 |
| | | | |
|
|
Construction & Engineering (1.6%) | | | |
Foster Wheeler Ltd. (b) | | 6,300 | | | 178,164 |
Washington Group International, Inc. (b) | | 1,170 | | | 58,149 |
| | | | |
|
|
| | | | | | 236,313 |
| | | | |
|
|
Construction Materials (0.6%) | | | |
Texas Industries, Inc. | | 1,800 | | | 89,280 |
| | | | |
|
|
Consumer Finance (1.2%) | | | | | |
Advanta Corp. (c) | | 6,042 | | | 171,412 |
| | | | |
|
|
Electric Utilities (2.2%) | | | | | |
El Paso Electric Co. (b) | | 8,400 | | | 181,860 |
Westar Energy, Inc. | | 6,300 | | | 139,230 |
| | | | |
|
|
| | | | | | 321,090 |
| | | | |
|
|
Electrical Equipment (3.6%) | | | |
Genlyte Group, Inc. (b) | | 3,220 | | | 164,123 |
Regal-Beloit Corp. (c) | | 5,600 | | | 178,248 |
Thomas & Betts Corp. (b) | | 4,600 | | | 179,032 |
| | | | |
|
|
| | | | | | 521,403 |
| | | | |
|
|
Electronic Equipment & Instruments (0.9%) |
Coherent, Inc. (b) | | 4,200 | | | 124,362 |
| | | | |
|
|
Energy Equipment & Services (2.7%) | | | |
Hanover Compressor Co. (b) (c) | | 11,000 | | | 141,460 |
Hornbeck Offshore Services, Inc. (b) | | 3,877 | | | 124,878 |
Pioneer Drilling Co. (b) | | 7,330 | | | 125,563 |
| | | | |
|
|
| | | | | | 391,901 |
| | | | |
|
|
Food & Staples Retailing (1.4%) | | | | | |
Casey’s General Stores, Inc. | | 3,700 | | | 79,846 |
Longs Drug Stores Corp. | | 1,300 | | | 54,223 |
Wild Oats Markets, Inc. (b) | | 6,100 | | | 67,832 |
| | | | |
|
|
| | | | | | 201,901 |
| | | | |
|
|
Food Products (1.2%) | | | | | |
Flowers Foods, Inc. | | 2,950 | | | 86,435 |
Reddy Ice Holdings, Inc. | | 4,100 | | | 89,298 |
| | | | |
|
|
| | | | | | 175,733 |
| | | | |
|
|
Statement of Investments (Continued)
October 31, 2005
Gartmore Value Opportunities Fund (Continued)
Common Stocks (continued)
| |
| | | | | |
| | | Shares or
Principal Amount | | Value |
| | | | | | |
Gas Utilities (0.8%) | | | |
South Jersey Industries, Inc. | | 4,100 | | $ | 114,595 |
| | | | |
|
|
Healthcare Equipment & Supplies (2.9%) | | | |
Adeza Biomedical Corp. (b) | | 5,129 | | | 87,449 |
Integra Lifesciences Corp. (b) | | 3,300 | | | 113,850 |
IntraLase Corp. (b) (c) | | 9,100 | | | 140,686 |
Symmetry Medical, Inc. (b) | | 3,900 | | | 86,346 |
| | | | |
|
|
| | | | | | 428,331 |
| | | | |
|
|
Healthcare Providers & Services (1.9%) | | | |
HealthTronics, Inc. (b) | | 15,500 | | | 140,895 |
LifePoint Hospitals, Inc. (b) | | 3,600 | | | 140,760 |
| | | | |
|
|
| | | | | | 281,655 |
| | | | |
|
|
Hotels Restaurants & Leisure (1.2%) | | | |
Denny’s Corp. (b) | | 18,100 | | | 72,400 |
Jack in the Box, Inc. (b) | | 1,200 | | | 35,640 |
Sunterra Corp. (b) | | 6,000 | | | 72,060 |
| | | | |
|
|
| | | | | | 180,100 |
| | | | |
|
|
Household Durables (2.6%) | | | |
Champion Enterprises, Inc. (b) | | 10,700 | | | 148,516 |
Jarden Corp. (b) (c) | | 3,650 | | | 123,334 |
Snap-On, Inc. | | 3,100 | | | 111,662 |
| | | | |
|
|
| | | | | | 383,512 |
| | | | |
|
|
Insurance (6.0%) | | | |
Allmerica Financial Corp. (b) | | 5,800 | | | 220,980 |
National Financial Partners Corp. | | 4,000 | | | 180,920 |
ProAssurance Corp. (b) (c) | | 1,700 | | | 79,560 |
Scottish Re Group Ltd. | | 6,700 | | | 164,485 |
Tower Group, Inc. | | 10,980 | | | 211,585 |
| | | | |
|
|
| | | | | | 857,530 |
| | | | |
|
|
Internet & Catalog Retail (0.3%) | | | |
J. Jill Group, Inc. (b) | | 3,000 | | | 38,100 |
| | | | |
|
|
Internet Software & Services (2.6%) | | | |
Akamai Technologies, Inc. (b) (c) | | 4,900 | | | 84,966 |
HomeStore, Inc. (b) | | 26,900 | | | 97,647 |
Jupitermedia Corp. (b) (c) | | 6,400 | | | 108,800 |
United Online, Inc. | | 6,600 | | | 88,506 |
| | | | |
|
|
| | | | | | 379,919 |
| | | | |
|
|
IT Services (0.8%) | | | |
Covansys Corp. (b) | | 7,500 | | | 120,000 |
| | | | |
|
|
| | | | | |
| | | Shares or
Principal Amount | | Value |
| | | | | | |
Machinery (5.0%) | | | |
Actuant Corp. (c) | | 3,400 | | $ | 165,580 |
Gardner Denver, Inc. (b) | | 3,300 | | | 160,380 |
Greenbrier Cos., Inc. (The) (c) | | 4,000 | | | 110,200 |
Stewart & Stevenson Services, Inc. | | 5,800 | | | 138,388 |
Wabtec Corp. | | 5,400 | | | 146,880 |
| | | | |
|
|
| | | | | | 721,428 |
| | | | |
|
|
Media (2.0%) | | | |
Lions Gate Entertainment
Corp. (b) (c) | | 10,000 | | | 96,000 |
Salem Communications Corp. (b) | | 4,100 | | | 76,752 |
Scholastic Corp. (b) (c) | | 3,799 | | | 123,657 |
| | | | |
|
|
| | | | | | 296,409 |
| | | | |
|
|
Metals & Mining (1.8%) | | | | | |
Aleris International, Inc. (b) | | 5,000 | | | 129,800 |
Allegheny Technologies, Inc. | | 4,800 | | | 137,808 |
| | | | |
|
|
| | | | | | 267,608 |
| | | | |
|
|
Multi-Utilities (2.3%) | | | | | |
Avista Corp. | | 10,600 | | | 185,712 |
WPS Resources Corp. | | 2,700 | | | 147,312 |
| | | | |
|
|
| | | | | | 333,024 |
| | | | |
|
|
Oil Gas & Consumable Fuels (1.7%) | | | |
KCS Energy, Inc. (b) (c) | | 5,100 | | | 123,012 |
Southwestern Energy Co. (b) | | 1,700 | | | 123,318 |
| | | | |
|
|
| | | | | | 246,330 |
| | | | |
|
|
Personal Products (0.7%) | | | | | |
Elizabeth Arden, Inc. (b) | | 4,600 | | | 99,682 |
| | | | |
|
|
Pharmaceuticals (0.7%) | | | | | |
Kos Pharmaceuticals, Inc. (b) (c) | | 1,800 | | | 108,000 |
| | | | |
|
|
Real Estate (9.8%) | | | | | |
American Campus Communities, Inc. | | 5,200 | | | 128,700 |
American Financial Realty Trust | | 11,700 | | | 144,027 |
Ashford Hospitality Trust | | 18,245 | | | 191,573 |
BioMed Realty Trust, Inc. | | 5,900 | | | 147,559 |
Eagle Hospitality Properties Trust | | 13,340 | | | 126,863 |
First Industrial Realty Trust (c) | | 4,800 | | | 195,024 |
First Potomac Realty Trust | | 4,600 | | | 116,564 |
JER Investors Trust, Inc. | | 6,700 | | | 114,235 |
Gartmore Value Opportunities Fund (Continued)
Common Stocks (continued)
| |
| | | | | |
| | | Shares or
Principal Amount | | Value |
| | | | | | |
Real Estate (continued) | | | |
Medical Properties Trust, Inc. | | 15,300 | | $ | 136,782 |
Trammell Crow Co. (b) | | 4,193 | | | 107,215 |
| | | | |
|
|
| | | | | | 1,408,542 |
| | | | |
|
|
Road & Rail (1.6%) | | | | | |
Laidlaw International, Inc. | | 6,100 | | | 138,714 |
RailAmerica, Inc. (b) | | 8,113 | | | 96,139 |
| | | | |
|
|
| | | | | | 234,853 |
| | | | |
|
|
Semiconductors & Semiconductor Equipment (2.8%) |
Cirrus Logic, Inc. (b) | | 17,600 | | | 115,456 |
Mattson Technology (b) | | 13,800 | | | 108,882 |
ON Semiconductor Corp. (b) | | 17,700 | | | 82,128 |
Silicon Storage Technology (b) (c) | | 20,000 | | | 101,000 |
| | | | |
|
|
| | | | | | 407,466 |
| | | | |
|
|
Software (4.0%) | | | | | |
Aspen Technologies, Inc. (b) | | 20,500 | | | 124,025 |
InterVoice, Inc. (b) (c) | | 6,462 | | | 60,226 |
Lawson Software (b) (c) | | 15,300 | | | 117,198 |
Parametric Technology Corp. (b) | | 15,800 | | | 102,858 |
Take-Two Interactive Software,
Inc. (b) | | 4,200 | | | 86,730 |
TIBCO Software, Inc. (b) | | 11,600 | | | 88,044 |
| | | | |
|
|
| | | | | | 579,081 |
| | | | |
|
|
Specialty Retail (3.3%) | | | | | |
AnnTaylor Stores Corp. (b) | | 3,900 | | | 94,653 |
Hot Topic, Inc. (b) (c) | | 7,300 | | | 108,697 |
Jos. A. Bank Clothiers, Inc. (b) | | 1,800 | | | 73,458 |
Too, Inc. (b) | | 4,000 | | | 113,640 |
United Auto Group, Inc. (c) | | 2,800 | | | 94,444 |
| | | | |
|
|
| | | | | | 484,892 |
| | | | |
|
|
Thrifts & Mortgage Finance (2.6%) | | | |
Commercial Capital Bancorp, Inc. | | 8,500 | | | 136,510 |
First Place Financial Corp. | | 2,905 | | | 65,304 |
Franklin Bank Corp. (b) (c) | | 10,500 | | | 181,125 |
| | | | |
|
|
| | | | | | 382,939 |
| | | | |
|
|
Trading Companies & Distributors (0.5%) | | | |
Beacon Roofing Supply, Inc. (b) (c) | | 2,400 | | | 65,424 |
UAP Holding Corp. | | 700 | | | 13,370 |
| | | | |
|
|
| | | | | | 78,794 |
| | | | |
|
|
| | | | | | | |
| | | Shares or
Principal Amount | | Value | |
| | | | | | | | |
Wireless Telecommunication Services (1.5%) | |
Dobson Communications Corp. (b) (c) | | | 13,700 | | $ | 99,873 | |
NII Holdings, Inc. (b) | | | 1,400 | | | 116,088 | |
| | | | | |
|
|
|
| | | | | | | 215,961 | |
| | | | | |
|
|
|
| | |
Total Common Stocks | | | | | | 13,768,592 | |
| | | | | |
|
|
|
|
Cash Equivalents (4.5%) | |
Investments in repurchase agreements (collateralized by U.S. Government Agencies and U.S. Government Agency Mortgages, in a joint trading account at 3.90%, dated 10/31/05, due 11/01/05, repurchase price $648,520) | | $ | 648,450 | | | 648,450 | |
| | | | | |
|
|
|
| | |
Total Cash Equivalents | | | | | | 648,450 | |
| | | | | |
|
|
|
|
Lending (20.2%) Short-Term Securities Held as Collateral for Securities | |
Pool of short-term securities for Gartmore Mutual Funds — note 2 (Securities Lending) | | $ | 2,939,861 | | | 2,939,861 | |
| | | | | |
|
|
|
| |
Total Short-Term Securities Held as Collateral for Securities Lending | | | 2,939,861 | |
| | | | | |
|
|
|
| |
Total Investments
(Cost $16,458,858) (a) — 119.5% | | | 17,356,903 | |
| |
Liabilities in excess of other
assets — (19.5)% | | | (2,831,173 | ) |
| | | | | |
|
|
|
| | |
NET ASSETS — 100.0% | | | | | $ | 14,525,730 | |
| | | | | |
|
|
|
| | (a) | See notes to financial statements for tax unrealized appreciation (depreciation) of securities. |
| | (b) | Non-income producing securities. |
| | (c) | All or part of the security was on loan as of October 31, 2005. |
See notes to financial statements.
Statements of Assets and Liabilities
October 31, 2005
| | | | | | | | | | | | |
| | | Gartmore
Convertible Fund | | Gartmore High
Yield Bond Fund | | | Gartmore Micro Cap Equity Fund |
Assets: | | | | | | | | | | | | |
Investments, at value (cost $42,634,439; $21,834,610 and $118,597,570; respectively) | | $ | 42,929,664 | | $ | 21,610,966 | | | $ | 134,556,960 | | |
Repurchase agreements, at cost and value | | | 6,618,892 | | | 2,347,214 | | | | 15,375,163 | | |
| | |
|
| |
|
|
| |
|
| | |
Total Investments | | | 49,548,556 | | | 23,958,180 | | | | 149,932,123 | | |
| | |
|
| |
|
|
| |
|
| | |
Cash | | | — | | | 5,177,480 | | | | — | | |
Interest and dividends receivable | | | 272,325 | | | 522,164 | | | | 74,281 | | |
Receivable for capital shares issued | | | 3,604 | | | 6,146 | | | | 95,230 | | |
Receivable for investments sold | | | 1,292,200 | | | 47,875 | | | | 1,192,462 | | |
Receivable from adviser | | | — | | | — | | | | 7,390 | | |
Prepaid expenses and other assets | | | 346 | | | 515 | | | | 24,840 | | |
| | |
|
| |
|
|
| |
|
| | |
Total Assets | | | 52,279,710 | | | 29,712,360 | | | | 151,326,326 | | |
| | |
|
| |
|
|
| |
|
| | |
| | | | |
Liabilities: | | | | | | | | | | | | |
Payable to custodian | | | 194,732 | | | — | | | | — | | |
Distributions payable | | | — | | | 12,828 | | | | — | | |
Payable to adviser | | | 1,164 | | | 6,776 | | | | — | | |
Payable for investments purchased | | | 3,065,279 | | | 5,607,081 | | | | 312,553 | | |
Payable for capital shares redeemed | | | 28,782 | | | 13,280 | | | | 631,077 | | |
Payable for return of collateral received for securities on loan | | | — | | | — | | | | 27,810,992 | | |
Accrued expenses and other payables | | | | | | | | | | | | |
Investment advisory fees | | | 25,847 | | | 11,193 | | | | 132,785 | | |
Fund administration and transfer agent fees | | | 3,332 | | | 3,653 | | | | 21,544 | | |
Distribution fees | | | 3,658 | | | 2,332 | | | | 54,335 | | |
Administrative servicing fees | | | 1 | | | 2,153 | | | | 2 | | |
Trustee fees | | | 101 | | | 56 | | | | 317 | | |
Other | | | 12,380 | | | — | | | | 20,877 | | |
| | |
|
| |
|
|
| |
|
| | |
Total Liabilities | | | 3,335,276 | | | 5,659,352 | | | | 28,984,482 | | |
| | |
|
| |
|
|
| |
|
| | |
Net Assets | | $ | 47,781,755 | | $ | 24,053,008 | | | $ | 122,341,844 | | |
| | |
|
| |
|
|
| |
|
| | |
| | | | |
Represented by: | | | | | | | | | | | | |
Capital | | $ | 47,236,775 | | $ | 59,894,801 | | | $ | 99,002,798 | | |
Accumulated net investment income (loss) | | | 184,907 | | | 1 | | | | — | | |
Accumulated net realized gains (losses) from investment transactions | | | 64,848 | | | (35,618,150 | ) | | | 7,379,656 | | |
Net unrealized appreciation (depreciation) on investments | | | 295,225 | | | (223,644 | ) | | | 15,959,390 | | |
| | |
|
| |
|
|
| |
|
| | |
Net Assets | | $ | 47,781,755 | | $ | 24,053,008 | | | $ | 122,341,844 | | |
| | |
|
| |
|
|
| |
|
| | |
| | | | | | | | | | | | | |
| | | | | | | | | | | | | |
| | | | | | | | | | | | | |
| | | | | | | | | | | | | |
| | | | | | | | | | | | | |
| | | | | | | | | | | | | |
| | | | | | | | | | | | | |
| | | | | | | | | | | | | |
| | | | | | | | | | | | | |
See notes to financial statements.
Statements of Assets and Liabilities (Continued)
| | | | | | | | | | | | | | |
| | | Gartmore
Convertible Fund | | | Gartmore High
Yield Bond Fund | | | Gartmore Micro Cap Equity Fund |
Net Assets: | | | | | | | | | | | | | | |
Class A Shares | | $ | 2,046,918 | | | $ | 2,686,585 | | | $ | 68,375,303 | | | |
Class B Shares | | | 253,291 | | | | 760,225 | | | | 7,646,929 | | | |
Class C Shares | | | 3,503,562 | | | | 1,317,516 | | | | 37,980,433 | | | |
Class R Shares | | | 1,080 | | | | 1,080 | | | | 1,238 | | | |
Institutional Service Class Shares | | | 323,926 | | | | 18,272,500 | | | | 224,832 | | | |
Institutional Class Shares | | | 41,652,978 | | | | 1,015,102 | | | | 8,113,109 | | | |
| | |
|
|
| |
|
|
| |
|
|
| | |
Total | | $ | 47,781,755 | | | $ | 24,053,008 | | | $ | 122,341,844 | | | |
| | |
|
|
| |
|
|
| |
|
|
| | |
| | | | |
Shares outstanding (unlimited number of shares authorized): | | | | | | | | | | | | | | |
Class A Shares | | | 201,872 | | | | 398,626 | | | | 3,183,988 | | | |
Class B Shares | | | 25,124 | | | | 112,964 | | | | 365,312 | | | |
Class C Shares | | | 347,209 | | | | 195,645 | | | | 1,812,729 | | | |
Class R Shares | | | 108 | | | | 161 | | | | 59 | | | |
Institutional Service Class Shares | | | 31,969 | | | | 2,689,132 | | | | 10,387 | | | |
Institutional Class Shares | | | 4,110,944 | | | | 149,371 | | | | 374,777 | | | |
| | |
|
|
| |
|
|
| |
|
|
| | |
Total | | | 4,717,226 | | | | 3,545,899 | | | | 5,747,252 | | | |
| | |
|
|
| |
|
|
| |
|
|
| | |
| | | | |
Net asset value and redemption price per share: | | | | | | | | | | | | | | |
Class A Shares | | $ | 10.14 | | | $ | 6.74 | | | $ | 21.47 | | | |
Class B Shares (a) | | $ | 10.08 | | | $ | 6.73 | | | $ | 20.93 | | | |
Class C Shares (b) | | $ | 10.09 | | | $ | 6.73 | | | $ | 20.95 | | | |
Class R Shares | | $ | 10.09 | (c) | | $ | 6.72 | (c) | | $ | 21.13 | (c) | | |
Institutional Service Class Shares | | $ | 10.13 | | | $ | 6.79 | | | $ | 21.64 | | | |
Institutional Class Shares | | $ | 10.13 | | | $ | 6.80 | | | $ | 21.65 | | | |
| | | | |
Maximum offering price per share (100%/(100%-maximum sales charge) of net asset value adjusted to the nearest cent): | | | | | | | | | | | | | | |
Class A Shares | | $ | 10.76 | | | $ | 7.08 | | | $ | 22.78 | | | |
| | |
|
|
| |
|
|
| |
|
|
| | |
Maximum Sales Charge — Class A Shares | | | 5.75 | % | | | 4.75 | % | | | 5.75 | % | | |
| | |
|
|
| |
|
|
| |
|
|
| | |
| | | | | | | | | | | | | | | |
| | | | | | | | | | | | | | | |
| | | | | | | | | | | | | | | |
| | | | | | | | | | | | | | | |
| | | | | | | | | | | | | | | |
| | | | | | | | | | | | | | | |
| | | | | | | | | | | | | | | |
| | | | | | | | | | | | | | | |
| | | | | | | | | | | | | | | |
| | | | | | | | | | | | | | | |
| | | | | | | | | | | | | | | |
| (a) | For Class B Shares, the redemption price per share varies by the length of time shares are held. |
| (b) | For Class C Shares, the redemption price per share is reduced by 1.00% for shares held less than one year. |
| (c) | Due to rounding, Net Assets divided by shares outstanding does not equal the NAV. |
See notes to financial statements.
Statements of Assets and Liabilities (Continued)
October 31, 2005
| | | | | | | | | | | | | |
| | | Gartmore
Small Cap
Growth Fund | | | Gartmore U.S.
Growth Leaders
Long-Short Fund | | | Gartmore Value Opportunities Fund |
Assets: | | | | | | | | | | | | | |
Investments, at value (cost $2,787,420; $38,322,559 and $15,810,408;
respectively) | | $ | 2,842,415 | | | $ | 39,427,813 | | | $ | 16,708,453 | | |
Repurchase agreements, at cost and value | | | 49,976 | | | | 16,917,639 | | | | 648,450 | | |
| | |
|
|
| |
|
|
| |
|
| | |
Total Investments | | | 2,892,391 | | | | 56,345,452 | | | | 17,356,903 | | |
| | |
|
|
| |
|
|
| |
|
| | |
Cash | | | — | | | | 16,039 | | | | 12,635 | | |
Deposits with broker for securities sold short | | | — | | | | 27,534,655 | | | | — | | |
Interest and dividends receivable | | | 746 | | | | 128,799 | | | | 4,994 | | |
Receivable for capital shares issued | | | — | | | | 93,925 | | | | 1,552 | | |
Receivable for investments sold | | | 188,968 | | | | 10,191,425 | | | | 219,364 | | |
Receivable from adviser | | | — | | | | 15,860 | | | | 4,553 | | |
Prepaid expenses and other assets | | | 18,026 | | | | 5,997 | | | | 5,785 | | |
| | |
|
|
| |
|
|
| |
|
| | |
Total Assets | | | 3,100,131 | | | | 94,332,152 | | | | 17,605,786 | | |
| | |
|
|
| |
|
|
| |
|
| | |
| | | | |
Liabilities: | | | | | | | | | | | | | |
Securities sold short, at value (proceeds $0, $26,339,352, and $0;
respectively) | | | — | | | | 26,305,662 | | | | — | | |
Payable to adviser | | | 15,564 | | | | — | | | | — | | |
Payable for investments purchased | | | 128,091 | | | | 9,949,289 | | | | 108,165 | | |
Payable for capital shares redeemed | | | — | | | | — | | | | 782 | | |
Payable for return of collateral received for securities on loan | | | — | | | | — | | | | 2,939,861 | | |
Accrued expenses and other payables | | | | | | | | | | | | | |
Investment advisory fees | | | 2,385 | | | | 72,277 | | | | 8,566 | | |
Fund administration and transfer agent fees | | | 1,249 | | | | 9,728 | | | | 3,258 | | |
Distribution fees | | | 69 | | | | 23,688 | | | | 5,116 | | |
Administrative servicing fees | | | 1 | | | | 3,344 | | | | 8,040 | | |
Trustee fees | | | 7 | | | | 120 | | | | 37 | | |
Other | | | 10,995 | | | | 76,187 | | | | 6,231 | | |
| | |
|
|
| |
|
|
| |
|
| | |
Total Liabilities | | | 158,361 | | | | 36,440,295 | | | | 3,080,056 | | |
| | |
|
|
| |
|
|
| |
|
| | |
Net Assets | | $ | 2,941,770 | | | $ | 57,891,857 | | | $ | 14,525,730 | | |
| | |
|
|
| |
|
|
| |
|
| | |
| | | | |
Represented by: | | | | | | | | | | | | | |
Capital | | $ | 3,154,765 | | | $ | 75,251,878 | | | $ | 11,656,520 | | |
Accumulated net investment income (loss) | | | — | | | | (5,817 | ) | | | — | | |
Accumulated net realized gains (losses) from investments | | | (267,990 | ) | | | (18,493,148 | ) | | | 1,971,165 | | |
Net unrealized appreciation (depreciation) on investments | | | 54,995 | | | | 1,138,944 | | | | 898,045 | | |
| | |
|
|
| |
|
|
| |
|
| | |
Net Assets | | $ | 2,941,770 | | | $ | 57,891,857 | | | $ | 14,525,730 | | |
| | |
|
|
| |
|
|
| |
|
| | |
| | | | | | | | | | | | | | |
| | | | | | | | | | | | | | |
| | | | | | | | | | | | | | |
| | | | | | | | | | | | | | |
| | | | | | | | | | | | | | |
| | | | | | | | | | | | | | |
See notes to financial statements.
Statements of Assets and Liabilities (Continued)
| | | | | | | | | | | | | | |
| | | Gartmore
Small Cap
Growth Fund | | | Gartmore U.S.
Growth Leaders
Long-Short Fund | | | Gartmore Value Opportunities Fund |
Net Assets: | | | | | | | | | | | | | | |
Class A Shares | | $ | 146,083 | | | $ | 33,828,067 | | | $ | 11,262,515 | | | |
Class B Shares | | | 5,218 | | | | 814,113 | | | | 2,591,795 | | | |
Class C Shares | | | 35,885 | | | | 19,371,854 | | | | 669,117 | | | |
Class R Shares | | | 913 | | | | 1,084 | | | | 1,165 | | | |
Institutional Service Class Shares | | | 919 | | | | — | | | | — | | | |
Institutional Class Shares | | | 2,752,752 | | | | 3,876,739 | | | | 1,138 | | | |
| | |
|
|
| |
|
|
| |
|
|
| | |
Total | | $ | 2,941,770 | | | $ | 57,891,857 | | | $ | 14,525,730 | | | |
| | |
|
|
| |
|
|
| |
|
|
| | |
| | | | |
Shares outstanding (unlimited number of shares authorized): | | | | | | | | | | | | | | |
Class A Shares | | | 15,968 | | | | 3,442,614 | | | | 742,580 | | | |
Class B Shares | | | 577 | | | | 84,897 | | | | 174,694 | | | |
Class C Shares | | | 3,967 | | | | 2,658,569 | | | | 45,219 | | | |
Class R Shares | | | 100 | | | | 112 | | | | 78 | | | |
Institutional Service Class Shares | | | 100 | | | | — | | | | — | | | |
Institutional Class Shares | | | 299,500 | | | | 393,404 | | | | 74 | | | |
| | |
|
|
| |
|
|
| |
|
|
| | |
Total | | | 320,212 | | | | 6,579,596 | | | | 962,645 | | | |
| | |
|
|
| |
|
|
| |
|
|
| | |
| | | | |
Net asset value and redemption price per share: | | | | | | | | | | | | | | |
Class A Shares | | $ | 9.15 | | | $ | 9.83 | | | $ | 15.17 | | | |
Class B Shares (a) | | $ | 9.04 | | | $ | 9.59 | | | $ | 14.84 | | | |
Class C Shares (b) | | $ | 9.05 | | | $ | 7.29 | | | $ | 14.80 | | | |
Class R Shares | | $ | 9.13 | | | $ | 9.68 | | | $ | 14.98 | (c) | | |
Institutional Service Class Shares | | $ | 9.19 | | | $ | — | | | $ | — | | | |
Institutional Class Shares | | $ | 9.19 | | | $ | 9.85 | | | $ | 15.35 | (c) | | |
| | | | |
Maximum offering price per share (100%/(100%-maximum sales charge) of net asset value adjusted to the nearest cent): | | | | | | | | | | | | | | |
Class A Shares | | $ | 9.71 | | | $ | 10.43 | | | $ | 16.10 | | | |
| | |
|
|
| |
|
|
| |
|
|
| | |
Maximum Sales Charge — Class A Shares | | | 5.75 | % | | | 5.75 | % | | | 5.75 | % | | |
| | |
|
|
| |
|
|
| |
|
|
| | |
| | | | | | | | | | | | | | | |
| | | | | | | | | | | | | | | |
| | | | | | | | | | | | | | | |
| | | | | | | | | | | | | | | |
| | | | | | | | | | | | | | | |
| | | | | | | | | | | | | | | |
| | | | | | | | | | | | | | | |
| | | | | | | | | | | | | | | |
| | | | | | | | | | | | | | | |
| | | | | | | | | | | | | | | |
| | | | | | | | | | | | | | | |
| (a) | For Class B Shares, the redemption price per share varies by the length of time shares are held. |
| (b) | For Class C Shares, the redemption price per share is reduced by 1.00% for shares held less than one year. |
| (c) | Due to rounding, Net Assets divided by shares outstanding does not equal the NAV. |
See notes to financial statements.
Statements of Operations
For the Year Ended October 31, 2005
| | | | | | | | | | | | | | |
| | | Gartmore
Convertible Fund | | | Gartmore High
Yield Bond Fund | | | Gartmore Micro Cap Equity Fund |
INVESTMENT INCOME: | | | | | | | | | | | | | | |
Interest income | | $ | 780,962 | | | $ | 1,936,816 | | | $ | 135,460 | | | |
Dividend income | | | 880,998 | | | | 26,025 | | | | 330,043 | | | |
Income from securities lending | | | — | | | | — | | | | 318,411 | | | |
| | |
|
|
| |
|
|
| |
|
|
| | |
Total Income | | | 1,661,960 | | | | 1,962,841 | | | | 783,914 | | | |
| | |
|
|
| |
|
|
| |
|
|
| | |
| | | | |
Expenses: | | | | | | | | | | | | | | |
Investment advisory fees | | | 269,558 | | | | 131,576 | | | | 1,759,262 | | | |
Fund administration and transfer agent fees | | | 57,424 | | | | 55,040 | | | | 268,601 | | | |
Distribution fees Class A | | | 6,384 | | | | 8,392 | | | | 207,175 | | | |
Distribution fees Class B | | | 2,533 | | | | 7,606 | | | | 82,220 | | | |
Distribution fees Class C | | | 38,055 | | | | 14,740 | | | | 416,008 | | | |
Distribution fees Class R | | | 4 | | | | 4 | | | | 4 | | | |
Administrative servicing fees Class A | | | — | | | | 2,502 | | | | 8,807 | | | |
Administrative servicing fees Institutional Service Class | | | — | | | | 9,252 | | | | — | | | |
Registration and filing fees | | | 51,185 | | | | 49,612 | | | | 67,200 | | | |
Trustee fees | | | 1,708 | | | | 269 | | | | 5,754 | | | |
Other | | | 14,535 | | | | 3,590 | | | | 176,196 | | | |
| | |
|
|
| |
|
|
| |
|
|
| | |
Total expenses before reimbursed expenses | | | 441,386 | | | | 282,583 | | | | 2,991,227 | | | |
Earnings credit (Note 5) | | | (1,174 | ) | | | (1,378 | ) | | | (2,435 | ) | | |
Expenses reimbursed | | | — | | | | (47,602 | ) | | | (19,206 | ) | | |
| | |
|
|
| |
|
|
| |
|
|
| | |
Total Expenses | | | 440,212 | | | | 233,603 | | | | 2,969,586 | | | |
| | |
|
|
| |
|
|
| |
|
|
| | |
Net Investment Income (Loss) | | | 1,221,748 | | | | 1,729,238 | | | | (2,185,672 | ) | | |
| | |
|
|
| |
|
|
| |
|
|
| | |
| | | | |
REALIZED/UNREALIZED GAINS (LOSSES) FROM INVESTMENTS: | | | | | | | | | | | | | | |
Net realized gains (losses) on investment transactions | | | 474,484 | | | | 189,291 | | | | 8,767,558 | | | |
Net change in unrealized appreciation/depreciation from investments | | | 471,459 | | | | (1,403,019 | ) | | | 6,799,515 | | | |
| | |
|
|
| |
|
|
| |
|
|
| | |
Net realized/unrealized gains (losses) on investments | | | 945,943 | | | | (1,213,728 | ) | | | 15,567,073 | | | |
| | |
|
|
| |
|
|
| |
|
|
| | |
CHANGE IN NET ASSETS RESULTING FROM OPERATIONS | | $ | 2,167,691 | | | $ | 515,510 | | | $ | 13,381,401 | | | |
| | |
|
|
| |
|
|
| |
|
|
| | |
| | | | | | | | | | | | | | | |
See notes to financial statements.
Statements of Operations
For the Year Ended October 31, 2005
| | | | | | | | | | | | | | |
| | | Gartmore Small Cap Growth Fund | | | Gartmore U.S. Growth Leaders Long-Short Fund | | | Gartmore Value Opportunities Fund |
INVESTMENT INCOME: | | | | | | | | | | | | | | |
Interest income | | $ | 3,418 | | | $ | 954,401 | | | $ | 17,384 | | | |
Dividend income | | | 12,531 | | | | 232,403 | | | | 285,367 | | | |
Income from securities lending | | | – | | | | – | | | | 6,479 | | | |
| | |
|
|
| |
|
|
| |
|
|
| | |
Total Income | | | 15,949 | | | | 1,186,804 | | | | 309,230 | | | |
| | |
|
|
| |
|
|
| |
|
|
| | |
| | | | |
Expenses: | | | | | | | | | | | | | | |
Investment advisory fees | | | 28,162 | | | | 666,637 | | | | 139,810 | | | |
Fund administration and transfer agent fees | | | 6,429 | | | | 89,592 | | | | 33,999 | | | |
Distribution fees Class A | | | 207 | | | | 70,756 | | | | 30,069 | | | |
Distribution fees Class B | | | 127 | | | | 7,768 | | | | 26,882 | | | |
Distribution fees Class C | | | 438 | | | | 131,617 | | | | 7,005 | | | |
Distribution fees Class R | | | 4 | | | | 4 | | | | 4 | | | |
Administrative servicing fees Class A | | | – | | | | 6,870 | | | | 12,162 | | | |
Administrative servicing fees Institutional Service Class | | | – | | | | – | | | | 10,443 | | | |
Custodian fees | | | 1,284 | | | | 35,439 | | | | 17,594 | | | |
Dividend expense for securities sold short | | | – | | | | 285,777 | | | | – | | | |
Registration and filing fees | | | 31,088 | | | | 38,087 | | | | 54,372 | | | |
Printing fees | | | 102 | | | | 46,713 | | | | 33,577 | | | |
Trustee fees | | | 116 | | | | 1,769 | | | | 677 | | | |
Other | | | 641 | | | | 9,698 | | | | 4,374 | | | |
| | |
|
|
| |
|
|
| |
|
|
| | |
Total expenses before reimbursed expenses | | | 68,598 | | | | 1,390,727 | | | | 370,968 | | | |
Earnings credit (Note 5) | | | (23 | ) | | | (1,438 | ) | | | (49 | ) | | |
Expenses reimbursed | | | (27,746 | ) | | | (43,113 | ) | | | (54,601 | ) | | |
| | |
|
|
| |
|
|
| |
|
|
| | |
Total Expenses | | | 40,829 | | | | 1,346,176 | | | | 316,318 | | | |
| | |
|
|
| |
|
|
| |
|
|
| | |
Net Investment Income (Loss) | | | (24,880 | ) | | | (159,372 | ) | | | (7,088 | ) | | |
| | |
|
|
| |
|
|
| |
|
|
| | |
| | | | |
REALIZED/UNREALIZED GAINS (LOSSES) FROM INVESTMENTS: | | | | | | | | | | | | | | |
Net realized gains (losses) on investment transactions | | | 18,586 | | | | 2,626,065 | | | | 5,310,694 | | | |
Net change in unrealized appreciation/depreciation on investments | | | (1,715 | ) | | | 488,936 | | | | (2,049,777 | ) | | |
| | |
|
|
| |
|
|
| |
|
|
| | |
Net realized/unrealized gains (losses) on investments | | | 16,871 | | | | 3,115,001 | | | | 3,260,917 | | | |
| | |
|
|
| |
|
|
| |
|
|
| | |
CHANGE IN NET ASSETS RESULTING FROM OPERATIONS | | $ | (8,009 | ) | | $ | 2,955,629 | | | $ | 3,253,829 | | | |
| | |
|
|
| |
|
|
| |
|
|
| | |
| | | | | | | | | | | | | | | |
| | | | | | | | | | | | | | | |
| | | | | | | | | | | | | | | |
| | | | | | | | | | | | | | | |
| | | | | | | | | | | | | | | |
| | | | | | | | | | | | | | | |
| | | | | | | | | | | | | | | |
| | | | | | | | | | | | | | | |
| | | | | | | | | | | | | | | |
| | | | | | | | | | | | | | | |
| | | | | | | | | | | | | | | |
See notes to financial statements.
Statements of Changes in Net Assets
| | | | | | | | | | | | | | | | | | |
| | | Gartmore Convertible Fund | | | Gartmore High Yield Bond Fund |
| | | Year Ended
October 31, 2005 | | | Period Ended
October 31, 2004 (a) | | | Year Ended
October 31, 2005 | | | Year Ended
October 31, 2004 | | | |
FROM INVESTMENT ACTIVITIES: | | | | | | | | | | | | | | | | | | |
Operations: | | | | | | | | | | | | | | | | | | |
Net investment income (loss) | | $ | 1,221,748 | | | $ | 448,406 | | | $ | 1,729,238 | | | $ | 6,245,178 | | | |
Net realized gains (losses) on investment transactions | | | 474,484 | | | | (409,636 | ) | | | 189,291 | | | | 5,076,078 | | | |
Net change in unrealized appreciation/depreciation on investments | | | 471,459 | | | | (176,234 | ) | | | (1,403,019 | ) | | | (5,990,113 | ) | | |
| | |
|
|
| |
|
|
| |
|
|
| |
|
|
| | |
Change in net assets resulting from operations | | | 2,167,691 | | | | (137,464 | ) | | | 515,510 | | | | 5,331,143 | | | |
| | |
|
|
| |
|
|
| |
|
|
| |
|
|
| | |
| | | | | |
Distributions to Class A Shareholders from: | | | | | | | | | | | | | | | | | | |
Net investment income | | | (63,556 | ) | | | (31,238 | ) (b) | | | (239,415 | ) | | | (318,947 | ) | | |
| | | | | |
Distributions to Class B Shareholders from: | | | | | | | | | | | | | | | | | | |
Net investment income | | | (4,809 | ) | | | (1,215 | ) (b) | | | (49,100 | ) | | | (48,620 | ) | | |
| | | | | |
Distributions to Class C Shareholders from: | | | | | | | | | | | | | | | | | | |
Net investment income | | | (69,633 | ) | | | (20,050 | ) (b) | | | (95,312 | ) | | | (184,379 | ) | | |
| | | | | |
Distributions to Class R Shareholders from: | | | | | | | | | | | | | | | | | | |
Net investment income | | | (26 | ) | | | (9 | ) (c) | | | (77 | ) | | | (46 | )(d) | | |
| | | | | |
Distributions to Institutional Service Class Shareholders from: | | | | | | | | | | | | | | | | | | |
Net investment income | | | (8,949 | ) | | | (2,589 | ) (b) | | | (1,339,607 | ) | | | (5,693,160 | ) | | |
| | | | | |
Distributions to Institutional Class Shareholders from: | | | | | | | | | | | | | | | | | | |
Net investment income | | | (969,285 | ) | | | (323,490 | ) | | | (5,727 | ) | | | (26 | )(e) | | |
| | |
|
|
| |
|
|
| |
|
|
| |
|
|
| | |
Change in net assets from shareholder distributions | | | (1,116,258 | ) | | | (378,591 | ) | | | (1,729,238 | ) | | | (6,245,178 | ) | | |
| | |
|
|
| |
|
|
| |
|
|
| |
|
|
| | |
Change in net assets from capital transactions | | | 11,667,574 | | | | 35,578,803 | | | | 828,746 | | | | (88,703,708 | ) | | |
| | |
|
|
| |
|
|
| |
|
|
| |
|
|
| | |
Change in net assets | | | 12,719,007 | | | | 35,062,748 | | | | (384,982 | ) | | | (89,617,743 | ) | | |
| | | | | |
Net Assets: | | | | | | | | | | | | | | | | | | |
Beginning of period | | | 35,062,748 | | | | — | | | | 24,437,990 | | | | 114,055,733 | | | |
| | |
|
|
| |
|
|
| |
|
|
| |
|
|
| | |
End of period | | $ | 47,781,755 | | | $ | 35,062,748 | | | $ | 24,053,008 | | | $ | 24,437,990 | | | |
| | |
|
|
| |
|
|
| |
|
|
| |
|
|
| | |
Accumulated net investment income (loss) | | $ | 184,907 | | | $ | 79,417 | | | $ | 1 | | | $ | 1 | | | |
| | |
|
|
| |
|
|
| |
|
|
| |
|
|
| | |
| | | | | | | | | | | | | | | | | | | |
| | | | | | | | | | | | | | | | | | | |
| | | | | | | | | | | | | | | | | | | |
| | | | | | | | | | | | | | | | | | | |
| | | | | | | | | | | | | | | | | | | |
| | | | | | | | | | | | | | | | | | | |
| (a) | For the period from December 29, 2003 (commencement of operations) through October 31, 2004. |
| (b) | For the period from January 20, 2004 (commencement of operations) through October 31, 2004. |
| (c) | For the period from May 14, 2004 (commencement of operations) through October 31, 2004. |
| (d) | For the period from February 27, 2004 (commencement of operations) through October 31, 2004. |
| (e) | For the period from June 29, 2004 (commencement of operations) through October 31, 2004. |
See notes to financial statements.
Statements of Changes in Net Assets
| | | | | | | | | | | | | | | | | | |
| | | Gartmore Micro Cap Equity Fund | | | Gartmore Small Cap Growth Fund |
| | | Year Ended
October 31, 2005 | | | Year Ended
October 31, 2004 | | | Year Ended
October 31, 2005 | | | Period Ended
October 31, 2004 (a) |
FROM INVESTMENT ACTIVITIES: | | | | | | | | | | | | | | | | | | |
Operations: | | | | | | | | | | | | | | | | | | |
Net investment income (loss) | | $ | (2,185,672 | ) | | $ | (1,199,048 | ) | | $ | (24,880 | ) | | $ | (12,230 | ) | | |
Net realized gains (losses) on investment transactions | | | 8,767,558 | | | | 4,115,524 | | | | 18,586 | | | | (288,140 | ) | | |
Net change in unrealized appreciation/depreciation on investments | | | 6,799,515 | | | | 5,816,745 | | | | (1,715 | ) | | | 56,710 | | | |
| | |
|
|
| |
|
|
| |
|
|
| |
|
|
| | |
Change in net assets resulting from operations | | | 13,381,401 | | | | 8,733,221 | | | | (8,009 | ) | | | (243,660 | ) | | |
| | |
|
|
| |
|
|
| |
|
|
| |
|
|
| | |
| | | | | |
Distributions to Class A Shareholders from: | | | | | | | | | | | | | | | | | | |
Net investment income | | | — | | | | — | | | | — | | | | — | | | |
Net realized gains on investments | | | (1,846,386 | ) | | | (8,895 | ) | | | — | | | | — | | | |
| | | | | |
Distributions to Class B Shareholders from: | | | | | | | | | | | | | | | | | | |
Net investment income | | | — | | | | — | | | | — | | | | — | | | |
Net realized gains on investments | | | (163,298 | ) | | | (889 | ) | | | — | | | | — | | | |
| | | | | |
Distributions to Class C Shareholders from: | | | | | | | | | | | | | | | | | | |
Net investment income | | | — | | | | — | | | | — | | | | — | | | |
Net realized gains on investments | | | (853,621 | ) | | | (3,920 | ) | | | — | | | | — | | | |
| | | | | |
Distributions to Class R Shareholders from: | | | | | | | | | | | | | | | | | | |
Net investment income | | | — | | | | — | | | | — | | | | — | | | |
Net realized gains on investments | | | (23 | ) | | | — | (b)(c) | | | — | | | | — | | | |
| | | | | |
Distributions to Institutional Service Class Shareholders from: | | | | | | | | | | | | | | | | | | |
Net investment income | | | — | | | | — | | | | — | | | | — | | | |
Net realized gains on investments | | | (2,437 | ) | | | (7 | ) | | | — | | | | — | | | |
| | | | | |
Distributions to Institutional Class Shareholders from: | | | | | | | | | | | | | | | | | | |
Net investment income | | | — | | | | — | | | | — | | | | — | | | |
Net realized gains on investments | | | (59,761 | ) | | | (506 | ) | | | — | | | | — | | | |
| | |
|
|
| |
|
|
| |
|
|
| |
|
|
| | |
Change in net assets from shareholder distributions | | | (2,925,526 | ) | | | (14,217 | ) | | | — | | | | — | | | |
| | |
|
|
| |
|
|
| |
|
|
| |
|
|
| | |
Change in net assets from capital transactions | | | (3,422,201 | ) | | | 79,393,895 | | | | 128,905 | | | | 3,064,534 | | | |
| | |
|
|
| |
|
|
| |
|
|
| |
|
|
| | |
Change in net assets | | | 7,033,674 | | | | 88,112,899 | | | | 120,896 | | | | 2,820,874 | | | |
| | | | | |
Net Assets: | | | | | | | | | | | | | | | | | | |
Beginning of period | | | 115,308,170 | | | | 27,195,271 | | | | 2,820,874 | | | | — | | | |
| | |
|
|
| |
|
|
| |
|
|
| |
|
|
| | |
End of period | | $ | 122,341,844 | | | $ | 115,308,170 | | | $ | 2,941,770 | | | $ | 2,820,874 | | | |
| | |
|
|
| |
|
|
| |
|
|
| |
|
|
| | |
Accumulated net investment income (loss) | | $ | — | | | $ | — | | | $ | — | | | $ | — | | | |
| | |
|
|
| |
|
|
| |
|
|
| |
|
|
| | |
| | | | | | | | | | | | | | | | | | | |
| (a) | For the period from March 30, 2004 (commencement of operations) through October 31, 2004. |
| (b) | For the period from December 30, 2003 (commencement of operations) through October 31, 2004. |
| (c) | Amount is less than $1. |
See notes to financial statements.
Statements of Changes in Net Assets
| | | | | | | | | | | | | | | | | | |
| | | Gartmore U.S. Growth Leaders
Long-Short Fund | | | Gartmore Value Opportunities Fund |
| | | Year Ended
October 31, 2005 | | | Year Ended October 31, 2004 | | | Year Ended
October 31, 2005 | | | Year Ended
October 31, 2004 |
FROM INVESTMENT ACTIVITIES: | | | | | | | | | | | | | | | | | | |
Operations: | | | | | | | | | | | | | | | | | | |
Net investment income (loss) | | $ | (159,372 | ) | | $ | (454,861 | ) | | $ | (7,088 | ) | | $ | 18,758 | | | |
Net realized gains (losses) on investment transactions | | | 2,626,065 | | | | 2,736,596 | | | | 5,310,694 | | | | 5,404,162 | | | |
Net change in unrealized appreciation/depreciation on investments | | | 488,936 | | | | 154,329 | | | | (2,049,777 | ) | | | (1,765,389 | ) | | |
| | |
|
|
| |
|
|
| |
|
|
| |
|
|
| | |
Change in net assets resulting from operations | | | 2,955,629 | | | | 2,436,064 | (a) | | | 3,253,829 | | | | 3,657,531 | | | |
| | |
|
|
| |
|
|
| |
|
|
| |
|
|
| | |
| | | | | |
Distributions to Class A Shareholders from: | | | | | | | | | | | | | | | | | | |
Net investment income | | | (796,091 | ) | | | (7,546,048 | ) | | | (19,254 | ) | | | (9,434 | ) | | |
Net realized gains on investments | | | — | | | | — | | | | (2,094,330 | ) | | | — | | | |
| | | | | |
Distributions to Class B Shareholders from: | | | | | | | | | | | | | | | | | | |
Net investment income | | | (18,985 | ) | | | (119,661 | ) | | | — | | | | — | | | |
Net realized gains on investments | | | — | | | | — | | | | (468,923 | ) | | | — | | | |
| | | | | |
Distributions to Class C Shareholders from: | | | | | | | | | | | | | | | | | | |
Net investment income | | | (256,975 | ) | | | (513,025 | ) | | | — | | | | — | | | |
Net realized gains on investments | | | — | | | | — | | | | (121,288 | ) | | | — | | | |
| | | | | |
Distributions to Class R Shareholders from: | | | | | | | | | | | | | | | | | | |
Net investment income | | | (32 | ) | | | — | | | | (2 | ) | | | — | | | |
Net realized gains on investments | | | — | | | | — | | | | (187 | ) | | | — | | | |
| | | | | |
Distributions to Institutional Service Class Shareholders from: | | | | | | | | | | | | | | | | | | |
Net investment income | | | — | | | | — | | | | (6,938 | ) | | | (24,707 | ) | | |
Net realized gains on investments | | | — | | | | — | | | | (2,552,592 | ) | | | — | | | |
| | | | | |
Distributions to Institutional Class Shareholders from: | | | | | | | | | | | | | | | | | | |
Net investment income | | | (30,947 | ) | | | — | | | | (4 | ) | | | — | | | |
Net realized gains on investments | | | — | | | | — | | | | (178 | ) | | | — | | | |
| | |
|
|
| |
|
|
| |
|
|
| |
|
|
| | |
Change in net assets from shareholder distributions | | | (1,103,030 | ) | | | (8,178,734 | ) | | | (5,263,696 | ) | | | (34,141 | ) | | |
| | |
|
|
| |
|
|
| |
|
|
| |
|
|
| | |
Change in net assets from capital transactions | | | 28,002,160 | | | | 2,411,514 | | | | (15,490,924 | ) | | | (8,405,689 | ) | | |
| | |
|
|
| |
|
|
| |
|
|
| |
|
|
| | |
Change in net assets | | | 29,854,759 | | | | (3,331,156 | ) | | | (17,500,791 | ) | | | (4,782,299 | ) | | |
| | | | | |
Net Assets: | | | | | | | | | | | | | | | | | | |
Beginning of period | | | 28,037,098 | | | | 31,368,254 | | | | 32,026,521 | | | | 36,808,820 | | | |
| | |
|
|
| |
|
|
| |
|
|
| |
|
|
| | |
End of period | | $ | 57,891,857 | | | $ | 28,037,098 | | | $ | 14,525,730 | | | $ | 32,026,521 | | | |
| | |
|
|
| |
|
|
| |
|
|
| |
|
|
| | |
Accumulated net investment income (loss) | | $ | (5,817 | ) | | $ | 914,137 | | | $ | — | | | $ | — | | | |
| | |
|
|
| |
|
|
| |
|
|
| |
|
|
| | |
| | | | | | | | | | | | | | | | | | | |
| (a) | The amount reported as the “Change in net assets resulting from operations” of $(2,764,853) in the October 31, 2004 annual report contained a typographical error resulting in the reporting of Total Net Assets by the Fund of $22,836,181. The amount reported as the “Change in net assets resulting from operations” should have been $2,436,064 resulting in Total Net Assets at the end of the period of $28,037,098. |
See notes to financial statements.
Financial Highlights
Selected Data for Each Share of Capital Outstanding
Gartmore Convertible Fund
| | | | | | | | | | | | | | | | | | | | | | | | | | | | | | | | | | | | | | | | |
| | | | | Investment Activities | | | Distributions | | | | | | | | Ratios/Supplemental Data |
| | | Net Asset
Value,
Beginning
of Period | | Net
Investment
Income
(Loss) | | Net Realized
and
Unrealized
Gains
(Losses) on
Investments | | | Total
from
Investment
Activities | | | Net
Investment
Income | | | Total
Distributions | | | Net
Asset
Value, End
of Period | | Total
Return (a) | | | Net Assets
at End of
Period
(000s) | | Ratio of
Expenses
to Average
Net Assets | | | Ratio of Net
Investment
Income
(Loss)
to Average
Net Assets | | | Ratio of
Expenses
(Prior to
Reimbursements)
to Average
Net Assets (b) | | | Ratio of Net
Investment
Income (Loss)
(Prior to
Reimbursements)
to Average
Net Assets (b) | | | Portfolio
Turnover (c) |
| | | | | | | | | | | | | | |
Class A Shares | | | | | | | | | | | | | | | | | | | | | | | | | | | | | | | | | | | | | | | | |
Period Ended October 31, 2004 (d) | | $ | 10.09 | | 0.15 | | (0.32 | ) | | (0.17 | ) | | (0.14 | ) | | (0.14 | ) | | $ | 9.78 | | (1.68% | )(g) | | $ | 2,988 | | 1.20% | (h) | | 2.28% | (h) | | 1.36% | (h) | | 2.12% | (h) | | 153.08% |
Year Ended October 31, 2005 | | $ | 9.78 | | 0.30 | | 0.31 | | | 0.61 | | | (0.25 | ) | | (0.25 | ) | | $ | 10.14 | | 6.32% | | | $ | 2,047 | | 1.20% | | | 2.80% | | | (i | ) | | (i | ) | | 169.53% |
| | | | | | | | | | | | | | |
Class B Shares | | | | | | | | | | | | | | | | | | | | | | | | | | | | | | | | | | | | | | | | |
Period Ended October 31, 2004 (d) | | $ | 10.09 | | 0.10 | | (0.35 | ) | | (0.25 | ) | | (0.11 | ) | | (0.11 | ) | | $ | 9.73 | | (2.46% | )(g) | | $ | 210 | | 1.95% | (h) | | 1.55% | (h) | | 2.08% | (h) | | 1.42% | (h) | | 153.08% |
Year Ended October 31, 2005 | | $ | 9.73 | | 0.20 | | 0.34 | | | 0.54 | | | (0.19 | ) | | (0.19 | ) | | $ | 10.08 | | 5.52% | | | $ | 253 | | 1.95% | | | 2.05% | | | (i | ) | | (i | ) | | 169.53% |
| | | | | | | | | | | | | | |
Class C Shares | | | | | | | | | | | | | | | | | | | | | | | | | | | | | | | | | | | | | | | | |
Period Ended October 31, 2004 (d) | | $ | 10.09 | | 0.10 | | (0.34 | ) | | (0.24 | ) | | (0.11 | ) | | (0.11 | ) | | $ | 9.74 | | (2.41% | )(g) | | $ | 3,253 | | 1.95% | (h) | | 1.52% | (h) | | 2.09% | (h) | | 1.38% | (h) | | 153.08% |
Year Ended October 31, 2005 | | $ | 9.74 | | 0.21 | | 0.32 | | | 0.53 | | | (0.18 | ) | | (0.18 | ) | | $ | 10.09 | | 5.48% | | | $ | 3,504 | | 1.95% | | | 2.05% | | | (i | ) | | (i | ) | | 169.53% |
| | | | | | | | | | | | | | |
Class R Shares | | | | | | | | | | | | | | | | | | | | | | | | | | | | | | | | | | | | | | | | |
Period Ended October 31, 2004 (e) | | $ | 9.66 | | 0.08 | | 0.09 | | | 0.17 | | | (0.09 | ) | | (0.09 | ) | | $ | 9.74 | | 1.72% | (g) | | $ | 1 | | 1.58% | (h) | | 1.75% | (h) | | 1.59% | (h) | | 1.75% | (h) | | 153.08% |
Year Ended October 31, 2005 | | $ | 9.74 | | 0.27 | | 0.33 | | | 0.60 | | | (0.25 | ) | | (0.25 | ) | | $ | 10.09 | | 6.16% | | | $ | 1 | | 1.33% | | | 2.67% | | | (i | ) | | (i | ) | | 169.53% |
| | | | | | | | | | | | | | |
Institutional Service Class Shares | | | | | | | | | | | | | | | | | | | | | | | | | | | | | | | | | | | | | | | | |
Period Ended October 31, 2004 (d) | | $ | 10.09 | | 0.12 | | (0.28 | ) | | (0.16 | ) | | (0.15 | ) | | (0.15 | ) | | $ | 9.78 | | (0.68% | )(g) | | $ | 311 | | 0.95% | (h) | | 2.28% | (h) | | 1.10% | (h) | | 2.13% | (h) | | 153.08% |
Year Ended October 31, 2005 | | $ | 9.78 | | 0.31 | | 0.32 | | | 0.63 | | | (0.28 | ) | | (0.28 | ) | | $ | 10.13 | | 6.50% | | | $ | 324 | | 0.95% | | | 3.04% | | | (i | ) | | (i | ) | | 169.53% |
| | | | | | | | | | | | | | |
Institutional Class Shares | | | | | | | | | | | | | | | | | | | | | | | | | | | | | | | | | | | | | | | | |
Period Ended October 31, 2004 (f) | | $ | 10.00 | | 0.18 | | (0.25 | ) | | (0.07 | ) | | (0.15 | ) | | (0.15 | ) | | $ | 9.78 | | (1.56% | )(g) | | $ | 28,299 | | 0.95% | (h) | | 2.53% | (h) | | 1.12% | (h) | | 2.36% | (h) | | 153.08% |
Year Ended October 31, 2005 | | $ | 9.78 | | 0.30 | | 0.33 | | | 0.63 | | | (0.28 | ) | | (0.28 | ) | | $ | 10.13 | | 6.50% | | | $ | 41,653 | | 0.95% | | | 3.06% | | | (i | ) | | (i | ) | | 169.53% |
| | | | | | | | | | | | | | | | | | | | | | | | | | | | | | | | | | | | | | | | | |
| | | | | | | | | | | | | | | | | | | | | | | | | | | | | | | | | | | | | | | | | |
| | | | | | | | | | | | | | | | | | | | | | | | | | | | | | | | | | | | | | | | | |
| | | | | | | | | | | | | | | | | | | | | | | | | | | | | | | | | | | | | | | | | |
| | | | | | | | | | | | | | | | | | | | | | | | | | | | | | | | | | | | | | | | | |
| | | | | | | | | | | | | | | | | | | | | | | | | | | | | | | | | | | | | | | | | |
| | | | | | | | | | | | | | | | | | | | | | | | | | | | | | | | | | | | | | | | | |
| | | | | | | | | | | | | | | | | | | | | | | | | | | | | | | | | | | | | | | | | |
| | | | | | | | | | | | | | | | | | | | | | | | | | | | | | | | | | | | | | | | | |
| | | | | | | | | | | | | | | | | | | | | | | | | | | | | | | | | | | | | | | | | |
| | | | | | | | | | | | | | | | | | | | | | | | | | | | | | | | | | | | | | | | | |
|
(a) Excludes sales charge. |
(b) During the period certain fees were waived and/or reimbursed. If such waivers/reimbursements had not occurred, the ratios would have been as indicated. |
(c) Portfolio turnover is calculated on the basis of the Fund as a whole without distinguishing among the classes of shares. |
(d) For the period from January 20, 2004 (commencement of operations) through October 31, 2004. |
(e) For the period from May 14, 2004 (commencement of operations) through October 31, 2004. |
(f) For the period from December 29, 2003 (commencement of operations) through October 31, 2004. |
(g) Not annualized. |
(h)Annualized. |
(i) There were no fee reductions during this period. |
See notes to financial statements.
Financial Highlights
Selected Data for Each Share of Capital Outstanding
Gartmore High Yield Bond Fund
| | | | | | | | | | | | | | | | | | | | | | | | | | | | | | | | | | | | | | | | |
| | | | | Investment Activities | | | Distributions | | | | | | Ratios/Supplemental Data |
| | | Net Asset
Value,
Beginning
of Period | | Net
Investment
Income
(Loss) | | Net Realized
and
Unrealized
Gains
(Losses) on
Investments | | | Total
from
Investment
Activities | | | Net
Investment
Income | | | Total
Distributions | | | Net
Asset
Value, End
of Period | | Total
Return (a) | | | Net Assets
at End of
Period
(000s) | | Ratio of
Expenses
to Average
Net Assets | | | Ratio of Net
Investment
Income
(Loss) to Average
Net Assets | | | Ratio of
Expenses
(Prior to
Reimbursements)
to Average
Net Assets (b) | | | Ratio of Net
Investment
Income (Loss)
(Prior to
Reimbursements)
to Average
Net Assets (b) | | | Portfolio
Turnover (c) |
| | | | | | | | | | | | | | |
Class A Shares | | | | | | | | | | | | | | | | | | | | | | | | | | | | | | | | | | | | | | | | |
Year Ended October 31, 2001 | | $ | 7.96 | | 0.84 | | (1.10 | ) | | (0.26 | ) | | (0.84 | ) | | (0.84 | ) | | $ | 6.86 | | (3.59% | ) | | $ | 2,801 | | 0.95% | | | 11.10% | | | 1.11% | | | 10.94% | | | 83.79% |
Year Ended October 31, 2002 | | $ | 6.86 | | 0.61 | | (0.87 | ) | | (0.26 | ) | | (0.61 | ) | | (0.61 | ) | | $ | 5.99 | | (4.27% | ) | | $ | 2,002 | | 0.97% | | | 9.20% | | | 1.09% | | | 9.08% | | | 93.27% |
Year Ended October 31, 2003 | | $ | 5.99 | | 0.56 | | 0.89 | | | 1.45 | | | (0.56 | ) | | (0.56 | ) | | $ | 6.88 | | 25.18% | | | $ | 4,028 | | 1.02% | | | 8.47% | | | 1.10% | | | 8.39% | | | 104.54% |
Year Ended October 31, 2004 | | $ | 6.88 | | 0.51 | | 0.20 | | | 0.71 | | | (0.51 | ) | | (0.51 | ) | | $ | 7.08 | | 10.65% | | | $ | 4,027 | | 1.03% | | | 7.34% | | | 1.20% | | | 7.17% | | | 77.13% |
Year Ended October 31, 2005 | | $ | 7.08 | | 0.50 | | (0.34 | ) | | 0.16 | | | (0.50 | ) | | (0.50 | ) | | $ | 6.74 | | 2.23% | | | $ | 2,687 | | 1.13% | | | 7.13% | | | 1.35% | | | 6.92% | | | 72.82% |
| | | | | | | | | | | | | | |
Class B Shares | | | | | | | | | | | | | | | | | | | | | | | | | | | | | | | | | | | | | | | | |
Year Ended October 31, 2001 | | $ | 7.96 | | 0.78 | | (1.10 | ) | | (0.32 | ) | | (0.78 | ) | | (0.78 | ) | | $ | 6.86 | | (4.31% | ) | | $ | 244 | | 1.70% | | | 10.35% | | | 2.43% | | | 9.62% | | | 83.79% |
Year Ended October 31, 2002 | | $ | 6.86 | | 0.56 | | (0.88 | ) | | (0.32 | ) | | (0.56 | ) | | (0.56 | ) | | $ | 5.98 | | (5.11% | ) | | $ | 355 | | 1.70% | | | 8.46% | | | 1.83% | | | 8.33% | | | 93.27% |
Year Ended October 31, 2003 | | $ | 5.98 | | 0.52 | | 0.89 | | | 1.41 | | | (0.52 | ) | | (0.52 | ) | | $ | 6.87 | | 24.36% | | | $ | 764 | | 1.69% | | | 7.81% | | | 1.78% | | | 7.73% | | | 104.54% |
Year Ended October 31, 2004 | | $ | 6.87 | | 0.46 | | 0.20 | | | 0.66 | | | (0.46 | ) | | (0.46 | ) | | $ | 7.07 | | 9.92% | | | $ | 734 | | 1.70% | | | 6.63% | | | 1.89% | | | 6.45% | | | 77.13% |
Year Ended October 31, 2005 | | $ | 7.07 | | 0.45 | | (0.34 | ) | | 0.11 | | | (0.45 | ) | | (0.45 | ) | | $ | 6.73 | | 1.55% | | | $ | 760 | | 1.81% | | | 6.46% | | | 2.01% | | | 6.26% | | | 72.82% |
| | | | | | | | | | | | | | |
Class C Shares | | | | | | | | | | | | | | | | | | | | | | | | | | | | | | | | | | | | | | | | |
Period Ended October 31, 2001 (d) | | $ | 8.07 | | 0.40 | | (1.21 | ) | | (0.81 | ) | | (0.40 | ) | | (0.40 | ) | | $ | 6.86 | | (10.15% | )(g) | | $ | 5 | | 1.70% | (h) | | 10.05% | (h) | | 8.58% | (h) | | 3.17% | (h) | | 83.79% |
Year Ended October 31, 2002 | | $ | 6.86 | | 0.56 | | (0.87 | ) | | (0.31 | ) | | (0.56 | ) | | (0.56 | ) | | $ | 5.99 | | (4.96% | ) | | $ | 53 | | 1.70% | | | 8.55% | | | 1.97% | | | 8.28% | | | 93.27% |
Year Ended October 31, 2003 | | $ | 5.99 | | 0.52 | | 0.89 | | | 1.41 | | | (0.52 | ) | | (0.52 | ) | | $ | 6.88 | | 24.32% | | | $ | 2,986 | | 1.71% | | | 7.45% | | | 1.77% | | | 7.39% | | | 104.54% |
Year Ended October 31, 2004 | | $ | 6.88 | | 0.46 | | 0.20 | | | 0.66 | | | (0.46 | ) | | (0.46 | ) | | $ | 7.08 | | 9.92% | | | $ | 1,836 | | 1.71% | | | 6.66% | | | 1.86% | | | 6.51% | | | 77.13% |
Year Ended October 31, 2005 | | $ | 7.08 | | 0.45 | | (0.35 | ) | | 0.10 | | | (0.45 | ) | | (0.45 | ) | | $ | 6.73 | | 1.40% | | | $ | 1,318 | | 1.80% | | | 6.47% | | | 2.02% | | | 6.26% | | | 72.82% |
| | | | | | | | | | | | | | |
Class R Shares | | | | | | | | | | | | | | | | | | | | | | | | | | | | | | | | | | | | | | | | |
Period Ended October 31, 2004 (e) | | $ | 7.00 | | 0.32 | | 0.07 | | | 0.39 | | | (0.32 | ) | | (0.32 | ) | | $ | 7.07 | | 5.73% | (g) | | $ | 1 | | 1.32% | (h) | | 6.89% | (h) | | 1.55% | (h) | | 6.66% | (h) | | 77.13% |
Year Ended October 31, 2005 | | $ | 7.07 | | 0.50 | | (0.35 | ) | | 0.15 | | | (0.50 | ) | | (0.50 | ) | | $ | 6.72 | | 2.05% | | | $ | 1 | | 1.21% | | | 7.10% | | | 1.45% | | | 6.87% | | | 72.82% |
| | | | | | | | | | | | | | |
Institutional Service Class Shares | | | | | | | | | | | | | | | | | | | | | | | | | | | | | | | | | | | | | | | | |
Year Ended October 31, 2001 | | $ | 8.01 | | 0.87 | | (1.10 | ) | | (0.23 | ) | | (0.86 | ) | | (0.86 | ) | | $ | 6.92 | | (3.19% | ) | | $ | 85,885 | | 0.70% | | | 11.30% | | | 0.76% | | | 11.24% | | | 83.79% |
Year Ended October 31, 2002 | | $ | 6.92 | | 0.63 | | (0.88 | ) | | (0.25 | ) | | (0.63 | ) | | (0.63 | ) | | $ | 6.04 | | (4.12% | ) | | $ | 82,967 | | 0.70% | | | 9.38% | | | 0.79% | | | 9.29% | | | 93.27% |
Year Ended October 31, 2003 | | $ | 6.04 | | 0.58 | | 0.90 | | | 1.48 | | | (0.58 | ) | | (0.58 | ) | | $ | 6.94 | | 25.51% | | | $ | 106,278 | | 0.70% | | | 8.87% | | | 0.78% | | | 8.79% | | | 104.54% |
Year Ended October 31, 2004 | | $ | 6.94 | | 0.53 | | 0.20 | | | 0.73 | | | (0.53 | ) | | (0.53 | ) | | $ | 7.14 | | 10.90% | | | $ | 17,839 | | 0.71% | | | 7.60% | | | 0.77% | | | 7.53% | | | 77.13% |
Year Ended October 31, 2005 | | $ | 7.14 | | 0.52 | | (0.35 | ) | | 0.17 | | | (0.52 | ) | | (0.52 | ) | | $ | 6.79 | | 2.34% | | | $ | 18,272 | | 0.86% | | | 7.34% | | | 1.05% | | | 7.14% | | | 72.82% |
| | | | | | | | | | | | | | |
Institutional Class Shares | | | | | | | | | | | | | | | | | | | | | | | | | | | | | | | | | | | | | | | | |
Period Ended October 31, 2004 (f) | | $ | 6.90 | | 0.18 | | 0.24 | | | 0.42 | | | (0.18 | ) | | (0.18 | ) | | $ | 7.14 | | 6.10% | (g) | | $ | 1 | | 0.71% | (h) | | 7.44% | (h) | | 1.24% | (h) | | 6.91% | (h) | | 77.13% |
Year Ended October 31, 2005 | | $ | 7.14 | | 0.52 | | (0.34 | ) | | 0.18 | | | (0.52 | ) | | (0.52 | ) | | $ | 6.80 | | 2.54% | | | $ | 1,015 | | 0.53% | | | 7.54% | | | 0.53% | | | 7.54% | | | 72.82% |
| | | | | | | | | | | | | | | | | | | | | | | | | | | | | | | | | | | | | | | | | |
| | | | | | | | | | | | | | | | | | | | | | | | | | | | | | | | | | | | | | | | | |
| (a) | Excludes sales charge. |
| (b) | During the period certain fees were waived and/or reimbursed. If such waivers/reimbursements had not occurred, the ratios would have been as indicated. |
| (c) | Portfolio turnover is calculated on the basis of the Fund as whole without distinguishing among the classes of shares. |
| (d) | For the period from March 1, 2001 (commencement of operations) through October 31, 2001. |
| (e) | For the period from February 27, 2004 (commencement of operations) through October 31, 2004. |
| (f) | For the period from June 29, 2004 (commencement of operations) through October 31, 2004. |
See notes to financial statements.
Financial Highlights
Selected Data for Each Share of Capital Outstanding
Gartmore Micro Cap Equity Fund
| | | | | | | | | | | | | | | | | | | | | | | | | | | | | | | | | | | | | | | | | | | |
| | | | | Investment Activities | | | Distributions | | | | | | | | Ratios/Supplemental Data |
| | | Net Asset
Value,
Beginning
of Period | | Net
Investment
Income
(Loss) | | | Redemption
Fees | | Net Realized
and
Unrealized
Gains
(Losses) on
Investments | | | Total
from
Investment
Activities | | | Net
Realized
Gains | | | Total
Distributions | | | Net
Asset
Value, End
of Period | | Total
Return (a) | | | Net Assets
at End of
Period
(000s) | | Ratio of
Expenses
to Average
Net Assets | | | Ratio of Net
Investment
Income
(Loss)
to Average
Net Assets | | | Ratio of
Expenses
(Prior to
Reimbursements)
to Average
Net Assets (b) | | | Ratio of Net
Investment
Income (Loss)
(Prior to
Reimbursements)
to Average
Net Assets (b) | | | Portfolio
Turnover (c) |
| | | | | | | | | | | | | | | |
Class A Shares | | | | | | | | | | | | | | | | | | | | | | | | | | | | | | | | | | | | | | | | | | | |
Period Ended October 31, 2002 (d) (e) | | $ | 10.00 | | (0.04 | ) | | – | | (1.32 | ) | | (1.36 | ) | | – | | | – | | | $ | 8.64 | | (13.60% | )(g) | | $ | 310 | | 1.80% | (h) | | (1.32% | )(h) | | 8.73% | (h) | | (8.25% | )(h) | | 56.08% |
Year Ended October 31, 2003 | | $ | 8.64 | | (0.02 | ) | | – | | 7.29 | | | 7.27 | | | – | | | – | | | $ | 15.91 | | 84.14% | | | $ | 17,023 | | 1.82% | | | (1.32% | ) | | 2.26% | | | (1.76% | ) | | 104.50% |
Year Ended October 31, 2004 | | $ | 15.91 | | (0.18 | ) | | 0.02 | | 3.81 | | | 3.65 | | | – | (i) | | – | (i) | | $ | 19.56 | | 22.96% | | | $ | 74,983 | | 1.81% | | | (1.35% | ) | | 1.82% | | | (1.37% | ) | | 107.36% |
Year Ended October 31, 2005 | | $ | 19.56 | | (0.34 | ) | | 0.02 | | 2.63 | | | 2.31 | | | (0.40 | ) | | (0.40 | ) | | $ | 21.47 | | 11.69% | | | $ | 68,375 | | 1.86% | | | (1.31% | ) | | 1.87% | | | (1.32% | ) | | 108.54% |
| | | | | | | | | | | | | | | |
Class B Shares | | | | | | | | | | | | | | | | | | | | | | | | | | | | | | | | | | | | | | | | | | | |
Period Ended October 31, 2002 (d) | | $ | 10.00 | | (0.06 | ) | | – | | (1.33 | ) | | (1.39 | ) | | – | | | – | | | $ | 8.61 | | (13.90% | )(g) | | $ | 43 | | 2.55% | (h) | | (2.04% | )(h) | | 8.46% | (h) | | (7.95% | )(h) | | 56.08% |
Year Ended October 31, 2003 | | $ | 8.61 | | (0.06 | ) | | – | | 7.19 | | | 7.13 | | | – | | | – | | | $ | 15.74 | | 82.81% | | | $ | 1,611 | | 2.54% | | | (2.08% | ) | | 2.99% | | | (2.52% | ) | | 104.50% |
Year Ended October 31, 2004 | | $ | 15.74 | | (0.26 | ) | | 0.02 | | 3.72 | | | 3.48 | | | – | (i) | | – | (i) | | $ | 19.22 | | 22.13% | | | $ | 6,403 | | 2.55% | | | (2.11% | ) | | 2.57% | | | (2.13% | ) | | 107.36% |
Year Ended October 31, 2005 | | $ | 19.22 | | (0.46 | ) | | 0.02 | | 2.55 | | | 2.11 | | | (0.40 | ) | | (0.40 | ) | | $ | 20.93 | | 10.84% | | | $ | 7,647 | | 2.61% | | | (2.04% | ) | | 2.62% | | | (2.06% | ) | | 108.54% |
| | | | | | | | | | | | | | | |
Class C Shares | | | | | | | | | | | | | | | | | | | | | | | | | | | | | | | | | | | | | | | | | | | |
Period Ended October 31, 2002 (d) | | $ | 10.00 | | (0.06 | ) | | – | | (1.33 | ) | | (1.39 | ) | | – | | | – | | | $ | 8.61 | | (13.90% | )(g) | | $ | 43 | | 2.55% | (h) | | (2.04% | )(h) | | 8.46% | (h) | | (7.95% | )(h) | | 56.08% |
Year Ended October 31, 2003 | | $ | 8.61 | | (0.05 | ) | | – | | 7.20 | | | 7.15 | | | – | | | – | | | $ | 15.76 | | 83.04% | | | $ | 5,609 | | 2.54% | | | (2.04% | ) | | 2.90% | | | (2.40% | ) | | 104.50% |
Year Ended October 31, 2004 | | $ | 15.76 | | (0.24 | ) | | 0.02 | | 3.70 | | | 3.48 | | | – | (i) | | – | (i) | | $ | 19.24 | | 22.10% | | | $ | 30,377 | | 2.55% | | | (2.11% | ) | | 2.57% | | | (2.13% | ) | | 107.36% |
Year Ended October 31, 2005 | | $ | 19.24 | | (0.47 | ) | | 0.02 | | 2.56 | | | 2.11 | | | (0.40 | ) | | (0.40 | ) | | $ | 20.95 | | 10.83% | | | $ | 37,980 | | 2.61% | | | (2.05% | ) | | 2.62% | | | (2.06% | ) | | 108.54% |
| | | | | | | | | | | | | | | |
Class R Shares | | | | | | | | | | | | | | | | | | | | | | | | | | | | | | | | | | | | | | | | | | | |
Period Ended October 31, 2004 (f) | | $ | 17.38 | | (0.27 | ) | | 0.02 | | 2.14 | | | 1.89 | | | – | (i) | | – | (i) | | $ | 19.27 | | 10.89% | (g) | | $ | 1 | | 2.17% | (h) | | (1.78% | )(h) | | 2.17% | (h) | | (1.78% | )(h) | | 107.36% |
Year Ended October 31, 2005 | | $ | 19.27 | | (0.29 | ) | | 0.02 | | 2.53 | | | 2.26 | | | (0.40 | ) | | (0.40 | ) | | $ | 21.13 | | 11.61% | | | $ | 1 | | 1.94% | | | (1.39% | ) | | 1.94% | | | (1.39% | ) | | 108.54% |
| | | | | | | | | | | | | | | |
Institutional Service Class Shares | | | | | | | | | | | | | | | | | | | | | | | | | | | | | | | | | | | | | | | | | | | |
Period Ended October 31, 2002 (d) | | $ | 10.00 | | (0.03 | ) | | – | | (1.33 | ) | | (1.36 | ) | | – | | | – | | | $ | 8.64 | | (13.60% | )(g) | | $ | 43 | | 1.55% | (h) | | (1.04% | )(h) | | 7.45% | (h) | | (6.94% | )(h) | | 56.08% |
Year Ended October 31, 2003 | | $ | 8.64 | | (0.13 | ) | | – | | 7.45 | | | 7.32 | | | – | | | – | | | $ | 15.96 | | 84.72% | | | $ | 80 | | 1.55% | | | (1.15% | ) | | 2.40% | | | (2.00% | ) | | 104.50% |
Year Ended October 31, 2004 | | $ | 15.96 | | (0.28 | ) | | 0.02 | | 3.97 | | | 3.71 | | | – | (i) | | – | (i) | | $ | 19.67 | | 23.26% | | | $ | 51 | | 1.51% | | | (1.10% | ) | | 1.52% | | | (1.11% | ) | | 107.36% |
Year Ended October 31, 2005 | | $ | 19.67 | | (0.19 | ) | | 0.02 | | 2.54 | | | 2.37 | | | (0.40 | ) | | (0.40 | ) | | $ | 21.64 | | 11.93% | | | $ | 225 | | 1.62% | | | (1.05% | ) | | 1.64% | | | (1.07% | ) | | 108.54% |
| | | | | | | | | | | | | | | |
Institutional Class Shares | | | | | | | | | | | | | | | | | | | | | | | | | | | | | | | | | | | | | | | | | | | |
Period Ended October 31, 2002 (d) | | $ | 10.00 | | (0.03 | ) | | – | | (1.33 | ) | | (1.36 | ) | | – | | | – | | | $ | 8.64 | | (13.60% | )(g) | | $ | 1,556 | | 1.55% | (h) | | (1.04% | )(h) | | 7.46% | (h) | | (6.95% | )(h) | | 56.08% |
Year Ended October 31, 2003 | | $ | 8.64 | | (0.13 | ) | | – | | 7.45 | | | 7.32 | | | – | | | – | | | $ | 15.96 | | 84.72% | | | $ | 2,873 | | 1.55% | | | (1.15% | ) | | 2.40% | | | (2.00% | ) | | 104.50% |
Year Ended October 31, 2004 | | $ | 15.96 | | (0.16 | ) | | 0.02 | | 3.85 | | | 3.71 | | | – | (i) | | – | (i) | | $ | 19.67 | | 23.26% | | | $ | 3,493 | | 1.52% | | | (1.14% | ) | | 1.54% | | | (1.15% | ) | | 107.36% |
Year Ended October 31, 2005 | | $ | 19.67 | | (0.22 | ) | | 0.02 | | 2.58 | | | 2.38 | | | (0.40 | ) | | (0.40 | ) | | $ | 21.65 | | 11.98% | | | $ | 8,113 | | 1.63% | | | (1.05% | ) | | 1.65% | | | (1.07% | ) | | 108.54% |
| | | | | | | | | | | | | | | | | | | | | | | | | | | | | | | | | | | | | | | | | | | | |
| | | | | | | | | | | | | | | | | | | | | | | | | | | | | | | | | | | | | | | | | | | | |
| (a) | Excludes sales charge. |
| (b) | During the period certain fees were waived and/or reimbursed. If such waivers/reimbursements had not occurred, the ratios would have been as indicated. |
| (c) | Portfolio turnover is calculated on the basis of the Fund as whole without distinguishing among the classes of shares. |
| (d) | For the period from June 27, 2002 (commencement of operations) through October 31, 2002. |
| (e) | Net investment income (loss) is based on average shares outstanding during the period. |
| (f) | For the period from December 30, 2003 (commencement of operations) through October 31, 2004. |
| (i) | Amount is less than $0.005. |
See notes to financial statements.
Financial Highlights
Selected Data for Each Share of Capital Outstanding
Gartmore Small Cap Growth Fund
| | | | | | | | | | | | | | | | | | | | | | | | | | | | | | | | | | | |
| | | | | Investment Activities | | | | | | Ratios/Supplemental Data |
| | | Net Asset
Value,
Beginning
of Period | | Net
Investment
Income
(Loss) | | | Net Realized
and
Unrealized
Gains
(Losses) on
Investments | | | Total
from
Investment
Activities | | | Net
Asset
Value, End
of Period | | Total
Return (a) | | | Net Assets
at End of
Period
(000s) | | Ratio of Expenses
to Average
Net Assets | | | Ratio of Net
Investment
Income
(Loss)
to Average
Net Assets | | | Ratio of
Expenses
(Prior to
Reimbursements)
to Average
Net Assets (b) | | | Ratio of Net
Investment
Income
(Loss)
(Prior to
Reimbursements)
to Average
Net Assets (b) | | | Portfolio
Turnover (c) |
| | | | | | | | | | | | |
Class A Shares | | | | | | | | | | | | | | | | | | | | | | | | | | | | | | | | | | | |
Period Ended October 31, 2004 (d) | | $ | 10.00 | | (0.01 | ) | | (0.82 | ) | | (0.83 | ) | | $ | 9.17 | | (8.30% | )(e) | | $ | 14 | | 1.67% | (f) | | (0.81% | )(f) | | 4.98% | (f) | | (4.12% | )(f) | | 633.92% |
Year Ended October 31, 2005 | | $ | 9.17 | | (0.05 | ) | | 0.03 | | | (0.02 | ) | | $ | 9.15 | | (0.22% | ) | | $ | 146 | | 1.60% | | | (1.05% | ) | | 2.51% | | | (1.97% | ) | | 1,068.13% |
| | | | | | | | | | | | |
Class B Shares | | | | | | | | | | | | | | | | | | | | | | | | | | | | | | | | | | | |
Period Ended October 31, 2004 (d) | | $ | 10.00 | | (0.02 | ) | | (0.84 | ) | | (0.86 | ) | | $ | 9.14 | | (8.60% | )(e) | | $ | 13 | | 2.37% | (f) | | (1.66% | )(f) | | 5.65% | (f) | | (4.94% | )(f) | | 633.92% |
Year Ended October 31, 2005 | | $ | 9.14 | | (0.17 | ) | | 0.07 | | | (0.10 | ) | | $ | 9.04 | | (1.09% | ) | | $ | 5 | | 2.35% | | | (1.81% | ) | | 3.34% | | | (2.80% | ) | | 1,068.13% |
| | | | | | | | | | | | |
Class C Shares | | | | | | | | | | | | | | | | | | | | | | | | | | | | | | | | | | | |
Period Ended October 31, 2004 (d) | | $ | 10.00 | | (0.02 | ) | | (0.85 | ) | | (0.87 | ) | | $ | 9.13 | | (8.60% | )(e) | | $ | 40 | | 2.35% | (f) | | (1.68% | )(f) | | 5.42% | (f) | | (4.76% | )(f) | | 633.92% |
Year Ended October 31, 2005 | | $ | 9.13 | | (0.20 | ) | | 0.12 | | | (0.08 | ) | | $ | 9.05 | | (0.98% | ) | | $ | 36 | | 2.35% | | | (1.82% | ) | | 3.29% | | | (2.76% | ) | | 1,068.13% |
| | | | | | | | | | | | |
Class R Shares | | | | | | | | | | | | | | | | | | | | | | | | | | | | | | | | | | | |
Period Ended October 31, 2004 (d) | | $ | 10.00 | | (0.07 | ) | | (0.77 | ) | | (0.84 | ) | | $ | 9.16 | | (8.40% | )(e) | | $ | 1 | | 1.82% | (f) | | (1.25% | )(f) | | 5.07% | (f) | | (4.50% | )(f) | | 633.92% |
Year Ended October 31, 2005 | | $ | 9.16 | | (0.11 | ) | | 0.08 | | | (0.03 | ) | | $ | 9.13 | | (0.33% | ) | | $ | 1 | | 1.73% | | | (1.21% | ) | | 2.86% | | | (2.33% | ) | | 1,068.13% |
| | | | | | | | | | | | |
Institutional Service Class Shares | | | | | | | | | | | | | | | | | | | | | | | | | | | | | | | | | | | |
Period Ended October 31, 2004 (d) | | $ | 10.00 | | (0.04 | ) | | (0.77 | ) | | (0.81 | ) | | $ | 9.19 | | (8.10% | )(e) | | $ | 1 | | 1.28% | (f) | | (0.71% | )(f) | | 4.44% | (f) | | (3.87% | )(f) | | 633.92% |
Year Ended October 31, 2005 | | $ | 9.19 | | (0.08 | ) | | 0.08 | | | – | | | $ | 9.19 | | 0.00% | | | $ | 1 | | 1.35% | | | (0.83% | ) | | 1.97% | | | (1.44% | ) | | 1,068.13% |
| | | | | | | | | | | | |
Institutional Class Shares | | | | | | | | | | | | | | | | | | | | | | | | | | | | | | | | | | | |
Period Ended October 31, 2004 (d) | | $ | 10.00 | | (0.04 | ) | | (0.77 | ) | | (0.81 | ) | | $ | 9.19 | | (8.10% | )(e) | | $ | 2,752 | | 1.37% | (f) | | (0.75% | )(f) | | 4.69% | (f) | | (4.07% | )(f) | | 633.92% |
Year Ended October 31, 2005 | | $ | 9.19 | | (0.08 | ) | | 0.08 | | | – | | | $ | 9.19 | | 0.00% | | | $ | 2,753 | | 1.35% | | | (0.81% | ) | | 2.28% | | | (1.75% | ) | | 1,068.13% |
| | | | | | | | | | | | | | | | | | | | | | | | | | | | | | | | | | | | |
| | | | | | | | | | | | | | | | | | | | | | | | | | | | | | | | | | | | |
| | | | | | | | | | | | | | | | | | | | | | | | | | | | | | | | | | | | |
| | | | | | | | | | | | | | | | | | | | | | | | | | | | | | | | | | | | |
| | | | | | | | | | | | | | | | | | | | | | | | | | | | | | | | | | | | |
| | | | | | | | | | | | | | | | | | | | | | | | | | | | | | | | | | | | |
| | | | | | | | | | | | | | | | | | | | | | | | | | | | | | | | | | | | |
| | | | | | | | | | | | | | | | | | | | | | | | | | | | | | | | | | | | |
| | | | | | | | | | | | | | | | | | | | | | | | | | | | | | | | | | | | |
| | | | | | | | | | | | | | | | | | | | | | | | | | | | | | | | | | | | |
| | | | | | | | | | | | | | | | | | | | | | | | | | | | | | | | | | | | |
| | | | | | | | | | | | | | | | | | | | | | | | | | | | | | | | | | | | |
| (a) | Excludes sales charge. |
| (b) | During the period certain fees were waived and/or reimbursed. If such waivers/reimbursements had not occurred, the ratios would have been as indicated. |
| (c) | Portfolio turnover is calculated on the basis of the Fund as a whole without distinguishing among the classes of shares. |
| (d) | For the period from March 30, 2004 (commencement of operations) through October 31, 2004. |
See notes to financial statements.
Financial Highlights
Selected Data for Each Share of Capital Outstanding
Gartmore U.S. Growth Leaders Long-Short Fund
| | | | | | | | | | | | | | | | | | | | | | | | | | | | | | | | | | | | | | | | | | | | | | |
| | | | | Investment Activities | | | Distributions | | | | | | | | | | Ratios / Supplemental Data 
|
| | | Net Asset
Value,
Beginning
of Period | | Net
Investment
Income
(Loss) | | | Net Realized
and
Unrealized
Gains
(Losses) on
Investments | | | Total
from
Investment
Activities | | | Net
Investment
Income | | | Net
Realized
Gains | | | Total
Distributions | | | Net
Asset
Value, End
of Period | | Total
Return (a) | | | Net Assets
at End of
Period
(000s) | | Ratio of
Expenses
to Average
Net Assets
(Excludes
Dividend
Expense) | | | Ratio of Net
Investment
Income
(Loss)
to Average
Net Assets | | | Ratio of
Expenses
(Prior to
Reimbursements)
to Average
Net Assets
(Excludes
Dividend
Expense) (b) | | | Ratio of Net
Investment
Income (Loss)
(Prior to
Reimbursements)
to Average
Net Assets (b) | | | Dividend
Expense (c) | | Portfolio
Turnover (d) |
| | | | | | | | | | | | | | | | |
Class A Shares | | | | | | | | | | | | | | | | | | | | | | | | | | | | | | | | | | | | | | | | | | | | | | |
Period Ended June 30, 2002 (e) | | $ | 11.14 | | 6.65 | | | (6.90 | ) | | (0.25 | ) | | — | | | — | | | — | | | $ | 10.89 | | (2.24% | )(j) | | $ | 144 | | 1.95% | (k) | | 122.95% | (k) | | 2.26% | (k) | | 122.64% | (k) | | 0.03% | | 425% |
Year Ended June 30, 2003 (g) | | $ | 10.89 | | (0.08 | ) | | 0.14 | | | 0.06 | | | — | | | — | | | — | | | $ | 10.95 | | 0.55% | | | $ | 29,561 | | 3.47% | | | (2.04% | ) | | 3.66% | | | (2.23% | ) | | 0.40% | | 424% |
Period Ended October 31, 2003 (f) | | $ | 10.95 | | (0.07 | ) | | 1.12 | | | 1.05 | | | — | | | — | | | — | | | $ | 12.00 | | 9.59% | (j) | | $ | 29,468 | | 3.23% | (k) | | (1.77% | )(k) | | (l) | | | (l) | | | 1.65% | | 126.69% |
Year Ended October 31, 2004 | | $ | 12.00 | | 0.11 | | | 0.77 | | | 0.88 | | | (3.32 | ) | | — | | | (3.32 | ) | | $ | 9.56 | | 9.03% | | | $ | 24,411 | | 2.20% | | | (1.65% | ) | | 2.25% | | | (1.70% | ) | | 0.73% | | 577.36% |
Year Ended October 31, 2005 | | $ | 9.56 | | (0.02 | ) | | 0.59 | | | 0.57 | | | (0.30 | ) | | — | | | (0.30 | ) | | $ | 9.83 | | 6.09% | | | $ | 33,828 | | 2.81% | | | (0.18% | ) | | 2.91% | | | (0.27% | ) | | 0.64% | | 827.26% |
| | | | | | | | | | | | | | | | |
Class B Shares | | | | | | | | | | | | | | | | | | | | | | | | | | | | | | | | | | | | | | | | | | | | | | |
Period Ended June 30, 2002 (e) | | $ | 11.14 | | (0.07 | ) | | (0.17 | ) | | (0.24 | ) | | — | | | — | | | — | | | $ | 10.90 | | (2.15% | )(j) | | $ | 121 | | 2.74% | (k) | | (1.45% | )(k) | | 2.86% | (k) | | (1.57% | )(k) | | 0.03% | | 425% |
Year Ended June 30, 2003 (g) | | $ | 10.90 | | (0.23 | ) | | 0.19 | | | (0.04 | ) | | — | | | — | | | — | | | $ | 10.86 | | (0.37% | ) | | $ | 141 | | 3.73% | | | (2.31% | ) | | 4.54% | | | (3.12% | ) | | 0.40% | | 424% |
Period Ended October 31, 2003 (f) (g) | | $ | 10.86 | | (0.10 | ) | | 1.12 | | | 1.02 | | | — | | | — | | | — | | | $ | 11.88 | | 9.39% | (j) | | $ | 414 | | 3.98% | (k) | | (2.54% | )(k) | | (l) | | | (l) | | | 1.65% | | 126.69% |
Year Ended October 31, 2004 | | $ | 11.88 | | 0.22 | | | 0.58 | | | 0.80 | | | (3.30 | ) | | — | | | (3.30 | ) | | $ | 9.38 | | 8.22% | | | $ | 653 | | 2.93% | | | (2.30% | ) | | 3.00% | | | (2.36% | ) | | 0.73% | | 577.36% |
Year Ended October 31, 2005 | | $ | 9.38 | | (0.09 | ) | | 0.58 | | | 0.49 | | | (0.28 | ) | | — | | | (0.28 | ) | | $ | 9.59 | | 5.33% | | | $ | 814 | | 3.53% | | | (0.90% | ) | | 3.62% | | | (0.99% | ) | | 0.64% | | 827.26% |
| | | | | | | | | | | | | | | | |
Class C Shares | | | | | | | | | | | | | | | | | | | | | | | | | | | | | | | | | | | | | | | | | | | | | | |
Year Ended June 30, 2001 | | $ | 27.72 | | (0.15 | ) | | (8.43 | ) | | (8.58 | ) | | — | | | (9.12 | ) | | (9.12 | ) | | $ | 10.02 | | (40.62% | ) | | $ | 3,102 | | 3.04% | | | (1.51% | ) | | 3.82% | | | (2.29% | ) | | 0.09% | | 143% |
Year Ended June 30, 2002 | | $ | 10.02 | | (0.66 | ) | | (0.31 | ) | | (0.97 | ) | | — | | | — | | | — | | | $ | 9.05 | | (17.65% | ) | | $ | 1,819 | | 3.28% | | | (5.41% | ) | | 3.71% | | | (5.87% | ) | | 0.03% | | 425% |
Year Ended June 30, 2003 | | $ | 9.05 | | (0.19 | ) | | 0.17 | | | (0.02 | ) | | — | | | — | | | — | | | $ | 9.03 | | (0.22% | ) | | $ | 1,323 | | 3.72% | | | (2.31% | ) | | 4.54% | | | (3.13% | ) | | 0.40% | | 424% |
Period Ended October 31, 2003 (f) | | $ | 9.03 | | (0.08 | ) | | 0.93 | | | 0.85 | | | — | | | — | | | — | | | $ | 9.88 | | 9.41% | (j) | | $ | 1,487 | | 3.98% | (k) | | (2.52% | )(k) | | (l) | | | (l) | | | 1.65% | | 126.69% |
Year Ended October 31, 2004 | | $ | 9.88 | | 0.64 | | | (0.01 | ) | | 0.63 | | | (3.30 | ) | | — | | | (3.30 | ) | | $ | 7.21 | | 8.20% | | | $ | 2,641 | | 2.92% | | | (2.29% | ) | | 3.00% | | | (2.37% | ) | | 0.73% | | 577.36% |
Year Ended October 31, 2005 | | $ | 7.21 | | (0.05 | ) | | 0.42 | | | 0.37 | | | (0.29 | ) | | — | | | (0.29 | ) | | $ | 7.29 | | 5.35% | | | $ | 19,372 | | 3.55% | | | (0.81% | ) | | 3.65% | | | (0.91% | ) | | 0.64% | | 827.26% |
| | | | | | | | | | | | | | | | |
Class R Shares | | | | | | | | | | | | | | | | | | | | | | | | | | | | | | | | | | | | | | | | | | | | | | |
Period Ended October 31, 2004 (h) | | $ | 9.21 | | (0.11 | ) | | 0.31 | | | 0.20 | | | — | | | — | | | — | | | $ | 9.41 | | 2.17% | (j) | | $ | 1 | | 2.45% | (k) | | (1.74% | )(k) | | 2.49% | (k) | | (1.78% | )(k) | | 0.73% | | 577.36% |
Year Ended October 31, 2005 | | $ | 9.41 | | (0.03 | ) | | 0.59 | | | 0.56 | | | (0.29 | ) | | — | | | (0.29 | ) | | $ | 9.68 | | 6.16% | | | $ | 1 | | 2.82% | | | (0.20% | ) | | 2.86% | | | (0.25% | ) | | 0.64% | | 827.26% |
| | | | | | | | | | | | | | | | |
Institutional Class Shares | | | | | | | | | | | | | | | | | | | | | | | | | | | | | | | | | | | | | | | | | | | | | | |
Period Ended October 31, 2004 (i) | | $ | 9.28 | | (0.02 | ) | | 0.31 | | | 0.29 | | | — | | | — | | | — | | | $ | 9.57 | | 3.12% | (j) | | $ | 331 | | 1.90% | (k) | | (0.52% | )(k) | | 2.09% | (k) | | (0.72% | )(k) | | 0.73% | | 577.36% |
Year Ended October 31, 2005 | | $ | 9.57 | | (0.05 | ) | | 0.63 | | | 0.58 | | | (0.30 | ) | | — | | | (0.30 | ) | | $ | 9.85 | | 6.27% | | | $ | 3,877 | | 2.56% | | | 0.19% | | | 2.67% | | | 0.08% | | | 0.64% | | 827.26% |
| | | | | | | | | | | | | | | | | | | | | | | | | | | | | | | | | | | | | | | | | | | | | | | |
| (a) | Excludes sales charge. |
| (b) | During the period certain fees were waived and/or reimbursed. If such waivers/reimbursements had not occurred, the ratios would have been as indicated. |
| (c) | Indicates the ratio of dividend expense charged for the period to average net assets. |
| (d) | Portfolio turnover is calculated on the basis of the Fund as whole without distinguishing among the classes of shares. |
| (e) | For the period from October 31, 2001 (commencement of operations) through June 30, 2002. |
| (f) | For the period from July 1, 2003 through October 31, 2003. |
| (g) | Net investment income (loss) is based on average shares outstanding during the period. |
| (h) | For the period from February 27, 2004 (commencement of operations) through October 31, 2004. |
| (i) | For the period from June 29, 2004 (commencement of operations) through October 31, 2004. |
| (l) | There were no fee reductions in this period. |
See notes to financial statements.
Financial Highlights
Selected Data for Each Share of Capital Outstanding
Gartmore Value Opportunities Fund
| | | | | | | | | | | | | | | | | | | | | | | | | | | | | | | | | | | | | | | | | | | | | | |
| | | | | Investment Activities | | | Distributions | | | | | | | | Ratios/Supplemental Data |
| | | Net Asset
Value,
Beginning
of Period | | Net
Investment
Income
(Loss) | | | Redemption
Fees | | Net Realized
and
Unrealized
Gains
(Losses) on
Investments | | | Total
from
Investment
Activities | | | Net
Investment
Income | | | Net
Realized
Gains | | | Total
Distributions | | | Net
Asset
Value, End
of Period | | Total
Return (a) | | | Net Assets
at End of
Period
(000s) | | Ratio of
Expenses
to Average
Net Assets | | | Ratio of Net
Investment
Income
(Loss)
to Average
Net Assets | | | Ratio of
Expenses
(Prior to
Reimbursements)
to Average
Net Assets (b) | | | Ratio of Net
Investment
Income (Loss)
(Prior to
Reimbursements)
to Average
Net Assets (b) | | | Portfolio
Turnover (c) |
| | | | | | | | | | | | | | | | |
Class A Shares | | | | | | | | | | | | | | | | | | | | | | | | | | | | | | | | | | | | | | | | | | | | | | |
Year Ended October 31, 2001 | | $ | 12.37 | | 0.10 | | | — | | (0.20 | ) | | (0.10 | ) | | (0.10 | ) | | — | | | (0.10 | ) | | $ | 12.17 | | (0.87% | ) | | $ | 10,789 | | 1.35% | | | 0.69% | | | 2.07% | | | (0.03% | ) | | 139.75% |
Year Ended October 31, 2002 | | $ | 12.17 | | 0.05 | | | 0.01 | | (0.98 | ) | | (0.92 | ) | | (0.05 | ) | | (0.15 | ) | | (0.20 | ) | | $ | 11.05 | | (7.75% | ) | | $ | 9,766 | | 1.31% | | | 0.39% | | | 1.48% | | | 0.22% | | | 108.62% |
Year Ended October 31, 2003 | | $ | 11.05 | | 0.03 | | | — | | 3.42 | | | 3.45 | | | (0.03 | ) | | — | | | (0.03 | ) | | $ | 14.47 | | 31.32% | | | $ | 12,156 | | 1.30% | | | 0.20% | | | 1.41% | | | 0.09% | | | 90.02% |
Year Ended October 31, 2004 | | $ | 14.47 | | — | | | — | | 1.55 | | | 1.55 | | | (0.01 | ) | | — | | | (0.01 | ) | | $ | 16.01 | | 10.72% | | | $ | 12,244 | | 1.36% | | | (0.01% | ) | | 1.39% | | | (0.04% | ) | | 146.98% |
Year Ended October 31, 2005 | | $ | 16.01 | | — | | | — | | 2.07 | | | 2.07 | | | (0.02 | ) | | (2.89 | ) | | (2.91 | ) | | $ | 15.17 | | 13.59% | | | $ | 11,263 | | 1.49% | | | 0.02% | | | 1.85% | | | (0.34% | ) | | 187.36% |
| | | | | | | | | | | | | | | | |
Class B Shares | | | | | | | | | | | | | | | | | | | | | | | | | | | | | | | | | | | | | | | | | | | | | | |
Year Ended October 31, 2001 | | $ | 12.36 | | 0.02 | | | — | | (0.20 | ) | | (0.18 | ) | | (0.02 | ) | | — | | | (0.02 | ) | | $ | 12.16 | | (1.45% | ) | | $ | 2,708 | | 1.95% | | | 0.09% | | | 3.06% | | | (1.02% | ) | | 139.75% |
Year Ended October 31, 2002 | | $ | 12.16 | | (0.03 | ) | | 0.01 | | (0.98 | ) | | (1.00 | ) | | (0.01 | ) | | (0.15 | ) | | (0.16 | ) | | $ | 11.00 | | (8.39% | ) | | $ | 2,362 | | 1.98% | | | (0.28% | ) | | 2.22% | | | (0.52% | ) | | 108.62% |
Year Ended October 31, 2003 | | $ | 11.00 | | (0.06 | ) | | — | | 3.40 | | | 3.34 | | | — | | | — | | | — | | | $ | 14.34 | | 30.39% | | | $ | 2,641 | | 2.00% | | | (0.49% | ) | | 2.12% | | | (0.60% | ) | | 90.02% |
Year Ended October 31, 2004 | | $ | 14.34 | | (0.11 | ) | | — | | 1.55 | | | 1.44 | | | — | | | — | | | — | | | $ | 15.78 | | 10.04% | | | $ | 2,631 | | 2.01% | | | (0.66% | ) | | 2.04% | | | (0.69% | ) | | 146.98% |
Year Ended October 31, 2005 | | $ | 15.78 | | (0.10 | ) | | — | | 2.05 | | | 1.95 | | | — | | | (2.89 | ) | | (2.89 | ) | | $ | 14.84 | | 12.90% | | | $ | 2,592 | | 2.14% | | | (0.64% | ) | | 2.50% | | | (0.99% | ) | | 187.36% |
| | | | | | | | | | | | | | | | |
Class C Shares | | | | | | | | | | | | | | | | | | | | | | | | | | | | | | | | | | | | | | | | | | | | | | |
Period Ended October 31, 2001 (d) | | $ | 13.08 | | 0.01 | | | — | | (0.93 | ) | | (0.92 | ) | | (0.03 | ) | | — | | | (0.03 | ) | | $ | 12.13 | | (7.08% | )(g) | | $ | 108 | | 1.95% | (h) | | (0.01% | )(h) | | 3.29% | (h) | | (1.35% | )(h) | | 139.75% |
Year Ended October 31, 2002 | | $ | 12.13 | | (0.03 | ) | | 0.01 | | (0.97 | ) | | (0.99 | ) | | (0.01 | ) | | (0.15 | ) | | (0.16 | ) | | $ | 10.98 | | (8.31% | ) | | $ | 133 | | 1.99% | | | (0.30% | ) | | 2.23% | | | (0.54% | ) | | 108.62% |
Year Ended October 31, 2003 | | $ | 10.98 | | (0.04 | ) | | — | | 3.37 | | | 3.33 | | | — | | | — | | | — | | | $ | 14.31 | | 30.35% | | | $ | 342 | | 2.00% | | | (0.56% | ) | | 2.09% | | | (0.65% | ) | | 90.02% |
Year Ended October 31, 2004 | | $ | 14.31 | | (0.09 | ) | | — | | 1.53 | | | 1.44 | | | — | | | — | | | — | | | $ | 15.75 | | 10.06% | | | $ | 652 | | 2.01% | | | (0.67% | ) | | 2.05% | | | (0.71% | ) | | 146.98% |
Year Ended October 31, 2005 | | $ | 15.75 | | (0.10 | ) | | — | | 2.04 | | | 1.94 | | | — | | | (2.89 | ) | | (2.89 | ) | | $ | 14.80 | | 12.86% | | | $ | 669 | | 2.14% | | | (0.62% | ) | | 2.51% | | | (0.99% | ) | | 187.36% |
| | | | | | | | | | | | | | | | |
Class R Shares | | | | | | | | | | | | | | | | | | | | | | | | | | | | | | | | | | | | | | | | | | | | | | |
Period Ended October 31, 2004 (e) | | $ | 15.45 | | (0.05 | ) | | — | | 0.43 | | | 0.38 | | | — | | | — | | | — | | | $ | 15.83 | | 2.46% | (g) | | $ | 1 | | 1.60% | (h) | | (0.35% | )(h) | | 1.64% | (h) | | (0.39% | )(h) | | 146.98% |
Year Ended October 31, 2005 | | $ | 15.83 | | 0.01 | | | — | | 2.06 | | | 2.07 | | | (0.03 | ) | | (2.89 | ) | | (2.92 | ) | | $ | 14.98 | | 13.71% | | | $ | 1 | | 1.61% | | | 0.06% | | | 1.99% | | | (0.32% | ) | | 187.36% |
| | | | | | | | | | | | | | | | |
Institutional Class Shares | | | | | | | | | | | | | | | | | | | | | | | | | | | | | | | | | | | | | | | | | | | | | | |
Year Ended October 31, 2004 (f) | | $ | 16.18 | | — | | | — | | (0.04 | ) | | (0.04 | ) | | — | | | — | | | — | | | $ | 16.14 | | (0.19% | )(g) | | $ | 1 | | 1.09% | (h) | | 0.09% | (h) | | 1.17% | (h) | | 0.01% | (h) | | 146.98% |
Year Ended October 31, 2005 | | $ | 16.14 | | 0.06 | | | — | | 2.09 | | | 2.15 | | | (0.05 | ) | | (2.89 | ) | | (2.94 | ) | | $ | 15.35 | | 13.96% | | | $ | 1 | | 1.08% | | | 0.39% | | | 1.30% | | | 0.17% | | | 187.36% |
| | | | | | | | | | | | | | | | | | | | | | | | | | | | | | | | | | | | | | | | | | | | | | | |
| (a) | Excludes sales charge. |
| (b) | During the period certain fees were waived and/or reimbursed. If such waivers/reimbursements had not occurred, the ratios would have been as indicated. |
| (c) | Portfolio turnover is calculated on the basis of the Fund as whole without distinguishing among the classes of shares. |
| (d) | For the period from March 1, 2001 (commencement of operations) through October 31, 2001. |
| (e) | For the period from December 30, 2003 (commencement of operations) through October 31, 2004. |
| (f) | For the period from June 29, 2004 (commencement of operations) through October 31, 2004. |
See notes to financial statements.
Notes to Financial Statements
October 31, 2005
1. Organization
Gartmore Mutual Funds (the “Trust”) is an open-end management investment company, organized under the laws of Delaware by an amended and restated Agreement and Declaration of Trust, dated October 28, 2004, as amended to date. Prior to January 25, 2002 the Trust was named Nationwide Mutual Funds. The Trust, originally created under the laws of Ohio as an Ohio business trust pursuant to a Declaration of Trust dated, as of October 30, 1997, as subsequently amended and redomesticated as a Delaware Statutory Trust on February 28, 2005, is registered under the Investment Company Act of 1940, as amended (the “1940 Act”). The redomestication was a change in statutory status and did not affect the operations of the Trust. As of October 31, 2005, the Trust had authorized an unlimited number of shares of beneficial interest (“shares”) without par value. The Trust operates forty-six (46) separate series, or mutual funds, each with its own investment objectives and strategies. This report contains the financial statements and financial highlights of the 19 funds listed below (individually, a “Fund”; collectively, the “Funds”):
- Gartmore Global Financial Services Fund (“Global Financial Services”)
- Gartmore Global Health Sciences Fund (“Global Health Sciences”)
- Gartmore Global Natural Resources Fund (“Global Natural Resources”)
- Gartmore Global Technology and Communications Fund (“Global Technology and Communications”)
- Gartmore Global Utilities Fund (“Global Utilities”)
- Gartmore Mid Cap Growth Leaders Fund (“Mid Cap Growth Leaders”)
- Gartmore Nationwide Leaders Fund (“Nationwide Leaders”)
- Gartmore Small Cap Leaders Fund (“Small Cap Leaders”)
- Gartmore U.S. Growth Leaders Fund (“U.S. Growth Leaders”)
- Gartmore Worldwide Leaders Fund (“Worldwide Leaders”)
- Gartmore China Opportunities Fund (“China Opportunities”)
- Gartmore Emerging Markets Fund (“Emerging Markets”)
- Gartmore International Growth Fund (“International Growth”)
- Gartmore Convertible Fund (“Convertible”)
- Gartmore High Yield Bond Fund (“High Yield Bond”)
- Gartmore Micro Cap Equity Fund (“Micro Cap Equity”)
- Gartmore Small Cap Growth Fund (“Small Cap Growth”)
- Gartmore U.S. Growth Leaders Long-Short Fund (“U.S. Growth Leaders Long-Short”)
- Gartmore Value Opportunities Fund (“Value Opportunities”)
Under the Trust’s organizational documents, the Trust’s officers and trustees are indemnified against certain liabilities arising out of the performance of their duties to the Trust. In addition, the Trust has entered into Indemnification Agreements with its Trustees and certain of its Officers. Trust Officers receive no compensation from the Trust for serving as its Officers. In addition, in the normal course of business, the Trust enters into contracts with the Trust’s vendors and others that provide for general indemnifications. The Trust’s maximum liability under these arrangements is unknown, as this would involve future claims that may be made against the Trust. However, based on experience, the Trust expects that risk of loss to be remote.
2. Summary of Significant Accounting Policies
The following is a summary of significant accounting policies followed by the Funds in the preparation of their financial statements. The policies are in conformity with accounting principles generally accepted in the United States of America (“GAAP”). The preparation of financial statements requires management to make estimates and assumptions that affect the reported amounts of assets and liabilities, the disclosure of contingent assets and liabilities at the date of the financial statements, and the reported amounts of income and expenses for the period. Actual results could differ from those estimates.
Securities for which market quotations are readily available are valued at current market value as of “Valuation Time.” Valuation Time is as of the close of regular trading on the New York Stock Exchange (usually 4 p.m. Eastern time). Equity securities are valued at the last quoted sale price or, if there is no sale price, the last quoted bid
Notes to Financial Statements (Continued)
October 31, 2005
price provided by an independent pricing service approved by the Trust’s Board of Trustees. Securities traded on NASDAQ are valued at the NASDAQ Official Closing Price. Prices are taken from the primary market or exchange in which each security trades. Most securities listed on a foreign exchange are valued either at fair value (see description below) or at the last sale price at the close of the exchange on which the security is principally traded. Foreign securities, currencies, and other assets and liabilities denominated in foreign currencies are translated into U.S. dollars at the exchange rate of said currencies against the U.S. Dollar, as of Valuation Time, as provided by an independent pricing service approved by the Board of Trustees.
Debt and other fixed income securities (other than short-term obligations) are valued at the last quoted bid price and/or by using a combination of daily quotes and matrix evaluations provided by an independent pricing service, the use of which has been approved by the Trust’s Board of Trustees. Short-term debt securities such as commercial paper and U.S. Treasury Bills having a remaining maturity of 60 days or less at the time of purchase are considered to be “short-term” and are valued at amortized cost which approximates market value.
Securities for which market quotations are not readily available, or for which an independent pricing service does not provide a value or provides a value that does not represent fair value in the judgment of the Funds’ investment adviser or designee, are valued at fair value under procedures approved by the Trust’s Board of Trustees. The “Fair Value” of these securities is determined in good faith by taking into account relevant factors and surrounding circumstances. Methods utilized to obtain a “Fair Value” may include the following non-exclusive list of SEC acceptable methods: (i) a multiple of earnings; (ii) the discount from market value of a similar, freely traded security; (iii) the yield-to-maturity for debt issues; or (iv) a consolidation of the methods. The Gartmore Fair Value Committee considers a non-exclusive list of factors to arrive at the appropriate method of determining “Fair Value.” For example, fair value determinations are required for securities whose value is affected by a “significant” event that materially affects the value of a domestic or foreign security which occurs subsequent to the time of the close of the principal market on which such domestic or foreign security trades and before the Valuation Time (i.e., a “subsequent event”). Typically, this will involve events occurring after the close of a foreign market on which a security trades and before the next Valuation Time
The Funds holding foreign equity securities (the “Foreign Equity Funds”) value foreign securities at fair value in the circumstances described below. Generally, trading in foreign securities markets is completed each day at various times prior to the Valuation Time. Due to the time differences between the closings of the relevant foreign securities exchanges and the Valuation Time for the Foreign Equity Funds, the Foreign Equity Funds will fair value their foreign investments when it is determined that the market quotations for the foreign investments either are not readily available or are unreliable and, therefore, do not represent fair value. When the fair value prices are utilized, these prices will attempt to reflect the impact of the U.S. financial markets’ perceptions and trading activities on the Foreign Equity Funds’ foreign investments since the last closing prices of the foreign investments were calculated on their primary foreign securities markets or exchanges. For these purposes, the Board of Trustees of the Trust has determined that movements in relevant indices or other appropriate market indicators, after the close of the foreign securities exchanges, may demonstrate that market quotations are unreliable, and may trigger fair value pricing for certain securities. Consequently, fair valuation of portfolio securities may occur on a daily basis. In determining fair value prices, the Trust utilizes data furnished by an independent pricing service (and that data draws upon, among other information, the market values of foreign investments). The fair value prices of portfolio securities generally will be used when it is determined that the use of these prices will have a material impact on the net asset value of a Foreign Equity Fund. When a Foreign Equity Fund uses fair value pricing, the values assigned to the Foreign Equity Fund’s foreign investments may not be the quoted or published prices of the investments on their primary markets or exchanges.
| (b) | | Repurchase Agreements |
The Funds may enter into repurchase agreements with an entity which is a member of the Federal Reserve System or which is a “primary dealer” (as designated by the Federal Reserve Bank of New York) in U.S. Government obligations. The repurchase price generally equals the price paid by a Fund plus interest negotiated on the basis of current short-term rates, which may be more or less than the rate on the underlying portfolio securities. The seller
under a repurchase agreement is required to maintain the value of the collateral held pursuant to the agreement at a market value equal to or greater than the repurchase price (including accrued interest). Collateral subject to repurchase agreements is held by the Funds’ custodian or another qualified sub-custodian or in the Federal Reserve/ Treasury book-entry system. If the counterparty defaults and the fair value of the collateral declines, realization of the collateral by the Funds may be delayed or limited. The Funds may transfer uninvested cash balances into a pooled cash account. These balances are invested in one or more repurchase agreements, which are fully collateralized by U.S. Government Agencies and U.S. Government Agency Mortgages with the counterparties of CS First Boston and Nomura Securities.
| (c) | | Foreign Currency Transactions |
The accounting records of the Funds are maintained in U.S. dollars. Foreign currency amounts are translated into U.S. dollars at the current rate of exchange to determine the value of investments, assets and liabilities. Purchases and sales of securities, and income and expenses are translated at the prevailing rate of exchange on the respective date of these transactions. The Funds do not isolate that portion of the results of operations resulting from changes in foreign exchange rates on investments from fluctuations arising from changes in market prices of securities held. These fluctuations are included with the net realized and unrealized gain or loss from investments and foreign currencies.
| (d) | | Risks Associated with Foreign Securities and Currencies |
Investments in securities of foreign issuers carry certain risks not ordinarily associated with investments in securities of U.S. issuers. These risks include future political and economic developments, and the possible imposition of exchange controls or other foreign governmental laws and restrictions. In addition, with respect to certain countries, there is the possibility of expropriation of assets, confiscatory taxation, political or social instability or diplomatic developments, which could adversely affect investments in those countries.
Certain countries also may impose substantial restrictions on investments in their capital markets by foreign entities, including restrictions on investments in issuers of industries deemed sensitive to relevant national interests. These factors may limit the investment opportunities available and result in a lack of liquidity and a high price volatility with respect to securities of issuers from developing countries.
| (e) | | Forward Foreign Currency Contracts |
Certain Funds may enter into forward foreign currency exchange contracts in connection with planned purchases or sales of securities or to hedge the U.S. dollar value of portfolio securities denominated in a particular currency. The Funds could be exposed to risks if the counterparties to the contracts are unable to meet the terms of their contracts and from unanticipated movements in the value of a foreign currency relative to the U.S. dollar. Forward foreign currency contracts are valued at the current cost of covering these contracts, as provided by an independent pricing service approved by the Board of Trustees. The forward foreign currency contracts are adjusted by the daily exchange rate of the underlying currency and any gains or losses are recorded for financial statement purposes as unrealized gains or losses until the contract settlement date.
Certain Funds may invest in financial futures contracts (“futures contracts”) for the purpose of hedging their existing portfolio securities or securities that the Funds intend to purchase against fluctuations in value caused by changes in prevailing market interest rates or prices. Futures contracts may also be entered into for non-hedging purposes.
Upon entering into a futures contract, these Funds are required to pledge to the broker an amount of cash and/or other assets equal to a certain percentage of the contract amount (initial margin deposit). Subsequent payments, known as “variation margin”, are made each day, depending on the daily fluctuations in the fair value/market value of the underlying assets. A gain or loss equal to the daily variation margin is recognized on a daily basis. Futures contracts are valued daily at their last quoted sale price.
A “sale” of a futures contract means a contractual obligation to deliver the securities or foreign currency called for by the contract at a fixed price at a specified time in the future. A “purchase” of a futures contract means a contractual obligation to acquire the securities or foreign currency at a fixed price at a specified time in the future.
Notes to Financial Statements (Continued)
October 31, 2005
Should market conditions change unexpectedly, a Fund may not achieve the anticipated benefits of the futures contracts and may realize a loss. The use of futures transactions for hedging purposes involves the risk of imperfect correlation in movements in the price of futures contracts, interest rates, and the value/market value of the underlying hedged assets.
During the period, the U.S. Growth Leaders Long-Short Fund engaged in short-selling of portfolio securities. The Fund is authorized to engage in short-selling of portfolio securities, which obligates the Fund to replace any security that the Fund has borrowed by purchasing the security at current market value sometime in the future. The Fund will incur a loss if the price of the security increases between the date of the short sale and the date on which the Fund replaces the borrowed security. The Fund generally will realize a gain if the price of the security declines between these dates. Until the Fund replaces the borrowed security, the Fund will maintain a segregated account with cash, U.S. government securities and/or securities held long to sufficiently cover the Fund’s short position on a daily basis. Dividends declared on securities sold short are recorded as an expense on the ex-dividend date and paid to the counterparty on the dividend pay date. The collateral for securities sold short includes the deposits with brokers and securities held long as shown in the Statement of Investments for the Fund.
To generate additional income, each of the Funds may lend up to 33 1/3% of the Fund’s total assets pursuant to agreements, requiring that the borrower deliver cash or securities as collateral with respect to each new loan of U.S. securities, equal to at least 102% of the value of the portfolio securities loaned, and with respect to each new loan of non-U.S. securities, collateral of at least 105% of the value of the portfolio securities loaned, and thereafter requiring the borrower to mark to market the collateral on a daily basis and requiring the borrower to make up any shortfall of collateral. The Funds receive payments from borrowers of the dividends and interest that the Funds are entitled to for the positions on loan. These loan positions simultaneously earn income on the investment of cash collateral. Collateral is marked to market daily to provide a level of collateral at least equal to the market value of securities loaned. There may be risks of delay in recovery of the securities should the borrower of the securities fail financially. Loans will be made, however, only to borrowers deemed by the Funds’ investment adviser to be of good standing and creditworthy under guidelines established by the Board of Trustees and when, in the judgment of the adviser, the consideration which can be earned currently from these securities loans justifies the attendant risks. Loans are subject to termination by the Funds or the borrower at any time, and, therefore, are not considered to be illiquid investments. JPMorgan Chase Bank serves as custodian for the securities lending program of the Funds. JP Morgan Chase Bank receives a fee based on the value of collateral received from borrowers.
The cash collateral received by the Funds at October 31, 2005, was pooled and invested in the following:
| | | | | | | | | | |
| Security Type | | Issuer | | Value | | Maturity Rate | | | Maturity Date |
Bank Note — Floating Rate | | U.S. Bank N.A. | | $ | 2,998,279 | | 3.85 | % | | 11/02/05 |
Master Note — Floating | | Merrill Lynch Mortgage Capital | | | 25,700,000 | | 4.16 | % | | 11/01/05 |
Medium Term Note — Floating | | General Electric Capital Corp | | | 1,500,213 | | 3.79 | % | | 12/08/05 |
Medium Term Note — Floating | | ISLANDSBANKI HF Corp | | | 1,000,000 | | 4.08 | % | | 11/22/05 |
Repurchase Agreement — U.S. Government
Agency Mortgages | | Nomura Securities | | | 22,300,563 | | 4.05 | % | | 11/01/05 |
Information on the investment of cash collateral is shown in the Statement of Investments.
As of October 31, 2005, the following Funds had securities with the following market values on loan:
| | | | | | |
| Fund | | Value of
Loaned Securities | | Value of
Collateral |
Global Health Sciences | | $ | 2,478,401 | | $ | 2,497,502 |
Global Technology and Communications | | | 879,648 | | | 888,600 |
Mid Cap Growth Leaders | | | 2,159,932 | | | 2,121,265 |
U.S. Growth Leaders | | | 12,767,277 | | | 12,814,285 |
Worldwide Leaders | | | 4,231,922 | | | 4,426,550 |
Micro Cap Equity | | | 27,521,427 | | | 27,810,992 |
Value Opportunities | | | 2,934,040 | | | 2,939,861 |
| (i) | | Security Transactions and Investment Income |
Security transactions are accounted for on the date the security is purchased or sold (“trade date”). Securities gains and losses are calculated on the identified cost basis. Interest income is recognized on the accrual basis and includes, where applicable, the amortization or accretion of premium or discount. Dividend income is recorded on the ex-dividend date.
| (j) | | Distributions to Shareholders |
Net investment income, if any, is declared daily and paid monthly for High Yield Bond and is declared and paid quarterly for all other Funds. For all Funds, distributable net realized capital gains, if any, are declared and distributed at least annually.
Dividends and distributions to shareholders are determined in accordance with federal income tax regulations, which may differ from GAAP. These “book/tax” differences are considered either permanent or temporary in nature. In accordance with American Institute of Certified Public Accountants (the “AICPA”) Statement of Position 93-2, permanent differences (i.e., reclassification of market discounts, gain/loss, paydowns, and distributions) are reclassified within the capital accounts based on their nature for federal income tax purposes; temporary differences do not require reclassification. These reclassifications have no effect upon the net asset value of the respective Funds. To the extent distributions exceed current and accumulated earnings and profits for federal income tax purposes, these distributions are reported as distributions of paid-in-capital.
It is the policy of each Fund to qualify or continue to qualify as a “regulated investment company” by complying with the provisions available to certain investment companies, as defined in applicable sections of the Internal Revenue Code, and to make distributions of net investment income and net realized capital gains sufficient to relieve the Fund from all, or substantially all, federal income taxes.
| (l) | | Allocation of Expenses, Income, and Gains and Losses |
Expenses directly attributable to a Fund are charged to that Fund. Expenses not directly attributable to a Fund are allocated proportionately among various or all Funds within the Trust. For the Equity Funds, the method for allocating income, fund level expenses, and realized and unrealized gains or losses is based on the fair value of shares outstanding relative to net assets. Under this method, each class of shares participates based on the total net asset value of that class’s shares in proportion to the total net assets of the Fund. For the Bond Funds, the allocation method used is based on the fair value of settled shares outstanding. Under this method, earnings are allocated based on the fair value of settled shares. Expenses specific to a class (such as Rule 12b-1 and administrative services fees) are charged to that class.
Notes to Financial Statements (Continued)
October 31, 2005
| (m) | | Capital Share Transactions |
Transactions in capital shares of the Funds were as follows:
| | | | | | | | | | | | | | | | | | |
| | | Global Financial Services | | | Global Health Sciences |
| | | Year Ended
October 31, 2005 | | | Year Ended
October 31, 2004 | | | Year Ended
October 31, 2005 | | | Year Ended
October 31, 2004 |
CAPITAL TRANSACTIONS: | | | | | | | | | | | | | | | | | | |
Class A Shares | | | | | | | | | | | | | | | | | | |
Proceeds from shares issued (b) | | $ | 2,116,941 | | | $ | 2,120,548 | | | $ | 6,872,505 | | | $ | 6,977,872 | | | |
Dividends reinvested | | | 136,625 | | | | 133,277 | | | | 34,040 | | | | 274,185 | | | |
Cost of shares redeemed | | | (400,441 | ) | | | (1,097,974 | ) | | | (3,025,980 | ) | | | (4,950,075 | ) | | |
| | |
|
|
| |
|
|
| |
|
|
| |
|
|
| | |
| | | | 1,853,125 | | | | 1,155,851 | | | | 3,880,565 | | | | 2,301,982 | | | |
| | |
|
|
| |
|
|
| |
|
|
| |
|
|
| | |
| | | | | |
Class B Shares | | | | | | | | | | | | | | | | | | |
Proceeds from shares issued (b) | | | 48,565 | | | | 27,905 | | | | 129,644 | | | | 165,325 | | | |
Dividends reinvested | | | 73,769 | | | | 89,141 | | | | 6,107 | | | | 74,963 | | | |
Cost of shares redeemed | | | (27,739 | ) | | | (8,388 | ) | | | (71,992 | ) | | | (27,500 | ) | | |
| | |
|
|
| |
|
|
| |
|
|
| |
|
|
| | |
| | | | 94,595 | | | | 108,658 | | | | 63,759 | | | | 212,788 | | | |
| | |
|
|
| |
|
|
| |
|
|
| |
|
|
| | |
| | | | | |
Class C Shares | | | | | | | | | | | | | | | | | | |
Proceeds from shares issued (b) | | | 407,937 | | | | 70,192 | | | | 2,336,230 | | | | 2,138,361 | | | |
Dividends reinvested | | | 74,188 | | | | 86,070 | | | | 1,371 | | | | 11,366 | | | |
Cost of shares redeemed | | | (67,277 | ) | | | (6,719 | ) | | | (927,955 | ) | | | (74,108 | ) | | |
| | |
|
|
| |
|
|
| |
|
|
| |
|
|
| | |
| | | | 414,848 | | | | 149,543 | | | | 1,409,646 | | | | 2,075,619 | | | |
| | |
|
|
| |
|
|
| |
|
|
| |
|
|
| | |
| | | | | |
Class R Shares | | | | | | | | | | | | | | | | | | |
Proceeds from shares issued (b) | | | — | | | | 1,000 | (c) | | | — | | | | 1,000 | (c) | | |
Dividends reinvested | | | 80 | | | | 6 | (c) | | | 6 | | | | — | | | |
| | |
|
|
| |
|
|
| |
|
|
| |
|
|
| | |
| | | | 80 | �� | | | 1,006 | | | | 6 | | | | 1,000 | | | |
| | |
|
|
| |
|
|
| |
|
|
| |
|
|
| | |
| | | | | |
Institutional Service Class Shares | | | | | | | | | | | | | | | | | | |
Proceeds from shares issued (b) | | | 144 | | | | 119 | | | | 2,627,578 | | | | 5,333,588 | | | |
Dividends reinvested | | | 79,497 | | | | 93,480 | | | | 28,114 | | | | 300,573 | | | |
Cost of shares redeemed | | | 98 | | | | — | | | | (2,574,711 | ) | | | (4,200,651 | ) | | |
| | |
|
|
| |
|
|
| |
|
|
| |
|
|
| | |
| | | | 79,739 | | | | 93,599 | | | | 80,981 | | | | 1,433,510 | | | |
| | |
|
|
| |
|
|
| |
|
|
| |
|
|
| | |
| | | | | |
Institutional Class Shares | | | | | | | | | | | | | | | | | | |
Proceeds from shares issued (b) | | | 6,507,099 | | | | 707,404 | (a) | | | 3,979,739 | | | | 452,027 | (a) | | |
Dividends reinvested | | | 155,329 | | | | 1,601 | (a) | | | 6,183 | | | | — | | | |
Cost of shares redeemed | | | (1,382,017 | ) | | | (52,182 | )(a) | | | (842,304 | ) | | | (19,432 | )(a) | | |
| | |
|
|
| |
|
|
| |
|
|
| |
|
|
| | |
| | | | 5,280,411 | | | | 656,823 | | | | 3,143,618 | | | | 432,595 | | | |
| | |
|
|
| |
|
|
| |
|
|
| |
|
|
| | |
Change in net assets from capital transactions | | $ | 7,722,798 | | | $ | 2,165,480 | | | $ | 8,578,575 | | | $ | 6,457,494 | | | |
| | |
|
|
| |
|
|
| |
|
|
| |
|
|
| | |
| (a) | For the period from June 29, 2004 (commencement of operations) through October 31, 2004. |
| (b) | Amount includes redemption fees, if any. |
| (c) | For the period from December 30, 2003 (commencement of operations) through October 31, 2004. |
| | | | | | | | | | | | | | |
| | | Global Financial Services | | | Global Health Sciences |
| | | Year Ended
October 31, 2005 | | | Year Ended
October 31, 2004 | | | Year Ended
October 31, 2005 | | | Year Ended
October 31, 2004 |
SHARE TRANSACTIONS: | | | | | | | | | | | | | | |
Class A Shares | | | | | | | | | | | | | | |
Issued | | 162,896 | | | 171,290 | | | 611,372 | | | 656,551 | | | |
Reinvested | | 10,433 | | | 11,537 | | | 3,067 | | | 27,255 | | | |
Redeemed | | (30,974 | ) | | (90,241 | ) | | (269,467 | ) | | (470,608 | ) | | |
| | |
|
| |
|
| |
|
| |
|
| | |
| | | 142,355 | | | 92,586 | | | 344,972 | | | 213,198 | | | |
| | |
|
| |
|
| |
|
| |
|
| | |
| | | | | |
Class B Shares | | | | | | | | | | | | | | |
Issued | | 3,785 | | | 2,283 | | | 11,814 | | | 15,742 | | | |
Reinvested | | 5,721 | | | 7,867 | | | 566 | | | 7,603 | | | |
Redeemed | | (2,236 | ) | | (695 | ) | | (6,741 | ) | | (2,656 | ) | | |
| | |
|
| |
|
| |
|
| |
|
| | |
| | | 7,270 | | | 9,455 | | | 5,639 | | | 20,689 | | | |
| | |
|
| |
|
| |
|
| |
|
| | |
| | | | | |
Class C Shares | | | | | | | | | | | | | | |
Issued | | 31,898 | | | 5,711 | | | 213,246 | | | 207,003 | | | |
Reinvested | | 5,754 | | | 7,596 | | | 127 | | | 1,153 | | | |
Redeemed | | (5,314 | ) | | (574 | ) | | (80,969 | ) | | (7,242 | ) | | |
| | |
|
| |
|
| |
|
| |
|
| | |
| | | 32,338 | | | 12,733 | | | 132,404 | | | 200,914 | | | |
| | |
|
| |
|
| |
|
| |
|
| | |
| | | | | |
Class R Shares | | | | | | | | | | | | | | |
Issued | | — | | | 88 | (b) | | — | | | 100 | (b) | | |
Reinvested | | 6 | | | — | | | — | | | — | | | |
| | |
|
| |
|
| |
|
| |
|
| | |
| | | 6 | | | 88 | | | — | | | 100 | | | |
| | |
|
| |
|
| |
|
| |
|
| | |
| | | | | |
Institutional Service Class Shares | | | | | | | | | | | | | | |
Issued | | — | (c) | | — | (c) | | 230,623 | | | 490,765 | | | |
Reinvested | | 6,044 | | | 8,061 | | | 2,508 | | | 29,613 | | | |
Redeemed | | — | (c) | | — | | | (228,849 | ) | | (391,931 | ) | | |
| | |
|
| |
|
| |
|
| |
|
| | |
| | | 6,044 | | | 8,061 | | | 4,282 | | | 128,447 | | | |
| | |
|
| |
|
| |
|
| |
|
| | |
| | | | | |
Institutional Class Shares | | | | | | | | | | | | | | |
Issued | | 500,181 | | | 57,838 | (a) | | 350,724 | | | 41,764 | (a) | | |
Reinvested | | 11,847 | | | 130 | (a) | | 551 | | | — | | | |
Redeemed | | (104,374 | ) | | (4,229 | )(a) | | (70,946 | ) | | (1,899 | )(a) | | |
| | |
|
| |
|
| |
|
| |
|
| | |
| | | 407,654 | | | 53,739 | | | 280,329 | | | 39,865 | | | |
| | |
|
| |
|
| |
|
| |
|
| | |
Total change in shares | | 595,667 | | | 176,662 | | | 767,626 | | | 603,213 | | | |
| | |
|
| |
|
| |
|
| |
|
| | |
| (a) | For the period from June 29, 2004 (commencement of operations) through October 31, 2004. |
| (b) | For the period from December 30, 2003 (commencement of operations) through October 31, 2004. |
Notes to Financial Statements (Continued)
October 31, 2005
| | | | | | | | | |
| | | Gartmore Global Natural Resources Fund |
| | | Year Ended
October 31, 2005 | | | Period Ended
October 31, 2004 (a) |
CAPITAL TRANSACTIONS: | | | | | | | | | |
Class A Shares | | | | | | | | | |
Proceeds from shares issued (b) | | $ | 10,680,867 | | | $ | 103,923 | | |
Dividends reinvested | | | 9,625 | | | | 87 | | |
Cost of shares redeemed | | | (805,016 | ) | | | — | | |
| | |
|
|
| |
|
| | |
| | | | 9,885,476 | | | | 104,010 | | |
| | |
|
|
| |
|
| | |
Class B Shares | | | | | | | | | |
Proceeds from shares issued (b) | | | 620,232 | | | | 1,000 | | |
Dividends reinvested | | | 120 | | | | — | | |
Cost of shares redeemed | | | (45,110 | ) | | | — | | |
| | |
|
|
| |
|
| | |
| | | | 575,242 | | | | 1,000 | | |
| | |
|
|
| |
|
| | |
Class C Shares | | | | | | | | | |
Proceeds from shares issued (b) | | | 4,707,988 | | | | 6,000 | | |
Dividends reinvested | | | 221 | | | | — | | |
Cost of shares redeemed | | | (326,016 | ) | | | — | | |
| | |
|
|
| |
|
| | |
| | | | 4,382,193 | | | | 6,000 | | |
| | |
|
|
| |
|
| | |
Class R Shares | | | | | | | | | |
Proceeds from shares issued (b) | | | 21,058 | | | | 1,000 | | |
Dividends reinvested | | | 40 | | | | — | | |
Cost of shares redeemed | | | (153 | ) | | | — | | |
| | |
|
|
| |
|
| | |
| | | | 20,935 | | | | 1,000 | | |
| | |
|
|
| |
|
| | |
Institutional Service Class Shares | | | | | | | | | |
Proceeds from shares issued (b) | | | 234,993 | | | | 1,000 | | |
Dividends reinvested | | | 42 | | | | 2 | | |
Cost of shares redeemed | | | (70,489 | ) | | | — | | |
| | |
|
|
| |
|
| | |
| | | | 164,546 | | | | 1,002 | | |
| | |
|
|
| |
|
| | |
Institutional Class Shares | | | | | | | | | |
Proceeds from shares issued (b) | | | 2,625,287 | | | | 3,000,000 | | |
Dividends reinvested | | | 127,224 | | | | 5,728 | | |
Cost of shares redeemed | | | (27,205 | ) | | | — | | |
| | |
|
|
| |
|
| | |
| | | | 2,725,306 | | | | 3,005,728 | | |
| | |
|
|
| |
|
| | |
Change in net assets from capital transactions | | $ | 17,753,698 | | | $ | 3,118,740 | | |
| | |
|
|
| |
|
| | |
| (a) | For the period from June 29, 2004 (commencement of operations) through October 31, 2004. |
| (b) | Amount includes redemption fees, if any. |
| | | | | | | | |
| | | Gartmore Global Natural Resources Fund |
| | | Year Ended
October 31, 2005 | | | Period Ended
October 31, 2004 (a) |
SHARE TRANSACTIONS: | | | | | | | | |
Class A Shares | | | | | | | | |
Issued | | 644,698 | | | 9,549 | | | |
Reinvested | | 821 | | | 8 | | | |
Redeemed | | (47,714 | ) | | — | | | |
| | |
|
| |
|
| | |
| | | 597,805 | | | 9,557 | | | |
| | |
|
| |
|
| | |
| | | |
Class B Shares | | | | | | | | |
Issued | | 39,514 | | | 100 | | | |
Reinvested | | 10 | | | — | | | |
Redeemed | | (3,263 | ) | | — | | | |
| | |
|
| |
|
| | |
| | | 36,261 | | | 100 | | | |
| | |
|
| |
|
| | |
| | | |
Class C Shares | | | | | | | | |
Issued | | 297,507 | | | 546 | | | |
Reinvested | | 19 | | | — | | | |
Redeemed | | (21,085 | ) | | — | | | |
| | |
|
| |
|
| | |
| | | 276,441 | | | 546 | | | |
| | |
|
| |
|
| | |
| | | |
Class R Shares | | | | | | | | |
Issued | | 1,190 | | | 100 | | | |
Reinvested | | 3 | | | — | | | |
Redeemed | | (12 | ) | | — | | | |
| | |
|
| |
|
| | |
| | | 1,181 | | | 100 | | | |
| | |
|
| |
|
| | |
| | | |
Institutional Service Class Shares | | | | | | | | |
Issued | | 13,232 | | | 100 | | | |
Reinvested | | 4 | | | — | (b) | | |
Redeemed | | (3,880 | ) | | — | | | |
| | |
|
| |
|
| | |
| | | 9,356 | | | 100 | | | |
| | |
|
| |
|
| | |
| | | |
Institutional Class Shares | | | | | | | | |
Issued | | 138,552 | | | 300,001 | | | |
Reinvested | | 10,854 | | | 525 | | | |
Redeemed | | (1,511 | ) | | — | | | |
| | |
|
| |
|
| | |
| | | 147,895 | | | 300,526 | | | |
| | |
|
| |
|
| | |
Total change in shares | | 1,068,939 | | | 310,929 | | | |
| | |
|
| |
|
| | |
| (a) | For the period from June 29, 2004 (commencement of operations) through October 31, 2004. |
Notes to Financial Statements (Continued)
October 31, 2005
| | | | | | | | | | | | | | | | | | |
| | | Global Technology and Communications | | | Global Utilities |
| | | Year Ended
October 31, 2005 | | | Year Ended
October 31, 2004 | | | Year Ended
October 31, 2005 | | | Year Ended
October 31, 2004 |
CAPITAL TRANSACTIONS: | | | | | | | | | | | | | | | | | | |
Class A Shares | | | | | | | | | | | | | | | | | | |
Proceeds from shares issued (b) | | $ | 960,162 | | | $ | 2,570,801 | | | $ | 1,667,526 | | | $ | 324,651 | | | |
Dividends reinvested | | | — | | | | — | | | | 59,285 | | | | 3,218 | | | |
Cost of shares redeemed | | | (1,047,328 | ) | | | (2,542,220 | ) | | | (759,875 | ) | | | (104,532 | ) | | |
| | |
|
|
| |
|
|
| |
|
|
| |
|
|
| | |
| | | | (87,166 | ) | | | 28,581 | | | | 966,936 | | | | 223,337 | | | |
| | |
|
|
| |
|
|
| |
|
|
| |
|
|
| | |
| | | | | |
Class B Shares | | | | | | | | | | | | | | | | | | |
Proceeds from shares issued (b) | | | 102,837 | | | | 39,198 | | | | 197,399 | | | | 60,112 | | | |
Dividends reinvested | | | — | | | | — | | | | 31,795 | | | | 461 | | | |
Cost of shares redeemed | | | (178,116 | ) | | | (57,189 | ) | | | (36,712 | ) | | | (1,000 | ) | | |
| | |
|
|
| |
|
|
| |
|
|
| |
|
|
| | |
| | | | (75,279 | ) | | | (17,991 | ) | | | 192,482 | | | | 59,573 | | | |
| | |
|
|
| |
|
|
| |
|
|
| |
|
|
| | |
| | | | | |
Class C Shares | | | | | | | | | | | | | | | | | | |
Proceeds from shares issued (b) | | | 9,558 | | | | 63,326 | | | | 1,875,230 | | | | 2,928,501 | | | |
Dividends reinvested | | | — | | | | — | | | | 30,079 | | | | 1,393 | | | |
Cost of shares redeemed | | | (57,584 | ) | | | (16,426 | ) | | | (3,401,068 | ) | | | (515,979 | ) | | |
| | |
|
|
| |
|
|
| |
|
|
| |
|
|
| | |
| | | | (48,026 | ) | | | 46,900 | | | | (1,495,759 | ) | | | 2,413,915 | | | |
| | |
|
|
| |
|
|
| |
|
|
| |
|
|
| | |
| | | | | |
Class R Shares | | | | | | | | | | | | | | | | | | |
Proceeds from shares issued (b) | | | — | | | | 1,000 | (c) | | | — | | | | 1,000 | (c) | | |
Dividends reinvested | | | — | | | | — | | | | 53 | | | | 3 | (c) | | |
| | |
|
|
| |
|
|
| |
|
|
| |
|
|
| | |
| | | | — | | | | 1,000 | | | | 53 | | | | 1,003 | | | |
| | |
|
|
| |
|
|
| |
|
|
| |
|
|
| | |
| | | | | |
Institutional Service Class Shares | | | | | | | | | | | | | | | | | | |
Proceeds from shares issued (b) | | | 2,908,267 | | | | 7,786,911 | | | | — | | | | 16 | | | |
Dividends reinvested | | | — | | | | — | | | | 31,183 | | | | 3,949 | | | |
Cost of shares redeemed | | | (3,969,476 | ) | | | (7,813,268 | ) | | | — | | | | — | | | |
| | |
|
|
| |
|
|
| |
|
|
| |
|
|
| | |
| | | | (1,061,209 | ) | | | (26,357 | ) | | | 31,183 | | | | 3,965 | | | |
| | |
|
|
| |
|
|
| |
|
|
| |
|
|
| | |
| | | | | |
Institutional Class Shares | | | | | | | | | | | | | | | | | | |
Proceeds from shares issued (b) | | | 2,254,450 | | | | 271,151 | (a) | | | 2,671,571 | | | | 254,404 | (a) | | |
Dividends reinvested | | | — | | | | — | | | | 50,767 | | | | 557 | (a) | | |
Cost of shares redeemed | | | (237,659 | ) | | | (27,375 | )(a) | | | (1,210,150 | ) | | | (32,826 | )(a) | | |
| | |
|
|
| |
|
|
| |
|
|
| |
|
|
| | |
| | | | 2,016,791 | | | | 243,776 | | | | 1,512,188 | | | | 222,135 | | | |
| | |
|
|
| |
|
|
| |
|
|
| |
|
|
| | |
Change in net assets from capital transactions | | $ | 745,111 | | | $ | 275,909 | | | $ | 1,207,083 | | | $ | 2,923,928 | | | |
| | |
|
|
| |
|
|
| |
|
|
| |
|
|
| | |
| (a) | For the period from June 29, 2004 (commencement of operations) through October 31, 2004. |
| (b) | Amount includes redemption fees, if any. |
| (c) | For the period from December 30, 2003 (commencement of operations) through October 31, 2004. |
| | | | | | | | | | | | | | |
| | | Global Technology and Communications | | | Global Utilities |
| | | Year Ended
October 31, 2005 | | | Year Ended
October 31, 2004 | | | Year Ended
October 31, 2005 | | | Year Ended
October 31, 2004 |
SHARE TRANSACTIONS: | | | | | | | | | | | | | | |
Class A Shares | | | | | | | | | | | | | | |
Issued | | 272,111 | | | 667,050 | | | 142,064 | | | 32,008 | | | |
Reinvested | | — | | | — | | | 4,972 | | | 324 | | | |
Redeemed | | (296,153 | ) | | (671,531 | ) | | (63,338 | ) | | (11,504 | ) | | |
| | |
|
| |
|
| |
|
| |
|
| | |
| | | (24,042 | ) | | (4,481 | ) | | 83,698 | | | 20,828 | | | |
| | |
|
| |
|
| |
|
| |
|
| | |
| | | | | |
Class B Shares | | | | | | | | | | | | | | |
Issued | | 29,559 | | | 10,466 | | | 16,910 | | | 6,405 | | | |
Reinvested | | — | | | — | | | 2,707 | | | 48 | | | |
Redeemed | | (51,316 | ) | | (15,646 | ) | | (3,053 | ) | | (109 | ) | | |
| | |
|
| |
|
| |
|
| |
|
| | |
| | | (21,757 | ) | | (5,180 | ) | | 16,564 | | | 6,344 | | | |
| | |
|
| |
|
| |
|
| |
|
| | |
| | | | | |
Class C Shares | | | | | | | | | | | | | | |
Issued | | 2,824 | | | 16,917 | | | 160,808 | | | 307,736 | | | |
Reinvested | | — | | | — | | | 2,561 | | | 143 | | | |
Redeemed | | (16,620 | ) | | (4,276 | ) | | (294,034 | ) | | (52,626 | ) | | |
| | |
|
| |
|
| |
|
| |
|
| | |
| | | (13,796 | ) | | 12,641 | | | (130,665 | ) | | 255,253 | | | |
| | |
|
| |
|
| |
|
| |
|
| | |
| | | | | |
Class R Shares | | | | | | | | | | | | | | |
Issued | | — | | | 270 | (b) | | — | | | 110 | (b) | | |
Reinvested | | — | | | — | | | 4 | | | — | (c) | | |
| | |
|
| |
|
| |
|
| |
|
| | |
| | | — | | | 270 | | | 4 | | | 110 | | | |
| | |
|
| |
|
| |
|
| |
|
| | |
| | | | | |
Institutional Service Class Shares | | | | | | | | | | | | | | |
Issued | | 805,508 | | | 2,042,497 | | | — | | | — | | | |
Reinvested | | — | | | — | | | 3,220 | | | 396 | | | |
Redeemed | | (1,095,352 | ) | | (2,100,008 | ) | | — | | | — | (c) | | |
| | |
|
| |
|
| |
|
| |
|
| | |
| | | (289,844 | ) | | (57,511 | ) | | 3,220 | | | 396 | | | |
| | |
|
| |
|
| |
|
| |
|
| | |
| | | | | |
Institutional Class Shares | | | | | | | | | | | | | | |
Issued | | 617,938 | | | 72,478 | (a) | | 221,182 | | | 25,982 | (a) | | |
Reinvested | | — | | | — | | | 4,176 | | | 55 | (a) | | |
Redeemed | | (64,328 | ) | | (7,801 | )(a) | | (94,769 | ) | | (3,152 | )(a) | | |
| | |
|
| |
|
| |
|
| |
|
| | |
| | | 553,610 | | | 64,677 | | | 130,589 | | | 22,885 | | | |
| | |
|
| |
|
| |
|
| |
|
| | |
Total change in shares | | 204,171 | | | 10,416 | | | 103,410 | | | 305,816 | | | |
| | |
|
| |
|
| |
|
| |
|
| | |
| (a) | For the period from June 29, 2004 (commencement of operations) through October 31, 2004. |
| (b) | For the period from December 30, 2003 (commencement of operations) through October 31, 2004. |
Notes to Financial Statements (Continued)
October 31, 2005
| | | | | | | | | | | | | | | | | | |
| | | Mid Cap Growth Leaders | | | Nationwide Leaders |
| | | Year Ended
October 31, 2005 | | | Year Ended
October 31, 2004 | | | Year Ended
October 31, 2005 | | | Year Ended
October 31, 2004 |
CAPITAL TRANSACTIONS: | | | | | | | | | | | | | | | | | | |
Class A Shares | | | | | | | | | | | | | | | | | | |
Proceeds from shares issued (a) | | $ | 3,195,833 | | | $ | 1,770,984 | | | $ | 5,244,155 | | | $ | 354,697 | | | |
Dividends reinvested | | | — | | | | — | | | | 128,717 | | | | — | | | |
Cost of shares redeemed | | | (3,398,486 | ) | | | (2,551,054 | ) | | | (1,798,800 | ) | | | (378,856 | ) | | |
| | |
|
|
| |
|
|
| |
|
|
| |
|
|
| | |
| | | | (202,653 | ) | | | (780,070 | ) | | | 3,574,072 | | | | (24,159 | ) | | |
| | |
|
|
| |
|
|
| |
|
|
| |
|
|
| | |
| | | | | |
Class B Shares | | | | | | | | | | | | | | | | | | |
Proceeds from shares issued (a) | | | 277,323 | | | | 271,598 | | | | 293,433 | | | | 46,866 | | | |
Dividends reinvested | | | — | | | | — | | | | 26,402 | | | | — | | | |
Cost of shares redeemed | | | (805,028 | ) | | | (619,738 | ) | | | (18,065 | ) | | | (20,483 | ) | | |
| | |
|
|
| |
|
|
| |
|
|
| |
|
|
| | |
| | | | (527,705 | ) | | | (348,140 | ) | | | 301,770 | | | | 26,383 | | | |
| | |
|
|
| |
|
|
| |
|
|
| |
|
|
| | |
| | | | | |
Class C Shares | | | | | | | | | | | | | | | | | | |
Proceeds from shares issued (a) | | | 378,214 | | | | 22,951 | | | | 1,588,219 | | | | 30,791 | | | |
Dividends reinvested | | | — | | | | — | | | | 25,378 | | | | 2 | | | |
Cost of shares redeemed | | | (34,611 | ) | | | (16,234 | ) | | | (63,840 | ) | | | (17,259 | ) | | |
| | |
|
|
| |
|
|
| |
|
|
| |
|
|
| | |
| | | | 343,603 | | | | 6,717 | | | | 1,549,757 | | | | 13,534 | | | |
| | |
|
|
| |
|
|
| |
|
|
| |
|
|
| | |
| | | | | |
Class D Shares | | | | | | | | | | | | | | | | | | |
Proceeds from shares issued (a) | | | 415,661 | | | | 951,537 | | | | — | | | | — | | | |
Cost of shares redeemed | | | (2,066,348 | ) | | | (2,060,020 | ) | | | — | | | | — | | | |
| | |
|
|
| |
|
|
| |
|
|
| |
|
|
| | |
| | | | (1,650,687 | ) | | | (1,108,483 | ) | | | — | | | | — | | | |
| | |
|
|
| |
|
|
| |
|
|
| |
|
|
| | |
| | | | | |
Class R Shares | | | | | | | | | | | | | | | | | | |
Proceeds from shares issued (a) | | | — | | | | 1,000 | (b) | | | 175 | | | | — | | | |
Dividends reinvested | | | — | | | | — | | | | 77 | | | | — | | | |
Cost of shares redeemed | | | — | | | | — | | | | (176 | ) | | | — | | | |
| | |
|
|
| |
|
|
| |
|
|
| |
|
|
| | |
| | | | — | | | | 1,000 | | | | 76 | | | | — | | | |
| | |
|
|
| |
|
|
| |
|
|
| |
|
|
| | |
| | | | | |
Institutional Service Class Shares | | | | | | | | | | | | | | | | | | |
Proceeds from shares issued (a) | | | — | | | | — | | | | 6,113,110 | | | | 3,536,833 | | | |
Dividends reinvested | | | — | | | | — | | | | 201,427 | | | | — | | | |
Cost of shares redeemed | | | — | | | | — | | | | (2,506,086 | ) | | | (2,731,189 | ) | | |
| | |
|
|
| |
|
|
| |
|
|
| |
|
|
| | |
| | | | — | | | | — | | | | 3,808,451 | | | | 805,644 | | | |
| | |
|
|
| |
|
|
| |
|
|
| |
|
|
| | |
| | | | | |
Institutional Class Shares | | | | | | | | | | | | | | | | | | |
Proceeds from shares issued (a) | | | 15,000,488 | | | | 1,000 | (c) | | | — | | | | 1,000 | (d) | | |
Dividends reinvested | | | — | | | | — | | | | 72 | | | | — | | | |
| | |
|
|
| |
|
|
| |
|
|
| |
|
|
| | |
| | | | 15,000,488 | | | | 1,000 | | | | 72 | | | | 1,000 | | | |
| | |
|
|
| |
|
|
| |
|
|
| |
|
|
| | |
Change in net assets from capital transactions | | $ | 12,963,046 | | | $ | (2,227,976 | ) | | $ | 9,234,198 | | | $ | 822,402 | | | |
| | |
|
|
| |
|
|
| |
|
|
| |
|
|
| | |
| (a) | Amount includes redemption fees, if any. |
| (b) | For the period from December 30, 2003 (commencement of operations) through October 31, 2004. |
| (c) | For the period from September 28, 2004 (commencement of operations) through October 31, 2004. |
| (d) | For the period from June 29, 2004 (commencement of operations) through October 31, 2004. |
| | | | | | | | | | | | | | |
| | | Mid Cap Growth Leaders | | | Nationwide Leaders |
| | | Year Ended
October 31, 2005 | | | Year Ended
October 31, 2004 | | | Year Ended
October 31, 2005 | | | Year Ended
October 31, 2004 |
SHARE TRANSACTIONS: | | | | | | | | | | | | | | |
Class A Shares | | | | | | | | | | | | | | |
Issued | | 241,365 | | | 155,883 | | | 392,591 | | | 29,076 | | | |
Reinvested | | — | | | — | | | 9,709 | | | — | | | |
Redeemed | | (260,452 | ) | | (225,143 | ) | | (136,107 | ) | | (32,354 | ) | | |
| | |
|
| |
|
| |
|
| |
|
| | |
| | | (19,087 | ) | | (69,260 | ) | | 266,193 | | | (3,278 | ) | | |
| | |
|
| |
|
| |
|
| |
|
| | |
| | | | | |
Class B Shares | | | | | | | | | | | | | | |
Issued | | 23,005 | | | 25,682 | | | 22,458 | | | 3,985 | | | |
Reinvested | | — | | | — | | | 2,039 | | | — | | | |
Redeemed | | (66,500 | ) | | (58,766 | ) | | (1,347 | ) | | (1,767 | ) | | |
| | |
|
| |
|
| |
|
| |
|
| | |
| | | (43,495 | ) | | (33,084 | ) | | 23,150 | | | 2,218 | | | |
| | |
|
| |
|
| |
|
| |
|
| | |
| | | | | |
Class C Shares | | | | | | | | | | | | | | |
Issued | | 29,245 | | | 2,138 | | | 120,520 | | | 2,566 | | | |
Reinvested | | — | | | — | | | 1,955 | | | — | | | |
Redeemed | | (2,691 | ) | | (1,518 | ) | | (4,999 | ) | | (1,531 | ) | | |
| | |
|
| |
|
| |
|
| |
|
| | |
| | | 26,554 | | | 620 | | | 117,476 | | | 1,035 | | | |
| | |
|
| |
|
| |
|
| |
|
| | |
| | | | | |
Class D Shares | | | | | | | | | | | | | | |
Issued | | 31,286 | | | 81,455 | | | — | | | — | | | |
Redeemed | | (157,226 | ) | | (179,984 | ) | | — | | | — | | | |
| | |
|
| |
|
| |
|
| |
|
| | |
| | | (125,940 | ) | | (98,529 | ) | | — | | | — | | | |
| | |
|
| |
|
| |
|
| |
|
| | |
| | | | | |
Class R Shares | | | | | | | | | | | | | | |
Issued | | — | | | 87 | (a) | | 13 | | | — | | | |
Reinvested | | — | | | — | | | 6 | | | — | | | |
Redeemed | | — | | | — | | | (13 | ) | | — | | | |
| | |
|
| |
|
| |
|
| |
|
| | |
| | | — | | | 87 | | | 6 | | | — | | | |
| | |
|
| |
|
| |
|
| |
|
| | |
| | | | | |
Institutional Service Class Shares | | | | | | | | | | | | | | |
Issued | | — | | | — | | | 460,372 | | | 294,832 | | | |
Reinvested | | — | | | — | | | 15,158 | | | — | | | |
Redeemed | | — | | | — | | | (186,564 | ) | | (227,885 | ) | | |
| | |
|
| |
|
| |
|
| |
|
| | |
| | | — | | | — | | | 288,966 | | | 66,947 | | | |
| | |
|
| |
|
| |
|
| |
|
| | |
| | | | | |
Institutional Class Shares | | | | | | | | | | | | | | |
Issued | | 1,158,301 | | | 89 | (b) | | — | | | 82 | (c) | | |
Reinvested | | — | | | — | | | 5 | | | — | | | |
| | |
|
| |
|
| |
|
| |
|
| | |
| | | 1,158,301 | | | 89 | | | 5 | | | 82 | | | |
| | |
|
| |
|
| |
|
| |
|
| | |
Total change in shares | | 996,333 | | | (200,077 | ) | | 695,796 | | | 67,004 | | | |
| | |
|
| |
|
| |
|
| |
|
| | |
| (a) | For the period from December 30, 2003 (commencement of operations) through October 31, 2004. |
| (b) | For the period from September 28, 2004 (commencement of operations) through October 31, 2004. |
| (c) | For the period from June 29, 2004 (commencement of operations) through October 31, 2004. |
Notes to Financial Statements (Continued)
October 31, 2005
| | | | | | |
| | | Small Cap Leaders |
| | | Period Ended
October 31, 2005 (a) |
CAPITAL TRANSACTIONS: | | | | | | |
Class A Shares | | | | | | |
Proceeds from shares issued (b) | | $ | 5,807,632 | | | |
Cost of shares redeemed | | | (431,184 | ) | | |
| | |
|
|
| | |
| | | | 5,376,448 | | | |
| | |
|
|
| | |
| | |
Class B Shares | | | | | | |
Proceeds from shares issued (b) | | | 902,719 | | | |
Cost of shares redeemed | | | (28 | ) | | |
| | |
|
|
| | |
| | | | 902,691 | | | |
| | |
|
|
| | |
| | |
Class C Shares | | | | | | |
Proceeds from shares issued (b) | | | 5,709,006 | | | |
Dividends reinvested | | | — | | | |
Cost of shares redeemed | | | (133,766 | ) | | |
| | |
|
|
| | |
| | | | 5,575,240 | | | |
| | |
|
|
| | |
| | |
Class R Shares | | | | | | |
Proceeds from shares issued (b) | | | 1,000 | | | |
| | |
|
|
| | |
| | | | 1,000 | | | |
| | |
|
|
| | |
| | |
Institutional Service Class Shares | | | | | | |
Proceeds from shares issued (b) | | | 1,000 | | | |
| | |
|
|
| | |
| | | | 1,000 | | | |
| | |
|
|
| | |
| | |
Institutional Class Shares | | | | | | |
Proceeds from shares issued (b) | | | 4,000,743 | | | |
| | |
|
|
| | |
| | | | 4,000,743 | | | |
| | |
|
|
| | |
Change in net assets from capital transactions | | $ | 15,857,122 | | | |
| | |
|
|
| | |
| (a) | For the period from December 29, 2004 (commencement of operations) through October 31, 2005. |
| (b) | Amount includes redemption fees, if any. |
| | | | | |
| | | Small Cap Leaders |
| | | Period Ended
October 31, 2005 (a) |
SHARE TRANSACTIONS: | | | | | |
Class A Shares | | | | | |
Issued | | 583,595 | | | |
Redeemed | | (43,230 | ) | | |
| | |
|
| | |
| | | 540,365 | | | |
| | |
|
| | |
| | |
Class B Shares | | | | | |
Issued | | 88,601 | | | |
Redeemed | | (3 | ) | | |
| | |
|
| | |
| | | 88,598 | | | |
| | |
|
| | |
| | |
Class C Shares | | | | | |
Issued | | 577,052 | | | |
Redeemed | | (13,415 | ) | | |
| | |
|
| | |
| | | 563,637 | | | |
| | |
|
| | |
| | |
Class R Shares | | | | | |
Issued | | 100 | | | |
| | |
|
| | |
| | | 100 | | | |
| | |
|
| | |
| | |
Institutional Service Class Shares | | | | | |
Issued | | 100 | | | |
| | |
|
| | |
| | | 100 | | | |
| | |
|
| | |
| | |
Institutional Class Shares | | | | | |
Issued | | 400,000 | | | |
| | |
|
| | |
| | | 400,000 | | | |
| | |
|
| | |
Total change in shares | | 1,592,800 | | | |
| | |
|
| | |
| (a) | For the period from December 29, 2004 (commencement of operations) through October 31, 2005. |
Notes to Financial Statements (Continued)
October 31, 2005
| | | | | | | | | | | | | | | | | | |
| | | U.S. Growth Leaders | | | Worldwide Leaders |
| | | Year Ended
October 31, 2005 | | | Year Ended
October 31, 2004 | | | Year Ended
October 31, 2005 | | | Year Ended
October 31, 2004 |
CAPITAL TRANSACTIONS: | | | | | | | | | | | | | | | | | | |
Class A Shares | | | | | | | | | | | | | | | | | | |
Proceeds from shares issued (a) | | $ | 63,048,164 | | | $ | 19,925,366 | | | $ | 2,362,146 | | | $ | 2,010,399 | | | |
Dividends reinvested | | | — | | | | — | | | | 109,050 | | | | — | | | |
Cost of shares redeemed | | | (13,052,247 | ) | | | (7,735,866 | ) | | | (7,302,078 | ) | | | (8,476,526 | ) | | |
| | |
|
|
| |
|
|
| |
|
|
| |
|
|
| | |
| | | | 49,995,917 | | | | 12,189,500 | | | | (4,830,882 | ) | | | (6,466,127 | ) | | |
| | |
|
|
| |
|
|
| |
|
|
| |
|
|
| | |
| | | | | |
Class B Shares | | | | | | | | | | | | | | | | | | |
Proceeds from shares issued (a) | | | 1,612,378 | | | | 900,558 | | | | 196,575 | | | | 29,165 | | | |
Dividends reinvested | | | — | | | | — | | | | 252 | | | | — | | | |
Cost of shares redeemed | | | (399,183 | ) | | | (414,447 | ) | | | (6,965 | ) | | | (10,448 | ) | | |
| | |
|
|
| |
|
|
| |
|
|
| |
|
|
| | |
| | | | 1,213,195 | | | | 486,111 | | | | 189,862 | | | | 18,717 | | | |
| | |
|
|
| |
|
|
| |
|
|
| |
|
|
| | |
| | | | | |
Class C Shares | | | | | | | | | | | | | | | | | | |
Proceeds from shares issued (a) | | | 19,890,657 | | | | 2,914,899 | | | | 672,330 | | | | 5,300 | | | |
Dividends reinvested | | | — | | | | — | | | | 93 | | | | — | | | |
Cost of shares redeemed | | | (2,244,937 | ) | | | (595,773 | ) | | | (60,011 | ) | | | (587 | ) | | |
| | |
|
|
| |
|
|
| |
|
|
| |
|
|
| | |
| | | | 17,645,720 | | | | 2,319,126 | | | | 612,412 | | | | 4,713 | | | |
| | |
|
|
| |
|
|
| |
|
|
| |
|
|
| | |
| | | | | |
Class R Shares | | | | | | | | | | | | | | | | | | |
Proceeds from shares issued (a) | | | 635,099 | | | | — | | | | 175 | | | | — | | | |
Dividends reinvested | | | — | | | | — | | | | 4 | | | | — | | | |
Cost of shares redeemed | | | (1,924 | ) | | | — | | | | (177 | ) | | | — | | | |
| | |
|
|
| |
|
|
| |
|
|
| |
|
|
| | |
| | | | 633,175 | | | | — | | | | 2 | | | | — | | | |
| | |
|
|
| |
|
|
| |
|
|
| |
|
|
| | |
| | | | | |
Institutional Service Class Shares | | | | | | | | | | | | | | | | | | |
Proceeds from shares issued (a) | | | 3,648,636 | | | | 7,443,652 | | | | 3,594,305 | | | | 2,362,333 | | | |
Dividends reinvested | | | — | | | | — | | | | 6,902 | | | | — | | | |
Cost of shares redeemed | | | (3,041,751 | ) | | | (7,128,734 | ) | | | (1,465,199 | ) | | | (2,469,063 | ) | | |
| | |
|
|
| |
|
|
| |
|
|
| |
|
|
| | |
| | | | 606,885 | | | | 314,918 | | | | 2,136,008 | | | | (106,730 | ) | | |
| | |
|
|
| |
|
|
| |
|
|
| |
|
|
| | |
| | | | | |
Institutional Class Shares | | | | | | | | | | | | | | | | | | |
Proceeds from shares issued (a) | | | 1,610,464 | | | | 252,268 | (b) | | | — | | | | 1,000 | (b) | | |
Dividends reinvested | | | — | | | | — | | | | 5 | | | | — | | | |
Cost of shares redeemed | | | (214,343 | ) | | | (18,027 | )(b) | | | — | | | | — | | | |
| | |
|
|
| |
|
|
| |
|
|
| |
|
|
| | |
| | | | 1,396,121 | | | | 234,241 | | | | 5 | | | | 1,000 | | | |
| | |
|
|
| |
|
|
| |
|
|
| |
|
|
| | |
Change in net assets from capital transactions | | $ | 71,491,013 | | | $ | 15,543,896 | | | $ | (1,892,593 | ) | | $ | (6,548,427 | ) | | |
| | |
|
|
| |
|
|
| |
|
|
| |
|
|
| | |
| (a) | Amount includes redemption fees, if any. |
| (b) | For the period from June 29, 2004 (commencement of operations) through October 31, 2004. |
| | | | | | | | | | | | | | |
| | | U.S. Growth Leaders | | | Worldwide Leaders |
| | | Year Ended
October 31, 2005 | | | Year Ended
October 31, 2004 | | | Year Ended
October 31, 2005 | | | Year Ended
October 31, 2004 |
SHARE TRANSACTIONS: | | | | | | | | | | | | | | |
Class A Shares | | | | | | | | | | | | | | |
Issued | | 6,578,117 | | | 2,389,900 | | | 273,057 | | | 277,674 | | | |
Reinvested | | — | | | — | | | 13,170 | | | — | | | |
Redeemed | | (1,373,410 | ) | | (944,347 | ) | | (868,127 | ) | | (1,170,017 | ) | | |
| | |
|
| |
|
| |
|
| |
|
| | |
| | | 5,204,707 | | | 1,445,553 | | | (581,900 | ) | | (892,343 | ) | | |
| | |
|
| |
|
| |
|
| |
|
| | |
| | | | | |
Class B Shares | | | | | | | | | | | | | | |
Issued | | 174,768 | | | 112,068 | | | 22,463 | | | 4,158 | | | |
Reinvested | | — | | | — | | | 31 | | | — | | | |
Redeemed | | (43,686 | ) | | (51,717 | ) | | (826 | ) | | (1,433 | ) | | |
| | |
|
| |
|
| |
|
| |
|
| | |
| | | 131,082 | | | 60,351 | | | 21,668 | | | 2,725 | | | |
| | |
|
| |
|
| |
|
| |
|
| | |
| | | | | |
Class C Shares | | | | | | | | | | | | | | |
Issued | | 2,118,509 | | | 357,925 | | | 78,996 | | | 727 | | | |
Reinvested | | — | | | — | | | 11 | | | — | | | |
Redeemed | | (241,558 | ) | | (74,068 | ) | | (7,093 | ) | | (80 | ) | | |
| | |
|
| |
|
| |
|
| |
|
| | |
| | | 1,876,951 | | | 283,857 | | | 71,914 | | | 647 | | | |
| | |
|
| |
|
| |
|
| |
|
| | |
| | | | | |
Class R Shares | | | | | | | | | | | | | | |
Issued | | 65,689 | | | — | | | 22 | | | — | | | |
Reinvested | | — | | | — | | | 1 | | | — | | | |
Redeemed | | (201 | ) | | — | | | (22 | ) | | — | | | |
| | |
|
| |
|
| |
|
| |
|
| | |
| | | 65,488 | | | — | | | 1 | | | — | | | |
| | |
|
| |
|
| |
|
| |
|
| | |
| | | | | |
Institutional Service Class Shares | | | | | | | | | | | | | | |
Issued | | 379,893 | | | 878,553 | | | 406,743 | | | 324,332 | | | |
Reinvested | | — | | | — | | | 825 | | | — | | | |
Redeemed | | (322,362 | ) | | (852,335 | ) | | (172,868 | ) | | (341,204 | ) | | |
| | |
|
| |
|
| |
|
| |
|
| | |
| | | 57,531 | | | 26,218 | | | 234,700 | | | (16,872 | ) | | |
| | |
|
| |
|
| |
|
| |
|
| | |
| | | | | |
Institutional Class Shares | | | | | | | | | | | | | | |
Issued | | 166,071 | | | 29,370 | (b) | | — | | | 138 | (a) | | |
Reinvested | | — | | | — | | | 1 | | | — | | | |
Redeemed | | (21,381 | ) | | (2,170 | )(b) | | — | | | — | | | |
| | |
|
| |
|
| |
|
| |
|
| | |
| | | 144,690 | | | 27,200 | | | 1 | | | 138 | | | |
| | |
|
| |
|
| |
|
| |
|
| | |
Total change in shares | | 7,480,449 | | | 1,843,179 | | | (253,616 | ) | | (905,705 | ) | | |
| | |
|
| |
|
| |
|
| |
|
| | |
| (a) | For the period from June 29, 2004 (commencement of operations) through October 31, 2004. |
Notes to Financial Statements (Continued)
October 31, 2005
| | | | | | | | | | | | | | | | | |
| | | China Opportunities | | Emerging Markets |
| | | Year Ended
October 31, 2005 | | | Period Ended
October 31, 2004 (a) | | Year Ended
October 31, 2005 | | | Year Ended
October 31, 2004 |
CAPITAL TRANSACTIONS: | | | | | | | | | | | | | | | | | |
Class A Shares | | | | | | | | | | | | | | | | | |
Proceeds from shares issued (b) | | $ | 2,394,876 | | | $ | 972,446 | | $ | 15,138,571 | | | $ | 21,100,437 | | | |
Dividends reinvested | | | 46,813 | | | | 1,204 | | | 821,320 | | | | 40,819 | | | |
Cost of shares redeemed | | | (517,891 | ) | | | — | | | (10,965,121 | ) | | | (17,474,697 | ) | | |
| | |
|
|
| |
|
| |
|
|
| |
|
|
| | |
| | | | 1,923,798 | | | | 973,650 | | | 4,994,770 | | | | 3,666,559 | | | |
| | |
|
|
| |
|
| |
|
|
| |
|
|
| | |
| | | | | |
Class B Shares | | | | | | | | | | | | | | | | | |
Proceeds from shares issued (b) | | | 356,379 | | | | 18,290 | | | 480,941 | | | | 612,196 | | | |
Dividends reinvested | | | 3,448 | | | | 5 | | | 179,085 | | | | 3,397 | | | |
Cost of shares redeemed | | | (46,127 | ) | | | — | | | (153,766 | ) | | | (52,390 | ) | | |
| | |
|
|
| |
|
| |
|
|
| |
|
|
| | |
| | | | 313,700 | | | | 18,295 | | | 506,260 | | | | 563,203 | | | |
| | |
|
|
| |
|
| |
|
|
| |
|
|
| | |
| | | | | |
Class C Shares | | | | | | | | | | | | | | | | | |
Proceeds from shares issued (b) | | | 1,477,604 | | | | 37,312 | | | 2,053,869 | | | | 3,051,586 | | | |
Dividends reinvested | | | 11,784 | | | | — | | | 52,700 | | | | 923 | | | |
Cost of shares redeemed | | | (189,410 | ) | | | — | | | (582,201 | ) | | | (2,188,175 | ) | | |
| | |
|
|
| |
|
| |
|
|
| |
|
|
| | |
| | | | 1,299,978 | | | | 37,312 | | | 1,524,368 | | | | 864,334 | | | |
| | |
|
|
| |
|
| |
|
|
| |
|
|
| | |
| | | | | |
Class R Shares | | | | | | | | | | | | | | | | | |
Proceeds from shares issued (b) | | | 245 | | | | 1,000 | | | 7,959 | | | | 1,003 | (c) | | |
Dividends reinvested | | | 40 | | | | 1 | | | 80 | | | | 3 | (c) | | |
Cost of shares redeemed | | | (235 | ) | | | — | | | — | | | | — | | | |
| | |
|
|
| |
|
| |
|
|
| |
|
|
| | |
| | | | 50 | | | | 1,001 | | | 8,039 | | | | 1,006 | | | |
| | |
|
|
| |
|
| |
|
|
| |
|
|
| | |
| | | | | |
Institutional Service Class Shares | | | | | | | | | | | | | | | | | |
Proceeds from shares issued (b) | | | — | | | | 1,000 | | | 3,589,734 | | | | 1,717,456 | | | |
Dividends reinvested | | | 43 | | | | 2 | | | 308,864 | | | | 16,749 | | | |
Cost of shares redeemed | | | — | | | | — | | | (116,941 | ) | | | (9,154 | ) | | |
| | |
|
|
| |
|
| |
|
|
| |
|
|
| | |
| | | | 43 | | | | 1,002 | | | 3,781,657 | | | | 1,725,051 | | | |
| | |
|
|
| |
|
| |
|
|
| |
|
|
| | |
| | | | | |
Institutional Class Shares | | | | | | | | | | | | | | | | | |
Proceeds from shares issued (b) | | | 1,972 | | | | 4,999,850 | | | 2,730,614 | | | | 240,552 | (a) | | |
Dividends reinvested | | | 219,153 | | | | 11,472 | | | 71,261 | | | | 831 | (a) | | |
Cost of shares redeemed | | | (894 | ) | | | — | | | (757,787 | ) | | | (27,560 | )(a) | | |
| | |
|
|
| |
|
| |
|
|
| |
|
|
| | |
| | | | 220,231 | | | | 5,011,322 | | | 2,044,088 | | | | 213,823 | | | |
| | |
|
|
| |
|
| |
|
|
| |
|
|
| | |
Change in net assets from capital transactions | | $ | 3,757,800 | | | $ | 6,042,582 | | $ | 12,859,182 | | | $ | 7,033,976 | | | |
| | |
|
|
| |
|
| |
|
|
| |
|
|
| | |
| (a) | For the period from June 29, 2004 (commencement of operations) through October 31, 2004. |
| (b) | Amount includes redemption fees, if any. |
| (c) | For the period from December 30, 2003 (commencement of operations) through October 31, 2004. |
| | | | | | | | | | | | | | |
| | | China Opportunities | | | Emerging Markets |
| | | Year Ended
October 31, 2005 | | | Period Ended
October 31, 2004 (a) | | | Year Ended
October 31, 2005 | | | Year Ended
October 31, 2004 |
SHARE TRANSACTIONS: | | | | | | | | | | | | | | |
Class A Shares | | | | | | | | | | | | | | |
Issued | | 200,989 | | | 91,381 | | | 1,101,653 | | | 1,761,117 | | | |
Reinvested | | 3,943 | | | 112 | | | 64,514 | | | 3,445 | | | |
Redeemed | | (43,439 | ) | | — | | | (822,792 | ) | | (1,492,739 | ) | | |
| | |
|
| |
|
| |
|
| |
|
| | |
| | | 161,493 | | | 91,493 | | | 343,375 | | | 271,823 | | | |
| | |
|
| |
|
| |
|
| |
|
| | |
| | | | | |
Class B Shares | | | | | | | | | | | | | | |
Issued | | 30,068 | | | 1,700 | | | 35,794 | | | 51,884 | | | |
Reinvested | | 291 | | | — | (c) | | 14,516 | | | 289 | | | |
Redeemed | | (3,913 | ) | | — | | | (11,697 | ) | | (4,650 | ) | | |
| | |
|
| |
|
| |
|
| |
|
| | |
| | | 26,446 | | | 1,700 | | | 38,613 | | | 47,523 | | | |
| | |
|
| |
|
| |
|
| |
|
| | |
| | | | | |
Class C Shares | | | | | | | | | | | | | | |
Issued | | 124,492 | | | 3,395 | | | 150,512 | | | 251,795 | | | |
Reinvested | | 994 | | | — | | | 4,211 | | | 78 | | | |
Redeemed | | (16,502 | ) | | — | | | (44,446 | ) | | (202,776 | ) | | |
| | |
|
| |
|
| |
|
| |
|
| | |
| | | 108,984 | | | 3,395 | | | 110,277 | | | 49,097 | | | |
| | |
|
| |
|
| |
|
| |
|
| | |
| | | | | |
Class R Shares | | | | | | | | | | | | | | |
Issued | | 21 | | | 100 | | | 542 | | | 89 | (b) | | |
Reinvested | | 3 | | | — | (c) | | 7 | | | — | (c) | | |
Redeemed | | (20 | ) | | — | | | — | | | — | | | |
| | |
|
| |
|
| |
|
| |
|
| | |
| | | 4 | | | 100 | | | 549 | | | 89 | | | |
| | |
|
| |
|
| |
|
| |
|
| | |
| | | | | |
Institutional Service Class Shares | | | | | | | | | | | | | | |
Issued | | — | | | 100 | | | 275,886 | | | 132,149 | | | |
Reinvested | | 4 | | | — | (c) | | 23,727 | | | 1,399 | | | |
Redeemed | | — | | | — | | | (8,771 | ) | | — | | | |
| | |
|
| |
|
| |
|
| |
|
| | |
| | | 4 | | | 100 | | | 290,842 | | | 133,548 | | | |
| | |
|
| |
|
| |
|
| |
|
| | |
| | | | | |
Institutional Class Shares | | | | | | | | | | | | | | |
Issued | | — | | | 500,000 | | | 200,450 | | | 21,217 | (a) | | |
Reinvested | | 18,432 | | | 1,062 | | | 5,453 | | | 68 | (a) | | |
Redeemed | | — | | | — | | | (51,111 | ) | | (2,294 | )(a) | | |
| | |
|
| |
|
| |
|
| |
|
| | |
| | | 18,432 | | | 501,062 | | | 154,792 | | | 18,991 | | | |
| | |
|
| |
|
| |
|
| |
|
| | |
Total change in shares | | 315,363 | | | 597,850 | | | 938,448 | | | 521,071 | | | |
| | |
|
| |
|
| |
|
| |
|
| | |
| (a) | For the period from June 29, 2004 (commencement of operations) through October 31, 2004. |
| (b) | For the period from December 30, 2003 (commencement of operations) through October 31, 2004. |
| (c) | Amount less than 1 share. |
Notes to Financial Statements (Continued)
October 31, 2005
| | | | | | | | | | |
| | | International Growth |
| | | Year Ended
October 31, 2005 | | | Year Ended
October 31, 2004 |
CAPITAL TRANSACTIONS: | | | | | | | | | | |
Class A Shares | | | | | | | | | | |
Proceeds from shares issued (b) | | $ | 4,744,441 | | | $ | 1,251,219 | | | |
Dividends reinvested | | | 29,882 | | | | — | | | |
Cost of shares redeemed | | | (713,183 | ) | | | (1,047,248 | ) | | |
| | |
|
|
| |
|
|
| | |
| | | | 4,061,140 | | | | 203,971 | | | |
| | |
|
|
| |
|
|
| | |
| | | |
Class B Shares | | | | | | | | | | |
Proceeds from shares issued (b) | | | 100,394 | | | | 65,727 | | | |
Dividends reinvested | | | 19,435 | | | | — | | | |
Cost of shares redeemed | | | (22,369 | ) | | | (11,557 | ) | | |
| | |
|
|
| |
|
|
| | |
| | | | 97,460 | | | | 54,170 | | | |
| | |
|
|
| |
|
|
| | |
| | | |
Class C Shares | | | | | | | | | | |
Proceeds from shares issued (b) | | | 178,420 | | | | 94,470 | | | |
Dividends reinvested | | | 204 | | | | — | | | |
Cost of shares redeemed | | | (46,799 | ) | | | (5,063 | ) | | |
| | |
|
|
| |
|
|
| | |
| | | | 131,825 | | | | 89,407 | | | |
| | |
|
|
| |
|
|
| | |
| | | |
Class R Shares | | | | | | | | | | |
Proceeds from shares issued (b) | | | — | | | | 1,001 | (c) | | |
Dividends reinvested | | | 11 | | | | — | | | |
| | |
|
|
| |
|
|
| | |
| | | | 11 | | | | 1,001 | | | |
| | |
|
|
| |
|
|
| | |
| | | |
Institutional Service Class Shares | | | | | | | | | | |
Proceeds from shares issued (b) | | | 235 | | | | 13,535 | | | |
Dividends reinvested | | | 32,201 | | | | — | | | |
Cost of shares redeemed | | | (13 | ) | | | — | | | |
| | |
|
|
| |
|
|
| | |
| | | | 32,423 | | | | 13,535 | | | |
| | |
|
|
| |
|
|
| | |
| | | |
Institutional Class Shares | | | | | | | | | | |
Proceeds from shares issued (b) | | | 1,460,894 | | | | 199,054 | (a) | | |
Dividends reinvested | | | 6,631 | | | | — | | | |
Cost of shares redeemed | | | (446,718 | ) | | | (19,173 | )(a) | | |
| | |
|
|
| |
|
|
| | |
| | | | 1,020,807 | | | | 179,881 | | | |
| | |
|
|
| |
|
|
| | |
Change in net assets from capital transactions | | $ | 5,343,666 | | | $ | 541,965 | | | |
| | |
|
|
| |
|
|
| | |
| (a) | For the period from June 29, 2004 (commencement of operations) through October 31, 2004. |
| (b) | Amount includes redemption fees, if any. |
| (c) | For the period from December 30, 2003 (commencement of operations) through October 31, 2004. |
| | | | | | | | |
| | | International Growth |
| | | Year Ended
October 31, 2005 | | | Year Ended
October 31, 2004 |
SHARE TRANSACTIONS: | | | | | | | | |
Class A Shares | | | | | | | | |
Issued | | 506,034 | | | 165,100 | | | |
Reinvested | | 3,473 | | | — | | | |
Redeemed | | (83,344 | ) | | (138,962 | ) | | |
| | |
|
| |
|
| | |
| | | 426,163 | | | 26,138 | | | |
| | |
|
| |
|
| | |
| | | |
Class B Shares | | | | | | | | |
Issued | | 12,012 | | | 7,114 | | | |
Reinvested | | 2,333 | | | — | | | |
Redeemed | | (2,680 | ) | | (1,521 | ) | | |
| | |
|
| |
|
| | |
| | | 11,665 | | | 5,593 | | | |
| | |
|
| |
|
| | |
| | | |
Class C Shares | | | | | | | | |
Issued | | 19,844 | | | 13,049 | | | |
Reinvested | | 24 | | | — | | | |
Redeemed | | (5,614 | ) | | (692 | ) | | |
| | |
|
| |
|
| | |
| | | 14,254 | | | 12,357 | | | |
| | |
|
| |
|
| | |
| | | |
Class R Shares | | | | | | | | |
Issued | | — | | | 138 | (b) | | |
Reinvested | | 1 | | | — | | | |
| | |
|
| |
|
| | |
| | | 1 | | | 138 | | | |
| | |
|
| |
|
| | |
| | | |
Institutional Service Class Shares | | | | | | | | |
Issued | | — | | | — | | | |
Reinvested | | 3,702 | | | — | | | |
Redeemed | | — | | | — | | | |
| | |
|
| |
|
| | |
| | | 3,702 | | | — | | | |
| | |
|
| |
|
| | |
| | | |
Institutional Class Shares | | | | | | | | |
Issued | | 159,844 | | | 26,463 | (a) | | |
Reinvested | | 759 | | | — | | | |
Redeemed | | (44,689 | ) | | (2,480 | )(a) | | |
| | |
|
| |
|
| | |
| | | 115,914 | | | 23,983 | | | |
| | |
|
| |
|
| | |
Total change in shares | | 571,699 | | | 68,209 | | | |
| | |
|
| |
|
| | |
| (a) | For the period from June 29, 2004 (commencement of operations) through October 31, 2004. |
| (b) | For the period from December 30, 2003 (commencement of operations) through October 31, 2004. |
Notes to Financial Statements (Continued)
October 31, 2005
| | | | | | | | | | | | | | | | | | |
| | | Convertible | | | High Yield Bond |
| | | Year Ended October 31, 2005 | | | Period Ended
October 31, 2004 | | | Year Ended October 31, 2005 | | | Year Ended
October 31, 2004 |
CAPITAL TRANSACTIONS: | | | | | | | | | | | | | | | | | | |
Class A Shares | | | | | | | | | | | | | | | | | | |
Proceeds from shares issued (a) | | $ | 570,170 | | | $ | 3,480,288 | (e) | | $ | 3,267,190 | | | $ | 14,289,113 | | | |
Dividends reinvested | | | 35,855 | | | | 21,236 | (e) | | | 210,984 | | | | 263,908 | | | |
Cost of shares redeemed | | | (1,631,799 | ) | | | (480,135 | )(e) | | | (4,648,334 | ) | | | (14,716,542 | ) | | |
| | |
|
|
| |
|
|
| |
|
|
| |
|
|
| | |
| | | | (1,025,774 | ) | | | 3,021,389 | | | | (1,170,160 | ) | | | (163,521 | ) | | |
| | |
|
|
| |
|
|
| |
|
|
| |
|
|
| | |
| | | | | |
Class B Shares | | | | | | | | | | | | | | | | | | |
Proceeds from shares issued (a) | | | 54,639 | | | | 214,625 | (e) | | | 148,663 | | | | 133,684 | | | |
Dividends reinvested | | | 442 | | | | 85 | (e) | | | 14,767 | | | | 15,008 | | | |
Cost of shares redeemed | | | (18,316 | ) | | | (3,911 | )(e) | | | (99,377 | ) | | | (203,299 | ) | | |
| | |
|
|
| |
|
|
| |
|
|
| |
|
|
| | |
| | | | 36,765 | | | | 210,799 | | | | 64,053 | | | | (54,607 | ) | | |
| | |
|
|
| |
|
|
| |
|
|
| |
|
|
| | |
| | | | | |
Class C Shares | | | | | | | | | | | | | | | | | | |
Proceeds from shares issued (a) | | | 1,061,175 | | | | 3,337,486 | (e) | | | 293,017 | | | | 752,245 | | | |
Dividends reinvested | | | 10,738 | | | | 2,057 | (e) | | | 4,614 | | | | 15,729 | | | |
Cost of shares redeemed | | | (935,939 | ) | | | (86,362 | )(e) | | | (746,139 | ) | | | (1,962,402 | ) | | |
| | |
|
|
| |
|
|
| |
|
|
| |
|
|
| | |
| | | | 135,974 | | | | 3,253,181 | | | | (448,508 | ) | | | (1,194,428 | ) | | |
| | |
|
|
| |
|
|
| |
|
|
| |
|
|
| | |
| | | | | |
Class R Shares | | | | | | | | | | | | | | | | | | |
Proceeds from shares issued (a) | | | — | | | | 1,000 | (f) | | | — | | | | 1,000 | (b) | | |
Dividends reinvested | | | 26 | | | | 9 | (f) | | | 83 | | | | 40 | (b) | | |
| | |
|
|
| |
|
|
| |
|
|
| |
|
|
| | |
| | | | 26 | | | | 1,009 | | | | 83 | | | | 1,040 | | | |
| | |
|
|
| |
|
|
| |
|
|
| |
|
|
| | |
| | | | | |
Institutional Service Class Shares | | | | | | | | | | | | | | | | | | |
Proceeds from shares issued (a) | | | — | | | | 316,000 | (e) | | | 2,115,222 | | | | 17,216,382 | | | |
Dividends reinvested | | | 2,160 | | | | 1,161 | (e) | | | 1,443,956 | | | | 6,331,095 | | | |
Cost of shares redeemed | | | (1,029 | ) | | | — | | | | (2,210,266 | ) | | | (110,840,689 | ) | | |
| | |
|
|
| |
|
|
| |
|
|
| |
|
|
| | |
| | | | 1,131 | | | | 317,161 | | | | 1,348,912 | | | | (87,293,212 | ) | | |
| | |
|
|
| |
|
|
| |
|
|
| |
|
|
| | |
| | | | | |
Institutional Class Shares | | | | | | | | | | | | | | | | | | |
Proceeds from shares issued (a) | | | 25,460,897 | | | | 30,065,920 | (d) | | | 1,030,831 | | | | 1,000 | (c) | | |
Dividends reinvested | | | 802,004 | | | | 290,722 | (d) | | | 5,738 | | | | 20 | (c) | | |
Cost of shares redeemed | | | (13,743,449 | ) | | | (1,581,378 | )(d) | | | (2,203 | ) | | | — | | | |
| | |
|
|
| |
|
|
| |
|
|
| |
|
|
| | |
| | | | 12,519,452 | | | | 28,775,264 | | | | 1,034,366 | | | | 1,020 | | | |
| | |
|
|
| |
|
|
| |
|
|
| |
|
|
| | |
Change in net assets from capital transactions | | $ | 11,667,574 | | | $ | 35,578,803 | | | $ | 828,746 | | | $ | (88,703,708 | ) | | |
| | |
|
|
| |
|
|
| |
|
|
| |
|
|
| | |
| (a) | Amount includes redemption fees, if any. |
| (b) | For the period from February 27, 2004 (commencement of operations) through October 31, 2004. |
| (c) | For the period from June 29, 2004 (commencement of operations) through October 31, 2004. |
| (d) | For the period from December 29, 2003 (commencement of operations) through October 31, 2004. |
| (e) | For the period from January 20, 2004 (commencement of operations) through October 31, 2004. |
| (f) | For the period from May 14, 2004 (commencement of operations) through October 31, 2004. |
| | | | | | | | | | | | | | |
| | | Convertible | | | High Yield Bond |
| | | Year Ended October 31, 2005 | | | Period Ended
October 31, 2004 | | | Year Ended October 31, 2005 | | | Year Ended
October 31, 2004 |
SHARE TRANSACTIONS: | | | | | | | | | | | | | | |
Class A Shares | | | | | | | | | | | | | | |
Issued | | 56,439 | | | 352,634 | (d) | | 460,085 | | | 2,042,569 | | | |
Reinvested | | 3,556 | | | 2,159 | (d) | | 30,036 | | | 37,914 | | | |
Redeemed | | (163,536 | ) | | (49,380 | )(d) | | (660,047 | ) | | (2,097,436 | ) | | |
| | |
|
| |
|
| |
|
| |
|
| | |
| | | (103,541 | ) | | 305,413 | | | (169,926 | ) | | (16,953 | ) | | |
| | |
|
| |
|
| |
|
| |
|
| | |
| | | | | |
Class B Shares | | | | | | | | �� | | | | | | |
Issued | | 5,341 | | | 21,990 | (d) | | 21,233 | | | 19,331 | | | |
Reinvested | | 44 | | | 9 | (d) | | 2,111 | | | 2,163 | | | |
Redeemed | | (1,858 | ) | | (402 | )(d) | | (14,156 | ) | | (28,884 | ) | | |
| | |
|
| |
|
| |
|
| |
|
| | |
| | | 3,527 | | | 21,597 | | | 9,188 | | | (7,390 | ) | | |
| | |
|
| |
|
| |
|
| |
|
| | |
| | | | | |
Class C Shares | | | | | | | | | | | | | | |
Issued | | 105,490 | | | 342,677 | (d) | | 41,604 | | | 107,259 | | | |
Reinvested | | 1,072 | | | 210 | (d) | | 653 | | | 2,263 | | | |
Redeemed | | (93,400 | ) | | (8,840 | )(d) | | (106,010 | ) | | (284,276 | ) | | |
| | |
|
| |
|
| |
|
| |
|
| | |
| | | 13,162 | | | 334,047 | | | (63,753 | ) | | (174,754 | ) | | |
| | |
|
| |
|
| |
|
| |
|
| | |
| | | | | |
Class R Shares | | | | | | | | | | | | | | |
Issued | | — | | | 104 | (e) | | — | | | 143 | (a) | | |
Reinvested | | 3 | | | 1 | (e) | | 12 | | | 6 | (a) | | |
| | |
|
| |
|
| |
|
| |
|
| | |
| | | 3 | | | 105 | | | 12 | | | 149 | | | |
| | |
|
| |
|
| |
|
| |
|
| | |
| | | | | |
Institutional Service Class Shares | | | | | | | | | | | | | | |
Issued | | — | | | 31,738 | (d) | | 297,732 | | | 2,439,580 | | | |
Reinvested | | 214 | | | 118 | (d) | | 204,404 | | | 902,593 | | | |
Redeemed | | (101 | ) | | — | | | (310,653 | ) | | (16,159,153 | ) | | |
| | |
|
| |
|
| |
|
| |
|
| | |
| | | 113 | | | 31,856 | | | 191,483 | | | (12,816,980 | ) | | |
| | |
|
| |
|
| |
|
| |
|
| | |
| | | | | |
Institutional Class Shares | | | | | | | | | | | | | | |
Issued | | 2,517,308 | | | 3,026,263 | (c) | | 148,699 | | | 145 | (b) | | |
Reinvested | | 79,705 | | | 29,579 | (c) | | 843 | | | 3 | (b) | | |
Redeemed | | (1,380,621 | ) | | (161,290 | )(c) | | (319 | ) | | — | | | |
| | |
|
| |
|
| |
|
| |
|
| | |
| | | 1,216,392 | | | 2,894,552 | | | 149,223 | | | 148 | | | |
| | |
|
| |
|
| |
|
| |
|
| | |
Total change in shares | | 1,129,656 | | | 3,587,570 | | | 116,227 | | | (13,015,780 | ) | | |
| | |
|
| |
|
| |
|
| |
|
| | |
| (a) | For the period from February 27, 2004 (commencement of operations) through October 31, 2004. |
| (b) | For the period from June 29, 2004 (commencement of operations) through October 31, 2004. |
| (c) | For the period from December 29, 2003 (commencement of operations) through October 31, 2004. |
| (d) | For the period from January 20, 2004 (commencement of operations) through October 31, 2004. |
| (e) | For the period from May 14, 2004 (commencement of operations) through October 31, 2004. |
Notes to Financial Statements (Continued)
October 31, 2005
| | | | | | | | | | |
| | | Micro Cap Equity |
| | | Year Ended
October 31, 2005 | | | Year Ended
October 31, 2004 |
CAPITAL TRANSACTIONS: | | | | | | | | | | |
Class A Shares | | | | | | | | | | |
Proceeds from shares issued (a) | | $ | 29,351,797 | | | $ | 87,603,317 | | | |
Dividends reinvested | | | 903,175 | | | | 4,741 | | | |
Cost of shares redeemed | | | (44,080,513 | ) | | | (34,687,906 | ) | | |
| | |
|
|
| |
|
|
| | |
| | | | (13,825,541 | ) | | | 52,920,152 | | | |
| | |
|
|
| |
|
|
| | |
| | | |
Class B Shares | | | | | | | | | | |
Proceeds from shares issued (a) | | | 2,228,445 | | | | 5,089,914 | | | |
Dividends reinvested | | | 66,705 | | | | 354 | | | |
Cost of shares redeemed | | | (1,565,577 | ) | | | (901,253 | ) | | |
| | |
|
|
| |
|
|
| | |
| | | | 729,573 | | | | 4,189,015 | | | |
| | |
|
|
| |
|
|
| | |
| | | |
Class C Shares | | | | | | | | | | |
Proceeds from shares issued (a) | | | 17,384,877 | | | | 27,633,405 | | | |
Dividends reinvested | | | 231,756 | | | | 994 | | | |
Cost of shares redeemed | | | (12,515,777 | ) | | | (5,120,062 | ) | | |
| | |
|
|
| |
|
|
| | |
| | | | 5,100,856 | | | | 22,514,337 | | | |
| | |
|
|
| |
|
|
| | |
| | | |
Class R Shares | | | | | | | | | | |
Proceeds from shares issued (a) | | | 2 | | | | 1,001 | (b) | | |
Dividends reinvested | | | 23 | | | | — | | | |
| | |
|
|
| |
|
|
| | |
| | | | 25 | | | | 1,001 | | | |
| | |
|
|
| |
|
|
| | |
| | | |
Institutional Service Class Shares | | | | | | | | | | |
Proceeds from shares issued (a) | | | 171,187 | | | | 50,384 | | | |
Dividends reinvested | | | 2,437 | | | | 7 | | | |
Cost of shares redeemed | | | (4,201 | ) | | | (97,410 | ) | | |
| | |
|
|
| |
|
|
| | |
| | | | 169,423 | | | | (47,019 | ) | | |
| | |
|
|
| |
|
|
| | |
| | | |
Institutional Class Shares | | | | | | | | | | |
Proceeds from shares issued (a) | | | 10,111,244 | | | | 3,377,757 | | | |
Dividends reinvested | | | 59,761 | | | | 506 | | | |
Cost of shares redeemed | | | (5,767,542 | ) | | | (3,561,854 | ) | | |
| | |
|
|
| |
|
|
| | |
| | | | 4,403,463 | | | | (183,591 | ) | | |
| | |
|
|
| |
|
|
| | |
Change in net assets from capital transactions | | $ | (3,422,201 | ) | | $ | 79,393,895 | | | |
| | |
|
|
| |
|
|
| | |
| (a) | Amount includes redemption fees, if any. |
| (b) | For the period from December 30, 2003 (commencement of operations) through October 31, 2004. |
| | | | | | | | |
| | | Micro Cap Equity |
| | | Year Ended
October 31, 2005 | | | Year Ended
October 31, 2004 |
SHARE TRANSACTIONS: | | | | | | | | |
Class A Shares | | | | | | | | |
Issued | | 1,367,124 | | | 4,677,213 | | | |
Reinvested | | 40,070 | | | 251 | | | |
Redeemed | | (2,056,075 | ) | | (1,914,311 | ) | | |
| | |
|
| |
|
| | |
| | | (648,881 | ) | | 2,763,153 | | | |
| | |
|
| |
|
| | |
| | | |
Class B Shares | | | | | | | | |
Issued | | 105,329 | | | 280,168 | | | |
Reinvested | | 3,017 | | | 19 | | | |
Redeemed | | (76,253 | ) | | (49,310 | ) | | |
| | |
|
| |
|
| | |
| | | 32,093 | | | 230,877 | | | |
| | |
|
| |
|
| | |
| | | |
Class C Shares | | | | | | | | |
Issued | | 829,503 | | | 1,513,352 | | | |
Reinvested | | 10,472 | | | 54 | | | |
Redeemed | | (606,456 | ) | | (290,066 | ) | | |
| | |
|
| |
|
| | |
| | | 233,519 | | | 1,223,340 | | | |
| | |
|
| |
|
| | |
| | | |
Class R Shares | | | | | | | | |
Issued | | — | | | 58 | (a) | | |
Reinvested | | 1 | | | — | | | |
| | |
|
| |
|
| | |
| | | 1 | | | 58 | | | |
| | |
|
| |
|
| | |
| | | |
Institutional Service Class Shares | | | | | | | | |
Issued | | 7,895 | | | 2,528 | | | |
Reinvested | | 107 | | | — | | | |
Redeemed | | (194 | ) | | (4,949 | ) | | |
| | |
|
| |
|
| | |
| | | 7,808 | | | (2,421 | ) | | |
| | |
|
| |
|
| | |
| | | |
Institutional Class Shares | | | | | | | | |
Issued | | 464,797 | | | 178,566 | | | |
Reinvested | | 2,636 | | | 27 | | | |
Redeemed | | (270,264 | ) | | (180,985 | ) | | |
| | |
|
| |
|
| | |
| | | 197,169 | | | (2,392 | ) | | |
| | |
|
| |
|
| | |
Total change in shares | | (178,291 | ) | | 4,212,615 | | | |
| | |
|
| |
|
| | |
| (a) | For the period from December 30, 2003 (commencement of operations) through October 31, 2004. |
Notes to Financial Statements (Continued)
October 31, 2005
| | | | | | | | | | | | | | | | | | |
| | | Small Cap Growth | | | U.S. Growth Leaders Long-Short |
| | | Year Ended
October 31, 2005 | | | Period Ended
October 31, 2004 (c) | | | Year Ended
October 31, 2005 | | | Year Ended
October 31, 2004 |
CAPITAL TRANSACTIONS: | | | | | | | | | | | | | | | | | | |
Class A Shares | | | | | | | | | | | | | | | | | | |
Proceeds from shares issued (d) | | $ | 151,880 | | | $ | 13,629 | | | $ | 19,462,563 | | | $ | 4,499,603 | | | |
Dividends reinvested | | | — | | | | — | | | | 553,213 | | | | 5,979,998 | | | |
Cost of shares redeemed | | | (11,542 | ) | | | — | | | | (11,669,614 | ) | | | (10,248,730 | ) | | |
| | |
|
|
| |
|
|
| |
|
|
| |
|
|
| | |
| | | | 140,338 | | | | 13,629 | | | | 8,346,162 | | | | 230,871 | | | |
| | |
|
|
| |
|
|
| |
|
|
| |
|
|
| | |
| | | | | |
Class B Shares | | | | | | | | | | | | | | | | | | |
Proceeds from shares issued (d) | | | 2,740 | | | | 12,740 | | | | 357,674 | | | | 446,346 | | | |
Dividends reinvested | | | — | | | | — | | | | 864 | | | | 1,465 | | | |
Cost of shares redeemed | | | (10,530 | ) | | | — | | | | (220,207 | ) | | | (128,952 | ) | | |
| | |
|
|
| |
|
|
| |
|
|
| |
|
|
| | |
| | | | (7,790 | ) | | | 12,740 | | | | 138,331 | | | | 318,859 | | | |
| | |
|
|
| |
|
|
| |
|
|
| |
|
|
| | |
| | | | | |
Class C Shares | | | | | | | | | | | | | | | | | | |
Proceeds from shares issued (d) | | | 7,909 | | | | 40,782 | | | | 18,472,048 | | | | 1,933,492 | | | |
Dividends reinvested | | | — | | | | — | | | | 9,370 | | | | 44,874 | | | |
Cost of shares redeemed | | | (11,709 | ) | | | 55 | | | | (2,349,131 | ) | | | (438,533 | ) | | |
| | |
|
|
| |
|
|
| |
|
|
| |
|
|
| | |
| | | | (3,800 | ) | | | 40,837 | | | | 16,132,287 | | | | 1,539,833 | | | |
| | |
|
|
| |
|
|
| |
|
|
| |
|
|
| | |
| | | | | |
Class R Shares | | | | | | | | | | | | | | | | | | |
Proceeds from shares issued (d) | | | — | (e) | | | 1,000 | | | | 1 | | | | 1,000 | (a) | | |
Dividends reinvested | | | — | | | | — | | | | 32 | | | | — | | | |
| | |
|
|
| |
|
|
| |
|
|
| |
|
|
| | |
| | | | — | | | | 1,000 | | | | 33 | | | | 1,000 | | | |
| | |
|
|
| |
|
|
| |
|
|
| |
|
|
| | |
| | | | | |
Institutional Service Class Shares | | | | | | | | | | | | | | | | | | |
Proceeds from shares issued (d) | | | — | | | | 1,000 | | | | — | | | | — | | | |
| | |
|
|
| |
|
|
| |
|
|
| |
|
|
| | |
| | | | — | | | | 1,000 | | | | — | | | | — | | | |
| | |
|
|
| |
|
|
| |
|
|
| |
|
|
| | |
| | | | | |
Institutional Class Shares | | | | | | | | | | | | | | | | | | |
Proceeds from shares issued (d) | | | 160 | | | | 2,995,383 | | | | 3,980,265 | | | | 343,762 | (b) | | |
Dividends reinvested | | | — | | | | — | | | | 30,947 | | | | — | | | |
Cost of shares redeemed | | | (3 | ) | | | (55 | ) | | | (625,865 | ) | | | (22,811 | )(b) | | |
| | |
|
|
| |
|
|
| |
|
|
| |
|
|
| | |
| | | | 157 | | | | 2,995,328 | | | | 3,385,347 | | | | 320,951 | | | |
| | |
|
|
| |
|
|
| |
|
|
| |
|
|
| | |
Change in net assets from capital transactions | | $ | 128,905 | | | $ | 3,064,534 | | | $ | 28,002,160 | | | $ | 2,411,514 | | | |
| | |
|
|
| |
|
|
| |
|
|
| |
|
|
| | |
| (a) | For the period from February 27, 2004 (commencement of operations) through October 31, 2004. |
| (b) | For the period from June 29, 2004 (commencement of operations) through October 31, 2004. |
| (c) | For the period March 30, 2004 (commencement of operations) through October 31, 2004. |
| (d) | Amount includes redemption fees, if any. |
| (e) | Amount is less than a $1. |
| | | | | | | | | | | | | |
| | | Small Cap Growth | | U.S. Growth Leaders Long-Short |
| | | Year Ended
October 31, 2005 | | | Period Ended
October 31, 2004 (c) | | Year Ended
October 31, 2005 | | | Year Ended
October 31, 2004 |
SHARE TRANSACTIONS: | | | | | | | | | | | | | |
Class A Shares | | | | | | | | | | | | | |
Issued | | 15,687 | | | 1,532 | | 2,069,240 | | | 480,510 | | | |
Reinvested | | — | | | — | | 59,167 | | | 663,707 | | | |
Redeemed | | (1,251 | ) | | — | | (1,239,751 | ) | | (1,045,702 | ) | | |
| | |
|
| |
| |
|
| |
|
| | |
| | | 14,436 | | | 1,532 | | 888,656 | | | 98,515 | | | |
| | | | | |
Class B Shares | | | | | | | | | | | | | |
Issued | | 314 | | | 1,384 | | 38,825 | | | 48,887 | | | |
Reinvested | | — | | | — | | 94 | | | 165 | | | |
Redeemed | | (1,121 | ) | | — | | (23,682 | ) | | (14,223 | ) | | |
| | |
|
| |
| |
|
| |
|
| | |
| | | (807 | ) | | 1,384 | | 15,237 | | | 34,829 | | | |
| | |
|
| |
| |
|
| |
|
| | |
| | | | | |
Class C Shares | | | | | | | | | | | | | |
Issued | | 895 | | | 4,391 | | 2,627,135 | | | 270,981 | | | |
Reinvested | | — | | | — | | 1,342 | | | 6,560 | | | |
Redeemed | | (1,319 | ) | | — | | (336,177 | ) | | (61,807 | ) | | |
| | |
|
| |
| |
|
| |
|
| | |
| | | (424 | ) | | 4,391 | | 2,292,300 | | | 215,734 | | | |
| | |
|
| |
| |
|
| |
|
| | |
| | | | | |
Class R Shares | | | | | | | | | | | | | |
Issued | | — | (d) | | 100 | | — | | | 109 | (a) | | |
Reinvested | | — | | | — | | 3 | | | — | | | |
| | |
|
| |
| |
|
| |
|
| | |
| | | — | | | 100 | | 3 | | | 109 | | | |
| | |
|
| |
| |
|
| |
|
| | |
| | | | | |
Institutional Service Class Shares | | | | | | | | | | | | | |
Issued | | — | | | 100 | | — | | | — | | | |
| | |
|
| |
| |
|
| |
|
| | |
| | | — | | | 100 | | — | | | — | | | |
| | |
|
| |
| |
|
| |
|
| | |
| | | | | |
Institutional Class Shares | | | | | | | | | | | | | |
Issued | | — | | | 299,500 | | 420,898 | | | 36,989 | (b) | | |
Reinvested | | — | | | — | | 3,306 | | | — | | | |
Redeemed | | — | | | — | | (65,381 | ) | | (2,408 | )(b) | | |
Redeemed adjustment | | — | | | — | | — | | | — | | | |
| | |
|
| |
| |
|
| |
|
| | |
| | | — | | | 299,500 | | 358,823 | | | 34,581 | | | |
| | |
|
| |
| |
|
| |
|
| | |
Total change in shares | | 13,205 | | | 307,007 | | 3,555,019 | | | 383,768 | | | |
| | |
|
| |
| |
|
| |
|
| | |
| (a) | For the period from February 27, 2004 (commencement of operations) through October 31, 2004. |
| (b) | For the period from June 29, 2004 (commencement of operations) through October 31, 2004. |
| (c) | For the period March 30, 2004 (commencement of operations) through October 31, 2004. |
| (d) | Amount is less than 1 share. |
Notes to Financial Statements (Continued)
October 31, 2005
| | | | | | | | | | |
| | | Value Opportunities |
| | | Year Ended
October 31, 2005 | | | Year Ended
October 31, 2004 |
CAPITAL TRANSACTIONS: | | | | | | | | | | |
Class A Shares | | | | | | | | | | |
Proceeds from shares issued (c) | | $ | 2,251,626 | | | $ | 6,571,082 | | | |
Dividends reinvested | | | 2,042,734 | | | | 8,924 | | | |
Cost of shares redeemed | | | (4,748,347 | ) | | | (7,634,809 | ) | | |
| | |
|
|
| |
|
|
| | |
| | | | (453,987 | ) | | | (1,054,803 | ) | | |
| | |
|
|
| |
|
|
| | |
| | | |
Class B Shares | | | | | | | | | | |
Proceeds from shares issued (c) | | | 100,473 | | | | 152,412 | | | |
Dividends reinvested | | | 455,669 | | | | — | | | |
Cost of shares redeemed | | | (461,294 | ) | | | (421,794 | ) | | |
| | |
|
|
| |
|
|
| | |
| | | | 94,848 | | | | (269,382 | ) | | |
| | |
|
|
| |
|
|
| | |
| | | |
Class C Shares | | | | | | | | | | |
Proceeds from shares issued (c) | | | 245,563 | | | | 376,871 | | | |
Dividends reinvested | | | 51,746 | | | | — | | | |
Cost of shares redeemed | | | (243,920 | ) | | | (101,083 | ) | | |
| | |
|
|
| |
|
|
| | |
| | | | 53,389 | | | | 275,788 | | | |
| | |
|
|
| |
|
|
| | |
| | | |
Class R Shares | | | | | | | | | | |
Proceeds from shares issued (c) | | | — | | | | 1,000 | (b) | | |
Dividends reinvested | | | 189 | | | | — | | | |
| | |
|
|
| |
|
|
| | |
| | | | 189 | | | | 1,000 | | | |
| | |
|
|
| |
|
|
| | |
| | | |
Institutional Service Class Shares | | | | | | | | | | |
Proceeds from shares issued (c) | | | 773,382 | | | | 12,107,929 | | | |
Dividends reinvested | | | 2,559,530 | | | | 24,708 | | | |
Cost of shares redeemed | | | (18,518,457 | ) | | | (19,491,929 | ) | | |
| | |
|
|
| |
|
|
| | |
| | | | (15,185,545 | ) | | | (7,359,292 | ) | | |
| | |
|
|
| |
|
|
| | |
| | | |
Institutional Class Shares | | | | | | | | | | |
Proceeds from shares issued (c) | | | — | | | | 1,000 | (a) | | |
Dividends reinvested | | | 182 | | | | — | | | |
| | |
|
|
| |
|
|
| | |
| | | | 182 | | | | 1,000 | | | |
| | |
|
|
| |
|
|
| | |
Change in net assets from capital transactions | | $ | (15,490,924 | ) | | $ | (8,405,689 | ) | | |
| | |
|
|
| |
|
|
| | |
| (a) | For the period from June 29, 2004 (commencement of operations) through October 31, 2004. |
| (b) | For the period from December 30, 2003 (commencement of operations) through October 31, 2004. |
| (c) | Amount includes redemption fees, if any. |
| | | | | | | | |
| | | Value Opportunities |
| | | Year Ended
October 31, 2005 | | | Year Ended
October 31, 2004 |
SHARE TRANSACTIONS: | | | | | | | | |
Class A Shares | | | | | | | | |
Issued | | 146,961 | | | 406,198 | | | |
Reinvested | | 139,332 | | | 563 | | | |
Redeemed | | (308,654 | ) | | (482,133 | ) | | |
| | |
|
| |
|
| | |
| | | (22,361 | ) | | (75,372 | ) | | |
| | |
|
| |
|
| | |
| | | |
Class B Shares | | | | | | | | |
Issued | | 6,890 | | | 9,831 | | | |
Reinvested | | 31,644 | | | — | | | |
Redeemed | | (30,561 | ) | | (27,202 | ) | | |
| | |
|
| |
|
| | |
| | | 7,973 | | | (17,371 | ) | | |
| | |
|
| |
|
| | |
| | | |
Class C Shares | | | | | | | | |
Issued | | 16,605 | | | 24,277 | | | |
Reinvested | | 3,603 | | | — | | | |
Redeemed | | (16,413 | ) | | (6,770 | ) | | |
| | |
|
| |
|
| | |
| | | 3,795 | | | 17,507 | | | |
| | |
|
| |
|
| | |
| | | |
Class R Shares | | | | | | | | |
Issued | | — | | | 65 | (b) | | |
Reinvested | | 13 | | | — | | | |
| | |
|
| |
|
| | |
| | | 13 | | | 65 | | | |
| | |
|
| |
|
| | |
| | | |
Institutional Service Class Shares | | | | | | | | |
Issued | | 48,557 | | | 761,883 | | | |
Reinvested | | 172,941 | | | 1,571 | | | |
Redeemed | | (1,244,048 | ) | | (1,229,044 | ) | | |
| | |
|
| |
|
| | |
| | | (1,022,550 | ) | | (465,590 | ) | | |
| | |
|
| |
|
| | |
| | | |
Institutional Class Shares | | | | | | | | |
Issued | | — | | | 62 | (a) | | |
Reinvested | | 12 | | | — | | | |
| | |
|
| |
|
| | |
| | | 12 | | | 62 | | | |
| | |
|
| |
|
| | |
Total change in shares | | (1,033,118 | ) | | (540,699 | ) | | |
| | |
|
| |
|
| | |
| (a) | For the period from June 29, 2004 (commencement of operations) through October 31, 2004. |
| (b) | For the period from December 30, 2003 (commencement of operations) through October 31, 2004. |
Notes to Financial Statements (Continued)
October 31, 2005
3. Transactions with Affiliates
Under the terms of the Trust’s Investment Advisory Agreements, Gartmore Global Asset Management Trust (“GGAMT”) or Gartmore Mutual Fund Capital Trust (“GMF”) manages the investment of the assets and supervises the daily business affairs of their respective Funds (as shown in table below). GMF is a wholly-owned subsidiary of Gartmore Global Investments, Inc. (“GGI”), a holding company. GGI is a majority-owned subsidiary of GGAMT. GGAMT is a wholly-owned subsidiary of Nationwide Corporation. All of the common stock of Nationwide Corporation is held by Nationwide Mutual Insurance Company (95.2%) and Nationwide Mutual Fire Insurance Company (4.8%), each of which is a mutual company owned by its policyholders. In addition, GMF and GGAMT provides investment management evaluation services in initially selecting subadvisors and monitoring, on an ongoing basis, the performance of the subadvisers, if applicable, for the Funds that GMF or GGAMT advise. The subadvisers manage each of their respective Fund’s investments and have the responsibility for making all investment decisions for the applicable Funds. The adviser and subadviser, if applicable, for each Fund is as follows:
| | | | |
| Fund | | Adviser | | Subadviser |
Global Financial Services | | GGAMT | | Gartmore Global Partners (a) |
Global Health Sciences | | GMF | | n/a |
Global Natural Resources | | GMF | | Gartmore Global Partners (a) |
Global Technology and Communications | | GMF | | n/a |
Global Utilities | | GGAMT | | Gartmore Global Partners (a) |
Mid Cap Growth Leaders | | GMF | | n/a |
Nationwide Leaders | | GMF | | n/a |
Small Cap Leaders | | GMF | | n/a |
U.S. Growth Leaders | | GMF | | n/a |
Worldwide Leaders | | GGAMT | | Gartmore Global Partners (a) |
China Opportunities | | GMF | | Gartmore Global Partners (a) |
Emerging Markets | | GGAMT | | Gartmore Global Partners (a) |
International Growth | | GGAMT | | Gartmore Global Partners (a) |
Convertible | | GMF | | n/a |
High Yield Bond | | GMF | | n/a |
Micro Cap Equity | | GMF | | n/a |
Small Cap Growth | | GMF | | n/a |
U.S Growth Leaders Long-Short | | GMF | | n/a |
Value Opportunities | | GMF | | NorthPointe Capital, LLC (a) |
| (a) | Affiliate of GMF and GGAMT. |
Under the terms of the Investment Advisory Agreements, each Fund pays the Fund’s respective adviser an investment advisory fee based on that Fund’s average daily net assets. From such fees, pursuant to the subadvisory agreements, the adviser pays fees to the applicable subadviser, if any. Additional information regarding the investment advisory fees and subadvisory fees for GGAMT, GMF and the subadvisers, where applicable, is as follows for the year ended October 31, 2005:
| | | | | | | | |
| Fund | | Fee Schedule | | Total
Fees | | Fees
Retained | | Paid to
Subadviser |
Global Financial Services (1) | | Up to $500 million | | 0.90% | | 0.45% | | 0.45% |
| | | $500 million up to $2 billion | | 0.85% | | 0.425% | | 0.425% |
| | | On $2 billion and more | | 0.80% | | 0.40% | | 0.40% |
| Refer | to footnote (1) on page 210. |
| | | | | | | | |
| Fund | | Fee Schedule | | Total
Fees | | Fees
Retained | | Paid to
Subadviser |
Global Health Sciences (1) | | Up to $500 million | | 0.90% | | 0.90% | | — |
| | | $500 million up to $2 billion | | 0.85% | | 0.85% | | — |
| | | On $2 billion and more | | 0.80% | | 0.80% | | — |
Global Natural Resources (a) (1) | | Up to $500 million | | 0.70% | | 0.35% | | 0.35% |
| | | $500 million up to $2 billion | | 0.65% | | 0.325% | | 0.325% |
| | | On $2 billion and more | | 0.60% | | 0.30% | | 0.30% |
Global Technology and Communications (1) | | Up to $500 million | | 0.88% | | 0.88% | | — |
| | | $500 million up to $2 billion | | 0.83% | | 0.83% | | — |
| | | On $2 billion and more | | 0.78% | | 0.78% | | — |
Global Utilities (1) | | Up to $500 million | | 0.70% | | 0.35% | | 0.35% |
| | | $500 million up to $2 billion | | 0.65% | | 0.325% | | 0.325% |
| | | On $2 billion and more | | 0.60% | | 0.30% | | 0.30% |
Mid Cap Growth Leaders | | Up to $250 million | | 0.80% | | 0.80% | | — |
| | | $250 million up to $1 billion | | 0.77% | | 0.77% | | — |
| | | $1 billion up to $2 billion | | 0.74% | | 0.74% | | — |
| | | $2 billion up to $5 billion | | 0.71% | | 0.71% | | — |
| | | On $5 billion and more | | 0.68% | | 0.68% | | — |
Nationwide Leaders (1) | | Up to $500 million | | 0.80% | | 0.80% | | — |
| | | $500 million up to $2 billion | | 0.70% | | 0.70% | | — |
| | | On $2 billion and more | | 0.65% | | 0.65% | | — |
Small Cap Leaders | | All Assets | | 0.95% | | 0.95% | | — |
U.S. Growth Leaders (2) | | Up to $500 million | | 0.90% | | 0.90% | | — |
| | | $500 million up to $2 billion | | 0.80% | | 0.80% | | — |
| | | On $2 billion and more | | 0.75% | | 0.75% | | — |
Worldwide Leaders (1) | | Up to $500 million | | 0.90% | | 0.45% | | 0.45% |
| | | $500 million up to $2 billion | | 0.85% | | 0.425% | | 0.425% |
| | | On $2 billion and more | | 0.80% | | 0.40% | | 0.40% |
China Opportunities (1) | | Up to $500 million | | 1.25% | | 0.625% | | 0.625% |
| | | $500 million up to $2 billion | | 1.20% | | 0.60% | | 0.60% |
| | | On $2 billion and more | | 1.15% | | 0.575% | | 0.575% |
Emerging Markets (1) | | Up to $500 million | | 1.05% | | 0.525% | | 0.525% |
| | | $500 million up to $2 billion | | 1.00% | | 0.50% | | 0.50% |
| | | On $2 billion and more | | 0.95% | | 0.475% | | 0.475% |
International Growth (1) | | Up to $500 million | | 0.90% | | 0.45% | | 0.45% |
| | | $500 million up to $2 billion | | 0.85% | | 0.425% | | 0.425% |
| | | On $2 billion and more | | 0.80% | | 0.40% | | 0.40% |
Convertible | | Up to $500 million | | 0.65% | | 0.65% | | — |
| | | $500 million up to $1 billion | | 0.60% | | 0.60% | | — |
| | | On $1 billion and more | | 0.55% | | 0.55% | | — |
High Yield Bond | | Up to $250 million | | 0.55% | | 0.55% | | — |
| | | On the next $750 million | | 0.525% | | 0.525% | | — |
| | | On the next $1 billion | | 0.50% | | 0.50% | | — |
| | | On the next $3 billion | | 0.475% | | 0.475% | | — |
| | | On $5 billion and more | | 0.45% | | 0.45% | | — |
Micro Cap Equity | | All Assets | | 1.25% | | 1.25% | | — |
Small Cap Growth | | All Assets | | 0.95% | | 0.95% | | — |
| Refer | to footnote (1) on page 210. |
Notes to Financial Statements (Continued)
October 31, 2005
| | | | | | | | |
| Fund | | Fee Schedule | | Total
Fees | | Fees
Retained | | Paid to
Subadviser |
U.S. Growth Leaders Long-Short | | Up to $50 million | | 1.50% | | 1.50% | | — |
| | | On the next $200 million | | 1.50% | | 1.50% | | — |
| | | On $250 million and more | | 1.25% | | 1.25% | | — |
Value Opportunities | | Up to $250 million | | 0.70% | | — | | 0.70% |
| | | On the next $750 million | | 0.675% | | — | | 0.675% |
| | | On the next $1 billion | | 0.65% | | — | | 0.65% |
| | | On the next $3 billion | | 0.625% | | — | | 0.625% |
| | | On $5 billion and more | | 0.60% | | — | | 0.60% |
| (a) | Prior to December 27, 2004 the advisory fee was 0.90% on assets up to $500 million, 0.85% on the next $500 million, and 0.80% on the assets over $2 billion. |
| (1) | Each Fund pays the Fund’s respective adviser a base management fee (as shown above) which may be adjusted upward or downward each quarter depending on the performance of Class A shares of each Fund relative to each Fund’s benchmark (see benchmark table below). The calculation of this fee is done in two separate steps. First, each fund pays a base fee, as adjusted for any applicable breakpoints as described above. The base fee rate is an annual fee, calculated each quarter, and is applied to each such fund’s average net assets over that quarter. Second, a performance adjustment percentage is applied to each fund’s average net assets over the 12 month rolling performance period. The base fee and the performance adjustment percentage are then added (or subtracted, as applicable) to arrive at each Fund’s respective overall advisory fee for the current period. The table below shows the performance adjustment rate applicable to each Fund’s base fee (as such base fee may be adjusted by Base Fee Breakpoints, as described in the table above): |
| | |
| Out or Underperformance | | Change in Fees |
+/- 1 percentage point | | +/- 0.02% |
+/- 2 percentage point | | +/- 0.04% |
+/- 3 percentage point | | +/- 0.06% |
+/- 4 percentage point | | +/- 0.08% |
+/- 5 percentage point | | +/- 0.10% |
The table below lists the benchmarks used to measure against the performance of Class A shares of the Funds:
| | |
| Fund | | Benchmark |
Global Financial Services | | MSCI World Financials Index |
Global Health Sciences | | GS Healthcare Index |
Global Natural Resources | | GS Natural Resources Index |
Global Technology and Communications | | GS Technology Composite Index |
Global Utilities | | 60% MSCI World Telecommunications Service Index |
| | | 40% MSCI World Utilities Index |
Nationwide Leaders | | S&P 500 Index |
Worldwide Leaders | | MSCI World Index |
China Opportunities | | MSCI Zhong Hua Index |
Emerging Markets | | MSCI Emerging Markets Index |
International Growth | | MSCI All Country World |
| (2) | The U.S. Growth Leaders Fund pays GMF a base management fee (as shown above) which may be adjusted upward or downward each quarter depending on the performance of Class A shares of the Fund relative to its benchmark, the S&P 500. Thus, if Class A shares of the Fund outperforms its benchmark by 12% or more over a 36 month period, the Fund will pay higher management fees. Conversely, if Class A of the Fund underperforms its benchmark by 12% or more over a 36 month period, the Fund will pay lower management fees. No adjustment will |
| | take place if the under or overperformance is less than 12% and GMF will receive the applicable base fee. The base fee is either increased or decreased by the following amounts at each breakpoint: |
| | |
| Fee Schedule | | Fee Adjustment |
Up to $500 million | | +/- 0.22% |
$500 million up to $2 billion | | +/- 0.18% |
On $2 billion and more | | +/- 0.16% |
On September 21, 2004, the Enforcement Staff of the Securities and Exchange Commission’s Fort Worth District Office (the “Staff”) contacted Gartmore Mutual Fund Capital Trust (the “Adviser”), the investment adviser to the Gartmore U.S. Growth Leaders Fund (the “Fund”), a series of the Trust. The Staff asserted that the methodology used to calculate the performance fee for the Fund did not comply with the requirements of Rule 205-2 under the Investment Advisers Act of 1940 (“Advisers Act”). The Adviser agreed temporarily to forego the collection of performance fees on the Fund pending an evaluation of the Staff’s assertion. Discussions with the Staff are ongoing, and the outcome of those discussions will determine the remedial steps, if any, to be taken.
GMF or GGAMT, where applicable, and the Funds have entered into written contracts (“Expense Limitation Agreements”) that limit operating expenses (excluding any taxes, interest, brokerage fees, extraordinary expenses, short-sale dividend expenses, Rule 12b-1 fees, and administrative services fees) from exceeding the amounts listed in the table below until February 28, 2006:
| | | | |
| Fund | | Expense Caps | | Amount |
Global Financial Services | | All Classes | | 1.40% |
Global Health Sciences | | All Classes | | 1.40% |
Global Natural Resources | | All Classes | | 1.20% |
Global Technology and Communications | | All Classes | | 1.38% |
Global Utilities | | All Classes | | 1.20% |
Mid Cap Growth Leaders | | All Classes | | 1.20% |
Nationwide Leaders | | All Classes | | 1.20% |
Small Cap Leaders | | All Classes | | 1.35% |
U.S. Growth Leaders | | All Classes | | 1.30% |
Worldwide Leaders | | All Classes | | 1.40% |
China Opportunities | | All Classes | | 1.75% |
Emerging Markets | | All Classes | | 1.55% |
International Growth | | All Classes | | 1.40% |
Convertible | | All Classes | | 0.95% |
High Yield Bond | | All Classes | | 0.85% |
Micro Cap Equity | | All Classes | | 1.65% |
Small Cap Growth | | All Classes | | 1.35% |
U.S. Growth Leaders Long-Short | | All Classes | | 1.90% |
Value Opportunities | | All Classes | | 1.10% |
GMF or GGAMT may request and receive reimbursement from a Fund of the advisory fees waived and other expenses reimbursed by GMF and GGAMT, respectively, pursuant to the Expense Limitation Agreements at a later date not to exceed (i) five fiscal years from commencement of operations or (ii) three years from the fiscal year in which the corresponding reimbursement to the Fund was made, depending on the Fund (as described below), if the Fund has reached a sufficient asset size to permit reimbursement to be made without causing the total annual operating expense ratio of the Fund to exceed the limits set forth above. No reimbursement will be made unless: (i) the Fund’s assets exceed
Notes to Financial Statements (Continued)
October 31, 2005
$100 million; (ii) the total annual expense ratio of the Class making such reimbursement is less than the limit set forth above; and (iii) the payment of such reimbursement is approved by the Board of Trustees on a quarterly basis. Except as provided for in the Expense Limitation Agreements, reimbursement of amounts previously waived or assumed by GMF or GGAMT is not permitted. As of the year ended October 31, 2005, the cumulative potential reimbursements of the following Funds based on expenses reimbursed by GMF or GGAMT within five years from commencement of operations of the Fund would be:
| | | | | |
| Fund | | Amount | | Expires |
Global Financial Services | | $ | 167,505 | | December 18, 2006 |
Global Health Sciences | | | 244,966 | | December 29, 2005 |
Global Utilities | | | 192,258 | | December 18, 2006 |
Nationwide Leaders | | | 188,563 | | December 28, 2006 |
Micro Cap Equity | | | 102,798 | | June 27, 2007 |
As of the year ended October 31, 2005, the cumulative potential reimbursements of the following Funds (unless otherwise indicated), based on reimbursements within three years from the fiscal year in which the corresponding reimbursement to the Fund was made for expenses reimbursed by GMF or GGAMT, would be:
| | | | | | | | | |
| Fund | | Fiscal Year
2003 | | Fiscal Year
2004 | | Fiscal Year
2005 |
Global Natural Resources | | $ | — | | $ | 21,945 | | $ | 37,587 |
Mid Cap Growth Leaders | | | 82,484 | | | 98,160 | | | 83,813 |
Small Cap Leaders | | | — | | | — | | | 62,315 |
China Opportunities | | | — | | | 50,098 | | | 66,130 |
Convertible | | | — | | | 30,330 | | | — |
Small Cap Growth | | | — | | | 53,910 | | | 45,746 |
U.S. Growth Leaders Long-Short | | | — | | | 14,723 | | | 43,113 |
Under the terms of a Distribution Plan under Rule 12b-1 of the 1940 Act, Gartmore Distribution Services, Inc. (“GDSI”), the Funds’ distributor, is compensated by the Funds for expenses associated with the distribution of Class A, Class B, Class C, and Class R shares of the Funds. These fees are based on average daily net assets of the respective class of the Funds at an annual rate not to exceed 0.25% for Class A shares, 1.00% for Class B and Class C shares, and 0.50% for Class R shares.
Pursuant to an Underwriting Agreement, GDSI serves as principal underwriter of the Funds in the continuous distribution of their shares and receives commissions in the form of a front-end sales charge on the Class A and Class D shares. These fees are deducted from and are not included in proceeds from sales of Class A and Class D shares. From these fees, GDSI pays sales commissions, salaries, and other expenses in connection with generating new sales of Class A and Class D shares of the Funds. GDSI also receives fees for services as principal underwriter for Class B shares of the Funds. These fees are contingent deferred sales charges (“CDSCs”) ranging from 1% to 5% imposed on redemptions of Class B shares which may cause the current value of a shareholder’s account to fall below the total purchase payments.
The CDSC, if applicable, will be imposed on redemptions made within six years of the purchase. Class C shares have a CDSC of 1% imposed on redemptions of Class C shares made within one year of purchase. For the year ended October 31, 2005, GDSI received commissions of $1,764,781 from front-end sales charges of Class A and Class D shares and from CDSC fees from Class B and Class C shares of the Funds, of which $77,931 was reallowed to affiliated broker-dealers of the Funds.
Under the terms of a Fund Administration and Transfer Agency Agreement, Gartmore SA Capital Trust (“GSA”) provides various administrative and accounting services, and Gartmore Investors Services, Inc. (“GISI”), an indirect subsidiary of GSA, serves as Transfer Agent and Dividend Disbursing Agent for each of the Funds. For the period ended November 1, 2004 through December 31, 2004, the fees for the services provided under such agreement were calculated based on the Trust’s average daily net assets according to the fee schedule below. The fees are then allocated proportionately among all funds within the Trust in relation to the average daily net assets of each fund and are paid to GSA. GSA pays GISI from these fees for GISI’s services.
| | |
| Combined Fee Schedule* | | |
Up to $1 billion | | 0.25% |
$1 billion and more up to $3 billion | | 0.18% |
$3 billion and more up to $4 billion | | 0.14% |
$4 billion and more up to $5 billion | | 0.07% |
$5 billion and more up to $10 billion | | 0.04% |
$10 billion and more up to $12 billion | | 0.02% |
$12 billion or more | | 0.01% |
| * | The assets of the Gartmore Investor Destinations Aggressive, Gartmore Investor Destinations Moderately Aggressive, Gartmore Investor Destinations Moderate, Gartmore Investor Destinations Moderately Conservative and Gartmore Investor Destinations Conservative Funds (collectively, the “Investor Destinations Funds”) and the Gartmore Optimal Allocations Fund: Aggressive, Gartmore Optimal Allocations Fund: Moderate, Gartmore Optimal Allocations Fund: Moderately Aggressive, and Gartmore Optimal Allocations Fund: Specialty (collectively, the “Optimal Funds”) are excluded from the Trust asset level amount in order to calculate this asset based fee. The Investor Destinations Funds and the Optimal Funds do not pay any part of this fee. |
Effective January 1, 2005, the fee for the fund administration and transfer agency services increased as set forth below. The fees are calculated based on the Trust’s average daily net assets according to the fee schedule below. The fees are then allocated proportionately among all funds within the Trust in relation to the average daily net assets of each fund and are paid to GSA.
| | |
| Combined Fee Schedule* | | |
Up to $1 billion | | 0.26% |
$1 billion and more up to $3 billion | | 0.19% |
$3 billion and more up to $4 billion | | 0.15% |
$4 billion and more up to $5 billion | | 0.08% |
$5 billion and more up to $10 billion | | 0.05% |
$10 billion and more up to $12 billion | | 0.03% |
$12 billion or more | | 0.02% |
| * | The assets of the Gartmore Investor Destinations Funds and the Optimal Funds are excluded from the Trust asset level amount in order to calculate this asset based fee. The Investor Destinations Funds and the Optimal Funds do not pay any part of this fee. |
GSA and GISI have entered into agreements with BISYS Fund Services Ohio, Inc. (“BISYS”), pursuant to which BISYS provides sub-administration and sub-transfer agency services, respectively, to the Funds.
Under the terms of an Administrative Services Plan, the Funds may pay fees to servicing organizations, such as broker-dealers, including Nationwide Financial Services, and financial institutions, which agree to provide administrative support services to the shareholders of certain classes. These services include, but are not limited to, the following: establishing and maintaining shareholder accounts; processing purchase and redemption transactions; arranging bank wires; performing shareholder sub-accounting; answering inquiries regarding the Funds; and other such services. These fees are based on an annual rate of up to 0.25% of the average daily net assets of the Class A, Class D, Class R, and Institutional Service Class shares of each of the Funds.
Notes to Financial Statements (Continued)
October 31, 2005
As of October 31, 2005, GMF, GGAMT or their affiliates directly held the percentage indicated below of the shares outstanding of the applicable Fund:
| | |
| Fund | | % of Shares
Outstanding
Owned |
Global Financial Services | | 32% |
Global Health Sciences | | 12% |
Global Natural Resources | | 23% |
Global Technology and Communications | | 20% |
Global Utilities | | 43% |
Mid Cap Growth Leaders | | 42% |
Nationwide Leaders | | 10% |
Small Cap Leaders | | 25% |
China Opportunities | | 57% |
Emerging Markets | | 19% |
International Growth | | 59% |
High Yield Bond | | 63% |
Small Cap Growth | | 94% |
4. Short-Term Trading Fees
The Funds assess a 2.00% redemption fee on all classes of shares that are purchased and are sold or exchanged within 90 days of purchase (within 30 days for the Nationwide Leaders and U.S. Growth Leaders Funds and within five days for the High Yield Bond and Convertible Funds). The redemption fee, if any, is paid directly to the applicable Fund and is designed to offset brokerage commissions, market impact and other costs associated with short-term trading of Fund shares. For purposes of determining whether the redemption fee applies, the shares that were held the longest will be redeemed first. This redemption fee is in addition to any CDSCs that may be applicable at the time of sale. The redemption fee may not apply in certain circumstances, such as redemptions or exchanges of shares held in certain omnibus accounts or retirement plans that cannot implement the redemption fee. The fee does not apply to shares purchased through reinvested dividends or capital gains.
For the year ended October 31, 2005, the following Funds had contributions to capital due to collection of redemption fees:
| | | |
| Fund | | Amount |
Global Natural Resources | | $ | 14,950 |
Global Utilities | | | 15,821 |
Micro Cap Equity | | | 117,749 |
5. Bank Loans and Earnings Credit
The Trust has a credit agreement of $100,000,000 with J.P. Morgan Chase & Co. Borrowings under this arrangement bear interest at the Federal Funds rate plus 0.50%. The interest costs are included in custodian fees in the Statement of Operations. No compensating balances were required under the terms of the line of credit. There were no borrowings outstanding as of October 31, 2005.
The Trust’s custodian bank has agreed to reduce its fees when the funds of the Trust maintain cash on deposit in non-interest-bearing custody and Demand Deposit Accounts.
6. Investment Transactions
Purchases and sales of securities (excluding short-term securities) for the year ended October 31, 2005 are summarized as follows:
| | | | | | |
| Fund | | Purchases | | Sales |
Global Financial Services | | $ | 28,364,892 | | $ | 21,621,637 |
Global Health Sciences | | | 85,572,207 | | | 77,164,023 |
Global Natural Resources | | | 40,917,991 | | | 25,461,470 |
Global Technology and Communications | | | 58,624,696 | | | 57,533,274 |
Global Utilities | | | 26,706,485 | | | 25,839,625 |
Mid Cap Growth Leaders | | | 54,731,646 | | | 44,778,521 |
Nationwide Leaders | | | 59,625,250 | | | 50,974,769 |
Small Cap Leaders | | | 55,061,087 | | | 40,308,643 |
U.S. Growth Leaders | | | 346,268,967 | | | 274,902,355 |
Worldwide Leaders | | | 117,282,076 | | | 119,031,949 |
China Opportunities | | | 15,832,567 | | | 12,190,733 |
Emerging Markets | | | 51,630,286 | | | 42,454,857 |
International Growth | | | 32,701,727 | | | 27,137,500 |
Convertible | | | 74,906,861 | | | 66,145,891 |
High Yield Bond | | | 16,585,950 | | | 15,960,311 |
Micro Cap Equity | | | 144,608,380 | | | 157,295,909 |
Small Cap Growth | | | 28,436,992 | | | 28,579,467 |
U.S. Growth Leaders Long-Short | | | 249,655,655 | | | 230,865,979 |
Value Opportunities | | | 36,903,265 | | | 57,787,999 |
Purchases and sales of U.S. Government securities for the year ended October 31, 2005, are summarized as follows:
| | | | | | |
| Fund | | Purchases | | Sales |
Mid Cap Growth Leaders | | $ | 2,855,763 | | $ | – |
7. Portfolio Investment Risks
Credit and Market Risk. Funds that invest in high yield and emerging market instruments are subject to certain additional credit and market risks. The yields of high yield and emerging market debt obligations reflect, among other things, perceived credit risk. The Funds’ investment in securities rated below investment grade typically involve risks not associated with higher rated securities including, among others, greater risk of not receiving timely and/or ultimate payment of interest and principal, greater market price volatility, and less liquid secondary market trading. The consequences of political, social, economic, or diplomatic changes may have disruptive effects on the market prices of emerging markets investments held by the Funds.
Notes to Financial Statements (Continued)
October 31, 2005
8. Federal Tax Information
The tax character of distributions paid during the fiscal year ended October 31, 2005, was as follows: (Total distributions paid may differ from the Statement of Changes in Net Assets because for tax purposes dividends are recognized when paid.)
| | | | | | | | | | | | |
| | | Distributions paid from
| | | | |
| Fund | | Ordinary
Income | | Net Long
Term Capital
Gains | | Total Taxable
Distributions | | Total
Distributions
Paid |
Global Financial Services | | $ | 559,748 | | $ | 21,752 | | $ | 581,500 | | $ | 581,500 |
Global Health Sciences | | | 93,310 | | | — | | | 93,310 | | | 93,310 |
Global Natural Resources | | | 137,307 | | | — | | | 137,307 | | | 137,307 |
Global Technology and Communications | | | — | | | — | | | — | | | — |
Global Utilities | | | 186,261 | | | 111,800 | | | 298,061 | | | 298,061 |
Mid Cap Growth Leaders | | | — | | | — | | | — | | | — |
Nationwide Leaders | | | 319,593 | | | 68,858 | | | 388,451 | | | 388,451 |
Small Cap Leaders | | | — | | | — | | | — | | | — |
U.S. Growth Leaders | | | — | | | — | | | — | | | — |
Worldwide Leaders | | | 120,250 | | | — | | | 120,250 | | | 120,250 |
China Opportunities | | | 311,165 | | | — | | | 311,165 | | | 311,165 |
Emerging Markets | | | 686,019 | | | 1,110,863 | | | 1,796,882 | | | 1,796,882 |
International Growth | | | 90,633 | | | — | | | 90,633 | | | 90,633 |
Convertible | | | 1,116,258 | | | — | | | 1,116,258 | | | 1,116,258 |
High Yield Bond | | | 1,721,964 | | | — | | | 1,721,964 | | | 1,721,964 |
Micro Cap Equity | | | 2,041,683 | | | 883,843 | | | 2,925,526 | | | 2,925,526 |
Small Cap Growth | | | — | | | — | | | — | | | — |
U.S. Growth Leaders Long-Short | | | 1,103,030 | | | — | | | 1,103,030 | | | 1,103,030 |
Value Opportunities | | | 1,101,269 | | | 4,162,427 | | | 5,263,696 | | | 5,263,696 |
The tax character of distributions paid during the fiscal year ended October 31, 2004 were as follows: (Total distributions paid may differ from the Statement of Changes in Net Assets because for tax purposes dividends are recognized when paid.)
| | | | | | | | | | | | | | | |
| | | Distributions paid from
| | | | | | |
| Fund | | Ordinary
Income | | Net Long
Term Capital
Gains | | Total Taxable
Distributions | | Return of
Capital | | Total
Distributions
Paid |
Global Financial Services | | $ | 438,819 | | $ | – | | $ | 438,819 | | $ | – | | $ | 438,819 |
Global Health Sciences | | | 707,293 | | | – | | | 707,293 | | | – | | | 707,293 |
Global Natural Resources | | | 5,817 | | | – | | | 5,817 | | | – | | | 5,817 |
Global Technology and Communications | | | – | | | – | | | – | | | – | | | – |
Global Utilities | | | 12,874 | | | – | | | 12,874 | | | – | | | 12,874 |
Mid Cap Growth Leaders | | | – | | | – | | | – | | | – | | | – |
Nationwide Leaders | | | – | | | – | | | – | | | – | | | – |
U.S. Growth Leaders | | | – | | | – | | | – | | | – | | | – |
Worldwide Leaders | | | – | | | – | | | – | | | – | | | – |
China Opportunities | | | 12,685 | | | – | | | 12,685 | | | – | | | 12,685 |
Emerging Markets | | | 72,828 | | | – | | | 72,828 | | | – | | | 72,828 |
International Growth | | | – | | | – | | | – | | | – | | | – |
High Yield Bond | | | 6,900,084 | | | – | | | 6,900,084 | | | – | | | 6,900,084 |
Value Opportunities | | | 34,141 | | | – | | | 34,141 | | | – | | | 34,141 |
Micro Cap Equity | | | – | | | 14,217 | | | 14,217 | | | – | | | 14,217 |
U.S. Growth Leaders Long-Short | | | 8,178,734 | | | – | | | 8,178,734 | | | – | | | 8,178,734 |
Convertible | | | 378,591 | | | – | | | 378,591 | | | – | | | 378,591 |
Small Cap Growth | | | – | | | – | | | – | | | – | | | – |
Notes to Financial Statements (Continued)
October 31, 2005
As of October 31, 2005, the components of accumulated earnings (deficit) on a tax basis was as follows: (Total distributions paid differ from the Statement of Changes in Net Assets because for tax purposes dividends are recognized when actually paid.)
| | | | | | | | | | | | | | | | | | | | | | | | | |
| Fund | | Undistributed
Ordinary
Income | | Undistributed
Long-Term
Capital Gains | | Accumulated
Earnings | | Distributions
Payable | | | Accumulated
Capital and
Other Losses | | | Unrealized
Appreciation
(Depreciation)* | | | Total
Accumulated
Earnings
(Deficit) | |
Global Financial Services | | $ | 469,966 | | $ | 428,495 | | $ | 898,461 | | $ | — | | | $ | — | | | $ | 673,876 | | | $ | 1,572,337 | |
Global Health Sciences | | | 2,560,788 | | | — | | | 2,560,788 | | | — | | | | — | | | | 86,784 | | | | 2,647,572 | |
Global Natural Resources | | | 2,551,064 | | | 157,431 | | | 2,708,495 | | | — | | | | — | | | | 1,195,612 | | | | 3,904,107 | |
Global Technology and Communications | | | — | | | — | | | — | | | — | | | | (5,792,364 | ) | | | 62,212 | | | | (5,730,152 | ) |
Global Utilities | | | 1,399,268 | | | 49,352 | | | 1,488,620 | | | — | | | | — | | | | 195,477 | | | | 1,644,097 | |
Mid Cap Growth Leaders | | | — | | | — | | | — | | | — | | | | (32,901,017 | ) | | | 3,035,148 | | | | (29,865,869 | ) |
Nationwide Leaders | | | 1,516,799 | | | 187,009 | | | 1,703,808 | | | — | | | | — | | | | (167,875 | ) | | | 1,535,933 | |
Small Cap Leaders | | | 306,349 | | | — | | | 306,349 | | | — | | | | — | | | | (102,849 | ) | | | 203,500 | |
U.S. Growth Leaders | | | 8,591,262 | | | 201,192 | | | 8,792,454 | | | — | | | | — | | | | 1,837,751 | | | | 10,630,205 | |
Worldwide Leaders | | | 2 | | | — | | | 2 | | | — | | | | (37,902,045 | ) | | | 2,302,829 | | | | (35,599,212 | ) |
China Opportunities | | | 772,707 | | | 70,442 | | | 843,149 | | | — | | | | — | | | | (362,078 | ) | | | 481,071 | |
Emerging Markets | | | 2,692,302 | | | 2,214,182 | | | 4,906,484 | | | — | | | | — | | | | 4,812,374 | | | | 9,718,858 | |
International Growth | | | 34,299 | | | — | | | 34,299 | | | — | | | | (660,514 | ) | | | 1,089,190 | | | | 462,975 | |
Convertible | | | 265,433 | | | — | | | 265,433 | | | — | | | | — | | | | 279,547 | | | | 544,980 | |
High Yield Bond | | | 149,217 | | | — | | | 149,217 | | | (149,216 | ) | | | (35,577,154 | ) | | | (269,890 | ) | | | (35,847,043 | ) |
Micro Cap Equity | | | 7,502,788 | | | — | | | 7,502,788 | | | — | | | | — | | | | 15,836,258 | | | | 23,339,046 | |
Small Cap Growth | | | — | | | — | | | — | | | — | | | | (256,138 | ) | | | 43,143 | | | | (212,995 | ) |
U.S. Growth Leaders Long-Short | | | — | | | — | | | — | | | — | | | | (18,045,031 | ) | | | 657,137 | | | | (17,387,894 | ) |
Value Opportunities | | | 1,228,379 | | | 775,897 | | | 2,004,276 | | | — | | | | — | | | | 864,934 | | | | 2,869,210 | |
| * | The differences between the book-basis and tax-basis unrealized appreciation (depreciation) is attributable primarily to: tax deferral of losses on wash sales; the difference between book and tax amortization methods for premium and market discount; and the return of capital adjustments from real estate investment trusts. Excludes unrealized on short sales. |
As of October 31, 2005, the tax cost of securities and the breakdown of unrealized appreciation (depreciation) for each Fund were as follows:
| | | | | | | | | | | | | | |
| Fund | | Tax Cost of
Securities | | Unrealized
Appreciation | | Unrealized
Depreciation | | | Net
Unrealized
Appreciation
(Depreciation) | |
Global Financial Services | | $ | 14,411,719 | | $ | 927,712 | | $ | (253,836 | ) | | $ | 673,876 | |
Global Health Sciences | | | 29,918,088 | | | 1,015,324 | | | (928,540 | ) | | | 86,784 | |
Global Natural Resources | | | 24,519,953 | | | 1,527,658 | | | (332,046 | ) | | | 1,195,612 | |
Global Technology and Communications | | | 10,671,409 | | | 480,855 | | | (417,928 | ) | | | 62,927 | |
Global Utilities | | | 8,711,519 | | | 439,919 | | | (241,794 | ) | | | 198,125 | |
Mid Cap Growth Leaders | | | 37,088,421 | | | 3,447,473 | | | (412,325 | ) | | | 3,035,148 | |
Nationwide Leaders | | | 15,452,804 | | | 303,372 | | | (471,247 | ) | | | (167,875 | ) |
Small Cap Leaders | | | 15,075,780 | | | 647,333 | | | (750,182 | ) | | | (102,849 | ) |
U.S. Growth Leaders | | | 128,605,167 | | | 4,351,242 | | | (2,513,491 | ) | | | 1,837,751 | |
Worldwide Leaders | | | 39,750,880 | | | 3,145,400 | | | (843,124 | ) | | | 2,302,276 | |
China Opportunities | | | 10,504,911 | | | 693,760 | | | (1,055,936 | ) | | | (362,176 | ) |
Emerging Markets | | | 35,413,667 | | | 6,040,791 | | | (1,226,850 | ) | | | 4,813,941 | |
International Growth | | | 15,051,968 | | | 1,397,253 | | | (311,274 | ) | | | 1,085,979 | |
Convertible | | | 49,269,009 | | | 864,729 | | | (585,182 | ) | | | 279,547 | |
High Yield Bond | | | 24,224,245 | | | 755,876 | | | (1,021,941 | ) | | | (269,890 | ) |
Micro Cap Equity | | | 134,095,865 | | | 18,560,058 | | | (2,723,800 | ) | | | 15,836,258 | |
Small Cap Growth | | | 2,849,248 | | | 145,476 | | | (102,333 | ) | | | 43,143 | |
U.S. Growth Leaders Long-Short | | | 55,688,315 | | | 1,915,760 | | | (1,258,623 | ) | | | 657,137 | |
Value Opportunities | | | 16,491,969 | | | 1,298,481 | | | (433,547 | ) | | | 864,934 | |
As of October 31, 2005, for Federal income tax purposes, the following Funds have capital loss carryforwards available to offset capital gains, if any, to the extent provided by the treasury regulations:
| | | | | |
| Fund | | Amount | | Expires |
Global Technology and Communications | | $ | 3,567,841 | | 2009 |
Global Technology and Communications | | | 1,182,126 | | 2010 |
Global Technology and Communications | | | 1,042,397 | | 2012 |
Mid Cap Growth Leaders | | | 28,131,638 | | 2009 |
Mid Cap Growth Leaders | | | 4,769,379 | | 2010 |
Worldwide Leaders | | | 26,522,176 | | 2009 |
Worldwide Leaders | | | 7,814,294 | | 2010 |
International Growth | | | 660,514 | | 2010 |
High Yield Bond | | | 16,778,327 | | 2009 |
High Yield Bond | | | 18,798,827 | | 2010 |
Small Cap Growth | | | 256,138 | | 2012 |
U.S. Growth Leaders Long-Short | | | 4,127,981 | | 2009 |
U.S. Growth Leaders Long-Short | | | 8,923,711 | | 2010 |
U.S. Growth Leaders Long-Short | | | 4,469,833 | | 2011 |
U.S. Growth Leaders Long-Short | | | 523,506 | | 2012 |
Notes to Financial Statements (Continued)
October 31, 2005
As of October 31, 2005, the following Funds have additional capital loss carryforwards, subject to any applicable limitations on availability, to offset future capital gains, if any, as the successor of a merger Funds:
| | | | | |
| Fund | | Amount | | Expires |
Worldwide Leaders | | $ | 1,673,106 | | 2008 |
Worldwide Leaders | | | 408,349 | | 2009 |
Worldwide Leaders | | | 557,702 | | 2009 |
Worldwide Leaders | | | 557,702 | | 2010 |
Worldwide Leaders | | | 368,716 | | 2010 |
Report of Independent Registered Public Accounting Firm
To the Board of Trustees and Shareholders of Gartmore Mutual Funds:
In our opinion, the accompanying statements of assets and liabilities, including the statements of investments, and the related statements of operations and of changes in net assets and the financial highlights present fairly, in all material respects, the financial position of Gartmore Global Financial Services Fund, Gartmore Global Health Sciences Fund, Gartmore Global Natural Resources Fund, Gartmore Global Technology and Communications Fund, Gartmore Global Utilities Fund, Gartmore Mid Cap Growth Leaders Fund, Gartmore Nationwide Leaders Fund, Gartmore Small Cap Leaders Fund, Gartmore U.S. Growth Leaders Fund, Gartmore Worldwide Leaders Fund, Gartmore China Opportunities Fund, Gartmore Emerging Markets Fund, Gartmore International Growth Fund, Gartmore Convertible Fund, Gartmore High Yield Bond Fund, Gartmore Micro Cap Equity Fund, Gartmore Small Cap Growth Fund, Gartmore U.S. Growth Leaders Long-Short Fund and Gartmore Value Opportunities Fund (nineteen series of Gartmore Mutual Funds, hereafter referred to as the “Funds”) at October 31, 2005, the results of each of their operations for the year (or period) then ended, the changes in each of their net assets for each of the two years (or periods) then ended and the financial highlights for each of the four years (or periods) then ended in conformity with accounting principles generally accepted in the United States of America. These financial statements and financial highlights (hereafter referred to as “financial statements”) are the responsibility of the Funds’ management; our responsibility is to express an opinion on these financial statements based on our audits. We conducted our audits of these financial statements in accordance with the standards of the Public Company Accounting Oversight Board (United States.) Those standards require that we plan and perform the audit to obtain reasonable assurance about whether the financial statements are free of material misstatement. An audit includes examining, on a test basis, evidence supporting the amounts and disclosures in the financial statements, assessing the accounting principles used and significant estimates made by management, and evaluating the overall financial statement presentation. We believe that our audits, which included confirmation of securities at October 31, 2005 by correspondence with the custodian and brokers, provide a reasonable basis for our opinion. The financial highlights of Gartmore Global Health Sciences Fund, Gartmore Global Technology and Communications Fund, Gartmore Mid Cap Growth Leaders Fund, Gartmore U.S. Growth Leaders Fund, Gartmore Worldwide Leaders Fund, Gartmore Emerging Markets Fund, Gartmore International Growth Fund, Gartmore High Yield Bond Fund and Gartmore Value Opportunities Fund for the year (or period) ended October 31, 2001 were audited by other independent accountants whose report dated December 14, 2001 expressed an unqualified opinion on those financial statements.
PricewaterhouseCoopers LLP
Philadelphia, Pennsylvania
December 22, 2005
Supplemental Information (Unaudited)
1. Other Federal Tax Information (Unaudited):
For the period ended October 31, 2005, certain dividends paid by the Funds may be subject to a maximum tax rate of 15% as provided for by the Jobs and Growth Tax Relief Reconciliation Act of 2003. The Funds intend to designate the maximum amount allowable as taxed at a maximum rate 15%. Complete information will be reported in conjunction with your 2005 Form 1099-DIV.
For the period ended October 31, 2005, the following Funds paid qualified dividend income:
| | | |
| Fund | | Qualified
Dividend
Income |
Global Financial Services | | $ | 263,342 |
Global Health Sciences | | | 145,388 |
Global Natural Resources | | | 77,540 |
Global Technology & Communications | | | 44,339 |
Global Utilities | | | 290,358 |
Mid Cap Growth Leaders | | | 164,180 |
Nationwide Leaders | | | 177,951 |
Small Cap Leaders | | | 90,452 |
China Opportunities | | | 268,926 |
Emerging Markets | | | 678,911 |
International Growth | | | 281,608 |
Convertible | | | 572,801 |
High Yield Bond | | | 12,391 |
Micro Cap Equity | | | 347,319 |
Small Cap Growth | | | 5,277 |
U.S. Growth Leaders Long-Short | | | 150,498 |
Value Opportunities | | | 294,750 |
For the taxable year ended October 31, 2005, the following percentage of income dividends paid by the Funds qualify for the dividends received deduction available to corporations:
| | |
| Fund | | Dividends
Received
Deduction |
Global Financial Services | | 15% |
Global Health Sciences | | 100% |
Global Natural Resources | | 9% |
Global Utilities | | 20% |
Nationwide Leaders | | 17% |
Convertible | | 33% |
High Yield Bond | | 2% |
Micro Cap Equity | | 11% |
U.S. Growth Leaders Long-Short | | 7% |
Value Opportunities | | 45% |
The Funds designate the following amounts as long term capital gain distributions qualifying for the maximum 15% income tax rate for individuals:
| | | |
| Fund | | Amount |
Micro Cap Equity | | $ | 900,920 |
Value Opportunities | | | 4,773,897 |
2. Shareholder Meeting
A separate shareholder meeting was held on Tuesday, December 23, 2004, for the shareholders of the Trust’s predecessor pursuant to a Proxy Statement on Schedule 14A, dated October 29, 2004, and mailed to the shareholders of the Trust’s predecessor on or around November 5, 2004.
Two Proposals: The purpose of the December 23, 2004 meeting was to allow the shareholders of the Trust’s predecessor to vote on:
i. Proposal One: The election of the Trust’s predecessor’s Board of Trustees; and
ii. Proposal Two: The approval of an “Agreement and Plan of Reorganization” that provided for the reorganization of the Trust from an Ohio business trust into a Delaware statutory trust.
Proposal One: As set forth in the October 29, 2004 Proxy Statement, the nominees for election as Trustees of the Trust’s predecessor were: Charles E. Allen, Michael J. Baresich, Paula H.J. Cholmondeley, C. Brent DeVore, Phyllis Kay Dryden, Robert M. Duncan, Barbara L. Hennigar, Paul J. Hondros, Barbara I Jacobs, Thomas J. Kerr IV, Douglas F. Kridler, Michael D. McCarthy, Arden L. Shisler, and David C. Wetmore.
Proposal Two: As specifically set forth in the October 29, 2004 Proxy Statement, the Reorganization proposal requested the shareholders of the Trust’s predecessor to approve the proposed “Agreement and Plan of Reorganization” of the Trust’s predecessor (on behalf of each of the Trust’s funds) with and into a new Delaware-domiciled Trust, whereby the Funds of the new Delaware Trust would acquire all of the assets of the corresponding funds of the Trust’s predecessor subject to the liabilities, expenses, costs, charges, and reserves of the corresponding funds of the Trust’s predecessor (contingent or otherwise), in exchange for shares of the acquiring funds of the Trust to be distributed pro rata by the Trust to the holders of the shares of the funds of the Trust’s predecessor, in a complete liquidation of the Trust’s predecessor.
Supplemental Information (Unaudited)
Voting Results:
The shareholders of the Trust’s predecessor voted to approve both Proposal One and Proposal Two, as follows:
| | |
| Proposal One: | | Election of a Board of Trustees of the Trust’s Predecessor |
Charles E. Allen: | | |
FOR | | 1,484,045,010.745 shares (96.963%) |
WITHHOLD | | 46,475,965.981 shares (3.037%) |
TOTAL | | 1,530,520,976.726 shares (100.000%) |
| |
Michael J. Baresich: | | |
FOR | | 1,479,546,876.136 shares (96.669%) |
WITHHOLD | | 50,974,100.590 shares (3.331%) |
TOTAL | | 1,530,520,976.726 shares (100.000%) |
| |
Paula H.J. Cholmondeley: | | |
FOR | | 1,483,986,754.474 shares (96.960%) |
WITHHOLD | | 46,534,222.252 shares (3.040%) |
TOTAL | | 1,530,520,976.726 shares (100.000%) |
| |
C. Brent DeVore: | | |
FOR | | 1,483,232,555.715 shares (96.910%) |
WITHHOLD | | 47,288,421.011 shares (3.090%) |
TOTAL | | 1,530,520,976.726 shares (100.000%) |
| |
Phyllis Kay Dryden: | | |
FOR | | 1,483,461,670.269 shares (96.925%) |
WITHHOLD | | 47,059,306.457 shares (3.075%) |
TOTAL | | 1,530,520,976.726 shares (100.000%) |
| |
Robert M. Duncan: | | |
FOR | | 1,478,518,553.740 shares (96.602%) |
WITHHOLD | | 52,002,422.986 shares (3.398%) |
TOTAL | | 1,530,520,976.726 shares (100.000%) |
| |
Barbara L. Hennigar: | | |
FOR | | 1,483,932,926.673 shares (96.956%) |
WITHHOLD | | 46,588,050.053 shares (3.044%) |
TOTAL | | 1,530,520,976.726 shares (100.000%) |
| |
Paul J. Hondros: | | |
FOR | | 1,483,799,576.741 shares (96.947%) |
WITHHOLD | | 46,721,399.985 shares (3.053%) |
TOTAL | | 1,530,520,976.726 shares (100.000%) |
| |
Barbara I. Jacobs: | | |
FOR | | 1,482,757,593.191 shares (96.879%) |
WITHHOLD | | 47,763,383.535 shares (3.121%) |
TOTAL | | 1,530,520,976.726 shares (100.000%) |
| | |
| Proposal One: | | Election of a Board of Trustees of Gartmore Mutual Funds |
Thomas J. Kerr IV: | | |
FOR | | 1,477,143,243.388 shares (96.512%) |
WITHHOLD | | 53,377,733.338 shares (3.488%) |
TOTAL | | 1,530,520,976.726 shares (100.000%) |
| |
Douglas F. Kridler: | | |
FOR | | 1,484,100,191.103 shares (96.967%) |
WITHHOLD | | 46,420,785.623 shares (3.033%) |
TOTAL | | 1,530,520,976.726 shares (100.000%) |
| |
Michael D. McCarthy: | | |
FOR | | 1,483,352,898.255 shares (96.918%) |
WITHHOLD | | 47,168,078.471 shares (3.082%) |
TOTAL | | 1,530,520,976.726 shares (100.000%) |
| |
Arden L. Shisler: | | |
FOR | | 1,483,661,174.441 shares (96.938%) |
WITHHOLD | | 46,859,802.285 shares (3.062%) |
TOTAL | | 1,530,520,976.726 shares (100.000%) |
| |
David C. Wetmore: | | |
FOR | | 1,484,021,388.615 shares (96.962%) |
WITHHOLD | | 46,499,588.111 shares (3.038%) |
TOTAL | | 1,530,520,976.726 shares (100.000%) |
| |
| Proposal Two: | | Approval of the Agreement and Plan of Reorganization of the
Trust’s Predecessor: |
FOR | | 1,338,850,729.743 shares (87.477%) |
AGAINST | | 48,927,279.322 shares (3.197%) |
ABSTAIN | | 86,596,336.653 shares (5.658%) |
BROKER NON-VOTES | | 56,146,631.008 shares (3.668%) |
TOTAL | | 1,530,520,976.726 shares (100.000%) |
Management Information (Unaudited)
Trustees who are not Interested Persons (as defined in the 1940 Act) and Officers of the Funds
as of October 31, 2005
| | | | | | | | |
Name, Address
and Year of Birth | | Position(s) Held
with the Trust
and Length of
Time Served1 | | Principal Occupation(s)
During Past
5 Years | | Number of Portfolios
in the
Gartmore Fund
Complex Overseen
by Trustee | | Other Directorships Held by Trustee or Nominee2 |
| | | | |
Charles E. Allen c/o Gartmore Global Investments, Inc. 1200 River Road,
Suite 1000 Conshohocken, PA 19428 1948 | | Trustee
since July 2000 | | Mr. Allen is Chairman, Chief Executive Officer and President of the Graimark Realty Advisors, Inc. (real estate development, investment and asset management). | | 84 | | None |
| | | | |
Paula H.J. Cholmondeley c/o Gartmore Global Investments, Inc. 1200 River Road,
Suite 1000 Conshohocken, PA 19428 1947 | | Trustee
since July 2000 | | Ms. Cholmondeley has been the Chairman and Chief Executive Officer of the Sorrel Group, a management consulting company, since January 2004. Prior thereto, Ms. Cholmondeley was Vice President and General Manager of Sappi Fine Paper North America. | | 84 | | Director of Dentsply International, Inc., Ultralife Batteries, Inc. , Terex Corporation, Minerals Technology, Inc. and Albany International Corp. |
| | | | |
C. Brent DeVore c/o Gartmore Global Investments, Inc. 1200 River Road,
Suite 1000 Conshohocken, PA 19428 1940 | | Trustee
since
1990 | | Dr. DeVore is President of Otterbein College. | | 84 | | None |
| | | | |
Phyllis K. Dryden c/o Gartmore Global Investments, Inc. 1200 River Road, Suite 1000 Conshohocken, PA 19428 1947 | | Trustee since December 2004 | | Ms. Dryden was a former Managing Partner of marchFIRST, a global management consulting firm prior to February, 2001. | | 84 | | None |
| | | | |
Barbara L. Hennigar c/o Gartmore Global Investments, Inc. 1200 River Road, Suite 1000 Conshohocken, PA 19428 1935 | | Trustee since July 2000 | | Retired. | | 84 | | None |
Trustees who are not Interested Persons (as defined in the 1940 Act) and Officers of the Funds
as of October 31, 2005 (Continued)
| | | | | | | | |
Name, Address
and Year of Birth | | Position(s) Held
with the Trust
and Length of
Time Served1 | | Principal Occupation(s)
During Past
5 Years | | Number of Portfolios
in the
Gartmore Fund
Complex Overseen
by Trustee | | Other Directorships Held by Trustee or Nominee2 |
| | | | |
Barbara I. Jacobs c/o Gartmore Global Investments, Inc. 1200 River Road, Suite 1000 Conshohocken, PA 19428 1950 | | Trustee since December 2004 | | Ms. Jacobs has served as Chairman of the Board of Directors of KICAP Network Fund, a European (United Kingdom) hedge fund, since December 2000. Prior to 2004, Ms. Jacobs was also a Managing Director and European Portfolio Manager with CREF Investments (Teachers Insurance Annuity Association – College Retirement Equity Fund). | | 84 | | None |
| | | | |
Douglas F. Kridler c/o Gartmore Global Investments, Inc. 1200 River Road, Suite 1000 Conshohocken, PA 19428 1955 | | Trustee since September 1997 | | Mr. Kridler has served as the President and Chief Executive Officer of the Columbus Foundation (a Columbus, OH-based foundation which manages over 1,300 individual endowment funds) since February 2002. Mr. Kridler was the President of the Columbus Association for the Performing Arts prior thereto and Chairman of the Greater Columbus Convention and Visitors Bureau during 2000 and 2001. | | 84 | | None |
| | | | |
Michael D. McCarthy c/o Gartmore Global Investments, Inc. 1200 River Road, Suite 1000 Conshohocken, PA 19428 1947 | | Trustee since December 2004 | | Mr. McCarthy serves as: the Founder and Chairman of The Eureka Foundation (which sponsors and funds the “Great Museums” series on PBS); and a Partner of Pineville Properties LLC (a commercial real estate development firm). | | 843 | | None |
| | | | |
David C. Wetmore c/o Gartmore Global Investments, Inc. 1200 River Road, Suite 1000 Conshohocken, PA 19428 1948 | | Trustee since 1995 and Chairman since February 2005 | | Retired. | | 84 | | None |
| 1 | Length of time served includes time served with the Trust’s predecessor. |
| 2 | Directorships held in (1) any other investment companies registered under the 1940 Act, (2) any company with a class of securities registered pursuant to Section 12 of the Securities Exchange Act of 1934, as amended (the “Exchange Act”), or (3) any company subject to the requirements of Section 15(d) of the Exchange Act. |
| 3 | Mr. McCarthy was also an Administrative Committee Member for the Alphagen Arneb Fund, LLC , The Healthcare Fund LDC, The Leaders Long-Short Fund, LLC, and The Leaders Long-Short Fund LDC, four private investment companies (hedge funds) managed by GSA. Mr. McCarthy resigned as an Administrative Committee Member effective June 30, 2005. |
Trustees and Officers who are not Interested Persons (as defined in the 1940 Act) of the Funds received aggregate compensation of $548,510 from the Trust for the year ended October 31, 2005. Additional information regarding the Trustees and Officers may be found in the Trust’s statement of additional information, which is available without charge upon request, by calling 800-848-0920.
Management Information (Unaudited)
Trustees who are Interested Persons (as defined in the 1940 Act) and/or Officers of the Funds
as of October 31, 2005
| | | | | | | | |
Name, Address
and Year of Birth | | Position(s) Held
with the Trust
and Length of
Time Served1 | | Principal Occupation(s)
During Past
5 Years | | Number of Portfolios
in the
Gartmore Fund
Complex Overseen
by Trustee | | Other Directorships Held by Trustee2 |
| | | | |
Paul J. Hondros Gartmore Global Investments, Inc. 1200 River Road, Suite 1000 Conshohocken, PA 19428 1948 | | Trustee
since
July 2000 | | Mr. Hondros has been President and Chief Executive Officer of various Gartmore entities, including Gartmore Distribution Services, Inc. (“GDSI”),3 Gartmore Investor Services, Inc. (“GISI”),3 Gartmore Morley Capital Management, Inc. (“GMCM”),3 Gartmore Morley Financial Services, Inc. (“GMFS”), 3 NorthPointe Capital, LLC (“NorthPointe”),3 Gartmore Global Asset Management Trust (“GGAMT”)3,, Gartmore Global Investments, Inc. (“GGI”)3, Gartmore Mutual Fund Capital Trust (“GMFCT”)3 and Gartmore SA Capital Trust (“GSA”)3; and a Director of Nationwide Securities, Inc.3, as well as several entities within Nationwide Financial Services, Inc. | | 844 | | None |
| | | | |
Arden L. Shisler c/o Gartmore Global Investments, Inc. 1200 River Road, Suite 1000 Conshohocken, PA 19428 1941 | | Trustee
since
February 2000 | | Mr. Shisler has been a consultant since January 2003. Prior thereto, he was President and Chief Executive Officer of K&B Transport, Inc., a trucking firm. Since 1992, Mr. Shisler has also been Chairman of the Board for Nationwide Mutual Insurance Company3. | | 84 | | Director of Nationwide Financial Services, Inc. |
| | | | |
Gerald J. Holland Gartmore Global Investments, Inc. 1200 River Road, Suite 1000 Conshohocken, PA 19428 1951 | | Treasurer
since
March 2001 | | Mr. Holland is Senior Vice President – Operations for GGI3, GMFCT3 , and GSA3. | | 84 | | None |
| | | | |
Michael A. Krulikowski Gartmore Global Investments, Inc. 1200 River Road, Suite 1000 Conshohocken, PA 19428 1959 | | Chief Compliance Officer since June 2004 | | Since November 1999, Mr. Krulikowski has served as a Vice President and Chief Compliance Officer of GGI. Since June 2004, Mr. Krulikowski has also served as Chief Compliance Officer of the Trust. | | 84 | | None |
Trustees who are Interested Persons (as defined in the 1940 Act) and/or Officers of the Funds
as of October 31, 2005 (Continued)
| | | | | | | | |
Name, Address
and Year of Birth | | Position(s) Held
with the Trust
and Length of
Time Served1 | | Principal Occupation(s)
During Past
5 Years | | Number of Portfolios
in the
Gartmore Fund
Complex Overseen
by Trustee | | Other Directorships Held by Trustee2 |
| | | | |
Eric E. Miller Gartmore Global Investments, Inc. 1200 River Road, Suite 1000 Conshohocken, PA 19428 1953 | | Secretary since December 2002 | | Mr. Miller is Senior Vice President, Chief Counsel for GGI3, GMFCT3 and GSA3 since August 2002. From August 2000 to August 2002, Mr. Miller was a Partner with Stradley Ronan Stevens & Young, LLP. | | 84 | | None |
| 1 | Length of time served includes time served with the Trust’s predecessor. |
| 2 | Directorships held in (1) any other investment companies registered under the 1940 Act, (2) any company with a class of securities registered pursuant to Section 12 of the Securities Exchange Act of 1934, as amended (the “Exchange Act”), or (3) any company subject to the requirements of Section 15(d) of the Exchange Act. |
| 3 | This position is held with an affiliated person or principal underwriter of the Trust. |
| 4 | Mr. Hondros was also an Administrative Committee Member for the Alphagen Arneb Fund, LLC , The Healthcare Fund LDC, The Leaders Long-Short Fund, LLC, and The Leaders Long-Short Fund LDC, four private investment companies (hedge funds) managed by GSA. Mr. Hondros resigned as an Administrative Committee Member effective June 30, 2005. |
Federal law requires the Trust, each of its investment advisers and sub-advisers to adopt procedures for voting proxies (“Proxy Voting Guidelines”) and to provide a summary of those Proxy Voting Guidelines used to vote the securities held by the Funds. The Funds’ proxy voting policies and procedures are available without charge (i) upon request, by calling 800-848-0920, (ii) on the Fund’s website at www.gartmorefunds.com, or (iii) on the Securities and Exchange Commission’s website at www.sec.gov.
Index Definitions
Citigroup 3-Month T-Bill Index: An unmanaged index that is generally representative of 3-month Treasury bills; consists of an average of the last 3-month Treasury bill issues (excluding the current month-end bill).
Citigroup High Yield Market Index: An unmanaged index of high-yield debt securities that is a broad market measure.
Goldman Sachs Convertible 100 Index: An unmanaged index that tracks the performance of 100 equally weighted convertible issues, each with a market capitalization of at least $100 million. The index measures the performance of its components against that of their underlying common stocks as well as against other broad market indexes.
Goldman Sachs Healthcare Index: An unmanaged, market capitalization-weighted index that is generally representative of the stocks in the health-care sector.
Goldman Sachs Natural Resources Index: An unmanaged, modified capitalization-weighted sector index of U.S.-traded natural resource-related stocks; includes companies in the categories of extractive industries, energy companies, owners and operators of timber tracts, forestry services, producers of pulp and paper, and owners of plantations.
Goldman Sachs Technology Composite Index (GSTI®): An unmanaged, market capitalization-weighted index that is designed to measure the performance of companies in the technology sector.
Morgan Stanley Capital International (MSCI) All Country World excluding U.S. Index: An unmanaged, free float-adjusted, market-capitalization index that is designed to measure the performance of the stocks in companies in all countries except the United States.
Morgan Stanley Capital International (MSCI) Emerging Markets IndexSM: An unmanaged, free float-adjusted, market-capitalization index that is designed to measure the performance of the stocks in emerging-country markets.
Morgan Stanley Capital International (MSCI) World IndexSM: An unmanaged, free float-adjusted, market-capitalization index that is designed to measure the performance of global developed-market equities.
Morgan Stanley Capital International (MSCI) World Financials IndexSM: An unmanaged index that is based on developed-market country indexes and is generally representative of the stocks in the global financial services sector.
Morgan Stanley Capital International (MSCI) World Telecommunication Services IndexSM: An unmanaged index that is based on developed-market country indexes and is generally representative of the stocks in the global utilities sector.
Morgan Stanley Capital International (MSCI) World Utilities IndexSM: An unmanaged index that is based on developed-market country indexes and is generally representative of the stocks in the utilities sector, which includes industry groups such as electric, gas, multi-utilities, and unregulated power and water.
Morgan Stanley Capital International (MSCI) Zhong Hua Index: An unmanaged, free float-adjusted, market capitalization-weighted index that is designed to measure the performance of stocks in the developed markets of China and Hong Kong; the index gives one-third of its weightings to China stocks and the remainder to Hong Kong stocks.
Russell 2000® Index: An unmanaged index that measures the performance of the stocks of small-capitalization U.S. companies; includes the smallest 2,000 U.S. companies in the Russell 3000® Index, which measures the performance of the largest 3,000 U.S. companies, based on market capitalization.
Russell 2000® Growth Index: An unmanaged index that measures the performance of the stocks of U.S. companies in the Russell 2000® Index (the smallest 2,000 U.S. companies, based on market capitalization) with higher price-to-book ratios and higher forecasted growth values.
Russell Midcap® Growth Index: An unmanaged index of mid-capitalization growth stocks of U.S. companies; measures the performance of the stocks of those Russell Midcap® Index companies with higher price-to-book ratios and higher forecasted growth values, and gives a broad look at how the stock prices of medium-sized U.S. companies have performed.
Standard & Poor’s 500® (S&P 500) Index: An unmanaged, capitalization-weighted index of 500 widely held stocks of large-cap U.S. companies that gives a broad look at how the stock prices of those companies have performed.
Wilshire Micro-Cap® Index: An unmanaged, capitalization-weighted index that measures small-cap stocks in the bottom “half” of the Wilshire 5000 Total Market Index as of June 30 of each year; the Wilshire 5000 Total Market Index contains more than 6,500 stocks that trade and are based in the United States.

Gartmore Funds
1200 River Road, Suite 1000
Conshohocken, PA 19428
www.gartmorefunds.com
Federal law requires the Fund, and the Fund’s investment advisers and subadvisers, to adopt procedures for voting proxies (“Proxy Voting Guidelines”) and to provide a summary of those Proxy Voting Guidelines used to vote the securities held by the Funds. The Fund’s proxy voting policies and procedures are available without charge (i) upon request, by calling 800-848-0920, (ii) on the Fund’s Web site at www.gartmorefunds.com, or (iii) on the U.S. Securities and Exchange Commission’s Web site at www.sec.gov.
© 2005 Gartmore Global Investments, Inc.
All rights reserved.
AR-Spec 12/05
Annual Report
| | |
| | |

| | October 31, 2005 |
Gartmore Bond Index Fund
Gartmore International Index Fund
Gartmore Mid Cap Market Index Fund
Gartmore S&P 500 Index Fund
Gartmore Small Cap Index Fund
www.gartmorefunds.com

Solutions.

| | | | |
| UNITED STATES | | UNITED KINGDOM | | JAPAN |
Based in greater metropolitan Philadelphia, Gartmore is the global asset management arm of Nationwide®. Gartmore’s affiliated advisers* collectively manage more than $82 billion1 in assets through its global investment platform encompassing more than 185 investment management professionals supported by an 800-person staff.
We provide core and specialty equity, fixed-income and alternative investment solutions through mutual funds, separate accounts, commingled portfolios and wrap accounts to individual and institutional clients around the world.
This wide range of investment opportunities is built on sound investment management processes designed to increase the probability of delivering enhanced risk-adjusted returns over the long term.
Our investment management teams incorporate fundamental stock selection with the application of technology to help control risk and add to returns. Insightful stock selection is a function of the efforts of talented alpha-driven managers and analysts, working in an entrepreneurial environment, who are specialists in their respective investment disciplines.
www.gartmore.com
*Gartmore’s Affiliated Advisers
The following 11 asset management affiliates of Nationwide do business under the trade name “Gartmore Group”: Gartmore Capital Management Ltd2, Gartmore Fund Managers Ltd2, Gartmore Global Partners2, 3, Gartmore Investment Ltd2, Gartmore Japan Ltd2, Gartmore Morley Capital Management, Inc.3, Gartmore Mutual Fund Capital Trust3, 4, Gartmore Riverview, LLC3, Gartmore SA Capital Trust3, 4, Gartmore Separate Accounts LLC3, and NorthPointe Capital® LLC3
| 2. | | These advisers are subsidiaries of Gartmore Investment Management plc, which ultimately reports to Nationwide®. |
| 3. | | These are SEC-registered investment advisers based in the United States. Collectively, these advisers manage $43 billion as of Oct. 31, 2005. |
| 4. | | Together, these advisers do business as Gartmore Global Investments, Inc. |
Gartmore Global Investments is the investment adviser to Gartmore Funds. NorthPointe Capital is a federally registered service mark of Gartmore Global Investments, Inc. Nationwide is a federally registered service mark of Nationwide Mutual Insurance Company.
Gartmore Funds distributed by Gartmore Distribution Services, Inc., Member NASD. 1200 River Road, Suite 1000, Conshohocken, PA 19428.
© 2005 Gartmore Global Investments, Inc. All rights reserved.
Annual Report
| | |
| | |
| | October 31, 2005 |
International investing involves additional risks, including currency fluctuations, differences in accounting standards, political instability and foreign regulations, all of which are magnified in emerging markets.
Small-company stocks have higher risks than the stocks of larger, more established companies and have significant short-term price volatility.
Investing in mutual funds involves risk, including possible loss of principal.
There is no assurance that the investment objective of any fund will be achieved.
Although third party information has been obtained from and is based on sources the Firm believes to be reliable, the Firm does not guarantee the accuracy of the information, and it may be incomplete or condensed.
PAST PERFORMANCE DOES NOT GUARANTEE FUTURE RESULTS. Performance shown is for Class A shares of the Fund at NAV. The investment return and principal value of an investment will fluctuate, so that an investor’s shares, when redeemed, may be worth more or less than their original cost. The indexes shown are unmanaged and do not reflect any fees or expenses. Investors cannot invest directly in market indexes. To obtain performance information current to the most recent month-end, which may be higher or lower than the performance shown, please call 800-848-0920 or visit www.gartmorefunds.com.
Commentary provided by Gartmore Global Investments, the investment adviser to Gartmore Funds. All opinions and estimates included in this report constitute Gartmore Global Investments’ judgment as of the date of this report and are subject to change without notice.
Investors should carefully consider a fund’s investment objectives, risks, fees, charges and expenses before investing any money. To obtain this and other information on Gartmore’s funds, please call 800-848-0920 to request a prospectus, or download a prospectus at www.gartmorefunds.com. Please read it carefully before investing any money.
Statement Regarding Availability of Quarterly Portfolio Schedule.
The Gartmore Funds file complete schedules of portfolio holdings for each Fund with the Securities and Exchange Commission (the “Commission”) for the first and third quarters of each fiscal year on Form N-Q. The Funds’ Forms N-Q are available on the Commission’s website at http://www.sec.gov. The Funds’ Forms N-Q may be reviewed and copied at the Commission’s Public Reference Room in Washington, DC, and information on the operation of the Public Reference Room may be obtained by calling 800-SEC-0330; and the Funds make the information on Form N-Q available to shareholders on www.gartmorefunds.com or upon request without charge.
Statement Regarding Availability of Proxy Voting Record.
Information regarding how the Fund voted proxies relating to portfolio securities held during the most recent 12-month period ended June 30, 2005 is available without charge, upon request, by calling 800-848-0920, and on the Commission’s website at http://www.sec.gov.
Gartmore Bond Index Fund
For the annual period ended Oct. 31, 2005, the Gartmore Bond Index Fund (Class A at NAV) returned 0.56% versus 1.14% for its benchmark, the Lehman Brothers U.S. Aggregate Index (Lehman Aggregate Index). For broader comparison, the average return for the Fund’s Lipper peer category of Intermediate Investment Grade Debt Funds was 0.82%.
The U.S. fixed-income markets, represented by the Lehman Aggregate Index, experienced a generally volatile environment during the reporting period. The Federal Reserve Board, through the Federal Open Market Committee (FOMC), continued its “measured pace” of monetary tightening by raising the federal funds rate 25 basis points at eight consecutive meetings. This brought the rate up to 3.75% from 1.75%. While short-term rates rose throughout the reporting period, longer-term rates took a circuitous route before ending higher at the conclusion of the period.
The yield on the two-year U.S. Treasury note rose steadily from 2.58% to 4.37%, an increase of 1.79%. In the meantime, the yield on the 10-year U.S. Treasury note began the period at 4.07% and dipped as low as 3.89% in June before ending at 4.55%. Overall, this movement caused the yield curve [a plotted graph line of the yields (or interest rates) on long-term and short-term maturity bonds, usually treasury securities] to flatten dramatically. The spread between yields on the two-year and 10-year U.S. Treasury notes began the reporting period at 1.49% (or 149 basis points), compressed to as low as 14 basis points during the aftermath of Hurricane Katrina, and finished at about 18 basis points. Essentially, longer-term rates continue to be low relative to shorter-term rates due to: 1) the lack of clear evidence that inflation is seeping into the prices of finished goods; 2) demand for long-term U.S. bonds by foreign investors–particularly Asian central banks; and 3) demand from U.S. pension plans for long-term securities to match the profile of their liabilities.
We evaluate the three major components of the Lehman Aggregate Index (italicized below) when analyzing its total returns. During the reporting period, the government bond sector posted a total return of 0.94%, which was slightly less than the return of the overall Index. The U.S. Treasury component of the Index posted a total return of 0.88% as rising yields caused prices to decline, particularly in the shorter-term issues. The U.S. Government Agency component of the government bond sector fared better with 1.27%. While yield spreads on agency debt relative to comparably maturing Treasury notes increased somewhat during the period, the Agency debt’s higher absolute yield levels provided the impetus for total returns that were higher than those of the U.S. Treasury sector.
The credit sector posted a 0.75% total return during the reporting period, which was 39 basis points less than the return of the Index. Overall, corporate bonds, which comprise the largest component of this sector, performed well. The continued expansion of the economy and the relative financial health of corporate balance sheets and income statements were the major factors in the performance of corporate bonds. Yield spreads on corporate bonds relative to U.S. Treasury securities began the period at about 98 basis points and ended at about 88 basis points. Meaningful volatility occurred during the period, however, in the fallout from the rating agencies’ decision to downgrade Ford Motor Co. and General Motors Corp. debt in April and May. At that time, spreads widened quickly and dramatically before settling into a relatively tight trading range. Exacerbating this condition were the decisions made by the benchmark Index purveyor about whether or not to remove and re-include these issues in the Index.
The securitized sector (dominated by mortgage-backed securities, or MBS) fared the best with a total return of 1.61%. The MBS market is influenced by changing interest rates and how they translate into lending and refinancing activity. Long-term rates during the reporting period were relatively stable before trending higher toward the end of the period. As a result, refinancing activity slowed and become more predictable than it had been in previous periods, contributing to the sector’s relative outperformance. In addition, rising short-term rates made hybrid and floating-rate structures less attractive to homeowners, who were more likely to lock in longer-term rates that continue to be attractive.
Portfolio Manager:
Fund Asset Management, L.P.-Subadviser
| | |
Fund Performance | | Gartmore Bond Index Fund |
Average Annual Total Return
(For periods ended October 31, 2005)
| | | | | | | | |
| | | | | 1 Yr. | | 5 Yr. | | Inception1 |
| Class A | | w/o SC2 | | 0.56% | | 5.83% | | 6.14% |
| | | w/SC3 | | -5.23% | | 4.60% | | 5.41% |
| Class B4 | | w/o SC2 | | -0.04% | | 5.32% | | 5.84% |
| | | w/SC5 | | -4.88% | | 4.99% | | 5.84% |
| Institutional Class6 | | | | 0.97% | | 6.27% | | 6.46% |
All figures showing the effect of a sales charge reflect the maximum charge possible, because it has the most dramatic effect on performance data.
| 1 | These returns until the creation of Class A and Institutional shares (12/29/99) include the performance of the Master Aggregate Bond Index Series (the “Series”), which began operations on April 3, 1997. Excluding the effect of any fee waivers or reimbursements, such prior performance is similar to what Class A and Institutional Class shares would have produced because these classes of the Fund’s shares invested in the same portfolio of securities as the Series. The performance for these classes has been restated to reflect differences in sales charges (where applicable), but does not reflect the differing levels of other fees applicable to such classes; if these fees were reflected, the performance for Class A and Institutional Class shares would have been lower. |
| 2 | These returns do not reflect the effects of sales charges (SC). |
| 3 | A 5.75% front-end sales charge was deducted. |
| 4 | These returns until the creation of Class B shares (10/12/01) include performance based on the Series for the period through December 28, 1999 and the Fund’s Class A shares for the period from December 29, 1999 to October 11, 2001. Excluding the effect of any fee waivers or reimbursements, such prior performance is similar to what Class B shares would have produced because Class B shares invest in the same portfolio of securities as Class A shares. The performance for these classes has been restated to reflect differences in sales charges (where applicable), but does not reflect the differing levels of other fees (primarily Rule 12b-1 and/or administrative services fees) applicable to such classes; if these fees were reflected, the performance for Class B shares would have been lower. |
| 5 | A 5.00% maximum contingent deferred sales charge (CDSC) was deducted. The CDSC declines to 0% after 6 years. |
| 6 | Not subject to any sales charges. |
Performance of a $10,000 Investment
Investment return and principal value will fluctuate, and when redeemed, shares may be worth more or less than original cost. Past performance is no guarantee of future results and does not reflect the deduction of taxes that a shareholder would pay on fund distributions or the redemption of fund shares. Investing in mutual funds involves market risk, including loss of principal. Performance returns assume the reinvestment of all distributions.
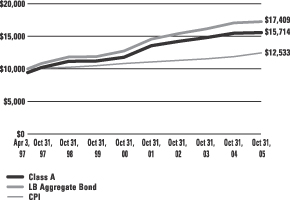
Comparative performance of $10,000 invested in Class A shares of the Gartmore Bond Index Fund, the Lehman Brothers Aggregate Bond Index (LB Aggregate Bond)(a), and the Consumer Price Index (CPI)(b) since inception. Unlike the Fund, the returns for these unmanaged indexes do not reflect any fees, expenses, or sales charges. Investors cannot invest directly in market indexes.
| (a) | The LB Aggregate Bond is an unmanaged index comprised of U.S. government securities and corporate debt securities and is generally representative of the bond market as a whole. |
| (b) | The CPI represents changes in prices of a basket of goods and services purchased for consumption by urban households. |
| | |
Shareholder Expense Example | | Gartmore Bond Index Fund |
As a shareholder of the Fund, you incur two types of costs: (1) transaction costs, including sales charges (loads) paid on purchase payments and redemption fees; and (2) ongoing costs, including investment advisory fees, administration fees, distribution fees and other Fund expenses. The examples below are intended to help you understand your ongoing costs (in dollars) of investing in the Fund and to compare these costs with the ongoing costs of investing in other mutual funds. Per SEC requirements, the examples assume that you had a $1,000 investment in the Class at the beginning of the reporting period, May 1, 2005, and continued to hold your shares at the end of the reporting period, October 31, 2005.
Actual Expenses
For each Class of the Fund in the table below, the first line provides information about actual account values and actual expenses. You may use the information in this line, together with the amount you invested, to estimate the expenses that you paid over the period. Simply divide your account value by $1,000 (for example, an $8,600 account value divided by $1,000 = 8.6), then multiply the result by the number in the first line of each Class under the heading entitled “Expenses Paid During Period” to estimate the expenses you paid on your account during the period.
Hypothetical Example for Comparison Purposes
The second line of each Class in the table below provides information about hypothetical account values and hypothetical expenses based on the Class’ actual expense ratio and an assumed rate of return of 5% per year before expenses, which is not the Class’ actual return. The hypothetical account values and expenses may not be used to estimate the actual ending account balance or expenses you paid for the period. You may use this information to compare the ongoing costs of investing in the Class of the Fund and other funds. To do so, compare this 5% hypothetical example with the 5% hypothetical examples that appear in the shareholder reports of the other funds.
Please note that the expenses shown in the table are meant to highlight your ongoing costs only and do not reflect any transaction costs, such as sales charges (loads) or redemption fees. Therefore, the second line for each Class in the table is useful in comparing ongoing costs only, and will not help you determine the relative total costs of owning different funds. In addition, if these transaction costs were included, your costs would have been higher. The examples also assume all dividends and distributions have been reinvested.
Schedule of Shareholder Expenses
Expense Analysis of a $1,000 Investment
(October 31, 2005)
| | | | | | | | | | | | | | |
| Bond Index Fund | | | | | Beginning
Account Value,
5/1/05 | | Ending
Account Value,
10/31/05 | | Expenses Paid
During Period* | | Annualized
Expense Ratio* |
| Class A | | Actual | | | $ | 1,000.00 | | $ | 998.60 | | $ | 3.57 | | 0.72% |
| | | Hypothetical | 1 | | $ | 1,000.00 | | $ | 1,021.43 | | $ | 3.62 | | 0.72% |
| Class B | | Actual | | | $ | 1,000.00 | | $ | 995.60 | | $ | 6.53 | | 1.32% |
| | | Hypothetical | 1 | | $ | 1,000.00 | | $ | 1,018.45 | | $ | 6.63 | | 1.32% |
| Institutional Class | | Actual | | | $ | 1,000.00 | | $ | 1,000.70 | | $ | 1.59 | | 0.32% |
| | | Hypothetical | 1 | | $ | 1,000.00 | | $ | 1,023.41 | | $ | 1.61 | | 0.32% |
| * | Expenses are equal to the Fund’s annualized expense ratio multiplied by the average account value over the period multiplied by 184/365 (to reflect the one-half year period). The expense ratio presented represents a six month, annualized ratio in accordance with SEC guidelines. |
| 1 | Represents the hypothetical 5% return before expenses. |
| | |
Portfolio Summary | | Gartmore Bond Index Fund |
October 31, 2005
The SEC adopted a requirement that Funds present their portfolio holdings in a table, chart or graph format in their annual and semiannual reports to shareholders, whether or not a statement of investments is utilized. The following tables, which present portfolio holdings as a percentage of net assets, are provided in compliance with this requirement.
| | |
| Asset Allocation | | |
| U.S. Government and Agency Long-Term Obligations | | 71.2% |
| Corporate Bonds | | 34.5% |
| Soverign Bonds | | 2.1% |
| Cash Equivalents | | 1.8% |
| Municipal Bonds | | 0.1% |
| Other Investments* | | 16.1% |
| Liabilites in excess of Other Assets** | | -25.8 % |
| | |
|
| | | 100.0% |
| * | Includes value of collateral received from securities lending. |
| ** | Includes value of collateral owed from securities lending. |
| | |
| Top Industries | | |
| Federal Home Loan Mortgage Corporation | | 43.6% |
| Financial Services | | 16.3% |
| Federal National Mortgage Association | | 13.7% |
| U.S. Treasury Bonds | | 5.8% |
| Government National Mortgage Association | | 4.6% |
| Banking | | 4.1% |
| U.S. Treasury Notes | | 3.5% |
| Special Purpose Entity | | 1.8% |
| Telecommunications | | 1.8% |
| Electric – Integrated | | 1.4% |
| Other Industries | | 3.4% |
| | |
|
| | | 100.0% |
| | |
| Top Holdings*** | | |
Federal Home Loan Mortgage Corporation, TBA,
5.50%, 11/15/35 | | 6.3% |
Federal National Mortgage Association,
5.75%, 02/15/08 | | 5.1% |
Federal Home Loan Mortgage Corporation,
4.88%, 03/15/07 | | 3.2% |
Federal National Mortgage Association,
6.00%, 05/15/11 | | 2.1% |
Federal Home Loan Mortgage Corporation,
3.25%, 08/15/08 | | 2.0% |
Federal Home Loan Mortgage Corporation,
5.00%, 08/01/35 | | 2.0% |
Wachovia Bank Commercial Mortgage,
4.14%, 10/15/15 | | 2.0% |
U.S. Treasury Bonds,
6.25%, 08/15/23 | | 1.9% |
Federal Home Loan Mortgage Corporation,
6.63%, 09/15/09 | | 1.8% |
Federal Home Loan Mortgage Corporation,
5.50%, 07/15/06 | | 1.7% |
| Other Holdings | | 71.9% |
| | |
|
| | | 100.0% |
| *** | For purpose of listing top holdings, repurchase agreements are considered cash equivalents and are included as part of Other Holdings. |
Statement of Investments
October 31, 2005
Gartmore Bond Index Fund
| | U.S. Government and Agency Long-Term Obligations (71.2%) |
| | | | | | |
| | | Principal
Amount | | Value |
| | | | | | | |
Federal Home Loan Mortgage Corporation (43.6%) |
5.25%, 06/15/06 (e) | | $ | 365,000 | | $ | 366,767 |
7.18%, 06/27/06 | | | 55,000 | | | 55,978 |
5.50%, 07/15/06 | | | 25,420,000 | | | 25,604,473 |
4.88%, 03/15/07 (e) | | | 47,910,000 | | | 48,088,753 |
3.25%, 08/15/08 (e) | | | 31,595,000 | | | 30,436,381 |
6.63%, 09/15/09 (e) | | | 1,075,000 | | | 1,145,062 |
6.63%, 09/15/09 | | | 26,165,000 | | | 27,879,802 |
5.13%, 07/15/12 (e) | | | 10,325,000 | | | 10,478,543 |
4.88%, 11/15/13 (e) | | | 17,050,000 | | | 17,019,293 |
6.00%, 04/01/14 | | | 370,800 | | | 378,974 |
5.00%, 07/15/14 (e) | | | 5,655,000 | | | 5,680,272 |
4.38%, 07/17/15 (e) | | | 12,230,000 | | | 11,703,878 |
5.00%, 09/01/18 | | | 385,202 | | | 380,262 |
5.50%, 04/01/19 | | | 336,795 | | | 339,008 |
5.50%, 11/01/19 | | | 802,099 | | | 807,369 |
5.50%, 12/01/19 | | | 388,704 | | | 391,258 |
4.00%, 03/01/20 | | | 436,211 | | | 412,588 |
4.00%, 03/01/20 | | | 53,527 | | | 50,647 |
4.50%, 03/01/20 | | | 561,946 | | | 543,805 |
4.00%, 04/01/20 | | | 122,978 | | | 116,318 |
4.00%, 04/01/20 | | | 489,246 | | | 462,750 |
4.00%, 04/01/20 | | | 58,454 | | | 55,308 |
4.50%, 04/01/20 | | | 11,246,857 | | | 10,883,795 |
5.00%, 04/01/20 | | | 952,355 | | | 939,766 |
5.00%, 04/01/20 | | | 481,618 | | | 475,252 |
5.00%, 04/01/20 | | | 980,850 | | | 967,884 |
5.00%, 04/01/20 | | | 488,568 | | | 482,110 |
5.00%, 04/01/20 | | | 761,419 | | | 751,354 |
5.50%, 05/01/20 | | | 389,989 | | | 392,565 |
5.00%, 06/01/20 | | | 295,414 | | | 291,509 |
5.00%, 06/01/20 | | | 476,622 | | | 470,322 |
5.00%, 06/01/20 | | | 901,500 | | | 889,583 |
6.00%, 06/01/20 | | | 382,720 | | | 390,988 |
4.50%, 07/01/20 | | | 500,001 | | | 483,860 |
5.00%, 07/01/20 | | | 1,262,929 | | | 1,246,235 |
4.00%, 08/01/20 | | | 11,905,683 | | | 11,260,916 |
4.50%, 10/01/20 | | | 600,000 | | | 580,631 |
6.75%, 09/15/29 | | | 945,000 | | | 1,146,481 |
6.50%, 05/01/31 | | | 65,669 | | | 67,454 |
6.50%, 09/15/31 | | | 576,285 | | | 598,118 |
6.50%, 03/15/32 | | | 1,703,254 | | | 1,767,423 |
7.00%, 04/15/32 | | | 365,427 | | | 384,173 |
7.00%, 05/15/32 | | | 286,423 | | | 301,093 |
| | | | | | |
| | | Principal
Amount | | Value |
| | | | | | | |
Federal Home Loan Mortgage Corporation (continued) |
7.00%, 06/15/32 | | $ | 347,595 | | $ | 365,397 |
6.25%, 07/15/32 (e) | | | 2,110,000 | | | 2,446,959 |
7.00%, 07/15/32 | | | 562,291 | | | 591,089 |
6.50%, 02/01/33 | | | 784,180 | | | 806,065 |
6.00%, 11/01/33 | | | 2,791,707 | | | 2,821,549 |
6.50%, 12/01/33 | | | 1,133,287 | | | 1,161,950 |
6.50%, 05/01/34 | | | 1,110,194 | | | 1,138,273 |
6.50%, 05/01/34 | | | 900,001 | | | 922,763 |
6.00%, 06/01/34 | | | 696,242 | | | 703,402 |
6.00%, 06/01/34 | | | 367,906 | | | 371,689 |
6.00%, 07/01/34 | | | 390,643 | | | 394,660 |
6.00%, 08/01/34 | | | 1,719,029 | | | 1,736,707 |
6.00%, 08/01/34 | | | 684,757 | | | 691,798 |
6.00%, 08/15/34 | | | 424,354 | | | 432,122 |
6.50%, 08/15/34 | | | 1,335,644 | | | 1,386,263 |
6.00%, 10/15/34 | | | 841,536 | | | 856,940 |
6.50%, 01/01/35 | | | 592,847 | | | 607,841 |
6.00%, 02/01/35 | | | 337,862 | | | 341,325 |
6.00%, 02/01/35 | | | 1,082,014 | | | 1,093,106 |
6.00%, 03/01/35 | | | 1,882,027 | | | 1,902,145 |
6.00%, 03/01/35 | | | 2,600,001 | | | 2,626,738 |
6.50%, 04/01/35 | | | 368,938 | | | 378,266 |
6.00%, 05/01/35 | | | 965,453 | | | 975,381 |
6.50%, 05/01/35 | | | 308,241 | | | 316,034 |
5.00%, 08/01/35 | | | 31,450,009 | | | 30,268,731 |
5.00%, 08/01/35 | | | 11,174,756 | | | 10,755,026 |
5.00%, 08/01/35 | | | 798,041 | | | 768,067 |
5.00%, 08/01/35 | | | 18,950,310 | | | 18,238,527 |
5.00%, 08/01/35 | | | 797,101 | | | 767,161 |
5.00%, 08/01/35 | | | 8,462,229 | | | 8,144,384 |
5.00%, 08/01/35 | | | 11,942,186 | | | 11,493,631 |
5.00%, 08/01/35 | | | 4,737,521 | | | 4,559,577 |
5.50%, 08/01/35 | | | 5,100,509 | | | 5,036,444 |
5.00%, 08/15/35 | | | 498,771 | | | 486,765 |
4.50%, 09/01/35 | | | 699,999 | | | 653,483 |
4.50%, 09/01/35 | | | 8,828,008 | | | 8,241,373 |
4.50%, 09/01/35 | | | 600,000 | | | 560,129 |
5.00%, 09/01/35 | | | 699,999 | | | 673,707 |
5.00%, 09/01/35 | | | 8,800,000 | | | 8,469,467 |
5.00%, 09/01/35 | | | 7,500,750 | | | 7,219,018 |
5.50%, 09/01/35 | | | 9,410,006 | | | 9,291,812 |
5.00%, 10/01/35 | | | 1,500,000 | | | 1,443,659 |
5.50%, 10/01/35 | | | 6,900,000 | | | 6,813,333 |
| | U.S. Government and Agency Long-Term Obligations (continued) |
| | | | | | |
| | | Principal
Amount | | Value |
| | | | | | | |
Federal Home Loan Mortgage Corporation (continued) |
5.50%, 10/01/35 | | $ | 9,600,960 | | $ | 9,480,367 |
5.50%, 10/01/35 | | | 7,400,000 | | | 7,307,052 |
6.50%, 10/01/35 | | | 400,000 | | | 410,113 |
Gold, Pool #E00282, 6.50%, 03/01/09 | | | 212,117 | | | 218,754 |
Gold, Pool #G10399, 6.50%, 07/01/09 | | | 100,597 | | | 102,916 |
Gold, Pool #E00394, 7.50%, 09/01/10 | | | 143,304 | | | 149,954 |
Gold, Pool #M80898, 4.50%, 02/01/11 | | | 1,125,304 | | | 1,106,917 |
Gold, Pool #M80904, 4.50%, 03/01/11 | | | 731,517 | | | 718,952 |
Gold, Pool #M80917, 4.50%, 05/01/11 | | | 163,903 | | | 161,225 |
Gold, Pool #M80926, 4.50%, 07/01/11 | | | 667,681 | | | 656,772 |
Gold, Pool #M80934, 4.50%, 08/01/11 | | | 820,186 | | | 806,098 |
Gold, Pool #G10940, 6.50%, 11/01/11 | | | 54,905 | | | 56,608 |
Gold, Pool #E00507, 7.50%, 09/01/12 | | | 10,283 | | | 10,844 |
Gold, Pool #G10749, 6.00%, 10/01/12 | | | 250,099 | | | 255,523 |
Gold, Pool #E69050, 6.00%, 02/01/13 | | | 128,200 | | | 130,984 |
Gold, Pool #E72896, 7.00%, 10/01/13 | | | 44,150 | | | 46,031 |
Gold, Pool #E00802, 7.50%, 02/01/15 | | | 163,203 | | | 172,107 |
Gold, Pool #G11001, 6.50%, 03/01/15 | | | 119,329 | | | 123,124 |
Gold, Pool #G11003, 7.50%, 04/01/15 | | | 8,779 | | | 9,258 |
Gold, Pool #G11164, 7.00%, 05/01/15 | | | 29,946 | | | 31,224 |
Gold, Pool #E81396, 7.00%, 10/01/15 | | | 5,433 | | | 5,665 |
Gold, Pool #E81394, 7.50%, 10/01/15 | | | 41,195 | | | 43,441 |
Gold, Pool #E84097, 6.50%, 12/01/15 | | | 17,367 | | | 17,915 |
| | | | | | |
| | | Principal
Amount | | Value |
| | | | | | | |
Federal Home Loan Mortgage Corporation (continued) |
Gold, Pool #E00938, 7.00%, 01/01/16 | | $ | 81,356 | | $ | 84,825 |
Gold, Pool #E82132, 7.00%, 01/01/16 | | | 13,641 | | | 14,222 |
Gold, Pool #E82815, 6.00%, 03/01/16 | | | 65,960 | | | 67,414 |
Gold, Pool #E83233, 6.00%, 04/01/16 | | | 40,601 | | | 41,492 |
Gold, Pool #E83231, 6.00%, 04/01/16 | | | 15,723 | | | 16,068 |
Gold, Pool #E83046, 7.00%, 04/01/16 | | | 8,429 | | | 8,788 |
Gold, Pool #E83355, 6.00%, 05/01/16 | | | 56,986 | | | 58,236 |
Gold, Pool #E00975, 6.00%, 05/01/16 | | | 211,208 | | | 215,865 |
Gold, Pool #E83636, 6.00%, 05/01/16 | | | 103,500 | | | 105,771 |
Gold, Pool #E83933, 6.50%, 05/01/16 | | | 2,835 | | | 2,924 |
Gold, Pool #E00985, 6.00%, 06/01/16 | | | 113,440 | | | 115,940 |
Gold, Pool #E84236, 6.50%, 06/01/16 | | | 25,586 | | | 26,387 |
Gold, Pool #E00987, 6.50%, 06/01/16 | | | 99,608 | | | 102,747 |
Gold, Pool #E00996, 6.50%, 07/01/16 | | | 12,248 | | | 12,634 |
Gold, Pool #E84912, 6.50%, 08/01/16 | | | 51,381 | | | 52,989 |
Gold, Pool #E85137, 6.50%, 08/01/16 | | | 42,639 | | | 43,974 |
Gold, Pool #E85387, 6.00%, 09/01/16 | | | 139,654 | | | 142,719 |
Gold, Pool #E85800, 6.50%, 10/01/16 | | | 28,095 | | | 28,974 |
Gold, Pool #E86183, 6.00%, 11/01/16 | | | 16,831 | | | 17,201 |
Gold, Pool #E01083, 7.00%, 11/01/16 | | | 23,619 | | | 24,621 |
Gold, Pool #G11207, 7.00%, 11/01/16 | | | 66,223 | | | 69,044 |
Gold, Pool #E86746, 5.50%, 12/01/16 | | | 255,952 | | | 257,642 |
Statement of Investments (Continued)
October 31, 2005
Gartmore Bond Index Fund (Continued)
| | U.S. Government and Agency Long-Term Obligations (continued) |
| | | | | | |
| | | Principal
Amount | | Value |
| | | | | | | |
Federal Home Loan Mortgage Corporation (continued) |
Gold, Pool #E86533, 6.00%, 12/01/16 | | $ | 41,091 | | $ | 41,993 |
Gold, Pool #E87584, 6.00%, 01/01/17 | | | 36,844 | | | 37,653 |
Gold, Pool #E01095, 6.00%, 01/01/17 | | | 44,830 | | | 45,814 |
Gold, Pool #E86995, 6.50%, 01/01/17 | | | 79,191 | | | 81,670 |
Gold, Pool #E87291, 6.50%, 01/01/17 | | | 118,364 | | | 122,069 |
Gold, Pool #E87446, 6.50%, 01/01/17 | | | 25,460 | | | 26,257 |
Gold, Pool #E88076, 6.00%, 02/01/17 | | | 32,323 | | | 33,032 |
Gold, Pool #E88106, 6.50%, 02/01/17 | | | 139,855 | | | 144,235 |
Gold, Pool #E88055, 6.50%, 02/01/17 | | | 178,266 | | | 183,849 |
Gold, Pool #E01127, 6.50%, 02/01/17 | | | 74,476 | | | 76,811 |
Gold, Pool #E88474, 6.00%, 03/01/17 | | | 69,606 | | | 71,132 |
Gold, Pool #E01137, 6.00%, 03/01/17 | | | 67,227 | | | 68,703 |
Gold, Pool #E88134, 6.00%, 03/01/17 | | | 13,177 | | | 13,465 |
Gold, Pool #E88768, 6.00%, 03/01/17 | | | 159,935 | | | 163,445 |
Gold, Pool #E01138, 6.50%, 03/01/17 | | | 36,798 | | | 37,950 |
Gold, Pool #E88729, 6.00%, 04/01/17 | | | 50,264 | | | 51,366 |
Gold, Pool #E89222, 6.00%, 04/01/17 | | | 248,459 | | | 253,906 |
Gold, Pool #E89496, 6.00%, 04/01/17 | | | 63,776 | | | 65,174 |
Gold, Pool #E89149, 6.00%, 04/01/17 | | | 86,910 | | | 88,815 |
Gold, Pool #E01139, 6.00%, 04/01/17 | | | 297,679 | | | 304,211 |
Gold, Pool #E89151, 6.00%, 04/01/17 | | | 67,236 | | | 68,710 |
Gold, Pool #E89347, 6.00%, 04/01/17 | | | 15,704 | | | 16,048 |
| | | | | | |
| | | Principal
Amount | | Value |
| | | | | | | |
Federal Home Loan Mortgage Corporation (continued) |
Gold, Pool #E89217, 6.00%, 04/01/17 | | $ | 39,095 | | $ | 39,952 |
Gold, Pool #E89203, 6.50%, 04/01/17 | | | 36,201 | | | 37,334 |
Gold, Pool #E89746, 6.00%, 05/01/17 | | | 477,734 | | | 488,206 |
Gold, Pool #E01140, 6.00%, 05/01/17 | | | 262,038 | | | 267,789 |
Gold, Pool #E89909, 6.00%, 05/01/17 | | | 64,776 | | | 66,196 |
Gold, Pool #E89788, 6.00%, 05/01/17 | | | 41,030 | | | 41,929 |
Gold, Pool #E89530, 6.00%, 05/01/17 | | | 171,802 | | | 175,568 |
Gold, Pool #E89924, 6.50%, 05/01/17 | | | 175,248 | | | 180,737 |
Gold, Pool #E01156, 6.50%, 05/01/17 | | | 102,652 | | | 105,867 |
Gold, Pool #E90194, 6.00%, 06/01/17 | | | 56,243 | | | 57,476 |
Gold, Pool #B15071, 6.00%, 06/01/17 | | | 771,511 | | | 788,442 |
Gold, Pool #E90313, 6.00%, 06/01/17 | | | 24,136 | | | 24,665 |
Gold, Pool #E90227, 6.00%, 06/01/17 | | | 42,224 | | | 43,149 |
Gold, Pool #E01157, 6.00%, 06/01/17 | | | 182,931 | | | 186,945 |
Gold, Pool #E90591, 5.50%, 07/01/17 | | | 256,955 | | | 258,707 |
Gold, Pool #E90645, 6.00%, 07/01/17 | | | 322,503 | | | 329,573 |
Gold, Pool #E90594, 6.00%, 07/01/17 | | | 155,826 | | | 159,242 |
Gold, Pool #E90667, 6.00%, 07/01/17 | | | 43,748 | | | 44,707 |
Gold, Pool #E01186, 5.50%, 08/01/17 | | | 571,272 | | | 575,187 |
Gold, Pool #E01205, 6.50%, 08/01/17 | | | 73,333 | | | 75,630 |
Gold, Pool #G11295, 5.50%, 09/01/17 | | | 380,539 | | | 383,132 |
Gold, Pool #G11458, 6.00%, 09/01/17 | | | 161,194 | | | 164,746 |
| | U.S. Government and Agency Long-Term Obligations (continued) |
| | | | | | |
| | | Principal
Amount | | Value |
| | | | | | | |
Federal Home Loan Mortgage Corporation (continued) |
Gold, Pool #E93476, 5.00%, 01/01/18 | | $ | 471,195 | | $ | 465,292 |
Gold, Pool #G11434, 6.50%, 01/01/18 | | | 121,989 | | | 125,807 |
Gold, Pool #E01311, 5.50%, 02/01/18 | | | 5,667,291 | | | 5,705,851 |
Gold, Pool #E01344, 4.50%, 04/01/18 | | | 318,951 | | | 309,107 |
Gold, Pool #E98207, 5.00%,��04/01/18 | | | 143,004 | | | 141,170 |
Gold, Pool #G11399, 5.50%, 04/01/18 | | | 561,089 | | | 564,949 |
Gold, Pool #E96459, 5.00%, 05/01/18 | | | 190,737 | | | 188,290 |
Gold, Pool #E99869, 5.00%, 06/01/18 | | | 243,146 | | | 240,100 |
Gold, Pool #E97702, 5.00%, 07/01/18 | | | 1,571,324 | | | 1,551,170 |
Gold, Pool #E97335, 5.00%, 07/01/18 | | | 3,860,551 | | | 3,811,036 |
Gold, Pool #E98258, 5.00%, 07/01/18 | | | 686,474 | | | 677,669 |
Gold, Pool #E97366, 5.00%, 07/01/18 | | | 989,946 | | | 977,249 |
Gold, Pool #E99579, 5.00%, 09/01/18 | | | 318,318 | | | 314,235 |
Gold, Pool #E99498, 5.00%, 09/01/18 | | | 356,484 | | | 351,912 |
Gold, Pool #E99673, 5.00%, 10/01/18 | | | 189,177 | | | 186,750 |
Gold, Pool #E01488, 5.00%, 10/01/18 | | | 351,781 | | | 347,288 |
Gold, Pool #E99675, 5.00%, 10/01/18 | | | 1,905,284 | | | 1,880,847 |
Gold, Pool #G11480, 5.00%, 11/01/18 | | | 1,858,880 | | | 1,835,038 |
Gold, Pool #B10650, 5.00%, 11/01/18 | | | 537,533 | | | 530,639 |
Gold, Pool #B10653, 5.50%, 11/01/18 | | | 696,311 | | | 700,899 |
Gold, Pool #B11186, 4.50%, 12/01/18 | | | 13,054,783 | | | 12,649,247 |
Gold, Pool #E01538, 5.00%, 12/01/18 | | | 2,333,965 | | | 2,303,988 |
| | | | | | |
| | | Principal
Amount | | Value |
| | | | | | | |
Federal Home Loan Mortgage Corporation (continued) |
Gold, Pool #B11548, 5.50%, 12/01/18 | | $ | 488,771 | | $ | 491,999 |
Gold, Pool #B13147, 5.00%, 01/01/19 | | | 1,442,230 | | | 1,423,732 |
Gold, Pool #B12214, 5.00%, 02/01/19 | | | 872,260 | | | 860,768 |
Gold, Pool #G11531, 5.50%, 02/01/19 | | | 251,758 | | | 253,417 |
Gold, Pool #B12737, 4.50%, 03/01/19 | | | 1,120,000 | | | 1,084,240 |
Gold, Pool #E01604, 5.50%, 03/01/19 | | | 420,329 | | | 423,105 |
Gold, Pool #B12908, 5.50%, 03/01/19 | | | 393,914 | | | 396,502 |
Gold, Pool #B13671, 5.00%, 04/01/19 | | | 318,868 | | | 314,667 |
Gold, Pool #B13600, 5.50%, 04/01/19 | | | 266,691 | | | 268,443 |
Gold, Pool #B14236, 5.00%, 05/01/19 | | | 983,959 | | | 970,996 |
Gold, Pool #B15172, 4.50%, 06/01/19 | | | 775,924 | | | 751,151 |
Gold, Pool #B15013, 5.00%, 06/01/19 | | | 749,166 | | | 739,296 |
Gold, Pool #B15396, 5.50%, 06/01/19 | | | 456,716 | | | 459,717 |
Gold, Pool #B15759, 4.50%, 07/01/19 | | | 1,139,667 | | | 1,103,280 |
Gold, Pool #G18002, 5.00%, 07/01/19 | | | 408,334 | | | 402,955 |
Gold, Pool #B15717, 5.00%, 07/01/19 | | | 842,864 | | | 831,760 |
Gold, Pool #B15872, 5.00%, 07/01/19 | | | 433,218 | | | 427,511 |
Gold, Pool #B15503, 5.00%, 07/01/19 | | | 498,215 | | | 491,652 |
Gold, Pool #G18007, 6.00%, 07/01/19 | | | 230,441 | | | 235,424 |
Gold, Pool #G18005, 5.00%, 08/01/19 | | | 1,083,032 | | | 1,068,764 |
Gold, Pool #G18006, 5.50%, 08/01/19 | | | 394,662 | | | 397,255 |
Gold, Pool #B16087, 6.00%, 08/01/19 | | | 824,482 | | | 842,312 |
Statement of Investments (Continued)
October 31, 2005
Gartmore Bond Index Fund (Continued)
| | U.S. Government and Agency Long-Term Obligations (continued) |
| | | | | | |
| | | Principal
Amount | | Value |
| | | | | | | |
Federal Home Loan Mortgage Corporation (continued) |
Gold, Pool #B16657, 5.00%, 09/01/19 | | $ | 548,664 | | $ | 541,436 |
Gold, Pool #G18009, 5.00%, 09/01/19 | | | 1,934,610 | | | 1,909,123 |
Gold, Pool #B16626, 5.00%, 09/01/19 | | | 2,207,985 | | | 2,178,896 |
Gold, Pool #B16648, 5.00%, 09/01/19 | | | 414,223 | | | 408,765 |
Gold, Pool #B16826, 5.00%, 10/01/19 | | | 687,327 | | | 678,272 |
Gold, Pool #B16985, 5.00%, 10/01/19 | | | 339,394 | | | 334,923 |
Gold, Pool #B17371, 5.00%, 12/01/19 | | | 817,816 | | | 807,042 |
Gold, Pool #B14668, 5.00%, 01/01/20 | | | 1,533,394 | | | 1,513,124 |
Gold, Pool #C00351, 8.00%, 07/01/24 | | | 7,198 | | | 7,688 |
Gold, Pool #D60780, 8.00%, 06/01/25 | | | 11,976 | | | 12,783 |
Gold, Pool #D64617, 8.00%, 10/01/25 | | | 77,246 | | | 82,509 |
Gold, Pool #D82854, 7.00%, 10/01/27 | | | 26,327 | | | 27,526 |
Gold, Pool #C00566, 7.50%, 12/01/27 | | | 33,285 | | | 35,268 |
Gold, Pool #C16221, 7.00%, 10/01/28 | | | 1,354 | | | 1,415 |
Gold, Pool #C00676, 6.50%, 11/01/28 | | | 163,629 | | | 168,381 |
Gold, Pool #C00678, 7.00%, 11/01/28 | | | 44,510 | | | 46,524 |
Gold, Pool #C18271, 7.00%, 11/01/28 | | | 32,515 | | | 33,987 |
Gold, Pool #C24416, 8.50%, 02/01/29 | | | 4,966 | | | 5,390 |
Gold, Pool #C00836, 7.00%, 07/01/29 | | | 18,200 | | | 19,006 |
Gold, Pool #C30265, 6.50%, 08/01/29 | | | 44,830 | | | 46,115 |
Gold, Pool #A16201, 7.00%, 08/01/29 | | | 352,309 | | | 367,916 |
Gold, Pool #C31285, 7.00%, 09/01/29 | | | 39,285 | | | 41,025 |
| | | | | | |
| | | Principal
Amount | | Value |
| | | | | | | |
Federal Home Loan Mortgage Corporation (continued) |
Gold, Pool #C31282, 7.00%, 09/01/29 | | $ | 4,815 | | $ | 5,028 |
Gold, Pool #A18212, 7.00%, 11/01/29 | | | 710,676 | | | 742,160 |
Gold, Pool #C32914, 8.00%, 11/01/29 | | | 15,264 | | | 16,263 |
Gold, Pool #C37436, 8.00%, 01/01/30 | | | 24,253 | | | 25,842 |
Gold, Pool #C36306, 7.00%, 02/01/30 | | | 23,139 | | | 24,156 |
Gold, Pool #C36429, 7.00%, 02/01/30 | | | 28,128 | | | 29,364 |
Gold, Pool #C00921, 7.50%, 02/01/30 | | | 24,258 | | | 25,657 |
Gold, Pool #G01108, 7.00%, 04/01/30 | | | 15,832 | | | 16,534 |
Gold, Pool #C37703, 7.50%, 04/01/30 | | | 17,724 | | | 18,746 |
Gold, Pool #G01133, 6.50%, 07/01/30 | | | 117,130 | | | 120,531 |
Gold, Pool #C41561, 8.00%, 08/01/30 | | | 7,910 | | | 8,426 |
Gold, Pool #C01051, 8.00%, 09/01/30 | | | 49,623 | | | 52,861 |
Gold, Pool #C43550, 7.00%, 10/01/30 | | | 43,082 | | | 44,976 |
Gold, Pool #C44017, 7.50%, 10/01/30 | | | 4,889 | | | 5,171 |
Gold, Pool #C43967, 8.00%, 10/01/30 | | | 92,779 | | | 98,831 |
Gold, Pool #C44978, 7.00%, 11/01/30 | | | 3,967 | | | 4,142 |
Gold, Pool #C44535, 7.50%, 11/01/30 | | | 15,240 | | | 16,118 |
Gold, Pool #C44957, 8.00%, 11/01/30 | | | 24,975 | | | 26,604 |
Gold, Pool #C01106, 7.00%, 12/01/30 | | | 256,215 | | | 267,481 |
Gold, Pool #C01103, 7.50%, 12/01/30 | | | 21,141 | | | 22,360 |
Gold, Pool #C46932, 7.50%, 01/01/31 | | | 44,675 | | | 47,252 |
Gold, Pool #C01116, 7.50%, 01/01/31 | | | 20,680 | | | 21,873 |
| | U.S. Government and Agency Long-Term Obligations (continued) |
| | | | | | |
| | | Principal
Amount | | Value |
| | | | | | | |
Federal Home Loan Mortgage Corporation (continued) |
Gold, Pool #C47143, 8.00%, 01/01/31 | | $ | 88,304 | | $ | 94,065 |
Gold, Pool #C47287, 7.50%, 02/01/31 | | | 19,281 | | | 20,393 |
Gold, Pool #G01217, 7.00%, 03/01/31 | | | 206,497 | | | 215,577 |
Gold, Pool #C48851, 7.00%, 03/01/31 | | | 26,787 | | | 27,966 |
Gold, Pool #C48206, 7.50%, 03/01/31 | | | 28,479 | | | 30,122 |
Gold, Pool #C48938, 7.50%, 03/01/31 | | | 52,781 | | | 55,825 |
Gold, Pool #C01172, 6.50%, 05/01/31 | | | 111,418 | | | 114,446 |
Gold, Pool #C52136, 7.00%, 05/01/31 | | | 60,214 | | | 62,864 |
Gold, Pool #C53589, 6.50%, 06/01/31 | | | 235,347 | | | 241,743 |
Gold, Pool #C53324, 7.00%, 06/01/31 | | | 44,008 | | | 45,945 |
Gold, Pool #C01209, 8.00%, 06/01/31 | | | 13,748 | | | 14,645 |
Gold, Pool #C54897, 6.50%, 07/01/31 | | | 143,908 | | | 147,819 |
Gold, Pool #C54792, 7.00%, 07/01/31 | | | 226,015 | | | 235,962 |
Gold, Pool #C55071, 7.50%, 07/01/31 | | | 7,068 | | | 7,474 |
Gold, Pool #G01309, 7.00%, 08/01/31 | | | 55,124 | | | 57,550 |
Gold, Pool #C56769, 8.00%, 08/01/31 | | | 19,504 | | | 20,768 |
Gold, Pool #C58362, 6.50%, 09/01/31 | | | 64,376 | | | 66,126 |
Gold, Pool #C58215, 6.50%, 09/01/31 | | | 6,682 | | | 6,864 |
Gold, Pool #C01220, 6.50%, 09/01/31 | | | 27,470 | | | 28,217 |
Gold, Pool #G01311, 7.00%, 09/01/31 | | | 330,881 | | | 345,430 |
Gold, Pool #C01222, 7.00%, 09/01/31 | | | 39,195 | | | 40,920 |
Gold, Pool #G01315, 7.00%, 09/01/31 | | | 12,806 | | | 13,369 |
| | | | | | |
| | | Principal
Amount | | Value |
| | | | | | | |
Federal Home Loan Mortgage Corporation (continued) |
Gold, Pool #C58961, 6.50%, 10/01/31 | | $ | 1,297,828 | | $ | 1,333,100 |
Gold, Pool #C01244, 6.50%, 10/01/31 | | | 156,258 | | | 160,504 |
Gold, Pool #C58694, 7.00%, 10/01/31 | | | 106,096 | | | 110,765 |
Gold, Pool #C58647, 7.00%, 10/01/31 | | | 6,019 | | | 6,284 |
Gold, Pool #C60991, 6.50%, 11/01/31 | | | 22,068 | | | 22,668 |
Gold, Pool #C60012, 7.00%, 11/01/31 | | | 27,504 | | | 28,714 |
Gold, Pool #C61298, 8.00%, 11/01/31 | | | 39,168 | | | 41,706 |
Gold, Pool #C01271, 6.50%, 12/01/31 | | | 47,234 | | | 48,518 |
Gold, Pool #C61105, 7.00%, 12/01/31 | | | 19,841 | | | 20,714 |
Gold, Pool #C01305, 7.50%, 12/01/31 | | | 22,582 | | | 23,881 |
Gold, Pool #C63171, 7.00%, 01/01/32 | | | 94,013 | | | 98,151 |
Gold, Pool #C62218, 7.00%, 01/01/32 | | | 58,732 | | | 61,317 |
Gold, Pool #C01355, 6.50%, 02/01/32 | | | 1,486,332 | | | 1,526,727 |
Gold, Pool #C64121, 7.50%, 02/01/32 | | | 63,200 | | | 66,835 |
Gold, Pool #C01310, 6.50%, 03/01/32 | | | 258,397 | | | 265,276 |
Gold, Pool #C64668, 6.50%, 03/01/32 | | | 54,313 | | | 55,759 |
Gold, Pool #C65466, 6.50%, 03/01/32 | | | 448,584 | | | 460,526 |
Gold, Pool #C66088, 6.50%, 04/01/32 | | | 35,607 | | | 36,555 |
Gold, Pool #C66191, 6.50%, 04/01/32 | | | 82,524 | | | 84,720 |
Gold, Pool #C01343, 6.50%, 04/01/32 | | | 228,537 | | | 234,621 |
Gold, Pool #C66192, 6.50%, 04/01/32 | | | 48,327 | | | 49,614 |
Gold, Pool #C66744, 7.00%, 04/01/32 | | | 15,024 | | | 15,679 |
Statement of Investments (Continued)
October 31, 2005
Gartmore Bond Index Fund (Continued)
| | U.S. Government and Agency Long-Term Obligations (continued) |
| | | | | | |
| | | Principal
Amount | | Value |
| | | | | | | |
Federal Home Loan Mortgage Corporation (continued) |
Gold, Pool #C01345, 7.00%, 04/01/32 | | $ | 157,628 | | $ | 164,507 |
Gold, Pool #G01391, 7.00%, 04/01/32 | | | 557,540 | | | 582,055 |
Gold, Pool #C65717, 7.50%, 04/01/32 | | | 36,453 | | | 38,548 |
Gold, Pool #C01370, 8.00%, 04/01/32 | | | 45,049 | | | 47,970 |
Gold, Pool #C01351, 6.50%, 05/01/32 | | | 149,512 | | | 153,492 |
Gold, Pool #C67097, 6.50%, 05/01/32 | | | 31,962 | | | 32,812 |
Gold, Pool #C66919, 6.50%, 05/01/32 | | | 19,747 | | | 20,272 |
Gold, Pool #C67313, 6.50%, 05/01/32 | | | 19,259 | | | 19,772 |
Gold, Pool #C66758, 6.50%, 05/01/32 | | | 965,475 | | | 991,178 |
Gold, Pool #C67235, 7.00%, 05/01/32 | | | 281,748 | | | 294,044 |
Gold, Pool #C66916, 7.00%, 05/01/32 | | | 94,965 | | | 99,109 |
Gold, Pool #C67259, 7.00%, 05/01/32 | | | 18,446 | | | 19,251 |
Gold, Pool #C01381, 8.00%, 05/01/32 | | | 241,677 | | | 257,340 |
Gold, Pool #C72361, 6.50%, 06/01/32 | | | 78,316 | | | 80,444 |
Gold, Pool #C72497, 6.50%, 06/01/32 | | | 59,609 | | | 61,229 |
Gold, Pool #C67996, 6.50%, 06/01/32 | | | 35,778 | | | 36,731 |
Gold, Pool #C01364, 6.50%, 06/01/32 | | | 151,514 | | | 155,547 |
Gold, Pool #C68300, 7.00%, 06/01/32 | | | 233,841 | | | 244,046 |
Gold, Pool #C68290, 7.00%, 06/01/32 | | | 48,546 | | | 50,665 |
Gold, Pool #C68307, 8.00%, 06/01/32 | | | 21,805 | | | 23,219 |
Gold, Pool #C71403, 6.50%, 07/01/32 | | | 176,704 | | | 181,506 |
Gold, Pool #G01433, 6.50%, 07/01/32 | | | 82,063 | | | 84,247 |
| | | | | | |
| | | Principal
Amount | | Value |
| | | | | | | |
Federal Home Loan Mortgage Corporation (continued) |
Gold, Pool #G01449, 7.00%, 07/01/32 | | $ | 387,171 | | $ | 404,195 |
Gold, Pool #C68988, 7.50%, 07/01/32 | | | 8,306 | | | 8,784 |
Gold, Pool #C74006, 6.50%, 08/01/32 | | | 44,754 | | | 45,945 |
Gold, Pool #G01444, 6.50%, 08/01/32 | | | 555,425 | | | 570,520 |
Gold, Pool #G01443, 6.50%, 08/01/32 | | | 554,312 | | | 569,068 |
Gold, Pool #C69951, 6.50%, 08/01/32 | | | 185,437 | | | 190,374 |
Gold, Pool #C01385, 6.50%, 08/01/32 | | | 212,436 | | | 218,091 |
Gold, Pool #C70211, 7.00%, 08/01/32 | | | 218,300 | | | 227,827 |
Gold, Pool #C69908, 7.00%, 08/01/32 | | | 208,039 | | | 217,118 |
Gold, Pool #C01396, 6.50%, 09/01/32 | | | 343,484 | | | 352,628 |
Gold, Pool #C71089, 7.50%, 09/01/32 | | | 83,615 | | | 88,419 |
Gold, Pool #C01404, 6.50%, 10/01/32 | | | 883,962 | | | 907,494 |
Gold, Pool #C72160, 7.50%, 10/01/32 | | | 31,352 | | | 33,153 |
Gold, Pool #A14012, 6.50%, 11/01/32 | | | 235,459 | | | 241,727 |
Gold, Pool #C73984, 6.50%, 12/01/32 | | | 81,793 | | | 83,971 |
Gold, Pool #C77238, 6.00%, 02/01/33 | | | 779,741 | | | 788,076 |
Gold, Pool #C77531, 6.50%, 02/01/33 | | | 264,357 | | | 271,395 |
Gold, Pool #G01536, 7.00%, 03/01/33 | | | 290,625 | | | 303,199 |
Gold, Pool #G01580, 6.00%, 06/01/33 | | | 6,625,926 | | | 6,696,754 |
Gold, Pool #A10212, 6.50%, 06/01/33 | | | 126,542 | | | 129,742 |
Gold, Pool #A11792, 6.00%, 08/01/33 | | | 335,221 | | | 338,804 |
Gold, Pool #A15173, 6.00%, 11/01/33 | | | 2,015,137 | | | 2,036,678 |
| | U.S. Government and Agency Long-Term Obligations (continued) |
| | | | | | |
| | | Principal
Amount | | Value |
| | | | | | | |
Federal Home Loan Mortgage Corporation (continued) |
Gold, Pool #A15675, 6.00%, 11/01/33 | | $ | 5,589,588 | | $ | 5,649,338 |
Gold, Pool #A16419, 6.50%, 11/01/33 | | | 190,233 | | | 195,044 |
Gold, Pool #A16590, 6.00%, 12/01/33 | | | 653,797 | | | 660,500 |
Gold, Pool #A17177, 6.50%, 12/01/33 | | | 185,303 | | | 189,989 |
Gold, Pool #A17262, 6.50%, 12/01/33 | | | 448,994 | | | 460,350 |
Gold, Pool #A17499, 6.00%, 01/01/34 | | | 1,824,369 | | | 1,843,130 |
Gold, Pool #C01806, 7.00%, 01/01/34 | | | 249,323 | | | 260,110 |
Gold, Pool #A18186, 6.00%, 02/01/34 | | | 1,861,033 | | | 1,880,171 |
Gold, Pool #564799, 6.00%, 03/15/34 | | | 2,143,080 | | | 2,182,309 |
Gold, Pool #A21356, 6.50%, 04/01/34 | | | 784,441 | | | 804,281 |
Gold, Pool #C01851, 6.50%, 04/01/34 | | | 809,403 | | | 829,874 |
Gold, Pool #A24297, 6.00%, 05/01/34 | | | 761,550 | | | 769,358 |
Gold, Pool #A24123, 6.00%, 06/01/34 | | | 317,851 | | | 321,109 |
Gold, Pool #A25000, 6.00%, 07/01/34 | | | 2,020,372 | | | 2,041,149 |
Gold, Pool #A25219, 6.00%, 07/01/34 | | | 671,363 | | | 678,267 |
Gold, Pool #A24927, 6.00%, 07/01/34 | | | 4,949,682 | | | 5,000,583 |
Gold, Pool #A24746, 6.00%, 07/01/34 | | | 866,304 | | | 875,185 |
Gold, Pool #A26088, 6.00%, 09/01/34 | | | 4,060,720 | | | 4,102,479 |
Gold, Pool #A26688, 6.00%, 09/01/34 | | | 553,835 | | | 559,530 |
Gold, Pool #788027, 6.50%, 09/01/34 | | | 709,415 | | | 728,190 |
Gold, Pool #G01741, 6.50%, 10/01/34 | | | 526,748 | | | 540,771 |
Gold, Pool #G08023, 6.50%, 11/01/34 | | | 749,405 | | | 768,359 |
| | | | | | |
| | | Principal
Amount | | Value |
| | | | | | | |
Federal Home Loan Mortgage Corporation (continued) |
Gold, Pool #804847, 4.50%, 01/01/35 | | $ | 698,023 | | $ | 653,075 |
TBA, 5.00%, 11/01/20 (c) | | | 3,600,000 | | | 3,550,500 |
TBA, 5.50%, 11/01/20 (c) | | | 700,000 | | | 704,375 |
TBA, 6.00%, 11/01/20 (c) | | | 400,000 | | | 408,500 |
TBA, 4.50%, 12/01/20 (c) | | | 4,700,000 | | | 4,541,375 |
TBA, 5.00%, 12/01/20 (c) | | | 1,500,000 | | | 1,477,968 |
TBA, 6.00%, 12/01/20 (c) | | | 300,000 | | | 306,188 |
TBA, 4.50%, 11/15/20 (c) | | | 15,659,000 | | | 15,145,197 |
TBA, 6.50%, 11/01/35 (c) | | | 1,000,000 | | | 1,025,000 |
TBA, 5.00%, 12/01/35 (c) | | | 800,000 | | | 768,750 |
TBA, 5.50%, 12/01/35 (c) | | | 400,000 | | | 394,250 |
TBA, 5.50%, 01/01/35 (c) | | | 1,100,000 | | | 1,082,813 |
TBA, 4.50%, 11/01/35 (c) | | | 2,200,000 | | | 2,052,875 |
TBA, 5.00%, 11/15/35 (c) | | | 7,400,000 | | | 7,117,875 |
TBA, 5.50%, 11/15/35 (c) | | | 96,847,000 | | | 95,575,884 |
TBA, 6.00%, 11/15/35 (c) | | | 900,000 | | | 908,719 |
| | | | | |
|
|
| | | | | | | 659,212,624 |
| | | | | |
|
|
Federal National Mortgage Association (13.7%) |
2.63%, 11/15/06 (e) | | | 11,050,000 | | | 10,832,768 |
5.75%, 02/15/08 (e) | | | 75,495,000 | | | 77,250,561 |
2.50%, 06/15/08 (e) | | | 17,335,000 | | | 16,402,897 |
5.50%, 03/15/11 (e) | | | 13,930,000 | | | 14,357,066 |
6.00%, 05/15/11 | | | 30,460,000 | | | 32,149,951 |
5.38%, 11/15/11 (e) | | | 7,315,000 | | | 7,513,646 |
4.38%, 03/15/13 (e) | | | 19,695,000 | | | 19,081,717 |
4.63%, 10/15/14 (e) | | | 23,015,000 | | | 22,480,799 |
5.00%, 04/15/15 (e) | | | 2,600,000 | | | 2,608,775 |
Pool #709921, 5.00%, 06/01/18 | | | 203,163 | | | 200,553 |
Pool #255315, 4.00%, 07/01/19 | | | 531,540 | | | 504,064 |
Pool #811970, 4.50%, 02/01/20 | | | 216,850 | | | 209,782 |
Pool #560868, 7.50%, 02/01/31 | | | 14,918 | | | 15,747 |
Pool #607212, 7.50%, 10/01/31 | | | 246,923 | | | 260,654 |
Pool #607632, 6.50%, 11/01/31 | | | 5,212 | | | 5,360 |
Pool #607559, 6.50%, 11/01/31 | | | 8,877 | | | 9,130 |
Pool #661664, 7.50%, 09/01/32 | | | 225,175 | | | 237,681 |
Pool #694846, 6.50%, 04/01/33 | | | 138,092 | | | 141,756 |
Pool #750229, 6.50%, 10/01/33 | | | 656,285 | | | 673,698 |
Pool #A25413, 6.00%, 08/01/34 | | | 2,386,634 | | | 2,411,102 |
| | | | | |
|
|
| | | | | | | 207,347,707 |
| | | | | |
|
|
Statement of Investments (Continued)
October 31, 2005
Gartmore Bond Index Fund (Continued)
| | U.S. Government and Agency Long-Term Obligations (continued) |
| | | | | | |
| | | Principal
Amount | | Value |
| | | | | | | |
Government National Mortgage Association (4.6%) |
4.50%, 10/15/08 (e) | | $ | 405,000 | | $ | 402,679 |
5.25%, 01/15/09 | | | 7,040,000 | | | 7,160,440 |
4.25%, 08/15/10 (e) | | | 6,480,000 | | | 6,323,054 |
4.38%, 10/15/15 (e) | | | 200,000 | | | 190,897 |
4.75%, 11/17/15 | | | 630,000 | | | 619,483 |
5.50%, 10/01/18 | | | 1,185,664 | | | 1,193,494 |
Pool #279461, 9.00%, 11/15/19 | | | 8,730 | | | 9,532 |
Pool #G11742, 5.00%, 07/01/20 | | | 2,460,648 | | | 2,428,230 |
Pool #376510, 7.00%, 05/15/24 | | | 28,174 | | | 29,750 |
Pool #457801, 7.00%, 08/15/28 | | | 36,925 | | | 38,858 |
Pool #490258, 6.50%, 02/15/29 | | | 7,624 | | | 7,923 |
Pool #486936, 6.50%, 02/15/29 | | | 29,610 | | | 30,773 |
Pool #502969, 6.00%, 03/15/29 | | | 76,406 | | | 77,843 |
Pool #487053, 7.00%, 03/15/29 | | | 31,796 | | | 33,442 |
Pool #781014, 6.00%, 04/15/29 | | | 79,388 | | | 80,906 |
Pool #509099, 7.00%, 06/15/29 | | | 33,682 | | | 35,426 |
Pool #470643, 7.00%, 07/15/29 | | | 83,846 | | | 88,188 |
Pool #434505, 7.50%, 08/15/29 | | | 6,303 | | | 6,679 |
Pool #416538, 7.00%, 10/15/29 | | | 16,956 | | | 17,834 |
Pool #524269, 8.00%, 11/15/29 | | | 19,128 | | | 20,454 |
Pool #781124, 7.00%, 12/15/29 | | | 160,943 | | | 169,320 |
Pool #525561, 8.00%, 01/15/30 | | | 15,059 | | | 16,099 |
Pool #531352, 7.50%, 09/15/30 | | | 32,278 | | | 34,189 |
Pool #507396, 7.50%, 09/15/30 | | | 297,344 | | | 314,952 |
Pool #536334, 7.50%, 10/15/30 | | | 4,227 | | | 4,477 |
Pool #519020, 7.50%, 11/15/30 | | | 6,881 | | | 7,289 |
Pool #545233, 7.50%, 12/15/30 | | | 992 | | | 1,051 |
Pool #540659, 7.00%, 01/15/31 | | | 2,097 | | | 2,205 |
Pool #535388, 7.50%, 01/15/31 | | | 13,702 | | | 14,510 |
Pool #486019, 7.50%, 01/15/31 | | | 22,581 | | | 23,913 |
Pool #537406, 7.50%, 02/15/31 | | | 10,878 | | | 11,520 |
Pool #528589, 6.50%, 03/15/31 | | | 164,408 | | | 170,637 |
Pool #533723, 7.50%, 04/15/31 | | | 11,936 | | | 12,640 |
Pool #508473, 7.50%, 04/15/31 | | | 48,377 | | | 51,230 |
Pool #544470, 8.00%, 04/15/31 | | | 20,484 | | | 21,890 |
Pool #781287, 7.00%, 05/15/31 | | | 97,982 | | | 103,027 |
Pool #549742, 7.00%, 07/15/31 | | | 61,524 | | | 64,681 |
Pool #781319, 7.00%, 07/15/31 | | | 32,571 | | | 34,244 |
Pool #485879, 7.00%, 08/15/31 | | | 100,888 | | | 106,065 |
Pool #781328, 7.00%, 09/15/31 | | | 89,614 | | | 94,231 |
Pool #555125, 7.00%, 09/15/31 | | | 20,181 | | | 21,216 |
Pool #550991, 6.50%, 10/15/31 | | | 37,238 | | | 38,648 |
Pool #571267, 7.00%, 10/15/31 | | | 13,723 | | | 14,427 |
| | | | | | |
| | | Principal
Amount | | Value |
| | | | | | | |
Government National Mortgage Association (continued) |
Pool #547948, 6.50%, 11/15/31 | | $ | 17,619 | | $ | 18,286 |
Pool #574837, 7.50%, 11/15/31 | | | 11,748 | | | 12,441 |
Pool #555171, 6.50%, 12/15/31 | | | 14,176 | | | 14,713 |
Pool #781380, 7.50%, 12/15/31 | | | 29,839 | | | 31,598 |
Pool #781481, 7.50%, 01/15/32 | | | 162,576 | | | 172,215 |
Pool #580972, 6.50%, 02/15/32 | | | 32,698 | | | 33,926 |
Pool # 781401, 7.50%, 02/15/32 | | | 85,030 | | | 90,057 |
Pool #552474, 7.00%, 03/15/32 | | | 55,948 | | | 58,814 |
Pool #781478, 7.50%, 03/15/32 | | | 51,238 | | | 54,275 |
Pool #781429, 8.00%, 03/15/32 | | | 75,680 | | | 80,906 |
Pool #583645, 8.00%, 07/15/32 | | | 42,399 | | | 45,308 |
Pool #595077, 6.00%, 10/15/32 | | | 251,179 | | | 255,641 |
Pool #596657, 7.00%, 10/15/32 | | | 23,184 | | | 24,372 |
Pool #552903, 6.50%, 11/15/32 | | | 1,322,389 | | | 1,372,075 |
Pool #552952, 6.00%, 12/15/32 | | | 271,558 | | | 276,382 |
Pool #612953, 7.00%, 12/15/32 | | | 109,269 | | | 114,866 |
Pool #602102, 6.00%, 02/15/33 | | | 322,662 | | | 328,379 |
Pool #588192, 6.00%, 02/15/33 | | | 132,061 | | | 134,400 |
Pool #603520, 6.00%, 03/15/33 | | | 296,373 | | | 301,624 |
Pool #604243, 6.00%, 04/15/33 | | | 543,781 | | | 553,414 |
Pool #611526, 6.00%, 05/15/33 | | | 179,789 | | | 182,974 |
Pool #631924, 6.00%, 05/15/33 | | | 400,039 | | | 407,127 |
Pool #553320, 6.00%, 06/15/33 | | | 728,224 | | | 741,125 |
Pool #572733, 6.00%, 07/15/33 | | | 144,989 | | | 147,558 |
Pool #573916, 6.00%, 11/15/33 | | | 525,459 | | | 534,768 |
Pool #781690, 6.00%, 12/15/33 | | | 426,130 | | | 433,695 |
Pool #604875, 6.00%, 12/15/33 | | | 1,211,089 | | | 1,232,545 |
Pool #781688, 6.00%, 12/15/33 | | | 1,000,000 | | | 1,017,740 |
Pool #781699, 7.00%, 12/15/33 | | | 186,888 | | | 196,481 |
Pool #621856, 6.00%, 01/15/34 | | | 512,867 | | | 522,255 |
Pool #629973, 6.00%, 06/15/34 | | | 1,110,619 | | | 1,130,949 |
Pool #486921, 5.50%, 02/15/35 | | | 474,000 | | | 473,552 |
5.50%, 09/15/35 | | | 4,000,001 | | | 3,996,212 |
5.50%, 10/15/35 | | | 7,000,000 | | | 6,993,369 |
5.50%, 10/15/35 | | | 6,000,000 | | | 5,994,316 |
TBA, 5.00%, 11/01/35 (c) | | | 11,582,000 | | | 11,296,065 |
TBA, 4.50%, 12/01/35 (c) | | | 3,145,000 | | | 2,969,075 |
TBA, 5.50%, 01/01/35 (c) | | | 800,000 | | | 796,750 |
TBA, 5.00%, 01/01/35 (c) | | | 1,100,000 | | | 1,070,093 |
TBA, 5.50%, 11/15/35 (c) | | | 4,196,000 | | | 4,189,446 |
TBA, 6.00%, 11/15/35 (c) | | | 1,100,000 | | | 1,119,593 |
TBA, 5.00%, 12/15/35 (c) | | | 400,000 | | | 389,625 |
| | | | | |
|
|
| | | | | | | 69,937,351 |
| | | | | |
|
|
U.S. Government and Agency Long-Term Obligations (continued)
| | | | | | |
| | | Principal
Amount | | Value |
| | | | | | | |
Tennessee Valley Authority (0.0%) | | | |
6.25%, 12/15/17 | | $ | 85,000 | | $ | 94,489 |
| | | | | |
|
|
U.S. Treasury Bonds (5.8%) | | | | | | |
8.75%, 05/15/17 (e) | | | 11,060,000 | | | 15,019,137 |
8.50%, 02/15/20 (e) | | | 6,680,000 | | | 9,222,314 |
6.25%, 08/15/23 (e) | | | 24,680,000 | | | 28,803,288 |
6.38%, 08/15/27 (e) | | | 20,650,000 | | | 24,927,606 |
5.38%, 02/15/31 (e) | | | 8,550,000 | | | 9,324,844 |
| | | | | |
|
|
| | | | | | | 87,297,189 |
| | | | | |
|
|
U.S. Treasury Notes (3.5%) | | | | | | |
2.75%, 07/31/06 (e) | | | 21,825,000 | | | 21,579,469 |
4.38%, 05/15/07 (e) | | | 3,795,000 | | | 3,794,556 |
2.75%, 08/15/07 (e) | | | 3,000,000 | | | 2,916,093 |
3.25%, 08/15/07 (e) | | | 2,260,000 | | | 2,216,124 |
3.00%, 11/15/07 (e) | | | 1,965,000 | | | 1,912,650 |
3.13%, 09/15/08 (e) | | | 1,820,000 | | | 1,757,012 |
3.13%, 10/15/08 (e) | | | 1,325,000 | | | 1,277,642 |
3.38%, 11/15/08 (e) | | | 8,640,000 | | | 8,381,474 |
4.88%, 02/15/12 (e) | | | 1,000,000 | | | 1,019,883 |
4.00%, 11/15/12 (e) | | | 5,180,000 | | | 5,020,150 |
4.00%, 02/15/15 (e) | | | 3,510,000 | | | 3,356,301 |
| | | | | |
|
|
| | | | | | | 53,231,354 |
| | | | | |
|
|
| |
Total U.S. Government and Agency
Long-Term Obligations | | | 1,077,120,714 |
| | | | | |
|
|
|
Corporate Bonds (34.5%) |
Aerospace (0.3%) | | | | | | |
Boeing Co., 6.13%, 02/15/33 | | | 500,000 | | | 534,973 |
General Dynamics Corp., 3.00%, 05/15/08 | | | 425,000 | | | 406,409 |
Lockheed Martin Corp., 8.50%, 12/01/29 | | | 600,000 | | | 807,790 |
Northrop Grumman Corp., 7.13%, 02/15/11 | | | 1,035,000 | | | 1,130,122 |
Raytheon Co., 8.30%, 03/01/10 | | | 250,000 | | | 280,553 |
Raytheon Co., 5.50%, 11/15/12 | | | 150,000 | | | 152,241 |
Raytheon Co., 7.00%, 11/01/28 | | | 225,000 | | | 257,822 |
Rockwell Collins Corp., 4.75%, 12/01/13 | | | 500,000 | | | 490,781 |
Corporate Bonds (continued)
| | | | | | |
| | | Principal
Amount | | Value |
| | | | | | | |
Aerospace (continued) | | | | | | |
United Technologies Corp., 6.35%, 03/01/11 | | $ | 675,000 | | $ | 717,534 |
United Technologies Corp., 5.40%, 05/01/35 | | | 450,000 | | | 437,396 |
| | | | | |
|
|
| | | | | | | 5,215,621 |
| | | | | |
|
|
Agricultural Products (0.0%) | | | | | | |
Bunge Ltd. Finance Corp., 5.10%, 07/15/15 (b) | | | 150,000 | | | 144,147 |
Potash Corp. of Saskatchewan, Inc., 7.75%, 05/31/11 | | | 70,000 | | | 78,514 |
Potash Corp. of Saskatchewan, Inc., 4.88%, 03/01/13 | | | 280,000 | | | 273,179 |
| | | | | |
|
|
| | | | | | | 495,840 |
| | | | | |
|
|
Airlines (0.1%) | | | | | | |
Continental Airlines, Inc., 6.56%, 08/15/13 | | | 395,000 | | | 406,268 |
Continental Airlines, Inc., 7.88%, 07/02/18 | | | 223,512 | | | 203,951 |
Southwest Airlines Corp., 7.88%, 09/01/07 | | | 24,000 | | | 25,150 |
Southwest Airlines Corp., 5.13%, 03/01/17 | | | 250,000 | | | 229,866 |
| | | | | |
|
|
| | | | | | | 865,235 |
| | | | | |
|
|
Apparel Manufacturers (0.0%) | | | | | | |
Jones Apparel Group, Inc. | | | 160,000 | | | 133,146 |
| | | | | |
|
|
Automobiles (0.3%) | | | | | | |
DaimlerChrysler AG, 4.05%, 06/04/08 | | | 1,100,000 | | | 1,067,935 |
DaimlerChrysler AG, 7.30%, 01/15/12 | | | 660,000 | | | 706,746 |
DaimlerChrysler AG, 6.50%, 11/15/13 | | | 200,000 | | | 207,326 |
DaimlerChrysler AG, 8.50%, 01/18/31 | | | 625,000 | | | 733,511 |
DaimlerChrysler NA Holdings, 4.75%, 01/15/08 | | | 1,000,000 | | | 989,615 |
Nissan Motor Acceptance, 4.63%, 03/08/10 (b) | | | 520,000 | | | 505,907 |
Toyota Motor Credit Corp., 4.25%, 03/15/10 (e) | | | 570,000 | | | 555,431 |
| | | | | |
|
|
| | | | | | | 4,766,471 |
| | | | | |
|
|
Statement of Investments (Continued)
October 31, 2005
Gartmore Bond Index Fund (Continued)
| | Corporate Bonds (continued) |
| | | | | | |
| | | Principal
Amount | | Value |
| | | | | | | |
Banking (4.1%) | | | | | | |
American Express Centurion Bank, 4.38%, 07/30/09 | | $ | 400,000 | | $ | 391,852 |
Anadarko Finance Co., 6.75%, 05/01/11 | | | 200,000 | | | 214,948 |
Andina de Fomento Corp., 6.88%, 03/15/12 | | | 400,000 | | | 432,313 |
Banco Nacional de Comercio Exterior, 3.88%, 01/21/09 (b) | | | 100,000 | | | 95,350 |
Bank of America Corp., 4.75%, 10/15/06 | | | 1,000,000 | | | 1,000,220 |
Bank of America Corp., 3.25%, 08/15/08 | | | 450,000 | | | 431,733 |
Bank of America Corp., 4.50%, 08/01/10 | | | 350,000 | | | 342,409 |
Bank of America Corp., 4.88%, 09/15/12 | | | 490,000 | | | 483,442 |
Bank of America Corp., 4.88%, 01/15/13 | | | 1,100,000 | | | 1,079,917 |
Bank of America Corp., 5.38%, 06/15/14 | | | 500,000 | | | 506,125 |
Bank of America Corp., 4.75%, 08/01/15 | | | 350,000 | | | 335,788 |
Bank of America Corp., 5.25%, 12/01/15 | | | 1,250,000 | | | 1,241,020 |
Bank of New York Corp., 5.20%, 07/01/07 | | | 565,000 | | | 568,740 |
Bank One Corp., 4.13%, 09/01/07 (e) | | | 1,615,000 | | | 1,599,571 |
Bank One Corp., 3.70%, 01/15/08 | | | 500,000 | | | 489,104 |
Bank One Corp., 7.88%, 08/01/10 | | | 100,000 | | | 111,108 |
Bank One Corp., 5.25%, 01/30/13 | | | 800,000 | | | 794,234 |
Bank One Corp., 8.00%, 04/29/27 | | | 492,000 | | | 609,265 |
BB&T Corp., 6.50%, 08/01/11 | | | 300,000 | | | 320,467 |
BB&T Corp., 4.75%, 10/01/12 | | | 400,000 | | | 391,244 |
BHP Finance Corp., 6.42%, 03/01/26 | | | 135,000 | | | 147,716 |
BSCH Issuances Ltd., 7.63%, 11/03/09 | | | 600,000 | | | 657,122 |
BSCH Issuances Ltd., 7.63%, 09/14/10 | | | 100,000 | | | 111,460 |
Citigroup, Inc., 5.50%, 08/09/06 (e) | | | 350,000 | | | 352,304 |
Citigroup, Inc., 5.50%, 11/30/07 (e) | | | 1,500,000 | | | 1,518,680 |
Citigroup, Inc., 6.38%, 11/15/08 | | | 275,000 | | | 286,515 |
| | | | | | |
| | | Principal
Amount | | Value |
| | | | | | | |
Banking (continued) | | | | | | |
Citigroup, Inc., 3.63%, 02/09/09 | | $ | 1,850,000 | | $ | 1,779,612 |
Citigroup, Inc., 4.13%, 02/22/10 | | | 500,000 | | | 483,244 |
Citigroup, Inc., 6.50%, 01/18/11 | | | 225,000 | | | 239,800 |
Citigroup, Inc., 5.63%, 08/27/12 | | | 500,000 | | | 513,365 |
Citigroup, Inc., 5.00%, 09/15/14 | | | 733,000 | | | 717,819 |
Citigroup, Inc., 6.63%, 06/15/32 | | | 565,000 | | | 617,995 |
Citigroup, Inc., 5.88%, 02/22/33 | | | 200,000 | | | 199,305 |
Citigroup, Inc., 5.85%, 12/11/34 | | | 850,000 | | | 858,275 |
Comerica, Inc., 4.80%, 05/01/15 | | | 300,000 | | | 287,633 |
Deutsche Bank Financial LLC., 7.50%, 04/25/09 | | | 100,000 | | | 107,963 |
Deutsche Bank Financial LLC., 5.38%, 03/02/15 | | | 300,000 | | | 302,057 |
European Investment Bank, 3.38%, 03/16/09 | | | 1,600,000 | | | 1,540,178 |
European Investment Bank, 4.63%, 05/15/14 | | | 525,000 | | | 521,921 |
Fifth Third Bank, 3.38%, 08/15/08 (e) | | | 280,000 | | | 269,190 |
Fifth Third Bank, 4.20%, 02/23/10 | | | 525,000 | | | 510,464 |
Firstbank Puerto Rico Corp., 7.63%, 12/20/05 | | | 100,000 | | | 100,152 |
FleetBoston Financial Corp., 4.20%, 11/30/07 | | | 300,000 | | | 297,093 |
FleetBoston Financial Corp., 3.85%, 02/15/08 | | | 750,000 | | | 736,268 |
HBOS PLC, 5.38%, 11/29/49 (b) | | | 600,000 | | | 593,316 |
HSBC Bank USA, 7.50%, 07/15/09 | | | 955,000 | | | 1,034,667 |
HSBC Bank USA, 3.88%, 09/15/09 | | | 1,100,000 | | | 1,058,228 |
HSBC Bank USA, 4.63%, 04/01/14 | | | 400,000 | | | 381,873 |
HSBC Bank USA, 5.88%, 11/01/34 | | | 910,000 | | | 900,621 |
Inter-American Development Bank, 5.75%, 02/26/08 | | | 250,000 | | | 256,424 |
Inter-American Development Bank, 6.80%, 10/15/25 | | | 700,000 | | | 818,705 |
International Bank for Reconstruction & Development, 7.63%, 01/19/23 | | | 750,000 | | | 972,464 |
International Lease Finance Corp., 5.75%, 02/15/07 | | | 415,000 | | | 418,270 |
International Lease Finance Corp., 3.50%, 04/01/09 | | | 500,000 | | | 473,726 |
| | Corporate Bonds (continued) |
| | | | | | |
| | | Principal
Amount | | Value |
| | | | | | | |
Banking (continued) | | | | | | |
JP Morgan Chase & Co., 5.25%, 05/30/07 | | $ | 950,000 | | $ | 957,465 |
JP Morgan Chase & Co., 6.25%, 01/15/09 | | | 100,000 | | | 103,565 |
JP Morgan Chase & Co., 3.50%, 03/15/09 (e) | | | 2,450,000 | | | 2,340,991 |
JP Morgan Chase & Co., 4.50%, 11/15/10 (e) | | | 500,000 | | | 487,002 |
JP Morgan Chase & Co., 6.63%, 03/15/12 | | | 940,000 | | | 1,007,475 |
JP Morgan Chase & Co., 5.15%, 10/01/15 | | | 250,000 | | | 243,574 |
Key Bank NA, 5.70%, 08/15/12 | | | 450,000 | | | 463,230 |
Key Bank NA, 5.80%, 07/01/14 | | | 250,000 | | | 258,629 |
Key Bank NA, 6.95%, 02/01/28 | | | 225,000 | | | 253,575 |
KFW International Finance, Inc., 4.75%, 01/24/07 | | | 2,005,000 | | | 2,006,134 |
M & T Bank Corp., 3.85%, 04/01/13 | | | 300,000 | | | 291,999 |
Marshall & Ilsley Bank, 4.13%, 09/04/07 | | | 125,000 | | | 123,678 |
Marshall & Ilsley Bank, 3.80%, 02/08/08 | | | 600,000 | | | 586,603 |
Marshall & Ilsley Bank, 5.25%, 09/04/12 | | | 275,000 | | | 275,298 |
MBNA America Bank Corp., 6.25%, 01/17/07 | | | 495,000 | | | 502,706 |
MBNA America Bank Corp., 5.38%, 01/15/08 | | | 195,000 | | | 196,804 |
MBNA America Bank Corp., 4.63%, 08/03/09 (b) | | | 1,650,000 | | | 1,632,844 |
MBNA America Bank Corp., 5.00%, 05/04/10 | | | 550,000 | | | 548,029 |
MBNA America Bank Corp., 7.13%, 11/15/12 | | | 315,000 | | | 349,907 |
National Bank of Australia, 8.60%, 05/19/10 | | | 300,000 | | | 341,113 |
National City Bank of Indiana, 4.00%, 09/28/07 | | | 300,000 | | | 296,690 |
National City Corp., 3.20%, 04/01/08 | | | 400,000 | | | 386,266 |
National City Corp., 6.20%, 12/15/11 | | | 300,000 | | | 317,942 |
Nationsbank Corp., 6.60%, 05/15/10 | | | 200,000 | | | 212,715 |
| | | | | | |
| | | Principal
Amount | | Value |
| | | | | | | |
Banking (continued) | | | | | | |
Oester Kontroll Bank, 4.50%, 03/09/15 | | $ | 400,000 | | $ | 391,052 |
PNC Funding Corp., 5.25%, 11/15/15 | | | 600,000 | | | 594,934 |
Popular North America, Inc., 4.70%, 06/30/09 | | | 550,000 | | | 543,321 |
Regions Financial Corp., 6.38%, 05/15/12 | | | 150,000 | | | 159,938 |
Sanwa Bank Ltd., 7.40%, 06/15/11 (e) | | | 600,000 | | | 657,172 |
Sovereign Bancorp., Inc., 5.13%, 03/15/13 | | | 200,000 | | | 196,098 |
St. George Bank Ltd., 5.30%, 10/15/15 (b) (e) | | | 400,000 | | | 400,294 |
SunTrust Banks, Inc., 5.20%, 01/17/17 | | | 300,000 | | | 295,793 |
SunTrust Banks, Inc., 5.45%, 12/01/17 | | | 310,000 | | | 310,866 |
U.S. Bancorp, 5.10%, 07/15/07 | | | 500,000 | | | 502,435 |
Union Planters Corp., 4.38%, 12/01/10 | | | 150,000 | | | 145,568 |
Unionbancal Corp., 5.25%, 12/16/13 | | | 350,000 | | | 347,016 |
US Bank NA, 2.85%, 11/15/06 | | | 1,500,000 | | | 1,466,330 |
US Bank NA, 4.95%, 10/30/14 | | | 450,000 | | | 442,310 |
US Bank NA, 4.80%, 04/15/15 | | | 225,000 | | | 218,713 |
US Bank NA, 6.38%, 08/01/11 | | | 250,000 | | | 266,286 |
Wachovia Corp., 4.95%, 11/01/06 | | | 195,000 | | | 195,189 |
Wachovia Corp., 4.85%, 07/30/07 (e) | | | 1,550,000 | | | 1,550,642 |
Wachovia Corp., 3.63%, 02/17/09 | | | 2,175,000 | | | 2,091,973 |
Wachovia Corp., 4.88%, 02/15/14 | | | 310,000 | | | 301,437 |
Wachovia Corp., 5.50%, 08/01/35 | | | 550,000 | | | 518,537 |
Wells Fargo & Co., 3.50%, 04/04/08 (e) | | | 625,000 | | | 606,405 |
Wells Fargo & Co., 3.13%, 04/01/09 | | | 1,400,000 | | | 1,321,715 |
Wells Fargo & Co., 6.45%, 02/01/11 | | | 1,440,000 | | | 1,531,809 |
Wells Fargo & Co., 5.13%, 09/15/16 | | | 350,000 | | | 344,896 |
Wells Fargo & Co., 5.38%, 02/07/35 (e) | | | 450,000 | | | 430,771 |
Westpac Banking Corp., 4.63%, 06/01/18 | | | 250,000 | | | 232,683 |
| | | | | |
|
|
| | | | | | | 61,751,692 |
| | | | | |
|
|
Statement of Investments (Continued)
October 31, 2005
Gartmore Bond Index Fund (Continued)
| | Corporate Bonds (continued) |
| | | | | | |
| | | Principal
Amount | | Value |
| | | | | | | |
Building & Construction (0.3%) | | | | | | |
Catepillar, Inc., 7.30%, 05/01/31 | | $ | 170,000 | | $ | 208,715 |
Centex Corp., 7.88%, 02/01/11 | | | 250,000 | | | 274,198 |
Centex Corp., 7.50%, 01/15/12 | | | 100,000 | | | 108,000 |
Hanson Australia Funding, 5.25%, 03/15/13 | | | 450,000 | | | 442,989 |
Korea Development Bank Corp., 4.25%, 11/13/07 (e) | | | 250,000 | | | 246,631 |
Lennar Corp., 5.95%, 03/01/13 | | | 90,000 | | | 90,261 |
Lennar Corp., 5.50%, 09/01/14 | | | 500,000 | | | 480,399 |
Masco Corp., 5.88%, 07/15/12 | | | 360,000 | | | 370,877 |
MDC Holdings, Inc., 5.50%, 05/15/13 (e) | | | 250,000 | | | 240,873 |
Pulte Homes, Inc., 4.88%, 07/15/09 | | | 575,000 | | | 564,044 |
Pulte Homes, Inc., 7.88%, 08/01/11 | | | 40,000 | | | 43,807 |
Pulte Homes, Inc., 6.25%, 02/15/13 (e) | | | 105,000 | | | 105,846 |
Pulte Homes, Inc., 6.00%, 02/15/35 (e) | | | 250,000 | | | 218,183 |
Ryland Group, 5.38%, 01/15/15 | | | 400,000 | | | 372,860 |
Toll Brothers, Inc., 6.88%, 11/15/12 | | | 150,000 | | | 158,743 |
| | | | | |
|
|
| | | | | | | 3,926,426 |
| | | | | |
|
|
Business Services (0.1%) | | | | | | |
Cendant Corp., 7.38%, 01/15/13 | | | 390,000 | | | 426,207 |
First Data Corp., 3.38%, 08/01/08 | | | 600,000 | | | 577,040 |
Pitney Bowes, Inc., 4.75%, 01/15/16 | | | 500,000 | | | 478,507 |
Pitney Bowes, Inc., 4.75%, 05/15/18 | | | 150,000 | | | 141,331 |
| | | | | |
|
|
| | | | | | | 1,623,085 |
| | | | | |
|
|
Cable (0.4%) | | | | | | |
British Sky Broadcasting Group PLC, 8.20%, 07/15/09 | | | 375,000 | | | 411,494 |
Comcast Corp., 6.20%, 11/15/08 (e) | | | 475,000 | | | 488,978 |
Comcast Corp., 6.88%, 06/15/09 | | | 800,000 | | | 841,799 |
Comcast Corp., 5.85%, 01/15/10 | | | 465,000 | | | 473,128 |
Comcast Corp., 8.38%, 03/15/13 | | | 400,000 | | | 460,763 |
Comcast Corp., 9.46%, 11/15/22 | | | 200,000 | | | 259,715 |
Comcast Corp., 7.05%, 03/15/33 (e) | | | 500,000 | | | 534,570 |
Comcast Corp., 5.65%, 06/15/35 | | | 400,000 | | | 357,684 |
Cox Communications, Inc., 7.13%, 10/01/12 (e) | | | 500,000 | | | 535,558 |
| | | | | | |
| | | Principal
Amount | | Value |
| | | | | | | |
Cable (continued) | | | | | | |
Cox Enterprises, 4.38%, 05/01/08 (b) | | $ | 250,000 | | $ | 244,321 |
Harris Corp., 6.35%, 02/01/28 | | | 250,000 | | | 258,005 |
Teck Cominco Ltd., 6.13%, 10/01/35 | | | 250,000 | | | 234,662 |
USA Interactive, 7.00%, 01/15/13 (e) | | | 300,000 | | | 307,467 |
| | | | | |
|
|
| | | | | | | 5,408,144 |
| | | | | |
|
|
Chemicals (0.2%) | | | | | | |
Albemarle Corp., 5.10%, 02/01/15 | | | 200,000 | | | 192,145 |
Chevron Phillips Chemical, 5.38%, 06/15/07 | | | 100,000 | | | 100,461 |
ICI North America, 8.88%, 11/15/06 | | | 300,000 | | | 311,168 |
Lubrizol Corp., 5.50%, 10/01/14 | | | 600,000 | | | 591,261 |
Lubrizol Corp., 6.50%, 10/01/34 (e) | | | 250,000 | | | 252,925 |
Praxair, Inc., 3.95%, 06/01/13 (e) | | | 300,000 | | | 278,693 |
Rohm & Haas Co., 7.40%, 07/15/09 | | | 156,000 | | | 168,488 |
Rohm & Haas Co., 7.85%, 07/15/29 | | | 200,000 | | | 252,125 |
Yara International Asa, 5.25%, 12/15/14 (b) | | | 250,000 | | | 241,055 |
| | | | | |
|
|
| | | | | | | 2,388,321 |
| | | | | |
|
|
Commercial Services (0.0%) | | | | | | |
Aramark Services, Inc., 6.38%, 02/15/08 | | | 140,000 | | | 143,614 |
Cendant Corp., 6.88%, 08/15/06 | | | 580,000 | | | 587,510 |
| | | | | |
|
|
| | | | | | | 731,124 |
| | | | | |
|
|
Computers (0.3%) | | | | | | |
Computer Associates, Inc., 5.63%, 12/01/14 (b) | | | 250,000 | | | 241,633 |
Dell Computer Corp., 7.10%, 04/15/28 | | | 250,000 | | | 292,595 |
First Data Corp., 6.38%, 12/15/07 | | | 350,000 | | | 360,470 |
Hewlett Packard Co., 3.63%, 03/15/08 | | | 250,000 | | | 243,370 |
Hewlett Packard Co., 6.50%, 07/01/12 | | | 250,000 | | | 268,078 |
IBM Corp., 6.45%, 08/01/07 | | | 115,000 | | | 118,109 |
IBM Corp., 3.80%, 02/01/08 | | | 1,415,000 | | | 1,385,284 |
IBM Corp., 5.50%, 01/15/09 | | | 200,000 | | | 204,260 |
IBM Corp., 4.75%, 11/29/12 | | | 875,000 | | | 863,956 |
| | Corporate Bonds (continued) |
| | | | | | |
| | | Principal
Amount | | Value |
| | | | | | | |
Computers (continued) | | | | | | |
IBM Corp., 5.88%, 11/29/32 | | $ | 415,000 | | $ | 428,434 |
Kern River Funding Corp., 4.89%, 04/30/18 (b) | | | 89,500 | | | 87,243 |
| | | | | |
|
|
| | | | | | | 4,493,432 |
| | | | | |
|
|
Conglomerates (0.1%) | | | | | | |
Fortune Brands, Inc., 2.88%, 12/01/06 | | | 500,000 | | | 488,611 |
Procter & Gamble Co., 6.88%, 09/15/09 (e) | | | 320,000 | | | 343,127 |
Procter & Gamble Co., 4.95%, 08/15/14 | | | 500,000 | | | 497,224 |
Procter & Gamble Co., 5.80%, 08/15/34 | | | 350,000 | | | 359,408 |
| | | | | |
|
|
| | | | | | | 1,688,370 |
| | | | | |
|
|
Containers (0.0%) | | | | | | |
Newell Rubbermaid, Inc., 4.00%, 05/01/10 | | | 150,000 | | | 141,261 |
Sealed Air Corp., 5.38%, 04/15/08 (b) | | | 200,000 | | | 199,801 |
Sealed Air Corp., 6.95%, 05/15/09 (b) | | | 55,000 | | | 57,672 |
| | | | | |
|
|
| | | | | | | 398,734 |
| | | | | |
|
|
Cruise Lines (0.0%) | | | | | | |
Carnival Corp., 3.75%, 11/15/07 (b) | | | 500,000 | | | 488,970 |
| | | | | |
|
|
Department Stores (0.1%) | | | | | | |
Federated Department Stores, 6.63%, 04/01/11 (e) | | | 370,000 | | | 393,376 |
Federated Department Stores, 6.90%, 04/01/29 | | | 250,000 | | | 261,306 |
Kimberly-Clark Corp., 7.10%, 08/01/07 | | | 106,000 | | | 110,112 |
Kimberly-Clark Corp., 5.63%, 02/15/12 (e) | | | 500,000 | | | 517,756 |
Kohl’s Corp., 6.30%, 03/01/11 | | | 50,000 | | | 52,471 |
| | | | | |
|
|
| | | | | | | 1,335,021 |
| | | | | |
|
|
Electric - Integrated (1.4%) | | | | | | |
Alabama Power Co., 5.70%, 02/15/33 | | | 200,000 | | | 201,224 |
Amerenenergy Generating Co., 7.95%, 06/01/32 | | | 105,000 | | | 130,306 |
| | | | | | |
| | | Principal
Amount | | Value |
| | | | | | | |
Electric - Integrated (continued) | | | | | | |
American Electric Power Co., 6.13%, 05/15/06 | | $ | 249,000 | | $ | 250,599 |
Arizona Public Service Co., 5.50%, 09/01/35 | | | 365,000 | | | 337,156 |
Carolina Power & Light, 5.70%, 04/01/35 | | | 300,000 | | | 293,495 |
Cincinnati Gas & Electric Corp., 5.70%, 09/15/12 | | | 70,000 | | | 71,231 |
Commonwealth Edison Corp., 6.15%, 03/15/12 | | | 200,000 | | | 205,925 |
Consolidated Edison, Inc., 7.15%, 12/01/09 | | | 60,000 | | | 64,824 |
Consolidated Edison, Inc., 4.88%, 02/01/13 (e) | | | 210,000 | | | 207,039 |
Consolidated Edison, Inc., 5.88%, 04/01/33 | | | 200,000 | | | 205,234 |
Constellation Energy Group, Inc., 6.13%, 09/01/09 | | | 530,000 | | | 544,978 |
Consumers Energy — ITC, 4.25%, 04/15/08 | | | 205,000 | | | 200,988 |
Consumers Energy — ITC, 4.00%, 05/15/10 | | | 200,000 | | | 190,050 |
Dominion Resource, Inc., 6.30%, 03/15/33 (e) | | | 750,000 | | | 754,325 |
Duke Energy Corp., 3.75%, 03/05/08 (e) | | | 1,200,000 | | | 1,169,044 |
Duke Energy Corp., 6.25%, 01/15/12 | | | 770,000 | | | 806,952 |
Emerson Electric Co., 6.00%, 08/15/32 | | | 140,000 | | | 147,708 |
Entergy Gulf States, Inc., 5.25%, 08/01/15 | | | 300,000 | | | 279,100 |
Entergy Mississippi, Inc., 5.15%, 02/01/13 | | | 490,000 | | | 468,116 |
Exelon Corp., 5.63%, 06/15/35 (e) | | | 400,000 | | | 362,701 |
Firstenergy Corp., 7.38%, 11/15/31 | | | 700,000 | | | 797,133 |
Florida Power & Light Co., 6.88%, 12/01/05 | | | 225,000 | | | 225,414 |
Florida Power & Light Co., 5.85%, 02/01/33 | | | 170,000 | | | 174,562 |
Florida Power & Light Co., 5.90%, 03/01/33 | | | 115,000 | | | 115,690 |
Statement of Investments (Continued)
October 31, 2005
Gartmore Bond Index Fund (Continued)
| | Corporate Bonds (continued) |
| | | | | | |
| | | Principal
Amount | | Value |
| | | | | | | |
Electric - Integrated (continued) | | | | | | |
Florida Power & Light Co., 5.95%, 10/01/33 | | $ | 130,000 | | $ | 134,970 |
Florida Power & Light Co., 5.40%, 09/01/35 | | | 220,000 | | | 211,024 |
FPL Group Capital, Inc., 7.63%, 09/15/06 | | | 85,000 | | | 87,054 |
General Electric Capital Corp., 5.38%, 03/15/07 | | | 650,000 | | | 655,144 |
General Electric Capital Corp., 4.63%, 09/15/09 | | | 1,075,000 | | | 1,063,051 |
General Electric Capital Corp., 3.75%, 12/15/09 | | | 1,400,000 | | | 1,339,150 |
General Electric Capital Corp., 5.00%, 02/01/13 | | | 1,575,000 | | | 1,561,737 |
Georgia Power Corp., 5.13%, 11/15/12 | | | 180,000 | | | 180,692 |
Midamerican Energy Holdings Co., 5.88%, 10/01/12 | | | 675,000 | | | 691,728 |
New York State Electric & Gas Corp., 5.75%, 05/01/23 | | | 100,000 | | | 97,261 |
Nisource Finance Corp., 5.25%, 09/15/17 | | | 440,000 | | | 420,870 |
Ohio Power Co., 6.60%, 02/15/33 (b) | | | 200,000 | | | 214,442 |
Oncor, Inc., 6.38%, 05/01/12 | | | 165,000 | | | 172,987 |
Pacific Gas & Electric, 3.60%, 03/01/09 | | | 1,100,000 | | | 1,051,742 |
Pacific Gas & Electric, 4.80%, 03/01/14 | | | 500,000 | | | 481,385 |
Pacific Gas & Electric Co., 4.20%, 03/01/11 | | | 1,200,000 | | | 1,142,184 |
Pacificorp Corp., 5.25%, 06/15/35 | | | 300,000 | | | 276,565 |
Pepco Holdings, Inc., 6.45%, 08/15/12 | | | 180,000 | | | 188,424 |
Progress Energy, Inc., 5.85%, 10/30/08 (e) | | | 105,000 | | | 106,842 |
Progress Energy, Inc., 7.10%, 03/01/11 | | | 440,000 | | | 470,851 |
PSEG Power Corp., 6.95%, 06/01/12 | | | 125,000 | | | 134,108 |
Public Service Electric & Gas, 5.13%, 09/01/12 | | | 330,000 | | | 329,337 |
| | | | | | |
| | | Principal
Amount | | Value |
| | | | | | | |
Electric - Integrated (continued) | | | | | | |
Public Service New Mexico Corp., 4.40%, 09/15/08 | | $ | 175,000 | | $ | 171,238 |
Puget Energy, Inc., 5.48%, 06/01/35 | | | 250,000 | | | 236,985 |
Scana Corp., 6.88%, 05/15/11 | | | 50,000 | | | 53,840 |
Scana Corp., 6.25%, 02/01/12 | | | 250,000 | | | 263,018 |
Scottish Power, 5.81%, 03/15/25 | | | 200,000 | | | 196,677 |
Southern California Edison Co., 6.00%, 01/15/34 | | | 300,000 | | | 308,462 |
Southern California Edison Co., 5.55%, 01/15/36 | | | 400,000 | | | 386,063 |
Southern Power Co., 6.25%, 07/15/12 | | | 225,000 | | | 235,752 |
Wisconsin Electric Power, 5.63%, 05/15/33 | | | 100,000 | | | 98,212 |
| | | | | |
|
|
| | | | | | | 21,165,589 |
| | | | | |
|
|
Electric - Distribution (0.2%) | | | | | | |
Cincinnati Gas and Electric Co., 5.40%, 06/15/33 | | | 125,000 | | | 112,838 |
Hydro Quebec Corp., 8.88%, 03/01/26 | | | 265,000 | | | 381,780 |
Ohio Power Co., 6.60%, 02/15/33 | | | 200,000 | | | 214,442 |
PPL Electric Utility, 5.88%, 08/15/07 | | | 1,000,000 | | | 1,017,463 |
PSEG Power, 5.50%, 12/01/15 | | | 200,000 | | | 195,325 |
TXU Energy Co., 6.13%, 03/15/08 | | | 770,000 | | | 780,669 |
TXU Energy Co., 6.15%, 11/15/13 (b) | | | 320,000 | | | 339,555 |
Wisconsin Energy Corp., 5.50%, 12/01/08 | | | 300,000 | | | 304,995 |
| | | | | |
|
|
| | | | | | | 3,347,067 |
| | | | | |
|
|
Farm Machinery & Equipment (0.0%) | | | |
Deere & Co., 7.85%, 05/15/10 | | | 220,000 | | | 245,430 |
| | | | | |
|
|
Financial Services (16.3%) | | | | | | |
Ace Ina Holdings, 8.30%, 08/15/06 | | | 250,000 | | | 256,653 |
Ace Ina Holdings, 5.88%, 06/15/14 | | | 350,000 | | | 353,779 |
American Express, 3.75%, 11/20/07 | | | 280,000 | | | 274,582 |
American Express Co., 4.88%, 07/15/13 | | | 285,000 | | | 281,249 |
American General Finance, 4.50%, 11/15/07 | | | 900,000 | | | 893,454 |
| | Corporate Bonds (continued) |
| | | | | | |
| | | Principal
Amount | | Value |
| | | | | | | |
Financial Services (continued) | | | | | | |
American General Finance, 5.38%, 10/01/12 | | $ | 350,000 | | $ | 350,212 |
Associates Corp. of North America, 6.95%, 11/01/18 | | | 575,000 | | | 656,877 |
Axa Financial, Inc., 7.75%, 08/01/10 | | | 450,000 | | | 497,745 |
Axa Financial, Inc., 7.00%, 04/01/28 | | | 225,000 | | | 256,631 |
Bear Stearns Co., Inc., 5.70%, 01/15/07 (e) | | | 1,000,000 | | | 1,009,672 |
Bear Stearns Co., Inc., 5.70%, 11/15/14 | | | 625,000 | | | 638,681 |
Bear Stearns Co., Inc., 4.65%, 07/02/18 | | | 600,000 | | | 553,700 |
Boeing Capital Corp., 5.75%, 02/15/07 | | | 1,200,000 | | | 1,213,838 |
Boeing Capital Corp., 6.10%, 03/01/11 (e) | | | 85,000 | | | 89,266 |
Bskyb Finance UK LTD., 5.63%, 10/15/15 (b) | | | 250,000 | | | 246,181 |
Capital One Bank, 6.88%, 02/01/06 | | | 120,000 | | | 120,676 |
Capital One Bank, 4.88%, 05/15/08 | | | 700,000 | | | 695,732 |
Capital One Financial, 5.25%, 02/21/17 | | | 545,000 | | | 517,864 |
Caterpillar Financial Services Corp., 4.88%, 06/15/07 | | | 90,000 | | | 90,162 |
Caterpillar Financial Services Corp., 2.70%, 07/15/08 (e) | | | 700,000 | | | 662,164 |
Caterpillar Financial Services Corp., 4.50%, 06/15/09 (e) | | | 350,000 | | | 345,483 |
CIT Group Co. of Canada, 5.20%, 06/01/15 (b) | | | 300,000 | | | 292,216 |
CIT Group, Inc., 3.88%, 11/03/08 | | | 780,000 | | | 755,837 |
CIT Group, Inc., 4.75%, 12/15/10 | | | 340,000 | | | 334,421 |
CIT Group, Inc., 5.13%, 09/30/14 | | | 425,000 | | | 416,127 |
CitiFinancial Credit Co., 10.00%, 05/15/09 | | | 100,000 | | | 115,468 |
Countrywide Financial Corp., 5.63%, 07/15/09 | | | 950,000 | | | 963,916 |
Countrywide Home Loan, 3.25%, 05/21/08 | | | 305,000 | | | 292,138 |
Countrywide Home Loan, 4.00%, 03/22/11 | | | 900,000 | | | 844,580 |
Credit Suisse First Boston USA, Inc., 5.75%, 04/15/07 | | | 300,000 | | | 303,994 |
| | | | | | |
| | | Principal
Amount | | Value |
| | | | | | | |
Financial Services (continued) | | | | | | |
Credit Suisse First Boston USA, Inc., 4.63%, 01/15/08 | | $ | 1,525,000 | | $ | 1,517,907 |
Credit Suisse First Boston USA, Inc., 6.13%, 11/15/11 | | | 450,000 | | | 471,329 |
Credit Suisse First Boston USA, Inc., 6.50%, 01/15/12 | | | 600,000 | | | 640,638 |
Credit Suisse First Boston USA, Inc., 5.13%, 01/15/14 | | | 290,000 | | | 286,171 |
Credit Suisse First Boston USA, Inc., 4.19%, 05/15/14 (d) | | | 8,928,123 | | | 8,931,545 |
Credit Suisse First Boston USA, Inc., 4.17%, 08/15/18 (d) | | | 10,485,963 | | | 10,485,239 |
Credit Suisse First Boston USA, Inc., 4.11%, 02/15/20 (d) | | | 19,382,632 | | | 19,382,573 |
Credit Suisse First Boston USA, Inc., 7.13%, 07/15/32 | | | 400,000 | | | 469,038 |
Credit Suisse USA, 4.13%, 01/15/10 | | | 675,000 | | | 650,666 |
Erp Operating LP, 5.25%, 09/15/14 (e) | | | 800,000 | | | 790,821 |
Financing Corp., 9.80%, 11/30/17 | | | 30,000 | | | 42,720 |
Ford Motor Credit Co., 6.88%, 02/01/06 | | | 1,194,000 | | | 1,193,386 |
Ford Motor Credit Co., 6.50%, 01/25/07 | | | 950,000 | | | 938,726 |
Ford Motor Credit Co., 4.95%, 01/15/08 | | | 1,600,000 | | | 1,500,526 |
Ford Motor Credit Co., 7.25%, 10/25/11 | | | 2,125,000 | | | 1,980,472 |
Ford Motor Credit Co., 7.00%, 10/01/13 (e) | | | 1,400,000 | | | 1,281,372 |
General Electric Capital Corp., 4.25%, 01/15/08 | | | 1,480,000 | | | 1,462,552 |
General Electric Capital Corp., 5.88%, 02/15/12 | | | 100,000 | | | 104,454 |
General Electric Capital Corp., 6.00%, 06/15/12 | | | 445,000 | | | 468,056 |
General Electric Capital Corp., 5.45%, 01/15/13 | | | 200,000 | | | 203,616 |
General Electric Capital Corp., 4.88%, 03/04/15 | | | 600,000 | | | 587,121 |
General Electric Capital Corp., 6.75%, 03/15/32 | | | 2,145,000 | | | 2,453,372 |
Statement of Investments (Continued)
October 31, 2005
Gartmore Bond Index Fund (Continued)
| | Corporate Bonds (continued) |
| | | | | | |
| | | Principal
Amount | | Value |
| | | | | | | |
Financial Services (continued) | | | | | | |
Golden West Financial Corp., 4.75%, 10/01/12 | | $ | 265,000 | | $ | 258,059 |
Goldman Sachs Group, Inc., 4.13%, 01/15/08 | | | 1,060,000 | | | 1,043,814 |
Goldman Sachs Group, Inc., 3.88%, 01/15/09 | | | 1,000,000 | | | 967,239 |
Goldman Sachs Group, Inc., 6.65%, 05/15/09 | | | 700,000 | | | 735,848 |
Goldman Sachs Group, Inc., 6.60%, 01/15/12 | | | 175,000 | | | 187,039 |
Goldman Sachs Group, Inc., 5.25%, 04/01/13 | | | 1,125,000 | | | 1,116,835 |
Goldman Sachs Group, Inc., 5.25%, 10/15/13 | | | 1,475,000 | | | 1,458,726 |
Goldman Sachs Group, Inc., 6.13%, 02/15/33 | | | 1,200,000 | | | 1,211,345 |
Greenwich Capital Commercial Funding Corp., 4.06%, 11/05/19 (d) | | | 20,000,000 | | | 20,004,625 |
Harley Davidson Funding, 3.63%, 12/15/08 (b) | | | 600,000 | | | 578,409 |
Household Finance Corp., 5.88%, 02/01/09 | | | 1,620,000 | | | 1,658,459 |
Household Finance Corp., 7.00%, 05/15/12 | | | 1,375,000 | | | 1,500,989 |
HSBC Finance Corp., 5.00%, 06/30/15 | | | 400,000 | | | 385,338 |
International Lease Finance Corp., 4.38%, 12/15/05 | | | 125,000 | | | 124,988 |
International Lease Finance Corp., 5.00%, 04/15/10 | | | 1,000,000 | | | 992,259 |
J Paul Getty Trust Corp., 5.88%, 10/01/33 | | | 500,000 | | | 507,266 |
John Deere Capital Corp., 3.90%, 01/15/08 | | | 1,000,000 | | | 980,029 |
John Deere Capital Corp., 4.40%, 07/15/09 | | | 650,000 | | | 639,179 |
John Hancock Financial Services, Inc., 5.63%, 12/01/08 | | | 100,000 | | | 102,085 |
JP Morgan Chase & Co., 4.15%, 04/16/19 (d) | | | 20,000,000 | | | 20,013,541 |
JP Morgan Chase Commercial Mortgage, 4.15%, 02/15/19 (d) | | | 23,644,855 | | | 24,368,999 |
| | | | | | |
| | | Principal
Amount | | Value |
| | | | | | | |
Financial Services (continued) | | | | | | |
KFW International Finance, 3.25%, 03/30/09 | | $ | 900,000 | | $ | 860,777 |
KFW International Finance, 5.13%, 05/13/09 | | | 1,500,000 | | | 1,525,016 |
KFW International Finance, 4.38%, 07/21/15 (e) | | | 450,000 | | | 434,275 |
Korea Development Bank, 4.75%, 07/20/09 | | | 1,500,000 | | | 1,479,990 |
Lehman Brothers Holdings, Inc., 3.50%, 08/07/08 | | | 1,000,000 | | | 964,252 |
Lehman Brothers Holdings, Inc., 4.25%, 01/27/10 | | | 775,000 | | | 751,367 |
Lehman Brothers Holdings, Inc., 7.88%, 08/15/10 | | | 97,000 | | | 108,023 |
Lehman Brothers Holdings, Inc., 6.63%, 01/18/12 | | | 890,000 | | | 956,188 |
Lehman Brothers Holdings, Inc., 4.80%, 03/13/14 | | | 600,000 | | | 580,408 |
Lehman Brothers Holdings, Inc., 4.14%, 10/15/17 (d) | | | 20,000,000 | | | 20,011,873 |
Lehman Brothers Holdings, Inc., 4.07%, 07/15/18 (d) | | | 10,498,871 | | | 10,498,871 |
Mellon Financial Corp., 7.00%, 03/15/06 | | | 200,000 | | | 201,667 |
Mellon Financial Corp., 6.40%, 05/14/11 | | | 450,000 | | | 478,944 |
Mellon Financial Corp., 5.00%, 12/01/14 | | | 200,000 | | | 197,351 |
Morgan Stanley, 5.80%, 04/01/07 | | | 850,000 | | | 860,356 |
Morgan Stanley, 3.63%, 04/01/08 | | | 1,750,000 | | | 1,700,274 |
Morgan Stanley, 6.60%, 04/01/12 | | | 450,000 | | | 482,508 |
Morgan Stanley, 5.30%, 03/01/13 | | | 625,000 | | | 622,564 |
Morgan Stanley, 4.75%, 04/01/14 | | | 1,000,000 | | | 943,340 |
Morgan Stanley, 7.25%, 04/01/32 | | | 250,000 | | | 292,247 |
National Rural Utilities, 4.75%, 03/01/14 | | | 550,000 | | | 534,889 |
Nisource Finance Corp., 7.63%, 11/15/05 | | | 170,000 | | | 170,177 |
Prudential Financial, Inc., 3.75%, 05/01/08 | | | 655,000 | | | 643,226 |
Prudential Financial, Inc., 5.10%, 09/20/14 | | | 500,000 | | | 491,767 |
Residential Capital Corp., 6.38%, 06/30/10 | | | 500,000 | | | 507,872 |
| | Corporate Bonds (continued) |
| | | | | | |
| | | Principal
Amount | | Value |
| | | | | | | |
Financial Services (continued) | | | | | | |
Residential Capital Corp., 6.88%, 06/30/15 | | $ | 300,000 | | $ | 316,074 |
Residential Capital Corp., 4.39%, 08/25/35 (d) | | | 14,703,179 | | | 14,680,693 |
Royal Bank of Scotland Group, 5.00%, 11/12/13 (e) | | | 400,000 | | | 397,864 |
Royal Bank of Scotland Group, 5.05%, 01/08/15 (e) | | | 535,000 | | | 525,739 |
Royal Bank of Scotland Group, 4.70%, 07/03/18 | | | 800,000 | | | 750,187 |
SLM Corp., 5.38%, 05/15/14 | | | 1,850,000 | | | 1,864,251 |
Synovus Financial Corp., 4.88%, 02/15/13 | | | 150,000 | | | 145,846 |
Textron Financial Corp., 4.13%, 03/03/08 | | | 600,000 | | | 589,741 |
Wachovia Bank Commercial Mortgage, 4.14%, 10/15/15 (d) | | | 30,000,000 | | | 30,018,149 |
Washington Mutual, Inc., 5.63%, 01/15/07 | | | 900,000 | | | 907,340 |
Washington Mutual, Inc., 4.38%, 01/15/08 (e) | | | 750,000 | | | 741,824 |
Washington Mutual, Inc., 5.50%, 01/15/13 (e) | | | 445,000 | | | 447,894 |
Washington Mutual, Inc., 5.65%, 08/15/14 | | | 500,000 | | | 503,884 |
| | | | | |
|
|
| | | | | | | 247,188,377 |
| | | | | |
|
|
Food & Related (0.9%) | | | | | | |
Anheuser-Busch Co., Inc., 4.38%, 01/15/13 | | | 50,000 | | | 48,190 |
Anheuser-Busch Co., Inc., 5.00%, 03/01/19 | | | 400,000 | | | 385,642 |
Anheuser-Busch Co., Inc., 6.00%, 11/01/41 | | | 250,000 | | | 258,678 |
Archer Daniels Midland Co., 5.94%, 10/01/32 | | | 585,000 | | | 597,266 |
Cadbury Schweppes PLC, 5.13%, 10/01/13 (b) | | | 300,000 | | | 295,550 |
Campbell Soup Co., 4.88%, 10/01/13 | | | 400,000 | | | 392,737 |
Coca-Cola Bottling Co., 5.00%, 11/15/12 | | | 150,000 | | | 148,061 |
Coca-Cola Enterprises, Inc., 6.13%, 08/15/11 (e) | | | 535,000 | | | 567,846 |
| | | | | | |
| | | Principal
Amount | | Value |
| | | | | | | |
Food & Related (continued) | | | | | | |
Coca-Cola Enterprises, Inc., 6.95%, 11/15/26 | | $ | 250,000 | | $ | 284,009 |
Coca-Cola Enterprises, Inc., 6.75%, 09/15/28 (e) | | | 395,000 | | | 442,159 |
Conagra Foods, Inc., 6.75%, 09/15/11 | | | 150,000 | | | 159,551 |
Conagra Foods, Inc., 7.00%, 10/01/28 | | | 375,000 | | | 400,884 |
Diageo Capital PLC, 3.50%, 11/19/07 | | | 860,000 | | | 838,684 |
Diageo Capital PLC, 5.30%, 10/28/15 | | | 250,000 | | | 248,857 |
General Mills, Inc., 5.13%, 02/15/07 | | | 350,000 | | | 350,465 |
General Mills, Inc., 6.00%, 02/15/12 | | | 452,000 | | | 471,160 |
HJ Heinz Finance, 6.75%, 03/15/32 | | | 150,000 | | | 165,215 |
Kellogg Co., 2.88%, 06/01/08 | | | 1,025,000 | | | 975,046 |
Kraft Foods, Inc., 4.63%, 11/01/06 | | | 60,000 | | | 59,825 |
Kraft Foods, Inc., 4.13%, 11/12/09 | | | 1,000,000 | | | 965,968 |
Kraft Foods, Inc., 5.63%, 11/01/11 | | | 794,000 | | | 811,594 |
Kraft Foods, Inc., 6.50%, 11/01/31 (e) | | | 320,000 | | | 344,915 |
Kroger Co., 6.80%, 04/01/11 | | | 340,000 | | | 355,309 |
Kroger Co., 6.20%, 06/15/12 | | | 400,000 | | | 407,368 |
Kroger Co., 7.50%, 04/01/31 | | | 435,000 | | | 459,551 |
Miller Brewing Co., 5.50%, 08/15/13 (b) | | | 250,000 | | | 251,998 |
Pepsi Bottling Group, Inc., 7.00%, 03/01/29 | | | 350,000 | | | 412,316 |
Pepsiamericas, Inc., 4.88%, 01/15/15 | | | 750,000 | | | 729,186 |
Safeway, Inc., 6.15%, 03/01/06 | | | 150,000 | | | 150,370 |
Safeway, Inc., 6.50%, 03/01/11 (e) | | | 400,000 | | | 410,917 |
Sara Lee Corp., 6.25%, 09/15/11 | | | 425,000 | | | 438,061 |
Supervalu, Inc., 7.50%, 05/15/12 | | | 125,000 | | | 133,506 |
Sysco Corp., 5.38%, 09/21/35 | | | 180,000 | | | 173,639 |
Tricon Global Restaurant, 8.88%, 04/15/11 | | | 200,000 | | | 232,958 |
Wrigley JR Co., 4.65%, 07/15/15 | | | 365,000 | | | 351,987 |
| | | | | |
|
|
| | | | | | | 13,719,468 |
| | | | | |
|
|
Healthcare Services (0.1%) | | | | | | |
Eli Lilly & Co., 6.00%, 03/15/12 (e) | | | 300,000 | | | 316,797 |
Eli Lilly & Co., 7.13%, 06/01/25 | | | 200,000 | | | 236,977 |
Statement of Investments (Continued)
October 31, 2005
Gartmore Bond Index Fund (Continued)
| | Corporate Bonds (continued) |
| | | | | | |
| | | Principal
Amount | | Value |
| | | | | | | |
Healthcare Services (continued) | | | | | | |
Health Care Property Investors, Inc., 6.45%, 06/25/12 | | $ | 95,000 | | $ | 98,982 |
Wellpoint, Inc., 5.95%, 12/15/34 | | | 200,000 | | | 202,485 |
| | | | | |
|
|
| | | | | | | 855,241 |
| | | | | |
|
|
Hotels (0.1%) | | | | | | |
Harrahs Operating Co., Inc., 7.13%, 06/01/07 | | | 400,000 | | | 411,965 |
Harrahs Operating Co., Inc., 5.50%, 07/01/10 | | | 380,000 | | | 377,354 |
Harrahs Operating Co., Inc., 5.63%, 06/01/15 (b) | | | 500,000 | | | 479,785 |
Harrahs Operating Co., Inc., 5.75%, 10/01/17 (b) | | | 375,000 | | | 354,869 |
| | | | | |
|
|
| | | | | | | 1,623,973 |
| | | | | |
|
|
Household Products (0.0%) | | | | | | |
Clorox Co., 4.20%, 01/15/10 | | | 530,000 | | | 516,038 |
| | | | | |
|
|
Insurance (0.8%) | | | | | | |
Allstate Corp., 5.38%, 12/01/06 | | | 675,000 | | | 678,100 |
Allstate Corp., 6.13%, 02/15/12 | | | 430,000 | | | 449,857 |
Allstate Corp., 6.13%, 12/15/32 | | | 200,000 | | | 202,942 |
American General Corp., 7.50%, 07/15/25 | | | 250,000 | | | 299,351 |
Berkley Corp., 5.13%, 09/30/10 | | | 175,000 | | | 172,906 |
Berkshire Hathaway, Inc., 4.13%, 01/15/10 | | | 1,400,000 | | | 1,359,114 |
Farmers Insurance Exchange, 8.63%, 05/01/24 (b) | | | 400,000 | | | 472,647 |
Hartford Financial Services Group, 4.75%, 03/01/14 | | | 200,000 | | | 192,227 |
Hartford Life, Inc., 7.38%, 03/01/31 | | | 100,000 | | | 118,365 |
Infinity Property & Casualty, 5.50%, 02/18/14 | | | 200,000 | | | 192,764 |
ING Sec Life Institutional Fund, 4.25%, 01/15/10 (b) | | | 2,000,000 | | | 1,940,274 |
Marsh & McLennan Cos., Inc., 6.25%, 03/15/12 | | | 175,000 | | | 179,006 |
Marsh & McLennan Cos., Inc., 5.75%, 09/15/15 | | | 820,000 | | | 797,708 |
Metlife, Inc., 6.13%, 12/01/11 | | | 835,000 | | | 877,425 |
Metlife, Inc., 5.70%, 06/15/35 | | | 300,000 | | | 289,651 |
Monumental Global Funding II, 4.38%, 07/30/09 (b) | | | 500,000 | | | 488,085 |
| | | | | | |
| | | Principal
Amount | | Value |
| | | | | | | |
Insurance (continued) | | | | | | |
New York Life Insurance, 5.88%, 05/15/33 (b) (e) | | $ | 200,000 | | $ | 202,705 |
NLV Financial Corp., 7.50%, 08/15/33 (b) | | | 125,000 | | | 134,723 |
North Front Pass, 5.81%, 12/15/24 | | | 500,000 | | | 494,780 |
Principal Life Global Funding, 6.25%, 02/15/12 (b) | | | 150,000 | | | 158,840 |
Progressive Corp., 6.25%, 12/01/32 (e) | | | 150,000 | | | 157,656 |
RLI Corp., 5.95%, 01/15/14 (e) | | | 200,000 | | | 197,322 |
St. Paul Travelers Companies, Inc., 5.01%, 08/16/07 | | | 225,000 | | | 224,357 |
Travelers Property Casualty Corp., 6.38%, 03/15/33 | | | 200,000 | | | 202,693 |
Western & Southern Finance, 5.75%, 07/15/33 (b) | | | 250,000 | | | 244,555 |
Willis Group North America, Inc., 5.63%, 07/15/15 (e) | | | 300,000 | | | 294,369 |
XL Capital Ltd., 5.25%, 09/15/14 | | | 1,020,000 | | | 977,371 |
| | | | | |
|
|
| | | | | | | 11,999,793 |
| | | | | |
|
|
Manufacturing (0.2%) | | | | | | |
Cooper Industries, Inc., 5.50%, 11/01/09 | | | 175,000 | | | 177,500 |
Dover, Corp., 4.88%, 10/15/15 | | | 380,000 | | | 371,064 |
Honeywell International, Inc., 6.13%, 11/01/11 | | | 250,000 | | | 263,091 |
Norsk Hydro AS, 6.36%, 01/15/09 | | | 460,000 | | | 478,977 |
Tyco International Group SA, 6.13%, 01/15/09 | | | 635,000 | | | 654,549 |
Tyco International Group SA, 6.00%, 11/15/13 (e) | | | 1,100,000 | | | 1,141,082 |
Tyco International Group SA, 6.88%, 01/15/29 | | | 125,000 | | | 138,925 |
| | | | | |
|
|
| | | | | | | 3,225,188 |
| | | | | |
|
|
Medical Products (0.3%) | | | | | | |
Amgen, Inc., 4.00%, 11/18/09 | | | 325,000 | | | 314,618 |
Baxter International, Inc., 4.63%, 03/15/15 (b) | | | 130,000 | | | 122,753 |
Boston Scientific, 5.45%, 06/15/14 (e) | | | 600,000 | | | 597,923 |
Johnson & Johnson, 4.95%, 05/15/33 (e) | | | 700,000 | | | 664,708 |
| | Corporate Bonds (continued) |
| | | | | | |
| | | Principal
Amount | | Value |
| | | | | | | |
Medical Products (continued) | | | | | | |
Medtronic, Inc., 4.38%, 09/15/10 (b) (e) | | $ | 315,000 | | $ | 307,767 |
Quest Diagnostic, Inc., 5.45%, 11/01/15 (b) | | | 550,000 | | | 548,323 |
Wyeth, 5.50%, 02/01/14 | | | 900,000 | | | 906,437 |
Wyeth, 6.50%, 02/01/34 | | | 350,000 | | | 380,705 |
| | | | | |
|
|
| | | | | | | 3,843,234 |
| | | | | |
|
|
Metals & Minerals (0.2%) | | | | | | |
Alcan, Inc., 6.45%, 03/15/11 | | | 75,000 | | | 78,817 |
Alcan, Inc., 4.50%, 05/15/13 | | | 230,000 | | | 217,029 |
Alcan, Inc., 5.75%, 06/01/35 (e) | | | 700,000 | | | 658,401 |
Alcoa, Inc., 6.00%, 01/15/12 | | | 310,000 | | | 323,036 |
Barrick Gold Finance, Inc., 4.88%, 11/15/14 | | | 390,000 | | | 371,401 |
BHP Billiton Ltd., 4.80%, 04/15/13 (b) | | | 400,000 | | | 391,810 |
Codelco, Inc., 6.38%, 11/30/12 (b) | | | 120,000 | | | 127,821 |
Inco Ltd., 7.75%, 05/15/12 | | | 300,000 | | | 333,560 |
Newmont Minning Corp., 5.88%, 04/01/35 | | | 400,000 | | | 384,228 |
Noranda, Inc., 6.20%, 06/15/35 | | | 300,000 | | | 281,678 |
Placer Dome, Inc., 6.38%, 03/01/33 | | | 235,000 | | | 238,027 |
| | | | | |
|
|
| | | | | | | 3,405,808 |
| | | | | |
|
|
Multimedia (0.6%) | | | | | | |
AOL Time Warner, Inc., 6.13%, 04/15/06 (e) | | | 475,000 | | | 477,813 |
AOL Time Warner, Inc., 6.88%, 05/01/12 | | | 820,000 | | | 877,694 |
AOL Time Warner, Inc., 6.88%, 06/15/18 | | | 298,000 | | | 318,663 |
AOL Time Warner, Inc., 7.63%, 04/15/31 | | | 300,000 | | | 338,254 |
AOL Time Warner, Inc., 7.70%, 05/01/32 | | | 1,130,000 | | | 1,286,947 |
Belo Corp., 8.00%, 11/01/08 | | | 145,000 | | | 154,510 |
Clear Channel Communications, Inc., 4.40%, 05/15/11 | | | 200,000 | | | 184,522 |
Gannet Co., Inc., 5.50%, 04/01/07 | | | 185,000 | | | 186,791 |
Johnson Controls, Inc., 4.88%, 09/15/13 | | | 300,000 | | | 291,397 |
News America Holdings, Inc., 9.25%, 02/01/13 | | | 200,000 | | | 242,646 |
| | | | | | |
| | | Principal
Amount | | Value |
| | | | | | | |
Multimedia (continued) | | | | | | |
News America Holdings, Inc., 8.00%, 10/17/16 | | $ | 200,000 | | $ | 232,649 |
News America Holdings, Inc., 7.28%, 06/30/28 | | | 130,000 | | | 139,177 |
News America Holdings, Inc., 6.20%, 12/15/34 | | | 500,000 | | | 481,802 |
Reed Elsevier Capital, 6.13%, 08/01/06 | | | 900,000 | | | 906,241 |
Viacom, Inc., 5.63%, 05/01/07 | | | 1,000,000 | | | 1,008,741 |
Viacom, Inc., 5.63%, 08/15/12 | | | 250,000 | | | 248,065 |
Viacom, Inc., 7.88%, 07/30/30 | | | 135,000 | | | 150,320 |
Viacom, Inc., 5.50%, 05/15/33 | | | 200,000 | | | 172,862 |
Walt Disney Co., 5.38%, 06/01/07 (e) | | | 725,000 | | | 730,903 |
Walt Disney Co., 6.38%, 03/01/12 | | | 236,000 | | | 248,561 |
Walt Disney Co., 6.20%, 06/20/14 | | | 400,000 | | | 423,123 |
| | | | | |
|
|
| | | | | | | 9,101,681 |
| | | | | |
|
|
Non-Hazardous Waste Disposal (0.1%) | | | |
Waste Management, Inc., 7.38%, 08/01/10 | | | 250,000 | | | 271,809 |
Waste Management, Inc., 6.38%, 11/15/12 (e) | | | 350,000 | | | 370,126 |
Waste Management, Inc., 7.00%, 7/15/28 | | | 275,000 | | | 303,004 |
| | | | | |
|
|
| | | | | | | 944,939 |
| | | | | |
|
|
Oil & Gas (1.5%) | | | | | | |
AGL Capital Corp., 4.45%, 04/15/13 (b) | | | 300,000 | | | 285,529 |
Amerada Hess Corp., 7.30%, 08/15/31 | | | 600,000 | | | 677,581 |
Anadarko Petroleum Corp., 7.50%, 05/01/31 | | | 505,000 | | | 607,044 |
Apache Corp., 6.25%, 04/15/12 (e) | | | 390,000 | | | 418,055 |
Apache Corp., 7.63%, 07/01/19 | | | 100,000 | | | 121,404 |
Apache Finance Canada, 4.38%, 05/15/15 | | | 400,000 | | | 381,510 |
Atmos Energy Corp., 5.13%, 01/15/13 | | | 225,000 | | | 220,295 |
Australian Gas Light Co., 5.30%, 09/25/15 (b) | | | 150,000 | | | 147,400 |
BP Amoco PLC, 5.90%, 04/15/09 | | | 200,000 | | | 207,415 |
Statement of Investments (Continued)
October 31, 2005
Gartmore Bond Index Fund (Continued)
| | Corporate Bonds (continued) |
| | | | | | |
| | | Principal
Amount | | Value |
| | | | | | | |
Oil & Gas (continued) | | | | | | |
BP Capital Markets America, 4.20%, 06/15/18 | | $ | 250,000 | | $ | 226,130 |
Brascan Corp., 5.75%, 03/01/10 | | | 305,000 | | | 310,008 |
Burlington Resources Finance Co., 6.40%, 08/15/11 | | | 210,000 | | | 221,447 |
Burlington Resources, Inc., 6.50%, 12/01/11 | | | 350,000 | | | 374,890 |
ChevronTexaco Capital Corp., 3.50%, 09/17/07 | | | 90,000 | | | 88,127 |
ChevronTexaco Capital Corp., 3.38%, 02/15/08 | | | 500,000 | | | 485,361 |
ChevronTexaco Capital Corp., 8.63%, 06/30/10 | | | 120,000 | | | 138,746 |
Colonial Pipeline, 7.63%, 04/15/32 (b) | | | 365,000 | | | 466,292 |
Conoco Funding Co., 6.35%, 10/15/11 | | | 600,000 | | | 641,918 |
Conoco Funding Co., 4.75%, 10/15/12 (e) | | | 1,300,000 | | | 1,286,434 |
Conoco, Inc., 6.35%, 04/15/09 | | | 250,000 | | | 263,388 |
Conoco, Inc., 6.95%, 04/15/29 | | | 170,000 | | | 201,498 |
Conocophillips, 5.90%, 10/15/32 (e) | | | 300,000 | | | 315,881 |
Consolidated Natural Gas, Inc., 5.38%, 11/01/06 | | | 60,000 | | | 60,310 |
Consolidated Natural Gas, Inc., 6.25%, 11/01/11 | | | 264,000 | | | 277,026 |
Devon Financing Corp., 6.88%, 09/30/11 | | | 140,000 | | | 151,593 |
Encana Corp., 4.75%, 10/15/13 | | | 575,000 | | | 559,075 |
Encana Holdings Finance Corp., 5.80%, 05/01/14 | | | 425,000 | | | 441,768 |
Enterprise Products, 5.60%, 10/15/14 | | | 800,000 | | | 785,098 |
Halliburton Co., 5.50%, 10/15/10 (e) | | | 400,000 | | | 408,311 |
Keyspan Corp., 7.63%, 11/15/10 | | | 210,000 | | | 233,598 |
Keyspan Corp., 5.80%, 04/01/35 | | | 400,000 | | | 406,682 |
Kinder Morgan Energy Partners LP, 7.50%, 11/01/10 | | | 351,000 | | | 384,496 |
Kinder Morgan Energy Partners LP, 6.75%, 03/15/11 | | | 155,000 | | | 164,885 |
Kinder Morgan Energy Partners LP, 6.50%, 09/01/12 | | | 300,000 | | | 317,467 |
| | | | | | |
| | | Principal
Amount | | Value |
| | | | | | | |
Oil & Gas (continued) | | | | | | |
Kinder Morgan Energy Partners LP, 5.15%, 03/01/15 (e) | | $ | 165,000 | | $ | 159,416 |
Kinder Morgan Energy Partners LP, 5.80%, 03/15/35 (e) | | | 350,000 | | | 326,244 |
Marathon Oil Corp., 5.38%, 06/01/07 | | | 810,000 | | | 815,946 |
Marathon Oil Corp, 6.80%, 03/15/32 | | | 200,000 | | | 224,484 |
Motiva Enterprises Corp., 5.20%, 09/15/12 (b) | | | 125,000 | | | 123,908 |
Murphy Oil Corp., 6.38%, 05/01/12 | | | 100,000 | | | 106,152 |
Nabors, Inc., 5.38%, 08/15/12 | | | 70,000 | | | 70,752 |
Nexen, Inc., 5.05%, 11/20/13 | | | 500,000 | | | 488,781 |
Occidental Petroleum, 6.75%, 01/15/12 (e) | | | 450,000 | | | 493,947 |
Ocean Energy, Inc., 7.25%, 10/01/11 | | | 980,000 | | | 1,074,843 |
Pemex Project Funding Master, 9.13%, 10/13/10 (e) | | | 885,000 | | | 1,016,422 |
Pemex Project Funding Master, 7.38%, 12/15/14 | | | 625,000 | | | 683,125 |
Pemex Project Funding Master Trust Corp., 6.63%, 06/15/35 (b) | | | 250,000 | | | 240,000 |
PETRO-CANADA, 5.95%, 05/15/35 | | | 300,000 | | | 292,863 |
Petroleos Mexicanos, 8.85%, 09/15/07 (b) (e) | | | 475,000 | | | 506,588 |
Praxair, Inc., 6.50%, 03/01/08 | | | 390,000 | | | 401,953 |
PTT Public Co. Ltd., 5.88%, 08/03/38 | | | 300,000 | | | 277,081 |
South Carolina Electric & Gas Co., 4.80%, 10/01/12 | | | 650,000 | | | 638,399 |
Talisman Energy, Inc., 7.25%, 10/15/27 | | | 225,000 | | | 254,438 |
Transocean Sedco Forex, Inc., 7.50%, 04/15/31 | | | 300,000 | | | 367,396 |
Valero Energy Corp., 6.88%, 04/15/12 | | | 300,000 | | | 325,268 |
Valero Energy Corp., 7.50%, 04/15/32 (e) | | | 200,000 | | | 235,932 |
XTO Energy, Inc., 4.90%, 02/01/14 | | | 250,000 | | | 240,945 |
XTO Energy, Inc., 5.30%, 06/30/15 | | | 225,000 | | | 222,286 |
| | | | | |
|
|
| | | | | | | 21,863,831 |
| | | | | |
|
|
| | Corporate Bonds (continued) |
| | | | | | |
| | | Principal
Amount | | Value |
| | | | | | | |
Paper & Forest Products (0.2%) | | | | | | |
Celulosa Arauco Constitucion SA, 5.13%, 07/09/13 | | $ | 300,000 | | $ | 286,328 |
International Paper Co., 4.00%, 04/01/10 | | | 850,000 | | | 795,562 |
International Paper Co., 5.85%, 10/30/12 | | | 300,000 | | | 300,510 |
Inversiones CMPC SA, 4.88%, 06/18/13 (b) | | | 300,000 | | | 287,368 |
Norske Skogindustrier, 6.13%, 10/15/15 (b) | | | 150,000 | | | 144,760 |
Sappi Papier Holding AG, 6.75%, 06/15/12 (b) | | | 80,000 | | | 79,325 |
Westvaco Corp., 7.95%, 02/15/31 | | | 200,000 | | | 223,370 |
Weyerhaeuser Co., 5.95%, 11/01/08 (e) | | | 309,000 | | | 316,260 |
Weyerhaeuser Co., 6.75%, 03/15/12 | | | 725,000 | | | 767,701 |
Weyerhaeuser Co., 7.38%, 03/15/32 | | | 375,000 | | | 403,952 |
| | | | | |
|
|
| | | | | | | 3,605,136 |
| | | | | |
|
|
Pharmaceuticals (0.2%) | | | | | | |
Abbott Laboratories, 5.63%, 07/01/06 | | | 104,000 | | | 104,747 |
Abbott Laboratories, 6.40%, 12/01/06 | | | 550,000 | | | 559,393 |
Abbott Laboratories, 5.40%, 09/15/08 | | | 250,000 | | | 253,857 |
Abbott Laboratories, 3.50%, 02/17/09 | | | 200,000 | | | 192,261 |
Astrazeneca PLC, 5.40%, 06/01/14 | | | 500,000 | | | 510,399 |
Genentech, Inc., 4.40%, 07/15/10 (b) | | | 280,000 | | | 273,939 |
Glaxosmithkline PLC, 5.38%, 04/15/34 | | | 340,000 | | | 334,873 |
Merck & Co., Inc., 5.95%, 12/01/28 | | | 275,000 | | | 272,939 |
Pfizer, Inc., 4.65%, 03/01/18 | | | 450,000 | | | 427,257 |
Pharmacia Corp., 6.60%, 12/01/28 | | | 300,000 | | | 341,545 |
| | | | | |
|
|
| | | | | | | 3,271,210 |
| | | | | |
|
|
Pipelines (0.1%) | | | | | | |
Centerpoint Energy Resources, 7.88%, 04/01/13 | | | 600,000 | | | 677,598 |
Panhandle Eastern Pipeline, 2.75%, 03/15/07 (b) | | | 400,000 | | | 388,567 |
| | | | | | |
| | | Principal
Amount | | Value |
| | | | | | | |
Pipelines (continued) | | | | | | |
Plains All American Pipeline, 5.63%, 12/15/13 | | $ | 560,000 | | $ | 560,503 |
Texas Gas Transmission, 4.60%, 06/01/15 (b) | | | 300,000 | | | 279,880 |
TGT Pipelines LLC, 5.20%, 06/01/18 | | | 150,000 | | | 140,634 |
| | | | | |
|
|
| | | | | | | 2,047,182 |
| | | | | |
|
|
Printing (0.0%) | | | | | | |
Donnelley (R.R) & Sons Co., 4.95%, 04/01/14 | | | 200,000 | | | 188,927 |
| | | | | |
|
|
Publishing - Newspapers (0.1%) | | | | | | |
Gannett Co., 6.38%, 04/01/12 (e) | | | 400,000 | | | 425,268 |
Thomson Corp., 4.25%, 08/15/09 | | | 425,000 | | | 412,726 |
| | | | | |
|
|
| | | | | | | 837,994 |
| | | | | |
|
|
Real Estate Investment Trusts (0.4%) | | | |
Avalonbay Communities, Inc., 6.63%, 09/15/11 | | | 150,000 | | | 160,059 |
BRE Properties, Inc., 5.95%, 03/15/07 | | | 140,000 | | | 141,145 |
Camden Property Trust Corp., 7.00%, 11/15/06 | | | 600,000 | | | 611,626 |
Centerpoint Properties Corp., 4.75%, 08/01/10 | | | 350,000 | | | 340,348 |
Developers Diversified Realty Corp., 6.63%, 01/15/08 | | | 250,000 | | | 256,744 |
Duke Realty Corp., 5.25%, 01/15/10 | | | 300,000 | | | 300,340 |
EOP Operating LP, 6.75%, 02/15/12 | | | 200,000 | | | 213,779 |
Health Care REIT, Inc., 6.00%, 11/15/13 | | | 300,000 | | | 297,516 |
HRPT Properties Trust Corp., 5.75%, 02/15/14 | | | 300,000 | | | 301,160 |
JDN Realty Corp., 6.95%, 08/01/07 | | | 20,000 | | | 20,462 |
Liberty Property LP, 7.25%, 03/15/11 | | | 65,000 | | | 70,454 |
Prologis, 5.25%, 11/15/10 | | | 800,000 | | | 797,112 |
Simon Property Group LP, 4.60%, 06/15/10 | | | 400,000 | | | 390,636 |
Simon Property Group LP, 5.10%, 06/15/15 | | | 500,000 | | | 480,640 |
Spieker Properties LP, 7.65%, 12/15/10 | | | 1,000,000 | | | 1,122,303 |
Statement of Investments (Continued)
October 31, 2005
Gartmore Bond Index Fund (Continued)
| | Corporate Bonds (continued) |
| | | | | | |
| | | Principal
Amount | | Value |
| | | | | | | |
Real Estate Investment Trusts (continued) | | | |
Washington REIT, 5.25%, 01/15/14 (e) | | $ | 200,000 | | $ | 196,821 |
Westfield Capital Corp., 5.13%, 11/15/14 (b) | | | 260,000 | | | 253,866 |
| | | | | |
|
|
| | | | | | | 5,955,011 |
| | | | | |
|
|
Research & Development (0.0%) | | | |
Science Applications International Co., 5.50%, 07/01/33 (b) | | | 300,000 | | | 282,799 |
| | | | | |
|
|
Retail (0.4%) | | | | | | |
CVS Corp., 4.00%, 09/15/09 | | | 200,000 | | | 192,357 |
Limited Brands, Inc., 6.13%, 12/01/12 | | | 250,000 | | | 249,158 |
Lowe’s Cos., Inc., 6.50%, 03/15/29 | | | 400,000 | | | 441,496 |
Staples, Inc., 7.13%, 08/15/07 | | | 500,000 | | | 518,406 |
Target Corp., 10.00%, 01/01/11 | | | 112,000 | | | 134,586 |
Target Corp., 6.35%, 01/15/11 | | | 210,000 | | | 222,995 |
Target Corp., 7.00%, 07/15/31 | | | 295,000 | | | 349,335 |
Target Corp., 6.35%, 11/01/32 | | | 230,000 | | | 252,499 |
Wal-Mart Stores, Inc., 6.88%, 08/10/09 | | | 1,390,000 | | | 1,483,203 |
Wal-Mart Stores, Inc., 4.13%, 07/01/10 | | | 700,000 | | | 675,504 |
Wal-Mart Stores, Inc., 4.13%, 02/15/11 (e) | | | 650,000 | | | 624,559 |
Wal-Mart Stores, Inc., 7.55%, 02/15/30 | | | 200,000 | | | 248,852 |
Wal-Mart Stores, Inc., 5.25%, 09/01/35 | | | 800,000 | | | 750,764 |
| | | | | |
|
|
| | | | | | | 6,143,714 |
| | | | | |
|
|
Special Purpose Entity (1.8%) | | | | | | |
BAE Systems Holdings, Inc., 4.75%, 08/15/10 (b) | | | 400,000 | | | 391,095 |
Comercial Mortgage Pass Through, 4.07%, 04/15/17 (d) | | | 19,330,632 | | | 19,327,469 |
Morgan Stanley TRACERS, 5.88%, 03/01/07 (b) (d) | | | 4,264,000 | | | 4,276,707 |
Morgan Stanley TRACERS, 6.79%, 06/15/12 (b) (d) | | | 1,820,000 | | | 1,883,008 |
Morgan Stanley TRACERS, 5.38%, 10/15/15 | | | 370,000 | | | 365,209 |
| | | | | | |
| | | Principal
Amount | | Value |
| | | | | | | |
Special Purpose Entity (continued) | | | |
Unilever Capital Corp., 7.13%, 11/01/10 | | $ | 550,000 | | $ | 601,676 |
Unilever Capital Corp., 5.90%, 11/15/32 | | | 350,000 | | | 360,319 |
| | | | | |
|
|
| | | | | | | 27,205,483 |
| | | | | |
|
|
Telecommunications (1.8%) | | | | | | |
Alltel Corp., 7.00%, 07/01/12 | | | 640,000 | | | 698,497 |
America Movil SA de CV, 6.38%, 03/01/35 | | | 300,000 | | | 281,330 |
Ameritech Capital Funding, 6.45%, 01/15/18 | | | 150,000 | | | 155,611 |
AT&T Wireless Services, Inc., 8.13%, 05/01/12 | | | 75,000 | | | 86,252 |
AT&T Wireless Services, Inc., 8.75%, 03/01/31 | | | 545,000 | | | 710,708 |
BellSouth Corp., 4.20%, 09/15/09 | | | 600,000 | | | 581,909 |
BellSouth Corp., 6.00%, 10/15/11 | | | 1,421,000 | | | 1,471,367 |
BellSouth Corp., 5.20%, 09/15/14 | | | 700,000 | | | 685,419 |
BellSouth Corp., 6.55%, 06/15/34 | | | 300,000 | | | 308,848 |
BellSouth Corp., 6.00%, 11/15/34 | | | 200,000 | | | 192,429 |
British Telecom PLC, 8.38%, 12/15/10 | | | 1,720,000 | | | 1,961,025 |
Cingular Wireless LLC, 7.13%, 12/15/31 | | | 700,000 | | | 780,723 |
Clear Channel Communications, Inc., 4.25%, 05/15/09 (e) | | | 600,000 | | | 573,107 |
Clear Channel Communications, Inc., 7.65%, 09/15/10 (e) | | | 200,000 | | | 214,016 |
Clear Channel Communications, Inc., 5.50%, 09/15/14 (e) | | | 510,000 | | | 478,968 |
Cox Communications, Inc., 5.50%, 10/01/15 | | | 300,000 | | | 291,292 |
Deutsche Telekom International Finance, 3.88%, 07/22/08 | | | 700,000 | | | 682,436 |
Deutsche Telekom International Finance, 5.25%, 07/22/13 | | | 600,000 | | | 593,248 |
Deutsche Telekom International Finance, 8.75%, 06/15/30 | | | 625,000 | | | 774,989 |
France Telecom, 7.75%, 03/01/11 | | | 650,000 | | | 723,997 |
France Telecom, 8.50%, 03/01/31 | | | 690,000 | | | 901,571 |
GTE Corp., 6.84%, 04/15/18 | | | 350,000 | | | 372,065 |
GTE Corp., 6.94%, 04/15/28 | | | 250,000 | | | 261,220 |
| | Corporate Bonds (continued) |
| | | | | | |
| | | Principal
Amount | | Value |
| | | | | | | |
Telecommunications (continued) | | | |
Koninklijke KPN NV, 8.00%, 10/01/10 | | $ | 525,000 | | $ | 585,384 |
Motorola, Inc., 7.50%, 05/15/25 (e) | | | 350,000 | | | 413,287 |
SBC Communications, Inc., 4.13%, 09/15/09 | | | 750,000 | | | 722,123 |
SBC Communications, Inc., 6.25%, 03/15/11 | | | 205,000 | | | 213,425 |
SBC Communications, Inc., 5.88%, 08/15/12 | | | 720,000 | | | 736,721 |
SBC Communications, Inc., 5.10%, 09/15/14 | | | 200,000 | | | 193,086 |
SBC Communications, Inc., 6.15%, 09/15/34 (e) | | | 575,000 | | | 561,673 |
Sprint Capital Corp., 6.13%, 11/15/08 | | | 850,000 | | | 875,407 |
Sprint Capital Corp., 6.38%, 05/01/09 | | | 375,000 | | | 388,950 |
Sprint Capital Corp., 8.38%, 03/15/12 (b) | | | 950,000 | | | 1,096,101 |
Sprint Capital Corp., 8.38%, 03/15/12 | | | 400,000 | | | 461,516 |
Sprint Capital Corp., 8.75%, 03/15/32 | | | 900,000 | | | 1,164,092 |
Tele-Communications, Inc., 9.80%, 02/01/12 | | | 520,000 | | | 629,394 |
Telecom Italia Capital, 4.95%, 09/30/14 | | | 500,000 | | | 474,430 |
Telecom Italia Capital, 6.00%, 09/30/34 | | | 390,000 | | | 370,278 |
Univison Communication, Inc., 7.85%, 07/15/11 | | | 250,000 | | | 274,185 |
Verizon Global Funding Corp., 6.75%, 12/01/05 | | | 270,000 | | | 270,493 |
Verizon Global Funding Corp., 7.25%, 12/01/10 | | | 450,000 | | | 488,031 |
Verizon Global Funding Corp., 6.88%, 06/15/12 (e) | | | 80,000 | | | 86,306 |
Verizon Global Funding Corp., 7.38%, 09/01/12 | | | 885,000 | | | 981,540 |
Verizon Global Funding Corp., 4.38%, 06/01/13 (e) | | | 625,000 | | | 584,124 |
Verizon Global Funding Corp., 7.75%, 12/01/30 | | | 1,000,000 | | | 1,159,758 |
| | | | | | |
| | | Principal
Amount | | Value |
| | | | | | | |
Telecommunications (continued) | | | |
Verizon Global Funding Corp., 5.85%, 09/15/35 | | $ | 200,000 | | $ | 187,048 |
| | | | | |
|
|
| | | | | | | 26,698,379 |
| | | | | |
|
|
Tobacco (0.0%) | | | | | | |
Altria Group, Inc., 7.00%, 11/04/13 | | | 400,000 | | | 433,306 |
| | | | | |
|
|
Tools & Accessories (0.0%) | | | | | | |
Black & Decker Corp., 4.75%, 11/01/14 | | | 390,000 | | | 366,560 |
Stanley Works, 4.90%, 11/01/12 | | | 225,000 | | | 221,729 |
| | | | | |
|
|
| | | | | | | 588,289 |
| | | | | |
|
|
Transportation & Shipping (0.5%) | | | |
Burlington Northern Santa Fe Corp., 6.75%, 07/15/11 | | | 365,000 | | | 392,226 |
Burlington Northern Santa Fe Corp., 7.95%, 08/15/30 | | | 350,000 | | | 447,687 |
Canadian National Railway Co., 6.90%, 07/15/28 | | | 410,000 | | | 475,924 |
CSX Corp., 7.45%, 05/01/07 | | | 180,000 | | | 186,638 |
CSX Corp., 6.25%, 10/15/08 | | | 1,050,000 | | | 1,084,819 |
CSX Corp., 6.75%, 03/15/11 (e) | | | 225,000 | | | 240,863 |
CSX Corp., 5.50%, 08/01/13 | | | 240,000 | | | 242,995 |
FedEx Corp., 2.65%, 04/01/07 (e) | | | 700,000 | | | 678,677 |
Norfolk Southern Corp., 6.75%, 02/15/11 | | | 835,000 | | | 896,028 |
Norfolk Southern Corp., 5.59%, 05/17/25 | | | 143,000 | | | 140,153 |
Norfolk Southern Corp., 7.25%, 02/15/31 | | | 457,000 | | | 545,448 |
TTX Co., 4.90%, 03/01/15 (b) | | | 375,000 | | | 358,461 |
Union Pacific Corp., 5.75%, 10/15/07 | | | 545,000 | | | 553,186 |
Union Pacific Corp., 3.63%, 06/01/10 | | | 410,000 | | | 384,576 |
Union Pacific Corp., 5.38%, 06/01/33 | | | 105,000 | | | 98,207 |
United Parcel Service, Inc., 8.38%, 04/01/20 | | | 200,000 | | | 260,228 |
| | | | | |
|
|
| | | | | | | 6,986,116 |
| | | | | |
|
|
| | |
Total Corporate Bonds | | | | | | 522,998,835 |
| | | | | |
|
|
Statement of Investments (Continued)
October 31, 2005
Gartmore Bond Index Fund (Continued)
| | | | | | |
| | | Principal
Amount | | Value |
| | | | | | | |
Canada (0.5%) | | | | | | |
Canadian Natural Resources, 4.90%, 12/01/14 | | $ | 475,000 | | $ | 461,129 |
Government of Canada, 5.25%, 11/05/08 | | | 1,630,000 | | | 1,665,060 |
Ontario Province, 5.50%, 10/01/08 | | | 350,000 | | | 358,504 |
Ontario Province, 4.38%, 02/15/13 (e) | | | 725,000 | | | 708,423 |
Providence of Manitoba, 7.50%, 02/22/10 | | | 500,000 | | | 551,931 |
Province of British Columbia, 4.63%, 10/03/06 | | | 100,000 | | | 100,090 |
Province of British Columbia, 5.38%, 10/29/08 | | | 400,000 | | | 407,344 |
Province of British Columbia, 4.30%, 05/30/13 | | | 270,000 | | | 260,853 |
Province of Ontario, 3.38%, 01/15/08 | | | 1,000,000 | | | 972,991 |
Province of Quebec, 5.00%, 07/17/09 | | | 1,400,000 | | | 1,409,443 |
Quebec Province, 4.60%, 05/26/15 | | | 400,000 | | | 385,907 |
Quebec Province, 7.50%, 09/15/29 | | | 980,000 | | | 1,267,583 |
| | | | | |
|
|
| | | | | | | 8,549,258 |
| | | | | |
|
|
Chile (0.1%) | | | | | | |
Republic of Chile, 5.63%, 07/23/07 (e) | | | 900,000 | | | 911,340 |
Republic of Chile, 5.50%, 01/15/13 | | | 300,000 | | | 307,140 |
| | | | | |
|
|
| | | | | | | 1,218,480 |
| | | | | |
|
|
China (0.0%) | | | | | | |
People’s Republic of China, 4.75%, 10/29/13 (e) | | | 500,000 | | | 486,108 |
| | | | | |
|
|
Denmark (0.0%) | | | | | | |
KFW International Finance, 4.13%, 10/15/14 | | | 400,000 | | | 381,655 |
| | | | | |
|
|
Finland (0.1%) | | | | | | |
Republic of Finland, 5.88%, 02/27/06 | | | 300,000 | | | 301,425 |
Republic of Finland, 4.75%, 03/06/07 | | | 700,000 | | | 699,544 |
| | | | | |
|
|
| | | | | | | 1,000,969 |
| | | | | |
|
|
| | | | | | |
| | | Principal
Amount | | Value |
| | | | | | | |
Italy (0.6%) | | | | | | |
Republic of Italy, 4.38%, 10/25/06 | | $ | 3,500,000 | | $ | 3,492,681 |
Republic of Italy, 3.25%, 05/15/09 | | | 1,700,000 | | | 1,623,944 |
Republic of Italy, 4.38%, 06/15/13 | | | 950,000 | | | 928,655 |
Republic of Italy, 4.50%, 01/21/15 (e) | | | 1,140,000 | | | 1,101,587 |
Republic of Italy, 6.88%, 09/27/23 | | | 425,000 | | | 500,933 |
Republic of Italy, 5.38%, 06/15/33 | | | 750,000 | | | 741,440 |
| | | | | |
|
|
| | | | | | | 8,389,240 |
| | | | | |
|
|
Korea (0.1%) | | | | | | |
Bank of Korea Corp., 4.63%, 03/16/10 | | | 700,000 | | | 684,488 |
Korea Developmental Bank, 5.75%, 09/10/13 | | | 200,000 | | | 205,588 |
| | | | | |
|
|
| | | | | | | 890,076 |
| | | | | |
|
|
Luxembourg (0.1%) | | | | | | |
Telecom Italia Capital, 5.25%, 11/15/13 | | | 1,000,000 | | | 977,645 |
| | | | | |
|
|
Mexico (0.5%) | | | | | | |
United Mexican States, 9.88%, 02/01/10 | | | 2,750,000 | | | 3,233,999 |
United Mexican States, 6.38%, 01/16/13 (e) | | | 2,775,000 | | | 2,906,813 |
United Mexican States, 7.50%, 04/08/33 | | | 775,000 | | | 878,463 |
United Mexican States, 6.75%, 09/27/34 (e) | | | 750,000 | | | 781,875 |
| | | | | |
|
|
| | | | | | | 7,801,150 |
| | | | | |
|
|
Poland (0.0%) | | | | | | |
Republic of Poland, 5.00%, 10/19/15 | | | 380,000 | | | 375,440 |
| | | | | |
|
|
South Africa (0.0%) | | | | | | |
Republic of South Africa, 6.50%, 06/02/14 (e) | | | 350,000 | | | 374,063 |
| | | | | |
|
|
United Kingdom (0.1%) | | | | | | |
British Telecom PLC, 8.63%, 12/15/30 | | | 100,000 | | | 130,636 |
Vodafone Group PLC, 7.75%, 02/15/10 | | | 150,000 | | | 165,002 |
Sovereign Bonds (continued)
| | | | | | |
| | | Principal
Amount | | Value |
| | | | | | | |
United Kingdom (continued) | | | | | | |
Vodafone Group PLC, 5.00%, 12/16/13 | | $ | 1,125,000 | | $ | 1,104,423 |
Vodafone Group PLC, 7.88%, 02/15/30 | | | 350,000 | | | 431,474 |
| | | | | |
|
|
| | | | | | | 1,831,535 |
| | | | | |
|
|
| | |
Total Sovereign Bonds | | | | | | 32,275,619 |
| | | | | |
|
|
|
Municipal Bonds (0.1%) |
Illinois (0.0%) | | | | | | |
State Taxable Pension GO, 5.10%, 06/01/33 | | | 700,000 | | | 671,055 |
| | | | | |
|
|
Texas (0.1%) | | | | | | |
City of Dallas, 5.25%, 02/15/24 | | | 1,200,000 | | | 1,200,312 |
| | | | | |
|
|
| | |
Total Municipal Bonds | | | | | | 1,871,367 |
| | | | | |
|
|
|
Cash Equivalents (1.8%) |
Investments in repurchase agreements (collateralized by U.S. Government Agencies and U.S. Government Agency Mortgages in a joint trading account at 3.90%, dated 10/31/05, due 11/01/05, repurchase price $26,675,746) | | | 26,672,856 | | | 26,672,856 |
| | | | | |
|
|
| | |
Total Cash Equivalents | | | | | | 26,672,856 |
| | | | | |
|
|
Short-Term Securities Held as Collateral for
Securities Lending (16.1%)
| | | | | | | |
| | | Principal
Amount | | Value | |
| | | | | | | | |
Pool of short-term securities for Gartmore Mutual Funds — note 2 (Securities Lending) | | $ | 243,805,654 | | $ | 243,805,654 | |
| | | | | |
|
|
|
| |
Total Short-Term Securities Held as Collateral for Securities Lending | | | 243,805,654 | |
| | | | | |
|
|
|
| |
Total Investments
(Cost $1,929,826,753) (a) — 125.8% | | | 1,904,745,045 | |
| | |
Liabilities in excess of other assets — (25.8)% | | | | | | (391,718,446 | ) |
| | | | | |
|
|
|
| | |
NET ASSETS — 100.0% | | | | | $ | 1,513,026,599 | |
| | | | | |
|
|
|
| | (a) | See notes to financial statements for tax unrealized appreciation (depreciation) of securities. |
| | (b) | Rule 144A, Section 4(2) or other security, which is restricted as to resale to institutional investors. The security has been deemed liquid pursuant to procedures approved by the Board of Trustees. |
| | (d) | Variable rate security. The rate reflected in the Statement of Investments is the rate reflected in effect on October 31, 2005. |
| | (e) | All or part of the security was on loan as of October 31, 2005. |
| | TRACERS | Tradable Custodial Receipts |
See notes to financial statements.
Gartmore International Index Fund
For the annual period ended Oct. 31, 2005, the Gartmore International Index Fund (Class A at NAV) returned 17.83% versus 18.09% for its benchmark, the Morgan Stanley Capital International Europe, Australasia and Far East (MSCI EAFE®) Index. For broader comparison, the average return for the Fund’s Lipper peer category of International Multi-Cap Core Funds was 18.11%.
The reporting period was a strong one for the international equity markets, as all of the country markets comprising the MSCI EAFE Index (except Portugal) registered positive returns. November and December of 2004 were positive months as international market indexes experienced strong global economic growth and earnings momentum after the summer lull. November saw the largest gains as oil prices began to recede from their October highs, business confidence strengthened, corporate profits came in generally better than expected, and economically sensitive commodity prices rose. Eurozone stock markets generally strengthened, particularly in Germany, Italy and France. In the United Kingdom, the market benefited from its sizable exposure to energy and metals. In the Asia Pacific region, Japan’s market increased on falling crude oil prices, and Hong Kong’s market rose on speculation of devaluation of the country’s currency that would lead to increased trade with China. Australia’s market advanced on gains in financial and industrial sectors.
The New Year began with a slide after the strong fourth quarter of 2004; January, March and April were negative months as economic growth began to slow. Concerns about energy prices, inflation and currency volatility led to a decline in the global equity markets. In Germany, Europe’s largest economy, industrial production fell more than it had in two years, and investor confidence dropped–partly due to high oil costs and partly due to unemployment, which remained at a post-World War II high of 12%. In the United Kingdom, manufacturing activity also decreased and growth in retail sales, a key indicator of consumer spending, weakened modestly.
Global equity markets rebounded in May with solid gains that continued through September. Then came another downturn in October as the markets felt pressure from inflation concerns. In Europe, the turnaround was led by renewed takeover activity and generally encouraging company earnings, especially in the United Kingdom, where growth remained in the high single digits for much of the period, boosted by the strong performance of energy companies. In Japan, optimism continued to build that the country is moving past its long deflationary cycle and is growing economically.
Portfolio Manager:
Fund Asset Management, L.P.-Subadviser
| | |
Fund Performance | | Gartmore International Index Fund |
Average Annual Total Return
(For periods ended October 31, 2005)
| | | | | | | | |
| | | | | 1 Yr. | | 5 Yr. | | Inception1 |
| Class A | | w/o SC2 | | 17.83% | | 1.88% | | -0.79% |
| | | w/SC3 | | 10.99% | | 0.68% | | -1.79% |
| Class B | | w/o SC2 | | 17.17% | | 1.21% | | -1.46% |
| | | w/SC4 | | 12.17% | | 0.83% | | -1.62% |
| Class C5,7 | | w/o SC2 | | 15.59% | | 0.94% | | -1.69% |
| | | w/SC7 | | 14.59% | | 0.94% | | -1.69% |
| Institutional Class6 | | 18.26% | | 2.24% | | -0.42% |
All figures showing the effect of a sales charge reflect the maximum charge possible, because it has the most dramatic effect on performance data.
| 1 | Fund commenced operations on December 29, 1999. |
| 2 | These returns do not reflect the effects of sales charges (SC). |
| 3 | A 5.75% front-end sales charge was deducted. |
| 4 | A 5.00% maximum contingent deferred sales charge (CDSC) was deducted. The CDSC declines to 0% after 6 years. |
| 5 | These returns until the creation of Class C shares (02/14/05) include the performance of the Fund’s Class B shares, which began operations on December 29, 1999 prior to the creation of the Class C . Excluding the effect of any fee waivers or reimbursements, such prior performance is similar to what Class C would have produced because Class C and invest in the same portfolio of securities as Class B shares. The performance for Class C has been restated for sales charges (where applicable), but does not reflect the differing levels of other fees (primarily Rule 12b-1 and/or administrative services fees) applicable to such classes. |
| 6 | Not subject to any sales charges. |
| 7 | A CDSC of 1.00% was deducted from the one year return because it is charged when you sell Class C shares within the first year after purchase. |
Performance of a $10,000 Investment
Investment return and principal value will fluctuate, and when redeemed, shares may be worth more or less than original cost. Past performance is no guarantee of future results and does not reflect the deduction of taxes that a shareholder would pay on fund distributions or the redemption of fund shares. Investing in mutual funds involves market risk, including loss of principal. Performance returns assume the reinvestment of all distributions.
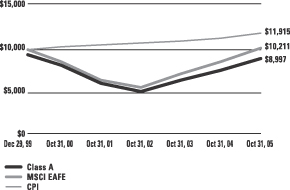
Comparative performance of $10,000 invested in Class A shares of the Gartmore International Index Fund, the Morgan Stanley Capital International - Europe, Australasia, and Far East Index (MSCI EAFE)(a), and the Consumer Price Index (CPI)(b) since inception. Unlike the Fund, the returns for these unmanaged indexes do not reflect any fees, expenses, or sales charges. Investors cannot invest directly in market indexes.
| (a) | The MSCI EAFE is an unmanaged index that measures the performance of equity securities of global companies from various industrial sectors whose primary trading markets are located outside the United States. |
| (b) | The CPI represents changes in prices of a basket of goods and services purchased for consumption by urban households. |
| | |
Shareholder Expense Example | | Gartmore International Index Fund |
As a shareholder of the Fund, you incur two types of costs: (1) transaction costs, including sales charges (loads) paid on purchase payments and redemption fees; and (2) ongoing costs, including investment advisory fees, administration fees, distribution fees and other Fund expenses. The examples below are intended to help you understand your ongoing costs (in dollars) of investing in the Fund and to compare these costs with the ongoing costs of investing in other mutual funds. Per SEC requirements, the examples assume that you had a $1,000 investment in the Class at the beginning of the reporting period, May 1, 2005, and continued to hold your shares at the end of the reporting period, October 31, 2005.
Actual Expenses
For each Class of the Fund in the table below, the first line provides information about actual account values and actual expenses. You may use the information in this line, together with the amount you invested, to estimate the expenses that you paid over the period. Simply divide your account value by $1,000 (for example, an $8,600 account value divided by $1,000 = 8.6), then multiply the result by the number in the first line of each Class under the heading entitled “Expenses Paid During Period” to estimate the expenses you paid on your account during the period.
Hypothetical Example for Comparison Purposes
The second line of each Class in the table below provides information about hypothetical account values and hypothetical expenses based on the Class’ actual expense ratio and an assumed rate of return of 5% per year before expenses, which is not the Class’ actual return. The hypothetical account values and expenses may not be used to estimate the actual ending account balance or expenses you paid for the period. You may use this information to compare the ongoing costs of investing in the Class of the Fund and other funds. To do so, compare this 5% hypothetical example with the 5% hypothetical examples that appear in the shareholder reports of the other funds.
Please note that the expenses shown in the table are meant to highlight your ongoing costs only and do not reflect any transaction costs, such as sales charges (loads) or redemption fees. Therefore, the second line for each Class in the table is useful in comparing ongoing costs only, and will not help you determine the relative total costs of owning different funds. In addition, if these transaction costs were included, your costs would have been higher. The examples also assume all dividends and distributions have been reinvested.
Schedule of Shareholder Expenses
Expense Analysis of a $1,000 Investment
(October 31, 2005)
| | | | | | | | | | | | | | |
| International Index Fund | | | | | Beginning
Account Value,
5/1/05 | | Ending
Account Value,
10/31/05 | | Expenses Paid
During Period* | | Annualized
Expense Ratio* |
| Class A | | Actual | | | $ | 1,000.00 | | $ | 1,084.40 | | $ | 3.98 | | 0.77% |
| | | Hypothetical | 1 | | $ | 1,000.00 | | $ | 1,021.18 | | $ | 3.87 | | 0.77% |
| Class B | | Actual | | | $ | 1,000.00 | | $ | 1,082.80 | | $ | 7.07 | | 1.37% |
| | | Hypothetical | 1 | | $ | 1,000.00 | | $ | 1,018.21 | | $ | 6.88 | | 1.37% |
| Class C | | Actual | | | $ | 1,000.00 | | $ | 1,082.50 | | $ | 2.93 | | 1.37% |
| | | Hypothetical | 1 | | $ | 1,000.00 | | $ | 1,022.18 | | $ | 2.85 | | 1.37% |
| Institutional Class | | Actual | | | $ | 1,000.00 | | $ | 1,086.50 | | $ | 1.91 | | 0.37% |
| | | Hypothetical | 1 | | $ | 1,000.00 | | $ | 1,023.17 | | $ | 1.86 | | 0.37% |
| * | Expenses are equal to the Fund’s annualized expense ratio multiplied by the average account value over the period multiplied by 184/365 (to reflect the one-half year period). The expense ratio presented represents a six month, annualized ratio in accordance with SEC guidelines. |
| 1 | Represents the hypothetical 5% return before expenses. |
| | |
Portfolio Summary | | Gartmore International Index Fund |
The SEC adopted a requirement that Funds present their portfolio holdings in a table, chart or graph format in their annual and semiannual reports to shareholders, whether or not a statement of investments is utilized. The following tables, which present portfolio holdings as a percentage of net assets, are provided in compliance with this requirement.
| | |
| Asset Allocation | | |
| Common Stocks | | 96.0% |
| Cash Equivalents | | 1.7% |
| Preferred Stocks | | 0.0% |
| Rights | | 0.0% |
| Warrants | | 0.0% |
| Other Investments* | | 13.3% |
| Liabilities in excess of Other Assets** | | -11.0 % |
| | |
|
| | | 100.0% |
| * | Includes value of collateral received from securities lending. |
| ** | Includes value of collateral owed from securities lending. |
| | |
| Top Industries | | |
| Banks | | 17.1% |
| Telecommunications | | 8.3% |
| Energy | | 8.0% |
| Pharmaceuticals | | 5.9% |
| Utilities | | 4.8% |
| Food Products | | 4.7% |
| Electronics & Electrical Equipment | | 3.9% |
| Insurance | | 3.9% |
| Automotive | | 3.7% |
| Financial Services | | 2.9% |
| Other Industries | | 36.8% |
| | |
|
| | | 100.0% |
| | |
| Top Holdings*** | | |
| BP Amoco PLC | | 2.3% |
| HSBC Holdings PLC | | 1.8% |
| Vodafone Group PLC | | 1.7% |
| Glaxosmithkline PLC | | 1.5% |
| TotalFinaElf SA | | 1.4% |
| Toyota Motor Co. Ltd. | | 1.4% |
| Novartis AG | | 1.3% |
| Nestle SA | | 1.3% |
| Royal Dutch Shell PLC, Class B | | 1.2% |
| Roche Holding AG-Genusscheine | | 1.1% |
| Other Holdings | | 85.0% |
| | |
|
| | | 100.0% |
| *** | For purpose of listing top holdings, repurchase agreements are considered cash equivalents and are included as part of Other Holdings. |
Statement of Investments
October 31, 2005
Gartmore International Index Fund
| | | | | |
| | | Shares or
Principal Amount | | Value |
| | | | | | |
AUSTRALIA (5.0%) | | | | | |
Airlines (0.0%) | | | | | |
Qantas Airways Ltd. (d) | | 108,155 | | $ | 277,200 |
| | | | |
|
|
Banks (1.5%) | | | | | |
Australia & New Zealand Banking Group Ltd. (d) | | 220,891 | | | 3,898,469 |
Commonwealth Bank of Australia (d) (e) | | 155,974 | | | 4,540,381 |
Macquarie Bank Ltd. (d) (e) | | 33,996 | | | 1,650,200 |
National Australia Bank Ltd. (d) | | 221,292 | | | 5,472,284 |
Suncorp-Metway Ltd. (d) | | 61,990 | | | 894,798 |
Westpac Banking Corp. Ltd. (d) | | 246,449 | | | 3,829,622 |
| | | | |
|
|
| | | | | | 20,285,754 |
| | | | |
|
|
Brewery (0.1%) | | | | | |
Foster’s Group Ltd. (d) | | 234,098 | | | 1,017,925 |
Lion Nathan Ltd. (d) | | 1,340 | | | 7,924 |
| | | | |
|
|
| | | | | | 1,025,849 |
| | | | |
|
|
Building & Construction (0.3%) | | | |
Boral Ltd. (d) | | 79,450 | | | 451,647 |
CSR Ltd. (d) | | 124,762 | | | 273,116 |
James Hardie Industries NV (d) | | 58,218 | | | 371,397 |
Leighton Holdings Ltd. (d) | | 37,177 | | | 425,367 |
Multiplex Group (d) | | 192,870 | | | 478,655 |
Rinker Group Ltd. (d) | | 152,750 | | | 1,732,327 |
| | | | |
|
|
| | | | | | 3,732,509 |
| | | | |
|
|
Casino & Gambling (0.0%) | | | | | |
Aristocrat Leisure Ltd. (d) (e) | | 57,873 | | | 504,721 |
Unitab Ltd. (d) | | 16,444 | | | 156,809 |
| | | | |
|
|
| | | | | | 661,530 |
| | | | |
|
|
Commercial Services (0.1%) | | | | | |
Brambles Industries Ltd. (d) (e) | | 148,947 | | | 944,435 |
Mayne Nickless Ltd. (d) | | 100,202 | | | 392,590 |
| | | | |
|
|
| | | | | | 1,337,025 |
| | | | |
|
|
Computer Software & Services (0.0%) | | | |
Computershare Ltd. (d) | | 17,524 | | | 86,265 |
| | | | |
|
|
Consumer Products (0.0%) | | | | | |
Pacific Brands Ltd. (d) | | 55,889 | | | 114,448 |
| | | | |
|
|
| | | | | |
| | | Shares or
Principal Amount | | Value |
| | | | | | |
AUSTRALIA (continued) | | | | | |
Diversified (0.2%) | | | | | |
Futuris Corp. Ltd. (d) | | 67,964 | | $ | 94,375 |
Orica Ltd. (d) | | 17,055 | | | 244,663 |
Patrick Corp. Ltd. (d) | | 145,076 | | | 742,970 |
Wesfarmers Ltd. (d) | | 49,239 | | | 1,317,438 |
| | | | |
|
|
| | | | | | 2,399,446 |
| | | | |
|
|
Energy (0.2%) | | | | | |
Australian Gas and Light Co. Ltd. (d) | | 50,139 | | | 568,900 |
Origin Energy Ltd. (d) | | 46,233 | | | 232,421 |
Santos Ltd. (d) | | 81,305 | | | 666,850 |
Woodside Petroleum Ltd. (d) | | 71,776 | | | 1,698,569 |
| | | | |
|
|
| | | | | | 3,166,740 |
| | | | |
|
|
Entertainment (0.1%) | | | | | |
TABCORP Holdings Ltd. (d) | | 71,987 | | | 863,553 |
| | | | |
|
|
Financial Services (0.1%) | | | | | |
Australian Stock Exchange Ltd. (d) | | 463 | | | 9,979 |
Babcock & Brown Ltd. (d) | | 7,333 | | | 91,784 |
Challenger Financial Services Group Ltd. (d) (e) | | 136,840 | | | 373,344 |
Perpetual Trustees Australia Ltd. (d) (e) | | 160 | | | 7,523 |
SFE Corp. Ltd. (d) | | 46,358 | | | 432,552 |
| | | | |
|
|
| | | | | | 915,182 |
| | | | |
|
|
Food & Beverage (0.0%) | | | | | |
Coca-Cola Amatil Ltd. (d) (e) | | 61,193 | | | 349,330 |
| | | | |
|
|
Food Products (0.2%) | | | | | |
Coles Myer Ltd. (d) (e) | | 172,205 | | | 1,293,603 |
Woolworths Ltd. (d) | | 148,211 | | | 1,810,663 |
| | | | |
|
|
| | | | | | 3,104,266 |
| | | | |
|
|
Healthcare (0.0%) | | | | | |
Cochlear Ltd. (d) (e) | | 14,207 | | | 404,676 |
| | | | |
|
|
Industrial (0.1%) | | | | | |
BHP Steel Ltd. (d) (e) | | 98,181 | | | 625,013 |
OneSteel Ltd. (d) | | 121,136 | | | 320,522 |
| | | | |
|
|
| | | | | | 945,535 |
| | | | |
|
|
| | Common Stocks (continued) |
| | | | | |
| | | Shares or
Principal Amount | | Value |
| | | | | | |
AUSTRALIA (continued) | | | | | |
Insurance (0.3%) | | | | | |
AMP Ltd. (d) | | 255,675 | | $ | 1,398,947 |
AXA Asia Pacific Holdings Ltd. (d) (e) | | 163,563 | | | 580,357 |
Insurance Australia Group Ltd. (d) | | 219,292 | | | 851,150 |
QBE Insurance Group Ltd. (d) (e) | | 107,839 | | | 1,438,877 |
| | | | |
|
|
| | | | | | 4,269,331 |
| | | | |
|
|
Investment Companies (0.1%) | | | |
Macquarie Airports (d) | | 5,060 | | | 11,392 |
Macquarie Communications Infrastructure Group (d) | | 94,409 | | | 406,674 |
Macquarie Infrastructure Group (d) | | 347,002 | | | 892,534 |
| | | | |
|
|
| | | | | | 1,310,600 |
| | | | |
|
|
Manufacturing (0.0%) | | | | | |
Ansell Ltd. (d) | | 21,093 | | | 166,565 |
| | | | |
|
|
Medical & Medical Services (0.0%) | | | |
Sonic Healthcare Ltd. (d) | | 1,126 | | | 12,333 |
| | | | |
|
|
Metals & Mining (0.2%) | | | | | |
Newcrest Mining Ltd. (d) | | 58,414 | | | 794,837 |
Rio Tinto Ltd. (d) (e) | | 39,064 | | | 1,651,362 |
WMC Ltd. (d) | | 139,860 | | | 605,209 |
| | | | |
|
|
| | | | | | 3,051,408 |
| | | | |
|
|
Minerals (0.6%) | | | | | |
BHP Billiton Ltd. (d) | | 493,783 | | | 7,656,326 |
Iluka Resources Ltd. (d) | | 68,235 | | | 395,267 |
| | | | |
|
|
| | | | | | 8,051,593 |
| | | | |
|
|
Multi-Media (0.0%) | | | | | |
Publishing & Broadcasting Ltd. (d) | | 26,129 | | | 316,111 |
| | | | |
|
|
Paper Products (0.1%) | | | | | |
Amcor Ltd. (d) (e) | | 135,692 | | | 678,377 |
Paperlinx Ltd. (d) (e) | | 37,495 | | | 86,590 |
| | | | |
|
|
| | | | | | 764,967 |
| | | | |
|
|
| | | | | |
| | | Shares or
Principal Amount | | Value |
| | | | | | |
AUSTRALIA (continued) | | | | | |
Pharmaceuticals (0.1%) | | | | | |
CSL Ltd. (d) | | 26,031 | | $ | 732,173 |
| | | | |
|
|
Printing & Publishing (0.0%) | | | | | |
John Fairfax Holdings Ltd. (d) (e) | | 177,108 | | | 547,806 |
| | | | |
|
|
Property Trust (0.5%) | | | | | |
Centro Properties Group (d) | | 64,033 | | | 285,470 |
Centro Retail Trust (b) (d) | | 21,343 | | | 24,489 |
Commonwealth Property Office Fund (d) (e) | | 184,635 | | | 168,141 |
DB RREEF Trust (d) (e) | | 424,684 | | | 424,172 |
Gandel Retail Trust (d) (e) | | 216,863 | | | 302,734 |
General Property Trust (d) | | 312,427 | | | 898,199 |
ING Industrial Fund (d) | | 2,224 | | | 3,811 |
Investa Property Group (d) (e) | | 205,222 | | | 299,447 |
Macquarie Goodman Group (d) | | 58,113 | | | 175,801 |
Mirvac Group (d) | | 207,466 | | | 593,111 |
Stockland Trust Group (d) | | 169,647 | | | 776,622 |
Westfield Group (d) | | 186,789 | | | 2,323,827 |
| | | | |
|
|
| | | | | | 6,275,824 |
| | | | |
|
|
Public Thoroughfares (0.1%) | | | | | |
Transurban Group (d) | | 145,604 | | | 698,609 |
| | | | |
|
|
Real Estate (0.0%) | | | | | |
Lend Lease Corp. Ltd. (d) | | 65,603 | | | 670,307 |
| | | | |
|
|
Retail (0.0%) | | | | | |
Harvey Norman Holdings Ltd. (d) (e) | | 33,787 | | | 72,088 |
| | | | |
|
|
Telecommunications (0.1%) | | | | | |
Telstra Corp. Ltd. (d) | | 285,476 | | | 899,875 |
| | | | |
|
|
Transportation (0.0%) | | | | | |
Toll Holdings Ltd. (d) (e) | | 41,220 | | | 386,246 |
| | | | |
|
|
| | | | | | 67,895,144 |
| | | | |
|
|
AUSTRIA (0.4%) | | | | | |
Airports (0.0%) | | | | | |
Flughafen Wien AG (d) | | 25 | | | 1,618 |
| | | | |
|
|
Statement of Investments (Continued)
October 31, 2005
Gartmore International Index Fund (Continued)
| | Common Stocks (continued) |
| | | | | |
| | | Shares or
Principal Amount | | Value |
| | | | | | |
AUSTRIA (continued) | | | | | |
Banks (0.2%) | | | | | |
Bank Austria Creditanstalt (d) | | 5,597 | | $ | 615,384 |
Ersete Bank Der Oesterreichischen Sparkassen AG (d) | | 24,165 | | | 1,257,084 |
| | | | |
|
|
| | | | | | 1,872,468 |
| | | | |
|
|
Building & Construction (0.0%) | | | |
Wienerberger AG (d) | | 9,564 | | | 369,720 |
| | | | |
|
|
Energy (0.1%) | | | | | |
OMV AG (d) | | 23,230 | | | 1,253,230 |
| | | | |
|
|
Industrial (0.0%) | | | | | |
Andritz AG (d) | | 4,197 | | | 381,262 |
| | | | |
|
|
Manufacturing (0.0%) | | | | | |
RHI AG (b) (d) | | 8,930 | | | 247,768 |
| | | | |
|
|
Paper Products (0.0%) | | | | | |
Mayr-Melnhof Karton AG (d) | | 15 | | | 2,056 |
| | | | |
|
|
Real Estate (0.0%) | | | | | |
Immofinanz Immobilien Anlagen AG (b) (d) | | 18,434 | | | 178,291 |
| | | | |
|
|
Steel (0.0%) | | | | | |
Boehler-Uddeholm AG (d) | | 2,508 | | | 380,341 |
Voest-Alpine AG (d) | | 1,961 | | | 163,397 |
| | | | |
|
|
| | | | | | 543,738 |
| | | | |
|
|
Telecommunications (0.1%) | | | | | |
Telekom Austria AG (d) (e) | | 48,312 | | | 999,803 |
| | | | |
|
|
Utilities (0.0%) | | | | | |
Oesterrichische Elektrizktaetswirtschafts AG (d) | | 100 | | | 31,875 |
| | | | |
|
|
| | | | | | 5,881,829 |
| | | | |
|
|
BELGIUM (1.3%) | | | | | |
Banks (0.6%) | | | | | |
Dexia (d) | | 83,323 | | | 1,799,434 |
Fortis (d) | | 166,245 | | | 4,731,476 |
KBC Bankverzekeringsholding (d) | | 25,839 | | | 2,105,707 |
| | | | |
|
|
| | | | | | 8,636,617 |
| | | | |
|
|
| | | | | |
| | | Shares or
Principal Amount | | Value |
| | | | | | |
BELGIUM (continued) | | | | | |
Brewery (0.1%) | | | | | |
Interbrew (d) | | 19,993 | | $ | 798,582 |
| | | | |
|
|
Chemicals (0.1%) | | | | | |
Solvay SA (d) | | 7,056 | | | 821,280 |
| | | | |
|
|
Consumer Cyclicals (0.0%) | | | | | |
D’ Ieteren NV (d) | | 381 | | | 96,907 |
| | | | |
|
|
Diversified (0.1%) | | | | | |
Groupe Bruxelles Lambert SA (d) | | 10,122 | | | 923,123 |
| | | | |
|
|
Electronics (0.0%) | | | | | |
Barco NV (d) (e) | | 2,459 | | | 176,380 |
| | | | |
|
|
Food Products (0.0%) | | | | | |
Colruyt NV (d) | | 1,132 | | | 146,615 |
| | | | |
|
|
Manufacturing (0.0%) | | | | | |
Bekaert SA (d) | | 48 | | | 3,996 |
| | | | |
|
|
Metals (0.0%) | | | | | |
Umicore (d) | | 6,530 | | | 653,454 |
| | | | |
|
|
Pharmaceuticals (0.1%) | | | | | |
Omega Pharma SA (d) | | 2,857 | | | 147,554 |
UCB SA (d) | | 13,329 | | | 658,989 |
| | | | |
|
|
| | | | | | 806,543 |
| | | | |
|
|
Photographic Products (0.0%) | | | | | |
AGFA Gevaert NV (d) (e) | | 14,758 | | | 317,810 |
| | | | |
|
|
Real Estate (0.0%) | | | | | |
Cofinimmo (d) (e) | | 660 | | | 103,532 |
| | | | |
|
|
Retail (0.0%) | | | | | |
Delhaize Le Lion SA (d) (e) | | 10,715 | | | 621,169 |
| | | | |
|
|
Telecommunications (0.1%) | | | | | |
Belgacom SA (d) | | 29,544 | | | 990,077 |
Mobistar SA (d) | | 1,519 | | | 122,970 |
| | | | |
|
|
| | | | | | 1,113,047 |
| | | | |
|
|
| | Common Stocks (continued) |
| | | | | |
| | | Shares or
Principal Amount | | Value |
| | | | | | |
BELGIUM (continued) | | | | | |
Transportation (0.0%) | | | | | |
Compagnie Maritime Belge SA (d) | | 5,335 | | $ | 177,654 |
Euronav SA (d) | | 5,335 | | | 164,290 |
| | | | |
|
|
| | | | | | 341,944 |
| | | | |
|
|
Utilities (0.2%) | | | | | |
Electrabel SA (d) | | 4,514 | | | 2,233,462 |
| | | | |
|
|
| | | | | | 17,794,461 |
| | | | |
|
|
DENMARK (0.8%) | | | | | |
Airports (0.0%) | | | | | |
Kobenhavns Lufthavne AS (d) | | 23 | | | 7,289 |
| | | | |
|
|
Banks (0.2%) | | | | | |
Danske Bank AS (d) | | 66,620 | | | 2,089,820 |
| | | | |
|
|
Brewery (0.0%) | | | | | |
Carlsberg AG (d) | | 5,891 | | | 322,226 |
| | | | |
|
|
Electronics (0.1%) | | | | | |
Bang & Olufsen AS (d) (e) | | 2,558 | | | 244,716 |
Vestas Wind Systems AS (b) (d) (e) | | 33,311 | | | 721,102 |
| | | | |
|
|
| | | | | | 965,818 |
| | | | |
|
|
Food Products (0.0%) | | | | | |
Danisco AS (d) | | 10,357 | | | 661,907 |
East Asiatic Co. Ltd. (d) | | 70 | | | 5,300 |
| | | | |
|
|
| | | | | | 667,207 |
| | | | |
|
|
Healthcare (0.0%) | | | | | |
Coloplast AS (d) | | 3,108 | | | 178,269 |
| | | | |
|
|
Insurance (0.0%) | | | | | |
Topdanmark AS (b) (d) | | 2,908 | | | 221,878 |
| | | | |
|
|
Medical Products (0.0%) | | | | | |
William Demant Holding AS (b) (d) | | 123 | | | 5,572 |
| | | | |
|
|
Pharmaceuticals (0.2%) | | | | | |
H. Lunbeck AS (d) (e) | | 4,154 | | | 97,136 |
Novo Nordisk AS, Class B (d) | | 39,968 | | | 2,051,886 |
Novozymes AS, Class B (d) | | 2,868 | | | 149,994 |
| | | | |
|
|
| | | | | | 2,299,016 |
| | | | |
|
|
| | | | | |
| | | Shares or
Principal Amount | | Value |
| | | | | | |
DENMARK (continued) | | | | | |
Security Services (0.0%) | | | | | |
Group 4 Securicor PLC (d) | | 85,993 | | $ | 229,521 |
| | | | |
|
|
Telecommunications (0.2%) | | | | | |
GN Store Nord AS (GN Great Nordic) (d) | | 39,917 | | | 481,276 |
TDC AS (d) | | 33,067 | | | 1,853,352 |
| | | | |
|
|
| | | | | | 2,334,628 |
| | | | |
|
|
Transportation (0.1%) | | | | | |
Dampskibsselskabet Svendborg AS (d) | | 159 | | | 1,438,462 |
DSV, De Sammensluttede Vognmaend (d) | | 3,225 | | | 314,433 |
| | | | |
|
|
| | | | | | 1,752,895 |
| | | | |
|
|
| | | | | | 11,074,139 |
| | | | |
|
|
FINLAND (1.4%) | | | | | |
Computer Software & Services (0.0%) | | | |
TietoEnator Oyj (d) | | 12,039 | | | 382,512 |
| | | | |
|
|
Energy (0.1%) | | | | | |
Neste Oil Oyj (b) (d) | | 22,674 | | | 701,743 |
| | | | |
|
|
Financial Services (0.1%) | | | | | |
Sampo Insurance Co. Oyj (d) | | 52,276 | | | 801,876 |
| | | | |
|
|
Food Products (0.0%) | | | | | |
Kesko Oyj (d) | | 9,736 | | | 267,592 |
| | | | |
|
|
Industrial (0.0%) | | | | | |
Metso Oyj (d) | | 16,956 | | | 441,040 |
| | | | |
|
|
Insurance (0.0%) | | | | | |
Pohjola Group PLC, Class D (d) | | 3,726 | | | 59,743 |
| | | | |
|
|
Machinery & Equipment (0.1%) | | | |
KCI Konecranes Oyj (d) (e) | | 7,293 | | | 316,807 |
Kone Corporation, Class B (b) (d) | | 5,792 | | | 390,227 |
| | | | |
|
|
| | | | | | 707,034 |
| | | | |
|
|
Manufacturing (0.0%) | | | | | |
Amer Group Ltd. (d) | | 9,040 | | | 164,595 |
Uponor Oyj (d) (e) | | 9,034 | | | 194,804 |
Wartsila Corp. (d) | | 5,543 | | | 153,789 |
| | | | |
|
|
| | | | | | 513,188 |
| | | | |
|
|
Statement of Investments (Continued)
October 31, 2005
Gartmore International Index Fund (Continued)
| | Common Stocks (continued) |
| | | | | |
| | | Shares or
Principal Amount | | Value |
| | | | | | |
FINLAND (continued) | | | | | |
Metal Fabricate & Hardware (0.0%) | | | |
Rautaruukki Oyj (d) | | 19,196 | | $ | 391,777 |
| | | | |
|
|
Metals (0.0%) | | | | | |
Outokumpu Oyj (d) (e) | | 3,277 | | | 42,066 |
| | | | |
|
|
Oil & Gas (0.1%) | | | | | |
Fortum Oyj (d) | | 66,172 | | | 1,171,056 |
| | | | |
|
|
Paper Products (0.2%) | | | | | |
Stora Enso Oyj (d) | | 91,848 | | | 1,174,866 |
UPM-Kymmene Oyj (d) | | 82,081 | | | 1,586,469 |
| | | | |
|
|
| | | | | | 2,761,335 |
| | | | |
|
|
Pharmaceuticals (0.0%) | | | | | |
Orion Oyj (d) | | 8,093 | | | 175,913 |
| | | | |
|
|
Telecommunications (0.8%) | | | | | |
Elisa Oyj (d) (e) | | 8,361 | | | 146,398 |
Nokia Oyj (d) | | 593,677 | | | 9,946,715 |
| | | | |
|
|
| | | | | | 10,093,113 |
| | | | |
|
|
Tire & Rubber (0.0%) | | | | | |
Nokian Renkaat Oyj (d) | | 20,780 | | | 323,793 |
| | | | |
|
|
Transportation (0.0%) | | | | | |
Cargotec Corp., Class B (b) (d) | | 5,792 | | | 171,405 |
| | | | |
|
|
| | | | | | 19,005,186 |
| | | | |
|
|
FRANCE (8.7%) | | | | | |
Advertising (0.0%) | | | | | |
PagesJaunes SA (d) | | 7,046 | | | 181,567 |
Publicis Groupe SA (d) (e) | | 11,862 | | | 392,259 |
| | | | |
|
|
| | | | | | 573,826 |
| | | | |
|
|
Aerospace/Defense (0.2%) | | | | | |
European Aeronautic Defence & Space Co. (d) | | 35,556 | | | 1,231,832 |
Thales SA (d) (e) | | 15,995 | | | 688,974 |
Zodiac SA (d) | | 5,565 | | | 303,388 |
| | | | |
|
|
| | | | | | 2,224,194 |
| | | | |
|
|
Airlines (0.0%) | | | | | |
Air France (d) (e) | | 15,717 | | | 264,274 |
| | | | |
|
|
| | | | | |
| | | Shares or
Principal Amount | | Value |
| | | | | | |
FRANCE (continued) | | | | | |
Apparel (0.0%) | | | | | |
Hermes International (d) | | 238 | | $ | 53,395 |
| | | | |
|
|
Automotive (0.3%) | | | | | |
PSA Peugeot Citroen (d) (e) | | 24,495 | | | 1,488,350 |
Renault SA (d) (e) | | 22,184 | | | 1,921,057 |
Valeo SA (d) | | 16,280 | | | 609,540 |
| | | | |
|
|
| | | | | | 4,018,947 |
| | | | |
|
|
Banks (1.1%) | | | | | |
Banque Nationale de Paris (d) | | 106,126 | | | 8,048,289 |
Credit Agricole SA (d) (e) | | 74,971 | | | 2,198,062 |
Societe BIC SA (d) | | 257 | | | 14,598 |
Societe Generale (d) (e) | | 43,758 | | | 4,997,377 |
| | | | |
|
|
| | | | | | 15,258,326 |
| | | | |
|
|
Building & Construction (0.4%) | | | |
Compagnie Francaise d’Etudes et de Construction Technip SA (d) | | 16,900 | | | 914,330 |
Imerys SA (d) | | 850 | | | 58,794 |
Lafarge SA (d) | | 27,997 | | | 2,298,532 |
Vinci SA (b) (d) | | 21,689 | | | 1,695,676 |
| | | | |
|
|
| | | | | | 4,967,332 |
| | | | |
|
|
Chemicals (0.2%) | | | | | |
L’Air Liquide SA (d) | | 16,134 | | | 2,934,047 |
| | | | |
|
|
Computer Software & Services (0.2%) | | | |
Atos Origin SA (b) (d) | | 7,861 | | | 540,125 |
Business Objects SA (b) (d) | | 15,218 | | | 521,377 |
Cap Gemini SA (b) (d) (e) | | 23,417 | | | 861,148 |
Dassault Systems SA (d) | | 4,166 | | | 215,196 |
| | | | |
|
|
| | | | | | 2,137,846 |
| | | | |
|
|
Cosmetics/Personal Care (0.2%) | | | |
L’Oreal SA (d) (e) | | 35,516 | | | 2,611,436 |
| | | | |
|
|
Electronics & Electrical Equipment (0.3%) | | | |
Sagem SA (d) | | 14,624 | | | 290,930 |
Schneider Electric SA (d) (e) | | 33,297 | | | 2,736,060 |
Thomson Multimedia (d) (e) | | 48,745 | | | 918,937 |
| | | | |
|
|
| | | | | | 3,945,927 |
| | | | |
|
|
| | Common Stocks (continued) |
| | | | | |
| | | Shares or
Principal Amount | | Value |
| | | | | | |
FRANCE (continued) | | | | | |
Energy (1.5%) | | | | | |
TotalFinaElf SA (d) | | 75,618 | | $ | 19,027,639 |
| | | | |
|
|
Entertainment (0.3%) | | | | | |
Vivendi Universal SA (d) | | 145,188 | | | 4,569,391 |
| | | | |
|
|
Financial Services (0.1%) | | | | | |
Pernod Ricard SA (d) (e) | | 10,887 | | | 1,904,407 |
| | | | |
|
|
Food Products (0.5%) | | | | | |
Carrefour SA (d) | | 84,103 | | | 3,740,020 |
Casino Guichard Perrachon SA (d) (e) | | 3,314 | | | 226,394 |
Groupe Danone (d) (e) | | 31,299 | | | 3,181,076 |
| | | | |
|
|
| | | | | | 7,147,490 |
| | | | |
|
|
Healthcare (0.9%) | | | | | |
Essilor International SA (d) | | 16,241 | | | 1,337,142 |
Sanofi-Synthelabo SA (d) | | 138,887 | | | 11,125,809 |
| | | | |
|
|
| | | | | | 12,462,951 |
| | | | |
|
|
Hotels & Lodging (0.1%) | | | | | |
Accor SA (d) | | 28,979 | | | 1,447,341 |
| | | | |
|
|
Insurance (0.4%) | | | | | |
Axa (d) | | 187,352 | | | 5,426,113 |
CNP Assurances (d) | | 1,329 | | | 92,452 |
SCOR (d) | | 174,382 | | | 346,357 |
| | | | |
|
|
| | | | | | 5,864,922 |
| | | | |
|
|
Machinery (0.1%) | | | | | |
Alstom SA (b) (d) (e) | | 14,618 | | | 700,491 |
| | | | |
|
|
Manufacturing (0.3%) | | | | | |
Compagnie de Saint-Gobain (d) (e) | | 43,937 | | | 2,406,790 |
Compagnie Generale des Etablissements Michelin (d) | | 25,598 | | | 1,381,240 |
Neopost SA (d) | | 3,694 | | | 356,342 |
| | | | |
|
|
| | | | | | 4,144,372 |
| | | | |
|
|
Printing & Publishing (0.1%) | | | | | |
Lagardere S.C.A. (d) | | 18,818 | | | 1,293,405 |
| | | | |
|
|
| | | | | |
| | | Shares or
Principal Amount | | Value |
| | | | | | |
FRANCE (continued) | | | | | |
Public Thoroughfares (0.0%) | | | | | |
Autoroutes du Sud de la France (d) | | 6,917 | | $ | 386,229 |
Societe des Autoroutes Paris-Rhin-Rhone (d) | | 400 | | | 26,153 |
| | | | |
|
|
| | | | | | 412,382 |
| | | | |
|
|
Real Estate (0.1%) | | | | | |
Gecina SA (d) | | 1,421 | | | 157,176 |
Klepierre (d) (e) | | 3,346 | | | 313,591 |
Unibail SA (d) (e) | | 6,962 | | | 919,500 |
| | | | |
|
|
| | | | | | 1,390,267 |
| | | | |
|
|
Restaurants (0.0%) | | | | | |
Sodexho Alliance SA (d) | | 14,707 | | | 572,246 |
| | | | |
|
|
Retail (0.1%) | | | | | |
Pinault-Printemps-Redoute SA (d) | | 11,399 | | | 1,197,915 |
| | | | |
|
|
Telecommunications (0.9%) | | | | | |
Alcatel SA (b) (d) | | 159,306 | | | 1,871,900 |
Bouygues SA (d) | | 33,166 | | | 1,636,732 |
France Telecom SA (d) (e) | | 215,284 | | | 5,596,274 |
LVMH Moet Louis Vuitton Hennessy SA (d) (e) | | 32,071 | | | 2,597,231 |
| | | | |
|
|
| | | | | | 11,702,137 |
| | | | |
|
|
Television (0.0%) | | | | | |
Societe Television Francaise 1 (d) | | 17,970 | | | 460,956 |
| | | | |
|
|
Utilities (0.4%) | | | | | |
Suez SA (d) (e) | | 124,298 | | | 3,367,409 |
Veolia Environnement (d) (e) | | 45,326 | | | 1,886,032 |
| | | | |
|
|
| | | | | | 5,253,441 |
| | | | |
|
|
| | | | | | 118,541,303 |
| | | | |
|
|
GERMANY (6.3%) | | | | | |
Airlines (0.1%) | | | | | |
Lufthansa AG (d) | | 54,322 | | | 728,309 |
| | | | |
|
|
Apparel (0.2%) | | | | | |
Adidas AG (d) | | 7,912 | | | 1,327,418 |
Puma AG (d) | | 3,257 | | | 821,318 |
| | | | |
|
|
| | | | | | 2,148,736 |
| | | | |
|
|
Statement of Investments (Continued)
October 31, 2005
Gartmore International Index Fund (Continued)
| | Common Stocks (continued) |
| | | | | |
| | | Shares or
Principal Amount | | Value |
| | | | | | |
GERMANY (continued) | | | | | |
Automotive (0.8%) | | | | | |
DaimlerChrysler AG (d) | | 122,608 | | $ | 6,128,822 |
Deutsche Post AG (d) | | 86,890 | | | 1,941,862 |
Porsche AG (d) | | 1,390 | | | 1,005,122 |
Volkswagen AG (d) (e) | | 32,566 | | | 1,778,243 |
| | | | |
|
|
| | | | | | 10,854,049 |
| | | | |
|
|
Banks (0.8%) | | | | | |
Bayerische Vereins AG (b) (d) | | 83,935 | | | 2,345,908 |
Commerzbank AG (d) (e) | | 67,159 | | | 1,754,902 |
Deutsche Bank AG (d) | | 67,892 | | | 6,351,453 |
Hypo Real Estate Holding AG (d) | | 19,352 | | | 933,467 |
| | | | |
|
|
| | | | | | 11,385,730 |
| | | | |
|
|
Building & Construction (0.0%) | | | |
Hochtief AG (d) | | 3,039 | | | 123,297 |
| | | | |
|
|
Chemicals (0.7%) | | | | | |
BASF AG (d) | | 72,308 | | | 5,204,473 |
Bayer AG (d) | | 83,251 | | | 2,890,190 |
Henkel KGaA (d) | | 9,057 | | | 777,098 |
| | | | |
|
|
| | | | | | 8,871,761 |
| | | | |
|
|
Computer Hardware (0.0%) | | | | | |
Wincor Nixdorf AG (d) | | 3,933 | | | 344,703 |
| | | | |
|
|
Computer Software & Services (0.3%) | | | |
Sap AG (d) | | 27,452 | | | 4,706,988 |
| | | | |
|
|
Electronics & Electrical Equipment (0.0%) | | | |
Epcos AG (b) (d) | | 7,445 | | | 90,270 |
| | | | |
|
|
Financial Services (0.1%) | | | | | |
Deutsche Boerse AG (d) | | 17,368 | | | 1,634,157 |
MLP AG (d) | | 9,253 | | | 178,063 |
| | | | |
|
|
| | | | | | 1,812,220 |
| | | | |
|
|
Food Products (0.0%) | | | | | |
Suedzucker AG (d) | | 222 | | | 4,670 |
| | | | |
|
|
Healthcare (0.0%) | | | | | |
Fresenius Medical Care AG (d) (e) | | 2,224 | | | 200,776 |
| | | | |
|
|
| | | | | |
| | | Shares or
Principal Amount | | Value |
| | | | | | |
GERMANY (continued) | | | | | |
Hotels & Lodging (0.0%) | | | | | |
Preussag AG (d) (e) | | 32,008 | | $ | 622,455 |
| | | | |
|
|
Industrial (0.7%) | | | | | |
Linde AG (d) | | 12,703 | | | 906,477 |
MAN AG (d) | | 25,621 | | | 1,188,057 |
Siemens AG (d) (e) | | 103,970 | | | 7,728,521 |
| | | | |
|
|
| | | | | | 9,823,055 |
| | | | |
|
|
Insurance (0.7%) | | | | | |
Allianz AG (d) | | 48,642 | | | 6,858,229 |
Muenchener Rueckversicherungs-Gesellschaft AG (d) | | 23,146 | | | 2,717,103 |
| | | | |
|
|
| | | | | | 9,575,332 |
| | | | |
|
|
Manufacturing (0.1%) | | | | | |
Continental AG (d) | | 18,504 | | | 1,414,106 |
| | | | |
|
|
Metals & Mining (0.1%) | | | | | |
Thyssen Krupp AG (d) (e) | | 57,813 | | | 1,176,467 |
| | | | |
|
|
Personal Care (0.0%) | | | | | |
Beiersdorf AG (d) | | 645 | | | 69,577 |
| | | | |
|
|
Pharmaceuticals (0.2%) | | | | | |
Altana AG (d) (e) | | 14,383 | | | 811,441 |
Gehe AG (d) | | 1,701 | | | 143,822 |
Merck KGaA (d) | | 7,384 | | | 610,764 |
Schering AG (d) | | 28,497 | | | 1,756,888 |
| | | | |
|
|
| | | | | | 3,322,915 |
| | | | |
|
|
Real Estate (0.0%) | | | | | |
IVG Immobilien AG (d) | | 10,576 | | | 203,450 |
| | | | |
|
|
Retail (0.1%) | | | | | |
Douglas Holding AG (d) | | 2,372 | | | 90,074 |
Karstadt AG (b) (d) (e) | | 24,689 | | | 291,867 |
Metro AG (d) | | 18,778 | | | 849,975 |
| | | | |
|
|
| | | | | | 1,231,916 |
| | | | |
|
|
Semiconductors (0.1%) | | | | | |
Infineon Technologies AG (b) (d) (e) | | 96,897 | | | 906,332 |
| | | | |
|
|
| | Common Stocks (continued) |
| | | | | |
| | | Shares or
Principal Amount | | Value |
| | | | | | |
GERMANY (continued) | | | | | |
Telecommunications (0.5%) | | | | | |
Deutsche Telecom AG (d) (e) | | 347,043 | | $ | 6,136,737 |
| | | | |
|
|
Utilities (0.8%) | | | | | |
E.On AG (d) | | 79,066 | | | 7,163,543 |
RWE AG (d) | | 56,591 | | | 3,601,605 |
| | | | |
|
|
| | | | | | 10,765,148 |
| | | | |
|
|
| | | | | | 86,518,999 |
| | | | |
|
|
GREECE (0.6%) | | | | | |
Banks (0.4%) | | | | | |
Alpha Bank A.E. (d) | | 51,695 | | | 1,484,327 |
Commercial Bank of Greece SA (b) (d) | | 3,650 | | | 101,866 |
Eurobank (d) | | 18,091 | | | 545,219 |
National Bank of Greece SA (d) | | 47,090 | | | 1,837,265 |
Piraeus Bank SA (d) | | 20,849 | | | 423,016 |
| | | | |
|
|
| | | | | | 4,391,693 |
| | | | |
|
|
Beverages (0.0%) | | | | | |
Hellenic Bottling Co. SA (d) | | 5,706 | | | 155,516 |
| | | | |
|
|
Building & Construction (0.0%) | | | |
Hellenic Technodomiki Tev SA (d) | | 14,706 | | | 76,154 |
Technical Olympic SA (d) | | 12,569 | | | 71,666 |
Titan Cement Co. SA (d) | | 253 | | | 8,650 |
| | | | |
|
|
| | | | | | 156,470 |
| | | | |
|
|
Casino & Gambling (0.1%) | | | | | |
Greek Organization of Football Prognostics (d) | | 34,939 | | | 1,011,247 |
| | | | |
|
|
Electric Utility (0.0%) | | | | | |
Public Power Corp. (d) | | 27,906 | | | 590,733 |
| | | | |
|
|
Energy (0.0%) | | | | | |
Hellenic Petroleum SA (d) | | 487 | | | 6,890 |
| | | | |
|
|
Hotels & Motels (0.0%) | | | | | |
Hyatt Regency Hotels & Tourism SA (d) | | 131 | | | 1,608 |
| | | | |
|
|
| | | | | |
| | | Shares or
Principal Amount | | Value |
| | | | | | |
GREECE (continued) | | | | | |
Metals & Mining (0.0%) | | | | | |
Viohalco, Hellenic Copper & Aluminum Industry SA (d) | | 376 | | $ | 2,435 |
| | | | |
|
|
Retail (0.0%) | | | | | |
Folli-Follie SA (d) | | 1,393 | | | 37,586 |
Germanos SA (d) | | 15,982 | | | 237,900 |
Hellenic Duty Free Shops SA (d) | | 5,509 | | | 97,744 |
| | | | |
|
|
| | | | | | 373,230 |
| | | | |
|
|
Telecommunications (0.1%) | | | | | |
Cosmote Mobile Telecommunications SA (d) | | 16,827 | | | 346,668 |
Hellenic Telecommunication Organization SA (b) (d) | | 38,413 | | | 792,660 |
Intracom SA (d) | | 13,026 | | | 86,688 |
| | | | |
|
|
| | | | | | 1,226,016 |
| | | | |
|
|
Tobacco (0.0%) | | | | | |
Papastratos Cigarette Co. (b) (d) | | 5,006 | | | 108,096 |
| | | | |
|
|
| | | | | | 8,023,934 |
| | | | |
|
|
HONG KONG (1.5%) | | | | | |
Airlines (0.0%) | | | | | |
Cathay Pacific Airways Ltd. (d) | | 95,000 | | | 149,444 |
| | | | |
|
|
Banks (0.3%) | | | | | |
Bank of East Asia Ltd. (d) | | 204,700 | | | 599,462 |
BOC Hong Kong Holdings Ltd. (d) | | 473,200 | | | 884,321 |
Hang Seng Bank Ltd. (d) | | 100,100 | | | 1,299,640 |
| | | | |
|
|
| | | | | | 2,783,423 |
| | | | |
|
|
Broadcasting & Television (0.0%) | | | |
Television Broadcasts Ltd. (d) | | 16,000 | | | 89,054 |
| | | | |
|
|
Building & Construction (0.0%) | | | |
Cheung Kong Infrastructure Holdings Ltd. (d) | | 2,000 | | | 6,238 |
| | | | |
|
|
Chemicals (0.0%) | | | | | |
Kingboard Chemical Holdings Ltd. (d) | | 67,548 | | | 143,222 |
| | | | |
|
|
Statement of Investments (Continued)
October 31, 2005
Gartmore International Index Fund (Continued)
| | Common Stocks (continued) |
| | | | | |
| | | Shares or
Principal Amount | | Value |
| | | | | | |
HONG KONG (continued) | | | | | |
Distribution (0.1%) | | | | | |
Esprit Asia Holdings Ltd. (d) | | 101,000 | | $ | 715,567 |
Li & Fung Ltd. (d) | | 216,000 | | | 463,539 |
| | | | |
|
|
| | | | | | 1,179,106 |
| | | | |
|
|
Diversified Operations (0.1%) | | | | | |
Swire Pacific Ltd. (d) | | 133,800 | | | 1,203,912 |
Wharf Holdings Ltd. (d) | | 82,700 | | | 283,329 |
| | | | |
|
|
| | | | | | 1,487,241 |
| | | | |
|
|
Electronics & Electrical Equipment (0.1%) | | | |
Hongkong Electric Holdings Ltd. (d) | | 193,100 | | | 913,308 |
Johnson Electric Holdings Ltd. (d) | | 192,400 | | | 174,276 |
| | | | |
|
|
| | | | | | 1,087,584 |
| | | | |
|
|
Financial Services (0.0%) | | | | | |
Hong Kong Exchanges & Clearing Ltd. (d) | | 170,000 | | | 570,076 |
| | | | |
|
|
Hotels & Motels (0.0%) | | | | | |
Shangri-La Asia Ltd. (d) | | 4,000 | | | 5,611 |
| | | | |
|
|
Industrial (0.2%) | | | | | |
Hutchison Whampoa Ltd. (d) | | 277,000 | | | 2,635,934 |
| | | | |
|
|
Manufacturing (0.0%) | | | | | |
Techtronic Industries Co. Ltd. (d) | | 41,370 | | | 101,830 |
Yue Yuen Industrial Holdings Ltd. (d) | | 35,000 | | | 88,363 |
| | | | |
|
|
| | | | | | 190,193 |
| | | | |
|
|
Printing & Publishing (0.0%) | | | | | |
South China Morning Post Ltd. (d) | | 4,000 | | | 1,488 |
| | | | |
|
|
Real Estate (0.5%) | | | | | |
Cheung Kong Holdings Ltd. (d) | | 222,000 | | | 2,319,099 |
Hang Lung Properties Ltd. (d) | | 381,000 | | | 547,737 |
Henderson Land Development Co. Ltd. (d) | | 95,100 | | | 425,563 |
Hopewell Holdings Ltd. (d) | | 74,569 | | | 182,393 |
Hysan Development Co. Ltd. (d) | | 2,673 | | | 5,825 |
| | | | | |
| | | Shares or
Principal Amount | | Value |
| | | | | | |
HONG KONG (continued) | | | | | |
Real Estate (continued) | | | | | |
Kerry Properties Ltd. (d) | | 2,000 | | $ | 5,015 |
New World Developments Co. (d) | | 427,679 | | | 529,351 |
Sino Land Co. Ltd. (d) (e) | | 304,000 | | | 338,704 |
Sun Hung Kai Properties Ltd. (d) | | 180,700 | | | 1,715,141 |
| | | | |
|
|
| | | | | | 6,068,828 |
| | | | |
|
|
Retail (0.0%) | | | | | |
Giordano International Ltd. (d) | | 226,600 | | | 130,419 |
| | | | |
|
|
Semiconductors (0.0%) | | | | | |
ASM Pacific Technology Ltd. (d) | | 26,400 | | | 122,576 |
| | | | |
|
|
Telecommunications (0.0%) | | | | | |
Hutchison Telecommunications International Ltd. (b) (d) | | 147,642 | | | 187,696 |
PCCW Ltd. (d) | | 505,400 | | | 310,042 |
| | | | |
|
|
| | | | | | 497,738 |
| | | | |
|
|
Transportation (0.0%) | | | | | |
MTR Corp. Ltd. (d) (e) | | 22,214 | | | 42,098 |
Orient Overseas International (d) | | 33,338 | | | 106,352 |
| | | | |
|
|
| | | | | | 148,450 |
| | | | |
|
|
Utilities (0.2%) | | | | | |
CLP Holdings Ltd. (d) | | 254,600 | | | 1,461,810 |
Hong Kong & China Gas Co. Ltd. (d) | | 504,900 | | | 1,043,693 |
| | | | |
|
|
| | | | | | 2,505,503 |
| | | | |
|
|
| | | | | | 19,802,128 |
| | | | |
|
|
IRELAND (0.8%) | | | | | |
Airlines (0.0%) | | | | | |
Ryanair Holdings PLC (b) (d) | | 3,804 | | | 32,122 |
| | | | |
|
|
Banks (0.5%) | | | | | |
Allied Irish Banks PLC (d) | | 122,427 | | | 2,581,318 |
Bank of Ireland (d) | | 147,338 | | | 2,247,962 |
Depfa Bank PLC (d) | | 40,692 | | | 634,640 |
| | | | |
|
|
| | | | | | 5,463,920 |
| | | | |
|
|
Building & Construction (0.2%) | | | |
CRH PLC (d) | | 81,699 | | | 2,041,998 |
Kingspan Group PLC (d) | | 23,725 | | | 272,923 |
| | | | |
|
|
| | | | | | 2,314,921 |
| | | | |
|
|
| | Common Stocks (continued) |
| | | | | |
| | | Shares or
Principal Amount | | Value |
| | | | | | |
IRELAND (continued) | | | | | |
Casino & Gambling (0.0%) | | | | | |
Paddy Power PLC (d) | | 10,408 | | $ | 175,988 |
| | | | |
|
|
Consumer Products (0.0%) | | | | | |
Waterford Wedgewood PLC (b) (d) | | 403 | | | 31 |
| | | | |
|
|
Diversified (0.0%) | | | | | |
DCC PLC (d) | | 2,840 | | | 52,739 |
| | | | |
|
|
Financial Services (0.0%) | | | | | |
Irish Life & Permanent PLC (d) | | 38,358 | | | 675,876 |
| | | | |
|
|
Food Products (0.1%) | | | | | |
C&C Group PLC (d) | | 26,200 | | | 161,745 |
Fyffes PLC (d) | | 1,184 | | | 3,434 |
Greencore Group PLC (d) | | 42,284 | | | 159,690 |
IAWS Group PLC (d) | | 13,536 | | | 186,605 |
Kerry Group PLC (d) | | 17,416 | | | 364,124 |
| | | | |
|
|
| | | | | | 875,598 |
| | | | |
|
|
Multi-Media (0.0%) | | | | | |
Independent News & Media PLC (d) | | 2,840 | | | 7,691 |
| | | | |
|
|
Pharmaceuticals (0.0%) | | | | | |
Elan Corp. PLC (b) (d) | | 51,638 | | | 423,577 |
| | | | |
|
|
Retail (0.0%) | | | | | |
Grafton Group PLC (b) (d) | | 39,058 | | | 385,021 |
| | | | |
|
|
Telecommunications (0.0%) | | | | | |
Eircom Group PLC (d) | | 130,445 | | | 312,784 |
| | | | |
|
|
| | | | | | 10,720,268 |
| | | | |
|
|
ITALY (3.5%) | | | | | |
Aerospace & Defense (0.1%) | | | | | |
Finmeccanica SpA (d) | | 44,643 | | | 811,871 |
| | | | |
|
|
Apparel (0.0%) | | | | | |
Benetton Group SpA (d) | | 1,026 | | | 10,837 |
| | | | |
|
|
Automotive (0.0%) | | | | | |
Fiat SpA (b) (d) (e) | | 34,868 | | | 284,109 |
| | | | |
|
|
| | | | | |
| | | Shares or
Principal Amount | | Value |
| | | | | | |
ITALY (continued) | | | | | |
Banks (1.1%) | | | | | |
Banc Monte Dei Paschi Di Seina SpA (d) | | 73,701 | | $ | 334,621 |
Banca Antonveneta SpA (d) | | 15,567 | | | 486,402 |
Banca di Roma SpA (d) (e) | | 209,827 | | | 1,094,899 |
Banca Intesa SpA (d) | | 61,028 | | | 264,319 |
Banca Nazionale del Lavoro (BNC) (b) (d) (e) | | 232,582 | | | 749,995 |
Banche Popolari Unite Scrl (d) | | 41,494 | | | 878,091 |
Banco Popolare di Verona e Novara Scrl (d) | | 58,896 | | | 1,086,972 |
FinecoGroup SpA (d) | | 23,651 | | | 204,698 |
IntesaBci SpA (d) | | 431,147 | | | 2,013,581 |
Mediobanca SpA (d) | | 81,257 | | | 1,438,686 |
San Paolo IMI SpA (d) | | 152,440 | | | 2,200,867 |
UniCredito Italiano SpA (d) (e) | | 736,368 | | | 4,111,609 |
| | | | |
|
|
| | | | | | 14,864,740 |
| | | | |
|
|
Broadcasting & Television (0.1%) | | | |
Mediaset SpA (d) | | 139,344 | | | 1,530,430 |
| | | | |
|
|
Building & Construction (0.0%) | | | |
Italcementi SpA (d) | | 310 | | | 5,084 |
| | | | |
|
|
Energy (0.7%) | | | | | |
Eni SpA (d) (e) | | 338,050 | | | 9,047,832 |
| | | | |
|
|
Financial Services (0.0%) | | | | | |
Banca Fideuram SpA (d) (e) | | 70,803 | | | 382,420 |
Mediolanum SpA (d) (e) | | 40,463 | | | 256,138 |
| | | | |
|
|
| | | | | | 638,558 |
| | | | |
|
|
Gas-Transportation (0.1%) | | | | | |
Snam Rete Gas SpA (d) (e) | | 164,760 | | | 904,557 |
| | | | |
|
|
Insurance (0.4%) | | | | | |
Alleanza Assicurazioni SpA (d) (e) | | 64,036 | | | 739,475 |
Assicurazioni Generali SpA (d) | | 138,564 | | | 4,120,253 |
Riunione Adriatica di Sicurta SpA (d) (e) | | 47,828 | | | 1,087,624 |
| | | | |
|
|
| | | | | | 5,947,352 |
| | | | |
|
|
Statement of Investments (Continued)
October 31, 2005
Gartmore International Index Fund (Continued)
| | Common Stocks (continued) |
| | | | | |
| | | Shares or
Principal Amount | | Value |
| | | | | | |
ITALY (continued) | | | | | |
Medical Products (0.0%) | | | | | |
Luxottica Group SA (d) | | 6,419 | | $ | 154,891 |
| | | | |
|
|
Multi-Media (0.0%) | | | | | |
Seat Pagine Gialle SpA (b) (d) | | 185,042 | | | 85,960 |
Telecom Italia Media SpA (b) (d) (e) | | 86,234 | | | 48,757 |
| | | | |
|
|
| | | | | | 134,717 |
| | | | |
|
|
Pharmaceuticals (0.0%) | | | | | |
Banca Popolare de Milano (d) | | 52,118 | | | 496,657 |
| | | | |
|
|
Printing & Publishing (0.0%) | | | | | |
Gruppo Editorale L’Espresso SA (d) (e) | | 6,274 | | | 33,399 |
| | | | |
|
|
Public Thoroughfares (0.1%) | | | | | |
Autostrade SpA (d) | | 49,633 | | | 1,135,193 |
| | | | |
|
|
Publishing (0.0%) | | | | | |
Mondadori (Arnoldo) Editore SpA (d) | | 639 | | | 5,947 |
| | | | |
|
|
Restaurants (0.0%) | | | | | |
Autogrill SpA (d) | | 17,345 | | | 236,810 |
| | | | |
|
|
Retail (0.0%) | | | | | |
Bulgari SpA (d) | | 22,544 | | | 238,892 |
| | | | |
|
|
Telecommunications (0.5%) | | | | | |
Telecom Italia SpA (d) | | 769,067 | | | 1,859,645 |
Telecom Italia SpA (d) | | 1,441,574 | | | 4,171,645 |
Tiscali SpA (b) (d) (e) | | 90,285 | | | 313,703 |
| | | | |
|
|
| | | | | | 6,344,993 |
| | | | |
|
|
Tire & Rubber (0.0%) | | | | | |
Pirelli & C. SpA (d) | | 215,146 | | | 191,114 |
| | | | |
|
|
Utilities (0.4%) | | | | | |
Edison SpA (b) (d) (e) | | 124,266 | | | 251,833 |
Enel SpA (d) (e) | | 548,605 | | | 4,418,208 |
Terna SpA (d) (e) | | 195,496 | | | 471,004 |
| | | | |
|
|
| | | | | | 5,141,045 |
| | | | |
|
|
| | | | | | 48,159,028 |
| | | | |
|
|
| | | | | |
| | | Shares or
Principal Amount | | Value |
| | | | | | |
JAPAN (23.0%) | | | | | |
Advertising (0.0%) | | | | | |
Asatsu-DK, Inc. (d) | | 200 | | $ | 6,342 |
Dentsu, Inc. (d) (e) | | 241 | | | 653,381 |
Hakuhodo DY Holdings, Inc. (d) | | 300 | | | 20,162 |
| | | | |
|
|
| | | | | | 679,885 |
| | | | |
|
|
Agriculture (0.1%) | | | | | |
Ajinomoto Co., Inc. (d) | | 104,000 | | | 1,014,418 |
| | | | |
|
|
Airline Services (0.1%) | | | | | |
All Nippon Airways Co. Ltd. (d) | | 70,000 | | | 227,249 |
Japan Airlines System Corp. (d) | | 81,000 | | | 212,836 |
Yamato Transport Co. Ltd. (d) (e) | | 71,000 | | | 1,169,689 |
| | | | |
|
|
| | | | | | 1,609,774 |
| | | | |
|
|
Apparel (0.1%) | | | | | |
Fast Retailing Co. Ltd. (d) (e) | | 4,200 | | | 294,778 |
Gunze Ltd. (d) | | 83,000 | | | 435,843 |
Wacoal Corp. (d) (e) | | 4,000 | | | 56,700 |
| | | | |
|
|
| | | | | | 787,321 |
| | | | |
|
|
Audio & Video Products (0.0%) | | | |
Yamaha Corp. (d) (e) | | 23,200 | | | 410,436 |
| | | | |
|
|
Automotive (2.4%) | | | |
Aisin Seiki Co. Ltd. (d) | | 18,300 | | | 550,895 |
Denso Corp. (d) | | 72,900 | | | 2,075,732 |
Hino Motors Ltd. (d) | | 10,000 | | | 63,967 |
Honda Motor Co. Ltd. (d) | | 101,600 | | | 5,651,483 |
NGK Spark Plug Co. (d) (e) | | 44,000 | | | 707,117 |
NHK Spring Co. Ltd. (d) (e) | | 51,000 | | | 400,913 |
Nissan Motor Co. (d) (e) | | 265,000 | | | 2,778,644 |
Nok Corp. (d) (e) | | 7,000 | | | 211,206 |
Sanden Corp. (d) (e) | | 50,000 | | | 251,869 |
Toyoda Gosei Co. Ltd. (d) (e) | | 2,000 | | | 37,444 |
Toyota Industries Corp. (d) | | 14,000 | | | 470,424 |
Toyota Motor Co. Ltd. (d) | | 400,300 | | | 18,565,293 |
USS Co. Ltd. (d) (e) | | 7,430 | | | 508,823 |
Yamaha Motor Co. Ltd. (d) | | 24,000 | | | 515,564 |
| | | | |
|
|
| | | | | | 32,789,374 |
| | | | |
|
|
Banks (2.6%) | | | | | |
77th Bank Ltd. (The) (d) | | 19,800 | | | 158,063 |
Bank of Fukuoka Ltd. (The) (d) (e) | | 78,000 | | | 606,260 |
| | Common Stocks (continued) |
| | | | | |
| | | Shares or
Principal Amount | | Value |
| | | | | | |
JAPAN (continued) | | | | | |
Banks (continued) | | | | | |
Bank of Yokohama Ltd. (The) (d) | | 192,000 | | $ | 1,563,528 |
Chiba Bank (d) (e) | | 102,000 | | | 908,086 |
Daiwa Bank Holdings, Inc. (b) (d) (e) | | 517 | | | 1,499,177 |
Gunma Bank Ltd. (d) | | 10,000 | | | 71,255 |
Hokugin Financial Group, Inc. (d) (e) | | 125,000 | | | 517,077 |
Joyo Bank (d) | | 38,000 | | | 254,069 |
Mitsubishi Tokyo Financial Group, Inc. (d) | | 1,052 | | | 13,224,281 |
Mitsui Trust Holdings, Inc. (d) (e) | | 74,200 | | | 894,070 |
Mizuho Financial Group, Inc. (d) | | 1,134 | | | 7,571,613 |
Nishi-Nippon City Bank Ltd. (d) | | 8,000 | | | 46,693 |
Shinsei Bank Ltd. (d) | | 170,000 | | | 989,332 |
Shizuoka Bank Ltd. (The) (d) (e) | | 58,200 | | | 611,288 |
Sumitomo Mitsui Financial Group, Inc. (d) | | 629 | | | 5,810,093 |
Suruga Bank Ltd. (The) (d) | | 7,000 | | | 85,495 |
| | | | |
|
|
| | | | | | 34,810,380 |
| | | | |
|
|
Beverages (0.0%) | | | | | |
Ito En Ltd. (d) | | 1,300 | | | 62,557 |
Takara Shuzo Co. Ltd. (d) (e) | | 24,600 | | | 145,721 |
Yakult Honsha Co. Ltd. (d) (e) | | 14,000 | | | 342,359 |
| | | | |
|
|
| | | | | | 550,637 |
| | | | |
|
|
Brewery (0.2%) | | | | | |
Asahi Breweries Ltd. (d) (e) | | 64,000 | | | 800,161 |
Kirin Brewery Co. Ltd. (d) | | 73,000 | | | 812,127 |
Sapporo Holdings Ltd. (d) (e) | | 90,000 | | | 445,776 |
| | | | |
|
|
| | | | | | 2,058,064 |
| | | | |
|
|
Broadcasting & Television (0.0%) | | | |
Fuji Television Network, Inc. (d) | | 149 | | | 330,946 |
| | | | |
|
|
Building & Construction (0.9%) | | | |
Asahi Glass Co. Ltd. (d) (e) | | 103,700 | | | 1,121,311 |
Central Glass Co. Ltd. (d) (e) | | 5,000 | | | 27,824 |
Daikin Industries Ltd. (d) | | 39,300 | | | 1,025,538 |
Daiwa House Industry Co. Ltd. (d) | | 70,600 | | | 946,406 |
| | | | | |
| | | Shares or
Principal Amount | | Value |
| | | | | | |
JAPAN (continued) | | | | | |
Building & Construction (continued) | | | |
Hitachi Construction Machinery Co. Ltd. (d) | | 23,000 | | $ | 439,011 |
Kajima Corp. (d) (e) | | 127,500 | | | 663,704 |
Keio Teito Electric Railway Co. Ltd. (d) (e) | | 77,500 | | | 447,302 |
Komatsu Ltd. (d) | | 139,000 | | | 1,852,451 |
Matsushita Electric Works Ltd. (d) (e) | | 38,284 | | | 358,247 |
Nippon Sheet Glass Co. Ltd. (d) (e) | | 44,000 | | | 187,361 |
Nippon Yusen Kabushiki Kaisha (d) (e) | | 119,000 | | | 720,085 |
Nishimatsu Construction Co. Ltd. (d) (e) | | 99,600 | | | 461,250 |
Obayashi Corp. (d) | | 72,300 | | | 529,863 |
Okumura Corp. (d) (e) | | 26,000 | | | 162,744 |
Sanwa Shutter Corp. (d) (e) | | 38,000 | | | 236,178 |
Sekisui House Ltd. (d) (e) | | 69,300 | | | 863,162 |
Shimizu Corp. (d) (e) | | 56,000 | | | 379,973 |
Sumitomo Osaka Cement Co. Ltd. (d) (e) | | 144,400 | | | 407,904 |
Taiheiyo Cement Corp. (d) (e) | | 115,000 | | | 415,660 |
Taisei Construction Corp. (d) | | 161,000 | | | 715,048 |
Toda Corp. (d) (e) | | 44,000 | | | 254,547 |
Tostem Inax Holding Corp. (d) | | 29,100 | | | 494,562 |
| | | | |
|
|
| | | | | | 12,710,131 |
| | | | |
|
|
Chemicals (1.0%) | | | | | |
Asahi Kasei Corp. (d) | | 121,700 | | | 651,546 |
Daicel Chemical Industries Ltd. (d) (e) | | 2,000 | | | 12,956 |
Dainippon Ink & Chemicals, Inc. (d) | | 22,000 | | | 65,469 |
Denki Kagaku Kogyo Kabushiki Kaisha (d) | | 2,000 | | | 7,332 |
Hitachi Chemical Co. Ltd. (d) | | 3,000 | | | 64,631 |
Ishihara Sangyo Kaisha Ltd. (d) (e) | | 148,000 | | | 283,597 |
Kaneka Corp. (d) | | 42,000 | | | 520,205 |
Kansai Paint Co. Ltd. (d) | | 30,000 | | | 180,559 |
Kuraray Co. (d) (e) | | 52,000 | | | 493,718 |
Statement of Investments (Continued)
October 31, 2005
Gartmore International Index Fund (Continued)
| | Common Stocks (continued) |
| | | | | |
| | | Shares or
Principal Amount | | Value |
| | | | | | |
JAPAN (continued) | | | | | |
Chemicals (continued) | | | | | |
Mitsubishi Chemical Holdings Corp. (b) (d) | | 125,500 | | $ | 780,668 |
Mitsubishi Gas Chemical Co. Ltd. (d) | | 15,000 | | | 102,187 |
Mitsui Chemicals, Inc. (d) (e) | | 121,100 | | | 725,623 |
Nippon Kayaku Co. Ltd. (d) | | 20,000 | | | 159,194 |
Nippon Shokubai Co. Ltd. (d) (e) | | 16,000 | | | 173,424 |
Nissan Chemical Industries Ltd. (d) (e) | | 42,000 | | | 489,338 |
Nitto Denko Corp. (d) | | 22,410 | | | 1,357,099 |
Sekisui Chemical Co. Ltd. (d) | | 45,800 | | | 289,824 |
Shin-Etsu Chemical Co. Ltd. (d) | | 57,900 | | | 2,776,455 |
Showa Denko K.K. (d) | | 227,000 | | | 726,170 |
Sumitomo Bakelite Co. Ltd. (d) (e) | | 25,000 | | | 166,312 |
Sumitomo Chemical Co. Ltd. (d) | | 160,200 | | | 945,640 |
Tokuyama Corp. (d) (e) | | 54,000 | | | 536,537 |
Toray Industries, Inc. (d) | | 141,000 | | | 782,462 |
Tosoh Corp. (d) | | 121,000 | | | 536,419 |
Ube Industries Ltd. (d) | | 195,000 | | | 499,211 |
| | | | |
|
|
| | | | | | 13,326,576 |
| | | | |
|
|
Commercial Services (0.2%) | | | | | |
Goodwill Group, Inc. (d) (e) | | 88 | | | 155,781 |
Nichii Gakkan Co. (d) (e) | | 8,100 | | | 193,893 |
NTT Data Corp. (d) (e) | | 90 | | | 313,881 |
Secom Co. (d) | | 34,000 | | | 1,696,719 |
TIS, Inc. (d) | | 5,100 | | | 120,042 |
| | | | |
|
|
| | | | | | 2,480,316 |
| | | | |
|
|
Computer Hardware (0.4%) | | | | | |
Fujitsu Ltd. (d) (e) | | 215,200 | | | 1,424,100 |
NEC Corp. (d) | | 295,000 | | | 1,467,873 |
NEC Electronics Corp. (d) (e) | | 5,200 | | | 139,537 |
Toshiba Corp. (d) | | 378,000 | | | 1,755,019 |
| | | | |
|
|
| | | | | | 4,786,529 |
| | | | |
|
|
Computer Software & Services (0.4%) | | | |
CSK Corp. (d) (e) | | 9,300 | | | 361,253 |
eAccess Ltd. (d) (e) | | 454 | | | 281,966 |
Fuji Soft ABC, Inc. (d) | | 5,400 | | | 148,323 |
| | | | | |
| | | Shares or
Principal Amount | | Value |
| | | | | | |
JAPAN (continued) | | | | | |
Computer Software & Services (continued) | | | |
Hitachi Software Engineering Co. Ltd. (d) | | 16,400 | | $ | 275,429 |
Index Corp. (d) (e) | | 260 | | | 292,547 |
Konami Co. Ltd. (d) (e) | | 12,600 | | | 260,031 |
Meitec Corp. (d) | | 4,900 | | | 158,386 |
Net One Systems Co. Ltd. (d) (e) | | 132 | | | 252,658 |
Nomura Research Institute Ltd. (d) | | 2,500 | | | 259,095 |
OBIC Co. Ltd. (d) | | 100 | | | 16,310 |
Oracle Corp. (d) (e) | | 1,100 | | | 46,216 |
Rakuten, Inc. (d) (e) | | 693 | | | 450,817 |
SBI Holdings, Inc. (b) (d) | | 82 | | | 40,935 |
Softbank Corp. (d) (e) | | 30,300 | | | 1,718,147 |
Trend Micro, Inc. (d) (e) | | 18,000 | | | 564,840 |
Yahoo! Japan Corp. (b) (d) | | 421 | | | 452,144 |
Yahoo! Japan Corp. — W/I (d) | | 421 | | | 446,935 |
| | | | |
|
|
| | | | | | 6,026,032 |
| | | | |
|
|
Consumer Products (0.0%) | | | | | |
Onward Kashiyama Co. Ltd. (d) | | 14,700 | | | 234,950 |
| | | | |
|
|
Containers (0.0%) | | | | | |
Toyo Seikan Kaisha Ltd. (d) (e) | | 17,400 | | | 245,845 |
| | | | |
|
|
Cosmetics & Toiletries (0.0%) | | | | | |
Uni-Charm Corp. (d) | | 6,400 | | | 289,123 |
| | | | |
|
|
Electric Utilities (0.0%) | | | | | |
Alps Electric Co. Ltd. (d) (e) | | 24,600 | | | 391,410 |
| | | | |
|
|
Electronics & Electrical Equipment (3.0%) | | | |
Anritsu Corp. (d) (e) | | 42,000 | | | 210,863 |
Canon, Inc. (d) | | 103,100 | | | 5,457,936 |
Casio Computer Co. Ltd. (d) (e) | | 36,000 | | | 543,786 |
Dainippon Screen Manufacturing Co. Ltd. (d) (e) | | 44,000 | | | 270,937 |
Fuji Electric Holdings Co. Ltd. (d) | | 2,000 | | | 8,962 |
Fujikura Ltd. (d) (e) | | 47,000 | | | 304,301 |
Furukawa Electric Co. Ltd. (b) (d) (e) | | 122,300 | | | 582,061 |
Hirose Electric Co. Ltd. (d) (e) | | 3,400 | | | 388,848 |
Hitachi Ltd. (d) (e) | | 410,200 | | | 2,526,341 |
| | Common Stocks (continued) |
| | | | | |
| | | Shares or
Principal Amount | | Value |
| | | | | | |
JAPAN (continued) | | | | | |
Electronics & Electrical Equipment (continued) |
Hoya Corp. (d) | | 16,100 | | $ | 563,990 |
Hoya Corp. (b) (d) | | 48,300 | | | 1,672,386 |
Ibiden Co. Ltd. (d) | | 14,000 | | | 567,364 |
Keyence Corp. (d) | | 3,880 | | | 892,948 |
Kyocera Corp. (d) (e) | | 24,900 | | | 1,615,205 |
Mabuchi Motor Co. Ltd. (d) (e) | | 3,900 | | | 190,178 |
Matsushita Electric Industrial Co. Ltd. (d) | | 293,602 | | | 5,381,315 |
Mitsumi Electric Co. Ltd. (d) (e) | | 29,200 | | | 283,349 |
Murata Manufacturing Co. (d) | | 28,900 | | | 1,449,385 |
NGK Insulators Ltd. (d) (e) | | 22,000 | | | 262,563 |
Nidec Corp. (d) (e) | | 5,400 | | | 316,874 |
Nidec Corp. (b) (d) | | 5,400 | | | 299,253 |
Nintendo Co. (d) | | 14,800 | | | 1,659,890 |
Nippon Electric Glass Co. Ltd. (d) | | 11,000 | | | 210,608 |
Omron Corp. (d) | | 19,300 | | | 455,442 |
Pioneer Electronic Corp. (d) (e) | | 37,600 | | | 476,016 |
Ricoh Co. Ltd. (d) (e) | | 92,800 | | | 1,474,947 |
Sanyo Electric Co. (d) (e) | | 220,200 | | | 459,371 |
Sharp Corp. (d) | | 133,900 | | | 1,838,946 |
Sony Corp. (d) (e) | | 148,500 | | | 4,852,303 |
Stanley Electric Co. Ltd. (d) (e) | | 23,000 | | | 353,783 |
Sumitomo Electric Industries Ltd. (d) | | 71,000 | | | 934,441 |
Taiyo Yuden Co. Ltd. (d) (e) | | 28,000 | | | 277,561 |
TDK Corp. (d) | | 19,300 | | | 1,301,539 |
Uniden Corp. (d) (e) | | 18,000 | | | 311,392 |
Ushio, Inc. (d) (e) | | 3,000 | | | 55,911 |
Yokogawa Electric Co. Ltd. (d) (e) | | 44,000 | | | 648,378 |
| | | | |
|
|
| | | | | | 39,099,373 |
| | | | |
|
|
Energy (0.2%) | | | | | |
Inpex Corp. (d) | | 74 | | | 518,932 |
Nippon Oil Co. Ltd. (d) | | 176,600 | | | 1,508,407 |
Teikoko Oil Co. Ltd. (d) (e) | | 59,000 | | | 567,817 |
TonenGeneral Sekiyu K.K. (d) (e) | | 11,000 | | | 122,868 |
| | | | |
|
|
| | | | | | 2,718,024 |
| | | | |
|
|
Engineering (0.1%) | | | | | |
Chiyoda Corp. (d) (e) | | 31,000 | | | 535,406 |
COMSYS Holdings Corp. (d) (e) | | 35,227 | | | 396,430 |
| | | | | |
| | | Shares or
Principal Amount | | Value |
| | | | | | |
JAPAN (continued) | | | | | |
Engineering (continued) | | | | | |
Mitsui Engineering & Shipbuilding Co. Ltd. (d) (e) | | 174,000 | | $ | 418,006 |
Takuma Co. Ltd. (d) | | 42,100 | | | 323,241 |
| | | | |
|
|
| | | | | | 1,673,083 |
| | | | |
|
|
Entertainment (0.0%) | | | | | |
Sankyo Co. Ltd. (d) (e) | | 2,200 | | | 116,353 |
Toho Co. Ltd. (d) | | 3,100 | | | 59,101 |
| | | | |
|
|
| | | | | | 175,454 |
| | | | |
|
|
Financial Services (1.1%) | | | | | |
Acom Co. Ltd. (d) | | 9,510 | | | 618,153 |
Aeon Credit Service Co. Ltd. (d) (e) | | 3,100 | | | 243,544 |
Aiful Corp. (d) | | 7,667 | | | 573,573 |
Credit Saison Co. (d) (e) | | 29,300 | | | 1,329,588 |
Daiwa Securities Ltd. (d) | | 180,900 | | | 1,486,261 |
Hitachi Capital Corp. (d) (e) | | 200 | | | 4,254 |
Itochu Techno-Science Corp. (d) (e) | | 600 | | | 22,960 |
JAFCO Co. Ltd. (d) (e) | | 1,200 | | | 72,407 |
Matsui Securities Co. Ltd. (d) (e) | | 33,200 | | | 368,958 |
Nikko Securities Co. Ltd. (d) | | 133,000 | | | 1,614,851 |
Nomura Securities Co. (d) | | 269,300 | | | 4,155,121 |
Orix Corp. (d) | | 12,400 | | | 2,325,497 |
Promise Co. Ltd. (d) | | 9,900 | | | 625,657 |
Sumitomo Trust & Banking Co. Ltd. (d) | | 130,000 | | | 1,106,923 |
Takefuji Corp. (d) | | 15,180 | | | 1,062,554 |
| | | | |
|
|
| | | | | | 15,610,301 |
| | | | |
|
|
Food Products (0.3%) | | | | | |
Ariake Japan Co. Ltd. (d) | | 13,200 | | | 296,527 |
Japan Tobacco, Inc. (d) | | 138 | | | 2,182,041 |
Katokichi Co. Ltd. (d) | | 6,253 | | | 40,787 |
Kikkoman Corp. (d) (e) | | 23,000 | | | 222,054 |
Kita Kyushu Coca-Cola (d) (e) | | 200 | | | 4,451 |
Meiji Seika Kaisha Ltd. (d) (e) | | 8,000 | | | 41,753 |
Nichirei Corp. (d) | | 43,000 | | | 201,642 |
Nippon Meat Packers, Inc. (d) | | 30,000 | | | 333,005 |
Nisshin Seifun Group, Inc. (d) | | 27,060 | | | 275,637 |
Statement of Investments (Continued)
October 31, 2005
Gartmore International Index Fund (Continued)
| | Common Stocks (continued) |
| | | | | |
| | | Shares or
Principal Amount | | Value |
| | | | | | |
JAPAN (continued) | | | | | |
Food Products (continued) | | | | | |
Nissin Food Products Co. Ltd. (d) (e) | | 11,000 | | $ | 289,151 |
Q.P. Corp. (d) | | 14,000 | | | 124,954 |
Toyo Suisan Kaisha Ltd. (d) | | 4,400 | | | 76,312 |
Yamazaki Baking Co. Ltd. (d) (e) | | 1,800 | | | 15,013 |
| | | | |
|
|
| | | | | | 4,103,327 |
| | | | |
|
|
Furniture & Furnishings (0.0%) | | | |
Kokuyo Co. Ltd. (d) | | 200 | | | 2,987 |
| | | | |
|
|
Healthcare (0.1%) | | | | | |
Terumo Corp. (d) | | 23,800 | | | 722,074 |
| | | | |
|
|
Holding Companies - Diversified (0.2%) | | | |
JFE Holdings, Inc. (d) (e) | | 66,700 | | | 2,072,318 |
| | | | |
|
|
Household Products (0.2%) | | | | | |
Kao Corp. (d) | | 77,000 | | | 1,844,501 |
Shiseido Co. Ltd. (d) (e) | | 51,200 | | | 821,448 |
Toto Ltd. (d) (e) | | 39,100 | | | 299,430 |
| | | | |
|
|
| | | | | | 2,965,379 |
| | | | |
|
|
Import & Export (0.7%) | | | | | |
Itochu Corp. (d) (e) | | 159,000 | | | 1,090,001 |
Marubenii Corp. (d) | | 201,000 | | | 942,193 |
Mitsubishi Corp. (d) | | 175,600 | | | 3,415,354 |
Mitsui & Co. Ltd. (d) | | 190,000 | | | 2,333,368 |
Sojitz Holdings Corp. (b) (d) (e) | | 29,067 | | | 159,377 |
Sumitomo Corp. (d) | | 121,000 | | | 1,352,863 |
Toyota Tsusho Corp. (d) | | 17,300 | | | 383,139 |
| | | | |
|
|
| | | | | | 9,676,295 |
| | | | |
|
|
Industrial (0.8%) | | | | | |
Ebara Corp. (d) (e) | | 40,300 | | | 165,763 |
Fanuc Co. Ltd. (d) | | 23,300 | | | 1,836,472 |
JGC Corp. (d) (e) | | 31,000 | | | 507,580 |
Kawasaki Heavy Industries Ltd. (d) (e) | | 174,000 | | | 454,572 |
Kubota Corp. (d) | | 93,000 | | | 676,703 |
Minebea Co. Ltd. (d) | | 54,000 | | | 211,331 |
Mitsubishi Heavy Industries Ltd. (d) | | 462,200 | | | 1,746,812 |
| | | | | |
| | | Shares or
Principal Amount | | Value |
| | | | | | |
JAPAN (continued) | | | | | |
Industrial (continued) | | | | | |
Nippon Steel Corp. (d) | | 925,000 | | $ | 3,305,405 |
SMC Corp. (d) | | 7,600 | | | 1,011,568 |
THK Co. Ltd. (d) | | 14,500 | | | 327,296 |
| | | | |
|
|
| | | | | | 10,243,502 |
| | | | |
|
|
Insurance (0.6%) | | | | | |
Millea Holdings, Inc. (d) | | 190 | | | 3,437,938 |
Mitsui Sumito Insurance Co. (d) | | 170,900 | | | 2,188,728 |
T&D Holdings, Inc (d) | | 26,000 | | | 1,635,270 |
Yasuda Fire & Marine Insurance Co. Ltd. (d) | | 95,600 | | | 1,437,042 |
| | | | |
|
|
| | | | | | 8,698,978 |
| | | | |
|
|
Manufacturing (0.4%) | | | | | |
Amada Co. Ltd. (d) | | 36,000 | | | 275,076 |
Amano Corp. (d) (e) | | 29,000 | | | 477,647 |
Daido Steel Co. Ltd. (d) (e) | | 87,000 | | | 603,247 |
Ishikawajima-Harima Heavy Industries Co. Ltd. (b) (d) (e) | | 265,000 | | | 617,913 |
JSR Corp. (d) | | 31,000 | | | 730,881 |
Kobe Steel Ltd. (d) (e) | | 242,000 | | | 715,119 |
Komori Corp. (d) (e) | | 10,000 | | | 174,103 |
Koyo Seiko Co. Ltd. (d) (e) | | 13,000 | | | 208,906 |
Makita Corp. (d) (e) | | 2,000 | | | 46,434 |
Nisshin Steel Co. Ltd. (d) | | 119,900 | | | 380,680 |
NTN Corp. (d) (e) | | 55,800 | | | 378,924 |
Rinnai Corp. (d) (e) | | 200 | | | 4,763 |
Shimano, Inc. (d) | | 2,400 | | | 59,428 |
Sumitomo Heavy Industries Ltd. (d) | | 77,300 | | | 541,370 |
| | | | |
|
|
| | | | | | 5,214,491 |
| | | | |
|
|
Metals & Mining (0.4%) | | | | | |
Dowa Mining Co. Ltd. (d) | | 38,900 | | | 313,766 |
Mitsubishi Material Corp. (d) (e) | | 188,000 | | | 647,206 |
Mitsui Mining & Smelting Co. Ltd. (d) | | 84,000 | | | 479,963 |
Nippon Light Metal Co. Ltd. (d) (e) | | 2,000 | | | 5,298 |
Nippon Minings Holdings, Inc. (d) | | 104,000 | | | 772,274 |
NSK Ltd. (d) (e) | | 62,300 | | | 363,513 |
| | Common Stocks (continued) |
| | | | | |
| | | Shares or
Principal Amount | | Value |
| | | | | | |
JAPAN (continued) | | | | | |
Metals & Mining (continued) | | | | | |
Sumitomo Metal & Mining Corp. (d) (e) | | 101,000 | | $ | 920,343 |
Sumitomo Metal Industries Ltd. (d) (e) | | 539,000 | | | 1,866,394 |
| | | | |
|
|
| | | | | | 5,368,757 |
| | | | |
|
|
Multi-Media (0.0%) | | | | | |
Tokyo Broadcasting System, Inc. (d) | | 3,900 | | | 110,264 |
| | | | |
|
|
Office Equipment & Supplies (0.0%) | | | |
Seiko Epson Corp. (d) | | 12,400 | | | 305,676 |
| | | | |
|
|
Paper Products (0.1%) | | | | | |
Nippon Unipac Holding (d) (e) | | 65 | | | 222,707 |
Oji Paper Ltd. (d) (e) | | 129,000 | | | 654,558 |
| | | | |
|
|
| | | | | | 877,265 |
| | | | |
|
|
Personal Care (0.0%) | | | |
Aderans Co. Ltd. (d) | | 14,700 | | | 392,888 |
| | | | |
|
|
Pharmaceuticals (1.2%) | | | |
Alfresa Holdings Corp. (d) | | 3,900 | | | 190,508 |
Chugai Pharmaceutical Ltd. (d) (e) | | 52,400 | | | 1,147,566 |
Daiichi Sankyo Co. Ltd. (b) (d) (e) | | 114,851 | | | 2,082,100 |
Eisai Co. (d) (e) | | 31,300 | | | 1,226,018 |
Kaken Pharmaceutical Co. Ltd. (d) (e) | | 45,000 | | | 319,425 |
Kyowa Hakko Kogyo Co. Ltd. (d) (e) | | 20,000 | | | 154,683 |
MEDICEO Holdings Co. Ltd. (d) | | 400 | | | 6,201 |
Santen Pharmaceutical Co. Ltd. (d) (e) | | 5,200 | | | 132,774 |
Shionogi & Co. (d) (e) | | 49,400 | | | 600,825 |
Suzuken Co. Ltd. (d) | | 1,300 | | | 39,756 |
Taisho Pharmacuetical Co. Ltd. (d) (e) | | 16,200 | | | 291,591 |
Takeda Chemical Industries Ltd. (d) | | 132,300 | | | 7,253,019 |
Tanabe Seiyaku Co. Ltd. (d) | | 6,000 | | | 57,791 |
Yamanouchi Pharmaceutical Co. Ltd. (d) | | 77,600 | | | 2,772,307 |
| | | | |
|
|
| | | | | | 16,274,564 |
| | | | |
|
|
| | | | | |
| | | Shares or
Principal Amount | | Value |
| | | | | | |
JAPAN (continued) | | | | | |
Photographic Products (0.3%) | | | |
Fuji Photo Film Ltd. (d) | | 76,500 | | $ | 2,434,577 |
Konica Corp. (d) | | 69,900 | | | 579,944 |
Nikon Corp. (d) (e) | | 39,000 | | | 500,295 |
Olympus Optical Co. Ltd. (d) (e) | | 36,000 | | | 801,282 |
| | | | |
|
|
| | | | | | 4,316,098 |
| | | | |
|
|
Printing & Publishing (0.2%) | | | |
Dai Nippon Printing Co. Ltd. (d) | | 90,500 | | | 1,481,220 |
Toppan Printing Co. Ltd. (d) | | 85,000 | | | 820,266 |
| | | | |
|
|
| | | | | | 2,301,486 |
| | | | |
|
|
Railroads (0.6%) | | | | | |
Central Japan Railway Co. (d) | | 265 | | | 2,254,105 |
East Japan Railway Co. (d) | | 444 | | | 2,638,465 |
Keihin Electric Express Railway Co. Ltd. (d) (e) | | 12,000 | | | 76,744 |
Keisei Electric Railway Co. Ltd. (d) (e) | | 87,000 | | | 564,638 |
Kinki Nippon Railway Co. Ltd. (d) (e) | | 113,000 | | | 414,369 |
Odakyu Electric Railway Co. Ltd. (d) (e) | | 90,000 | | | 503,970 |
Tobu Railway Co. Ltd. (d) | | 45,000 | | | 192,785 |
West Japan Railway Co. (d) | | 300 | | | 1,063,846 |
| | | | |
|
|
| | | | | | 7,708,922 |
| | | | |
|
|
Real Estate (0.7%) | | | |
Daito Trust Construction Co. Ltd. (d) (e) | | 10,700 | | | 530,264 |
Japan Real Estate Investment Corp. (d) | | 73 | | | 556,491 |
Japan Retail Fund Investment Corp. (d) | | 39 | | | 282,265 |
MDI Corp. (d) | | 21,375 | | | 554,517 |
Mitsubishi Estate Co. (d) (e) | | 170,600 | | | 2,522,351 |
Mitsui Fudosan Co. Ltd. (d) (e) | | 127,700 | | | 2,090,824 |
Nippon Building Fund, Inc. (d) (e) | | 53 | | | 421,311 |
Nomura Real Estate Office Fund, Inc. (d) (e) | | 55 | | | 369,788 |
Sumitomo Realty & Development Co. Ltd. (d) | | 67,000 | | | 1,084,056 |
Tokyo Tatemono Co. Ltd. (d) (e) | | 55,000 | | | 456,342 |
Tokyu Land Corp. (d) (e) | | 80,000 | | | 636,618 |
| | | | |
|
|
| | | | | | 9,504,827 |
| | | | |
|
|
Statement of Investments (Continued)
October 31, 2005
Gartmore International Index Fund (Continued)
| | Common Stocks (continued) |
| | | | | |
| | | Shares or
Principal Amount | | Value |
| | | | | | |
JAPAN (continued) | | | | | |
Resorts & Theme Parks (0.0%) | | | |
Oriental Land Co. Ltd. (d) | | 3,100 | | $ | 172,601 |
| | | | |
|
|
Restaurants (0.0%) | | | |
Skylark Co. Ltd. (d) | | 1,500 | | | 24,762 |
| | | | |
|
|
Retail (0.9%) | | | |
Aeon Co. Ltd. (d) | | 74,000 | | | 1,537,808 |
Aoyama Trading Co., Inc. (d) | | 1,600 | | | 48,185 |
Autobacs Seven Co. Ltd. (d) (e) | | 10,800 | | | 441,672 |
Circle K Sunkus Co. Ltd. (d) | | 195 | | | 4,485 |
Citizen Watch Co. Ltd. (d) (e) | | 51,000 | | | 387,687 |
Daimaru, Inc. (The) (d) (e) | | 8,000 | | | 97,844 |
FamilyMart Co. Ltd. (d) | | 8,800 | | | 261,850 |
Isetan Co. Ltd. (d) (e) | | 36,000 | | | 648,601 |
Lawson, Inc. (d) (e) | | 4,300 | | | 165,060 |
Marui Co. (d) | | 62,400 | | | 1,035,336 |
Matsumotokiyoshi Co. Ltd. (d) (e) | | 6,100 | | | 184,202 |
Mitsukoshi Ltd. (d) | | 31,300 | | | 136,893 |
Ryohin Keikaku Co. Ltd. (d) (e) | | 6,200 | | | 413,472 |
Seven & I Holdings Co. Ltd. (b) (d) | | 111,759 | | | 3,648,803 |
Shimachu Co. Ltd. (d) | | 4,200 | | | 119,515 |
Shimamura Co. Ltd. (d) (e) | | 2,200 | | | 282,257 |
Takashimaya Co. (d) (e) | | 61,000 | | | 820,513 |
Tokyo Style Co. (d) | | 5,000 | | | 61,033 |
Uny Co. Ltd. (d) | | 18,100 | | | 225,642 |
Yamada Denki Co. Ltd. (d) (e) | | 14,300 | | | 1,263,292 |
| | | | |
|
|
| | | | | | 11,784,150 |
| | | | |
|
|
Schools (0.0%) | | | |
Benesse Corp. (d) | | 2,700 | | | 95,766 |
| | | | |
|
|
Semiconductors (0.2%) | | | |
Advantest Corp. (d) (e) | | 12,500 | | | 906,698 |
Rohm Co. (d) | | 15,200 | | | 1,232,127 |
Tokyo Electron Ltd. (d) | | 24,700 | | | 1,241,876 |
| | | | |
|
|
| | | | | | 3,380,701 |
| | | | |
|
|
Telecommunications (0.6%) | | | |
Hikari Tsushin, Inc. (d) | | 3,000 | | | 192,794 |
KDDI Corp. (d) | | 293 | | | 1,679,444 |
| | | | | |
| | | Shares or
Principal Amount | | Value |
| | | | | | |
JAPAN (continued) | | | | | |
Telecommunications (continued) | | | |
Nippon Telegraph & Telephone Corp. (d) | | 597 | | $ | 2,854,157 |
NTT Docomo, Inc. (d) | | 2,205 | | | 3,808,557 |
Oki Electric Industry Co. Ltd. (d) (e) | | 74,000 | | | 230,779 |
| | | | |
|
|
| | | | | | 8,765,731 |
| | | | |
|
|
Textile Products (0.1%) | | | |
Mitsubishi Rayon Co. Ltd. (d) | | 57,000 | | | 265,017 |
Nisshinbo Industries, Inc. (d) (e) | | 21,900 | | | 215,537 |
Teijin Ltd. (d) (e) | | 119,000 | | | 708,772 |
Toyobo Co. Ltd. (d) (e) | | 116,000 | | | 293,790 |
| | | | |
|
|
| | | | | | 1,483,116 |
| | | | |
|
|
Tire & Rubber (0.1%) | | | |
Bridgestone Corp. (d) | | 86,500 | | | 1,767,119 |
| | | | |
|
|
Toys (0.1%) | | | |
Namco Bandai Holdings, Inc. (b) (d) | | 24,800 | | | 373,097 |
Sega Sammy Holdings, Inc. (d) | | 10,900 | | | 392,287 |
Sega Sammy Holdings, Inc. (b) (d) | | 10,900 | | | 392,396 |
| | | | |
|
|
| | | | | | 1,157,780 |
| | | | |
|
|
Transportation (0.3%) | | | |
Kamigumi Co. Ltd. (d) | | 14,000 | | | 115,413 |
Kawasaki Kisen Kaisha Ltd. (d) (e) | | 103,000 | | | 643,923 |
Mitsubishi Logistics Corp. (d) (e) | | 12,100 | | | 166,728 |
Mitsui O.S.K. Lines Ltd. (d) (e) | | 183,000 | | | 1,292,899 |
Nippon Express Co. Ltd. (d) | | 142,500 | | | 780,806 |
Seino Transportation Co. Ltd. (d) (e) | | 37,000 | | | 341,718 |
Tokyo Corp. (d) | | 124,400 | | | 679,959 |
| | | | |
|
|
| | | | | | 4,021,446 |
| | | | |
|
|
Utilities (1.1%) | | | |
Chubu Electric Power Co., Inc. (d) (e) | | 83,200 | | | 2,062,165 |
Electric Power Development Co. Ltd. (d) (e) | | 21,900 | | | 716,756 |
| | Common Stocks (continued) |
| | | | | |
| | | Shares or
Principal Amount | | Value |
| | | | | | |
JAPAN (continued) | | | | | |
Utilities (continued) | | | |
Hokkaido Electric Power Co., Inc. (d) | | 19,200 | | $ | 397,317 |
Kansai Electric Power, Inc. (d) | | 88,100 | | | 1,937,849 |
Kyushu Electric Power Co., Inc. (d) | | 53,600 | | | 1,150,270 |
Mitsubishi Electric Co. (d) | | 201,600 | | | 1,208,825 |
Osaka Gas Co. Ltd. (d) | | 227,000 | | | 830,139 |
Tohoku Electric Power Co. Ltd. (d) (e) | | 49,400 | | | 1,008,030 |
Tokyo Electric Power Co. Ltd. (d) | | 160,800 | | | 3,998,858 |
Tokyo Gas Ltd. (d) (e) | | 317,400 | | | 1,248,407 |
| | | | |
|
|
| | | | | | 14,558,616 |
| | | | |
|
|
| | | | | | 312,880,268 |
| | | | |
|
|
LUXEMBOURG (0.1%) | | | | | |
Steel (0.1%) | | | | | |
Arcelor (d) | | 76,462 | | | 1,815,490 |
| | | | |
|
|
NETHERLANDS (4.5%) | | | | | |
Banks (0.4%) | | | | | |
ABN Amro Holding NV (d) | | 235,317 | | | 5,565,438 |
| | | | |
|
|
Biotechnology (0.0%) | | | |
Qiagen NV (b) (d) | | 8,829 | | | 105,124 |
| | | | |
|
|
Business Services (0.0%) | | | |
Vedior NV (d) | | 9,495 | | | 126,825 |
| | | | |
|
|
Chemicals (0.2%) | | | |
Akzo Nobel NV (d) (e) | | 36,511 | | | 1,578,032 |
Koninklijke DSM NV (d) | | 43,033 | | | 1,544,957 |
| | | | |
|
|
| | | | | | 3,122,989 |
| | | | |
|
|
Commercial Services (0.0%) | | | |
Randstad Holding NV (d) | | 1,427 | | | 54,658 |
| | | | |
|
|
Computer Service (0.0%) | | | |
Getronics NV (d) | | 31,668 | | | 394,031 |
| | | | |
|
|
Diversified (0.1%) | | | |
Hagemeyer NV (b) (d) (e) | | 115,831 | | | 314,017 |
IHC Caland NV (d) | | 5,088 | | | 393,470 |
| | | | |
|
|
| | | | | | 707,487 |
| | | | |
|
|
| | | | | |
| | | Shares or
Principal Amount | | Value |
| | | | | | |
NETHERLANDS (continued) | | | | | |
Electronics & Electrical Equipment (0.4%) | | | |
Koninklijke Ahold NV (b) (d) | | 181,373 | | $ | 1,265,442 |
Philips Electronics NV (d) | | 172,105 | | | 4,500,282 |
| | | | |
|
|
| | | | | | 5,765,724 |
| | | | |
|
|
Energy (1.1%) | | | |
Royal Dutch Shell PLC, Class A (d) | | 518,626 | | | 15,990,325 |
| | | | |
|
|
Financial Services (0.6%) | | | |
Euronext NV (d) | | 17,308 | | | 735,451 |
ING Groep NV (d) | | 238,103 | | | 6,866,488 |
| | | | |
|
|
| | | | | | 7,601,939 |
| | | | |
|
|
Food Products (0.6%) | | | |
Heineken NV (d) | | 37,387 | | | 1,184,787 |
Koninklijke Numico NV (b) (d) | | 22,837 | | | 924,850 |
Unilever NV CVA (d) (e) | | 77,029 | | | 5,419,472 |
| | | | |
|
|
| | | | | | 7,529,109 |
| | | | |
|
|
Insurance (0.2%) | | | |
Aegon NV (d) | | 186,858 | | | 2,817,610 |
| | | | |
|
|
Printing & Publishing (0.3%) | | | |
Elsevier NV (d) | | 99,202 | | | 1,335,943 |
Oce NV (d) | | 412 | | | 5,894 |
VNU NV (d) | | 49,753 | | | 1,583,077 |
Wolters Kluwer CVA (d) | | 43,102 | | | 799,588 |
| | | | |
|
|
| | | | | | 3,724,502 |
| | | | |
|
|
Real Estate (0.1%) | | | |
Corio NV (d) | | 6,189 | | | 351,433 |
Rodamco Europe NV (d) | | 3,638 | | | 289,635 |
Wereldhave NV (d) | | 1,758 | | | 170,043 |
| | | | |
|
|
| | | | | | 811,111 |
| | | | |
|
|
Semiconductors (0.2%) | | | |
ASML Holding NV (b) (d) (e) | | 89,982 | | | 1,523,539 |
STMicroelectronics NV (d) | | 97,945 | | | 1,612,907 |
| | | | |
|
|
| | | | | | 3,136,446 |
| | | | |
|
|
Telecommunications (0.2%) | | | |
KPN NV (d) | | 315,854 | | | 3,000,851 |
| | | | |
|
|
Statement of Investments (Continued)
October 31, 2005
Gartmore International Index Fund (Continued)
| | Common Stocks (continued) |
| | | | | |
| | | Shares or
Principal Amount | | Value |
| | | | | | |
NETHERLANDS (continued) | | | | | |
Transportation (0.1%) | | | |
TPG NV (d) | | 59,254 | | $ | 1,397,168 |
| | | | |
|
|
| | | | | | 61,851,337 |
| | | | |
|
|
NEW ZEALAND (0.2%) | | | | | |
Airports (0.0%) | | | | | |
Auckland International Airport Ltd. (d) (e) | | 37,929 | | | 52,130 |
| | | | |
|
|
Building & Construction (0.0%) | | | |
Fletcher Building Ltd. (d) | | 37,470 | | | 206,073 |
| | | | |
|
|
Entertainment (0.0%) | | | |
Sky City Entertainment Group Ltd. (d) | | 63,632 | | | 202,354 |
Sky Network Television Ltd. (b) (d) | | 11,860 | | | 51,353 |
| | | | |
|
|
| | | | | | 253,707 |
| | | | |
|
|
Financial Services (0.0%) | | | |
Tower Ltd. (b) (d) | | 43,698 | | | 64,303 |
| | | | |
|
|
Healthcare (0.0%) | | | |
Fisher & Paykel Industries Ltd. (d) | | 121,168 | | | 295,019 |
| | | | |
|
|
Household Products (0.0%) | | | |
Fisher & Paykel Appliances Holdings Ltd. (d) (e) | | 38,164 | | | 86,157 |
| | | | |
|
|
Retail (0.0%) | | | |
Warehouse Group Ltd. (The) (d) (e) | | 20,915 | | | 57,187 |
| | | | |
|
|
Telecommunications (0.2%) | | | |
Telecom Corp. of New Zealand Ltd. (d) (e) | | 297,838 | | | 1,216,791 |
| | | | |
|
|
Utilities (0.0%) | | | |
Contact Energy Ltd. (d) | | 1,137 | | | 5,492 |
| | | | |
|
|
Waste Disposal (0.0%) | | | |
Waste Management NZ Ltd. (d) | | 68,528 | | | 282,998 |
| | | | |
|
|
| | | | | | 2,519,857 |
| | | | |
|
|
| | | | | |
| | | Shares or
Principal Amount | | Value |
| | | | | | |
NORWAY (0.8%) | | | | | |
Banks (0.1%) | | | | | |
DnB Holding ASA (d) | | 101,889 | | $ | 1,041,506 |
| | | | |
|
|
Chemicals (0.0%) | | | |
Yara International ASA (d) | | 34,414 | | | 566,948 |
| | | | |
|
|
Energy (0.0%) | | | |
Petroleum Geo-Services ASA (b) (d) | | 210 | | | 5,286 |
| | | | |
|
|
Food Products (0.1%) | | | |
Orkla ASA (d) | | 29,096 | | | 1,020,710 |
| | | | |
|
|
Industrial (0.3%) | | | |
Norsk Hydro ASA (d) | | 22,922 | | | 2,275,613 |
Tomra Systems ASA (d) (e) | | 51,388 | | | 351,318 |
| | | | |
|
|
| | | | | | 2,626,931 |
| | | | |
|
|
Insurance (0.0%) | | | |
Storebrand ASA (d) (e) | | 60,122 | | | 552,530 |
| | | | |
|
|
Oil & Gas (0.2%) | | | |
Statoil ASA (d) (e) | | 86,071 | | | 1,911,249 |
Stolt Offshore SA (b) (d) (e) | | 22,993 | | | 238,783 |
| | | | |
|
|
| | | | | | 2,150,032 |
| | | | |
|
|
Paper Products (0.0%) | | | |
Norske Skogsindustrier ASA (d) | | 17,208 | | | 245,219 |
| | | | |
|
|
Printing & Publishing (0.0%) | | | |
Schibsted ASA (d) (e) | | 212 | | | 6,112 |
| | | | |
|
|
Shipping (0.0%) | | | |
Frontline Ltd. (d) (e) | | 11,986 | | | 476,655 |
| | | | |
|
|
Telecommunications (0.1%) | | | |
Tandberg ASA (d) (e) | | 20,487 | | | 201,470 |
Tandberg Television ASA (b) (d) (e) | | 20,950 | | | 261,022 |
Telenor ASA (d) | | 120,054 | | | 1,170,952 |
| | | | |
|
|
| | | | | | 1,633,444 |
| | | | |
|
|
| | | | | | 10,325,373 |
| | | | |
|
|
| | Common Stocks (continued) |
| | | | | |
| | | Shares or
Principal Amount | | Value |
| | | | | | |
PORTUGAL (0.3%) | | | | | |
Automotive (0.0%) | | | | | |
Brisa-Auto Estradas SA (d) (e) | | 22,024 | | $ | 174,163 |
| | | | |
|
|
Banks (0.0%) | | | |
Banco Commercial Portuguese SA (d) (e) | | 241,177 | | | 610,027 |
Banco Espirito Santo SA (d) (e) | | 2,616 | | | 41,383 |
| | | | |
|
|
| | | | | | 651,410 |
| | | | |
|
|
Building Products (0.0%) | | | |
CIMPOR-Cimentos de Portugal SGPS SA (d) (e) | | 27,513 | | | 148,359 |
| | | | |
|
|
Financial Services (0.0%) | | | |
BPI-SGPS SA (d) | | 41,125 | | | 174,965 |
| | | | |
|
|
Food Products (0.0%) | | | |
Jeronimo Martins SGPS SA (d) | | 22 | | | 317 |
| | | | |
|
|
Industrial (0.0%) | | | |
Sonae SGPS SA (d) | | 187,675 | | | 303,596 |
| | | | |
|
|
Telecommunications (0.2%) | | | |
Portugal Telecom SA (d) (e) | | 139,528 | | | 1,261,465 |
PT Multimedia-Servicos de Telecomunicacoes e Multimedia (b) (d) | | 5,274 | | | 56,332 |
| | | | |
|
|
| | | | | | 1,317,797 |
| | | | |
|
|
Utilities (0.1%) | | | |
Electricidade de Portugal SA (d) | | 291,994 | | | 826,117 |
| | | | |
|
|
| | | | | | 3,596,724 |
| | | | |
|
|
SINGAPORE (0.8%) | | | | | |
Aerospace & Defense (0.0%) | | | | | |
Singapore Tech Engineering Ltd. (d) | | 45,000 | | | 67,866 |
| | | | |
|
|
Airlines (0.0%) | | | |
Singapore Airlines Ltd. (d) | | 60,600 | | | 401,425 |
| | | | |
|
|
Banks (0.4%) | | | |
Development Bank of Singapore Ltd. (d) | | 170,100 | | | 1,540,233 |
| | | | | |
| | | Shares or
Principal Amount | | Value |
| | | | | | |
SINGAPORE (continued) | | | | | |
Banks (continued) | | | |
Oversea-Chinese Banking Corp. Ltd. (d) | | 423,600 | | $ | 1,577,423 |
United Overseas Bank Ltd. (d) | | 175,600 | | | 1,433,901 |
| | | | |
|
|
| | | | | | 4,551,557 |
| | | | |
|
|
Beverages (0.0%) | | | |
Fraser & Neave Ltd. (d) | | 12,690 | | | 126,119 |
| | | | |
|
|
Defense (0.0%) | | | |
Sembcorp Marine (d) (e) | | 82,000 | | | 133,070 |
| | | | |
|
|
Distribution & Wholesale (0.0%) | | | |
Jardine Cycle & Carriage Ltd. (d) | | 11,804 | | | 73,419 |
| | | | |
|
|
Diversified (0.1%) | | | |
Haw Par Corporation Ltd. (d) | | 36,226 | | | 109,221 |
Keppel Corp. (d) (e) | | 109,000 | | | 748,018 |
| | | | |
|
|
| | | | | | 857,239 |
| | | | |
|
|
Energy (0.0%) | | | |
Singapore Petroleum Co. Ltd. (d) | | 400 | | | 1,139 |
| | | | |
|
|
Engineering (0.0%) | | | |
Sembcorp Industries Ltd. (d) | | 131,043 | | | 208,875 |
| | | | |
|
|
Finance (0.0%) | | | |
Singapore Exchange Ltd. (d) | | 111,100 | | | 177,573 |
| | | | |
|
|
Financial Services (0.0%) | | | |
Creative Technology Ltd. (d) | | 4,700 | | | 34,325 |
| | | | |
|
|
Healthcare (0.0%) | | | |
Parkway Holdings Ltd. (d) | | 239,000 | | | 280,262 |
| | | | |
|
|
Manufacturing (0.0%) | | | |
Venture Manufacturing Ltd. (d) | | 36,800 | | | 272,435 |
| | | | |
|
|
Printing & Publishing (0.1%) | | | |
Singapore Press Holdings Ltd. (d) | | 260,500 | | | 690,183 |
| | | | |
|
|
Property Trust (0.0%) | | | |
CapitaMall Trust (d) | | 2,000 | | | 2,734 |
| | | | |
|
|
Statement of Investments (Continued)
October 31, 2005
Gartmore International Index Fund (Continued)
| | Common Stocks (continued) |
| | | | | |
| | | Shares or
Principal Amount | | Value |
| | | | | | |
SINGAPORE (continued) | | | | | |
Real Estate (0.1%) | | | |
Capitaland Ltd. (d) | | 187,897 | | $ | 353,710 |
City Developments Ltd. (d) | | 109,000 | | | 568,397 |
Keppel Land Ltd. (d) | | 54,400 | | | 123,132 |
United Overseas Land Ltd. (d) (e) | | 166,120 | | | 229,550 |
| | | | |
|
|
| | | | | | 1,274,789 |
| | | | |
|
|
Semiconductors (0.0%) | | | |
Chartered Semiconductor Manufacturing Ltd. (b) (d) | | 266,000 | | | 166,486 |
ST Assembly Test Services Ltd. (b) (d) (e) | | 123,000 | | | 68,362 |
| | | | |
|
|
| | | | | | 234,848 |
| | | | |
|
|
Shipping (0.0%) | | | |
Singapore Post Ltd. (d) | | 327,221 | | | 220,426 |
| | | | |
|
|
Telecommunications (0.1%) | | | |
Datacraft Asia Ltd. (b) (d) | | 109,000 | | | 90,990 |
Singapore Telecommunications Ltd. (d) | | 839,109 | | | 1,156,342 |
| | | | |
|
|
| | | | | | 1,247,332 |
| | | | |
|
|
Transportation (0.0%) | | | |
ComfortDelgro Corp. Ltd. (d) | | 267,120 | | | 233,992 |
Cosco Corporation Singapore Ltd. (d) (e) | | 187,533 | | | 244,482 |
| | | | |
|
|
| | | | | | 478,474 |
| | | | |
|
|
| | | | | | 11,334,090 |
| | | | |
|
|
SPAIN (3.7%) | | | | | |
Advertising (0.0%) | | | | | |
Telefonica Publicidad e Informacion SA (d) | | 30,267 | | | 243,131 |
| | | | |
|
|
Agriculture (0.0%) | | | |
Azucarera Ebro Agricolas SA (d) | | 7,600 | | | 126,682 |
| | | | |
|
|
Airline Services (0.0%) | | | |
Iberia Lineas Aereas de Espana SA (d) (e) | | 71,865 | | | 180,090 |
| | | | |
|
|
| | | | | |
| | | Shares or
Principal Amount | | Value |
| | | | | | |
SPAIN (continued) | | | | | |
Banks (1.5%) | | | |
Banco Bilbao Vizcaya Argentaria SA (d) (e) | | 477,364 | | $ | 8,416,880 |
Banco Popular Espanol SA (d) (e) | | 132,750 | | | 1,611,822 |
Banco Santander Central Hispanoamericano SA (d) (e) | | 744,410 | | | 9,478,192 |
| | | | |
|
|
| | | | | | 19,506,894 |
| | | | |
|
|
Broadcasting & Television (0.0%) | | | |
Antena 3 de Television SA (d) (e) | | 11,896 | | | 231,309 |
Sogecable SA (b) (d) (e) | | 6,801 | | | 258,535 |
| | | | |
|
|
| | | | | | 489,844 |
| | | | |
|
|
Building & Construction (0.2%) | | | |
Acciona SA (d) | | 3,749 | | | 410,274 |
ACS, Actividades de Construccion y Servicios SA (d) (e) | | 32,772 | | | 936,311 |
Fomento De Construcciones Y Contrates SA (d) | | 3,651 | | | 200,350 |
Grupo Ferrovial SA (d) (e) | | 12,455 | | | 920,106 |
| | | | |
|
|
| | | | | | 2,467,041 |
| | | | |
|
|
Computer Software & Services (0.0%) | | | |
Indra Sistemas SA (d) | | 23,297 | | | 477,286 |
| | | | |
|
|
Energy (0.3%) | | | |
Gamesa Corporacion Tecnologica SA (d) | | 16,006 | | | 222,228 |
Repsol SA (d) (e) | | 109,157 | | | 3,251,068 |
| | | | |
|
|
| | | | | | 3,473,296 |
| | | | |
|
|
Food Products (0.1%) | | | |
Altadis SA (d) | | 43,135 | | | 1,830,402 |
| | | | |
|
|
Hotels & Lodging (0.0%) | | | |
NH Hoteles SA (d) | | 26,318 | | | 394,301 |
| | | | |
|
|
Insurance (0.0%) | | | |
Corporacion Mapfre SA (d) (e) | | 15,188 | | | 265,943 |
| | | | |
|
|
Metals & Mining (0.0%) | | | |
Acerinox SA (d) (e) | | 28,375 | | | 371,828 |
| | | | |
|
|
| | Common Stocks (continued) |
| | | | | |
6 | | Shares or
Principal Amount | | Value |
| | | | | | |
SPAIN (continued) | | | | | |
Multimedia (0.0%) | | | |
Promotora de Informaciones SA (d) | | 950 | | $ | 17,421 |
| | | | |
|
|
Pharmaceuticals (0.0%) | | | |
Zeltia SA (b) (d) (e) | | 2,938 | | | 20,791 |
| | | | |
|
|
Public Thoroughfares (0.0%) | | | |
Cintra Concesiones Infraestructuras de Transporte SA (d) | | 28,566 | | | 338,765 |
| | | | |
|
|
Railroads (0.1%) | | | |
Autopistas, Concesionaria Espanola SA (d) (e) | | 32,887 | | | 898,410 |
| | | | |
|
|
Real Estate (0.1%) | | | |
Inmobiliaria Colonial SA (d) (e) | | 8,921 | | | 518,327 |
Metrovacesa SA (d) | | 3,056 | | | 211,927 |
Vallehermoso SA (d) | | 8,302 | | | 220,008 |
| | | | |
|
|
| | | | | | 950,262 |
| | | | |
|
|
Retail (0.1%) | | | |
Industria de Diseno Textil SA (d) | | 33,253 | | | 984,421 |
| | | | |
|
|
Telecommunications (0.7%) | | | |
Telefonica SA (d) | | 590,990 | | | 9,432,357 |
| | | | |
|
|
Utilities (0.6%) | | | |
Endesa SA (d) (e) | | 145,137 | | | 3,603,269 |
Gas Natural SA (d) (e) | | 18,053 | | | 492,737 |
Iberdrola SA (d) | | 116,465 | | | 3,118,269 |
Union Electrica Fenosa SA (d) (e) | | 32,539 | | | 1,076,442 |
| | | | |
|
|
| | | | | | 8,290,717 |
| | | | |
|
|
Water Utility (0.0%) | | | |
Aquas De Barcelona (d) | | 214 | | | 4,936 |
| | | | |
|
|
| | | | | | 50,764,818 |
| | | | |
|
|
SWEDEN (2.2%) | | | | | |
Airlines (0.0%) | | | | | |
SAS AB (b) (d) (e) | | 16,950 | | | 185,902 |
| | | | |
|
|
| | | | | |
| | | Shares or
Principal Amount | | Value |
| | | | | | |
SWEDEN (continued) | | | | | |
Automotive (0.1%) | | | |
Scania AB, Class B (d) | | 11,984 | | $ | 403,744 |
Volvo AB, Class A (d) | | 6,376 | | | 253,417 |
Volvo AB, Class B (d) (e) | | 30,104 | | | 1,238,543 |
| | | | |
|
|
| | | | | | 1,895,704 |
| | | | |
|
|
Banks (0.5%) | | | |
Nordea AB (d) | | 294,749 | | | 2,888,631 |
Skandiaviska Enskilda Banken AB (d) | | 75,379 | | | 1,406,574 |
Svenska Handelsbanken AB (d) | | 78,982 | | | 1,801,038 |
| | | | |
|
|
| | | | | | 6,096,243 |
| | | | |
|
|
Building & Construction (0.1%) | | | |
Assa Abloy AB (d) | | 42,048 | | | 602,390 |
Skanska AB (d) | | 50,656 | | | 709,683 |
| | | | |
|
|
| | | | | | 1,312,073 |
| | | | |
|
|
Commercial Services (0.1%) | | | |
Securitas AB (d) | | 51,908 | | | 789,282 |
| | | | |
|
|
Computer Software & Services (0.0%) | | | |
WM-data AB, Class B (d) | | 30,482 | | | 83,880 |
| | | | |
|
|
Engineering (0.0%) | | | |
Alfa Laval AB (d) | | 360 | | | 6,827 |
| | | | |
|
|
Finance (0.0%) | | | |
Om Gruppen AB (b) (d) | | 343 | | | 4,191 |
| | | | |
|
|
Financial Services (0.0%) | | | |
D. Carnegie & Co. AB (d) | | 6,653 | | | 81,065 |
| | | | |
|
|
Healthcare (0.0%) | | | |
Capio AB (b) (d) | | 249 | | | 4,303 |
| | | | |
|
|
Household Products (0.1%) | | | |
Electrolux AB, Class B (d) | | 47,546 | | | 1,109,401 |
| | | | |
|
|
Industrial (0.2%) | | | |
Atlas Copco AB, Class A (d) | | 51,774 | | | 946,643 |
Atlas Copco AB, Class B (d) | | 9,822 | | | 160,408 |
Sandvik AB (d) | | 33,295 | | | 1,602,730 |
Trelleborg AB, Class B (d) | | 6,975 | | | 107,036 |
| | | | |
|
|
| | | | | | 2,816,817 |
| | | | |
|
|
Statement of Investments (Continued)
October 31, 2005
Gartmore International Index Fund (Continued)
| | Common Stocks (continued) |
| | | | | |
| | | Shares or
Principal Amount | | Value |
| | | | | | |
SWEDEN (continued) | | | | | |
Insurance (0.1%) | | | |
Skandia Forsakrings AB (d) (e) | | 168,039 | | $ | 838,349 |
| | | | |
|
|
Medical Instruments (0.0%) | | | |
Elekta AB, Class B (d) | | 1,188 | | | 18,135 |
Getinge AB, Class B (d) | | 27,252 | | | 340,760 |
| | | | |
|
|
| | | | | | 358,895 |
| | | | |
|
|
Medical Products (0.0%) | | | |
Gambro AB (d) | | 7,239 | | | 102,340 |
Gambro AB, Class B (d) | | 364 | | | 5,123 |
| | | | |
|
|
| | | | | | 107,463 |
| | | | |
|
|
Metal Fabricate & Hardware (0.0%) | | | |
SSAB Svenskt Stal AB (d) | | 239 | | | 7,135 |
| | | | |
|
|
Metals (0.1%) | | | |
Hoganas AB (d) | | 68 | | | 1,423 |
SKF AB, Class B (d) | | 77,406 | | | 977,318 |
| | | | |
|
|
| | | | | | 978,741 |
| | | | |
|
|
Oil & Gas (0.0%) | | | |
Lundin Petroleum AB (b) (d) | | 25,291 | | | 255,473 |
| | | | |
|
|
Paper Products (0.1%) | | | |
Billerud (d) (e) | | 13,113 | | | 150,292 |
Holmen AB (d) | | 246 | | | 7,174 |
Svenska Cellusoa (d) | | 34,663 | | | 1,169,936 |
| | | | |
|
|
| | | | | | 1,327,402 |
| | | | |
|
|
Personal Care (0.0%) | | | |
Oriflame Cosmetics SA SDR (d) | | 12,368 | | | 319,230 |
| | | | |
|
|
Printing & Publishing (0.0%) | | | |
Eniro AB (d) (e) | | 21,666 | | | 237,029 |
| | | | |
|
|
Real Estate (0.0%) | | | |
Castellum AB (d) | | 4,060 | | | 140,803 |
Fabege AB (d) | | 10,145 | | | 171,471 |
Wihlborgs Fastigheter AB (b) (d) | | 2,029 | | | 43,595 |
| | | | |
|
|
| | | | | | 355,869 |
| | | | |
|
|
| | | | | |
| | | Shares or
Principal Amount | | Value |
| | | | | | |
SWEDEN (continued) | | | | | |
Retail (0.1%) | | | |
Axfood AB (d) | | 66 | | $ | 1,651 |
Hennes & Mauritz AB (d) | | 60,912 | | | 1,977,385 |
| | | | |
|
|
| | | | | | 1,979,036 |
| | | | |
|
|
Telecommunications (0.7%) | | | |
Ericsson SA (d) | | 1,956,877 | | | 6,414,286 |
Tele2 AB, Class B (d) (e) | | 44,099 | | | 418,433 |
Telia AB (d) | | 241,187 | | | 1,179,961 |
| | | | |
|
|
| | | | | | 8,012,680 |
| | | | |
|
|
Television (0.0%) | | | |
Modern Times Group AB,
Class B (b) (d) (e) | | 7,762 | | | 297,530 |
| | | | |
|
|
Tobacco (0.0%) | | | |
Swedish Match AB (d) | | 45,328 | | | 515,129 |
| | | | |
|
|
| | | | | | 29,975,649 |
| | | | |
|
|
SWITZERLAND (6.1%) | | | | | |
Aerospace & Defense (0.0%) | | | | | |
Unaxis Holdings AG (b) (d) | | 2,440 | | | 327,534 |
| | | | |
|
|
Banks (0.6%) | | | |
Credit Suisse Group (d) | | 184,918 | | | 8,181,407 |
| | | | |
|
|
Building & Construction (0.1%) | | | |
Geberit AG (d) | | 281 | | | 194,756 |
Holcim Ltd. (d) | | 24,720 | | | 1,539,558 |
| | | | |
|
|
| | | | | | 1,734,314 |
| | | | |
|
|
Chemicals (0.2%) | | | |
Ciba Specialty Chemicals AG (d) | | 10,222 | | | 587,170 |
Clariant AG (b) (d) | | 35,039 | | | 467,547 |
Lonza Group AG (d) | | 6,003 | | | 346,062 |
Syngenta AG (d) | | 18,213 | | | 1,956,453 |
| | | | |
|
|
| | | | | | 3,357,232 |
| | | | |
|
|
Commercial Services (0.1%) | | | |
Adecco SA (d) | | 21,200 | | | 904,660 |
SGS Societe Generale de Surveillance Holdings SA (d) | | 356 | | | 262,418 |
| | | | |
|
|
| | | | | | 1,167,078 |
| | | | |
|
|
| | Common Stocks (continued) |
| | | | | |
| | | Shares or
Principal Amount | | Value |
| | | | | | |
SWITZERLAND (continued) | | | | | |
Computers (0.0%) | | | |
Logitech International SA (b) (d) | | 9,465 | | $ | 358,854 |
| | | | |
|
|
Electronics & Electrical Equipment (0.1%) | | | |
ABB Ltd. (b) (d) | | 253,703 | | | 1,967,997 |
| | | | |
|
|
Food Products (1.4%) | | | |
Nestle SA (d) | | 57,743 | | | 17,198,077 |
| | | | |
|
|
Industrial (0.0%) | | | |
Rieter Holding AG (d) | | 689 | | | 196,763 |
| | | | |
|
|
Insurance (0.5%) | | | |
Swiss Re (d) | | 45,990 | | | 3,105,097 |
Zurich Financial Services AG (d) | | 21,469 | | | 3,661,838 |
| | | | |
|
|
| | | | | | 6,766,935 |
| | | | |
|
|
Manufacturing (0.0%) | | | |
Schindler Holding AG (d) | | 67 | | | 25,549 |
Sulzer AG (d) | | 506 | | | 243,376 |
| | | | |
|
|
| | | | | | 268,925 |
| | | | |
|
|
Medical Products (0.1%) | | | |
Nobel Biocare Holding AG (d) | | 3,805 | | | 877,428 |
Phonak Holding AG (d) | | 7,874 | | | 328,429 |
Straumann Holding AG (d) | | 366 | | | 85,362 |
Synthes, Inc. (d) | | 6,048 | | | 640,609 |
| | | | |
|
|
| | | | | | 1,931,828 |
| | | | |
|
|
Pharmaceuticals (2.6%) | | | |
Givaudan (d) | | 994 | | | 640,739 |
Novartis AG (d) | | 340,955 | | | 18,342,935 |
Roche Holding AG-Genusscheine (d) (e) | | 99,349 | | | 14,847,154 |
Serono SA (d) | | 1,126 | | | 728,833 |
| | | | |
|
|
| | | | | | 34,559,661 |
| | | | |
|
|
Real Estate (0.0%) | | | |
PSP Swiss Property AG (b) (d) | | 547 | | | 23,808 |
| | | | |
|
|
Retail (0.3%) | | | |
Compagnie Finacnce Richemont AG (d) | | 75,119 | | | 2,858,511 |
Swatch Group AG (d) | | 1,531 | | | 43,519 |
| | | | | |
| | | Shares or
Principal Amount | | Value |
| | | | | | |
SWITZERLAND (continued) | | | | | |
Retail (continued) | | | |
Swatch Group AG, Class B (d) | | 5,059 | | $ | 701,967 |
Valora Holding AG (d) | | 16 | | | 2,855 |
| | | | |
|
|
| | | | | | 3,606,852 |
| | | | |
|
|
Semiconductors (0.0%) | | | |
Micronas Semiconductor Holding AG (b) (d) | | 5,729 | | | 194,243 |
| | | | |
|
|
Telecommunications (0.1%) | | | |
Kudelski SA (d) | | 6,733 | | | 238,752 |
Swisscom AG (d) | | 3,461 | | | 1,138,770 |
| | | | |
|
|
| | | | | | 1,377,522 |
| | | | |
|
|
Travel Services (0.0%) | | | |
Kuoni Reisen Holding AG (b) (d) | | 49 | | | 18,405 |
| | | | |
|
|
| | | | | | 83,237,435 |
| | | | |
|
|
UNITED KINGDOM (24.0%) | | | | | |
Advertising (0.1%) | | | | | |
Aegis Group PLC (d) | | 88,316 | | | 194,715 |
WPP Group PLC (d) | | 184,904 | | | 1,816,185 |
| | | | |
|
|
| | | | | | 2,010,900 |
| | | | |
|
|
Aerospace & Defense (0.3%) | | | |
British Aerospace PLC (d) | | 511,241 | | | 2,991,188 |
Cobham PLC (b) (d) | | 59,320 | | | 161,739 |
Meggitt PLC (d) | | 10,610 | | | 56,825 |
Rolls-Royce Group PLC (d) | | 236,965 | | | 1,531,455 |
| | | | |
|
|
| | | | | | 4,741,207 |
| | | | |
|
|
Airlines (0.2%) | | | |
BAA PLC (d) | | 172,282 | | | 1,871,527 |
British Airways PLC (b) (d) | | 107,706 | | | 575,432 |
| | | | |
|
|
| | | | | | 2,446,959 |
| | | | |
|
|
Automotive (0.0%) | | | |
GKN PLC (d) | | 136,323 | | | 671,625 |
| | | | |
|
|
Banks (5.0%) | | | |
Barclays PLC (d) | | 904,087 | | | 8,958,606 |
HBOS PLC (d) | | 527,845 | | | 7,796,614 |
HSBC Holdings PLC (d) | | 1,524,225 | | | 23,946,039 |
MAN Group PLC (d) | | 47,111 | | | 1,284,749 |
Statement of Investments (Continued)
October 31, 2005
Gartmore International Index Fund (Continued)
| | Common Stocks (continued) |
| | | | | |
| | | Shares or
Principal Amount | | Value |
| | | | | | |
UNITED KINGDOM (continued) | | | | | |
Banks (continued) | | | |
Royal Bank of Scotland Group PLC (d) | | 427,000 | | $ | 11,823,078 |
UBS AG (d) | | 150,406 | | | 12,826,278 |
| | | | |
|
|
| | | | | | 66,635,364 |
| | | | |
|
|
Brewery (0.2%) | | | |
SABMiller PLC (d) | | 96,048 | | | 1,811,927 |
Scottish & Newcastle PLC (d) | | 123,302 | | | 1,020,419 |
| | | | |
|
|
| | | | | | 2,832,346 |
| | | | |
|
|
Building & Construction (0.3%) | | | |
Berkeley Group Holdings PLC (b) (d) | | 5,255 | | | 80,917 |
BICC Group PLC (d) | | 13,400 | | | 72,393 |
BPB PLC (d) | | 93,047 | | | 1,204,090 |
George Wimpey PLC (d) | | 59,866 | | | 433,762 |
Hanson PLC (d) | | 118,439 | | | 1,200,392 |
Persimmon PLC (d) | | 49,827 | | | 760,407 |
Pilkington PLC (d) | | 22,657 | | | 61,485 |
Taylor Woodrow PLC (d) | | 118,671 | | | 657,849 |
Travis Perkins PLC (d) | | 5,944 | | | 146,248 |
| | | | |
|
|
| | | | | | 4,617,543 |
| | | | |
|
|
Building-Heavy Construction (0.0%) | | | |
Bellway (d) | | 518 | | | 7,975 |
| | | | |
|
|
Chemicals (0.2%) | | | |
BOC Group PLC (d) | | 80,194 | | | 1,580,800 |
Imperial Chemical Industries PLC (d) | | 117,817 | | | 599,917 |
| | | | |
|
|
| | | | | | 2,180,717 |
| | | | |
|
|
Commercial Services (0.2%) | | | |
Aggreko PLC (d) | | 1,063 | | | 4,500 |
Brambles Industries PLC (d) | | 127,543 | | | 737,321 |
Capita Group PLC (d) | | 124,002 | | | 856,018 |
Davis Service Group PLC (d) | | 777 | | | 6,272 |
Intertek Group PLC (d) | | 716 | | | 9,033 |
Rentokil Initial PLC (d) | | 335,037 | | | 910,612 |
| | | | |
|
|
| | | | | | 2,523,756 |
| | | | |
|
|
| | | | | |
| | | Shares or
Principal Amount | | Value |
| | | | | | |
UNITED KINGDOM (continued) | | | | | |
Computer Software & Services (0.1%) | | | |
Hays PLC (d) | | 297,710 | | $ | 603,668 |
Logica PLC (d) | | 114,474 | | | 287,849 |
Mysis PLC (d) | | 73,826 | | | 268,030 |
Sage Group PLC (The) (d) | | 139,899 | | | 531,376 |
| | | | |
|
|
| | | | | | 1,690,923 |
| | | | |
|
|
Consumer Products (0.2%) | | | |
Reckitt Benckiser PLC (d) | | 82,118 | | | 2,481,014 |
| | | | |
|
|
Diversified (0.0%) | | | |
Serco Group PLC (d) | | 8,159 | | | 38,310 |
Tompkins PLC (d) | | 117,869 | | | 549,813 |
| | | | |
|
|
| | | | | | 588,123 |
| | | | |
|
|
Electronics & Electrical Equipment (0.0%) | | | |
Electrocomponents PLC (d) | | 21,600 | | | 87,184 |
Premier Farnell PLC (d) | | 1,751 | | | 4,309 |
| | | | |
|
|
| | | | | | 91,493 |
| | | | |
|
|
Energy (3.7%) | | | |
BG PLC (d) | | 506,658 | | | 4,456,777 |
BP Amoco PLC (d) | | 2,891,136 | | | 32,023,736 |
BP PLC ADR (d) | | 100 | | | 6,640 |
Royal Dutch Shell PLC, Class A (d) | | 48,936 | | | 1,517,859 |
Royal Dutch Shell PLC, Class B (d) | | 375,107 | | | 12,234,925 |
| | | | |
|
|
| | | | | | 50,239,937 |
| | | | |
|
|
Engineering (0.1%) | | | |
AMEC PLC (d) | | 12,280 | | | 74,132 |
Barratt Developments PLC (d) | | 49,454 | | | 662,294 |
| | | | |
|
|
| | | | | | 736,426 |
| | | | |
|
|
Entertainment (0.5%) | | | |
British Sky Broadcasting Group PLC (d) | | 181,253 | | | 1,635,873 |
Carnival PLC (d) | | 17,207 | | | 872,491 |
EMI Group PLC (d) | | 125,468 | | | 475,738 |
Enterprise Inns PLC (d) | | 56,399 | | | 778,405 |
Hilton Group PLC (d) | | 245,473 | | | 1,475,068 |
| | Common Stocks (continued) |
| | | | | |
| | | Shares or
Principal Amount | | Value |
| | | | | | |
UNITED KINGDOM (continued) | | | | | |
Entertainment (continued) | | | |
Rank Group PLC (d) | | 83,940 | | $ | 439,917 |
William Hill PLC (d) | | 80,443 | | | 761,173 |
| | | | |
|
|
| | | | | | 6,438,665 |
| | | | |
|
|
Financial Services (0.7%) | | | |
3I Group PLC (d) | | 102,381 | | | 1,373,540 |
Amvescap PLC (d) | | 111,302 | | | 698,941 |
Cattles PLC (d) | | 5,991 | | | 29,010 |
Close Brothers Group PLC (d) | | 4,089 | | | 55,501 |
ICAP PLC (d) | | 13,720 | | | 83,921 |
Lloyds TSB Group PLC (d) | | 805,495 | | | 6,586,448 |
London Stock Exchange PLC (d) | | 60,073 | | | 602,360 |
Provident Financial PLC (d) | | 16,900 | | | 179,505 |
| | | | |
|
|
| | | | | | 9,609,226 |
| | | | |
|
|
Food Products (1.4%) | | | |
Cadbury Schweppes PLC (d) | | 309,754 | | | 3,052,114 |
Diageo PLC (d) | | 422,198 | | | 6,235,470 |
Tate & Lyle PLC (d) | | 67,947 | | | 557,533 |
Tesco PLC (d) | | 1,010,964 | | | 5,382,660 |
Unilever PLC (d) | | 351,239 | | | 3,553,182 |
| | | | |
|
|
| | | | | | 18,780,959 |
| | | | |
|
|
Healthcare (0.8%) | | | |
AstraZeneca Group PLC (d) | | 230,208 | | | 10,297,193 |
Smith & Nephew PLC (d) | | 131,657 | | | 1,113,589 |
| | | | |
|
|
| | | | | | 11,410,782 |
| | | | |
|
|
Hotels & Motels (0.1%) | | | |
InterContinental Hotels Group PLC (d) | | 85,648 | | | 1,070,369 |
| | | | |
|
|
Import/Export (0.1%) | | | |
Wolseley PLC (d) | | 98,390 | | | 2,001,382 |
| | | | |
|
|
Industrial (0.2%) | | | |
BBA Group PLC (d) | | 19,247 | | | 99,189 |
FKI PLC (d) | | 88,765 | | | 160,277 |
IMI PLC (d) | | 36,934 | | | 276,936 |
Invensys PLC (b) (d) | | 866,880 | | | 199,387 |
Smiths Industries PLC (d) | | 99,272 | | | 1,603,673 |
| | | | |
|
|
| | | | | | 2,339,462 |
| | | | |
|
|
| | | | | |
| | | Shares or
Principal Amount | | Value |
| | | | | | |
UNITED KINGDOM (continued) | | | | | |
Insurance (0.7%) | | | |
Aviva PLC (d) | | 312,864 | | $ | 3,694,340 |
Friends Provident PLC (d) | | 311,361 | | | 971,373 |
Legal & General Group PLC (d) | | 865,138 | | | 1,643,035 |
Prudential PLC (d) | | 350,446 | | | 2,939,891 |
Royal & Sun Alliance Insurance Group PLC (d) | | 404,653 | | | 688,803 |
| | | | |
|
|
| | | | | | 9,937,442 |
| | | | |
|
|
Investment Companies (0.0%) | | | |
Schroders PLC (d) | | 715 | | | 10,876 |
| | | | |
|
|
Manufacturing (0.0%) | | | |
Cookson Group PLC (b) (d) | | 868 | | | 4,884 |
| | | | |
|
|
Medical Products (0.0%) | | | |
Alliance Unichem PLC (d) | | 34,795 | | | 474,652 |
SSL International PLC (d) | | 6,270 | | | 29,253 |
| | | | |
|
|
| | | | | | 503,905 |
| | | | |
|
|
Metals & Mining (1.3%) | | | |
Anglo American PLC (d) | | 185,496 | | | 5,489,999 |
BHP Billiton PLC (d) | | 350,069 | | | 5,150,877 |
Corus Group PLC (d) | | 458,227 | | | 388,123 |
Johnson Matthey PLC (d) | | 37,336 | | | 773,476 |
Rio Tinto PLC (d) | | 140,855 | | | 5,365,973 |
| | | | |
|
|
| | | | | | 17,168,448 |
| | | | |
|
|
Paper Products (0.1%) | | | |
Bunzl PLC (d) | | 62,479 | | | 625,140 |
Rexam PLC (d) | | 88,049 | | | 750,132 |
| | | | |
|
|
| | | | | | 1,375,272 |
| | | | |
|
|
Pharmaceuticals (1.5%) | | | |
Glaxosmithkline PLC (d) | | 790,838 | | | 20,566,967 |
| | | | |
|
|
Printing & Publishing (0.5%) | | | |
Daily Mail & General Trust (d) | | 19,616 | | | 217,438 |
De La Rue PLC (d) | | 672 | | | 4,638 |
EMAP PLC (d) | | 35,709 | | | 517,324 |
Pearson PLC (d) | | 120,989 | | | 1,345,372 |
Reed International PLC (d) | | 199,707 | | | 1,824,024 |
Reuters Group PLC (d) | | 178,134 | | | 1,132,073 |
Statement of Investments (Continued)
October 31, 2005
Gartmore International Index Fund (Continued)
| | Common Stocks (continued) |
| | | | | |
| | | Shares or
Principal Amount | | Value |
| | | | | | |
UNITED KINGDOM (continued) | | | | | |
Printing & Publishing (continued) | | | |
Trinity Mirror PLC (d) | | 17,945 | | $ | 189,132 |
United Business Media PLC (d) | | 67,192 | | | 637,902 |
Yell Group PLC (d) | | 135,288 | | | 1,059,764 |
| | | | |
|
|
| | | | | | 6,927,667 |
| | | | |
|
|
Railroads (0.0%) | | | |
FirstGroup PLC (d) | | 60,756 | | | 352,536 |
| | | | |
|
|
Real Estate (0.3%) | | | |
British Land Co. PLC (d) | | 84,486 | | | 1,331,168 |
Great Portland Estates PLC (d) | | 9,539 | | | 63,303 |
Hammerson PLC (d) | | 19,420 | | | 306,727 |
Land Securities Group PLC (d) | | 75,153 | | | 1,848,262 |
Liberty International PLC (d) | | 32,382 | | | 533,409 |
Slough Estates PLC (d) | | 29,358 | | | 263,529 |
| | | | |
|
|
| | | | | | 4,346,398 |
| | | | |
|
|
Restaurants (0.2%) | | | |
Compass Group PLC (d) | | 347,399 | | | 1,169,003 |
Mitchells & Butlers PLC (d) | | 77,725 | | | 499,242 |
Whitbread PLC (d) | | 30,582 | | | 508,971 |
| | | | |
|
|
| | | | | | 2,177,216 |
| | | | |
|
|
Retail (0.9%) | | | |
Boots Group PLC (d) | | 139,365 | | | 1,518,873 |
Dixons Group PLC (d) | | 260,912 | | | 665,073 |
Great Universal Stores PLC (d) | | 145,985 | | | 2,177,250 |
HMV Group PLC (d) | | 1,813 | | | 6,040 |
Inchcape PLC (d) | | 3,136 | | | 114,454 |
J. Sainsbury PLC (d) | | 212,700 | | | 1,050,614 |
Kesa Electricals PLC (d) | | 58,819 | | | 249,990 |
Kingfisher PLC (d) | | 383,071 | | | 1,437,734 |
Marks & Spencer PLC (d) | | 258,256 | | | 1,909,002 |
MFI Furniture Group PLC (d) | | 150,310 | | | 218,294 |
Next PLC (d) | | 57,560 | | | 1,359,196 |
Punch Taverns PLC (d) | | 30,274 | | | 391,924 |
Signet Group PLC (d) | | 264,519 | | | 476,188 |
| | | | |
|
|
| | | | | | 11,574,632 |
| | | | |
|
|
Security Services (0.0%) | | | |
Group 4 Securicor PLC (d) | | 114,996 | | | 306,542 |
| | | | |
|
|
| | | | | |
| | | Shares or
Principal Amount | | Value |
| | | | | | |
UNITED KINGDOM (continued) | | | | | |
Semiconductors (0.0%) | | | |
Arm Holdings PLC (d) | | 215,874 | | $ | 414,163 |
| | | | |
|
|
Telecommunications (2.1%) | | | |
BT Group PLC (d) | | 1,264,472 | | | 4,759,471 |
Cable & Wireless PLC (d) | | 332,034 | | | 677,052 |
Marconi Corp. PLC (b) (d) | | 8,908 | | | 58,749 |
Vodafone Group PLC (d) | | 8,629,278 | | | 22,653,579 |
| | | | |
|
|
| | | | | | 28,148,851 |
| | | | |
|
|
Television (0.1%) | | | |
ITV PLC (d) | | 470,632 | | | 866,682 |
| | | | |
|
|
Tobacco (0.7%) | | | |
British American Tobacco PLC (d) | | 213,405 | | | 4,695,557 |
Gallaher Group PLC (d) | | 104,449 | | | 1,622,799 |
Imperial Tobacco Group PLC (d) | | 99,484 | | | 2,850,640 |
| | | | |
|
|
| | | | | | 9,168,996 |
| | | | |
|
|
Transportation (0.2%) | | | |
Arriva PLC (d) | | 881 | | | 8,996 |
Associated British Ports Holdings PLC (d) | | 18,435 | | | 178,779 |
Exel PLC (d) (e) | | 55,478 | | | 1,184,856 |
National Express Group PLC (d) | | 3,527 | | | 51,352 |
Peninsular & Oriental Steam Navigation Co. (d) | | 136,869 | | | 979,049 |
Stagecoach Group PLC (d) | | 71,971 | | | 136,628 |
| | | | |
|
|
| | | | | | 2,539,660 |
| | | | |
|
|
Utilities (1.0%) | | | | | |
Centrica PLC (d) | | 569,087 | | | 2,405,211 |
International Power PLC (d) | | 239,102 | | | 981,790 |
National Grid Group PLC (d) | | 388,101 | | | 3,549,402 |
Scottish & Southern Energy PLC (d) | | 119,917 | | | 2,080,496 |
Scottish Power PLC (d) | | 268,095 | | | 2,623,546 |
Severn Trent PLC (d) | | 47,956 | | | 812,378 |
United Utilities PLC (d) | | 120,349 | | | 1,328,646 |
| | | | |
|
|
| | | | | | 13,781,469 |
| | | | |
|
|
Common Stocks (continued)
| | | | | | |
| | | Shares or
Principal Amount | | Value |
| | | | | | | |
UNITED KINGDOM (continued) | | | |
Water/Sewer (0.0%) | | | | | | |
Kelda Group PLC (d) | | | 52,042 | | $ | 641,226 |
| | | | | |
|
|
| | | | | | | 326,960,985 |
| | | | | |
|
|
| | |
Total Common Stocks | | | | | | 1,308,678,445 |
| | | | | |
|
|
|
Cash Equivalents (1.7%) |
Investments in repurchase agreements (Collateralized by U.S. Government Agencies and U.S. Government Agency Mortgages, in a joint trading account at 3.90%, dated 10/31/05, due 11/01/05, repurchase price $23,358,699) | | $ | 23,356,169 | | | 23,356,169 |
| | | | | |
|
|
| | |
Total Cash Equivalents | | | | | | 23,356,169 |
| | | | | |
|
|
|
Preferred Stocks (0.0%) |
GERMANY (0.0%) | | | | | | |
Automotive (0.0%) | | | | | | |
Volkswagen AG, 3.29% (d) | | | 7,914 | | | 321,105 |
| | | | | |
|
|
Healthcare (0.0%) | | | | | | |
Fresenius Medical Care AG, 1.72% (d) | | | 749 | | | 57,517 |
| | | | | |
|
|
Television (0.0%) | | | | | | |
ProSiebenSat.1 Media AG, 2.03% (d) (e) | | | 13,440 | | | 231,328 |
| | | | | |
|
|
Utilities (0.0%) | | | | | | |
RWE AG, 3.10% (d) | | | 891 | | | 49,462 |
| | | | | |
|
|
| | |
Total Preferred Stocks | | | | | | 659,412 |
| | | | | |
|
|
Rights (0.0%)
| | | | | | | |
| | | Shares or
Principal Amount | | Value | |
| | | | | | | | |
SINGAPORE (0.0%) | | | | | | | |
Property Trust (0.0%) | | | | | | | |
CapitaMall Trust (c) (d) | | | 2,000 | | $ | 0 | |
| | | | | |
|
|
|
UNITED KINGDOM (0.0%) | | | | | | | |
Computer Software/Services (0.0%) | | | | |
LogicaCMG PLC (d) | | | 57,237 | | | 34,441 | |
| | | | | |
|
|
|
| | |
Total Rights | | | | | | 34,441 | |
| | | | | |
|
|
|
|
WARRANTS (0.0%) | |
HONG KONG (0.0%) | | | | | | | |
Chemicals (0.0%) | | | | | | | |
Kingboard Chemical Holding Ltd., Expires 12/31/06 (b) (d) | | | 80 | | | 21 | |
| | | | | |
|
|
|
Real Estate (0.0%) | | | | | | | |
Hopewell Holdings Ltd., Expires 08/05/06 (b) (d) | | | 7,158 | | | 1,191 | |
| | | | | |
|
|
|
| | |
Total Warrants | | | | | | 1,212 | |
| | | | | |
|
|
|
|
Short-Term Securities Held as Collateral for | |
| Securities Lending (13.3%) | |
Pool of short-term securities for Gartmore Mutual Funds —note 2 (Securities Lending) | | $ | 180,683,964 | | | 180,683,964 | |
| | | | | |
|
|
|
| |
Total Short-Term Securities Held as Collateral for Securities Lending | | | 180,683,964 | |
| | | | | |
|
|
|
| |
Total Investments
(Cost $1,275,030,712) (a) — 111.0% | | | 1,513,413,643 | |
| |
Liabilities in excess of other
assets — (11.0)% | | | (151,636,068 | ) |
| | | | | |
|
|
|
| |
NET ASSETS — 100.0% | | $ | 1,361,777,575 | |
| | | | | |
|
|
|
Statement of Investments (Continued)
October 31, 2005
| | (a) | See notes to financial statements for tax unrealized appreciation (depreciation) of securities. |
| | (b) | Denotes a non-income producing security. |
| | (c) | Security has been deemed illiquid. The pricing committee has deemed the security to have zero value based upon the procedures adopted by the Board of Trustees. |
| | (e) | All or part of the security was on loan as of October 31, 2005. |
| | SDR | Special Drawing Rights |
At October 31, 2005, the Fund’s open forward foreign currency contracts were as follows:
| | | | | | | | | | | | |
Currency
| | Delivery
Date
| | Contract
Value
| | Market
Value
| | Unrealized
Appreciation/
(Depreciation)
| |
| Short Contracts: | | | | | | | | | | | | |
| Australia Dollar | | 11/07/05 | | $ | 757,977 | | $ | 754,766 | | $ | 3,211 | |
| British Pound | | 11/07/05 | | | 5,035,126 | | | 5,052,343 | | | (17,217 | ) |
| Euro | | 11/07/05 | | | 4,472,224 | | | 4,459,338 | | | 12,886 | |
| Japanese Yen | | 11/07/05 | | | 2,572,014 | | | 2,545,190 | | | 26,824 | |
| Swedish Krone | | 11/07/05 | | | 426,767 | | | 421,052 | | | 5,715 | |
| Swiss Franc | | 11/07/05 | | | 1,243,217 | | | 1,245,958 | | | (2,741 | ) |
| | | | |
|
| |
|
| |
|
|
|
| Total Short Contracts | | | | $ | 14,507,325 | | $ | 14,478,647 | | $ | 28,678 | |
| | | | |
|
| |
|
| |
|
|
|
| | | | |
Currency
| | Delivery
Date
| | Contract
Value
| | Market
Value
| | Unrealized
Appreciation/
(Depreciation)
| |
| Long Contracts: | | | | | | | | | | | | |
| Australia Dollar | | 11/07/05 | | $ | 1,899,942 | | $ | 1,886,168 | | $ | (13,774 | ) |
| British Pound | | 11/07/05 | | | 12,409,084 | | | 12,458,318 | | | 49,234 | |
| Danish Kroner | | 11/07/05 | | | 8,034 | | | 8,034 | | | 0 | |
| Euro | | 11/07/05 | | | 16,187,272 | | | 16,165,099 | | | (22,173 | ) |
| Hong Kong Dollar | | 11/07/05 | | | 161,254 | | | 161,255 | | | 1 | |
| Japanese Yen | | 11/07/05 | | | 6,412,634 | | | 6,311,383 | | | (101,251 | ) |
| Norwegian Krone | | 11/07/05 | | | 27,872 | | | 27,678 | | | (194 | ) |
| Singapore Dollar | | 11/07/05 | | | 53,155 | | | 53,163 | | | 8 | |
| Swedish Krone | | 11/07/05 | | | 1,104,893 | | | 1,085,936 | | | (18,957 | ) |
| Swiss Franc | | 11/07/05 | | | 4,125,801 | | | 4,129,905 | | | 4,104 | |
| | | | |
|
| |
|
| |
|
|
|
| Total Long Contracts | | | | $ | 42,389,941 | | $ | 42,286,939 | | $ | (103,002 | ) |
| | | | |
|
| |
|
| |
|
|
|
At October 31, 2005, the Fund’s open long futures contracts were as follows:
| | | | | | | | | | | | |
| | | Number of
Contracts
| | Long Contracts*
| | Expiration
| | Market Value
Covered By
Contract
| | Unrealized
Appreciation
(Depreciation)
|
| Australia | | 45 | | S&P ASX 200 Index | | 12/16/05 | | | $3,748,907 | | | $(58,585) |
| Europe | | 10 | | DAX Index | | 12/16/05 | | | 1,475,998 | | | 13,673 |
| Europe | | 346 | | DJ Euro Stoxx 50 | | 12/16/05 | | | 13,744,308 | | | (183,870) |
| Europe | | 1 | | S&P MIB 30 Index | | 12/16/05 | | | 196,334 | | | (9,105) |
| Hong Kong | | 26 | | Hang Seng Index | | 11/30/05 | | | 2,412,302 | | | (6,098) |
| Japan | | 123 | | Topix Index | | 12/09/05 | | | 15,323,481 | | | 886,921 |
| Sweden | | 169 | | OMX Index | | 11/25/05 | | | 1,875,218 | | | 24,871 |
| United Kingdom | | 111 | | FTSE 100 Index | | 12/16/05 | | | 10,455,853 | | | (38,875) |
| | | | | | | | |
|
| |
|
|
| | | | | | | | | $ | 49,232,401 | | $ | 628,932 |
| | | | | | | | |
|
| |
|
|
| | * | Cash pledged as collateral |
See notes to financial statements.
Gartmore Mid Cap Market Index Fund
For the annual period ended Oct. 31, 2005, the Gartmore Mid Cap Market Index Fund (Class A at NAV) returned 16.94% versus 17.65% for its benchmark, the S&P MidCap 400 Index. For broader comparison, the average return for the Fund’s Lipper peer category of Mid-Cap Core Funds was 14.91%.
The reporting period was a strong one for the U.S. mid-cap equity market. As a result of several factors–the conclusion of the U.S. presidential election, reasonably good economic and earnings news, reactions to the $32 billion Microsoft dividend and the beginning of the seasonally strong year-end period–the mid-cap equity market experienced most of its gains for the reporting period in November and December of 2004.
January 2005 began with a slide after the strong fourth quarter of 2004, with cyclical and small-capitalization stocks performing the worst out of the gate. January was characterized by mixed economic data, increasing interest rates, disappointing earnings reports and climbing oil prices. In addition, gross domestic product growth for the fourth quarter, released during January, came in weaker than expected at 3.1%, primarily as a result of the foreign trade deficit. The mid-cap equity market was able to reverse course in February, even as the productivity report showed a continued slowdown in productivity growth and oil prices continued to climb. Good signs for the markets came in the form of accelerated hiring plans by corporations, reasonably robust capital spending and strong merger-and-acquisition activity. In March and April, the mid-cap equity market resumed the downward slide experienced in January due to a combination of factors–the trade deficit, mixed economic news, high oil prices and rising interest rates. Oil prices, reaching as high as $56 a barrel, continued to trade above $50 a barrel.
Despite slowing profit growth, continually higher oil prices and inflation concerns, first-quarter 2005 corporate earnings came in strong; a rebound in the mid-cap equity market occurred in May and continued through July.
The mid-cap equity market lost steam in August, however, due to several events, including terrorism overseas, two devastating hurricanes in the U.S. Gulf Coast, oil prices that reached $70 per barrel, a strong dollar and increasing interest rates. Improved profits in the energy sector counterbalanced the negative impact that Hurricanes Katrina and Rita had on the retail, transportation, tourism and insurance sectors in September.
Portfolio Manager:
Fund Asset Management, L.P.-Subadviser
| | |
Fund Performance | | Gartmore Mid Cap Market Index Fund |
Average Annual Total Return
(For periods ended October 31, 2005)
| | | | | | | | |
| | | | | 1 Yr. | | 5 Yr. | | Inception1 |
| Class A | | w/o SC2 | | 16.94% | | 6.61% | | 8.75% |
| | | w/SC3 | | 10.19% | | 5.35% | | 7.65% |
| Class B4 | | w/o SC2 | | 16.15% | | 5.97% | | 8.19% |
| | | w/SC5 | | 11.15% | | 5.65% | | 8.07% |
| Class C6 | | w/o SC2 | | 16.13% | | 5.95% | | 8.18% |
| | | w/SC7 | | 15.13% | | 5.95% | | 8.18% |
| Institutional Class8 | | 17.41% | | 7.06% | | 9.22% |
All figures showing the effect of a sales charge reflect the maximum charge possible, because it has the most dramatic effect on performance data.
| 1 | Fund commenced operations on December 29, 1999. |
| 2 | These returns do not reflect the effects of sales charges (SC). |
| 3 | A 5.75% front-end sales charge was deducted. |
| 4 | These returns until the creation of Class B shares (5/25/01) include performance based on the Fund’s Class A shares. Excluding the effect of any fee waivers or reimbursements, such prior performance is similar to what Class B shares would have produced because Class B shares invest in the same portfolio of securities as Class A shares. The performance for this class has been restated to reflect differences in sales charges (where applicable), but does not reflect the differing levels of other fees (primarily Rule 12b-1 and/or administrative services fees) applicable to such classes; if these fees were reflected, the performance for Class B shares would have been lower. |
| 5 | A 5.00% maximum contingent deferred sales charge (CDSC) was deducted. The CDSC declines to 0% after 6 years. |
| 6 | These returns until the creation of Class C shares (10/22/03) include the performance of the Fund’s Class A for the period through May 24, 2001 and the Fund’s Class B shares for the period from May 25, 2001 to October 21, 2003. Excluding the effect of any fee waivers or reimbursements, such prior performance is similar to what Class C shares would have produced because Class C shares invest in the same portfolio of securities as the Fund’s other classes. The performance for the Class C shares has been restated to reflect differences in sales charges (where applicable), but does not reflect the differing levels of other fees (primarily Rule 12b-1 and/or administrative services fees) applicable to such classes; if these fees were reflected, the performance for Class C shares would have been lower. |
| 7 | A CDSC of 1.00% was deducted from the one year return because it is charged when you sell Class C shares within the first year after purchase. |
| 8 | Not subject to any sales charges. |
Performance of a $10,000 Investment
Investment return and principal value will fluctuate, and when redeemed, shares may be worth more or less than original cost. Past performance is no guarantee of future results and does not reflect the deduction of taxes that a shareholder would pay on fund distributions or the redemption of fund shares. Investing in mutual funds involves market risk, including loss of principal. Performance returns assume the reinvestment of all distributions.
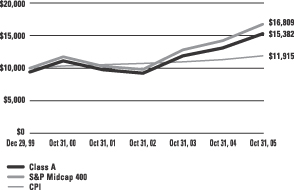
Comparative performance of $10,000 invested in Class A shares of the Gartmore Mid Cap Market Index Fund, the S&P MidCap 400 Index(a), and the Consumer Price Index (CPI)(b) since inception. Unlike the Fund, the returns for these unmanaged indexes do not reflect any fees, expenses, or sales charges. Investors cannot invest directly in market indexes.
| (a) | The S&P MidCap 400 Index is an unmanaged index that measures the performance of mid-sized U.S. companies. |
| (b) | The CPI represents changes in prices of a basket of goods and services purchased for consumption by urban households. |
| | |
Shareholder Expense Example | | Gartmore Mid Cap Market Index Fund |
As a shareholder of the Fund, you incur two types of costs: (1) transaction costs, including sales charges (loads) paid on purchase payments and redemption fees; and (2) ongoing costs, including investment advisory fees, administration fees, distribution fees and other Fund expenses. The examples below are intended to help you understand your ongoing costs (in dollars) of investing in the Fund and to compare these costs with the ongoing costs of investing in other mutual funds. Per SEC requirements, the examples assume that you had a $1,000 investment in the Class at the beginning of the reporting period, May 1, 2005, and continued to hold your shares at the end of the reporting period, October 31, 2005.
Actual Expenses
For each Class of the Fund in the table below, the first line provides information about actual account values and actual expenses. You may use the information in this line, together with the amount you invested, to estimate the expenses that you paid over the period. Simply divide your account value by $1,000 (for example, an $8,600 account value divided by $1,000 = 8.6), then multiply the result by the number in the first line of each Class under the heading entitled “Expenses Paid During Period” to estimate the expenses you paid on your account during the period.
Hypothetical Example for Comparison Purposes
The second line of each Class in the table below provides information about hypothetical account values and hypothetical expenses based on the Class’ actual expense ratio and an assumed rate of return of 5% per year before expenses, which is not the Class’ actual return. The hypothetical account values and expenses may not be used to estimate the actual ending account balance or expenses you paid for the period. You may use this information to compare the ongoing costs of investing in the Class of the Fund and other funds. To do so, compare this 5% hypothetical example with the 5% hypothetical examples that appear in the shareholder reports of the other funds.
Please note that the expenses shown in the table are meant to highlight your ongoing costs only and do not reflect any transaction costs, such as sales charges (loads) or redemption fees. Therefore, the second line for each Class in the table is useful in comparing ongoing costs only, and will not help you determine the relative total costs of owning different funds. In addition, if these transaction costs were included, your costs would have been higher. The examples also assume all dividends and distributions have been reinvested.
Schedule of Shareholder Expenses
Expense Analysis of a $1,000 Investment
(October 31, 2005)
| | | | | | | | | | | | | | |
| Mid Cap Market Index Fund | | | | | Beginning
Account Value,
5/1/05 | | Ending
Account Value,
10/31/05 | | Expenses Paid
During Period* | | Annualized
Expense Ratio* |
| Class A | | Actual | | | $ | 1,000.00 | | $ | 1,110.70 | | $ | 3.72 | | 0.71% |
| | | Hypothetical | 1 | | $ | 1,000.00 | | $ | 1,021.48 | | $ | 3.56 | | 0.71% |
| Class B | | Actual | | | $ | 1,000.00 | | $ | 1,106.60 | | $ | 6.89 | | 1.32% |
| | | Hypothetical | 1 | | $ | 1,000.00 | | $ | 1,018.45 | | $ | 6.63 | | 1.32% |
| Class C | | Actual | | | $ | 1,000.00 | | $ | 1,106.60 | | $ | 6.89 | | 1.32% |
| | | Hypothetical | 1 | | $ | 1,000.00 | | $ | 1,018.45 | | $ | 6.63 | | 1.32% |
| Institutional Class | | Actual | | | $ | 1,000.00 | | $ | 1,113.00 | | $ | 1.68 | | 0.32% |
| | | Hypothetical | 1 | | $ | 1,000.00 | | $ | 1,023.41 | | $ | 1.61 | | 0.32% |
| * | Expenses are equal to the Fund’s annualized expense ratio multiplied by the average account value over the period multiplied by 184/365 (to reflect the one-half year period). The expense ratio presented represents a six month, annualized ratio in accordance with SEC guidelines. |
| 1 | Represents the hypothetical 5% return before expenses. |
| | |
Portfolio Summary | | Gartmore Mid Cap Market Index Fund |
The SEC adopted a requirement that Funds present their portfolio holdings in a table, chart or graph format in their annual and semiannual reports to shareholders, whether or not a statement of investments is utilized. The following tables, which present portfolio holdings as a percentage of net assets, are provided in compliance with this requirement.
| | |
| Asset Allocation | | |
| Common Stocks | | 84.3% |
| Cash Equivalents | | 14.9% |
| Other Investments* | | 18.4% |
| Liabilities in excess of Other Assets** | | -17.6 % |
| | |
|
| | | 100.0% |
| * | Includes value of collateral received from securities lending. |
| ** | Includes value of collateral owed from securities lending. |
| | |
| Top Industries | | |
| Utilities | | 6.3% |
| Healthcare | | 6.0% |
| Retail | | 6.0% |
| Oil & Gas | | 5.9% |
| Computer Software & Services | | 5.2% |
| Insurance | | 5.1% |
| Banks | | 4.0% |
| Electronics | | 3.9% |
| Financial Services | | 3.9% |
| Real Estate Investment Trusts | | 2.8% |
| Other Industries | | 50.9% |
| | |
|
| | | 100.0% |
| | |
| Top Holdings*** | | |
| Legg Mason, Inc. | | 1.0% |
| SanDisk Corp. | | 0.9% |
| Peabody Energy Corp. | | 0.8% |
| Whole Foods Market, Inc. | | 0.8% |
| Pioneer Natural Resources Co. | | 0.6% |
| Noble Energy, Inc. | | 0.6% |
| ENSCO International, Inc. | | 0.6% |
| Smith International, Inc. | | 0.6% |
| Harman International Industries, Inc. | | 0.5% |
| Precision Castparts Corp. | | 0.5% |
| Other Holdings | | 93.3% |
| | |
|
| | | 100.0% |
| *** | For purpose of listing top holdings, repurchase agreements are considered cash equivalents and are included as part of Other Holdings. |
Statement of Investments
October 31, 2005
Gartmore Mid Cap Market Index Fund
| | | | | |
| | | Shares or
Principal Amount | | Value |
| | | | | | |
Aerospace & Defense (0.8%) | | | | | |
Alliant Techsystems, Inc. (b) (c) | | 30,500 | | $ | 2,141,710 |
Precision Castparts Corp. | | 107,500 | | | 5,091,200 |
Sequa Corp. (b) (c) | | 5,960 | | | 367,732 |
| | | | |
|
|
| | | | | | 7,600,642 |
| | | | |
|
|
Agricultural Products (0.1%) | | | | | |
Universal Corp. (c) | | 20,040 | | | 750,298 |
| | | | |
|
|
Airlines (0.3%) | | | | | |
AirTran Holdings, Inc. (b) (c) | | 65,500 | | | 979,880 |
Alaska Air Group, Inc. (b) (c) | | 21,700 | | | 684,201 |
JetBlue Airways Corp. (b) (c) | | 78,150 | | | 1,454,372 |
| | | | |
|
|
| | | | | | 3,118,453 |
| | | | |
|
|
Amusement & Recreation (0.2%) | | | |
Callaway Golf Co. (c) | | 57,200 | | | 815,100 |
International Speedway Corp. | | 30,400 | | | 1,571,072 |
| | | | |
|
|
| | | | | | 2,386,172 |
| | | | |
|
|
Auction House & Art Dealer (0.2%) | | | |
Adesa, Inc. | | 71,000 | | | 1,519,400 |
| | | | |
|
|
Auto Parts & Equipment (1.2%) | | | |
Advance Auto Parts, Inc. (b) | | 87,000 | | | 3,262,499 |
ArvinMeritor, Inc. (c) | | 54,460 | | | 872,994 |
Bandag, Inc. (c) | | 11,500 | | | 488,750 |
BorgWarner Automotive, Inc. | | 45,320 | | | 2,628,107 |
Gentex Corp. (c) | | 125,180 | | | 2,355,888 |
Lear Corp. (c) | | 54,820 | | | 1,669,817 |
Modine Manufacturing Co. (c) | | 25,900 | | | 856,254 |
| | | | |
|
|
| | | | | | 12,134,309 |
| | | | |
|
|
Automotive (0.2%) | | | | | |
Carmax, Inc. (b) | | 84,700 | | | 2,275,889 |
| | | | |
|
|
Banks (4.0%) | | | | | |
Associated Banc Corp. | | 109,321 | | | 3,411,908 |
Astoria Financial Corp. | | 76,320 | | | 2,133,144 |
Cathay Bancorp, Inc. | | 48,300 | | | 1,883,217 |
City National Corp. | | 34,900 | | | 2,560,962 |
Colonial Bancgroup, Inc. | | 122,740 | | | 2,988,719 |
Cullen/Frost Bankers, Inc. | | 37,080 | | | 1,958,566 |
FirstMerit Corp. (c) | | 65,680 | | | 1,731,982 |
Greater Bay Bancorp (c) | | 41,880 | | | 1,050,769 |
| | | | | |
| | | Shares or
Principal Amount | | Value |
| | | | | | |
Banks (continued) | | | | | |
Independence Community Bank Corp. | | 59,635 | | $ | 2,358,564 |
IndyMac Bancorp, Inc. (c) | | 51,600 | | | 1,926,228 |
Mercantile Bankshare Corp. | | 65,450 | | | 3,688,763 |
New York Community Bancorp, Inc. (c) | | 197,414 | | | 3,192,184 |
SVB Financial Group (b) (c) | | 29,020 | | | 1,442,584 |
TCF Financial Corp. | | 96,000 | | | 2,601,600 |
Texas Regional Bancshares, Inc. (c) | | 34,300 | | | 1,006,019 |
Washington Federal, Inc. (c) | | 66,012 | | | 1,517,616 |
Webster Financial Corp. | | 43,000 | | | 1,985,310 |
West America Bancorp (c) | | 24,720 | | | 1,317,823 |
Wilmington Trust Corp. (c) | | 53,400 | | | 2,024,394 |
| | | | |
|
|
| | | | | | 40,780,352 |
| | | | |
|
|
Biotechnology (0.8%) | | | | | |
Millenium Pharmaceuticals, Inc. (b) | | 243,963 | | | 2,224,943 |
Protein Design Labs, Inc. (b) (c) | | 86,220 | | | 2,415,884 |
Valeant Pharmaceuticals International (c) | | 76,100 | | | 1,305,876 |
Vertex Pharmaceuticals, Inc. (b) (c) | | 80,480 | | | 1,830,920 |
| | | | |
|
|
| | | | | | 7,777,623 |
| | | | |
|
|
Broadcasting (0.3%) | | | | | |
Emmis Communications Corp. (b) (c) | | 30,000 | | | 587,100 |
Entercom Communications Corp. (b) | | 33,080 | | | 955,020 |
Westwood One, Inc. | | 59,080 | | | 1,092,980 |
| | | | |
|
|
| | | | | | 2,635,100 |
| | | | |
|
|
Business Services (2.4%) | | | | | |
Acxiom Corp. (c) | | 66,440 | | | 1,417,830 |
Catalina Marketing Corp. (c) | | 35,900 | | | 935,554 |
Ceridian Corp. (b) | | 118,540 | | | 2,597,211 |
CheckFree Corp. (b) | | 71,700 | | | 3,047,250 |
ChoicePoint, Inc. (b) | | 71,920 | | | 3,039,339 |
Corporate Executive Board Co. (The) | | 33,400 | | | 2,760,176 |
CSG Systems International, Inc. (b) (c) | | 41,080 | | | 965,791 |
Statement of Investments (Continued)
October 31, 2005
Gartmore Mid Cap Market Index Fund (Continued)
| | Common Stocks (continued) |
| | | | | |
| | | Shares or
Principal Amount | | Value |
| | | | | | |
Business Services (continued) | | | | | |
Fair Issac Corp. | | 52,450 | | $ | 2,190,312 |
Gartner Group, Inc. (b) (c) | | 52,080 | | | 627,043 |
Harte-Hanks, Inc. | | 50,740 | | | 1,298,944 |
Kelly Services, Inc. (c) | | 18,775 | | | 519,692 |
Korn/Ferry International (b) (c) | | 30,000 | | | 516,600 |
Manpower, Inc. | | 71,360 | | | 3,231,181 |
MPS Group, Inc. (b) (c) | | 79,040 | | | 984,048 |
| | | | |
|
|
| | | | | | 24,130,971 |
| | | | |
|
|
Chemicals (2.2%) | | | | | |
Airgas, Inc. (c) | | 53,900 | | | 1,523,753 |
Albemarle Corp. (c) | | 33,700 | | | 1,182,533 |
Cabot Corp. (c) | | 48,900 | | | 1,667,979 |
Chemtura Corp. | | 189,700 | | | 2,029,790 |
Cytec Industries, Inc. | | 33,900 | | | 1,400,070 |
Ferro Corp. (c) | | 35,400 | | | 631,536 |
FMC Corp. (b) | | 29,560 | | | 1,609,246 |
Lubrizol Corp. | | 52,480 | | | 2,182,643 |
Lyondell Chemical Co. | | 168,081 | | | 4,504,572 |
Minerals Technologies, Inc. | | 17,240 | | | 921,650 |
Olin Corp. (c) | | 60,160 | | | 1,075,661 |
RPM, Inc. (c) | | 92,400 | | | 1,720,488 |
Valspar Corp. (c) | | 81,200 | | | 1,790,460 |
| | | | |
|
|
| | | | | | 22,240,381 |
| | | | |
|
|
Communication Equipment (2.0%) | | | |
Adtran, Inc. (c) | | 56,300 | | | 1,703,075 |
Cincinnati Bell, Inc. (b) (c) | | 186,500 | | | 738,540 |
CommScope, Inc. (b) (c) | | 42,520 | | | 829,990 |
Harman International Industries, Inc. | | 53,300 | | | 5,322,539 |
Harris Corp. | | 108,180 | | | 4,446,198 |
Plantronics, Inc. (c) | | 38,900 | | | 1,161,165 |
Polycom, Inc. (b) | | 79,500 | | | 1,216,350 |
Powerwave Technologies, Inc. (b) (c) | | 84,520 | | | 947,469 |
Telephone & Data Systems, Inc. | | 44,200 | | | 1,671,644 |
Telephone & Data Systems, Inc., Special Shares | | 41,100 | | | 1,485,765 |
Utstarcom, Inc. (b) (c) | | 85,100 | | | 469,752 |
| | | | |
|
|
| | | | | | 19,992,487 |
| | | | |
|
|
| | | | | |
| | | Shares or
Principal Amount | | Value |
| | | | | | |
Computer Hardware (0.3%) | | | | | |
National Instruments Corp. (c) | | 47,030 | | $ | 1,124,017 |
Western Digital Corp. (b) | | 170,400 | | | 2,061,840 |
| | | | |
|
|
| | | | | | 3,185,857 |
| | | | |
|
|
Computer Software & Services (5.2%) | | | |
3COM Corp. (b) | | 303,620 | | | 1,168,937 |
Activision, Inc. (b) | | 218,221 | | | 3,441,350 |
Advent Software, Inc. (b) (c) | | 14,969 | | | 459,848 |
Anteon International Corp. (b) (c) | | 26,100 | | | 1,179,720 |
Avocent Corp. (b) | | 40,200 | | | 1,232,532 |
Cadence Design Systems, Inc. (b) | | 221,980 | | | 3,547,240 |
CDW Corp. (c) | | 52,340 | | | 2,949,359 |
Cognizant Technology Solutions Corp. (b) | | 110,740 | | | 4,870,345 |
DST Systems, Inc. (b) | | 58,240 | | | 3,268,429 |
F5 Networks, Inc. (b) (c) | | 31,200 | | | 1,623,336 |
GameStop Corp. (b) (c) | | 51,200 | | | 1,816,576 |
Henry (Jack) & Associates, Inc. (c) | | 61,500 | | | 1,105,770 |
Ingram Micro, Inc. (b) | | 103,000 | | | 1,864,300 |
Macromedia, Inc. (b) | | 60,100 | | | 2,639,592 |
Macrovision Corp. (b) (c) | | 42,520 | | | 801,077 |
McAfee, Inc. (b) | | 134,100 | | | 4,027,023 |
McData Corp. (b) (c) | | 122,400 | | | 588,744 |
Mentor Graphics Corp. (b) | | 57,500 | | | 475,525 |
RSA Security, Inc. (b) (c) | | 57,400 | | | 654,360 |
SanDisk Corp. (b) (c) | | 147,100 | | | 8,662,719 |
SRA International, Inc., Class A (b) | | 34,300 | | | 1,125,726 |
Sybase, Inc. (b) (c) | | 71,800 | | | 1,597,550 |
Synopsys, Inc. (b) | | 113,820 | | | 2,156,889 |
Transaction Systems Architects, Inc. (b) (c) | | 28,900 | | | 780,589 |
Wind River Systems, Inc. (b) (c) | | 60,400 | | | 791,240 |
| | | | |
|
|
| | | | | | 52,828,776 |
| | | | |
|
|
Construction (1.8%) | | | | | |
Beazer Homes USA, Inc. (c) | | 38,000 | | | 2,202,100 |
Dycom Industries, Inc. (b) (c) | | 30,700 | | | 611,851 |
Granite Construction, Inc. (c) | | 27,660 | | | 943,483 |
Hovnanian Enterprises, Inc. (b) (c) | | 30,020 | | | 1,350,600 |
| | Common Stocks (continued) |
| | | | | |
| | | Shares or
Principal Amount | | Value |
| | | | | | |
Construction (continued) | | | | | |
Jacobs Engineering Group, Inc. (b) | | 45,980 | | $ | 2,931,225 |
Martin Marietta Materials, Inc. | | 38,400 | | | 3,030,144 |
Ryland Group, Inc. (The) | | 38,400 | | | 2,584,320 |
Thor Industries, Inc. (c) | | 30,100 | | | 982,163 |
Toll Brothers, Inc. (b) | | 96,200 | | | 3,550,741 |
| | | | |
|
|
| | | | | | 18,186,627 |
| | | | |
|
|
Consumer & Commercial Services (1.7%) | | | |
Alliance Data Systems Corp. (b) | | 54,600 | | | 1,941,576 |
Career Education Corp. (b) | | 81,360 | | | 2,895,602 |
Corinthian Colleges, Inc. (b) (c) | | 72,680 | | | 904,139 |
Deluxe Corp. (c) | | 40,073 | | | 1,335,633 |
DeVry, Inc. (b) (c) | | 45,100 | | | 1,019,260 |
Dun & Bradstreet Corp. (b) | | 53,660 | | | 3,397,752 |
MoneyGram International, Inc. (c) | | 65,800 | | | 1,598,940 |
Quanta Services, Inc. (b) (c) | | 91,300 | | | 1,049,037 |
Rent-A-Center, Inc. (b) | | 58,700 | | | 1,057,774 |
Rollins, Inc. (c) | | 27,865 | | | 529,992 |
Sotheby’s Holdings, Inc. (b) | | 36,400 | | | 566,748 |
United Rentals, Inc. (b) (c) | | 57,000 | | | 1,115,490 |
| | | | |
|
|
| | | | | | 17,411,943 |
| | | | |
|
|
Consumer Products (1.4%) | | | | | |
Blyth Industries, Inc. (c) | | 24,840 | | | 453,082 |
Church & Dwight, Inc. (c) | | 50,500 | | | 1,770,025 |
Energizer Holdings, Inc. (b) | | 58,300 | | | 2,943,567 |
Furniture Brands International, Inc. (c) | | 45,100 | | | 818,565 |
Lancaster Colony Corp. | | 22,140 | | | 887,593 |
Mohawk Industries Co. (b) | | 44,040 | | | 3,437,321 |
Scotts Miracle-Gro Co. (The) (c) | | 19,460 | | | 1,708,393 |
Timberland Co., Class A (b) | | 47,000 | | | 1,323,050 |
Tupperware Corp. (c) | | 46,533 | | | 1,067,002 |
| | | | |
|
|
| | | | | | 14,408,598 |
| | | | |
|
|
Containers & Packaging (0.3%) | | | |
Packaging Corp. of America (c) | | 55,620 | | | 1,128,530 |
Sonoco Products Co. | | 77,700 | | | 2,198,910 |
| | | | |
|
|
| | | | | | 3,327,440 |
| | | | |
|
|
Electric & Electronic Equipment (0.1%) | | | |
Mine Safety Appliances Co. | | 25,500 | | | 1,068,195 |
| | | | |
|
|
| | | | | |
| | | Shares or
Principal Amount | | Value |
| | | | | | |
Electronics (3.9%) | | | | | |
Amphenol Corp., Class A | | 69,800 | | $ | 2,789,906 |
Arrow Electronics, Inc. (b) | | 92,900 | | | 2,741,479 |
Atmel Corp. (b) (c) | | 336,400 | | | 827,544 |
Avnet, Inc. (b) | | 114,778 | | | 2,645,633 |
Cabot Microelectronics Corp. (b) (c) | | 21,428 | | | 629,983 |
Credence Systems Corp. (b) (c) | | 74,260 | | | 571,802 |
Cree, Inc. (b) (c) | | 61,788 | | | 1,485,384 |
Cypress Semiconductor Corp. (b) (c) | | 111,700 | | | 1,519,120 |
Hubbell, Inc. | | 47,300 | | | 2,277,968 |
Integrated Device Technology, Inc. (b) (c) | | 165,010 | | | 1,630,299 |
International Rectifier Corp. (b) (c) | | 56,600 | | | 1,674,794 |
Intersil Corp. | | 123,200 | | | 2,804,032 |
Kemet Corp. (b) (c) | | 64,460 | | | 446,063 |
Lam Research Corp. (b) | | 112,160 | | | 3,784,278 |
Lattice Semiconductor Corp. (b) (c) | | 80,160 | | | 351,101 |
Micrel, Inc. (b) (c) | | 58,400 | | | 584,000 |
Microchip Technology, Inc. | | 169,672 | | | 5,119,005 |
Newport Corp. (b) (c) | | 31,200 | | | 406,848 |
Plexus Corp. (b) (c) | | 32,200 | | | 568,974 |
RF Micro Devices, Inc. (b) (c) | | 148,000 | | | 775,520 |
SPX Corp. | | 61,020 | | | 2,625,080 |
Thomas & Betts Corp. (b) | | 45,048 | | | 1,753,268 |
TriQuint Semiconductor, Inc. (b) (c) | | 98,605 | | | 414,141 |
Vishay Intertechnology, Inc. (b) (c) | | 146,530 | | | 1,661,650 |
| | | | |
|
|
| | | | | | 40,087,872 |
| | | | |
|
|
Energy (0.3%) | | | | | |
MDU Resources Group, Inc. | | 93,850 | | | 3,094,235 |
| | | | |
|
|
Financial Services (3.9%) | | | | | |
AmeriCredit Corp. (b) | | 115,100 | | | 2,572,485 |
Bank of Hawaii Corp. | | 41,500 | | | 2,132,270 |
BISYS Group, Inc. (The) (b) | | 94,700 | | | 1,200,796 |
Certegy, Inc. | | 48,900 | | | 1,831,794 |
Commerce Bancorp, Inc. (c) | | 135,840 | | | 4,139,045 |
Eaton Vance Corp. (c) | | 101,600 | | | 2,528,824 |
Statement of Investments (Continued)
October 31, 2005
Gartmore Mid Cap Market Index Fund (Continued)
| | Common Stocks (Continued) |
| | | | | |
| | | Shares or
Principal Amount | | Value |
| | | | | | |
Financial Services (continued) | | | | | |
Edwards (A.G.), Inc. | | 62,500 | | $ | 2,645,000 |
Investors Financial Services Corp. (c) | | 54,684 | | | 2,087,835 |
Jefferies Group, Inc. (c) | | 39,700 | | | 1,685,662 |
Labranche & Co., Inc. (b) (c) | | 50,300 | | | 479,862 |
Legg Mason, Inc. | | 90,970 | | | 9,761,990 |
PMI Group, Inc. | | 71,700 | | | 2,859,396 |
Raymond James Financial, Inc. (c) | | 49,420 | | | 1,681,763 |
SEI Investments Co. (c) | | 54,440 | | | 2,112,272 |
Waddell & Reed Financial, Inc. (c) | | 62,900 | | | 1,206,422 |
| | | | |
|
|
| | | | | | 38,925,416 |
| | | | |
|
|
Food & Beverage (2.1%) | | | | | |
Dean Foods Co. (b) | | 121,298 | | | 4,384,923 |
Hormel Foods Corp. | | 61,820 | | | 1,965,876 |
J.M. Smucker Co. | | 48,371 | | | 2,211,038 |
PepsiAmericas, Inc. | | 55,000 | | | 1,282,600 |
Sensient Technologies Corp. (c) | | 35,580 | | | 629,410 |
Smithfield Foods, Inc. (b) | | 78,600 | | | 2,324,988 |
Tootsie Roll Industries, Inc. (c) | | 23,538 | | | 713,201 |
Whole Foods Market, Inc. | | 54,480 | | | 7,852,203 |
| | | | |
|
|
| | | | | | 21,364,239 |
| | | | |
|
|
Gaming (0.5%) | | | | | |
Boyd Gaming Corp. | | 36,800 | | | 1,518,000 |
GTECH Holdings Corp. | | 100,500 | | | 3,199,920 |
| | | | |
|
|
| | | | | | 4,717,920 |
| | | | |
|
|
Healthcare (6.0%) | | | | | |
Apria Healthcare Group, Inc. (b) | | 40,900 | | | 943,563 |
Beckman Coulter, Inc. | | 50,340 | | | 2,479,748 |
Cephalon, Inc. (b) | | 47,600 | | | 2,170,084 |
Community Health Systems, Inc. (b) | | 70,300 | | | 2,608,833 |
Covance, Inc. (b) | | 49,880 | | | 2,426,662 |
Cytyc Corp. (b) | | 90,040 | | | 2,282,514 |
Dentsply International, Inc. | | 62,680 | | | 3,456,175 |
Edwards Lifesciences Corp. (b) | | 49,000 | | | 2,027,620 |
Health Net, Inc. (b) | | 92,240 | | | 4,320,522 |
Henry Schein, Inc. (b) (c) | | 68,480 | | | 2,714,547 |
LifePoint Hospitals, Inc. (b) | | 44,560 | | | 1,742,296 |
Lincare Holdings, Inc. (b) | | 80,380 | | | 3,283,523 |
| | | | | |
| | | Shares or
Principal Amount | | Value |
| | | | | | |
Healthcare (continued) | | | | | |
Omnicare, Inc. | | 86,700 | | $ | 4,690,470 |
PacifiCare Health Systems, Inc. (b) | | 70,900 | | | 5,839,323 |
Par Pharmaceutical Cos., Inc. (b) (c) | | 29,200 | | | 755,696 |
Perrigo Co. (c) | | 71,300 | | | 953,281 |
Renal Care Group, Inc. (b) | | 54,150 | | | 2,536,928 |
Sepracor, Inc. (b) | | 85,500 | | | 4,809,375 |
Steris Corp. | | 52,280 | | | 1,192,507 |
Triad Hospitals, Inc. (b) | | 69,713 | | | 2,867,296 |
Universal Health Services, Inc. (c) | | 46,800 | | | 2,206,152 |
Varian Medical Systems, Inc. (b) | | 105,900 | | | 4,824,804 |
| | | | |
|
|
| | | | | | 61,131,919 |
| | | | |
|
|
Insurance (5.1%) | | | | | |
Allmerica Financial Corp. (b) | | 42,200 | | | 1,607,820 |
American Financial Group, Inc. (c) | | 40,600 | | | 1,387,708 |
AmerUs Group Co. (c) | | 32,000 | | | 1,891,840 |
Arthur J. Gallagher & Co. (c) | | 77,400 | | | 2,277,108 |
Brown & Brown, Inc. (c) | | 46,860 | | | 2,545,904 |
Everest Re Group Ltd. | | 50,480 | | | 5,020,236 |
Fidelity National Financial, Inc. | | 139,975 | | | 5,243,464 |
Fidelity National Title Group, Inc., Class A | | 24,495 | | | 532,766 |
First American Financial Corp. | | 74,820 | | | 3,278,612 |
HCC Insurance Holdings, Inc. (c) | | 84,390 | | | 2,531,700 |
Horace Mann Educators Corp. (c) | | 32,300 | | | 626,943 |
Leucadia National Corp. (c) | | 68,530 | | | 2,944,049 |
Mercury General Corp. (c) | | 30,400 | | | 1,837,680 |
Ohio Casualty Corp. (c) | | 51,600 | | | 1,407,648 |
Old Republic International Corp. | | 146,230 | | | 3,788,819 |
Protective Life Corp. | | 57,500 | | | 2,520,800 |
Radian Group, Inc. (c) | | 69,500 | | | 3,620,950 |
Stancorp Financial Group, Inc. | | 23,300 | | | 2,145,930 |
Unitrin, Inc. | | 39,200 | | | 1,803,200 |
W.R. Berkley Corp. | | 92,350 | | | 4,035,695 |
| | | | |
|
|
| | | | | | 51,048,872 |
| | | | |
|
|
Machinery (0.6%) | | | | | |
AGCO Corp. (b) (c) | | 72,400 | | | 1,157,676 |
Graco, Inc. | | 55,370 | | | 1,897,530 |
| | Common Stocks (continued) |
| | | | | |
| | | Shares or
Principal Amount | | Value |
| | | | | | |
Machinery (continued) | | | | | |
Tecumseh Products Co. (c) | | 15,600 | | $ | 314,028 |
Zebra Technologies Corp., Class A (b) | | 58,640 | | | 2,527,970 |
| | | | |
|
|
| | | | | | 5,897,204 |
| | | | |
|
|
Manufacturing (2.7%) | | | | | |
Ametek, Inc. | | 55,400 | | | 2,256,442 |
Brink’s Co. (The) | | 46,680 | | | 1,833,124 |
Carlisle Cos., Inc. | | 26,040 | | | 1,736,608 |
Crane Co. | | 41,466 | | | 1,283,787 |
Diebold, Inc. | | 58,600 | | | 2,117,804 |
Donaldson Co., Inc. | | 57,680 | | | 1,802,500 |
Federal Signal Corp. (c) | | 39,800 | | | 645,556 |
Flowserve Corp. (b) (c) | | 42,920 | | | 1,502,200 |
Harsco Corp. | | 33,000 | | | 2,120,250 |
Hillenbrand Industry, Inc. (c) | | 47,600 | | | 2,192,932 |
Nordson Corp. (c) | | 24,800 | | | 921,816 |
Pentair, Inc. | | 82,760 | | | 2,688,872 |
Teleflex, Inc. (c) | | 32,220 | | | 2,132,642 |
Trinity Industries, Inc. (c) | | 34,800 | | | 1,324,140 |
Varian, Inc. (b) | | 27,860 | | | 1,024,412 |
York International Corp. | | 35,300 | | | 1,980,683 |
| | | | |
|
|
| | | | | | 27,563,768 |
| | | | |
|
|
Medical Products (0.8%) | | | | | |
Gen-Probe, Inc. (b) | | 41,700 | | | 1,703,028 |
INAMED Corp. (b) | | 28,900 | | | 2,054,790 |
Intuitive Surgical, Inc. (b) (c) | | 29,000 | | | 2,573,170 |
Techne Corp. (b) (c) | | 31,900 | | | 1,729,618 |
| | | | |
|
|
| | | | | | 8,060,606 |
| | | | |
|
|
Medical Services (0.6%) | | | | | |
Charles River Laboratories International, Inc. (b) | | 55,874 | | | 2,445,046 |
Invitrogen Corp. (b) (c) | | 42,100 | | | 2,677,139 |
Martek Biosciences Corp. (b) (c) | | 25,700 | | | 793,359 |
| | | | |
|
|
| | | | | | 5,915,544 |
| | | | |
|
|
Metals (0.6%) | | | | | |
Kennametal, Inc. | | 32,000 | | | 1,635,520 |
MSC Industrial Direct Co., Class A | | 50,600 | | | 1,931,908 |
Timken Co. (The) | | 69,900 | | | 1,982,364 |
| | | | |
|
|
| | | | | | 5,549,792 |
| | | | |
|
|
| | | | | |
| | | Shares or
Principal Amount | | Value |
| | | | | | |
Mining (1.5%) | | | | | |
Arch Coal, Inc. (c) | | 52,640 | | $ | 4,056,965 |
Joy Global, Inc. | | 65,300 | | | 2,995,311 |
Peabody Energy Corp. | | 106,140 | | | 8,295,902 |
| | | | |
|
|
| | | | | | 15,348,178 |
| | | | |
|
|
Office Equipment & Supplies (0.5%) | | | |
Herman Miller, Inc. | | 55,200 | | | 1,513,032 |
HNI Corp. | | 43,870 | | | 2,145,243 |
Reynolds & Reynolds Co. | | 45,000 | | | 1,194,300 |
| | | | |
|
|
| | | | | | 4,852,575 |
| | | | |
|
|
Oil & Gas (5.9%) | | | | | |
Cooper Cameron Corp. (b) | | 44,940 | | | 3,313,426 |
Denbury Resources, Inc. (b) (c) | | 46,600 | | | 2,033,158 |
ENSCO International, Inc. | | 122,960 | | | 5,605,746 |
FMC Technologies, Inc. (b) (c) | | 55,862 | | | 2,036,729 |
Forest Oil Corp. (b) | | 46,000 | | | 2,009,280 |
Grant Prideco, Inc. (b) | | 102,820 | | | 3,998,670 |
Hanover Compressor Co. (b) (c) | | 68,100 | | | 875,766 |
Helmerich & Payne, Inc. | | 41,700 | | | 2,310,180 |
Newfield Exploration Co. (b) | | 102,700 | | | 4,655,391 |
Noble Energy, Inc. | | 141,100 | | | 5,651,055 |
Patterson-UTI Energy, Inc. | | 138,940 | | | 4,742,022 |
Pioneer Natural Resources Co. | | 116,460 | | | 5,828,823 |
Plains Exploration & Production Co. (b) | | 62,501 | | | 2,437,539 |
Pogo Producing Co. (c) | | 49,800 | | | 2,514,900 |
Pride International, Inc. (b) | | 124,900 | | | 3,505,943 |
Smith International, Inc. | | 171,840 | | | 5,567,616 |
Tidewater, Inc. (c) | | 50,520 | | | 2,321,899 |
| | | | |
|
|
| | | | | | 59,408,143 |
| | | | |
|
|
Optical Supplies (0.2%) | | | | | |
Advanced Medical Optics, Inc. (b) | | 55,346 | | | 1,974,745 |
| | | | |
|
|
Paper & Forest Products (0.6%) | | | |
Bowater, Inc. (c) | | 47,100 | | | 1,248,150 |
Glatfelter Co. (c) | | 30,400 | | | 413,136 |
Longview Fibre Co. (c) | | 39,440 | | | 741,472 |
Potlatch Corp. | | 24,600 | | | 1,100,358 |
Rayonier, Inc. | | 59,880 | | | 2,289,212 |
| | | | |
|
|
| | | | | | 5,792,328 |
| | | | |
|
|
Statement of Investments (Continued)
October 31, 2005
Gartmore Mid Cap Market Index Fund (Continued)
| | Common Stocks (Continued) |
| | | | | |
| | | Shares or
Principal Amount | | Value |
| | | | | | |
Pharmaceuticals (1.0%) | | | | | |
Barr Pharmaceuticals, Inc. (b) | | 86,145 | | $ | 4,949,030 |
IVAX Corp. (b) | | 176,318 | | | 5,033,879 |
| | | | |
|
|
| | | | | | 9,982,909 |
| | | | |
|
|
Photography / Imaging (0.1%) | | | |
Imation Corp. | | 28,480 | | | 1,219,229 |
| | | | |
|
|
Publishing & Printing (1.3%) | | | | | |
American Greetings Corp., Class A (c) | | 55,800 | | | 1,408,950 |
Banta Corp. (c) | | 20,900 | | | 1,052,106 |
Belo Corp., Class A | | 81,520 | | | 1,760,832 |
Lee Enterprises, Inc. (c) | | 35,380 | | | 1,387,250 |
Media General, Inc. | | 17,800 | | | 938,950 |
Reader’s Digest Association (c) | | 77,500 | | | 1,187,300 |
Scholastic Corp. (b) (c) | | 31,100 | | | 1,012,305 |
Valassis Communications, Inc. (b) (c) | | 39,200 | | | 1,225,000 |
Washington Post Co. (c) | | 4,863 | | | 3,622,935 |
| | | | |
|
|
| | | | | | 13,595,628 |
| | | | |
|
|
Real Estate Investment Trusts (2.8%) | | | |
AMB Property Corp. | | 67,720 | | | 2,991,870 |
Developers Diversified Realty Corp. | | 88,200 | | | 3,852,576 |
Highwood Properties, Inc. | | 45,660 | | | 1,288,069 |
Hospitality Properties Trust | | 55,860 | | | 2,217,642 |
Liberty Property Trust | | 71,300 | | | 2,972,497 |
Macerich Co. (The) | | 49,700 | | | 3,194,219 |
Mack-Cali Realty Corp. | | 48,900 | | | 2,085,585 |
New Plan Excel Realty Trust (c) | | 85,860 | | | 1,973,921 |
Regency Centers Corp. | | 51,700 | | | 2,878,139 |
United Dominion Realty Trust, Inc. | | 109,600 | | | 2,425,448 |
Weingarten Realty Investors | | 66,200 | | | 2,354,072 |
| | | | |
|
|
| | | | | | 28,234,038 |
| | | | |
|
|
Restaurants (1.1%) | | | | | |
Applebee’s International, Inc. | | 64,400 | | | 1,411,004 |
Bob Evans Farms, Inc. (c) | | 29,800 | | | 667,818 |
Brinker International, Inc. (b) | | 69,850 | | | 2,662,682 |
CBRL Group, Inc. | | 39,400 | | | 1,367,180 |
Cheesecake Factory, Inc. (The) (b) (c) | | 61,850 | | | 2,122,692 |
| | | | | |
| | | Shares or
Principal Amount | | Value |
| | | | | | |
Restaurants (continued) | | | | | |
Outback Steakhouse, Inc. | | 55,700 | | $ | 2,097,662 |
Ruby Tuesday, Inc. (c) | | 52,100 | | | 1,141,511 |
| | | | |
|
|
| | | | | | 11,470,549 |
| | | | |
|
|
Retail (6.0%) | | | | | |
99 Cents Only Stores (b) (c) | | 44,033 | | | 424,918 |
Abercrombie & Fitch Co. | | 70,333 | | | 3,656,613 |
Aeropostale, Inc. (b) (c) | | 42,500 | | | 830,450 |
American Eagle Outfitters Ltd. | | 108,374 | | | 2,552,208 |
Anntaylor Stores Corp. (b) | | 60,190 | | | 1,460,811 |
Barnes & Noble, Inc. | | 46,340 | | | 1,675,654 |
BJ’s Wholesale Club, Inc. (b) | | 54,400 | | | 1,549,312 |
Borders Group, Inc. (c) | | 56,195 | | | 1,103,108 |
Chico’s FAS, Inc. (b) | | 146,180 | | | 5,779,958 |
Claire’s Stores, Inc. | | 77,660 | | | 2,023,043 |
Copart, Inc. (b) (c) | | 59,100 | | | 1,382,349 |
Dollar Tree Stores, Inc. (b) | | 83,950 | | | 1,809,962 |
Fastenal Co. (c) | | 51,620 | | | 3,620,111 |
Foot Locker, Inc. | | 126,500 | | | 2,459,160 |
Michael’s Stores, Inc. | | 108,740 | | | 3,597,119 |
O’Reilly Automotive, Inc. (b) (c) | | 88,046 | | | 2,482,897 |
Pacific Sunwear of California, Inc. (b) | | 61,900 | | | 1,548,738 |
Payless ShoeSource, Inc. (b) (c) | | 55,295 | | | 1,015,769 |
PETsMART, Inc. | | 116,360 | | | 2,734,460 |
Pier 1 Imports, Inc. (c) | | 72,540 | | | 748,613 |
Polo Ralph Lauren Corp. | | 49,400 | | | 2,430,480 |
Regis Corp. | | 35,920 | | | 1,377,891 |
Ross Stores, Inc. | | 119,640 | | | 3,235,066 |
Ruddick Corp. | | 31,500 | | | 693,315 |
Saks, Inc. (b) (c) | | 113,500 | | | 2,060,025 |
Tech Data Corp. (b) | | 48,660 | | | 1,685,582 |
Urban Outfitters, Inc. (b) | | 91,600 | | | 2,595,028 |
Williams Sonoma, Inc. (b) | | 92,340 | | | 3,611,417 |
| | | | |
|
|
| | | | | | 60,144,057 |
| | | | |
|
|
Schools (0.5%) | | | | | |
Education Management Corp. (b) | | 56,200 | | | 1,733,208 |
ITT Educational Services, Inc. (b) | | 32,140 | | | 1,776,699 |
Laureate Education, Inc. (b) (c) | | 40,680 | | | 2,009,592 |
| | | | |
|
|
| | | | | | 5,519,499 |
| | | | |
|
|
| | Common Stocks (continued) |
| | | | | |
| | | Shares or
Principal Amount | | Value |
| | | | | | |
Semiconductors (0.6%) | | | | | |
Fairchild Semiconductor International, Inc. (b) | | 92,720 | | $ | 1,427,888 |
MEMC Electronic Materials, Inc. (b) | | 127,800 | | | 2,292,732 |
Semtech Corp. (b) (c) | | 55,530 | | | 837,392 |
Silicon Laboratories, Inc. (b) | | 37,840 | | | 1,217,313 |
| | | | |
|
|
| | | | | | 5,775,325 |
| | | | |
|
|
Shipping & Transportation (2.3%) | | | |
Alexander & Baldwin, Inc. | | 35,300 | | | 1,727,582 |
C.H. Robinson Worldwide, Inc. | | 139,160 | | | 4,906,782 |
CNF Transportation, Inc. | | 41,440 | | | 2,331,829 |
Expeditors International of Washington, Inc. | | 86,520 | | | 5,249,167 |
GATX Corp. (c) | | 41,900 | | | 1,565,803 |
Hunt (J.B.) Transport Services, Inc. | | 106,700 | | | 2,071,047 |
Overseas Shipholding Group, Inc. (c) | | 25,300 | | | 1,204,280 |
Swift Transportation Co., Inc. (b) (c) | | 45,910 | | | 837,858 |
Werner Enterprises, Inc. (c) | | 46,105 | | | 826,202 |
Yellow Roadway Corp. (b) | | 45,162 | | | 2,052,613 |
| | | | |
|
|
| | | | | | 22,773,163 |
| | | | |
|
|
Steel (0.2%) | | | | | |
Steel Dynamics, Inc. (c) | | 29,200 | | | 904,324 |
Worthington Industries, Inc. | | 59,687 | | | 1,200,902 |
| | | | |
|
|
| | | | | | 2,105,226 |
| | | | |
|
|
Utilities (6.3%) | | | | | |
AGL Resources, Inc. | | 61,440 | | | 2,162,074 |
Alliant Energy Corp. | | 91,400 | | | 2,417,530 |
Aqua America, Inc. (c) | | 75,545 | | | 2,559,465 |
Aquila, Inc. (b) | | 300,337 | | | 1,063,193 |
Black Hills Corp. (c) | | 27,900 | | | 1,159,803 |
DPL, Inc. | | 106,570 | | | 2,746,309 |
Duquesne Light Holdings, Inc. (c) | | 66,600 | | | 1,111,554 |
Energy East Corp. | | 120,520 | | | 2,874,402 |
Equitable Resources, Inc. | | 99,400 | | | 3,841,810 |
Great Plains Energy, Inc. (c) | | 60,200 | | | 1,728,342 |
Hawaiian Electric Industries, Inc. (c) | | 64,900 | | | 1,710,115 |
| | | | | | |
| | | Shares or
Principal Amount | | Value |
| | | | | | | |
Utilities (continued) | | | | | | |
Idacorp, Inc. (c) | | | 35,200 | | $ | 1,016,224 |
National Fuel Gas Co. | | | 64,900 | | | 1,956,086 |
Northeast Utilities | | | 100,800 | | | 1,833,552 |
NSTAR (c) | | | 85,720 | | | 2,331,584 |
Oklahoma Gas & Electric Co. (c) | | | 70,600 | | | 1,818,656 |
Oneok, Inc. | | | 83,780 | | | 2,407,837 |
Pepco Holdings, Inc. | | | 149,594 | | | 3,214,775 |
PNM, Inc. (c) | | | 57,950 | | | 1,469,033 |
Puget Energy, Inc. | | | 94,900 | | | 2,034,656 |
Questar Corp. | | | 68,900 | | | 5,425,874 |
Scana Corp. | | | 92,379 | | | 3,664,675 |
Sierra Pacific Resources (b) | | | 152,680 | | | 1,977,206 |
Vectren Corp. (c) | | | 58,260 | | | 1,581,759 |
Westar Energy, Inc. | | | 70,950 | | | 1,567,995 |
Western Gas Resources, Inc. | | | 48,200 | | | 2,087,060 |
WGL Holdings, Inc. (c) | | | 41,200 | | | 1,280,496 |
Wisconsin Energy Corp. | | | 93,300 | | | 3,529,539 |
WPS Resources Corp. (c) | | | 30,600 | | | 1,669,536 |
| | | | | |
|
|
| | | | | | | 64,241,140 |
| | | | | |
|
|
Veterinary Diagnostics (0.2%) | | | |
VCA Antech, Inc. (b) (c) | | | 63,400 | | | 1,635,720 |
| | | | | |
|
|
Waste Disposal (0.6%) | | | | | | |
Republic Services, Inc. | | | 102,860 | | | 3,636,101 |
Stericycle, Inc. (b) (c) | | | 36,460 | | | 2,098,638 |
| | | | | |
|
|
| | | | | | | 5,734,739 |
| | | | | |
|
|
| | |
Total Common Stocks | | | | | | 850,924,091 |
| | | | | |
|
|
|
Cash Equivalents (14.9%) |
Investments in repurchase agreements (Collateralized by U.S. Government Agencies and U.S. Government Agency Mortgages, in a joint trading account at 3.90%, dated 10/31/05, due 11/01/05, repurchase price $150,482,992) | | $ | 150,466,691 | | | 150,466,691 |
| | | | | |
|
|
| | |
Total Cash Equivalents | | | | | | 150,466,691 |
| | | | | |
|
|
Statement of Investments (Continued)
October 31, 2005
Gartmore Mid Cap Market Index Fund Fund (Continued)
Short-Term Securities Held as Collateral for
Securities Lending (18.4%)
| | | | | | | |
| | | Principal
Amount | | Value | |
Pool of short-term securities for Gartmore Mutual Funds — note 2 (Securities Lending) | | $ | 185,502,716 | | $ | 185,502,716 | |
| | | | | |
|
|
|
| |
Total Short-Term Securities Held as Collateral for Securities Lending | | | 185,502,716 | |
| | | | | |
|
|
|
| |
Total Investments
(Cost $1,068,090,920) (a) — 117.6% | | | 1,186,893,498 | |
| | |
Liabilities in excess of other assets — (17.6)% | | | | | | (178,005,625 | ) |
| | | | | |
|
|
|
| | |
NET ASSETS — 100.0% | | | | | $ | 1,008,887,873 | |
| | | | | |
|
|
|
| | (a) | See notes to financial statements for tax unrealized appreciation (depreciation) of securities. |
| | (b) | Denotes a non-income producing security. |
| | (c) | All or part of the security was on loan as of October 31, 2005. |
At October 31, 2005, the Fund’s open long futures contracts were as follows:
| | | | | | | | | | | |
Number of
Contracts
| | Long
Contracts*
| | Expiration
| | Market Value
Covered By
Contracts
| | Unrealized
Appreciation
(Depreciation)
| |
| 444 | | S&P400 | | 12/16/05 | | $ | 156,066,000 | | $ | (2,833,982 | ) |
| | * | Cash pledged as collateral. |
See notes to financial statements.
Gartmore S&P 500 Index Fund
For the annual period ended Oct. 31, 2005, the Gartmore S&P 500 Index Fund (Class A at NAV) returned 8.11% versus 8.72% for its benchmark, the S&P 500® Index. For broader comparison, the average return for the Fund’s Lipper peer category of S&P 500 Index Objective Funds was 8.14%.
The reporting period was strong for the U.S. large-cap equity market. As a result of several factors–the conclusion of the U.S. presidential election, reasonably good economic and earnings news, reactions to the $32 billion Microsoft dividend and the beginning of the seasonally strong year-end period–the large-cap equity market experienced most of its gains for the reporting period in November and December of 2004.
January 2005 began with a slide after the strong fourth quarter of 2004, with cyclical and small-capitalization stocks performing the worst out of the gate. January was characterized by mixed economic data, increasing interest rates, disappointing earnings reports and climbing oil prices. In addition, gross domestic product growth for the fourth quarter, released during January, came in weaker than expected at 3.1%, primarily as a result of the foreign trade deficit. The large-cap equity market was able to reverse course in February, even as the productivity report showed a continued slowdown in productivity growth and oil prices continued to climb. Good signs for the markets came in the form of accelerated hiring plans by corporations, reasonably robust capital spending and strong merger-and-acquisition activity. In March and April, the large-cap equity market resumed the downward slide experienced in January due to a combination of factors–the trade deficit, mixed economic news, high oil prices and rising interest rates. Oil prices, reaching as high as $56 a barrel, continued to trade above $50 a barrel.
Despite slowing profit growth, continually higher oil prices and inflation concerns, first-quarter corporate earnings came in strong; a rebound in the large-cap equity market occurred in May. The rally did not last into June, however, as investors continued to worry about economic deceleration. In addition, oil continued to pressure stock valuations, with the price climbing to a record high of more than $60 per barrel.
U.S. equity markets regained momentum in July, despite several negative events, such as terrorism overseas, two devastating hurricanes in the U.S. Gulf Coast, oil prices reaching $70 per barrel, a strong dollar and increasing interest rates. In addition, improved profits in the energy sector counterbalanced the negative impact that Hurricanes Katrina and Rita had on the retail, transportation, tourism and insurance sectors in September.
Portfolio Manager:
Fund Asset Management, L.P.-Subadviser
| | |
Fund Performance | | Gartmore S&P 500 Index Fund |
Average Annual Total Return
(For periods ended October 31, 2005)
| | | | | | | | |
| | | | | 1 Yr. | | 5 Yr. | | Inception1 |
| Class A2 | | w/o SC3 | | 8.11% | | -2.26% | | 1.83% |
| | | w/SC4 | | 1.93% | | -3.41% | | 1.01% |
| Class B2 | | w/o SC3 | | 7.45% | | -2.91% | | 1.30% |
| | | w/SC5 | | 2.45% | | -3.29% | | 1.30% |
| Class C6 | | w/o SC3 | | 7.44% | | -2.92% | | 1.29% |
| | | w/SC7 | | 6.44% | | -2.92% | | 1.29% |
| Institutional Service Class2,9 | | 8.29% | | -2.17% | | 1.83% |
| Institutional Class8,9 | | | | 8.55% | | -1.93% | | 2.11% |
| Local Fund Shares9 | | | | 8.45% | | -2.01% | | 1.98% |
| Service Class2,9 | | | | 8.06% | | -2.33% | | 1.65% |
All figures showing the effect of a sales charge reflect the maximum charge possible, because it has the most dramatic effect on performance data.
| 1 | Fund commenced operations on July 24, 1998. |
| 2 | These returns for the period prior to the creation of a particular class include the performance of the Fund’s Local Fund Shares. These returns were achieved prior to the creation of Class A and Class B shares (12/29/99) and Service Class and Institutional Service Class shares (11/2/98). Excluding the effect of any fee waivers or reimbursements, such prior performance is similar to what Class A, Class B, Service Class and Institutional Service Class shares would have produced because all classes of the Fund’s shares invest in the same portfolio of securities. The performance for these classes has been restated to reflect differences in sales charges (where applicable), but does not reflect the differing levels of other fees (primarily Rule 12b-1 and/or administrative services fees) applicable to such classes; if these fees were reflected, the performance for Class A, Class B, Service Class and Institutional Service Class would have been lower. |
| 3 | These returns do not reflect the effects of sales charges (SC). |
| 4 | A 5.75% front-end sales charge was deducted. |
| 5 | A 5.00% contingent deferred sales charge (CDSC) was deducted. The CDSC declines to 0% after 6 years. |
| 6 | These returns until the creation of Class C shares (10/22/03) include the performance of the Fund’s Local Fund Shares for the period through December 28, 1999 and the Fund’s Class B shares for the period from December 29, 1999 to October 21, 2003. Excluding the effect of any fee waivers or reimbursements, such prior performance is similar to what Class C shares would have produced because Class C shares invest in the same portfolio of securities as the Fund’s other classes. The performance for the Class C shares has been restated to reflect differences in sales charges (where applicable), but does not reflect the differing levels of other fees (primarily Rule 12b-1 and/or administrative services fees) applicable to such classes; if these fees were reflected, the performance for Class C shares would have been lower |
| 7 | A CDSC of 1.00% was deducted from the one year return because it is charged when you sell Class C shares within the first year after purchase. |
| 8 | These returns until the creation of the Institutional Class shares (12/29/99) include the performance of the Fund’s Local Fund shares. The returns have not been adjusted for the lower expenses applicable to Institutional Class shares. Excluding the effect of any fee waivers or reimbursements, such prior performance is similar to what Institutional Class shares would have produced because Institutional Class shares invest in the same portfolio of securities as Local Fund Shares. |
| 9 | Not subject to any sales charges. |
Performance of a $10,000 Investment
Investment return and principal value will fluctuate, and when redeemed, shares may be worth more or less than original cost. Past performance is no guarantee of future results and does not reflect the deduction of taxes that a shareholder would pay on fund distributions or the redemption of fund shares. Investing in mutual funds involves market risk, including loss of principal. Performance returns assume the reinvestment of all distributions.
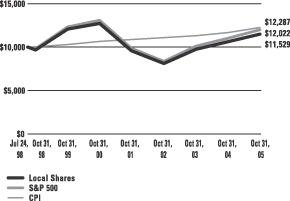
Comparative performance of $10,000 invested in Local Fund Shares of the Gartmore S&P 500 Index Fund, the S&P 500 Index(a), and the Consumer Price Index (CPI)(b) since inception. Unlike the Fund, the returns for these unmanaged indexes do not reflect any fees, expenses, or sales charges. Investors cannot invest directly in market indexes.
| (a) | The S&P 500 is an unmanaged index of 500 widely held stocks of large U.S. companies that gives a broad look at how the stock prices of large U.S. companies have performed. |
| (b) | The CPI represents changes in prices of a basket of goods and services purchased for consumption by urban households. |
| | |
Shareholder Expense Example | | Gartmore S&P 500 Index Fund |
As a shareholder of the Fund, you incur two types of costs: (1) transaction costs, including sales charges (loads) paid on purchase payments and redemption fees; and (2) ongoing costs, including investment advisory fees, administration fees, distribution fees and other Fund expenses. The examples below are intended to help you understand your ongoing costs (in dollars) of investing in the Fund and to compare these costs with the ongoing costs of investing in other mutual funds. Per SEC requirements, the examples assume that you had a $1,000 investment in the Class at the beginning of the reporting period, May 1, 2005, and continued to hold your shares at the end of the reporting period, October 31, 2005.
Actual Expenses
For each Class of the Fund in the table below, the first line provides information about actual account values and actual expenses. You may use the information in this line, together with the amount you invested, to estimate the expenses that you paid over the period. Simply divide your account value by $1,000 (for example, an $8,600 account value divided by $1,000 = 8.6), then multiply the result by the number in the first line of each Class under the heading entitled “Expenses Paid During Period” to estimate the expenses you paid on your account during the period.
Hypothetical Example for Comparison Purposes
The second line of each Class in the table below provides information about hypothetical account values and hypothetical expenses based on the Class’ actual expense ratio and an assumed rate of return of 5% per year before expenses, which is not the Class’ actual return. The hypothetical account values and expenses may not be used to estimate the actual ending account balance or expenses you paid for the period. You may use this information to compare the ongoing costs of investing in the Class of the Fund and other funds. To do so, compare this 5% hypothetical example with the 5% hypothetical examples that appear in the shareholder reports of the other funds.
Please note that the expenses shown in the table are meant to highlight your ongoing costs only and do not reflect any transaction costs, such as sales charges (loads) or redemption fees. Therefore, the second line for each Class in the table is useful in comparing ongoing costs only, and will not help you determine the relative total costs of owning different funds. In addition, if these transaction costs were included, your costs would have been higher. The examples also assume all dividends and distributions have been reinvested.
Schedule of Shareholder Expenses
Expense Analysis of a $1,000 Investment
October 31, 2005
| | | | | | | | | | | | | | |
| S&P 500 Index Fund | | | | | Beginning
Account Value,
5/1/05 | | Ending
Account Value,
10/31/05 | | Expenses Paid
During Period* | | Annualized
Expense Ratio* |
| Class A | | Actual | | | $ | 1,000.00 | | $ | 1,049.70 | | $ | 2.59 | | 0.51% |
| | | Hypothetical | 1 | | $ | 1,000.00 | | $ | 1,022.47 | | $ | 2.56 | | 0.51% |
| Class B | | Actual | | | $ | 1,000.00 | | $ | 1,046.80 | | $ | 6.24 | | 1.23% |
| | | Hypothetical | 1 | | $ | 1,000.00 | | $ | 1,018.90 | | $ | 6.18 | | 1.23% |
| Class C | | Actual | | | $ | 1,000.00 | | $ | 1,045.80 | | $ | 6.24 | | 1.23% |
| | | Hypothetical | 1 | | $ | 1,000.00 | | $ | 1,018.90 | | $ | 6.18 | | 1.23% |
| Institutional Service Class | | Actual | | | $ | 1,000.00 | | $ | 1,050.40 | | $ | 2.44 | | 0.48% |
| | | Hypothetical | 1 | | $ | 1,000.00 | | $ | 1,022.62 | | $ | 2.41 | | 0.48% |
| Institutional Class | | Actual | | | $ | 1,000.00 | | $ | 1,051.70 | | $ | 1.17 | | 0.23% |
| | | Hypothetical | 1 | | $ | 1,000.00 | | $ | 1,023.86 | | $ | 1.15 | | 0.23% |
| Local Fund Shares | | Actual | | | $ | 1,000.00 | | $ | 1,051.20 | | $ | 1.53 | | 0.30% |
| | | Hypothetical | 1 | | $ | 1,000.00 | | $ | 1,023.51 | | $ | 1.51 | | 0.30% |
| Service Class | | Actual | | | $ | 1,000.00 | | $ | 1,048.80 | | $ | 3.20 | | 0.63% |
| | | Hypothetical | 1 | | $ | 1,000.00 | | $ | 1,021.88 | | $ | 3.16 | | 0.63% |
| * | Expenses are equal to the Fund’s annualized expense ratio multiplied by the average account value over the period multiplied by 184/365 (to reflect the one-half year period). The expense ratio presented represents a six month, annualized ratio in accordance with SEC guidelines. |
| 1 | Represents the hypothetical 5% return before expenses. |
| | |
Portfolio Summary | | Gartmore S&P 500 Index Fund |
October 31, 2005
The SEC adopted a requirement that Funds present their portfolio holdings in a table, chart or graph format in their annual and semiannual reports to shareholders, whether or not a statement of investments is utilized. The following tables, which present portfolio holdings as a percentage of net assets, are provided in compliance with this requirement.
| | |
| Asset Allocation | | |
| Common Stock | | 95.9% |
| Cash Equivalents | | 3.6% |
| Other Investments* | | 7.0% |
| Liabilities in excess of Other Assets** | | -6.5 % |
| | |
|
| | | 100.0% |
| * | Includes value of collateral received from securities lending. |
| ** | Includes value of collateral owed from securities lending. |
| | |
| Top Industries | | |
| Oil & Gas | | 7.2% |
| Healthcare | | 6.4% |
| Banks | | 6.2% |
| Computer Software & Services | | 5.6% |
| Drugs | | 5.0% |
| Insurance | | 4.9% |
| Retail | | 4.8% |
| Electrical Equipment | | 3.9% |
| Financial | | 3.2% |
| Telecommunications | | 3.0% |
| Utilities | | 2.8% |
| Other Industries | | 47.0% |
| | |
|
| | | 100.0% |
| | |
| Top Holdings*** | | |
| General Electric Co. | | 3.2% |
| Exxon Mobil Corp. | | 3.1% |
| Microsoft Corp. | | 2.1% |
| Citigroup, Inc. | | 2.1% |
| Procter & Gamble Co. | | 1.7% |
| Johnson & Johnson Co. | | 1.6% |
| Bank of America Corp. | | 1.5% |
| American International Group, Inc. | | 1.5% |
| Pfizer, Inc. | | 1.4% |
| Altria Group, Inc. | | 1.4% |
| Other Holdings | | 80.4% |
| | |
|
| | | 100.0% |
| *** | For purpose of listing top holdings, repurchase agreements are considered cash equivalents and are included as part of Other Holdings. |
Statement of Investments
October 31, 2005
Gartmore S&P 500 Index Fund
| | | | | |
| | | Shares or
Principal Amount | | Value |
| | | | | | |
Advertising Services (0.0%) | | | | | |
Interpublic Group of Cos., Inc. (The) (b) (c) | | 91,478 | | $ | 944,968 |
| | | | |
|
|
Aerospace & Defense (1.8%) | | | | | |
Boeing Co. (The) | | 193,871 | | | 12,531,821 |
General Dynamics Corp. | | 47,231 | | | 5,492,965 |
Goodrich Corp. | | 27,751 | | | 1,000,979 |
Lockheed Martin Corp. | | 89,622 | | | 5,427,508 |
Northrop Grumman Corp. | | 84,276 | | | 4,521,407 |
Raytheon Co. | | 102,487 | | | 3,786,895 |
Rockwell Collins, Inc. | | 41,341 | | | 1,894,245 |
United Technologies Corp. | | 242,056 | | | 12,412,632 |
| | | | |
|
|
| | | | | | 47,068,452 |
| | | | |
|
|
Agriculture (0.1%) | | | | | |
Monsanto Co. | | 63,290 | | | 3,987,903 |
| | | | |
|
|
Airlines (0.3%) | | | | | |
FedEx Corp. | | 71,602 | | | 6,582,372 |
Southwest Airlines Co. | | 170,276 | | | 2,726,119 |
| | | | |
|
|
| | | | | | 9,308,491 |
| | | | |
|
|
Alcoholic Beverages (0.4%) | | | | | |
Anheuser-Busch Cos., Inc. | | 183,434 | | | 7,568,487 |
Brown-Forman Corp., Class B (c) | | 23,871 | | | 1,511,989 |
Constellation Brands, Inc. (b) (c) | | 45,200 | | | 1,064,008 |
Molson Coors Brewing Co., Class B (c) | | 16,370 | | | 1,010,029 |
| | | | |
|
|
| | | | | | 11,154,513 |
| | | | |
|
|
Analytical Instruments (0.1%) | | | |
Applera Corp.-Applied Biosystems Group (c) | | 44,971 | | | 1,091,446 |
Waters Corp. (b) | | 27,171 | | | 983,590 |
| | | | |
|
|
| | | | | | 2,075,036 |
| | | | |
|
|
Apparel (0.2%) | | | | | |
Nike, Inc., Class B | | 48,136 | | | 4,045,831 |
Reebok International Ltd. (c) | | 12,175 | | | 694,584 |
| | | | |
|
|
| | | | | | 4,740,415 |
| | | | |
|
|
Apparel & Accessories (0.2%) | | | | | |
Coach, Inc. (b) | | 89,400 | | | 2,876,892 |
Liz Claiborne, Inc. (c) | | 25,311 | | | 890,947 |
V.F. Corp. | | 23,406 | | | 1,222,964 |
| | | | |
|
|
| | | | | | 4,990,803 |
| | | | |
|
|
| | | | | |
| | | Shares or
Principal Amount | | Value |
| | | | | | |
Appliances & Household Durables (0.1%) | | | |
Maytag Corp. | | 17,665 | | $ | 304,191 |
Newell Rubbermaid, Inc. (c) | | 57,042 | | | 1,311,396 |
| | | | |
|
|
| | | | | | 1,615,587 |
| | | | |
|
|
Auto Parts & Equipment (0.2%) | | | |
AutoNation, Inc. (b) (c) | | 52,491 | | | 1,043,521 |
Dana Corp. (c) | | 35,401 | | | 265,862 |
Genuine Parts Co. | | 40,016 | | | 1,775,510 |
Ingersoll Rand Co. | | 77,852 | | | 2,942,027 |
Snap-On, Inc. (c) | | 12,870 | | | 463,577 |
| | | | |
|
|
| | | | | | 6,490,497 |
| | | | |
|
|
Automobiles (0.4%) | | | | | |
Ford Motor Co. (c) | | 448,996 | | | 3,735,647 |
General Motors Corp. (c) | | 137,356 | | | 3,763,554 |
PACCAR, Inc. | | 39,596 | | | 2,772,512 |
Visteon Corp. (b) (c) | | 30,287 | | | 252,291 |
| | | | |
|
|
| | | | | | 10,524,004 |
| | | | |
|
|
Banks (6.2%) | | | | | |
AmSouth Bancorp (c) | | 82,452 | | | 2,080,264 |
Bank of America Corp. | | 949,006 | | | 41,509,522 |
Bank of New York Co., Inc. | | 183,644 | | | 5,746,221 |
BB&T Corp. | | 125,073 | | | 5,295,591 |
Bear Stearns Cos., Inc. | | 25,767 | | | 2,726,149 |
Compass Bancshares, Inc. (c) | | 29,233 | | | 1,425,401 |
Fifth Third Bancorp | | 126,504 | | | 5,081,666 |
Huntington Bancshares, Inc. (c) | | 54,320 | | | 1,263,483 |
J.P. Morgan Chase & Co. | | 830,501 | | | 30,412,947 |
KeyCorp | | 93,472 | | | 3,013,537 |
M&T Bank Corp. (c) | | 21,561 | | | 2,319,532 |
Mellon Financial Corp. | | 97,722 | | | 3,096,810 |
National City Corp. | | 137,253 | | | 4,423,664 |
North Fork Bancorp, Inc. | | 106,166 | | | 2,690,246 |
Northern Trust Corp. | | 46,936 | | | 2,515,770 |
PNC Bank Corp. | | 67,301 | | | 4,085,844 |
Regions Financial Corp. (c) | | 105,107 | | | 3,421,233 |
State Street Corp. (c) | | 78,077 | | | 4,312,193 |
SunTrust Banks, Inc. | | 85,626 | | | 6,206,172 |
Synovus Financial Corp. (c) | | 70,417 | | | 1,934,355 |
U.S. Bancorp | | 431,703 | | | 12,769,775 |
Wachovia Corp. | | 372,755 | | | 18,831,583 |
Zions Bancorp (c) | | 20,820 | | | 1,529,645 |
| | | | |
|
|
| | | | | | 166,691,603 |
| | | | |
|
|
Statement of Investments (Continued)
October 31, 2005
Gartmore S&P 500 Index Fund (Continued)
| | Common Stocks (continued) |
| | | | | |
| | | Shares or
Principal Amount | | Value |
| | | | | | |
Biotechnology (0.0%) | | | | | |
Chiron Corp. (b) (c) | | 29,881 | | $ | 1,318,947 |
| | | | |
|
|
Broadcast Media & Cable Television (0.7%) |
Clear Channel Communications, Inc. | | 128,100 | | | 3,896,802 |
Comcast Corp. Special, Class A (b) | | 50,800 | | | 1,392,428 |
Comcast Corp., Class A (b) | | 467,875 | | | 13,020,961 |
| | | | |
|
|
| | | | | | 18,310,191 |
| | | | |
|
|
Business Services (0.3%) | | | | | |
Cintas Corp. | | 34,501 | | | 1,399,705 |
Compuware Corp. (b) | | 86,207 | | | 697,415 |
Convergys Corp. (b) (c) | | 33,082 | | | 537,583 |
Monster Worldwide, Inc. (b) (c) | | 23,731 | | | 778,614 |
NCR Corp. (b) | | 43,790 | | | 1,323,334 |
Pitney Bowes, Inc. | | 53,296 | | | 2,242,695 |
| | | | |
|
|
| | | | | | 6,979,346 |
| | | | |
|
|
Chemicals (0.2%) | | | | | |
Millipore Corp. (b) (c) | | 12,025 | | | 736,171 |
Praxair, Inc. | | 74,032 | | | 3,657,920 |
Sigma Aldrich Corp. (c) | | 16,025 | | | 1,020,793 |
| | | | |
|
|
| | | | | | 5,414,884 |
| | | | |
|
|
Communications Equipment (1.6%) | | | |
CIENA Corp. (b) (c) | | 107,908 | | | 255,742 |
Citizens Communications Co. | | 84,836 | | | 1,038,393 |
Corning, Inc. (b) | | 347,022 | | | 6,971,672 |
JDS Uniphase Corp. (b) (c) | | 470,254 | | | 987,533 |
Motorola, Inc. | | 583,128 | | | 12,922,116 |
Tellabs, Inc. (b) | | 120,252 | | | 1,149,609 |
Verizon Communications, Inc. | | 653,180 | | | 20,581,702 |
| | | | |
|
|
| | | | | | 43,906,767 |
| | | | |
|
|
Computer Equipment (1.8%) | | | | | |
American Power Conversion Corp. | | 42,031 | | | 899,043 |
Dell Computer Corp. (b) | | 566,258 | | | 18,052,305 |
EMC Corp. (b) | | 562,287 | | | 7,849,527 |
Gateway, Inc. (b) (c) | | 64,362 | | | 183,432 |
Hewlett Packard Co. | | 676,690 | | | 18,974,387 |
Network Appliance, Inc. (b) (c) | | 79,384 | | | 2,171,946 |
| | | | |
|
|
| | | | | | 48,130,640 |
| | | | |
|
|
| | | | | |
| | | Shares or
Principal Amount | | Value |
| | | | | | |
Computer Integrated Systems Design (0.0%) |
Avaya, Inc. (b) (c) | | 93,319 | | $ | 1,075,035 |
| | | | |
|
|
Computer Software & Services (5.6%) | | | |
Adobe Systems, Inc. (c) | | 115,542 | | | 3,726,230 |
Affiliated Computer Services, Inc., Class A (b) (c) | | 29,141 | | | 1,576,820 |
Automatic Data Processing, Inc. | | 134,178 | | | 6,260,745 |
BMC Software, Inc. (b) (c) | | 51,156 | | | 1,002,146 |
Cisco Systems, Inc. (b) | | 1,509,509 | | | 26,340,932 |
Citrix Systems, Inc. (b) | | 39,071 | | | 1,077,187 |
Computer Associates International, Inc. (c) | | 114,738 | | | 3,209,222 |
Electronic Data Systems Corp. (c) | | 117,962 | | | 2,749,694 |
First Data Corp. | | 186,252 | | | 7,533,893 |
Fiserv, Inc. (b) (c) | | 44,166 | | | 1,929,171 |
Intuit, Inc. (b) (c) | | 42,831 | | | 1,967,228 |
Mercury Interactive Corp. (b) (c) | | 20,120 | | | 699,975 |
Microsoft Corp. | | 2,177,089 | | | 55,951,186 |
Novell, Inc. (b) (c) | | 82,972 | | | 632,247 |
NVIDIA Corp. (b) (c) | | 44,061 | | | 1,478,247 |
Oracle Corp. (b) | | 895,238 | | | 11,351,618 |
Parametric Technology Corp. (b) | | 54,751 | | | 356,429 |
Siebel Systems, Inc. | | 119,303 | | | 1,234,786 |
Sun Microsystems, Inc. (b) | | 803,482 | | | 3,213,928 |
Symantec Corp. (b) | | 282,274 | | | 6,732,235 |
Symbol Technologies, Inc. (c) | | 56,636 | | | 470,079 |
Unisys Corp. (b) | | 79,862 | | | 408,095 |
Yahoo!, Inc. (b) | | 298,348 | | | 11,029,926 |
| | | | |
|
|
| | | | | | 150,932,019 |
| | | | |
|
|
Computers & Hardware (1.6%) | | | |
Apple Computer, Inc. (b) | | 195,174 | | | 11,240,071 |
International Business Machines Corp. | | 376,910 | | | 30,861,390 |
Lexmark International, Inc. (b) | | 29,401 | | | 1,220,730 |
| | | | |
|
|
| | | | | | 43,322,191 |
| | | | |
|
|
Conglomerates (0.8%) | | | | | |
Illinois Tool Works, Inc. | | 52,147 | | | 4,419,980 |
ITT Industries, Inc. | | 20,130 | | | 2,045,208 |
Johnson Controls, Inc. | | 44,786 | | | 3,047,687 |
Tyco International Ltd. | | 472,900 | | | 12,479,831 |
| | | | |
|
|
| | | | | | 21,992,706 |
| | | | |
|
|
| | Common Stocks (continued) |
| | | | | |
| | | Shares or
Principal Amount | | Value |
| | | | | | |
Construction & Building Materials (0.4%) | | | |
Centex Corp. | | 32,481 | | $ | 2,090,152 |
Fluor Corp. | | 20,485 | | | 1,302,846 |
KB Home (c) | | 20,330 | | | 1,328,566 |
Pulte Corp. | | 53,882 | | | 2,036,201 |
Sherwin Williams Co. | | 29,986 | | | 1,275,904 |
Vulcan Materials Co. (c) | | 23,276 | | | 1,512,940 |
| | | | |
|
|
| | | | | | 9,546,609 |
| | | | |
|
|
Construction & Housing (0.2%) | | | |
Lennar Corp. | | 37,467 | | | 2,082,416 |
Masco Corp. | | 101,527 | | | 2,893,519 |
| | | | |
|
|
| | | | | | 4,975,935 |
| | | | |
|
|
Construction Machinery (0.3%) | | | |
Caterpillar, Inc. | | 159,964 | | | 8,412,507 |
| | | | |
|
|
Consumer Durable (0.3%) | | | | | |
Black & Decker Corp. | | 18,465 | | | 1,516,530 |
Danaher Corp. (c) | | 60,247 | | | 3,138,869 |
Fortune Brands, Inc. | | 34,286 | | | 2,604,707 |
Whirlpool Corp. | | 18,125 | | | 1,422,813 |
| | | | |
|
|
| | | | | | 8,682,919 |
| | | | |
|
|
Consumer Finance (2.1%) | | | | | |
Citigroup, Inc. | | 1,221,188 | | | 55,905,987 |
| | | | |
|
|
Consumer Non-Cyclical (2.5%) | | | |
Alberto Culver Co., Class B | | 16,020 | | | 695,428 |
Avon Products, Inc. (c) | | 112,017 | | | 3,023,339 |
Clorox Co. (The) (c) | | 35,486 | | | 1,920,502 |
Colgate-Palmolive Co. | | 122,608 | | | 6,493,320 |
Ecolab, Inc. (c) | | 51,611 | | | 1,707,292 |
International Flavor and Fragrances, Inc. (c) | | 18,740 | | | 618,233 |
Kimberly-Clark Corp. | | 112,587 | | | 6,399,445 |
Pall Corp. | | 27,591 | | | 721,781 |
Procter & Gamble Co. | | 811,903 | | | 45,458,448 |
| | | | |
|
|
| | | | | | 67,037,788 |
| | | | |
|
|
Containers (0.1%) | | | | | |
Ball Corp. | | 25,730 | | | 1,012,990 |
Bemis Co., Inc. (c) | | 25,096 | | | 663,036 |
Sealed Air Corp. (b) (c) | | 19,597 | | | 985,925 |
| | | | |
|
|
| | | | | | 2,661,951 |
| | | | |
|
|
| | | | | |
| | | Shares or
Principal Amount | | Value |
| | | | | | |
Credit Reporting Services (0.1%) | | | |
Moody’s Corp. (c) | | 63,602 | | $ | 3,387,443 |
| | | | |
|
|
Data Processing & Reproduction (0.1%) | | | |
Computer Sciences Corp. (b) (c) | | 41,381 | | | 2,120,776 |
| | | | |
|
|
Dental Supplies & Equipment (0.1%) | | | |
Patterson Companies, Inc. (b) (c) | | 33,500 | | | 1,386,230 |
| | | | |
|
|
Distribution (0.2%) | | | | | |
SYSCO Corp. | | 143,033 | | | 4,564,183 |
| | | | |
|
|
Diversified Chemicals (1.3%) | | | | | |
Air Products & Chemicals, Inc. | | 52,366 | | | 2,997,430 |
Ashland, Inc. | | 15,525 | | | 830,743 |
E.I. du Pont de Nemours and Co. (c) | | 234,350 | | | 9,770,052 |
Eastman Chemical Co. (c) | | 18,560 | | | 979,226 |
Engelhard Corp. (c) | | 27,091 | | | 736,875 |
Hercules, Inc. (b) (c) | | 19,821 | | | 220,806 |
Occidental Petroleums Corp. | | 95,427 | | | 7,527,282 |
Rohm & Haas Co. (c) | | 40,677 | | | 1,770,670 |
The Dow Chemical Co. | | 224,490 | | | 10,295,110 |
| | | | |
|
|
| | | | | | 35,128,194 |
| | | | |
|
|
Drugs (5.0%) | | | | | |
Amerisource Bergen Corp. (c) | | 24,326 | | | 1,855,344 |
Amgen Corp. (b) | | 291,448 | | | 22,080,100 |
Biogen, Inc. (b) | | 79,972 | | | 3,249,262 |
Eli Lilly & Co. | | 267,791 | | | 13,333,314 |
Express Scripts, Inc. (b) (c) | | 34,220 | | | 2,580,530 |
Forest Laboratories, Inc. (b) | | 80,132 | | | 3,037,804 |
Genzyme Corp. (b) | | 60,551 | | | 4,377,837 |
Gilead Sciences, Inc. (b) | | 107,300 | | | 5,069,925 |
Laboratory Corp. of America Holdings (b) | | 31,000 | | | 1,495,750 |
Medimmune, Inc. (b) (c) | | 58,161 | | | 2,034,472 |
Merck & Co., Inc. | | 520,076 | | | 14,676,545 |
Mylan Laboratories, Inc. | | 53,251 | | | 1,022,952 |
Pfizer, Inc. | | 1,740,934 | | | 37,847,906 |
Schering Plough Corp. | | 347,827 | | | 7,074,801 |
Wyeth | | 316,772 | | | 14,115,360 |
| | | | |
|
|
| | | | | | 133,851,902 |
| | | | |
|
|
Educational Services (0.1%) | | | | | |
Apollo Group, Inc. (b) (c) | | 36,926 | | | 2,327,077 |
| | | | |
|
|
Statement of Investments (Continued)
October 31, 2005
Gartmore S&P 500 Index Fund (Continued)
| | Common Stocks (continued) |
| | | | | |
| | | Shares or
Principal Amount | | Value |
| | | | | | |
Electrical Equipment (3.9%) | | | | | |
Agilent Technologies, Inc. (b) | | 114,263 | | $ | 3,657,559 |
Cooper Industries Ltd., Class A | | 19,530 | | | 1,384,482 |
Eaton Corp. | | 34,616 | | | 2,036,459 |
Emerson Electric Co. | | 96,782 | | | 6,731,188 |
Fisher Scientific International, Inc. (b) (c) | | 27,700 | | | 1,565,050 |
General Electric Co. | | 2,503,832 | | | 84,904,943 |
Rockwell International Corp. | | 41,776 | | | 2,220,394 |
W.W. Grainger, Inc. | | 19,225 | | | 1,287,691 |
| | | | |
|
|
| | | | | | 103,787,766 |
| | | | |
|
|
Electronics (2.6%) | | | | | |
Altera Corp. (b) | | 85,582 | | | 1,424,940 |
Applied Micro Circuits Corp. (b) (c) | | 70,962 | | | 173,147 |
Broadcom Corp., Class A (b) | | 67,531 | | | 2,867,366 |
Intel Corp. | | 1,439,338 | | | 33,824,444 |
Jabil Circuit, Inc. (b) (c) | | 35,141 | | | 1,048,959 |
KLA-Tencor Corp. (c) | | 48,121 | | | 2,227,521 |
L-3 Communications Holdings, Inc. (c) | | 26,438 | | | 2,057,405 |
Linear Technology Corp. | | 75,667 | | | 2,512,901 |
LSI Logic Corp. (b) (c) | | 85,082 | | | 690,015 |
Maxim Integrated Products, Inc. (c) | | 79,514 | | | 2,757,546 |
Molex, Inc. | | 39,921 | | | 1,010,401 |
National Semiconductor Corp. (c) | | 81,077 | | | 1,834,773 |
PMC-Sierra, Inc. (b) (c) | | 41,711 | | | 296,148 |
QLogic Corp. (b) | | 22,445 | | | 676,941 |
RadioShack Corp. (c) | | 34,571 | | | 764,019 |
Sanmina Corp. (b) | | 121,339 | | | 442,887 |
Solectron Corp. (b) | | 189,076 | | | 667,438 |
Tektronix, Inc. (c) | | 19,995 | | | 459,485 |
Teradyne, Inc. (b) (c) | | 45,401 | | | 614,730 |
Texas Instruments, Inc. | | 383,359 | | | 10,944,899 |
Xilinx, Inc. (c) | | 81,022 | | | 1,940,477 |
| | | | |
|
|
| | | | | | 69,236,442 |
| | | | |
|
|
Entertainment (0.7%) | | | | | |
Electronic Arts, Inc. (b) | | 72,007 | | | 4,095,758 |
International Game Technology (c) | | 79,332 | | | 2,101,505 |
| | | | | |
| | | Shares or
Principal Amount | | Value |
| | | | | | |
Entertainment (continued) | | | | | |
Walt Disney Co. (The) | | 474,340 | | $ | 11,559,666 |
| | | | |
|
|
| | | | | | 17,756,929 |
| | | | |
|
|
Farm Machinery (0.1%) | | �� | | | |
Deere & Co. | | 59,646 | | | 3,619,319 |
| | | | |
|
|
Financial (3.2%) | | | | | |
American Express Co. | | 293,157 | | | 14,590,423 |
Capital One Financial Corp. | | 67,286 | | | 5,137,286 |
Charles Schwab Corp. | | 256,087 | | | 3,892,522 |
CIT Group, Inc. | | 46,500 | | | 2,126,445 |
Comerica, Inc. | | 38,926 | | | 2,249,144 |
Countrywide Credit Industries, Inc. | | 144,292 | | | 4,584,157 |
Fannie Mae | | 228,575 | | | 10,861,884 |
Federated Investors, Inc. (c) | | 21,411 | | | 749,599 |
Golden West Financial Corp. (c) | | 64,322 | | | 3,777,631 |
Goldman Sachs Group, Inc. | | 109,872 | | | 13,884,525 |
Lehman Brothers Holdings, Inc. | | 64,301 | | | 7,694,901 |
MBNA Corp. | | 296,047 | | | 7,569,922 |
Washington Mutual, Inc. | | 234,911 | | | 9,302,476 |
| | | | |
|
|
| | | | | | 86,420,915 |
| | | | |
|
|
Financial Services (1.6%) | | | | | |
AMBAC Financial Group, Inc. (c) | | 22,101 | | | 1,566,740 |
Ameriprise Financial Inc (b) | | 58,551 | | | 2,179,269 |
E*TRADE Financial Corp. (b) | | 79,522 | | | 1,475,133 |
First Horizon National Corp. (c) | | 29,491 | | | 1,140,712 |
H&R Block, Inc. (c) | | 76,272 | | | 1,896,122 |
Janus Capital Group, Inc. (c) | | 52,731 | | | 925,429 |
Marshall & Ilsley Corp. (c) | | 48,866 | | | 2,099,283 |
SLM Corp. (c) | | 98,522 | | | 5,470,927 |
Sovereign Bancorp, Inc. (c) | | 80,400 | | | 1,734,228 |
Wells Fargo Co. | | 398,764 | | | 24,005,593 |
| | | | |
|
|
| | | | | | 42,493,436 |
| | | | |
|
|
Food & Drug Retail (0.7%) | | | | | |
Albertson’s, Inc. | | 95,461 | | | 2,397,026 |
Kroger Co. (b) | | 167,709 | | | 3,337,409 |
Safeway, Inc. | | 97,482 | | | 2,267,431 |
Supervalu, Inc. | | 31,031 | | | 975,304 |
Walgreen Co. | | 237,625 | | | 10,795,304 |
| | | | |
|
|
| | | | | | 19,772,474 |
| | | | |
|
|
| | Common Stocks (continued) |
| | | | | |
| | | Shares or
Principal Amount | | Value |
| | | | | | |
Food & Related (2.4%) | | | | | |
Altria Group, Inc. | | 490,143 | | $ | 36,785,232 |
Archer-Daniels Midland Co. | | 147,843 | | | 3,602,934 |
Campbell Soup Co. | | 52,432 | | | 1,525,771 |
ConAgra, Inc. | | 117,928 | | | 2,744,185 |
General Mills, Inc. | | 81,362 | | | 3,926,530 |
H.J. Heinz Co. | | 80,357 | | | 2,852,674 |
Hershey Foods Corp. | | 45,322 | | | 2,575,649 |
Kellogg Co. | | 66,142 | | | 2,921,492 |
McCormick & Co. (c) | | 31,546 | | | 955,528 |
Sara Lee Corp. | | 183,999 | | | 3,284,382 |
Tyson Foods, Inc., Class A (c) | | 58,800 | | | 1,046,640 |
W.M. Wrigley Jr. Co. (c) | | 46,156 | | | 3,207,842 |
| | | | |
|
|
| | | | | | 65,428,859 |
| | | | |
|
|
Furniture & Home Furnishings (0.0%) | | | |
Leggett & Platt, Inc. (c) | | 44,201 | | | 885,788 |
| | | | |
|
|
Healthcare (6.4%) | | | | | |
Abbott Laboratories | | 367,163 | | | 15,806,367 |
Allergan, Inc. | | 30,816 | | | 2,751,869 |
Bard (C.R.), Inc. (c) | | 24,886 | | | 1,552,389 |
Bausch & Lomb, Inc. (c) | | 11,545 | | | 856,524 |
Baxter International, Inc. | | 145,273 | | | 5,553,787 |
Becton Dickinson & Co. | | 57,786 | | | 2,932,640 |
Biomet, Inc. (c) | | 58,051 | | | 2,021,916 |
Boston Scientific Corp. (b) | | 144,854 | | | 3,638,732 |
Bristol-Myers Squibb Co. | | 460,740 | | | 9,753,866 |
Cardinal Health, Inc. | | 100,697 | | | 6,294,569 |
Coventry Health Care, Inc. (b) | | 41,100 | | | 2,218,989 |
Guidant Corp. | | 76,267 | | | 4,804,821 |
HCA, Inc. | | 103,113 | | | 4,969,015 |
Health Management Associates, Inc., Class A | | 56,841 | | | 1,216,966 |
Humana, Inc. (b) (c) | | 38,161 | | | 1,693,967 |
Johnson & Johnson Co. | | 702,625 | | | 43,998,377 |
King Pharmaceuticals, Inc. (b) | | 56,823 | | | 876,779 |
Manor Care, Inc. (c) | | 20,020 | | | 745,745 |
McKesson HBOC, Inc. | | 70,547 | | | 3,204,950 |
Medco Health Solutions, Inc. (b) | | 70,326 | | | 3,973,419 |
Medtronic, Inc. | | 286,106 | | | 16,210,766 |
Quest Diagnostics, Inc. | | 42,072 | | | 1,965,183 |
St. Jude Medical, Inc. (b) | | 86,222 | | | 4,144,692 |
Stryker Corp. | | 72,777 | | | 2,988,951 |
| | | | | |
| | | Shares or
Principal Amount | | Value |
| | | | | | |
Healthcare (continued) | | | | | |
Tenet Healthcare Corp. (b) (c) | | 110,487 | | $ | 930,301 |
UnitedHealth Group, Inc. | | 298,418 | | | 17,275,418 |
Watson Pharmaceutical, Inc. (b) | | 22,106 | | | 763,983 |
Wellpoint, Inc. (b) | | 144,102 | | | 10,761,537 |
| | | | |
|
|
| | | | | | 173,906,518 |
| | | | |
|
|
Hotels & Casinos (0.1%) | | | | | |
Harrah’s Entertainment, Inc. | | 44,821 | | | 2,710,774 |
| | | | |
|
|
Hotels & Motels (0.4%) | | | | | |
Cendant Corp. | | 240,845 | | | 4,195,521 |
Hilton Hotels Corp. | | 86,887 | | | 1,689,952 |
Marriott International, Inc., Class A | | 44,481 | | | 2,651,957 |
Starwood Hotels & Resorts Worldwide, Inc. | | 50,724 | | | 2,963,803 |
| | | | |
|
|
| | | | | | 11,501,233 |
| | | | |
|
|
Industrial Diversified (0.1%) | | | | | |
Parker Hannifin Corp. | | 26,456 | | | 1,658,263 |
Thermo Electron Corp. (b) (c) | | 38,076 | | | 1,149,514 |
| | | | |
|
|
| | | | | | 2,807,777 |
| | | | |
|
|
Insurance (4.9%) | | | | | |
ACE Ltd. | | 67,911 | | | 3,538,163 |
Aetna, Inc. | | 68,542 | | | 6,070,080 |
AFLAC, Inc. | | 114,313 | | | 5,461,875 |
Allstate Corp. (The) | | 158,614 | | | 8,373,233 |
American International Group, Inc. | | 612,966 | | | 39,720,197 |
AON Corp. (c) | | 69,927 | | | 2,367,029 |
Chubb Corp. (The) | | 45,881 | | | 4,265,557 |
CIGNA Corp. | | 31,261 | | | 3,622,212 |
Cincinnati Financial Corp. | | 38,689 | | | 1,646,217 |
Hartford Financial Services Group, Inc. | | 70,271 | | | 5,604,112 |
Jefferson-Pilot Corp. | | 31,661 | | | 1,737,556 |
Lincoln National Corp. | | 40,736 | | | 2,061,649 |
Loews Corp. | | 34,671 | | | 3,223,710 |
MBIA, Inc. (c) | | 35,776 | | | 2,083,594 |
MetLife, Inc. | | 173,179 | | | 8,556,774 |
MGIC Investment Corp. | | 19,160 | | | 1,135,038 |
Principal Financial Group, Inc. (c) | | 67,807 | | | 3,365,261 |
Progressive Corp. (The) | | 45,900 | | | 5,315,679 |
Statement of Investments (Continued)
October 31, 2005
Gartmore S&P 500 Index Fund (Continued)
| | Common Stocks (continued) |
| | | | | |
| | | Shares or
Principal Amount | | Value |
| | | | | | |
Insurance (continued) | | | | | |
Prudential Financial, Inc. | | 120,243 | | $ | 8,752,488 |
SAFECO Corp. | | 29,351 | | | 1,634,851 |
St. Paul Cos., Inc. | | 155,815 | | | 7,016,349 |
Torchmark Corp. (c) | | 24,631 | | | 1,301,256 |
UnumProvident Corp. (c) | | 75,649 | | | 1,534,918 |
XL Capital Ltd., Class A | | 36,746 | | | 2,353,949 |
| | | | |
|
|
| | | | | | 130,741,747 |
| | | | |
|
|
Insurance Brokers (0.1%) | | | | | |
Marsh & McLennan Cos., Inc. | | 125,293 | | | 3,652,291 |
| | | | |
|
|
Investment Management (1.2%) | | | |
Franklin Resources, Inc. | | 38,071 | | | 3,364,334 |
Merrill Lynch & Co. | | 218,895 | | | 14,171,263 |
Morgan Stanley Dean Witter & Co. | | 256,542 | | | 13,958,450 |
T. Rowe Price Group, Inc. | | 27,091 | | | 1,775,002 |
| | | | |
|
|
| | | | | | 33,269,049 |
| | | | |
|
|
Leisure Products (0.3%) | | | | | |
Brunswick Corp. | | 22,940 | | | 874,702 |
Carnival Corp. | | 105,963 | | | 5,263,182 |
Hasbro, Inc. | | 41,921 | | | 789,792 |
Mattel, Inc. | | 95,223 | | | 1,404,539 |
| | | | |
|
|
| | | | | | 8,332,215 |
| | | | |
|
|
Manufacturing (1.1%) | | | | | |
3M Co. | | 180,689 | | | 13,728,750 |
American Standard Cos., Inc. | | 46,616 | | | 1,773,273 |
Cummins, Inc. (c) | | 12,200 | | | 1,041,514 |
Dover Corp. | | 47,356 | | | 1,845,937 |
Honeywell International, Inc. | | 201,969 | | | 6,907,340 |
PPG Industries, Inc. | | 39,606 | | | 2,375,172 |
Stanley Works (The) (c) | | 17,380 | | | 833,023 |
Textron, Inc. | | 30,046 | | | 2,164,514 |
| | | | |
|
|
| | | | | | 30,669,523 |
| | | | |
|
|
Medical Equipment & Supplies (0.0%) | | | |
PerkinElmer, Inc. | | 23,096 | | | 509,729 |
| | | | |
|
|
Medical Products (0.1%) | | | | | |
Zimmer Holdings, Inc. (b) | | 58,246 | | | 3,714,347 |
| | | | |
|
|
| | | | | |
| | | Shares or
Principal Amount | | Value |
| | | | | | |
Metals & Mining (0.6%) | | | | | |
Alcoa, Inc. | | 205,826 | | $ | 4,999,513 |
Freeport-McMoRan Copper & Gold, Inc. (c) | | 46,406 | | | 2,293,385 |
Newmont Mining Corp. (c) | | 110,632 | | | 4,712,923 |
Phelps Dodge Corp. | | 24,343 | | | 2,932,601 |
| | | | |
|
|
| | | | | | 14,938,422 |
| | | | |
|
|
Mortgage & Asset Backed Obligations (0.4%) |
Freddie Mac | | 160,538 | | | 9,849,006 |
| | | | |
|
|
Motor Vehicles (0.1%) | | | | | |
Harley-Davidson, Inc. (c) | | 67,927 | | | 3,364,425 |
Navistar International Corp. (b) (c) | | 15,320 | | | 421,606 |
| | | | |
|
|
| | | | | | 3,786,031 |
| | | | |
|
|
Multimedia (1.5%) | | | | | |
News Corp., Class A | | 589,300 | | | 8,397,525 |
Time Warner, Inc. | | 1,108,693 | | | 19,767,996 |
Viacom, Inc., Class A | | 200 | | | 6,210 |
Viacom, Inc., Class B | | 374,374 | | | 11,594,363 |
| | | | |
|
|
| | | | | | 39,766,094 |
| | | | |
|
|
Natural Gas (0.1%) | | | | | |
NICOR, Inc. (c) | | 8,805 | | | 345,156 |
People’s Energy Corp. (c) | | 7,575 | | | 281,790 |
Sempra Energy | | 53,681 | | | 2,378,068 |
| | | | |
|
|
| | | | | | 3,005,014 |
| | | | |
|
|
Non-Alcoholic Beverages (1.8%) | | | |
Coca-Cola Co. | | 490,417 | | | 20,980,039 |
Coca-Cola Enterprises, Inc. | | 82,557 | | | 1,560,327 |
Pepsi Bottling Group, Inc. (The) | | 41,821 | | | 1,188,971 |
PepsiCo, Inc. | | 394,374 | | | 23,299,617 |
| | | | |
|
|
| | | | | | 47,028,954 |
| | | | |
|
|
Office Equipment & Supplies (0.2%) | | | |
Avery Dennison Corp. (c) | | 23,716 | | | 1,343,511 |
Xerox Corp. (b) | | 217,254 | | | 2,948,137 |
| | | | |
|
|
| | | | | | 4,291,648 |
| | | | |
|
|
Oil & Gas (7.2%) | | | | | |
Amerada Hess Corp. (c) | | 20,420 | | | 2,554,542 |
Apache Corp. | | 77,324 | | | 4,935,591 |
BJ Services Co. (c) | | 81,092 | | | 2,817,947 |
| | Common Stocks (continued) |
| | | | | |
| | | Shares or
Principal Amount | | Value |
| | | | | | |
Oil & Gas (continued) | | | | | |
ChevronTexaco Corp. | | 531,917 | | $ | 30,356,503 |
ConocoPhillips | | 328,782 | | | 21,495,767 |
Devon Energy Corp. | | 107,108 | | | 6,467,181 |
El Paso Corp. (c) | | 141,613 | | | 1,679,530 |
EOG Resources, Inc. | | 56,582 | | | 3,835,128 |
Exxon Mobil Corp. | | 1,489,261 | | | 83,607,112 |
KeySpan Corp. (c) | | 37,591 | | | 1,299,521 |
Kinder Morgan, Inc. | | 25,276 | | | 2,297,588 |
Marathon Oil Corp. | | 89,312 | | | 5,373,010 |
Murphy Oil Corp. | | 40,900 | | | 1,916,165 |
Nabors Industries Ltd. (b) | | 34,277 | | | 2,352,431 |
Noble Corp. | | 31,831 | | | 2,049,280 |
Rowan Cos., Inc. | | 31,586 | | | 1,042,022 |
Sunoco, Inc. | | 34,220 | | | 2,549,390 |
Transocean Sedco Forex, Inc. (b) | | 80,907 | | | 4,651,343 |
Valero Energy Corp. | | 72,092 | | | 7,586,962 |
Williams Cos., Inc. (The) | | 130,738 | | | 2,915,457 |
XTO Energy, Inc. | | 81,899 | | | 3,559,331 |
| | | | |
|
|
| | | | | | 195,341,801 |
| | | | |
|
|
Oil Equipment & Services (1.6%) | | | |
Anadarko Petroleum Corp. | | 56,438 | | | 5,119,491 |
Baker Hughes, Inc. | | 79,847 | | | 4,388,391 |
Burlington Resources, Inc. | | 89,162 | | | 6,439,280 |
Dynegy, Inc., Class A (b) (c) | | 81,172 | | | 360,404 |
Halliburton Co. | | 119,862 | | | 7,083,844 |
Kerr-Mcgee Corp. | | 29,594 | | | 2,516,674 |
National-Oilwell Varco, Inc. (b) | | 40,194 | | | 2,510,919 |
Schlumberger Ltd. | | 133,968 | | | 12,160,275 |
Weatherford International Ltd. (b) (c) | | 36,400 | | | 2,278,640 |
| | | | |
|
|
| | | | | | 42,857,918 |
| | | | |
|
|
Paper & Forest Products (0.5%) | | | |
Georgia-Pacific Corp. | | 59,054 | | | 1,921,027 |
International Paper Co. | | 113,058 | | | 3,299,033 |
Louisiana-Pacific Corp. (c) | | 26,096 | | | 650,573 |
MeadWestvaco Corp. (c) | | 43,947 | | | 1,152,290 |
Pactiv Corp. (b) (c) | | 35,336 | | | 696,119 |
Temple Inland, Inc. | | 29,310 | | | 1,079,487 |
Weyerhaeuser Co. | | 57,401 | | | 3,635,780 |
| | | | |
|
|
| | | | | | 12,434,309 |
| | | | |
|
|
| | | | | |
| | | Shares or
Principal Amount | | Value |
| | | | | | |
Pharmacy Services (0.3%) | | | | | |
Caremark Rx, Inc. (b) | | 105,920 | | $ | 5,550,208 |
Hospira, Inc. (b) | | 37,546 | | | 1,496,208 |
| | | | |
|
|
| | | | | | 7,046,416 |
| | | | |
|
|
Photographic (0.1%) | | | | | |
Eastman Kodak Co. (c) | | 73,646 | | | 1,612,847 |
| | | | |
|
|
Pollution Control (0.2%) | | | | | |
Allied Waste Industries, Inc. (b) (c) | | 60,107 | | | 489,271 |
Waste Management, Inc. | | 131,413 | | | 3,877,998 |
| | | | |
|
|
| | | | | | 4,367,269 |
| | | | |
|
|
Printing & Publishing (0.5%) | | | | | |
Dow Jones & Company, Inc. (c) | | 16,480 | | | 558,837 |
Gannett Co., Inc. | | 57,676 | | | 3,613,978 |
Knight-Ridder, Inc. (c) | | 16,575 | | | 884,774 |
McGraw-Hill Cos., Inc. (The) | | 88,202 | | | 4,316,605 |
Meredith Corp. | | 10,335 | | | 515,717 |
New York Times Co., Class A (c) | | 34,206 | | | 931,771 |
R.R. Donnelley & Sons Co. (c) | | 42,706 | | | 1,495,564 |
Tribune Co. | | 67,709 | | | 2,133,511 |
| | | | |
|
|
| | | | | | 14,450,757 |
| | | | |
|
|
Railroads (0.6%) | | | | | |
Burlington Northern Santa Fe Corp. | | 90,052 | | | 5,588,627 |
CSX Corp. | | 47,106 | | | 2,157,926 |
Norfolk Southern Corp. | | 95,037 | | | 3,820,487 |
Union Pacific Corp. | | 61,816 | | | 4,276,431 |
| | | | |
|
|
| | | | | | 15,843,471 |
| | | | |
|
|
Real Estate Investment Trusts (0.8%) | | | |
Apartment Investment & Management Co. (c) | | 26,740 | | | 1,026,816 |
Archstone-Smith Trust (c) | | 43,900 | | | 1,781,023 |
Equity Office Properties Trust | | 104,282 | | | 3,211,886 |
Equity Residential Property Trust (c) | | 63,511 | | | 2,492,807 |
Plum Creek Timber Co., Inc. (c) | | 42,861 | | | 1,667,293 |
ProLogis Trust | | 65,951 | | | 2,835,893 |
Public Storage, Inc. (c) | | 23,500 | | | 1,555,700 |
Simon Property Group, Inc. (c) | | 46,501 | | | 3,330,401 |
Vornado Realty Trust (c) | | 30,700 | | | 2,486,700 |
| | | | |
|
|
| | | | | | 20,388,519 |
| | | | |
|
|
Statement of Investments (Continued)
October 31, 2005
Gartmore S&P 500 Index Fund (Continued)
| | Common Stocks (continued) |
| | | | | |
| | | Shares or
Principal Amount | | Value |
| | | | | | |
Restaurants (0.6%) | | | | | |
Darden Restaurants, Inc. | | 33,676 | | $ | 1,091,776 |
McDonald’s Corp. | | 295,641 | | | 9,342,256 |
Wendy’s International, Inc. | | 26,536 | | | 1,239,762 |
YUM! Brands, Inc. | | 67,381 | | | 3,427,671 |
| | | | |
|
|
| | | | | | 15,101,465 |
| | | | |
|
|
Retail (4.8%) | | | | | |
AutoZone, Inc. (b) (c) | | 15,210 | | | 1,230,489 |
Bed Bath & Beyond, Inc. (b) | | 69,702 | | | 2,824,325 |
Best Buy Co., Inc. | | 98,015 | | | 4,338,144 |
Big Lots, Inc. (b) (c) | | 24,551 | | | 284,055 |
Circuit City Stores, Inc. (c) | | 40,836 | | | 726,472 |
Costco Wholesale Corp. | | 112,857 | | | 5,457,765 |
CVS Corp. | | 190,934 | | | 4,660,699 |
Dillards, Inc., Class A (c) | | 17,690 | | | 366,360 |
Dollar General Corp. | | 68,997 | | | 1,341,302 |
Family Dollar Stores, Inc. (c) | | 37,306 | | | 825,955 |
Federated Department Stores, Inc. | | 62,376 | | | 3,828,015 |
Gap, Inc. (The) | | 144,140 | | | 2,490,739 |
Home Depot, Inc. | | 505,567 | | | 20,748,470 |
J.C. Penney Co., Inc. | | 61,781 | | | 3,163,187 |
Jones Apparel Group, Inc. (c) | | 27,891 | | | 760,866 |
Kohl’s Corp. (b) | | 79,397 | | | 3,821,378 |
Limited, Inc. (The) (c) | | 86,828 | | | 1,737,428 |
Lowe’s Cos., Inc. | | 182,899 | | | 11,114,772 |
Nordstrom, Inc. | | 55,792 | | | 1,933,193 |
Office Depot, Inc. (b) | | 68,862 | | | 1,895,771 |
OfficeMax, Inc. | | 21,910 | | | 613,918 |
Sears Holding Corp. (b) | | 24,861 | | | 2,989,535 |
Staples, Inc. | | 173,272 | | | 3,938,473 |
Starbucks Corp. (b) | | 186,524 | | | 5,274,899 |
Target Corp. | | 208,690 | | | 11,621,946 |
Tiffany & Co. (c) | | 28,886 | | | 1,138,108 |
TJX Cos., Inc. (c) | | 110,068 | | | 2,369,764 |
Wal-Mart Stores, Inc. | | 590,482 | | | 27,935,703 |
| | | | |
|
|
| | | | | | 129,431,731 |
| | | | |
|
|
Semiconductors (0.6%) | | | | | |
Advanced Micro Devices, Inc. (b) | | 92,242 | | | 2,141,859 |
Analog Devices, Inc. | | 85,957 | | | 2,989,584 |
Applied Materials, Inc. | | 384,519 | | | 6,298,422 |
Freescale Semiconductor, Inc., Class B (b) | | 88,409 | | | 2,111,207 |
| | | | | |
| | | Shares or
Principal Amount | | Value |
| | | | | | |
Semiconductors (continued) | | | | | |
Micron Technology, Inc. (b) | | 144,868 | | $ | 1,881,835 |
Novellus Systems, Inc. (b) (c) | | 31,821 | | | 695,607 |
| | | | |
|
|
| | | | | | 16,118,514 |
| | | | |
|
|
Services (1.2%) | | | | | |
Autodesk, Inc. (c) | | 52,762 | | | 2,381,149 |
eBay, Inc. (b) | | 263,276 | | | 10,425,730 |
Equifax, Inc. (c) | | 30,651 | | | 1,056,540 |
Exelon Corp. | | 157,898 | | | 8,215,433 |
IMS Health, Inc. | | 53,074 | | | 1,232,909 |
Omnicom Group, Inc. | | 42,991 | | | 3,566,533 |
Paychex, Inc. | | 82,352 | | | 3,191,964 |
Robert Half International, Inc. (c) | | 36,806 | | | 1,357,405 |
Ryder System, Inc. (c) | | 14,705 | | | 583,347 |
Sabre Holdings, Inc. (c) | | 30,873 | | | 602,950 |
| | | | |
|
|
| | | | | | 32,613,960 |
| | | | |
|
|
Shelter (0.1%) | | | | | |
D. R. Horton, Inc. | | 64,100 | | | 1,967,229 |
| | | | |
|
|
Steel (0.2%) | | | | | |
Allegheny Teledyne, Inc. | | 19,875 | | | 570,611 |
Nucor Corp. (c) | | 39,630 | | | 2,371,856 |
United States Steel Corp. (c) | | 30,031 | | | 1,097,032 |
| | | | |
|
|
| | | | | | 4,039,499 |
| | | | |
|
|
Telecommunications (3.0%) | | | | | |
ADC Telecommunications, Inc. (b) (c) | | 21,427 | | | 373,901 |
ALLTEL Corp. | | 89,867 | | | 5,559,173 |
Andrew Corp. (b) (c) | | 38,346 | | | 407,235 |
AT&T Corp. | | 189,100 | | | 3,740,398 |
BellSouth Corp. | | 429,824 | | | 11,184,020 |
CenturyTel, Inc. | | 30,776 | | | 1,007,298 |
Comverse Technology, Inc. (b) (c) | | 47,506 | | | 1,192,401 |
Lucent Technologies, Inc. (b) (c) | | 1,047,932 | | | 2,986,606 |
QUALCOMM, Inc. | | 385,178 | | | 15,314,677 |
Qwest Communications International, Inc. (b) | | 385,930 | | | 1,682,655 |
SBC Communications, Inc. | | 780,418 | | | 18,612,970 |
Scientific-Atlanta, Inc. | | 34,616 | | | 1,226,791 |
Sprint Corp. | | 692,814 | | | 16,149,494 |
Univision Communications, Inc., Class A (b) (c) | | 61,217 | | | 1,600,212 |
| | | | |
|
|
| | | | | | 81,037,831 |
| | | | |
|
|
Common Stocks (continued)
| | | | | |
| | | Shares or
Principal Amount | | Value |
| | | | | | |
Tire & Rubber (0.0%) | | | | | |
Cooper Tire & Rubber Co. (c) | | 16,545 | | $ | 226,005 |
Goodyear Tire & Rubber Co. (b) (c) | | 41,521 | | | 649,388 |
| | | | |
|
|
| | | | | | 875,393 |
| | | | |
|
|
Tobacco (0.1%) | | | | | |
Reynolds American, Inc. (c) | | 23,395 | | | 1,988,575 |
UST, Inc. (c) | | 37,881 | | | 1,567,895 |
| | | | |
|
|
| | | | | | 3,556,470 |
| | | | |
|
|
Trucking (0.7%) | | | | | |
United Parcel Service, Inc., Class B | | 261,516 | | | 19,074,977 |
| | | | |
|
|
Utilities (2.8%) | | | | | |
AES Corp. (The) (b) | | 145,793 | | | 2,316,651 |
Allegheny Energy, Inc. (b) (c) | | 32,996 | | | 932,467 |
Ameren Corp. (c) | | 42,556 | | | 2,238,446 |
American Electric Power Co., Inc. | | 99,197 | | | 3,765,518 |
Calpine Corp. (b) (c) | | 177,742 | | | 423,026 |
Centerpoint Energy, Inc. (c) | | 68,742 | | | 910,144 |
Cinergy Corp. | | 40,236 | | | 1,605,416 |
CMS Energy Corp. (b) (c) | | 55,856 | | | 832,813 |
Consolidated Edison, Inc. (c) | | 62,826 | | | 2,858,583 |
Constellation Energy Group, Inc. | | 41,286 | | | 2,262,473 |
Dominion Resources, Inc. | | 82,994 | | | 6,314,183 |
DTE Energy Co. (c) | | 35,591 | | | 1,537,531 |
Duke Energy Corp. (c) | | 217,917 | | | 5,770,442 |
Edison International | | 78,332 | | | 3,427,808 |
Entergy Corp. | | 52,276 | | | 3,696,959 |
FirstEnergy Corp. | | 74,500 | | | 3,538,750 |
FPL Group, Inc. | | 98,232 | | | 4,229,870 |
NiSource, Inc. (c) | | 61,058 | | | 1,444,022 |
PG&E Corp. (c) | | 94,572 | | | 3,440,529 |
Pinnacle West Capital Corp. (c) | | 21,925 | | | 915,588 |
PPL Corp. | | 83,062 | | | 2,603,163 |
Progress Energy, Inc. (c) | | 59,451 | | | 2,591,469 |
Public Service Enterprise Group, Inc. | | 56,211 | | | 3,535,110 |
Southern Co. (c) | | 173,049 | | | 6,054,984 |
TECO Energy, Inc. (c) | | 47,781 | | | 826,611 |
TXU Corp. | | 58,222 | | | 5,865,867 |
Xcel Energy, Inc. (c) | | 93,187 | | | 1,708,118 |
| | | | |
|
|
| | | | | | 75,646,541 |
| | | | |
|
|
| |
Total Common Stocks | | | 2,578,653,716 |
| | | | |
|
|
Cash Equivalents (3.6%)
| | | | | | | |
| | | Shares or
Principal Amount | | Value | |
| | | | | | | | |
Investments in repurchase agreements (Collateralized by U.S. Government Agencies and U.S. Government Agency Mortgages, in a joint trading account at 3.90%, dated 10/31/05, due 11/01/05, repurchase price $96,288,136) | | $ | 96,277,706 | | $ | 96,277,706 | |
| | | | | |
|
|
|
| |
Total Cash Equivalents | | | 96,277,706 | |
| | | | | |
|
|
|
|
Short-Term Securities Held as Collateral for | |
| Securities Lending (7.0%) | |
Pool of short-term securities for Gartmore Mutual Funds — note 2 (Securities Lending) | | | 187,378,599 | | | 187,378,599 | |
| | | | | |
|
|
|
| |
Total Short-Term Securities Held as Collateral for Securities Lending | | | 187,378,599 | |
| | | | | |
|
|
|
| |
Total Investments
(Cost $2,671,094,751) (a) — 106.5% | | | 2,862,310,021 | |
| |
Liabilities in excess of other
assets — (6.5%) | | | (175,463,631 | ) |
| | | | | |
|
|
|
| |
NET ASSETS — 100.0% | | $ | 2,686,846,390 | |
| | | | | |
|
|
|
| | (a) | See notes to financial statements for unrealized appreciation (depreciation) of securities. |
| | (b) | Denotes a non-income producing security. |
| | (c) | All or part of the securities was on loan as of October 31, 2005. |
At October 31, 2005 the Fund’s open long future contracts were as follow:
| | | | | | | | | | | |
Number of
Contracts
| | Long
Contracts*
| | Expiration
| | Market Value
Covered by
Securities
| | Unrealized
Appreciation
(Depreciation)
| |
| 348 | | S&P 500 Index | | 12/16/2005 | | $ | 105,252,600 | | $ | (870,792 | ) |
| | * | Cash pledged as collateral. |
See notes to financial statements.
Gartmore Small Cap Index Fund
For the annual period ended Oct. 31, 2005, the Gartmore Small Cap Index Fund (Class A at NAV) returned 11.67% versus 12.08% for its benchmark, the Russell 2000® Index. For broader comparison, the average return for the Fund’s Lipper peer category of Small-Cap Core Funds was 13.22%.
The reporting period was strong for the U.S. small-cap equity market. As a result of several factors–the conclusion of the U.S. presidential election, reasonably good economic and earnings news, reactions to the $32 billion Microsoft dividend and the beginning of the seasonally strong year-end period–the small-cap equity market experienced most of its gains for the reporting period in November and December of 2004.
January 2005 began with a slide after the strong fourth quarter of 2004, with cyclical and small-capitalization stocks performing the worst out of the gate. January was characterized by mixed economic data, increasing interest rates, disappointing earnings reports and climbing oil prices. In addition, gross domestic product growth for the fourth quarter, released during January, came in weaker than expected at 3.1%, primarily as a result of the foreign trade deficit. The small-cap equity market was able to reverse course in February, even as the productivity report showed a continued slowdown in productivity growth and oil prices continued to climb. Good signs for the markets came in the form of accelerated hiring plans by corporations, reasonably robust capital spending and strong merger-and-acquisition activity. In March and April, the small-cap equity market resumed the downward slide experienced in January due to a combination of factors–the trade deficit, mixed economic news, high oil prices and rising interest rates. Oil prices, reaching as high as $56 a barrel, continued to trade above $50 a barrel.
Despite slowing profit growth, continually higher oil prices and inflation concerns, first-quarter 2005 corporate earnings came in strong, and the small-cap equity market rebounded in May. The rally did not last into June, however, as investors continued to worry about economic deceleration. In addition, oil continued to pressure stock valuations, with the per-barrel price climbing to a record high of more than $60.
U.S. equity markets regained momentum in July, even amid terrorism overseas, two devastating hurricanes along the U.S. Gulf Coast, oil prices that reached $70 per barrel, a strong dollar and increasing interest rates. In addition, improved profits in the energy sector counterbalanced the negative impact that Hurricanes Katrina and Rita had on the retail, transportation, tourism and insurance sectors in September.
Portfolio Manager:
Fund Asset Management, L.P.-Subadviser
| | |
Fund Performance | | Gartmore Small Cap Index Fund |
Average Annual Total Return
(For periods ended October 31, 2005)
| | | | | | | | |
| | | | | 1 Yr. | | 5 Yr. | | Inception1 |
| Class A | | w/o SC2 | | 11.67% | | 6.09% | | 8.36% |
| | | w/SC3 | | 5.25% | | 4.84% | | 7.61% |
| Class B4 | | w/o SC2 | | 10.98% | | 5.56% | | 8.04% |
| | | w/SC5 | | 5.98% | | 5.23% | | 8.04% |
| Class C6 | | w/o SC2 | | 10.99% | | 5.58% | | 8.05% |
| | | w/SC7 | | 9.99% | | 5.58% | | 8.05% |
| Institutional Class8 | | 12.11% | | 6.56% | | 8.70% |
All figures showing the effect of a sales charge reflect the maximum charge possible, because it has the most dramatic effect on performance data.
| 1 | These returns until the creation of Class A and Institutional shares (12/29/99) include the performance of the Master Small Cap Series (the “Series”), which began operations on April 9, 1997. Excluding the effect of any fee waivers or reimbursements, such prior performance is similar to what Class A and Institutional Class shares would have produced because these classes of the Fund’s shares invested in the same portfolio of securities as the Series. The performance for these classes has been restated to reflect differences in sales charges (where applicable), but does not reflect the differing levels of other fees applicable to such classes; if these fees were reflected, the performance for Class A and Institutional Class shares would have been lower. |
| 2 | These returns do not reflect the effects of sales charges (SC). |
| 3 | A 5.75% front-end sales charge was deducted. |
| 4 | These returns until the creation of Class B shares (11/29/01) include performance based on the Series for the period through December 28, 1999 and the Fund’s Class A shares for the period from December 29, 1999 to November 28, 2001. Excluding the effect of any fee waivers or reimbursements, such prior performance is similar to what Class B shares would have produced because Class B shares invest in the same portfolio of securities as Class A shares. The performance for these classes has been restated to reflect differences in sales charges (where applicable), but does not reflect the differing levels of other fees (primarily Rule 12b-1 and/or administrative services fees) applicable to such classes; if these fees were reflected, the performance for Class B shares would have been lower. |
| 5 | A 5.00% maximum contingent deferred sales charge (CDSC) would be deducted. The CDSC declines to 0% after 6 years. |
| 6 | These returns until the creation of Class C shares (10/22/03) include the performance of the Series for the period through December 28, 1999 and the Fund’s Class A shares for the period from December 29, 1999 to November 28, 2001 and the Fund’s Class B shares for the period from November 29, 2001 to October 21, 2003. Excluding the effect of any fee waivers or reimbursements, such prior performance is similar to what Class C shares would have produced because Class C shares invest in the same portfolio of securities as the Fund’s other classes. The performance for the Class C shares has been restated to reflect differences in sales charges (where applicable), but does not reflect the differing levels of other fees (primarily Rule 12b-1 and/or administrative services fees) applicable to such classes; if these fees were reflected, the performance for Class C shares would have been lower. |
| 7 | A CDSC of 1.00% was deducted from the one year return because it is charged when you sell Class C shares within the first year after purchase. |
| 8 | Not subject to any sales charges. |
Performance of a $10,000 Investment
Investment return and principal value will fluctuate, and when redeemed, shares may be worth more or less than original cost. Past performance is no guarantee of future results and does not reflect the deduction of taxes that a shareholder would pay on fund distributions or the redemption of fund shares. Investing in mutual funds involves market risk, including loss of principal. Performance returns assume the reinvestment of all distributions.
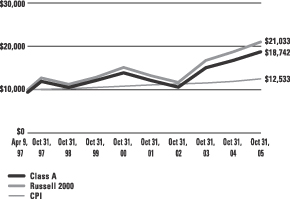
Comparative performance of $10,000 invested in Class A shares of the Gartmore Small Cap Index Fund, the Russell 2000 Index (Russell 2000)(a), and the Consumer Price Index (CPI)(b) since inception. Unlike the Fund, the returns for these unmanaged indexes do not reflect any fees, expenses, or sales charges. Investors cannot invest directly in market indexes.
| (a) | The Russell 2000 is an unmanaged index of approximately 2000 companies with small market capitalizations relative to the market capitalizations of other U.S. companies. |
| (b) | The CPI represents changes in prices of a basket of goods and services purchased for consumption by urban households. |
| | |
Shareholder Expense Example | | Gartmore Small Cap Index Fund |
As a shareholder of the Fund, you incur two types of costs: (1) transaction costs, including sales charges (loads) paid on purchase payments and redemption fees; and (2) ongoing costs, including investment advisory fees, administration fees, distribution fees and other Fund expenses. The examples below are intended to help you understand your ongoing costs (in dollars) of investing in the Fund and to compare these costs with the ongoing costs of investing in other mutual funds. Per SEC requirements, the examples assume that you had a $1,000 investment in the Class at the beginning of the reporting period, May 1, 2005, and continued to hold your shares at the end of the reporting period, October 31, 2005.
Actual Expenses
For each Class of the Fund in the table below, the first line provides information about actual account values and actual expenses. You may use the information in this line, together with the amount you invested, to estimate the expenses that you paid over the period. Simply divide your account value by $1,000 (for example, an $8,600 account value divided by $1,000 = 8.6), then multiply the result by the number in the first line of each Class under the heading entitled “Expenses Paid During Period” to estimate the expenses you paid on your account during the period.
Hypothetical Example for Comparison Purposes
The second line of each Class in the table below provides information about hypothetical account values and hypothetical expenses based on the Class’ actual expense ratio and an assumed rate of return of 5% per year before expenses, which is not the Class’ actual return. The hypothetical account values and expenses may not be used to estimate the actual ending account balance or expenses you paid for the period. You may use this information to compare the ongoing costs of investing in the Class of the Fund and other funds. To do so, compare this 5% hypothetical example with the 5% hypothetical examples that appear in the shareholder reports of the other funds.
Please note that the expenses shown in the table are meant to highlight your ongoing costs only and do not reflect any transaction costs, such as sales charges (loads) or redemption fees. Therefore, the second line for each Class in the table is useful in comparing ongoing costs only, and will not help you determine the relative total costs of owning different funds. In addition, if these transaction costs were included, your costs would have been higher. The examples also assume all dividends and distributions have been reinvested.
Schedule of Shareholder Expenses
Expense Analysis of a $1,000 Investment
(October 31, 2005)
| | | | | | | | | | | | | | |
| Small Cap Index Fund | | | | | Beginning
Account Value,
5/1/05 | | Ending
Account Value,
10/31/05 | | Expenses Paid
During Period* | | Annualized
Expense Ratio* |
| Class A | | Actual | | | $ | 1,000.00 | | $ | 1,120.60 | | $ | 3.68 | | 0.70% |
| | | Hypothetical | 1 | | $ | 1,000.00 | | $ | 1,021.53 | | $ | 3.51 | | 0.70% |
| Class B | | Actual | | | $ | 1,000.00 | | $ | 1,117.20 | | $ | 6.82 | | 1.30% |
| | | Hypothetical | 1 | | $ | 1,000.00 | | $ | 1,018.55 | | $ | 6.53 | | 1.30% |
| Class C | | Actual | | | $ | 1,000.00 | | $ | 1,117.30 | | $ | 6.82 | | 1.30% |
| | | Hypothetical | 1 | | $ | 1,000.00 | | $ | 1,018.55 | | $ | 6.53 | | 1.30% |
| Institutional Class | | Actual | | | $ | 1,000.00 | | $ | 1,122.90 | | $ | 1.58 | | 0.30% |
| | | Hypothetical | 1 | | $ | 1,000.00 | | $ | 1,023.51 | | $ | 1.51 | | 0.30% |
| * | Expenses are equal to the Fund’s annualized expense ratio multiplied by the average account value over the period multiplied by 184/365 (to reflect the one-half year period). The expense ratio presented represents a six month, annualized ratio in accordance with SEC guidelines. |
| 1 | Represents the hypothetical 5% return before expenses. |
| | |
Portfolio Summary | | Gartmore Small Cap Index Fund |
The SEC adopted a requirement that Funds present their portfolio holdings in a table, chart or graph format in their annual and semiannual reports to shareholders, whether or not a statement of investments is utilized. The following tables, which present portfolio holdings as a percentage of net assets, are provided in compliance with this requirement.
| | |
| Asset Allocation | | |
| Common Stocks | | 83.4% |
| Corporate Bonds | | 0.0% |
| Cash Equivalents | | 15.3% |
| Other Investments* | | 26.8% |
| Liabilities in excess of Other Assets** | | -25.5% |
| | |
|
| | | 100.0% |
| * | Includes value of collateral received from securities lending. |
| ** | Includes value of collateral owed from securities lending. |
| | |
| Top Industries | | |
| Bank Holdings Companies | | 7.9% |
| Real Estate Investment Trusts | | 5.1% |
| Oil & Gas | | 3.3% |
| Computer Software & Services | | 3.2% |
| Retail | | 3.2% |
| Semiconductors | | 2.9% |
| Financial | | 2.6% |
| Business Services | | 2.6% |
| Pharmaceuticals | | 2.4% |
| Medical Equipment & Supplies | | 2.2% |
| Other Industries | | 64.6% |
| | |
|
| | | 100.0% |
| | |
| Top Holdings*** | | |
| Amylin Pharmaceuticals, Inc. | | 0.3% |
| Cimarex Energy Co. | | 0.2% |
| Intuitive Surgical, Inc. | | 0.2% |
| Cal Dive International, Inc. | | 0.2% |
| Hughes Supply, Inc. | | 0.2% |
| Cabot Oil & Gas Corp. | | 0.2% |
| Todco, Class A | | 0.2% |
| Vertex Pharmaceuticals, Inc. | | 0.2% |
| Eagle Materials, Inc. | | 0.2% |
| ADTRAN, Inc. | | 0.2% |
| Other Holdings | | 97.9% |
| | |
|
| | | 100.0% |
| *** | For purpose of listing top holdings, repurchase agreements are considered cash equivalents and are included as part of Other Holdings. |
Statement of Investments
October 31, 2005
Gartmore Small Cap Index Fund
| | | | | |
| | | Shares or
Principal Amount | | Value |
| | | | | | |
Advertising Services (0.1%) | | | | | |
Cross Media Marketing Corp. (b) (d) | | 100 | | $ | 0 |
Greenfield Online, Inc. (b) (e) | | 7,600 | | | 38,152 |
Ventiv Health, Inc. (b) | | 8,900 | | | 224,636 |
| | | | |
|
|
| | | | | | 262,788 |
| | | | |
|
|
Aerospace & Defense (0.9%) | | | | | |
AAR Corp. (b) | | 9,968 | | | 158,790 |
ARGON ST., Inc. (b) | | 2,340 | | | 62,010 |
BE Aerospace, Inc. (b) (e) | | 18,767 | | | 340,246 |
Curtiss-Wright Corp. (e) | | 6,829 | | | 391,643 |
DRS Technologies, Inc. | | 8,022 | | | 395,164 |
Esterline Technologies Corp. (b) | | 6,401 | | | 240,998 |
Gencorp, Inc. (b) (e) | | 15,074 | | | 276,457 |
HEICO Corp. (e) | | 7,783 | | | 172,549 |
Herley Industries, Inc. (b) | | 5,860 | | | 99,093 |
Hexcel Corp. (b) (e) | | 19,600 | | | 310,072 |
Innovative Solutions and Support, Inc. (b) (e) | | 5,002 | | | 71,479 |
K&F Industries Holdings, Inc. (b) (e) | | 6,000 | | | 93,840 |
Kaman Corp., Class A | | 7,608 | | | 178,255 |
Moog, Inc., Class A (b) | | 10,733 | | | 318,233 |
Sequa Corp., Class A (b) | | 1,341 | | | 82,740 |
Taser International, Inc. (b) (e) | | 19,316 | | | 118,793 |
Teledyne Technologies, Inc. (b) | | 9,763 | | | 344,243 |
United Industrial Corp. (e) | | 3,400 | | | 119,986 |
| | | | |
|
|
| | | | | | 3,774,591 |
| | | | |
|
|
Agricultural Products (0.2%) | | | | | |
Alico, Inc. | | 1,000 | | | 44,030 |
Andersons, Inc. (The) | | 1,000 | | | 34,850 |
CF Industries Holdings, Inc. (b) (e) | | 14,800 | | | 204,536 |
Delta and Pine Land Co. (e) | | 10,628 | | | 265,169 |
Maui Land & Pineapple Co., Inc. (b) | | 637 | | | 17,377 |
UAP Holding Corp. | | 7,360 | | | 140,576 |
| | | | |
|
|
| | | | | | 706,538 |
| | | | |
|
|
Airlines (0.4%) | | | | | |
AirTran Holdings, Inc. (b) (e) | | 22,694 | | | 339,502 |
Alaska Air Group, Inc. (b) | | 7,978 | | | 251,546 |
| | | | | |
| | | Shares or
Principal Amount | | Value |
| | | | | | |
Airlines (continued) | | | | | |
Continental Airlines, Inc., Class B (b) | | 19,739 | | $ | 255,620 |
ExpressJet Holdings, Inc. (b) | | 8,746 | | | 78,627 |
Frontier Airlines, Inc. (b) (e) | | 10,557 | | | 99,764 |
Mesa Air Group, Inc. (b) (e) | | 8,619 | | | 97,222 |
Pinnacle Airlines Corp. (b) | | 7,625 | | | 48,724 |
Republic Airways Holdings, Inc. (b) | | 2,100 | | | 32,760 |
SkyWest, Inc. | | 18,723 | | | 548,771 |
World Air Holdings Inc. (b) | | 4,300 | | | 45,150 |
| | | | |
|
|
| | | | | | 1,797,686 |
| | | | |
|
|
Analytical Instruments (0.5%) | | | |
ArthroCare Corp. (b) (e) | | 8,007 | | | 294,097 |
Datascope Corp. | | 3,493 | | | 110,973 |
Diagnostic Products Corp. | | 6,514 | | | 274,239 |
Haemonetics Corp. (b) | | 7,615 | | | 368,948 |
Illumina, Inc. (b) (e) | | 11,100 | | | 172,827 |
Inverness Medical Innovations,
Inc. (b) (e) | | 4,476 | | | 106,439 |
Molecular Devices Corp. (b) | | 6,341 | | | 142,038 |
Thoratec Corp. (b) (e) | | 13,967 | | | 276,267 |
Ventana Medical Systems,
Inc. (b) (e) | | 8,636 | | | 331,018 |
West Pharmaceutical Services, Inc. | | 8,002 | | | 191,888 |
| | | | |
|
|
| | | | | | 2,268,734 |
| | | | |
|
|
Apparel & Accessories (1.5%) | | | |
Aeropostale, Inc. (b) | | 15,846 | | | 309,631 |
Angelica Corp. (e) | | 3,472 | | | 49,268 |
Brown Shoe Co., Inc. (e) | | 5,402 | | | 175,403 |
Buckle, Inc. (The) | | 1,144 | | | 42,145 |
Burlington Coat Factory Warehouse Corp. | | 4,925 | | | 189,908 |
Charming Shoppes, Inc. (b) | | 35,510 | | | 397,712 |
Cherokee, Inc. | | 3,100 | | | 106,733 |
Deb Shops, Inc. | | 100 | | | 2,529 |
Deckers Outdoor Corp. (b) (e) | | 3,848 | | | 65,993 |
DHB Industries, Inc. (b) | | 10,290 | | | 30,664 |
DSW, Inc., Class A (b) | | 4,000 | | | 83,280 |
Finish Line, Inc., Class A (e) | | 14,574 | | | 227,937 |
G & K Services, Inc., Class A | | 5,722 | | | 216,807 |
| | Common Stocks (continued) |
| | | | | |
| | | Shares or
Principal Amount | | Value |
| | | | | | |
Apparel & Accessories (continued) | | | |
Goody’s Family Clothing, Inc. | | 7,620 | | $ | 72,390 |
Guess?, Inc. (b) (e) | | 3,600 | | | 97,632 |
Hartmarx Corp. (b) (e) | | 4,205 | | | 29,351 |
HOT Topic, Inc. (b) (e) | | 14,838 | | | 220,938 |
Jos. A. Bank Clothiers, Inc. (b) | | 4,340 | | | 177,115 |
K-Swiss, Inc., Class A | | 6,981 | | | 212,571 |
Kellwood Co. (e) | | 8,207 | | | 179,815 |
Kenneth Cole Productions, Inc., Class A | | 2,470 | | | 61,750 |
Maidenform Brands, Inc. (b) | | 4,500 | | | 56,655 |
Oxford Industries, Inc. (e) | | 4,628 | | | 227,929 |
Pacific Sunwear of California, Inc. (b) | | 23,260 | | | 581,964 |
Payless ShoeSource, Inc. (b) | | 18,404 | | | 338,081 |
Perry Ellis International, Inc. (b) | | 4,468 | | | 92,443 |
Phillips-Van Heusen Corp. | | 8,190 | | | 233,006 |
Russell Corp. (e) | | 9,686 | | | 131,052 |
Shoe Carnival, Inc. (b) | | 1,900 | | | 31,806 |
Skechers U.S.A., Inc. (b) | | 6,685 | | | 84,699 |
Stage Stores, Inc. | | 9,301 | | | 257,824 |
Steven Madden Ltd. (b) | | 5,192 | | | 133,123 |
Stride Rite Corp. (The) | | 10,812 | | | 140,772 |
UniFirst Corp. | | 2,498 | | | 87,580 |
Volcom, Inc. (b) | | 1,600 | | | 48,928 |
Warnaco Group, Inc. (The) (b) | | 15,223 | | | 345,258 |
Wet Seal, Inc. (The) (b) (e) | | 8,500 | | | 43,945 |
Wilsons The Leather Experts, Inc. (b) | | 2,200 | | | 11,066 |
Wolverine World Wide, Inc. | | 17,346 | | | 363,399 |
| | | | |
|
|
| | | | | | 6,159,102 |
| | | | |
|
|
Appliances & Household Durables (0.2%) |
Color Kinetics, Inc. (b) | | 5,500 | | | 83,820 |
Maytag Corp. | | 22,320 | | | 384,350 |
Middleby Corp. (b) (e) | | 1,935 | | | 140,288 |
National Presto Industries, Inc. | | 1,381 | | | 60,529 |
| | | | |
|
|
| | | | | | 668,987 |
| | | | |
|
|
Auto Parts & Equipment (0.9%) | | | |
A.S.V., Inc. (b) (e) | | 6,742 | | | 157,358 |
Accuride Corp. (b) | | 1,300 | | | 16,510 |
Aftermarket Technology Corp. (b) | | 7,736 | | | 142,574 |
| | | | | |
| | | Shares or
Principal Amount | | Value |
| | | | | | |
Auto Parts & Equipment (continued) | | | |
American Axle & Manufacturing Holdings, Inc. (e) | | 13,700 | | $ | 298,660 |
ArvinMeritor, Inc. | | 20,204 | | | 323,871 |
Commercial Vehicle Group, Inc. (b) (e) | | 2,800 | | | 54,656 |
Dollar Thrifty Automotive Group, Inc. (b) (e) | | 7,500 | | | 282,750 |
Electro Rent Corp. (b) (e) | | 2,700 | | | 34,668 |
Hayes Lemmerz International, Inc. (b) (e) | | 14,000 | | | 54,740 |
Hayes Lemmerz International, Inc. (b) (c) (d) | | 110 | | | 0 |
Lithia Motors, Inc., Class A (e) | | 4,373 | | | 119,121 |
LKQ Corp. (b) (e) | | 5,200 | | | 157,560 |
McGrath Rentcorp | | 6,706 | | | 191,456 |
Midas, Inc. (b) (e) | | 5,300 | | | 103,668 |
Modine Manufacturing Co. | | 10,340 | | | 341,841 |
Monro Muffler, Inc. | | 2,250 | | | 67,388 |
Noble International Ltd. | | 2,070 | | | 48,624 |
Pep Boys - Manny, Moe & Jack (The) (e) | | 17,583 | | | 242,645 |
Quantum Fuel Systems Technologies | | 16,800 | | | 55,944 |
Worldwide, Inc. (b) (e) | | | | | |
R&B, Inc. (b) (e) | | 600 | | | 6,660 |
Standard Motor Products, Inc. (e) | | 1,800 | | | 15,048 |
Strattec Security Corp. (b) | | 400 | | | 18,968 |
Superior Industries International, Inc. (e) | | 7,085 | | | 144,180 |
Tenneco Automotive, Inc. (b) | | 12,910 | | | 213,273 |
Titan International, Inc. (e) | | 4,900 | | | 86,877 |
United Auto Group, Inc. (e) | | 6,657 | | | 224,541 |
Visteon Corp. (b) | | 37,965 | | | 316,248 |
Wabash National Corp. (e) | | 9,140 | | | 168,267 |
| | | | |
|
|
| | | | | | 3,888,096 |
| | | | |
|
|
Bank Holdings Companies (7.9%) | | | |
1st Source Corp. (e) | | 2,500 | | | 59,650 |
ABC Bancorp | | 3,228 | | | 62,462 |
Alabama National Bancorp | | 3,711 | | | 240,027 |
AMCORE Financial, Inc. | | 7,295 | | | 216,734 |
AmericanWest Bancorp (b) | | 5,080 | | | 116,586 |
Statement of Investments (Continued)
October 31, 2005
Gartmore Small Cap Index Fund (Continued)
| | Common Stocks (continued) |
| | | | | |
| | | Shares or
Principal Amount | | Value |
| | | | | | |
Bank Holdings Companies (continued) | | | |
Ames National Corp. (e) | | 1,200 | | $ | 32,448 |
Arrow Financial Corp. (e) | | 2,051 | | | 55,172 |
BancFirst Corp. | | 1,600 | | | 132,928 |
Bancorp, Inc. (The) (b) | | 2,505 | | | 43,512 |
BancorpSouth, Inc. | | 23,104 | | | 512,216 |
BancTrust Financial Group, Inc. | | 1,400 | | | 25,788 |
Bank Mutual Corp. (e) | | 16,060 | | | 166,382 |
Bank of Granite Corp. | | 2,287 | | | 46,906 |
Bank of the Ozarks, Inc. (e) | | 3,116 | | | 109,278 |
BankAtlantic Bancorp, Inc., Class A | | 15,512 | | | 215,462 |
BankUnited Financial Corp. (e) | | 9,299 | | | 220,572 |
Banner Corp. | | 2,587 | | | 77,662 |
Berkshire Hills Bancorp, Inc. | | 3,040 | | | 106,461 |
BFC Financial Corp. (b) | | 9,675 | | | 52,729 |
Boston Private Financial Holdings, Inc. | | 9,775 | | | 282,986 |
Brookline Bancorp, Inc. (e) | | 19,365 | | | 272,078 |
Calamos Asset Management, Inc., Class A | | 6,700 | | | 162,743 |
Camden National Corp. (e) | | 1,100 | | | 38,115 |
Capital City Bank Group, Inc. (e) | | 2,192 | | | 80,052 |
Capital Corp of the West (e) | | 2,360 | | | 77,880 |
Capital Crossing Bank (b) | | 2,900 | | | 98,571 |
Capitol Bancorp Ltd. | | 2,240 | | | 77,683 |
Cardinal Financial Corp. | | 200 | | | 2,022 |
Cascade Bancorp (e) | | 6,775 | | | 154,470 |
Cathay Bancorp, Inc. (e) | | 14,293 | | | 557,283 |
Center Financial Corp. (e) | | 4,780 | | | 121,125 |
Central Coast Bancorp (b) | | 1,452 | | | 35,632 |
Charter Financial, Inc. | | 200 | | | 7,272 |
Chemical Financial Corp. | | 6,741 | | | 216,993 |
Chittenden Corp. | | 13,091 | | | 376,628 |
Citizens & Northern Corp. | | 1,000 | | | 27,230 |
Citizens Banking Corp. (e) | | 13,955 | | | 406,788 |
City Bank (e) | | 1,307 | | | 48,085 |
City Holding Co. | | 6,462 | | | 236,768 |
Clifton Savings Bancorp, Inc. (e) | | 1,000 | | | 10,380 |
Coastal Financial Corp. (e) | | 3,416 | | | 51,478 |
CoBiz, Inc. (e) | | 2,974 | | | 52,729 |
Colony Bancorp, Inc. | | 300 | | | 7,494 |
Columbia Bancorp | | 2,700 | | | 109,188 |
| | | | | |
| | | Shares or
Principal Amount | | Value |
| | | | | | |
Bank Holdings Companies (continued) | | | |
Columbia Banking System, Inc. | | 6,309 | | $ | 182,393 |
Commercial Bankshares, Inc. | | 300 | | | 10,650 |
Commercial Federal Corp. | | 11,824 | | | 404,381 |
Community Bancorp (b) | | 2,600 | | | 84,864 |
Community Bank System, Inc. (e) | | 7,464 | | | 177,270 |
Community Banks, Inc. (e) | | 8,888 | | | 255,708 |
Community Trust Bancorp, Inc. | | 2,966 | | | 102,297 |
Corus Bankshares, Inc. (e) | | 6,360 | | | 349,164 |
CVB Financial Corp. (e) | | 12,050 | | | 237,506 |
Dime Community Bancshares (e) | | 10,564 | | | 152,122 |
Enterprise Financial Services Corp. | | 400 | | | 9,112 |
Eurobancshares, Inc. (b) | | 5,014 | | | 52,246 |
F.N.B. Corp. (e) | | 16,559 | | | 296,737 |
Farmers Capital Bank Corp. (e) | | 720 | | | 22,975 |
Fidelity Bankshares, Inc. (e) | | 6,671 | | | 188,122 |
Financial Institutions, Inc. (e) | | 900 | | | 16,542 |
First Bancorp | | 1,564 | | | 32,860 |
First Bancorp (e) | | 22,010 | | | 251,354 |
First Busey Corp. (e) | | 2,050 | | | 41,246 |
First Charter Corp. (e) | | 8,468 | | | 215,849 |
First Citizens BancShares, Inc., Class A | | 1,834 | | | 306,278 |
First Commonwealth Financial Corp. | | 18,266 | | | 240,563 |
First Community Bancorp | | 4,782 | | | 240,630 |
First Community Bankshares, Inc. (e) | | 1,820 | | | 55,164 |
First Defiance Financial Corp. | | 600 | | | 16,800 |
First Financial Bancorp (e) | | 11,346 | | | 211,943 |
First Financial Bankshares, Inc. | | 4,429 | | | 159,444 |
First Financial Corp. (e) | | 3,994 | | | 109,835 |
First Indiana Corp. (e) | | 4,376 | | | 152,985 |
First Merchants Corp. (e) | | 3,825 | | | 96,161 |
First Midwest Bancorp, Inc. (e) | | 14,647 | | | 556,879 |
First Niagara Financial Group, Inc. | | 35,180 | | | 518,201 |
First Oak Brook Bank | | 700 | | | 18,550 |
First Place Financial Corp. | | 2,035 | | | 45,747 |
First Regional Bancorp (b) (e) | | 200 | | | 13,444 |
First Republic Bancorp, Inc. | | 5,993 | | | 227,195 |
| | Common Stocks (continued) |
| | | | | |
| | | Shares or
Principal Amount | | Value |
| | | | | | |
Bank Holdings Companies (continued) | | | |
First South Bancorp, Inc. | | 200 | | $ | 6,800 |
First State Bancorp (e) | | 6,126 | | | 136,671 |
FirstFed Financial Corp. (b) (e) | | 5,591 | | | 299,063 |
Flagstar Bancorp, Inc. (e) | | 10,395 | | | 139,501 |
Flushing Financial Corp. | | 3,950 | | | 63,832 |
FNB Corp. (e) | | 800 | | | 22,552 |
Franklin Bank Corp. (b) (e) | | 5,960 | | | 102,810 |
Frontier Financial Corp. (e) | | 5,621 | | | 181,221 |
GB&T Bancshares, Inc. (e) | | 3,325 | | | 73,117 |
Glacier Bancorp, Inc. (e) | | 9,742 | | | 287,194 |
Great Southern Bancorp, Inc. (e) | | 1,876 | | | 54,216 |
Greater Bay Bancorp (e) | | 16,997 | | | 426,455 |
Greene County Bancshares, Inc. (e) | | 3,200 | | | 84,992 |
Hancock Holding Co. (e) | | 8,162 | | | 291,139 |
Hanmi Financial Corp. | | 9,528 | | | 174,458 |
Harbor Florida Bancshares, Inc. (e) | | 6,219 | | | 219,779 |
Harleysville National Corp. | | 8,119 | | | 166,521 |
Heartland Financial USA, Inc. (e) | | 1,450 | | | 29,696 |
Heritage Commerce Corp. (e) | | 5,500 | | | 120,835 |
HomeBanc Corp. (e) | | 11,647 | | | 83,858 |
Horizon Financial Corp. | | 2,500 | | | 53,650 |
Hudson United Bancorp | | 12,420 | | | 515,057 |
Iberiabank Corp. | | 3,625 | | | 193,756 |
Independent Bank Corp. (e) | | 6,010 | | | 180,240 |
Independent Bank Corp. | | 8,021 | | | 229,320 |
Integra Bank Corp. (e) | | 4,598 | | | 92,926 |
Interchange Financial Services Corp. | | 2,900 | | | 49,010 |
ITLA Capital Corp. (b) (e) | | 2,335 | | | 116,213 |
Kearny Financial Corp. (e) | | 6,200 | | | 73,036 |
KNBT Bancorp, Inc. (e) | | 11,900 | | | 190,043 |
Lakeland Bancorp, Inc. | | 2,763 | | | 42,246 |
Lakeland Financial Corp. | | 2,600 | | | 107,094 |
Macatawa Bank Corp. (e) | | 1,603 | | | 58,205 |
MAF Bancorp, Inc. | | 9,845 | | | 408,961 |
Main Street Banks, Inc. | | 4,390 | | | 120,286 |
MB Financial, Inc. (e) | | 6,152 | | | 229,285 |
MBT Financial Corp. (e) | | 2,138 | | | 40,088 |
Mercantile Bank Corp. | | 2,972 | | | 113,382 |
Mid-State Bancshares, Inc. (e) | | 6,800 | | | 184,484 |
| | | | | |
| | | Shares or
Principal Amount | | Value |
| | | | | | |
Bank Holdings Companies (continued) | | | |
Midwest Banc Holding, Inc. (e) | | 5,440 | | $ | 122,074 |
Nara Bancorp, Inc. | | 8,174 | | | 147,377 |
NASB Financial, Inc. | | 400 | | | 15,076 |
National Penn Bancshares, Inc. (e) | | 10,475 | | | 205,415 |
NBC Capital Corp. (e) | | 804 | | | 19,827 |
NBT Bancorp, Inc. (e) | | 8,454 | | | 200,698 |
NewAlliance Bancshares, Inc. (e) | | 37,220 | | | 536,712 |
Northern Empire Bancshares (b) | | 900 | | | 22,275 |
Northwest Bancorp, Inc. (e) | | 4,100 | | | 92,783 |
OceanFirst Financial Corp. (e) | | 1,434 | | | 32,365 |
Ocwen Financial Corp. (b) (e) | | 9,560 | | | 74,281 |
Old National Bancorp (e) | | 20,195 | | | 442,472 |
Old Second Bancorp, Inc. (e) | | 4,024 | | | 125,026 |
Omega Financial Corp. (e) | | 2,633 | | | 76,620 |
Oriental Financial Group, Inc. (e) | | 8,104 | | | 100,652 |
Pacific Capital Bancorp | | 15,061 | | | 543,250 |
Park National Corp. (e) | | 3,311 | | | 358,316 |
Partners Trust Financial Group, Inc. (e) | | 10,952 | | | 127,591 |
Peapack-Gladstone Financial Corp. | | 1,037 | | | 27,999 |
PennFed Financial Services, Inc. | | 2,540 | | | 49,657 |
Peoples Bancorp, Inc. | | 3,435 | | | 98,722 |
PFF Bancorp, Inc. | | 5,806 | | | 174,397 |
Pinnacle Financial Partners, Inc. (b) | | 3,700 | | | 83,731 |
Placer Sierra Bancshares | | 1,800 | | | 48,456 |
Preferred Bank | | 2,100 | | | 89,880 |
PremierWest Bancorp (b) | | 1,100 | | | 15,576 |
PrivateBancorp, Inc. | | 5,602 | | | 190,300 |
Prosperity Bancshares, Inc. (e) | | 7,740 | | | 235,993 |
Provident Bankshares Corp. | | 11,063 | | | 385,656 |
Provident Financial Holdings, Inc. | | 1,390 | | | 36,766 |
Provident Financial Services, Inc. | | 21,486 | | | 378,154 |
Provident New York Bancorp | | 9,775 | | | 106,548 |
R&G Finanical Corp., Class B | | 9,898 | | | 97,000 |
Renasant Corp. (e) | | 1,617 | | | 50,774 |
Republic Bancorp, Inc. | | 21,885 | | | 298,730 |
Statement of Investments (Continued)
October 31, 2005
Gartmore Small Cap Index Fund (Continued)
| | Common Stocks (continued) |
| | | | | |
| | | Shares or
Principal Amount | | Value |
| | | | | | |
Bank Holdings Companies (continued) | | | |
Republic Bancorp, Inc., Class A (e) | | 2,126 | | $ | 43,583 |
Rockville Financial, Inc. (b) | | 5,600 | | | 73,640 |
Royal Bancshares of Pennsylvania, Inc., Class A | | 812 | | | 19,139 |
S&T Bancorp, Inc. (e) | | 6,901 | | | 256,786 |
S.Y. Bancorp, Inc. | | 1,500 | | | 35,610 |
Sandy Spring Bancorp, Inc. (e) | | 4,056 | | | 142,974 |
Santander BanCorp | | 342 | | | 8,707 |
Seacoast Banking Corporation of Florida | | 3,025 | | | 69,152 |
Security Bank Corp. (e) | | 2,600 | | | 64,168 |
Signature Bank (b) (e) | | 5,068 | | | 146,972 |
Simmons First National Corp., Class A | | 2,813 | | | 79,327 |
Sound Federal Bancorp, Inc. (e) | | 600 | | | 10,170 |
Southside Bancshares, Inc. (e) | | 2,269 | | | 44,404 |
Southwest Bancorp, Inc. | | 5,900 | | | 138,119 |
State Bancorp, Inc. | | 926 | | | 17,353 |
Sterling Bancorp | | 3,930 | | | 76,556 |
Sterling Bancshares, Inc. | | 16,095 | | | 238,045 |
Sterling Financial Corp. (e) | | 7,565 | | | 159,168 |
Sterling Financial Corp. | | 11,910 | | | 298,226 |
Suffolk Bancorp (e) | | 3,183 | | | 104,880 |
Summit Bancshares, Inc. | | 600 | | | 11,154 |
Sun Bancorp, Inc. (b) (e) | | 4,266 | | | 84,851 |
Susquehanna Bancshares, Inc. | | 14,481 | | | 334,366 |
SVB Financial Group (b) | | 11,370 | | | 565,202 |
Taylor Capital Group, Inc. | | 2,300 | | | 94,622 |
Texas Capital Bancshares, Inc. (b) | | 8,520 | | | 182,413 |
Texas Regional Bancshares, Inc. | | 13,811 | | | 405,077 |
The Banc Corp. (b) | | 200 | | | 2,234 |
Tierone Corp. | | 5,461 | | | 154,328 |
Tompkins Trustco, Inc. (e) | | 2,148 | | | 94,748 |
TriCo Bancshares | | 3,224 | | | 72,766 |
TrustCo Bank Corp. NY (e) | | 22,408 | | | 289,063 |
Trustmark Corp. (e) | | 15,720 | | | 440,789 |
U.S.B Holding Co., Inc. (e) | | 2,648 | | | 56,138 |
UCBH Holdings, Inc. (e) | | 29,480 | | | 512,952 |
UMB Financial Corp. | | 5,385 | | | 360,687 |
Umpqua Holdings Corp. | | 15,048 | | | 400,277 |
Union Bankshares Corp. | | 2,430 | | | 108,743 |
| | | | | |
| | | Shares or
Principal Amount | | Value |
| | | | | | |
Bank Holdings Companies (continued) | | | |
United Bankshares, Inc. (e) | | 12,380 | | $ | 451,870 |
United Community Banks, Inc. | | 7,686 | | | 227,813 |
United Community Financial Corp. | | 7,311 | | | 84,808 |
United Security Bancshares, Inc. (e) | | 300 | | | 8,175 |
Univest Corporation of Pennsylvania (e) | | 1,650 | | | 42,900 |
Unizan Financial Corp. | | 6,415 | | | 168,330 |
Vineyard National Bancorp Co. (e) | | 3,300 | | | 96,624 |
Virginia Commerce Bancorp, Inc. (b) (e) | | 2,706 | | | 74,415 |
Virginia Financial Group, Inc. | | 3,200 | | | 117,376 |
W Holding Co., Inc. | | 28,780 | | | 221,894 |
Washington Trust Bancorp (e) | | 3,640 | | | 102,757 |
WesBanco, Inc. | | 6,800 | | | 208,760 |
West America Bancorp, Inc. | | 10,537 | | | 561,726 |
West Bancorp, Inc. (e) | | 4,750 | | | 87,875 |
West Coast Bancorp (e) | | 4,100 | | | 108,445 |
Western Sierra Bancorp (b) | | 1,745 | | | 57,742 |
Westfield Financial, Inc. | | 100 | | | 2,401 |
Wilshire Bancorp, Inc. | | 4,496 | | | 73,420 |
Wintrust Financial Corp. | | 7,852 | | | 421,495 |
Yardville National Bancorp (e) | | 3,068 | | | 111,430 |
| | | | |
|
|
| | | | | | 33,058,651 |
| | | | |
|
|
Beverages & Alcoholic (0.0%) | | | |
Boston Beer Co., Inc., Class A (b) | | 4,480 | | | 114,688 |
| | | | |
|
|
Biotechnology (0.9%) | | | | | |
Abgenix, Inc. (b) (e) | | 28,503 | | | 296,431 |
Arena Pharmaceuticals, Inc. (b) (e) | | 13,300 | | | 138,320 |
Cambrex Corp. (e) | | 8,624 | | | 164,546 |
Coley Pharmaceutical Group, Inc. (b) | | 2,300 | | | 34,063 |
Cotherix, Inc. (b) | | 1,800 | | | 25,650 |
CuraGen Corp. (b) | | 10,800 | | | 50,220 |
Curis, Inc. (b) | | 7,800 | | | 31,980 |
Cypress Bioscience, Inc. (b) | | 9,620 | | | 48,677 |
Digene Corp. (b) (e) | | 4,941 | | | 149,218 |
Diversa Corp. (b) | | 6,333 | | | 33,882 |
| | Common Stocks (continued) |
| | | | | |
| | | Shares or
Principal Amount | | Value |
| | | | | | |
Biotechnology (continued) | | | |
Enzo Biochem, Inc. (b) (e) | | 6,029 | | $ | 82,236 |
Exelixis, Inc. (b) (e) | | 19,860 | | | 153,518 |
Genitope Corp. (b) (e) | | 10,300 | | | 71,482 |
GTx, Inc. (b) (e) | | 200 | | | 1,760 |
Human Genome Sciences, Inc. (b) (e) | | 40,780 | | | 340,513 |
Idenix Pharmaceuticals, Inc. (b) (e) | | 2,215 | | | 46,094 |
Integra LifeSciences Holdings (b) (e) | | 7,180 | | | 247,710 |
Lexicon Genetics, Inc. (b) | | 16,006 | | | 63,864 |
Luminex Corp. (b) | | 4,700 | | | 49,021 |
Maxygen, Inc. (b) (e) | | 5,009 | | | 43,879 |
Medarex, Inc. (b) (e) | | 32,747 | | | 286,209 |
Monogram Biosciences, Inc. (b) | | 25,800 | | | 57,018 |
Myogen, Inc. (b) | | 6,581 | | | 131,949 |
Myriad Genetics, Inc. (b) (e) | | 9,069 | | | 175,757 |
Nabi Biopharmaceuticals (b) (e) | | 19,151 | | | 246,090 |
Nuvasive, Inc. (b) (e) | | 6,200 | | | 108,066 |
Palomar Medical Technologies, Inc. (b) (e) | | 3,760 | | | 102,836 |
SonoSite, Inc. (b) (e) | | 4,600 | | | 135,194 |
StemCells, Inc. (b) (e) | | 14,300 | | | 65,351 |
ViaCell, Inc. (b) | | 100 | | | 505 |
Zymogenetics, Inc. (b) (e) | | 9,954 | | | 174,394 |
| | | | |
|
|
| | | | | | 3,556,433 |
| | | | |
|
|
Broadcast Media & Cable Television (0.8%) |
4Kids Entertainment, Inc. (b) (e) | | 3,301 | | | 56,315 |
Charter Communications, Inc., Class A (b) (e) | | 102,120 | | | 122,544 |
Crown Media Holdings, Inc. (b) (e) | | 4,358 | | | 46,631 |
Cumulus Media, Inc. (b) (e) | | 17,814 | | | 216,618 |
Emmis Communications Corp. (b) (e) | | 15,647 | | | 306,212 |
Entravision Communications Corp. (b) | | 17,473 | | | 143,279 |
Fisher Companies, Inc. (b) | | 1,100 | | | 53,691 |
Insight Communications Co., Inc. (b) | | 14,609 | | | 168,004 |
Journal Communications, Inc. | | 10,820 | | | 153,103 |
Liberty Corp. | | 4,625 | | | 214,785 |
| | | | | |
| | | Shares or
Principal Amount | | Value |
| | | | | | |
Broadcast Media & Cable Television (continued) |
Lin TV Corp., Class A (b) | | 10,200 | | $ | 130,866 |
Macrovision Corp. (b) | | 16,452 | | | 309,956 |
Martha Stewart Living Omnimedia, Inc. (b) (e) | | 7,408 | | | 127,566 |
Media General, Inc. | | 6,400 | | | 337,599 |
Mediacom Communications Corp. (b) (e) | | 18,041 | | | 104,818 |
Outdoor Channel Holdings, Inc. (b) | | 200 | | | 3,220 |
Readers Digest Association, Inc. (The) | | 31,305 | | | 479,592 |
Salem Communications Corp., Class A (b) | | 2,300 | | | 43,056 |
Sinclair Broadcast Group, Inc., Class A | | 16,035 | | | 132,930 |
TiVo, Inc. (b) (e) | | 19,239 | | | 93,117 |
ValueVision International, Inc., Class A (b) (e) | | 8,058 | | | 79,130 |
| | | | |
|
|
| | | | | | 3,323,032 |
| | | | |
|
|
Business Services (2.6%) | | | | | |
Aaron Rents, Inc. | | 9,646 | | | 190,026 |
ABM Industries, Inc. | | 11,678 | | | 230,991 |
Acxiom Corp. | | 27,920 | | | 595,812 |
Administaff, Inc. (e) | | 6,074 | | | 257,052 |
Advisory Board Co. (The) (b) | | 6,200 | | | 299,150 |
ADVO, Inc. | | 9,192 | | | 227,042 |
AMN Healthcare Services, Inc. (b) | | 5,366 | | | 88,539 |
BearingPoint, Inc. (b) | | 51,040 | | | 358,301 |
Catalina Marketing Corp. (e) | | 14,283 | | | 372,215 |
CBIZ, Inc. (b) | | 16,143 | | | 92,822 |
CDI Corp. (e) | | 4,521 | | | 124,644 |
Chemed Corp. | | 7,100 | | | 341,368 |
Ciber, Inc. (b) (e) | | 15,754 | | | 100,511 |
Circor International, Inc. | | 2,785 | | | 78,453 |
Comsys IT Partners, Inc. (b) | | 2,000 | | | 27,960 |
Consolidated Graphics, Inc. (b) | | 3,514 | | | 137,011 |
CoStar Group, Inc. (b) (e) | | 5,400 | | | 258,930 |
CRA International, Inc. (b) (e) | | 3,831 | | | 169,560 |
DiamondCluster International, Inc. (b) (e) | | 6,700 | | | 43,081 |
Statement of Investments (Continued)
October 31, 2005
Gartmore Small Cap Index Fund (Continued)
| | Common Stocks (continued) |
| | | | | |
| | | Shares or
Principal Amount | | Value |
| | | | | | |
Business Services (continued) |
E-LOAN, Inc. (b) | | 16,100 | | $ | 68,425 |
FTD Group, Inc. (b) (e) | | 3,600 | | | 39,816 |
Gartner Group, Inc. (b) (e) | | 18,126 | | | 218,237 |
Gevity HR, Inc. (e) | | 8,153 | | | 209,858 |
GSI Commerce, Inc. (b) (e) | | 7,823 | | | 125,012 |
Heidrick & Struggles International, Inc. (b) | | 6,555 | | | 211,595 |
Hudson Highland Group, Inc. (b) (e) | | 8,050 | | | 192,637 |
Huron Consulting Group, Inc. (b) | | 600 | | | 15,930 |
Hypercom Corp. (b) | | 15,530 | | | 92,404 |
Infocrossing, Inc. (b) (e) | | 7,500 | | | 51,825 |
iPayment Holdings, Inc. (b) | | 4,540 | | | 163,258 |
Jack Henry & Associates, Inc. | | 23,900 | | | 429,722 |
Kelly Services, Inc., Class A | | 5,440 | | | 150,579 |
Korn/Ferry International (b) (e) | | 9,534 | | | 164,175 |
LECG Corp. (b) | | 4,000 | | | 88,360 |
Marchex, Inc., Class B (b) (e) | | 4,200 | | | 70,770 |
Marlin Business Services, Inc. (b) | | 1,500 | | | 35,250 |
MAXIMUS, Inc. | | 4,562 | | | 165,373 |
Metris Cos., Inc. (b) (e) | | 14,900 | | | 218,881 |
MicroStrategy, Inc. (b) (e) | | 5,241 | | | 371,587 |
Modis Professional Services, Inc. (b) | | 29,901 | | | 372,267 |
Navigant Consulting Co. (b) (e) | | 15,509 | | | 325,224 |
NCO Group, Inc. (b) | | 8,438 | | | 151,631 |
NetRatings, Inc. (b) (e) | | 2,646 | | | 39,372 |
Online Resources Corp. (b) | | 8,400 | | | 100,800 |
Paxar Corp. (b) | | 12,716 | | | 218,334 |
Phase Forward (b) | | 9,900 | | | 108,108 |
Polycom, Inc. (b) | | 27,400 | | | 419,220 |
Portfolio Recovery Associates, Inc. (b) (e) | | 5,332 | | | 207,415 |
Prepaid Depot, Inc. (e) | | 2,950 | | | 126,260 |
Resources Connection, Inc. (b) (e) | | 14,680 | | | 419,114 |
RSA Security, Inc. (b) | | 20,038 | | | 228,433 |
SOURCECORP, Inc. (b) | | 5,824 | | | 132,496 |
Spherion Corp. (b) (e) | | 18,367 | | | 163,466 |
StarTek, Inc. (e) | | 4,762 | | | 60,573 |
TeleTech Holdings, Inc. (b) (e) | | 10,611 | | | 110,673 |
| | | | | |
| | | Shares or
Principal Amount | | Value |
| | | | | | |
Business Services (continued) |
Terremark Worlwide, Inc. (b) | | 6,590 | | $ | 18,386 |
Viad Corp. | | 5,125 | | | 147,651 |
Watson Wyatt & Co. Holdings | | 11,205 | | | 296,933 |
| | | | |
|
|
| | | | | | 10,723,518 |
| | | | |
|
|
Capital Goods (1.0%) | | | | | |
C&D Technologies, Inc. | | 7,511 | | | 68,575 |
Kennametal, Inc. | | 12,205 | | | 623,798 |
Lawson Products, Inc. | | 1,400 | | | 47,810 |
Libbey, Inc. (e) | | 4,304 | | | 48,420 |
Lifetime Brands, Inc. | | 2,138 | | | 49,986 |
Lindsay Manufacturing Co. (e) | | 4,568 | | | 93,872 |
Manitowoc Co., Inc. | | 8,874 | | | 472,186 |
Nu Skin Enterprises, Inc. | | 16,798 | | | 282,878 |
Parlux Fragrances, Inc. (b) (e) | | 2,400 | | | 55,584 |
Regal-Beloit Corp. | | 7,536 | | | 239,871 |
Robbins & Myers, Inc. | | 2,723 | | | 58,790 |
Technitrol, Inc. | | 10,426 | | | 175,365 |
Tecumseh Products Co. | | 5,001 | | | 100,670 |
Texas Industries, Inc. | | 7,223 | | | 358,261 |
Trinity Industries, Inc. (e) | | 11,440 | | | 435,292 |
Vicor Corp. | | 4,888 | | | 82,363 |
Yankee Candle Co., Inc. (e) | | 15,038 | | | 340,009 |
York International Corp. | | 12,042 | | | 675,677 |
| | | | |
|
|
| | | | | | 4,209,407 |
| | | | |
|
|
Chemicals (1.1%) | | | | | |
A. Schulman, Inc. (e) | | 11,208 | | | 228,755 |
American Vanguard Corp. (e) | | 2,800 | | | 58,156 |
Arch Chemicals, Inc. | | 8,830 | | | 231,964 |
Balchem Corp. | | 900 | | | 24,696 |
Cabot Microelectronics Corp. (b) (e) | | 6,572 | | | 193,217 |
Ferro Corp. | | 13,742 | | | 245,157 |
Georgia Gulf Corp. | | 10,081 | | | 293,357 |
H.B. Fuller Co. | | 9,705 | | | 290,859 |
Hercules, Inc. (b) | | 32,998 | | | 367,598 |
MacDermid, Inc. | | 7,255 | | | 203,140 |
Minerals Technologies, Inc. | | 6,435 | | | 344,015 |
NewMarket Corp. (b) (e) | | 2,700 | | | 50,490 |
NL Industries, Inc. (e) | | 2,328 | | | 39,460 |
Octel Corp. (e) | | 3,372 | | | 50,546 |
Olin Corp. | | 19,863 | | | 355,150 |
| | Common Stocks (continued) |
| | | | | |
| | | Shares or
Principal Amount | | Value |
| | | | | | |
Chemicals (continued) |
OM Group, Inc. (b) | | 8,400 | | $ | 134,232 |
Pioneer Cos., Inc. (b) | | 3,540 | | | 83,155 |
PolyOne Corp. (b) | | 27,088 | | | 156,298 |
Rockwood Holdings, Inc. (b) | | 7,300 | | | 146,511 |
Schawk, Inc., Class A (e) | | 1,900 | | | 37,867 |
Spartech Corp. | | 11,388 | | | 216,030 |
Symyx Technologies, Inc. (b) (e) | | 9,559 | | | 255,608 |
Terra Industries, Inc. (b) | | 23,200 | | | 141,752 |
W.R. Grace & Co. (b) | | 19,800 | | | 148,896 |
Wellman, Inc. | | 10,958 | | | 71,665 |
Westlake Chemical Corp. | | 2,630 | | | 76,533 |
Zoltek Cos., Inc. (b) (e) | | 5,000 | | | 45,000 |
| | | | |
|
|
| | | | | | 4,490,107 |
| | | | |
|
|
Circuit Boards (0.2%) | | | | | |
Micrel, Inc. (b) (e) | | 19,158 | | | 191,580 |
Park Electrochemical Corp. | | 5,963 | | | 149,671 |
RF Micro Devices, Inc. (b) | | 57,116 | | | 299,288 |
| | | | |
|
|
| | | | | | 640,539 |
| | | | |
|
|
Coal (0.2%) | | | | | |
Alpha Natural Resources, Inc. (b) | | 8,200 | | | 194,750 |
Foundation Coal Holdings, Inc. (e) | | 7,380 | | | 276,750 |
James River Coal Co. (b) (e) | | 4,600 | | | 196,696 |
KFX, Inc. (b) (e) | | 17,270 | | | 251,624 |
| | | | |
|
|
| | | | | | 919,820 |
| | | | |
|
|
Communications Equipment (0.4%) | | | |
Anixter International, Inc. (e) | | 9,785 | | | 362,828 |
Audiovox Corp. (b) | | 5,088 | | | 72,300 |
Gray Television, Inc. | | 10,033 | | | 90,297 |
Harmonic, Inc. (b) | | 21,684 | | | 99,963 |
Inter-Tel, Inc. (e) | | 7,151 | | | 132,365 |
LodgeNet Entertainment Corp. (b) | | 4,389 | | | 57,057 |
Sonus Networks, Inc. (b) | | 69,380 | | | 302,497 |
Standard Microsystems Corp. (b) | | 7,561 | | | 213,749 |
Superior Essex, Inc. (b) | | 7,200 | | | 122,184 |
Terayon Communications Systems, Inc. (b) (e) | | 25,224 | | | 67,853 |
| | | | |
|
|
| | | | | | 1,521,093 |
| | | | |
|
|
| | | | | |
| | | Shares or
Principal Amount | | Value |
| | | | | | |
Computer Equipment (0.7%) | | | | | |
Analogic Corp. | | 5,009 | | $ | 234,421 |
Avocent Corp. (b) | | 13,900 | | | 426,174 |
GameStop Corp., Class A (b) (e) | | 15,195 | | | 539,119 |
Gateway, Inc. (b) (e) | | 65,861 | | | 187,704 |
Hutchinson Technology, Inc. (b) (e) | | 8,191 | | | 203,137 |
Komag, Inc. (b) (e) | | 9,331 | | | 250,257 |
Maxtor Corp. (b) | | 71,420 | | | 249,970 |
McData Corp. (b) (e) | | 50,680 | | | 243,771 |
Palm, Inc. (b) (e) | | 13,045 | | | 335,126 |
Par Technology Corp. (b) (e) | | 1,800 | | | 43,902 |
Rimage Corp. (b) | | 4,100 | | | 118,818 |
| | | | |
|
|
| | | | | | 2,832,399 |
| | | | |
|
|
Computer Integrated Systems Design (0.7%) |
Adaptec, Inc. (b) | | 33,830 | | | 139,041 |
Brady Corp., Class A | | 10,764 | | | 309,680 |
Digital River, Inc. (b) (e) | | 9,498 | | | 266,039 |
Eclipsys Corp. (b) | | 10,237 | | | 163,792 |
eSPEED, Inc., Class A (b) | | 8,511 | | | 64,343 |
FileNET Corp. (b) | | 12,117 | | | 341,094 |
Foundry Networks, Inc. (b) | | 34,120 | | | 407,052 |
Integral Systems, Inc. | | 1,400 | | | 30,856 |
Keynote Systems, Inc. (b) (e) | | 2,883 | | | 37,565 |
MTS Systems Corp. | | 6,856 | | | 273,966 |
Netscout Systems, Inc. (b) | | 3,700 | | | 20,868 |
RadiSys Corp. (b) (e) | | 6,660 | | | 107,026 |
SafeNet, Inc. (b) (e) | | 7,350 | | | 243,800 |
Sapient Corp. (b) | | 23,762 | | | 123,325 |
Tekelec (b) (e) | | 18,235 | | | 250,184 |
WebEx Communications, Inc. (b) (e) | | 9,729 | | | 222,891 |
| | | | |
|
|
| | | | | | 3,001,522 |
| | | | |
|
|
Computer Software & Services (3.2%) |
3Com Corp. (b) | | 104,880 | | | 403,788 |
3D Systems Corp. (b) (e) | | 2,300 | | | 41,538 |
Advanced Digital Information Corp. (b) | | 18,940 | | | 173,112 |
Advent Software, Inc. (b) | | 6,893 | | | 211,753 |
Agile Software Corp. (b) (e) | | 20,096 | | | 142,682 |
Agilysys, Inc. | | 9,085 | | | 135,730 |
Altiris, Inc. (b) (e) | | 6,899 | | | 116,593 |
Statement of Investments (Continued)
October 31, 2005
Gartmore Small Cap Index Fund (Continued)
| | Common Stocks (continued) |
| | | | | |
| | | Shares or
Principal Amount | | Value |
| | | | | | |
Computer Software & Services (continued) |
Ansys, Inc. (b) | | 9,436 | | $ | 351,585 |
Anteon International Corp. (b) | | 7,238 | | | 327,158 |
Aspen Technologies, Inc. (b) (e) | | 12,739 | | | 77,071 |
Blackbaud, Inc. | | 2,594 | | | 37,354 |
Borland Software Corp. (b) | | 23,546 | | | 118,907 |
Bottomline Technologies, Inc. (b) | | 4,200 | | | 53,130 |
Catapult Communications Corp. (b) (e) | | 4,028 | | | 73,672 |
CCC Information Services Group, Inc. (b) | | 2,090 | | | 54,256 |
Click Commerce, Inc. (b) (e) | | 3,200 | | | 58,432 |
Computer Programs & Systems, Inc. | | 3,100 | | | 114,390 |
Covansys Corp. (b) | | 7,502 | | | 120,032 |
Cybersource Corp. (b) | | 7,500 | | | 50,250 |
Dendrite International, Inc. (b) | | 12,305 | | | 215,953 |
Digital Insight Corp. (b) | | 11,371 | | | 339,197 |
Digitas, Inc. (b) | | 23,596 | | | 254,837 |
Echelon Corp. (b) | | 8,687 | | | 67,324 |
Electronics For Imaging, Inc. (b) | | 17,403 | | | 436,990 |
Emageon, Inc. (b) (e) | | 2,500 | | | 32,775 |
Epicor Software Corp. (b) | | 15,689 | | | 192,661 |
EPIQ Systems, Inc. (b) | | 5,617 | | | 107,004 |
Eresearch Technology, Inc. (b) (e) | | 14,789 | | | 211,926 |
Extreme Networks, Inc. (b) | | 35,962 | | | 173,696 |
FactSet Research Systems, Inc. (e) | | 9,070 | | | 318,085 |
FalconStor Software, Inc. (b) (e) | | 8,599 | | | 56,753 |
iGATE Corp. (b) | | 2,500 | | | 9,250 |
Informatica Corp. (b) | | 23,853 | | | 283,851 |
Intervideo, Inc. (b) (e) | | 4,400 | | | 41,932 |
Iris International, Inc. (b) (e) | | 5,900 | | | 138,355 |
JDA Software Group, Inc. (b) | | 8,929 | | | 144,382 |
Keane, Inc. (b) (e) | | 14,232 | | | 160,822 |
Lawson Software, Inc. (b) (e) | | 23,240 | | | 178,018 |
Lexar Media, Inc. (b) (e) | | 23,616 | | | 177,120 |
Magma Design Automation, Inc. (b) (e) | | 7,798 | | | 67,687 |
ManTech International Corp., Class A (b) | | 4,496 | | | 124,539 |
MapInfo Corp. (b) | | 5,500 | | | 67,595 |
Mentor Graphics Corp. (b) | | 19,600 | | | 162,092 |
| | | | | |
| | | Shares or
Principal Amount | | Value |
| | | | | | |
Computer Software & Services (continued) |
Mercury Computer Systems, Inc. (b) (e) | | 6,353 | | $ | 120,643 |
Micromuse, Inc. (b) | | 23,800 | | | 170,646 |
Motive, Inc. (b) (e) | | 8,700 | | | 31,668 |
MRO Software, Inc. (b) | | 5,100 | | | 83,538 |
NETGEAR, Inc. (b) (e) | | 10,400 | | | 203,320 |
NetiQ Corp. (b) (e) | | 18,477 | | | 221,539 |
Nuance Communications, Inc. (b) (e) | | 29,962 | | | 154,005 |
Open Solutions, Inc. (b) (e) | | 6,700 | | | 143,447 |
Packeteer, Inc. (b) | | 9,929 | | | 78,340 |
Parametric Technology Corp. (b) | | 78,788 | | | 512,911 |
PDF Solutions, Inc. (b) (e) | | 3,700 | | | 55,093 |
Phoenix Technology Ltd. (b) | | 4,000 | | | 23,760 |
PlxTech, Inc. (b) | | 5,900 | | | 44,191 |
QAD, Inc. | | 2,300 | | | 18,262 |
Quantum Corp. (b) | | 43,202 | | | 130,470 |
Quest Software, Inc. (b) | | 16,807 | | | 233,785 |
Radiant Systems, Inc. (b) | | 8,500 | | | 96,560 |
RealNetworks, Inc. (b) | | 27,938 | | | 217,916 |
Renaissance Learning, Inc. (e) | | 1,265 | | | 19,038 |
SeaChange International, Inc. (b) | | 10,375 | | | 64,948 |
Serena Software, Inc. (b) (e) | | 9,203 | | | 201,454 |
SI International, Inc. (b) (e) | | 3,428 | | | 98,966 |
SonicWall, Inc. (b) | | 15,126 | | | 105,277 |
SPSS, Inc. (b) | | 6,373 | | | 145,304 |
SS&C Technologies, Inc. | | 5,510 | | | 197,478 |
SSA Global Technologies, Inc. (b) | | 600 | | | 9,390 |
Stratasys, Inc. (b) (e) | | 3,000 | | | 71,160 |
Sykes Enterprises, Inc. (b) | | 8,567 | | | 123,707 |
Synaptics, Inc. (b) (e) | | 8,257 | | | 191,810 |
SYNNEX Corp. (b) | | 700 | | | 12,397 |
Syntel, Inc. (e) | | 540 | | | 10,957 |
Sypris Solutions, Inc. (e) | | 1,300 | | | 13,325 |
TALX Corp. | | 6,350 | | | 251,016 |
THQ, Inc. (b) (e) | | 18,291 | | | 423,985 |
Tibco Software, Inc. (b) | | 66,160 | | | 502,155 |
Tradestation Group, Inc. (b) (e) | | 4,700 | | | 46,906 |
Transaction Systems Architects, Inc. (b) | | 11,206 | | | 302,674 |
Trident Microsystems, Inc. (b) (e) | | 8,409 | | | 254,456 |
Tyler Technologies, Inc. (b) (e) | | 9,200 | | | 74,888 |
Ulticom, Inc. (b) | | 3,540 | | | 37,276 |
| | Common Stocks (continued) |
| | | | | |
| | | Shares or
Principal Amount | | Value |
| | | | | | |
Computer Software & Services (continued) |
Ultimate Software Group, Inc. (The) (b) (e) | | 4,900 | | $ | 83,251 |
Vasco Data Security International, Inc. (b) (e) | | 4,700 | | | 50,196 |
VeriFone Holdings, Inc. (b) | | 6,100 | | | 141,520 |
Verint Systems, Inc. (b) | | 3,000 | | | 114,870 |
Verity, Inc. (b) | | 10,998 | | | 109,430 |
Vignette Corp. (b) | | 10,231 | | | 169,937 |
Viisage Technology, Inc. (b) | | 8,200 | | | 37,720 |
webMethods, Inc. (b) (e) | | 15,780 | | | 109,829 |
WebSideStory, Inc. (b) (e) | | 4,100 | | | 71,299 |
Wind River Systems, Inc. (b) | | 21,631 | | | 283,366 |
Witness Systems, Inc. (b) (e) | | 6,400 | | | 125,440 |
Zoran Corp. (b) | | 12,849 | | | 188,623 |
| | | | |
|
|
| | | | | | 13,808,419 |
| | | | |
|
|
Construction & Building Materials (1.3%) |
AMCOL International Corp. | | 5,850 | | | 118,872 |
Brookfield Homes Corp. (e) | | 4,400 | | | 220,396 |
Builders FirstSource, Inc. (b) | | 4,300 | | | 84,065 |
Ceradyne, Inc. (b) (e) | | 7,380 | | | 289,296 |
Comfort Systems USA, Inc. (b) (e) | | 6,900 | | | 58,650 |
Comstock Homebuilding Cos., Inc., Class A (b) (e) | | 2,700 | | | 44,820 |
Dot Hill Systems Corp. (b) (e) | | 16,800 | | | 116,424 |
Drew Industries, Inc. (b) (e) | | 5,298 | | | 152,847 |
ElkCorp (e) | | 6,544 | | | 206,987 |
Genlyte Group, Inc. (The) (b) | | 6,768 | | | 344,965 |
Granite Construction, Inc. | | 9,105 | | | 310,572 |
Infrasource Services, Inc. (b) | | 1,600 | | | 20,704 |
JLG Industries, Inc. (e) | | 15,095 | | | 579,044 |
Kronos Worldwide, Inc. (e) | | 1,152 | | | 36,069 |
Layne Christensen Co. (b) | | 3,340 | | | 70,307 |
LSI Industries, Inc. | | 8,175 | | | 147,068 |
NCI Building Systems, Inc. (b) (e) | | 7,264 | | | 298,768 |
Orleans Homebuilders, Inc. (e) | | 600 | | | 11,952 |
Shaw Group, Inc. (The) (b) (e) | | 22,591 | | | 605,439 |
Simpson Manufacturing Co., Inc. (e) | | 9,608 | | | 379,132 |
Technical Olympic USA, Inc. (e) | | 3,425 | | | 72,405 |
| | | | | |
| | | Shares or
Principal Amount | | Value |
| | | | | | |
Construction & Building Materials (continued) |
Trex Co., Inc. (b) (e) | | 3,400 | | $ | 70,618 |
Universal Display Corp. (b) (e) | | 5,200 | | | 55,484 |
Walter Industries, Inc. (e) | | 10,717 | | | 489,445 |
Washington Group International, Inc. (b) | | 8,600 | | | 427,420 |
| | | | |
|
|
| | | | | | 5,211,749 |
| | | | |
|
|
Consumer Durables (0.6%) | | | | | |
1-800 CONTACTS, Inc. (b) (e) | | 800 | | | 14,192 |
Blyth, Inc. (e) | | 8,920 | | | 162,701 |
Central Garden & Pet Co. (b) | | 6,700 | | | 287,229 |
Charles & Colvard Ltd. (e) | | 4,610 | | | 106,952 |
Chattem, Inc. (b) (e) | | 5,866 | | | 193,578 |
CNS, Inc. | | 5,200 | | | 135,564 |
Coca-Cola Bottling Co. (e) | | 800 | | | 36,488 |
Elizabeth Arden, Inc. (b) | | 7,507 | | | 162,677 |
Greif Bros Corp., Class A | | 4,400 | | | 268,400 |
Innovo Group, Inc. (b) | | 11,800 | | | 14,514 |
Nature’s Sunshine Products, Inc. | | 4,730 | | | 91,526 |
Playtex Products, Inc. (b) (e) | | 11,200 | | | 149,968 |
Prestige Brands Holdings, Inc. (b) | | 7,800 | | | 93,990 |
Revlon Co., Inc. (b) | | 33,304 | | | 97,914 |
Russ Berrie & Co., Inc. (e) | | 3,857 | | | 52,031 |
Silgan Holdings, Inc. | | 7,096 | | | 228,278 |
Tupperware Corp. | | 17,553 | | | 402,489 |
Ultralife Batteries, Inc. (b) (e) | | 5,796 | | | 70,248 |
Water Pik Technologies, Inc. (b) (e) | | 1,500 | | | 29,625 |
| | | | |
|
|
| | | | | | 2,598,364 |
| | | | |
|
|
Data Processing & Reproduction (0.4%) |
CSG Systems International, Inc. (b) | | 15,927 | | | 374,444 |
eFunds Corp. (b) | | 13,493 | | | 278,361 |
HomeStore, Inc. (b) | | 48,939 | | | 177,649 |
infoUSA, Inc. | | 12,300 | | | 131,856 |
Intrado, Inc. (b) (e) | | 6,558 | | | 126,832 |
Moneygram International, Inc. | | 23,860 | | | 579,797 |
Pegasystems, Inc. (b) (e) | | 800 | | | 5,088 |
| | | | |
|
|
| | | | | | 1,674,027 |
| | | | |
|
|
Statement of Investments (Continued)
October 31, 2005
Gartmore Small Cap Index Fund (Continued)
| | Common Stocks (continued) |
| | | | | |
| | | Shares or
Principal Amount | | Value |
| | | | | | |
Distribution (0.9%) | | | | | |
Actuant Corp. (e) | | 7,900 | | $ | 384,730 |
Aviall, Inc. (b) | | 8,754 | | | 276,189 |
Bell Microproducts, Inc. (b) (e) | | 11,100 | | | 76,479 |
Brightpoint, Inc. (b) (e) | | 9,200 | | | 198,628 |
Central European Distribution Corp. (b) | | 4,730 | | | 188,301 |
Handleman Co. (e) | | 9,332 | | | 111,051 |
Hughes Supply, Inc. | | 21,160 | | | 707,802 |
Huttig Building Products, Inc. (b) | | 900 | | | 7,650 |
Interline Brands, Inc. (b) | | 3,400 | | | 66,402 |
Keystone Automotive Industries, Inc. (b) (e) | | 5,855 | | | 167,512 |
Navarre Corp. (b) (e) | | 7,200 | | | 31,896 |
Owens & Minor, Inc. | | 11,692 | | | 344,329 |
Provide Commerce (b) (e) | | 3,200 | | | 77,856 |
ScanSource, Inc. (b) (e) | | 4,360 | | | 246,950 |
United Stationers, Inc. (b) | | 10,811 | | | 490,495 |
Watsco, Inc. | | 5,573 | | | 316,714 |
| | | | |
|
|
| | | | | | 3,692,984 |
| | | | |
|
|
Drugs (1.3%) | | | | | |
ABIOMED, Inc. (b) (e) | | 4,511 | | | 38,930 |
Adolor Corp. (b) | | 14,262 | | | 151,177 |
Alkermes, Inc. (b) (e) | | 28,357 | | | 461,936 |
Alpharma, Inc. | | 12,548 | | | 312,320 |
Amylin Pharmaceuticals, Inc. (b) (e) | | 33,480 | | | 1,124,928 |
ARIAD, Inc. (b) (e) | | 18,514 | | | 128,857 |
ArQule, Inc. (b) | | 5,900 | | | 42,126 |
Bentley Pharmaceuticals, Inc. (b) (e) | | 3,149 | | | 37,788 |
Bio-Rad Laboratories, Inc., Class A (b) | | 5,100 | | | 298,452 |
Caraco Pharmaceutical Laboratories Ltd. (b) | | 700 | | | 6,195 |
Cell Therapeutics, Inc. (b) (e) | | 21,642 | | | 51,941 |
Connetics Corp. (b) (e) | | 11,334 | | | 147,795 |
CV Therapeutics, Inc. (b) (e) | | 12,254 | | | 307,085 |
Decode Genetics, Inc. (b) (e) | | 16,174 | | | 141,037 |
DUSA Pharmaceuticals, Inc. (b) (e) | | 7,300 | | | 72,124 |
Hi-Tech Pharmacal Co., Inc. (b) | | 2,200 | | | 82,610 |
| | | | | |
| | | Shares or
Principal Amount | | Value |
| | | | | | |
Drugs (continued) | | | | | |
Incyte Genomics, Inc. (b) | | 24,629 | | $ | 122,899 |
InterMune, Inc. (b) (e) | | 9,183 | | | 124,889 |
K-V Pharmaceutical Co., Class A (b) (e) | | 9,423 | | | 161,416 |
Marshall Edwards, Inc. (b) (e) | | 200 | | | 1,386 |
Martek Biosciences Corp. (b) (e) | | 9,400 | | | 290,178 |
Nanogen, Inc. (b) (e) | | 9,700 | | | 27,257 |
NBTY, Inc. (b) | | 15,340 | | | 306,953 |
NPS Pharmaceuticals, Inc. (b) (e) | | 12,307 | | | 121,347 |
Par Pharmaceutical Cos, Inc. (b) (e) | | 9,495 | | | 245,731 |
Rigel Pharmaceuticals, Inc. (b) (e) | | 5,774 | | | 129,626 |
Seattle Genetics, Inc. (b) (e) | | 7,408 | | | 40,670 |
SFBC International, Inc. (b) (e) | | 5,460 | | | 232,814 |
Tanox, Inc. (b) | | 7,355 | | | 102,676 |
| | | | |
|
|
| | | | | | 5,313,143 |
| | | | |
|
|
Educational Services (0.5%) | | | | | |
Ambassadors Groups, Inc. | | 4,800 | | | 124,704 |
Blackboard, Inc. (b) (e) | | 3,900 | | | 109,590 |
Bright Horizons Family Solutions, Inc. (b) | | 8,356 | | | 333,989 |
Corinthian Colleges, Inc. (b) (e) | | 24,700 | | | 307,268 |
DeVry, Inc. (b) | | 17,000 | | | 384,200 |
Educate, Inc. (b) | | 3,200 | | | 37,696 |
Leapfrog Enterprises, Inc. (b) (e) | | 9,040 | | | 135,600 |
Learning Tree International, Inc. (b) (e) | | 5,241 | | | 71,068 |
Strayer Education, Inc. (e) | | 4,574 | | | 409,419 |
Universal Technical Institute, Inc. (b) (e) | | 5,268 | | | 165,046 |
| | | | |
|
|
| | | | | | 2,078,580 |
| | | | |
|
|
Electrical Equipment (0.8%) | | | | | |
ADE Corp. (b) | | 4,000 | | | 81,600 |
Artesyn Technologies, Inc. (b) (e) | | 11,019 | | | 96,857 |
Avista Corp. | | 14,316 | | | 250,816 |
Bel Fuse, Inc., Class B (e) | | 3,249 | | | 97,795 |
Cleco Corp. | | 14,732 | | | 312,318 |
DSP Group, Inc. (b) | | 10,048 | | | 246,980 |
| | Common Stocks (continued) |
| | | | | |
| | | Shares or
Principal Amount | | Value |
| | | | | | |
Electrical Equipment (continued) | | | |
El Paso Electric Co. (b) | | 15,331 | | $ | 331,916 |
EMCOR Group, Inc. (b) | | 4,600 | | | 280,600 |
Encore Wire Corp. (b) (e) | | 5,571 | | | 120,166 |
Energy Conversion Devices, Inc. (b) (e) | | 6,780 | | | 209,773 |
Evergreen Solar, Inc. (b) (e) | | 14,200 | | | 117,150 |
II-VI Corp. (b) | | 6,484 | | | 115,545 |
Intergrated Silicon Solution, Inc. (b) | | 13,147 | | | 101,495 |
ITC Holdings Corp. (e) | | 4,500 | | | 123,750 |
Measurement Specialties, Inc. (b) (e) | | 2,001 | | | 47,804 |
Plug Power, Inc. (b) (e) | | 14,989 | | | 86,936 |
Power-One, Inc. (b) (e) | | 20,800 | | | 118,144 |
Rambus, Inc. (b) | | 29,180 | | | 372,045 |
SpatiaLight, Inc. (b) (e) | | 8,100 | | | 35,964 |
Tripath Imaging, Inc. (b) (e) | | 8,357 | | | 58,165 |
Triumph Group, Inc. (b) | | 4,490 | | | 156,432 |
| | | | |
|
|
| | | | | | 3,362,251 |
| | | | |
|
|
Electronics (0.9%) | | | | | |
Aeroflex, Inc. (b) | | 22,014 | | | 199,447 |
American Science & Engineering, Inc. (b) (e) | | 2,900 | | | 166,692 |
Ansoft Corp. (b) | | 1,800 | | | 57,600 |
Badger Meter, Inc. (e) | | 600 | | | 19,800 |
Belden CDT, Inc. (e) | | 13,952 | | | 278,063 |
Coherent, Inc. (b) | | 9,114 | | | 269,866 |
Daktronics, Inc. (e) | | 4,101 | | | 88,623 |
EDO Corp. | | 4,679 | | | 135,223 |
Electro Scientific Industries, Inc. (b) (e) | | 8,454 | | | 185,734 |
Engineered Support Systems, Inc. | | 13,157 | | | 532,201 |
Fargo Electronics (b) | | 5,000 | | | 94,200 |
FARO Technologies, Inc. (b) (e) | | 4,300 | | | 89,268 |
Graftech International Ltd. (b) (e) | | 28,816 | | | 141,198 |
International DisplayWorks, Inc. (b) | | 10,400 | | | 61,256 |
Itron, Inc. (b) | | 7,504 | | | 326,124 |
Keithley Instruments, Inc. | | 3,179 | | | 51,023 |
Labarge, Inc. (b) | | 3,300 | | | 47,982 |
| | | | | |
| | | Shares or
Principal Amount | | Value |
| | | | | | |
Electronics (continued) | | | |
LeCroy Corp. (b) (e) | | 4,975 | | $ | 76,416 |
LoJack Corp. (b) | | 6,500 | | | 123,565 |
Methode Electronics, Inc. | | 10,700 | | | 109,782 |
Mobility Electronics, Inc. (b) (e) | | 7,500 | | | 67,725 |
Multi-Fineline Electronix, Inc. (b) (e) | | 2,200 | | | 58,564 |
Rogers Corp. (b) (e) | | 4,923 | | | 183,874 |
TTM Technologies, Inc. (b) (e) | | 10,371 | | | 82,864 |
Watts Industries, Inc., Class A (e) | | 8,630 | | | 239,569 |
| | | | |
|
|
| | | | | | 3,686,659 |
| | | | |
|
|
Entertainment (0.5%) | | | | | |
Carmike Cinemas, Inc. (e) | | 5,255 | | | 116,030 |
Dover Downs Entertainment, Inc. | | 2,406 | | | 30,219 |
Dover Motorsports, Inc. | | 4,812 | | | 29,834 |
Gaylord Entertainment Co. (b) | | 11,736 | | | 463,338 |
Gemstar-TV Guide International, Inc. (b) | | 65,840 | | | 171,184 |
Magna Entertainment Corp., Class A (b) (e) | | 14,161 | | | 94,595 |
Majesco Entertainment Co. (b) | | 7,400 | | | 12,506 |
Midway Games, Inc. (b) (e) | | 7,637 | | | 142,659 |
Multimedia Games, Inc. (b) (e) | | 8,578 | | | 85,094 |
Pinnacle Entertainment, Inc. (b) (e) | | 13,266 | | | 251,391 |
Shuffle Master, Inc. (b) (e) | | 11,460 | | | 290,626 |
Six Flags, Inc. (b) (e) | | 32,000 | | | 236,480 |
Steinway Musical Instruments, Inc. (b) | | 1,900 | | | 50,369 |
World Wrestling Federation Entertainment, Inc. | | 4,399 | | | 56,087 |
WPT Enterprises, Inc. (b) (e) | | 2,700 | | | 19,413 |
| | | | |
|
|
| | | | | | 2,049,825 |
| | | | |
|
|
Fiber Optics (0.1%) | | | | | |
C-Cor.net Corp. (b) (e) | | 17,600 | | | 93,808 |
MRV Communications, Inc. (b) (e) | | 31,095 | | | 60,013 |
Newport Corp. (b) | | 11,045 | | | 144,027 |
Sycamore Networks, Inc. (b) (e) | | 48,118 | | | 187,179 |
| | | | |
|
|
| | | | | | 485,027 |
| | | | |
|
|
Statement of Investments (Continued)
October 31, 2005
Gartmore Small Cap Index Fund (Continued)
| | Common Stocks (continued) |
| | | | | |
| | | Shares or
Principal Amount | | Value |
| | | | | | |
Financial (2.6%) | | | | | |
Accredited Home Lenders Holding Co. (b) (e) | | 5,802 | | $ | 209,684 |
ACE Cash Express, Inc. (b) (e) | | 4,180 | | | 85,732 |
Advanta Corp., Class B (e) | | 6,660 | | | 188,944 |
Amegy Bancorp, Inc. (e) | | 21,892 | | | 506,362 |
Anchor BanCorp Wisconsin, Inc. | | 7,117 | | | 225,324 |
Anworth Mtg Asset Corp. (e) | | 14,000 | | | 112,560 |
Apollo Investment Corp. | | 20,930 | | | 390,972 |
Archipelago Holdings, Inc. (b) (e) | | 8,800 | | | 422,400 |
Ares Capital Corp. | | 5,288 | | | 81,012 |
Asset Acceptance Capital Corp. (b) (e) | | 1,100 | | | 29,139 |
ASTA Funding, Inc. (e) | | 3,700 | | | 100,381 |
BankFinancial Corp. (b) | | 8,700 | | | 121,626 |
Bankrate, Inc. (b) | | 2,640 | | | 70,567 |
Beverly Hills Bancorp, Inc. | | 1,100 | | | 11,220 |
BKF Capital Group | | 3,040 | | | 52,227 |
Capital Southwest Corp. | | 300 | | | 26,235 |
Central Pacific Financial Corp. | | 9,575 | | | 345,658 |
Charter Municipal Mortgage | | 13,221 | | | 271,692 |
Acceptance Co. (e) | | | | | |
Cohen & Steers, Inc. (e) | | 1,050 | | | 19,404 |
Collegiate Funding Services (b) (e) | | 1,900 | | | 27,854 |
Commercial Capital Bancorp, Inc. | | 13,144 | | | 211,093 |
CompuCredit Corp. (b) (e) | | 5,651 | | | 247,627 |
Delta Financial Corp. | | 300 | | | 2,268 |
Doral Financial Corp. (e) | | 27,480 | | | 235,229 |
Encore Capital Group, Inc. (b) | | 4,322 | | | 74,295 |
Euronet Worldwide, Inc. (b) (e) | | 8,138 | | | 228,678 |
Federal Agricultural Mortgage Corp. (e) | | 4,700 | | | 122,200 |
Financial Federal Corp. (e) | | 5,482 | | | 209,303 |
First Cash Financial Services, Inc. (b) | | 5,200 | | | 136,396 |
First Financial Holdings, Inc. | | 3,700 | | | 107,337 |
GAMCO, Investors, Inc., Class A | | 1,568 | | | 73,163 |
GATX Corp. | | 14,158 | | | 529,084 |
GFI Group, Inc. (b) (e) | | 1,600 | | | 71,936 |
Gladstone Capital Corp. (e) | | 4,928 | | | 105,952 |
Gladstone Investment Corp. | | 6,000 | | | 85,260 |
| | | | | |
| | | Shares or
Principal Amount | | Value |
| | | | | | |
Financial (continued) | | | | | |
Gold Banc Corp., Inc. | | 13,946 | | $ | 206,680 |
Greenhill & Co., Inc. (e) | | 4,500 | | | 215,775 |
Harris & Harris Group, Inc. (b) | | 7,100 | | | 78,668 |
International Securities Exchange, Inc. (b) (e) | | 1,800 | | | 44,298 |
Investment Technology Group, Inc. (b) | | 12,297 | | | 399,775 |
Irwin Financial Corp. (e) | | 6,345 | | | 132,420 |
Jackson Hewitt Tax Service, Inc. | | 10,470 | | | 258,818 |
Knight Capital Group, Inc. (b) (e) | | 33,920 | | | 324,614 |
Labranche & Co., Inc. (b) | | 18,706 | | | 178,455 |
MainSource Financial Group, Inc. | | 5,640 | | | 102,479 |
Marketaxess Holdings, Inc. (b) (e) | | 8,400 | | | 103,656 |
MCG Capital Corp. (e) | | 16,908 | | | 279,320 |
Morningstar, Inc. (b) | | 3,200 | | | 94,080 |
Nasdaq Stock Market, Inc. (b) (e) | | 13,700 | | | 423,193 |
National Financial Partners Corp. | | 11,501 | | | 520,190 |
NGP Capital Resources Co. | | 6,020 | | | 86,387 |
Novastar Financial, Inc. (e) | | 8,267 | | | 243,298 |
optionsXpress Holdings, Inc. (e) | | 5,800 | | | 109,388 |
Piper Jaffray Companies, Inc. (b) (e) | | 5,734 | | | 196,963 |
PRG-Schultz International, Inc. (b) | | 17,125 | | | 15,070 |
Resource America, Inc., Class A | | 3,805 | | | 61,793 |
Royal Gold, Inc. | | 6,400 | | | 147,328 |
Sanders Morris Harris Group, Inc. (e) | | 3,453 | | | 58,839 |
SCBT Financial Corp. | | 1,097 | | | 35,159 |
Stifel Financial Corp. (b) (e) | | 633 | | | 23,769 |
Summit Financial Group, Inc. | | 200 | | | 4,882 |
SWS Group, Inc. | | 4,550 | | | 80,581 |
Technology Investment Capital Corp. | | 1,000 | | | 15,210 |
TNS, Inc. (b) | | 3,200 | | | 56,256 |
United Panam Financial Corp. (b) (e) | | 1,100 | | | 24,519 |
Value Line, Inc. | | 100 | | | 3,900 |
Waddell & Reed Financial, Inc. | | 20,940 | | | 401,629 |
| | Common Stocks (continued) |
| | | | | |
| | | Shares or
Principal Amount | | Value |
| | | | | | |
Financial (continued) | | | | | |
World Acceptance Corp. (b) | | 6,734 | | $ | 189,495 |
WSFS Financial Corp. | | 2,209 | | | 136,848 |
| | | | |
|
|
| | | | | | 10,992,549 |
| | | | |
|
|
Food & Related (1.3%) | | | | | |
American Italian Pasta Co. (e) | | 8,260 | | | 53,277 |
Aurora Foods, Inc. (c) (d) (b) | | 100 | | | 0 |
Chiquita Brands International, Inc. | | 11,755 | | | 324,556 |
Corn Products International, Inc. | | 22,266 | | | 530,153 |
Darling International, Inc. (b) (e) | | 13,600 | | | 47,328 |
Farmer Brothers Co. | | 1,100 | | | 21,945 |
Flowers Foods, Inc. | | 14,918 | | | 437,097 |
Gold Kist, Inc. (b) (e) | | 14,920 | | | 256,475 |
Great Atlantic & Pacific Tea Co., Inc. (b) | | 5,752 | | | 161,574 |
Green Mountain Coffee, Inc. (b) | | 400 | | | 16,804 |
Hain Celestial Group, Inc. (b) (e) | | 8,493 | | | 164,085 |
Hansen Natural Corp. (b) (e) | | 4,760 | | | 240,475 |
J & J Snack Foods Corp. | | 1,892 | | | 106,728 |
Jarden Corp. (b) (e) | | 16,065 | | | 542,837 |
John B. Sanfilippo & Son, Inc. (b) (e) | | 2,944 | | | 53,816 |
Krispy Kreme Doughnuts, Inc. (b) (e) | | 19,263 | | | 89,573 |
Lance, Inc. | | 9,416 | | | 165,062 |
National Beverage Corp. (b) | | 2,210 | | | 16,376 |
NuCo2, Inc. (b) (e) | | 4,700 | | | 107,630 |
Peet’s Coffee & Tea, Inc. (b) (e) | | 4,782 | | | 159,097 |
Performance Food Group Co. (b) (e) | | 15,276 | | | 421,465 |
Premium Standard Farms, Inc. | | 3,400 | | | 58,038 |
Ralcorp Holding, Inc. (b) | | 8,823 | | | 343,215 |
Red Robin Gourmet Burgers (b) (e) | | 4,824 | | | 232,662 |
Ryan’s Restaurant Group, Inc. (b) (e) | | 12,429 | | | 132,493 |
Sanderson Farms, Inc. | | 6,159 | | | 212,547 |
Seaboard Corp. (e) | | 100 | | | 142,100 |
Sensient Technologies Corp. | | 13,954 | | | 246,846 |
Tejon Ranch Co. (b) (e) | | 1,743 | | | 77,389 |
Tootsie Roll Industries, Inc. | | 7,154 | | | 216,766 |
| | | | |
|
|
| | | | | | 5,578,409 |
| | | | |
|
|
| | | | | |
| | | Shares or
Principal Amount | | Value |
| | | | | | |
Furniture (0.4%) | | | | | |
American Woodmark Corp. | | 2,800 | | $ | 86,716 |
Bassett Furniture Industries, Inc. | | 3,737 | | | 69,957 |
Bombay Co., Inc. (b) (e) | | 10,600 | | | 42,506 |
Ethan Allen Interiors, Inc. (e) | | 11,500 | | | 388,929 |
Furniture Brands International, Inc. (e) | | 14,500 | | | 263,175 |
Hooker Furniture Corp. (e) | | 2,075 | | | 29,984 |
Kimball International, Inc., Class B | | 6,648 | | | 73,394 |
La-Z-Boy, Inc. (e) | | 15,500 | | | 183,520 |
Select Comfort Corp. (b) (e) | | 10,986 | | | 240,593 |
Stanley Furniture Co., Inc. | | 3,984 | | | 85,258 |
| | | | |
|
|
| | | | | | 1,464,032 |
| | | | |
|
|
Gambling – Non-Hotel Casinos (0.1%) | | | |
Churchill Downs, Inc. (e) | | 1,200 | | | 38,532 |
Isle of Capris Casinos, Inc. (b) (e) | | 5,351 | | | 113,869 |
Mikohn Gaming Corp. (b) (e) | | 8,500 | | | 89,165 |
| | | | |
|
|
| | | | | | 241,566 |
| | | | |
|
|
Gas – Distribution (0.7%) | | | | | |
Cascade Natural Gas Corp. (e) | | 5,339 | | | 109,983 |
New Jersey Resources Corp. (e) | | 8,903 | | | 384,253 |
Nicor, Inc. (e) | | 14,082 | | | 552,014 |
Northwest Natural Gas Co. | | 8,216 | | | 284,274 |
Peoples Energy Corp. (e) | | 12,255 | | | 455,886 |
South Jersey Industries, Inc. | | 8,304 | | | 232,097 |
Southwest Gas Corp. | | 9,666 | | | 263,495 |
WGL Holdings, Inc. | | 15,195 | | | 472,261 |
| | | | |
|
|
| | | | | | 2,754,263 |
| | | | |
|
|
Healthcare (2.0%) | | | | | |
Allied Healthcare International, Inc. (b) | | 8,825 | | | 53,744 |
Amedisys, Inc. (b) (e) | | 5,341 | | | 204,080 |
America Service Group, Inc. (b) | | 4,374 | | | 67,491 |
American Dental Partners, Inc. (b) | | 2,887 | | | 61,204 |
American Healthways, Inc. (b) (e) | | 9,736 | | | 394,892 |
American Medical Systems Holdings, Inc. (b) | | 20,976 | | | 342,958 |
American Retirement Corp. (b) | | 8,040 | | | 153,644 |
Statement of Investments (Continued)
October 31, 2005
Gartmore Small Cap Index Fund (Continued)
| | Common Stocks (continued) |
| | | | | |
| | | Shares or
Principal Amount | | Value |
| | | | | | |
Healthcare (continued) | | | | | |
AmSurg Corp. (b) | | 9,813 | | $ | 233,059 |
Apria Healthcare Group, Inc. (b) | | 15,500 | | | 357,585 |
Beverly Enterprises, Inc. (b) (e) | | 32,384 | | | 380,188 |
Centene Corp. (b) | | 13,434 | | | 270,695 |
CorVel Corp. (b) | | 1,800 | | | 39,564 |
Cross Country Healthcare, Inc. (b) (e) | | 7,500 | | | 136,275 |
DJ Orthopedics, Inc. (b) | | 5,342 | | | 155,345 |
Genesis HealthCare Corp. (b) (e) | | 6,849 | | | 277,932 |
Gentiva Health Services, Inc. (b) | | 8,649 | | | 127,054 |
HealthExtras, Inc. (b) (e) | | 5,593 | | | 117,733 |
Hooper Holmes, Inc. (e) | | 11,849 | | | 34,244 |
Horizon Health Corp. (b) (e) | | 1,800 | | | 35,712 |
Immucor, Inc. (b) | | 13,594 | | | 352,356 |
Invacare Corp. (e) | | 8,949 | | | 302,387 |
Kindred Healthcare, Inc. (b) (e) | | 8,611 | | | 241,108 |
LCA-Vision, Inc. (e) | | 5,430 | | | 228,114 |
Magellan Health Services, Inc. (b) | | 8,715 | | | 259,097 |
Matria Healthcare, Inc. (b) (e) | | 6,951 | | | 233,067 |
Medcath Corp. (b) (e) | | 1,800 | | | 33,102 |
Molina Healthcare, Inc. (b) (e) | | 4,034 | | | 82,899 |
OCA, Inc. (b) (e) | | 24,700 | | | 25,688 |
Odyssey Healthcare, Inc. (b) (e) | | 11,723 | | | 202,573 |
Option Care, Inc. (e) | | 8,554 | | | 106,668 |
Pediatrix Medical Group, Inc. (b) | | 6,800 | | | 524,009 |
Per-Se Technologies, Inc. (b) (e) | | 7,613 | | | 169,237 |
PolyMedica Corp. (e) | | 7,093 | | | 234,140 |
Psychiatric Solutions, Inc. (b) (e) | | 8,022 | | | 438,804 |
Quality Systems, Inc. | | 2,612 | | | 174,612 |
RehabCare Group, Inc. (b) | | 5,760 | | | 122,630 |
Res-Care, Inc. (b) | | 3,800 | | | 61,332 |
Sunrise Assisted Living, Inc. (b) | | 11,098 | | | 358,909 |
Symbion, Inc. (b) | | 3,540 | | | 80,110 |
U.S. Physical Therapy, Inc. (b) | | 5,100 | | | 91,902 |
United Surgical Partners International, Inc. (b) | | 13,938 | | | 499,678 |
USNA Health Sciences, Inc. (b) (e) | | 3,480 | | | 153,190 |
Vistacare, Inc. (b) | | 4,893 | | | 56,367 |
| | | | |
|
|
| | | | | | 8,475,378 |
| | | | |
|
|
| | | | | |
| | | Shares or
Principal Amount | | Value |
| | | | | | |
Hotels & Casinos (0.1%) | | | | | |
Ameristar Casinos, Inc. | | 8,292 | | $ | 176,868 |
Aztar Corp. (b) (e) | | 10,347 | | | 311,135 |
Monarch Casino & Resort, Inc. (b) (e) | | 1,200 | | | 23,244 |
MTR Gaming Group, Inc. (b) | | 9,200 | | | 61,640 |
Riviera Holdings Corp. (b) (e) | | 1,200 | | | 20,220 |
| | | | |
|
|
| | | | | | 593,107 |
| | | | |
|
|
Hotels & Motels (0.1%) | | | | | |
Lodgian, Inc. (b) | | 4,600 | | | 46,828 |
Marcus Corp. | | 5,234 | | | 114,938 |
Sunterra Corp. (b) | | 7,350 | | | 88,274 |
| | | | |
|
|
| | | | | | 250,040 |
| | | | |
|
|
Human Resources (0.0%) | | | | | |
Kforce, Inc. (b) | | 8,280 | | | 89,424 |
| | | | |
|
|
Insurance (1.6%) | | | | | |
21st Century Insurance Group (e) | | 8,300 | | | 132,385 |
Affirmative Insurance Holdings, Inc. | | 4,800 | | | 66,816 |
Alfa Corp. | | 7,924 | | | 132,965 |
American Equity Investment Life Holding Co. | | 12,200 | | | 142,008 |
American Physicians Capital, Inc. (b) | | 3,150 | | | 133,151 |
Argonaut Group, Inc. (b) (e) | | 8,880 | | | 258,941 |
Baldwin & Lyons, Inc., Class B (e) | | 3,881 | | | 99,703 |
Bristol West Holdings, Inc. (e) | | 2,800 | | | 53,984 |
Ceres Group, Inc. (b) | | 8,800 | | | 49,720 |
Citizens, Inc. (b) | | 4,708 | | | 26,836 |
CNA Surety Corp. (b) | | 1,700 | | | 23,868 |
Direct General Corp. (e) | | 5,941 | | | 115,018 |
Donegal Group, Inc., Class A | | 1,866 | | | 41,351 |
EMC Insurance Group, Inc. | | 1,670 | | | 30,895 |
Enstar Group, Inc. (The) (b) (e) | | 300 | | | 19,932 |
FBL Financial Group, Inc., Class A | | 2,102 | | | 65,540 |
First Acceptance Corp. (b) (e) | | 2,900 | | | 29,493 |
FPIC Insurance Group, Inc. (b) | | 2,760 | | | 103,914 |
Fremont General Corp. (e) | | 17,780 | | | 385,648 |
| | Common Stocks (continued) |
| | | | | |
| | | Shares or
Principal Amount | | Value |
| | | | | | |
Insurance (continued) | | | | | |
Harleysville Group, Inc. | | 4,058 | | $ | 98,609 |
Horace Mann Educators Corp. | | 12,759 | | | 247,652 |
Independence Holding Co. | | 920 | | | 16,486 |
Infinity Property & Casualty Corp. | | 7,285 | | | 271,148 |
Kansas City Life Insurance Co. | | 400 | | | 20,400 |
LandAmerica Financial Group, Inc. (e) | | 5,423 | | | 342,517 |
Midland Co. (The) | | 1,901 | | | 71,801 |
Navigators Group, Inc. (b) | | 2,392 | | | 92,810 |
Odyssey Re Holdings Corp. (e) | | 1,700 | | | 43,656 |
Ohio Casualty Corp. | | 19,921 | | | 543,444 |
PICO Holdings, Inc. (b) (e) | | 1,500 | | | 50,370 |
PMA Capital Corp., Class A (b) (e) | | 10,823 | | | 96,000 |
ProAssurance Corp. (b) (e) | | 8,317 | | | 389,235 |
RLI Corp. | | 5,814 | | | 312,503 |
Safety Insurance Group, Inc. (e) | | 4,500 | | | 169,245 |
Selective Insurance Group, Inc. (e) | | 8,734 | | | 479,583 |
State Auto Financial Corp. | | 3,300 | | | 108,702 |
Stewart Information Services Corp. (e) | | 4,762 | | | 242,529 |
Tower Group, Inc. | | 7,100 | | | 136,817 |
Triad Guaranty, Inc. (b) (e) | | 2,434 | | | 102,374 |
U.S.I. Holdings Corp. (b) (e) | | 11,140 | | | 146,491 |
United Fire & Casualty Co. (e) | | 5,222 | | | 235,094 |
Zenith National Insurance Co. | | 8,152 | | | 367,003 |
| | | | |
|
|
| | | | | | 6,496,637 |
| | | | |
|
|
Insurance & Life (0.4%) | | | | | |
Delphi Financial Group, Inc. | | 8,546 | | | 400,294 |
Great American Financial Resources, Inc. | | 2,520 | | | 51,458 |
KMG America Corp. (b) | | 5,100 | | | 43,860 |
National Western Life Insurance Co., Class A | | 454 | | | 91,940 |
Phoenix Co., Inc. (The) (e) | | 27,676 | | | 358,404 |
Presidential Life Corp. | | 5,581 | | | 105,593 |
UICI | | 10,965 | | | 396,056 |
Universal American Financial Corp. (b) | | 8,700 | | | 128,760 |
| | | | |
|
|
| | | | | | 1,576,365 |
| | | | |
|
|
| | | | | |
| | | Shares or
Principal Amount | | Value |
| | | | | | |
Insurance Brokers (0.1%) | | | | | |
Crawford & Co., Class B (e) | | 6,920 | | $ | 48,578 |
Hilb, Rogal & Hamilton Co. (e) | | 8,989 | | | 336,638 |
| | | | |
|
|
| | | | | | 385,216 |
| | | | |
|
|
Internet (1.7%) | | | | | |
Alloy, Inc. (b) | | 10,833 | | | 49,832 |
Applied Digital Solutions, Inc. (b) | | 11,200 | | | 34,944 |
Arbinet Holdings, Inc. (b) | | 1,800 | | | 11,340 |
Ariba, Inc. (b) (e) | | 19,610 | | | 153,154 |
AsiaInfo Holdings, Inc. (b) (e) | | 14,503 | | | 55,982 |
Audible, Inc. (b) (e) | | 8,000 | | | 83,600 |
Autobytel, Inc. (b) (e) | | 11,607 | | | 51,187 |
Blue Coat Systems, Inc. (b) | | 3,695 | | | 173,628 |
Blue Nile, Inc. (b) (e) | | 5,068 | | | 181,789 |
Brocade Communications Systems, Inc. (b) | | 73,807 | | | 274,562 |
CMGI, Inc. (b) (e) | | 127,647 | | | 201,682 |
CNET Networks, Inc. (b) | | 39,691 | | | 539,401 |
Drugstore.com, Inc. (b) (e) | | 14,030 | | | 44,475 |
EarthLink, Inc. (b) | | 38,885 | | | 428,124 |
eCollege.com (b) (e) | | 6,765 | | | 107,631 |
Entrust, Inc. (b) | | 21,862 | | | 97,286 |
Equinix, Inc. (b) (e) | | 4,060 | | | 149,773 |
Harris Interactive, Inc. (b) | | 13,100 | | | 54,627 |
Internet Capital Group, Inc. (b) (e) | | 13,900 | | | 118,706 |
Internet Security, Inc. (b) (e) | | 10,907 | | | 268,639 |
Interwoven, Inc. (b) | | 12,261 | | | 115,253 |
iPass, Inc. (b) (e) | | 13,971 | | | 76,841 |
iVillage, Inc. (b) (e) | | 9,500 | | | 69,825 |
j2 Global Communications, Inc. (b) (e) | | 6,665 | | | 294,660 |
Jupitermedia Corp. (b) (e) | | 5,200 | | | 88,400 |
MatrixOne, Inc. (b) | | 15,209 | | | 76,653 |
Net.B@nk, Inc. | | 17,607 | | | 137,687 |
Netflix, Inc. (b) (e) | | 11,500 | | | 303,715 |
NIC, Inc. (b) | | 7,500 | | | 45,375 |
Nutri/System, Inc. (b) (e) | | 5,820 | | | 174,425 |
Openwave Systems, Inc. (b) (e) | | 19,579 | | | 349,877 |
Overstock.com, Inc. (b) (e) | | 3,700 | | | 123,321 |
Priceline.com, Inc. (b) (e) | | 7,499 | | | 142,256 |
Redback Networks, Inc. (b) | | 11,976 | | | 125,868 |
Statement of Investments (Continued)
October 31, 2005
Gartmore Small Cap Index Fund (Continued)
| | Common Stocks (continued) |
| | | | | |
| | | Shares or
Principal Amount | | Value |
| | | | | | |
Internet (continued) | | | | | |
RightNow Technologies, Inc. (b) (e) | | 5,200 | | $ | 79,144 |
S1 Corp. (b) (e) | | 20,778 | | | 91,215 |
Sohu.com, Inc. (b) | | 8,546 | | | 129,386 |
Stamps.com, Inc. (b) (e) | | 5,596 | | | 112,815 |
Stellent, Inc. (b) | | 8,260 | | | 75,744 |
SupportSoft, Inc. (b) (e) | | 12,100 | | | 48,521 |
Travelzoo, Inc. (b) (e) | | 960 | | | 17,875 |
TriZetto Group, Inc. (The) (b) | | 13,598 | | | 192,684 |
United Online, Inc. | | 15,970 | | | 214,158 |
ValueClick, Inc. (b) (e) | | 25,849 | | | 452,358 |
Websense, Inc. (b) (e) | | 7,275 | | | 429,807 |
| | | | |
|
|
| | | | | | 7,048,225 |
| | | | |
|
|
Lasers (0.1%) | | | | | |
IntraLase Corp. (b) (e) | | 5,400 | | | 83,484 |
Ionatron, Inc. (b) (e) | | 6,820 | | | 71,542 |
Metrologic Instruments, Inc. (b) | | 5,200 | | | 101,764 |
Rofin-Sinar Technologies, Inc. (b) | | 4,442 | | | 163,732 |
| | | | |
|
|
| | | | | | 420,522 |
| | | | |
|
|
Leisure Products (0.6%) | | | | | |
Alliance Gaming Corp. (b) (e) | | 14,422 | | | 155,902 |
Atari, Inc. (b) | | 6,140 | | | 7,982 |
Callaway Golf Co. | | 21,089 | | | 300,517 |
Coachmen Industries, Inc. (e) | | 5,280 | | | 62,885 |
Escala Group, Inc. (b) (e) | | 1,938 | | | 31,899 |
Escalade, Inc. | | 800 | | | 10,456 |
Great Wolf Resorts, Inc. (b) | | 9,500 | | | 83,600 |
JAKKS Pacific, Inc. (b) (e) | | 8,887 | | | 163,343 |
K2, Inc. (b) (e) | | 10,930 | | | 109,628 |
LIFE TIME FITNESS, Inc. (b) (e) | | 5,640 | | | 209,470 |
Marine Products Corp. (e) | | 1,826 | | | 17,420 |
MarineMax, Inc. (b) | | 3,300 | | | 81,510 |
Nautilus Group, Inc. (The) (e) | | 9,830 | | | 178,218 |
Party City Corp. (b) (e) | | 3,354 | | | 54,939 |
RC2 Corp. (b) | | 5,065 | | | 177,174 |
Speedway Motorsports, Inc. | | 3,500 | | | 124,110 |
Topps Co., Inc. (e) | | 13,827 | | | 100,661 |
Vail Resorts, Inc. (b) | | 7,508 | | | 251,518 |
WMS Industries, Inc. (b) | | 6,485 | | | 162,968 |
| | | | |
|
|
| | | | | | 2,284,200 |
| | | | |
|
|
| | | | | |
| | | Shares or
Principal Amount | | Value |
| | | | | | |
Machinery (1.5%) | | | | | |
Advanced Energy Industries, Inc. (b) | | 8,745 | | $ | 94,009 |
AGCO Corp. (b) | | 24,840 | | | 397,192 |
Alamo Group, Inc. | | 100 | | | 1,945 |
Albany International Corp., Class A | | 7,267 | | | 280,724 |
Applied Industrial Technologies, Inc. | | 8,875 | | | 292,431 |
Astec Industries, Inc. (b) | | 5,159 | | | 146,309 |
Baldor Electric Co. (e) | | 9,089 | | | 220,863 |
Blount International, Inc. (b) | | 6,800 | | | 107,848 |
Briggs & Stratton Corp. | | 16,680 | | | 533,426 |
Bucyrus International, Inc., Class A | | 5,981 | | | 248,511 |
Cascade Corp. | | 3,446 | | | 167,820 |
Cubic Corp. (e) | | 5,546 | | | 91,010 |
Flowserve Corp. (b) | | 16,375 | | | 573,125 |
Franklin Electric Co., Inc. | | 5,446 | | | 236,411 |
Gardner Denver, Inc. (b) | | 7,403 | | | 359,786 |
Gehl Co. (b) (e) | | 4,250 | | | 97,623 |
Gorman-Rupp (e) | | 1,175 | | | 27,378 |
Intermagnetics General Corp. (b) (e) | | 8,335 | | | 238,798 |
Intevac, Inc. (b) (e) | | 7,600 | | | 69,464 |
Kadant, Inc. (b) (e) | | 3,203 | | | 53,810 |
Lennox International, Inc. (e) | | 15,062 | | | 420,079 |
NACCO Industries, Inc. | | 1,122 | | | 130,275 |
Nordson Corp. | | 8,332 | | | 309,700 |
Photon Dynamics, Inc. (b) (e) | | 6,242 | | | 108,673 |
Sauer-Danfoss, Inc. | | 1,093 | | | 21,018 |
Stewart & Stevenson Services, Inc. | | 8,614 | | | 205,530 |
Tennant Co. | | 2,362 | | | 102,865 |
Turbochef Technologies, Inc. (b) (e) | | 4,900 | | | 66,640 |
UNOVA, Inc. (b) (e) | | 14,501 | | | 449,531 |
Wabtec Corp. | | 12,373 | | | 336,546 |
| | | | |
|
|
| | | | | | 6,389,340 |
| | | | |
|
|
Manufactured Housing (0.6%) | | | |
Aaon, Inc. (b) | | 1,100 | | | 18,920 |
Apogee Enterprises, Inc. | | 8,930 | | | 146,273 |
Eagle Materials, Inc. (e) | | 5,890 | | | 627,225 |
| | Common Stocks (continued) |
| | | | | |
| | | Shares or
Principal Amount | | Value |
| | | | | | |
Manufactured Housing (continued) | | | |
Fleetwood Enterprises, Inc. (b) (e) | | 17,161 | | $ | 189,629 |
Highwood Properties, Inc. | | 17,104 | | | 482,504 |
Levitt Corp., Class A | | 4,882 | | | 95,931 |
Monaco Coach Corp. (e) | | 7,739 | | | 94,958 |
Palm Harbor Homes, Inc. (b) (e) | | 3,741 | | | 68,947 |
Skyline Corp. | | 1,118 | | | 44,441 |
WCI Communities, Inc. (b) (e) | | 9,968 | | | 249,399 |
Winnebago Industries, Inc. (e) | | 9,618 | | | 282,000 |
| | | | |
|
|
| | | | | | 2,300,227 |
| | | | |
|
|
Manufacturing (1.1%) | | | | | |
American Superconductor Corp. (b) | | 11,636 | | | 95,532 |
Applied Films Corp. (b) | | 5,847 | | | 113,549 |
Armor Holdings, Inc. (b) (e) | | 11,226 | | | 501,913 |
Champion Enterprises, Inc. (b) (e) | | 22,384 | | | 310,690 |
Checkpoint Systems, Inc. (b) (e) | | 12,808 | | | 307,392 |
Cognex Corp. | | 12,279 | | | 350,934 |
Crane Co. | | 13,960 | | | 432,202 |
CSS Industries, Inc. (e) | | 1,505 | | | 51,366 |
Dixie Group, Inc. (The) (b) (e) | | 1,200 | | | 16,464 |
EnerSys (b) (e) | | 11,530 | | | 172,719 |
EnPro Industries, Inc. (b) | | 6,100 | | | 170,190 |
Freightcar America, Inc. | | 4,000 | | | 174,960 |
Identix, Inc. (b) (e) | | 31,125 | | | 137,884 |
Jacuzzi Brands, Inc. (b) (e) | | 26,386 | | | 194,729 |
Lincoln Electric Holdings, Inc. | | 12,046 | | | 476,660 |
Mine Safety Appliances Co. (e) | | 7,712 | | | 323,056 |
Myers Industries, Inc. | | 7,800 | | | 89,076 |
Powell Industries, Inc. (b) | | 1,769 | | | 37,096 |
Raven Industries, Inc. (e) | | 5,180 | | | 162,859 |
Reddy Ice Holdings, Inc. | | 3,500 | | | 76,230 |
Sturm, Ruger & Co., Inc. (e) | | 9,337 | | | 68,440 |
Valence Technology, Inc. (b) (e) | | 10,530 | | | 24,851 |
Woodward Governor Co. | | 2,540 | | | 202,946 |
Young Innovations, Inc. | | 500 | | | 16,140 |
| | | | |
|
|
| | | | | | 4,507,878 |
| | | | |
|
|
Manufacturing & Diversified (0.8%) | | | |
A.O. Smith Corp. | | 5,709 | | | 184,857 |
Acuity Brands, Inc. | | 13,151 | | | 365,729 |
| | | | | |
| | | Shares or
Principal Amount | | Value |
| | | | | | |
Manufacturing & Diversified (continued) | | | |
Barnes Group, Inc. | | 6,307 | | $ | 220,745 |
CLARCOR, Inc. (e) | | 16,194 | | | 445,335 |
ESCO Technologies, Inc. (b) | | 7,588 | | | 328,257 |
Federal Signal Corp. (e) | | 14,343 | | | 232,643 |
Global Power Equipment Group, Inc. (b) (e) | | 6,500 | | | 40,755 |
Griffon Corp. (b) | | 9,860 | | | 216,920 |
Imation Corp. | | 9,900 | | | 423,819 |
Lancaster Colony Corp. | | 8,302 | | | 332,827 |
Matthews International Corp., Class A | | 8,357 | | | 300,351 |
Standex International Corp. | | 3,654 | | | 98,731 |
Tredegar Industries, Inc. (e) | | 7,106 | | | 89,465 |
| | | | |
|
|
| | | | | | 3,280,434 |
| | | | |
|
|
Medical Equipment & Supplies (2.2%) | | | |
Abaxis, Inc. (b) (e) | | 5,600 | | | 96,320 |
Adeza Biomedical Corp. (b) | | 2,800 | | | 47,740 |
Advanced Neuromodulation Systems, Inc. (b) (e) | | 6,311 | | | 384,908 |
Allscripts Healthcare Solution, Inc. (b) (e) | | 11,494 | | | 183,904 |
Amicas, Inc. (b) | | 13,080 | | | 57,421 |
Animas Corp. (b) | | 3,510 | | | 57,740 |
Arrow International, Inc. | | 5,244 | | | 151,761 |
Aspect Medical Systems, Inc. (b) (e) | | 4,280 | | | 139,614 |
Bruker BioSciences Corp. (b) | | 4,913 | | | 20,438 |
Caliper Life Sciences, Inc. (b) | | 3,000 | | | 19,560 |
Candela Corp. (b) (e) | | 7,582 | | | 70,892 |
Cantel Medical Corp. (b) | | 2,100 | | | 40,635 |
Cepheid, Inc. (b) | | 12,500 | | | 79,250 |
CONMED Corp. (b) | | 10,029 | | | 240,495 |
Cyberonics, Inc. (b) | | 6,939 | | | 208,309 |
Durect Corp. (b) (e) | | 15,300 | | | 97,002 |
Encore Medical Corp. (b) (e) | | 10,474 | | | 52,475 |
EPIX Medical, Inc. (b) (e) | | 9,430 | | | 66,010 |
ev3, Inc. (b) | | 3,400 | | | 50,966 |
Foxhollow Technologies, Inc. (b) (e) | | 4,600 | | | 208,426 |
Greatbatch, Inc. (b) (e) | | 5,930 | | | 154,536 |
Healthtronics Surgical Services, Inc. (b) | | 11,500 | | | 104,535 |
Statement of Investments (Continued)
October 31, 2005
Gartmore Small Cap Index Fund (Continued)
| | Common Stocks (continued) |
| | | | | |
| | | Shares or
Principal Amount | | Value |
| | | | | | |
Medical Equipment & Supplies (continued) |
Hologic, Inc. (b) | | 6,660 | | $ | 369,364 |
I-Flow Corp. (b) (e) | | 7,469 | | | 90,151 |
ICU Medical, Inc. (b) | | 5,250 | | | 183,278 |
IDX Systems Corp. (b) | | 8,512 | | | 369,336 |
Intuitive Surgical, Inc. (b) (e) | | 10,657 | | | 945,595 |
Kensey Nash Corp. (b) | | 3,782 | | | 86,721 |
Kyphon, Inc. (b) (e) | | 8,782 | | | 352,070 |
Landauer, Inc. (e) | | 1,822 | | | 91,100 |
Laserscope (b) (e) | | 5,900 | | | 159,359 |
Lifeline Systems, Inc. (b) | | 3,301 | | | 108,933 |
Mannkind Corp. (b) | | 7,500 | | | 84,825 |
Mentor Corp. (e) | | 9,959 | | | 448,155 |
Meridian Bioscience, Inc. | | 6,750 | | | 141,345 |
Merit Medical Systems, Inc. (b) | | 7,432 | | | 88,589 |
Neurometrix, Inc. (b) (e) | | 2,900 | | | 107,967 |
Oakley, Inc. (e) | | 6,823 | | | 100,980 |
OraSure Technologies, Inc. (b) | | 15,173 | | | 167,055 |
PSS World Medical, Inc. (b) | | 21,176 | | | 294,982 |
Radiation Therapy Services, Inc. (b) (e) | | 3,900 | | | 117,156 |
Serologicals Corp. (b) (e) | | 11,469 | | | 223,416 |
Somanetics Corp. (b) | | 4,100 | | | 125,132 |
Stereotaxis, Inc. (b) (e) | | 400 | | | 2,840 |
STERIS Corp. | | 20,000 | | | 456,200 |
Surmodics, Inc. (b) (e) | | 5,323 | | | 210,365 |
Sybron Dental Specialties, Inc. (b) | | 11,852 | | | 508,450 |
Symmetry Medical, Inc. (b) | | 2,300 | | | 50,922 |
ThermoGenesis Corp. (b) | | 8,105 | | | 40,363 |
Viasys Healthcare, Inc. (b) | | 8,825 | | | 210,829 |
Vital Images, Inc. (b) (e) | | 5,000 | | | 116,250 |
Vital Signs, Inc. | | 1,430 | | | 67,181 |
WellCare Health Plans, Inc. (b) (e) | | 4,750 | | | 149,625 |
Wright Medical Group, Inc. (b) (e) | | 9,952 | | | 185,207 |
Zoll Medical Corp. (b) | | 3,846 | | | 95,458 |
| | | | |
|
|
| | | | | | 9,282,136 |
| | | | |
|
|
Medical Laboratories (0.2%) | | | | | |
Alliance Imaging, Inc. (b) (e) | | 1,600 | | | 11,056 |
Applera Corp. - Celera Genomics Group (b) | | 21,873 | | | 259,851 |
| | | | | |
| | | Shares or
Principal Amount | | Value |
| | | | | | |
Medical Laboratories (continued) | | | |
Bio-Reference Laboratories, Inc. (b) | | 3,600 | | $ | 68,256 |
Discovery Laboratories, Inc. (b) | | 17,240 | | | 121,370 |
LabOne, Inc. (b) (e) | | 5,839 | | | 256,157 |
Orchid Cellmark, Inc. (b) (e) | | 4,900 | | | 28,812 |
Specialty Laboratories, Inc. (b) | | 376 | | | 4,873 |
| | | | |
|
|
| | | | | | 750,375 |
| | | | |
|
|
Metal Processors (0.7%) | | | | | |
A.M. Castle & Co. (b) | | 1,100 | | | 21,923 |
Commercial Metals Co. | | 17,892 | | | 568,786 |
Dynamic Materials Corp. (e) | | 2,400 | | | 49,968 |
Earle M. Jorgensen Co. (b) | | 2,200 | | | 18,656 |
Kaydon Corp. (e) | | 9,248 | | | 273,278 |
Metal Management, Inc. (e) | | 7,500 | | | 181,575 |
Metals USA, Inc. (b) (e) | | 6,800 | | | 141,304 |
Mueller Industries, Inc. | | 10,825 | | | 298,121 |
NN, Inc. | | 7,585 | | | 79,567 |
Quanex Corp. (e) | | 7,500 | | | 434,325 |
RBC Bearings, Inc. (b) | | 3,000 | | | 46,860 |
Steel Technologies, Inc. (e) | | 4,760 | | | 124,760 |
Sun Hydraulics Corp. (e) | | 2,850 | | | 63,156 |
Valmont Industries, Inc. (e) | | 3,400 | | | 110,738 |
Worthington Industries, Inc. (e) | | 18,300 | | | 368,196 |
| | | | |
|
|
| | | | | | 2,781,213 |
| | | | |
|
|
Metals (0.5%) | | | | | |
Brush Engineered Materials, Inc. (b) | | 5,436 | | | 81,975 |
Century Aluminum Co. (b) | | 6,727 | | | 122,297 |
Cleveland-Cliffs, Inc. (e) | | 6,594 | | | 537,674 |
Coeur d’Alene Mines Corp. (b) | | 74,315 | | | 280,167 |
Compass Minerals International, Inc. | | 4,000 | | | 89,560 |
Gibraltar Industries, Inc. | | 7,778 | | | 157,505 |
Hecla Mining Co. (b) (e) | | 42,218 | | | 142,275 |
RTI International Metals, Inc. (b) | | 7,435 | | | 249,221 |
Stepan Co. | | 700 | | | 17,920 |
Stillwater Mining Co. (b) (e) | | 9,835 | | | 99,334 |
Titanium Metals Corp. (b) (e) | | 2,536 | | | 119,699 |
USEC, Inc. (e) | | 24,078 | | | 240,780 |
| | | | |
|
|
| | | | | | 2,138,407 |
| | | | |
|
|
| | Common Stocks (continued) |
| | | | | |
| | | Shares or
Principal Amount | | Value |
| | | | | | |
Natural Gas (0.2%) | | | | | |
EnergySouth, Inc. | | 2,200 | | $ | 62,590 |
Laclede Group, Inc. (The) (e) | | 6,200 | | | 185,380 |
St. Mary Land & Exploration Co. (e) | | 16,966 | | | 577,014 |
Syntroleum Corp. (b) (e) | | 13,108 | | | 93,722 |
| | | | |
|
|
| | | | | | 918,706 |
| | | | |
|
|
Office Equipment & Supplies (0.4%) | | | |
Ennis Business Forms, Inc. (e) | | 9,300 | | | 159,030 |
Global Imaging Systems, Inc. (b) (e) | | 8,044 | | | 286,447 |
IKON Office Solutions, Inc. | | 30,480 | | | 304,190 |
Interface, Inc. (b) | | 13,455 | | | 103,873 |
John H. Harland Co. | | 9,234 | | | 384,042 |
Knoll, Inc. | | 3,000 | | | 47,790 |
School Specialty, Inc. (b) (e) | | 7,288 | | | 247,063 |
Standard Register Co. | | 5,051 | | | 76,775 |
TRM Corp. (b) (e) | | 4,400 | | | 59,444 |
| | | | |
|
|
| | | | | | 1,668,654 |
| | | | |
|
|
Oil & Gas (3.3%) | | | | | |
Alon USA Energy, Inc. (b) | | 3,700 | | | 72,150 |
Atlas America, Inc. (b) | | 3,440 | | | 160,304 |
ATP Oil & Gas Corp. (b) (e) | | 5,300 | | | 168,169 |
Atwood Oceanics, Inc. (b) | | 4,243 | | | 298,792 |
Berry Petroleum Co. | | 4,880 | | | 292,117 |
Bill Barrett Corp. (b) | | 3,600 | | | 114,588 |
Bois d’Arc Energy, Inc. (b) (e) | | 1,300 | | | 18,798 |
Brigham Exploration Co. (b) | | 9,102 | | | 128,702 |
Bronco Drilling Co., Inc. (b) | | 1,800 | | | 43,632 |
Cabot Oil & Gas Corp. (e) | | 15,349 | | | 702,831 |
Cal Dive International, Inc. (b) (e) | | 12,165 | | | 748,634 |
Callon Petroleum Co. (b) | | 4,600 | | | 84,180 |
Carrizo Oil & Gas, Inc. (b) (e) | | 7,080 | | | 183,655 |
Cheniere Energy, Inc. (b) | | 13,700 | | | 510,051 |
Cimarex Energy Co. (b) | | 24,740 | | | 971,291 |
Clayton Williams Energy, Inc. (b) | | 1,500 | | | 56,820 |
Comstock Resources, Inc. (b) | | 11,756 | | | 353,973 |
Crosstex Energy, Inc. | | 1,500 | | | 99,315 |
Delta Petroleum Corp. (b) (e) | | 10,600 | | | 186,984 |
Edge Petroleum Corp. (b) (e) | | 6,846 | | | 165,879 |
| | | | | |
| | | Shares or
Principal Amount | | Value |
| | | | | | |
Oil & Gas (continued) | | | | | |
Encore Acquisition Co. (b) | | 13,470 | | $ | 462,156 |
Endeavour International Corp. (b) (e) | | 9,300 | | | 36,363 |
Energy Partners Ltd. (b) | | 9,480 | | | 240,508 |
FX Energy, Inc. (b) (e) | | 11,937 | | | 125,816 |
Gasco Energy, Inc. (b) (e) | | 14,400 | | | 87,552 |
Giant Industries, Inc. (b) (e) | | 4,600 | | | 263,074 |
Goodrich Petroleum Corp. (b) (e) | | 4,100 | | | 91,430 |
Grey Wolf, Inc. (b) | | 54,917 | | | 421,763 |
Hanover Compressor Co. (b) | | 24,470 | | | 314,684 |
Harvest Natural Resources, Inc. (b) (e) | | 13,465 | | | 130,341 |
Houston Exploration Co. (The) (b) | | 9,043 | | | 466,167 |
KCS Energy, Inc. (b) (e) | | 14,731 | | | 355,312 |
Lufkin Industries, Inc. | | 4,704 | | | 218,736 |
McMoRan Exploration Co. (b) (e) | | 6,507 | | | 110,424 |
Meridian Resource Corp. (The) (b) | | 25,600 | | | 115,968 |
Newpark Resources, Inc. (b) (e) | | 24,984 | | | 202,370 |
Oceaneering International, Inc. (b) | | 8,502 | | | 409,116 |
Parallel Petroleum Corp. (b) | | 11,700 | | | 154,791 |
Parker Drilling Co. (b) (e) | | 28,277 | | | 249,969 |
Penn Virginia Corp. (e) | | 4,760 | | | 258,754 |
Petrohawk Energy Corp. (b) | | 17,955 | | | 221,924 |
Petroleum Development Corp. (b) | | 5,856 | | | 196,644 |
Petroquest Energy, Inc. (b) (e) | | 15,200 | | | 147,592 |
Remington Oil & Gas Corp. (b) (e) | | 6,980 | | | 244,300 |
RPC, Inc. | | 4,401 | | | 120,851 |
Spinnaker Exploration Co. (b) (e) | | 8,110 | | | 499,414 |
Stone Energy Corp. (b) | | 7,784 | | | 357,286 |
Swift Energy Co. (b) (e) | | 8,420 | | | 367,617 |
Todco, Class A | | 15,160 | | | 678,410 |
Toreador Resources Corp. (b) (e) | | 5,000 | | | 137,650 |
Tri-Valley Corp. (b) (e) | | 4,500 | | | 37,035 |
W&T Offshore, Inc. | | 3,500 | | | 102,200 |
Warren Resources, Inc. (b) (e) | | 7,140 | | | 110,456 |
Whiting Petroleum Corp. (b) | | 7,920 | | | 321,156 |
World Fuel Services Corp. | | 8,620 | | | 274,978 |
| | | | |
|
|
| | | | | | 13,893,672 |
| | | | |
|
|
Statement of Investments (Continued)
October 31, 2005
Gartmore Small Cap Index Fund (Continued)
| | Common Stocks (continued) |
| | | | | |
| | | Shares or
Principal Amount | | Value |
| | | | | | |
Oil Equipment & Services (1.1%) | | | |
CARBO Ceramics, Inc. (e) | | 5,424 | | $ | 320,884 |
Dril-Quip, Inc. (b) | | 3,213 | | | 131,412 |
Frontier Oil Corp. | | 17,042 | | | 628,508 |
Global Industries Ltd. (b) | | 26,948 | | | 342,509 |
Holly Corp. | | 6,486 | | | 373,594 |
Hydril Co. (b) | | 6,410 | | | 425,239 |
Lone Star Technologies, Inc. (b) | | 8,734 | | | 399,581 |
Pioneer Drilling Co. (b) | | 3,300 | | | 56,529 |
SEACOR SMIT, Inc. (b) | | 5,749 | | | 411,801 |
SJW Corp. | | 1,200 | | | 58,704 |
Superior Energy Services, Inc. (b) | | 22,133 | | | 451,071 |
TETRA Technologies, Inc. (b) (e) | | 10,062 | | | 281,434 |
Veritas DGC, Inc. (b) | | 9,960 | | | 320,812 |
W-H Energy Services, Inc. (b) | | 8,200 | | | 248,460 |
WD-40 Co. | | 5,127 | | | 141,146 |
| | | | |
|
|
| | | | | | 4,591,684 |
| | | | |
|
|
Oil Field Machinery & Equipment (0.2%) |
Gulf Island Fabrication, Inc. | | 3,887 | | | 104,016 |
Oil States International, Inc. (b) | | 13,230 | | | 437,913 |
Superior Well Services, Inc. (b) | | 2,200 | | | 51,414 |
Universal Compression Holdings, Inc. (b) | | 4,268 | | | 152,154 |
| | | | |
|
|
| | | | | | 745,497 |
| | | | |
|
|
Paper & Forest Products (0.6%) | | | |
Bowater, Inc. (e) | | 15,700 | | | 416,050 |
Buckeye Technologies, Inc. (b) | | 5,690 | | | 42,675 |
Caraustar Industries, Inc. (b) (e) | | 8,524 | | | 74,415 |
Chesapeake Corp. (e) | | 4,370 | | | 88,012 |
Deltic Timber Corp. | | 2,956 | | | 135,976 |
Glatfelter & Co. | | 9,865 | | | 134,065 |
Graphic Packaging Corp. (b) | | 14,200 | | | 37,630 |
Longview Fibre Co. | | 15,100 | | | 283,880 |
Mercer International, Inc. (b) | | 7,920 | | | 61,776 |
Neenah Paper, Inc. (e) | | 5,200 | | | 151,060 |
Potlatch Corp. | | 9,457 | | | 423,011 |
Rock-Tenn Co. | | 6,143 | | | 85,203 |
Schweitzer-Mauduit International, Inc. | | 4,742 | | | 114,851 |
Universal Forest Products, Inc. | | 5,146 | | | 284,780 |
Wausau-Mosinee Paper Corp. | | 12,847 | | | 140,675 |
Xerium Technologies, Inc. | | 800 | | | 8,360 |
| | | | |
|
|
| | | | | | 2,482,419 |
| | | | |
|
|
| | | | | |
| | | Shares or
Principal Amount | | Value |
| | | | | | |
Pharmaceuticals (2.4%) | | | | | |
Aastrom Biosciences, Inc. (b) (e) | | 36,000 | | $ | 82,440 |
Acadia Pharmaceuticals, Inc. (b) | | 1,600 | | | 16,800 |
Adams Respiratory Therapeutics, Inc. (b) | | 2,800 | | | 104,720 |
Alexion Pharmaceuticals, Inc. (b) (e) | | 9,929 | | | 271,955 |
American Pharmaceutical Partners, Inc. (b) | | 1 | | | 43 |
Andrx Corp (b) | | 22,960 | | | 355,191 |
Array BioPharma, Inc. (b) | | 5,100 | | | 36,210 |
AtheroGenics, Inc. (b) (e) | | 11,134 | | | 167,010 |
AVANIR Pharmaceuticals (b) | | 22,400 | | | 69,216 |
Barrier Therapeutics, Inc. (b) (e) | | 2,600 | | | 18,720 |
Bioenvision, Inc. (b) | | 8,300 | | | 50,879 |
BioMarin Pharmaceutical, Inc. (b) (e) | | 21,368 | | | 179,491 |
BioScrip, Inc. (b) (e) | | 6,400 | | | 38,400 |
Cell Genesys, Inc. (b) (e) | | 16,092 | | | 86,736 |
Conor Medsystems, Inc. (b) (e) | | 2,300 | | | 51,612 |
Cubist Pharmaceuticals, Inc. (b) (e) | | 15,750 | | | 318,308 |
Dendreon Corp. (b) (e) | | 17,578 | | | 108,280 |
DOV Pharmaceutical, Inc. (b) (e) | | 7,720 | | | 119,892 |
Encysive Pharmaceuticals, Inc. (b) | | 17,977 | | | 188,759 |
Enzon, Inc. (b) | | 15,700 | | | 110,057 |
Eyetech Pharmaceuticals, Inc. (b) | | 11,300 | | | 199,332 |
First Horizon Pharmaceutical Corp. (b) (e) | | 8,100 | | | 116,883 |
Geron Corp. (b) (e) | | 18,817 | | | 169,918 |
ICOS Corp. (b) (e) | | 20,300 | | | 547,694 |
ImmunoGen, Inc. (b) (e) | | 12,138 | | | 67,973 |
Inspire Pharmaceuticals, Inc. (b) | | 12,469 | | | 78,555 |
Inter Parfums, Inc. | | 1,800 | | | 27,270 |
Introgen Therapeutics, Inc. (b) (e) | | 8,800 | | | 45,496 |
Isis Pharmaceuticals, Inc. (b) (e) | | 21,480 | | | 93,223 |
Ista Pharmaceuticals, Inc. (b) | | 1,973 | | | 12,193 |
Keryx Biopharmaceuticals, Inc. (b) (e) | | 8,136 | | | 117,565 |
LifeCell Corp. (b) (e) | | 10,240 | | | 165,888 |
Mannatech, Inc. (e) | | 4,500 | | | 41,400 |
| | Common Stocks (continued) |
| | | | | |
| | | Shares or
Principal Amount | | Value |
| | | | | | |
Pharmaceuticals (continued) | | | | | |
Medical Co. (b) (e) | | 16,279 | | $ | 279,022 |
Medicis Pharmaceutical Corp. (e) | | 15,160 | | | 447,220 |
Momenta Pharmaceuticals, Inc. (b) | | 3,500 | | | 75,355 |
Nastech Pharmaceutical Co., Inc. (b) (e) | | 6,800 | | | 90,712 |
Nektar Therapeutic (b) | | 25,140 | | | 378,608 |
NeoPharm, Inc. (b) (e) | | 6,715 | | | 64,531 |
Neurocrine Biosciences, Inc. (b) (e) | | 11,580 | | | 611,656 |
New River Pharmaceuticals, Inc. (b) (e) | | 1,100 | | | 52,349 |
NitroMed, Inc. (b) (e) | | 3,580 | | | 58,247 |
Northfield Laboratories, Inc. (b) | | 6,600 | | | 82,104 |
Noven Pharmaceuticals, Inc. (b) (e) | | 7,000 | | | 98,630 |
Nuvelo, Inc. (b) (e) | | 11,623 | | | 97,633 |
Onyx Pharmaceuticals, Inc. (b) (e) | | 10,675 | | | 274,241 |
Pain Therapeutics, Inc. (b) (e) | | 7,810 | | | 45,220 |
PainCare Holdings, Inc. (b) | | 7,400 | | | 26,566 |
Parexel International Corp. (b) | | 8,371 | | | 183,157 |
Penwest Pharmaceuticals Co. (b) | | 8,090 | | | 128,307 |
Perrigo Co. (e) | | 26,731 | | | 357,393 |
Pharmion Corp. (b) (e) | | 6,280 | | | 118,629 |
POZEN, Inc. (b) (e) | | 7,150 | | | 69,713 |
PRA International (b) | | 2,100 | | | 55,776 |
Progenics Pharmaceuticals, Inc. (b) | | 4,200 | | | 98,868 |
Regeneron Pharmaceuticals, Inc. (b) (e) | | 9,117 | | | 114,054 |
Renovis, Inc. (b) (e) | | 6,900 | | | 96,807 |
Salix Pharmaceuticals, Inc. (b) (e) | | 13,280 | | | 238,243 |
Savient Pharmaceuticals, Inc. (b) | | 22,900 | | | 85,875 |
SuperGen, Inc. (b) (e) | | 16,134 | | | 91,157 |
Telik, Inc. (b) (e) | | 16,006 | | | 239,130 |
Tercica, Inc. (b) | | 2,700 | | | 26,973 |
United Therapeutics Corp. (b) (e) | | 7,267 | | | 536,741 |
Vertex Pharmaceuticals, Inc. (b) (e) | | 29,484 | | | 670,760 |
| | | | |
|
|
| | | | | | 9,851,786 |
| | | | |
|
|
| | | | | |
| | | Shares or
Principal Amount | | Value |
| | | | | | |
Pipelines (0.1%) | | | | | |
Aquila, Inc. (b) (e) | | 110,520 | | $ | 391,241 |
TransMontaigne, Inc. (b) | | 13,354 | | | 74,115 |
| | | | |
|
|
| | | | | | 465,356 |
| | | | |
|
|
Pollution Control (0.3%) | | | | | |
Aleris International, Inc. (b) | | 8,000 | | | 207,680 |
Calgon Carbon Corp. (e) | | 14,648 | | | 79,832 |
Casella Waste Systems, Inc., Class A (b) | | 5,447 | | | 69,286 |
Clean Harbors, Inc. (b) | | 5,100 | | | 172,890 |
Duratek, Inc. (b) (e) | | 4,323 | | | 61,689 |
Flanders Corp. (b) (e) | | 5,080 | | | 55,524 |
Waste Connections, Inc. (b) | | 14,736 | | | 491,740 |
| | | | |
|
|
| | | | | | 1,138,641 |
| | | | |
|
|
Printing & Publishing (0.6%) | | | | | |
Banta Corp. | | 7,407 | | | 372,868 |
Bowne & Co., Inc. (e) | | 11,888 | | | 169,047 |
Cenveo, Inc. (b) | | 14,200 | | | 140,296 |
Courier Corp. | | 1,650 | | | 54,038 |
Hollinger International, Inc. | | 16,754 | | | 146,933 |
Journal Register Co. | | 9,561 | | | 153,263 |
Playboy Enterprises, Inc. (b) | | 5,834 | | | 88,327 |
Presstek, Inc. (b) (e) | | 10,685 | | | 109,521 |
PRIMEDIA, Inc. (b) (e) | | 42,400 | | | 89,040 |
ProQuest Co. (b) (e) | | 7,379 | | | 218,787 |
Scholastic Corp. (b) (e) | | 10,962 | | | 356,813 |
Thomas Nelson, Inc. | | 3,440 | | | 73,650 |
Valassis Communications, Inc. (b) | | 15,100 | | | 471,876 |
| | | | |
|
|
| | | | | | 2,444,459 |
| | | | |
|
|
Radio (0.3%) | | | | | |
Beasley Broadcast Group, Inc. (b) | | 1,330 | | | 19,378 |
Citadel Broadcasting Co. (b) (e) | | 9,700 | | | 133,666 |
Cox Radio, Inc. (b) (e) | | 8,200 | | | 117,260 |
Entercom Communications Corp. (b) | | 9,100 | | | 262,717 |
Radio One, Inc. (b) (e) | | 28,060 | | | 331,108 |
Saga Communications, Inc. (b) | | 4,025 | | | 50,675 |
Spanish Broadcasting System, Inc. (b) | | 14,379 | | | 87,712 |
WorldSpace, Inc., Class A (b) | | 4,100 | | | 53,464 |
| | | | |
|
|
| | | | | | 1,055,980 |
| | | | |
|
|
Statement of Investments (Continued)
October 31, 2005
Gartmore Small Cap Index Fund (Continued)
| | Common Stocks (continued) |
| | | | | |
| | | Shares or
Principal Amount | | Value |
| | | | | | |
Railroads (0.1%) | | | | | |
Florida East Coast Industries, Inc. (e) | | 8,560 | | $ | 373,130 |
| | | | |
|
|
Real Estate (0.3%) | | | | | |
Avatar Holdings, Inc. (b) (e) | | 1,592 | | | 90,187 |
California Coastal Communities, Inc. (b) | | 1,100 | | | 39,270 |
Consolidated-Tomoka Land Co. | | 1,580 | | | 94,073 |
Getty Realty Corp. (e) | | 4,135 | | | 112,679 |
Jones Lang LaSalle, Inc. | | 10,062 | | | 505,917 |
Tarragon Realty Investors, Inc. (b) | | 1,687 | | | 31,648 |
Trammell Crow Co. (b) | | 8,774 | | | 224,351 |
| | | | |
|
|
| | | | | | 1,098,125 |
| | | | |
|
|
Real Estate Investment Trusts (5.1%) | | | |
Aames Investment Corp. | | 11,400 | | | 68,286 |
Acadia Realty Trust | | 9,999 | | | 189,981 |
Affordable Residential Communities | | 10,900 | | | 108,891 |
Agree Realty Corp. | | 800 | | | 21,560 |
Alexandria Real Estate Equities, Inc. | | 6,931 | | | 560,371 |
American Campus Communities, Inc. | | 4,150 | | | 102,713 |
American Home Mortgage Investment Corp. (e) | | 9,355 | | | 252,866 |
Amli Residential Properties Trust (e) | | 7,501 | | | 283,913 |
Anthracite Capital, Inc. (e) | | 17,251 | | | 180,963 |
Arbor Realty Trust, Inc. (e) | | 3,780 | | | 99,641 |
Ashford Hospitality Trust | | 13,700 | | | 143,850 |
Bedford Property Investors, Inc. | | 6,250 | | | 140,313 |
Bimini Mortgage Management, Inc., Class A | | 7,480 | | | 74,052 |
BioMed Realty Trust, Inc. | | 11,638 | | | 291,066 |
Bluegreen Corp. (b) (e) | | 4,500 | | | 68,265 |
Boykin Lodging Co. (b) | | 8,200 | | | 90,446 |
Brandywine Realty Trust | | 18,086 | | | 495,556 |
Capital Automotive | | 12,466 | | | 481,437 |
Capital Lease Funding, Inc. | | 10,500 | | | 103,110 |
Capital Trust, Inc., Class A | | 2,108 | | | 64,547 |
Cedar Shopping Centers, Inc. | | 8,900 | | | 124,778 |
Colonial Properties Trust | | 11,912 | | | 520,674 |
| | | | | |
| | | Shares or
Principal Amount | | Value |
| | | | | | |
Real Estate Investment Trusts (continued) |
Columbia Equity Trust, Inc. | | 4,900 | | $ | 71,883 |
Commercial Net Lease Realty (e) | | 14,105 | | | 273,355 |
Corporate Office Properties Trust | | 8,090 | | | 281,208 |
Correctional Properties Trust | | 2,700 | | | 75,870 |
Corrections Corporation of America (b) (e) | | 10,925 | | | 435,689 |
Cousins Properties, Inc. | | 10,902 | | | 322,045 |
CRIIMI MAC, Inc. (b) | | 2,600 | | | 50,934 |
Deerfield Triarc Capital Corp. (b) | | 8,900 | | | 115,433 |
DiamondRock Hospitality Co. | | 10,500 | | | 117,075 |
Digital Reality Trust, Inc. | | 4,900 | | | 93,982 |
EastGroup Properties, Inc. | | 7,110 | | | 310,707 |
ECC Capital Corp. | | 16,000 | | | 42,080 |
Education Realty Trust, Inc. | | 6,200 | | | 96,100 |
Entertainment Properties Trust | | 7,614 | | | 305,321 |
Equity Inns, Inc. | | 16,036 | | | 209,109 |
Equity Lifestyle Properties, Inc. | | 5,736 | | | 242,805 |
Equity One, Inc. (e) | | 8,835 | | | 207,181 |
Extra Space Storage, Inc. (e) | | 7,790 | | | 113,734 |
FelCor Lodging Trust, Inc. (b) (e) | | 14,800 | | | 220,816 |
Fieldstone Investment Co. (e) | | 13,700 | | | 139,877 |
First Industrial Realty Trust, Inc. (e) | | 13,802 | | | 560,775 |
First Potomac Realty Trust | | 4,700 | | | 119,098 |
Glenborough Realty Trust, Inc. | | 11,594 | | | 221,793 |
Glimcher Realty Trust | | 11,378 | | | 261,353 |
GMH Communities Trust | | 8,900 | | | 133,233 |
Government Properties Trust, Inc. (e) | | 10,180 | | | 92,434 |
Gramercy Capital Corp. | | 3,700 | | | 87,283 |
Heritage Property Investment | | 8,853 | | | 288,608 |
Hersha Hospitality Trust | | 9,800 | | | 96,040 |
Highland Hospitality Corp. | | 7,500 | | | 78,825 |
Home Properties of New York, Inc. | | 10,465 | | | 406,565 |
Impac Mortgage Holdings, Inc. (e) | | 22,228 | | | 223,169 |
Inland Real Estate Corp. (e) | | 17,140 | | | 244,245 |
Innkeepers USA Trust | | 11,061 | | | 172,552 |
Investors Real Estate Trust (e) | | 13,197 | | | 123,128 |
Jer Investors Trust, Inc. | | 4,300 | | | 73,315 |
| | Common Stocks (continued) |
| | | | | |
| | | Shares or
Principal Amount | | Value |
| | | | | | |
Real Estate Investment Trusts (continued) |
Kilroy Realty Corp. | | 9,261 | | $ | 520,005 |
Kite Realty Group Trust | | 5,269 | | | 77,876 |
La Quinta Corp. (b) | | 53,867 | | | 449,789 |
LaSalle Hotel Properties (e) | | 8,796 | | | 311,290 |
Lexington Corporate Properties Trust (e) | | 13,685 | | | 298,059 |
LTC Properties, Inc. | | 4,640 | | | 95,074 |
Luminent Mortgage Capital, Inc. (e) | | 16,057 | | | 112,078 |
Maguire Properties, Inc. | | 10,735 | | | 322,050 |
Medical Properties Trust, Inc. (e) | | 4,500 | | | 40,230 |
MeriStar Hospitality Corp. (b) (e) | | 23,409 | | | 202,956 |
MFA Mortgage Investments, Inc. | | 24,274 | | | 139,576 |
Mid-America Apartment Communities, Inc. (e) | | 5,992 | | | 279,527 |
MortgageIT Holdings, Inc. | | 4,485 | | | 56,870 |
National Health Investors, Inc. | | 6,437 | | | 172,833 |
Nationwide Health Properties, Inc. | | 21,269 | | | 493,228 |
Newcastle Investment Corp. (e) | | 11,677 | | | 306,988 |
Northstar Realty Finance Corp. | | 1,800 | | | 17,028 |
Omega Healthcare Investors, Inc. | | 15,100 | | | 185,579 |
One Liberty Properties Inc. | | 400 | | | 7,500 |
Origen Financial, Inc. | | 4,900 | | | 35,133 |
Parkway Properties, Inc. (e) | | 4,902 | | | 230,443 |
Pennsylvania Real Estate Investment Trust | | 11,867 | | | 456,880 |
Post Properties, Inc. (e) | | 12,876 | | | 525,341 |
Prentiss Properties Trust | | 14,491 | | | 571,814 |
PS Business Parks, Inc. | | 3,945 | | | 183,600 |
Rait Investment Trust | | 8,168 | | | 216,942 |
Ramco-Gershenson Properties Trust | | 3,939 | | | 109,268 |
Redwood Trust, Inc. (e) | | 5,820 | | | 270,921 |
Saul Centers, Inc. | | 3,245 | | | 113,575 |
Saxon Capital, Inc. (e) | | 14,000 | | | 139,300 |
Senior Housing Properties Trust (e) | | 15,362 | | | 272,061 |
Sizeler Property Investors | | 5,225 | | | 60,715 |
Sovran Self Storage, Inc. | | 5,701 | | | 265,268 |
| | | | | |
| | | Shares or
Principal Amount | | Value |
| | | | | | |
Real Estate Investment Trusts (continued) |
Spirit Finance Corp. | | 18,900 | | $ | 212,058 |
Strategic Hotel Capital, Inc. | | 14,652 | | | 248,937 |
Sun Communities, Inc. (e) | | 6,110 | | | 186,233 |
Sunstone Hotel Investors, Inc. | | 9,060 | | | 202,944 |
Tanger Factory Outlet Centers, Inc. (e) | | 8,222 | | | 221,090 |
Taubman Centers, Inc. | | 14,837 | | | 489,176 |
Town & Country Trust (e) | | 6,253 | | | 185,089 |
Trustreet Properties, Inc. (e) | | 16,227 | | | 243,892 |
U-Store-It Trust | | 8,000 | | | 166,880 |
Universal Health Realty Income Trust (e) | | 4,473 | | | 145,596 |
Urstadt Biddle Properties, Inc., Class A | | 5,980 | | | 99,148 |
Washington Real Estate Investment Trust (e) | | 11,329 | | | 338,171 |
Winston Hotels, Inc. | | 9,145 | | | 94,285 |
| | | | |
|
|
| | | | | | 21,748,195 |
| | | | |
|
|
Recreational Vehicles & Boats (0.1%) | | | |
Arctic Cat, Inc. | | 5,778 | | | 108,222 |
Thor Industries, Inc. (e) | | 10,228 | | | 333,740 |
| | | | |
|
|
| | | | | | 441,962 |
| | | | |
|
|
Research & Development (0.3%) | | | |
Albany Molecular Research, Inc. (b) | | 8,885 | | | 119,059 |
Antigenics, Inc. (b) (e) | | 8,550 | | | 44,204 |
Biosite, Inc. (b) (e) | | 5,571 | | | 307,686 |
Exponet, Inc. (b) (e) | | 2,100 | | | 60,522 |
Forrester Research, Inc. (b) | | 3,581 | | | 68,970 |
MGI PHARMA, Inc. (b) (e) | | 22,560 | | | 423,226 |
Neurogen Corp. (b) (e) | | 3,800 | | | 26,942 |
Senomyx, Inc. (b) (e) | | 4,600 | | | 65,550 |
Trimeris, Inc. (b) (e) | | 6,368 | | | 81,128 |
| | | | |
|
|
| | | | | | 1,197,287 |
| | | | |
|
|
Residential Building Construction (0.3%) |
Ameron International Corp. (e) | | 3,500 | | | 149,625 |
Beacon Roofing Supply, Inc. (b) | | 3,840 | | | 104,678 |
BlueLinx Holdings, Inc. | | 3,580 | | | 43,461 |
Design Within Reach, Inc. (b) | | 6,543 | | | 52,802 |
Dycom Industries, Inc. (b) (e) | | 15,396 | | | 306,842 |
Statement of Investments (Continued)
October 31, 2005
Gartmore Small Cap Index Fund (Continued)
| | Common Stocks (continued) |
| | | | | |
| | | Shares or
Principal Amount | | Value |
| | | | | | |
Residential Building Construction (continued) |
Insituform Technologies, Inc. (b) (e) | | 9,382 | | $ | 168,501 |
M/I Schottenstein Homes, Inc. (e) | | 4,292 | | | 192,711 |
William Lyon Homes (b) | | 1,035 | | | 123,010 |
| | | | |
|
|
| | | | | | 1,141,630 |
| | | | |
|
|
Restaurants (1.0%) | | | | | |
AFC Enterprises, Inc. | | 8,100 | | | 93,960 |
BJ’s Restaurants, Inc. (b) (e) | | 2,700 | | | 58,590 |
Bob Evans Farms, Inc. (e) | | 12,184 | | | 273,043 |
Buffalo Wild Wings, Inc. (b) | | 2,900 | | | 79,576 |
California Pizza Kitchen, Inc. (b) | | 7,120 | | | 227,911 |
CKE Restaurants, Inc. (e) | | 14,762 | | | 187,773 |
Dave & Buster’s, Inc. (b) (e) | | 4,700 | | | 63,826 |
Denny’s Corp. (b) (e) | | 26,500 | | | 106,000 |
Domino’s Pizza, Inc. | | 7,600 | | | 181,792 |
IHOP Corp. (e) | | 6,360 | | | 300,319 |
Jack in the Box, Inc. (b) | | 10,805 | | | 320,909 |
Landry’s Restaurants, Inc. (e) | | 5,814 | | | 159,885 |
Lone Star Steakhouse & Saloon, Inc. | | 5,361 | | | 138,367 |
Luby’s, Inc. (b) | | 9,000 | | | 113,220 |
O’Charley’s, Inc. (b) | | 8,740 | | | 119,825 |
P.F. Chang’s China Bistro, Inc. (b) (e) | | 8,695 | | | 397,710 |
Papa John’s International, Inc. (b) | | 3,962 | | | 205,747 |
Ruby Tuesday, Inc. (e) | | 17,660 | | | 386,931 |
Ruth’s Chris Steak House, Inc. (b) | | 4,500 | | | 80,370 |
Steak n Shake Co. (The) (b) (e) | | 5,812 | | | 107,057 |
Texas Roadhouse, Inc., Class A (b) (e) | | 9,600 | | | 151,104 |
Triarc Cos., Inc. (e) | | 12,690 | | | 188,700 |
| | | | |
|
|
| | | | | | 3,942,615 |
| | | | |
|
|
Retail (3.2%) | | | | | |
1-800-FLOWERS.COM (b) | | 9,446 | | | 64,138 |
99 CENTS Only Stores (b) (e) | | 11,816 | | | 114,024 |
A.C. Moore Arts & Crafts, Inc. (b) (e) | | 4,980 | | | 68,525 |
Alexander’s, Inc. (b) | | 500 | | | 120,000 |
America’s Car-Mart, Inc. (b) (e) | | 2,686 | | | 43,406 |
| | | | | |
| | | Shares or
Principal Amount | | Value |
| | | | | | |
Retail (continued) | | | | | |
Asbury Automotive Group, Inc. (b) | | 1,300 | | $ | 21,970 |
Big 5 Sporting Goods Corp. | | 4,700 | | | 104,246 |
Big Lots, Inc. (b) | | 31,300 | | | 362,141 |
Blair Corp. | | 1,895 | | | 71,442 |
Blockbuster, Inc. (e) | | 61,680 | | | 281,261 |
Bon-Ton Stores, Inc. (The) | | 3,000 | | | 60,150 |
Build-A-Bear-Workshop, Inc. (b) (e) | | 3,900 | | | 93,444 |
Building Materials Holding Corp. (e) | | 4,368 | | | 371,324 |
Cabela’s Inc. (b) (e) | | 6,800 | | | 111,520 |
Cache, Inc. (b) (e) | | 5,100 | | | 81,396 |
Carter’s, Inc. (b) | | 4,924 | | | 310,951 |
Casey’s General Stores, Inc. | | 15,775 | | | 340,425 |
Cash America International, Inc. | | 8,754 | | | 191,362 |
Casual Male Retail Group, Inc. (b) | | 10,106 | | | 58,312 |
Cato Corp. | | 8,991 | | | 179,640 |
CEC Entertainment, Inc. (b) | | 10,748 | | | 363,390 |
Charlotte Russe Holding, Inc. (b) | | 5,236 | | | 92,258 |
Children’s Place Retail Store, Inc. (The) (b) | | 5,331 | | | 228,860 |
Christopher & Banks Corp. (e) | | 10,619 | | | 141,976 |
Citi Trends, Inc. (b) | | 2,700 | | | 77,301 |
Coldwater Creek, Inc. (b) (e) | | 10,172 | | | 274,542 |
Conn’s, Inc. (b) (e) | | 2,800 | | | 81,956 |
Cost Plus, Inc. (b) (e) | | 7,785 | | | 119,578 |
CSK Auto Corp. (b) | | 11,600 | | | 175,508 |
Digital Theater Systems, Inc. (b) (e) | | 4,512 | | | 73,094 |
Dress Barn, Inc. (b) | | 7,762 | | | 206,236 |
Fossil, Inc. (b) (e) | | 16,260 | | | 254,632 |
Fred’s, Inc. (e) | | 14,260 | | | 212,474 |
Genesco, Inc. (b) (e) | | 6,720 | | | 247,296 |
Group 1 Automotive, Inc. (b) | | 5,103 | | | 141,047 |
Guitar Center, Inc. (b) (e) | | 8,455 | | | 440,590 |
Gymboree Corp. (b) (e) | | 9,442 | | | 167,123 |
Haverty Furniture Co., Inc. (e) | | 3,400 | | | 41,616 |
Hibbet Sporting Goods, Inc. (b) | | 11,124 | | | 291,783 |
Insight Enterprises, Inc. (b) | | 14,362 | | | 294,708 |
J. Jill Group, Inc. (b) (e) | | 7,503 | | | 95,288 |
| | Common Stocks (continued) |
| | | | | |
| | | Shares or
Principal Amount | | Value |
| | | | | | |
Retail (continued) | | | | | |
Jo-Ann Stores, Inc. (b) | | 6,883 | | $ | 100,561 |
Linens ‘n Things, Inc. (b) | | 13,750 | | | 345,675 |
M&F Worldwide Corp. (b) | | 2,500 | | | 42,125 |
Movado Group, Inc. | | 3,762 | | | 65,948 |
Movie Gallery, Inc. (e) | | 8,707 | | | 60,601 |
New York & Co., Inc. (b) | | 2,100 | | | 28,350 |
Pantry, Inc. (The) (b) | | 5,600 | | | 216,664 |
PETCO Animal Supplies, Inc. (b) | | 18,440 | | | 350,544 |
Pier 1 Imports, Inc. (e) | | 25,400 | | | 262,128 |
RARE Hospitality International, Inc. (b) (e) | | 11,801 | | | 360,639 |
Regis Corp. | | 13,500 | | | 517,859 |
Rent-Way, Inc. (b) (e) | | 7,363 | | | 45,430 |
Restoration Hardware, Inc. (b) | | 7,700 | | | 45,661 |
Retail Ventures, Inc. (b) | | 2,700 | | | 28,053 |
Rush Enterprises, Inc. (b) | | 8,100 | | | 121,986 |
Sharper Image Corp. (b) (e) | | 4,865 | | | 49,574 |
ShopKo Stores, Inc. (b) | | 8,800 | | | 252,296 |
Smart & Final, Inc. (b) (e) | | 3,604 | | | 45,230 |
Sonic Automotive, Inc. | | 8,452 | | | 186,874 |
Sports Authority, Inc. (The) (b) (e) | | 7,680 | | | 213,811 |
Stein Mart, Inc. | | 6,333 | | | 116,211 |
Talbots, Inc. | | 5,500 | | | 143,495 |
TBC Corp. (b) | | 6,166 | | | 213,282 |
Too, Inc. (b) | | 10,132 | | | 287,850 |
Tractor Supply Co. (b) (e) | | 10,483 | | | 508,425 |
Trans World Entertainment Corp. (b) | | 6,305 | | | 40,226 |
Tuesday Morning Corp. | | 8,122 | | | 194,847 |
United Rentals, Inc. (b) (e) | | 21,665 | | | 423,984 |
Weis Markets, Inc. | | 4,183 | | | 159,581 |
WESCO International, Inc. (b) | | 9,620 | | | 382,395 |
West Marine, Inc. (b) (e) | | 5,262 | | | 71,405 |
Zale Corp. (b) | | 15,002 | | | 420,506 |
Zumiez, Inc. (b) | | 1,800 | | | 61,452 |
| | | | |
|
|
| | | | | | 13,434,601 |
| | | | |
|
|
Retail & Food & Drug (0.4%) | | | | | |
Arden Group, Inc., Class A | | 168 | | | 12,602 |
Ingles Markets, Inc., Class A (e) | | 5,152 | | | 83,050 |
Longs Drug Stores Corp. | | 8,268 | | | 344,858 |
Nash-Finch Co. (e) | | 4,560 | | | 141,634 |
| | | | | |
| | | Shares or
Principal Amount | | Value |
| | | | | | |
Retail & Food & Drug (continued) | | | |
Pathmark Stores, Inc. (b) | | 17,818 | | $ | 173,726 |
Ruddick Corp. | | 10,089 | | | 222,059 |
Spartan Stores, Inc. (b) | | 7,500 | | | 74,175 |
United Natural Foods, Inc. (b) (e) | | 12,972 | | | 364,642 |
Wild Oats Markets, Inc. (b) (e) | | 9,890 | | | 109,977 |
| | | | |
|
|
| | | | | | 1,526,723 |
| | | | |
|
|
Semiconductors (2.9%) | | | | | |
Actel Corp. (b) | | 8,974 | | | 125,187 |
Advanced Analogic Technologies, Inc. (b) | | 3,900 | | | 42,510 |
AMIS Holdings, Inc. (b) | | 9,500 | | | 105,830 |
Amkor Technology, Inc. (b) (e) | | 32,600 | | | 172,128 |
Applied Micro Circuits Corp. (b) | | 82,440 | | | 201,154 |
Asyst Technologies, Inc. (b) (e) | | 14,109 | | | 60,951 |
Atmel Corp. (b) (e) | | 115,220 | | | 283,441 |
ATMI, Inc. (b) (e) | | 9,657 | | | 263,733 |
August Technology Corp. (b) | | 6,500 | | | 66,040 |
Axcelis Technologies, Inc. (b) | | 29,663 | | | 129,034 |
Brooks Automation, Inc. (b) | | 22,978 | | | 269,072 |
Cirrus Logic, Inc. (b) (e) | | 22,547 | | | 147,908 |
COHU, Inc. | | 6,945 | | | 160,846 |
Conexant Systems, Inc. (b) (e) | | 131,940 | | | 255,964 |
Credence Systems Corp. (b) (e) | | 24,237 | | | 186,625 |
Cymer, Inc. (b) (e) | | 10,013 | | | 348,953 |
Cypress Semiconductor Corp. (b) (e) | | 38,980 | | | 530,129 |
Diodes, Inc. (b) | | 3,570 | | | 129,448 |
EMCORE Corp. (b) (e) | | 5,900 | | | 32,686 |
Emulex Corp. (b) | | 24,660 | | | 456,457 |
Entegris, Inc. (b) | | 34,519 | | | 336,905 |
Exar Corp. (b) | | 15,164 | | | 190,915 |
Fairchild Semiconductor International, Inc. (b) | | 33,040 | | | 508,817 |
FEI Co. (b) (e) | | 6,523 | | | 123,285 |
FormFactor, Inc. (b) (e) | | 8,437 | | | 207,719 |
Genesis Microchip, Inc. (b) | | 10,744 | | | 206,715 |
Integrated Device Technology, Inc. (b) | | 62,330 | | | 615,821 |
Ixia (b) (e) | | 7,936 | | | 100,152 |
IXYS Corp. (b) | | 5,302 | | | 54,292 |
Kopin Corp. (b) (e) | | 20,807 | | | 117,560 |
Statement of Investments (Continued)
October 31, 2005
Gartmore Small Cap Index Fund (Continued)
| | Common Stocks (continued) |
| | | | | |
| | | Shares or
Principal Amount | | Value |
| | | | | | |
Semiconductors (continued) | | | | | |
Leadis Technology, Inc. (b) | | 3,600 | | $ | 18,792 |
LTX Corp. (b) | | 17,853 | | | 61,414 |
Mattson Technology, Inc. (b) | | 9,224 | | | 72,777 |
Microsemi Corp. (b) | | 18,258 | | | 423,038 |
Microtune, Inc. (b) (e) | | 12,200 | | | 47,092 |
MIPS Technologies, Inc. (b) | | 9,174 | | | 51,466 |
MKS Instruments, Inc. (b) (e) | | 9,623 | | | 181,586 |
Monolithic Power Systems (b) | | 2,200 | | | 28,226 |
Netlogic Microsystems, Inc. (b) (e) | | 4,400 | | | 86,064 |
OmniVision Technologies, Inc. (b) | | 18,328 | | | 236,248 |
ON Semiconductor Corp. (b) | | 37,408 | | | 173,573 |
Oplink Communications, Inc. (b) (e) | | 27,281 | | | 43,650 |
Optical Communication Products, Inc. (b) | | 1,817 | | | 3,561 |
OSI Systems, Inc. (b) (e) | | 5,376 | | | 89,242 |
Pericom Semiconductor Corp. (b) | | 6,300 | | | 50,022 |
Photronics Corp. (b) | | 10,492 | | | 188,856 |
Pixelworks, Inc. (b) | | 13,730 | | | 75,652 |
PMC-Sierra, Inc. (b) | | 50,660 | | | 359,686 |
PortalPlayer, Inc. (b) (e) | | 5,400 | | | 109,026 |
Power Integrations, Inc. (b) (e) | | 8,631 | | | 182,200 |
Rudolph Technologies, Inc. (b) (e) | | 3,800 | | | 46,284 |
Semitool, Inc. (b) (e) | | 4,318 | | | 39,337 |
Semtech Corp. (b) | | 24,100 | | | 363,428 |
Sigmatel, Inc. (b) (e) | | 10,520 | | | 143,177 |
Silicon Image, Inc. (b) | | 23,406 | | | 214,867 |
Silicon Laboratories, Inc. (b) | | 13,600 | | | 437,512 |
Silicon Storage Technology, Inc. (b) (e) | | 25,984 | | | 131,219 |
SiRF Technology Holdings, Inc. (b) | | 11,700 | | | 301,743 |
Skyworks Solutions Co. (b) | | 47,537 | | | 254,798 |
Supertex, Inc. (b) | | 3,080 | | | 112,851 |
Tessera Technologies, Inc. (b) (e) | | 12,248 | | | 341,719 |
Transwitch Corp. (b) | | 39,200 | | | 62,720 |
TriQuint Semiconductor, Inc. (b) | | 38,839 | | | 163,124 |
Ultratech Stepper, Inc. (b) (e) | | 8,650 | | | 119,197 |
Veeco Instruments, Inc. (b) (e) | | 8,942 | | | 142,088 |
| | | | | |
| | | Shares or
Principal Amount | | Value |
| | | | | | |
Semiconductors (continued) | | | | | |
Virage Logic Corp. (b) | | 1,600 | | $ | 12,528 |
Vitesse Semiconductor Corp. (b) (e) | | 64,588 | | | 106,570 |
Volterra Semiconductor Corp. (b) (e) | | 4,300 | | | 53,019 |
X-Rite, Inc. (e) | | 5,941 | | | 61,133 |
| | | | |
|
|
| | | | | | 12,019,762 |
| | | | |
|
|
Services (1.5%) | | | | | |
Advance America Cash Advance | | 19,000 | | | 230,850 |
Centers, Inc. (e) | | | | | |
Alderwoods Group, Inc. (b) | | 13,841 | | | 217,857 |
American Ecology Corp. | | 5,500 | | | 88,990 |
aQuantive, Inc. (b) (e) | | 16,899 | | | 365,863 |
Arbitron, Inc. | | 9,243 | | | 345,781 |
Clark, Inc. | | 4,200 | | | 64,260 |
Cogent, Inc. (b) (e) | | 8,100 | | | 215,055 |
Coinstar, Inc. (b) (e) | | 8,138 | | | 206,542 |
CyberGuard Corp. (b) | | 9,283 | | | 79,648 |
First Advantage Corp., Class A (b) | | 2,336 | | | 61,156 |
FTI Consulting, Inc. (b) | | 11,275 | | | 308,597 |
Geo Group, Inc. (The) (b) | | 2,600 | | | 56,784 |
Healthcare Services Group, Inc. (e) | | 9,900 | | | 184,536 |
Labor Ready, Inc. (b) | | 15,894 | | | 371,125 |
Manhattan Associates, Inc. (b) | | 9,440 | | | 209,662 |
MasTec, Inc. (b) | | 4,971 | | | 50,654 |
National Healthcare Corp. | | 1,300 | | | 46,800 |
NDCHealth Corp. | | 11,603 | | | 218,601 |
Odyssey Marine Exploration, Inc. (b) | | 6,100 | | | 19,337 |
Perini Corp. (b) | | 3,183 | | | 64,870 |
Perot Systems Corp., Class A (b) (e) | | 21,783 | | | 301,912 |
PHH Corp. (b) | | 17,220 | | | 484,399 |
Providence Service Corp. (b) (e) | | 1,400 | | | 43,218 |
Quanta Services, Inc. (b) (e) | | 32,968 | | | 378,802 |
Rollins, Inc. | | 8,461 | | | 160,928 |
Secure Computing Corp. (b) (e) | | 10,650 | | | 127,587 |
Sotheby’s Holdings, Inc. (b) | | 13,098 | | | 203,936 |
Source Interlink Cos., Inc. (b) (e) | | 11,884 | | | 120,979 |
| | Common Stocks (continued) |
| | | | | |
| | | Shares or
Principal Amount | | Value |
| | | | | | |
Services (continued) | | | | | |
Stewart Enterprises, Inc., Class A | | 29,472 | | $ | 150,307 |
Tetra Tech, Inc. (b) (e) | | 16,147 | | | 249,310 |
URS Corp. (b) | | 12,944 | | | 523,327 |
Vertrue, Inc. (b) (e) | | 1,900 | | | 71,535 |
Volt Information Sciences, Inc. (b) | | 1,505 | | | 28,294 |
Waste Services, Inc. (b) | | 11,500 | | | 43,010 |
| | | | |
|
|
| | | | | | 6,294,512 |
| | | | |
|
|
Steel (0.8%) | | | | | |
AK Steel Holding Corp. (b) (e) | | 32,500 | | | 227,175 |
Carpenter Technology Corp. (e) | | 6,851 | | | 413,115 |
Chaparral Steel Co. (b) | | 8,123 | | | 202,913 |
Maverick Tube Corp. (b) (e) | | 12,747 | | | 394,647 |
NS Group, Inc. (b) | | 5,786 | | | 200,253 |
Oregon Steel Mills, Inc. (b) (e) | | 10,491 | | | 266,366 |
Reliance Steel & Aluminum Co. (e) | | 8,928 | | | 509,075 |
Roanoke Electric Steel Corp. (e) | | 5,000 | | | 109,550 |
Ryerson Tull, Inc. (e) | | 8,674 | | | 175,128 |
Schnitzer Steel Industries, Inc. (e) | | 7,479 | | | 238,580 |
Steel Dynamics, Inc. (e) | | 12,975 | | | 401,836 |
Wheeling-Pittsburgh Corp. (b) | | 3,540 | | | 45,560 |
| | | | |
|
|
| | | | | | 3,184,198 |
| | | | |
|
|
Technology (1.6%) | | | | | |
American Reprographics Co. (b) | | 3,600 | | | 60,660 |
Benchmark Electronics, Inc. (b) | | 12,263 | | | 344,468 |
Black Box Corp. | | 5,782 | | | 231,974 |
CommScope, Inc. (b) (e) | | 15,917 | | | 310,700 |
Concur Technologies, Inc. (b) (e) | | 6,200 | | | 83,762 |
CTS Corp. (e) | | 10,837 | | | 127,660 |
Digi International, Inc. (b) | | 9,500 | | | 100,795 |
Dionex Corp. (b) | | 6,945 | | | 336,346 |
Excel Technology, Inc. (b) | | 2,519 | | | 65,872 |
Input/Output, Inc. (b) (e) | | 19,081 | | | 146,542 |
Intergraph Corp. (b) (e) | | 9,318 | | | 450,805 |
Kanbay International, Inc. (b) | | 6,000 | | | 87,480 |
KEMET Corp. (b) | | 24,206 | | | 167,506 |
Kronos, Inc. (b) (e) | | 9,697 | | | 444,704 |
Kulicke & Soffa Industries, Inc. (b) (e) | | 17,868 | | | 112,032 |
| | | | | |
| | | Shares or
Principal Amount | | Value |
Technology (continued) | | | | | |
| | | | | | |
Lattice Semiconductor Corp. (b) | | 31,645 | | $ | 138,605 |
Lionbridge Technologies, Inc. (b) | | 12,000 | | | 81,240 |
Medis Technologies, Inc. (b) (e) | | 5,777 | | | 97,458 |
Merge Technologies, Inc. (b) | | 6,760 | | | 155,953 |
Micros Systems, Inc. (b) | | 12,044 | | | 553,060 |
MTC Technologies, Inc. (b) (e) | | 3,962 | | | 128,012 |
Ness Technologies, Inc. (b) | | 5,075 | | | 46,132 |
Opsware, Inc. (b) | | 16,508 | | | 84,851 |
Orbital Sciences Corp. (b) | | 16,422 | | | 190,988 |
Plantronics, Inc. | | 13,640 | | | 407,154 |
Plexus Corp. (b) | | 13,134 | | | 232,078 |
Progress Software Corp. (b) | | 12,325 | | | 383,801 |
Sonic Solutions (b) | | 7,200 | | | 137,808 |
Symmetricom, Inc. (b) (e) | | 16,700 | | | 133,099 |
Varian Semiconductor Equipment Associates, Inc. (b) | | 11,676 | | | 441,586 |
Varian, Inc. (b) | | 11,069 | | | 407,007 |
| | | | |
|
|
| | | | | | 6,690,138 |
| | | | |
|
|
Telecommunications (1.8%) | | | | | |
ADTRAN, Inc. | | 20,640 | | | 624,359 |
Airspan Networks, Inc. (b) (e) | | 14,720 | | | 73,306 |
Alaska Communications Systems Holdings, Inc. | | 6,800 | | | 74,732 |
Align Technology, Inc. (b) (e) | | 17,892 | | | 132,043 |
Anaren Microwave, Inc. (b) | | 5,833 | | | 82,537 |
Applied Signal Technology, Inc. (e) | | 4,298 | | | 73,754 |
Arris Group, Inc. (b) | | 28,833 | | | 238,449 |
Broadwing Corp. (b) (e) | | 18,151 | | | 115,077 |
Centennial Communications Corp. (b) | | 4,400 | | | 65,164 |
Ciena Corp. (b) (e) | | 168,700 | | | 399,819 |
Cincinnati Bell, Inc. (b) | | 67,279 | | | 266,425 |
Commonwealth Telephone Enterprises, Inc. (e) | | 7,448 | | | 267,309 |
Comtech Telecommunications Corp. (b) (e) | | 6,310 | | | 242,052 |
Consolidated Communications Holdings, Inc. | | 5,700 | | | 75,582 |
CT Communications, Inc. | | 5,000 | | | 56,600 |
Ditech Communications Corp. (b) (e) | | 12,400 | | | 78,988 |
Statement of Investments (Continued)
October 31, 2005
Gartmore Small Cap Index Fund (Continued)
| | Common Stocks (continued) |
| | | | | |
| | | Shares or
Principal Amount | | Value |
| | | | | | |
Telecommunications (continued) | | | |
Dobson Communications Corp. (b) (e) | | 37,540 | | $ | 273,667 |
Essex Corp (b) | | 6,000 | | | 107,820 |
FairPoint Communications, Inc. | | 10,500 | | | 143,535 |
Finisar Corp. (b) (e) | | 53,880 | | | 81,359 |
General Cable Corp. (b) (e) | | 11,700 | | | 190,125 |
General Communication, Inc. (b) (e) | | 19,248 | | | 184,973 |
Globetel Communications Corp. (b) (e) | | 10,600 | | | 21,306 |
Golden Telecom, Inc. (e) | | 5,215 | | | 151,496 |
IDT Corp. (b) | | 13,300 | | | 158,802 |
InfoSpace, Inc. (b) | | 10,634 | | | 267,126 |
InterVoice-Brite, Inc. (b) (e) | | 12,856 | | | 119,818 |
Iowa Telecommunications Services, Inc. (e) | | 8,800 | | | 145,200 |
JAMDAT Mobile, Inc. (b) (e) | | 4,000 | | | 73,680 |
Level 3 Communications, Inc. (b) (e) | | 213,640 | | | 619,556 |
Neon Communications, Inc. (c) (d) (b) | | 125 | | | 0 |
NeuStar, Inc., Class A (b) | | 8,600 | | | 263,160 |
North Pittsburgh Systems, Inc. | | 2,863 | | | 57,546 |
Premiere Global Services, Inc. (b) (e) | | 18,975 | | | 160,908 |
Price Communications Corp. (b) | | 13,537 | | | 206,033 |
RCN Corp. (b) (e) | | 5,300 | | | 107,590 |
Regent Communications, Inc. (b) | | 6,531 | | | 33,112 |
SBA Communications Corp. (b) (e) | | 21,900 | | | 323,463 |
Shenandoah Telecommunications Co. (e) | | 1,046 | | | 44,560 |
SureWest Communications (e) | | 4,000 | | | 112,160 |
Talk America Holdings, Inc. (b) | | 10,720 | | | 103,341 |
Telkonet, Inc. (b) (e) | | 14,700 | | | 71,883 |
UbiquiTel, Inc. (b) | | 24,600 | | | 212,544 |
UTStarcom, Inc. (b) (e) | | 30,000 | | | 165,600 |
Valor Communications Group, Inc. | | 9,180 | | | 116,861 |
Westell Technologies, Inc., Class A (b) (e) | | 21,929 | | | 103,066 |
| | | | | |
| | | Shares or
Principal Amount | | Value |
| | | | | | |
Telecommunications (continued) | | | |
XO Communications, Inc. (c) (d) (b) | | 5,400 | | $ | 0 |
Zhone Technologies, Inc. (b) | | 19,340 | | | 43,708 |
| | | | |
|
|
| | | | | | 7,530,194 |
| | | | |
|
|
Tire & Rubber (0.1%) | | | | | |
Bandag, Inc. (e) | | 3,187 | | | 135,448 |
Cooper Tire & Rubber Co. | | 21,173 | | | 289,223 |
| | | | |
|
|
| | | | | | 424,671 |
| | | | |
|
|
Tobacco (0.1%) | | | | | |
Alliance One International, Inc. (e) | | 25,721 | | | 64,045 |
Star Scientific, Inc. (b) | | 12,897 | | | 34,564 |
Universal Corp. | | 8,687 | | | 325,242 |
Vector Group Ltd. (e) | | 9,566 | | | 190,937 |
| | | | |
|
|
| | | | | | 614,788 |
| | | | |
|
|
Transportation Services (1.3%) | | | |
Abx Air, Inc. (b) | | 13,000 | | | 103,870 |
AMERCO, Inc. (e) | | 2,504 | | | 146,058 |
Arkansas Best Corp. (e) | | 8,880 | | | 344,189 |
Covenant Transport, Inc., Class A (b) (e) | | 5,103 | | | 54,347 |
Dynamex, Inc. (b) (e) | | 1,100 | | | 18,062 |
EGL, Inc. (b) | | 11,953 | | | 335,043 |
Forward Air Corp. (e) | | 8,451 | | | 299,588 |
Frozen Food Express Industries, Inc. (b) (e) | | 1,300 | | | 14,664 |
Genesee & Wyoming, Inc., Class A (b) | | 5,430 | | | 174,032 |
Greenbrier Cos., Inc. (e) | | 2,700 | | | 74,385 |
Gulfmark Offshore, Inc. (b) (e) | | 5,040 | | | 143,842 |
Heartland Express, Inc. (e) | | 14,485 | | | 286,079 |
Hornbeck Offshore Services, Inc. (b) | | 2,900 | | | 93,409 |
HUB Group, Inc., Class A (b) (e) | | 4,870 | | | 177,122 |
Interpool, Inc. | | 500 | | | 9,750 |
Kansas City Southern Industries, Inc. (b) | | 22,419 | | | 496,804 |
Kirby Corp. (b) | | 6,457 | | | 333,633 |
Knight Transportation, Inc. (e) | | 9,597 | | | 261,134 |
Maritrans, Inc. | | 3,800 | | | 113,316 |
| | Common Stocks (continued) |
| | | | | |
| | | Shares or
Principal Amount | | Value |
| | | | | | |
Transportation Services (continued) | | | |
Marten Transport Ltd. (b) | | 1,200 | | $ | 31,884 |
Offshore Logistics, Inc. (b) | | 6,900 | | | 234,600 |
Old Dominion Freight Line, Inc. (b) | | 6,053 | | | 214,216 |
P.A.M. Transportation Services, Inc. (b) | | 1,200 | | | 20,352 |
Pacer International, Inc. | | 9,354 | | | 241,801 |
Pegasus Solutions, Inc. (b) (e) | | 7,855 | | | 66,610 |
RailAmerica, Inc. (b) (e) | | 9,819 | | | 116,355 |
SCS Transportation, Inc. (b) | | 4,625 | | | 92,408 |
Sirva, Inc. (b) (e) | | 4,100 | | | 28,823 |
U.S. Xpress Enterprises, Inc. (b) | | 5,000 | | | 61,000 |
Universal Truckload Services, Inc. (b) | | 1,500 | | | 30,225 |
USA Truck, Inc. (b) | | 2,500 | | | 58,025 |
Werner Enterprises, Inc. | | 17,662 | | | 316,503 |
Wright Express Corp. (b) | | 11,200 | | | 241,696 |
| | | | |
|
|
| | | | | | 5,233,825 |
| | | | |
|
|
Utilities (1.3%) | | | | | |
ALLETE, Inc. | | 8,560 | | | 376,726 |
Black Hills Corp. | | 10,470 | | | 435,238 |
Calpine Corp. (b) (e) | | 160,540 | | | 382,085 |
Central Vermont Public Service Corp. | | 5,794 | | | 92,820 |
CH Energy Group, Inc. (e) | | 4,663 | | | 217,063 |
Covanta Holding Corp. (b) | | 30,070 | | | 348,511 |
Duquesne Light Holdings, Inc. (e) | | 23,624 | | | 394,285 |
Empire District Electric Co. (e) | | 8,081 | | | 163,236 |
FuelCell Energy, Inc. (b) (e) | | 14,943 | | | 130,901 |
Headwaters, Inc. (b) (e) | | 12,344 | | | 393,033 |
IDACORP, Inc. | | 12,914 | | | 372,827 |
Littlelfuse, Inc. (b) | | 6,331 | | | 155,173 |
MGE Energy, Inc. (e) | | 4,863 | | | 172,345 |
Northwestern Corp. | | 11,500 | | | 342,125 |
Otter Tail Co. | | 8,340 | | | 248,949 |
Pike Electric Corp. (b) | | 4,800 | | | 90,720 |
Sierra Pacific Resources (b) | | 36,644 | | | 474,539 |
| | | | | |
| | | Shares or
Principal Amount | | Value |
| | | | | | |
Utilities (continued) | | | |
Time Warner Telecom, Inc. (b) (e) | | 17,974 | | $ | 150,622 |
UIL Holdings Corp. (e) | | 4,428 | | | 219,186 |
UniSource Energy Corp. | | 10,989 | | | 351,318 |
| | | | |
|
|
| | | | | | 5,511,702 |
| | | | |
|
|
Warehousing (0.1%) | | | | | |
Mobile Mini, Inc. (b) (e) | | 4,912 | | | 229,292 |
| | | | |
|
|
Water (0.1%) | | | | | |
American States Water Co. (e) | | 4,901 | | | 153,598 |
California Water Service Group (e) | | 4,052 | | | 144,859 |
Connecticut Water Service, Inc. | | 1,211 | | | 30,263 |
Middlesex Water Co. | | 5,116 | | | 108,868 |
Southwest Water Co. (e) | | 8,700 | | | 119,451 |
| | | | |
|
|
| | | | | | 557,039 |
| | | | |
|
|
Wireless Equipment (0.4%) | | | |
Atheros Communications (b) (e) | | 7,100 | | | 61,557 |
Endwave Corp. (b) (e) | | 2,700 | | | 33,480 |
Glenayre Technologies, Inc. (b) (e) | | 24,900 | | | 93,873 |
InPhonic, Inc. (b) (e) | | 6,180 | | | 89,363 |
InterDigital Communications Corp. (b) | | 15,800 | | | 303,203 |
Novatel Wireless, Inc. (b) (e) | | 10,604 | | | 134,671 |
Powerwave Technologies, Inc. (b) (e) | | 29,105 | | | 326,268 |
SpectraLink Corp. | | 7,830 | | | 98,501 |
Syniverse Holdings, Inc. (b) | | 5,000 | | | 90,500 |
Universal Electronics, Inc. (b) (e) | | 3,656 | | | 63,358 |
USA Mobility, Inc. (b) (e) | | 8,749 | | | 218,812 |
ViaSat, Inc. (b) (e) | | 6,123 | | | 151,789 |
Wireless Facilities, Inc. (b) (e) | | 19,460 | | | 130,187 |
| | | | |
|
|
| | | | | | 1,795,562 |
| | | | |
|
|
| | |
Total Common Stocks | | | | | 346,205,507 |
| | | | |
|
|
Statement of Investments (Continued)
October 31, 2005
Gartmore Small Cap Index Fund (Continued)
Cash Equivalents (15.3%)
| | | | | | |
| | | Principal
Amount | | Value |
| | | | | | | |
Investments in repurchase agreements (Collateralized by U.S. Government Agencies and U.S. Government Agency Mortgages, in a joint trading account at 3.90%, dated 10/31/05, due 11/01/05, repurchase price $63,496,622) | | $ | 63,489,744 | | $ | 63,489,744 |
| | | | | |
|
|
| | |
Total Cash Equivalents | | | | | | 63,489,744 |
| | | | | |
|
|
|
Corporate Bonds (0.0%) |
Construction & Building Materials (0.0%) | | | |
Brookfield Homes, 12.00%, 6/30/20 | | | 450 | | | 450 |
| | | | | |
|
|
| | |
Total Corporate Bonds | | | | | | 450 |
| | | | | |
|
|
Short-Term Securities Held as Collateral for
Securities Lending (26.8%)
| | | | | | | |
| | | Principal
Amount | | Value | |
| | | | | | | | |
Pool of short-term securities for Gartmore Mutual Funds — note 2 (Securities Lending) | | $ | 111,168,600 | | $ | 111,168,600 | |
| | | | | |
|
|
|
| |
Total Short-Term Securities Held as Collateral for Securities Lending | | | 111,168,600 | |
| | | | | |
|
|
|
| |
Total Investments
(Cost $482,383,815) (a) — 125.5% | | | 520,864,301 | |
| |
Liabilities in excess of other
assets — (25.5)% | | | (105,960,255 | ) |
| | | | | |
|
|
|
| | |
NET ASSETS — 100.0% | | | | | $ | 414,904,046 | |
| | | | | |
|
|
|
| | (a) | See notes to financial statements for tax unrealized appreciation (depreciation) of securities. |
| | (b) | Denotes a non-income producing security. |
| | (d) | Security has been deemed illiquid. The pricing committee has deemed the security to have zero value based upon procedures adopted by the Board Of Trustees. |
| | (e) | All or part of the security was on loan as of October 31, 2005. |
At October 31, 2005, the Fund’s open long futures contracts were as follows:
| | | | | | | | | | | |
Number of
Contracts
| | Long
Contracts*
| | Expiration
| | Market Value
Covered By
Contracts
| | Unrealized
Appreciation
(Depreciation)
| |
| 210 | | Russell 2000 | | 12/16/05 | | $ | 68,166,000 | | $ | (2,606,668 | ) |
| | * | Cash pledged as collateral. |
See notes to financial statements.
Statements of Assets and Liabilities
October 31, 2005
| | | | | | | | | | | | | | | | | | | | |
| | | Gartmore Bond
Index Fund | | | Gartmore
International
Index Fund | | | Gartmore
Mid Cap Market
Index Fund | | Gartmore
S&P 500
Index Fund | | | Gartmore Small Cap Index Fund |
Assets: | | | | | | | | | | | | | | | | | | | | |
Investments, at value
(cost $1,903,153,897; $1,251,674,543; $917,624,229; $2,574,817,045; and $418,894,071; respectively) | | $ | 1,878,072,189 | | | $ | 1,490,057,474 | | | $ | 1,036,426,807 | | $ | 2,766,032,315 | | | $ | 457,374,557 | | |
Repurchase agreements, at cost and value | | | 26,672,856 | | | | 23,356,169 | | | | 150,466,691 | | | 96,277,706 | | | | 63,489,744 | | |
| | |
|
|
| |
|
|
| |
|
| |
|
|
| |
|
| | |
Total Investments | | | 1,904,745,045 | | | | 1,513,413,643 | | | | 1,186,893,498 | | | 2,862,310,021 | | | | 520,864,301 | | |
| | |
|
|
| |
|
|
| |
|
| |
|
|
| |
|
| | |
Cash | | | 365 | | | | — | | | | 577 | | | 1,307,697 | | | | 137,918 | | |
Cash collateral pledged for futures | | | — | | | | 17,545,472 | | | | 5,953,500 | | | 5,339,250 | | | | 2,808,000 | | |
Foreign currency, at value
(cost $0; $8,436,061; $0;
$0 and $0; respectively) | | | — | | | | 8,416,700 | | | | — | | | — | | | | — | | |
Interest and dividends receivable | | | 15,293,149 | | | | 1,897,555 | | | | 915,595 | | | 2,717,624 | | | | 422,389 | | |
Receivable for capital shares issued | | | 1,682,723 | | | | 2,168,042 | | | | 1,273,827 | | | 3,352,380 | | | | 575,504 | | |
Receivable for investments sold | | | — | | | | — | | | | 448,821 | | | — | | | | 40,898 | | |
Unrealized appreciation on forward foreign currency contracts | | | — | | | | 101,983 | | | | — | | | — | | | | — | | |
Receivable from adviser | | | 45,610 | | | | 76,408 | | | | 55,606 | | | 125,886 | | | | 10,860 | | |
Receivable for variation margin on futures contracts | | | — | | | | 853,210 | | | | 2,779,786 | | | 858,914 | | | | 1,446,791 | | |
Reclaims receivable | | | — | | | | 184,787 | | | | — | | | — | | | | — | | |
Prepaid expenses and other assets | | | 15,567 | | | | 13,339 | | | | 11,343 | | | 20,095 | | | | 2,367 | | |
| | |
|
|
| |
|
|
| |
|
| |
|
|
| |
|
| | |
Total Assets | | | 1,921,782,459 | | | | 1,544,671,139 | | | | 1,198,332,553 | | | 2,876,031,867 | | | | 526,309,028 | | |
| | |
|
|
| |
|
|
| |
|
| |
|
|
| |
|
| | |
| | | | | | |
Liabilities: | | | | | | | | | | | | | | | | | | | | |
Payable to custodian | | | — | | | | 1,170,644 | | | | — | | | — | | | | — | | |
Distributions payable | | | 375 | | | | — | | | | — | | | — | | | | — | | |
Payable for investments purchased | | | 162,932,748 | | | | — | | | | 3,280,213 | | | — | | | | — | | |
Payable for capital shares redeemed | | | 996,748 | | | | 364,054 | | | | 321,256 | | | 1,047,167 | | | | 96,362 | | |
Unrealized depreciation on forward foreign currency contracts | | | — | | | | 176,307 | | | | — | | | — | | | | — | | |
Unrealized depreciation on open swap contracts | | | 588,903 | | | | — | | | | — | | | — | | | | — | | |
Payable for return of collateral received for securities on loan | | | 243,805,654 | | | | 180,683,964 | | | | 185,502,716 | | | 187,378,599 | | | | 111,168,600 | | |
Accrued expenses and other payables | | | | | | | | | | | | | | | | | | | | |
Investment advisory fees | | | 280,351 | | | | 308,402 | | | | 183,657 | | | 281,166 | | | | 69,170 | | |
Fund administration and transfer agent fees | | | 122,125 | | | | 155,276 | | | | 84,074 | | | 223,535 | | | | 36,632 | | |
Distribution fees | | | 9,258 | | | | 8,848 | | | | 32,120 | | | 83,592 | | | | 14,441 | | |
Administrative servicing fees | | | 7,316 | | | | 6,002 | | | | 17,128 | | | 104,699 | | | | 11,220 | | |
Trustee fees | | | 3,210 | | | | 3,109 | | | | 2,236 | | | 6,009 | | | | 942 | | |
Other | | | 9,172 | | | | 16,958 | | | | 21,280 | | | 60,710 | | | | 7,615 | | |
| | |
|
|
| |
|
|
| |
|
| |
|
|
| |
|
| | |
Total Liabilities | | | 408,755,860 | | | | 182,893,564 | | | | 189,444,680 | | | 189,185,477 | | | | 111,404,982 | | |
| | |
|
|
| |
|
|
| |
|
| |
|
|
| |
|
| | |
Net Assets | | $ | 1,513,026,599 | | | $ | 1,361,777,575 | | | $ | 1,008,887,873 | | $ | 2,686,846,390 | | | $ | 414,904,046 | | |
| | |
|
|
| |
|
|
| |
|
| |
|
|
| |
|
| | |
| | | | | | |
Represented by: | | | | | | | | | | | | | | | | | | | | |
Capital | | $ | 1,541,329,162 | | | $ | 1,089,222,850 | | | $ | 842,543,775 | | $ | 2,500,592,416 | | | $ | 359,424,338 | | |
Accumulated net investment income (loss) | | | 866,187 | | | | (2,108,220 | ) | | | 1,465,171 | | | 2,807,688 | | | | 267,728 | | |
Accumulated net realized gains (losses) from investment, futures and foreign currency transactions | | | (3,498,139 | ) | | | 36,030,178 | | | | 48,910,331 | | | (6,898,191 | ) | | | 19,338,162 | | |
Net unrealized appreciation (depreciation) on investments, futures, swaps and translation of assets and liabilities denominated in foreign currencies | | | (25,670,611 | ) | | | 238,632,767 | | | | 115,968,596 | | | 190,344,478 | | | | 35,873,818 | | |
| | |
|
|
| |
|
|
| |
|
| |
|
|
| |
|
| | |
Net Assets | | $ | 1,513,026,599 | | | $ | 1,361,777,575 | | | $ | 1,008,887,873 | | $ | 2,686,846,390 | | | $ | 414,904,046 | | |
| | |
|
|
| |
|
|
| |
|
| |
|
|
| |
|
| | |
| | | | | | | | | | | | | | | | | | | | | |
See notes to financial statements.
Statements of Assets and Liabilities (Continued)
October 31, 2005
| | | | | | | | | | | | | | | | | | | | | | |
| | | Gartmore Bond
Index Fund | | | Gartmore
International
Index Fund | | | Gartmore Mid Cap Market Index Fund | | | Gartmore S&P 500 Index Fund | | | Gartmore Small Cap Index Fund |
Net Assets: | | | | | | | | | | | | | | | | | | | | | | |
Class A Shares | | $ | 42,125,615 | | | $ | 40,558,775 | | | $ | 150,304,580 | | | $ | 24,805,311 | | | $ | 65,750,869 | | | |
Class B Shares | | | 217,526 | | | | 395,925 | | | | 884,018 | | | | 5,707,020 | | | | 444,173 | | | |
Class C Shares | | | — | | | | 151,484 | | | | 224,692 | | | | 831,234 | | | | 199,527 | | | |
Institutional Class Shares | | | 1,470,683,458 | | | | 1,320,671,391 | | | | 857,474,583 | | | | 2,007,289,506 | | | | 348,509,477 | | | |
Service Class Shares | | | — | | | | — | | | | — | | | | 578,102,425 | | | | — | | | |
Institutional Service Class Shares | | | — | | | | — | | | | — | | | | 69,995,616 | | | | — | | | |
Local Fund Shares | | | — | | | | — | | | | — | | | | 115,278 | | | | — | | | |
| | |
|
|
| |
|
|
| |
|
|
| |
|
|
| |
|
|
| | |
Total | | $ | 1,513,026,599 | | | $ | 1,361,777,575 | | | $ | 1,008,887,873 | | | $ | 2,686,846,390 | | | $ | 414,904,046 | | | |
| | |
|
|
| |
|
|
| |
|
|
| |
|
|
| |
|
|
| | |
| | | | | | |
Shares outstanding (unlimited number of shares authorized): | | | | | | | | | | | | | | | | | | | | | | |
Class A Shares | | | 3,910,548 | | | | 4,668,752 | | | | 10,242,102 | | | | 2,393,510 | | | | 5,523,392 | | | |
Class B Shares | | | 20,192 | | | | 46,197 | | | | 60,948 | | | | 552,598 | | | | 37,580 | | | |
Class C Shares | | | — | | | | 17,947 | | | | 15,542 | | | | 80,834 | | | | 16,902 | | | |
Institutional Class Shares | | | 136,607,931 | | | | 151,860,586 | | | | 58,069,427 | | | | 192,838,074 | | | | 29,043,125 | | | |
Service Class Shares | | | — | | | | — | | | | — | | | | 55,795,024 | | | | — | | | |
Institutional Service Class Shares | | | — | | | | — | | | | — | | | | 6,730,808 | | | | — | | | |
Local Fund Shares | | | — | | | | — | | | | — | | | | 11,053 | | | | — | | | |
| | |
|
|
| |
|
|
| |
|
|
| |
|
|
| |
|
|
| | |
Total | | | 140,538,671 | | | | 156,593,482 | | | | 68,388,019 | | | | 258,401,901 | | | | 34,620,999 | | | |
| | |
|
|
| |
|
|
| |
|
|
| |
|
|
| |
|
|
| | |
| | | | | | |
Net asset value and redemption price per share: | | | | | | | | | | | | | | | | | | | | | | |
Class A Shares | | $ | 10.77 | | | $ | 8.69 | | | $ | 14.68 | | | $ | 10.36 | | | $ | 11.90 | | | |
Class B Shares (a) | | $ | 10.77 | | | $ | 8.57 | | | $ | 14.50 | | | $ | 10.33 | | | $ | 11.82 | | | |
Class C Shares (b) | | $ | — | | | $ | 8.44 | | | $ | 14.46 | | | $ | 10.28 | | | $ | 11.80 | | | |
Institutional Class Shares | | $ | 10.77 | | | $ | 8.70 | | | $ | 14.77 | | | $ | 10.41 | | | $ | 12.00 | | | |
Service Class Shares | | $ | — | | | $ | — | | | $ | — | | | $ | 10.36 | | | $ | — | | | |
Institutional Service Class Shares | | $ | — | | | $ | — | | | $ | — | | | $ | 10.40 | | | $ | — | | | |
Local Fund Shares | | $ | — | | | $ | — | | | $ | — | | | $ | 10.43 | | | $ | — | | | |
| | | | | | |
Maximum offering price per share (100%/100%-maximum sales charge) of net asset value adjusted to the nearest cent): | | | | | | | | | | | | | | | | | | | | | | |
Class A Shares | | $ | 11.43 | | | $ | 9.22 | | | $ | 15.58 | | | $ | 10.99 | | | $ | 12.63 | | | |
| | |
|
|
| |
|
|
| |
|
|
| |
|
|
| |
|
|
| | |
Maximum Sales Charge — Class A Shares | | | 5.75 | % | | | 5.75 | % | | | 5.75 | % | | | 5.75 | % | | | 5.75 | % | | |
| | |
|
|
| |
|
|
| |
|
|
| |
|
|
| |
|
|
| | |
| | | | | | | | | | | | | | | | | | | | | | | |
| | | | | | | | | | | | | | | | | | | | | | | |
| | | | | | | | | | | | | | | | | | | | | | | |
| | | | | | | | | | | | | | | | | | | | | | | |
| | | | | | | | | | | | | | | | | | | | | | | |
| (a) | For Class B shares, the redemption price per share varies by length of time shares are held. |
| (b) | For Class C shares, the redemption price per share is reduced by 1.00% for shares held less than one year. |
See notes to financial statements.
Statements of Operations
For the Year Ended October 31, 2005
| | | | | | | | | | | | | | | | | | | | | | |
| | | Gartmore Bond
Index Fund | | | Gartmore
International
Index Fund | | | Gartmore
Mid Cap Market
Index Fund | | | Gartmore S&P 500 Index Fund | | | Gartmore Small Cap Index Fund |
INVESTMENT INCOME: | | | | | | | | | | | | | | | | | | | | | | |
Interest income | | $ | 55,530,868 | | | $ | 1,319,036 | | | $ | 2,405,245 | | | $ | 3,724,906 | | | $ | 1,739,424 | | | |
Dividend income (net of foreign witholding tax of $0; $3,055,350; $0; $0 and $0; respectively) | | | — | | | | 26,662,245 | | | | 10,474,479 | | | | 44,627,389 | | | | 3,400,659 | | | |
Income from securities lending | | | 433,399 | | | | 1,038,698 | | | | 340,596 | | | | 355,972 | | | | 503,079 | | | |
| | |
|
|
| |
|
|
| |
|
|
| |
|
|
| |
|
|
| | |
Total Income | | | 55,964,267 | | | | 29,019,979 | | | | 13,220,320 | | | | 48,708,267 | | | | 5,643,162 | | | |
| | |
|
|
| |
|
|
| |
|
|
| |
|
|
| |
|
|
| | |
| | | | | | |
Expenses: | | | | | | | | | | | | | | | | | | | | | | |
Investment advisory fees | | | 2,761,503 | | | | 3,111,608 | | | | 1,824,667 | | | | 2,929,247 | | | | 714,354 | | | |
Fund administration and transfer agent fees | | | 1,487,803 | | | | 1,427,578 | | | | 921,691 | | | | 2,523,149 | | | | 422,548 | | | |
Distribution fees Class A | | | 104,588 | | | | 92,717 | | | | 304,298 | | | | 34,264 | | | | 180,141 | | | |
Distribution fees Class B | | | 2,661 | | | | 3,271 | | | | 7,636 | | | | 54,479 | | | | 3,890 | | | |
Distribution fees Class C | | | — | | | | 902 | | | | 986 | | | | 6,786 | | | | 994 | | | |
Distribution fees Service Class | | | — | | | | — | | | | — | | | | 856,730 | | | | — | | | |
Distribution fees Local Class | | | — | | | | — | | | | — | | | | 79 | | | | — | | | |
Administrative servicing fees Class A | | | 62,749 | | | | 54,527 | | | | 169,718 | | | | 3,807 | | | | 108,101 | | | |
Administrative servicing fees Service Class | | | — | | | | — | | | | — | | | | 1,404,048 | | | | — | | | |
Administrative servicing fees Institutional Service Class | | | — | | | | — | | | | — | | | | 176,217 | | | | — | | | |
Registration and filing fees | | | 97,430 | | | | 94,944 | | | | 80,666 | | | | 109,941 | | | | 65,471 | | | |
Trustee fees | | | 51,314 | | | | 47,082 | | | | 33,387 | | | | 94,195 | | | | 14,450 | | | |
Other | | | 305,127 | | | | 310,724 | | | | 296,611 | | | | 789,815 | | | | 103,418 | | | |
| | |
|
|
| |
|
|
| |
|
|
| |
|
|
| |
|
|
| | |
Total expenses before reimbursed expenses | | | 4,873,175 | | | | 5,143,353 | | | | 3,639,660 | | | | 8,982,757 | | | | 1,613,367 | | | |
Earnings credit (Note 5) | | | (11,457 | ) | | | (4,689 | ) | | | (5,547 | ) | | | (10,459 | ) | | | (2,258 | ) | | |
Expenses reimbursed | | | (710,181 | ) | | | (756,273 | ) | | | (519,931 | ) | | | (1,108,994 | ) | | | (256,790 | ) | | |
| | |
|
|
| |
|
|
| |
|
|
| |
|
|
| |
|
|
| | |
Total Expenses | | | 4,151,537 | | | | 4,382,391 | | | | 3,114,182 | | | | 7,863,304 | | | | 1,354,319 | | | |
| | |
|
|
| |
|
|
| |
|
|
| |
|
|
| |
|
|
| | |
Net Investment Income (Loss) | | | 51,812,730 | | | | 24,637,588 | | | | 10,106,138 | | | | 40,844,963 | | | | 4,288,843 | | | |
| | |
|
|
| |
|
|
| |
|
|
| |
|
|
| |
|
|
| | |
| | | | | | |
REALIZED/UNREALIZED GAINS (LOSSES) FROM INVESTMENTS: | | | | | | | | | | | | | | | | | | | | | | |
Net realized gains (losses) on investment transactions | | | (708,614 | ) | | | 26,181,765 | | | | 38,346,130 | | | | (4,219,685 | ) | | | 13,434,826 | | | |
Net realized gains (losses) on future transactions | | | — | | | | 16,916,666 | | | | 11,947,546 | | | | 14,093,160 | | | | 7,410,648 | | | |
Net realized gains (losses) on foreign currency transactions | | | — | | | | (2,940,305 | ) | | | — | | | | — | | | | — | | | |
Net realized gains (losses) on swap transactions | | | (881,271 | ) | | | — | | | | — | | | | — | | | | — | | | |
| | |
|
|
| |
|
|
| |
|
|
| |
|
|
| |
|
|
| | |
Net realized gains (losses) on investment, futures and foreign currency transactions | | | (1,589,885 | ) | | | 40,158,126 | | | | 50,293,676 | | | | 9,873,475 | | | | 20,845,474 | | | |
Net change in unrealized appreciation/depreciation on investments, futures, swaps and translation of assets and liabilities denominated in foreign currencies | | | (40,578,235 | ) | | | 123,259,235 | | | | 59,756,849 | | | | 116,601,416 | | | | 12,196,781 | | | |
| | |
|
|
| |
|
|
| |
|
|
| |
|
|
| |
|
|
| | |
Net realized/unrealized gains (losses) on investments, futures and foreign currencies | | | 42,168,120 | | | | 163,417,361 | | | | 110,050,525 | | | | 126,474,891 | | | | 33,042,255 | | | |
| | |
|
|
| |
|
|
| |
|
|
| |
|
|
| |
|
|
| | |
CHANGE IN NET ASSETS
RESULTING FROM OPERATIONS | | $ | 9,644,610 | | | $ | 188,054,949 | | | $ | 120,156,663 | | | $ | 167,319,854 | | | $ | 37,331,098 | | | |
| | |
|
|
| |
|
|
| |
|
|
| |
|
|
| |
|
|
| | |
| | | | | | | | | | | | | | | | | | | | | | | |
See notes to financial statements.
Statements of Changes in Net Assets
| | | | | | | | | | | | | | | | | | |
| | | Gartmore Bond Index Fund | | | Gartmore International Index Fund |
| | | Year Ended
October 31, 2005 | | | Year Ended
October 31, 2004 | | | Year Ended
October 31, 2005 | | | Year Ended
October 31, 2004 |
FROM INVESTMENT ACTIVITIES: | | | | | | | | | | | | | | | | | | |
Operations: | | | | | | | | | | | | | | | | | | |
Net investment income (loss) | | $ | 55,530,868 | | | $ | 28,396,698 | | | $ | 24,637,588 | | | $ | 12,496,942 | | | |
Net realized gains (losses) on investment, futures and foreign currency transactions | | | (1,589,985 | ) | | | 2,967,606 | | | | 40,158,126 | | | | 12,656,265 | | | |
Net change in unrealized appreciation/depreciation on investments, futures, swaps and translation of assets and liabilities denominated in foreign currencies | | | (40,578,235 | ) | | | 11,512,393 | | | | 123,259,235 | | | | 68,963,585 | | | |
| | |
|
|
| |
|
|
| |
|
|
| |
|
|
| | |
Change in net assets resulting from operations | | | 9,644,610 | | | | 42,876,697 | | | | 188,054,949 | | | | 94,116,792 | | | |
| | |
|
|
| |
|
|
| |
|
|
| |
|
|
| | |
| | | | | |
Distributions to Class A Shareholders from: | | | | | | | | | | | | | | | | | | |
Net investment income | | | (1,589,869 | ) | | | (1,379,130 | ) | | | (887,978 | ) | | | (311,725 | ) | | |
Net realized gains on investments | | | (21,640 | ) | | | — | | | | (372,809 | ) | | | (3,274 | ) | | |
| | | | | |
Distributions to Class B Shareholders from: | | | | | | | | | | | | | | | | | | |
Net investment income | | | (8,494 | ) | | | (9,948 | ) | | | (6,059 | ) | | | (1,045 | ) | | |
Net realized gains on investments | | | (138 | ) | | | — | | | | (2,547 | ) | | | (24 | ) | | |
| | | | | |
Distributions to Class C Shareholders from: | | | | | | | | | | | | | | | | | | |
Net investment income | | | — | | | | — | | | | (1,839 | ) (a) | | | — | | | |
| | | | | |
Distributions to Institutional Class Shareholders from: | | | | | | | | | | | | | | | | | | |
Net investment income | | | (51,119,187 | ) | | | (28,789,702 | ) | | | (30,547,982 | ) | | | (10,010,686 | ) | | |
Net realized gains on investments | | | (539,426 | ) | | | — | | | | (10,207,889 | ) | | | (77,718 | ) | | |
| | |
|
|
| |
|
|
| |
|
|
| |
|
|
| | |
Change in net assets from shareholder distributions | | | (53,278,754 | ) | | | (30,178,780 | ) | | | (42,027,103 | ) | | | (10,404,472 | ) | | |
| | |
|
|
| |
|
|
| |
|
|
| |
|
|
| | |
Change in net assets from capital transactions | | | 563,405,652 | | | | 456,683,198 | | | | 326,357,828 | | | | 429,465,827 | | | |
| | |
|
|
| |
|
|
| |
|
|
| |
|
|
| | |
Change in net assets | | | 519,771,508 | | | | 469,381,115 | | | | 472,385,674 | | | | 513,178,147 | | | |
| | | | | |
Net Assets: | | | | | | | | | | | | | | | | | | |
Beginning of period | | | 993,255,091 | | | | 523,873,976 | | | | 889,391,901 | | | | 376,213,754 | | | |
| | |
|
|
| |
|
|
| |
|
|
| |
|
|
| | |
End of period | | $ | 1,513,026,599 | | | $ | 993,255,091 | | | $ | 1,361,777,575 | | | $ | 889,391,901 | | | |
| | |
|
|
| |
|
|
| |
|
|
| |
|
|
| | |
Accumulated net investment income (loss) | | $ | 866,187 | | | $ | (15,084 | ) | | $ | (2,108,220 | ) | | $ | 5,972,697 | | | |
| | |
|
|
| |
|
|
| |
|
|
| |
|
|
| | |
| | | | | | | | | | | | | | | | | | | |
| | | | | | | | | | | | | | | | | | | |
| | | | | | | | | | | | | | | | | | | |
| | | | | | | | | | | | | | | | | | | |
| | | | | | | | | | | | | | | | | | | |
| | | | | | | | | | | | | | | | | | | |
| | | | | | | | | | | | | | | | | | | |
| | | | | | | | | | | | | | | | | | | |
| | | | | | | | | | | | | | | | | | | |
| | | | | | | | | | | | | | | | | | | |
| (a) | For the period from February 14, 2005 (commencement of operations) through October 31, 2005. |
See notes to financial statements.
Statements of Changes in Net Assets
| | | | | | | | | | |
| | | Gartmore Mid Cap Market Index Fund |
| | | Year Ended
October 31, 2005 | | | Year Ended
October 31, 2004 |
FROM INVESTMENT ACTIVITIES: | | | | | | | | | | |
Operations: | | | | | | | | | | |
Net investment income (loss) | | $ | 10,106,138 | | | $ | 3,699,561 | | | |
Net realized gains (losses) on investment and futures transactions | | | 50,293,676 | | | | 17,269,819 | | | |
Net change in unrealized appreciation/depreciation on investments and futures | | | 59,756,849 | | | | 17,534,939 | | | |
| | |
|
|
| |
|
|
| | |
Change in net assets resulting from operations | | | 120,156,663 | | | | 38,504,319 | | | |
| | |
|
|
| |
|
|
| | |
| | | |
Distributions to Class A Shareholders from: | | | | | | | | | | |
Net investment income | | | (986,365 | ) | | | (183,148 | ) | | |
Net realized gains on investments | | | (1,521,298 | ) | | | (455,159 | ) | | |
| | | |
Distributions to Class B Shareholders from: | | | | | | | | | | |
Net investment income | | | (1,707 | ) | | | — | | | |
Net realized gains on investments | | | (13,730 | ) | | | (3,534 | ) | | |
| | | |
Distributions to Class C Shareholders from: | | | | | | | | | | |
Net investment income | | | (561 | ) | | | (7 | ) | | |
Net realized gains on investments | | | (530 | ) | | | (229 | ) | | |
| | | |
Distributions to Institutional Class Shareholders from: | | | | | | | | | | |
Net investment income | | | (8,089,901 | ) | | | (3,295,582 | ) | | |
Net realized gains on investments | | | (11,631,944 | ) | | | (2,971,536 | ) | | |
| | |
|
|
| |
|
|
| | |
Change in net assets from shareholder distributions | | | (22,246,036 | ) | | | (6,909,195 | ) | | |
| | |
|
|
| |
|
|
| | |
Change in net assets from capital transactions | | | 315,044,639 | | | | 277,368,892 | | | |
| | |
|
|
| |
|
|
| | |
Change in net assets | | | 412,955,266 | | | | 308,964,016 | | | |
| | | |
Net Assets: | | | | | | | | | | |
Beginning of period | | | 595,932,607 | | | | 286,968,591 | | | |
| | |
|
|
| |
|
|
| | |
End of period | | $ | 1,008,887,873 | | | $ | 595,932,607 | | | |
| | |
|
|
| |
|
|
| | |
Accumulated net investment income (loss) | | $ | 1,465,171 | | | $ | 437,567 | | | |
| | |
|
|
| |
|
|
| | |
| | | | | | | | | | | |
| | | | | | | | | | | |
| | | | | | | | | | | |
| | | | | | | | | | | |
| | | | | | | | | | | |
| | | | | | | | | | | |
| | | | | | | | | | | |
| | | | | | | | | | | |
| | | | | | | | | | | |
| | | | | | | | | | | |
| | | | | | | | | | | |
| | | | | | | | | | | |
| | | | | | | | | | | |
| | | | | | | | | | | |
See notes to financial statements.
Statements of Changes in Net Assets
| | | | | | | | | | | | | | | | | | |
| | | Gartmore S&P 500 Index Fund | | | Gartmore Small Cap Index Fund |
| | | | |
| | | Year Ended
October 31, 2005 | | | Year Ended
October 31, 2004 | | | Year Ended
October 31, 2005 | | | Year Ended
October 31, 2004 |
FROM INVESTMENT ACTIVITIES: | | | | | | | | | | | | | | | | | | |
Operations: | | | | | | | | | | | | | | | | | | |
Net investment income (loss) | | $ | 40,844,963 | | | $ | 19,675,698 | | | $ | 4,288,843 | | | $ | 1,793,646 | | | |
Net realized gains (losses) on investment transactions | | | 9,873,475 | | | | (2,348,411 | ) | | | 20,845,474 | | | | 14,224,436 | | | |
Net change in unrealized appreciation/depreciation on investments | | | 116,601,416 | | | | 98,975,299 | | | | 12,196,781 | | | | 4,487,848 | | | |
| | |
|
|
| |
|
|
| |
|
|
| |
|
|
| | |
Change in net assets resulting from operations | | | 167,319,854 | | | | 116,302,586 | | | | 37,331,098 | | | | 20,505,930 | | | |
| | |
|
|
| |
|
|
| |
|
|
| |
|
|
| | |
| | | | | |
Distributions to Class A Shareholders from: | | | | | | | | | | | | | | | | | | |
Net investment income | | | (229,328 | ) | | | (79,387 | ) | | | (639,517 | ) | | | (287,052 | ) | | |
Net realized gains on investments | | | — | | | | — | | | | (2,760,397 | ) | | | (802,932 | ) | | |
| | | | | |
Distributions to Class B Shareholders from: | | | | | | | | | | | | | | | | | | |
Net investment income | | | (47,910 | ) | | | (19,380 | ) | | | (1,102 | ) | | | (6 | ) | | |
Net realized gains on investments | | | — | | | | — | | | | (14,014 | ) | | | (4,908 | ) | | |
| | | | | |
Distributions to Class C Shareholders from: | | | | | | | | | | | | | | | | | | |
Net investment income | | | (6,857 | ) | | | (607 | ) | | | (466 | ) | | | (18 | ) | | |
Net realized gains on investments | | | — | | | | — | | | | (1,577 | ) | | | (343 | ) | | |
| | | | | |
Distributions to Institutional Class Shareholders from: | | | | | | | | | | | | | | | | | | |
Net investment income | | | (30,571,334 | ) | | | (13,237,951 | ) | | | (3,706,523 | ) | | | (1,326,145 | ) | | |
Net realized gains on investments | | | — | | | | — | | | | (9,044,421 | ) | | | (1,892,332 | ) | | |
| | | | | |
Distributions to Service Class Shareholders from: | | | | | | | | | | | | | | | | | | |
Net investment income | | | (8,422,320 | ) | | | (4,915,272 | ) | | | — | | | | — | | | |
| | | | | |
Distributions to Institutional Service Class Shareholders from: | | | | | | | | | | | | | | | | | | |
Net investment income | | | (1,169,535 | ) | | | (759,266 | ) | | | — | | | | — | | | |
| | | | | |
Distributions to Local Fund Shareholders from: | | | | | | | | | | | | | | | | | | |
Net investment income | | | (2,026 | ) | | | (1,378 | ) | | | — | | | | — | | | |
| | |
|
|
| |
|
|
| |
|
|
| |
|
|
| | |
Change in net assets from shareholder distributions | | | (40,449,310 | ) | | | (19,013,241 | ) | | | (16,168,017 | ) | | | (4,313,736 | ) | | |
| | |
|
|
| |
|
|
| |
|
|
| |
|
|
| | |
Change in net assets from capital transactions | | | 707,220,071 | | | | 656,502,224 | | | | 120,267,223 | | | | 114,765,029 | | | |
| | |
|
|
| |
|
|
| |
|
|
| |
|
|
| | |
Change in net assets | | | 834,090,615 | | | | 753,791,569 | | | | 141,430,304 | | | | 130,957,223 | | | |
| | | | | |
Net Assets: | | | | | | | | | | | | | | | | | | |
Beginning of period | | | 1,852,755,775 | | | | 1,098,964,206 | | | | 273,473,742 | | | | 142,516,519 | | | |
| | |
|
|
| |
|
|
| |
|
|
| |
|
|
| | |
End of period | | $ | 2,686,846,390 | | | $ | 1,852,755,775 | | | $ | 414,904,046 | | | $ | 273,473,742 | | | |
| | |
|
|
| |
|
|
| |
|
|
| |
|
|
| | |
Accumulated net investment income (loss) | | $ | 2,807,688 | | | $ | 2,412,035 | | | $ | 267,728 | | | $ | 326,493 | | | |
| | |
|
|
| |
|
|
| |
|
|
| |
|
|
| | |
| | | | | | | | | | | | | | | | | | | |
| | | | | | | | | | | | | | | | | | | |
See notes to financial statements.
Financial Highlights
Selected Data for Each Share of Capital Outstanding
Gartmore Bond Index Fund
| | | | | | | | | | | | | | | | | | | | | | | | | | | | | | | | | | | | | | | | | | | |
| | | | | Investment Activities | | | Distributions | | | | | | | | Ratios/Supplemental Data |
| | | Net Asset
Value,
Beginning
of Period | | Net
Investment
Income
(Loss) | | Net Realized
and
Unrealized
Gains
(Losses) on
Investments | | | Total
from
Investment
Activities | | | Net
Investment
Income | | | Net
Realized
Gains | | | Total
Distributions | | | Net
Asset
Value, End
of Period | | Total
Return (a) | | | Net Assets
at End of
Period
(000s) | | Ratio of
Expenses
to Average
Net Assets | | | Ratio of Net
Investment
Income
(Loss)
to Average
Net Assets | | | Ratio of
Expenses
(Prior to
Reimbursements)
to Average
Net Assets (b) | | | Ratio of Net
Investment
Income (Loss)
(Prior to
Reimbursements)
to Average
Net Assets (b) | | | Portfolio
Turnover (c) |
| | | | | | | | | | | | | | | |
Class A Shares | | | | | | | | | | | | | | | | | | | | | | | | | | | | | | | | | | | | | | | | | | | |
Year Ended October 31, 2001 | | $ | 10.08 | | 0.57 | | 0.93 | | | 1.50 | | | (0.57 | ) | | (0.08 | ) | | (0.65 | ) | | $ | 10.93 | | 15.28% | | | $ | 9,693 | | 0.81% | | | 5.04% | | | 1.12% | | | 4.73% | | | 150.27% |
Year Ended October 31, 2002 | | $ | 10.93 | | 0.47 | | 0.05 | | | 0.52 | | | (0.48 | ) | | (0.01 | ) | | (0.49 | ) | | $ | 10.96 | | 5.01% | | | $ | 38,447 | | 0.72% | | | 4.29% | | | 0.84% | | | 4.17% | | | 124.75% |
Year Ended October 31, 2003 | | $ | 10.96 | | 0.34 | | 0.09 | | | 0.43 | | | (0.40 | ) | | (0.01 | ) | | (0.41 | ) | | $ | 10.98 | | 3.96% | | | $ | 42,292 | | 0.71% | | | 3.07% | | | 0.82% | | | 2.96% | | | 139.66% |
Year Ended October 31, 2004 | | $ | 10.98 | | 0.36 | | 0.17 | | | 0.53 | | | (0.38 | ) | | — | | | (0.38 | ) | | $ | 11.13 | | 4.94% | | | $ | 40,757 | | 0.71% | | | 3.25% | | | 0.77% | | | 3.19% | | | 151.56% |
Year Ended October 31, 2005 | | $ | 11.13 | | 0.41 | | (0.34 | ) | | 0.07 | | | (0.42 | ) | | (0.01 | ) | | (0.43 | ) | | $ | 10.77 | | 0.56% | | | $ | 42,126 | | 0.71% | | | 3.74% | | | 0.77% | | | 3.69% | | | 153.31% |
| | | | | | | | | | | | | | | |
Class B Shares | | | | | | | | | | | | | | | | | | | | | | | | | | | | | | | | | | | | | | | | | | | |
Period Ended October 31, 2001 (d) | | $ | 10.75 | | 0.02 | | 0.18 | | | 0.20 | | | (0.02 | ) | | — | | | (0.02 | ) | | $ | 10.93 | | 1.85% | (e) | | $ | 10 | | 1.41% | (f) | | 3.05% | (f) | | 1.63% | (f) | | 2.83% | (f) | | 150.27% |
Year Ended October 31, 2002 | | $ | 10.93 | | 0.41 | | 0.05 | | | 0.46 | | | (0.42 | ) | | (0.01 | ) | | (0.43 | ) | | $ | 10.96 | | 4.38% | | | $ | 28 | | 1.33% | | | 3.69% | | | 1.44% | | | 3.58% | | | 124.75% |
Year Ended October 31, 2003 | | $ | 10.96 | | 0.29 | | 0.07 | | | 0.36 | | | (0.33 | ) | | (0.01 | ) | | (0.34 | ) | | $ | 10.98 | | 3.34% | | | $ | 256 | | 1.31% | | | 2.10% | | | 1.41% | | | 2.00% | | | 139.66% |
Year Ended October 31, 2004 | | $ | 10.98 | | 0.30 | | 0.17 | | | 0.47 | | | (0.32 | ) | | — | | | (0.32 | ) | | $ | 11.13 | | 4.32% | | | $ | 457 | | 1.31% | | | 2.70% | | | 1.37% | | | 2.65% | | | 151.56% |
Year Ended October 31, 2005 | | $ | 11.13 | | 0.33 | | (0.33 | ) | | (0.00 | ) | | (0.35 | ) | | (0.01 | ) | | (0.36 | ) | | $ | 10.77 | | (0.04% | ) | | $ | 218 | | 1.31% | | | 3.18% | | | 1.37% | | | 3.09% | | | 153.31% |
| | | | | | | | | | | | | | | |
Institutional Class Shares | | | | | | | | | | | | | | | | | | | | | | | | | | | | | | | | | | | | | | | | | | | |
Year Ended October 31, 2001 | | $ | 10.09 | | 0.63 | | 0.91 | | | 1.54 | | | (0.63 | ) | | (0.08 | ) | | (0.71 | ) | | $ | 10.92 | | 15.71% | | | $ | 45,750 | | 0.31% | | | 5.51% | | | 1.10% | | | 4.72% | | | 150.27% |
Year Ended October 31, 2002 | | $ | 10.92 | | 0.52 | | 0.05 | | | 0.57 | | | (0.53 | ) | | (0.01 | ) | | (0.54 | ) | | $ | 10.95 | | 5.46% | | | $ | 185,141 | | 0.31% | | | 4.67% | | | 0.45% | | | 4.53% | | | 124.75% |
Year Ended October 31, 2003 | | $ | 10.95 | | 0.39 | | 0.09 | | | 0.48 | | | (0.44 | ) | | (0.01 | ) | | (0.45 | ) | | $ | 10.98 | | 4.47% | | | $ | 481,326 | | 0.31% | | | 3.34% | | | 0.42% | | | 3.23% | | | 139.66% |
Year Ended October 31, 2004 | | $ | 10.98 | | 0.41 | | 0.17 | | | 0.58 | | | (0.43 | ) | | — | | | (0.43 | ) | | $ | 11.13 | | 5.36% | | | $ | 952,042 | | 0.31% | | | 3.69% | | | 0.37% | | | 3.63% | | | 151.56% |
Year Ended October 31, 2005 | | $ | 11.13 | | 0.45 | | (0.34 | ) | | 0.11 | | | (0.46 | ) | | (0.01 | ) | | (0.47 | ) | | $ | 10.77 | | 0.97% | | | $ | 1,470,683 | | 0.31% | | | 4.14% | | | 0.37% | | | 4.09% | | | 153.31% |
| (a) | Excludes sales charge. |
| (b) | During the period certain fees were waived and/or reimbursed. If such waivers/reimbursements had not occurred, the ratios would have been as indicated. |
| (c) | Portfolio turnover is calculated on the basis of the Fund as a whole without distinguishing among the classes of shares. |
| (d) | For the period from October 12, 2001 (commencement of operations) through October 31, 2001. |
See notes to financial statements.
Financial Highlights
Selected Data for Each Share of Capital Outstanding
Gartmore International Index Fund
| | | | | | | | | | | | | | | | | | | | | | | | | | | | | | | | | | | | | | | | | | | |
| | | | | Investment Activities | | | Distributions | | | | | | Ratios/Supplemental Data |
| | | Net Asset
Value,
Beginning
of Period | | Net
Investment
Income
(Loss) | | Net Realized
and
Unrealized
Gains
(Losses) on
Investments | | | Total
from
Investment
Activities | | | Net
Investment
Income | | | Net
Realized
Gains | | | Total
Distributions | | | Net
Asset
Value, End
of Period | | Total
Return (a) | | | Net Assets
at End of
Period
(000s) | | Ratio of
Expenses
to Average
Net Assets | | | Ratio of Net
Investment
Income
(Loss)
to Average
Net Assets | | | Ratio of
Expenses
(Prior to
Reimbursements)
to Average
Net Assets (b) | | | Ratio of Net
Investment
Income (Loss)
(Prior to
Reimbursements)
to Average
Net Assets (b) | | | Portfolio
Turnover (c) |
| | | | | | | | | | | | | | | |
Class A Shares | | | | | | | | | | | | | | | | | | | | | | | | | | | | | | | | | | | | | | | | | | | |
Year Ended October 31, 2001 | | $ | 8.65 | | 0.08 | | (2.28 | ) | | (2.20 | ) | | (0.08 | ) | | — | | | (0.08 | ) | | $ | 6.37 | | (25.44% | ) | | $ | 10,877 | | 0.86% | | | 1.17% | | | 3.97% | | | (1.94% | ) | | 30.18% |
Year Ended October 31, 2002 | | $ | 6.37 | | 0.08 | | (1.06 | ) | | (0.98 | ) | | (0.08 | ) | | — | | | (0.08 | ) | | $ | 5.31 | | (15.65% | ) | | $ | 12,549 | | 0.79% | | | 1.15% | | | 0.96% | | | 0.98% | | | 32.45% |
Year Ended October 31, 2003 | | $ | 5.31 | | 0.09 | | 1.25 | | | 1.34 | | | (0.10 | ) | | — | | | (0.10 | ) | | $ | 6.55 | | 25.51% | | | $ | 16,404 | | 0.75% | | | 1.71% | | | 0.88% | | | 1.58% | | | 7.71% |
Year Ended October 31, 2004 | | $ | 6.55 | | 0.10 | | 1.07 | | | 1.17 | | | (0.09 | ) | | — | (g) | | (0.09 | ) | | $ | 7.63 | | 18.01% | | | $ | 34,183 | | 0.76% | | | 1.57% | | | 0.82% | | | 1.51% | | | 7.62% |
Year Ended October 31, 2005 | | $ | 7.63 | | 0.16 | | 1.18 | | | 1.34 | | | (0.20 | ) | | (0.08 | ) | | (0.28 | ) | | $ | 8.69 | | 17.83% | | | $ | 40,565 | | 0.76% | | | 1.81% | | | 0.83% | | | 1.75% | | | 12.24% |
| | | | | | | | | | | | | | | |
Class B Shares | | | | | | | | | | | | | | | | | | | | | | | | | | | | | | | | | | | | | | | | | | | |
Year Ended October 31, 2001 | | $ | 8.62 | | 0.04 | | (2.30 | ) | | (2.26 | ) | | (0.04 | ) | | — | | | (0.04 | ) | | $ | 6.32 | | (26.17% | ) | | $ | 59 | | 1.46% | | | 0.42% | | | 7.41% | | | (5.53% | ) | | 30.18% |
Year Ended October 31, 2002 | | $ | 6.32 | | 0.03 | | (1.04 | ) | | (1.01 | ) | | (0.05 | ) | | — | | | (0.05 | ) | | $ | 5.26 | | (16.12% | ) | | $ | 80 | | 1.39% | | | 0.64% | | | 1.72% | | | 0.31% | | | 32.45% |
Year Ended October 31, 2003 | | $ | 5.26 | | 0.06 | | 1.24 | | | 1.30 | | | (0.08 | ) | | — | | | (0.08 | ) | | $ | 6.48 | | 24.88% | | | $ | 105 | | 1.36% | | | 1.03% | | | 1.48% | | | 0.90% | | | 7.71% |
Year Ended October 31, 2004 | | $ | 6.48 | | 0.06 | | 1.05 | | | 1.11 | | | (0.05 | ) | | — | (g) | | (0.05 | ) | | $ | 7.54 | | 17.21% | | | $ | 159 | | 1.36% | | | 0.98% | | | 1.42% | | | 0.92% | | | 7.62% |
Year Ended October 31, 2005 | | $ | 7.54 | | 0.08 | | 1.19 | | | 1.27 | | | (0.16 | ) | | (0.08 | ) | | (0.24 | ) | | $ | 8.57 | | 17.17% | | | $ | 396 | | 1.36% | | | 1.14% | | | 1.43% | | | 1.07% | | | 12.24% |
| | | | | | | | | | | | | | | |
Class C Shares | | | | | | | | | | | | | | | | | | | | | | | | | | | | | | | | | | | | | | | | | | | |
Period Ended October 31, 2005 (d) | | $ | 8.27 | | 0.09 | | 0.19 | | | 0.28 | | | (0.11 | ) | | — | | | (0.11 | ) | | $ | 8.44 | | 3.63% | (e) | | $ | 152 | | 1.36% | (f) | | 1.57% | (f) | | 1.43% | (f) | | 1.50% | (f) | | 12.24% |
| | | | | | | | | | | | | | | |
Institutional Class Shares | | | | | | | | | | | | | | | | | | | | | | | | | | | | | | | | | | | | | | | | | | | |
Year Ended October 31, 2001 | | $ | 8.66 | | 0.10 | | (2.29 | ) | | (2.19 | ) | | (0.10 | ) | | — | | | (0.10 | ) | | $ | 6.37 | | (25.28% | ) | | $ | 32,422 | | 0.36% | | | 1.42% | | | 2.60% | | | (0.82% | ) | | 30.18% |
Year Ended October 31, 2002 | | $ | 6.37 | | 0.09 | | (1.04 | ) | | (0.95 | ) | | (0.10 | ) | | — | | | (0.10 | ) | | $ | 5.32 | | (15.20% | ) | | $ | 119,502 | | 0.36% | | | 1.66% | | | 0.56% | | | 1.46% | | | 32.45% |
Year Ended October 31, 2003 | | $ | 5.32 | | 0.11 | | 1.25 | | | 1.36 | | | (0.12 | ) | | — | | | (0.12 | ) | | $ | 6.56 | | 25.90% | | | $ | 359,705 | | 0.36% | | | 1.99% | | | 0.48% | | | 1.87% | | | 7.71% |
Year Ended October 31, 2004 | | $ | 6.56 | | 0.12 | | 1.08 | | | 1.20 | | | (0.12 | ) | | — | (g) | | (0.12 | ) | | $ | 7.64 | | 18.43% | | | $ | 855,050 | | 0.36% | | | 1.99% | | | 0.42% | | | 1.93% | | | 7.62% |
Year Ended October 31, 2005 | | $ | 7.64 | | 0.18 | | 1.19 | | | 1.37 | | | (0.23 | ) | | (0.08 | ) | | (0.31 | ) | | $ | 8.70 | | 18.26% | | | $ | 1,320,858 | | 0.36% | | | 2.17% | | | 0.43% | | | 2.10% | | | 12.24% |
| (a) | Excludes sales charge. |
| (b) | During the period certain fees were waived and/or reimbursed. If such waivers/reimbursements had not occurred, the ratios would have been as indicated. |
| (c) | Portfolio turnover is calculated on the basis of the Fund as a whole without distinguishing among the classes of shares. |
| (d) | For period from February 14, 2005 (commencement of operations) through October 31, 2005. |
| (g) | The amount is less than $0.005. |
See notes to financial statements.
Financial Highlights
Selected Data for Each Share of Capital Outstanding
Gartmore Mid Cap Market Index Fund
| | | | | | | | | | | | | | | | | | | | | | | | | | | | | | | | | | | | | | | | | | | | |
| | | | | Investment Activities | | | Distributions | | | | | | Ratios/Supplemental Data |
| | | Net Asset
Value,
Beginning
of Period | | Net
Investment
Income
(Loss) | | | Net Realized
and
Unrealized
Gains
(Losses) on
Investments | | | Total
from
Investment
Activities | | | Net
Investment
Income | | | Net
Realized
Gains | | | Total
Distributions | | | Net
Asset
Value, End
of Period | | Total
Return (a) | | | Net Assets
at End of
Period
(000s) | | Ratio of
Expenses
to Average
Net Assets | | | Ratio of Net
Investment
Income
(Loss)
to Average
Net Assets | | | Ratio of
Expenses
(Prior to
Reimbursements)
to Average
Net Assets (b) | | | Ratio of Net
Investment
Income (Loss)
(Prior to
Reimbursements)
to Average
Net Assets (b) | | | Portfolio
Turnover (c) |
| | | | | | | | | | | | | | | |
Class A Shares | | | | | | | | | | | | | | | | | | | | | | | | | | | | | | | | | | | | | | | | | | | | |
Year Ended October 31, 2001 | | $ | 11.77 | | 0.07 | | | (1.50 | ) | | (1.43 | ) | | (0.08 | ) | | (0.47 | ) | | (0.55 | ) | | $ | 9.79 | | (12.57% | ) | | $ | 9,028 | | 0.81% | | | 0.56% | | | 1.27% | | | 0.10% | | | 119.76% |
Year Ended October 31, 2002 | | $ | 9.79 | | 0.04 | | | (0.59 | ) | | (0.55 | ) | | (0.05 | ) | | — | | | (0.05 | ) | | $ | 9.19 | | (5.67% | ) | | $ | 19,002 | | 0.73% | | | 0.42% | | | 0.83% | | | 0.32% | | | 15.82% |
Year Ended October 31, 2003 | | $ | 9.19 | | 0.04 | | | 2.68 | | | 2.72 | | | (0.04 | ) | | — | | | (0.04 | ) | | $ | 11.87 | | 29.72% | | | $ | 38,693 | | 0.71% | | | 0.48% | | | 0.82% | | | 0.37% | | | 8.26% |
Year Ended October 31, 2004 | | $ | 11.87 | | 0.05 | | | 1.13 | | | 1.18 | | | (0.04 | ) | | (0.12 | ) | | (0.16 | ) | | $ | 12.89 | | 10.07% | | | $ | 65,059 | | 0.70% | | | 0.50% | | | 0.77% | | | 0.44% | | | 15.75% |
Year Ended October 31, 2005 | | $ | 12.89 | | 0.12 | | | 2.04 | | | 2.16 | | | (0.11 | ) | | (0.26 | ) | | (0.37 | ) | | $ | 14.68 | | 16.94% | | | $ | 150,305 | | 0.70% | | | 0.90% | | | 0.77% | | | 0.84% | | | 18.44% |
| | | | | | | | | | | | | | | |
Class B Shares | | | | | | | | | | | | | | | | | | | | | | | | | | | | | | | | | | | | | | | | | | | | |
Period Ended October 31, 2001 (d) | | $ | 11.62 | | — | | | (1.83 | ) | | (1.83 | ) | | — | | | (0.05 | ) | | (0.05 | ) | | $ | 9.74 | | (16.05% | )(f) | | $ | 6 | | 1.41% | (g) | | (0.38% | )(g) | | 3.66% | (g) | | (2.63% | )(g) | | 119.76% |
Year Ended October 31, 2002 | | $ | 9.74 | | (0.01 | ) | | (0.58 | ) | | (0.59 | ) | | (0.02 | ) | | — | | | (0.02 | ) | | $ | 9.13 | | (6.13% | ) | | $ | 86 | | 1.32% | | | (0.16% | ) | | 1.44% | | | (0.28% | ) | | 15.82% |
Year Ended October 31, 2003 | | $ | 9.13 | | (0.02 | ) | | 2.66 | | | 2.64 | | | — | | | — | | | — | | | $ | 11.77 | | 28.96% | | | $ | 295 | | 1.31% | | | (0.13% | ) | | 1.42% | | | (0.25% | ) | | 8.26% |
Year Ended October 31, 2004 | | $ | 11.77 | | (0.02 | ) | | 1.12 | | | 1.10 | | | — | | | (0.12 | ) | | (0.12 | ) | | $ | 12.75 | | 9.44% | | | $ | 657 | | 1.31% | | | (0.10% | ) | | 1.37% | | | (0.17% | ) | | 15.75% |
Year Ended October 31, 2005 | | $ | 12.75 | | 0.03 | | | 2.01 | | | 2.04 | | | (0.03 | ) | | (0.26 | ) | | (0.29 | ) | | $ | 14.50 | | 16.15% | | | $ | 884 | | 1.31% | | | 0.27% | | | 1.38% | | | 0.21% | | | 18.44% |
| | | | | | | | | | | | | | | |
Class C Shares | | | | | | | | | | | | | | | | | | | | | | | | | | | | | | | | | | | | | | | | | | | | |
Period Ended October 31, 2003 (e) | | $ | 11.43 | | — | | | 0.33 | | | 0.33 | | | — | | | — | | | — | | | $ | 11.76 | | 2.89% | (f) | | $ | 21 | | 1.31% | (g) | | 0.16% | (g) | | 1.71% | (g) | | (0.24% | )(g) | | 8.26% |
Year Ended October 31, 2004 | | $ | 11.76 | | (0.02 | ) | | 1.12 | | | 1.10 | | | — | | | (0.12 | ) | | (0.12 | ) | | $ | 12.74 | | 9.48% | | | $ | 26 | | 1.31% | | | (0.10% | ) | | 1.38% | | | (0.17% | ) | | 15.75% |
Year Ended October 31, 2005 | | $ | 12.74 | | 0.02 | | | 2.01 | | | 2.03 | | | (0.05 | ) | | (0.26 | ) | | (0.31 | ) | | $ | 14.46 | | 16.13% | | | $ | 225 | | 1.31% | | | 0.28% | | | 1.39% | | | 0.21% | | | 18.44% |
| | | | | | | | | | | | | | | |
Institutional Class Shares | | | | | | | | | | | | | | | | | | | | | | | | | | | | | | | | | | | | | | | | | | | | |
Year Ended October 31, 2001 | | $ | 11.80 | | 0.10 | | | (1.49 | ) | | (1.39 | ) | | (0.10 | ) | | (0.47 | ) | | (0.57 | ) | | $ | 9.84 | | (12.17% | ) | | $ | 26,719 | | 0.31% | | | 1.08% | | | 1.00% | | | 0.39% | | | 119.76% |
Year Ended October 31, 2002 | | $ | 9.84 | | 0.08 | | | (0.58 | ) | | (0.50 | ) | | (0.09 | ) | | — | | | (0.09 | ) | | $ | 9.25 | | (5.19% | ) | | $ | 84,128 | | 0.31% | | | 0.84% | | | 0.44% | | | 0.71% | | | 15.82% |
Year Ended October 31, 2003 | | $ | 9.25 | | 0.08 | | | 2.70 | | | 2.78 | | | (0.08 | ) | | — | | | (0.08 | ) | | $ | 11.95 | | 30.21% | | | $ | 247,960 | | 0.31% | | | 0.87% | | | 0.42% | | | 0.76% | | | 8.26% |
Year Ended October 31, 2004 | | $ | 11.95 | | 0.11 | | | 1.13 | | | 1.24 | | | (0.11 | ) | | (0.12 | ) | | (0.23 | ) | | $ | 12.96 | | 10.47% | | | $ | 530,191 | | 0.31% | | | 0.89% | | | 0.37% | | | 0.83% | | | 15.75% |
Year Ended October 31, 2005 | | $ | 12.96 | | 0.17 | | | 2.06 | | | 2.23 | | | (0.16 | ) | | (0.26 | ) | | (0.42 | ) | | $ | 14.77 | | 17.41% | | | $ | 857,475 | | 0.31% | | | 1.27% | | | 0.38% | | | 1.21% | | | 18.44% |
| (a) | Excludes sales charge. |
| (b) | During the period certain fees were waived and/or reimbursed. If such waivers/reimbursements had not occurred, the ratios would have been as indicated. |
| (c) | Portfolio turnover is calculated on the basis of the Fund as a whole without distinguishing among the classes of shares. |
| (d) | For the period from May 25, 2001 (commencement of operations) through October 31, 2001. |
| (e) | For the period from October 22, 2003 (commencement of operations) through October 31, 2003. |
See notes to financial statements.
Financial Highlights
Selected Data for Each Share of Capital Outstanding
Gartmore S&P 500 Index Fund
| | | | | | | | | | | | | | | | | | | | | | | | | | | | | | | | | | | | | | | | | | | |
| | | | | Investment Activities | | | Distributions | | | | | | Ratios/Supplemental Data |
| | | Net Asset
Value,
Beginning
of Period | | Net
Investment
Income
(Loss) | | Net Realized
and
Unrealized
Gains
(Losses) on
Investments | | | Total
from
Investment
Activities | | | Net
Investment
Income | | | Net
Realized
Gains | | | Total
Distributions | | | Net
Asset
Value, End
of Period | | Total
Return (a) | | | Net Assets
at End of
Period
(000s) | | Ratio of
Expenses
to Average
Net Assets | | | Ratio of Net
Investment
Income
(Loss)
to Average
Net Assets | | | Ratio of
Expenses
(Prior to
Reimbursements)
to Average
Net Assets (b) | | | Ratio of Net
Investment
Income (Loss)
(Prior to
Reimbursements)
to Average
Net Assets (b) | | | Portfolio
Turnover (c) |
| | | | | | | | | | | | | | | |
Class A Shares | | | | | | | | | | | | | | | | | | | | | | | | | | | | | | | | | | | | | | | | | | | |
Year Ended October 31, 2001 | | $ | 12.46 | | 0.06 | | (3.17 | ) | | (3.11 | ) | | (0.06 | ) | | (0.17 | ) | | (0.23 | ) | | $ | 9.12 | | (25.24% | ) | | $ | 3,237 | | 0.63% | | | 0.70% | | | 1.03% | | | 0.30% | | | 1.85% |
Year Ended October 31, 2002 | | $ | 9.12 | | 0.09 | | (1.50 | ) | | (1.41 | ) | | (0.09 | ) | | — | | | (0.09 | ) | | $ | 7.62 | | (15.62% | ) | | $ | 3,942 | | 0.52% | | | 1.06% | | | 0.61% | | | 0.97% | | | 3.06% |
Year Ended October 31, 2003 | | $ | 7.62 | | 0.10 | | 1.41 | | | 1.51 | | | (0.09 | ) | | — | | | (0.09 | ) | | $ | 9.04 | | 20.03% | | | $ | 5,795 | | 0.48% | | | 1.28% | | | 0.56% | | | 1.21% | | | 1.30% |
Year Ended October 31, 2004 | | $ | 9.04 | | 0.11 | | 0.70 | | | 0.81 | | | (0.11 | ) | | — | | | (0.11 | ) | | $ | 9.74 | | 8.99% | | | $ | 7,822 | | 0.50% | | | 1.18% | | | 0.54% | | | 1.13% | | | 1.71% |
Year Ended October 31, 2005 | | $ | 9.74 | | 0.15 | | 0.64 | | | 0.79 | | | (0.17 | ) | | — | | | (0.17 | ) | | $ | 10.36 | | 8.11% | | | $ | 24,805 | | 0.50% | | | 1.49% | | | 0.56% | | | 1.43% | | | 5.28% |
| | | | | | | | | | | | | | | |
Class B Shares | | | | | | | | | | | | | | | | | | | | | | | | | | | | | | | | | | | | | | | | | | | |
Year Ended October 31, 2001 | | $ | 12.42 | | 0.01 | | (3.16 | ) | | (3.15 | ) | | (0.01 | ) | | (0.17 | ) | | (0.18 | ) | | $ | 9.09 | | (25.65% | ) | | $ | 1,879 | | 1.23% | | | 0.11% | | | 2.21% | | | (0.87% | ) | | 1.85% |
Year Ended October 31, 2002 | | $ | 9.09 | | 0.03 | | (1.50 | ) | | (1.47 | ) | | (0.03 | ) | | — | | | (0.03 | ) | | $ | 7.59 | | (16.24% | ) | | $ | 2,423 | | 1.23% | | | 0.35% | | | 1.39% | | | 0.19% | | | 3.06% |
Year Ended October 31, 2003 | | $ | 7.59 | | 0.04 | | 1.41 | | | 1.45 | | | (0.04 | ) | | — | | | (0.04 | ) | | $ | 9.00 | | 19.14% | | | $ | 3,713 | | 1.23% | | | 0.54% | | | 1.30% | | | 0.47% | | | 1.30% |
Year Ended October 31, 2004 | | $ | 9.00 | | 0.05 | | 0.69 | | | 0.74 | | | (0.04 | ) | | — | | | (0.04 | ) | | $ | 9.70 | | 8.23% | | | $ | 4,820 | | 1.23% | | | 0.45% | | | 1.27% | | | 0.41% | | | 1.71% |
Year Ended October 31, 2005 | | $ | 9.70 | | 0.09 | | 0.63 | | | 0.72 | | | (0.09 | ) | | — | | | (0.09 | ) | | $ | 10.33 | | 7.45% | | | $ | 5,707 | | 1.23% | | | 0.90% | | | 1.28% | | | 0.86% | | | 5.28% |
| | | | | | | | | | | | | | | |
Class C Shares | | | | | | | | | | | | | | | | | | | | | | | | | | | | | | | | | | | | | | | | | | | |
Period Ended October 31, 2003 (d) | | $ | 8.83 | | — | | 0.18 | | | 0.18 | | | — | | | — | | | — | | | $ | 9.01 | | 2.04% | (e) | | $ | 10 | | 1.23% | (f) | | 0.48% | (f) | | 1.23% | (f) | | 0.48% | (f) | | 1.30% |
Year Ended October 31, 2004 | | $ | 9.01 | | 0.05 | | 0.67 | | | 0.72 | | | (0.06 | ) | | — | | | (0.06 | ) | | $ | 9.67 | | 8.06% | | | $ | 250 | | 1.23% | | | 0.46% | | | 1.27% | | | 0.42% | | | 1.71% |
Year Ended October 31, 2005 | | $ | 9.67 | | 0.08 | | 0.64 | | | 0.72 | | | (0.11 | ) | | — | | | (0.11 | ) | | $ | 10.28 | | 7.44% | | | $ | 831 | | 1.23% | | | 0.71% | | | 1.28% | | | 0.65% | | | 5.28% |
| | | | | | | | | | | | | | | |
Institutional Class Shares | | | | | | | | | | | | | | | | | | | | | | | | | | | | | | | | | | | | | | | | | | | |
Year Ended October 31, 2001 | | $ | 12.49 | | 0.11 | | (3.17 | ) | | (3.06 | ) | | (0.11 | ) | | (0.17 | ) | | (0.28 | ) | | $ | 9.15 | | (24.84% | ) | | $ | 107,955 | | 0.23% | | | 1.10% | | | 0.29% | | | 1.04% | | | 1.85% |
Year Ended October 31, 2002 | | $ | 9.15 | | 0.11 | | (1.51 | ) | | (1.40 | ) | | (0.11 | ) | | — | | | (0.11 | ) | | $ | 7.64 | | (15.44% | ) | | $ | 235,333 | | 0.23% | | | 1.37% | | | 0.33% | | | 1.27% | | | 3.06% |
Year Ended October 31, 2003 | | $ | 7.64 | | 0.11 | | 1.43 | | | 1.54 | | | (0.11 | ) | | — | | | (0.11 | ) | | $ | 9.07 | | 20.39% | | | $ | 620,598 | | 0.23% | | | 1.52% | | | 0.30% | | | 1.45% | | | 1.30% |
Year Ended October 31, 2004 | | $ | 9.07 | | 0.13 | | 0.70 | | | 0.83 | | | (0.13 | ) | | — | | | (0.13 | ) | | $ | 9.77 | | 8.86% | | | $ | 1,247,061 | | 0.23% | | | 1.45% | | | 0.27% | | | 1.41% | | | 1.71% |
Year Ended October 31, 2005 | | $ | 9.77 | | 0.19 | | 0.64 | | | 0.83 | | | (0.19 | ) | | — | | | (0.19 | ) | | $ | 10.41 | | 8.55% | | | $ | 2,007,290 | | 0.23% | | | 1.86% | | | 0.28% | | | 1.81% | | | 5.28% |
| | | | | | | | | | | | | | | |
Service Class Shares | | | | | | | | | | | | | | | | | | | | | | | | | | | | | | | | | | | | | | | | | | | |
Year Ended October 31, 2001 | | $ | 12.45 | | 0.07 | | (3.17 | ) | | (3.10 | ) | | (0.07 | ) | | (0.17 | ) | | (0.24 | ) | | $ | 9.11 | | (25.22% | ) | | $ | 233,943 | | 0.63% | | | 0.70% | | | 0.69% | | | 0.64% | | | 1.85% |
Year Ended October 31, 2002 | | $ | 9.11 | | 0.08 | | (1.50 | ) | | (1.42 | ) | | (0.08 | ) | | — | | | (0.08 | ) | | $ | 7.61 | | (15.73% | ) | | $ | 266,515 | | 0.63% | | | 0.94% | | | 0.72% | | | 0.85% | | | 3.06% |
Year Ended October 31, 2003 | | $ | 7.61 | | 0.09 | | 1.41 | | | 1.50 | | | (0.08 | ) | | — | | | (0.08 | ) | | $ | 9.03 | | 19.89% | | | $ | 413,554 | | 0.63% | | | 1.14% | | | 0.70% | | | 1.06% | | | 1.30% |
Year Ended October 31, 2004 | | $ | 9.03 | | 0.11 | | 0.69 | | | 0.80 | | | (0.10 | ) | | — | | | (0.10 | ) | | $ | 9.73 | | 9.24% | | | $ | 523,127 | | 0.63% | | | 1.05% | | | 0.67% | | | 1.01% | | | 1.71% |
Year Ended October 31, 2005 | | $ | 9.73 | | 0.16 | | 0.62 | | | 0.78 | | | (0.15 | ) | | — | | | (0.15 | ) | | $ | 10.36 | | 8.06% | | | $ | 578,102 | | 0.63% | | | 1.51% | | | 0.67% | | | 1.47% | | | 5.28% |
| | | | | | | | | | | | | | | |
Institutional Service Class Shares | | | | | | | | | | | | | | | | | | | | | | | | | | | | | | | | | | | | | | | | | | | |
Year Ended October 31, 2001 | | $ | 12.48 | | 0.08 | | (3.17 | ) | | (3.09 | ) | | (0.08 | ) | | (0.17 | ) | | (0.25 | ) | | $ | 9.14 | | (25.04% | ) | | $ | 35,097 | | 0.48% | | | 0.84% | | | 0.54% | | | 0.78% | | | 1.85% |
Year Ended October 31, 2002 | | $ | 9.14 | | 0.09 | | (1.50 | ) | | (1.41 | ) | | (0.09 | ) | | — | | | (0.09 | ) | | $ | 7.64 | | (15.56% | ) | | $ | 41,498 | | 0.48% | | | 1.09% | | | 0.57% | | | 1.00% | | | 3.06% |
Year Ended October 31, 2003 | | $ | 7.64 | | 0.10 | | 1.42 | | | 1.52 | | | (0.09 | ) | | — | | | (0.09 | ) | | $ | 9.07 | | 20.11% | | | $ | 55,197 | | 0.48% | | | 1.29% | | | 0.55% | | | 1.21% | | | 1.30% |
Year Ended October 31, 2004 | | $ | 9.07 | | 0.12 | | 0.69 | | | 0.81 | | | (0.11 | ) | | — | | | (0.11 | ) | | $ | 9.77 | | 9.14% | | | $ | 69,569 | | 0.48% | | | 1.21% | | | 0.52% | | | 1.16% | | | 1.71% |
Year Ended October 31, 2005 | | $ | 9.77 | | 0.18 | | 0.62 | | | 0.80 | | | (0.17 | ) | | — | | | (0.17 | ) | | $ | 10.40 | | 8.29% | | | $ | 69,996 | | 0.48% | | | 1.68% | | | 0.52% | | | 1.63% | | | 5.28% |
| | | | | | | | | | | | | | | |
Local Fund Shares | | | | | | | | | | | | | | | | | | | | | | | | | | | | | | | | | | | | | | | | | | | |
Year Ended October 31, 2001 | | $ | 12.48 | | 0.07 | | (3.14 | ) | | (3.07 | ) | | (0.07 | ) | | (0.17 | ) | | (0.24 | ) | | $ | 9.17 | | (24.91% | ) | | $ | 96 | | 0.35% | | | 0.94% | | | 0.37% | | | 0.92% | | | 1.85% |
Year Ended October 31, 2002 | | $ | 9.17 | | 0.11 | | (1.52 | ) | | (1.41 | ) | | (0.10 | ) | | — | | | (0.10 | ) | | $ | 7.66 | | (15.47% | ) | | $ | 81 | | 0.31% | | | 1.25% | | | 0.39% | | | 1.17% | | | 3.06% |
Year Ended October 31, 2003 | | $ | 7.66 | | 0.12 | | 1.42 | | | 1.54 | | | (0.11 | ) | | — | | | (0.11 | ) | | $ | 9.09 | | 20.26% | | | $ | 97 | | 0.30% | | | 1.47% | | | 0.37% | | | 1.40% | | | 1.30% |
Year Ended October 31, 2004 | | $ | 9.09 | | 0.14 | | 0.69 | | | 0.83 | | | (0.13 | ) | | — | | | (0.13 | ) | | $ | 9.79 | | 8.85% | | | $ | 106 | | 0.30% | | | 1.38% | | | 0.34% | | | 1.34% | | | 1.71% |
Year Ended October 31, 2005 | | $ | 9.79 | | 0.20 | | 0.63 | | | 0.83 | | | (0.19 | ) | | — | | | (0.19 | ) | | $ | 10.43 | | 8.45% | | | $ | 115 | | 0.30% | | | 1.85% | | | 0.35% | | | 1.80% | | | 5.28% |
| (a) | Excludes sales charge. |
| (b) | During the period certain fees were waived and/or reimbursed. If such waivers/reimbursements had not occurred, the ratios would have been as indicated. |
| (c) | Portfolio turnover is calculated on the basis of the Fund as a whole without distinguishing among the classes of shares. |
| (d) | For the period from October 22, 2003 (commencement of operations) through October 31, 2003. |
See notes to financial statements.
Financial Highlights
Selected Data for Each Share of Capital Outstanding
Gartmore Small Cap Index Fund
| | | | | | | | | | | | | | | | | | | | | | | | | | | | | | | | | | | | | | | | | | | | |
| | | | | Investment Activities | | | Distributions | | | | | | Ratios/Supplemental Data |
| | | Net Asset
Value,
Beginning
of Period | | Net
Investment
Income
(Loss) | | | Net Realized
and
Unrealized
Gains
(Losses) on
Investments | | | Total
from
Investment
Activities | | | Net
Investment
Income | | | Net
Realized
Gains | | | Total
Distributions | | | Net
Asset
Value, End
of Period | | Total
Return (a) | | | Net Assets
at End of
Period
(000s) | | Ratio of
Expenses
to Average
Net Assets | | | Ratio of Net
Investment
Income
(Loss)
to Average
Net Assets | | | Ratio of
Expenses
(Prior to
Reimbursements)
to Average
Net Assets (b) | | | Ratio of Net
Investment
Income (Loss)
(Prior to
Reimbursements)
to Average
Net Assets (b) | | | Portfolio
Turnover (c) |
| | | | | | | | | | | | | | | |
Class A Shares | | | | | | | | | | | | | | | | | | | | | | | | | | | | | | | | | | | | | | | | | | | | |
Year Ended October 31, 2001 | | $ | 9.67 | | 0.07 | | | (1.32 | ) | | (1.25 | ) | | (0.08 | ) | | — | | | (0.08 | ) | | $ | 8.34 | | (12.95% | ) | | $ | 4,098 | | 0.79% | | | 0.75% | | | 1.64% | | | (0.10% | ) | | 50.19% |
Year Ended October 31, 2002 | | $ | 8.34 | | 0.05 | | | (1.07 | ) | | (1.02 | ) | | (0.05 | ) | | — | | | (0.05 | ) | | $ | 7.27 | | (12.29% | ) | | $ | 11,079 | | 0.71% | | | 0.71% | | | 0.97% | | | 0.45% | | | 34.77% |
Year Ended October 31, 2003 | | $ | 7.27 | | 0.05 | | | 2.98 | | | 3.03 | | | (0.05 | ) | | — | | | (0.05 | ) | | $ | 10.25 | | 41.89% | | | $ | 42,343 | | 0.69% | | | 0.61% | | | 0.83% | | | 0.47% | | | 25.63% |
Year Ended October 31, 2004 | | $ | 10.25 | | 0.06 | | | 1.06 | | | 1.12 | | | (0.05 | ) | | (0.17 | ) | | (0.22 | ) | | $ | 11.15 | | 11.08% | | | $ | 62,688 | | 0.69% | | | 0.56% | | | 0.77% | | | 0.48% | | | 24.10% |
Year Ended October 31, 2005 | | $ | 11.15 | | 0.10 | | | 1.20 | | | 1.30 | | | (0.10 | ) | | (0.45 | ) | | (0.55 | ) | | $ | 11.90 | | 11.67% | | | $ | 65,751 | | 0.69% | | | 0.90% | | | 0.77% | | | 0.82% | | | 24.14% |
| | | | | | | | | | | | | | | |
Class B Shares | | | | | | | | | | | | | | | | | | | | | | | | | | | | | | | | | | | | | | | | | | | | |
Period Ended October 31, 2002 (d) | | $ | 8.84 | | 0.03 | | | (1.59 | ) | | (1.56 | ) | | (0.03 | ) | | — | | | (0.03 | ) | | $ | 7.25 | | (17.68% | )(f) | | $ | 89 | | 1.29% | (g) | | 0.15% | (g) | | 1.55% | (g) | | (0.11% | )(g) | | 34.77% |
Year Ended October 31, 2003 | | $ | 7.25 | | — | | | 2.97 | | | 2.97 | | | (0.01 | ) | | — | | | (0.01 | ) | | $ | 10.21 | | 40.98% | | | $ | 249 | | 1.29% | | | 0.04% | | | 1.44% | | | (0.11% | ) | | 25.63% |
Year Ended October 31, 2004 | | $ | 10.21 | | (0.01 | ) | | 1.05 | | | 1.04 | | | — | | | (0.17 | ) | | (0.17 | ) | | $ | 11.08 | | 10.28% | | | $ | 424 | | 1.29% | | | (0.04% | ) | | 1.37% | | | (0.12% | ) | | 24.10% |
Year Ended October 31, 2005 | | $ | 11.08 | | 0.03 | | | 1.19 | | | 1.22 | | | (0.03 | ) | | (0.45 | ) | | (0.48 | ) | | $ | 11.82 | | 10.98% | | | $ | 444 | | 1.29% | | | 0.28% | | | 1.37% | | | 0.21% | | | 24.14% |
| | | | | | | | | | | | | | | |
Class C Shares | | | | | | | | | | | | | | | | | | | | | | | | | | | | | | | | | | | | | | | | | | | | |
Period Ended October 31, 2003 (e) | | $ | 9.91 | | — | | | 0.29 | | | 0.29 | | | — | | | — | | | — | | | $ | 10.20 | | 2.93% | (f) | | $ | 21 | | 1.29% | (g) | | 0.07% | (g) | | 1.38% | (g) | | (0.02% | )(g) | | 25.63% |
Year Ended October 31, 2004 | | $ | 10.20 | | — | | | 1.06 | | | 1.06 | | | (0.01 | ) | | (0.17 | ) | | (0.18 | ) | | $ | 11.08 | | 10.48% | | | $ | 39 | | 1.29% | | | (0.04% | ) | | 1.37% | | | (0.12% | ) | | 24.10% |
Year Ended October 31, 2005 | | $ | 11.08 | | 0.03 | | | 1.19 | | | 1.22 | | | (0.05 | ) | | (0.45 | ) | | (0.50 | ) | | $ | 11.80 | | 10.99% | | | $ | 200 | | 1.29% | | | 0.23% | | | 1.37% | | | 0.16% | | | 24.14% |
| | | | | | | | | | | | | | | |
Institutional Class Shares | | | | | | | | | | | | | | | | | | | | | | | | | | | | | | | | | | | | | | | | | | | | |
Year Ended October 31, 2001 | | $ | 9.70 | | 0.11 | | | (1.32 | ) | | (1.21 | ) | | (0.11 | ) | | — | | | (0.11 | ) | | $ | 8.38 | | (12.54% | ) | | $ | 11,366 | | 0.29% | | | 1.30% | | | 1.94% | | | (0.35% | ) | | 50.19% |
Year Ended October 31, 2002 | | $ | 8.38 | | 0.08 | | | (1.06 | ) | | (0.98 | ) | | (0.08 | ) | | — | | | (0.08 | ) | | $ | 7.32 | | (11.80% | ) | | $ | 33,247 | | 0.29% | | | 1.14% | | | 0.58% | | | 0.85% | | | 34.77% |
Year Ended October 31, 2003 | | $ | 7.32 | | 0.08 | | | 3.00 | | | 3.08 | | | (0.08 | ) | | — | | | (0.08 | ) | | $ | 10.32 | | 42.49% | | | $ | 99,904 | | 0.29% | | | 1.04% | | | 0.44% | | | 0.89% | | | 25.63% |
Year Ended October 31, 2004 | | $ | 10.32 | | 0.10 | | | 1.09 | | | 1.19 | | | (0.10 | ) | | (0.17 | ) | | (0.27 | ) | | $ | 11.24 | | 11.51% | | | $ | 210,322 | | 0.29% | | | 0.97% | | | 0.37% | | | 0.88% | | | 24.10% |
Year Ended October 31, 2005 | | $ | 11.24 | | 0.15 | | | 1.21 | | | 1.36 | | | (0.15 | ) | | (0.45 | ) | | (0.60 | ) | | $ | 12.00 | | 12.11% | | | $ | 348,509 | | 0.29% | | | 1.28% | | | 0.37% | | | 1.21% | | | 24.14% |
| (a) | Excludes sales charge. |
| (b) | During the period certain fees were waived and/or reimbursed. If such waivers/reimbursements had not occurred, the ratios would have been as indicated. |
| (c) | Portfolio turnover is calculated on the basis of the Fund as a whole without distinguishing among the classes of shares. |
| (d) | For the period from November 29, 2001 (commencement of operations) through October 31, 2002. |
| (e) | For the period from October 22, 2003 (commencement of operations) through October 31, 2003. |
See notes to financial statements.
Notes to Financial Statements
October 31, 2005
1. Organization
Gartmore Mutual Funds (the “Trust”) is an open-end management investment company, organized under the laws of Delaware by an amended and restated Agreement and Declaration of Trust, dated October 28, 2004, as amended to date. Prior to January 25, 2002, the Trust was named “Nationwide Mutual Funds”. The Trust was originally created under the laws of Ohio as an Ohio business trust pursuant to a Declaration of Trust dated, as of October 30, 1997, as subsequently amended, and redomesticated as a Delaware Statutory Trust on February 28, 2005, is registered under the Investment Company Act of 1940, as amended (the “1940 Act”). The redomestication was a change in statutory status and did not affect the operations of the Trust. As of October 31, 2005, the Trust had authorized an unlimited number of shares of beneficial interest (“shares”) without par value. The Trust operates forty-six (46) separate series, or mutual funds, each with its own investment objectives and strategies. This report contains the financial statements and financial highlights of the five (5) funds listed below (individually, a “Fund”; collectively, the “Funds”):
- Gartmore Bond Index Fund (“Bond Index”)
- Gartmore International Index Fund (“International Index”)
- Gartmore Mid Cap Market Index Fund (“Mid Cap Market Index”)
- Gartmore S&P 500 Index Fund (“S&P 500 Index”)
- Gartmore Small Cap Index Fund (“Small Cap Index”)
Under the Trust’s organizational documents, its officers and trustees are indemnified against certain liabilities arising out of the performance of their duties to the Trust. In addition, the Trust has entered into Indemnification Agreements with its Trustees and certain of its Officers. Trust Officers receive no compensation from the Trust for serving as its Officers. In addition, in the normal course of business, the Trust enters into contracts with its vendors and others that provide for general indemnifications. The Trust’s maximum liability under these arrangements is unknown, as this would involve future claims that may be made against the Trust. Based on experience however, the Trust expects that risk of loss to be remote.
2. Summary of Significant Accounting Policies
The following is a summary of significant accounting policies followed by the Funds in the preparation of their financial statements. The policies are in conformity with accounting principles generally accepted in the United States of America (“GAAP”). The preparation of financial statements requires management to make estimates and assumptions that affect the reported amounts of assets and liabilities, disclosure of contingent assets and liabilities at the date of the financial statements, and the reported amounts of income and expenses for the period. Actual results could differ from those estimates.
Securities for which market quotations are readily available are valued at current market value as of “Valuation Time.” Valuation Time is as of the close of regular trading on the New York Stock Exchange (usually 4 p.m. Eastern time). Equity securities are valued at the last quoted sale price or, if there is no sale price, the last quoted bid price provided by an independent pricing service approved by the Trust’s Board of Trustees. Securities traded on NASDAQ are valued at the NASDAQ Official Closing Price. Prices are taken from the primary market or exchange in which each security trades. Prices are taken from the primary market or exchange in which each security trades. Most securities listed on a foreign exchange are valued either at fair value (see description below) or at the last sale price at the close of the exchange on which the security is principally traded. Foreign securities, currencies, and other assets and liabilities denominated in foreign currencies are translated into U.S. dollars at the exchange rate of said currencies against the U.S. Dollar, as of Valuation Time, as provided by an independent pricing service approved by the Board of Trustees.
Debt and other fixed income securities (other than short-term obligations) are valued at the last quoted bid price and/or by using a combination of daily quotes and matrix evaluations provided by an independent pricing service, the use of which has been approved by the Trust’s Board of Trustees. Short-term debt securities such as commercial paper and U.S. Treasury Bills having a remaining maturity of 60 days or less at the time of purchase are considered to be “short-term” and are valued at amortized cost which approximates market value.
Securities for which market quotations are not readily available, or for which an independent pricing service does not provide a value or provides a value that does not represent fair value in the judgment of the Funds’ investment adviser or designee, are valued at fair value under procedures approved by the Trust’s Board of Trustees. The “Fair Value” of these securities is determined in good faith by taking into account relevant factors and surrounding circumstances. Methods utilized to obtain a “Fair Value” may include the following non-exclusive list of SEC acceptable methods: (i) a multiple of earnings; (ii) the discount from market value of a similar, freely traded security; (iii) the yield-to-maturity for debt issues; or (iv) a consolidation of the methods. The Gartmore Fair Value Committee considers a non-exclusive list of factors to arrive at the appropriate method of determining “Fair Value.” For example, fair value determinations are required for securities whose value is affected by a “significant” event that materially affects the value of a domestic or foreign security which occurs subsequent to the time of the close of the principal market on which such domestic or foreign security trades and before the Valuation Time (i.e., a “subsequent event”). Typically, this will involve events occurring after the close of a foreign market on which a security trades and before the next Valuation Time.
The Funds holding foreign equity securities (the “Foreign Equity Funds”) value foreign securities at fair value in the circumstances described below. Generally, trading in foreign securities markets is completed each day at various times prior to the Valuation Time. Due to the time differences between the closings of the relevant foreign securities exchanges and the Valuation Time for the Foreign Equity Funds, the Foreign Equity Funds will fair value their foreign investments when it is determined that the market quotations for the foreign investments either are not readily available or are unreliable and, therefore, do not represent fair value. When the fair value prices are utilized, these prices will attempt to reflect the impact of the U.S. financial markets’ perceptions and trading activities on the Foreign Equity Funds’ foreign investments since the last closing prices of the foreign investments were calculated on their primary foreign securities markets or exchanges. For these purposes, the Board of Trustees of the Trust has determined that movements in relevant indices or other appropriate market indicators, after the close of the foreign securities exchanges, may demonstrate that market quotations are unreliable, and may trigger fair value pricing for certain securities. Consequently, fair valuation of portfolio securities may occur on a daily basis. In determining fair value prices, the Trust utilizes data furnished by an independent pricing service (and that data draws upon, among other information, the market values of foreign investments). The fair value prices of portfolio securities generally will be used when it is determined that the use of these prices will have a material impact on the net asset value of a Foreign Equity Fund. When a Foreign Equity Fund uses fair value pricing, the values assigned to the Foreign Equity Fund’s foreign investments may not be the quoted or published prices of the investments on their primary markets or exchanges.
| (b) | | Repurchase Agreements |
The Funds may enter into repurchase agreements with an entity which is a member of the Federal Reserve System or which is a “primary dealer” (as designated by the Federal Reserve Bank of New York) in U.S. Government obligations. The repurchase price generally equals the price paid by a Fund plus interest negotiated on the basis of current short-term rates, which may be more or less than the rate on the underlying portfolio securities. The seller under a repurchase agreement is required to maintain the value of the collateral held pursuant to the agreement at a market value equal to or greater than the repurchase price (including accrued interest). Collateral subject to repurchase agreements is held by the Funds’ custodian or another qualified sub-custodian or in the Federal Reserve/ Treasury book-entry system. If the counterparty defaults and the fair value of the collateral declines, realization of the collateral by the Funds may be delayed or limited. The Funds may transfer uninvested cash balances into a pooled cash account. These balances are invested in one or more repurchase agreements, which are fully collateralized by U.S. Government Agencies and U.S. Government Agency Mortgages with the counterparties of CS First Boston and Nomura Securities.
| (c) | | Foreign Currency Transactions |
The accounting records of the Funds are maintained in U.S. dollars. Foreign currency amounts are translated into U.S. dollars at the current rate of exchange to determine the value of investments, assets and liabilities. Purchases
Notes to Financial Statements (Continued)
October 31, 2005
and sales of securities, and income and expenses are translated at the prevailing rate of exchange on the respective date of these transactions. The Funds do not isolate that portion of the results of operations resulting from changes in foreign exchange rates on investments from fluctuations arising from changes in market prices of securities held. These fluctuations are included with the net realized and unrealized gain or loss from investments and foreign currencies.
| (d) | | Risks Associated with Foreign Securities and Currencies |
Investments in securities of foreign issuers carry certain risks not ordinarily associated with investments in securities of U.S. issuers. These risks include future political and economic developments, and the possible imposition of exchange controls or other foreign governmental laws and restrictions. In addition, with respect to certain countries, there is the possibility of expropriation of assets, confiscatory taxation, political or social instability or diplomatic developments, which could adversely affect investments in those countries.
Certain countries also may impose substantial restrictions on investments in their capital markets by foreign entities, including restrictions on investments in issuers of industries deemed sensitive to relevant national interests. These factors may limit the investment opportunities available and result in a lack of liquidity and a high price volatility with respect to securities of issuers from developing countries.
| (e) | | Forward Foreign Currency Contracts |
Certain Funds may enter into forward foreign currency exchange contracts in connection with planned purchases or sales of securities or to hedge the U.S. dollar value of portfolio securities denominated in a particular currency. The Funds could be exposed to risks if the counterparties to the contracts are unable to meet the terms of their contracts and from unanticipated movements in the value of a foreign currency relative to the U.S. dollar. The forward foreign currency contracts are adjusted by the daily exchange rate of the underlying currency and any gains or losses are recorded for financial statement purposes as unrealized gains or losses until the contract settlement date.
Certain Funds may invest in financial futures contracts (“futures contracts”) for the purpose of hedging their existing portfolio securities or securities that the Funds intend to purchase against fluctuations in value caused by changes in prevailing market interest rates or prices. Futures contracts may also be entered into for non-hedging purposes. Upon entering into a futures contract, these Funds are required to pledge to the broker an amount of cash and/or other assets equal to a certain percentage of the contract amount (initial margin deposit). Subsequent payments, known as “variation margin”, are made each day, depending on the daily fluctuations in the fair value/market value of the underlying assets. A gain or loss equal to the daily variation margin is recognized on a daily basis. Future contracts are valued daily at their last quoted sale price.
A “sale” of a futures contract means a contractual obligation to deliver the securities or foreign currency called for by the contract at a fixed price at a specified time in the future. A “purchase” of a futures contract means a contractual obligation to acquire the securities or foreign currency at a fixed price at a specified time in the future.
Should market conditions change unexpectedly, a Fund may not achieve the anticipated benefits of the futures contracts and may realize a loss. The use of futures transactions for hedging purposes involves the risk of imperfect correlation in movements in the price of futures contracts, interest rates, and the value of the underlying hedged assets.
The Funds may engage in swap contracts in order to obtain a desired return at a lower cost than if the Funds had invested directly in the asset that yielded the desired return. Unrealized gains are reported as an asset and unrealized losses are reported as a liability on the Statement of Assets and Liabilities. The change in unrealized gains or losses on swap contracts is reported as unrealized gains or losses in the Statement of Operations. A realized gain or loss is
recorded upon termination of swap contracts. Swap contracts are stated at fair value. Notional principal amounts are used to express the extent of involvement in these contracts, but the amounts potentially subject to credit risk are much smaller.
At October 31, 2005, Bond Index’s open swap contracts were as follows:
| | | | | | | | | |
| Description | | Expiration
Date | | Underlying
Notional
Value | | Unrealized
Appreciation
(Depreciation) | |
Index Swap with Morgan Stanley Capital Services Inc., Pays net of the total return of the Lehman Brothers CMBS Investment Grade plus 100 bps minus Libor less 15 bps. Gartmore Bond Index Fund receives positive pays negative | | 12/31/05 | | $ | 54,000,000 | | $ | (588,903 | ) |
| (h) | | Mortgage Dollar Rolls |
Certain Funds may enter into mortgage “dollar rolls” in which a Fund sells mortgage-backed securities for delivery in the current month and simultaneously contracts to repurchase substantially similar (same type, coupon and maturity) securities on a specified future date. Mortgage dollar rolls are referred to as TBA’s on the Statement of Investments of the applicable Funds. During the roll period, the Fund foregoes principal and interest paid on the mortgage-backed securities. The Fund is compensated by fee income or the difference between the current sales price and the lower forward price for the future purchase. Such compensation is amortized over the life of the dollar roll and included in investment income on the Statement of Operations. Mortgage dollar rolls are valued at the last quoted bid price and/or by using a combination of daily quotes and matrix evaluations provided by an independent pricing service, the use of which has been approved by the Fund’s Board of Trustees.
| (i) | | Security Transactions and Investment Income |
Security transactions are accounted for on the date the security is purchased or sold (“trade date”). Securities gains and losses are calculated on the identified cost basis. Interest income is recognized on the accrual basis and includes, where applicable, the amortization or accretion of premium or discount. Dividend income is recorded on the ex-dividend date.
To generate additional income, each of the Funds may lend up to 33 1/3% of the Fund’s total assets pursuant to agreements, requiring that the borrower deliver cash or securities as collateral with respect to each new loan of U.S. securities, equal to at least 102% of the value of the portfolio securities loaned, and with respect to each new loan of non-U.S. securities, collateral of at least 105% of the value of the portfolio securities loaned, and thereafter requiring the borrower to mark to market the collateral on a daily basis and requiring the borrower to make up any shortfall of collateral. The Funds receive payments from borrowers of the dividends and interest that the Funds are entitled to for the positions on loan. These loan positions simultaneously earn income on the investment of cash collateral. Collateral is marked to market daily to provide a level of collateral at least equal to the market value of securities loaned. There may be risks of delay in recovery of the securities should the borrower of the securities fail financially. Loans will be made, however, only to borrowers deemed by the Funds’ investment adviser to be of good standing and creditworthy under guidelines established by the Board of Trustees and when, in the judgment of the adviser, the consideration which can be earned currently from these securities loans justifies the attendant risks. Loans are subject to termination by the Funds or the borrower at any time, and, therefore, are not considered to be illiquid investments. JPMorgan Chase Bank serves as custodian for the securities lending program of the Funds. JP Morgan Chase Bank receives a custody fee based on the value of collateral received from borrowers.
Notes to Financial Statements (Continued)
October 31, 2005
The cash collateral received by the Funds at October 31, 2005, was pooled and invested in the following:
| | | | | | | | | | |
| Security Type | | Issuer Name | | Value | | Maturity Rate | | | Maturity Date |
Bank Note — Floating Rate | | U.S. Bank N.A. | | $ | 36,978,777 | | 3.85 | % | | 11/02/05 |
Funding Agreement — GIC | | GE Life and Annuity | | | 22,800,000 | | 4.05 | % | | 11/14/05 |
Funding Agreement — GIC | | General Electric Capital Corp. | | | 9,000,000 | | 3.95 | % | | 12/15/05 |
Funding Agreement — GIC | | ING USA | | | 25,000,000 | | 3.87 | % | | 11/18/05 |
Funding Agreement — GIC | | Protective Life Insurance Company | | | 25,000,000 | | 4.36 | % | | 01/30/06 |
Master Note — Floating | | Bank of America Corp. | | | 7,500,000 | | 4.14 | % | | 11/01/05 |
Master Note — Floating | | CDC Financial Product Inc. | | | 106,900,000 | | 4.16 | % | | 11/01/05 |
Master Note — Floating | | Citigroup Global Markets Inc. | | | 56,300,000 | | 4.13 | % | | 11/01/05 |
Master Note — Floating | | Goldman Sachs Group LP | | | 50,000,000 | | 3.92 | % | | 11/02/05 |
Master Note — Floating | | Merrill Lynch Mortgage Capital | | | 47,000,000 | | 4.16 | % | | 11/01/05 |
Medium Term Note — Floating | | Deutsche Bank Financial | | | 15,000,000 | | 4.19 | % | | 11/01/05 |
Medium Term Note — Floating | | General Electric Capital Corp. | | | 19,464,025 | | 3.79 | % | | 12/08/05 |
Medium Term Note — Floating | | ISLANDSBANKI HF Corp. | | | 20,500,000 | | 4.08 | % | | 11/22/05 |
Medium Term Note — Floating | | Nationwide Building Society | | | 22,214,017 | | 4.22 | % | | 01/23/06 |
Medium Term Note — Floating | | Northern Rock PLC | | | 1,000,000 | | 3.84 | % | | 12/09/05 |
Medium Term Note — Floating | | Pacific Life Global Funding | | | 29,996,059 | | 4.27 | % | | 01/26/06 |
Medium Term Note — Floating | | Royal Bank of Scotland Group PLC | | | 25,000,000 | | 4.02 | % | | 12/30/05 |
Medium Term Note — Floating | | Sigma Finance Inc. | | | 4,610,244 | | 3.83 | % | | 11/01/05 |
Medium Term Note — Floating | | Tango Finance Corp. | | | 5,997,651 | | 3.89 | % | | 11/01/05 |
Repurchase Agreement | | Normura Securities | | | 325,785,300 | | 4.05 | % | | 11/01/05 |
Yankee Certificates of Deposits — Floating | | Canadian Imperial Bank NY | | | 33,495,760 | | 4.28 | % | | 11/01/05 |
Yankee Certificates of Deposits — Floating | | Natexis Banques Populaires NY | | | 18,997,700 | | 4.32 | % | | 11/01/05 |
Information on the investment of cash collateral is shown in the Statement of Investments.
As of October 31, 2005, the following Funds had securities with the following values on loan:
| | | | | | |
| Fund | | Value of
Loaned Securities | | Value of
Collateral* |
Bond Index | | $ | 387,200,047 | | $ | 395,178,573 |
International Index | | | 172,518,995 | | | 180,683,964 |
Mid Cap Market Index | | | 185,300,812 | | | 185,502,716 |
S&P 500 Index | | | 186,074,150 | | | 187,378,599 |
Small Cap Index | | | 110,818,393 | | | 111,169,660 |
| | * | Includes securities and cash collateral |
| (k) | | Distributions to Shareholders |
Net investment income, if any, is declared daily and paid monthly for the Bond Index Fund and is declared and paid quarterly for all other Funds. For all Funds, distributable net realized capital gains, if any, are declared and distributed at least annually.
Dividends and distributions to shareholders are determined in accordance with federal income tax regulations, which may differ from GAAP. These “book/tax” differences are considered either permanent or temporary in nature. In accordance with American Institute of Certified Public Accountants Statement of Position 93-2, permanent differences (i.e., reclassification of market discounts, gain/loss, paydowns and distributions) are
reclassified within the capital accounts based on their nature for federal income tax purposes; temporary differences do not require reclassification. These reclassifications have no effect upon the net asset value of the respective Funds. To the extent distributions exceed current and accumulated earnings and profits for federal income tax purposes, these excesses are reported as distributions of paid-in-capital.
It is the policy of each Fund to qualify or continue to qualify as a regulated investment company by complying with the provisions available to certain investment companies, as defined in applicable sections of the Internal Revenue Code, and to make distributions of net investment income and net realized capital gains sufficient to relieve the Fund from all, or substantially all, federal income taxes.
| (m) | | Allocation of Expenses, Income, and Gains and Losses |
Expenses directly attributable to a Fund are charged to that Fund. Expenses not directly attributable to a Fund are allocated proportionately among various or all Funds within the Trust. For the Equity Funds, the method for allocating income, fund level expenses, and realized and unrealized gains or losses is based on the fair value of shares outstanding relative to net assets. Under this method, each class of shares participates based on the total net asset value of that class’s shares in proportion to the total net assets of the Fund. For the Bond Funds, the allocation method used is based on the fair value of settled shares outstanding. Under this method, earnings are allocated based on the fair value of settled shares. Expenses specific to a class (such as rule 12b-1 and administrative services fees) are charged to that class.
| (n) | | Capital Share Transactions |
Transactions in capital shares of the Funds were as follows:
| | | | | | | | | | | | | | | | | | |
| | | Bond Index | | | International Index |
| | | Year Ended
October 31, 2005 | | | Year Ended
October 31, 2004 | | | Year Ended
October 31, 2005 | | | Year Ended
October 31, 2004 |
CAPITAL TRANSACTIONS: | | | | | | | | | | | | | | | | | | |
Class A Shares | | | | | | | | | | | | | | | | | | |
Proceeds from shares issued (a) | | $ | 11,921,461 | | | $ | 13,347,490 | | | $ | 26,347,086 | | | $ | 42,445,138 | | | |
Dividends reinvested | | | 1,766,838 | | | | 1,350,691 | | | | 1,249,230 | | | | 310,013 | | | |
Cost of shares redeemed | | | (10,926,951 | ) | | | (16,812,393 | ) | | | (26,127,338 | ) | | | (28,400,557 | ) | | |
| | |
|
|
| |
|
|
| |
|
|
| |
|
|
| | |
| | | | 2,761,348 | | | | (2,114,212 | ) | | | 1,468,978 | | | | 14,354,594 | | | |
| | |
|
|
| |
|
|
| |
|
|
| |
|
|
| | |
| | | | | |
Class B Shares | | | | | | | | | | | | | | | | | | |
Proceeds from shares issued (a) | | | 86,753 | | | | 222,398 | | | | 235,088 | | | | 75,346 | | | |
Dividends reinvested | | | 9,945 | | | | 7,736 | | | | 7,847 | | | | 1,045 | | | |
Cost of shares redeemed | | | (326,869 | ) | | | (35,062 | ) | | | (46,512 | ) | | | (42,325 | ) | | |
| | |
|
|
| |
|
|
| |
|
|
| |
|
|
| | |
| | | | (230,171 | ) | | | 195,072 | | | | 196,423 | | | | 34,066 | | | |
| | |
|
|
| |
|
|
| |
|
|
| |
|
|
| | |
| | | | | |
Class C Shares | | | | | | | | | | | | | | | | | | |
Proceeds from shares issued (a) | | | — | | | | — | | | | 150,474 | (b) | | | — | | | |
Dividends reinvested | | | — | | | | — | | | | 945 | (b) | | | — | | | |
Cost of shares redeemed | | | — | | | | — | | | | (2,509 | )(b) | | | — | | | |
| | |
|
|
| |
|
|
| |
|
|
| |
|
|
| | |
| | | | — | | | | — | | | | 148,910 | | | | — | | | |
| | |
|
|
| |
|
|
| |
|
|
| |
|
|
| | |
| | | | | |
Institutional Class Shares | | | | | | | | | | | | | | | | | | |
Proceeds from shares issued (a) | | | 561,634,706 | | | | 509,207,305 | | | | 477,687,940 | | | | 461,901,238 | | | |
Dividends reinvested | | | 55,627,987 | | | | 26,390,060 | | | | 40,755,707 | | | | 10,088,380 | | | |
Cost of shares redeemed | | | (56,388,218 | ) | | | (76,995,027 | ) | | | (193,900,130 | ) | | | (56,912,451 | ) | | |
| | |
|
|
| |
|
|
| |
|
|
| |
|
|
| | |
| | | | 560,874,475 | | | | 458,602,338 | | | | 324,543,517 | | | | 415,077,167 | | | |
| | |
|
|
| |
|
|
| |
|
|
| |
|
|
| | |
Change in net assets from capital transactions | | $ | 563,405,652 | | | $ | 456,683,198 | | | $ | 326,357,828 | | | $ | 429,465,827 | | | |
| | |
|
|
| |
|
|
| |
|
|
| |
|
|
| | |
| (a) | Includes redemption fees, if any. |
| (b) | For the period from February 14, 2005 (commencement of operations) through October 31, 2005. |
Notes to Financial Statements (Continued)
October 31, 2005
| | | | | | | | | | | | | | |
| | | Bond Index | | | International Index |
| | | Year Ended
October 31, 2005 | | | Year Ended
October 31, 2004 | | | Year Ended
October 31, 2005 | | | Year Ended
October 31, 2004 | | | |
SHARE TRANSACTIONS: | | | | | | | | | | | | | | |
Class A Shares | | | | | | | | | | | | | | |
Issued | | 1,083,235 | | | 1,210,795 | | | 3,186,846 | | | 5,890,638 | | | |
Reinvested | | 160,606 | | | 122,641 | | | 150,754 | | | 42,652 | | | |
Redeemed | | (994,100 | ) | | (1,523,237 | ) | | (3,149,382 | ) | | (3,956,219 | ) | | |
| | |
|
| |
|
| |
|
| |
|
| | |
| | | 249,741 | | | (189,801 | ) | | 188,218 | | | 1,977,071 | | | |
| | |
|
| |
|
| |
|
| |
|
| | |
| | | | | |
Class B Shares | | | | | | | | | | | | | | |
Issued | | 7,897 | | | 20,196 | | | 29,541 | | | 10,681 | | | |
Reinvested | | 902 | | | 702 | | | 962 | | | 146 | | | |
Redeemed | | (29,622 | ) | | (3,184 | ) | | (5,414 | ) | | (5,909 | ) | | |
| | |
|
| |
|
| |
|
| |
|
| | |
| | | (20,823 | ) | | 17,714 | | | 25,089 | | | 4,918 | | | |
| | |
|
| |
|
| |
|
| |
|
| | |
| | | | | |
Class C Shares | | | | | | | | | | | | | | |
Issued | | — | | | — | | | 18,137 | (a) | | — | | | |
Reinvested | | — | | | — | | | 118 | (a) | | — | | | |
Redeemed | | — | | | — | | | (308 | )(a) | | — | | | |
| | |
|
| |
|
| |
|
| |
|
| | |
| | | — | | | — | | | 17,947 | | | — | | | |
| | |
|
| |
|
| |
|
| |
|
| | |
| | | | | |
Institutional Class Shares | | | | | | | | | | | | | | |
Issued | | 51,110,919 | | | 46,269,303 | | | 57,463,660 | | | 63,612,835 | | | |
Reinvested | | 5,061,735 | | | 2,398,550 | | | 4,907,293 | | | 1,388,539 | | | |
Redeemed | | (5,130,492 | ) | | (6,954,345 | ) | | (22,470,829 | ) | | (7,893,235 | ) | | |
| | |
|
| |
|
| |
|
| |
|
| | |
| | | 51,042,162 | | | 41,713,508 | | | 39,900,124 | | | 57,108,139 | | | |
| | |
|
| |
|
| |
|
| |
|
| | |
Total change in shares | | 51,271,080 | | | 41,541,421 | | | 40,131,378 | | | 59,090,128 | | | |
| | |
|
| |
|
| |
|
| |
|
| | |
| (a) | For the period from February 14, 2005 (commencement of operations) through October 31, 2005. |
| | | | | | | | | | | | | | | | | | |
| | | Mid Cap Market Index | | | S&P 500 Index |
| | | Year Ended
October 31, 2005 | | | Year Ended
October 31, 2004 | | | Year Ended
October 31, 2005 | | | Year Ended
October 31, 2004 |
CAPITAL TRANSACTIONS: | | | | | | | | | | | | | | | | | | |
Class A Shares | | | | | | | | | | | | | | | | | | |
Proceeds from shares issued (a) | | $ | 98,144,558 | | | $ | 43,015,880 | | | $ | 22,204,730 | | | $ | 3,841,704 | | | |
Dividends reinvested | | | 2,318,171 | | | | 629,448 | | | | 220,161 | | | | 76,060 | | | |
Cost of shares redeemed | | | (28,200,639 | ) | | | (21,026,712 | ) | | | (5,798,251 | ) | | | (2,337,539 | ) | | |
| | |
|
|
| |
|
|
| |
|
|
| |
|
|
| | |
| | | | 72,262,090 | | | | 22,618,616 | | | | 16,626,640 | | | | 1,580,225 | | | |
| | |
|
|
| |
|
|
| |
|
|
| |
|
|
| | |
| | | | | |
Class B Shares | | | | | | | | | | | | | | | | | | |
Proceeds from shares issued (a) | | | 227,014 | | | | 404,383 | | | | 1,517,492 | | | | 1,646,256 | | | |
Dividends reinvested | | | 14,359 | | | | 3,504 | | | | 35,761 | | | | 15,986 | | | |
Cost of shares redeemed | | | (106,040 | ) | | | (74,493 | ) | | | (984,230 | ) | | | (837,720 | ) | | |
| | |
|
|
| |
|
|
| |
|
|
| |
|
|
| | |
| | | | 135,333 | | | | 333,394 | | | | 569,023 | | | | 824,522 | | | |
| | |
|
|
| |
|
|
| |
|
|
| |
|
|
| | |
| | | | | |
Class C Shares | | | | | | | | | | | | | | | | | | |
Proceeds from shares issued (a) | | | 252,062 | | | | 2,986 | | | | 1,256,656 | | | | 237,978 | | | |
Dividends reinvested | | | 648 | | | | 229 | | | | 2,602 | | | | 573 | | | |
Cost of shares redeemed | | | (61,173 | ) | | | — | | | | (693,175 | ) | | | (1,200 | ) | | |
| | |
|
|
| |
|
|
| |
|
|
| |
|
|
| | |
| | | | 191,537 | | | | 3,215 | | | | 566,083 | | | | 237,351 | | | |
| | |
|
|
| |
|
|
| |
|
|
| |
|
|
| | |
| | | | | |
Institutional Class Shares | | | | | | | | | | | | | | | | | | |
Proceeds from shares issued (a) | | | 286,440,128 | | | | 293,159,004 | | | | 749,189,581 | | | | 736,845,278 | | | |
Dividends reinvested | | | 19,721,809 | | | | 6,267,087 | | | | 30,520,255 | | | | 13,212,499 | | | |
Cost of shares redeemed | | | (63,706,258 | ) | | | (45,012,424 | ) | | | (106,627,479 | ) | | | (182,979,506 | ) | | |
| | |
|
|
| |
|
|
| |
|
|
| |
|
|
| | |
| | | | 242,455,679 | | | | 254,413,667 | | | | 673,082,357 | | | | 567,078,271 | | | |
| | |
|
|
| |
|
|
| |
|
|
| |
|
|
| | |
| | | | | |
Service Class Shares | | | | | | | | | | | | | | | | | | |
Proceeds from shares issued (a) | | | — | | | | — | | | | 83,776,172 | | | | 124,577,939 | | | |
Dividends reinvested | | | — | | | | — | | | | 8,422,320 | | | | 4,915,270 | | | |
Cost of shares redeemed | | | — | | | | — | | | | (71,764,682 | ) | | | (52,626,707 | ) | | |
| | |
|
|
| |
|
|
| |
|
|
| |
|
|
| | |
| | | | — | | | | — | | | | 20,433,810 | | | | 76,866,502 | | | |
| | |
|
|
| |
|
|
| |
|
|
| |
|
|
| | |
| | | | | |
Institutional Service Class Shares | | | | | | | | | | | | | | | | | | |
Proceeds from shares issued (a) | | | — | | | | — | | | | 11,593,467 | | | | 22,349,604 | | | |
Dividends reinvested | | | — | | | | — | | | | 1,169,535 | | | | 759,266 | | | |
Cost of shares redeemed | | | — | | | | — | | | | (16,822,870 | ) | | | (13,194,895 | ) | | |
| | |
|
|
| |
|
|
| |
|
|
| |
|
|
| | |
| | | | — | | | | — | | | | (4,059,868 | ) | | | 9,913,975 | | | |
| | |
|
|
| |
|
|
| |
|
|
| |
|
|
| | |
| | | | | |
Local Fund Shares | | | | | | | | | | | | | | | | | | |
Dividends reinvested | | | — | | | | — | | | | 2,026 | | | | 1,378 | | | |
| | |
|
|
| |
|
|
| |
|
|
| |
|
|
| | |
| | | | — | | | | — | | | | 2,026 | | | | 1,378 | | | |
| | |
|
|
| |
|
|
| |
|
|
| |
|
|
| | |
Change in net assets from capital transactions | | $ | 315,044,639 | | | $ | 277,368,892 | | | $ | 707,220,071 | | | $ | 656,502,224 | | | |
| | |
|
|
| |
|
|
| |
|
|
| |
|
|
| | |
| (a) | Includes redemption fees, if any. |
Notes to Financial Statements (Continued)
October 31, 2005
| | | | | | | | | | | | | | |
| | | Mid Cap Market Index | | | S&P 500 Index |
| | | Year Ended
October 31, 2005 | | | Year Ended
October 31, 2004 | | | Year Ended
October 31, 2005 | | | Year Ended
October 31, 2004 |
SHARE TRANSACTIONS: | | | | | | | | | | | | | | |
Class A Shares | | | | | | | | | | | | | | |
Issued | | 6,977,286 | | | 3,397,710 | | | 2,132,450 | | | 399,081 | | | |
Reinvested | | 165,326 | | | 51,098 | | | 21,314 | | | 7,956 | | | |
Redeemed | | (1,947,668 | ) | | (1,662,023 | ) | | (563,477 | ) | | (244,706 | ) | | |
| | |
|
| |
|
| |
|
| |
|
| | |
| | | 5,194,944 | | | 1,786,785 | | | 1,590,287 | | | 162,331 | | | |
| | |
|
| |
|
| |
|
| |
|
| | |
| | | | | |
Class B Shares | | | | | | | | | | | | | | |
Issued | | 15,949 | | | 32,301 | | | 147,956 | | | 171,050 | | | |
Reinvested | | 1,041 | | | 289 | | | 3,473 | | | 1,682 | | | |
Redeemed | | (7,554 | ) | | (6,184 | ) | | (96,021 | ) | | (87,911 | ) | | |
| | |
|
| |
|
| |
|
| |
|
| | |
| | | 9,436 | | | 26,406 | | | 55,408 | | | 84,821 | | | |
| | |
|
| |
|
| |
|
| |
|
| | |
| | | | | |
Class C Shares | | | | | | | | | | | | | | |
Issued | | 17,885 | | | 241 | | | 124,173 | | | 24,813 | | | |
Reinvested | | 47 | | | 19 | | | 255 | | | 60 | | | |
Redeemed | | (4,400 | ) | | — | | | (69,473 | ) | | (127 | ) | | |
| | |
|
| |
|
| |
|
| |
|
| | |
| | | 13,532 | | | 260 | | | 54,955 | | | 24,746 | | | |
| | |
|
| |
|
| |
|
| |
|
| | |
| | | | | |
Institutional Class Shares | | | | | | | | | | | | | | |
Issued | | 20,219,151 | | | 23,165,268 | | | 72,560,117 | | | 76,540,250 | | | |
Reinvested | | 1,398,577 | | | 500,868 | | | 2,949,467 | | | 1,376,142 | | | |
Redeemed | | (4,452,655 | ) | | (3,519,484 | ) | | (10,263,495 | ) | | (18,716,166 | ) | | |
| | |
|
| |
|
| |
|
| |
|
| | |
| | | 17,165,073 | | | 20,146,652 | | | 65,246,089 | | | 59,200,226 | | | |
| | |
|
| |
|
| |
|
| |
|
| | |
| | | | | |
Service Class Shares | | | | | | | | | | | | | | |
Issued | | — | | | — | | | 8,170,050 | | | 12,975,238 | | | |
Reinvested | | — | | | — | | | 816,841 | | | 514,689 | | | |
Redeemed | | — | | | — | | | (6,956,564 | ) | | (5,500,195 | ) | | |
| | |
|
| |
|
| |
|
| |
|
| | |
| | | — | | | — | | | 2,030,327 | | | 7,989,732 | | | |
| | |
|
| |
|
| |
|
| |
|
| | |
| | | | | |
Institutional Service Class Shares | | | | | | | | | | | | | | |
Issued | | — | | | — | | | 1,125,943 | | | 2,323,717 | | | |
Reinvested | | — | | | — | | | 113,056 | | | 79,256 | | | |
Redeemed | | — | | | — | | | (1,632,706 | ) | | (1,366,721 | ) | | |
| | |
|
| |
|
| |
|
| |
|
| | |
| | | — | | | — | | | (393,707 | ) | | 1,036,252 | | | |
| | |
|
| |
|
| |
|
| |
|
| | |
| | | | | |
Local Fund Shares | | | | | | | | | | | | | | |
Reinvested | | — | | | — | | | 195 | | | 144 | | | |
| | |
|
| |
|
| |
|
| |
|
| | |
| | | — | | | — | | | 195 | | | 144 | | | |
| | |
|
| |
|
| |
|
| |
|
| | |
Total change in shares | | 22,382,985 | | | 21,960,103 | | | 68,583,554 | | | 68,498,252 | | | |
| | |
|
| |
|
| |
|
| |
|
| | |
| | | | | | | | | | |
| | | Small Cap Index |
| | | Year Ended
October 31, 2005 | | | Year Ended
October 31, 2004 |
CAPITAL TRANSACTIONS: | | | | | | | | | | |
Class A Shares | | | | | | | | | | |
Proceeds from shares issued (a) | | $ | 30,542,516 | | | $ | 55,133,106 | | | |
Dividends reinvested | | | 3,382,379 | | | | 1,085,234 | | | |
Cost of shares redeemed | | | (35,279,663 | ) | | | (40,084,424 | ) | | |
| | |
|
|
| |
|
|
| | |
| | | | (1,354,768 | ) | | | 16,133,916 | | | |
| | |
|
|
| |
|
|
| | |
| | | |
Class B Shares | | | | | | | | | | |
Proceeds from shares issued (a) | | | 83,965 | | | | 177,466 | | | |
Dividends reinvested | | | 14,247 | | | | 4,574 | | | |
Cost of shares redeemed | | | (106,390 | ) | | | (27,774 | ) | | |
| | |
|
|
| |
|
|
| | |
| | | | (8,178 | ) | | | 154,266 | | | |
| | |
|
|
| |
|
|
| | |
| | | |
Class C Shares | | | | | | | | | | |
Proceeds from shares issued (a) | | | 174,494 | | | | 17,986 | | | |
Dividends reinvested | | | 1,080 | | | | 362 | | | |
Cost of shares redeemed | | | (18,545 | ) | | | (2,025 | ) | | |
| | |
|
|
| |
|
|
| | |
| | | | 157,029 | | | | 16,323 | | | |
| | |
|
|
| |
|
|
| | |
| | | |
Institutional Class Shares | | | | | | | | | | |
Proceeds from shares issued (a) | | | 132,154,739 | | | | 125,348,059 | | | |
Dividends reinvested | | | 12,750,909 | | | | 3,218,879 | | | |
Cost of shares redeemed | | | (23,432,508 | ) | | | (30,106,414 | ) | | |
| | |
|
|
| |
|
|
| | |
| | | | 121,473,140 | | | | 98,460,524 | | | |
| | |
|
|
| |
|
|
| | |
Change in net assets from capital transactions | | $ | 120,267,223 | | | $ | 114,765,029 | | | |
| | |
|
|
| |
|
|
| | |
| (a) | Includes redemption fees, if any. |
Notes to Financial Statements (Continued)
October 31, 2005
| | | | | | | | |
| | | Small Cap Index |
| | | Year Ended
October 31, 2005 | | | Year Ended
October 31, 2004 |
SHARE TRANSACTIONS: | | | | | | | | |
Class A Shares | | | | | | | | |
Issued | | 2,585,251 | | | 5,049,499 | | | |
Reinvested | | 282,319 | | | 101,916 | | | |
Redeemed | | (2,964,492 | ) | | (3,661,727 | ) | | |
| | |
|
| |
|
| | |
| | | (96,922 | ) | | 1,489,688 | | | |
| | |
|
| |
|
| | |
| | | |
Class B Shares | | | | | | | | |
Issued | | 7,222 | | | 16,234 | | | |
Reinvested | | 1,193 | | | 434 | | | |
Redeemed | | (9,121 | ) | | (2,745 | ) | | |
| | |
|
| |
|
| | |
| | | (706 | ) | | 13,923 | | | |
| | |
|
| |
|
| | |
| | | |
Class C Shares | | | | | | | | |
Issued | | 14,919 | | | 1,657 | | | |
Reinvested | | 91 | | | 34 | | | |
Redeemed | | (1,637 | ) | | (180 | ) | | |
| | |
|
| |
|
| | |
| | | 13,373 | | | 1,511 | | | |
| | |
|
| |
|
| | |
| | | |
Institutional Class Shares | | | | | | | | |
Issued | | 11,224,475 | | | 11,448,553 | | | |
Reinvested | | 1,057,777 | | | 298,715 | | | |
Redeemed | | (1,952,254 | ) | | (2,710,102 | ) | | |
| | |
|
| |
|
| | |
| | | 10,329,998 | | | 9,037,166 | | | |
| | |
|
| |
|
| | |
Total change in shares | | 10,245,743 | | | 10,542,288 | | | |
| | |
|
| |
|
| | |
3. Transactions with Affiliates
Under the terms of the Trust’s Investment Advisory Agreement, Gartmore Mutual Fund Capital Trust (“GMF”) manages the investment of the assets and supervises the daily business affairs of the Funds (as shown in the table below). GMF is a wholly-owned subsidiary of Gartmore Global Investments, Inc. (“GGI”), a holding company. GGI is a majority-owned subsidiary of Gartmore Global Asset Management Trust (“GGAMT”). GGAMT is a wholly-owned subsidiary of Nationwide Corporation. All of the common stock of Nationwide Corporation is held by Nationwide Mutual Insurance Company (95.2%) and Nationwide Mutual Fire Insurance Company (4.8%), each of which is a mutual company owned by its policyholders. GMF provides investment management evaluation services in initially selecting and monitoring on an ongoing basis, the performance of the subadviser for the Funds that GMF advises. The subadviser manages each of its respective Fund’s investments and has the responsibility for making all investment decisions for the applicable Funds. The adviser and subadviser for each Fund is as follows:
| | | | |
| Fund | | Adviser | | Subadviser |
Bond Index | | GMF | | Fund Asset Management, L.P. |
International Index | | GMF | | Fund Asset Management, L.P. |
Mid Cap Market Index | | GMF | | Fund Asset Management, L.P. |
S&P 500 Index | | GMF | | Fund Asset Management, L.P. |
Small Cap Index | | GMF | | Fund Asset Management, L.P. |
Under the terms of the Investment Advisory Agreement, each Fund pays GMF an investment advisory fee based on that Fund’s average daily net assets. From such fees, pursuant to the subadvisory agreements, GMF pays fees to the subadviser. Additional information regarding the investment advisory fees and subadvisory fees for GMF and the subadviser is as follows for the year ended October 31, 2005:
| | | | | | | | |
| Fund | | Fee Schedule | | Total
Fees | | Fees
Retained | | Paid to
Subadviser |
Bond Index | | Up to $1.5 billion | | 0.22% | | 0.13% | | 0.09% |
| | | On the next $1.5 billion | | 0.21% | | 0.12% | | 0.09% |
| | | On $3 billion and more | | 0.20% | | 0.11% | | 0.09% |
International Index | | Up to $1.5 billion | | 0.27% | | 0.15% | | 0.12% |
| | | On the next $1.5 billion | | 0.26% | | 0.14% | | 0.12% |
| | | On $3 billion and more | | 0.25% | | 0.13% | | 0.12% |
Mid Cap Market Index | | Up to $1.5 billion | | 0.22% | | 0.13% | | 0.09% |
| | | On the next $1.5 billion | | 0.21% | | 0.12% | | 0.09% |
| | | On $3 billion and more | | 0.20% | | 0.11% | | 0.09% |
S&P 500 Index | | Up to $1.5 billion | | 0.13% | | 0.11% | | 0.02% |
| | | On the next $1.5 billion | | 0.12% | | 0.10% | | 0.02% |
| | | On $3 billion and more | | 0.11% | | 0.09% | | 0.02% |
Small Cap Index | | Up to $1.5 billion | | 0.20% | | 0.13% | | 0.07% |
| | | On the next $1.5 billion | | 0.19% | | 0.12% | | 0.07% |
| | | On $3 billion and more | | 0.18% | | 0.11% | | 0.07% |
Notes to Financial Statements (Continued)
October 31, 2005
GMF and the Funds have entered into written contracts (“Expense Limitation Agreements”) that limit operating expenses (excluding any taxes, interest, brokerage fees, extraordinary expenses, short sale dividend expenses, Rule 12b-1 fees, and administrative services fees) from exceeding the amounts listed in the table below until February 28, 2006:
| | | | | | | | | | | | | | | | | | | | | | | | |
| | | Expense Caps | |
| Fund | | Class A
Shares | | | Class B
Shares | | | Class C
Shares | | | Class R
Shares | | | Institutional
Class Shares | | | Institutional Service
Class Shares | | | Service
Class Shares | | | Local Fund
Shares | |
Bond Index (a) | | 0.32 | % | | 0.32 | % | | 0.32 | % | | 0.32 | % | | 0.32 | % | | n/a | | | n/a | | | n/a | |
International Index (a) | | 0.37 | % | | 0.37 | % | | 0.37 | % | | 0.37 | % | | 0.37 | % | | n/a | | | n/a | | | n/a | |
Mid Cap Market Index | | 0.32 | % | | 0.32 | % | | 0.32 | % | | 0.32 | % | | 0.32 | % | | n/a | | | n/a | | | n/a | |
S&P 500 Index | | 0.23 | % | | 0.23 | % | | 0.23 | % | | 0.23 | % | | 0.23 | % | | 0.23 | % | | 0.23 | % | | 0.23 | % |
Small Cap Index (a) | | 0.30 | % | | 0.30 | % | | 0.30 | % | | 0.30 | % | | 0.30 | % | | n/a | | | n/a | | | n/a | |
| (a) | The Expense Limitation Agreement for these Funds also states that the expense ratio for each class will not exceed 4.00% through March 1, 2011. |
Under the terms of a Distribution Plan under Rule 12b-1 of the 1940 Act, Gartmore Distribution Services, Inc. (“GDSI”), the Funds’ distributor, is compensated by the Funds for expenses associated with the distribution of certain classes of shares of the Funds. These fees are based on average daily net assets of the respective class of the Funds at an annual rate not to exceed the following:
| | | | | | | | | | | | | | | | | | |
| Fund | | Class A
Shares | | | Class B
Shares | | | Class C
Shares | | | Class R
Shares | | | Service
Class
Shares | | | Local Fund
Shares | |
Bond Index | | 0.25 | % | | 1.00 | % | | n/a | | | 0.50 | % | | n/a | | | n/a | |
International Index | | 0.25 | % | | 1.00 | % | | n/a | | | 0.50 | % | | n/a | | | n/a | |
Mid Cap Market Index | | 0.25 | % | | 1.00 | % | | 1.00 | % | | 0.50 | % | | n/a | | | n/a | |
S&P 500 Index | | 0.25 | % | | 1.00 | % | | 1.00 | % | | 0.50 | % | | 0.15 | % | | 0.07 | % |
Small Cap Index | | 0.25 | % | | 1.00 | % | | 1.00 | % | | 0.50 | % | | n/a | | | n/a | |
Pursuant to an Underwriting Agreement, GDSI serves as principal underwriter of the Funds in the continuous distribution of their shares and receives commissions in the form of a front-end sales charge on the Class A shares. These fees are deducted from and are not included in proceeds from sales of Class A shares. From these fees, GDSI pays sales commissions, salaries, and other expenses in connection with generating new sales of Class A shares of the Funds. GDSI also receives fees for services as principal underwriter for Class B shares of the Funds. These fees are contingent deferred sales charges (“CDSCs”) ranging from 1% to 5% imposed on redemptions of Class B shares which may cause the current value of a shareholder’s account to fall below the total purchase payments. The CDSC, if applicable, will be imposed on redemptions made within six years of the purchase. Class C shares have a CDSC fee of 1% imposed on redemptions of Class C shares made within one year of purchase. For the year ended October 31, 2005, GDSI received commissions of $125,073 from front-end sales charges of Class A shares and from CDSC fees from Class B and Class C shares of the Funds, of which $16,432 was reallowed to affiliated broker-dealers of the Funds.
Under the terms of a Fund Administration and Transfer Agency Agreement, Gartmore SA Capital Trust (“GSA”) provides various administrative and accounting services for the Funds, and Gartmore Investors Services, Inc. (“GISI”), an
indirect subsidiary of GSA, serves as Transfer Agent and Dividend Disbursing Agent for each of the Funds. For the period November 1, 2004 through December 31, 2004, the fees for the services provided under such agreement were calculated based on the Trust’s average daily net assets according to the fee schedule below. The fees then are allocated proportionately among all Funds within the Trust in relation to the average daily net assets of each Fund and are paid to GSA. GSA pays GISI from these fees for GISI’s services.
| | |
| Combined Fee Schedule* | | |
Up to $1 billion | | 0.25% |
$1 billion and more up to $3 billion | | 0.18% |
$3 billion and more up to $4 billion | | 0.14% |
$4 billion and more up to $5 billion | | 0.07% |
$5 billion and more up to $10 billion | | 0.04% |
$10 billion and more up to $12 billion | | 0.02% |
$12 billion or more | | 0.01% |
| * | The assets of the Gartmore Investor Destinations Aggressive, Gartmore Investor Destinations Moderately Aggressive, Gartmore Investor Destinations Moderate, Gartmore Investor Destinations Moderately Conservative and Gartmore Investor Destinations Conservative Funds (collectively, the “Investor Destinations Funds”) and the Gartmore Optimal Allocations Fund: Aggressive, Gartmore Optimal Allocations Fund: Moderate, Gartmore Optimal Allocations Fund: Moderately Aggressive, and Gartmore Optimal Allocations Fund: Specialty (collectively, the “Optimal Funds”) are excluded from the Trust asset level amount in order to calculate this asset based fee. The Investor Destinations Funds and the Optimal Funds do not pay any part of this fee. |
Effective January 1, 2005, the fee for the fund administration and transfer agency services increased as set forth below. The fees are calculated based on the Trust’s average daily net assets according to the fee schedule below. The fees are then allocated proportionately among all funds within the Trust in relation to the average daily net assets of each fund and are paid to GSA.
| | |
| Combined Fee Schedule* | | |
Up to $1 billion | | 0.26% |
$1 billion and more up to $3 billion | | 0.19% |
$3 billion and more up to $4 billion | | 0.15% |
$4 billion and more up to $5 billion | | 0.08% |
$5 billion and more up to $10 billion | | 0.05% |
$10 billion and more up to $12 billion | | 0.03% |
$12 billion or more | | 0.02% |
| * | The assets of the Investor Destinations Funds and the Optimal Funds are excluded from the Trust asset level amount in order to calculate this asset based fee. The Investor Destinations Funds and the Optimal Funds do not pay any part of this fee. |
GSA and GISI have entered into agreements with BISYS Fund Services Ohio, Inc. (“BISYS”), pursuant to which BISYS provides sub-administration and sub-transfer agency services, respectively, to the Funds.
Under the terms of an Administrative Services Plan, the Funds may pay fees to servicing organizations, such as brokerdealers, including Nationwide Financial Services, and financial institutions, which agree to provide administrative support services to the shareholders of certain classes. These services include, but are not limited, to the following: establishing and maintaining shareholder accounts; processing purchase and redemption transactions; arranging bank wires; performing shareholder sub-accounting; answering inquiries regarding the Funds; and other such services. These fees are based on an annual rate of up to 0.25% of the average daily net assets of the Class A, Class R, Service Class, and Institutional Service Class shares of each of the Funds.
Notes to Financial Statements (Continued)
October 31, 2005
4. Short-Term Trading Fees
The Funds assess a 2.00% redemption fee on all classes of shares that are purchased and are sold or exchanged within five days of purchase. The redemption fee, if any, is paid directly to the applicable Fund and is designed to offset brokerage commissions, market impact and other costs associated with short-term trading of Fund shares. For purposes of determining whether the redemption fee applies, the shares that were held the longest will be redeemed first. This redemption fee is in addition to any CDSCs that may be applicable at the time of sale. The redemption fee may not apply in certain circumstances, such as redemptions or exchanges of shares held in certain omnibus accounts or retirement plans that cannot implement the redemption fee. The fee does not apply to shares purchased through reinvested dividends or capital gains. For the year ended October 31, 2005, the Funds had no contributions to capital due to collection of redemption fees.
5. Bank Loans and Earnings Credit
The Trust has a credit agreement of $100,000,000 with J.P. Morgan Chase & Co. Borrowings under this arrangement bear interest at the Federal Funds rate plus 0.50%. The interest costs are included in custodian fees in the Statement of Operations. No compensating balances were required under the terms of the line of credit. There were no borrowings outstanding as of October 31, 2005.
The Trust’s custodian bank has agreed to reduce its fees when the Funds of the Trust maintain cash on deposit in non-interest-bearing custody and Demand Deposit Accounts.
6. Investment Transactions
Purchases and sales of securities (excluding short-term securities) for the year ended October 31, 2005, are summarized as follows:
| | | | | | |
| Fund | | Purchases | | Sales |
Bond Index | | $ | 2,693,810,791 | | $ | 2,072,135,566 |
International Index | | | 422,304,012 | | | 133,889,713 |
Mid Cap Market Index | | | 351,060,198 | | | 137,629,184 |
S&P 500 Index | | | 840,904,794 | | | 115,484,041 |
Small Cap Index | | | 151,685,414 | | | 71,576,729 |
Purchases and sales of U.S. Government securities for the year ended October 31, 2005, are summarized as follows:
| | | | | | |
| Fund | | Purchases | | Sales |
Bond Index | | $ | 2,762,348,155 | | $ | 1,950,593,468 |
International Index | | | — | | | 1,498,276 |
7. Federal Tax Information
The tax character of distributions paid during the fiscal year ended October 31, 2005, was as follows: (total distributions paid may differ from the Statement of Changes in Net Assets because for tax purposes dividends are recognized when paid.)
| | | | | | | | | |
| | | Distributions paid from
| | |
| Fund | | Ordinary
Income | | Net Long
Term
Capital
Gains | | Total
Distributions
Paid |
Bond Index | | $ | 52,182,582 | | $ | – | | $ | 52,182,582 |
International Index | | | 35,814,307 | | | 6,212,796 | | | 42,027,103 |
Mid Cap Market Index | | | 13,066,934 | | | 9,179,102 | | | 22,246,036 |
S&P 500 Index | | | 40,449,310 | | | – | | | 40,449,310 |
Small Cap Index | | | 9,500,597 | | | 6,667,420 | | | 16,168,017 |
The tax character of distributions paid during the fiscal year ended October 31, 2004 was as follows: (Total distributions paid may differ from the Statement of Changes in Net Assets because for tax purposes dividends are recognized when paid.)
| | | | | | | | | | | | | | | |
| | | Distributions paid from
| | | | | | |
| Fund | | Ordinary
Income | | Net Long
Term Capital
Gains | | Total Taxable
Distributions | | Tax Exempt
Distributions | | Total
Distributions
Paid |
Bond Index | | $ | 27,750,785 | | $ | – | | $ | 27,750,785 | | $ | – | | $ | 27,750,785 |
International Index | | | 10,404,472 | | | – | | | 10,404,472 | | | – | | | 10,404,472 |
Mid Cap Market Index | | | 3,948,470 | | | 2,960,725 | | | 6,909,195 | | | – | | | 6,909,195 |
S&P 500 Index | | | 19,013,241 | | | – | | | 19,013,241 | | | – | | | 19,013,241 |
Small Cap Index | | | 3,020,382 | | | 1,293,354 | | | 4,313,736 | | | – | | | 4,313,736 |
As of October 31, 2005, the components of accumulated earnings (deficit) on a tax basis were as follows:
| | | | | | | | | | | | | | | | | | | | | | | | | |
| Fund | | Undistributed
Ordinary
Income | | Undistributed
Long-Term
Capital Gains | | Accumulated
Earnings | | Distributions
Payable | | | Accumulated
Capital and
Other Losses | | | Unrealized
Appreciation
(Depreciation)* | | | Total
Accumulated
Earnings
(Deficit) | |
Bond Index | | $ | 6,091,864 | | $ | – | | $ | 6,091,864 | | $ | (5,225,677 | ) | | $ | (3,181,987 | ) | | $ | (25,986,763 | ) | | $ | (28,302,563 | ) |
International Index | | | 22,546,434 | | | 18,970,040 | | | 41,516,474 | | | – | | | | – | | | | 231,038,251 | | | | 272,554,725 | |
Mid Cap Market Index | | | 11,149,066 | | | 37,247,799 | | | 48,396,865 | | | – | | | | – | | | | 117,947,233 | | | | 166,344,098 | |
S&P 500 Index | | | 2,750,307 | | | 20,491,137 | | | 23,241,444 | | | – | | | | – | | | | 163,012,531 | | | | 186,253,975 | |
Small Cap Index | | | 4,045,097 | | | 13,602,881 | | | 17,647,978 | | | – | | | | – | | | | 37,831,730 | | | | 55,479,708 | |
| * | The differences between the book-basis and tax-basis unrealized appreciation (depreciation) is attributable primarily to: tax deferral of losses on wash sales; the difference between book and tax amortization methods for premium and market discount; and the return of capital adjustments from real estate investment trusts. |
Notes to Financial Statements (Continued)
October 31, 2005
As of October 31, 2005, the tax cost of securities and the breakdown of unrealized appreciation (depreciation) for each Fund were as follows:
| | | | | | | | | | | | | |
| Fund | | Tax Cost of
Securities | | Unrealized
Appreciation | | Unrealized
Depreciation | | | Net
Unrealized
Appreciation
(Depreciation) | |
Bond Index | | $ | 1,930,142,905 | | $ | 2,985,140 | | $ | (28,383,000 | ) | | (25,397,860 | ) |
International Index | | | 1,282,699,553 | | | 253,008,809 | | | (22,294,719 | ) | | 230,714,090 | |
Mid Cap Market Index | | | 1,068,946,265 | | | 152,077,147 | | | (34,129,914 | ) | | 117,947,233 | |
S&P 500 Index | | | 2,699,297,490 | | | 326,065,089 | | | (163,108,634 | ) | | 163,012,531 | |
Small Cap Index | | | 483,032,571 | | | 60,806,493 | | | (22,974,763 | ) | | 37,831,730 | |
As of October 31, 2005, for Federal income tax purposes, the following Funds have capital loss carryforwards available to offset capital gains, if any, to the extent provided by the treasury regulations:
| | | | | |
| Fund | | Amount | | Expires |
Bond Index | | $ | 3,181,987 | | 2013 |
Report of Independent Registered Public
Accounting Firm
To the Board of Trustees and Shareholders of Gartmore Mutual Funds:
In our opinion, the accompanying statements of assets and liabilities, including the statements of investments, and the related statements of operations and of changes in net assets and the financial highlights present fairly, in all material respects, the financial position of Gartmore Bond Index Fund, Gartmore International Index Fund, Gartmore Mid Cap Market Index Fund, Gartmore S&P 500 Index Fund and Gartmore Small Cap Index Fund (five series of Gartmore Mutual Funds, hereafter referred to as the “Funds”) at October 31, 2005, the results of each of their operations for the year then ended, the changes in each of their net assets for each of the two years then ended and the financial highlights for each of the four years (or periods) then ended in conformity with accounting principles generally accepted in the United States of America. These financial statements and financial highlights (hereafter referred to as “financial statements”) are the responsibility of the Funds’ management; our responsibility is to express an opinion on these financial statements based on our audits. We conducted our audits of these financial statements in accordance with the standards of the Public Company Accounting Oversight Board (United States.) Those standards require that we plan and perform the audit to obtain reasonable assurance about whether the financial statements are free of material misstatement. An audit includes examining, on a test basis, evidence supporting the amounts and disclosures in the financial statements, assessing the accounting principles used and significant estimates made by management, and evaluating the overall financial statement presentation. We believe that our audits, which included confirmation of securities at October 31, 2005 by correspondence with the custodian and brokers, provide a reasonable basis for our opinion. The financial highlights of the Funds for the year (or period) ended October 31, 2001 were audited by other independent accountants whose report dated December 14, 2001 expressed an unqualified opinion on those financial statements.
PricewaterhouseCoopers LLP
Philadelphia, Pennsylvania
December 22, 2005
Supplemental Information
1. Other Federal Tax Information (Unaudited):
For the period ended October 31, 2005, certain dividends paid by the Funds may be subject to a maximum tax rate of 15% as provided for by the Jobs and Growth Tax Relief Reconciliation Act of 2003. The Funds intend to designate the maximum amount allowable as taxed at a maximum rate of 15%. Complete information will be reported in conjunction with your 2005 Form 1099-DIV.
For the period ended October 31, 2005, the following Funds paid qualified dividend income:
| | | |
| Fund | | Qualified
Dividend
Income |
International Index | | $ | 31,309,293 |
Mid Cap Market Index | | | 10,022,193 |
S&P 500 Index | | | 44,446,341 |
Small Cap Index | | | 3,719,120 |
For the taxable year ended October 31, 2005, the following percentage of income dividends paid by the Funds qualify for the dividends received deduction available to corporations:
| | | |
| Fund | | Dividends
Received
Deduction | |
Mid Cap Market Index | | 54 | % |
S&P 500 Index | | 100 | % |
Small Cap Index | | 37 | % |
The International Index Fund intends to elect to pass through to shareholders the income tax credit for taxes paid to foreign countries. Foreign source income on October 31, 2005 was 0.02 per outstanding share.
2. Shareholder Meeting
A separate shareholder meeting was held on Tuesday, December 23, 2004, for the shareholders of the Trust’s predecessor pursuant to a Proxy Statement on Schedule 14A, dated October 29, 2004, and mailed to the shareholders of the Trust’s predecessor on or around November 5, 2004.
Two Proposals: The purpose of the December 23, 2004 meeting was to allow the shareholders of the Trust’s predecessor to vote on:
i. Proposal One: The election of the Trust’s Predecessor’s Board of Trustees; and
ii. Proposal Two: The approval of an “Agreement and Plan of Reorganization” that provided for the reorganization of the Trust from an Ohio business trust into a Delaware statutory trust.
Proposal One: As set forth in the October 29, 2004 Proxy Statement, the nominees for election as Trustees of the Trust’s predecessor were: Charles E. Allen, Michael J. Baresich, Paula H.J. Cholmondeley, C. Brent DeVore, Phyllis Kay Dryden, Robert M. Duncan, Barbara L. Hennigar, Paul J. Hondros, Barbara I. Jacobs, Thomas J. Kerr IV, Douglas F. Kridler, Michael D. McCarthy, Arden L. Shisler, and David C. Wetmore.
Proposal Two: As specifically set forth in the October 29, 2004 Proxy Statement, the Reorganization proposal requested the shareholders of the Trust’s predecessor to approve the proposed “Agreement and Plan of Reorganization” of the Trust’s predecessor (on behalf of each of the Trust’s funds) with and into a new Delaware-domiciled Trust, whereby the Funds of the new Delaware Trust would acquire all of the assets of the corresponding funds of the Trust’s predecessor subject to the liabilities, expenses, costs, charges, and reserves of the corresponding funds of the Trust’s predecessor (contingent or otherwise), in exchange for shares of the acquiring funds of the Trust to be distributed pro rata by the Trust to the holders of the shares of the funds of the Trust’s predecessor, in a complete liquidation of the Trust’s predecessor.
Voting Results:
The shareholders of the Trust’s predecessor voted to approve both Proposal One and Proposal Two, as follows:
| | |
| Proposal One: | | Election of a Board of Trustees of the Trust’s Predecessor |
Charles E. Allen: | | |
| |
FOR | | 1,484,045,010.745 shares (96.963%) |
WITHHOLD | | 46,475,965.981 shares (3.037%) |
TOTAL | | 1,530,520,976.726 shares (100.000%) |
| |
Michael J. Baresich: | | |
| |
FOR | | 1,479,546,876.136 shares (96.669%) |
WITHHOLD | | 50,974,100.590 shares (3.331%) |
TOTAL | | 1,530,520,976.726 shares (100.000%) |
| |
Paula H.J. Cholmondeley: | | |
| |
FOR | | 1,483,986,754.474 shares (96.960%) |
WITHHOLD | | 46,534,222.252 shares (3.040%) |
TOTAL | | 1,530,520,976.726 shares (100.000%) |
| |
C. Brent DeVore: | | |
| |
FOR | | 1,483,232,555.715 shares (96.910%) |
WITHHOLD | | 47,288,421.011 shares (3.090%) |
TOTAL | | 1,530,520,976.726 shares (100.000%) |
Phyllis Kay Dryden: | | |
| |
FOR | | 1,483,461,670.269 shares (96.925%) |
WITHHOLD | | 47,059,306.457 shares (3.075%) |
TOTAL | | 1,530,520,976.726 shares (100.000%) |
| |
Robert M. Duncan: | | |
| |
FOR | | 1,478,518,553.740 shares (96.602%) |
WITHHOLD | | 52,002,422.986 shares (3.398%) |
TOTAL | | 1,530,520,976.726 shares (100.000%) |
| |
Barbara L. Hennigar: | | |
| |
FOR | | 1,483,932,926.673 shares (96.956%) |
WITHHOLD | | 46,588,050.053 shares (3.044%) |
TOTAL | | 1,530,520,976.726 shares (100.000%) |
| |
Paul J. Hondros: | | |
| |
FOR | | 1,483,799,576.741 shares (96.947%) |
WITHHOLD | | 46,721,399.985 shares (3.053%) |
TOTAL | | 1,530,520,976.726 shares (100.000%) |
| |
Barbara I. Jacobs: | | |
| |
FOR | | 1,482,757,593.191 shares (96.879%) |
WITHHOLD | | 47,763,383.535 shares (3.121%) |
TOTAL | | 1,530,520,976.726 shares (100.000%) |
| |
Thomas J. Kerr IV: | | |
| |
FOR | | 1,477,143,243.388 shares (96.512%) |
WITHHOLD | | 53,377,733.338 shares (3.488%) |
TOTAL | | 1,530,520,976.726 shares (100.000%) |
Supplemental Information (continued)
| | |
| Proposal One: | | Election of a Board of Trustees of the Trust’s Predecessor |
| |
Douglas F. Kridler: | | |
| |
FOR | | 1,484,100,191.103 shares (96.967%) |
WITHHOLD | | 46,420,785.623 shares (3.033%) |
TOTAL | | 1,530,520,976.726 shares (100.000%) |
| |
Michael D. McCarthy: | | |
| |
FOR | | 1,483,352,898.255 shares (96.918%) |
WITHHOLD | | 47,168,078.471 shares (3.082%) |
TOTAL | | 1,530,520,976.726 shares (100.000%) |
| |
Arden L. Shisler: | | |
FOR | | 1,483,661,174.441 shares (96.938%) |
WITHHOLD | | 46,859,802.285 shares (3.062%) |
TOTAL | | 1,530,520,976.726 shares (100.000%) |
| |
David C. Wetmore: | | |
| |
FOR | | 1,484,021,388.615 shares (96.962%) |
WITHHOLD | | 46,499,588.111 shares (3.038%) |
TOTAL | | 1,530,520,976.726 shares (100.000%) |
| | |
| Proposal Two: | | Approval of the Agreement and Plan of Reorganization of
the Trust’s Predecessor: |
FOR | | 1,338,850,729.743 shares (87.477%) |
AGAINST | | 48,927,279.322 shares (3.197%) |
ABSTAIN | | 86,596,336.653 shares (5.658%) |
BROKER NON-VOTES | | 56,146,631.008 shares (3.668%) |
TOTAL | | 1,530,520,976.726 shares (100.000%) |
Management Information (Unaudited)
Trustees who are not Interested Persons (as defined in the 1940 Act) and Officers of the Funds as of
October 31, 2005
| | | | | | | | |
Name, Address
and Year of Birth | | Position(s) Held
with the Trust
and Length of
Time Served1 | | Principal Occupation(s)
During Past
Five Years | | Number of Portfolios
in the
Gartmore Fund
Complex Overseen
by Trustee | | Other Directorships Held by Trustee or Nominee 2 |
| | | | |
Charles E. Allen c/o Gartmore Global Investments, Inc. 1200 River Road, Suite 1000 Conshohocken, PA 19428 1948 | | Trustee
since July 2000 | | Mr. Allen is Chairman, Chief Executive Officer and President of the Graimark Realty Advisors, Inc. (real estate development, investment and asset management). | | 84 | | None |
| | | | |
Paula H.J. Cholmondeley c/o Gartmore Global Investments, Inc. 1200 River Road, Suite 1000 Conshohocken, PA 19428 1947 | | Trustee
since July 2000 | | Ms. Cholmondeley has been the Chairman and Chief Executive Officer of the Sorrel Group, a management consulting company, since January 2004. Prior thereto, Ms. Cholmondeley was Vice President and General Manager of Sappi Fine Paper North America. Prior thereto, Ms. Cholmondeley was Vice President and General Manager of Residential Insulation of Owens Corning. | | 84 | | Director of Dentsply International, Inc., Ultralife Batteries, Inc. , Terex Corporation, Minerals Technology, Inc. and Albany International Corp. |
| | | | |
C. Brent DeVore c/o Gartmore Global Investments, Inc. 1200 River Road, Suite 1000 Conshohocken, PA 19428 1940 | | Trustee
since
1990 | | Dr. DeVore is President of Otterbein College. | | 84 | | None |
| | | | |
Phyllis K. Dryden c/o Gartmore Global Investments, Inc. 1200 River Road, Suite 1000 Conshohocken, PA 19428 1947 | | Trustee
since December 2004 | | Ms. Dryden was a former Managing Partner of marchFIRST, a global management consulting firm prior to February 2001. | | 84 | | None |
| | | | |
Barbara L. Hennigar c/o Gartmore Global Investments, Inc. 1200 River Road, Suite 1000 Conshohocken, PA 19428 1935 | | Trustee
since July 2000 | | Retired. | | 84 | | None |
Management Information (Unaudited)
Trustees who are not Interested Persons (as defined in the 1940 Act) and Officers of the Funds as of
October 31, 2005 (Continued)
| | | | | | | | |
Name, Address
and Year of Birth | | Position(s) Held
with the Trust
and Length of
Time Served1 | | Principal Occupation(s)
During Past
Five Years | | Number of Portfolios
in the
Gartmore Fund
Complex Overseen
by Trustee | | Other Directorships Held by Trustee or Nominee 2 |
| | | | |
Barbara I. Jacobs c/o Gartmore Global Investments, Inc. 1200 River Road, Suite 1000 Conshohocken, PA 19428 1950 | | Trustee
since December 2004 | | Ms. Jacobs has served as Chairman of the Board of Directors of KICAP Network Fund, a European (United Kingdom) hedge fund, since December 2000. Prior to 2004, Ms. Jacobs was also a Managing Director and European Portfolio Manager with CREF Investments (Teachers Insurance Annuity Association — College Retirement Equity Fund). | | 84 | | None |
| | | | |
Douglas F. Kridler c/o Gartmore Global Investments, Inc. 1200 River Road, Suite 1000 Conshohocken, PA 19428 1955 | | Trustee
since September 1997 | | Mr. Kridler has served as the President and Chief Executive Officer of the Columbus Foundation (a Columbus, OH-based foundation which manages over 1,300 individual endowment funds) since February 2002. Mr. Kridler was the President of the Columbus Association for the Performing Arts prior thereto and Chairman of the Greater Columbus Convention and Visitors Bureau during 2000 and 2001. | | 84 | | None |
| | | | |
Michael D. McCarthy c/o Gartmore Global Investments, Inc. 1200 River Road, Suite 1000 Conshohocken, PA 19428 1947 | | Trustee
since December 2004 | | Mr. McCarthy serves as: the Founder and Chairman of The Eureka Foundation (which sponsors and funds the “Great Museums” series on PBS); and a Partner of Pineville Properties LLC (a commercial real estate development firm). | | 843 | | None |
| | | | |
David C. Wetmore c/o Gartmore Global Investments, Inc. 1200 River Road, Suite 1000 Conshohocken, PA 19428 1948 | | Trustee
since 1995 and Chairman since
February 2005 | | Retired. | | 84 | | None |
| 1 | Length of time served includes time served with the Trust’s predecessor. |
| 2 | Directorships held in (1) any other investment companies registered under the 1940 Act, (2) any company with a class of securities registered pursuant to Section 12 of the Securities Exchange Act of 1934, as amended (the “Exchange Act”), or (3) any company subject to the requirements of Section 15(d) of the Exchange Act. |
| 3 | Mr. McCarthy was also an Administrative Committee Member for the Alphagen Arneb Fund, LLC , The Healthcare Fund LDC, The Leaders Long-Short Fund, LLC, and The Leaders Long-Short Fund LDC, four private investment companies (hedge funds) managed by GSA. Mr. McCarthy resigned as an Administrative Committee Member effective June 30, 2005. |
Trustees and Officers who are not Interested Persons (as defined in the 1940 Act) of the Funds received aggregate compensation of $548,510 from the Trust for the year ended October 31, 2005. Additional information regarding the Trustees and Officers may be found in the Trust’s statement of additional information, which is available without charge upon request, by calling 800-848-0920.
Trustees who are Interested Persons (as defined in the 1940 Act) and/or Officers of the Funds as of
October 31, 2005
| | | | | | | | |
Name, Address
and Year of Birth | | Position(s) Held
with the Trust
and Length of
Time Served1 | | Principal Occupation(s)
During Past
Five Years | | Number of Portfolios
in the
Gartmore Fund
Complex Overseen
by Trustee | | Other Directorships Held by Trustee2 |
| | | | |
Paul J. Hondros Gartmore Global Investments, Inc. 1200 River Road, Suite 1000 Conshohocken, PA 19428 1948 | | Trustee
since July 2000 | | Mr. Hondros has been President and Chief Executive Officer of various Gartmore entities, including Gartmore Distribution Services, Inc. (“GDSI”),3 Gartmore Investor Services, Inc. (“GISI”),3 Gartmore Morley Capital Management, Inc. (“GMCM”),3 Gartmore Morley Financial Services, Inc. (“GMFS”),3 NorthPointe Capital, LLC (“NorthPointe”),3 Gartmore Global Asset Management Trust (“GGAMT”)3, Gartmore Global Investments, Inc. (“GGI”)3, Gartmore Mutual Fund Capital Trust (“GMFCT”)3 and Gartmore SA Capital Trust (“GSA”)3; and a Director of Nationwide Securities, Inc.3, as well as several entities within Nationwide Financial Services, Inc. | | 844 | | None |
| | | | |
Arden L. Shisler c/o Gartmore Global Investments, Inc. 1200 River Road, Suite 1000 Conshohocken, PA 19428 1941 | | Trustee
since February 2000 | | Mr. Shisler has been a consultant since January 2003. Prior thereto, he was President and Chief Executive Officer of K&B Transport, Inc., a trucking firm. Since 1992, Mr. Shisler has also been Chairman of the Board for Nationwide Mutual Insurance Company3. | | 84 | | Director of Nationwide Financial Services, Inc. |
| | | | |
Gerald J. Holland Gartmore Global Investments, Inc. 1200 River Road, Suite 1000 Conshohocken, PA 19428 1951 | | Treasurer
since March 2001 | | Mr. Holland is Senior Vice President — Operations for GGI3, GMFCT3, and GSA3. | | 84 | | None |
| | | | |
Michael A. Krulikowski Gartmore Global Investments, Inc. 1200 River Road, Suite 1000 Conshohocken, PA 19428 1959 | | Chief Compliance Officer
since June 2004 | | Since November 1999, Mr. Krulikowski has served as a Vice President and Chief Compliance Officer of GGI. Since June 2004, Mr. Krulikowski has also served as Chief Compliance Officer of the Trust. | | 84 | | None |
| | | | |
Eric E. Miller Gartmore Global Investments, Inc. 1200 River Road, Suite 1000 Conshohocken, PA 19428 1953 | | Secretary since December 2002 | | Mr. Miller is Senior Vice President, Chief Counsel for GGI3, GMFCT3 and GSA3 since August 2002. From August 2000 to August 2002, Mr. Miller was a Partner with Stradley Ronan Stevens & Young, LLP. | | 84 | | None |
Management Information (Unaudited)
| 1 | Length of time served includes time served with the Trust’s predecessor. |
| 2 | Directorships held in (1) any other investment companies registered under the 1940 Act, (2) any company with a class of securities registered pursuant to Section 12 of the Securities Exchange Act of 1934, as amended (the “Exchange Act”), or (3) any company subject to the requirements of Section 15(d) of the Exchange Act. |
| 3 | This position is held with an affiliated person or principal underwriter of the Trust. |
| 4 | Mr. Hondros was also an Administrative Committee Member for the Alphagen Arneb Fund, LLC , The Healthcare Fund LDC, The Leaders Long-Short Fund, LLC, and The Leaders Long-Short Fund LDC, four private investment companies (hedge funds) managed by GSA. Mr. Hondros resigned as an Administrative Committee Member effective June 30, 2005. |
Federal law requires the Trust, each of its investment advisers and sub-advisers to adopt procedures for voting proxies (“Proxy Voting Guidelines”) and to provide a summary of those Proxy Voting Guidelines used to vote the securities held by the Funds. The Funds’ proxy voting policies and procedures are available without charge (i) upon request, by calling 800-848-0920, (ii) on the Fund’s website at www.gartmorefunds.com, or (iii) on the Securities and Exchange Commission’s website at www.sec.gov.
Index Definitions
Lipper Analytical Services, Inc. is an industry research firm whose rankings are based on total return performance and do not reflect the effect of sales charges. Each fund is ranked within a universe of funds similar in investment objective as determined by Lipper.
Lehman Brothers U.S. Aggregate Index: An unmanaged, market value-weighted index of investment-grade, fixed-rate debt issues (including government, corporate, asset-backed, and mortgage-backed securities with maturities of one year or more) that is generally representative of the bond market as a whole.
Morgan Stanley Capital International Europe, Australasia and Far East (MSCI EAFE®) Index: An unmanaged, free float-adjusted, market capitalization-weighted index that is designed to measure the performance of stocks in developed markets outside the United States and Canada.
Russell 2000® Index: An unmanaged index that measures the performance of the stocks of small-capitalization U.S. companies; includes the smallest 2,000 U.S. companies in the Russell 3000® Index, which measures the performance of the largest 3,000 U.S. companies, based on market capitalization.
Standard & Poor’s (S&P) MidCap 400 Index: An unmanaged index that measures the performance of 400 stocks of medium-sized U.S. companies.
Standard & Poor’s 500® (S&P 500) Index: An unmanaged, capitalization-weighted index of 500 widely held stocks of large-cap U.S. companies that gives a broad look at how the stock prices of those companies have performed.

Gartmore Funds
1200 River Road, Suite 1000
Conshohocken, PA 19428
www.gartmorefunds.com
Federal law requires the Fund, and the Fund’s investment advisers and subadvisers, to adopt procedures for voting proxies (“Proxy Voting Guidelines”) and to provide a summary of those Proxy Voting Guidelines used to vote the securities held by the Funds. The Fund’s proxy voting policies and procedures are available without charge (i) upon request, by calling 800-848-0920, (ii) on the Fund’s Web site at www.gartmorefunds.com, or (iii) on the U.S. Securities and Exchange Commission’s Web site at www.sec.gov.
© 2005 Gartmore Global Investments, Inc.
All rights reserved.
AR-IDX 12/05
Annual Report
| | |
| | |

| | October 31, 2005 |
Core Asset Allocation Series
Gartmore Investor Destinations Aggressive Fund
Gartmore Investor Destinations Moderately Aggressive Fund
Gartmore Investor Destinations Moderate Fund
Gartmore Investor Destinations Moderately Conservative Fund
Gartmore Investor Destinations Conservative Fund
Gartmore Optimal Allocations Funds: Aggressive
Gartmore Optimal Allocations Funds: Moderately Aggressive
Gartmore Optimal Allocations Funds: Moderate
Gartmore Optimal Allocations Funds: Speciality
www.gartmorefunds.com

Solutions.

| | | | |
| UNITED STATES | | UNITED KINGDOM | | JAPAN |
Based in greater metropolitan Philadelphia, Gartmore is the global asset management arm of Nationwide®. Gartmore’s affiliated advisers* collectively manage more than $82 billion1 in assets through its global investment platform encompassing more than 185 investment management professionals supported by an 800-person staff.
We provide core and specialty equity, fixed-income and alternative investment solutions through mutual funds, separate accounts, commingled portfolios and wrap accounts to individual and institutional clients around the world.
This wide range of investment opportunities is built on sound investment management processes designed to increase the probability of delivering enhanced risk-adjusted returns over the long term.
Our investment management teams incorporate fundamental stock selection with the application of technology to help control risk and add to returns. Insightful stock selection is a function of the efforts of talented alpha-driven managers and analysts, working in an entrepreneurial environment, who are specialists in their respective investment disciplines.
www.gartmore.com
*Gartmore’s Affiliated Advisers
The following 11 asset management affiliates of Nationwide do business under the trade name “Gartmore Group”: Gartmore Capital Management Ltd2, Gartmore Fund Managers Ltd2, Gartmore Global Partners2, 3, Gartmore Investment Ltd2, Gartmore Japan Ltd2, Gartmore Morley Capital Management, Inc.3, Gartmore Mutual Fund Capital Trust3, 4, Gartmore Riverview, LLC3, Gartmore SA Capital Trust3, 4, Gartmore Separate Accounts LLC3, and NorthPointe Capital® LLC3
| 2. | | These advisers are subsidiaries of Gartmore Investment Management plc, which ultimately reports to Nationwide®. |
| 3. | | These are SEC-registered investment advisers based in the United States. Collectively, these advisers manage $43 billion as of Oct. 31, 2005. |
| 4. | | Together, these advisers do business as Gartmore Global Investments, Inc. |
Gartmore Global Investments is the investment adviser to Gartmore Funds. NorthPointe Capital is a federally registered service mark of Gartmore Global Investments, Inc. Nationwide is a federally registered service mark of Nationwide Mutual Insurance Company.
Gartmore Funds distributed by Gartmore Distribution Services, Inc., Member NASD. 1200 River Road, Suite 1000, Conshohocken, PA 19428.
© 2005 Gartmore Global Investments, Inc. All rights reserved.
Annual Report
| | |
| | |
| | October 31, 2005 |
Commentary provided by Gartmore Global Investments, investment adviser to Gartmore Funds. All opinions and estimates included in this report constitute Gartmore Global Investments’ judgment as of the date of this report and are subject to change without notice.
Statement Regarding Availability of Quarterly Portfolio Schedule.
The Gartmore Funds file complete schedules of portfolio holdings for each Fund with the Securities and Exchange Commission (the “Commission”) for the first and third quarters of each fiscal year on Form N-Q. The Funds’ Forms N-Q are available on the Commission’s website at http://www.sec.gov. The Funds’ Forms N-Q may be reviewed and copied at the Commission’s Public Reference Room in Washington, DC, and information on the operation of the Public Reference Room may be obtained by calling 800-SEC-0330; and the Funds make the information on Form N-Q available to shareholders on www.gartmorefunds.com or upon request without charge.
Statement Regarding Availability of Proxy Voting Record.
Information regarding how the Fund voted proxies relating to portfolio securities held during the most recent 12-month period ended June 30, 2005 is available without charge, upon request, by calling 800-848-0920, and on the Commission’s website at http://www.sec.gov.
Message to Shareholders
October 31, 2005
Dear Shareholders,
At times during the annual reporting period ended Oct. 31, 2005, it seemed as though a host of uncertain and unpredictable events coalesced into a “perfect storm” of market volatility.
Hurricane Katrina is one example. This Category 5 storm not only bore down on a major American city and its environs, it also had one of the country’s largest energy-producing regions in its sights. If that weren’t enough, the storm occurred just as oil and natural gas prices were spiraling to record levels, concurrent with fears of a great strain on global supply and capacity.
On another front, the intent to better integrate the member nations of the European Union (EU) was dealt a blow by France’s repudiation of a proposed EU constitution, a move that called into question the EU’s long-term effectiveness. Within a matter of weeks, France itself was rocked by what initially appeared to be youthful unrest in one section of Paris. As riots spread across the country, however, the situation revealed a disturbing and broad-based economic condition; unemployment among France’s immigrant population is five times the national average, and the segment’s per capita income is 40% below the national average. The lingering sense is that a number of European countries will have to deal with a long-overlooked social and economic issue at a time when the EU is struggling to retain its authority.
These are just two examples illustrating that market volatility can be a function of unexpected, and sometimes unrelated, global events. The accompanying “Market Perspectives” commentary provides a more detailed analysis of the various economic and social factors that influenced the market during the past year. I’d like to focus on Gartmore’s view on how best to navigate uncertain domestic and global markets in the pursuit of acceptable investment returns.
Risk, regardless of its source, is part and parcel of investing. The challenge is to mitigate risk as much as possible through sound portfolio diversification. Gartmore is committed to offering a diverse range of equity, fixed-income and alternative investment solutions designed to capture global investment opportunities. The informed investment response to complex, volatile markets is to configure a series of diverse, uncorrelated, well-performing funds into a dynamic portfolio. At Gartmore, we seek to provide the core and satellite investments needed to construct a broadly diversified investment portfolio.
Moreover, Gartmore believes that seasoned investment experts employing well-articulated and tested processes and aided by global research form the path to acceptable risk-adjusted returns. We hold a core belief that the ideas and insights of talented investment professionals can add quantifiable investment returns. In that regard, we are pleased to report that the returns of 30 of our 47 retail mutual funds (Class A at NAV) exceeded their respective benchmarks for the annual period ended Oct. 31, 2005.
The performance of a number of Gartmore’s funds from a variety of sectors and regions strengthens the case for holding uncorrelated investments. For example, the performance of the Gartmore Global Natural Resources Fund, which during the reporting period returned 65.51% (Class A at NAV) versus the Goldman Sachs Natural Resources Index return of 34.75%, was driven by escalating energy prices derived from increased global demand coupled with concerns about supply shortages. Within the energy sector, the Fund concentrated on smaller companies with higher capacity for growth. It is widely believed that energy will be in great demand for an extended period of time; therefore, the Fund will remain focused on the energy services sector companies that acquire, develop, and exploit oil and natural gas properties. The Wall Street Journal cited the Fund as a “Category King” in the Mutual Fund Monthly Review of Sept. 6, 2005.
The Gartmore Small Cap Fund garnered above-average returns during the reporting period, posting a 31.51% return (Class A at NAV) versus the Russell 2000® Index return of 12.08%. Most of the Fund’s outperformance came from strong stock selection in the information technology and energy sectors, in addition to astute sector allocations. Shortly after the close of the period, the Fund was cited in The Wall Street Journal as a “Category King” and noted as the second-best-performing fund in its respective sector for October 2005.
In addition, during the reporting period, Gartmore’s small-cap investment team was enhanced by the hiring of senior portfolio manager Jayne Stevlingson, who has managed small-cap funds at both OppenheimerFunds, Inc. and Morgan Stanley.
The case for broad global diversification was made through the performance of several of our non-U.S. funds during the reporting period. In comparison to equity prices in Europe and Japan, those in the United States were more muted during the past year, reflecting stretched valuations and increasing uncertainty in the outlook for consumers. The emerging markets, however, outperformed all other regions. Though its performance slightly lagged that of its benchmark, the Gartmore Emerging Markets Fund
Message to Shareholders
Continued
posted very strong returns of 30.02% (Class A at NAV) for the reporting period. The Gartmore International Growth Fund, returning 26.13% (Class A at NAV) versus the Morgan Stanley Capital International (MSCI) All Country World ex-U.S. Index return of 20.06%, also benefited from the impressive performance of emerging-market and Pacific Rim equities. In addition, Latin American securities delivered notably robust performance on the back of strong commodity prices.
The Gartmore Worldwide Leaders Fund, which returned 23.44% (Class A at NAV) versus 13.27% for the MSCI World IndexSM, benefited from both domestic and international developments. Overall, U.S. growth remained strong in the face of inflationary worries, while both Europe and Japan showed increasing signs of recovery. European export growth increased due to the weak euro at the same time that Japan experienced rising real incomes and increased capital expenditures. As a result, the Fund’s largest regional contributors were the United States, the United Kingdom and Japan. The Fund also benefited from strong stock selection within the technology, financial services, health-care and energy sectors.
Despite considerable volatility in both the U.S. economy and the U.S. equity markets during the past year, the Gartmore U.S. Growth Leaders Fund handily outperformed the Standard & Poor’s (S&P) 500® Index return of 8.72% with a return of 17.31% (Class A at NAV). The Fund’s performance was almost exclusively driven by strong stock selection, particularly in the technology and consumer goods areas. Concurrently, the Gartmore U.S. Growth Leaders Long-Short Fund returned 6.09% (Class A at NAV) versus 2.68% for its benchmark, the Citigroup 3-Month T-Bill Index. Again, adept stock selection, coupled with strong sector allocations, drove the Fund’s outperformance.
In addition to a suite of actively managed funds, Gartmore provides packaged asset allocation and diversification solutions. The Gartmore Optimal Allocations Funds, launched in June 2004, consist primarily of various proprietary Gartmore funds offered in four varieties, calibrated to different levels of risk: Moderate, Moderately Aggressive, Aggressive and Specialty. We are very pleased to report that each of these Funds, which serve as complements to actively managed holdings, outperformed their respective composite benchmarks for the reporting period.
| | | | | | |
| Fund Name | | Fund
Return* | | Benchmark Return | | Benchmark |
| Gartmore Optimal Allocations: Moderate | | 10.41% | | 7.56% | | S&P 500 (40%); MSCI EAFE (20%); Lehman Brothers U.S. Aggregate (40%) |
| Gartmore Optimal Allocations: Moderately Aggressive | | 12.77% | | 9.08% | | S&P 500 (60%); MSCI EAFE (20%); Lehman Brothers U.S. Aggregate (20%) |
| Gartmore Optimal Allocations: Aggressive | | 14.86% | | 10.67% | | S&P 500 (70%); MSCI EAFE (25%); Lehman Brothers U.S. Aggregate (5%) |
| Gartmore Optimal Allocations: Specialty | | 14.59% | | 11.50% | | S&P 500 (70%); MSCI EAFE (30%) |
| * | All Fund returns are Class A at NAV, as of Oct. 31, 2005. |
As we head into 2006, the only constant is uncertainty, which is a companion to opportunity. The informed and experienced investment manager, supported by broad-based research and analysis, can discern the investment opportunities associated with volatility. In today’s global investment landscape, a host of variables exist that impact investment returns, both positively and negatively. At Gartmore, we put all of our resources into our goal of achieving acceptable risk-adjusted returns on behalf of our investors. We measure our investment success by your performance standards. We appreciate the trust you have placed in us, and we will continue to strive to fulfill your investment objectives in the coming year.
Wishing you a very happy and prosperous 2006,

Young D. Chin
Co-Global Chief Investment Officer–Equities
President and CEO
Gartmore Global Investments
Market Perspectives
October 31, 2005
Market volatility continues, but with a positive trend
The one-year period ended Oct. 31, 2005, witnessed considerable quarter-to-quarter volatility. The past 12 months clearly have been rife with reasons to justify the wide swings in market pricing. Although the markets gave investors a bumpy ride, most of those who held on were rewarded, illustrated by the fact that, for the annual reporting period, the Morgan Stanley Capital International Europe, Australasia and Far East (MSCI EAFE®) Index returned 18.59% and the Standard & Poor’s (S&P) 500® Index was up 8.72%.
A broad rally in global equity markets took hold in the final two months of 2004. International stocks, as represented by the MSCI EAFE Index, advanced 11.55% during this period, while the S&P 500 Index, a broad measure of the U.S. equity market, gained 7.59%.
As 2005 began, however, concerns about slack economic growth, the onset of inflation, increasing interest rates and spiraling energy costs led to a far less favorable environment for stocks, leaving most markets on the defensive. To varying degrees, these concerns would continue to plague the equity markets for the remainder of the year. The overall global economy nonetheless proved resilient. In the United States, the economy grew at a faster pace during the fiscal third quarter than initially anticipated, signaling improving economic health. From July through September, gross domestic product, the broadest measure of U.S. economic activity, grew 4.3%.
The dominant topic in 2005, particularly during the latter half of the year, was the continued impact of rising energy costs. As Hurricane Katrina barreled down on the energy-intensive Louisiana coast, the futures price of crude oil rose to a high of $70 per barrel while natural gas prices doubled--a classic one-two economic punch. A confluence of increased global demand, particularly from China, and concerns about supply shortages also contributed to energy price hikes.
Meanwhile, the Federal Reserve Board continued its measured increases of short-term interest rates, despite speculation that the moves would halt amid spiking energy costs. Throughout the reporting period, the rate rose from 1.75% to 3.75% as a result of eight consecutive 0.25% increases. As September wound down, however, energy prices began to fall, though they still were far above their year-ago averages. Further, inflationary fears began to subside as the Fed displayed its confidence in the economy. Ben Bernanke was appointed the new Fed Chairman in October to replace Alan Greenspan, who retires at the end of his term in January 2006.
Toward the end of the reporting period, consumer sentiment began to lag. From August to September, the consumer confidence measure fell from 105.5 to 86.6. In August, wages and salaries increased by 6.6%, yet disposable income declined 0.1% along with personal spending, which fell 0.5%--the biggest drop in more than three years.
During the reporting period, energy and natural resource company profits surged alongside soaring energy costs and expanding global demand. In the telecommunications industry, on the other hand, the costs of consolidation muted returns. Domestically, within the S&P 500 Index for the entire reporting period, sector performance ranged from a high of 59% for health services (31% in the MSCI EAFE Index) to a low of -5% for consumer services (9% in the MSCI EAFE Index). Stocks in industrials, energy and distribution services delivered returns of 42%, 31% and 25% (43%, 24% and 46% in the MSCI EAFE Index), respectively, while stocks in consumer durables and communications delivered negative returns of -4% and -0.5% (14% and 5% in the MSCI EAFE Index), respectively.
Key trends for investors to watch
As we look toward the coming year, these are some of the key trends that we are paying particularly close attention to as we shape our investment strategies at Gartmore:
An aging population. During 2005, a landmark social milestone occurred when the leading edge of the baby boom generation reached 60 years of age. Since the early post-World War II years, the baby boomers, as one of the largest subsections of the U.S. population, have reshaped the social landscape in innumerable ways. This group’s retirement will continue the process. The country’s financial institutions, for example, will accelerate the re-engineering of their products and services toward wealth preservation, not just wealth generation. On the downside, though, the strain on many under-funded pension plans, in addition to the Social Security system, may reverberate through the markets in unexpected and unsettling ways.
Housing prices—up, down or sideways? The housing market remained strong during the reporting period, with
30-year fixed mortgage rates remaining below 6% for the majority of the time. Confounding expectations amid Hurricanes Katrina and Rita and rising energy costs, existing home sales advanced to an all-time high of 2% in August. The robust housing market contributed much to the overall “wealth effect” for real estate investors. By the end of the reporting period, however, more pronounced signs of softening became evident.
One housing trend associated with the aging of the population: a wave of residential downsizing as retirees seek more practical, late-in-life living arrangements. Moreover, individuals are pulling back from the real estate speculation of the past few years as quick price appreciation has cooled in once-hot markets such as Las Vegas, Miami, Phoenix and San Diego.
The cost of socialization. During the past year, it has become even clearer that many corporations and countries must take a harder look at dealing with the burgeoning weight of socialization, which consists of, among other factors, health-care and retirement benefits. In fact, the future cost of socialization at both the corporate and country level will be of increasing concern in determining investment potential. Many longstanding business models and corporate policies will be revised in light of unsustainably heavy socialization costs.
France’s refusal to endorse the European Union (EU) constitution, for example, can be tied to the issue of socialization. Most observers believe that voters feared that a stronger EU would create an influx of cheap labor just as France was struggling to reduce high unemployment. In the United States, the issue of socialization was clearly evident in the United Auto Workers’ agreement with General Motors Corp. (GM) to cut health-care benefits for employees, retirees and their families. GM successfully argued that escalating pension and health-care benefits for a vast pool of retirees was forcing the enterprise into bankruptcy, which is a landmark shift in the auto industry’s historical model.
The international economic picture. In the latter part of 2005, the economies of Japan and Europe, including the United Kingdom, improved due to strong corporate profitability and expectations of higher levels of merger-and-acquisition activity. Europe was buoyed by export growth on the back of the weak euro. In Japan, meanwhile, rising real incomes and capital expenditure led to hopes of a sustainable recovery. Expectations rose when Prime Minister Junichiro Koizumi achieved a resounding victory in parliamentary elections, which gave his government a solid mandate for reform.
China’s economy grew rapidly during the reporting period. Despite ongoing criticism that governmental controls on the economy were overly rigid—particularly regarding commodity prices and imports/exports—China’s economy has largely stabilized and shows strong signs of continued growth. In fact, the government’s economic controls, once viewed as unduly prohibitive, are now credited with controlling what was becoming a dangerously overheated economy. For example, new factories were being developed in China at a rapid rate based on capital secured with minimal credit checks. Before long, some banks held portfolios with up to 45% nonperforming loans as a result of default. Government regulators subsequently mandated stricter credit rules and have even expressed a desire to improve China’s banks to such a degree that their credit quality would be attractive to foreign investors.
Throughout the first half of the year, the U.S. dollar continued its sustained, three-year decline versus benchmark currencies such as the euro. In mid-summer, however, the dollar reversed its multi-year trend. The dollar’s increase is due primarily to the strengthening U.S. economic outlook relative to the global platform and disappointment in European reform. In addition, two factors—the United Kingdom’s halting of interest-rate hikes and France’s vote against the EU constitution—have placed pressure on the euro, effectively bolstering the U.S. dollar.
The return of capital expenditures. As we look toward 2006, we are seeing a trend toward companies deploying large amounts of excess cash on their balance sheets. Since the 2000 market meltdown, many companies have relied on cash as their primary hedge against diminished revenues. Now, however, as the equity markets continue to recover, many of these firms are feeling the pressure either to put the money to work in various ways, such as toward acquisitions, or return the money to shareholders in the form of dividend payouts or share buybacks. The technology sector could be a notable beneficiary of this trend. Research and development as well as new product rollouts are key drivers in the technology industry, and both areas will be bolstered by increased spending.
Looking ahead
For the near term, investors will face a mixture of positive and negative factors. On the one hand, economic and corporate earnings growth is likely to slow in the coming months. Counterbalancing this slowdown could be positive sentiment surrounding the end of the Fed’s cycle of interest-rate hikes,
Market Perspectives
Continued
which we anticipate will occur in the first half of 2006. If, as we expect, the peak in rates is accompanied by softening oil prices and a firm U.S. dollar, the investment environment should be favorable for equity markets.
PAST PERFORMANCE DOES NOT GUARANTEE FUTURE RESULTS.
To obtain performance information current to the most recent month-end, which may be higher or lower than the performance shown above, please call 800-848-0920 or go to www.gartmorefunds.com
The opinions expressed herein are those of Gartmore Global Investments and may not come to pass.
Investing in mutual funds involves risk, including possible loss of principal. There is no assurance that the investment objective of any fund will be achieved.
The Gartmore Optimal Allocations Funds are designed to provide diversification and asset allocation across several types of investments and asset classes, primarily by investing in underlying Gartmore funds.
There is no assurance that a diversified portfolio will produce better results than a nondiversified one.
Each Fund is subject to different levels of risk, based on the size of its asset class allocations.
Index performance is provided for comparison purposes only; indexes are unmanaged and no fees or expenses are reflected. Individuals cannot invest directly in an index. Market index performance is provided by a third party source that Gartmore deems reliable.
The Gartmore Small Cap Fund may purchase securities in initial public offerings, which can be very volatile and carry high transaction costs.
Small-company stocks have higher risks than the stocks of larger, more established companies and have significant short-term price volatility.
Funds that concentrate on specific sectors or a relatively small number of securities may be subject to greater volatility than that of other mutual funds. International investing involves additional risks, including currency fluctuations, differences in accounting standards, political instability and foreign regulations, all of which are magnified in emerging markets.
In order to achieve the Gartmore U.S. Growth Leaders Long-Short Fund’s objective, the managers may use sophisticated investment strategies such as short selling, short-term trading and investing in smaller companies. These strategies may cause the Fund to have greater risk and volatility, and higher expenses, than those of other investments. The risks of investing in this Fund are more fully detailed within the Fund’s prospectus.
The Gartmore Optimal Allocations Fund: Aggressive benchmark consists of 70% S&P 500 Index, 25% MSCI EAFE Index and 5% Lehman Brothers U.S. Aggregate Index.
The Gartmore Optimal Allocations Fund: Moderately Aggressive benchmark consists of 60% S&P 500 Index, 20% MSCI EAFE Index and 20% Lehman Brothers U.S. Aggregate Index.
The Gartmore Optimal Allocations Fund: Moderate benchmark consists of 40% S&P 500 Index, 20% MSCI EAFE Index and 40% Lehman Brothers U.S. Aggregate Index.
The Gartmore Optimal Allocations Fund: Specialty benchmark consists of 70& S&P 500 Index and 30% MSCI EAFE Index.
Standard & Poor’s 500® (S&P 500) Index: An unmanaged, market capitalization-weighted index of 500 widely held stocks of large-cap U.S. companies that gives a broad look at how the stock prices of those companies have performed.
Lehman Brothers U.S. Aggregate Index: An unmanaged, market value-weighted index of investment-grade, fixed-rate debt issues (including government, corporate, asset-backed, and mortgage-backed securities with maturities of one year or more) that is generally representative of the bond market as a whole.
Morgan Stanley Capital International Europe, Australasia and Far East (MSCI EAFE®) Index: An unmanaged, free float-adjusted, market capitalization-weighted index that is designed to measure the performance of stocks in developed markets outside the United States and Canada.
Goldman Sachs Natural Resources Index: An unmanaged, modified market capitalization-weighted sector index of U.S.-traded natural resource-related stocks; includes companies in the categories of extractive industries, energy companies, owners and operators of timber tracts, forestry services, producers of pulp and paper, and owners of plantations.
Citigroup 3-Month T-Bill Index: An unmanaged index that is generally representative of 3-month Treasury bills; consists of an average of the last 3-month Treasury bill issues (excluding the current month-end bill).
Morgan Stanley Capital International Emerging Markets (MSCI EM) IndexSM: An unmanaged, free float-adjusted, market capitalization-weighted index that is designed to measure the performance of the stocks in emerging-country markets.
Morgan Stanley Capital International (MSCI) All Country World excluding U.S. Index: An unmanaged, free float-adjusted, market-capitalization weighted index that is designed to measure the performance of the stocks in companies in all countries except the United States.
Morgan Stanley Capital International (MSCI) World IndexSM: An unmanaged, free float-adjusted, market capitalization-weighted index that is designed to measure the performance of global developed-market equities.
Russell 2000® Index: An unmanaged index that measures the performance of the stocks of small-capitalization U.S. companies; includes the smallest 2,000 U.S. companies in the Russell 3000® Index, which measures the performance of the largest 3,000 U.S. companies, based on market capitalization.
Each Fund’s underlying funds may be subject to specific investment risks such as those associated with a concentrated number of securities (such as REITs), small companies, international stocks, initial public offerings, short selling, short-term trading, bonds and short-term instruments.
Investors should carefully consider a fund’s investment objectives, risks, fees, charges and expenses before investing any money. To obtain this and other information on Gartmore’s funds, please call 800-848-0920 to request a prospectus, or download a prospectus at www.gartmorefunds.com. Please read it carefully before investing any money.
Gartmore Funds distributed by Gartmore Distribution Services, Inc., Member NASD. 1200 River Road, Suite 1000, Conshohocken, PA 19428.
Lipper Analytical Services, Inc. is an industry research firm whose rankings are based on total return performance and do not reflect the effect of sales charges. Each fund is ranked within a universe of funds similar in investment objective as determined by Lipper.
Market Perspectives
Continued
The Gartmore Investor Destinations Funds are designed to provide diversification and asset allocation across several types of investments and asset classes, primarily by investing in underlying funds. Therefore, in addition to the expenses of the Gartmore Investor Destinations Funds, you are indirectly paying a proportionate share of the applicable fees and expenses of the underlying funds. When discussing asset allocation theory and the three major asset classes, short-term investments typically are represented by an investment in 90-day Treasury bills. The short-term investments component of the Gartmore Investor Destinations Funds comprises an investment in one or a combination of the following: the Gartmore Morley Enhanced Income Fund (a short-term fixed-income fund), the Gartmore Money Market Fund and/or the Nationwide Contract (a fixed-interest contract issued and guaranteed by the Nationwide Life Insurance Company). While there can be no guarantee, it is believed that this strategy will provide a return in excess of the 90-day T-bill without substantially increasing risk.
The Gartmore Optimal Allocations Funds are designed to provide diversification and asset allocation across several types of investments and asset classes, primarily by investing in underlying Gartmore funds.
Each Fund is subject to different levels of risk, based on the size of its asset class allocations. Each Fund’s underlying funds may be subject to specific investment risks such as those associated with a concentrated number of securities (such as REITs), small companies, international stocks, initial public offerings, short selling, short-term trading, bonds and short-term instruments.
Investing in mutual funds involves risk, including possible loss of principal.
There is no assurance that the investment objective of any fund or underlying fund will be achieved or that a diversified portfolio will produce better results than a nondiversified one.
PAST PERFORMANCE DOES NOT GUARANTEE FUTURE RESULTS. Performance shown is for Class A shares of the Fund at NAV and the underlying funds. The investment return and principal value of an investment will fluctuate, so that an investor’s shares, when redeemed, may be worth more or less than their original cost. The indexes shown are unmanaged and do not reflect any fees or expenses. Investors cannot invest directly in market indexes. To obtain performance information current to the most recent month-end, which may be higher or lower than the performance shown, please call 800-848-0920 or visit www.gartmorefunds.com.
Commentary provided by Gartmore Global Investments, the investment adviser to Gartmore Funds. All opinions and estimates included in this report constitute Gartmore Global Investments’ judgment as of the date of this report and are subject to change without notice.
Gartmore Global Investments, one of its affiliated advisers, or its employees, may have a position in the securities named in this report.
This report is for informational purposes only, and is not intended as an offer or recommendation with respect to the purchase or sale of any security, option, future or other derivatives in such securities.
Although third party information has been obtained from and is based on sources the Firm believes to be reliable, the Firm does not guarantee the accuracy of the information, and it may be incomplete or condensed.
Investors should carefully consider a fund’s (and each of its underlying funds’) investment objectives, risks, fees, charges and expenses before investing any money. To obtain this and other information on Gartmore’s funds, please call 800-848-0920 to request a prospectus, or download a prospectus at www.gartmorefunds.com. Please read it carefully before investing any money.
Gartmore Investor Destinations Aggressive Fund
For the annual period ended Oct. 31, 2005, the Gartmore Investor Destinations Aggressive Fund (Class A at NAV) returned 12.36% versus 8.35% for its benchmark, which consists of 95% S&P 500® Index and 5% Lehman Brothers U.S. Aggregate Index. For broader comparison, the average return for the Fund’s Lipper peer category of Global Multi-Cap Core Funds was 13.33%.
The reporting period was a strong one for equity markets. As a result of several factors–lower oil prices, the conclusion of the U.S. presidential election, reasonably good economic and earnings news, reactions to the $32 billion Microsoft dividend and the beginning of the seasonally strong year-end period–equity markets experienced most of their gains for the reporting period in November and December of 2004.
January 2005 began with a slide after the strong previous quarter, with cyclical and small-capitalization stocks performing the worst out of the gate. January was characterized by mixed economic data, increasing interest rates, disappointing earnings reports and climbing oil prices. In addition, gross domestic product growth for the fourth quarter was released during January, coming in weaker than expected at 3.1%, primarily as a result of the foreign trade deficit.
Equity markets were able to reverse course in February, even as the productivity report showed a continued slowdown in productivity growth and oil prices continued to climb. Good signs for the markets came in the form of accelerated hiring plans by corporations, reasonably robust capital spending and strong merger-and-acquisition activity. In March and April, equity markets resumed the downward slide experienced in January due to a combination of factors–the trade deficit, mixed economic news, high oil prices and rising interest rates. Oil prices, reaching as high as $56 per barrel, continued to trade above $50 per barrel.
Despite slowing profit growth, continually higher oil prices and inflation concerns, first-quarter corporate earnings came in strong and equity markets rebounded in May. The rally did not last into June, however, as investors continued to worry about economic deceleration. In addition, oil continued to pressure stock valuations, with the price climbing to a record high of more than $60 per barrel.
Equity markets regained momentum in July, despite several negative events, such as terrorism overseas, two devastating hurricanes in the U.S. Gulf Coast, oil prices reaching $70 per barrel, a strong dollar and increasing interest rates. The London terror attacks in early July did little to shake investors, as the S&P 500 Index recovered its immediate 4% loss the next day. In addition, improved profits in the energy sector counterbalanced the negative impact that Hurricanes Katrina and Rita had on the retail, transportation, tourism and insurance sectors in September. Year-to-date through Oct. 31, 2005, stocks remained in one of the narrowest trading ranges in history.
As expected, interest rates moved considerably during the period as the yield curve flattened dramatically. The Federal Reserve Board, through the Federal Open Market Committee, continued its “measured pace” of monetary tightening by raising the federal funds rate 25 basis points eight times during the reporting period. This brought the rate to 3.75% from 1.75%.
The chart below illustrates the manager’s target allocation for each of the Fund’s underlying funds, and how each of the Fund’s underlying funds performed during the period.
| | | | |
| Underlying Fund | | 12-Month
Return | | Target
Allocation |
| Gartmore S&P 500 Index Fund | | 8.55% | | 40% |
| Gartmore International Index Fund | | 18.26% | | 30% |
| Gartmore Mid Cap Market Index Fund | | 17.41% | | 15% |
| Gartmore Small Cap Index Fund | | 12.11% | | 10% |
| Gartmore Bond Index Fund | | 0.97% | | 5% |
The Fund will continue to pursue its primary goal of maximizing total investment return by seeking growth of capital and income. The Fund will remain heavily weighted toward stock investments while including a position in bonds, with the goal of adding income and reducing volatility.
Portfolio Manager:
Young Chin
| | |
Fund Performance | | Gartmore Investor Destinations Aggressive Fund |
Average Annual Total Return
(For periods ended October 31, 2005)
| | | | | | | | |
| | | | | 1 Yr. | | 5 Yr. | | Inception1 |
| Class A | | w/o SC2 | | 12.36% | | 1.58% | | 0.22% |
| | | w/SC3 | | 5.84% | | 0.39% | | -0.84% |
Class B | | w/o SC2 | | 11.46% | | 0.84% | | -0.49% |
| | | w/SC4 | | 6.46% | | 0.45% | | -0.66% |
Class C5 | | w/o SC2 | | 11.49% | | 0.85% | | -0.48% |
| | | w/SC6 | | 10.49% | | 0.85% | | -0.48% |
| Class R7,8 | | 12.19% | | 1.11% | | -0.26% |
| Institutional Class9 | | 12.86% | | 1.62% | | 0.28% |
| Service Class7 | | 12.18% | | 1.50% | | 0.17% |
All figures showing the effect of a sales charge reflect the maximum charge possible, because it has the most dramatic effect on performance data.
| 1 | Fund commenced operations on March 31, 2000. |
| 2 | These returns do not reflect the effects of sales charges (SC). |
| 3 | A 5.75% front-end sales charge was deducted. |
| 4 | A 5.00% contingent deferred sales charge (CDSC) was deducted. The CDSC declines to 0% after 6 years. |
| 5 | These returns until the creation of Class C shares (3/1/01) include the performance of the Fund’s Class B shares. Excluding the effect of any fee waivers or reimbursements, such prior performance is substantially similar to what Class C shares would have produced because Class C shares invest in the same portfolio of securities as Class B shares and have the same expenses after any fee waivers or reimbursements. For Class C shares returns with sales charges, these returns have been restated for the applicable sales charges. |
| 6 | A CDSC of 1.00% was deducted from the one year return because it is charged when you sell Class C shares within the first year after purchase. |
| 7 | Not subject to any sales charges. |
| 8 | These returns until the creation of Class R shares (10/1/03) include the performance of the Fund’s Class B shares. The returns have been adjusted for the fact that Class R shares do not have any applicable sales charges but have not been adjusted for the lower expenses applicable to Class R shares. Excluding the effect of any fee waivers or reimbursements, such prior performance is similar to what Class R shares would have produced because the Class R shares invest in the same portfolio of securities as Class B shares. |
| 9 | These returns until the creation of Institutional Class shares (12/29/04) include the performance of the Fund’s Class B shares. The returns have been adjusted for the fact that Institutional Class shares do not have any applicable sales charges but have not been adjusted for the lower expenses applicable to Institutional Class shares. Excluding the effect of any fee waivers or reimbursements, such prior performance is similar to what Institutional Class shares would have produced because the Institutional Class shares invest in the same portfolio of securities as Class B shares. |
Performance of a $10,000 Investment
Investment return and principal value will fluctuate, and when redeemed, shares may be worth more or less than original cost. Past performance is no guarantee of future results and does not reflect the deduction of taxes that a shareholder would pay on fund distributions or the redemption of fund shares. Investing in mutual funds involves market risk, including loss of principal. Performance returns assume the reinvestment of all distributions.
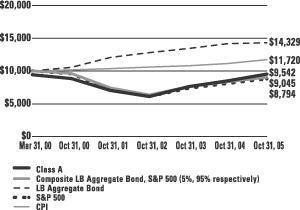
Comparative performance of $10,000 invested in Class A shares of the Gartmore Investor Destinations Aggressive Fund, Lehman Brothers U.S. Aggregate Bond Index (LB U.S. Aggregate Bond Index)(a), S&P 500 Index (S&P 500)(b), Morgan Stanley Capital International–Europe, Australasia, and Far East Index (MSCI EAFE)(c), the S&P MidCap 400 Index(d), the Russell 2000 Index (Russell 2000)(e), the Aggressive Composite (old) Index (f), the Aggressive Composite (new) Index (g), and the Consumer Price Index (CPI)(h) since inception. Unlike the Fund, the returns for these unmanaged indexes do not reflect any fees, expenses, or sales charges. Investors cannot invest directly in market indexes.
| (a) | LB U.S. Aggregate Bond Index is an unmanaged, market value-weighted index of investment-grade, fixed-rate debt issues including government, corporate, asset-backed, and mortgage-backed securities with maturities of one year or more. |
| (b) | The S&P 500 is an unmanaged index of 500 widely held stocks of large U.S. companies that gives a broad look at how the stock prices of large U.S. companies have performed. |
| (c) | The MSCI EAFE Index is an unmanaged, market capitalization-weighted index that is designed to represent the performance of developed stock markets outside the United States and Canada. |
| (d) | The S&P MidCap 400 Index is an unmanaged index that measures the performance of mid-sized U.S. companies. |
| (e) | The Russell 2000 is an unmanaged index of approximately 2000 companies with small market capitalizations relative to the market capitalizations of other U.S. companies. |
| (f) | The Aggressive Composite (old) Index is a combination of S&P 500 (40%), MSCI EAFE (30%), S&P MidCap 400 Index (15%), Russell 2000 (10%), and LB Aggregate Bond (5%). |
| (g) | The Aggressive Composite(new) Index is an unmanaged, hypothetical representation of the performance of each of the Fund’s asset classes according to their respective weightings. The Aggressive Composite is a combination of the S&P 500 (95%) and the LB U.S. Aggregate Bond (5%). |
| (h) | The CPI represents changes in prices of a basket of goods and services purchased for consumption by urban households. |
| | |
Shareholder Expense Example | | Gartmore Investor Destinations Aggressive Fund |
As a shareholder of the Fund, you incur two types of costs: (1) transaction costs, including sales charges (loads) paid on purchase payments and redemption fees; and (2) ongoing costs, including investment advisory fees, administration fees, distribution fees and other Fund expenses. The examples below are intended to help you understand your ongoing costs (in dollars) of investing in the Fund and to compare these costs with the ongoing costs of investing in other mutual funds. Per SEC requirements, the examples assume that you had a $1,000 investment in the Class at the beginning of the reporting period, May 1, 2005, and continued to hold your shares at the end of the reporting period, October 31, 2005.
Actual Expenses
For each Class of the Fund in the table below, the first line provides information about actual account values and actual expenses. You may use the information in this line, together with the amount you invested, to estimate the expenses that you paid over the period. Simply divide your account value by $1,000 (for example, an $8,600 account value divided by $1,000 = 8.6), then multiply the result by the number in the first line of each Class under the heading entitled “Expenses Paid During Period” to estimate the expenses you paid on your account during the period.
Hypothetical Example for Comparison Purposes
The second line of each Class in the table below provides information about hypothetical account values and hypothetical expenses based on the Class’ actual expense ratio and an assumed rate of return of 5% per year before expenses, which is not the Class’ actual return. The hypothetical account values and expenses may not be used to estimate the actual ending account balance or expenses you paid for the period. You may use this information to compare the ongoing costs of investing in the Class of the Fund and other funds. To do so, compare this 5% hypothetical example with the 5% hypothetical examples that appear in the shareholder reports of the other funds.
Please note that the expenses shown in the table are meant to highlight your ongoing costs only and do not reflect any transaction costs, such as sales charges (loads) or redemption fees. Therefore, the second line for each Class in the table is useful in comparing ongoing costs only, and will not help you determine the relative total costs of owning different funds. In addition, if these transaction costs were included, your costs would have been higher. The examples also assume all dividends and distributions have been reinvested.
Schedule of Shareholder Expenses
Expense Analysis of a $1,000 Investment
(October 31, 2005)
| | | | | | | | | | | | | | |
| Investor Destinations Aggressive Fund | | | | | Beginning
Account Value,
5/1/05 | | Ending
Account Value,
10/31/05 | | Expenses Paid
During Period*2 | | Annualized
Expense Ratio*2 |
| Class A | | Actual | | | $ | 1,000.00 | | $ | 1,074.20 | | $ | 2.67 | | 0.51% |
| | | Hypothetical | 1 | | $ | 1,000.00 | | $ | 1,022.43 | | $ | 2.60 | | 0.51% |
| Class B | | Actual | | | $ | 1,000.00 | | $ | 1,068.90 | | $ | 6.47 | | 1.24% |
| | | Hypothetical | 1 | | $ | 1,000.00 | | $ | 1,018.75 | | $ | 6.33 | | 1.24% |
| Class C | | Actual | | | $ | 1,000.00 | | $ | 1,070.10 | | $ | 6.47 | | 1.24% |
| | | Hypothetical | 1 | | $ | 1,000.00 | | $ | 1,018.75 | | $ | 6.33 | | 1.24% |
| Class R | | Actual | | | $ | 1,000.00 | | $ | 1,073.10 | | $ | 3.29 | | 0.63% |
| | | Hypothetical | 1 | | $ | 1,000.00 | | $ | 1,021.82 | | $ | 3.22 | | 0.63% |
| Institutional Service Class | | Actual | | | $ | 1,000.00 | | $ | 1,073.40 | | $ | 3.34 | | 0.64% |
| | | Hypothetical | 1 | | $ | 1,000.00 | | $ | 1,021.77 | | $ | 3.27 | | 0.64% |
| Institutional Class | | Actual | | | $ | 1,000.00 | | $ | 1,076.50 | | $ | 1.31 | | 0.25% |
| | | Hypothetical | 1 | | $ | 1,000.00 | | $ | 1,025.00 | | $ | 1.28 | | 0.25% |
| * | Expenses are equal to the Fund’s annualized expense ratio multiplied by the average account value over the period multiplied by 184/365 (to reflect the one-half year period). The expense ratio presented represents a six month, annualized ratio in accordance with SEC guidelines. |
| 1 | Represents the hypothetical 5% return before expenses. |
| 2 | Expenses are based on the direct expenses of the Fund and do not include the effect of the underlying Funds’ expenses, which are disclosed in the Fee and Expense table and described more fully in a footnote to that table in your Fund prospectus. |
| | |
Portfolio Summary | | Gartmore Investor Destinations Aggressive Fund |
The SEC adopted a requirement that Funds present their portfolio holdings in a table, chart or graph format in their annual and semiannual reports to shareholders, whether or not a statement of investments is utilized. The following tables, which present portfolio holdings as a percentage of net assets, are provided in compliance with this requirement.
| | |
| Asset Allocation | | |
| Mutual Funds | | 100.1% |
| Liabilities in excess of Other Assets | | -0.1% |
| | |
|
| | | 100.0% |
| | |
| Asset Allocation Detail | | |
| Equity Funds | | 95.0% |
| Fixed Income Funds | | 5.1% |
| Other | | -0.1% |
| | |
|
| | | 100.0% |
| | |
| Top Holdings | | |
| Gartmore S&P 500 Index Fund, Institutional Class | | 40.2% |
| Gartmore International Index Fund, Institutional Class | | 29.7% |
| Gartmore Mid Cap Market Index Fund, Institutional Class | | 15.1% |
| Gartmore Small Cap Index Fund, Institutional Class | | 10.0% |
| Gartmore Bond Index Fund, Institutional Class | | 5.1% |
| Other | | -0.1% |
| | |
|
| | | 100% |
Statement of Investments
October 31, 2005
Gartmore Investor Destinations Aggressive Fund
| | | | | |
| | | Shares | | Value |
Equity Funds (95.0%) | | | | | |
Gartmore International Index Fund, Institutional Class (b) | | 19,164,924 | | $ | 166,734,839 |
Gartmore Mid Cap Market Index Fund, Institutional Class (b) | | 5,746,430 | | | 84,874,764 |
Gartmore S&P 500 Index Fund, Institutional Class (b) | | 21,710,572 | | | 226,007,051 |
Gartmore Small Cap Index Fund, Institutional Class (b) | | 4,658,078 | | | 55,896,931 |
| | | | |
|
|
| | | | | | 533,513,585 |
| | | | |
|
|
| | | | | | | |
| | | Shares | | Value | |
Fixed Income Funds (5.1%) | | | | | | | |
Gartmore Bond Index Fund, Institutional Class (b) | | $ | 2,648,858 | | $ | 28,528,197 | |
| | | | | |
|
|
|
| | |
Total Mutual Funds | | | | | | 562,041,782 | |
| | | | | |
|
|
|
| |
Total Investments
(Cost $495,857,119) (a) — 100.1% | | | 562,041,782 | |
| |
Liabilities in excess of other
assets — (0.1)% | | | (283,360 | ) |
| | | | | |
|
|
|
| | |
NET ASSETS — 100.0% | | | | | $ | 561,758,422 | |
| | | | | |
|
|
|
| | (a) | See notes to financial statements for tax unrealized appreciation (depreciation) of securities. |
| | (b) | Investment in affiliate. |
See notes to financial statements.
Gartmore Investor Destinations Moderately Aggressive Fund
For the annual period ended Oct. 31, 2005, the Gartmore Investor Destinations Moderately Aggressive Fund (Class A at NAV) returned 10.47% versus 7.32% for its benchmark, which consists of 80% S&P 500® Index, 15% Lehman Brothers U.S. Aggregate Index and 5% Citigroup 3-Month T-Bill Index. For broader comparison, the average return for the Fund’s Lipper peer category of Global Flexible Portfolio Funds was 11.20%.
The reporting period was a strong one for equity markets. As a result of several factors–lower oil prices, the conclusion of the U.S. presidential election, reasonably good economic and earnings news, reactions to the $32 billion Microsoft dividend and the beginning of the seasonally strong year-end period–equity markets experienced most of their gains for the reporting period in November and December of 2004.
January 2005 began with a slide after the strong previous quarter, with cyclical and small-capitalization stocks performing the worst out of the gate. January was characterized by mixed economic data, increasing interest rates, disappointing earnings reports and climbing oil prices. In addition, gross domestic product growth for the fourth quarter was released during January, coming in weaker than expected at 3.1%, primarily as a result of the foreign trade deficit.
Equity markets were able to reverse course in February, even as the productivity report showed a continued slowdown in productivity growth and oil prices continued to climb. Good signs for the markets came in the form of accelerated hiring plans by corporations, reasonably robust capital spending and strong merger-and-acquisition activity. In March and April, equity markets resumed the downward slide experienced in January due to a combination of factors–the trade deficit, mixed economic news, high oil prices and rising interest rates. Oil prices, reaching as high as $56 per barrel, continued to trade above $50 per barrel.
Despite slowing profit growth, continually higher oil prices and inflation concerns, first-quarter corporate earnings came in strong and equity markets rebounded in May. The rally did not last into June, however, as investors continued to worry about economic deceleration. In addition, oil continued to pressure stock valuations, with the price climbing to a record high of more than $60 per barrel.
Equity markets regained momentum in July, despite several negative events, such as terrorism overseas, two devastating hurricanes in the U.S. Gulf Coast, oil prices reaching $70 per barrel, a strong dollar, and increasing interest rates. The London terror attacks in early July did little to shake investors, as the S&P 500 Index recovered its immediate 4% loss the next day. In addition, improved profits in the energy sector counterbalanced the negative impact that Hurricanes Katrina and Rita had on the retail, transportation, tourism and insurance sectors in September. Year-to-date through Oct. 31, 2005, stocks remained in one of the narrowest trading ranges in history.
As expected, interest rates moved considerably during the period as the yield curve flattened dramatically. The Federal Reserve Board, through the Federal Open Market Committee, continued its “measured pace” of monetary tightening by raising the federal funds rate 25 basis points eight times during the reporting period. This brought the rate to 3.75% from 1.75%.
The chart below illustrates the manager’s target allocation for each of the Fund’s underlying funds, and how each of the Fund’s underlying funds performed during the period.
| | | | |
| Underlying Fund | | 12-Month
Return | | Target
Allocation |
| Gartmore S&P 500 Index Fund | | 8.55% | | 35% |
| Gartmore International Index Fund | | 18.26% | | 25% |
| Gartmore Mid Cap Market Index Fund | | 17.41% | | 15% |
| Gartmore Small Cap Index Fund | | 12.11% | | 5% |
| Gartmore Bond Index Fund | | 0.97% | | 15% |
| Short-Term Investments | | 2.78% | | 5% |
The Fund will continue to pursue its primary goal of maximizing total investment return by seeking growth of capital and income. The Fund will remain weighted toward stock investments while including a sizable position in bonds and short-term investments, with the goal of adding income and reducing volatility.
Portfolio Manager:
Young Chin
| | |
Fund Performance | | Gartmore Investor Destinations Moderately Aggressive Fund |
Average Annual Total Return
(For periods ended October 31, 2005)
| | | | | | | | |
| | | | | 1 Yr. | | 5 Yr. | | Inception1 |
| Class A | | w/o SC2 | | 10.47% | | 2.14% | | 1.15% |
| | | w/SC3 | | 4.07% | | 0.93% | | 0.09% |
| Class B | | w/o SC2 | | 9.74% | | 1.39% | | 0.43% |
| | | w/SC4 | | 4.74% | | 1.01% | | 0.26% |
| Class C5 | | w/o SC2 | | 9.74% | | 1.44% | | 0.47% |
| | | w/SC6 | | 8.74% | | 1.44% | | 0.47% |
| Class R7,8 | | 10.49% | | 1.64% | | 0.65% |
| Institutional Class8,9 | | 11.02% | | 2.17% | | 1.19% |
| Service Class7 | | 10.48% | | 2.07% | | 1.10% |
All figures showing the effect of a sales charge reflect the maximum charge possible, because it has the most dramatic effect on performance data.
| 1 | Fund commenced operations on March 31, 2000. |
| 2 | These returns do not reflect the effects of sales charges (SC). |
| 3 | A 5.75% front-end sales charge was deducted. |
| 4 | A 5.00% contingent deferred sales charge (CDSC) was deducted. The CDSC declines to 0% after 6 years. |
| 5 | These returns until the creation of Class C shares (3/1/01) include the performance of the Fund’s Class B shares. Excluding the effect of any fee waivers or reimbursements, such prior performance is substantially similar to what Class C shares would have produced because Class C shares invest in the same portfolio of securities as Class B shares and have the same expenses after any fee waivers or reimbursements. For Class C shares returns with sales charges, these returns have been restated for the applicable sales charges. |
| 6 | A CDSC of 1.00% was deducted from the one year return because it is charged when you sell Class C shares within the first year after purchase. |
| 7 | Not subject to any sales charges. |
| 8 | These returns until the creation of Class R shares (10/1/03) include the performance of the Fund’s Class B shares. The returns have been adjusted for the fact that Class R shares do not have any applicable sales charges but have not been adjusted for the lower expenses applicable to Class R shares. Excluding the effect of any fee waivers or reimbursements, such prior performance is similar to what Class R shares would have produced because the Class R shares invest in the same portfolio of securities as Class B shares. |
| 9 | These returns until the creation of Institutional Class shares (12/29/04) include the performance of the Fund’s Class B shares. The returns have been adjusted for the fact that Institutional Class shares do not have any applicable sales charges but have not been adjusted for the lower expenses applicable to Institutional Class shares. Excluding the effect of any fee waivers or reimbursements, such prior performance is similar to what Institutional Class shares would have produced because the Institutional Class shares invest in the same portfolio of securities as Class B shares. |
Performance of a $10,000 Investment
Investment return and principal value will fluctuate, and when redeemed, shares may be worth more or less than original cost. Past performance is no guarantee of future results and does not reflect the deduction of taxes that a shareholder would pay on fund distributions or the redemption of fund shares. Investing in mutual funds involves market risk, including loss of principal. Performance returns assume the reinvestment of all distributions.
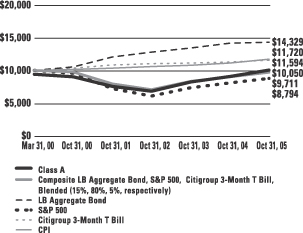
Comparative performance of $10,000 invested in Class A shares of the Gartmore Investor Destinations Moderately Aggressive Fund, Lehman Brothers Aggregate Bond Index (LB Aggregate Bond)(a), S&P 500 Index (S&P 500)(b), Morgan Stanley Capital International–Europe, Australasia, and Far East Index (MSCI EAFE)(c), the S&P MidCap 400 Index(d), the Russell 2000 Index (Russell 2000)(e), the Citigroup 3-Month T Bill Index(f), the Moderately Aggressive Composite (old) Index (g), the Moderately Aggressive Composite (new) Index(h), and the Consumer Price Index (CPI)(i) since inception. Unlike the Fund, the returns for these unmanaged indexes do not reflect any fees, expenses, or sales charges. Investors cannot invest directly in market indexes.
| (a) | LB U.S. Aggregate Bond Index is an unmanaged, market value-weighted index of investment-grade, fixed-rate debt issues including government, corporate, asset-backed, and mortgage-backed securities with maturities of one year or more. |
| (b) | The S&P 500 is an unmanaged index of 500 widely held stocks of large U.S. companies that gives a broad look at how the stock prices of large U.S. companies have performed. |
| (c) | The MSCI EAFE Index is an unmanaged, market capitalization-weighted index that is designed to represent the performance of developed stock markets outside the United States and Canada. |
| (d) | The S&P MidCap 400 Index is an unmanaged index that measures the performance of mid-sized U.S. companies. |
| (e) | The Russell 2000 is an unmanaged index of approximately 2000 companies with small market capitalizations relative to the market capitalizations of other U.S. companies. |
| (f) | The Citigroup 3-Month T Bill Index is an average of the last 3-month treasury bill issues (excluding the current month-end bill). |
| (g) | The Moderately Aggressive Composite (old) is a combination of S&P 500 (35%), MSCI EAFE (25%), S&P MidCap 400 Index (15%), LB Aggregate Bond (15%), Russell 2000 (5%), and Citigroup 3-Month T Bill Index (5%). |
| (h) | The Moderately Aggressive Composite (new) is an unmanaged, hypothetical representation of the performance of each of the Fund’s asset classes according to their respective weightings. The Moderately Aggressive Composite (new) is a combination of the S&P 500 (80%), the LB Aggregate Bond (15%) and the Citigroup 3-Month T Bill Index (5%). |
| (i) | The CPI represents changes in prices of a basket of goods and services purchased for consumption by urban households. |
| | |
Shareholder Expense Example | | Gartmore Investor Destinations Moderately Aggressive Fund |
As a shareholder of the Fund, you incur two types of costs: (1) transaction costs, including sales charges (loads) paid on purchase payments and redemption fees; and (2) ongoing costs, including investment advisory fees, administration fees, distribution fees and other Fund expenses. The examples below are intended to help you understand your ongoing costs (in dollars) of investing in the Fund and to compare these costs with the ongoing costs of investing in other mutual funds. Per SEC requirements, the examples assume that you had a $1,000 investment in the Class at the beginning of the reporting period, May 1, 2005, and continued to hold your shares at the end of the reporting period, October 31, 2005.
Actual Expenses
For each Class of the Fund in the table below, the first line provides information about actual account values and actual expenses. You may use the information in this line, together with the amount you invested, to estimate the expenses that you paid over the period. Simply divide your account value by $1,000 (for example, an $8,600 account value divided by $1,000 = 8.6), then multiply the result by the number in the first line of each Class under the heading entitled “Expenses Paid During Period” to estimate the expenses you paid on your account during the period.
Hypothetical Example for Comparison Purposes
The second line of each Class in the table below provides information about hypothetical account values and hypothetical expenses based on the Class’ actual expense ratio and an assumed rate of return of 5% per year before expenses, which is not the Class’ actual return. The hypothetical account values and expenses may not be used to estimate the actual ending account balance or expenses you paid for the period. You may use this information to compare the ongoing costs of investing in the Class of the Fund and other funds. To do so, compare this 5% hypothetical example with the 5% hypothetical examples that appear in the shareholder reports of the other funds.
Please note that the expenses shown in the table are meant to highlight your ongoing costs only and do not reflect any transaction costs, such as sales charges (loads) or redemption fees. Therefore, the second line for each Class in the table is useful in comparing ongoing costs only, and will not help you determine the relative total costs of owning different funds. In addition, if these transaction costs were included, your costs would have been higher. The examples also assume all dividends and distributions have been reinvested.
Schedule of Shareholder Expenses
Expense Analysis of a $1,000 Investment
(October 31, 2005)
| | | | | | | | | | | | | | |
Investor Destinations Moderately
Aggressive Fund | | | | | Beginning
Account Value,
5/1/05 | | Ending
Account Value,
10/31/05 | | Expenses Paid
During Period*2 | | Annualized
Expense Ratio*2 |
| Class A | | Actual | | | $ | 1,000.00 | | $ | 1,060.50 | | $ | 2.65 | | 0.51% |
| | | Hypothetical | 1 | | $ | 1,000.00 | | $ | 1,022.43 | | $ | 2.60 | | 0.51% |
| Class B | | Actual | | | $ | 1,000.00 | | $ | 1,056.50 | | $ | 6.32 | | 1.22% |
| | | Hypothetical | 1 | | $ | 1,000.00 | | $ | 1,018.85 | | $ | 6.23 | | 1.22% |
| Class C | | Actual | | | $ | 1,000.00 | | $ | 1,056.50 | | $ | 6.32 | | 1.22% |
| | | Hypothetical | 1 | | $ | 1,000.00 | | $ | 1,018.85 | | $ | 6.23 | | 1.22% |
| Class R | | Actual | | | $ | 1,000.00 | | $ | 1,060.70 | | $ | 3.22 | | 0.62% |
| | | Hypothetical | 1 | | $ | 1,000.00 | | $ | 1,021.87 | | $ | 3.16 | | 0.62% |
| Institutional Service Class | | Actual | | | $ | 1,000.00 | | $ | 1,060.00 | | $ | 3.27 | | 0.63% |
| | | Hypothetical | 1 | | $ | 1,000.00 | | $ | 1,021.82 | | $ | 3.22 | | 0.63% |
| Institutional Class | | Actual | | | $ | 1,000.00 | | $ | 1,063.10 | | $ | 1.30 | | 0.25% |
| | | Hypothetical | 1 | | $ | 1,000.00 | | $ | 1,025.00 | | $ | 1.28 | | 0.25% |
| * | Expenses are equal to the Fund’s annualized expense ratio multiplied by the average account value over the period multiplied by 184/365 (to reflect the one-half year period). The expense ratio presented represents a six month, annualized ratio in accordance with SEC guidelines. |
| 1 | Represents the hypothetical 5% return before expenses. |
| 2 | Expenses are based on the direct expenses of the Fund and do not include the effect of the underlying Funds’ expenses, which are disclosed in the Fee and Expense table and described more fully in a footnote to that table in your Fund prospectus. |
| | |
Portfolio Summary October 31, 2005 | | Gartmore Investor Destinations Moderately Aggressive Fund |
The SEC adopted a requirement that Funds present their portfolio holdings in a table, chart or graph format in their annual and semiannual reports to shareholders, whether or not a statement of investments is utilized. The following tables, which present portfolio holdings as a percentage of net assets, are provided in compliance with this requirement.
| | |
| Asset Allocation | | |
| Mutual Funds | | 97.4% |
| Fixed Contract | | 2.6% |
| Liabilities in excess of Other Assets | | 0.0% |
| | |
|
| | | 100.0% |
| | |
| Asset Allocation Detail | | |
| Equity Funds | | 79.7% |
| Fixed Income Funds | | 17.7% |
| Fixed Contract | | 2.6% |
| | |
|
| | | 100.0% |
| | |
| Top Holdings | | |
| Gartmore S&P 500 Index Fund, Institutional Class | | 35.0% |
Gartmore International Index Fund,
Institutional Class | | 24.6% |
| Gartmore Bond Index Fund, Institutional Class | | 15.1% |
| Gartmore Mid Cap Market Index Fund, Institutional Class | | 15.1% |
Gartmore Small Cap Index Fund,
Institutional Class | | 5.0% |
| Gartmore Morley Enhanced Income Fund, Institutional Class | | 2.6% |
| Nationwide Fixed Contract, 3.50% | | 2.6% |
| | |
|
| | | 100.0% |
Statement of Investments
October 31, 2005
Gartmore Investor Destinations Moderately Aggressive Fund
Mutual Funds (97.4%)
| | | | | |
| | | Shares | | Value |
Equity Funds (79.7%) | | | | | |
Gartmore International Index Fund, Institutional Class (b) | | 27,739,339 | | $ | 241,332,247 |
Gartmore Mid Cap Market Index Fund, Institutional Class (b) | | 9,981,538 | | | 147,427,320 |
Gartmore S&P 500 Index Fund, Institutional Class (b) | | 32,996,210 | | | 343,490,549 |
Gartmore Small Cap Index Fund, Institutional Class (b) | | 4,045,724 | | | 48,548,688 |
| | | | |
|
|
| | | | | | 780,798,804 |
| | | | |
|
|
Fixed Income Funds (17.7%) |
Gartmore Bond Index Fund, Institutional Class (b) | | 13,800,447 | | | 148,630,816 |
Gartmore Morley Enhanced Income Fund, Institutional Class (b) | | 2,753,734 | | | 25,031,439 |
| | | | |
|
|
| | | | | | 173,662,255 |
| | | | |
|
|
| | |
Total Mutual Funds | | | | | 954,461,059 |
| | | | |
|
|
Fixed Contract (2.6%)
| | | | | | | |
| | | Principal Amount | | Value | |
Nationwide Fixed Contract, 3.50% (b) (c) | | $ | 24,993,175 | | $ | 24,993,175 | |
| | | | | |
|
|
|
| | |
Total Fixed Contract | | | | | | 24,993,175 | |
| | | | | |
|
|
|
| |
Total Investments
(Cost $888,621,698) (a) — 100.0% | | | 979,454,234 | |
| |
Liabilities in excess of other
assets — (0.0)% | | | (330,278 | ) |
| | | | | |
|
|
|
| | |
NET ASSETS — 100.0% | | | | | $ | 979,123,956 | |
| | | | | |
|
|
|
| | (a) | See Notes to Financial Statements for tax unrealized appreciation (depreciation) of securities. |
| | (b) | Investment in affiliate. |
| | (c) | The Nationwide Fixed Contract rate changes quarterly. The security is restricted and as the affiliated counterparty is required by contract to redeem within five days upon request, it has been deemed liquid pursuant to procedures approved by the Board of Trustees. |
See notes to financial statements.
Gartmore Investor Destinations Moderate Fund
For the annual period ended Oct. 31, 2005, the Gartmore Investor Destinations Moderate Fund (Class A at NAV) returned 7.86% versus 5.94% for its benchmark, which consists of 60% S&P 500® Index, 25% Lehman Brothers U.S. Aggregate Index and 15% Citigroup 3-Month T-Bill Index. For broader comparison, the average return for the Fund’s Lipper peer category of Balanced Funds was 6.81%.
The reporting period was a strong one for equity markets. As a result of several factors–lower oil prices, the conclusion of the U.S. presidential election, reasonably good economic and earnings news, reactions to the $32 billion Microsoft dividend and the beginning of the seasonally strong year-end period–equity markets experienced most of their gains for the reporting period in November and December of 2004.
January 2005 began with a slide after the strong previous quarter, with cyclical and small-capitalization stocks performing the worst out of the gate. January was characterized by mixed economic data, increasing interest rates, disappointing earnings reports and climbing oil prices. In addition, gross domestic product growth for the fourth quarter was released during January, coming in weaker than expected at 3.1%, primarily as a result of the foreign trade deficit.
Equity markets were able to reverse course in February, even as the productivity report showed a continued slowdown in productivity growth and oil prices continued to climb. Good signs for the markets came in the form of accelerated hiring plans by corporations, reasonably robust capital spending and strong merger-and-acquisition activity. In March and April, equity markets resumed the downward slide experienced in January due to a combination of factors–the trade deficit, mixed economic news, high oil prices and rising interest rates. Oil prices, reaching as high as $56 per barrel, continued to trade above $50 per barrel.
Despite slowing profit growth, continually higher oil prices and inflation concerns, first-quarter corporate earnings came in strong and equity markets rebounded in May. The rally did not last into June, however, as investors continued to worry about economic deceleration. In addition, oil continued to pressure stock valuations, with the price climbing to a record high of more than $60 per barrel.
Equity markets regained momentum in July, despite several negative events, such as terrorism overseas, two devastating hurricanes in the U.S. Gulf Coast, oil prices reaching $70 per barrel, a strong dollar and increasing interest rates. The London terror attacks in early July did little to shake investors, as the S&P 500 Index recovered its immediate 4% loss the next day. In addition, improved profits in the energy sector counterbalanced the negative impact that Hurricanes Katrina and Rita had on the retail, transportation, tourism and insurance sectors in September. Year-to-date through Oct. 31, 2005, stocks remained in one of the narrowest trading ranges in history.
The U.S. fixed-income markets, represented by the Lehman Brothers U.S. Aggregate Index, experienced a generally volatile environment during the reporting period. The Federal Reserve Board, through the Federal Open Market Committee (FOMC), continued its “measured pace” of monetary tightening by raising the federal funds rate 25 basis points at eight consecutive meetings. This brought the rate up to 3.75% from 1.75%. While short-term rates rose throughout the reporting period, longer-term rates took a circuitous route before ending higher at the conclusion of the period.
The chart below illustrates the manager’s target allocation for each of the Fund’s underlying funds, and how each of the Fund’s underlying funds performed during the period.
| | | | |
| Underlying Fund | | 12-Month
Return | | Target
Allocation |
| Gartmore S&P 500 Index Fund | | 8.55% | | 30% |
| Gartmore Bond Index Fund | | 0.97% | | 25% |
| Short-Term Investments | | 2.78% | | 15% |
| Gartmore International Index Fund | | 18.26% | | 15% |
| Gartmore Mid Cap Market Index Fund | | 17.41% | | 10% |
| Gartmore Small Cap Index Fund | | 12.11% | | 5% |
The Fund will continue to pursue its primary goal of maximizing total investment return by seeking growth of capital and income. The Fund will remain weighted toward stock investments while including a sizable position in bonds and short-term investments, with the goal of adding income and reducing volatility.
Portfolio Manager:
Young Chin
| | |
Fund Performance | | Gartmore Investor Destinations Moderate Fund |
Average Annual Total Return
(For periods ended October 31, 2005)
| | | | | | | | |
| | | | | 1 Yr. | | 5 Yr. | | Inception1 |
| Class A | | w/o SC2 | | 7.86% | | 2.61% | | 2.11% |
| | | w/SC3 | | 1.61% | | 1.40% | | 1.04% |
| Class B | | w/o SC2 | | 6.96% | | 1.89% | | 1.39% |
| | | w/SC4 | | 1.96% | | 1.51% | | 1.22% |
| Class C5 | | w/o SC2 | | 6.98% | | 1.86% | | 1.37% |
| | | w/SC6 | | 5.98% | | 1.86% | | 1.37% |
| Class R7,8 | | 7.68% | | 2.11% | | 1.59% |
| Institutional Class8,9 | | 8.27% | | 2.65% | | 2.16% |
| Service Class7 | | 7.66% | | 2.53% | | 2.06% |
All figures showing the effect of a sales charge reflect the maximum charge possible, because it has the most dramatic effect on performance data.
| 1 | Fund commenced operations on March 31, 2000. |
| 2 | These returns do not reflect the effects of sales charges (SC). |
| 3 | A 5.75% front-end sales charge was deducted. |
| 4 | A 5.00% contingent deferred sales charge (CDSC) was deducted. The CDSC declines to 0% after 6 years. |
| 5 | These returns until the creation of Class C shares (3/1/01) include the performance of the Fund’s Class B shares. Excluding the effect of any fee waivers or reimbursements, such prior performance is substantially similar to what Class C shares would have produced because Class C shares invest in the same portfolio of securities as Class B shares and have the same expenses after any fee waivers or reimbursements. For Class C shares returns with sales charges, these returns have been restated for the applicable sales charges. |
| 6 | A CDSC of 1.00% was deducted from the one year return because it is charged when you sell Class C shares within the first year after purchase. |
| 7 | Not subject to any sales charges. |
| 8 | These returns until the creation of Class R shares (10/1/03) include the performance of the Fund’s Class B shares. The returns have been adjusted for the fact that Class R shares do not have any applicable sales charges but have not been adjusted for the lower expenses applicable to Class R shares. Excluding the effect of any fee waivers or reimbursements, such prior performance is similar to what Class R shares would have produced because the Class R shares invest in the same portfolio of securities as Class B shares. |
| 9 | These returns until the creation of Institutional Class shares (12/29/04) include the performance of the Fund’s Class B shares. The returns have been adjusted for the fact that Institutional Class shares do not have any applicable sales charges but have not been adjusted for the lower expenses applicable to Institutional Class shares. Excluding the effect of any fee waivers or reimbursements, such prior performance is similar to what Institutional Class shares would have produced because the Institutional Class shares invest in the same portfolio of securities as Class B shares. |
Performance of a $10,000 Investment
Investment return and principal value will fluctuate, and when redeemed, shares may be worth more or less than original cost. Past performance is no guarantee of future results and does not reflect the deduction of taxes that a shareholder would pay on fund distributions or the redemption of fund shares. Investing in mutual funds involves market risk, including loss of principal. Performance returns assume the reinvestment of all distributions.
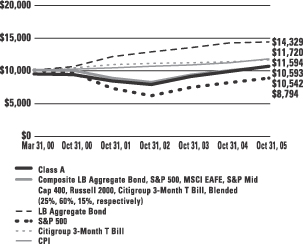
Comparative performance of $10,000 invested in Class A shares of the Gartmore Investor Destinations Moderate Fund, Lehman Brothers Aggregate Bond Index (LB Aggregate Bond)(a), S&P 500 Index (S&P 500)(b), Morgan Stanley Capital International–Europe, Australasia, and Far East Index (MSCI EAFE)(c), the S&P MidCap 400 Index(d), the Russell 2000 Index (Russell 2000)(e), the Citigroup 3-Month T Bill Index(f), the Moderate Composite (old) Index (g), the Moderate Composite (new) Index(h), and the Consumer Price Index (CPI)(i) since inception. Unlike the Fund, the returns for these unmanaged indexes do not reflect any fees, expenses, or sales charges. Investors cannot invest directly in market indexes.
| (a) | LB U.S. Aggregate Bond Index is an unmanaged, market value-weighted index of investment-grade, fixed-rate debt issues including government, corporate, asset-backed, and mortgage-backed securities with maturities of one year or more. |
| (b) | The S&P 500 is an unmanaged index of 500 widely held stocks of large U.S. companies that gives a broad look at how the stock prices of large U.S. companies have performed. |
| (c) | The MSCI EAFE Index is an unmanaged, market capitalization-weighted index that is designed to represent the performance of developed stock markets outside the United States and Canada. |
| (d) | The S&P MidCap 400 Index is an unmanaged index that measures the performance of mid-sized U.S. companies. |
| (e) | The Russell 2000 is an unmanaged index of approximately 2000 companies with small market capitalizations relative to the market capitalizations of other U.S. companies. |
| (f) | The Citigroup 3-Month T Bill Index is an average of the last 3-month treasury bill issues (excluding the current month-end bill). |
| (g) | The Moderate Composite (old) is a combination of S&P 500 (30%), MSCI EAFE (15%), S&P MidCap 400 Index (10%), LB Aggregate Bond (25%), Russell 2000 (5%), and Citigroup 3-Month T Bill Index (15%). |
| (h) | The Moderate Composite(new) is an unmanaged, hypothetical representation of the performance of each of the Fund’s asset classes according to their respective weightings. The Moderate Composite (new) is a combination of S&P 500 (60%), LB Aggregate Bond (25%) and Citigroup 3-Month T Bill Index (15%). |
| (i) | The CPI represents changes in prices of a basket of goods and services purchased for consumption by urban households. |
| | |
Shareholder Expense Example | | Gartmore Investor Destinations Moderate Fund |
As a shareholder of the Fund, you incur two types of costs: (1) transaction costs, including sales charges (loads) paid on purchase payments and redemption fees; and (2) ongoing costs, including investment advisory fees, administration fees, distribution fees and other Fund expenses. The examples below are intended to help you understand your ongoing costs (in dollars) of investing in the Fund and to compare these costs with the ongoing costs of investing in other mutual funds. Per SEC requirements, the examples assume that you had a $1,000 investment in the Class at the beginning of the reporting period, May 1, 2005, and continued to hold your shares at the end of the reporting period, October 31, 2005.
Actual Expenses
For each Class of the Fund in the table below, the first line provides information about actual account values and actual expenses. You may use the information in this line, together with the amount you invested, to estimate the expenses that you paid over the period. Simply divide your account value by $1,000 (for example, an $8,600 account value divided by $1,000 = 8.6), then multiply the result by the number in the first line of each Class under the heading entitled “Expenses Paid During Period” to estimate the expenses you paid on your account during the period.
Hypothetical Example for Comparison Purposes
The second line of each Class in the table below provides information about hypothetical account values and hypothetical expenses based on the Class’ actual expense ratio and an assumed rate of return of 5% per year before expenses, which is not the Class’ actual return. The hypothetical account values and expenses may not be used to estimate the actual ending account balance or expenses you paid for the period. You may use this information to compare the ongoing costs of investing in the Class of the Fund and other funds. To do so, compare this 5% hypothetical example with the 5% hypothetical examples that appear in the shareholder reports of the other funds.
Please note that the expenses shown in the table are meant to highlight your ongoing costs only and do not reflect any transaction costs, such as sales charges (loads) or redemption fees. Therefore, the second line for each Class in the table is useful in comparing ongoing costs only, and will not help you determine the relative total costs of owning different funds. In addition, if these transaction costs were included, your costs would have been higher. The examples also assume all dividends and distributions have been reinvested.
Schedule of Shareholder Expenses
Expense Analysis of a $1,000 Investment
(October 31, 2005)
| | | | | | | | | | | | | | |
| Investor Destinations Moderate Fund | | | | | Beginning
Account Value,
5/1/ 05 | | Ending
Account Value,
10/31/05 | | Expenses Paid
During Period*2 | | Annualized
Expense Ratio*2 |
| Class A | | Actual | | | $ | 1,000.00 | | $ | 1,045.20 | | $ | 2.58 | | 0.50% |
| | | Hypothetical | 1 | | $ | 1,000.00 | | $ | 1,022.48 | | $ | 2.55 | | 0.50% |
| Class B | | Actual | | | $ | 1,000.00 | | $ | 1,040.90 | | $ | 6.28 | | 1.22% |
| | | Hypothetical | 1 | | $ | 1,000.00 | | $ | 1,018.85 | | $ | 6.23 | | 1.22% |
| Class C | | Actual | | | $ | 1,000.00 | | $ | 1,041.00 | | $ | 6.28 | | 1.22% |
| | | Hypothetical | 1 | | $ | 1,000.00 | | $ | 1,018.85 | | $ | 6.23 | | 1.22% |
| Class R | | Actual | | | $ | 1,000.00 | | $ | 1,045.10 | | $ | 3.20 | | 0.62% |
| | | Hypothetical | 1 | | $ | 1,000.00 | | $ | 1,021.87 | | $ | 3.16 | | 0.62% |
| Institutional Service Class | | Actual | | | $ | 1,000.00 | | $ | 1,044.90 | | $ | 3.20 | | 0.62% |
| | | Hypothetical | 1 | | $ | 1,000.00 | | $ | 1,021.87 | | $ | 3.16 | | 0.62% |
| Institutional Class | | Actual | | | $ | 1,000.00 | | $ | 1,047.70 | | $ | 1.29 | | 0.25% |
| | | Hypothetical | 1 | | $ | 1,000.00 | | $ | 1,025.00 | | $ | 1.28 | | 0.25% |
| * | Expenses are equal to the Fund’s annualized expense ratio multiplied by the average account value over the period multiplied by 184/365 (to reflect the one-half year period). The expense ratio presented represents a six month, annualized ratio in accordance with SEC guidelines. |
| 1 | Represents the hypothetical 5% return before expenses. |
| 2 | Expenses are based on the direct expenses of the Fund and do not include the effect of the underlying Funds’ expenses, which are disclosed in the Fee and Expense table and described more fully in a footnote to that table in your Fund prospectus. |
| | |
Portfolio Summary October 31, 2005 | | Gartmore Investor Destinations Moderate Fund |
The SEC adopted a requirement that Funds present their portfolio holdings in a table, chart or graph format in their annual and semiannual reports to shareholders, whether or not a statement of investments is utilized. The following tables, which present portfolio holdings as a percentage of net assets, are provided in compliance with this requirement.
| | |
| Asset Allocation | | |
| Mutual Funds | | 92.4% |
| Fixed Contract | | 7.6% |
| Liabilities in excess of Other Assets | | 0.0% |
| | |
|
| | | 100.0% |
| | |
| Asset Allocation Detail | | |
| Equity Funds | | 59.6% |
| Fixed Income Funds | | 32.8% |
| Fixed Contract | | 7.6% |
| | |
|
| | | 100.0% |
| | |
| Top Holdings | | |
| Gartmore S&P 500 Index Fund, Institutional Class | | 30.0% |
| Gartmore Bond Index Fund, Institutional Class | | 25.2% |
Gartmore International Index Fund,
Institutional Class | | 14.7% |
| Gartmore Mid Cap Market Index Fund, Institutional Class | | 10.0% |
| Gartmore Morley Enhanced Income Fund, Institutional Class | | 7.6% |
| Nationwide Fixed Contract, 3.50% | | 7.6% |
Gartmore Small Cap Index Fund,
Institutional Class | | 4.9% |
| | |
|
| | | 100.0% |
Statement of Investments
October 31, 2005
Gartmore Investor Destinations Moderate Fund
Mutual Funds (92.4%)
| | | | | |
| | | Shares | | Value |
Equity Funds (59.6%) | | | | | |
Gartmore International Index Fund, Institutional Class (b) | | 19,819,150 | | $ | 172,426,605 |
Gartmore Mid Cap Market Index Fund, Institutional Class (b) | | 7,923,968 | | | 117,037,002 |
Gartmore S&P 500 Index Fund, Institutional Class (b) | | 33,680,279 | | | 350,611,705 |
Gartmore Small Cap Index Fund, Institutional Class (b) | | 4,817,086 | | | 57,805,027 |
| | | | |
|
|
| | | | | | 697,880,339 |
| | | | |
|
|
Fixed Income Funds (32.8%) | | | | | |
Gartmore Bond Index Fund, Institutional Class (b) | | 27,400,496 | | | 295,103,340 |
Gartmore Morley Enhanced Income Fund, Institutional Class (b) | | 9,841,968 | | | 89,463,492 |
| | | | |
|
|
| | | | | | 384,566,832 |
| | | | |
|
|
| | |
Total Mutual Funds | | | | | 1,082,447,171 |
| | | | |
|
|
Fixed Contract (7.6%)
| | | | | | | |
| | | Principal Amount | | Value | |
Nationwide Fixed
Contract, 3.50% (b) (c) | | $ | 89,319,949 | | $ | 89,319,949 | |
| | | | | |
|
|
|
| | |
Total Fixed Contract | | | | | | 89,319,949 | |
| | | | | |
|
|
|
| |
Total Investments
(Cost $1,108,753,491) (a) — 100.0% | | | 1,171,767,120 | |
| |
Liabilities in excess of other
assets — (0.0)% | | | (460,810 | ) |
| | | | | |
|
|
|
| | |
NET ASSETS — 100.0% | | | | | $ | 1,171,306,310 | |
| | | | | |
|
|
|
| | (a) | See Notes to Financial Statements for tax unrealized appreciation (depreciation) of securities. |
| | (b) | Investment in affiliate. |
| | (c) | The Nationwide Fixed Contract rate changes quarterly. The security is restricted and as the affiliated counterparty is required by contract to redeem within five days upon request, it has been deemed liquid pursuant to procedures approved by the Board of Trustees. |
See notes to financial statements.
Gartmore Investor Destinations Moderately Conservative Fund
For the annual period ended Oct. 31, 2005, the Gartmore Investor Destinations Moderately Conservative Fund (Class A at NAV) returned 5.78% versus 4.61% for its benchmark, which consists of 40% S&P 500® Index, 35% Lehman Brothers U.S. Aggregate Index and 25% Citigroup 3-Month T-Bill Index. For broader comparison, the average return for the Fund’s Lipper peer category of Income Funds was 5.10%.
The reporting period was a strong one for equity markets. As a result of several factors–lower oil prices, the conclusion of the U.S. presidential election, reasonably good economic and earnings news, reactions to the $32 billion Microsoft dividend and the beginning of the seasonally strong year-end period–equity markets experienced most of their gains for the reporting period in November and December of 2004.
January 2005 began with a slide after the strong previous quarter, with cyclical and small-capitalization stocks performing the worst out of the gate. January was characterized by mixed economic data, increasing interest rates, disappointing earnings reports and climbing oil prices. In addition, gross domestic product growth for the fourth quarter was released during January, coming in weaker than expected at 3.1%, primarily as a result of the foreign trade deficit.
Equity markets were able to reverse course in February, even as the productivity report showed a continued slowdown in productivity growth and oil prices continued to climb. Good signs for the markets came in the form of accelerated hiring plans by corporations, reasonably robust capital spending and strong merger-and-acquisition activity. In March and April, equity markets resumed the downward slide experienced in January due to a combination of factors–the trade deficit, mixed economic news, high oil prices and rising interest rates. Oil prices, reaching as high as $56 per barrel, continued to trade above $50 per barrel.
Despite slowing profit growth, continually higher oil prices and inflation concerns, first-quarter corporate earnings came in strong and equity markets rebounded in May. The rally did not last into June, however, as investors continued to worry about economic deceleration. In addition, oil continued to pressure stock valuations, with the price climbing to a record high of more than $60 per barrel.
Equity markets regained momentum in July, despite several negative events, such as terrorism overseas, two devastating hurricanes in the U.S. Gulf Coast, oil prices reaching $70 per barrel, a strong dollar and increasing interest rates. The London terror attacks in early July did little to shake investors, as the S&P 500 Index recovered its immediate 4% loss the next day. In addition, improved profits in the energy sector counterbalanced the negative impact that Hurricanes Katrina and Rita had on the retail, transportation, tourism and insurance sectors in September. Year-to-date through Oct. 31, 2005, stocks remained in one of the narrowest trading ranges in history.
The U.S. fixed-income markets, represented by the Lehman Brothers U.S. Aggregate Index, experienced a generally volatile environment during the reporting period. The Federal Reserve Board, through the Federal Open Market Committee (FOMC), continued its “measured pace” of monetary tightening by raising the federal funds rate 25 basis points at eight consecutive meetings. This brought the rate up to 3.75% from 1.75%. While short-term rates rose throughout the reporting period, longer-term rates took a circuitous route before ending higher at the conclusion of the period.
The chart below illustrates the manager’s target allocation for each of the Fund’s underlying funds, and how each of the Fund’s underlying funds performed during the period.
| | | | |
| Underlying Fund | | 12-Month
Return | | Target
Allocation |
| Gartmore Bond Index Fund | | 0.97% | | 35% |
| Short-Term Investments | | 2.78% | | 25% |
| Gartmore S&P 500 Index Fund | | 8.55% | | 20% |
| Gartmore International Index Fund | | 18.26% | | 10% |
| Gartmore Mid Cap Market Index Fund | | 17.41% | | 10% |
The Fund will continue to pursue its primary goal of maximizing total investment return by seeking income and, secondarily, long-term growth of capital. The Fund will remain weighted toward bonds and short-term investments, while including substantial stock investments for long-term growth.
Portfolio Manager:
Young Chin
| | |
Fund Performance | | Gartmore Investor Destinations Moderately Conservative Fund |
Average Annual Total Return
(For periods ended October 31, 2005)
| | | | | | | | |
| | | | | 1 Yr. | | 5 Yr. | | Inception1 |
| Class A | | w/o SC2 | | 5.78% | | 3.21% | | 2.88% |
| | | w/SC3 | | -0.28% | | 2.00% | | 1.80% |
| Class B | | w/o SC2 | | 5.08% | | 2.55% | | 2.23% |
| | | w/SC4 | | 0.08% | | 2.19% | | 2.07% |
| Class C5 | | w/o SC2 | | 5.01% | | 2.53% | | 2.22% |
| | | w/SC6 | | 4.01% | | 2.53% | | 2.22% |
| Class R7,8 | | 5.73% | | 2.81% | | 2.46% |
| Institutional Class8,9 | | 6.29% | | 3.29% | | 2.97% |
| Service Class7 | | 5.67% | | 3.17% | | 2.87% |
All figures showing the effect of a sales charge reflect the maximum charge possible, because it has the most dramatic effect on performance data.
| 1 | Fund commenced operations on March 31, 2000. |
| 2 | These returns do not reflect the effects of sales charges (SC). |
| 3 | A 5.75% front-end sales charge was deducted. |
| 4 | A 5.00% contingent deferred sales charge (CDSC) was deducted. The CDSC declines to 0% after 6 years. |
| 5 | These returns until the creation of Class C shares (3/1/01) include the performance of the Fund’s Class B shares. Excluding the effect of any fee waivers or reimbursements, such prior performance is substantially similar to what Class C shares would have produced because Class C shares invest in the same portfolio of securities as Class B shares and have the same expenses after any fee waivers or reimbursements. For Class C shares returns with sales charges, these returns have been restated for the applicable sales charges. |
| 6 | A CDSC of 1.00% was deducted from the one year return because it is charged when you sell Class C shares within the first year after purchase. |
| 7 | Not subject to any sales charges. |
| 8 | These returns until the creation of Class R shares (10/1/03) include the performance of the Fund’s Class B shares. The returns have been adjusted for the fact that Class R shares do not have any applicable sales charges but have not been adjusted for the lower expenses applicable to Class R shares. Excluding the effect of any fee waivers or reimbursements, such prior performance is similar to what Class R shares would have produced because the Class R shares invest in the same portfolio of securities as Class B shares. |
| 9 | These returns until the creation of Institutional Class shares (12/29/04) include the performance of the Fund’s Class B shares. The returns have been adjusted for the fact that Institutional Class shares do not have any applicable sales charges but have not been adjusted for the lower expenses applicable to Institutional Class shares. Excluding the effect of any fee waivers or reimbursements, such prior performance is similar to what Institutional Class shares would have produced because the Institutional Class shares invest in the same portfolio of securities as Class B shares. |
Performance of a $10,000 Investment
Investment return and principal value will fluctuate, and when redeemed, shares may be worth more or less than original cost. Past performance is no guarantee of future results and does not reflect the deduction of taxes that a shareholder would pay on fund distributions or the redemption of fund shares. Investing in mutual funds involves market risk, including loss of principal. Performance returns assume the reinvestment of all distributions.
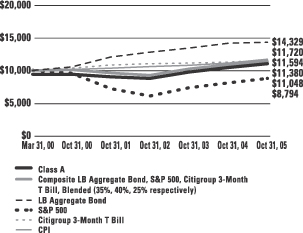
Comparative performance of $10,000 invested in Class A shares of the Gartmore Investor Destinations Moderately Conservative Fund, Lehman Brothers Aggregate Bond Index (LB Aggregate Bond)(a), S&P 500 Index (S&P 500)(b), Morgan Stanley Capital International–Europe, Australasia, and Far East Index (MSCI EAFE)(c), the S&P MidCap 400 Index(d), the Citigroup 3-Month T Bill Index(e), the Moderately Conservative Composite (old) Index (f), the Moderately Conservative Composite (new) Index(g), and the Consumer Price Index (CPI)(h) since inception. Unlike the Fund, the returns for these unmanaged indexes do not reflect any fees, expenses, or sales charges. Investors cannot invest directly in market indexes.
| (a) | LB U.S. Aggregate Bond Index is an unmanaged, market value-weighted index of investment-grade, fixed-rate debt issues including government, corporate, asset-backed, and mortgage-backed securities with maturities of one year or more. |
| (b) | The S&P 500 is an unmanaged index of 500 widely held stocks of large U.S. companies that gives a broad look at how the stock prices of large U.S. companies have performed. |
| (c) | The MSCI EAFE Index is an unmanaged, market capitalization-weighted index that is designed to represent the performance of developed stock markets outside the United States and Canada. |
| (d) | The S&P MidCap 400 Index is an unmanaged index that measures the performance of mid-sized U.S. companies. |
| (e) | The Citigroup 3-Month T Bill Index is an average of the last 3-month treasury bill issues (excluding the current month-end bill). |
| (f) | The Moderately Conservative Composite (old) is a combination of LB Aggregate Bond (35%), Citigroup 3-Month T Bill Index (25%), S&P 500 (20%), MSCI EAFE (10%), and S&P MidCap 400 Index (10%). |
| (g) | The Moderately Conservative Composite (new) is an unmanaged, hypothetical representation of the performance of each of the Fund’s asset classes according to their respective weightings. The Moderate Composite (new) is a combination of LB Aggregate Bond (35%), S&P 500 (40%), and Citigroup 3-Month T Bill Index (25%). |
| (h) | The CPI represents changes in prices of a basket of goods and services purchased for consumption by urban households. |
| | |
Shareholder Expense Example | | Gartmore Investor Destinations Moderately Conservative Fund |
As a shareholder of the Fund, you incur two types of costs: (1) transaction costs, including sales charges (loads) paid on purchase payments and redemption fees; and (2) ongoing costs, including investment advisory fees, administration fees, distribution fees and other Fund expenses. The examples below are intended to help you understand your ongoing costs (in dollars) of investing in the Fund and to compare these costs with the ongoing costs of investing in other mutual funds. Per SEC requirements, the examples assume that you had a $1,000 investment in the Class at the beginning of the reporting period, May 1, 2005, and continued to hold your shares at the end of the reporting period, October 31, 2005.
Actual Expenses
For each Class of the Fund in the table below, the first line provides information about actual account values and actual expenses. You may use the information in this line, together with the amount you invested, to estimate the expenses that you paid over the period. Simply divide your account value by $1,000 (for example, an $8,600 account value divided by $1,000 = 8.6), then multiply the result by the number in the first line of each Class under the heading entitled “Expenses Paid During Period” to estimate the expenses you paid on your account during the period.
Hypothetical Example for Comparison Purposes
The second line of each Class in the table below provides information about hypothetical account values and hypothetical expenses based on the Class’ actual expense ratio and an assumed rate of return of 5% per year before expenses, which is not the Class’ actual return. The hypothetical account values and expenses may not be used to estimate the actual ending account balance or expenses you paid for the period. You may use this information to compare the ongoing costs of investing in the Class of the Fund and other funds. To do so, compare this 5% hypothetical example with the 5% hypothetical examples that appear in the shareholder reports of the other funds.
Please note that the expenses shown in the table are meant to highlight your ongoing costs only and do not reflect any transaction costs, such as sales charges (loads) or redemption fees. Therefore, the second line for each Class in the table is useful in comparing ongoing costs only, and will not help you determine the relative total costs of owning different funds. In addition, if these transaction costs were included, your costs would have been higher. The examples also assume all dividends and distributions have been reinvested.
Schedule of Shareholder Expenses
Expense Analysis of a $1,000 Investment
(October 31, 2005)
| | | | | | | | | | | | | |
Investor Destinations Moderately Conservative Fund | | | | Beginning
Account Value,
5/1/05 | | Ending
Account Value,
10/31/05 | | Expenses Paid
During Period*2 | | Annualized
Expense Ratio*2 |
| Class A | | Actual | | $ | 1,000.00 | | $ | 1,031.40 | | $ | 2.82 | | 0.55% |
| | | Hypothetical1 | | $ | 1,000.00 | | $ | 1,022.23 | | $ | 2.81 | | 0.55% |
| Class B | | Actual | | $ | 1,000.00 | | $ | 1,028.00 | | $ | 6.29 | | 1.23% |
| | | Hypothetical1 | | $ | 1,000.00 | | $ | 1,018.80 | | $ | 6.28 | | 1.23% |
| Class C | | Actual | | $ | 1,000.00 | | $ | 1,027.10 | | $ | 6.28 | | 1.23% |
| | | Hypothetical1 | | $ | 1,000.00 | | $ | 1,018.80 | | $ | 6.28 | | 1.23% |
| Class R | | Actual | | $ | 1,000.00 | | $ | 1,031.10 | | $ | 3.17 | | 0.62% |
| | | Hypothetical1 | | $ | 1,000.00 | | $ | 1,021.87 | | $ | 3.16 | | 0.62% |
| Institutional Service Class | | Actual | | $ | 1,000.00 | | $ | 1,030.90 | | $ | 3.28 | | 0.64% |
| | | Hypothetical1 | | $ | 1,000.00 | | $ | 1,021.77 | | $ | 3.27 | | 0.64% |
| Institutional Class | | Actual | | $ | 1,000.00 | | $ | 1,035.00 | | $ | 1.28 | | 0.25% |
| | | Hypothetical1 | | $ | 1,000.00 | | $ | 1,025.00 | | $ | 1.28 | | 0.25% |
| * | Expenses are equal to the Fund’s annualized expense ratio multiplied by the average account value over the period multiplied by 184/365 (to reflect the one-half year period). The expense ratio presented represents a six month, annualized ratio in accordance with SEC guidelines. |
| 1 | Represents the hypothetical 5% return before expenses. |
| 2 | Expenses are based on the direct expenses of the Fund and do not include the effect of the underlying Funds’ expenses, which are disclosed in the Fee and Expense table and described more fully in a footnote to that table in your Fund prospectus. |
| | |
Portfolio Summary | | Gartmore Investor Destinations Moderately Conservative Fund |
The SEC adopted a requirement that Funds present their portfolio holdings in a table, chart or graph format in their annual and semiannual reports to shareholders, whether or not a statement of investments is utilized. The following tables, which present portfolio holdings as a percentage of net assets, are provided in compliance with this requirement.
| | |
| Asset Allocation | | |
| Mutual Funds | | 87.4% |
| Fixed Contract | | 12.7% |
| Liabilities in excess of Other Assets | | -0.1% |
| | |
|
| | | 100.0% |
| |
| Asset Allocation Detail | | |
| Fixed Income Funds | | 47.8% |
| Equity Funds | | 39.6% |
| Fixed Contract | | 12.7% |
| Other | | -0.1% |
| | |
|
| | | 100.0% |
| | |
| Top Holdings | | |
| Gartmore Bond Index Fund, Institutional Class | | 35.1% |
| Gartmore S&P 500 Index Fund, Institutional Class | | 19.8% |
| Gartmore Morley Enhanced Income Fund, Institutional Class | | 12.7% |
| Nationwide Fixed Contract, 3.50% | | 12.7% |
| Gartmore Mid Cap Market Index Fund, Institutional Class | | 10.0% |
| Gartmore International Index Fund, Institutional Class | | 9.8% |
| Other | | -0.1% |
| | |
|
| | | 100.0% |
Statement of Investments
October 31, 2005
Gartmore Investor Destinations Moderately Conservative Fund
Mutual Funds (87.4%)
| | | | | |
| | | Shares | | Value |
Equity Funds (39.6%) | | | | | |
Gartmore International Index Fund, Institutional Class (b) | | 2,901,873 | | $ | 25,246,294 |
Gartmore Mid Cap Market Index Fund, Institutional Class (b) | | 1,740,126 | | | 25,701,663 |
Gartmore S&P 500 Index Fund, Institutional Class (b) | | 4,930,771 | | | 51,329,323 |
| | | | |
|
|
| | | | | | 102,277,280 |
| | | | |
|
|
Fixed Income Funds (47.8%) | | | | | |
Gartmore Bond Index Fund, Institutional Class (b) | | 8,422,591 | | | 90,711,304 |
Gartmore Morley Enhanced Income Fund, Institutional Class (b) | | 3,601,339 | | | 32,736,171 |
| | | | |
|
|
| | | | | | 123,447,475 |
| | | | |
|
|
| | |
Total Mutual Funds | | | | | 225,724,755 |
| | | | |
|
|
Fixed Contract (12.7%)
| | | | | | | |
| | | Principal
Amount | | Value | |
Nationwide Fixed Contract, 3.50% (b) (c) | | $ | 32,683,889 | | $ | 32,683,889 | |
| | | | | |
|
|
|
| | |
Total Fixed Contract | | | | | | 32,683,889 | |
| | | | | |
|
|
|
| |
Total Investments
(Cost $247,597,438) (a) — 100.1% | | | 258,408,644 | |
| |
Liabilities in excess of other
assets — (0.1)% | | | (145,870 | ) |
| | | | | |
|
|
|
| | |
NET ASSETS — 100.0% | | | | | $ | 258,262,774 | |
| | | | | |
|
|
|
| | (a) | See Notes to Financial Statements for tax unrealized appreciation (depreciation) of securities. |
| | (b) | Investment in affiliate. |
| | (c) | The Nationwide Fixed Contract rate changes quarterly. The security is restricted and as the affiliated counterparty is required by contract to redeem within five days upon request, it has been deemed liquid pursuant to procedures approved by the Board of Trustees. |
See notes to financial statements.
Gartmore Investor Destinations Conservative Fund
For the annual period ended Oct. 31, 2005, the Gartmore Investor Destinations Conservative Fund (Class A at NAV) returned 3.67% versus 3.36% for its benchmark, which consists of 45% Citigroup 3-Month T-Bill Index, 35% Lehman Brothers U.S. Aggregate Index and 20% S&P 500® Index. For broader comparison, the average return for the Fund’s Lipper peer category of Income Funds was 5.10%.
The reporting period was a strong one for equity markets. As a result of several factors–lower oil prices, the conclusion of the U.S. presidential election, reasonably good economic and earnings news, reactions to the $32 billion Microsoft dividend and the beginning of the seasonally strong year-end period–equity markets experienced most of their gains for the reporting period in November and December of 2004.
January 2005 began with a slide after the strong previous quarter, with cyclical and small-capitalization stocks performing the worst out of the gate. January was characterized by mixed economic data, increasing interest rates, disappointing earnings reports and climbing oil prices. In addition, gross domestic product growth for the fourth quarter was released during January, coming in weaker than expected at 3.1%, primarily as a result of the foreign trade deficit.
Equity markets were able to reverse course in February, even as the productivity report showed a continued slowdown in productivity growth and oil prices continued to climb. Good signs for the markets came in the form of accelerated hiring plans by corporations, reasonably robust capital spending and strong merger-and-acquisition activity. In March and April, equity markets resumed the downward slide experienced in January due to a combination of factors–the trade deficit, mixed economic news, high oil prices and rising interest rates. Oil prices, reaching as high as $56 per barrel, continued to trade above $50 per barrel.
Despite slowing profit growth, continually higher oil prices and inflation concerns, first-quarter corporate earnings came in strong and equity markets rebounded in May. The rally did not last into June, however, as investors continued to worry about economic deceleration. In addition, oil continued to pressure stock valuations, with the price climbing to a record high of more than $60 per barrel.
Equity markets regained momentum in July, despite several negative events, such as terrorism overseas, two devastating hurricanes in the U.S. Gulf Coast, oil prices reaching $70 per barrel, a strong dollar and increasing interest rates. The London terror attacks in early July did little to shake investors, as the S&P 500 Index recovered its immediate 4% loss the next day. In addition, improved profits in the energy sector counterbalanced the negative impact that Hurricanes Katrina and Rita had on the retail, transportation, tourism and insurance sectors in September. Year-to-date through Oct. 31, 2005, stocks remained in one of the narrowest trading ranges in history.
The U.S. fixed-income markets, represented by the Lehman Brothers U.S. Aggregate Index, experienced a generally volatile environment during the reporting period. The Federal Reserve Board, through the Federal Open Market Committee (FOMC), continued its “measured pace” of monetary tightening by raising the federal funds rate 25 basis points at eight consecutive meetings. This brought the rate up to 3.75% from 1.75%. While short-term rates rose throughout the reporting period, longer-term rates took a circuitous route before ending higher at the conclusion of the period.
The chart below illustrates the manager’s target allocation for each of the Fund’s underlying funds, and how each of the Fund’s underlying funds performed during the period.
| | | | |
| Underlying Fund | | 12-Month
Return | | Target
Allocation |
| Short-Term Investments | | 2.78% | | 45% |
| Gartmore Bond Index Fund | | 0.97% | | 35% |
| Gartmore S&P 500 Index Fund | | 8.55% | | 10% |
| Gartmore International Index Fund | | 18.26% | | 5% |
| Gartmore Mid Cap Market Index Fund | | 17.41% | | 5% |
The Fund will continue to pursue its primary goal of maximizing total investment return by seeking income and, secondarily, long-term growth of capital. The Fund will remain weighted toward bonds and short-term investments while including some stock investments for long-term growth.
Portfolio Manager:
Young Chin
| | |
Fund Performance | | Gartmore Investor Destinations Conservative Fund |
Average Annual Total Return
(For periods ended October 31, 2005)
| | | | | | | | |
| | | | | 1 Yr. | | 5 Yr. | | Inception1 |
| Class A | | w/o SC2 | | 3.67% | | 3.49% | | 3.39% |
| | | w/SC3 | | -2.31% | | 2.27% | | 2.30% |
| Class B | | w/o SC2 | | 3.02% | | 2.77% | | 2.68% |
| | | w/SC4 | | -1.98% | | 2.41% | | 2.52% |
| Class C5 | | w/o SC2 | | 2.95% | | 2.76% | | 2.67% |
| | | w/SC6 | | 1.95% | | 2.76% | | 2.67% |
| Class R7,8 | | 3.65% | | 3.04% | | 2.92% |
| Institutional Class8,9 | | 4.23% | | 3.56% | | 3.47% |
| Service Class7 | | 3.62% | | 3.44% | | 3.36% |
All figures showing the effect of a sales charge reflect the maximum charge possible, because it has the most dramatic effect on performance data.
| 1 | Fund commenced operations on March 31, 2000. |
| 2 | These returns do not reflect the effects of sales charges (SC). |
| 3 | A 5.75% front-end sales charge was deducted. |
| 4 | A 5.00% contingent deferred sales charge (CDSC) was deducted. The CDSC declines to 0% after 6 years. |
| 5 | These returns until the creation of Class C shares (3/1/01) include the performance of the Fund’s Class B shares. Excluding the effect of any fee waivers or reimbursements, such prior performance is substantially similar to what Class C shares would have produced because Class C shares invest in the same portfolio of securities as Class B shares and have the same expenses after any fee waivers or reimbursements. For Class C shares returns with sales charges, these returns have been restated for the applicable sales charges. |
| 6 | A CDSC of 1.00% was deducted from the one year return because it is charged when you sell Class C shares within the first year after purchase. |
| 7 | Not subject to any sales charges. |
| 8 | These returns until the creation of Class R shares (10/1/03) include the performance of the Fund’s Class B shares. The returns have been adjusted for the fact that Class R shares do not have any applicable sales charges but have not been adjusted for the lower expenses applicable to Class R shares. Excluding the effect of any fee waivers or reimbursements, such prior performance is similar to what Class R shares would have produced because the Class R shares invest in the same portfolio of securities as Class B shares. |
| 9 | These returns until the creation of Institutional Class shares (12/29/04) include the performance of the Fund’s Class B shares. The returns have been adjusted for the fact that Institutional Class shares do not have any applicable sales charges but have not been adjusted for the lower expenses applicable to Institutional Class shares. Excluding the effect of any fee waivers or reimbursements, such prior performance is similar to what Institutional Class shares would have produced because the Institutional Class shares invest in the same portfolio of securities as Class B shares. |
Performance of a $10,000 Investment
Investment return and principal value will fluctuate, and when redeemed, shares may be worth more or less than original cost. Past performance is no guarantee of future results and does not reflect the deduction of taxes that a shareholder would pay on fund distributions or the redemption of fund shares. Investing in mutual funds involves market risk, including loss of principal. Performance returns assume the reinvestment of all distributions.
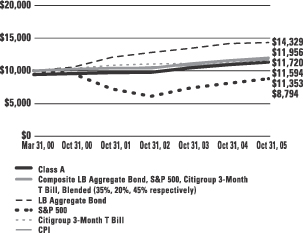
Comparative performance of $10,000 invested in Class A shares of the Gartmore Investor Destinations Conservative Fund, Lehman Brothers Aggregate Bond Index (LB Aggregate Bond)(a), S&P 500 Index (S&P 500)(b), Morgan Stanley Capital International–Europe, Australasia, and Far East Index (MSCI EAFE)(c), the S&P MidCap 400 Index(d), the Citigroup 3-Month T Bill Index(e), the Conservative Composite (old) Index (f), the Conservative Composite (new) Index(g), and the Consumer Price Index (CPI)(h) since inception. Unlike the Fund, the returns for these unmanaged indexes do not reflect any fees, expenses, or sales charges. Investors cannot invest directly in market indexes.
| (a) | LB U.S. Aggregate Bond Index is an unmanaged, market value-weighted index of investment-grade, fixed-rate debt issues including government, corporate, asset-backed, and mortgage-backed securities with maturities of one year or more. |
| (b) | The S&P 500 is an unmanaged index of 500 widely held stocks of large U.S. companies that gives a broad look at how the stock prices of large U.S. companies have performed. |
| (c) | The MSCI EAFE Index is an unmanaged, market capitalization-weighted index that is designed to represent the performance of developed stock markets outside the United States and Canada. |
| (d) | The S&P MidCap 400 Index is an unmanaged index that measures the performance of mid-sized U.S. companies. |
| (e) | The Citigroup 3-Month T Bill Index is an average of the last 3-month treasury bill issues (excluding the current month-end bill). |
| (f) | The Conservative Composite (old) is a combination of LB Aggregate Bond (35%), Citigroup 3-Month T Bill Index (45%), S&P 500 (10%), MSCI EAFE (5%), and S&P MidCap 400 Index (5%). |
| (g) | The Conservative Composite (new) is an unmanaged, hypothetical representation of the performance of each of the Fund’s asset classes according to their respective weightings. The Conservative Composite (new) is a combination of LB Aggregate Bond (35%), S&P 500 (20%), and Citigroup 3-Month T Bill Index (45%). |
| (h) | The CPI represents changes in prices of a basket of goods and services purchased for consumption by urban households. |
| | |
Shareholder Expense Example | | Gartmore Investor Destinations Conservative Fund |
As a shareholder of the Fund, you incur two types of costs: (1) transaction costs, including sales charges (loads) paid on purchase payments and redemption fees; and (2) ongoing costs, including investment advisory fees, administration fees, distribution fees and other Fund expenses. The examples below are intended to help you understand your ongoing costs (in dollars) of investing in the Fund and to compare these costs with the ongoing costs of investing in other mutual funds. Per SEC requirements, the examples assume that you had a $1,000 investment in the Class at the beginning of the reporting period, May 1, 2005, and continued to hold your shares at the end of the reporting period, October 31, 2005.
Actual Expenses
For each Class of the Fund in the table below, the first line provides information about actual account values and actual expenses. You may use the information in this line, together with the amount you invested, to estimate the expenses that you paid over the period. Simply divide your account value by $1,000 (for example, an $8,600 account value divided by $1,000 = 8.6), then multiply the result by the number in the first line of each Class under the heading entitled “Expenses Paid During Period” to estimate the expenses you paid on your account during the period.
Hypothetical Example for Comparison Purposes
The second line of each Class in the table below provides information about hypothetical account values and hypothetical expenses based on the Class’ actual expense ratio and an assumed rate of return of 5% per year before expenses, which is not the Class’ actual return. The hypothetical account values and expenses may not be used to estimate the actual ending account balance or expenses you paid for the period. You may use this information to compare the ongoing costs of investing in the Class of the Fund and other funds. To do so, compare this 5% hypothetical example with the 5% hypothetical examples that appear in the shareholder reports of the other funds.
Please note that the expenses shown in the table are meant to highlight your ongoing costs only and do not reflect any transaction costs, such as sales charges (loads) or redemption fees. Therefore, the second line for each Class in the table is useful in comparing ongoing costs only, and will not help you determine the relative total costs of owning different funds. In addition, if these transaction costs were included, your costs would have been higher. The examples also assume all dividends and distributions have been reinvested.
Schedule of Shareholder Expenses
Expense Analysis of a $1,000 Investment
(October 31, 2005)
| | | | | | | | | | | | | | |
| Investor Destinations Conservative Fund | | | | | Beginning
Account Value
5/1/05 | | Ending
Account Value
10/31/05 | | Expenses Paid
During Period*2 | | Annualized
Expense Ratio*2 |
| Class A | | Actual | | | $ | 1,000.00 | | $ | 1,018.60 | | $ | 2.70 | | 0.53% |
| | | Hypothetical | 1 | | $ | 1,000.00 | | $ | 1,022.33 | | $ | 2.71 | | 0.53% |
| Class B | | Actual | | | $ | 1,000.00 | | $ | 1,015.50 | | $ | 6.25 | | 1.23% |
| | | Hypothetical | 1 | | $ | 1,000.00 | | $ | 1,018.80 | | $ | 6.28 | | 1.23% |
| Class C | | Actual | | | $ | 1,000.00 | | $ | 1,015.70 | | $ | 6.25 | | 1.23% |
| | | Hypothetical | 1 | | $ | 1,000.00 | | $ | 1,018.80 | | $ | 6.28 | | 1.23% |
| Class R | | Actual | | | $ | 1,000.00 | | $ | 1,018.70 | | $ | 3.41 | | 0.67% |
| | | Hypothetical | 1 | | $ | 1,000.00 | | $ | 1,021.62 | | $ | 3.42 | | 0.67% |
| Institutional Service Class | | Actual | | | $ | 1,000.00 | | $ | 1,019.50 | | $ | 3.26 | | 0.64% |
| | | Hypothetical | 1 | | $ | 1,000.00 | | $ | 1,021.77 | | $ | 3.27 | | 0.64% |
| Institutional Class | | Actual | | | $ | 1,000.00 | | $ | 1,022.60 | | $ | 1.27 | | 0.25% |
| | | Hypothetical | 1 | | $ | 1,000.00 | | $ | 1,025.00 | | $ | 1.28 | | 0.25% |
| * | Expenses are equal to the Fund’s annualized expense ratio multiplied by the average account value over the period multiplied by 184/365 (to reflect the one-half year period). The expense ratio presented represents a six month, annualized ratio in accordance with SEC guidelines. |
| 1 | Represents the hypothetical 5% return before expenses. |
| 2 | Expenses are based on the direct expenses of the Fund and do not include the effect of the underlying Funds’ expenses, which are disclosed in the Fee and Expense table and described more fully in a footnote to that table in your Fund prospectus. |
| | |
Portfolio Summary | | Gartmore Investor Destinations Conservative Fund |
The SEC adopted a requirement that Funds present their portfolio holdings in a table, chart or graph format in their annual and semiannual reports to shareholders, whether or not a statement of investments is utilized. The following tables, which present portfolio holdings as a percentage of net assets, are provided in compliance with this requirement.
| | |
| Asset Allocation | | |
| Mutual Funds | | 77.4% |
| Fixed Contract | | 22.7% |
| Liabilities in excess of Other Assets | | -0.1% |
| | |
|
| | | 100.0% |
| | |
| Asset Allocation Detail | | |
| Fixed Income Funds | | 57.7% |
| Fixed Contract | | 22.7% |
| Equity Funds | | 19.7% |
| Other | | -0.1% |
| | |
|
| | | 100.0% |
| | |
| Top Holdings | | |
| Gartmore Bond Index Fund, Institutional Class | | 35.0% |
| Gartmore Morley Enhanced Income Fund, Institutional Class | | 22.7% |
| Nationwide Fixed Contract, 3.50% | | 22.7% |
| Gartmore S&P 500 Index Fund, Institutional Class | | 9.8% |
| Gartmore Mid Cap Market Index Fund, Institutional Class | | 5.0% |
| Gartmore International Index Fund, Institutional Class | | 4.9% |
| Other | | -0.1% |
| | |
|
| | | 100.0% |
Statement of Investments
October 31, 2005
Gartmore Investor Destinations Conservative Fund
Mutual Funds (77.4%)
| | | | | |
| | | Shares | | Value |
Equity Funds (19.7%) | | | | | |
Gartmore International Index Fund, Institutional Class (b) | | 1,060,279 | | $ | 9,224,430 |
Gartmore Mid Cap Market Index Fund, Institutional Class (b) | | 635,881 | | | 9,391,962 |
Gartmore S&P 500 Index Fund, | | | | | |
Institutional Class (b) | | 1,801,852 | | | 18,757,280 |
| | | | |
|
|
| | | | | | 37,373,672 |
| | | | |
|
|
Fixed Income Funds (57.7%) | | | | | |
Gartmore Bond Index Fund, Institutional Class (b) | | 6,157,244 | | | 66,313,515 |
Gartmore Morley Enhanced Income Fund, Institutional Class (b) | | 4,739,201 | | | 43,079,334 |
| | | | |
|
|
| | | | | | 109,392,849 |
| | | | |
|
|
| | |
Total Mutual Funds | | | | | 146,766,521 |
| | | | |
|
|
Fixed Contract (22.7%)
| | | | | | | |
| | | Principal
Amount | | Value | |
Nationwide Fixed Contract, 3.50% (b) (c) | | $ | 43,008,207 | | $ | 43,008,207 | |
| | | | | |
|
|
|
| | |
Total Fixed Contract | | | | | | 43,008,207 | |
| | | | | |
|
|
|
| |
Total Investments
(Cost $188,395,207) (a) — 100.1% | | | 189,774,728 | |
| |
Liabilities in excess of other
assets — (0.1)% | | | (100,114 | ) |
| | | | | |
|
|
|
| | |
NET ASSETS — 100.0% | | | | | $ | 189,674,614 | |
| | | | | |
|
|
|
| | (a) | See Notes to Financial Statements for tax unrealized appreciation (depreciation) of securities. |
| | (b) | Investment in affiliate. |
| | (c) | The Nationwide Fixed Contract rate changes quarterly. The security is restricted and as the affiliated counterparty is required by contract to redeem within five days upon request, it has been deemed liquid pursuant to procedures approved by the Board of Trustees. |
See notes to financial statements.
Statements of Assets and Liabilities
October 31, 2005
| | | | | | | | | | | |
| | | Gartmore Investor
Destinations Aggressive Fund | | Gartmore Investor
Destinations Moderately Aggressive Fund | | Gartmore Investor Destinations Moderate Fund |
Assets: | | | | | | | | | | | |
Investments in affiliated securities at value (cost $495,857,119; $888,621,698 and $1,108,753,491, respectively) | | $ | 562,041,782 | | $ | 979,454,234 | | $ | 1,171,767,120 | | |
Interest and dividends receivable | | | 98,437 | | | 586,345 | | | 1,289,632 | | |
Receivable for capital shares issued | | | 1,195,579 | | | 1,196,262 | | | 808,247 | | |
Receivable for investments sold | | | — | | | 77,107 | | | 1,256,186 | | |
Prepaid expenses and other assets | | | 6,171 | | | 20,034 | | | 21,196 | | |
| | |
|
| |
|
| |
|
| | |
Total Assets | | | 563,341,969 | | | 981,333,982 | | | 1,175,142,381 | | |
| | |
|
| |
|
| |
|
| | |
| | | | |
Liabilities: | | | | | | | | | | | |
Payable for investments purchased | | | 1,149,997 | | | 584,086 | | | 1,281,556 | | |
Payable for capital shares redeemed | | | 92,554 | | | 1,046,562 | | | 1,895,575 | | |
Accrued expenses and other payables | | | | | | | | | | | |
Investment advisory fees | | | 61,016 | | | 106,445 | | | 128,334 | | |
Distribution fees | | | 169,704 | | | 321,874 | | | 359,960 | | |
Administrative servicing fees | | | 67,328 | | | 117,996 | | | 152,313 | | |
Trustee fees | | | 1,267 | | | 2,180 | | | 2,261 | | |
Other | | | 41,681 | | | 30,883 | | | 16,072 | | |
| | |
|
| |
|
| |
|
| | |
Total Liabilities | | | 1,583,547 | | | 2,210,026 | | | 3,836,071 | | |
| | |
|
| |
|
| |
|
| | |
Net Assets | | $ | 561,758,422 | | $ | 979,123,956 | | $ | 1,171,306,310 | | |
| | |
|
| |
|
| |
|
| | |
| | | | |
Represented by: | | | | | | | | | | | |
Capital | | $ | 492,070,742 | | $ | 876,388,858 | | $ | 1,097,176,891 | | |
Accumulated net investment income (loss) | | | — | | | 63,952 | | | 999,525 | | |
Accumulated net realized gains (losses) on investment transactions | | | 3,503,017 | | | 11,838,610 | | | 10,116,265 | | |
Net unrealized appreciation (depreciation) on investments | | | 66,184,663 | | | 90,832,536 | | | 63,013,629 | | |
| | |
|
| |
|
| |
|
| | |
Net Assets | | $ | 561,758,422 | | $ | 979,123,956 | | $ | 1,171,306,310 | | |
| | |
|
| |
|
| |
|
| | |
| | | | | | | | | | | | |
| | | | | | | | | | | | |
| | | | | | | | | | | | |
| | | | | | | | | | | | |
| | | | | | | | | | | | |
| | | | | | | | | | | | |
| | | | | | | | | | | | |
| | | | | | | | | | | | |
| | | | | | | | | | | | |
| | | | | | | | | | | | |
| | | | | | | | | | | | |
| | | | | | | | | | | | |
| | | | | | | | | | | | |
| | | | | | | | | | | | |
| | | | | | | | | | | | |
| | | | | | | | | | | | |
See notes to financial statements.
Statements of Assets and Liabilities (Continued)
October 31, 2005
| | | | | | | | | | | | | | |
| | | Gartmore Investor
Destinations Aggressive Fund | | | Gartmore Investor
Destinations Moderately Aggressive Fund | | | Gartmore Investor Destinations Moderate Fund |
Net Assets: | | | | | | | | | | | | | | |
Class A Shares | | $ | 38,583,404 | | | $ | 57,072,820 | | | $ | 57,505,312 | | | |
Class B Shares | | | 11,760,611 | | | | 30,176,729 | | | | 28,906,723 | | | |
Class C Shares | | | 71,231,493 | | | | 155,315,482 | | | | 150,491,449 | | | |
Class R Shares | | | 215,578 | | | | 253,440 | | | | 198,589 | | | |
Institutional Class Shares | | | 1,036 | | | | 1,033 | | | | 1,027 | | | |
Service Class Shares | | | 439,966,300 | | | | 736,304,452 | | | | 934,203,210 | | | |
| | |
|
|
| |
|
|
| |
|
|
| | |
Total | | $ | 561,758,422 | | | $ | 979,123,956 | | | $ | 1,171,306,310 | | | |
| | |
|
|
| |
|
|
| |
|
|
| | |
| | | | |
Shares outstanding (unlimited number of shares authorized): | | | | | | | | | | | | | | |
Class A Shares | | | 4,071,828 | | | | 5,798,908 | | | | 5,686,677 | | | |
Class B Shares | | | 1,253,252 | | | | 3,104,098 | | | | 2,878,280 | | | |
Class C Shares | | | 7,605,989 | | | | 15,973,446 | | | | 15,028,272 | | | |
Class R Shares | | | 22,886 | | | | 26,006 | | | | 19,744 | | | |
Institutional Class Shares | | | 109 | | | | 105 | | | | 101 | | | |
Service Class Shares | | | 46,321,879 | | | | 74,898,133 | | | | 92,562,471 | | | |
| | |
|
|
| |
|
|
| |
|
|
| | |
Total | | | 59,275,943 | | | | 99,800,696 | | | | 116,175,545 | | | |
| | |
|
|
| |
|
|
| |
|
|
| | |
| | | | |
Net asset value and redemption price per share: | | | | | | | | | | | | | | |
Class A Shares | | $ | 9.48 | | | $ | 9.84 | | | $ | 10.11 | | | |
Class B Shares (a) | | $ | 9.38 | | | $ | 9.72 | | | $ | 10.04 | | | |
Class C Shares (b) | | $ | 9.37 | | | $ | 9.72 | | | $ | 10.01 | | | |
Class R Shares | | $ | 9.42 | | | $ | 9.75 | | | $ | 10.06 | | | |
Institutional Class Shares | | $ | 9.53 | (c) | | $ | 9.85 | (c) | | $ | 10.12 | (c) | | |
Service Class Shares | | $ | 9.50 | | | $ | 9.83 | | | $ | 10.09 | | | |
| | | | |
Maximum offering price per share (100%/100%-maximum sales charge of net asset value adjusted to the nearest cent): | | | | | | | | | | | | | | |
Class A Shares | | $ | 10.06 | | | $ | 10.44 | | | $ | 10.73 | | | |
| | |
|
|
| |
|
|
| |
|
|
| | |
Maximum Sales Charge — Class A Shares | | | 5.75 | % | | | 5.75 | % | | | 5.75 | % | | |
| | |
|
|
| |
|
|
| |
|
|
| | |
| | | | | | | | | | | | | | | |
| | | | | | | | | | | | | | | |
| | | | | | | | | | | | | | | |
| | | | | | | | | | | | | | | |
| | | | | | | | | | | | | | | |
| | | | | | | | | | | | | | | |
| | | | | | | | | | | | | | | |
| | | | | | | | | | | | | | | |
| | | | | | | | | | | | | | | |
| | | | | | | | | | | | | | | |
| | | | | | | | | | | | | | | |
| | | | | | | | | | | | | | | |
| (a) | For Class B Shares, the redemption price per share varies by the length of time shares held. |
| (b) | For Class C Shares, the redemption price per share is reduced by 1.00% for shares held less than one year. |
| (c) | Due to rounding, Net Assets divided by shares outstanding do not equal the NAV. |
See notes to financial statements.
| | | | | | | | |
| | | Gartmore Investor Destinations Moderately Conservative Fund | | Gartmore Investor Destinations Conservative Fund |
Assets: | | | | | | | | |
Investments in affiliated securities at value (cost $247,597,438 and $188,395,207, respectively) | | $ | 258,408,644 | | $ | 189,774,728 | | |
Cash | | | — | | | 202 | | |
Interest and dividends receivable | | | 409,719 | | | 358,790 | | |
Receivable for capital shares issued | | | 203,930 | | | 21,917 | | |
Receivable for investments sold | | | — | | | 342,459 | | |
Prepaid expenses and other assets | | | 10,074 | | | 4,393 | | |
| | |
|
| |
|
| | |
Total Assets | | | 259,032,367 | | | 190,502,489 | | |
| | |
|
| |
|
| | |
| | | |
Liabilities: | | | | | | | | |
Payable for investments purchased | | | 409,308 | | | 354,902 | | |
Payable for capital shares redeemed | | | 201,092 | | | 366,599 | | |
Accrued expenses and other payables | | | | | | | | |
Investment advisory fees | | | 28,195 | | | 20,890 | | |
Distribution fees | | | 83,179 | | | 55,014 | | |
Administrative servicing fees | | | 41,040 | | | 26,259 | | |
Trustee fees | | | 581 | | | 422 | | |
Other | | | 6,198 | | | 3,789 | | |
| | |
|
| |
|
| | |
Total Liabilities | | | 769,593 | | | 827,875 | | |
| | |
|
| |
|
| | |
Net Assets | | $ | 258,262,774 | | $ | 189,674,614 | | |
| | |
|
| |
|
| | |
| | | |
Represented by: | | | | | | | | |
Capital | | $ | 244,004,343 | | $ | 186,161,224 | | |
Accumulated net investment income (loss) | | | 405,565 | | | 438,220 | | |
Accumulated net realized gains (losses) on investment transactions | | | 3,041,660 | | | 1,695,649 | | |
Net unrealized appreciation (depreciation) on investments | | | 10,811,206 | | | 1,379,521 | | |
| | |
|
| |
|
| | |
Net Assets | | $ | 258,262,774 | | $ | 189,674,614 | | |
| | |
|
| |
|
| | |
| | | | | | | | | |
| | | | | | | | | |
| | | | | | | | | |
| | | | | | | | | |
| | | | | | | | | |
| | | | | | | | | |
| | | | | | | | | |
| | | | | | | | | |
| | | | | | | | | |
| | | | | | | | | |
| | | | | | | | | |
| | | | | | | | | |
| | | | | | | | | |
| | | | | | | | | |
| | | | | | | | | |
| | | | | | | | | |
| | | | | | | | | |
See notes to financial statements.
Statements of Assets and Liabilities (Continued)
October 31, 2005
| | | | | | | | | | |
| | | Gartmore Investor Destinations Moderately Conservative Fund | | | Gartmore Investor Destinations Conservative Fund |
Net Assets: | | | | | | | | | | |
Class A Shares | | $ | 16,923,424 | | | $ | 28,965,461 | | | |
Class B Shares | | | 6,001,750 | | | | 4,010,143 | | | |
Class C Shares | | | 39,545,053 | | | | 19,105,966 | | | |
Class R Shares | | | 1,141 | | | | 3,156 | | | |
Institutional Class Shares | | | 1,027 | | | | 1,024 | | | |
Service Class Shares | | | 195,790,379 | | | | 137,588,864 | | | |
| | |
|
|
| |
|
|
| | |
Total | | $ | 258,262,774 | | | $ | 189,674,614 | | | |
| | |
|
|
| |
|
|
| | |
| | | |
Shares outstanding (unlimited number of shares authorized): | | | | | | | | | | |
Class A Shares | | | 1,662,765 | | | | 2,848,634 | | | |
Class B Shares | | | 589,733 | | | | 394,609 | | | |
Class C Shares | | | 3,898,490 | | | | 1,885,772 | | | |
Class R Shares | | | 112 | | | | 310 | | | |
Institutional Class Shares | | | 100 | | | | 100 | | | |
Service Class Shares | | | 19,176,084 | | | | 13,494,338 | | | |
| | |
|
|
| |
|
|
| | |
Total | | | 25,327,284 | | | | 18,623,763 | | | |
| | |
|
|
| |
|
|
| | |
| | | |
Net asset value and redemption price per share: | | | | | | | | | | |
Class A Shares | | $ | 10.18 | | | $ | 10.17 | | | |
Class B Shares (a) | | $ | 10.18 | | | $ | 10.16 | | | |
Class C Shares (b) | | $ | 10.14 | | | $ | 10.13 | | | |
Class R Shares | | $ | 10.22 | (c) | | $ | 10.20 | (c) | | |
Institutional Class Shares | | $ | 10.24 | (c) | | $ | 10.23 | (c) | | |
Service Class Shares | | $ | 10.21 | | | $ | 10.20 | | | |
| | | |
Maximum offering price per share (100%/100%-maximum sales charge of net asset value adjusted to the nearest cent): | | | | | | | | | | |
Class A Shares | | $ | 10.80 | | | $ | 10.79 | | | |
| | |
|
|
| |
|
|
| | |
Maximum Sales Charge — Class A Shares | | | 5.75 | % | | | 5.75 | % | | |
| | |
|
|
| |
|
|
| | |
| | | | | | | | | | | |
| | | | | | | | | | | |
| | | | | | | | | | | |
| | | | | | | | | | | |
| | | | | | | | | | | |
| | | | | | | | | | | |
| | | | | | | | | | | |
| | | | | | | | | | | |
| | | | | | | | | | | |
| | | | | | | | | | | |
| | | | | | | | | | | |
| | | | | | | | | | | |
| (a) | For Class B Shares, the redemption price per share varies by the length of time shares held. |
| (b) | For Class C Shares, the redemption price per share is reduced by 1.00% for shares held less than one year. |
| (c) | Due to rounding, Net Assets divided by shares outstanding do not equal the NAV. |
See notes to financial statements.
Statements of Operations
For the Year Ended October 31, 2005
| | | | | | | | | | | | | | |
| | | Gartmore Investor Destinations Aggressive Fund | | | Gartmore Investor Destinations Moderately Aggressive Fund | | | Gartmore Investor Destinations Moderate Fund |
INVESTMENT INCOME: | | | | | | | | | | | | | | |
Dividend income from affiliates | | $ | 11,419,113 | | | $ | 20,462,354 | | | $ | 22,350,128 | | | |
Interest income from affiliates | | | — | | | | 693,435 | | | | 2,196,811 | | | |
| | |
|
|
| |
|
|
| |
|
|
| | |
Total Income | | | 11,419,113 | | | | 21,155,789 | | | | 24,546,939 | | | |
| | |
|
|
| |
|
|
| |
|
|
| | |
| | | | |
Expenses: | | | | | | | | | | | | | | |
Investment advisory fees | | | 621,717 | | | | 1,062,546 | | | | 1,121,567 | | | |
Distribution fees Class A | | | 82,361 | | | | 120,688 | | | | 119,973 | | | |
Distribution fees Class B | | | 99,043 | | | | 265,080 | | | | 249,031 | | | |
Distribution fees Class C | | | 624,220 | | | | 1,336,248 | | | | 1,322,932 | | | |
Distribution fees Class R | | | 534 | | | | 754 | | | | 436 | | | |
Distribution fees Service Class | | | 932,110 | | | | 1,521,887 | | | | 1,643,645 | | | |
Administrative servicing fees Class A | | | 6,933 | | | | 15,688 | | | | 16,445 | | | |
Administrative servicing fees Service Class | | | 564,020 | | | | 920,434 | | | | 999,589 | | | |
Registration and filing fees | | | 77,627 | | | | 90,513 | | | | 90,904 | | | |
Trustee fees | | | 19,639 | | | | 33,469 | | | | 34,402 | | | |
Other | | | 305,603 | | | | 505,749 | | | | 476,959 | | | |
| | |
|
|
| |
|
|
| |
|
|
| | |
Total expenses before reimbursed expenses | | | 3,333,807 | | | | 5,873,056 | | | | 6,075,883 | | | |
Earnings credit (Note 4) | | | (301 | ) | | | (1,291 | ) | | | (705 | ) | | |
| | |
|
|
| |
|
|
| |
|
|
| | |
Total Expenses | | | 3,333,506 | | | | 5,871,765 | | | | 6,075,178 | | | |
| | |
|
|
| |
|
|
| |
|
|
| | |
Net Investment Income (Loss) | | | 8,085,607 | | | | 15,284,024 | | | | 18,471,761 | | | |
| | |
|
|
| |
|
|
| |
|
|
| | |
| | | | |
REALIZED/UNREALIZED GAINS (LOSSES) FROM INVESTMENTS: | | | | | | | | | | | | | | |
Realized gains (losses) on investment transactions with affiliates | | | 10,836,098 | | | | 11,247,025 | | | | 11,725,425 | | | |
Realized gain distributions from underlying funds | | | 2,420,188 | | | | 3,218,591 | | | | 2,422,265 | | | |
| | |
|
|
| |
|
|
| |
|
|
| | |
Net realized gains (losses) on investment transactions | | | 13,256,286 | | | | 14,465,616 | | | | 14,147,690 | | | |
Net change in unrealized appreciation/depreciation on investments | | | 27,349,928 | | | | 42,163,334 | | | | 22,070,381 | | | |
| | |
|
|
| |
|
|
| |
|
|
| | |
Net realized/unrealized gains (losses) on investment transactions | | | 40,606,214 | | | | 56,628,950 | | | | 36,218,071 | | | |
| | |
|
|
| |
|
|
| |
|
|
| | |
CHANGE IN NET ASSETS RESULTING FROM OPERATIONS | | $ | 48,691,821 | | | $ | 71,912,974 | | | $ | 54,689,832 | | | |
| | |
|
|
| |
|
|
| |
|
|
| | |
| | | | | | | | | | | | | | | |
| | | | | | | | | | | | | | | |
| | | | | | | | | | | | | | | |
| | | | | | | | | | | | | | | |
| | | | | | | | | | | | | | | |
| | | | | | | | | | | | | | | |
| | | | | | | | | | | | | | | |
| | | | | | | | | | | | | | | |
| | | | | | | | | | | | | | | |
| | | | | | | | | | | | | | | |
| | | | | | | | | | | | | | | |
| | | | | | | | | | | | | | | |
| | | | | | | | | | | | | | | |
| | | | | | | | | | | | | | | |
See notes to financial statements.
Statements of Operations
For the Year Ended October 31, 2005
| | | | | | | | | | |
| | | Gartmore Investor Destinations Moderately Conservative Fund | | | Gartmore Investor Destinations Conservative Fund |
INVESTMENT INCOME: | | | | | | | | | | |
Dividend income from affiliates | | $ | 6,036,710 | | | $ | 4,054,964 | | | |
Interest income from affiliates | | | 956,228 | | | | 1,216,081 | | | |
| | |
|
|
| |
|
|
| | |
Total Income | | | 6,992,938 | | | | 5,271,045 | | | |
| | |
|
|
| |
|
|
| | |
| | | |
Expenses: | | | | | | | | | | |
Investment advisory fees | | | 291,939 | | | | 206,010 | | | |
Distribution fees Class A | | | 35,371 | | | | 33,550 | | | |
Distribution fees Class B | | | 54,553 | | | | 38,207 | | | |
Distribution fees Class C | | | 344,264 | | | | 175,059 | | | |
Distribution fees Class R | | | 8 | | | | 9 | | | |
Distribution fees Service Class | | | 426,344 | | | | 309,303 | | | |
Administrative servicing fees Class A | | | 9,424 | | | | 7,204 | | | |
Administrative servicing fees Service Class | | | 258,156 | | | | 187,079 | | | |
Registration and filing fees | | | 67,275 | | | | 64,886 | | | |
Trustee fees | | | 9,280 | | | | 6,446 | | | |
Other | | | 126,275 | | | | 79,394 | | | |
| | |
|
|
| |
|
|
| | |
Total expenses before reimbursed expenses | | | 1,622,889 | | | | 1,107,147 | | | |
Earnings credit (Note 4) | | | (219 | ) | | | (135 | ) | | |
Expenses reimbursed | | | (260 | ) | | | (3,651 | ) | | |
| | |
|
|
| |
|
|
| | |
Total Expenses | | | 1,622,410 | | | | 1,103,361 | | | |
| | |
|
|
| |
|
|
| | |
Net Investment Income (Loss) | | | 5,370,528 | | | | 4,167,684 | | | |
| | |
|
|
| |
|
|
| | |
| | | |
REALIZED/UNREALIZED GAINS (LOSSES) FROM INVESTMENTS: | | | | | | | | | | |
Realized gains (losses) on investment transactions with affiliates | | | 3,922,470 | | | | 2,187,456 | | | |
Realized gain distributions from underlying funds | | | 403,027 | | | | 140,641 | | | |
| | |
|
|
| |
|
|
| | |
Net realized gains (losses) on investment transactions | | | 4,325,497 | | | | 2,328,097 | | | |
Net change in unrealized appreciation/depreciation on investments | | | 1,502,325 | | | | (1,460,973 | ) | | |
| | |
|
|
| |
|
|
| | |
Net realized/unrealized gains (losses) on investment transactions | | | 5,827,822 | | | | 867,124 | | | |
| | |
|
|
| |
|
|
| | |
CHANGE IN NET ASSETS RESULTING FROM OPERATIONS | | $ | 11,198,350 | | | $ | 5,034,808 | | | |
| | |
|
|
| |
|
|
| | |
| | | | | | | | | | | |
| | | | | | | | | | | |
| | | | | | | | | | | |
| | | | | | | | | | | |
| | | | | | | | | | | |
| | | | | | | | | | | |
| | | | | | | | | | | |
| | | | | | | | | | | |
| | | | | | | | | | | |
| | | | | | | | | | | |
| | | | | | | | | | | |
| | | | | | | | | | | |
| | | | | | | | | | | |
| | | | | | | | | | | |
See notes to financial statements.
Statements of Changes in Net Assets
| | | | | | | | | | | | | | | | | | |
| | | Gartmore Investor Destinations Aggressive Fund | | | Gartmore Investor Destinations Moderately Aggressive Fund 
Gartmore Investor Destinations Moderately Aggressive Fund |
| | | Year Ended
October 31, 2005 | | | Year Ended
October 31, 2004 | | | Year Ended
October 31, 2005 | | | Year Ended
October 31, 2004 |
FROM INVESTMENT ACTIVITIES: | | | | | | | | | | | | | | | | | | |
Operations: | | | | | | | | | | | | | | | | | | |
Net investment income (loss) | | $ | 8,085,607 | | | $ | 2,219,962 | | | $ | 15,284,024 | | | $ | 5,098,027 | | | |
Net realized gains (losses) on investment transactions | | | 13,256,286 | | | | 1,034,228 | | | | 14,465,616 | | | | 1,530,754 | | | |
Net change in unrealized appreciation/depreciation on investments | | | 27,349,928 | | | | 18,905,762 | | | | 42,163,334 | | | | 28,746,017 | | | |
| | |
|
|
| |
|
|
| |
|
|
| |
|
|
| | |
Change in net assets resulting from operations | | | 48,691,821 | | | | 22,159,952 | | | | 71,912,974 | | | | 35,374,798 | | | |
| | |
|
|
| |
|
|
| |
|
|
| |
|
|
| | |
| | | | | |
Distributions to Class A Shareholders from: | | | | | | | | | | | | | | | | | | |
Net investment income | | | (637,312 | ) | | | (139,877 | ) | | | (1,016,018 | ) | | | (336,949 | ) | | |
Net realized gain on investments | | | — | | | | — | | | | (3,210 | ) | | | — | | | |
| | | | | |
Distributions to Class B Shareholders from: | | | | | | | | | | | | | | | | | | |
Net investment income | | | (127,363 | ) | | | (22,875 | ) | | | (381,919 | ) | | | (91,228 | ) | | |
Net realized gain on investments | | | — | | | | — | | | | (1,783 | ) | | | — | | | |
| | | | | |
Distributions to Class C Shareholders from: | | | | | | | | | | | | | | | | | | |
Net investment income | | | (798,240 | ) | | | (128,175 | ) | | | (1,910,861 | ) | | | (461,825 | ) | | |
Net realized gain on investments | | | — | | | | — | | | | (8,792 | ) | | | — | | | |
| | | | | |
Distributions to Class R Shareholders from: | | | | | | | | | | | | | | | | | | |
Net investment income | | | (2,069 | ) | | | (94 | ) | | | (3,692 | ) | | | (124 | ) | | |
Net realized gain on investments | | | — | | | | — | | | | (10 | ) | | | — | | | |
| | | | | |
Distributions to Institutional Class Shareholders from: | | | | | | | | | | | | | | | | | | |
Net investment income | | | (13 | )(a) | | | — | | | | (15 | )(a) | | | — | | | |
| | | | | |
Distributions to Service Class Shareholders from: | | | | | | | | | | | | | | | | | | |
Net investment income | | | (6,795,353 | ) | | | (2,076,163 | ) | | | (12,003,528 | ) | | | (4,111,940 | ) | | |
Net realized gain on investments | | | — | | | | — | | | | (39,082 | ) | | | — | | | |
| | |
|
|
| |
|
|
| |
|
|
| |
|
|
| | |
Change in net assets from shareholder distributions | | | (8,360,350 | ) | | | (2,367,184 | ) | | | (15,368,910 | ) | | | (5,002,066 | ) | | |
| | |
|
|
| |
|
|
| |
|
|
| |
|
|
| | |
Change in net assets from capital transactions | | | 168,084,375 | | | | 190,827,750 | | | | 316,106,723 | | | | 328,725,614 | | | |
| | |
|
|
| |
|
|
| |
|
|
| |
|
|
| | |
Change in net assets | | | 208,415,846 | | | | 210,620,518 | | | | 372,650,787 | | | | 359,098,346 | | | |
| | | | | |
Net Assets: | | | | | | | | | | | | | | | | | | |
Beginning of period | | | 353,342,576 | | | | 142,722,058 | | | | 606,473,169 | | | | 247,374,823 | | | |
| | |
|
|
| |
|
|
| |
|
|
| |
|
|
| | |
End of period | | $ | 561,758,422 | | | $ | 353,342,576 | | | $ | 979,123,956 | | | $ | 606,473,169 | | | |
| | |
|
|
| |
|
|
| |
|
|
| |
|
|
| | |
Accumulated net investment income (loss) | | $ | — | | | $ | — | | | $ | 63,952 | | | $ | 95,961 | | | |
| | |
|
|
| |
|
|
| |
|
|
| |
|
|
| | |
| | | | | | | | | | | | | | | | | | | |
| | | | | | | | | | | | | | | | | | | |
| | | | | | | | | | | | | | | | | | | |
| | | | | | | | | | | | | | | | | | | |
| (a) | For the period from December 29, 2004 (commencement of operations) through October 31, 2005. |
See notes to financial statements.
Statements of Changes in Net Assets
| | | | | | | | | | |
| | | Gartmore Investor Destinations Moderate Fund |
| | | Year Ended
October 31, 2005 | | | Year Ended
October 31, 2004 |
FROM INVESTMENT ACTIVITIES: | | | | | | | | | | |
Operations: | | | | | | | | | | |
Net investment income (loss) | | $ | 18,471,761 | | | $ | 7,453,822 | | �� | |
Net realized gains (losses) on investment transactions | | | 14,147,690 | | | | 2,162,916 | | | |
Net change in unrealized appreciation/depreciation on investments | | | 22,070,381 | | | | 21,880,339 | | | |
| | |
|
|
| |
|
|
| | |
Change in net assets resulting from operations | | | 54,689,832 | | | | 31,497,077 | | | |
| | |
|
|
| |
|
|
| | |
| | | |
Distributions to Class A Shareholders from: | | | | | | | | | | |
Net investment income | | | (1,084,376 | ) | | | (418,888 | ) | | |
Net realized gain on investments | | | (31,242 | ) | | | — | | | |
| | | |
Distributions to Class B Shareholders from: | | | | | | | | | | |
Net investment income | | | (403,638 | ) | | | (136,511 | ) | | |
Net realized gain on investments | | | (17,393 | ) | | | — | | | |
| | | |
Distributions to Class C Shareholders from: | | | | | | | | | | |
Net investment income | | | (2,144,297 | ) | | | (702,793 | ) | | |
Net realized gain on investments | | | (91,232 | ) | | | — | | | |
| | | |
Distributions to Class R Shareholders from: | | | | | | | | | | |
Net investment income | | | (2,167 | ) | | | (168 | ) | | |
Net realized gain on investments | | | (35 | ) | | | — | | | |
| | | |
Distributions to Institutional Class Shareholders from: | | | | | | | | | | |
Net investment income | | | (17 | )(a) | | | — | | | |
| | | |
Distributions to Service Class Shareholders from: | | | | | | | | | | |
Net investment income | | | (14,418,045 | ) | | | (5,748,426 | ) | | |
Net realized gain on investments | | | (422,661 | ) | | | — | | | |
| | |
|
|
| |
|
|
| | |
Change in net assets from shareholder distributions | | | (18,615,103 | ) | | | (7,006,786 | ) | | |
| | |
|
|
| |
|
|
| | |
Change in net assets from capital transactions | | | 491,340,279 | | | | 333,780,395 | | | |
| | |
|
|
| |
|
|
| | |
Change in net assets | | | 527,415,008 | | | | 358,270,686 | | | |
| | | |
Net Assets: | | | | | | | | | | |
Beginning of period | | | 643,891,302 | | | | 285,620,616 | | | |
| | |
|
|
| |
|
|
| | |
End of period | | $ | 1,171,306,310 | | | $ | 643,891,302 | | | |
| | |
|
|
| |
|
|
| | |
Accumulated net investment income (loss) | | $ | 999,525 | | | $ | 580,304 | | | |
| | |
|
|
| |
|
|
| | |
| | | | | | | | | | | |
| | | | | | | | | | | |
| | | | | | | | | | | |
| | | | | | | | | | | |
| | | | | | | | | | | |
| | | | | | | | | | | |
| (a) | For the period from December 29, 2004 (commencement of operations) through October 31, 2005. |
See notes to financial statements.
Statements of Changes in Net Assets
| | | | | | | | | | | | | | | | | | |
| | | Gartmore Investor Destinations
Moderately Conservative Fund | | | Gartmore Investor Destinations Conservative Fund |
| | | Year Ended
October 31, 2005 | | | Year Ended
October 31, 2004 | | | Year Ended
October 31, 2005 | | | Year Ended
October 31, 2004 |
FROM INVESTMENT ACTIVITIES: | | | | | | | | | | | | | | | | | | |
Operations: | | | | | | | | | | | | | | | | | | |
Net investment income (loss) | | $ | 5,370,528 | | | $ | 2,719,860 | | | $ | 4,167,684 | | | $ | 2,130,178 | | | |
Net realized gains (losses) on investment transactions | | | 4,325,497 | | | | 633,817 | | | | 2,328,097 | | | | 837,209 | | | |
Net change in unrealized appreciation/depreciation on investments | | | 1,502,325 | | | | 4,608,482 | | | | (1,460,973 | ) | | | 1,062,558 | | | |
| | |
|
|
| |
|
|
| |
|
|
| |
|
|
| | |
Change in net assets resulting from operations | | | 11,198,350 | | | | 7,962,159 | | | | 5,034,808 | | | | 4,029,945 | | | |
| | |
|
|
| |
|
|
| |
|
|
| |
|
|
| | |
| | | | | |
Distributions to Class A Shareholders from: | | | | | | | | | | | | | | | | | | |
Net investment income | | | (355,077 | ) | | | (168,377 | ) | | | (414,662 | ) | | | (72,584 | ) | | |
Net realized gain on investments | | | (11,948 | ) | | | — | | | | (25,251 | ) | | | — | | | |
| | | | | |
Distributions to Class B Shareholders from: | | | | | | | | | | | | | | | | | | |
Net investment income | | | (102,106 | ) | | | (47,361 | ) | | | (75,356 | ) | | | (39,149 | ) | | |
Net realized gain on investments | | | (4,988 | ) | | | — | | | | (19,666 | ) | | | — | | | |
| | | | | |
Distributions to Class C Shareholders from: | | | | | | | | | | | | | | | | | | |
Net investment income | | | (650,956 | ) | | | (263,241 | ) | | | (349,210 | ) | | | (147,275 | ) | | |
Net realized gain on investments | | | (30,548 | ) | | | — | | | | (80,722 | ) | | | — | | | |
| | | | | |
Distributions to Class R Shareholders from: | | | | | | | | | | | | | | | | | | |
Net investment income | | | (48 | ) | | | (17 | ) | | | (57 | ) | | | (19 | ) | | |
Net realized gain on investments | | | (2 | ) | | | — | | | | (8 | ) | | | — | | | |
| | | | | |
Distributions to Institutional Class Shareholders from: | | | | | | | | | | | | | | | | | | |
Net investment income | | | (20 | )(a) | | | — | | | | (21 | )(a) | | | — | | | |
| | | | | |
Distributions to Service Class Shareholders from: | | | | | | | | | | | | | | | | | | |
Net investment income | | | (4,146,870 | ) | | | (2,042,335 | ) | | | (3,158,214 | ) | | | (1,696,250 | ) | | |
Net realized gain on investments | | | (149,433 | ) | | | — | | | | (586,594 | ) | | | — | | | |
| | |
|
|
| |
|
|
| |
|
|
| |
|
|
| | |
Change in net assets from shareholder distributions | | | (5,451,996 | ) | | | (2,521,331 | ) | | | (4,709,761 | ) | | | (1,955,277 | ) | | |
| | |
|
|
| |
|
|
| |
|
|
| |
|
|
| | |
Change in net assets from capital transactions | | | 73,623,254 | | | | 80,796,231 | | | | 65,959,285 | | | | 54,831,720 | | | |
| | |
|
|
| |
|
|
| |
|
|
| |
|
|
| | |
Change in net assets | | | 79,369,608 | | | | 86,237,059 | | | | 66,284,332 | | | | 56,906,388 | | | |
| | | | | |
Net Assets: | | | | | | | | | | | | | | | | | | |
Beginning of period | | | 178,893,166 | | | | 92,656,107 | | | | 123,390,282 | | | | 66,483,894 | | | |
| | |
|
|
| |
|
|
| |
|
|
| |
|
|
| | |
End of period | | $ | 258,262,774 | | | $ | 178,893,166 | | | $ | 189,674,614 | | | $ | 123,390,282 | | | |
| | |
|
|
| |
|
|
| |
|
|
| |
|
|
| | |
Accumulated net investment income (loss) | | $ | 405,565 | | | $ | 290,114 | | | $ | 438,220 | | | $ | 268,056 | | | |
| | |
|
|
| |
|
|
| |
|
|
| |
|
|
| | |
| | | | | | | | | | | | | | | | | | | |
| | | | | | | | | | | | | | | | | | | |
| | | | | | | | | | | | | | | | | | | |
| | | | | | | | | | | | | | | | | | | |
| (a) | For the period from December 29, 2004 (commencement of operations) through October 31, 2005. |
See notes to financial statements.
Financial Highlights
Selected Data for Each Share of Capital Outstanding
Gartmore Investor Destinations Aggressive Fund
| | | | | | | | | | | | | | | | | | | | | | | | | | | | | | | | | | | | | | | | | | | | |
| | | | | Investment Activities | | | Distributions | | | | | | Ratios/Supplemental Data |
| | | Net Asset
Value,
Beginning
of Period | | Net
Investment
Income
(Loss) | | | Net Realized
and
Unrealized
Gains
(Losses) on
Investments | | | Total
from
Investment
Activities | | | Net
Investment
Income | | | Return of
Capital | | | Total
Distributions | | | Net
Asset
Value, End
of Period | | Total
Return (a) | | | Net Assets
at End of
Period
(000s) | | Ratio of
Expenses
to Average
Net Assets | | | Ratio of Net
Investment
Income
(Loss)
to Average
Net Assets | | | Ratio of
Expenses
(Prior to
Reimbursements)
to Average
Net Assets (b) | | | Ratio of Net
Investment
Income (Loss)
(Prior to
Reimbursements)
to Average
Net Assets (b) | | | Portfolio
Turnover (c) |
| | | | | | | | | | | | | | | |
Class A Shares | | | | | | | | | | | | | | | | | | | | | | | | | | | | | | | | | | | | | | | | | | | | |
Year Ended October 31, 2001 | | $ | 9.37 | | 0.09 | | | (2.01 | ) | | (1.92 | ) | | (0.07 | ) | | (0.02 | ) | | (0.09 | ) | | $ | 7.36 | | (20.53% | ) | | $ | 7 | | 0.71% | | | 1.09% | | | 3.71% | | | (1.91% | ) | | 190.23% |
Year Ended October 31, 2002 | | $ | 7.36 | | 0.07 | | | (1.00 | ) | | (0.93 | ) | | (0.07 | ) | | — | | | (0.07 | ) | | $ | 6.36 | | (12.67% | ) | | $ | 247 | | 0.50% | | | 1.42% | | | 0.50% | | | 1.42% | | | 26.33% |
Year Ended October 31, 2003 | | $ | 6.36 | | 0.08 | | | 1.45 | | | 1.53 | | | (0.08 | ) | | — | | | (0.08 | ) | | $ | 7.81 | | 24.34% | | | $ | 3,742 | | 0.52% | | | 1.04% | | | (i | ) | | (i) | | | 44.11% |
Year Ended October 31, 2004 | | $ | 7.81 | | 0.10 | | | 0.80 | | | 0.90 | | | (0.10 | ) | | — | | | (0.10 | ) | | $ | 8.61 | | 11.55% | | | $ | 19,737 | | 0.47% | | | 1.06% | | | (i | ) | | (i) | | | 2.12% |
Year Ended October 31, 2005 | | $ | 8.61 | | 0.19 | | | 0.87 | | | 1.06 | | | (0.19 | ) | | — | | | (0.19 | ) | | $ | 9.48 | | 12.36% | | | $ | 38,583 | | 0.49% | | | 1.87% | | | (i | ) | | (i) | | | 6.51% |
| | | | | | | | | | | | | | | |
Class B Shares | | | | | | | | | | | | | | | | | | | | | | | | | | | | | | | | | | | | | | | | | | | | |
Year Ended October 31, 2001 | | $ | 9.33 | | 0.04 | | | (2.00 | ) | | (1.96 | ) | | (0.05 | ) | | (0.01 | ) | | (0.06 | ) | | $ | 7.31 | | (21.12% | ) | | $ | 7 | | 1.31% | | | 0.50% | | | 4.47% | | | (2.66% | ) | | 190.23% |
Year Ended October 31, 2002 | | $ | 7.31 | | 0.02 | | | (0.99 | ) | | (0.97 | ) | | (0.02 | ) | | — | | | (0.02 | ) | | $ | 6.32 | | (13.30% | ) | | $ | 48 | | 1.24% | | | 0.04% | | | 1.27% | | | 0.01% | | | 26.33% |
Year Ended October 31, 2003 | | $ | 6.32 | | 0.04 | | | 1.43 | | | 1.47 | | | (0.05 | ) | | — | | | (0.05 | ) | | $ | 7.74 | | 23.42% | | | $ | 1,557 | | 1.25% | | | 0.16% | | | (i | ) | | (i) | | | 44.11% |
Year Ended October 31, 2004 | | $ | 7.74 | | 0.04 | | | 0.80 | | | 0.84 | | | (0.05 | ) | | — | | | (0.05 | ) | | $ | 8.53 | | 10.86% | | | $ | 7,414 | | 1.20% | | | 0.35% | | | (i | ) | | (i) | | | 2.12% |
Year Ended October 31, 2005 | | $ | 8.53 | | 0.11 | | | 0.86 | | | 0.97 | | | (0.12 | ) | | — | | | (0.12 | ) | | $ | 9.38 | | 11.46% | | | $ | 11,761 | | 1.21% | | | 1.18% | | | (i | ) | | (i) | | | 6.51% |
| | | | | | | | | | | | | | | |
Class C Shares | | | | | | | | | | | | | | | | | | | | | | | | | | | | | | | | | | | | | | | | | | | | |
Period Ended October 31, 2001 (d) | | $ | 8.44 | | (0.03 | ) | | (1.05 | ) | | (1.08 | ) | | — | | | — | | | — | | | $ | 7.36 | | (12.80% | )(g) | | $ | — | | 1.31% | (h) | | (0.62% | )(h) | | 125.82% | (h) | | (125.13% | )(h) | | 190.23% |
Year Ended October 31, 2002 | | $ | 7.36 | | — | | | (1.04 | ) | | (1.04 | ) | | — | | | — | | | — | | | $ | 6.32 | | (13.30% | ) | | $ | 48 | | 1.24% | | | (0.96% | ) | | 1.48% | | | (1.20% | ) | | 26.33% |
Year Ended October 31, 2003 | | $ | 6.32 | | 0.05 | | | 1.42 | | | 1.47 | | | (0.06 | ) | | — | | | (0.06 | ) | | $ | 7.73 | | 23.41% | | | $ | 7,706 | | 1.26% | | | 0.22% | | | (i | ) | | (i) | | | 44.11% |
Year Ended October 31, 2004 | | $ | 7.73 | | 0.04 | | | 0.80 | | | 0.84 | | | (0.05 | ) | | — | | | (0.05 | ) | | $ | 8.52 | | 10.88% | | | $ | 43,668 | | 1.20% | | | 0.32% | | | (i | ) | | (i) | | | 2.12% |
Year Ended October 31, 2005 | | $ | 8.52 | | 0.12 | | | 0.86 | | | 0.98 | | | (0.13 | ) | | — | | | (0.13 | ) | | $ | 9.37 | | 11.49% | | | $ | 71,231 | | 1.21% | | | 1.16% | | | (i | ) | | (i) | | | 6.51% |
| | | | | | | | | | | | | | | |
Class R Shares | | | | | | | | | | | | | | | | | | | | | | | | | | | | | | | | | | | | | | | | | | | | |
Period Ended October 31, 2003 (e) | | $ | 7.45 | | — | | | 0.29 | | | 0.29 | | | — | | | — | | | — | | | $ | 7.74 | | 3.89% | (g) | | $ | 1 | | 0.82% | (h) | | (0.46% | )(h) | | 0.92% | (h) | | (0.56% | )(h) | | 44.11% |
Year Ended October 31, 2004 | | $ | 7.74 | | 0.07 | | | 0.82 | | | 0.89 | | | (0.07 | ) | | — | | | (0.07 | ) | | $ | 8.56 | | 11.58% | | | $ | 38 | | 0.63% | | | 0.93% | | | (i | ) | | (i) | | | 2.12% |
Year Ended October 31, 2005 | | $ | 8.56 | | 0.18 | | | 0.86 | | | 1.04 | | | (0.18 | ) | | — | | | (0.18 | ) | | $ | 9.42 | | 12.19% | | | $ | 216 | | 0.63% | | | 1.47% | | | (i | ) | | (i) | | | 6.51% |
| | | | | | | | | | | | | | | |
Institutional Class Shares | | | | | | | | | | | | | | | | | | | | | | | | | | | | | | | | | | | | | | | | | | | | |
Period Ended October 31, 2005 (f) | | $ | 9.31 | | 0.09 | | | 0.25 | | | 0.34 | | | (0.12 | ) | | — | | | (0.12 | ) | | $ | 9.53 | | 3.66% | (g) | | $ | 1 | | 0.24% | (h) | | 1.39% | (h) | | (i | ) | | (i) | | | 6.51% |
| | | | | | | | | | | | | | | |
Service Class Shares | | | | | | | | | | | | | | | | | | | | | | | | | | | | | | | | | | | | | | | | | | | | |
Year Ended October 31, 2001 | | $ | 9.37 | | 0.10 | | | (2.01 | ) | | (1.91 | ) | | (0.08 | ) | | (0.02 | ) | | (0.10 | ) | | $ | 7.36 | | (20.55% | ) | | $ | 26,663 | | 0.61% | | | 0.38% | | | 1.62% | | | (0.63% | ) | | 190.23% |
Year Ended October 31, 2002 | | $ | 7.36 | | 0.07 | | | (0.99 | ) | | (0.92 | ) | | (0.07 | ) | | — | | | (0.07 | ) | | $ | 6.37 | | (12.64% | ) | | $ | 54,923 | | 0.61% | | | 0.91% | | | 0.67% | | | 0.85% | | | 26.33% |
Year Ended October 31, 2003 | | $ | 6.37 | | 0.07 | | | 1.45 | | | 1.52 | | | (0.07 | ) | | — | | | (0.07 | ) | | $ | 7.82 | | 24.08% | | | $ | 129,717 | | 0.61% | | | 0.98% | | | 0.63% | | | 0.96% | | | 44.11% |
Year Ended October 31, 2004 | | $ | 7.82 | | 0.09 | | | 0.81 | | | 0.90 | | | (0.09 | ) | | — | | | (0.09 | ) | | $ | 8.63 | | 11.50% | | | $ | 282,486 | | 0.59% | | | 0.94% | | | 0.60% | | | 0.94% | | | 2.12% |
Year Ended October 31, 2005 | | $ | 8.63 | | 0.18 | | | 0.87 | | | 1.05 | | | (0.18 | ) | | — | | | (0.18 | ) | | $ | 9.50 | | 12.18% | | | $ | 439,966 | | 0.62% | | | 1.78% | | | (i | ) | | (i) | | | 6.51% |
| | | | | | | | | | | | | | | | | | | | | | | | | | | | | | | | | | | | | | | | | | | | | |
| (a) | Excludes sales charge. |
| (b) | During the period certain fees were waived and/or reimbursed. If such waivers/reimbursements had not occurred, the ratios would have been as indicated. |
| (c) | Portfolio turnover is calculated on the basis of the Fund as a whole without distinguishing among the classes of shares. |
| (d) | For the period from March 1, 2001 (commencement of operations) through October 31, 2001. |
| (e) | For the period from October 1, 2003 (commencement of operations) through October 31, 2003. |
| (f) | For the period from December 29, 2004 (commencement of operations) through October 31, 2005. |
| (i) | There were no fee reductions in this period. |
See notes to financial statements.
Financial Highlights
Selected Data for Each Share of Capital Outstanding
Gartmore Investor Destinations Moderately Aggressive Fund
| | | | | | | | | | | | | | | | | | | | | | | | | | | | | | | | | | | | | | | | | | | | |
| | | | | Investment Activities | | | Distributions | | | | | | | | Ratios/Supplemental Data 
|
| | | Net Asset
Value,
Beginning
of Period | | Net
Investment
Income
(Loss) | | | Net Realized
and
Unrealized
Gains
(Losses) on
Investments | | | Total
from
Investment
Activities | | | Net
Investment
Income | | | Net
Realized
Gains | | | Total
Distributions | | | Net
Asset
Value, End
of Period | | Total
Return (a) | | | Net Assets
at End of
Period
(000s) | | Ratio of
Expenses
to Average
Net Assets | | | Ratio of Net
Investment
Income
(Loss)
to Average
Net Assets | | | Ratio of
Expenses
(Prior to
Reimbursements)
to Average
Net Assets (b) | | | Ratio of Net
Investment
Income (Loss)
(Prior to
Reimbursements)
to Average
Net Assets (b) | | | Portfolio
Turnover (c) |
| | | | | | | | | | | | | | | |
Class A Shares | | | | | | | | | | | | | | | | | | | | | | | | | | | | | | | | | | | | | | | | | | | | |
Year Ended October 31, 2001 | | $ | 9.59 | | 0.17 | | | (1.71 | ) | | (1.54 | ) | | (0.13 | ) | | — | | | (0.13 | ) | | $ | 7.92 | | (16.16% | ) | | $ | 8 | | 0.71% | | | 1.44% | | | 3.28% | | | (1.13% | ) | | 226.13% |
Year Ended October 31, 2002 | | $ | 7.92 | | 0.10 | | | (0.87 | ) | | (0.77 | ) | | (0.11 | ) | | — | | | (0.11 | ) | | $ | 7.04 | | (9.78% | ) | | $ | 1,072 | | 0.49% | | | 1.69% | | | 0.49% | | | 1.69% | | | 28.41% |
Year Ended October 31, 2003 | | $ | 7.04 | | 0.11 | | | 1.31 | | | 1.42 | | | (0.11 | ) | | — | | | (0.11 | ) | | $ | 8.35 | | 20.42% | | | $ | 9,729 | | 0.48% | | | 1.42% | | | (i) | | | (i) | | | 8.08% |
Year Ended October 31, 2004 | | $ | 8.35 | | 0.12 | | | 0.75 | | | 0.87 | | | (0.12 | ) | | — | | | (0.12 | ) | | $ | 9.10 | | 10.48% | | | $ | 35,416 | | 0.47% | | | 1.37% | | | 0.47% | | | 1.37% | | | 2.74% |
Year Ended October 31, 2005 | | $ | 9.10 | | 0.21 | | | 0.74 | | | 0.95 | | | (0.21 | ) | | — | (j) | | (0.21 | ) | | $ | 9.84 | | 10.47% | | | $ | 57,073 | | 0.49% | | | 2.10% | | | (i) | | | (i) | | | 5.51% |
| | | | | | | | | | | | | | | |
Class B Shares | | | | | | | | | | | | | | | | | | | | | | | | | | | | | | | | | | | | | | | | | | | | |
Year Ended October 31, 2001 | | $ | 9.56 | | 0.12 | | | (1.71 | ) | | (1.59 | ) | | (0.09 | ) | | — | | | (0.09 | ) | | $ | 7.88 | | (16.75% | ) | | $ | 8 | | 1.31% | | | 1.32% | | | 4.04% | | | (1.41% | ) | | 226.13% |
Year Ended October 31, 2002 | | $ | 7.88 | | 0.06 | | | (0.88 | ) | | (0.82 | ) | | (0.07 | ) | | — | | | (0.07 | ) | | $ | 6.99 | | (10.46% | ) | | $ | 130 | | 1.25% | | | 1.39% | | | 1.26% | | | 1.38% | | | 28.41% |
Year Ended October 31, 2003 | | $ | 6.99 | | 0.07 | | | 1.28 | | | 1.35 | | | (0.08 | ) | | — | | | (0.08 | ) | | $ | 8.26 | | 19.43% | | | $ | 5,740 | | 1.22% | | | 0.63% | | | (i) | | | (i) | | | 8.08% |
Year Ended October 31, 2004 | | $ | 8.26 | | 0.07 | | | 0.73 | | | 0.80 | | | (0.07 | ) | | — | | | (0.07 | ) | | $ | 8.99 | | 9.66% | | | $ | 19,546 | | 1.19% | | | 0.67% | | | 1.19% | | | 0.67% | | | 2.74% |
Year Ended October 31, 2005 | | $ | 8.99 | | 0.14 | | | 0.73 | | | 0.87 | | | (0.14 | ) | | — | (j) | | (0.14 | ) | | $ | 9.72 | | 9.74% | | | $ | 30,177 | | 1.21% | | | 1.40% | | | (i) | | | (i) | | | 5.51% |
| | | | | | | | | | | | | | | |
Class C Shares | | | | | | | | | | | | | | | | | | | | | | | | | | | | | | | | | | | | | | | | | | | | |
Period Ended October 31, 2001 (d) | | $ | 8.83 | | (0.04 | ) | | (0.88 | ) | | (0.92 | ) | | — | | | — | | | — | | | $ | 7.91 | | (10.42% | )(g) | | $ | — | | 1.31% | (h) | | (0.68% | )(h) | | 124.67% | (h) | | (124.04% | )(h) | | 226.13% |
Year Ended October 31, 2002 | | $ | 7.91 | | — | | | (0.91 | ) | | (0.91 | ) | | — | | | — | | | — | | | $ | 7.00 | | (10.33% | ) | | $ | 15 | | 1.25% | | | (0.21% | ) | | 3.34% | | | (2.30% | ) | | 28.41% |
Year Ended October 31, 2003 | | $ | 7.00 | | 0.08 | | | 1.28 | | | 1.36 | | | (0.09 | ) | | — | | | (0.09 | ) | | $ | 8.27 | | 19.64% | | | $ | 17,804 | | 1.22% | | | 0.64% | | | (i) | | | (i) | | | 8.08% |
Year Ended October 31, 2004 | | $ | 8.27 | | 0.07 | | | 0.72 | | | 0.79 | | | (0.07 | ) | | — | | | (0.07 | ) | | $ | 8.99 | | 9.58% | | | $ | 99,211 | | 1.19% | | | 0.66% | | | 1.19% | | | 0.66% | | | 2.74% |
Year Ended October 31, 2005 | | $ | 8.99 | | 0.14 | | | 0.73 | | | 0.87 | | | (0.14 | ) | | — | (j) | | (0.14 | ) | | $ | 9.72 | | 9.74% | | | $ | 155,315 | | 1.21% | | | 1.39% | | | (i) | | | (i) | | | 5.51% |
| | | | | | | | | | | | | | | |
Class R Shares | | | | | | | | | | | | | | | | | | | | | | | | | | | | | | | | | | | | | | | | | | | | |
Period Ended October 31, 2003 (e) | | $ | 8.01 | | — | | | 0.25 | | | 0.25 | | | — | | | — | | | — | | | $ | 8.26 | | 3.12% | (g) | | $ | 1 | | 0.75% | (h) | | (0.04% | )(h) | | 0.85% | (h) | | (0.14% | )(h) | | 8.08% |
Year Ended October 31, 2004 | | $ | 8.26 | | 0.10 | | | 0.75 | | | 0.85 | | | (0.10 | ) | | — | | | (0.10 | ) | | $ | 9.01 | | 10.27% | | | $ | 63 | | 0.62% | | | 1.19% | | | (i) | | | (i) | | | 2.74% |
Year Ended October 31, 2005 | | $ | 9.01 | | 0.20 | | | 0.74 | | | 0.94 | | | (0.20 | ) | | — | (j) | | (0.20 | ) | | $ | 9.75 | | 10.49% | | | $ | 253 | | 0.61% | | | 1.92% | | | (i) | | | (i) | | | 5.51% |
| | | | | | | | | | | | | | | |
Institutional Class Shares | | | | | | | | | | | | | | | | | | | | | | | | | | | | | | | | | | | | | | | | | | | | |
Period Ended October 31, 2005 (f) | | $ | 9.67 | | 0.12 | | | 0.20 | | | 0.32 | | | (0.14 | ) | | — | | | (0.14 | ) | | $ | 9.85 | | 3.37% | (g) | | $ | 1 | | 0.24% | (h) | | 1.73% | (h) | | (i) | | | (i) | | | 5.51% |
| | | | | | | | | | | | | | | |
Service Class Shares | | | | | | | | | | | | | | | | | | | | | | | | | | | | | | | | | | | | | | | | | | | | |
Year Ended October 31, 2001 | | $ | 9.59 | | 0.15 | | | (1.67 | ) | | (1.52 | ) | | (0.16 | ) | | — | | | (0.16 | ) | | $ | 7.91 | | (16.05% | ) | | $ | 36,670 | | 0.61% | | | 1.15% | | | 1.44% | | | 0.32% | | | 226.13% |
Year Ended October 31, 2002 | | $ | 7.91 | | 0.11 | | | (0.88 | ) | | (0.77 | ) | | (0.11 | ) | | — | | | (0.11 | ) | | $ | 7.03 | | (9.88% | ) | | $ | 90,512 | | 0.61% | | | 1.46% | | | 0.65% | | | 1.42% | | | 28.41% |
Year Ended October 31, 2003 | | $ | 7.03 | | 0.10 | | | 1.31 | | | 1.41 | | | (0.10 | ) | | — | | | (0.10 | ) | | $ | 8.34 | | 20.26% | | | $ | 214,101 | | 0.61% | | | 1.36% | | | (i) | | | (i) | | | 8.08% |
Year Ended October 31, 2004 | | $ | 8.34 | | 0.11 | | | 0.74 | | | 0.85 | | | (0.11 | ) | | — | | | (0.11 | ) | | $ | 9.08 | | 10.22% | | | $ | 452,237 | | 0.59% | | | 1.26% | | | 0.59% | | | 1.26% | | | 2.74% |
Year Ended October 31, 2005 | | $ | 9.08 | | 0.20 | | | 0.75 | | | 0.95 | | | (0.20 | ) | | — | (j) | | (0.20 | ) | | $ | 9.83 | | 10.48% | | | $ | 736,304 | | 0.61% | | | 1.98% | | | (i) | | | (i) | | | 5.51% |
| | | | | | | | | | | | | | | | | | | | | | | | | | | | | | | | | | | | | | | | | | | | | |
| (a) | Excludes sales charge. |
| (b) | During the period certain fees were waived and/or reimbursed. If such waivers/reimbursements had not occurred, the ratios would have been as indicated. |
| (c) | Portfolio turnover is calculated on the basis of the Fund as a whole without distinguishing among the classes of shares. |
| (d) | For the period from March 1, 2001 (commencement of operations) through October 31, 2001. |
| (e) | For the period from October 1, 2003 (commencement of operations) through October 31, 2003. |
| (f) | For the period from December 29, 2004 (commencement of operations) through October 31, 2005. |
| (i) | There were no fee reductions in this period. |
| (j) | The amount is less than $0.005 |
See notes to financial statements.
Financial Highlights
Selected Data for Each Share of Capital Outstanding
Gartmore Investor Destinations Moderate Fund
| | | | | | | | | | | | | | | | | | | | | | | | | | | | | | | | | | | | | | | | | | | | |
| | | | | Investment Activities | | | Distributions | | | | | | Ratios/Supplemental Data |
| | | Net Asset
Value,
Beginning
of Period | | Net
Investment
Income
(Loss) | | | Net Realized
and
Unrealized
Gains
(Losses) on
Investments | | | Total
from
Investment
Activities | | | Net
Investment
Income | | | Net
Realized
Gains | | | Total
Distributions | | | Net
Asset
Value, End
of Period | | Total
Return (a) | | | Net Assets
at End of
Period
(000s) | | Ratio of
Expenses
to Average
Net Assets | | | Ratio of Net
Investment
Income
(Loss)
to Average
Net Assets | | | Ratio of
Expenses
(Prior to
Reimbursements)
to Average
Net Assets (b) | | | Ratio of Net
Investment
Income (Loss)
(Prior to
Reimbursements)
to Average
Net Assets (b) | | | Portfolio
Turnover (c) |
| | | | | | | | | | | | | | | |
Class A Shares | | | | | | | | | | | | | | | | | | | | | | | | | | | | | | | | | | | | | | | | | | | | |
Year Ended October 31, 2001 (d) | | $ | 9.81 | | 0.22 | | | (1.23 | ) | | (1.01 | ) | | (0.16 | ) | | — | | | (0.16 | ) | | $ | 8.64 | | (10.41% | ) | | $ | 9 | | 0.71% | | | 2.40% | | | 2.39% | | | 0.72% | | | 258.23% |
Year Ended October 31, 2002 | | $ | 8.64 | | 0.17 | | | (0.69 | ) | | (0.52 | ) | | (0.18 | ) | | — | | | (0.18 | ) | | $ | 7.94 | | (6.12% | ) | | $ | 1,186 | | 0.48% | | | 2.37% | | | 0.48% | | | 2.37% | | | 34.36% |
Year Ended October 31, 2003 | | $ | 7.94 | | 0.15 | | | 1.08 | | | 1.23 | | | (0.16 | ) | | — | | | (0.16 | ) | | $ | 9.01 | | 15.75% | | | $ | 9,972 | | 0.47% | | | 1.88% | | | (j | ) | | (j | ) | | 13.50% |
Year Ended October 31, 2004 | | $ | 9.01 | | 0.17 | | | 0.58 | �� | | 0.75 | | | (0.16 | ) | | — | | | (0.16 | ) | | $ | 9.60 | | 8.36% | | | $ | 35,157 | | 0.47% | | | 1.78% | | | 0.47% | | | 1.78% | | | 5.64% |
Year Ended October 31, 2005 | | $ | 9.60 | | 0.23 | | | 0.52 | | | 0.75 | | | (0.23 | ) | | (0.01 | ) | | (0.24 | ) | | $ | 10.11 | | 7.86% | | | $ | 57,505 | | 0.48% | | | 2.35% | | | (j | ) | | (j | ) | | 5.91% |
| | | | | | | | | | | | | | | |
Class B Shares | | | | | | | | | | | | | | | | | | | | | | | | | | | | | | | | | | | | | | | | | | | | |
Year Ended October 31, 2001 | | $ | 9.81 | | 0.19 | | | (1.25 | ) | | (1.06 | ) | | (0.11 | ) | | — | | | (0.11 | ) | | $ | 8.64 | | (10.84% | ) | | $ | 9 | | 1.31% | | | 2.11% | | | 4.08% | | | (0.66% | ) | | 258.23% |
Year Ended October 31, 2002 | | $ | 8.64 | | 0.11 | | | (0.71 | ) | | (0.60 | ) | | (0.12 | ) | | — | | | (0.12 | ) | | $ | 7.92 | | (6.96% | ) | | $ | 161 | | 1.23% | | | 1.33% | | | 1.24% | | | 1.32% | | | 34.36% |
Year Ended October 31, 2003 | | $ | 7.92 | | 0.11 | | | 1.06 | | | 1.17 | | | (0.13 | ) | | — | | | (0.13 | ) | | $ | 8.96 | | 14.89% | | | $ | 6,229 | | 1.21% | | | 1.09% | | | (j | ) | | (j | ) | | 13.50% |
Year Ended October 31, 2004 | | $ | 8.96 | | 0.10 | | | 0.59 | | | 0.69 | | | (0.10 | ) | | — | | | (0.10 | ) | | $ | 9.55 | | 7.72% | | | $ | 19,504 | | 1.19% | | | 1.07% | | | 1.19% | | | 1.07% | | | 5.64% |
Year Ended October 31, 2005 | | $ | 9.55 | | 0.16 | | | 0.50 | | | 0.66 | | | (0.16 | ) | | (0.01 | ) | | (0.17 | ) | | $ | 10.04 | | 6.96% | | | $ | 28,907 | | 1.20% | | | 1.66% | | | (j | ) | | (j | ) | | 5.91% |
| | | | | | | | | | | | | | | |
Class C Shares | | | | | | | | | | | | | | | | | | | | | | | | | | | | | | | | | | | | | | | | | | | | |
Period Ended October 31, 2001 (e) | | $ | 9.32 | | (0.04 | ) | | (0.62 | ) | | (0.66 | ) | | — | | | — | | | — | | | $ | 8.66 | | (7.08% | )(h) | | $ | — | | 1.31% | (i) | | (0.67% | )(i) | | 123.09% | (i) | | (122.45% | )(j) | | 258.23% |
Year Ended October 31, 2002 | | $ | 8.66 | | 0.04 | | | (0.75 | ) | | (0.71 | ) | | (0.05 | ) | | — | | | (0.05 | ) | | $ | 7.90 | | (7.13% | ) | | $ | 416 | | 1.23% | | | 1.89% | | | 1.29% | | | 1.83% | | | 34.36% |
Year Ended October 31, 2003 | | $ | 7.90 | | 0.11 | | | 1.06 | | | 1.17 | | | (0.13 | ) | | — | | | (0.13 | ) | | $ | 8.94 | | 14.98% | | | $ | 21,995 | | 1.22% | | | 0.98% | | | (j | ) | | (j | ) | | 13.50% |
Year Ended October 31, 2004 | | $ | 8.94 | | 0.10 | | | 0.58 | | | 0.68 | | | (0.10 | ) | | — | | | (0.10 | ) | | $ | 9.52 | | 7.67% | | | $ | 102,058 | | 1.19% | | | 1.07% | | | 1.19% | | | 1.07% | | | 5.64% |
Year Ended October 31, 2005 | | $ | 9.52 | | 0.16 | | | 0.50 | | | 0.66 | | | (0.16 | ) | | (0.01 | ) | | (0.17 | ) | | $ | 10.01 | | 6.98% | | | $ | 150,491 | | 1.20% | | | 1.66% | | | (j | ) | | (j | ) | | 5.91% |
| | | | | | | | | | | | | | | |
Class R Shares | | | | | | | | | | | | | | | | | | | | | | | | | | | | | | | | | | | | | | | | | | | | |
Period Ended October 31, 2003 (f) | | $ | 8.77 | | 0.01 | | | 0.18 | | | 0.19 | | | — | | | — | | | — | | | $ | 8.96 | | 2.17% | (h) | | $ | 1 | | 0.74% | (i) | | 0.68% | (i) | | 0.84% | (i) | | 0.58% | (j) | | 13.50% |
Year Ended October 31, 2004 | | $ | 8.96 | | 0.13 | | | 0.60 | | | 0.73 | | | (0.13 | ) | | — | | | (0.13 | ) | | $ | 9.56 | | 8.19% | | | $ | 42 | | 0.62% | | | 1.79% | | | (j | ) | | (j | ) | | 5.64% |
Year Ended October 31, 2005 | | $ | 9.56 | | 0.22 | | | 0.51 | | | 0.73 | | | (0.22 | ) | | (0.01 | ) | | (0.23 | ) | | $ | 10.06 | | 7.68% | | | $ | 199 | | 0.61% | | | 2.09% | | | (j | ) | | (j | ) | | 5.91% |
| | | | | | | | | | | | | | | |
Institutional Class Shares | | | | | | | | | | | | | | | | | | | | | | | | | | | | | | | | | | | | | | | | | | | | |
Period Ended October 31, 2005 (g) | | $ | 10.02 | | 0.18 | | | 0.09 | | | 0.27 | | | (0.17 | ) | | — | | | (0.17 | ) | | $ | 10.12 | | 2.71% | (h) | | $ | 1 | | 0.23% | (i) | | 2.45% | (i) | | (j | ) | | (j | ) | | 5.91% |
| | | | | | | | | | | | | | | |
Service Class Shares | | | | | | | | | | | | | | | | | | | | | | | | | | | | | | | | | | | | | | | | | | | | |
Year Ended October 31, 2001 | | $ | 9.82 | | 0.19 | | | (1.19 | ) | | (1.00 | ) | | (0.19 | ) | | — | | | (0.19 | ) | | $ | 8.63 | | (10.26% | ) | | $ | 58,228 | | 0.61% | | | 2.06% | | | 0.97% | | | 1.70% | | | 258.23% |
Year Ended October 31, 2002 | | $ | 8.63 | | 0.17 | | | (0.71 | ) | | (0.54 | ) | | (0.17 | ) | | — | | | (0.17 | ) | | $ | 7.92 | | (6.35% | ) | | $ | 123,963 | | 0.61% | | | 2.13% | | | 0.65% | | | 2.09% | | | 34.36% |
Year Ended October 31, 2003 | | $ | 7.92 | | 0.15 | | | 1.07 | | | 1.22 | | | (0.15 | ) | | — | | | (0.15 | ) | | $ | 8.99 | | 15.59% | | | $ | 247,424 | | 0.60% | | | 1.82% | | | (j | ) | | (j | ) | | 13.50% |
Year Ended October 31, 2004 | | $ | 8.99 | | 0.16 | | | 0.59 | | | 0.75 | | | (0.15 | ) | | — | | | (0.15 | ) | | $ | 9.59 | | 8.34% | | | $ | 487,130 | | 0.59% | | | 1.66% | | | 0.59% | | | 1.66% | | | 5.64% |
Year Ended October 31, 2005 | | $ | 9.59 | | 0.22 | | | 0.51 | | | 0.73 | | | (0.22 | ) | | (0.01 | ) | | (0.23 | ) | | $ | 10.09 | | 7.66% | | | $ | 934,203 | | 0.60% | | | 2.24% | | | (j | ) | | (j | ) | | 5.91% |
| | | | | | | | | | | | | | | | | | | | | | | | | | | | | | | | | | | | | | | | | | | | | |
| (a) | Excludes sales charge. |
| (b) | During the period certain fees were waived and/or reimbursed. If such waivers/reimbursements had not occurred, the ratios would have been as indicated. |
| (c) | Portfolio turnover is calculated on the basis of the Fund as a whole without distinguishing among the classes of shares. |
| (d) | Net investment income (loss) is based on average shares outstanding during the period. |
| (e) | For the period from March 1, 2001 (commencement of operations) through October 31, 2001. |
| (f) | For the period from October 1, 2003 (commencement of operations) through October 31, 2003. |
| (g) | For the period from December 29, 2004 (commencement of operations) through October 31, 2005. |
See notes to financial statements.
Financial Highlights
Selected Data for Each Share of Capital Outstanding
Gartmore Investor Destinations Moderately Conservative Fund
| | | | | | | | | | | | | | | | | | | | | | | | | | | | | | | | | | | | | | | | | | | | |
| | | | | Investment Activities | | | Distributions | | | | | | Ratios/Supplemental Data
|
| | | Net Asset
Value,
Beginning
of Period | | Net
Investment
Income
(Loss) | | | Net Realized
and
Unrealized
Gains
(Losses) on
Investments | | | Total
from
Investment
Activities | | | Net
Investment
Income | | | Net
Realized
Gains | | | Total
Distributions | | | Net
Asset
Value, End
of Period | | Total
Return (a) | | | Net Assets
at End of
Period
(000s) | | Ratio of
Expenses
to Average
Net Assets | | | Ratio of Net
Investment
Income
(Loss)
to Average
Net Assets | | | Ratio of
Expenses
(Prior to
Reimbursements)
to Average
Net Assets (b) | | | Ratio of Net
Investment
Income (Loss)
(Prior to
Reimbursements)
to Average
Net Assets (b) | | | Portfolio
Turnover (c) |
| | | | | | | | | | | | | | | |
Class A Shares | | | | | | | | | | | | | | | | | | | | | | | | | | | | | | | | | | | | | | | | | | | | |
Year Ended October 31, 2001 (d) | | $ | 9.89 | | 0.35 | | | (0.75 | ) | | (0.40 | ) | | (0.30 | ) | | — | | | (0.30 | ) | | $ | 9.19 | | (4.06% | ) | | $ | 10 | | 0.71% | | | 3.66% | | | 3.81% | | | 0.56% | | | 235.84% |
Year Ended October 31, 2002 (d) | | $ | 9.19 | | 0.26 | | | (0.49 | ) | | (0.23 | ) | | (0.25 | ) | | — | | | (0.25 | ) | | $ | 8.71 | | (2.60% | ) | | $ | 898 | | 0.50% | | | 2.99% | | | 0.51% | | | 2.98% | | | 49.00% |
Year Ended October 31, 2003 | | $ | 8.71 | | 0.20 | | | 0.75 | | | 0.95 | | | (0.22 | ) | | — | | | (0.22 | ) | | $ | 9.44 | | 11.02% | | | $ | 4,482 | | 0.53% | | | 2.34% | | | (j | ) | | (j | ) | | 19.93% |
Year Ended October 31, 2004 | | $ | 9.44 | | 0.19 | | | 0.44 | | | 0.63 | | | (0.19 | ) | | — | | | (0.19 | ) | | $ | 9.88 | | 6.71% | | | $ | 11,157 | | 0.52% | | | 2.12% | | | 0.52% | | | 2.12% | | | 6.66% |
Year Ended October 31, 2005 | | $ | 9.88 | | 0.26 | | | 0.31 | | | 0.57 | | | (0.26 | ) | | (0.01 | ) | | (0.27 | ) | | $ | 10.18 | | 5.78% | | | $ | 16,923 | | 0.54% | | | 2.57% | | | 0.54% | | | 2.57% | | | 8.37% |
| | | | | | | | | | | | | | | |
Class B Shares | | | | | | | | | | | | | | | | | | | | | | | | | | | | | | | | | | | | | | | | | | | | |
Year Ended October 31, 2001 | | $ | 9.89 | | 0.29 | | | (0.75 | ) | | (0.46 | ) | | (0.23 | ) | | — | | | (0.23 | ) | | $ | 9.20 | | (4.67% | ) | | $ | 10 | | 1.31% | | | 3.14% | | | 4.52% | | | (0.07% | ) | | 235.84% |
Year Ended October 31, 2002 (d) | | $ | 9.20 | | 0.20 | | | (0.49 | ) | | (0.29 | ) | | (0.19 | ) | | — | | | (0.19 | ) | | $ | 8.72 | | (3.22% | ) | | $ | 83 | | 1.27% | | | 2.24% | | | 1.29% | | | 2.22% | | | 49.00% |
Year Ended October 31, 2003 | | $ | 8.72 | | 0.14 | | | 0.75 | | | 0.89 | | | (0.17 | ) | | — | | | (0.17 | ) | | $ | 9.44 | | 10.37% | | | $ | 2,453 | | 1.28% | | | 1.52% | | | (j | ) | | (j | ) | | 19.93% |
Year Ended October 31, 2004 | | $ | 9.44 | | 0.13 | | | 0.43 | | | 0.56 | | | (0.12 | ) | | — | | | (0.12 | ) | | $ | 9.88 | | 5.99% | | | $ | 4,606 | | 1.21% | | | 1.41% | | | (j | ) | | (j | ) | | 6.66% |
Year Ended October 31, 2005 | | $ | 9.88 | | 0.20 | | | 0.31 | | | 0.51 | | | (0.20 | ) | | (0.01 | ) | | (0.21 | ) | | $ | 10.18 | | 5.08% | | | $ | 6,002 | | 1.22% | | | 1.90% | | | 1.22% | | | 1.90% | | | 8.37% |
| | | | | | | | | | | | | | | |
Class C Shares | | | | | | | | | | | | | | | | | | | | | | | | | | | | | | | | | | | | | | | | | | | | |
Period Ended October 31, 2001 (e) | | $ | 9.64 | | (0.04 | ) | | (0.38 | ) | | (0.42 | ) | | — | | | — | | | — | | | $ | 9.22 | | (4.36% | )(h) | | $ | — | | 1.31% | (i) | | (0.79% | )(i) | | 122.29% | (i) | | (121.77% | )(i) | | 235.84% |
Year Ended October 31, 2002 | | $ | 9.22 | | — | | | (0.44 | ) | | (0.44 | ) | | (0.06 | ) | | — | | | (0.06 | ) | | $ | 8.72 | | (3.14% | ) | | $ | 88 | | 1.27% | | | 2.48% | | | 1.33% | | | 2.42% | | | 49.00% |
Year Ended October 31, 2003 | | $ | 8.72 | | 0.15 | | | 0.73 | | | 0.88 | | | (0.18 | ) | | — | | | (0.18 | ) | | $ | 9.42 | | 10.26% | | | $ | 7,530 | | 1.29% | | | 1.45% | | | (j | ) | | (j | ) | | 19.93% |
Year Ended October 31, 2004 | | $ | 9.42 | | 0.13 | | | 0.43 | | | 0.56 | | | (0.13 | ) | | — | | | (0.13 | ) | | $ | 9.85 | | 5.99% | | | $ | 26,760 | | 1.22% | | | 1.42% | | | (j | ) | | (j | ) | | 6.66% |
Year Ended October 31, 2005 | | $ | 9.85 | | 0.18 | | | 0.31 | | | 0.49 | | | (0.19 | ) | | (0.01 | ) | | (0.20 | ) | | $ | 10.14 | | 5.01% | | | $ | 39,545 | | 1.22% | | | 1.90% | | | 1.22% | | | 1.90% | | | 8.37% |
| | | | | | | | | | | | | | | |
Class R Shares | | | | | | | | | | | | | | | | | | | | | | | | | | | | | | | | | | | | | | | | | | | | |
Period Ended October 31, 2003 (f) | | $ | 9.33 | | 0.01 | | | 0.11 | | | 0.12 | | | — | | | — | | | — | | | $ | 9.45 | | 1.29% | (h) | | $ | 1 | | 0.81% | (i) | | 1.34% | (i) | | 0.91% | (i) | | 1.24% | (i) | | 19.93% |
Year Ended October 31, 2004 | | $ | 9.45 | | 0.20 | | | 0.42 | | | 0.62 | | | (0.16 | ) | | — | | | (0.16 | ) | | $ | 9.91 | | 6.55% | | | $ | 1 | | 0.60% | | | 2.01% | | | (j | ) | | (j | ) | | 6.66% |
Year Ended October 31, 2005 | | $ | 9.91 | | 0.25 | | | 0.31 | | | 0.56 | | | (0.24 | ) | | (0.01 | ) | | (0.25 | ) | | $ | 10.22 | | 5.73% | | | $ | 1 | | 0.65% | | | 2.54% | | | 0.65% | | | 2.54% | | | 8.37% |
| | | | | | | | | | | | | | | |
Institutional Class Shares | | | | | | | | | | | | | | | | | | | | | | | | | | | | | | | | | | | | | | | | | | | | |
Period Ended October 31, 2005 (g) | | $ | 10.17 | | 0.23 | | | 0.04 | | | 0.27 | | | (0.20 | ) | | — | | | (0.20 | ) | | $ | 10.24 | | 3.70% | (h) | | $ | 1 | | 0.29% | (i) | | 3.17% | (i) | | (h | ) | | (h | ) | | 8.37% |
| | | | | | | | | | | | | | | |
Service Class Shares | | | | | | | | | | | | | | | | | | | | | | | | | | | | | | | | | | | | | | | | | | | | |
Year Ended October 31, 2001 | | $ | 9.90 | | 0.31 | | | (0.70 | ) | | (0.39 | ) | | (0.31 | ) | | — | | | (0.31 | ) | | $ | 9.20 | | (3.99% | ) | | $ | 14,772 | | 0.61% | | | 3.34% | | | 2.50% | | | 1.45% | | | 235.84% |
Year Ended October 31, 2002 (d) | | $ | 9.20 | | 0.26 | | | (0.50 | ) | | (0.24 | ) | | (0.24 | ) | | — | | | (0.24 | ) | | $ | 8.72 | | (2.70% | ) | | $ | 36,927 | | 0.61% | | | 2.82% | | | 0.69% | | | 2.74% | | | 49.00% |
Year Ended October 31, 2003 | | $ | 8.72 | | 0.19 | | | 0.76 | | | 0.95 | | | (0.20 | ) | | — | | | (0.20 | ) | | $ | 9.47 | | 11.09% | | | $ | 78,189 | | 0.61% | | | 2.28% | | | 0.65% | | | 2.24% | | | 19.93% |
Year Ended October 31, 2004 | | $ | 9.47 | | 0.19 | | | 0.43 | | | 0.62 | | | (0.18 | ) | | — | | | (0.18 | ) | | $ | 9.91 | | 6.59% | | | $ | 136,368 | | 0.61% | | | 2.01% | | | 0.61% | | | 2.01% | | | 6.66% |
Year Ended October 31, 2005 | | $ | 9.91 | | 0.25 | | | 0.31 | | | 0.56 | | | (0.25 | ) | | (0.01 | ) | | (0.26 | ) | | $ | 10.21 | | 5.67% | | | $ | 195,790 | | 0.62% | | | 2.49% | | | 0.62% | | | 2.49% | | | 8.37% |
| | | | | | | | | | | | | | | | | | | | | | | | | | | | | | | | | | | | | | | | | | | | | |
| (a) | Excludes sales charge. |
| (b) | During the period certain fees were waived and/or reimbursed. If such waivers/reimbursements had not occurred, the ratios would have been as indicated. |
| (c) | Portfolio turnover is calculated on the basis of the Fund as a whole without distinguishing among the classes of shares. |
| (d) | Net investment income (loss) is based on average shares outstanding during the period. |
| (e) | For the period from March 1, 2001 (commencement of operations) through October 31, 2001. |
| (f) | For the period from October 1, 2003 (commencement of operations) through October 31, 2003. |
| (g) | For the period from December 29, 2004 (commencement of operations) through October 31, 2005. |
| (j) | There were no fee reductions in this period. |
See notes to financial statements.
Financial Highlights
Selected Data for Each Share of Capital Outstanding
Gartmore Investor Destinations Conservative Fund
| | | | | | | | | | | | | | | | | | | | | | | | | | | | | | | | | | | | | | | | | | | | |
| | | | | Investment Activities | | | Distributions | | | | | | Ratios/Supplemental Data
|
| | | Net Asset
Value,
Beginning
of Period | | Net
Investment
Income
(Loss) | | | Net Realized
and
Unrealized
Gains
(Losses) on
Investments | | | Total
from
Investment
Activities | | | Net
Investment
Income | | | Net
Realized
Gains | | | Total
Distributions | | | Net
Asset
Value, End
of Period | | Total
Return (a) | | | Net Assets
at End of
Period
(000s) | | Ratio of
Expenses
to Average
Net Assets | | | Ratio of Net
Investment
Income
(Loss)
to Average
Net Assets | | | Ratio of
Expenses
(Prior to
Reimbursements)
to Average
Net Assets (b) | | | Ratio of Net
Investment
Income (Loss)
(Prior to
Reimbursements)
to Average
Net Assets (b) | | | Portfolio
Turnover (c) |
| | | | | | | | | | | | | | | |
Class A Shares | | | | | | | | | | | | | | | | | | | | | | | | | | | | | | | | | | | | | | | | | | | | |
Year Ended October 31, 2001 | | $ | 9.99 | | 0.45 | | | (0.28 | ) | | 0.17 | | | (0.38 | ) | | — | | | (0.38 | ) | | $ | 9.78 | | 1.71% | | | $ | 10 | | 0.71% | | | 4.45% | | | 6.91% | | | (1.75% | ) | | 176.59% |
Year Ended October 31, 2002 | | $ | 9.78 | | 0.28 | | | (0.24 | ) | | 0.04 | | | (0.31 | ) | | — | | | (0.31 | ) | | $ | 9.51 | | 0.45% | | | $ | 802 | | 0.50% | | | 3.62% | | | 0.50% | | | 3.62% | | | 46.89% |
Year Ended October 31, 2003 | | $ | 9.51 | | 0.26 | | | 0.39 | | | 0.65 | | | (0.28 | ) | | — | | | (0.28 | ) | | $ | 9.88 | | 6.89% | | | $ | 1,798 | | 0.53% | | | 2.83% | | | (i | ) | | | (i) | | 32.93% |
Year Ended October 31, 2004 | | $ | 9.88 | | 0.22 | | | 0.25 | | | 0.47 | | | (0.22 | ) | | — | | | (0.22 | ) | | $ | 10.13 | | 4.84% | | | $ | 5,008 | | 0.50% | | | 2.43% | | | 0.51% | | | 2.43% | | | 11.67% |
Year Ended October 31, 2005 | | $ | 10.13 | | 0.24 | | | 0.12 | | | 0.36 | | | (0.27 | ) | | (0.05 | ) | | (0.32 | ) | | $ | 10.17 | | 3.67% | | | $ | 28,965 | | 0.53% | | | 2.85% | | | 0.53% | | | 2.85% | | | 13.42% |
| | | | | | | | | | | | | | | |
Class B Shares | | | | | | | | | | | | | | | | | | | | | | | | | | | | | | | | | | | | | | | | | | | | |
Year Ended October 31, 2001 | | $ | 9.99 | | 0.38 | | | (0.28 | ) | | 0.10 | | | (0.30 | ) | | — | | | (0.30 | ) | | $ | 9.79 | | 1.04% | | | $ | 10 | | 1.31% | | | 3.82% | | | 7.70% | | | (2.57% | ) | | 176.59% |
Year Ended October 31, 2002 | | $ | 9.79 | | 0.24 | | | (0.25 | ) | | (0.01 | ) | | (0.25 | ) | | — | | | (0.25 | ) | | $ | 9.53 | | (0.15% | ) | | $ | 75 | | 1.27% | | | 2.77% | | | 1.33% | | | 2.71% | | | 46.89% |
Year Ended October 31, 2003 | | $ | 9.53 | | 0.19 | | | 0.38 | | | 0.57 | | | (0.23 | ) | | — | | | (0.23 | ) | | $ | 9.87 | | 6.05% | | | $ | 1,622 | | 1.29% | | | 1.96% | | | (i | ) | | | (i) | | 32.93% |
Year Ended October 31, 2004 | | $ | 9.87 | | 0.15 | | | 0.25 | | | 0.40 | | | (0.15 | ) | | — | | | (0.15 | ) | | $ | 10.12 | | 4.12% | | | $ | 3,437 | | 1.23% | | | 1.70% | | | (i | ) | | | (i) | | 11.67% |
Year Ended October 31, 2005 | | $ | 10.12 | | 0.21 | | | 0.08 | | | 0.29 | | | (0.20 | ) | | (0.05 | ) | | (0.25 | ) | | $ | 10.16 | | 3.02% | | | $ | 4,010 | | 1.22% | | | 2.10% | | | 1.22% | | | 2.10% | | | 13.42% |
| | | | | | | | | | | | | | | |
Class C Shares | | | | | | | | | | | | | | | | | | | | | | | | | | | | | | | | | | | | | | | | | | | | |
Period Ended October 31, 2001 (d) | | $ | 9.97 | | (0.05 | ) | | (0.13 | ) | | (0.18 | ) | | — | | | — | | | — | | | $ | 9.79 | | (1.81% | )(g) | | $ | — | | 1.31% | (h) | | (0.90% | )(h) | | 121.18% | (h) | | (120.77% | )(h) | | 176.59% |
Year Ended October 31, 2002 | | $ | 9.79 | | 0.23 | | | (0.25 | ) | | (0.02 | ) | | (0.26 | ) | | — | | | (0.26 | ) | | $ | 9.51 | | (0.21% | ) | | $ | 400 | | 1.27% | | | 2.75% | | | 1.29% | | | 2.73% | | | 46.89% |
Year Ended October 31, 2003 | | $ | 9.51 | | 0.20 | | | 0.37 | | | 0.57 | | | (0.23 | ) | | — | | | (0.23 | ) | | $ | 9.85 | | 6.03% | | | $ | 3,592 | | 1.29% | | | 1.95% | | | (i | ) | | | (i) | | 32.93% |
Year Ended October 31, 2004 | | $ | 9.85 | | 0.16 | | | 0.24 | | | 0.40 | | | (0.16 | ) | | — | | | (0.16 | ) | | $ | 10.09 | | 4.10% | | | $ | 13,683 | | 1.24% | | | 1.69% | | | (i | ) | | | (i) | | 11.67% |
Year Ended October 31, 2005 | | $ | 10.09 | | 0.21 | | | 0.08 | | | 0.29 | | | (0.20 | ) | | (0.05 | ) | | (0.25 | ) | | $ | 10.13 | | 2.95% | | | $ | 19,106 | | 1.23% | | | 2.10% | | | 1.23% | | | 2.10% | | | 13.42% |
| | | | | | | | | | | | | | | |
Class R Shares | | | | | | | | | | | | | | | | | | | | | | | | | | | | | | | | | | | | | | | | | | | | |
Period Ended October 31, 2003 (e) | | $ | 9.83 | | 0.02 | | | 0.02 | | | 0.04 | | | — | | | — | | | — | | | $ | 9.87 | | 0.41% | (g) | | $ | 1 | | 0.84% | (h) | | 2.03% | (h) | | 0.94% | (h) | | 1.93% | (h) | | 32.93% |
Year Ended October 31, 2004 | | $ | 9.87 | | 0.22 | | | 0.24 | | | 0.46 | | | (0.18 | ) | | — | | | (0.18 | ) | | $ | 10.15 | | 4.73% | | | $ | 1 | | 0.62% | | | 2.30% | | | (i | ) | | | (i) | | 11.67% |
Year Ended October 31, 2005 | | $ | 10.15 | | 0.22 | | | 0.14 | | | 0.36 | | | (0.26 | ) | | (0.05 | ) | | (0.31 | ) | | $ | 10.20 | | 3.65% | | | $ | 3 | | 0.65% | | | 2.67% | | | 0.65% | | | 2.67% | | | 13.42% |
| | | | | | | | | | | | | | | |
Institutional Class Shares | | | | | | | | | | | | | | | | | | | | | | | | | | | | | | | | | | | | | | | | | | | | |
Period Ended October 31, 2005 (f) | | $ | 10.20 | | 0.27 | | | (0.02 | ) | | 0.25 | | | (0.22 | ) | | — | | | (0.22 | ) | | $ | 10.23 | | 2.44% | (g) | | $ | 1 | | 0.28% | (h) | | 3.74% | (h) | | 0.28% | | | 3.74% | | | 13.42% |
| | | | | | | | | | | | | | | |
Service Class Shares | | | | | | | | | | | | | | | | | | | | | | | | | | | | | | | | | | | | | | | | | | | | |
Year Ended October 31, 2001 | | $ | 10.00 | | 0.41 | | | (0.24 | ) | | 0.17 | | | (0.38 | ) | | — | | | (0.38 | ) | | $ | 9.79 | | 1.75% | | | $ | 11,459 | | 0.61% | | | 4.17% | | | 2.58% | | | 2.20% | | | 176.59% |
Year Ended October 31, 2002 | | $ | 9.79 | | 0.31 | | | (0.26 | ) | | 0.05 | | | (0.31 | ) | | — | | | (0.31 | ) | | $ | 9.53 | | 0.48% | | | $ | 28,253 | | 0.61% | | | 3.49% | | | 0.72% | | | 3.38% | | | 46.89% |
Year Ended October 31, 2003 | | $ | 9.53 | | 0.26 | | | 0.38 | | | 0.64 | | | (0.27 | ) | | — | | | (0.27 | ) | | $ | 9.90 | | 6.76% | | | $ | 59,472 | | 0.61% | | | 2.73% | | | 0.67% | | | 2.68% | | | 32.93% |
Year Ended October 31, 2004 | | $ | 9.90 | | 0.23 | | | 0.23 | | | 0.46 | | | (0.21 | ) | | — | | | (0.21 | ) | | $ | 10.15 | | 4.69% | | | $ | 101,261 | | 0.61% | | | 2.31% | | | 0.63% | | | 2.29% | | | 11.67% |
Year Ended October 31, 2005 | | $ | 10.15 | | 0.27 | | | 0.09 | | | 0.36 | | | (0.26 | ) | | (0.05 | ) | | (0.31 | ) | | $ | 10.20 | | 3.62% | | | $ | 137,589 | | 0.62% | | | 2.70% | | | 0.63% | | | 2.70% | | | 13.42% |
| | | | | | | | | | | | | | | | | | | | | | | | | | | | | | | | | | | | | | | | | | | | | |
| (a) | Excludes sales charge. |
| (b) | During the period certain fees were waived and/or reimbursed. If such waivers/reimbursements had not occurred, the ratios would have been as indicated. |
| (c) | Portfolio turnover is calculated on the basis of the Fund as a whole without distinguishing among the classes of shares. |
| (d) | For the period from March 1, 2001 (commencement of operations) through October 31, 2001. |
| (e) | For the period from October 1, 2003 (commencement of operations) through October 31, 2003. |
| (f) | For the period from December 29, 2004 (commencement of operations) through October 31, 2005. |
| (i) | There were no fee reductions in this period. |
See notes to financial statements.
Gartmore Optimal Allocations Fund: Aggressive
For the annual period ended Oct. 31, 2005, the Gartmore Optimal Allocations Fund: Aggressive (Class A at NAV) returned 14.87% versus 10.67% for its composite benchmark, which consists of 70% S&P 500® Index, 25% Morgan Stanley Capital International Europe, Australasia and Far East (MSCI EAFE®) Index and 5% Lehman Brothers U.S. Aggregate Index. For broader comparison, the average return for the Fund’s Lipper peer category of Multi-Cap Core Funds was 10.50%.
The Fund is a diversified “fund of funds” designed to serve as an aggressive investor’s total asset allocation solution. Its institutional-quality design was developed by Ibbotson Associates, a leading asset allocation authority. The Fund invests in a diverse set of underlying funds with an allocation mix that has been designed to expand the “efficient frontier”—the line on a risk-reward graph representing the most efficient combination of various asset classes to achieve the highest possible return for a given level of risk. In other words, by incorporating a combination of diverse asset classes that behave differently under various market conditions, it is possible for the Fund to achieve higher risk-adjusted returns than those that could be achieved with a nondiversified portfolio.
The Fund’s allocations are reviewed quarterly by Ibbotson and Gartmore, and are subject to change. On Oct. 1, 2005, several changes took effect, including the addition of an allocation to the Gartmore Global Natural Resources Fund. At the same time, the Gartmore Mid Cap Growth Fund was removed, at which point it had posted a gain of 18.68%, to allow for a greater allocation to the Gartmore Small Cap Fund. Gartmore implemented these underlying fund changes in the belief that they would enhance the overall diversification of the Fund and improve the Fund’s risk-return profile. The Gartmore Optimal Allocations Fund: Aggressive is currently invested in a set of 13 underlying funds.
| | | | |
| Fund Allocations* | | Target
Allocation | | 12-Month
Returns of
Underlying
Funds* |
| Gartmore Global Financial Services Fund | | 16% | | 15.20% |
| Gartmore Nationwide Fund | | 15% | | 12.19% |
| Gartmore Global Health Sciences Fund | | 11% | | 16.90% |
| Gartmore Global Technology and Communications Fund | | 10% | | 5.87% |
| Gartmore U.S. Growth Leaders Fund | | 10% | | 17.69% |
| | | | |
| Fund Allocations* | | Target
Allocation | | 12-Month
Returns of
Underlying
Funds* |
| Gartmore Small Cap Fund | | 7% | | 31.93% |
| iShares Cohen & Steers Realty Majors Index Fund | | 6% | | 18.94% |
| Gartmore Global Natural Resources Fund** | | 5% | | -4.71% |
| Gartmore International Growth Fund | | 5% | | 26.36% |
Gartmore U.S. Growth Leaders
Long-Short Fund | | 5% | | 6.27% |
| Gartmore Emerging Markets Fund | | 4% | | 30.60% |
| Gartmore Micro Cap Equity Fund | | 4% | | 11.98% |
| Gartmore Mid Cap Growth Fund*** | | 3% | | 18.68% |
| Gartmore Global Utilities Fund | | 2% | | 18.62% |
Fund in italics was added on 10/1/05.
| * | Fund allocations and Institutional Share Class returns as of 10/31/05. |
| ** | New fund added effective 10/1/05; performance represents one-month period through 10/31/05. |
| *** | Fund removed effective 10/1/05; performance represents 11-month period through 9/30/05. |
The reporting period ended Oct. 31, 2005, witnessed considerable volatility in the global equity markets, beginning with a broad rally in the final two months of 2004. As the new year began, however, concerns about slackened economic growth, the onset of inflation, increasing interest rates and spiraling energy costs led to a far less favorable environment for stocks, leaving most markets on the defensive. In varying degrees, these concerns would continue to plague the equity markets for the remainder of the fiscal year. The overall global economy nonetheless proved resilient. The U.S. economy grew at a faster pace during the fiscal third quarter than initially anticipated, signaling improving economic health. From July through September, gross domestic product, the broadest measure of U.S. economic activity, grew 4.3%. For the reporting period, the MSCI EAFE Index returned 18.59% and the S&P 500 Index was up 8.72%.
The Federal Reserve Board continued its measured increases of short-term interest rates, despite speculation that the moves would halt amid spiking energy costs. Throughout the reporting period, the rate rose from 1.75% to 3.75% as a result of eight consecutive 0.25% increases. The housing market remained strong, with 30-year fixed mortgage rates
Gartmore Optimal Allocations Fund: Aggressive
Continued
remaining below 6% for the majority of the reporting period. Confounding expectations amid Hurricanes Katrina and Rita and rising energy costs, existing home sales advanced to an all-time high of 2% in August.
Equity prices in the United States somewhat disappointed, reflecting stretched valuations and consumer uncertainty, compared with stronger performance in Europe and Japan. Emerging-market economies were quite healthy, with Latin America delivering notably robust performance due to strong commodity prices.
In the latter part of the reporting period, the economies of Japan and Europe, including the United Kingdom, improved due to strong corporate profitability and expectations of higher levels of merger-and-acquisition activity. Europe was buoyed by export growth on the back of the weak euro. In Japan, meanwhile, rising real incomes and capital expenditure led to hopes of a recovery. Expectations rose when Prime Minister Junichiro Koizumi achieved a resounding victory in parliamentary elections, which gave his government a solid mandate for reform.
Among the underlying funds in the portfolio during the entire reporting period, the best performers were the Gartmore Small Cap Fund, the Gartmore Emerging Markets Fund and the Gartmore International Growth Fund, which returned 31.93%, 30.60% and 26.36%, respectively.
Conversely, the weakest performers were the Gartmore Global Technology and Communications Fund and the Gartmore U.S. Growth Leaders Long-Short Fund, which returned 5.87% and 6.27%, respectively.
Looking ahead, we believe that this Fund is positioned to deliver higher returns than those of its blended benchmark, while generating a marginally higher risk level. The returns are expected to be derived from greater diversification that is achieved by allocating assets across 13 different underlying funds representing a broad range of asset classes that are not highly correlated.
Portfolio Manager:
Young Chin
| | |
Fund Performance | | Gartmore Optimal Allocations Fund: Aggressive |
Average Annual Total Return
(For periods ended October 31, 2005)
| | | | | | |
| | | | | 1 Yr. | | Inception1 |
| Class A | | w/o SC2 | | 14.87% | | 11.64% |
| | | w/SC3 | | 8.22% | | 6.82% |
| Class B | | w/o SC2 | | 14.07% | | 10.65% |
| | | w/SC4 | | 9.07% | | 7.76% |
| Class C | | w/o SC2 | | 14.07% | | 10.66% |
| | | w/SC5 | | 13.07% | | 10.66% |
| Class R6 | | 14.70% | | 11.19% |
| Institutional Class6 | | 15.25% | | 11.84% |
| Institutional Service Class6 | | 15.10% | | 11.73% |
All figures showing the effect of a sales charge reflect the maximum charge possible, because it has the most dramatic effect on performance data.
| 1 | Fund commenced operations on June 29, 2004. |
| 2 | These returns do not reflect the effects of sales charges (SC). |
| 3 | A 5.75% front-end sales charge was deducted. |
| 4 | A 5.00% contingent deferred sales charge (CDSC) was deducted. The CDSC declines to 1% after 6 years. |
| 5 | A CDSC of 1.00% was deducted because it is charged when you sell Class C shares within the first year after purchase. |
| 6 | Not subject to any sales charges. |
Performance of a $10,000 Investment
Investment return and principal value will fluctuate, and when redeemed, shares may be worth more or less than original cost. Past performance is no guarantee of future results and does not reflect the deduction of taxes that a shareholder would pay on fund distributions or the redemption of fund shares. Investing in mutual funds involves market risk, including loss of principal. Performance returns assume the reinvestment of all distributions.
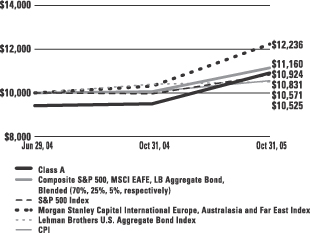
Comparative performance of $10,000 invested in Class A shares of the Gartmore Optimal Allocations Fund: Aggressive, the Optimal Allocations Aggressive Composite Index (Composite)(a), S&P 500 Index (S&P 500)(b), Morgan Stanley Capital International Europe, Australasia, and Far East Index (MSCI EAFE)(c), Lehman Brothers Aggregate Bond Index (LB Aggregate Bond)(d), and the Consumer Price Index (CPI)(e) since inception. Unlike the Fund, the returns for these unmanaged indexes do not reflect any fees, expenses, or sales charges. Investors cannot invest directly in market indexes.
| (a) | The Optimal Allocation Aggressive Composite is an unmanaged, hypothetical representation of the performance of each of the Fund’s asset classes according to their respective weightings. The composite is a combination of the S&P 500 (70%), the MSCI EAFE (25%) and the LB Aggregate Bond (5%). |
| (b) | The S&P 500 is an unmanaged index of 500 widely held stocks of large U.S. companies that gives a broad look at how the stock prices of large U.S. companies have performed. |
| (c) | The MSCI EAFE is an unmanaged, market capitalization-weighted index that is designed to represent the performance of developed stock markets outside the United States and Canada. |
| (d) | The LB Aggregate Bond is an unmanaged, market value-weighted index of investment grade fixed-rate debt issues including government, corporate, asset-backed and mortgage-backed securities with maturities of one year or more. |
| (e) | The CPI represents changes in prices of a basket of goods and services purchased for consumption by urban households. |
| | |
Shareholder Expense Example | | Gartmore Optimal Allocations Fund: Aggressive |
As a shareholder of the Fund, you incur two types of costs: (1) transaction costs, including sales charges (loads) paid on purchase payments and redemption fees; and (2) ongoing costs, including investment advisory fees, administration fees, distribution fees and other Fund expenses. The examples below are intended to help you understand your ongoing costs (in dollars) of investing in the Fund and to compare these costs with the ongoing costs of investing in other mutual funds. Per SEC requirements, the examples assume that you had a $1,000 investment in the Class at the beginning of the reporting period, May 1, 2005, and continued to hold your shares at the end of the reporting period, October 31, 2005.
Actual Expenses
For each Class of the Fund in the table below, the first line provides information about actual account values and actual expenses. You may use the information in this line, together with the amount you invested, to estimate the expenses that you paid over the period. Simply divide your account value by $1,000 (for example, an $8,600 account value divided by $1,000 = 8.6), then multiply the result by the number in the first line of each Class under the heading entitled “Expenses Paid During Period” to estimate the expenses you paid on your account during the period.
Hypothetical Example for Comparison Purposes
The second line of each Class in the table below provides information about hypothetical account values and hypothetical expenses based on the Class’ actual expense ratio and an assumed rate of return of 5% per year before expenses, which is not the Class’ actual return. The hypothetical account values and expenses may not be used to estimate the actual ending account balance or expenses you paid for the period. You may use this information to compare the ongoing costs of investing in the Class of the Fund and other funds. To do so, compare this 5% hypothetical example with the 5% hypothetical examples that appear in the shareholder reports of the other funds.
Please note that the expenses shown in the table are meant to highlight your ongoing costs only and do not reflect any transaction costs, such as sales charges (loads) or redemption fees. Therefore, the second line for each Class in the table is useful in comparing ongoing costs only, and will not help you determine the relative total costs of owning different funds. In addition, if these transaction costs were included, your costs would have been higher. The examples also assume all dividends and distributions have been reinvested.
Schedule of Shareholder Expenses
Expense Analysis of a $1,000 Investment
(October 31, 2005)
| | | | | | | | | | | | | | |
| Optimal Allocations: Aggressive Fund | | | | | Beginning
Account Value,
5/1/05 | | Ending
Account Value,
10/31/05 | | Expenses Paid
During Period*2 | | Annualized
Expense Ratio*2 |
| Class A | | Actual | | | $ | 1,000.00 | | $ | 1,103.40 | | $ | 2.76 | | 0.52% |
| | | Hypothetical | 1 | | $ | 1,000.00 | | $ | 1,022.38 | | $ | 2.65 | | 0.52% |
| Class B | | Actual | | | $ | 1,000.00 | | $ | 1,099.80 | | $ | 6.62 | | 1.25% |
| | | Hypothetical | 1 | | $ | 1,000.00 | | $ | 1,018.70 | | $ | 6.38 | | 1.25% |
| Class C | | Actual | | | $ | 1,000.00 | | $ | 1,100.10 | | $ | 6.62 | | 1.25% |
| | | Hypothetical | 1 | | $ | 1,000.00 | | $ | 1,018.70 | | $ | 6.38 | | 1.25% |
| Class R | | Actual | | | $ | 1,000.00 | | $ | 1,103.70 | | $ | 3.82 | | 0.72% |
| | | Hypothetical | 1 | | $ | 1,000.00 | | $ | 1,021.37 | | $ | 3.67 | | 0.72% |
| Institutional Service Class | | Actual | | | $ | 1,000.00 | | $ | 1,105.30 | | $ | 1.70 | | 0.32% |
| | | Hypothetical | 1 | | $ | 1,000.00 | | $ | 1,023.39 | | $ | 1.63 | | 0.32% |
| Institutional Class | | Actual | | | $ | 1,000.00 | | $ | 1,106.20 | | $ | 1.33 | | 0.25% |
| | | Hypothetical | 1 | | $ | 1,000.00 | | $ | 1,023.74 | | $ | 1.28 | | 0.25% |
| * | Expenses are equal to the Fund’s annualized expense ratio multiplied by the average account value over the period multiplied by 184/365 (to reflect the one-half year period). The expense ratio presented represents a six month, annualized ratio in accordance with SEC guidelines. |
| 1 | Represents the hypothetical 5% return before expenses. |
| 2 | Expenses are based on the direct expenses of the Fund and do not include the effect of the underlying Funds’ expenses, which are disclosed in the Fee and Expense table and described more fully in a footnote to that table in your Fund prospectus. |
| | |
Portfolio Summary | | Gartmore Optimal Allocations Fund: Aggressive |
October 31, 2005
The SEC adopted a requirement that Funds present their portfolio holdings in a table, chart or graph format in their annual and semiannual reports to shareholders, whether or not a statement of investments is utilized. The following tables, which present portfolio holdings as a percentage of net assets, are provided in compliance with this requirement.
| | |
| Asset Allocation | | |
| Mutual Funds | | 99.5% |
| Other assets in excess of liabilities | | 0.5% |
| | |
|
| | | 100.0% |
| | |
| Asset Allocation Detail | | |
| Equity Funds | | 99.5% |
| Other | | 0.5% |
| | |
|
| | | 100.0% |
| | |
| Top Holdings | | |
| Gartmore Global Financial Services Fund Institutional Class | | 16.6% |
| Gartmore Nationwide Fund Institutional Class | | 15.3% |
| Gartmore Global Health Sciences Fund Institutional Class | | 11.0% |
| Gartmore Global Technology and Communications Fund Institutional Class | | 10.3% |
| Gartmore U.S. Growth Leaders Fund Institutional Class | | 10.2% |
| Gartmore Small Cap Fund Institutional Class | | 7.0% |
| Gartmore U.S. Growth Leaders Long-Short Fund Institutional Class | | 5.2% |
| Gartmore International Growth Fund Institutional Class | | 5.0% |
| Gartmore Global Natural Resources Fund Institutional Class | | 4.9% |
| iShares Cohen & Steers Realty Majors Index Fund | | 4.2% |
| Other Mutual Funds | | 10.3% |
| | |
|
| | | 100.0% |
Statement of Investments
October 31, 2005
Gartmore Optimal Allocations Fund: Aggressive
| | | | | |
| | | Shares | | Value |
| | | | | | |
Equity Funds (99.5%) | | | | | |
Gartmore Emerging Markets Fund Institutional Class (b) | | 9,837 | | $ | 148,932 |
Gartmore Global Financial Services Fund Institutional Class (b) | | 47,674 | | | 642,640 |
Gartmore Global Health Sciences Fund Institutional Class (b) | | 36,048 | | | 425,003 |
Gartmore Global Natural Resources Fund Institutional Class (b) | | 10,498 | | | 189,060 |
Gartmore Global Technology and Communications Fund Institutional Class (b) | | 104,771 | | | 397,082 |
Gartmore Global Utilities Fund Institutional Class (b) | | 6,205 | | | 76,696 |
Gartmore International Growth Fund Institutional Class (b) | | 19,661 | | | 192,873 |
Gartmore Micro Cap Equity Fund Institutional Class (b) | | 7,041 | | | 152,430 |
Gartmore Nationwide Fund Institutional Class (b) | | 28,498 | | | 591,612 |
| | | | | |
| | | Shares | | Value |
Equity Funds (continued) | | | | | |
Gartmore Small Cap Fund Institutional Class (b) | | 14,632 | | $ | 271,429 |
Gartmore U.S. Growth Leaders Fund Institutional Class (b) | | 39,030 | | | 394,589 |
Gartmore U.S. Growth Leaders Long-Short Fund Institutional Class (b) | | 20,489 | | | 201,820 |
iShares Cohen & Steers Realty Majors Index Fund | | 2,268 | | | 163,069 |
| | | | |
|
|
| | |
Total Mutual Funds | | | | | 3,847,235 |
| | | | |
|
|
| |
Total Investments
(Cost $3,676,552) (a) — 99.5% | | | 3,847,235 |
| |
Other assets in excess of
liabilities — 0.5% | | | 19,847 |
| | | | |
|
|
| | |
NET ASSETS — 100.0% | | | | $ | 3,867,082 |
| | | | |
|
|
| | (a) | See notes to financial statements for tax unrealized appreciation (depreciation) of securities. |
| | (b) | Investment in affiliate. |
See notes to financial statements.
Gartmore Optimal Allocations Fund: Moderately Aggressive
For the annual period ended Oct. 31, 2005, the Gartmore Optimal Allocations Fund: Moderately Aggressive (Class A at NAV) returned 12.77% versus 9.08% for its composite benchmark, which consists of 60% S&P 500® Index, 20% Morgan Stanley Capital International Europe, Australasia and Far East (MSCI EAFE®) Index, and 20% Lehman Brothers U.S. Aggregate Index. For broader comparison, the average return for the Fund’s Lipper peer category of Flexible Portfolio Funds was 8.23%.
The Fund is a diversified “fund of funds” designed to serve as a moderately aggressive investor’s total asset allocation solution. Its institutional-quality design was developed by Ibbotson Associates, a leading asset allocation authority. The Fund invests in a diverse set of underlying funds with an allocation mix that has been designed to expand the “efficient frontier”—the line on a risk-reward graph representing the most efficient combination of various asset classes to achieve the highest possible return for a given level of risk. In other words, by incorporating a combination of diverse asset classes that behave differently under various market conditions, it is possible for the Fund to achieve higher risk-adjusted returns than those that could be achieved with a nondiversified portfolio.
The Fund’s allocations are reviewed quarterly by Ibbotson and Gartmore, and are subject to change. On Oct. 1, 2005, several changes took effect, including the addition of an allocation to the Gartmore High Yield Bond Fund and the Gartmore Global Natural Resources Fund. At the same time, the Gartmore Government Bond Fund, which at that point had posted a gain of 2.41%, was removed from the portfolio. The 5% allocation previously attributed to the Gartmore Government Bond Fund was redistributed between the Gartmore Bond Fund and the Gartmore High Yield Bond Fund. Gartmore implemented these underlying fund changes in the belief that they would enhance the overall diversification of the Fund and improve the Fund’s risk-return profile. The Gartmore Optimal Allocations Fund: Moderately Aggressive is currently invested in 16 underlying funds.
| | | | |
| Fund Allocations* | | Target
Allocation | | 12-Month
Returns of
Underlying
Funds* |
| Gartmore Bond Fund | | 13% | | 2.30% |
| Gartmore Global Financial Services Fund | | 12% | | 15.20% |
| Gartmore Nationwide Fund | | 12% | | 12.19% |
| | | | |
| Fund Allocations* | | Target
Allocation | | 12-Month
Returns of
Underlying
Funds* |
| Gartmore U.S. Growth Leaders Fund | | 8% | | 17.69% |
| Gartmore Global Health Sciences Fund | | 7% | | 16.90% |
| Gartmore Small Cap Fund | | 6% | | 31.93% |
| Gartmore U.S. Growth Leaders Long-Short Fund | | 6% | | 6.27% |
| Gartmore Global Natural Resources Fund** | | 5% | | -4.71% |
| Gartmore Government Bond Fund*** | | 5% | | 2.41% |
| Gartmore Global Technology and Communications Fund | | 5% | | 5.87% |
| Gartmore International Growth Fund | | 5% | | 26.36% |
| iShares Cohen & Steers Realty Majors Index Fund | | 5% | | 18.94% |
| Gartmore Convertible Fund | | 4% | | 6.50% |
| Gartmore Emerging Markets Fund | | 3% | | 30.60% |
| Gartmore Global Utilities Fund | | 3% | | 18.62% |
| Gartmore High Yield Bond Fund** | | 3% | | -1.38% |
| Gartmore Mid Cap Growth Fund | | 3% | | 14.79% |
Funds in italics were added on 10/1/05.
| * | Fund allocations and Institutional Share Class returns as of 10/31/05. |
| ** | New fund added effective 10/1/05; performance represents one-month period through 10/31/05. |
| *** | Fund removed effective 10/1/05; performance represents 11-month period through 9/30/05. |
The reporting period ended Oct. 31, 2005, witnessed considerable volatility in the global equity markets, beginning with a broad rally in the final two months of 2004. As the new year began, however, concerns about slackened economic growth, the onset of inflation, increasing interest rates and spiraling energy costs led to a far less favorable environment for stocks, leaving most markets on the defensive. In varying degrees, these concerns would continue to plague the equity markets for the remainder of the fiscal year. The overall global economy nonetheless proved resilient. The U.S. economy grew at a faster pace during the fiscal third quarter than initially anticipated, signaling improving economic health.
Gartmore Optimal Allocations Fund: Moderately Aggressive Continued
From July through September, gross domestic product, the broadest measure of U.S. economic activity, grew 4.3%. For the reporting period, the MSCI EAFE Index returned 18.59% and the S&P 500 Index was up 8.72%.
The Federal Reserve Board continued its measured increases of short-term interest rates, despite speculation that the moves would halt amid spiking energy costs. Throughout the reporting period, the rate rose from 1.75% to 3.75% as a result of eight consecutive 0.25% increases. The housing market remained strong, with 30-year fixed mortgage rates remaining below 6% for the majority of the reporting period. Confounding expectations amid Hurricanes Katrina and Rita and rising energy costs, existing home sales advanced to an all-time high of 2% in August.
Equity prices in the United States somewhat disappointed, reflecting stretched valuations and consumer uncertainty, compared with stronger performance in Europe and Japan. Emerging-market economies were quite healthy, with Latin America delivering notably robust performance due to strong commodity prices.
In the latter part of the reporting period, the economies of Japan and Europe, including the United Kingdom, improved due to strong corporate profitability and expectations of higher levels of merger-and-acquisition activity. Europe was buoyed by export growth on the back of the weak euro. In Japan, meanwhile, rising real incomes and capital expenditure led to hopes of a recovery. Expectations rose when Prime Minister Junichiro Koizumi achieved a resounding victory in parliamentary elections, which gave his government a solid mandate for reform.
Among the underlying funds in the portfolio during the entire reporting period, the best performers were the Gartmore Small Cap Fund, the Gartmore Emerging Markets Fund and the Gartmore International Growth Fund, which returned 31.93%, 30.60% and 26.36%, respectively.
Conversely, the weakest performers were the Gartmore Bond Fund and the Gartmore Global Technology and Communications Fund, which returned 2.30% and 5.87%, respectively.
Looking ahead, we believe that this Fund is positioned to deliver higher returns than those of its blended benchmark, while generating a marginally higher risk level. The returns are expected to be derived from greater diversification that is achieved by allocating assets across different underlying funds representing a broad range of asset classes that are not highly correlated.
Portfolio Manager:
Young Chin
| | |
Fund Performance | | Gartmore Optimal Allocations Fund: Moderately Aggressive |
Average Annual Total Return
(For periods ended October 31, 2005)
| | | | | | |
| | | | | 1 Yr. | | Inception1 |
| Class A | | w/o SC2 | | 12.77% | | 11.10% |
| | | w/SC3 | | 6.32% | | 6.30% |
| Class B | | w/o SC2 | | 12.07% | | 10.25% |
| | | w/SC4 | | 7.07% | | 7.35% |
| Class C | | w/o SC2 | | 11.98% | | 10.19% |
| | | w/SC5 | | 10.98% | | 10.19% |
| Class R6 | | 12.50% | | 10.73% |
| Institutional Class6 | | 13.16% | | 11.38% |
| Institutional Service Class6 | | 13.00% | | 11.27% |
All figures showing the effect of a sales charge reflect the maximum charge possible, because it has the most dramatic effect on performance data.
| 1 | Fund commenced operations on June 29, 2004. |
| 2 | These returns do not reflect the effects of sales charges (SC). |
| 3 | A 5.75% front-end sales charge was deducted. |
| 4 | A 5.00% contingent deferred sales charge (CDSC) was deducted. The CDSC declines to 1% after 6 years. |
| 5 | A CDSC of 1.00% was deducted because it is charged when you sell Class C shares within the first year after purchase. |
| 6 | Not subject to any sales charges. |
Performance of a $10,000 Investment
Investment return and principal value will fluctuate, and when redeemed, shares may be worth more or less than original cost. Past performance is no guarantee of future results and does not reflect the deduction of taxes that a shareholder would pay on fund distributions or the redemption of fund shares. Investing in mutual funds involves market risk, including loss of principal. Performance returns assume the reinvestment of all distributions.

Comparative performance of $10,000 invested in Class A shares of the Gartmore Optimal Allocations Fund: Moderately Aggressive, the Optimal Allocations Moderately Aggressive Composite Index (Composite)(a), S&P 500 Index (S&P 500)(b), Morgan Stanley Capital International Europe, Australasia, and Far East Index (MSCI EAFE)(c), Lehman Brothers Aggregate Bond Index (LB Aggregate Bond)(d), and the Consumer Price Index (CPI)(e) since inception. Unlike the Fund, the returns for these unmanaged indexes do not reflect any fees, expenses, or sales charges. Investors cannot invest directly in market indexes.
| (a) | The Optimal Allocation Moderately Aggressive Composite is an unmanaged, hypothetical representation of the performance of each of the Fund’s asset classes according to their respective weightings. The composite is a combination of the S&P 500 (60%), the MSCI EAFE (20%) and the LB Aggregate Bond (20%). |
| (b) | The S&P 500 is an unmanaged index of 500 widely held stocks of large U.S. companies that gives a broad look at how the stock prices of large U.S. companies have performed. |
| (c) | The MSCI EAFE is an unmanaged, market capitalization-weighted index that is designed to represent the performance of developed stock markets outside the United States and Canada. |
| (d) | The LB Aggregate Bond is an unmanaged, market value-weighted index of investment grade fixed-rate debt issues including government, corporate, asset-backed and mortgage-backed securities with maturities of one year or more. |
| (e) | The CPI represents changes in prices of a basket of goods and services purchased for consumption by urban households. |
| | |
Shareholder Expense Example | | Gartmore Optimal Allocations Fund: Moderately Aggressive |
As a shareholder of the Fund, you incur two types of costs: (1) transaction costs, including sales charges (loads) paid on purchase payments and redemption fees; and (2) ongoing costs, including investment advisory fees, administration fees, distribution fees and other Fund expenses. The examples below are intended to help you understand your ongoing costs (in dollars) of investing in the Fund and to compare these costs with the ongoing costs of investing in other mutual funds. Per SEC requirements, the examples assume that you had a $1,000 investment in the Class at the beginning of the reporting period, May 1, 2005, and continued to hold your shares at the end of the reporting period, October 31, 2005.
Actual Expenses
For each Class of the Fund in the table below, the first line provides information about actual account values and actual expenses. You may use the information in this line, together with the amount you invested, to estimate the expenses that you paid over the period. Simply divide your account value by $1,000 (for example, an $8,600 account value divided by $1,000 = 8.6), then multiply the result by the number in the first line of each Class under the heading entitled “Expenses Paid During Period” to estimate the expenses you paid on your account during the period.
Hypothetical Example for Comparison Purposes
The second line of each Class in the table below provides information about hypothetical account values and hypothetical expenses based on the Class’ actual expense ratio and an assumed rate of return of 5% per year before expenses, which is not the Class’ actual return. The hypothetical account values and expenses may not be used to estimate the actual ending account balance or expenses you paid for the period. You may use this information to compare the ongoing costs of investing in the Class of the Fund and other funds. To do so, compare this 5% hypothetical example with the 5% hypothetical examples that appear in the shareholder reports of the other funds.
Please note that the expenses shown in the table are meant to highlight your ongoing costs only and do not reflect any transaction costs, such as sales charges (loads) or redemption fees. Therefore, the second line for each Class in the table is useful in comparing ongoing costs only, and will not help you determine the relative total costs of owning different funds. In addition, if these transaction costs were included, your costs would have been higher. The examples also assume all dividends and distributions have been reinvested.
Schedule of Shareholder Expenses
Expense Analysis of a $1,000 Investment
(October 31, 2005)
| | | | | | | | | | | | | | |
Optimal Allocations: Moderately
Aggressive Fund | | | | | Beginning
Account Value,
5/1/05 | | Ending
Account Value,
10/31/05 | | Expenses Paid
During Period*2 | | Annualized
Expense Ratio*2 |
| Class A | | Actual | | | $ | 1,000.00 | | $ | 1,082.80 | | $ | 2.73 | | 0.52% |
| | | Hypothetical | 1 | | $ | 1,000.00 | | $ | 1,022.38 | | $ | 2.65 | | 0.52% |
| Class B | | Actual | | | $ | 1,000.00 | | $ | 1,078.60 | | $ | 6.55 | | 1.25% |
| | | Hypothetical | 1 | | $ | 1,000.00 | | $ | 1,018.70 | | $ | 6.38 | | 1.25% |
| Class C | | Actual | | | $ | 1,000.00 | | $ | 1,079.20 | | $ | 6.55 | | 1.25% |
| | | Hypothetical | 1 | | $ | 1,000.00 | | $ | 1,018.70 | | $ | 6.38 | | 1.25% |
| Class R | | Actual | | | $ | 1,000.00 | | $ | 1,081.40 | | $ | 3.78 | | 0.72% |
| | | Hypothetical | 1 | | $ | 1,000.00 | | $ | 1,021.37 | | $ | 3.67 | | 0.72% |
| Institutional Service Class | | Actual | | | $ | 1,000.00 | | $ | 1,083.90 | | $ | 1.68 | | 0.32% |
| | | Hypothetical | 1 | | $ | 1,000.00 | | $ | 1,023.39 | | $ | 1.63 | | 0.32% |
| Institutional Class | | Actual | | | $ | 1,000.00 | | $ | 1,083.80 | | $ | 1.31 | | 0.25% |
| | | Hypothetical | 1 | | $ | 1,000.00 | | $ | 1,023.74 | | $ | 1.28 | | 0.25% |
| * | Expenses are equal to the Fund’s annualized expense ratio multiplied by the average account value over the period multiplied by 184/365 (to reflect the one-half year period). The expense ratio presented represents a six month, annualized ratio in accordance with SEC guidelines. |
| 1 | Represents the hypothetical 5% return before expenses. |
| 2 | Expenses are based on the direct expenses of the Fund and do not include the effect of the underlying Funds’ expenses, which are disclosed in the Fee and Expense table and described more fully in a footnote to that table in your Fund prospectus. |
| | |
Portfolio Summary | | Gartmore Optimal Allocations Fund: Moderately Aggressive |
October 31, 2005
The SEC adopted a requirement that Funds present their portfolio holdings in a table, chart or graph format in their annual and semiannual reports to shareholders, whether or not a statement of investments is utilized. The following tables, which present portfolio holdings as a percentage of net assets, are provided in compliance with this requirement.
| | |
| Asset Allocation | | |
| Mutual Funds | | 100.1% |
| Liabilities in excess of other assets | | -0.1% |
| | |
|
| | | 100.0% |
| | |
| Asset Allocation Detail | | |
| Equity Funds | | 79.7% |
| Fixed Income Funds | | 20.4% |
| Other | | -0.1% |
| | |
|
| | | 100.0% |
| | |
| Top Holdings | | |
| Gartmore Bond Fund Institutional Class | | 13.3% |
| Gartmore Global Financial Services Fund Institutional Class | | 12.4% |
| Gartmore Nationwide Fund Institutional Class | | 12.2% |
| Gartmore U.S. Growth Leaders Fund Institutional Class | | 8.1% |
| Gartmore Global Health Sciences Fund Institutional Class | | 6.9% |
| Gartmore U.S. Growth Leaders Long-Short Fund Institutional Class | | 6.2% |
| Gartmore Small Cap Fund Institutional Class | | 6.0% |
| Gartmore Global Technology and Communications Fund Institutional Class | | 5.1% |
| Gartmore International Growth Fund Institutional Class | | 5.0% |
| Gartmore Global Natural Resources Fund Institutional Class | | 4.9% |
| Other Mutual Funds | | 19.9% |
| | |
|
| | | 100.0% |
Statement of Investments
October 31, 2005
Gartmore Optimal Allocations Fund: Moderately Aggressive
| | | | | |
| | | Shares | | Value |
| | | | | | |
Equity Funds (79.7%) | | | | | |
Gartmore Emerging Markets Fund Institutional Class (b) | | 17,781 | | $ | 269,201 |
Gartmore Global Financial Services Fund Institutional Class (b) | | 85,949 | | | 1,158,593 |
Gartmore Global Health Sciences Fund Institutional Class (b) | | 55,192 | | | 650,711 |
Gartmore Global Natural Resources Fund Institutional Class (b) | | 25,308 | | | 455,803 |
Gartmore Global Technology and Communications Fund Institutional Class (b) | | 125,942 | | | 477,320 |
Gartmore Global Utilities Fund Institutional Class (b) | | 22,429 | | | 277,227 |
Gartmore International Growth Fund Institutional Class (b) | | 47,328 | | | 464.286 |
Gartmore Mid Cap Growth Fund Institutional Class (b) | | 17,818 | | | 279,202 |
Gartmore Nationwide Fund Institutional Class (b) | | 54,832 | | | 1,138,314 |
Gartmore Small Cap Fund Institutional Class (b) | | 30,179 | | | 559,814 |
Gartmore U.S. Growth Leaders Fund Institutional Class (b) | | 75,108 | | | 759,339 |
Gartmore U.S. Growth Leaders Long-Short Fund Institutional Class (b) | | 59,046 | | | 581,606 |
iShares Cohen & Steers Realty Majors Index Fund | | 5,325 | | | 382,868 |
| | | | |
|
|
| | | | | | 7,454,284 |
| | | | |
|
|
| | | | | | |
| | | Shares | | Value | |
| | | | | | | |
Fixed Income Funds (20.4%) | | | | | | |
Gartmore Bond Fund Institutional Class (b) | | 130,630 | | $ | 1,247,520 | |
Gartmore Convertible Fund Institutional Class (b) | | 37,607 | | | 380,963 | |
Gartmore High Yield Bond Fund Institutional Class (b) | | 41,889 | | | 284,842 | |
| | | | |
|
|
|
| | | | | | 1,913,325 | |
| | | | |
|
|
|
| | |
Total Mutual Funds | | | | | 9,367,609 | |
| | | | |
|
|
|
| |
Total Investments
(Cost $9,156,749) (a) — 100.1% | | | 9,367,609 | |
| |
Liabilities in excess of other
assets — (0.1)% | | | (5,992 | ) |
| | | | |
|
|
|
| | |
NET ASSETS — 100.0% | | | | $ | 9,361,617 | |
| | | | |
|
|
|
| | (a) | See notes to financial statements for tax unrealized appreciation (depreciation) of securities. |
| | (b) | Investment in affiliate. |
See notes to financial statements.
Gartmore Optimal Allocations Fund: Moderate
For the annual period ended Oct. 31, 2005, the Gartmore Optimal Allocations Fund: Moderate (Class A at NAV) returned 10.41% versus 7.56% for its composite benchmark, which consists of 40% S&P 500® Index, 20% Morgan Stanley Capital International Europe, Australasia and Far East (MSCI EAFE®) Index and 40% Lehman Brothers U.S. Aggregate Index. For broader comparison, the average return for the Fund’s Lipper peer category of Balanced Funds was 6.81%.
The Fund is a diversified “fund of funds” designed to serve as a moderate investor’s total asset allocation solution. Its institutional-quality design was developed by Ibbotson Associates, a leading asset allocation authority. The Fund invests in a diverse set of underlying funds with an allocation mix that has been designed to expand the “efficient frontier”—the line on a risk-reward graph representing the most efficient combination of various asset classes to achieve the highest possible return for a given level of risk. In other words, by incorporating a combination of diverse asset classes that behave differently under various market conditions, it is possible for the Fund to achieve higher risk-adjusted returns than those that could be achieved with a nondiversified portfolio.
The Fund’s allocations are reviewed quarterly by Ibbotson and Gartmore, and are subject to change. On Oct. 1, 2005, several changes took effect, including the addition of an allocation to the Gartmore High Yield Bond Fund, the Gartmore Short Duration Bond Fund, the Gartmore Global Natural Resources Fund and the Gartmore Global Technology and Communications Fund. At the same time, the Gartmore Government Bond Fund, which at that point had posted a gain of 2.41%, was removed to allow for a higher allocation to the Gartmore Bond Fund as well as the addition of the Gartmore High Yield Bond Fund and the Gartmore Short Duration Bond Fund. Gartmore implemented these underlying fund changes in the belief that they would enhance the overall diversification of the Fund and improve the Fund’s risk-return profile. The Gartmore Optimal Allocations Fund: Moderate is currently invested in 17 underlying funds.
| | | | |
| Fund Allocations* | | Target
Allocation | | 12-Month
Returns of
Underlying
Funds* |
| Gartmore Bond Fund | | 23% | | 2.30% |
| Gartmore Nationwide Fund | | 11% | | 12.19% |
| Gartmore Government Bond Fund*** | | 10% | | 2.41% |
| Gartmore Global Financial Services Fund | | 8% | | 15.20% |
| Gartmore U.S. Growth Leaders Long-Short Fund | | 7% | | 6.27% |
| Gartmore Convertible Fund | | 6% | | 6.50% |
| Gartmore High Yield Bond Fund** | | 5% | | -1.38% |
| Gartmore International Growth Fund | | 5% | | 26.36% |
| Gartmore Global Natural Resources Fund** | | 5% | | -4.71% |
| iShares Cohen & Steers Realty Majors Index Fund | | 5% | | 18.94% |
| Gartmore Global Health Sciences Fund | | 4% | | 16.90% |
| Gartmore Global Utilities Fund | | 4% | | 18.62% |
| Gartmore Mid Cap Growth Fund | | 4% | | 14.79% |
| Gartmore U.S. Growth Leaders Fund | | 4% | | 17.69% |
| Gartmore Money Market Fund | | 3% | | 2.41% |
| Gartmore Global Technology and Communications Fund** | | 2% | | -0.79% |
| Gartmore Short Duration Bond Fund** | | 2% | | 0.07% |
| Gartmore Small Cap Fund | | 2% | | 31.93% |
Funds in italics were added on 10/1/05.
| * | Fund allocations and Institutional Share Class returns as of 10/31/05. |
| ** | New fund added effective 10/1/05; performance represents one-month period through 10/31/05. |
| *** | Fund removed effective 10/1/05; performance represents 11-month period through 9/30/05. |
Gartmore Optimal Allocations Fund: Moderate
Continued
The reporting period ended Oct. 31, 2005, witnessed considerable volatility in the global equity markets, beginning with a broad rally in the final two months of 2004. As the new year began, however, concerns about slackened economic growth, the onset of inflation, increasing interest rates and spiraling energy costs led to a far less favorable environment for stocks, leaving most markets on the defensive. In varying degrees, these concerns would continue to plague the equity market for the remainder of the fiscal year. The overall global economy nonetheless proved resilient. The U.S. economy grew at a faster pace during the fiscal third quarter than initially anticipated, signaling improving economic health. From July through September, gross domestic product, the broadest measure of U.S. economic activity, grew 4.3%. For the reporting period, the MSCI EAFE Index returned 18.59% and the S&P 500 Index was up 8.72%.
The Federal Reserve Board continued its measured increases of short-term interest rates, despite speculation that the moves would halt amid spiking energy costs. Throughout the reporting period, the rate rose from 1.75% to 3.75% as a result of eight consecutive 0.25% increases. The housing market remained strong, with 30-year fixed mortgage rates remaining below 6% for the majority of the reporting period. Confounding expectations amid Hurricanes Katrina and Rita and rising energy costs, existing home sales advanced to an all-time high of 2% in August.
Equity prices in the United States somewhat disappointed, reflecting stretched valuations and consumer uncertainty, compared with stronger performance in Europe and Japan. Emerging-market economies were quite healthy, with Latin America delivering notably robust performance due to strong commodity prices.
In the latter part of the reporting period, the economies of Japan and Europe, including the United Kingdom, improved due to strong corporate profitability and expectations of higher levels of merger-and-acquisition activity. Europe was buoyed by export growth on the back of the weak euro. In Japan, meanwhile, rising real incomes and capital expenditure led to hopes of a recovery. Expectations rose when Prime Minister Junichiro Koizumi achieved a resounding victory in parliamentary elections, which gave his government a solid mandate for reform.
Among the underlying funds in the portfolio during the entire reporting period, the best performers were the Gartmore Small Cap Fund, the Gartmore International Growth Fund and the iShares Cohen & Steers Realty Majors Index Fund, which returned 31.93%, 26.36% and 18.94%, respectively.
Conversely, the weakest performers were the Gartmore Bond Fund and the Gartmore Money Market Fund, which returned 2.30% and 2.41%, respectively.
Looking ahead, we believe that this Fund is positioned to deliver higher returns than those of its blended benchmark, while generating a marginally higher risk level. The returns are expected to be derived from greater diversification that is achieved by allocating assets across different underlying funds representing a broad range of asset classes that are not highly correlated.
Portfolio Manager:
Young Chin
| | |
Fund Performance | | Gartmore Optimal Allocations Fund: Moderate |
Average Annual Total Return
(For periods ended October 31, 2005)
| | | | | | |
| | | | | 1 Yr. | | Inception1 |
| Class A | | w/o SC2 | | 10.41% | | 10.23% |
| | | w/SC3 | | 4.06% | | 5.47% |
| Class B | | w/o SC2 | | 9.13% | | 8.81% |
| | | w/SC4 | | 4.13% | | 5.89% |
| Class C | | w/o SC2 | | 9.50% | | 9.08% |
| | | w/SC5 | | 8.50% | | 9.08% |
| Class R6 | | 9.94% | | 9.49% |
| Institutional Class6 | | 10.54% | | 10.17% |
| Institutional Service Class6 | | 10.39% | | 10.06% |
All figures showing the effect of a sales charge reflect the maximum charge possible, because it has the most dramatic effect on performance data.
| 1 | Fund commenced operations on June 29, 2004. |
| 2 | These returns do not reflect the effects of sales charges (SC). |
| 3 | A 5.75% front-end sales charge was deducted. |
| 4 | A 5.00% contingent deferred sales charge (CDSC) was deducted. The CDSC declines to 1% after 6 years. |
| 5 | A CDSC of 1.00% was deducted because it is charged when you sell Class C shares within the first year after purchase. |
| 6 | Not subject to any sales charges. |
Performance of a $10,000 Investment
Investment return and principal value will fluctuate, and when redeemed, shares may be worth more or less than original cost. Past performance is no guarantee of future results and does not reflect the deduction of taxes that a shareholder would pay on fund distributions or the redemption of fund shares. Investing in mutual funds involves market risk, including loss of principal. Performance returns assume the reinvestment of all distributions.
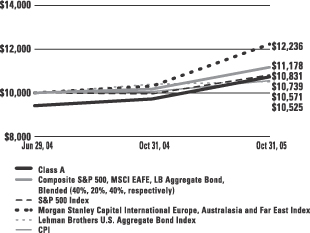
Comparative performance of $10,000 invested in Class A shares of the Gartmore Optimal Allocations Fund: Moderate, the Optimal Allocations Moderate Composite Index (Composite)(a), S&P 500 Index (S&P 500)(b), Morgan Stanley Capital International Europe, Australasia, and Far East Index (MSCI EAFE)(c), Lehman Brothers Aggregate Bond Index (LB Aggregate Bond)(d), and the Consumer Price Index (CPI)(e) since inception. Unlike the Fund, the returns for these unmanaged indexes do not reflect any fees, expenses, or sales charges. Investors cannot invest directly in market indexes.
| (a) | The Optimal Allocation Moderate Composite is an unmanaged, hypothetical representation of the performance of each of the Fund’s asset classes according to their respective weightings. The composite is a combination of the S&P 500 (40%), the MSCI EAFE (20%) and the LB Aggregate Bond (40%). |
| (b) | The S&P 500 is an unmanaged index of 500 widely held stocks of large U.S. companies that gives a broad look at how the stock prices of large U.S. companies have performed. |
| (c) | The MSCI EAFE is an unmanaged, market capitalization-weighted index that is designed to represent the performance of developed stock markets outside the United States and Canada. |
| (d) | The LB Aggregate Bond is an unmanaged, market value-weighted index of investment grade fixed-rate debt issues including government, corporate, asset-backed and mortgage-backed securities with maturities of one year or more. |
| (e) | The CPI represents changes in prices of a basket of goods and services purchased for consumption by urban households. |
| | |
Shareholder Expense Example | | Gartmore Optimal Allocations Fund: Moderate |
As a shareholder of the Fund, you incur two types of costs: (1) transaction costs, including sales charges (loads) paid on purchase payments and redemption fees; and (2) ongoing costs, including investment advisory fees, administration fees, distribution fees and other Fund expenses. The examples below are intended to help you understand your ongoing costs (in dollars) of investing in the Fund and to compare these costs with the ongoing costs of investing in other mutual funds. Per SEC requirements, the examples assume that you had a $1,000 investment in the Class at the beginning of the reporting period, May 1, 2005, and continued to hold your shares at the end of the reporting period, October 31, 2005.
Actual Expenses
For each Class of the Fund in the table below, the first line provides information about actual account values and actual expenses. You may use the information in this line, together with the amount you invested, to estimate the expenses that you paid over the period. Simply divide your account value by $1,000 (for example, an $8,600 account value divided by $1,000 = 8.6), then multiply the result by the number in the first line of each Class under the heading entitled “Expenses Paid During Period” to estimate the expenses you paid on your account during the period.
Hypothetical Example for Comparison Purposes
The second line of each Class in the table below provides information about hypothetical account values and hypothetical expenses based on the Class’ actual expense ratio and an assumed rate of return of 5% per year before expenses, which is not the Class’ actual return. The hypothetical account values and expenses may not be used to estimate the actual ending account balance or expenses you paid for the period. You may use this information to compare the ongoing costs of investing in the Class of the Fund and other funds. To do so, compare this 5% hypothetical example with the 5% hypothetical examples that appear in the shareholder reports of the other funds.
Please note that the expenses shown in the table are meant to highlight your ongoing costs only and do not reflect any transaction costs, such as sales charges (loads) or redemption fees. Therefore, the second line for each Class in the table is useful in comparing ongoing costs only, and will not help you determine the relative total costs of owning different funds. In addition, if these transaction costs were included, your costs would have been higher. The examples also assume all dividends and distributions have been reinvested.
Schedule of Shareholder Expenses
Expense Analysis of a $1,000 Investment
(October 31, 2005)
| | | | | | | | | | | | | | |
| Optimal Allocations: Moderate Fund | | | | | Beginning
Account Value,
5/1/05 | | Ending
Account Value,
10/31/05 | | Expenses Paid
During Period*2 | | Annualized
Expense Ratio*2 |
| Class A | | Actual | | | $ | 1,000.00 | | $ | 1,060.80 | | $ | 2.70 | | 0.52% |
| | | Hypothetical | 1 | | $ | 1,000.00 | | $ | 1,022.38 | | $ | 2.65 | | 0.52% |
| Class B | | Actual | | | $ | 1,000.00 | | $ | 1,056.50 | | $ | 5.18 | | 1.00% |
| | | Hypothetical | 1 | | $ | 1,000.00 | | $ | 1,018.70 | | $ | 6.38 | | 1.25% |
| Class C | | Actual | | | $ | 1,000.00 | | $ | 1,056.80 | | $ | 6.48 | | 1.25% |
| | | Hypothetical | 1 | | $ | 1,000.00 | | $ | 1,018.70 | | $ | 6.38 | | 1.25% |
| Class R | | Actual | | | $ | 1,000.00 | | $ | 1,059.40 | | $ | 3.84 | | 0.74% |
| | | Hypothetical | 1 | | $ | 1,000.00 | | $ | 1,021.27 | | $ | 3.78 | | 0.74% |
| Institutional Service Class | | Actual | | | $ | 1,000.00 | | $ | 1,062.00 | | $ | 1.72 | | 0.33% |
| | | Hypothetical | 1 | | $ | 1,000.00 | | $ | 1,023.34 | | $ | 1.68 | | 0.33% |
| Institutional Class | | Actual | | | $ | 1,000.00 | | $ | 1,061.90 | | $ | 1.30 | | 0.25% |
| | | Hypothetical | 1 | | $ | 1,000.00 | | $ | 1,023.74 | | $ | 1.28 | | 0.25% |
| * | Expenses are equal to the Fund’s annualized expense ratio multiplied by the average account value over the period multiplied by 184/365 (to reflect the one-half year period). The expense ratio presented represents a six month, annualized ratio in accordance with SEC guidelines. |
| 1 | Represents the hypothetical 5% return before expenses. |
| 2 | Expenses are based on the direct expenses of the Fund and do not include the effect of the underlying Funds’ expenses, which are disclosed in the Fee and Expense table and described more fully in a footnote to that table in your Fund prospectus. |
| | |
Portfolio Summary | | Gartmore Optimal Allocations Fund: Moderate |
The SEC adopted a requirement that Funds present their portfolio holdings in a table, chart or graph format in their annual and semiannual reports to shareholders, whether or not a statement of investments is utilized. The following tables, which present portfolio holdings as a percentage of net assets, are provided in compliance with this requirement.
| | |
| Asset Allocation | | |
| Mutual Funds | | 99.8% |
| Other assets in excess of liabilities | | 0.2% |
| | |
|
| | | 100.0% |
| | |
| Asset Allocation Detail | | |
| Equity Funds | | 60.6% |
| Fixed Income Funds | | 36.2% |
| Money Market Funds | | 3.0% |
| Other | | 0.2% |
| | |
|
| | | 100% |
| | |
| Top Holdings | | |
| Gartmore Bond Fund Institutional Class | | 23.2% |
| Gartmore Nationwide Fund Institutional Class | | 10.9% |
| Gartmore Global Financial Services Fund Institutional Class | | 8.1% |
| Gartmore U.S. Growth Leaders Long-Short Fund Institutional Class | | 7.1% |
| Gartmore Convertible Fund Institutional Class | | 6.0% |
| iShares Cohen & Steers Realty Majors Index Fund | | 5.1% |
| Gartmore High Yield Bond Fund Institutional Class | | 5.0% |
| Gartmore International Growth Fund Institutional Class | | 4.9% |
| Gartmore Global Natural Resources Fund Institutional Class | | 4.8% |
| Gartmore U.S. Growth Leaders Fund Institutional Class | | 4.0% |
| Other Mutual Funds | | 20.9% |
| | |
|
| | | 100.0% |
Statement of Investments
October 31, 2005
Gartmore Optimal Allocations Fund: Moderate
| | | | | |
| | | Shares | | Value |
| | | | | | |
Equity Funds (60.6%) | | | | | |
Gartmore Global Financial Services Fund Institutional Class (b) | | 88,063 | | $ | 1,187,092 |
Gartmore Global Health Sciences Fund Institutional Class (b) | | 48,512 | | | 571,957 |
Gartmore Global Natural Resources Fund Institutional Class (b) | | 38,903 | | | 700,646 |
Gartmore Global Technology and Communications Fund Institutional Class (b) | | 77,276 | | | 292,876 |
Gartmore Global Utilities Fund Institutional Class (b) | | 45,962 | | | 568,091 |
Gartmore International Growth Fund Institutional Class (b) | | 72,774 | | | 713,914 |
Gartmore Mid Cap Growth Fund Institutional Class (b) | | 36,490 | | | 571,806 |
Gartmore Nationwide Fund Institutional Class (b) | | 77,287 | | | 1,604,473 |
Gartmore Small Cap Fund Institutional Class (b) | | 15,534 | | | 288,154 |
Gartmore U.S. Growth Leaders Fund Institutional Class (b) | | 57,753 | | | 583,881 |
Gartmore U.S. Growth Leaders Long-Short Fund Institutional Class (b) | | 105,916 | | | 1,043,273 |
iShares Cohen & Steers Realty Majors Index Fund | | 10,412 | | | 748,623 |
| | | | |
|
|
| | | | | | 8,874,786 |
| | | | |
|
|
| | | | | |
| | | Shares | | Value |
| | | | | | |
Fixed Income Funds (36.2%) | | | | | |
Gartmore Bond Fund Institutional Class (b) | | 355,392 | | $ | 3,393,994 |
Gartmore Convertible Fund Institutional Class (b) | | 86,722 | | | 878,490 |
Gartmore High Yield Bond Fund Institutional Class (b) | | 107,322 | | | 729,792 |
Gartmore Short Duration Bond Fund Institutional Class (b) | | 30,117 | | | 296,050 |
| | | | |
|
|
| | | | | | 5,298,326 |
| | | | |
|
|
Money Market Funds (3.0%) | | | | | |
Gartmore Money Market Fund Institutional Class (b) | | 445,183 | | | 445,183 |
| | | | |
|
|
| | |
Total Mutual Funds | | | | | 14,618,295 |
| | | | |
|
|
| | |
Total Investments
(Cost $14,499,431) (a) — 99.8% | | | | | 14,618,295 |
| | |
Other assets in excess of
liabilities — 0.2% | | | | | 33,409 |
| | | | |
|
|
| | |
NET ASSETS — 100.0% | | | | $ | 14,651,704 |
| | | | |
|
|
| | (a) | See notes to financial statements for tax unrealized appreciation (depreciation) of securities. |
| | (b) | Investment in affiliate. |
See notes to financial statements.
Gartmore Optimal Allocations Fund: Specialty
For the annual period ended Oct. 31, 2005, the Gartmore Optimal Allocations Fund: Specialty (Class A at NAV) returned 14.59% versus 11.50% for its composite benchmark, which consists of 70% S&P 500® Index and 30% Morgan Stanley Capital International Europe, Australasia and Far East (MSCI EAFE®) Index. For broader comparison, the average return for the Fund’s Lipper peer category of Specialty/Miscellaneous Funds was 8.36%.
The Fund is a diversified “fund of funds” designed to serve as an alpha-enhancing supplement to an investor’s core portfolio. Its institutional-quality design was developed by Ibbotson Associates, a leading asset allocation authority. The Fund invests in a diverse set of underlying funds with an allocation mix that has been designed to expand the “efficient frontier”—the line on a risk-reward graph representing the most efficient combination of various asset classes to achieve the highest possible return for a given level of risk. In other words, by incorporating a combination of diverse asset classes that behave differently under various market conditions, it is possible for the Fund to achieve higher risk-adjusted returns than those that could be achieved with a nondiversified portfolio.
The Fund’s allocations are reviewed quarterly by Ibbotson and Gartmore, and are subject to change. On Oct. 1, 2005, several changes took effect, including the addition of an allocation to the Gartmore Global Natural Resources Fund. Gartmore implemented this underlying fund change in the belief that it would enhance the overall diversification of the Fund and improve the Fund’s risk-return profile. The Gartmore Optimal Allocations Fund: Specialty is currently invested in a set of nine underlying funds.
| | | | |
| Fund Allocations* | | Target
Allocation | | 12-Month
Returns of
Underlying
Funds* |
| Gartmore Global Financial Services Fund | | 19% | | 15.20% |
| Gartmore Emerging Markets Fund | | 14% | | 30.60% |
| Gartmore Global Health Sciences Fund | | 13% | | 16.90% |
| Gartmore U.S. Growth Leaders Long-Short Fund | | 12% | | 6.27% |
| Gartmore Micro Cap Equity Fund | | 12% | | 11.98% |
| iShares Cohen & Steers Realty Majors Index Fund | | 10% | | 18.94% |
Gartmore Global Technology and Communications Fund | | 7% | | 5.87% |
| | | | |
| Fund Allocations* | | Target
Allocation | | 12-Month
Returns of
Underlying
Funds* |
| Gartmore Global Natural Resources Fund** | | 7% | | -4.71% |
| Gartmore Global Utilities Fund | | 6% | | 18.62% |
Fund in italics was added on 10/1/05.
| * | Fund allocations and Institutional Share Class returns as of 10/31/05. |
| ** | New fund added effective 10/1/05; performance represents one-month period through 10/31/05. |
The reporting period ended Oct. 31, 2005, witnessed considerable volatility in the global equity markets, beginning with a broad rally in the final two months of 2004. As the new year began, however, concerns about slackened economic growth, the onset of inflation, increasing interest rates and spiraling energy costs led to a far less favorable environment for stocks, leaving most markets on the defensive. In varying degrees, these concerns would continue to plague the equity markets for the remainder of the fiscal year. The overall global economy nonetheless proved resilient. The U.S. economy grew at a faster pace during the fiscal third quarter than initially anticipated, signaling improving economic health. From July through September, gross domestic product, the broadest measure of U.S. economic activity, grew 4.3%. For the reporting period, the MSCI EAFE Index returned 18.59% and the S&P 500 Index was up 8.72%.
The Federal Reserve Board continued its measured increases of short-term interest rates, despite speculation that the moves would halt amid spiking energy costs. Throughout the reporting period, the rate rose from 1.75% to 3.75% as a result of eight consecutive 0.25% increases. The housing market remained strong, with 30-year fixed mortgage rates remaining below 6% for the majority of the reporting period. Confounding expectations amid Hurricanes Katrina and Rita and rising energy costs, existing home sales advanced to an all-time high of 2% in August.
Equity prices in the United States somewhat disappointed, reflecting stretched valuations and consumer uncertainty, compared with stronger performance in Europe and Japan. Emerging-market economies were quite healthy, with Latin America delivering notably robust performance due to strong commodity prices.
In the latter part of the reporting period, the economies of Japan and Europe, including the United Kingdom, improved due to strong corporate profitability and
Gartmore Optimal Allocations Fund: Specialty
Continued
expectations of higher levels of merger-and-acquisition activity. Europe was buoyed by export growth on the back of the weak euro. In Japan, meanwhile, rising real incomes and capital expenditure led to hopes of a recovery. Expectations rose when Prime Minister Junichiro Koizumi achieved a resounding victory in parliamentary elections, which gave his government a solid mandate for reform.
Among the underlying funds in the portfolio during the entire reporting period, the best performers were the Gartmore Emerging Markets Fund, the iShares Cohen & Steers Realty Majors Index Fund and the Gartmore Global Utilities Fund, which returned 30.60%, 18.94% and 18.62%, respectively.
Conversely, the weakest performers were the Gartmore Global Technology and Communications Fund and the Gartmore U.S. Growth Leaders Long-Short Fund, which returned 5.87% and 6.27%, respectively.
Looking ahead, we believe that this Fund is positioned to deliver higher returns than those of its blended benchmark, while generating a marginally higher risk level. The returns are expected to be derived from greater diversification that is achieved by allocating assets across different underlying funds, representing a broad range of asset classes that are not highly correlated.
Portfolio Manager:
Young Chin
| | |
Fund Performance | | Gartmore Optimal Allocations Fund: Specialty |
Average Annual Total Return
(For periods ended October 31, 2005)
| | | | | | |
| | | | | 1 Yr. | | Inception1 |
| Class A | | w/o SC2 | | 14.59% | | 13.50% |
| | | w/SC3 | | 8.01% | | 8.59% |
| Class B | | w/o SC2 | | 13.89% | | 12.65% |
| | | w/SC4 | | 8.89% | | 9.77% |
| Class C | | w/o SC2 | | 13.90% | | 12.66% |
| | | w/SC5 | | 12.90% | | 12.66% |
| Class R6 | | 14.36% | | 13.16% |
| Institutional Class6 | | 15.07% | | 13.86% |
| Institutional Service Class6 | | 14.92% | | 13.74% |
All figures showing the effect of a sales charge reflect the maximum charge possible, because it has the most dramatic effect on performance data.
| 1 | Fund commenced operations on June 29, 2004. |
| 2 | These returns do not reflect the effects of sales charges (SC). |
| 3 | A 5.75% front-end sales charge was deducted. |
| 4 | A 5.00% contingent deferred sales charge (CDSC) was deducted. The CDSC declines to 1% after 6 years. |
| 5 | A CDSC of 1.00% was deducted because it is charged when you sell Class C shares within the first year after purchase. |
| 6 | Not subject to any sales charges. |
Performance of a $10,000 Investment
Investment return and principal value will fluctuate, and when redeemed, shares may be worth more or less than original cost. Past performance is no guarantee of future results and does not reflect the deduction of taxes that a shareholder would pay on fund distributions or the redemption of fund shares. Investing in mutual funds involves market risk, including loss of principal. Performance returns assume the reinvestment of all distributions.
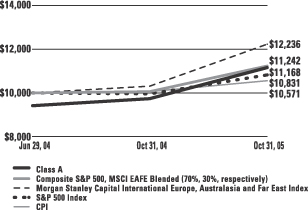
Comparative performance of $10,000 invested in Class A shares of the Gartmore Optimal Allocations Fund: Specialty, the Optimal Allocations Specialty Composite Index (Composite)(a), S&P 500 Index (S&P 500)(b), Morgan Stanley Capital International Europe, Australasia, and Far East Index (MSCI EAFE)(c), and the Consumer Price Index (CPI)(d) since inception. Unlike the Fund, the returns for these unmanaged indexes do not reflect any fees, expenses, or sales charges. Investors cannot invest directly in market indexes.
| (a) | The Optimal Allocation Specialty Composite is an unmanaged, hypothetical representation of the performance of each of the Fund’s asset classes according to their respective weightings. The composite is a combination of the S&P 500 (70%) and the MSCI EAFE (30%). |
| (b) | The S&P 500 is an unmanaged index of 500 widely held stocks of large U.S. companies that gives a broad look at how the stock prices of large U.S. companies have performed. |
| (c) | The MSCI EAFE is an unmanaged, market capitalization-weighted index that is designed to represent the performance of developed stock markets outside the United States and Canada. |
| (d) | The CPI represents changes in prices of a basket of goods and services purchased for consumption by urban households. |
| | |
Shareholder Expense Example | | Gartmore Optimal Allocations Fund: Specialty |
As a shareholder of the Fund, you incur two types of costs: (1) transaction costs, including sales charges (loads) paid on purchase payments and redemption fees; and (2) ongoing costs, including investment advisory fees, administration fees, distribution fees and other Fund expenses. The examples below are intended to help you understand your ongoing costs (in dollars) of investing in the Fund and to compare these costs with the ongoing costs of investing in other mutual funds. Per SEC requirements, the examples assume that you had a $1,000 investment in the Class at the beginning of the reporting period, May 1, 2005, and continued to hold your shares at the end of the reporting period, October 31, 2005.
Actual Expenses
For each Class of the Fund in the table below, the first line provides information about actual account values and actual expenses. You may use the information in this line, together with the amount you invested, to estimate the expenses that you paid over the period. Simply divide your account value by $1,000 (for example, an $8,600 account value divided by $1,000 = 8.6), then multiply the result by the number in the first line of each Class under the heading entitled “Expenses Paid During Period” to estimate the expenses you paid on your account during the period.
Hypothetical Example for Comparison Purposes
The second line of each Class in the table below provides information about hypothetical account values and hypothetical expenses based on the Class’ actual expense ratio and an assumed rate of return of 5% per year before expenses, which is not the Class’ actual return. The hypothetical account values and expenses may not be used to estimate the actual ending account balance or expenses you paid for the period. You may use this information to compare the ongoing costs of investing in the Class of the Fund and other funds. To do so, compare this 5% hypothetical example with the 5% hypothetical examples that appear in the shareholder reports of the other funds.
Please note that the expenses shown in the table are meant to highlight your ongoing costs only and do not reflect any transaction costs, such as sales charges (loads) or redemption fees. Therefore, the second line for each Class in the table is useful in comparing ongoing costs only, and will not help you determine the relative total costs of owning different funds. In addition, if these transaction costs were included, your costs would have been higher. The examples also assume all dividends and distributions have been reinvested.
Schedule of Shareholder Expenses
Expense Analysis of a $1,000 Investment
(October 31, 2005)
| | | | | | | | | | | | | | |
| Optimal Allocations: Specialty Fund | | | | | Beginning
Account Value,
5/1/05 | | Ending
Account Value,
10/31/05 | | Expenses Paid
During Period*2 | | Annualized
Expense Ratio*2 |
| Class A | | Actual | | | $ | 1,000.00 | | $ | 1,099.50 | | $ | 2.75 | | 0.52% |
| | | Hypothetical | 1 | | $ | 1,000.00 | | $ | 1,022.38 | | $ | 2.65 | | 0.52% |
| Class B | | Actual | | | $ | 1,000.00 | | $ | 1,094.40 | | $ | 6.60 | | 1.25% |
| | | Hypothetical | 1 | | $ | 1,000.00 | | $ | 1,018.70 | | $ | 6.38 | | 1.25% |
| Class C | | Actual | | | $ | 1,000.00 | | $ | 1,095.50 | | $ | 6.60 | | 1.25% |
| | | Hypothetical | 1 | | $ | 1,000.00 | | $ | 1,018.70 | | $ | 6.38 | | 1.25% |
| Class R | | Actual | | | $ | 1,000.00 | | $ | 1,098.00 | | $ | 4.39 | | 0.83% |
| | | Hypothetical | 1 | | $ | 1,000.00 | | $ | 1,020.82 | | $ | 4.24 | | 0.83% |
| Institutional Service Class | | Actual | | | $ | 1,000.00 | | $ | 1,100.10 | | $ | 1.75 | | 0.33% |
| | | Hypothetical | 1 | | $ | 1,000.00 | | $ | 1,023.34 | | $ | 1.68 | | 0.33% |
| Institutional Class | | Actual | | | $ | 1,000.00 | | $ | 1,101.00 | | $ | 1.32 | | 0.25% |
| | | Hypothetical | 1 | | $ | 1,000.00 | | $ | 1,023.74 | | $ | 1.28 | | 0.25% |
| * | Expenses are equal to the Fund’s annualized expense ratio multiplied by the average account value over the period multiplied by 184/365 (to reflect the one-half year period). The expense ratio presented represents a six month, annualized ratio in accordance with SEC guidelines. |
| 1 | Represents the hypothetical 5% return before expenses. |
| 2 | Expenses are based on the direct expenses of the Fund and do not include the effect of the underlying Funds’ expenses, which are disclosed in the Fee and Expense table and described more fully in a footnote to that table in your Fund prospectus. |
| | |
Portfolio Summary | | Gartmore Optimal Allocations Fund: Specialty |
The SEC adopted a requirement that Funds present their portfolio holdings in a table, chart or graph format in their annual and semiannual reports to shareholders, whether or not a statement of investments is utilized. The following tables, which present portfolio holdings as a percentage of net assets, are provided in compliance with this requirement.
| | |
| Asset Allocation | | |
| Mutual Funds | | 100.1% |
| Liabilities in excess of other assets | | -0.1 % |
| | |
|
| | | 100.0% |
| | |
| Asset Allocation Detail | | |
| Equity Funds | | 100.1% |
| Other | | -0.1 % |
| | |
|
| | | 100.0% |
| | |
| Top Holdings | | |
| Gartmore Global Financial Services Fund Institutional Class | | 19.7% |
| Gartmore Emerging Markets Fund Institutional Class | | 13.4% |
| Gartmore Global Health Sciences Fund Institutional Class | | 12.9% |
| Gartmore U.S. Growth Leaders Long-Short Fund Institutional Class | | 12.4% |
| Gartmore Micro Cap Equity Fund Institutional Class | | 11.7% |
| iShares Cohen & Steers Realty Majors Index Fund | | 10.2% |
| Gartmore Global Technology and Communications Fund Institutional Class | | 7.1% |
| Gartmore Global Natural Resources Fund Institutional Class | | 6.8% |
| Gartmore Global Utilities Fund Institutional Class | | 5.9% |
| Other | | -0.1 % |
| | |
|
| | | 100.0% |
Statement of Investments
October 31, 2005
Gartmore Optimal Allocations Fund: Specialty
| | | | | |
| | | Shares | | Value |
| | | | | | |
Equity Funds (100.1%) | | | | | |
Gartmore Emerging Markets Fund Institutional Class (b) | | 146,070 | | $ | 2,211,503 |
Gartmore Global Financial Services Fund Institutional Class (b) | | 239,706 | | | 3,231,238 |
Gartmore Global Health Sciences Fund Institutional Class (b) | | 180,444 | | | 2,127,431 |
Gartmore Global Natural Resources Fund Institutional Class (b) | | 62,332 | | | 1,122,602 |
Gartmore Global Technology and Communications Fund Institutional Class (b) | | 310,298 | | | 1,176,031 |
Gartmore Global Utilities Fund Institutional Class (b) | | 78,878 | | | 974,927 |
Gartmore Micro Cap Equity Fund Institutional Class (b) | | 89,543 | | | 1,938,597 |
| | | | | | |
| | | Shares | | Value | |
| | | | | | | |
Equity Funds (continued) | | | | | | |
Gartmore U.S. Growth Leaders Long-Short Fund Institutional Class (b) | | 207,952 | | $ | 2,048,330 | |
iShares Cohen & Steers Realty Majors Index Fund | | 23,424 | | | 1,684,186 | |
| | | | |
|
|
|
| | |
Total Mutual Funds | | | | | 16,514,845 | |
| | | | |
|
|
|
| |
Total Investments
(Cost $15,840,993) (a) — 100.1% | | | 16,514,845 | |
| |
Liabilities in excess of other
assets — (0.1)% | | | (9,135 | ) |
| | | | |
|
|
|
| | |
NET ASSETS — 100.0% | | | | $ | 16,505,710 | |
| | | | |
|
|
|
| | (a) | See notes to financial statements for tax unrealized appreciation (depreciation) of securities. |
| | (b) | Investment in affiliate. |
See notes to financial statements.
Statements of Assets and Liabilities
October 31, 2005
| | | | | | | | |
| | | Gartmore Optimal
Allocations
Fund: Aggressive | | Gartmore Optimal Allocations Fund - Moderately Aggressive |
Assets: | | | | | | | | |
Investments, at value (cost $145,531 and $360,400, respectively) | | $ | 163,069 | | $ | 382,868 | | |
Investment in affiliates, at value (cost $3,531,021 and $8,796,349 respectively) | | | 3,684,166 | | | 8,984,741 | | |
| | |
|
| |
|
| | |
Total Investments | | | 3,847,235 | | | 9,367,609 | | |
| | |
|
| |
|
| | |
Cash | | | — | | | 527 | | |
Interest and dividends receivable | | | — | | | 6,442 | | |
Receivable for capital shares issued | | | 21,745 | | | 68,245 | | |
Receivable for investments sold | | | 92 | | | 139 | | |
Prepaid expenses and other assets | | | 13,367 | | | 21,011 | | |
| | |
|
| |
|
| | |
Total Assets | | | 3,882,439 | | | 9,463,973 | | |
| | |
|
| |
|
| | |
| | | |
Liabilities: | | | | | | | | |
Payable to adviser | | | 8,422 | | | 6,344 | | |
Payable to custodian | | | 92 | | | — | | |
Payable for investments purchased | | | 2,244 | | | 84,891 | | |
Payable for capital shares redeemed | | | 281 | | | 281 | | |
Accrued expenses and other payables | | | | | | | | |
Investment advisory fees | | | 479 | | | 1,132 | | |
Distribution fees | | | 1,592 | | | 4,537 | | |
Administrative servicing fees | | | 152 | | | 303 | | |
Trustee fees | | | 10 | | | 17 | | |
Other | | | 2,085 | | | 4,851 | | |
| | |
|
| |
|
| | |
Total Liabilities | | | 15,357 | | | 102,356 | | |
| | |
|
| |
|
| | |
Net Assets | | $ | 3,867,082 | | $ | 9,361,617 | | |
| | |
|
| |
|
| | |
| | | |
Represented by: | | | | | | | | |
Capital | | $ | 3,620,666 | | $ | 8,988,806 | | |
Accumulated net investment income (loss) | | | — | | | — | | |
Accumulated net realized gains (losses) on investment transactions | | | 75,733 | | | 161,951 | | |
Net unrealized appreciation (depreciation) on investments | | | 170,683 | | | 210,860 | | |
| | |
|
| |
|
| | |
Net Assets | | $ | 3,867,082 | | $ | 9,361,617 | | |
| | |
|
| |
|
| | |
| | | | | | | | | |
| | | | | | | | | |
| | | | | | | | | |
| | | | | | | | | |
| | | | | | | | | |
| | | | | | | | | |
| | | | | | | | | |
| | | | | | | | | |
| | | | | | | | | |
| | | | | | | | | |
| | | | | | | | | |
| | | | | | | | | |
See notes to financial statements.
Statements of Assets and Liabilities (Continued)
October 31, 2005
| | | | | | | | | | |
| | | Gartmore Optimal
Allocations
Fund: Aggressive | | | Gartmore Optimal Allocations Fund - Moderately Aggressive |
Net Assets: | | | | | | | | | | |
Class A Shares | | $ | 998,122 | | | $ | 3,418,664 | | | |
Class B Shares | | | 189,113 | | | | 1,182,600 | | | |
Class C Shares | | | 1,517,049 | | | | 3,603,739 | | | |
Class R Shares | | | 1,162 | | | | 1,145 | | | |
Institutional Service Class Shares | | | 1,158 | | | | 1,153 | | | |
Institutional Class Shares | | | 1,160,478 | | | | 1,154,316 | | | |
| | |
|
|
| |
|
|
| | |
Total | | $ | 3,867,082 | | | $ | 9,361,617 | | | |
| | |
|
|
| |
|
|
| | |
| | | |
Shares outstanding (unlimited number of shares authorized) | | | | | | | | | | |
Class A Shares | | | 88,057 | | | | 304,963 | | | |
Class B Shares | | | 16,835 | | | | 106,102 | | | |
Class C Shares | | | 135,171 | | | | 323,436 | | | |
Class R Shares | | | 103 | | | | 102 | | | |
Institutional Service Class Shares | | | 102 | | | | 103 | | | |
Institutional Class Shares | | | 102,355 | | | | 102,786 | | | |
| | |
|
|
| |
|
|
| | |
Total | | | 342,623 | | | | 837,492 | | | |
| | |
|
|
| |
|
|
| | |
| | | |
Net asset value and redemption price per share: | | | | | | | | | | |
Class A Shares | | $ | 11.33 | | | $ | 11.21 | | | |
Class B Shares (a) | | $ | 11.23 | | | $ | 11.16 | (c) | | |
Class C Shares (b) | | $ | 11.22 | | | $ | 11.14 | | | |
Class R Shares | | $ | 11.31 | (c) | | $ | 11.21 | (c) | | |
Institutional Service Class Shares | | $ | 11.34 | (c) | | $ | 11.23 | (c) | | |
Institutional Class Shares | | $ | 11.35 | (c) | | $ | 11.23 | | | |
| | | |
Maximum offering price per share (100%/(100%-maximum sales charge) of net asset value adjusted to the nearest cent | | | | | | | | | | |
Class A Shares | | $ | 12.03 | | | $ | 11.90 | | | |
| | |
|
|
| |
|
|
| | |
Maximum Sales Charge — Class A Shares | | | 5.75 | % | | | 5.75 | % | | |
| | |
|
|
| |
|
|
| | |
| | | | | | | | | | | |
| | | | | | | | | | | |
| | | | | | | | | | | |
| | | | | | | | | | | |
| | | | | | | | | | | |
| | | | | | | | | | | |
| | | | | | | | | | | |
| | | | | | | | | | | |
| | | | | | | | | | | |
| | | | | | | | | | | |
| (a) | For Class B shares, the redemption price per share varies by length of time shares are held. |
| (b) | For Class C shares, the redemption price per share is reduced by 1.00% for shares held less than one year. |
| (c) | Due to rounding, Net Assets divided by Shares Outstanding does not equal the NAV. |
See notes to financial statements.
| | | | | | | | |
| | | Gartmore Optimal
Allocations
Fund: Moderate | | Gartmore Optimal Allocations Fund - Specialty |
Assets: | | | | | | | | |
Investments, at value (cost $715,974 and $1,571,581, respectively) | | $ | 748,623 | | $ | 1,684,186 | | |
Investment in affiliates, at value (cost $13,783,457 and $14,269,412 respectively) | | | 13,869,672 | | | 14,830,659 | | |
| | |
|
| |
|
| | |
Total Investments | | | 14,618,295 | | | 16,514,845 | | |
| | |
|
| |
|
| | |
Cash | | | 726 | | | 1,813 | | |
Interest and dividends receivable | | | 19,372 | | | — | | |
Receivable for capital shares issued | | | 71,326 | | | 82,041 | | |
Receivable for investments sold | | | 420 | | | — | | |
Prepaid expenses and other assets | | | 16,512 | | | 17,362 | | |
| | |
|
| |
|
| | |
Total Assets | | | 14,726,651 | | | 16,616,061 | | |
| | |
|
| |
|
| | |
| | | |
Liabilities: | | | | | | | | |
Payable to adviser | | | 6,500 | | | 3,787 | | |
Payable for investments purchased | | | 54,127 | | | 91,454 | | |
Payable for capital shares redeemed | | | 280 | | | 185 | | |
Accrued expenses and other payables | | | | | | | | |
Investment advisory fees | | | 1,779 | | | 2,007 | | |
Distribution fees | | | 8,106 | | | 9,322 | | |
Administrative servicing fees | | | 389 | | | 1,060 | | |
Trustee fees | | | 23 | | | 34 | | |
Other | | | 3,743 | | | 2,502 | | |
| | |
|
| |
|
| | |
Total Liabilities | | | 74,947 | | | 110,351 | | |
| | |
|
| |
|
| | |
Net Assets | | $ | 14,651,704 | | $ | 16,505,710 | | |
| | |
|
| |
|
| | |
| | | |
Represented by: | | | | | | | | |
Capital | | $ | 14,353,159 | | $ | 15,619,089 | | |
Accumulated net investment income (loss) | | | 8,998 | | | — | | |
Accumulated net realized gains (losses) on investment transactions | | | 170,683 | | | 212,768 | | |
Net unrealized appreciation (depreciation) on investments | | | 118,864 | | | 673,853 | | |
| | |
|
| |
|
| | |
Net Assets | | $ | 14,651,704 | | $ | 16,505,710 | | |
| | |
|
| |
|
| | |
| | | | | | | | | |
| | | | | | | | | |
| | | | | | | | | |
| | | | | | | | | |
| | | | | | | | | |
| | | | | | | | | |
| | | | | | | | | |
| | | | | | | | | |
| | | | | | | | | |
| | | | | | | | | |
| | | | | | | | | |
| | | | | | | | | |
See notes to financial statements.
Statements of Assets and Liabilities (Continued)
October 31, 2005
| | | | | | | | | | |
| | | Gartmore Optimal
Allocations
Fund: Moderate | | | Gartmore Optimal Allocations Fund - Specialty |
Net Assets: | | | | | | | | | | |
Class A Shares | | $ | 4,594,507 | | | $ | 5,132,561 | | | |
Class B Shares | | | 1,269,469 | | | | 981,751 | | | |
Class C Shares | | | 7,647,537 | | | | 9,199,884 | | | |
Class R Shares | | | 1,129 | | | | 1,190 | | | |
Institutional Service Class Shares | | | 1,136 | | | | 1,188 | | | |
Institutional Class Shares | | | 1,137,926 | | | | 1,189,136 | | | |
| | |
|
|
| |
|
|
| | |
Total | | $ | 14,651,704 | | | $ | 16,505,710 | | | |
| | |
|
|
| |
|
|
| | |
| | | |
Shares outstanding (unlimited number of shares authorized) | | | | | | | | | | |
Class A Shares | | | 416,112 | | | | 445,084 | | | |
Class B Shares | | | 116,191 | | | | 85,684 | | | |
Class C Shares | | | 699,382 | | | | 803,238 | | | |
Class R Shares | | | 102 | | | | 103 | | | |
Institutional Service Class Shares | | | 103 | | | | 103 | | | |
Institutional Class Shares | | | 103,037 | | | | 102,840 | | | |
| | |
|
|
| |
|
|
| | |
Total | | | 1,334,927 | | | | 1,437,052 | | | |
| | |
|
|
| |
|
|
| | |
| | | |
Net asset value and redemption price per share: | | | | | | | | | | |
Class A Shares | | $ | 11.04 | | | $ | 11.53 | | | |
Class B Shares (a) | | $ | 10.93 | | | $ | 11.46 | | | |
Class C Shares (b) | | $ | 10.93 | | | $ | 11.45 | | | |
Class R Shares | | $ | 11.02 | (c) | | $ | 11.54 | (c) | | |
Institutional Service Class Shares | | $ | 11.04 | (c) | | $ | 11.56 | (c) | | |
Institutional Class Shares | | $ | 11.04 | | | $ | 11.56 | | | |
| | | |
Maximum offering price per share (100%/(100%-maximum sales charge) of net asset value adjusted to the nearest cent | | | | | | | | | | |
Class A Shares | | $ | 11.72 | | | $ | 12.24 | | | |
| | |
|
|
| |
|
|
| | |
Maximum Sales Charge — Class A Shares | | | 5.75 | % | | | 5.75 | % | | |
| | |
|
|
| |
|
|
| | |
| | | | | | | | | | | |
| | | | | | | | | | | |
| | | | | | | | | | | |
| | | | | | | | | | | |
| | | | | | | | | | | |
| | | | | | | | | | | |
| | | | | | | | | | | |
| | | | | | | | | | | |
| | | | | | | | | | | |
| | | | | | | | | | | |
| (a) | For Class B shares, the redemption price per share varies by length of time shares are held. |
| (b) | For Class C shares, the redemption price per share is reduced by 1.00% for shares held less than one year. |
| (c) | Due to rounding, Net Assets divided by Shares Outstanding does not equal the NAV. |
See notes to financial statements.
Statements of Operations
For the Year Ended October 31, 2005
| | | | | | | | | | | | | | | | | | |
| | | Gartmore Optimal
Allocations
Fund: Aggressive | | | Gartmore Optimal Allocations Fund: Moderately Aggressive | | | Gartmore Optimal
Allocations
Fund: Moderate | | | Gartmore Optimal Allocations Fund - Specialty |
INVESTMENT INCOME: | | | | | | | | | | | | | | | | | | |
Dividend income | | $ | 4,348 | | | $ | 7,771 | | | $ | 12,804 | | | $ | 45,251 | | | |
Dividend income from affiliates | | | 31,945 | | | | 77,344 | | | | 133,311 | | | | 176,240 | | | |
| | |
|
|
| |
|
|
| |
|
|
| |
|
|
| | |
Total Income | | | 36,293 | | | | 85,115 | | | | 146,115 | | | | 221,491 | | | |
| | |
|
|
| |
|
|
| |
|
|
| |
|
|
| | |
| | | | | |
Expenses: | | | | | | | | | | | | | | | | | | |
Investment advisory fees | | | 3,626 | | | | 6,638 | | | | 8,887 | | | | 15,656 | | | |
Distribution fees Class A | | | 1,315 | | | | 3,272 | | | | 4,430 | | | | 8,310 | | | |
Distribution fees Class B | | | 1,560 | | | | 4,320 | | | | 5,264 | | | | 5,483 | | | |
Distribution fees Class C | | | 6,292 | | | | 15,777 | | | | 25,249 | | | | 54,274 | | | |
Distribution fees Class R | | | 4 | | | | 4 | | | | 4 | | | | 23 | | | |
Administrative servicing fees Class A | | | 149 | | | | 301 | | | | 385 | | | | 1,044 | | | |
Administrative servicing fees Class R | | | 2 | | | | 2 | | | | 2 | | | | 12 | | | |
Registration and filing fees | | | 74,425 | | | | 74,436 | | | | 74,429 | | | | 74,439 | | | |
Printing fees | | | 9,755 | | | | 17,578 | | | | 15,945 | | | | 27,124 | | | |
Trustee fees | | | 3 | | | | 64 | | | | 38 | | | | 293 | | | |
Other | | | 7,047 | | | | 8,635 | | | | 8,656 | | | | 13,503 | | | |
| | |
|
|
| |
|
|
| |
|
|
| |
|
|
| | |
Total expenses before reimbursed expenses | | | 104,178 | | | | 131,027 | | | | 143,289 | | | | 200,161 | | | |
Earnings credit (Note 4) | | | (15 | ) | | | (185 | ) | | | (39 | ) | | | (33 | ) | | |
Expenses reimbursed | | | (88,800 | ) | | | (96,103 | ) | | | (93,106 | ) | | | (104,891 | ) | | |
| | |
|
|
| |
|
|
| |
|
|
| |
|
|
| | |
Total Expenses | | | 15,363 | | | | 34,739 | | | | 50,144 | | | | 95,237 | | | |
| | |
|
|
| |
|
|
| |
|
|
| |
|
|
| | |
Net Investment Income (Loss) | | | 20,930 | | | | 50,376 | | | | 95,971 | | | | 126,254 | | | |
| | |
|
|
| |
|
|
| |
|
|
| |
|
|
| | |
| | | | | |
REALIZED/UNREALIZED GAINS (LOSSES) FROM INVESTMENTS: | | | | | | | | | | | | | | | | | | |
Net realized gains (losses) on investment transactions | | | 78,752 | | | | 158,774 | | | | 162,189 | | | | 222,076 | | | |
Net realized gains (losses) on investment transactions from affiliates | | | 13,066 | | | | 13,238 | | | | 8,494 | | | | 47,545 | | | |
| | |
|
|
| |
|
|
| |
|
|
| |
|
|
| | |
Net realized gains (losses) on investments | | | 91,818 | | | | 172,012 | | | | 170,683 | | | | 269,621 | | | |
Net change in unrealized appreciation/depreciation on investments | | | 161,909 | | | | 190,216 | | | | 93,915 | | | | 639,257 | | | |
| | |
|
|
| |
|
|
| |
|
|
| |
|
|
| | |
Net realized/unrealized gains (losses) on investments | | | 253,727 | | | | 362,228 | | | | 264,598 | | | | 908,878 | | | |
| | |
|
|
| |
|
|
| |
|
|
| |
|
|
| | |
CHANGE IN NET ASSETS RESULTING FROM OPERATIONS | | $ | 274,657 | | | $ | 412,604 | | | $ | 360,569 | | | $ | 1,035,132 | | | |
| | |
|
|
| |
|
|
| |
|
|
| |
|
|
| | |
| | | | | | | | | | | | | | | | | | | |
| | | | | | | | | | | | | | | | | | | |
| | | | | | | | | | | | | | | | | | | |
| | | | | | | | | | | | | | | | | | | |
| | | | | | | | | | | | | | | | | | | |
| | | | | | | | | | | | | | | | | | | |
| | | | | | | | | | | | | | | | | | | |
| | | | | | | | | | | | | | | | | | | |
| | | | | | | | | | | | | | | | | | | |
| | | | | | | | | | | | | | | | | | | |
| | | | | | | | | | | | | | | | | | | |
| | | | | | | | | | | | | | | | | | | |
See notes to financial statements.
Statements of Changes in Net Assets
| | | | | | | | | | | | | | | | | | |
| | | Gartmore Optimal Allocations Fund: Aggressive | | | Gartmore Optimal Allocations Fund - Moderately Aggressive
Gartmore Optimal Allocations Fund: Moderately Aggressive |
| | | Year Ended
October 31, 2005 | | | Period Ended
October 31, 2004 (a) | | | Year Ended
October 31, 2005 | | | Period Ended
October 31, 2004 (a) |
FROM INVESTMENT ACTIVITIES: | | | | | | | | | | | | | | | | | | |
Operations: | | | | | | | | | | | | | | | | | | |
Net investment income (loss) | | $ | 20,930 | | | $ | 497 | | | $ | 50,376 | | | $ | 2,795 | | | |
Net realized gains (losses) on investment transactions | | | 91,818 | | | | (964 | ) | | | 172,012 | | | | (329 | ) | | |
Net change in unrealized appreciation/depreciation on investment transactions | | | 161,909 | | | | 8,774 | | | | 190,216 | | | | 20,644 | | | |
| | |
|
|
| |
|
|
| |
|
|
| |
|
|
| | |
Change in net assets resulting from operations | | | 274,657 | | | | 8,307 | | | | 412,604 | | | | 23,110 | | | |
| | |
|
|
| |
|
|
| |
|
|
| |
|
|
| | |
| | | | | |
Distributions to Class A Shareholders from: | | | | | | | | | | | | | | | | | | |
Net investment income | | | (5,583 | ) | | | — | | | | (17,194 | ) | | | — | | | |
| | | | | |
Distributions to Class B Shareholders from: | | | | | | | | | | | | | | | | | | |
Net investment income | | | (2,024 | ) | | | — | | | | (2,886 | ) | | | — | | | |
| | | | | |
Distributions to Class C Shareholders from: | | | | | | | | | | | | | | | | | | |
Net investment income | | | (3,950 | ) | | | — | | | | (13,117 | ) | | | — | | | |
| | | | | |
Distributions to Class R Shareholders from: | | | | | | | | | | | | | | | | | | |
Net investment income | | | (23 | ) | | | — | | | | (26 | ) | | | — | | | |
| | | | | |
Distributions to Institutional Service Class Shareholders from: | | | | | | | | | | | | | | | | | | |
Net investment income | | | (25 | ) | | | — | | | | (30 | ) | | | — | | | |
| | | | | |
Distributions to Institutional Class Shareholders from: | | | | | | | | | | | | | | | | | | |
Net investment income | | | (25,377 | ) | | | — | | | | (30,095 | ) | | | — | | | |
| | |
|
|
| |
|
|
| |
|
|
| |
|
|
| | |
Change in net assets from shareholder distributions | | | (36,982 | ) | | | — | | | | (63,348 | ) | | | — | | | |
| | |
|
|
| |
|
|
| |
|
|
| |
|
|
| | |
Change in net assets from capital transactions | | | 2,612,976 | | | | 1,008,124 | | | | 7,901,251 | | | | 1,088,000 | | | |
| | |
|
|
| |
|
|
| |
|
|
| |
|
|
| | |
Change in net assets | | | 2,850,651 | | | | 1,016,431 | | | | 8,250,507 | | | | 1,111,110 | | | |
| | | | | |
Net Assets: | | | | | | | | | | | | | | | | | | |
Beginning of period | | | 1,016,431 | | | | — | | | | 1,111,110 | | | | — | | | |
| | |
|
|
| |
|
|
| |
|
|
| |
|
|
| | |
End of period | | $ | 3,867,082 | | | $ | 1,016,431 | | | $ | 9,361,617 | | | $ | 1,111,110 | | | |
| | |
|
|
| |
|
|
| |
|
|
| |
|
|
| | |
Accumulated net investment income (loss) | | $ | — | | | $ | 930 | | | $ | — | | | $ | 3,240 | | | |
| | |
|
|
| |
|
|
| |
|
|
| |
|
|
| | |
| | | | | | | | | | | | | | | | | | | |
| | | | | | | | | | | | | | | | | | | |
| | | | | | | | | | | | | | | | | | | |
| | | | | | | | | | | | | | | | | | | |
| | | | | | | | | | | | | | | | | | | |
| | | | | | | | | | | | | | | | | | | |
| | | | | | | | | | | | | | | | | | | |
| | | | | | | | | | | | | | | | | | | |
| (a) | For the period from June 29, 2004 (commencement of operations) through October 31, 2004. |
See notes to financial statements.
Statements of Changes in Net Assets
| | | | | | | | | | | | | | | | |
| | | Gartmore Optimal Allocations Fund: Moderate | |
Gartmore Optimal Allocations Fund: Specialty Gartmore Optimal Allocations Fund - Specialty |
| | | Year Ended
October 31, 2005 | | | Period Ended
October 31, 2004 (a) | | Year Ended
October 31, 2005 | | | Period Ended
October 31, 2004 (a) |
FROM INVESTMENT ACTIVITIES: | | | | | | | | | | | | | | | | |
Operations: | | | | | | | | | | | | | | | | |
Net investment income (loss) | | $ | 95,971 | | | $ | 4,680 | | $ | 126,254 | | | $ | 1,464 | | |
Net realized gains (losses) on investment transactions | | | 170,683 | | | | 950 | | | 269,621 | | | | 695 | | |
Net change in unrealized appreciation/depreciation on investment transactions | | | 93,915 | | | | 24,949 | | | 639,257 | | | | 34,596 | | |
| | |
|
|
| |
|
| |
|
|
| |
|
| | |
Change in net assets resulting from operations | | | 360,569 | | | | 30,579 | | | 1,035,132 | | | | 36,755 | | |
| | |
|
|
| |
|
| |
|
|
| |
|
| | |
| | | | | |
Distributions to Class A Shareholders from: | | | | | | | | | | | | | | | | |
Net investment income | | | (26,920 | ) | | | — | | | (75,274 | ) | | | — | | |
Net realized gains on investments | | | (54 | ) | | | — | | | (318 | ) | | | — | | |
| | | | | |
Distributions to Class B Shareholders from: | | | | | | | | | | | | | | | | |
Net investment income | | | (5,442 | ) | | | — | | | (6,754 | ) | | | — | | |
Net realized gains on investments | | | (17 | ) | | | — | | | (23 | ) | | | — | | |
| | | | | |
Distributions to Class C Shareholders from: | | | | | | | | | | | | | | | | |
Net investment income | | | (27,797 | ) | | | — | | | (71,934 | ) | | | — | | |
Net realized gains on investments | | | (104 | ) | | | — | | | (222 | ) | | | — | | |
| | | | | |
Distributions to Class R Shareholders from: | | | | | | | | | | | | | | | | |
Net investment income | | | (27 | ) | | | — | | | (27 | ) | | | — | | |
Net realized gain on investment | | | (1 | ) | | | — | | | — | | | | — | | |
| | | | | |
Distributions to Institutional Service Class Shareholders from: | | | | | | | | | | | | | | | | |
Net investment income | | | (31 | ) | | | — | | | (30 | ) | | | — | | |
Net realized gains on investments | | | (1 | ) | | | — | | | — | | | | — | | |
| | | | | |
Distributions to Institutional Class Shareholders from: | | | | | | | | | | | | | | | | |
Net investment income | | | (31,883 | ) | | | — | | | (30,997 | ) | | | — | | |
Net realized gains on investments | | | (773 | ) | | | — | | | (132 | ) | | | — | | |
| | |
|
|
| |
|
| |
|
|
| |
|
| | |
Change in net assets from shareholder distributions | | | (93,050 | ) | | | — | | | (185,711 | ) | | | — | | |
| | |
|
|
| |
|
| |
|
|
| |
|
| | |
Change in net assets from capital transactions | | | 13,348,606 | | | | 1,005,000 | | | 14,502,445 | | | | 1,117,089 | | |
| | |
|
|
| |
|
| |
|
|
| |
|
| | |
Change in net assets | | | 13,616,125 | | | | 1,035,579 | | | 15,351,866 | | | | 1,153,844 | | |
| | | | | |
Net Assets: | | | | | | | | | | | | | | | | |
Beginning of period | | | 1,035,579 | | | | — | | | 1,153,844 | | | | — | | |
| | |
|
|
| |
|
| |
|
|
| |
|
| | |
End of period | | $ | 14,651,704 | | | $ | 1,035,579 | | $ | 16,505,710 | | | $ | 1,153,844 | | |
| | |
|
|
| |
|
| |
|
|
| |
|
| | |
Accumulated net investment income (loss) | | $ | 8,998 | | | $ | 5,127 | | $ | — | | | $ | 1,909 | | |
| | |
|
|
| |
|
| |
|
|
| |
|
| | |
| | | | | | | | | | | | | | | | | |
| | | | | | | | | | | | | | | | | |
| (a) | For the period from June 29, 2004 (commencement of operations) through October 31, 2005. |
See notes to financial statements.
Financial Highlights
Selected Data for Each Share of Capital Outstanding
Gartmore Optimal Allocations Fund: Aggressive
| | | | | | | | | | | | | | | | | | | | | | | | | | | | | | | | | | | | | | | |
| | | | | Investment Activities | | Distributions | | | | | | Ratios/Supplemental Data |
| | | Net Asset
Value,
Beginning
of Period | | Net
Investment
Income
(Loss) | | | Net Realized
and
Unrealized
Gains
(Losses) on
Investments | | Total
from
Investment
Activities | | Net
Investment
Income | | | Total
Distributions | | | Net Asset
Value, End
of Period | | Total
Return (a) | | | Net Assets
at End of
Period
(000s) | | Ratio of
Expenses
to Average
Net Assets | | | Ratio of Net
Investment
Income
(Loss)
to Average
Net Assets | | | Ratio of
Expenses
(Prior to
Reimbursements)
to Average
Net Assets (b) | | | Ratio of Net
Investment
Income (Loss)
(Prior to
Reimbursements)
to Average
Net Assets (b) | | | Portfolio
Turnover (c) |
| | | | | | | | | | | | | | |
Class A Shares | | | | | | | | | | | | | | | | | | | | | | | | | | | | | | | | | | | | | | | |
Period Ended October 31, 2004 (d) | | $ | 10.00 | | — | | | 0.09 | | 0.09 | | — | | | — | | | $ | 10.09 | | 0.90% | (e) | | $ | 4 | | 0.56% | (f) | | (0.27% | )(f) | | 13.04% | (f) | | (12.75% | )(f) | | 7.82% |
Year Ended October 31, 2005 | | $ | 10.09 | | 0.17 | | | 1.31 | | 1.48 | | (0.24 | ) | | (0.24 | ) | | $ | 11.33 | | 14.87% | | | $ | 998 | | 0.53% | | | 0.41% | | | 3.91% | | | (2.97% | ) | | 31.16% |
| | | | | | | | | | | | | | |
Class B Shares | | | | | | | | | | | | | | | | | | | | | | | | | | | | | | | | | | | | | | | |
Period Ended October 31, 2004 (d) | | $ | 10.00 | | (0.03 | ) | | 0.07 | | 0.04 | | — | | | — | | | $ | 10.04 | | 0.40% | (e) | | $ | 1 | | 1.25% | (f) | | (0.85% | )(f) | | 13.48% | (f) | | (13.08% | )(f) | | 7.82% |
Year Ended October 31, 2005 | | $ | 10.04 | | 0.12 | | | 1.27 | | 1.39 | | (0.20 | ) | | (0.20 | ) | | $ | 11.23 | | 14.07% | | | $ | 189 | | 1.25% | | | 0.68% | | | 5.11% | | | (3.18% | ) | | 31.16% |
| | | | | | | | | | | | | | |
Class C Shares | | | | | | | | | | | | | | | | | | | | | | | | | | | | | | | | | | | | | | | |
Period Ended October 31, 2004 (d) | | $ | 10.00 | | (0.03 | ) | | 0.07 | | 0.04 | | — | | | — | | | $ | 10.04 | | 0.40% | (e) | | $ | 1 | | 1.25% | (f) | | (0.85% | )(f) | | 13.48% | (f) | | (13.08% | )(f) | | 7.82% |
Year Ended October 31, 2005 | | $ | 10.04 | | 0.13 | | | 1.26 | | 1.39 | | (0.21 | ) | | (0.21 | ) | | $ | 11.22 | | 14.07% | | | $ | 1,517 | | 1.25% | | | (0.71% | ) | | 4.35% | | | (3.82% | ) | | 31.16% |
| | | | | | | | | | | | | | |
Class R Shares | | | | | | | | | | | | | | | | | | | | | | | | | | | | | | | | | | | | | | | |
Period Ended October 31, 2004 (d) | | $ | 10.00 | | (0.01 | ) | | 0.07 | | 0.06 | | — | | | — | | | $ | 10.06 | | 0.50% | (e) | | $ | 1 | | 0.85% | (f) | | (0.45% | )(f) | | 13.07% | (f) | | (12.67% | )(f) | | 7.82% |
Year Ended October 31, 2005 | | $ | 10.06 | | 0.19 | | | 1.27 | | 1.46 | | (0.21 | ) | | (0.21 | ) | | $ | 11.31 | | 14.70% | | | $ | 1 | | 0.80% | | | 1.80% | | | 5.55% | | | (2.94% | ) | | 31.16% |
| | | | | | | | | | | | | | |
Institutional Service Class Shares | | | | | | | | | | | | | | | | | | | | | | | | | | | | | | | | | | | | | | | |
Period Ended October 31, 2004 (d) | | $ | 10.00 | | — | | | 0.07 | | 0.07 | | — | | | — | | | $ | 10.07 | | 0.80% | (e) | | $ | 1 | | 0.40% | (f) | | 0.00% | (f) | | 12.62% | (f) | | (12.22% | )(f) | | 7.82% |
Year Ended October 31, 2005 | | $ | 10.07 | | 0.24 | | | 1.28 | | 1.52 | | (0.25 | ) | | (0.25 | ) | | $ | 11.34 | | 15.10% | | | $ | 1 | | 0.30% | | | 2.30% | | | 5.78% | | | (3.15% | ) | | 31.16% |
| | | | | | | | | | | | | | |
Institutional Class Shares | | | | | | | | | | | | | | | | | | | | | | | | | | | | | | | | | | | | | | | |
Period Ended October 31, 2004 (d) | | $ | 10.00 | | — | | | 0.08 | | 0.08 | | — | | | — | | | $ | 10.08 | | 0.80% | (e) | | $ | 1,008 | | 0.25% | (f) | | 0.15% | (f) | | 12.47% | (f) | | (12.07% | )(f) | | 7.82% |
Year Ended October 31, 2005 | | $ | 10.08 | | 0.25 | | | 1.27 | | 1.52 | | (0.25 | ) | | (0.25 | ) | | $ | 11.35 | | 15.25% | | | $ | 1,160 | | 0.25% | | | 2.35% | | | 4.36% | | | (1.76% | ) | | 31.16% |
| | | | | | | | | | | | | | | | | | | | | | | | | | | | | | | | | | | | | | | | |
| | | | | | | | | | | | | | | | | | | | | | | | | | | | | | | | | | | | | | | | |
| | | | | | | | | | | | | | | | | | | | | | | | | | | | | | | | | | | | | | | | |
| | | | | | | | | | | | | | | | | | | | | | | | | | | | | | | | | | | | | | | | |
| | | | | | | | | | | | | | | | | | | | | | | | | | | | | | | | | | | | | | | | |
| | | | | | | | | | | | | | | | | | | | | | | | | | | | | | | | | | | | | | | | |
| | | | | | | | | | | | | | | | | | | | | | | | | | | | | | | | | | | | | | | | |
| | | | | | | | | | | | | | | | | | | | | | | | | | | | | | | | | | | | | | | | |
| | | | | | | | | | | | | | | | | | | | | | | | | | | | | | | | | | | | | | | | |
| | | | | | | | | | | | | | | | | | | | | | | | | | | | | | | | | | | | | | | | |
| | | | | | | | | | | | | | | | | | | | | | | | | | | | | | | | | | | | | | | | |
| | | | | | | | | | | | | | | | | | | | | | | | | | | | | | | | | | | | | | | | |
| (a) | Excludes sales charge. |
| (b) | During the period certain fees were waived and/or reimbursed. If such waivers/reimbursements had not occurred, the ratios would have been indicated. |
| (c) | Portfolio turnover is calculated on the basis of the Fund as a whole without distinguishing among the classes of shares. |
| (d) | For the period from June 29, 2004 (commencement of operations) through October 31, 2004. |
See notes to financial statements.
Financial Highlights
Selected Data for Each Share of Capital Outstanding
Gartmore Optimal Allocations Fund: Moderately Aggressive
| | | | | | | | | | | | | | | | | | | | | | | | | | | | | | | | | | | | | | |
| | | | | Investment Activities | | Distributions | | | | | | Ratios/Supplemental Data |
| | | Net Asset
Value,
Beginning
of Period | | Net
Investment
Income
(Loss) | | Net Realized
and
Unrealized
Gains
(Losses) on
Investments | | Total
from
Investment
Activities | | Net
Investment
Income | | | Total
Distributions | | | Net
Asset
Value, End
of Period | | Total
Return (a) | | | Net Assets
at End of
Period
(000s) | | Ratio of
Expenses
to Average
Net Assets | | | Ratio of Net
Investment
Income
(Loss)
to Average
Net Assets | | | Ratio of
Expenses
(Prior to
Reimbursements)
to Average
Net Assets (b) | | | Ratio of Net
Investment
Income (Loss)
(Prior to
Reimbursements)
to Average
Net Assets (b) | | | Portfolio
Turnover (c) |
| | | | | | | | | | | | | | |
Class A Shares | | | | | | | | | | | | | | | | | | | | | | | | | | | | | | | | | | | | | | |
Period Ended October 31, 2004 (d) | | $ | 10.00 | | 0.02 | | 0.20 | | 0.22 | | — | | | — | | | $ | 10.22 | | 2.10% | (e) | | $ | 1 | | 0.56% | (f) | | (0.27% | )(f) | | 13.04% | (f) | | (12.75% | )(f) | | 9.79% |
Year Ended October 31, 2005 | | $ | 10.22 | | 0.23 | | 1.04 | | 1.27 | | (0.28 | ) | | (0.28 | ) | | $ | 11.21 | | 12.77% | | | $ | 3,419 | | 0.52% | | | 1.13% | | | 2.32% | | | (0.66% | ) | | 47.04% |
| | | | | | | | | | | | | | |
Class B Shares | | | | | | | | | | | | | | | | | | | | | | | | | | | | | | | | | | | | | | |
Period Ended October 31, 2004 (d) | | $ | 10.00 | | — | | 0.17 | | 0.17 | | — | | | — | | | $ | 10.17 | | 1.70% | (e) | | $ | 7 | | 1.25% | (f) | | (0.85% | )(f) | | 13.48% | (f) | | (13.08% | )(f) | | 9.79% |
Year Ended October 31, 2005 | | $ | 10.17 | | 0.18 | | 1.04 | | 1.22 | | (0.23 | ) | | (0.23 | ) | | $ | 11.16 | | 12.07% | | | $ | 1,183 | | 1.25% | | | (0.09% | ) | | 3.00% | | | (1.84% | ) | | 47.04% |
| | | | | | | | | | | | | | |
Class C Shares | | | | | | | | | | | | | | | | | | | | | | | | | | | | | | | | | | | | | | |
Period Ended October 31, 2004 (d) | | $ | 10.00 | | — | | 0.17 | | 0.17 | | — | | | — | | | $ | 10.17 | | 1.70% | (e) | | $ | 80 | | 1.25% | (f) | | (0.85% | )(f) | | 13.48% | (f) | | (13.08% | )(f) | | 9.79% |
Year Ended October 31, 2005 | | $ | 10.17 | | 0.18 | | 1.02 | | 1.20 | | (0.23 | ) | | (0.23 | ) | | $ | 11.14 | | 11.98% | | | $ | 3,604 | | 1.25% | | | 0.20% | | | 3.20% | | | (1.76% | ) | | 47.04% |
| | | | | | | | | | | | | | |
Class R Shares | | | | | | | | | | | | | | | | | | | | | | | | | | | | | | | | | | | | | | |
Period Ended October 31, 2004 (d) | | $ | 10.00 | | 0.01 | | 0.18 | | 0.19 | | — | | | — | | | $ | 10.19 | | 1.90% | (e) | | $ | 1 | | 0.85% | (f) | | (0.45% | )(f) | | 13.07% | (f) | | (12.67% | )(f) | | 9.79% |
Year Ended October 31, 2005 | | $ | 10.19 | | 0.25 | | 1.01 | | 1.26 | | (0.24 | ) | | (0.24 | ) | | $ | 11.21 | | 12.50% | | | $ | 1 | | 0.80% | | | 2.16% | | | 4.28% | | | (1.32% | ) | | 47.04% |
| | | | | | | | | | | | | | |
Institutional Service Class Shares | | | | | | | | | | | | | | | | | | | | | | | | | | | | | | | | | | | | | | |
Period Ended October 31, 2004 (d) | | $ | 10.00 | | 0.02 | | 0.19 | | 0.21 | | — | | | — | | | $ | 10.21 | | 2.10% | (e) | | $ | 1 | | 0.40% | (f) | | 0.00% | (f) | | 12.62% | (f) | | (12.22% | )(f) | | 9.79% |
Year Ended October 31, 2005 | | $ | 10.21 | | 0.31 | | 1.00 | | 1.31 | | (0.29 | ) | | (0.29 | ) | | $ | 11.23 | | 13.00% | | | $ | 1 | | 0.34% | | | 2.69% | | | 4.45% | | | (1.42% | ) | | 47.04% |
| | | | | | | | | | | | | | |
Institutional Class Shares | | | | | | | | | | | | | | | | | | | | | | | | | | | | | | | | | | | | | | |
Period Ended October 31, 2004 (d) | | $ | 10.00 | | 0.03 | | 0.18 | | 0.21 | | — | | | — | | | $ | 10.21 | | 2.10% | (e) | | $ | 1,021 | | 0.25% | (f) | | 0.15% | (f) | | 12.47% | (f) | | (12.07% | )(f) | | 9.79% |
Year Ended October 31, 2005 | | $ | 10.21 | | 0.32 | | 1.00 | | 1.32 | | (0.30 | ) | | (0.30 | ) | | $ | 11.23 | | 13.16% | | | $ | 1,154 | | 0.25% | | | 2.73% | | | 3.33% | | | (0.36% | ) | | 47.04% |
| | | | | | | | | | | | | | | | | | | | | | | | | | | | | | | | | | | | | | | |
| | | | | | | | | | | | | | | | | | | | | | | | | | | | | | | | | | | | | | | |
| | | | | | | | | | | | | | | | | | | | | | | | | | | | | | | | | | | | | | | |
| | | | | | | | | | | | | | | | | | | | | | | | | | | | | | | | | | | | | | | |
| | | | | | | | | | | | | | | | | | | | | | | | | | | | | | | | | | | | | | | |
| | | | | | | | | | | | | | | | | | | | | | | | | | | | | | | | | | | | | | | |
| | | | | | | | | | | | | | | | | | | | | | | | | | | | | | | | | | | | | | | |
| | | | | | | | | | | | | | | | | | | | | | | | | | | | | | | | | | | | | | | |
| | | | | | | | | | | | | | | | | | | | | | | | | | | | | | | | | | | | | | | |
| | | | | | | | | | | | | | | | | | | | | | | | | | | | | | | | | | | | | | | |
| | | | | | | | | | | | | | | | | | | | | | | | | | | | | | | | | | | | | | | |
| | | | | | | | | | | | | | | | | | | | | | | | | | | | | | | | | | | | | | | |
| (a) | Excludes sales charge. |
| (b) | During the period certain fees were waived and/or reimbursed. If such waivers/reimbursements had not occurred, the ratios would have been indicated. |
| (c) | Portfolio turnover is calculated on the basis of the Fund as a whole without distinguishing among the classes of shares. |
| (d) | For the period from June 29, 2004 (commencement of operations) through October 31, 2004. |
See notes to financial statements.
Financial Highlights
Selected Data for Each Share of Capital Outstanding
Gartmore Optimal Allocations Fund: Moderate
| | | | | | | | | | | | | | | | | | | | | | | | | | | | | | | | | | | | | | | | | |
| | | | | Investment Activities | | Distributions | | | | | | | | Ratios/Supplemental Data |
| | | Net Asset
Value,
Beginning
of Period | | Net
Investment
Income
(Loss) | | Net Realized
and
Unrealized
Gains
(Losses) on
Investments | | Total
from
Investment
Activities | | Net
Investment
Income | | | Net
Realized
Gains | | | Total
Distributions | | | Net
Asset
Value, End
of Period | | Total
Return (a) | | | Net Assets
at End of
Period
(000s) | | Ratio of
Expenses
to Average
Net Assets | | | Ratio of Net
Investment
Income
(Loss)
to Average
Net Assets | | | Ratio of
Expenses
(Prior to
Reimbursements)
to Average
Net Assets (b) | | | Ratio of Net
Investment
Income (Loss)
(Prior to
Reimbursements)
to Average
Net Assets (b) | | | Portfolio
Turnover (c) |
| | | | | | | | | | | | | | | |
Class A Shares | | | | | | | | | | | | | | | | | | | | | | | | | | | | | | | | | | | | | | | | | |
Period Ended October 31, 2004 (d) | | $ | 10.00 | | 0.04 | | 0.28 | | 0.32 | | — | | | — | | | — | | | $ | 10.32 | | 3.20% | (e) | | $ | 1 | | 0.56% | (f) | | 1.06% | (f) | | 12.40% | (f) | | (10.78% | )(f) | | 7.57% |
Year Ended October 31, 2005 | | $ | 10.32 | | 0.28 | | 0.77 | | 1.05 | | (0.32 | ) | | (0.01 | ) | | (0.33 | ) | | $ | 11.04 | | 10.41% | | | $ | 4,595 | | 0.52% | | | 1.73% | | | 1.88% | | | 0.38% | | | 61.59% |
| | | | | | | | | | | | | | | |
Class B Shares | | | | | | | | | | | | | | | | | | | | | | | | | | | | | | | | | | | | | | | | | |
Period Ended October 31, 2004 (d) | | $ | 10.00 | | 0.01 | | 0.24 | | 0.25 | | — | | | — | | | — | | | $ | 10.25 | | 2.60% | (e) | | $ | 1 | | 1.25% | (f) | | 0.37% | (f) | | 13.50% | (f) | | (11.88% | )(f) | | 7.57% |
Year Ended October 31, 2005 | | $ | 10.25 | | 0.20 | | 0.74 | | 0.94 | | (0.25 | ) | | (0.01 | ) | | (0.26 | ) | | $ | 10.93 | | 9.13% | | | $ | 1,269 | | 1.25% | | | 0.65% | | | 2.70% | | | (0.80% | ) | | 61.59% |
| | | | | | | | | | | | | | | |
Class C Shares | | | | | | | | | | | | | | | | | | | | | | | | | | | | | | | | | | | | | | | | | |
Period Ended October 31, 2004 (d) | | $ | 10.00 | | 0.01 | | 0.24 | | 0.25 | | — | | | — | | | — | | | $ | 10.25 | | 2.60% | (e) | | $ | 1 | | 1.25% | (f) | | 0.37% | (f) | | 13.50% | (f) | | (11.88% | )(f) | | 7.57% |
Year Ended October 31, 2005 | | $ | 10.25 | | 0.23 | | 0.74 | | 0.97 | | (0.28 | ) | | (0.01 | ) | | (0.29 | ) | | $ | 10.93 | | 9.50% | | | $ | 7,648 | | 1.25% | | | 0.72% | | | 2.51% | | | (0.54% | ) | | 61.59% |
| | | | | | | | | | | | | | | |
Class R Shares | | | | | | | | | | | | | | | | | | | | | | | | | | | | | | | | | | | | | | | | | |
Period Ended October 31, 2004 (d) | | $ | 10.00 | | 0.03 | | 0.24 | | 0.27 | | — | | | — | | | — | | | $ | 10.27 | | 2.70% | (e) | | $ | 1 | | 0.85% | (f) | | 0.77% | (f) | | 12.85% | (f) | | (11.23% | )(f) | | 7.57% |
Year Ended October 31, 2005 | | $ | 10.27 | | 0.28 | | 0.73 | | 1.01 | | (0.25 | ) | | (0.01 | ) | | (0.26 | ) | | $ | 11.02 | | 9.94% | | | $ | 1 | | 0.81% | | | 2.35% | | | 3.85% | | | (0.37% | ) | | 61.59% |
| | | | | | | | | | | | | | | |
Institutional Service Class Shares | | | | | | | | | | | | | | | | | | | | | | | | | | | | | | | | | | | | | | | | | |
Period Ended October 31, 2004 (d) | | $ | 10.00 | | 0.04 | | 0.26 | | 0.30 | | — | | | — | | | — | | | $ | 10.30 | | 3.00% | (e) | | $ | 1 | | 0.40% | (f) | | 1.22% | (f) | | 12.23% | (f) | | (10.61% | )(f) | | 7.57% |
Year Ended October 31, 2005 | | $ | 10.30 | | 0.35 | | 0.71 | | 1.06 | | (0.31 | ) | | (0.01 | ) | | (0.32 | ) | | $ | 11.04 | | 10.39% | | | $ | 1 | | 0.34% | | | 2.83% | | | 3.93% | | | (0.76% | ) | | 61.59% |
| | | | | | | | | | | | | | | |
Institutional Class Shares | | | | | | | | | | | | | | | | | | | | | | | | | | | | | | | | | | | | | | | | | |
Period Ended October 31, 2004 (d) | | $ | 10.00 | | 0.05 | | 0.25 | | 0.30 | | — | | | — | | | — | | | $ | 10.30 | | 3.00% | (e) | | $ | 1,030 | | 0.25% | (f) | | 1.37% | (f) | | 12.08% | (f) | | (10.46% | )(f) | | 7.57% |
Year Ended October 31, 2005 | | $ | 10.30 | | 0.35 | | 0.72 | | 1.07 | | (0.32 | ) | | (0.01 | ) | | (0.33 | ) | | $ | 11.04 | | 10.54% | | | $ | 1,138 | | 0.25% | | | 2.90% | | | 2.94% | | | 0.20% | | | 61.59% |
| | | | | | | | | | | | | | | | | | | | | | | | | | | | | | | | | | | | | | | | | | |
| | | | | | | | | | | | | | | | | | | | | | | | | | | | | | | | | | | | | | | | | | |
| | | | | | | | | | | | | | | | | | | | | | | | | | | | | | | | | | | | | | | | | | |
| | | | | | | | | | | | | | | | | | | | | | | | | | | | | | | | | | | | | | | | | | |
| | | | | | | | | | | | | | | | | | | | | | | | | | | | | | | | | | | | | | | | | | |
| | | | | | | | | | | | | | | | | | | | | | | | | | | | | | | | | | | | | | | | | | |
| | | | | | | | | | | | | | | | | | | | | | | | | | | | | | | | | | | | | | | | | | |
| | | | | | | | | | | | | | | | | | | | | | | | | | | | | | | | | | | | | | | | | | |
| | | | | | | | | | | | | | | | | | | | | | | | | | | | | | | | | | | | | | | | | | |
| | | | | | | | | | | | | | | | | | | | | | | | | | | | | | | | | | | | | | | | | | |
| | | | | | | | | | | | | | | | | | | | | | | | | | | | | | | | | | | | | | | | | | |
| | | | | | | | | | | | | | | | | | | | | | | | | | | | | | | | | | | | | | | | | | |
| (a) | Excludes sales charge. |
| (b) | During the period certain fees were waived and/or reimbursed. If such waivers/reimbursements had not occurred, the ratios would have been indicated. |
| (c) | Portfolio turnover is calculated on the basis of the Fund as a whole without distinguishing among the classes of shares. |
| (d) | For the period from June 29, 2004 (commencement of operations) through October 31, 2004. |
See notes to financial statements.
Financial Highlights
Selected Data for Each Share of Capital Outstanding
Gartmore Optimal Allocations Fund: Specialty
| | | | | | | | | | | | | | | | | | | | | | | | | | | | | | | | | | | | | | | | | | |
| | | | | Investment Activities | | Distributions | | | | | | Ratios/Supplemental Data |
| | | Net Asset
Value,
Beginning
of Period | | Net
Investment
Income
(Loss) | | | Net Realized
and
Unrealized
Gains
(Losses) on
Investments | | Total
from
Investment
Activities | | Net
Investment
Income | | | Net
Realized
Gains | | | Total
Distributions | | | Net
Asset
Value, End
of Period | | Total
Return (a) | | | Net Assets
at End of
Period
(000s) | | Ratio of
Expenses
to Average
Net Assets | | | Ratio of Net
Investment
Income
(Loss)
to Average
Net Assets | | | Ratio of
Expenses
(Prior to
Reimbursements)
to Average
Net Assets (b) | | | Ratio of Net
Investment
Income (Loss)
(Prior to
Reimbursements)
to Average
Net Assets (b) | | | Portfolio
Turnover (c) |
| | | | | | | | | | | | | | | |
Class A Shares | | | | | | | | | | | | | | | | | | | | | | | | | | | | | | | | | | | | | | | | | | |
Period Ended October 31, 2004 (d) | | $ | 10.00 | | — | | | 0.34 | | 0.34 | | — | | | — | | | — | | | $ | 10.34 | | 3.40% | (e) | | $ | 80 | | 0.56% | (f) | | 0.75% | (f) | | 12.49% | (f) | | (11.17% | )(f) | | 7.19% |
Year Ended October 31, 2005 | | $ | 10.34 | | 0.27 | | | 1.21 | | 1.48 | | (0.29 | ) | | — | (g) | | (0.29 | ) | | $ | 11.53 | | 14.59% | | | $ | 5,133 | | 0.53% | | | 2.31% | | | 1.54% | | | 1.30% | | | 28.77% |
| | | | | | | | | | | | | | | |
Class B Shares | | | | | | | | | | | | | | | | | | | | | | | | | | | | | | | | | | | | | | | | | | |
Period Ended October 31, 2004 (d) | | $ | 10.00 | | (0.02 | ) | | 0.32 | | 0.30 | | — | | | — | | | — | | | $ | 10.30 | | 3.00% | (e) | | $ | 1 | | 1.25% | (f) | | (0.58% | )(f) | | 12.98% | (f) | | (12.30% | )(f) | | 7.19% |
Year Ended October 31, 2005 | | $ | 10.30 | | 0.17 | | | 1.24 | | 1.41 | | (0.25 | ) | | — | (g) | | (0.25 | ) | | $ | 11.46 | | 13.89% | | | $ | 982 | | 1.25% | | | 0.27% | | | 2.22% | | | (0.70% | ) | | 28.77% |
| | | | | | | | | | | | | | | |
Class C Shares | | | | | | | | | | | | | | | | | | | | | | | | | | | | | | | | | | | | | | | | | | |
Period Ended October 31, 2004 (d) | | $ | 10.00 | | — | | | 0.30 | | 0.30 | | — | | | — | | | — | | | $ | 10.30 | | 3.00% | (e) | | $ | 36 | | 1.25% | (f) | | (1.04% | )(f) | | 12.92% | (f) | | (12.72% | )(f) | | 7.19% |
Year Ended October 31, 2005 | | $ | 10.30 | | 0.17 | | | 1.24 | | 1.41 | | (0.26 | ) | | — | (g) | | (0.26 | ) | | $ | 11.45 | | 13.90% | | | $ | 9,200 | | 1.25% | | | 0.25% | | | 2.22% | | | (0.72% | ) | | 28.77% |
| | | | | | | | | | | | | | | |
Class R Shares | | | | | | | | | | | | | | | | | | | | | | | | | | | | | | | | | | | | | | | | | | |
Period Ended October 31, 2004 (d) | | $ | 10.00 | | (0.01 | ) | | 0.33 | | 0.32 | | — | | | — | | | — | | | $ | 10.32 | | 3.20% | (e) | | $ | 1 | | 0.85% | (f) | | (0.18% | )(f) | | 12.57% | (f) | | (11.90% | )(f) | | 7.19% |
Year Ended October 31, 2005 | | $ | 10.32 | | (0.34 | ) | | 1.81 | | 1.47 | | (0.25 | ) | | — | (g) | | (0.25 | ) | | $ | 11.54 | | 14.36% | | | $ | 1 | | 0.84% | | | (0.55% | ) | | 1.90% | | | (1.62% | ) | | 28.77% |
| | | | | | | | | | | | | | | |
Institutional Service Class Shares | | | | | | | | | | | | | | | | | | | | | | | | | | | | | | | | | | | | | | | | | | |
Period Ended October 31, 2004 (d) | | $ | 10.00 | | 0.01 | | | 0.33 | | 0.34 | | — | | | — | | | — | | | $ | 10.34 | | 3.40% | (e) | | $ | 1 | | 0.40% | (f) | | 0.27% | (f) | | 12.12% | (f) | | (11.44% | )(f) | | 7.19% |
Year Ended October 31, 2005 | | $ | 10.34 | | 0.33 | | | 1.19 | | 1.52 | | (0.30 | ) | | — | (g) | | (0.30 | ) | | $ | 11.56 | | 14.92% | | | $ | 1 | | 0.33% | | | 2.98% | | | 1.94% | | | 1.38% | | | 28.77% |
| | | | | | | | | | | | | | | |
Institutional Class Shares | | | | | | | | | | | | | | | | | | | | | | | | | | | | | | | | | | | | | | | | | | |
Period Ended October 31, 2004 (d) | | $ | 10.00 | | 0.01 | | | 0.33 | | 0.34 | | — | | | — | | | — | | | $ | 10.34 | | 3.40% | (e) | | $ | 1,034 | | 0.25% | (f) | | 0.42% | (f) | | 11.97% | (f) | | (11.29% | )(f) | | 7.19% |
Year Ended October 31, 2005 | | $ | 10.34 | | 0.34 | | | 1.19 | | 1.53 | | (0.31 | ) | | — | (g) | | (0.31 | ) | | $ | 11.56 | | 15.07% | | | $ | 1,189 | | 0.25% | | | 3.04% | | | 1.41% | | | 1.87% | | | 28.77% |
| | | | | | | | | | | | | | | | | | | | | | | | | | | | | | | | | | | | | | | | | | | |
| | | | | | | | | | | | | | | | | | | | | | | | | | | | | | | | | | | | | | | | | | | |
| | | | | | | | | | | | | | | | | | | | | | | | | | | | | | | | | | | | | | | | | | | |
| | | | | | | | | | | | | | | | | | | | | | | | | | | | | | | | | | | | | | | | | | | |
| | | | | | | | | | | | | | | | | | | | | | | | | | | | | | | | | | | | | | | | | | | |
| | | | | | | | | | | | | | | | | | | | | | | | | | | | | | | | | | | | | | | | | | | |
| | | | | | | | | | | | | | | | | | | | | | | | | | | | | | | | | | | | | | | | | | | |
| | | | | | | | | | | | | | | | | | | | | | | | | | | | | | | | | | | | | | | | | | | |
| | | | | | | | | | | | | | | | | | | | | | | | | | | | | | | | | | | | | | | | | | | |
| | | | | | | | | | | | | | | | | | | | | | | | | | | | | | | | | | | | | | | | | | | |
| | | | | | | | | | | | | | | | | | | | | | | | | | | | | | | | | | | | | | | | | | | |
| (a) | Excludes sales charge. |
| (b) | During the period certain fees were waived and/or reimbursed. If such waivers/reimbursements had not occurred, the ratios would have been indicated. |
| (c) | Portfolio turnover is calculated on the basis of the Fund as a whole without distinguishing among the classes of shares. |
| (d) | For the period from June 29, 2004 (commencement of operations) through October 31, 2004. |
| (g) | The amount is less than $0.005. |
See notes to financial statements.
Notes to Financial Statements
October 31, 2005
1. Organization
Gartmore Mutual Funds (the “Trust”) is an open-end management investment company, organized under the laws of Delaware by an amended and restated Agreement and Declaration of Trust, dated October 28, 2004, as amended to date. Prior to January 25, 2002, the Trust was named “Nationwide Mutual Funds”. The Trust, originally created under the laws of Ohio as an Ohio business trust pursuant to a Declaration of Trust dated, as of October 30, 1997, was subsequently amended and redomesticated as a Delaware Statutory Trust on February 28, 2005, and is registered under the Investment Company Act of 1940, as amended (the “1940 Act”). The redomestication was a change in statutory status and did not affect the operations of the Trust. As of October 31, 2005, the Trust had authorized an unlimited number of shares of beneficial interest (“shares”) without par value. The Trust operates forty-six (46) separate series, or mutual funds, each with its own investment objectives and strategies. This report contains the financial statements and financial highlights of the nine (9) funds listed below (individually, a “Fund”; collectively, the “Funds”):
- Gartmore Investor Destinations Aggressive Fund (“Investor Destinations Aggressive”)
- Gartmore Investor Destinations Moderately Aggressive Fund (“Investor Destinations Moderately Aggressive”)
- Gartmore Investor Destinations Moderate Fund (“Investor Destinations Moderate”)
- Gartmore Investor Destinations Moderately Conservative Fund (“Investor Destinations Moderately Conservative”)
- Gartmore Investor Destinations Conservative Fund (“Investor Destinations Conservative”)
- Gartmore Optimal Allocations Fund: Aggressive (“Optimal Allocations Aggressive”)
- Gartmore Optimal Allocations Fund: Moderately Aggressive (“Optimal Allocations Moderately Aggressive”)
- Gartmore Optimal Allocations Fund: Moderate (“Optimal Allocations Moderate”)
- Gartmore Optimal Allocations Fund: Specialty (“Optimal Allocations Specialty”)
Each of the Funds is constructed as a “fund of funds,” which means that each of these Funds pursues its investment objectives primarily by allocating its investments among other affiliated and unaffiliated mutual funds (“Underlying Funds”). The Underlying Funds typically invest, either directly or indirectly, in stocks, bonds, and other securities. The Investor Destinations Aggressive, the Investor Destinations Moderately Aggressive, the Investor Destinations Moderate, the Investor Destinations Moderately Conservative and the Investor Destinations Conservative Funds (collectively, the “Investor Destinations Funds”) may also invest in a non-registered Fixed Interest Contract issued by Nationwide Life Insurance Company (“Fixed Interest Contract”) up to each Fund’s designated limit.
Under the Trust’s organizational documents, its officers and trustees are indemnified against certain liabilities arising out of the performance of their duties to the Trust. In addition, the Trust has entered into Indemnification Agreements with its Trustees and certain of its Officers. Trust Officers receive no compensation from the Trust for serving as its Officers. In addition, in the normal course of business, the Trust enters into contracts with its vendors and others that provide for general indemnifications. The Trust’s maximum liability under these arrangements is unknown, as this would involve future claims that may be made against the Trust. Based on experience, however, the Trust expects that risk of loss to be remote.
2. Summary of Significant Accounting Policies:
The following is a summary of significant accounting policies followed by the Funds in the preparation of their financial statements. The policies are in conformity with accounting principles generally accepted in the United States of America (“GAAP”). The preparation of financial statements requires management to make estimates and assumptions that affect the reported amounts of assets and liabilities, disclosure of contingent assets and liabilities at the date of the financial statements, and the reported amounts of income and expenses for the period. Actual results could differ from those estimates.
(a) Security Valuation
Shares of the Underlying Funds in which the Funds invest are valued at their respective net asset values as reported by the Underlying Funds. The securities in the Underlying Funds are generally valued as of the close of business of the regular session of trading on the New York Stock Exchange. Underlying Funds generally value securities and assets at fair value.
Each of the Investor Destinations Funds (except the Investor Destinations Aggressive Fund) currently invests in the Nationwide Contract. The Nationwide Contract is a fixed interest contract issued and guaranteed by Nationwide Life Insurance Company (“Nationwide”). This contract has a stable principal value and will pay each such Fund a fixed rate of interest. The fixed interest rate must be at least 3.50% (on an annualized basis), but may be higher and is currently adjusted on a quarterly basis. Nationwide will calculate the interest rate in the same way that it calculates guaranteed interest rates for similar contracts. Because the contract is guaranteed by Nationwide, assuming no default, the Funds receive no more or less than the guaranteed amount and will not directly participate in the actual experience of the assets underlying the contract. Although under certain market conditions a Fund’s performance may be hurt by its investment in the Nationwide Contract, Gartmore Mutual Fund Capital Trust (“GMF”) believes that the relatively stable nature of the Nationwide Contract should reduce a Fund’s volatility and overall risk, especially when the bond and stock markets decline simultaneously.
| (b) | | Security Transactions and Investment Income |
Security transactions are accounted for on the date the security is purchased or sold (“trade date”). Securities gains and losses are calculated on the identified cost basis. Interest income is recognized on the accrual basis and includes, where applicable, the amortization or accretion of premium or discount. Dividend income is recorded on the ex-dividend date.
| (c) | | Distributions to Shareholders |
Net investment income, if any, is declared daily and paid quarterly for the Funds. For all Funds, distributable net realized capital gains, if any, are declared and distributed at least annually.
Dividends and distributions to shareholders are determined in accordance with federal income tax regulations, which may differ from GAAP. These “book/tax” differences are considered either permanent or temporary in nature. In accordance with American Institute of Certified Public Accountants (the “AICPA”) Statement of Position 93-2, permanent differences (i.e., reclassification of market discounts, gain/loss, paydowns and distributions) are reclassified within the capital accounts based on their nature for federal income tax purposes; temporary differences do not require reclassification. These reclassifications have no effect upon the net asset value of the respective Funds. To the extent distributions exceed current and accumulated earnings and profits for federal income tax purposes, these excesses are reported as distributions of paid-in-capital.
It is the policy of each Fund to qualify or continue to qualify as a regulated investment company by complying with the provisions available to certain investment companies, as defined in applicable sections of the Internal Revenue Code, and to make distributions of net investment income and net realized capital gains sufficient to relieve the Fund from all, or substantially all, federal income taxes.
| (e) | | Allocation of Expenses, Income, and Gains and Losses |
Expenses directly attributable to a Fund are charged to that Fund. Expenses not directly attributable to a Fund are allocated proportionately among various or all Funds within the Trust. For the Funds, the method for allocating income, fund level expenses, and realized and unrealized gains or losses is based on the fair value of shares outstanding relative to net assets. Under this method, each class of shares participates based on the total net asset value of that class’s shares in proportion to the total net assets of the Fund. Expenses specific to a class (such as rule 12b-1 and administrative services fees) are charged to that class.
Notes to Financial Statements (Continued)
October 31, 2005
| (f) | | Capital Share Transactions |
Transactions in capital shares of the Funds were as follows:
| | | | | | | | | | | | | | | | | | |
| | | Investor Destinations
Aggressive | | | Investor Destinations Moderately Aggressive |
| | | Year Ended
October 31, 2005 | | | Year Ended
October 31, 2004 | | | Year Ended
October 31, 2005 | | | Year Ended
October 31, 2004 |
CAPITAL TRANSACTIONS: | | | | | | | | | | | | | | | | | | |
Class A Shares | | | | | | | | | | | | | | | | | | |
Proceeds from shares issued | | $ | 25,435,569 | | | $ | 21,668,419 | | | $ | 31,065,260 | | | $ | 29,075,809 | | | |
Dividends reinvested | | | 310,140 | | | | 67,625 | | | | 502,537 | | | | 166,167 | | | |
Cost of shares redeemed | | | (9,485,634 | ) | | | (6,633,812 | ) | | | (13,254,773 | ) | | | (5,060,251 | ) | | |
| | |
|
|
| |
|
|
| |
|
|
| |
|
|
| | |
| | | | 16,260,075 | | | | 15,102,232 | | | | 18,313,024 | | | | 24,181,725 | | | |
| | |
|
|
| |
|
|
| |
|
|
| |
|
|
| | |
| | | | | |
Class B Shares | | | | | | | | | | | | | | | | | | |
Proceeds from shares issued | | | 4,421,894 | | | | 5,717,425 | | | | 11,375,463 | | | | 13,608,132 | | | |
Dividends reinvested | | | 81,988 | | | | 14,290 | | | | 221,234 | | | | 53,483 | | | |
Cost of shares redeemed | | | (994,302 | ) | | | (191,398 | ) | | | (2,779,236 | ) | | | (743,029 | ) | | |
| | |
|
|
| |
|
|
| |
|
|
| |
|
|
| | |
| | | | 3,509,580 | | | | 5,540,317 | | | | 8,817,461 | | | | 12,918,586 | | | |
| | |
|
|
| |
|
|
| |
|
|
| |
|
|
| | |
| | | | | |
Class C Shares | | | | | | | | | | | | | | | | | | |
Proceeds from shares issued | | | 32,109,603 | | | | 36,327,447 | | | | 61,409,175 | | | | 81,881,317 | | | |
Dividends reinvested | | | 153,280 | | | | 26,537 | | | | 432,097 | | | | 118,357 | | | |
Cost of shares redeemed | | | (9,793,328 | ) | | | (2,129,482 | ) | | | (14,922,934 | ) | | | (4,268,083 | ) | | |
| | |
|
|
| |
|
|
| |
|
|
| |
|
|
| | |
| | | | 22,469,555 | | | | 34,224,502 | | | | 46,918,338 | | | | 77,731,591 | | | |
| | |
|
|
| |
|
|
| |
|
|
| |
|
|
| | |
| | | | | |
Class R Shares | | | | | | | | | | | | | | | | | | |
Proceeds from shares issued | | | 175,195 | | | | 34,333 | | | | 187,261 | | | | 59,943 | | | |
Dividends reinvested | | | 24 | | | | 10 | | | | 25 | | | | 12 | | | |
Cost of shares redeemed | | | (11,594 | ) | | | — | | | | (9,790 | ) | | | — | | | |
| | |
|
|
| |
|
|
| |
|
|
| |
|
|
| | |
| | | | 163,625 | | | | 34,343 | | | | 177,496 | | | | 59,955 | | | |
| | |
|
|
| |
|
|
| |
|
|
| |
|
|
| | |
| | | | | |
Intitutional Class Shares | | | | | | | | | | | | | | | | | | |
Proceeds from shares issued | | | 1,000 | (a) | | | — | | | | 1,000 | (a) | | | — | | | |
Dividends reinvested | | | 13 | (a) | | | — | | | | 15 | (a) | | | — | | | |
| | |
|
|
| |
|
|
| |
|
|
| |
|
|
| | |
| | | | 1,013 | | | | — | | | | 1,015 | | | | — | | | |
| | |
|
|
| |
|
|
| |
|
|
| |
|
|
| | |
| | | | | |
Service Class Shares | | | | | | | | | | | | | | | | | | |
Proceeds from shares issued | | | 147,958,245 | | | | 152,585,830 | | | | 259,286,178 | | | | 237,274,734 | | | |
Dividends reinvested | | | 6,795,353 | | | | 2,076,144 | | | | 12,042,601 | | | | 4,111,940 | | | |
Cost of shares redeemed | | | (29,073,071 | ) | | | (18,735,618 | ) | | | (29,449,390 | ) | | | (27,552,917 | ) | | |
| | |
|
|
| |
|
|
| |
|
|
| |
|
|
| | |
| | | | 125,680,527 | | | | 135,926,356 | | | | 241,879,389 | | | | 213,833,757 | | | |
| | |
|
|
| |
|
|
| |
|
|
| |
|
|
| | |
Change in net assets from capital transactions | | $ | 168,084,375 | | | $ | 190,827,750 | | | $ | 316,106,723 | | | $ | 328,725,614 | | | |
| | |
|
|
| |
|
|
| |
|
|
| |
|
|
| | |
| (a) | For the period from December 29, 2004 (commencement of operations) through October 31, 2005. |
| | | | | | | | | | | | | | |
| | | Investor Destinations
Aggressive | | | Investor Destinations Moderately Aggressive |
| | | Year Ended
October 31, 2005 | | | Year Ended
October 31, 2004 | | | Year Ended
October 31, 2005 | | | Year Ended
October 31, 2004 |
SHARE TRANSACTIONS: | | | | | | | | | | | | | | |
Class A Shares | | | | | | | | | | | | | | |
Issued | | 2,774,547 | | | 2,591,594 | | | 3,227,490 | | | 3,278,521 | | | |
Reinvested | | 33,465 | | | 8,052 | | | 51,942 | | | 18,669 | | | |
Redeemed | | (1,027,402 | ) | | (787,762 | ) | | (1,374,009 | ) | | (568,297 | ) | | |
| | |
|
| |
|
| |
|
| |
|
| | |
| | | 1,780,610 | | | 1,811,884 | | | 1,905,423 | | | 2,728,893 | | | |
| | |
|
| |
|
| |
|
| |
|
| | |
| | | | | |
Class B Shares | | | | | | | | | | | | | | |
Issued | | 483,830 | | | 689,149 | | | 1,198,403 | | | 1,558,732 | | | |
Reinvested | | 8,935 | | | 1,719 | | | 23,153 | | | 6,084 | | | |
Redeemed | | (108,402 | ) | | (23,051 | ) | | (291,889 | ) | | (85,185 | ) | | |
| | |
|
| |
|
| |
|
| |
|
| | |
| | | 384,363 | | | 667,817 | | | 929,667 | | | 1,479,631 | | | |
| | |
|
| |
|
| |
|
| |
|
| | |
| | | | | |
Class C Shares | | | | | | | | | | | | | | |
Issued | | 3,534,525 | | | 4,383,105 | | | 6,453,483 | | | 9,358,201 | | | |
Reinvested | | 16,745 | | | 3,201 | | | 45,210 | | | 13,462 | | | |
Redeemed | | (1,072,264 | ) | | (256,556 | ) | | (1,561,943 | ) | | (488,888 | ) | | |
| | |
|
| |
|
| |
|
| |
|
| | |
| | | 2,479,006 | | | 4,129,750 | | | 4,936,750 | | | 8,882,775 | | | |
| | |
|
| |
|
| |
|
| |
|
| | |
| | | | | |
Class R Shares | | | | | | | | | | | | | | |
Issued | | 19,741 | | | 4,248 | | | 20,034 | | | 6,853 | | | |
Reinvested | | 3 | | | 1 | | | 3 | | | 1 | | | |
Redeemed | | (1,241 | ) | | — | | | (1,010 | ) | | — | | | |
| | |
|
| |
|
| |
|
| |
|
| | |
| | | 18,503 | | | 4,249 | | | 19,027 | | | 6,854 | | | |
| | |
|
| |
|
| |
|
| |
|
| | |
| | | | | |
Intitutional Class Shares | | | | | | | | | | | | | | |
Issued | | 108 | (a) | | — | | | 104 | (a) | | — | | | |
Reinvested | | 1 | (a) | | — | | | 1 | (a) | | — | | | |
| | |
|
| |
|
| |
|
| |
|
| | |
| | | 109 | | | — | | | 105 | | | — | | | |
| | |
|
| |
|
| |
|
| |
|
| | |
| | | | | |
Service Class Shares | | | | | | | | | | | | | | |
Issued | | 15,982,444 | | | 18,118,430 | | | 26,910,875 | | | 26,738,835 | | | |
Reinvested | | 731,650 | | | 246,979 | | | 1,246,322 | | | 463,056 | | | |
Redeemed | | (3,117,948 | ) | | (2,228,254 | ) | | (3,039,191 | ) | | (3,093,329 | ) | | |
| | |
|
| |
|
| |
|
| |
|
| | |
| | | 13,596,146 | | | 16,137,155 | | | 25,118,006 | | | 24,108,562 | | | |
| | |
|
| |
|
| |
|
| |
|
| | |
Total change in shares | | 18,258,737 | | | 22,750,855 | | | 32,908,978 | | | 37,206,715 | | | |
| | |
|
| |
|
| |
|
| |
|
| | |
| (a) | For the period from December 29, 2004 (commencement of operations) through October 31, 2005. |
Notes to Financial Statements (Continued)
October 31, 2005
| | | | | | | | | | |
| | | Investor Destinations Moderate |
| | | Year Ended
October 31, 2005 | | | Year Ended
October 31, 2004 |
CAPITAL TRANSACTIONS: | | | | | | | | | | |
Class A Shares | | | | | | | | | | |
Proceeds from shares issued | | $ | 29,173,832 | | | $ | 28,300,143 | | | |
Dividends reinvested | | | 552,154 | | | | 209,300 | | | |
Cost of shares redeemed | | | (9,510,032 | ) | | | (4,510,995 | ) | | |
| | |
|
|
| |
|
|
| | |
| | | | 20,215,954 | | | | 23,998,448 | | | |
| | |
|
|
| |
|
|
| | |
| | | |
Class B Shares | | | | | | | | | | |
Proceeds from shares issued | | | 10,319,440 | | | | 13,421,315 | | | |
Dividends reinvested | | | 214,779 | | | | 69,279 | | | |
Cost of shares redeemed | | | (2,254,040 | ) | | | (869,023 | ) | | |
| | |
|
|
| |
|
|
| | |
| | | | 8,280,179 | | | | 12,621,571 | | | |
| | |
|
|
| |
|
|
| | |
| | | |
Class C Shares | | | | | | | | | | |
Proceeds from shares issued | | | 66,651,045 | | | | 84,358,359 | | | |
Dividends reinvested | | | 503,535 | | | | 164,758 | | | |
Cost of shares redeemed | | | (24,653,412 | ) | | | (7,305,391 | ) | | |
| | |
|
|
| |
|
|
| | |
| | | | 42,501,168 | | | | 77,217,726 | | | |
| | |
|
|
| |
|
|
| | |
| | | |
Class R Shares | | | | | | | | | | |
Proceeds from shares issued | | | 150,588 | | | | 39,600 | | | |
Dividends reinvested | | | 27 | | | | 15 | | | |
Cost of shares redeemed | | | (176 | ) | | | — | | | |
| | |
|
|
| |
|
|
| | |
| | | | 150,439 | | | | 39,615 | | | |
| | |
|
|
| |
|
|
| | |
| | | |
Intitutional Class Shares | | | | | | | | | | |
Proceeds from shares issued | | | 1,000 | (a) | | | — | | | |
Dividends reinvested | | | 17 | (a) | | | — | | | |
| | |
|
|
| |
|
|
| | |
| | | | 1,017 | | | | — | | | |
| | |
|
|
| |
|
|
| | |
| | | |
Service Class Shares | | | | | | | | | | |
Proceeds from shares issued | | | 451,686,838 | | | | 256,521,364 | | | |
Dividends reinvested | | | 14,840,668 | | | | 5,748,426 | | | |
Cost of shares redeemed | | | (46,335,984 | ) | | | (42,366,755 | ) | | |
| | |
|
|
| |
|
|
| | |
| | | | 420,191,522 | | | | 219,903,035 | | | |
| | |
|
|
| |
|
|
| | |
Change in net assets from capital transactions | | $ | 491,340,279 | | | $ | 333,780,395 | | | |
| | |
|
|
| |
|
|
| | |
| (a) | For the period from December 29, 2004 (commencement of operations) through October 31, 2005. |
| | | | | | | | |
| | | Investor Destinations Moderate |
| | | Year Ended
October 31, 2005 | | | Year Ended
October 31, 2004 |
SHARE TRANSACTIONS: | | | | | | | | |
Class A Shares | | | | | | | | |
Issued | | 2,917,469 | | | 3,011,399 | | | |
Reinvested | | 55,133 | | | 22,187 | | | |
Redeemed | | (946,237 | ) | | (479,820 | ) | | |
| | |
|
| |
|
| | |
| | | 2,026,365 | | | 2,553,766 | | | |
| | |
|
| |
|
| | |
| | | |
Class B Shares | | | | | | | | |
Issued | | 1,039,051 | | | 1,433,413 | | | |
Reinvested | | 21,584 | | | 7,382 | | | |
Redeemed | | (225,675 | ) | | (92,522 | ) | | |
| | |
|
| |
|
| | |
| | | 834,960 | | | 1,348,273 | | | |
| | |
|
| |
|
| | |
| | | |
Class C Shares | | | | | | | | |
Issued | | 6,733,517 | | | 9,031,094 | | | |
Reinvested | | 50,740 | | | 17,614 | | | |
Redeemed | | (2,479,989 | ) | | (784,797 | ) | | |
| | |
|
| |
|
| | |
| | | 4,304,268 | | | 8,263,911 | | | |
| | |
|
| |
|
| | |
| | | |
Class R Shares | | | | | | | | |
Issued | | 15,362 | | | 4,280 | | | |
Reinvested | | 3 | | | 2 | | | |
Redeemed | | (17 | ) | | — | | | |
| | |
|
| |
|
| | |
| | | 15,348 | | | 4,282 | | | |
| | |
|
| |
|
| | |
| | | |
Intitutional Class Shares | | | | | | | | |
Issued | | 99 | (a) | | — | | | |
Reinvested | | 2 | (a) | | — | | | |
| | |
|
| |
|
| | |
| | | 101 | | | — | | | |
| | |
|
| |
|
| | |
| | | |
Service Class Shares | | | | | | | | |
Issued | | 44,901,627 | | | 27,161,559 | | | |
Reinvested | | 1,481,988 | | | 610,271 | | | |
Redeemed | | (4,620,580 | ) | | (4,483,160 | ) | | |
| | |
|
| |
|
| | |
| | | 41,763,035 | | | 23,288,670 | | | |
| | |
|
| |
|
| | |
Total change in shares | | 48,944,077 | | | 35,458,902 | | | |
| | |
|
| |
|
| | |
| (a) | For the period from December 29, 2004 (commencement of operations) through October 31, 2005. |
Notes to Financial Statements (Continued)
October 31, 2005
| | | | | | | | | | | | | | | | | | |
| | | Investor Destinations
Moderately Conservative | | | Investor Destinations
Investor Destinations Conservative Conservative |
| | | Year Ended
October 31, 2005 | | | Year Ended
October 31, 2004 | | | Year Ended
October 31, 2005 | | | Year Ended
October 31, 2004 |
CAPITAL TRANSACTIONS: | | | | | | | | | | | | | | | | | | |
Class A Shares | | | | | | | | | | | | | | | | | | |
Proceeds from shares issued | | $ | 8,559,550 | | | $ | 9,525,868 | | | $ | 27,118,931 | | | $ | 4,116,231 | | | |
Dividends reinvested | | | 231,436 | | | | 101,639 | | | | 367,592 | | | | 42,702 | | | |
Cost of shares redeemed | | | (3,385,621 | ) | | | (3,295,669 | ) | | | (3,403,087 | ) | | | (1,014,708 | ) | | |
| | |
|
|
| |
|
|
| |
|
|
| |
|
|
| | |
| | | | 5,405,365 | | | | 6,331,838 | | | | 24,083,436 | | | | 3,144,225 | | | |
| | |
|
|
| |
|
|
| |
|
|
| |
|
|
| | |
| | | | | |
Class B Shares | | | | | | | | | | | | | | | | | | |
Proceeds from shares issued | | | 2,125,480 | | | | 2,661,539 | | | | 1,207,447 | | | | 2,087,549 | | | |
Dividends reinvested | | | 54,257 | | | | 24,872 | | | | 49,753 | | | | 23,210 | | | |
Cost of shares redeemed | | | (926,469 | ) | | | (686,483 | ) | | | (696,745 | ) | | | (351,106 | ) | | |
| | |
|
|
| |
|
|
| |
|
|
| |
|
|
| | |
| | | | 1,253,268 | | | | 1,999,928 | | | | 560,455 | | | | 1,759,653 | | | |
| | |
|
|
| |
|
|
| |
|
|
| |
|
|
| | |
| | | | | |
Class C Shares | | | | | | | | | | | | | | | | | | |
Proceeds from shares issued | | | 19,736,585 | | | | 22,705,109 | | | | 9,315,568 | | | | 12,228,628 | | | |
Dividends reinvested | | | 167,458 | | | | 82,699 | | | | 122,219 | | | | 49,034 | | | |
Cost of shares redeemed | | | (7,937,298 | ) | | | (4,177,562 | ) | | | (4,060,443 | ) | | | (2,320,470 | ) | | |
| | |
|
|
| |
|
|
| |
|
|
| |
|
|
| | |
| | | | 11,966,745 | | | | 18,610,246 | | | | 5,377,344 | | | | 9,957,192 | | | |
| | |
|
|
| |
|
|
| |
|
|
| |
|
|
| | |
| | | | | |
Class R Shares | | | | | | | | | | | | | | | | | | |
Proceeds from shares issued | | | 1,471 | | | | 37 | | | | 2,129 | | | | 140 | | | |
Dividends reinvested | | | 28 | | | | 17 | | | | 33 | | | | 19 | | | |
Cost of shares redeemed | | | (1,531 | ) | | | — | | | | (198 | ) | | | — | | | |
| | |
|
|
| |
|
|
| |
|
|
| |
|
|
| | |
| | | | (32 | ) | | | 54 | | | | 1,964 | | | | 159 | | | |
| | |
|
|
| |
|
|
| |
|
|
| |
|
|
| | |
| | | | | |
Intitutional Class Shares | | | | | | | | | | | | | | | | | | |
Proceeds from shares issued | | | 1,000 | (a) | | | — | | | | 1,000 | (a) | | | — | | | |
Dividends reinvested | | | 20 | (a) | | | — | | | | 21 | (a) | | | — | | | |
| | |
|
|
| |
|
|
| |
|
|
| |
|
|
| | |
| | | | 1,020 | | | | — | | | | 1,021 | | | | — | | | |
| | |
|
|
| |
|
|
| |
|
|
| |
|
|
| | |
| | | | | |
Service Class Shares | | | | | | | | | | | | | | | | | | |
Proceeds from shares issued | | | 72,268,066 | | | | 68,707,212 | | | | 61,190,122 | | | | 58,037,110 | | | |
Dividends reinvested | | | 4,296,297 | | | | 2,042,334 | | | | 3,744,799 | | | | 1,696,250 | | | |
Cost of shares redeemed | | | (21,567,475 | ) | | | (16,895,381 | ) | | | (28,999,856 | ) | | | (19,762,869 | ) | | |
| | |
|
|
| |
|
|
| |
|
|
| |
|
|
| | |
| | | | 54,996,888 | | | | 53,854,165 | | | | 35,935,065 | | | | 39,970,491 | | | |
| | |
|
|
| |
|
|
| |
|
|
| |
|
|
| | |
Change in net assets from capital transactions | | $ | 73,623,254 | | | $ | 80,796,231 | | | $ | 65,959,285 | | | $ | 54,831,720 | | | |
| | |
|
|
| |
|
|
| |
|
|
| |
|
|
| | |
| (a) | For the period from December 29, 2004 (commencement of operations) through October 31, 2005. |
| | | | | | | | | | | | | | |
| | | Investor Destinations
Moderately Conservative | | | Investor Destinations Conservative |
| | | Year Ended
October 31, 2005 | | | Year Ended
October 31, 2004 | | | Year Ended
October 31, 2005 | | | Year Ended
October 31, 2004 |
SHARE TRANSACTIONS: | | | | | | | | | | | | | | |
Class A Shares | | | | | | | | | | | | | | |
Issued | | 845,183 | | | 982,378 | | | 2,651,433 | | | 409,200 | | | |
Reinvested | | 22,836 | | | 10,435 | | | 36,071 | | | 4,256 | | | |
Redeemed | | (334,580 | ) | | (338,213 | ) | | (333,263 | ) | | (100,949 | ) | | |
| | |
|
| |
|
| |
|
| |
|
| | |
| | | 533,439 | | | 654,600 | | | 2,354,241 | | | 312,507 | | | |
| | |
|
| |
|
| |
|
| |
|
| | |
| | | | | |
Class B Shares | | | | | | | | | | | | | | |
Issued | | 210,031 | | | 273,936 | | | 118,393 | | | 208,358 | | | |
Reinvested | | 5,352 | | | 2,552 | | | 4,895 | | | 2,315 | | | |
Redeemed | | (91,866 | ) | | (70,137 | ) | | (68,506 | ) | | (35,104 | ) | | |
| | |
|
| |
|
| |
|
| |
|
| | |
| | | 123,517 | | | 206,351 | | | 54,782 | | | 175,569 | | | |
| | |
|
| |
|
| |
|
| |
|
| | |
| | | | | |
Class C Shares | | | | | | | | | | | | | | |
Issued | | 1,951,694 | | | 2,339,588 | | | 916,795 | | | 1,219,283 | | | |
Reinvested | | 16,569 | | | 8,508 | | | 12,062 | | | 4,904 | | | |
Redeemed | | (786,262 | ) | | (430,830 | ) | | (399,383 | ) | | (232,553 | ) | | |
| | |
|
| |
|
| |
|
| |
|
| | |
| | | 1,182,001 | | | 1,917,266 | | | 529,474 | | | 991,634 | | | |
| | |
|
| |
|
| |
|
| |
|
| | |
| | | | | |
Class R Shares | | | | | | | | | | | | | | |
Issued | | 145 | | | 4 | | | 208 | | | 13 | | | |
Reinvested | | 3 | | | 2 | | | 3 | | | 2 | | | |
Redeemed | | (149 | ) | | — | | | (18 | ) | | — | | | |
| | |
|
| |
|
| |
|
| |
|
| | |
| | | (1 | ) | | 6 | | | 193 | | | 15 | | | |
| | |
|
| |
|
| |
|
| |
|
| | |
| | | | | |
Intitutional Class Shares | | | | | | | | | | | | | | |
Issued | | 98 | (a) | | — | | | 98 | (a) | | — | | | |
Reinvested | | 2 | (a) | | — | | | 2 | (a) | | — | | | |
| | |
|
| |
|
| |
|
| |
|
| | |
| | | 100 | | | — | | | 100 | | | — | | | |
| | |
|
| |
|
| |
|
| |
|
| | |
| | | | | |
Service Class Shares | | | | | | | | | | | | | | |
Issued | | 7,110,668 | | | 7,024,940 | | | 5,986,237 | | | 5,764,611 | | | |
Reinvested | | 422,500 | | | 209,104 | | | 367,413 | | | 168,801 | | | |
Redeemed | | (2,117,234 | ) | | (1,732,898 | ) | | (2,837,442 | ) | | (1,964,374 | ) | | |
| | |
|
| |
|
| |
|
| |
|
| | |
| | | 5,415,934 | | | 5,501,146 | | | 3,516,208 | | | 3,969,038 | | | |
| | |
|
| |
|
| |
|
| |
|
| | |
Total change in shares | | 7,254,990 | | | 8,279,369 | | | 6,454,998 | | | 5,448,763 | | | |
| | |
|
| |
|
| |
|
| |
|
| | |
| (a) | For the period from December 29, 2004 (commencement of operations) through October 31, 2005. |
Notes to Financial Statements (Continued)
October 31, 2005
| | | | | | | | | | | | | | | | |
| | | Optimal Allocations Aggressive | | Optima Allocations Moderately Aggressive |
| | | Year Ended
October 31, 2005 | | | Period Ended
October 31, 2004 (a) | | Year Ended
October 31, 2005 | | | Period Ended
October 31, 2004 (a) |
CAPITAL TRANSACTIONS: | | | | | | | | | | | | | | | | |
Class A Shares | | | | | | | | | | | | | | | | |
Proceeds from shares issued | | $ | 1,168,374 | | | $ | 4,124 | | $ | 3,366,154 | | | $ | 1,000 | | |
Dividends reinvested | | | 1,164 | | | | — | | | 7,457 | | | | — | | |
Cost of shares redeemed | | | (218,894 | ) | | | — | | | (48,511 | ) | | | — | | |
| | |
|
|
| |
|
| |
|
|
| |
|
| | |
| | | | 950,644 | | | | 4,124 | | | 3,325,100 | | | | 1,000 | | |
| | |
|
|
| |
|
| |
|
|
| |
|
| | |
| | | | | |
Class B Shares | | | | | | | | | | | | | | | | |
Proceeds from shares issued | | | 253,499 | | | | 1,000 | | | 1,148,412 | | | | 7,000 | | |
Dividends reinvested | | | 46 | | | | — | | | 1,690 | | | | — | | |
Cost of shares redeemed | | | (77,752 | ) | | | — | | | (4,741 | ) | | | — | | |
| | |
|
|
| |
|
| |
|
|
| |
|
| | |
| | | | 175,793 | | | | 1,000 | | | 1,145,361 | | | | 7,000 | | |
| | |
|
|
| |
|
| |
|
|
| |
|
| | |
| | | | | |
Class C Shares | | | | | | | | | | | | | | | | |
Proceeds from shares issued | | | 1,472,761 | | | | 1,000 | | | 4,129,749 | | | | 78,000 | | |
Dividends reinvested | | | 370 | | | | — | | | 4,364 | | | | — | | |
Cost of shares redeemed | | | (11,760 | ) | | | — | | | (733,470 | ) | | | — | | |
| | |
|
|
| |
|
| |
|
|
| |
|
| | |
| | | | 1,461,371 | | | | 1,000 | | | 3,400,643 | | | | 78,000 | | |
| | |
|
|
| |
|
| |
|
|
| |
|
| | |
| | | | | |
Class R Shares | | | | | | | | | | | | | | | | |
Proceeds from shares issued | | | 238 | | | | 1,000 | | | 249 | | | | 1,000 | | |
Dividends reinvested | | | 21 | | | | — | | | 24 | | | | — | | |
Cost of shares redeemed | | | (229 | ) | | | — | | | (250 | ) | | | — | | |
| | |
|
|
| |
|
| |
|
|
| |
|
| | |
| | | | 30 | | | | 1,000 | | | 23 | | | | 1,000 | | |
| | |
|
|
| |
|
| |
|
|
| |
|
| | |
| | | | | |
Institutional Service Class Shares | | | | | | | | | | | | | | | | |
Proceeds from shares issued | | | — | | | | 1,000 | | | — | | | | 1,000 | | |
Dividends reinvested | | | 25 | | | | — | | | 30 | | | | — | | |
| | |
|
|
| |
|
| |
|
|
| |
|
| | |
| | | | 25 | | | | 1,000 | | | 30 | | | | 1,000 | | |
| | |
|
|
| |
|
| |
|
|
| |
|
| | |
| | | | | |
Institutional Class Shares | | | | | | | | | | | | | | | | |
Proceeds from shares issued | | | — | | | | 1,000,000 | | | — | | | | 1,000,000 | | |
Dividends reinvested | | | 25,113 | | | | — | | | 30,094 | | | | — | | |
| | |
|
|
| |
|
| |
|
|
| |
|
| | |
| | | | 25,113 | | | | 1,000,000 | | | 30,094 | | | | 1,000,000 | | |
| | |
|
|
| |
|
| |
|
|
| |
|
| | |
Change in net assets from capital transactions | | $ | 2,612,976 | | | $ | 1,008,124 | | $ | 7,901,251 | | | $ | 1,088,000 | | |
| | |
|
|
| |
|
| |
|
|
| |
|
| | |
| (a) | For the period from June 29, 2004 (commencement of operations) through October 31, 2004. |
| | | | | | | | | | | | |
| | | Optimal Allocations Aggressive | | Optima Allocations Moderately Aggressive |
| | | Year Ended
October 31, 2005 | | | Period Ended
October 31, 2004 (a) | | Year Ended
October 31, 2005 | | | Period Ended
October 31, 2004 (a) |
SHARE TRANSACTIONS: | | | | | | | | | | | | |
Class A Shares | | | | | | | | | | | | |
Issued | | 107,133 | | | 416 | | 308,600 | | | 100 | | |
Reinvested | | 110 | | | — | | 682 | | | — | | |
Redeemed | | (19,602 | ) | | — | | (4,419 | ) | | — | | |
| | |
|
| |
| |
|
| |
| | |
| | | 87,641 | | | 416 | | 304,863 | | | 100 | | |
| | |
|
| |
| |
|
| |
| | |
| | | | | |
Class B Shares | | | | | | | | | | | | |
Issued | | 23,680 | | | 100 | | 105,682 | | | 699 | | |
Reinvested | | 4 | | | — | | 158 | | | — | | |
Redeemed | | (6,949 | ) | | — | | (437 | ) | | — | | |
| | |
|
| |
| |
|
| |
| | |
| | | 16,735 | | | 100 | | 105,403 | | | 699 | | |
| | |
|
| |
| |
|
| |
| | |
| | | | | |
Class C Shares | | | | | | | | | | | | |
Issued | | 136,132 | | | 100 | | 382,131 | | | 7,831 | | |
Reinvested | | 35 | | | — | | 408 | | | — | | |
Redeemed | | (1,096 | ) | | — | | (66,934 | ) | | — | | |
| | |
|
| |
| |
|
| |
| | |
| | | 135,071 | | | 100 | | 315,605 | | | 7,831 | | |
| | |
|
| |
| |
|
| |
| | |
| | | | | |
Class R Shares | | | | | | | | | | | | |
Issued | | 22 | | | 100 | | 23 | | | 100 | | |
Reinvested | | 2 | | | — | | 2 | | | — | | |
Redeemed | | (21 | ) | | — | | (23 | ) | | — | | |
| | |
|
| |
| |
|
| |
| | |
| | | 3 | | | 100 | | 2 | | | 100 | | |
| | |
|
| |
| |
|
| |
| | |
| | | | | |
Institutional Service Class Shares | | | | | | | | | | | | |
Issued | | — | | | 100 | | — | | | 100 | | |
Reinvested | | 2 | | | — | | 3 | | | — | | |
| | |
|
| |
| |
|
| |
| | |
| | | 2 | | | 100 | | 3 | | | 100 | | |
| | |
|
| |
| |
|
| |
| | |
| | | | | |
Institutional Class Shares | | | | | | | | | | | | |
Issued | | — | | | 100,000 | | — | | | 100,000 | | |
Reinvested | | 2,355 | | | — | | 2,786 | | | — | | |
| | |
|
| |
| |
|
| |
| | |
| | | 2,355 | | | 100,000 | | 2,786 | | | 100,000 | | |
| | |
|
| |
| |
|
| |
| | |
Total change in shares | | 241,807 | | | 100,816 | | 728,662 | | | 108,830 | | |
| | |
|
| |
| |
|
| |
| | |
| (a) | For the period from June 29, 2004 (commencement of operations) through October 31, 2004. |
Notes to Financial Statements (Continued)
October 31, 2005
| | | | | | | | | | | | | | | | |
| | | Optimal Allocations Moderate | | Optimal Allocations Specialty |
| | | Year Ended
October 31, 2005 | | | Period Ended
October 31, 2004 (a) | | Year Ended
October 31, 2005 | | | Period Ended
October 31, 2004 (a) |
CAPITAL TRANSACTIONS: | | | | | | | | | | | | | | | | |
Class A Shares | | | | | | | | | | | | | | | | |
Proceeds from shares issued | | $ | 4,646,233 | | | $ | 1,000 | | $ | 6,859,908 | | | $ | 79,478 | | |
Dividends reinvested | | | 13,909 | | | | — | | | 20,239 | | | | — | | |
Cost of shares redeemed | | | (154,670 | ) | | | — | | | (2,083,851 | ) | | | — | | |
| | |
|
|
| |
|
| |
|
|
| |
|
| | |
| | | | 4,505,472 | | | | 1,000 | | | 4,796,296 | | | | 79,478 | | |
| | |
|
|
| |
|
| |
|
|
| |
|
| | |
| | | | | |
Class B Shares | | | | | | | | | | | | | | | | |
Proceeds from shares issued | | | 1,270,605 | | | | 1,000 | | | 939,685 | | | | 999 | | |
Dividends reinvested | | | 2,478 | | | | — | | | 1,370 | | | | — | | |
Cost of shares redeemed | | | (35,765 | ) | | | — | | | (3,966 | ) | | | — | | |
| | |
|
|
| |
|
| |
|
|
| |
|
| | |
| | | | 1,237,318 | | | | 1,000 | | | 937,089 | | | | 999 | | |
| | |
|
|
| |
|
| |
|
|
| |
|
| | |
| | | | | |
Class C Shares | | | | | | | | | | | | | | | | |
Proceeds from shares issued | | | 7,925,581 | | | | 1,000 | | | 9,304,238 | | | | 35,455 | | |
Dividends reinvested | | | 3,367 | | | | — | | | 8,344 | | | | — | | |
Cost of shares redeemed | | | (355,846 | ) | | | — | | | (573,314 | ) | | | — | | |
| | |
|
|
| |
|
| |
|
|
| |
|
| | |
| | | | 7,573,102 | | | | 1,000 | | | 8,739,268 | | | | 35,455 | | |
| | |
|
|
| |
|
| |
|
|
| |
|
| | |
| | | | | |
Class R Shares | | | | | | | | | | | | | | | | |
Proceeds from shares issued | | | 249 | | | | 1,000 | | | 104,020 | | | | 999 | | |
Dividends reinvested | | | 26 | | | | — | | | 24 | | | | — | | |
Cost of shares redeemed | | | (249 | ) | | | — | | | (105,447 | ) | | | — | | |
| | |
|
|
| |
|
| |
|
|
| |
|
| | |
| | | | 26 | | | | 1,000 | | | (1,403 | ) | | | 999 | | |
| | |
|
|
| |
|
| |
|
|
| |
|
| | |
| | | | | |
Institutional Service Class Shares | | | | | | | | | | | | | | | | |
Proceeds from shares issued | | | — | | | | 1,000 | | | — | | | | 999 | | |
Dividends reinvested | | | 32 | | | | — | | | 31 | | | | — | | |
| | |
|
|
| |
|
| |
|
|
| |
|
| | |
| | | | 32 | | | | 1,000 | | | 31 | | | | 999 | | |
| | |
|
|
| |
|
| |
|
|
| |
|
| | |
| | | | | |
Institutional Class Shares | | | | | | | | | | | | | | | | |
Proceeds from shares issued | | | — | | | | 1,000,000 | | | 35 | | | | 999,159 | | |
Dividends reinvested | | | 32,656 | | | | — | | | 31,129 | | | | — | | |
| | |
|
|
| |
|
| |
|
|
| |
|
| | |
| | | | 32,656 | | | | 1,000,000 | | | 31,164 | | | | 999,159 | | |
| | |
|
|
| |
|
| |
|
|
| |
|
| | |
Change in net assets from capital transactions | | $ | 13,348,606 | | | $ | 1,005,000 | | $ | 14,502,445 | | | $ | 1,117,089 | | |
| | |
|
|
| |
|
| |
|
|
| |
|
| | |
| | | | | | | | | | | | |
| | | Optimal Allocations Moderate | | Optimal Allocations Specialty |
| | | Year Ended
October 31, 2005 | | | Period Ended
October 31, 2004 (a) | | Year Ended
October 31, 2005 | | | Period Ended
October 31, 2004 (a) |
SHARE TRANSACTIONS: | | | | | | | | | | | | |
Class A Shares | | | | | | | | | | | | |
Issued | | 428,983 | | | 100 | | 625,720 | | | 7,773 | | |
Reinvested | | 1,273 | | | — | | 1,855 | | | — | | |
Redeemed | | (14,244 | ) | | — | | (190,264 | ) | | — | | |
| | |
|
| |
| |
|
| |
| | |
| | | 416,012 | | | 100 | | 437,311 | | | 7,773 | | |
| | |
|
| |
| |
|
| |
| | |
| | | | | |
Class B Shares | | | | | | | | | | | | |
Issued | | 119,195 | | | 100 | | 85,811 | | | 100 | | |
Reinvested | | 232 | | | — | | 127 | | | — | | |
Redeemed | | (3,336 | ) | | — | | (354 | ) | | — | | |
| | |
|
| |
| |
|
| |
| | |
| | | 116,091 | | | 100 | | 85,584 | | | 100 | | |
| | |
|
| |
| |
|
| |
| | |
| | | | | |
Class C Shares | | | | | | | | | | | | |
Issued | | 731,168 | | | 100 | | 851,265 | | | 3,483 | | |
Reinvested | | 312 | | | — | | 770 | | | — | | |
Redeemed | | (32,198 | ) | | — | | (52,280 | ) | | — | | |
| | |
|
| |
| |
|
| |
| | |
| | | 699,282 | | | 100 | | 799,755 | | | 3,483 | | |
| | |
|
| |
| |
|
| |
| | |
| | | | | |
Class R Shares | | | | | | | | | | | | |
Issued | | 23 | | | 100 | | 9,675 | | | 100 | | |
Reinvested | | 2 | | | — | | 2 | | | — | | |
Redeemed | | (23 | ) | | — | | (9,674 | ) | | — | | |
| | |
|
| |
| |
|
| |
| | |
| | | 2 | | | 100 | | 3 | | | 100 | | |
| | |
|
| |
| |
|
| |
| | |
| | | | | |
Institutional Service Class Shares | | | | | | | | | | | | |
Issued | | — | | | 100 | | — | | | 100 | | |
Reinvested | | 3 | | | — | | 3 | | | — | | |
| | |
|
| |
| |
|
| |
| | |
| | | 3 | | | 100 | | 3 | | | 100 | | |
| | |
|
| |
| |
|
| |
| | |
| | | | | |
Institutional Class Shares | | | | | | | | | | | | |
Issued | | — | | | 100,000 | | — | | | 100,000 | | |
Reinvested | | 3,037 | | | — | | 2,840 | | | — | | |
| | |
|
| |
| |
|
| |
| | |
| | | 3,037 | | | 100,000 | | 2,840 | | | 100,000 | | |
| | |
|
| |
| |
|
| |
| | |
Total change in shares | | 1,234,427 | | | 100,500 | | 1,325,496 | | | 111,556 | | |
| | |
|
| |
| |
|
| |
| | |
| (a) | For the period from June 29, 2004 (commencement of operations) through October 31, 2004. |
Notes to Financial Statements (Continued)
October 31, 2005
3. Transactions with Affiliates
Under the terms of the Trust’s Investment Advisory Agreement, Gartmore Mutual Fund Capital Trust (“GMF”) manages the investment of the assets and supervises the daily business affairs of the Funds. GMF is a wholly-owned subsidiary of Gartmore Global Investments, Inc. (“GGI”), a holding company. GGI is a majority-owned subsidiary of Gartmore Global Asset Management Trust (“GGAMT”). GGAMT is a wholly-owned subsidiary of Nationwide Corporation. All of the common stock of Nationwide Corporation is held by Nationwide Mutual Insurance Company (95.2%) and Nationwide Mutual Fire Insurance Company (4.8%), each of which is a mutual company owned by its policyholders. Under the terms of the Investment Advisory Agreement, the Optimal Allocations Aggressive, the Optimal Allocations Moderately Aggressive, the Optimal Allocations Moderate, and the Optimal Allocations Specialty (collectively, the “Optimal Funds”) each pays GMF an investment advisory fee of 0.15% based on the Fund’s average daily net assets. The Investor Destinations Funds each pay GMF an investment advisory fee of 0.13% based on the Fund’s average daily net assets.
GMF and the Funds have entered into written contracts (“Expense Limitation Agreements”) that limits operating expenses (excluding any taxes, interest, brokerage fees, extraordinary expenses, short sale dividend expenses, Rule 12b-1 fees, and administrative services fees) from exceeding 0.25% for all share classes of the Funds, until February 28, 2006.
GMF may request and receive reimbursement from certain Funds of the advisory fees waived and other expenses reimbursed by GMF pursuant to the Expense Limitation Agreements at a later date not to exceed three fiscal years from commencement of operations if the Fund has reached a sufficient asset size to permit reimbursement to be made without causing the total annual operating expense ratio of the Fund to exceed the limits set forth above. No reimbursement will be made unless: (i) the Fund’s assets exceed $100 million; (ii) the total annual expense ratio of the class making such reimbursement is less than the limit set forth above; and (iii) the payment of such reimbursement is approved by the Board of Trustees on a quarterly basis. Except as provided for in the Expense Limitation Agreements, reimbursement of amounts previously waived or assumed by GMF is not permitted.
As of the year ended October 31, 2005, the cumulative potential reimbursements of the following Funds (unless otherwise indicated), based on reimbursements which expire within three years from the fiscal year in which the corresponding reimbursements to the Fund was made for expenses reimbursed by GMF or GMCM, would be:
| | | | | | |
| Fund | | Fiscal Year
2004 | | Fiscal Year
2005 |
Optimal Allocations Aggressive | | $ | 40,836 | | $ | 88,800 |
Optimal Allocations Moderately Aggressive | | | 40,411 | | | 96,103 |
Optimal Allocations Moderate | | | 40,408 | | | 93,106 |
Optimal Allocations Specialty | | | 40,408 | | | 104,891 |
Under the terms of a Distribution Plan under Rule 12b-1 of the 1940 Act, Gartmore Distribution Services, Inc. (“GDSI”), the Funds’ distributor, is compensated by the Funds for expenses associated with the distribution of Class A, Class B, Class C, Class R, and Service Class shares of the Funds. These fees are based on average daily net assets of the respective class of the Funds at an annual rate not to exceed 0.25% for Class A and Service Class shares, 1.00% for Class B and Class C shares, and 0.50% for Class R shares.
Pursuant to an Underwriting Agreement, GDSI serves as principal underwriter of the Funds in the continuous distribution of their shares and receives commissions in the form of a front-end sales charge on the Class A shares. These fees are deducted from and are not included in proceeds from sales of Class A shares. From these fees, GDSI pays sales commissions, salaries, and other expenses in connection with generating new sales of Class A shares of the Funds. GDSI also receives fees for services as principal underwriter for Class B shares of the Funds. These fees are contingent deferred sales charges (“CDSCs”) ranging from 1% to 5% imposed on redemptions of Class B shares which may cause the current value of a shareholder’s account to fall below the total purchase payments. The CDSC, if applicable, will be imposed on redemptions made within six years of the purchase. Class C shares have a CDSC fee of 1% imposed on
redemptions of Class C shares made within one year of purchase. For the year ended October 31, 2005, GDSI received commissions of $5,010,262 from front-end sales charges of Class A shares and from CDSC fees from Class B and Class C shares of the Funds, of which $192,829 was re-allowed to affiliated broker-dealers of the Funds.
Under the terms of a Fund Administration and Transfer Agency Agreement, Gartmore SA Capital Trust (‘‘GSA’’) provides various administrative and accounting services for the Funds, and Gartmore Investors Services, Inc. (‘‘GISI’’), an indirect subsidiary of GSA, serves as Transfer Agent and Dividend Disbursing Agent for each of the Funds. The Funds do not pay a fee for these services.
Gartmore SA Capital Trust and GISI have entered into agreements with BISYS Fund Services Ohio, Inc. (“BISYS”), pursuant to which BISYS provides sub-administration and sub-transfer agency services, respectively, to the Funds.
Under the terms of an Administrative Services Plan, the Funds may pay fees to servicing organizations, such as brokerdealers, including Nationwide Financial Services, and financial institutions, which agree to provide administrative support services to the shareholders of certain classes. These services include, but are not limited, to the following: establishing and maintaining shareholder accounts; processing purchase and redemption transactions; arranging bank wires; performing shareholder sub-accounting; answering inquiries regarding the Funds; and other such services. These fees are based on an annual rate of up to 0.25% of the average daily net assets of the Class A, Class R, Service Class, and Institutional Service Class shares of each of the Funds.
As of October 31, 2005, the advisers or affiliates directly held the percentage indicated below of the shares outstanding of the applicable Fund:
| | | |
| Fund | | % of Shares
Outstanding
Owned | |
Optimal Allocations Aggressive | | 30 | % |
Optimal Allocations Moderately Aggressive | | 12 | % |
4. Bank Loans and Earnings Credit
The Trust has a credit agreement of $100,000,000 with J.P. Morgan Chase & Co. Borrowings under this arrangement bear interest at the Federal Funds rate plus 0.50%. The interest costs are included in custodian fees in the Statement of Operations. No compensating balances were required under the terms of the line of credit. There were no borrowings outstanding as of October 31, 2005.
The Trust’s custodian bank has agreed to reduce its fees when the funds of the Trust maintain cash on deposit in non-interest-bearing custody and Demand Deposit Accounts.
5. Investment Transactions
Purchases and sales of Underlying Funds for the year ended October 31, 2005, are summarized as follows:
| | | | | | |
| Fund | | Purchases | | Sales |
Investor Destinations Aggressive | | $ | 200,987,523 | | $ | 31,047,504 |
Investor Destinations Moderately Aggressive | | | 352,427,646 | | | 43,812,496 |
Investor Destinations Moderate | | | 499,642,415 | | | 47,581,175 |
Investor Destinations Moderately Conservative | | | 79,944,014 | | | 16,383,827 |
Investor Destinations Conservative | | | 66,583,021 | | | 16,454,818 |
Optimal Allocations Aggressive | | | 3,388,576 | | | 744,418 |
Optimal Allocations Moderately Aggressive | | | 10,037,504 | | | 2,076,764 |
Optimal Allocations Moderate | | | 17,031,846 | | | 3,651,543 |
Optimal Allocations Specialty | | | 17,504,014 | | | 2,950,877 |
Notes to Financial Statements (Continued)
October 31, 2005
6. Federal Tax Information
The tax character of distributions paid during the fiscal year ended October 31, 2005, was as follows: (total distributions paid may differ from the Statement of Changes in Net Assets because for tax purposes dividends are recognized when paid.)
| | | | | | | | | | | | | | | |
| | | Distributions paid from
| | | | | | |
| Fund | | Ordinary
Income | | Net Long
Term Capital
Gains | | Total Taxable
Distributions | | Return of
Capital | | Total
Distributions
Paid |
Investor Destinations Aggressive | | $ | 8,635,093 | | $ | – | | $ | 8,635,093 | | $ | – | | $ | 8,635,093 |
Investor Destinations Moderately Aggressive | | | 15,316,033 | | | 52,876 | | | 15,368,909 | | | – | | | 15,368,909 |
Investor Destinations Moderate | | | 18,052,540 | | | 562,563 | | | 18,615,103 | | | – | | | 18,615,103 |
Investor Destinations Moderately Conservative | | | 5,255,078 | | | 196,919 | | | 5,451,997 | | | – | | | 5,451,997 |
Investor Destinations Conservative | | | 3,997,520 | | | 712,241 | | | 4,709,761 | | | – | | | 4,709,761 |
Optimal Allocations Aggressive | | | 36,982 | | | – | | | 36,982 | | | – | | | 36,982 |
Optimal Allocations Moderately Aggressive | | | 63,348 | | | – | | | 63,348 | | | – | | | 63,348 |
Optimal Allocations Moderate | | | 93,050 | | | – | | | 93,050 | | | – | | | 93,050 |
Optimal Allocations Specialty | | | 185,711 | | | – | | | 185,711 | | | – | | | 185,711 |
The tax character of distributions paid during the fiscal year ended October 31, 2004 was as follows: (total distributions paid may differ from the Statement of Changes in Net Assets because for tax purposes dividends are recognized when paid.)
| | | | | | | | | | | | | | | |
| | | Distributions paid from
| | | | | | |
| Fund | | Ordinary
Income | | Net Long
Term Capital
Gains | | Total Taxable
Distributions | | Tax
Exempt
Distributions | | Total
Distributions
Paid |
Investor Destinations Aggressive | | $ | 2,367,184 | | $ | – | | $ | 2,367,184 | | $ | – | | $ | 2,367,184 |
Investor Destinations Moderately Aggressive | | | 5,002,066 | | | – | | | 5,002,066 | | | – | | | 5,002,066 |
Investor Destinations Moderate | | | 7,006,786 | | | – | | | 7,006,786 | | | – | | | 7,006,786 |
Investor Destinations Moderately Conservative | | | 2,521,331 | | | – | | | 2,521,331 | | | – | | | 2,521,331 |
Investor Destinations Conservative | | | 1,955,277 | | | – | | | 1,955,277 | | | – | | | 1,955,277 |
Optimal Allocations Aggressive | | | – | | | – | | | – | | | – | | | – |
Optimal Allocations Moderately Aggressive | | | – | | | – | | | – | | | – | | | – |
Optimal Allocations Moderate | | | – | | | – | | | – | | | – | | | – |
Optimal Allocations Specialty | | | – | | | – | | | – | | | – | | | – |
As of October 31, 2005, the components of accumulated earnings (deficit) on a tax basis were as follows:
| | | | | | | | | | | | | | |
| Fund | | Undistributed
Ordinary
Income | | Undistributed
Long-Term
Capital Gains | | Accumulated
Earnings | | Unrealized
Appreciation
(Depreciation)* | | Total
Accumulated
Earnings
(Deficit) |
Investor Destinations Aggressive | | $ | – | | $ | 11,597,446 | | $ | 11,597,446 | | $ | 58,090,234 | | 69,687,680 |
Investor Destinations Moderately Aggressive | | | 63,952 | | | 13,980,503 | | | 14,044,455 | | | 88,690,643 | | 102,735,098 |
Investor Destinations Moderate | | | 999,526 | | | 13,729,148 | | | 14,728,674 | | | 59,400,745 | | 74,129,419 |
Investor Destinations Moderately Conservative | | | 405,564 | | | 4,174,086 | | | 4,579,650 | | | 9,678,781 | | 14,258,431 |
Investor Destinations Conservative | | | 438,220 | | | 2,212,875 | | | 2,651,095 | | | 862,295 | | 3,513,390 |
Optimal Allocations Aggressive | | | 5,779 | | | 69,954 | | | 75,733 | | | 170,683 | | 246,416 |
Optimal Allocations Moderately Aggressive | | | 79,765 | | | 82,186 | | | 161,951 | | | 210,860 | | 372,811 |
Optimal Allocations Moderate | | | 110,910 | | | 68,771 | | | 179,681 | | | 118,864 | | 298,545 |
Optimal Allocations Specialty | | | 168,324 | | | 47,545 | | | 215,869 | | | 670,752 | | 886,621 |
| * | The differences between the book-basis and tax-basis unrealized appreciation (depreciation) is attributable primarily to: tax deferral of losses on wash sales; the difference between book and tax amortization methods for premium and market discount. |
As of October 31, 2005, the tax cost of securities and the breakdown of unrealized appreciation (depreciation) for each Fund were as follows:
| | | | | | | | | | | | |
| Fund | | Tax Cost of
Securities | | Unrealized
Appreciation | | Unrealized
Depreciation | | | Net
Unrealized
Appreciation
(Depreciation) |
Investor Destinations Aggressive | | $ | 503,951,548 | | $ | 58,727,856 | | $ | (637,622 | ) | | 58,090,234 |
Investor Destinations Moderately Aggressive | | | 890,763,591 | | | 92,218,603 | | | (3,527,960 | ) | | 88,690,643 |
Investor Destinations Moderate | | | 1,112,366,375 | | | 66,761,058 | | | (7,360,313 | ) | | 59,400,745 |
Investor Destinations Moderately Conservative | | | 248,729,863 | | | 12,229,264 | | | (2,550,483 | ) | | 9,678,781 |
Investor Destinations Conservative | | | 188,912,433 | | | 2,999,932 | | | (2,137,637 | ) | | 862,295 |
Optimal Allocations Aggressive | | | 3,676,552 | | | 182,888 | | | (12,205 | ) | | 170,683 |
Optimal Allocations Moderately Aggressive | | | 9,156,749 | | | 261,521 | | | (50,661 | ) | | 210,860 |
Optimal Allocations Moderate | | | 14,499,431 | | | 229,684 | | | (110,820 | ) | | 118,864 |
Optimal Allocations Specialty | | | 15,844,093 | | | 730,736 | | | (59,984 | ) | | 670,752 |
Report of Independent Registered Public
Accounting Firm
To the Board of Trustees and Shareholders of Gartmore Mutual Funds:
In our opinion, the accompanying statements of assets and liabilities, including the statements of investments, and the related statements of operations and of changes in net assets and the financial highlights present fairly, in all material respects, the financial position of Gartmore Investor Destinations Aggressive Fund, Gartmore Investor Destinations Moderately Aggressive Fund, Gartmore Investor Destinations Moderate Fund, Gartmore Investor Destinations Moderately Conservative Fund, Gartmore Investor Destinations Conservative Fund, Gartmore Optimal Allocations Fund: Aggressive, Gartmore Optimal Allocations Fund: Moderately Aggressive, Gartmore Optimal Allocations Fund: Moderate and Gartmore Optimal Allocations Fund: Specialty (nine series of Gartmore Mutual Funds, hereafter referred to as the “Funds”) at October 31, 2005, the results of each of their operations for the year then ended, the changes in each of their net assets each of the two years (or periods) then ended and the financial highlights for each of the four years (or periods) then ended in conformity with accounting principles generally accepted in the United States of America. These financial statements and financial highlights (hereafter referred to as “financial statements”) are the responsibility of the Funds’ management; our responsibility is to express an opinion on these financial statements based on our audits. We conducted our audits of these financial statements in accordance with the standards of the Public Company Accounting Oversight Board (United States.) Those standards require that we plan and perform the audit to obtain reasonable assurance about whether the financial statements are free of material misstatement. An audit includes examining, on a test basis, evidence supporting the amounts and disclosures in the financial statements, assessing the accounting principles used and significant estimates made by management, and evaluating the overall financial statement presentation. We believe that our audits, which included confirmation of Mutual Funds at October 31, 2005 by correspondence with the transfer agent provide a reasonable basis for our opinion. The financial highlights of Gartmore Investor Destinations Aggressive Fund, Gartmore Investor Destinations Moderately Aggressive Fund, Gartmore Investor Destinations Moderate Fund, Gartmore Investor Destinations Moderately Conservative Fund and Gartmore Investor Destinations Conservative Fund for the year (or period) ended October 31, 2001 were audited by other independent accountants whose report dated December 14, 2001 expressed an unqualified opinion on those financial statements.
PricewaterhouseCoopers LLP
Philadelphia, Pennsylvania
December 22, 2005
Supplemental Information (Unaudited)
1. Other Federal Tax Information (Unaudited):
For the period ended October 31, 2005, certain dividends paid by the Funds may be subject to a maximum tax rate of 15% as provided for by the Jobs and Growth Tax Relief Reconciliation Act of 2003. The Funds intend to designate the maximum amount allowable as taxed at a maximum rate of 15%. Complete information will be reported in conjunction with your 2005 Form DIV-1099.
For the period ended October 31, 2005, the following Funds paid qualified dividend income:
| | | |
| Fund | | Qualified
Dividend
Income |
Investor Destinations Aggressive | | $ | 7,691,354 |
Investor Destinations Moderately Aggressive | | | 11,167,922 |
Investor Destinations Moderate | | | 6,000,301 |
Investor Destinations Moderately Conservative | | | 1,531,686 |
Investor Destinations Conservative | | | 369,215 |
Optimal Allocations Aggressive | | | 4,280 |
Optimal Allocations Moderately Aggressive | | | 7,191 |
Optimal Allocations Moderate | | | 12,113 |
Optimal Allocations Specialty | | | 51,600 |
For the taxable year ended October 31, 2005, the following percentage of income dividends paid by the Funds qualify for the dividends received deduction available to corporations:
| | |
| Fund | | Dividend
Received
Deduction |
Investor Destinations Aggressive | | 56% |
Investor Destinations Moderately Aggressive | | 44% |
Investor Destinations Moderate | | 47% |
Investor Destinations Moderately Conservative | | 19% |
Investor Destinations Conservative | | 13% |
Optimal Allocations Aggressive | | 22% |
Optimal Allocations Moderately Aggressive | | 11% |
Optimal Allocations Moderate | | 9% |
Optimal Allocations Specialty | | 7% |
2. Shareholder Meeting
A separate shareholder meeting was held on Tuesday, December 23, 2004, for the shareholders of the Trust’s predecessor pursuant to a Proxy Statement on Schedule 14A, dated October 29, 2004, and mailed to the shareholders of the Trust’s predecessor on or around November 5, 2004.
Two Proposals: The purpose of the December 23, 2004 meeting was to allow the shareholders of the Trust’s predecessor to vote on:
i. Proposal One: The election of the Trust’s predecessor’s Board of Trustees; and
ii. Proposal Two: The approval of an “Agreement and Plan of Reorganization” that provided for the reorganization of the Trust from an Ohio business trust into a Delaware statutory trust.
Supplemental Information (Unaudited) (Continued)
Proposal One: As set forth in the October 29, 2004 Proxy Statement, the nominees for election as Trustees of the Trust’s predecessor were: Charles E. Allen, Michael J. Baresich, Paula H.J. Cholmondeley, C. Brent DeVore, Phyllis Kay Dryden, Robert M. Duncan, Barbara L. Hennigar, Paul J. Hondros, Barbara I. Jacobs, Thomas J. Kerr, IV, Douglas F. Kridler, Michael D. McCarthy, Arden L. Shisler, and David C. Wetmore.
Proposal Two: As specifically set forth in the October 29, 2004 Proxy Statement, the Reorganization proposal requested the shareholders of the Trust’s predecessor to approve the proposed “Agreement and Plan of Reorganization” of the Trust’s predecessor (on behalf of each of the Trust’s funds) with and into a new Delaware-domiciled Trust, whereby the Funds of the new Delaware Trust would acquire all of the assets of the corresponding funds of the Trust’s predecessor subject to the liabilities, expenses, costs, charges, and reserves of the corresponding funds of the Trust’s predecessor (contingent or otherwise), in exchange for shares of the acquiring funds of the Trust to be distributed pro rata by the Trust to the holders of the shares of the funds of the Trust’s predecessor, in a complete liquidation of the Trust’s predecessor.
Voting Results:
The shareholders of the Trust’s predecessor voted to approve both Proposal One and Proposal Two, as follows:
| | |
| Proposal One: | | Election of a Board of Trustees of the Trust’s Predecessor |
Charles E. Allen: | | |
FOR | | 1,484,045,010.745 shares (96.963%) |
WITHHOLD | | 46,475,965.981 shares (3.037%) |
TOTAL | | 1,530,520,976.726 shares (100.000%) |
Michael J. Baresich: | | |
FOR | | 1,479,546,876.136 shares (96.669%) |
WITHHOLD | | 50,974,100.590 shares (3.331%) |
TOTAL | | 1,530,520,976.726 shares (100.000%) |
| |
Paula H.J. Cholmondeley: | | |
FOR | | 1,483,986,754.474 shares (96.960%) |
WITHHOLD | | 46,534,222.252 shares (3.040%) |
TOTAL | | 1,530,520,976.726 shares (100.000%) |
| |
C. Brent DeVore: | | |
FOR | | 1,483,232,555.715 shares (96.910%) |
WITHHOLD | | 47,288,421.011 shares (3.090%) |
TOTAL | | 1,530,520,976.726 shares (100.000%) |
| |
Phyllis Kay Dryden: | | |
FOR | | 1,483,461,670.269 shares (96.925%) |
WITHHOLD | | 47,059,306.457 shares (3.075%) |
TOTAL | | 1,530,520,976.726 shares (100.000%) |
| |
Robert M. Duncan: | | |
FOR | | 1,478,518,553.740 shares (96.602%) |
WITHHOLD | | 52,002,422.986 shares (3.398%) |
TOTAL | | 1,530,520,976.726 shares (100.000%) |
| |
Barbara L. Hennigar: | | |
FOR | | 1,483,932,926.673 shares (96.956%) |
WITHHOLD | | 46,588,050.053 shares (3.044%) |
TOTAL | | 1,530,520,976.726 shares (100.000%) |
| | |
| Proposal One: | | Election of a Board of Trustees of the Trust’s Predecessor |
| |
Paul J. Hondros: | | |
FOR | | 1,483,799,576.741 shares (96.947%) |
WITHHOLD | | 46,721,399.985 shares (3.053%) |
TOTAL | | 1,530,520,976.726 shares (100.000%) |
| |
Barbara I. Jacobs: | | |
FOR | | 1,482,757,593.191 shares (96.879%) |
WITHHOLD | | 47,763,383.535 shares (3.121%) |
TOTAL | | 1,530,520,976.726 shares (100.000%) |
| |
Thomas J. Kerr IV: | | |
FOR | | 1,477,143,243.388 shares (96.512%) |
WITHHOLD | | 53,377,733.338 shares (3.488%) |
TOTAL | | 1,530,520,976.726 shares (100.000%) |
| |
Douglas F. Kridler: | | |
FOR | | 1,484,100,191.103 shares (96.967%) |
WITHHOLD | | 46,420,785.623 shares (3.033%) |
TOTAL | | 1,530,520,976.726 shares (100.000%) |
Michael D. McCarthy: | | |
FOR | | 1,483,352,898.255 shares (96.918%) |
WITHHOLD | | 47,168,078.471 shares (3.082%) |
TOTAL | | 1,530,520,976.726 shares (100.000%) |
| |
Arden L. Shisler: | | |
FOR | | 1,483,661,174.441 shares (96.938%) |
WITHHOLD | | 46,859,802.285 shares (3.062%) |
TOTAL | | 1,530,520,976.726 shares (100.000%) |
| |
David C. Wetmore: | | |
FOR | | 1,484,021,388.615 shares (96.962%) |
WITHHOLD | | 46,499,588.111 shares (3.038%) |
TOTAL | | 1,530,520,976.726 shares (100.000%) |
| | |
| Proposal Two: | | Approval of the Agreement and Plan of Reorganization of the
Trust’s Predecessor: |
FOR | | 1,338,850,729.743 shares (87.477%) |
AGAINST | | 48,927,279.322 shares (3.197%) |
ABSTAIN | | 86,596,336.653 shares (5.658%) |
BROKER NON-VOTES | | 56,146,631.008 shares (3.668%) |
TOTAL | | 1,530,520,976.726 shares (100.000%) |
Management Information (Unaudited)
Trustees who are not Interested Persons (as defined in the 1940 Act) and Officers of the Funds as of October 31, 2005
| | | | | | | | |
Name, Address
and Year of Birth | | Position(s) Held
with the Trust
and Length of
Time Served1 | | Principal Occupation(s)
During Past
Five Years | | Number of Portfolios
in the
Gartmore Fund
Complex Overseen
by Trustee | | Other Directorships Held by Trustee or Nominee2 |
| | | | |
Charles E. Allen c/o Gartmore Global Investments, Inc. 1200 River Road,
Suite 1000 Conshohocken, PA 19428 1948 | | Trustee
since
July 2000 | | Mr. Allen is Chairman, Chief Executive Officer and President of the Graimark Realty Advisors, Inc. (real estate development, investment and asset management). | | 84 | | None |
| | | | |
Paula H.J. Cholmondeley c/o Gartmore Global Investments, Inc. 1200 River Road,
Suite 1000 Conshohocken, PA 19428 1947 | | Trustee
since
July 2000 | | Ms. Cholmondeley has been the Chairman and Chief Executive Officer of the Sorrel Group, a management consulting company, since January 2004. Prior thereto, Ms. Cholmondeley was Vice President and General Manager of Sappi Fine Paper North America. | | 84 | | Director of Dentsply International, Inc., Ultralife Batteries, Inc. , Terex Corporation, Minerals Technology, Inc. and Albany International Corp. |
| | | | |
C. Brent DeVore c/o Gartmore Global Investments, Inc. 1200 River Road,
Suite 1000 Conshohocken, PA 19428 1940 | | Trustee
since
1990 | | Dr. DeVore is President of Otterbein College. | | 84 | | None |
| | | | |
Phyllis K. Dryden c/o Gartmore Global Investments, Inc. 1200 River Road,
Suite 1000 Conshohocken, PA 19428 1947 | | Trustee
since December 2004 | | Ms. Dryden was a former Managing Partner of marchFIRST, a global management consulting firm prior to February, 2001. | | 84 | | None |
| | | | |
Barbara L. Hennigar c/o Gartmore Global Investments, Inc. 1200 River Road,
Suite 1000 Conshohocken, PA 19428 1935 | | Trustee
since
July 2000 | | Retired. | | 84 | | None |
| | | | |
Barbara I. Jacobs c/o Gartmore Global Investments, Inc. 1200 River Road,
Suite 1000 Conshohocken, PA 19428 1950 | | Trustee
since December 2004 | | Ms. Jacobs has served as Chairman of the Board of Directors of KICAP Network Fund, a European (United Kingdom) hedge fund, since December 2000. Prior to 2004, Ms. Jacobs was also a Managing Director and European Portfolio Manager with CREF Investments (Teachers Insurance Annuity Association–College Retirement Equity Fund). | | 84 | | None |
Trustees who are not Interested Persons (as defined in the 1940 Act) and Officers of the Funds as of October 31, 2005 (Continued)
| | | | | | | | |
Name, Address
and Year of Birth | | Position(s) Held
with the Trust
and Length of
Time Served1 | | Principal Occupation(s)
During Past
Five Years | | Number of Portfolios
in the
Gartmore Fund
Complex Overseen
by Trustee | | Other Directorships Held by Trustee or Nominee2 |
| | | | |
Douglas F. Kridler c/o Gartmore Global Investments, Inc. 1200 River Road,
Suite 1000 Conshohocken, PA 19428 1955 | | Trustee
since September 1997 | | Mr. Kridler has served as the President and Chief Executive Officer of the Columbus Foundation (a Columbus, OH-based foundation which manages over 1,300 individual endowment funds) since February 2002. Mr. Kridler was the President of the Columbus Association for the Performing Arts prior thereto and Chairman of the Greater Columbus Convention and Visitors Bureau during 2000 and 2001. | | 84 | | None |
| | | | |
Michael D. McCarthy c/o Gartmore Global Investments, Inc. 1200 River Road,
Suite 1000 Conshohocken, PA 19428 1947 | | Trustee
since December 2004 | | Mr. McCarthy serves as: the Founder and Chairman of The Eureka Foundation (which sponsors and funds the “Great Museums” series on PBS); and a Partner of Pineville Properties LLC (a commercial real estate development firm). | | 843 | | None |
| | | | |
David C. Wetmore c/o Gartmore Global Investments, Inc. 1200 River Road,
Suite 1000 Conshohocken, PA 19428 1948 | | Trustee
since
1995
and Chairman since
February 2005 | | Retired. | | 84 | | None |
| 1 | Length of time served includes time served with the Trust’s predecessor. |
| 2 | Directorships held in (1) any other investment companies registered under the 1940 Act, (2) any company with a class of securities registered pursuant to Section 12 of the Securities Exchange Act of 1934, as amended (the “Exchange Act”), or (3) any company subject to the requirements of Section 15(d) of the Exchange Act. |
| 3 | Mr. McCarthy was also an Administrative Committee Member for the Alphagen Arneb Fund, LLC , The Healthcare Fund LDC, The Leaders Long-Short Fund, LLC, and The Leaders Long-Short Fund LDC, four private investment companies (hedge funds) managed by GSA. Mr. McCarthy resigned as an Administrative Committee Member effective June 30, 2005. |
Trustees and Officers who are not Interested Persons (as defined in the 1940 Act) of the Funds received aggregate compensation of $548,510 from the Trust for the year ended October 31, 2005. Additional information regarding the Trustees and Officers may be found in the Trust’s statement of additional information, which is available without charge upon request, by calling 800-848-0920.
Management Information (Unaudited) (Continued)
Trustees who are Interested Persons (as defined in the 1940 Act) and/or Officers of the Funds as of October 31, 2005
| | | | | | | | |
Name, Address
and Year of Birth | | Position(s) Held
with the Trust
and Length of
Time Served1 | | Principal Occupation(s)
During Past
Five Years | | Number of Portfolios
in the
Gartmore Fund
Complex Overseen
by Trustee | | Other Directorships Held by Trustee2 |
| | | | |
Paul J. Hondros Gartmore Global Investments, Inc. 1200 River Road,
Suite 1000 Conshohocken, PA 19428 1948 | | Trustee
since
July 2000 | | Mr. Hondros has been President and Chief Executive Officer of various Gartmore entities, including Gartmore Distribution Services, Inc. (“GDSI”),3 Gartmore Investor Services, Inc. (“GISI”),3 Gartmore Morley Capital Management, Inc. (“GMCM”),3 Gartmore Morley Financial Services, Inc. (“GMFS”),3 NorthPointe Capital, LLC (“NorthPointe”),3 Gartmore Global Asset Management Trust (“GGAMT”)3, Gartmore Global Investments, Inc. (“GGI”)3, Gartmore Mutual Fund Capital Trust (“GMFCT”)3 and Gartmore SA Capital Trust (“GSA”)3; and a Director of Nationwide Securities, Inc.3, as well as several entities within Nationwide Financial Services, Inc. | | 844 | | None |
| | | | |
Arden L. Shisler c/o Gartmore Global Investments, Inc. 1200 River Road,
Suite 1000 Conshohocken, PA 19428 1941 | | Trustee
since
February 2000 | | Mr. Shisler has been a consultant since January 2003. Prior thereto, he was President and Chief Executive Officer of K&B Transport, Inc., a trucking firm. Since 1992, Mr. Shisler has also been Chairman of the Board for Nationwide Mutual Insurance Company3. | | 84 | | Director of Nationwide Financial Services, Inc. |
| | | | |
Gerald J. Holland Gartmore Global Investments, Inc.
1200 River Road, Suite 1000 Conshohocken, PA 19428 1951 | | Treasurer
since
March 2001 | | Mr. Holland is Senior Vice President – Operations for GGI3, GMFCT3, and GSA3. | | 84 | | None |
| | | | |
Michael A. Krulikowski Gartmore Global Investments, Inc.
1200 River Road, Suite 1000 Conshohocken, PA 19428 1959 | | Chief Compliance Officer
since June 2004 | | Since November 1999, Mr. Krulikowski has served as a Vice President and Chief Compliance Officer of GGI. Since June 2004, Mr. Krulikowski has also served as Chief Compliance Officer of the Trust. | | 84 | | None |
Trustees who are Interested Persons (as defined in the 1940 Act) and/or Officers of the Funds as of October 31, 2005 (Continued)
| | | | | | | | |
Name, Address
and Year of Birth | | Position(s) Held
with the Trust
and Length of
Time Served1 | | Principal Occupation(s)
During Past
Five Years | | Number of Portfolios
in the
Gartmore Fund
Complex Overseen
by Trustee | | Other Directorships Held by Trustee2 |
| | | | |
Eric E. Miller Gartmore Global Investments, Inc.
1200 River Road, Suite 1000 Conshohocken, PA 19428 1953 | | Secretary since December 2002 | | Mr. Miller is Senior Vice President, Chief Counsel for GGI3, GMFCT3 and GSA3 since August 2002. From August 2000 to August 2002, Mr. Miller was a Partner with Stradley Ronan Stevens & Young, LLP. | | 84 | | None |
| 1 | Length of time served includes time served with the Trust’s predecessor. |
| 2 | Directorships held in (1) any other investment companies registered under the 1940 Act, (2) any company with a class of securities registered pursuant to Section 12 of the Securities Exchange Act of 1934, as amended (the “Exchange Act”), or (3) any company subject to the requirements of Section 15(d) of the Exchange Act. |
| 3 | This position is held with an affiliated person or principal underwriter of the Trust. |
| 4 | Mr. Hondros was also an Administrative Committee Member for the Alphagen Arneb Fund, LLC , The Healthcare Fund LDC, The Leaders Long-Short Fund, LLC, and The Leaders Long-Short Fund LDC, four private investment companies (hedge funds) managed by GSA. Mr. Hondros resigned as an Administrative Committee Member effective June 30, 2005. |
Federal law requires the Trust, each of its investment advisers and sub-advisers to adopt procedures for voting proxies (“Proxy Voting Guidelines”) and to provide a summary of those Proxy Voting Guidelines used to vote the securities held by the Funds. The Funds’ proxy voting policies and procedures are available without charge (i) upon request, by calling 800-848-0920, (ii) on the Fund’s website at www.gartmorefunds.com, or (iii) on the Securities and Exchange Commission’s website at www.sec.gov.
Index Definitions
Lipper Analytical Services, Inc. is an industry research firm whose rankings are based on total return performance and do not reflect the effect of sales charges. Each fund is ranked within a universe of funds similar in investment objective as determined by Lipper.
The Gartmore Investor Destinations Aggressive Fund benchmark consists of 95% S&P 500 Index and 5% Lehman Brothers U.S. Aggregate Index.
The Gartmore Investor Destinations Moderately Aggressive Fund benchmark consists of 80% S&P 500 Index, 15% Lehman Brothers U.S. Aggregate Index and 5% Citigroup 3-Month T-Bill Index.
The Gartmore Investor Destinations Moderate Fund benchmark consists of 60% S&P 500 Index, 25% Lehman Brothers U.S. Aggregate Index and 15% Citigroup 3-Month T-Bill Index.
The Gartmore Investor Destinations Moderately Conservative Fund benchmark consists of 35% Lehman Brothers U.S. Aggregate Index, 25% Citigroup 3-Month T-Bill Index and 40% S&P 500 Index.
The Gartmore Investor Destinations Conservative Fund benchmark consists of 45% Citigroup 3-Month T-Bill Index, 35% Lehman Brothers U.S. Aggregate Index and 20% S&P 500 Index.
The Gartmore Optimal Allocations Fund: Aggressive benchmark consists of 70% S&P 500 Index, 25% MSCI EAFE Index and 5% Lehman Brothers U.S. Aggregate Index.
The Gartmore Optimal Allocations Fund: Moderately Aggressive benchmark consists of 60% S&P 500 Index, 20% MSCI EAFE Index and 20% Lehman Brothers U.S. Aggregate Index.
The Gartmore Optimal Allocations Fund: Moderate benchmark consists of 40% S&P 500 Index, 20% MSCI EAFE Index and 40% Lehman Brothers U.S. Aggregate Index.
The Gartmore Optimal Allocations Fund: Specialty benchmark consists of 70& S&P 500 Index and 30% MSCI EAFE Index.
Citigroup 3-Month T-Bill Index: An unmanaged index that is generally representative of 3-month Treasury bills; consists of an average of the last 3-month Treasury bill issues (excluding the current month-end bill).
Lehman Brothers U.S. Aggregate Index: An unmanaged, market value-weighted index of investment-grade, fixed-rate debt issues (including government, corporate, asset-backed, and mortgage-backed securities with maturities of one year or more) that is generally representative of the bond market as a whole.
Morgan Stanley Capital International Europe, Australia and Far East (MSCI EAFE®) Index: An unmanaged, free float-adjusted, market capitalization-weighted index that is designed to measure the performance of stocks in developed markets outside the United States and Canada.
Standard & Poor’s 500® (S&P 500) Index: An unmanaged, capitalization-weighted index of 500 widely held stocks of large-cap U.S. companies that gives a broad look at how the stock prices of those companies have performed.

Gartmore Funds
1200 River Road, Suite 1000
Conshohocken, PA 19428
www.gartmorefunds.com
Federal law requires the Fund, and the Fund’s investment advisers and subadvisers, to adopt procedures for voting proxies (“Proxy Voting Guidelines”) and to provide a summary of those Proxy Voting Guidelines used to vote the securities held by the Funds. The Fund’s proxy voting policies and procedures are available without charge (i) upon request, by calling 800-848-0920, (ii) on the Fund’s Web site at www.gartmorefunds.com, or (iii) on the U.S. Securities and Exchange Commission’s Web site at www.sec.gov.
© 2005 Gartmore Global Investments, Inc.
All rights reserved.
AR-AA 12/05
Annual Report
| | |
| | |

| | October 31, 2005 |
Gartmore Growth Fund
Gartmore Nationwide Fund
Gartmore Money Market Fund
www.gartmorefunds.com

Solutions.

| | | | |
| UNITED STATES | | UNITED KINGDOM | | JAPAN |
Based in greater metropolitan Philadelphia, Gartmore is the global asset management arm of Nationwide®. Gartmore’s affiliated advisers* collectively manage more than $82 billion1 in assets through its global investment platform encompassing more than 185 investment management professionals supported by an 800-person staff.
We provide core and specialty equity, fixed-income and alternative investment solutions through mutual funds, separate accounts, commingled portfolios and wrap accounts to individual and institutional clients around the world.
This wide range of investment opportunities is built on sound investment management processes designed to increase the probability of delivering enhanced risk-adjusted returns over the long term.
Our investment management teams incorporate fundamental stock selection with the application of technology to help control risk and add to returns. Insightful stock selection is a function of the efforts of talented alpha-driven managers and analysts, working in an entrepreneurial environment, who are specialists in their respective investment disciplines.
www.gartmore.com
*Gartmore’s Affiliated Advisers
The following 11 asset management affiliates of Nationwide do business under the trade name “Gartmore Group”: Gartmore Capital Management Ltd2, Gartmore Fund Managers Ltd2, Gartmore Global Partners2, 3, Gartmore Investment Ltd2, Gartmore Japan Ltd2, Gartmore Morley Capital Management, Inc.3, Gartmore Mutual Fund Capital Trust3, 4, Gartmore Riverview, LLC3, Gartmore SA Capital Trust3, 4, Gartmore Separate Accounts LLC3, and NorthPointe Capital® LLC3
| 2. | | These advisers are subsidiaries of Gartmore Investment Management plc, which ultimately reports to Nationwide®. |
| 3. | | These are SEC-registered investment advisers based in the United States. Collectively, these advisers manage $43 billion as of Oct. 31, 2005. |
| 4. | | Together, these advisers do business as Gartmore Global Investments, Inc. |
Gartmore Global Investments is the investment adviser to Gartmore Funds. NorthPointe Capital is a federally registered service mark of Gartmore Global Investments, Inc. Nationwide is a federally registered service mark of Nationwide Mutual Insurance Company.
Gartmore Funds distributed by Gartmore Distribution Services, Inc., Member NASD. 1200 River Road, Suite 1000, Conshohocken, PA 19428.
© 2005 Gartmore Global Investments, Inc. All rights reserved.
Annual Report
| | |
| | |
| | October 31, 2005 |
Commentary provided by Gartmore Global Investments, investment adviser to Gartmore Funds. All opinions and estimates included in this report constitute Gartmore Global Investments’ judgment as of the date of this report and are subject to change without notice.
Statement Regarding Availability of Quarterly Portfolio Schedule.
The Gartmore Funds file complete schedules of portfolio holdings for each Fund with the Securities and Exchange Commission (the “Commission”) for the first and third quarters of each fiscal year on Form N-Q. The Funds’ Forms N-Q are available on the Commission’s website at http://www.sec.gov. The Funds’ Forms N-Q may be reviewed and copied at the Commission’s Public Reference Room in Washington, DC, and information on the operation of the Public Reference Room may be obtained by calling 800-SEC-0330; and the Funds make the information on Form N-Q available to shareholders on www.gartmorefunds.com or upon request without charge.
Statement Regarding Availability of Proxy Voting Record.
Information regarding how the Fund voted proxies relating to portfolio securities held during the most recent 12-month period ended June 30, 2005 is available without charge, upon request, by calling 800-848-0920, and on the Commission’s website at http://www.sec.gov.
Message to Shareholders
October 31, 2005
Dear Fellow Shareholders,
At times during the annual reporting period ended Oct. 31, 2005, it seemed as though a host of uncertain and unpredictable events coalesced into a “perfect storm” of market volatility.
Hurricane Katrina is one example. This Category 5 storm not only bore down on a major American city and its environs, it also had one of the country’s largest energy-producing regions in its sights. If that weren’t enough, the storm occurred just as oil and natural gas prices were spiraling to record levels, concurrent with fears of a great strain on global supply and capacity.
On another front, the intent to better integrate the member nations of the European Union (EU) was dealt a blow by France’s repudiation of a proposed EU constitution, a move that called into question the EU’s long-term effectiveness. Within a matter of weeks, France itself was rocked by what initially appeared to be youthful unrest in one section of Paris. As riots spread across the country, however, the situation revealed a disturbing and broad-based economic condition; unemployment among France’s immigrant population is five times the national average, and the segment’s per capita income is 40% below the national average. The lingering sense is that a number of European countries will have to deal with a long-overlooked social and economic issue at a time when the EU is struggling to retain its authority.
These are just two examples illustrating that market volatility can be a function of unexpected, and sometimes unrelated, global events. The accompanying “Market Perspectives” commentary provides a more detailed analysis of the various economic and social factors that influenced the market during the past year. I’d like to focus on Gartmore’s view on how best to navigate uncertain domestic and global markets in the pursuit of acceptable investment returns.
Risk, regardless of its source, is part and parcel of investing. The challenge is to mitigate risk as much as possible through sound portfolio diversification. Gartmore is committed to offering a diverse range of equity, fixed-income and alternative investment solutions designed to capture global investment opportunities. The informed investment response to complex, volatile markets is to configure a series of diverse, uncorrelated, well-performing funds into a dynamic portfolio. At Gartmore, we seek to provide the core and satellite investments needed to construct a broadly diversified investment portfolio.
Moreover, Gartmore believes that seasoned investment experts employing well-articulated and tested processes and aided by global research form the path to acceptable risk-adjusted returns. We hold a core belief that the ideas and insights of talented investment professionals can add quantifiable investment returns. In that regard, we are pleased to report that the returns of 30 of our 47 retail mutual funds (Class A at NAV) exceeded their respective benchmarks for the annual period ended Oct. 31, 2005.
The performance of a number of Gartmore’s funds from a variety of sectors and regions strengthens the case for holding uncorrelated investments. For example, the performance of the Gartmore Global Natural Resources Fund, which during the reporting period returned 65.51% (Class A at NAV) versus the Goldman Sachs Natural Resources Index return of 34.75%, was driven by escalating energy prices derived from increased global demand coupled with concerns about supply shortages. Within the energy sector, the Fund concentrated on smaller companies with higher capacity for growth. It is widely believed that energy will be in great demand for an extended period of time; therefore, the Fund will remain focused on the energy services sector companies that acquire, develop, and exploit oil and natural gas properties. The Wall Street Journal cited the Fund as a “Category King” in the Mutual Fund Monthly Review of Sept. 6, 2005.
The Gartmore Small Cap Fund garnered above-average returns during the reporting period, posting a 31.51% return (Class A at NAV) versus the Russell 2000® Index return of 12.08%. Most of the Fund’s outperformance came from strong stock selection in the information technology and energy sectors, in addition to astute sector allocations. Shortly after the close of the period, the Fund was cited in The Wall Street Journal as a “Category King” and noted as the second-best-performing fund in its respective sector for October 2005.
In addition, during the reporting period, Gartmore’s small-cap investment team was enhanced by the hiring of senior portfolio manager Jayne Stevlingson, who has managed small-cap funds at both OppenheimerFunds, Inc. and Morgan Stanley.
The case for broad global diversification was made through the performance of several of our non-U.S. funds during the reporting period. In comparison to equity prices in Europe and Japan, those in the United States were more muted during the past year, reflecting stretched valuations and increasing uncertainty in the outlook for consumers. The emerging markets, however, outperformed all other regions. Though its performance slightly lagged that of its benchmark, the Gartmore Emerging Markets Fund
Message to Shareholders
October 31, 2005
posted very strong returns of 30.02% (Class A at NAV) for the reporting period. The Gartmore International Growth Fund, returning 26.13% (Class A at NAV) versus the Morgan Stanley Capital International (MSCI) All Country World ex-U.S. Index return of 20.06%, also benefited from the impressive performance of emerging-market and Pacific Rim equities. In addition, Latin American securities delivered notably robust performance on the back of strong commodity prices.
The Gartmore Worldwide Leaders Fund, which returned 23.44% (Class A at NAV) versus 13.27% for the MSCI World IndexSM, benefited from both domestic and international developments. Overall, U.S. growth remained strong in the face of inflationary worries, while both Europe and Japan showed increasing signs of recovery. European export growth increased due to the weak euro at the same time that Japan experienced rising real incomes and increased capital expenditures. As a result, the Fund’s largest regional contributors were the United States, the United Kingdom and Japan. The Fund also benefited from strong stock selection within the technology, financial services, health-care and energy sectors.
Despite considerable volatility in both the U.S. economy and the U.S. equity markets during the past year, the Gartmore U.S. Growth Leaders Fund handily outperformed the Standard & Poor’s (S&P) 500® Index return of 8.72% with a return of 17.31% (Class A at NAV). The Fund’s performance was almost exclusively driven by strong stock selection, particularly in the technology and consumer goods areas. Concurrently, the Gartmore U.S. Growth Leaders Long-Short Fund returned 6.09% (Class A at NAV) versus 2.68% for its benchmark, the Citigroup 3-Month T-Bill Index. Again, adept stock selection, coupled with strong sector allocations, drove the Fund’s outperformance.
In addition to a suite of actively managed funds, Gartmore provides packaged asset allocation and diversification solutions. The Gartmore Optimal Allocations Funds, launched in June 2004, consist primarily of various proprietary Gartmore funds offered in four varieties, calibrated to different levels of risk: Moderate, Moderately Aggressive, Aggressive and Specialty. We are very pleased to report that each of these Funds, which serve as complements to actively managed holdings, outperformed their respective composite benchmarks for the reporting period.
| | | | | | |
| Fund Name | | Fund
Return* | | Benchmark Return | | Benchmark |
| Gartmore Optimal Allocations: Moderate | | 10.41% | | 7.56% | | S&P 500 (40%); MSCI EAFE (20%); Lehman Brothers U.S. Aggregate (40%) |
| Gartmore Optimal Allocations: Moderately Aggressive | | 12.77% | | 9.08% | | S&P 500 (60%); MSCI EAFE (20%); Lehman Brothers U.S. Aggregate (20%) |
| Gartmore Optimal Allocations: Aggressive | | 14.86% | | 10.67% | | S&P 500 (70%); MSCI EAFE (25%); Lehman Brothers U.S. Aggregate (5%) |
| Gartmore Optimal Allocations: Specialty | | 14.59% | | 11.50% | | S&P 500 (70%); MSCI EAFE (30%) |
| *All | Fund returns are Class A at NAV, as of Oct. 31, 2005. |
As we head into 2006, the only constant is uncertainty, which is a companion to opportunity. The informed and experienced investment manager, supported by broad-based research and analysis, can discern the investment opportunities associated with volatility. In today’s global investment landscape, a host of variables exist that impact investment returns, both positively and negatively. At Gartmore, we put all of our resources into our goal of achieving acceptable risk-adjusted returns on behalf of our investors. We measure our investment success by your performance standards. We appreciate the trust you have placed in us, and we will continue to strive to fulfill your investment objectives in the coming year.
Wishing you a very happy and prosperous 2006,

Young D. Chin
Co-Global Chief Investment Officer-Equities President and CEO
Gartmore Global Investments
Market Perspectives
October 31, 2005
Market volatility continues, but with a positive trend
The one-year period ended Oct. 31, 2005, witnessed considerable quarter-to-quarter volatility. The past 12 months clearly have been rife with reasons to justify the wide swings in market pricing. Although the markets gave investors a bumpy ride, most of those who held on were rewarded, illustrated by the fact that, for the annual reporting period, the Morgan Stanley Capital International Europe, Australasia and Far East (MSCI EAFE®) Index returned 18.59% and the Standard & Poor’s (S&P) 500® Index was up 8.72%.
A broad rally in global equity markets took hold in the final two months of 2004. International stocks, as represented by the MSCI EAFE Index, advanced 11.55% during this period, while the S&P 500 Index, a broad measure of the U.S. equity market, gained 7.59%.
As 2005 began, however, concerns about slack economic growth, the onset of inflation, increasing interest rates and spiraling energy costs led to a far less favorable environment for stocks, leaving most markets on the defensive. To varying degrees, these concerns would continue to plague the equity markets for the remainder of the year. The overall global economy nonetheless proved resilient. In the United States, the economy grew at a faster pace during the fiscal third quarter than initially anticipated, signaling improving economic health. From July through September, gross domestic product, the broadest measure of U.S. economic activity, grew 4.3%.
The dominant topic in 2005, particularly during the latter half of the year, was the continued impact of rising energy costs. As Hurricane Katrina barreled down on the energy-intensive Louisiana coast, the futures price of crude oil rose to a high of $70 per barrel while natural gas prices doubled–a classic one-two economic punch. A confluence of increased global demand, particularly from China, and concerns about supply shortages also contributed to energy price hikes.
Meanwhile, the Federal Reserve Board continued its measured increases of short-term interest rates, despite speculation that the moves would halt amid spiking energy costs. Throughout the reporting period, the rate rose from 1.75% to 3.75% as a result of eight consecutive 0.25% increases. As September wound down, however, energy prices began to fall, though they still were far above their year-ago averages. Further, inflationary fears began to subside as the Fed displayed its confidence in the economy. Ben Bernanke was appointed the new Fed Chairman in October to replace Alan Greenspan, who retires at the end of his term in January 2006.
Toward the end of the reporting period, consumer sentiment began to lag. From August to September, the consumer confidence measure fell from 105.5 to 86.6. In August, wages and salaries increased by 6.6%, yet disposable income declined 0.1% along with personal spending, which fell 0.5%–the biggest drop in more than three years.
During the reporting period, energy and natural resource company profits surged alongside soaring energy costs and expanding global demand. In the telecommunications industry, on the other hand, the costs of consolidation muted returns. Domestically, within the S&P 500 Index for the entire reporting period, sector performance ranged from a high of 59% for health services (31% in the MSCI EAFE Index) to a low of –5% for consumer services (9% in the MSCI EAFE Index). Stocks in industrials, energy and distribution services delivered returns of 42%, 31% and 25% (43%, 24% and 46% in the MSCI EAFE Index), respectively, while stocks in consumer durables and communications delivered negative returns of –4% and –0.5% (14% and 5% in the MSCI EAFE Index), respectively.
Key trends for investors to watch
As we look toward the coming year, these are some of the key trends that we are paying particularly close attention to as we shape our investment strategies at Gartmore:
An aging population. During 2005, a landmark social milestone occurred when the leading edge of the baby boom generation reached 60 years of age. Since the early post-World War II years, the baby boomers, as one of the largest subsections of the U.S. population, have reshaped the social landscape in innumerable ways. This group’s retirement will continue the process. The country’s financial institutions, for example, will accelerate the re-engineering of their products and services toward wealth preservation, not just wealth generation. On the downside, though, the strain on many under-funded pension plans, in addition to the Social Security system, may reverberate through the markets in unexpected and unsettling ways.
Housing prices–up, down or sideways? The housing market remained strong during the reporting period, with 30-year fixed mortgage rates remaining below 6% for the majority of the time. Confounding expectations amid Hurricanes Katrina and Rita and rising energy costs, existing home sales advanced to an all-time high of 2% in August. The robust housing market contributed much to the overall “wealth effect” for real estate investors. By the end of the reporting period, however, more pronounced signs of softening became evident.
One housing trend associated with the aging of the population: a wave of residential downsizing as retirees seek more practical, late-in-life living arrangements. Moreover, individuals are pulling back from the real estate speculation of the past few years as quick price appreciation has cooled in once-hot markets such as Las Vegas, Miami, Phoenix and San Diego.
The cost of socialization. During the past year, it has become even clearer that many corporations and countries must take a harder look at dealing with the burgeoning weight of socialization, which consists of, among other factors, health-care and retirement benefits. In fact, the future cost of socialization at both the corporate and country level will be of increasing concern in determining investment potential. Many longstanding business models and corporate policies will be revised in light of unsustainably heavy socialization costs.
France’s refusal to endorse the European Union (EU) constitution, for example, can be tied to the issue of socialization. Most observers believe that voters feared that a stronger EU would create an influx of cheap labor just as France was struggling to reduce high unemployment. In the United States, the issue of socialization was clearly evident in the United Auto Workers’ agreement with General Motors Corp. (GM) to cut health-care benefits for employees, retirees and their families. GM successfully argued that escalating pension and health-care benefits for a vast pool of retirees was forcing the enterprise into bankruptcy, which is a landmark shift in the auto industry’s historical model.
The international economic picture. In the latter part of 2005, the economies of Japan and Europe, including the United Kingdom, improved due to strong corporate profitability and expectations of higher levels of merger-and-acquisition activity. Europe was buoyed by export growth on the back of the weak euro. In Japan, meanwhile, rising real incomes and capital expenditure led to hopes of a sustainable recovery. Expectations rose when Prime Minister Junichiro Koizumi achieved a resounding victory in parliamentary elections, which gave his government a solid mandate for reform.
China’s economy grew rapidly during the reporting period. Despite ongoing criticism that governmental controls on the economy were overly rigid–particularly regarding commodity prices and imports/exports–China’s economy has largely stabilized and shows strong signs of continued growth. In fact, the government’s economic controls, once viewed as unduly prohibitive, are now credited with controlling what was becoming a dangerously overheated economy. For example, new factories were being developed in China at a rapid rate based on capital secured with minimal credit checks. Before long, some banks held portfolios with up to 45% nonperforming loans as a result of default. Government regulators subsequently mandated stricter credit rules and have even expressed a desire to improve China’s banks to such a degree that their credit quality would be attractive to foreign investors.
Throughout the first half of the year, the U.S. dollar continued its sustained, three-year decline versus benchmark currencies such as the euro. In mid-summer, however, the dollar reversed its multi-year trend. The dollar’s increase is due primarily to the strengthening U.S. economic outlook relative to the global platform and disappointment in European reform. In addition, two factors–the United Kingdom’s halting of interest-rate hikes and France’s vote against the EU constitution–have placed pressure on the euro, effectively bolstering the U.S. dollar.
The return of capital expenditures. As we look toward 2006, we are seeing a trend toward companies deploying large amounts of excess cash on their balance sheets. Since the 2000 market meltdown, many companies have relied on cash as their primary hedge against diminished revenues. Now, however, as the equity markets continue to recover, many of these firms are feeling the pressure either to put the money to work in various ways, such as toward acquisitions, or return the money to shareholders in the form of dividend payouts or share buybacks. The technology sector could be a notable beneficiary of this trend. Research and development as well as new product rollouts are key drivers in the technology industry, and both areas will be bolstered by increased spending.
Looking ahead
For the near term, investors will face a mixture of positive and negative factors. On the one hand, economic and corporate earnings growth is likely to slow in the coming months. Counterbalancing this slowdown could be positive sentiment surrounding the end of the Fed’s cycle of interest-rate hikes, which we anticipate will occur in the first half of 2006. If, as we expect, the peak in rates is accompanied by softening oil prices and a firm U.S. dollar, the investment environment should be favorable for equity markets.
The opinions expressed herein are those of Gartmore Global Investments and may not come to pass.
Investing in mutual funds involves risk, including possible loss of principal. There is no assurance that the investment objective of any fund will be achieved.
Market Perspectives
Continued
The Gartmore Optimal Allocations Funds are designed to provide diversification and asset allocation across several types of investments and asset classes, primarily by investing in underlying Gartmore funds.
There is no assurance that a diversified portfolio will produce better results than a nondiversified one.
Each Fund is subject to different levels of risk, based on the size of its asset class allocations.
Index performance is provided for comparison purposes only; indexes are unmanaged and no fees or expenses are reflected. Individuals cannot invest directly in an index. Market index performance is provided by a third party source that Gartmore deems reliable.
The Gartmore Small Cap Fund may purchase securities in initial public offerings, which can be very volatile and carry high transaction costs.
Small-company stocks have higher risks than the stocks of larger, more established companies and have significant short-term price volatility.
Funds that concentrate on specific sectors or a relatively small number of securities may be subject to greater volatility than that of other mutual funds. International investing involves additional risks, including currency fluctuations, differences in accounting standards, political instability and foreign regulations, all of which are magnified in emerging markets.
In order to achieve the Gartmore U.S. Growth Leaders Long-Short Fund’s objective, the managers may use sophisticated investment strategies such as short selling, short-term trading and investing in smaller companies. These strategies may cause the Fund to have greater risk and volatility, and higher expenses, than those of other investments. The risks of investing in this Fund are more fully detailed within the Fund’s prospectus.
The Gartmore Optimal Allocations Fund: Aggressive benchmark consists of 70% S&P 500 Index, 25% MSCI EAFE Index and 5% Lehman Brothers U.S. Aggregate Index.
The Gartmore Optimal Allocations Fund: Moderately Aggressive benchmark consists of 60% S&P 500 Index, 20% MSCI EAFE Index and 20% Lehman Brothers U.S. Aggregate Index.
The Gartmore Optimal Allocations Fund: Moderate benchmark consists of 40% S&P 500 Index, 20% MSCI EAFE Index and 40% Lehman Brothers U.S. Aggregate Index.
The Gartmore Optimal Allocations Fund: Specialty benchmark consists of 70& S&P 500 Index and 30% MSCI EAFE Index.
Standard & Poor’s 500® (S&P 500) Index: An unmanaged, market capitalization-weighted index of 500 widely held stocks of large-cap U.S. companies that gives a broad look at how the stock prices of those companies have performed.
Lehman Brothers U.S. Aggregate Index: An unmanaged, market value-weighted index of investment-grade, fixed-rate debt issues (including government, corporate, asset-backed, and mortgage-backed securities with maturities of one year or more) that is generally representative of the bond market as a whole.
Morgan Stanley Capital International Europe, Australasia and Far East (MSCI EAFE®) Index: An unmanaged, free float-adjusted, market capitalization-weighted index that is designed to measure the performance of stocks in developed markets outside the United States and Canada.
Goldman Sachs Natural Resources Index: An unmanaged, modified market capitalization-weighted sector index of U.S.-traded natural resource-related stocks; includes companies in the categories of extractive industries, energy companies, owners and operators of timber tracts, forestry services, producers of pulp and paper, and owners of plantations.
Citigroup 3-Month T-Bill Index: An unmanaged index that is generally representative of 3-month Treasury bills; consists of an average of the last 3-month Treasury bill issues (excluding the current month-end bill).
Morgan Stanley Capital International Emerging Markets (MSCI EM) IndexSM: An unmanaged, free float-adjusted, market capitalization-weighted index that is designed to measure the performance of the stocks in emerging-country markets.
Morgan Stanley Capital International (MSCI) All Country World excluding U.S. Index: An unmanaged, free float-adjusted, market-capitalization weighted index that is designed to measure the performance of the stocks in companies in all countries except the United States.
Morgan Stanley Capital International (MSCI) World IndexSM: An unmanaged, free float-adjusted, market capitalization-weighted index that is designed to measure the performance of global developed-market equities.
Russell 2000® Index: An unmanaged index that measures the performance of the stocks of small-capitalization U.S.
companies; includes the smallest 2,000 U.S. companies in the Russell 3000® Index, which measures the performance of the largest 3,000 U.S. companies, based on market capitalization.
Each Fund’s underlying funds may be subject to specific investment risks such as those associated with a concentrated number of securities (such as REITs), small companies, international stocks, initial public offerings, short selling, short-term trading, bonds and short-term instruments.
Gartmore Funds distributed by Gartmore Distribution Services, Inc., Member NASD. 1200 River Road, Suite 1000, Conshohocken, PA 19428.
Investing in mutual funds involves risk, including possible loss of principal.
There is no assurance that the investment objective of any fund will be achieved.
An investment in a money market fund is not insured or guaranteed by the FDIC or any other government agency. Although a money market fund seeks to preserve the value of your investment at $1.00 per share, it is possible to lose money by investing in the money market.
Commentary provided by Gartmore Global Investments, the investment adviser to Gartmore Funds. All opinions and estimates included in this report constitute Gartmore Global Investments’ judgment as of the date of this report and are subject to change without notice.
Gartmore Global Investments, one of its affiliated advisers, or its employees, may have a position in the securities named in this report.
This report is for informational purposes only, and is not intended as an offer or recommendation with respect to the purchase or sale of any security, option, future or other derivatives in such securities.
A complete list of all transactions in the last 12-months is available upon request.
Although third party information has been obtained from and is based on sources the Firm believes to be reliable, the Firm does not guarantee the accuracy of the information, and it may be incomplete or condensed.
Investors should carefully consider a fund’s investment objectives, risks, fees, charges and expenses before investing any money. To obtain this and other information on Gartmore’s funds, please call 800-848-0920 to request a prospectus, or download a prospectus at www.gartmorefunds.com. Please read it carefully before investing any money.
Gartmore Growth Fund
For the annual period ended Oct. 31, 2005, the Gartmore Growth Fund (Class A at NAV) returned 10.22% versus 8.81% for its benchmark, the Russell 1000® Growth Index. For broader comparison, the average return for the Fund’s Lipper peer category of Large-Cap Growth Funds was 10.06%.
During the reporting period, the U.S. economy and the equity markets experienced a considerable amount of volatility. Late in the first calendar quarter of 2005, and into the second quarter, the fear of inflation heightened as the Federal Reserve Board (the “Fed”) continued to raise short-term interest rates; as a result, the market began trending downward. Toward the end of the second quarter, however, it became evident that the Fed’s philosophy of increasing rates at a “measured pace” would not stave off economic growth at the level initially anticipated. Confounding expectations, particularly in light of the devastation brought to the Gulf Coast by Hurricanes Katrina and Rita, gross domestic product growth accelerated from July through September.
Strong stock selection had a positive effect on Fund performance during the reporting period in contrast to sector allocations, which slightly detracted from performance.
On a stock-specific level, among the Fund’s best performers were MGM Mirage and Nordstrom, Inc. The Las Vegas market has been performing well, and MGM Mirage stands as one of the premiere casinos/hotels along the “strip.” MGM’s recent acquisition of Mandalay Bay has added to MGM’s profits and increased the firm’s reach in the market. Retailer Nordstrom Inc. is well-positioned in the high-end retail market, and, as a result of the firm extending its growth margins, has seen positive earnings revisions.
Recently, another Fund holding, Starwood Hotels & Resorts Worldwide, Inc., has benefited from the supply/demand wave striking hotels. Though the stock was a slight detractor from performance during the reporting period, we feel that going forward the company is in a good position to add value to the Fund. Not long ago, the company sold off some of its more undesirable assets and purchased a number of hotel chains that it believes will increase its bottom line.
Among significant detractors from Fund performance, VeriSign, Inc., a premiere Internet security vendor and domain distributor, saw significant declines as its wireless ring tone market dropped off faster than expected in the second and third quarters of 2005. Also of note, another Fund holding, Investors Financial Services Corp., declined as the flattening yield curve, which represents the actual or projected yields of fixed-income securities in relation to their maturities, continued to compress earnings.
Despite facing many obstacles, the economy has shown a high degree of resiliency during the reporting period, and its continued growth has left us with a positive outlook on the market. We believe that the Fed will soon ease up on increasing interest rates, and, when that happens, we expect to see price/earnings multiples expand, signaling a positive event for the Fund. As always, we maintain our strategy of investing in growth companies that we expect to generate positive earnings revisions and positive growth rates relative to the market.
Portfolio Managers:
Christopher Baggini, CFA and Douglas Burtnick, CFA
| | |
Fund Performance | | Gartmore Growth Fund |
Average Annual Total Return
(For periods ended October 31, 2005)
| | | | | | | | |
| | | | | 1 Yr. | | 5 Yr. | | 10 Yr. |
| Class A1 | | w/o SC2 | | 10.22% | | -9.74% | | 1.21% |
| | | w/SC3 | | 3.89% | | -10.79% | | 0.61% |
| Class B1 | | w/o SC2 | | 9.63% | | -10.79% | | 0.43% |
| | | w/SC4 | | 4.63% | | -11.05% | | 0.43% |
| Class C1 | | w/o SC2 | | 9.61% | | -10.42% | | 0.86% |
| | | w/SC5 | | 8.61% | | -10.42% | | 0.86% |
| Class D6 | | w/o SC2 | | 10.74% | | -9.44% | | 1.41% |
| | | w/SC7 | | 5.77% | | -10.27% | | 0.95% |
| Class R1,8 | | | | 10.28% | | -9.58% | | 1.33% |
| Institutional Service Class1,8 | | 10.55% | | -9.41% | | 1.43% |
| Institutional Class1,8 | | 10.59% | | -9.47% | | 1.40% |
All figures showing the effect of a sales charge reflect the maximum charge possible, because it has the most dramatic effect on performance data.
| 1 | These returns through May 11, 1998 include the performance of the Fund’s predecessor fund, and, for periods from May 11, 1998 to the creation of the class, include the performance of the Fund’s Class D shares. These returns were achieved prior to the creation of Class A and Class B shares (5/11/98), Class C shares (3/1/01), Institutional Service Class shares (1/2/02), Class R shares (10/1/03), and Institutional Class shares (6/29/04). Excluding the effect of any fee waivers or reimbursements, such prior performance is similar to what Class A, Class B, Class C, Institutional Service Class, Class R shares and Institutional Class shares would have produced during those periods because all classes of the Fund’s shares invest in the same portfolio of securities. The performance for these classes has been restated to reflect differences in sales charges (where applicable), but does not reflect the differing levels of other fees (primarily Rule 12b-1 and/or administrative services fees) applicable to such classes. If these other fees were reflected, the performance for Class A, Class B, Class C and Class R shares would have been lower. |
| 2 | These returns do not reflect the effects of sales charges (SC). |
| 3 | A 5.75% front-end sales charge was deducted. |
| 4 | A 5.00% contingent deferred sales charge (CDSC) was deducted. The CDSC declines to 0% after 6 years. |
| 5 | A CDSC of 1.00% was deducted from the one year return because it is charged when you sell Class C shares within the first year after purchase. |
| 6 | These returns through May 11, 1998 include the performance of the Fund’s predecessor fund. |
| 7 | A 4.50% front-end sales charge was deducted. |
| 8 | Not subject to any sales charges. |
Performance of a $10,000 Investment
Investment return and principal value will fluctuate, and when redeemed, shares may be worth more or less than original cost. Past performance is no guarantee of future results and does not reflect the deduction of taxes that a shareholder would pay on fund distributions or the redemption of fund shares. Investing in mutual funds involves market risk, including loss of principal. Performance returns assume the reinvestment of all distributions.
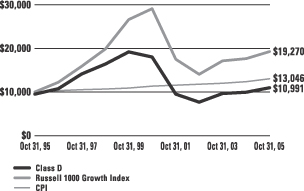
Comparative performance of $10,000 invested in Class D shares of the Gartmore Growth Fund, the Russell 1000 Growth Index (Russell 1000 Growth)(a), and the Consumer Price Index (CPI)(b) over a 10-year period ended October 31, 2005. Unlike the Fund, the returns for these unmanaged indexes do not reflect any fees, expenses, or sales charges. Investors cannot invest directly in market indexes.
| (a) | The Russell 1000 Growth measures the performance of those companies in the Russell 1000 Index (the largest 1000 companies in the U.S.) with higher price-to-book ratios and higher forecasted growth values. |
| (b) | The CPI represents changes in prices of a basket of goods and services purchased for consumption by urban households. |
| | |
Shareholder Expense Example | | Gartmore Growth Fund |
As a shareholder of the Fund, you incur two types of costs: (1) transaction costs, including sales charges (loads) paid on purchase payments and redemption fees; and (2) ongoing costs, including investment advisory fees, administration fees, distribution fees and other Fund expenses. The examples below are intended to help you understand your ongoing costs (in dollars) of investing in the Fund and to compare these costs with the ongoing costs of investing in other mutual funds. Per SEC requirements, the examples assume that you had a $1,000 investment in the Class at the beginning of the reporting period, May 1, 2005, and continued to hold your shares at the end of the reporting period, October 31, 2005.
Actual Expenses
For each Class of the Fund in the table below, the first line provides information about actual account values and actual expenses. You may use the information in this line, together with the amount you invested, to estimate the expenses that you paid over the period. Simply divide your account value by $1,000 (for example, an $8,600 account value divided by $1,000 = 8.6), then multiply the result by the number in the first line of each Class under the heading entitled “Expenses Paid During Period” to estimate the expenses you paid on your account during the period.
Hypothetical Example for Comparison Purposes
The second line of each Class in the table below provides information about hypothetical account values and hypothetical expenses based on the Class’ actual expense ratio and an assumed rate of return of 5% per year before expenses, which is not the Class’ actual return. The hypothetical account values and expenses may not be used to estimate the actual ending account balance or expenses you paid for the period. You may use this information to compare the ongoing costs of investing in the Class of the Fund and other funds. To do so, compare this 5% hypothetical example with the 5% hypothetical examples that appear in the shareholder reports of the other funds.
Please note that the expenses shown in the table are meant to highlight your ongoing costs only and do not reflect any transaction costs, such as sales charges (loads) or redemption fees. Therefore, the second line for each Class in the table is useful in comparing ongoing costs only, and will not help you determine the relative total costs of owning different funds. In addition, if these transaction costs were included, your costs would have been higher. The examples also assume all dividends and distributions have been reinvested.
Schedule of Shareholder Expenses
Expense Analysis of a $1,000 Investment
(October 31, 2005)
| | | | | | | | | | | | | | |
| Growth Fund | | | | | Beginning
Account Value,
5/1/05 | | Ending
Account Value,
10/31/05 | | Expenses Paid
During Period* | | Annualized
Expense Ratio* |
| Class A | | Actual | | | $ | 1,000.00 | | $ | 1,072.10 | | $ | 7.42 | | 1.42% |
| | | Hypothetical | 1 | | $ | 1,000.00 | | $ | 1,017.84 | | $ | 7.25 | | 1.42% |
| Class B | | Actual | | | $ | 1,000.00 | | $ | 1,069.60 | | $ | 10.69 | | 2.05% |
| | | Hypothetical | 1 | | $ | 1,000.00 | | $ | 1,014.67 | | $ | 10.46 | | 2.05% |
| Class C | | Actual | | | $ | 1,000.00 | | $ | 1,069.40 | | $ | 10.90 | | 2.09% |
| | | Hypothetical | 1 | | $ | 1,000.00 | | $ | 1,014.46 | | $ | 10.67 | | 2.09% |
| Class D | | Actual | | | $ | 1,000.00 | | $ | 1,074.10 | | $ | 5.54 | | 1.06% |
| | | Hypothetical | 1 | | $ | 1,000.00 | | $ | 1,019.66 | | $ | 5.41 | | 1.06% |
| Class R | | Actual | | | $ | 1,000.00 | | $ | 1,072.90 | | $ | 7.21 | | 1.38% |
| | | Hypothetical | 1 | | $ | 1,000.00 | | $ | 1,018.04 | | $ | 7.04 | | 1.38% |
| Institutional Service Class | | Actual | | | $ | 1,000.00 | | $ | 1,074.00 | | $ | 5.85 | | 1.12% |
| | | Hypothetical | 1 | | $ | 1,000.00 | | $ | 1,019.35 | | $ | 5.72 | | 1.12% |
| Institutional Class | | Actual | | | $ | 1,000.00 | | $ | 1,074.20 | | $ | 5.80 | | 1.11% |
| | | Hypothetical | 1 | | $ | 1,000.00 | | $ | 1,019.40 | | $ | 5.67 | | 1.11% |
| * | Expenses are equal to the Fund’s annualized expense ratio multiplied by the average account value over the period multiplied by 184/365 (to reflect the one-half year period). The expense ratio presented represents a six month, annualized ratio in accordance with SEC guidelines. |
| 1 | Represents the hypothetical 5% return before expenses. |
| | |
Portfolio Summary | | Gartmore Growth Fund |
The SEC adopted a requirement that Funds present their portfolio holdings in a table, chart or graph format in their annual and semiannual reports to shareholders, whether or not a statement of investments is utilized. The following tables, which present portfolio holdings as a percentage of net assets, are provided in compliance with this requirement.
| | |
| Asset Allocation | | |
| Common Stock | | 99.9% |
| Commercial Paper | | 0.1% |
| Other Investments* | | 8.0% |
| Liabilities in excess of other assets** | | -8.0% |
| | |
|
| | | 100.0% |
| * | Includes value of collateral received from securities lending. |
| ** | Includes value of collateral owed from securities lending. |
| | |
| Top Industries | | |
| Computer Software & Services | | 15.8% |
| Healthcare | | 11.5% |
| Retail | | 11.1% |
| Manufacturing | | 6.6% |
| Financial Services | | 6.2% |
| Telecommunications | | 5.2% |
| Semiconductors | | 5.2% |
| Consumer Products | | 4.7% |
| Oil & Gas | | 4.5% |
| Food & Beverage | | 4.2% |
| Other Industries | | 25.0% |
| | |
|
| | | 100.0% |
| | |
| Top Holdings | | |
| General Electric Corp. | | 4.6% |
| Microsoft Corp. | | 3.8% |
| Johnson & Johnson | | 3.6% |
| Amgen, Inc. | | 2.8% |
| Intel Corp. | | 2.7% |
| Home Depot, Inc. | | 2.2% |
| UnitedHealth Group, Inc. | | 2.2% |
| PepsiCo, Inc. | | 2.1% |
| Google, Inc. | | 1.9% |
| Staples, Inc. | | 1.6% |
| Other Holdings | | 72.5% |
| | |
|
| | | 100.0% |
Statement of Investments
October 31, 2005
Gartmore Growth Fund
| | | | | |
| | | Shares or
Principal Amount | | Value |
| | | | | | |
Aerospace & Defense (1.5%) | | | | | |
Boeing Co. (The) | | 54,450 | | $ | 3,519,648 |
| | | | |
|
|
Business Services (1.9%) | | | | | |
CRA International, Inc. (b) (c) | | 30,000 | | | 1,327,800 |
Paychex, Inc. | | 33,000 | | | 1,279,080 |
Resources Connection, Inc. (b) (c) | | 64,120 | | | 1,830,626 |
| | | | |
|
|
| | | | | | 4,437,506 |
| | | | |
|
|
Coal (0.5%) | | | | | |
Peabody Energy Corp. | | 15,750 | | | 1,231,020 |
| | | | |
|
|
Computer Equipment (4.2%) | | | | | |
Cisco Systems, Inc. (b) | | 136,510 | | | 2,382,100 |
Dell, Inc. (b) | | 72,570 | | | 2,313,532 |
EMC Corp. (b) | | 211,490 | | | 2,952,400 |
International Business Machines Corp. | | 28,400 | | | 2,325,392 |
| | | | |
|
|
| | | | | | 9,973,424 |
| | | | |
|
|
Computer Software & Services (15.8%) | | | |
Autodesk, Inc. | | 25,760 | | | 1,162,549 |
Business Objects S.A. ADR — FR (b) (c) | | 67,890 | | | 2,326,590 |
Cognizant Technology Solutions Corp., Class A (b) | | 65,170 | | | 2,866,177 |
Google, Inc. (b) | | 12,300 | | | 4,577,322 |
Hyperion Solutions Corp. (b) | | 33,850 | | | 1,636,986 |
Intel Corp. | | 270,000 | | | 6,344,999 |
McAfee, Inc. (b) (c) | | 127,730 | | | 3,835,732 |
Microsoft Corp. | | 348,680 | | | 8,961,075 |
Satyam Computer Services Ltd. ADR — IN | | 42,600 | | | 1,456,068 |
SPSS, Inc. (b) (c) | | 53,300 | | | 1,215,240 |
Yahoo!, Inc. (b) | | 87,674 | | | 3,241,308 |
| | | | |
|
|
| | | | | | 37,624,046 |
| | | | |
|
|
Consumer Products (4.7%) | | | | | |
Colgate-Palmolive Co. | | 49,200 | | | 2,605,632 |
Johnson & Johnson | | 136,820 | | | 8,567,668 |
| | | | |
|
|
| | | | | | 11,173,300 |
| | | | |
|
|
E-Commerce & Services (1.1%) | | | |
Monster Worldwide, Inc. (b) (c) | | 78,150 | | | 2,564,102 |
| | | | |
|
|
| | | | | |
| | | Shares or
Principal Amount | | Value |
| | | | | | |
Entertainment (1.6%) | | | | | |
Carnival Corp. | | 74,440 | | $ | 3,697,435 |
| | | | |
|
|
Financial Services (6.2%) | | | | | |
American Express Corp. | | 48,450 | | | 2,411,356 |
Charles Schwab Corp. (The) | | 116,450 | | | 1,770,040 |
Franklin Resources, Inc. | | 19,150 | | | 1,692,286 |
Goldman Sachs Group, Inc. | | 16,920 | | | 2,138,180 |
Hudson City Bancorp, Inc. | | 111,200 | | | 1,316,608 |
Legg Mason, Inc. | | 20,300 | | | 2,178,393 |
State Street Corp. | | 36,820 | | | 2,033,569 |
T. Rowe Price Group, Inc. | | 18,670 | | | 1,223,258 |
| | | | |
|
|
| | | | | | 14,763,690 |
| | | | |
|
|
Food & Beverage (4.2%) | | | | | |
Coca Cola Co. (The) | | 61,300 | | | 2,622,414 |
Kellogg Co. | | 53,420 | | | 2,359,561 |
PepsiCo, Inc. | | 85,870 | | | 5,073,200 |
| | | | |
|
|
| | | | | | 10,055,175 |
| | | | |
|
|
Healthcare (11.5%) | | | | | |
Abgenix, Inc. (b) (c) | | 88,740 | | | 922,896 |
Aetna, Inc. | | 19,400 | | | 1,718,064 |
Alcon, Inc. ADR — CH | | 11,080 | | | 1,472,532 |
Amgen, Inc. (b) | | 87,420 | | | 6,622,938 |
Genentech, Inc. (b) | | 21,600 | | | 1,956,960 |
Medco Health Solutions, Inc. (b) | | 48,350 | | | 2,731,775 |
St. Jude Medical, Inc. (b) | | 47,740 | | | 2,294,862 |
United Surgical Partners International, Inc. (b) (c) | | 31,850 | | | 1,141,823 |
UnitedHealth Group, Inc. | | 89,030 | | | 5,153,946 |
WellPoint, Inc. (b) | | 45,910 | | | 3,428,559 |
| | | | |
|
|
| | | | | | 27,444,355 |
| | | | |
|
|
Hotels & Casinos (2.3%) | | | | | |
Starwood Hotels & Resorts Worldwide, Inc. | | 61,590 | | | 3,598,704 |
Station Casinos, Inc. (c) | | 28,120 | | | 1,802,492 |
| | | | |
|
|
| | | | | | 5,401,196 |
| | | | |
|
|
Instruments – Scientific (1.0%) | | | |
Thermo Electron Corp. (b) | | 78,050 | | | 2,356,330 |
| | | | |
|
|
| | Common Stocks (continued) |
| | | | | |
| | | Shares or
Principal Amount | | Value |
| | | | | | |
Insurance (1.8%) | | | | | |
American International Group, Inc. | | 37,470 | | $ | 2,428,056 |
Endurance Specialty Holdings Ltd. | | 54,400 | | | 1,803,904 |
| | | | |
|
|
| | | | | | 4,231,960 |
| | | | |
|
|
Manufacturing (6.6%) | | | | | |
Danaher Corp. | | 46,420 | | | 2,418,482 |
General Electric Corp. | | 323,540 | | | 10,971,241 |
Textron, Inc. | | 32,070 | | | 2,310,323 |
| | | | |
|
|
| | | | | | 15,700,046 |
| | | | |
|
|
Medical & Medical Services (2.1%) | | | |
Genzyme Corp. (b) | | 34,200 | | | 2,472,660 |
McKesson Corp. | | 39,450 | | | 1,792,214 |
Protein Design Labs, Inc. (b) | | 29,800 | | | 834,996 |
| | | | |
|
|
| | | | | | 5,099,870 |
| | | | |
|
|
Multimedia (0.8%) | | | | | |
McGraw-Hill Cos., Inc. (The) | | 39,050 | | | 1,911,107 |
| | | | |
|
|
Oil & Gas (4.5%) | | | | | |
ENSCO International, Inc. | | 43,220 | | | 1,970,400 |
Halliburton Co. | | 40,500 | | | 2,393,550 |
Nabors Industries Ltd. (b) | | 17,700 | | | 1,214,751 |
Praxair, Inc. | | 62,070 | | | 3,066,879 |
Questar Corp. | | 25,340 | | | 1,995,525 |
| | | | |
|
|
| | | | | | 10,641,105 |
| | | | |
|
|
Pharmaceuticals (3.3%) | | | | | |
Myogen, Inc. (b) | | 40,510 | | | 812,226 |
Sepracor, Inc. (b) (c) | | 32,950 | | | 1,853,438 |
Shire Pharmaceuticals Group PLC ADR — GB (c) | | 33,890 | | | 1,214,618 |
Teva Pharmaceutical Industries Ltd. ADR — IL | | 43,200 | | | 1,646,784 |
Wyeth | | 53,940 | | | 2,403,565 |
| | | | |
|
|
| | | | | | 7,930,631 |
| | | | |
|
|
Railroads (0.7%) | | | | | |
Burlington Northern Santa Fe Corp. | | 27,300 | | | 1,694,238 |
| | | | |
|
|
| | | | | |
| | | Shares or
Principal Amount | | Value |
| | | | | | |
Retail (11.1%) | | | | | |
Abercrombie & Fitch Co. | | 49,470 | | $ | 2,571,945 |
Brinker International, Inc. (b) (c) | | 79,680 | | | 3,037,402 |
CVS Corp. | | 102,140 | | | 2,493,237 |
Golf Galaxy, Inc. (b) (c) | | 79,700 | | | 1,231,365 |
Home Depot, Inc. | | 126,115 | | | 5,175,759 |
Kohl’s Corp. (b) | | 66,300 | | | 3,191,019 |
Lowe’s Cos., Inc. | | 48,800 | | | 2,965,576 |
Panera Bread Co. (b) (c) | | 33,650 | | | 1,991,744 |
Staples, Inc. | | 168,810 | | | 3,837,051 |
| | | | |
|
|
| | | | | | 26,495,098 |
| | | | |
|
|
Semiconductors (5.2%) | | | | | |
Advanced Micro Devices, Inc. (b) | | 100,440 | | | 2,332,217 |
ASML Holding N. V. (b) | | 67,200 | | | 1,141,056 |
Broadcom Corp., Class A (b) | | 43,580 | | | 1,850,407 |
Lam Research Corp. (b) | | 25,000 | | | 843,500 |
Marvell Technology Group Ltd. (b) | | 43,220 | | | 2,005,840 |
National Semiconductor Corp. | | 75,740 | | | 1,713,996 |
Texas Instruments, Inc. | | 85,000 | | | 2,426,750 |
| | | | |
|
|
| | | | | | 12,313,766 |
| | | | |
|
|
Steel (0.6%) | | | | | |
Nucor Corp. | | 22,900 | | | 1,370,565 |
| | | | |
|
|
Telecommunications (5.2%) | | | | | |
Comverse Technology, Inc. (b) | | 118,200 | | | 2,966,820 |
Corning, Inc. (b) | | 128,900 | | | 2,589,601 |
QUALCOMM, Inc. | | 85,960 | | | 3,417,770 |
Sprint Corp. | | 101,800 | | | 2,372,958 |
Tellabs, Inc. (b) | | 118,820 | | | 1,135,919 |
| | | | |
|
|
| | | | | | 12,483,068 |
| | | | |
|
|
Transportation (0.7%) | | | | | |
Forward Air Corp. (c) | | 46,970 | | | 1,665,087 |
| | | | |
|
|
Wireless Equipment (0.8%) | | | | | |
Motorola, Inc. | | 90,300 | | | 2,001,048 |
| | | | |
|
|
| | |
Total Common Stocks | | | | | 237,778,816 |
| | | | |
|
|
Statement of Investments (Continued)
October 31, 2005
Gartmore Growth Fund (Continued)
Commercial Paper (0.1%)
| | | | | | | |
| | | Principal
Amount | | Value | |
Financial Services (0.1%) | | | | | | | |
Countrywide Home Loans, 4.08%, 11/01/05 | | $ | 155,000 | | $ | 155,000 | |
| | | | | |
|
|
|
| | |
Total Commercial Paper | | | | | | 155,000 | |
| | | | | |
|
|
|
|
Lending (8.0%) Short-Term Securities Held as Collateral for Securities | |
Pool of short-term securities for Gartmore Mutual Funds — note 2 (Securities Lending) | | | 19,033,119 | | | 19,033,119 | |
| | | | | |
|
|
|
| |
Total Short-Term Securities Held as Collateral for Securities Lending | | | 19,033,119 | |
| | | | | |
|
|
|
| |
Total Investments
(Cost $249,958,976) (a) — 108.0% | | | 256,966,935 | |
| | |
Liabilities in excess of other
assets — (8.0)% | | | | | | (18,939,947 | ) |
| | | | | |
|
|
|
| | |
NET ASSETS — 100.0% | | | | | $ | 238,026,988 | |
| | | | | |
|
|
|
| | (a) | See notes to financial statements for tax unrealized appreciation (depreciation) of securities. |
| | (b) | Denotes a non-income producing security. |
| | (c) | All or part of the security was on loan as of October 31, 2005. |
| | ADR | American Depositary Receipt |
See notes to financial statements.
Gartmore Nationwide Fund
For the annual period ended Oct. 31, 2005, the Gartmore Nationwide Fund (Class A at NAV) returned 11.88% versus 8.72% for its benchmark, the S&P 500® Index. For broader comparison, the average return for the Fund’s Lipper peer category of Large-Cap Core Funds was 8.35%.
U.S. stock prices seesawed but finished the reporting period with respectable gains, primarily due to a rally in the late spring and early summer. First-quarter earnings reports were stronger than expected, and investors grew more confident about the U.S. economy’s ability to grow despite rising interest rates and surging crude oil prices. However, the rally was cut short in August, as oil made a run at the $70-per-barrel level and Hurricane Katrina ravaged the Gulf Coast. For the balance of the period, uncertainty over the economic impact of two more hurricanes, Rita and Wilma, kept investors off balance. Large caps underperformed small caps and mid-caps for the full year under review but outperformed their smaller counterparts in the final three months.
Financials, consumer discretionary and health care topped the list of sectors that contributed to the Fund’s performance. In financials, Fund holding Lehman Brothers Holdings Inc. was beneficial, as the company did a good job of managing its fixed-income brokerage business. Fund holdings Prudential Financial Inc. and Goldman Sachs Group Inc. also had a positive impact on Fund results. In the consumer discretionary sector, Starwood Hotels & Resorts Worldwide Inc. was one of the top contributors to Fund performance. The hotel chain operator continued to benefit from robust occupancy numbers fueled by strong consumer and business travel. In health care, the share prices of HMOs UnitedHealth Group Inc., Aetna Inc. and WellPoint, Inc. all posted healthy gains and contributed to Fund performance.
Holdings that detracted from Fund performance included Biogen Idec Inc., a biotechnology company that withdrew its drug Tysabri from the market after it was reportedly implicated in the deaths of several users. The shares of drugmaker Pfizer Inc. also struggled due to the controversy over Cox-2 inhibitors, which included Pfizer’s Celebrex medication. The share price of Fund holding Dell Inc., the computer maker, dropped sharply in August and continued to lose ground for the rest of the period after Dell announced disappointing second-quarter revenues and issued weaker-than-expected sales and earnings guidance for the third quarter.
With a moderately favorable investment backdrop and sector valuations roughly where they should be, the Fund’s sector weightings, for the most part, are not too different from those in the benchmark as of Oct. 31, 2005. This situation could change as the economy moves from a rising-rate environment to one featuring more stable rates, which could happen sometime in the first half of 2006. At that point, new market leadership may emerge that will require us to revisit the Fund’s sector allocations. That said, our company-specific research continues to uncover interesting opportunities that we will try to capitalize on for the benefit of the Fund’s shareholders.
Portfolio Manager:
Gary Haubold, CFA and William H. Miller
| | |
Fund Performance | | Gartmore Nationwide Fund |
| | | | | | | | |
Average Annual Total Return (For periods ended October 31, 2005) |
| | | | | 1 Yr. | | 5 Yr. | | 10 Yr. |
| Class A1 | | w/o SC2 | | 11.88% | | -0.31% | | 9.33% |
| | | w/SC3 | | 5.43% | | -1.48% | | 8.68% |
| Class B1 | | w/o SC2 | | 11.09% | | -1.05% | | 8.70% |
| | | w/SC4 | | 6.09% | | -1.33% | | 8.70% |
| Class C1 | | w/o SC2 | | 11.04% | | -0.95% | | 9.01% |
| | | w/SC5 | | 10.04% | | -0.95% | | 9.01% |
| Class D6 | | w/o SC2 | | 12.11% | | -0.07% | | 9.49% |
| | | w/SC7 | | 7.05% | | -0.99% | | 8.99% |
| Class R1,8 | | | | 11.95% | | -0.20% | | 9.42% |
| Institutional Class1,8 | | 12.19% | | -0.05% | | 9.50% |
All figures showing the effect of a sales charge reflect the maximum charge possible, because it has the most dramatic effect on performance data.
| 1 | These returns through May 11, 1998 include the performance of the Fund’s predecessor fund, and, for periods from May 11, 1998 to the creation of the class, include the performance of the Fund’s Class D shares. These returns were achieved prior to the creation of Class A and Class B shares (5/11/98), Class C shares (3/1/01), Institutional Service Class shares (1/2/02), Class R shares (10/1/03), and Institutional Class shares (06/29/04). Excluding the effect of any fee waivers or reimbursements, such prior performance is similar to what Class A, Class B, Class C, Institutional Service Class, Class R shares and Institutional Class shares would have produced during those periods because all classes of the Fund’s shares invest in the same portfolio of securities. The performance for these classes has been restated to reflect differences in sales charges (where applicable), but does not reflect the differing levels of other fees (primarily Rule 12b-1 and/or administrative services fees) applicable to such classes. If these other fees were reflected, the performance for Class A, Class B, Class C and Class R shares would have been lower. |
| 2 | These returns do not reflect the effects of sales charges (SC). |
| 3 | A 5.75% front-end sales charge was deducted. |
| 4 | A 5.00% contingent deferred sales charge (CDSC) was deducted. The CDSC declines to 0% after 6 years. |
| 5 | A CDSC of 1.00% was deducted from the one year return because it is charged when you sell Class C shares within the first year after purchase. |
| 6 | These returns through May 11, 1998 include the performance of the Fund’s predecessor fund. |
| 7 | A 4.50% front-end sales charge was deducted. |
| 8 | Not subject to any sales charges. |
Performance of a $10,000 Investment
Investment return and principal value will fluctuate, and when redeemed, shares may be worth more or less than original cost. Past performance is no guarantee of future results and does not reflect the deduction of taxes that a shareholder would pay on fund distributions or the redemption of fund shares. Investing in mutual funds involves market risk, including loss of principal. Performance returns assume the reinvestment of all distributions.
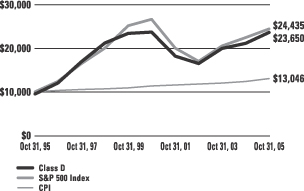
Comparative performance of $10,000 invested in Class D shares of the Gartmore Nationwide Fund, S&P 500 Index (S&P 500)(a), and the Consumer Price Index (CPI)(b) over a 10-year period ended October 31, 2005. Unlike the Fund, the returns for these unmanaged indexes do not reflect any fees, expense, or sales charges. Investors cannot invest directly in market indexes.
| (a) | The S&P 500 is an unmanaged index of 500 widely held stocks of large U.S. companies that gives a broad look at how the stock prices of large U.S. companies have performed. |
| (b) | The CPI represents changes in prices of a basket of goods and services purchased for consumption by urban households. |
| | |
Shareholder Expense Example | | Gartmore Nationwide Fund |
As a shareholder of the Fund, you incur two types of costs: (1) transaction costs, including sales charges (loads) paid on purchase payments and redemption fees; and (2) ongoing costs, including investment advisory fees, administration fees, distribution fees and other Fund expenses. The examples below are intended to help you understand your ongoing costs (in dollars) of investing in the Fund and to compare these costs with the ongoing costs of investing in other mutual funds. Per SEC requirements, the examples assume that you had a $1,000 investment in the Class at the beginning of the reporting period, May 1, 2005, and continued to hold your shares at the end of the reporting period, October 31, 2005.
Actual Expenses
For each Class of the Fund in the table below, the first line provides information about actual account values and actual expenses. You may use the information in this line, together with the amount you invested, to estimate the expenses that you paid over the period. Simply divide your account value by $1,000 (for example, an $8,600 account value divided by $1,000 = 8.6), then multiply the result by the number in the first line of each Class under the heading entitled “Expenses Paid During Period” to estimate the expenses you paid on your account during the period.
Hypothetical Example for Comparison Purposes
The second line of each Class in the table below provides information about hypothetical account values and hypothetical expenses based on the Class’ actual expense ratio and an assumed rate of return of 5% per year before expenses, which is not the Class’ actual return. The hypothetical account values and expenses may not be used to estimate the actual ending account balance or expenses you paid for the period. You may use this information to compare the ongoing costs of investing in the Class of the Fund and other funds. To do so, compare this 5% hypothetical example with the 5% hypothetical examples that appear in the shareholder reports of the other funds.
Please note that the expenses shown in the table are meant to highlight your ongoing costs only and do not reflect any transaction costs, such as sales charges (loads) or redemption fees. Therefore, the second line for each Class in the table is useful in comparing ongoing costs only, and will not help you determine the relative total costs of owning different funds. In addition, if these transaction costs were included, your costs would have been higher. The examples also assume all dividends and distributions have been reinvested.
Schedule of Shareholder Expenses
Expense Analysis of a $1,000 Investment
(October 31, 2005)
| | | | | | | | | | | | | | |
| Nationwide Fund | | | | | Beginning
Account Value,
5/1/05 | | Ending
Account Value,
10/31/05 | | Expenses Paid
During Period* | | Annualized
Expense Ratio* |
| Class A | | Actual | | | $ | 1,000.00 | | $ | 1,071.90 | | $ | 5.95 | | 1.14% |
| | | Hypothetical | 1 | | $ | 1,000.00 | | $ | 1,019.25 | | $ | 5.82 | | 1.14% |
| Class B | | Actual | | | $ | 1,000.00 | | $ | 1,068.90 | | $ | 9.39 | | 1.80% |
| | | Hypothetical | 1 | | $ | 1,000.00 | | $ | 1,015.93 | | $ | 9.19 | | 1.80% |
| Class C | | Actual | | | $ | 1,000.00 | | $ | 1,068.40 | | $ | 9.38 | | 1.80% |
| | | Hypothetical | 1 | | $ | 1,000.00 | | $ | 1,015.93 | | $ | 9.19 | | 1.80% |
| Class D | | Actual | | | $ | 1,000.00 | | $ | 1,073.60 | | $ | 4.55 | | 0.87% |
| | | Hypothetical | 1 | | $ | 1,000.00 | | $ | 1,020.61 | | $ | 4.44 | | 0.87% |
| Class R | | Actual | | | $ | 1,000.00 | | $ | 1,072.80 | | $ | 5.12 | | 0.98% |
| | | Hypothetical | 1 | | $ | 1,000.00 | | $ | 1,020.06 | | $ | 5.00 | | 0.98% |
| Institutional Class | | Actual | | | $ | 1,000.00 | | $ | 1,074.00 | | $ | 4.23 | | 0.81% |
| | | Hypothetical | 1 | | $ | 1,000.00 | | $ | 1,020.92 | | $ | 4.13 | | 0.81% |
| * | Expenses are equal to the Fund’s annualized expense ratio multiplied by the average account value over the period multiplied by 184/365 (to reflect the one-half year period). The expense ratio presented represents a six month, annualized ratio in accordance with SEC guidelines. |
| 1 | Represents the hypothetical 5% return before expenses. |
| | |
Portfolio Summary | | Gartmore Nationwide Fund |
The SEC adopted a requirement that Funds present their portfolio holdings in a table, chart or graph format in their annual and semiannual reports to shareholders, whether or not a statement of investments is utilized. The following tables, which present portfolio holdings as a percentage of net assets, are provided in compliance with this requirement.
| | |
| Asset Allocation | | |
| Common Stocks | | 97.7% |
| Commercial Paper | | 2.0% |
| Other Investments* | | 6.3% |
| Liabilities in excess of other assets** | | -6.0% |
| | |
|
| | | 100.0% |
| * | Includes value of collateral received from securities lending. |
| ** | Includes value of collateral owed from securities lending. |
| | |
| Top Industries | | |
| Healthcare | | 8.5% |
| Oil & Gas | | 8.4% |
| Financial Services | | 8.0% |
| Computer Software & Services | | 7.1% |
| Retail | | 7.1% |
| Banks | | 6.3% |
| Insurance | | 5.6% |
| Telecommunications | | 4.0% |
| Manufacturing | | 3.7% |
| Computer Equipment | | 3.3% |
| Other Industries | | 38.0% |
| | |
|
| | | 100.0% |
| | |
| Top Holdings | | |
| Bank of America Corp. | | 3.6% |
| Johnson & Johnson | | 2.8% |
| Microsoft Corp. | | 2.5% |
| Exxon Mobil Corp. | | 2.4% |
| General Electric Corp. | | 2.4% |
| Countrywide Home Loans, 4.08%, 11/01/05 | | 2.0% |
| ChevronTexaco Corp. | | 1.8% |
| Altria Group, Inc. | | 1.8% |
| Burlington Northern Santa Fe Corp. | | 1.4% |
| UnitedHealth Group, Inc. | | 1.4% |
| Other Holdings | | 77.9% |
| | |
|
| | | 100.0% |
Statement of Investments
October 31, 2005
Gartmore Nationwide Fund

| Common Stocks (97.7%) |
| | | | | |
| | | Shares or
Principal Amount | | Value |
| | | | | | |
Aerospace & Defense (1.6%) |
Boeing Co. (The) | | 50,500 | | $ | 3,264,320 |
General Dynamics Corp. | | 11,400 | | | 1,325,820 |
Goodrich (B.F.) Co. | | 44,900 | | | 1,619,543 |
Lockheed Martin Corp. | | 25,400 | | | 1,538,224 |
Northrop Grumman Corp. | | 182,308 | | | 9,780,824 |
United Technologies Corp. | | 63,100 | | | 3,235,768 |
| | | | |
|
|
| | | | | | 20,764,499 |
| | | | |
|
|
Apparel (0.2%) |
Liz Claiborne, Inc. | | 17,700 | | | 623,040 |
V.F. Corp. | | 25,500 | | | 1,332,375 |
| | | | |
|
|
| | | | | | 1,955,415 |
| | | | |
|
|
Automotive (0.3%) |
Autoliv, Inc. | | 88,750 | | | 3,812,700 |
| | | | |
|
|
Banks (6.3%) |
ABN AMRO Holding NV ADR — NL | | 51,600 | | | 1,224,984 |
AmSouth Bancorp | | 58,800 | | | 1,483,524 |
Australia & New Zealand Banking Group Ltd.
ADR — AU | | 300 | | | 26,559 |
Bank of America Corp. | | 1,062,281 | | | 46,464,170 |
Bank of New York Co., Inc. (The) | | 83,501 | | | 2,612,746 |
Barclays PLC ADR — UK | | 69,800 | | | 2,765,476 |
Bear Stearns Cos., Inc.
(The) (c) | | 74,800 | | | 7,913,840 |
Comerica, Inc. | | 15,600 | | | 901,368 |
Deutsche Bank, AG. | | 7,000 | | | 655,200 |
HSBC Holdings PLC
ADR — UK (c) | | 32,695 | | | 2,575,058 |
J.P. Morgan Chase & Co. | | 171,680 | | | 6,286,922 |
KeyCorp | | 35,380 | | | 1,140,651 |
National City Corp. | | 45,200 | | | 1,456,796 |
PNC Bank Corp. | | 40,139 | | | 2,436,839 |
Suntrust Banks, Inc. | | 36,440 | | | 2,641,171 |
| | | | |
|
|
| | | | | | 80,585,304 |
| | | | |
|
|
Broadcast Media & Cable Television (1.6%) |
Comcast Corp., Class A (b) | | 315,950 | | | 8,792,888 |
Liberty Media Corp. (b) | | 735,550 | | | 5,862,334 |
Viacom, Inc., Class B | | 189,711 | | | 5,875,350 |
| | | | |
|
|
| | | | | | 20,530,572 |
| | | | |
|
|
| | | | | |
| | | Shares or
Principal Amount | | Value |
| | | | | | |
Building – Residential & Commercial (0.2%) |
Pulte Homes, Inc. | | 78,786 | | $ | 2,977,323 |
| | | | |
|
|
Capital Goods (0.3%) |
PACCAR, Inc. | | 62,125 | | | 4,349,993 |
| | | | |
|
|
Casino Hotels (0.1%) |
Boyd Gaming Corp. | | 33,950 | | | 1,400,438 |
| | | | |
|
|
Chemicals (1.6%) |
Air Products & Chemicals, Inc. | | 15,600 | | | 892,944 |
Ashland, Inc. | | 104,800 | | | 5,607,849 |
Dow Chemical Co. | | 88,028 | | | 4,036,964 |
Huntsman Corp. (b) | | 152,921 | | | 3,040,069 |
Lubrizol Corp. | | 121,200 | | | 5,040,708 |
Mosaic Co. (The) (b) (c) | | 61,400 | | | 810,480 |
Olin Corp. (c) | | 56,100 | | | 1,003,068 |
Sigma-Aldrich Corp. | | 12,000 | | | 764,400 |
| | | | |
|
|
| | | | | | 21,196,482 |
| | | | |
|
|
Coal (0.5%) |
Foundation Coal Holdings,
Inc. (c) | | 79,700 | | | 2,988,750 |
Peabody Energy Corp. | | 38,404 | | | 3,001,657 |
| | | | |
|
|
| | | | | | 5,990,407 |
| | | | |
|
|
Computer Equipment (3.3%) |
Cisco Systems, Inc. (b) | | 413,266 | | | 7,211,492 |
Dell, Inc. (b) | | 378,372 | | | 12,062,499 |
EMC Corp. (b) | | 550,851 | | | 7,689,880 |
Hewlett-Packard Co. | | 257,550 | | | 7,221,702 |
Ingram Micro, Inc. (b) | | 188,550 | | | 3,412,755 |
International Business
Machines Corp. | | 55,811 | | | 4,569,805 |
| | | | |
|
|
| | | | | | 42,168,133 |
| | | | |
|
|
Computer Software & Services (7.1%) |
Affiliated Computer Services,
Inc., Class A (b) | | 75,750 | | | 4,098,833 |
Business Objects S.A.
ADR — FR (b) (c) | | 75,919 | | | 2,601,744 |
Cognizant Technology
Solutions Corp., Class A (b) | | 33,061 | | | 1,454,023 |
Computer Sciences Corp. (b) | | 77,050 | | | 3,948,813 |
eBay, Inc. (b) | | 54,300 | | | 2,150,280 |
Electronic Data Systems Corp. | | 156,200 | | | 3,641,022 |
Statement of Investments (Continued)
October 31, 2005
Gartmore Nationwide Fund (Continued)
| Common Stocks (continued) |
| | | | | |
| | | Shares or
Principal Amount | | Value |
| | | | | | |
Computer Software & Services (continued) |
Hyperion Solutions
Corp. (b) (c) | | 126,761 | | $ | 6,130,162 |
Intel Corp. | | 694,690 | | | 16,325,215 |
Microsoft Corp. | | 1,248,970 | | | 32,098,528 |
NCR Corp. (b) | | 108,700 | | | 3,284,914 |
Oracle Corp. (b) | | 560,237 | | | 7,103,805 |
RadioShack Corp. (c) | | 173,884 | | | 3,842,836 |
Yahoo!, Inc. (b) | | 128,861 | | | 4,763,991 |
| | | | |
|
|
| | | | | | 91,444,166 |
| | | | |
|
|
Construction & Building Materials (0.6%) |
Fluor Corp. | | 14,400 | | | 915,840 |
Lafarge North America, Inc. | | 113,220 | | | 6,850,942 |
Masco Corp. | | 3,800 | | | 108,300 |
| | | | |
|
|
| | | | | | 7,875,082 |
| | | | |
|
|
Consumer Products (1.1%) |
Black & Decker Corp. | | 14,700 | | | 1,207,311 |
Colgate-Palmolive Corp. | | 172,534 | | | 9,137,401 |
Kimberly-Clark Corp. | | 55,900 | | | 3,177,356 |
| | | | |
|
|
| | | | | | 13,522,068 |
| | | | |
|
|
Containers (0.2%) |
Ball Corp. | | 54,399 | | | 2,141,689 |
| | | | |
|
|
Distribution & Wholesale (0.1%) |
W.W. Grainger, Inc. | | 12,000 | | | 803,760 |
| | | | |
|
|
Electric – Integrated (1.0%) |
AES Corp. (b) | | 165,168 | | | 2,624,520 |
Constellation Energy Group | | 77,800 | | | 4,263,439 |
DTE Energy Co. | | 26,500 | | | 1,144,800 |
PNM Resources, Inc. (c) | | 111,950 | | | 2,837,933 |
Public Service Enterprise
Group, Inc. | | 34,400 | | | 2,163,416 |
| | | | |
|
|
| | | | | | 13,034,108 |
| | | | |
|
|
Electronics (1.7%) |
Altera Corp. (b) | | 243,700 | | | 4,057,605 |
Arrow Electronics, Inc. (b) | | 150,300 | | | 4,435,353 |
Avnet, Inc. (b) (c) | | 144,950 | | | 3,341,098 |
Microchip Technology, Inc. | | 210,373 | | | 6,346,953 |
SPX Corp. | | 76,950 | | | 3,310,389 |
| | | | |
|
|
| | | | | | 21,491,398 |
| | | | |
|
|
| | | | | |
| | | Shares or
Principal Amount | | Value |
| | | | | | |
Environmental Services (0.1%) |
Republic Services, Inc. | | 41,013 | | $ | 1,449,810 |
| | | | |
|
|
Financial Services (8.0%) |
Centerstate Bank of Florida, Inc. | | 11,590 | | | 395,799 |
Charles Schwab Corp. (The) | | 50,600 | | | 769,120 |
Citigroup, Inc. | | 123,627 | | | 5,659,644 |
Compass Bancshares, Inc. | | 10,000 | | | 487,600 |
Countrywide Financial Corp. | | 46,337 | | | 1,472,126 |
Dun & Bradstreet Corp.
(The) (b) | | 13,000 | | | 823,160 |
First American Financial Corp. | | 91,400 | | | 4,005,148 |
Goldman Sachs Group, Inc. (c) | | 105,823 | | | 13,372,852 |
Hudson City Bancorp, Inc. | | 828,337 | | | 9,807,510 |
KKR Financial Corp. | | 251,400 | | | 5,611,248 |
Lehman Brothers Holdings, Inc. | | 134,749 | | | 16,125,412 |
Marsh & McLennan Cos., Inc. | | 25,000 | | | 728,750 |
Merrill Lynch & Co., Inc. | | 46,601 | | | 3,016,949 |
Morgan Stanley | | 16,282 | | | 885,904 |
Prudential Financial, Inc. | | 156,550 | | | 11,395,275 |
U.S. Bancorp | | 190,200 | | | 5,626,116 |
UBS AG | | 10,200 | | | 873,834 |
Wachovia Corp. | | 265,600 | | | 13,418,111 |
Wells Fargo & Co. | | 77,289 | | | 4,652,798 |
Zions Bancorp | | 43,378 | | | 3,186,982 |
| | | | |
|
|
| | | | | | 102,314,338 |
| | | | |
|
|
Food & Beverage (2.8%) |
Archer-Daniels-Midland Co. | | 207,950 | | | 5,067,742 |
Brown-Forman Corp., Class B | | 28,924 | | | 1,832,046 |
Campbell Soup Co. | | 190,906 | | | 5,555,364 |
Coca Cola Co. (The) | | 88,100 | | | 3,768,918 |
Coca-Cola Enterprises, Inc. | | 190,750 | | | 3,605,175 |
Constellation Brands, Inc. (b) | | 154,000 | | | 3,625,160 |
Dean Foods Co. (b) (c) | | 751 | | | 27,149 |
Hershey Foods Corp. | | 15,400 | | | 875,182 |
Hormel Foods Corp. | | 107,600 | | | 3,421,680 |
Kellogg Co. | | 49,463 | | | 2,184,781 |
PepsiCo, Inc. | | 84,658 | | | 5,001,595 |
Smithfield Foods, Inc. (b) (c) | | 54,606 | | | 1,615,245 |
| | | | |
|
|
| | | | | | 36,580,037 |
| | | | |
|
|
| | Common Stocks (continued) |
| | | | | |
| | | Shares or
Principal Amount | | Value |
| | | | | | |
Healthcare (8.5%) |
Aetna, Inc. | | 83,990 | | $ | 7,438,154 |
Amgen, Inc. (b) | | 137,901 | | | 10,447,380 |
Becton Dickinson & Co. | | 60,990 | | | 3,095,243 |
Biogen Idec, Inc. (b) | | 29,600 | | | 1,202,648 |
Bristol-Myers Squibb Co. | | 305,735 | | | 6,472,410 |
Gilead Sciences, Inc. (b) | | 30,700 | | | 1,450,575 |
Johnson & Johnson | | 570,023 | | | 35,694,839 |
McKesson Corp. | | 80,850 | | | 3,673,016 |
Medco Health Solutions,
Inc. (b) | | 71,500 | | | 4,039,750 |
Medtronic, Inc. | | 120,836 | | | 6,846,568 |
Sierra Health Services, Inc. (b) | | 900 | | | 67,500 |
Triad Hospitals, Inc. (b) | | 75,678 | | | 3,112,636 |
UnitedHealth Group, Inc. | | 300,819 | | | 17,414,412 |
WellPoint, Inc. (b) | | 127,102 | | | 9,491,977 |
| | | | |
|
|
| | | | | | 110,447,108 |
| | | | |
|
|
Hotels & Casinos (0.6%) |
Starwood Hotels & Resorts Worldwide, Inc. | | 127,849 | | | 7,470,217 |
| | | | |
|
|
Instruments – Scientific (0.6%) |
Fisher Scientific International, Inc. (b) (c) | | 72,100 | | | 4,073,650 |
PerkinElmer, Inc. | | 158,000 | | | 3,487,060 |
| | | | |
|
|
| | | | | | 7,560,710 |
| | | | |
|
|
Instruments – Controls (0.4%) |
Thermo Electron Corp. (b) (c) | | 188,223 | | | 5,682,452 |
| | | | |
|
|
Insurance (5.6%) |
AFLAC, Inc. | | 66,409 | | | 3,173,022 |
Allstate Corp. (The) | | 121,909 | | | 6,435,576 |
American International Group, Inc. | | 108,795 | | | 7,049,916 |
Assurant, Inc. | | 146,921 | | | 5,612,382 |
Chubb Corp. | | 88,350 | | | 8,213,901 |
Genworth Financial, Inc. | | 204,877 | | | 6,492,552 |
Hartford Financial Services Group, Inc. (The) | | 89,150 | | | 7,109,713 |
Loews Corp. | | 68,050 | | | 6,327,289 |
Manulife Financial Corp. | | 67,924 | | | 3,543,023 |
MetLife, Inc. | | 159,074 | | | 7,859,846 |
| | | | | |
| | | Shares or
Principal Amount | | Value |
| | | | | | |
Insurance (continued) |
Old Republic International Corp. | | 32,400 | | $ | 839,484 |
St. Paul Cos., Inc. | | 143,778 | | | 6,474,323 |
Unitrin, Inc. | | 72,200 | | | 3,321,200 |
| | | | |
|
|
| | | | | | 72,452,227 |
| | | | |
|
|
Machinery (0.2%) |
Caterpillar, Inc. | | 29,100 | | | 1,530,369 |
Deere & Co. | | 21,700 | | | 1,316,756 |
| | | | |
|
|
| | | | | | 2,847,125 |
| | | | |
|
|
Manufacturing (3.7%) |
3M Co. | | 27,700 | | | 2,104,646 |
Danaher Corp. | | 61,736 | | | 3,216,446 |
Garmin Ltd. | | 50,300 | | | 2,888,729 |
General Electric Corp. | | 899,552 | | | 30,503,808 |
Illinois Tool Works, Inc. | | 31,130 | | | 2,638,579 |
Ingersoll-Rand Co., Class A | | 169,028 | | | 6,387,568 |
| | | | |
|
|
| | | | | | 47,739,776 |
| | | | |
|
|
Medical & Medical Services (0.3%) |
Genzyme Corp. (b) | | 49,424 | | | 3,573,355 |
| | | | |
|
|
Medical Products (0.4%) |
AmerisourceBergen Corp. (c) | | 48,300 | | | 3,683,841 |
Millipore Corp. (b) | | 16,400 | | | 1,004,008 |
| | | | |
|
|
| | | | | | 4,687,849 |
| | | | |
|
|
Metal Mining (0.4%) |
Southern Copper Corp. (c) | | 95,133 | | | 5,245,634 |
| | | | |
|
|
Metal Processors (0.3%) |
Timken Co. (c) | | 144,000 | | | 4,083,840 |
| | | | |
|
|
Metals (0.7%) |
Phelps Dodge Corp. | | 77,001 | | | 9,276,310 |
| | | | |
|
|
Multimedia (2.2%) |
ATI Technologies, Inc. (b) (c) | | 104,900 | | | 1,515,805 |
DreamWorks Animation SKG, Inc. (b) (c) | | 13,600 | | | 348,704 |
Monster Worldwide, Inc. (b) | | 133,786 | | | 4,389,519 |
News Corp. | | 314,570 | | | 4,482,623 |
Time Warner, Inc. | | 528,860 | | | 9,429,573 |
Walt Disney Co. (The) | | 346,946 | | | 8,455,074 |
| | | | |
|
|
| | | | | | 28,621,298 |
| | | | |
|
|
Statement of Investments (Continued)
October 31, 2005
Gartmore Nationwide Fund (Continued)
| | Common Stocks (continued) |
| | | | | |
| | | Shares or
Principal Amount | | Value |
| | | | | | |
Natural Gas (0.5%) |
ONEOK, Inc. (c) | | 11 | | $ | 316 |
Sempra Energy | | 148,300 | | | 6,569,690 |
| | | | |
|
|
| | | | | | 6,570,006 |
| | | | |
|
|
Natural Resources (0.3%) |
BHP Billiton Ltd. ADR — AU (c) | | 127,500 | | | 3,958,875 |
| | | | |
|
|
Office Equipment & Supplies (0.3%) |
Pitney Bowes, Inc. | | 87,870 | | | 3,697,570 |
| | | | |
|
|
Oil & Gas (8.4%) |
Atmos Energy Corp. (c) | | 178,800 | | | 4,702,440 |
Baker Hughes, Inc. | | 30,500 | | | 1,676,280 |
BJ Services Co. (c) | | 14,998 | | | 521,181 |
ChevronTexaco Corp. | | 411,812 | | | 23,502,110 |
ConocoPhillips | | 224,886 | | | 14,703,046 |
Exxon Mobil Corp. | | 551,433 | | | 30,957,448 |
Halliburton Co. | | 86,200 | | | 5,094,420 |
Hanover Compressor Co. (b) (c) | | 163,700 | | | 2,105,182 |
Kerr-McGee Corp. | | 56,200 | | | 4,779,248 |
Marathon Oil Corp. | | 60,063 | | | 3,613,390 |
Nabors Industries Ltd. (b) | | 84,528 | | | 5,801,157 |
National-Oilwell, Inc. (b) | | 82,287 | | | 5,140,469 |
Praxair, Inc. | | 82,520 | | | 4,077,313 |
Questar Corp. | | 14,030 | | | 1,104,863 |
| | | | |
|
|
| | | | | | 107,778,547 |
| | | | |
|
|
Paper & Forest Products (0.9%) |
International Paper Co. | | 296,846 | | | 8,661,966 |
Weyerhaeuser Co. | | 43,550 | | | 2,758,457 |
| | | | |
|
|
| | | | | | 11,420,423 |
| | | | |
|
|
Pharmaceuticals (1.3%) |
Pfizer, Inc. | | 607,244 | | | 13,201,485 |
Shire Pharmaceuticals Group PLC ADR — UK (c) | | 41,825 | | | 1,499,008 |
Wyeth | | 48,600 | | | 2,165,616 |
| | | | |
|
|
| | | | | | 16,866,109 |
| | | | |
|
|
Railroads (2.7%) |
Burlington Northern Santa Fe Corp. | | 284,900 | | | 17,680,894 |
CSX Corp. | | 61,700 | | | 2,826,477 |
| | | | | |
| | | Shares or
Principal Amount | | Value |
| | | | | | |
Railroads (continued) |
Norfolk Southern Corp. | | 272,893 | | $ | 10,970,299 |
Union Pacific Corp. | | 45,300 | | | 3,133,854 |
| | | | |
|
|
| | | | | | 34,611,524 |
| | | | |
|
|
Real Estate Investment & Management (0.1%) |
Developers Diversified Realty Corp. (c) | | 20,900 | | | 912,912 |
| | | | |
|
|
Real Estate Investment Trusts (0.0%) |
Lexington Corporate Properties Trust (c) | | 20,510 | | | 446,708 |
| | | | |
|
|
Recreational Vehicles (0.1%) |
Fleetwood Enterprises,
Inc. (b) (c) | | 62,100 | | | 686,205 |
| | | | |
|
|
Restaurants (0.0%) |
Outback Steakhouse | | 12,209 | | | 459,791 |
| | | | |
|
|
Retail (7.1%) |
American Eagle Outfitters, Inc. | | 128,400 | | | 3,023,820 |
AutoZone, Inc. (b) | | 2,800 | | | 226,520 |
Bebe Stores, Inc. (b) (c) | | 52,800 | | | 746,592 |
Coach, Inc. (b) | | 47,306 | | | 1,522,307 |
Costco Wholesale Corp. | | 141,050 | | | 6,821,178 |
CVS Corp. | | 401,500 | | | 9,800,615 |
Dollar General Corp. | | 145,248 | | | 2,823,621 |
Federated Department
Stores, Inc. | | 69,450 | | | 4,262,147 |
Home Depot, Inc. | | 262,237 | | | 10,762,206 |
Kohl’s Corp. (b) | | 127,865 | | | 6,154,142 |
Kroger Co. (b) | | 317,908 | | | 6,326,369 |
Lowe’s Cos., Inc. | | 107,385 | | | 6,525,786 |
McDonald’s Corp. | | 121,191 | | | 3,829,636 |
Nordstrom, Inc. | | 20,000 | | | 693,000 |
Office Depot, Inc. (b) | | 107,711 | | | 2,965,284 |
Safeway, Inc. | | 144,289 | | | 3,356,162 |
Staples, Inc. | | 48,220 | | | 1,096,041 |
SUPERVALU, Inc. | | 148,900 | | | 4,679,927 |
Talbots, Inc. (c) | | 58,200 | | | 1,518,438 |
Target Corp. | | 26,419 | | | 1,471,274 |
Tiffany & Co. | | 90,006 | | | 3,546,236 |
| | Common Stocks (continued) |
| | | | | |
| | | Shares or
Principal Amount | | Value |
| | | | | | |
Retail (continued) |
TJX Cos., Inc. (The) | | 110,200 | | $ | 2,372,606 |
Wal-Mart Stores, Inc. | | 136,554 | | | 6,460,370 |
| | | | |
|
|
| | | | | | 90,984,277 |
| | | | |
|
|
Search and Navigation Equipment (0.7%) |
Raytheon Co. | | 241,150 | | | 8,910,493 |
| | | | |
|
|
Semiconductors (2.9%) |
Advanced Micro Devices,
Inc. (b) | | 321,100 | | | 7,455,942 |
Analog Devices, Inc. | | 30,400 | | | 1,057,312 |
Applied Materials, Inc. | | 41,900 | | | 686,322 |
Freescale Semiconductor,
Inc. (b) | | 134,800 | | | 3,219,024 |
KLA-Tencor Corp. | | 88,354 | | | 4,089,907 |
Maxim Integrated
Products, Inc. | | 154,882 | | | 5,371,308 |
Micron Technology, Inc. (b) (c) | | 217,938 | | | 2,831,015 |
National Semiconductor Corp. | | 35,000 | | | 792,050 |
Texas Instruments, Inc. | | 402,033 | | | 11,478,041 |
| | | | |
|
|
| | | | | | 36,980,921 |
| | | | |
|
|
Steel (0.2%) |
Nucor Corp. | | 34,800 | | | 2,082,780 |
| | | | |
|
|
Telecommunications (4.0%) |
ALLTEL Corp. | | 76,500 | | | 4,732,290 |
Citizens Communications Co. | | 97,675 | | | 1,195,542 |
Corning, Inc. (b) | | 114,570 | | | 2,301,711 |
Motorola, Inc. | | 663,114 | | | 14,694,606 |
SBC Communications, Inc. | | 514,749 | | | 12,276,764 |
Sprint Corp. | | 268,114 | | | 6,249,737 |
Verizon Communications, Inc. | | 330,319 | | | 10,408,352 |
| | | | |
|
|
| | | | | | 51,859,002 |
| | | | |
|
|
Tire & Rubber (0.0%) |
Cooper Tire & Rubber Co. (c) | | 19,700 | | | 269,102 |
| | | | |
|
|
Tobacco (2.9%) |
Altria Group, Inc. | | 310,300 | | | 23,288,015 |
Gallaher Group plc, | | 2,100 | | | 130,242 |
| | | | | | |
| | | Shares or
Principal Amount | | Value |
| | | | | | | |
Tobacco (continued) |
Reynolds American, Inc. (c) | | | 135,370 | | $ | 11,506,450 |
UST, Inc. (c) | | | 64,600 | | | 2,673,794 |
| | | | | |
|
|
| | | | | | | 37,598,501 |
| | | | | |
|
|
Transportation (0.9%) |
FedEx Corp. | | | 38,100 | | | 3,502,533 |
United Parcel Service, Inc., Class B | | | 117,600 | | | 8,577,744 |
| | | | | |
|
|
| | | | | | | 12,080,277 |
| | | | | |
|
|
Utilities (1.7%) |
Ameren Corp. | | | 15,600 | | | 820,560 |
Consolidated Edison, Inc. (c) | | | 16,000 | | | 728,000 |
Dominion Resources, Inc. | | | 58,100 | | | 4,420,248 |
Duke Energy Corp. (c) | | | 297,300 | | | 7,872,504 |
Exelon Corp. | | | 50,000 | | | 2,601,500 |
PP&L Resources, Inc. | | | 20,000 | | | 626,800 |
Progress Energy, Inc. (c) | | | 35,000 | | | 1,525,650 |
Southern Co. (The) | | | 19,000 | | | 664,810 |
TXU Corp. | | | 28,000 | | | 2,821,000 |
| | | | | |
|
|
| | | | | | | 22,081,072 |
| | | | | |
|
|
Waste Disposal (0.1%) |
Waste Management, Inc. | | | 51,963 | | | 1,533,428 |
| | | | | |
|
|
| | |
Total Common Stocks | | | | | | 1,257,864,146 |
| | | | | |
|
|
|
Commercial Paper (2.0%) |
Financial Services (2.0%) |
Countrywide Home Loans,
4.08%, 11/01/05 | | $ | 25,795,000 | | | 25,795,000 |
| | | | | |
|
|
| | |
Total Commercial Paper | | | | | | 25,795,000 |
| | | | | |
|
|
Statement of Investments (Continued)
October 31, 2005
Gartmore Nationwide Fund (Continued)
Short-Term Securities Held as Collateral for Securities
Lending (6.3%)
| | | | | | | |
| | | Shares or
Principal Amount | | Value | |
Pool of short-term securities for Gartmore Mutual Funds — note 2 (Securities Lending) | | $ | 81,117,579 | | $ | 81,117,579 | |
| | | | | |
|
|
|
| |
Total Short-Term Securities Held as Collateral for Securities Lending | | | 81,117,579 | |
| | | | | |
|
|
|
| |
Total Investments
(Cost $1,301,238,829) (a) — 106.0% | | | 1,364,776,725 | |
| |
Liabilities in excess of other
assets — (6.0)% | | | (78,707,780 | ) |
| | | | | |
|
|
|
| | |
NET ASSETS — 100.0% | | | | | $ | 1,286,068,945 | |
| | | | | |
|
|
|
| | (a) | See notes to financial statements for tax unrealized appreciation (depreciation) of securities. |
| | (b) | Denotes a non-income producing security. |
| | (c) | All or part of the security was on loan as of October 31, 2005. |
| | ADR | American Depositary Receipt |
At October 31, 2005, the Fund’s open long futures contracts were as follows:
| | | | | | | | | | | |
Number of
Contracts
| | Long
Contracts*
| | Expiration
| | Market Value
Covered by
Contracts
| | Unrealized
Appreciation
(Depreciation)
| |
| 75 | | S&P 500 | | 12/16/05 | | $ | 4,536,563 | | $ | (108,938 | ) |
| | * | Cash pledged as collateral. |
See notes to financial statements.
Statements of Assets and Liabilities
October 31, 2005
| | | | | | | | | |
| | | Gartmore
Growth Fund | | | Gartmore Nationwide Fund |
Assets: | | | | | | | | | |
Investments, at value (cost $249,958,976 and $1,301,238,829, respectively) | | $ | 256,966,935 | | | $ | 1,364,776,725 | | |
Cash | | | 567 | | | | 3,985 | | |
Cash collateral pledged for futures | | | — | | | | 236,250 | | |
Interest and dividends receivable | | | 50,471 | | | | 857,935 | | |
Receivable for capital shares issued | | | 16,022 | | | | 496,776 | | |
Receivable for investments sold | | | 10,540,071 | | | | 40,139,178 | | |
Net receivable for variation margin on futures contracts | | | — | | | | 37,688 | | |
Prepaid expenses and other assets | | | 14,095 | | | | 11,826 | | |
| | |
|
|
| |
|
| | |
Total Assets | | | 267,588,161 | | | | 1,406,560,363 | | |
| | |
|
|
| |
|
| | |
| | | |
Liabilities: | | | | | | | | | |
Payable for investments purchased | | | 10,079,724 | | | | 37,070,888 | | |
Payable for capital shares redeemed | | | 77,472 | | | | 1,034,532 | | |
Payable for return of collateral received for securities on loan | | | 19,033,119 | | | | 81,117,579 | | |
Accrued expenses and other payables | | | | | | | | | |
Investment advisory fees | | | 120,630 | | | | 622,692 | | |
Fund administration and transfer agent fees | | | 47,841 | | | | 223,110 | | |
Distribution fees | | | 11,152 | | | | 51,426 | | |
Administrative servicing fees | | | 18,354 | | | | 296,275 | | |
Trustee fees | | | 586 | | | | 3,129 | | |
Other | | | 172,295 | | | | 71,787 | | |
| | |
|
|
| |
|
| | |
Total Liabilities | | | 29,561,173 | | | | 120,491,418 | | |
| | |
|
|
| |
|
| | |
Net Assets | | $ | 238,026,988 | | | $ | 1,286,068,945 | | |
| | |
|
|
| |
|
| | |
| | | |
Represented by: | | | | | | | | | |
Capital | | $ | 489,478,076 | | | $ | 1,057,092,208 | | |
Accumulated net investment income (loss) | | | — | | | | — | | |
Accumulated net realized gains (losses) from investment, futures, and foreign currency transactions | | | (258,459,047 | ) | | | 165,547,778 | | |
Net unrealized appreciation (depreciation) on investments, futures, and translation of assets and liabilities denominated in foreign currencies | | | 7,007,959 | | | | 63,428,958 | | |
| | |
|
|
| |
|
| | |
Net Assets | | $ | 238,026,988 | | | $ | 1,286,068,945 | | |
| | |
|
|
| |
|
| | |
| | | | | | | | | | |
| | | | | | | | | | |
| | | | | | | | | | |
| | | | | | | | | | |
| | | | | | | | | | |
| | | | | | | | | | |
| | | | | | | | | | |
| | | | | | | | | | |
| | | | | | | | | | |
| | | | | | | | | | |
| | | | | | | | | | |
| | | | | | | | | | |
See notes to financial statements.
Statements of Assets and Liabilities (Continued)
| | | | | | | | | | |
| | | Gartmore
Growth Fund | | | Gartmore Nationwide Fund |
Net Assets: | | | | | | | | | | |
Class A Shares | | $ | 29,467,129 | | | $ | 119,614,916 | | | |
Class B Shares | | | 5,324,797 | | | | 29,959,872 | | | |
Class C Shares | | | 549,708 | | | | 965,423 | | | |
Class D Shares | | | 202,682,030 | | | | 1,132,192,238 | | | |
Class R Shares | | | 1,177 | | | | 1,219 | | | |
Institutional Service Class Shares | | | 1,071 | | | | — | | | |
Institutional Class Shares | | | 1,076 | | | | 3,335,277 | | | |
| | |
|
|
| |
|
|
| | |
Total | | $ | 238,026,988 | | | $ | 1,286,068,945 | | | |
| | |
|
|
| |
|
|
| | |
| | | |
Shares outstanding (unlimited number of shares authorized) | | | | | | | | | | |
Class A Shares | | | 4,404,996 | | | | 5,713,187 | | | |
Class B Shares | | | 865,995 | | | | 1,474,500 | | | |
Class C Shares | | | 89,302 | | | | 47,550 | | | |
Class D Shares | | | 29,777,536 | | | | 54,538,936 | | | |
Class R Shares | | | 174 | | | | 59 | | | |
Institutional Service Class Shares | | | 158 | | | | — | | | |
Institutional Class Shares | | | 159 | | | | 160,670 | | | |
| | |
|
|
| |
|
|
| | |
Total | | | 35,138,320 | | | | 61,934,902 | | | |
| | |
|
|
| |
|
|
| | |
| | | |
Net asset value and redemption price per share: | | | | | | | | | | |
Class A Shares | | $ | 6.69 | | | $ | 20.94 | | | |
Class B Shares (a) | | $ | 6.15 | | | $ | 20.32 | | | |
Class C Shares (b) | | $ | 6.16 | | | $ | 20.30 | | | |
Class D Shares | | $ | 6.81 | | | $ | 20.76 | | | |
Class R Shares | | $ | 6.77 | (c) | | $ | 20.78 | (c) | | |
Institutional Service Class Shares | | $ | 6.82 | (c) | | $ | — | | | |
Institutional Class Shares | | $ | 6.80 | (c) | | $ | 20.76 | | | |
| | | |
Maximum offering price per share (100%/(100%-maximum sales charge) of net asset value adjusted to the nearest cent): | | | | | | | | | | |
Class A Shares | | $ | 7.10 | | | $ | 22.22 | | | |
Class D Shares | | $ | 7.13 | | | $ | 21.74 | | | |
| | |
|
|
| |
|
|
| | |
Maximum Sales Charge — Class A Shares | | | 5.75 | % | | | 5.75 | % | | |
| | |
|
|
| |
|
|
| | |
Maximum Sales Charge — Class D Shares | | | 4.50 | % | | | 4.50 | % | | |
| | |
|
|
| |
|
|
| | |
| | | | | | | | | | | |
| | | | | | | | | | | |
| | | | | | | | | | | |
| | | | | | | | | | | |
| | | | | | | | | | | |
| (a) | For Class B shares, the redemption price per share varies by the length of time shares are held. |
| (b) | For Class C Shares, the redemption price per share is reduced by 1.00% for shares held less than one year. |
| (c) | Due to rounding, Net Assets divided by Shares Outstanding does not equal the NAV. |
See notes to financial statements.
Statements of Operations
October 31, 2005
| | | | | | | | | | |
| | | Gartmore Growth Fund | | | Gartmore Nationwide Fund |
INVESTMENT INCOME: | | | | | | | | | | |
Interest income | | $ | 32,300 | | | $ | 1,035,552 | | | |
Dividend income | | | 2,953,062 | | | | 28,106,807 | | | |
Income from securities lending | | | 38,182 | | | | 163,061 | | | |
| | |
|
|
| |
|
|
| | |
Total Income | | | 3,023,544 | | | | 29,305,420 | | | |
| | |
|
|
| |
|
|
| | |
| | | |
Expenses: | | | | | | | | | | |
Investment advisory fees | | | 1,512,351 | | | | 7,933,531 | | | |
Fund administration and transfer agent fees | | | 327,352 | | | | 1,774,267 | | | |
Distribution fees Class A | | | 76,026 | | | | 437,556 | | | |
Distribution fees Class B | | | 58,043 | | | | 347,283 | | | |
Distribution fees Class C | | | 3,285 | | | | 9,403 | | | |
Distribution fees Class R | | | 4 | | | | 4 | | | |
Administrative servicing fees Class A | | | 34,208 | | | | 191,101 | | | |
Administrative servicing fees Class D | | | 27,719 | | | | 749,457 | | | |
Custodian fees | | | 277,173 | | | | 197,949 | | | |
Registration and filing fees | | | 50,615 | | | | 93,988 | | | |
Printing | | | 241,556 | | | | 555,095 | | | |
Trustee fees | | | 10,547 | | | | 60,347 | | | |
Other | | | 54,898 | | | | 287,413 | | | |
| | |
|
|
| |
|
|
| | |
Total expenses before reimbursed expenses | | | 2,673,777 | | | | 12,637,394 | | | |
Earnings credit (Note 5) | | | (10,407 | ) | | | (5,982 | ) | | |
| | |
|
|
| |
|
|
| | |
Total Expenses | | | 2,663,370 | | | | 12,631,412 | | | |
| | |
|
|
| |
|
|
| | |
Net Investment Income (Loss) | | | 360,174 | | | | 16,674,008 | | | |
| | |
|
|
| |
|
|
| | |
| | | |
REALIZED/UNREALIZED GAINS (LOSSES) FROM INVESTMENTS: | | | | | | | | | | |
Net realized gains (losses) on investment transactions | | | 29,235,412 | | | | 178,047,400 | | | |
Net realized gains (losses) on futures transactions | | | — | | | | 80,854 | | | |
Net realized gains (losses) on foreign currency transactions | | | — | | | | (14,329 | ) | | |
| | |
|
|
| |
|
|
| | |
Net realized gains (losses) on investment, futures and foreign currency transactions | | | 29,235,412 | | | | 178,113,925 | | | |
Net change in unrealized appreciation/depreciation on investments, futures, and translation of assets and liabilities denominated in foreign currencies | | | (3,761,798 | ) | | | (20,765,695 | ) | | |
| | |
|
|
| |
|
|
| | |
Net realized/unrealized gains (losses) on investments, futures, and foreign currencies | | | 25,473,614 | | | | 157,348,230 | | | |
| | |
|
|
| |
|
|
| | |
CHANGE IN NET ASSETS RESULTING FROM OPERATIONS | | $ | 25,833,788 | | | $ | 174,022,238 | | | |
| | |
|
|
| |
|
|
| | |
| | | | | | | | | | | |
| | | | | | | | | | | |
| | | | | | | | | | | |
| | | | | | | | | | | |
| | | | | | | | | | | |
| | | | | | | | | | | |
| | | | | | | | | | | |
See notes to financial statements.
Statements of Changes in Net Assets
October 31, 2005
| | | | | | | | | | | | | | | | | | |
| | | Gartmore Growth Fund | | | Gartmore Nationwide Fund |
| | | Year Ended
October 31, 2005 | | | Year Ended
October 31, 2004 | | | Year Ended
October 31, 2005 | | | Year Ended
October 31, 2004 |
FROM INVESTMENT ACTIVITIES: | | | | | | | | | | | | | | | | | | |
Operations: | | | | | | | | | | | | | | | | | | |
Net investment income (loss) | | $ | 360,174 | | | $ | (130,834 | ) | | $ | 16,674,008 | | | $ | 10,065,234 | | | |
Net realized gains (losses) on investment, futures, and foreign currency transactions | | | 29,235,412 | | | | 40,517,152 | | | | 178,113,925 | | | | 198,132,003 | | | |
Net change in unrealized appreciation/depreciation on investments, futures, and translation of assets and liabilities denominated in foreign currencies | | | (3,761,798 | ) | | | (28,125,753 | ) | | | (20,765,695 | ) | | | (111,442,519 | ) | | |
| | |
|
|
| |
|
|
| |
|
|
| |
|
|
| | |
Change in net assets resulting from operations | | | 25,833,788 | | | | 12,260,565 | | | | 174,022,238 | | | | 96,754,718 | | | |
| | |
|
|
| |
|
|
| |
|
|
| |
|
|
| | |
| | | | | |
Distributions to Class A Shareholders from: | | | | | | | | | | | | | | | | | | |
Net investment income | | | (52,234 | ) | | | — | | | | (1,816,560 | ) | | | (2,015,525 | ) | | |
Net realized gains on investments | | | — | | | | — | | | | (984,339 | ) | | | — | | | |
| | | | | |
Distributions to Class B Shareholders from: | | | | | | | | | | | | | | | | | | |
Net investment income | | | — | | | | — | | | | (189,801 | ) | | | — | | | |
Net realized gains on investments | | | — | | | | — | | | | (153,661 | ) | | | — | | | |
| | | | | |
Distributions to Class C Shareholders from: | | | | | | | | | | | | | | | | | | |
Net investment income | | | — | | | | — | | | | (5,099 | ) | | | (458 | ) | | |
Net realized gains on investments | | | — | | | | — | | | | (4,195 | ) | | | — | | | |
| | | | | |
Distributions to Class D Shareholders from: | | | | | | | | | | | | | | | | | | |
Net investment income | | | (741,746 | ) | | | (82,259 | ) | | | (15,158,855 | ) | | | (8,641,837 | ) | | |
Net realized gains on investments | | | — | | | | — | | | | (4,909,336 | ) | | | — | | | |
| | | | | |
Distributions to Class R Shareholders from: | | | | | | | | | | | | | | | | | | |
Net investment income | | | (2 | ) | | | — | | | | (12 | ) | | | (2 | ) | | |
Net realized gains on investments | | | — | | | | — | | | | (5 | ) | | | — | | | |
| | | | | |
Distributions to Institutional Service Class Shareholders from: | | | | | | | | | | | | | | | | | | |
Net investment income | | | (4 | ) | | | (28,144 | ) | | | (8 | ) | | | (161,778 | ) | | |
Net realized gains on investments | | | — | | | | — | | | | (4 | ) | | | — | | | |
| | | | | |
Distributions to Institutional Class Shareholders from: | | | | | | | | | | | | | | | | | | |
Net investment income | | | (4 | ) | | | — | | | | (13,953 | ) | | | (537 | )(a) | | |
Net realized gains on investments | | | — | | | | — | | | | (1,862 | ) | | | — | | | |
| | |
|
|
| |
|
|
| |
|
|
| |
|
|
| | |
Change in net assets from shareholder distributions | | | (793,990 | ) | | | (110,403 | ) | | | (23,237,690 | ) | | | (10,820,137 | ) | | |
| | |
|
|
| |
|
|
| |
|
|
| |
|
|
| | |
Change in net assets from capital transactions | | | (40,564,697 | ) | | | (79,970,320 | ) | | | (510,938,937 | ) | | | (344,305,799 | ) | | |
| | |
|
|
| |
|
|
| |
|
|
| |
|
|
| | |
Change in net assets | | | (15,524,899 | ) | | | (67,820,158 | ) | | | (360,154,389 | ) | | | (258,371,218 | ) | | |
| | | | | |
Net Assets: | | | | | | | | | | | | | | | | | | |
Beginning of period | | | 253,551,887 | | | | 321,372,045 | | | | 1,646,223,334 | | | | 1,904,594,552 | | | |
| | |
|
|
| |
|
|
| |
|
|
| |
|
|
| | |
End of period | | $ | 238,026,988 | | | $ | 253,551,887 | | | $ | 1,286,068,945 | | | $ | 1,646,223,334 | | | |
| | |
|
|
| |
|
|
| |
|
|
| |
|
|
| | |
| | | | | |
Accumulated net investment income (loss) | | $ | — | | | $ | 43 | | | $ | — | | | $ | 554,054 | | | |
| | |
|
|
| |
|
|
| |
|
|
| |
|
|
| | |
| | | | | | | | | | | | | | | | | | | |
| (a) | For the period from June 29, 2004 (commencement of operations) through October 31, 2004 |
See notes to financial statements.
Financial Highlights
Selected Data for Each Share of Capital Outstanding
Gartmore Growth Fund
| | | | | | | | | | | | | | | | | | | | | | | | | | | | | | | | | | | | | | | | | | | | |
| | | | | Investment Activities | | | Distributions | | | | | | | | Ratios / Supplemental Data |
| | | Net Asset
Value,
Beginning
of Period | | Net
Investment
Income
(Loss) | | | Net Realized
and
Unrealized
Gains
(Losses) on
Investments | | | Total
from
Investment
Activities | | | Net
Investment
Income | | | Net
Realized
Gains | | | Total
Distributions | | | Net
Asset
Value, End
of Period | | Total
Return (a) | | | Net Assets
at End of
Period
(000s) | | Ratio of
Expenses
to Average
Net Assets | | | Ratio of Net
Investment
Income
(Loss)
to Average
Net Assets | | | Ratio of
Expenses
(Prior to
Reimbursements)
to Average
Net Assets (b) | | | Ratio of Net
Investment
Income (Loss)
(Prior to
Reimbursements)
to Average
Net Assets (b) | | | Portfolio
Turnover (c) |
| | | | | | | | | | | | | | | |
Class A Shares | | | | | | | | | | | | | | | | | | | | | | | | | | | | | | | | | | | | | | | | | | | | |
Year Ended October 31, 2001 | | $ | 14.99 | | (0.05 | ) | | (5.85 | ) | | (5.90 | ) | | — | | | (3.20 | ) | | (3.20 | ) | | $ | 5.89 | | (47.33% | ) | | $ | 5,268 | | 1.33% | | | (0.60% | ) | | (j | ) | | (j | ) | | 210.72% |
Year Ended October 31, 2002 | | $ | 5.89 | | (0.02 | ) | | (1.13 | ) | | (1.15 | ) | | — | | | — | | | — | | | $ | 4.74 | | (19.52% | ) | | $ | 4,828 | | 1.17% | | | (0.34% | ) | | (j | ) | | (j | ) | | 241.95% |
Year Ended October 31, 2003 | | $ | 4.74 | | (0.01 | ) | | 1.19 | | | 1.18 | | | — | | | — | | | — | | | $ | 5.92 | | 24.89% | | | $ | 6,529 | | 1.13% | | | (0.22% | ) | | (j | ) | | (j | ) | | 281.63% |
Year Ended October 31, 2004 | | $ | 5.92 | | (0.02 | ) | | 0.18 | | | 0.16 | | | — | | | — | | | — | | | $ | 6.08 | | 2.70% | | | $ | 30,641 | | 1.19% | | | (0.36% | ) | | (j | ) | | (j | ) | | 286.06% |
Year Ended October 31, 2005 | | $ | 6.08 | | (0.01 | ) | | 0.63 | | | 0.62 | | | (0.01 | ) | | — | | | (0.01 | ) | | $ | 6.69 | | 10.22% | | | $ | 29,467 | | 1.34% | | | (0.14% | ) | | (j | ) | | (j | ) | | 281.51% |
| | | | | | | | | | | | | | | |
Class B Shares | | | | | | | | | | | | | | | | | | | | | | | | | | | | | | | | | | | | | | | | | | | | |
Year Ended October 31, 2001 | | $ | 14.71 | | (0.10 | ) | | (5.87 | ) | | (5.97 | ) | | — | | | (3.20 | ) | | (3.20 | ) | | $ | 5.54 | | (49.10% | ) | | $ | 4,288 | | 2.12% | | | (1.36% | ) | | (j | ) | | (j | ) | | 210.72% |
Year Ended October 31, 2002 | | $ | 5.54 | | (0.06 | ) | | (1.04 | ) | | (1.10 | ) | | — | | | — | | | — | | | $ | 4.44 | | (19.86% | ) | | $ | 3,299 | | 1.90% | | | (1.08% | ) | | (j | ) | | (j | ) | | 241.95% |
Year Ended October 31, 2003 | | $ | 4.44 | | (0.04 | ) | | 1.11 | | | 1.07 | | | — | | | — | | | — | | | $ | 5.51 | | 24.10% | | | $ | 3,980 | | 1.84% | | | (0.93% | ) | | (j | ) | | (j | ) | | 281.63% |
Year Ended October 31, 2004 | | $ | 5.51 | | (0.05 | ) | | 0.15 | | | 0.10 | | | — | | | — | | | — | | | $ | 5.61 | | 1.81% | | | $ | 5,817 | | 1.84% | | | (1.00% | ) | | (j | ) | | (j | ) | | 286.06% |
Year Ended October 31, 2005 | | $ | 5.61 | | (0.05 | ) | | 0.59 | | | 0.54 | | | — | | | — | | | — | | | $ | 6.15 | | 9.63% | | | $ | 5,325 | | 1.98% | | | (0.78% | ) | | (j | ) | | (j | ) | | 281.51% |
| | | | | | | | | | | | | | | |
Class C Shares | | | | | | | | | | | | | | | | | | | | | | | | | | | | | | | | | | | | | | | | | | | | |
Period Ended October 31, 2001 (d) | | $ | 7.11 | | (0.03 | ) | | (1.53 | ) | | (1.56 | ) | | — | | | — | | | — | | | $ | 5.55 | | (21.94% | )(h) | | $ | 58 | | 2.27% | (i) | | (1.41% | )(i) | | (j | ) | | (j | ) | | 210.72% |
Year Ended October 31, 2002 | | $ | 5.55 | | (0.06 | ) | | (1.05 | ) | | (1.11 | ) | | — | | | — | | | — | | | $ | 4.44 | | (20.00% | ) | | $ | 52 | | 1.90% | | | (1.08% | ) | | (j | ) | | (j | ) | | 241.95% |
Year Ended October 31, 2003 | | $ | 4.44 | | (0.04 | ) | | 1.11 | | | 1.07 | | | — | | | — | | | — | | | $ | 5.51 | | 24.10% | | | $ | 101 | | 1.84% | | | (0.95% | ) | | (j | ) | | (j | ) | | 281.63% |
Year Ended October 31, 2004 | | $ | 5.51 | | (0.05 | ) | | 0.16 | | | 0.11 | | | — | | | — | | | — | | | $ | 5.62 | | 2.00% | | | $ | 248 | | 1.84% | | | (1.01% | ) | | (j | ) | | (j | ) | | 286.06% |
Year Ended October 31, 2005 | | $ | 5.62 | | (0.04 | ) | | 0.58 | | | 0.54 | | | — | | | — | | | — | | | $ | 6.16 | | 9.61% | | | $ | 550 | | 2.03% | | | (0.96% | ) | | (j | ) | | (j | ) | | 281.51% |
| | | | | | | | | | | | | | | |
Class D Shares | | | | | | | | | | | | | | | | | | | | | | | | | | | | | | | | | | | | | | | | | | | | |
Year Ended October 31, 2001 | | $ | 15.03 | | (0.03 | ) | | (5.86 | ) | | (5.89 | ) | | — | | | (3.20 | ) | | (3.20 | ) | | $ | 5.94 | | (47.07% | ) | | $ | 385,898 | | 1.10% | | | (0.38% | ) | | (j | ) | | (j | ) | | 210.72% |
Year Ended October 31, 2002 | | $ | 5.94 | | (0.01 | ) | | (1.14 | ) | | (1.15 | ) | | — | | | — | | | — | | | $ | 4.79 | | (19.36% | ) | | $ | 207,357 | | 0.93% | | | (0.10% | ) | | (j | ) | | (j | ) | | 241.95% |
Year Ended October 31, 2003 | | $ | 4.79 | | — | | | 1.21 | | | 1.21 | | | — | | | — | | | — | | | $ | 6.00 | | 25.26% | | | $ | 235,758 | | 0.86% | | | 0.05% | | | (j | ) | | (j | ) | | 281.63% |
Year Ended October 31, 2004 | | $ | 6.00 | | — | (k) | | 0.17 | | | 0.17 | | | — | (k) | | — | | | — | | | $ | 6.17 | | 2.87% | | | $ | 216,843 | | 0.85% | | | (0.01% | ) | | (j | ) | | (j | ) | | 286.06% |
Year Ended October 31, 2005 | | $ | 6.17 | | 0.01 | | | 0.65 | | | 0.66 | | | (0.02 | ) | | — | | | (0.02 | ) | | $ | 6.81 | | 10.74% | | | $ | 202,682 | | 0.99% | | | 0.21% | | | (j | ) | | (j | ) | | 281.51% |
| | | | | | | | | | | | | | | |
Class R Shares | | | | | | | | | | | | | | | | | | | | | | | | | | | | | | | | | | | | | | | | | | | | |
Period Ending October 31, 2003 (e) | | $ | 5.76 | | (0.01 | ) | | 0.25 | | | 0.24 | | | — | | | — | | | — | | | $ | 6.00 | | 4.17% | (h) | | $ | 1 | | 1.42% | (i) | | (0.76% | )(i) | | 1.52% | (i) | | 0.86% | (i) | | 281.63% |
Year Ended October 31, 2004 | | $ | 6.00 | | (0.03 | ) | | 0.18 | | | 0.15 | | | — | | | — | | | — | | | $ | 6.15 | | 2.50% | | | $ | 1 | | 1.29% | | | (0.46% | ) | | (j | ) | | (j | ) | | 286.06% |
Year Ended October 31, 2005 | | $ | 6.15 | | (0.01 | ) | | 0.64 | | | 0.63 | | | (0.01 | ) | | — | | | (0.01 | ) | | $ | 6.77 | | 10.28% | | | $ | 1 | | 1.29% | | | (0.14% | ) | | (j | ) | | (j | ) | | 281.51% |
| | | | | | | | | | | | | | | |
Institutional Service Class Shares | | | | | | | | | | | | | | | | | | | | | | | | | | | | | | | | | | | | | | | | | | | | |
Period Ended October 31, 2002 (f) | | $ | 6.59 | | (0.01 | ) | | (1.79 | ) | | (1.80 | ) | | — | | | — | | | — | | | $ | 4.79 | | (27.31% | )(h) | | $ | 59,307 | | 0.88% | (i) | | (0.11% | )(i) | | (j | ) | | (j | ) | | 241.95% |
Year Ended October 31, 2003 | | $ | 4.79 | | — | | | 1.22 | | | 1.22 | | | — | | | — | | | — | | | $ | 6.01 | | 25.47% | | | $ | 75,002 | | 0.84% | | | 0.06% | | | (j | ) | | (j | ) | | 281.63% |
Year Ended October 31, 2004 (l) | | $ | 6.01 | | 0.01 | | | 0.17 | | | 0.18 | | | — | (k) | | — | | | — | | | $ | 6.19 | | 3.03% | | | $ | 1 | | 0.84% | | | 0.22% | | | (j | ) | | (j | ) | | 286.06% |
Year Ended October 31, 2005 | | $ | 6.19 | | — | | | 0.65 | | | 0.65 | | | (0.02 | ) | | — | | | (0.02 | ) | | $ | 6.82 | | 10.55% | | | $ | 1 | | 1.04% | | | 0.11% | | | (j | ) | | (j | ) | | 281.51% |
| | | | | | | | | | | | | | | |
Institutional Class Shares | | | | | | | | | | | | | | | | | | | | | | | | | | | | | | | | | | | | | | | | | | | | |
Period Ended October 31, 2004 (g) | | $ | 6.34 | | — | | | (0.17 | ) | | (0.17 | ) | | — | | | — | | | — | | | $ | 6.17 | | (2.68% | )(h) | | $ | 1 | | 0.80% | (i) | | (0.06% | )(i) | | (j | ) | | (j | ) | | 286.06% |
Year Ended October 31, 2005 | | $ | 6.17 | | — | | | 0.65 | | | 0.65 | | | (0.02 | ) | | — | | | (0.02 | ) | | $ | 6.80 | | 10.59% | | | $ | 1 | | 1.04% | | | 0.11% | | | (j | ) | | (j | ) | | 281.51% |
| | |
(a) Excludes sales charge. | | (g) For the period from June 29, 2004 (commencement of operations) through October 31, 2004 |
(b) During the period certain fees were waived and/or reimbursed. If such waivers/reimbursements had not occurred, the ratio would have been as indicated. | | (h)Not annualized. (i) Annualized. (j) There were no fee reductions during the period. (k) The amount is less than $0.005. (l) Net investment income (loss) is based on average shares outstanding during the period. |
(c) Portfolio turnover is calculated on the basis of the Fund as a whole without distinguishing among the classes of shares. | |
(d) For the period from March 1, 2001 (commencement of operations) through October 31, 2001. | |
(e) For the period from October 1, 2003 (commencement of operations) through October 31, 2003. | |
(f) For the period from January 2, 2002 (commencement of operations) through October 31, 2002. | |
See notes to financial statements.
Financial Highlights
Selected Data for Each Share of Capital Outstanding
Gartmore Nationwide Fund
| | | | | | | | | | | | | | | | | | | | | | | | | | | | | | | | | | | | | | | | | | | | |
| | | | | Investment Activities | | | Distributions | | | | | | | | Ratios/Supplemental Data |
| | | Net Asset
Value,
Beginning
of Period | | Net
Investment
Income
(Loss) | | | Net Realized
and
Unrealized
Gains
(Losses) on
Investments | | | Total
from
Investment
Activities | | | Net
Investment
Income | | | Net
Realized
Gains | | | Total
Distributions | | | Net
Asset
Value, End
of Period | | Total
Return (a) | | | Net Assets
at End of
Period
(000s) | | Ratio of
Expenses
to Average
Net Assets | | | Ratio of Net
Investment
Income
(Loss)
to Average
Net Assets | | | Ratio of
Expenses
(Prior to
Reimbursements)
to Average
Net Assets (b) | | | Ratio of Net
Investment
Income (Loss)
(Prior to
Reimbursements)
to Average
Net Assets (b) | | | Portfolio
Turnover (c) |
| | | | | | | | | | | | | | | |
Class A Shares | | | | | | | | | | | | | | | | | | | | | | | | | | | | | | | | | | | | | | | | | | | | |
Year Ended October 31, 2001 | | $ | 30.80 | | 0.08 | | | (5.66 | ) | | (5.58 | ) | | (0.10 | ) | | (8.37 | ) | | (8.47 | ) | | $ | 16.75 | | (23.34% | ) | | $ | 149,086 | | 1.15% | | | 0.32% | | | (i | ) | | (i | ) | | 71.36% |
Year Ended October 31, 2002 | | $ | 16.75 | | 0.07 | | | (1.68 | ) | | (1.61 | ) | | (0.08 | ) | | — | | | (0.08 | ) | | $ | 15.06 | | (9.64% | ) | | $ | 362,435 | | 1.14% | | | 0.46% | | | (i | ) | | (i | ) | | 25.51% |
Year Ended October 31, 2003 | | $ | 15.06 | | 0.09 | | | 3.02 | | | 3.11 | | | (0.09 | ) | | — | | | (0.09 | ) | | $ | 18.08 | | 20.74% | | | $ | 571,918 | | 1.13% | | | 0.57% | | | (i | ) | | (i | ) | | 120.02% |
Year Ended October 31, 2004 | | $ | 18.08 | | 0.07 | | | 0.87 | | | 0.94 | | | (0.06 | ) | | — | | | (0.06 | ) | | $ | 18.96 | | 5.22% | | | $ | 447,884 | | 1.10% | | | 0.35% | | | (i | ) | | (i | ) | | 144.61% |
Year Ended October 31, 2005 | | $ | 18.96 | | 0.38 | | | 1.86 | | | 2.24 | | | (0.18 | ) | | (0.08 | ) | | (0.26 | ) | | $ | 20.94 | | 11.88% | | | $ | 119,615 | | 1.14% | | | 1.64% | | | (i | ) | | (i | ) | | 145.66% |
| | | | | | | | | | | | | | | |
Class B Shares | | | | | | | | | | | | | | | | | | | | | | | | | | | | | | | | | | | | | | | | | | | | |
Year Ended October 31, 2001 | | $ | 30.48 | | (0.06 | ) | | (5.65 | ) | | (5.71 | ) | | — | | | (8.37 | ) | | (8.37 | ) | | $ | 16.40 | | (24.19% | ) | | $ | 36,241 | | 1.85% | | | (0.30% | ) | | (i | ) | | (i | ) | | 71.36% |
Year Ended October 31, 2002 | | $ | 16.40 | | (0.03 | ) | | (1.65 | ) | | (1.68 | ) | | — | | | — | | | — | | | $ | 14.72 | | (10.24% | ) | | $ | 31,267 | | 1.80% | | | (0.18% | ) | | (i | ) | | (i | ) | | 25.51% |
Year Ended October 31, 2003 | | $ | 14.72 | | — | | | 2.94 | | | 2.94 | | | (0.01 | ) | | — | | | (0.01 | ) | | $ | 17.65 | | 19.99% | | | $ | 35,564 | | 1.79% | | | (0.06% | ) | | (i | ) | | (i | ) | | 120.02% |
Year Ended October 31, 2004 | | $ | 17.65 | | (0.05 | ) | | 0.86 | | | 0.81 | | | — | | | — | | | — | | | $ | 18.46 | | 4.59% | | | $ | 35,073 | | 1.76% | | | (0.30% | ) | | (i | ) | | (i | ) | | 144.61% |
Year Ended October 31, 2005 | | $ | 18.46 | | 0.03 | | | 2.01 | | | 2.04 | | | (0.10 | ) | | (0.08 | ) | | (0.18 | ) | | $ | 20.32 | | 11.09% | | | $ | 29,960 | | 1.79% | | | 0.25% | | | (i | ) | | (i | ) | | 145.66% |
| | | | | | | | | | | | | | | |
Class C Shares | | | | | | | | | | | | | | | | | | | | | | | | | | | | | | | | | | | | | | | | | | | | |
Period Ended October 31, 2001 (d) | | $ | 19.12 | | (0.03 | ) | | (2.68 | ) | | (2.71 | ) | | (0.01 | ) | | — | | | (0.01 | ) | | $ | 16.40 | | (14.16% | )(g) | | $ | 175 | | 1.89% | (h) | | (0.45% | )(h) | | (i | ) | | (i | ) | | 71.36% |
Year Ended October 31, 2002 | | $ | 16.40 | | (0.03 | ) | | (1.65 | ) | | (1.68 | ) | | — | | | — | | | — | | | $ | 14.72 | | (10.24% | ) | | $ | 212 | | 1.80% | | | (0.20% | ) | | (i | ) | | (i | ) | | 25.51% |
Year Ended October 31, 2003 | | $ | 14.72 | | (0.01 | ) | | 2.95 | | | 2.94 | | | (0.01 | ) | | — | | | (0.01 | ) | | $ | 17.65 | | 20.00% | | | $ | 714 | | 1.79% | | | (0.16% | ) | | (i | ) | | (i | ) | | 120.02% |
Year Ended October 31, 2004 | | $ | 17.65 | | (0.06 | ) | | 0.87 | | | 0.81 | | | (0.01 | ) | | — | | | (0.01 | ) | | $ | 18.45 | | 4.58% | | | $ | 989 | | 1.76% | | | (0.32% | ) | | (i | ) | | (i | ) | | 144.61% |
Year Ended October 31, 2005 | | $ | 18.45 | | 0.04 | | | 1.99 | | | 2.03 | | | (0.10 | ) | | (0.08 | ) | | (0.18 | ) | | $ | 20.30 | | 11.04% | | | $ | 965 | | 1.79% | | | 0.27% | | | (i | ) | | (i | ) | | 145.66% |
| | | | | | | | | | | | | | | |
Class D Shares | | | | | | | | | | | | | | | | | | | | | | | | | | | | | | | | | | | | | | | | | | | | |
Year Ended October 31, 2001 | | $ | 30.67 | | 0.13 | | | (5.65 | ) | | (5.52 | ) | | (0.14 | ) | | (8.37 | ) | | (8.51 | ) | | $ | 16.64 | | (23.22% | ) | | $ | 1,458,371 | | 0.89% | | | 0.64% | | | (i | ) | | (i | ) | | 71.36% |
Year Ended October 31, 2002 | | $ | 16.64 | | 0.13 | | | (1.69 | ) | | (1.56 | ) | | (0.12 | ) | | — | | | (0.12 | ) | | $ | 14.96 | | (9.43% | ) | | $ | 1,125,402 | | 0.86% | | | 0.77% | | | (i | ) | | (i | ) | | 25.51% |
Year Ended October 31, 2003 | | $ | 14.96 | | 0.13 | | | 3.00 | | | 3.13 | | | (0.13 | ) | | — | | | (0.13 | ) | | $ | 17.96 | | 21.07% | | | $ | 1,240,520 | | 0.85% | | | 0.89% | | | (i | ) | | (i | ) | | 120.02% |
Year Ended October 31, 2004 | | $ | 17.96 | | 0.12 | | | 0.88 | | | 1.00 | | | (0.13 | ) | | — | | | (0.13 | ) | | $ | 18.83 | | 5.59% | | | $ | 1,161,934 | | 0.82% | | | 0.64% | | | (i | ) | | (i | ) | | 144.61% |
Year Ended October 31, 2005 | | $ | 18.83 | | 0.23 | | | 2.04 | | | 2.27 | | | (0.26 | ) | | (0.08 | ) | | (0.34 | ) | | $ | 20.76 | | 12.11% | | | $ | 1,132,192 | | 0.85% | | | 1.17% | | | (i | ) | | (i | ) | | 145.66% |
| | | | | | | | | | | | | | | |
Class R Shares | | | | | | | | | | | | | | | | | | | | | | | | | | | | | | | | | | | | | | | | | | | | |
Period Ended October 31, 2003 (e) | | $ | 17.32 | | — | | | 0.63 | | | 0.63 | | | — | | | — | | | — | | | $ | 17.95 | | 3.64% | (g) | | $ | 1 | | 1.52% | (h) | | 0.07% | (h) | | 1.62% | (h) | | (0.03% | )(h) | | 120.02% |
Year Ended October 31, 2004 | | $ | 17.95 | | 0.03 | | | 0.88 | | | 0.91 | | | (0.03 | ) | | — | | | (0.03 | ) | | $ | 18.83 | | 5.08% | | | $ | 1 | | 1.27% | | | 0.16% | | | (i | ) | | (i | ) | | 144.61% |
Year Ended October 31, 2005 | | $ | 18.83 | | 0.19 | | | 2.05 | | | 2.24 | | | (0.21 | ) | | (0.08 | ) | | (0.29 | ) | | $ | 20.78 | | 11.95% | | | $ | 1 | | 0.96% | | | 0.95% | | | (i | ) | | (i | ) | | 145.66% |
| | | | | | | | | | | | | | | |
Institutional Class Shares | | | | | | | | | | | | | | | | | | | | | | | | | | | | | | | | | | | | | | | | | | | | |
Period Ended October 31, 2004 (f) | | $ | 19.00 | | 0.03 | | | (0.17 | ) | | (0.14 | ) | | (0.03 | ) | | — | | | (0.03 | ) | | $ | 18.83 | | (0.74% | )(g) | | $ | 341 | | 0.78% | (h) | | 0.54% | (h) | | (i | ) | | (i | ) | | 144.61% |
Year Ended October 31, 2005 | | $ | 18.83 | | 0.24 | | | 2.04 | | | 2.28 | | | (0.27 | ) | | (0.08 | ) | | (0.35 | ) | | $ | 20.76 | | 12.19% | | | $ | 3,335 | | 0.81% | | | 0.81% | | | (i | ) | | (i | ) | | 145.66% |
| | |
(a) Excludes sales charge. | | (f) For the period from June 29, 2004 (commencement of operations) through October 31, 2004 (g) Not annualized. (h)Annualized. (i) There were no fee reductions during the period. |
(b) During the period certain fees were waived and/or reimbursed. If such waivers/reimbursements had not occurred, the ratios would have been as indicated. | |
(c) Portfolio turnover is calculated on the basis of the Fund as a whole without distinguishing among the classes of shares. | |
(d) For the period from March 1, 2001 (commencement of operations) through October 31, 2001. | |
(e) For the period from October 1, 2003 (commencement of operations) through October 31, 2003. | |
See notes to financial statements.
Gartmore Money Market Fund
For the annual period ended Oct. 31, 2005, the Gartmore Money Market Fund (Prime Shares) returned 2.36% versus 2.32% for its benchmark, the iMoneyNet First Tier Retail Index. For broader comparison, the average return for the Fund’s Lipper peer category of Money Market Funds was 2.30%.
The Federal Open Market Committee’s (FOMC) assessment of growth/prices was balanced during the reporting period. The target federal funds rate was increased, in 25-basis-point increments, eight times during the fiscal year. The rate rose 200 basis points from 1.75% on Sept. 21, 2004, to 3.75% on Sept. 20, 2005. Because the weighted average maturity of the Fund fluctuated between 30 and 50 days, on average, the Fund benefited because maturing assets were consistently re-invested at higher yields.
On Oct. 31, 2005, the Fund held 76.38% of its assets in fixed-rate securities and 23.62% in variable-rate securities. Asset-backed securities represented 50.95% of the fixed-rate obligations. Spreads on asset-backed securities were one to three basis points above those of their corporate counterparts. The supply of asset-backed obligations grew during the reporting period, and investor utilization of existing conduits and liquidity notes was strong.
Because the federal funds target rate was anticipated to be increased by 25 basis points at each FOMC meeting, it was prudent to invest assets in vehicles that would mature at about the same time as the FOMC meeting dates and to utilize floating-rate obligations that reset to current market levels monthly.
Because the leadership of the FOMC changes in January 2006, the Fund will monitor closely financial market sentiment. Alan Greenspan will retire and Ben Bernanke will replace him. Financial markets expect that, for the near term, Ben Bernanke will continue Greenspan’s policies.
The Fund’s weighted average maturity (WAM) was 38 days as of Oct. 31, 2005, and for the near term, the strategy will be to keep the WAM between 30 and 50 days. When extension opportunities prevail, the Fund will attempt to capitalize on them by extending the WAM. The Fund also will endeavor to maximize the opportunity to invest in eligible asset-backed commercial paper, investment vehicles which can typically provide one to three basis points of yield above that of their corporate counterparts, and liquidity notes, which can provide up to five basis points of additional return. The issues approved for purchase by the Fund are highly liquid.
Portfolio Manager:
Patricia A. Mynster
| | |
Fund Performance | | Gartmore Money Market Fund |
Average Annual Total Return
(For periods ended October 31, 2005)
| | | | | | |
| | | 1 Yr. | | 5 Yr. | | 10 Yr. |
| Institutional Class Shares1 | | 2.41% | | 1.88% | | 3.49% |
| Prime Shares | | 2.36% | | 1.83% | | 3.46% |
| Service Class Shares1 | | 2.21% | | 1.71% | | 3.38% |
There is no sales charge on the shares of the Money Market Fund. Past performance is no guarantee of future results.
| 1 | These returns through May 11, 1998 include the performance of the Fund’s predecessor fund, and, for periods from May 11, 1998 to the creation of the class, include the performance of the Fund’s Prime shares. These returns were achieved prior to the creation of Service Class shares (1/4/99), and Institutional Class shares (12/13/01). Excluding the effects of any fee waivers or reimbursements, such prior performance is similar to what Service Class and Institutional Class shares would have produced during those periods because all classes of the Fund’s shares invest in the same portfolio of securities. The performance does not reflect the differing levels of other fees (primarily Rule 12b-1 and/or administrative services fees) applicable to such classes. If these other fees were reflected, the performance for the Service Class shares would have been lower. |
Performance of a $10,000 Investment
Investment return and principal value will fluctuate, and when redeemed, shares may be worth more or less than original cost. Past performance is no guarantee of future results and does not reflect the deduction of taxes that a shareholder would pay on fund distributions or the redemption of fund shares. Investing in mutual funds involves market risk, including loss of principal. Performance returns assume the reinvestment of all distributions.
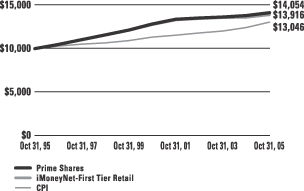
Comparative performance of $10,000 invested in Prime Shares of the Gartmore Money Market Fund, the iMoneyNet-First Tier Retail(a), and the Consumer Price Index (CPI)(b) over a 10-year period ended October 31, 2005. Unlike the Fund, the returns for these unmanaged indexes does not reflect any fees or expenses. Investors cannot invest directly in market indexes.
| (a) | The IMoneyNet-First Tier Retail is an average of non-government retail money market mutual funds that do not invest in any second tier securities. Portfolio holdings of first tier money market mutual funds include U.S. Treasury, U.S. other, repurchase agreements, time deposits, domestic bank obligations, foreign bank obligations, first tier commercial paper, floating rate notes, and asset-backed commercial paper. |
| (b) | The CPI represents changes in prices of a basket of goods and services purchased for consumption by urban households. |
| | |
Shareholder Expense Example | | Gartmore Money Market Fund |
As a shareholder of the Fund, you incur two types of costs: (1) transaction costs, including sales charges (loads) paid on purchase payments and redemption fees; and (2) ongoing costs, including investment advisory fees, administration fees, distribution fees and other Fund expenses. The examples below are intended to help you understand your ongoing costs (in dollars) of investing in the Fund and to compare these costs with the ongoing costs of investing in other mutual funds. Per SEC requirements, the examples assume that you had a $1,000 investment in the Class at the beginning of the reporting period, May 1, 2005, and continued to hold your shares at the end of the reporting period, October 31, 2005.
Actual Expenses
For each Class of the Fund in the table below, the first line provides information about actual account values and actual expenses. You may use the information in this line, together with the amount you invested, to estimate the expenses that you paid over the period. Simply divide your account value by $1,000 (for example, an $8,600 account value divided by $1,000 = 8.6), then multiply the result by the number in the first line of each Class under the heading entitled “Expenses Paid During Period” to estimate the expenses you paid on your account during the period.
Hypothetical Example for Comparison Purposes
The second line of each Class in the table below provides information about hypothetical account values and hypothetical expenses based on the Class’ actual expense ratio and an assumed rate of return of 5% per year before expenses, which is not the Class’ actual return. The hypothetical account values and expenses may not be used to estimate the actual ending account balance or expenses you paid for the period. You may use this information to compare the ongoing costs of investing in the Class of the Fund and other funds. To do so, compare this 5% hypothetical example with the 5% hypothetical examples that appear in the shareholder reports of the other funds.
Please note that the expenses shown in the table are meant to highlight your ongoing costs only and do not reflect any transaction costs, such as sales charges (loads) or redemption fees. Therefore, the second line for each Class in the table is useful in comparing ongoing costs only, and will not help you determine the relative total costs of owning different funds. In addition, if these transaction costs were included, your costs would have been higher. The examples also assume all dividends and distributions have been reinvested.
Schedule of Shareholder Expenses
Expense Analysis of a $1,000 Investment
(October 31, 2005)
| | | | | | | | | | | | | | |
| Money Market Fund | | | | | Beginning
Account Value,
5/1/05 | | Ending
Account Value,
10/31/05 | | Expenses Paid
During Period* | | Annualized
Expense Ratio* |
| Institutional Class | | Actual | | | $ | 1,000.00 | | $ | 1,014.70 | | $ | 2.79 | | 0.55% |
| | | Hypothetical | 1 | | $ | 1,000.00 | | $ | 1,022.23 | | $ | 2.81 | | 0.55% |
| Prime | | Actual | | | $ | 1,000.00 | | $ | 1,014.40 | | $ | 3.10 | | 0.61% |
| | | Hypothetical | 1 | | $ | 1,000.00 | | $ | 1,021.92 | | $ | 3.11 | | 0.61% |
| Service Class | | Actual | | | $ | 1,000.00 | | $ | 1,013.70 | | $ | 3.76 | | 0.74% |
| | | Hypothetical | 1 | | $ | 1,000.00 | | $ | 1,021.27 | | $ | 3.78 | | 0.74% |
| * | Expenses are equal to the Fund’s annualized expense ratio multiplied by the average account value over the period multiplied by 184/365 (to reflect the one-half year period). The expense ratio presented represents a six month, annualized ratio in accordance with SEC guidelines. |
| 1 | Represents the hypothetical 5% return before expenses. |
| | |
Portfolio Summary | | Gartmore Money Market Fund |
The SEC adopted a requirement that Funds present their portfolio holdings in a table, chart or graph format in their annual and semiannual reports to shareholders, whether or not a statement of investments is utilized. The following tables, which present portfolio holdings as a percentage of net assets, are provided in compliance with this requirement.
| | |
| Asset Allocation | | |
| Commercial Paper | | 67.9% |
| Floating Rate Notes | | 22.0% |
U.S. Government Sponsored & Agency Obligations | | 6.7% |
| Taxable Municipal Notes | | 3.8% |
| Certificates of Deposit | | 0.5% |
| Money Market | | 0.0% |
| Liabilities in excess of other assets | | -0.9% |
| | |
|
| | | 100.0% |
| | |
| Top Industries | | |
| Asset Backed Securities – Yankee | | 13.4% |
| Asset Backed Trade & Term Receivables | | 11.6% |
| Personal Credit Institutions | | 9.2% |
| Banks – Foreign | | 8.5% |
| Asset Backed Securities – Domestic | | 6.9% |
| Asset Backed Home Loans | | 6.6% |
| Banks – Mortgage | | 6.2% |
| Security Broker & Dealers | | 5.9% |
| Asset Backed CDO | | 4.0% |
| Finance Lessors | | 3.4% |
| Other Industries | | 24.3% |
| | |
|
| | | 100.0% |
| | |
| Top Holdings | | |
| Old Line Funding Corp., 3.84%, 11/18/05 | | 2.5 % |
Federal National Mortgage Association, 4.00%, 08/08/06 | | 2.1% |
| Thornburg Mortgage Capital, 4.06%, 11/23/05 | | 2.1% |
| K2 (USA) LLC, 4.03%, 01/27/06 | | 2.1% |
| Iowa Student Loan Liq. Co., 3.97%, 11/29/05 | | 1.9% |
| Countrywide Home Loans, 4.08%, 11/01/05 | | 1.6% |
Federal Home Loan Mortgage Corp.,
4.13%, 12/27/05 | | 1.6% |
| Newcastle CDO, Ltd., 4.04%, 04/04/06 | | 1.6% |
Societe Generale North American, 3.78%, 11/02/05 | | 1.6% |
| Greyhawk Funding LLC, 3.81%, 11/03/05 | | 1.6% |
| Other Holdings | | 81.3% |
| | |
|
| | | 100.0% |
Statement of Investments
October 31, 2005
Gartmore Money Market Fund
| Commercial Paper (67.9%) |
| | | | | | |
| | | Principal
Amount | | Value |
| | | | | | | |
AGRICULTURAL SERVICES (0.4%) | | | |
Cargill, Inc. (b) (0.4%) | | | | | | |
3.90%, 12/02/05 | | $ | 7,444,000 | | $ | 7,419,129 |
| | | | | |
|
|
ASSET BACKED – REPURCHASE AGREEMENT (2.6%) |
Liquid Funding (2.6%) | | | | | | |
3.60%, 12/06/05 | | | 11,500,000 | | | 11,460,309 |
3.90%, 12/01/05 | | | 3,000,000 | | | 2,990,300 |
3.95%, 07/06/06 | | | 20,000,000 | | | 19,998,529 |
4.05%, 11/01/05 | | | 14,084,000 | | | 14,084,000 |
| | | | | |
|
|
| | | | | | | 48,533,138 |
| | | | | |
|
|
ASSET BACKED CDO – TRUST PREFERRED (2.4%) |
Lockhart Funding LLC (2.4%) | | | | | | |
3.86%, 11/04/05 | | | 22,358,000 | | | 22,350,807 |
3.88%, 11/07/05 | | | 5,000,000 | | | 4,996,775 |
3.94%, 11/14/05 | | | 7,000,000 | | | 6,990,066 |
4.21%, 01/04/06 | | | 10,975,000 | | | 10,957,211 |
| | | | | |
|
|
| | | | | | | 45,294,859 |
| | | | | |
|
|
ASSET BACKED HOME LOANS (6.6%) | | | |
Georgetown Funding Co. (3.4%) | | | |
3.90%, 11/17/05 | | | 4,000,000 | | | 3,993,084 |
3.99%, 11/21/05 | | | 30,000,000 | | | 29,933,668 |
4.07%, 12/06/05 | | | 30,000,000 | | | 29,881,583 |
| | | | | |
|
|
| | | | | | | 63,808,335 |
| | | | | |
|
|
Thornburg Mortgage Capital (3.2%) | | | |
3.92%, 11/08/05 | | | 20,000,000 | | | 19,984,794 |
4.06%, 11/23/05 | | | 40,000,000 | | | 39,901,000 |
| | | | | |
|
|
| | | | | | | 59,885,794 |
| | | | | |
|
|
| | | | | | | 123,694,129 |
| | | | | |
|
|
ASSET BACKED SECURITIES – DOMESTIC (4.9%) |
CC USA, Inc. (3.4%) | | | | | | |
3.80%, 11/28/05 | | | 25,000,000 | | | 24,929,313 |
3.97%, 11/22/05 | | | 23,400,000 | | | 23,345,946 |
4.11%, 01/17/06 | | | 15,000,000 | | | 14,869,421 |
| | | | | |
|
|
| | | | | | | 63,144,680 |
| | | | | |
|
|
Harrier Financial Funding US LLC (1.5%) | | | |
3.84%, 11/08/05 | | | 13,000,000 | | | 12,990,319 |
4.16%, 01/20/05 | | | 15,000,000 | | | 14,862,666 |
| | | | | |
|
|
| | | | | | | 27,852,985 |
| | | | | |
|
|
| | | | | | | 90,997,665 |
| | | | | |
|
|
| | | | | | |
| | | Principal
Amount | | Value |
| | | | | | | |
ASSET BACKED SECURITIES – YANKEE (8.5%) |
Giro Funding Corp. (0.8%) | | | | | | |
3.74%, 11/15/05 | | $ | 10,000,000 | | $ | 9,985,572 |
3.83%, 11/01/05 | | | 4,077,000 | | | 4,077,000 |
| | | | | |
|
|
| | | | | | | 14,062,572 |
| | | | | |
|
|
Greyhawk Funding LLC (2.5%) | | | |
3.81%, 11/03/05 | | | 30,000,000 | | | 29,993,666 |
3.86%, 11/08/05 | | | 4,141,000 | | | 4,137,900 |
3.97%, 11/09/05 | | | 1,100,000 | | | 1,099,030 |
3.97%, 11/21/05 | | | 8,000,000 | | | 7,982,400 |
4.09%, 01/17/06 | | | 5,000,000 | | | 4,956,688 |
| | | | �� | |
|
|
| | | | | | | 48,169,684 |
| | | | | |
|
|
K2 (USA) LLC (2.2%) | | | | | | |
3.84%, 11/23/05 | | | 1,050,000 | | | 1,047,549 |
4.03%, 01/27/06 | | | 40,000,000 | | | 39,615,267 |
| | | | | |
|
|
| | | | | | | 40,662,816 |
| | | | | |
|
|
Premier Asset Collateralized Entity LLC (1.2%) |
3.78%, 11/21/05 | | | 1,397,000 | | | 1,394,090 |
3.83%, 11/04/05 | | | 21,126,000 | | | 21,119,274 |
| | | | | |
|
|
| | | | | | | 22,513,364 |
| | | | | |
|
|
Sigma Finance, Inc. (0.6%) | | | | | | |
3.45%, 11/16/05 | | | 12,000,000 | | | 11,983,000 |
| | | | | |
|
|
Stanfield Victoria Funding LLC (1.2%) | | | |
3.60%, 12/12/05 | | | 14,000,000 | | | 13,943,397 |
3.61%, 12/16/05 | | | 8,000,000 | | | 7,964,300 |
| | | | | |
|
|
| | | | | | | 21,907,697 |
| | | | | |
|
|
| | | | | | | 159,299,133 |
| | | | | |
|
|
ASSET BACKED TRADE & TERM RECEIVABLES (11.6%) |
Falcon Asset Securitization Corp. (3.1%) | | | |
2.50%, 11/09/05 | | | 30,000,000 | | | 29,974,334 |
3.88%, 11/10/05 | | | 8,000,000 | | | 7,992,260 |
3.94%, 11/18/05 | | | 7,000,000 | | | 6,987,009 |
3.98%, 11/28/05 | | | 12,357,000 | | | 12,320,207 |
| | | | | |
|
|
| | | | | | | 57,273,810 |
| | | | | |
|
|
Golden Funding Corp. (1.1%) | | | | | | |
3.85%, 11/09/05 | | | 20,000,000 | | | 19,982,933 |
| | | | | |
|
|
Statement of Investments (Continued)
October 31, 2005
Gartmore Money Market Fund (Continued)
| Commercial Paper (continued) |
| | | | | | |
| | | Principal
Amount | | Value |
| | | | | | | |
ASSET BACKED TRADE & TERM RECEIVABLES (continued) |
Kitty Hawk Funding Corp. (3.0%) | | | |
3.75%, 11/10/05 | | $ | 29,152,000 | | $ | 29,123,867 |
3.91%, 11/15/05 | | | 18,186,000 | | | 18,158,418 |
3.98%, 11/23/05 | | | 11,000,000 | | | 10,973,313 |
| | | | | |
|
|
| | | | | | | 58,255,598 |
| | | | | |
|
|
Old Line Funding Corp. (2.5%) | | | |
3.84%, 11/18/05 | | | 47,312,000 | | | 47,226,329 |
| | | | | |
|
|
Preferred Receivables Funding (1.1%) | | | |
2.47%, 11/16/05 | | | 3,964,000 | | | 3,957,476 |
3.87%, 11/10/05 | | | 5,244,000 | | | 5,238,940 |
3.96%, 11/16/05 | | | 10,871,000 | | | 10,839,446 |
| | | | | |
|
|
| | | | | | | 20,035,862 |
| | | | | |
|
|
Variable Funding Capital Corp. (0.8%) | | | |
3.94%, 11/09/05 | | | 15,000,000 | | | 14,986,867 |
| | | | | |
|
|
| | | | | | | 217,761,399 |
| | | | | |
|
|
BANKS – DOMESTIC (0.3%) | | | | | | |
National City Credit Corp. (0.3%) | | | |
3.84%, 11/02/05 | | | 5,100,000 | | | 5,099,456 |
| | | | | |
|
|
BANKS – FOREIGN (7.0%) | | | | | | |
ANZ National (Int’l) Ltd. (1.4%) | | | |
3.85%, 11/08/05 | | | 1,100,000 | | | 1,099,179 |
3.98%, 12/12/05 | | | 1,000,000 | | | 995,490 |
4.09%, 01/17/06 | | | 25,000,000 | | | 24,783,437 |
| | | | | |
|
|
| | | | | | | 26,878,106 |
| | | | | |
|
|
Dresdner US Finance, Inc. (1.6%) | | | |
3.91%, 11/17/05 | | | 30,000,000 | | | 29,947,933 |
| | | | | |
|
|
Societe Generale North American (1.6%) | | | |
3.78%, 11/02/05 | | | 30,000,000 | | | 29,996,846 |
| | | | | |
|
|
UBS Finance LLC (2.3%) | | | | | | |
3.82%, 11/21/05 | | | 1,200,000 | | | 1,197,460 |
3.84%, 11/17/05 | | | 2,800,000 | | | 2,795,259 |
3.86%, 11/14/05 | | | 20,000,000 | | | 19,972,158 |
3.87%, 11/18/05 | | | 17,134,000 | | | 17,102,688 |
4.00%, 11/28/05 | | | 1,000,000 | | | 997,098 |
| | | | | |
|
|
| | | | | | | 42,064,663 |
| | | | | |
|
|
| | | | | | |
| | | Principal
Amount | | Value |
| | | | | | | |
BANKS – FOREIGN (continued) | | | |
Westpac Capital Corp. (0.1%) | | | |
3.54%, 11/07/05 | | $ | 1,025,000 | | $ | 1,024,402 |
| | | | | |
|
|
| | | | | | | 129,911,950 |
| | | | | |
|
|
BANKS – MORTGAGE BANKERS (4.5%) | | | |
Countrywide Home Loans (3.4%) | | | |
3.84%, 11/03/05 | | | 14,397,000 | | | 14,393,926 |
3.95%, 12/02/05 | | | 20,000,000 | | | 19,931,369 |
4.08%, 11/01/05 | | | 30,000,000 | | | 30,000,000 |
| | | | | |
|
|
| | | | | | | 64,325,295 |
| | | | | |
|
|
Northern Rock PLC (1.1%) | | | | | | |
3.88%, 11/14/05 | | | 20,000,000 | | | 19,972,050 |
| | | | | |
|
|
| | | | | | | 84,297,345 |
| | | | | |
|
|
FINANCE LESSORS (3.4%) | | | | | | |
PB Finance (3.4%) | | | | | | |
3.87%, 11/08/05 | | | 2,983,000 | | | 2,980,761 |
3.90%, 11/16/05 | | | 15,000,000 | | | 14,975,563 |
3.94%, 11/17/05 | | | 25,000,000 | | | 24,956,333 |
4.01%, 11/21/05 | | | 10,000,000 | | | 9,977,778 |
4.07%, 11/28/05 | | | 11,550,000 | | | 11,514,830 |
| | | | | |
|
|
| | | | | | | 64,405,265 |
| | | | | |
|
|
FINANCIAL SERVICES (1.5%) | | | | | | |
ING US Funding (1.4%) | | | | | | |
3.90%, 11/14/05 | | | 6,533,000 | | | 6,523,823 |
4.10%, 12/30/05 | | | 20,000,000 | | | 19,866,267 |
| | | | | |
|
|
| | | | | | | 26,390,090 |
| | | | | |
|
|
Rabobank USA Finance Corp. (0.1%) | | | |
4.11%, 12/30/05 | | | 1,000,000 | | | 993,297 |
| | | | | |
|
|
| | | | | | | 27,383,387 |
| | | | | |
|
|
PERSONAL CREDIT INSTITUTIONS (4.7%) | | | |
American Honda Finance Corp. (1.6%) | | | |
3.95%, 12/05/05 | | | 30,000,000 | | | 29,888,367 |
| | | | | |
|
|
KLIO II Funding Corp – RMBS (3.1%) | | | |
4.01%, 11/22/05 | | | 28,000,000 | | | 27,934,667 |
4.05%, 11/30/05 | | | 30,000,000 | | | 29,902,527 |
| | | | | |
|
|
| | | | | | | 57,837,194 |
| | | | | |
|
|
| | | | | | | 87,725,561 |
| | | | | |
|
|
Commercial Paper (continued)
| | | | | | |
| | | Principal
Amount | | Value |
| | | | | | | |
SECURITY BROKERS & DEALERS (4.0%) | | | |
Bear Stearns Cos., Inc. (2.7%) | | | | | | |
3.82%, 11/07/05 | | $ | 30,000,000 | | $ | 29,980,949 |
3.87%, 11/15/05 | | | 20,000,000 | | | 19,969,978 |
| | | | | |
|
|
| | | | | | | 49,950,927 |
| | | | | |
|
|
Morgan Stanley Dean Witter & Co. (1.3%) | | | |
3.85%, 11/10/05 | | | 25,000,000 | | | 24,975,938 |
| | | | | |
|
|
| | | | | | | 74,926,865 |
| | | | | |
|
|
SOFTWARE (0.3%) | | | | | | |
Oracle, Corp. (0.3%) | | | | | | |
4.01%, 11/29/05 | | | 5,600,000 | | | 5,582,578 |
| | | | | |
|
|
SUBDIVIDERS & DEVELOPERS (2.5%) | | | |
Yorkshire Building Society (2.5%) | | | |
3.73%, 11/10/05 | | | 6,923,000 | | | 6,916,572 |
3.84%, 11/07/05 | | | 22,791,000 | | | 22,776,452 |
3.87%, 11/28/05 | | | 1,800,000 | | | 1,794,809 |
4.08%, 01/05/06 | | | 14,500,000 | | | 14,393,969 |
| | | | | |
|
|
| | | | | | | 45,881,802 |
| | | | | |
|
|
SURGICAL AND MEDICAL INSTRUMENTS (2.7%) |
Boston Scientific Corp. (2.7%) | | | |
4.02%, 12/13/05 | | | 20,000,000 | | | 19,906,667 |
| | | | 30,000,000 | | | 29,885,533 |
| | | | | |
|
|
| | | | | | | 49,792,200 |
| | | | | |
|
|
| | |
Total Commercial Paper | | | | | | 1,268,005,861 |
| | | | | |
|
|
|
Floating Rate Notes (22.0%) |
ASSET BACKED – REPURCHASE AGREEMENT (0.8%) |
Liquid Funding (0.8%) | | | | | | |
3.95%, 07/13/06 | | | 15,000,000 | | | 14,999,009 |
| | | | | |
|
|
ASSET BACKED CDO (4.0%) | | | | | | |
Commodore CDO I LTD (0.8%) | | | |
3.91%, 07/13/06 | | | 15,000,000 | | | 15,000,000 |
| | | | | |
|
|
Newcastle CDO, Ltd. (2.1%) | | | | | | |
4.04%, 04/04/06 | | | 30,000,000 | | | 30,000,000 |
4.06%, 09/25/06 | | | 10,000,000 | | | 10,000,000 |
| | | | | |
|
|
| | | | | | | 40,000,000 |
| | | | | |
|
|
Floating Rate Notes (continued)
| | | | | | |
| | | Principal
Amount | | Value |
| | | | | | | |
ASSET BACKED CDO (continued) |
NorthLake CDO Class I-MM (1.1%) | | | |
3.86%, 03/06/06 | | $ | 20,000,000 | | $ | 20,000,000 |
| | | | | |
|
|
| | | | | | | 75,000,000 |
| | | | | |
|
|
ASSET BACKED SECURITIES – DOMESTIC (2.0%) |
Harrier Financial Funding US LLC (2.0%) | | | |
3.94%, 02/15/06 (b) | | | 12,000,000 | | | 11,999,652 |
3.93%, 03/15/06 | | | 10,000,000 | | | 9,999,198 |
3.93%, 09/15/06 (b) | | | 15,000,000 | | | 14,996,916 |
| | | | | |
|
|
| | | | | | | 36,995,766 |
| | | | | |
|
|
ASSET BACKED SECURITIES – YANKEE (4.9%) |
Premier Asset Collateralized Entity LLC (1.1%) |
3.93%, 09/15/06 (b) | | | 20,000,000 | | | 19,996,515 |
| | | | | |
|
|
Sigma Finance Inc. (1.8%) | | | | | | |
3.93%, 09/12/06 (b) | | | 15,000,000 | | | 14,998,589 |
3.99%, 11/29/05 (b) | | | 19,000,000 | | | 18,999,398 |
| | | | | |
|
|
| | | | | | | 33,997,987 |
| | | | | |
|
|
Stanfield Victoria Funding LLC (2.0%) | | | |
3.99%, 05/24/06 (b) | | | 10,000,000 | | | 9,999,156 |
3.85%, 06/06/06 (b) | | | 10,000,000 | | | 9,998,501 |
3.93%, 08/09/06 | | | 17,000,000 | | | 16,998,020 |
| | | | | |
|
|
| | | | | | | 36,995,677 |
| | | | | |
|
|
| | | | | | | 90,990,179 |
| | | | | |
|
|
BANKS – DOMESTIC (1.2%) | | | | | | |
Bank Of America Corp. (0.5%) | | | |
3.80%, 12/14/05 | | | 10,000,000 | | | 10,000,000 |
| | | | | |
|
|
Wells Fargo & Co. (0.7%) | | | | | | |
3.91%, 11/02/05 | | | 13,000,000 | | | 13,000,000 |
| | | | | |
|
|
| | | | | | | 23,000,000 |
| | | | | |
|
|
BANKS – FOREIGN (1.0%) | | | | | | |
HBOS Treasury Services PLC (1.0%) | | | |
3.87%, 09/22/06 | | | 18,000,000 | | | 18,000,000 |
| | | | | |
|
|
BANKS – MORTGAGE (1.7%) | | | | | | |
Northern Rock PLC (1.7%) | | | | | | |
3.85%, 07/07/06 (b) | | | 12,500,000 | | | 12,500,000 |
3.87%, 02/03/06 (b) | | | 20,000,000 | | | 20,000,000 |
| | | | | |
|
|
| | | | | | | 32,500,000 |
| | | | | |
|
|
Statement of Investments (Continued)
October 31, 2005
Gartmore Money Market Fund (Continued)
Floating Rate Notes (continued)
| | | | | | |
| | | Principal
Amount | | Value |
| | | | | | | |
PERSONAL CREDIT INSTITUTIONS (4.5%) | | | |
Allstate Life Global Funding (1.5%) | | | |
3.08%, 06/27/06 | | $ | 12,500,000 | | $ | 12,500,000 |
3.96%, 11/08/06 (b) | | | 15,000,000 | | | 15,000,000 |
| | | | | |
|
|
| | | | | | | 27,500,000 |
| | | | | |
|
|
American Honda Finance Corp. (0.5%) | | | |
3.86%, 12/06/05 (b) | | | 10,000,000 | | | 10,000,000 |
| | | | | |
|
|
General Electric Capital Corp. (1.4%) | | | |
3.89%, 09/15/06 | | | 7,000,000 | | | 7,000,000 |
4.04%, 11/09/06 | | | 19,000,000 | | | 19,000,000 |
| | | | | |
|
|
| | | | | | | 26,000,000 |
| | | | | |
|
|
HSBC Americas, Inc. (1.1%) | | | | | | |
4.02%, 11/24/06 | | | 20,000,000 | | | 20,000,000 |
| | | | | |
|
|
| | | | | | | 83,500,000 |
| | | | | |
|
|
SECURITY BROKERS & DEALERS (1.9%) | | | |
Bear Stearns Cos., Inc. (0.1%) | | | | | | |
4.20%, 09/15/06 | | | 2,500,000 | | | 2,504,108 |
| | | | | |
|
|
Goldman Sachs Group, Inc. (0.7%) | | | |
4.10%, 05/22/06 | | | 13,000,000 | | | 13,000,000 |
| | | | | |
|
|
Morgan Stanley Dean Witter & Co. (1.1%) | | | |
3.67%, 11/03/06 | | | 20,000,000 | | | 20,000,000 |
| | | | | |
|
|
| | | | | | | 35,504,108 |
| | | | | |
|
|
| | |
Total Floating Rate Notes | | | | | | 410,489,062 |
| | | | | |
|
|
|
U.S. Government Sponsored & Agency Obligations (6.7%) |
FEDERAL HOME LOAN BANK (1.3%) | | | |
3.75%, 02/06/06 | | | 15,000,000 | | | 15,000,000 |
4.13%, 09/28/06 | | | 10,000,000 | | | 9,990,025 |
| | | | | |
|
|
| | | | | | | 24,990,025 |
| | | | | |
|
|
FEDERAL HOME LOAN MORTGAGE CORP. (3.3%) |
4.13%, 12/27/05 | | | 30,000,000 | | | 30,000,000 |
4.50%, 01/13/06 | | | 15,000,000 | | | 15,000,000 |
4.50%, 11/09/06 | | | 15,150,000 | | | 15,142,425 |
| | | | | |
|
|
| | | | | | | 60,142,425 |
| | | | | |
|
|
U.S. Government Sponsored & Agency Obligations (continued)
| | | | | | |
| | | Shares or
Principal Amount | | Value |
| | | | | | | |
FEDERAL NATIONAL MORTGAGE ASSOCIATION (2.1%) |
4.00%, 08/08/06 | | $ | 40,000,000 | | $ | 40,000,000 |
| | | | | |
|
|
| |
Total U.S. Government Sponsored & Agency Obligations | | | 125,132,450 |
| | | | | |
|
|
|
Taxable Municipal Notes (3.8%) |
EDUCATIONAL SERVICES (1.9%) | | | |
Iowa Student Loan Liq. Co. (1.9%) | | | |
3.97%, 11/29/05 | | | 35,038,000 | | | 34,929,536 |
| | | | | |
|
|
ELECTRIC UTILITY (0.8%) | | | | | | |
South Carolina Public Service Authority (0.8%) | | | |
4.06%, 11/30/05 | | | 15,600,000 | | | 15,549,105 |
| | | | | |
|
|
FINANCE, TAXATION, & MONETARY POLICY (1.1%) |
Sunshine State Governmental Financing Commission (1.1%) | | | |
3.97%, 12/01/05 | | | 20,380,000 | | | 20,312,916 |
| | | | | |
|
|
| |
Total Taxable Municipal Notes | | | 70,791,557 |
| | | | | |
|
|
|
Certificates of Deposit (0.5%) |
BANKS – FOREIGN (0.5%) | | | | | | |
Societe Generale North American (0.5%) | | | |
3.56%, 12/16/05 | | | 10,000,000 | | | 10,000,123 |
| | | | | |
|
|
| |
Total Certificates of Deposit | | | 10,000,123 |
| | | | | |
|
|
|
Money Market (0.0%) |
Investment Companies (0.0%) | | | |
AIM Liquid Assets Portfolio — Institutional Class | | | 222,360 | | | 222,360 |
| | | | | |
|
|
| | |
Total Money Market | | | | | | 222,360 |
| | | | | |
|
|
| | | | | | |
| | | | | Value | |
| | | | | | | |
Total Investments
(Cost $1,884,641,413) (a) — 100.9% | | $ | 1,884,641,413 | |
| | |
Liabilities in excess of other assets — (0.9)% | | | | | (17,453,297 | ) |
| | | | |
|
|
|
| | |
NET ASSETS — 100.0% | | | | $ | 1,867,188,116 | |
| | | | |
|
|
|
| | (a) | See notes to financial statements for tax unrealized appreciation (depreciation) of securities. |
| | (b) | Rule 144A, Section 4(2) or other security, which is restricted as to resale to institutional investors. The security has been deemed liquid pursuant to procedures approved by the Board of Trustees. |
| | CDO | Collaterialized Debt Obligation |
See notes to financial statements.
Statements of Assets and Liabilities
October 31, 2005
| | | | | | |
| | | Gartmore Money Market Fund |
Assets: | | | | | | |
Investments, at cost and value | | $ | 1,884,641,413 | | | |
Cash | | | 833 | | | |
Interest and dividends receivable | | | 1,866,604 | | | |
Receivable for capital shares issued | | | 658,351 | | | |
Prepaid expenses and other assets | | | 268,741 | | | |
| | |
|
|
| | |
Total Assets | | | 1,887,435,942 | | | |
| | |
|
|
| | |
| | |
Liabilities: | | | | | | |
Payable to adviser | | | 318 | | | |
Distributions payable | | | 47,518 | | | |
Payable for investments purchased | | | 15,142,425 | | | |
Payable for capital shares redeemed | | | 4,033,806 | | | |
Accrued expenses and other payables | | | | | | |
Investment advisory fees | | | 570,121 | | | |
Fund administration and transfer agent fees | | | 174,690 | | | |
Distribution fees | | | 555 | | | |
Administrative servicing fees | | | 39,660 | | | |
Trustee fees | | | 3,560 | | | |
Other | | | 235,173 | | | |
| | |
|
|
| | |
Total Liabilities | | | 20,247,826 | | | |
| | |
|
|
| | |
Net Assets | | $ | 1,867,188,116 | | | |
| | |
|
|
| | |
| | |
Represented by: | | | | | | |
Capital | | $ | 1,867,200,224 | | | |
Accumulated net investment income (loss) | | | 2 | | | |
Accumulated net realized gains (losses) on investment transactions | | | (12,110 | ) | | |
| | |
|
|
| | |
Net Assets | | $ | 1,867,188,116 | | | |
| | |
|
|
| | |
| | |
Net Assets: | | | | | | |
Institutional Class Shares | | $ | 1,525,486,972 | | | |
Service Class Shares | | | 6,709,751 | | | |
Prime Shares | | | 334,991,393 | | | |
| | |
|
|
| | |
Total | | $ | 1,867,188,116 | | | |
| | |
|
|
| | |
| | |
Shares outstanding (unlimited number of shares authorized): | | | | | | |
Institutional Class Shares | | | 1,525,546,564 | | | |
Service Class Shares | | | 6,708,716 | | | |
Prime Shares | | | 335,213,177 | | | |
| | |
|
|
| | |
Total | | | 1,867,468,457 | | | |
| | |
|
|
| | |
| | |
Net asset value and redemption price per share: | | | | | | |
Institutional Class Shares | | $ | 1.00 | | | |
Service Class Shares | | $ | 1.00 | | | |
Prime Shares | | $ | 1.00 | | | |
See notes to financial statements.
Statement of Operations
For the Year Ended October 31, 2005
| | | | | | |
| | | Gartmore Money Market Fund |
INVESTMENT INCOME: | | | | | | |
Interest income | | $ | 46,525,258 | | | |
Dividend income | | | 17,910 | | | |
| | |
|
|
| | |
Total Income | | | 46,543,168 | | | |
| | |
|
|
| | |
| | |
Expenses: | | | | | | |
Investment advisory fees | | | 6,218,898 | | | |
Fund administration and transfer agent fees | | | 1,780,215 | | | |
Distribution fees Service Class | | | 5,474 | | | |
Administrative servicing fees Service Class | | | 7,262 | | | |
Administrative servicing fees Prime Shares | | | 184,650 | | | |
Trustee fees | | | 64,802 | | | |
Other | | | 608,359 | | | |
| | |
|
|
| | |
Total expenses before reimbursed expenses | | | 8,869,660 | | | |
Earnings credit (Note 5) | | | (9,143 | ) | | |
Expenses reimbursed | | | (1,938 | ) | | |
| | |
|
|
| | |
Total Expenses | | | 8,858,579 | | | |
| | |
|
|
| | |
Net Investment Income | | | 37,684,589 | | | |
| | |
|
|
| | |
| | |
REALIZED/UNREALIZED GAINS (LOSSES) FROM INVESTMENTS: | | | | | | |
Net realized gains (losses) on investment transactions | | | (1,927 | ) | | |
| | |
|
|
| | |
CHANGE IN NET ASSETS RESULTING FROM OPERATIONS | | $ | 37,682,662 | | | |
| | |
|
|
| | |
| | | | | | | |
| | | | | | | |
| | | | | | | |
| | | | | | | |
| | | | | | | |
| | | | | | | |
| | | | | | | |
| | | | | | | |
| | | | | | | |
| | | | | | | |
| | | | | | | |
| | | | | | | |
| | | | | | | |
| | | | | | | |
| | | | | | | |
| | | | | | | |
| | | | | | | |
| | | | | | | |
| | | | | | | |
| | | | | | | |
| | | | | | | |
| | | | | | | |
See notes to financial statements.
Statements of Changes in Net Assets
| | | | | | | | | | |
| | | Gartmore Money Market Fund |
| | | Year Ended
October 31, 2005 | | | Year Ended
October 31, 2004 |
FROM INVESTMENT ACTIVITIES: | | | | | | | | | | |
Operations: | | | | | | | | | | |
Net investment income | | $ | 37,684,589 | | | $ | 11,655,528 | | | |
Net realized gains (losses) on investment transactions | | | (1,927 | ) | | | (951 | ) | | |
| | |
|
|
| |
|
|
| | |
Change in net assets from operations | | | 37,682,662 | | | | 11,654,577 | | | |
| | |
|
|
| |
|
|
| | |
| | | |
Distributions to Institutional Class Shareholders from: | | | | | | | | | | |
Net investment income | | | (29,469,125 | ) | | | (8,807,543 | ) | | |
| | | |
Distributions to Service Class Shareholders from: | | | | | | | | | | |
Net investment income | | | (125,918 | ) | | | (32,428 | ) | | |
| | | |
Distributions to Prime Class Shareholders from: | | | | | | | | | | |
Net investment income | | | (8,089,546 | ) | | | (2,815,557 | ) | | |
| | |
|
|
| |
|
|
| | |
Change in net assets from shareholder distributions | | | (37,684,589 | ) | | | (11,655,528 | ) | | |
| | |
|
|
| |
|
|
| | |
Change in net assets from capital transactions | | | 246,856,378 | | | | (73,315,619 | ) | | |
| | |
|
|
| |
|
|
| | |
Change in net assets | | | 246,854,451 | | | | (73,316,570 | ) | | |
| | | |
Net Assets: | | | | | | | | | | |
Beginning of period | | | 1,620,333,665 | | | | 1,693,650,235 | | | |
| | |
|
|
| |
|
|
| | |
End of period | | $ | 1,867,188,116 | | | $ | 1,620,333,665 | | | |
| | |
|
|
| |
|
|
| | |
Accumulated net investment income (loss) | | $ | 2 | | | $ | 2 | | | |
| | |
|
|
| |
|
|
| | |
| | | | | | | | | | | |
| | | | | | | | | | | |
| | | | | | | | | | | |
| | | | | | | | | | | |
| | | | | | | | | | | |
| | | | | | | | | | | |
| | | | | | | | | | | |
| | | | | | | | | | | |
| | | | | | | | | | | |
| | | | | | | | | | | |
| | | | | | | | | | | |
| | | | | | | | | | | |
| | | | | | | | | | | |
| | | | | | | | | | | |
| | | | | | | | | | | |
| | | | | | | | | | | |
| | | | | | | | | | | |
| | | | | | | | | | | |
| | | | | | | | | | | |
| | | | | | | | | | | |
| | | | | | | | | | | |
See notes to financial statements.
Financial Highlights
Selected Data for Each Share of Capital Outstanding
Gartmore Money Market Fund
| | | | | | | | | | | | | | | | | | | | | | | | | | | | | | | | | | |
| | | | | Investment Activities | | Distributions | | | | | | Ratios/Supplemental Data | |
| | | Net Asset
Value,
Beginning
of Period | | Net
Investment
Income | | Total from
Investment
Activities | | Net
Investment
Income | | | Total
Distributions | | | Net Asset
Value, End
of Period | | Total
Return | | | Net Assets
at End of Period
(000s) | | Ratio of
Expenses to
Average Net
Assets | | | Ratio of Net
Investment
Income
to Average
Net Assets | | | Ratio of Expenses
(Prior to
Reimbursements)
to Average Net
Assets (a) | | | Ratio of Net
Investment
Income (Prior to
Reimbursements)
to Average Net
Assets (a) | |
| | | | | | | | | | | | |
Institutional Class Shares | | | | | | | | | | | | | | | | | | | | | | | | | | | | | | | | | | |
Period Ended October 31, 2002 (b) | | $ | 1.00 | | 0.01 | | 0.01 | | (0.01 | ) | | (0.01 | ) | | $ | 1.00 | | 1.12% | (c) | | $ | 8,606 | | 0.59% | (d) | | 1.25% | (d) | | (e | ) | | (e | ) |
Year Ended October 31, 2003 | | $ | 1.00 | | 0.01 | | 0.01 | | (0.01 | ) | | (0.01 | ) | | $ | 1.00 | | 0.77% | | | $ | 1,214,406 | | 0.56% | | | 0.73% | | | (e | ) | | (e | ) |
Year Ended October 31, 2004 | | $ | 1.00 | | 0.01 | | 0.01 | | (0.01 | ) | | (0.01 | ) | | $ | 1.00 | | 0.73% | | | $ | 1,219,343 | | 0.54% | | | 0.73% | | | (e | ) | | (e | ) |
Year Ended October 31, 2005 | | $ | 1.00 | | 0.02 | | 0.02 | | (0.02 | ) | | (0.02 | ) | | $ | 1.00 | | 2.41% | | | $ | 1,525,487 | | 0.55% | | | 2.40% | | | (e | ) | | (e | ) |
| | | | | | | | | | | | |
Service Class Shares | | | | | | | | | | | | | | | | | | | | | | | | | | | | | | | | | | |
Year Ended October 31, 2001 | | $ | 1.00 | | 0.04 | | 0.04 | | (0.04 | ) | | (0.04 | ) | | $ | 1.00 | | 4.15% | | | $ | 440,874 | | 0.75% | | | 3.85% | | | 0.91% | | | 3.69% | |
Year Ended October 31, 2002 | | $ | 1.00 | | 0.01 | | 0.01 | | (0.01 | ) | | (0.01 | ) | | $ | 1.00 | | 1.11% | | | $ | 627,365 | | 0.80% | | | 1.09% | | | 0.96% | | | 0.93% | |
Year Ended October 31, 2003 | | $ | 1.00 | | 0.01 | | 0.01 | | (0.01 | ) | | (0.01 | ) | | $ | 1.00 | | 0.59% | | | $ | 8,473 | | 0.75% | | | 0.89% | | | 0.92% | | | 0.72% | |
Year Ended October 31, 2004 | | $ | 1.00 | | 0.01 | | 0.01 | | (0.01 | ) | | (0.01 | ) | | $ | 1.00 | | 0.52% | | | $ | 5,952 | | 0.75% | | | 0.51% | | | 0.78% | | | 0.48% | |
Year Ended October 31, 2005 | | $ | 1.00 | | 0.02 | | 0.02 | | (0.02 | ) | | (0.02 | ) | | $ | 1.00 | | 2.21% | | | $ | 6,710 | | 0.75% | | | 2.30% | | | 0.88% | | | 2.16% | |
| | | | | | | | | | | | |
Prime Shares | | | | | | | | | | | | | | | | | | | | | | | | | | | | | | | | | | |
Year Ended October 31, 2001 | | $ | 1.00 | | 0.04 | | 0.04 | | (0.04 | ) | | (0.04 | ) | | $ | 1.00 | | 4.22% | | | $ | 1,385,774 | | 0.68% | | | 4.10% | | | (e | ) | | (e | ) |
Year Ended October 31, 2002 | | $ | 1.00 | | 0.01 | | 0.01 | | (0.01 | ) | | (0.01 | ) | | $ | 1.00 | | 1.23% | | | $ | 1,177,541 | | 0.70% | | | 1.22% | | | (e | ) | | (e | ) |
Year Ended October 31, 2003 | | $ | 1.00 | | 0.01 | | 0.01 | | (0.01 | ) | | (0.01 | ) | | $ | 1.00 | | 0.69% | | | $ | 470,771 | | 0.64% | | | 0.73% | | | (e | ) | | (e | ) |
Year Ended October 31, 2004 | | $ | 1.00 | | 0.01 | | 0.01 | | (0.01 | ) | | (0.01 | ) | | $ | 1.00 | | 0.67% | | | $ | 395,038 | | 0.60% | | | 0.66% | | | (e | ) | | (e | ) |
Year Ended October 31, 2005 | | $ | 1.00 | | 0.02 | | 0.02 | | (0.02 | ) | | (0.02 | ) | | $ | 1.00 | | 2.36% | | | $ | 334,991 | | 0.60% | | | 2.31% | | | (e | ) | | (e | ) |
| (a) | During the period certain fees were waived and/or reimbursed. If such waivers/reimbursements had not occurred, the ratios would have been as indicated. |
| (b) | For the period from December 13, 2001 (commencement of operations) through October 31, 2002. |
| (e) | There were no fee reductions in this period. |
See notes to financial statements.
Notes to Financial Statements
October 31, 2005
1. Organization
Gartmore Mutual Funds (the “Trust”) is an open-end management investment company, organized under the laws of Delaware by amended and restated Agreement and Declaration of Trust, dated October 28, 2004, as amended to date. Prior to January 25, 2002, the Trust was named “Nationwide Mutual Funds”. The Trust, originally created under the laws of Ohio as an Ohio business trust pursuant to a Declaration of Trust dated, as of October 30, 1997, as subsequently amended and redomesticated as a Delaware Statutory Trust on February 28, 2005, is registered under the Investment Company Act of 1940, as amended (the “1940 Act”). The redomestication was a change in statutory status and did not affect the operations of the Trust. As of October 31, 2005, the Trust had authorized an unlimited number of shares of beneficial interest (“shares”) without par value. The Trust operates forty-six (46) separate series, or mutual funds, each with its own investment objectives and strategies. This report contains the financial statements and financial highlights of the three (3) funds listed below (individually, a “Fund”; collectively, the “Funds”):
- Gartmore Growth Fund (“Growth”)
- Gartmore Nationwide Fund (“Nationwide”)
- Gartmore Money Market Fund (“Money Market”)
Under the Trust’s organizational documents, the Trust’s officers and trustees are indemnified against certain liabilities arising out of the performance of their duties to the Trust. In addition, the Trust has entered into Indemnification Agreements with its Trustees and certain of its Officers. Trust Officers receive no compensation from the Trust for serving as its Officers. In addition, in the normal course of business, the Trust enters into contracts with the Trust’s vendors and others that provide for general indemnifications. The Trust’s maximum liability under these arrangements is unknown, as this would involve future claims that may be made against the Trust. Based on experience, however, the Trust expects that risk of loss to be remote.
2. Summary of Significant Accounting Policies
The following is a summary of significant accounting policies followed by the Funds in the preparation of their financial statements. The policies are in conformity with accounting principles generally accepted in the United States of America (“GAAP”). The preparation of financial statements requires management to make estimates and assumptions that affect the reported amounts of assets and liabilities, the disclosure of contingent assets and liabilities at the date of the financial statements, and the reported amounts of income and expenses for the period. Actual results could differ from those estimates.
Securities for which market quotations are readily available are valued at current market value as of “Valuation Time.” Valuation Time is as of the close of regular trading on the New York Stock Exchange (usually 4 p.m. Eastern time). Equity securities are valued at the last quoted sale price or, if there is no sale price, the last quoted bid price provided by an independent pricing service approved by the Trust’s Board of Trustees. Securities traded on NASDAQ are valued at the NASDAQ official closing price. Prices are taken from the primary market or exchange in which each security trades. Most securities listed on a foreign exchange are valued either at fair value (see description below) or at the last sale price at the close of the exchange on which the security is principally traded.
Debt and other fixed income securities (other than short-term obligations) on which the Growth and Nationwide Funds invest are valued at the last quoted bid price and/or by using a combination of daily quotes and matrix evaluations provided by an independent pricing service, the use of which has been approved by the Trust’s Board of Trustees. Short-term debt securities such as commercial paper and U.S. Treasury Bills, having a remaining maturity of 60 days or less at the time of purchase are considered to be “short-term” and are valued at amortized cost which approximates market value.
Investments of the Money Market Fund are valued at amortized cost, which approximates market value. Under the amortized cost method, premium or discount, if any, is amortized or accreted, respectively, on a constant (straight-line) basis to the maturity of the security.
The Nationwide Fund holds foreign equity securities and values the foreign securities at fair value in the circumstances described below. Generally, trading in foreign securities markets is completed each day at various times prior to the Valuation Time. Due to the time differences between the closings of the relevant foreign securities exchanges and the Valuation Time for the Nationwide Fund, the Nationwide Fund will fair value its foreign investments when it is determined that the market quotations for the foreign investments either are not readily available or are unreliable and, therefore, do not represent fair value. When the fair value prices are utilized, these prices will attempt to reflect the impact of the U.S. financial markets’ perceptions and trading activities on the Nationwide Fund’s foreign investments since the last closing prices of the foreign investments were calculated on their primary foreign securities markets or exchanges. For these purposes, the Board of Trustees of the Trust has determined that movements in relevant indices or other appropriate market indicators, after the close of the foreign securities exchanges, may demonstrate that market quotations are unreliable, and may trigger fair value pricing for certain securities. Consequently, fair valuation of portfolio securities may occur on a daily basis.
| (b) | | Repurchase Agreements |
The Funds may enter into repurchase agreements with an entity which is a member of the Federal Reserve System or which is a “primary dealer” (as designated by the Federal Reserve Bank of New York) in U.S. Government obligations. The repurchase price generally equals the price paid by a Fund plus interest negotiated on the basis of current short-term rates, which may be more or less than the rate on the underlying portfolio securities. The seller under a repurchase agreement is required to maintain the value of the collateral held pursuant to the agreement at a market value equal to or greater than the repurchase price (including accrued interest). Collateral subject to repurchase agreements is held by the Funds’ custodian or another qualified sub-custodian or in the Federal Reserve/ Treasury book-entry system. If the counterparty defaults and the fair value of the collateral declines, realization of the collateral by the Funds may be delayed or limited. The Funds may transfer uninvested cash balances into a pooled cash account. These balances are invested in one or more repurchase agreements, with the counterparties of CS First Boston and Nomura Securities which are fully collateralized by U.S. Government Agencies and U.S. Government Agency Mortgages.
| (c) | | Foreign Currency Transactions |
The accounting records of the Funds are maintained in U.S. dollars. Foreign currency amounts are translated into U.S. dollars at the current rate of exchange to determine the value of investments, assets and liabilities. Purchases and sales of securities, and income and expenses are translated at the prevailing rate of exchange on the respective date of these transactions. The Funds do not isolate that portion of the results of operations resulting from changes in foreign exchange rates on investments from fluctuations arising from changes in market prices of securities held. These fluctuations are included with the net realized and unrealized gain or loss from investments and foreign currencies.
Certain Funds may invest in financial futures contracts (“futures contracts”) for the purpose of hedging their existing portfolio securities or securities that the Funds intend to purchase against fluctuations in value caused by changes in prevailing market interest rates or prices. Futures contracts may also be entered into for non-hedging purposes. Upon entering into a futures contract, these Funds are required to pledge to the broker an amount of cash and/or other assets equal to a certain percentage of the contract amount (initial margin deposit). Subsequent payments, known as “variation margin”, are made each day, depending on the daily fluctuations in the fair value/market value of the underlying assets. A gain or loss equal to the daily variation margin is recognized on a daily basis. Future contracts are valued daily at their last quoted sale price.
A “sale” of a futures contract means a contractual obligation to deliver the securities or foreign currency called for by the contract at a fixed price at a specified time in the future. A “purchase” of a futures contract means a contractual obligation to acquire the securities or foreign currency at a fixed price at a specified time in the future.
Notes to Financial Statements (Continued)
October 31, 2005
Should market conditions change unexpectedly, the Funds may not achieve the anticipated benefits of the futures contracts and may realize a loss. The use of futures transactions for hedging purposes involves the risk of imperfect correlation in movements in the price of futures contracts, interest rates, and the value of the underlying hedged assets.
| (e) | | Security Transactions and Investment Income |
Security transactions are accounted for on the date the security is purchased or sold (i.e., the “trade date”). Securities gains and losses are calculated on the identified cost basis. Interest income is recognized on the accrual basis and includes, where applicable, the amortization or accretion of premium or discount. Dividend income is recorded on the ex-dividend date.
To generate additional income, each of the Funds with the exception of the Money Market Fund, may lend up to 33 1/3% of the Fund’s total assets pursuant to agreements, requiring that the borrower deliver cash or securities as collateral with respect to each new loan of U.S. securities, equal to at least 102% of the value of the portfolio securities loaned, and with respect to each new loan of non-U.S. securities, collateral of at least 105% of the value of the portfolio securities loaned, and thereafter requiring the borrower to mark to market the collateral on a daily basis and requiring the borrower to make up any shortfall of collateral. The Funds receive payments from borrowers of the dividends and interest that the Funds are entitled to for the positions on loan. These loan positions simultaneously earn income on the investment of cash collateral. Collateral is marked to market daily to provide a level of collateral at least equal to the market value of securities loaned. There may be risks of delay in recovery of the securities should the borrower of the securities fail financially. Loans will be made, however, only to borrowers deemed by the Funds’ investment adviser to be of good standing and creditworthy under guidelines established by the Board of Trustees and when, in the judgment of the adviser, the consideration which can be earned currently from these securities loans justifies the attendant risks. Loans are subject to termination by the Funds or the borrower at any time, and, therefore, are not considered to be illiquid investments. JPMorgan Chase Bank serves as custodian for the securities lending program of the Funds. JP Morgan Chase Bank receives a fee based on the value of collateral received from borrowers.
The cash collateral received by the Funds at October 31, 2005, was pooled and invested in the following:
| | | | | | | | | |
| Security Type | | Issuer | | Value | | Maturity Rate | | Maturity Date |
Bank Note — Floating Rate | | U.S. BANK N.A. | | $ | 7,995,412 | | 3.85% | | 11/02/05 |
Funding Agreement — GIC | | GE LIFE AND ANNUITY | | | 4,400,000 | | 4.05% | | 11/14/05 |
Master Note — Floating | | BANK OF AMERICA CORP (MN) | | | 1,500,000 | | 4.14% | | 11/01/05 |
Master Note — Floating | | CDC FINANCIAL PROD INC | | | 30,000,000 | | 4.16% | | 11/01/05 |
Master Note — Floating | | CITIGROUP GLOBAL MARKETS INC | | | 10,000,000 | | 4.13% | | 11/01/05 |
Master Note — Floating | | MERRILL LYNCH MORTGAGE CAPITAL | | | 20,000,000 | | 4.16% | | 11/01/05 |
Medium Term Note — Floating | | GENERAL ELECTRIC CAPITAL CORP. | | | 3,000,426 | | 3.79% | | 12/08/05 |
Medium Term Note — Floating | | ISLANDSBANKI HF CORP | | | 2,500,000 | | 4.08% | | 11/22/05 |
Repurchase Agreement | | NOMURA SECURITIES | | | 20,754,860 | | 4.05% | | 11/01/05 |
Information on the investment of cash collateral is shown in the Statement of Investments.
As of October 31, 2005, the following Funds had securities with the following market value on loan:
| | | | | | |
| Fund | | Value of
Loaned Securities | | Value of
Collateral |
Growth | | $ | 19,038,718 | | $ | 19,033,119 |
Nationwide | | | 80,854,635 | | | 81,117,579 |
| (g) | | Distributions to Shareholders |
Net investment income, if any, is declared and paid quarterly for the Growth and Nationwide Funds and is declared daily and paid monthly for the Money Market Fund. For all Funds, distributable net realized capital gains, if any, are declared and distributed at least annually.
Dividends and distributions to shareholders are determined in accordance with federal income tax regulations, which may differ from GAAP. These “book/tax” differences are considered either permanent or temporary in nature. In accordance with American Institute of Certified Public Accountants (the “AICPA”“) Statement of Position 93-2, permanent differences (i.e., reclassification of market discounts, gain/loss, paydowns and distributions) are reclassified within the capital accounts based on their nature for federal income tax purposes; temporary differences do not require reclassification. These reclassifications have no effect upon the net asset value of the respective Funds. To the extent distributions exceed current and accumulated earnings and profits for federal income tax purposes, these excesses are reported as distributions of paid-in-capital.
It is the policy of each Fund to qualify or continue to qualify as a “regulated investment company” by complying with the provisions available to certain investment companies, as defined in applicable sections of the Internal Revenue Code, and to make distributions of net investment income and net realized capital gains sufficient to relieve the Fund from all, or substantially all, federal income taxes.
| (i) | | Allocation of Expenses, Income, and Gains and Losses |
Expenses directly attributable to a Fund are charged to that Fund. Expenses not directly attributable to a Fund are allocated proportionately among various or all Funds within the Trust. For the Funds, the method for allocating income, fund level expenses, and realized and unrealized gains or losses is based on the fair value of shares outstanding relative to net assets. Under this method, each class of shares participates based on the total net asset value of that class’s shares in proportion to the total net assets of the Fund. Expenses specific to a class (such as rule 12b-1 and administrative services fees) are charged to that class.
Notes to Financial Statements (Continued)
October 31, 2005
| (j) | | Capital Share Transactions |
| | | | | | | | | | | | | | | | | | |
| | | Growth | | | Nationwide |
| | | Year Ended
October 31, 2005 | | | Year Ended
October 31, 2004 | | | Year Ended
October 31, 2005 | | | Year Ended
October 31, 2004 |
CAPITAL TRANSACTIONS: | | | | | | | | | | | | | | | | | | |
Class A Shares | | | | | | | | | | | | | | | | | | |
Proceeds from shares issued (a) | | $ | 7,735,517 | | | $ | 7,859,219 | | | $ | 25,695,566 | | | $ | 214,013,083 | | | |
Proceeds from shares issued in connection with merger | | | — | | | | 25,745,232 | | | | — | | | | — | | | |
Dividends reinvested | | | 51,958 | | | | — | | | | 1,886,839 | | | | 1,728,517 | | | |
Cost of shares redeemed | | | (11,941,022 | ) | | | (9,914,834 | ) | | | (387,432,451 | ) | | | (359,515,876 | ) | | |
| | |
|
|
| |
|
|
| |
|
|
| |
|
|
| | |
| | | | (4,153,547 | ) | | | 23,689,617 | | | | (359,850,046 | ) | | | (143,774,276 | ) | | |
| | |
|
|
| |
|
|
| |
|
|
| |
|
|
| | |
| | | | | |
Class B Shares | | | | | | | | | | | | | | | | | | |
Proceeds from shares issued (a) | | | 438,258 | | | | 584,632 | | | | 1,971,460 | | | | 2,694,414 | | | |
Proceeds from shares issued in connection with merger | | | — | | | | 2,002,751 | | | | — | | | | — | | | |
Dividends reinvested | | | — | | | | — | | | | 340,027 | | | | — | | | |
Cost of shares redeemed | | | (1,474,562 | ) | | | (835,589 | ) | | | (10,865,494 | ) | | | (4,792,571 | ) | | |
| | |
|
|
| |
|
|
| |
|
|
| |
|
|
| | |
| | | | (1,036,304 | ) | | | 1,751,794 | | | | (8,554,007 | ) | | | (2,098,157 | ) | | |
| | |
|
|
| |
|
|
| |
|
|
| |
|
|
| | |
| | | | | |
Class C Shares | | | | | | | | | | | | | | | | | | |
Proceeds from shares issued (a) | | | 446,463 | | | | 127,521 | | | | 204,882 | | | | 432,663 | | | |
Proceeds from shares issued in connection with merger | | | — | | | | 54,708 | | | | — | | | | — | | | |
Dividends reinvested | | | — | | | | — | | | | 4,842 | | | | 210 | | | |
Cost of shares redeemed | | | (166,627 | ) | | | (34,209 | ) | | | (331,720 | ) | | | (193,194 | ) | | |
| | |
|
|
| |
|
|
| |
|
|
| |
|
|
| | |
| | | | 279,836 | | | | 148,020 | | | | (121,996 | ) | | | 239,679 | | | |
| | |
|
|
| |
|
|
| |
|
|
| |
|
|
| | |
| | | | | |
Class D Shares | | | | | | | | | | | | | | | | | | |
Proceeds from shares issued (a) | | | 6,887,357 | | | | 8,752,070 | | | | 43,291,189 | | | | 49,440,425 | | | |
Dividends reinvested | | | 721,641 | | | | 79,967 | | | | 18,992,305 | | | | 8,190,661 | | | |
Cost of shares redeemed | | | (43,263,689 | ) | | | (34,708,301 | ) | | | (207,623,010 | ) | | | (195,870,077 | ) | | |
| | |
|
|
| |
|
|
| |
|
|
| |
|
|
| | |
| | | | (35,654,691 | ) | | | (25,876,264 | ) | | | (145,339,516 | ) | | | (138,238,991 | ) | | |
| | |
|
|
| |
|
|
| |
|
|
| |
|
|
| | |
| | | | | |
Class R Shares | | | | | | | | | | | | | | | | | | |
Proceeds from shares issued (a) | | | 175 | | | | — | | | | 175 | | | | — | | | |
Dividends reinvested | | | 2 | | | | — | | | | 17 | | | | 2 | | | |
Cost of shares redeemed | | | (176 | ) | | | — | | | | (176 | ) | | | — | | | |
| | |
|
|
| |
|
|
| |
|
|
| |
|
|
| | |
| | | | 1 | | | | — | | | | 16 | | | | 2 | | | |
| | |
|
|
| |
|
|
| |
|
|
| |
|
|
| | |
| | | | | |
Institutional Service Class Shares | | | | | | | | | | | | | | | | | | |
Proceeds from shares issued (a) | | | — | | | | 3,159,908 | | | | — | | | | 1,760,405 | | | |
Dividends reinvested | | | 4 | | | | 28,144 | | | | 12 | | | | 161,778 | | | |
Cost of shares redeemed | | | — | | | | (82,872,540 | ) | | | (1,052 | ) | | | (62,700,633 | ) | | |
| | |
|
|
| |
|
|
| |
|
|
| |
|
|
| | |
| | | | 4 | | | | (79,684,488 | ) | | | (1,040 | ) | | | (60,778,450 | ) | | |
| | |
|
|
| |
|
|
| |
|
|
| |
|
|
| | |
| (a) | Includes redemption fees, if any. |
| | | | | | | | | | | | | | | | | | |
| | | Growth | | | Nationwide |
| | | Year Ended
October 31, 2005 | | | Year Ended
October 31, 2004 | | | Year Ended
October 31, 2005 | | | Year Ended
October 31, 2004 |
Institutional Class Shares | | | | | | | | | | | | | | | | | | |
Proceeds from shares issued (a) | | $ | — | | | $ | 1,000 | (b) | | $ | 3,055,202 | | | $ | 365,541 | (b) | | |
Dividends reinvested | | | 4 | | | | — | | | | 15,815 | | | | 537 | (b) | | |
Cost of shares redeemed | | | — | | | | — | | | | (143,365 | ) | | | (21,684 | )(b) | | |
| | |
|
|
| |
|
|
| |
|
|
| |
|
|
| | |
| | | | 4 | | | | 1,000 | | | | 2,927,652 | | | | 344,394 | | | |
| | |
|
|
| |
|
|
| |
|
|
| |
|
|
| | |
Change in net assets from capital transactions | | $ | (40,564,697 | ) | | $ | (79,970,320 | ) | | $ | (510,938,937 | ) | | $ | (344,305,799 | ) | | |
| | |
|
|
| |
|
|
| |
|
|
| |
|
|
| | |
| | | | | |
SHARE TRANSACTIONS: | | | | | | | | | | | | | | | | | | |
Class A Shares | | | | | | | | | | | | | | | | | | |
Issued | | | 1,177,335 | | | | 1,291,849 | | | | 1,268,312 | | | | 11,308,654 | | | |
Issued in connection with merger | | | — | | | | 4,274,297 | | | | — | | | | — | | | |
Reinvested | | | 7,944 | | | | — | | | | 92,206 | | | | 92,155 | | | |
Redeemed | | | (1,820,994 | ) | | | (1,627,493 | ) | | | (19,265,093 | ) | | | (19,420,042 | ) | | |
| | |
|
|
| |
|
|
| |
|
|
| |
|
|
| | |
| | | | (635,715 | ) | | | 3,938,653 | | | | (17,904,575 | ) | | | (8,019,233 | ) | | |
| | |
|
|
| |
|
|
| |
|
|
| |
|
|
| | |
| | | | | |
Class B Shares | | | | | | | | | | | | | | | | | | |
Issued | | | 72,386 | | | | 103,358 | | | | 99,512 | | | | 146,163 | | | |
Issued in connection with merger | | | — | | | | 358,069 | | | | — | | | | — | | | |
Reinvested | | | — | | | | — | | | | 17,096 | | | | — | | | |
Redeemed | | | (242,627 | ) | | | (147,973 | ) | | | (542,265 | ) | | | (260,865 | ) | | |
| | |
|
|
| |
|
|
| |
|
|
| |
|
|
| | |
| | | | (170,241 | ) | | | 313,454 | | | | (425,657 | ) | | | (114,702 | ) | | |
| | |
|
|
| |
|
|
| |
|
|
| |
|
|
| | |
| | | | | |
Class C Shares | | | | | | | | | | | | | | | | | | |
Issued | | | 72,512 | | | | 22,287 | | | | 10,248 | | | | 23,828 | | | |
Issued in connection with merger | | | — | | | | 9,772 | | | | — | | | | — | | | |
Reinvested | | | — | | | | — | | | | 244 | | | | 12 | | | |
Redeemed | | | (27,310 | ) | | | (6,263 | ) | | | (16,582 | ) | | | (10,633 | ) | | |
| | |
|
|
| |
|
|
| |
|
|
| |
|
|
| | |
| | | | 45,202 | | | | 25,796 | | | | (6,090 | ) | | | 13,207 | | | |
| | |
|
|
| |
|
|
| |
|
|
| |
|
|
| | |
| | | | | |
Class D Shares | | | | | | | | | | | | | | | | | | |
Issued | | | 1,036,633 | | | | 1,414,110 | | | | 2,138,657 | | | | 2,630,865 | | | |
Reinvested | | | 108,977 | | | | 13,284 | | | | 934,057 | | | | 439,561 | | | |
Redeemed | | | (6,492,159 | ) | | | (5,603,737 | ) | | | (10,243,564 | ) | | | (10,423,824 | ) | | |
| | |
|
|
| |
|
|
| |
|
|
| |
|
|
| | |
| | | | (5,346,549 | ) | | | (4,176,343 | ) | | | (7,170,850 | ) | | | (7,353,398 | ) | | |
| | |
|
|
| |
|
|
| |
|
|
| |
|
|
| | |
| (a) | Includes redemption fees, if any. |
| (b) | For the period from June 29, 2004 (commencement of operations) through October 31, 2004. |
Notes to Financial Statements (Continued)
October 31, 2005
| | | | | | | | | | | | | | |
| | | Growth | �� | | Nationwide |
| | | Year Ended
October 31, 2005 | | | Year Ended
October 31, 2004 | | | Year Ended
October 31, 2005 | | | Year Ended
October 31, 2004 |
Class R Shares | | | | | | | | | | | | | | |
Issued | | 26 | | | — | | | 9 | | | — | | | |
Reinvested | | — | (b) | | — | | | 1 | | | — | | | |
Redeemed | | (26 | ) | | — | | | (9 | ) | | — | | | |
| | |
|
| |
|
| |
|
| |
|
| | |
| | | — | | | — | | | 1 | | | — | | | |
| | |
|
| |
|
| |
|
| |
|
| | |
| | | | | |
Institutional Service Class Shares | | | | | | | | | | | | | | |
Issued | | — | | | 508,713 | | | — | | | 93,373 | | | |
Reinvested | | 1 | | | 4,667 | | | 1 | | | 8,764 | | | |
Redeemed | | — | | | (12,993,820 | ) | | (52 | ) | | (3,213,563 | ) | | |
| | |
|
| |
|
| |
|
| |
|
| | |
| | | 1 | | | (12,480,440 | ) | | (51 | ) | | (3,111,426 | ) | | |
| | |
|
| |
|
| |
|
| |
|
| | |
Institutional Class Shares | | | | | | | | | | | | | | |
Issued | | — | | | 158 | (a) | | 148,721 | | | 19,274 | (a) | | |
Reinvested | | 1 | | | — | | | 774 | | | 29 | (a) | | |
Redeemed | | — | | | — | | | (6,950 | ) | | (1,178 | )(a) | | |
| | |
|
| |
|
| |
|
| |
|
| | |
| | | 1 | | | 158 | | | 142,545 | | | 18,125 | | | |
| | |
|
| |
|
| |
|
| |
|
| | |
Total change in shares | | (6,107,301 | ) | | (12,378,722 | ) | | (25,364,677 | ) | | (18,567,427 | ) | | |
| | |
|
| |
|
| |
|
| |
|
| | |
| (a) | For the period from June 29, 2004 (commencement of operations) through October 31, 2004. |
| | | | | | | | | | |
| | | Money Market |
| | | Year Ended
October 31, 2005 | | | Year Ended
October 31, 2004 |
CAPITAL TRANSACTIONS: | | | | | | | | | | |
Institutional Class Shares | | | | | | | | | | |
Proceeds from shares issued (a) | | $ | 1,612,122,138 | | | $ | 1,179,019,081 | | | |
Dividends reinvested | | | 30,702,262 | | | | 8,180,833 | | | |
Cost of shares redeemed | | | (1,336,678,883 | ) | | | (1,182,262,579 | ) | | |
| | |
|
|
| |
|
|
| | |
| | | | 306,145,517 | | | | 4,937,335 | | | |
| | |
|
|
| |
|
|
| | |
| | | |
Service Class Shares | | | | | | | | | | |
Proceeds from shares issued (a) | | | 10,375,235 | | | | 50,997,429 | | | |
Dividends reinvested | | | 131,417 | | | | 31,400 | | | |
Cost of shares redeemed | | | (9,749,220 | ) | | | (53,549,396 | ) | | |
| | |
|
|
| |
|
|
| | |
| | | | 757,432 | | | | (2,520,567 | ) | | |
| | |
|
|
| |
|
|
| | |
| | | |
Prime Shares | | | | | | | | | | |
Proceeds from shares issued (a) | | | 240,503,800 | | | | 325,149,966 | | | |
Dividends reinvested | | | 8,075,815 | | | | 2,503,157 | | | |
Cost of shares redeemed | | | (308,626,186 | ) | | | (403,385,510 | ) | | |
| | |
|
|
| |
|
|
| | |
| | | | (60,046,571 | ) | | | (75,732,387 | ) | | |
| | |
|
|
| |
|
|
| | |
Change in net assets from capital transactions | | $ | 246,856,378 | | | $ | (73,315,619 | ) | | |
| | |
|
|
| |
|
|
| | |
| | | |
SHARE TRANSACTIONS: | | | | | | | | | | |
Institutional Class Shares | | | | | | | | | | |
Issued | | | 1,612,122,138 | | | | 1,179,019,081 | | | |
Reinvested | | | 30,702,261 | | | | 8,180,833 | | | |
Redeemed | | | (1,336,678,882 | ) | | | (1,182,262,579 | ) | | |
| | |
|
|
| |
|
|
| |
|
| | | | 306,145,517 | | | | 4,937,335 | | | |
| | |
|
|
| |
|
|
| |
|
Service Class Shares | | | | | | | | | | |
Issued | | | 10,375,235 | | | | 50,997,429 | | | |
Reinvested | | | 131,417 | | | | 31,400 | | | |
Redeemed | | | (9,749,220 | ) | | | (53,549,396 | ) | | |
| | |
|
|
| |
|
|
| |
|
| | | | 757,432 | | | | (2,520,567 | ) | | |
| | |
|
|
| |
|
|
| |
|
Prime Shares | | | | | | | | | | |
Issued | | | 240,503,720 | | | | 325,149,866 | | | |
Reinvested | | | 8,075,815 | | | | 2,503,157 | | | |
Redeemed | | | (308,626,186 | ) | | | (403,385,510 | ) | | |
| | |
|
|
| |
|
|
| |
|
| | | | (60,046,651 | ) | | | (75,732,487 | ) | | |
| | |
|
|
| |
|
|
| |
|
Total change in shares | | | 246,856,298 | | | | (73,315,719 | ) | | |
| | |
|
|
| |
|
|
| | |
| (a) | Includes redemption fees, if any. |
Notes to Financial Statements (Continued)
October 31, 2005
3. Transactions with Affiliates
Under the terms of the Trust’s Investment Advisory Agreement, Gartmore Mutual Fund Capital Trust (“GMF”) manages the investment of the assets and supervises the daily business affairs of the Funds. GMF is a wholly-owned subsidiary of Gartmore Global Investments, Inc. (“GGI”), a holding company. GGI is a majority-owned subsidiary of Gartmore Global Asset Management Trust (“GGAMT”). GGAMT is a wholly-owned subsidiary of Nationwide Corporation. All of the common stock of Nationwide Corporation is held by Nationwide Mutual Insurance Company (95.2%) and Nationwide Mutual Fire Insurance Company (4.8%), each of which is a mutual company owned by its policyholders.
Under the terms of the Investment Advisory Agreement, each Fund pays GMF an investment advisory fee based on that Fund’s average daily net assets. Additional information regarding the investment advisory fees for GMF is as follows for the year ended October 31, 2005:
| | | | | | |
| Fund | | Fee Schedule | | Total
Fees | | Fees
Retained |
Growth and Nationwide | | Up to $250 million | | 0.60% | | 0.60% |
| | | On the next $750 million | | 0.575% | | 0.575% |
| | | On the next $1 billion | | 0.55% | | 0.55% |
| | | On the next $3 billion | | 0.525% | | 0.525% |
| | | On $5 billion and more | | 0.50% | | 0.50% |
Money Market | | Up to $1 billion | | 0.40% | | 0.40% |
| | | On the next $1 billion | | 0.38% | | 0.38% |
| | | On the next $3 billion | | 0.36% | | 0.36% |
| | | On $5 billion and more | | 0.34% | | 0.34% |
GMF and the Money Market Fund have entered into a written contract (“Expense Limitation Agreement”) that limits operating expenses (excluding any taxes, interest, brokerage fees, extraordinary expenses, short sale dividend expenses, Rule 12b-1 fees, and administrative services fees) from exceeding 0.59% for all share classes until February 28, 2006.
GMF may request and receive reimbursement from the Money Market Fund of the advisory fees waived and other expenses reimbursed by GMF pursuant to the Expense Limitation Agreement at a later date not to exceed three years from the fiscal year in which the corresponding reimbursement to the Fund was made, depending on the Fund (as described below), if the Fund has reached a sufficient asset size to permit reimbursement to be made without causing the total annual operating expense ratio of the Fund to exceed the limits set forth above. No reimbursement will be made unless: (i) the Fund’s assets exceed $100 million; (ii) the total annual expense ratio of the Class making such reimbursement is less than the limit set forth above; and (iii) the payment of such reimbursement is approved by the Board of Trustees on a quarterly basis. Except as provided for in the Expense Limitation Agreement, reimbursement of amounts previously waived or assumed by GMF is not permitted.
As of the year ended October 31, 2005, the cumulative potential reimbursements for the Money Market Fund, based on reimbursements which expire within three years from the fiscal year in which the corresponding reimbursements to the Fund was made for expenses reimbursed by GMF would be:
| | | | | | | | | |
| Fund | | Fiscal Year
2003 | | Fiscal Year
2004 | | Fiscal Year
2005 |
Money Market | | $ | 102,737 | | $ | 1,937 | | $ | 1,938 |
Under the terms of a Distribution Plan under Rule 12b-1 of the 1940 Act, Gartmore Distribution Services, Inc. (“GDSI”), the Funds’ distributor, is compensated by the Funds for expenses associated with the distribution of certain classes of shares of the Funds. These fees are based on average daily net assets of the respective class of the Funds at an annual rate not to exceed the following:
| | | | | | | | | | | | | | | |
| Fund | | Class A
Shares | | | Class B
Shares | | | Class C
Shares | | | Class R
Shares | | | Service Class
Shares | |
Growth | | 0.25 | % | | 1.00 | % | | 1.00 | % | | 0.50 | % | | n/a | |
Nationwide | | 0.25 | % | | 1.00 | % | | 1.00 | % | | 0.50 | % | | n/a | |
Money Market | | n/a | | | n/a | | | n/a | | | n/a | | | 0.15 | % |
Pursuant to an Underwriting Agreement, GDSI serves as principal underwriter of the Funds in the continuous distribution of their shares and receives commissions in the form of a front-end sales charge on the Class A and Class D shares. These fees are deducted from and are not included in proceeds from sales of Class A and Class D shares. From these fees, GDSI pays sales commissions, salaries, and other expenses in connection with generating new sales of Class A and Class D shares of the Funds. GDSI also receives fees for services as principal underwriter for Class B shares of the Funds. These fees are contingent deferred sales charges (“CDSCs”) ranging from 1% to 5% imposed on redemptions of Class B shares, which may cause the current value of a shareholder’s account to fall below the total purchase payments. The CDSC, if applicable, will be imposed on redemptions made within six years of the purchase. Class C shares have a CDSC fee of 1% imposed on redemptions of Class C shares made within one year of purchase. For the year ended October 31, 2005, GDSI received commissions of $354,808 from front-end sales charges of Class A and Class D shares and from CDSC fees from Class B and Class C shares of the Funds, of which $66,712 was reallowed to affiliated broker-dealers of the Funds.
Under the terms of a Fund Administration and Transfer Agency Agreement, Gartmore SA Capital Trust (“GSA”) provides various administrative and accounting services for the Funds, and Gartmore Investors Services, Inc. (“GISI”), an indirect subsidiary of GSA, serves as Transfer Agent and Dividend Disbursing Agent for each of the Funds. For the period November 1, 2004 through December 31, 2004, the fees for the services provided under this agreement were calculated based on the Trust’s average daily net assets according to the fee schedule below. The fees were then allocated proportionately among all funds within the Trust in relation to the average daily net assets of each fund and are paid to GSA. GSA pays GISI from these fees for GISI’s services.
| | |
| Combined Fee Schedule* | | |
Up to $1 billion | | 0.25% |
$ 1 billion and more up to $3 billion | | 0.18% |
$ 3 billion and more up to $4 billion | | 0.14% |
$ 4 billion and more up to $5 billion | | 0.07% |
$ 5 billion and more up to $10 billion | | 0.04% |
$ 10 billion and more up to $12 billion | | 0.02% |
$ 12 billion or more | | 0.01% |
| * | The assets of the Gartmore Investor Destinations Aggressive, Gartmore Investor Destinations Moderately Aggressive, Gartmore Investor Destinations Moderate, Gartmore Investor Destinations Moderately Conservative and Gartmore Investor Destinations Conservative Funds (collectively, the “Investor Destinations Funds”) and the Gartmore Optimal Allocations Fund: Aggressive, Gartmore Optimal Allocations Fund: Moderate, Gartmore Optimal Allocations Fund: Moderately Aggressive, and Gartmore Optimal Allocations Fund: Specialty (collectively, the “Optimal Funds”) are excluded from the Trust asset level amount in order to calculate this asset based fee. The Investor Destinations Funds and the Optimal Funds do not pay any part of this fee. |
Notes to Financial Statements (Continued)
October 31, 2005
Effective January 1, 2005, the fee for the fund administration and transfer agency services increased as set forth below. The fees are calculated based on the Trust’s average daily net assets according to the fee schedule below. The fees are then allocated proportionately among all funds within the Trust in relation to the average daily net assets of each fund and are paid to GSA.
| | |
| Combined Fee Schedule* | | |
Up to $1 billion | | 0.26% |
$ 1 billion and more up to $3 billion | | 0.19% |
$ 3 billion and more up to $4 billion | | 0.15% |
$ 4 billion and more up to $5 billion | | 0.08% |
$ 5 billion and more up to $10 billion | | 0.05% |
$ 10 billion and more up to $12 billion | | 0.03% |
$ 12 billion or more | | 0.02% |
| * | The assets of the Investor Destinations Funds and the Optimal Funds are excluded from the Trust asset level amount in order to calculate this asset based fee. The Investor Destinations Funds and the Optimal Funds do not pay any part of this fee. |
GSA and GISI have entered into agreements with BISYS Fund Services Ohio, Inc.(“BISYS”), pursuant to which BISYS provides sub-administration and sub-transfer agency services, respectively, to the Funds.
Under the terms of an Administrative Services Plan, the Funds may pay fees to servicing organizations, such as broker-dealers, including Nationwide Financial Services, and financial institutions, which agree to provide administrative support services to the shareholders of certain classes. These services include, but are not limited, to the following: establishing and maintaining shareholder accounts; processing purchase and redemption transactions; arranging bank wires; performing shareholder sub-accounting; answering inquiries regarding the Funds; and other such services. These fees are based on an annual rate of up to 0.25% of the average daily net assets of the Class A, Class D, Class R, Prime Shares, Service Class and Institutional Service Class shares of each of the Funds.
4. Short-Term Trading Fees
The Funds (except the Money Market Fund) assess a 2.00% redemption fee on all classes of shares that are purchased and are sold or exchanged within 30 days of purchase. The redemption fee, if any, is paid directly to the applicable Fund and is designed to offset brokerage commissions, market impact, and other costs associated with short-term trading of Fund shares. For purposes of determining whether the redemption fee applies, the shares that were held the longest will be redeemed first. This redemption fee is in addition to any CDSCs that may be applicable at the time of sale. The redemption fee may not apply in certain circumstances, such as redemptions or exchanges of shares held in certain omnibus accounts or retirement plans that cannot implement the redemption fee. The fee does not apply to shares purchased through reinvested dividends or capital gains. For the year ended October 31, 2005, the Funds had no contributions to capital due to collection of redemption fees.
5. Bank Loans and Earnings Credit
The Trust has a credit agreement of $100,000,000 with J.P. Morgan Chase & Co. Borrowings under this arrangement bear interest at the Federal Funds rate plus 0.50%. The interest costs are included in custodian fees in the Statement of Operations. No compensating balances were required under the terms of the line of credit. There were no borrowings outstanding as of October 31, 2005.
The Trust’s custodian bank has agreed to reduce its fees when the funds of the Trust maintain cash on deposit in non-interest-bearing custody and Demand Deposit Accounts.
6. Investment Transactions
Purchases and sales of securities (excluding short-term securities) for the year ended October 31, 2005, are summarized as follows:
| | | | | | |
| Fund | | Purchases | | Sales |
Growth | | $ | 705,923,909 | | $ | 747,794,871 |
Nationwide | | | 1,980,241,869 | | | 2,429,218,900 |
Purchases and sales of U.S. Government securities for the year ended October 31, 2005, are summarized as follows:
| | | | | | |
| Fund | | Purchases | | Sales |
Money Market | | $ | 182,846,385 | | $ | — |
Nationwide | | | 21,098,869 | | | — |
7. Federal Tax Information
The tax character of distributions paid during the fiscal year ended October 31, 2005, was as follows: (total distributions paid may differ from the Statement of Changes in Net Assets because for tax purposes dividends are recognized when actually paid.)
| | | | | | | | | |
| | | Distributions paid from
| | |
| Fund | | Ordinary
Income | | Net Long
Term Capital
Gains | | Total
Distributions
Paid |
Growth | | $ | 793,990 | | $ | — | | $ | 793,990 |
Nationwide | | | 17,184,288 | | | 6,053,402 | | | 23,237,690 |
Money Market | | | 34,471,949 | | | — | | | 34,471,949 |
The tax character of distributions paid during the fiscal year ended October 31, 2004 was as follows: (total distributions paid differ from the Statement of Changes in Net Assets because for tax purposes dividends are recognized when actually paid.)
| | | | | | | | | | | | | | | | | | |
| | | Distributions paid from
| | | | | | | | |
| Fund | | Ordinary
Income | | Net Long
Term Capital
Gains | | Total Taxable
Distributions | | Tax Exempt
Distributions | | Return of
Capital | | Total
Distributions
Paid |
Growth | | $ | 110,403 | | $ | — | | $ | 110,403 | | $ | — | | $ | — | | $ | 110,403 |
Nationwide | | | 10,820,137 | | | — | | | 10,820,137 | | | — | | | — | | | 10,820,137 |
Money Market | | | 10,841,503 | | | — | | | 10,841,503 | | | — | | | — | | | 10,841,503 |
As of October 31, 2005, the components of accumulated earnings (deficit) on a tax basis were as follows:
| | | | | | | | | | | | | | | | | | | | | | | | |
| Fund | | Undistributed
Ordinary
Income | | Undistributed
Long-Term
Capital Gains | | Accumulated
Earnings | | Distributions
Payable | | | Accumulated
Capital and
Other Losses | | | Unrealized
Appreciation
(Depreciation)* | | Total
Accumulated
Earnings
(Deficit) | |
Growth | | $ | — | | $ | — | | $ | — | | $ | — | | | $ | (256,950,242 | ) | | $ | 5,499,154 | | $ | (251,451,088 | ) |
Nationwide | | | 102,505,816 | | | 68,221,381 | | | 170,727,197 | | | — | | | | — | | | | 58,249,539 | | | 228,976,736 | |
Money Market | | | 4,850,886 | | | — | | | 4,850,886 | | | (4,850,884 | ) | | | (12,110 | ) | | | — | | | (12,108 | ) |
| * | The differences between the book-basis and tax-basis unrealized appreciation (depreciation) is attributable primarily to: tax deferral of losses on wash sales; the difference between book and tax amortization methods for premium and market discount; and the return of capital adjustments from real estate investment trusts. |
Notes to Financial Statements (Continued)
October 31, 2005
As of October 31, 2005, the tax cost of securities and the breakdown of unrealized appreciation (depreciation) for each Fund were as follows:
| | | | | | | | | | | | | |
| Fund | | Tax Cost of
Securities | | Unrealized
Appreciation | | Unrealized
Depreciation | | | Net
Unrealized
Appreciation
(Depreciation) |
Growth | | $ | 251,467,781 | | $ | 10,976,630 | | $ | (5,477,476 | ) | | $ | 5,499,154 |
Nationwide | | | 1,306,527,186 | | | 101,108,663 | | | (42,859,124 | ) | | | 58,249,539 |
Money Market | | | 1,884,641,413 | | | — | | | — | | | | — |
As of October 31, 2005, for Federal income tax purposes, the following Funds have capital loss carryforwards available to offset capital gains, if any, to the extent provided by the treasury regulations:
| | | | | |
| Fund | | Amount | | Expires |
Growth | | $ | 178,388,858 | | 2009 |
Growth | | | 71,971,609 | | 2010 |
Money Market | | | 1,238 | | 2008 |
Money Market | | | 7,994 | | 2010 |
Money Market | | | 951 | | 2012 |
Money Market | | | 1,927 | | 2013 |
As of October 31, 2005, the following Funds have additional capital loss carryforwards, subject to any applicable limitations on availability, to offset future capital gains, if any, as the successor of a merger Funds:
| | | | | |
| Fund | | Amount | | Expires |
Growth | | $ | 3,953,865 | | 2008 |
Growth | | | 1,317,955 | | 2009 |
Growth | | | 1,317,955 | | 2010 |
Report of Independent Registered Public Accounting Firm
To the Board of Trustees and Shareholders of Gartmore Mutual Funds:
In our opinion, the accompanying statements of assets and liabilities, including the statements of investments, and the related statements of operations and of changes in net assets and the financial highlights present fairly, in all material respects, the financial position of Gartmore Growth Fund, Gartmore Nationwide Fund and Gartmore Money Market Fund (three series of Gartmore Mutual Funds, hereafter referred to as the “Funds”) at October 31, 2005, the results of each of their operations for the year then ended, the changes in each of their net assets for each of the two years then ended and the financial highlights for each of the four years (or periods) then ended in conformity with accounting principles generally accepted in the United States of America. These financial statements and financial highlights (hereafter referred to as “financial statements”) are the responsibility of the Funds’ management; our responsibility is to express an opinion on these financial statements based on our audits. We conducted our audits of these financial statements in accordance with the standards of the Public Company Accounting Oversight Board (United States.) Those standards require that we plan and perform the audit to obtain reasonable assurance about whether the financial statements are free of material misstatement. An audit includes examining, on a test basis, evidence supporting the amounts and disclosures in the financial statements, assessing the accounting principles used and significant estimates made by management, and evaluating the overall financial statement presentation. We believe that our audits, which included confirmation of securities at October 31, 2005 by correspondence with the custodian, the transfer agent and brokers, provide a reasonable basis for our opinion. The financial highlights of the Funds for the year (or period) ended October 31, 2001 were audited by other independent accountants whose report dated December 14, 2001 expressed an unqualified opinion on those financial statements.
PricewaterhouseCoopers LLP
Philadelphia, Pennsylvania
December 22, 2005
Supplemental Information (Unaudited)
1. Other Federal Tax Information (Unaudited):
For the period ended October 31, 2005, certain dividends paid by the Funds may be subject to a maximum tax rate of 15% as provided for by the Jobs and Growth Tax Relief Reconciliation Act of 2003. The Funds intend to designate the maximum amount allowable as taxed at a maximum rate of 15%. Complete information will be reported in conjunction with your 2005 Form 1099-DIV.
For the period ended October 31, 2005, the following Funds paid qualified dividend income:
| | | |
| Fund | | Qualified
Dividend
Income |
Growth | | $ | 2,733,347 |
For the taxable year ended October 31, 2005, the following percentage of income dividends paid by the Funds qualify for the dividends received deduction available to corporations:
| | | |
| Fund | | Dividend
Received
Deduction | |
Growth | | 90 | % |
2. Shareholder Meeting
A separate shareholder meeting was held on Tuesday, December 23, 2004, for the shareholders of the Trust’s predecessor pursuant to a Proxy Statement on Schedule 14A, dated October 29, 2004, and mailed to the shareholders of the Trust’s predecessor on or around November 5, 2004.
Two Proposals: The purpose of the December 23, 2004 meeting was to allow the shareholders of the Trust’s predecessor to vote on:
i. Proposal One: The election of the predecessor’s Trust’s Board of Trustees; and
ii. Proposal Two: The approval of an “Agreement and Plan of Reorganization” that provided for the reorganization of the Trust from an Ohio business trust into a Delaware statutory trust.
Proposal One: As set forth in the October 29, 2004 Proxy Statement, the nominees for election as Trustees of the Trust’s predecessor were: Charles E. Allen, Michael J. Baresich, Paula H.J. Cholmondeley, C. Brent DeVore, Phyllis Kay Dryden, Robert M. Duncan, Barbara L. Hennigar, Paul J. Hondros, Barbara I. Jacobs, Thomas J. Kerr, IV, Douglas F. Kridler, Michael D. McCarthy, Arden L. Shisler, and David C. Wetmore.
Proposal Two: As specifically set forth in the October 29, 2004 Proxy Statement, the Reorganization proposal requested the shareholders of the Trust’s predecessor to approve the proposed “Agreement and Plan of Reorganization” of the Trust’s predecessor (on behalf of each of the Trust’s funds) with and into a new Delaware-domiciled Trust, whereby the Funds of the new Delaware Trust would acquire all of the assets of the corresponding funds of the Trust’s predecessor subject to the liabilities, expenses, costs, charges, and reserves of the corresponding funds of the Trust’s predecessor (contingent or otherwise), in exchange for shares of the acquiring funds of the Trust to be distributed pro rata by the Trust to the holders of the shares of the funds of the Trust’s predecessor, in a complete liquidation of the Trust’s predecessor.
Voting Results:
The shareholders of the Trust’s predecessor voted to approve both Proposal One and Proposal Two, as follows:
| | |
| Proposal One: | | Election of a Board of Trustees of the Trust’s Predecessor |
Charles E. Allen: | | |
FOR | | 1,484,045,010.745 shares (96.963%) |
WITHHOLD | | 46,475,965.981 shares (3.037%) |
TOTAL | | 1,530,520,976.726 shares (100.000%) |
| |
Michael J. Baresich: | | |
FOR | | 1,479,546,876.136 shares (96.669%) |
WITHHOLD | | 50,974,100.590 shares (3.331%) |
TOTAL | | 1,530,520,976.726 shares (100.000%) |
| |
Paula H.J. Cholmondeley: | | |
FOR | | 1,483,986,754.474 shares (96.960%) |
WITHHOLD | | 46,534,222.252 shares (3.040%) |
TOTAL | | 1,530,520,976.726 shares (100.000%) |
| |
C. Brent DeVore: | | |
FOR | | 1,483,232,555.715 shares (96.910%) |
WITHHOLD | | 47,288,421.011 shares (3.090%) |
TOTAL | | 1,530,520,976.726 shares (100.000%) |
| |
Phyllis Kay Dryden: | | |
FOR | | 1,483,461,670.269 shares (96.925%) |
WITHHOLD | | 47,059,306.457 shares (3.075%) |
TOTAL | | 1,530,520,976.726 shares (100.000%) |
| |
Robert M. Duncan: | | |
FOR | | 1,478,518,553.740 shares (96.602%) |
WITHHOLD | | 52,002,422.986 shares (3.398%) |
TOTAL | | 1,530,520,976.726 shares (100.000%) |
| |
Barbara L. Hennigar: | | |
FOR | | 1,483,932,926.673 shares (96.956%) |
WITHHOLD | | 46,588,050.053 shares (3.044%) |
TOTAL | | 1,530,520,976.726 shares (100.000%) |
| |
Paul J. Hondros: | | |
FOR | | 1,483,799,576.741 shares (96.947%) |
WITHHOLD | | 46,721,399.985 shares (3.053%) |
TOTAL | | 1,530,520,976.726 shares (100.000%) |
| |
Barbara I. Jacobs: | | |
FOR | | 1,482,757,593.191 shares (96.879%) |
WITHHOLD | | 47,763,383.535 shares (3.121%) |
TOTAL | | 1,530,520,976.726 shares (100.000%) |
Supplemental Information (Unaudited) (Continued)
| | |
| Proposal One: | | Election of a Board of Trustees of the Trust’s Predecessor |
Thomas J. Kerr, IV: | | |
FOR | | 1,477,143,243.388 shares (96.512%) |
WITHHOLD | | 53,377,733.338 shares (3.488%) |
TOTAL | | 1,530,520,976.726 shares (100.000%) |
| |
Douglas F. Kridler: | | |
FOR | | 1,484,100,191.103 shares (96.967%) |
WITHHOLD | | 46,420,785.623 shares (3.033%) |
TOTAL | | 1,530,520,976.726 shares (100.000%) |
| |
Michael D. McCarthy: | | |
FOR | | 1,483,352,898.255 shares (96.918%) |
WITHHOLD | | 47,168,078.471 shares (3.082%) |
TOTAL | | 1,530,520,976.726 shares (100.000%) |
| |
Arden L. Shisler: | | |
FOR | | 1,483,661,174.441 shares (96.938%) |
WITHHOLD | | 46,859,802.285 shares (3.062%) |
TOTAL | | 1,530,520,976.726 shares (100.000%) |
| |
David C. Wetmore: | | |
FOR | | 1,484,021,388.615 shares (96.962%) |
WITHHOLD | | 46,499,588.111 shares (3.038%) |
TOTAL | | 1,530,520,976.726 shares (100.000%) |
| |
| Proposal 2: | | Approval of the Agreement and Plan of Reorganization of the
Trust’s Predecessor: |
FOR | | 1,338,850,729.743 shares (87.477%) |
AGAINST | | 48,927,279.322 shares (3.197%) |
ABSTAIN | | 86,596,336.653 shares (5.658%) |
BROKER NON-VOTES | | 56,146,631.008 shares (3.668%) |
TOTAL | | 1,530,520,976.726 shares (100.000%) |
Management Information (Unaudited)
Trustees who are not Interested Persons (as defined in the 1940 Act) and Officers of the Funds as of October 31, 2005
| | | | | | | | |
Name, Address
and Year of Birth | | Position(s) Held
with the Trust
and Length of
Time Served1 | | Principal Occupation(s)
During Past
Five Years | | Number of Portfolios
in the
Gartmore Fund
Complex Overseen
by Trustee | | Other Directorships Held by Trustee or Nominee2 |
| | | | |
Charles E. Allen c/o Gartmore Global Investments, Inc. 1200 River Road,
Suite 1000 Conshohocken, PA 19428 1948 | | Trustee
since
July 2000 | | Mr. Allen is Chairman, Chief Executive Officer and President of the Graimark Realty Advisors, Inc. (real estate development, investment and asset management). | | 84 | | None |
| | | | |
Paula H.J. Cholmondeley c/o Gartmore Global Investments, Inc. 1200 River Road,
Suite 1000 Conshohocken, PA 19428 1947 | | Trustee
since
July 2000 | | Ms. Cholmondeley has been the Chairman and Chief Executive Officer of the Sorrel Group, a management consulting company, since January 2004. Prior thereto, Ms. Cholmondeley was Vice President and General Manager of Sappi Fine Paper North America. | | 84 | | Director of Dentsply International, Inc., Ultralife Batteries, Inc. , Terex Corporation, Minerals Technology, Inc. and Albany International Corp. |
| | | | |
C. Brent DeVore c/o Gartmore Global Investments, Inc. 1200 River Road,
Suite 1000 Conshohocken, PA 19428 1940 | | Trustee
since
1990 | | Dr. DeVore is President of Otterbein College. | | 84 | | None |
| | | | |
Phyllis K. Dryden c/o Gartmore Global Investments, Inc. 1200 River Road,
Suite 1000 Conshohocken, PA 19428 1947 | | Trustee
since December 2004 | | Ms. Dryden was a former Managing Partner of marchFIRST, a global management consulting firm prior to February, 2001. | | 84 | | None |
| | | | |
Barbara L. Hennigar c/o Gartmore Global Investments, Inc. 1200 River Road,
Suite 1000 Conshohocken, PA 19428 1935 | | Trustee
since
July 2000 | | Retired. | | 84 | | None |
Management Information (Unaudited) (Continued)
Trustees who are not Interested Persons (as defined in the 1940 Act) and Officers of the Funds as of October 31, 2005 (Continued)
| | | | | | | | |
Name, Address
and Year of Birth | | Position(s) Held
with the Trust
and Length of
Time Served1 | | Principal Occupation(s)
During Past
Five Years | | Number of Portfolios
in the
Gartmore Fund
Complex Overseen
by Trustee | | Other Directorships Held by Trustee or Nominee2 |
| | | | |
Barbara I. Jacobs c/o Gartmore Global Investments, Inc. 1200 River Road,
Suite 1000 Conshohocken, PA 19428 1950 | | Trustee
since December 2004 | | Ms. Jacobs has served as Chairman of the Board of Directors of KICAP Network Fund, a European (United Kingdom) hedge fund, since December 2000. Prior to 2004, Ms. Jacobs was also a Managing Director and European Portfolio Manager with CREF Investments (Teachers Insurance Annuity Association - College Retirement Equity Fund). | | 84 | | None |
| | | | |
Douglas F. Kridler c/o Gartmore Global Investments, Inc. 1200 River Road,
Suite 1000 Conshohocken, PA 19428 1955 | | Trustee
since September 1997 | | Mr. Kridler has served as the President and Chief Executive Officer of the Columbus Foundation (a Columbus, OH-based foundation which manages over 1,300 individual endowment funds) since February 2002. Mr. Kridler was the President of the Columbus Association for the Performing Arts prior thereto and Chairman of the Greater Columbus Convention and Visitors Bureau during 2000 and 2001. | | 84 | | None |
| | | | |
Michael D. McCarthy c/o Gartmore Global Investments, Inc. 1200 River Road,
Suite 1000 Conshohocken, PA 19428 1947 | | Trustee
since December 2004 | | Mr. McCarthy serves as: the Founder and Chairman of The Eureka Foundation (which sponsors and funds the “Great Museums” series on PBS); and a Partner of Pineville Properties LLC (a commercial real estate development firm). | | 843 | | None |
| | | | |
David C. Wetmore c/o Gartmore Global Investments, Inc. 1200 River Road,
Suite 1000 Conshohocken, PA 19428 1948 | | Trustee
since 1995 and Chairman since
February 2005 | | Retired. | | 84 | | None |
| 1 | Length of time served includes time served with the Trust’s predecessor. |
| 2 | Directorships held in (1) any other investment companies registered under the 1940 Act, (2) any company with a class of securities registered pursuant to Section 12 of the Securities Exchange Act of 1934, as amended (the “Exchange Act”), or (3) any company subject to the requirements of Section 15(d) of the Exchange Act. |
| 3 | Mr. McCarthy was also an Administrative Committee Member for the Alphagen Arneb Fund, LLC , The Healthcare Fund LDC, The Leaders Long-Short Fund, LLC, and The Leaders Long-Short Fund LDC, four private investment companies (hedge funds) managed by GSA. Mr. McCarthy resigned as an Administrative Committee Member effective June 30, 2005. |
Trustees and Officers who are not Interested Persons (as defined in the 1940 Act) of the Funds received aggregate compensation of $548,510 from the Trust for the year ended October 31, 2005. Additional information regarding the Trustees and Officers may be found in the Trust’s statement of additional information, which is available without charge upon request, by calling 800-848-0920.
Trustees who are Interested Persons (as defined in the 1940 Act) and/or Officers of the Funds as of October 31, 2005
| | | | | | | | |
Name, Address
and Year of Birth | | Position(s) Held
with the Trust
and Length of
Time Served1 | | Principal Occupation(s) During Past Five Years | | Number of Portfolios
in the
Gartmore Fund
Complex Overseen
by Trustee | | Other Directorships Held by Trustee2 |
| | | | |
Paul J. Hondros Gartmore Global Investments, Inc. 1200 River Road,
Suite 1000 Conshohocken, PA 19428 1948 | | Trustee
since
July 2000 | | Mr. Hondros has been President and Chief Executive Officer of various Gartmore entities, including Gartmore Distribution Services, Inc. (“GDSI”),3 Gartmore Investor Services, Inc. (“GISI”),3 Gartmore Morley Capital Management, Inc. (“GMCM”),3 Gartmore Morley Financial Services, Inc. (“GMFS”), 3 NorthPointe Capital, LLC (“NorthPointe”),3 Gartmore Global Asset Management Trust (“GGAMT”)3,, Gartmore Global Investments, Inc. (“GGI”)3, Gartmore Mutual Fund Capital Trust (“GMFCT”)3 and Gartmore SA Capital Trust (“GSA”)3; and a Director of Nationwide Securities, Inc.3, as well as several entities within Nationwide Financial Services, Inc. | | 844 | | None |
| | | | |
Arden L. Shisler c/o Gartmore Global Investments, Inc. 1200 River Road,
Suite 1000 Conshohocken, PA 19428 1941 | | Trustee
since
February 2000 | | Mr. Shisler has been a consultant since January 2003. Prior thereto, he was President and Chief Executive Officer of K&B Transport, Inc., a trucking firm. Since 1992, Mr. Shisler has also been Chairman of the Board for Nationwide Mutual Insurance Company3. | | 84 | | Director of Nationwide Financial
Services, Inc. |
| | | | |
Gerald J. Holland Gartmore Global Investments, Inc.
1200 River Road, Suite 1000 Conshohocken, PA 19428 1951 | | Treasurer
since
March 2001 | | Mr. Holland is Senior Vice President - Operations for GGI3, GMFCT3 , and GSA3. | | 84 | | None |
| | | | |
Michael A. Krulikowski Gartmore Global Investments, Inc.
1200 River Road, Suite 1000 Conshohocken, PA 19428 1959 | | Chief Compliance Officer
since
June 2004 | | Since November 1999, Mr. Krulikowski has served as a Vice President and Chief Compliance Officer of GGI. Since June 2004, Mr. Krulikowski has also served as Chief Compliance Officer of the Trust. | | 84 | | None |
| | | | |
Eric E. Miller Gartmore Global Investments, Inc.
1200 River Road, Suite 1000 Conshohocken, PA 19428 1953 | | Secretary since December 2002 | | Mr. Miller is Senior Vice President, Chief Counsel for GGI3, GMFCT3 and GSA3 since August 2002. From August 2000 to August 2002, Mr. Miller was a Partner with Stradley Ronan Stevens & Young, LLP. | | 84 | | None |
Management Information (Unaudited) (Continued)
| 1 | Length of time served includes time served with the Trust’s predecessor. |
| 2 | Directorships held in (1) any other investment companies registered under the 1940 Act, (2) any company with a class of securities registered pursuant to Section 12 of the Securities Exchange Act of 1934, as amended (the “Exchange Act”), or (3) any company subject to the requirements of Section 15(d) of the Exchange Act. |
| 3 | This position is held with an affiliated person or principal underwriter of the Trust. |
| 4 | Mr. Hondros was also an Administrative Committee Member for the Alphagen Arneb Fund, LLC , The Healthcare Fund LDC, The Leaders Long-Short Fund, LLC, and The Leaders Long-Short Fund LDC, four private investment companies (hedge funds) managed by GSA. Mr. Hondros resigned as an Administrative Committee Member effective June 30, 2005. |
Federal law requires the Trust, each of its investment advisers and sub-advisers to adopt procedures for voting proxies (“Proxy Voting Guidelines”) and to provide a summary of those Proxy Voting Guidelines used to vote the securities held by the Funds. The Funds’ proxy voting policies and procedures are available without charge (i) upon request, by calling 800-848-0920, (ii) on the Fund’s website at www.gartmorefunds.com, or (iii) on the Securities and Exchange Commission’s website at www.sec.gov.
Index Definitions
Lipper Analytical Services, Inc. is an industry research firm whose rankings are based on total return performance and do not reflect the effect of sales charges. Each fund is ranked within a universe of funds similar in investment objective as determined by Lipper.
Russell 1000® Growth Index: An unmanaged index that measures the performance of the stocks of U.S. companies in the Russell 1000® Index (the largest 1,000 U.S. companies, based on market capitalization) with higher price-to-book ratios and higher forecasted growth values.
iMoneyNet First Tier Retail Index: An unmanaged index that is an
average of non-government retail money market mutual funds that do not invest in any second-tier securities. Portfolio holdings of first-tier money market mutual funds include U.S. Treasury, U.S. other, repurchase agreements, time deposits, domestic and foreign bank obligations, first-tier commercial paper, floating-rate notes and asset-backed commercial paper.
Standard & Poor’s 500® (S&P 500) Index: An unmanaged, market capitalization-weighted index of 500 widely held stocks of large-cap U.S. companies that gives a broad look at how the stock prices of those companies have performed.

Gartmore Funds
1200 River Road, Suite 1000
Conshohocken, PA 19428
www.gartmorefunds.com
Federal law requires the Fund, and the Fund’s investment advisers and subadvisers, to adopt procedures for voting proxies (“Proxy Voting Guidelines”) and to provide a summary of those Proxy Voting Guidelines used to vote the securities held by the Funds. The Fund’s proxy voting policies and procedures are available without charge (i) upon request, by calling 800-848-0920, (ii) on the Fund’s Web site at www.gartmorefunds.com, or (iii) on the U.S. Securities and Exchange Commission’s Web site at www.sec.gov.
© 2005 Gartmore Global Investments, Inc.
All rights reserved.
AR-Core 2 12/05
Annual Report
| | |
| | |

| | October 31, 2005 |
NorthPointe Small Cap Growth Fund
NorthPointe Small Cap Value Fund
www.gartmorefunds.com

Solutions.

| | | | |
| UNITED STATES | | UNITED KINGDOM | | JAPAN |
Based in greater metropolitan Philadelphia, Gartmore is the global asset management arm of Nationwide®. Gartmore’s affiliated advisers* collectively manage more than $82 billion1 in assets through its global investment platform encompassing more than 185 investment management professionals supported by an 800-person staff.
We provide core and specialty equity, fixed-income and alternative investment solutions through mutual funds, separate accounts, commingled portfolios and wrap accounts to individual and institutional clients around the world.
This wide range of investment opportunities is built on sound investment management processes designed to increase the probability of delivering enhanced risk-adjusted returns over the long term.
Our investment management teams incorporate fundamental stock selection with the application of technology to help control risk and add to returns. Insightful stock selection is a function of the efforts of talented alpha-driven managers and analysts, working in an entrepreneurial environment, who are specialists in their respective investment disciplines.
www.gartmore.com
*Gartmore’s Affiliated Advisers
The following 11 asset management affiliates of Nationwide do business under the trade name “Gartmore Group”: Gartmore Capital Management Ltd2, Gartmore Fund Managers Ltd2, Gartmore Global Partners2, 3, Gartmore Investment Ltd2, Gartmore Japan Ltd2, Gartmore Morley Capital Management, Inc.3, Gartmore Mutual Fund Capital Trust3, 4, Gartmore Riverview, LLC3, Gartmore SA Capital Trust3, 4, Gartmore Separate Accounts LLC3, and NorthPointe Capital® LLC3
| 2. | | These advisers are subsidiaries of Gartmore Investment Management plc, which ultimately reports to Nationwide®. |
| 3. | | These are SEC-registered investment advisers based in the United States. Collectively, these advisers manage $43 billion as of Oct. 31, 2005. |
| 4. | | Together, these advisers do business as Gartmore Global Investments, Inc. |
Gartmore Global Investments is the investment adviser to Gartmore Funds. NorthPointe Capital is a federally registered service mark of Gartmore Global Investments, Inc. Nationwide is a federally registered service mark of Nationwide Mutual Insurance Company.
Gartmore Funds distributed by Gartmore Distribution Services, Inc., Member NASD. 1200 River Road, Suite 1000, Conshohocken, PA 19428.
© 2005 Gartmore Global Investments, Inc. All rights reserved.
Annual Report
| | |
| | |
| | October 31, 2005 |
Commentary provided by Gartmore Global Investments, investment adviser to Gartmore Funds. All opinions and estimates included in this report constitute Gartmore Global Investments’ judgment as of the date of this report and are subject to change without notice.
Statement Regarding Availability of Quarterly Portfolio Schedule.
The Gartmore Funds file complete schedules of portfolio holdings for each Fund with the Securities and Exchange Commission (the “Commission”) for the first and third quarters of each fiscal year on Form N-Q. The Funds’ Forms N-Q are available on the Commission’s website at http://www.sec.gov. The Funds’ Forms N-Q may be reviewed and copied at the Commission’s Public Reference Room in Washington, DC, and information on the operation of the Public Reference Room may be obtained by calling 800-SEC-0330; and the Funds make the information on Form N-Q available to shareholders on www.gartmorefunds.com or upon request without charge.
Statement Regarding Availability of Proxy Voting Record.
Information regarding how the Fund voted proxies relating to portfolio securities held during the most recent 12-month period ended June 30, 2005 is available without charge, upon request, by calling 800-848-0920, and on the Commission’s website at http://www.sec.gov.
Message to Shareholders
October 31, 2005
Dear Fellow Shareholders,
At times during the annual reporting period ended Oct. 31, 2005, it seemed as though a host of uncertain and unpredictable events coalesced into a “perfect storm” of market volatility.
Hurricane Katrina is one example. This Category 5 storm not only bore down on a major American city and its environs, it also had one of the country’s largest energy-producing regions in its sights. If that weren’t enough, the storm occurred just as oil and natural gas prices were spiraling to record levels, concurrent with fears of a great strain on global supply and capacity.
On another front, the intent to better integrate the member nations of the European Union (EU) was dealt a blow by France’s repudiation of a proposed EU constitution, a move that called into question the EU’s long-term effectiveness. Within a matter of weeks, France itself was rocked by what initially appeared to be youthful unrest in one section of Paris. As riots spread across the country, however, the situation revealed a disturbing and broad-based economic condition; unemployment among France’s immigrant population is five times the national average, and the segment’s per capita income is 40% below the national average. The lingering sense is that a number of European countries will have to deal with a long-overlooked social and economic issue at a time when the EU is struggling to retain its authority.
These are just two examples illustrating that market volatility can be a function of unexpected, and sometimes unrelated, global events. The accompanying “Market Perspectives” commentary provides a more detailed analysis of the various economic and social factors that influenced the market during the past year. I’d like to focus on Gartmore’s view on how best to navigate uncertain domestic and global markets in the pursuit of acceptable investment returns.
Risk, regardless of its source, is part and parcel of investing. The challenge is to mitigate risk as much as possible through sound portfolio diversification. Gartmore is committed to offering a diverse range of equity, fixed-income and alternative investment solutions designed to capture global investment opportunities. The informed investment response to complex, volatile markets is to configure a series of diverse, uncorrelated, well-performing funds into a dynamic portfolio. At Gartmore, we seek to provide the core and satellite investments needed to construct a broadly diversified investment portfolio.
Moreover, Gartmore believes that seasoned investment experts employing well-articulated and tested processes and aided by global research form the path to acceptable risk-adjusted returns. We hold a core belief that the ideas and insights of talented investment professionals can add quantifiable investment returns. In that regard, we are pleased to report that the returns of 30 of our 47 retail mutual funds (Class A at NAV) exceeded their respective benchmarks for the annual period ended Oct. 31, 2005.
The performance of a number of Gartmore’s funds from a variety of sectors and regions strengthens the case for holding uncorrelated investments. For example, the performance of the Gartmore Global Natural Resources Fund, which during the reporting period returned 65.51% (Class A at NAV) versus the Goldman Sachs Natural Resources Index return of 34.75%, was driven by escalating energy prices derived from increased global demand coupled with concerns about supply shortages. Within the energy sector, the Fund concentrated on smaller companies with higher capacity for growth. It is widely believed that energy will be in great demand for an extended period of time; therefore, the Fund will remain focused on the energy services sector companies that acquire, develop, and exploit oil and natural gas properties. The Wall Street Journal cited the Fund as a “Category King” in the Mutual Fund Monthly Review of Sept. 6, 2005.
The Gartmore Small Cap Fund garnered above-average returns during the reporting period, posting a 31.51% return (Class A at NAV) versus the Russell 2000® Index return of 12.08%. Most of the Fund’s outperformance came from strong stock selection in the information technology and energy sectors, in addition to astute sector allocations. Shortly after the close of the period, the Fund was cited in The Wall Street Journal as a “Category King” and noted as the second-best-performing fund in its respective sector for October 2005.
In addition, during the reporting period, Gartmore’s small-cap investment team was enhanced by the hiring of senior portfolio manager Jayne Stevlingson, who has managed small-cap funds at both OppenheimerFunds, Inc. and Morgan Stanley.
The case for broad global diversification was made through the performance of several of our non-U.S. funds during the reporting period. In comparison to equity prices in Europe and Japan, those in the United States were more muted during the past year, reflecting stretched valuations and increasing uncertainty in the outlook for consumers. The emerging markets, however, outperformed all other regions. Though its performance slightly lagged that of its benchmark, the Gartmore Emerging Markets Fund posted very strong returns of 30.02% (Class A at NAV) for the reporting period. The Gartmore International Growth Fund, returning 26.13%
(Class A at NAV) versus the Morgan Stanley Capital International (MSCI) All Country World ex-U.S. Index return of 20.06%, also benefited from the impressive performance of emerging-market and Pacific Rim equities. In addition, Latin American securities delivered notably robust performance on the back of strong commodity prices.
The Gartmore Worldwide Leaders Fund, which returned 23.44% (Class A at NAV) versus 13.27% for the MSCI World IndexSM, benefited from both domestic and international developments. Overall, U.S. growth remained strong in the face of inflationary worries, while both Europe and Japan showed increasing signs of recovery. European export growth increased due to the weak euro at the same time that Japan experienced rising real incomes and increased capital expenditures. As a result, the Fund’s largest regional contributors were the United States, the United Kingdom and Japan. The Fund also benefited from strong stock selection within the technology, financial services, health-care and energy sectors.
Despite considerable volatility in both the U.S. economy and the U.S. equity markets during the past year, the Gartmore U.S. Growth Leaders Fund handily outperformed the Standard & Poor’s (S&P) 500® Index return of 8.72% with a return of 17.31% (Class A at NAV). The Fund’s performance was almost exclusively driven by strong stock selection, particularly in the technology and consumer goods areas. Concurrently, the Gartmore U.S. Growth Leaders Long-Short Fund returned 6.09% (Class A at NAV) versus 2.68% for its benchmark, the Citigroup 3-Month T-Bill Index. Again, adept stock selection, coupled with strong sector allocations, drove the Fund’s outperformance.
In addition to a suite of actively managed funds, Gartmore provides packaged asset allocation and diversification solutions. The Gartmore Optimal Allocations Funds, launched in June 2004, consist primarily of various proprietary Gartmore funds offered in four varieties, calibrated to different levels of risk: Moderate, Moderately Aggressive, Aggressive and Specialty. We are very pleased to report that each of these Funds, which serve as complements to actively managed holdings, outperformed their respective composite benchmarks for the reporting period.
| | | | | | |
| Fund Name | | Fund
Return* | | Benchmark Return | | Benchmark |
| Gartmore Optimal Allocations: Moderate | | 10.41% | | 7.56% | | S&P 500 (40%); MSCI EAFE (20%); Lehman Brothers U.S. Aggregate (40%) |
| Gartmore Optimal Allocations: Moderately Aggressive | | 12.77% | | 9.08% | | S&P 500 (60%); MSCI EAFE (20%); Lehman Brothers U.S. Aggregate (20%) |
| Gartmore Optimal Allocations: Aggressive | | 14.86% | | 10.67% | | S&P 500 (70%); MSCI EAFE (25%); Lehman Brothers U.S. Aggregate (5%) |
| Gartmore Optimal Allocations: Specialty | | 14.59% | | 11.50% | | S&P 500 (70%); MSCI EAFE (30%) |
| * | All Fund returns are Class A at NAV, as of Oct. 31, 2005. |
As we head into 2006, the only constant is uncertainty, which is a companion to opportunity. The informed and experienced investment manager, supported by broad-based research and analysis, can discern the investment opportunities associated with volatility. In today’s global investment landscape, a host of variables exist that impact investment returns, both positively and negatively. At Gartmore, we put all of our resources into our goal of achieving acceptable risk-adjusted returns on behalf of our investors. We measure our investment success by your performance standards. We appreciate the trust you have placed in us, and we will continue to strive to fulfill your investment objectives in the coming year.
Wishing you a very happy and prosperous 2006,

Young D. Chin
Co-Global Chief Investment Officer — Equities
President and CEO
Gartmore Global Investments
Market Perspectives
October 31, 2005
Market volatility continues, but with a positive trend
The one-year period ended Oct. 31, 2005, witnessed considerable quarter-to-quarter volatility. The past 12 months clearly have been rife with reasons to justify the wide swings in market pricing. Although the markets gave investors a bumpy ride, most of those who held on were rewarded, illustrated by the fact that, for the annual reporting period, the Morgan Stanley Capital International Europe, Australasia and Far East (MSCI EAFE®) Index returned 18.59% and the Standard & Poor’s (S&P) 500® Index was up 8.72%.
A broad rally in global equity markets took hold in the final two months of 2004. International stocks, as represented by the MSCI EAFE Index, advanced 11.55% during this period, while the S&P 500 Index, a broad measure of the U.S. equity market, gained 7.59%.
As 2005 began, however, concerns about slack economic growth, the onset of inflation, increasing interest rates and spiraling energy costs led to a far less favorable environment for stocks, leaving most markets on the defensive. To varying degrees, these concerns would continue to plague the equity markets for the remainder of the year. The overall global economy nonetheless proved resilient. In the United States, the economy grew at a faster pace during the fiscal third quarter than initially anticipated, signaling improving economic health. From July through September, gross domestic product, the broadest measure of U.S. economic activity, grew 4.3%.
The dominant topic in 2005, particularly during the latter half of the year, was the continued impact of rising energy costs. As Hurricane Katrina barreled down on the energy-intensive Louisiana coast, the futures price of crude oil rose to a high of $70 per barrel while natural gas prices doubled—a classic one-two economic punch. A confluence of increased global demand, particularly from China, and concerns about supply shortages also contributed to energy price hikes.
Meanwhile, the Federal Reserve Board continued its measured increases of short-term interest rates, despite speculation that the moves would halt amid spiking energy costs. Throughout the reporting period, the rate rose from 1.75% to 3.75% as a result of eight consecutive 0.25% increases. As September wound down, however, energy prices began to fall, though they still were far above their year-ago averages. Further, inflationary fears began to subside as the Fed displayed its confidence in the economy. Ben Bernanke was appointed the new Fed Chairman in October to replace Alan Greenspan, who retires at the end of his term in January 2006.
Toward the end of the reporting period, consumer sentiment began to lag. From August to September, the consumer confidence measure fell from 105.5 to 86.6. In August, wages and salaries increased by 6.6%, yet disposable income declined 0.1% along with personal spending, which fell 0.5%—the biggest drop in more than three years.
During the reporting period, energy and natural resource company profits surged alongside soaring energy costs and expanding global demand. In the telecommunications industry, on the other hand, the costs of consolidation muted returns. Domestically, within the S&P 500 Index for the entire reporting period, sector performance ranged from a high of 59% for health services (31% in the MSCI EAFE Index) to a low of –5% for consumer services (9% in the MSCI EAFE Index). Stocks in industrials, energy and distribution services delivered returns of 42%, 31% and 25% (43%, 24% and 46% in the MSCI EAFE Index), respectively, while stocks in consumer durables and communications delivered negative returns of –4% and –0.5% (14% and 5% in the MSCI EAFE Index), respectively.
Key trends for investors to watch
As we look toward the coming year, these are some of the key trends that we are paying particularly close attention to as we shape our investment strategies at Gartmore:
An aging population. During 2005, a landmark social milestone occurred when the leading edge of the baby boom generation reached 60 years of age. Since the early post-World War II years, the baby boomers, as one of the largest subsections of the U.S. population, have reshaped the social landscape in innumerable ways. This group’s retirement will continue the process. The country’s financial institutions, for example, will accelerate the re-engineering of their products and services toward wealth preservation, not just wealth generation. On the downside, though, the strain on many under-funded pension plans, in addition to
the Social Security system, may reverberate through the markets in unexpected and unsettling ways.
Housing prices—up, down or sideways? The housing market remained strong during the reporting period, with 30-year fixed mortgage rates remaining below 6% for the majority of the time. Confounding expectations amid Hurricanes Katrina and Rita and rising energy costs, existing home sales advanced to an all-time high of 2% in August. The robust housing market contributed much to the overall “wealth effect” for real estate investors. By the end of the reporting period, however, more pronounced signs of softening became evident.
One housing trend associated with the aging of the population: a wave of residential downsizing as retirees seek more practical, late-in-life living arrangements. Moreover, individuals are pulling back from the real estate speculation of the past few years as quick price appreciation has cooled in once-hot markets such as Las Vegas, Miami, Phoenix and San Diego.
The cost of socialization. During the past year, it has become even clearer that many corporations and countries must take a harder look at dealing with the burgeoning weight of socialization, which consists of, among other factors, health-care and retirement benefits. In fact, the future cost of socialization at both the corporate and country level will be of increasing concern in determining investment potential. Many longstanding business models and corporate policies will be revised in light of unsustainably heavy socialization costs.
France’s refusal to endorse the European Union (EU) constitution, for example, can be tied to the issue of socialization. Most observers believe that voters feared that a stronger EU would create an influx of cheap labor just as France was struggling to reduce high unemployment. In the United States, the issue of socialization was clearly evident in the United Auto Workers’ agreement with General Motors Corp. (GM) to cut health-care benefits for employees, retirees and their families. GM successfully argued that escalating pension and health-care benefits for a vast pool of retirees was forcing the enterprise into bankruptcy, which is a landmark shift in the auto industry’s historical model.
The international economic picture. In the latter part of 2005, the economies of Japan and Europe, including the United Kingdom, improved due to strong corporate profitability and expectations of higher levels of merger-and-acquisition activity. Europe was buoyed by export growth on the back of the weak euro. In Japan, meanwhile, rising real incomes and capital expenditure led to hopes of a sustainable recovery. Expectations rose when Prime Minister Junichiro Koizumi achieved a resounding victory in parliamentary elections, which gave his government a solid mandate for reform.
China’s economy grew rapidly during the reporting period. Despite ongoing criticism that governmental controls on the economy were overly rigid—particularly regarding commodity prices and imports/exports—China’s economy has largely stabilized and shows strong signs of continued growth. In fact, the government’s economic controls, once viewed as unduly prohibitive, are now credited with controlling what was becoming a dangerously overheated economy. For example, new factories were being developed in China at a rapid rate based on capital secured with minimal credit checks. Before long, some banks held portfolios with up to 45% nonperforming loans as a result of default. Government regulators subsequently mandated stricter credit rules and have even expressed a desire to improve China’s banks to such a degree that their credit quality would be attractive to foreign investors.
Throughout the first half of the year, the U.S. dollar continued its sustained, three-year decline versus benchmark currencies such as the euro. In mid-summer, however, the dollar reversed its multi-year trend. The dollar’s increase is due primarily to the strengthening U.S. economic outlook relative to the global platform and disappointment in European reform. In addition, two factors—the United Kingdom’s halting of interest-rate hikes and France’s vote against the EU constitution—have placed pressure on the euro, effectively bolstering the U.S. dollar.
The return of capital expenditures. As we look toward 2006, we are seeing a trend toward companies deploying large amounts of excess cash on their balance sheets. Since the 2000 market meltdown, many companies have relied on cash as their primary hedge against diminished revenues. Now, however, as the equity markets continue to recover, many of these firms are feeling the pressure either to put the money to work in various ways, such as toward acquisitions, or return the money to shareholders in the form of dividend payouts or share buybacks. The technology sector could be a notable beneficiary of this trend. Research and development as well as new product rollouts are key drivers in the technology industry, and both areas will be bolstered by increased spending.
Market Perspectives
Continued
Looking ahead
For the near term, investors will face a mixture of positive and negative factors. On the one hand, economic and corporate earnings growth is likely to slow in the coming months. Counterbalancing this slowdown could be positive sentiment surrounding the end of the Fed’s cycle of interest-rate hikes, which we anticipate will occur in the first half of 2006. If, as we expect, the peak in rates is accompanied by softening oil prices and a firm U.S. dollar, the investment environment should be favorable for equity markets.
PAST PERFORMANCE DOES NOT GUARANTEE FUTURE RESULTS. To obtain performance information current to the most recent month-end, which may be higher or lower than the performance shown above, please call 800-848-0920 or go to www.gartmorefunds.com
The opinions expressed herein are those of Gartmore Global Investments and may not come to pass.
Investing in mutual funds involves risk, including possible loss of principal. There is no assurance that the investment objective of any fund will be achieved.
The Gartmore Optimal Allocations Funds are designed to provide diversification and asset allocation across several types of investments and asset classes, primarily by investing in underlying Gartmore funds.
There is no assurance that a diversified portfolio will produce better results than a nondiversified one.
Each Fund is subject to different levels of risk, based on the size of its asset class allocations.
Index performance is provided for comparison purposes only; indexes are unmanaged and no fees or expenses are reflected. Individuals cannot invest directly in an index. Market index performance is provided by a third party source that Gartmore deems reliable.
The Gartmore Small Cap Fund may purchase securities in initial public offerings, which can be very volatile and carry high transaction costs.
Small-company stocks have higher risks than the stocks of larger, more established companies and have significant short-term price volatility.
Funds that concentrate on specific sectors or a relatively small number of securities may be subject to greater volatility than that of other mutual funds. International investing involves additional risks, including currency fluctuations, differences in accounting standards, political instability and foreign regulations, all of which are magnified in emerging markets.
In order to achieve the Gartmore U.S. Growth Leaders Long-Short Fund’s objective, the managers may use sophisticated investment strategies such as short selling, short-term trading and investing in smaller companies. These strategies may cause the Fund to have greater risk and volatility, and higher expenses, than those of other investments. The risks of investing in this Fund are more fully detailed within the Fund’s prospectus.
The Gartmore Optimal Allocations Fund: Aggressive benchmark consists of 70% S&P 500 Index, 25% MSCI EAFE Index and 5% Lehman Brothers U.S. Aggregate Index.
The Gartmore Optimal Allocations Fund: Moderately Aggressive benchmark consists of 60% S&P 500 Index, 20% MSCI EAFE Index and 20% Lehman Brothers U.S. Aggregate Index.
The Gartmore Optimal Allocations Fund: Moderate benchmark consists of 40% S&P 500 Index, 20% MSCI EAFE Index and 40% Lehman Brothers U.S. Aggregate Index.
The Gartmore Optimal Allocations Fund: Specialty benchmark consists of 70& S&P 500 Index and 30% MSCI EAFE Index.
Standard & Poor’s 500® (S&P 500) Index: An unmanaged, market capitalization-weighted index of 500 widely held stocks of large-cap U.S. companies that gives a broad look at how the stock prices of those companies have performed.
Lehman Brothers U.S. Aggregate Index: An unmanaged, market value-weighted index of investment-grade, fixed-rate debt issues (including government, corporate, asset-backed, and mortgage-backed securities with maturities of one year or more) that is generally representative of the bond market as a whole.
Morgan Stanley Capital International Europe, Australasia and Far East (MSCI EAFE®) Index: An unmanaged, free float-adjusted, market capitalization-weighted index that is designed to measure the performance of stocks in developed markets outside the United States and Canada.
Goldman Sachs Natural Resources Index: An unmanaged, modified market capitalization-weighted sector index of U.S.-traded natural resource-related stocks; includes companies in the categories of extractive industries, energy companies, owners and operators of timber tracts, forestry
services, producers of pulp and paper, and owners of plantations.
Citigroup 3-Month T-Bill Index: An unmanaged index that is generally representative of 3-month Treasury bills; consists of an average of the last 3-month Treasury bill issues (excluding the current month-end bill).
Morgan Stanley Capital International Emerging Markets (MSCI EM) IndexSM: An unmanaged, free float-adjusted, market capitalization-weighted index that is designed to measure the performance of the stocks in emerging-country markets.
Morgan Stanley Capital International (MSCI) All Country World excluding U.S. Index: An unmanaged, free float-adjusted, market-capitalization weighted index that is designed to measure the performance of the stocks in companies in all countries except the United States.
Morgan Stanley Capital International (MSCI) World IndexSM: An unmanaged, free float-adjusted, market capitalization-weighted index that is designed to measure the performance of global developed-market equities.
Russell 2000® Index: An unmanaged index that measures the performance of the stocks of small-capitalization U.S. companies; includes the smallest 2,000 U.S. companies in the Russell 3000® Index, which measures the performance of the largest 3,000 U.S. companies, based on market capitalization.
Each Fund’s underlying funds may be subject to specific investment risks such as those associated with a concentrated number of securities (such as REITs), small companies, international stocks, initial public offerings, short selling, short-term trading, bonds and short-term instruments.
Investors should carefully consider a fund’s investment objectives, risks, fees, charges and expenses before investing any money. To obtain this and other information on Gartmore’s funds, please call 800-848-0920 to request a prospectus, or download a prospectus at www.gartmorefunds.com. Please read it carefully before investing any money.
Gartmore Funds distributed by Gartmore Distribution Services, Inc., Member NASD. 1200 River Road, Suite 1000, Conshohocken, PA 19428.
Investing in mutual funds involves risk, including possible loss of principal.
There is no assurance that the investment objective of any fund will be achieved.
Commentary provided by Gartmore Global Investments, the investment adviser to Gartmore Funds. All opinions and estimates included in this report constitute Gartmore Global Investments’ judgment as of the date of this report and are subject to change without notice.
Gartmore Global Investments, one of its affiliated advisers, or its employees, may have a position in the securities named in this report.
This report is for informational purposes only, and is not intended as an offer or recommendation with respect to the purchase or sale of any security, option, future or other derivatives in such securities.
A complete list of all transactions in the last 12-months is available upon request.
Although third party information has been obtained from and is based on sources the Firm believes to be reliable, the Firm does not guarantee the accuracy of the information, and it may be incomplete or condensed.
Gartmore Global Investments is the investment adviser to Gartmore Funds. NorthPointe Capital is a federally registered service mark of Gartmore Global Investments, Inc. Nationwide is a federally registered service mark of Nationwide Mutual Insurance Company.
[This Page Left Blank Intentionally]
NorthPointe Small Cap Growth Fund
For the annual period ended Oct. 31, 2005, the NorthPointe Small Cap Growth Fund (Class A at NAV) returned 11.46% versus 10.91% for its benchmark, the Russell 2000® Growth Index. For broader comparison, the average return for the Fund’s Lipper peer category of Small-Cap Growth Funds was 11.79%.
The gains in small-cap growth stocks were due in large part to a strong rally that occurred in May, June and July on the heels of better-than-expected first-quarter earnings reports. Market action was choppy before and after that three-month period, as rising interest rates and surging crude oil prices combined to keep investors on the defensive. Small-cap shares turned in better performances than large caps but trailed the mid-cap group. The Fund was positioned to navigate through the market’s volatility, maintaining relative outperformance versus the benchmark. The strength of our investment process-focusing on high-quality stocks–helped the Fund during this challenging period.
From a small-cap perspective, all 10 sectors of the Russell 2000 Growth Index produced positive returns for the period. By strictly adhering to our bottom-up investment process for the Fund, we were able to generate an excess return over that of the benchmark.
From a sector standpoint, health care was the greatest contributor to the Fund’s return. Three of the Fund’s largest holdings, Thoratec Corp., LifeCell Corp. and Option Care, Inc., drove outperformance despite the Fund’s underweight position relative to the sector. Other sectors that contributed positively to the Fund’s performance were industrials and energy.
Detractors from Fund performance during the reporting period were in the consumer discretionary and materials sectors. The modest adverse impact of the Fund’s exposure to these areas was isolated to specific companies; we sold these securities during the period.
Overall, the Fund continues to be well positioned for 2006. We feel that we are entering the second phase of an earnings recovery in which higher-quality companies with sustainable earnings growth tend to outperform. We continue to believe that the Fund attempts to provide a level of downside protection by our careful attention to stock selection. Nevertheless our core philosophy has not changed. The Fund remains relatively sector-neutral to the benchmark, because we prefer to let stock selection drive performance. We remain focused on high-quality companies with sustainable competitive advantages, strong balance sheets and industry-leading returns trading at a reasonable valuation. We are confident that our strategy will be rewarded during the complete market cycle.
Portfolio Managers:
Carl P. Wilk and Karl Knas
NorthPointe Small Cap Growth Fund
Average Annual Total Return
(For periods ended October 31, 2005)
| | | | | | |
| | | | | 1 Yr. | | Inception1 |
| Class A | | w/o SC6 | | 11.46% | | 15.26% |
| | | w/SC3 | | 5.04% | | 9.15% |
| Class B | | w/o SC6 | | 10.71% | | 14.44% |
| | | w/SC4 | | 5.71% | | 10.80% |
| Class C | | w/o SC6 | | 10.71% | | 14.44% |
| | | w/SC5 | | 9.71% | | 14.44% |
| Class R2 | | | | 11.19% | | 14.89% |
| Institutional Service Class2 | | | | 11.75% | | 15.53% |
| Institutional Class2 | | | | 11.84% | | 15.62% |
| 1 | Fund commenced operations on September 29, 2004. |
| 2 | Not subject to any sales charges. |
| 3 | A 5.75% front-end sales charge was deducted. |
| 4 | A 5.00% contingent deferred sales charge (CDSC) was deducted. The CDSC declines to 0% after 6 years. |
| 5 | A CDSC of 1.00% was deducted because it is charged when you sell Class C shares within the first year after purchase. |
| 6 | These returns do not reflect the effects of sales charges (SC). |
Performance of a $10,000 Investment
Investment return and principal value will fluctuate, and when redeemed, shares may be worth more or less than original cost. Past performance is no guarantee of future results and does not reflect the deduction of taxes that a shareholder would pay on fund distributions or the redemption of fund shares. Investing in mutual funds involves market risk, including loss of principal. Performance returns assume the reinvestment of all distributions.
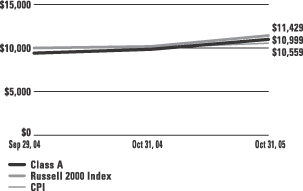
Comparative performance of $10,000 invested in the Class A of the NorthPointe Small Cap Growth Fund, Russell 2000 Index (Russell 2000)(a), and the Consumer Price Index (CPI)(b) since inception. Unlike the Fund, the returns for these unmanaged indexes do not reflect any fees, expenses, or sales charges. Investors cannot invest directly in market indexes.
| (a) | The Russell 2000 is an unmanaged index of approximately 2,000 companies with small market capitalizations relative to the market capilizations of other U.S. companies. |
| (b) | The CPI represents changes in prices of a basket of goods and services purchased for consumption by urban households. |
| | |
Shareholder Expense Example | | NorthPointe Small Cap Growth Fund |
As a shareholder of the Fund, you incur two types of costs: (1) transaction costs, including sales charges (loads) paid on purchase payments and redemption fees; and (2) ongoing costs, including investment advisory fees, administration fees, distribution fees and other Fund expenses. The examples below are intended to help you understand your ongoing costs (in dollars) of investing in the Fund and to compare these costs with the ongoing costs of investing in other mutual funds. Per SEC requirements, the examples assume that you had a $1,000 investment in the Class at the beginning of the reporting period, May 1, 2005, and continued to hold your shares at the end of the reporting period, October 31, 2005.
Actual Expenses
For each Class of the Fund in the table below, the first line provides information about actual account values and actual expenses. You may use the information in this line, together with the amount you invested, to estimate the expenses that you paid over the period. Simply divide your account value by $1,000 (for example, an $8,600 account value divided by $1,000 = 8.6), then multiply the result by the number in the first line of each Class under the heading entitled “Expenses Paid During Period” to estimate the expenses you paid on your account during the period.
Hypothetical Example for Comparison Purposes
The second line of each Class in the table below provides information about hypothetical account values and hypothetical expenses based on the Class’ actual expense ratio and an assumed rate of return of 5% per year before expenses, which is not the Class’ actual return. The hypothetical account values and expenses may not be used to estimate the actual ending account balance or expenses you paid for the period. You may use this information to compare the ongoing costs of investing in the Class of the Fund and other funds. To do so, compare this 5% hypothetical example with the 5% hypothetical examples that appear in the shareholder reports of the other funds.
Please note that the expenses shown in the table are meant to highlight your ongoing costs only and do not reflect any transaction costs, such as sales charges (loads) or redemption fees. Therefore, the second line for each Class in the table is useful in comparing ongoing costs only, and will not help you determine the relative total costs of owning different funds. In addition, if these transaction costs were included, your costs would have been higher. The examples also assume all dividends and distributions have been reinvested.
Schedule of Shareholder Expenses
Expense Analysis of a $1,000 Investment
(October 31, 2005)
| | | | | | | | | | | | | | |
| Small Cap Growth Fund | | | | | Beginning
Account Value
May 1, 2005 | | Ending
Account Value
October 31, 2005 | | Expenses Paid
During Period* | | Annualized
Expense Ratio* |
| Class A | | Actual | | | $ | 1,000 | | $ | 1,111 | | $ | 7.24 | | 1.36% |
| | | Hypothetical(1) | | | $ | 1,000 | | $ | 1,018 | | $ | 6.94 | | 1.36% |
| Class B | | Actual | | | $ | 1,000 | | $ | 1,106 | | $ | 10.94 | | 2.06% |
| | | Hypothetical(1) | | | $ | 1,000 | | $ | 1,015 | | $ | 10.51 | | 2.06% |
| Class C | | Actual | | | $ | 1,000 | | $ | 1,106 | | $ | 10.94 | | 2.06% |
| | | Hypothetical | (1) | | $ | 1,000 | | $ | 1,015 | | $ | 10.51 | | 2.06% |
| Class R | | Actual | | | $ | 1,000 | | $ | 1,109 | | $ | 8.45 | | 1.59% |
| | | Hypothetical(1) | | | $ | 1,000 | | $ | 1,017 | | $ | 8.12 | | 1.59% |
| Institutional Service Class | | Actual | | | $ | 1,000 | | $ | 1,111 | | $ | 6.33 | | 1.19% |
| | | Hypothetical(1) | | | $ | 1,000 | | $ | 1,019 | | $ | 6.07 | | 1.19% |
| Institutional Class | | Actual | | | $ | 1,000 | | $ | 1,112 | | $ | 5.86 | | 1.10% |
| | | Hypothetical(1) | | | $ | 1,000 | | $ | 1,019 | | $ | 5.61 | | 1.10% |
| * | Expenses are equal to the Fund’s annualized expense ratio multiplied by the average account value over the period multiplied by 184/365 (to reflect the one-half year period). The expense ratio presented represents a six month, annualized ratio in accordance with SEC guidelines. |
| (1) | Represents the hypothetical 5% return before expenses. |
| | |
Portfolio Summary | | NorthPointe Small Cap Growth Fund |
The SEC adopted a requirement that Funds present their portfolio holdings in a table, chart or graph format in their annual and semiannual reports to shareholders, whether or not a statement of investments is utilized. The following tables, which present portfolio holdings as a percentage of net assets, are provided in compliance with this requirement.
| | |
| Asset Allocation | | |
| Common Stocks | | 99.0% |
| Cash Equivalents | | 3.7% |
| Liabilities in excess of Other Assets | | –2.7% |
| | |
|
| | | 100.0% |
| | |
| Top Industries | | |
| Computer Software & Services | | 9.8% |
| Semiconductors | | 8.0% |
| Telecommunications | | 6.0% |
| Transportation | | 5.3% |
| Medical Products | | 5.2% |
| Oil & Gas | | 4.5% |
| Banks | | 4.2% |
| Retail | | 4.0% |
| Advertising | | 3.5% |
| Electronics | | 3.1% |
| Other Industries | | 46.4% |
| | |
|
| | | 100.0% |
| | |
| Top Holdings* | | |
Celadon Group, Inc. | | 1.9% |
Ventiv Health, Inc. | | 1.9% |
Marten Transport | | 1.9% |
Multi-Fineline Electronix, Inc. | | 1.9% |
Armor Holdings, Inc. | | 1.9% |
Jupitermedia Corp. | | 1.9% |
Volcom, Inc. | | 1.8% |
Jos. A. Bank Clothiers, Inc. | | 1.8% |
Shuffle Master, Inc. | | 1.8% |
East West Bancorp, Inc. | | 1.7% |
Other Holdings | | 81.5% |
| | |
|
| | | 100.0% |
| * | For purpose of listing top holdings, repurchase agreements are considered cash equivalents and are included as part of Other Holdings. |
Statement of Investments
October 31, 2005
NorthPointe Small Cap Growth Fund
| | | | | |
| | | Shares or
Principal Amount | | Value |
| | | | | | |
Advertising (3.5%) | | | |
24/7 Real Media, Inc. (b) | | 100,000 | | $ | 639,000 |
Ventiv Health, Inc. (b) | | 31,000 | | | 782,440 |
| | | | |
|
|
| | | | | | 1,421,440 |
| | | | |
|
|
Aerospace & Defense (1.9%) | | | |
Armor Holdings, Inc. (b) | | 17,000 | | | 760,070 |
| | | | |
|
|
Apparel (2.7%) | | | |
Maidenform Brands, Inc. (b) | | 30,500 | | | 383,995 |
Volcom, Inc. (b) | | 24,300 | | | 743,094 |
| | | | |
|
|
| | | | | | 1,127,089 |
| | | | |
|
|
Banks (4.2%) | | | |
East West Bancorp, Inc. | | 18,400 | | | 704,536 |
Royal Bancshares of Pennsylvania, Inc., Class A | | 20,000 | | | 471,400 |
Wintrust Financial Corp. | | 10,000 | | | 536,800 |
| | | | |
|
|
| | | | | | 1,712,736 |
| | | | |
|
|
Building & Construction Products (1.4%) | | | |
Trex Co., Inc. (b) | | 27,200 | | | 564,944 |
| | | | |
|
|
Business Services (2.7%) | | | |
Kforce, Inc. (b) | | 62,000 | | | 669,600 |
Source Interlink Cos., Inc. (b) | | 45,000 | | | 458,100 |
| | | | |
|
|
| | | | | | 1,127,700 |
| | | | |
|
|
Casino Services (3.0%) | | | |
Monarch Casino & Resort, Inc. (b) | | 25,800 | | | 499,746 |
Shuffle Master, Inc. (b) | | 28,500 | | | 722,760 |
| | | | |
|
|
| | | | | | 1,222,506 |
| | | | |
|
|
Computer Software & Services (9.8%) | | | |
Avid Technology, Inc. (b) | | 11,700 | | | 575,991 |
Dendrite International, Inc. (b) | | 21,100 | | | 370,305 |
Interwoven, Inc. (b) | | 55,000 | | | 517,000 |
Jupitermedia Corp. (b) | | 45,200 | | | 768,401 |
Merge Technologies, Inc. (b) | | 26,800 | | | 618,276 |
Rimage Corp. (b) | | 17,500 | | | 507,150 |
Smith Micro Software, Inc. (b) | | 100,000 | | | 720,000 |
| | | | |
|
|
| | | | | | 4,077,123 |
| | | | |
|
|
Consulting Services (1.3%) | | | |
CRA International, Inc. (b) | | 12,100 | | | 535,546 |
| | | | |
|
|
Consumer Products (2.7%) | | | |
Central Garden & Pet Co. (b) | | 9,600 | | | 411,552 |
| | | | | |
| | | Shares or
Principal Amount | | Value |
| | | | | | |
Consumer Products (continued) | | | |
Jarden Corp. (b) | | 20,500 | | $ | 692,695 |
| | | | |
|
|
| | | | | | 1,104,247 |
| | | | |
|
|
Cosmetics & Toiletries (1.7%) | | | |
Parlux Fragrances, Inc. (b) | | 29,800 | | | 690,168 |
| | | | |
|
|
Diversified Manufacturing (2.8%) | | | |
Actuant Corp. | | 10,000 | | | 487,000 |
Raven Industries, Inc. | | 20,800 | | | 653,952 |
| | | | |
|
|
| | | | | | 1,140,952 |
| | | | |
|
|
Electronics (3.1%) | | | |
Cyberoptics Corp. (b) | | 37,000 | | | 489,880 |
Multi-Fineline Electronix, Inc. (b) | | 29,000 | | | 771,980 |
| | | | |
|
|
| | | | | | 1,261,860 |
| | | | |
|
|
Energy (1.4%) | | | |
Headwaters, Inc. (b) | | 18,700 | | | 595,408 |
| | | | |
|
|
Financial Services (1.7%) | | | |
World Acceptance Corp. (b) | | 24,600 | | | 692,244 |
| | | | |
|
|
Food (1.2%) | | | |
SunOpta, Inc. (b) | | 100,000 | | | 494,000 |
| | | | |
|
|
Healthcare (1.3%) | | | |
Allied Healthcare International, Inc. (b) | | 85,000 | | | 517,650 |
| | | | |
|
|
Insurance (2.8%) | | | |
Navigators Group, Inc. (The) (b) | | 15,000 | | | 582,000 |
ProAssurance Corp. (b) | | 12,000 | | | 561,600 |
| | | | |
|
|
| | | | | | 1,143,600 |
| | | | |
|
|
Internet Security (1.3%) | | | |
Aladdin Knowledge Systems, Inc. (b) | | 30,100 | | | 529,459 |
| | | | |
|
|
Lasers (1.7%) | | | |
Cymer, Inc. (b) | | 20,000 | | | 697,000 |
| | | | |
|
|
Lottery Services (1.7%) | | | |
Scientific Games Corp. (b) | | 23,000 | | | 689,080 |
| | | | |
|
|
Machinery & Equipment (2.7%) | | | |
Lufkin Industries, Inc. | | 12,600 | | | 585,900 |
Middleby Corp. (The) (b) | | 7,500 | | | 543,750 |
| | | | |
|
|
| | | | | | 1,129,650 |
| | | | |
|
|
Statement of Investments (Continued)
October 31, 2005
NorthPointe Small Cap Growth Fund (Continued)
| | Common Stocks (continued) |
| | | | | |
| | | Shares or
Principal Amount | | Value |
| | | | | | |
Machinery, Equipment, & Supplies (2.7%) | | | |
Gehl Co. (b) | | 18,422 | | $ | 423,153 |
Mattson Technology (b) | | 85,000 | | | 670,650 |
| | | | |
|
|
| | | | | | 1,093,803 |
| | | | |
|
|
Medical Products (5.2%) | | | |
Encore Medical Corp. (b) | | 82,000 | | | 410,820 |
Haemonetics Corp. (b) | | 12,000 | | | 581,400 |
Thoratec Corp. (b) | | 28,000 | | | 553,840 |
West Pharmaceutical Services, Inc. | | 24,000 | | | 575,520 |
| | | | |
|
|
| | | | | | 2,121,580 |
| | | | |
|
|
Oil & Gas (4.5%) | | | |
Core Laboratories NV (b) | | 12,000 | | | 386,520 |
KCS Energy, Inc. (b) | | 16,000 | | | 385,920 |
Petrohawk Energy Corp. (b) | | 44,100 | | | 545,076 |
World Fuel Services Corp. | | 16,300 | | | 519,970 |
| | | | |
|
|
| | | | | | 1,837,486 |
| | | | |
|
|
Pharmaceuticals (1.2%) | | | |
First Horizon Pharmaceutical Corp. (b) | | 34,900 | | | 503,607 |
| | | | |
|
|
Real Estate Services (1.6%) | | | |
HouseValues, Inc. (b) | | 43,400 | | | 638,848 |
| | | | |
|
|
Restaurants (1.1%) | | | |
Buffalo Wild Wings, Inc. (b) | | 16,000 | | | 439,040 |
| | | | |
|
|
Retail (4.0%) | �� | | |
Aaron Rents, Inc. | | 30,900 | | | 608,730 |
Jos. A. Bank Clothiers, Inc. (b) | | 18,000 | | | 734,580 |
Rush Enterprises, Inc. (b) | | 20,000 | | | 301,200 |
| | | | |
|
|
| | | | | | 1,644,510 |
| | | | |
|
|
Schools (1.2%) | | | |
Universal Technical Institute, Inc. (b) | | 16,000 | | | 501,280 |
| | | | |
|
|
Semiconductors (8.0%) | | | |
02Micro International Ltd. (b) | | 48,500 | | | 635,350 |
Diodes, Inc. (b) | | 13,000 | | | 471,380 |
Photronics Corp. (b) | | 31,900 | | | 574,200 |
Rudolph Technologies, Inc. (b) | | 40,000 | | | 487,200 |
Silicon Image, Inc. (b) | | 63,500 | | | 582,930 |
Varian Semiconductor Equipment Associates, Inc. (b) | | 15,000 | | | 567,300 |
| | | | |
|
|
| | | | | | 3,318,360 |
| | | | |
|
|
| | | | | | | |
| | | Shares or
Principal Amount | | Value | |
| | | | | | | | |
Telecommunications (6.0%) | | | | |
Arris Group, Inc. (b) | | | 88,600 | | $ | 732,722 | |
Digi International, Inc. (b) | | | 48,500 | | | 514,585 | |
J2 Global Communications, Inc. (b) | | | 15,000 | | | 663,150 | |
Neustar, Inc. (b) | | | 19,300 | | | 590,580 | |
| | | | | |
|
|
|
| | | | | | | 2,501,037 | |
| | | | | |
|
|
|
Transportation (5.3%) | | | | |
Celadon Group, Inc. (b) | | | 34,000 | | | 787,440 | |
Genesee & Wyoming, Inc. Class A (b) | | | 20,000 | | | 641,000 | |
Marten Transport (b) | | | 29,300 | | | 778,500 | |
| | | | | |
|
|
|
| | | | | | | 2,206,940 | |
| | | | | |
|
|
|
Veterinary Diagnostics (1.6%) | | | | |
VCA Antech, Inc. (b) | | | 25,000 | | | 645,000 | |
| | | | | |
|
|
|
| | |
Total Common Stocks | | | | | | 40,685,963 | |
| | | | | |
|
|
|
|
Cash Equivalents (3.7%) | |
Investments in repurchase agreements (Collateralized by U.S. Government Agencies and U.S. Government Agency Mortgages, in a joint trading account at 3.90%, dated 10/31/05, due 11/01/05, repurchase price $1,522,388) | | $ | 1,522,223 | | | 1,522,223 | |
| | | | | |
|
|
|
| | |
Total Cash Equivalents | | | | | | 1,522,223 | |
| | | | | |
|
|
|
| |
Total Investments
(Cost $39,576,636) (a) — 102.7% | | | 42,208,186 | |
| |
Liabilities in excess of other
assets — (2.7)% | | | (1,128,837 | ) |
| | | | | |
|
|
|
| |
NET ASSETS — 100.0% | | $ | 41,079,349 | |
| | | | | |
|
|
|
| | (a) | See notes to financial statements for tax unrealized appreciation (depreciation) of securities. |
| | (b) | Represents non-income producing securities. |
See notes to financial statements.
NorthPointe Small Cap Value Fund
For the annual period ended Oct. 31, 2005, the NorthPointe Small Cap Value Fund (Institutional Class at NAV) returned 15.39% versus 12.08% for its benchmark, the Russell 2000® Index. For broader comparison, the average return for this Fund’s Lipper peer category of Small-Cap Core Funds was 13.22%.
Equity markets rallied in the last fiscal quarter of 2004 before slowing in early 2005, as investors took profits amid growing concerns that the Federal Reserve Board’s measured increases in interest rates might slow economic growth. Small-cap stocks experienced a period of difficulty, given the circumstances, and the mindset of many market analysts shifted toward large caps.
The current investing environment is a welcome change from the frustrating situation we encountered one year ago. At that time, the stock market was rewarding speculative companies and seemed to ignore those with strong and/or improving fundamentals. Typically, these speculative periods are unsustainable. The Fund’s solid performance in 2005 is evidence that the stock market has regained its “value” investing style (i.e., rewarding stocks with strong fundamentals). Within a value-style environment, the Fund has outperformed its benchmark.
During the reporting period, our stock selection for the Fund was strongest in the technology and financials sectors. Technology name Comtech Telecommunications Corp. and financial name Tower Group, Inc. were particularly strong performers for the Fund. Comtech benefited from the U.S. Army’s large orders for a new radio system, while Tower Group, a specialized property and casualty insurance provider, achieved robust earnings growth in part due to rising insurance premiums.
Conversely, our stock selection for the Fund was weaker in the health-care and consumer discretionary sectors. Health-care name Impax Laboratories, Inc. had a tough year as the company’s auditors were unable to ascertain the quarterly impact of a particular accounting transaction, which caused the company to delay its filing of financial reports. As a result, the NASDAQ market subsequently delisted the stock.
Despite the economic disruption caused by Hurricanes Katrina and Rita toward the end of the reporting period, our outlook remains unchanged. We expect those sectors that have exhibited improving fundamentals—particularly industrials and financials—to continue to be rewarded in the stock market, and we have positioned the Fund to benefit from such moves.
Our objective remains the same: to buy, at attractive valuations, well-positioned companies in which we see tangible evidence of fundamental improvement.
The portfolio continues to be characterized by stocks with favorable cash flow characteristics, earnings improvement and broad sector diversification. As 2006 unfolds, we believe that: 1) investors will continue to pay attention to the fundamentals that we think are important for long-term investing success; and 2) our investment discipline and style will yield favorable results.
Portfolio Managers:
Jeffery Petherick, CFA and Mary Champagne, CFA
| | |
NorthPointe Small Cap Value Fund |
Average Annual Total Return
(For periods ended October 31, 2005)
| | | | | | |
| | | 1 Yr. | | 5 Yr. | | Inception1 |
| Institutional Class | | 15.39% | | 12.49% | | 12.71% |
There are no sales charges on the shares of the NorthPointe Small Cap Value Fund.
| 1 | Fund commenced operations on June 29, 2000. |
Performance of a $10,000 Investment
Investment return and principal value will fluctuate, and when redeemed, shares may be worth more or less than original cost. Past performance is no guarantee of future results and does not reflect the deduction of taxes that a shareholder would pay on fund distributions or the redemption of fund shares. Investing in mutual funds involves market risk, including loss of principal. Performance returns assume the reinvestment of all distributions.
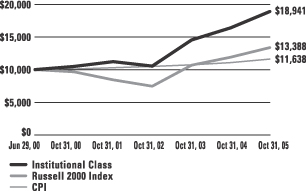
Comparative performance of $10,000 invested in the Institutional Class of the NorthPointe Small Cap Value Fund, Russell 2000 Index (Russell 2000)(a), and the Consumer Price Index (CPI)(b) since inception. Unlike the Fund, the returns for these unmanaged indexes do not reflect any fees, expenses, or sales charges. Investors cannot invest directly in market indexes.
| (a) | The Russell 2000 is an unmanaged index of approximately 2,000 companies with small market capitalizations relative to the market capitalizations of other U.S. companies. |
| (b) | The CPI represents changes in prices of a basket of goods and services purchased for consumption by urban households. |
| | |
Shareholder Expense Example | | NorthPointe Small Cap Value Fund |
As a shareholder of the Fund, you incur two types of costs: (1) transaction costs, including sales charges (loads) paid on purchase payments and redemption fees; and (2) ongoing costs, including investment advisory fees, administration fees, distribution fees and other Fund expenses. The examples below are intended to help you understand your ongoing costs (in dollars) of investing in the Fund and to compare these costs with the ongoing costs of investing in other mutual funds. Per SEC requirements, the examples assume that you had a $1,000 investment in the Class at the beginning of the reporting period, May 1, 2005, and continued to hold your shares at the end of the reporting period, October 31, 2005.
Actual Expenses
For each Class of the Fund in the table below, the first line provides information about actual account values and actual expenses. You may use the information in this line, together with the amount you invested, to estimate the expenses that you paid over the period. Simply divide your account value by $1,000 (for example, an $8,600 account value divided by $1,000 = 8.6), then multiply the result by the number in the first line of each Class under the heading entitled “Expenses Paid During Period” to estimate the expenses you paid on your account during the period.
Hypothetical Example for Comparison Purposes
The second line of each Class in the table below provides information about hypothetical account values and hypothetical expenses based on the Class’ actual expense ratio and an assumed rate of return of 5% per year before expenses, which is not the Class’ actual return. The hypothetical account values and expenses may not be used to estimate the actual ending account balance or expenses you paid for the period. You may use this information to compare the ongoing costs of investing in the Class of the Fund and other funds. To do so, compare this 5% hypothetical example with the 5% hypothetical examples that appear in the shareholder reports of the other funds.
Please note that the expenses shown in the table are meant to highlight your ongoing costs only and do not reflect any transaction costs, such as sales charges (loads) or redemption fees. Therefore, the second line for each Class in the table is useful in comparing ongoing costs only, and will not help you determine the relative total costs of owning different funds. In addition, if these transaction costs were included, your costs would have been higher. The examples also assume all dividends and distributions have been reinvested.
Schedule of Shareholder Expenses
Expense Analysis of a $1,000 Investment
(October 31, 2005)
| | | | | | | | | | | | | | |
| Small Cap Value Fund | | | | | Beginning
Account Value,
May 1, 2005 | | Ending
Account Value,
October 31, 2005 | | Expenses Paid
During Period* | | Annualized
Expense Ratio* |
| Institutional Class | | Actual | | | $ | 1,000.00 | | $ | 1,119.50 | | $ | 5.34 | | 1.00% |
| | | Hypothetical | (1) | | $ | 1,000.00 | | $ | 1,019.96 | | $ | 5.10 | | 1.00% |
| * | Expenses are equal to the Fund’s annualized expense ratio multiplied by the average account value over the period multiplied by 184/365 (to reflect the one-half year period). The expense ratio presented represents a six month, annualized ratio in accordance with SEC guidelines. |
| (1) | Represents the hypothetical 5% return before expenses. |
| | |
Portfolio Summary | | NorthPointe Small Cap Value Fund |
The SEC adopted a requirement that Funds present their portfolio holdings in a table, chart or graph format in their annual and semiannual reports to shareholders, whether or not a statement of investments is utilized. The following tables, which present portfolio holdings as a percentage of net assets, are provided in compliance with this requirement.
| | |
| Asset Allocation | | |
| Common Stocks | | 92.9% |
| Cash Equivalents | | 6.4% |
| Other Investments* | | 0.2% |
| Other Assets in excess of Liabilities** | | 0.5% |
| | |
|
| | | 100.0% |
| * | Includes value of collateral received from securities lending. |
| ** | Includes value of collateral owed from securities lending. |
| | |
| Top Industries | | |
| Capital Goods | | 12.2% |
| Banks | | 10.5% |
| Real Estate | | 9.5% |
| Software & Services | | 7.2% |
| Insurance | | 5.8% |
| Materials | | 5.7% |
| Utilities | | 5.2% |
| Health Care Equipments & Services | | 4.9% |
| Energy | | 4.4% |
| Retailing | | 3.5% |
| Other Industries | | 31.1% |
| | |
|
| | | 100.0% |
| | |
| Top Holdings*** | | |
| Allmerica Financial Corp. | | 1.5% |
| Tower Group, Inc. | | 1.4% |
| First Industrial Realty Trust | | 1.3% |
| Avista Corp. | | 1.3% |
| National Financial Partners Corp. | | 1.3% |
| Ashford Hospitality Trust | | 1.3% |
| El Paso Electric Co. | | 1.3% |
| Franklin Bank Corp. | | 1.2% |
| Thomas & Betts Corp. | | 1.2% |
| Regal-Beloit Corp. | | 1.2% |
| Other Holdings | | 87.0% |
| | |
|
| | | 100.0% |
| *** | For purpose of listing top holdings, repurchase agreements are considered cash equivalents and are included as part of Other Holdings. |
Statement of Investments
October 31, 2005
NorthPointe Small Cap Value Fund
| | | | | |
| | | Shares or
Principal Amount | | Value |
| | | | | | |
Automobiles (0.4%) | | | | | |
Drew Industries, Inc. (b) | | 3,900 | | $ | 112,515 |
| | | | |
|
|
Banks (10.5%) | | | | | |
Capital Corp. of the West | | 8,105 | | | 267,465 |
Columbia Banking System, Inc. | | 8,250 | | | 238,508 |
Commercial Capital Bancorp, Inc. | | 13,900 | | | 223,234 |
East West Bancorp, Inc. | | 7,600 | | | 291,004 |
First Place Financial Corp. | | 4,744 | | | 106,645 |
Franklin Bank Corp. (b) | | 18,040 | | | 311,190 |
Greene County Bancshares, Inc. | | 9,000 | | | 239,040 |
Midwest Banc Holding, Inc. | | 7,400 | | | 166,056 |
Placer Sierra Bancshares | | 10,644 | | | 286,536 |
Security Bank Corp. (c) | | 11,180 | | | 275,922 |
Vineyard National Bancorp Co. | | 8,090 | | | 236,875 |
| | | | |
|
|
| | | | | | 2,642,475 |
| | | | |
|
|
Capital Goods (12.2%) | | | | | |
Actuant Corp. | | 5,600 | | | 272,720 |
Beacon Roofing Supply, Inc. (b) | | 4,200 | | | 114,492 |
ElkCorp. | | 1,100 | | | 34,793 |
Foster Wheeler Ltd. (b) | | 10,300 | | | 291,284 |
Gardner Denver, Inc. (b) | | 5,500 | | | 267,300 |
Genlyte Group, Inc. (b) | | 5,090 | | | 259,437 |
Greenbrier Cos., Inc. (The) | | 6,800 | | | 187,340 |
Regal-Beloit Corp. | | 9,400 | | | 299,202 |
Stewart & Stevenson Services, Inc. | | 9,543 | | | 227,696 |
Teledyne Technologies, Inc. (b) | | 6,000 | | | 211,560 |
Thomas & Betts Corp. (b) | | 7,700 | | | 299,683 |
UAP Holding Corp. | | 1,200 | | | 22,920 |
United Industrial Corp. | | 6,200 | | | 218,798 |
Wabtec Corp. | | 9,000 | | | 244,800 |
Washington Group International, Inc. (b) | | 2,150 | | | 106,855 |
| | | | |
|
|
| | | | | | 3,058,880 |
| | | | |
|
|
Commercial Services & Supplies (0.4%) | | | |
Steelcase, Inc., Class A | | 7,300 | | | 104,536 |
| | | | |
|
|
Consumer Durables & Apparel (2.6%) | | | |
Champion Enterprises, Inc. (b) | | 18,400 | | | 255,392 |
Jarden Corp. (b) | | 6,350 | | | 214,567 |
Snap-On, Inc. | | 5,100 | | | 183,702 |
| | | | |
|
|
| | | | | | 653,661 |
| | | | |
|
|
| | | | | |
| | | Shares or
Principal Amount | | Value |
| | | | | | |
Consumer Services (1.3%) | | | | | |
Denny’s Corp. (b) | | 31,100 | | $ | 124,400 |
Jack in the Box, Inc. (b) | | 2,100 | | | 62,370 |
Sunterra Corp. (b) | | 11,800 | | | 141,718 |
| | | | |
|
|
| | | | | | 328,488 |
| | | | |
|
|
Diversified Financials (2.3%) | | | | | |
Advanta Corp. | | 9,993 | | | 283,501 |
Affiliated Managers Group, Inc. (b) | | 3,750 | | | 287,813 |
| | | | |
|
|
| | | | | | 571,314 |
| | | | |
|
|
Energy (4.4%) | | | | | |
Hanover Compressor Co. (b) | | 18,900 | | | 243,055 |
Hornbeck Offshore Services, Inc. (b) | | 6,629 | | | 213,520 |
KCS Energy, Inc. (b) | | 8,720 | | | 210,326 |
Pioneer Drilling Co. (b) | | 12,810 | | | 219,435 |
Southwestern Energy Co. (b) | | 3,000 | | | 217,620 |
| | | | |
|
|
| | | | | | 1,103,956 |
| | | | |
|
|
Food & Beverage (1.2%) | | | | | |
Flowers Foods, Inc. | | 5,000 | | | 146,500 |
Reddy Ice Holdings, Inc. | | 7,000 | | | 152,460 |
| | | | |
|
|
| | | | | | 298,960 |
| | | | |
|
|
Food & Staples Retailing (1.4%) | | | | | |
Casey’s General Stores, Inc. | | 6,400 | | | 138,112 |
Longs Drug Stores Corp. | | 2,300 | | | 95,933 |
Wild Oats Markets, Inc. (b) | | 10,000 | | | 111,200 |
| | | | |
|
|
| | | | | | 345,245 |
| | | | |
|
|
Healthcare Equipments & Services (4.9%) | | | |
Adeza Biomedical Corp. (b) | | 8,920 | | | 152,086 |
HealthTronics, Inc. (b) | | 26,400 | | | 239,976 |
Integra Lifesciences Corp. (b) | | 5,600 | | | 193,200 |
IntraLase Corp. (b) | | 15,700 | | | 242,722 |
LifePoint Hospitals, Inc. (b) | | 6,200 | | | 242,420 |
Symmetry Medical, Inc. (b) | | 6,700 | | | 148,338 |
| | | | |
|
|
| | | | | | 1,218,742 |
| | | | |
|
|
Household & Personal Products (0.7%) | | | |
Elizabeth Arden, Inc. (b) | | 8,400 | | | 182,028 |
| | | | |
|
|
Insurance (5.8%) | | | | | |
Allmerica Financial Corp. (b) | | 9,900 | | | 377,190 |
National Financial Partners Corp. | | 7,000 | | | 316,610 |
ProAssurance Corp. (b) | | 2,800 | | | 131,040 |
Statement of Investments (Continued)
October 31, 2005
NorthPointe Small Cap Value Fund (Continued)
| | Common Stocks (continued) |
| | | | | |
| | | Shares or
Principal Amount | | Value |
| | | | | | |
Insurance (continued) | | | |
Scottish Re Group Ltd. | | 11,500 | | $ | 282,325 |
Tower Group, Inc. | | 18,280 | | | 352,256 |
| | | | |
|
|
| | | | | | 1,459,421 |
| | | | |
|
|
Materials (5.7%) | | | | | |
Airgas, Inc. | | 7,900 | | | 223,333 |
Aleris International, Inc. (b) | | 8,300 | | | 215,468 |
Allegheny Technologies, Inc. | | 7,900 | | | 226,809 |
Olin Corp. | | 13,700 | | | 244,956 |
Omnova Solutions, Inc. (b) | | 31,391 | | | 141,260 |
RPM International, Inc. | | 10,500 | | | 195,510 |
Texas Industries, Inc. | | 3,500 | | | 173,600 |
| | | | |
|
|
| | | | | | 1,420,936 |
| | | | |
|
|
Media (2.0%) | | | | | |
Lions Gate Entertainment Corp. (b) | | 17,200 | | | 165,120 |
Salem Communications Corp. (b) | | 7,000 | | | 131,040 |
Scholastic Corp. (b) | | 6,398 | | | 208,255 |
| | | | |
|
|
| | | | | | 504,415 |
| | | | |
|
|
Pharmaceuticals & Biotechnology (1.4%) | | | |
Kos Pharmaceuticals, Inc. (b) | | 3,200 | | | 192,000 |
Serologicals Corp. (b) | | 8,100 | | | 157,788 |
| | | | |
|
|
| | | | | | 349,788 |
| | | | |
|
|
Real Estate (9.5%) | | | | | |
American Campus Communities, Inc. | | 9,000 | | | 222,750 |
American Financial Realty Trust | | 19,700 | | | 242,507 |
Ashford Hospitality Trust | | 29,934 | | | 314,307 |
BioMed Realty Trust, Inc. | | 10,000 | | | 250,100 |
Eagle Hospitality Properties Trust | | 22,340 | | | 212,453 |
First Industrial Realty Trust | | 8,200 | | | 333,166 |
First Potomac Realty Trust | | 8,000 | | | 202,720 |
JER Investors Trust, Inc. | | 11,200 | | | 190,960 |
Medical Properties Trust, Inc. | | 26,400 | | | 236,016 |
Trammell Crow Co. (b) | | 7,331 | | | 187,454 |
| | | | |
|
|
| | | | | | 2,392,433 |
| | | | |
|
|
Retailing (3.5%) | | | | | |
AnnTaylor Stores Corp. (b) | | 6,500 | | | 157,755 |
Hot Topic, Inc. (b) | | 12,600 | | | 187,614 |
J. Jill Group, Inc. (b) | | 5,500 | | | 69,850 |
Jos. A. Bank Clothiers, Inc. (b) | | 3,100 | | | 126,511 |
| | | | | |
| | | Shares or
Principal Amount | | Value |
| | | | | | |
Retailing (continued) | | | | | |
Too, Inc. (b) | | 6,600 | | $ | 187,506 |
United Auto Group, Inc. (c) | | 4,600 | | | 155,158 |
| | | | |
|
|
| | | | | | 884,394 |
| | | | |
|
|
Semiconductors & Equipment (2.5%) | | | |
Cirrus Logic, Inc. (b) | | 28,900 | | | 189,584 |
Mattson Technology (b) | | 14,700 | | | 115,983 |
ON Semiconductor Corp. (b) | | 30,500 | | | 141,520 |
Silicon Storage Technology (b) | | 33,600 | | | 169,680 |
| | | | |
|
|
| | | | | | 616,767 |
| | | | |
|
|
Software & Services (7.2%) | | | | | |
Akamai Technologies, Inc. (b) | | 8,500 | | | 147,390 |
Aspen Technologies, Inc. (b) | | 33,000 | | | 199,650 |
Covansys Corp. (b) | | 12,300 | | | 196,800 |
HomeStore, Inc. (b) | | 44,500 | | | 161,535 |
InterVoice, Inc. (b) | | 11,162 | | | 104,030 |
Jupitermedia Corp. (b) | | 10,500 | | | 178,500 |
Lawson Software (b) | | 26,500 | | | 202,990 |
Parametric Technology Corp. (b) | | 26,800 | | | 174,468 |
Take-Two Interactive Software, Inc. (b) | | 7,300 | | | 150,745 |
TIBCO Software, Inc. (b) | | 19,200 | | | 145,728 |
United Online, Inc. | | 11,400 | | | 152,874 |
| | | | |
|
|
| | | | | | 1,814,710 |
| | | | |
|
|
Technology Hardware & Equipment (3.5%) | | | |
3Com Corp. (b) | | 38,500 | | | 148,225 |
Coherent, Inc. (b) | | 7,000 | | | 207,270 |
Dot Hill Systems Corp. (b) | | 24,000 | | | 166,320 |
Intergraph Corp. (b) | | 2,300 | | | 111,274 |
Polycom, Inc. (b) | | 15,400 | | | 235,620 |
| | | | |
|
|
| | | | | | 868,709 |
| | | | |
|
|
Telecommunications (1.5%) | | | | | |
Dobson Communications Corp. (b) | | 22,600 | | | 164,754 |
NII Holdings, Inc. (b) | | 2,400 | | | 199,008 |
| | | | |
|
|
| | | | | | 363,762 |
| | | | |
|
|
Transportation (2.7%) | | | | | |
Alaska Air Group, Inc. (b) | | 8,800 | | | 277,464 |
Laidlaw International, Inc. | | 10,500 | | | 238,770 |
RailAmerica, Inc. (b) | | 13,400 | | | 158,790 |
| | | | |
|
|
| | | | | | 675,024 |
| | | | |
|
|
Statement of Investments (Continued)
October 31, 2005
NorthPointe Small Cap Value Fund (Continued)
Common Stocks (continued)
| | | | | | |
| | | Shares or
Principal Amount | | Value |
| | | | | | | |
Utilities (5.2%) | | | | | | |
Avista Corp. | | | 18,200 | | $ | 318,864 |
El Paso Electric Co. (b) | | | 14,500 | | | 313,925 |
South Jersey Industries, Inc. | | | 7,100 | | | 198,445 |
Westar Energy, Inc. | | | 10,400 | | | 229,840 |
WPS Resources Corp. | | | 4,600 | | | 250,976 |
| | | | | |
|
|
| | | | | | | 1,312,050 |
| | | | | |
|
|
| | |
Total Common Stocks | | | | | | 23,283,209 |
| | | | | |
|
|
|
Cash Equivalents (6.4%) |
Investments in repurchase agreements (Collateralized by U.S. Government Agencies and U.S. Government Agency Mortgages, in a joint trading account at 3.90%, dated 10/31/05, due 11/01/05, repurchase price $1,599,687) | | $ | 1,599,514 | | | 1,599,514 |
| | | | | |
|
|
| | |
Total Cash Equivalents | | | | | | 1,599,514 |
| | | | | |
|
|
Short-Term Securities Held as Collateral for Securities
Lending (0.2%)
| | | | | | |
| | | Shares or
Principal Amount | | Value |
Pool of short-term securities for Gartmore Mutual Funds —
note 2 (Securities Lending | | $ | 58,670 | | $ | 58,670 |
| | | | | |
|
|
| |
Total Short-Term Securities Held as Collateral for Securities Lending | | | 58,670 |
| | | | | |
|
|
| |
Total Investments
(Cost $23,249,074) (a) — 99.5% | | | 24,941,393 |
| |
Other assets in excess of
liabilities — 0.5% | | | 127,477 |
| | | | | |
|
|
| |
NET ASSETS — 100.0% | | $ | 25,068,870 |
| | | | | |
|
|
| | (a) | See notes to financial statements for tax unrealized appreciation (depreciation) of securities. |
| | (b) | Denotes a non-income producing security. |
| | (c) | All or part of the security was on loan as of October 31, 2005. |
See notes to financial statements.
Statements of Assets and Liabilities
October 31, 2005
| | | | | | | | |
| | | NorthPointe Small
Cap Growth Fund | | NorthPointe Small Cap Value Fund |
Assets: | | | | | | | | |
Investments, at value (cost $38,054,413 and $21,649,560; respectively) | | $ | 40,685,963 | | $ | 23,341,879 | | |
Repurchase agreements, at cost and value | | | 1,522,223 | | | 1,599,514 | | |
| | |
|
| |
|
| | |
Total Investments | | | 42,208,186 | | | 24,941,393 | | |
| | |
|
| |
|
| | |
Interest and dividends receivable | | | 8,115 | | | 9,970 | | |
Receivable for investments sold | | | 364,498 | | | 374,346 | | |
Prepaid expenses and other assets | | | 447 | | | 3,433 | | |
| | |
|
| |
|
| | |
Total Assets | | | 42,581,246 | | | 25,329,142 | | |
| | |
|
| |
|
| | |
| | | |
Liabilities: | | | | | | | | |
Payable to investment adviser | | | 6,960 | | | 858 | | |
Payable for investments purchased | | | 1,451,536 | | | 178,682 | | |
Payable for return of collateral received for securities on loan | | | — | | | 58,670 | | |
Accrued expenses and other payables | | | | | | | | |
Investment advisory fees | | | 27,159 | | | 17,936 | | |
Fund administration and transfer agent fees | | | 2,989 | | | 3,007 | | |
Administrative servicing fees | | | 2 | | | — | | |
Trustee fees | | | 99 | | | 45 | | |
Other | | | 13,152 | | | 1,074 | | |
| | |
|
| |
|
| | |
Total Liabilities | | | 1,501,897 | | | 260,272 | | |
| | |
|
| |
|
| | |
Net Assets | | $ | 41,079,349 | | $ | 25,068,870 | | |
| | |
|
| |
|
| | |
| | | |
Represented by: | | | | | | | | |
Capital | | $ | 35,052,279 | | $ | 18,117,027 | | |
Accumulated net investment income (loss) | | | — | | | — | | |
Accumulated net realized gains (losses) from investment transactions | | | 3,395,520 | | | 5,259,524 | | |
Net unrealized appreciation (depreciation) on investments | | | 2,631,550 | | | 1,692,319 | | |
| | |
|
| |
|
| | |
Net Assets | | $ | 41,079,349 | | $ | 25,068,870 | | |
| | |
|
| |
|
| | |
| | | | | | | | | |
| | | | | | | | | |
| | | | | | | | | |
| | | | | | | | | |
| | | | | | | | | |
| | | | | | | | | |
| | | | | | | | | |
| | | | | | | | | |
| | | | | | | | | |
| | | | | | | | | |
| | | | | | | | | |
| | | | | | | | | |
| | | | | | | | | |
| | | | | | | | | |
| | | | | | | | | |
| | | | | | | | | |
| | | | | | | | | |
See notes to financial statements.
Statements of Assets and Liabilities (Continued)
October 31, 2005
| | | | | | | | | |
| | | NorthPointe Small
Cap Growth Fund | | | NorthPointe Small Cap Value Fund |
Net Assets: | | | | | | | | | |
Class A Shares | | $ | 1,167 | | | $ | — | | |
Class B Shares | | | 1,158 | | | | — | | |
Class C Shares | | | 1,158 | | | | — | | |
Class R Shares | | | 1,163 | | | | — | | |
Institutional Service Class Shares | | | 1,170 | | | | — | | |
Institutional Class Shares | | | 41,073,533 | | | | 25,068,870 | | |
| | |
|
|
| |
|
| | |
Total | | $ | 41,079,349 | | | $ | 25,068,870 | | |
| | |
|
|
| |
|
| | |
| | | |
Shares outstanding (unlimited number of shares authorized): | | | | | | | | | |
Class A Shares | | | 100 | | | | — | | |
Class B Shares | | | 100 | | | | — | | |
Class C Shares | | | 100 | | | | — | | |
Class R Shares | | | 100 | | | | — | | |
Institutional Service Class Shares | | | 100 | | | | — | | |
Institutional Class Shares | | | 3,508,819 | | | | 2,004,123 | | |
| | |
|
|
| |
|
| | |
Total | | | 3,509,319 | | | | 2,004,123 | | |
| | |
|
|
| |
|
| | |
| | | |
Net asset value and redemption price per share: | | | | | | | | | |
Class A Shares | | $ | 11.67 | | | $ | — | | |
Class B Shares (a) | | $ | 11.58 | | | $ | — | | |
Class C Shares (b) | | $ | 11.58 | | | $ | — | | |
Class R Shares | | $ | 11.63 | | | $ | — | | |
Institutional Service Class Shares | | $ | 11.70 | | | $ | — | | |
Institutional Class Shares | | $ | 11.71 | | | $ | 12.51 | | |
| | | |
Maximum offering price per share (100%/(100%-maximum sales charge) of net asset value adjusted to the nearest cent): | | | | | | | | | |
Class A Shares | | $ | 12.38 | | | $ | — | | |
| | |
|
|
| |
|
| | |
Maximum Sales Charge — Class A Shares | | | 5.75 | % | | | | | |
| | |
|
|
| |
|
| | |
| | | | | | | | | | |
| | | | | | | | | | |
| | | | | | | | | | |
| | | | | | | | | | |
| | | | | | | | | | |
| | | | | | | | | | |
| | | | | | | | | | |
| | | | | | | | | | |
| | | | | | | | | | |
| | | | | | | | | | |
| | | | | | | | | | |
| (a) | For Class B shares, the redemption price per share varies by the length of time shares are held |
| (b) | For Class C Shares, the redemption price per share is reduced by 1.00% for shares held less than one year |
See notes to financial statements.
Statements of Operations
October 31, 2005
| | | | | | | | | | |
| | | NorthPointe Small
Cap Growth Fund | | | NorthPointe Small Cap Value Fund |
INVESTMENT INCOME: | | | | | | | | | | |
Interest income | | $ | 41,385 | | | $ | 32,957 | | | |
Dividend income | | | 83,053 | | | | 416,272 | | | |
Income from securities lending | | | 24,156 | | | | 10,872 | | | |
| | |
|
|
| |
|
|
| | |
Total Income | | | 148,594 | | | | 460,101 | | | |
| | |
|
|
| |
|
|
| | |
| | | |
Expenses: | | | | | | | | | | |
Investment advisory fees | | | 479,342 | | | | 243,983 | | | |
Fund administration and transfer agent fees | | | 62,861 | | | | 34,784 | | | |
Distribution fees Class A | | | 4 | | | | — | | | |
Distribution fees Class B | | | 11 | | | | — | | | |
Distribution fees Class C | | | 11 | | | | — | | | |
Distribution fees Class R | | | 4 | | | | — | | | |
Administrative Servicing fees Class R | | | 2 | | | | — | | | |
Registration and filing fees | | | 34,638 | | | | — | | | |
Trustee fees | | | 1,847 | | | | 1,209 | | | |
Other | | | 20,811 | | | | 11,390 | | | |
| | |
|
|
| |
|
|
| | |
Total expenses before waived or reimbursed expenses | | | 599,531 | | | | 291,366 | | | |
Earnings credit (Note 5) | | | (147 | ) | | | (66 | ) | | |
Expenses reimbursed | | | (44,324 | ) | | | (4,960 | ) | | |
| | |
|
|
| |
|
|
| | |
Total Expenses | | | 555,060 | | | | 286,340 | | | |
| | |
|
|
| |
|
|
| | |
Net Investment Income (Loss) | | | (406,466 | ) | | | 173,761 | | | |
| | |
|
|
| |
|
|
| | |
| | | |
REALIZED/UNREALIZED GAINS (LOSSES) FROM INVESTMENTS: | | | | | | | | | | |
Realized gains (losses) on investments transactions | | | 3,804,514 | | | | 5,765,598 | | | |
Net change in unrealized appreciation/depreciation on investments | | | 2,824,368 | | | | (1,593,752 | ) | | |
| | |
|
|
| |
|
|
| | |
Net realized/unrealized gains (losses) on investments | | | 6,628,882 | | | | 4,171,846 | | | |
| | |
|
|
| |
|
|
| | |
CHANGE IN NET ASSETS RESULTING FROM OPERATIONS | | $ | 6,222,416 | | | $ | 4,345,607 | | | |
| | |
|
|
| |
|
|
| | |
| | | | | | | | | | | |
| | | | | | | | | | | |
| | | | | | | | | | | |
| | | | | | | | | | | |
| | | | | | | | | | | |
| | | | | | | | | | | |
| | | | | | | | | | | |
| | | | | | | | | | | |
| | | | | | | | | | | |
| | | | | | | | | | | |
| | | | | | | | | | | |
| | | | | | | | | | | |
| | | | | | | | | | | |
| | | | | | | | | | | |
| | | | | | | | | | | |
| | | | | | | | | | | |
See notes to financial statements.
Statements of Changes in Net Assets
October 31, 2005
| | | | | | | | | | | | | | | | | | |
| | | NorthPointe Small Cap Growth Fund | | | NorthPointe Small Cap Value Fund |
| | | Year Ended October 31, 2005 | | | Period Ended
October 31, 2004 (a) | | | Year Ended October 31, 2005 | | | Year Ended
October 31, 2004 |
FROM INVESTMENT ACTIVITIES: | | | | | | | | | | | | | | | | | | |
Operations: | | | | | | | | | | | | | | | | | | |
Net investment income (loss) | | $ | (406,466 | ) | | $ | (6,591 | ) | | $ | 173,761 | | | $ | 67,196 | | | |
Net realized gains (losses) on investment transactions | | | 3,804,514 | | | | (2,528 | ) | | | 5,765,598 | | | | 7,609,857 | | | |
Net change in unrealized appreciation/depreciation on investments | | | 2,824,368 | | | | (192,818 | ) | | | (1,593,752 | ) | | | (3,245,906 | ) | | |
| | |
|
|
| |
|
|
| |
|
|
| |
|
|
| | |
Change in net assets resulting from operations | | | 6,222,416 | | | | (201,937 | ) | | | 4,345,607 | | | | 4,431,147 | | | |
| | |
|
|
| |
|
|
| |
|
|
| |
|
|
| | |
| | | | | |
Distributions to Institutional Class Shareholders from: | | | | | | | | | | | | | | | | | | |
Net investment income | | | — | | | | — | | | | (177,262 | ) | | | (65,374 | ) | | |
Net realized gains on investments | | | — | | | | — | | | | (7,680,667 | ) | | | (2,004,933 | ) | | |
| | |
|
|
| |
|
|
| |
|
|
| |
|
|
| | |
Change in net assets from shareholder distributions | | | — | | | | — | | | | (7,857,929 | ) | | | (2,070,307 | ) | | |
| | |
|
|
| |
|
|
| |
|
|
| |
|
|
| | |
Change in net assets from capital transactions | | | (14,941,130 | ) | | | 50,000,000 | | | | (3,575,161 | ) | | | (9,532,527 | ) | | |
| | |
|
|
| |
|
|
| |
|
|
| |
|
|
| | |
Change in net assets | | | (8,718,714 | ) | | | 49,798,063 | | | | (7,087,483 | ) | | | (7,171,687 | ) | | |
| | | | | |
Net Assets: | | | | | | | | | | | | | | | | | | |
Beginning of period | | | 49,798,063 | | | | – | | | | 32,156,353 | | | | 39,328,040 | | | |
| | |
|
|
| |
|
|
| |
|
|
| |
|
|
| | |
End of period | | $ | 41,079,349 | | | $ | 49,798,063 | | | $ | 25,068,870 | | | $ | 32,156,353 | | | |
| | |
|
|
| |
|
|
| |
|
|
| |
|
|
| | |
Accumulated net investment income (loss) | | $ | — | | | $ | (30 | ) | | $ | — | | | $ | 1,822 | | | |
| | |
|
|
| |
|
|
| |
|
|
| |
|
|
| | |
| | | | | | | | | | | | | | | | | | | |
| | | | | | | | | | | | | | | | | | | |
| | | | | | | | | | | | | | | | | | | |
| | | | | | | | | | | | | | | | | | | |
| | | | | | | | | | | | | | | | | | | |
| | | | | | | | | | | | | | | | | | | |
| | | | | | | | | | | | | | | | | | | |
| | | | | | | | | | | | | | | | | | | |
| | | | | | | | | | | | | | | | | | | |
| | | | | | | | | | | | | | | | | | | |
| | | | | | | | | | | | | | | | | | | |
| | | | | | | | | | | | | | | | | | | |
| | | | | | | | | | | | | | | | | | | |
| | | | | | | | | | | | | | | | | | | |
| | | | | | | | | | | | | | | | | | | |
| | | | | | | | | | | | | | | | | | | |
| | | | | | | | | | | | | | | | | | | |
| | | | | | | | | | | | | | | | | | | |
| | | | | | | | | | | | | | | | | | | |
| | | | | | | | | | | | | | | | | | | |
| | | | | | | | | | | | | | | | | | | |
| (a) | For the period from September 29, 2004 (commencement of operations) through October 31, 2004. |
See notes to financial statements.
Financial Highlights
Selected Data for Each Share of Capital Outstanding
NorthPointe Small Cap Growth Fund
| | | | | | | | | | | | | | | | | | | | | | | | | | | | | | | | | |
| | | | | Investment Activities | | | | | Ratios/Supplemental Data |
| | | Net Asset
Value,
Beginning
of Period | | Net
Investment
Income
(Loss) | | | Net Realized
and
Unrealized
Gains
(Losses) on
Investments | | Total
from
Investment
Activities | | Net
Asset
Value, End
of Period | | Total
Return (a) | | | Net Assets
at End of
Period
(000s) | | Ratio of
Expenses
to Average
Net Assets | | | Ratio of Net
Investment
Income
(Loss)
to Average
Net Assets | | | Ratio of
Expenses
(Prior to
Reimbursements)
to Average
Net Assets (b) | | | Ratio of Net
Investment
Income (Loss)
(Prior to
Reimbursements)
to Average
Net Assets (b) | | | Portfolio
Turnover (c) |
| | | | | | | | | | | | |
Class A Shares | | | | | | | | | | | | | | | | | | | | | | | | | | | | | | | | | |
Period Ended October 31, 2004 (d) | | $ | 10.00 | | (0.01 | ) | | 0.48 | | 0.47 | | $ | 10.47 | | 4.70% | (e) | | $ | 1 | | 1.50% | (f) | | (1.17% | )(f) | | 9.82% | (f) | | (9.48% | )(f) | | 0.48% |
Year Ended October 31, 2005 | | $ | 10.47 | | (0.13 | ) | | 1.33 | | 1.20 | | $ | 11.67 | | 11.46% | | | $ | 1 | | 1.58% | | | (1.11% | ) | | 1.69% | | | (1.22% | ) | | 144.08% |
| | | | | | | | | | | | |
Class B Shares | | | | | | | | | | | | | | | | | | | | | | | | | | | | | | | | | |
Period Ended October 31, 2004 (d) | | $ | 10.00 | | (0.01 | ) | | 0.47 | | 0.46 | | $ | 10.46 | | 4.60% | (e) | | $ | 1 | | 2.07% | (f) | | (1.78% | )(f) | | 9.13% | (f) | | (8.84% | )(f) | | 0.48% |
Year Ended October 31, 2005 | | $ | 10.46 | | (0.20 | ) | | 1.32 | | 1.12 | | $ | 11.58 | | 10.71% | | | $ | 1 | | 2.02% | | | (1.79% | ) | | 2.10% | | | (1.87% | ) | | 144.08% |
| | | | | | | | | | | | |
Class C Shares | | | | | | | | | | | | | | | | | | | | | | | | | | | | | | | | | |
Period Ended October 31, 2004 (d) | | $ | 10.00 | | (0.01 | ) | | 0.47 | | 0.46 | | $ | 10.46 | | 4.60% | (e) | | $ | 1 | | 2.07% | (f) | | (1.78% | )(f) | | 9.13% | (f) | | (8.84% | )(f) | | 0.48% |
Year Ended October 31, 2005 | | $ | 10.46 | | (0.20 | ) | | 1.32 | | 1.12 | | $ | 11.58 | | 10.71% | | | $ | 1 | | 2.02% | | | (1.79% | ) | | 2.11% | | | (1.87% | ) | | 144.08% |
| | | | | | | | | | | | |
Class R Shares | | | | | | | | | | | | | | | | | | | | | | | | | | | | | | | | | |
Period Ended October 31, 2004 (d) | | $ | 10.00 | | (0.01 | ) | | 0.47 | | 0.46 | | $ | 10.46 | | 4.60% | (e) | | $ | 1 | | 1.73% | (f) | | (1.17% | )(f) | | 8.65% | (f) | | (6.92% | )(f) | | 0.48% |
Year Ended October 31, 2005 | | $ | 10.46 | | (0.16 | ) | | 1.33 | | 1.17 | | $ | 11.63 | | 11.19% | | | $ | 1 | | 1.55% | | | (1.41% | ) | | 1.56% | | | (1.43% | ) | | 144.08% |
| | | | | | | | | | | | |
Institutional Service Class Shares | | | | | | | | | | | | | | | | | | | | | | | | | | | | | | | | | |
Period Ended October 31, 2004 (d) | | $ | 10.00 | | (0.01 | ) | | 0.48 | | 0.47 | | $ | 10.47 | | 4.70% | (e) | | $ | 1 | | 1.04% | (f) | | (0.74% | )(f) | | 8.22% | (f) | | (7.92% | )(f) | | 0.48% |
Year Ended October 31, 2005 | | $ | 10.47 | | (0.10 | ) | | 1.33 | | 1.23 | | $ | 11.70 | | 11.75% | | | $ | 1 | | 1.19% | | | (0.87% | ) | | 1.40% | | | (1.08% | ) | | 144.08% |
| | | | | | | | | | | | |
Institutional Class Shares | | | | | | | | | | | | | | | | | | | | | | | | | | | | | | | | | |
Period Ended October 31, 2004 (d) | | $ | 10.00 | | (0.01 | )(g) | | 0.48 | | 0.47 | | $ | 10.47 | | 4.70% | (e) | | $ | 49,793 | | 1.07% | (f) | | (1.02% | )(f) | | 2.18% | (f) | | (2.14% | )(f) | | 0.48% |
Year Ended October 31, 2005 | | $ | 10.47 | | (0.12 | ) | | 1.36 | | 1.24 | | $ | 11.71 | | 11.84% | | | $ | 41,074 | | 1.10% | | | (0.81% | ) | | 1.19% | | | (0.89% | ) | | 144.08% |
| | | | | | | | | | | | | | | | | | | | | | | | | | | | | | | | | | |
| | | | | | | | | | | | | | | | | | | | | | | | | | | | | | | | | | |
| | | | | | | | | | | | | | | | | | | | | | | | | | | | | | | | | | |
| | | | | | | | | | | | | | | | | | | | | | | | | | | | | | | | | | |
| | | | | | | | | | | | | | | | | | | | | | | | | | | | | | | | | | |
| | | | | | | | | | | | | | | | | | | | | | | | | | | | | | | | | | |
| | | | | | | | | | | | | | | | | | | | | | | | | | | | | | | | | | |
| | | | | | | | | | | | | | | | | | | | | | | | | | | | | | | | | | |
| | | | | | | | | | | | | | | | | | | | | | | | | | | | | | | | | | |
| | | | | | | | | | | | | | | | | | | | | | | | | | | | | | | | | | |
| (a) | Excludes sales charges |
| (b) | During the period certain fees were waived and/or reimbursed. If such waivers/reimbursements had not occurred, the ratios would have been as indicated. |
| (c) | Portfolio turnover is calculated on the basis of the Fund as a whole without distinguishing among the classes of shares. |
| (d) | For the period from September 29, 2004 (commencement of operations) through October 31, 2004. |
| (g) | Net investment income (loss) is based on average shares outstanding during the period. |
See notes to financial statements.
Financial Highlights
Selected Data for Each Share of Capital Outstanding
NorthPointe Small Cap Value Fund
| | | | | | | | | | | | | | | | | | | | | | | | | | | | | | | | | | | | | | | |
| | | | | Investment Activities | | | Distributions | | | | | | | | Ratios/Supplemental Data |
| | | Net Asset
Value,
Beginning
of Period | | Net
Investment
Income (Loss) | | Net Realized
and
Unrealized Gains
(Losses) on
Investments | | | Total from
Investment
Activities | | | Net
Investment
Income | | | Net
Realized
Gains | | | Total
Distributions | | | Net Asset
Value, End
of Period | | Total Return | | | Net Assets at End of
Period (000s) | | Ratio of Expenses to Average Net Assets | | Ratio of Net
Investment
Income (Loss) to Average Net Assets | | Ratio of
Expenses (Prior to
Reimbursements)
to Average Net Assets (a) | | Ratio of Net
Investment
Income (Prior to
Reimbursements)
to Average Net Assets (a) | | Portfolio
Turnover |
| | | | | | | | | | | | | | | |
Institutional Class Shares | | | | | | | | | | | | | | | | | | | | | | | | | | | | | | | | | | | | | | | |
Year Ended October 31, 2001 | | $ | 10.50 | | 0.13 | | 0.62 | | | 0.75 | | | (0.11 | ) | | — | | | (0.11 | ) | | $ | 11.14 | | 7.13% | | | $ | 30,470 | | 1.00% | | 1.00% | | 1.38% | | 0.62% | | 150.45% |
Year Ended October 31, 2002 | | $ | 11.14 | | 0.06 | | (0.69 | ) | | (0.63 | ) | | (0.06 | ) | | (0.63 | ) | | (0.69 | ) | | $ | 9.82 | | (6.43% | ) | | $ | 29,961 | | 1.00% | | 0.52% | | 1.06% | | 0.46% | | 105.59% |
Year Ended October 31, 2003 | | $ | 9.82 | | 0.03 | | 3.72 | | | 3.75 | | | (0.04 | ) | | — | | | (0.04 | ) | | $ | 13.53 | | 38.25% | | | $ | 39,328 | | 1.00% | | 0.25% | | 1.01% | | 0.23% | | 102.63% |
Year Ended October 31, 2004 | | $ | 13.53 | | 0.03 | | 1.64 | | | 1.67 | | | (0.03 | ) | | (0.74 | ) | | (0.77 | ) | | $ | 14.43 | | 12.65% | | | $ | 32,156 | | 0.99% | | 0.19% | | 1.00% | | 0.18% | | 135.45% |
Year Ended October 31, 2005 | | $ | 14.43 | | 0.08 | | 1.99 | | | 2.07 | | | (0.08 | ) | | (3.91 | ) | | (3.99 | ) | | $ | 12.51 | | 15.39% | | | $ | 25,069 | | 1.00% | | 0.61% | | 1.03% | | 0.59% | | 164.93% |
| | | | | | | | | | | | | | | | | | | | | | | | | | | | | | | | | | | | | | | | |
| | | | | | | | | | | | | | | | | | | | | | | | | | | | | | | | | | | | | | | | |
| | | | | | | | | | | | | | | | | | | | | | | | | | | | | | | | | | | | | | | | |
| | | | | | | | | | | | | | | | | | | | | | | | | | | | | | | | | | | | | | | | |
| | | | | | | | | | | | | | | | | | | | | | | | | | | | | | | | | | | | | | | | |
| | | | | | | | | | | | | | | | | | | | | | | | | | | | | | | | | | | | | | | | |
| | | | | | | | | | | | | | | | | | | | | | | | | | | | | | | | | | | | | | | | |
| | | | | | | | | | | | | | | | | | | | | | | | | | | | | | | | | | | | | | | | |
| | | | | | | | | | | | | | | | | | | | | | | | | | | | | | | | | | | | | | | | |
| | | | | | | | | | | | | | | | | | | | | | | | | | | | | | | | | | | | | | | | |
| | | | | | | | | | | | | | | | | | | | | | | | | | | | | | | | | | | | | | | | |
| | | | | | | | | | | | | | | | | | | | | | | | | | | | | | | | | | | | | | | | |
| | | | | | | | | | | | | | | | | | | | | | | | | | | | | | | | | | | | | | | | |
| | | | | | | | | | | | | | | | | | | | | | | | | | | | | | | | | | | | | | | | |
| | | | | | | | | | | | | | | | | | | | | | | | | | | | | | | | | | | | | | | | |
| | | | | | | | | | | | | | | | | | | | | | | | | | | | | | | | | | | | | | | | |
| | | | | | | | | | | | | | | | | | | | | | | | | | | | | | | | | | | | | | | | |
| | | | | | | | | | | | | | | | | | | | | | | | | | | | | | | | | | | | | | | | |
| | | | | | | | | | | | | | | | | | | | | | | | | | | | | | | | | | | | | | | | |
| | | | | | | | | | | | | | | | | | | | | | | | | | | | | | | | | | | | | | | | |
| | | | | | | | | | | | | | | | | | | | | | | | | | | | | | | | | | | | | | | | |
| | | | | | | | | | | | | | | | | | | | | | | | | | | | | | | | | | | | | | | | |
| | | | | | | | | | | | | | | | | | | | | | | | | | | | | | | | | | | | | | | | |
| | | | | | | | | | | | | | | | | | | | | | | | | | | | | | | | | | | | | | | | |
| | | | | | | | | | | | | | | | | | | | | | | | | | | | | | | | | | | | | | | | |
| | | | | | | | | | | | | | | | | | | | | | | | | | | | | | | | | | | | | | | | |
| | | | | | | | | | | | | | | | | | | | | | | | | | | | | | | | | | | | | | | | |
| (a) | During the period certain fees were waived and/or reimbursed. If such waivers/reimbursements had not occurred, the ratios would have been as indicated. |
See notes to financial statements.
Notes to Financial Statements
October 31, 2005
1. Organization
Gartmore Mutual Funds (the “Trust”) is an open-end management investment company, organized under the laws of Delaware by an amended and restated Agreement and Declaration of Trust, dated October 28, 2004, as amended to date. Prior to January 25, 2002, the Trust was named “Nationwide Mutual Funds”. The Trust was originally created under the laws of Ohio as an Ohio business trust pursuant to a Declaration of Trust dated, as of October 30, 1997, as subsequently amended, and redomesticated as a Delaware Statutory Trust on February 28, 2005, is registered under the Investment Company Act of 1940, as amended (the “1940 Act”). The redomestication was a change in statutory status and did not affect the operations of the Trust. As of October 31, 2005, the Trust had authorized an unlimited number of shares of beneficial interest (“shares”) without par value. The Trust operates forty-six (46) separate series, or mutual funds, each with its own investment objectives and strategies. This report contains the financial statements and financial highlights of the two (2) funds listed below (individually, a “Fund”; collectively, the “Funds”):
- NorthPointe Small Cap Growth Fund (“Small Cap Growth”)
- NorthPointe Small Cap Value Fund (“Small Cap Value”)
Under the Trust’s organizational documents, its officers and trustees are indemnified against certain liabilities arising out of the performance of their duties to the Trust. In addition, the Trust has entered into Indemnification Agreements with its Trustees and certain of its Officers. Trust Officers receive no compensation from the Trust for serving as its Officers. In addition, in the normal course of business, the Trust enters into contracts with its vendors and others that provide for general indemnifications. The Trust’s maximum liability under these arrangements is unknown, as this would involve future claims that may be made against the Trust. Based on experience however, the Trust expects that risk of loss to be remote.
2. Summary of Significant Accounting Policies
The following is a summary of significant accounting policies followed by the Funds in the preparation of their financial statements. The policies are in conformity with accounting principles generally accepted in the United States of America (“GAAP”). The preparation of financial statements requires management to make estimates and assumptions that affect the reported amounts of assets and liabilities, disclosure of contingent assets and liabilities at the date of the financial statements, and the reported amounts of income and expenses for the period. Actual results could differ from those estimates.
Securities for which market quotations are readily available are valued at current market value as of “Valuation Time.” Valuation Time is as of the close of regular trading on the New York Stock Exchange (usually 4 p.m. Eastern time). Equity securities are valued at the last quoted sale price or, if there is no sale price, the last quoted bid price provided by an independent pricing service approved by the Trust’s Board of Trustees. Securities traded on NASDAQ are valued at the NASDAQ Official Closing Price. Prices are taken from the primary market or exchange in which each security trades. Prices are taken from the primary market or exchange in which each security trades. Most securities listed on a foreign exchange are valued either at fair value (see description below) or at the last sale price at the close of the exchange on which the security is principally traded. Foreign securities, currencies, and other assets and liabilities denominated in foreign currencies are translated into U.S. dollars at the exchange rate of said currencies against the U.S. Dollar, as of Valuation Time, as provided by an independent pricing service approved by the Board of Trustees.
Securities for which market quotations are not readily available, or for which an independent pricing service does not provide a value or provides a value that does not represent fair value in the judgment of the Funds’ investment adviser or designee, are valued at fair value under procedures approved by the Trust’s Board of Trustees. The “Fair Value” of these securities is determined in good faith by taking into account relevant factors and surrounding circumstances. Methods utilized to obtain a “Fair Value” may include the following non-exclusive list of SEC acceptable methods: (i) a multiple of earnings; (ii) the discount from market value of a similar, freely traded security;
(iii) the yield-to-maturity for debt issues; or (iv) a consolidation of the methods. The Gartmore Fair Value Committee considers a non-exclusive list of factors to arrive at the appropriate method of determining “Fair Value.” For example, fair value determinations are required for securities whose value is affected by a “significant” event that materially affects the value of a domestic or foreign security which occurs subsequent to the time of the close of the principal market on which such domestic or foreign security trades and before the Valuation Time (i.e., a “subsequent event”). Typically, this will involve events occurring after the close of a foreign market on which a security trades and before the next Valuation Time.
The Funds holding foreign equity securities (the “Foreign Equity Funds”) value foreign securities at fair value in the circumstances described below. Generally, trading in foreign securities markets is completed each day at various times prior to the Valuation Time. Due to the time differences between the closings of the relevant foreign securities exchanges and the Valuation Time for the Foreign Equity Funds, the Foreign Equity Funds will fair value their foreign investments when it is determined that the market quotations for the foreign investments either are not readily available or are unreliable and, therefore, do not represent fair value. When the fair value prices are utilized, these prices will attempt to reflect the impact of the U.S. financial markets’ perceptions and trading activities on the Foreign Equity Funds’ foreign investments since the last closing prices of the foreign investments were calculated on their primary foreign securities markets or exchanges. For these purposes, the Board of Trustees of the Trust has determined that movements in relevant indices or other appropriate market indicators, after the close of the foreign securities exchanges, may demonstrate that market quotations are unreliable, and may trigger fair value pricing for certain securities. Consequently, fair valuation of portfolio securities may occur on a daily basis. In determining fair value prices, the Trust utilizes data furnished by an independent pricing service (and that data draws upon, among other information, the market values of foreign investments). The fair value prices of portfolio securities generally will be used when it is determined that the use of these prices will have a material impact on the net asset value of a Foreign Equity Fund. When a Foreign Equity Fund uses fair value pricing, the values assigned to the Foreign Equity Fund’s foreign investments may not be the quoted or published prices of the investments on their primary markets or exchanges. As of October 31, 2005, the Funds did not hold any foreign equity securities.
| (b) | | Repurchase Agreements |
The Funds may enter into repurchase agreements with an entity which is a member of the Federal Reserve System or which is a “primary dealer” (as designated by the Federal Reserve Bank of New York) in U.S. Government obligations. The repurchase price generally equals the price paid by a Fund plus interest negotiated on the basis of current short-term rates, which may be more or less than the rate on the underlying portfolio securities. The seller under a repurchase agreement is required to maintain the value of the collateral held pursuant to the agreement at a market value equal to or greater than the repurchase price (including accrued interest). Collateral subject to repurchase agreements is held by the Funds’ custodian or another qualified sub-custodian or in the Federal Reserve/ Treasury book-entry system. If the counterparty defaults and the fair value of the collateral declines, realization of the collateral by the Funds may be delayed or limited. The Funds may transfer uninvested cash balances into a pooled cash account. These balances are invested in one or more repurchase agreements, with the counterparties of CS First Boston and Nomura Securities which are fully collateralized by U.S. Government Agencies and U.S. Government Agency Mortgages.
The Funds may invest in financial futures contracts (“futures contracts”) for the purpose of hedging their existing portfolio securities or securities that the Funds intend to purchase against fluctuations in value caused by changes in prevailing market interest rates or prices. Futures contracts may also be entered into for non-hedging purposes. Upon entering into a futures contract, these Funds are required to pledge to the broker an amount of cash and/or other assets equal to a certain percentage of the contract amount (initial margin deposit). Subsequent payments, known as “variation margin”, are made each day, depending on the daily fluctuations in the fair value/market value of the underlying assets. A gain or loss equal to the daily variation margin is recognized on a daily basis. Future contracts are valued daily at their last quoted sale price.
Notes to Financial Statements (Continued)
October 31, 2005
A “sale” of a futures contract means a contractual obligation to deliver the securities or foreign currency called for by the contract at a fixed price at a specified time in the future. A “purchase” of a futures contract means a contractual obligation to acquire the securities or foreign currency at a fixed price at a specified time in the future.
Should market conditions change unexpectedly, a Fund may not achieve the anticipated benefits of the futures contracts and may realize a loss. The use of futures transactions for hedging purposes involves the risk of imperfect correlation in movements in the price of futures contracts, interest rates, and the value of the underlying hedged assets.
The Funds did not have any futures contracts during the year ended October 31, 2005.
| (d) | | Security Transactions and Investment Income |
Security transactions are accounted for on the date the security is purchased or sold (“trade date”). Securities gains and losses are calculated on the identified cost basis. Interest income is recognized on the accrual basis and includes, where applicable, the amortization or accretion of premium or discount. Dividend income is recorded on the ex-dividend date.
To generate additional income, each of the Funds may lend up to 331/3% of the Fund’s total assets pursuant to agreements, requiring that the borrower deliver cash or securities as collateral with respect to each new loan of U.S. securities, equal to at least 102% of the value of the portfolio securities loaned, and with respect to each new loan of non-U.S. securities, collateral of at least 105% of the value of the portfolio securities loaned, and thereafter requiring the borrower to mark to market the collateral on a daily basis and requiring the borrower to make up any shortfall of collateral. The Funds receive payments from borrowers of the dividends and interest that the Funds are entitled to for the positions on loan. These loan positions simultaneously earn income on the investment of cash collateral. Collateral is marked to market daily to provide a level of collateral at least equal to the value of securities loaned. There may be risks of delay in recovery of the securities should the borrower of the securities fail financially. Loans will be made, however, only to borrowers deemed by the Funds’ investment adviser to be of good standing and creditworthy under guidelines established by the Board of Trustees and when, in the judgment of the adviser, the consideration which can be earned currently from these securities loans justifies the attendant risks. Loans are subject to termination by the Funds or the borrower at any time, and, therefore, are not considered to be illiquid investments. JPMorgan Chase Bank serves as custodian for the securities lending program of the Funds. JP Morgan Chase Bank receives a fee based on the value of collateral received from borrowers.
The cash collateral received by the Funds at October 31, 2005, was pooled and invested in the following:
| | | | | | | | | | |
| Security Type | | Issuer | | Value | | Maturity Rate | | | Maturity Date |
Repurchase Agreement | | Nomura Securities | | $ | 58,670 | | 4.05 | % | | 11/01/05 |
Information on the investment of cash collateral is shown in the Statement of Investments.
As of October 31, 2005, the following Funds had securities with the following values on loan:
| | | | | | |
| Fund | | Value of
Loaned Securities | | Value of
Collateral |
Small Cap Value | | $ | 59,051 | | $ | 58,670 |
| (f) | | Distributions to Shareholders |
Net investment income, if any, is declared and paid quarterly for the Funds. Distributable net realized capital gains, if any, are declared and distributed at least annually.
Dividends and distributions to shareholders are determined in accordance with federal income tax regulations, which may differ from GAAP. These “book/tax” differences are considered either permanent or temporary in
nature. In accordance with American Institute of Certified Public Accountants (the “AICPA”) Statement of Position 93-2, permanent differences (i.e., reclassification of market discounts, gain/loss, paydowns and distributions) are reclassified within the capital accounts based on their nature for federal income tax purposes; temporary differences do not require reclassification. These reclassifications have no effect upon the net asset value of the respective Funds. To the extent distributions exceed current and accumulated earnings and profits for federal income tax purposes, these excesses are reported as distributions of paid-in-capital.
It is the policy of each Fund to qualify or continue to qualify as a regulated investment company by complying with the provisions available to certain investment companies, as defined in applicable sections of the Internal Revenue Code, and to make distributions of net investment income and net realized capital gains sufficient to relieve the Fund from all, or substantially all, federal income taxes.
| (h) | | Allocation of Expenses, Income, and Gains and Losses |
Expenses directly attributable to a Fund are charged to that Fund. Expenses not directly attributable to a Fund are allocated proportionately among various or all Funds within the Trust. For the Funds, the method for allocating income, fund level expenses, and realized and unrealized gains or losses is based on the fair value of shares outstanding relative to net assets. Under this method, each class of shares participates based on the total net asset value of that class’s shares in proportion to the total net assets of the Fund. Expenses specific to a class (such as Rule 12b-1 and administrative services fees) are charged to that class.
| (i) | | Capital Share Transactions |
Transactions in capital shares of the Funds were as follows:
| | | | | | | | | | | | | | |
| | | Small Cap Growth | | Small Cap Value |
| | | Year Ended
October 31, 2005 | | Period Ended
October 31, 2004 (a) | | Year Ended
October 31, 2005 | | Year Ended
October 31, 2004 |
CAPITAL TRANSACTIONS: | | | | | | | | | | | | | | |
Class A Shares | | | | | | | | | | | | | | |
Proceeds from shares issued | | $ | — | | $ | 1,000 | | $ | — | | $ | — | | |
| | |
|
| |
|
| |
|
| |
|
| | |
| | | | — | | | 1,000 | | | — | | | — | | |
| | |
|
| |
|
| |
|
| |
|
| | |
| | | | | |
Class B Shares | | | | | | | | | | | | | | |
Proceeds from shares issued | | | — | | | 1,000 | | | — | | | — | | |
| | |
|
| |
|
| |
|
| |
|
| | |
| | | | — | | | 1,000 | | | — | | | — | | |
| | |
|
| |
|
| |
|
| |
|
| | |
| | | | | |
Class C Shares | | | | | | | | | | | | | | |
Proceeds from shares issued | | | — | | | 1,000 | | | — | | | — | | |
| | |
|
| |
|
| |
|
| |
|
| | |
| | | | — | | | 1,000 | | | — | | | — | | |
| | |
|
| |
|
| |
|
| |
|
| | |
| | | | | |
Class R Shares | | | | | | | | | | | | | | |
Proceeds from shares issued | | | — | | | 1,000 | | | — | | | — | | |
| | |
|
| |
|
| |
|
| |
|
| | |
| | | | — | | | 1,000 | | | — | | | — | | |
| | |
|
| |
|
| |
|
| |
|
| | |
| | | | | |
Institutional Service Class Shares | | | | | | | | | | | | | | |
Proceeds from shares issued | | | — | | | 1,000 | | | — | | | — | | |
| | |
|
| |
|
| |
|
| |
|
| | |
| | | | — | | | 1,000 | | | | | | | | |
| | |
|
| |
|
| |
|
| |
|
| | |
| (a) | For the period from September 29, 2004 (commencement of operations) through October 31, 2004. |
Notes to Financial Statements (Continued)
October 31, 2005
| | | | | | | | | | | | | | | | | |
| | | Small Cap Growth | | Small Cap Value |
| | | Year Ended
October 31, 2005 | | | Period Ended
October 31, 2004 (a) | | Year Ended
October 31, 2005 | | | Year Ended
October 31, 2004 |
| | | | | |
Institutional Class Shares | | | | | | | | | | | | | | | | | |
Proceeds from shares issued | | | 14,000,073 | | | | 49,995,000 | | | 175,000 | | | | 3,946,839 | | | |
Dividends reinvested | | | — | | | | — | | | 7,634,747 | | | | 2,016,737 | | | |
Cost of shares redeemed | | | (28,941,203 | ) | | | — | | | (11,384,908 | ) | | | (15,496,103 | ) | | |
| | |
|
|
| |
|
| |
|
|
| |
|
|
| | |
| | | | (14,941,130 | ) | | | 49,995,000 | | | (3,575,161 | ) | | | (9,532,527 | ) | | |
| | |
|
|
| |
|
| |
|
|
| |
|
|
| | |
Change in net assets from capital transactions | | $ | (14,941,130 | ) | | $ | 50,000,000 | | $ | (3,575,161 | ) | | $ | (9,532,527 | ) | | |
| | |
|
|
| |
|
| |
|
|
| |
|
|
| | |
SHARE TRANSACTIONS: | | | | | | | | | | | | | | | | | |
Class A Shares | | | | | | | | | | | | | | | | | |
Issued | | | — | | | | 100 | | | — | | | | — | | | |
| | |
|
|
| |
|
| |
|
|
| |
|
|
| | |
| | | | — | | | | 100 | | | — | | | | — | | | |
| | |
|
|
| |
|
| |
|
|
| |
|
|
| | |
| | | | | |
Class B Shares | | | | | | | | | | | | | | | | | |
Issued | | | — | | | | 100 | | | — | | | | — | | | |
| | |
|
|
| |
|
| |
|
|
| |
|
|
| | |
| | | | — | | | | 100 | | | — | | | | — | | | |
| | |
|
|
| |
|
| |
|
|
| |
|
|
| | |
| | | | | |
Class C Shares | | | | | | | | | | | | | | | | | |
Issued | | | — | | | | 100 | | | — | | | | — | | | |
| | |
|
|
| |
|
| |
|
|
| |
|
|
| | |
| | | | — | | | | 100 | | | — | | | | — | | | |
| | |
|
|
| |
|
| |
|
|
| |
|
|
| | |
| | | | | |
Class R Shares | | | | | | | | | | | | | | | | | |
Issued | | | — | | | | 100 | | | — | | | | — | | | |
| | |
|
|
| |
|
| |
|
|
| |
|
|
| | |
| | | | — | | | | 100 | | | — | | | | — | | | |
| | |
|
|
| |
|
| |
|
|
| |
|
|
| | |
| | | | | |
Institutional Service Class Shares | | | | | | | | | | | | | | | | | |
Issued | | | — | | | | 100 | | | — | | | | — | | | |
| | |
|
|
| |
|
| |
|
|
| |
|
|
| | |
| | | | — | | | | 100 | | | — | | | | — | | | |
| | |
|
|
| |
|
| |
|
|
| |
|
|
| | |
Institutional Class Shares | | | | | | | | | | | | | | | | | |
Issued | | | 1,211,225 | | | | 4,755,967 | | | 15,138 | | | | 269,490 | | | |
Reinvested | | | — | | | | — | | | 629,899 | | | | 147,071 | | | |
Redeemed | | | (2,458,373 | ) | | | — | | | (870,005 | ) | | | (1,093,972 | ) | | |
| | |
|
|
| |
|
| |
|
|
| |
|
|
| | |
| | | | (1,247,148 | ) | | | 4,755,967 | | | (224,968 | ) | | | (677,411 | ) | | |
| | |
|
|
| |
|
| |
|
|
| |
|
|
| | |
Total change in shares | | | (1,247,148 | ) | | | 4,756,467 | | | (224,968 | ) | | | (677,411 | ) | | |
| | |
|
|
| |
|
| |
|
|
| |
|
|
| | |
| (a) | For the period from September 29, 2004 (commencement of operations) through October 31, 2004. |
3. Transactions with Affiliates
Under the terms of the Trust’s Investment Advisory Agreement, Gartmore Mutual Fund Capital Trust (“GMF”) manages the investment of the assets and supervises the daily business affairs of the Funds. GMF is a wholly-owned subsidiary of Gartmore Global Investments, Inc. (“GGI”), a holding company. GGI is a majority-owned subsidiary of Gartmore Global Asset Management Trust (“GGAMT”). GGAMT is a wholly-owned subsidiary of Nationwide Corporation. All of the common stock of Nationwide Corporation is held by Nationwide Mutual Insurance Company (95.2%) and Nationwide Mutual Fire Insurance Company (4.8%), each of which is a mutual company owned by its policyholders. GMF provides investment management evaluation services in initially selecting and monitoring on an ongoing basis, the performance of the subadviser, NorthPointe, LLC (“NorthPointe”) for the Funds. NorthPointe manages each of the Fund’s investments and has the responsibility for making all investment decisions for the Funds.
Under the terms of the Investment Advisory Agreement, each Fund pays GMF an investment advisory fee based on that Fund’s average daily net assets. From such fees, pursuant to the subadvisory agreement, GMF pays fees to NorthPointe. Additional information regarding the investment advisory fees and subadvisory fees for GMF and the subadvisers is as follows for the year ended October 31, 2005:
| | | | | | | | |
| Fund | | Fee Schedule | | Total
Fees | | Fees
Retained | | Paid to
Subadviser |
Small Cap Growth | | All Assets | | 0.95% | | — | | 0.95% |
Small Cap Value | | All Assets | | 0.85% | | — | | 0.85% |
GMF and the Funds have entered into written contracts (“Expense Limitation Agreements”) that limit operating expenses (excluding any taxes, interest, brokerage fees, extraordinary expenses, short sale dividend expenses, Rule 12b-1 fees, and administrative services fees) from exceeding 1.10% for all classes on Small Cap Growth and 1.00% for all classes on Small Cap Value until February 28, 2006.
GMF may request and receive reimbursement from the Small Cap Growth Fund of the advisory fees waived and other expenses reimbursed by GMF pursuant to the Expense Limitation Agreement at a later date not to exceed three years from the fiscal year in which the fees were waived or expenses reimbursed if the Fund has reached a sufficient asset size to permit reimbursement to be made without causing the total annual operating expense ratio of the Fund to exceed the limits set forth above. No reimbursement will be made unless: (i) the Fund’s assets exceed $100 million; (ii) the total annual expense ratio of the class making such reimbursement is less than the limit set forth above; and (iii) the payment of such reimbursement is approved by the Board of Trustees on a quarterly basis. Except as provided for in the Expense Limitation Agreement, reimbursement of amounts previously waived or assumed by GMF is not permitted.
As of the year ended October 31, 2005, the cumulative potential reimbursements of the Small Cap Growth Fund, based on reimbursements which expire within three years from the fiscal year in which the corresponding reimbursements to the Fund was made for expenses reimbursed by GMF would be:
| | | | | | |
| Fund | | Fiscal Year
2004 | | Fiscal Year
2005 |
Small Cap Growth | | $ | 7,391 | | $ | 44,324 |
Under the terms of a Distribution Plan under Rule 12b-1 of the 1940 Act, Gartmore Distribution Services, Inc. (“GDSI”), the Fund’s distributor, is compensated by the Fund for expenses associated with the distribution of certain classes of shares of the Fund. These fees are based on average daily net assets of the respective class of the Fund at an annual rate not to exceed the following:
| | | | | | | | | | | | |
| Fund | | Class A
Shares | | | Class B
Shares | | | Class C
Shares | | | Class R
Shares | |
Small Cap Growth | | 0.25 | % | | 1.00 | % | | 1.00 | % | | 0.50 | % |
Pursuant to an Underwriting Agreement, GDSI serves as principal underwriter of the Fund in the continuous distribution of their shares and receives commissions in the form of a front-end sales charge on the Class A shares. These fees are deducted from and are not included in proceeds from sales of Class A shares. From these fees, GDSI pays sales commissions, salaries, and other expenses in connection with generating new sales of Class A shares of the Small Cap Growth Fund. GDSI also receives fees for services as principal underwriter for Class B shares of the Small Cap Growth Fund. These fees are contingent deferred sales charges (“CDSCs”) ranging from 1% to 5% imposed on redemptions of Class B shares which may cause the current value of a shareholder’s account to fall below the total purchase payments. The CDSC, if applicable, will be imposed on redemptions made within six years of the purchase. Class C shares have a CDSC fee of 1% imposed on redemptions of Class C shares of the Small Cap Growth Fund made within one year of purchase. For the year ended October 31, 2005, GDSI received no commissions from front-end sales charges of Class A shares and from CDSC fees from Class B and Class C shares of the Small Cap Growth Fund.
Notes to Financial Statements (Continued)
October 31, 2005
Under the terms of a Fund Administration and Transfer Agency Agreement, Gartmore SA Capital Trust (“GSA”) provides various administrative and accounting services for the Funds, and Gartmore Investors Services, Inc. (“GISI”), an indirect subsidiary of GSA, serves as Transfer Agent and Dividend Disbursing Agent for each of the Funds. For the period November 1, 2004 through December 31, 2004, the fees for the services provided under such agreement were calculated based on the Trust’s average daily net assets according to the fee schedule below. The fees then are allocated proportionately among all Funds within the Trust in relation to the average daily net assets of each Fund and are paid to GSA. GSA pays GISI from these fees for GISI’s services.
| | |
| Combined Fee Schedule* |
Up to $1 billion | | 0.25% |
$1 billion and more up to $3 billion | | 0.18% |
$3 billion and more up to $4 billion | | 0.14% |
$4 billion and more up to $5 billion | | 0.07% |
$5 billion and more up to $10 billion | | 0.04% |
$10 billion and more up to $12 billion | | 0.02% |
$12 billion or more | | 0.01% |
| * | The assets of the Gartmore Investor Destinations Aggressive, Gartmore Investor Destinations Moderately Aggressive, Gartmore Investor Destinations Moderate, Gartmore Investor Destinations Moderately Conservative and Gartmore Investor Destinations Conservative Funds (collectively, the “Investor Destinations Funds”) and the Gartmore Optimal Allocations Fund: Aggressive, Gartmore Optimal Allocations Fund: Moderate, Gartmore Optimal Allocations Fund: Moderately Aggressive, and Gartmore Optimal Allocations Fund: Specialty (collectively, the “Optimal Funds”) are excluded from the Trust asset level amount in order to calculate this asset based fee. The Investor Destinations Funds and the Optimal Funds do not pay any part of this fee. |
Effective January 1, 2005, the fee for the fund administration and transfer agency services increased as set forth below. The fees are calculated based on the Trust’s average daily net assets according to the fee schedule below. The fees are then allocated proportionately among all funds within the Trust in relation to the average daily net assets of each fund and are paid to GSA.
| | |
| Combined Fee Schedule* |
Up to $1 billion | | 0.26% |
$1 billion and more up to $3 billion | | 0.19% |
$3 billion and more up to $4 billion | | 0.15% |
$4 billion and more up to $5 billion | | 0.08% |
$5 billion and more up to $10 billion | | 0.05% |
$10 billion and more up to $12 billion | | 0.03% |
$12 billion or more | | 0.02% |
| * | The assets of the Investor Destinations Funds and the Optimal Funds are excluded from the Trust asset level amount in order to calculate this asset based fee. The Investor Destinations Funds and the Optimal Funds do not pay any part of this fee. |
GSA and GISI have entered into agreements with BISYS Fund Services Ohio, Inc. (“BISYS”), pursuant to which BISYS provides sub-administration and sub-transfer agency services, respectively, to the Funds.
Under the terms of an Administrative Services Plan, the Funds may pay fees to servicing organizations, such as brokerdealers, including Nationwide Financial Services, and financial institutions, which agree to provide administrative support services to the shareholders of certain classes. These services include, but are not limited, to the following: establishing and maintaining shareholder accounts; processing purchase and redemption transactions; arranging bank wires; performing shareholder sub-accounting; answering inquiries regarding the Funds; and other such services. These
fees are based on an annual rate of up to 0.25% of the average daily net assets of the Class A, Class R and Institutional Service Class shares of each of the Funds.
As of October 31, 2005, the advisers or affiliates of the advisers directly held 100% of the shares outstanding of the Small Cap Growth Fund.
| 4. | | Short-Term Trading Fees |
The Small Cap Growth Fund assesses a 2.00% redemption fee on all classes of shares that are purchased and are sold or exchanged within 90 days of purchase. The redemption fee, if any, is paid directly to the Fund and is designed to offset brokerage commissions, market impact and other costs associated with short-term trading of Fund shares. For purposes of determining whether the redemption fee applies, the shares that were held the longest will be redeemed first. This redemption fee is in addition to any CDSCs that may be applicable at the time of sale. The redemption fee may not apply in certain circumstances, such as redemptions or exchanges of shares held in certain omnibus accounts or retirement plans that cannot implement the redemption fee. The fee does not apply to shares purchased through reinvested dividends or capital gains. For the year ended October 31, 2005, the Fund had no contributions to capital due to collection of redemption fees.
| 5. | | Bank Loans and Earnings Credit |
The Trust has a credit agreement of $100,000,000 with J.P. Morgan Chase & Co. Borrowings under this arrangement bear interest at the Federal Funds rate plus 0.50%. The interest costs are included in custodian fees in the Statement of Operations. No compensating balances were required under the terms of the line of credit. There were no borrowings outstanding as of October 31, 2005.
The Trusts’ custodian bank has agreed to reduce its fees when the funds of the Trust maintain cash on deposit in non-interest-bearing custody and Demand Deposit Accounts.
6. Investment Transactions
Purchases and sales of securities (excluding short-term securities) for the year ended October 31, 2005, are summarized as follows:
| | | | | | |
| Fund | | Purchases | | Sales |
Small Cap Growth | | $ | 70,836,147 | | $ | 83,241,222 |
Small Cap Value | | | 45,528,928 | | | 57,475,719 |
7. Federal Tax Information
The tax character of distributions paid during the fiscal year ended October 31, 2005, was as follows: (total distributions paid may differ from the Statement of Changes in Net Assets because for tax purposes dividends are recognized when paid.)
| | | | | | | | | |
| | | Distributions paid from
| | |
| Fund | | Ordinary
Income | | Net Long
Term Capital
Gains | | Total
Distributions
Paid |
Small Cap Growth | | $ | – | | $ | – | | $ | – |
Small Cap Value | | | 1,994,975 | | | 5,862,954 | | | 7,857,929 |
Notes to Financial Statements (Continued)
October 31, 2005
The tax character of distributions paid during the fiscal year ended October 31, 2004 was as follows: (total distributions paid differ from the Statement of Changes in Net Assets because for tax purposes dividends are recognized when paid.)
| | | | | | | | | | | | | | | |
| | | Distributions paid from
| | | | | | |
| Fund | | Ordinary
Income | | Net Long
Term Capital
Gains | | Total Taxable
Distributions | | Tax Exempt
Distributions | | Total
Distributions
Paid |
Small Cap Growth | | $ | – | | $ | – | | $ | – | | $ | – | | $ | – |
Small Cap Value | | | 1,222,852 | | | 847,455 | | | 2,070,307 | | | – | | | 2,070,307 |
As of October 31, 2005, the components of accumulated earnings (deficit) on a tax basis was as follows:
| | | | | | | | | | | | | | | |
| Fund | | Undistributed
Ordinary
Income | | Undistributed
Long-Term
Capital Gains | | Accumulated
Earnings | | Unrealized
Appreciation
(Depreciation)* | | Total
Accumulated
Earnings
(Deficit) |
Small Cap Growth | | $ | 3,586,567 | | $ | – | | $ | 3,586,567 | | $ | 2,440,503 | | $ | 6,027,070 |
Small Cap Value | | | 2,782,240 | | | 2,557,998 | | | 5,340,238 | | | 1,611,605 | | | 6,951,843 |
| * | The differences between the book-basis and tax-basis unrealized appreciation (depreciation) is attributable primarily to: tax deferral of losses on wash sales; the difference between book and tax amortization methods for premium and market discount; and the return of capital adjustments from real estate investment trusts. |
As of October 31, 2005, the tax cost of securities and the breakdown of unrealized appreciation (depreciation) for each Fund were as follows:
| | | | | | | | | | | | | |
| Fund | | Tax Cost of
Securities | | Unrealized
Appreciation | | Unrealized
Depreciation | | | Net
Unrealized
Appreciation
(Depreciation) |
Small Cap Growth | | $ | 39,767,683 | | $ | 4,525,510 | | $ | (2,085,007 | ) | | $ | 2,440,503 |
Small Cap Value | | | 23,329,788 | | | 2,360,975 | | | (749,370 | ) | | | 1,611,605 |
Report of Independent Registered Public Accounting Firm
To the Board of Trustees and Shareholders of Gartmore Mutual Funds:
In our opinion, the accompanying statements of assets and liabilities, including the statements of investments, and the related statements of operations and of changes in net assets and the financial highlights present fairly, in all material respects, the financial position of Gartmore NorthPointe Small Cap Growth Fund and Gartmore NorthPointe Small Cap Value Fund (two series of Gartmore Mutual Funds, hereafter referred to as the “Funds”) at October 31, 2005, the results of each of their operations for the year then ended, the changes in each of their net assets for each of the two years (or periods) then ended and the financial highlights for each of the four years (or periods) then ended in conformity with accounting principles generally accepted in the United States of America. These financial statements and financial highlights (hereafter referred to as “financial statements”) are the responsibility of the Funds’ management; our responsibility is to express an opinion on these financial statements based on our audits. We conducted our audits of these financial statements in accordance with the standards of the Public Company Accounting Oversight Board (United States.) Those standards require that we plan and perform the audit to obtain reasonable assurance about whether the financial statements are free of material misstatement. An audit includes examining, on a test basis, evidence supporting the amounts and disclosures in the financial statements, assessing the accounting principles used and significant estimates made by management, and evaluating the overall financial statement presentation. We believe that our audits, which included confirmation of securities at October 31, 2005 by correspondence with the custodian and brokers, provide a reasonable basis for our opinion. The financial highlights of Gartmore NorthPointe Small Cap Value Fund for the year ended October 31, 2001 were audited by other independent accountants whose report dated December 14, 2001 expressed an unqualified opinion on those financial statements.
PricewaterhouseCoopers LLP
Philadelphia, Pennsylvania
December 22, 2005
Supplemental Information (unaudited)
1. Other Federal Tax Information (Unaudited):
For the period ended October 31, 2005, certain dividends paid by the Funds may be subject to a maximum tax rate of 15% as provided for by the Jobs and Growth Tax Relief Reconciliation Act of 2003. The Funds intend to designate the maximum amount allowable as taxed at a maximum rate of 15%. Complete information will be reported in conjunction with your 2005 Form 1099-DIV.
For the period ended October 31, 2005, the following Funds paid qualified dividend income:
| | | |
| Fund | | Qualified
Dividend
Income |
Small Cap Growth | | $ | 112,583 |
Small Cap Value | | | 418,013 |
For the taxable year ended October 31, 2005, the following percentage of income dividends paid by the Funds qualify for the dividends received deduction available to corporations:
| | | |
| Fund | | Dividends
Received
Deduction | |
Small Cap Value | | 19 | % |
2. Shareholder Meeting
A separate shareholder meeting was held on Tuesday, December 23, 2004, for the shareholders of the Trust’s predecessor pursuant to a Proxy Statement on Schedule 14A, dated October 29, 2004, and mailed to the shareholders of the Trust’s predecessor on or around November 5, 2004.
Two Proposals: The purpose of the December 23, 2004 meeting was to allow the shareholders of the Trust’s predecessor to vote on:
i. Proposal One: The election of the Trust’s Predecessor’s Board of Trustees; and
ii. Proposal Two: The approval of an “Agreement and Plan of Reorganization” that provided for the reorganization of the Trust from an Ohio business trust into a Delaware statutory trust.
Proposal One: As set forth in the October 29, 2004 Proxy Statement, the nominees for election as Trustees of the Trust’s predecessor were: Charles E. Allen, Michael J. Baresich, Paula H.J. Cholmondeley, C. Brent DeVore, Phyllis Kay Dryden, Robert M. Duncan, Barbara L. Hennigar, Paul J. Hondros, Barbara I. Jacobs, Thomas J. Kerr, IV, Douglas F. Kridler, Michael D. McCarthy, Arden L. Shisler, and David C. Wetmore.
Proposal Two: As specifically set forth in the October 29, 2004 Proxy Statement, the Reorganization proposal requested the shareholders of the Trust’s predecessor to approve the proposed “Agreement and Plan of Reorganization” of the Trust’s predecessor (on behalf of each of the Trust’s funds) with and into a new Delaware-domiciled Trust, whereby the Funds of the new Delaware Trust would acquire all of the assets of the corresponding funds of the Trust’s predecessor subject to the liabilities, expenses, costs, charges, and reserves of the corresponding funds of the Trust’s predecessor (contingent or otherwise), in exchange for shares of the acquiring funds of the Trust to be distributed pro rata by the Trust to the holders of the shares of the funds of the Trust’s predecessor, in a complete liquidation of the Trust’s predecessor.
Voting Results:
The shareholders of the Trust’s predecessor voted to approve both Proposal One and Proposal Two, as follows:
| | |
| Proposal One: | | Election of a Board of Trustees of the Trust’s Predecessor |
Charles E. Allen: | | |
FOR | | 1,484,045,010.745 shares (96.963%) |
WITHHOLD | | 46,475,965.981 shares (3.037%) |
TOTAL | | 1,530,520,976.726 shares (100.000%) |
| |
Michael J. Baresich: | | |
FOR | | 1,479,546,876.136 shares (96.669%) |
WITHHOLD | | 50,974,100.590 shares (3.331%) |
TOTAL | | 1,530,520,976.726 shares (100.000%) |
| |
Paula H.J. Cholmondeley: | | |
FOR | | 1,483,986,754.474 shares (96.960%) |
WITHHOLD | | 46,534,222.252 shares (3.040%) |
TOTAL | | 1,530,520,976.726 shares (100.000%) |
| |
C. Brent DeVore: | | |
FOR | | 1,483,232,555.715 shares (96.910%) |
WITHHOLD | | 47,288,421.011 shares (3.090%) |
TOTAL | | 1,530,520,976.726 shares (100.000%) |
| |
Phyllis Kay Dryden: | | |
FOR | | 1,483,461,670.269 shares (96.925%) |
WITHHOLD | | 47,059,306.457 shares (3.075%) |
TOTAL | | 1,530,520,976.726 shares (100.000%) |
| |
Robert M. Duncan: | | |
FOR | | 1,478,518,553.740 shares (96.602%) |
WITHHOLD | | 52,002,422.986 shares (3.398%) |
TOTAL | | 1,530,520,976.726 shares (100.000%) |
| |
Barbara L. Hennigar: | | |
FOR | | 1,483,932,926.673 shares (96.956%) |
WITHHOLD | | 46,588,050.053 shares (3.044%) |
TOTAL | | 1,530,520,976.726 shares (100.000%) |
| |
Paul J. Hondros: | | |
FOR | | 1,483,799,576.741 shares (96.947%) |
WITHHOLD | | 46,721,399.985 shares (3.053%) |
TOTAL | | 1,530,520,976.726 shares (100.000%) |
| |
Barbara I. Jacobs: | | |
FOR | | 1,482,757,593.191 shares (96.879%) |
WITHHOLD | | 47,763,383.535 shares (3.121%) |
TOTAL | | 1,530,520,976.726 shares (100.000%) |
Supplemental Information (unaudited) (continued)
| | |
| Proposal One: | | Election of a Board of Trustees of the Trust’s Predecessor |
Thomas J. Kerr IV: | | |
FOR | | 1,477,143,243.388 shares (96.512%) |
WITHHOLD | | 53,377,733.338 shares (3.488%) |
TOTAL | | 1,530,520,976.726 shares (100.000%) |
| |
Douglas F. Kridler: | | |
FOR | | 1,484,100,191.103 shares (96.967%) |
WITHHOLD | | 46,420,785.623 shares (3.033%) |
TOTAL | | 1,530,520,976.726 shares (100.000%) |
| |
Michael D. McCarthy: | | |
FOR | | 1,483,352,898.255 shares (96.918%) |
WITHHOLD | | 47,168,078.471 shares (3.082%) |
TOTAL | | 1,530,520,976.726 shares (100.000%) |
| |
Arden L. Shisler: | | |
FOR | | 1,483,661,174.441 shares (96.938%) |
WITHHOLD | | 46,859,802.285 shares (3.062%) |
TOTAL | | 1,530,520,976.726 shares (100.000%) |
| |
David C. Wetmore: | | |
FOR | | 1,484,021,388.615 shares (96.962%) |
WITHHOLD | | 46,499,588.111 shares (3.038%) |
TOTAL | | 1,530,520,976.726 shares (100.000%) |
| | |
| Proposal Two: | | Approval of the Agreement and Plan of Reorganization of the
Trust’s Predecessor: |
FOR | | 1,338,850,729.743 shares (87.477%) |
AGAINST | | 48,927,279.322 shares (3.197%) |
ABSTAIN | | 86,596,336.653 shares (5.658%) |
BROKER NON-VOTES | | 56,146,631.008 shares (3.668%) |
TOTAL | | 1,530,520,976.726 share (100.000%) |
Management Information (Unaudited)
Trustees who are not Interested Persons (as defined in the 1940 Act) and Officers of the Funds as of
October 31, 2005
| | | | | | | | |
Name, Address
and Year of Birth | | Position(s) Held
with the Trust
and Length of
Time Served1 | | Principal Occupation(s)
During Past
Five Years | | Number of Portfolios
in the
Gartmore Fund
Complex Overseen
by Trustee | | Other Directorships Held by Trustee or Nominee2 |
| | | | |
Charles E. Allen c/o Gartmore Global Investments, Inc. 1200 River Road, Suite 1000 Conshohocken, PA 19428 1948 | | Trustee
since July 2000 | | Mr. Allen is Chairman, Chief Executive Officer and President of the Graimark Realty Advisors, Inc. (real estate development, investment and asset management). | | 84 | | None |
| | | | |
Paula H.J. Cholmondeley c/o Gartmore Global Investments, Inc. 1200 River Road, Suite 1000 Conshohocken, PA 19428 1947 | | Trustee
since July 2000 | | Ms. Cholmondeley has been the Chairman and Chief Executive Officer of the Sorrel Group, a management consulting company, since January 2004. Prior thereto, Ms. Cholmondeley was Vice President and General Manager of Sappi Fine Paper North America. | | 84 | | Director of Dentsply International, Inc., Ultralife Batteries, Inc. , Terex Corporation, Minerals Technology, Inc. and Albany International Corp. |
| | | | |
C. Brent DeVore c/o Gartmore Global Investments, Inc. 1200 River Road, Suite 1000 Conshohocken, PA 19428 1940 | | Trustee
since 1990 | | Dr. DeVore is President of Otterbein College. | | 84 | | None |
| | | | |
Phyllis K. Dryden c/o Gartmore Global Investments, Inc. 1200 River Road, Suite 1000 Conshohocken, PA 19428 1947 | | Trustee since December 2004 | | Ms. Dryden was a former Managing Partner of marchFIRST, a global management consulting firm prior to February, 2001. | | 84 | | None |
| | | | |
Barbara L. Hennigar c/o Gartmore Global Investments, Inc. 1200 River Road, Suite 1000 Conshohocken, PA 19428 1935 | | Trustee since July 2000 | | Retired. | | 84 | | None |
Management Information (Unaudited) (continued)
Trustees who are not Interested Persons (as defined in the 1940 Act) and Officers of the Funds as of
October 31, 2005 (Continued)
| | | | | | | | |
Name, Address
and Year of Birth | | Position(s) Held
with the Trust
and Length of
Time Served1 | | Principal Occupation(s)
During Past
Five Years | | Number of Portfolios
in the
Gartmore Fund
Complex Overseen
by Trustee | | Other Directorships Held by Trustee or Nominee2 |
| | | | |
Barbara I. Jacobs c/o Gartmore Global Investments, Inc. 1200 River Road, Suite 1000 Conshohocken, PA 19428 1950 | | Trustee
since December 2004 | | Ms. Jacobs has served as Chairman of the Board of Directors of KICAP Network Fund, a European (United Kingdom) hedge fund , since December 2000. Prior to 2004, Ms. Jacobs was also a Managing Director and European Portfolio Manager with CREF Investments (Teachers Insurance Annuity Association — College Retirement Equity Fund). | | 84 | | None |
| | | | |
Douglas F. Kridler c/o Gartmore Global Investments, Inc. 1200 River Road, Suite 1000 Conshohocken, PA 19428 1955 | | Trustee
since September 1997 | | Mr. Kridler has served as the President and Chief Executive Officer of the Columbus Foundation (a Columbus, OH-based foundation which manages over 1,300 individual endowment funds) since February 2002. Mr. Kridler was the President of the Columbus Association for the Performing Arts prior thereto and Chairman of the Greater Columbus Convention and Visitors Bureau during 2000 and 2001. | | 84 | | None |
| | | | |
Michael D. McCarthy c/o Gartmore Global Investments, Inc. 1200 River Road, Suite 1000 Conshohocken, PA 19428 1947 | | Trustee
since December 2004 | | Mr. McCarthy serves as: the Founder and Chairman of The Eureka Foundation (which sponsors and funds the “Great Museums” series on PBS); and a Partner of Pineville Properties LLC (a commercial real estate development firm). | | 843 | | None |
| | | | |
David C. Wetmore c/o Gartmore Global Investments, Inc. 1200 River Road, Suite 1000 Conshohocken, PA 19428 1948 | | Trustee
since 1995 and Chairman since February 2005 | | Retired. | | 84 | | None |
| 1 | Length of time served includes time served with the Trust’s predecessor. |
| 2 | Directorships held in (1) any other investment companies registered under the 1940 Act, (2) any company with a class of securities registered pursuant to Section 12 of the Securities Exchange Act of 1934, as amended (the “Exchange Act”), or (3) any company subject to the requirements of Section 15(d) of the Exchange Act. |
| 3 | Mr. McCarthy was also an Administrative Committee Member for the Alphagen Arneb Fund, LLC , The Healthcare Fund LDC, The Leaders Long-Short Fund, LLC, and The Leaders Long-Short Fund LDC, four private investment companies (hedge funds) managed by GSA. Mr. McCarthy resigned as an Administrative Committee Member effective June 30, 2005. |
Trustees and Officers who are not Interested Persons (as defined in the 1940 Act) of the Funds received aggregate compensation of $548,510 from the Trust for the year ended October 31, 2005. Additional information regarding the Trustees and Officers may be found in the Trust’s statement of additional information, which is available without charge upon request, by calling 800-848-0920.
Trustees who are Interested Persons (as defined in the 1940 Act) and/or Officers of the Funds as of
October 31, 2005
| | | | | | | | |
Name, Address
and Year of Birth | | Position(s) Held
with the Trust
and Length of
Time Served1 | | Principal Occupation(s)
During Past
Five Years | | Number of Portfolios
in the
Gartmore Fund
Complex Overseen
by Trustee | | |
| | | | |
Paul J. Hondros Gartmore Global Investments, Inc. 1200 River Road, Suite 1000 Conshohocken, PA 19428 1948 | | Trustee
since July 2000 | | Mr. Hondros has been President and Chief Executive Officer of various Gartmore entities, including Gartmore Distribution Services, Inc. (“GDSI”),3 Gartmore Investor Services, Inc. (“GISI”),3 Gartmore Morley Capital Management, Inc. (“GMCM”),3 Gartmore Morley Financial Services, Inc. (“GMFS”), 3 NorthPointe Capital, LLC (“NorthPointe”),3 Gartmore Global Asset Management Trust (“GGAMT”)3,, Gartmore Global Investments, Inc. (“GGI”)3, Gartmore Mutual Fund Capital Trust (“GMFCT”)3 and Gartmore SA Capital Trust (“GSA”)3; and a Director of Nationwide Securities, Inc.3, as well as several entities within Nationwide Financial Services, Inc. | | 844 | | None |
| | | | |
Arden L. Shisler Gartmore Global Investments, Inc. 1200 River Road, Suite 1000 Conshohocken, PA 19428 1941 | | Trustee
since February 2000 | | Mr. Shisler has been a consultant since January 2003. Prior thereto, he was President and Chief Executive Officer of K&B Transport, Inc., a trucking firm. Since 1992, Mr. Shisler has also been Chairman of the Board for Nationwide Mutual Insurance Company3. | | 84 | | Director of Nationwide Financial Services, Inc. |
| | | | |
Gerald J. Holland Gartmore Global Investments, Inc. 1200 River Road, Suite 1000 Conshohocken, PA 19428 1951 | | Treasurer
since March 2001 | | Mr. Holland is Senior Vice President — Operations for GGI3, GMFCT3 , and GSA3. | | 84 | | None |
| | | | |
Michael A. Krulikowski Gartmore Global Investments, Inc. 1200 River Road, Suite 1000 Conshohocken, PA 19428 1959 | | Chief Compliance Officer since June 2004 | | Since November 1999, Mr. Krulikowski has served as a Vice President and Chief Compliance Officer of GGI. Since June 2004, Mr. Krulikowski has also served as Chief Compliance Officer of the Trust. | | 84 | | None |
Management Information (Unaudited) (continued)
Trustees who are Interested Persons (as defined in the 1940 Act) and/or Officers of the Funds as of
October 31, 2005 (Continued)
| | | | | | | | |
Name, Address
and Year of Birth | | Position(s) Held
with the Trust
and Length of
Time Served1 | | Principal Occupation(s)
During Past
Five Years | | Number of Portfolios
in the
Gartmore Fund
Complex Overseen
by Trustee | | |
| | | | |
Eric E. Miller Gartmore Global Investments, Inc. 1200 River Road, Suite 1000 Conshohocken, PA 19428 1953 | | Secretary since December 2002 | | Mr. Miller is Senior Vice President, Chief Counsel for GGI3, GMFCT3 and GSA3 since August 2002. From August 2000 to August 2002, Mr. Miller was a Partner with Stradley Ronan Stevens & Young, LLP. | | 84 | | None |
| 1 | Length of time served includes time served with the Trust’s predecessor. |
| 2 | Directorships held in (1) any other investment companies registered under the 1940 Act, (2) any company with a class of securities registered pursuant to Section 12 of the Securities Exchange Act of 1934, as amended (the “Exchange Act”), or (3) any company subject to the requirements of Section 15(d) of the Exchange Act. |
| 3 | This position is held with an affiliated person or principal underwriter of the Trust. |
| 4 | Mr. Hondros was also an Administrative Committee Member for the Alphagen Arneb Fund, LLC , The Healthcare Fund LDC, The Leaders Long-Short Fund, LLC, and The Leaders Long-Short Fund LDC, four private investment companies (hedge funds) managed by GSA. Mr. Hondros resigned as an Administrative Committee Member effective June 30, 2005. |
Federal law requires the Trust, each of its investment advisers and sub-advisers to adopt procedures for voting proxies (“Proxy Voting Guidelines”) and to provide a summary of those Proxy Voting Guidelines used to vote the securities held by the Funds. The Funds’ proxy voting policies and procedures are available without charge (i) upon request, by calling 800-848-0920, (ii) on the Fund’s website at www.gartmorefunds.com, or (iii) on the Securities and Exchange Commission’s website at www.sec.gov.
Index Definitions
Lipper Analytical Services, Inc. is an industry research firm whose rankings are based on total return performance and do not reflect the effect of sales charges. Each fund is ranked within a universe of funds similar in investment objective as determined by Lipper.
Russell 2000® Growth Index: An unmanaged index that measures the performance of the stocks of U.S. companies in the Russell 2000® Index (the smallest 2,000 U.S. companies, based on market capitalization) with higher price-to-book ratios and higher forecasted growth values.
Russell 2000® Index: An unmanaged index that measures the performance of the stocks of small-capitalization U.S. companies; includes the smallest 2,000 U.S. companies in the Russell 3000® Index, which measures the performance of the largest 3,000 U.S. companies, based on market capitalization.

Gartmore Funds
1200 River Road, Suite 1000
Conshohocken, PA 19428
www.gartmorefunds.com
Federal law requires the Fund, and the Fund’s investment advisers and subadvisers, to adopt procedures for voting proxies (“Proxy Voting Guidelines”) and to provide a summary of those Proxy Voting Guidelines used to vote the securities held by the Funds. The Fund’s proxy voting policies and procedures are available without charge (i) upon request, by calling 800-848-0920, (ii) on the Fund’s Web site at www.gartmorefunds.com, or (iii) on the U.S. Securities and Exchange Commission’s Web site at www.sec.gov.
© 2005 Gartmore Global Investments, Inc.
All rights reserved.
AR-NP 12/05
Disclose whether, as of the end of the period covered by the report, the registrant has adopted a code of ethics that applies to the registrant’s principal executive officer, principal financial officer, principal accounting officer or controller, or persons performing similar functions, regardless of whether these individuals are employed by the registrant or a third party. If the registrant has not adopted such a code of ethics, explain why it has not done so.
The registrant has adopted a code of ethics that applies to the registrant’s principal executive officer, principal financial officer, principal accounting officer or controller, or persons performing similar functions. This code of ethics is included as Exhibit 12 (a)(1).
The registrant must briefly describe the nature of any amendment, during the period covered by the report, to a provision of its code of ethics that applies to the registrant’s principal executive officer, principal financial officer, principal accounting officer or controller, or persons performing similar functions, regardless of whether these individuals are employed by the registrant or a third party, and that relates to any element of the code of ethics definition enumerated in paragraph (b) of this Item. The registrant must file a copy of any such amendment as an exhibit pursuant to Item 11(a)(1), unless the registrant has elected to satisfy paragraph (f) of this Item by posting its code of ethics on its website pursuant to paragraph (f)(2) of this Item, or by undertaking to provide its code of ethics to any person without charge, upon request, pursuant to paragraph (f)(3) of this Item.
If the registrant has, during the period covered by the report, granted a waiver, including an implicit waiver, from a provision of the code of ethics that applies to the registrant’s principal executive officer, principal financial officer, principal accounting officer or controller, or persons performing similar functions, regardless of whether these individuals are employed by the registrant or a third party, that relates to one or more items set forth in paragraph (b) of this Item, the registrant must briefly describe the nature of the waiver, the name of the person to whom the waiver was granted, and the date of the waiver.
During the period covered by the report, with respect to the registrant’s code of ethics that applies to the registrant’s principal executive officer, principal financial officer, principal accounting officer or controller, or persons performing similar functions, there have been no amendments to, nor any waivers granted from, a provision that relates to any element of the code of ethics definition enumerated in paragraph (b) of this Item 2.
| Item 3. | Audit Committee Financial Expert. |
(a) (1) Disclose that the registrant’s board of directors has determined that the registrant either:
(i) Has at least one audit committee financial expert serving on its audit committee; or
(ii) Does not have an audit committee financial expert serving on its audit committee.
(2) If the registrant provides the disclosure required by paragraph (a)(1)(i) of this Item, it must disclose the name of the audit committee financial expert and whether that person is “independent.” In order to be considered “independent” for purposes of this Item, a member of an audit committee may not, other than in his or her capacity as a member of the audit committee, the board of directors, or any other board committee:
(i) Accept directly or indirectly any consulting, advisory, or other compensatory fee from the issuer; or
(ii) Be an “interested person” of the investment company as defined in Section 2(a)(19) of the Act (15 U.S.C. 80a-
2(a)(19)).
(3) If the registrant provides the disclosure required by paragraph (a)(1)(ii) of this Item, it must explain why it does not have an audit committee financial expert.
| | |
3(a) (1) | | The registrant’s board of trustees has determined that the registrant has at least one audit committee financial expert serving on board’s audit committee. |
| |
3(a)(2) | | The audit committee financial expert of the registrant’s board of trustees is Paula Cholmondeley, who, for purposes of this Item 3 of Form N-CSR, is an “independent” trustee of the registrant. |
| Item 4. | Principal Accountant Fees and Services. |
(a) Disclose, under the caption Audit Fees, the aggregate fees billed for each of the last two fiscal years for professional services rendered by the principal accountant for the audit of the registrant’s annual financial statements or services that are normally provided by the accountant in connection with statutory and regulatory filings or engagements for those fiscal years.
(b) Disclose, under the caption Audit-Related Fees, the aggregate fees billed in each of the last two fiscal years for assurance and related services by the principal accountant that are reasonably related to the performance of the audit of the registrant’s financial statements and are not reported under paragraph (a) of this Item. Registrants shall describe the nature of the services comprising the fees disclosed under this category.
(c) Disclose, under the caption Tax Fees, the aggregate fees billed in each of the last two fiscal years for professional services rendered by the principal accountant for tax compliance, tax advice, and tax planning. Registrants shall describe the nature of the services comprising the fees disclosed under this category.
(d) Disclose, under the caption All Other Fees, the aggregate fees billed in each of the last two fiscal years for products and services provided by the principal accountant, other than the services reported in paragraphs (a) through (c) of this Item. Registrants shall describe the nature of the services comprising the fees disclosed under this category.
4(a) through 4(d): The information in the table below is provided for services rendered to the registrant by the registrant’s principal accountant, PricewaterhouseCoopers LLP (“PwC”), for the registrant’s fiscal years ended October 31, 2004 and October 31, 2005.
| | | | | | |
| | | 2004
| | 2005
|
Audit Fees | | $ | 396,045 | | $ | 455,145 |
Audit-Related Fees1 | | $ | 30,000 | | $ | 0 |
Tax Fees2 | | $ | 118,125 | | $ | 211,750 |
All Other Fees | | $ | 0 | | $ | 0 |
| | |
Total | | $ | 544,170 | | $ | 666,895 |
| 1 | Services include security counts performed under Rule 17f-2 of the 1940 Act. |
| 2 | Tax services in connection with the Funds’ excise tax calculations and review of the Funds’ applicable tax returns. |
The information in the table below is provided with respect to non-audit services that directly relate to the registrant’s operations and financial reporting and that were rendered by PwC to the registrant’s investment advisers (i.e., Gartmore Mutual Fund Capital Trust, Gartmore Global Asset Management Trust, and Gartmore Morley Capital Management, Inc.) (hereinafter referred to collectively as “Gartmore Global Investments” or “GGI”), and any service provider to the registrant controlling, controlled by, or under common control with GGI that provided ongoing services to the registrant (hereinafter referred to collectively as the “Covered Services Provider”), for the registrant’s fiscal years ended October 31, 2004 and October 31, 2005.
| | | | |
| | | 2004
| | 2005
|
Audit-Related Fees | | None | | None |
Tax Fees | | None | | None |
All Other Fees | | None | | None |
| | |
Total | | None | | None |
(e) (1) Disclose the audit committee’s pre-approval policies and procedures described in paragraph (c)(7) of Rule 2-01 of Regulation S-X.
(2) Disclose the percentage of services described in each of paragraphs (b) through (d) of this Item that were approved by the audit committee pursuant to paragraph (c)(7)(i)(C) of Rule 2-01 of Regulation S-X.
4(e)(1) Pre-Approval Policies and Procedures. The Audit Committee (the “Committee”) of the registrant is responsible for pre-approving (i) all audit and permissible non-audit services to be provided by the independent auditors to the registrant and (ii) all permissible non-audit services to be provided by the independent auditors to GGI and any Covered Services Provider if the engagement relates directly to the operations and financial reporting of the registrant. The Committee may delegate the Committee’s responsibility to pre-approve any such audit and permissible non-audit services to the Chairperson of the Committee, and the Chairperson shall report to the Committee, at the Committee’s next regularly-scheduled meeting after the Chairperson’s pre-approval of such services, his or her decision(s). The Committee also may establish detailed pre-approval policies and procedures for pre-approval of these services in accordance with applicable laws, including the delegation of some or all of the Committee’s pre-approval responsibilities
to other persons (other than GGI or the registrant’s officers). Pre-approval by the Committee of any permissible non-audit services shall not be required so long as: (i) the aggregate amount of all said permissible non-audit services provided to the registrant, GGI, and any Covered Services Provider constitutes not more than five percent (5%) of the total amount of revenues paid by the registrant to the registrant’s independent auditors during the fiscal year in which the permissible non-audit services are provided; (ii) the permissible non-audit services were not recognized by the registrant at the time of the engagement to be non-audit services; and (iii) these services are promptly brought to the attention of the Committee and approved by the Committee (or the Committee’s delegate(s)) prior to the completion of the audit.
4(e)(2) The information in the table below sets forth the percentages of fees for services (other than audit, review, or attest services) rendered by PwC to the registrant for which the pre-approval requirement was waived pursuant to Rule 2-01(c)(7)(i)(C) of Regulation S-X, for the registrant’s fiscal years ended October 31, 2004 and October 31, 2005:
| | | | |
| | | 2004
| | 2005
|
Audit-Related Fees | | None | | None |
Tax Fees | | None | | None |
All Other Fees | | None | | None |
| | |
Total | | None | | None |
The information in the table below sets forth the percentages of fees for services (other than audit, review, or attest services) rendered by PwC to GGI and any Covered Services Provider required to be approved pursuant to Rule 2-01(c)(7)(ii)of Regulation S-X, for the registrant’s fiscal years ended October 31, 2004 and October 31, 2005:
| | | | |
| | | 2004
| | 2005
|
Audit-Related Fees | | N/A | | N/A |
Tax Fees | | N/A | | N/A |
All Other Fees | | N/A | | N/A |
| | |
Total | | N/A | | N/A |
(f) If greater than 50 percent, disclose the percentage of hours expended on the principal accountant’s engagement to audit the registrant’s financial statements for the most recent fiscal year that were attributed to work performed by persons other than the principal accountant’s full-time, permanent employees.
4(f) The percentage of hours expended to audit the registrant’s financial statements for the fiscal year ended October 31, 2005, that were attributed to work performed by persons other than PwC’s full-time, permanent employees was ___% [if over 50%]. Not Applicable
(g) Disclose the aggregate non-audit fees billed by the registrant’s accountant for services rendered to the registrant, and rendered to the registrant’s investment adviser (not including any sub-adviser whose role is primarily portfolio management and is subcontracted with or overseen by another investment adviser), and any entity controlling, controlled by, or under common control with the adviser that provides ongoing services to the registrant for each of the last two fiscal years of the registrant.
4(g) The aggregate fees billed by PwC for non-audit services rendered to the registrant and service affiliates for the fiscal years ended October 31, 2004, and October 31, 2005 were $1,855,629, and $3,984,969, respectively.
(h) Disclose whether the registrant’s audit committee of the board of directors has considered whether the provision of non-audit services that were rendered to the registrant’s investment adviser (not including any subadviser whose role is primarily portfolio management and is subcontracted with or overseen by another investment adviser), and any entity controlling, controlled by, or under common control with the investment adviser that provides ongoing services to the registrant that were not pre-approved pursuant to paragraph (c)(7)(ii) of Rule 2-01 of Regulation S-X is compatible with maintaining the principal accountant’s independence.
4(h) The registrant’s Audit Committee has considered whether the provision by PwC of non-audit services to GGI and Covered Services Providers that were not pre-approved pursuant to Rule 2-01(c)(7)(ii) of Regulation S-X because these
services did not directly relate to the registrant’s operations and financial reporting is compatible with maintaining PwC’s independence. Not Applicable
| Item 5. | Audit Committee of Listed Registrants. |
(a) If the registrant is a listed issuer as defined in Rule 10A-3 under the Exchange Act (17CFR 240.10A-3), state whether or not the registrant has a separately-designated standing audit committee established in accordance with Section 3(a)(58)(A) of the Exchange Act (15 U.S.C. 78c(a)(58)(A)). If the registrant has such a committee, however designated, identify each committee member. If the entire board of directors is acting as the registrant’s audit committee as specified in Section 3(a)(58)(B) of the Exchange Act (15 U.S.C. 78c(a)(58)(B)), so state.
Not applicable.
(b) If applicable, provide the disclosure required by Rule 10A-3(d) under the Exchange Act (17CFR 240.10A-3(d)) regarding an exemption from the listing standards for all audit committees.
Not applicable.
| Item 6. | Schedule of Investments. |
File Schedule I – Investments in securities of unaffiliated issuers as of the close of the reporting period as set forth in § 210.12-12 of Regulation S-X, unless the schedule is included as part of the report to shareholders filed under Item 1 of this Form.
This schedule is included as part of the report to shareholders filed under Item 1 of this Form N-CSR.
| Item 7. | Disclosure of Proxy Voting Policies and Procedures for Closed-End Management Investment Companies. |
A closed-end management investment company that is filing an annual report on this Form N-CSR must, unless it invests exclusively in non-voting securities, describe the policies and procedures that it uses to determine how to vote proxies relating to portfolio securities, including the procedures that the company uses when a vote presents a conflict between the interests of its shareholders, on the one hand, and those of the company’s investment adviser; principal underwriter; or any affiliated person (as defined in Section 2(a)(3) of the Investment Company Act of 1940 (15 U.S.C. 80a-2(a)(3)) and the rules thereunder) of the company, its investment adviser, or its principal underwriter, on the other. Include any policies and procedures of the company’s investment adviser, or any other third party, that the company uses, or that are used on the company’s behalf, to determine how to vote proxies relating to portfolio securities.
Not applicable
| Item 8. | Portfolio Managers of Closed-End Management Investment Companies. |
If the registrant is a closed-end management investment company that is filing an annual report on this Form N-CSR, provide the information specified in paragraphs (a) and (b) of this Item with respect to portfolio managers.
Not applicable.
| Item 9. | Purchases of Equity Securities by Closed-End Management Investment Company and Affiliated Purchasers. |
If the registrant is a closed-end management investment company, provide the information specified in paragraph (b) of this Item with respect to any purchase made by or on behalf of the registrant or any “affiliated purchaser,” as defined in Rule 10b-18(a)(3) under the Exchange Act (17 CFR 240.10b-18(a)(3)), of shares or other units of any class of the registrant’s equity securities that is registered by the registrant pursuant to Section 12 of the Exchange Act (15 U.S.C. 781).
Not applicable.
| Item 10. | Submission of Matters to a Vote of Security Holders. |
Describe any material changes to the procedures by which shareholders may recommend nominees to the registrant’s board of directors, where those changes were implemented after the registrant last provided disclosure in response to the requirements of Item 7(d)(2)(ii)(G) of Schedule 14A (17 CFR 240.14a-101), or this Item.
The Independent Trustees and the Board of Trustees of the registrant adopted a formal, written “Policy Regarding Shareholder Submission of Trustee Candidates,” as well as a formal, written “Statement of Policy On Criteria For Selecting Trustees,” on June 9, 2004, and June 10, 2004, respectively. Neither this policy nor this statement of policy has been materially changed since the Board of Trustees adoption of the policy and the statement of policy, respectively. The Nominating and Fund Governance Committee of the Board of Trustees, however, on November 11, 2005, approved amendments to this policy and recommended that the Board of Trustees approve the amendments to the policy at the Board’s next regular meeting, to be held on January 12, 2006. The proposed Board amendments to the policy, though, concern the criteria for selecting candidates for Trustees and the characteristics expected of candidates for Trustees, as set forth in the Exhibit A, “Statement of Policy On Criteria For Selecting Trustees,” to the policy and, arguably, may not be deemed to be material changes to the policy.
| Item 11. | Controls and Procedures. |
(a) Disclose the conclusions of the registrant’s principal executive and principal financial officers, or persons performing similar functions, regarding the effectiveness of the registrant’s disclosure controls and procedures (as defined in Rule 30a-3(c) under the Act (17 CFR 270.30a-3(c))) as of a date within 90 days of the filing date of the report that includes the disclosure required by this paragraph, based on the evaluation of these controls and procedures required by Rule 30a-3(b) under the Act (17 CFR 270.30a-3(b)) and Rules 13a-15(b) or 15d-15(b) under the Exchange Act (17 CFR 240.13a-15(b) or 240.15d-15(b)).
The registrant’s principal executive officer and principal financial officer have concluded, based on their evaluation of the registrant’s disclosure controls and procedures as conducted within ninety (90) days of the filing date of this report, that these disclosure controls and procedures are adequately designed and are operating effectively to ensure that information required to be disclosed by the registrant on Form N-CSR is: (i) accumulated and communicated to the investment company’s management, including the investment company’s certifying officers, to allow timely decisions regarding required disclosure; and (ii) recorded, processed, summarized, and reported within the time periods specified in the Securities and Exchange Commission’s rules and forms.
(b) Disclose any change in the registrant’s internal control over financial reporting (as defined in Rule 30a-3(d) under the Act (17 CFR 270.30a-3(d)) that occurred during the second fiscal quarter of the period covered by this report that has materially affected, or is reasonably likely to materially affect, the registrant’s internal control over financial reporting.
There were no changes in the registrant’s internal control over financial reporting that occurred during the second fiscal quarter of the period covered by this report that have materially affected or are reasonably likely to materially affect, the registrant’s internal control over financial reporting.
(a) File the exhibits listed below as part of this Form. Letter or number the exhibits in the sequence indicated.
(a)(1) Any code of ethics, or amendment thereto, that is the subject of the disclosure required by Item 2, to the extent that the
registrant intends to satisfy the Item 2 requirements through filing of an exhibit.
(a)(2) A separate certification for each principal executive officer and principal financial officer of the registrant as required by Rule 30a-2(a) under the Act (17 CFR 270.30a-2).
Certifications executed pursuant to Rule 30a-2(a) are attached hereto.
(a)(3) Any written solicitation to purchase securities under Rule 23c-1 under the Act (17 CFR 270.23c-1) sent or given during the period covered by the report by or on behalf of the registrant to 10 or more persons.
Not applicable.
(b) If the report is filed under Section 13(a) or 15(d) of the Exchange Act, provide the certifications required by rule 30a-2(b) under the Act as an exhibit. A certification furnished pursuant to this paragraph will not be deemed “filed” for purposes of Section 18 of the Exchange Act, or otherwise subject to the liability of that section. Such certification will not be deemed to be incorporated by reference into any filing under the Securities Act of 1933 or the Exchange Act, except to the extent that the registrant incorporates it by reference.
Certifications executed pursuant to Rule 30a-2(b) are attached hereto.
SIGNATURES
Pursuant to the requirements of the Securities Exchange Act of 1934 and the Investment Company Act of 1940, the registrant has duly caused this report to be signed on its behalf by the undersigned, thereunto duly authorized.
| | | | | | | | |
| (Registrant) | | | | GARTMORE MUTUAL FUNDS |
| | | |
| By (Signature and Title) | | | | | | /s/ GERALD J. HOLLAND |
| | | | | | | Name: | | Gerald J. Holland |
| | | | | | | Title: | | Treasurer |
| | | | | | | Date: | | January 6, 2006 |
Pursuant to the requirements of the Securities Exchange Act of 1934 and the Investment Company Act of 1940, this report has been signed below by the following persons on behalf of the registrant and in the capacities and on the dates indicated.
| | | | | | | | |
| | | |
| By (Signature and Title) | | | | | | /s/ PAUL J. HONDROS |
| | | | | | | Name: | | Paul J. Hondros |
| | | | | | | Title: | | President |
| | | | | | | Date: | | January 6, 2006 |
| | | |
| By (Signature and Title) | | | | | | /s/ GERALD J. HOLLAND |
| | | | | | | Name: | | Gerald J. Holland |
| �� | | | | | | Title: | | Treasurer |
| | | | | | | Date: | | January 6, 2006 |