UNITED STATES
SECURITIES AND EXCHANGE COMMISSION
Washington, D.C. 20549
FORM N-CSR
CERTIFIED SHAREHOLDER REPORT OF REGISTERED
MANAGEMENT INVESTMENT COMPANIES
Investment Company Act File Number: 811-08495
GARTMORE MUTUAL FUNDS
(Exact name of registrant as specified in charter)
| | |
1200 RIVER ROAD, SUITE 1000, CONSHOHOCKEN, PENNSYLVANIA | | 19428 |
| (Address of principal executive offices) | | (Zip code) |
Eric Miller
1200 River Road
Suite 1000
Conshohocken, Pennsylvania 19428
(Name and address of agent for service)
Registrant’s telephone number, including area code: (484) 530-1300
Date of fiscal year end: October 31, 2006
Date of reporting period: October 31, 2006
Form N-CSR is to be used by management investment companies to file reports with the Commission not later than 10 days after the transmission to stockholders of any report that is required to be transmitted to stockholders under Rule 30e-1 under the Investment Company Act of 1940 (17 CFR 270.30e-1). The Commission may use the information provided on Form N-CSR in its regulatory, disclosure review, inspection, and policymaking roles.
A registrant is required to disclose the information specified by Form N-CSR, and the Commission will make this information public. A registrant is not required to respond to the collection of information contained in Form N-CSR unless the Form displays a currently valid Office of Management and Budget (“OMB”) control number. Please direct comments concerning the accuracy of the information collection burden estimate and any suggestions for reducing the burden to Secretary, Securities and Exchange Commission, 450 Fifth Street, NW, Washington, DC 20549-0609. The OMB has reviewed this collection of information under the clearance requirements of 44 U.S.C. § 3507.
Item 1. Reports to Stockholders.
Include a copy of the report transmitted to stockholders pursuant to Rule 30e-1 under the Act (17 CFR 270.30e-1).
AnnualReport
| | |
| | |

| | October 31, 2006 |
Commentary provided by Gartmore Mutual Fund Capital Trust and Gartmore Morley Capital Management, Inc. (the “Advisers”), investment advisers to Gartmore Funds. All opinions and estimates included in this report constitute the Advisers’ judgment as of the date of this report and are subject to change without notice.
As of September 29, 2006, Gartmore Funds and its U.S. operations, as well as the Funds’ Advisers, distributor, and other service providers, are no longer affiliated with Gartmore Investment Management plc (Gartmore U.K.) or other Gartmore international businesses. Certain Gartmore U.S. companies, and marketing materials related to them, will continue to carry the Gartmore name for the next several months under the terms of an agreement with Gartmore U.K. For more information call, 800-848-0920.
Statement Regarding Availability of Quarterly Portfolio Schedule.
The Gartmore Funds file complete schedules of portfolio holdings for each Fund with the Securities and Exchange Commission (the “Commission”) for the first and third quarters of each fiscal year on Form N-Q. The Funds’ Forms N-Q are available on the Commission’s website at http://www.sec.gov. The Funds’ Forms N-Q may be reviewed and copied at the Commission’s Public Reference Room in Washington, DC, and information on the operation of the Public Reference Room may be obtained by calling 800-SEC-0330; and the Funds make the information on Form N-Q available to shareholders on www.nwdfunds.com or upon request without charge.
Statement Regarding Availability of Proxy Voting Record.
Information regarding how the Funds voted proxies relating to portfolio securities held during the most recent 12-month period ended June 30, 2006 is available without charge, upon request, by calling 800-848-0920, and on the Commission’s website at http://www.sec.gov.
Message to Shareholders
December 15, 2006
Dear Shareholders:
This reporting period has been a time of change for our company. First, in September 2006, our parent company, Nationwide Mutual Insurance Company (Nationwide), completed the sale of the U.K.-based Gartmore Investment Management Ltd. (Gartmore U.K.). As a result of the sale, on November 30, 2006, Gartmore Global Investments, the U.S. division of Nationwide’s asset management business, changed its name to NWD Investments. All of the mutual funds advised by NWD Investments, however, will retain the Gartmore Funds name until May 2007. In addition, Gartmore U.K. will continue to act as subadviser for a number of Gartmore Funds, and, as a result, investors in those funds that include foreign exposure can expect “business as usual”. Nationwide has been examining how best to align NWD Investments as a part of its operations since the sale of Gartmore U.K. and on December 21, 2006, announced that it had reached a preliminary agreement of terms to sell NWD Investment’s retail operations to Nationwide Financial Services, Inc.
Second, I must report that this will be my final shareholder letter. Effective December 15, 2006, John Grady, who joined our firm in October as transition manager, was named as president of NWD Investments and was elected by the Gartmore Funds Board of Trustees to the role of president and chief executive officer. I’m confident that John’s extensive background in this industry will serve NWD Investments well as the company prepares for its next chapter of growth. I have enjoyed serving all of you, and I wish you much success in the years to come.
Market Overview
Global stock markets delivered strong gains for the year ended October 31, 2006, but the period was not without its share of volatility. During the first six months, the markets did a good job of advancing despite the headwinds of rising crude oil prices, interest-rate hikes by the Federal Reserve Board and the replacement of retiring Federal Reserve Chairman Alan Greenspan by Ben Bernanke. The central bank’s May 10 rate hike, however, marked a critical turning point. Disappointment that the Fed did not stand pat, together with concerns about inflationary pressures and the possibility of further rate hikes, triggered sharp declines in global stock markets. Small-capitalization stocks and growth sectors such as technology generally suffered the most during the sell-off.
Throughout the summer, inflation moderated a bit, and more evidence of a slowing U.S. economy emerged. The Fed reacted by leaving interest rates unchanged at its August, September and October meetings. Falling energy prices in the final months of the reporting period provided further fuel for the markets, sparking a rebound in stock prices. For the one-year reporting period, the S&P 500® Index recorded a return of 16.34%. A weak U.S. dollar helped lift foreign markets to even better returns; the Morgan Stanley Capital International Europe, Australasia and Far East (MSCI EAFE®) Index posted a gain of 28.04%. Value stocks maintained a commanding lead over growth shares during the period, while small-cap issues topped larger caps.
It’s Official—We’re Lipper’s best “Overall Small Fund Family”
From the beginning, we’ve made it our mission to be good stewards of our investors’ money. Stewardship can be measured in various ways, but in the mutual fund business, investment performance is one obvious yardstick. That’s why we’re delighted to have been honored with the best “Overall Small Fund Family” award at the 2006 Lipper Fund Awards. Significantly, this award was not based on results tallied over just one year. According to Lipper, a key factor in the selection process was our consistent, strong risk-adjusted returns in several different asset classes relative to those of our peers for three years ended December 31, 2005. We appreciate this recognition of our commitment to delivering returns for our investors, and we consider the award a validation of our approach.
International Fund Highlights
Our confidence in our non-U.S. subadvised funds was amply rewarded during the one-year reporting period. For example, the Gartmore Worldwide Leaders Fund posted a gain of 26.22%*, compared with 21.91% for the MSCI World IndexSM. The Fund’s performance placed the Fund in the top 4% among its Lipper peer group, Global Large-Cap Core Funds (consisting of 59 funds as of October 31, 2006). In recognition of the Gartmore Worldwide Leaders Fund’s outstanding track record, it received the nod as Best Global Large-Cap Core Fund at the 2006 Lipper Fund Awards. Also meriting mention was the Gartmore International Growth Fund, whose 38.22% return went above and beyond the 28.91% return posted by the MSCI All Country World excluding U.S. Index and earned it a ranking in the top 1% among its Lipper peer group, International Multi-Cap Core Funds (consisting of 904 funds as of October 31, 2006).
Small-Cap Lineup Delivers Strong Results
Our commitment to small-cap investing remains an important theme. Offering several investment choices, including funds that invest in companies that may receive scant attention from the vast majority of Wall Street analysts, small caps typically are a much less efficient asset class than their large-cap and even mid-cap counterparts. This means that more
opportunities may exist for our experienced portfolio managers to identify and potentially capitalize on mispriced stocks. Our success in this area was reflected in strong performance during the past year across most of our small-cap products.
One of our newer entries, the Gartmore Small Cap Leaders Fund, offers exposure to both growth and value opportunities through two separate “sleeves” or subportfolios, each with its own management team. During the one-year reporting period, this Fund delivered a 30.65% return, far surpassing the 19.98% result of the Russell 2000® Index. The Fund also finished in the top 2% of Lipper Small-Cap Core Funds (consisting of 689 funds as of October 31, 2006). The Gartmore Small Cap Fund delivered comparable results, with a 30.98% return, beating the same benchmark, the Russell 2000 Index. Notably, this Fund also posted exceptionally strong performance over longer periods of time, placing in the top 2% of its peers among Lipper Small-Cap Core Funds (consisting of 689 funds as of October 31, 2006). for the five years ended October 31, 2006.
To further broaden investors’ choices in the small-cap area and to leverage the experience of our seasoned portfolio managers, we introduced three new funds near the end of September 2006: the Gartmore Small Cap Growth Opportunities Fund, the Gartmore Small Cap Core Fund and the Gartmore Small Cap Value Fund. At the same time, we debuted two absolute-return products: the Gartmore Market Neutral Fund and the Gartmore Hedged Core Equity Fund. These two products are designed for more conservative investors looking for a fund that offers a mix of long and short positions, as well as the potential for lower correlation with the broader equity markets.
Diversifying with Sector Funds
Once an investor has built a solid portfolio around a select group of core funds, sector funds may offer an effective way to enhance both long-term performance and diversification. In this category, several funds with a global scope performed well, including the Gartmore Global Natural Resources Fund, with a 22.87% gain that outdistanced the 17.96% return of its benchmark, the Goldman Sachs Natural Resources Index. Also finishing the period in fine form was the Gartmore Global Utilities Fund, with a return of 27.56%—performance that was good enough to surpass that of the Fund’s composite benchmark of 60% MSCI World Telecommunication Services IndexSM and 40% MSCI World Utilities IndexSM, which returned 25.61%. Last of all, amid considerable volatility for technology stocks, the Gartmore Global Technology and Communications Fund posted a 13.48% return, handily beating the 10.35% return of the Goldman Sachs Technology Composite Index (GSTI®), our benchmark for this Fund.
Strategically combining core equity and fixed-income funds with sector exposure is exhibited in our Gartmore Optimal Allocations “fund of funds” series. We now offer five variations on this theme, three of which are designed to be complete asset allocation solutions: these are the Aggressive, Moderately Aggressive and Moderate Funds within the Optimal Allocations series—each with different mixes of underlying funds—targeting specific risk levels fitting those descriptions. The Gartmore Optimal Allocations Fund: Specialty is intended for investors who already have core investments in place and seek to enhance their overall risk-adjusted returns by exposure to a select group of specialty funds. After the one-year reporting period closed, moreover, we launched the Gartmore Optimal Allocations Fund: Defensive. This new offering is designed for investors who have a lower tolerance for risk and want to complement a core holding by seeking sustainable real returns as a hedge against possible economic deterioration, including inflation, deflation or rising interest rates.
With asset allocation models designed by Ibbotson Associates, a leading authority on asset allocation, the Optimal Allocations Funds are designed to expand an average investor’s “efficient frontier”—that is, they seek to provide the most efficient combination of various asset classes to achieve the highest possible return for a given level of risk. The results to date have been gratifying: for the one-year reporting period, all four Optimal Allocations funds placed in the top quartile of their respective Lipper peer groups (consisting of 592 Mixed-Asset Target Allocation Growth Funds, 414 Mixed-Asset Target Allocation Moderate Funds, 904 Multi-Cap Core Funds and 104 Specialty/Miscellaneous Funds as of October 31, 2006).
Short-Term Shortfall from Long-Term Winner
Although the Gartmore U.S. Growth Leaders Fund, which is managed by one of our talented, veteran portfolio managers, Christopher Baggini, struggled during this reporting period with a return of 1.77%, the Fund’s longer-term record remained enviable: its five-year return of 10.98% was well ahead of the S&P 500 Index’s 7.26% gain, and the Fund occupied the 8th percentile versus other Lipper Multi-Cap Growth Funds (consisting of 332 funds as of Oct. 31, 2006).
Message to Shareholders
Continued
We Appreciate Your Business
We take the charge of managing your assets very seriously. While other companies might make that same claim, we can point to our recent company-level and fund-specific Lipper awards as evidence that we have “walked the talk”. As we close the books on an eventful year—both for the markets and for our company—you can be sure that NWD Investments will continue its pursuit of superior long-term, risk-adjusted returns for the benefit of you, our valued shareholders.

Paul J. Hondros

John H. Grady
| * | All Gartmore Funds performance returns are Class A at NAV, except where noted. |
Lipper, a wholly owned subsidiary of Reuters, is a leading global provider of mutual fund information and analysis to fund companies, financial intermediaries and media organizations. The firm competed with 17 eligible small fund families, defined as groups with at least three equity, three bond and three mixed-equity portfolios that received Consistent Return scores as of Dec. 31, 2005. Consistent Return is a quantitative metric that incorporates two characteristics: risk-adjusted return and the strength of the fund’s performance trend. Lipper determined the award winner by averaging the decile rank of the three-year Consistent Return scores for all of the funds within the eligible groups. The fund family with the lowest average decile rank received the award. Although Lipper makes reasonable efforts to ensure the accuracy and reliability of the data, the accuracy is not guaranteed by Lipper.
For the “Global Large Cap Core Funds” award, Lipper determined the award winner by calculating the highest Consistent Return over the three-year time period ended Dec. 31, 2005. Gartmore Funds competed among 16 global large-cap core portfolios to win the award.
Funds that concentrate on specific sectors or a relatively small number of securities may be subject to greater volatility than that of other mutual funds.
International investing involves additional risks, including currency fluctuations, differences in accounting standards, political instability and foreign regulations, all of which are magnified in emerging markets.
Small-company stocks have higher risks than the stocks of larger, more established companies and have significant short-term price volatility.
Sophisticated investment strategies such as leverage, short selling, short-term trading and investing in derivatives, REITs and IPOs may cause a Fund to have greater risk and volatility and higher expenses than those of other investments.
The Gartmore Optimal Allocations Funds are designed to provide diversification and asset allocation across several types of investments and asset classes, primarily by investing in underlying Gartmore Funds. Each Fund is subject to different levels of risk, based on the size of its asset class allocations. Each Fund’s underlying funds may be subject to specific investment risks such as those associated with a concentrated number of securities (such as REITs), small companies, international stocks, initial public offerings, short selling, short-term trading, bonds and short-term instruments. There is no assurance that a diversified portfolio will produce better results than a nondiversified one.
Index returns do not include the effect of any sales charges or expenses. If sales charges and expenses were deducted, the actual returns of each Index would be lower. It is not possible to invest directly in an Index.
Goldman Sachs Natural Resources Index: An unmanaged, modified market capitalization-weighted sector index of U.S.-traded natural resource-related stocks; includes companies in the categories of extractive industries, energy companies, owners and operators of timber tracts, forestry services, producers of pulp and paper, and owners of plantations.
Morgan Stanley Capital International (MSCI) All Country World excluding U.S. Index: An unmanaged, free float-adjusted, market-capitalization weighted index that is designed to measure the performance of the stocks in companies in all countries except the United States.
Morgan Stanley Capital International Europe, Australasia and Far East (MSCI EAFE®) Index: An unmanaged, free float-adjusted, market capitalization-weighted index that is designed to measure the performance of stocks in developed markets outside the United States and Canada.
Morgan Stanley Capital International (MSCI) World IndexSM: An unmanaged, free float-adjusted, market capitalization-weighted index that is designed to measure the performance of global developed-market equities.
Morgan Stanley Capital International (MSCI) World Telecommunication Services IndexSM: An unmanaged index that is based on developed-market country indexes and is generally representative of the stocks in the global utilities sector.
Morgan Stanley Capital International (MSCI) World Utilities IndexSM: An unmanaged index that is based on developed- market
country indexes and is generally representative of the stocks in the utilities sector, which includes industry groups such as electric, gas, multi-utilities, and unregulated power and water.
Russell 2000® Index: An unmanaged index that measures the performance of the stocks of U.S. companies.
Standard & Poor’s 500® (S&P 500) Index: An unmanaged, market capitalization-weighted index of 500 widely held stocks of large-cap U.S. companies that gives a broad look at how the stock prices of those companies have performed.
Lipper Analytical Services, Inc. is an industry research firm whose rankings are based on total return performance and do not reflect the effect of sales charges. Each fund is ranked within a universe of funds similar in investment objective as determined by Lipper.
The Lipper scores listed are based on monthly data. Lipper scores are subject to change every month. The Lipper Average is a straight average of the specific Lipper Universe.
This information is provided for educational purposes only and should not be considered investment advice. Lipper ratings are not intended to predict future results, and Lipper does not guarantee the accuracy of this information.
Small-company stocks have higher risks than the stocks of larger, more established companies and have significant short-term price volatility.
International investing involves additional risks, including currency fluctuations, differences in accounting standards, political instability and foreign regulations, all of which are magnified in emerging markets.
The Gartmore Small Cap Fund may purchase securities in initial public offerings, which can be volatile and carry high transaction costs.
While the Gartmore Bond Fund, the Gartmore Government Bond Fund, the Gartmore Short Duration Bond Fund and the Gartmore Enhanced Income Fund invest primarily in securities of the U.S. government and its agencies, these Funds’ value is not guaranteed by these entities.
For some investors, income from the Gartmore Tax-Free Income Fund may be subject to state and local taxes, and the Federal Alternative Minimum Tax.
Investing in mutual funds involves risk, including possible loss of principal.
There is no assurance that the investment objective of any fund will be achieved.
There is no assurance that a diversified portfolio will produce better results than a non-diversified one.
Third-party information has been obtained from and is based on sources the Firm believes to be reliable.
Views expressed within are as of the date noted and are subject to change at any time.
The Funds’ adviser, one of its affiliated advisers, or its employees, may have a position in the securities named in this report.
This report is for informational purposes only, and is not intended as an offer or recommendation with respect to the purchase or sale of any security, option, future or other derivatives in such securities.
PAST PERFORMANCE DOES NOT GUARANTEE FUTURE RESULTS. To obtain performance information current to the most recent month-end, which may be higher or lower than the performance shown, please call 800-848-0920 or visit www.nwdfunds.com.
Investors should carefully consider a fund’s investment objectives, risks, fees, charges and expenses before investing any money. To obtain this and other fund information, please call 800-848-0920 to request a prospectus, or download a prospectus at www.nwdfunds.com. Please read it carefully before investing any money.
Gartmore Funds distributed by Gartmore Distribution Services, Inc., Member NASD. 1200 River Road, Suite 1000, Conshohocken, Pa. 19428.
As of September 29, 2006, Gartmore Funds and its U.S. operations, as well as the Funds’ advisers, distributor, and other service providers, are no longer affiliated with Gartmore Investment Management plc (Gartmore U.K.) or other Gartmore international businesses. Certain Gartmore U.S. companies, and marketing materials related to them, will continue to carry the Gartmore name for the next several months under the terms of an agreement with Gartmore U.K. For more information call, 800-848-0920.
Key Investment Terminology
In an effort to help you better understand the many concepts involved in annual reports, we have defined the following terms:
Common stock—securities representing shares of ownership of a corporation.
Message to Shareholders
Continued
Convertible securities—debt securities or preferred stocks that may be converted into common stock. While a convertible security is a fixed-income security that typically pays interest or dividend income, its market value also tends to correspond to market changes in the value of the underlying common stock.
Equity securities—securities including common stock, preferred stock, securities convertible into common stock or securities (or other investments) with prices linked to the value of common stocks, foreign investment funds or trusts and depositary receipts, that represent an ownership interest in the issuer.
Growth style—a style of investing in equity securities of companies that the Fund’s management believes have above-average rates of earnings growth and which therefore may experience above-average increases in stock price.
Large-cap companies—companies whose market capitalization is similar to those of companies included in the Russell 1000® Index, ranging from $563 million to $371.7 billion as of December 31, 2005.
Market capitalization—a common way of measuring the size of a company based on the price of its common stock times the number of outstanding shares.
Mid-cap companies—companies whose market capitalization is similar to those of companies included in the Russell Midcap® Index, ranging from $565 million to $18.4 billion as of December 31, 2005.
Small-cap companies—companies whose market capitalization similar to those of companies included in the Russell 2000® Index, ranging from $26 million to $4.4 billion as of December 31, 2005.
Total return—investment return that reflects both capital appreciation or depreciation (increase or decrease in the market value of a security) and income (i.e., interest or dividends).
Valuation—the process of determining the current worth of an asset or company.
Value style—a style of investing in equity securities that the Fund’s management believes are undervalued, which means that their prices are less than Fund management believes they are worth, based on such factors as price-to-book ratio, price-to-earnings ratio and cash flow. Companies issuing such securities may be currently out of favor or experiencing poor operating conditions that Fund management believes to be temporary.
Asset-backed securities—fixed-income securities issued by a trust or other legal entity established for the purpose of issuing securities and holding certain assets, such as credit card receivables or auto leases, that pay down over time and generate sufficient cash to pay holders of the securities.
Commercial paper—short-term debt instruments, usually unsecured, issued by banks and corporations in order to finance their short-term credit needs, such as accounts receivable or inventory and is acquired at either a discount or is interest bearing.
Corporate bonds—debt securities issued by corporate issuers, as distinct from fixed-income securities issued by a government or its agencies or instrumentalities.
Duration—related in part to the remaining time until maturity of a bond, duration is a measure of how much the price of a bond would change compared to a change in market interest rates. A bond’s value drops when interest rates rise, and vice versa. Bonds with longer durations have higher risk and volatility.
Fixed-income securities—securities, including bonds and other debt securities, that represent an obligation by the issuer to pay a specified rate of interest or dividend at specified times.
Investment grade—the four highest rating categories of nationally recognized rating agencies, including Moody’s, Standard & Poor’s and Fitch.
High-yield bonds—fixed-income securities rated below investment grade by nationally recognized rating agencies, including Moody’s, Standard & Poor’s and Fitch, or unrated securities that Fund management believes are of comparable quality. These bonds are often referred to as “junk bonds”. They generally offer investors higher interest rates as a way to help compensate for the fact that the issuer is at greater risk of default.
U.S. government agency securities—debt securities issued and/or guaranteed as to principal and interest by U.S.
government agencies, U.S. government-sponsored enterprises and U.S. government instrumentalities that are not direct obligations of the United States. Such securities may not be supported by the full faith and credit of the United States.
U.S. government securities—debt securities issued and/or guaranteed as to principal and interest by the U.S. government that are supported by the full faith and credit of the United States.
Gartmore Large Cap Value Fund
For the annual period ended Oct. 31, 2006, the Gartmore Large Cap Value Fund (Class A at NAV) returned 20.81% versus 21.46% for its benchmark, the Russell 1000® Value Index. For broader comparison, the average return for the Fund’s Lipper peer category of Large Cap-Value Funds (consisting of 492 funds as of Oct. 31, 2006) was 17.73%.
The U.S. large-capitalization equity market was strong during the reporting period. Large-cap value stocks, as measured by the Russell 1000 Value Index, outperformed large-cap growth stocks, as measured by the Russell 1000® Growth Index, returning 21.46% versus 10.84%, respectively. U.S. equity markets surged during the second half of the reporting period. The key influences were the nearly 25% decline in oil prices and the 30% decline in gasoline prices, reduced inflation expectations (as seen by the almost 50-basis-point rally in longer-term Treasuries) and, last of all, robust earnings reports from the largest S&P 500® Index constituents.
Stock selection continued to drive Fund performance, with the strongest results coming from the financials, information technology and telecommunications services sectors. Within the financials sector, the Fund’s stock selection was strongest in the thrifts and mortgage finance industry. Among the Fund’s information technology issues, Hewlett Packard Co., a leading maker of personal computers and printers, was the standout performer. Hewlett Packard was bolstered by its ability to gain market share in the PC space. In addition, it demonstrated its ability to effectively leverage Wal-Mart’s retail distribution networks. In the telecom services sector, AT&T Inc. and BellSouth were the Fund’s star performers. This is mostly the result of the market reacting favorably to BellSouth’s agreement to be bought by AT&T. The two companies are perceived to have a cost structure and customer base that can be better leveraged as a combined entity.
Fund returns were challenged in the energy, industrials and consumer staples sectors. Valero Energy Corp., YRC Worldwide Inc. and Pilgrim’s Pride Corp. were three of the main detractors from portfolio performance. Since Valero is predominantly a marketer of refined petroleum products, its shares suffered during the third-quarter 2006 when oil and gasoline prices dropped over 20%. YRC Worldwide was impacted by the market’s rotation out of freight transportation companies amid uncertainty over how long cyclical upturn in the U.S. economy might last. During the first-quarter of 2006, Pilgrim Pride was impacted by the uncertainty surrounding Avian Bird Influenza, and the extent to which customers would be willing to purchase Pilgrim’s packaged chicken products.
The Fund is positioned to perform in a stock market that rewards investing in undervalued companies—those that are experiencing improving fundamentals. During the reporting period, the market seemed to reward value-oriented investment strategies. Within our macroeconomic sector framework, value factors were the leading contributors to model performance in three out of four of our categories. In interest-rate-sensitive stocks, low forward price-to-earnings ratios and the absence of downward earnings-estimate revisions were the most effective factors. In our high-growth area, high earnings quality and low forward price-to-earnings ratios yielded the strongest results. In the steady growth area, positive one-month earnings-estimate changes and low trailing price-to-earnings ratios worked best. Finally, within cyclical stocks high analyst estimate agreement and low financial leverage were winning strategies. As a result, we have begun to place more emphasis on valuation in our investment process. We continue to believe that a sound value investment philosophy should be coupled with a focus on earnings momentum; however, current market conditions and our disciplined process have us placing more emphasis on valuation at present.
We continue to focus on delivering competitive, active large-cap value performance through the consistent use of quantitative stock selection and portfolio construction techniques. Given the high-profile nature of large-cap value stocks, achieving outperformance can be a challenge. We believe that the best route to success is adherence to our investment decision-making process.
Portfolio Manager:
Peter Cahill, CFA
| | |
Fund Performance | | Gartmore Large Cap Value Fund |
Average Annual Total Return
(For periods ended October 31, 2006)
| | | | | | | | |
| | | | | 1 Yr. | | 5 Yr. | | Inception1 |
| Class A | | w/o SC2 | | 20.81% | | 11.45% | | 7.44% |
| | | w/SC3 | | 13.88% | | 10.14% | | 6.65% |
| Class B | | w/o SC2 | | 20.06% | | 10.78% | | 6.66% |
| | | w/SC4 | | 15.06% | | 10.51% | | 6.66% |
| Class C5 | | w/o SC2 | | 20.11% | | 10.79% | | 6.69% |
| | | w/SC6 | | 19.11% | | 10.79% | | 6.69% |
| Class R7,8 | | | | 20.69% | | 11.15% | | 6.89% |
All figures showing the effect of a sales charge reflect the maximum charge possible, because it has the most dramatic effect on performance data.
| 1 | Fund commenced operations on November 2, 1998. |
| 2 | These returns do not reflect the effects of sales charges (SC). |
| 3 | A 5.75% front-end sales charge was deducted. |
| 4 | A 5.00% contingent deferred sales charge (CDSC) was deducted. The CDSC declines to 0% after 6 years. |
| 5 | These returns until the creation of Class C shares (3/1/01) include the performance of the Fund’s Class B shares. Excluding the effects of any fee waivers or reimbursements, such prior performance is substantially similar to what Class C shares would have produced because Class C shares invest in the same portfolio of securities as Class B shares and have the same expenses after fee waivers or reimbursements. For Class C shares returns with sales charges, these returns have been restated for the applicable sales charges. |
| 6 | A CDSC of 1.00% was deducted from the one year return because it is charged when you sell Class C shares within the first year after purchase. |
| 7 | These returns until the creation of Class R shares (10/1/03) include the performance of the Fund’s Class B shares. The returns have been adjusted for the fact that Class R shares do not have any applicable sales charges but have not been adjusted for the lower expenses applicable to Class R shares. Excluding the effect of any fee waivers or reimbursements, such prior performance is similar to what Class R shares would have produced because the Class R shares will invest in the same portfolio of securities as Class B shares. |
| 8 | Not subject to any sales charges. |
Performance of a $10,000 Investment
Investment return and principal value will fluctuate, and when redeemed, shares may be worth more or less than original cost. Past performance is no guarantee of future results and does not reflect the deduction of taxes that a shareholder would pay on fund distributions or the redemption of fund shares. Investing in mutual funds involves market risk, including loss of principal. Performance returns assume the reinvestment of all distributions.
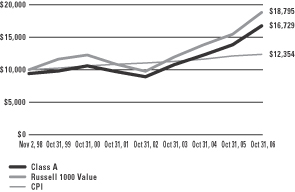
Comparative performance of $10,000 invested in Class A shares of the Gartmore Large Cap Value Fund, the Russell 1000 Value Index (Russell 1000 Value)(a), and the Consumer Price Index (CPI)(b) since inception. Unlike the Fund, the returns for these unmanaged indexes do not reflect any fees, expenses, or sales charges. Investors cannot invest directly in market indexes.
| (a) | The Russell 1000 Value is an unmanaged index of large capitalization value securities of U.S. companies included in the Russel 1000 Value Index. The Russell 1000 Value Index offers investors access to the large-cap value segment of the U.S. equity universe. The Russell 1000 Value is constructed to provide a comprehensive and unbiased barometer of the large-cap value market. |
| (b) | The CPI represents changes in prices of a basket of goods and services purchased for consumption by urban households. |
| | |
Shareholder Expense Example | | Gartmore Large Cap Value Fund |
As a shareholder of the Fund, you incur two types of costs: (1) transaction costs, including sales charges (loads) paid on purchase payments and redemption fees; and (2) ongoing costs, including investment advisory fees, administration fees, distribution fees and other Fund expenses. The examples below are intended to help you understand your ongoing costs (in dollars) of investing in the Fund and to compare these costs with the ongoing costs of investing in other mutual funds. Per SEC requirements, the examples assume that you had a $1,000 investment in the Class at the beginning of the reporting period, May 1, 2006 and continued to hold your shares at the end of the reporting period, October 31, 2006.
Actual Expenses
For each Class of the Fund in the table below, the first line provides information about actual account values and actual expenses. You may use the information in this line, together with the amount you invested, to estimate the expenses that you paid over the period. Simply divide your account value by $1,000 (for example, an $8,600 account value divided by $1,000 = 8.6), then multiply the result by the number in the first line of each Class under the heading entitled “Expenses Paid During Period” to estimate the expenses you paid on your account during the period.
Hypothetical Example for Comparison Purposes
The second line of each Class in the table below provides information about hypothetical account values and hypothetical expenses based on the Class’ actual expense ratio and an assumed rate of return of 5% per year before expenses, which is not the Class’ actual return. The hypothetical account values and expenses may not be used to estimate the actual ending account balance or expenses you paid for the period. You may use this information to compare the ongoing costs of investing in the Class of the Fund and other funds. To do so, compare this 5% hypothetical example with the 5% hypothetical examples that appear in the shareholder reports of the other funds.
Please note that the expenses shown in the table are meant to highlight your ongoing costs only and do not reflect any transaction costs, such as sales charges (loads) or redemption fees. Therefore, the second line for each Class in the table is useful in comparing ongoing costs only, and will not help you determine the relative total costs of owning different funds. In addition, if these transaction costs were included, your costs would have been higher. The examples also assume all dividends and distributions have been reinvested.
Schedule of Shareholder Expenses
Expense Analysis of a $1,000 Investment
(October 31, 2006)
| | | | | | | | | | | | | | |
| Large Cap Value Fund | | | | | Beginning
Account Value,
5/1/06 | | Ending
Account Value,
10/31/06 | | Expenses Paid
During Period* | | Annualized
Expense Ratio* |
| Class A | | Actual | | | $ | 1,000.00 | | $ | 1,075.00 | | $ | 7.17 | | 1.37% |
| | | Hypothetical | 1 | | $ | 1,000.00 | | $ | 1,018.09 | | $ | 6.99 | | 1.37% |
| Class B | | Actual | | | $ | 1,000.00 | | $ | 1,072.00 | | $ | 10.29 | | 1.97% |
| | | Hypothetical | 1 | | $ | 1,000.00 | | $ | 1,015.07 | | $ | 10.06 | | 1.97% |
| Class C | | Actual | | | $ | 1,000.00 | | $ | 1,072.00 | | $ | 10.34 | | 1.98% |
| | | Hypothetical | 1 | | $ | 1,000.00 | | $ | 1,015.02 | | $ | 10.11 | | 1.98% |
| Class R | | Actual | | | $ | 1,000.00 | | $ | 1,074.00 | | $ | 8.26 | | 1.58% |
| | | Hypothetical | 1 | | $ | 1,000.00 | | $ | 1,017.04 | | $ | 8.06 | | 1.58% |
| * | Expenses are equal to the Fund’s annualized expense ratio multiplied by the average account value over the period multiplied by 184/365 (to reflect the one-half year period). The expense ratio presented represents a six-month, annualized ratio in accordance with SEC guidelines. |
| 1 | Represents the hypothetical 5% return before expenses. |
| | |
Portfolio Summary | | Gartmore Large Cap Value Fund |
October 31, 2006
The SEC adopted a requirement that Funds present their portfolio holdings in a table, chart or graph format in their annual and semiannual reports to shareholders, whether or not a statement of investments is utilized. The following tables, which present portfolio holdings as a percentage of net assets, are provided in compliance with this requirement.
| | |
| Asset Allocation | | |
| Common Stocks | | 98.5% |
| Repurchase Agreements | | 4.0% |
| Other Investments* | | 6.7% |
| Liabilities in excess of other assets** | | -9.2% |
| | |
| | 100.0% |
| | |
| Top Industries | | |
| Oil & Gas | | 13.1% |
| Banks | | 11.9% |
| Diversified Financials | | 11.5% |
| Insurance | | 8.2% |
| Pharmaceuticals | | 6.3% |
| Telecommunications | | 5.9% |
| Electric Utilities | | 5.7% |
| Media | | 3.4% |
| Financial—Investment Banker/Broker | | 3.1% |
| Retail | | 3.0% |
| Other Assets | | 27.9% |
| | |
| | 100.0% |
| | |
| Top Holdings*** | | |
| Exxon Mobil Corp. | | 5.5% |
| Pfizer, Inc. | | 4.3% |
| Bank of America Corp. | | 3.7% |
| Citigroup, Inc. | | 3.0% |
| J.P. Morgan Chase & Co. | | 2.4% |
| ChevronTexaco Corp. | | 2.3% |
| Morgan Stanley Dean Witter & Co. | | 2.1% |
| ConocoPhillips | | 2.0% |
| Bellsouth Corp. | | 1.9% |
| American International Group, Inc. | | 1.9% |
| Other Assets | | 70.9% |
| | |
| | 100.0% |
| * | Includes value of collateral received from securities lending. |
| ** | Includes value of collateral owed from securities lending. |
| *** | For purpose of listing top holdings, repurchase agreements are considered cash equivalents and are included as part of Other Assets. |
Statement of Investments
October 31, 2006
Gartmore Large Cap Value Fund
Common Stocks (98.5%)
| | | | | |
| | | Shares or Principal Amount | | Value |
| | | | | |
Aerospace & Defense (0.8%) | | | |
Northrop Grumman Corp. | | 3,900 | | $ | 258,921 |
| | | | | |
Banks (11.9%) | | | |
Bank of America Corp. | | 21,218 | | | 1,143,014 |
IndyMac Bancorp, Inc. (c) | | 5,300 | | | 240,885 |
KeyCorp | | 7,800 | | | 289,692 |
PNC Bank Corp. | | 6,000 | | | 420,180 |
U.S. Bancorp | | 15,800 | | | 534,672 |
Wachovia Corp. | | 10,400 | | | 577,200 |
Wells Fargo Co. | | 14,500 | | | 526,205 |
| | | | | |
| | | | | 3,731,848 |
| | | | | |
Capital Goods (1.5%) | | | |
Cummins Engine, Inc. | | 2,600 | | | 330,148 |
Teleflex, Inc. | | 2,000 | | | 124,400 |
| | | | | |
| | | | | 454,548 |
| | | | | |
Chemicals (0.7%) | | | |
Ashland, Inc. | | 3,700 | | | 218,670 |
| | | | | |
Communications Equipment (0.8%) | | | |
Motorola, Inc. | | 10,200 | | | 235,212 |
| | | | | |
Computer Services (0.5%) | | | |
FactSet Research Systems, Inc. | | 3,100 | | | 157,790 |
| | | | | |
Computers & Peripherals (2.0%) | | | |
DST Systems, Inc. (b) | | 3,300 | | | 203,907 |
Hewlett-Packard Co. | | 10,500 | | | 406,770 |
| | | | | |
| | | | | 610,677 |
| | | | | |
Diversified Financials (11.5%) | | | |
Citigroup, Inc. | | 18,460 | | | 925,954 |
Countrywide Credit Industries, Inc. | | 9,298 | | | 354,440 |
Fannie Mae | | 6,000 | | | 355,560 |
Goldman Sachs Group, Inc. | | 2,000 | | | 379,580 |
J.P. Morgan Chase & Co. | | 16,028 | | | 760,368 |
Merrill Lynch & Co., Inc. | | 1,900 | | | 166,098 |
Morgan Stanley Dean Witter & Co. | | 8,800 | | | 672,584 |
| | | | | |
| | | | | 3,614,584 |
| | | | | |
Electric Utilities (5.7%) | | | |
American Electric Power Co., Inc. | | 5,900 | | | 244,437 |
Dominion Resources, Inc. | | 2,000 | | | 161,980 |
Emerson Electric Co. | | 2,000 | | | 168,800 |
| | | | | |
| | | Shares or Principal Amount | | Value |
| | | | | |
Electric Utilities (continued) | | | |
FirstEnergy Corp. | | 8,300 | | $ | 488,455 |
FPL Group, Inc. | | 6,500 | | | 331,500 |
MDU Resources Group, Inc. (c) | | 7,650 | | | 196,452 |
Public Service Enterprise Group, Inc. | | 3,100 | | | 189,255 |
| | | | | |
| | | | | 1,780,879 |
| | | | | |
Electronics – Military (0.7%) | | | |
L-3 Communications Holdings, Inc. | | 2,900 | | | 233,508 |
| | | | | |
Fertilizers (0.9%) | | | |
Scotts Co. (The) (c) | | 5,900 | | | 291,814 |
| | | | | |
Financial – Investment Banker/Broker (3.1%) |
Capital One Financial Corp. | | 1,900 | | | 150,727 |
Cit Group, Inc. | | 3,900 | | | 202,995 |
Lehman Brothers Holdings, Inc. | | 5,600 | | | 435,904 |
New Century Financial Corp. (c) | | 4,200 | | | 165,396 |
| | | | | |
| | | | | 955,022 |
| | | | | |
Food & Beverages (2.4%) | | | | | |
Archer-Daniels-Midland Co. | | 5,700 | | | 219,450 |
Coca-Cola Co. | | 6,900 | | | 322,368 |
Hormel Foods Corp. | | 5,800 | | | 209,438 |
| | | | | |
| | | | | 751,256 |
| | | | | |
Gas Utilities (1.3%) | | | | | |
Sempra Energy | | 7,900 | | | 419,016 |
| | | | | |
Household Durables (0.7%) | | | | | |
Whirlpool Corp. | | 2,400 | | | 208,632 |
| | | | | |
Household Products (2.4%) | | | | | |
Colgate-Palmolive Co. | | 2,700 | | | 172,719 |
Procter & Gamble Co. | | 8,900 | | | 564,171 |
| | | | | |
| | | | | 736,890 |
| | | | | |
Insurance (8.2%) | | | | | |
American International Group, Inc. | | 8,650 | | | 581,021 |
Chubb Corp. (The) | | 4,300 | | | 228,545 |
CIGNA Corp. | | 3,400 | | | 397,732 |
Hartford Financial Services Group, Inc. | | 5,100 | | | 444,567 |
MetLife, Inc. | | 7,500 | | | 428,475 |
St. Paul Travelers Cos., Inc. (The) | | 9,700 | | | 495,961 |
| | | | | |
| | | | | 2,576,301 |
| | | | | |
Common Stocks (continued)
| | | | | |
| | | Shares or Principal Amount | | Value |
| | | | | |
Media (3.4%) | | | | | |
News Corp. | | 18,800 | | $ | 391,980 |
Time Warner, Inc. | | 14,100 | | | 282,141 |
Walt Disney Co. (The) | | 12,200 | | | 383,812 |
| | | | | |
| | | | | 1,057,933 |
| | | | | |
Metals (0.4%) | | | | | |
Reliance Steel & Aluminum Co. | | 3,900 | | | 133,965 |
| | | | | |
Multi-Sector Companies (1.6%) | | | |
General Electric Co. | | 14,200 | | | 498,562 |
| | | | | |
Music (0.7%) | | | | | |
Warner Music Group Corp. | | 8,000 | | | 207,440 |
| | | | | |
Oil & Gas (13.1%) | | | | | |
ChevronTexaco Corp. | | 10,500 | | | 705,600 |
ConocoPhillips | | 10,400 | | | 626,496 |
Exxon Mobil Corp. | | 24,200 | | | 1,728,363 |
Frontier Oil Corp. (c) | | 5,300 | | | 155,820 |
Marathon Oil Corp. | | 3,500 | | | 302,400 |
Sunoco, Inc. | | 2,000 | | | 132,260 |
Tesoro Petroleum Corp. | | 2,700 | | | 172,638 |
Valero Energy Corp. | | 5,200 | | | 272,116 |
| | | | | |
| | | | | 4,095,693 |
| | | | | |
Packaging & Containers (0.5%) | | | |
Sonoco Products Co. (c) | | 4,800 | | | 170,304 |
| | | | | |
Paper & Related Products (0.6%) | | | |
MeadWestvaco Corp. | | 6,500 | | | 178,880 |
| | | | | |
Pharmaceuticals (6.3%) | | | | | |
Merck & Co., Inc. | | 7,600 | | | 345,192 |
Pfizer, Inc. | | 51,100 | | | 1,361,815 |
Wyeth | | 5,400 | | | 275,562 |
| | | | | |
| | | | | 1,982,569 |
| | | | | |
Real Estate Investment Trusts (2.0%) | | | |
Mack-Cali Realty Corp. | | 5,500 | | | 290,950 |
Weinharten Realty Investors (c) | | 7,300 | | | 339,450 |
| | | | | |
| | | | | 630,400 |
| | | | | |
Restaurants (1.0%) | | | |
Darden Restaurants, Inc. | | 3,700 | | | 155,030 |
McDonald’s Corp. | | 3,800 | | | 159,296 |
| | | | | |
| | | | | 314,326 |
| | | | | |
| | | | | | |
| | | Shares or Principal Amount | | Value |
| | | | | | |
Retail (3.0%) | | | |
Brunswick Corp. | | | 5,500 | | $ | 173,250 |
CVS Corp. | | | 9,000 | | | 282,420 |
Dillard’s, Inc. | | | 8,300 | | | 250,411 |
V.F. Corp. | | | 3,000 | | | 228,030 |
| | | | | | |
| | | | | | 934,111 |
| | | | | | |
Schools (0.7%) | | | |
Laureate Education, Inc. (b) (c) | | | 4,200 | | | 221,424 |
| | | | | | |
Semiconductor Components – Integrated Circuits (0.5%) | | | |
Integrated Device Technology,
Inc. (b) | | | 10,300 | | | 163,255 |
| | | | | | |
Services (1.0%) | | | |
Manpower, Inc. | | | 4,700 | | | 318,519 |
| | | | | | |
Steel (0.6%) | | | |
Steel Dynamics, Inc. | | | 2,900 | | | 174,319 |
| | | | | | |
Telecommunications (5.9%) | | | |
AT&T Inc. | | | 15,800 | | | 541,150 |
Bellsouth Corp. | | | 13,300 | | | 599,830 |
Qwest Communications International, Inc. (b) | | | 25,200 | | | 217,476 |
Verizon Communications, Inc. | | | 13,300 | | | 492,100 |
| | | | | | |
| | | | | | 1,850,556 |
| | | | | | |
Tobacco (1.3%) | | | |
Altria Group, Inc. | | | 4,900 | | | 398,517 |
| | | | | | |
Transportation (0.8%) | | | |
YRC Worldwide, Inc. (b) (c) | | | 6,700 | | | 259,558 |
| | | | | | |
| | |
Total Common Stocks | | | | | | 30,825,899 |
| | | | | | |
|
Repurchase Agreements (4.0%) |
| | |
CS First Boston, 5.17%, dated 10/31/06, due 11/01/06, repurchase price $639,528, collateralized by U.S. Government Agency Mortgages with a market value of $652,226 | | $ | 639,436 | | | 639,436 |
Statement of Investments (Continued)
October 31, 2006
Gartmore Large Cap Value Fund (Continued)
Repurchase Agreements (continued)
| | | | | | |
| | | Principal
Amount | | Value |
| | | | | | |
Nomura Securities, 5.17%, dated 10/31/06, due 11/01/06, repurchase price $610,604, collateralized by U.S. Government Agency Mortgages with a market value of $622,727 | | $ | 610,516 | | $ | 610,516 |
| | | | | | |
| | |
Total Repurchase Agreements | | | | | | 1,249,952 |
| | | | | | |
|
Short-Term Securities Held as Collateral For Securities on Loan (6.7%) |
Beta Finance, Inc. Medium Term Note, 5.37%, 11/01/06 | | | 300,000 | | | 300,000 |
Unicredito Italiano Bank (IRE) PLC, Medium Term Note,
5.33%, 11/09/06 | | | 200,000 | | | 200,000 |
Banc of America Securities LLC Repurchase Agreement,
5.32%, dated 10/31/06, due 11/01/06, repurchase price $1,602,477, collateralized by U.S. Government Agency Mortgages with a market value of $1,634,285 | | | 1,602,240 | | | 1,602,240 |
| | | | | | |
| | |
Total Short-Term Securities Held as Collateral for Securities on Loan | | | | | | 2,102,240 |
| | | | | | |
| | | | | | |
| | | | |
Value | |
| | | | | | |
Total Investments
(Cost $29,720,160) (a) — 109.2% | | $ | 34,178,091 | |
| |
Liabilities in excess of other
assets — (9.2)% | | | (2,869,832 | ) |
| | | | | | |
| | |
NET ASSETS — 100.0% | | | | $ | 31,308,259 | |
| | | | | | |
| | (a) | See notes to financial statements for tax unrealized appreciation (depreciation) of securities. |
| | (b) | Denotes a non-income producing security. |
| | (c) | All or part of the security was on loan as of October 31, 2006. |
See notes to financial statements.
Gartmore Mid Cap Growth Fund
For the annual period ended Oct. 31, 2006, the Gartmore Mid Cap Growth Fund (Class A at NAV) returned 13.51% versus 14.51% for its benchmark, the Russell Midcap® Growth Index. For broader comparison, the average return for the Fund’s Lipper peer category of Mid-Cap Growth Funds (consisting of 611 funds as of Oct. 31, 2006) was 11.52%.
During the period, equity markets closely followed the flow of economic data. This data suggested that the economy is slowing and that the string of interest rate hikes by the Federal Reserve is most likely over. This environment could lead to future valuation multiple expansion for equities; thus investors pushed stocks higher led by the large capitalization stocks. The strong performance of large company stocks proved challenging for mid-capitalization equity mangers. As measured by the Russell Midcap Growth Index, the Index underperformed its larger counterpart, the S&P 500® Index, by a sizable margin. Macroeconomic concerns played a key role in this underperformance. Despite falling oil prices and a pause in interest-rate action by the Federal Reserve Board, concerns about inflation and future U.S. economic growth caused investors to seek larger companies because they tend to do well when the economy is slowing.
The Fund’s performance trailed that of the benchmark Index for the latter half of the reporting period. Detractors from Fund performance during the reporting period included Multi-Fineline Electronix, Inc. (printed circuits), NAVTEQ Corp. (technology) and ResMed Inc. (medical products and services). Multi-Fineline and NAVTEQ reported disappointing financial results, and ResMed (medical products and services) experienced what we believe to be temporary softness in sales.
The largest contributors to Fund performance during the reporting period included Crocs, Inc. (shoe manufacturer), IntercontinentalExchange (financial services) and Abercrombie & Fitch (retail). All three firms benefited from strong operational performance.
The Fund’s positioning remains relatively the same as it was throughout the reporting period. Our portfolio remains underweight in consumer staples, industrials and health care, and it is overweight in technology, financials and telecommunications services. Currently, our largest positions are Office Depot, Inc.(retail), ResMed (medical products and services) and XTO Energy Inc. (oil&gas). The positioning of the Fund portfolio is a direct result of our bottom-up, fundamental research process.
Our outlook for the mid-cap market remains positive, and we have several reasons for our optimism. First, increasingly we are finding good earnings growth companies with solid balance sheets trading at attractive valuations. Second, the steep decline in the prices of energy and raw materials is likely to temper the degree of moderation in economic growth through year-end. Finally, the combination of a moderating economy and attractive valuations is likely to further fuel merger-and-acquisition activity, providing a solid underpinning for equity valuations.
Portfolio Manager:
Robert D. Glise, CFA
| | |
Fund Performance | | Gartmore Mid Cap Growth Fund |
Average Annual Total Return
(For periods ended October 31, 2006)
| | | | | | |
| | | | | 1 Yr. | | Inception1 |
| Class A2 | | w/o SC3 | | 13.51% | | 16.96% |
| | | w/SC4 | | 6.97% | | 15.27% |
| Class B2 | | w/o SC3 | | 12.68% | | 16.35% |
| | | w/SC5 | | 7.68% | | 16.04% |
| Class C2 | | w/o SC3 | | 12.68% | | 16.35% |
| | | w/SC6 | | 11.68% | | 16.35% |
| Class R2,7 | | | | 13.27% | | 16.82% |
| Institutional Class7 | | | | 13.80% | | 17.24% |
All figures showing the effect of a sales charge reflect the maximum charge possible, because it has the most dramatic effect on performance data.
| 1 | Fund commenced operations on October 1, 2002. |
| 2 | These returns included performance based on the Fund’s Institutional Class shares, which was achieved prior to the creation of Class A shares (3/5/03), Class B and Class C shares (8/21/03), and Class R shares (10/1/03). Excluding the effects of any fee waivers or reimbursements, such prior performance is similar to what Class A, Class B, Class C and Class R shares would have produced because all classes of the Fund’s shares invest in the same portfolio of securities. The performance for these classes has been restated to reflect differences in sales charges (where applicable), but does not reflect the differing levels of other fees (primarily Rule 12b-1 and/or administrative services fees) applicable to such classes; if these fees were reflected, the performance for Class A, Class B, Class C and Class R would have been lower. |
| 3 | These returns do not reflect the effects of sales charges (SC). |
| 4 | A 5.75% front-end sales charge was deducted. |
| 5 | A 5.00% contingent deferred sales charge (CDSC) was deducted. The CDSC declines to 0% after 6 years. |
| 6 | A CDSC of 1.00% was deducted from the one year return because it is charged when you sell Class C shares within the first year after purchase. |
| 7 | Not subject to any sales charges. |
Performance of a $10,000 Investment
Investment return and principal value will fluctuate, and when redeemed, shares may be worth more or less than original cost. Past performance is no guarantee of future results and does not reflect the deduction of taxes that a shareholder would pay on fund distributions or the redemption of fund shares. Investing in mutual funds involves market risk, including loss of principal. Performance returns assume the reinvestment of all distributions.
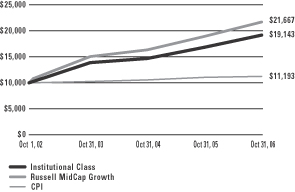
Comparative performance of $10,000 invested in the Institutional Class shares the Gartmore Mid Cap Growth Fund, Russell Mid Cap Growth Index (Russell Mid Cap Growth)(a), and the Consumer Price Index (CPI)(b) since inception. Unlike the Fund, the returns for these unmanaged indexes do not reflect any fees, expenses, or sales charges. Investors cannot invest directly in market indexes.
| (a) | The Russell Mid Cap Growth—an unmanaged index of medium-size U.S. companies with a capitalization range of $1.4 billion to $18.6 billion as of October 31, 2006, gives a broad look at how the stock price of medium-size U.S. companies have performed. |
| (b) | The CPI represents changes in prices of a basket of goods and services purchased for consumption by urban households. |
| | |
Shareholder Expense Example | | Gartmore Mid Cap Growth Fund |
As a shareholder of the Fund, you incur two types of costs: (1) transaction costs, including sales charges (loads) paid on purchase payments and redemption fees; and (2) ongoing costs, including investment advisory fees, administration fees, distribution fees and other Fund expenses. The examples below are intended to help you understand your ongoing costs (in dollars) of investing in the Fund and to compare these costs with the ongoing costs of investing in other mutual funds. Per SEC requirements, the examples assume that you had a $1,000 investment in the Class at the beginning of the reporting period, May 1, 2006 and continued to hold your shares at the end of the reporting period, October 31, 2006.
Actual Expenses
For each Class of the Fund in the table below, the first line provides information about actual account values and actual expenses. You may use the information in this line, together with the amount you invested, to estimate the expenses that you paid over the period. Simply divide your account value by $1,000 (for example, an $8,600 account value divided by $1,000 = 8.6), then multiply the result by the number in the first line of each Class under the heading entitled “Expenses Paid During Period” to estimate the expenses you paid on your account during the period.
Hypothetical Example for Comparison Purposes
The second line of each Class in the table below provides information about hypothetical account values and hypothetical expenses based on the Class’ actual expense ratio and an assumed rate of return of 5% per year before expenses, which is not the Class’ actual return. The hypothetical account values and expenses may not be used to estimate the actual ending account balance or expenses you paid for the period. You may use this information to compare the ongoing costs of investing in the Class of the Fund and other funds. To do so, compare this 5% hypothetical example with the 5% hypothetical examples that appear in the shareholder reports of the other funds.
Please note that the expenses shown in the table are meant to highlight your ongoing costs only and do not reflect any transaction costs, such as sales charges (loads) or redemption fees. Therefore, the second line for each Class in the table is useful in comparing ongoing costs only, and will not help you determine the relative total costs of owning different funds. In addition, if these transaction costs were included, your costs would have been higher. The examples also assume all dividends and distributions have been reinvested.
Schedule of Shareholder Expenses
Expense Analysis of a $1,000 Investment
(October 31, 2006)
| | | | | | | | | | | | | | |
| Mid Cap Growth Fund | | | | | Beginning
Account Value,
5/1/06 | | Ending
Account Value,
10/31/06 | | Expenses Paid
During Period* | | Annualized
Expense Ratio* |
| Class A | | Actual | | | $ | 1,000.00 | | $ | 982.40 | | $ | 7.10 | | 1.42% |
| | | Hypothetical | 1 | | $ | 1,000.00 | | $ | 1,017.84 | | $ | 7.25 | | 1.42% |
| Class B | | Actual | | | $ | 1,000.00 | | $ | 979.10 | | $ | 10.77 | | 2.16% |
| | | Hypothetical | 1 | | $ | 1,000.00 | | $ | 1,014.11 | | $ | 11.02 | | 2.16% |
| Class C | | Actual | | | $ | 1,000.00 | | $ | 979.10 | | $ | 10.77 | | 2.16% |
| | | Hypothetical | 1 | | $ | 1,000.00 | | $ | 1,014.11 | | $ | 11.02 | | 2.16% |
| Class R | | Actual | | | $ | 1,000.00 | | $ | 980.60 | | $ | 8.59 | | 1.72% |
| | | Hypothetical | 1 | | $ | 1,000.00 | | $ | 1,016.33 | | $ | 8.78 | | 1.72% |
| Institutional Class | | Actual | | | $ | 1,000.00 | | $ | 983.70 | | $ | 5.80 | | 1.16% |
| | | Hypothetical | 1 | | $ | 1,000.00 | | $ | 1,019.15 | | $ | 5.92 | | 1.16% |
| * | Expenses are equal to the Fund’s annualized expense ratio multiplied by the average account value over the period multiplied by 184/365 (to reflect the one-half year period). The expense ratio presented represents a six-month, annualized ratio in accordance with SEC guidelines. |
| 1 | Represents the hypothetical 5% return before expenses. |
| | |
Portfolio Summary | | Gartmore Mid Cap Growth Fund |
October 31, 2006
The SEC adopted a requirement that Funds present their portfolio holdings in a table, chart or graph format in their annual and semiannual reports to shareholders, whether or not a statement of investments is utilized. The following tables, which present portfolio holdings as a percentage of net assets, are provided in compliance with this requirement.
| | |
| Asset Allocation | | |
| Common Stock | | 95.9% |
| Repurchase Agreements | | 1.4% |
| Other assets in excess of liabilities | | 2.7% |
| | |
| | 100.0% |
Top Industries | | |
| Computer Software & Services | | 9.6% |
| Retail | | 8.5% |
| Financial Services | | 7.2% |
| Oil & Gas | | 7.2% |
| Telecommunications | | 6.4% |
| Medical Products & Services | | 6.0% |
| Consumer Products | | 5.8% |
| Electronics | | 4.7% |
| Construction | | 4.2% |
| Consumer & Commercial Services | | 4.2% |
| Other Assets | | 36.2% |
| | |
| | 100.0% |
| | |
| Top Holdings* | | |
| Office Depot, Inc. | | 2.2% |
| XTO Energy, Inc. | | 2.1% |
| ResMed, Inc. | | 2.1% |
| L-3 Communications Holdings, Inc. | | 2.0% |
| Alliance Data Systems Corp. | | 1.9% |
| Comverse Technology, Inc. | | 1.9% |
| W.R. Berkley Corp. | | 1.9% |
| NII Holdings, Inc. | | 1.9% |
| Network Appliance, Inc. | | 1.8% |
| Amdocs Ltd. – GG | | 1.7% |
| Other Assets | | 80.5% |
| | |
| | 100.0% |
| * | For purpose of listing top holdings, repurchase agreements are considered cash equivalents and are included as part of Other Assets. |
Statement of Investments
October 31, 2006
Gartmore Mid Cap Growth Fund
Common Stocks (95.9%)
| | | | | |
| | | Shares or Principal Amount | | Value |
| | | | | |
Aerospace & Defense (2.0%) | | | |
L-3 Communications Holdings, Inc. | | 1,780 | | $ | 143,326 |
| | | | | |
Auction Houses & Art Dealers (0.9%) | | | |
Ritchie Brothers Auctioneers,
Inc. — CA | | 1,250 | | | 68,163 |
| | | | | |
Audio & Video Products (1.1%) | | | |
Harman International Industries | | 800 | | | 81,880 |
| | | | | |
Banks (1.2%) | | | |
East West Bancorp, Inc. | | 2,420 | | | 88,354 |
| | | | | |
Business Consulting (1.4%) | | | |
SAIC, Inc. (b) | | 4,890 | | | 97,800 |
| | | | | |
Business Services (2.3%) | | | |
Copart, Inc. (b) | | 2,380 | | | 68,853 |
Corporate Executive Board Co. | | 1,040 | | | 93,413 |
| | | | | |
| | | | | 162,266 |
| | | | | |
Computer Hardware (1.5%) | | | |
Logitech International — CH (b) | | 4,210 | | | 111,355 |
| | | | | |
Computer Software & Services (9.6%) | | | |
Akamai Technologies, Inc. (b) | | 1,240 | | | 58,106 |
F5 Networks, Inc. (b) | | 1,380 | | | 91,342 |
FactSet Research Systems, Inc. | | 1,660 | | | 84,494 |
Intuit, Inc. (b) | | 2,370 | | | 83,661 |
Micros Systems, Inc. (b) | | 1,740 | | | 86,443 |
Network Appliance, Inc. (b) | | 3,560 | | | 129,940 |
Research In Motion Ltd. — CA (b) | | 700 | | | 82,236 |
Satyam Computer Services Ltd. — IN | | 3,520 | | | 77,827 |
| | | | | |
| | | | | 694,049 |
| | | | | |
Construction (4.2%) | | | |
Beacon Roofing Supply, Inc. (b) | | 3,870 | | | 76,626 |
D.R. Horton, Inc. | | 2,273 | | | 53,256 |
Florida Rock Industries, Inc. | | 1,850 | | | 79,365 |
Pool Corp. | | 2,340 | | | 95,894 |
| | | | | |
| | | | | 305,141 |
| | | | | |
Consumer & Commercial Services (4.2%) | | | |
Alliance Data Systems Corp. (b) | | 2,300 | | | 139,656 |
Dun & Bradstreet Corp. (b) | | 1,200 | | | 92,688 |
Heartland Payment Systems, Inc. | | 2,640 | | | 70,541 |
| | | | | |
| | | | | 302,885 |
| | | | | |
| | | | | |
| | | Shares or Principal Amount | | Value |
| | | | | |
Consumer Products (5.8%) | | | |
Ecolab, Inc. | | 1,970 | | $ | 89,340 |
Fortune Brands, Inc. | | 920 | | | 70,794 |
Gildan Activewear, Inc.,
Class A — CA (b) | | 1,540 | | | 78,586 |
Jarden Corp. (b) | | 2,525 | | | 90,849 |
Nutri/System, Inc. (b) | | 1,410 | | | 86,969 |
| | | | | |
| | | | | 416,538 |
| | | | | |
Electronics (4.7%) | | | |
Diodes, Inc. (b) | | 2,021 | | | 89,005 |
FLIR Systems, Inc. (b) | | 2,670 | | | 85,280 |
Jabil Circuit, Inc. | | 2,610 | | | 74,933 |
Microchip Technology, Inc. | | 2,710 | | | 89,240 |
| | | | | |
| | | | | 338,458 |
| | | | | |
Energy (1.4%) | | | |
Headwaters, Inc. (b) | | 4,190 | | | 103,703 |
| | | | | |
Financial Services (7.2%) | | | |
Affiliated Managers Group, Inc. (b) | | 720 | | | 72,101 |
Chicago Mercantile Exchange | | 140 | | | 70,140 |
Intercontinental Exchange, Inc. (b) | | 1,240 | | | 104,680 |
Investors Financial Services Corp. | | 1,530 | | | 60,160 |
SEI Investments Co. | | 2,070 | | | 116,499 |
TD Ameritrade Holding Corp. (b) | | 5,850 | | | 96,350 |
| | | | | |
| | | | | 519,930 |
| | | | | |
Gaming & Leisure (2.6%) | | | |
Penn National Gaming, Inc. (b) | | 3,250 | | | 118,852 |
Shuffle Master, Inc. (b) | | 2,420 | | | 67,712 |
| | | | | |
| | | | | 186,564 |
| | | | | |
Healthcare (3.8%) | | | |
Express Scripts, Inc. (b) | | 1,320 | | | 84,110 |
Patterson Cos., Inc. (b) | | 2,550 | | | 83,768 |
St. Jude Medical, Inc. (b) | | 3,160 | | | 108,546 |
| | | | | |
| | | | | 276,424 |
| | | | | |
Insurance (3.1%) | | | |
Brown & Brown, Inc. | | 3,000 | | | 87,780 |
W.R. Berkley Corp. | | 3,755 | | | 138,409 |
| | | | | |
| | | | | 226,189 |
| | | | | |
Machinery (1.0%) | | | |
Graco, Inc. | | 1,770 | | | 72,145 |
| | | | | |
Statement of Investments (Continued)
October 31, 2006
Gartmore Mid Cap Growth Fund (Continued)
Common Stocks (continued)
| | | | | |
| | | Shares or Principal Amount | | Value |
| | | | | |
Medical Products & Services (6.0%) | | | |
Fisher Scientific International, Inc. (b) | | 1,410 | | $ | 120,724 |
QIAGEN N.V. (b) | | 5,030 | | | 79,524 |
ResMed, Inc. (b) | | 3,490 | | | 153,525 |
VCA Antech, Inc. (b) | | 2,380 | | | 77,041 |
| | | | | |
| | | | | 430,814 |
| | | | | |
Oil & Gas (7.2%) | | | |
EOG Resources, Inc. | | 1,490 | | | 99,130 |
Patterson-UTI Energy, Inc. | | 3,840 | | | 89,088 |
TETRA Technologies, Inc. (b) | | 2,850 | | | 73,815 |
World Fuel Services Corp. | | 2,350 | | | 101,097 |
XTO Energy, Inc. | | 3,300 | | | 153,978 |
| | | | | |
| | | | | 517,108 |
| | | | | |
Pharmaceuticals (2.8%) | | | |
Barr Pharmaceuticals, Inc. (b) | | 1,850 | | | 96,885 |
Waters Corp. (b) | | 2,040 | | | 101,592 |
| | | | | |
| | | | | 198,477 |
| | | | | |
Retail (8.5%) | | | |
Abercrombie & Fitch Co. | | 1,360 | | | 104,244 |
Bed, Bath & Beyond, Inc. (b) | | 2,330 | | | 93,876 |
Coach, Inc. (b) | | 2,610 | | | 103,460 |
J. Crew Group, Inc. (b) | | 2,600 | | | 80,184 |
Office Depot, Inc. (b) | | 3,800 | | | 159,562 |
Williams-Sonoma, Inc. | | 2,200 | | | 74,822 |
| | | | | |
| | | | | 616,148 |
| | | | | |
Semiconductors (3.4%) | | | |
Marvell Technology Group
Ltd. — BM (b) | | 4,860 | | | 88,841 |
MEMC Electronic Materials, Inc. (b) | | 1,570 | | | 55,735 |
Tessera Technologies, Inc. (b) | | 2,820 | | | 98,446 |
| | | | | |
| | | | | 243,022 |
| | | | | |
Telecommunications (6.4%) | | | |
Amdocs Ltd. — GG (b) | | 3,150 | | | 122,094 |
Comverse Technology, Inc. (b) | | 6,410 | | | 139,546 |
NeuStar, Inc. (b) | | 2,160 | | | 63,115 |
NII Holdings, Inc. (b) | | 2,110 | | | 137,213 |
| | | | | |
| | | | | 461,968 |
| | | | | |
| | | | | | |
| | | Shares or Principal Amount | | Value |
| | | | | | |
Transportation (2.5%) | | | |
American Commercial Lines, Inc. (b) | | | 1,077 | | $ | 69,090 |
Expeditors International of Washington, Inc. | | | 810 | | | 38,402 |
Oshkosh Truck Corp. | | | 1,600 | | | 72,336 |
| | | | | | |
| | | | | | 179,828 |
| | | | | | |
Waste Disposal (1.1%) | | | |
Stericycle, Inc. (b) | | | 1,140 | | | 80,608 |
| | | | | | |
| | |
Total Common Stocks | | | | | | 6,923,143 |
| | | | | | |
|
Repurchase Agreements (1.4%) |
| | |
CS First Boston, 5.17%, dated 10/31/06, due 11/01/06, repurchase price $51,893, collateralized by U.S. Government Agency Mortgages with a market value of $52,924 | | $ | 51,886 | | | 51,886 |
| | |
Nomura Securities, 5.17%, dated 10/31/06, due 11/01/06, repurchase price $49,547, collateralized by U.S. Government Agency Mortgages with a market value of $50,531 | | | 49,540 | | | 49,540 |
| | | | | | |
| | |
Total Repurchase Agreements | | | | | | 101,426 |
| | | | | | |
| |
Total Investments
(Cost $6,143,953) (a) — 97.3% | | | 7,024,569 |
| |
Other assets in excess of liabilities — 2.7% | | | 196,779 |
| | | | | | |
| | |
NET ASSETS — 100.0% | | | | | $ | 7,221,348 |
| | | | | | |
| | (a) | See notes to financial statements for tax unrealized appreciation (depreciation) of securities. |
| | (b) | Denotes a non-income producing security. |
See notes to financial statements.
Gartmore Small Cap Fund
For the annual period ended Oct. 31, 2006, the Gartmore Small Cap Fund (Class A at NAV) returned 30.98% versus 19.98% for its benchmark, the Russell 2000® Index. For broader comparison, the average return for the Fund’s Lipper peer category of Small-Cap Core Funds (consisting of 689 funds as of Oct. 31, 2006) was 16.40%.
Small-capitalization stocks continued their dominance over large- and mid-cap stocks during the reporting period. The exception to that trend occurred during May through July, when small-cap stocks declined sharply and investors became concerned about worsening inflation and the possibility that the Federal Reserve Board might increase interest rates further than expected. As the summer progressed, however, inflation remained in check and the economy appeared to be slowing, providing the Federal Reserve with the flexibility it needed to hold rates steady at its August, September and October Federal Open Market Committee meetings. Adding to the positive backdrop late in the reporting period were a relatively benign hurricane season and a sharp decline in crude oil and natural gas prices.
The Fund benefited significantly from favorable stock selection in information technology, industrials and health care. In technology, two of the Fund’s standout performers were webMethods, Inc. and Integrated Device Technology, Inc. In the case of webMethods, a provider of enterprise application integration software, the company reported very strong financial results for the fourth quarter of 2005 and the first quarter of 2006; therefore, we closed out the Fund’s position. Integrated Device Technology, a provider of integrated circuits, was aided by cost-cutting associated with a recent merger and also by some favorable product cycles, we no longer hold this position. In the industrials sector, the stock price of the Fund’s holding in The GEO Group, Inc., a private-sector prison company, more than doubled as the demand for prison space remained high. Williams Scotsman International, Inc., a modular building provider, was another contributor to Fund performance. We continue to hold positions in The GEO Group and Williams Scotsman International.
Materials and energy were the sectors that had the biggest negative impact on performance versus the benchmark. In materials, chemical conglomerate Chemtura Corp. fell sharply as some of the company’s restructuring initiatives failed to gain traction. In the energy sector, the Fund was hurt by its exposure to Warren Resources, Inc., an oil and natural gas producer encountered various operational problems.
We remain positive about the prospects for small-cap stocks. Despite the group’s strong returns during the past six years, valuations are roughly comparable to what they were in 1999 because earnings have risen along with share prices. Furthermore, we foresee a healthy level of mergers-and-acquisitions activity in the group, since many larger companies have ample cash on their balance sheets, and small caps are common takeover targets.
Portfolio Managers:
Charles Purcell, CFA; William Gerlach, CFA; and Gary Haubold, CFA
| | |
Fund Performance | | Gartmore Small Cap Fund |
Average Annual Total Return
(For periods ended October 31, 2006)
| | | | | | | | |
| | | | | 1 Yr. | | 5 Yr. | | Inception1 |
| Class A | | w/o SC2 | | 30.98% | | 20.29% | | 14.75% |
| | | w/SC3 | | 23.42% | | 18.87% | | 13.90% |
| Class B | | w/o SC2 | | 30.16% | | 19.55% | | 14.04% |
| | | w/SC4 | | 25.16% | | 19.35% | | 14.04% |
| Class C5 | | w/o SC2 | | 30.17% | | 19.54% | | 14.06% |
| | | w/SC6 | | 29.17% | | 19.54% | | 14.06% |
| Class R7,9 | | | | 30.87% | | 19.91% | | 14.26% |
| Institutional Service Class9 | | 31.64% | | 20.59% | | 15.00% |
| Institutional Class8,9 | | 31.52% | | 20.60% | | 15.01% |
All figures showing the effect of a sales charge reflect the maximum charge possible, because it has the most dramatic effect on performance data.
| 1 | Fund commenced operations on November 2, 1998. |
| 2 | These returns do not reflect the effects of sales charges (SC). |
| 3 | A 5.75% front-end sales charge was deducted. |
| 4 | A 5.00% contingent deferred sales charge (CDSC) was deducted. The CDSC declines to 0% after 6 years. |
| 5 | These returns until the creation of Class C shares (3/1/01) include the performance of the Fund’s Class B shares. Excluding the effect of any fee waivers or reimbursements, such prior performance is substantially similar to what Class C shares would have produced because Class C shares invest in the same portfolio of securities as Class B shares and have the same expenses after any fee waivers or reimbursements. For Class C shares returns with sales charges, these returns have been restated for the applicable sales charges. |
| 6 | A CDSC of 1.00% was deducted from the one year return because it is charged when you sell Class C shares within the first year after purchase. |
| 7 | These returns until the creation of Class R shares (12/30/03) include the performance of the Fund’s Class B shares. The returns have been adjusted for the fact that Class R shares do not have any applicable sales charges but have not been adjusted for the lower expenses applicable to Class R shares. Excluding the effect of any fee waivers or reimbursements, such prior performance is similar to what Class R shares would have produced because the Class R shares will invest in the same portfolio of securities as Class B shares. |
| 8 | These returns until the creation of Institutional Class shares (06/29/04) include the performance of the Fund’s Institutional Service Class shares. The returns have been adjusted for the fact that Institutional Class shares do not have any applicable sales charges but have not been adjusted for the lower expenses applicable to Institutional Class shares. Excluding the effect of any fee waivers or reimbursements, such prior performance is similar to what Institutional Class shares would have produced because the Institutional Class shares will invest in the same portfolio of securities as Institutional Service shares. |
| 9 | Not subject to any sales charges. |
Performance of a $10,000 Investment
Investment return and principal value will fluctuate, and when redeemed, shares may be worth more or less than original cost. Past performance is no guarantee of future results and does not reflect the deduction of taxes that a shareholder would pay on fund distributions or the redemption of fund shares. Investing in mutual funds involves market risk, including loss of principal. Performance returns assume the reinvestment of all distributions.
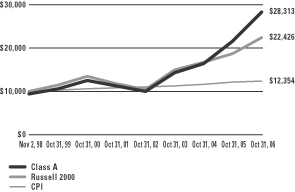
Comparative performance of $10,000 invested in Class A shares of the Gartmore Small Cap Fund, the Russell 2000 Index (Russell 2000)(a), and the Consumer Price Index (CPI)(b) since inception. Unlike the Fund, the returns for these unmanaged indexes do not reflect any fees, expenses, or sales charges. Investors cannot invest directly in market indexes.
| (a) | The Russell 2000 is an unmanaged index of approximately 2000 companies with small market capitalizations relative to the market capitalizations of other U.S. companies. |
| (b) | The CPI represents changes in prices of a basket of goods and services purchased for consumption by urban households. |
| | |
Shareholder Expense Example | | Gartmore Small Cap Fund |
As a shareholder of the Fund, you incur two types of costs: (1) transaction costs, including sales charges (loads) paid on purchase payments and redemption fees; and (2) ongoing costs, including investment advisory fees, administration fees, distribution fees and other Fund expenses. The examples below are intended to help you understand your ongoing costs (in dollars) of investing in the Fund and to compare these costs with the ongoing costs of investing in other mutual funds. Per SEC requirements, the examples assume that you had a $1,000 investment in the Class at the beginning of the reporting period, May 1, 2006 and continued to hold your shares at the end of the reporting period, October 31, 2006.
Actual Expenses
For each Class of the Fund in the table below, the first line provides information about actual account values and actual expenses. You may use the information in this line, together with the amount you invested, to estimate the expenses that you paid over the period. Simply divide your account value by $1,000 (for example, an $8,600 account value divided by $1,000 = 8.6), then multiply the result by the number in the first line of each Class under the heading entitled “Expenses Paid During Period” to estimate the expenses you paid on your account during the period.
Hypothetical Example for Comparison Purposes
The second line of each Class in the table below provides information about hypothetical account values and hypothetical expenses based on the Class’ actual expense ratio and an assumed rate of return of 5% per year before expenses, which is not the Class’ actual return. The hypothetical account values and expenses may not be used to estimate the actual ending account balance or expenses you paid for the period. You may use this information to compare the ongoing costs of investing in the Class of the Fund and other funds. To do so, compare this 5% hypothetical example with the 5% hypothetical examples that appear in the shareholder reports of the other funds.
Please note that the expenses shown in the table are meant to highlight your ongoing costs only and do not reflect any transaction costs, such as sales charges (loads) or redemption fees. Therefore, the second line for each Class in the table is useful in comparing ongoing costs only, and will not help you determine the relative total costs of owning different funds. In addition, if these transaction costs were included, your costs would have been higher. The examples also assume all dividends and distributions have been reinvested.
Schedule of Shareholder Expenses
Expense Analysis of a $1,000 Investment
(October 31, 2006)
| | | | | | | | | | | | | | |
| Small Cap Fund | | | | | Beginning
Account Value,
5/1/06 | | Ending
Account Value,
10/31/06 | | Expenses Paid
During Period* | | Annualized
Expense Ratio* |
| Class A | | Actual | | | $ | 1,000.00 | | $ | 1,045.40 | | $ | 7.11 | | 1.38% |
| | | Hypothetical | 1 | | $ | 1,000.00 | | $ | 1,018.04 | | $ | 7.04 | | 1.38% |
| Class B | | Actual | | | $ | 1,000.00 | | $ | 1,042.00 | | $ | 10.65 | | 2.07% |
| | | Hypothetical | 1 | | $ | 1,000.00 | | $ | 1,014.56 | | $ | 10.57 | | 2.07% |
| Class C | | Actual | | | $ | 1,000.00 | | $ | 1,041.90 | | $ | 10.65 | | 2.07% |
| | | Hypothetical | 1 | | $ | 1,000.00 | | $ | 1,014.56 | | $ | 10.57 | | 2.07% |
| Class R | | Actual | | | $ | 1,000.00 | | $ | 1,044.30 | | $ | 8.97 | | 1.74% |
| | | Hypothetical | 1 | | $ | 1,000.00 | | $ | 1,016.23 | | $ | 8.88 | | 1.74% |
| Institutional Service Class | | Actual | | | $ | 1,000.00 | | $ | 1,046.30 | | $ | 6.55 | | 1.27% |
| | | Hypothetical | 1 | | $ | 1,000.00 | | $ | 1,018.60 | | $ | 6.48 | | 1.27% |
| Institutional Class | | Actual | | | $ | 1,000.00 | | $ | 1,047.70 | | $ | 5.52 | | 1.07% |
| | | Hypothetical | 1 | | $ | 1,000.00 | | $ | 1,019.61 | | $ | 5.46 | | 1.07% |
| * | Expenses are equal to the Fund’s annualized expense ratio multiplied by the average account value over the period multiplied by 184/365 (to reflect the one-half year period). The expense ratio presented represents a six-month, annualized ratio in accordance with SEC guidelines. |
| 1 | Represents the hypothetical 5% return before expenses. |
| | |
Portfolio Summary | | Gartmore Small Cap Fund |
October 31, 2006
The SEC adopted a requirement that Funds present their portfolio holdings in a table, chart or graph format in their annual and semiannual reports to shareholders, whether or not a statement of investments is utilized. The following tables, which present portfolio holdings as a percentage of net assets, are provided in compliance with this requirement.
| | |
| Asset Allocation | | |
| Common Stock | | 95.7% |
| Repurchase Agreements | | 5.9% |
| Exchange-Traded Fund | | 0.5% |
| Other Investments* | | 1.6% |
| Liabilities in excess of other assets** | | -3.7% |
| | |
| | 100.0% |
| | |
| Top Industries | | |
| Computer Software & Services | | 10.6% |
| Financial Services | | 6.0% |
| Insurance | | 5.4% |
| Banking | | 5.4% |
| Retail | | 4.5% |
| Medical | | 4.2% |
| Oil & Gas | | 3.9% |
| Semiconductors | | 3.8% |
| Construction & Building Materials | | 3.8% |
| Real Estate Investment Trusts | | 3.7% |
| Other Assets | | 48.7% |
| | |
| | 100.0% |
| | |
| Top Holdings*** | | |
| Deerfield Triarc Capital Corp. | | 1.6% |
| Owens-Illinois, Inc. | | 1.3% |
| SVB Financial Group | | 1.3% |
| Guitar Center, Inc. | | 1.3% |
| Great Wolf Resorts, Inc. | | 1.2% |
| Navigant Consulting Co. | | 1.2% |
| Ariba, Inc. | | 1.2% |
| WebMethods, Inc. | | 1.1% |
| Euronet Worldwide, Inc. | | 1.1% |
| Williams Scotsman International, Inc. | | 1.1% |
| Other Assets | | 87.6% |
| | |
| | 100.0% |
| * | Includes value of collateral received from securities lending. |
| ** | Includes value of collateral owed from securities lending. |
| *** | For purpose of listing top holdings, repurchase agreements are considered cash equivalents and are included as part of Other Assets. |
Statement of Investments
October 31, 2006
Gartmore Small Cap Fund
Common Stocks (95.7%)
| | | | | |
| | | Shares or Principal Amount | | Value |
| | | | | |
Aerospace & Defense (0.7%) | | | |
MTC Technologies, Inc. (b) | | 163,416 | | $ | 3,699,738 |
| | | | | |
Aircraft Parts (0.4%) | | | |
Hexcel Corp. (b) | | 141,203 | | | 2,286,077 |
| | | | | |
Airlines (1.1%) | | | |
JetBlue Airways Corp. (b) | | 158,660 | | | 1,992,770 |
UAL Corp. (b) | | 119,740 | | | 4,303,455 |
| | | | | |
| | | | | 6,296,225 |
| | | | | |
Apparel (1.8%) | | | |
Foot Locker, Inc. | | 104,810 | | | 2,430,544 |
Hot Topic, Inc. (b) (c) | | 239,230 | | | 2,418,615 |
Pacific Sunwear of California,
Inc. (b) | | 197,043 | | | 3,471,898 |
The Warnaco Group, Inc. (b) (c) | | 85,629 | | | 1,818,760 |
| | | | | |
| | | | | 10,139,817 |
| | | | | |
Auto Parts & Equipment (0.3%) | | | |
CSK Auto Corp. (b) | | 109,940 | | | 1,715,064 |
| | | | | |
Banking (5.4%) | | | |
Accredited Home Lenders Holding Co. (b) | | 54,120 | | | 1,656,072 |
Boston Private Financial Holdings, Inc. | | 168,936 | | | 4,669,391 |
Cadence Financial Corp. | | 263,605 | | | 5,403,903 |
Dime Community Bancshares | | 43,317 | | | 604,272 |
First Commonwealth Financial Corp. | | 157,224 | | | 2,102,085 |
Mainsource Financial Group, Inc. | | 81,534 | | | 1,482,288 |
Placer Sierra Bancshares | | 86,871 | | | 2,060,580 |
SVB Financial Group (b) | | 153,926 | | | 7,083,675 |
UCBH Holdings, Inc. | | 122,046 | | | 2,091,868 |
Wintrust Financial Corp. | | 58,858 | | | 2,840,487 |
| | | | | |
| | | | | 29,994,621 |
| | | | | |
Building Materials (0.6%) | | | |
Hovnanian Enterprises, Inc.,
Class A (b) | | 61,860 | | | 1,908,381 |
KB Home | | 36,370 | | | 1,634,468 |
| | | | | |
| | | | | 3,542,849 |
| | | | | |
| | | | | |
| | | Shares or Principal Amount | | Value |
| | | | | |
Business Services & Equipment (3.3%) | | | |
Administaff, Inc. | | 63,496 | | $ | 2,187,437 |
Ariba, Inc. (b) | | 857,041 | | | 6,470,660 |
Ciber, Inc. (b) | | 169,864 | | | 1,163,568 |
Gevity HR, Inc. | | 153,860 | | | 3,477,236 |
Hudson Highland Group, Inc. (b) | | 78,020 | | | 912,054 |
John H. Harland Co. | | 104,658 | | | 4,279,466 |
| | | | | |
| | | | | 18,490,421 |
| | | | | |
Chemicals (1.3%) | | | |
Chemtura Corp. | | 439,981 | | | 3,775,037 |
Huntsman Corp. (b) | | 99,004 | | | 1,709,799 |
Schawk, Inc., Class A | | 101,322 | | | 1,909,920 |
| | | | | |
| | | | | 7,394,756 |
| | | | | |
Coal (0.5%) | | | |
Alpha Natural Resources (b) | | 43,500 | | | 692,085 |
Arch Coal, Inc. | | 56,482 | | | 1,955,972 |
| | | | | |
| | | | | 2,648,057 |
| | | | | |
Commercial Services (0.3%) | | | |
DynCorp International, Inc. (b) (c) | | 173,891 | | | 1,825,856 |
| | | | | |
Computer Software & Services (10.6%) | | | |
Agile Software Corp. (b) | | 709,890 | | | 4,784,658 |
CACI International, Inc., Class A (b) | | 75,800 | | | 4,361,532 |
CheckFree Corp. (b) | | 91,190 | | | 3,600,181 |
Citrix Systems, Inc. (b) | | 143,810 | | | 4,246,709 |
Compuware Corp. (b) | | 755,348 | | | 6,072,997 |
Corel Corp. — CA (b) | | 313,367 | | | 3,917,088 |
Foundry Networks, Inc. (b) | | 254,891 | | | 3,226,920 |
Neoware, Inc. (b) | | 297,533 | | | 3,561,470 |
Quest Software, Inc. (b) | | 184,230 | | | 2,713,708 |
SI International, Inc. (b) | | 46,760 | | | 1,550,562 |
SPSS, Inc. (b) (c) | | 129,410 | | | 3,580,775 |
TIBCO Software, Inc. (b) | | 184,427 | | | 1,705,950 |
Vignette Corp. (b) | | 265,228 | | | 4,323,216 |
WebMethods, Inc. (b) (c) | | 843,796 | | | 6,345,345 |
WebSideStory, Inc. (b) | | 232,214 | | | 3,030,393 |
Witness Systems, Inc. (b) | | 120,570 | | | 2,138,912 |
| | | | | |
| | | | | 59,160,416 |
| | | | | |
Statement of Investments (Continued)
October 31, 2006
Gartmore Small Cap Fund (Continued)
Common Stocks (continued)
| | | | | |
| | | Shares or Principal Amount | | Value |
| | | | | |
Construction & Building Materials (3.8%) |
Beazer Homes USA, Inc. | | 24,710 | | $ | 1,070,931 |
H&E Equipment Services, Inc. (b) | | 167,120 | | | 4,483,830 |
Martin Marietta Materials, Inc. | | 39,492 | | | 3,475,296 |
RPM International, Inc. | | 153,043 | | | 2,930,773 |
Superior Well Services, Inc. (b) | | 6,800 | | | 164,152 |
Technical Olympic USA, Inc. | | 246,110 | | | 2,731,821 |
Williams Scotsman International, Inc. (b) (c) | | 259,453 | | | 6,104,930 |
| | | | | |
| | | | | 20,961,733 |
| | | | | |
Consulting Services (0.6%) | | | |
LECG Corp. (b) | | 170,148 | | | 3,350,214 |
| | | | | |
Consumer Goods & Services (0.8%) | | | |
R. H. Donnelley Corp. | | 74,871 | | | 4,508,732 |
| | | | | |
Containers (1.3%) | | | |
Owens-Illinois, Inc. (b) | | 431,293 | | | 7,159,464 |
| | | | | |
Correctional Institutions (0.3%) | | | |
Geo Group, Inc. (b) | | 42,533 | | | 1,616,235 |
| | | | | |
Defense (0.6%) | | | |
Kaman, Class A | | 170,646 | | | 3,479,472 |
| | | | | |
Distribution (1.0%) | | | |
Bell Microproducts, Inc. (b) (c) | | 788,470 | | | 5,314,288 |
| | | | | |
Drugs (0.2%) | | | |
CV Therapeutics (b) | | 65,500 | | | 848,225 |
| | | | | |
Electric Utilities (0.7%) | | | |
CMS Energy Corp. (b) | | 155,691 | | | 2,318,239 |
ITC Holdings Corp. | | 48,420 | | | 1,719,878 |
| | | | | |
| | | | | 4,038,117 |
| | | | | |
Electronics (3.6%) | | | |
Arrow Electronics, Inc. (b) | | 161,230 | | | 4,812,716 |
Celestica, Inc. — CA (b) | | 98,964 | | | 972,816 |
EDO Corp. | | 188,000 | | | 4,495,080 |
Hubbell, Inc., Class B | | 108,479 | | | 5,371,880 |
Integrated Silicon Solution, Inc. (b) | | 167,588 | | | 886,541 |
Jabil Circuit, Inc. | | 44,640 | | | 1,281,614 |
Microsemi Corp. (b) | | 113,320 | | | 2,221,072 |
| | | | | |
| | | | | 20,041,719 |
| | | | | |
| | | | | |
| | | Shares or Principal Amount | | Value |
| | | | | |
Energy (0.2%) | | | |
Evergreen Energy, Inc. (b) | | 91,000 | | $ | 1,169,350 |
| | | | | |
Engineering (0.5%) | | | |
The Shaw Group, Inc. (b) (c) | | 107,282 | | | 2,849,410 |
| | | | | |
Entertainment (2.0%) | | | |
Carmike Cinemas, Inc. | | 80,573 | | | 1,607,431 |
Emmis Communications Corp. (b) | | 241,430 | | | 2,979,246 |
Great Wolf Resorts, Inc. (b) | | 506,208 | | | 6,661,698 |
| | | | | |
| | | | | 11,248,375 |
| | | | | |
Financial Services (6.0%) | | | |
Cowen Group, Inc. (b) | | 301,834 | | | 4,361,501 |
Euronet Worldwide, Inc. (b) | | 205,460 | | | 6,106,270 |
IntercontinentalExchange, Inc. (b) | | 18,930 | | | 1,598,071 |
KKR Financial Corp. | | 109,248 | | | 2,931,124 |
Nasdaq Stock Market, Inc. (b) | | 115,594 | | | 4,130,174 |
Sanders Morris Harris Group Inc. | | 489,040 | | | 5,751,109 |
Senior Housing Properties Trust | | 56,933 | | | 1,305,474 |
South Financial Group, Inc. | | 41,804 | | | 1,109,060 |
Thomas Weisel Partners Group, Inc. (b) | | 323,772 | | | 5,183,590 |
United PanAm Financial Corp. (b) | | 95,045 | | | 1,235,585 |
| | | | | |
| | | | | 33,711,958 |
| | | | | |
Food & Related (1.3%) | | | |
Performance Food Group Co. (b) | | 117,566 | | | 3,417,644 |
Smithfield Foods, Inc. (b) | | 147,670 | | | 3,969,369 |
| | | | | |
| | | | | 7,387,013 |
| | | | | |
Gaming & Leisure (1.0%) | | | |
Boyd Gaming Corp. | | 79,826 | | | 3,150,732 |
Shuffle Master, Inc. (b) | | 91,196 | | | 2,551,664 |
| | | | | |
| | | | | 5,702,396 |
| | | | | |
Healthcare (2.3%) | | | |
Brookdale Senior Living, Inc. | | 21,516 | | | 1,035,350 |
Capital Senior Living Corp. (b) (c) | | 49,400 | | | 471,770 |
Covance, Inc. (b) | | 50,704 | | | 2,966,184 |
Five Star Quality Care (b) | | 467,563 | | | 4,820,574 |
Hythiam, Inc. (b) | | 438,361 | | | 3,563,875 |
| | | | | |
| | | | | 12,857,753 |
| | | | | |
Common Stocks (continued)
| | | | | |
| | | Shares or Principal Amount | | Value |
| | | | | |
Insurance (5.4%) | | | |
Arthur J. Gallagher & Co. | | 93,490 | | $ | 2,603,697 |
Aspen Insurance Holdings Ltd. | | 238,510 | | | 5,919,817 |
Conseco, Inc. (b) | | 134,025 | | | 2,726,069 |
Endurance Specialty Holdings Ltd. | | 118,752 | | | 4,233,509 |
First Mercury Financial Corp. (b) | | 71,070 | | | 1,471,149 |
Phoenix Cos., Inc. (The) | | 119,444 | | | 1,891,993 |
PMI Group, Inc. (The) | | 89,618 | | | 3,822,208 |
U.S.I. Holdings Corp. (b) | | 185,254 | | | 2,951,096 |
United Fire & Casualty Co. | | 133,518 | | | 4,723,866 |
| | | | | |
| | | | | 30,343,404 |
| | | | | |
Internet (0.3%) | | | |
Corillian Corp. (b) | | 554,515 | | | 1,646,910 |
| | | | | |
Machinery (0.5%) | | | |
Blount International, Inc. (b) | | 250,680 | | | 2,744,946 |
| | | | | |
Management Consulting Services (1.2%) | | | |
Navigant Consulting Co. (b) | | 363,810 | | | 6,479,456 |
| | | | | |
Manufacturing (1.8%) | | | |
Barnes Group, Inc. | | 118,053 | | | 2,366,963 |
Ceradyne, Inc. (b) | | 104,730 | | | 4,320,112 |
Knoll, Inc. | | 120,810 | | | 2,392,038 |
Pall Corp. | | 33,467 | | | 1,067,597 |
| | | | | |
| | | | | 10,146,710 |
| | | | | |
Medical (4.2%) | | | |
Adolor Corp. (b) | | 93,276 | | | 1,278,814 |
Community Health Systems, Inc. (b) | | 19,100 | | | 619,795 |
Cutera, Inc. (b) | | 19,752 | | | 562,734 |
I-FLOW Corp. (b) | | 150,000 | | | 2,326,500 |
Immucor, Inc. (b) | | 51,342 | | | 1,413,445 |
Iridex Corp. (b) | | 275,504 | | | 2,686,164 |
LHC Group, Inc. (b) | | 177,222 | | | 4,363,207 |
Momenta Pharmaceuticals, Inc. (b) | | 140,894 | | | 2,099,321 |
Neurometrix, Inc. (b) | | 103,594 | | | 1,687,546 |
Nighthawk Radiology Holdings, Inc. (b) | | 137,500 | | | 2,798,125 |
Northstar Neuroscience, Inc. (b) | | 28,800 | | | 432,576 |
Osiris Therapeutics, Inc. (b) (c) | | 51,000 | | | 785,910 |
Sun Healthcare Group, Inc. (b) | | 37,080 | | | 485,006 |
| | | | | |
| | | Shares or Principal Amount | | Value |
| | | | | |
Medical (continued) | | | |
The Spectranetics Corp. (b) (c) | | 140,982 | | $ | 1,750,996 |
| | | | | |
| | | | | 23,290,139 |
| | | | | |
Metals (0.3%) | | | |
Coeur d’Alene Mines Corp. (b) | | 329,800 | | | 1,616,020 |
| | | | | |
Motion Picture & Video Production (0.6%) |
DreamWorks Animation SKG, Inc. (b) | | 120,511 | | | 3,187,516 |
| | | | | |
Newspapers (0.3%) | | | |
GateHouse Media, Inc. (b) (c) | | 88,700 | | | 1,902,615 |
| | | | | |
Oil & Gas (3.9%) | | | |
ATP Oil & Gas Corp. (b) | | 8,500 | | | 365,415 |
Atwood Oceanics, Inc. (b) | | 33,200 | | | 1,533,840 |
Aurora Oil & Gas Corp. (b) | | 50,210 | | | 155,651 |
Cabot Oil & Gas Corp. | | 28,840 | | | 1,525,924 |
Denbury Resources, Inc. (b) | | 17,758 | | | 510,365 |
Energy Transfer Equity | | 40,060 | | | 1,161,740 |
EXCO Resources, Inc. (b) | | 60,220 | | | 871,986 |
Exploration Company of Delaware (b) | | 30,800 | | | 340,956 |
Geomet, Inc. (b) (c) | | 63,496 | | | 713,060 |
Hiland Holdings GP, LP (b) | | 120,900 | | | 2,900,391 |
Ivanhoe Energy, Inc. — CA (b) | | 320,579 | | | 445,605 |
McMoRan Exploration Co. (b) | | 56,800 | | | 858,816 |
Newfield Exploration Co. (b) | | 22,200 | | | 905,538 |
Parallel Petroleum (b) | | 126,768 | | | 2,567,052 |
Particle Drilling Technologies, Inc. (b) | | 46,200 | | | 123,354 |
Range Resources Corp. | | 12,500 | | | 339,375 |
Superior Energy Services, Inc. (b) (c) | | 26,767 | | | 837,807 |
Swift Energy Co. (b) | | 57,319 | | | 2,677,944 |
Transglobe Energy Corp. — CA (b) | | 145,507 | | | 669,332 |
Universal Compression Partners LP (b) | | 28,870 | | | 704,717 |
W&T Offshore, Inc. (c) | | 53,659 | | | 1,812,064 |
| | | | | |
| | | | | 22,020,932 |
| | | | | |
Paper & Related Products (0.6%) | | | |
Smurfit-Stone Container Corp. (b) | | 325,544 | | | 3,470,299 |
| | | | | |
Statement of Investments (Continued)
October 31, 2006
Gartmore Small Cap Fund (Continued)
Common Stocks (continued)
| | | | | |
| | | Shares or Principal Amount | | Value |
| | | | | |
Pharmaceuticals (0.9%) | | | |
Acadia Pharmaceuticals, Inc. (b) | | 281,839 | | $ | 2,671,834 |
Alnylam Pharmaceuticals, Inc. (b) | | 63,138 | | | 1,245,081 |
Human Genome Sciences, Inc. (b) | | 34,520 | | | 460,842 |
Nuvelo, Inc. (b) | | 28,203 | | | 520,063 |
| | | | | |
| | | | | 4,897,820 |
| | | | | |
Radio (0.4%) | | | |
Entercom Communications Corp. | | 72,273 | | | 1,999,794 |
| | | | | |
Real Estate Investment Trusts (3.7%) | | | |
American Financial Realty Trust (c) | | 175,975 | | | 2,053,628 |
Deerfield Triarc Capital Corp. | | 595,881 | | | 8,854,791 |
Douglas Emmett, Inc. (b) | | 43,910 | | | 1,047,254 |
Hersha Hospitality Trust | | 194,123 | | | 2,127,588 |
Lexington Corporate Properties Trust | | 131,322 | | | 2,797,159 |
The Mills Corp. | | 103,340 | | | 1,888,022 |
Trammell Crow Co. (b) (c) | | 40,928 | | | 1,995,240 |
| | | | | |
| | | | | 20,763,682 |
| | | | | |
Restaurants (3.0%) | | | | | |
CBRL Group, Inc. | | 75,105 | | | 3,297,861 |
Cheesecake Factory, Inc. (The) (b) | | 121,170 | | | 3,423,053 |
Lone Star Steakhouse & Saloon, Inc. (c) | | 182,630 | | | 4,985,799 |
Ruth’s Chris Steak House, Inc. (b) | | 260,910 | | | 5,137,317 |
| | | | | |
| | | | | 16,844,030 |
| | | | | |
Retail (4.5%) | | | | | |
99 Cents Only Stores (b) | | 396,450 | | | 4,753,436 |
Callaway Golf Co. | | 298,148 | | | 4,004,128 |
Central Garden & Pet Co. (b) | | 47,985 | | | 2,397,810 |
Elizabeth Arden, Inc. (b) | | 194,320 | | | 3,388,941 |
Guitar Center, Inc. (b) | | 161,760 | | | 7,015,531 |
New York & Co., Inc. (b) | | 123,703 | | | 1,608,139 |
Urban Outfitters, Inc. (b) | | 100,596 | | | 1,760,430 |
| | | | | |
| | | | | 24,928,415 |
| | | | | |
Semiconductors (3.8%) | | | | | |
Advanced Analogic Technologies, Inc. (b) | | 376,920 | | | 2,344,442 |
Avnet, Inc. (b) | | 127,212 | | | 3,012,380 |
| | | | | |
| | | Shares or Principal Amount | | Value |
| | | | | |
Semiconductors (continued) | | | | | |
DSP Group, Inc. (b) | | 208,051 | | $ | 4,518,868 |
Emulex Corp. (b) | | 130,550 | | | 2,454,340 |
Photronics, Inc. (b) | | 199,919 | | | 2,796,867 |
Silicon Laboratories, Inc. (b) | | 106,676 | | | 3,480,838 |
Skyworks Solutions, Inc. (b) | | 394,786 | | | 2,617,431 |
| | | | | |
| | | | | 21,225,166 |
| | | | | |
Services (0.4%) | | | | | |
Plexus Corp. (b) | | 103,470 | | | 2,268,062 |
| | | | | |
Steel Producers (0.5%) | | | | | |
Reliance Steel & Aluminum Co. | | 79,070 | | | 2,716,055 |
| | | | | |
Telecommunications (3.5%) | | | | | |
ADC Telecommunications, Inc. (b) | | 168,460 | | | 2,410,663 |
Andrew Corp. (b) (c) | | 491,119 | | | 4,547,761 |
C&D Technologies, Inc. (c) | | 913,459 | | | 4,530,757 |
Ciena Corp. (b) | | 73,270 | | | 1,722,578 |
Cincinnati Bell, Inc. (b) | | 880,839 | | | 4,131,135 |
NTELOS Holdings Corp. (b) | | 146,814 | | | 2,059,800 |
| | | | | |
| | | | | 19,402,694 |
| | | | | |
Theaters (0.8%) | | | | | |
Regal Entertainment Group, Class A | | 221,470 | | | 4,591,073 |
| | | | | |
Transportation (1.8%) | | | | | |
Aircastle Ltd. | | 11,363 | | | 366,002 |
Greenbrier Cos., Inc. (The) | | 115,459 | | | 4,329,713 |
Omega Navigation Enterprises, Inc., Class A | | 91,567 | | | 1,455,915 |
RailAmerica, Inc. (b) | | 312,070 | | | 3,654,340 |
StealthGas, Inc. | | 13,865 | | | 175,115 |
| | | | | |
| | | | | 9,981,085 |
| | | | | |
Water Treatment Systems (0.3%) | | | |
Basin Water, Inc. (b) | | 175,250 | | | 1,461,585 |
| | | | | |
Wireless Equipment (0.5%) | | | |
Powerwave Technologies, Inc. (b) | | 418,571 | | | 2,724,898 |
| | | | | |
| | |
Total Common Stocks | | | | | 534,091,657 |
| | | | | |
Repurchase Agreements (5.9%)
| | | | | | |
| | | Shares or Principal Amount | | Value |
CS First Boston, 5.17%, dated 10/31/06, due 11/01/06, repurchase price $16,885,536, collateralized by U.S. Government Agency Mortgages with a market value of $17,220,802 | | $ | 16,883,111 | | $ | 16,883,111 |
Nomura Securities, 5.17%, dated 10/31/06, due 11/01/06, repurchase price $16,121,826 collateralized by U.S. Government Agency Mortgages with a market value of $16,441,929 | | | 16,119,511 | | | 16,119,511 |
| | | | | | |
| | |
Total Repurchase Agreements | | | | | | 33,002,622 |
| | | | | | |
|
Exchange-Traded Fund (0.5%) |
| | |
iShares Russell 2000 Index Fund | | | 35,570 | | | 2,707,233 |
| | | | | | |
| | |
Total Exchange-Traded Fund | | | | | | 2,707,233 |
| | | | | | |
Short-Term Securities Held as Collateral for Securities on Loan (1.6%)
| | | | | | | |
| | | Principal
Amount | | Value | |
ASIF Global Funding XV Note, 5.38%, 11/01/06 | | $ | 2,000,932 | | $ | 2,000,932 | |
Banc of America Securities LLC Repurchase Agreement, 5.32%, dated 10/31/06, due 11/01/06, repurchase price $6,880,001, collateralized by U.S. Government Agency Mortgages with a market value of $7,016,564 | | | 6,878,984 | | | 6,878,984 | |
| | | | | | | |
| | |
Total Short-Term Securities Held as Collateral for Securities on Loan | | | | | | 8,879,916 | |
| | | | | | | |
| |
Total Investments
(Cost $559,670,882) (a) — 103.7% | | | 578,681,428 | |
| | |
Liabilities in excess of other
assets — (3.7)% | | | | | | (20,352,146 | ) |
| | | | | | | |
| | |
NET ASSETS — 100.0% | | | | | $ | 558,329,282 | |
| | | | | | | |
| | (a) | See notes to financial statements for tax unrealized appreciation (depreciation) of securities. |
| | (b) | Denotes a non-income producing security. |
| | (c) | All or part of security was on loan as of October 31, 2006. |
See notes to financial statements.
Statements of Assets and Liabilities
October 31, 2006
| | | | | | | | | | | |
| | | Gartmore Large Cap
Value Fund | | Gartmore Mid Cap
Growth Fund | | Gartmore
Small Cap Fund |
Assets: | | | | | | | | | | | |
Investments, at value (cost $26,867,968; $6,042,527; and $519,789,276; respectively)* | | $ | 31,325,899 | | $ | 6,923,143 | | $ | 538,799,822 | | |
Repurchase agreements, at cost and value** | | | 2,852,192 | | | 101,426 | | | 39,881,606 | | |
| | | | | | | | | | | |
Total Investments | | | 34,178,091 | | | 7,024,569 | | | 578,681,428 | | |
| | | | | | | | | | | |
Interest and dividends receivable | | | 34,591 | | | 1,898 | | | 279,584 | | |
Receivable for capital shares issued | | | 145,081 | | | 4,361 | | | 13,585,348 | | |
Receivable for investments sold | | | 5,739,132 | | | 170,621 | | | 12,003,922 | | |
Prepaid expenses | | | 8,439 | | | 28,984 | | | 33,843 | | |
| | | | | | | | | | | |
Total Assets: | | | 40,105,334 | | | 7,230,433 | | | 604,584,125 | | |
| | | | | | | | | | | |
| | | | |
Liabilities: | | | | | | | | | | | |
Payable to custodian | | | — | | | — | | | 2,063,276 | | |
Payable for investments purchased | | | 531,460 | | | — | | | 29,429,850 | | |
Payable for capital shares redeemed | | | 6,112,699 | | | 2,987 | | | 5,324,779 | | |
Payable for return of collateral received for securities on loan | | | 2,102,240 | | | — | | | 8,879,916 | | |
Accrued expenses and other payables | | | | | | | | | | | |
Investment advisory fees | | | 23,145 | | | 2,582 | | | 315,771 | | |
Fund administration and transfer agent fees | | | 1,441 | | | 654 | | | 9,148 | | |
Distribution fees | | | 12,327 | | | 1,154 | | | 158,464 | | |
Administrative servicing fees | | | 5,717 | | | 512 | | | 32,746 | | |
Trustee fees | | | 5 | | | 1 | | | 36 | | |
Compliance program fees (Note 3) | | | 283 | | | 8 | | | 2,400 | | |
Other | | | 7,758 | | | 1,187 | | | 38,457 | | |
| | | | | | | | | | | |
Total Liabilities: | | | 8,797,075 | | | 9,085 | | | 46,254,843 | | |
| | | | | | | | | | | |
Net Assets | | $ | 31,308,259 | | $ | 7,221,348 | | $ | 558,329,282 | | |
| | | | | | | | | | | |
| | | | |
Represented by: | | | | | | | | | | | |
Capital | | $ | 22,573,147 | | $ | 5,868,831 | | $ | 511,837,504 | | |
Accumulated net investment income (loss) | | | 59,409 | | | — | | | — | | |
Accumulated net realized gains (losses) on investment and futures transactions | | | 4,217,772 | | | 471,901 | | | 27,481,232 | | |
Net unrealized appreciation (depreciation) on investments | | | 4,457,931 | | | 880,616 | | | 19,010,546 | | |
| | | | | | | | | | | |
Net Assets | | $ | 31,308,259 | | $ | 7,221,348 | | $ | 558,329,282 | | |
| | | | | | | | | | | |
| | | | | | | | | | | |
| | | | | | | | | | | |
| | | | | | | | | | | |
| | | | | | | | | | | |
| | | | | | | | | | | |
| | | | | | | | | | | |
| | | | | | | | | | | |
| | | | | | | | | | | |
| | | | | | | | | | | | |
| * | Includes securities held as collateral for securities on loan of $500,000; $0; and $2,000,932; respectively. |
| ** | Includes securities held as collateral for securities on loan of $1,602,240; $0; and $6,878,984; respectively. |
See notes to financial statements.
Statements of Assets and Liabilities (Continued)
| | | | | | | | | | | | | | |
| | | Gartmore Large Cap
Value Fund | | | Gartmore Mid Cap
Growth Fund | | | Gartmore
Small Cap Fund |
Net Assets: | | | | | | | | | | | | | | |
Class A Shares | | $ | 23,752,997 | | | $ | 2,405,449 | | | $ | 376,717,976 | | | |
Class B Shares | | | 1,587,540 | | | | 220,396 | | | | 11,701,269 | | | |
Class C Shares | | | 5,966,114 | | | | 540,940 | | | | 115,137,782 | | | |
Class R Shares | | | 1,608 | | | | 1,515 | | | | 1,431,424 | | | |
Institutional Service Class Shares | | | — | | | | — | | | | 11,945,314 | | | |
Institutional Class Shares | | | — | | | | 4,053,048 | | | | 41,395,517 | | | |
| | | | | | | | | | | | | | |
Total | | $ | 31,308,259 | | | $ | 7,221,348 | | | $ | 558,329,282 | | | |
| | | | | | | | | | | | | | |
Shares outstanding (unlimited number of shares authorized): | | | | | | | | | | | | | | |
Class A Shares | | | 1,581,034 | | | | 143,586 | | | | 17,682,799 | | | |
Class B Shares | | | 107,256 | | | | 13,456 | | | | 582,087 | | | |
Class C Shares | | | 404,598 | | | | 33,025 | | | | 5,717,411 | | | |
Class R Shares | | | 109 | | | | 91 | | | | 70,075 | | | |
Institutional Service Class Shares | | | — | | | | — | | | | 549,987 | | | |
Institutional Class Shares | | | — | | | | 239,355 | | | | 1,905,395 | | | |
| | | | | | | | | | | | | | |
Total | | | 2,092,997 | | | | 429,513 | | | | 26,507,754 | | | |
| | | | | | | | | | | | | | |
| | | | |
Net asset value and redemption price per share (Net assets by
class divided by shares outstanding by class, respectively): | | | | | | | | | | | | | | |
Class A Shares | | $ | 15.02 | | | $ | 16.75 | | | $ | 21.30 | | | |
Class B Shares (a) | | $ | 14.80 | | | $ | 16.38 | | | $ | 20.10 | | | |
Class C Shares (b) | | $ | 14.75 | | | $ | 16.38 | | | $ | 20.14 | | | |
Class R Shares | | $ | 14.81 | (c) | | $ | 16.67 | (c) | | $ | 20.43 | | | |
Institutional Service Class Shares | | $ | — | | | $ | — | | | $ | 21.72 | | | |
Institutional Class Shares | | $ | — | | | $ | 16.93 | | | $ | 21.73 | | | |
| | | | |
Maximum offering price per share (100%/(100%-maximum sales charge) of net asset value adjusted to the nearest cent): | | | | | | | | | | | | | | |
Class A Shares | | $ | 15.94 | | | $ | 17.77 | | | $ | 22.60 | | | |
| | | | | | | | | | | | | | |
Maximum Sales Charge — Class A Shares | | | 5.75 | % | | | 5.75 | % | | | 5.75 | % | | |
| | | | | | | | | | | | | | |
| | | | | | | | | | | | | | |
| | | | | | | | | | | | | | |
| | | | | | | | | | | | | | |
| | | | | | | | | | | | | | |
| | | | | | | | | | | | | | |
| | | | | | | | | | | | | | |
| | | | | | | | | | | | | | |
| | | | | | | | | | | | | | |
| | | | | | | | | | | | | | |
| | | | | | | | | | | | | | | |
| (a) | For Class B Shares, the redemption price per share varies by the length of time shares are held. |
| (b) | For Class C Shares, the redemption price per share is reduced by 1.00% for shares held less than one year. |
| (c) | The NAV reported above represents the traded NAV at October 31, 2006. Due to the financial statement rounding of class assets and class shares above, the NAV results in a different NAV than the traded NAV. |
See notes to financial statements.
Statements of Operations
For the Year Ended October 31, 2006
| | | | | | | | | | | | | | |
| | | Gartmore Large Cap
Value Fund | | | Gartmore Mid Cap
Growth Fund | | | Gartmore
Small Cap Fund |
INVESTMENT INCOME: | | | | | | | | | | | | | | |
Interest income | | $ | 17,064 | | | $ | 10,899 | | | $ | 390,365 | | | |
Dividend income | | | 882,762 | | | | 39,352 | | | | 2,235,778 | | | |
Income from securities lending | | | 3,524 | | | | — | | | | 139,984 | | | |
| | | | | | | | | | | | | | |
Total Income | | | 903,350 | | | | 50,251 | | | | 2,766,127 | | | |
| | | | | | | | | | | | | | |
| | | | |
Expenses: | | | | | | | | | | | | | | |
Investment advisory fees | | | 262,617 | | | | 46,187 | | | | 1,722,854 | | | |
Fund administration and transfer agent fees | | | 48,427 | | | | 10,091 | | | | 273,987 | | | |
Distribution fees Class A | | | 71,115 | | | | 5,495 | | | | 302,514 | | | |
Distribution fees Class B | | | 14,676 | | | | 1,984 | | | | 61,743 | | | |
Distribution fees Class C | | | 51,006 | | | | 4,333 | | | | 436,948 | | | |
Distribution fees Class R | | | 7 | | | | 6 | | | | 1,747 | | | |
Administrative servicing fees Class A | | | 37,331 | | | | 535 | | | | 82,873 | | | |
Administrative servicing fees Institutional Service Class | | | — | | | | — | | | | 1,857 | | | |
Administrative servicing fees Class R | | | 1 | | | | 1 | | | | 866 | | | |
Registration and filing fees | | | 40,692 | | | | 38,944 | | | | 43,215 | | | |
Trustee fees | | | 1,205 | | | | 205 | | | | 5,560 | | | |
Compliance program fees (Note 3) | | | 587 | | | | 66 | | | | 4,575 | | | |
Other | | | 18,273 | | | | 3,669 | | | | 83,856 | | | |
| | | | | | | | | | | | | | |
Total expenses before reimbursed expenses | | | 545,937 | | | | 111,516 | | | | 3,022,595 | | | |
Earnings credit (Note 5) | | | (385 | ) | | | (354 | ) | | | (1,801 | ) | | |
Expenses reimbursed | | | — | | | | (27,464 | ) | | | — | | | |
Expenses voluntarily waived by administrator | | | (2,159 | ) | | | (323 | ) | | | (5,786 | ) | | |
| | | | | | | | | | | | | | |
Net Expenses | | | 543,393 | | | | 83,375 | | | | 3,015,008 | | | |
| | | | | | | | | | | | | | |
Net Investment Income (Loss) | | | 359,957 | | | | (33,124 | ) | | | (248,881 | ) | | |
| | | | | | | | | | | | | | |
| | | | |
REALIZED/UNREALIZED GAINS (LOSSES) FROM INVESTMENTS: | | | | | | | | | | | | | | |
Net realized gains (losses) on investment transactions | | | 6,757,557 | | | | 506,535 | | | | 28,274,238 | | | |
Net realized gains (losses) on futures transactions | | | — | | | | — | | | | (152,102 | ) | | |
| | | | | | | | | | | | | | |
Net realized gains (losses) on investment and futures transactions | | | 6,757,557 | | | | 506,535 | | | | 28,122,136 | | | |
Net change in unrealized appreciation/depreciation on investments | | | (447,307 | ) | | | 223,145 | | | | 18,557,364 | | | |
| | | | | | | | | | | | | | |
Net realized/unrealized gains (losses) on investments and futures | | | 6,310,250 | | | | 729,680 | | | | 46,679,500 | | | |
| | | | | | | | | | | | | | |
CHANGE IN NET ASSETS RESULTING FROM OPERATIONS | | $ | 6,670,207 | | | $ | 696,556 | | | $ | 46,430,619 | | | |
| | | | | | | | | | | | | | |
| | | | | | | | | | | | | | |
| | | | | | | | | | | | | | |
| | | | | | | | | | | | | | |
| | | | | | | | | | | | | | |
| | | | | | | | | | | | | | |
| | | | | | | | | | | | | | |
| | | | | | | | | | | | | | |
| | | | | | | | | | | | | | |
| | | | | | | | | | | | | | |
| | | | | | | | | | | | | | |
| | | | | | | | | | | | | | | |
See notes to financial statements.
Statements of Changes in Net Assets
| | | | | | | | | | | | | | | | | | |
| | | Gartmore Large Cap Value Fund | | | Gartmore Mid Cap Growth Fund |
| | | Year Ended
October 31, 2006 | | | Year Ended
October 31, 2005 | | | Year Ended
October 31, 2006 | | | Year Ended
October 31, 2005 | | | |
FROM INVESTMENT ACTIVITIES: | | | | | | | | | | | | | | | | | | |
Operations: | | | | | | | | | | | | | | | | | | |
Net investment income (loss) | | $ | 359,957 | | | $ | 318,056 | | | $ | (33,124 | ) | | $ | (33,008 | ) | | |
Net realized gains (losses) on investment transactions | | | 6,757,557 | | | | 2,593,142 | | | | 506,535 | | | | 289,653 | | | |
Net change in unrealized appreciation/depreciation on investment transactions | | | (447,307 | ) | | | 630,826 | | | | 223,145 | | | | 257,619 | | | |
| | | | | | | | | | | | | | | | | | |
Change in net assets resulting from operations | | | 6,670,207 | | | | 3,542,024 | | | | 696,556 | | | | 514,264 | | | |
| | | | | | | | | | | | | | | | | | |
| | | | | |
Distributions to Class A Shareholders from: | | | | | | | | | | | | | | | | | | |
Net investment income | | | (300,461 | ) | | | (292,757 | ) | | | — | | | | — | | | |
Net realized gains on investments | | | (1,268,930 | ) | | | — | | | | (97,283 | ) | | | (71,449 | ) | | |
| | | | | |
Distributions to Class B Shareholders from: | | | | | | | | | | | | | | | | | | |
Net investment income | | | (6,905 | ) | | | (5,475 | ) | | | — | | | | — | | | |
Net realized gains on investments | | | (63,086 | ) | | | — | | | | (9,402 | ) | | | (7,217 | ) | | |
| | | | | |
Distributions to Class C Shareholders from: | | | | | | | | | | | | | | | | | | |
Net investment income | | | (23,378 | ) | | | (15,770 | ) | | | — | | | | — | | | |
Net realized gains on investments | | | (238,237 | ) | | | — | | | | (18,732 | ) | | | (10,728 | ) | | |
| | | | | |
Distributions to Class R Shareholders from: | | | | | | | | | | | | | | | | | | |
Net investment income | | | (15 | ) | | | (15 | ) | | | — | | | | — | | | |
Net realized gains on investments | | | (61 | ) | | | — | | | | (69 | ) | | | (54 | ) | | |
| | | | | |
Distributions to Institutional Class Shareholders from: | | | | | | | | | | | | | | | | | | |
Net investment income | | | — | | | | — | | | | — | | | | — | | | |
Net realized gains on investments | | | — | | | | — | | | | (142,046 | ) | | | (75,664 | ) | | |
| | | | | | | | | | | | | | | | | | |
Change in net assets from shareholder distributions | | | (1,901,073 | ) | | | (314,017 | ) | | | (267,532 | ) | | | (165,112 | ) | | |
| | | | | | | | | | | | | | | | | | |
Change in net assets from capital transactions | | | (7,924,957 | ) | | | 4,663,284 | | | | 2,179,134 | | | | 869,394 | | | |
| | | | | | | | | | | | | | | | | | |
Change in net assets | | | (3,155,823 | ) | | | 7,891,291 | | | | 2,608,158 | | | | 1,218,546 | | | |
| | | | | |
Net Assets: | | | | | | | | | | | | | | | | | | |
Beginning of period | | | 34,464,082 | | | | 26,572,791 | | | | 4,613,190 | | | | 3,394,644 | | | |
| | | | | | | | | | | | | | | | | | |
End of period | | $ | 31,308,259 | | | $ | 34,464,082 | | | $ | 7,221,348 | | | $ | 4,613,190 | | | |
| | | | | | | | | | | | | | | | | | |
| | | | | |
Accumulated net investment income (loss) at end of period | | $ | 59,409 | | | $ | 30,211 | | | $ | — | | | $ | — | | | |
| | | | | | | | | | | | | | | | | | |
| | | | | | | | | | | | | | | | | | |
| | | | | | | | | | | | | | | | | | |
| | | | | | | | | | | | | | | | | | | |
See notes to financial statements.
Statements of Changes in Net Assets (Continued)
| | | | | | | | | | |
| | | Gartmore Small Cap Fund |
| | | Year Ended
October 31, 2006 | | | Year Ended
October 31, 2005 | | | |
FROM INVESTMENT ACTIVITIES: | | | | | | | | | | |
Operations: | | | | | | | | | | |
Net investment income (loss) | | $ | (248,881 | ) | | $ | (105,845 | ) | | |
Net realized gains (losses) on investment transactions | | | 28,122,136 | | | | 7,924,590 | | | |
Net change in unrealized appreciation/depreciation on investment transactions | | | 18,557,364 | | | | (99,177 | ) | | |
| | | | | | | | | | |
Change in net assets resulting from operations | | | 46,430,619 | | | | 7,719,568 | | | |
| | | | | | | | | | |
| | | |
Distributions to Class A Shareholders from: | | | | | | | | | | |
Net investment income | | | (101,788 | ) | | | — | | | |
Net realized gains on investments | | | (5,779,273 | ) | | | (2,870,561 | ) | | |
| | | |
Distributions to Class B Shareholders from: | | | | | | | | | | |
Net investment income | | | — | | | | — | | | |
Net realized gains on investments | | | (354,694 | ) | | | (192,097 | ) | | |
| | | |
Distributions to Class C Shareholders from: | | | | | | | | | | |
Net investment income | | | — | | | | — | | | |
Net realized gains on investments | | | (1,081,774 | ) | | | (25,187 | ) | | |
| | | |
Distributions to Class R Shareholders from: | | | | | | | | | | |
Net investment income | | | (343 | ) | | | — | | | |
Net realized gains on investments | | | (26,624 | ) | | | (138 | ) | | |
| | | |
Distributions to Institutional Service Class Shareholders from: | | | | | | | | | | |
Net investment income | | | (823 | ) | | | — | | | |
Net realized gains on investments | | | (62,291 | ) | | | (894 | ) | | |
| | | |
Distributions to Institutional Class Shareholders from: | | | | | | | | | | |
Net investment income | | | (39,925 | ) | | | — | | | |
Net realized gains on investments | | | (161,036 | ) | | | (18,313 | ) | | |
| | | | | | | | | | |
Change in net assets from shareholder distributions | | | (7,608,571 | ) | | | (3,107,190 | ) | | |
| | | | | | | | | | |
Change in net assets from capital transactions | | | 469,927,156 | | | | 20,140,520 | | | |
| | | | | | | | | | |
Change in net assets | | | 508,749,204 | | | | 24,752,898 | | | |
| | | |
Net Assets: | | | | | | | | | | |
Beginning of period | | | 49,580,078 | | | | 24,827,180 | | | |
| | | | | | | | | | |
End of period | | $ | 558,329,282 | | | $ | 49,580,078 | | | |
| | | | | | | | | | |
| | | |
Accumulated net investment income (loss) at end of period | | $ | — | | | $ | — | | | |
| | | | | | | | | | |
| | | | | | | | | | |
| | | | | | | | | | |
| | | | | | | | | | |
| | | | | | | | | | |
| | | | | | | | | | |
| | | | | | | | | | |
| | | | | | | | | | | |
See notes to financial statements.
Statements of Changes in Net Assets (Continued)
| | | | | | | | | | | | | | | | | | | | | | | | | | |
| | | Gartmore Large Cap Value Fund | | | Gartmore Mid Cap Growth Fund | | | Gartmore Small Cap Fund |
| | | Year Ended
October 31, 2006 | | | Year Ended
October 31, 2005 | | | Year Ended
October 31, 2006 | | | Year Ended
October 31, 2005 | | | Year Ended
October 31, 2006 | | | Year Ended
October 31, 2005 |
CAPITAL TRANSACTIONS: | | | | | | | | | | | | | | | | | | | | | | | | | | |
Class A Shares | | | | | | | | | | | | | | | | | | | | | | | | | | |
Proceeds from shares issued | | $ | 15,043,875 | | | $ | 11,891,199 | | | $ | 1,007,173 | | | $ | 478,348 | | | $ | 377,873,174 | | | $ | 23,584,972 | | | |
Dividends reinvested | | | 1,473,290 | | | | 279,932 | | | | 77,703 | | | | 60,128 | | | | 5,077,474 | | | | 2,851,134 | | | |
Cost of shares redeemed (a) | | | (24,940,854 | ) | | | (11,718,871 | ) | | | (503,584 | ) | | | (461,655 | ) | | | (69,387,944 | ) | | | (13,022,021 | ) | | |
| | | | | | | | | | | | | | | | | | | | | | | | | | |
| | | (8,423,689 | ) | | | 452,260 | | | | 581,292 | | | | 76,821 | | | | 313,562,704 | | | | 13,414,085 | | | |
| | | | | | | | | | | | | | | | | | | | | | | | | | |
| | | | | | | |
Class B Shares | | | | | | | | | | | | | | | | | | | | | | | | | | |
Proceeds from shares issued | | | 301,562 | | | | 436,577 | | | | 38,440 | | | | 30,647 | | | | 8,720,081 | | | | 786,210 | | | |
Dividends reinvested | | | 55,996 | | | | 4,640 | | | | 8,122 | | | | 5,636 | | | | 297,392 | | | | 192,009 | | | |
Cost of shares redeemed (a) | | | (307,160 | ) | | | (202,227 | ) | | | (12,309 | ) | | | (30,774 | ) | | | (638,812 | ) | | | (429,030 | ) | | |
| | | | | | | | | | | | | | | | | | | | | | | | | | |
| | | 50,398 | | | | 238,990 | | | | 34,253 | | | | 5,509 | | | | 8,378,661 | | | | 549,189 | | | |
| | | | | | | | | | | | | | | | | | | | | | | | | | |
| | | | | | | |
Class C Shares | | | | | | | | | | | | | | | | | | | | | | | | | | |
Proceeds from shares issued | | | 2,818,583 | | | | 4,247,596 | | | | 319,285 | | | | 86,157 | | | | 105,485,946 | | | | 5,235,353 | | | |
Dividends reinvested | | | 106,585 | | | | 6,284 | | | | 3,716 | | | | 3,584 | | | | 381,358 | | | | 20,926 | | | |
Cost of shares redeemed (a) | | | (2,476,910 | ) | | | (281,859 | ) | | | (32,076 | ) | | | (106,638 | ) | | | (5,597,834 | ) | | | (113,838 | ) | | |
| | | | | | | | | | | | | | | | | | | | | | | | | | |
| | | 448,258 | | | | 3,972,021 | | | | 290,925 | | | | (16,897 | ) | | | 100,269,470 | | | | 5,142,441 | | | |
| | | | | | | | | | | | | | | | | | | | | | | | | | |
| | | | | | | |
Class R Shares | | | | | | | | | | | | | | | | | | | | | | | | | | |
Proceeds from shares issued | | | 150 | | | | 175 | | | | 218 | | | | 175 | | | | 1,314,310 | | | | 134,193 | | | |
Dividends reinvested | | | 76 | | | | 15 | | | | 69 | | | | 54 | | | | 185 | | | | 138 | | | |
Cost of shares redeemed (a) | | | (150 | ) | | | (177 | ) | | | (151 | ) | | | (176 | ) | | | (150,590 | ) | | | (2,155 | ) | | |
| | | | | | | | | | | | | | | | | | | | | | | | | | |
| | | 76 | | | | 13 | | | | 136 | | | | 53 | | | | 1,163,905 | | | | 132,176 | | | |
| | | | | | | | | | | | | | | | | | | | | | | | | | |
| | | | | | | |
Institutional Service Class Shares | | | | | | | | | | | | | | | | | | | | | | | | | | |
Proceeds from shares issued | | | — | | | | — | | | | — | | | | — | | | | 13,782,957 | | | | 122,388 | | | |
Dividends reinvested | | | — | | | | — | | | | — | | | | — | | | | 62,414 | | | | 894 | | | |
Cost of shares redeemed (a) | | | — | | | | — | | | | — | | | | — | | | | (2,153,377 | ) | | | (132,819 | ) | | |
| | | | | | | | | | | | | | | | | | | | | | | | | | |
| | | — | | | | — | | | | — | | | | — | | | | 11,691,994 | | | | (9,537 | ) | | |
| | | | | | | | | | | | | | | | | | | | | | | | | | |
| | | | | | | |
Institutional Class Shares | | | | | | | | | | | | | | | | | | | | | | | | | | |
Proceeds from shares issued | | | — | | | | — | | | | 1,523,055 | | | | 890,194 | | | | 44,438,924 | | | | 1,140,758 | | | |
Dividends reinvested | | | — | | | | — | | | | 142,046 | | | | 75,664 | | | | 167,082 | | | | 18,314 | | | |
Cost of shares redeemed (a) | | | — | | | | — | | | | (392,573 | ) | | | (161,950 | ) | | | (9,745,584 | ) | | | (246,906 | ) | | |
| | | | | | | | | | | | | | | | | | | | | | | | | | |
| | | — | | | | — | | | | 1,272,528 | | | | 803,908 | | | | 34,860,422 | | | | 912,166 | | | |
| | | | | | | | | | | | | | | | | | | | | | | | | | |
Change in net assets from capital transactions | | $ | (7,924,957 | ) | | $ | 4,663,284 | | | $ | 2,179,134 | | | $ | 869,394 | | | $ | 469,927,156 | | | $ | 20,140,520 | | | |
| | | | | | | | | | | | | | | | | | | | | | | | | | | |
| (a) | Includes redemption fees, if any. |
See notes to financial statements.
Statements of Changes in Net Assets (Continued)
| | | | | | | | | | | | | | | | | | | | |
| | | Gartmore Large Cap Value Fund | | | Gartmore Mid Cap Growth Fund | | | Gartmore Small Cap Fund |
| | | Year Ended
October 31, 2006 | | | Year Ended
October 31, 2005 | | | Year Ended
October 31, 2006 | | | Year Ended
October 31, 2005 | | | Year Ended
October 31, 2006 | | | Year Ended
October 31, 2005 |
SHARE TRANSACTIONS: | | | | | | | | | | | | | | | | | | | | |
Class A Shares | | | | | | | | | | | | | | | | | | | | |
Issued | | 1,078,112 | | | 930,948 | | | 61,896 | | | 31,775 | | | 18,760,867 | | | 1,345,613 | | | |
Reinvested | | 112,275 | | | 21,733 | | | 4,965 | | | 4,003 | | | 289,542 | | | 179,317 | | | |
Redeemed | | (1,757,119 | ) | | (912,386 | ) | | (31,149 | ) | | (30,916 | ) | | (3,585,786 | ) | | (783,370 | ) | | |
| | | | | | | | | | | | | | | | | | | | |
| | (566,732 | ) | | 40,295 | | | 35,712 | | | 4,862 | | | 15,464,623 | | | 741,560 | | | |
| | | | | | | | | | | | | | | | | | | | |
| | | | | | | |
Class B Shares | | | | | | | | | | | | | | | | | | | | |
Issued | | 22,237 | | | 34,557 | | | 2,418 | | | 2,104 | | | 467,464 | | | 46,521 | | | |
Reinvested | | 4,344 | | | 364 | | | 527 | | | 378 | | | 17,904 | | | 12,583 | | | |
Redeemed | | (22,887 | ) | | (15,833 | ) | | (779 | ) | | (2,042 | ) | | (35,202 | ) | | (26,586 | ) | | |
| | | | | | | | | | | | | | | | | | | | |
| | 3,694 | | | 19,088 | | | 2,166 | | | 440 | | | 450,166 | | | 32,518 | | | |
| | | | | | | | | | | | | | | | | | | | |
| | | | | | | |
Class C Shares | | | | | | | | | | | | | | | | | | | | |
Issued | | 203,719 | | | 336,380 | | | 19,761 | | | 5,796 | | | 5,688,712 | | | 306,215 | | | |
Reinvested | | 8,315 | | | 493 | | | 241 | | | 241 | | | 22,918 | | | 1,369 | | | |
Redeemed | | (186,047 | ) | | (22,351 | ) | | (2,005 | ) | | (6,891 | ) | | (307,047 | ) | | (6,697 | ) | | |
| | | | | | | | | | | | | | | | | | | | |
| | 25,987 | | | 314,522 | | | 17,997 | | | (854 | ) | | 5,404,583 | | | 300,887 | | | |
| | | | | | | | | | | | | | | | | | | | |
| | | | | | | |
Class R Shares | | | | | | | | | | | | | | | | | | | | |
Issued | | 11 | | | 14 | | | 14 | | | 11 | | | 69,402 | | | 8,662 | | | |
Reinvested | | 6 | | | 1 | | | 4 | | | 4 | | | 11 | | | 9 | | | |
Redeemed | | (11 | ) | | (14 | ) | | (9 | ) | | (11 | ) | | (7,957 | ) | | (123 | ) | | |
| | | | | | | | | | | | | | | | | | | | |
| | 6 | | | 1 | | | 9 | | | 4 | | | 61,456 | | | 8,548 | | | |
| | | | | | | | | | | | | | | | | | | | |
| | | | | | | |
Institutional Service Class Shares | | | | | | | | | | | | | | | | | | | | |
Issued | | — | | | — | | | — | | | — | | | 661,271 | | | 7,182 | | | |
Reinvested | | — | | | — | | | — | | | — | | | 3,506 | | | 56 | | | |
Redeemed | | — | | | — | | | — | | | — | | | (114,791 | ) | | (7,699 | ) | | |
| | | | | | | | | | | | | | | | | | | | |
| | — | | | — | | | — | | | — | | | 549,986 | | | (461 | ) | | |
| | | | | | | | | | | | | | | | | | | | |
| | | | | | | |
Institutional Class Shares | | | | | | | | | | | | | | | | | | | | |
Issued | | — | | | — | | | 92,998 | | | 57,744 | | | 2,329,963 | | | 65,027 | | | |
Reinvested | | — | | | — | | | 9,002 | | | 5,011 | | | 9,349 | | | 1,138 | | | |
Redeemed | | — | | | — | | | (24,140 | ) | | (10,098 | ) | | (494,263 | ) | | (13,453 | ) | | |
| | | | | | | | | | | | | | | | | | | | |
| | — | | | — | | | 77,860 | | | 52,657 | | | 1,845,049 | | | 52,712 | | | |
| | | | | | | | | | | | | | | | | | | | |
Total change in shares | | (537,045 | ) | | 373,906 | | | 133,744 | | | 57,109 | | | 23,775,863 | | | 1,135,764 | | | |
| | | | | | | | | | | | | | | | | | | | | |
See notes to financial statements.
Financial Highlights
Selected Data for Each Share of Capital Outstanding
Gartmore Large Cap Value Fund
| | | | | | | | | | | | | | | | | | | | | | | | | | | | | | | | | | | | | | | | | | | |
| | | | | Investment Activities | | | Distributions | | | | | | | | Ratios/Supplemental Data |
| | | Net Asset
Value,
Beginning
of Period | | Net
Investment
Income
(Loss) | | Net Realized
and
Unrealized
Gains
(Losses) on
Investments | | | Total
from
Investment
Activities | | | Net
Investment
Income | | | Net
Realized
Gains | | | Total
Distributions | | | Net
Asset
Value, End
of Period | | Total
Return (a) | | | Net Assets
at End of
Period
(000s) | | Ratio of
Expenses
to Average
Net Assets | | | Ratio of Net
Investment
Income
(Loss)
to Average
Net Assets | | | Ratio of
Expenses
(Prior to
Reimbursements)
to Average
Net Assets (b) | | | Ratio of Net
Investment
Income (Loss)
(Prior to
Reimbursements)
to Average
Net Assets (b) | | | Portfolio
Turnover (c) |
| | | | | | | | | | | | | | | |
Class A Shares | | | | | | | | | | | | | | | | | | | | | | | | | | | | | | | | | | | | | | | | | | | |
Year Ended October 31, 2002 | | $ | 9.98 | | 0.08 | | (0.82 | ) | | (0.74 | ) | | (0.08 | ) | | (0.41 | ) | | (0.49 | ) | | $ | 8.75 | | (7.98% | ) | | $ | 23,581 | | 1.36% | | | 0.81% | | | 1.48% | | | 0.69% | | | 91.03% |
Year Ended October 31, 2003 | | $ | 8.75 | | 0.10 | | 1.69 | | | 1.79 | | | (0.10 | ) | | — | | | (0.10 | ) | | $ | 10.44 | | 20.57% | | | $ | 24,800 | | 1.39% | | | 1.06% | | | 1.47% | | | 0.98% | | | 77.28% |
Year Ended October 31, 2004 | | $ | 10.44 | | 0.10 | | 1.35 | | | 1.45 | | | (0.10 | ) | | — | | | (0.10 | ) | | $ | 11.79 | | 13.92% | | | $ | 24,846 | | 1.39% | | | 0.91% | | | 1.45% | | | 0.84% | | | 58.61% |
Year Ended October 31, 2005 | | $ | 11.79 | | 0.15 | | 1.34 | | | 1.49 | | | (0.14 | ) | | — | | | (0.14 | ) | | $ | 13.14 | | 12.63% | | | $ | 28,232 | | 1.44% | | | 1.09% | | | 1.47% | | | 1.06% | | | 67.00% |
Year Ended October 31, 2006 | | $ | 13.14 | | 0.17 | | 2.46 | | | 2.63 | | | (0.15 | ) | | (0.60 | ) | | (0.75 | ) | | $ | 15.02 | | 20.81% | | | $ | 23,753 | | 1.44% | | | 1.14% | | | 1.44% | | | 1.14% | | | 95.14% |
| | | | | | | | | | | | | | | |
Class B Shares | | | | | | | | | | | | | | | | | | | | | | | | | | | | | | | | | | | | | | | | | | | |
Year Ended October 31, 2002 | | $ | 9.86 | | 0.01 | | (0.80 | ) | | (0.79 | ) | | (0.02 | ) | | (0.41 | ) | | (0.43 | ) | | $ | 8.64 | | (8.53% | ) | | $ | 576 | | 2.02% | | | 0.14% | | | 2.17% | | | (0.01% | ) | | 91.03% |
Year Ended October 31, 2003 | | $ | 8.64 | | 0.03 | | 1.67 | | | 1.70 | | | (0.04 | ) | | — | | | (0.04 | ) | | $ | 10.30 | | 19.80% | | | $ | 751 | | 2.00% | | | 0.43% | | | 2.08% | | | 0.35% | | | 77.28% |
Year Ended October 31, 2004 | | $ | 10.30 | | 0.03 | | 1.33 | | | 1.36 | | | (0.03 | ) | | — | | | (0.03 | ) | | $ | 11.63 | | 13.25% | | | $ | 982 | | 2.00% | | | 0.29% | | | 2.06% | | | 0.22% | | | 58.61% |
Year Ended October 31, 2005 | | $ | 11.63 | | 0.06 | | 1.33 | | | 1.39 | | | (0.06 | ) | | — | | | (0.06 | ) | | $ | 12.96 | | 11.97% | | | $ | 1,342 | | 2.06% | | | 0.46% | | | 2.08% | | | 0.44% | | | 67.00% |
Year Ended October 31, 2006 | | $ | 12.96 | | 0.07 | | 2.43 | | | 2.50 | | | (0.06 | ) | | (0.60 | ) | | (0.66 | ) | | $ | 14.80 | | 20.06% | | | $ | 1,588 | | 2.05% | | | 0.52% | | | 2.06% | | | 0.51% | | | 95.14% |
| | | | | | | | | | | | | | | |
Class C Shares | | | | | | | | | | | | | | | | | | | | | | | | | | | | | | | | | | | | | | | | | | | |
Year Ended October 31, 2002 | | $ | 9.85 | | 0.01 | | (0.79 | ) | | (0.78 | ) | | (0.03 | ) | | (0.41 | ) | | (0.44 | ) | | $ | 8.63 | | (8.50% | ) | | $ | 80 | | 2.03% | | | 0.13% | | | 2.15% | | | 0.01% | | | 91.03% |
Year Ended October 31, 2003 | | $ | 8.63 | | 0.04 | | 1.66 | | | 1.70 | | | (0.05 | ) | | — | | | (0.05 | ) | | $ | 10.28 | | 19.77% | | | $ | 248 | | 2.00% | | | 0.38% | | | 2.08% | | | 0.30% | | | 77.28% |
Year Ended October 31, 2004 | | $ | 10.28 | | 0.03 | | 1.33 | | | 1.36 | | | (0.04 | ) | | — | | | (0.04 | ) | | $ | 11.60 | | 13.25% | | | $ | 743 | | 2.00% | | | 0.21% | | | 2.06% | | | 0.14% | | | 58.61% |
Year Ended October 31, 2005 | | $ | 11.60 | | 0.06 | | 1.33 | | | 1.39 | | | (0.08 | ) | | — | | | (0.08 | ) | | $ | 12.91 | | 11.98% | | | $ | 4,888 | | 2.06% | | | 0.34% | | | 2.07% | | | 0.34% | | | 67.00% |
Year Ended October 31, 2006 | | $ | 12.91 | | 0.07 | | 2.43 | | | 2.50 | | | (0.06 | ) | | (0.60 | ) | | (0.66 | ) | | $ | 14.75 | | 20.11% | | | $ | 5,966 | | 2.06% | | | 0.52% | | | 2.06% | | | 0.51% | | | 95.14% |
| | | | | | | | | | | | | | | |
Class R Shares | | | | | | | | | | | | | | | | | | | | | | | | | | | | | | | | | | | | | | | | | | | |
Period Ended October 31, 2003 (d) | | $ | 9.92 | | — | | 0.39 | | | 0.39 | | | — | | | — | | | — | | | $ | 10.31 | | 3.93% | (e) | | $ | 1 | | 1.60% | (f) | | 0.48% | (f) | | 2.06% | (f) | | 0.02% | (f) | | 77.28% |
Year Ended October 31, 2004 | | $ | 10.31 | | 0.08 | | 1.33 | | | 1.41 | | | (0.08 | ) | | — | | | (0.08 | ) | | $ | 11.64 | | 13.71% | | | $ | 1 | | 1.54% | | | 0.75% | | | 1.86% | | | 0.42% | | | 58.61% |
Year Ended October 31, 2005 | | $ | 11.64 | | 0.15 | | 1.33 | | | 1.48 | | | (0.15 | ) | | — | | | (0.15 | ) | | $ | 12.97 | | 12.73% | | | $ | 1 | | 1.33% | | | 1.18% | | | 1.38% | | | 1.12% | | | 67.00% |
Year Ended October 31, 2006 | | $ | 12.97 | | 0.14 | | 2.44 | | | 2.58 | | | (0.14 | ) | | (0.60 | ) | | (0.74 | ) | | $ | 14.81 | | 20.69% | | | $ | 2 | | 1.57% | | | 1.00% | | | 1.59% | | | 0.98% | | | 95.14% |
| | |
(a) Excludes sales charge. | | (d) For the period from October 1, 2003 (commencement of operations) through October 31, 2003. |
(b) During the period certain fees were waived and/or reimbursed. If such waivers/reimbursements had not occurred, the ratios would have been as indicated. | | (e) Not annualized. (f) Annualized. |
(c) Portfolio turnover is calculated on the basis of the Fund as a whole without distinguishing among the classes of shares. | | |
See notes to financial statements.
Financial Highlights
Selected Data for Each Share of Capital Outstanding
Gartmore Mid Cap Growth Fund
| | | | | | | | | | | | | | | | | | | | | | | | | | | | | | | | | | | | | | | | | |
| | | | | Investment Activities | | Distributions | | | | | | | | Ratios/Supplemental Data |
| | | Net Asset
Value,
Beginning
of Period | | Net
Investment
Income
(Loss) | | | Net Realized
and
Unrealized
Gains
(Losses) on
Investments | | Total
from
Investment
Activities | | Net
Realized
Gains | | | Total
Distributions | | | Redemption
Fees | | Net
Asset
Value, End
of Period | | Total
Return (a) | | | Net Assets
at End of
Period
(000s) | | Ratio of
Expenses
to Average
Net Assets | | | Ratio of Net
Investment
Income
(Loss)
to Average
Net Assets | | | Ratio of
Expenses
(Prior to
Reimbursements)
to Average
Net Assets (b) | | | Ratio of Net
Investment
Income (Loss)
(Prior to
Reimbursements)
to Average
Net Assets (b) | | | Portfolio
Turnover (c) |
| | | | | | | | | | | | | | | |
Class A Shares | | | | | | | | | | | | | | | | | | | | | | | | | | | | | | | | | | | | | | | | | |
Period Ended October 31, 2003 (d) (e) | | $ | 9.88 | | (0.08 | ) | | 4.04 | | 3.96 | | — | | | — | | | — | | $ | 13.84 | | 40.08% | (i) | | $ | 522 | | 1.40% | (j) | | (1.02% | )(j) | | 7.09% | (j) | | (6.71% | )(j) | | 74.46% |
Year Ended October 31, 2004 | | $ | 13.84 | | (0.13 | ) | | 0.87 | | 0.74 | | (0.37 | ) | | (0.37 | ) | | — | | $ | 14.21 | | 5.44% | | | $ | 1,463 | | 1.40% | | | (0.98% | ) | | 2.51% | | | (2.08% | ) | | 94.56% |
Year Ended October 31, 2005 | | $ | 14.21 | | (0.13 | ) | | 2.16 | | 2.03 | | (0.69 | ) | | (0.69 | ) | | — | | $ | 15.55 | | 14.42% | | | $ | 1,678 | | 1.42% | | | (0.87% | ) | | 2.38% | | | (1.84% | ) | | 68.86% |
Year Ended October 31, 2006 | | $ | 15.55 | | (0.09 | ) | | 2.12 | | 2.03 | | (0.84 | ) | | (0.84 | ) | | 0.01 | | $ | 16.75 | | 13.51% | | | $ | 2,405 | | 1.43% | | | (0.60% | ) | | 1.89% | | | (1.06% | ) | | 68.88% |
| | | | | | | | | | | | | | | |
Class B Shares | | | | | | | | | | | | | | | | | | | | | | | | | | | | | | | | | | | | | | | | | |
Period Ended October 31, 2003 (e) (f) | | $ | 13.17 | | (0.05 | ) | | 0.72 | | 0.67 | | — | | | — | | | — | | $ | 13.84 | | 5.09% | (i) | | $ | 18 | | 2.15% | (j) | | (1.82% | )(j) | | 7.76% | (j) | | (7.43% | )(j) | | 74.46% |
Year Ended October 31, 2004 | | $ | 13.84 | | (0.20 | ) | | 0.84 | | 0.64 | | (0.37 | ) | | (0.37 | ) | | — | | $ | 14.11 | | 4.70% | | | $ | 153 | | 2.15% | | | (1.74% | ) | | 3.27% | | | (2.86% | ) | | 94.56% |
Year Ended October 31, 2005 | | $ | 14.11 | | (0.24 | ) | | 2.15 | | 1.91 | | (0.69 | ) | | (0.69 | ) | | — | | $ | 15.33 | | 13.65% | | | $ | 173 | | 2.15% | | | (1.61% | ) | | 3.11% | | | (2.56% | ) | | 68.86% |
Year Ended October 31, 2006 | | $ | 15.33 | | (0.19 | ) | | 2.07 | | 1.88 | | (0.84 | ) | | (0.84 | ) | | 0.01 | | $ | 16.38 | | 12.68% | | | $ | 220 | | 2.15% | | | (1.31% | ) | | 2.62% | | | (1.77% | ) | | 68.88% |
| | | | | | | | | | | | | | | |
Class C Shares | | | | | | | | | | | | | | | | | | | | | | | | | | | | | | | | | | | | | | | | | |
Period Ended October 31, 2003 (f) | | $ | 13.17 | | (0.05 | ) | | 0.72 | | 0.67 | | — | | | — | | | — | | $ | 13.84 | | 5.09% | (i) | | $ | 1 | | 2.15% | (j) | | (1.87% | )(j) | | 7.55% | (j) | | (7.27% | )(j) | | 74.46% |
Year Ended October 31, 2004 | | $ | 13.84 | | (0.23 | ) | | 0.87 | | 0.64 | | (0.37 | ) | | (0.37 | ) | | — | | $ | 14.11 | | 4.70% | | | $ | 224 | | 2.15% | | | (1.72% | ) | | 3.17% | | | (2.74% | ) | | 94.56% |
Year Ended October 31, 2005 | | $ | 14.11 | | (0.27 | ) | | 2.18 | | 1.91 | | (0.69 | ) | | (0.69 | ) | | — | | $ | 15.33 | | 13.65% | | | $ | 230 | | 2.15% | | | (1.60% | ) | | 3.18% | | | (2.64% | ) | | 68.86% |
Year Ended October 31, 2006 | | $ | 15.33 | | (0.18 | ) | | 2.06 | | 1.88 | | (0.84 | ) | | (0.84 | ) | | 0.01 | | $ | 16.38 | | 12.68% | | | $ | 541 | | 2.15% | | | (1.34% | ) | | 2.60% | | | (1.79% | ) | | 68.88% |
| | | | | | | | | | | | | | | |
Class R Shares | | | | | | | | | | | | | | | | | | | | | | | | | | | | | | | | | | | | | | | | | |
Period Ended October 31, 2003 (g) | | $ | 13.08 | | (0.01 | ) | | 0.79 | | 0.78 | | — | | | — | | | — | | $ | 13.86 | | 5.96% | (i) | | $ | 1 | | 1.75% | (j) | | (1.54% | )(j) | | 7.41% | (j) | | (7.20% | )(j) | | 74.46% |
Year Ended October 31, 2004 | | $ | 13.86 | | (0.17 | ) | | 0.86 | | 0.69 | | (0.37 | ) | | (0.37 | ) | | — | | $ | 14.18 | | 5.06% | | | $ | 1 | | 1.66% | | | (1.27% | ) | | 2.63% | | | (2.24% | ) | | 94.56% |
Year Ended October 31, 2005 | | $ | 14.18 | | (0.15 | ) | | 2.17 | | 2.02 | | (0.69 | ) | | (0.69 | ) | | — | | $ | 15.51 | | 14.38% | | | $ | 1 | | 1.49% | | | (0.97% | ) | | 2.53% | | | (2.00% | ) | | 68.86% |
Year Ended October 31, 2006 | | $ | 15.51 | | (0.12 | ) | | 2.11 | | 1.99 | | (0.84 | ) | | (0.84 | ) | | 0.01 | | $ | 16.67 | | 13.27% | | | $ | 2 | | 1.64% | | | (0.79% | ) | | 2.18% | | | (1.33% | ) | | 68.88% |
| | | | | | | | | | | | | | | |
Institutional Class Shares | | | | | | | | | | | | | | | | | | | | | | | | | | | | | | | | | | | | | | | | | |
Period Ended October 31, 2002 (h) | | $ | 10.00 | | (0.01 | ) | | 0.27 | | 0.26 | | — | | | — | | | — | | $ | 10.26 | | 2.60% | (i) | | $ | 1,026 | | 1.15% | (j) | | (0.69% | )(j) | | 20.62% | (j) | | (20.16% | )(j) | | 3.74% |
Year Ended October 31, 2003 | | $ | 10.26 | | (0.09 | ) | | 3.69 | | 3.60 | | — | | | — | | | — | | $ | 13.86 | | 35.09% | | | $ | 1,384 | | 1.15% | | | (0.76% | ) | | 5.96% | | | (5.56% | ) | | 74.46% |
Year Ended October 31, 2004 | | $ | 13.86 | | (0.10 | ) | | 0.88 | | 0.78 | | (0.37 | ) | | (0.37 | ) | | — | | $ | 14.27 | | 5.73% | | | $ | 1,553 | | 1.15% | | | (0.72% | ) | | 2.26% | | | (1.83% | ) | | 94.56% |
Year Ended October 31, 2005 | | $ | 14.27 | | (0.07 | ) | | 2.16 | | 2.09 | | (0.69 | ) | | (0.69 | ) | | — | | $ | 15.67 | | 14.79% | | | $ | 2,531 | | 1.15% | | | (0.61% | ) | | 1.98% | | | (1.43% | ) | | 68.86% |
Year Ended October 31, 2006 | | $ | 15.67 | | (0.05 | ) | | 2.14 | | 2.09 | | (0.84 | ) | | (0.84 | ) | | 0.01 | | $ | 16.93 | | 13.80% | | | $ | 4,053 | | 1.15% | | | (0.34% | ) | | 1.61% | | | (0.79% | ) | | 68.88% |
| | | | | | | | | | | | | | | | | | | | | | | | | | | | | | | | | | | | | | | | | | |
| | | | | | | | | | | | | | | | | | | | | | | | | | | | | | | | | | | | | | | | | | |
| | | | | | | | | | | | | | | | | | | | | | | | | | | | | | | | | | | | | | | | | | |
| | | | | | | | | | | | | | | | | | | | | | | | | | | | | | | | | | | | | | | | | | |
| | | | | | | | | | | | | | | | | | | | | | | | | | | | | | | | | | | | | | | | | | |
| | | | | | | | | | | | | | | | | | | | | | | | | | | | | | | | | | | | | | | | | | |
| | | | | | | | | | | | | | | | | | | | | | | | | | | | | | | | | | | | | | | | | | |
| | |
(a) Excludes sales charge. (b) During the period certain fees were waived and/or reimbursed. If such waivers/reimbursements had not occurred, the ratios would have been as indicated. (c) Portfolio turnover is calculated on the basis of the Fund as a whole without distinguishing among the classes of shares. (d) For the period from March 5, 2003 (commencement of operations) through October 31, 2003. | | (e) Net investment income (loss) is based on average shares outstanding during the period. (f) For the period from August 21, 2003 (commencement of operations) through October 31, 2003. (g) For the period from October 1, 2003 (commencement of operations) through October 31, 2003. (h)For the period from October 1, 2002 (commencement of operations) through October 31, 2002. (i) Not annualized. (j) Annualized. |
See notes to financial statements.
Financial Highlights
Selected Data for Each Share of Capital Outstanding
Gartmore Small Cap Fund
| | | | | | | | | | | | | | | | | | | | | | | | | | | | | | | | | | | | | | | | | | | | | | | |
| | | | | Investment Activities | | | Distributions | | | | | | | | Ratios/Supplemental Data |
| | | Net Asset
Value,
Beginning
of Period | | Net
Investment
Income
(Loss) | | | Net Realized
and
Unrealized
Gains
(Losses) on
Investments | | | Total
from
Investment
Activities | | | Net
Investment
Income | | | Net
Realized
Gains | | | Total
Distributions | | | Redemption
Fees | | Net
Asset
Value, End
of Period | | Total
Return (a) | | | Net Assets
at End of
Period
(000s) | | | Ratio of
Expenses
to Average
Net Assets | | | Ratio of Net
Investment
Income
(Loss)
to Average
Net Assets | | | Ratio of
Expenses
(Prior to
Reimbursements)
to Average
Net Assets (b) | | | Ratio of Net
Investment
Income (Loss)
(Prior to
Reimbursements)
to Average
Net Assets (b) | | | Portfolio
Turnover (c) |
| | | | | | | | | | | | | | | | |
Class A Shares | | | | | | | | | | | | | | | | | | | | | | | | | | | | | | | | | | | | | | | | | | | | | | | |
Year Ended October 31, 2002 | | $ | 10.79 | | (0.02 | ) | | (1.16 | ) | | (1.18 | ) | | — | | | — | | | — | | | — | | $ | 9.61 | | (10.94% | ) | | $ | 20,290 | | | 1.51% | | | (0.24% | ) | | 1.72% | | | (0.45% | ) | | 111.00% |
Year Ended October 31, 2003 | | $ | 9.61 | | (0.05 | ) | | 4.12 | | | 4.07 | | | — | | | — | | | — | | | — | | $ | 13.68 | | 42.35% | | | $ | 21,198 | | | 1.59% | | | (0.37% | ) | | 1.70% | | | (0.48% | ) | | 100.05% |
Year Ended October 31, 2004 | | $ | 13.68 | | (0.09 | ) | | 2.12 | | | 2.03 | | | — | | | (0.17 | ) | | (0.17 | ) | | 0.05 | | $ | 15.59 | | 15.33% | | | $ | 23,023 | | | 1.59% | | | (0.55% | ) | | (i | ) | | (i | ) | | 341.57% |
Year Ended October 31, 2005 | | $ | 15.59 | | (0.03 | ) | | 4.65 | | | 4.62 | | | — | | | (1.93 | ) | | (1.93 | ) | | — | | $ | 18.28 | | 31.51% | | | $ | 40,539 | | | 1.67% | | | (0.27% | ) | | 1.69% | | | (0.28% | ) | | 292.46% |
Year Ended October 31, 2006 | | $ | 18.28 | | — | | | 5.18 | | | 5.18 | | | (0.01 | ) | | (2.16 | ) | | (2.17 | ) | | 0.01 | | $ | 21.30 | | 30.98% | | | $ | 376,718 | | | 1.39% | | | 0.00% | | | 1.39% | | | 0.00% | | | 219.51% |
| | | | | | | | | | | | | | | | |
Class B Shares | | | | | | | | | | | | | | | | | | | | | | | | | | | | | | | | | | | | | | | | | | | | | | | |
Year Ended October 31, 2002 | | $ | 10.61 | | (0.09 | ) | | (1.13 | ) | | (1.22 | ) | | — | | | — | | | — | | | — | | $ | 9.39 | | (11.50% | ) | | $ | 950 | | | 2.17% | | | (0.89% | ) | | 2.41% | | | (1.13% | ) | | 111.00% |
Year Ended October 31, 2003 | | $ | 9.39 | | (0.10 | ) | | 4.00 | | | 3.90 | | | — | | | — | | | — | | | — | | $ | 13.29 | | 41.53% | | | $ | 1,368 | | | 2.20% | | | (1.00% | ) | | 2.30% | | | (1.10% | ) | | 100.05% |
Year Ended October 31, 2004 | | $ | 13.29 | | (0.17 | ) | | 2.04 | | | 1.87 | | | — | | | (0.17 | ) | | (0.17 | ) | | 0.05 | | $ | 15.04 | | 14.57% | | | $ | 1,496 | | | 2.20% | | | (1.16% | ) | | (i | ) | | (i | ) | | 341.57% |
Year Ended October 31, 2005 | | $ | 15.04 | | (0.12 | ) | | 4.46 | | | 4.34 | | | — | | | (1.93 | ) | | (1.93 | ) | | — | | $ | 17.45 | | 30.72% | | | $ | 2,302 | | | 2.29% | | | (0.88% | ) | | 2.32% | | | (0.90% | ) | | 292.46% |
Year Ended October 31, 2006 | | $ | 17.45 | | (0.07 | ) | | 4.87 | | | 4.80 | | | — | | | (2.16 | ) | | (2.16 | ) | | 0.01 | | $ | 20.10 | | 30.16% | | | $ | 11,701 | | | 2.08% | | | (0.63% | ) | | 2.08% | | | (0.63% | ) | | 219.51% |
| | | | | | | | | | | | | | | | |
Class C Shares | | | | | | | | | | | | | | | | | | | | | | | | | | | | | | | | | | | | | | | | | | | | | | | |
Year Ended October 31, 2002 | | $ | 10.63 | | (0.09 | ) | | (1.13 | ) | | (1.22 | ) | | — | | | — | | | — | | | — | | $ | 9.41 | | (11.48% | ) | | $ | 28 | | | 2.17% | | | (0.90% | ) | | 2.47% | | | (1.20% | ) | | 111.00% |
Year Ended October 31, 2003 | | $ | 9.41 | | (0.09 | ) | | 3.99 | | | 3.90 | | | — | | | — | | | — | | | — | | $ | 13.31 | | 41.45% | | | $ | 89 | | | 2.20% | | | (1.04% | ) | | 2.31% | | | (1.15% | ) | | 100.05% |
Year Ended October 31, 2004 | | $ | 13.31 | | (0.13 | ) | | 2.01 | | | 1.88 | | | — | | | (0.17 | ) | | (0.17 | ) | | 0.05 | | $ | 15.07 | | 14.62% | | | $ | 180 | | | 2.20% | | | (1.16% | ) | | (i | ) | | (i | ) | | 341.57% |
Year Ended October 31, 2005 (h) | | $ | 15.07 | | (0.17 | ) | | 4.51 | | | 4.34 | | | — | | | (1.93 | ) | | (1.93 | ) | | — | | $ | 17.48 | | 30.67% | | | $ | 5,468 | | | 2.33% | | | (1.00% | ) | | 2.33% | | | (1.00% | ) | | 292.46% |
Year Ended October 31, 2006 | | $ | 17.48 | | (0.06 | ) | | 4.87 | | | 4.81 | | | — | | | (2.16 | ) | | (2.16 | ) | | 0.01 | | $ | 20.14 | | 30.17% | | | $ | 115,138 | | | 2.06% | | | (0.72% | ) | | 2.07% | | | (0.72% | ) | | 219.51% |
| | | | | | | | | | | | | | | | |
Class R Shares | | | | | | | | | | | | | | | | | | | | | | | | | | | | | | | | | | | | | | | | | | | | | | | |
Period Ended October 31, 2004 (d) | | $ | 14.03 | | (0.09 | ) | | 1.11 | | | 1.02 | | | — | | | — | | | — | | | 0.05 | | $ | 15.10 | | 7.63% | (f) | | $ | 1 | | | 1.73% | (g) | | (0.63% | )(g) | | (i | ) | | (i | ) | | 341.57% |
Year Ended October 31, 2005 | | $ | 15.10 | | (0.03 | ) | | 4.49 | | | 4.46 | | | — | | | (1.93 | ) | | (1.93 | ) | | — | | $ | 17.63 | | 31.47% | | | $ | 152 | | | 1.74% | | | (0.25% | ) | | 1.74% | | | (0.25% | ) | | 292.46% |
Year Ended October 31, 2006 | | $ | 17.63 | | — | | | 4.97 | | | 4.97 | | | (0.02 | ) | | (2.16 | ) | | (2.18 | ) | | 0.01 | | $ | 20.43 | | 30.87% | | | $ | 1,431 | | | 1.68% | | | (0.30% | ) | | 1.68% | | | (0.30% | ) | | 219.51% |
| | | | | | | | | | | | | | | | |
Institutional Service Class Shares | | | | | | | | | | | | | | | | | | | | | | | | | | | | | | | | | | | | | | | | | | | | | | | |
Year Ended October 31, 2002 | | $ | 10.84 | | (0.01 | ) | | (1.16 | ) | | (1.17 | ) | | — | | | — | | | — | | | — | | $ | 9.67 | | (10.79% | ) | | $ | 5,856 | | | 1.38% | | | (0.11% | ) | | 1.57% | | | (0.30% | ) | | 111.00% |
Year Ended October 31, 2003 | | $ | 9.67 | | (0.02 | ) | | 4.14 | | | 4.12 | | | — | | | — | | | — | | | — | | $ | 13.79 | | 42.61% | | | $ | 18,584 | | | 1.45% | | | (0.35% | ) | | 1.54% | | | (0.44% | ) | | 100.05% |
Year Ended October 31, 2004 (h) | | $ | 13.79 | | (0.06 | ) | | 2.11 | | | 2.05 | | | — | | | (0.17 | ) | | (0.17 | ) | | 0.05 | | $ | 15.72 | | 15.43% | | | $ | 7 | | | 1.45% | | | (0.39% | ) | | (i | ) | | (i | ) | | 341.57% |
Year Ended October 31, 2005 | | $ | 15.72 | | 0.11 | | | 4.62 | | | 4.73 | | | — | | | (1.93 | ) | | (1.93 | ) | | — | | $ | 18.52 | | 31.91% | | | $ | — | (j) | | 1.49% | | | 0.76% | | | 1.58% | | | 0.68% | | | 292.46% |
Year Ended October 31, 2006 | | $ | 18.52 | | 0.02 | | | 5.35 | | | 5.37 | | | (0.02 | ) | | (2.16 | ) | | (2.18 | ) | | 0.01 | | $ | 21.72 | | 31.64% | | | $ | 11,945 | | | 1.25% | | | (0.04% | ) | | 1.26% | | | (0.05% | ) | | 219.51% |
| | | | | | | | | | | | | | | | |
Institutional Class Shares | | | | | | | | | | | | | | | | | | | | | | | | | | | | | | | | | | | | | | | | | | | | | | | |
Period Ended October 31, 2004 (e) | | $ | 15.64 | | (0.01 | ) | | 0.07 | | | 0.06 | | | — | | | — | | | — | | | 0.05 | | $ | 15.75 | | 0.70% | (f) | | $ | 120 | | | 1.20% | (g) | | (0.22% | )(g) | | (i | ) | | (i | ) | | 341.57% |
Year Ended October 31, 2005 | | $ | 15.75 | | 0.01 | | | 4.72 | | | 4.73 | | | — | | | (1.93 | ) | | (1.93 | ) | | — | | $ | 18.55 | | 31.93% | | | $ | 1,120 | | | 1.32% | | | 0.12% | | | 1.32% | | | 0.12% | | | 292.46% |
Year Ended October 31, 2006 | | $ | 18.55 | | 0.06 | | | 5.30 | | | 5.36 | | | (0.03 | ) | | (2.16 | ) | | (2.19 | ) | | 0.01 | | $ | 21.73 | | 31.52% | | | $ | 41,396 | | | 1.06% | | | 0.41% | | | 1.07% | | | 0.41% | | | 219.51% |
| | | | | | | | | | | | | | | | | | | | | | | | | | | | | | | | | | | | | | | | | | | | | | | | |
| | | | | | | | | | | | | | | | | | | | | | | | | | | | | | | | | | | | | | | | | | | | | | | | |
| | |
(a) Excludes sales charge. | | (e) For the period from June 29, 2004 (commencement of operations) through October 31, 2004. |
(b) During the period certain fees were waived and/or reimbursed. If such waivers/reimbursements had not occurred, the ratios would have been as indicated. | | (f) Not annualized. (g) Annualized. |
(c) Portfolio turnover is calculated on the basis of the Fund as a whole without distinguishing among the classes of shares. | | (h)Net investment income (loss) is based on average shares outstanding during the period. (i) There were no fee reductions during the period. |
(d) For the period from December 30, 2003 (commencement of operations) through October 31, 2004. | | (j) The amount is less than $1,000. |
See notes to financial statements.
Gartmore Bond Fund
For the annual period ended Oct. 31, 2006, the Gartmore Bond Fund (Class A at NAV) returned 5.22% versus 4.90% for its benchmark, the Lehman Brothers Government/Credit Bond Index. For broader comparison, the average return for the Fund’s Lipper peer category of Corporate Debt Funds A Rated (consisting of 172 funds as of Oct. 31, 2006) was 4.58%.
During the reporting period, the Federal Reserve Board raised the federal funds rate in six 0.25% increments, increasing it from 3.75% to 5.25% by October 2006. The yield curve (a plotted graph line of the yields, or interest rates, on long-term and short-term maturity bonds) inverted during the reporting period and flattened. The 10-year Treasury yield rose by 32 basis points, while the 30-year Treasury yield fell by 4 basis points.
We continued to incrementally increase the Fund’s holdings in the intermediate part of the yield curve (bonds with durations of approximately three to six years) in preparation for what we believe to be the beginning of the Federal Reserve’s interest-rate-easing cycle. As the curve steepens, intermediate bonds tend to outperform both shorter-term and longer-term bonds. During the reporting period, we increased our exposure to mortgage-backed securities (MBS) and asset-backed securities (ABS) to benefit from a lower-volatility environment.
An overweight in mortgages and lower-quality auto paper relative to the Index added to Fund performance. The duration of the Fund (4.71 years) was modestly shorter than that of the benchmark (5.09 years), which also aided the Fund’s performance.
The Fund’s overweight position in Kinder Morgan, Inc. bonds relative to the Index detracted from performance. Kinder Morgan (Baa2/BBB) was put on review for downgrade by both credit-rating agencies due to its proposed management-led leveraged buyout (LBO); Moody’s Investors Service proposed a downgrade to Ba2 because the deal added about $7.1 billion of new debt, bringing Kinder Morgan’s total debt to $7.6 billion. Kinder Morgan is currently in the Fund’s benchmark Index, but the Fund was overweight in it versus the benchmark. Although Kinder Morgan’s bonds have not yet been downgraded, the bond market initially reacted negatively to the announcement of the LBO due to the potential increase in debt; the bonds have since rallied. When the bonds eventually are downgraded to Ba2, they will drop out of the Index.
During the coming months, when it becomes clear that the Fed has finished raising interest rates, we will likely continue to move back into intermediate bonds, because the yield curve typically stops flattening under these conditions. The Fund will endeavor to remain diversified to mitigate exposure to credit-specific risk.
We expect Treasuries to be somewhat more volatile due to uncertainty about whether or not inflation will slow enough for the Fed to find it unnecessary to continue raising the federal funds rate. We will attempt to maintain the Fund’s duration close to that of the benchmark Index.
Portfolio Managers:
Gary Davis, CFA and Mabel Brown, CFA
| | |
Fund Performance | | Gartmore Bond Fund |
Average Annual Total Return
(For periods ended October 31, 2006)
| | | | | | | | |
| | | | | 1 Yr. | | 5 Yr. | | 10 Yr. |
| Class A1 | | w/o SC2 | | 5.22% | | 4.75% | | 5.74% |
| | | w/SC3 | | 0.78% | | 3.84% | | 5.29% |
| Class B4 | | w/o SC2 | | 4.41% | | 4.08% | | 5.18% |
| | | w/SC5 | | –0.59% | | 3.73% | | 5.18% |
| Class C6 | | w/o SC2 | | 4.40% | | 4.06% | | 5.39% |
| | | w/SC7 | | 3.40% | | 4.06% | | 5.39% |
| Class D8 | | w/o SC2 | | 5.39% | | 5.02% | | 5.96% |
| | | w/SC9 | | 0.65% | | 4.06% | | 5.48% |
| Class R1,10 | | | | 4.88% | | 4.69% | | 5.80% |
| Class X1 | | w/o SC2 | | 4.57% | | 4.20% | | 5.33% |
| | | w/SC5 | | –0.43% | | 3.86% | | 5.33% |
| Class Y1 | | w/o SC2 | | 4.56% | | 4.19% | | 5.45% |
| | | w/SC7 | | 3.56% | | 4.19% | | 5.45% |
| Institutional Class1,10 | | | | 5.45% | | 5.04% | | 5.97% |
All figures showing the effect of a sales charge reflect the maximum charge possible, because it has the most dramatic effect on performance data.
| 1 | These returns through May 11, 1998 include performance of the Fund’s predecessor fund, and, for periods from May 11, 1998 to the creation of the class, include the performance of the Fund’s Class D shares. These returns were achieved prior to the creation of Class A and Class X shares (5/11/98), Class Y shares (3/1/01), Class R shares (10/1/03), and Intitutional Class shares (6/29/04) . Excluding the effect of any fee waivers or reimbursements, such prior performance is similar to what Class A, Class R, Class X Class Y and Institutional Class shares would have produced during those periods because all classes of the Fund’s shares invest in the same portfolio of securities. The performance for these classes has been restated to reflect differences in sales charges (where applicable), but does not reflect the differing levels of other fees (primarily Rule 12b-1 and/or administrative services fees) applicable to such classes. If these other fees were reflected, the performance for each of these classes of shares would have been lower. |
| 2 | These returns do not reflect the effects of sales charges (SC). |
| 3 | A 4.25% front-end sales charge was deducted. |
| 4 | These returns through May 11, 1998 include performance of the Fund’s predecessor fund, and for the period from May 11, 1998 to the creation of the Fund’s Class B shares on September 4, 2003, include the performance of the Fund’s Class X shares. Excluding the effect of any fee waivers or reimbursements, such prior performance is similar to what Class B shares would have produced during those periods because all classes of the Fund’s shares invest in the same portfolio of securities. The performance for these classes has been restated to reflect differences in sales charges (where applicable), but does not reflect the differing levels of other fees (primarily Rule 12b-1 and/or administrative services fees) applicable to such classes. If these other fees were reflected, the performance for the Class B shares would have been lower. |
| 5 | A 5.00% contingent deferred sales charge (CDSC) was deducted. The CDSC declines to 0% after 6 years. |
| 6 | These returns through May 11, 1998 include performance of the Fund’s predecessor fund, for the period from May 11, 1998 to March 1, 2001 include the performance of the Fund’s Class D shares and for the period from March 1, 2001 to the creation of the Fund’s Class C shares on September 4, 2003, include the performance of the Fund’s Class Y shares. Excluding the effect of any fee waivers or reimbursements, such prior performance is similar to what Class C shares would have produced during those periods because all classes of the Fund’s shares invest in the same portfolio of securities. The performance for these classes has been restated to reflect differences in sales charges (where applicable), but does not reflect the differing levels of other fees (primarily Rule 12b-1 and/or administrative services fees) applicable to such classes. If these other fees were reflected, the performance for Class C shares would have been lower. |
| 7 | A CDSC of 1.00% was deducted from the one year return because it is charged when you sell Class C or Class Y shares within the first year after purchase. |
| 8 | These returns through May 11, 1998 include the performance of the fund’s predecessor fund. |
| 9 | A 4.50% front-end sales charge was deducted. |
| 10 | Not subject to any sales charges. |
| | |
Fund Performance | | Gartmore Bond Fund |
Continued
Performance of a $10,000 Investment
Investment return and principal value will fluctuate, and when redeemed, shares may be worth more or less than original cost. Past performance is no guarantee of future results and does not reflect the deduction of taxes that a shareholder would pay on fund distributions or the redemption of fund shares. Investing in mutual funds involves market risk, including loss of principal. Performance returns assume the reinvestment of all distributions.
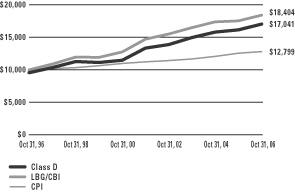
Comparative performance of $10,000 invested in Class D shares of the Gartmore Bond Fund, the Lehman Brothers Government/Credit Bond Index (LBG/CBI)(a), and the Consumer Price Index (CPI)(b) over a 10-year period ended 10/31/06. Unlike the Fund, the returns for these unmanaged indexes do not reflect any fees, expenses, or sales charges. Investors cannot invest directly in market indexes.
| (a) | The LBG/CBI is an unmanaged index of government and corporate bonds-gives a broad look at how the prices of U.S. government and corporate bonds have performed. |
| (b) | The CPI represents changes in prices of a basket of goods and services purchased for consumption by urban households. |
| | |
Shareholder Expense Example | | Gartmore Bond Fund |
As a shareholder of the Fund, you incur two types of costs: (1) transaction costs, including sales charges (loads) paid on purchase payments and redemption fees; and (2) ongoing costs, including investment advisory fees, administration fees, distribution fees and other Fund expenses. The examples below are intended to help you understand your ongoing costs (in dollars) of investing in the Fund and to compare these costs with the ongoing costs of investing in other mutual funds. Per SEC requirements, the examples assume that you had a $1,000 investment in the Class at the beginning of the reporting period, May 1, 2006 and continued to hold your shares at the end of the reporting period, October 31, 2006.
Actual Expenses
For each Class of the Fund in the table below, the first line provides information about actual account values and actual expenses. You may use the information in this line, together with the amount you invested, to estimate the expenses that you paid over the period. Simply divide your account value by $1,000 (for example, an $8,600 account value divided by $1,000 = 8.6), then multiply the result by the number in the first line of each Class under the heading entitled “Expenses Paid During Period” to estimate the expenses you paid on your account during the period.
Hypothetical Example for Comparison Purposes
The second line of each Class in the table below provides information about hypothetical account values and hypothetical expenses based on the Class’ actual expense ratio and an assumed rate of return of 5% per year before expenses, which is not the Class’ actual return. The hypothetical account values and expenses may not be used to estimate the actual ending account balance or expenses you paid for the period. You may use this information to compare the ongoing costs of investing in the Class of the Fund and other funds. To do so, compare this 5% hypothetical example with the 5% hypothetical examples that appear in the shareholder reports of the other funds.
Please note that the expenses shown in the table are meant to highlight your ongoing costs only and do not reflect any transaction costs, such as sales charges (loads) or redemption fees. Therefore, the second line for each Class in the table is useful in comparing ongoing costs only, and will not help you determine the relative total costs of owning different funds. In addition, if these transaction costs were included, your costs would have been higher. The examples also assume all dividends and distributions have been reinvested.
Schedule of Shareholder Expenses
Expense Analysis of a $1,000 Investment
(October 31, 2006)
| | | | | | | | | | | | | | |
| Bond Fund | | | | | Beginning
Account Value,
5/1/06 | | Ending
Account Value,
10/31/06 | | Expenses Paid
During Period* | | Annualized
Expense Ratio* |
| Class A | | Actual | | | $ | 1,000.00 | | $ | 1,048.20 | | $ | 5.47 | | 1.06% |
| | | Hypothetical | 1 | | $ | 1,000.00 | | $ | 1,019.66 | | $ | 5.41 | | 1.06% |
| Class B | | Actual | | | $ | 1,000.00 | | $ | 1,043.60 | | $ | 8.91 | | 1.73% |
| | | Hypothetical | 1 | | $ | 1,000.00 | | $ | 1,016.28 | | $ | 8.83 | | 1.73% |
| Class C | | Actual | | | $ | 1,000.00 | | $ | 1,043.50 | | $ | 8.91 | | 1.73% |
| | | Hypothetical | 1 | | $ | 1,000.00 | | $ | 1,016.28 | | $ | 8.83 | | 1.73% |
| Class D | | Actual | | | $ | 1,000.00 | | $ | 1,049.50 | | $ | 4.08 | | 0.79% |
| | | Hypothetical | 1 | | $ | 1,000.00 | | $ | 1,021.02 | | $ | 4.03 | | 0.79% |
| Class R | | Actual | | | $ | 1,000.00 | | $ | 1,046.10 | | $ | 6.34 | | 1.23% |
| | | Hypothetical | 1 | | $ | 1,000.00 | | $ | 1,018.80 | | $ | 6.28 | | 1.23% |
| Class X | | Actual | | | $ | 1,000.00 | | $ | 1,045.40 | | $ | 8.15 | | 1.58% |
| | | Hypothetical | 1 | | $ | 1,000.00 | | $ | 1,017.04 | | $ | 8.06 | | 1.58% |
| Class Y | | Actual | | | $ | 1,000.00 | | $ | 1,045.40 | | $ | 8.15 | | 1.58% |
| | | Hypothetical | 1 | | $ | 1,000.00 | | $ | 1,017.04 | | $ | 8.06 | | 1.58% |
| Institutional Class | | Actual | | | $ | 1,000.00 | | $ | 1,049.80 | | $ | 3.72 | | 0.72% |
| | | Hypothetical | 1 | | $ | 1,000.00 | | $ | 1,021.37 | | $ | 3.67 | | 0.72% |
| * | Expenses are equal to the Fund’s annualized expense ratio multiplied by the average account value over the period multiplied by 184/365 (to reflect the one-half year period). The expense ratio presented represents a six-month, annualized ratio in accordance with SEC guidelines. |
| 1 | Represents the hypothetical 5% return before expenses. |
| | |
Portfolio Summary | | Gartmore Bond Fund |
The SEC adopted a requirement that Funds present their portfolio holdings in a table, chart or graph format in their annual and semiannual reports to shareholders, whether or not a statement of investments is utilized. The following tables, which present portfolio holdings as a percentage of net assets, are provided in compliance with this requirement.
| | |
| Asset Allocation | | |
| Corporate Bonds | | 40.5% |
U.S. Government Sponsored & Agency Obligations | | 26.2% |
| Commercial Paper | | 12.3% |
| Asset-Backed Securities | | 9.8% |
| Commercial Mortgage-Backed Securities | | 8.2% |
| Taxable Municipal Bonds | | 1.3% |
| Principal Only Bond | | 1.1% |
| Other Investments* | | 3.4% |
| Liabilities in excess of other assets** | | -2.8% |
| | |
| | 100.0% |
| * | Includes value of collateral received from securities lending. |
| ** | Includes value of collateral owed from securities lending. |
| | |
| Top Industries | | |
| U.S. Treasury Notes | | 9.1% |
| Federal National Mortgage Association | | 7.7% |
| Commercial Services | | 7.3% |
| Financial Miscellaneous | | 6.2% |
| U.S. Treasury Bonds | | 6.0% |
| Oil & Gas | | 4.1% |
| Airlines | | 3.6% |
| Banks | | 3.3% |
| Federal Home Loan Mortgage Corporation | | 3.0% |
| Insurance | | 3.0% |
| Other Assets | | 46.7% |
| | |
| | 100.0% |
| | |
| Top Holdings | | |
| U.S. Treasury Bond, 5.50%, 08/15/28 | | 5.4% |
| U.S. Treasury Note, 5.13%, 06/30/11 | | 4.6% |
Preferred Receivable Funding Corporation,
5.30%, 11/01/06 | | 3.6% |
| Giro Funding U.S. Corp., 5.33%, 11/01/06 | | 3.6% |
Federal Home Loan Mortgage Corporation, 3.50%, 07/01/18 | | 3.0% |
Federal National Mortgage Association,
7.30%, 05/25/10 | | 2.9% |
| Carrera Capital Finance LLC, 5.27%, 11/03/06 | | 2.7% |
| Countrywide Home Loans, 5.45%, 11/01/06 | | 2.5% |
JP Morgan Chase Commercial Mortgage Securities, 6.26%, 03/15/33 | | 1.9% |
Federal National Mortgage Association,
6.62%, 06/01/16 | | 1.8% |
| Other Assets | | 68.0% |
| | |
| | 100.0% |
Gartmore Bond Fund
Statement of Investments
October 31, 2006
Asset-Backed Securities (9.8%)
| | | | | | |
| | | Principal
Amount | | Value |
| | | | | | |
American Home Mortgage Investment Trust, 4.82%, 10/25/34 | | $ | 1,000,000 | | $ | 969,459 |
Ameriquest Mortgage Securities, Inc., 7.14%, 02/25/33 | | | 225,453 | | | 224,602 |
Chase Funding Mortgage Loan, 6.24%, 01/25/13 | | | 1,203,182 | | | 1,208,571 |
Countrywide Home Loans, 5.50%, 08/25/35 | | | 1,000,000 | | | 993,277 |
Embarcadero Aircraft Securitization Trust, 5.80%, 08/15/25 (b) | | | 771,833 | | | 738,065 |
Enterprise Mortgage Acceptance Co., 6.63%, 01/15/25 | | | 933,341 | | | 845,635 |
Master Alternative Loans Trust, 5.50%, 12/25/35 | | | 1,000,000 | | | 986,109 |
Opteum Mortgage Acceptance Corp., 5.68%, 12/25/35 | | | 1,000,000 | | | 999,340 |
Residential Asset Mortgage Products, Inc., 2002-RSI-AI5, 5.91%, 01/25/32 | | | 974,518 | | | 970,699 |
Residential Funding Securities Corp. 2003-RM2-AI3, 4.50%, 05/25/33 | | | 1,000,000 | | | 964,814 |
Salomon Smith Barney Recreational Vehicle Trust, 6.30%, 04/15/16 | | | 1,000,000 | | | 1,001,155 |
Structured Asset Securities Corp., Series 2004-6XS, Class A6, 4.63%, 03/25/34 | | | 1,000,000 | | | 967,689 |
| | | | | | |
| | |
Total Asset-Backed Securities | | | | | | 10,869,415 |
| | | | | | |
|
Commercial Mortgage-Backed Securities (8.2%) |
Banks (0.9%) | | | | | | |
ABN Amro Mortgage Corp., Class A23, 5.50%, 06/25/33 | | | 1,000,000 | | | 990,355 |
| | | | | | |
Commercial Services (7.3%) | | | | | | |
Commercial Mortgage, Series 2001-J1A, Class B, 6.61%, 02/16/34, (b) | | | 1,000,000 | | | 1,053,049 |
Heller Financial Commercial Mortgage Asset, 6.85%, 05/15/31 | | | 1,926,314 | | | 1,979,387 |
JP Morgan Chase Commercial Mortgage Securities, 6.26%, 03/15/33 | | | 1,999,941 | | | 2,069,901 |
Commercial Mortgage-Backed Securities (continued)
| | | | | | |
| | | Principal
Amount | | Value |
| | | | | | |
Commercial Services (continued) | | | |
Merrill Lynch Mortgage Investors, Inc., 7.56%, 11/15/31 | | $ | 1,837,031 | | $ | 1,924,253 |
Nomura Asset Securities Corp., 6.69%, 03/15/30 | | | 1,000,000 | | | 1,065,183 |
| | | | | | |
| | | | | | 8,091,773 |
| | | | | | |
| |
Total Commercial Mortgage-Backed Securities | | | 9,082,128 |
| | | | | | |
|
Corporate Bonds (40.5%) |
Air Freight & Couriers (1.0%) | | | |
Federal Express Corp., 7.63%, 01/01/15 | | | 1,000,000 | | | 1,054,310 |
| | | | | | |
Airlines (3.6%) | | | | | | |
America West Airlines, Series A, 6.85%, 07/02/09 | | | 231,761 | | | 231,761 |
Continental Airlines, Inc., Class A-2, Series 98-3, 6.32%, 11/01/08 | | | 1,000,000 | | | 1,013,157 |
Northwest Airlines, Inc., 6.84%, 04/01/11 | | | 1,000,000 | | | 991,250 |
United Airlines, 6.93%, 09/01/11 | | | 1,000,000 | | | 1,095,000 |
United Airlines, 6.60%, 09/01/13 | | | 665,641 | | | 671,466 |
| | | | | | |
| | | | | | 4,002,634 |
| | | | | | |
Banks (2.4%) | | | |
Rabobank Cap III, 5.25%, 12/29/49 (b) | | | 1,000,000 | | | 970,995 |
Regions Financial Corp., 7.00%, 03/01/11 | | | 1,600,000 | | | 1,709,586 |
| | | | | | |
| | | | | | 2,680,581 |
| | | | | | |
Cars & Light Trucks (1.8%) | | | |
DaimlerChrysler, 7.30%, 01/15/12 | | | 1,000,000 | | | 1,067,041 |
Nissan Motor Acceptance, 4.63%, 03/08/10 (b) | | | 1,000,000 | | | 974,437 |
| | | | | | |
| | | | | | 2,041,478 |
| | | | | | |
Chemicals (0.9%) | | | |
Chemtura Corp., 6.88%, 06/01/16 | | | 1,000,000 | | | 977,500 |
| | | | | | |
Statement of Investments (Continued)
October 31, 2006
Gartmore Bond Fund (Continued)
Corporate Bonds (continued)
| | | | | | |
| | | Principal
Amount | | Value |
| | | | | | |
Computers (1.5%) | | | | | | |
Cisco Systems, Inc., 5.50%, 02/22/16 | | $ | 1,000,000 | | $ | 1,011,525 |
Digital Equipment Corp., 7.75%, 04/01/23 | | | 625,000 | | | 690,339 |
| | | | | | |
| | | | | | 1,701,864 |
| | | | | | |
Construction & Building Materials (0.5%) | | | |
Caterpillar, Inc., 9.38%, 08/15/11 | | | 500,000 | | | 586,870 |
| | | | | | |
Electric (0.9%) | | | |
MidAmerican Energy Holdings, 6.13%, 04/01/36 | | | 1,000,000 | | | 1,028,337 |
| | | | | | |
Financial Miscellaneous (6.2%) | | | |
Block Financial Corp., 8.50%, 04/15/07 | | | 1,000,000 | | | 1,012,182 |
Deluxe Corp., 3.50%, 10/01/07 | | | 1,000,000 | | | 975,000 |
Ford Motor Credit Co., 7.38%, 02/01/11 | | | 500,000 | | | 477,741 |
General Motors Acceptance Corp., 6.75%, 12/01/14 (c) | | | 500,000 | | | 495,718 |
John Deere Capital Corp., 4.50%, 08/25/08 | | | 1,000,000 | | | 987,703 |
Nuveen Investments, 5.50%, 09/15/15 | | | 1,000,000 | | | 978,677 |
OMX Timber Fin Inv LLC, Class A1, 5.42%, 01/29/20 (b) | | | 1,000,000 | | | 970,520 |
SLM Corp., 5.71%, 12/15/08 | | | 1,000,000 | | | 1,000,893 |
| | | | | | |
| | | | | | 6,898,434 |
| | | | | | |
Food & Related (1.6%) | | | |
Whitman Corp., 7.29%, 09/15/26 | | | 1,500,000 | | | 1,753,595 |
| | | | | | |
Hotels & Casinos (0.9%) | | | |
MGM Mirage, Inc., 6.75%, 08/01/07 | | | 1,000,000 | | | 1,005,000 |
| | | | | | |
Insurance (3.0%) | | | |
AMBAC, Inc., 9.38%, 08/01/11 | | | 1,000,000 | | | 1,167,346 |
Ohio Casualty Corp., 7.30%, 06/15/14 | | | 1,000,000 | | | 1,068,940 |
Oil Insurance Ltd., 7.56%, 12/29/49 (b) | | | 1,000,000 | | | 1,040,280 |
| | | | | | |
| | | | | | 3,276,566 |
| | | | | | |
Machinery & Capital Goods (1.1%) | | | |
Clark Equipment Co., 8.00%, 05/01/23 | | | 1,000,000 | | | 1,242,594 |
| | | | | | |
| | | | | | |
| | | Principal
Amount | | Value |
| | | | | | |
Medical Equipment & Supplies (1.9%) | | | |
Bard (C.R.), Inc., 6.70%, 12/01/26 | | $ | 1,000,000 | | $ | 1,077,643 |
Baxter Finco BV, 4.75%, 10/15/10 | | | 1,000,000 | | | 983,530 |
| | | | | | |
| | | | | | 2,061,173 |
| | | | | | |
Motor Vehicle Parts & Accessories (1.7%) | | | |
Eaton Corp., 8.88%, 06/15/19 | | | 1,500,000 | | | 1,916,340 |
| | | | | | |
Office Furniture (0.9%) | | | |
Herman Miller, Inc., 7.13%, 03/15/11 | | | 1,000,000 | | | 1,044,894 |
| | | | | | |
Oil & Gas (4.1%) | | | |
Energy Transfer Partners, 5.65%, 08/01/12 | | | 1,000,000 | | | 1,001,603 |
Kinder Morgan, Inc., 6.50%, 09/01/12 | | | 1,500,000 | | | 1,511,136 |
Pemex, 5.75%, 12/15/15 | | | 1,000,000 | | | 987,500 |
Premcor Refining Group, 9.25%, 02/01/10 | | | 1,000,000 | | | 1,055,005 |
| | | | | | |
| | | | | | 4,555,244 |
| | | | | | |
Paper & Allied Products (1.0%) | | | |
Stora Enso Oyj, 7.25%, 04/15/36 (b) | | | 1,000,000 | | | 1,047,691 |
| | | | | | |
Pharmaceuticals (0.9%) | | | |
Allergan, Inc., 5.75%, 04/01/16 (b) | | | 1,000,000 | | | 1,014,451 |
| | | | | | |
Telecommunications (1.9%) | | | |
TCI Communications, Inc., 9.80%, 02/01/12 | | | 1,000,000 | | | 1,182,451 |
U.S. West Communications, Inc., 6.88%, 09/15/33 | | | 1,000,000 | | | 936,250 |
| | | | | | |
| | | | | | 2,118,701 |
| | | | | | |
Utilities (2.7%) | | | |
Baltimore Gas & Electric, 7.50%, 01/15/07 | | | 1,200,000 | | | 1,204,461 |
Pacific Gas & Electric, 6.05%, 03/01/34 | | | 750,000 | | | 766,130 |
Southwestern Electric Power Co., 7.00%, 09/01/07 | | | 1,000,000 | | | 1,012,542 |
| | | | | | |
| | | | | | 2,983,133 |
| | | | | | |
| | |
Total Corporate Bonds | | | | | | 44,991,390 |
| | | | | | |
Principal Only Bond (1.1%)
| | | | | | |
| | | Principal
Amount | | Value |
| | | | | | |
U.S. Treasury STRIP (1.1%) | | | | | | |
8.75%, 08/15/20 (d) (e) | | $ | 2,500,000 | | $ | 1,289,383 |
| | | | | | |
| | |
Total Principal Only Bond | | | | | | 1,289,383 |
| | | | | | |
|
Taxable Municipal Bonds (1.3%) |
Iowa (0.9%) | | | |
Tobacco Settlement Authority, 6.50%, 06/01/23 | | | 985,000 | | | 988,033 |
| | | | | | |
Louisiana (0.4%) | | | |
Tobacco Settlement Financing Corp., 6.36%, 05/15/25 | | | 501,864 | | | 502,517 |
| | | | | | |
| | |
Total Taxable Municipal Bonds | | | | | | 1,490,550 |
| | | | | | |
|
U.S. Government Sponsored & Agency Obligations (26.2%) |
Federal Home Loan Mortgage Corporation (3.0%) | | | |
3.50%, 07/01/18, Gold Pool E01443 | | | 3,551,864 | | | 3,280,946 |
| | | | | | |
Federal National Mortgage Association (7.7%) | | | |
7.32%, 09/01/07,
Pool #323286 | | | 257,915 | | | 263,488 |
7.30%, 05/25/10,
Series 00-T5 | | | 3,000,000 | | | 3,230,087 |
6.62%, 06/01/16,
Pool #383661 | | | 1,873,039 | | | 2,044,795 |
5.00%, 04/01/19,
Pool #386905 | | | 965,942 | | | 949,248 |
6.85%, 05/17/20,
Series 97-M6 | | | 35,326 | | | 35,268 |
5.50%, 05/25/23,
Series 03-33 | | | 2,000,000 | | | 2,010,162 |
| | | | | | |
| | | | | | 8,533,048 |
| | | | | | |
Sovereign Agency (0.4%) | | | |
AID-Israel, 4.92%, 05/15/24 (d) (e) | | | 1,000,000 | | | 409,209 |
| | | | | | |
U.S. Government Sponsored & Agency Obligations (continued)
| | | | | | |
| | | Principal
Amount | | Value |
| | | | | | |
U.S. Treasury Bonds (6.0%) | | | |
5.50%, 08/15/28 (c) | | $ | 5,500,000 | | $ | 6,019,920 |
5.38%, 02/15/31 (c) | | | 685,000 | | | 743,707 |
| | | | | | |
| | | | | | 6,763,627 |
| | | | | | |
U.S. Treasury Notes (9.1%) | | | |
4.13%, 08/15/08 (c) | | | 1,000,000 | | | 990,820 |
4.88%, 05/31/11 | | | 1,000,000 | | | 1,012,188 |
5.13%, 06/30/11 | | | 5,000,000 | | | 5,113,085 |
4.88%, 07/31/11 (c) | | | 1,000,000 | | | 1,012,422 |
4.50%, 02/15/16 (c) | | | 2,000,000 | | | 1,984,218 |
| | | | | | |
| | |
Total Treasury Notes | | | | | | 10,112,733 |
| | | | | | |
| |
Total U.S. Government Sponsored & Agency Obligations | | | 29,099,563 |
| | | | | | |
|
Commercial Paper (12.3%) |
| | |
Carrera Capital Finance LLC, 5.27%, 11/03/06 (e) | | | 3,000,000 | | | 2,999,100 |
Countrywide Home Loans, 5.45%, 11/01/06 (e) | | | 2,735,000 | | | 2,735,000 |
Giro Funding U.S. Corp., 5.33%, 11/01/06 (b) (e) | | | 4,000,000 | | | 3,999,408 |
Preferred Receivable Funding Corp., 5.30%, 11/01/06 (b) (e) | | | 4,000,000 | | | 3,999,411 |
| | | | | | |
| | |
Total Commercial Paper | | | | | | 13,732,919 |
| | | | | | |
|
Short-Term Securities Held as Collateral for Securities on Loan (3.4%) |
| | |
Banc of America Securities LLC Repurchase Agreement, 5.32%, dated 10/31/06, due 11/01/06, repurchase price $3,724,506, collateralized by U.S. Government Agency Mortgages with a market value of $3,798,435 | | | 3,723,956 | | | 3,723,956 |
| | | | | | |
| |
Total Short-Term Securities Held as Collateral for Securities on Loan | | | 3,723,956 |
| | | | | | |
Statement of Investments (Continued)
October 31, 2006
Gartmore Bond Fund (Continued)
| | | | | | |
| | | | | Value | |
| | | | | | |
Total Investments
(Cost $111,247,100) (a) — 102.8% | | $ | 114,279,304 | |
| |
Liabilities in excess of other
assets — (2.8)% | | | (3,154,313 | ) |
| | | | | | |
| | |
NET ASSETS — 100.0% | | | | $ | 111,124,991 | |
| | | | | | |
| | (a) | See notes to financial statements for tax unrealized appreciation (depreciation) of securities. |
| | (b) | Rule 144A, Section 4(2) or other security, which is restricted as to resale to institutional investors. The security has been deemed liquid pursuant to procedures approved by the Board of Trustees. |
| | (c) | All of part of the security was on loan as of October 31, 2006. |
| | (d) | Denotes a non-income producing security. |
| | (e) | The rate reflected in the Statement of Investments is the effective yield as of October 31, 2006. |
See notes to financial statements.
Gartmore Enhanced Income Fund
(Formerly Gartmore Morley Enhanced Income Fund)
For the annual period ended Oct. 31, 2006, the Gartmore Enhanced Income Fund (Class A at NAV) returned 4.13% versus 4.49% for its benchmark, which is composed of 50% Merrill Lynch (ML) 6-Month Treasury Bill (T-Bill) Index and 50% ML 1-Year T-Bill Index. For broader comparison, the average return for the Fund’s Lipper peer category of Ultra-Short Obligations Funds (consisting of 80 funds as of Oct. 31, 2006) was 4.40%.
The Federal Open Market Committee (FOMC) raised the target federal funds rate by 25 basis points at each of its six meetings from October 2005 through June 2006. The FOMC policy action brought the rate to 5.25% from 3.75% at the beginning of the reporting period. The Federal Reserve Board held the federal funds rate steady at both third-quarter 2006 FOMC meetings as energy prices had declined and the housing market weakened. Core inflation measures trended higher during the reporting period, but a decline in commodities prices in the third quarter sparked a similar decline in headline inflation numbers, supporting the Federal Reserve’s decision to keep rates on hold after the June 2006 FOMC meeting.
Yields on short-maturity U.S. Treasuries rose in line with the Fed’s monetary tightening, while longer rates were flat to modestly higher during the reporting period. The yield curve (a plotted graph line of the yields [or interest rates] on long-term and short-term maturity bonds) consequently inverted as the yield spread between the 10-year Treasury note and the 3-month Treasury bill moved from positive 67 basis points at Oct. 31, 2005, to negative 47 basis points at Oct. 31, 2006. Long-maturity yields were supported by strong demand from overseas investors and pension fund hedging. Risk premiums in the spread sectors (non-Treasury fixed income sectors), held steady or tightened during the reporting period, leaving premiums at historically low levels. With the Fed near or at the end of its tightening cycle, volatility has remained extremely low, favorably affecting these sectors. Excess returns relative to Treasuries were positive in these sectors during the reporting period. The commercial mortgage-backed securities, asset-backed securities and credit sectors posted the strongest curve-adjusted performance, while Agency debentures and residential mortgage-backed securities posted weaker but still positive returns relative to Treasuries.
The Fund’s yield curve exposure from structured products, such as asset backed securities and collaterized mortgages, detracted from Fund performance because these types of longer maturities tend to underperform in a rising rate environment. In addition, due to a large outflow of $111 million, the Fund had limited cash to reinvest in higher coupon rate securities. The Fund maintained a high-quality focus because risk premiums for moving down in quality were at historically low levels. As of Oct. 31, 2006, the Fund comprised 85% AAA-rated securities, with the balance in AA-rated and A-rated issues. The continued drop in volatility gave lower-rated assets an advantage over higher-quality assets, which also detracted from Fund performance The Fund’s futures hedge was eliminated during the reporting period as we gradually covered the short position of 225 two-year Treasury note contracts in place at the beginning of the fiscal year. The hedge reduction was driven by the declining Fund size as well as the anticipated end to the Fed’s tightening cycle.
Until risk premiums widen to more attractive levels, we intend to maintain a higher quality/liquidity bias for the Fund, because the potential for return enhancement opportunities from spread compression are limited, given tight absolute spread levels. We have de-emphasized sectors most likely to underperform in a weakening economy, including lower-grade corporates.
Portfolio Manager:
Perpetua M. Phillips
| | |
Fund Performance | | Gartmore Enhanced Income Fund |
Average Annual Total Return
(For periods ended October 31, 2006)
| | | | | | | | |
| | | | | 1 Yr. | | 5 Yr. | | Inception1 |
| Class A | | w/o SC2 | | 4.15% | | 1.88% | | 2.41% |
| | | w/SC3 | | 1.45% | | 1.43% | | 2.07% |
| Class R4,5 | | | | 4.12% | | 1.85% | | 2.39% |
| Institutional Service Class4 | | 4.17% | | 1.96% | | 2.54% |
| Institutional Class4 | | 4.31% | | 2.22% | | 2.78% |
All figures showing the effect of a sales charge reflect the maximum charge possible, because it has the most dramatic effect on performance data.
| 1 | Fund commenced operations on December 29, 1999. |
| 2 | These returns do not reflect the effects of sales charges (SC). |
| 3 | A 2.25% front-end sales charge was deducted. |
| 4 | Not subject to any sales charges. |
| 5 | These returns until the creation of Class R shares (10/1/03) include the performance of the Fund’s Class A shares. Excluding the effects of any fee waivers or reimbursements, such prior performance is similar to what Class R shares would have produced because Class R shares invest in the same portfolio of securities as Class A shares. The performance for these classes has been restated to reflect the fact that Class R shares do not have any applicable sales charges, but does not reflect the differing levels of other fees (primarily Rule 12b-1 and/or administrative services fees) applicable to Class R shares; if these fees were reflected, the performance for Class R shares would have been lower. |
Performance of a $10,000 Investment
Investment return and principal value will fluctuate, and when redeemed, shares may be worth more or less than original cost. Past performance is no guarantee of future results and does not reflect the deduction of taxes that a shareholder would pay on fund distributions or the redemption of fund shares. Investing in mutual funds involves market risk, including loss of principal. Performance returns assume the reinvestment of all distributions.
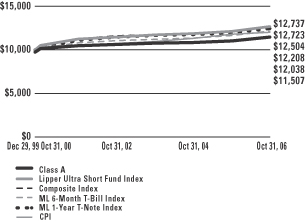
Comparative performance of $10,000 invested in Class A shares of the Gartmore Enhanced Income Fund, Lipper Ultra Short Fund Index (old)(a), Composite Index (new)(b), the Merrill Lynch 6-Month Treasury Bill Index (c), the Merrill Lynch 1-Year Treasury Note Index(d), and the Consumer Price Index (CPI)(e) since inception. Unlike the Fund, the returns for these unmanaged indexes do not reflect any fees, expenses, or sales charges. Investors cannot invest directly in market indexes.
| (a) | The Lipper Ultra-Short Bond Fund Index (old) consists of funds with at least 65% of their assets in investment-grade debt instruments and maintains a portfolio with average maturity between 91 and 365 days. |
| (b) | The Composite Index is composed of 50% Merrill Lynch (ML) 6-Month Treasury Bill (T-Bill) Index and 50% Merrill Lynch 1-Year Treasury Bill Index. |
| (c) | The Merrill Lynch 6-Month Treasury Bill Index comprises a single issue purchased at the beginning of a month and held for a full month. At the end of that month, that issue is sold and rolled into a newly selected issue. The issue selected at each month-end re-balancing is the outstanding T-Bill that matures closest to, but not beyond, six months from the re-balancing date. |
| | |
Fund Performance | | Gartmore Enhanced Income Fund |
| (d) | The Merrill Lynch 1-Year Treasury Note Index comprises a single issue purchased at the beginning of a month and held for a full month. At the end of that month, that issue is sold and rolled into a newly selected issue. The issue selected at each month-end re-balancing is the outstanding T-Note with the longest maturity. |
| (e) | The CPI represents changes in prices of a basket of goods and services purchased for consumption by urban households. |
| | |
Shareholder Expense Example | | Gartmore Enhanced Income Fund |
As a shareholder of the Fund, you incur two types of costs: (1) transaction costs, including sales charges (loads) paid on purchase payments and redemption fees; and (2) ongoing costs, including investment advisory fees, administration fees, distribution fees and other Fund expenses. The examples below are intended to help you understand your ongoing costs (in dollars) of investing in the Fund and to compare these costs with the ongoing costs of investing in other mutual funds. Per SEC requirements, the examples assume that you had a $1,000 investment in the Class at the beginning of the reporting period, May 1, 2006 and continued to hold your shares at the end of the reporting period, October 31, 2006.
Actual Expenses
For each Class of the Fund in the table below, the first line provides information about actual account values and actual expenses. You may use the information in this line, together with the amount you invested, to estimate the expenses that you paid over the period. Simply divide your account value by $1,000 (for example, an $8,600 account value divided by $1,000 = 8.6), then multiply the result by the number in the first line of each Class under the heading entitled “Expenses Paid During Period” to estimate the expenses you paid on your account during the period.
Hypothetical Example for Comparison Purposes
The second line of each Class in the table below provides information about hypothetical account values and hypothetical expenses based on the Class’ actual expense ratio and an assumed rate of return of 5% per year before expenses, which is not the Class’ actual return. The hypothetical account values and expenses may not be used to estimate the actual ending account balance or expenses you paid for the period. You may use this information to compare the ongoing costs of investing in the Class of the Fund and other funds. To do so, compare this 5% hypothetical example with the 5% hypothetical examples that appear in the shareholder reports of the other funds.
Please note that the expenses shown in the table are meant to highlight your ongoing costs only and do not reflect any transaction costs, such as sales charges (loads) or redemption fees. Therefore, the second line for each Class in the table is useful in comparing ongoing costs only, and will not help you determine the relative total costs of owning different funds. In addition, if these transaction costs were included, your costs would have been higher. The examples also assume all dividends and distributions have been reinvested.
Schedule of Shareholder Expenses
Expense Analysis of a $1,000 Investment
(October 31, 2006)
| | | | | | | | | | | | | | |
| Enhanced Income Fund | | | | | Beginning
Account Value,
5/1/06 | | Ending
Account Value,
10/31/06 | | Expenses Paid
During Period* | | Annualized
Expense Ratio* |
| Class A | | Actual | | | $ | 1,000.00 | | $ | 1,019.22 | | $ | 3.62 | | 0.71% |
| | | Hypothetical | 1 | | $ | 1,000.00 | | $ | 1,021.42 | | $ | 3.62 | | 0.71% |
| Class R | | Actual | | | $ | 1,000.00 | | $ | 1,019.77 | | $ | 3.88 | | 0.76% |
| | | Hypothetical | 1 | | $ | 1,000.00 | | $ | 1,021.17 | | $ | 3.88 | | 0.76% |
| Institutional Service Class | | Actual | | | $ | 1,000.00 | | $ | 1,020.37 | | $ | 3.57 | | 0.70% |
| | | Hypothetical | 1 | | $ | 1,000.00 | | $ | 1,021.47 | | $ | 3.57 | | 0.70% |
| Institutional Class | | Actual | | | $ | 1,000.00 | | $ | 1,021.83 | | $ | 2.30 | | 0.45% |
| | | Hypothetical | 1 | | $ | 1,000.00 | | $ | 1,022.73 | | $ | 2.30 | | 0.45% |
| * | Expenses are equal to the Fund’s annualized expense ratio multiplied by the average account value over the period multiplied by 184/365 (to reflect the one-half year period). The expense ratio presented represents a six-month, annualized ratio in accordance with SEC guidelines. |
| 1 | Represents the hypothetical 5% return before expenses. |
| | |
Portfolio Summary | | Gartmore Enhanced Income Fund |
October 31, 2006
The SEC adopted a requirement that Funds present their portfolio holdings in a table, chart or graph format in their annual and semiannual reports to shareholders, whether or not a statement of investments is utilized. The following tables, which present portfolio holdings as a percentage of net assets, are provided in compliance with this requirement.
| | |
| Asset Allocation | | |
Asset-Backed Securities | | 52.1% |
Commercial Mortgage-Backed Securities | | 20.4% |
Corporate Bonds | | 15.6% |
Collaterized Mortgage Obligations | | 6.2% |
Repurchase Agreements | | 2.6% |
U.S. Treasury Notes | | 2.3% |
U.S. Government Agencies—Mortgages | | 0.8% |
Other Investments* | | 3.2% |
| Liabilities in excess of other assets** | | -3.2% |
| | |
| | 100.0% |
| | |
| Top Industries | | |
Auto Loans | | 21.7% |
Credit Cards | | 15.9% |
Financial Services | | 15.6% |
Mortgage-Backed | | 9.2% |
Federal Home Loan Mortgage Corporation | | 4.1% |
Equipment | | 2.9% |
Rate Reduction Bonds | | 2.0% |
Federal National Mortgage Association | | 1.4% |
Government National Mortgage Association | | 1.2% |
Federal National Mortgage Association | | 0.7% |
| Other Assets | | 25.3% |
| | |
| | 100.0% |
| | |
| Top Holdings*** | | |
Discover Card Master Trust I, 5.15%, 10/15/09 | | 2.1% |
Citibank Credit Card Issuance Trust, 4.95%, 02/09/09 | | 2.0% |
Morgan Stanley, 5.80%, 04/01/07 | | 2.0% |
Daimler Chrysler Auto Trust, Series 2004-A, Class A4, 2.58%, 04/08/09 | | 1.9% |
MBNA Corp., 5.63%, 11/30/07 | | 1.9% |
USAA Auto Owner Trust, Series, 5.31%, 03/16/09 | | 1.8% |
AIG SunAmerica Global Finance XII, 5.30%, 05/30/07 | | 1.8% |
LB-UBS Commercial Mortgage Trust, 4.90%, 06/15/26 | | 1.8% |
Americredit Automobile Receivables Trust, 4.47%, 05/06/10 | | 1.8% |
Citibank Credit Card Issuance Trust, 2.55%, 01/20/09 | | 1.8% |
| Other Assets | | 81.1% |
| | |
| | 100.0% |
| * | Includes value of collateral received from securities lending. |
| ** | Includes value of collateral owed from securities lending. |
| *** | For purpose of listing top holdings, repurchase agreements are considered cash equivalents and are included as part of Other Assets. |
Statement of Investments
October 31, 2006
Gartmore Enhanced Income Fund
Asset-Backed Securities (52.1%)
| | | | | | |
| | | Principal
Amount | | Value |
| | | | | | |
Agency Wrapped (0.4%) | | | |
Federal Home Loan Mortgage Corporation | | | |
Series T-50, Class A7, 3.55%, 10/27/31 | | $ | 2,000,000 | | $ | 1,929,294 |
| | | | | | |
Auto Loans (21.7%) | | | |
Americredit Automobile Receivables Trust, 3.10%, 11/06/09 | | | 2,260,998 | | | 2,245,670 |
Americredit Automobile Receivables Trust, 2.72%, 01/06/10 | | | 2,500,556 | | | 2,473,886 |
Americredit Automobile Receivables Trust, Series 2005-CF, Class A3, 4.47%, 05/06/10 | | | 8,000,000 | | | 7,955,062 |
BMW Vehicle Owner Trust, 2.67%, 03/25/08 | | | 463,931 | | | 462,376 |
BMW Vehicle Owner Trust, 4.04%, 02/25/09 | | | 4,341,265 | | | 4,315,253 |
Capital Auto Receivables Asset Trust, Series 2003-3, Class A4A, 3.40%, 08/15/08 | | | 7,400,000 | | | 7,313,809 |
Capital One Auto Finance Trust, 2.96%, 04/15/09 | | | 1,696,421 | | | 1,691,121 |
Capital One Auto Finance Trust, 3.44%, 06/15/09 | | | 1,865,410 | | | 1,854,358 |
DaimlerChrysler Auto Trust, Series 2004-A, Class A4, 2.58%, 04/08/09 | | | 8,400,000 | | | 8,282,839 |
Ford Credit Auto Owner Trust, 3.48%, 11/15/08 | | | 3,077,809 | | | 3,054,965 |
Honda Auto Receivables Owner Trust, Series 2004-3, Class A3, 2.91%, 10/20/08 | | | 3,094,396 | | | 3,059,097 |
Honda Auto Receivables Owner Trust, Series 2003-3, Class A4, 2.77%, 11/21/08 | | | 1,966,669 | | | 1,953,180 |
Household Automotive Trust, 4.80%, 10/18/10 | | | 7,000,000 | | | 6,968,730 |
Nissan Auto Receivables Owner Trust, Series 2004-B, Class A3, 3.35%, 05/15/08 | | | 2,962,367 | | | 2,940,916 |
Nissan Auto Receivables Owner Trust, Series 2006-B, Class A2, 5.18%, 08/15/08 | | | 5,000,000 | | | 4,995,857 |
| | | | | | |
| | | Principal
Amount | | Value |
| | | | | | |
Auto Loans (continued) | | | |
Onyx Acceptance Auto Trust, 2.94%, 12/15/10 | | $ | 4,359,421 | | $ | 4,300,733 |
USAA Auto Owner Trust, Series 2005-3 Class A2, 4.52%, 06/16/08 | | | 4,774,771 | | | 4,763,136 |
USAA Auto Owner Trust, Series 2004-3, Class A3, 3.16%, 02/17/09 | | | 4,216,923 | | | 4,182,111 |
USAA Auto Owner Trust, Series 2006-2, Class A2, 5.31%, 03/16/09 | | | 8,000,000 | | | 7,999,510 |
WFS Financial Owner Trust, 2.74%, 09/20/10 | | | 2,256,661 | | | 2,249,277 |
WFS Financial Owner Trust, 2.41%, 12/20/10 | | | 2,964,998 | | | 2,934,757 |
WFS Financial Owner Trust, 4.39%, 11/19/12 | | | 4,963,000 | | | 4,913,500 |
World Omni Auto Receivables Trust, 4.30%, 03/20/08 | | | 1,439,885 | | | 1,437,467 |
World Omni Auto Receivables Trust, 3.29%, 11/12/08 | | | 2,904,634 | | | 2,888,309 |
| | | | | | |
| | | | | | 95,235,919 |
| | | | | | |
Credit Cards (15.9%) | | | |
Bank One Issuance Trust, Series 2002-A3, Class A3, 3.59%, 05/17/10 | | | 6,050,000 | | | 5,961,766 |
Bank One Issuance Trust, Series 2003-A7, Class A7, 3.35%, 03/15/11 | | | 5,000,000 | | | 4,872,324 |
Chase Credit Card Master Trust, Series 2001-6, Class A, 5.45%, 03/16/09 (b) | | | 4,000,000 | | | 3,999,946 |
Chase Credit Card Issuance Trust, Series 2004-A9, Class A9, 3.22%, 06/15/10 | | | 6,825,000 | | | 6,699,907 |
Citibank Credit Card Issuance Trust, Series 2004-A1, Class A1, 2.55%, 01/20/09 | | | 8,000,000 | | | 7,951,619 |
Citibank Credit Card Issuance Trust, Series 2002-A1, Class A1, 4.95%, 02/09/09 | | | 8,890,000 | | | 8,879,778 |
Asset-Backed Securities (continued)
| | | | | | |
| | | Principal
Amount | | Value |
| | | | | | |
Credit Cards (continued) | | | |
Citibank Credit Card Issuance Trust, Series 2004-A4, Class A4, 3.20%, 08/24/09 | | $ | 8,000,000 | | $ | 7,867,986 |
Discover Card Master Trust I, Series 2002-2, Class A, 5.15%, 10/15/09 | | | 9,000,000 | | | 8,995,231 |
MBNA Credit Card Master Note Trust, 4.95%, 06/15/09 | | | 6,700,000 | | | 6,696,501 |
MBNA Credit Card Master Note Trust, 2.70%, 09/15/09 | | | 8,000,000 | | | 7,909,498 |
| | | | | | |
| | | | | | 69,834,556 |
| | | | | | |
Equipment (2.9%) | | | |
Caterpillar Financial Asset Trust, Series 2004-A, Class A3, 3.13%, 01/26/09 | | | 2,176,072 | | | 2,154,457 |
CIT Equipment Collateral, Series 2005-EF1, Class A2, 4.30%, 12/20/07 | | | 1,159,348 | | | 1,157,460 |
CIT Equipment Collateral, Series 2006-VT1, Class A2, 5.13%, 03/20/08 | | | 5,000,000 | | | 4,988,973 |
John Deere Owner Trust, 3.98%, 06/15/09 | | | 3,995,000 | | | 3,955,754 |
MBNA Practice Solutions Owner Trust, 2005-2, Class A1, 3.93%, 01/15/08 | | | 486,268 | | | 485,648 |
| | | | | | |
| | | | | | 12,742,292 |
| | | | | | |
Mortgage-Backed (9.2%) | | | |
Centex Home Equity, 4.20%, 06/25/35 | | | 190,547 | | | 189,842 |
Centex Home Equity, 5.04%, 10/25/35 | | | 2,084,565 | | | 2,074,556 |
Chase Funding Mortgage Loan, 2.98%, 04/25/26 | | | 1,205,472 | | | 1,195,275 |
Chase Funding Mortgage Loan, 3.34%, 05/25/26 | | | 3,426,730 | | | 3,367,168 |
Chase Funding Mortgage Loan, 4.21%, 09/25/26 | | | 3,508,094 | | | 3,486,113 |
| | | | | | |
| | | Principal
Amount | | Value |
| | | | | | |
Mortgage-Backed (continued) | | | |
Chase Funding Mortgage Loan, 3.30%, 11/25/29 | | $ | 3,347,337 | | $ | 3,296,180 |
Citigroup Residential Mortgage Securities, Series 2006-1, Class A1, 5.96%, 07/25/36 | | | 4,778,949 | | | 4,780,848 |
Countrywide Asset-Backed Certificates, 4.32%, 11/25/35 | | | 108,580 | | | 108,159 |
Countrywide Asset-Backed Certificates, 4.37%, 11/25/35 | | | 8,000,000 | | | 7,916,783 |
Popular ABS Mortgage Pass-Through Trust, 5.46%, 09/25/35 (b) | | | 2,162,275 | | | 2,163,122 |
Popular ABS Mortgage Pass-Through Trust, 5.45%, 11/25/35 (b) | | | 2,652,822 | | | 2,653,504 |
Popular ABS Mortgage Pass-Through Trust, 5.36%, 01/25/36 | | | 4,074,539 | | | 4,052,834 |
Residential Asset Mortgage Products, Inc., 3.35%, 08/25/29 | | | 81,948 | | | 81,628 |
Residential Asset Mortgage Products, Inc., 5.00%, 03/25/31 | | | 1,393,779 | | | 1,386,892 |
Residential Funding Mortgage Securities I, Series 2003-S11, Class A1, 2.50%, 06/25/18 | | | 1,408,577 | | | 1,347,944 |
Residential Funding Mortgage Securities I, Series 2004-HS1, Class AI3, 2.68%, 01/25/19 | | | 2,056,710 | | | 2,025,929 |
| | | | | | |
| | | | | | 40,126,777 |
| | | | | | |
Rate Reduction Bonds (2.0%) | | | |
Massachusetts RRB Special Purpose Trust, Series 1999-1, Class A4, 6.91%, 09/15/09 | | | 3,608,933 | | | 3,640,167 |
Public Service New Hampshire Funding LLC, Series 2001-1 Class A2, 5.73%, 11/01/10 | | | 4,956,714 | | | 4,983,234 |
| | | | | | |
| | | | | | 8,623,401 |
| | | | | | |
| | |
Total Asset-Backed Securities | | | | | | 228,492,239 |
| | | | | | |
Statement of Investments (Continued)
October 31, 2006
Gartmore Enhanced Income Fund (Continued)
Commercial Mortgare-Backed Securities (20.4%)
| | | | | | |
| | | Principal
Amount | | Value |
| | | | | | |
Asset Securitization Corp., 7.40%, 10/13/26 | | $ | 929,398 | | $ | 957,582 |
Banc of America Commercial Mortgage, Inc., Series 2004-3, Class A1, 2.98%, 06/10/39 | | | 372,862 | | | 372,241 |
Banc of America Commercial Mortgage, Inc., Series 2005-1, Class A1, 4.36%, 11/10/42 | | | 3,188,702 | | | 3,165,623 |
Banc of America Commercial Mortgage, Inc., Series 2005-2, Class A1, 4.04%, 07/10/43 | | | 5,226,698 | | | 5,179,885 |
Bear Stearns Commercial Mortgage Securities, Inc., Series 2001-TOP2, Class A1, 6.08%, 02/15/35 | | | 958,300 | | | 974,148 |
Citigroup Commercial Mortgage Trust, Series 2004-C2, Class A1, 3.79%, 10/15/41 | | | 6,464,158 | | | 6,335,686 |
Commercial Mortgage Asset Trust, 6.59%, 01/17/32 | | | 1,755,893 | | | 1,757,456 |
Commercial Mortgage Pass-Through Certificates, Series 1999-1, Class A2, 6.46%, 05/15/32 | | | 4,891,749 | | | 4,972,062 |
CS First Boston Mortgage Securities Corp., 2.61%, 08/15/36 | | | 1,376,441 | | | 1,346,325 |
CS First Boston Mortgage Securities Corp., 2.08%, 05/15/38 | | | 4,670,521 | | | 4,539,534 |
GE Capital Commercial Mortgage Corp., Series 2003-C1, Class A1, 3.09%, 01/10/38 | | | 6,528,972 | | | 6,378,568 |
GMAC Commercial Mortgage Securities, Inc., 3.11%, 12/10/41 | | | 259,034 | | | 258,616 |
GS Mortgage Securities Corp. II, Series 2004-GG2, Class A1, 3.11%, 08/10/38 | | | 122,654 | | | 122,464 |
JP Morgan Chase Commercial Mortgage Securities Corp., Series 2004-PNC1, Class A1, 2.80%, 06/12/41 | | | 5,395,892 | | | 5,249,384 |
LB-UBS Commercial Mortgage Trust, Series 2000-C5, Class A1, 6.41%, 12/15/19 | | | 6,741,651 | | | 6,788,582 |
| | | | | | |
| | | Principal
Amount | | Value |
| | | | | | |
LB-UBS Commercial Mortgage Trust, Series 2001-C7, Class A2, 5.53%, 12/15/25 | | $ | 2,810,452 | | $ | 2,817,023 |
LB-UBS Commercial Mortgage Trust, Series 2002-C1, Class A2, 5.97%, 03/15/26 | | | 5,746,406 | | | 5,759,651 |
LB-UBS Commercial Mortgage Trust, Series 2002-C2, Class A2, 4.90%, 06/15/26 | | | 8,000,000 | | | 7,964,895 |
LB-UBS Commercial Mortgage Trust, Series 2002-C7, Class A1, 3.17%, 12/15/26 | | | 718,348 | | | 707,568 |
LB-UBS Commercial Mortgage Trust, 3.90%, 12/15/26 | | | 4,035,000 | | | 3,976,121 |
LB-UBS Commercial Mortgage Trust, Series 2003-C1, Class A1, 2.72%, 03/15/27 | | | 4,152,064 | | | 4,051,172 |
Morgan Stanley Dean Witter Capital I, Series 2001-TOP1, Class A3, 6.46%, 02/15/33 | | | 1,451,314 | | | 1,460,022 |
Morgan Stanley Dean Witter Capital I, Series 2001-TOP5, Class A2, 5.90%, 10/15/35 | | | 2,225,121 | | | 2,223,708 |
Morgan Stanley Dean Witter Capital I, Series 2003-T11, Class A1, 3.26%, 06/13/41 | | | 1,897,125 | | | 1,850,864 |
Morgan Stanley Dean Witter Capital I, Series 2005-T17, Class A1, 3.39%, 12/13/41 | | | 333,377 | | | 332,285 |
Nomura Asset Securities Corp., 6.59%, 03/15/30 | | | 6,987,429 | | | 7,094,346 |
Wachovia Bank Commercial Mortgage Trust, 3.00%, 11/15/34 | | | 2,859,222 | | | 2,830,173 |
| | | | | | |
| |
Total Commercial Mortgage-Backed Securities | | | 89,465,984 |
| | | | | | |
|
Corporate Bonds (15.6%) |
Financial Services (15.6%) | | | | | | |
AIG SunAmerica Global Finance XII, 5.30%, 05/30/07 (d) | | | 8,000,000 | | | 7,995,584 |
Bank of America Corp., 5.25%, 02/01/07 | | | 7,000,000 | | | 6,996,227 |
Corporate Bonds (continued)
| | | | | | |
| | | Principal
Amount | | Value |
| | | | | | |
Financial Services (continued) | | | | | | |
Bear Stearns Co., Inc., 5.70%, 01/15/07 | | $ | 4,000,000 | | $ | 4,001,280 |
Caterpillar Financial Service Corp., 2.63%, 01/30/07 | | | 5,000,000 | | | 4,967,540 |
General Electric Capital Corp., 7.88%, 12/01/06 (c) | | | 4,000,000 | | | 4,007,880 |
Goldman Sachs Group, Inc., 4.13%, 01/15/08 (c) | | | 8,000,000 | | | 7,897,376 |
MBNA Corp., 5.63%, 11/30/07 | | | 8,100,000 | | | 8,124,794 |
Merrill Lynch & Co., 3.00%, 04/30/07 | | | 5,000,000 | | | 4,943,440 |
Morgan Stanley, 5.80%, 04/01/07 (c) | | | 8,675,000 | | | 8,685,532 |
US Bank NA, 2.85%, 11/15/06 | | | 6,000,000 | | | 5,994,846 |
Wachovia Corp., 4.95%, 11/01/06 | | | 5,000,000 | | | 5,000,000 |
| | | | | | |
| | |
Total Corporate Bonds | | | | | | 68,614,499 |
| | | | | | |
|
Collateralized Mortgage Obligations (6.2%) |
Federal Home Loan Mortgage Corporation (3.6%) | | | |
Series 2611, Class KC, 3.50%, 01/15/17 | | | 1,461,648 | | | 1,406,541 |
Series 2691, Class MA, 4.00%, 01/15/18 | | | 404,011 | | | 402,586 |
Series 2664, Class GA, 4.50%, 01/15/18 | | | 1,564,317 | | | 1,536,427 |
Series 2700, Class PA, 4.50%, 04/15/18 | | | 442,611 | | | 441,155 |
Series 2613, Class PA, 3.25%, 05/15/18 | | | 1,581,495 | | | 1,473,449 |
Series 2630, Class JA, 3.00%, 06/15/18 | | | 1,557,079 | | | 1,485,497 |
Series 2928, Class NA, 5.00%, 11/15/19 | | | 4,537,094 | | | 4,515,263 |
Series 2682, Class XK, 3.00%, 01/15/21 | | | 3,059,805 | | | 3,013,183 |
Series 2726, Class AC, 3.75%, 09/15/22 | | | 1,625,554 | | | 1,606,629 |
| | | | | | |
| | | | | | 15,880,730 |
| | | | | | |
Federal National Mortgage Association (1.4%) | | | |
Series 2004-34, Class PL, 3.50%, 05/25/14 | | | 3,004,010 | | | 2,936,004 |
Series 2003-61, Class HK, 3.00%, 12/25/17 | | | 120,622 | | | 120,165 |
Series 2003-57, Class NB, 3.00%, 06/25/18 | | | 1,361,497 | | | 1,274,875 |
Collateralized Mortgage Obligations (continued)
| | | | | | |
| | | Principal
Amount | | Value |
| | | | | | |
Federal National Mortgage Association (continued) |
Series 2003-75, Class NB, 3.25%, 08/25/18 | | $ | 1,069,452 | | $ | 1,022,831 |
Series 2003-14, Class AN, 3.50%, 03/25/33 | | | 935,860 | | | 878,314 |
| | | | | | |
| | | | | | 6,232,189 |
| | | | | | |
Government National Mortgage Association (1.2%) | | | |
Series 2004-103, Class A, 3.88%, 12/16/19 | | | 5,154,494 | | | 5,045,450 |
| | | | | | |
| |
Total Collateralized Mortgage Obligations | | | 27,158,369 |
| | | | | | |
|
U.S. Treasury Notes (2.3%) |
| | |
4.88%, 08/31/08 (c) | | | 5,000,000 | | | 5,012,305 |
4.63%, 09/30/08 (c) | | | 5,000,000 | | | 4,991,990 |
| | | | | | |
| | |
Total U.S. Treasury Notes | | | | | | 10,004,295 |
| | | | | | |
|
U.S. Government Agencies — Mortgages (0.8%) |
Federal Home Loan Mortgage Corporation (0.1%) | | | |
Pool #E00678,
6.50%, 06/01/14 | | | 186,843 | | | 190,712 |
Pool #E00991,
6.00%, 07/01/16 | | | 231,695 | | | 235,211 |
| | | | | | |
| | | | | | 425,923 |
| | | | | | |
Federal National Mortgage Association (0.7%) | | | |
Pool #190255,
6.50%, 02/01/09 | | | 95,771 | | | 96,039 |
Pool #254256,
5.50%, 04/01/09 | | | 68,518 | | | 68,695 |
Pool #253845,
6.00%, 06/01/16 | | | 292,277 | | | 297,106 |
Pool #254089,
6.00%, 12/01/16 | | | 439,078 | | | 446,332 |
Pool #545415,
6.00%, 01/01/17 | | | 391,405 | | | 397,872 |
Pool #625178,
5.50%, 02/01/17 | | | 853,965 | | | 857,213 |
Pool #254195,
5.50%, 02/01/17 | | | 913,138 | | | 916,611 |
| | | | | | |
| | | | | | 3,079,868 |
| | | | | | |
| |
Total U.S. Government Agencies — Mortgages | | | 3,505,791 |
| | | | | | |
Statement of Investments (Continued)
October 31, 2006
Gartmore Enhanced Income Fund (Continued)
Repurchase Agreements (2.6%)
| | | | | | |
| | | Principal
Amount | | Value |
| | | | | | |
CS First Boston, 5.17%, dated 10/31/06, due 11/01/06, repurchase price $5,778,105, collateralized by U.S. Government Agency Mortgages with a market value of $5,892,830 | | $ | 5,777,275 | | $ | 5,777,275 |
Nomura Securities, 5.17%, dated 10/31/06, due 11/01/06, repurchase price $5,516,768, collateralized by U.S. Government Agency Mortgages with a market value of $5,626,305 | | | 5,515,976 | | | 5,515,976 |
| | | | | | |
| | |
Total Repurchase Agreements | | | | | | 11,293,251 |
| | | | | | |
|
Short-Term Securities Held as Collateral For Securities on Loan (6.7%) |
Banc of America Securities LLC Repurchase Agreement, 5.32%, dated 10/31/06, due 11/01/06, repurchase price $14,036,470, collateralized by U.S. Government Agency Mortgages with a market value of $14,315,084 | | | 14,034,396 | | | 14,034,396 |
| | | | | | |
| |
Total Short-Term Securities Held as Collateral for Securities on Loan | | | 14,034,396 |
| | | | | | |
| | | | | | |
| |
Total Investments
(Cost $453,953,014) (a) — 103.2% | | | 452,568,824 | |
| |
Liabilities in excess of other
assets — (3.2%) | | | (13,934,303 | ) |
| | | | | | |
| | |
NET ASSETS — 100.0% | | | | $ | 438,634,521 | |
| | | | | | |
| | (a) | See notes to financial statements for tax unrealized appreciation (depreciation) of securities. |
| | (b) | Variable Rate Security. The rate reflected in the Statement of Investments is the rate in effect on October 31, 2006. The maturity date represents the actual maturity date. |
| | (c) | All or part of the security was on loan as of October 31, 2006. |
| | (d) | Represents a restricted security acquired and eligible for resale under Rule 144A, which limits the resale to certain qualified buyers. These securities were deemed liquid pursuant to procedures approved by the Board of Trustees. |
See notes to financial statements.
Gartmore Government Bond Fund
For the annual period ended Oct. 31, 2006, the Gartmore Government Bond Fund (Class A at NAV) returned 4.25% versus 4.59% for its benchmark, the Merrill Lynch Government Master Index. For broader comparison, the average return for the Fund’s Lipper peer category of Intermediate U.S. Government Funds (consisting of 79 funds as of Oct. 31, 2006) was 4.12%.
The fixed-income markets experienced a challenging environment during the reporting period as the Federal Reserve Board increased the federal funds rate to 5.25%. Longer-term rates rose in sympathy, with the two-year Treasury rising 47 basis points and the 10-year Treasury rising 14 basis points. This flattening of the yield curve (a plotted graph line of the yields [or interest rates] on long-term and short-term maturity bonds) resulted in longer-maturity bonds producing better returns than shorter-maturity bonds.
To attempt to capture the expected flattening of the yield curve, the Fund was positioned with an emphasis on bonds with maturities of less than four years as well as bonds with maturities of 10 or more years. With intermediate-maturity bonds outperforming bonds with less than four years to maturity, this underweighting hurt Fund performance relative to the Index.
Positive contributors to Fund performance included bonds that were part of the Fund’s emphasis on overweighting mortgage-backed issues and Agency notes at the expense of Treasury securities.
Since the Federal Reserve paused in its tightening campaign, interest rates have fallen somewhat and are expected to be range-bound during the next three to six months. This environment should be positive for non-Treasury fixed-income sectors, and we will emphasize mortgage-backed and callable Agencies at the expense of Treasury holdings. We anticipate that the Fed may lower rates in the first half of 2007, and we will begin to position the Fund with an increase in intermediate bonds, which should benefit in such an environment.
Portfolio Manager:
Gary Hunt
| | |
Fund Performance | | Gartmore Government Bond Fund |
Average Annual Total Return
(For periods ended October 31, 2006)
| | | | | | | | |
| | | | | 1 Yr. | | 5 Yr. | | 10 Yr. |
| Class A1 | | w/o SC2 | | 4.25% | | 3.61% | | 5.64% |
| | | w/SC3 | | –0.17% | | 2.70% | | 5.18% |
| Class B4 | | w/o SC2 | | 3.61% | | 3.04% | | 5.12% |
| | | w/SC5 | | –1.39% | | 2.71% | | 5.12% |
| Class C6 | | w/o SC2 | | 3.69% | | 3.04% | | 5.31% |
| | | w/SC7 | | 2.69% | | 3.04% | | 5.31% |
| Class D8 | | w/o SC2 | | 4.55% | | 3.88% | | 5.87% |
| | | w/SC9 | | –0.16% | | 2.92% | | 5.39% |
| Class R1,10 | | | | 4.35% | | 3.65% | | 5.75% |
| Class X1 | | w/o SC2 | | 3.77% | | 3.12% | | 5.23% |
| | | w/SC5 | | –1.23% | | 2.79% | | 5.23% |
| Class Y1 | | w/o SC2 | | 3.77% | | 3.12% | | 5.35% |
| | | w/SC7 | | 2.77% | | 3.12% | | 5.35% |
| Institutional Class1,10 | | 4.68% | | 3.92% | | 5.89% |
All figures showing the effect of a sales charge reflect the maximum charge possible, because it has the most dramatic effect on performance data.
| 1 | These returns through May 11, 1998 include performance of the Fund’s predecessor fund, and, for periods from May 11, 1998 to the creation of the class, include the performance of the Fund’s Class D shares. These returns were achieved prior to the creation of Class A and Class X shares (5/11/98), Class Y shares (3/1/01),Class R shares (10/1/03), and Institutional Class shares (6/29/04). Excluding the effect of any fee waivers or reimbursements, such prior performance is similar to what Class A, Class R, Class X, Class Y and Institutional Class shares would have produced during those periods because all classes of the Fund’s shares invest in the same portfolio of securities. The performance for these classes has been restated to reflect differences in sales charges (where applicable), but does not reflect the differing levels of other fees (primarily Rule 12b-1 and/or administrative services fees) applicable to such classes. If these other fees were reflected, the performance for each of these classes of shares would have been lower. |
| 2 | These returns do not reflect the effects of sales charges (SC). |
| 3 | A 4.25% front-end sales charge was deducted. |
| 4 | These returns through May 11, 1998 include performance of the Fund’s predecessor fund, and for the period from May 11, 1998 to the creation of the Fund’s Class B shares on September 4, 2003, include the performance of the Fund’s Class X shares. Excluding the effect of any fee waivers or reimbursements, such prior performance is similar to what Class B shares would have produced during those periods because all classes of the Fund’s shares invest in the same portfolio of securities. The performance for these classes has been restated to reflect differences in sales charges (where applicable), but does not reflect the differing levels of other fees (primarily Rule 12b-1 and/or administrative services fees) applicable to such classes. If these other fees were reflected, the performance for the Class B shares would have been lower. |
| 5 | A 5.00% contingent deferred sales charge (CDSC) was deducted. The CDSC declines to 0% after 6 years. |
| 6 | These returns through May 11, 1998 include performance of the Fund’s predecessor fund, for the period from May 11, 1998 to March 1, 2001 include the performance of the Fund’s Class D shares and for the period from March 1, 2001 to the creation of the Fund’s Class C shares on September 4, 2003, include the performance of the Fund’s Class Y shares. Excluding the effect of any fee waivers or reimbursements, such prior performance is similar to what Class C shares would have produced during those periods because all classes of the Fund’s shares invest in the same portfolio of securities. The performance for these classes has been restated to reflect differences in sales charges (where applicable), but does not reflect the differing levels of other fees (primarily Rule 12b-1 and/or administrative services fees) applicable to such classes. If these other fees were reflected, the performance for Class C shares would have been lower. |
| 7 | A CDSC of 1.00% was deducted from the one year return because it is charged when you sell Class C or Class Y shares within the first year after purchased. |
| 8 | These returns through May 11, 1998 include the performance of the fund’s predecessor fund. |
| 9 | A 4.50% front-end sales charge was deducted. |
| 10 | Not subject to any sales charges. |
| | |
Fund Performance | | Gartmore Government Bond Fund |
Continued
Performance of a $10,000 Investment
Investment return and principal value will fluctuate, and when redeemed, shares may be worth more or less than original cost. Past performance is no guarantee of future results and does not reflect the deduction of taxes that a shareholder would pay on fund distributions or the redemption of fund shares. Investing in mutual funds involves market risk, including loss of principal. Performance returns assume the reinvestment of all distributions.
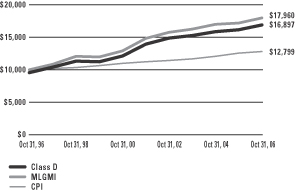
Comparative performance of $10,000 invested in Class D shares of the Gartmore Government Bond Fund, the Merrill Lynch Government Master Index (MLGMI)(a), and the Consumer Price Index (CPI)(b) over a 10-year period ended 10/31/06. Unlike the Fund, the returns for these unmanaged indexes do not reflect any fees, expenses, or sales charges. Investors cannot invest directly in market indexes.
| (a) | The MLGMI gives a broad look at how U.S. government bonds have performed. |
| (b) | The CPI represents changes in prices of a basket of goods and services purchased for consumption by urban households. |
| | |
Shareholder Expense Example | | Gartmore Government Bond Fund |
As a shareholder of the Fund, you incur two types of costs: (1) transaction costs, including sales charges (loads) paid on purchase payments and redemption fees; and (2) ongoing costs, including investment advisory fees, administration fees, distribution fees and other Fund expenses. The examples below are intended to help you understand your ongoing costs (in dollars) of investing in the Fund and to compare these costs with the ongoing costs of investing in other mutual funds. Per SEC requirements, the examples assume that you had a $1,000 investment in the Class at the beginning of the reporting period, May 1, 2006 and continued to hold your shares at the end of the reporting period, October 31, 2006.
Actual Expenses
For each Class of the Fund in the table below, the first line provides information about actual account values and actual expenses. You may use the information in this line, together with the amount you invested, to estimate the expenses that you paid over the period. Simply divide your account value by $1,000 (for example, an $8,600 account value divided by $1,000 = 8.6), then multiply the result by the number in the first line of each Class under the heading entitled “Expenses Paid During Period” to estimate the expenses you paid on your account during the period.
Hypothetical Example for Comparison Purposes
The second line of each Class in the table below provides information about hypothetical account values and hypothetical expenses based on the Class’ actual expense ratio and an assumed rate of return of 5% per year before expenses, which is not the Class’ actual return. The hypothetical account values and expenses may not be used to estimate the actual ending account balance or expenses you paid for the period. You may use this information to compare the ongoing costs of investing in the Class of the Fund and other funds. To do so, compare this 5% hypothetical example with the 5% hypothetical examples that appear in the shareholder reports of the other funds.
Please note that the expenses shown in the table are meant to highlight your ongoing costs only and do not reflect any transaction costs, such as sales charges (loads) or redemption fees. Therefore, the second line for each Class in the table is useful in comparing ongoing costs only, and will not help you determine the relative total costs of owning different funds. In addition, if these transaction costs were included, your costs would have been higher. The examples also assume all dividends and distributions have been reinvested.
Schedule of Shareholder Expenses
Expense Analysis of a $1,000 Investment
(October 31, 2006)
| | | | | | | | | | | | | | |
| Government Bond Fund | | | | | Beginning
Account Value,
5/1/06 | | Ending
Account Value,
10/31/06 | | Expenses Paid
During Period* | | Annualized
Expense Ratio* |
| Class A | | Actual | | | $ | 1,000.00 | | $ | 1,042.30 | | $ | 5.61 | | 1.09% |
| | | Hypothetical | 1 | | $ | 1,000.00 | | $ | 1,019.51 | | $ | 5.56 | | 1.09% |
| Class B | | Actual | | | $ | 1,000.00 | | $ | 1,039.00 | | $ | 8.69 | | 1.69% |
| | | Hypothetical | 1 | | $ | 1,000.00 | | $ | 1,016.48 | | $ | 8.63 | | 1.69% |
| Class C | | Actual | | | $ | 1,000.00 | | $ | 1,040.10 | | $ | 8.69 | | 1.69% |
| | | Hypothetical | 1 | | $ | 1,000.00 | | $ | 1,016.48 | | $ | 8.63 | | 1.69% |
| Class D | | Actual | | | $ | 1,000.00 | | $ | 1,043.80 | | $ | 4.07 | | 0.79% |
| | | Hypothetical | 1 | | $ | 1,000.00 | | $ | 1,021.02 | | $ | 4.03 | | 0.79% |
| Class R | | Actual | | | $ | 1,000.00 | | $ | 1,043.20 | | $ | 5.66 | | 1.10% |
| | | Hypothetical | 1 | | $ | 1,000.00 | | $ | 1,019.45 | | $ | 5.61 | | 1.10% |
| Class X | | Actual | | | $ | 1,000.00 | | $ | 1,039.90 | | $ | 7.97 | | 1.55% |
| | | Hypothetical | 1 | | $ | 1,000.00 | | $ | 1,017.19 | | $ | 7.91 | | 1.55% |
| Class Y | | Actual | | | $ | 1,000.00 | | $ | 1,039.90 | | $ | 7.97 | | 1.55% |
| | | Hypothetical | 1 | | $ | 1,000.00 | | $ | 1,017.19 | | $ | 7.91 | | 1.55% |
| Institutional Class | | Actual | | | $ | 1,000.00 | | $ | 1,044.60 | | $ | 3.71 | | 0.72% |
| | | Hypothetical | 1 | | $ | 1,000.00 | | $ | 1,021.37 | | $ | 3.67 | | 0.72% |
| * | Expenses are equal to the Fund’s annualized expense ratio multiplied by the average account value over the period multiplied by 184/365 (to reflect the one-half year period). The expense ratio presented represents a six-month, annualized ratio in accordance with SEC guidelines. |
| 1 | Represents the hypothetical 5% return before expenses. |
| | |
Portfolio Summary | | Gartmore Government Bond Fund |
October 31, 2006
The SEC adopted a requirement that Funds present their portfolio holdings in a table, chart or graph format in their annual and semiannual reports to shareholders, whether or not a statement of investments is utilized. The following tables, which present portfolio holdings as a percentage of net assets, are provided in compliance with this requirement.
| | |
| Asset Allocation | | |
U.S. Government Sponsored and Agency Obligations | | 107.4% |
Repurchase Agreements | | 0.6% |
| Liabilities in excess of other assets | | -8.0% |
| | |
| | 100.0% |
| | |
| Top Industries | | |
Federal National Mortgage Association | | 60.7% |
Federal Home Loan Mortgage Corporation | | 26.2% |
U.S. Treasury Inflation Protected Bonds | | 7.9% |
U.S. Treasury Bonds | | 7.1% |
Federal Home Loan Bank | | 2.0% |
Federal Farm Credit Bank | | 1.9% |
Sovereign Agency | | 1.6% |
| Liabilities in excess of other assets | | -7.4% |
| | |
| | 100.0% |
| | |
| Top Holdings* | | |
Federal National Mortgage Association, 5.28%, 02/27/09 | | 11.5% |
U.S. Treasury Inflation Protected Bonds, 2.50%, 07/15/16 | | 7.9% |
U.S. Treasury Bonds, 8.13%, 08/15/19 | | 7.1% |
Federal National Mortgage Association, 5.56%, 07/01/36, Pool #745769 | | 7.1% |
Federal National Mortgage Association, 4.92%, 04/01/35, Pool #773298 | | 6.5% |
Federal National Mortgage Association, 5.54%, 07/01/36, Pool #813605 | | 6.5% |
Federal Home Loan Mortgage Corporation, 5.00%, 12/15/27, Series 2594-TD | | 6.4% |
Federal National Mortgage Association, 8.20%, 03/10/16 | | 4.8% |
Federal Home Loan Mortgage Corporation, 5.00%, 10/15/16, Series 2562, Class PE | | 4.6% |
Federal Home Loan Mortgage Corporation, 5.50%, 05/15/25, Series 2970, Class DY | | 3.8% |
| Other Assets | | 33.8% |
| | |
| | 100.0% |
| * | For purpose of listing top holdings, repurchase agreements are considered cash equivalents and are included as part of Other Assets. |
Statement of Investments
October 31, 2006
Gartmore Government Bond Fund
U.S. Government Sponsored & Agency Obligations (107.4%)
| | | | | | |
| | | Principal
Amount | | Value |
| | | | | | |
Federal Farm Credit Bank (1.9%) | | | |
4.70%, 08/10/15 | | $ | 2,480,000 | | $ | 2,432,667 |
| | | | | | |
Federal Home Loan Bank (2.0%) | | | |
6.02%, 01/09/08, Series AA-08 | | | 1,000,000 | | | 1,010,715 |
5.99%, 04/15/13, Series BD-13 | | | 1,500,000 | | | 1,586,315 |
| | | | | | |
| | | | | | 2,597,030 |
| | | | | | |
Federal Home Loan Mortgage Corporation (26.2%) | | | |
5.50%, 04/01/07,
Gold Pool #M90718 | | | 186,992 | | | 186,491 |
5.00%, 10/15/16, Series 2562, Class PE | | | 6,087,000 | | | 5,994,553 |
5.50%, 11/15/20, REMIC, Series 2541-VL | | | 1,500,000 | | | 1,496,907 |
5.50%, 01/15/22, REMIC, Series 2666-OC | | | 1,500,000 | | | 1,508,931 |
5.50%, 12/15/22, Series 2533-PG | | | 2,500,000 | | | 2,473,540 |
5.00%, 02/15/23, Series 2960, Class BL | | | 3,916,728 | | | 3,808,826 |
6.50%, 03/15/24, REMIC, Series 1684-I | | | 2,000,000 | | | 2,070,414 |
5.50%, 05/15/25, Series 2970, Class DY | | | 5,000,000 | | | 4,968,634 |
5.00%, 12/15/27, Series 2594-TD | | | 8,393,707 | | | 8,288,564 |
5.00%, 10/15/28, Series 2644, Class AY | | | 3,080,000 | | | 3,037,259 |
6.50%, 03/15/31, REMIC, Series 2296-H | | | 219,893 | | | 225,777 |
| | | | | | |
| | | | | | 34,059,896 |
| | | | | | |
Federal National Mortgage Association (60.7%) | | | |
6.00%, 11/25/08, REMIC, Series 94-48-E | | | 17,028 | | | 16,964 |
5.28%, 02/27/09 | | | 15,000,000 | | | 14,989,006 |
6.30%, 05/01/13,
Pool #380311 | | | 1,771,673 | | | 1,782,977 |
6.30%, 04/01/14,
Pool #381570 | | | 997,789 | | | 1,058,353 |
7.90%, 08/01/15,
Pool #381190 | | | 1,551,922 | | | 1,778,676 |
7.11%, 10/01/15,
Pool #383142 | | | 2,458,819 | | | 2,591,669 |
6.35%, 03/01/16,
Pool #380082 | | | 3,943,137 | | | 4,176,047 |
| | | | | | |
| | | Principal
Amount | | Value |
| | | | | | |
Federal National Mortgage Association (continued) | | | |
8.20%, 03/10/16 | | $ | 5,000,000 | | $ | 6,208,875 |
5.50%, 04/25/16, REMIC, Series 02-55-QD | | | 3,000,000 | | | 2,996,122 |
6.68%, 05/01/16,
Pool #383452 | | | 1,755,760 | | | 1,831,706 |
4.50%, 12/18/17 | | | 3,748,000 | | | 3,489,976 |
9.25%, 10/25/18, REMIC, Series 88-25-B | | | 16,696 | | | 18,053 |
8.50%, 01/25/20, REMIC, Series 90-7-B | | | 46,278 | | | 49,696 |
6.85%, 05/17/20, Series 97-M6-C | | | 54,579 | | | 54,489 |
7.50%, 02/25/23, REMIC, Series 93-16-Z | | | 191,923 | | | 202,543 |
6.00%, 12/25/23, REMIC, Series 93-226-PK | | | 1,000,000 | | | 1,020,301 |
5.50%, 09/25/24, Series 2004-68-DY | | | 2,391,304 | | | 2,383,642 |
6.00%, 10/25/32, Series 2004-45-ZL | | | 2,201,681 | | | 2,211,298 |
3.50%, 11/25/32, REMIC, Series 03-66-AP | | | 3,525,225 | | | 3,267,039 |
6.27%, 02/25/35, REMIC, Series 98-M4-D | | | 2,500,000 | | | 2,570,219 |
4.92%, 04/01/35,
Pool #773298 | | | 8,560,581 | | | 8,439,152 |
5.54%, 07/01/36,
Pool #813605 | | | 8,421,658 | | | 8,420,977 |
5.56%, 07/01/36,
Pool #745769 | | | 9,188,032 | | | 9,224,160 |
| | | | | | |
| | | | | | 78,781,940 |
| | | | | | |
Sovereign Agency (1.6%) | | | |
AID — Israel, 6.80%, 02/15/12, Series 3-D | | | 2,000,000 | | | 2,121,978 |
| | | | | | |
U.S. Treasury Bonds (7.1%) | | | |
8.13%, 08/15/19 (b) | | | 7,000,000 | | | 9,247,658 |
| | | | | | |
U.S. Treasury Inflation Protected Bonds (7.9%) | | | |
2.50%, 07/15/16 | | | 10,000,000 | | | 10,241,637 |
| | | | | | |
| |
Total U.S. Government Sponsored & Agency Obligations | | | 139,482,806 |
| | | | | | |
Repurchase Agreement (0.6%)
| | | | | | | |
| | | Principal
Amount | | Value | |
| | | | | | | |
CS First Boston, 5.17%, dated 10/31/06, due 11/01/06, repurchase price $383,229, collateralized by U.S. Government Agency Mortgages with a market value of $390,838 | | $ | 383,174 | | $ | 383,174 | |
Nomura Securities, 5.17%, dated 10/31/06, due 11/01/06, repurchase price $365,897, collateralized by U.S. Government Agency Mortgages with a market value of $373,161 | | | 365,844 | | | 365,844 | |
| | | | | | | |
| | |
Total Repurchase Agreements | | | | | | 749,018 | |
| | | | | | | |
| |
Total Investments
(Cost $139,317,049) (a) — 108.0% | | | 140,231,824 | |
| | |
Liabilities in excess of other
assets — (8.0%) | | | | | | (10,353,433 | ) |
| | | | | | | |
| | |
NET ASSETS — 100.0% | | | | | $ | 129,878,391 | |
| | | | | | | |
| | (a) | See notes to financial statements for tax unrealized appreciation (depreciation) of securities. |
| | (b) | All or part of the security was on loan as of October 31, 2006. |
| | REMIC | Real Estate Mortgage Investment Conduit |
See notes to financial statements.
Gartmore Short Duration Bond Fund
For the annual period ended Oct. 31, 2006, the Gartmore Short Duration Bond Fund (Class A at NAV) returned 3.87% versus 4.15% for its benchmark, the Merrill Lynch 1-3 Year Treasury Index. For broader comparison, the average return for the Fund’s Lipper peer category of Short Investment Grade Debt Funds (consisting of 232 funds as of Oct. 31, 2006) was 4.11%.
The Federal Reserve Board remained vigilant in its tightening policy during the first eight months of the reporting period. The Federal Open Market Committee (FOMC) raised the target federal funds rate by 25 basis points six consecutive times at its meetings from Oct. 31, 2005, to June 29, 2006, increasing the rate from 3.75% to 5.25%. The Federal Reserve paused at the subsequent three FOMC meetings in August, September and October 2006, leaving the target rate at 5.25%. Interest rates on the short end of the yield curve rose as the Fed continued its tightening policy, while longer rates were only slightly higher during the reporting period. This activity resulted in an inversion of the yield curve (defined as the difference between the 10-year Treasury bill and the 6-month Treasury note) from a positive 34 basis points to a negative 51 basis points on Oct. 31, 2006. Strong economic growth at the beginning of the reporting period began to moderate later as the housing sector, which had been a strong contributor to growth, began to show signs of weakness. Higher energy prices earlier in the reporting period led to an increase in the headline inflation number, while core inflation numbers (e.g., food and energy) were slightly tamer but trending higher.
With energy and commodity prices having moderated, recent data indicates that inflation is weaker than the markets anticipated, suggesting that the Fed was correct in its decision to pause in raising the federal funds rate. Returns in the non-Treasury fixed income sectors, were positive during the reporting period; asset-backed securities, commercial mortgage-backed securities and credit sectors were the strongest performers.
The increase in Fund quality detracted from performance, because lower-quality assets exhibited greater returns versus AAA assets during the reporting period. The Fund’s duration was 1.59 years versus 1.67 years for the benchmark Index as of Oct. 31, 2006. The Fund maintained a near-Index duration for much of the first half of the reporting period, but a slightly shorter duration position during the latter half which proved negative for Fund performance because rates fell during that period.
An overweight position in non-Treasury fixed income sectors was positive for Fund performance, because as mentioned above these sectors provided greater returns. The Fund continued to focus on high-quality assets during the reporting period.
Looking ahead, we will continue to maintain near-Index duration. We will look to extend the Fund’s duration if signs become more evident of a weakening economy that will allow the Fed to begin easing the target federal funds rate. The Fund is positioned more defensively with increased allocation to Treasuries and high-quality assets, which tend to perform better in a weakening economic environment with greater volatility. We will continue to overweight high-quality spread sectors relative to the Fund’s benchmark in order to maintain yield advantage over the Index.
Portfolio Managers:
Perpetua Phillips and Shane Johnston
| | |
Fund Performance | | Gartmore Short Duration Bond Fund |
Average Annual Total Return
(For periods ended October 31, 2006)
| | | | | | | | |
| | | | | 1 Yr. | | 5 Yr. | | Inception1 |
| Class A2 | | w/o SC3 | | 3.87% | | 2.92% | | 3.78% |
| | | w/SC4 | | 1.49% | | 2.29% | | 3.38% |
| Class C6 | | w/o SC3 | | 3.52% | | 2.77% | | 3.69% |
| | | w/SC7 | | 2.77% | | 2.77% | | 3.69% |
| Institutional Class Shares5 | | 4.13% | | 3.26% | | 4.15% |
| IRA Shares5 | | 3.73% | | 2.86% | | 3.74% |
| Service Class Shares5 | | 3.78% | | 2.89% | | 3.77% |
| 1 | Fund commenced operations on February 1, 1999. |
| 2 | These returns until the creation of Class A shares (7/16/03) include the performance of the Fund’s IRA Class shares. Excluding the effects of any fee waivers or reimbursements, such performance is substantially similar to what Class A shares would have produced because Class A shares invest in the same portfolio of securities as IRA Class shares and have the same expenses after any fee waivers or reimbursements. For Class A returns including sales charges, these returns have been restated for the applicable sales charges. |
| 3 | These returns do not reflect the effects of sales charges (SC). |
| 4 | A 2.25% front-end sales charge was deducted. |
| 5 | Not subject to any sales charges. |
| 6 | These returns until the creation of Class C shares (2/28/05) include the performance of the Fund’s Class A shares. Excluding the effects of any fee waivers or reimbursements, such performance is substantially similar to what Class C shares would have produced because Class C shares invest in the same portfolio of securities as Class A shares. The performance for Class C has been restated to reflect differences in sales charges, but does not reflect the differing levels of other fees (primarily Rule 12b-1 fees) applicable to the classes. If these other fees were reflected, the performance for each of these classes of shares would have been lower. |
| 7 | A CDSC of 0.75% was deducted from the one year return because it is charged when you sell Class C shares within the first year after purchase. |
Performance of a $10,000 Investment
Investment return and principal value will fluctuate, and when redeemed, shares may be worth more or less than original cost. Past performance is no guarantee of future results and does not reflect the deduction of taxes that a shareholder would pay on fund distributions or the redemption of fund shares. Investing in mutual funds involves market risk, including loss of principal. Performance returns assume the reinvestment of all distributions.
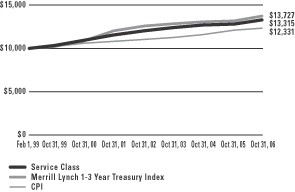
Comparative performance of $10,000 invested in the Gartmore Short Duration Bond Fund Service Class, the Merrill Lynch 1-3 Year Treasury Index(a), and the Consumer Price Index (CPI)(b) since inception. Unlike the Fund, the returns for these unmanaged indexes do not reflect any fees or expenses. Investors cannot invest directly in market indexes.
| (a) | The Merrill Lynch 1-3 Year Treasury Index is an unmanaged index comprised of U.S. Treasury securities with maturities ranging from one to three years, which are guaranteed as to the timely payment of principal and interest by the U.S. government. |
| (b) | The CPI represents changes in prices of a basket of goods and services purchased for consumption by urban households. |
| | |
Shareholder Expense Example | | Gartmore Short Duration Bond Fund |
As a shareholder of the Fund, you incur two types of costs: (1) transaction costs, including sales charges (loads) paid on purchase payments and redemption fees; and (2) ongoing costs, including investment advisory fees, administration fees, distribution fees and other Fund expenses. The examples below are intended to help you understand your ongoing costs (in dollars) of investing in the Fund and to compare these costs with the ongoing costs of investing in other mutual funds. Per SEC requirements, the examples assume that you had a $1,000 investment in the Class at the beginning of the reporting period, May 1, 2006 and continued to hold your shares at the end of the reporting period, October 31, 2006.
Actual Expenses
For each Class of the Fund in the table below, the first line provides information about actual account values and actual expenses. You may use the information in this line, together with the amount you invested, to estimate the expenses that you paid over the period. Simply divide your account value by $1,000 (for example, an $8,600 account value divided by $1,000 = 8.6), then multiply the result by the number in the first line of each Class under the heading entitled “Expenses Paid During Period” to estimate the expenses you paid on your account during the period.
Hypothetical Example for Comparison Purposes
The second line of each Class in the table below provides information about hypothetical account values and hypothetical expenses based on the Class’ actual expense ratio and an assumed rate of return of 5% per year before expenses, which is not the Class’ actual return. The hypothetical account values and expenses may not be used to estimate the actual ending account balance or expenses you paid for the period. You may use this information to compare the ongoing costs of investing in the Class of the Fund and other funds. To do so, compare this 5% hypothetical example with the 5% hypothetical examples that appear in the shareholder reports of the other funds.
Please note that the expenses shown in the table are meant to highlight your ongoing costs only and do not reflect any transaction costs, such as sales charges (loads) or redemption fees. Therefore, the second line for each Class in the table is useful in comparing ongoing costs only, and will not help you determine the relative total costs of owning different funds. In addition, if these transaction costs were included, your costs would have been higher. The examples also assume all dividends and distributions have been reinvested.
Schedule of Shareholder Expenses
Expense Analysis of a $1,000 Investment
(October 31, 2006)
| | | | | | | | | | | | | | |
| Short Duration Bond Fund | | | | | Beginning
Account Value,
5/1/06 | | Ending
Account Value,
10/31/06 | | Expenses Paid
During Period* | | Annualized
Expense Ratio* |
| Class A | | Actual | | | $ | 1,000.00 | | $ | 1,026.30 | | $ | 3.42 | | 0.67% |
| | | Hypothetical | 1 | | $ | 1,000.00 | | $ | 1,021.62 | | $ | 3.42 | | 0.67% |
| Class C | | Actual | | | $ | 1,000.00 | | $ | 1,023.70 | | $ | 5.97 | | 1.17% |
| | | Hypothetical | 1 | | $ | 1,000.00 | | $ | 1,019.10 | | $ | 5.97 | | 1.17% |
| Institutional Class | | Actual | | | $ | 1,000.00 | | $ | 1,027.50 | | $ | 2.15 | | 0.42% |
| | | Hypothetical | 1 | | $ | 1,000.00 | | $ | 1,022.88 | | $ | 2.14 | | 0.42% |
| IRA Class | | Actual | | | $ | 1,000.00 | | $ | 1,025.40 | | $ | 4.34 | | 0.85% |
| | | Hypothetical | 1 | | $ | 1,000.00 | | $ | 1,020.72 | | $ | 4.34 | | 0.85% |
| Service Class | | Actual | | | $ | 1,000.00 | | $ | 1,025.80 | | $ | 3.93 | | 0.77% |
| | | Hypothetical | 1 | | $ | 1,000.00 | | $ | 1,021.12 | | $ | 3.93 | | 0.77% |
| * | Expenses are equal to the Fund’s annualized expense ratio multiplied by the average account value over the period multiplied by 184/365 (to reflect the one-half year period). The expense ratio presented represents a six-month, annualized ratio in accordance with SEC guidelines. |
| 1 | Represents the hypothetical 5% return before expenses. |
| | |
Portfolio Summary | | Gartmore Short Duration Bond Fund |
October 31, 2006
The SEC adopted a requirement that Funds present their portfolio holdings in a table, chart or graph format in their annual and semiannual reports to shareholders, whether or not a statement of investments is utilized. The following tables, which present portfolio holdings as a percentage of net assets, are provided in compliance with this requirement.
| | |
| Asset Allocation | | |
| U.S. Treasury Notes | | 33.6% |
U.S. Government Sponsored Mortgage-Backed Obligations | | 21.7% |
| Commercial Mortgage-Backed Securities | | 16.6% |
| Asset-Backed Securities | | 13.0% |
| Corporate Bonds | | 7.7% |
| Repurchase Agreements | | 5.2% |
| Agency Asset-Backed | | 1.8% |
| Other assets in excess of liabilities | | 0.4% |
| | |
| | 100.0% |
| | |
| Top Industries | | |
| U.S. Treasury Notes | | 33.6% |
| Home Equity Loans | | 11.5% |
| Federal National Mortgage Association | | 11.3% |
| Federal Home Loan Mortgage Corp. | | 8.4% |
| Financial Services | | 4.6% |
| Government National Mortgage Association | | 3.8% |
| Banks | | 3.1% |
| Automobiles | | 1.5% |
| Other Assets | | 22.2% |
| | |
| | 100.0% |
| | |
| Top Holdings* | | |
U.S. Treasury Notes, 4.38%, 11/15/08 | | 12.4% |
U.S. Treasury Notes, 4.13%, 08/15/08 | | 9.2% |
U.S. Treasury Notes, 4.88%, 08/15/09 | | 5.7% |
Federal National Mortgage Association, 4.00%, 10/25/13, Series 2004-9, Class YJ | | 5.1% |
Federal National Mortgage Association, 4.00%, 10/25/16, Series 2004-80, Class LG | | 4.4% |
U.S. Treasury Notes, 4.88%, 05/15/09 | | 4.2% |
Centex Home Equity, Series 2004-B, 4.12%, 01/25/32, Class AF4 | | 4.0% |
Wachovia Corp., 4.95%, 11/01/06 | | 3.1% |
Federal Home Loan Mortgage Corp., 4.50%, 07/15/14, Series 2870, Class BC | | 3.1% |
CitiFinancial Mortgage Securities, Inc., 4.43%, 10/25/33, Series 2003-4, Class AF4, | | 3.1% |
Other Assets | | 45.7% |
| | |
| | 100.0% |
| * | For purpose of listing top holdings, repurchase agreements are considered cash equivalents and are included as part of Other Assets. |
Statement of Investments
October 31, 2006
Gartmore Short Duration Bond Fund
Asset-Backed Securities (13.0%)
| | | | | | |
| | | Principal
Amount | | Value |
| | | | | | |
Automobiles (1.5%) | | | | | | |
Americredit Automobile Receivables Trust, Series 2005-CF, Class A4, 4.63%, 06/06/12 | | $ | 1,500,000 | | $ | 1,488,177 |
| | | | | | |
Home Equity Loans (11.5%) | | | | | | |
Centex Home Equity, Series 2004-B, Class AF4, 4.12%, 01/25/32 | | | 4,000,000 | | | 3,898,957 |
CitiFinancial Mortgage Securities, Inc., Series 2003-4, Class AF4, 4.43%, 10/25/33 | | | 3,000,000 | | | 2,952,579 |
Equity One, Inc., Series 2004-3, Class AF3, 4.27%, 07/25/34 | | | 1,617,256 | | | 1,608,948 |
Residential Asset Mortgage Products, Inc., Class 2003-KS10, 4.47%, 03/25/32 | | | 2,661,958 | | | 2,623,573 |
| | | | | | |
| | | | | | 11,084,057 |
| | | | | | |
| | |
Total Asset-Backed Securities | | | | | | 12,572,234 |
| | | | | | |
|
Commercial Mortgage-Backed Securities (16.6%) |
| | |
Bear Stearns Commercial Mortgage Securities, Inc., Series 2001-TOP4, 5.06%, 11/15/16 | | | 2,075,122 | | | 2,068,795 |
Bear Stearns Commercial Mortgage Securities, Inc., Series 2001-TOP2, 6.08%, 02/15/35 | | | 1,118,016 | | | 1,136,506 |
CS First Boston Mortgage Securities Corp., Series 2000-C1, Class A1, 7.33%, 04/15/62 | | | 1,691,830 | | | 1,725,899 |
LB-UBS Commercial Mortgage Trust, 4.89%, 09/15/30 | | | 2,000,000 | | | 1,987,798 |
Merrill Lynch Commercial Mortgage Trust, 4.71%, 07/12/46 (b) | | | 1,485,552 | | | 1,470,081 |
Morgan Stanley Dean Witter Capital I, Series 1998-WFS, Class A2, 6.54%, 07/15/30 | | | 2,275,262 | | | 2,307,006 |
Morgan Stanley Dean Witter Capital I, Series 2001-TOP1, 6.46%, 02/15/33 | | | 1,161,051 | | | 1,168,017 |
Morgan Stanley Dean Witter Capital I, Series 2001-TOP3, 6.01%, 07/15/33 | | | 1,200,690 | | | 1,205,770 |
Commercial Mortgage-Backed Securities (continued)
| | | | | | |
| | | Principal
Amount | | Value |
| | | | | | |
Nomura Asset Securities Corp., Series 1998-D6, 6.59%, 03/15/30 | | $ | 2,869,837 | | $ | 2,913,750 |
| | | | | | |
| |
Total Commercial Mortgage-Backed Securities | | | 15,983,622 |
| | | | | | |
|
Corporate Bonds (7.7%) |
Banks (3.1%) | | | | | | |
Wachovia Corp., 4.95%, 11/01/06 | | | 3,000,000 | | | 3,000,000 |
| | | | | | |
Financial Services (4.6%) | | | | | | |
Household Finance Co., 5.88%, 02/01/09 | | | 1,500,000 | | | 1,524,255 |
Province of Ontario, 3.38%, 01/15/08 | | | 3,000,000 | | | 2,937,720 |
| | | | | | |
| | | | | | 4,461,975 |
| | | | | | |
| | |
Total Corporate Bonds | | | | | | 7,461,975 |
| | | | | | |
|
Agency Asset-Backed (1.8%) |
Federal Home Loan Mortgage Corp. (1.8%) | | | |
Series T-50, Class A6, 3.61%, 09/27/12 | | | 1,784,902 | | | 1,739,007 |
| | | | | | |
| | |
Total Agency Asset-Backed | | | | | | 1,739,007 |
| | | | | | |
|
U.S. Government Sponsored Mortgage-Backed Obligations (21.7%) |
Federal Home Loan Mortgage Corp. (6.6%) | | | |
Series 2870, Class BC, 4.50%, 07/15/14 | | | 3,000,000 | | | 2,964,089 |
Series 2676, Class CV, 4.00%, 05/15/16 | | | 1,669,738 | | | 1,620,080 |
Series 2626, Class UN, 4.00%, 08/15/29 | | | 1,838,627 | | | 1,801,229 |
| | | | | | |
| | |
| | | | | | 6,385,398 |
| | | | | | |
U.S. Government Sponsored Mortgage-Backed Obligations (continued)
| | | | | | |
| | | Principal
Amount | | Value |
| | | | | | |
Federal National Mortgage Association (11.3%) | | | |
Series 2004-79, Class VE, 4.50%, 08/25/10 | | $ | 1,716,128 | | $ | 1,693,304 |
Series 2004-9, Class YJ, 4.00%, 10/25/13 | | | 5,000,000 | | | 4,911,500 |
Series 2004-80, Class LG, 4.00%, 10/25/16 | | | 4,307,158 | | | 4,204,090 |
| | | | | | |
| | |
| | | | | | 10,808,894 |
| | | | | | |
Government National Mortgage Association (3.8%) | | | |
Series 2004-76, Class QA, 4.00%, 01/20/34 | | | 1,920,129 | | | 1,831,893 |
Series 2004-22, Class BK, 3.47%, 04/20/34 | | | 1,945,629 | | | 1,875,801 |
| | | | | | |
| | | | | | 3,707,694 |
| | | | | | |
| | |
Total U.S. Government Sponsored Mortgage-Backed Obligations | | | | | | 20,901,986 |
| | | | | | |
|
U.S. Treasury Notes (33.6%) |
| | |
5.00%, 07/31/08 | | | 2,000,000 | | | 2,008,440 |
4.13%, 08/15/08 | | | 9,000,000 | | | 8,917,380 |
4.38%, 11/15/08 | | | 12,000,000 | | | 11,926,439 |
4.88%, 05/15/09 | | | 4,000,000 | | | 4,022,800 |
4.88%, 08/15/09 | | | 5,500,000 | | | 5,535,640 |
| | | | | | |
| | |
Total U.S. Treasury Notes | | | | | | 32,410,699 |
| | | | | | |
Repurchase Agreements (5.2%)
| | | | | | |
| | | Principal
Amount | | Value |
| | | | | | |
CS First Boston, 5.17%, dated 10/31/06, due 11/01/06, repurchase price $2,589,995, collateralized by U.S. Government Agency Mortgages with a market value of $2,641,420 | | $ | 2,589,623 | | $ | 2,589,623 |
Nomura Securities, 5.17%, dated 10/31/06, due 11/01/06, repurchase price $2,472,853, collateralized by U.S. Government Agency Mortgages with a market value of $2,521,952 | | | 2,472,498 | | | 2,472,498 |
| | | | | | |
| | |
Total Repurchase Agreements | | | | | | 5,062,121 |
| | | | | | |
| |
Total Investments
(Cost $97,542,676) (a) — 99.6% | | | 96,131,644 |
| |
Other assets in excess of
liabilities — 0.4% | | | 403,130 |
| | | | | | |
| | |
NET ASSETS — 100.0% | | | | | $ | 96,534,774 |
| | | | | | |
| | (a) | See notes to financial statements for tax unrealized appreciation (depreciation) of securities. |
| | (b) | Variable rate security. The rate reflected in the Statement of Investments is the rate in effect on October 31, 2006. |
See notes to financial statements.
Gartmore Tax-Free Income Fund
For the annual period ended Oct. 31, 2006, the Gartmore Tax-Free Income Fund (Class A at NAV) returned 4.30% versus 5.76% for its benchmark, the Lehman Brothers Municipal Bond Index. For broader comparison, the average return for the Fund’s Lipper peer category of General Municipal Debt Funds (consisting of 258 funds as of Oct. 31, 2006) was 5.41%.
Calendar year-to-date, the supply of municipal bonds declined, partly due to a substantial decline in refunding activity; new issuances were down 12.5% from the same period in 2005. Three years of record refunding issuance prompted by the low-interest-rate environment effectively exhausted a significant portion of the economically justified deals at current yield levels. Concurrently, the need for newly issued bonds lessened for many municipalities, thanks to higher tax receipts coupled with better expense management. Sharp declines in new issue volume along with rising yields in 2006 have created a favorable environment for municipal bond investors.
During the reporting period, the Federal Reserve Board continued to hike the federal funds rate, increasing it by 25 basis points at each of six consecutive Federal Open Market Committee (FOMC) meetings to end at 5.25% in August 2006. The rate remained unchanged through the October FOMC session, a pause that precipitated a strong rally in the bond markets. The FOMC noted that economic growth has slowed, and the near-term economy seems likely to expand at a moderated pace. Inflation is a lingering concern, and the extent to which the Fund’s portfolio may need to be repositioned remains to be seen.
The Fund’s duration was 4.13 years, which was shorter than the 5.15 years duration of the Fund’s benchmark index, causing the Fund to underperform. Duration is a measure of a bond or a bond fund’s sensitivity to changes in interest rates. Longer durations indicate greater interest-rate sensitivity, and shorter durations generally limit a bond fund’s volatility and total return potential. According to the Fund’s benchmark index, investors in longer-duration bonds maturing in 22+ years received the greatest return: 7.91%. Intermediate-duration bonds maturing in 10 years returned 5.99%, while short-duration bonds maturing in one year returned 3.05%.
The Fund’s strategy remains focused on monitoring market developments and using any opportunity to redeploy assets further out of longer-duration bonds to bring maturities better in line with that of the benchmark.
Portfolio Manager:
Alpha Benson
| | |
Fund Performance | | Gartmore Tax-Free Income Fund |
Average Annual Total Return
(For periods ended October 31, 2006)
| | | | | | | | |
| | | | | 1 Yr. | | 5 Yr. | | 10 Yr. |
| Class A1 | | w/o SC2 | | 4.30% | | 4.17% | | 4.93% |
| | | w/SC3 | | –0.18% | | 3.27% | | 4.48% |
| Class B4 | | w/o SC2 | | 3.52% | | 3.47% | | 4.35% |
| | | w/SC5 | | –1.48% | | 3.12% | | 4.35% |
| Class C6 | | w/o SC2 | | 3.53% | | 3.49% | | 4.52% |
| | | w/SC7 | | 2.53% | | 3.49% | | 4.52% |
| Class D8 | | w/o SC2 | | 4.56% | | 4.46% | | 5.15% |
| | | w/SC9 | | –0.11% | | 3.51% | | 4.67% |
| Class X1 | | w/o SC2 | | 3.68% | | 3.58% | | 4.48% |
| | | w/SC5 | | –1.32% | | 3.23% | | 4.48% |
| Class Y1 | | w/o SC2 | | 3.59% | | 3.56% | | 4.56% |
| | | w/SC7 | | 2.59% | | 3.56% | | 4.56% |
All figures showing the effect of a sales charge reflect the maximum charge possible, because it has the most dramatic effect on performance data.
| 1 | These returns through May 11, 1998 include performance of the Fund’s predecessor fund, and, for periods from May 11, 1998 to the creation of the class, include the performance of the Fund’s Class D shares. These returns were achieved prior to the creation of Class A and Class X shares (5/11/98) and Class Y shares (3/1/01). Excluding the effect of any fee waivers or reimbursements, such prior performance is similar to what Class A, Class X and Class Y shares would have produced during those periods because all classes of the Fund’s shares invest in the same portfolio of securities. The performance for these classes has been restated to reflect differences in sales charges (where applicable), but does not reflect the differing levels of other fees (primarily Rule 12b-1 and/or administrative services fees) applicable to such classes. If these other fees were reflected, the performance for each of these classes of shares would have been lower. |
| 2 | These returns do not reflect the effects of sales charges (SC). |
| 3 | A 4.25% front-end sales charge was deducted. |
| 4 | These returns through May 11, 1998 include performance of the Fund’s predecessor fund, and for the period from May 11, 1998 to the creation of the Fund’s Class B shares on September 4, 2003, include the performance of the Fund’s Class X shares. Excluding the effect of any fee waivers or reimbursements, such prior performance is similar to what Class B shares would have produced during those periods because all classes of the Fund’s shares invest in the same portfolio of securities. The performance for these classes has been restated to reflect differences in sales charges (where applicable), but does not reflect the differing levels of other fees (primarily Rule 12b-1 and/or administrative services fees) applicable to such classes. If these other fees were reflected, the performance for the Class B shares would have been lower. |
| 5 | A 5.00% contingent deferred sales charge (CDSC) was deducted. The CDSC declines to 0% after 6 years. |
| 6 | These returns through May 11, 1998 include performance of the Fund’s predecessor fund, for the period from May 11, 1998 to March 1, 2001 include the performance of the Fund’s Class D shares and for the period from March 1, 2001 to the creation of the Fund’s Class C shares on September 4, 2003, include the performance of the Fund’s Class Y shares. Excluding the effect of any fee waivers or reimbursements, such prior performance is similar to what Class C shares would have produced during those periods because all classes of the Fund’s shares invest in the same portfolio of securities. The performance for these classes has been restated to reflect differences in sales charges (where applicable), but does not reflect the differing levels of other fees (primarily Rule 12b-1 and/or administrative services fees) applicable to such classes. If these other fees were reflected, the performance for Class C shares would have been lower. |
| 7 | A CDSC of 1.00% was deducted from the one year return because it is charged when you sell Class C or Class Y shares within the first year after purchase. |
| 8 | These returns through May 11, 1998 include the performance of the fund’s predecessor fund. |
| 9 | A 4.50% front-end sales charge was deducted. |
| | |
Fund Performance | | Gartmore Tax-Free Income Fund |
Continued
Performance of a $10,000 Investment
Investment return and principal value will fluctuate, and when redeemed, shares may be worth more or less than original cost. Past performance is no guarantee of future results and does not reflect the deduction of taxes that a shareholder would pay on fund distributions or the redemption of fund shares. Investing in mutual funds involves market risk, including loss of principal. Performance returns assume the reinvestment of all distributions.
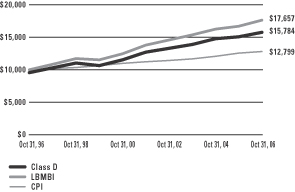
Comparative performance of $10,000 invested in Class D shares of the Gartmore Tax-Free Income Fund, the Lehman Brothers Municipal Bond Index (LBMBI)(a), and the Consumer Price Index (CPI)(b) over a 10-year period ended 10/31/06. Unlike the Fund, the returns for these unmanaged indexes do not reflect any fees, expenses, or sales charges. Investors cannot invest directly inmarket indexes.
| (a) | The LBMBI is an unmanaged index of municipal bonds-gives a broad look at how the bond prices on municipal bonds have performed. |
| (b) | The CPI represents changes in prices of a basket of goods and services purchased for consumption by urban households. |
| | |
Shareholder Expense Example | | Gartmore Tax-Free Income Fund |
As a shareholder of the Fund, you incur two types of costs: (1) transaction costs, including sales charges (loads) paid on purchase payments and redemption fees; and (2) ongoing costs, including investment advisory fees, administration fees, distribution fees and other Fund expenses. The examples below are intended to help you understand your ongoing costs (in dollars) of investing in the Fund and to compare these costs with the ongoing costs of investing in other mutual funds. Per SEC requirements, the examples assume that you had a $1,000 investment in the Class at the beginning of the reporting period, May 1, 2006 and continued to hold your shares at the end of the reporting period, October 31, 2006.
Actual Expenses
For each Class of the Fund in the table below, the first line provides information about actual account values and actual expenses. You may use the information in this line, together with the amount you invested, to estimate the expenses that you paid over the period. Simply divide your account value by $1,000 (for example, an $8,600 account value divided by $1,000 = 8.6), then multiply the result by the number in the first line of each Class under the heading entitled “Expenses Paid During Period” to estimate the expenses you paid on your account during the period.
Hypothetical Example for Comparison Purposes
The second line of each Class in the table below provides information about hypothetical account values and hypothetical expenses based on the Class’ actual expense ratio and an assumed rate of return of 5% per year before expenses, which is not the Class’ actual return. The hypothetical account values and expenses may not be used to estimate the actual ending account balance or expenses you paid for the period. You may use this information to compare the ongoing costs of investing in the Class of the Fund and other funds. To do so, compare this 5% hypothetical example with the 5% hypothetical examples that appear in the shareholder reports of the other funds.
Please note that the expenses shown in the table are meant to highlight your ongoing costs only and do not reflect any transaction costs, such as sales charges (loads) or redemption fees. Therefore, the second line for each Class in the table is useful in comparing ongoing costs only, and will not help you determine the relative total costs of owning different funds. In addition, if these transaction costs were included, your costs would have been higher. The examples also assume all dividends and distributions have been reinvested.
Schedule of Shareholder Expenses
Expense Analysis of a $1,000 Investment
(October 31, 2006)
| | | | | | | | | | | | | | |
| Tax-Free Income Fund | | | | | Beginning
Account Value,
5/1/06 | | Ending
Account Value,
10/31/06 | | Expenses Paid
During Period* | | Annualized
Expense Ratio* |
| Class A | | Actual | | | $ | 1,000.00 | | $ | 1,030.80 | | $ | 4.81 | | 0.94% |
| | | Hypothetical | 1 | | $ | 1,000.00 | | $ | 1,020.26 | | $ | 4.80 | | 0.94% |
| Class B | | Actual | | | $ | 1,000.00 | | $ | 1,027.90 | | $ | 8.64 | | 1.69% |
| | | Hypothetical | 1 | | $ | 1,000.00 | | $ | 1,016.48 | | $ | 8.63 | | 1.69% |
| Class C | | Actual | | | $ | 1,000.00 | | $ | 1,028.00 | | $ | 8.64 | | 1.69% |
| | | Hypothetical | 1 | | $ | 1,000.00 | | $ | 1,016.48 | | $ | 8.63 | | 1.69% |
| Class D | | Actual | | | $ | 1,000.00 | | $ | 1,033.10 | | $ | 3.54 | | 0.69% |
| | | Hypothetical | 1 | | $ | 1,000.00 | | $ | 1,021.52 | | $ | 3.52 | | 0.69% |
| Class X | | Actual | | | $ | 1,000.00 | | $ | 1,027.70 | | $ | 7.87 | | 1.54% |
| | | Hypothetical | 1 | | $ | 1,000.00 | | $ | 1,017.24 | | $ | 7.86 | | 1.54% |
| Class Y | | Actual | | | $ | 1,000.00 | | $ | 1,027.80 | | $ | 7.87 | | 1.54% |
| | | Hypothetical | 1 | | $ | 1,000.00 | | $ | 1,017.24 | | $ | 7.86 | | 1.54% |
| * | Expenses are equal to the Fund’s annualized expense ratio multiplied by the average account value over the period multiplied by 184/365 (to reflect the one-half year period). The expense ratio presented represents a six-month, annualized ratio in accordance with SEC guidelines. |
| 1 | Represents the hypothetical 5% return before expenses. |
| | |
Portfolio Summary | | Gartmore Tax Free Income Fund |
October 31, 2006
The SEC adopted a requirement that Funds present their portfolio holdings in a table, chart or graph format in their annual and semiannual reports to shareholders, whether or not a statement of investments is utilized. The following tables, which present portfolio holdings as a percentage of net assets, are provided in compliance with this requirement.
| | |
| Asset Allocation | | |
Municipal Bonds | | 98.9% |
Other assets in excess of liabilities | | 1.1% |
| | |
| | 100.0% |
| | |
| Top States | | |
Texas | | 17.3% |
Illinois | | 13.5% |
Alabama | | 5.9% |
Indiana | | 5.0% |
Massachusetts | | 5.0% |
Washington | | 4.8% |
Michigan | | 4.8% |
Georgia | | 4.3% |
South Carolina | | 3.8% |
Ohio | | 3.8% |
Other Assets | | 31.8% |
| | |
| | 100.0% |
| | |
| Top Holdings | | |
Indiana State Toll Road Commission East-West Toll Road Revenue Bonds, Series 1980, 9.00%, 01/01/15 | | 4.3% |
Harris County, Texas Health Facilities Development Corporation Revenue School Health Care Systems, Series B,
5.75%, 07/01/27 | | 4.0% |
Metropolitan Pier & Exposition Authority
Illinois Dedicated State Tax Revenue Bonds (McCormick Place Expansion Project), 5.50%, 12/15/24 | | 3.0% |
Shelby County, Tennessee Educational & Housing Facilities Board Revenue Bonds (St. Judes Children's Research), 5.38%, 07/01/24 | | 2.8% |
Alabama 21st Century Authority Tobacco Settlement Revenue Bonds, 5.50%, 12/01/21 | | 2.6% |
Michigan State General Obligation Unlimited
Tax Bonds (Environmental Protection Program), Series 1992, 6.25%, 11/01/12 | | 2.4% |
Illinois State General Obligation Unlimited Revenue Bonds, 5.25%, 05/01/23 | | 2.3% |
Denver, Colorado City & County Airport
Revenue Bonds, Series B, 5.50%, 11/15/25 | | 2.2% |
Washington State Motor Vehicle Fuel Tax
General Obligation Unlimited Tax Bonds, Series 1997-D, 5.38%, 01/01/22 | | 2.2% |
Tampa Bay Water Florida Utility System
Revenue Bonds, 5.50%, 10/01/18 | | 2.2% |
Other Assets | | 72.0% |
| | |
| | 100.0% |
Statement of Investments
October 31, 2006
Gartmore Tax-Free Fund
Municipal Bonds (98.9%)
| | | | | | |
| | | Principal Amount | | Value |
| | | | | | |
Alabama (5.9%) | | | | | | |
Alabama 21st Century Authority Tobacco Settlement Revenue Bonds, 5.75%, 12/01/90 | | $ | 1,500,000 | | $ | 1,614,825 |
Alabama 21st Century Authority Tobacco Settlement Revenue Bonds, 5.50%, 12/01/21 | | | 4,000,000 | | | 4,167,639 |
Auburn University Alabama General Fee Revenue Bonds, 5.50%, 06/01/18 | | | 1,685,000 | | | 1,808,746 |
Birmingham, Alabama Water & Sewer Revenue Warrants, Series 1998-A, 4.75%, 01/01/29 | | | 1,750,000 | | | 1,767,273 |
| | | | | | |
| | | | | | 9,358,483 |
| | | | | | |
Arizona (1.2%) | | | | | | |
Mesa, Arizona Industrial Development Authority Revenue Bonds, (Discovery Health Systems), Series A, 5.63%, 01/01/29 | | | 1,800,000 | | | 1,925,082 |
| | | | | | |
Colorado (2.2%) | | | | | | |
Denver, Colorado City & County Airport Revenue Bonds, Series B, 5.50%, 11/15/25 | | | 3,500,000 | | | 3,537,240 |
| | | | | | |
District of Columbia (1.6%) | | | | | | |
District of Columbia General Obligation Unlimited Bonds, Series A, 5.50%, 06/01/29 | | | 1,775,000 | | | 1,860,768 |
District of Columbia Prerefunded General Obligation Unlimited, Series A, 5.50%, 06/01/29 | | | 725,000 | | | 765,767 |
| | | | | | |
| | | | | | 2,626,535 |
| | | | | | |
Florida (2.9%) | | | | | | |
Florida State Board of Education Capital Outlay (Public Education), Series D, 5.75%, 06/01/22 | | | 1,050,000 | | | 1,128,131 |
Tampa Bay Water Florida Utility System Revenue Bonds, 5.50%, 10/01/18 | | | 3,000,000 | | | 3,463,020 |
| | | | | | |
| | | | | | 4,591,151 |
| | | | | | |
| | | | | | |
| | | Principal Amount | | Value |
| | | | | | |
Georgia (4.3%) | | | | | | |
Atlanta, Georgia Airport General Obligation Refunding Revenue Bonds, Series A, 5.50%, 01/01/26 | | $ | 1,000,000 | | $ | 1,068,270 |
Georgia Local Government Certificates of Participation Grantor Trust, Series 1998-A, 4.75%, 06/01/28 | | | 1,000,000 | | | 1,058,480 |
Georgia Municipal Electric Power Authority Revenue Bonds, Prerefunded Series V, 6.60%, 01/01/18 | | | 465,000 | | | 564,138 |
Georgia Municipal Electric Power Authority Revenue Bonds, Prerefunded Series V, 6.60%, 01/01/18 | | | 55,000 | | | 64,514 |
Georgia Municipal Electric Power Authority Revenue Bonds, Unrefunded Series V, 6.60%, 01/01/18 | | | 2,230,000 | | | 2,643,397 |
Georgia Private College & Universities Authority, Refunding Revenue Bonds, (Mercer University Project), Series A, 5.25%, 10/01/25 | | | 1,500,000 | | | 1,540,590 |
| | | | | | |
| | | | | | 6,939,389 |
| | | | | | |
Illinois (13.5%) | | | | | | |
Chicago Illinois Prerefunded Project General Obligation Limited, Series A, 5.38%, 01/01/24 | | | 1,995,000 | | | 2,089,763 |
Chicago Illinois Unrefunded Project General Obligation Limited, Series A, 5.38%, 01/01/24 | | | 935,000 | | | 974,635 |
Chicago Park District, Illinois General Obligation Unlimited Tax Park Bonds, Series 1996, 5.60%, 01/01/21 | | | 3,050,000 | | | 3,090,504 |
Illinois Development Finance Authority Hospital Revenue Bonds, (Adventist Health Systems/Sunbelt Obligation), 5.50%, 11/15/20 | | | 1,750,000 | | | 1,856,785 |
Statement of Investments (Continued)
October 31, 2006
Gartmore Tax-Free Fund (Continued)
Municipal Bonds (continued)
| | | | | | |
| | | Principal Amount | | Value |
| | | | | | |
Illinois (continued) | | | | | | |
Illinois Development Finance Authority Hospital Revenue Bonds, (Adventist Health Systems/Sunbelt Obligation), 5.65%, 11/15/24 | | $ | 3,000,000 | | $ | 3,195,870 |
Illinois State General Obligation Unlimited Revenue Bonds, 5.25%, 05/01/23 | | | 3,425,000 | | | 3,635,671 |
Illinois State Toll Highway Authority Revenue Bonds, 5.00%, 01/01/27 | | | 2,000,000 | | | 2,134,060 |
Metropolitan Pier & Exposition Authority Illinois Dedicated State Tax Revenue Bonds (McCormick Place Expansion Project), 5.50%, 12/15/24 | | | 4,500,000 | | | 4,758,569 |
| | | | | | |
| | | | | | 21,735,857 |
| | | | | | |
Indiana (5.0%) | | | | | | |
Ball State University Student Fee Revenue Bonds, Series J, 6.20%, 07/01/20 | | | 1,000,000 | | | 1,099,690 |
Indiana State Toll Road Commission East-West Toll Road Revenue Bonds, Series 1980, 9.00%, 01/01/15 | | | 5,335,000 | | | 6,892,607 |
| | | | | | |
| | | | | | 7,992,297 |
| | | | | | |
Kansas (1.0%) | | | | | | |
Wichita, Kansas Hospital Revenue Refunding Bonds (Facilities Improvements Series 11), 6.75%, 11/15/19 | | | 1,500,000 | | | 1,665,915 |
| | | | | | |
Louisiana (1.2%) | | | | | | |
Tobacco Settlement Financing Corp. (Louisiana Revenue Asset Backed), Series 2001B, 5.88%, 05/15/39 | | | 1,750,000 | | | 1,859,025 |
| | | | | | |
Massachusetts (5.0%) | | | | | | |
Massachusetts State Consumer Loan General Obligation Limited, Series C, 5.50%, 11/01/15 | | | 1,500,000 | | | 1,695,180 |
| | | | | | |
| | | Principal Amount | | Value |
| | | | | | |
Massachusetts (continued) | | | | | | |
Massachusetts State Consumer Loan General Obligation Limited, Series D, 5.50%, 10/01/16 | | $ | 1,000,000 | | $ | 1,137,500 |
Massachusetts State Consumer Loan General Obligation Limited, Series D, 5.50%, 08/01/19 | | | 1,000,000 | | | 1,153,970 |
Massachusetts State General Obligation Unlimited Bonds, Series D, 5.50%, 10/01/18 | | | 2,000,000 | | | 2,298,380 |
Massachusetts State Prerefunded Consumer Loan General Obligation Limited, Series B, 5.25%, 03/01/21 | | | 95,000 | | | 102,485 |
Massachusetts State Unrefunded Consumer Loan General Obligation Limited, Series B, 5.25%, 03/01/21 | | | 1,405,000 | | | 1,515,700 |
| | | | | | |
| | | | | | 7,903,215 |
| | | | | | |
Michigan (4.8%) | | | | | | |
Michigan State General Obligation Unlimited Tax Bonds (Environmental Protection Program), Series 1992, 6.25%, 11/01/12 | | | 3,500,000 | | | 3,851,015 |
Michigan State Hospital Finance Authority Refunding Revenue Bonds, (Henry Ford Health), 6.00%, 11/15/24 | | | 1,500,000 | | | 1,615,110 |
Michigan State Hospital Finance Authority Revenue Bonds, (Ascension Health Credit), Series A, 5.75%, 11/15/18 | | | 2,000,000 | | | 2,145,220 |
| | | | | | |
| | | | | | 7,611,345 |
| | | | | | |
Minnesota (1.0%) | | | | | | |
St. Louis Park, Minnesota Independent School District Number 283 General Obligation Unlimited Tax Bonds, 5.75%, 02/01/18 | | | 1,500,000 | | | 1,569,180 |
| | | | | | |
Municipal Bonds (continued)
| | | | | | |
| | | Principal Amount | | Value |
| | | | | | |
Missouri (1.2%) | | | | | | |
Jackson County, Missouri Special Obligation Revenue Bonds, Series A, 5.50%, 12/01/12 | | $ | 1,415,000 | | $ | 1,553,260 |
Missouri State Environmental Improvement & Energy Resource Authority, State Revolving Fund-Multiple, Series A, Refunded Portion, 6.55%, 07/01/14 | | | 365,000 | | | 365,394 |
| | | | | | |
| | | | | | 1,918,654 |
| | | | | | |
Nevada (0.8%) | | | | | | |
University of Nevada Community College Revenue Bonds, 5.38%, 07/01/20 | | | 1,200,000 | | | 1,263,960 |
| | | | | | |
New Jersey (2.9%) | | | | | | |
New Jersey State Transportation Trust Fund Authority, Transportation Systems Revenue Bonds, Series A, 5.75%, 06/15/17 | | | 1,000,000 | | | 1,150,130 |
New Jersey State Transportation Trust Fund Authority, Transportation Systems Revenue Bonds, Series B, 6.00%, 12/15/15 | | | 2,000,000 | | | 2,229,320 |
New Jersey State Turnpike Authority Revenue Bonds, Prerefunded Series 1991-C, 6.50%, 01/01/16 | | | 790,000 | | | 925,382 |
New Jersey State Turnpike Authority Revenue Bonds, Prerefunded Series 1991-C, 6.50%, 01/01/16 | | | 55,000 | | | 64,423 |
New Jersey State Turnpike Authority Revenue Bonds, Unrefunded Series 1991-C, 6.50%, 01/01/16 | | | 155,000 | | | 178,951 |
| | | | | | |
| | | | | | 4,548,206 |
| | | | | | |
New Mexico (1.0%) | | | | | | |
Bernalillo County, New Mexico Gross Receipts Tax Revenue Bonds, 5.25%, 10/01/26 | | | 1,500,000 | | | 1,569,045 |
| | | | | | |
| | | | | | |
| | | Principal Amount | | Value |
| | | | | | |
New York (1.4%) | | | | | | |
New York State Local Government Assistance Corporation Revenue Refunding Bonds, Series 1993-E, 6.00%, 04/01/14 | | $ | 1,000,000 | | $ | 1,129,149 |
New York, New York City Transitional Finance Authority Future Tax Secured Revenue Bonds, 5.75%, 11/15/19 | | | 205,000 | | | 222,159 |
New York, New York City Transitional Finance Authority Future Tax Secured Revenue Bonds, 5.75%, 11/15/19 | | | 795,000 | | | 861,542 |
| | | | | | |
| | | | | | 2,212,850 |
| | | | | | |
North Carolina (3.1%) | | | | | | |
North Carolina Housing Finance Agency, Single-Family Revenue Bonds, Series A, 6.25%, 03/01/17 | | | 600,000 | | | 603,576 |
North Carolina Med Care Commission Hospital Revenue Bonds, (Gaston Health Care), Prerefunded, 5.00%, 02/15/29 | | | 1,070,000 | | | 1,098,783 |
North Carolina Med Care Commission Hospital Revenue Bonds, (Gaston Health Care), Unrefunded, 5.00%, 02/15/29 | | | 1,230,000 | | | 1,245,129 |
North Carolina Medical Care Commission Hospital Revenue Bonds (Firsthealth of the Carolinas), 4.75%, 10/01/26 | | | 2,000,000 | | | 2,038,040 |
| | | | | | |
| | | | | | 4,985,528 |
| | | | | | |
Ohio (3.8%) | | | | | | |
Cleveland, Ohio Waterworks Revenue Bonds, Series K, 5.25%, 01/01/20 | | | 1,000,000 | | | 1,078,990 |
Franklin County, Ohio Hospital Refunding & Improvement Revenue Bonds, (The Children’s Hospital Project), Series 1996-A, 5.75%, 11/01/20 | | | 1,100,000 | | | 1,111,000 |
Hamilton, Ohio City School District General Obligation Bonds, Series A, 5.50%, 12/01/19 | | | 1,000,000 | | | 1,066,230 |
Statement of Investments (Continued)
October 31, 2006
Gartmore Tax-Free Fund (Continued)
Municipal Bonds (continued)
| | | | | | |
| | | Principal Amount | | Value |
| | | | | | |
Ohio (continued) | | | | | | |
Montgomery County, Ohio Hospital Revenue Bonds (Kettering Medical Center), 6.75%, 04/01/18 | | $ | 2,500,000 | | $ | 2,774,400 |
| | | | | | |
| | | | | | 6,030,620 |
| | | | | | |
South Carolina (3.8%) | | | | | | |
Greenville, South Carolina Waterworks Revenue Bonds, 5.25%, 02/01/16 | | | 1,685,000 | | | 1,810,027 |
South Carolina State Public Service Authority Revenue Bonds, Series A, 5.50%, 01/01/22 | | | 1,000,000 | | | 1,056,860 |
South Carolina Transportation Infrastructure Revenue Bonds, Series A, 5.38%, 10/01/24 | | | 3,000,000 | | | 3,179,700 |
| | | | | | |
| | | | | | 6,046,587 |
| | | | | | |
Tennessee (3.5%) | | | | | | |
Shelby County, Tennessee Educational & Housing Facilities Board Revenue Bonds (St. Judes Children’s Research), 5.38%, 07/01/24 | | | 4,200,000 | | | 4,438,392 |
Shelby County, Tennessee Health Educational & Housing Facilities Board Revenue Bonds (St. Judes Children’s Research), 6.00%, 07/01/14 | | | 1,000,000 | | | 1,076,130 |
| | | | | | |
| | | | | | 5,514,522 |
| | | | | | |
Texas (17.3%) | | | | | | |
Collin County, Texas Permanent Improvement General Obligation Limited Tax Bonds, Series A, 5.50%, 02/15/19 | | | 1,300,000 | | | 1,355,055 |
Comal, Texas Independent School District General Obligation Unlimited Tax School Building and Refunding Bonds, 5.63%, 08/01/19 | | | 2,000,000 | | | 2,104,820 |
Fort Bend Independent School District, Texas General Obligation Unlimited Tax Bonds, Series 1996, 5.00%, 02/15/18 | | | 2,300,000 | | | 2,544,536 |
| | | | | | |
| | | Principal Amount | | Value |
| | | | | | |
Texas (continued) | | | | | | |
Fort Worth, Texas General Obligation Limited Tax Bonds, 5.63%, 03/01/17 | | $ | 1,350,000 | | $ | 1,359,234 |
Harris County, Texas Health Facilities Development Corporation Revenue School Health Care Systems, Series B, 5.75%, 07/01/27 | | | 5,325,000 | | | 6,398,679 |
Houston, Texas Independent School District General Obligation Limited Tax School House Refunding Bonds, Series 1997, 5.38%, 08/15/17 | | | 1,500,000 | | | 1,507,245 |
Houston, Texas Independent School District General Obligation Limited Tax School House Refunding Bonds, Series A, 4.75%, 02/15/26 | | | 2,000,000 | | | 2,020,980 |
Leander, Texas Independent School District General Obligation Unlimited Refunding Bonds, 5.00%, 08/15/22 | | | 1,000,000 | | | 1,047,960 |
Lower Colorado River Authority, Texas Junior Lien Refunding Revenue Bonds, Escrowed Series 1992, 6.00%, 01/01/17 | | | 1,245,000 | | | 1,474,018 |
Montgomery County, Texas General Obligation Limited, 5.25%, 09/01/19 | | | 1,000,000 | | | 1,059,930 |
San Antonio, Texas Water Revenue Bonds, 5.00%, 05/15/25 | | | 1,000,000 | | | 1,043,630 |
Socorro, Texas Independent School District General Obligation Unlimited Tax Bonds, Series A, 5.75%, 02/15/14 | | | 1,000,000 | | | 1,027,560 |
Spring Branch, Texas Independent School District General Obligation Limited, 5.20%, 02/01/20 | | | 1,500,000 | | | 1,581,510 |
United Independent School District General Obligation Unlimited Tax Bonds, 5.38%, 08/15/25 | | | 1,000,000 | | | 1,047,910 |
Wichita Falls, Texas Water and Sewer Revenue Bonds (Priority Lien), 5.38%, 08/01/19 | | | 2,000,000 | | | 2,143,520 |
| | | | | | |
| | | | | | 27,716,587 |
| | | | | | |
Municipal Bonds (continued)
| | | | | | |
| | | Principal Amount | | Value |
| | | | | | |
Vermont (1.4%) | | | | | | |
Vermont Educational & Health Buildings Financing Agency Revenue Bonds (Fletcher Allen Health), Series A, 6.00%, 12/01/23 | | $ | 2,000,000 | | $ | 2,175,520 |
| | | | | | |
Virginia (2.6%) | | | | | | |
Fairfax County, Virginia Water Authority Refunding Revenue Bonds, Series 1992, 6.00%, 04/01/22 | | | 940,000 | | | 967,551 |
Virginia College Building Authority Educational Facilities Revenue Bonds, 5.00%, 02/01/18 | | | 2,955,000 | | | 3,129,198 |
| | | | | | |
| | | | | | 4,096,749 |
| | | | | | |
Washington (4.8%) | | | | | | |
Seattle, Washington Municipal Light & Power Revenue Improvement & Refunding Revenue Bonds, 5.13%, 03/01/26 | | | 1,000,000 | | | 1,041,020 |
Seattle, Washington Water Systems Revenue Bonds, 5.38%, 03/01/29 | | | 2,000,000 | | | 2,082,120 |
Washington State Motor Vehicle Fuel Tax General Obligation Unlimited Tax Bonds, Series 1997-D, 5.38%, 01/01/22 | | | 3,500,000 | | | 3,510,430 |
Washington State Motor Vehicle Fuel Tax General Obligation Unlimited Tax Bonds, Series C, 5.80%, 01/01/17 | | | 1,000,000 | | | 1,065,740 |
| | | | | | |
| | | | | | 7,699,310 |
| | | | | | |
Wisconsin (1.7%) | | | | | | |
Wisconsin State General Obligation Unlimited, Series C, 5.55%, 05/01/21 | | | 1,000,000 | | | 1,064,170 |
Wisconsin State Transportation Revenue Bonds, Series A, 5.50%, 07/01/16 | | | 1,500,000 | | | 1,600,575 |
| | | | | | |
| | | | | | 2,664,745 |
| | | | | | |
| |
Total Municipal Bonds | | | 157,757,597 |
| | | | | | |
| | | | | |
| | | | |
Value |
| | | | | |
Total Investments
(Cost $146,086,708) (a) — 98.9% | | $ | 157,757,597 |
| |
Other assets in excess of
liabilities — 1.1% | | | 1,810,430 |
| | | | | |
| | |
NET ASSETS — 100.0% | | | | $ | 159,568,027 |
| | | | | |
| | (a) | See notes to financial statements for tax unrealized appreciation (depreciation) of securities. |
Distribution of investments, as a percentage of net assets in securities at value, is as follows:
| | | | | |
| Industry | | Percent | | Value |
Air, Water, and Solid Waste | | 1.34% | | $ | 2,143,520 |
Airports-Flying Fields | | 2.89% | | | 4,605,510 |
Colleges and Universities | | 5.06% | | | 8,081,397 |
Educational Services | | 0.64% | | | 1,027,560 |
Elementary and Secondary Schools | | 5.18% | | | 8,268,455 |
Environmental Quality | | 0.23% | | | 365,394 |
Facilities Support Services | | 3.64% | | | 5,802,200 |
Finance, Taxation, and Money | | 7.24% | | | 11,550,605 |
General Obligation | | 24.27% | | | 38,673,818 |
Health Services | | 8.83% | | | 14,088,722 |
Hospitals | | 12.95% | | | 20,671,334 |
Regulation, Administration of Transportation | | 1.74% | | | 2,769,331 |
Regulation, Administration of Utilities | | 0.65% | | | 1,041,020 |
Single Family Housing | | 0.38% | | | 603,576 |
Tobacco and Tobacco Products | | 4.79% | | | 7,641,490 |
Transportation Services | | 8.43% | | | 13,451,757 |
Water, Sewer, and Utility | | 10.64% | | | 16,971,908 |
See notes to financial statements.
Statements of Assets and Liabilities
October 31, 2006
| | | | | | | | | | | | | | | | | | | | | | |
| | | Gartmore
Bond Fund | | | Gartmore
Enhanced
Income Fund | | | Gartmore
Government
Bond Fund | | | Gartmore Short
Duration
Bond Fund | | | Gartmore
Tax-Free Income
Fund |
Assets: | | | | | | | | | | | | | | | | | | | | | | |
Investments, at value
(cost $107,523,144; $428,625,367; $138,568,031; $92,480,555; and $146,086,708; respectively) | | $ | 110,555,348 | | | $ | 427,241,177 | | | $ | 139,482,806 | | | $ | 91,069,523 | | | $ | 157,757,597 | | | |
Repurchase agreements, at cost and value* | | | 3,723,956 | | | | 25,327,647 | | | | 749,018 | | | | 5,062,121 | | | | — | | | |
| | | | | | | | | | | | | | | | | | | | | | | |
Total Investments | | | 114,279,304 | | | | 452,568,824 | | | | 140,231,824 | | | | 96,131,644 | | | | 157,757,597 | | | |
| | | | | | | | | | | | | | | | | | | | | | | |
Cash | | | 1,253 | | | | 23 | | | | — | | | | — | | | | — | | | |
Interest and dividends receivable | | | 1,072,128 | | | | 2,306,971 | | | | 987,058 | | | | 831,750 | | | | 2,638,003 | | | |
Receivable for capital shares issued | | | 49,303 | | | | 1,091 | | | | 7,831 | | | | 8,397 | | | | 2,625 | | | |
Prepaid expenses and other assets | | | 26,641 | | | | 20,231 | | | | 25,522 | | | | 671 | | | | 10,762 | | | |
| | | | | | | | | | | | | | | | | | | | | | | |
Total Assets | | | 115,428,629 | | | | 454,897,140 | | | | 141,252,235 | | | | 96,972,462 | | | | 160,408,987 | | | |
| | | | | | | | | | | | | | | | | | | | | | | |
| | | | | | |
Liabilities | | | | | | | | | | | | | | | | | | | | | | |
Payable to custodian | | | — | | | | — | | | | — | | | | — | | | | 401,189 | | | |
Distributions payable | | | 57,156 | | | | 1,173 | | | | 51,710 | | | | 7,182 | | | | 149,145 | | | |
Payable for return of collateral received for securities on loan | | | 3,723,956 | | | | 14,034,396 | | | | — | | | | — | | | | — | | | |
Payable for capital shares redeemed | | | 399,206 | | | | 2,037,531 | | | | 11,186,107 | | | | 309,539 | | | | 151,962 | | | |
Accrued expenses and other payables | | | | | | | | | | | | | | | | | | | | | | |
Investment advisory fees | | | 47,029 | | | | 114,690 | | | | 60,235 | | | | 20,803 | | | | 67,857 | | | |
Fund administration and transfer agent fees | | | 12,064 | | | | 49,910 | | | | 17,234 | | | | 19,831 | | | | 18,943 | | | |
Distribution fees | | | 5,148 | | | | 339 | | | | 13,840 | | | | 19,895 | | | | 6,009 | | | |
Administrative servicing fees | | | 9,344 | | | | 1,218 | | | | 14,567 | | | | 17,857 | | | | 675 | | | |
Trustee fees | | | 15 | | | | 69 | | | | 21 | | | | 14 | | | | 22 | | | |
Compliance program fees (Note 3) | | | 960 | | | | 4,478 | | | | 1,356 | | | | 883 | | | | 1,458 | | | |
Other | | | 48,760 | | | | 18,815 | | | | 28,774 | | | | 41,684 | | | | 43,700 | | | |
| | | | | | | | | | | | | | | | | | | | | | | |
Total Liabilities | | | 4,303,638 | | | | 16,262,619 | | | | 11,373,844 | | | | 437,688 | | | | 840,960 | | | |
| | | | | | | | | | | | | | | | | | | | | | | |
Net Assets | | $ | 111,124,991 | | | $ | 438,634,521 | | | $ | 129,878,391 | | | $ | 96,534,774 | | | $ | 159,568,027 | | | |
| | | | | | | | | | | | | | | | | | | | | | | |
| | | | | | |
Represented by: | | | | | | | | | | | | | | | | | | | | | | |
Capital | | $ | 110,439,162 | | | $ | 445,982,924 | | | $ | 129,921,326 | | | $ | 100,810,653 | | | $ | 147,758,882 | | | |
Accumulated net investment
income (loss) | | | 130,670 | | | | 119,508 | | | | 67,517 | | | | (50,356 | ) | | | (155,747 | ) | | |
Accumulated net realized gains (losses) on investment and futures transactions | | | (2,477,045 | ) | | | (6,083,721 | ) | | | (1,025,227 | ) | | | (2,814,491 | ) | | | 294,003 | | | |
Net unrealized appreciation (depreciation) on investments | | | 3,032,204 | | | | (1,384,190 | ) | | | 914,775 | | | | (1,411,032 | ) | | | 11,670,889 | | | |
| | | | | | | | | | | | | | | | | | | | | | | |
Net Assets | | $ | 111,124,991 | | | $ | 438,634,521 | | | $ | 129,878,391 | | | $ | 96,534,774 | | | $ | 159,568,027 | | | |
| | | | | | | | | | | | | | | | | | | | | | | |
| | | | | | | | | | | | | | | | | | | | | | | |
| | | | | | | | | | | | | | | | | | | | | | | |
| * | Includes securities held as collateral for securities on loan of $3,723,956; $14,034,396; $0; $0 and $0; respectively. |
See notes to financial statements.
Statements of Assets and Liabilities (Continued)
| | | | | | | | | | | | | | | | | | | | | | |
| | | Gartmore
Bond Fund | | | Gartmore
Enhanced
Income Fund | | | Gartmore
Government
Bond Fund | | | Gartmore Short
Duration
Bond Fund | | | Gartmore
Tax-Free Income
Fund |
Net Assets: | | | | | | | | | | | | | | | | | | | | | | |
Class A Shares | | $ | 11,434,384 | | | $ | 1,569,685 | | | $ | 31,585,695 | | | $ | 958,610 | | | $ | 8,714,399 | | | |
Class B Shares | | | 268,065 | | | | — | | | | 360,941 | | | | — | | | | 791,932 | | | |
Class C Shares | | | 1,305,823 | | | | — | | | | 2,645,133 | | | | 141,729 | | | | 1,206,952 | | | |
Class D Shares | | | 83,878,254 | | | | — | | | | 92,547,417 | | | | — | | | | 145,552,965 | | | |
Class R Shares | | | 1,112 | | | | 1,062 | | | | 1,081 | | | | — | | | | — | | | |
Class X Shares | | | 1,853,579 | | | | — | | | | 1,907,290 | | | | — | | | | 3,167,023 | | | |
Class Y Shares | | | 150,773 | | | | — | | | | 829,792 | | | | — | | | | 134,756 | | | |
Institutional Service Class Shares | | | — | | | | 11,872 | | | | — | | | | — | | | | — | | | |
Institutional Class Shares | | | 12,233,001 | | | | 437,051,902 | | | | 1,042 | | | | 5,354,369 | | | | — | | | |
IRA Class Shares | | | — | | | | — | | | | — | | | | 22,262,998 | | | | — | | | |
Service Class Shares | | | — | | | | — | | | | — | | | | 67,817,068 | | | | — | | | |
| | | | | | | | | | | | | | | | | | | | | | | |
Total | | $ | 111,124,991 | | | $ | 438,634,521 | | | $ | 129,878,391 | | | $ | 96,534,774 | | | $ | 159,568,027 | | | |
| | | | | | | | | | | | | | | | | | | | | | | |
| | | | | | |
Shares outstanding (unlimited
number of shares authorized): | | | | | | | | | | | | | | | | | | | | | | |
Class A Shares | | | 1,194,116 | | | | 171,860 | | | | 3,100,201 | | | | 97,111 | | | | 829,934 | | | |
Class B Shares | | | 27,996 | | | | — | | | | 35,422 | | | | — | | | | 75,436 | | | |
Class C Shares | | | 136,276 | | | | — | | | | 259,669 | | | | 14,347 | | | | 115,200 | | | |
Class D Shares | | | 8,747,751 | | | | — | | | | 9,078,678 | | | | — | | | | 13,862,077 | | | |
Class R Shares | | | 116 | | | | 117 | | | | 106 | | | | — | | | | — | | | |
Class X Shares | | | 193,552 | | | | — | | | | 187,346 | | | | — | | | | 301,602 | | | |
Class Y Shares | | | 15,727 | | | | — | | | | 81,512 | | | | — | | | | 12,866 | | | |
Institutional Service Class Shares | | | — | | | | 1,300 | | | | — | | | | — | | | | — | | | |
Institutional Class Shares | | | 1,275,558 | | | | 47,857,572 | | | | 102 | | | | 542,295 | | | | — | | | |
IRA Class Shares | | | — | | | | — | | | | — | | | | 2,255,003 | | | | — | | | |
Service Class Shares | | | — | | | | — | | | | — | | | | 6,869,686 | | | | — | | | |
| | | | | | | | | | | | | | | | | | | | | | | |
Total | | | 11,591,092 | | | | 48,030,849 | | | | 12,743,036 | | | | 9,778,442 | | | | 15,197,115 | | | |
| | | | | | | | | | | | | | | | | | | | | | | |
| | | | | | |
Net asset value and redemption price per share (Net assets by class divided by shares outstanding by class, respectively): | | | | | | | | | | | | | | | | | | | | | | |
Class A Shares | | $ | 9.58 | | | $ | 9.13 | | | $ | 10.19 | | | $ | 9.87 | | | $ | 10.50 | | | |
Class B Shares (a) | | $ | 9.57 | (c) | | $ | — | | | $ | 10.19 | | | $ | — | | | $ | 10.50 | | | |
Class C Shares (b) | | $ | 9.58 | | | $ | — | | | $ | 10.19 | | | $ | 9.88 | | | $ | 10.48 | | | |
Class D Shares | | $ | 9.59 | | | $ | — | | | $ | 10.19 | | | $ | — | | | $ | 10.50 | | | |
Class R Shares | | $ | 9.59 | | | $ | 9.14 | (c) | | $ | 10.20 | | | $ | — | | | $ | — | | | |
Class X Shares (a) | | $ | 9.58 | | | $ | — | | | $ | 10.18 | | | $ | — | | | $ | 10.50 | | | |
Class Y Shares (b) | | $ | 9.59 | | | $ | — | | | $ | 10.18 | | | $ | — | | | $ | 10.47 | | | |
Institutional Service Class Shares | | $ | — | | | $ | 9.14 | (c) | | $ | — | | | $ | — | | | $ | — | | | |
Institutional Class Shares | | $ | 9.59 | | | $ | 9.13 | | | $ | 10.19 | (c) | | $ | 9.87 | | | $ | — | | | |
IRA Class Shares | | $ | — | | | $ | — | | | $ | — | | | $ | 9.87 | | | $ | — | | | |
Service Class Shares | | $ | — | | | $ | — | | | $ | — | | | $ | 9.87 | | | $ | — | | | |
| | | | | | |
Maximum offering price per share (100%/(100%-maximum sales charge) of net asset value adjusted to the nearest cent): | | | | | | | | | | | | | | | | | | | | | | |
Class A Shares | | $ | 10.01 | | | $ | 9.34 | | | $ | 10.64 | | | $ | 10.10 | | | $ | 10.97 | | | |
Class D Shares | | $ | 10.04 | | | $ | — | | | $ | 10.67 | | | $ | — | | | $ | 10.99 | | | |
| | | | | | | | | | | | | | | | | | | | | | | |
Maximum Sales Charge — Class A Shares | | | 4.25 | % | | | 2.25 | % | | | 4.25 | % | | | 2.25 | % | | | 4.25 | % | | |
| | | | | | | | | | | | | | | | | | | | | | | |
Maximum Sales Charge — Class D Shares | | | 4.50 | % | | | — | | | | 4.50 | % | | | — | | | | 4.50 | % | | |
| | | | | | | | | | | | | | | | | | | | | | | |
| (a) | For Class B and Class X Shares, the redemption price per share varies by length of time shares are held. |
| (b) | For Class C and Class Y Shares, the redemption price per share is reduced by 1.00% for shares held less than one year. |
| (c) | The NAV reported above represents the traded NAV at October 31, 2006. Due to the financial statement rounding of class assets and class shares above, the NAV results in a different NAV than the traded NAV. |
See notes to financial statements.
Statements of Operations
For the Year Ended October 31, 2006
| | | | | | | | | | | | | | | | | | | | | | |
| | | Gartmore
Bond Fund | | | Gartmore
Enhanced
Income Fund | | | Gartmore
Government
Bond Fund | | | Gartmore Short
Duration
Bond Fund | | | Gartmore
Tax-Free Income
Fund |
INVESTMENT INCOME: | | | | | | | | | | | | | | | | | | | | | | |
Interest income | | $ | 6,501,968 | | | $ | 20,957,441 | | | $ | 7,696,090 | | | $ | 4,234,394 | | | $ | 8,547,989 | | | |
Income from securities lending | | | 22,688 | | | | 3,576 | | | | 13,040 | | | | — | | | | — | | | |
| | | | | | | | | | | | | | | | | | | | | | | |
Total Income | | | 6,524,656 | | | | 20,961,017 | | | | 7,709,130 | | | | 4,234,394 | | | | 8,547,989 | | | |
| | | | | | | | | | | | | | | | | | | | | | | |
| | | | | | |
Expenses: | | | | | | | | | | | | | | | | | | | | | | |
Investment advisory fees | | | 560,910 | | | | 1,730,576 | | | | 765,900 | | | | 386,120 | | | | 842,625 | | | |
Fund administration and transfer agent fees | | | 136,062 | | | | 490,593 | | | | 166,625 | | | | 123,973 | | | | 194,601 | | | |
Distribution fees Class A | | | 26,275 | | | | 4,703 | | | | 125,749 | | | | 2,543 | | | | 22,231 | | | |
Distribution fees Class B | | | 2,662 | | | | — | | | | 2,410 | | | | — | | | | 6,972 | | | |
Distribution fees Class C | | | 10,708 | | | | — | | | | 18,460 | | | | 655 | | | | 12,157 | | | |
Distribution fees Class R | | | 4 | | | | 4 | | | | 4 | | | | — | | | | — | | | |
Distribution fees Class X | | | 19,119 | | | | — | | | | 21,749 | | | | — | | | | 35,255 | | | |
Distribution fees Class Y | | | 1,395 | | | | — | | | | 7,057 | | | | — | | | | 1,946 | | | |
Distribution fees IRA Class | | | — | | | | — | | | | — | | | | 76,451 | | | | — | | | |
Distribution fees Service Class | | | — | | | | — | | | | — | | | | 182,125 | | | | — | | | |
Administrative servicing fees Class A | | | 8,348 | | | | 353 | | | | 66,826 | | | | — | | | | 107 | | | |
Administrative servicing fees Class D | | | 45,350 | | | | — | | | | 88,126 | | | | — | | | | — | | | |
Administrative servicing fees Institutional Service Class | | | — | | | | 9,612 | | | | — | | | | — | | | | — | | | |
Administrative servicing fees IRA Class | | | — | | | | — | | | | — | | | | 39,022 | | | | — | | | |
Administrative servicing fees Service Class | | | — | | | | — | | | | — | | | | 60,059 | | | | — | | | |
Registration and filing fees | | | 51,425 | | | | 57,595 | | | | 55,048 | | | | 57,295 | | | | 42,351 | | | |
Printing fees | | | 53,902 | | | | 7,999 | | | | 38,577 | | | | 22,403 | | | | 50,299 | | | |
Trustee fees | | | 3,861 | | | | 17,041 | | | | 5,303 | | | | 3,842 | | | | 5,817 | | | |
Compliance program fees (Note 3) | | | 1,922 | | | | 9,068 | | | | 2,685 | | | | 1,794 | | | | 2,917 | | | |
Other | | | 43,374 | | | | 105,811 | | | | 45,679 | | | | 22,286 | | | | 51,015 | | | |
| | | | | | | | | | | | | | | | | | | | | | | |
Total expenses before voluntary fee reductions | | | 965,317 | | | | 2,433,355 | | | | 1,410,198 | | | | 978,568 | | | | 1,268,293 | | | |
Earnings credit (Note 5) | | | (6,245 | ) | | | (12,273 | ) | | | (2,032 | ) | | | (1,917 | ) | | | (7,923 | ) | | |
Expenses voluntarily reduced by Investment Adviser | | | — | | | | — | | | | — | | | | (110,319 | ) | | | — | | | |
Expenses reimbursed | | | — | | | | (180,035 | ) | | | — | | | | — | | | | — | | | |
Expenses voluntarily waived by administrator | | | (801 | ) | | | (347 | ) | | | (466 | ) | | | — | | | | (706 | ) | | |
| | | | | | | | | | | | | | | | | | | | | | | |
Net Expenses | | | 958,271 | | | | 2,240,700 | | | | 1,407,700 | | | | 866,332 | | | | 1,259,664 | | | |
| | | | | | | | | | | | | | | | | | | | | | | |
Net Investment Income (Loss) | | | 5,566,385 | | | | 18,720,317 | | | | 6,301,430 | | | | 3,368,062 | | | | 7,288,325 | | | |
| | | | | | | | | | | | | | | | | | | | | | | |
| | | | | | |
REALIZED/UNREALIZED GAINS
(LOSSES) FROM INVESTMENTS: | | | | | | | | | | | | | | | | | | | | | | |
Net realized gains (losses) on investment transactions | | | 424,133 | | | | (672,047 | ) | | | (1,025,947 | ) | | | (520,530 | ) | | | 617,994 | | | |
Net realized gains (losses) on futures transactions | | | — | | | | 527,688 | | | | — | | | | — | | | | — | | | |
| | | | | | | | | | | | | | | | | | | | | | | |
Net realized gains (losses) on investment and futures transactions | | | 424,133 | | | | (144,359 | ) | | | (1,025,947 | ) | | | (520,530 | ) | | | 617,994 | | | |
Net change in unrealized appreciation/depreciation on investments | | | (230,405 | ) | | | 2,700,418 | | | | 1,226,402 | | | | 1,195,324 | | | | (454,755 | ) | | |
| | | | | | | | | | | | | | | | | | | | | | | |
Net realized/unrealized gains (losses) on investments and futures | | | 193,728 | | | | 2,556,059 | | | | 200,455 | | | | 674,794 | | | | 163,239 | | | |
| | | | | | | | | | | | | | | | | | | | | | | |
CHANGE IN NET ASSETS
RESULTING FROM OPERATIONS | | $ | 5,760,113 | | | $ | 21,276,376 | | | $ | 6,501,885 | | | $ | 4,042,856 | | | $ | 7,451,564 | | | |
| | | | | | | | | | | | | | | | | | | | | | | |
See notes to financial statements.
Statements of Changes in Net Assets
| | | | | | | | | | | | | | | | | | |
| | | Gartmore Bond Fund | | | Gartmore Enhanced Income Fund |
| | | Year Ended
October 31, 2006 | | | Year Ended
October 31, 2005 | | | Year Ended
October 31, 2006 | | | Year Ended
October 31, 2005 |
FROM INVESTMENT ACTIVITIES: | | | | | | | | | | | | | | | | | | |
Operations: | | | | | | | | | | | | | | | | | | |
Net investment income | | $ | 5,566,385 | | | $ | 5,334,101 | | | $ | 18,720,317 | | | $ | 10,512,686 | | | |
Net realized gains (losses) on investment and futures transactions | | | 424,133 | | | | 1,051,917 | | | | (144,359 | ) | | | 250,527 | | | |
Net change in unrealized appreciation/depreciation on investments | | | (230,405 | ) | | | (3,797,729 | ) | | | 2,700,418 | | | | (2,909,779 | ) | | |
| | | | | | | | | | | | | | | | | | |
Change in net assets from operations | | | 5,760,113 | | | | 2,588,289 | | | | 21,276,376 | | | | 7,853,434 | | | |
| | | | | | | | | | | | | | | | | | |
| | | | | |
Distributions to Class A Shareholders from: | | | | | | | | | | | | | | | | | | |
Net investment income | | | (481,376 | ) | | | (400,142 | ) | | | (66,019 | ) | | | (31,968 | ) | | |
| | | | | |
Distributions to Class B Shareholders from: | | | | | | | | | | | | | | | | | | |
Net investment income | | | (10,430 | ) | | | (5,213 | ) | | | — | | | | — | | | |
| | | | | |
Distributions to Class C Shareholders from: | | | | | | | | | | | | | | | | | | |
Net investment income | | | (41,997 | ) | | | (17,810 | ) | | | — | | | | — | | | |
| | | | | |
Distributions to Class D Shareholders from: | | | | | | | | | | | | | | | | | | |
Net investment income | | | (4,354,026 | ) | | | (4,714,110 | ) | | | — | | | | — | | | |
| | | | | |
Distributions to Class R Shareholders from: | | | | | | | | | | | | | | | | | | |
Net investment income | | | (47 | ) | | | (43 | ) | | | (36 | ) | | | (26 | ) | | |
| | | | | |
Distributions to Class X Shareholders from: | | | | | | | | | | | | | | | | | | |
Net investment income | | | (90,700 | ) | | | (116,559 | ) | | | — | | | | — | | | |
| | | | | |
Distributions to Class Y Shareholders from: | | | | | | | | | | | | | | | | | | |
Net investment income | | | (6,609 | ) | | | (7,971 | ) | | | — | | | | — | | | |
| | | | | |
Distributions to Institutional Service Class Shareholders from: | | | | | | | | | | | | | | | | | | |
Net investment income | | | — | | | | — | | | | (138,118 | ) | | | (174,593 | ) | | |
| | | | | |
Distributions to Institutional Class Shareholders from: | | | | | | | | | | | | | | | | | | |
Net investment income | | | (392,477 | ) | | | (64,941 | ) | | | (18,544,991 | ) | | | (10,887,612 | ) | | |
| | | | | | | | | | | | | | | | | | |
Change in net assets from shareholder distributions | | | (5,377,662 | ) | | | (5,326,789 | ) | | | (18,749,164 | ) | | | (11,094,199 | ) | | |
| | | | | | | | | | | | | | | | | | |
Change in net assets from capital transactions | | | (7,184,180 | ) | | | (6,874,780 | ) | | | (23,545,406 | ) | | | 153,943,037 | | | |
| | | | | | | | | | | | | | | | | | |
Change in net assets | | | (6,801,729 | ) | | | (9,613,280 | ) | | | (21,018,194 | ) | | | 150,702,272 | | | |
| | | | | |
Net Assets: | | | | | | | | | | | | | | | | | | |
Beginning of period | | | 117,926,720 | | | | 127,540,000 | | | | 459,652,715 | | | | 308,950,443 | | | |
| | | | | | | | | | | | | | | | | | |
End of period | | $ | 111,124,991 | | | $ | 117,926,720 | | | $ | 438,634,521 | | | $ | 459,652,715 | | | |
| | | | | | | | | | | | | | | | | | |
Accumulated net investment income (loss) at end of period | | $ | 130,670 | | | $ | (8,583 | ) | | $ | 119,508 | | | $ | 8,219 | | | |
| | | | | | | | | | | | | | | | | | |
| | | | | | | | | | | | | | | | | | | |
See notes to financial statements.
Statements of Changes in Net Assets (Continued)
| | | | | | | | | | |
| | | Gartmore Government Bond Fund |
| | | Year Ended
October 31, 2006 | | | Year Ended
October 31, 2005 |
FROM INVESTMENT ACTIVITIES: | | | | | | | | | | |
Operations: | | | | | | | | | | |
Net investment income | | $ | 6,301,430 | | | $ | 6,204,349 | | | |
Net realized gains (losses) on investment and futures transactions | | | (1,025,947 | ) | | | 1,115,473 | | | |
Net change in unrealized appreciation/depreciation on investments | | | 1,226,402 | | | | (4,458,806 | ) | | |
| | | | | | | | | | |
Change in net assets from operations | | | 6,501,885 | | | | 2,861,016 | | | |
| | | | | | | | | | |
| | | |
Distributions to Class A Shareholders from: | | | | | | | | | | |
Net investment income | | | (1,954,841 | ) | | | (1,860,894 | ) | | |
Net realized gains on investments | | | (43,893 | ) | | | — | | | |
| | | |
Distributions to Class B Shareholders from: | | | | | | | | | | |
Net investment income | | | (8,030 | ) | | | (4,091 | ) | | |
Net realized gains on investments | | | (110 | ) | | | — | | | |
| | | |
Distributions to Class C Shareholders from: | | | | | | | | | | |
Net investment income | | | (61,902 | ) | | | (7,026 | ) | | |
Net realized gains on investments | | | (515 | ) | | | — | | | |
| | | |
Distributions to Class D Shareholders from: | | | | | | | | | | |
Net investment income | | | (4,068,467 | ) | | | (4,149,513 | ) | | |
Net realized gains on investments | | | (85,199 | ) | | | — | | | |
| | | |
Distributions to Class R Shareholders from: | | | | | | | | | | |
Net investment income | | | (41 | ) | | | (35 | ) | | |
Net realized gains on investments | | | (1 | ) | | | — | | | |
| | | |
Distributions to Class X Shareholders from: | | | | | | | | | | |
Net investment income | | | (86,790 | ) | | | (117,368 | ) | | |
Net realized gains on investments | | | (2,674 | ) | | | — | | | |
| | | |
Distributions to Class Y Shareholders from: | | | | | | | | | | |
Net investment income | | | (28,448 | ) | | | (26,680 | ) | | |
Net realized gains on investments | | | (712 | ) | | | — | | | |
| | | |
Distributions to Institutional Class Shareholders from: | | | | | | | | | | |
Net investment income | | | (43 | ) | | | (24,866 | ) | | |
Net realized gains on investments | | | (1 | ) | | | — | | | |
| | | | | | | | | | |
Change in net assets from shareholder distributions | | | (6,341,667 | ) | | | (6,190,473 | ) | | |
| | | | | | | | | | |
Change in net assets from capital transactions | | | (35,168,351 | ) | | | (14,723,998 | ) | | |
| | | | | | | | | | |
Change in net assets | | | (35,008,133 | ) | | | (18,053,455 | ) | | |
| | | |
Net Assets: | | | | | | | | | | |
Beginning of period | | | 164,886,524 | | | | 182,939,979 | | | |
| | | | | | | | | | |
End of period | | $ | 129,878,391 | | | $ | 164,886,524 | | | |
| | | | | | | | | | |
Accumulated net investment income (loss) at end of period | | $ | 67,517 | | | $ | 18,760 | | | |
| | | | | | | | | | |
| | | | | | | | | | |
| | | | | | | | | | | |
See notes to financial statements.
Statements of Changes in Net Assets (Continued)
| | | | | | | | | | | | | | | | | | |
| | | Gartmore Short Duration Bond Fund | | | Gartmore Tax-Free Income Fund |
| | | Year Ended
October 31, 2006 | | | Year Ended
October 31, 2005 | | | Year Ended
October 31, 2006 | | | Year Ended
October 31, 2005 |
FROM INVESTMENT ACTIVITIES: | | | | | | | | | | | | | | | | | | |
Operations: | | | | | | | | | | | | | | | | | | |
Net investment income | | $ | 3,368,062 | | | $ | 5,451,203 | | | $ | 7,288,325 | | | $ | 7,214,378 | | | |
Net realized gains (losses) on investment transactions | | | (520,530 | ) | | | (1,216,116 | ) | | | 617,994 | | | | 267,828 | | | |
Net change in unrealized appreciation/depreciation on investments | | | 1,195,324 | | | | (2,606,356 | ) | | | (454,755 | ) | | | (3,449,647 | ) | | |
| | | | | | | | | | | | | | | | | | |
Change in net assets from operations | | | 4,042,856 | | | | 1,628,731 | | | | 7,451,564 | | | | 4,032,559 | | | |
| | | | | | | | | | | | | | | | | | |
| | | | | |
Distributions to Class A Shareholders from: | | | | | | | | | | | | | | | | | | |
Net investment income | | | (34,533 | ) | | | (22,192 | ) | | | (366,349 | ) | | | (345,087 | ) | | |
| | | | | |
Distributions to Class B Shareholders from: | | | | | | | | | | | | | | | | | | |
Net investment income | | | — | | | | — | | | | (23,522 | ) | | | (15,552 | ) | | |
| | | | | |
Distributions to Class C Shareholders from: | | | | | | | | | | | | | | | | | | |
Net investment income | | | (2,628 | ) | | | (16 | ) (a) | | | (41,100 | ) | | | (34,172 | ) | | |
| | | | | |
Distributions to Class D Shareholders from: | | | | | | | | | | | | | | | | | | |
Net investment income | | | — | | | | — | | | | (6,702,585 | ) | | | (6,630,409 | ) | | |
| | | | | |
Distributions to Class X Shareholders from: | | | | | | | | | | | | | | | | | | |
Net investment income | | | — | | | | — | | | | (145,972 | ) | | | (177,039 | ) | | |
| | | | | |
Distributions to Class Y Shareholders from: | | | | | | | | | | | | | | | | | | |
Net investment income | | | — | | | | — | | | | (8,080 | ) | | | (12,197 | ) | | |
| | | | | |
Distributions to Institutional Class Shareholders from: | | | | | | | | | | | | | | | | | | |
Net investment income | | | (210,474 | ) | | | (450,062 | ) | | | — | | | | — | | | |
| | | | | |
Distributions to IRA Class Shareholders from: | | | | | | | | | | | | | | | | | | |
Net investment income | | | (988,134 | ) | | | (2,313,572 | ) | | | — | | | | — | | | |
| | | | | |
Distributions to Service Class Shareholders from: | | | | | | | | | | | | | | | | | | |
Net investment income | | | (2,410,332 | ) | | | (2,895,479 | ) | | | — | | | | — | | | |
| | | | | | | | | | | | | | | | | | |
Change in net assets from shareholder distributions | | | (3,646,101 | ) | | | (5,681,321 | ) | | | (7,287,608 | ) | | | (7,214,456 | ) | | |
| | | | | | | | | | | | | | | | | | |
Change in net assets from capital transactions | | | (36,327,002 | ) | | | (570,977,333 | ) | | | (19,736,491 | ) | | | (9,916,817 | ) | | |
| | | | | | | | | | | | | | | | | | |
Change in net assets | | | (35,930,247 | ) | | | (575,029,923 | ) | | | (19,572,535 | ) | | | (13,098,714 | ) | | |
| | | | | |
Net Assets: | | | | | | | | | | | | | | | | | | |
Beginning of period | | | 132,465,021 | | | | 707,494,944 | | | | 179,140,562 | | | | 192,239,276 | | | |
| | | | | | | | | | | | | | | | | | |
End of period | | $ | 96,534,774 | | | $ | 132,465,021 | | | $ | 159,568,027 | | | $ | 179,140,562 | | | |
| | | | | | | | | | | | | | | | | | |
| | | | | |
Accumulated net investment income (loss) at end of period | | $ | (50,356 | ) | | $ | (50,356 | ) | | $ | (155,747 | ) | | $ | (156,464 | ) | | |
| | | | | | | | | | | | | | | | | | |
| | | | | | | | | | | | | | | | | | |
| | | | | | | | | | | | | | | | | | |
| | | | | | | | | | | | | | | | | | | |
| (a) | For the period from February 28, 2005 (commencement of operations) through October 31, 2005. |
See notes to financial statements.
Statements of Changes in Net Assets (Continued)
| | | | | | | | | | | | | | | | | | |
| | | Gartmore Bond Fund | | | Gartmore Enhanced Income Fund |
| | | Year Ended
October 31, 2006 | | | Year Ended
October 31, 2005 | | | Year Ended
October 31, 2006 | | | Year Ended
October 31, 2005 |
CAPITAL TRANSACTIONS: | | | | | | | | | | | | | | | | | | |
Class A Shares | | | | | | | | | | | | | | | | | | |
Proceeds from shares issued | | $ | 3,955,612 | | | $ | 4,055,723 | | | $ | 3,295,079 | | | $ | 874,861 | | | |
Dividends reinvested | | | 442,054 | | | | 406,101 | | | | 41,316 | | | | 25,597 | | | |
Cost of shares redeemed (a) | | | (3,227,067 | ) | | | (4,685,722 | ) | | | (3,019,740 | ) | | | (1,222,359 | ) | | |
| | | | | | | | | | | | | | | | | | |
| | | 1,170,599 | | | | (223,898 | ) | | | 316,655 | | | | (321,901 | ) | | |
| | | | | | | | | | | | | | | | | | |
| | | | | |
Class B Shares | | | | | | | | | | | | | | | | | | |
Proceeds from shares issued | | | 97,926 | | | | 126,569 | | | | — | | | | — | | | |
Dividends reinvested | | | 5,061 | | | | 2,952 | | | | — | | | | — | | | |
Cost of shares redeemed (a) | | | (59,784 | ) | | | (4,599 | ) | | | — | | | | — | | | |
| | | | | | | | | | | | | | | | | | |
| | | 43,203 | | | | 124,922 | | | | — | | | | — | | | |
| | | | | | | | | | | | | | | | | | |
| | | | | |
Class C Shares | | | | | | | | | | | | | | | | | | |
Proceeds from shares issued | | | 1,101,537 | | | | 713,393 | | | | — | | | | — | | | |
Dividends reinvested | | | 5,924 | | | | 1,578 | | | | — | | | | — | | | |
Cost of shares redeemed (a) | | | (510,782 | ) | | | (186,808 | ) | | | — | | | | — | | | |
| | | | | | | | | | | | | | | | | | |
| | | 596,679 | | | | 528,163 | | | | — | | | | — | | | |
| | | | | | | | | | | | | | | | | | |
| | | | | |
Class D Shares | | | | | | | | | | | | | | | | | | |
Proceeds from shares issued | | | 5,182,727 | | | | 7,898,707 | | | | — | | | | — | | | |
Dividends reinvested | | | 3,802,762 | | | | 4,505,994 | | | | — | | | | — | | | |
Cost of shares redeemed (a) | | | (24,458,861 | ) | | | (23,549,676 | ) | | | — | | | | — | | | |
| | | | | | | | | | | | | | | | | | |
| | | (15,473,372 | ) | | | (11,144,975 | ) | | | — | | | | — | | | |
| | | | | | | | | | | | | | | | | | |
| | | | | |
Class R Shares | | | | | | | | | | | | | | | | | | |
Proceeds from shares issued | | | 150 | | | | 175 | | | | 150 | | | | 175 | | | |
Dividends reinvested | | | 47 | | | | 46 | | | | 36 | | | | 28 | | | |
Cost of shares redeemed (a) | | | (150 | ) | | | (175 | ) | | | (150 | ) | | | (175 | ) | | |
| | | | | | | | | | | | | | | | | | |
| | | 47 | | | | 46 | | | | 36 | | | | 28 | | | |
| | | | | | | | | | | | | | | | | | |
| | | | | |
Class X Shares | | | | | | | | | | | | | | | | | | |
Proceeds from shares issued | | | 52,869 | | | | 66,620 | | | | — | | | | — | | | |
Dividends reinvested | | | 77,083 | | | | 113,057 | | | | — | | | | — | | | |
Cost of shares redeemed (a) | | | (1,097,389 | ) | | | (747,797 | ) | | | — | | | | — | | | |
| | | | | | | | | | | | | | | | | | |
| | | (967,437 | ) | | | (568,120 | ) | | | — | | | | — | | | |
| | | | | | | | | | | | | | | | | | |
| | | | | |
Class Y Shares | | | | | | | | | | | | | | | | | | |
Proceeds from shares issued | | | 1,540 | | | | 2,118 | | | | — | | | | — | | | |
Dividends reinvested | | | 5,338 | | | | 6,965 | | | | — | | | | — | | | |
Cost of shares redeemed (a) | | | (55,276 | ) | | | (43,748 | ) | | | — | | | | — | | | |
| | | | | | | | | | | | | | | | | | |
| | | (48,398 | ) | | | (34,665 | ) | | | — | | | | — | | | |
| | | | | | | | | | | | | | | | | | |
| | | | | |
Institutional Service Class Shares | | | | | | | | | | | | | | | | | | |
Proceeds from shares issued | | | — | | | | — | | | | 1,055,301 | | | | 1,621,939 | | | |
Dividends reinvested | | | — | | | | — | | | | 138,106 | | | | 188,032 | | | |
Cost of shares redeemed (a) | | | — | | | | — | | | | (6,860,807 | ) | | | (3,566,138 | ) | | |
| | | | | | | | | | | | | | | | | | |
| | | — | | | | — | | | | (5,667,400 | ) | | | (1,756,167 | ) | | |
| | | | | | | | | | | | | | | | | | |
| | | | | |
Institutional Class Shares | | | | | | | | | | | | | | | | | | |
Proceeds from shares issued | | | 9,205,127 | | | | 4,489,496 | | | | 129,936,382 | | | | 167,884,563 | | | |
Dividends reinvested | | | 392,436 | | | | 65,905 | | | | 18,545,313 | | | | 11,483,917 | | | |
Cost of shares redeemed (a) | | | (2,103,064 | ) | | | (111,654 | ) | | | (166,676,392 | ) | | | (23,347,403 | ) | | |
| | | | | | | | | | | | | | | | | | |
| | | 7,494,499 | | | | 4,443,747 | | | | (18,194,697 | ) | | | 156,021,077 | | | |
| | | | | | | | | | | | | | | | | | |
Change in net assets from capital transactions | | $ | (7,184,180 | ) | | $ | (6,874,780 | ) | | $ | (23,545,406 | ) | | $ | 153,943,037 | | | |
| | | | | | | | | | | | | | | | | | | |
| (a) | Includes redemption fees, if any. |
See notes to financial statements.
Statements of Changes in Net Assets (Continued)
| | | | | | | | | | | | | | |
| | | Gartmore Bond Fund | | | Gartmore Enhanced Income Fund |
| | | Year Ended
October 31, 2006 | | | Year Ended
October 31, 2005 | | | Year Ended
October 31, 2006 | | | Year Ended
October 31, 2005 |
SHARE TRANSACTIONS: | | | | | | | | | | | | | | |
Class A Shares | | | | | | | | | | | | | | |
Issued | | 416,952 | | | 418,178 | | | 362,490 | | | 95,994 | | | |
Reinvested | | 46,693 | | | 41,912 | | | 4,537 | | | 2,807 | | | |
Redeemed | | (340,751 | ) | | (483,142 | ) | | (331,861 | ) | | (133,975 | ) | | |
| | | | | | | | | | | | | | |
| | 122,894 | | | (23,052 | ) | | 35,166 | | | (35,174 | ) | | |
| | | | | | | | | | | | | | |
| | | | | |
Class B Shares | | | | | | | | | | | | | | |
Issued | | 10,363 | | | 13,085 | | | — | | | — | | | |
Reinvested | | 535 | | | 305 | | | — | | | — | | | |
Redeemed | | (6,295 | ) | | (472 | ) | | — | | | — | | | |
| | | | | | | | | | | | | | |
| | 4,603 | | | 12,918 | | | — | | | — | | | |
| | | | | | | | | | | | | | |
| | | | | |
Class C Shares | | | | | | | | | | | | | | |
Issued | | 116,582 | | | 73,390 | | | — | | | — | | | |
Reinvested | | 625 | | | 163 | | | — | | | — | | | |
Redeemed | | (53,886 | ) | | (19,292 | ) | | — | | | — | | | |
| | | | | | | | | | | | | | |
| | 63,321 | | | 54,261 | | | — | | | — | | | |
| | | | | | | | | | | | | | |
| | | | | |
Class D Shares | | | | | | | | | | | | | | |
Issued | | 547,076 | | | 812,463 | | | — | | | — | | | |
Reinvested | | 401,016 | | | 464,200 | | | — | | | — | | | |
Redeemed | | (2,583,235 | ) | | (2,427,717 | ) | | — | | | — | | | |
| | | | | | | | | | | | | | |
| | (1,635,143 | ) | | (1,151,054 | ) | | — | | | — | | | |
| | | | | | | | | | | | | | |
| | | | | |
Class R Shares | | | | | | | | | | | | | | |
Issued | | 16 | | | 18 | | | 16 | | | 19 | | | |
Reinvested | | 5 | | | 5 | | | 4 | | | 3 | | | |
Redeemed | | (16 | ) | | (18 | ) | | (16 | ) | | (19 | ) | | |
| | | | | | | | | | | | | | |
| | 5 | | | 5 | | | 4 | | | 3 | | | |
| | | | | | | | | | | | | | |
| | | | | |
Class X Shares | | | | | | | | | | | | | | |
Issued | | 5,584 | | | 6,873 | | | | | | | | | |
Reinvested | | 8,138 | | | 11,661 | | | — | | | — | | | |
Redeemed | | (116,015 | ) | | (77,106 | ) | | — | | | — | | | |
| | | | | | | | | | | | | | |
| | (102,293 | ) | | (58,572 | ) | | — | | | — | | | |
| | | | | | | | | | | | | | |
| | | | | |
Class Y Shares | | | | | | | | | | | | | | |
Issued | | 163 | | | 218 | | | — | | | — | | | |
Reinvested | | 563 | | | 718 | | | — | | | — | | | |
Redeemed | | (5,815 | ) | | (4,512 | ) | | — | | | — | | | |
| | | | | | | | | | | | | | |
| | (5,089 | ) | | (3,576 | ) | | — | | | — | | | |
| | | | | | | | | | | | | | |
| | | | | |
Institutional Service Class Shares | | | | | | | | | | | | | | |
Issued | | — | | | — | | | 115,940 | | | 177,656 | | | |
Reinvested | | — | | | — | | | 15,166 | | | 20,613 | | | |
Redeemed | | — | | | — | | | (752,568 | ) | | (390,867 | ) | | |
| | | | | | | | | | | | | | |
| | — | | | — | | | (621,462 | ) | | (192,598 | ) | | |
| | | | | | | | | | | | | | |
| | | | | |
Institutional Class Shares | | | | | | | | | | | | | | |
Issued | | 969,766 | | | 464,108 | | | 14,286,599 | | | 18,412,038 | | | |
Reinvested | | 41,419 | | | 6,813 | | | 2,037,221 | | | 1,259,899 | | | |
Redeemed | | (221,649 | ) | | (11,518 | ) | | (18,298,892 | ) | | (2,561,322 | ) | | |
| | | | | | | | | | | | | | |
| | 789,536 | | | 459,403 | | | (1,975,072 | ) | | 17,110,615 | | | |
| | | | | | | | | | | | | | |
Total change in shares | | (762,166 | ) | | (709,667 | ) | | (2,561,364 | ) | | 16,882,846 | | | |
| | | | | | | | | | | | | | | |
See notes to financial statements.
Statements of Changes in Net Assets (Continued)
| | | | | | | | | | |
| | | Gartmore Government Bond Fund |
| | | Year Ended
October 31, 2006 | | | Year Ended
October 31, 2005 |
CAPITAL TRANSACTIONS: | | | | | | | | | | |
Class A Shares | | | | | | | | | | |
Proceeds from shares issued | | $ | 15,745,314 | | | $ | 19,047,496 | | | |
Dividends reinvested | | | 1,967,329 | | | | 1,997,849 | | | |
Cost of shares redeemed (a) | | | (40,346,345 | ) | | | (21,290,605 | ) | | |
| | | | | | | | | | |
| | | (22,633,702 | ) | | | (245,260 | ) | | |
| | | | | | | | | | |
| | | |
Class B Shares | | | | | | | | | | |
Proceeds from shares issued | | | 255,860 | | | | 96,097 | | | |
Dividends reinvested | | | 4,102 | | | | 4,016 | | | |
Cost of shares redeemed (a) | | | (56,005 | ) | | | (114,337 | ) | | |
| | | | | | | | | | |
| | | 203,957 | | | | (14,224 | ) | | |
| | | | | | | | | | |
| | | |
Class C Shares | | | | | | | | | | |
Proceeds from shares issued | | | 2,886,936 | | | | 256,951 | | | |
Dividends reinvested | | | 3,295 | | | | 3,301 | | | |
Cost of shares redeemed (a) | | | (600,745 | ) | | | (219,601 | ) | | |
| | | | | | | | | | |
| | | 2,289,486 | | | | 40,651 | | | |
| | | | | | | | | | |
| | | |
Class D Shares | | | | | | | | | | |
Proceeds from shares issued | | | 9,785,364 | | | | 14,862,951 | | | |
Dividends reinvested | | | 3,697,984 | | | | 4,001,046 | | | |
Cost of shares redeemed (a) | | | (27,005,536 | ) | | | (32,058,741 | ) | | |
| | | | | | | | | | |
| | | (13,522,188 | ) | | | (13,194,744 | ) | | |
| | | | | | | | | | |
| | | |
Class R Shares | | | | | | | | | | |
Proceeds from shares issued | | | 150 | | | | 175 | | | |
Dividends reinvested | | | 42 | | | | 38 | | | |
Cost of shares redeemed (a) | | | (150 | ) | | | (175 | ) | | |
| | | | | | | | | | |
| | | 42 | | | | 38 | | | |
| | | | | | | | | | |
| | | |
Class X Shares | | | | | | | | | | |
Proceeds from shares issued | | | 74,647 | | | | 67,684 | | | |
Dividends reinvested | | | 85,514 | | | | 117,990 | | | |
Cost of shares redeemed (a) | | | (1,639,260 | ) | | | (1,274,785 | ) | | |
| | | | | | | | | | |
| | | (1,479,099 | ) | | | (1,089,111 | ) | | |
| | | | | | | | | | |
| | | |
Class Y Shares | | | | | | | | | | |
Proceeds from shares issued | | | 14,803 | | | | 10,389 | | | |
Dividends reinvested | | | 19,003 | | | | 17,984 | | | |
Cost of shares redeemed (a) | | | (60,697 | ) | | | (116,255 | ) | | |
| | | | | | | | | | |
| | | (26,891 | ) | | | (87,882 | ) | | |
| | | | | | | | | | |
| | | |
Institutional Class Shares | | | | | | | | | | |
Proceeds from shares issued | | | — | | | | 1,649,975 | | | |
Dividends reinvested | | | 44 | | | | 25,339 | | | |
Cost of shares redeemed (a) | | | — | | | | (1,808,780 | ) | | |
| | | | | | | | | | |
| | | 44 | | | | (133,466 | ) | | |
| | | | | | | | | | |
Change in net assets from capital transactions | | $ | (35,168,351 | ) | | $ | (14,723,998 | ) | | |
| | | | | | | | | | | |
| (a) | Includes redemption fees, if any. |
See notes to financial statements.
Statements of Changes in Net Assets (Continued)
| | | | | | | | |
| | | Gartmore Government Bond Fund |
| | | Year Ended
October 31, 2006 | | | Year Ended
October 31, 2005 | | | |
SHARE TRANSACTIONS: | | | | | | | | |
Class A Shares | | | | | | | | |
Issued | | 1,561,204 | | | 1,848,683 | | | |
Reinvested | | 194,954 | | | 193,764 | | | |
Redeemed | | (3,983,387 | ) | | (2,066,139 | ) | | |
| | | | | | | | |
| | (2,227,229 | ) | | (23,692 | ) | | |
| | | | | | | | |
| | | |
Class B Shares | | | | | | | | |
Issued | | 25,561 | | | 9,335 | | | |
Reinvested | | 406 | | | 390 | | | |
Redeemed | | (5,542 | ) | | (11,091 | ) | | |
| | | | | | | | |
| | 20,425 | | | (1,366 | ) | | |
| | | | | | | | |
| | | |
Class C Shares | | | | | | | | |
Issued | | 286,431 | | | 25,046 | | | |
Reinvested | | 326 | | | 320 | | | |
Redeemed | | (59,620 | ) | | (21,375 | ) | | |
| | | | | | | | |
| | 227,137 | | | 3,991 | | | |
| | | | | | | | |
| | | |
Class D Shares | | | | | | | | |
Issued | | 971,712 | | | 1,441,742 | | | |
Reinvested | | 366,243 | | | 387,899 | | | |
Redeemed | | (2,677,452 | ) | | (3,106,476 | ) | | |
| | | | | | | | |
| | (1,339,497 | ) | | (1,276,835 | ) | | |
| | | | | | | | |
| | | |
Class R Shares | | | | | | | | |
Issued | | 15 | | | 17 | | | |
Reinvested | | 4 | | | 4 | | | |
Redeemed | | (15 | ) | | (17 | ) | | |
| | | | | | | | |
| | 4 | | | 4 | | | |
| | | | | | | | |
| | | |
Class X Shares | | | | | | | | |
Issued | | 7,400 | | | 6,568 | | | |
Reinvested | | 8,476 | | | 11,452 | | | |
Redeemed | | (162,542 | ) | | (123,865 | ) | | |
| | | | | | | | |
| | (146,666 | ) | | (105,845 | ) | | |
| | | | | | | | |
| | | |
Class Y Shares | | | | | | | | |
Issued | | 1,474 | | | 1,010 | | | |
Reinvested | | 1,885 | | | 1,746 | | | |
Redeemed | | (6,038 | ) | | (11,299 | ) | | |
| | | | | | | | |
| | (2,679 | ) | | (8,543 | ) | | |
| | | | | | | | |
| | | |
Institutional Class Shares | | | | | | | | |
Issued | | — | | | 159,833 | | | |
Reinvested | | 4 | | | 2,453 | | | |
Redeemed | | — | | | (176,569 | ) | | |
| | | | | | | | |
| | 4 | | | (14,283 | ) | | |
| | | | | | | | |
Total change in shares | | (3,468,501 | ) | | (1,426,569 | ) | | |
| | | | | | | | | |
See notes to financial statements.
Statements of Changes in Net Assets (Continued)
| | | | | | | | | | | | | | | | | | |
| | | Gartmore Short Duration Bond Fund | | | Gartmore Tax-Free Income Fund |
| | | Year Ended
October 31, 2006 | | | Year Ended
October 31, 2005 | | | Year Ended
October 31, 2006 | | | Year Ended
October 31, 2005 |
CAPITAL TRANSACTIONS: | | | | | | | | | | | | | | | | | | |
Class A Shares | | | | | | | | | | | | | | | | | | |
Proceeds from shares issued | | $ | 284,372 | | | $ | 584,707 | | | $ | 2,162,518 | | | $ | 2,165,534 | | | |
Dividends reinvested | | | 27,906 | | | | 18,258 | | | | 268,234 | | | | 256,141 | | | |
Cost of shares redeemed (a) | | | (374,411 | ) | | | (1,156,254 | ) | | | (3,781,933 | ) | | | (1,796,086 | ) | | |
| | | | | | | | | | | | | | | | | | |
| | | (62,133 | ) | | | (553,289 | ) | | | (1,351,181 | ) | | | 625,589 | | | |
| | | | | | | | | | | | | | | | | | |
| | | | | |
Class B Shares | | | | | | | | | | | | | | | | | | |
Proceeds from shares issued | | | — | | | | — | | | | 176,125 | | | | 360,216 | | | |
Dividends reinvested | | | — | | | | — | | | | 17,596 | | | | 12,588 | | | |
Cost of shares redeemed (a) | | | — | | | | — | | | | (6,292 | ) | | | (132,372 | ) | | |
| | | | | | | | | | | | | | | | | | |
| | | — | | | | — | | | | 187,429 | | | | 240,432 | | | |
| | | | | | | | | | | | | | | | | | |
| | | | | |
Class C Shares | | | | | | | | | | | | | | | | | | |
Proceeds from shares issued | | | 152,160 | | | | 1,000 | (b) | | | 99,480 | | | | 359,548 | | | |
Dividends reinvested | | | 1,181 | | | | 18 | (b) | | | 13,562 | | | | 11,259 | | | |
Cost of shares redeemed (a) | | | (13,826 | ) | | | — | | | | (118,259 | ) | | | (123,105 | ) | | |
| | | | | | | | | | | | | | | | | | |
| | | 139,515 | | | | 1,018 | | | | (5,217 | ) | | | 247,702 | | | |
| | | | | | | | | | | | | | | | | | |
| | | | | |
Class D Shares | | | | | | | | | | | | | | | | | | |
Proceeds from shares issued | | | — | | | | — | | | | 2,734,732 | | | | 5,686,108 | | | |
Dividends reinvested | | | — | | | | — | | | | 5,078,795 | | | | 5,464,894 | | | |
Cost of shares redeemed (a) | | | — | | | | — | | | | (24,551,788 | ) | | | (20,573,357 | ) | | |
| | | | | | | | | | | | | | | | | | |
| | | — | | | | — | | | | (16,738,261 | ) | | | (9,422,355 | ) | | |
| | | | | | | | | | | | | | | | | | |
| | | | | |
Class X Shares | | | | | | | | | | | | | | | | | | |
Proceeds from shares issued | | | — | | | | — | | | | 97,793 | | | | 63,939 | | | |
Dividends reinvested | | | — | | | | — | | | | 116,832 | | | | 141,455 | | | |
Cost of shares redeemed (a) | | | — | | | | — | | | | (1,946,838 | ) | | | (1,555,958 | ) | | |
| | | | | | | | | | | | | | | | | | |
| | | — | | | | — | | | | (1,732,213 | ) | | | (1,350,564 | ) | | |
| | | | | | | | | | | | | | | | | | |
| | | | | |
Class Y Shares | | | | | | | | | | | | | | | | | | |
Proceeds from shares issued | | | — | | | | — | | | | 100 | | | | 2 | | | |
Dividends reinvested | | | — | | | | — | | | | 8,319 | | | | 13,583 | | | |
Cost of shares redeemed (a) | | | — | | | | — | | | | (105,467 | ) | | | (271,206 | ) | | |
| | | | | | | | | | | | | | | | | | |
| | | — | | | | — | | | | (97,048 | ) | | | (257,621 | ) | | |
| | | | | | | | | | | | | | | | | | |
| | | | | |
Institutional Class Shares | | | | | | | | | | | | | | | | | | |
Proceeds from shares issued | | | 1,391,707 | | | | 3,811,812 | | | | — | | | | — | | | |
Dividends reinvested | | | 208,565 | | | | 505,967 | | | | — | | | | — | | | |
Cost of shares redeemed (a) | | | (3,008,726 | ) | | | (70,241,568 | ) | | | — | | | | — | | | |
| | | | | | | | | | | | | | | | | | |
| | | (1,408,454 | ) | | | (65,923,789 | ) | | | — | | | | — | | | |
| | | | | | | | | | | | | | | | | | |
| | | | | |
IRA Class Shares | | | | | | | | | | | | | | | | | | |
Proceeds from shares issued | | | 590,183 | | | | 2,003,658 | | | | — | | | | — | | | |
Dividends reinvested | | | 879,462 | | | | 2,471,501 | | | | — | | | | — | | | |
Cost of shares redeemed (a) | | | (23,159,377 | ) | | | (327,936,551 | ) | | | — | | | | — | | | |
| | | | | | | | | | | | | | | | | | |
| | | (21,689,732 | ) | | | (323,461,392 | ) | | | — | | | | — | | | |
| | | | | | | | | | | | | | | | | | |
| | | | | |
Service Class Shares | | | | | | | | | | | | | | | | | | |
Proceeds from shares issued | | | 18,208,172 | | | | 27,160,906 | | | | — | | | | — | | | |
Dividends reinvested | | | 2,383,738 | | | | 3,053,504 | | | | — | | | | — | | | |
Cost of shares redeemed (a) | | | (33,898,108 | ) | | | (211,254,291 | ) | | | — | | | | — | | | |
| | | | | | | | | | | | | | | | | | |
| | | (13,306,198 | ) | | | (181,039,881 | ) | | | — | | | | — | | | |
| | | | | | | | | | | | | | | | | | |
Change in net assets from capital transactions | | $ | (36,327,002 | ) | | $ | (570,977,333 | ) | | $ | (19,736,491 | ) | | $ | (9,916,817 | ) | | |
| | | | | | | | | | | | | | | | | | | |
| (a) | Includes redemption fees, if any. |
| (b) | For the period from February 28, 2005 (commencement of operations) through October 31, 2005. |
See notes to financial statements.
Statements of Changes in Net Assets (Continued)
| | | | | | | | | | | | | | |
| | | Gartmore Short Duration Bond Fund | | | Gartmore Tax-Free Income Fund |
| | | Year Ended
October 31, 2006 | | | Year Ended
October 31, 2005 | | | Year Ended
October 31, 2006 | | | Year Ended
October 31, 2005 |
SHARE TRANSACTIONS: | | | | | | | | | | | | | | |
Class A Shares | | | | | | | | | | | | | | |
Issued | | 28,977 | | | 59,186 | | | 206,971 | | | 204,027 | | | |
Reinvested | | 2,843 | | | 1,842 | | | 25,655 | | | 24,122 | | | |
Redeemed | | (38,197 | ) | | (116,000 | ) | | (361,536 | ) | | (169,080 | ) | | |
| | | | | | | | | | | | | | |
| | (6,377 | ) | | (54,972 | ) | | (128,910 | ) | | 59,069 | | | |
| | | | | | | | | | | | | | |
| | | | | |
Class B Shares | | | | | | | | | | | | | | |
Issued | | — | | | — | | | 16,915 | | | 33,977 | | | |
Reinvested | | — | | | — | | | 1,683 | | | 1,186 | | | |
Redeemed | | — | | | — | | | (604 | ) | | (12,438 | ) | | |
| | | | | | | | | | | | | | |
| | — | | | — | | | 17,994 | | | 22,725 | | | |
| | | | | | | | | | | | | | |
| | | | | |
Class C Shares | | | | | | | | | | | | | | |
Issued | | 15,534 | | | 101 | (a) | | 9,520 | | | 33,838 | | | |
Reinvested | | 120 | | | 2 | (a) | | 1,300 | | | 1,063 | | | |
Redeemed | | (1,410 | ) | | — | | | (11,345 | ) | | (11,599 | ) | | |
| | | | | | | | | | | | | | |
| | 14,244 | | | 103 | | | (525 | ) | | 23,302 | | | |
| | | | | | | | | | | | | | |
| | | | | |
Class D Shares | | | | | | | | | | | | | | |
Issued | | — | | | — | | | 261,210 | | | 535,982 | | | |
Reinvested | | — | | | — | | | 485,667 | | | 514,654 | | | |
Redeemed | | — | | | — | | | (2,350,643 | ) | | (1,935,661 | ) | | |
| | | | | | | | | | | | | | |
| | — | | | — | | | (1,603,766 | ) | | (885,025 | ) | | |
| | | | | | | | | | | | | | |
| | | | | |
Class X Shares | | | | | | | | | | | | | | |
Issued | | — | | | — | | | 9,325 | | | 6,023 | | | |
Reinvested | | — | | | — | | | 11,170 | | | 13,321 | | | |
Redeemed | | — | | | — | | | (186,540 | ) | | (146,276 | ) | | |
| | | | | | | | | | | | | | |
| | — | | | — | | | (166,045 | ) | | (126,932 | ) | | |
| | | | | | | | | | | | | | |
| | | | | |
Class Y Shares | | | | | | | | | | | | | | |
Issued | | — | | | — | | | 9 | | | — | (b) | | |
Reinvested | | — | | | — | | | 797 | | | 1,281 | | | |
Redeemed | | — | | | — | | | (10,095 | ) | | (25,430 | ) | | |
| | | | | | | | | | | | | | |
| | — | | | — | | | (9,289 | ) | | (24,149 | ) | | |
| | | | | | | | | | | | | | |
| | | | | |
Institutional Class Shares | | | | | | | | | | | | | | |
Issued | | 141,721 | | | 383,565 | | | — | | | — | | | |
Reinvested | | 21,246 | | | 50,884 | | | — | | | — | | | |
Redeemed | | (306,630 | ) | | (7,047,742 | ) | | — | | | — | | | |
| | | | | | | | | | | | | | |
| | (143,663 | ) | | (6,613,293 | ) | | — | | | — | | | |
| | | | | | | | | | | | | | |
| | | | | |
IRA Class Shares | | | | | | | | | | | | | | |
Issued | | 59,932 | | | 200,710 | | | — | | | — | | | |
Reinvested | | 89,583 | | | 248,790 | | | — | | | — | | | |
Redeemed | | (2,360,767 | ) | | (32,883,434 | ) | | — | | | — | | | |
| | | | | | | | | | | | | | |
| | (2,211,252 | ) | | (32,433,934 | ) | | — | | | — | | | |
| | | | | | | | | | | | | | |
| | | | | |
Service Class Shares | | | | | | | | | | | | | | |
Issued | | 1,854,735 | | | 2,735,458 | | | — | | | — | | | |
Reinvested | | 242,819 | | | 307,860 | | | — | | | — | | | |
Redeemed | | (3,452,909 | ) | | (21,207,445 | ) | | — | | | — | | | |
| | | | | | | | | | | | | | |
| | (1,355,355 | ) | | (18,164,127 | ) | | — | | | — | | | |
| | | | | | | | | | | | | | |
Total change in shares | | (3,702,403 | ) | | (57,266,223 | ) | | (1,890,541 | ) | | (931,010 | ) | | |
| | | | | | | | | | | | | | | |
| (a) | For the period from February 28, 2005 (commencement of operations) through October 31, 2005. |
| (b) | Amount is less than 1 share. |
See notes to financial statements.
Financial Highlights
Selected Data for Each Share of Capital Outstanding
Gartmore Bond Fund
| | | | | | | | | | | | | | | | | | | | | | | | | | | | | | | | | | | | | | | |
| | | | | Investment Activities | | Distributions | | | | | | Ratios/Supplemental Data |
| | | Net Asset
Value,
Beginning
of Period | | Net
Investment
Income | | Net Realized
and
Unrealized
Gains
(Losses) on
Investments | | | Total
from
Investment
Activities | | Net
Investment
Income | | | Total
Distributions | | | Net
Asset
Value, End
of Period | | Total
Return (a) | | | Net Assets
at End of
Period
(000s) | | Ratio of
Expenses
to Average
Net Assets | | | Ratio of Net
Investment
Income
to Average
Net Assets | | | Ratio of
Expenses
(Prior to
Reimbursements)
to Average
Net Assets (b) | | | Ratio of
Investment
Income
(Prior to
Reimbursements)
to Average
Net Assets (b) | | | Portfolio
Turnover (c) |
| | | | | | | | | | | | | | |
Class A Shares | | | | | | | | | | | | | | | | | | | | | | | | | | | | | | | | | | | | | | | |
Year Ended October 31, 2002 | | $ | 9.58 | | 0.50 | | (0.15 | ) | | 0.35 | | (0.50 | ) | | (0.50 | ) | | $ | 9.43 | | 3.84% | | | $ | 7,551 | | 1.06% | | | 5.34% | | | (k | ) | | (k | ) | | 27.66% |
Year Ended October 31, 2003 | | $ | 9.43 | | 0.46 | | 0.24 | | | 0.70 | | (0.46 | ) | | (0.46 | ) | | $ | 9.67 | | 7.55% | | | $ | 10,128 | | 1.08% | | | 4.74% | | | (k | ) | | (k | ) | | 17.73% |
Year Ended October 31, 2004 | | $ | 9.67 | | 0.43 | | 0.08 | | | 0.51 | | (0.43 | ) | | (0.43 | ) | | $ | 9.75 | | 5.37% | | | $ | 10,669 | | 1.04% | | | 4.38% | | | (k | ) | | (k | ) | | 17.20% |
Year Ended October 31, 2005 | | $ | 9.75 | | 0.40 | | (0.22 | ) | | 0.18 | | (0.40 | ) | | (0.40 | ) | | $ | 9.53 | | 1.87% | | | $ | 10,212 | | 1.10% | | | 4.15% | | | (k | ) | | (k | ) | | 34.08% |
Year Ended October 31, 2006 | | $ | 9.53 | | 0.44 | | 0.04 | | | 0.48 | | (0.43 | ) | | (0.43 | ) | | $ | 9.58 | | 5.22% | | | $ | 11,434 | | 1.08% | | | 4.76% | | | 1.08% | | | 4.76% | | | 36.06% |
| | | | | | | | | | | | | | |
Class B Shares | | | | | | | | | | | | | | | | | | | | | | | | | | | | | | | | | | | | | | | |
Period Ended October 31, 2003 (d) | | $ | 9.49 | | 0.06 | | 0.18 | | | 0.24 | | (0.06 | ) | | (0.06 | ) | | $ | 9.67 | | 2.50% | (h) | | $ | 24 | | 1.83% | (i) | | 3.62% | (i) | | (k | ) | | (k | ) | | 17.73% |
Year Ended October 31, 2004 | | $ | 9.67 | | 0.36 | | 0.08 | | | 0.44 | | (0.36 | ) | | (0.36 | ) | | $ | 9.75 | | 4.66% | | | $ | 102 | | 1.72% | | | 3.64% | | | (k | ) | | (k | ) | | 17.20% |
Year Ended October 31, 2005 | | $ | 9.75 | | 0.34 | | (0.22 | ) | | 0.12 | | (0.34 | ) | | (0.34 | ) | | $ | 9.53 | | 1.18% | | | $ | 223 | | 1.78% | | | 3.46% | | | (k | ) | | (k | ) | | 34.08% |
Year Ended October 31, 2006 | | $ | 9.53 | | 0.39 | | 0.02 | | | 0.41 | | (0.37 | ) | | (0.37 | ) | | $ | 9.57 | | 4.41% | | | $ | 268 | | 1.75% | | | 4.12% | | | 1.75% | | | 4.12% | | | 36.06% |
| | | | | | | | | | | | | | |
Class C Shares | | | | | | | | | | | | | | | | | | | | | | | | | | | | | | | | | | | | | | | |
Period Ended October 31, 2003 (d) | | $ | 9.50 | | 0.06 | | 0.18 | | | 0.24 | | (0.06 | ) | | (0.06 | ) | | $ | 9.68 | | 2.49% | (h) | | $ | 9 | | 1.87% | (i) | | 3.60% | (i) | | (k | ) | | (k | ) | | 17.73% |
Year Ended October 31, 2004 | | $ | 9.68 | | 0.36 | | 0.08 | | | 0.44 | | (0.36 | ) | | (0.36 | ) | | $ | 9.76 | | 4.63% | | | $ | 182 | | 1.72% | | | 3.48% | | | (k | ) | | (k | ) | | 17.20% |
Year Ended October 31, 2005 | | $ | 9.76 | | 0.34 | | (0.22 | ) | | 0.12 | | (0.34 | ) | | (0.34 | ) | | $ | 9.54 | | 1.18% | | | $ | 696 | | 1.78% | | | 3.45% | | | (k | ) | | (k | ) | | 34.08% |
Year Ended October 31, 2006 | | $ | 9.54 | | 0.39 | | 0.02 | | | 0.41 | | (0.37 | ) | | (0.37 | ) | | $ | 9.58 | | 4.40% | | | $ | 1,306 | | 1.74% | | | 4.15% | | | 1.74% | | | 4.15% | | | 36.06% |
| | | | | | | | | | | | | | |
Class D Shares | | | | | | | | | | | | | | | | | | | | | | | | | | | | | | | | | | | | | | | |
Year Ended October 31, 2002 | | $ | 9.59 | | 0.52 | | (0.15 | ) | | 0.37 | | (0.52 | ) | | (0.52 | ) | | $ | 9.44 | | 4.07% | | | $ | 136,049 | | 0.83% | | | 5.58% | | | (k | ) | | (k | ) | | 27.66% |
Year Ended October 31, 2003 | | $ | 9.44 | | 0.49 | | 0.24 | | | 0.73 | | (0.49 | ) | | (0.49 | ) | | $ | 9.68 | | 7.81% | | | $ | 127,591 | | 0.82% | | | 5.00% | | | (k | ) | | (k | ) | | 17.73% |
Year Ended October 31, 2004 | | $ | 9.68 | | 0.45 | | 0.09 | | | 0.54 | | (0.45 | ) | | (0.45 | ) | | $ | 9.77 | | 5.75% | | | $ | 112,631 | | 0.78% | | | 4.64% | | | (k | ) | | (k | ) | | 17.20% |
Year Ended October 31, 2005 | | $ | 9.77 | | 0.43 | | (0.22 | ) | | 0.21 | | (0.43 | ) | | (0.43 | ) | | $ | 9.55 | | 2.15% | | | $ | 99,133 | | 0.83% | | | 4.41% | | | (k | ) | | (k | ) | | 34.08% |
Year Ended October 31, 2006 | | $ | 9.55 | | 0.48 | | 0.02 | | | 0.50 | | (0.46 | ) | | (0.46 | ) | | $ | 9.59 | | 5.39% | | | $ | 83,878 | | 0.80% | | | 5.00% | | | 0.80% | | | 5.00% | | | 36.06% |
| | | | | | | | | | | | | | | | | | | | | | | | | | | | | | | | | | | | | | | | |
| | | | | | | | | | | | | | | | | | | | | | | | | | | | | | | | | | | | | | | | |
| | | | | | | | | | | | | | | | | | | | | | | | | | | | | | | | | | | | | | | | |
| | | | | | | | | | | | | | | | | | | | | | | | | | | | | | | | | | | | | | | | |
| | | | | | | | | | | | | | | | | | | | | | | | | | | | | | | | | | | | | | | | |
| (a) | Excludes sales charge. |
| (b) | During the period certain fees were waived and /or reimbursed. If such waivers/ reimbursements had not occurred, the ratios would have been as indicated. |
| (c) | Portfolio turnover is calculated on the basis of the Fund as a whole without distinguishing among the classes of shares. |
| (d) | For the period from September 4, 2003 (commencement of operations) through October 31, 2003. |
| (e) | For the period from October 1, 2003 (commencement of operations) through October 31, 2003. |
| (f) | Effective September 1, 2003, Class B and Class C were renamed renamed Class X and Class Y, respectively. |
| (g) | For the period from June 29, 2004 (commencement of operations) through October 31, 2004. |
| (k) | There were no fee reductions during the period. |
See notes to financial statements.
Financial Highlights
Selected Data for Each Share of Capital Outstanding
Gartmore Bond Fund (Continued)
| | | | | | | | | | | | | | | | | | | | | | | | | | | | | | | | | | | | | | | | |
| | | | | Investment Activities | | | Distributions | | | | | | Ratios/Supplemental Data |
| | | Net Asset
Value,
Beginning
of Period | | Net
Investment
Income | | Net Realized
and
Unrealized
Gains
(Losses) on
Investments | | | Total
from
Investment
Activities | | | Net
Investment
Income | | | Total
Distributions | | | Net
Asset
Value, End
of Period | | Total
Return (a) | | | Net Assets
at End of
Period
(000s) | | Ratio of
Expenses
to Average
Net Assets | | | Ratio of Net
Investment
Income
to Average
Net Assets | | | Ratio of
Expenses
(Prior to
Reimbursements)
to Average
Net Assets (b) | | | Ratio of
Investment
Income
(Prior to
Reimbursements)
to Average
Net Assets (b) | | | Portfolio
Turnover (c) |
| | | | | | | | | | | | | | |
Class R Shares | | | | | | | | | | | | | | | | | | | | | | | | | | | | | | | | | | | | | | | | |
Period Ended October 31, 2003 (e) | | $ | 9.80 | | 0.03 | | (0.12 | ) | | (0.09 | ) | | (0.03 | ) | | (0.03 | ) | | $ | 9.68 | | (0.92% | )(h) | | $ | 1 | | 1.85% | (i) | | 3.48% | (i) | | 1.95% | (i) | | 3.38% | (i) | | 17.73% |
Year Ended October 31, 2004 | | $ | 9.68 | | 0.39 | | 0.09 | | | 0.48 | | | (0.39 | ) | | (0.39 | ) | | $ | 9.77 | | 5.06% | | | $ | 1 | | 1.37% | | | 3.99% | | | (k | ) | | (k | ) | | 17.20% |
Year Ended October 31, 2005 | | $ | 9.77 | | 0.40 | | (0.22 | ) | | 0.18 | | | (0.40 | ) | | (0.40 | ) | | $ | 9.55 | | 1.81% | | | $ | 1 | | 1.14% | | | 4.08% | | | (k | ) | | (k | ) | | 34.08% |
Year Ended October 31, 2006 | | $ | 9.55 | | 0.42 | | 0.03 | | | 0.45 | | | (0.41 | ) | | (0.41 | ) | | $ | 9.59 | | 4.88% | | | $ | 1 | | 1.30% | | | 4.53% | | | 1.30% | | | 4.53% | | | 36.06% |
| | | | | | | | | | | | | | |
Class X Shares | | | | | | | | | | | | | | | | | | | | | | | | | | | | | | | | | | | | | | | | |
Year Ended October 31, 2002 | | $ | 9.58 | | 0.45 | | (0.15 | ) | | 0.30 | | | (0.45 | ) | | (0.45 | ) | | $ | 9.43 | | 3.26% | | | $ | 3,548 | | 1.62% | | | 4.79% | | | (k | ) | | (k | ) | | 27.66% |
Year Ended October 31, 2003 (f) | | $ | 9.43 | | 0.41 | | 0.24 | | | 0.65 | | | (0.41 | ) | | (0.41 | ) | | $ | 9.67 | | 6.98% | | | $ | 3,674 | | 1.60% | | | 4.22% | | | (k | ) | | (k | ) | | 17.73% |
Year Ended October 31, 2004 | | $ | 9.67 | | 0.38 | | 0.08 | | | 0.46 | | | (0.38 | ) | | (0.38 | ) | | $ | 9.75 | | 4.82% | | | $ | 3,457 | | 1.57% | | | 3.85% | | | (k | ) | | (k | ) | | 17.20% |
Year Ended October 31, 2005 | | $ | 9.75 | | 0.35 | | (0.21 | ) | | 0.14 | | | (0.35 | ) | | (0.35 | ) | | $ | 9.54 | | 1.44% | | | $ | 2,821 | | 1.63% | | | 3.62% | | | (k | ) | | (k | ) | | 34.08% |
Year Ended October 31, 2006 | | $ | 9.54 | | 0.40 | | 0.02 | | | 0.42 | | | (0.38 | ) | | (0.38 | ) | | $ | 9.58 | | 4.57% | | | $ | 1,854 | | 1.61% | | | 4.18% | | | 1.61% | | | 4.18% | | | 36.06% |
| | | | | | | | | | | | | | |
Class Y Shares | | | | | | | | | | | | | | | | | | | | | | | | | | | | | | | | | | | | | | | | |
Year Ended October 31, 2002 | | $ | 9.59 | | 0.45 | | (0.15 | ) | | 0.30 | | | (0.45 | ) | | (0.45 | ) | | $ | 9.44 | | 3.26% | | | $ | 272 | | 1.62% | | | 4.78% | | | (k | ) | | (k | ) | | 27.66% |
Year Ended October 31, 2003 (f) | | $ | 9.44 | | 0.41 | | 0.24 | | | 0.65 | | | (0.41 | ) | | (0.41 | ) | | $ | 9.68 | | 6.97% | | | $ | 256 | | 1.60% | | | 4.21% | | | (k | ) | | (k | ) | | 17.73% |
Year Ended October 31, 2004 | | $ | 9.68 | | 0.38 | | 0.08 | | | 0.46 | | | (0.38 | ) | | (0.38 | ) | | $ | 9.76 | | 4.81% | | | $ | 238 | | 1.57% | | | 3.85% | | | (k | ) | | (k | ) | | 17.20% |
Year Ended October 31, 2005 | | $ | 9.76 | | 0.35 | | (0.21 | ) | | 0.14 | | | (0.35 | ) | | (0.35 | ) | | $ | 9.55 | | 1.44% | | | $ | 199 | | 1.63% | | | 3.62% | | | (k | ) | | (k | ) | | 34.08% |
Year Ended October 31, 2006 | | $ | 9.55 | | 0.40 | | 0.02 | | | 0.42 | | | (0.38 | ) | | (0.38 | ) | | $ | 9.59 | | 4.56% | | | $ | 151 | | 1.60% | | | 4.18% | | | 1.60% | | | 4.18% | | | 36.06% |
| | | | | | | | | | | | | | |
Institutional Class Shares | | | | | | | | | | | | | | | | | | | | | | | | | | | | | | | | | | | | | | | | |
Period Ended October 31, 2004 (g) | | $ | 9.50 | | 0.15 | | 0.26 | | | 0.41 | | | (0.15 | ) | | (0.15 | ) | | $ | 9.76 | | 4.32% | (h) | | $ | 260 | | 0.73% | (i) | | 4.51% | (i) | | (k | ) | | (k | ) | | 17.20% |
Year Ended October 31, 2005 | | $ | 9.76 | | 0.43 | | (0.21 | ) | | 0.22 | | | (0.43 | ) | | (0.43 | ) | | $ | 9.55 | | 2.30% | | | $ | 4,641 | | 0.78% | | | 4.47% | | | (k | ) | | (k | ) | | 34.08% |
Year Ended October 31, 2006 | | $ | 9.55 | | 0.47 | | 0.03 | | | 0.50 | | | (0.46 | ) | | (0.46 | ) | | $ | 9.59 | | 5.45% | | | $ | 12,233 | | 0.74% | | | 5.17% | | | 0.74% | | | 5.17% | | | 36.06% |
| | | | | | | | | | | | | | | | | | | | | | | | | | | | | | | | | | | | | | | | | |
| | | | | | | | | | | | | | | | | | | | | | | | | | | | | | | | | | | | | | | | | |
| | | | | | | | | | | | | | | | | | | | | | | | | | | | | | | | | | | | | | | | | |
| | | | | | | | | | | | | | | | | | | | | | | | | | | | | | | | | | | | | | | | | |
| | | | | | | | | | | | | | | | | | | | | | | | | | | | | | | | | | | | | | | | | |
| | | | | | | | | | | | | | | | | | | | | | | | | | | | | | | | | | | | | | | | | |
| | | | | | | | | | | | | | | | | | | | | | | | | | | | | | | | | | | | | | | | | |
| | |
(a) Excludes sales charge. (b) During the period certain fees were waived and /or reimbursed. If such waivers/ reimbursements had not occurred, the ratios would have been as indicated. (c) Portfolio turnover is calculated on the basis of the Fund as a whole without distinguishing among the classes of shares. (d) For the period from September 4, 2003 (commencement of operations) through October 31, 2003. (e) For the period from October 1, 2003 (commencement of operations) through October 31, 2003. (f) Effective September 1, 2003, Class B and Class C were renamed renamed Class X and Class Y, respectively. (g) For the period from June 29, 2004 (commencement of operations) through October 31, 2004. (h)Not annualized. (i) Annualized. (k) There were no fee reductions during the period. |
See notes to financial statements.
Financial Highlights
Selected Data for Each Share of Capital Outstanding
Gartmore Enhanced Income Fund
| | | | | | | | | | | | | | | | | | | | | | | | | | | | | | | | | | | | | | | | |
| | | | | Investment Activities | | | Distributions | | | | | | Ratios/Supplemental Data |
| | | Net Asset
Value,
Beginning
of Period | | Net
Investment
Income | | Net Realized
and
Unrealized
Gains
(Losses) on
Investments | | | Total
from
Investment
Activities | | | Net
Investment
Income | | | Total
Distributions | | | Net
Asset
Value, End
of Period | | Total
Return (a) | | | Net Assets
at End of
Period
(000s) | | Ratio of
Expenses
to Average
Net Assets | | | Ratio of Net
Investment
Income
to Average
Net Assets | | | Ratio of
Expenses
(Prior to
Reimbursements)
to Average
Net Assets (b) | | | Ratio of Net
Investment
Income
(Prior to
Reimbursements)
to Average
Net Assets (b) | | | Portfolio
Turnover (c) |
| | | | | | | | | | | | | | |
Class A Shares | | | | | | | | | | | | | | | | | | | | | | | | | | | | | | | | | | | | | | | | |
Year Ended October 31, 2002 | | $ | 9.70 | | 0.41 | | (0.26 | ) | | 0.15 | | | (0.41 | ) | | (0.41 | ) | | $ | 9.44 | | 1.60% | | | $ | 1,691 | | 0.79% | | | 4.28% | | | 0.95% | | | 4.12% | | | 32.97% |
Year Ended October 31, 2003 | | $ | 9.44 | | 0.30 | | (0.18 | ) | | 0.12 | | | (0.30 | ) | | (0.30 | ) | | $ | 9.26 | | 1.31% | | | $ | 2,404 | | 0.78% | | | 3.11% | | | 0.88% | | | 3.01% | | | 29.97% |
Year Ended October 31, 2004 | | $ | 9.26 | | 0.16 | | (0.09 | ) | | 0.07 | | | (0.17 | ) | | (0.17 | ) | | $ | 9.16 | | 0.73% | | | $ | 1,575 | | 0.80% | | | 1.74% | | | 0.85% | | | 1.69% | | | 51.59% |
Year Ended October 31, 2005 | | $ | 9.16 | | 0.22 | | (0.07 | ) | | 0.15 | | | (0.23 | ) | | (0.23 | ) | | $ | 9.08 | | 1.66% | | | $ | 1,242 | | 0.80% | | | 2.36% | | | 0.85% | | | 2.31% | | | 60.80% |
Year Ended October 31, 2006 | | $ | 9.08 | | 0.32 | | 0.05 | | | 0.37 | | | (0.32 | ) | | (0.32 | ) | | $ | 9.13 | | 4.15% | | | $ | 1,570 | | 0.72% | | | 3.51% | | | 0.76% | | | 3.47% | | | 77.44% |
| | | | | | | | | | | | | | |
Class R Shares | | | | | | | | | | | | | | | | | | | | | | | | | | | | | | | | | | | | | | | | |
Period Ended October 31, 2003 (d) | | $ | 9.30 | | 0.02 | | (0.03 | ) | | (0.01 | ) | | (0.02 | ) | | (0.02 | ) | | $ | 9.27 | | (0.13% | )(e) | | $ | 1 | | 1.05% | (f) | | 2.01% | (f) | | 1.15% | (f) | | 1.91% | (f) | | 29.97% |
Year Ended October 31, 2004 | | $ | 9.27 | | 0.13 | | (0.09 | ) | | 0.04 | | | (0.14 | ) | | (0.14 | ) | | $ | 9.17 | | 0.48% | | | $ | 1 | | 1.00% | | | 1.49% | | | 1.00% | | | 1.49% | | | 51.59% |
Year Ended October 31, 2005 | | $ | 9.17 | | 0.22 | | (0.07 | ) | | 0.15 | | | (0.23 | ) | | (0.23 | ) | | $ | 9.09 | | 1.70% | | | $ | 1 | | 0.72% | | | 2.42% | | | 0.72% | | | 2.42% | | | 60.80% |
Year Ended October 31, 2006 | | $ | 9.09 | | 0.32 | | 0.05 | | | 0.37 | | | (0.32 | ) | | (0.32 | ) | | $ | 9.14 | | 4.12% | | | $ | 1 | | 0.74% | | | 3.50% | | | 0.74% | | | 3.50% | | | 77.44% |
| | | | | | | | | | | | | | |
Institutional Service Class Shares | | | | | | | | | | | | | | | | | | | | | | | | | | | | | | | | | | | | | | | | |
Year Ended October 31, 2002 | | $ | 9.71 | | 0.42 | | (0.27 | ) | | 0.15 | | | (0.42 | ) | | (0.42 | ) | | $ | 9.44 | | 1.60% | | | $ | 10,093 | | 0.70% | | | 4.41% | | | 0.90% | | | 4.21% | | | 32.97% |
Year Ended October 31, 2003 | | $ | 9.44 | | 0.31 | | (0.17 | ) | | 0.14 | | | (0.31 | ) | | (0.31 | ) | | $ | 9.27 | | 1.50% | | | $ | 9,256 | | 0.70% | | | 3.25% | | | 0.80% | | | 3.15% | | | 29.97% |
Year Ended October 31, 2004 | | $ | 9.27 | | 0.17 | | (0.09 | ) | | 0.08 | | | (0.18 | ) | | (0.18 | ) | | $ | 9.17 | | 0.82% | | | $ | 7,476 | | 0.70% | | | 1.84% | | | 0.75% | | | 1.79% | | | 51.59% |
Year Ended October 31, 2005 | | $ | 9.17 | | 0.23 | | (0.07 | ) | | 0.16 | | | (0.24 | ) | | (0.24 | ) | | $ | 9.09 | | 1.77% | | | $ | 5,661 | | 0.70% | | | 2.47% | | | 0.75% | | | 2.42% | | | 60.80% |
Year Ended October 31, 2006 (g) | | $ | 9.09 | | 0.32 | | 0.05 | | | 0.37 | | | (0.32 | ) | | (0.32 | ) | | $ | 9.14 | | 4.17% | | | $ | 12 | | 0.70% | | | 3.47% | | | 0.73% | | | 3.44% | | | 77.44% |
| | | | | | | | | | | | | | |
Institutional Class Shares | | | | | | | | | | | | | | | | | | | | | | | | | | | | | | | | | | | | | | | | |
Year Ended October 31, 2002 | | $ | 9.70 | | 0.45 | | (0.26 | ) | | 0.19 | | | (0.45 | ) | | (0.45 | ) | | $ | 9.44 | | 1.96% | | | $ | 57,703 | | 0.45% | | | 4.57% | | | 0.64% | | | 4.38% | | | 32.97% |
Year Ended October 31, 2003 | | $ | 9.44 | | 0.33 | | (0.18 | ) | | 0.15 | | | (0.33 | ) | | (0.33 | ) | | $ | 9.26 | | 1.64% | | | $ | 155,704 | | 0.45% | | | 3.40% | | | 0.55% | | | 3.30% | | | 29.97% |
Year Ended October 31, 2004 | | $ | 9.26 | | 0.19 | | (0.08 | ) | | 0.11 | | | (0.20 | ) | | (0.20 | ) | | $ | 9.17 | | 1.07% | | | $ | 299,898 | | 0.45% | | | 2.05% | | | 0.50% | | | 2.00% | | | 51.59% |
Year Ended October 31, 2005 | | $ | 9.17 | | 0.25 | | (0.07 | ) | | 0.18 | | | (0.26 | ) | | (0.26 | ) | | $ | 9.09 | | 2.13% | | | $ | 452,749 | | 0.45% | | | 2.76% | | | 0.50% | | | 2.71% | | | 60.80% |
Year Ended October 31, 2006 | | $ | 9.09 | | 0.34 | | 0.04 | | | 0.38 | | | (0.34 | ) | | (0.34 | ) | | $ | 9.13 | | 4.31% | | | $ | 437,052 | | 0.45% | | | 3.79% | | | 0.49% | | | 3.75% | | | 77.44% |
| | | | | | | | | | | | | | | | | | | | | | | | | | | | | | | | | | | | | | | | |
| | | | | | | | | | | | | | | | | | | | | | | | | | | | | | | | | | | | | | | | |
| | | | | | | | | | | | | | | | | | | | | | | | | | | | | | | | | | | | | | | | |
| | | | | | | | | | | | | | | | | | | | | | | | | | | | | | | | | | | | | | | | |
| | | | | | | | | | | | | | | | | | | | | | | | | | | | | | | | | | | | | | | | |
| | | | | | | | | | | | | | | | | | | | | | | | | | | | | | | | | | | | | | | | |
| | | | | | | | | | | | | | | | | | | | | | | | | | | | | | | | | | | | | | | | |
| | | | | | | | | | | | | | | | | | | | | | | | | | | | | | | | | | | | | | | | | |
|
(a) Excludes sales charge. (b) During the period certain fees were waived and/or reimbursed. If such waivers/reimbursements had not occurred, the ratios would have been as indicated. (c) Portfolio turnover is calculated on the basis of the Fund as a whole without distinguishing among the classes of shares. (d) For the period from October 1, 2003 (commencement of operations) through October 31, 2003. (e) Not annualized. (f) Annualized. (g) Net investment income (loss) is based on average shares outstanding during the period. |
See notes to financial statements.
Financial Highlights
Selected Data for Each Share of Capital Outstanding
Gartmore Government Bond Fund
| | | | | | | | | | | | | | | | | | | | | | | | | | | | | | | | | | | | | | | | | | |
| | | | | Investment Activities | | Distributions | | | | | | Ratios/Supplemental Data |
| | | Net Asset
Value,
Beginning
of Period | | Net
Investment
Income | | Net Realized
and
Unrealized
Gains
(Losses) on
Investments | | | Total
from
Investment
Activities | | Net
Investment
Income | | | Net
Realized
Gains | | | Total
Distributions | | | Net
Asset
Value, End
of Period | | Total
Return (a) | | | Net Assets
at End of
Period
(000s) | | Ratio of
Expenses
to Average
Net Assets | | | Ratio of Net
Investment
Income
to Average
Net Assets | | | Ratio of
Expenses
(Prior to
Reimbursements)
to Average
Net Assets (b) | | | Ratio of
Investment
Income
(Prior to
Reimbursements)
to Average
Net Assets (b) | | | Portfolio
Turnover (c) |
| | | | | | | | | | | | | | | |
Class A Shares | | | | | | | | | | | | | | | | | | | | | | | | | | | | | | | | | | | | | | | | | | |
Year Ended October 31, 2002 | | $ | 10.95 | | 0.45 | | 0.20 | | | 0.65 | | (0.45 | ) | | (0.20 | ) | | (0.65 | ) | | $ | 10.95 | | 6.42% | | | $ | 55,510 | | 1.07% | | | 4.28% | | | 1.11% | | | 4.24% | | | 99.42% |
Year Ended October 31, 2003 | | $ | 10.95 | | 0.41 | | (0.16 | ) | | 0.25 | | (0.40 | ) | | (0.19 | ) | | (0.59 | ) | | $ | 10.61 | | 2.29% | | | $ | 56,589 | | 1.10% | | | 3.76% | | | (j | ) | | (j | ) | | 106.65% |
Year Ended October 31, 2004 | | $ | 10.61 | | 0.35 | | 0.03 | | | 0.38 | | (0.36 | ) | | (0.26 | ) | | (0.62 | ) | | $ | 10.37 | | 3.68% | | | $ | 55,481 | | 1.07% | | | 3.37% | | | (j | ) | | (j | ) | | 110.72% |
Year Ended October 31, 2005 | | $ | 10.37 | | 0.35 | | (0.20 | ) | | 0.15 | | (0.35 | ) | | — | | | (0.35 | ) | | $ | 10.17 | | 1.46% | | | $ | 54,166 | | 1.10% | | | 3.41% | | | (j | ) | | (j | ) | | 117.67% |
Year Ended October 31, 2006 | | $ | 10.17 | | 0.40 | | 0.02 | | | 0.42 | | (0.39 | ) | | (0.01 | ) | | (0.40 | ) | | $ | 10.19 | | 4.25% | | | $ | 31,586 | | 1.09% | | | 3.95% | | | 1.09% | | | 3.95% | | | 150.10% |
| | | | | | | | | | | | | | | |
Class B Shares | | | | | | | | | | | | | | | | | | | | | | | | | | | | | | | | | | | | | | | | | | |
Period Ended October 31, 2003 (d) | | $ | 10.48 | | 0.06 | | 0.12 | | | 0.18 | | (0.05 | ) | | — | | | (0.05 | ) | | $ | 10.61 | | 1.73% | (h) | | $ | 1 | | 1.80% | (i) | | 3.52% | (i) | | (j | ) | | (j | ) | | 106.65% |
Year Ended October 31, 2004 | | $ | 10.61 | | 0.28 | | 0.03 | | | 0.31 | | (0.29 | ) | | (0.26 | ) | | (0.55 | ) | | $ | 10.37 | | 3.04% | | | $ | 170 | | 1.69% | | | 2.75% | | | (j | ) | | (j | ) | | 110.72% |
Year Ended October 31, 2005 | | $ | 10.37 | | 0.29 | | (0.20 | ) | | 0.09 | | (0.29 | ) | | — | | | (0.29 | ) | | $ | 10.17 | | 0.85% | | | $ | 152 | | 1.71% | | | 2.79% | | | (j | ) | | (j | ) | | 117.67% |
Year Ended October 31, 2006 | | $ | 10.17 | | 0.34 | | 0.02 | | | 0.36 | | (0.33 | ) | | (0.01 | ) | | (0.34 | ) | | $ | 10.19 | | 3.61% | | | $ | 361 | | 1.69% | | | 3.42% | | | 1.69% | | | 3.42% | | | 150.10% |
| | | | | | | | | | | | | | | |
Class C Shares | | | | | | | | | | | | | | | | | | | | | | | | | | | | | | | | | | | | | | | | | | |
Period Ended October 31, 2003 (d) | | $ | 10.48 | | 0.06 | | 0.12 | | | 0.18 | | (0.05 | ) | | — | | | (0.05 | ) | | $ | 10.61 | | 1.73% | (h) | | $ | 65 | | 1.76% | (i) | | 4.11% | (i) | | (j | ) | | (j | ) | | 106.65% |
Year Ended October 31, 2004 | | $ | 10.61 | | 0.28 | | 0.03 | | | 0.31 | | (0.29 | ) | | (0.26 | ) | | (0.55 | ) | | $ | 10.37 | | 3.03% | | | $ | 296 | | 1.69% | | | 2.75% | | | (j | ) | | (j | ) | | 110.72% |
Year Ended October 31, 2005 | | $ | 10.37 | | 0.29 | | (0.21 | ) | | 0.08 | | (0.29 | ) | | — | | | (0.29 | ) | | $ | 10.16 | | 0.75% | | | $ | 331 | | 1.71% | | | 2.80% | | | (j | ) | | (j | ) | | 117.67% |
Year Ended October 31, 2006 | | $ | 10.16 | | 0.34 | | 0.03 | | | 0.37 | | (0.33 | ) | | (0.01 | ) | | (0.34 | ) | | $ | 10.19 | | 3.69% | | | $ | 2,645 | | 1.69% | | | 3.45% | | | 1.69% | | | 3.45% | | | 150.10% |
| | | | | | | | | | | | | | | |
Class D Shares | | | | | | | | | | | | | | | | | | | | | | | | | | | | | | | | | | | | | | | | | | |
Year Ended October 31, 2002 | | $ | 10.96 | | 0.48 | | 0.19 | | | 0.67 | | (0.48 | ) | | (0.20 | ) | | (0.68 | ) | | $ | 10.95 | | 6.61% | | | $ | 174,637 | | 0.81% | | | 4.52% | | | 0.81% | | | 4.52% | | | 99.42% |
Year Ended October 31, 2003 | | $ | 10.95 | | 0.44 | | (0.15 | ) | | 0.29 | | (0.43 | ) | | (0.19 | ) | | (0.62 | ) | | $ | 10.62 | | 2.67% | | | $ | 154,556 | | 0.82% | | | 4.03% | | | (j | ) | | (j | ) | | 106.65% |
Year Ended October 31, 2004 | | $ | 10.62 | | 0.38 | | 0.02 | | | 0.40 | | (0.39 | ) | | (0.26 | ) | | (0.65 | ) | | $ | 10.37 | | 3.87% | | | $ | 121,325 | | 0.78% | | | 3.66% | | | (j | ) | | (j | ) | | 110.72% |
Year Ended October 31, 2005 | | $ | 10.37 | | 0.38 | | (0.20 | ) | | 0.18 | | (0.38 | ) | | — | | | (0.38 | ) | | $ | 10.17 | | 1.76% | | | $ | 105,987 | | 0.81% | | | 3.70% | | | (j | ) | | (j | ) | | 117.67% |
Year Ended October 31, 2006 | | $ | 10.17 | | 0.43 | | 0.02 | | | 0.45 | | (0.42 | ) | | (0.01 | ) | | (0.43 | ) | | $ | 10.19 | | 4.55% | | | $ | 92,547 | | 0.79% | | | 4.24% | | | 0.79% | | | 4.24% | | | 150.10% |
| | | | | | | | | | | | | | | | | | | | | | | | | | | | | | | | | | | | | | | | | | | |
| | | | | | | | | | | | | | | | | | | | | | | | | | | | | | | | | | | | | | | | | | | |
| | | | | | | | | | | | | | | | | | | | | | | | | | | | | | | | | | | | | | | | | | | |
| | | | | | | | | | | | | | | | | | | | | | | | | | | | | | | | | | | | | | | | | | | |
| | | | | | | | | | | | | | | | | | | | | | | | | | | | | | | | | | | | | | | | | | | |
| | |
(a) Excludes sales charge. (b) During the period certain fees were waived and/or reimbursed. If such waivers/reimbursements had not occurred, the ratios would have been as indicated. (c) Portfolio turnover is calculated on the basis of the Fund as a whole without distinguishing among the classes of shares. (d) For the period from September 4, 2003 (commencement of operations) through October 31, 2003. (e) For the period from October 1, 2003 (commencement of operations) through October 31, 2003. (f) Effective September 1, 2003, Class B and Class C shares were renamed Class X and Class Y shares, respectively. (g) For the period from June 29, 2004 (commencement of operations) through October 31, 2004. (h)Not annualized. (i) Annualized. (j) There were no fee reductions during the period. (k) Net investment income (loss) is based on average shares outstanding during the period. |
See notes to financial statements.
Financial Highlights
Selected Data for Each Share of Capital Outstanding
Gartmore Government Bond Fund (Continued)
| | | | | | | | | | | | | | | | | | | | | | | | | | | | | | | | | | | | | | | | | | | |
| | | | | Investment Activities | | | Distributions | | | | | | Ratios/Supplemental Data |
| | | Net Asset
Value,
Beginning
of Period | | Net
Investment
Income | | Net Realized
and
Unrealized
Gains
(Losses) on
Investments | | | Total
from
Investment
Activities | | | Net
Investment
Income | | | Net
Realized
Gains | | | Total
Distributions | | | Net
Asset
Value, End
of Period | | Total
Return (a) | | | Net Assets
at End of
Period
(000s) | | Ratio of
Expenses
to Average
Net Assets | | | Ratio of Net
Investment
Income
to Average
Net Assets | | | Ratio of
Expenses
(Prior to
Reimbursements)
to Average
Net Assets (b) | | | Ratio of
Investment
Income
(Prior to
Reimbursements)
to Average
Net Assets (b) | | | Portfolio
Turnover (c) |
| | | | | | | | | | | | | | | |
Class R Shares | | | | | | | | | | | | | | | | | | | | | | | | | | | | | | | | | | | | | | | | | | | |
Period Ended October 31, 2003 (e) | | $ | 10.77 | | 0.04 | | (0.16 | ) | | (0.12 | ) | | (0.03 | ) | | — | | | (0.03 | ) | | $ | 10.62 | | (1.12% | )(h) | | $ | 1 | | 1.48% | (i) | | 4.13% | (i) | | 1.58% | (i) | | 4.03% | (i) | | 106.65% |
Year Ended October 31, 2004 | | $ | 10.62 | | 0.32 | | 0.03 | | | 0.35 | | | (0.33 | ) | | (0.26 | ) | | (0.59 | ) | | $ | 10.38 | | 3.41% | | | $ | 1 | | 1.37% | | | 3.12% | | | (j | ) | | (j | ) | | 110.72% |
Year Ended October 31, 2005 | | $ | 10.38 | | 0.35 | | (0.21 | ) | | 0.14 | | | (0.35 | ) | | — | | | (0.35 | ) | | $ | 10.17 | | 1.34% | | | $ | 1 | | 1.06% | | | 3.39% | | | (j | ) | | (j | ) | | 117.67% |
Year Ended October 31, 2006 | | $ | 10.17 | | 0.40 | | 0.03 | | | 0.43 | | | (0.39 | ) | | (0.01 | ) | | (0.40 | ) | | $ | 10.20 | | 4.35% | | | $ | 1 | | 1.08% | | | 3.96% | | | 1.08% | | | 3.96% | | | 150.10% |
| | | | | | | | | | | | | | | |
Class X Shares | | | | | | | | | | | | | | | | | | | | | | | | | | | | | | | | | | | | | | | | | | | |
Year Ended October 31, 2002 | | $ | 10.94 | | 0.40 | | 0.19 | | | 0.59 | | | (0.40 | ) | | (0.20 | ) | | (0.60 | ) | | $ | 10.93 | | 5.80% | | | $ | 6,067 | | 1.58% | | | 3.74% | | | 1.58% | | | 3.74% | | | 99.42% |
Year Ended October 31, 2003 (f) | | $ | 10.93 | | 0.36 | | (0.14 | ) | | 0.22 | | | (0.35 | ) | | (0.19 | ) | | (0.54 | ) | | $ | 10.61 | | 2.00% | | | $ | 5,689 | | 1.57% | | | 3.29% | | | (j | ) | | (j | ) | | 106.65% |
Year Ended October 31, 2004 | | $ | 10.61 | | 0.30 | | 0.02 | | | 0.32 | | | (0.31 | ) | | (0.26 | ) | | (0.57 | ) | | $ | 10.36 | | 3.10% | | | $ | 4,557 | | 1.54% | | | 2.91% | | | (j | ) | | (j | ) | | 110.72% |
Year Ended October 31, 2005 | | $ | 10.36 | | 0.30 | | (0.20 | ) | | 0.10 | | | (0.30 | ) | | — | | | (0.30 | ) | | $ | 10.16 | | 1.00% | | | $ | 3,394 | | 1.56% | | | 2.95% | | | (j | ) | | (j | ) | | 117.67% |
Year Ended October 31, 2006 | | $ | 10.16 | | 0.36 | | 0.02 | | | 0.38 | | | (0.35 | ) | | (0.01 | ) | | (0.36 | ) | | $ | 10.18 | | 3.77% | | | $ | 1,907 | | 1.56% | | | 3.44% | | | 1.56% | | | 3.44% | | | 150.10% |
| | | | | | | | | | | | | | | |
Class Y Shares | | | | | | | | | | | | | | | | | | | | | | | | | | | | | | | | | | | | | | | | | | | |
Year Ended October 31, 2002 | | $ | 10.94 | | 0.40 | | 0.19 | | | 0.59 | | | (0.40 | ) | | (0.20 | ) | | (0.60 | ) | | $ | 10.93 | | 5.80% | | | $ | 941 | | 1.58% | | | 3.72% | | | 1.58% | | | 3.72% | | | 99.42% |
Year Ended October 31, 2003 (f) | | $ | 10.93 | | 0.36 | | (0.14 | ) | | 0.22 | | | (0.35 | ) | | (0.19 | ) | | (0.54 | ) | | $ | 10.61 | | 2.00% | | | $ | 1,910 | | 1.57% | | | 3.28% | | | (j | ) | | (j | ) | | 106.65% |
Year Ended October 31, 2004 | | $ | 10.61 | | 0.30 | | 0.02 | | | 0.32 | | | (0.31 | ) | | (0.26 | ) | | (0.57 | ) | | $ | 10.36 | | 3.10% | | | $ | 961 | | 1.54% | | | 2.93% | | | (j | ) | | (j | ) | | 110.72% |
Year Ended October 31, 2005 | | $ | 10.36 | | 0.30 | | (0.20 | ) | | 0.10 | | | (0.30 | ) | | — | | | (0.30 | ) | | $ | 10.16 | | 1.00% | | | $ | 855 | | 1.56% | | | 2.95% | | | (j | ) | | (j | ) | | 117.67% |
Year Ended October 31, 2006 | | $ | 10.16 | | 0.36 | | 0.02 | | | 0.38 | | | (0.35 | ) | | (0.01 | ) | | (0.36 | ) | | $ | 10.18 | | 3.77% | | | $ | 830 | | 1.55% | | | 3.49% | | | 1.55% | | | 3.49% | | | 150.10% |
| | | | | | | | | | | | | | | |
Institutional Class Shares | | | | | | | | | | | | | | | | | | | | | | | | | | | | | | | | | | | | | | | | | | | |
Period Ended October 31, 2004 (g) | | $ | 10.11 | | 0.12 | | 0.28 | | | 0.40 | | | (0.13 | ) | | — | | | (0.13 | ) | | $ | 10.38 | | 4.00% | (h) | | $ | 14 | | 0.69% | (i) | | 3.66% | (i) | | (j | ) | | (j | ) | | 110.72% |
Year Ended October 31, 2005 (k) | | $ | 10.38 | | 0.39 | | (0.21 | ) | | 0.18 | | | (0.39 | ) | | — | | | (0.39 | ) | | $ | 10.17 | | 1.72% | | | $ | 1 | | 0.72% | | | 3.85% | | | (j | ) | | (j | ) | | 117.67% |
Year Ended October 31, 2006 | | $ | 10.17 | | 0.44 | | 0.02 | | | 0.46 | | | (0.43 | ) | | (0.01 | ) | | (0.44 | ) | | $ | 10.19 | | 4.68% | | | $ | 1 | | 0.72% | | | 4.38% | | | 0.72% | | | 4.38% | | | 150.10% |
| | | | | | | | | | | | | | | | | | | | | | | | | | | | | | | | | | | | | | | | | | | | |
| | | | | | | | | | | | | | | | | | | | | | | | | | | | | | | | | | | | | | | | | | | | |
| | | | | | | | | | | | | | | | | | | | | | | | | | | | | | | | | | | | | | | | | | | | |
| | | | | | | | | | | | | | | | | | | | | | | | | | | | | | | | | | | | | | | | | | | | |
| | |
(a) Excludes sales charge. (b) During the period certain fees were waived and/or reimbursed. If such waivers/reimbursements had not occurred, the ratios would have been as indicated. (c) Portfolio turnover is calculated on the basis of the Fund as a whole without distinguishing among the classes of shares. (d) For the period from September 4, 2003 (commencement of operations) through October 31, 2003. (e) For the period from October 1, 2003 (commencement of operations) through October 31, 2003. (f) Effective September 1, 2003, Class B and Class C shares were renamed Class X and Class Y shares, respectively. (g) For the period from June 29, 2004 (commencement of operations) through October 31, 2004. (h)Not annualized. (i) Annualized. (j) There were no fee reductions during the period. (k) Net investment income (loss) is based on average shares outstanding during the period. |
See notes to financial statements.
Financial Highlights
Selected Data for Each Share of Capital Outstanding
Gartmore Short Duration Bond Fund
| | | | | | | | | | | | | | | | | | | | | | | | | | | | | | | | | | | | | | | | | | | | | | | |
| | | | | Investment Activities | | Distributions | | | | | | |
| | | Net Asset
Value,
Beginning
of Period | | Net
Investment
Income
(Loss) | | Net Realized
and
Unrealized
Gains
(Losses) on
Investments | | | Total
from
Investment
Activities | | Net
Investment
Income | | | Net
Realized
Gains | | | Total
Distributions | | | Reverse
Stock Split | | | Capital
Contributions
from Adviser | | Net
Asset
Value, End
of Period | | Total
Return (a) | | | Net Assets
at End of
Period
(000s) | | Ratio of
Expenses
to Average
Net Assets | | | Ratio of Net
Investment
Income
(Loss)
to Average
Net Assets | | | Ratio of
Expenses
(Prior to
Reimbursements)
to Average
Net Assets (b) | | | Ratio of Net
Investment
Income (Loss)
(Prior to
Reimbursements)
to Average
Net Assets (b) | | | Portfolio
Turnover (c) |
| | | | | | | | | | | | | | | | | |
Class A Shares | | | | | | | | | | | | | | | | | | | | | | | | | | | | | | | | | | | | | | | | | | | | | | | |
Period Ended October 31, 2003 (d) | | $ | 10.00 | | 0.08 | | — | | | 0.08 | | (0.08 | ) | | — | | | (0.08 | ) | | — | | | — | | $ | 10.00 | | 0.76% | (f) | | $ | 42 | | 0.95% | (g) | | 2.68% | (g) | | 1.05% | (g) | | 2.58% | (g) | | 16.61% |
Year Ended October 31, 2004 | | $ | 10.00 | | 0.23 | | (0.07 | ) | | 0.16 | | (0.23 | ) | | (0.01 | ) | | (0.24 | ) | | 0.01 | (i) | | 0.07 | | $ | 10.00 | | 2.35% | (j) | | $ | 1,585 | | 0.86% | | | 2.08% | | | 0.96% | | | 1.98% | | | 129.96% |
Year Ended October 31, 2005 | | $ | 10.00 | | 0.25 | | (0.15 | ) | | 0.10 | | (0.27 | ) | | — | | | (0.27 | ) | | — | | | — | | $ | 9.83 | | 0.98% | | | $ | 1,017 | | 0.78% | | | 2.40% | | | 0.88% | | | 2.30% | | | 292.03% |
Year Ended October 31, 2006 | | $ | 9.83 | | 0.30 | | 0.07 | | | 0.37 | | (0.33 | ) | | — | | | (0.33 | ) | | — | | | — | | $ | 9.87 | | 3.87% | | | $ | 959 | | 0.71% | | | 3.14% | | | 0.81% | | | 3.04% | | | 28.68% |
| | | | | | | | | | | | | | | | | |
Class C Shares | | | | | | | | | | | | | | | | | | | | | | | | | | | | | | | | | | | | | | | | | | | | | | | |
Period Ended October 31, 2005 (e) | | $ | 9.91 | | 0.13 | | (0.06 | ) | | 0.07 | | (0.15 | ) | | — | | | (0.15 | ) | | — | | | — | | $ | 9.83 | | 0.76% | (f) | | $ | 1 | | 1.40% | (g) | | 2.08% | (g) | | 1.40% | (g) | | 2.08% | (g) | | 292.03% |
Year Ended October 31, 2006 | | $ | 9.83 | | 0.27 | | 0.07 | | | 0.34 | | (0.29 | ) | | — | | | (0.29 | ) | | — | | | — | | $ | 9.88 | | 3.52% | | | $ | 142 | | 1.18% | | | 2.71% | | | 1.28% | | | 2.61% | | | 28.68% |
| | | | | | | | | | | | | | | | | |
Institutional Class Shares | | | | | | | | | | | | | | | | | | | | | | | | | | | | | | | | | | | | | | | | | | | | | | | |
Year Ended October 31, 2002 | | $ | 10.00 | | 0.47 | | — | | | 0.47 | | (0.47 | ) | | (0.04 | ) | | (0.51 | ) | | 0.04 | (h) | | — | | $ | 10.00 | | 4.84% | | | $ | 19,239 | | 0.57% | | | 4.73% | | | 0.71% | | | 4.69% | | | 37.37% |
Year Ended October 31, 2003 | | $ | 10.00 | | 0.34 | | — | | | 0.34 | | (0.34 | ) | | — | | | (0.34 | ) | | — | | | — | | $ | 10.00 | | 3.41% | | | $ | 47,491 | | 0.60% | | | 3.40% | | | 0.70% | | | 3.30% | | | 16.61% |
Year Ended October 31, 2004 | | $ | 10.00 | | 0.27 | | (0.07 | ) | | 0.20 | | (0.27 | ) | | (0.01 | ) | | (0.28 | ) | | 0.01 | (i) | | 0.07 | | $ | 10.00 | | 2.69% | (k) | | $ | 72,996 | | 0.54% | | | 2.63% | | | 0.64% | | | 2.53% | | | 129.96% |
Year Ended October 31, 2005 | | $ | 10.00 | | 0.27 | | (0.15 | ) | | 0.12 | | (0.29 | ) | | — | | | (0.29 | ) | | — | | | — | | $ | 9.83 | | 1.24% | | | $ | 6,741 | | 0.49% | | | 2.46% | | | 0.59% | | | 2.36% | | | 292.03% |
Year Ended October 31, 2006 | | $ | 9.83 | | 0.33 | | 0.07 | | | 0.40 | | (0.36 | ) | | — | | | (0.36 | ) | | — | | | — | | $ | 9.87 | | 4.13% | | | $ | 5,354 | | 0.46% | | | 3.38% | | | 0.56% | | | 3.28% | | | 28.68% |
| | | | | | | | | | | | | | | | | |
IRA Class Shares | | | | | | | | | | | | | | | | | | | | | | | | | | | | | | | | | | | | | | | | | | | | | | | |
Year Ended October 31, 2002 | | $ | 10.00 | | 0.43 | | — | | | 0.43 | | (0.43 | ) | | (0.04 | ) | | (0.47 | ) | | 0.04 | (h) | | — | | $ | 10.00 | | 4.41% | | | $ | 38,001 | | 1.01% | | | 4.00% | | | 1.11% | | | 4.00% | | | 37.37% |
Year Ended October 31, 2003 | | $ | 10.00 | | 0.29 | | 0.01 | | | 0.30 | | (0.30 | ) | | — | | | (0.30 | ) | | — | | | — | | $ | 10.00 | | 2.99% | | | $ | 413,934 | | 1.01% | | | 2.90% | | | 1.11% | | | 2.80% | | | 16.61% |
Year Ended October 31, 2004 | | $ | 10.00 | | 0.23 | | (0.07 | ) | | 0.16 | | (0.23 | ) | | (0.01 | ) | | (0.24 | ) | | 0.01 | (i) | | 0.07 | | $ | 10.00 | | 2.30% | (l) | | $ | 369,014 | | 0.91% | | | 2.29% | | | 1.01% | | | 2.19% | | | 129.96% |
Year Ended October 31, 2005 | | $ | 10.00 | | 0.24 | | (0.15 | ) | | 0.09 | | (0.26 | ) | | — | | | (0.26 | ) | | — | | | — | | $ | 9.83 | | 0.90% | | | $ | 43,888 | | 0.83% | | | 2.21% | | | 0.93% | | | 2.11% | | | 292.03% |
Year Ended October 31, 2006 | | $ | 9.83 | | 0.28 | | 0.08 | | | 0.36 | | (0.32 | ) | | — | | | (0.32 | ) | | — | | | — | | $ | 9.87 | | 3.73% | | | $ | 22,263 | | 0.84% | | | 2.99% | | | 0.94% | | | 2.89% | | | 28.68% |
| | | | | | | | | | | | | | | | | |
Service Class Shares | | | | | | | | | | | | | | | | | | | | | | | | | | | | | | | | | | | | | | | | | | | | | | | |
Year Ended October 31, 2002 | | $ | 10.00 | | 0.44 | | — | | | 0.44 | | (0.44 | ) | | (0.04 | ) | | (0.48 | ) | | 0.04 | (h) | | — | | $ | 10.00 | | 4.44% | | | $ | 84,679 | | 0.96% | | | 4.23% | | | 1.08% | | | 4.21% | | | 37.37% |
Year Ended October 31, 2003 | | $ | 10.00 | | 0.30 | | — | | | 0.30 | | (0.30 | ) | | — | | | (0.30 | ) | | — | | | — | | $ | 10.00 | | 3.05% | | | $ | 196,569 | | 0.95% | | | 3.06% | | | 1.05% | | | 2.96% | | | 16.61% |
Year Ended October 31, 2004 | | $ | 10.00 | | 0.22 | | (0.07 | ) | | 0.15 | | (0.22 | ) | | (0.01 | ) | | (0.23 | ) | | 0.01 | (i) | | 0.07 | | $ | 10.00 | | 2.26% | (m) | | $ | 263,900 | | 0.97% | | | 2.20% | | | 1.07% | | | 2.10% | | | 129.96% |
Year Ended October 31, 2005 | | $ | 10.00 | | 0.24 | | (0.15 | ) | | 0.09 | | (0.26 | ) | | — | | | (0.26 | ) | | — | | | — | | $ | 9.83 | | 0.95% | | | $ | 80,818 | | 0.83% | | | 2.31% | | | 0.93% | | | 2.21% | | | 292.03% |
Year Ended October 31, 2006 | | $ | 9.83 | | 0.30 | | 0.07 | | | 0.37 | | (0.33 | ) | | — | | | (0.33 | ) | | — | | | — | | $ | 9.87 | | 3.78% | | | $ | 67,817 | | 0.79% | | | 3.05% | | | 0.89% | | | 2.95% | | | 28.68% |
| | |
(a) Excludes sales charge. (b) During the period certain fees were waived and/or reimbursed. If such waivers/reimbursements had not occurred, the ratios would have been as indicated. (c) Portfolio turnover is calculated on the basis of the Fund as a whole without distinguishing among the classes of shares. (d) For the period from July 16, 2003 (commencement of operations) through October 31, 2003. (e) For the period from February 28, 2005 (commencement of operations) through October 31, 2005. (f) Not annualized. (g) Annualized. (h) Per share numbers prior to December 31, 2001 have been adjusted to reflect a 1.003633 for 1 reverse stock split. | | (i) Per share numbers prior to April 16, 2004 have been adjusted to reflect a 1.00620 for 1 reverse stock split. (j) The total return includes a contribution from adviser. If that contribution had not taken place, the total return would have been 1.63%. (k) The total return includes a contribution from adviser. If that contribution had not taken place, the total return would have been 1.97%. (l) The total return includes a contribution from adviser. If that contribution had not taken place, the total return would have been 1.58%. (m) The total return includes a contribution from adviser. If that contribution had not taken place, the total return would have been 1.54%. |
| |
| |
| |
| |
See notes to financial statements.
Financial Highlights
Selected Data for Each Share of Capital Outstanding
Gartmore Tax-Free Income Fund
| | | | | | | | | | | | | | | | | | | | | | | | | | | | | | | | | |
| | | | | Investment Activities | | Distributions | | | | | | Ratios/Supplemental Data |
| | | Net Asset
Value,
Beginning of
Period | | Net
Investment
Income | | Net Realized
and
Unrealized
Gains
(Losses) on
Investments | | | Total
from
Investment
Activities | | Net
Investment
Income | | | Total
Distributions | | | Net
Asset
Value, End
of Period | | Total
Return (a) | | | Net Assets
at End of
Period
(000s) | | Ratio of
Expenses
to Average
Net Assets | | | Ratio of Net
Investment
Income
to Average
Net Assets | | | Portfolio
Turnover (b) |
| | | | | | | | | | | | |
Class A Shares | | | | | | | | | | | | | | | | | | | | | | | | | | | | | | | | | |
Year Ended October 31, 2002 | | $ | 10.51 | | 0.47 | | — | | | 0.47 | | (0.47 | ) | | (0.47 | ) | | $ | 10.51 | | 4.57% | | | $ | 7,586 | | 0.99% | | | 4.48% | | | 27.77% |
Year Ended October 31, 2003 | | $ | 10.51 | | 0.44 | | (0.02 | ) | | 0.42 | | (0.44 | ) | | (0.44 | ) | | $ | 10.49 | | 4.09% | | | $ | 7,580 | | 0.98% | | | 4.20% | | | 16.91% |
Year Ended October 31, 2004 | | $ | 10.49 | | 0.43 | | 0.18 | | | 0.61 | | (0.43 | ) | | (0.43 | ) | | $ | 10.67 | | 5.97% | | | $ | 9,599 | | 0.93% | | | 4.10% | | | 0.00% |
Year Ended October 31, 2005 | | $ | 10.67 | | 0.39 | | (0.18 | ) | | 0.21 | | (0.39 | ) | | (0.39 | ) | | $ | 10.49 | | 1.98% | | | $ | 10,054 | | 0.98% | | | 3.67% | | | 3.70% |
Year Ended October 31, 2006 | | $ | 10.49 | | 0.43 | | 0.01 | | | 0.44 | | (0.43 | ) | | (0.43 | ) | | $ | 10.50 | | 4.30% | | | $ | 8,714 | | 0.95% | | | 4.12% | | | 1.91% |
| | | | | | | | | | | | |
Class B Shares | | | | | | | | | | | | | | | | | | | | | | | | | | | | | | | | | |
Period Ended October 31, 2003 (c) | | $ | 10.28 | | 0.06 | | 0.20 | | | 0.26 | | (0.06 | ) | | (0.06 | ) | | $ | 10.48 | | 2.48% | (e) | | $ | 41 | | 1.72% | (f) | | 3.54% | (f) | | 16.91% |
Year Ended October 31, 2004 | | $ | 10.48 | | 0.35 | | 0.19 | | | 0.54 | | (0.35 | ) | | (0.35 | ) | | $ | 10.67 | | 5.28% | | | $ | 370 | | 1.68% | | | 3.36% | | | 0.00% |
Year Ended October 31, 2005 | | $ | 10.67 | | 0.32 | | (0.20 | ) | | 0.12 | | (0.31 | ) | | (0.31 | ) | | $ | 10.48 | | 1.19% | | | $ | 602 | | 1.73% | | | 2.90% | | | 3.70% |
Year Ended October 31, 2006 | | $ | 10.48 | | 0.35 | | 0.02 | | | 0.37 | | (0.35 | ) | | (0.35 | ) | | $ | 10.50 | | 3.52% | | | $ | 792 | | 1.70% | | | 3.37% | | | 1.91% |
| | | | | | | | | | | | |
Class C Shares | | | | | | | | | | | | | | | | | | | | | | | | | | | | | | | | | |
Period Ended October 31, 2003 (c) | | $ | 10.27 | | 0.06 | | 0.20 | | | 0.26 | | (0.06 | ) | | (0.06 | ) | | $ | 10.47 | | 2.48% | (e) | | $ | 1 | | 1.72% | (f) | | 3.65% | (f) | | 16.91% |
Year Ended October 31, 2004 | | $ | 10.47 | | 0.36 | | 0.17 | | | 0.53 | | (0.36 | ) | | (0.36 | ) | | $ | 10.64 | | 5.12% | | | $ | 984 | | 1.66% | | | 3.32% | | | 0.00% |
Year Ended October 31, 2005 | | $ | 10.64 | | 0.32 | | (0.19 | ) | | 0.13 | | (0.31 | ) | | (0.31 | ) | | $ | 10.46 | | 1.30% | | | $ | 1,211 | | 1.73% | | | 2.91% | | | 3.70% |
Year Ended October 31, 2006 | | $ | 10.46 | | 0.35 | | 0.02 | | | 0.37 | | (0.35 | ) | | (0.35 | ) | | $ | 10.48 | | 3.53% | | | $ | 1,207 | | 1.70% | | | 3.38% | | | 1.91% |
| | | | | | | | | | | | |
Class D Shares | | | | | | | | | | | | | | | | | | | | | | | | | | | | | | | | | |
Year Ended October 31, 2002 | | $ | 10.50 | | 0.49 | | 0.01 | | | 0.50 | | (0.49 | ) | | (0.49 | ) | | $ | 10.51 | | 4.94% | | | $ | 195,601 | | 0.73% | | | 4.74% | | | 27.77% |
Year Ended October 31, 2003 | | $ | 10.51 | | 0.47 | | (0.02 | ) | | 0.45 | | (0.47 | ) | | (0.47 | ) | | $ | 10.49 | | 4.36% | | | $ | 184,774 | | 0.72% | | | 4.47% | | | 16.91% |
Year Ended October 31, 2004 | | $ | 10.49 | | 0.46 | | 0.18 | | | 0.64 | | (0.46 | ) | | (0.46 | ) | | $ | 10.67 | | 6.23% | | | $ | 174,451 | | 0.68% | | | 4.35% | | | 0.00% |
Year Ended October 31, 2005 | | $ | 10.67 | | 0.42 | | (0.19 | ) | | 0.23 | | (0.42 | ) | | (0.42 | ) | | $ | 10.48 | | 2.24% | | | $ | 162,139 | | 0.72% | | | 3.92% | | | 3.70% |
Year Ended October 31, 2006 | | $ | 10.48 | | 0.46 | | 0.02 | | | 0.48 | | (0.46 | ) | | (0.46 | ) | | $ | 10.50 | | 4.56% | | | $ | 145,553 | | 0.70% | | | 4.37% | | | 1.91% |
| | | | | | | | | | | | |
Class X Shares | | | | | | | | | | | | | | | | | | | | | | | | | | | | | | | | | |
Year Ended October 31, 2002 | | $ | 10.50 | | 0.40 | | 0.01 | | | 0.41 | | (0.40 | ) | | (0.40 | ) | | $ | 10.51 | | 4.05% | | | $ | 6,445 | | 1.58% | | | 3.88% | | | 27.77% |
Year Ended October 31, 2003 (d) | | $ | 10.51 | | 0.38 | | (0.02 | ) | | 0.36 | | (0.38 | ) | | (0.38 | ) | | $ | 10.49 | | 3.48% | | | $ | 6,861 | | 1.57% | | | 3.61% | | | 16.91% |
Year Ended October 31, 2004 | | $ | 10.49 | | 0.37 | | 0.18 | | | 0.55 | | (0.37 | ) | | (0.37 | ) | | $ | 10.67 | | 5.34% | | | $ | 6,342 | | 1.53% | | | 3.50% | | | 0.00% |
Year Ended October 31, 2005 | | $ | 10.67 | | 0.32 | | (0.19 | ) | | 0.13 | | (0.32 | ) | | (0.32 | ) | | $ | 10.48 | | 1.36% | | | $ | 4,903 | | 1.57% | | | 3.06% | | | 3.70% |
Year Ended October 31, 2006 | | $ | 10.48 | | 0.37 | | 0.02 | | | 0.39 | | (0.37 | ) | | (0.37 | ) | | $ | 10.50 | | 3.68% | | | $ | 3,167 | | 1.55% | | | 3.52% | | | 1.91% |
| | | | | | | | | | | | |
Class Y Shares | | | | | | | | | | | | | | | | | | | | | | | | | | | | | | | | | |
Year Ended October 31, 2002 | | $ | 10.48 | | 0.41 | | — | | | 0.41 | | (0.40 | ) | | (0.40 | ) | | $ | 10.49 | | 4.06% | | | $ | 221 | | 1.59% | | | 3.87% | | | 27.77% |
Year Ended October 31, 2003 (d) | | $ | 10.49 | | 0.39 | | (0.03 | ) | | 0.36 | | (0.38 | ) | | (0.38 | ) | | $ | 10.47 | | 3.49% | | | $ | 652 | | 1.57% | | | 3.61% | | | 16.91% |
Year Ended October 31, 2004 | | $ | 10.47 | | 0.38 | | 0.17 | | | 0.55 | | (0.37 | ) | | (0.37 | ) | | $ | 10.65 | | 5.35% | | | $ | 493 | | 1.54% | | | 3.51% | | | 0.00% |
Year Ended October 31, 2005 | | $ | 10.65 | | 0.32 | | (0.18 | ) | | 0.14 | | (0.33 | ) | | (0.33 | ) | | $ | 10.46 | | 1.37% | | | $ | 232 | | 1.58% | | | 3.05% | | | 3.70% |
Year Ended October 31, 2006 | | $ | 10.46 | | 0.36 | | 0.02 | | | 0.38 | | (0.37 | ) | | (0.37 | ) | | $ | 10.47 | | 3.59% | | | $ | 135 | | 1.55% | | | 3.53% | | | 1.91% |
| | |
(a) Excludes sales charge. (b) Portfolio turnover is calculated on the basis of the Fund as a whole without distinguishing among the classes of shares. (c) For the period from September 4, 2003 (commencement of operations) through October 31, 2003. | | (d) Effective September 1, 2003, Class B and Class C shares were renamed Class X and Class Y shares, respectively. (e) Not annualized. (f) Annualized. |
| |
| |
See notes to financial statements.
Notes to Financial Statements
October 31, 2006
1. Organization
Gartmore Mutual Funds (the “Trust”) is an open-end management investment company, organized under the laws of Delaware by amended and restated Agreement and Declaration of Trust, dated October 28, 2004, as amended to date. Prior to January 25, 2002, the Trust was named “Nationwide Mutual Funds”. The Trust, originally created under the laws of Ohio as an Ohio business trust pursuant to a Declaration of Trust, dated as of October 30, 1997, as subsequently amended, and redomesticated as a Delaware Statutory Trust on February 28, 2005; the redomestication was a change in statutory status and did not affect the operations of the Trust. The Trust is registered under the Investment Company Act of 1940, as amended (the “1940 Act”). As of October 31, 2006, the Trust had authorized an unlimited number of shares of beneficial interest (“shares”) without par value. The Trust operates forty-nine (49) separate series, or mutual funds, each with its own investment objective(s) and strategies. This report contains the financial statements and financial highlights of the eight (8) funds listed below (individually, a “Fund”; collectively, the “Funds”):
- Gartmore Large Cap Value Fund (“Large Cap Value”)
- Gartmore Mid Cap Growth Fund (“Mid Cap Growth”)
- Gartmore Small Cap Fund (“Small Cap”)
- Gartmore Bond Fund (“Bond”)
- Gartmore Enhanced Income Fund (“Enhanced Income”), (formerly Gartmore Morley Enhanced Income Fund)
- Gartmore Government Bond Fund (“Government Bond”)
- Gartmore Short Duration Bond Fund (“Short Duration Bond”)
- Gartmore Tax-Free Income Fund (“Tax-Free Income”)
2. Summary of Significant Accounting Policies
The following is a summary of significant accounting policies followed by the Funds in the preparation of their financial statements. The policies are in conformity with accounting principles generally accepted in the United States of America (“GAAP”). The preparation of financial statements requires management to make estimates and assumptions that affect the reported amounts of assets and liabilities, the disclosure of contingent assets and liabilities at the date of the financial statements, and the reported amounts of income and expenses for the period. Actual results could differ from those estimates.
Securities for which market quotations are readily available are valued at current market value as of “Valuation Time.” Valuation Time is as of the close of regular trading on the New York Stock Exchange (usually 4 p.m. Eastern time). Equity securities are valued at the last quoted sale price or, if there is no sale price, the last quoted bid price provided by an independent pricing service approved by the Trust’s Board of Trustees. Securities traded on NASDAQ are valued at the NASDAQ official closing price. Prices are taken from the primary market or exchange in which each security trades.
Most securities listed on a foreign exchange are valued either at fair value (see description below) or at the last sale price at the close of the exchange on which the security is principally traded. Foreign securities, currencies, and other assets and liabilities denominated in foreign currencies are translated into U.S. dollars at the exchange rate of said currencies against the U.S. dollar, as of Valuation Time, as provided by an independent pricing service approved by the Board of Trustees.
Debt and other fixed-income securities (other than short-term obligations) are valued at the last quoted bid price and/or by using a combination of daily quotes and matrix evaluations provided by an independent pricing service, the use of which has been approved by the Trust’s Board of Trustees. Short-term debt securities such as commercial paper and U.S. Treasury Bills, having a remaining maturity of 60 days or less at the time of purchase are considered to be “short-term” and are valued at amortized cost which approximates market value.
Notes to Financial Statements (Continued)
October 31, 2006
Securities for which market quotations are not readily available, or for which an independent pricing service does not provide a value or provides a value that does not represent fair value in the judgment of the Funds’ investment adviser or designee, are valued at fair value under procedures approved by the Trust’s Board of Trustees. The “Fair Value” of these securities is determined in good faith by taking into account relevant factors and surrounding circumstances. Methods utilized to obtain a “Fair Value” may include the following non-exclusive list of acceptable methods: (i) a multiple of earnings; (ii) the discount from market value of a similar, freely traded security; (iii) the yield-to-maturity for debt issues; or (iv) a consolidation of the methods. The Gartmore Funds Fair Value Committee considers a non-exclusive list of factors to arrive at the appropriate method of determining “Fair Value.” For example, fair value determinations are required for securities whose value is affected by a “significant” event that materially affects the value of a domestic or foreign security which occurs subsequent to the time of the close of the principal market on which such domestic or foreign security trades and before the Valuation Time (i.e., a “subsequent event”). Typically, this will involve events occurring after the close of a foreign market on which a security trades and before the next Valuation Time.
The Funds holding foreign equity securities (the “Foreign Equity Funds”) value foreign securities at fair value in the circumstances described below. Generally, trading in foreign securities markets is completed each day at various times prior to the Valuation Time. Due to the time differences between the closings of the relevant foreign securities exchanges and the Valuation Time for the Foreign Equity Funds, the Foreign Equity Funds will fair value their foreign investments when it is determined that the market quotations for the foreign investments either are not readily available or are unreliable and, therefore, do not represent fair value. When the fair value prices are utilized, these prices will attempt to reflect the impact of the U.S. financial markets’ perceptions and trading activities on the Foreign Equity Funds’ foreign investments since the last closing prices of the foreign investments were calculated on their primary foreign securities markets or exchanges. For these purposes, the Board of Trustees of the Trust has determined that movements in relevant indices or other appropriate market indicators, after the close of the foreign securities exchanges, may demonstrate that market quotations are unreliable, and may trigger fair value pricing for certain securities. Consequently, fair valuation of portfolio securities may occur on a daily basis.
| (b) | | Repurchase Agreements |
The Funds may enter into repurchase agreements with an entity which is a member of the Federal Reserve System or which is a “primary dealer” (as designated by the Federal Reserve Bank of New York) in U.S. Government obligations. The repurchase price generally equals the price paid by a Fund plus interest negotiated on the basis of current short-term rates, which may be more or less than the rate on the underlying portfolio securities. The seller under a repurchase agreement is required to maintain the value of the collateral held pursuant to the agreement at a market value equal to or greater than the repurchase price (including accrued interest). Collateral subject to repurchase agreements is held by the Funds’ custodian or another qualified sub-custodian or in the Federal Reserve/Treasury book-entry system. If the counterparty defaults and the fair value of the collateral declines, realization of the collateral by the Funds may be delayed or limited. The Funds may transfer uninvested cash balances into a pooled cash account. These balances are invested in one or more repurchase agreements, which are fully collateralized by U.S. Government Agency Mortgages with the counterparties of CS First Boston and Nomura Securities.
Certain Funds may invest in financial futures contracts (“futures contracts”) for the purpose of hedging their existing portfolio securities or securities that the Funds intend to purchase against fluctuations in value caused by changes in prevailing market interest rates or prices. Futures contracts may also be entered into for non-hedging purposes.
Upon entering into a futures contract, these Funds are required to pledge to the broker an amount of cash and/or other assets equal to a certain percentage of the contract amount (initial margin deposit). Subsequent payments, known as “variation margin”, are made each day, depending on the daily fluctuations in the fair value/market value of the underlying assets. A gain or loss equal to the daily variation margin is recognized on a daily basis. Future contracts are valued daily at their last quoted sale price.
A “sale” of a futures contract means a contractual obligation to deliver the securities or foreign currency called for by the contract at a fixed price at a specified time in the future. A “purchase” of a futures contract means a contractual obligation to acquire the securities or foreign currency at a fixed price at a specified time in the future.
Should market conditions change unexpectedly, the Funds may not achieve the anticipated benefits of the futures contracts and may realize a loss. The use of futures transactions for hedging purposes involves the risk of imperfect correlation in movements in the price of futures contracts, interest rates and the value of the underlying hedged assets.
| (d) | | Security Transactions and Investment Income |
Security transactions are accounted for on the date the security is purchased or sold (i.e., the “trade date”). Securities gains and losses are calculated on the identified cost basis. Interest income is recognized on the accrual basis and includes, where applicable, the amortization or accretion of premium or discount. Dividend income is recorded on the ex-dividend date.
To generate additional income, each of the Funds may lend their respective portfolio securities, up to 33 1/3% of the Fund, to brokers, dealers and other financial institutions provided that (1) the borrower delivers cash or securities as collateral with respect to each new loan of U.S. securities, equal to at least 102% of the value of the portfolio securities loaned, and with respect to each new loan on non-U.S. securities, collateral of at least 105% of the value of the portfolio securities loaned; and (2) at all times thereafter shall require the borrower to mark-to-market the collateral on a daily basis so that the market value of such collateral does not fall below 100% of the value of securities loaned. The Funds receive payments from borrowers equivalent to the dividends and interest that would have been earned on securities loaned while simultaneously seeking to earn income on the investment of cash collateral. There may be risks of delay in recovery of the securities should the borrower of the securities fail financially. Loans will be made, however, only to borrowers deemed by the Funds’ investment adviser to be of good standing and creditworthy under guidelines established by the Board of Trustees and when, in judgment of the adviser, the consideration which can be earned currently from these securities loans justifies the attendant risks. Loans are subject to termination by the Funds or the borrower at any time, and, therefore, are not considered to be illiquid investments. JPMorgan Chase Bank serves as custodian for the securities lending program of the Funds. JPMorgan Chase Bank receives a fee based on the value of the collateral received from borrowers.
Information on the investment of cash collateral is shown in the Statement of Investments.
As of October 31, 2006, the following Funds had securities with the following value on loan:
| | | | | | |
| Fund | | Value of
Loaned Securities | | Value of
Collateral |
Large Cap Value | | $ | 2,065,799 | | $ | 2,102,240 |
Small Cap | | | 8,432,004 | | | 8,879,916 |
Bond* | | | 5,999,275 | | | 6,088,544 |
Enhanced Income** | | | 15,545,213 | | | 15,828,911 |
Government Bond*** | | | 9,368,180 | | | 9,555,544 |
| | * | Includes $2,364,588 of collateral in the form of U.S. Government Securities, interest rates ranging from 0.00% to 12.00% and maturity dates ranging from 12/15/06 to 01/25/48. |
| | ** | Includes $1,794,514 of collateral in the form of U.S. Government Securities, interest rates ranging from 0.00% to 6.07% and maturity date ranging from 09/27/07 to 05/12/16. |
| | *** | Includes $9,555,544 of collateral in the form of U.S. Government Securities, interest rates ranging from 0.00% to 6.07% and maturity dates ranging from 09/27/07 to 05/12/16. |
Notes to Financial Statements (Continued)
October 31, 2006
| (f) | | Distributions to Shareholders |
Distributions from net investment income, if any, are declared and paid quarterly for Large Cap Value, Mid Cap Growth, and Small Cap (the “Equity Funds”) and are declared daily and paid monthly for all other Funds. For all Funds, distributions from net realized capital gains, if any, are declared and distributed at least annually.
Dividends and distributions to shareholders are determined in accordance with federal income tax regulations, which may differ from GAAP. These “book/tax” differences are considered either permanent or temporary in nature. In accordance with American Institute of Certified Public Accountants Statement of Position 93-2, permanent differences (i.e., reclassification of market discounts, foreign exchange gain/loss, paydowns and distributions from real estate investment trusts) are reclassified within the capital accounts based on their nature for federal income tax purposes; temporary differences do not require reclassification. These reclassifications have no effect upon the net asset value of the respective Funds. To the extent distributions exceed current and accumulated earnings and profits for federal income tax purposes, these excesses are reported as distributions of paid-in-capital.
It is the policy of each Fund to qualify or continue to qualify as a “regulated investment company” by complying with the provisions available to certain investment companies, as defined in Subchapter M of the Internal Revenue Code, and to make distributions of net investment income and net realized capital gains sufficient to relieve the Fund from all, or substantially all, federal income taxes.
| (h) | | Allocation of Expenses, Income, and Gains and Losses |
Expenses directly attributable to a Fund are charged to that Fund. Expenses not directly attributable to a Fund are allocated proportionately among various or all Funds within the Trust. For each Fund, the method for allocating income, fund level expenses, and realized and unrealized gains or losses is based on the fair value of shares outstanding relative to net assets. Under this method, each class of shares participates based on the total net asset value of that class’s shares in proportion to the total net assets of the Fund. Expenses specific to a class (such as Rule 12b-1 and administrative services fees) are charged to that class.
3. Transactions with Affiliates
Under the terms of the Trust’s Investment Advisory Agreements, Gartmore Mutual Fund Capital Trust (“GMF”) or Gartmore Morley Capital Management, Inc. (“GMCM”) manages the investment of the assets and supervises the daily business affairs of their respective Funds (as shown in the table below). GMF is a wholly-owned subsidiary of NWD Investment Management, Inc., (prior to November 30, 2006 known as “Gartmore Global Investments, Inc.” (“GGI”)), a holding company. NWD Investment Management, Inc. is a majority-owned subsidiary of NWD Management & Research Trust, (prior to November 30, 2006 known as “Gartmore Global Asset Management Trust” (“GGAMT”)). NWD Management & Research Trust is a wholly-owned subsidiary of Nationwide Corporation. All of the common stock of Nationwide Corporation is held by Nationwide Mutual Insurance Company (95.2%) and Nationwide Mutual Fire Insurance Company (4.8%), each of which is a mutual company owned by its policyholders. GMCM is a wholly-owned subsidiary of Gartmore Morley Financial Services, Inc., an indirect subsidiary of NWD Investment Management, Inc. With respect to the Large Cap Value Fund, GMF provides investment management evaluation services in initially selecting and monitoring on an ongoing basis, the performance of the subadvisers for such Fund. NorthPointe Capital, LLC (“NorthPointe”), an indirect, majority owned subsidiary of NWD Investment Management, Inc., currently serves
as the subadviser for the Large Cap Value Fund and as such, manages the Fund’s investments and has the responsibility for making all investment decisions for the Fund. The adviser and subadviser, if applicable, for each Fund is as follows:
| | | | |
| Fund | | Adviser | | Subadviser |
Large Cap Value | | GMF | | NorthPointe Capital, LLC |
Mid Cap Growth | | GMF | | n/a |
Small Cap | | GMF | | n/a |
Bond | | GMF | | n/a |
Enhanced Income | | GMCM | | n/a |
Government Bond | | GMF | | n/a |
Short Duration Bond | | GMCM | | n/a |
Tax-Free Income | | GMF | | n/a |
Under the terms of the Investment Advisory Agreements, each Fund pays GMF or GMCM, as applicable, an investment advisory fee based on that Fund’s average daily net assets. From these fees, pursuant to the subadvisory agreement, GMF pays fees to NorthPointe. Additional information regarding the investment advisory fees and subadvisory fees for GMF, GMCM and NorthPointe is as follows for the year ended October 31, 2006:
| | | | | | | | |
| Fund | | Fee Schedule | | Total
Fees | | Fees
Retained | | Paid to
Subadviser |
Large Cap Value | | Up to $100 million | | 0.75% | | 0.40% | | 0.35% |
| | | On $100 million and more | | 0.70% | | 0.40% | | 0.30% |
Mid Cap Growth | | Up to $250 million | | 0.75% | | 0.75% | | — |
| | $250 million up to $1 billion | | 0.725% | | 0.725% | | — |
| | $1 billion up to $2 billion | | 0.70% | | 0.70% | | — |
| | $2 billion up to $5 billion | | 0.675% | | 0.675% | | — |
| | | On $5 billion and more | | 0.65% | | 0.65% | | — |
Small Cap | | Up to $100 million | | 0.95% | | 0.95% | | — |
| | | On $100 million and more | | 0.80% | | 0.80% | | — |
Bond, Government Bond and | | Up to $250 million | | 0.50% | | 0.50% | | — |
Tax-Free Income | | On the next $750 million | | 0.475% | | 0.475% | | — |
| | On the next $1 billion | | 0.45% | | 0.45% | | — |
| | On the next $3 billion | | 0.425% | | 0.425% | | — |
| | | On $5 billion and more | | 0.40% | | 0.40% | | — |
Enhanced Income and | | Up to $500 million | | 0.35% | | 0.35% | | — |
Short Duration Bond (a) | | $500 million up to $1 billion | | 0.34% | | 0.34% | | — |
| | $1 billion up to $3 billion | | 0.325% | | 0.325% | | — |
| | $3 billion up to $5 billion | | 0.30% | | 0.30% | | — |
| | $5 billion up to $10 billion | | 0.285% | | 0.285% | | — |
| | | $10 billion and more | | 0.275% | | 0.275% | | — |
| (a) | GMCM has agreed to voluntarily waive 0.10% of the advisory fee until further written notice to the shareholders, for the Short Duration Bond Fund. |
Notes to Financial Statements (Continued)
October 31, 2006
GMF or GMCM, where applicable, and the Funds have entered into written contracts (“Expense Limitation Agreements”) that limit operating expenses (excluding any taxes, interest, brokerage fees, extraordinary expenses, short sale dividend expenses, Rule 12b-1 fees, and administrative services fees) from exceeding the amounts listed in the table below until at least February 28, 2007.
| | | | | |
| Fund | | Expense Caps | | Amount | |
Large Cap Value | | All Classes | | 1.15 | % |
Mid Cap Growth | | All Classes | | 1.15 | % |
Small Cap | | All Classes | | 1.35 | % |
Enhanced Income | | All Classes | | 0.45 | % |
Short Duration Bond | | All Classes | | 0.55 | % |
GMF or GMCM may request and receive reimbursement from certain Funds of the advisory fees waived and other expenses reimbursed by GMF or GMCM, respectively, pursuant to the Expense Limitation Agreements at a later date not to exceed three years from the fiscal year in which the corresponding reimbursement to the Fund was made, depending on the Fund (as described below), if the Fund has reached a sufficient asset size to permit reimbursement to be made without causing the total annual operating expense ratio of the Fund to exceed the limits set forth above. No reimbursement will be made unless: (i) the Fund’s assets exceed $100 million; (ii) the total annual expense ratio of the Class making such reimbursement is at or less than the limit set forth above; and (iii) the payment of such reimbursement is approved by the Board of Trustees on a quarterly basis. Except as provided for in the Expense Limitation Agreements, reimbursement of amounts previously waived or assumed by GMF or GMCM is not permitted. Large Cap Value and Small Cap can no longer reimburse GMF under the terms of their expense limitation agreement.
As of October 31, 2006, the cumulative potential reimbursements of the following Funds, based on reimbursements which expire within three years from the fiscal year in which the corresponding reimbursements to the Fund were made for expenses reimbursed by GMF or GMCM, would be:
| | | | | | | | | |
| Fund | | Amount
Fiscal Year
2004 | | Amount
Fiscal Year
2005 | | Amount
Fiscal Year
2006 |
Large Cap Value | | $ | 17,394 | | $ | 8,421 | | $ | — |
Mid Cap Growth | | | 34,484 | | | 36,261 | | | 27,464 |
Small Cap | | | 13,994 | | | 3,826 | | | — |
Enhanced Income | | | — | | | — | | | 180,035 |
Under the terms of a Distribution Plan under Rule 12b-1 of the 1940 Act, Gartmore Distribution Services, Inc. (“GDSI”), the Funds’ principal underwriter, is compensated by the Funds for expenses associated with the distribution of certain classes of shares of the Funds. GDSI is a majority-owned subsidiary of NWD Management & Research Trust. These fees are based on average daily net assets of the respective class of the Funds at an annual rate not to exceed the following:
| | | | | | | | | | | | | | | | | | | | | | | | |
| Fund | | Class A
Shares | | | Class B
Shares | | | Class C
Shares | | | Class R
Shares | | | Class X
Shares | | | Class Y
Shares | | | Service Class
Shares | | | IRA
Class | |
Large Cap Value | | 0.25 | % | | 1.00 | % | | 1.00 | % | | 0.50 | % | | n/a | | | n/a | | | n/a | | | n/a | |
Mid Cap Growth | | 0.25 | % | | 1.00 | % | | 1.00 | % | | 0.50 | % | | n/a | | | n/a | | | n/a | | | n/a | |
Small Cap | | 0.25 | % | | 1.00 | % | | 1.00 | % | | 0.50 | % | | n/a | | | n/a | | | n/a | | | n/a | |
Bond | | 0.25 | % | | 1.00 | % | | 1.00 | % | | 0.50 | % | | 0.85 | % | | 0.85 | % | | n/a | | | n/a | |
Enhanced Income | | 0.25 | % | | n/a | | | n/a | | | 0.50 | % | | n/a | | | n/a | | | n/a | | | n/a | |
Government Bond | | 0.25 | % | | 1.00 | % | | 1.00 | % | | 0.50 | % | | 0.85 | % | | 0.85 | % | | n/a | | | n/a | |
Short Duration Bond | | 0.25 | % | | n/a | | | 0.75 | % | | n/a | | | n/a | | | n/a | | | 0.25 | % | | 0.25 | % |
Tax-Free Income | | 0.25 | % | | 1.00 | % | | 1.00 | % | | n/a | | | 0.85 | % | | 0.85 | % | | n/a | | | n/a | |
Pursuant to an Underwriting Agreement, GDSI serves as principal underwriter of the Funds in the continuous distribution of their shares and receives commissions in the form of a front-end sales charge on the Class A and Class D shares. These fees are deducted from and are not included in proceeds from sales of Class A and Class D shares. From these fees, GDSI pays sales commissions, salaries and other expenses in connection with generating new sales of Class A and Class D shares of the Funds. GDSI also receives fees for services as principal underwriter for Class B and Class X shares of the Funds. These fees are contingent deferred sales charges (“CDSCs”) ranging from 1% to 5% imposed on redemptions of Class B and Class X shares, which may cause the current value of a shareholder’s account to fall below the total purchase payments. The CDSC, if applicable, will be imposed on redemptions made within six years of purchase. Class C and Class Y shares have a CDSC fee of 1% imposed on redemptions of Class C and Class Y shares made within one year of purchase. For the year ended October 31, 2006, GDSI received commissions of $1,149,919 from front-end sales charges of Class A and Class D shares and from CDSC fees from Class B, Class C, Class X, and Class Y shares of the Funds, of which $720,997 was re-allowed to affiliated broker-dealers of the Funds.
Under the terms of a Fund Administration and Transfer Agency Agreement, Gartmore SA Capital Trust (“GSA”) provides various administrative and accounting services for the Funds, and Gartmore Investor Services, Inc. (“GISI”), an indirect subsidiary of GSA, serves as Transfer Agent and Dividend Disbursing Agent for each of the Funds. The fees for the services provided under this agreement are calculated based on the Trust’s average daily net assets according to the fee schedule below. The fees are then allocated proportionately among all funds within the Trust in relation to the average daily net assets of each Fund and are paid to GSA. GSA pays GISI from these fees for GISI’s services.
| | |
| Combined Fee Schedule* | | |
Up to $1 billion | | 0.26% |
$1 billion and more up to $3 billion | | 0.19% |
$3 billion and more up to $4 billion | | 0.15% |
$4 billion and more up to $5 billion | | 0.08% |
$5 billion and more up to $10 billion | | 0.05% |
$10 billion and more up to $12 billion | | 0.03% |
$12 billion or more | | 0.02% |
| * | The assets of the Gartmore Investor Destinations Aggressive, Gartmore Investor Destinations Moderately Aggressive, Gartmore Investor Destinations Moderate, Gartmore Investor Destinations Moderately Conservative and Gartmore Investor Destinations Conservative Funds (collectively, the “Investor Destinations Funds”) and the Gartmore Optimal Allocations Fund: Aggressive, Gartmore Optimal Allocations Fund: Moderate, Gartmore Optimal Allocations Fund: Moderately Aggressive, and Gartmore Optimal Allocations Fund: Specialty (collectively, the “Optimal Funds”) are excluded from the Trust asset level amount in order to calculate this asset based fee. The Investor Destinations Funds and the Optimal Funds do not pay any part of this fee. |
Notes to Financial Statements (Continued)
October 31, 2006
GSA and GISI have entered into agreements with BISYS Fund Services Ohio, Inc. (“BISYS”), pursuant to which BISYS provides sub-administration and sub-transfer agency services, respectively, to the Funds.
GSA and BISYS have agreed to designate certain sub-transfer agency agreements GSA enters into with respect to the Funds as “Qualifying Sub-TA Agreements.” With respect to Qualifying Sub-TA Agreements, BISYS will credit to GSA an amount equal to the lesser of (i) the actual amount GSA is charged by the sub-transfer agent under the applicable Qualifying Sub-TA Agreement or (ii) $10 per investor account; however, the aggregate amount paid with regard to all Qualifying Sub-TA Agreements, regardless of whether option (i) or (ii) applies, shall not exceed $200,000 per annum. BISYS will calculate and credit such amounts to GSA’s fees on a monthly basis. All amounts will be credited to each applicable Fund on a monthly basis.
Under the terms of an Administrative Services Plan, the Funds may pay fees to servicing organizations, such as broker-dealers, including Nationwide Financial Services, Inc. (“Nationwide Financial Services”), an affiliate of NWD Management & Research Trust, and financial institutions, which agree to provide administrative support services to the shareholders of certain classes. These services include, but are not limited, to the following: establishing and maintaining shareholder accounts; processing purchase and redemption transactions; arranging bank wires; performing shareholder sub-accounting; answering inquiries regarding the Funds; and other such services. These fees are based on an annual rate of up to 0.25% of the average daily net assets of the Class A, Class D, Class R, and Institutional Service Class shares of each of the Funds (except for the Short Duration Bond Fund). For the Short Duration Bond Fund, these fees are based on an annual rate of up to 0.25% of the average daily net assets of the IRA Class and Service Class shares.
For the year ended October 31, 2006, Nationwide Financial Services received the following amounts in Administrative Services Fees from each Fund:
| | | |
| Fund | | Amount |
Large Cap Value | | $ | 32,439 |
Small Cap | | | 40,545 |
Bond | | | 47,224 |
Enhanced Income | | | 5,976 |
Government Bond | | | 141,966 |
Short Duration Bond | | | 72,995 |
Under terms of a letter agreement dated September 12, 2006, by and among GSA and the Audit Committees of the Funds and Gartmore Variable Insurance Trust, the Funds have agreed to reimburse GSA their pro-rata portion of certain costs related to the Funds’ ongoing administration, monitoring and annual (audit) testing of the Funds’ Rule 38a-1 Compliance Program subject to the pre-approval of the Funds’ Audit Committee. Such costs include: (1) $160 per hour for services performed on behalf of the Funds by employees of GSA or GSA’s affiliates (other than the Fund CCO); (2) travel costs and other reasonable incidental expenses (without markup) incurred by employees of GSA or GSA’s affiliates in connection with performance of such services; and (3) in the event it becomes necessary to supplement the services of GSA’s (and GSA’s affiliates’) employees, in order to complete the Funds’ Rule 38a-1 annual compliance audit, the costs of a mutually-agreed upon independent contractor’s costs to provide such services.
As of October 31, 2006, the adviser or affiliates of the adviser directly held 26% of the shares outstanding of the Mid Cap Growth Fund.
4. Short-Term Trading Fees
The Funds (except the Enhanced Income Fund) assess a 2.00% redemption fee on all classes of shares that are purchased and are sold or exchanged within 30 calendar days of purchase (within 90 calendar days for the Mid Cap Growth and Small Cap Funds and within seven calendar days for the Bond, Government Bond, Short Duration Bond and Tax-Free Income Funds). The redemption fee, if any, is paid directly to the applicable Fund and is designed to offset brokerage commissions, market impact, and other costs associated with short-term trading of Fund shares. For purposes of determining whether the redemption fee applies, the shares that were held the longest will be redeemed first. This
redemption fee is in addition to any CDSCs that may be applicable at the time of sale. The redemption fee may not apply in certain circumstances, such as redemptions or exchanges of shares held in certain omnibus accounts or retirement plans that cannot implement the redemption fee. The fee does not apply to shares purchased through reinvested dividends or capital gains.
For the year ended October 31, 2006, the following Funds had contributions to capital due to collection of redemption fees:
| | | |
| Fund | | Amount |
Large Cap Value | | $ | 4,811 |
Mid Cap Growth | | | 3,516 |
Small Cap | | | 149,280 |
Bond | | | 1,527 |
Government Bond | | | 1,842 |
Short Duration Bond | | | 9,396 |
Tax-Free Income | | | 995 |
5. Bank Loans and Earnings Credit
The Trust has a credit agreement with JPMorgan Chase & Co, the Funds’ custodian bank, permitting the Trust to borrow up to $100,000,000. Borrowings under this arrangement bear interest at the Federal Funds rate plus 0.50%. The interest costs, if any, would be included in other fees in the Statement of Operations. No compensating balances were required under the terms of the line of credit. The line of credit is renewed annually, expiring on June 26, 2007, with a commitment fee of 0.08% per year on $100,000,000. There were no borrowings outstanding under this line of credit during the year ended October 31, 2006.
The Trust’s custodian bank has agreed to reduce the bank’s fees (earnings credits) when the Funds of the Trust maintain cash on deposit in non-interest-bearing custody and Demand Deposit Accounts. Earnings credits are shown as a reduction of total expenses on the Statement of Operations.
6. Investment Transactions
Purchases and sales of securities (excluding short-term securities) for the year ended October 31, 2006, are summarized as follows:
| | | | | | |
| Fund | | Purchases | | Sales |
Large Cap Value | | $ | 32,565,080 | | $ | 42,091,950 |
Mid Cap Growth | | | 5,743,374 | | | 4,049,334 |
Small Cap | | | 885,640,231 | | | 443,503,616 |
Bond | | | 35,278,742 | | | 38,555,622 |
Enhanced Income | | | 350,277,532 | | | 361,074,266 |
Government Bond | | | 213,724,846 | | | 241,250,636 |
Short Duration Bond | | | 29,953,110 | | | 63,408,818 |
Tax-Free Income | | | 3,181,470 | | | 21,797,786 |
Purchases and sales of U.S. Government securities for the year ended October 31, 2006, are summarized as follows:
| | | | | | |
| Fund | | Purchases | | Sales |
Bond | | $ | 12,394,141 | | $ | 10,759,737 |
Enhanced Income | | | 15,027,504 | | | — |
Government Bond | | | 207,470,731 | | | 205,347,094 |
Short Duration Bond | | | 23,479,336 | | | — |
Notes to Financial Statements (Continued)
October 31, 2006
7. Indemnifications
Under the Trust’s organizational documents, certain of the Trust’s Officers and Trustees are indemnified against certain liabilities arising out of the performance of their duties to the Trust. In addition, the Trust has entered into Indemnification Agreements with its Trustees and certain of its Officers. Trust Officers receive no compensation from the Trust for serving as its Officers. In addition, in the normal course of business, the Trust enters into contracts with the Trust’s vendors and others that provide for general indemnifications. The Trust’s maximum liability under these arrangements is unknown, as this would involve future claims that may be made against the Trust. Based on experience, however, the Trust expects the risk of loss to be remote.
8. Federal Tax Information
The tax character of distributions paid during the fiscal year ended October 31, 2006, was as follows: (Total distributions paid differ from the Statement of Changes in Net Assets because for tax purposes dividends are recognized when paid.)
| | | | | | | | | | | | | | | |
| | | Distributions paid from | | | | | | |
| Fund | | Ordinary Income | | Net Long- Term Capital Gains | | Total Taxable
Distributions | | Tax Exempt
Distributions | | Total Distributions Paid |
Large Cap Value | | $ | 330,759 | | $ | 1,570,314 | | $ | 1,901,073 | | $ | — | | $ | 1,901,073 |
Mid Cap Growth | | | — | | | 267,532 | | | 267,532 | | | — | | | 267,532 |
Small Cap | | | 7,356,751 | | | 251,820 | | | 7,608,571 | | | — | | | 7,608,571 |
Bond | | | 5,367,026 | | | — | | | 5,367,026 | | | — | | | 5,367,026 |
Enhanced Income | | | 18,403,447 | | | — | | | 18,403,447 | | | — | | | 18,403,447 |
Government Bond | | | 6,307,751 | | | 36,342 | | | 6,344,093 | | | — | | | 6,344,093 |
Short Duration Bond | | | 3,684,401 | | | — | | | 3,684,401 | | | — | | | 3,684,401 |
Tax-Free Income | | | 14,902 | | | — | | | 14,902 | | | 7,335,432 | | | 7,350,334 |
The tax character of distributions paid during the fiscal year ended October 31, 2005 was as follows: (Total distributions paid differ from the Statement of Changes in Net Assets because for tax purposes dividends are recognized when actually paid.)
| | | | | | | | | | | | | | | |
| | | Distributions paid from | | | | | | |
| Fund | | Ordinary Income | | Net Long- Term Capital Gains | | Total Taxable
Distributions | | Tax Exempt
Distributions | | Total Distributions Paid |
Large Cap Value | | $ | 314,017 | | $ | — | | $ | 314,017 | | $ | — | | $ | 314,017 |
Mid Cap Growth | | | — | | | 165,112 | | | 165,112 | | | — | | | 165,112 |
Small Cap | | | — | | | 3,107,190 | | | 3,107,190 | | | — | | | 3,107,190 |
Bond | | | 5,328,529 | | | — | | | 5,328,529 | | | — | | | 5,328,529 |
Enhanced Income | | | 10,386,236 | | | — | | | 10,386,236 | | | — | | | 10,386,236 |
Government Bond | | | 6,209,349 | | | — | | | 6,209,349 | | | — | | | 6,209,349 |
Short Duration Bond | | | 6,123,024 | | | — | | | 6,123,024 | | | — | | | 6,123,024 |
Tax-Free Income | | | 17,078 | | | — | | | 17,078 | | | 7,237,912 | | | 7,254,990 |
As of October 31, 2006, the components of accumulated earnings (deficit) on a tax basis were as follows:
| | | | | | | | | | | | | | | | | | | | | | | | | | | | |
| Fund | | Undistributed Tax Exempt Income | | Undistributed Ordinary Income | | Undistributed Long-Term Capital Gains | | Accumulated Earnings | | Distributions Payable | | | Accumulated Capital and Other Losses | | | Unrealized Appreciation (Depreciation)* | | | Total Accumulated Earnings (Deficit) | |
Large Cap Value | | $ | — | | $ | 1,359,414 | | $ | 2,782,085 | | $ | 4,141,499 | | $ | — | | | $ | — | | | $ | 4,345,710 | | | $ | 8,487,209 | |
Mid Cap Growth | | | — | | | 35,850 | | | 438,536 | | | 474,386 | | | — | | | | — | | | | 878,131 | | | | 1,352,517 | |
Small Cap | | | — | | | 28,381,274 | | | 1,378,292 | | | 29,759,566 | | | — | | | | — | | | | 16,732,212 | | | | 46,491,778 | |
Bond | | | — | | | 598,808 | | | — | | | 598,808 | | | (468,138 | ) | | | (2,472,771 | ) | | | 3,027,930 | | | | 685,829 | |
Enhanced Income | | | — | | | 1,784,270 | | | — | | | 1,784,270 | | | (1,664,763 | ) | | | (6,083,720 | ) | | | (1,384,190 | ) | | | (7,348,403 | ) |
Government Bond | | | — | | | 589,702 | | | — | | | 589,702 | | | (522,186 | ) | | | (1,025,226 | ) | | | 914,775 | | | | (42,935 | ) |
Short Duration Bond | | | — | | | 243,864 | | | — | | | 243,864 | | | (294,220 | ) | | | (2,814,491 | ) | | | (1,411,032 | ) | | | (4,275,879 | ) |
Tax-Free Income | | | 429,283 | | | — | | | 294,003 | | | 723,286 | | | (585,030 | ) | | | — | | | | 11,670,889 | | | | 11,809,145 | |
| * | The differences between the book-basis and tax-basis unrealized appreciation (depreciation) is attributable primarily to: tax deferral of losses on wash sales; the difference between book and tax amortization methods for premium and market discount; and return of capital adjustments from real estate investment trusts. |
As of October 31, 2006, the tax cost of securities and the breakdown of unrealized appreciation (depreciation) for each Fund were as follows:
| | | | | | | | | | | | | | |
| Fund | | Tax Cost of
Securities | | Unrealized
Appreciation | | Unrealized
Depreciation | | | Net
Unrealized
Appreciation
(Depreciation) | |
Large Cap Value | | $ | 29,832,381 | | $ | 4,579,055 | | $ | (233,345 | ) | | $ | 4,345,710 | |
Mid Cap Growth | | | 6,146,438 | | | 1,037,639 | | | (159,508 | ) | | | 878,131 | |
Small Cap | | | 561,949,216 | | | 29,967,406 | | | (13,235,194 | ) | | | 16,732,212 | |
Bond | | | 111,251,374 | | | 3,595,173 | | | (567,242 | ) | | | 3,027,931 | |
Enhanced Income | | | 453,953,014 | | | 405,208 | | | (1,789,398 | ) | | | (1,384,190 | ) |
Government Bond | | | 139,317,049 | | | 1,448,491 | | | (533,716 | ) | | | 914,775 | |
Short Duration Bond | | | 97,542,676 | | | 88,297 | | | (1,499,329 | ) | | | (1,411,032 | ) |
Tax-Free Income | | | 146,086,708 | | | 11,670,889 | | | — | | | | 11,670,889 | |
Notes to Financial Statements (Continued)
October 31, 2006
As of October 31, 2006, for Federal income tax purposes, the following Funds have capital loss carryforwards available to offset capital gains, if any, to the extent provided by the treasury regulations:
| | | | | |
| Fund | | Amount | | Expires |
Bond | | $ | 118,075 | | 2008 |
Bond | | | 813,853 | | 2009 |
Bond | | | 1,540,843 | | 2010 |
Enhanced Income | | | 90,981 | | 2008 |
Enhanced Income | | | 896,348 | | 2009 |
Enhanced Income | | | 1,947,216 | | 2010 |
Enhanced Income | | | 952,689 | | 2011 |
Enhanced Income | | | 1,507,694 | | 2012 |
Enhanced Income | | | 688,792 | | 2014 |
Government Bond | | | 1,025,226 | | 2014 |
Short Duration Bond | | | 569,688 | | 2012 |
Short Duration Bond | | | 1,446,234 | | 2013 |
Short Duration Bond | | | 798,570 | | 2014 |
Recently Issued Accounting Pronouncements–On July 13, 2006, the Financial Accounting Standards Board (“FASB”) released FASB Interpretation No. 48, Accounting for Uncertainty in Income Taxes (“FIN 48”). FIN 48 provides guidance for how uncertain tax positions should be recognized, measured, presented and disclosed in the financial statements. FIN 48 requires the affirmative evaluation of tax positions taken or expected to be taken in the course of preparing the Fund’s tax returns to determine whether it is more-likely-than-not (i.e., greater than 50 percent) that each tax position will be sustained upon examination by a taxing authority based on the technical merits of the position. A tax position that meets the more-likely-than-not recognition threshold is measured to determine the amount of benefit to recognize in the financial statements. Differences between tax positions taken in a tax return and amounts recognized in the financial statements will generally result in an increase in a liability for taxes payable (or a reduction of a tax refund receivable) and an increase in a deferred tax liability (or a reduction in a deferred tax asset). Adoption of FIN 48 is required for fiscal years beginning after December 15, 2006 and is to be applied to all open tax years as of the effective date. At this time, management is evaluating the implications of FIN 48. Its impact to the financial statements has not yet been determined.
Report of Independent Registered Public
Accounting Firm
To the Board of Trustees and Shareholders of Gartmore Mutual Funds:
In our opinion, the accompanying statements of assets and liabilities, including the statements of investments, and the related statements of operations and of changes in net assets and the financial highlights present fairly, in all material respects, the financial position of Gartmore Large Cap Value Fund, Gartmore Mid Cap Growth Fund, Gartmore Small Cap Fund, Gartmore Bond Fund, Gartmore Enhanced Income Fund, Gartmore Government Bond Fund, Gartmore Short Duration Bond Fund and Gartmore Tax-Free Income Fund (eight series of Gartmore Mutual Funds, hereafter referred to as the “Funds”) at October 31, 2006, the results of each of their operations for the year then ended, the changes in each of their net assets each of the two years in the period then ended and the financial highlights for each of the periods indicated, in conformity with accounting principles generally accepted in the United States of America. These financial statements and financial highlights (hereafter referred to as “financial statements”) are the responsibility of the Funds’ management; our responsibility is to express an opinion on these financial statements based on our audits. We conducted our audits of these financial statements in accordance with the standards of the Public Company Accounting Oversight Board (United States). Those standards require that we plan and perform the audit to obtain reasonable assurance about whether the financial statements are free of material misstatement. An audit includes examining, on a test basis, evidence supporting the amounts and disclosures in the financial statements, assessing the accounting principles used and significant estimates made by management, and evaluating the overall financial statement presentation. We believe that our audits, which included confirmation of securities at October 31, 2006 by correspondence with the custodian and brokers, provide a reasonable basis for our opinion.
PricewaterhouseCoopers LLP
Philadelphia, Pennsylvania
December 20, 2006
Supplemental Information
1. Other Federal Tax Information (Unaudited)
For the period ended October 31, 2006, certain dividends paid by the Funds may be subject to a maximum tax rate of 15% as provided for by the Jobs and Growth Tax Relief Reconciliation Act of 2003. The Funds intend to designate the maximum amount allowable as taxed at a maximum rate of 15%. Complete information will be reported in conjunction with your 2006 Form 1099-DIV.
For the period ended October 31, 2006, the following Funds paid qualified dividend income:
| | | |
| Fund | | Qualified
Dividend
Income |
Large Cap Value | | $ | 153,614 |
Small Cap Fund | | | 388,922 |
For the taxable year ended October 31, 2006, the following percentage of income dividends paid by the Funds qualify for the dividends received deduction available to corporations:
| | |
| Fund | | Dividends
Received
Deduction |
Large Cap Value | | 47% |
Small Cap Fund | | 5% |
The Funds designate the following amounts as long term capital gain distributions qualifying for the maximum 15% income tax rate for individuals:
| | | |
| Fund | | Amount |
Large Cap Value | | $ | 3,985,874 |
Mid Cap Growth | | | 267,532 |
Small Cap | | | 251,820 |
Government Bond | | | 36,342 |
Management Information (Unaudited)
Trustees who are not Interested Persons (as defined in the 1940 Act) and Officers of the Funds as of
October 31, 2006
| | | | | | | | |
Name, Address and Year of Birth | | Position(s) Held with the Trust and Length of Time Served1 | | Principal Occupation(s) During Past 5 Years | | Number of Portfolios in the Gartmore Fund Complex Overseen by Trustee | | Other Directorships Held by Trustee or Nominee2 |
| | | | |
Charles E. Allen c/o NWD Investment Management, Inc. 1200 River Road, Suite 1000 Conshohocken, PA 19428 1948 | | Trustee
since
July 2000 | | Mr. Allen is Chairman, Chief Executive Officer and President of the Graimark Realty Advisors, Inc. (real estate development, investment and asset management). | | 97 | | None |
| | | | |
Paula H.J. Cholmondeley c/o NWD Investment Management, Inc. 1200 River Road, Suite 1000 Conshohocken, PA 19428 1947 | | Trustee
since
July 2000 | | Ms. Cholmondeley is an independent strategy consultant. Ms. Cholmondeley was Vice President and General Manager of Sappi Fine Paper North America from April 2000 through December 2003. | | 97 | | Director of Dentsply International, Inc., Ultralife Batteries, Inc., Terex Corporation, Minerals Technology, Inc. and Albany International Corp. |
| | | | |
C. Brent DeVore3 c/o NWD Investment Management, Inc. 1200 River Road, Suite 1000 Conshohocken, PA 19428 1940 | | Trustee since
1990 | | Dr. DeVore is President of Otterbein College. | | 97 | | None |
| | | | |
Phyllis K. Dryden c/o NWD Investment Management, Inc. 1200 River Road, Suite 1000 Conshohocken, PA 19428 1947 | | Trustee
since December 2004 | | Beginning in February 2006 Ms. Dryden is employed by The Mitchell Madison Group, a management consulting company. Ms. Dryden was a former Managing Partner of marchFIRST, a global management consulting firm prior to February 2002. | | 97 | | None |
| | | | |
Barbara L. Hennigar c/o NWD Investment Management, Inc. 1200 River Road, Suite 1000 Conshohocken, PA 19428 1935 | | Trustee
since
July 2000 | | Retired. | | 97 | | None |
Management Information (Unaudited)
Trustees who are not Interested Persons (as defined in the 1940 Act) and Officers of the Funds as of
October 31, 2006 (Continued)
| | | | | | | | |
Name, Address and Year of Birth | | Position(s) Held with the Trust and Length of Time Served1 | | Principal Occupation(s) During Past 5 Years | | Number of Portfolios in the Gartmore Fund Complex Overseen by Trustee | | Other Directorships Held by Trustee or Nominee2 |
| | | | |
Barbara I. Jacobs c/o NWD Investment Management, Inc. 1200 River Road, Suite 1000 Conshohocken, PA 19428 1950 | | Trustee
since December 2004 | | Ms. Jacobs served as Chairman of the Board of Directors of KICAP Network Fund, a European (United Kingdom) hedge fund, from December 2000 through January 2006. Prior to 2004, Ms. Jacobs was also a Managing Director and European Portfolio Manager with Teachers Insurance and Annuity Association—College Retirement Equities Fund. | | 97 | | None |
| | | | |
Douglas F. Kridler c/o NWD Investment Management, Inc. 1200 River Road, Suite 1000 Conshohocken, PA 19428 1955 | | Trustee
since
September 1997 | | Mr. Kridler has served as the President and Chief Executive Officer of the Columbus Foundation (a Columbus, OH-based foundation which manages over 1,300 individual endowment funds) since February 2002. Prior to January 31, 2002, Mr. Kridler was the President of the Columbus Association for the Performing Arts and Chairman of the Greater Columbus Convention and Visitors Bureau. | | 97 | | None |
| | | | |
Michael D. McCarthy c/o NWD Investment Management, Inc. 1200 River Road, Suite 1000 Conshohocken, PA 19428 1947 | | Trustee
since December 2004 | | Retired. Mr. McCarthy was Chairman of VMAC (commodity swaps) from October 2002 until June 2005; and a partner of Pineville Properties LLC (a commercial real estate development firm). | | 97 | | None |
| | | | |
David C. Wetmore c/o NWD Investment Management, Inc. 1200 River Road, Suite 1000 Conshohocken, PA 19428 1948 | | Trustee
since 1995
and Chairman since
February 2005 | | Retired. | | 97 | | None |
| 1 | Length of time served includes time served with the Trust’s predecessors. |
| 2 | Directorships held in (1) any other investment companies registered under the 1940 Act, (2) any company with a class of securities registered pursuant to Section 12 of the Securities Exchange Act of 1934, as amended (the “Exchange Act”), or (3) any company subject to the requirements of Section 15(d) of the Exchange Act. |
| 3 | Mr. DeVore has served as President of Otterbein College since 1984. Mark Thresher, President and Chief Operating Officer of Nationwide Financial Services, Inc. (“NFS”) has served as a member of the Board of Trustees of Otterbein College since 2000, currently serves as one of 30 of its trustees, and is currently one of two Vice Chairmen of the Board. NFS is under common control with each of the Gartmore companies that serve as investment advisers and principal underwriter to the Trust, as each is a majority-owned subsidiary of Nationwide Corporation (“NC”) and, through NC, of Nationwide Mutual Insurance Company (95.2%) and Nationwide Mutual Fire Insurance Company (4.8%). |
Additional information regarding the Trustees and Officers may be found in the Trust’s Statement of Additional Information, which is available without charge upon request, by calling 800-848-0920.
Trustees who are Interested Persons (as defined in the 1940 Act) and/or Officers of the Funds as of
October 31, 2006
| | | | | | | | |
Name, Address and Year of Birth | | Position(s) Held with the Trust and Length of Time Served1 | | Principal Occupation(s) During Past 5 Years | | Number of Portfolios in the Gartmore Fund Complex Overseen by Trustee | | Other Directorships Held by Trustee2 |
| | | | |
Paul J. Hondros NWD Investment Management, Inc. 1200 River Road, Suite 1000 Conshohocken, PA 19428 1948 | | Trustee
since
July 2000 | | Mr. Hondros has been President and Chief Executive Officer of various NWD Investments Group entities, including Gartmore Distribution Services, Inc. (“GDSI”)3, Gartmore Investor Services, Inc. (“GISI”)3, Gartmore Morley Capital Management, Inc. (“GMCM”)3, Morley Financial Services, Inc. (“MFS”)3, NorthPointe Capital, LLC (“NorthPointe”)3, NWD Management & Research Trust (“NWDMRT”)3, NWD Investment Management, Inc. (“NWDIM”)3, Gartmore Mutual Fund Capital Trust (“GMFCT”)3 and Gartmore SA Capital Trust (“GSA”)3; and a Director of Nationwide Securities, Inc.3, as well as several entities within Nationwide Financial Services, Inc. | | 97 | | None |
| | | | |
Arden L. Shisler c/o NWD Investment Management, Inc. 1200 River Road, Suite 1000 Conshohocken, PA 19428 1941 | | Trustee
since
February 2000 | | Retired. Mr. Shisler is the former President and Chief Executive Officer of K&B Transport, Inc., a trucking firm (2000 through 2002). He served as a consultant to K&B from January 2003 through December 2004. Since 1992, Mr. Shisler has also been Chairman of the Board for Nationwide Mutual Insurance Company3. | | 97 | | Director of Nationwide Financial Services, Inc. |
| | | | |
Gerald J. Holland NWD Investment Management, Inc. 1200 River Road, Suite 1000 Conshohocken, PA 19428 1951 | | Treasurer
since
March 2001 | | Mr. Holland is Senior Vice President - Operations for NWDIM3, GMFCT3, and GSA3. | | N/A | | N/A |
| | | | |
Michael A. Krulikowski NWD Investment Management, Inc. 1200 River Road, Suite 1000 Conshohocken, PA 19428 1959 | | Chief Compliance Officer
since
June 2004 | | Since November 1999, Mr. Krulikowski has served as a Vice President and Chief Compliance Officer of NWDIM3. Since June 2004, Mr. Krulikowski has also served as Chief Compliance Officer of the Trust. | | N/A | | N/A |
| | | | |
Eric E. Miller NWD Investment Management, Inc. 1200 River Road, Suite 1000 Conshohocken, PA 19428 1953 | | Secretary
since
December 2002 | | Mr. Miller is Senior Vice President, Chief Counsel for NWDIM3, GMFCT3 and GSA3 since August 2002. From August 2000 to August 2002, Mr. Miller was a Partner with Stradley Ronan Stevens & Young, LLP. | | N/A | | N/A |
| 1 | Length of time served includes time served with the Trust’s predecessors. |
| 2 | Directorships held in (1) any other investment companies registered under the 1940 Act, (2) any company with a class of securities registered pursuant to Section 12 of the Securities Exchange Act of 1934, as amended (the “Exchange Act”), or (3) any company subject to the requirements of Section 15(d) of the Exchange Act. |
| 3 | This position is held with an affiliated person or principal underwriter of the Trust. |
Management Information (Unaudited)
Federal law requires the Trust, each of its investment advisers and sub-advisers to adopt procedures for voting proxies (“Proxy Voting Guidelines”) and to provide a summary of those Proxy Voting Guidelines used to vote the securities held by the Funds. The Funds’ proxy voting policies and procedures are available without charge (i) upon request, by calling 800-848-0920, (ii) on the Fund’s website at www.nwdfunds.com, or (iii) on the Securities and Exchange Commission’s website at www.sec.gov.
AnnualReport
| | |
| | |

| | October 31, 2006 |
Commentary provided by Gartmore Mutual Fund Capital Trust (the “Adviser”), investment adviser to Gartmore Funds. All opinions and estimates included in this report constitute the Advisers’ judgment as of the date of this report and are subject to change without notice.
As of September 29, 2006, Gartmore Funds and its U.S. operations, as well as the Funds’ Advisers, distributor, and other service providers, are no longer affiliated with Gartmore Investment Management plc (Gartmore U.K.), Gartmore Global Partners or other Gartmore international businesses. Certain Gartmore U.S. companies, and marketing materials related to them, will continue to carry the Gartmore name for the next several months under the terms of an agreement with Gartmore U.K. For more information call, 800-848-0920.
Statement Regarding Availability of Quarterly Portfolio Schedule.
The Gartmore Funds file complete schedules of portfolio holdings for each Fund with the Securities and Exchange Commission (the “Commission”) for the first and third quarters of each fiscal year on Form N-Q. The Funds’ Forms N-Q are available on the Commission’s website at http://www.sec.gov. The Funds’ Forms N-Q may be reviewed and copied at the Commission’s Public Reference Room in Washington, DC, and information on the operation of the Public Reference Room may be obtained by calling 800-SEC-0330; and the Funds make the information on Form N-Q available to shareholders on www.nwdfunds.com or upon request without charge.
Statement Regarding Availability of Proxy Voting Record.
Information regarding how the Funds voted proxies relating to portfolio securities held during the most recent 12-month period ended June 30, 2006 is available without charge, upon request, by calling 800-848-0920, and on the Commission’s website at http://www.sec.gov.
Message to Shareholders
December 15, 2006
Dear Shareholders:
This reporting period has been a time of change for our company. First, in September 2006, our parent company, Nationwide Mutual Insurance Company (Nationwide), completed the sale of the U.K.-based Gartmore Investment Management Ltd. (Gartmore U.K.). As a result of the sale, on November 30, 2006, Gartmore Global Investments, the U.S. division of Nationwide’s asset management business, changed its name to NWD Investments. All of the mutual funds advised by NWD Investments, however, will retain the Gartmore Funds name until May 2007. In addition, Gartmore U.K. will continue to act as subadviser for a number of Gartmore Funds, and, as a result, investors in those funds that include foreign exposure can expect “business as usual”. Nationwide has been examining how best to align NWD Investments as a part of its operations since the sale of Gartmore U.K. and on December 21, 2006, announced that it had reached a preliminary agreement of terms to sell NWD Investment’s retail operations to Nationwide Financial Services, Inc.
Second, I must report that this will be my final shareholder letter. Effective December 15, 2006, John Grady, who joined our firm in October as transition manager, was named as president of NWD Investments and was elected by the Gartmore Funds Board of Trustees to the role of president and chief executive officer. I’m confident that John’s extensive background in this industry will serve NWD Investments well as the company prepares for its next chapter of growth. I have enjoyed serving all of you, and I wish you much success in the years to come.
Market Overview
Global stock markets delivered strong gains for the year ended October 31, 2006, but the period was not without its share of volatility. During the first six months, the markets did a good job of advancing despite the headwinds of rising crude oil prices, interest-rate hikes by the Federal Reserve Board and the replacement of retiring Federal Reserve Chairman Alan Greenspan by Ben Bernanke. The central bank’s May 10 rate hike, however, marked a critical turning point. Disappointment that the Fed did not stand pat, together with concerns about inflationary pressures and the possibility of further rate hikes, triggered sharp declines in global stock markets. Small-capitalization stocks and growth sectors such as technology generally suffered the most during the sell-off.
Throughout the summer, inflation moderated a bit, and more evidence of a slowing U.S. economy emerged. The Fed reacted by leaving interest rates unchanged at its August, September and October meetings. Falling energy prices in the final months of the reporting period provided further fuel for the markets, sparking a rebound in stock prices. For the one-year reporting period, the S&P 500® Index recorded a return of 16.34%. A weak U.S. dollar helped lift foreign markets to even better returns; the Morgan Stanley Capital International Europe, Australasia and Far East (MSCI EAFE®) Index posted a gain of 28.04%. Value stocks maintained a commanding lead over growth shares during the period, while small-cap issues topped larger caps.
It’s Official—We’re Lipper’s best “Overall Small Fund Family”
From the beginning, we’ve made it our mission to be good stewards of our investors’ money. Stewardship can be measured in various ways, but in the mutual fund business, investment performance is one obvious yardstick. That’s why we’re delighted to have been honored with the best “Overall Small Fund Family” award at the 2006 Lipper Fund Awards. Significantly, this award was not based on results tallied over just one year. According to Lipper, a key factor in the selection process was our consistent, strong risk-adjusted returns in several different asset classes relative to those of our peers for three years ended December 31, 2005. We appreciate this recognition of our commitment to delivering returns for our investors, and we consider the award a validation of our approach.
International Fund Highlights
Our confidence in our non-U.S. subadvised funds was amply rewarded during the one-year reporting period. For example, the Gartmore Worldwide Leaders Fund posted a gain of 26.22%*, compared with 21.91% for the MSCI World IndexSM. The Fund’s performance placed the Fund in the top 4% among its Lipper peer group, Global Large-Cap Core Funds (consisting of 59 funds as of October 31, 2006). In recognition of the Gartmore Worldwide Leaders Fund’s outstanding track record, it received the nod as Best Global Large-Cap Core Fund at the 2006 Lipper Fund Awards. Also meriting mention was the Gartmore International Growth Fund, whose 38.22% return went above and beyond the 28.91% return posted by the MSCI All Country World excluding U.S. Index and earned it a ranking in the top 1% among its Lipper peer group, International Multi-Cap Core Funds (consisting of 904 funds as of October 31, 2006).
Small-Cap Lineup Delivers Strong Results
Our commitment to small-cap investing remains an important theme. Offering several investment choices, including funds that invest in companies that may receive scant attention from the vast majority of Wall Street analysts, small caps typically are a much less efficient asset class than their large-cap and even mid-cap counterparts. This means that more
opportunities may exist for our experienced portfolio managers to identify and potentially capitalize on mispriced stocks. Our success in this area was reflected in strong performance during the past year across most of our small-cap products.
One of our newer entries, the Gartmore Small Cap Leaders Fund, offers exposure to both growth and value opportunities through two separate “sleeves” or subportfolios, each with its own management team. During the one-year reporting period, this Fund delivered a 30.65% return, far surpassing the 19.98% result of the Russell 2000® Index. The Fund also finished in the top 2% of Lipper Small-Cap Core Funds (consisting of 689 funds as of October 31, 2006). The Gartmore Small Cap Fund delivered comparable results, with a 30.98% return, beating the same benchmark, the Russell 2000 Index. Notably, this Fund also posted exceptionally strong performance over longer periods of time, placing in the top 2% of its peers among Lipper Small-Cap Core Funds (consisting of 689 funds as of October 31, 2006). for the five years ended October 31, 2006.
To further broaden investors’ choices in the small-cap area and to leverage the experience of our seasoned portfolio managers, we introduced three new funds near the end of September 2006: the Gartmore Small Cap Growth Opportunities Fund, the Gartmore Small Cap Core Fund and the Gartmore Small Cap Value Fund. At the same time, we debuted two absolute-return products: the Gartmore Market Neutral Fund and the Gartmore Hedged Core Equity Fund. These two products are designed for more conservative investors looking for a fund that offers a mix of long and short positions, as well as the potential for lower correlation with the broader equity markets.
Diversifying with Sector Funds
Once an investor has built a solid portfolio around a select group of core funds, sector funds may offer an effective way to enhance both long-term performance and diversification. In this category, several funds with a global scope performed well, including the Gartmore Global Natural Resources Fund, with a 22.87% gain that outdistanced the 17.96% return of its benchmark, the Goldman Sachs Natural Resources Index. Also finishing the period in fine form was the Gartmore Global Utilities Fund, with a return of 27.56%—performance that was good enough to surpass that of the Fund’s composite benchmark of 60% MSCI World Telecommunication Services IndexSM and 40% MSCI World Utilities IndexSM, which returned 25.61%. Last of all, amid considerable volatility for technology stocks, the Gartmore Global Technology and Communications Fund posted a 13.48% return, handily beating the 10.35% return of the Goldman Sachs Technology Composite Index (GSTI®), our benchmark for this Fund.
Strategically combining core equity and fixed-income funds with sector exposure is exhibited in our Gartmore Optimal Allocations “fund of funds” series. We now offer five variations on this theme, three of which are designed to be complete asset allocation solutions: these are the Aggressive, Moderately Aggressive and Moderate Funds within the Optimal Allocations series—each with different mixes of underlying funds—targeting specific risk levels fitting those descriptions. The Gartmore Optimal Allocations Fund: Specialty is intended for investors who already have core investments in place and seek to enhance their overall risk-adjusted returns by exposure to a select group of specialty funds. After the one-year reporting period closed, moreover, we launched the Gartmore Optimal Allocations Fund: Defensive. This new offering is designed for investors who have a lower tolerance for risk and want to complement a core holding by seeking sustainable real returns as a hedge against possible economic deterioration, including inflation, deflation or rising interest rates.
With asset allocation models designed by Ibbotson Associates, a leading authority on asset allocation, the Optimal Allocations Funds are designed to expand an average investor’s “efficient frontier”—that is, they seek to provide the most efficient combination of various asset classes to achieve the highest possible return for a given level of risk. The results to date have been gratifying: for the one-year reporting period, all four Optimal Allocations funds placed in the top quartile of their respective Lipper peer groups (consisting of 592 Mixed-Asset Target Allocation Growth Funds, 414 Mixed-Asset Target Allocation Moderate Funds, 904 Multi-Cap Core Funds and 104 Specialty/Miscellaneous Funds as of October 31, 2006).
Short-Term Shortfall from Long-Term Winner
Although the Gartmore U.S. Growth Leaders Fund, which is managed by one of our talented, veteran portfolio managers, Christopher Baggini, struggled during this reporting period with a return of 1.77%, the Fund’s longer-term record remained enviable: its five-year return of 10.98% was well ahead of the S&P 500 Index’s 7.26% gain, and the Fund occupied the 8th percentile versus other Lipper Multi-Cap Growth Funds (consisting of 332 funds as of Oct. 31, 2006).
Message to Shareholders
Continued
We Appreciate Your Business
We take the charge of managing your assets very seriously. While other companies might make that same claim, we can point to our recent company-level and fund-specific Lipper awards as evidence that we have “walked the talk”. As we close the books on an eventful year—both for the markets and for our company—you can be sure that NWD Investments will continue its pursuit of superior long-term, risk-adjusted returns for the benefit of you, our valued shareholders.

Paul J. Hondros

John H. Grady
| * | All Gartmore Funds performance returns are Class A at NAV, except where noted. |
Lipper, a wholly owned subsidiary of Reuters, is a leading global provider of mutual fund information and analysis to fund companies, financial intermediaries and media organizations. The firm competed with 17 eligible small fund families, defined as groups with at least three equity, three bond and three mixed-equity portfolios that received Consistent Return scores as of Dec. 31, 2005. Consistent Return is a quantitative metric that incorporates two characteristics: risk-adjusted return and the strength of the fund’s performance trend. Lipper determined the award winner by averaging the decile rank of the three-year Consistent Return scores for all of the funds within the eligible groups. The fund family with the lowest average decile rank received the award. Although Lipper makes reasonable efforts to ensure the accuracy and reliability of the data, the accuracy is not guaranteed by Lipper.
For the “Global Large Cap Core Funds” award, Lipper determined the award winner by calculating the highest Consistent Return over the three-year time period ended Dec. 31, 2005. Gartmore Funds competed among 16 global large-cap core portfolios to win the award.
Funds that concentrate on specific sectors or a relatively small number of securities may be subject to greater volatility than that of other mutual funds.
International investing involves additional risks, including currency fluctuations, differences in accounting standards, political instability and foreign regulations, all of which are magnified in emerging markets.
Small-company stocks have higher risks than the stocks of larger, more established companies and have significant short-term price volatility.
Sophisticated investment strategies such as leverage, short selling, short-term trading and investing in derivatives, REITs and IPOs may cause a Fund to have greater risk and volatility and higher expenses than those of other investments.
The Gartmore Optimal Allocations Funds are designed to provide diversification and asset allocation across several types of investments and asset classes, primarily by investing in underlying Gartmore Funds. Each Fund is subject to different levels of risk, based on the size of its asset class allocations. Each Fund’s underlying funds may be subject to specific investment risks such as those associated with a concentrated number of securities (such as REITs), small companies, international stocks, initial public offerings, short selling, short-term trading, bonds and short-term instruments. There is no assurance that a diversified portfolio will produce better results than a nondiversified one.
Index returns do not include the effect of any sales charges or expenses. If sales charges and expenses were deducted, the actual returns of each Index would be lower. It is not possible to invest directly in an Index.
Goldman Sachs Natural Resources Index: An unmanaged, modified market capitalization-weighted sector index of U.S.-traded natural resource-related stocks; includes companies in the categories of extractive industries, energy companies, owners and operators of timber tracts, forestry services, producers of pulp and paper, and owners of plantations.
Morgan Stanley Capital International (MSCI) All Country World excluding U.S. Index: An unmanaged, free float-adjusted, market-capitalization weighted index that is designed to measure the performance of the stocks in companies in all countries except the United States.
Morgan Stanley Capital International Europe, Australasia and Far East (MSCI EAFE®) Index: An unmanaged, free float-adjusted, market capitalization-weighted index that is designed to measure the performance of stocks in developed markets outside the United States and Canada.
Morgan Stanley Capital International (MSCI) World IndexSM: An unmanaged, free float-adjusted, market capitalization-weighted index that is designed to measure the performance of global developed-market equities.
Morgan Stanley Capital International (MSCI) World Telecommunication Services IndexSM: An unmanaged index that is based on developed-market country indexes and is generally representative of the stocks in the global utilities sector.
Morgan Stanley Capital International (MSCI) World Utilities IndexSM: An unmanaged index that is based on developed- market
country indexes and is generally representative of the stocks in the utilities sector, which includes industry groups such as electric, gas, multi-utilities, and unregulated power and water.
Russell 2000® Index: An unmanaged index that measures the performance of the stocks of U.S. companies.
Standard & Poor’s 500® (S&P 500) Index: An unmanaged, market capitalization-weighted index of 500 widely held stocks of large-cap U.S. companies that gives a broad look at how the stock prices of those companies have performed.
X
Gartmore Global Financial Services Fund
For the annual period ended Oct. 31, 2006, the Gartmore Global Financial Services Fund (Class A at NAV) returned 23.87% versus 27.57% for its benchmark, the Morgan Stanley Capital International (MSCI) World Financials IndexSM. For broader comparison, the average return for the Fund’s Lipper peer category of Financial Services Funds (consisting of 123 funds as of Oct. 31, 2006) was 18.58%.
Financial services stocks performed well during the reporting period. Low levels of interest rates helped stimulate healthy loan growth for banks, although this positive factor was somewhat offset by widespread credit tightening in regions such as the United States, the 12-country Eurozone and Japan. Stateside, the Federal Reserve Board raised its target federal funds rate six times during the reporting period, reaching 5.25% with its June 29, 2006 adjustment; the rate was unchanged during the remainder of the reporting period. Despite rising interest rates, global economic activity remained generally healthy, earnings growth was solid, and the credit environment was benign, with only scattered pockets of weakness. The U.S. housing market slowed dramatically during the reporting period, however, with a number of data points showing weakness not seen since the depressed housing markets of the early 1990s.
The Fund’s performance was hurt by an underweighting and unfavorable stock selection in commercial banks. Within that group, we had an overweighted exposure to large U.S. banks, which tended to limit Fund performance because of the flattening U.S. yield curve (a plotted graph line of the yields—or interest rates—on long-term and short-term maturity bonds) and the weak U.S. dollar. The Fund’s underweighting in real estate management and development stocks as well as ineffective Fund stock selections in the real estate investment trust (REIT) group also hampered Fund results. Among individual Fund holdings, United PanAm Financial Corp. was the biggest detractor from Fund performance. A sub-prime auto lender, United PanAm Financial was hurt by some credit issues and the flattening yield curve, so we sold the stock. The Colonial BancGroup, Inc. was one of the Fund’s U.S. bank holdings that underperformed. Fund holding asset manager Legg Mason, Inc. also disappointed, because the integration of Citigroup’s asset management business proved more challenging than expected. Fund holding small-capitalization broker Thomas Weisel Partners Group, Inc. fared poorly during the May-July market correction, in which small-capitalization stocks were especially hard hit.
The Fund performed best versus the benchmark in the insurance and diversified financial services groups. An underweighting by the Fund in the insurance group proved helpful, while favorable stock selection by the Fund drove performance in the diversified financial services group. In diversified financials, Fund performance was aided by Fund holdings in Switzerland-based UBS AG, Dutch holding ING Groep N.V. and Netherlands-based stock Fortis N.V. Fund holdings in options broker optionsXpress Holdings, Inc. also had a positive impact on Fund returns due to strong account growth and high commission revenues per account. The Goldman Sachs Group, Inc. fared well amid a favorable environment for mergers and acquisitions.
With U.S. economic growth slowing and inflation apparently under control, investors will be watching to see if the Federal Reserve lowers interest rates in 2007. U.S. consumer balance sheets are loaded with debt and will need to be monitored, but so far the U.S. economy has been strong enough to avert widespread credit problems. Elsewhere, economic growth in Europe is solid, if not great, while Japan’s economy appears to be pulling out of its long slump. We continue to be cautious about banks that rely mostly on yield-curve spreads, and we remain particularly interested in companies with exposure to the capital markets, as well as life insurers.
Portfolio Managers:
Douglas Burtnick, CFA and Stuart Quint, CFA
| | |
Fund Performance | | Gartmore Global Financial Services Fund |
Average Annual Total Return
(For periods ended October 31, 2006)
| | | | | | |
| | | | | 1 Yr. | | Inception1 |
| Class A | | w/o SC2 | | 23.87% | | 14.95% |
| | | w/SC3 | | 16.73% | | 13.56% |
| Class B | | w/o SC2 | | 22.98% | | 14.11% |
| | | w/SC4 | | 17.98% | | 13.86% |
| Class C | | w/o SC2 | | 23.03% | | 14.10% |
| | | w/SC5 | | 22.03% | | 14.10% |
| Class R6,8 | | | | 23.59% | | 14.45% |
| Institutional Service Class8 | | | | 24.19% | | 15.24% |
| Institutional Class7,8 | | | | 24.19% | | 15.24% |
All figures showing the effect of a sales charge reflect the maximum charge possible, because it has the most dramatic effect on performance data.
| 1 | Fund commenced operations on December 18, 2001. |
| 2 | These returns do not reflect the effects of sales charges (SC). |
| 3 | A 5.75% front-end sales charge was deducted. |
| 4 | A 5.00% contingent deferred sales charge (CDSC) was deducted. The CDSC declines to 0% after 6 years. |
| 5 | A CDSC of 1.00% was deducted from the one year return because it is charged when you sell Class C shares within the first year after purchase. |
| 6 | These returns until the creation of Class R shares (12/30/03) include the performance of the Fund’s Class B shares. The returns have been adjusted for the fact that Class R shares do not have any applicable sales charges but have not been adjusted for the lower expenses applicable to Class R shares. Excluding the effect of any fee waivers or reimbursements, such prior performance is similar to what Class R shares would have produced because the Class R shares invest in the same portfolio of securities as Class B shares. |
| 7 | These returns until the creation of Institutional Class shares (6/29/04) include the performance of the Fund’s Institutional Service shares. The returns have been adjusted for the fact that Institutional Class shares do not have any applicable sales charges but have not been adjusted for the lower expenses applicable to Institutional Class shares. Excluding the effect of any fee waivers or reimbursements, such prior performance is similar to what Institutional Class shares would have produced because the Institutional Class shares invest in the same portfolio of securities as Institutional Service shares. |
| 8 | Not subject to any sales charges. |
Performance of a $10,000 Investment
Investment return and principal value will fluctuate, and when redeemed, shares may be worth more or less than original cost. Past performance is no guarantee of future results and does not reflect the deduction of taxes that a shareholder would pay on fund distributions or the redemption of fund shares. Investing in mutual funds involves market risk, including loss of principal. Performance returns assume the reinvestment of all distributions.
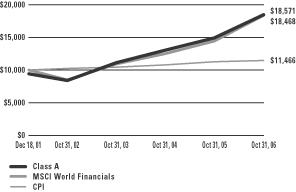
Comparative performance of $10,000 invested in Class A shares of the Gartmore Global Financial Services Fund, Morgan Stanley Capital International World Financials Index (MSCI World Financials)(a), and the Consumer Price Index (CPI)(b) since inception. Unlike the Fund, the returns for these unmanaged indexes do not reflect any fees, expenses, or sales charges. Investors cannot invest directly in market indexes.
| (a) | The MSCI World Financials is an unmanaged index representative of the stocks in the global financial services sector and is based on 23 developed market country indices. |
| (b) | The CPI represents changes in prices of a basket of goods and services purchased for consumption by urban households. |
| | |
Shareholder Expense Example | | Gartmore Global Financial Services Fund |
As a shareholder of the Fund, you incur two types of costs: (1) transaction costs, including sales charges (loads) paid on purchase payments and redemption fees; and (2) ongoing costs, including investment advisory fees, administration fees, distribution fees and other Fund expenses. The examples below are intended to help you understand your ongoing costs (in dollars) of investing in the Fund and to compare these costs with the ongoing costs of investing in other mutual funds. Per SEC requirements, the examples assume that you had a $1,000 investment in the Class at the beginning of the reporting period, May 1, 2006 and continued to hold your shares at the end of the reporting period, October 31, 2006.
Actual Expenses
For each Class of the Fund in the table below, the first line provides information about actual account values and actual expenses. You may use the information in this line, together with the amount you invested, to estimate the expenses that you paid over the period. Simply divide your account value by $1,000 (for example, an $8,600 account value divided by $1,000 = 8.6), then multiply the result by the number in the first line of each Class under the heading entitled “Expenses Paid During Period” to estimate the expenses you paid on your account during the period.
Hypothetical Example for Comparison Purposes
The second line of each Class in the table below provides information about hypothetical account values and hypothetical expenses based on the Class’ actual expense ratio and an assumed rate of return of 5% per year before expenses, which is not the Class’ actual return. The hypothetical account values and expenses may not be used to estimate the actual ending account balance or expenses you paid for the period. You may use this information to compare the ongoing costs of investing in the Class of the Fund and other funds. To do so, compare this 5% hypothetical example with the 5% hypothetical examples that appear in the shareholder reports of the other funds.
Please note that the expenses shown in the table are meant to highlight your ongoing costs only and do not reflect any transaction costs, such as sales charges (loads) or redemption fees. Therefore, the second line for each Class in the table is useful in comparing ongoing costs only, and will not help you determine the relative total costs of owning different funds. In addition, if these transaction costs were included, your costs would have been higher. The examples also assume all dividends and distributions have been reinvested.
Schedule of Shareholder Expenses
Expense Analysis of a $1,000 Investment
(October 31, 2006)
| | | | | | | | | | | | | | |
| Global Financial Services Fund | | | | | Beginning
Account Value,
5/1/06 | | Ending
Account Value,
10/31/06 | | Expenses Paid
During Period* | | Annualized
Expense Ratio* |
| Class A | | Actual | | | $ | 1,000.00 | | $ | 1,031.30 | | $ | 7.37 | | 1.44% |
| | | Hypothetical | 1 | | $ | 1,000.00 | | $ | 1,017.74 | | $ | 7.35 | | 1.44% |
| Class B | | Actual | | | $ | 1,000.00 | | $ | 1,027.70 | | $ | 10.99 | | 2.15% |
| | | Hypothetical | 1 | | $ | 1,000.00 | | $ | 1,014.16 | | $ | 10.97 | | 2.15% |
| Class C | | Actual | | | $ | 1,000.00 | | $ | 1,027.70 | | $ | 10.99 | | 2.15% |
| | | Hypothetical | 1 | | $ | 1,000.00 | | $ | 1,014.16 | | $ | 10.97 | | 2.15% |
| Class R | | Actual | | | $ | 1,000.00 | | $ | 1,029.10 | | $ | 9.05 | | 1.77% |
| | | Hypothetical | 1 | | $ | 1,000.00 | | $ | 1,016.08 | | $ | 9.03 | | 1.77% |
| Institutional Service Class | | Actual | | | $ | 1,000.00 | | $ | 1,032.40 | | $ | 5.89 | | 1.15% |
| | | Hypothetical | 1 | | $ | 1,000.00 | | $ | 1,019.20 | | $ | 5.87 | | 1.15% |
| Institutional Class | | Actual | | | $ | 1,000.00 | | $ | 1,033.10 | | $ | 5.89 | | 1.15% |
| | | Hypothetical | 1 | | $ | 1,000.00 | | $ | 1,019.20 | | $ | 5.87 | | 1.15% |
| * | Expenses are equal to the Fund’s annualized expense ratio multiplied by the average account value over the period multiplied by 184/365 (to reflect the one-half year period). The expense ratio presented represents a six-month, annualized ratio in accordance with SEC guidelines. |
| 1 | Represents the hypothetical 5% return before expenses. |
| | |
Portfolio Summary | | Gartmore Global Financial Services Fund |
October 31, 2006
The SEC adopted a requirement that Funds present their portfolio holdings in a table, chart or graph format in their annual and semiannual reports to shareholders, whether or not a statement of investments is utilized. The following tables, which present portfolio holdings as a percentage of net assets, are provided in compliance with this requirement.
| | |
| Asset Allocation | | |
| Common Stocks | | 96.9% |
Repurchase Agreements | | 2.1% |
| Other assets in excess of liabilities | | 1.0% |
| | |
| | 100.0% |
| | |
| Top Countries | | |
| United States | | 47.7% |
| United Kingdom | | 11.3% |
| Japan | | 8.2% |
| Australia | | 4.1% |
| Germany | | 3.8% |
| Greece | | 3.5% |
| France | | 3.2% |
| Switzerland | | 2.9% |
| Spain | | 2.9% |
| Italy | | 2.7% |
| Other Assets | | 9.7% |
| | |
| | 100.0% |
| | |
| Top Industries | | |
| Banking | | 45.6% |
| Financial Services | | 29.5% |
| Insurance | | 13.3% |
| Real Estate | | 4.3% |
| Real Estate Investment Trusts | | 3.0% |
| Property Trust | | 1.2% |
| Other Assets | | 3.1% |
| | |
| | 100.0% |
| | |
| Top Holdings* | | |
| Goldman Sachs Group, Inc. | | 3.3% |
| BNP Paribas SA | | 3.2% |
| Bank of America Corp. | | 3.1% |
| Wachovia Corp. | | 2.9% |
| UBS AG | | 2.9% |
| HSBC Holdings PLC | | 2.7% |
| UniCredito Italiano SpA | | 2.7% |
| Royal Bank of Scotland Group PLC | | 2.5% |
| Banco Bilbao Vizcaya Argentaria SA | | 2.4% |
| Citigroup, Inc. | | 2.4% |
| Other Assets | | 71.9% |
| | |
| | 100.0% |
| * | For purpose of listing top holdings, repurchase agreements are considered cash equivalents and are included as part of Other Assets. |
Statement of Investments
October 31, 2006
Gartmore Global Financial Services Fund
Common Stocks (96.9%)
| | | | | |
| | | Shares or
Principal Amount | | Value |
| | | | | |
AUSTRALIA (4.1%) | | | | | |
Banking (2.9%) | | | | | |
Australia & New Zealand Banking Group Ltd. (c) | | 38,920 | | $ | 871,421 |
Commonwealth Bank of Australia (c) | | 16,520 | | | 609,405 |
| | | | | |
| | | | | 1,480,826 |
| | | | | |
Property Trust (1.2%) | | | | | |
Westfield Group, Inc. (c) | | 42,270 | | | 609,441 |
| | | | | |
| | | | | 2,090,267 |
| | | | | |
CANADA (1.0%) | | | | | |
Banking (1.0%) | | | | | |
Royal Bank of Canada | | 11,960 | | | 530,514 |
| | | | | |
CHINA (0.5%) | | | | | |
Banking (0.5%) | | | | | |
China Construction Bank, Class H (c) | | 540,000 | | | 242,433 |
| | | | | |
FRANCE (3.2%) | | | | | |
Banking (3.2%) | | | | | |
BNP Paribas SA (c) | | 15,110 | | | 1,659,215 |
| | | | | |
GERMANY (3.8%) | | | | | |
Banking (0.9%) | | | | | |
Commerzbank AG (c) | | 12,720 | | | 451,077 |
| | | | | |
Financial Services (2.9%) | | | | | |
Deutsche Bank AG (c) | | 5,580 | | | 704,112 |
Deutsche Boerse AG (c) | | 2,100 | | | 338,131 |
Hypo Real Estate Holding AG (c) | | 7,110 | | | 447,894 |
| | | | | |
| | | | | 1,490,137 |
| | | | | |
| | | | | 1,941,214 |
| | | | | |
GREECE (3.5%) | | | | | |
Banking (3.5%) | | | | | |
Alpha Bank AE (c) | | 21,370 | | | 620,906 |
National Bank of Greece SA (c) | | 25,950 | | | 1,176,108 |
| | | | | |
| | | | | 1,797,014 |
| | | | | |
HONG KONG (0.6%) | | | | | |
Financial Services (0.6%) | | | | | |
Hang Lung Group Ltd. (c) | | 127,930 | | | 326,331 |
| | | | | |
| | | | | |
| | | Shares or
Principal Amount | | Value |
| | | | | |
IRELAND (2.4%) | | | | | |
Banking (2.4%) | | | | | |
Anglo Irish Bank Corp. PLC (c) | | 39,410 | | $ | 707,252 |
Bank of Ireland (c) | | 25,960 | | | 519,105 |
| | | | | |
| | | | | 1,226,357 |
| | | | | |
ITALY (2.7%) | | | | | |
Banking (2.7%) | | | | | |
UniCredito Italiano SpA (c) | | 165,518 | | | 1,371,389 |
| | | | | |
JAPAN (8.2%) | | | | | |
Banking (2.2%) | | | | | |
Mitsubishi UFJ Financial Group, Inc. (c) | | 59 | | | 748,462 |
Sumitomo Mitsui Financial Group, Inc. (c) | | 36 | | | 393,469 |
| | | | | |
| | | | | 1,141,931 |
| | | | | |
Financial Services (2.6%) | | | | | |
Mizuho Financial Group, Inc. (c) | | 116 | | | 901,779 |
Orix Corp. (c) | | 1,700 | | | 478,160 |
| | | | | |
| | | | | 1,379,939 |
| | | | | |
Insurance (0.8%) | | | | | |
Millea Holdings, Inc. (c) | | 11,000 | | | 414,252 |
| | | | | |
Real Estate (2.6%) | | | | | |
Mitsubishi Estate Co. Ltd. (c) | | 17,000 | | | 406,638 |
Mitsui Fudosan Co. Ltd. (c) | | 19,000 | | | 467,497 |
Sumitomo Realty & Development Co. Ltd. (c) | | 13,500 | | | 447,325 |
| | | | | |
| | | | | 1,321,460 |
| | | | | |
| | | | | 4,257,582 |
| | | | | |
NETHERLANDS (2.1%) | | | | | |
Financial Services (1.2%) | | | | | |
Fortis NV (c) | | 15,460 | | | 647,671 |
| | | | | |
Insurance (0.9%) | | | | | |
ING Groep NV (c) | | 10,330 | | | 457,422 |
| | | | | |
| | | | | 1,105,093 |
| | | | | |
SPAIN (2.9%) | | | | | |
Banking (2.4%) | | | | | |
Banco Bilbao Vizcaya Argentaria SA (c) | | 51,030 | | | 1,231,449 |
| | | | | |
Common Stocks (continued)
| | | | | |
| | | Shares or
Principal Amount | | Value |
| | | | | |
SPAIN (continued) | | | | | |
Financial Services (0.5%) | | | | | |
Bolsas y Mercados Espanoles (b) | | 6,740 | | $ | 250,114 |
| | | | | |
| | | | | 1,481,563 |
| | | | | |
SWITZERLAND (2.9%) | | | | | |
Financial Services (2.9%) | | | | | |
UBS AG (c) | | 24,890 | | | 1,486,662 |
| | | | | |
UNITED KINGDOM (11.3%) | | | | | |
Banking (9.6%) | | | | | |
Amvescap PLC (c) | | 48,950 | | | 559,210 |
Amvescap PLC ADR | | 8,550 | | | 196,479 |
HBOS PLC (c) | | 36,880 | | | 763,939 |
HSBC Holdings PLC (c) | | 73,026 | | | 1,385,530 |
Lloyds TSB Group PLC (c) | | 44,100 | | | 470,989 |
New Star Asset Management Group Ltd. (c) | | 49,740 | | | 357,593 |
Royal Bank of Scotland Group PLC (c) | | 35,610 | | | 1,267,481 |
| | | | | |
| | | | | 5,001,221 |
| | | | | |
Real Estate (1.7%) | | | | | |
British Land Co. PLC (c) | | 14,500 | | | 413,424 |
Land Securities Group PLC (c) | | 11,100 | | | 443,850 |
| | | | | |
| | | | | 857,274 |
| | | | | |
| | | | | 5,858,495 |
| | | | | |
UNITED STATES (47.7%) | | | | | |
Banking (14.3%) | | | | | |
Bank of America Corp. | | 29,540 | | | 1,591,320 |
Colonial Bancgroup, Inc. | | 10,930 | | | 260,571 |
First Midwest Bancorp, Inc. | | 6,750 | | | 256,703 |
Hudson City Bancorp, Inc. | | 46,390 | | | 636,935 |
J.P. Morgan Chase & Co. | | 18,700 | | | 887,128 |
State Street Corp. | | 10,510 | | | 675,057 |
SunTrust Banks, Inc. | | 5,410 | | | 427,336 |
SVB Financial Group (b) | | 5,400 | | | 248,508 |
U.S. Bancorp | | 19,190 | | | 649,390 |
Wachovia Corp. | | 26,890 | | | 1,492,395 |
Wintrust Financial Corp. | | 5,350 | | | 258,191 |
| | | | | |
| | | | | 7,383,534 |
| | | | | |
| | | | | |
| | | Shares or
Principal Amount | | Value |
| | | | | |
UNITED STATES (continued) | | | | | |
Financial Services (18.8%) | | | | | |
American Express Co. | | 3,440 | | $ | 198,866 |
Capital One Financial Corp. | | 9,980 | | | 791,713 |
Chicago Mercantile Exchange | | 1,000 | | | 501,000 |
Citigroup, Inc. | | 24,190 | | | 1,213,370 |
E*TRADE Financial Corp. (b) | | 23,290 | | | 542,191 |
Fannie Mae | | 7,260 | | | 430,228 |
Franklin Resources, Inc. | | 5,650 | | | 643,874 |
GFI Group, Inc. (b) | | 4,260 | | | 245,674 |
Goldman Sachs Group, Inc. | | 9,070 | | | 1,721,396 |
IntercontinentalExchange, Inc. (b) | | 5,680 | | | 479,506 |
Investment Technology Group, Inc. (b) | | 14,570 | | | 680,419 |
Legg Mason, Inc. | | 2,900 | | | 261,058 |
Lehman Brothers Holdings, Inc. | | 8,210 | | | 639,066 |
Moody’s Corp. | | 4,350 | | | 288,405 |
OptionsXpress Holdings, Inc. | | 13,180 | | | 409,634 |
Waddell and Reed Financial, Inc. | | 14,870 | | | 379,185 |
Wright Express Corp. (b) | | 10,970 | | | 300,249 |
| | | | | |
| | | | | 9,725,834 |
| | | | | |
Insurance (11.6%) | | | | | |
Allstate Corp. | | 4,300 | | | 263,848 |
American International Group, Inc. | | 16,460 | | | 1,105,618 |
Assurant, Inc. | | 9,090 | | | 478,679 |
Brown & Brown, Inc. | | 8,300 | | | 242,858 |
First Mercury Financial Corp. (b) | | 5,140 | | | 106,398 |
Hartford Financial Services Group, Inc. | | 7,000 | | | 610,190 |
Lincoln National Corp. | | 5,980 | | | 378,594 |
MetLife, Inc. | | 5,870 | | | 335,353 |
Partnerre Ltd. | | 5,690 | | | 397,845 |
Principal Financial Group, Inc. | | 5,900 | | | 333,291 |
Prudential Financial, Inc. | | 10,070 | | | 774,685 |
Security Capital Assurance Ltd. (b) | | 16,360 | | | 412,272 |
St. Paul Travelers Cos., Inc. | | 10,290 | | | 526,128 |
| | | | | |
| | | | | 5,965,759 |
| | | | | |
Statement of Investments (Continued)
October 31, 2006
Gartmore Global Financial Services Fund (Continued)
Common Stocks (continued)
| | | | | | |
| | | Shares or
Principal Amount | | Value |
UNITED STATES (continued) | | | | | | |
Real Estate Investment Trusts (3.0%) | | | |
Boston Properties, Inc. | | | 4,110 | | $ | 439,071 |
Douglas Emmett, Inc. (b) | | | 3,190 | | | 76,082 |
Potlatch Corp. | | | 5,797 | | | 235,358 |
ProLogis | | | 8,620 | | | 545,387 |
Simon Property Group, Inc. | | | 2,860 | | | 277,706 |
| | | | | | |
| | | | | | 1,573,604 |
| | | | | | |
| | | | | | 24,648,731 |
| | | | | | |
| | |
Total Common Stocks | | | | | | 50,022,860 |
| | | | | | |
|
Repurchase Agreements (2.1%) |
CS First Boston, 5.17%, dated 10/31/06, due 11/01/06, repurchase price $557,399, collateralized by U.S. Government Agency Mortgages with a market value of $568,467 | | $ | 557,319 | | | 557,319 |
Nomura Securities, 5.17%, dated 10/31/06, due 11/01/06, repurchase price $532,189, collateralized by U.S. Government Agency Mortgages with a market value of $542,756 | | | 532,113 | | | 532,113 |
| | | | | | |
| | |
Total Repurchase Agreements | | | | | | 1,089,432 |
| | | | | | |
| |
Total Investments
(Cost $47,155,908) (a) — 99.0% | | | 51,112,292 |
| |
Other assets in excess of
liabilities — 1.0% | | | 487,715 |
| | | | | | |
| | |
NET ASSETS — 100.0% | | | | | $ | 51,600,007 |
| | | | | | |
| | (a) | See notes to financial statements for tax unrealized appreciation (depreciation) of securities. |
| | (b) | Denotes a non-income producing security. |
See notes to financial statements.
Gartmore Global Health Sciences Fund
For the annual period ended Oct. 31, 2006, the Gartmore Global Health Sciences Fund (Class A at NAV) returned 5.52% versus 9.09% for its benchmark, the Goldman Sachs Healthcare Index. For broader comparison, the average return for the Fund’s Lipper peer category of Health/Biotechnology Funds (consisting of 178 funds as of Oct. 31, 2006) was 8.41%.
While health-care stocks performed well, they trailed most other market sectors. For example, among the 10 sectors in the S&P 500® Index, a widely followed U.S. stock index, health care was the second-worst performer, beating only information technology. Among the major health-care subsectors, the best performance came from the pharmaceuticals group, with a benchmark return of more than 19%. On the other hand, health-care providers and services, biotechnology, and health-care equipment and supplies all posted benchmark returns at about the break-even mark. The gains in pharmaceuticals occurred, in part, because controversies surrounding COX-2 inhibitors and other patent medications had driven down drug stocks to extremely low valuations at the beginning of the reporting period.
The Fund was hurt by unfavorable stock selection in health-care equipment and supplies as well as in biotechnology. In health-care equipment, Medtronic, Inc. was hampered by slowing sales of defibrillators. In biotechnology, we were not patient enough with Fund holding Cephalon, Inc., whose stock rallied nicely near the end of the reporting period—when we no longer owned it. Earlier in the year, Cephalon stock price had been slammed on the news that a panel of medical experts had recommended more safety tests for Sparlon, the company’s experimental treatment for attention deficit hyperactivity disorder (ADHD). In pharmaceuticals, Fund holding Pfizer Inc. performed well, but an underweighting hurt Fund performance versus the benchmark.
Contributors to Fund performance included Boston Scientific Corp., a poorly performing stock that we correctly underweighted. The Fund’s holdings in Baxter International, Inc. also aided Fund results; better pricing for the company’s plasma products and new management helped the stock. In the case of Fund holding Abbott Laboratories, the stock was cheap, and anticipation of the company’s new stent platform triggered a rally, during which we sold our position. Specialty pharmaceuticals stock Shire plc, a U.K. Fund holding, was helped by positive test data on its Alzheimer’s drug and a generally robust pipeline of products.
Health-care stocks face a year that should include a significant number of politically driven headlines about the costs of healthcare in the United States and about government’s involvement as a large-scale payer for healthcare. A large number of health-care drug and service provider companies have valuations which we already reflect some of these concerns. We believe that the current methods of paying for healthcare will remain largely intact, but that there will be much consternation about the issue in the early part of 2007. As such, we are on the lookout for situations where we may be able to buy either unaffected service or device providers or those which may be affected at times when the marketplace becomes negative about them. We are cautiously optimistic that the health-care environment, particularly in the United States will turn out to be a good investment universe for 2007, especially in a slower economic environment where investors will be interested in more consistent earnings models.
Portfolio Manager:
Paul Cluskey
| | |
Fund Performance | | Gartmore Global Health Sciences Fund |
Average Annual Total Return
(For periods ended October 31, 2006)
| | | | | | | | |
| | | | | 1 Yr. | | 5 Yr. | | Inception1 |
| Class A | | w/o SC2 | | 5.52% | | 7.46% | | 5.12% |
| | | w/SC3 | | -0.55% | | 6.20% | | 4.06% |
| Class B | | w/o SC2 | | 4.75% | | 6.74% | | 4.42% |
| | | w/SC4 | | 0.01% | | 6.43% | | 4.28% |
Class C5 | | w/o SC2 | | 4.84% | | 6.76% | | 4.44% |
| | | w/SC6 | | 3.89% | | 6.76% | | 4.44% |
| Class R7,9 | | | | 5.46% | | 7.10% | | 4.72% |
| Institutional Service Class9 | | 5.73% | | 7.66% | | 5.35% |
| Institutional Class8,9 | | | | 5.90% | | 7.75% | | 5.43% |
All figures showing the effect of a sales charge reflect the maximum charge possible, because it has the most dramatic effect on performance data.
| 1 | Fund commenced operations on December 29, 2000. |
| 2 | These returns do not reflect the effects of sales charges (SC). |
| 3 | A 5.75% front-end sales charge was deducted. |
| 4 | A 5.00% contingent deferred sales charge (CDSC) was deducted. The CDSC declines to 0% after 6 years. |
| 5 | These returns until the creation of Class C shares (9/23/02) include the performance of the Fund’s Class B shares. Excluding the effects of any fee waivers or reimbursements, such prior performance is substantially similar to what Class C shares would have produced because Class C shares invest in the same portfolio of securities as Class B shares and have the same expenses after any fee waivers or reimbursements. For Class C shares returns with sales charges, these returns have been restated for the applicable sales charges. |
| 6 | A CDSC of 1.00% was deducted from the one year return because it is charged when you sell Class C shares within the first year after purchase. |
| 7 | These returns until the creation of Class R shares (12/30/03) include the performance of the Fund’s Class B shares. The returns have been adjusted for the fact that Class R shares do not have any applicable sales charges but have not been adjusted for the lower expenses applicable to Class R shares. Excluding the effect of any fee waivers or reimbursements, such prior performance is similar to what Class R shares would have produced because the Class R shares invest in the same portfolio of securities as Class B shares. |
| 8 | These returns until the creation of Institutional Class shares (6/29/04) include the performance of the Fund’s Institutional Service shares. The returns have been adjusted for the fact that Institutional Class shares do not have any applicable sales charges but have not been adjusted for the lower expenses applicable to Institutional Class shares. Excluding the effect of any fee waivers or reimbursements, such prior performance is similar to what Institutional Class shares would have produced because the Institutional Class shares invest in the same portfolio of securities as Institutional Service shares. |
| 9 | Not subject to any sales charges. |
Performance of a $10,000 Investment
Investment return and principal value will fluctuate, and when redeemed, shares may be worth more or less than original cost. Past performance is no guarantee of future results and does not reflect the deduction of taxes that a shareholder would pay on fund distributions or the redemption of fund shares. Investing in mutual funds involves market risk, including loss of principal. Performance returns assume the reinvestment of all distributions.
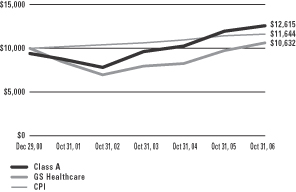
Comparative performance of $10,000 invested in Class A shares of the Gartmore Global Health Sciences Fund, the Goldman Sachs Healthcare Index (GS Healthcare)(a), and the Consumer Price Index (CPI)(b) since inception. Unlike the Fund, the returns for these unmanaged indexes do not reflect any fees, expenses, or sales charges. Investors cannot invest directly in market indexes.
| (a) | The GS Healthcare is an unmanaged index representative of the stocks in the healthcare sector. |
| (b) | The CPI represents changes in prices of a basket of goods and services purchased for consumption by urban households. |
| | |
Shareholder Expense Example | | Gartmore Global Health Sciences Fund |
As a shareholder of the Fund, you incur two types of costs: (1) transaction costs, including sales charges (loads) paid on purchase payments and redemption fees; and (2) ongoing costs, including investment advisory fees, administration fees, distribution fees and other Fund expenses. The examples below are intended to help you understand your ongoing costs (in dollars) of investing in the Fund and to compare these costs with the ongoing costs of investing in other mutual funds. Per SEC requirements, the examples assume that you had a $1,000 investment in the Class at the beginning of the reporting period, May 1, 2006 and continued to hold your shares at the end of the reporting period, October 31, 2006.
Actual Expenses
For each Class of the Fund in the table below, the first line provides information about actual account values and actual expenses. You may use the information in this line, together with the amount you invested, to estimate the expenses that you paid over the period. Simply divide your account value by $1,000 (for example, an $8,600 account value divided by $1,000 = 8.6), then multiply the result by the number in the first line of each Class under the heading entitled “Expenses Paid During Period” to estimate the expenses you paid on your account during the period.
Hypothetical Example for Comparison Purposes
The second line of each Class in the table below provides information about hypothetical account values and hypothetical expenses based on the Class’ actual expense ratio and an assumed rate of return of 5% per year before expenses, which is not the Class’ actual return. The hypothetical account values and expenses may not be used to estimate the actual ending account balance or expenses you paid for the period. You may use this information to compare the ongoing costs of investing in the Class of the Fund and other funds. To do so, compare this 5% hypothetical example with the 5% hypothetical examples that appear in the shareholder reports of the other funds.
Please note that the expenses shown in the table are meant to highlight your ongoing costs only and do not reflect any transaction costs, such as sales charges (loads) or redemption fees. Therefore, the second line for each Class in the table is useful in comparing ongoing costs only, and will not help you determine the relative total costs of owning different funds. In addition, if these transaction costs were included, your costs would have been higher. The examples also assume all dividends and distributions have been reinvested.
Schedule of Shareholder Expenses
Expense Analysis of a $1,000 Investment
(October 31, 2006)
| | | | | | | | | | | | | | |
| Global Health Sciences Fund | | | | | Beginning
Account Value,
5/1/06 | | Ending
Account Value,
10/31/06 | | Expenses Paid
During Period* | | Annualized
Expense Ratio* |
| Class A | | Actual | | | $ | 1,000.00 | | $ | 1,035.30 | | $ | 8.16 | | 1.59% |
| | | Hypothetical | 1 | | $ | 1,000.00 | | $ | 1,016.98 | | $ | 8.12 | | 1.59% |
| Class B | | Actual | | | $ | 1,000.00 | | $ | 1,031.90 | | $ | 11.47 | | 2.24% |
| | | Hypothetical | 1 | | $ | 1,000.00 | | $ | 1,013.71 | | $ | 11.43 | | 2.24% |
| Class C | | Actual | | | $ | 1,000.00 | | $ | 1,031.90 | | $ | 11.52 | | 2.25% |
| | | Hypothetical | 1 | | $ | 1,000.00 | | $ | 1,013.66 | | $ | 11.48 | | 2.25% |
| Class R | | Actual | | | $ | 1,000.00 | | $ | 1,034.30 | | $ | 9.08 | | 1.77% |
| | | Hypothetical | 1 | | $ | 1,000.00 | | $ | 1,016.08 | | $ | 9.03 | | 1.77% |
| Institutional Service Class | | Actual | | | $ | 1,000.00 | | $ | 1,036.70 | | $ | 6.73 | | 1.31% |
| | | Hypothetical | 1 | | $ | 1,000.00 | | $ | 1,018.40 | | $ | 6.69 | | 1.31% |
| Institutional Class | | Actual | | | $ | 1,000.00 | | $ | 1,037.40 | | $ | 6.32 | | 1.23% |
| | | Hypothetical | 1 | | $ | 1,000.00 | | $ | 1,018.80 | | $ | 6.28 | | 1.23% |
| * | Expenses are equal to the Fund’s annualized expense ratio multiplied by the average account value over the period multiplied by 184/365 (to reflect the one-half year period). The expense ratio presented represents a six-month, annualized ratio in accordance with SEC guidelines. |
| 1 | Represents the hypothetical 5% return before expenses. |
| | |
Portfolio Summary | | Gartmore Global Health Sciences Fund |
The SEC adopted a requirement that Funds present their portfolio holdings in a table, chart or graph format in their annual and semiannual reports to shareholders, whether or not a statement of investments is utilized. The following tables, which present portfolio holdings as a percentage of net assets, are provided in compliance with this requirement.
| | |
| Asset Allocation | | |
| Common Stocks | | 96.9% |
Repurchase Agreements | | 3.0% |
| Other Investments* | | 13.5% |
| Liabilities in excess of other assets** | | -13.4% |
| | |
| | 100.0% |
| | |
| Top Industries | | |
| Drugs | | 33.3% |
| Medical Products | | 19.9% |
| Therapeutics | | 10.6% |
| Medical Products & Services | | 9.7% |
| Medical Services | | 8.3% |
| Insurance | | 6.8% |
| Medical – Biomedical & Genetic | | 3.3% |
| Medical Laboratories | | 1.5% |
| Health Care Services | | 1.3% |
| Distribution & Wholesale | | 0.9% |
| Other Assets | | 4.4% |
| | |
| | 100.0% |
| | |
| Top Holdings*** | | |
| Johnson & Johnson | | 7.7% |
| Wyeth | | 6.3% |
| Merck & Co., Inc. | | 5.4% |
| Baxter International, Inc. | | 4.9% |
| McKesson Corp. | | 4.7% |
| Schering-Plough Corp. | | 4.1% |
| Genentech, Inc. | | 4.1% |
| UnitedHealth Group, Inc. | | 4.0% |
| Pfizer, Inc. | | 3.9% |
| Novartis AG ADR – CH | | 3.7% |
| Other Assets | | 51.2% |
| | |
| | 100.0% |
| * | Includes value of collateral received from securities lending. |
| ** | Includes value of collateral owed from securities lending. |
| *** | For purpose of listing top holdings, repurchase agreements are considered cash equivalents and are included as part of Other Assets. |
Gartmore Global Health Sciences Fund
Common Stocks (96.9%)
Statement of Investments
October 31, 2006
| | | | | |
| UNITED STATES (96.9%) | | Shares or
Principal Amount | | Value |
| | | | | |
Distribution & Wholesale (0.9%) | | | |
MWI Veterinary Supply, Inc. (b) (c) | | 7,800 | | $ | 261,378 |
| | | | | |
Drug Delivery Systems (0.6%) | | | |
Conor Medsystems, Inc. (b) | | 7,145 | | | 175,481 |
| | | | | |
Drugs (33.3%) | | | |
Allergan, Inc. | | 2,757 | | | 318,434 |
Amgen, Inc. (b) | | 12,923 | | | 980,985 |
Eli Lilly & Co. | | 10,140 | | | 567,941 |
Merck & Co., Inc. | | 35,001 | | | 1,589,745 |
Novartis AG ADR — CH | | 17,921 | | | 1,088,342 |
Pfizer, Inc. | | 42,672 | | | 1,137,209 |
Roche Holding AG — CH | | 4,584 | | | 802,833 |
Schering-Plough Corp. | | 54,978 | | | 1,217,213 |
ViroPharma, Inc. (b) | | 17,380 | | | 231,675 |
Wyeth | | 36,340 | | | 1,854,430 |
| | | | | |
| | | | | 9,788,807 |
| | | | | |
Health Care Services (1.3%) | | | |
Option Care, Inc. | | 11,948 | | | 151,381 |
WebMD Health Corp., Class A (b) (c) | | 6,625 | | | 241,548 |
| | | | | |
| | | | | 392,929 |
| | | | | |
Human Resources (0.7%) | | | |
AMN Healthcare Services, Inc. (b) (c) | | 8,371 | | | 211,703 |
| | | | | |
Insurance (6.8%) | | | |
UnitedHealth Group, Inc. | | 24,145 | | | 1,177,794 |
WellPoint, Inc. (b) | | 10,889 | | | 831,048 |
| | | | | |
| | | | | 2,008,842 |
| | | | | |
Medical – Biomedical & Genetic (3.3%) | | | |
Keryx Biopharmaceuticals, Inc. (b) | | 10,470 | | | 146,999 |
MedImmune, Inc. (b) | | 15,040 | | | 481,881 |
Vertex Pharmaceuticals, Inc. (b) | | 8,470 | | | 343,882 |
| | | | | |
| | | | | 972,762 |
| | | | | |
Medical Laboratories (1.5%) | | | |
Covance, Inc. (b) (c) | | 7,384 | | | 431,964 |
| | | | | |
| | | | | |
| | | Shares or
Principal Amount | | Value |
| | | | | |
UNITED STATES (continued) | | | | | |
Medical Products (19.9%) | | | |
Affymetrix, Inc. (b) | | 20,980 | | $ | 534,990 |
American Medical Systems Holdings, Inc. (b) | | 7,840 | | | 139,630 |
Applera Corp. — Celera Genomics Group (b) | | 4,980 | | | 77,290 |
Bard (C.R.), Inc. | | 10,968 | | | 898,937 |
Baxter International, Inc. | | 31,708 | | | 1,457,617 |
Johnson & Johnson | | 33,574 | | | 2,262,888 |
Northstar Neuroscience, Inc. (b) | | 15,902 | | | 238,848 |
NxStage Medical, Inc. (b) | | 15,770 | | | 115,594 |
Spectranetics Corp. (b) | | 10,541 | | | 130,919 |
| | | | | |
| | | | | 5,856,713 |
| | | | | |
Medical Products & Services (9.7%) | | | |
Cardinal Health, Inc. | | 13,393 | | | 876,572 |
Caremark Rx, Inc. | | 5,253 | | | 258,605 |
Celgene Corp. (b) | | 8,300 | | | 443,552 |
DJ Orthopedics, Inc. (b) (c) | | 5,770 | | | 232,127 |
Gentiva Health Services, Inc. (b) (c) | | 16,515 | | | 306,353 |
OSI Pharmaceuticals, Inc. (b) (c) | | 8,570 | | | 328,060 |
Pharmaceutical Product Development, Inc. | | 13,289 | | | 420,597 |
| | | | | |
| | | | | 2,865,866 |
| | | | | |
Medical Services (8.3%) | | | |
DaVita, Inc (b) | | 5,438 | | | 302,516 |
Manor Care, Inc. | | 11,369 | | | 545,598 |
McKesson Corp. | | 27,751 | | | 1,390,048 |
Sun Healthcare Group, Inc. (b) | | 15,851 | | | 207,331 |
| | | | | |
| | | | | 2,445,493 |
| | | | | |
Therapeutics (10.6%) | | | |
Biomarin Pharmaceutical, Inc. (b) | | 13,560 | | | 217,367 |
Genentech, Inc. (b) | | 14,532 | | | 1,210,515 |
Genzyme Corp. (b) | | 9,676 | | | 653,227 |
Gilead Sciences, Inc. (b) | | 15,335 | | | 1,056,582 |
| | | | | |
| | | | | 3,137,691 |
| | | | | |
| | |
Total Common Stocks | | | | | 28,549,629 |
| | | | | |
Statement of Investments (Continued)
October 31, 2006
Gartmore Global Health Sciences Fund (Continued)
Repurchase Agreements (3.0%)
| | | | | | |
| | | Shares or
Principal Amount | | Value |
| | | | | | |
CS First Boston, 5.17%, dated 10/31/06, due 11/01/06, repurchase price $453,704, collateralized by U.S. Government Agency Mortgages with a market value of $462,712 | | $ | 453,639 | | $ | 453,639 |
Nomura Securities, 5.17%, dated 10/31/06, due 11/01/06, repurchase price $433,183, collateralized by U.S. Government Agency Mortgages with a market value of $441,784 | | | 433,121 | | | 433,121 |
| | | | | | |
| | |
Total Repurchase Agreements | | | | | | 886,760 |
| | | | | | |
|
Short-Term Securities Held as Collateral for Securities
on Loan (13.5%) |
Banc of America Securities LLC Repurchase Agreement, 5.32%, dated 10/31/06, due 11/01/06, repurchase price $3,983,570, collateralized by U.S. Government Agency Mortgages with a market value of $4,062,640 | | | 3,982,981 | | | 3,982,981 |
| | | | | | |
| |
Total Short-Term Securities Held as Collateral for Securities on Loan | | | 3,982,981 |
| | | | | | |
| | | | | | |
| | | | | Value | |
Total Investments
(Cost $31,460,410) (a) — 113.4% | | $ | 33,419,370 | |
| |
Liabilities in excess of other
assets — (13.4)% | | | (3,938,650 | ) |
| | | | | | |
| | |
NET ASSETS — 100.0% | | | | $ | 29,480,720 | |
| | | | | | |
| | (a) | See notes to financial statements for tax unrealized appreciation (depreciation) of securities. |
| | (b) | Denotes a non-income producing security. |
| | (c) | All or part of the security was on loan as of October 31, 2006. |
| | ADR | American Depository Receipt |
See notes to financial statements.
Gartmore Global Natural Resources Fund
For the annual period ended Oct. 31, 2006, the Gartmore Global Natural Resources Fund (Class A at NAV) returned 22.87% versus 17.96% for its benchmark, the Goldman Sachs Natural Resources Index. For broader comparison, the average return for the Fund’s Lipper peer category of Natural Resources Funds (consisting of 109 funds as of Oct. 31, 2006) was 18.01%.
Relative to most other market sectors, natural resources stocks performed well, despite experiencing considerable volatility as energy prices seesawed at the upper end of their long-term range. A warm winter was one restraining influence, as was the lack of any significant hurricanes during the summer months. Still, robust global demand—particularly from China—pushed the price of crude oil to nearly $80 per barrel in July. Slowing U.S. economic growth and plentiful inventories led to sharp price declines in both crude oil and natural gas in the final months of the reporting period. Meanwhile, demand for industrial metals and minerals remained strong, leading to a surge in the prices of copper and zinc, among others. In addition, active trading in gold ETFs (exchange-traded funds) helped briefly to push the price above $700 per troy ounce in May.
The Fund benefited most from stock selection in the materials sector, with copper producer Phelps Dodge Corp. topping our list of contributors to Fund performance. As emerging markets such as China continued to build their electrical power grids, demand for copper remained strong. Nickel producer Inco Ltd. also posted a strong gain, as a bidding war for the company developed. Gerdau AmeriSteel Corp., a minimill steel producer, further boosted the Fund’s performance. An overweighting by the Fund in the exceptionally strong-performing industrials sector was another positive factor; in particular, H&E Equipment Services, Inc., which rents heavy construction and industrial equipment, aided performance, as did Aircastle Ltd., a commercial aircraft leasing company.
The factor that detracted most from Fund performance was the Fund’s average cash position of more than 6%, which hurt in a rising market. Given the volatility in the various markets we follow, however, we viewed cash as a welcome stabilizing influence. Individual holdings that worked against the Fund’s results included Aventine Renewable Energy Holdings, Inc., an ethanol producer whose stock price fell due to a spike in the price of corn, from which ethanol is made. Warren Resources, Inc., another detractor from Fund performance, encountered various operational problems, and we sold the stock. Underweighting Schlumberger Ltd., an energy services provider, proved to be counterproductive, given the stock’s strong gain.
As long as global economies continue to expand at roughly their current pace, the fundamental backdrop for energy and materials stocks should remain constructive. Given the volatility in these markets, however, we continue to favor buying on weakness and selling on strength rather than a buy-and-hold approach. Moreover, the global economic recovery that began a few years ago is likely in its latter stages, and, as time goes by, we anticipate placing more emphasis on companies with diversified revenue streams and strong balance sheets.
Portfolio Managers:
William Gerlach, CFA and Jason Kotik, CFA
| | |
Fund Performance | | Gartmore Global Natural Resources Fund |
Average Annual Total Return
(For periods ended October 31, 2006)
| | | | | | |
| | | | | 1 Yr. | | Inception1 |
| Class A | | w/o SC2 | | 22.87% | | 42.48% |
| | | w/SC3 | | 15.78% | | 38.92% |
| Class B | | w/o SC2 | | 21.94% | | 41.38% |
| | | w/SC4 | | 16.94% | | 40.57% |
| Class C | | w/o SC2 | | 21.92% | | 41.40% |
| | | w/SC5 | | 20.92% | | 41.40% |
| Class R6 | | | | 22.59% | | 42.02% |
| Institutional Service Class6 | | | | 23.20% | | 42.74% |
| Institutional Class6 | | | | 23.17% | | 42.82% |
All figures showing the effect of a sales charge reflect the maximum charge possible, because it has the most dramatic effect on performance data.
| 1 | Fund commenced operations on June 29, 2004. |
| 2 | These returns do not reflect the effects of sales charges (SC). |
| 3 | A 5.75% front-end sales charge was deducted. |
| 4 | A 5.00% contingent deferred sales charge (CDSC) was deducted. The CDSC declines to 0% after 6 years. |
| 5 | A CDSC of 1.00% was deducted from the one year return because it is charged when you sell Class C shares within the first year after purchase. |
| 6 | Not subject to any sales charges. |
Performance of a $10,000 Investment
Investment return and principal value will fluctuate, and when redeemed, shares may be worth more or less than original cost. Past performance is no guarantee of future results and does not reflect the deduction of taxes that a shareholder would pay on fund distributions or the redemption of fund shares. Investing in mutual funds involves market risk, including loss of principal. Performance returns assume the reinvestment of all distributions.
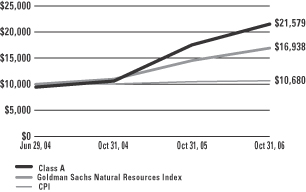
Comparative performance of $10,000 invested in Class A shares of the Gartmore Global Natural Resources Fund, Goldman Sachs Natural Resources Index (a), and the Consumer Price Index (CPI)(b) since inception. Unlike the Fund, the returns for these unmanaged indexes do not reflect any fees, expenses, or sales charges. Investors cannot invest directly in market indexes.
| (a) | Goldman Sachs Natural Resources is an unmanaged, modified market capitalization-weighted sector index of U.S.-traded natural resource-related stocks; includes companies in the categories of extractive industries, energy companies, owners and operators of timber tracts, forestry services, producers of pulp and paper, and owners of plantations. |
| (b) | The CPI represents changes in prices of a basket of goods and services purchased for consumption by urban households. |
| | |
Shareholder Expense Example | | Gartmore Global Natural Resources Fund |
As a shareholder of the Fund, you incur two types of costs: (1) transaction costs, including sales charges (loads) paid on purchase payments and redemption fees; and (2) ongoing costs, including investment advisory fees, administration fees, distribution fees and other Fund expenses. The examples below are intended to help you understand your ongoing costs (in dollars) of investing in the Fund and to compare these costs with the ongoing costs of investing in other mutual funds. Per SEC requirements, the examples assume that you had a $1,000 investment in the Class at the beginning of the reporting period, May 1, 2006 and continued to hold your shares at the end of the reporting period, October 31, 2006.
Actual Expenses
For each Class of the Fund in the table below, the first line provides information about actual account values and actual expenses. You may use the information in this line, together with the amount you invested, to estimate the expenses that you paid over the period. Simply divide your account value by $1,000 (for example, an $8,600 account value divided by $1,000 = 8.6), then multiply the result by the number in the first line of each Class under the heading entitled “Expenses Paid During Period” to estimate the expenses you paid on your account during the period.
Hypothetical Example for Comparison Purposes
The second line of each Class in the table below provides information about hypothetical account values and hypothetical expenses based on the Class’ actual expense ratio and an assumed rate of return of 5% per year before expenses, which is not the Class’ actual return. The hypothetical account values and expenses may not be used to estimate the actual ending account balance or expenses you paid for the period. You may use this information to compare the ongoing costs of investing in the Class of the Fund and other funds. To do so, compare this 5% hypothetical example with the 5% hypothetical examples that appear in the shareholder reports of the other funds.
Please note that the expenses shown in the table are meant to highlight your ongoing costs only and do not reflect any transaction costs, such as sales charges (loads) or redemption fees. Therefore, the second line for each Class in the table is useful in comparing ongoing costs only, and will not help you determine the relative total costs of owning different funds. In addition, if these transaction costs were included, your costs would have been higher. The examples also assume all dividends and distributions have been reinvested.
Schedule of Shareholder Expenses
Expense Analysis of a $1,000 Investment
(October 31, 2006)
| | | | | | | | | | | | | | |
| Global Natural Resources Fund | | | | | Beginning
Account Value,
5/1/06 | | Ending
Account Value,
10/31/06 | | Expenses Paid
During Period* | | Annualized
Expense Ratio* |
| Class A | | Actual | | | $ | 1,000 | | $ | 977 | | $ | 7.03 | | 1.41% |
| | | Hypothetical | 1 | | $ | 1,000 | | $ | 1,018 | | $ | 7.20 | | 1.41% |
| Class B | | Actual | | | $ | 1,000 | | $ | 974 | | $ | 10.70 | | 2.15% |
| | | Hypothetical | 1 | | $ | 1,000 | | $ | 1,014 | | $ | 10.97 | | 2.15% |
| Class C | | Actual | | | $ | 1,000 | | $ | 973 | | $ | 10.69 | | 2.15% |
| | | Hypothetical | 1 | | $ | 1,000 | | $ | 1,014 | | $ | 10.97 | | 2.15% |
| Class R | | Actual | | | $ | 1,000 | | $ | 976 | | $ | 9.11 | | 1.83% |
| | | Hypothetical | 1 | | $ | 1,000 | | $ | 1,016 | | $ | 9.34 | | 1.83% |
| Institutional Service Class | | Actual | | | $ | 1,000 | | $ | 978 | | $ | 5.78 | | 1.16% |
| | | Hypothetical | 1 | | $ | 1,000 | | $ | 1,019 | | $ | 5.92 | | 1.16% |
| Institutional Class | | Actual | | | $ | 1,000 | | $ | 978 | | $ | 5.78 | | 1.16% |
| | | Hypothetical | 1 | | $ | 1,000 | | $ | 1,019 | | $ | 5.92 | | 1.16% |
| * | Expenses are equal to the Fund’s annualized expense ratio multiplied by the average account value over the period multiplied by 184/365 (to reflect the one-half year period). The expense ratio presented represents a six-month, annualized ratio in accordance with SEC guidelines. |
| 1 | Represents the hypothetical 5% return before expenses. |
| | |
Portfolio Summary | | Gartmore Global Natural Resources Fund |
October 31, 2006
The SEC adopted a requirement that Funds present their portfolio holdings in a table, chart or graph format in their annual and semiannual reports to shareholders, whether or not a statement of investments is utilized. The following tables, which present portfolio holdings as a percentage of net assets, are provided in compliance with this requirement.
| | |
| Asset Allocation | | |
| Common Stocks | | 91.9% |
Repurchase Agreements | | 9.2% |
| Liabilities in excess of other assets | | -1.1 % |
| | |
| | 100.0% |
| | |
| Top Industries | | |
| Oil Company-Exploration & Production | | 37.7% |
| Oil Field Services | | 11.9% |
| Oil Company-Integrated | | 10.7% |
| Pipelines | | 5.1% |
| Coal Mining | | 4.7% |
| Oil Refining & Marketing | | 3.3% |
| Copper Production | | 3.2% |
| Oil & Gas Drilling | | 3.2% |
| Transport Services | | 3.0% |
| Energy | | 3.0% |
| Other Assets | | 14.2% |
| | |
| | 100.0% |
| | |
| Top Holdings* | | |
| Occidental Petroleum Corp. | | 7.3% |
| Exxon Mobil Corp. | | 4.8% |
| Phelps Dodge Corp. | | 3.2% |
| Devon Energy Corp. | | 3.2% |
| W&T Offshore, Inc. | | 3.0% |
| Swift Energy Co. | | 2.9% |
| Halliburton Co. | | 2.9% |
| Newfield Exploration Co. | | 2.9% |
| Schlumberger Ltd. – AN | | 2.6% |
| Anadarko Petroleum Corp. | | 2.6% |
| Other Assets | | 64.6% |
| | |
| | 100.0% |
| * | For purpose of listing top holdings, repurchase agreements are considered cash equivalents and are included as part of Other Assets. |
Gartmore Global Natural Resources Fund
Common Stocks (91.9%)
Statement of Investments
October 31, 2006
| | | | | |
| UNITED STATES (91.9%) | | Shares or
Principal Amount | | Value |
| | | | | |
Batteries (0.3%) | | | | | |
Energy Conversion Devices, Inc. (b) | | 3,418 | | $ | 125,748 |
| | | | | |
Capital Goods (0.7%) | | | | | |
HARSCO Corp. | | 4,000 | | | 326,520 |
| | | | | |
Coal Mining (4.7%) | | | | | |
Alpha Natural Resources, Inc. (b) | | 4,700 | | | 74,777 |
Arch Coal, Inc. | | 35,706 | | | 1,236,499 |
Peabody Energy Corp. | | 23,729 | | | 995,906 |
| | | | | |
| | | | | 2,307,182 |
| | | | | |
Copper Production (3.2%) | | | | | |
Phelps Dodge Corp. | | 15,856 | | | 1,591,625 |
| | | | | |
Energy (3.0%) | | | | | |
BJ Services Co. | | 15,263 | | | 460,332 |
Evergreen Energy, Inc. (b) | | 24,643 | | | 316,663 |
Murphy Oil Corp. | | 4,974 | | | 234,574 |
NRG Energy, Inc. (b) | | 9,074 | | | 436,913 |
TXU Corp. | | 500 | | | 31,565 |
| | | | | |
| | | | | 1,480,047 |
| | | | | |
Finance (0.2%) | | | | | |
Sanders Morris Harris Group, Inc. | | 10,000 | | | 117,600 |
| | | | | |
Gold Mining (2.9%) | | | | | |
Agnico-Eagle Mines, Ltd. — CA | | 4,900 | | | 181,153 |
Barrick Gold Corp. — CA | | 21,800 | | | 675,800 |
Freeport-McMoran Copper & Gold, Inc., Class B | | 9,600 | | | 580,608 |
| | | | | |
| | | | | 1,437,561 |
| | | | | |
Metals (0.5%) | | | | | |
Coeur d’Alene Mines Corp. (b) | | 53,930 | | | 264,257 |
| | | | | |
Oil & Gas Drilling (3.2%) | | | | | |
ENSCO International, Inc. | | 14,133 | | | 692,093 |
Hydril (b) | | 250 | | | 15,013 |
Noble Corp. | | 10,956 | | | 768,015 |
Todco (b) | | 3,010 | | | 102,731 |
| | | | | |
| | | | | 1,577,852 |
| | | | | |
| | | | | |
| | | Shares or
Principal Amount | | Value |
| | | | | |
UNITED STATES (continued) | | | | | |
Oil Company – Exploration & Production (37.7%) |
Anadarko Petroleum Corp. | | 27,400 | | $ | 1,271,908 |
ATP Oil & Gas Corp. (b) | | 1,500 | | | 64,485 |
Atwood Oceanics, Inc. (b) | | 12,000 | | | 554,400 |
Aurora Oil & Gas Corp. (b) | | 14,790 | | | 45,849 |
Berry Petroleum Co. | | 10,290 | | | 307,157 |
Cabot Oil & Gas Corp. | | 10,560 | | | 558,730 |
Canadian Natural Resources Ltd. — CA | | 15,900 | | | 829,185 |
Denbury Resources, Inc. (b) | | 30,666 | | | 881,341 |
Devon Energy Corp. | | 23,563 | | | 1,574,950 |
EOG Resources, Inc. | | 2,089 | | | 138,981 |
EXCO Resources, Inc. (b) | | 20,680 | | | 299,446 |
Gastar Exploration Ltd. (b) | | 2,000 | | | 4,329 |
Geomet, Inc. (b) | | 22,205 | | | 249,362 |
Ivanhoe Energy, Inc. — CA (b) | | 87,812 | | | 122,059 |
Kodiak Oil & Gas Corp. — CA (b) | | 45,000 | | | 171,000 |
McMoRan Exploration Co. (b) | | 19,088 | | | 288,611 |
Newfield Exploration Co. (b) | | 34,725 | | | 1,416,433 |
Noble Energy, Inc. | | 14,620 | | | 710,971 |
Occidental Petroleum Corp. | | 75,738 | | | 3,555,141 |
Parallel Petroleum Corp. (b) | | 32,327 | | | 654,622 |
Petrohawk Energy Corp. (b) | | 8,000 | | | 90,640 |
Range Resources Corp. | | 2,500 | | | 67,875 |
Storm Cat Energy Corp. — CA (b) | | 15,000 | | | 25,500 |
Swift Energy Co. (b) | | 30,890 | | | 1,443,181 |
Talisman Energy, Inc. — CA | | 6,373 | | | 105,218 |
Transglobe Energy Corp. — CA (b) | | 86,623 | | | 398,466 |
Transmeridian Exploration Inc. (b) | | 8,297 | | | 29,040 |
Transocean Sedco Forex, Inc. (b) | | 11,509 | | | 834,863 |
W&T Offshore, Inc. | | 43,532 | | | 1,470,075 |
Weatherford International, Inc. (b) | | 6,000 | | | 246,480 |
| | | | | |
| | | | | 18,410,298 |
| | | | | |
Oil Company-Integrated (10.7%) | | | |
BP PLC ADR — GB | | 7,272 | | | 487,951 |
ChevronTexaco Corp. | | 17,937 | | | 1,205,366 |
ConocoPhillips | | 5,066 | | | 305,176 |
Exxon Mobil Corp. | | 32,973 | | | 2,354,932 |
Marathon Oil Corp. | | 10,094 | | | 872,122 |
| | | | | |
| | | | | 5,225,547 |
| | | | | |
Statement of Investments (Continued)
October 31, 2006
Gartmore Global Natural Resources Fund (Continued)
Common Stocks (continued)
| | | | | |
| | | Shares or
Principal Amount | | Value |
| | | | | |
UNITED STATES (continued) | | | | | |
Oil Field Services (11.9%) | | | | | |
Baker Hughes, Inc. | | 7,500 | | $ | 517,875 |
FMC Technologies, Inc. (b) | | 5,000 | | | 302,250 |
Grant Prideco, Inc. (b) | | 5,093 | | | 192,363 |
Halliburton Co. | | 44,451 | | | 1,437,990 |
Key Energy Group (b) | | 12,473 | | | 174,622 |
National-Oilwell Varco, Inc. (b) | | 6,905 | | | 417,062 |
Particle Drilling Technologies, Inc. (b) | | 39,900 | | | 106,533 |
Schlumberger Ltd. — AN | | 20,500 | | | 1,293,140 |
Superior Energy Services, Inc. (b) | | 17,113 | | | 535,637 |
Superior Well Services, Inc. (b) | | 2,800 | | | 67,592 |
Universal Compression Holdings, Inc. (b) | | 1,722 | | | 103,768 |
Universal Compression Partners LP (b) | | 26,530 | | | 647,597 |
Warrior Energy Service Corp. (b) | | 719 | | | 20,412 |
| | | | | |
| | | | | 5,816,841 |
| | | | | |
Oil Refining & Marketing (3.3%) | | | |
Headwaters, Inc. (b) | | 603 | | | 14,924 |
Hiland Holdings GP, LP (b) | | 20,700 | | | 496,593 |
Valero Energy | | 21,200 | | | 1,109,396 |
| | | | | |
| | | | | 1,620,913 |
| | | | | |
Packaging & Containers (0.3%) | | | | | |
Owens-Illinois, Inc. (b) | | 10,000 | | | 166,000 |
| | | | | |
Paper & Related Products (0.1%) | | | |
Smurfit-Stone Container Corp. (b) | | 5,000 | | | 53,300 |
| | | | | |
Pipelines (5.1%) | | | | | |
Energy Transfer Equity | | 36,000 | | | 1,044,000 |
Questar Corp. | | 6,688 | | | 544,938 |
The Williams Cos., Inc. | | 36,293 | | | 886,638 |
| | | | | |
| | | | | 2,475,576 |
| | | | | |
Raw Materials (1.1%) | | | | | |
Alcoa, Inc. | | 9,000 | | | 260,190 |
BHP Billiton Ltd. ADR — AU | | 1,000 | | | 42,570 |
Companhia Vale do Rio Doce ADR — BR | | 8,000 | | | 203,520 |
Teck Cominco Ltd., Class B — CA | | 600 | | | 44,214 |
| | | | | |
| | | | | 550,494 |
| | | | | |
| | | | | | | |
| | | Shares or
Principal Amount | | Value | |
| | | | | | | |
UNITED STATES (continued) | | | | | | | |
Transport Services (3.0%) | | | | | | | |
Aircastle Ltd. | | | 12,837 | | $ | 413,480 | |
Omega Navigation Enterprises, Inc., Class A | | | 45,146 | | | 717,822 | |
StealthGas, Inc. | | | 28,072 | | | 354,548 | |
| | | | | | | |
| | | | | | 1,485,850 | |
| | | | | | | |
| | |
Total Common Stocks | | | | | | 45,033,211 | |
| | | | | | | |
|
Repurchase Agreements (9.2%) | |
CS First Boston, 5.17%, dated 10/31/06, due 11/01/06, repurchase price $2,306,945, collateralized by U.S. Government Agency Mortgages with a market value of $2,352,751 | | $ | 2,306,614 | | | 2,306,614 | |
Nomura Securities, 5.17%, dated 10/31/06, due 11/01/06, repurchase price $2,202,606, collateralized by U.S. Government Agency Mortgages with a market value of $2,246,339 | | | 2,202,290 | | | 2,202,290 | |
| | | | | | | |
| | |
Total Repurchase Agreements | | | | | | 4,508,904 | |
| | | | | | | |
| |
Total Investments
(Cost $47,892,866) (a) — 101.1% | | | 49,542,115 | |
| | |
Liabilities in excess of other
assets — (1.1)% | | | | | | (537,033 | ) |
| | | | | | | |
| | |
NET ASSETS — 100.0% | | | | | $ | 49,005,082 | |
| | | | | | | |
| | (a) | See notes to financial statements for tax unrealized appreciation (depreciation) of securities. |
| | (b) | Denotes a non-income producing security. |
| | ADR | American Depository Receipt |
See notes to financial statements.
Gartmore Global Technology and Communications Fund
Effective April 2006, Jayne Stevlingson became the Fund’s portfolio manager and is responsible for the day-to-day management, including selection of the Fund’s investments.
For the annual period ended Oct. 31, 2006, the Gartmore Global Technology and Communications Fund (Class A at NAV) returned 13.48% versus 10.35% for its benchmark, the Goldman Sachs Technology Composite Index (GSTI®). For broader comparison, the average return for the Fund’s Lipper peer category of Science & Technology Funds (consisting of 289 funds as of Oct. 31, 2006) was 10.21%.
Technology stocks encountered considerable volatility during the reporting period, but from November 2005 through April 2006 the environment was relatively favorable. After the Federal Reserve Board increased short-term interest rates in May, however, investors became risk-averse, which led to aggressive selling of technology and communications stocks. By mid-July the inflation concerns that had triggered the sell-off eased, and technology stocks began a rally that persisted through the end of October. The Federal Reserve’s decision to keep short-term interest rates unchanged at its August, September and October Federal Open Market Committee meetings, along with falling energy prices, helped to bolster investor sentiment during the final three months of the reporting period.
After taking over responsibility for the Fund in April, we repositioned it to be less concentrated, almost doubling the number of holdings. This shift reflected our preference to stay closer to the benchmark’s weightings unless we have a strong conviction, positive or negative, about a stock. We establish price targets for all of our holdings, and we are disciplined about selling when a stock hits its target. We look for opportunities in all capitalization groups; the Fund carries somewhat less of a small- to mid-cap bias than in the past. Our goal is to boost the Fund’s foreign holdings to roughly 20% of net assets, with stocks in China and India likely to account for many of the additions. At the end of the reporting period, the Fund had roughly a 13% weighting in global stocks.
Contributors to Fund performance included India-based Cognizant Technology Solutions Corp; the company enjoyed strong revenue and earnings growth based on its position as a leading provider of outsourced technology services. Also helping Fund results was 24/7 Real Media, Inc., an Internet advertising company; this stock performed well and hit our price target, so we sold it. Another contributor to Fund performance, Advanced Micro Devices, Inc. (AMD), generated a lot of excitement early in the reporting period, taking temporary leadership in the market for dual-core personal computer microprocessors. Rival firm Intel Corp., however, later rolled out its own version of the dual-core chip, undermining AMD’s advantage. Fortunately, our disciplined methodology enabled us to sell AMD for a profit. Further aiding the Fund’s return was another semiconductor stock, Power Integrations, Inc., which benefited from a new product cycle and favorable results in some patent infringement lawsuits.
Detractors from Fund performance included Neoware Systems Inc., a maker of “thin-client” computer hardware. While we liked the company’s products, we were less enthusiastic about the firm’s success in achieving its business goals, so we sold the holding. An underweighted position in enterprise software maker Oracle Corp. also hampered Fund performance. As the reporting period progressed, we grew more confident about the stock—in part, because of Oracle’s decision to offer support for the Linux operating system—and brought our stake up to roughly a market weighting by the end of October. An underweighting in Microsoft Corp. further limited the Fund’s gains. In that case, we favored other stocks that we thought would offer faster earnings growth.
A number of crosscurrents could make the stock market hard to read over the near term. For example, we think that investors may face the possibility of slowing consumer spending. That said, technology valuations are still reasonable, and stable or falling interest rates—at the moment, a more likely outcome, in our opinion, than further rate hikes—would likely provide a boost to share prices. Furthermore, we anticipate some exciting product introductions in the technology sector, along with reasonably strong corporate information technology spending.
Portfolio Manager:
Jayne Stevlingson, CFA
| | |
Fund Performance | | Gartmore Global Technology and Communications Fund |
Average Annual Total Return
(For periods ended October, 31 2006)
| | | | | | | | |
| | | | | 1 Yr. | | 5 Yr. | | Inception1 |
| Class A | | w/o SC2 | | 13.48% | | 0.93% | | -11.70% |
| | | w/SC3 | | 6.85% | | -0.28% | | -12.52% |
| Class B | | w/o SC2 | | 12.61% | | 0.25% | | -12.34% |
| | | w/SC4 | | 7.61% | | -0.15% | | -12.34% |
| Class C5 | | w/o SC2 | | 12.50% | | 0.30% | | -12.23% |
| | | w/SC6 | | 11.50% | | 0.30% | | -12.23% |
| Class R7,9 | | | | 13.06% | | 0.50% | | -12.16% |
| Institutional Service Class9 | | 14.81% | | 1.34% | | -11.27% |
| Institutional Class8,9 | | 13.72% | | 1.20% | | -11.37% |
All figures showing the effect of a sales charge reflect the maximum charge possible, because it has the most dramatic effect on performance data.
| 1 | Fund commenced operations on June 30, 2000. |
| 2 | These returns do not reflect the effects of sales charges (SC). |
| 3 | A 5.75% front-end sales charge was deducted. |
| 4 | A 5.00% contingent deferred sales charge (CDSC) was deducted. The CDSC declines to 0% after 6 years. |
| 5 | These returns until the creation of Class C shares (3/1/01) include the performance of the Fund’s Class B shares. Excluding the effects of any fee waivers or reimbursements, such prior performance is substantially similar to what Class C shares would have produced because Class C shares invest in the same portfolio of securities as Class B shares and have the same expenses after any fee waivers or reimbursements. For Class C shares returns with sales charges, these returns have been restated for the applicable sales charges. |
| 6 | A CDSC of 1.00% was deducted from the one year return because it is charged when you sell Class C shares within the first year after purchase. |
| 7 | These returns until the creation of Class R shares (12/30/03) include the performance of the Fund’s Class B shares. The returns have been adjusted for the fact that Class R shares do not have any applicable sales charges but have not been adjusted for the lower expenses applicable to Class R shares. Excluding the effect of any fee waivers or reimbursements, such prior performance is similar to what Class R shares would have produced because the Class R shares invest in the same portfolio of securities as Class B shares. |
| 8 | These returns until the creation of Institutional Class shares (6/29/04) include the performance of the Fund’s Institutional Service shares. The returns have been adjusted for the fact that Institutional Class shares do not have any applicable sales charges but have not been adjusted for the lower expenses applicable to Institutional Class shares. Excluding the effect of any fee waivers or reimbursements, such prior performance is similar to what Institutional Class shares would have produced because the Institutional Class shares invest in the same portfolio of securities as Institutional Service shares. |
| 9 | Not subject to any sales charges. |
Performance of a $10,000 Investment
Investment return and principal value will fluctuate, and when redeemed, shares may be worth more or less than original cost. Past performance is no guarantee of future results and does not reflect the deduction of taxes that a shareholder would pay on fund distributions or the redemption of fund shares. Investing in mutual funds involves market risk, including loss of principal. Performance returns assume the reinvestment of all distributions.
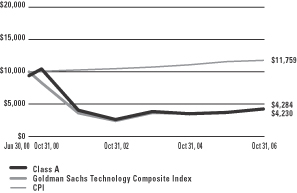
Comparative performance of $10,000 invested in Class A shares of the Gartmore Global Technology and Communications Fund, Goldman Sachs Technology Composite Index (GSTI®)(a), and the Consumer Price Index (CPI)(b) since inception. Unlike the Fund, the returns for these unmanaged indexes do not reflect any fees, expenses, or sales charges. Investors cannot invest directly in market indexes.
| (a) | The GSTI® is an unmanaged, modified, market capitalization-weighted index that is designed to measure performance of companies in the technology sector. |
| (b) | The CPI represents changes in prices of a basket of goods and services purchased for consumption by urban households. |
| | |
Shareholder Expense Example | | Gartmore Global Technology and Communications Fund |
As a shareholder of the Fund, you incur two types of costs: (1) transaction costs, including sales charges (loads) paid on purchase payments and redemption fees; and (2) ongoing costs, including investment advisory fees, administration fees, distribution fees and other Fund expenses. The examples below are intended to help you understand your ongoing costs (in dollars) of investing in the Fund and to compare these costs with the ongoing costs of investing in other mutual funds. Per SEC requirements, the examples assume that you had a $1,000 investment in the Class at the beginning of the reporting period, May 1, 2006 and continued to hold your shares at the end of the reporting period, October 31, 2006.
Actual Expenses
For each Class of the Fund in the table below, the first line provides information about actual account values and actual expenses. You may use the information in this line, together with the amount you invested, to estimate the expenses that you paid over the period. Simply divide your account value by $1,000 (for example, an $8,600 account value divided by $1,000 = 8.6), then multiply the result by the number in the first line of each Class under the heading entitled “Expenses Paid During Period” to estimate the expenses you paid on your account during the period.
Hypothetical Example for Comparison Purposes
The second line of each Class in the table below provides information about hypothetical account values and hypothetical expenses based on the Class’ actual expense ratio and an assumed rate of return of 5% per year before expenses, which is not the Class’ actual return. The hypothetical account values and expenses may not be used to estimate the actual ending account balance or expenses you paid for the period. You may use this information to compare the ongoing costs of investing in the Class of the Fund and other funds. To do so, compare this 5% hypothetical example with the 5% hypothetical examples that appear in the shareholder reports of the other funds.
Please note that the expenses shown in the table are meant to highlight your ongoing costs only and do not reflect any transaction costs, such as sales charges (loads) or redemption fees. Therefore, the second line for each Class in the table is useful in comparing ongoing costs only, and will not help you determine the relative total costs of owning different funds. In addition, if these transaction costs were included, your costs would have been higher. The examples also assume all dividends and distributions have been reinvested.
Schedule of Shareholder Expenses
Expense Analysis of a $1,000 Investment
(October 31, 2006)
| | | | | | | | | | | | | | |
| Global Technology and Communications Fund | | | | | Beginning
Account Value,
5/1/06 | | Ending
Account Value,
10/31/06 | | Expenses Paid
During Period* | | Annualized
Expense Ratio* |
| Class A | | Actual | | | $ | 1,000.00 | | $ | 1,019.40 | | $ | 7.94 | | 1.56% |
| | | Hypothetical | 1 | | $ | 1,000.00 | | $ | 1,017.14 | | $ | 7.96 | | 1.56% |
| Class B | | Actual | | | $ | 1,000.00 | | $ | 1,015.20 | | $ | 11.58 | | 2.28% |
| | | Hypothetical | 1 | | $ | 1,000.00 | | $ | 1,013.51 | | $ | 11.64 | | 2.28% |
| Class C | | Actual | | | $ | 1,000.00 | | $ | 1,015.00 | | $ | 11.48 | | 2.26% |
| | | Hypothetical | 1 | | $ | 1,000.00 | | $ | 1,013.61 | | $ | 11.54 | | 2.26% |
| Class R | | Actual | | | $ | 1,000.00 | | $ | 1,015.00 | | $ | 10.82 | | 2.13% |
| | | Hypothetical | 1 | | $ | 1,000.00 | | $ | 1,014.26 | | $ | 10.87 | | 2.13% |
| Institutional Service Class | | Actual | | | $ | 1,000.00 | | $ | 1,030.90 | | $ | 7.47 | | 1.46% |
| | | Hypothetical | 1 | | $ | 1,000.00 | | $ | 1,017.64 | | $ | 7.45 | | 1.46% |
| Institutional Class | | Actual | | | $ | 1,000.00 | | $ | 1,021.30 | | $ | 6.42 | | 1.26% |
| | | Hypothetical | 1 | | $ | 1,000.00 | | $ | 1,018.65 | | $ | 6.43 | | 1.26% |
| * | Expenses are equal to the Fund’s annualized expense ratio multiplied by the average account value over the period multiplied by 184/365 (to reflect the one-half year period). The expense ratio presented represents a six-month, annualized ratio in accordance with SEC guidelines. |
| 1 | Represents the hypothetical 5% return before expenses. |
| | |
Portfolio Summary | | Gartmore Global Technology & Communications Fund |
October 31, 2006
The SEC adopted a requirement that Funds present their portfolio holdings in a table, chart or graph format in their annual and semiannual reports to shareholders, whether or not a statement of investments is utilized. The following tables, which present portfolio holdings as a percentage of net assets, are provided in compliance with this requirement.
| | |
| Asset Allocation | | |
| Common Stocks | | 94.3% |
| Repurchase Agreements | | 1.0% |
| Other Investements* | | 10.2% |
| Liabilities in excess of other assets** | | -5.5 % |
| | |
| | 100.0% |
| | |
| Top Industries | | |
| Electronic Components | | 25.0% |
| Telecommunication Equipment | | 12.9% |
| Computer Software | | 12.6% |
| E-Commerce & Services | | 8.8% |
| Computer Services | | 7.6% |
| Wireless Equipment | | 6.6% |
| Computer Hardware | | 6.5% |
| Software | | 5.4% |
| Telecommunication Services | | 2.9% |
| Internet Security | | 2.1% |
| Other Assets | | 9.6% |
| | |
| | 100.0% |
| | |
| Top Holdings*** | | |
| Cisco Systems, Inc. | | 4.8% |
| Google, Inc. | | 4.4% |
| Oracle Corp. | | 3.9% |
| Hyperion Solutions Corp. | | 2.3% |
| International Business Machines Corp. | | 2.1% |
| Nokia Oyj ADR – FI | | 2.0% |
| Advanced Analogic Technologies, Inc. | | 1.9% |
| Marvell Technology Group Ltd. – BM | | 1.9% |
| RF Micro Devices, Inc. | | 1.9% |
| Juniper Networks, Inc. | | 1.9% |
| Other Assets | | 72.9% |
| | |
| | 100.0% |
| * | Includes value of collateral received from securities lending. |
| ** | Includes value of collateral owed from securities lending. |
| *** | For purpose of listing top holdings, repurchase agreements are considered cash equivalents and are included as part of Other Assets. |
Gartmore Global Technology and Communications Fund
Common Stocks (94.3%)
Statement of Investments
October 31, 2006
| | | | | |
| UNITED STATES (94.3%) | | Shares or
Principal Amount | | Value |
| | | | | |
Commercial Services (1.5%) | | | | | |
Alliance Data Systems Corp. (b) | | 3,100 | | $ | 188,232 |
| | | | | |
Computer Hardware (6.5%) | | | |
Acer, Inc. (c) | | 71,800 | | | 130,215 |
Dell, Inc. (b) | | 5,100 | | | 124,083 |
Hewlett Packard Co. | | 3,300 | | | 127,842 |
International Business Machines Corp. | | 2,900 | | | 267,757 |
Lexmark International, Inc. (b) | | 1,000 | | | 63,590 |
Palm, Inc. (b) | | 8,000 | | | 122,800 |
| | | | | |
| | | | | 836,287 |
| | | | | |
Computer Services (7.6%) | | | |
Cognizant Technology Solutions Corp. (b) | | 2,200 | | | 165,616 |
Internap Network Services Corp. (b) | | 8,300 | | | 136,784 |
MICROS Systems, Inc. (b) | | 2,500 | | | 124,200 |
Satyam Computer Services Ltd. ADR — IN (d) | | 5,800 | | | 128,238 |
Sun Microsystems, Inc. (b) | | 42,000 | | | 228,060 |
WebEx Communications, Inc. (b) | | 5,100 | | | 196,095 |
| | | | | |
| | | | | 978,993 |
| | | | | |
Computer Software (12.6%) | | | |
Autonomy Corp. PLC (b) (c) | | 19,100 | | | 174,823 |
Business Objects SA ADR — FR (b) | | 3,500 | | | 129,640 |
Epicor Software Corp. (b) | | 8,700 | | | 122,061 |
Hyperion Solutions Corp. (b) (d) | | 8,000 | | | 299,200 |
Microsoft Corp. | | 4,400 | | | 126,324 |
Oracle Corp. (b) | | 27,300 | | | 504,231 |
Salesforce.com, Inc. (b) | | 2,400 | | | 93,648 |
Tibco Software, Inc. (b) | | 18,900 | | | 174,825 |
| | | | | |
| | | | | 1,624,752 |
| | | | | |
E-Commerce & Services (8.8%) | | | |
Ariba, Inc. (b) | | 8,310 | | | 62,741 |
CheckFree Corp. (b) | | 4,100 | | | 161,868 |
First Data Corp. | | 4,100 | | | 99,425 |
Google, Inc. (b) | | 1,190 | | | 566,904 |
I2 Technologies, Inc. (b) | | 2,900 | | | 58,609 |
Shutterfly, Inc. (b) | | 3,400 | | | 44,710 |
Yahoo, Inc. (b) | | 5,200 | | | 136,968 |
| | | | | |
| | | | | 1,131,225 |
| | | | | |
| | | | | |
| | | Shares or
Principal Amount | | Value |
| | | | | |
UNITED STATES (continued) | | | | | |
Electronic Components (25.0%) | | | |
Advanced Analogic Technologies, Inc. (b) | | 40,200 | | $ | 250,043 |
Advanced Micro Devices, Inc. (b) | | 7,730 | | | 164,417 |
Anadigics, Inc. (b) | | 13,500 | | | 109,080 |
Bell Microproducts, Inc. (b) | | 24,200 | | | 163,108 |
Bookham, Inc. (b) | | 29,700 | | | 92,961 |
Chartered Semiconductor
ADR — SG (b) | | 16,100 | | | 125,258 |
Integrated Device Technology, Inc. (b) | | 8,480 | | | 134,408 |
Intel Corp. | | 11,300 | | | 241,142 |
International Rectifier Corp. (b) | | 3,300 | | | 118,701 |
Intersil Corp. | | 2,000 | | | 46,900 |
Linear Technology Corp. | | 2,400 | | | 74,688 |
LSI Logic Corp. (b) | | 13,000 | | | 130,650 |
Marvell Technology Group
Ltd. — BM (b) | | 13,500 | | | 246,780 |
Mattson Technology, Inc. (b) | | 9,500 | | | 92,910 |
MEMC Electronic Materials, Inc. (b) | | 3,400 | | | 120,700 |
Microsemi Corp. (b) | | 7,500 | | | 147,000 |
Monolithic Power System, Inc. (b) | | 8,100 | | | 81,324 |
Nextest Systems Corp. (b) | | 2,000 | | | 20,900 |
PLX Technology, Inc. (b) (d) | | 4,300 | | | 53,363 |
Power Integrations, Inc. (b) | | 5,800 | | | 127,252 |
Qimonda AG ADR — DE (b) | | 17,300 | | | 241,335 |
QLogic Corp. (b) | | 5,700 | | | 117,306 |
SiRF Technology Holdings, Inc. (b) | | 5,500 | | | 154,660 |
Syntax-Brillian Corp. (b) | | 28,000 | | | 177,800 |
| | | | | |
| | | | | 3,232,686 |
| | | | | |
Internet Security (2.1%) | | | |
McAfee, Inc. (b) | | 6,700 | | | 193,831 |
Vasco Data Security International, Inc. (b) | | 6,700 | | | 77,653 |
| | | | | |
| | | | | 271,484 |
| | | | | |
Media (1.1%) | | | |
Gatehouse Media, Inc. (b) | | 6,660 | | | 142,857 |
| | | | | |
Services (1.3%) | | | |
Lionbridge Technologies, Inc. (b) | | 24,500 | | | 165,865 |
| | | | | |
Software (5.4%) | | | |
Aspen Technology, Inc. (b) | | 17,500 | | | 175,350 |
Citrix Systems, Inc. (b) | | 6,400 | | | 188,992 |
Statement of Investments (Continued)
October 31, 2006
Gartmore Global Technology and Communications Fund (Continued)
Common Stocks (continued)
| | | | | | |
| UNITED STATES (continued) | | Shares or
Principal Amount | | Value |
| | | | | | |
Software (continued) | | | |
Webmethods, Inc. (b) | | | 24,600 | | $ | 184,992 |
WebSideStory, Inc. (b) | | | 11,100 | | | 144,855 |
| | | | | | |
| | | | | | 694,189 |
| | | | | | |
Telecommunication Equipment (12.9%) | | | |
3Com Corp. (b) | | | 35,500 | | | 172,530 |
Adaptec, Inc. (b) | | | 29,900 | | | 135,447 |
Ciena Corp. (b) | | | 1,814 | | | 42,647 |
Cisco Systems, Inc. (b) | | | 25,700 | | | 620,142 |
Comverse Technology, Inc. (b) | | | 11,000 | | | 239,470 |
Finisar Corp. (b) | | | 60,400 | | | 210,192 |
Juniper Networks, Inc. (b) | | | 14,170 | | | 244,007 |
| | | | | | |
| | | | | | 1,664,435 |
| | | | | | |
Telecommunication Services (2.9%) | | | |
Amdocs Ltd. — GG (b) | | | 1,600 | | | 62,016 |
China Grentech Corp Ltd. ADR — CN (b) | | | 6,000 | | | 84,000 |
Extreme Networks, Inc. (b) | | | 31,100 | | | 118,180 |
Kongzhong Corp. ADR — KY (b) | | | 13,400 | | | 109,478 |
| | | | | | |
| | | | | | 373,674 |
| | | | | | |
Wireless Equipment (6.6%) | | | |
American Tower Corp. (b) | | | 5,400 | | | 194,508 |
Nokia Oyj ADR — FI (d) | | | 12,700 | | | 252,476 |
Qualcomm, Inc. | | | 4,300 | | | 156,477 |
RF Micro Devices, Inc. (b) | | | 33,500 | | | 244,550 |
| | | | | | |
| | | | | | 848,011 |
| | | | | | |
| | |
Total Common Stocks | | | | | | 12,152,690 |
| | | | | | |
|
Repurchase Agreements (1.0%) |
CS First Boston, 5.17%, dated 10/31/06, due 11/01/06, repurchase price $67,708, collateralized by U.S. Government Agency Mortgages with a market value of $69,052 | | $ | 67,698 | | | 67,698 |
Nomura Securities, 5.17%, dated 10/31/06, due 11/01/06, repurchase price $64,645, collateralized by U.S. Government Agency Mortgages with a market value of $65,929 | | | 64,636 | | | 64,636 |
| | | | | | |
| | |
Total Repurchase Agreements | | | | | | 132,334 |
| | | | | | |
Short-Term Securities Held as Collateral for Securities on Loan (10.2%)
| | | | | | | |
| | | Shares or
Principal Amount | | Value | |
Banc of America Securities LLC Repurchase Agreement, 5.32%, dated 10/31/06, due 11/01/06, repurchase price $1,316,678, collateralized by U.S. Government Agency Mortgages with a market value of $1,342,812 | | $ | 1,316,483 | | $ | 1,316,483 | |
| | | | | | | |
| |
Total Short-Term Securities Held as Collateral for Securities on Loan | | | 1,316,483 | |
| | | | | | | |
| |
Total Investments
(Cost $12,654,257) (a) — 105.5% | | | 13,601,507 | |
| |
Liabilities in excess of
other assets — (5.5)% | | | (704,097 | ) |
| | | | |
| |
NET ASSETS — 100.0% | | $ | 12,897,410 | |
| | | | | | | |
| | (a) | See notes to financial statements for tax unrealized appreciation (depreciation) of securities. |
| | (b) | Denotes a non-income producing security. |
| | (d) | All or part of the security was on loan as of October 31, 2006. |
| | ADR | American Depository Receipt |
See notes to financial statements.
Gartmore Global Utilities Fund
For the annual period ended Oct. 31, 2006, the Gartmore Global Utilities Fund (Class A at NAV) returned 27.56% versus 25.61% for its benchmark, a blend of 60% Morgan Stanley Capital International (MSCI) World Telecommunication Services IndexSM and 40% MSCI World Utilities IndexSM. For broader comparison, the average return for the Fund’s Lipper peer category of Utility Funds (consisting of 104 funds as of Oct. 31, 2006) was 20.91%.
Global utilities benefited from a favorable investment environment during the reporting period, as many factors that prevailed in the first half of the period persisted into the second half. The notable exception was a rapid decline in the price of crude oil during August and September, aided in no small part by rising U.S. inventories and benign weather conditions in the Atlantic. Underpinning the performance of global utilities, however, was acceleration in corporate restructuring and a large number of mergers and acquisitions carried out within the sector.
Against this backdrop, stock selection was the primary driver of positive Fund performance during the reporting period, especially our decision to overweight selected European multi-utilities SUEZ S.A. of France and German-headquartered RWE AG, both of which yielded solid gains. These two firms experienced significant corporate activity during the reporting period. Investors remained notably positive on France’s second-largest utility, SUEZ, which—having rebuffed a takeover bid from Italy’s top utility group Enel S.p.A. earlier in the year—has been bid for by domestic peer Gaz de France. Meanwhile, Fund holding RWE of Germany has been focusing on divesting its water interests before considering potential acquisitions ahead of the opening of Europe’s energy markets to global competition in 2007.
Toward the beginning of 2006, we took the opportunity to lock in the energy sector’s gains that had been propelled higher by elevated oil and gas prices. We disposed of our holdings in EOG Resources, Inc. and The Williams Cos., Inc. while reducing our position in Suncor Energy Inc. We subsequently offloaded the rest of our Suncor holding in mid-2006, however, anticipating that oil prices would begin to trend lower in the short term, after they had surged to multi-year highs during the summer.
Indeed, the impending de-regulation of Europe’s utilities sector—arguably the driving force of the consolidation that we have seen in global markets—has been a prominent theme that the Fund has sought to exploit throughout the past year. In this vein, the Fund benefited substantially from investment in U.K. water companies AWG plc, Pennon Group Plc and Northumbrian Water Group plc, all of which have been buoyed by growing bid interest, mainly due to their stable revenue streams.
The main drag on Fund performance was underweight allocation to the outperforming diversified telecommunications sector, although our stock selection more than offset the impact (in particular, BellSouth Corp. was the key outperformer for the Fund, thanks to the company’s consenting to be acquired by larger rival AT&T Inc.).
Looking ahead, we believe that the Fund remains well positioned to benefit from a continuation of the trends we have successfully identified during the reporting period, and, therefore, we do not foresee a material shift in the Fund's core positioning in the near term.
Portfolio Manager:
Gartmore Global Partners—Ben Walker
| | |
Fund Performance | | Gartmore Global Utilities Fund |
Average Annual Total Return
(For periods ended October 31, 2006)
| | | | | | |
| | | | | 1 Yr. | | Inception1 |
| Class A | | w/o SC2 | | 27.56% | | 11.01% |
| | | w/SC3 | | 20.24% | | 9.67% |
| Class B | | w/o SC2 | | 26.57% | | 10.19% |
| | | w/SC4 | | 21.57% | | 9.91% |
| Class C | | w/o SC2 | | 26.60% | | 10.20% |
| | | w/SC5 | | 25.60% | | 10.20% |
| Class R6,8 | | | | 27.11% | | 10.53% |
| Institutional Service Class8 | | | | 27.88% | | 11.30% |
| Institutional Class7,8 | | | | 27.88% | | 11.30% |
All figures showing the effect of a sales charge reflect the maximum charge possible, because it has the most dramatic effect on performance data.
| 1 | Fund commenced operations on December 18, 2001. |
| 2 | These returns do not reflect the effects of sales charges (SC). |
| 3 | A 5.75% front-end sales charge was deducted. |
| 4 | A 5.00% contingent deferred sales charge (CDSC) was deducted. The CDSC declines to 0% after 6 years. |
| 5 | A CDSC of 1.00% was deducted from the one year return because it is charged when you sell Class C shares within the first year after purchase. |
| 6 | These returns until the creation of Class R shares (12/30/03) include the performance of the Fund’s Class B shares. The returns have been adjusted for the fact that Class R shares do not have any applicable sales charges but have not been adjusted for the lower expenses applicable to Class R shares. Excluding the effect of any fee waivers or reimbursements, such prior performance is similar to what Class R shares would have produced because the Class R shares invest in the same portfolio of securities as Class B shares. |
| 7 | These returns until the creation of Institutional Class shares (6/29/04) include the performance of the Fund’s Institutional Service shares. The returns have been adjusted for the fact that Institutional Class shares do not have any applicable sales charges but have not been adjusted for the lower expenses applicable to Institutional Class shares. Excluding the effect of any fee waivers or reimbursements, such prior performance is similar to what Institutional Class shares would have produced because the Institutional Class shares invest in the same portfolio of securities as Institutional Service shares. |
| 8 | Not subject to any sales charges. |
Performance of a $10,000 Investment
Investment return and principal value will fluctuate, and when redeemed, shares may be worth more or less than original cost. Past performance is no guarantee of future results and does not reflect the deduction of taxes that a shareholder would pay on fund distributions or the redemption of fund shares. Investing in mutual funds involves market risk, including loss of principal. Performance returns assume the reinvestment of all distributions.
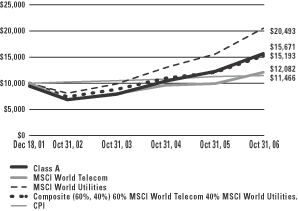
Comparative performance of $10,000 invested in Class A shares of the Gartmore Global Utilities Fund, Morgan Stanley Capital International World Telecommunications Services Index (MSCI World Telecom)(a), Morgan Stanley Capital International World Utilities Index (MSCI World Utilities)(b), Composite Index (Composite)(c), and the Consumer Price Index (CPI)(d) since inception. Unlike the Fund, the returns for these unmanaged indexes do not reflect any fees, expenses, or sales charges. Investors cannot invest directly in market indexes.
| (a) | The MSCI World Telecom is an unmanaged index representative of the stocks in the global telecom sector and is based on 23 developed market country indices. |
| (b) | The MSCI World Utilities is made up of industry groups such as electric, gas, multi utilities and unregulated power and water. |
| (c) | The Composite is a combination of 60% MSCI World Telecom and 40% MSCI World Utilities. |
| (d) | The CPI represents changes in prices of a basket of goods and services purchased for consumption by urban households. |
| | |
Shareholder Expense Example | | Gartmore Global Utilities Fund |
As a shareholder of the Fund, you incur two types of costs: (1) transaction costs, including sales charges (loads) paid on purchase payments and redemption fees; and (2) ongoing costs, including investment advisory fees, administration fees, distribution fees and other Fund expenses. The examples below are intended to help you understand your ongoing costs (in dollars) of investing in the Fund and to compare these costs with the ongoing costs of investing in other mutual funds. Per SEC requirements, the examples assume that you had a $1,000 investment in the Class at the beginning of the reporting period, May 1, 2006 and continued to hold your shares at the end of the reporting period, October 31, 2006.
Actual Expenses
For each Class of the Fund in the table below, the first line provides information about actual account values and actual expenses. You may use the information in this line, together with the amount you invested, to estimate the expenses that you paid over the period. Simply divide your account value by $1,000 (for example, an $8,600 account value divided by $1,000 = 8.6), then multiply the result by the number in the first line of each Class under the heading entitled “Expenses Paid During Period” to estimate the expenses you paid on your account during the period.
Hypothetical Example for Comparison Purposes
The second line of each Class in the table below provides information about hypothetical account values and hypothetical expenses based on the Class’ actual expense ratio and an assumed rate of return of 5% per year before expenses, which is not the Class’ actual return. The hypothetical account values and expenses may not be used to estimate the actual ending account balance or expenses you paid for the period. You may use this information to compare the ongoing costs of investing in the Class of the Fund and other funds. To do so, compare this 5% hypothetical example with the 5% hypothetical examples that appear in the shareholder reports of the other funds.
Please note that the expenses shown in the table are meant to highlight your ongoing costs only and do not reflect any transaction costs, such as sales charges (loads) or redemption fees. Therefore, the second line for each Class in the table is useful in comparing ongoing costs only, and will not help you determine the relative total costs of owning different funds. In addition, if these transaction costs were included, your costs would have been higher. The examples also assume all dividends and distributions have been reinvested.
Schedule of Shareholder Expenses
Expense Analysis of a $1,000 Investment
(October 31, 2006)
| | | | | | | | | | | | | | |
| Global Utilities Fund | | | | | Beginning
Account Value,
5/1/06 | | Ending
Account Value,
10/31/06 | | Expenses Paid
During Period* | | Annualized
Expense Ratio* |
| Class A | | Actual | | | $ | 1,000.00 | | $ | 1,152.20 | | $ | 7.65 | | 1.41% |
| | | Hypothetical | 1 | | $ | 1,000.00 | | $ | 1,017.89 | | $ | 7.20 | | 1.41% |
| Class B | | Actual | | | $ | 1,000.00 | | $ | 1,147.80 | | $ | 11.59 | | 2.14% |
| | | Hypothetical | 1 | | $ | 1,000.00 | | $ | 1,014.21 | | $ | 10.92 | | 2.14% |
| Class C | | Actual | | | $ | 1,000.00 | | $ | 1,148.10 | | $ | 11.48 | | 2.12% |
| | | Hypothetical | 1 | | $ | 1,000.00 | | $ | 1,014.31 | | $ | 10.82 | | 2.12% |
| Class R | | Actual | | | $ | 1,000.00 | | $ | 1,150.00 | | $ | 9.54 | | 1.76% |
| | | Hypothetical | 1 | | $ | 1,000.00 | | $ | 1,016.13 | | $ | 8.98 | | 1.76% |
| Institutional Service Class | | Actual | | | $ | 1,000.00 | | $ | 1,153.80 | | $ | 6.24 | | 1.15% |
| | | Hypothetical | 1 | | $ | 1,000.00 | | $ | 1,019.20 | | $ | 5.87 | | 1.15% |
| Institutional Class | | Actual | | | $ | 1,000.00 | | $ | 1,153.80 | | $ | 6.19 | | 1.14% |
| | | Hypothetical | 1 | | $ | 1,000.00 | | $ | 1,019.25 | | $ | 5.82 | | 1.14% |
| * | Expenses are equal to the Fund’s annualized expense ratio multiplied by the average account value over the period multiplied by 184/365 (to reflect the one-half year period). The expense ratio presented represents a six-month, annualized ratio in accordance with SEC guidelines. |
| 1 | Represents the hypothetical 5% return before expenses. |
| | |
Portfolio Summary | | Gartmore Global Utilities Fund |
October 31, 2006
The SEC adopted a requirement that Funds present their portfolio holdings in a table, chart or graph format in their annual and semiannual reports to shareholders, whether or not a statement of investments is utilized. The following tables, which present portfolio holdings as a percentage of net assets, are provided in compliance with this requirement.
| | |
| Asset Allocation | | |
| Common Stocks | | 97.9% |
| Repurchase Agreements | | 1.4% |
| Other assets in excess of liabilities | | 0.7% |
| | |
| | 100.0% |
| | |
| Top Countries | | |
| United States | | 39.3% |
| United Kingdom | | 20.7% |
| Spain | | 9.8% |
| Japan | | 6.1% |
| France | | 5.9% |
| Germany | | 4.4% |
| Italy | | 4.0% |
| Norway | | 1.8% |
| Belgium | | 1.4% |
| Greece | | 1.4% |
| Other Assets | | 5.2% |
| | |
| | 100.0% |
| | |
| Top Industries | | |
| Telecommunications | | 55.5% |
| Gas & Electric Utility | | 17.3% |
| Electric Utility | | 16.9% |
| Water Utility | | 6.1% |
| Electric & Other Services | | 0.6% |
| Oil & Gas Utility | | 0.4% |
| Building & Construction | | 0.4% |
| Gas Utility | | 0.4% |
| Recycling | | 0.2% |
| Oil & Gas | | 0.1% |
| Other Assets | | 2.1% |
| | |
| | 100.0% |
| | |
| Top Holdings* | | |
| Vodafone Group PLC | | 9.1% |
| AT&T Inc. | | 7.3% |
| Verizon Communications, Inc. | | 6.4% |
| Telefonica SA | | 6.1% |
| BellSouth Corp. | | 5.3% |
| France Telecom SA | | 3.8% |
| Sprint Nextel Corp. | | 3.1% |
| E. ON AG | | 2.3% |
| National Grid PLC | | 2.1% |
| Centrica PLC | | 2.0% |
| Other Assets | | 52.5% |
| | |
| | 100.0% |
| * | For purpose of listing top holdings, repurchase agreements are considered cash equivalents and are included as part of Other Assets. |
Gartmore Global Utilities Fund
Common Stocks (97.9%)
Statement of Investments
October 31, 2006
| | | | | |
| | | Shares or
Principal Amount | | Value |
| | | | | |
AUSTRIA (0.6%) | | | | | |
Telecommunications (0.6%) | | | | | |
Telekom Austria AG (c) | | 4,480 | | $ | 111,699 |
| | | | | |
BELGIUM (1.4%) | | | | | |
Electric & Other Services (0.6%) | | | | | |
Xcel Energy, Inc. | | 5,800 | | | 128,006 |
| | | | | |
Electric Utility (0.1%) | | | | | |
Elia System Operator SA (c) | | 500 | | | 19,039 |
| | | | | |
Telecommunications (0.7%) | | | | | |
Mobistar SA (c) | | 1,820 | | | 150,723 |
| | | | | |
| | | | | 297,768 |
| | | | | |
FINLAND (0.4%) | | | | | |
Oil & Gas Utility (0.4%) | | | | | |
Fortum Oyj (c) | | 3,221 | | | 88,909 |
| | | | | |
FRANCE (5.9%) | | | | | |
Building & Construction (0.4%) | | | | | |
Bouygues SA (c) | | 1,520 | | | 88,596 |
| | | | | |
Telecommunications (3.8%) | | | | | |
France Telecom SA (c) | | 29,243 | | | 761,419 |
| | | | | |
Water Utility (1.7%) | | | | | |
Suez SA (c) | | 7,583 | | | 339,598 |
| | | | | |
| | | | | 1,189,613 |
| | | | | |
GERMANY (4.4%) | | | | | |
Gas & Electric Utility (3.7%) | | | | | |
E. ON AG (c) | | 3,923 | | | 470,643 |
RWE AG (c) | | 2,700 | | | 266,648 |
| | | | | |
| | | | | 737,291 |
| | | | | |
Telecommunications (0.7%) | | | | | |
Deutsche Telekom AG (c) | | 8,504 | | | 147,848 |
| | | | | |
| | | | | 885,139 |
| | | | | |
GREECE (1.4%) | | | | | |
Telecommunications (1.4%) | | | | | |
Cosmote Mobile Telecommunications SA (c) | | 8,050 | | | 198,384 |
Hellenic Telecommunications Organization SA (b) (c) | | 3,587 | | | 92,837 |
| | | | | |
| | | | | 291,221 |
| | | | | |
| | | | | |
| | | Shares or
Principal Amount | | Value |
| | | | | |
HONG KONG (0.1%) | | | | | |
Electric Utility (0.1%) | | | | | |
CLP Holdings Ltd. (c) | | 4,000 | | $ | 25,407 |
| | | | | |
ITALY (4.0%) | | | | | |
Electric Utility (1.4%) | | | | | |
Enel SPA (c) | | 28,992 | | | 277,621 |
| | | | | |
Oil & Gas (0.1%) | | | | | |
Snam Rete Gas SPA (c) | | 4,551 | | | 23,172 |
| | | | | |
Telecommunications (2.5%) | | | | | |
Telecom Italia SPA (c) | | 118,586 | | | 359,138 |
Telecom Italia SPA RNC (c) | | 54,600 | | | 137,893 |
| | | | | |
| | | | | 497,031 |
| | | | | |
| | | | | 797,824 |
| | | | | |
JAPAN (6.1%) | | | | | |
Electric Utility (1.8%) | | | | | |
Chubu Electric Power Co., Inc. (c) | | 3,000 | | | 83,088 |
Kansai Electric Power Co., Inc. (c) | | 2,300 | | | 54,272 |
Kyushu Electric Power Co., Inc. (c) | | 1,900 | | | 44,432 |
Tohoku Electric Power Co., Inc. (c) | | 1,700 | | | 37,661 |
Tokyo Electric Power Co., Inc. (c) | | 4,800 | | | 139,528 |
| | | | | |
| | | | | 358,981 |
| | | | | |
Gas Utility (0.4%) | | | | | |
Osaka Gas Co., Ltd. (c) | | 10,000 | | | 36,046 |
Tokyo Gas Co., Ltd. (c) | | 8,000 | | | 40,842 |
| | | | | |
| | | | | 76,888 |
| | | | | |
Telecommunications (3.9%) | | | | | |
KDDI Corp. (c) | | 32 | | | 199,419 |
Nippon Telegraph & Telephone Corp. (c) | | 55 | | | 276,323 |
NTT DoCoMo, Inc. (c) | | 207 | | | 315,709 |
| | | | | |
| | | | | 791,451 |
| | | | | |
| | | | | 1,227,320 |
| | | | | |
MEXICO (0.8%) | | | | | |
Telecommunications (0.8%) | | | | | |
America Movil SA de CV | | 3,930 | | | 168,479 |
| | | | | |
NETHERLANDS (0.8%) | | | | | |
Telecommunications (0.8%) | | | | | |
Koninklijke KPN NV (c) | | 12,050 | | | 161,078 |
| | | | | |
Statement of Investments (Continued)
October 31, 2006
Gartmore Global Utilities Fund (Continued)
Common Stocks (continued)
| | | | | |
| | | Shares or
Principal Amount | | Value |
| | | | | |
NORWAY (1.8%) | | | | | |
Telecommunications (1.8%) | | | | | |
Telenor ASA (c) | | 22,500 | | $ | 356,080 |
| | | | | |
PORTUGAL (0.4%) | | | | | |
Electric Utility (0.4%) | | | | | |
EDP — Energias de Portugal SA (c) | | 19,900 | | | 89,482 |
| | | | | |
SPAIN (9.8%) | | | | | |
Electric Utility (2.1%) | | | | | |
Iberdrola SA (c) | | 5,860 | | | 268,527 |
Red Electrica de Espana (c) | | 3,800 | | | 147,455 |
| | | | | |
| | | | | 415,982 |
| | | | | |
Gas & Electric Utility (1.6%) | | | | | |
Endesa SA (c) | | 6,170 | | | 270,656 |
Union Fenosa SA (c) | | 1,079 | | | 54,742 |
| | | | | |
| | | | | 325,398 |
| | | | | |
Telecommunications (6.1%) | | | | | |
Telefonica SA (c) | | 63,260 | | | 1,217,677 |
| | | | | |
| | | | | 1,959,057 |
| | | | | |
UNITED KINGDOM (20.7%) | | | | | |
Electric Utility (2.5%) | | | | | |
International Power PLC (c) | | 13,960 | | | 89,104 |
Scottish & Southern Energy PLC (c) | | 8,156 | | | 204,588 |
Scottish Power PLC (c) | | 16,642 | | | 207,402 |
| | | | | |
| | | | | 501,094 |
| | | | | |
Gas & Electric Utility (4.1%) | | | | | |
Centrica PLC (c) | | 62,160 | | | 392,998 |
National Grid PLC (c) | | 33,204 | | | 423,334 |
| | | | | |
| | | | | 816,332 |
| | | | | |
Recycling (0.2%) | | | | | |
Biffa PLC (b) | | 8,280 | | | 42,087 |
| | | | | |
Telecommunications (9.5%) | | | | | |
Cable & Wireless PLC (c) | | 34,000 | | | 95,035 |
Vodafone Group PLC (c) | | 707,051 | | | 1,821,654 |
| | | | | |
| | | | | 1,916,689 |
| | | | | |
| | | | | |
| | | Shares or
Principal Amount | | Value |
| | | | | |
UNITED KINGDOM (continued) | | | | | |
Water Utility (4.4%) | | | | | |
Kelda Group PLC (c) | | 7,600 | | $ | 125,486 |
Northumbrian Water Group PLC (c) | | 39,912 | | | 220,512 |
Pennon Group PLC (c) | | 21,319 | | | 210,031 |
Severn Trent Water PLC (c) | | 5,520 | | | 146,905 |
United Utilities PLC (c) | | 13,100 | | | 178,284 |
| | | | | |
| | | | | 881,218 |
| | | | | |
| | | | | 4,157,420 |
| | | | | |
UNITED STATES (39.3%) | | | | | |
Electric Utility (8.5%) | | | | | |
AES Corp. (b) | | 7,800 | | | 171,522 |
Dominion Resources, Inc. | | 2,040 | | | 165,220 |
DPL, Inc. | | 6,530 | | | 187,542 |
Duke Energy Corp. | | 11,400 | | | 360,696 |
Edison International | | 2,071 | | | 92,035 |
Entergy Corp. | | 2,700 | | | 231,741 |
FPL Group, Inc. | | 3,310 | | | 168,810 |
PPL Corp. | | 9,414 | | | 324,971 |
| | | | | |
| | | | | 1,702,537 |
| | | | | |
Gas & Electric Utility (7.9%) | | | | | |
Centerpoint Energy, Inc. | | 11,000 | | | 170,280 |
Exelon Corp. | | 5,550 | | | 343,989 |
FirstEnergy Corp. | | 4,100 | | | 241,285 |
Nstar | | 2,100 | | | 73,059 |
PG&E Corp. | | 2,990 | | | 128,989 |
Progress Energy, Inc. | | 2,700 | | | 124,200 |
Sempra Energy | | 2,400 | | | 127,296 |
TXU Corp. | | 2,796 | | | 176,511 |
Wisconsin Energy Corp. | | 4,400 | | | 202,136 |
| | | | | |
| | | | | 1,587,745 |
| | | | | |
Telecommunications (22.9%) | | | | | |
ALLTEL Corp. | | 2,950 | | | 157,265 |
AT&T Inc. | | 42,893 | | | 1,469,084 |
BellSouth Corp. | | 23,501 | | | 1,059,895 |
Sprint Nextel Corp. | | 32,795 | | | 612,939 |
Verizon Communications, Inc. | | 34,550 | | | 1,278,350 |
| | | | | |
| | | | | 4,577,533 |
| | | | | |
| | | | | 7,867,815 |
| | | | | |
| | |
Total Common Stocks | | | | | 19,674,311 |
| | | | | |
Repurchase Agreements (1.4%)
| | | | | | |
| | | Shares or
Principal Amount | | Value |
CS First Boston, 5.17%, dated 10/31/06, due 11/01/06, repurchase price $143,955, collateralized by U.S. Government Agency Mortgages with a market value of $146,812 | | $ | 143,934 | | $ | 143,934 |
Nomura Securities, 5.17%, dated 10/31/06, due 11/01/06, repurchase price $137,443, collateralized by U.S. Government Agency Mortgages with a market value of $140,172 | | | 137,423 | | | 137,423 |
| | | | | | |
| | |
Total Repurchase Agreements | | | | | | 281,357 |
| | | | | | |
| |
Total Investments
(Cost $17,476,546) (a) — 99.3% | | | 19,955,669 |
| |
Other assets in excess of
liabilities — 0.7% | | | 136,467 |
| | | | | | |
| |
NET ASSETS — 100.0% | | $ | 20,092,135 |
| | | | | | |
| | (a) | See notes to financial statements for tax unrealized appreciation (depreciation) of securities. |
| | (b) | Non-income producing securities. |
See notes to financial statements.
Statements of Assets and Liabilities
October 31, 2006
| | | | | | | | | | | | | | | | | | | |
| | | Gartmore Global
Financial Services
Fund | | Gartmore Global
Health Sciences
Fund | | | Gartmore Global
Natural
Resources Fund | | Gartmore Global
Technology and
Communications
Fund | | | Gartmore Global
Utilities Fund |
Assets: | | | | | | | | | | | | | | | | | | | |
Investments, at value (cost $46,066,476; $26,590,669; $43,383,962; $11,205,440; and $17,195,189; respectively) | | $ | 50,022,860 | | $ | 28,549,629 | | | $ | 45,033,211 | | $ | 12,152,690 | | | $ | 19,674,312 | | |
Repurchase agreements, at cost and value* | | | 1,089,432 | | | 4,869,741 | | | | 4,508,904 | | | 1,448,817 | | | | 281,357 | | |
| | | | | | | | | | | | | | | | | | | | |
Total Investments | | | 51,112,292 | | | 33,419,370 | | | | 49,542,115 | | | 13,601,507 | | | | 19,955,669 | | |
| | | | | | | | | | | | | | | | | | | | |
Cash | | | 29,602 | | | — | | | | — | | | — | | | | — | | |
Foreign currency, at value (cost $30,724; $0; $6,398; $136,369 and $14,738; respectively) | | | 29,603 | | | — | | | | 6,413 | | | 136,336 | | | | 12,248 | | |
Interest and dividends receivable | | | 27,444 | | | 5,057 | | | | 23,637 | | | 2,583 | | | | 49,541 | | |
Receivable for capital shares issued | | | 282,622 | | | 86,485 | | | | 40,465 | | | 29,025 | | | | 58,587 | | |
Receivable for investments sold | | | 1,874,450 | | | — | | | | 1,111,185 | | | 550,700 | | | | 28,949 | | |
Reclaims receivable | | | 14,337 | | | — | | | | — | | | — | | | | 5,151 | | |
Prepaid expenses | | | 471 | | | 1,879 | | | | 21,980 | | | 13,106 | | | | 55 | | |
| | | | | | | | | | | | | | | | | | | | |
Total Assets | | | 53,370,821 | | | 33,512,791 | | | | 50,745,795 | | | 14,333,257 | | | | 20,110,200 | | |
| | | | | | | | | | | | | | | | | | | | |
| | | | | | |
Liabilities: | | | | | | | | | | | | | | | | | | | |
Payable to custodian | | | — | | | — | | | | 6,260 | | | — | | | | — | | |
Payable for investments purchased | | | 1,707,942 | | | — | | | | 1,381,650 | | | 100,617 | | | | — | | |
Payable for capital shares redeemed | | | 3,700 | | | 3,700 | | | | 302,117 | | | 7 | | | | 976 | | |
Unrealized depreciation on spot foreign currency contracts | | | — | | | — | | | | — | | | — | | | | 103 | | |
Payable for return of collateral received for securities on loan | | | — | | | 3,982,981 | | | | — | | | 1,316,483 | | | | — | | |
Accrued expenses and other payables | | | | | | | | | | | | | | | | | | | |
Investment advisory fees | | | 40,202 | | | 28,746 | | | | 29,957 | | | 5,300 | | | | 2,938 | | |
Fund administration and transfer agent fees | | | 2,183 | | | 958 | | | | 1,392 | | | 1,351 | | | | 1,713 | | |
Distribution fees | | | 11,410 | | | 6,793 | | | | 14,234 | | | 1,858 | | | | 6,905 | | |
Administrative servicing fees | | | 1,865 | | | 2,168 | | | | 2,624 | | | 614 | | | | 348 | | |
Trustee fees | | | 5 | | | 4 | | | | 7 | | | 1 | | | | 2 | | |
Compliance program fees (Note 3) | | | 314 | | | 200 | | | | 474 | | | 25 | | | | 77 | | |
Other | | | 3,193 | | | 6,521 | | | | 1,998 | | | 9,591 | | | | 5,003 | | |
| | | | | | | | | | | | | | | | | | | | |
Total Liabilities | | | 1,770,814 | | | 4,032,071 | | | | 1,740,713 | | | 1,435,847 | | | | 18,065 | | |
| | | | | | | | | | | | | | | | | | | | |
Net Assets | | $ | 51,600,007 | | $ | 29,480,720 | | | $ | 49,005,082 | | $ | 12,897,410 | | | $ | 20,092,135 | | |
| | | | | | | | | | | | | | | | | | | | |
| | | | | | |
Represented by: | | | | | | | | | | | | | | | | | | | |
Capital | | $ | 45,534,784 | | $ | 27,920,514 | | | $ | 41,102,457 | | $ | 14,738,545 | | | $ | 16,781,063 | | |
Accumulated net investment income (loss) | | | 95,265 | | | — | | | | — | | | — | | | | 55,982 | | |
Accumulated net realized gains (losses) from investment and foreign currency transactions | | | 2,013,919 | | | (398,754 | ) | | | 6,253,361 | | | (2,788,352 | ) | | | 778,433 | | |
Net unrealized appreciation (depreciation) on investments and translation of assets and liabilities denominated in foreign currencies | | | 3,956,039 | | | 1,958,960 | | | | 1,649,264 | | | 947,217 | | | | 2,476,657 | | |
| | | | | | | | | | | | | | | | | | | | |
Net Assets | | $ | 51,600,007 | | $ | 29,480,720 | | | $ | 49,005,082 | | $ | 12,897,410 | | | $ | 20,092,135 | | |
| | | | | | | | | | | | | | | | | | | | |
| | | | | | | | | | | | | | | | | | | | |
| * | Includes securities held as collateral for securities on loan of $0; $3,982,981; $0; $1,316,483; and $0; respectively. |
See notes to financial statements.
Statements of Assets and Liabilities (Continued)
October 31, 2006
| | | | | | | | | | | | | | | | | | | | | | |
| | | Gartmore Global
Financial Services
Fund | | | Gartmore Global
Health Sciences
Fund | | | Gartmore Global
Natural
Resources Fund | | | Gartmore Global
Technology and
Communications
Fund | | | Gartmore Global
Utilities Fund |
Net Assets: | | | | | | | | | | | | | | | | | | | | | | |
Class A Shares | | $ | 21,751,217 | | | $ | 10,635,520 | | | $ | 20,323,539 | | | $ | 3,796,669 | | | $ | 5,185,232 | | | |
Class B Shares | | | 2,992,486 | | | | 1,457,924 | | | | 1,861,983 | | | | 1,311,677 | | | | 1,875,483 | | | |
Class C Shares | | | 5,514,278 | | | | 3,787,751 | | | | 10,302,492 | | | | 78,530 | | | | 5,512,189 | | | |
Class R Shares | | | 78,669 | | | | 1,201 | | | | 249,443 | | | | 1,101 | | | | 1,768 | | | |
Institutional Service Class Shares | | | 1,496,218 | | | | 1,130,339 | | | | 536,828 | | | | 1,072 | | | | 1,263,837 | | | |
Institutional Class Shares | | | 19,767,139 | | | | 12,467,985 | | | | 15,730,797 | | | | 7,708,361 | | | | 6,253,626 | | | |
| | | | | | | | | | | | | | | | | | | | | | | |
Total | | $ | 51,600,007 | | | $ | 29,480,720 | | | $ | 49,005,082 | | | $ | 12,897,410 | | | $ | 20,092,135 | | | |
| | | | | | | | | | | | | | | | | | | | | | | |
| | | | | | |
Shares outstanding (unlimited number of shares authorized): | | | | | | | | | | | | | | | | | | | | | | |
Class A Shares | | | 1,387,294 | | | | 954,177 | | | | 1,000,774 | | | | 901,911 | | | | 399,301 | | | |
Class B Shares | | | 194,758 | | | | 136,468 | | | | 93,245 | | | | 326,182 | | | | 146,662 | | | |
Class C Shares | | | 359,013 | | | | 354,355 | | | | 515,597 | | | | 19,384 | | | | 431,104 | | | |
Class R Shares | | | 5,107 | | | | 110 | | | | 12,357 | | | | 270 | | | | 138 | | | |
Institutional Service Class Shares | | | 94,858 | | | | 99,917 | | | | 26,333 | | | | 247 | | | | 96,882 | | | |
Institutional Class Shares | | | 1,253,415 | | | | 1,097,711 | | | | 770,630 | | | | 1,788,333 | | | | 479,353 | | | |
| | | | | | | | | | | | | | | | | | | | | | | |
Total | | | 3,294,445 | | | | 2,642,738 | | | | 2,418,936 | | | | 3,036,327 | | | | 1,553,440 | | | |
| | | | | | | | | | | | | | | | | | | | | | | |
| | | | | | |
Net asset value and redemption price per share (net assets by class divided by shares outstanding by class, respectively): | | | | | | | | | | | | | | | | | | | | | | |
Class A Shares | | $ | 15.68 | | | $ | 11.15 | | | $ | 20.31 | | | $ | 4.21 | | | $ | 12.99 | | | |
Class B Shares (a) | | $ | 15.37 | | | $ | 10.68 | | | $ | 19.97 | | | $ | 4.02 | | | $ | 12.79 | | | |
Class C Shares (b) | | $ | 15.36 | | | $ | 10.69 | | | $ | 19.98 | | | $ | 4.05 | | | $ | 12.79 | | | |
Class R Shares | | $ | 15.40 | | | $ | 10.87 | (c) | | $ | 20.19 | | | $ | 4.07 | (c) | | $ | 12.83 | (c) | | |
Institutional Service Class Shares | | $ | 15.77 | | | $ | 11.31 | | | $ | 20.39 | | | $ | 4.34 | | | $ | 13.05 | | | |
Institutional Class Shares | | $ | 15.77 | | | $ | 11.36 | | | $ | 20.41 | | | $ | 4.31 | | | $ | 13.05 | | | |
| | | | | | |
Maximum offering price per share (100%/(100%-maximum sales charge) of net asset value adjusted to the nearest cent): | | | | | | | | | | | | | | | | | | | | | | |
Class A Shares | | $ | 16.64 | | | $ | 11.83 | | | $ | 21.55 | | | $ | 4.47 | | | $ | 13.78 | | | |
| | | | | | | | | | | | | | | | | | | | | | | |
Maximum Sales Charge — Class A Shares | | | 5.75 | % | | | 5.75 | % | | | 5.75 | % | | | 5.75 | % | | | 5.75 | % | | |
| | | | | | | | | | | | | | | | | | | | | | | |
| | | | | | | | | | | | | | | | | | | | | | | |
| (a) | For Class B Shares, the redemption price per share varies by length of time shares are held. |
| (b) | For Class C Shares, the redemption price per share is reduced by 1.00% for shares held less than one year. |
| (c) | The NAV reported above represents the traded NAV at October 31, 2006. Due to the financial statement rounding of class assets and class shares above, the NAV results in a different NAV than the traded NAV. |
See notes to financial statements.
Statements of Operations
October 31, 2006
| | | | | | | | | | | | | | | | | | | | | | |
| | | Gartmore Global
Financial Services
Fund | | | Gartmore Global
Health Sciences
Fund | | | Gartmore Global
Natural
Resources Fund | | | Gartmore Global
Technology and
Communications
Fund | | | Gartmore Global
Utilities Fund |
INVESTMENT INCOME: | | | | | | | | | | | | | | | | | | | | | | |
Interest income | | $ | 59,755 | | | $ | 63,168 | | | $ | 135,861 | | | $ | 24,447 | | | $ | 10,774 | | | |
Dividend income (net of foreign withholding tax of $42,051; $0; $3,387 $0 and $37,021; respectively) | | | 736,479 | | | | 281,483 | | | | 452,765 | | | | 39,524 | | | | 448,155 | | | |
Income from securities lending | | | — | | | | 14,861 | | | | — | | | | 5,750 | | | | — | | | |
| | | | | | | | | | | | | | | | | | | | | | | |
Total Income | | | 796,234 | | | | 359,512 | | | | 588,626 | | | | 69,721 | | | | 458,929 | | | |
| | | | | | | | | | | | | | | | | | | | | | | |
| | | | | | |
Expenses: | | | | | | | | | | | | | | | | | | | | | | |
Investment advisory fees | | | 272,215 | | | | 231,451 | | | | 348,236 | | | | 97,991 | | | | 90,092 | | | |
Fund administration and transfer agent fees | | | 47,710 | | | | 38,172 | | | | 71,122 | | | | 13,761 | | | | 27,337 | | | |
Distribution fees Class A | | | 28,946 | | | | 28,355 | | | | 52,805 | | | | 7,755 | | | | 6,955 | | | |
Distribution fees Class B | | | 22,250 | | | | 13,820 | | | | 15,418 | | | | 11,982 | | | | 13,391 | | | |
Distribution fees Class C | | | 36,666 | | | | 39,519 | | | | 98,688 | | | | 489 | | | | 29,594 | | | |
Distribution fees Class R | | | 249 | | | | 5 | | | | 443 | | | | 4 | | | | 7 | | | |
Administrative servicing fees Class A | | | 4,074 | | | | 10,484 | | | | 2,112 | | | | 1,842 | | | | 840 | | | |
Administrative servicing fees Class R | | | 93 | | | | — | | | | 220 | | | | 2 | | | | 1 | | | |
Administrative servicing fees Institutional Service Class | | | — | | | | 5,310 | | | | 65 | | | | 3,483 | | | | — | | | |
Registration and filing fees | | | 53,254 | | | | 49,718 | | | | 47,929 | | | | 52,577 | | | | 52,258 | | | |
Printing fees | | | 8,372 | | | | 10,028 | | | | 29,008 | | | | 14,061 | | | | 4,140 | | | |
Trustee fee | | | 969 | | | | 937 | | | | 1,559 | | | | 375 | | | | 381 | | | |
Compliance program fees (Note 3) | | | 652 | | | | 435 | | | | 926 | | | | 115 | | | | 194 | | | |
Other | | | 5,542 | | | | 6,792 | | | | 11,155 | | | | 7,155 | | | | 7,656 | | | |
| | | | | | | | | | | | | | | | | | | | | | | |
Total expenses before reimbursed expenses | | | 480,992 | | | | 435,026 | | | | 679,686 | | | | 211,592 | | | | 232,846 | | | |
Earnings credit (Note 5) | | | (294 | ) | | | (479 | ) | | | (1,078 | ) | | | (220 | ) | | | (215 | ) | | |
Expenses reimbursed | | | — | | | | — | | | | — | | | | (39,246 | ) | | | (38,548 | ) | | |
Expenses voluntarily waived by administrator | | | (800 | ) | | | (2,533 | ) | | | (1,347 | ) | | | (97 | ) | | | (1,547 | ) | | |
| | | | | | | | | | | | | | | | | | | | | | | |
Net Expenses | | | 479,898 | | | | 432,014 | | | | 677,261 | | | | 172,029 | | | | 192,536 | | | |
| | | | | | | | | | | | | | | | | | | | | | | |
Net Investment Income (Loss) | | | 316,336 | | | | (72,502 | ) | | | (88,635 | ) | | | (102,308 | ) | | | 266,393 | | | |
| | | | | | | | | | | | | | | | | | | | | | | |
| | | | | | |
REALIZED/UNREALIZED GAINS (LOSSES) FROM INVESTMENTS: | | | | | | | | | | | | | | | | | | | | | | |
Net realized gains (losses) on investment transactions | | | 2,296,437 | | | | 182,133 | * | | | 6,375,214 | | | | 928,804 | * | | | 847,406 | | | |
Net realized gains (losses) on foreign currency transactions | | | (40,356 | ) | | | (60,558 | ) | | | 4,234 | | | | (2,274 | ) | | | 3,937 | | | |
| | | | | | | | | | | | | | | | | | | | | | | |
Net realized gains (losses) on investment and foreign currency transactions | | | 2,256,081 | | | | 121,575 | | | | 6,379,448 | | | | 926,530 | | | | 851,343 | | | |
Net change in unrealized appreciation/depreciation on investments and translation of assets and liabilities denominated in foreign currencies | | | 3,133,275 | | | | 1,643,867 | | | | 418,435 | | | | 710,356 | | | | 2,210,358 | | | |
| | | | | | | | | | | | | | | | | | | | | | | |
Net realized/unrealized gains (losses) on investments and foreign currencies | | | 5,389,356 | | | | 1,765,442 | | | | 6,797,883 | | | | 1,636,886 | | | | 3,061,701 | | | |
| | | | | | | | | | | | | | | | | | | | | | | |
CHANGE IN NET ASSETS RESULTING FROM OPERATIONS | | $ | 5,705,692 | | | $ | 1,692,940 | | | $ | 6,709,248 | | | $ | 1,534,578 | | | $ | 3,328,094 | | | |
| | | | | | | | | | | | | | | | | | | | | | | |
| * | Includes realized gain as a result of a redemption in kind (Note 9). |
See notes to financial statements.
Statements of Changes in Net Assets
| | | | | | | | | | | | | | | | | | |
| | | Gartmore Global Financial Services Fund | | | Gartmore Global Health Sciences Fund |
| | | Year Ended
October 31, 2006 | | | Year Ended
October 31, 2005 | | | Year Ended
October 31, 2006 | | | Year Ended
October 31, 2005 |
FROM INVESTMENT ACTIVITIES: | | | | | | | | | | | | | | | | | | |
Operations: | | | | | | | | | | | | | | | | | | |
Net investment income (loss) | | $ | 316,336 | | | $ | 100,280 | | | $ | (72,502 | ) | | $ | (148,215 | ) | | |
Net realized gains (losses) on investment and foreign currency transactions | | | 2,256,081 | | | | 790,664 | | | | 121,575 | * | | | 2,698,697 | | | |
Net change in unrealized appreciation/depreciation on investments and translation of assets and liabilities denominated in foreign currencies | | | 3,133,275 | | | | 433,095 | | | | 1,643,867 | | | | 206,446 | | | |
| | | | | | | | | | | | | | | | | | |
Change in net assets resulting from operations | | | 5,705,692 | | | | 1,324,039 | | | | 1,692,940 | | | | 2,756,928 | | | |
| | | | | | | | | | | | | | | | | | |
| | | | | |
Distributions to Class A Shareholders from: | | | | | | | | | | | | | | | | | | |
Net investment income | | | (144,399 | ) | | | (30,875 | ) | | | — | | | | — | | | |
Net realized gains on investments | | | (265,328 | ) | | | (164,040 | ) | | | (1,072,942 | ) | | | (38,890 | ) | | |
| | | | | |
Distributions to Class B Shareholders from: | | | | | | | | | | | | | | | | | | |
Net investment income | | | (15,275 | ) | | | (4,210 | ) | | | — | | | | — | | | |
Net realized gains on investments | | | (70,727 | ) | | | (69,765 | ) | | | (128,492 | ) | | | (6,466 | ) | | |
| | | | | |
Distributions to Class C Shareholders from: | | | | | | | | | | | | | | | | | | |
Net investment income | | | (24,579 | ) | | | (5,299 | ) | | | — | | | | — | | | |
Net realized gains on investments | | | (88,208 | ) | | | (72,404 | ) | | | (395,927 | ) | | | (13,651 | ) | | |
| | | | | |
Distributions to Class R Shareholders from: | | | | | | | | | | | | | | | | | | |
Net investment income | | | (691 | ) | | | (10 | ) | | | — | | | | — | | | |
Net realized gains on investments | | | (58 | ) | | | (70 | ) | | | (110 | ) | | | (6 | ) | | |
| | | | | |
Distributions to Institutional Service Class Shareholders from: | | | | | | | | | | | | | | | | | | |
Net investment income | | | (21,427 | ) | | | (12,933 | ) | | | — | | | | — | | | |
Net realized gains on investments | | | (55,694 | ) | | | (66,565 | ) | | | (543,411 | ) | | | (28,114 | ) | | |
| | | | | |
Distributions to Institutional Class Shareholders from: | | | | | | | | | | | | | | | | | | |
Net investment income | | | (188,089 | ) | | | (53,869 | ) | | | — | | | | — | | | |
Net realized gains on investments | | | (338,332 | ) | | | (101,460 | ) | | | (419,905 | ) | | | (6,183 | ) | | |
| | | | | | | | | | | | | | | | | | |
Change in net assets from shareholder distributions | | | (1,212,807 | ) | | | (581,500 | ) | | | (2,560,787 | ) | | | (93,310 | ) | | |
| | | | | | | | | | | | | | | | | | |
Change in net assets from capital transactions | | | 32,304,010 | | | | 7,722,798 | | | | 4,410,596 | | | | 8,578,575 | | | |
| | | | | | | | | | | | | | | | | | |
Change in net assets | | | 36,796,895 | | | | 8,465,337 | | | | 3,542,749 | | | | 11,242,193 | | | |
| | | | | |
Net Assets: | | | | | | | | | | | | | | | | | | |
Beginning of period | | | 14,803,112 | | | | 6,337,775 | | | | 25,937,971 | | | | 14,695,778 | | | |
| | | | | | | | | | | | | | | | | | |
End of period | | $ | 51,600,007 | | | $ | 14,803,112 | | | $ | 29,480,720 | | | $ | 25,937,971 | | | |
| | | | | | | | | | | | | | | | | | |
Accumulated net investment income (loss) at end of period | | $ | 95,265 | | | $ | 34,572 | | | $ | — | | | $ | — | | | |
| | | | | | | | | | | | | | | | | | |
| | | | | | | | | | | | | | | | | | | |
| * | Includes realized gain as a result of a redemption in kind (Note 9). |
See notes to financial statements.
Statements of Changes in Net Assets (Continued)
| | | | | | | | | | | | | | | | | | |
| | | Gartmore Global Natural
Resources Fund | | | Gartmore Global Technology and
Communications Fund |
| | | Year Ended
October 31, 2006 | | | Year Ended
October 31, 2005 | | | Year Ended
October 31, 2006 | | | Year Ended
October 31, 2005 |
FROM INVESTMENT ACTIVITIES: | | | | | | | | | | | | | | | | | | |
Operations: | | | | | | | | | | | | | | | | | | |
Net investment income (loss) | | $ | (88,635 | ) | | $ | (4,399 | ) | | $ | (102,308 | ) | | $ | (80,018 | ) | | |
Net realized gains (losses) on investment and foreign currency transactions | | | 6,379,448 | | | | 2,684,232 | | | | 926,530 | * | | | 942,238 | | | |
Net change in unrealized appreciation/depreciation on investments and translation of assets and liabilities denominated in foreign currencies | | | 418,435 | | | | 982,481 | | | | 710,356 | | | | (331,575 | ) | | |
| | | | | | | | | | | | | | | | | | |
Change in net assets resulting from operations | | | 6,709,248 | | | | 3,662,314 | | | | 1,534,578 | | | | 530,645 | | | |
| | | | | | | | | | | | | | | | | | |
| | | | | |
Distributions to Class A Shareholders from: | | | | | | | | | | | | | | | | | | |
Net investment income | | | — | | | | (326 | ) | | | — | | | | — | | | |
Net realized gains on investments | | | (1,291,050 | ) | | | (9,325 | ) | | | — | | | | — | | | |
| | | | | |
Distributions to Class B Shareholders from: | | | | | | | | | | | | | | | | | | |
Net investment income | | | — | | | | (11 | ) | | | — | | | | — | | | |
Net realized gains on investments | | | (72,459 | ) | | | (116 | ) | | | — | | | | — | | | |
| | | | | |
Distributions to Class C Shareholders from: | | | | | | | | | | | | | | | | | | |
Net investment income | | | — | | | | — | | | | — | | | | — | | | |
Net realized gains on investments | | | (565,748 | ) | | | (221 | ) | | | — | | | | — | | | |
| | | | | |
Distributions to Class R Shareholders from: | | | | | | | | | | | | | | | | | | |
Net investment income | | | — | | | | — | | | | — | | | | — | | | |
Net realized gains on investments | | | (3,863 | ) | | | (43 | ) | | | — | | | | — | | | |
| | | | | |
Distributions to Institutional Service Class Shareholders from: | | | | | | | | | | | | | | | | | | |
Net investment income | | | — | | | | (1 | ) | | | — | | | | — | | | |
Net realized gains on investments | | | (37,045 | ) | | | (41 | ) | | | — | | | | — | | | |
| | | | | |
Distributions to Institutional Class Shareholders from: | | | | | | | | | | | | | | | | | | |
Net investment income | | | — | | | | (5,702 | ) | | | — | | | | — | | | |
Net realized gains on investments | | | (740,565 | ) | | | (121,521 | ) | | | — | | | | — | | | |
| | | | | | | | | | | | | | | | | | |
Change in net assets from shareholder distributions | | | (2,710,730 | ) | | | (137,307 | ) | | | — | | | | — | | | |
| | | | | | | | | | | | | | | | | | |
Change in net assets from capital transactions | | | 20,234,067 | | | | 17,753,698 | | | | 1,363,166 | | | | 745,111 | | | |
| | | | | | | | | | | | | | | | | | |
Change in net assets | | | 24,232,585 | | | | 21,278,705 | | | | 2,897,744 | | | | 1,275,756 | | | |
| | | | | |
Net Assets: | | | | | | | | | | | | | | | | | | |
Beginning of period | | | 24,772,497 | | | | 3,493,792 | | | | 9,999,666 | | | | 8,723,910 | | | |
| | | | | | | | | | | | | | | | | | |
End of period | | $ | 49,005,082 | | | $ | 24,772,497 | | | $ | 12,897,410 | | | $ | 9,999,666 | | | |
| | | | | | | | | | | | | | | | | | |
Accumulated net investment income (loss) at end of period | | $ | — | | | $ | — | | | $ | — | | | $ | 715 | | | |
| | | | | | | | | | | | | | | | | | |
| | | | | | | | | | | | | | | | | | | |
| * | Includes realized gain as a result of a redemption in kind (Note 9). |
See notes to financial statements.
Statements of Changes in Net Assets
| | | | | | | | | | |
| | | Gartmore Global Utilities Fund |
| | | Year Ended
October 31, 2006 | | | Year Ended
October 31, 2005 |
FROM INVESTMENT ACTIVITIES: | | | | | | | | | | |
Operations: | | | | | | | | | | |
Net investment income (loss) | | $ | 266,393 | | | $ | 128,395 | | | |
Net realized gains (losses) on investment and foreign currency transactions | | | 851,343 | | | | 1,417,891 | | | |
Net change in unrealized appreciation/depreciation on investments and translation of assets and liabilities denominated in foreign currencies | | | 2,210,358 | | | | (276,266 | ) | | |
| | | | | | | | | | |
Change in net assets resulting from operations | | | 3,328,094 | | | | 1,270,020 | | | |
| | | | | | | | | | |
| | | |
Distributions to Class A Shareholders from: | | | | | | | | | | |
Net investment income | | | (50,061 | ) | | | (37,306 | ) | | |
Net realized gains on investments | | | (372,015 | ) | | | (35,442 | ) | | |
| | | |
Distributions to Class B Shareholders from: | | | | | | | | | | |
Net investment income | | | (14,980 | ) | | | (13,834 | ) | | |
Net realized gains on investments | | | (192,407 | ) | | | (21,341 | ) | | |
| | | |
Distributions to Class C Shareholders from: | | | | | | | | | | |
Net investment income | | | (38,896 | ) | | | (30,306 | ) | | |
Net realized gains on investments | | | (379,746 | ) | | | (70,568 | ) | | |
| | | |
Distributions to Class R Shareholders from: | | | | | | | | | | |
Net investment income | | | (24 | ) | | | (23 | ) | | |
Net realized gains on investments | | | (222 | ) | | | (27 | ) | | |
| | | |
Distributions to Institutional Service Class Shareholders from: | | | | | | | | | | |
Net investment income | | | (21,794 | ) | | | (19,292 | ) | | |
Net realized gains on investments | | | (155,313 | ) | | | (19,154 | ) | | |
| | | |
Distributions to Institutional Class Shareholders from: | | | | | | | | | | |
Net investment income | | | (86,744 | ) | | | (37,552 | ) | | |
Net realized gains on investments | | | (348,917 | ) | | | (13,216 | ) | | |
| | | | | | | | | | |
Change in net assets from shareholder distributions | | | (1,661,119 | ) | | | (298,061 | ) | | |
| | | | | | | | | | |
Change in net assets from capital transactions | | | 9,526,855 | | | | 1,207,083 | | | |
| | | | | | | | | | |
Change in net assets | | | 11,193,830 | | | | 2,179,042 | | | |
| | | |
Net Assets: | | | | | | | | | | |
Beginning of period | | | 8,898,305 | | | | 6,719,263 | | | |
| | | | | | | | | | |
End of period | | $ | 20,092,135 | | | $ | 8,898,305 | | | |
| | | | | | | | | | |
Accumulated net investment income (loss) at end of period | | $ | 55,982 | | | $ | (1,849 | ) | | |
| | | | | | | | | | |
| | | | | | | | | | | |
See notes to financial statements.
Statements of Changes in Net Assets (Continued)
| | | | | | | | | | | | | | | | | | |
| | | Gartmore Global Financial Services Fund | | | Gartmore Global Health Sciences Fund |
| | | Year Ended
October 31, 2006 | | | Year Ended
October 31, 2005 | | | Year Ended
October 31, 2006 | | | Year Ended
October 31, 2005 |
CAPITAL TRANSACTIONS: | | | | | | | | | | | | | | | | | | |
Class A Shares | | | | | | | | | | | | | | | | | | |
Proceeds from shares issued | | $ | 19,353,566 | | | $ | 2,116,941 | | | $ | 5,045,255 | | | $ | 6,872,505 | | | |
Dividends reinvested | | | 274,027 | | | | 136,625 | | | | 927,566 | | | | 34,040 | | | |
Cost of shares redeemed (a) | | | (4,063,913 | ) | | | (400,441 | ) | | | (6,010,896 | ) | | | (3,025,980 | ) | | |
| | | | | | | | | | | | | | | | | | |
| | | 15,563,680 | | | | 1,853,125 | | | | (38,075 | ) | | | 3,880,565 | | | |
| | | | | | | | | | | | | | | | | | |
| | | | | |
Class B Shares | | | | | | | | | | | | | | | | | | |
Proceeds from shares issued | | | 1,561,919 | | | | 48,565 | | | | 203,629 | | | | 129,644 | | | |
Dividends reinvested | | | 72,910 | | | | 73,769 | | | | 114,523 | | | | 6,107 | | | |
Cost of shares redeemed (a) | | | (188,462 | ) | | | (27,739 | ) | | | (96,733 | ) | | | (71,992 | ) | | |
| | | | | | | | | | | | | | | | | | |
| | | 1,446,367 | | | | 94,595 | | | | 221,419 | | | | 63,759 | | | |
| | | | | | | | | | | | | | | | | | |
| | | | | |
Class C Shares | | | | | | | | | | | | | | | | | | |
Proceeds from shares issued | | | 3,840,833 | | | | 407,937 | | | | 1,167,861 | | | | 2,336,230 | | | |
Dividends reinvested | | | 97,986 | | | | 74,188 | | | | 27,152 | | | | 1,371 | | | |
Cost of shares redeemed (a) | | | (529,264 | ) | | | (67,277 | ) | | | (1,091,844 | ) | | | (927,955 | ) | | |
| | | | | | | | | | | | | | | | | | |
| | | 3,409,555 | | | | 414,848 | | | | 103,169 | | | | 1,409,646 | | | |
| | | | | | | | | | | | | | | | | | |
| | | | | |
Class R Shares | | | | | | | | | | | | | | | | | | |
Proceeds from shares issued | | | 103,947 | | | | — | | | | 200 | | | | — | | | |
Dividends reinvested | | | 76 | | | | 80 | | | | 110 | | | | 6 | | | |
Cost of shares redeemed (a) | | | (34,405 | ) | | | — | | | | (203 | ) | | | — | | | |
| | | | | | | | | | | | | | | | | | |
| | | 69,618 | | | | 80 | | | | 107 | | | | 6 | | | |
| | | | | | | | | | | | | | | | | | |
| | | | | |
Institutional Service Class Shares | | | | | | | | | | | | | | | | | | |
Proceeds from shares issued | | | 985 | | | | 144 | | | | 669,318 | | | | 2,627,578 | | | |
Dividends reinvested | | | 77,121 | | | | 79,497 | | | | 543,285 | | | | 28,114 | | | |
Cost of shares redeemed (a) | | | (62 | ) | | | 98 | | | | (5,734,101 | )* | | | (2,574,711 | ) | | |
| | | | | | | | | | | | | | | | | | |
| | | 78,044 | | | | 79,739 | | | | (4,521,498 | ) | | | 80,981 | | | |
| | | | | | | | | | | | | | | | | | |
| | | | | |
Institutional Class Shares | | | | | | | | | | | | | | | | | | |
Proceeds from shares issued | | | 13,852,448 | | | | 6,507,099 | | | | 9,525,219 | | | | 3,979,739 | | | |
Dividends reinvested | | | 526,420 | | | | 155,329 | | | | 419,905 | | | | 6,183 | | | |
Cost of shares redeemed (a) | | | (2,642,122 | ) | | | (1,382,017 | ) | | | (1,299,650 | ) | | | (842,304 | ) | | |
| | | | | | | | | | | | | | | | | | |
| | | 11,736,746 | | | | 5,280,411 | | | | 8,645,474 | | | | 3,143,618 | | | |
| | | | | | | | | | | | | | | | | | |
Change in net assets from capital transactions | | $ | 32,304,010 | | | $ | 7,722,798 | | | $ | 4,410,596 | | | $ | 8,578,575 | | | |
| | | | | | | | | | | | | | | | | | | |
| * | Includes redemption as a result of a redemption in kind (Note 9). |
| (a) | Amount includes redemption fees, if any. |
See notes to financial statements.
Statements of Changes in Net Assets
| | | | | | | | | | | | | | |
| | | Gartmore Global Financial Services Fund | | | Gartmore Global Health Sciences Fund |
| | | Year Ended
October 31, 2006 | | | Year Ended
October 31, 2005 | | | Year Ended
October 31, 2006 | | | Year Ended
October 31, 2005 |
SHARE TRANSACTIONS: | | | | | | | | | | | | | | |
Class A Shares | | | | | | | | | | | | | | |
Issued | | 1,302,537 | | | 162,896 | | | 457,413 | | | 611,372 | | | |
Reinvested | | 19,549 | | | 10,433 | | | 85,019 | | | 3,067 | | | |
Redeemed | | (273,791 | ) | | (30,974 | ) | | (545,423 | ) | | (269,467 | ) | | |
| | | | | | | | | | | | | | |
| | 1,048,295 | | | 142,355 | | | (2,991 | ) | | 344,972 | | | |
| | | | | | | | | | | | | | |
| | | | | |
Class B Shares | | | | | | | | | | | | | | |
Issued | | 107,940 | | | 3,785 | | | 19,193 | | | 11,814 | | | |
Reinvested | | 5,357 | | | 5,721 | | | 10,897 | | | 566 | | | |
Redeemed | | (12,926 | ) | | (2,236 | ) | | (9,298 | ) | | (6,741 | ) | | |
| | | | | | | | | | | | | | |
| | 100,371 | | | 7,270 | | | 20,792 | | | 5,639 | | | |
| | | | | | | | | | | | | | |
| | | | | |
Class C Shares | | | | | | | | | | | | | | |
Issued | | 267,615 | | | 31,898 | | | 108,220 | | | 213,246 | | | |
Reinvested | | 7,186 | | | 5,754 | | | 2,581 | | | 127 | | | |
Redeemed | | (36,551 | ) | | (5,314 | ) | | (102,688 | ) | | (80,969 | ) | | |
| | | | | | | | | | | | | | |
| | 238,250 | | | 32,338 | | | 8,113 | | | 132,404 | | | |
| | | | | | | | | | | | | | |
| | | | | |
Class R Shares | | | | | | | | | | | | | | |
Issued | | 7,425 | | | — | | | 19 | | | — | | | |
Reinvested | | 6 | | | 6 | | | 10 | | | — | | | |
Redeemed | | (2,418 | ) | | — | | | (19 | ) | | — | | | |
| | | | | | | | | | | | | | |
| | 5,013 | | | 6 | | | 10 | | | — | | | |
| | | | | | | | | | | | | | |
| | | | | |
Institutional Service Class Shares | | | | | | | �� | | | | | | | |
Issued | | — | | | — | (b) | | 57,910 | | | 230,623 | | | |
Reinvested | | 5,502 | | | 6,044 | | | 49,211 | | | 2,508 | | | |
Redeemed | | — | | | — | (b) | | (502,807 | )* | | (228,849 | ) | | |
| | | | | | | | | | | | | | |
| | 5,502 | | | 6,044 | | | (395,686 | ) | | 4,282 | | | |
| | | | | | | | | | | | | | |
| | | | | |
Institutional Class Shares | | | | | | | | | | | | | | |
Issued | | 939,360 | | | 500,181 | | | 857,608 | | | 350,724 | | | |
Reinvested | | 37,385 | | | 11,847 | | | 37,898 | | | 551 | | | |
Redeemed | | (184,723 | ) | | (104,374 | ) | | (117,989 | ) | | (70,946 | ) | | |
| | | | | | | | | | | | | | |
| | 792,022 | | | 407,654 | | | 777,517 | | | 280,329 | | | |
| | | | | | | | | | | | | | |
Total change in shares | | 2,189,453 | | | 595,667 | | | 407,755 | | | 767,626 | | | |
| | | | | | | | | | | | | | | |
| * | Includes redemption as a result of a redemption in kind (Note 9). |
See notes to financial statements.
Statements of Changes in Net Assets (Continued)
| | | | | | | | | | | | | | | | | | |
| | | Gartmore Global Natural
Resources Fund | | | Gartmore Global Technology and
Communications Fund |
| | | Year Ended
October 31, 2006 | | | Year Ended
October 31, 2005 | | | Year Ended
October 31, 2006 | | | Year Ended
October 31, 2005 |
CAPITAL TRANSACTIONS: | | | | | | | | | | | | | | | | | | |
Class A Shares | | | | | | | | | | | | | | | | | | |
Proceeds from shares issued | | $ | 21,061,198 | | | $ | 10,680,867 | | | $ | 1,812,676 | | | $ | 960,162 | | | |
Dividends reinvested | | | 1,066,581 | | | | 9,625 | | | | — | | | | — | | | |
Cost of shares redeemed (a) | | | (14,468,286 | ) | | | (805,016 | ) | | | (1,470,394 | ) | | | (1,047,328 | ) | | |
| | | | | | | | | | | | | | | | | | |
| | | 7,659,493 | | | | 9,885,476 | | | | 342,282 | | | | (87,166 | ) | | |
| | | | | | | | | | | | | | | | | | |
| | | | | |
Class B Shares | | | | | | | | | | | | | | | | | | |
Proceeds from shares issued | | | 1,477,914 | | | | 620,232 | | | | 242,701 | | | | 102,837 | | | |
Dividends reinvested | | | 61,453 | | | | 120 | | | | — | | | | — | | | |
Cost of shares redeemed (a) | | | (454,566 | ) | | | (45,110 | ) | | | (104,553 | ) | | | (178,116 | ) | | |
| | | | | | | | | | | | | | | | | | |
| | | 1,084,801 | | | | 575,242 | | | | 138,148 | | | | (75,279 | ) | | |
| | | | | | | | | | | | | | | | | | |
| | | | | |
Class C Shares | | | | | | | | | | | | | | | | | | |
Proceeds from shares issued | | | 9,745,181 | | | | 4,707,988 | | | | 43,282 | | | | 9,558 | | | |
Dividends reinvested | | | 401,955 | | | | 221 | | | | — | | | | — | | | |
Cost of shares redeemed (a) | | | (5,403,004 | ) | | | (326,016 | ) | | | (3,171 | ) | | | (57,584 | ) | | |
| | | | | | | | | | | | | | | | | | |
| | | 4,744,132 | | | | 4,382,193 | | | | 40,111 | | | | (48,026 | ) | | |
| | | | | | | | | | | | | | | | | | |
| | | | | |
Class R Shares | | | | | | | | | | | | | | | | | | |
Proceeds from shares issued | | | 265,062 | | | | 21,058 | | | | 200 | | | | — | | | |
Dividends reinvested | | | 161 | | | | 40 | | | | — | | | | — | | | |
Cost of shares redeemed (a) | | | (45,348 | ) | | | (163 | ) | | | (205 | ) | | | — | | | |
| | | | | | | | | | | | | | | | | | |
| | | 219,875 | | | | 20,935 | | | | (5 | ) | | | — | | | |
| | | | | | | | | | | | | | | | | | |
| | | | | |
Institutional Service Class Shares | | | | | | | | | | | | | | | | | | |
Proceeds from shares issued | | | 1,308,187 | | | | 234,993 | | | | 1,124,330 | | | | 2,908,267 | | | |
Dividends reinvested | | | 29,104 | | | | 42 | | | | — | | | | — | | | |
Cost of shares redeemed (a) | | | (1,015,521 | ) | | | (70,489 | ) | | | (4,954,567 | )* | | | (3,969,476 | ) | | |
| | | | | | | | | | | | | | | | | | |
| | | 321,770 | | | | 164,546 | | | | (3,830,237 | ) | | | (1,061,209 | ) | | |
| | | | | | | | | | | | | | | | | | |
| | | | | |
Institutional Class Shares | | | | | | | | | | | | | | | | | | |
Proceeds from shares issued | | | 6,959,970 | | | | 2,625,287 | | | | 6,011,705 | | | | 2,254,450 | | | |
Dividends reinvested | | | 740,565 | | | | 127,224 | | | | — | | | | — | | | |
Cost of shares redeemed (a) | | | (1,496,539 | ) | | | (27,205 | ) | | | (1,338,838 | ) | | | (237,659 | ) | | |
| | | | | | | | | | | | | | | | | | |
| | | 6,203,996 | | | | 2,725,306 | | | | 4,672,867 | | | | 2,016,791 | | | |
| | | | | | | | | | | | | | | | | | |
Change in net assets from capital transactions | | $ | 20,234,067 | | | $ | 17,753,698 | | | $ | 1,363,166 | | | $ | 745,111 | | | |
| | | | | | | | | | | | | | | | | | | |
| * | Includes redemption as a result of a redemption in kind (Note 9). |
| (a) | Amount includes redemption fees, if any. |
See notes to financial statements.
Statements of Changes in Net Assets
| | | | | | | | | | | | | | |
| | | Gartmore Global Natural
Resources Fund | | | Gartmore Global Technology and
Communications Fund |
| | | Year Ended
October 31, 2006 | | | Year Ended
October 31, 2005 | | | Year Ended
October 31, 2006 | | | Year Ended
October 31, 2005 |
SHARE TRANSACTIONS: | | | | | | | | | | | | | | |
Class A Shares | | | | | | | | | | | | | | |
Issued | | 1,091,718 | | | 644,698 | | | 444,428 | | | 272,111 | | | |
Reinvested | | 59,686 | | | 821 | | | — | | | — | | | |
Redeemed | | (757,992 | ) | | (47,714 | ) | | (369,158 | ) | | (296,153 | ) | | |
| | | | | | | | | | | | | | |
| | 393,412 | | | 597,805 | | | 75,270 | | | (24,042 | ) | | |
| | | | | | | | | | | | | | |
| | | | | |
Class B Shares | | | | | | | | | | | | | | |
Issued | | 77,074 | | | 39,514 | | | 62,605 | | | 29,559 | | | |
Reinvested | | 3,476 | | | 10 | | | — | | | — | | | |
Redeemed | | (23,666 | ) | | (3,263 | ) | | (27,070 | ) | | (51,316 | ) | | |
| | | | | | | | | | | | | | |
| | 56,884 | | | 36,261 | | | 35,535 | | | (21,757 | ) | | |
| | | | | | | | | | | | | | |
| | | | | |
Class C Shares | | | | | | | | | | | | | | |
Issued | | 508,362 | | | 297,507 | | | 11,061 | | | 2,824 | | | |
Reinvested | | 22,722 | | | 19 | | | — | | | — | | | |
Redeemed | | (292,474 | ) | | (21,085 | ) | | (815 | ) | | (16,620 | ) | | |
| | | | | | | | | | | | | | |
| | 238,610 | | | 276,441 | | | 10,246 | | | (13,796 | ) | | |
| | | | | | | | | | | | | | |
| | | | | |
Class R Shares | | | | | | | | | | | | | | |
Issued | | 13,410 | | | 1,190 | | | 53 | | | — | | | |
Reinvested | | 9 | | | 3 | | | — | | | — | | | |
Redeemed | | (2,343 | ) | | (12 | ) | | (53 | ) | | — | | | |
| | | | | | | | | | | | | | |
| | 11,076 | | | 1,181 | | | — | | | — | | | |
| | | | | | | | | | | | | | |
| | | | | |
Institutional Service Class Shares | | | | | | | | | | | | | | |
Issued | | 67,176 | | | 13,232 | | | 277,697 | | | 805,508 | | | |
Reinvested | | 1,626 | | | 4 | | | — | | | — | | | |
Redeemed | | (51,925 | ) | | (3,880 | ) | | (1,207,049 | )* | | (1,095,352 | ) | | |
| | | | | | | | | | | | | | |
| | 16,877 | | | 9,356 | | | (929,352 | ) | | (289,844 | ) | | |
| | | | | | | | | | | | | | |
| | | | | |
Institutional Class Shares | | | | | | | | | | | | | | |
Issued | | 357,001 | | | 138,552 | | | 1,504,534 | | | 617,938 | | | |
Reinvested | | 41,303 | | | 10,854 | | | — | | | — | | | |
Redeemed | | (76,095 | ) | | (1,511 | ) | | (334,488 | ) | | (64,328 | ) | | |
| | | | | | | | | | | | | | |
| | 322,209 | | | 147,895 | | | 1,170,046 | | | 553,610 | | | |
| | | | | | | | | | | | | | |
Total change in shares | | 1,039,068 | | | 1,068,939 | | | 361,745 | | | 204,171 | | | |
| | | | | | | | | | | | | | | |
| * | Includes redemption as a result of a redemption in kind (Note 9). |
See notes to financial statements.
Statements of Changes in Net Assets (Continued)
| | | | | | | | | | |
| | | Gartmore Global Utilities Fund |
| | | Year Ended
October 31, 2006 | | | Year Ended
October 31, 2005 |
CAPITAL TRANSACTIONS: | | | | | | | | | | |
Class A Shares | | | | | | | | | | |
Proceeds from shares issued | | $ | 2,892,002 | | | $ | 1,667,526 | | | |
Dividends reinvested | | | 370,070 | | | | 59,285 | | | |
Cost of shares redeemed (a) | | | (791,710 | ) | | | (759,875 | ) | | |
| | | | | | | | | | |
| | | 2,470,362 | | | | 966,936 | | | |
| | | | | | | | | | |
| | | |
Class B Shares | | | | | | | | | | |
Proceeds from shares issued | | | 462,630 | | | | 197,399 | | | |
Dividends reinvested | | | 178,513 | | | | 31,795 | | | |
Cost of shares redeemed (a) | | | (98,107 | ) | | | (36,712 | ) | | |
| | | | | | | | | | |
| | | 543,036 | | | | 192,482 | | | |
| | | | | | | | | | |
| | | |
Class C Shares | | | | | | | | | | |
Proceeds from shares issued | | | 3,334,663 | | | | 1,875,230 | | | |
Dividends reinvested | | | 193,426 | | | | 30,079 | | | |
Cost of shares redeemed (a) | | | (905,552 | ) | | | (3,401,068 | ) | | |
| | | | | | | | | | |
| | | 2,622,537 | | | | (1,495,759 | ) | | |
| | | | | | | | | | |
| | | |
Class R Shares | | | | | | | | | | |
Proceeds from shares issued | | | 200 | | | | — | | | |
Dividends reinvested | | | 246 | | | | 53 | | | |
Cost of shares redeemed (a) | | | (202 | ) | | | — | | | |
| | | | | | | | | | |
| | | 244 | | | | 53 | | | |
| | | | | | | | | | |
| | | |
Institutional Service Class Shares | | | | | | | | | | |
Proceeds from shares issued | | | 1,183 | | | | — | | | |
Dividends reinvested | | | 177,107 | | | | 31,183 | | | |
Cost of shares redeemed (a) | | | — | | | | — | | | |
| | | | | | | | | | |
| | | 178,290 | | | | 31,183 | | | |
| | | | | | | | | | |
| | | |
Institutional Class Shares | | | | | | | | | | |
Proceeds from shares issued | | | 4,207,805 | | | | 2,671,571 | | | |
Dividends reinvested | | | 435,661 | | | | 50,767 | | | |
Cost of shares redeemed (a) | | | (931,080 | ) | | | (1,210,150 | ) | | |
| | | | | | | | | | |
| | | 3,712,386 | | | | 1,512,188 | | | |
| | | | | | | | | | |
Change in net assets from capital transactions | | $ | 9,526,855 | | | $ | 1,207,083 | | | |
| | | | | | | | | | | |
| (a) | Amount includes redemption fees, if any. |
See notes to financial statements.
Statements of Changes in Net Assets
| | | | | | | | |
| | | Gartmore Global Utilities Fund |
| | | Year Ended
October 31, 2006 | | | Year Ended
October 31, 2005 |
SHARE TRANSACTIONS: | | | | | | | | |
Class A Shares | | | | | | | | |
Issued | | 239,607 | | | 142,064 | | | |
Reinvested | | 35,376 | | | 4,972 | | | |
Redeemed | | (68,861 | ) | | (63,338 | ) | | |
| | | | | | | | |
| | 206,122 | | | 83,698 | | | |
| | | | | | | | |
| | | |
Class B Shares | | | | | | | | |
Issued | | 39,431 | | | 16,910 | | | |
Reinvested | | 17,358 | | | 2,707 | | | |
Redeemed | | (9,021 | ) | | (3,053 | ) | | |
| | | | | | | | |
| | 47,768 | | | 16,564 | | | |
| | | | | | | | |
| | | |
Class C Shares | | | | | | | | |
Issued | | 293,094 | | | 160,808 | | | |
Reinvested | | 18,731 | | | 2,561 | | | |
Redeemed | | (81,067 | ) | | (294,034 | ) | | |
| | | | | | | | |
| | 230,758 | | | (130,665 | ) | | |
| | | | | | | | |
| | | |
Class R Shares | | | | | | | | |
Issued | | 18 | | | — | | | |
Reinvested | | 24 | | | 4 | | | |
Redeemed | | (18 | ) | | — | | | |
| | | | | | | | |
| | 24 | | | 4 | | | |
| | | | | | | | |
| | | |
Institutional Service Class Shares | | | | | | | | |
Issued | | 88 | | | — | | | |
Reinvested | | 16,876 | | | 3,220 | | | |
Redeemed | | — | | | — | | | |
| | | | | | | | |
| | 16,964 | | | 3,220 | | | |
| | | | | | | | |
| | | |
Institutional Class Shares | | | | | | | | |
Issued | | 365,865 | | | 221,182 | | | |
Reinvested | | 41,154 | | | 4,176 | | | |
Redeemed | | (81,140 | ) | | (94,769 | ) | | |
| | | | | | | | |
| | 325,879 | | | 130,589 | | | |
| | | | | | | | |
Total change in shares | | 827,515 | | | 103,410 | | | |
| | | | | | | | | |
See notes to financial statements.
Financial Highlights
Selected Data for Each Share of Capital Outstanding
Gartmore Global Financial Services Fund
| | | | | | | | | | | | | | | | | | | | | | | | | | | | | | | | | | | | | | | | | | | | | | |
| | | | | Investment Activities | | | Distributions | | | | | | | | Ratios/Supplemental Data |
| | | Net Asset
Value,
Beginning
of Period | | Net
Investment
Income
(Loss) | | | Net Realized
and
Unrealized
Gains
(Losses) on
Investments | | | Total
from
Investment
Activities | | | Net
Investment
Income | | | Net
Realized
Gains | | | Total
Distributions | | | Redemption
Fees | | Net Asset
Value, End
of Period | | Total
Return (a) | | | Net Assets
at End of
Period
(000s) | | Ratio of
Expenses
to Average
Net Assets | | | Ratio of Net
Investment
Income
(Loss)
to Average
Net Assets | | | Ratio of
Expenses
(Prior to
Reimbursements)
to Average
Net Assets (b) | | | Ratio of Net
Investment
Income (Loss)
(Prior to
Reimbursements)
to Average
Net Assets (b) | | | Portfolio
Turnover (c) |
| | | | | | | | | | | | | | | | |
Class A Shares | | | | | | | | | | | | | | | | | | | | | | | | | | | | | | | | | | | | | | | | | | | | | | |
Period Ended October 31, 2002 (d) | | $ | 10.00 | | 0.04 | | | (1.12 | ) | | (1.08 | ) | | — | | | — | | | — | | | — | | $ | 8.92 | | (10.78% | )(e) | | $ | 675 | | 1.66% | (f) | | 0.47% | (f) | | 3.76% | (f) | | (1.63% | )(f) | | 102.39% |
Year Ended October 31, 2003 | | $ | 8.92 | | 0.07 | | | 2.83 | | | 2.90 | | | (0.02 | ) | | — | | | (0.02 | ) | | — | | $ | 11.80 | | 32.59% | | | $ | 1,228 | | 1.65% | | | 0.81% | | | 2.78% | | | (0.33% | ) | | 256.82% |
Year Ended October 31, 2004 | | $ | 11.80 | | 0.12 | | | 1.77 | | | 1.89 | | | (0.09 | ) | | (1.11 | ) | | (1.20 | ) | | — | | $ | 12.49 | | 17.01% | | | $ | 2,457 | | 1.65% | | | 1.06% | | | 2.41% | | | 0.31% | | | 129.61% |
Year Ended October 31, 2005 | | $ | 12.49 | | 0.11 | | | 1.72 | | | 1.83 | | | (0.11 | ) | | (0.80 | ) | | (0.91 | ) | | — | | $ | 13.41 | | 14.91% | | | $ | 4,546 | | 1.66% | | | 1.00% | | | 2.00% | | | 0.66% | | | 213.88% |
Year Ended October 31, 2006 | | $ | 13.41 | | 0.16 | | | 2.92 | | | 3.08 | | | (0.20 | ) | | (0.62 | ) | | (0.82 | ) | | 0.01 | | $ | 15.68 | | 23.87% | | | $ | 21,752 | | 1.52% | | | 1.01% | | | 1.53% | | | 1.01% | | | 195.16% |
| | | | | | | | | | | | | | | | |
Class B Shares | | | | | | | | | | | | | | | | | | | | | | | | | | | | | | | | | | | | | | | | | | | | | | |
Period Ended October 31, 2002 (d) | | $ | 10.00 | | (0.02 | ) | | (1.11 | ) | | (1.13 | ) | | — | | | — | | | — | | | — | | $ | 8.87 | | (11.30% | )(e) | | $ | 672 | | 2.38% | (f) | | (0.25% | )(f) | | 4.51% | (f) | | (2.38% | )(f) | | 102.39% |
Year Ended October 31, 2003 | | $ | 8.87 | | 0.01 | | | 2.79 | | | 2.80 | | | — | | | — | | | — | | | — | | $ | 11.67 | | 31.60% | | | $ | 906 | | 2.40% | | | 0.08% | | | 3.67% | | | (1.20% | ) | | 256.82% |
Year Ended October 31, 2004 | | $ | 11.67 | | 0.02 | | | 1.75 | | | 1.77 | | | (0.03 | ) | | (1.11 | ) | | (1.14 | ) | | — | | $ | 12.30 | | 16.15% | | | $ | 1,072 | | 2.40% | | | 0.20% | | | 3.14% | | | (0.54% | ) | | 129.61% |
Year Ended October 31, 2005 | | $ | 12.30 | | 0.04 | | | 1.68 | | | 1.72 | | | (0.05 | ) | | (0.80 | ) | | (0.85 | ) | | — | | $ | 13.17 | | 14.02% | | | $ | 1,243 | | 2.40% | | | 0.28% | | | 2.80% | | | (0.12% | ) | | 213.88% |
Year Ended October 31, 2006 | | $ | 13.17 | | 0.05 | | | 2.87 | | | 2.92 | | | (0.11 | ) | | (0.62 | ) | | (0.73 | ) | | 0.01 | | $ | 15.37 | | 22.98% | | | $ | 2,993 | | 2.25% | | | 0.33% | | | 2.25% | | | 0.33% | | | 195.16% |
| | | | | | | | | | | | | | | | |
Class C Shares | | | | | | | | | | | | | | | | | | | | | | | | | | | | | | | | | | | | | | | | | | | | | | |
Period Ended October 31, 2002 (d) | | $ | 10.00 | | (0.02 | ) | | (1.11 | ) | | (1.13 | ) | | — | | | — | | | — | | | — | | $ | 8.87 | | (11.30% | )(e) | | $ | 665 | | 2.38% | (f) | | (0.25% | )(f) | | 4.51% | (f) | | (2.38% | )(f) | | 102.39% |
Year Ended October 31, 2003 | | $ | 8.87 | | 0.01 | | | 2.79 | | | 2.80 | | | — | | | — | | | — | | | — | | $ | 11.67 | | 31.60% | | | $ | 883 | | 2.40% | | | 0.08% | | | 3.68% | | | (1.20% | ) | | 256.82% |
Year Ended October 31, 2004 | | $ | 11.67 | | 0.02 | | | 1.75 | | | 1.77 | | | (0.03 | ) | | (1.11 | ) | | (1.14 | ) | | — | | $ | 12.30 | | 16.16% | | | $ | 1,088 | | 2.40% | | | 0.20% | | | 3.15% | | | (0.55% | ) | | 129.61% |
Year Ended October 31, 2005 | | $ | 12.30 | | 0.03 | | | 1.68 | | | 1.71 | | | (0.05 | ) | | (0.80 | ) | | (0.85 | ) | | — | | $ | 13.16 | | 13.94% | | | $ | 1,590 | | 2.40% | | | 0.30% | | | 2.77% | | | (0.08% | ) | | 213.88% |
Year Ended October 31, 2006 | | $ | 13.16 | | 0.06 | | | 2.86 | | | 2.92 | | | (0.11 | ) | | (0.62 | ) | | (0.73 | ) | | 0.01 | | $ | 15.36 | | 23.03% | | | $ | 5,514 | | 2.24% | | | 0.37% | | | 2.24% | | | 0.36% | | | 195.16% |
| | | | | | | | | | | | | | | | |
Class R Shares | | | | | | | | | | | | | | | | | | | | | | | | | | | | | | | | | | | | | | | | | | | | | | |
Period Ended October 31, 2004 (g) | | $ | 11.47 | | 0.04 | | | 0.86 | | | 0.90 | | | (0.06 | ) | | — | | | (0.06 | ) | | — | | $ | 12.31 | | 7.89% | (e) | | $ | 1 | | 1.98% | (f) | | 0.46% | (f) | | 2.74% | (f) | | (0.30% | )(f) | | 129.61% |
Year Ended October 31, 2005 | | $ | 12.31 | | 0.12 | | | 1.67 | | | 1.79 | | | (0.11 | ) | | (0.80 | ) | | (0.91 | ) | | — | | $ | 13.19 | | 14.82% | | | $ | 1 | | 1.71% | | | 0.96% | | | 2.27% | | | 0.41% | | | 213.88% |
Year Ended October 31, 2006 | | $ | 13.19 | | 0.14 | | | 2.86 | | | 3.00 | | | (0.18 | ) | | (0.62 | ) | | (0.80 | ) | | 0.01 | | $ | 15.40 | | 23.59% | | | $ | 79 | | 1.78% | | | 1.00% | | | 1.78% | | | 1.00% | | | 195.16% |
| | | | | | | | | | | | | | | | |
Institutional Service Class Shares | | | | | | | | | | | | | | | | | | | | | | | | | | | | | | | | | | | | | | | �� | | | | | | | |
Period Ended October 31, 2002 (d) | | $ | 10.00 | | 0.06 | | | (1.12 | ) | | (1.06 | ) | | — | | | — | | | — | | | — | | $ | 8.94 | | (10.57% | )(e) | | $ | 671 | | 1.40% | (f) | | 0.73% | (f) | | 3.51% | (f) | | (1.38% | )(f) | | 102.39% |
Year Ended October 31, 2003 | | $ | 8.94 | | 0.11 | | | 2.83 | | | 2.94 | | | (0.03 | ) | | — | | | (0.03 | ) | | — | | $ | 11.85 | | 32.95% | | | $ | 892 | | 1.40% | | | 1.08% | | | 2.68% | | | (0.20% | ) | | 256.82% |
Year Ended October 31, 2004 | | $ | 11.85 | | 0.15 | | | 1.78 | | | 1.93 | | | (0.12 | ) | | (1.11 | ) | | (1.23 | ) | | — | | $ | 12.55 | | 17.25% | | | $ | 1,046 | | 1.40% | | | 1.20% | | | 2.14% | | | 0.46% | | | 129.61% |
Year Ended October 31, 2005 | | $ | 12.55 | | 0.16 | | | 1.72 | | | 1.88 | | | (0.15 | ) | | (0.80 | ) | | (0.95 | ) | | — | | $ | 13.48 | | 15.20% | | | $ | 1,205 | | 1.40% | | | 1.27% | | | 1.79% | | | 0.88% | | | 213.88% |
Year Ended October 31, 2006 | | $ | 13.48 | | 0.19 | | | 2.94 | | | 3.13 | | | (0.23 | ) | | (0.62 | ) | | (0.85 | ) | | 0.01 | | $ | 15.77 | | 24.19% | | | $ | 1,496 | | 1.27% | | | 1.32% | | | 1.27% | | | 1.31% | | | 195.16% |
| | | | | | | | | | | | | | | | |
Institutional Class Shares | | | | | | | | | | | | | | | | | | | | | | | | | | | | | | | | | | | | | | | | | | | | | | |
Period Ended October 31, 2004 (h) | | $ | 12.22 | | 0.02 | | | 0.34 | | | 0.36 | | | (0.03 | ) | | — | | | (0.03 | ) | | — | | $ | 12.55 | | 2.96% | (e) | | $ | 674 | | 1.40% | (f) | | 0.53% | (f) | | 2.30% | (f) | | (0.37% | )(f) | | 129.61% |
Year Ended October 31, 2005 | | $ | 12.55 | | 0.12 | | | 1.76 | | | 1.88 | | | (0.15 | ) | | (0.80 | ) | | (0.95 | ) | | — | | $ | 13.48 | | 15.20% | | | $ | 6,219 | | 1.40% | | | 1.22% | | | 1.62% | | | 1.00% | | | 213.88% |
Year Ended October 31, 2006 | | $ | 13.48 | | 0.19 | | | 2.94 | | | 3.13 | | | (0.23 | ) | | (0.62 | ) | | (0.85 | ) | | 0.01 | | $ | 15.77 | | 24.19% | | | $ | 19,768 | | 1.24% | | | 1.31% | | | 1.25% | | | 1.31% | | | 195.16% |
| (a) | Excludes sales charge. |
| (b) | During the period certain fees were waived and/or reimbursed. If such waivers/reimbursements had not occurred, the ratio would have been as indicated. |
| (c) | Portfolio turnover is calculated on the basis of the Fund as a whole without distinguishing among the classes of shares. |
| (d) | For the period from December 18, 2001 (commencement of operations) through October 31, 2002. |
| (g) | For the period from December 30, 2003 (commencement of operations) through October 31, 2004. |
| (h) | For the period from June 29, 2004 (commencement of operations) through October 31, 2004. |
See notes to financial statements.
Financial Highlights
Selected Data for Each Share of Capital Outstanding
Gartmore Global Health Sciences Fund
| | | | | | | | | | | | | | | | | | | | | | | | | | | | | | | | | | | | | | | | | |
| | | | | Investment Activities | | | Distributions | | | | | | | | Ratios/Supplemental Data |
| | | Net Asset
Value,
Beginning
of Period | | Net
Investment
Income
(Loss) | | | Net Realized
and
Unrealized
Gains
(Losses)
on
Investments | | | Total
from
Investment
Activities | | | Net
Realized
Gains | | | Total
Distributions | | | Net
Asset
Value,
End of
Period | | Total
Return (a) | | | Net Assets
at End of
Period
(000s) | | Ratio of
Expenses
to Average
Net Assets | | | Ratio of
Net
Investment
Income
(Loss)
to Average
Net Assets | | | Ratio of
Expenses
(Prior to
Reimbursements)
to Average
Net Assets (b) | | | Ratio of Net
Investment
Income (Loss)
(Prior to
Reimbursements)
to Average
Net Assets (b) | | | Portfolio
Turnover (c) |
| | | | | | | | | | | | | | |
Class A Shares | | | | | | | | | | | | | | | | | | | | | | | | | | | | | | | | | | | | | | | | | |
Year Ended October 31, 2002 | | $ | 9.33 | | (0.06 | ) | | (0.97 | ) | | (1.03 | ) | | — | | | — | | | $ | 8.30 | | (11.04% | ) | | $ | 1,538 | | 1.60% | | | (0.99% | ) | | 3.10% | | | (2.49% | ) | | 893.80% |
Year Ended October 31, 2003 | | $ | 8.30 | | (0.05 | ) | | 1.99 | | | 1.94 | | | — | | | — | | | $ | 10.24 | | 23.37% | | | $ | 4,087 | | 1.57% | | | (0.75% | ) | | 2.29% | | | (1.47% | ) | | 570.16% |
Year Ended October 31, 2004 | | $ | 10.24 | | (0.06 | ) | | 0.70 | | | 0.64 | | | (0.84 | ) | | (0.84 | ) | | $ | 10.04 | | 6.26% | | | $ | 6,144 | | 1.59% | | | (0.67% | ) | | 1.90% | | | (0.98% | ) | | 388.52% |
Year Ended October 31, 2005 | | $ | 10.04 | | (0.06 | ) | | 1.71 | | | 1.65 | | | (0.06 | ) | | (0.06 | ) | | $ | 11.63 | | 16.47% | | | $ | 11,131 | | 1.64% | | | (0.66% | ) | | 1.72% | | | (0.74% | ) | | 401.37% |
Year Ended October 31, 2006 | | $ | 11.63 | | (0.03 | ) | | 0.65 | | | 0.62 | | | (1.10 | ) | | (1.10 | ) | | $ | 11.15 | | 5.52% | | | $ | 10,636 | | 1.57% | | | (0.24% | ) | | 1.58% | | | (0.25% | ) | | 268.38% |
| | | | | | | | | | | | | | |
Class B Shares | | | | | | | | | | | | | | | | | | | | | | | | | | | | | | | | | | | | | | | | | |
Year Ended October 31, 2002 | | $ | 9.29 | | (0.15 | ) | | (0.93 | ) | | (1.08 | ) | | — | | | — | | | $ | 8.21 | | (11.63% | ) | | $ | 730 | | 2.28% | | | (1.71% | ) | | 4.00% | | | (3.43% | ) | | 893.80% |
Year Ended October 31, 2003 | | $ | 8.21 | | (0.13 | ) | | 1.98 | | | 1.85 | | | — | | | — | | | $ | 10.06 | | 22.53% | | | $ | 899 | | 2.25% | | | (1.41% | ) | | 3.06% | | | (2.22% | ) | | 570.16% |
Year Ended October 31, 2004 | | $ | 10.06 | | (0.13 | ) | | 0.69 | | | 0.56 | | | (0.84 | ) | | (0.84 | ) | | $ | 9.78 | | 5.52% | | | $ | 1,076 | | 2.25% | | | (1.32% | ) | | 2.56% | | | (1.63% | ) | | 388.52% |
Year Ended October 31, 2005 | | $ | 9.78 | | (0.13 | ) | | 1.67 | | | 1.54 | | | (0.06 | ) | | (0.06 | ) | | $ | 11.26 | | 15.78% | | | $ | 1,302 | | 2.29% | | | (1.27% | ) | | 2.39% | | | (1.37% | ) | | 401.37% |
Year Ended October 31, 2006 | | $ | 11.26 | | (0.09 | ) | | 0.61 | | | 0.52 | | | (1.10 | ) | | (1.10 | ) | | $ | 10.68 | | 4.75% | | | $ | 1,458 | | 2.23% | | | (0.90% | ) | | 2.24% | | | (0.90% | ) | | 268.38% |
| | | | | | | | | | | | | | |
Class C Shares | | | | | | | | | | | | | | | | | | | | | | | | | | | | | | | | | | | | | | | | | |
Period Ended October 31, 2002 (d) | | $ | 7.92 | | (0.01 | ) | | 0.30 | | | 0.29 | | | — | | | — | | | $ | 8.21 | | 3.66% | (e) | | $ | 58 | | 2.25% | (f) | | (1.69% | )(f) | | 2.80% | (f) | | (2.24% | )(f) | | 893.80% |
Year Ended October 31, 2003 | | $ | 8.21 | | (0.12 | ) | | 1.98 | | | 1.86 | | | — | | | — | | | $ | 10.07 | | 22.66% | | | $ | 130 | | 2.25% | | | (1.45% | ) | | 2.96% | | | (2.16% | ) | | 570.16% |
Year Ended October 31, 2004 | | $ | 10.07 | | (0.04 | ) | | 0.59 | | | 0.55 | | | (0.84 | ) | | (0.84 | ) | | $ | 9.78 | | 5.52% | | | $ | 2,092 | | 2.25% | | | (1.44% | ) | | 2.57% | | | (1.76% | ) | | 388.52% |
Year Ended October 31, 2005 | | $ | 9.78 | | (0.12 | ) | | 1.66 | | | 1.54 | | | (0.06 | ) | | (0.06 | ) | | $ | 11.26 | | 15.66% | | | $ | 3,899 | | 2.30% | | | (1.30% | ) | | 2.37% | | | (1.37% | ) | | 401.37% |
Year Ended October 31, 2006 | | $ | 11.26 | | (0.10 | ) | | 0.63 | | | 0.53 | | | (1.10 | ) | | (1.10 | ) | | $ | 10.69 | | 4.84% | | | $ | 3,788 | | 2.23% | | | (0.90% | ) | | 2.24% | | | (0.91% | ) | | 268.38% |
| | | | | | | | | | | | | | |
Class R Shares | | | | | | | | | | | | | | | | | | | | | | | | | | | | | | | | | | | | | | | | | |
Period Ended October 31, 2004 (g) | | $ | 10.04 | | (0.09 | ) | | (0.14 | ) | | (0.23 | ) | | — | | | — | | | $ | 9.81 | | (2.29% | )(e) | | $ | 1 | | 1.88% | (f) | | (1.03% | )(f) | | 2.22% | (f) | | (1.37% | )(f) | | 388.52% |
Year Ended October 31, 2005 | | $ | 9.81 | | (0.06 | ) | | 1.68 | | | 1.62 | | | (0.06 | ) | | (0.06 | ) | | $ | 11.37 | | 16.55% | | | $ | 1 | | 1.60% | | | (0.59% | ) | | 1.67% | | | (0.65% | ) | | 401.37% |
Year Ended October 31, 2006 | | $ | 11.37 | | (0.03 | ) | | 0.63 | | | 0.60 | | | (1.10 | ) | | (1.10 | ) | | $ | 10.87 | | 5.46% | | | $ | 1 | | 1.63% | | | (0.29% | ) | | 1.64% | | | (0.30% | ) | | 268.38% |
| | | | | | | | | | | | | | |
Institutional Service Class Shares | | | | | | | | | | | | | | | | | | | | | | | | | | | | | | | | | | | | | | | | | |
Year Ended October 31, 2002 | | $ | 9.36 | | (0.04 | ) | | (0.97 | ) | | (1.01 | ) | | — | | | — | | | $ | 8.35 | | (10.79% | ) | | $ | 1,403 | | 1.27% | | | (0.66% | ) | | 2.85% | | | (2.24% | ) | | 893.80% |
Year Ended October 31, 2003 | | $ | 8.35 | | (0.04 | ) | | 2.01 | | | 1.97 | | | — | | | — | | | $ | 10.32 | | 23.59% | | | $ | 3,746 | | 1.42% | | | (0.61% | ) | | 2.12% | | | (1.31% | ) | | 570.16% |
Year Ended October 31, 2004 | | $ | 10.32 | | (0.06 | ) | | 0.71 | | | 0.65 | | | (0.84 | ) | | (0.84 | ) | | $ | 10.13 | | 6.30% | | | $ | 4,979 | | 1.46% | | | (0.54% | ) | | 1.76% | | | (0.84% | ) | | 388.52% |
Year Ended October 31, 2005 | | $ | 10.13 | | (0.05 | ) | | 1.74 | | | 1.69 | | | (0.06 | ) | | (0.06 | ) | | $ | 11.76 | | 16.72% | | | $ | 5,828 | | 1.50% | | | (0.47% | ) | | 1.59% | | | (0.57% | ) | | 401.37% |
Year Ended October 31, 2006 | | $ | 11.76 | | (0.04 | ) | | 0.69 | | | 0.65 | | | (1.10 | ) | | (1.10 | ) | | $ | 11.31 | | 5.73% | | | $ | 1,130 | | 1.39% | | | (0.15% | ) | | 1.40% | | | (0.16% | ) | | 268.38% |
| | | | | | | | | | | | | | |
Institutional Class Shares | | | | | | | | | | | | | | | | | | | | | | | | | | | | | | | | | | | | | | | | | |
Period Ended October 31, 2004 (h) | | $ | 10.92 | | (0.01 | ) | | (0.77 | ) | | (0.78 | ) | | — | | | — | | | $ | 10.14 | | (7.14% | )(e) | | $ | 404 | | 1.25% | (f) | | (0.25% | )(f) | | 1.54% | (f) | | (0.54% | )(f) | | 388.52% |
Year Ended October 31, 2005 | | $ | 10.14 | | (0.03 | ) | | 1.74 | | | 1.71 | | | (0.06 | ) | | (0.06 | ) | | $ | 11.79 | | 16.90% | | | $ | 3,776 | | 1.29% | | | (0.35% | ) | | 1.34% | | | (0.41% | ) | | 401.37% |
Year Ended October 31, 2006 | | $ | 11.79 | | 0.01 | | | 0.66 | | | 0.67 | | | (1.10 | ) | | (1.10 | ) | | $ | 11.36 | | 5.90% | | | $ | 12,468 | | 1.23% | | | 0.10% | | | 1.24% | | | 0.10% | | | 268.38% |
| | |
(a) Excludes sales charge. | | (g) For the period from December 30, 2003 (commencement of operations) through October 31, 2004. |
(b) During the period certain fees were waived and/or reimbursed. If such waivers/reimbursements had not occurred, the ratio would have been as indicated. | | (h)For the period from June 29, 2004 (commencement of operations) through October 31, 2004. |
(c) Portfolio turnover is calculated on the basis of the Fund as a whole without distinguishing among the classes of shares. (d) For the period from September 23, 2002 (commencement of operations) through October 31, 2002. (e) Not annualized. (f) Annualized. | | |
See notes to financial statements.
Financial Highlights
Selected Data for Each Share of Capital Outstanding
Gartmore Global Natural Resources Fund
| | | | | | | | | | | | | | | | | | | | | | | | | | | | | | | | | | | | | | | | | | | | |
| | | | | Investment Activities | | Distributions | | | | | Ratios/Supplemental Data |
| | | Net Asset
Value,
Beginning
of Period | | Net
Investment
Income
(Loss) | | | Net Realized
and
Unrealized
Gains
(Losses) on
Investments | | Total
from
Investment
Activities | | Net
Investment
Income | | | Net
Realized
Gains | | | Total
Distributions | | | Redemption
Fees | | Net Asset
Value,
End of
Period | | Total
Return (a) | | | Net Assets
at End of
Period
(000s) | | Ratio of
Expenses
to Average
Net Assets | | | Ratio of Net
Investment
Income
(Loss)
to Average
Net Assets | | | Ratio of
Expenses
(Prior to
Reimbursements)
to Average
Net Assets (b) | | | Ratio of Net
Investment
Income (Loss)
(Prior to
Reimbursements)
to Average
Net Assets (b) | | | Portfolio
Turnover (c) |
| | | | | | | | | | | | | | | | |
Class A Shares | | | | | | | | | | | | | | | | | | | | | | | | | | | | | | | | | | | | | | | | | | | | |
Period Ended October 31, 2004 (d) | | $ | 10.00 | | — | | | 1.25 | | 1.25 | | (0.02 | ) | | — | | | (0.02 | ) | | — | | $ | 11.23 | | 12.58% | (e) | | $ | 107 | | 1.58% | (f) | | (1.05% | )(f) | | 4.11% | (f) | | (3.59% | )(f) | | 48.29% |
Year Ended October 31, 2005 | | $ | 11.23 | | — | (g) | | 7.14 | | 7.14 | | (0.01 | ) | | (0.40 | ) | | (0.41 | ) | | 0.01 | | $ | 17.97 | | 65.51% | | | $ | 10,915 | | 1.47% | | | (0.13% | ) | | 1.59% | | | (0.25% | ) | | 313.92% |
Year Ended October 31, 2006 | | $ | 17.97 | | (0.02 | ) | | 3.90 | | 3.88 | | — | | | (1.56 | ) | | (1.56 | ) | | 0.02 | | $ | 20.31 | | 22.87% | | | $ | 20,324 | | 1.38% | | | (0.07% | ) | | 1.38% | | | (0.07% | ) | | 228.18% |
| | | | | | | | | | | | | | | | |
Class B Shares | | | | | | | | | | | | | | | | | | | | | | | | | | | | | | | | | | | | | | | | | | | | |
Period Ended October 31, 2004 (d) | | $ | 10.00 | | (0.03 | ) | | 1.24 | | 1.21 | | — | | | — | | | — | | | — | | $ | 11.21 | | 12.10% | (e) | | $ | 1 | | 2.30% | (f) | | (0.88% | )(f) | | 4.44% | (f) | | (3.02% | )(f) | | 48.29% |
Year Ended October 31, 2005 | | $ | 11.21 | | (0.04 | ) | | 7.04 | | 7.00 | | — | | | (0.40 | ) | | (0.40 | ) | | 0.01 | | $ | 17.82 | | 64.49% | | | $ | 648 | | 2.20% | | | (0.83% | ) | | 2.54% | | | (1.18% | ) | | 313.92% |
Year Ended October 31, 2006 | | $ | 17.82 | | (0.14 | ) | | 3.83 | | 3.69 | | — | | | (1.56 | ) | | (1.56 | ) | | 0.02 | | $ | 19.97 | | 21.94% | | | $ | 1,862 | | 2.12% | | | (0.84% | ) | | 2.13% | | | (0.85% | ) | | 228.18% |
| | | | | | | | | | | | | | | | |
Class C Shares | | | | | | | | | | | | | | | | | | | | | | | | | | | | | | | | | | | | | | | | | | | | |
Period Ended October 31, 2004 (d) | | $ | 10.00 | | (0.02 | ) | | 1.23 | | 1.21 | | — | | | — | | | — | | | — | | $ | 11.21 | | 12.20% | (e) | | $ | 6 | | 2.30% | (f) | | (1.29% | )(f) | | 4.77% | (f) | | (3.76% | )(f) | | 48.29% |
Year Ended October 31, 2005 | | $ | 11.21 | | (0.04 | ) | | 7.05 | | 7.01 | | — | | | (0.40 | ) | | (0.40 | ) | | 0.01 | | $ | 17.83 | | 64.42% | | | $ | 4,938 | | 2.20% | | | (0.87% | ) | | 2.27% | | | (0.94% | ) | | 313.92% |
Year Ended October 31, 2006 | | $ | 17.83 | | (0.16 | ) | | 3.85 | | 3.69 | | — | | | (1.56 | ) | | (1.56 | ) | | 0.02 | | $ | 19.98 | | 21.92% | | | $ | 10,302 | | 2.12% | | | (0.81% | ) | | 2.12% | | | (0.82% | ) | | 228.18% |
| | | | | | | | | | | | | | | | |
Class R Shares | | | | | | | | | | | | | | | | | | | | | | | | | | | | | | | | | | | | | | | | | | | | |
Period Ended October 31, 2004 (d) | | $ | 10.00 | | (0.02 | ) | | 1.24 | | 1.22 | | — | | | — | (g) | | — | | | — | | $ | 11.22 | | 12.22% | (e) | | $ | 1 | | 1.94% | (f) | | (0.53% | )(f) | | 3.91% | (f) | | (2.51% | )(f) | | 48.29% |
Year Ended October 31, 2005 | | $ | 11.22 | | — | (g) | | 7.08 | | 7.08 | | — | | | (0.40 | ) | | (0.40 | ) | | 0.01 | | $ | 17.91 | | 65.15% | | | $ | 23 | | 1.73% | | | (0.14% | ) | | 1.94% | | | (0.36% | ) | | 313.92% |
Year Ended October 31, 2006 | | $ | 17.91 | | (0.04 | ) | | 3.86 | | 3.82 | | — | | | (1.56 | ) | | (1.56 | ) | | 0.02 | | $ | 20.19 | | 22.59% | | | $ | 249 | | 1.75% | | | (0.43% | ) | | 1.77% | | | (0.45% | ) | | 228.18% |
| | | | | | | | | | | | | | | | |
Institutional Service Class Shares | | | | | | | | | | | | | | | | | | | | | | | | | | | | | | | | | | | | | | | | | | | | |
Period Ended October 31, 2004 (d) | | $ | 10.00 | | 0.02 | | | 1.23 | | 1.25 | | (0.02 | ) | | — | | | (0.02 | ) | | — | | $ | 11.23 | | 12.50% | (e) | | $ | 1 | | 1.39% | (f) | | 0.17% | (f) | | 3.56% | (f) | | (2.00% | )(f) | | 48.29% |
Year Ended October 31, 2005 | | $ | 11.23 | | 0.01 | | | 7.15 | | 7.16 | | (0.01 | ) | | (0.40 | ) | | (0.41 | ) | | 0.01 | | $ | 17.99 | | 65.89% | | | $ | 170 | | 1.22% | | | 0.03% | | | 0.80% | | | 0.45% | | | 313.92% |
Year Ended October 31, 2006 | | $ | 17.99 | | 0.03 | | | 3.91 | | 3.94 | | — | | | (1.56 | ) | | (1.56 | ) | | 0.02 | | $ | 20.39 | | 23.20% | | | $ | 537 | | 1.12% | | | 0.13% | | | 1.13% | | | 0.16% | | | 228.18% |
| | | | | | | | | | | | | | | | |
Institutional Class Shares | | | | | | | | | | | | | | | | | | | | | | | | | | | | | | | | | | | | | | | | | | | | |
Period Ended October 31, 2004 (d) | | $ | 10.00 | | 0.01 | | | 1.25 | | 1.26 | | (0.02 | ) | | — | | | (0.02 | ) | | — | | $ | 11.24 | | 12.60% | (e) | | $ | 3,377 | | 1.30% | (f) | | 0.27% | (f) | | 3.32% | (f) | | (1.74% | )(f) | | 48.29% |
Year Ended October 31, 2005 | | $ | 11.24 | | 0.03 | | | 7.15 | | 7.18 | | (0.02 | ) | | (0.40 | ) | | (0.42 | ) | | 0.01 | | $ | 18.01 | | 66.02% | | | $ | 8,078 | | 1.23% | | | 0.25% | | | 1.95% | | | (0.48% | ) | | 313.92% |
Year Ended October 31, 2006 | | $ | 18.01 | | 0.03 | | | 3.91 | | 3.94 | | — | | | (1.56 | ) | | (1.56 | ) | | 0.02 | | $ | 20.41 | | 23.17% | | | $ | 15,731 | | 1.11% | | | 0.16% | | | 1.13% | | | 0.13% | | | 228.18% |
| (a) | Excludes sales charge. |
| (b) | During the period certain fees were waived and/or reimbursed. If such waivers/reimbursements had not occurred, the ratio would have been as indicated. |
| (c) | Portfolio turnover is calculated on the basis of the Fund as a whole without distinguishing among the classes of shares. |
| (d) | For the period from June 29, 2004 (commencement of operations) through October 31, 2004. |
| (g) | Amount is less than $0.005. |
See notes to financial statements.
Financial Highlights
Selected Data for Each Share of Capital Outstanding
Gartmore Global Technology and Communications Fund
| | | | | | | | | | | | | | | | | | | | | | | | | | | | | | | | | | | |
| | | | | Investment Activities | | | | | | Ratios/Supplemental Data |
| | | Net Asset
Value,
Beginning
of Period | | Net
Investment
Income
(Loss) | | | Net Realized
and
Unrealized
Gains
(Losses) on
Investments | | | Total
from
Investment
Activities | | | Net Asset
Value, End
of Period | | Total
Return (a) | | | Net Assets
at End of
Period
(000s) | | Ratio of
Expenses
to Average
Net Assets | | | Ratio of Net
Investment
Income (Loss)
to Average
Net Assets | | | Ratio of
Expenses
(Prior to
Reimbursements)
to Average
Net Assets (b) | | | Ratio of Net
Investment
Income (Prior to
Reimbursements)
to Average
Net Assets (b) | | | Portfolio
Turnover (c) |
| | | | | | | | | | | | |
Class A Shares | | | | | | | | | | | | | | | | | | | | | | | | | | | | | | | | | | | |
Year Ended October 31, 2002 | | $ | 4.02 | | (0.04 | ) | | (1.35 | ) | | (1.39 | ) | | $ | 2.63 | | (34.58% | )(f) | | $ | 1,514 | | 1.69% | | | (1.37% | ) | | 2.56% | | | (2.24% | ) | | 944.01% |
Year Ended October 31, 2003 | | $ | 2.63 | | (0.04 | ) | | 1.27 | | | 1.23 | | | $ | 3.86 | | 46.77% | | | $ | 3,303 | | 1.69% | | | (1.38% | ) | | 2.96% | | | (2.64% | ) | | 1136.72% |
Year Ended October 31, 2004 | | $ | 3.86 | | (0.06 | ) | | (0.28 | ) | | (0.34 | ) | | $ | 3.52 | | (8.81% | ) | | $ | 2,991 | | 1.71% | | | (1.45% | ) | | 2.02% | | | (1.76% | ) | | 722.91% |
Year Ended October 31, 2005 | | $ | 3.52 | | (0.03 | ) | | 0.22 | | | 0.19 | | | $ | 3.71 | | 5.40% | | | $ | 3,071 | | 1.72% | | | (0.87% | ) | | 2.23% | | | (1.38% | ) | | 654.64% |
Year Ended October 31, 2006 | | $ | 3.71 | | (0.03 | ) | | 0.53 | | | 0.50 | | | $ | 4.21 | | 13.48% | | | $ | 3,797 | | 1.66% | | | (1.01% | ) | | 2.03% | | | (1.38% | ) | | 368.77% |
| | | | | | | | | | | | |
Class B Shares | | | | | | | | | | | | | | | | | | | | | | | | | | | | | | | | | | | |
Year Ended October 31, 2002 | | $ | 3.97 | | (0.07 | ) | | (1.32 | ) | | (1.39 | ) | | $ | 2.58 | | (35.01% | )(f) | | $ | 780 | | 2.38% | | | (2.02% | ) | | 3.32% | | | (2.96% | ) | | 944.01% |
Year Ended October 31, 2003 | | $ | 2.58 | | (0.06 | ) | | 1.25 | | | 1.19 | | | $ | 3.77 | | 46.12% | | | $ | 1,196 | | 2.40% | | | (2.07% | ) | | 3.73% | | | (3.40% | ) | | 1136.72% |
Year Ended October 31, 2004 | | $ | 3.77 | | (0.08 | ) | | (0.28 | ) | | (0.36 | ) | | $ | 3.41 | | (9.55% | ) | | $ | 1,064 | | 2.40% | | | (2.14% | ) | | 2.72% | | | (2.46% | ) | | 722.91% |
Year Ended October 31, 2005 | | $ | 3.41 | | (0.05 | ) | | 0.21 | | | 0.16 | | | $ | 3.57 | | 4.69% | | | $ | 1,038 | | 2.41% | | | (1.55% | ) | | 2.93% | | | (2.07% | ) | | 654.64% |
Year Ended October 31, 2006 | | $ | 3.57 | | (0.06 | ) | | 0.51 | | | 0.45 | | | $ | 4.02 | | 12.61% | | | $ | 1,312 | | 2.36% | | | (1.72% | ) | | 2.73% | | | (2.09% | ) | | 368.77% |
| | | | | | | | | | | | |
Class C Shares | | | | | | | | | | | | | | | | | | | | | | | | | | | | | | | | | | | |
Year Ended October 31, 2002 | | $ | 3.99 | | (0.08 | ) | | (1.31 | ) | | (1.39 | ) | | $ | 2.60 | | (34.84% | )(f) | | $ | 17 | | 2.38% | | | (1.83% | ) | | 3.40% | | | (2.85% | ) | | 944.01% |
Year Ended October 31, 2003 | | $ | 2.60 | | (0.06 | ) | | 1.25 | | | 1.19 | | | $ | 3.79 | | 45.77% | | | $ | 39 | | 2.40% | | | (2.10% | ) | | 3.65% | | | (3.35% | ) | | 1136.72% |
Year Ended October 31, 2004 | | $ | 3.79 | | (0.06 | ) | | (0.30 | ) | | (0.36 | ) | | $ | 3.43 | | (9.50% | ) | | $ | 79 | | 2.40% | | | (2.14% | ) | | 2.73% | | | (2.47% | ) | | 722.91% |
Year Ended October 31, 2005 (i) | | $ | 3.43 | | (0.05 | ) | | 0.22 | | | 0.17 | | | $ | 3.60 | | 4.96% | | | $ | 33 | | 2.41% | | | (1.51% | ) | | 3.06% | | | (2.16% | ) | | 654.64% |
Year Ended October 31, 2006 | | $ | 3.60 | | (0.04 | ) | | 0.49 | | | 0.45 | | | $ | 4.05 | | 12.50% | | | $ | 79 | | 2.33% | | | (1.71% | ) | | 2.73% | | | (2.11% | ) | | 368.77% |
| | | | | | | | | | | | |
Class R Shares | | | | | | | | | | | | | | | | | | | | | | | | | | | | | | | | | | | |
Period Ended October 31, 2004 (g) | | $ | 3.70 | | (0.05 | ) | | (0.23 | ) | | (0.28 | ) | | $ | 3.42 | | (7.57% | )(d) | | $ | 1 | | 1.99% | (e) | | (1.75% | )(e) | | 2.28% | (e) | | (2.04% | )(e) | | 722.91% |
Year Ended October 31, 2005 | | $ | 3.42 | | (0.03 | ) | | 0.21 | | | 0.18 | | | $ | 3.60 | | 5.26% | | | $ | 1 | | 1.83% | | | (1.01% | ) | | 2.33% | | | (1.51% | ) | | 654.64% |
Year Ended October 31, 2006 | | $ | 3.60 | | (0.05 | ) | | 0.52 | | | 0.47 | | | $ | 4.07 | | 13.06% | | | $ | 1 | | 1.97% | | | (1.34% | ) | | 2.39% | | | (1.75% | ) | | 368.77% |
| | | | | | | | | | | | |
Institutional Service Class Shares | | | | | | | | | | | | | | | | | | | | | | | | | | | | | | | | | | | |
Year Ended October 31, 2002 | | $ | 4.06 | | (0.03 | ) | | (1.37 | ) | | (1.40 | ) | | $ | 2.66 | | (34.48% | )(f) | | $ | 843 | | 1.41% | | | (1.37% | ) | | 2.08% | | | (2.04% | ) | | 944.01% |
Year Ended October 31, 2003 | | $ | 2.66 | | (0.04 | ) | | 1.30 | | | 1.26 | | | $ | 3.92 | | 47.37% | | | $ | 5,006 | | 1.58% | | | (1.29% | ) | | 2.65% | | | (2.36% | ) | | 1136.72% |
Year Ended October 31, 2004 | | $ | 3.92 | | (0.06 | ) | | (0.29 | ) | | (0.35 | ) | | $ | 3.57 | | (8.93% | ) | | $ | 4,358 | | 1.62% | | | (1.36% | ) | | 1.92% | | | (1.67% | ) | | 722.91% |
Year Ended October 31, 2005 | | $ | 3.57 | | (0.03 | ) | | 0.24 | | | 0.21 | | | $ | 3.78 | | 5.88% | | | $ | 3,513 | | 1.62% | | | (0.74% | ) | | 2.17% | | | (1.30% | ) | | 654.64% |
Year Ended October 31, 2006 (i) | | $ | 3.78 | | (0.46 | ) | | 1.02 | | | 0.56 | | | $ | 4.34 | | 14.81% | | | $ | 1 | | 1.58% | | | (0.83% | ) | | 1.81% | | | (1.06% | ) | | 368.77% |
| | | | | | | | | | | | |
Institutional Class Shares | | | | | | | | | | | | | | | | | | | | | | | | | | | | | | | | | | | |
Period Ended October 31, 2004 (h) | | $ | 3.81 | | (0.01 | ) | | (0.22 | ) | | (0.23 | ) | | $ | 3.58 | | (6.04% | )(d) | | $ | 231 | | 1.40% | (e) | | (1.05% | )(e) | | 1.92% | (e) | | (1.57% | )(e) | | 722.91% |
Year Ended October 31, 2005 | | $ | 3.58 | | (0.02 | ) | | 0.23 | | | 0.21 | | | $ | 3.79 | | 5.87% | | | $ | 2,344 | | 1.40% | | | (0.77% | ) | | 1.68% | | | (1.05% | ) | | 654.64% |
Year Ended October 31, 2006 | | $ | 3.79 | | (0.02 | ) | | 0.54 | | | 0.52 | | | $ | 4.31 | | 13.72% | | | $ | 7,708 | | 1.33% | | | (0.73% | ) | | 1.74% | | | (1.14% | ) | | 368.77% |
| (a) | Excludes sales charge. |
| (b) | During the period certain fees were waived and/or reimbursed. If such waivers/reimbursements had not occurred, the ratio would have been as indicated. |
| (c) | Portfolio turnover is calculated on the basis of the Fund as a whole without distinguishing among the classes of shares. |
| (f) | The total returns shown include losses realized on the disposal of investments that were reimbursed by the adviser, which otherwise would have reduced total returns by 0.54%, 0.60%, 0.89%, and 0.38% for Class A, Class B, Class C and Institutional Service Class shares, respectively. |
| (g) | For the period from December 30, 2003 (commencement of operations) through October 31, 2004. |
| (h) | For the period from June 29, 2004 (commencement of operations) through October 31, 2004. |
| (i) | Net investment income (loss) is based on average shares outstanding during the period. |
See notes to financial statements.
Financial Highlights
Selected Data for Each Share of Capital Outstanding
Gartmore Global Utilities Fund
| | | | | | | | | | | | | | | | | | | | | | | | | | | | | | | | | | | | | | | | | | | | | |
| | | | | Investment Activities | | | Distributions | | | | | Ratios/Supplemental Data |
| | | Net Asset
Value,
Beginning
of Period | | Net
Investment
Income
(Loss) | | Net Realized
and
Unrealized
Gains
(Losses) on
Investments | | | Total
from
Investment
Activities | | | Net
Investment
Income | | | Net
Realized
Gains | | | Total
Distributions | | | Redemption
Fees | | Net Asset
Value, End
of Period | | Total
Return (a) | | | Net Assets
at End of
Period
(000s) | | Ratio of
Expenses
to Average
Net Assets | | | Ratio of Net
Investment
Income
(Loss)
to Average
Net Assets | | | Ratio of
Expenses
(Prior to
Reimbursements)
to Average
Net Assets (b) | | | Ratio of Net
Investment
Income (Loss)
(Prior to
Reimbursements)
to Average
Net Assets (b) | | | Portfolio
Turnover (c) |
| | | | | | | | | | | | | | | | |
Class A Shares | | | | | | | | | | | | | | | | | | | | | | | | | | | | | | | | | | | | | | | | | | | | | |
Period Ended October 31, 2002 (d) | | $ | 10.00 | | 0.11 | | (2.85 | ) | | (2.74 | ) | | (0.06 | ) | | — | | | (0.06 | ) | | — | | $ | 7.20 | | (27.46% | )(e) | | $ | 547 | | 1.46% | (f) | | 1.46% | (f) | | 3.96% | (f) | | (1.04% | )(f) | | 146.88% |
Year Ended October 31, 2003 | | $ | 7.20 | | 0.07 | | 1.06 | | | 1.13 | | | (0.05 | ) | | — | | | (0.05 | ) | | — | | $ | 8.28 | | 15.80% | | | $ | 734 | | 1.45% | | | 0.96% | | | 3.06% | | | (0.65% | ) | | 112.34% |
Year Ended October 31, 2004 | | $ | 8.28 | | 0.09 | | 2.54 | | | 2.63 | | | (0.04 | ) | | — | | | (0.04 | ) | | — | | $ | 10.87 | | 31.81% | | | $ | 1,190 | | 1.45% | | | 1.14% | | | 2.70% | | | (0.10% | ) | | 391.22% |
Year Ended October 31, 2005 | | $ | 10.87 | | 0.19 | | 1.69 | | | 1.88 | | | (0.22 | ) | | (0.25 | ) | | (0.47 | ) | | 0.02 | | $ | 12.30 | | 17.73% | | | $ | 2,377 | | 1.47% | | | 1.70% | | | 2.02% | | | 1.15% | | | 295.27% |
Year Ended October 31, 2006 | | $ | 12.30 | | 0.24 | | 2.59 | | | 2.83 | | | (0.20 | ) | | (1.94 | ) | | (2.14 | ) | | — | | $ | 12.99 | | 27.56% | | | $ | 5,185 | | 1.45% | | | 2.32% | | | 1.80% | | | 1.97% | | | 83.30% |
| | | | | | | | | | | | | | | | |
Class B Shares | | | | | | | | | | | | | | | | | | | | | | | | | | | | | | | | | | | | | | | | | | | | | |
Period Ended October 31, 2002 (d) | | $ | 10.00 | | 0.05 | | (2.84 | ) | | (2.79 | ) | | (0.03 | ) | | — | | | (0.03 | ) | | — | | $ | 7.18 | | (27.93% | )(e) | | $ | 544 | | 2.18% | (f) | | 0.75% | (f) | | 4.71% | (f) | | (1.78% | )(f) | | 146.88% |
Year Ended October 31, 2003 | | $ | 7.18 | | 0.02 | | 1.05 | | | 1.07 | | | (0.03 | ) | | — | | | (0.03 | ) | | — | | $ | 8.22 | | 14.92% | | | $ | 625 | | 2.20% | | | 0.25% | | | 3.89% | | | (1.44% | ) | | 112.34% |
Year Ended October 31, 2004 | | $ | 8.22 | | 0.04 | | 2.50 | | | 2.54 | | | (0.01 | ) | | — | | | (0.01 | ) | | — | | $ | 10.75 | | 30.86% | | | $ | 885 | | 2.20% | | | 0.41% | | | 3.46% | | | (0.84% | ) | | 391.22% |
Year Ended October 31, 2005 | | $ | 10.75 | | 0.09 | | 1.68 | | | 1.77 | | | (0.14 | ) | | (0.25 | ) | | (0.39 | ) | | 0.02 | | $ | 12.15 | | 16.93% | | | $ | 1,202 | | 2.20% | | | 0.96% | | | 2.76% | | | 0.40% | | | 295.27% |
Year Ended October 31, 2006 | | $ | 12.15 | | 0.16 | | 2.54 | | | 2.70 | | | (0.12 | ) | | (1.94 | ) | | (2.06 | ) | | — | | $ | 12.79 | | 26.57% | | | $ | 1,875 | | 2.18% | | | 1.62% | | | 2.54% | | | 1.27% | | | 83.30% |
| | | | | | | | | | | | | | | | |
Class C Shares | | | | | | | | | | | | | | | | | | | | | | | | | | | | | | | | | | | | | | | | | | | | | |
Period Ended October 31, 2002 (d) | | $ | 10.00 | | 0.05 | | (2.84 | ) | | (2.79 | ) | | (0.03 | ) | | — | | | (0.03 | ) | | — | | $ | 7.18 | | (27.93% | )(e) | | $ | 541 | | 2.18% | (f) | | 0.75% | (f) | | 4.71% | (f) | | (1.78% | )(f) | | 146.88% |
Year Ended October 31, 2003 | | $ | 7.18 | | 0.02 | | 1.05 | | | 1.07 | | | (0.03 | ) | | — | | | (0.03 | ) | | — | | $ | 8.22 | | 14.92% | | | $ | 623 | | 2.20% | | | 0.25% | | | 3.89% | | | (1.44% | ) | | 112.34% |
Year Ended October 31, 2004 | | $ | 8.22 | | 0.03 | | 2.51 | | | 2.54 | | | (0.02 | ) | | — | | | (0.02 | ) | | — | | $ | 10.74 | | 30.90% | | | $ | 3,556 | | 2.20% | | | 0.43% | | | 3.33% | | | (0.70% | ) | | 391.22% |
Year Ended October 31, 2005 (i) | | $ | 10.74 | | 0.15 | | 1.62 | | | 1.77 | | | (0.13 | ) | | (0.25 | ) | | (0.38 | ) | | 0.02 | | $ | 12.15 | | 16.88% | | | $ | 2,435 | | 2.20% | | | 1.25% | | | 2.81% | | | 0.63% | | | 295.27% |
Year Ended October 31, 2006 | | $ | 12.15 | | 0.13 | | 2.58 | | | 2.71 | | | (0.13 | ) | | (1.94 | ) | | (2.07 | ) | | — | | $ | 12.79 | | 26.60% | | | $ | 5,512 | | 2.17% | | | 1.30% | | | 2.49% | | | 0.98% | | | 83.30% |
| | | | | | | | | | | | | | | | |
Class R Shares | | | | | | | | | | | | | | | | | | | | | | | | | | | | | | | | | | | | | | | | | | | | | |
Period Ended October 31, 2004 (g) | | $ | 9.14 | | 0.08 | | 1.58 | | | 1.66 | | | (0.02 | ) | | — | | | (0.02 | ) | | — | | $ | 10.78 | | 18.23% | (e) | | $ | 1 | | 1.78% | (f) | | 0.99% | (f) | | 3.14% | (f) | | (0.35% | )(f) | | 391.22% |
Year Ended October 31, 2005 | | $ | 10.78 | | 0.20 | | 1.66 | | | 1.86 | | | (0.21 | ) | | (0.25 | ) | | (0.46 | ) | | 0.02 | | $ | 12.20 | | 17.61% | | | $ | 1 | | 1.51% | | | 1.64% | | | 2.31% | | | 0.84% | | | 295.27% |
Year Ended October 31, 2006 | | $ | 12.20 | | 0.24 | | 2.51 | | | 2.75 | | | (0.18 | ) | | (1.94 | ) | | (2.12 | ) | | — | | $ | 12.83 | | 27.11% | | | $ | 2 | | 1.78% | | | 2.08% | | | 2.18% | | | 1.68% | | | 83.30% |
| | | | | | | | | | | | | | | | |
Institutional Service Class Shares | | | | | | | | | | | | | | | | | | | | | | | | | | | | | | | | | | | | | | | | | | | | | |
Period Ended October 31, 2002 (d) | | $ | 10.00 | | 0.13 | | (2.85 | ) | | (2.72 | ) | | (0.07 | ) | | — | | | (0.07 | ) | | — | | $ | 7.21 | | (27.27% | )(e) | | $ | 545 | | 1.20% | (f) | | 1.72% | (f) | | 3.71% | (f) | | (0.79% | )(f) | | 146.88% |
Year Ended October 31, 2003 | | $ | 7.21 | | 0.09 | | 1.06 | | | 1.15 | | | (0.06 | ) | | — | | | (0.06 | ) | | — | | $ | 8.30 | | 16.10% | | | $ | 633 | | 1.20% | | | 1.25% | | | 2.89% | | | (0.44% | ) | | 112.34% |
Year Ended October 31, 2004 | | $ | 8.30 | | 0.13 | | 2.53 | | | 2.66 | | | (0.05 | ) | | — | | | (0.05 | ) | | — | | $ | 10.91 | | 32.13% | | | $ | 837 | | 1.20% | | | 1.41% | | | 2.46% | | | 0.15% | | | 391.22% |
Year Ended October 31, 2005 | | $ | 10.91 | | 0.23 | | 1.69 | | | 1.92 | | | (0.25 | ) | | (0.25 | ) | | (0.50 | ) | | 0.02 | | $ | 12.35 | | 18.05% | | | $ | 987 | | 1.20% | | | 1.97% | | | 1.78% | | | 1.39% | | | 295.27% |
Year Ended October 31, 2006 | | $ | 12.35 | | 0.30 | | 2.57 | | | 2.87 | | | (0.23 | ) | | (1.94 | ) | | (2.17 | ) | | — | | $ | 13.05 | | 27.88% | | | $ | 1,264 | | 1.20% | | | 2.68% | | | 1.55% | | | 2.33% | | | 83.30% |
| | | | | | | | | | | | | | | | |
Institutional Class Shares | | | | | | | | | | | | | | | | | | | | | | | | | | | | | | | | | | | | | | | | | | | | | |
Period Ended October 31, 2004 (h) | | $ | 9.75 | | 0.03 | | 1.15 | | | 1.18 | | | (0.02 | ) | | — | | | (0.02 | ) | | — | | $ | 10.91 | | 12.15% | (e) | | $ | 250 | | 1.20% | (f) | | 1.02% | (f) | | 2.19% | (f) | | 0.03% | (f) | | 391.22% |
Year Ended October 31, 2005 | | $ | 10.91 | | 0.17 | | 1.75 | | | 1.92 | | | (0.25 | ) | | (0.25 | ) | | (0.50 | ) | | 0.02 | | $ | 12.35 | | 18.05% | | | $ | 1,896 | | 1.20% | | | 1.85% | | | 1.67% | | | 1.38% | | | 295.27% |
Year Ended October 31, 2006 | | $ | 12.35 | | 0.27 | | 2.60 | | | 2.87 | | | (0.23 | ) | | (1.94 | ) | | (2.17 | ) | | — | | $ | 13.05 | | 27.88% | | | $ | 6,254 | | 1.20% | | | 2.81% | | | 1.50% | | | 2.49% | | | 83.30% |
| | | | | | | | | | | | | | | | | | | | | | | | | | | | | | | | | | | | | | | | | | | | | | |
| (a) | Excludes sales charge. |
| (b) | During the period certain fees were waived and/or reimbursed. If such waivers/reimbursements had not occurred, the ratio would have been as indicated. |
| (c) | Portfolio turnover is calculated on the basis of the Fund as a whole without distinguishing among the classes of shares. |
| (d) | For the period from December 18, 2001 (commencement of operations) through October 31, 2002. |
| (g) | For the period from December 30, 2003 (commencement of operations) through October 31, 2004. |
| (h) | For the period from June 29, 2004 (commencement of operations) through October 31, 2004. |
| (i) | Net investment income (loss) is based on average shares outstanding during the period. |
See notes to financial statements.
Gartmore Mid Cap Growth Leaders Fund
For the annual period ended Oct. 31, 2006, the Gartmore Mid Cap Growth Leaders Fund (Class A at NAV) returned 9.89% versus 14.51% for its benchmark, the Russell Midcap® Growth Index. For broader comparison, the average return for the Fund’s Lipper peer category of Mid-Cap Growth Funds (consisting of 611 funds as of Oct. 31, 2006) was 11.52%.
The U.S. stock market posted healthy gains during the one-year reporting period, as strong corporate earnings offset the negative impact of rising interest rates and high energy prices. Mid-capitalization stocks trailed small caps but outperformed large caps by a substantial amount, while value stocks held a commanding lead over growth. The Fund beat its benchmark in 10 out of 12 months during the reporting period. Unfortunately, our underperformance in January and October, the two lagging months, was enough to put the Fund’s performance behind that of the benchmark for the period overall.
In January, the main problem was the Fund’s relatively defensive stance, which we adopted because of concerns about an inverted yield curve (a plotted graph line of the yields—or interest rates—on long-term and short-term maturity bonds) and the Federal Reserve Board’s hiking of interest rates; both factors typically signal slowing economic growth and mediocre stock-market returns. Although the market did eventually decline in the late spring and early summer, we fell behind early on as share prices advanced smartly at the start of 2006. October’s underperformance was chiefly due to stock-specific factors.
Information technology was the sector that hampered Fund performance most, with two stocks accounting for much of the damage—Jabil Circuit, Inc. and SanDisk Corp. Jabil Circuit, a contract manufacturer used by firms that make various kinds of electronic products, saw its stock
decline due to the company’s involvement with the options pricing controversy and also because of production issues related to Jabil’s rapid growth. We used the stock’s weakness to add to the Fund’s position. In the case of SanDisk, concerns about the possibility of oversupply and pricing pressure on the company’s NAND flash memory technology caused a sharp decline in the stock, and we liquidated the position.
On the positive side, our selections in the consumer discretionary and materials sectors bolstered the Fund’s performance. For example, retailer J.C. Penney Co., Inc. was helped by the company’s bid to serve a more upscale clientele and the decision to locate many of its new stores in strip shopping centers rather than in major malls. Coach, Inc. also contributed to Fund performance; the firm rebounded from weakness earlier in the period as fears about the potential impact of high energy prices on spending for luxury handbags and shoes eased. In addition, Coach effectively contained costs and continued to develop its presence in the Japanese market.
Looking ahead, we are encouraged by the drop in energy prices and the fact that the Federal Open Market Committee has stopped raising interest rates. Overall, we think inflation will remain under control, which should keep the Federal Reserve in pause mode or even allow the central bank to lower interest rates in 2007. If the economy avoids a recession, which we think is likely, the mid-cap segment of the market should continue to offer competitive performance, reflecting the group’s attractive risk profile relative to small caps as well as its strong earnings growth prospects. Versus large-caps, we continue to like the mid-cap segment’s relative growth potential.
Portfolio Manager:
Joseph O’Connor, CFA
| | |
Fund Performance | | Gartmore Mid Cap Growth Leaders Fund |
Average Annual Total Return
(For periods ended October 31, 2006)
| | | | | | | | |
| | | | | 1 Yr. | | 5 Yr. | | 10 Yr.1 |
| Class A | | w/o SC2 | | 9.89% | | 6.69% | | 6.99% |
| | | w/SC3 | | 3.56% | | 5.43% | | 6.63% |
| Class B | | w/o SC2 | | 9.18% | | 5.99% | | 6.52% |
| | | w/SC4 | | 4.18% | | 5.67% | | 6.52% |
| Class C | | w/o SC2 | | 9.18% | | 5.98% | | 6.74% |
| | | w/SC5 | | 8.18% | | 5.98% | | 6.74% |
| Class D | | w/o SC2 | | 10.32% | | 7.04% | | 7.14% |
| | | w/SC6 | | 5.37% | | 6.06% | | 6.86% |
| Class R7 | | | | 9.91% | | 6.78% | | 7.07% |
| Institutional Class7,8 | | | | 10.26% | | 7.01% | | 7.13% |
All figures showing the effect of a sales charge reflect the maximum charge possible, because it has the most dramatic effect on performance data.
| 1 | These returns through May 11, 1998 include the performance of the Fund’s predecessor fund, and, for periods from May 11, 1998 to the creation of the class, include the performance of the Fund’s Class D shares. These returns were achieved prior to the creation of Class A and Class B shares (5/11/98), Class C shares (3/1/01), and Class R shares (12/30/03). Excluding the effect of any fee waivers or reimbursements, such prior performance is similar to what Class A, Class B, Class C, and Class R shares would have produced during those periods because all classes of the Fund’s shares invest in the same portfolio of securities. The performance for these classes has been restated to reflect differences in sales charges (where applicable), but does not reflect the differing levels of other fees (primarily Rule 12b-1 and/or administrative services fees) applicable to such classes. If these other fees were reflected, the performance for Class A, Class B, Class C and Class R shares would have been lower. |
| 2 | These returns do not reflect the effects of sales charges (SC). |
| 3 | A 5.75% front-end sales charge was deducted. |
| 4 | A 5.00% contingent deferred sales charge (CDSC) was deducted. The CDSC declines to 0% after 6 years. |
| 5 | A CDSC of 1.00% was deducted from the one year return because it is charged when you sell Class C shares within the first year after purchase. |
| 6 | A 4.50% front-end sales charge was deducted. |
| 7 | Not subject to any sales charges. |
| 8 | These returns until the creation of Institutional Class shares (9/28/04) include the performance of the Fund’s Class D shares. The returns have been adjusted for the fact that Institutional Class shares do not have any applicable sales charges but have not been adjusted for the lower expenses applicable to Institutional Class shares. Excluding the effect of any fee waivers or reimbursements, such prior performance is similar to what Institutional Class shares would have produced because the Institutional Class shares invest in the same portfolio of securities as Institutional Service shares. |
Performance of a $10,000 Investment
Investment return and principal value will fluctuate, and when redeemed, shares may be worth more or less than original cost. Past performance is no guarantee of future results and does not reflect the deduction of taxes that a shareholder would pay on fund distributions or the redemption of fund shares. Investing in mutual funds involves market risk, including loss of principal. Performance returns assume the reinvestment of all distributions.
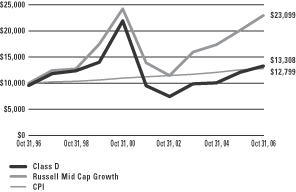
Comparative performance of $10,000 invested in Class D shares of the Mid Cap Growth Leaders, the Russell Mid Cap Growth Index (Russell Mid Cap Growth)(a), and the Consumer Price Index (CPI)(b) over a 10-year period ended 10/31/06. Unlike the Fund, the returns for these unmanaged indexes do not reflect any fees, expenses, or sales charges. Investors cannot invest directly in market indexes.
| (a) | The Russell Midcap Growth- an unmanaged index of the stock of medium-size U.S. companies with a capitalization range of $1.4 billion to 18.6 billion as of October 31, 2006, gives a broad look at how the stock price of medium-size U.S. companies have performed. |
| (b) | The CPI represents changes in prices of a basket of goods and services purchased for consumption by urban households. |
| | |
Shareholder Expense Example | | Gartmore Mid Cap Growth Leaders Fund |
As a shareholder of the Fund, you incur two types of costs: (1) transaction costs, including sales charges (loads) paid on purchase payments and redemption fees; and (2) ongoing costs, including investment advisory fees, administration fees, distribution fees and other Fund expenses. The examples below are intended to help you understand your ongoing costs (in dollars) of investing in the Fund and to compare these costs with the ongoing costs of investing in other mutual funds. Per SEC requirements, the examples assume that you had a $1,000 investment in the Class at the beginning of the reporting period, May 1, 2006 and continued to hold your shares at the end of the reporting period, October 31, 2006.
Actual Expenses
For each Class of the Fund in the table below, the first line provides information about actual account values and actual expenses. You may use the information in this line, together with the amount you invested, to estimate the expenses that you paid over the period. Simply divide your account value by $1,000 (for example, an $8,600 account value divided by $1,000 = 8.6), then multiply the result by the number in the first line of each Class under the heading entitled “Expenses Paid During Period” to estimate the expenses you paid on your account during the period.
Hypothetical Example for Comparison Purposes
The second line of each Class in the table below provides information about hypothetical account values and hypothetical expenses based on the Class’ actual expense ratio and an assumed rate of return of 5% per year before expenses, which is not the Class’ actual return. The hypothetical account values and expenses may not be used to estimate the actual ending account balance or expenses you paid for the period. You may use this information to compare the ongoing costs of investing in the Class of the Fund and other funds. To do so, compare this 5% hypothetical example with the 5% hypothetical examples that appear in the shareholder reports of the other funds.
Please note that the expenses shown in the table are meant to highlight your ongoing costs only and do not reflect any transaction costs, such as sales charges (loads) or redemption fees. Therefore, the second line for each Class in the table is useful in comparing ongoing costs only, and will not help you determine the relative total costs of owning different funds. In addition, if these transaction costs were included, your costs would have been higher. The examples also assume all dividends and distributions have been reinvested.
Schedule of Shareholder Expenses
Expense Analysis of a $1,000 Investment
(October 31, 2006)
| | | | | | | | | | | | | | |
| Mid Cap Growth Leaders Fund | | | | | Beginning
Account Value,
5/1/06 | | Ending
Account Value,
10/31/06 | | Expenses Paid
During Period* | | Annualized
Expense Ratio* |
| Class A | | Actual | | | $ | 1,000.00 | | $ | 978.00 | | $ | 7.13 | | 1.43% |
| | | Hypothetical | 1 | | $ | 1,000.00 | | $ | 1,017.79 | | $ | 7.30 | | 1.43% |
| Class B | | Actual | | | $ | 1,000.00 | | $ | 975.50 | | $ | 10.61 | | 2.13% |
| | | Hypothetical | 1 | | $ | 1,000.00 | | $ | 1,014.26 | | $ | 10.87 | | 2.13% |
| Class C | | Actual | | | $ | 1,000.00 | | $ | 974.80 | | $ | 10.60 | | 2.13% |
| | | Hypothetical | 1 | | $ | 1,000.00 | | $ | 1,014.26 | | $ | 10.87 | | 2.13% |
| Class D | | Actual | | | $ | 1,000.00 | | $ | 980.40 | | $ | 5.64 | | 1.13% |
| | | Hypothetical | 1 | | $ | 1,000.00 | | $ | 1,019.30 | | $ | 5.77 | | 1.13% |
| Class R | | Actual | | | $ | 1,000.00 | | $ | 977.70 | | $ | 8.13 | | 1.63% |
| | | Hypothetical | 1 | | $ | 1,000.00 | | $ | 1,016.78 | | $ | 8.32 | | 1.63% |
| Institutional Class | | Actual | | | $ | 1,000.00 | | $ | 979.70 | | $ | 5.64 | | 1.13% |
| | | Hypothetical | 1 | | $ | 1,000.00 | | $ | 1,019.30 | | $ | 5.77 | | 1.13% |
| * | Expenses are equal to the Fund’s annualized expense ratio multiplied by the average account value over the period multiplied by 184/365 (to reflect the one-half year period). The expense ratio presented represents a six-month, annualized ratio in accordance with SEC guidelines. |
| 1 | Represents the hypothetical 5% return before expenses. |
| | |
Portfolio Summary | | Gartmore Mid Cap Growth Leaders Fund |
October 31, 2006
The SEC adopted a requirement that Funds present their portfolio holdings in a table, chart or graph format in their annual and semiannual reports to shareholders, whether or not a statement of investments is utilized. The following tables, which present portfolio holdings as a percentage of net assets, are provided in compliance with this requirement.
| | |
| Asset Allocation | | |
| Common Stocks | | 91.2% |
| Commercial Paper | | 3.5% |
| Other Investments* | | 5.9% |
| Liabilities in excess of other assets** | | -0.5 % |
| | |
| | 100.1% |
| * | Includes value of collateral received from securities lending. |
| ** | Includes value of collateral owed from securities lending. |
| | |
| Top Industries | | |
| Financial Services | | 11.4% |
| Retail | | 10.7% |
| Medical Services | | 9.0% |
| Computer Software & Services | | 7.8% |
| Semiconductors | | 5.3% |
| Oil & Gas | | 5.3% |
| Manufacturing | | 5.2% |
| Industrial Gases | | 4.6% |
| Electronic Equipment | | 4.3% |
| Telecommunications | | 4.0% |
| Other Assets | | 32.4% |
| | |
| | 100.0% |
| | |
| Top Holdings | | |
| Precision Castparts Corp. | | 5.2% |
| Praxair, Inc. | | 4.6% |
| Assurant, Inc. | | 3.8% |
| Alliance Data Systems Corp. | | 3.8% |
| Fisher Scientific International, Inc. | | 3.7% |
| T. Rowe Price Group, Inc. | | 3.5% |
| Countrywide Home Loans, 5.44%, 11/01/06 | | 3.5% |
| Hyperion Solutions Corp. | | 3.3% |
| Staples, Inc. | | 3.0% |
| J.C. Penney Company, Inc. | | 3.0% |
| Other Assets | | 62.6% |
| | |
| | 100.0% |
Gartmore Mid Cap Growth Leaders Fund
Common Stocks (91.5%)
Statement of Investments
October 31, 2006
| | | | | |
| | | Shares or
Principal Amount | | Value |
| | | | | |
Aerospace & Defense (2.6%) | | | |
Rockwell Collins, Inc. | | 16,175 | | $ | 939,444 |
| | | | | |
Applications Software (1.5%) | | | |
Citrix Systems, Inc. (b) | | 18,860 | | | 556,936 |
| | | | | |
Coal (1.5%) | | | |
Peabody Energy Corp. | | 12,650 | | | 530,921 |
| | | | | |
Commercial Services (3.8%) | | | |
Alliance Data Systems Corp. (b) (c) | | 22,440 | | | 1,362,557 |
| | | | | |
Computer Software & Services (7.8%) | | | |
Adobe Systems, Inc. (b) | | 15,595 | | | 596,509 |
Cognizant Technology Solutions Corp. (b) | | 13,850 | | | 1,042,628 |
Hyperion Solutions Corp. (b) | | 32,000 | | | 1,196,800 |
| | | | | |
| | | | | 2,835,937 |
| | | | | |
Electronic Equipment (4.3%) | | | |
AMETEK, Inc. | | 22,015 | | | 1,027,660 |
Arrow Electronics, Inc. (b) | | 18,410 | | | 549,539 |
| | | | | |
| | | | | 1,577,199 |
| | | | | |
Financial Services (7.9%) | | | |
Investment Technology Group, Inc. (b) | | 14,915 | | | 696,531 |
State Street Corp. | | 14,030 | | | 901,147 |
T. Rowe Price Group, Inc. | | 27,090 | | | 1,281,627 |
| | | | | |
| | | | | 2,879,305 |
| | | | | |
Gaming & Leisure (2.3%) | | | |
Penn National Gaming, Inc. (b) (c) | | 23,000 | | | 841,110 |
| | | | | |
Hospitals (2.6%) | | | |
Community Health Systems, Inc. (b) | | 28,825 | | | 935,371 |
| | | | | |
Hotels & Motels (3.6%) | | | |
Hilton Hotels Corp. | | 23,725 | | | 686,127 |
Starwood Hotels & Resorts Worldwide, Inc. | | 10,550 | | | 630,257 |
| | | | | |
| | | | | 1,316,384 |
| | | | | |
Industrial Gases (4.6%) | | | |
Praxair, Inc. | | 27,400 | | | 1,650,850 |
| | | | | |
| | | | | |
| | | Shares or
Principal Amount | | Value |
| | | | | |
Insurance (3.8%) | | | |
Assurant, Inc. | | 26,265 | | $ | 1,383,115 |
| | | | | |
Manufacturing (5.2%) | | | |
Precision Castparts Corp. | | 27,710 | | | 1,885,943 |
| | | | | |
Medical Services (9.0%) | | | |
Express Scripts, Inc., Class A (b) | | 13,630 | | | 868,504 |
Fisher Scientific International, Inc. (b) | | 15,565 | | | 1,332,674 |
McKesson Corp. | | 20,735 | | | 1,038,616 |
| | | | | |
| | | | | 3,239,794 |
| | | | | |
Oil & Gas (5.3%) | | | |
Grand Prideco, Inc. (b) | | 19,540 | | | 738,026 |
Weatherford International, Inc. (b) | | 12,640 | | | 519,251 |
Williams Cos., Inc. (The) | | 27,245 | | | 665,596 |
| | | | | |
| | | | | 1,922,873 |
| | | | | |
Restaurants (2.4%) | | | |
Darden Restaurants, Inc. | | 20,780 | | | 870,682 |
| | | | | |
Retail (10.7%) | | | |
Circuit City Stores, Inc. | | 20,460 | | | 552,011 |
Coach, Inc. (b) | | 27,495 | | | 1,089,902 |
J.C. Penney Company, Inc. | | 14,565 | | | 1,095,724 |
Staples, Inc. | | 42,830 | | | 1,104,585 |
| | | | | |
| | | | | 3,842,222 |
| | | | | |
Semiconductors (5.3%) | | | |
International Rectifier Corp. (b) | | 15,235 | | | 548,003 |
Jabil Circuit, Inc. | | 30,070 | | | 863,310 |
Marvel Technology Group Ltd. (b) | | 28,325 | | | 517,781 |
| | | | | |
| | | | | 1,929,094 |
| | | | | |
Telecommunications (4.0%) | | | |
Juniper Networks, Inc. (b) | | 32,610 | | | 561,544 |
NeuStar, Inc. (b) (c) | | 31,160 | | | 910,495 |
| | | | | |
| | | | | 1,472,039 |
| | | | | |
Therapeutics (3.0%) | | | |
Gilead Sciences, Inc. (b) | | 15,890 | | | 1,094,821 |
| | | | | |
| | |
Total Common Stocks | | | | | 33,066,597 |
| | | | | |
Statement of Investments (Continued)
October 31, 2006
Gartmore Mid Cap Growth Leaders Fund
Commercial Paper (3.5%)
| | | | | | | |
| | | Shares or
Principal Amount | | Value | |
| | | | | | | |
Financial Services (3.5%) | | | | |
Countrywide Home Loans,
5.44%, 11/01/06 (d) | | $ | 1,252,000 | | $ | 1,252,000 | |
| | | | | | | |
| | |
Total Commercial Paper | | | | | | 1,252,000 | |
| | | | | | | |
|
Short-Term Securities Held as Collateral for Securities
on Loan (5.9%) | |
Banc of America Securities LLC Repurchase Agreement, 5.32%, dated 10/31/06, due 11/01/06, repurchase price $2,142,331, collateralized by U.S. Government Agency Mortgages with a market value of $2,184,855 | | | 2,142,014 | | | 2,142,014 | |
| | | | | | | |
| | |
Total Short-Term Securities Held as Collateral for Securities on Loan | | | | | | 2,142,014 | |
| | | | | | | |
| |
Total Investments
(Cost $33,417,539) (a) — 100.5% | | | 36,460,611 | |
| | |
Liabilities in excess of other
assets — (0.5)% | | | | | | (188,164 | ) |
| | | | | | | |
| | |
NET ASSETS — 100.0% | | | | | $ | 36,272,447 | |
| | | | | | | |
| | (a) | See notes to financial statements for tax unrealized appreciation (depreciation) of securities. |
| | (b) | Denotes a non-income producing security. |
| | (c) | All or part of security was on loan as of October 31, 2006. |
| | (d) | The rate reflected on the Statement of Investments is the effective yield as of October 31, 2006. |
See notes to financial statements.
Gartmore Nationwide Leaders Fund
For the annual period ended Oct. 31, 2006, the Gartmore Nationwide Leaders Fund (Class A at NAV) returned 15.16% versus 16.34% for its benchmark, the S&P 500® Index. For broader comparison, the average return for the Fund’s Lipper peer category of Multi-Cap Core Funds (consisting of 904 funds as of Oct. 31, 2006) was 14.49%.
Despite investors concerns about rising interest rates, high energy prices and a steadily deteriorating housing market, most broadly based stock indexes managed solid gains. Strength at the beginning and end of the reporting period was interrupted by a sharp correction from mid-May through early July, as investors fretted about worsening inflation and the possibility that the Federal Reserve Board might increase interest rates further than expected. As the summer progressed, however, inflation remained in check and the economy appeared to be slowing, providing the Federal Reserve with the flexibility it needed to hold rates steady at the August, September and October Federal Open Market Committee meetings. Adding to the positive backdrop late in the reporting period were a relatively benign hurricane season and a sharp decline in crude oil and natural gas prices.
Detracting sectors for the Fund included industrials and energy. In the industrials sector, our sale of the Fund’s railroad holdings Burlington Northern Santa Fe Corp. and CSX Corp. proved ill-timed, because those stocks went on to post strong double-digit gains over the remainder of the period. A Fund position in industrial conglomerate 3M Co. also was counterproductive; the company’s second-quarter earnings were disappointing due in part to an inventory glut in its specialty films division, and we sold the stock. In the energy sector, Fund results were held back by an overweighting in services provider Nabors Industries Ltd. and by an underweighting in Exxon Mobil Corp., an integrated energy giant that we thought was expensive due to its mediocre growth prospects.
Strong stock selection by the Fund in information technology aided performance versus the benchmark. Our disciplined approach of buying into weakness and selling into strength was rewarded in the cases of Advanced Micro Devices, Inc. (AMD) and Juniper Networks, Inc., two of the Fund’s top contributors. With AMD, we felt that its competitive advantage was eroding due to Intel Corp.’s development of a competing dual-core chip, and we liquidated the position. Conversely, after Juniper Networks had been beaten down during the spring/summer correction, we added aggressively to the position, making it one of the Fund’s largest holdings by the end of the reporting period. In consumer staples, a large overweighting by the Fund in tobacco stock Reynolds American Inc. was rewarding, given the company’s solid earnings growth, the stock’s inexpensive valuation and the favorable resolution of some key smoking-related litigation. We sold the stock as it rallied on the good news.
With three consecutive stand-pat decisions by the Fed, we believe the odds are increasing that we have seen at least a temporary peak in short-term rates, although the recent upward revision in third-quarter economic growth from 1.6% to 2.2% likely lessens the chances of a rate cut any time soon. As long as the economy avoids entering a recession—and, at present, we think it will succeed in doing so—we believe that the stock market will continue to offer potential for rewarding opportunities in the foreseeable future.
Portfolio Manager:
Gary Haubold, CFA
| | |
Fund Performance | | Gartmore Nationwide Leaders Fund |
Average Annual Total Return
(For periods ended October 31, 2006)
| | | | | | |
| | | | | 1 Yr. | | Inception1 |
| Class A | | w/o SC2 | | 15.16% | | 11.52% |
| | | w/SC3 | | 8.54% | | 10.15% |
| Class B | | w/o SC2 | | 14.35% | | 10.71% |
| | | w/SC4 | | 9.35% | | 10.43% |
| Class C | | w/o SC2 | | 14.32% | | 10.71% |
| | | w/SC5 | | 13.32% | | 10.71% |
| Class R6,7 | | | | 14.87% | | 11.09% |
| Institutional Service Class6 | | | | 15.27% | | 11.62% |
| Institutional Class6,8 | | | | 15.60% | | 11.74% |
All figures showing the effect of a sales charge reflect the maximum charge possible, because it has the most dramatic effect on performance data.
| 1 | Fund commenced operations on December 28, 2001. |
| 2 | These returns do not reflect the effects of sales charges (SC). |
| 3 | A 5.75% front-end sales charge was deducted. |
| 4 | A 5.00% contingent deferred sales charge (CDSC) was deducted. The CDSC declines to 0% after 6 years. |
| 5 | A CDSC of 1.00% was deducted from the one year return because it is charged when you sell Class C shares within the first year after purchase. |
| 6 | Not subject to any sales charges. |
| 7 | These returns until the creation of Class R shares (10/1/03) include the performance of the Fund’s Class B shares. The returns have been adjusted for the fact that Class R shares do not have any applicable sales charges but have not been adjusted for the lower expenses applicable to Class R shares. Excluding the effect of any fee waivers or reimbursements, such prior performance is similar to what Class R shares would have produced because the Class R shares invest in the same portfolio of securities as Class B shares. |
| 8 | These returns until the creation of Institutional Class shares (6/29/04) include the performance of the Fund’s Institutional Service shares. The returns have been adjusted for the fact that Institutional Class shares do not have any applicable sales charges but have not been adjusted for the lower expenses applicable to Institutional Class shares. Excluding the effect of any fee waivers or reimbursements, such prior performance is similar to what Institutional Class shares would have produced because the Institutional Class shares invest in the same portfolio of securities as Institutional Service shares. |
Performance of a $10,000 Investment
Investment return and principal value will fluctuate, and when redeemed, shares may be worth more or less than original cost. Past performance is no guarantee of future results and does not reflect the deduction of taxes that a shareholder would pay on fund distributions or the redemption of fund shares. Investing in mutual funds involves market risk, including loss of principal. Performance returns assume the reinvestment of all distributions.
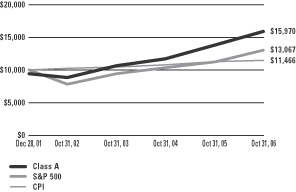
Comparative performance of $10,000 invested in Class A shares of the Gartmore Nationwide Leaders Fund, S&P 500 Index (S&P 500)(a) and the Consumer Price Index (CPI)(b) since inception. Unlike the Fund, the returns for these unmanaged indexes do not reflect any fees, expenses, or sales charges. Investors cannot invest directly in market indexes.
| (a) | The S&P 500 is an unmanaged index of 500 widely held stocks of large U.S. companies that gives a broad look at how the stock prices of large U.S. companies have performed. |
| (b) | The CPI represents changes in prices of a basket of goods and services purchased for consumption by urban households. |
| | |
Shareholder Expense Example | | Gartmore Nationwide Leaders Fund |
As a shareholder of the Fund, you incur two types of costs: (1) transaction costs, including sales charges (loads) paid on purchase payments and redemption fees; and (2) ongoing costs, including investment advisory fees, administration fees, distribution fees and other Fund expenses. The examples below are intended to help you understand your ongoing costs (in dollars) of investing in the Fund and to compare these costs with the ongoing costs of investing in other mutual funds. Per SEC requirements, the examples assume that you had a $1,000 investment in the Class at the beginning of the reporting period, May 1, 2006 and continued to hold your shares at the end of the reporting period, October 31, 2006.
Actual Expenses
For each Class of the Fund in the table below, the first line provides information about actual account values and actual expenses. You may use the information in this line, together with the amount you invested, to estimate the expenses that you paid over the period. Simply divide your account value by $1,000 (for example, an $8,600 account value divided by $1,000 = 8.6), then multiply the result by the number in the first line of each Class under the heading entitled “Expenses Paid During Period” to estimate the expenses you paid on your account during the period.
Hypothetical Example for Comparison Purposes
The second line of each Class in the table below provides information about hypothetical account values and hypothetical expenses based on the Class’ actual expense ratio and an assumed rate of return of 5% per year before expenses, which is not the Class’ actual return. The hypothetical account values and expenses may not be used to estimate the actual ending account balance or expenses you paid for the period. You may use this information to compare the ongoing costs of investing in the Class of the Fund and other funds. To do so, compare this 5% hypothetical example with the 5% hypothetical examples that appear in the shareholder reports of the other funds.
Please note that the expenses shown in the table are meant to highlight your ongoing costs only and do not reflect any transaction costs, such as sales charges (loads) or redemption fees. Therefore, the second line for each Class in the table is useful in comparing ongoing costs only, and will not help you determine the relative total costs of owning different funds. In addition, if these transaction costs were included, your costs would have been higher. The examples also assume all dividends and distributions have been reinvested.
Schedule of Shareholder Expenses
Expense Analysis of a $1,000 Investment
(October 31, 2006)
| | | | | | | | | | | | | | |
| Nationwide Leaders Fund | | | | | Beginning
Account Value,
5/1/06 | | Ending
Account Value,
10/31/06 | | Expenses Paid
During Period* | | Annualized
Expense Ratio* |
| Class A | | Actual | | | $ | 1,000.00 | | $ | 1,037.10 | | $ | 8.01 | | 1.56% |
| | | Hypothetical | 1 | | $ | 1,000.00 | | $ | 1,017.14 | | $ | 7.96 | | 1.56% |
| Class B | | Actual | | | $ | 1,000.00 | | $ | 1,033.00 | | $ | 11.63 | | 2.27% |
| | | Hypothetical | 1 | | $ | 1,000.00 | | $ | 1,013.56 | | $ | 11.59 | | 2.27% |
| Class C | | Actual | | | $ | 1,000.00 | | $ | 1,033.00 | | $ | 11.63 | | 2.27% |
| | | Hypothetical | 1 | | $ | 1,000.00 | | $ | 1,013.56 | | $ | 11.59 | | 2.27% |
| Class R | | Actual | | | $ | 1,000.00 | | $ | 1,034.90 | | $ | 9.49 | | 1.85% |
| | | Hypothetical | 1 | | $ | 1,000.00 | | $ | 1,015.67 | | $ | 9.44 | | 1.85% |
| Institutional Service Class | | Actual | | | $ | 1,000.00 | | $ | 1,037.40 | | $ | 7.19 | | 1.40% |
| | | Hypothetical | 1 | | $ | 1,000.00 | | $ | 1,017.94 | | $ | 7.15 | | 1.40% |
| Institutional Class | | Actual | | | $ | 1,000.00 | | $ | 1,039.10 | | $ | 6.22 | | 1.21% |
| | | Hypothetical | 1 | | $ | 1,000.00 | | $ | 1,018.90 | | $ | 6.18 | | 1.21% |
| * | Expenses are equal to the Fund’s annualized expense ratio multiplied by the average account value over the period multiplied by 184/365 (to reflect the one-half year period). The expense ratio presented represents a six-month, annualized ratio in accordance with SEC guidelines. |
| 1 | Represents the hypothetical 5% return before expenses. |
| | |
Portfolio Summary | | Gartmore Nationwide Leaders Fund |
October 31, 2005
The SEC adopted a requirement that Funds present their portfolio holdings in a table, chart or graph format in their annual and semiannual reports to shareholders, whether or not a statement of investments is utilized. The following tables, which present portfolio holdings as a percentage of net assets, are provided in compliance with this requirement.
| | |
| Asset Allocation | | |
| Common Stock | | 96.5% |
| Repurchase Agreements | | 3.5% |
| | |
| | 100.0% |
| | |
| Top Industries | | |
| Retail | | 18.8% |
| Computer Software & Services | | 14.5% |
| Semiconductors | | 11.7% |
| Food & Beverage | | 9.8% |
| Healthcare | | 7.5% |
| Insurance | | 7.0% |
| Transportation | | 4.9% |
| Electronics | | 4.7% |
| Aerospace & Defense | | 4.6% |
| Distribution & Wholesale | | 3.8% |
| Other Assets | | 12.7% |
| | |
| | 100.0% |
| | |
| Top Holdings* | | |
| Federated Department Stores, Inc. | | 7.2% |
| Texas Instruments, Inc. | | 7.1% |
| Allstate Corp. (The) | | 7.0% |
| Brown-Forman Corp., Class B | | 6.5% |
| Juniper Networks, Inc. | | 5.8% |
| Cisco Systems, Inc. | | 5.7% |
| TJX Cos., Inc. (The) | | 4.9% |
| FedEx Corp. | | 4.9% |
| Arrow Electronics, Inc. | | 4.7% |
| General Dynamics Corp. | | 4.6% |
| Other Assets | | 41.6% |
| | |
| | 100.0% |
| * | For purpose of listing top holdings, repurchase agreements are considered cash equivalents and are included as part of Other Assets. |
Gartmore Nationwide Leaders Fund
Common Stocks (96.5%)
Statement of Investments
October 31, 2006
| | | | | |
| | | Shares or
Principal Amount | | Value |
| | | | | |
Aerospace & Defense (4.6%) | | | | | |
General Dynamics Corp. | | 8,000 | | $ | 568,800 |
| | | | | |
Apparel (2.5%) | | | | | |
VF Corp. | | 4,000 | | | 304,040 |
| | | | | |
Banks (1.9%) |
Barclays PLC ADR — GB | | 4,200 | | | 228,102 |
| | | | | |
Computer Software & Services (14.5%) |
Cisco Systems, Inc. (b) | | 28,800 | | | 694,944 |
Juniper Networks, Inc. (b) | | 41,200 | | | 709,464 |
Oracle Corp. (b) | | 20,000 | | | 369,400 |
| | | | | |
| | | | | 1,773,808 |
| | | | | |
Distribution & Wholesale (3.8%) |
CDW Corp. | | 7,000 | | | 459,690 |
| | | | | |
Electronics (4.7%) |
Arrow Electronics, Inc. (b) | | 19,400 | | | 579,090 |
| | | | | |
Financial Services (1.9%) |
Northern Trust Corp. | | 3,900 | | | 229,008 |
| | | | | |
Food & Beverage (9.8%) |
Brown-Forman Corp., Class B | | 11,100 | | | 801,309 |
Constellation Brands, Inc., Class A (b) | | 14,700 | | | 404,103 |
| | | | | |
| | | | | 1,205,412 |
| | | | | |
Healthcare (7.5%) |
UnitedHealth Group, Inc. | | 9,900 | | | 482,922 |
WellPoint, Inc. (b) | | 5,700 | | | 435,024 |
| | | | | |
| | | | | 917,946 |
| | | | | |
Insurance (7.0%) |
Allstate Corp. (The) | | 14,000 | | | 859,040 |
| | | | | |
Metals (2.9%) |
Phelps Dodge Corp. | | 3,600 | | | 361,368 |
| | | | | |
Retail (18.8%) |
CVS Corp. | | 13,500 | | | 423,630 |
Federated Department Stores, Inc. | | 20,100 | | | 882,591 |
Home Depot, Inc. (The) | | 10,800 | | | 403,164 |
TJX Cos., Inc. (The) | | 20,600 | | | 596,370 |
| | | | | |
| | | | | 2,305,755 |
| | | | | |
| | | | | | |
| | | Shares or
Principal Amount | | Value |
| | | | | | |
Semiconductors (11.7%) |
Novellus Systems, Inc. (b) | | | 20,100 | | $ | 555,765 |
Texas Instruments, Inc. | | | 29,000 | | | 875,220 |
| | | | | | |
| | | | | | 1,430,985 |
| | | | | | |
Transportation (4.9%) |
FedEx Corp. | | | 5,200 | | | 595,608 |
| | | | | | |
| | |
Total Common Stocks | | | | | | 11,818,652 |
| | | | | | |
|
Repurchase Agreements (3.5%) |
CS First Boston, 5.17%, dated 10/31/06, due 11/01/06, repurchase price $219,776, collateralized by U.S. Government Agency Mortgages with a market value of $224,139 | | $ | 219,744 | | | 219,744 |
Nomura Securities, 5.17%, dated 10/31/06, due 11/01/06, repurchase price $209,835, collateralized by U.S. Government Agency Mortgages with a market value of $214,001 | | | 209,805 | | | 209,805 |
| | | | | | |
| |
Total Repurchase Agreements | | | 429,549 |
| | | | | | |
| |
Total Investments
(Cost $12,142,534) (a) — 100.0% | | | 12,248,201 |
| |
Other assets in excess of
liabilities — 0.0% | | | 3,685 |
| | | | | | |
| | |
NET ASSETS — 100.0% | | | | | $ | 12,251,886 |
| | | | | | |
| | (a) | See notes to financial statements for tax unrealized appreciation (depreciation) of securities. |
| | (b) | Denotes a non-income producing security. |
| | ADR | American Depository Receipts |
See notes to financial statements.
Gartmore Small Cap Leaders Fund
For the annual period ended Oct. 31, 2006, the Gartmore Small Cap Leaders Fund (Class A at NAV) returned 30.65% versus 19.98% for its benchmark, the Russell 2000® Index. For broader comparison, the average return for the Fund’s Lipper peer category of Small-Cap Core Funds (consisting of 689 funds as of Oct. 31, 2006) was 16.40%.
Small-capitalization stocks continued their dominance over large- and mid-cap stocks. The group got off to a strong start during the first half of the reporting period, aided by especially robust gains at the beginning of 2006. However, small caps were hurt badly from mid-May through mid-July, when the stock market declined sharply amid heightened investor concerns about worsening inflation and the possibility that the Federal Reserve Board might increase interest rates further than expected. During that spring/summer interval, investors favored large-cap stocks and defensive sectors as potential ways of dampening risk. The stock market’s volatility also hurt growth stocks relative to their value counterparts and enabled the value group to outperform growth during the period overall.
As the summer progressed, the inflation outlook improved, and the economy appeared to be slowing, providing the Federal Reserve with the flexibility it needed to hold interest rates steady at the August, September and October Federal Open Market Committee meetings. Adding to the positive backdrop late in the reporting period were a relatively benign hurricane season and a sharp decline in crude oil and natural gas prices. These factors served to help small caps lead the market higher in the final three months of the reporting period. Also benefiting small-cap stocks was an active mergers-and-acquisitions environment as private equity firms flush with cash used that capital to make acquisitions at healthy premiums.
Contributors to Fund performance in the Fund’s growth sleeve included shoe manufacturer Crocs, Inc.; semiconductor maker Rudolph Technologies, Inc.; and orthopedic device supplier Encore Medical Corp. We continued to own shares in all but Encore Medical, as this company was acquired during the reporting period.
Detractors from Fund performance in the Fund’s growth sleeve during the reporting period included railroad firm Genesee & Wyoming Inc. and prestige fragrance maker Parlux Fragrances, Inc. While Genesee & Wyoming experienced temporary operational disruptions, we expected those problems to be resolved; therefore, we maintained a position in the stock. On the other hand, we sold our stake in Parlux Fragrances due to concerns about the company’s strategic direction.
In the Fund’s value sleeve, Fund returns were helped by investments in a number of real estate investment trusts (REITs). For example, Entertainment Properties Trust, a leading cineplex REIT, benefited from its solid base of modern cineplex facilities, decent yield and promising growth prospects; we sold the stock. Fund holding Continental Airlines, Inc. also aided the Fund’s results; we purchased the stock when crude oil prices appeared to have peaked, and declining fuel prices, together with the constrained capacity resulting from a number of bankruptcies in the airline industry, aided the stock. Volatile oil service holding RPC, Inc. was another contributor to Fund performance; we bought the stock on weakness early in 2006 and sold it in the spring near the upper end of its recent range.
Conversely, the Fund’s position in Astec Industries, Inc., a maker of heavy equipment for highway construction, had a negative impact on Fund performance in the value sleeve. Increasing raw material costs and disappointing earnings triggered a steep sell-off in the stock, and we sold it. Another Fund holding, wireless communication transmission equipment maker Powerwave Technologies, Inc., also was a disappointment. Consolidation of the company’s customer base, along with market share gains by the firm’s primary competitor, hurt Powerwave Technologies’ stock.
Now that the Fed has kept interest rates steady during three consecutive FOMC meetings, we believe the odds are increasing that we have seen at least a temporary peak in short-term rates. The recent upward revision in third-quarter GDP growth from 1.6% to 2.2%, however, likely lessens the chances of a rate cut any time soon. Furthermore, we believe that the steep decline in the prices of energy and raw materials is likely to temper any slowdown in economic growth in 2007. At the company level, we continue to see plentiful opportunities to purchase attractive small-cap stocks.
Portfolio Managers:
Gary Haubold, CFA (value sleeve) and
Carl Wilk, CFP (growth sleeve)
| | |
Fund Performance | | Gartmore Small Cap Leaders Fund |
Average Annual Total Return
(For periods ended October 31, 2006)
| | | | | | |
| | | | | 1 Yr. | | Inception1 |
| Class A | | w/o SC2 | | 30.65% | | 16.16% |
| | | w/SC3 | | 24.13% | | 12.94% |
| Class B | | w/o SC2 | | 29.55% | | 15.31% |
| | | w/SC4 | | 24.55% | | 13.37% |
| Class C | | w/o SC2 | | 29.63% | | 15.41% |
| | | w/SC5 | | 28.63% | | 15.41% |
| Class R6 | | | | 30.32% | | 15.81% |
| Institutional Service Class6 | | | | 30.83% | | 16.37% |
| Institutional Class6 | | | | 31.03% | | 16.53% |
All figures showing the effect of a sales charge reflect the maximum charge possible, because it has the most dramatic effect on performance data.
| 1 | Fund commenced operations on December 29, 2004. |
| 2 | These returns do not reflect the effects of sales charges (SC). |
| 3 | A 5.75% front-end sales charge was deducted. |
| 4 | A 5.00% contingent deferred sales charge (CDSC) was deducted. The CDSC declines to 0% after 6 years. |
| 5 | A CDSC of 1.00% was deducted from the one year return because it is charged when you sell Class C shares within the first year after purchase. |
| 6 | Not subject to any sales charges. |
Performance of a $10,000 Investment
Investment return and principal value will fluctuate, and when redeemed, shares may be worth more or less than original cost. Past performance is no guarantee of future results and does not reflect the deduction of taxes that a shareholder would pay on fund distributions or the redemption of fund shares. Investing in mutual funds involves market risk, including loss of principal. Performance returns assume the reinvestment of all distributions.
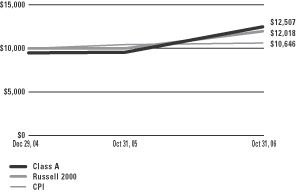
Comparative performance of $10,000 invested in Class A shares of the Gartmore Small Cap Leaders Fund, Russell 2000 Index(a), and the Consumer Price Index (CPI)(b) since inception. Unlike the Fund, the returns for these unmanaged indexes do not reflect any fees, expenses, or sales charges. Investors cannot invest directly in market indexes.
| (a) | The Russell 2000 is an unmanaged index of approximately 2,000 companies with small market capitalizations relative to the market capilizations of other U.S. companies. |
| (b) | The CPI represents changes in prices of a basket of goods and services purchased for consumption by urban households. |
| | |
Shareholder Expense Example | | Gartmore Small Cap Leaders Fund |
As a shareholder of the Fund, you incur two types of costs: (1) transaction costs, including sales charges (loads) paid on purchase payments and redemption fees; and (2) ongoing costs, including investment advisory fees, administration fees, distribution fees and other Fund expenses. The examples below are intended to help you understand your ongoing costs (in dollars) of investing in the Fund and to compare these costs with the ongoing costs of investing in other mutual funds. Per SEC requirements, the examples assume that you had a $1,000 investment in the Class at the beginning of the reporting period, May 1, 2006 and continued to hold your shares at the end of the reporting period, October 31, 2006.
Actual Expenses
For each Class of the Fund in the table below, the first line provides information about actual account values and actual expenses. You may use the information in this line, together with the amount you invested, to estimate the expenses that you paid over the period. Simply divide your account value by $1,000 (for example, an $8,600 account value divided by $1,000 = 8.6), then multiply the result by the number in the first line of each Class under the heading entitled “Expenses Paid During Period” to estimate the expenses you paid on your account during the period.
Hypothetical Example for Comparison Purposes
The second line of each Class in the table below provides information about hypothetical account values and hypothetical expenses based on the Class’ actual expense ratio and an assumed rate of return of 5% per year before expenses, which is not the Class’ actual return. The hypothetical account values and expenses may not be used to estimate the actual ending account balance or expenses you paid for the period. You may use this information to compare the ongoing costs of investing in the Class of the Fund and other funds. To do so, compare this 5% hypothetical example with the 5% hypothetical examples that appear in the shareholder reports of the other funds.
Please note that the expenses shown in the table are meant to highlight your ongoing costs only and do not reflect any transaction costs, such as sales charges (loads) or redemption fees. Therefore, the second line for each Class in the table is useful in comparing ongoing costs only, and will not help you determine the relative total costs of owning different funds. In addition, if these transaction costs were included, your costs would have been higher. The examples also assume all dividends and distributions have been reinvested.
Schedule of Shareholder Expenses
Expense Analysis of a $1,000 Investment
(October 31, 2006)
| | | | | | | | | | | | | | |
| Small Cap Leaders Fund | | | | | Beginning
Account Value,
5/1/06 | | Ending
Account Value,
10/31/06 | | Expenses Paid
During Period* | | Annualized
Expense Ratio* |
| Class A | | Actual | | | $ | 1,000.00 | | $ | 1,000.50 | | $ | 8.12 | | 1.61% |
| | | Hypothetical | 1 | | $ | 1,000.00 | | $ | 1,016.88 | | $ | 8.22 | | 1.61% |
| Class B | | Actual | | | $ | 1,000.00 | | $ | 996.20 | | $ | 11.82 | | 2.35% |
| | | Hypothetical | 1 | | $ | 1,000.00 | | $ | 1,013.15 | | $ | 11.99 | | 2.35% |
| Class C | | Actual | | | $ | 1,000.00 | | $ | 997.10 | | $ | 11.83 | | 2.35% |
| | | Hypothetical | 1 | | $ | 1,000.00 | | $ | 1,013.15 | | $ | 11.99 | | 2.35% |
| Class R | | Actual | | | $ | 1,000.00 | | $ | 998.70 | | $ | 10.28 | | 2.04% |
| | | Hypothetical | 1 | | $ | 1,000.00 | | $ | 1,014.72 | | $ | 10.41 | | 2.04% |
| Institutional Service Class | | Actual | | | $ | 1,000.00 | | $ | 1,000.80 | | $ | 7.56 | | 1.50% |
| | | Hypothetical | 1 | | $ | 1,000.00 | | $ | 1,017.44 | | $ | 7.66 | | 1.50% |
| Institutional Class | | Actual | | | $ | 1,000.00 | | $ | 1,001.80 | | $ | 6.81 | | 1.35% |
| | | Hypothetical | 1 | | $ | 1,000.00 | | $ | 1,018.19 | | $ | 6.89 | | 1.35% |
| * | Expenses are equal to the Fund’s annualized expense ratio multiplied by the average account value over the period multiplied by 184/365 (to reflect the one-half year period). The expense ratio presented represents a six-month, annualized ratio in accordance with SEC guidelines. |
| 1 | Represents the hypothetical 5% return before expenses. |
| | |
Portfolio Summary | | Gartmore Small Cap Leaders Fund |
October 31, 2006
The SEC adopted a requirement that Funds present their portfolio holdings in a table, chart or graph format in their annual and semiannual reports to shareholders, whether or not a statement of investments is utilized. The following tables, which present portfolio holdings as a percentage of net assets, are provided in compliance with this requirement.
| | |
| Asset Allocation | | |
| Common Stock | | 94.2% |
| Other assets in excess of liabilities | | 5.8% |
| | |
| | 100.0% |
| | |
| Top Industries | | |
| Transportation | | 8.7% |
| Financial | | 8.1% |
| Semiconductors | | 8.0% |
| Retail | | 7.3% |
| Real Estate | | 7.2% |
| Software | | 5.4% |
| Healthcare | | 4.4% |
| Electronics | | 4.1% |
| Financial Services | | 3.9% |
| Pharmaceuticals | | 3.2% |
| Other Assets | | 39.7% |
| | |
| | 100.0% |
| | |
| Top Holdings | | |
| Greenbrier Cos., Inc. | | 3.4% |
| Longs Drug Stores Corp. | | 3.1% |
| Ruby Tuesday, Inc. | | 2.7% |
| Ruth’s Chris Steak House, Inc. | | 2.4% |
| Sybase, Inc. | | 2.3% |
| Morningstar, Inc. | | 2.2% |
| CBRE Realty Finance, Inc. | | 2.2% |
| Celadon Group, Inc. | | 2.1% |
| Ceradyne, Inc. | | 2.1% |
| ATMI, Inc. | | 2.1% |
| Other Assets | | 75.4% |
| | |
| | 100.0% |
Statement of Investments
October 31, 2006
Gartmore Small Cap Leaders Fund
Common Stocks (94.2%)
| | | | | |
| | | Shares | | Value |
| | | | | |
Aerospace & Defense (2.2%) |
Aeroflex, Inc. (b) | | 24,900 | | $ | 268,920 |
Alliant Techsystems, Inc. (b) | | 7,800 | | | 602,238 |
| | | | | |
| | | | | 871,158 |
| | | | | |
Agricultural Operations (1.8%) |
Andersons, Inc. (The) | | 20,000 | | | 719,000 |
| | | | | |
Airlines (2.1%) |
Continental Airlines (b) | | 17,100 | | | 630,648 |
JetBlue Airways Corp. (b) | | 17,100 | | | 214,776 |
| | | | | |
| | | | | 845,424 |
| | | | | |
Apparel & Accessories (2.0%) |
Crocs, Inc. (b) | | 20,000 | | | 792,400 |
| | | | | |
Athletic Equipment (1.7%) |
Cybex International, Inc. (b) | | 92,200 | | | 682,280 |
| | | | | |
Construction Materials (2.1%) |
Ceradyne, Inc. (b) | | 20,400 | | | 841,500 |
| | | | | |
Distribution (1.9%) |
Central European Distribution Corp. (b) | | 30,000 | | | 761,400 |
| | | | | |
E-Commerce (1.0%) |
Ariba, Inc. (b) | | 54,800 | | | 413,740 |
| | | | | |
Electronics (4.1%) |
Benchmark Electronics, Inc. (b) | | 22,500 | | | 597,375 |
Directed Electronics, Inc. (b) | | 48,200 | | | 662,750 |
Technitrol, Inc. | | 15,100 | | | 380,822 |
| | | | | |
| | | | | 1,640,947 |
| | | | | |
Entertainment (1.3%) |
Regal Entertainment Group | | 26,470 | | | 548,723 |
| | | | | |
Financial (8.1%) |
Medallion Financial Corp. | | 50,000 | | | 597,500 |
Penson Worldwide, Inc. (b) | | 30,000 | | | 729,600 |
Sanders Morris Harris Group, Inc. | | 55,180 | | | 648,917 |
Thomas Weisel Partners Group, Inc. (b) | | 32,890 | | | 526,569 |
World Acceptance Corp. (b) | | 16,000 | | | 799,840 |
| | | | | |
| | | | | 3,302,426 |
| | | | | |
| | | | | |
| | | Shares | | Value |
| | | | | |
Financial Services (3.9%) |
KKR Financial Corp. | | 25,000 | | $ | 670,750 |
Morningstar, Inc. (b) | | 22,000 | | | 900,240 |
| | | | | |
| | | | | 1,570,990 |
| | | | | |
Food & Related (1.2%) |
Sunopta, Inc. — CA (b) | | 48,800 | | | 480,680 |
| | | | | |
Healthcare (4.4%) |
Covance, Inc. (b) | | 11,000 | | | 643,500 |
Five Star Quality Care, Inc. (b) | | 46,200 | | | 476,322 |
Hythiam, Inc. (b) | | 78,450 | | | 637,799 |
| | | | | |
| | | | | 1,757,621 |
| | | | | |
Human Resources (2.4%) |
Kforce, Inc. (b) | | 50,000 | | | 748,500 |
Korn/Ferry International (b) | | 10,200 | | | 225,522 |
| | | | | |
| | | | | 974,022 |
| | | | | |
Machinery (1.5%) |
Flow International Corp. (b) | | 49,700 | | | 585,466 |
| | | | | |
Manufacturing (1.6%) |
Phillips-Van Heusen Corp. | | 2,640 | | | 120,806 |
Rudolph Technologies, Inc. (b) | | 29,800 | | | 526,268 |
| | | | | |
| | | | | 647,074 |
| | | | | |
Marketing Services (1.8%) |
inVentiv Health, Inc. (b) | | 25,000 | | | 715,000 |
| | | | | |
Multimedia (1.6%) |
Sonic Solutions (b) | | 40,000 | | | 645,600 |
| | | | | |
Networking Products (1.2%) |
Anixter International, Inc. (b) | | 7,800 | | | 466,128 |
| | | | | |
Oil & Gas (2.6%) |
Cabot Oil & Gas Corp. | | 5,000 | | | 264,550 |
World Fuel Services Corp. | | 18,300 | | | 787,266 |
| | | | | |
| | | | | 1,051,816 |
| | | | | |
Pharmaceuticals (3.2%) |
Sciele Pharma, Inc. (b) | | 30,000 | | | 654,300 |
West Pharmaceutical Services, Inc. | | 15,000 | | | 630,600 |
| | | | | |
| | | | | 1,284,900 |
| | | | | |
Common Stocks (continued)
| | | | | |
| | | Shares | | Value |
| | | | | |
Real Estate (7.2%) |
CBRE Realty Finance, Inc. (b) | | 57,900 | | $ | 888,186 |
Equity Inns, Inc. | | 47,100 | | | 790,338 |
Hersha Hospitality Trust | | 20,200 | | | 221,392 |
Highland Hospitality Corp. | | 17,000 | | | 234,940 |
LTC Properties, Inc. | | 28,600 | | | 775,060 |
| | | | | |
| | | | | 2,909,916 |
| | | | | |
Restaurants (2.4%) |
Ruth’s Chris Steak House, Inc. (b) | | 48,800 | | | 960,872 |
| | | | | |
Retail (7.3%) |
Jos. A. Bank Clothiers, Inc. (b) | | 20,000 | | | 593,800 |
Longs Drug Stores Corp. | | 28,800 | | | 1,239,552 |
Ruby Tuesday, Inc. | | 39,700 | | | 1,101,675 |
| | | | | |
| | | | | 2,935,027 |
| | | | | |
Semiconductors (8.0%) |
ATMI, Inc. (b) | | 26,200 | | | 830,278 |
BTU International, Inc. (b) | | 60,000 | | | 597,000 |
ON Semiconductor Corp. (b) | | 109,000 | | | 677,980 |
Silicon Motion Technology Corp.
ADR — KY (b) | | 41,010 | | | 630,324 |
Varian Semiconductor Equipment Associates, Inc. (b) | | 14,100 | | | 514,509 |
| | | | | |
| | | | | 3,250,091 |
| | | | | |
Software (5.4%) |
Sybase, Inc. (b) | | 38,400 | | | 935,040 |
Synchronoss Technologies, Inc. (b) | | 56,454 | | | 568,492 |
Unica Corp. (b) | | 59,806 | | | 685,975 |
| | | | | |
| | | | | 2,189,507 |
| | | | | |
| | | | | |
| | | Shares | | Value |
| | | | | |
Telecommunications (1.5%) |
Sirenza Microdevices, Inc. (b) | | 84,900 | | $ | 622,317 |
| | | | | |
Transportation (8.7%) |
Atlas Air Worldwide Holdings, Inc. (b) | | 17,000 | | | 773,330 |
Celadon Group, Inc. (b) | | 45,000 | | | 844,200 |
Greenbrier Cos., Inc. | | 37,100 | | | 1,391,249 |
Omega Navigation Enterprises, Inc. — GR | | 34,350 | | | 546,165 |
| | | | | |
| | | | | 3,554,944 |
| | | | | |
| |
Total Common Stocks | | | 38,020,969 |
| | | | | |
| |
Total Investments
(Cost $35,611,701) (a) — 94.2% | | | 38,020,969 |
| |
Other assets in excess of
liabilities — 5.8% | | | 2,332,732 |
| | | | | |
| | |
NET ASSETS — 100.0% | | | | $ | 40,353,701 |
| | | | | |
| | (a) | See notes to financial statements for tax unrealized appreciation (depreciation) of securities. |
| | (b) | Denotes a non-income producing security. |
| | ADR | American Depository Receipt |
See notes to financial statements.
Gartmore U.S. Growth Leaders Fund
For the annual period ended Oct. 31, 2006, the Gartmore U.S. Growth Leaders Fund (Class A at NAV) returned 1.77% versus 16.34% for its benchmark, the S&P 500® Index. For broader comparison, the average return for the Fund’s Lipper peer category of Multi-Cap Growth Funds (consisting of 495 funds as of Oct. 31, 2006) was 10.39%.
Growth stocks posted respectable gains during the reporting period but trailed value stocks in all three major capitalization groups. Within the large-cap segment, value outperformed growth by almost a two-to-one margin. Value stocks were especially attractive to investors during the late spring/early summer market correction, which developed in response to fears about intensifying inflationary pressures and signs that the Federal Reserve Board might hike interest rates more than expected. Those fears eased during the summer months as inflation data moderated and economic growth decelerated. The Federal Reserve in turn held rates steady at its August, September and October Federal Open Market Committee meetings. Falling energy prices near the end of the reporting period added to investors’ optimism, resulting in growth stocks generally outpacing value during the rally that occurred in the final three months of the reporting period.
The Fund’s positioning was aggressive with a focus on companies with a smaller market capitalization from the beginning of the reporting period until April, which proved beneficial to the Fund’s returns. That said, we became aggressive again too early in the subsequent decline, which hurt Fund performance. One change we made was to increase the Fund’s weightings in proven market leaders such as Cisco Systems, Inc.; Apple Computer, Inc.; and Corning Inc., while reducing Fund exposure to stocks that were somewhat more speculative, even though we felt that they had great growth prospects. Concurrently, we scaled back the Fund’s stake in industrials stocks, which tend to be economically sensitive, from an overweighting to an underweighting to reflect the environment of slowing gross domestic product growth. We continued to carry a large Fund overweighting in technology at the end of the period, because we saw many opportunities there and remain very excited about technology stocks.
The Fund’s performance, relative to that of its benchmark, was hurt by unfavorable stock selection and a overweighting in the information technology sector. Other sectors that detracted from Fund performance included energy, consumer discretionary, health-care and consumer staples. A large position by the Fund in Marvell Technology Group Ltd. contributed most significantly to Fund underperformance, because the company was one of many technology firms that fell prey to the stock options pricing controversy. In energy services, we owned Schlumberger Ltd. for part of the reporting period, but unfortunately, missed the bulk of its advance.
Stock selection in materials added value to the Fund. Fund holding Inco Ltd., a producer of nickel, was acquired by a Brazilian iron ore mining company on favorable terms during the reporting period, while Fund holding Praxair, Inc. benefited from strong demand for its industrial gases.
At present, we are finding attractive opportunities across the full range of capitalization groups and will continue to use the Fund’s flexible mandate to exploit those opportunities. Overall, the Fund’s average weighted market capitalization increased during the reporting period (from $29.3 billion in October 2005 to a low of $17.4 in February ending at $37.3 billion in October 2006), reflecting our desire to add stability to the Fund while retaining its growth orientation.
Portfolio Managers:
Christopher Baggini, CFA and Douglas Burtnick, CFA
| | |
Fund Performance | | Gartmore U.S. Growth Leaders Fund |
Average Annual Total Return
(For periods ended October 31, 2006)
| | | | | | | | |
| | | | | 1 Yr. | | 5 Yr. | | Inception1 |
| Class A | | w/o SC2 | | 1.77% | | 10.98% | | 0.96% |
| | | w/SC3 | | -4.10% | | 9.67% | | 0.02% |
| Class B | | w/o SC2 | | 1.18% | | 10.24% | | 0.26% |
| | | w/SC4 | | -3.58% | | 9.97% | | 0.26% |
| Class C5 | | w/o SC2 | | 1.18% | | 10.23% | | 0.36% |
| | | w/SC6 | | 0.22% | | 10.23% | | 0.36% |
| Class R7,8 | | | | 1.60% | | 10.61% | | 0.53% |
| Institutional Service Class7 | | 1.95% | | 11.14% | | 1.17% |
| Institutional Class7,9 | | 2.16% | | 11.25% | | 1.25% |
All figures showing the effect of a sales charge reflect the maximum charge possible, because it has the most dramatic effect on performance data.
| 1 | Fund commenced operations on June 30, 2000. |
| 2 | These returns do not reflect the effects of sales charges (SC). |
| 3 | A 5.75% front-end sales charge was deducted. |
| 4 | A 5.00% contingent deferred sales charge (CDSC) was deducted. The CDSC declines to 0% after 6 years. |
| 5 | These returns until the creation of Class C shares (3/1/01) include the performance of the Fund’s Class B shares. Excluding the effects of any fee waivers or reimbursements, such prior performance is substantially similar to what Class C shares would have produced because Class C shares invest in the same portfolio of securities as Class B shares and have the same expenses after any fee waivers or reimbursements. For Class C shares returns with sales charges, these returns have been restated for the applicable sales charges. |
| 6 | A CDSC of 1.00% was deducted from the one year return because it is charged when you sell Class C shares within the first year after purchase. |
| 7 | Not subject to any sales charges. |
| 8 | These returns until the creation of Class R shares (10/1/03) include the performance of the Fund’s Class B shares. The returns have been adjusted for the fact that Class R shares do not have any applicable sales charges but have not been adjusted for the lower expenses applicable to Class R shares. Excluding the effect of any fee waivers or reimbursements, such prior performance is similar to what Class R shares would have produced because the Class R shares invest in the same portfolio of securities as Class B shares. |
| 9 | These returns until the creation of Institutional Class shares (6/29/04) include the performance of the Fund’s Institutional Service shares. The returns have been adjusted for the fact that Institutional Class shares do not have any applicable sales charges but have not been adjusted for the lower expenses applicable to Institutional Class shares. Excluding the effect of any fee waivers or reimbursements, such prior performance is similar to what Institutional Class shares would have produced because the Institutional Class shares invest in the same portfolio of securities as Institutional Service shares. |
Performance of a $10,000 Investment
Investment return and principal value will fluctuate, and when redeemed, shares may be worth more or less than original cost. Past performance is no guarantee of future results and does not reflect the deduction of taxes that a shareholder would pay on fund distributions or the redemption of fund shares. Investing in mutual funds involves market risk, including loss of principal. Performance returns assume the reinvestment of all distributions.
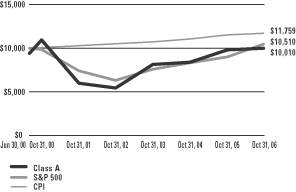
Comparative performance of $10,000 invested in Class A shares of the Gartmore U.S. Growth Leaders Fund, S&P 500 Index (S&P 500)(a), and the Consumer Price Index (CPI)(b) since inception. Unlike the Fund, the returns for these unmanaged indexes do not reflect any fees, expenses, or sales charges. Investors cannot invest directly in market indexes.
| (a) | The S&P 500 is an unmanaged index of 500 widely held stocks of large U.S. companies that gives a broad look at how the stock prices of large U.S. companies have performed. |
| (b) | The CPI represents changes in prices of a basket of goods and services purchased for consumption by urban households. |
| | |
Shareholder Expense Example | | Gartmore U.S. Growth Leaders Fund |
As a shareholder of the Fund, you incur two types of costs: (1) transaction costs, including sales charges (loads) paid on purchase payments and redemption fees; and (2) ongoing costs, including investment advisory fees, administration fees, distribution fees and other Fund expenses. The examples below are intended to help you understand your ongoing costs (in dollars) of investing in the Fund and to compare these costs with the ongoing costs of investing in other mutual funds. Per SEC requirements, the examples assume that you had a $1,000 investment in the Class at the beginning of the reporting period, May 1, 2006 and continued to hold your shares at the end of the reporting period, October 31, 2006.
Actual Expenses
For each Class of the Fund in the table below, the first line provides information about actual account values and actual expenses. You may use the information in this line, together with the amount you invested, to estimate the expenses that you paid over the period. Simply divide your account value by $1,000 (for example, an $8,600 account value divided by $1,000 = 8.6), then multiply the result by the number in the first line of each Class under the heading entitled “Expenses Paid During Period” to estimate the expenses you paid on your account during the period.
Hypothetical Example for Comparison Purposes
The second line of each Class in the table below provides information about hypothetical account values and hypothetical expenses based on the Class’ actual expense ratio and an assumed rate of return of 5% per year before expenses, which is not the Class’ actual return. The hypothetical account values and expenses may not be used to estimate the actual ending account balance or expenses you paid for the period. You may use this information to compare the ongoing costs of investing in the Class of the Fund and other funds. To do so, compare this 5% hypothetical example with the 5% hypothetical examples that appear in the shareholder reports of the other funds.
Please note that the expenses shown in the table are meant to highlight your ongoing costs only and do not reflect any transaction costs, such as sales charges (loads) or redemption fees. Therefore, the second line for each Class in the table is useful in comparing ongoing costs only, and will not help you determine the relative total costs of owning different funds. In addition, if these transaction costs were included, your costs would have been higher. The examples also assume all dividends and distributions have been reinvested.
Schedule of Shareholder Expenses
Expense Analysis of a $1,000 Investment
(October 31, 2006)
| | | | | | | | | | | | | | |
| U.S. Growth Leaders Fund | | | | | Beginning
Account Value,
5/1/06 | | Ending
Account Value,
10/31/06 | | Expenses Paid
During Period* | | Annualized
Expense Ratio* |
| Class A | | Actual | | | $ | 1,000.00 | | $ | 934.50 | | $ | 7.51 | | 1.54% |
| | | Hypothetical | 1 | | $ | 1,000.00 | | $ | 1,017.24 | | $ | 7.86 | | 1.54% |
| Class B | | Actual | | | $ | 1,000.00 | | $ | 931.60 | | $ | 10.95 | | 2.25% |
| | | Hypothetical | 1 | | $ | 1,000.00 | | $ | 1,013.66 | | $ | 11.48 | | 2.25% |
| Class C | | Actual | | | $ | 1,000.00 | | $ | 931.10 | | $ | 10.95 | | 2.25% |
| | | Hypothetical | 1 | | $ | 1,000.00 | | $ | 1,013.66 | | $ | 11.48 | | 2.25% |
| Class R | | Actual | | | $ | 1,000.00 | | $ | 933.70 | | $ | 9.36 | | 1.92% |
| | | Hypothetical | 1 | | $ | 1,000.00 | | $ | 1,015.32 | | $ | 9.80 | | 1.92% |
| Institutional Service Class | | Actual | | | $ | 1,000.00 | | $ | 935.40 | | $ | 6.83 | | 1.40% |
| | | Hypothetical | 1 | | $ | 1,000.00 | | $ | 1,017.94 | | $ | 7.15 | | 1.40% |
| Institutional Class | | Actual | | | $ | 1,000.00 | | $ | 936.60 | | $ | 6.10 | | 1.25% |
| | | Hypothetical | 1 | | $ | 1,000.00 | | $ | 1,018.70 | | $ | 6.38 | | 1.25% |
| * | Expenses are equal to the Fund’s annualized expense ratio multiplied by the average account value over the period multiplied by 184/365 (to reflect the one-half year period). The expense ratio presented represents a six-month, annualized ratio in accordance with SEC guidelines. |
| 1 | Represents the hypothetical 5% return before expenses. |
| | |
Portfolio Summary | | Gartmore U.S. Growth Leaders Fund |
October 31, 2006
The SEC adopted a requirement that Funds present their portfolio holdings in a table, chart or graph format in their annual and semiannual reports to shareholders, whether or not a statement of investments is utilized. The following tables, which present portfolio holdings as a percentage of net assets, are provided in compliance with this requirement.
| | |
| Asset Allocation | | |
| Common Stock | | 95.3% |
Repurchase Agreements | | 2.0% |
| Other Investments* | | 4.5% |
| Liabilities in excess of other assets** | | -1.8 % |
| | |
| | 100.0% |
| | |
| Top Industries | | |
| Computer Software & Services | | 12.8% |
| Financial Services | | 12.7% |
| Healthcare | | 12.0% |
| Computer Equipment | | 11.5% |
| Energy | | 8.3% |
| Telecommunications | | 5.3% |
| Semiconductors | | 5.2% |
| Retail | | 4.9% |
| Pharmaceuticals | | 4.7% |
| Electronics | | 3.5% |
| Other Assets | | 19.1% |
| | |
| | 100.0% |
| | |
| Top Holdings*** | | |
| Citrix Systems, Inc. | | 5.1% |
| Baxter International, Inc. | | 5.0% |
| Gilead Sciences, Inc. | | 4.1% |
| State Street Corp. | | 3.6% |
| Goldman Sachs Group, Inc. | | 3.6% |
| Emerson Electric Co. | | 3.5% |
| Corning, Inc. | | 3.4% |
| Comcast Corp., Class A | | 3.3% |
| E*TRADE Financial Corp. | | 3.3% |
| Integrated Device Technology, Inc. | | 3.2% |
| Other Assets | | 61.9% |
| | |
| | 100.0% |
| * | Includes value of collateral received from securities lending. |
| ** | Includes value of collateral owed from securities lending. |
| *** | For purpose of listing top holdings, repurchase agreements are considered cash equivalents and are included as part of Other Assets. |
Statement of Investments
October 31, 2006
Gartmore U.S. Growth Leaders Fund
Common Stocks (95.3%)
| | | | | |
| | | Shares or
Principal Amount | | Value |
| | | | | |
Aerospace & Defense (3.1%) | | | |
Boeing Co. (The) | | 51,510 | | $ | 4,113,589 |
| | | | | |
Banks (2.8%) | | | |
Wachovia Corp. | | 67,830 | | | 3,764,565 |
| | | | | |
Computer Equipment (11.5%) | | | |
Acme Packet, Inc. (b) (c) | | 71,490 | | | 1,229,628 |
Apple Computer, Inc. (b) | | 33,920 | | | 2,750,234 |
Juniper Networks, Inc. (b) | | 233,580 | | | 4,022,247 |
NVIDIA Corp. (b) | | 94,350 | | | 3,289,985 |
Sun Microsystems, Inc. (b) | | 767,250 | | | 4,166,167 |
| | | | | |
| | | | | 15,458,261 |
| | | | | |
Computer Software & Services (12.8%) | | | |
CheckFree Corp. (b) (c) | | 95,340 | | | 3,764,023 |
Cisco Systems, Inc. (b) | | 110,500 | | | 2,666,365 |
Citrix Systems, Inc. (b) | | 230,630 | | | 6,810,504 |
Hyperion Solutions Corp. (b) | | 110,500 | | | 4,132,700 |
| | | | | |
| | | | | 17,373,592 |
| | | | | |
Electronics (3.5%) | | | |
Emerson Electric Co. | | 55,690 | | | 4,700,236 |
| | | | | |
Energy (8.3%) | | | |
Peabody Energy Corp. | | 31,840 | | | 1,336,325 |
Praxair, Inc. | | 56,920 | | | 3,429,430 |
Valero Energy Corp. | | 50,710 | | | 2,653,654 |
XTO Energy, Inc. | | 79,330 | | | 3,701,538 |
| | | | | |
| | | | | 11,120,947 |
| | | | | |
Financial Services (12.7%) | | | |
E*TRADE Financial Corp. (b) | | 190,240 | | | 4,428,787 |
Goldman Sachs Group, Inc. | | 25,680 | | | 4,873,807 |
IntercontinentalExchange, Inc. (b) | | 37,000 | | | 3,123,540 |
State Street Corp. | | 75,890 | | | 4,874,415 |
| | | | | |
| | | | | 17,300,549 |
| | | | | |
Healthcare (12.0%) | | | |
Baxter International, Inc. | | 146,400 | | | 6,730,008 |
Gilead Sciences, Inc. (b) | | 80,020 | | | 5,513,378 |
WellPoint, Inc. (b) | | 52,200 | | | 3,983,904 |
| | | | | |
| | | | | 16,227,290 |
| | | | | |
Hotels & Casinos (3.1%) | | | |
Starwood Hotels & Resorts Worldwide | | 70,750 | | | 4,226,605 |
| | | | | |
| | | | | | |
| | | Shares or
Principal Amount | | Value |
| | | | | | |
Internet (2.1%) | | | |
Google, Inc. (b) | | | 6,000 | | $ | 2,858,340 |
| | | | | | |
Multimedia (3.3%) | | | |
Comcast Corp., Class A (b) (c) | | | 109,270 | | | 4,444,011 |
| | | | | | |
Pharmaceuticals (4.7%) | | | |
Novartis AG ADR — CH | | | 35,880 | | | 2,178,992 |
Wyeth | | | 81,120 | | | 4,139,554 |
| | | | | | |
| | | | | | 6,318,546 |
| | | | | | |
Retail (4.9%) | | | |
Abercrombie & Fitch Co. | | | 43,480 | | | 3,332,742 |
Best Buy Co., Inc. | | | 58,990 | | | 3,259,198 |
| | | | | | |
| | | | | | 6,591,940 |
| | | | | | |
Semiconductors (5.2%) | | | |
Broadcom Corp., Class A (b) | | | 87,000 | | | 2,633,490 |
Integrated Device Technology, Inc. (b) | | | 272,660 | | | 4,321,661 |
| | | | | | |
| | | | | | 6,955,151 |
| | | | | | |
Telecommunications (5.3%) | | | |
Corning, Inc. (b) | | | 227,200 | | | 4,641,696 |
Motorola, Inc. | | | 109,570 | | | 2,526,684 |
| | | | | | |
| | | | | | 7,168,380 |
| | | | | | |
| | |
Total Common Stocks | | | | | | 128,622,002 |
| | | | | | |
|
Repurchase Agreements (2.0%) |
CS First Boston, 5.17%, dated 10/31/06, due 11/01/06, repurchase price $1,352,711, collateralized by U.S. Government Agency Mortgages with a market value of $1,379,570 | | $ | 1,352,517 | | | 1,352,517 |
Nomura Securities, 5.17%, dated 10/31/06, due 11/01/06, repurchase price $1,291,529, collateralized by U.S. Government Agency Mortgages with a market value of $1,317,174 | | | 1,291,344 | | | 1,291,344 |
| | | | | | |
| | |
Total Repurchase Agreements | | | | | | 2,643,861 |
| | | | | | |
Short-Term Securities Held as Collateral for Securities on Loan (4.5%)
| | | | | | | |
| | | Shares or
Principal Amount | | Value | |
Banc of America Securities LLC Repurchase Agreement, 5.32%, dated 10/31/06, due 11/01/06, repurchase price $6,018,693, collateralized by U.S. Government Agency Mortgages with a market value of $6,138,160 | | $ | 6,017,804 | | $ | 6,017,804 | |
| | | | | | | |
| |
Total Short-Term Securities Held as Collateral for Securities on Loan | | | 6,017,804 | |
| | | | | | | |
| |
Total Investments
(Cost $129,395,535) (a) — 101.8% | | | 137,283,667 | |
| |
Liabilities in excess of other
assets — (1.8)% | | | (2,450,192 | ) |
| | | | | | | |
| | |
NET ASSETS — 100.0% | | | | | $ | 134,833,475 | |
| | | | | | | |
| | (a) | See notes to financial statements for tax unrealized appreciation (depreciation) of securities. |
| | (b) | Denotes a non-income producing security. |
| | (c) | All or part of the security was on loan as of October 31, 2006. |
| | ADR | American Depository Receipt |
See notes to financial statements.
Gartmore Worldwide Leaders Fund
On March 21, 2006, the Fund (Institutional Service Class) was recognized as the best “Global Large-Cap Core Fund” (among a field of 16 competitors) by Lipper, for the three-year period ended Dec. 31, 2005.
For the annual period ended Oct. 31, 2006, the Gartmore Worldwide Leaders Fund (Class A at NAV) returned 26.22% versus 21.91% for its benchmark, the Morgan Stanley Capital International (MSCI) World IndexSM. For broader comparison, the average return for the Fund’s Lipper peer category of Global Large-Cap Core Funds (consisting of 59 funds as of Oct. 31, 2006) was 20.74%.
Global economic growth remained robust during the first half of the reporting period, and rising oil and metals prices boosted several emerging markets. Merger-and-acquisition (M&A) activity buoyed European markets, and in Japan, rising land prices ended prolonged deflation, prompting the Bank of Japan to abandon its quantitative monetary easing. Meanwhile, investors, who were worried that U.S. monetary policy might further tighten, watched U.S. interest rates rise to avert inflation. These investor concerns persisted into May, prompting a significant global market correction; markets remained volatile as oil prices surged to nearly $80 per barrel in July and Middle East tensions grew. An increase in U.S. oil stockpiles in August significantly weakened oil prices, which had the effect of calming the markets. Also in August, signs of a slowing U.S. economy led the Federal Reserve Board to pause in its two-year cycle of raising rates; borrowing costs remained at 5.25% through the end of the reporting period. The improving global economic outlook seemed to encourage investors, and global markets—except for Japan—progressed in September and October.
Strong stock selection drove the Fund’s outperformance during the period. A large Fund overweight in Sumitomo Realty & Development Co., Ltd. was the greatest boost to Fund returns. Sumitomo and Mitsui Fudosan Co., Ltd.—Japan’s largest property developer and another large Fund overweight—are among the firms benefiting from recovering Japanese real estate prices. Our large Fund overweight in U.S. real-estate firm CB Richard Ellis Group, Inc. also helped the Fund after the company reported faster-than-expected earnings growth.
The Fund’s exposure in the energy sector detracted from performance, primarily due to holdings of ConocoPhillips, one of the world’s largest oil and gas companies. We bought the ConocoPhillips stock at what we believed to be a relatively cheap valuation as the company was enjoying significant earnings growth and share price appreciation. The company’s purchase of Burlington Resources Inc. in December 2005, however, was poorly received by the market as an overpriced deal. ConocoPhillips’ stock further underperformed as oil prices retreated toward the end of the reporting period, so we sold the position. Japanese retailer The Daiei, Inc. also undermined Fund performance. The firm’s real estate revaluation losses helped trigger a 97% slump in first-half profits. Another detractor from Fund performance was an overweight stake in major U.S. rail operator Norfolk Southern Corp.; the company was hit by higher fuel costs, and its share price lost ground after lower-than-expected second-quarter profits were reported.
We believe that the direction of interest rates and the pace of global economic growth are likely to remain key short-term concerns for investors, but we are cautiously optimistic about medium-term prospects for equities. Although global economic growth is slowing, it remains healthy. In addition, valuations are attractive, and continuing M&A activity should prove supportive. On a regional basis, we favor the United Kingdom and Europe, both of which we believe offer opportunities for good value.
Portfolio Manager:
Gartmore Global Partners—Neil Rogan
Lipper, a wholly owned subsidiary of Reuters, is a leading global provider of mutual fund information and analysis to fund companies, financial intermediaries and media organizations.
Although Lipper makes reasonable efforts to ensure the accuracy and reliability of the data, the accuracy is not guaranteed by Lipper.
For the “Global Large-Cap Core Funds” award, Lipper determined the award winner by calculating the highest Consistent Return over the three-year time period ended Dec. 31, 2005. Gartmore competed among 16 global large-cap core portfolios to win the award.
Award based on Institutional Service Class Shares of the Funds. Other share classes may have different performance characteristics. Fund performance may now be higher or lower than the performance that was calculated to win this award.
| | |
Fund Performance | | Gartmore Worldwide Leaders Fund |
Average Annual Total Return
(For periods ended October 31, 2006)
| | | | | | | | |
| | | | | 1 Yr. | | 5 Yr. | | Inception1 |
| Class A | | w/o SC2 | | 26.22% | | 13.36% | | 2.60% |
| | | w/SC3 | | 19.02% | | 12.03% | | 1.62% |
| Class B | | w/o SC2 | | 25.22% | | 12.59% | | 1.88% |
| | | w/SC4 | | 20.22% | | 12.34% | | 1.88% |
| Class C5 | | w/o SC2 | | 25.19% | | 12.59% | | 1.96% |
| | | w/SC6 | | 24.19% | | 12.59% | | 1.96% |
| Class R7,8 | | | | 25.78% | | 12.93% | | 2.13% |
| Institutional Service Class7 | | 26.17% | | 13.49% | | 2.78% |
| Institutional Class7,9 | | 26.49% | | 13.60% | | 2.86% |
All figures showing the effect of a sales charge reflect the maximum charge possible, because it has the most dramatic effect on performance data.
| 1 | Fund commenced operations on August 30, 2000. |
| 2 | These returns do not reflect the effects of sales charges (SC). |
| 3 | A 5.75% front-end sales charge was deducted. |
| 4 | A 5.00% contingent deferred sales charge (CDSC) was deducted. The CDSC declines to 0% after 6 years. |
| 5 | These returns until the creation of Class C shares (3/1/01) include the performance of the Fund’s Class B shares. Excluding the effects of any fee waivers or reimbursements, such prior performance is substantially similar to what Class C shares would have produced because Class C shares invest in the same portfolio of securities as Class B shares and have the same expenses after any fee waivers or reimbursements. For Class C shares returns with sales charges, these returns have been restated for the applicable sales charges. |
| 6 | A CDSC of 1.00% was deducted from the one year return because it is charged when you sell Class C shares within the first year after purchase. |
| 7 | Not subject to any sales charges. |
| 8 | These returns until the creation of Class R shares (10/1/03) include the performance of the Fund’s Class B shares. The returns have been adjusted for the fact that Class R shares do not have any applicable sales charges but have not been adjusted for the lower expenses applicable to Class R shares. Excluding the effect of any fee waivers or reimbursements, such prior performance is similar to what Class R shares would have produced because the Class R shares invest in the same portfolio of securities as Class B shares. |
| 9 | These returns until the creation of Institutional Class shares (6/29/04) include the performance of the Fund’s Institutional Service shares. The returns have been adjusted for the fact that Institutional Class shares do not have any applicable sales charges but have not been adjusted for the lower expenses applicable to Institutional Class shares. Excluding the effect of any fee waivers or reimbursements, such prior performance is similar to what Institutional Class shares would have produced because the Institutional Class shares invest in the same portfolio of securities as Institutional Service shares. |
Performance of a $10,000 Investment
Investment return and principal value will fluctuate, and when redeemed, shares may be worth more or less than original cost. Past performance is no guarantee of future results and does not reflect the deduction of taxes that a shareholder would pay on fund distributions or the redemption of fund shares. Investing in mutual funds involves market risk, including loss of principal. Performance returns assume the reinvestment of all distributions.
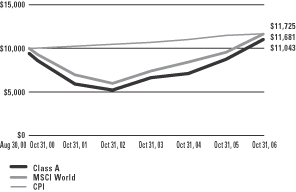
Comparative performance of $10,000 invested in Class A shares of the Gartmore Worldwide Leaders Fund, the Morgan Stanley Capital International World Index (MSCI World)(a), and the Consumer Price Index (CPI)(b) since inception. Unlike the Fund, the returns for these unmanaged indexes do not reflect any fees, expenses, or sales charges. Investors cannot invest directly in market indexes.
| (a) | The MSCI World- an unmanaged index of companies whose securities are listed on the stock exchanges of the U.S., Europe, Canada, Australia and the Far East- gives a broad look at how the stock prices of these companies have performed. |
| (b) | The CPI represents changes in prices of a basket of goods and services purchased for consumption by urban households. |
| | |
Shareholder Expense Example | | Gartmore Worldwide Leaders Fund |
As a shareholder of the Fund, you incur two types of costs: (1) transaction costs, including sales charges (loads) paid on purchase payments and redemption fees; and (2) ongoing costs, including investment advisory fees, administration fees, distribution fees and other Fund expenses. The examples below are intended to help you understand your ongoing costs (in dollars) of investing in the Fund and to compare these costs with the ongoing costs of investing in other mutual funds. Per SEC requirements, the examples assume that you had a $1,000 investment in the Class at the beginning of the reporting period, May 1, 2006 and continued to hold your shares at the end of the reporting period, October 31, 2006.
Actual Expenses
For each Class of the Fund in the table below, the first line provides information about actual account values and actual expenses. You may use the information in this line, together with the amount you invested, to estimate the expenses that you paid over the period. Simply divide your account value by $1,000 (for example, an $8,600 account value divided by $1,000 = 8.6), then multiply the result by the number in the first line of each Class under the heading entitled “Expenses Paid During Period” to estimate the expenses you paid on your account during the period.
Hypothetical Example for Comparison Purposes
The second line of each Class in the table below provides information about hypothetical account values and hypothetical expenses based on the Class’ actual expense ratio and an assumed rate of return of 5% per year before expenses, which is not the Class’ actual return. The hypothetical account values and expenses may not be used to estimate the actual ending account balance or expenses you paid for the period. You may use this information to compare the ongoing costs of investing in the Class of the Fund and other funds. To do so, compare this 5% hypothetical example with the 5% hypothetical examples that appear in the shareholder reports of the other funds.
Please note that the expenses shown in the table are meant to highlight your ongoing costs only and do not reflect any transaction costs, such as sales charges (loads) or redemption fees. Therefore, the second line for each Class in the table is useful in comparing ongoing costs only, and will not help you determine the relative total costs of owning different funds. In addition, if these transaction costs were included, your costs would have been higher. The examples also assume all dividends and distributions have been reinvested.
Schedule of Shareholder Expenses
Expense Analysis of a $1,000 Investment
(October 31, 2006)
| | | | | | | | | | | | | | |
| Worldwide Leaders Fund | | | | | Beginning
Account Value,
5/1/06 | | Ending
Account Value,
10/31/06 | | Expenses Paid
During Period* | | Annualized
Expense Ratio* |
| Class A | | Actual | | | $ | 1,000.00 | | $ | 1,035.10 | | $ | 7.80 | | 1.52% |
| | | Hypothetical | 1 | | $ | 1,000.00 | | $ | 1,017.34 | | $ | 7.76 | | 1.52% |
| Class B | | Actual | | | $ | 1,000.00 | | $ | 1,030.80 | | $ | 11.52 | | 2.25% |
| | | Hypothetical | 1 | | $ | 1,000.00 | | $ | 1,013.66 | | $ | 11.48 | | 2.25% |
| Class C | | Actual | | | $ | 1,000.00 | | $ | 1,030.50 | | $ | 11.57 | | 2.26% |
| | | Hypothetical | 1 | | $ | 1,000.00 | | $ | 1,013.61 | | $ | 11.54 | | 2.26% |
| Class R | | Actual | | | $ | 1,000.00 | | $ | 1,032.30 | | $ | 9.89 | | 1.93% |
| | | Hypothetical | 1 | | $ | 1,000.00 | | $ | 1,015.27 | | $ | 9.85 | | 1.93% |
| Institutional Service Class | | Actual | | | $ | 1,000.00 | | $ | 1,034.80 | | $ | 7.69 | | 1.50% |
| | | Hypothetical | 1 | | $ | 1,000.00 | | $ | 1,017.44 | | $ | 7.66 | | 1.50% |
| Institutional Class | | Actual | | | $ | 1,000.00 | | $ | 1,036.00 | | $ | 6.11 | | 1.19% |
| | | Hypothetical | 1 | | $ | 1,000.00 | | $ | 1,019.00 | | $ | 6.07 | | 1.19% |
| * | Expenses are equal to the Fund’s annualized expense ratio multiplied by the average account value over the period multiplied by 184/365 (to reflect the one-half year period). The expense ratio presented represents a six-month, annualized ratio in accordance with SEC guidelines. |
| 1 | Represents the hypothetical 5% return before expenses. |
| | |
Portfolio Summary | | Gartmore Worldwide Leaders Fund |
October 31, 2006
The SEC adopted a requirement that Funds present their portfolio holdings in a table, chart or graph format in their annual and semiannual reports to shareholders, whether or not a statement of investments is utilized. The following tables, which present portfolio holdings as a percentage of net assets, are provided in compliance with this requirement.
| | |
| Asset Allocation | | |
| Common Stocks | | 98.8% |
Repurchase Agreements | | 0.1% |
| Other Investments* | | 3.1% |
| Liabilities in excess of other assets** | | -2.0 % |
| | |
| | 100.0% |
| | |
| Top Countries | | |
| United States | | 42.0% |
| Japan | | 17.7% |
| United Kingdom | | 16.5% |
| Germany | | 5.5% |
| Italy | | 3.8% |
| Switzerland | | 3.5% |
| Netherlands | | 2.5% |
| Argentina | | 2.5% |
| Russia | | 2.1% |
| China | | 1.5% |
| Other Assets | | 2.4% |
| | |
| | 100.0% |
| | |
| Top Industries | | |
| Banking | | 12.7% |
| Real Estate | | 12.0% |
| Computers | | 7.2% |
| Television | | 6.8% |
| Insurance | | 5.3% |
| Financial Services | | 5.2% |
| Steel – Producers | | 5.0% |
| Mining | | 4.3% |
| Restaurants | | 3.9% |
| Finance | | 3.8% |
| Other Assets | | 33.8% |
| | |
| | 100.0% |
| | |
| Top Holdings*** | | |
| CB Richard Ellis Group, Inc. | | 5.1% |
| Rio Tinto PLC | | 4.3% |
| Microsoft Corp. | | 4.1% |
| McDonald’s Corp. | | 3.9% |
| Barclays PLC | | 3.9% |
| WellPoint, Inc. | | 3.8% |
| Lazard Ltd. | | 3.8% |
| UniCredito Italiano SpA | | 3.8% |
| DSG Int’l PLC | | 3.7% |
| Julius Baer Holding Ltd. | | 3.5% |
| Other Assets | | 60.1% |
| | |
| | 100.0% |
| * | Includes value of collateral received from securities lending. |
| ** | Includes value of collateral owed from securities lending. |
| *** | For purpose of listing top holdings, repurchase agreements are considered cash equivalents and are included as part of Other Assets. |
Statement of Investments
October 31, 2006
Gartmore Worldwide Leaders Fund
Common Stocks (98.8%)
| | | | | |
| | | Shares or
Principal Amount | | Value |
| | | | | |
ARGENTINA (2.5%) | | | |
Steel – Producers (2.5%) | | | |
Tenaris SA (c) | | 59,500 | | $ | 1,152,924 |
| | | | | |
CHINA (1.5%) | | | |
Banking (1.5%) | | | |
China Merchants Bank Co. Ltd. (b) (d) | | 286,500 | | | 447,248 |
Industrial & Commercial Bank of China (b) | | 532,000 | | | 238,065 |
| | | | | |
| | | | | 685,313 |
| | | | | |
GERMANY (5.5%) | | | |
Machinery (3.5%) | | | |
MAN AG (c) | | 18,100 | | | 1,608,095 |
| | | | | |
Semiconductors (2.0%) | | | |
Infineon Technologies AG (b) (c) | | 74,100 | | | 900,465 |
| | | | | |
| | | | | 2,508,560 |
| | | | | |
HONG KONG (1.2%) | | | |
Real Estate (1.2%) | | | |
New World Development Co. Ltd. (c) | | 333,000 | | | 569,076 |
| | | | | |
ITALY (3.8%) | | | |
Banking (3.8%) | | | |
UniCredito Italiano SpA (c) | | 210,800 | | | 1,746,570 |
| | | | | |
JAPAN (17.7%) | | | |
Automotive (3.0%) | | | |
Toyota Motor Corp. (c) | | 23,100 | | | 1,364,126 |
| | | | | |
Financial Services (4.1%) | | | |
Matsui Securities Co. Ltd. (c) | | 115,000 | | | 1,010,078 |
Mizuho Financial Group, Inc. (c) | | 112 | | | 870,683 |
| | | | | |
| | | | | 1,880,761 |
| | | | | |
Real Estate (5.7%) | | | |
Mitsui Fudosan Co. Ltd. (c) (d) | | 48,000 | | | 1,181,046 |
Sumitomo Realty & Development Co. Ltd. (c) | | 44,000 | | | 1,457,946 |
| | | | | |
| | | | | 2,638,992 |
| | | | | |
Tobacco (3.5%) | | | |
Japan Tobacco, Inc. (c) | | 366 | | | 1,593,204 |
| | | | | |
| | | | | |
| | | Shares or
Principal Amount | | Value |
| | | | | |
JAPAN (continued) | | | |
Toys (1.4%) | | | |
Nintendo Co. Ltd. (c) | | 3,200 | | $ | 654,068 |
| | | | | |
| | | | | 8,131,151 |
| | | | | |
NETHERLANDS (2.5%) | | | |
Steel – Producers (2.5%) | | | |
Mittal Steel Co. NV (c) | | 27,000 | | | 1,156,375 |
| | | | | |
RUSSIA (2.1%) | | | |
Oil & Gas (2.1%) | | | |
Oao Rosneft Oil Co. (b) | | 110,800 | | | 952,880 |
| | | | | |
SWITZERLAND (3.5%) | | | |
Banking (3.5%) | | | |
Julius Baer Holding Ltd. (c) | | 15,350 | | | 1,620,161 |
| | | | | |
UNITED KINGDOM (16.5%) | | | |
Banking (3.9%) | | | |
Barclays PLC (c) | | 132,000 | | | 1,778,287 |
| | | | | |
Insurance (1.5%) | | | |
Royal & Sun Alliance Insurance Group PLC (c) | | 241,000 | | | 677,757 |
| | | | | |
Mining (4.3%) | | | |
Rio Tinto PLC (c) | | 35,700 | | | 1,975,017 |
| | | | | |
Retail (3.7%) | | | |
DSG Int’l PLC (c) | | 410,100 | | | 1,700,997 |
| | | | | |
Telecommunications (3.1%) | | | |
Vodafone Group PLC (c) | | 550,762 | | | 1,418,989 |
| | | | | |
| | | | | 7,551,047 |
| | | | | |
UNITED STATES (42.0%) | | | |
Agriculture (2.0%) | | | |
Archer-Daniels-Midland Co. | | 23,700 | | | 912,450 |
| | | | | |
Airlines (2.4%) | | | |
Continental Airlines, Inc. (b) | | 29,600 | | | 1,091,648 |
| | | | | |
Computers (7.2%) | | | |
Apple Computer, Inc. (b) | | 16,900 | | | 1,370,252 |
Microsoft Corp. | | 66,200 | | | 1,900,602 |
| | | | | |
| | | | | 3,270,854 |
| | | | | |
Common Stocks (continued)
| | | | | | |
| | | Shares or
Principal Amount | | Value |
| | | | | | |
UNITED STATES (continued) | | | |
Diversified Manufacturing (3.0%) | | | |
General Electric Co. | | | 38,700 | | $ | 1,358,757 |
| | | | | | |
Finance (3.8%) | | | |
Lazard Ltd. | | | 41,200 | | | 1,746,880 |
| | | | | | |
Financial Services (1.1%) | | | |
Western Union Co. (b) | | | 23,300 | | | 513,765 |
| | | | | | |
Food & Beverage (2.9%) | | | |
Kellogg Co. | | | 26,800 | | | 1,348,308 |
| | | | | | |
Insurance (3.8%) | | | |
WellPoint, Inc. (b) | | | 23,100 | | | 1,762,992 |
| | | | | | |
Real Estate (5.1%) | | | |
CB Richard Ellis Group, Inc. (b) | | | 78,000 | | | 2,342,340 |
| | | | | | |
Restaurants (3.9%) | | | |
McDonald’s Corp. | | | 42,700 | | | 1,789,984 |
| | | | | | |
Television (6.8%) | | | |
CBS Corp., Class B | | | 54,800 | | | 1,585,912 |
Comcast Corp. (b) | | | 36,800 | | | 1,496,656 |
| | | | | | |
| | | | | | 3,082,568 |
| | | | | | |
| | | | | | 19,220,546 |
| | | | | | |
| | |
Total Common Stocks | | | | | | 45,294,603 |
| | | | | | |
|
Repurchase Agreements (0.1%) 
|
CS First Boston, 5.17%, dated 10/31/06, due 11/01/06, repurchase price $29,693, collateralized by U.S. Government Agency Mortgages with a market value of $30,283 | | $ | 29,689 | | | 29,689 |
Nomura Securities, 5.17%, dated 10/31/06, due 11/01/06, repurchase price $28,350, collateralized by U.S. Government Agency Mortgages with a market value of $28,913 | | | 28,346 | | | 28,346 |
| | | | | | |
| | |
Total Repurchase Agreements | | | | | | 58,035 |
| | | | | | |
Short-Term Securities Held as Collateral for Securities on Loan (3.1%)
| | | | | | | |
| | | Principal
Amount | | Value | |
Banc of America Securities LLC Repurchase Agreement, 5.32%, dated 10/31/06, due 11/01/06, repurchase price $1,024,651, collateralized by U.S. Government Agency Mortgages with a market value of $1,044,990 | | $ | 1,024,500 | | $ | 1,024,500 | |
Beta Finance, Inc. Medium Term Note, 5.37%, 11/01/06 | | | 200,000 | | | 200,000 | |
Unicredito Italiano Bank PLC Medium Term Note,
5.33%, 11/09/06 | | | 200,000 | | | 200,000 | |
| | | | | | | |
| |
Total Short-Term Securities Held as Collateral for Securities on Loan | | | 1,424,500 | |
| | | | | | | |
| |
Total Investments
(Cost $41,517,229) (a) — 102.0% | | | 46,777,138 | |
| |
Liabilities in excess of other
assets — (2.0)% | | | (933,750 | ) |
| | | | | | | |
| | |
NET ASSETS — 100.0% | | | | | $ | 45,843,388 | |
| | | | | | | |
| | (a) | See notes to financial statements for tax unrealized appreciation (depreciation) of securities. |
| | (b) | Denotes a non-income producing security. |
| | (d) | All or part of the security was on loan as of October 31, 2006. |
See notes to financial statements.
Statements of Assets and Liabilities
October 31, 2006
| | | | | | | | | | | | | | | | | | | | |
| | | Gartmore
Mid Cap Growth
Leaders Fund | | | Gartmore
Nationwide
Leaders Fund | | Gartmore
Small Cap
Leaders Fund | | Gartmore
U.S. Growth
Leaders Fund | | | Gartmore
Worldwide
Leaders Fund |
Assets: | | | | | | | | | | | | | | | | | | | | |
Investments, at value
(cost $31,275,525; $11,712,985; $35,611,701; $120,733,870; and $40,434,694 respectively)* | | $ | 34,318,597 | | | $ | 11,818,652 | | $ | 38,020,969 | | $ | 128,622,002 | | | $ | 45,694,603 | | | |
Repurchase agreements, at cost and value** | | | 2,142,014 | | | | 429,549 | | | — | | | 8,661,665 | | | | 1,082,535 | | | |
| | | | | | | | | | | | | | | | | | | | |
Total Investments | | | 36,460,611 | | | | 12,248,201 | | | 38,020,969 | | | 137,283,667 | | | | 46,777,138 | | | |
| | | | | | | | | | | | | | | | | | | | |
Cash | | | 2,114,904 | | | | — | | | 1,939,775 | | | — | | | | — | | | |
Foreign currency, at value
(cost $0; $0; $0; $0 and $865; respectively) | | | — | | | | — | | | — | | | — | | | | 857 | | | |
Interest and dividends receivable | | | 8,535 | | | | 4,189 | | | 12,668 | | | 29,966 | | | | 30,680 | | | |
Receivable for capital shares issued | | | 2,177 | | | | 1,535 | | | 348,034 | | | 103,858 | | | | 108,478 | | | |
Receivable for investments sold | | | 661,783 | | | | 1,449,565 | | | 4,430,714 | | | 8,050,693 | | | | 452,684 | | | |
Receivable from adviser | | | — | | | | 427 | | | — | | | — | | | | — | | | |
Receivable from administrator | | | — | | | | — | | | — | | | 6,914 | | | | — | | | |
Reclaims receivable | | | — | | | | — | | | — | | | — | | | | 490 | | | |
Prepaid expenses | | | 12,559 | | | | 15,623 | | | 125 | | | 22,454 | | | | 26,351 | | | |
| | | | | | | | | | | | | | | | | | | | |
Total Assets | | | 39,260,569 | | | | 13,719,540 | | | 44,752,285 | | | 145,497,552 | | | | 47,396,678 | | | |
| | | | | | | | | | | | | | | | | | | | |
| | | | | | |
Liabilities: | | | | | | | | | | | | | | | | | | | | |
Payable for investments purchased | | | 765,744 | | | | 1,458,626 | | | 4,243,196 | | | 4,051,087 | | | | — | | | |
Payable for capital shares redeemed | | | 19,402 | | | | — | | | 75,810 | | | 390,753 | | | | 43,643 | | | |
Payable for return of collateral received for securities on loan | | | 2,142,014 | | | | — | | | — | | | 6,017,804 | | | | 1,424,500 | | | |
Accrued expenses and other payables | | | | | | | | | | | | | | | | | | | | |
Investment advisory fees | | | 25,111 | | | | — | | | 30,590 | | | 107,137 | | | | 35,334 | | | |
Fund administration and transfer agent fees | | | 4,904 | | | | 1,088 | | | 4,395 | | | — | | | | 5,775 | | | |
Distribution fees | | | 4,767 | | | | 5,351 | | | 15,449 | | | 55,687 | | | | 12,184 | | | |
Administrative servicing fees | | | 472 | | | | 275 | | | 2,935 | | | 28,110 | | | | 7,647 | | | |
Trustee fees | | | 5 | | | | 1 | | | 4 | | | 19 | | | | 6 | | | |
Compliance program fees (Note 3) | | | 279 | | | | 22 | | | 239 | | | 1,186 | | | | 336 | | | |
Other | | | 25,424 | | | | 2,291 | | | 25,966 | | | 12,294 | | | | 23,865 | | | |
| | | | | | | | | | | | | | | | | | | | |
Total Liabilities | | | 2,988,122 | | | | 1,467,654 | | | 4,398,584 | | | 10,664,077 | | | | 1,553,290 | | | |
| | | | | | | | | | | | | | | | | | | | |
Net Assets | | $ | 36,272,447 | | | $ | 12,251,886 | | $ | 40,353,701 | | $ | 134,833,475 | | | $ | 45,843,388 | | | |
| | | | | | | | | | | | | | | | | | | | |
| | | | | | |
Represented by: | | | | | | | | | | | | | | | | | | | | |
Capital | | $ | 62,223,064 | | | $ | 10,797,656 | | $ | 34,631,310 | | $ | 132,559,016 | | | $ | 72,093,997 | | | |
Accumulated net investment income (loss) | | | 13,889 | | | | — | | | — | | | — | | | | — | | | |
Accumulated net realized gains (losses) from investment and foreign currency transactions | | | (29,007,578 | ) | | | 1,348,563 | | | 3,313,123 | | | (5,613,673 | ) | | | (31,510,562 | ) | | |
Net unrealized appreciation (depreciation) on investments and translation of assets and liabilities denominated in foreign currencies | | | 3,043,072 | | | | 105,667 | | | 2,409,268 | | | 7,888,132 | | | | 5,259,953 | | | |
| | | | | | | | | | | | | | | | | | | | |
Net Assets | | $ | 36,272,447 | | | $ | 12,251,886 | | $ | 40,353,701 | | $ | 134,833,475 | | | $ | 45,843,388 | | | |
| | | | | | | | | | | | | | | | | | | | |
| | | | | | | | | | | | | | | | | | | | | |
| * | Includes securities held as collateral for securities on loan of $0; $0; $0; $0; and $400,000; respectively. |
| ** | Includes securities held as collateral for securities on loan of $2,142,014; $0; $0; $6,017,804; and $1,024,500; respectively. |
See notes to financial statements.
Statements of Assets and Liabilities (Continued)
October 31, 2006
| | | | | | | | | | | | | | | | | | | | | | |
| | | Gartmore
Mid Cap Growth
Leaders Fund | | | Gartmore
Nationwide
Leaders Fund | | | Gartmore
Small Cap
Leaders Fund | | | Gartmore
U.S. Growth
Leaders Fund | | | Gartmore
Worldwide
Leaders Fund |
Net Assets: | | | | | | | | | | | | | | | | | | | | | | |
Class A Shares | | $ | 6,926,165 | | | $ | 7,116,626 | | | $ | 21,483,795 | | | $ | 86,364,000 | | | $ | 41,218,859 | | | |
Class B Shares | | | 3,095,816 | | | | 1,095,503 | | | | 1,783,462 | | | | 6,072,359 | | | | 805,734 | | | |
Class C Shares | | | 740,632 | | | | 3,606,314 | | | | 11,685,723 | | | | 36,040,029 | | | | 3,795,128 | | | |
Class D Shares | | | 10,614,279 | | | | — | | | | — | | | | — | | | | — | | | |
Class R Shares | | | 1,334 | | | | 1,530 | | | | 6,261 | | | | 1,036,576 | | | | 1,738 | | | |
Institutional Service Class Shares | | | — | | | | 430,505 | | | | 86,376 | | | | 719,057 | | | | 20,282 | | | |
Institutional Class Shares | | | 14,894,221 | | | | 1,408 | | | | 5,308,084 | | | | 4,601,454 | | | | 1,647 | | | |
| | | | | | | | | | | | | | | | | | | | | | |
Total | | $ | 36,272,447 | | | $ | 12,251,886 | | | $ | 40,353,701 | | | $ | 134,833,475 | | | $ | 45,843,388 | | | |
| | | | | | | | | | | | | | | | | | | | | | |
| | | | | | |
Shares Outstanding (unlimited number of shares authorized) | | | | | | | | | | | | | | | | | | | | | | |
Class A Shares | | | 458,305 | | | | 502,196 | | | | 1,664,084 | | | | 9,027,718 | | | | 3,548,365 | | | |
Class B Shares | | | 222,590 | | | | 79,474 | | | | 139,744 | | | | 664,797 | | | | 72,070 | | | |
Class C Shares | | | 53,211 | | | | 261,868 | | | | 914,719 | | | | 3,920,749 | | | | 338,190 | | | |
Class D Shares | | | 684,957 | | | | — | | | | — | | | | — | | | | — | | | |
Class R Shares | | | 87 | | | | 110 | | | | 488 | | | | 111,561 | | | | 154 | | | |
Institutional Service Class Shares | | | — | | | | 29,994 | | | | 6,670 | | | | 73,999 | | | | 1,728 | | | |
Institutional Class Shares | | | 961,926 | | | | 99 | | | | 409,091 | | | | 471,917 | | | | 140 | | | |
| | | | | | | | | | | | | | | | | | | | | | |
Total | | | 2,381,076 | | | | 873,741 | | | | 3,134,796 | | | | 14,270,741 | | | | 3,960,647 | | | |
| | | | | | | | | | | | | | | | | | | | | | |
| | | | | | |
Net asset value and redemption price per share (net assets by class divided by shares outstanding by class, respectively): | | | | | | | | | | | | | | | | | | | | | | |
Class A Shares | | $ | 15.11 | | | $ | 14.17 | | | $ | 12.91 | | | $ | 9.57 | | | $ | 11.62 | | | |
Class B Shares (a) | | $ | 13.91 | | | $ | 13.78 | | | $ | 12.76 | | | $ | 9.13 | | | $ | 11.18 | | | |
Class C Shares (b) | | $ | 13.92 | | | $ | 13.77 | | | $ | 12.78 | | | $ | 9.19 | | | $ | 11.22 | | | |
Class D Shares | | $ | 15.50 | | | $ | — | | | $ | — | | | $ | — | | | $ | — | | | |
Class R Shares | | $ | 15.31 | (c) | | $ | 13.93 | (c) | | $ | 12.84 | (c) | | $ | 9.29 | | | $ | 11.30 | (c) | | |
Institutional Service Class Shares | | $ | — | | | $ | 14.35 | | | $ | 12.95 | | | $ | 9.72 | | | $ | 11.74 | | | |
Institutional Class Shares | | $ | 15.48 | | | $ | 14.24 | (c) | | $ | 12.98 | | | $ | 9.75 | | | $ | 11.78 | (c) | | |
| | | | | | |
Maximum offering price per share (100%/(100%-maximum sales charge) of net asset value adjusted to the nearest cent) | | | | | | | | | | | | | | | | | | | | | | |
Class A Shares | | $ | 16.03 | | | $ | 15.03 | | | $ | 13.70 | | | $ | 10.15 | | | $ | 12.33 | | | |
Class D Shares | | $ | 16.23 | | | $ | — | | | $ | — | | | $ | — | | | $ | — | | | |
| | | | | | | | | | | | | | | | | | | | | | |
Maximum Sales Charge — Class A Shares | | | 5.75 | % | | | 5.75 | % | | | 5.75 | % | | | 5.75 | % | | | 5.75 | % | | |
| | | | | | | | | | | | | | | | | | | | | | |
Maximum Sales Charge — Class D Shares | | | 4.50 | % | | | — | | | | — | | | | — | | | | — | | | |
| | | | | | | | | | | | | | | | | | | | | | |
| | | | | | | | | | | | | | | | | | | | | | | |
| (a) | For Class B shares, the redemption price per share varies by length of time shares are held. |
| (b) | For Class C shares, the redemption price per share is reduced by 1.00% for shares held less than one year. |
| (c) | The NAV reported above represents the traded NAV at October 31, 2006. Due to the financial statement rounding of class assets and class shares above, the NAV results in a different NAV than the traded NAV. |
See notes to financial statements.
Statements of Operations
For the Year Ended October 31, 2006
| | | | | | | | | | | | | | | | | | | | | | |
| | | Gartmore
Mid Cap Growth
Leaders Fund | | | Gartmore
Nationwide
Leaders Fund | | | Gartmore
Small Cap
Leaders Fund | | | Gartmore
U.S. Growth
Leaders Fund | | | Gartmore
Worldwide
Leaders Fund |
INVESTMENT INCOME: | | | | | | | | | | | | | | | | | | | | | | |
Interest income | | $ | 112,246 | | | $ | 32,900 | | | $ | — | | | $ | 241,499 | | | $ | 46,346 | | | |
Dividend income (net of foreign withholding tax of $125; $0; $0; $0; and $48,644; respectively) | | | 245,241 | | | | 301,173 | | | | 434,846 | | | | 961,173 | | | | 800,948 | | | |
Income from securities lending | | | 3,155 | | | | — | | | | — | | | | 10,936 | | | | 32,210 | | | |
| | | | | | | | | | | | | | | | | | | | | | | |
Total Income | | | 360,642 | | | | 334,073 | | | | 434,846 | | | | 1,213,608 | | | | 879,504 | | | |
| | | | | | | | | | | | | | | | | | | | | | | |
| | | | | | |
Expenses: | | | | | | | | | | | | | | | | | | | | | | |
Investment advisory fees | | | 318,579 | | | | 109,349 | | | | 239,221 | | | | 1,353,017 | | | | 424,069 | | | |
Fund administration and transfer agent fees | | | 50,557 | | | | 18,418 | | | | 45,385 | | | | 267,594 | | | | 73,699 | | | |
Distribution fees Class A | | | 17,660 | | | | 15,404 | | | | 26,716 | | | | 255,444 | | | | 95,379 | | | |
Distribution fees Class B | | | 33,261 | | | | 8,915 | | | | 12,108 | | | | 56,475 | | | | 6,307 | | | |
Distribution fees Class C | | | 7,260 | | | | 27,712 | | | | 84,241 | | | | 359,117 | | | | 21,227 | | | |
Distribution fees Class R | | | 4 | | | | 7 | | | | 9 | | | | 3,717 | | | | 7 | | | |
Administrative servicing fees Class A | | | 4,164 | | | | 2,161 | | | | 1,069 | | | | 66,291 | | | | 11,121 | | | |
Administrative servicing fees Class R | | | 1 | | | | 1 | | | | 5 | | | | 1,305 | | | | 2 | | | |
Administrative servicing fees Institutional Service Class | | | — | | | | 6,803 | | | | 38 | | | | 9,359 | | | | 5,197 | | | |
Registration and filing fees | | | 53,708 | | | | 48,003 | | | | 55,197 | | | | 56,917 | | | | 47,092 | | | |
Printing fees | | | 55,076 | | | | 5,359 | | | | 6,476 | | | | 49,987 | | | | 54,479 | | | |
Trustee fees | | | 1,379 | | | | 471 | | | | 785 | | | | 5,313 | | | | 1,488 | | | |
Compliance program fees (Note 3) | | | 621 | | | | 114 | | | | 495 | | | | 2,485 | | | | 711 | | | |
Other | | | 13,434 | | | | 2,859 | | | | 5,854 | | | | 27,032 | | | | 3,864 | | | |
| | | | | | | | | | | | | | | | | | | | | | | |
Total expenses before reimbursed expenses | | | 555,704 | | | | 245,576 | | | | 477,599 | | | | 2,514,053 | | | | 744,642 | | | |
Earnings credit (Note 5) | | | (1,854 | ) | | | (194 | ) | | | (439 | ) | | | (1,715 | ) | | | (1,309 | ) | | |
Expenses reimbursed | | | (27,262 | ) | | | (22,019 | ) | | | (9,303 | ) | | | — | | | | (25,742 | ) | | |
Expense reimbursed from investment adviser (Note 3) | | | — | | | | — | | | | — | | | | (215,344 | ) | | | — | | | |
Expenses voluntarily waived by administrator | | | (369 | ) | | | (588 | ) | | | (3,725 | ) | | | (20,525 | ) | | | (632 | ) | | |
| | | | | | | | | | | | | | | | | | | | | | | |
Net Expenses | | | 526,219 | | | | 222,775 | | | | 464,132 | | | | 2,276,469 | | | | 716,959 | | | |
| | | | | | | | | | | | | | | | | | | | | | | |
Net Investment Income (Loss) | | | (165,577 | ) | | | 111,298 | | | | (29,286 | ) | | | (1,062,861 | ) | | | 162,545 | | | |
| | | | | | | | | | | | | | | | | | | | | | | |
| | | | | | |
REALIZED/UNREALIZED GAINS (LOSSES) FROM INVESTMENTS: | | | | | | | | | | | | | | | | | | | | | | |
Net realized gains (losses) on investment transactions | | | 3,902,595 | | | | 1,704,055 | * | | | 3,438,259 | | | | (4,653,935 | ) | | | 6,837,493 | * | | |
Net change in unrealized appreciation/depreciation on investments and translation of assets and liabilities denominated in foreign currencies | | | 90 | | | | 181,986 | | | | 2,451,843 | | | | 5,090,644 | | | | 2,846,773 | | | |
| | | | | | | | | | | | | | | | | | | | | | | |
Net realized/unrealized gains (losses) on investments and foreign currencies | | | 3,902,685 | | | | 1,886,041 | | | | 5,890,102 | | | | 436,709 | | | | 9,684,266 | | | |
| | | | | | | | | | | | | | | | | | | | | | | |
CHANGE IN NET ASSETS RESULTING FROM OPERATIONS | | $ | 3,737,108 | | | $ | 1,997,339 | | | $ | 5,860,816 | | | $ | (626,152 | ) | | $ | 9,846,811 | | | |
| | | | | | | | | | | | | | | | | | | | | | | |
| | | | | | | | | | | | | | | | | | | | | | | |
| * | Includes realized gain as a result of a redemption in kind. |
See notes to financial statements.
Statements of Changes in Net Assets
| | | | | | | | | | | | | | | | | | |
| | | Gartmore Mid Cap Growth Leaders Fund | | | Gartmore Nationwide Leaders Fund |
| | | Year Ended
October 31, 2006 | | | Year Ended
October 31, 2005 | | | Year Ended
October 31, 2006 | | | Year Ended
October 31, 2005 |
FROM INVESTMENT ACTIVITIES: | | | | | | | | | | | | | | | | | | |
Operations: | | | | | | | | | | | | | | | | | | |
Net investment income (loss) | | $ | (165,577 | ) | | $ | (199,286 | ) | | $ | 111,298 | | | $ | 90,008 | | | |
Net realized gains (losses) on investment transactions | | | 3,902,595 | | | | 2,941,837 | | | | 1,704,055 | * | | | 1,615,318 | | | |
Net change in unrealized appreciation/depreciation on investments | | | 90 | | | | 2,204,404 | | | | 181,986 | | | | (388,932 | ) | | |
| | | | | | | | | | | | | | | | | | |
Change in net assets resulting from operations | | | 3,737,108 | | | | 4,946,955 | | | | 1,997,339 | | | | 1,316,394 | | | |
| | | | | | | | | | | | | | | | | | |
| | | | | |
Distributions to Class A Shareholders from: | | | | | | | | | | | | | | | | | | |
Net investment income | | | — | | | | — | | | | (89,653 | ) | | | (24,752 | ) | | |
Net realized gains on investments | | | — | | | | — | | | | (593,298 | ) | | | (106,882 | ) | | |
| | | | | |
Distributions to Class B Shareholders from: | | | | | | | | | | | | | | | | | | |
Net investment income | | | — | | | | — | | | | (9,305 | ) | | | (1,131 | ) | | |
Net realized gains on investments | | | — | | | | — | | | | (83,541 | ) | | | (25,551 | ) | | |
| | | | | |
Distributions to Class C Shareholders from: | | | | | | | | | | | | | | | | | | |
Net investment income | | | — | | | | — | | | | (31,669 | ) | | | (3,506 | ) | | |
Net realized gains on investments | | | — | | | | — | | | | (261,388 | ) | | | (25,053 | ) | | |
| | | | | |
Distributions to Class R Shareholders from: | | | | | | | | | | | | | | | | | | |
Net investment income | | | — | | | | — | | | | (20 | ) | | | (7 | ) | | |
Net realized gain on investments | | | — | | | | — | | | | (144 | ) | | | (70 | ) | | |
| | | | | |
Distributions to Institutional Service Class Shareholders from: | | | | | | | | | | | | | | | | | | |
Net investment income | | | — | | | | — | | | | (34,354 | ) | | | (37,310 | ) | | |
Net realized gains on investments | | | — | | | | — | | | | (761,293 | ) | | | (164,117 | ) | | |
| | | | | |
Distributions to Institutional Class Shareholders from: | | | | | | | | | | | | | | | | | | |
Net investment income | | | — | | | | — | | | | (22 | ) | | | (10 | ) | | |
Net realized gains on investments | | | — | | | | — | | | | (130 | ) | | | (62 | ) | | |
| | | | | | | | | | | | | | | | | | |
Change in net assets from shareholder distributions | | | — | | | | — | | | | (1,864,817 | ) | | | (388,451 | ) | | |
| | | | | | | | | | | | | | | | | | |
Change in net assets from capital transactions | | | (5,402,832 | ) | | | 12,963,046 | | | | (2,681,354 | ) | | | 9,234,198 | | | |
| | | | | | | | | | | | | | | | | | |
Change in net assets | | | (1,665,724 | ) | | | 17,910,001 | | | | (2,548,832 | ) | | | 10,162,141 | | | |
| | | | | |
Net Assets: | | | | | | | | | | | | | | | | | | |
Beginning of period | | | 37,938,171 | | | | 20,028,170 | | | | 14,800,718 | | | | 4,638,577 | | | |
| | | | | | | | | | | | | | | | | | |
End of period | | $ | 36,272,447 | | | $ | 37,938,171 | | | $ | 12,251,886 | | | $ | 14,800,718 | | | |
| | | | | | | | | | | | | | | | | | |
| | | | | |
Accumulated net investment income (loss) at end of period | | $ | 13,889 | | | $ | 2,390 | | | $ | — | | | $ | 22,283 | | | |
| | | | | | | | | | | | | | | | | | |
| | | | | | | | | | | | | | | | | | |
| | | | | | | | | | | | | | | | | | |
| | | | | | | | | | | | | | | | | | | |
| * | Includes realized gain as a result of a redemption in kind (Note 9). |
See notes to financial statements.
Statements of Changes in Net Assets (Continued)
| | | | | | | | | | |
| | | Gartmore Small Cap Leaders Fund |
| | | Year Ended
October 31, 2006 | | | Period Ended
October 31, 2005 (a) |
FROM INVESTMENT ACTIVITIES: | | | | | | | | | | |
Operations: | | | | | | | | | | |
Net investment income (loss) | | $ | (29,286 | ) | | $ | (35,833 | ) | | |
Net realized gains (losses) on investment transactions | | | 3,438,259 | | | | 263,061 | | | |
Net change in unrealized appreciation/depreciation on investments | | | 2,451,843 | | | | (42,575 | ) | | |
| | | | | | | | | | |
Change in net assets resulting from operations | | | 5,860,816 | | | | 184,653 | | | |
| | | | | | | | | | |
| | | |
Distributions to Class A Shareholders from: | | | | | | | | | | |
Net investment income | | | (21,188 | ) | | | — | | | |
Net realized gains on investments | | | (104,156 | ) | | | — | | | |
| | | |
Distributions to Class B Shareholders from: | | | | | | | | | | |
Net investment income | | | (163 | ) | | | — | | | |
Net realized gains on investments | | | (17,000 | ) | | | — | | | |
| | | |
Distributions to Class C Shareholders from: | | | | | | | | | | |
Net investment income | | | (1,679 | ) | | | — | | | |
Net realized gains on investments | | | (108,828 | ) | | | — | | | |
| | | |
Distributions to Class R Shareholders from: | | | | | | | | | | |
Net investment income | | | (2 | ) | | | — | | | |
Net realized gain on investments | | | (19 | ) | | | — | | | |
| | | |
Distributions to Institutional Service Class Shareholders from: | | | | | | | | | | |
Net investment income | | | (110 | ) | | | — | | | |
Net realized gains on investments | | | (19 | ) | | | — | | | |
| | | |
Distributions to Institutional Class Shareholders from: | | | | | | | | | | |
Net investment income | | | (12,435 | ) | | | — | | | |
Net realized gains on investments | | | (76,326 | ) | | | — | | | |
| | | | | | | | | | |
Change in net assets from shareholder distributions | | | (341,925 | ) | | | — | | | |
| | | | | | | | | | |
Change in net assets from capital transactions | | | 18,793,035 | | | | 15,857,122 | | | |
| | | | | | | | | | |
Change in net assets | | | 24,311,926 | | | | 16,041,775 | | | |
| | | |
Net Assets: | | | | | | | | | | |
Beginning of period | | | 16,041,775 | | | | — | | | |
| | | | | | | | | | |
End of period | | $ | 40,353,701 | | | $ | 16,041,775 | | | |
| | | | | | | | | | |
| | | |
Accumulated net investment income (loss) at end of period | | $ | — | | | $ | — | | | |
| | | | | | | | | | |
| | | | | | | | | | |
| | | | | | | | | | |
| | | | | | | | | | |
| | | | | | | | | | |
| | | | | | | | | | |
| | | | | | | | | | | |
| (a) | For the period from December 29, 2004 (commencement of operations) through October 31, 2005. |
See notes to financial statements.
\
Statements of Changes in Net Assets
| | | | | | | | | | | | | | | | | | |
| | | Gartmore U.S. Growth Leaders Fund | | | Gartmore Worldwide Leaders Fund |
| | | Year Ended
October 31, 2006 | | | Year Ended
October 31, 2005 | | | Year Ended
October 31, 2006 | | | Year Ended
October 31, 2005 |
FROM INVESTMENT ACTIVITIES: | | | | | | | | | | | | | | | | | | |
Operations: | | | | | | | | | | | | | | | | | | |
Net investment income (loss) | | $ | (1,062,861 | ) | | $ | (645,728 | ) | | $ | 162,545 | | | $ | (95,956 | ) | | |
Net realized gains (losses) on investment and foreign currency transactions | | | (4,653,935 | ) | | | 9,000,143 | | | | 6,837,493 | * | | | 6,766,483 | | | |
Net change in unrealized appreciation/depreciation on investments and translation of assets and liabilities denominated in foreign currencies | | | 5,090,644 | | | | 36,165 | | | | 2,846,773 | | | | 422,042 | | | |
| | | | | | | | | | | | | | | | | | |
Change in net assets resulting from operations | | | (626,152 | ) | | | 8,390,580 | | | | 9,846,811 | | | | 7,092,569 | | | |
| | | | | | | | | | | | | | | | | | |
| | | | | |
Distributions to Class A Shareholders from: | | | | | | | | | | | | | | | | | | |
Net investment income | | | — | | | | — | | | | (181,971 | ) | | | (112,974 | ) | | |
Net realized gains on investments | | | (5,982,359 | ) | | | — | | | | — | | | | — | | | |
| | | | | |
Distributions to Class B Shareholders from: | | | | | | | | | | | | | | | | | | |
Net investment income | | | — | | | | — | | | | (952 | ) | | | (259 | ) | | |
Net realized gains on investments | | | (282,244 | ) | | | — | | | | — | | | | — | | | |
| | | | | |
Distributions to Class C Shareholders from: | | | | | | | | | | | | | | | | | | |
Net investment income | | | — | | | | — | | | | (5,840 | ) | | | (106 | ) | | |
Net realized gains on investments | | | (1,801,693 | ) | | | — | | | | — | | | | — | | | |
| | | | | |
Distributions to Class R Shareholders from: | | | | | | | | | | | | | | | | | | |
Net investment income | | | — | | | | — | | | | (6 | ) | | | (4 | ) | | |
Net realized gains on investments | | | (49,790 | ) | | | — | | | | — | | | | — | | | |
| | | | | |
Distributions to Institutional Service Class Shareholders from: | | | | | | | | | | | | | | | | | | |
Net investment income | | | — | | | | — | | | | (88 | ) | | | (6,902 | ) | | |
Net realized gains on investments | | | (549,932 | ) | | | — | | | | — | | | | — | | | |
| | | | | |
Distributions to Institutional Class Shareholders from: | | | | | | | | | | | | | | | | | | |
Net investment income | | | — | | | | — | | | | (9 | ) | | | (5 | ) | | |
From net realized gains on investments | | | (126,437 | ) | | | — | | | | — | | | | — | | | |
| | | | | | | | | | | | | | | | | | |
Change in net assets from shareholder distributions | | | (8,792,455 | ) | | | — | | | | (188,866 | ) | | | (120,250 | ) | | |
| | | | | | | | | | | | | | | | | | |
Change in net assets from capital transactions | | | 29,282,374 | | | | 71,491,013 | | | | (1,123,361 | ) | | | (1,892,593 | ) | | |
| | | | | | | | | | | | | | | | | | |
Change in net assets | | | 19,863,767 | | | | 79,881,593 | | | | 8,534,584 | | | | 5,079,726 | | | |
| | | | | |
Net Assets: | | | | | | | | | | | | | | | | | | |
Beginning of period | | | 114,969,708 | | | | 35,088,115 | | | | 37,308,804 | | | | 32,229,078 | | | |
| | | | | | | | | | | | | | | | | | |
End of period | | $ | 134,833,475 | | | $ | 114,969,708 | | | $ | 45,843,388 | | | $ | 37,308,804 | | | |
| | | | | | | | | | | | | | | | | | |
| | | | | |
Accumulated net investment income (loss) at end of period | | $ | — | | | $ | — | | | $ | — | | | $ | (601 | ) | | |
| | | | | | | | | | | | | | | | | | |
| | | | | | | | | | | | | | | | | | |
| | | | | | | | | | | | | | | | | | | |
| * | Includes realized gain as a result of a redemption in kind (Note 9). |
See notes to financial statements.
Statements of Changes in Net Assets (Continued)
| | | | | | | | | | | | | | | | | | |
| | | Gartmore Mid Cap Growth Leaders Fund | | | Gartmore Nationwide Leaders Fund |
| | | Year Ended
October 31, 2006 | | | Year Ended
October 31, 2005 | | | Year Ended
October 31, 2006 | | | Year Ended
October 31, 2005 |
CAPITAL TRANSACTIONS: | | | | | | | | | | | | | | | | | | |
Class A Shares | | | | | | | | | | | | | | | | | | |
Proceeds from shares issued | | $ | 2,497,796 | | | $ | 3,195,833 | | | $ | 3,153,293 | | | $ | 5,244,155 | | | |
Dividends reinvested | | | — | | | | — | | | | 601,984 | | | | 128,717 | | | |
Cost of shares redeemed (a) | | | (2,841,869 | ) | | | (3,398,486 | ) | | | (2,118,975 | ) | | | (1,798,800 | ) | | |
| | | | | | | | | | | | | | | | | | |
| | | (344,073 | ) | | | (202,653 | ) | | | 1,636,302 | | | | 3,574,072 | | | |
| | | | | | | | | | | | | | | | | | |
| | | | | |
Class B Shares | | | | | | | | | | | | | | | | | | |
Proceeds from shares issued | | | 337,160 | | | | 277,323 | | | | 262,295 | | | | 293,433 | | | |
Dividends reinvested | | | — | | | | — | | | | 68,334 | | | | 26,402 | | | |
Cost of shares redeemed (a) | | | (925,900 | ) | | | (805,028 | ) | | | (33,847 | ) | | | (18,065 | ) | | |
| | | | | | | | | | | | | | | | | | |
| | | (588,740 | ) | | | (527,705 | ) | | | 296,782 | | | | 301,770 | | | |
| | | | | | | | | | | | | | | | | | |
| | | | | |
Class C Shares | | | | | | | | | | | | | | | | | | |
Proceeds from shares issued | | | 466,150 | | | | 378,214 | | | | 1,604,667 | | | | 1,588,219 | | | |
Dividends reinvested | | | — | | | | — | | | | 159,202 | | | | 25,378 | | | |
Cost of shares redeemed (a) | | | (196,249 | ) | | | (34,611 | ) | | | (280,883 | ) | | | (63,840 | ) | | |
| | | | | | | | | | | | | | | | | | |
| | | 269,901 | | | | 343,603 | | | | 1,482,986 | | | | 1,549,757 | | | |
| | | | | | | | | | | | | | | | | | |
| | | | | |
Class D Shares | | | | | | | | | | | | | | | | | | |
Proceeds from shares issued | | | 1,202,408 | | | | 415,661 | | | | — | | | | — | | | |
Cost of shares redeemed (a) | | | (2,943,110 | ) | | | (2,066,348 | ) | | | — | | | | — | | | |
| | | | | | | | | | | | | | | | | | |
| | | (1,740,702 | ) | | | (1,650,687 | ) | | | — | | | | — | | | |
| | | | | | | | | | | | | | | | | | |
| | | | | |
Class R Shares | | | | | | | | | | | | | | | | | | |
Proceeds from shares issued | | | 200 | | | | — | | | | 150 | | | | 175 | | | |
Dividends reinvested | | | — | | | | — | | | | 164 | | | | 77 | | | |
Cost of shares redeemed (a) | | | (201 | ) | | | — | | | | (150 | ) | | | (176 | ) | | |
| | | | | | | | | | | | | | | | | | |
| | | (1 | ) | | | — | | | | 164 | | | | 76 | | | |
| | | | | | | | | | | | | | | | | | |
| | | | | |
Institutional Service Class Shares | | | | | | | | | | | | | | | | | | |
Proceeds from shares issued | | | — | | | | — | | | | 1,190,409 | | | | 6,113,110 | | | |
Dividends reinvested | | | — | | | | — | | | | 795,647 | | | | 201,427 | | | |
Cost of shares redeemed (a) | | | — | | | | — | | | | (8,083,796 | )* | | | (2,506,086 | ) | | |
| | | | | | | | | | | | | | | | | | |
| | | — | | | | — | | | | (6,097,740 | ) | | | 3,808,451 | | | |
| | | | | | | | | | | | | | | | | | |
| | | | | |
Institutional Class Shares | | | | | | | | | | | | | | | | | | |
Proceeds from shares issued | | | 1,130 | | | | 15,000,488 | | | | — | | | | — | | | |
Dividends reinvested | | | — | | | | — | | | | 152 | | | | 72 | | | |
Cost of shares redeemed (a) | | | (3,000,347 | ) | | | — | | | | — | | | | — | | | |
| | | | | | | | | | | | | | | | | | |
| | | (2,999,217 | ) | | | 15,000,488 | | | | 152 | | | | 72 | | | |
| | | | | | | | | | | | | | | | | | |
Change in net assets from capital transactions | | $ | (5,402,832 | ) | | $ | 12,963,046 | | | $ | (2,681,354 | ) | | $ | 9,234,198 | | | |
| | | | | | | | | | | | | | | | | | | |
| * | Includes redemption as a result of a redemption in kind (Note 9). |
| (a) | Amount includes redemption fees, if any. |
See notes to financial statements.
Statements of Changes in Net Assets
| | | | | | | | | | | | | | |
| | | Gartmore Mid Cap Growth Leaders Fund | | | Gartmore Nationwide Leaders Fund |
| | | Year Ended
October 31, 2006 | | | Year Ended
October 31, 2005 | | | Year Ended
October 31, 2006 | | | Year Ended
October 31, 2005 |
SHARE TRANSACTIONS: | | | | | | | | | | | | | | |
Class A Shares | | | | | | | | | | | | | | |
Issued | | 169,385 | | | 241,365 | | | 230,090 | | | 392,591 | | | |
Reinvested | | — | | | — | | | 46,338 | | | 9,709 | | | |
Redeemed | | (192,937 | ) | | (260,452 | ) | | (155,673 | ) | | (136,107 | ) | | |
| | | | | | | | | | | | | | |
| | (23,552 | ) | | (19,087 | ) | | 120,755 | | | 266,193 | | | |
| | | | | | | | | | | | | | |
| | | | | |
Class B Shares | | | | | | | | | | | | | | |
Issued | | 24,557 | | | 23,005 | | | 20,263 | | | 22,458 | | | |
Reinvested | | — | | | — | | | 5,387 | | | 2,039 | | | |
Redeemed | | (67,919 | ) | | (66,500 | ) | | (2,597 | ) | | (1,347 | ) | | |
| | | | | | | | | | | | | | |
| | (43,362 | ) | | (43,495 | ) | | 23,053 | | | 23,150 | | | |
| | | | | | | | | | | | | | |
| | | | | |
Class C Shares | | | | | | | | | | | | | | |
Issued | | 33,982 | | | 29,245 | | | 120,692 | | | 120,520 | | | |
Reinvested | | — | | | — | | | 12,560 | | | 1,955 | | | |
Redeemed | | (14,453 | ) | | (2,691 | ) | | (21,652 | ) | | (4,999 | ) | | |
| | | | | | | | | | | | | | |
| | 19,529 | | | 26,554 | | | 111,600 | | | 117,476 | | | |
| | | | | | | | | | | | | | |
| | | | | |
Class D Shares | | | | | | | | | | | | | | |
Issued | | 78,400 | | | 31,286 | | | — | | | — | | | |
Redeemed | | (192,959 | ) | | (157,226 | ) | | — | | | — | | | |
| | | | | | | | | | | | | | |
| | (114,559 | ) | | (125,940 | ) | | — | | | — | | | |
| | | | | | | | | | | | | | |
| | | | | |
Class R Shares | | | | | | | | | | | | | | |
Issued | | 13 | | | — | | | 11 | | | 13 | | | |
Reinvested | | — | | | — | | | 13 | | | 6 | | | |
Redeemed | | (13 | ) | | — | | | (11 | ) | | (13 | ) | | |
| | | | | | | | | | | | | | |
| | — | | | — | | | 13 | | | 6 | | | |
| | | | | | | | | | | | | | |
| | | | | |
Institutional Service Class Shares | | | | | | | | | | | | | | |
Issued | | — | | | — | | | 86,427 | | | 460,372 | | | |
Reinvested | | — | | | — | | | 61,249 | | | 15,158 | | | |
Redeemed | | — | | | — | | | (595,800 | )* | | (186,564 | ) | | |
| | | | | | | | | | | | | | |
| | — | | | — | | | (448,124 | ) | | 288,966 | | | |
| | | | | | | | | | | | | | |
| | | | | |
Institutional Class Shares | | | | | | | | | | | | | | |
Issued | | — | | | 1,158,301 | | | — | | | — | | | |
Reinvested | | — | | | — | | | 12 | | | 5 | | | |
Redeemed | | (196,464 | ) | | — | | | — | | | — | | | |
| | | | | | | | | | | | | | |
| | (196,464 | ) | | 1,158,301 | | | 12 | | | 5 | | | |
| | | | | | | | | | | | | | |
Total change in shares | | (358,408 | ) | | 996,333 | | | (192,691 | ) | | 695,796 | | | |
| | | | | | | | | | | | | | | |
| * | Includes redemption as a result of a redemption in kind (Note 9). |
See notes to financial statements.
Statements of Changes in Net Assets (Continued)
| | | | | | | | | | |
| | | Gartmore Small Cap Leaders Fund |
| | | Year Ended
October 31, 2006 | | | Period Ended
October 31, 2005 (b) |
CAPITAL TRANSACTIONS: | | | | | | | | | | |
Class A Shares | | | | | | | | | | |
Proceeds from shares issued | | $ | 16,118,945 | | | $ | 5,807,632 | | | |
Dividends reinvested | | | 47,649 | | | | — | | | |
Cost of shares redeemed (a) | | | (2,463,851 | ) | | | (431,184 | ) | | |
| | | | | | | | | | |
| | | 13,702,743 | | | | 5,376,448 | | | |
| | | | | | | | | | |
| | | |
Class B Shares | | | | | | | | | | |
Proceeds from shares issued | | | 681,666 | | | | 902,719 | | | |
Dividends reinvested | | | 1,016 | | | | — | | | |
Cost of shares redeemed (a) | | | (45,757 | ) | | | (28 | ) | | |
| | | | | | | | | | |
| | | 636,925 | | | | 902,691 | | | |
| | | | | | | | | | |
| | | |
Class C Shares | | | | | | | | | | |
Proceeds from shares issued | | | 5,861,792 | | | | 5,709,006 | | | |
Dividends reinvested | | | 13,478 | | | | — | | | |
Cost of shares redeemed (a) | | | (1,613,208 | ) | | | (133,766 | ) | | |
| | | | | | | | | | |
| | | 4,262,062 | | | | 5,575,240 | | | |
| | | | | | | | | | |
| | | |
Class R Shares | | | | | | | | | | |
Proceeds from shares issued | | | 4,551 | | | | 1,000 | | | |
Dividends reinvested | | | 21 | | | | — | | | |
Cost of shares redeemed (a) | | | (153 | ) | | | — | | | |
| | | | | | | | | | |
| | | 4,419 | | | | 1,000 | | | |
| | | | | | | | | | |
| | | |
Institutional Service Class Shares | | | | | | | | | | |
Proceeds from shares issued | | | 110,032 | | | | 1,000 | | | |
Dividends reinvested | | | 129 | | | | — | | | |
Cost of shares redeemed (a) | | | (25,025 | ) | | | — | | | |
| | | | | | | | | | |
| | | 85,136 | | | | 1,000 | | | |
| | | | | | | | | | |
| | | |
Institutional Class Shares | | | | | | | | | | |
Proceeds from shares issued | | | 14,758 | | | | 4,000,743 | | | |
Dividends reinvested | | | 88,761 | | | | — | | | |
Cost of shares redeemed (a) | | | (1,769 | ) | | | — | | | |
| | | | | | | | | | |
| | | 101,750 | | | | 4,000,743 | | | |
| | | | | | | | | | |
Change in net assets from capital transactions | | $ | 18,793,035 | | | $ | 15,857,122 | | | |
| | | | | | | | | | | |
| (a) | Amount includes redemption fees, if any. |
| (b) | For the period from December 29, 2004 (commencement of operations) through October 31, 2005. |
See notes to financial statements.
Statements of Changes in Net Assets
| | | | | | | | |
| | | Gartmore Small Cap Leaders Fund |
| | | Year Ended
October 31, 2006 | | | Period Ended
October 31, 2005 (b) |
SHARE TRANSACTIONS: | | | | | | | | |
Class A Shares | | | | | | | | |
Issued | | 1,326,177 | | | 583,595 | | | |
Reinvested | | 4,407 | | | — | | | |
Redeemed | | (206,865 | ) | | (43,230 | ) | | |
| | | | | | | | |
| | 1,123,719 | | | 540,365 | | | |
| | | | | | | | |
| | | |
Class B Shares | | | | | | | | |
Issued | | 54,954 | | | 88,601 | | | |
Reinvested | | 97 | | | — | | | |
Redeemed | | (3,905 | ) | | (3 | ) | | |
| | | | | | | | |
| | 51,146 | | | 88,598 | | | |
| | | | | | | | |
| | | |
Class C Shares | | | | | | | | |
Issued | | 484,961 | | | 577,052 | | | |
Reinvested | | 1,281 | | | — | | | |
Redeemed | | (135,160 | ) | | (13,415 | ) | | |
| | | | | | | | |
| | 351,082 | | | 563,637 | | | |
| | | | | | | | |
| | | |
Class R Shares | | | | | | | | |
Issued | | 399 | | | 100 | | | |
Reinvested | | 2 | | | — | | | |
Redeemed | | (13 | ) | | — | | | |
| | | | | | | | |
| | 388 | | | 100 | | | |
| | | | | | | | |
| | | |
Institutional Service Class Shares | | | | | | | | |
Issued | | 8,694 | | | 100 | | | |
Reinvested | | 11 | | | — | | | |
Redeemed | | (2,135 | ) | | — | | | |
| | | | | | | | |
| | 6,570 | | | 100 | | | |
| | | | | | | | |
| | | |
Institutional Class Shares | | | | | | | | |
Issued | | 843 | | | 400,000 | | | |
Reinvested | | 8,248 | | | — | | | |
Redeemed | | — | | | — | | | |
| | | | | | | | |
| | 9,091 | | | 400,000 | | | |
| | | | | | | | |
Total change in shares | | 1,541,996 | | | 1,592,800 | | | |
| | | | | | | | | |
| (b) | For the period from December 29, 2004 (commencement of operations) through October 31, 2005. |
See notes to financial statements.
Statements of Changes in Net Assets (Continued)
| | | | | | | | | | | | | | | | | | |
| | | Gartmore U.S. Growth Leaders Fund | | | Gartmore Worldwide Leaders Fund |
| | | Year Ended
October 31, 2006 | | | Year Ended
October 31, 2005 | | | Year Ended
October 31, 2006 | | | Year Ended
October 31, 2005 |
CAPITAL TRANSACTIONS: | | | | | | | | | | | | | | | | | | |
Class A Shares | | | | | | | | | | | | | | | | | | |
Proceeds from shares issued | | $ | 75,133,005 | | | $ | 63,048,164 | | | $ | 7,478,247 | | | $ | 2,362,146 | | | |
Dividends reinvested | | | 4,334,360 | | | | — | | | | 161,605 | | | | 109,050 | | | |
Cost of shares redeemed (a) | | | (63,403,917 | ) | | | (13,052,247 | ) | | | (7,201,253 | ) | | | (7,302,078 | ) | | |
| | | | | | | | | | | | | | | | | | |
| | | 16,063,448 | | | | 49,995,917 | | | | 438,599 | | | | (4,830,882 | ) | | |
| | | | | | | | | | | | | | | | | | |
| | | | | |
Class B Shares | | | | | | | | | | | | | | | | | | |
Proceeds from shares issued | | | 2,992,972 | | | | 1,612,378 | | | | 465,136 | | | | 196,575 | | | |
Dividends reinvested | | | 196,011 | | | | — | | | | 550 | | | | 252 | | | |
Cost of shares redeemed (a) | | | (1,008,192 | ) | | | (399,183 | ) | | | (122,438 | ) | | | (6,965 | ) | | |
| | | | | | | | | | | | | | | | | | |
| | | 2,180,791 | | | | 1,213,195 | | | | 343,248 | | | | 189,862 | | | |
| | | | | | | | | | | | | | | | | | |
| | | | | |
Class C Shares | | | | | | | | | | | | | | | | | | |
Proceeds from shares issued | | | 25,137,386 | | | | 19,890,657 | | | | 3,181,106 | | | | 672,330 | | | |
Dividends reinvested | | | 809,025 | | | | — | | | | 2,483 | | | | 93 | | | |
Cost of shares redeemed (a) | | | (10,035,027 | ) | | | (2,244,937 | ) | | | (458,128 | ) | | | (60,011 | ) | | |
| | | | | | | | | | | | | | | | | | |
| | | 15,911,384 | | | | 17,645,720 | | | | 2,725,461 | | | | 612,412 | | | |
| | | | | | | | | | | | | | | | | | |
| | | | | |
Class R Shares | | | | | | | | | | | | | | | | | | |
Proceeds from shares issued | | | 837,644 | | | | 635,099 | | | | 150 | | | | 175 | | | |
Dividends reinvested | | | 81 | | | | — | | | | 6 | | | | 4 | | | |
Cost of shares redeemed (a) | | | (395,267 | ) | | | (1,924 | ) | | | (151 | ) | | | (177 | ) | | |
| | | | | | | | | | | | | | | | | | |
| | | 442,458 | | | | 633,175 | | | | 5 | | | | 2 | | | |
| | | | | | | | | | | | | | | | | | |
| | | | | |
Institutional Service Class Shares | | | | | | | | | | | | | | | | | | |
Proceeds from shares issued | | | 1,993,334 | | | | 3,648,636 | | | | 2,774,186 | | | | 3,594,305 | | | |
Dividends reinvested | | | 549,931 | | | | — | | | | 88 | | | | 6,902 | | | |
Cost of shares redeemed (a) | | | (10,890,417 | ) | | | (3,041,751 | ) | | | (7,404,957 | )* | | | (1,465,199 | ) | | |
| | | | | | | | | | | | | | | | | | |
| | | (8,347,152 | ) | | | 606,885 | | | | (4,630,683 | ) | | | 2,136,008 | | | |
| | | | | | | | | | | | | | | | | | |
| | | | | |
Institutional Class Shares | | | | | | | | | | | | | | | | | | |
Proceeds from shares issued | | | 3,788,762 | | | | 1,610,464 | | | | — | | | | — | | | |
Dividends reinvested | | | 126,437 | | | | — | | | | 9 | | | | 5 | | | |
Cost of shares redeemed (a) | | | (883,754 | ) | | | (214,343 | ) | | | — | | | | — | | | |
| | | | | | | | | | | | | | | | | | |
| | | 3,031,445 | | | | 1,396,121 | | | | 9 | | | | 5 | | | |
| | | | | | | | | | | | | | | | | | |
Change in net assets from capital transactions | | $ | 29,282,374 | | | $ | 71,491,013 | | | $ | (1,123,361 | ) | | $ | (1,892,593 | ) | | |
| | | | | | | | | | | | | | | | | | | |
| * | Includes redemption as a result of a redemption in kind (Note 9). |
| (a) | Amount includes redemption fees, if any. |
See notes to financial statements.
Statements of Changes in Net Assets
| | | | | | | | | | | | | | |
| | | Gartmore U.S. Growth Leaders Fund | | | Gartmore Worldwide Leaders Fund |
| | | Year Ended
October 31, 2006 | | | Year Ended
October 31, 2005 | | | Year Ended
October 31, 2006 | | | Year Ended
October 31, 2005 |
SHARE TRANSACTIONS: | | | | | | | | | | | | | | |
Class A Shares | | | | | | | | | | | | | | |
Issued | | 7,438,195 | | | 6,578,117 | | | 715,404 | | | 273,057 | | | |
Reinvested | | 432,140 | | | — | | | 15,454 | | | 13,170 | | | |
Redeemed | | (6,552,791 | ) | | (1,373,410 | ) | | (685,963 | ) | | (868,127 | ) | | |
| | | | | | | | | | | | | | |
| | 1,317,544 | | | 5,204,707 | | | 44,895 | | | (581,900 | ) | | |
| | | | | | | | | | | | | | |
| | | | | |
Class B Shares | | | | | | | | | | | | | | |
Issued | | 308,750 | | | 174,768 | | | 45,706 | | | 22,463 | | | |
Reinvested | | 20,354 | | | — | | | 55 | | | 31 | | | |
Redeemed | | (107,628 | ) | | (43,686 | ) | | (12,072 | ) | | (826 | ) | | |
| | | | | | | | | | | | | | |
| | 221,476 | | | 131,082 | | | 33,689 | | | 21,668 | | | |
| | | | | | | | | | | | | | |
| | | | | |
Class C Shares | | | | | | | | | | | | | | |
Issued | | 2,557,616 | | | 2,118,509 | | | 307,345 | | | 78,996 | | | |
Reinvested | | 83,491 | | | — | | | 246 | | | 11 | | | |
Redeemed | | (1,079,969 | ) | | (241,558 | ) | | (44,710 | ) | | (7,093 | ) | | |
| | | | | | | | | | | | | | |
| | 1,561,138 | | | 1,876,951 | | | 262,881 | | | 71,914 | | | |
| | | | | | | | | | | | | | |
| | | | | |
Class R Shares | | | | | | | | | | | | | | |
Issued | | 85,659 | | | 65,689 | | | 14 | | | 22 | | | |
Reinvested | | 8 | | | — | | | 1 | | | 1 | | | |
Redeemed | | (39,728 | ) | | (201 | ) | | (15 | ) | | (22 | ) | | |
| | | | | | | | | | | | | | |
| | 45,939 | | | 65,488 | | | — | | | 1 | | | |
| | | | | | | | | | | | | | |
| | | | | |
Institutional Service Class Shares | | | | | | | | | | | | | | |
Issued | | 189,941 | | | 379,893 | | | 279,598 | | | 406,743 | | | |
Reinvested | | 54,074 | | | — | | | 8 | | | 825 | | | |
Redeemed | | (1,043,535 | ) | | (322,362 | ) | | (693,392 | )* | | (172,868 | ) | | |
| | | | | | | | | | | | | | |
| | (799,520 | ) | | 57,531 | | | (413,786 | ) | | 234,700 | | | |
| | | | | | | | | | | | | | |
| | | | | |
Institutional Class Shares | | | | | | | | | | | | | | |
Issued | | 375,708 | | | 166,071 | | | — | | | — | | | |
Reinvested | | 12,396 | | | — | | | 1 | | | 1 | | | |
Redeemed | | (88,077 | ) | | (21,381 | ) | | — | | | — | | | |
| | | | | | | | | | | | | | |
| | 300,027 | | | 144,690 | | | 1 | | | 1 | | | |
| | | | | | | | | | | | | | |
Total change in shares | | 2,646,604 | | | 7,480,449 | | | (72,320 | ) | | (253,616 | ) | | |
| | | | | | | | | | | | | | | |
| * | Includes redemption as a result of a redemption in kind (Note 9). |
See notes to financial statements.
Financial Highlights
Selected Data for Each Share of Capital Outstanding
Gartmore Mid Cap Growth Leaders Fund
| | | | | | | | | | | | | | | | | | | | | | | | | | | | | | | | | | | |
| | | | | Investment Activities | | | | | | | | Ratios/Supplemental Data |
| | | Net Asset
Value,
Beginning
of Period | | Net
Investment
Income
(Loss) | | | Net Realized
and
Unrealized
Gains
(Losses) on
Investments | | | Total
from
Investment
Activities | | | Net
Asset
Value, End
of Period | | Total
Return (a) | | | Net Assets
at End of
Period
(000s) | | Ratio of
Expenses
to Average
Net Assets | | | Ratio of Net
Investment
Income
(Loss)
to Average
Net Assets | | | Ratio of
Expenses
(Prior to
Reimbursements)
to Average
Net Assets (b) | | | Ratio of Net
Investment
Income (Loss)
(Prior to
Reimbursements)
to Average
Net Assets (b) | | | Portfolio
Turnover (c) |
| | | | | | | | | | | | |
Class A Shares | | | | | | | | | | | | | | | | | | | | | | | | | | | | | | | | | | | |
Year Ended October 31, 2002 | | $ | 10.93 | | (0.14 | ) | | (2.29 | ) | | (2.43 | ) | | $ | 8.50 | | (22.23% | ) | | $ | 4,880 | | 1.59% | | | (1.27% | ) | | 2.20% | | | (1.88% | ) | | 432.60% |
Year Ended October 31, 2003 | | $ | 8.50 | | (0.12 | ) | | 2.92 | | | 2.80 | | | $ | 11.30 | | 32.94% | | | $ | 6,441 | | 1.55% | | | (1.27% | ) | | 1.99% | | | (1.71% | ) | | 365.45% |
Year Ended October 31, 2004 | | $ | 11.30 | | (0.12 | ) | | 0.34 | | | 0.22 | | | $ | 11.52 | | 1.95% | | | $ | 5,769 | | 1.50% | | | (0.97% | ) | | 1.98% | | | (1.44% | ) | | 405.85% |
Year Ended October 31, 2005 | | $ | 11.52 | | (0.09 | ) | | 2.32 | | | 2.23 | | | $ | 13.75 | | 19.36% | | | $ | 6,624 | | 1.52% | | | (0.74% | ) | | 1.82% | | | (1.03% | ) | | 149.29% |
Year Ended October 31, 2006 | | $ | 13.75 | | (0.09 | ) | | 1.45 | | | 1.36 | | | $ | 15.11 | | 9.89% | | | $ | 6,926 | | 1.48% | | | (0.57% | ) | | 1.54% | | | (0.64% | ) | | 164.51% |
| | | | | | | | | | | | |
Class B Shares | | | | | | | | | | | | | | | | | | | | | | | | | | | | | | | | | | | |
Year Ended October 31, 2002 | | $ | 10.40 | | (0.19 | ) | | (2.18 | ) | | (2.37 | ) | | $ | 8.03 | | (22.79% | ) | | $ | 3,005 | | 2.25% | | | (1.94% | ) | | 2.90% | | | (2.59% | ) | | 432.60% |
Year Ended October 31, 2003 | | $ | 8.03 | | (0.18 | ) | | 2.76 | | | 2.58 | | | $ | 10.61 | | 32.13% | | | $ | 3,663 | | 2.24% | | | (1.96% | ) | | 2.68% | | | (2.40% | ) | | 365.45% |
Year Ended October 31, 2004 | | $ | 10.61 | | (0.18 | ) | | 0.31 | | | 0.13 | | | $ | 10.74 | | 1.23% | | | $ | 3,324 | | 2.20% | | | (1.66% | ) | | 2.67% | | | (2.13% | ) | | 405.85% |
Year Ended October 31, 2005 | | $ | 10.74 | | (0.19 | ) | | 2.19 | | | 2.00 | | | $ | 12.74 | | 18.62% | | | $ | 3,387 | | 2.22% | | | (1.43% | ) | | 2.52% | | | (1.72% | ) | | 149.29% |
Year Ended October 31, 2006 | | $ | 12.74 | | (0.19 | ) | | 1.36 | | | 1.17 | | | $ | 13.91 | | 9.18% | | | $ | 3,096 | | 2.17% | | | (1.25% | ) | | 2.24% | | | (1.32% | ) | | 164.51% |
| | | | | | | | | | | | |
Class C Shares | | | | | | | | | | | | | | | | | | | | | | | | | | | | | | | | | | | |
Year Ended October 31, 2002 | | $ | 10.41 | | (0.19 | ) | | (2.18 | ) | | (2.37 | ) | | $ | 8.04 | | (22.77% | ) | | $ | 45 | | 2.25% | | | (1.94% | ) | | 2.90% | | | (2.59% | ) | | 432.60% |
Year Ended October 31, 2003 | | $ | 8.04 | | (0.16 | ) | | 2.74 | | | 2.58 | | | $ | 10.62 | | 32.09% | | | $ | 69 | | 2.24% | | | (1.96% | ) | | 2.69% | | | (2.41% | ) | | 365.45% |
Year Ended October 31, 2004 | | $ | 10.62 | | (0.16 | ) | | 0.29 | | | 0.13 | | | $ | 10.75 | | 1.22% | | | $ | 77 | | 2.20% | | | (1.65% | ) | | 2.69% | | | (2.14% | ) | | 405.85% |
Year Ended October 31, 2005 (h) | | $ | 10.75 | | (0.18 | ) | | 2.18 | | | 2.00 | | | $ | 12.75 | | 18.60% | | | $ | 429 | | 2.23% | | | (1.45% | ) | | 2.46% | | | (1.69% | ) | | 149.29% |
Year Ended October 31, 2006 | | $ | 12.75 | | (0.18 | ) | | 1.35 | | | 1.17 | | | $ | 13.92 | | 9.18% | | | $ | 741 | | 2.16% | | | (1.29% | ) | | 2.23% | | | (1.35% | ) | | 164.51% |
| | | | | | | | | | | | |
Class D Shares | | | | | | | | | | | | | | | | | | | | | | | | | | | | | | | | | | | |
Year Ended October 31, 2002 | | $ | 11.03 | | (0.11 | ) | | (2.32 | ) | | (2.43 | ) | | $ | 8.60 | | (22.03% | ) | | $ | 10,192 | | 1.27% | | | (0.97% | ) | | 1.90% | | | (1.60% | ) | | 432.60% |
Year Ended October 31, 2003 | | $ | 8.60 | | (0.10 | ) | | 2.97 | | | 2.87 | | | $ | 11.47 | | 33.37% | | | $ | 11,747 | | 1.24% | | | (0.96% | ) | | 1.69% | | | (1.40% | ) | | 365.45% |
Year Ended October 31, 2004 | | $ | 11.47 | | (0.08 | ) | | 0.34 | | | 0.26 | | | $ | 11.73 | | 2.27% | | | $ | 10,857 | | 1.20% | | | (0.66% | ) | | 1.67% | | | (1.13% | ) | | 405.85% |
Year Ended October 31, 2005 | | $ | 11.73 | | (0.06 | ) | | 2.38 | | | 2.32 | | | $ | 14.05 | | 19.78% | | | $ | 11,232 | | 1.22% | | | (0.43% | ) | | 1.52% | | | (0.72% | ) | | 149.29% |
Year Ended October 31, 2006 | | $ | 14.05 | | (0.04 | ) | | 1.49 | | | 1.45 | | | $ | 15.50 | | 10.32% | | | $ | 10,614 | | 1.17% | | | (0.26% | ) | | 1.24% | | | (0.33% | ) | | 164.51% |
| | | | | | | | | | | | |
Class R Shares | | | | | | | | | | | | | | | | | | | | | | | | | | | | | | | | | | | |
Period Ended October 31, 2004 (f) | | $ | 11.47 | | (0.11 | ) | | 0.32 | | | 0.21 | | | $ | 11.68 | | 1.83% | (d) | | $ | 1 | | 1.72% | (e) | | (1.16% | )(e) | | 2.09% | (e) | | (1.53% | )(e) | | 405.85% |
Year Ended October 31, 2005 | | $ | 11.68 | | (0.11 | ) | | 2.36 | | | 2.25 | | | $ | 13.93 | | 19.26% | | | $ | 1 | | 1.60% | | | (0.83% | ) | | 1.90% | | | (1.13% | ) | | 149.29% |
Year Ended October 31, 2006 | | $ | 13.93 | | (0.09 | ) | | 1.47 | | | 1.38 | | | $ | 15.31 | | 9.91% | | | $ | 1 | | 1.53% | | | (0.63% | ) | | 1.57% | | | (0.66% | ) | | 164.51% |
| | | | | | | | | | | | |
Institutional Class Shares | | | | | | | | | | | | | | | | | | | | | | | | | | | | | | | | | | | |
Period Ended October 31, 2004 (g) | | $ | 11.23 | | (0.01 | ) | | 0.51 | | | 0.50 | | | $ | 11.73 | | 4.45% | (d) | | $ | 1 | | 1.08% | (e) | | (0.69% | )(e) | | 2.50% | (e) | | (2.11% | )(e) | | 405.85% |
Year Ended October 31, 2005 | | $ | 11.73 | | (0.05 | ) | | 2.36 | | | 2.31 | | | $ | 14.04 | | 19.69% | | | $ | 16,263 | | 1.23% | | | (0.51% | ) | | 1.43% | | | (0.71% | ) | | 149.29% |
Year Ended October 31, 2006 | | $ | 14.04 | | (0.05 | ) | | 1.49 | | | 1.44 | | | $ | 15.48 | | 10.26% | | | $ | 14,894 | | 1.17% | | | (0.26% | ) | | 1.24% | | | (0.33% | ) | | 164.51% |
| (a) | Excludes sales charge. |
| (b) | During the period certain fees were waived and/or reimbursed. If such waivers/reimbursements had not occurred, the ratios would have been as indicated. |
| (c) | Portfolio turnover is calculated on the basis of the Fund as a whole without distinguishing among the classes of shares. |
| (f) | For the period from December 30, 2003 (commencement of operations) through October 31, 2004. |
| (g) | For the period from September 28, 2004 (commencement of operations) through October 31, 2004. |
| (h) | Net investment income (loss) is based on average shares outstanding during the period. |
See notes to financial statements.
\
Financial Highlights
Selected Data for Each Share of Capital Outstanding
Gartmore Nationwide Leaders Fund
| | | | | | | | | | | | | | | | | | | | | | | | | | | | | | | | | | | | | | | | | | | | |
| | | | | Investment Activities | | | Distributions | | | | | | Ratios/Supplemental Data |
| | | Net Asset
Value,
Beginning
of Period | | Net
Investment
Income
(Loss) | | | Net Realized
and
Unrealized
Gains
(Losses) on
Investments | | | Total
from
Investment
Activities | | | Net
Investment
Income | | | Net
Realized
Gains | | | Total
Distributions | | | Net
Asset
Value, End
of Period | | Total
Return (a) | | | Net Assets
at End of
Period
(000s) | | Ratio of
Expenses
to Average
Net Assets | | | Ratio of Net
Investment
Income
(Loss)
to Average
Net Assets | | | Ratio of
Expenses
(Prior to
Reimbursements)
to Average
Net Assets (b) | | | Ratio of Net
Investment
Income (Loss)
(Prior to
Reimbursements)
to Average
Net Assets (b) | | | Portfolio
Turnover (c) |
| | | | | | | | | | | | | | | |
Class A Shares | | | | | | | | | | | | | | | | | | | | | | | | | | | | | | | | | | | | | | | | | | | | |
Period Ended October 31, 2002 (d) | | $ | 10.00 | | 0.02 | | | (0.55 | ) | | (0.53 | ) | | (0.01 | ) | | — | | | (0.01 | ) | | $ | 9.46 | | (5.34% | )(f) | | $ | 891 | | 1.45% | (g) | | 0.23% | (g) | | 4.93% | (g) | | (3.25% | )(g) | | 60.54% |
Year Ended October 31, 2003 | | $ | 9.46 | | — | | | 1.98 | | | 1.98 | | | (0.04 | ) | | — | | | (0.04 | ) | | $ | 11.40 | | 20.97% | | | $ | 1,351 | | 1.45% | | | (0.04% | ) | | 3.23% | | | (1.82% | ) | | 196.86% |
Year Ended October 31, 2004 | | $ | 11.40 | | (0.04 | ) | | 1.18 | | | 1.14 | | | — | | | — | | | — | | | $ | 12.54 | | 10.00% | | | $ | 1,445 | | 1.47% | | | (0.31% | ) | | 2.61% | | | (1.46% | ) | | 230.95% |
Year Ended October 31, 2005 | | $ | 12.54 | | 0.10 | | | 2.12 | | | 2.22 | | | (0.08 | ) | | (0.76 | ) | | (0.84 | ) | | $ | 13.92 | | 18.12% | | | $ | 5,309 | | 1.51% | | | 0.94% | | | 1.80% | | | 0.65% | | | 522.67% |
Year Ended October 31, 2006 | | $ | 13.92 | | 0.11 | | | 1.83 | | | 1.94 | | | (0.20 | ) | | (1.49 | ) | | (1.69 | ) | | $ | 14.17 | | 15.16% | | | $ | 7,117 | | 1.56% | | | 0.72% | | | 1.75% | | | 0.52% | | | 599.86% |
| | | | | | | | | | | | | | | |
Class B Shares | | | | | | | | | | | | | | | | | | | | | | | | | | | | | | | | | | | | | | | | | | | | |
Period Ended October 31, 2002 (d) | | $ | 10.00 | | (0.05 | ) | | (0.55 | ) | | (0.60 | ) | | — | | | — | | | — | | | $ | 9.40 | | (6.00% | )(f) | | $ | 317 | | 2.20% | (g) | | (0.58% | )(g) | | 5.78% | (g) | | (4.16% | )(g) | | 60.54% |
Year Ended October 31, 2003 | | $ | 9.40 | | (0.09 | ) | | 1.97 | | | 1.88 | | | (0.01 | ) | | — | | | (0.01 | ) | | $ | 11.27 | | 20.08% | | | $ | 350 | | 2.20% | | | (0.74% | ) | | 4.11% | | | (2.65% | ) | | 196.86% |
Year Ended October 31, 2004 | | $ | 11.27 | | (0.12 | ) | | 1.17 | | | 1.05 | | | — | | | — | | | — | | | $ | 12.32 | | 9.32% | | | $ | 410 | | 2.20% | | | (1.05% | ) | | 3.34% | | | (2.20% | ) | | 230.95% |
Year Ended October 31, 2005 | | $ | 12.32 | | 0.03 | | | 2.05 | | | 2.08 | | | (0.02 | ) | | (0.76 | ) | | (0.78 | ) | | $ | 13.62 | | 17.25% | | | $ | 769 | | 2.20% | | | 0.32% | | | 2.55% | | | (0.04% | ) | | 522.67% |
Year Ended October 31, 2006 | | $ | 13.62 | | 0.02 | | | 1.78 | | | 1.80 | | | (0.15 | ) | | (1.49 | ) | | (1.64 | ) | | $ | 13.78 | | 14.35% | | | $ | 1,096 | | 2.27% | | | (0.06% | ) | | 2.47% | | | (0.27% | ) | | 599.86% |
| | | | | | | | | | | | | | | |
Class C Shares | | | | | | | | | | | | | | | | | | | | | | | | | | | | | | | | | | | | | | | | | | | | |
Period Ended October 31, 2002 (d) | | $ | 10.00 | | (0.05 | ) | | (0.55 | ) | | (0.60 | ) | | — | | | — | | | — | | | $ | 9.40 | | (6.00% | )(f) | | $ | 243 | | 2.21% | (g) | | (0.60% | )(g) | | 5.80% | (g) | | (4.19% | )(g) | | 60.54% |
Year Ended October 31, 2003 | | $ | 9.40 | | (0.08 | ) | | 1.96 | | | 1.88 | | | (0.01 | ) | | — | | | (0.01 | ) | | $ | 11.27 | | 20.08% | | | $ | 358 | | 2.20% | | | (0.82% | ) | | 3.95% | | | (2.57% | ) | | 196.86% |
Year Ended October 31, 2004 | | $ | 11.27 | | (0.12 | ) | | 1.16 | | | 1.04 | | | — | | | — | | | — | | | $ | 12.31 | | 9.32% | | | $ | 404 | | 2.20% | | | (1.05% | ) | | 3.34% | | | (2.20% | ) | | 230.95% |
Year Ended October 31, 2005 | | $ | 12.31 | | 0.03 | | | 2.07 | | | 2.10 | | | (0.03 | ) | | (0.76 | ) | | (0.79 | ) | | $ | 13.62 | | 17.30% | | | $ | 2,046 | | 2.20% | | | 0.40% | | | 2.43% | | | 0.18% | | | 522.67% |
Year Ended October 31, 2006 | | $ | 13.62 | | 0.02 | | | 1.78 | | | 1.80 | | | (0.16 | ) | | (1.49 | ) | | (1.65 | ) | | $ | 13.77 | | 14.32% | | | $ | 3,606 | | 2.27% | | | (0.06% | ) | | 2.47% | | | (0.27% | ) | | 599.86% |
| | | | | | | | | | | | | | | |
Class R Shares | | | | | | | | | | | | | | | | | | | | | | | | | | | | | | | | | | | | | | | | | | | | |
Period Ended October 31, 2003 (e) | | $ | 10.98 | | (0.01 | ) | | 0.31 | | | 0.30 | | | — | | | — | | | — | | | $ | 11.28 | | 2.73% | (f) | | $ | 1 | | 1.80% | (g) | | (1.11% | )(g) | | 1.90% | (g) | | (1.21% | )(g) | | 196.86% |
Year Ended October 31, 2004 | | $ | 11.28 | | (0.08 | ) | | 1.17 | | | 1.09 | | | — | | | — | | | — | | | $ | 12.37 | | 9.66% | | | $ | 1 | | 1.81% | | | (0.69% | ) | | 2.91% | | | (1.79% | ) | | 230.95% |
Year Ended October 31, 2005 | | $ | 12.37 | | 0.14 | | | 2.06 | | | 2.20 | | | (0.08 | ) | | (0.76 | ) | | (0.84 | ) | | $ | 13.73 | | 18.19% | | | $ | 1 | | 1.45% | | | 1.04% | | | 1.79% | | | 0.70% | | | 522.67% |
Year Ended October 31, 2006 | | $ | 13.73 | | 0.07 | | | 1.81 | | | 1.88 | | | (0.19 | ) | | (1.49 | ) | | (1.68 | ) | | $ | 13.93 | | 14.87% | | | $ | 2 | | 1.80% | | | 0.50% | | | 2.02% | | | 0.28% | | | 599.86% |
| | | | | | | | | | | | | | | |
Institutional Service Class Shares | | | | | | | | | | | | | | | | | | | | | | | | | | | | | | | | | | | | | | | | | | | | |
Period Ended October 31, 2002 (d) | | $ | 10.00 | | 0.03 | | | (0.55 | ) | | (0.52 | ) | | (0.01 | ) | | — | | | (0.01 | ) | | $ | 9.47 | | (5.23% | )(f) | | $ | 778 | | 1.32% | (g) | | 0.39% | (g) | | 4.74% | (g) | | (3.03% | )(g) | | 60.54% |
Year Ended October 31, 2003 | | $ | 9.47 | | — | | | 1.99 | | | 1.99 | | | (0.04 | ) | | — | | | (0.04 | ) | | $ | 11.42 | | 21.10% | | | $ | 1,395 | | 1.38% | | | 0.01% | | | 3.06% | | | (1.67% | ) | | 196.86% |
Year Ended October 31, 2004 | | $ | 11.42 | | (0.03 | ) | | 1.18 | | | 1.15 | | | — | | | — | | | — | | | $ | 12.57 | | 10.07% | | | $ | 2,377 | | 1.41% | | | (0.27% | ) | | 2.56% | | | (1.42% | ) | | 230.95% |
Year Ended October 31, 2005 | | $ | 12.57 | | 0.12 | | | 2.12 | | | 2.24 | | | (0.09 | ) | | (0.76 | ) | | (0.85 | ) | | $ | 13.96 | | 18.23% | | | $ | 6,674 | | 1.43% | | | 0.98% | | | 1.75% | | | 0.66% | | | 522.67% |
Year Ended October 31, 2006 (j) | | $ | 13.96 | | 0.31 | | | 1.66 | | | 1.97 | | | (0.09 | ) | | (1.49 | ) | | (1.58 | ) | | $ | 14.35 | | 15.27% | | | $ | 431 | | 1.44% | | | 2.27% | | | 1.54% | | | 2.18% | | | 599.86% |
| | | | | | | | | | | | | | | |
Institutional Class Shares | | | | | | | | | | | | | | | | | | | | | | | | | | | | | | | | | | | | | | | | | | | | |
Period Ended October 31, 2004 (h) | | $ | 12.22 | | (0.01 | ) | | 0.37 | | | 0.36 | | | — | | | — | | | — | | | $ | 12.58 | | 2.95% | (f) | | $ | 1 | | 1.12% | (g) | | (0.17% | )(g) | | 2.44% | (g) | | (1.50% | )(g) | | 230.95% |
Year Ended October 31, 2005 | | $ | 12.58 | | 0.17 | | | 2.09 | | | 2.26 | | | (0.12 | ) | | (0.76 | ) | | (0.88 | ) | | $ | 13.96 | | 18.37% | | | $ | 1 | | 1.20% | | | 1.23% | | | 1.77% | | | 0.72% | | | 522.67% |
Year Ended October 31, 2006 | | $ | 13.96 | | 0.15 | | | 1.85 | | | 2.00 | | | (0.23 | ) | | (1.49 | ) | | (1.72 | ) | | $ | 14.24 | | 15.60% | | | $ | 1 | | 1.22% | | | 1.08% | | | 1.41% | | | 0.89% | | | 599.86% |
| | | | | | | | | | | | | | | | | | | | | | | | | | | | | | | | | | | | | | | | | | | | | |
| (a) | Excludes sales charge. |
| (b) | During the period certain fees were waived and/or reimbursed. If such waivers/reimbursements had not occurred, the ratios would have been as indicated. |
| (c) | Portfolio turnover is calculated on the basis of the Fund as a whole without distinguishing among the classes of shares. |
| (d) | For the period from December 18, 2001 (commencement of operations) through October 31, 2002. Registration of shares effective with the Securities and Exchange Commission on December 28, 2001. |
| (e) | For the period from October 1, 2003 (commencement of operations) through October 31, 2003. |
| (h) | For the period from June 29, 2004 (commencement of operations) through October 31, 2004. |
| (j) | Net investment income (loss) is based on average shares outstanding during the period. |
See notes to financial statements.
Financial Highlights
Selected Data for Each Share of Capital Outstanding
Gartmore Small Cap Leaders Fund
| | | | | | | | | | | | | | | | | | | | | | | | | | | | | | | | | | | | | | | | | | |
| | | | | Investment Activities | | Distributions | | | | | | Ratios/Supplemental Data |
| | | Net Asset
Value,
Beginning
of Period | | Net
Investment
Income
(Loss) | | | Net Realized
and
Unrealized
Gains
(Losses) on
Investments | | Total
from
Investment
Activities | | Net
Investment
Income | | | Net
Realized
Gains | | | Total
Distributions | | | Net
Asset
Value, End
of Period | | Total
Return (a) | | | Net Assets
at End of
Period
(000s) | | Ratio of
Expenses
to Average
Net Assets | | | Ratio of Net
Investment
Income
(Loss)
to Average
Net Assets | | | Ratio of
Expenses
(Prior to
Reimbursements)
to Average
Net Assets (b) | | | Ratio of Net
Investment
Income (Loss)
(Prior to
Reimbursements)
to Average
Net Assets (b) | | | Portfolio
Turnover (c) |
| | | | | | | | | | | | | | | |
Class A Shares | | | | | | | | | | | | | | | | | | | | | | | | | | | | | | | | | | | | | | | | | | |
Period Ended October 31, 2005 (d) | | $ | 10.00 | | (0.01 | ) | | 0.09 | | 0.08 | | — | | | — | | | — | | | $ | 10.08 | | 0.80% | (e) | | $ | 5,449 | | 1.80% | (f) | | (0.20% | )(f) | | 2.36% | (f) | | (0.76% | )(f) | | 372.55% |
Year Ended October 31, 2006 | | $ | 10.08 | | — | | | 3.04 | | 3.04 | | (0.02 | ) | | (0.19 | ) | | (0.21 | ) | | $ | 12.91 | | 30.65% | | | $ | 21,484 | | 1.61% | | | (0.05% | ) | | 1.66% | | | (0.10% | ) | | 440.62% |
| | | | | | | | | | | | | | | |
Class B Shares | | | | | | | | | | | | | | | | | | | | | | | | | | | | | | | | | | | | | | | | | | |
Period Ended October 31, 2005 (d) | | $ | 10.00 | | (0.02 | ) | | 0.05 | | 0.03 | | — | | | — | | | — | | | $ | 10.03 | | 0.30% | (e) | | $ | 888 | | 2.49% | (f) | | (0.88% | )(f) | | 3.00% | (f) | | (1.39% | )(f) | | 372.55% |
Year Ended October 31, 2006 | | $ | 10.03 | | (0.04 | ) | | 2.96 | | 2.92 | | — | (g) | | (0.19 | ) | | (0.19 | ) | | $ | 12.76 | | 29.55% | | | $ | 1,783 | | 2.35% | | | (0.50% | ) | | 2.40% | | | (0.55% | ) | | 440.62% |
| | | | | | | | | | | | | | | |
Class C Shares | | | | | | | | | | | | | | | | | | | | | | | | | | | | | | | | | | | | | | | | | | |
Period Ended October 31, 2005 (d) | | $ | 10.00 | | (0.04 | ) | | 0.08 | | 0.04 | | — | | | — | | | — | | | $ | 10.04 | | 0.40% | (e) | | $ | 5,657 | | 2.49% | (f) | | (0.90% | )(f) | | 3.04% | (f) | | (1.45% | )(f) | | 372.55% |
Year Ended October 31, 2006 | | $ | 10.04 | | (0.05 | ) | | 2.98 | | 2.93 | | — | (g) | | (0.19 | ) | | (0.19 | ) | | $ | 12.78 | | 29.63% | | | $ | 11,686 | | 2.35% | | | (0.57% | ) | | 2.40% | | | (0.63% | ) | | 440.62% |
| | | | | | | | | | | | | | | |
Class R Shares | | | | | | | | | | | | | | | | | | | | | | | | | | | | | | | | | | | | | | | | | | |
Period Ended October 31, 2005 (d) | | $ | 10.00 | | (0.06 | ) | | 0.11 | | 0.05 | | — | | | — | | | — | | | $ | 10.05 | | 0.50% | (e) | | $ | 1 | | 2.26% | (f) | | (0.74% | )(f) | | 3.03% | (f) | | (1.51% | )(f) | | 372.55% |
Year Ended October 31, 2006 | | $ | 10.05 | | — | (g) | | 3.00 | | 3.00 | | (0.02 | ) | | (0.19 | ) | | (0.21 | ) | | $ | 12.84 | | 30.32% | | | $ | 6 | | 1.95% | | | (0.46% | ) | | 1.99% | | | (0.50% | ) | | 440.62% |
| | | | | | | | | | | | | | | |
Institutional Service Class Shares | | | | | | | | | | | | | | | | | | | | | | | | | | | | | | | | | | | | | | | | | | |
Period Ended October 31, 2005 (d) | | $ | 10.00 | | — | | | 0.10 | | 0.10 | | — | | | — | | | — | | | $ | 10.10 | | 1.00% | (e) | | $ | 1 | | 1.57% | (f) | | (0.04% | )(f) | | 2.21% | (f) | | (0.69% | )(f) | | 372.55% |
Year Ended October 31, 2006 | | $ | 10.10 | | 0.01 | | | 3.06 | | 3.07 | | (0.03 | ) | | (0.19 | ) | | (0.22 | ) | | $ | 12.95 | | 30.83% | | | $ | 86 | | 1.50% | | | (0.56% | ) | | 1.54% | | | (0.60% | ) | | 440.62% |
| | | | | | | | | | | | | | | |
Institutional Class Shares | | | | | | | | | | | | | | | | | | | | | | | | | | | | | | | | | | | | | | | | | | |
Period Ended October 31, 2005 (d) | | $ | 10.00 | | (0.01 | ) | | 0.12 | | 0.11 | | — | | | — | | | — | | | $ | 10.11 | | 1.10% | (e) | | $ | 4,045 | | 1.49% | (f) | | 0.05% | (f) | | 2.29% | (f) | | (0.89% | )(f) | | 372.55% |
Year Ended October 31, 2006 | | $ | 10.11 | | 0.07 | | | 3.02 | | 3.09 | | (0.03 | ) | | (0.19 | ) | | (0.22 | ) | | $ | 12.98 | | 31.03% | | | $ | 5,308 | | 1.35% | | | 0.62% | | | 1.40% | | | 0.57% | | | 440.62% |
| (a) | Excludes sales charge. |
| (b) | During the period certain fees were waived and/or reimbursed. If such waivers/reimbursements had not occurred, the ratios would have been as indicated. |
| (c) | Portfolio turnover is calculated on the basis of the Fund as a whole without distinguishing among the classes of shares. |
| (d) | For the period from December 29, 2004 (commencement of operations) through October 31, 2005. |
| (g) | Amount is less than $0.005. |
See notes to financial statements.
Financial Highlights
Selected Data for Each Share of Capital Outstanding
Gartmore U.S. Growth Leaders Fund
| | | | | | | | | | | | | | | | | | | | | | | | | | | | | | | | | | | | | | | | | |
| | | | | Investment Activities | | | Distributions | | | | | | | | Ratios/Supplemental Data |
| | | Net Asset
Value,
Beginning
of Period | | Net
Investment
Income
(Loss) | | | Net Realized
and
Unrealized
Gains
(Losses) on
Investments | | | Total
from
Investment
Activities | | | Net
Realized
Gains | | | Total
Distributions | | | Net
Asset
Value, End
of Period | | Total
Return (a) | | | Net Assets
at End of
Period
(000s) | | Ratio of
Expenses
to Average
Net Assets | | | Ratio of Net
Investment
Income
(Loss)
to Average
Net Assets | | | Ratio of
Expenses
(Prior to
Reimbursements)
to Average
Net Assets (b) | | | Ratio of Net
Investment
Income (Loss)
(Prior to
Reimbursements)
to Average
Net Assets (b) | | | Portfolio
Turnover (c) |
| | | | | | | | | | | | | | |
Class A Shares | | | | | | | | | | | | | | | | | | | | | | | | | | | | | | | | | | | | | | | | | |
Year Ended October 31, 2002 | | $ | 6.02 | | (0.07 | ) | | (0.46 | ) | | (0.53 | ) | | — | | | — | | | $ | 5.49 | | (8.80% | ) | | $ | 1,356 | | 1.57% | | | (1.20% | ) | | 3.04% | | | (2.67% | ) | | 773.95% |
Year Ended October 31, 2003 | | $ | 5.49 | | (0.03 | ) | | 2.76 | | | 2.73 | | | — | | | — | | | $ | 8.22 | | 49.73% | | | $ | 8,714 | | 1.59% | | | (1.02% | ) | | 2.10% | | | (1.54% | ) | | 637.45% |
Year Ended October 31, 2004 | | $ | 8.22 | | (0.07 | ) | | 0.34 | | | 0.27 | | | — | | | — | | | $ | 8.49 | | 3.28% | | | $ | 21,273 | | 1.64% | | | (1.06% | ) | | 1.80% | | | (1.23% | ) | | 510.91% |
Year Ended October 31, 2005 | | $ | 8.49 | | (0.05 | ) | | 1.52 | | | 1.47 | | | — | | | — | | | $ | 9.96 | | 17.31% | | | $ | 76,762 | | 1.56% | | | (0.89% | ) | | (i | ) | | (i | ) | | 442.04% |
Year Ended October 31, 2006 | | $ | 9.96 | | (0.06 | ) | | 0.27 | | | 0.21 | | | (0.60 | ) | | (0.60 | ) | | $ | 9.57 | | 1.77% | (k) | | $ | 86,364 | | 1.46% | (j) | | (0.52% | )(j) | | 1.48% | (j) | | (0.54% | )(j) | | 389.34% |
| | | | | | | | | | | | | | |
Class B Shares | | | | | | | | | | | | | | | | | | | | | | | | | | | | | | | | | | | | | | | | | |
Year Ended October 31, 2002 | | $ | 5.96 | | (0.12 | ) | | (0.44 | ) | | (0.56 | ) | | — | | | — | | | $ | 5.40 | | (9.40% | ) | | $ | 719 | | 2.26% | | | (1.89% | ) | | 3.88% | | | (3.51% | ) | | 773.95% |
Year Ended October 31, 2003 (d) | | $ | 5.40 | | (0.11 | ) | | 2.74 | | | 2.63 | | | — | | | — | | | $ | 8.03 | | 48.70% | | | $ | 2,023 | | 2.30% | | | (1.72% | ) | | 2.96% | | | (2.38% | ) | | 637.45% |
Year Ended October 31, 2004 | | $ | 8.03 | | (0.13 | ) | | 0.34 | | | 0.21 | | | — | | | — | | | $ | 8.24 | | 2.62% | | | $ | 2,572 | | 2.30% | | | (1.71% | ) | | 2.45% | | | (1.86% | ) | | 510.91% |
Year Ended October 31, 2005 | | $ | 8.24 | | (0.12 | ) | | 1.47 | | | 1.35 | | | — | | | — | | | $ | 9.59 | | 16.38% | | | $ | 4,253 | | 2.24% | | | (1.53% | ) | | (i | ) | | (i | ) | | 442.04% |
Year Ended October 31, 2006 | | $ | 9.59 | | (0.11 | ) | | 0.25 | | | 0.14 | | | (0.60 | ) | | (0.60 | ) | | $ | 9.13 | | 1.18% | (k) | | $ | 6,072 | | 2.15% | (j) | | (1.24% | )(j) | | 2.18% | (j) | | (1.27% | )(j) | | 389.34% |
| | | | | | | | | | | | | | |
Class C Shares | | | | | | | | | | | | | | | | | | | | | | | | | | | | | | | | | | | | | | | | | |
Year Ended October 31, 2002 (d) | | $ | 6.00 | | (0.12 | ) | | (0.44 | ) | | (0.56 | ) | | — | | | — | | | $ | 5.44 | | (9.33% | ) | | $ | 16 | | 2.27% | | | (1.89% | ) | | 3.69% | | | (3.31% | ) | | 773.95% |
Year Ended October 31, 2003 (d) | | $ | 5.44 | | (0.13 | ) | | 2.77 | | | 2.64 | | | — | | | — | | | $ | 8.08 | | 48.53% | | | $ | 1,606 | | 2.30% | | | (1.76% | ) | | 2.60% | | | (2.07% | ) | | 637.45% |
Year Ended October 31, 2004 | | $ | 8.08 | | (0.11 | ) | | 0.32 | | | 0.21 | | | — | | | — | | | $ | 8.29 | | 2.60% | | | $ | 4,000 | | 2.30% | | | (1.74% | ) | | 2.47% | | | (1.91% | ) | | 510.91% |
Year Ended October 31, 2005 | | $ | 8.29 | | (0.15 | ) | | 1.51 | | | 1.36 | | | — | | | — | | | $ | 9.65 | | 16.41% | | | $ | 22,774 | | 2.22% | | | (1.56% | ) | | (i | ) | | (i | ) | | 442.04% |
Year Ended October 31, 2006 | | $ | 9.65 | | (0.11 | ) | | 0.25 | | | 0.14 | | | (0.60 | ) | | (0.60 | ) | | $ | 9.19 | | 1.18% | (k) | | $ | 36,040 | | 2.15% | (j) | | (1.23% | )(j) | | 2.18% | (j) | | (1.25% | )(j) | | 389.34% |
| | | | | | | | | | | | | | |
Class R Shares | | | | | | | | | | | | | | | | | | | | | | | | | | | | | | | | | | | | | | | | | |
Period Ended October 31, 2003 (e) | | $ | 7.49 | | (0.01 | ) | | 0.56 | | | 0.55 | | | — | | | — | | | $ | 8.04 | | 7.34% | (f) | | $ | 1 | | 1.90% | (g) | | (1.64% | )(g) | | 2.00% | (g) | | (1.74% | )(g) | | 637.45% |
Year Ended October 31, 2004 | | $ | 8.04 | | (0.11 | ) | | 0.34 | | | 0.23 | | | — | | | — | | | $ | 8.27 | | 2.86% | | | $ | 1 | | 1.89% | | | (1.33% | ) | | 2.20% | | | (1.64% | ) | | 510.91% |
Year Ended October 31, 2005 | | $ | 8.27 | | — | | | 1.44 | | | 1.44 | | | — | | | — | | | $ | 9.71 | | 17.41% | | | $ | 637 | | 1.54% | | | (0.93% | ) | | (i | ) | | (i | ) | | 442.04% |
Year Ended October 31, 2006 | | $ | 9.71 | | (0.07 | ) | | 0.25 | | | 0.18 | | | (0.60 | ) | | (0.60 | ) | | $ | 9.29 | | 1.60% | (k) | | $ | 1,037 | | 1.70% | (j) | | (0.79% | )(j) | | 1.72% | (j) | | (0.80% | )(j) | | 389.34% |
| | | | | | | | | | | | | | |
Institutional Service Class Shares | | | | | | | | | | | | | | | | | | | | | | | | | | | | | | | | | | | | | | | | | |
Year Ended October 31, 2002 (d) | | $ | 6.06 | | (0.06 | ) | | (0.46 | ) | | (0.52 | ) | | — | | | — | | | $ | 5.54 | | (8.58% | ) | | $ | 853 | | 1.32% | | | (0.95% | ) | | 2.52% | | | (2.15% | ) | | 773.95% |
Year Ended October 31, 2003 | | $ | 5.54 | | (0.03 | ) | | 2.80 | | | 2.77 | | | — | | | — | | | $ | 8.31 | | 50.00% | | | $ | 6,563 | | 1.50% | | | (0.94% | ) | | 2.00% | | | (1.44% | ) | | 637.45% |
Year Ended October 31, 2004 | | $ | 8.31 | | (0.09 | ) | | 0.37 | | | 0.28 | | | — | | | — | | | $ | 8.59 | | 3.37% | | | $ | 7,008 | | 1.54% | | | (0.93% | ) | | 1.68% | | | (1.08% | ) | | 510.91% |
Year Ended October 31, 2005 | | $ | 8.59 | | (0.07 | ) | | 1.56 | | | 1.49 | | | — | | | — | | | $ | 10.08 | | 17.35% | | | $ | 8,806 | | 1.48% | | | (0.77% | ) | | (i | ) | | (i | ) | | 442.04% |
Year Ended October 31, 2006 | | $ | 10.08 | | (0.06 | ) | | 0.30 | | | 0.24 | | | (0.60 | ) | | (0.60 | ) | | $ | 9.72 | | 1.95% | (k) | | $ | 719 | | 1.30% | (j) | | (0.11% | )(j) | | 1.33% | (j) | | (0.14% | )(j) | | 389.34% |
| | | | | | | | | | | | | | |
Institutional Class Shares | | | | | | | | | | | | | | | | | | | | | | | | | | | | | | | | | | | | | | | | | |
Period Ended October 31, 2004 (h) | | $ | 8.62 | | (0.02 | ) | | (0.01 | ) | | (0.03 | ) | | — | | | — | | | $ | 8.59 | | (0.35% | )(f) | | $ | 234 | | 1.30% | (g) | | (0.83% | )(g) | | 1.54% | (g) | | (1.07% | )(g) | | 510.91% |
Year Ended October 31, 2005 | | $ | 8.59 | | (0.03 | ) | | 1.55 | | | 1.52 | | | — | | | — | | | $ | 10.11 | | 17.69% | | | $ | 1,737 | | 1.23% | | | (0.55% | ) | | (i | ) | | (i | ) | | 442.04% |
Year Ended October 31, 2006 | | $ | 10.11 | | (0.02 | ) | | 0.26 | | | 0.24 | | | (0.60 | ) | | (0.60 | ) | | $ | 9.75 | | 2.16% | (k) | | $ | 4,601 | | 1.17% | (j) | | (0.29% | )(j) | | 1.19% | (j) | | (0.31% | )(j) | | 389.34% |
| (a) | Excludes sales charge. |
| (b) | During the period certain fees were waived and/or reimbursed. If such waivers/reimbursements had not occurred, the ratios would have been as indicated. |
| (c) | Portfolio turnover is calculated on the basis of the Fund as a whole without distinguishing among the classes of shares. |
| (d) | Net investment income (loss) is based on average shares outstanding during the period. |
| (e) | For the period from October 1, 2003 (commencement of operations) through October 31, 2003. |
| (h) | For the period from June 29, 2004 (commencement of operations) through October 31, 2004. |
| (i) | There were no fee reductions in this period. |
| (j) | Excludes reimbursement from the Investment Adviser (See Note 3). |
| (k) | Includes reimbursement from the Investment Adviser which increased the total return by 0.11% (See Note 3). |
See notes to financial statements.
Financial Highlights
Selected Data for Each Share of Capital Outstanding
Gartmore Worldwide Leaders Fund
| | | | | | | | | | | | | | | | | | | | | | | | | | | | | | | | | | | | | | | | | |
| | | | | Investment Activities | | | Distributions | | | | | | Ratios/Supplemental Data |
| | | Net Asset
Value,
Beginning
of Period | | Net
Investment
Income
(Loss) | | | Net Realized
and
Unrealized
Gains
(Losses) on
Investments | | | Total
from
Investment
Activities | | | Net
Investment
Income | | | Total
Distributions | | | Net
Asset
Value, End
of Period | | Total
Return (a) | | | Net Assets
at End of
Period
(000s) | | Ratio of
Expenses
to Average
Net Assets | | | Ratio of Net
Investment
Income
(Loss)
to Average
Net Assets | | | Ratio of
Expenses
(Prior to
Reimbursements)
to Average
Net Assets (b) | | | Ratio of Net
Investment
Income (Loss)
(Prior to
Reimbursements)
to Average
Net Assets (b) | | | Portfolio
Turnover (c) |
| | | | | | | | | | | | | | |
Class A Shares | | | | | | | | | | | | | | | | | | | | | | | | | | | | | | | | | | | | | | | | | |
Year Ended October 31, 2002 | | $ | 6.26 | | — | | | (0.76 | ) | | (0.76 | ) | | — | | | — | | | $ | 5.50 | | (12.14% | ) | | $ | 1,046 | | 1.69% | | | (0.03% | ) | | 2.60% | | | (0.94% | ) | | 467.35% |
Year Ended October 31, 2003 | | $ | 5.50 | | (0.02 | ) | | 1.53 | | | 1.51 | | | — | | | — | | | $ | 7.01 | | 27.45% | | | $ | 34,889 | | 1.67% | | | (0.47% | ) | | (i | ) | | (i | ) | | 689.06% |
Year Ended October 31, 2004 | | $ | 7.01 | | 0.05 | | | 0.46 | | | 0.51 | | | — | | | — | | | $ | 7.52 | | 7.28% | | | $ | 30,707 | | 1.70% | | | 0.53% | | | 1.85% | | | 0.38% | | | 495.62% |
Year Ended October 31, 2005 | | $ | 7.52 | | (0.02 | ) | | 1.78 | | | 1.76 | | | (0.03 | ) | | (0.03 | ) | | $ | 9.25 | | 23.44% | | | $ | 32,404 | | 1.69% | | | (0.26% | ) | | 1.94% | | | (0.50% | ) | | 352.57% |
Year Ended October 31, 2006 | | $ | 9.25 | | 0.04 | | | 2.38 | | | 2.42 | | | (0.05 | ) | | (0.05 | ) | | $ | 11.62 | | 26.22% | | | $ | 41,219 | | 1.62% | | | 0.42% | | | 1.68% | | | 0.36% | | | 298.51% |
| | | | | | | | | | | | | | |
Class B Shares | | | | | | | | | | | | | | | | | | | | | | | | | | | | | | | | | | | | | | | | | |
Year Ended October 31, 2002 | | $ | 6.20 | | (0.04 | ) | | (0.75 | ) | | (0.79 | ) | | — | | | — | | | $ | 5.41 | | (12.74% | ) | | $ | 936 | | 2.39% | | | (0.72% | ) | | 3.36% | | | (1.69% | ) | | 467.35% |
Year Ended October 31, 2003 (d) | | $ | 5.41 | | (0.04 | ) | | 1.48 | | | 1.44 | | | — | | | — | | | $ | 6.85 | | 26.62% | | | $ | 96 | | 2.39% | | | (0.72% | ) | | (i | ) | | (i | ) | | 689.06% |
Year Ended October 31, 2004 | | $ | 6.85 | | — | | | 0.45 | | | 0.45 | | | — | | | — | | | $ | 7.30 | | 6.57% | | | $ | 122 | | 2.40% | | | (0.13% | ) | | 2.57% | | | (0.30% | ) | | 495.62% |
Year Ended October 31, 2005 | | $ | 7.30 | | (0.05 | ) | | 1.71 | | | 1.66 | | | (0.02 | ) | | (0.02 | ) | | $ | 8.94 | | 22.70% | | | $ | 343 | | 2.41% | | | (0.94% | ) | | 2.64% | | | (1.18% | ) | | 352.57% |
Year Ended October 31, 2006 | | $ | 8.94 | | (0.02 | ) | | 2.27 | | | 2.25 | | | (0.01 | ) | | (0.01 | ) | | $ | 11.18 | | 25.22% | | | $ | 806 | | 2.33% | | | (0.24% | ) | | 2.40% | | | (0.31% | ) | | 298.51% |
| | | | | | | | | | | | | | |
Class C Shares | | | | | | | | | | | | | | | | | | | | | | | | | | | | | | | | | | | | | | | | | |
Year Ended October 31, 2002 | | $ | 6.23 | | (0.04 | ) | | (0.75 | ) | | (0.79 | ) | | — | | | — | | | $ | 5.44 | | (12.68% | ) | | $ | 19 | | 2.39% | | | (0.71% | ) | | 3.41% | | | (1.73% | ) | | 467.35% |
Year Ended October 31, 2003 | | $ | 5.44 | | (0.06 | ) | | 1.51 | | | 1.45 | | | — | | | — | | | $ | 6.89 | | 26.65% | | | $ | 19 | | 2.38% | | | (0.84% | ) | | (i | ) | | (i | ) | | 689.06% |
Year Ended October 31, 2004 | | $ | 6.89 | | — | | | 0.44 | | | 0.44 | | | — | | | — | | | $ | 7.33 | | 6.39% | | | $ | 25 | | 2.40% | | | (0.08% | ) | | 2.57% | | | (0.25% | ) | | 495.62% |
Year Ended October 31, 2005 | | $ | 7.33 | | (0.05 | ) | | 1.71 | | | 1.66 | | | (0.02 | ) | | (0.02 | ) | | $ | 8.97 | | 22.81% | | | $ | 676 | | 2.41% | | | (0.90% | ) | | 2.65% | | | (1.15% | ) | | 352.57% |
Year Ended October 31, 2006 | | $ | 8.97 | | (0.01 | ) | | 2.28 | | | 2.27 | | | (0.02 | ) | | (0.02 | ) | | $ | 11.22 | | 25.19% | | | $ | 3,795 | | 2.32% | | | (0.26% | ) | | 2.40% | | | (0.33% | ) | | 298.51% |
| | | | | | | | | | | | | | |
Class R Shares | | | | | | | | | | | | | | | | | | | | | | | | | | | | | | | | | | | | | | | | | |
Period Ended October 31, 2003 (g) | | $ | 6.55 | | (0.01 | ) | | 0.32 | | | 0.31 | | | — | | | — | | | $ | 6.86 | | 4.73% | (e) | | $ | 1 | | 1.87% | (f) | | (1.05% | )(f) | | 1.97% | (f) | | (1.15% | )(f) | | 689.06% |
Year Ended October 31, 2004 | | $ | 6.86 | | 0.02 | | | 0.45 | | | 0.47 | | | — | | | — | | | $ | 7.33 | | 7.00% | | | $ | 1 | | 1.96% | | | 0.28% | | | 2.12% | | | 0.12% | | | 495.62% |
Year Ended October 31, 2005 | | $ | 7.33 | | (0.03 | ) | | 1.75 | | | 1.72 | | | (0.03 | ) | | (0.03 | ) | | $ | 9.02 | | 23.33% | | | $ | 1 | | 1.75% | | | (0.33% | ) | | 1.75% | | | (0.34% | ) | | 352.57% |
Year Ended October 31, 2006 | | $ | 9.02 | | 0.01 | | | 2.31 | | | 2.32 | | | (0.04 | ) | | (0.04 | ) | | $ | 11.30 | | 25.78% | | | $ | 2 | | 1.92% | | | 0.11% | | | 1.98% | | | 0.06% | | | 298.51% |
| | | | | | | | | | | | | | |
Institutional Service Class Shares | | | | | | | | | | | | | | | | | | | | | | | | | | | | | | | | | | | | | | | | | |
Year Ended October 31, 2002 | | $ | 6.29 | | 0.01 | | | (0.76 | ) | | (0.75 | ) | | — | | | — | | | $ | 5.54 | | (11.92% | ) | | $ | 1,133 | | 1.42% | | | 0.25% | | | 2.34% | | | (0.67% | ) | | 467.35% |
Year Ended October 31, 2003 | | $ | 5.54 | | — | | | 1.54 | | | 1.54 | | | — | | | — | | | $ | 7.08 | | 27.80% | | | $ | 1,400 | | 1.46% | | | 0.12% | | | (i | ) | | (i | ) | | 689.06% |
Year Ended October 31, 2004 | | $ | 7.08 | | 0.05 | | | 0.47 | | | 0.52 | | | — | | | — | | | $ | 7.60 | | 7.34% | | | $ | 1,373 | | 1.65% | | | 0.61% | | | 1.80% | | | 0.46% | | | 495.62% |
Year Ended October 31, 2005 | | $ | 7.60 | | (0.01 | ) | | 1.79 | | | 1.78 | | | (0.03 | ) | | (0.03 | ) | | $ | 9.35 | | 23.48% | | | $ | 3,883 | | 1.64% | | | (0.15% | ) | | 1.89% | | | (0.40% | ) | | 352.57% |
Year Ended October 31, 2006 (d) | | $ | 9.35 | | 0.02 | | | 2.42 | | | 2.44 | | | (0.05 | ) | | (0.05 | ) | | $ | 11.74 | | 26.17% | | | $ | 20 | | 1.65% | | | 0.15% | | | 1.70% | | | 0.11% | | | 298.51% |
| | | | | | | | | | | | | | |
Institutional Class Shares | | | | | | | | | | | | | | | | | | | | | | | | | | | | | | | | | | | | | | | | | |
Period Ended October 31, 2004 (h) | | $ | 7.23 | | 0.02 | | | 0.35 | | | 0.37 | | | — | | | — | | | $ | 7.60 | | 5.12% | (e) | | $ | 1 | | 1.40% | (f) | | 0.72% | (f) | | 1.70% | (f) | | 0.42% | (f) | | 495.62% |
Year Ended October 31, 2005 | | $ | 7.60 | | 0.01 | | | 1.80 | | | 1.81 | | | (0.04 | ) | | (0.04 | ) | | $ | 9.37 | | 23.81% | | | $ | 1 | | 1.40% | | | 0.04% | | | 1.73% | | | (0.32% | ) | | 352.57% |
Year Ended October 31, 2006 | | $ | 9.37 | | 0.07 | | | 2.40 | | | 2.47 | | | (0.06 | ) | | (0.06 | ) | | $ | 11.78 | | 26.49% | | | $ | 2 | | 1.32% | | | 0.72% | | | 1.42% | | | 0.62% | | | 298.51% |
| | | | | | | | | | | | | | | | | | | | | | | | | | | | | | | | | | | | | | | | | | |
| (a) | Excludes sales charge. |
| (b) | During the period certain fees were waived and/or reimbursed. If such waivers/reimbursements had not occurred, the ratios would have been as indicated. |
| (c) | Portfolio turnover is calculated on the basis of the Fund as a whole without distinguishing among the classes of shares. |
| (d) | Net investment income (loss) is based on average shares outstanding during the period. |
| (g) | For the period from October 1, 2003 (commencement of operations) through October 31, 2003 |
| (h) | For the period from June 29, 2004 (commencement of operations) through October 31, 2004. |
| (i) | There were no fee reductions in this period. |
See notes to financial statements.
Gartmore China Opportunities Fund
Effective June 12, 2006, Charlie Awdry, CFA became portfolio manager of the Fund, and is responsible for its day-to-day management, including selection of the Fund’s investments. Mr. Awdry has assisted in the management of the Fund since its inception in June 2004.
For the annual period ended Oct. 31, 2006, the Gartmore China Opportunities Fund (Class A at NAV) returned 53.19% versus 36.66% for its benchmark, the Morgan Stanley Capital International (MSCI) Zhong Hua Index. For broader comparison, the average return for the Fund’s Lipper peer category of China Region Funds (consisting of 40 funds as of Oct. 31, 2006) was 45.51%.
Chinese equities, as measured by the MSCI Zhong Hua Index, outperformed versus the emerging markets asset class as represented by the MSCI Emerging Markets Index as a whole during the reporting period (in U.S. dollar terms). China’s gross domestic product rose by 9.9% in 2005 and continued at a strong pace in 2006 with an estimate of 10.1% dispelling the widely held belief that the Chinese government would overreact in reining in economic growth. Even the surprise interest rate hike by the Chinese authorities in April—the first time in 18 months that the People’s Bank of China had altered interest rates—failed to derail the market rally.
The consumer staples sector had the most positive impact on Fund performance during the reporting period, closely followed by materials. The core of our investment strategy was to focus on consumer-related stocks, because we felt that increasing urbanization and rising wages would stimulate higher levels of domestic consumption. This strategy paid dividends, because our overweight positions in the likes of Hengan International Group Co., the largest domestic producer of facial tissues and diapers, benefited from rising spending among Chinese consumers. Rising commodity prices and strong demand for raw materials promoted strong returns in mining stocks; our overweight positions in Sinochem Hong Kong Holdings Ltd. and Lingbao Gold Co. Ltd. were among the top-performing positions in the Fund.
The top performer at the stock level was an off-Index holding in medical equipment maker Shandong Weigao Group, which has exhibited strong growth since 2001 on the back of market share gain and accelerating local demand. The share price rallied strongly throughout the early months of 2006 after the firm announced a 53% jump in fiscal-year 2005 profits, which was the result of stronger-than-expected topline growth and prompted a raft of analyst upgrades.
Fund performance was dented somewhat by holdings in the information technology and telecommunications sectors. The Fund’s overweights in chip stocks Solomon Systech Ltd. and Advanced Semiconductor Manufacturing Corp. of Shanghai generated negative returns against a background of poor performance in the semiconductor space, with companies hurt by stiff price competition. An underweight allocation to China Mobile also generated negative returns during the reporting period, although we began building up our position in the latter months of the period. The biggest laggard was an overweight in lottery operator China LotSynergy Holdings Ltd., which suffered from a sharp bout of profit-taking after the stock price became overinflated.
The positioning of the Fund continues to reflect our key strategic theme: that of rising domestic consumption fueled by a combination of government measures to stimulate the domestic economy, increasing urbanization and rising income levels. We are encouraged by the pace of economic reform across many areas of the Chinese economy, from agriculture—where farmers are being taxed less and encouraged to invest by receiving private property rights on their land—to industry, where the Chinese are opening up and beginning to face international competition, which spurs them to be far more competitive and efficient operators.
Overall, we remain very positive in our outlook for China, encouraged by a much more sustainable growth picture, and we see the government’s measures as largely pre-emptive and focusing on growth.
Portfolio Manager:
Gartmore Global Partners—Charlie Awdry, CFA
| | |
Fund Performance | | Gartmore China Opportunities Fund |
Average Annual Total Return
(For periods ended October 31, 2006)
| | | | | | |
| | | | | 1 Yr. | | Inception1 |
| Class A | | w/o SC2 | | 53.19% | | 28.16% |
| | | w/SC3 | | 44.34% | | 24.95% |
| Class B | | w/o SC2 | | 52.07% | | 27.24% |
| | | w/SC4 | | 47.07% | | 26.31% |
| Class C | | w/o SC2 | | 52.11% | | 27.20% |
| | | w/SC5 | | 51.11% | | 27.20% |
| Class R6 | | | | 52.68% | | 27.75% |
| Institutional Service Class6 | | 53.57% | | 28.39% |
| Institutional Class6 | | 53.57% | | 28.51% |
All figures showing the effect of a sales charge reflect the maximum charge possible, because it has the most dramatic effect on performance data.
| 1 | Fund commenced operations on June 29, 2004. |
| 2 | These returns do not reflect the effects of sales charges (SC). |
| 3 | A 5.75% front-end sales charge was deducted. |
| 4 | A 5.00% contingent deferred sales charge (CDSC) was deducted. The CDSC declines to 0% after 6 years. |
| 5 | A CDSC of 1.00% was deducted from the one year return because it is charged when you sell Class C shares within the first year after purchase. |
| 6 | Not subject to any sales charges. |
Performance of a $10,000 Investment
Investment return and principal value will fluctuate, and when redeemed, shares may be worth more or less than original cost. Past performance is no guarantee of future results and does not reflect the deduction of taxes that a shareholder would pay on fund distributions or the redemption of fund shares. Investing in mutual funds involves market risk, including loss of principal. Performance returns assume the reinvestment of all distributions.
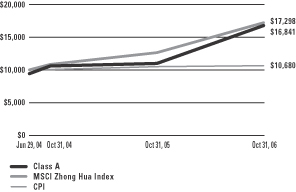
Comparative performance of $10,000 invested in Class A shares of the Gartmore China Opportunities Fund, Morgan Stanley Capital International (MSCI) Zhong Hua Index(a), and the Consumer Price Index (CPI)(b) since inception. Unlike the Fund, the returns for these unmanaged indexes do not reflect any fees, expenses, or sales charges. Investors cannot invest directly in market indexes.
| (a) | MSCI Zhong Hua is an unmanaged, free float-adjusted market capitalization-weighted index that is designed to measure the performance of stocks in the developed markets of China and Hong Kong; the index gives one- third of its weightings to China stocks and the remainder to Hong Kong Stocks. |
| (b) | The CPI represents changes in prices of a basket of goods and services purchased for consumption by urban households. |
| | |
Shareholder Expense Example | | Gartmore China Opportunities Fund |
As a shareholder of the Fund, you incur two types of costs: (1) transaction costs, including sales charges (loads) paid on purchase payments and redemption fees; and (2) ongoing costs, including investment advisory fees, administration fees, distribution fees and other Fund expenses. The examples below are intended to help you understand your ongoing costs (in dollars) of investing in the Fund and to compare these costs with the ongoing costs of investing in other mutual funds. Per SEC requirements, the examples assume that you had a $1,000 investment in the Class at the beginning of the reporting period, May 1, 2006 and continued to hold your shares at the end of the reporting period, October 31, 2006.
Actual Expenses
For each Class of the Fund in the table below, the first line provides information about actual account values and actual expenses. You may use the information in this line, together with the amount you invested, to estimate the expenses that you paid over the period. Simply divide your account value by $1,000 (for example, an $8,600 account value divided by $1,000 = 8.6), then multiply the result by the number in the first line of each Class under the heading entitled “Expenses Paid During Period” to estimate the expenses you paid on your account during the period.
Hypothetical Example for Comparison Purposes
The second line of each Class in the table below provides information about hypothetical account values and hypothetical expenses based on the Class’ actual expense ratio and an assumed rate of return of 5% per year before expenses, which is not the Class’ actual return. The hypothetical account values and expenses may not be used to estimate the actual ending account balance or expenses you paid for the period. You may use this information to compare the ongoing costs of investing in the Class of the Fund and other funds. To do so, compare this 5% hypothetical example with the 5% hypothetical examples that appear in the shareholder reports of the other funds.
Please note that the expenses shown in the table are meant to highlight your ongoing costs only and do not reflect any transaction costs, such as sales charges (loads) or redemption fees. Therefore, the second line for each Class in the table is useful in comparing ongoing costs only, and will not help you determine the relative total costs of owning different funds. In addition, if these transaction costs were included, your costs would have been higher. The examples also assume all dividends and distributions have been reinvested.
Schedule of Shareholder Expenses
Expense Analysis of a $1,000 Investment
(October 31, 2006)
| | | | | | | | | | | | | | |
| China Opportunities Fund | | | | | Beginning
Account Value,
5/1/06 | | Ending
Account Value,
10/31/06 | | Expenses Paid
During Period* | | Annualized
Expense Ratio* |
| Class A | | Actual | | | $ | 1,000 | | $ | 1,052 | | $ | 10.19 | | 1.97% |
| | | Hypothetical | 1 | | $ | 1,000 | | $ | 1,015 | | $ | 10.06 | | 1.97% |
| Class B | | Actual | | | $ | 1,000 | | $ | 1,047 | | $ | 13.93 | | 2.70% |
| | | Hypothetical | 1 | | $ | 1,000 | | $ | 1,011 | | $ | 13.78 | | 2.70% |
| Class C | | Actual | | | $ | 1,000 | | $ | 1,048 | | $ | 13.99 | | 2.71% |
| | | Hypothetical | 1 | | $ | 1,000 | | $ | 1,011 | | $ | 13.83 | | 2.71% |
| Class R | | Actual | | | $ | 1,000 | | $ | 1,049 | | $ | 11.93 | | 2.31% |
| | | Hypothetical | 1 | | $ | 1,000 | | $ | 1,013 | | $ | 11.79 | | 2.31% |
| Institutional Service Class | | Actual | | | $ | 1,000 | | $ | 1,052 | | $ | 8.90 | | 1.72% |
| | | Hypothetical | 1 | | $ | 1,000 | | $ | 1,016 | | $ | 8.78 | | 1.72% |
| Institutional Class | | Actual | | | $ | 1,000 | | $ | 1,053 | | $ | 8.85 | | 1.71% |
| | | Hypothetical | 1 | | $ | 1,000 | | $ | 1,016 | | $ | 8.73 | | 1.71% |
| * | Expenses are equal to the Fund’s annualized expense ratio multiplied by the average account value over the period multiplied by 184/365 (to reflect the one-half year period). The expense ratio presented represents a six-month, annualized ratio in accordance with SEC guidelines. |
| 1 | Represents the hypothetical 5% return before expenses. |
| | |
Portfolio Summary | | Gartmore China Opportunities Fund |
October 31, 2006
The SEC adopted a requirement that Funds present their portfolio holdings in a table, chart or graph format in their annual and semiannual reports to shareholders, whether or not a statement of investments is utilized. The following tables, which present portfolio holdings as a percentage of net assets, are provided in compliance with this requirement.
| | |
| Asset Allocation | | |
| Common Stocks | | 95.8% |
| Mutual Funds | | 2.2% |
| Repurchase Agreements | | 0.7% |
| Participation Notes | | 0.4% |
| Other assets in excess of liabilities | | 0.9% |
| | |
| | 100.0% |
| | |
| Top Countries | | |
| Hong Kong | | 75.0% |
| China | | 19.2% |
| Singapore | | 1.7% |
| Malaysia | | 1.4% |
| United Kingdom | | 1.1% |
| Other Assets | | 1.6% |
| | |
| | 100.0% |
| | |
| Top Industries | | |
| Real Estate | | 12.6% |
| Medical Products | | 7.9% |
| Transportation | | 6.7% |
| Oil & Gas | | 6.5% |
| Food | | 5.3% |
| Apparel | | 5.1% |
| Insurance | | 4.9% |
| Paper Products | | 4.5% |
| Retail | | 4.2% |
| Telecommunications | | 3.9% |
| Other Assets | | 38.4% |
| | |
| | 100.0% |
| | |
| Top Holdings* | | |
| China Life Insurance Co. Ltd. | | 3.3% |
| China Mobile Ltd. | | 3.0% |
| China Mengniu Dairy Co. | | 2.6% |
| Vision Grande Group Holdings Ltd. | | 2.3% |
| PetroChina Co. Ltd. | | 2.3% |
| Esprit Holdings Ltd. | | 2.3% |
| Pacific Basin Shipping Ltd. | | 2.2% |
| Nine Dragons Paper Holdings Ltd. | | 2.2% |
| iShares Asia Trust | | 2.2% |
| China Medical, Inc. ADR | | 2.2% |
| Other Assets | | 75.4% |
| | |
| | 100.0% |
| * | For purpose of listing top holdings, repurchase agreements are considered cash equivalents and are included as part of Other Assets. |
Gartmore China Opportunities Fund
Common Stocks (95.8%)
Statement of Investments
October 31, 2006
| | | | | |
| | | Shares or
Principal Amount | | Value |
| | | | | |
CHINA (18.8%) | | | | | |
Banks (0.5%) | | | | | |
Industrial & Commercial Bank of China (b) | | 329,000 | | $ | 147,224 |
| | | | | |
Building & Construction (3.1%) | | | | | |
Anhui Conch Cement Co. Ltd. (c) | | 180,000 | | | 398,435 |
Zhejiang Expressway Co. Ltd. (c) | | 802,000 | | | 541,811 |
| | | | | |
| | | | | 940,246 |
| | | | | |
Coal (2.1%) | | | | | |
China Shenhua Energy Co. (c) | | 354,500 | | | 621,995 |
| | | | | |
Medical Products (3.1%) | | | | | |
China Medical, Inc. ADR (b) | | 25,500 | | | 647,700 |
Mindray Medical International Ltd. ADR (b) | | 16,000 | | | 289,600 |
| | | | | |
| | | | | 937,300 |
| | | | | |
Oil & Gas (5.1%) | | | | | |
China Oilfield Servies Ltd. (c) | | 982,000 | | | 550,608 |
PetroChina Co. Ltd. (c) | | 630,000 | | | 695,287 |
PetroChina Co. Ltd. ADR | | 2,400 | | | 264,936 |
| | | | | |
| | | | | 1,510,831 |
| | | | | |
Real Estate (3.4%) | | | | | |
Guangzhou R&F Properties Co. Ltd. (c) | | 288,000 | | | 469,105 |
Shui on Land Ltd. (b) | | 734,000 | | | 566,307 |
| | | | | |
| | | | | 1,035,412 |
| | | | | |
Retail (1.5%) | | | | | |
Wumart Stores, Inc. (b) (c) | | 492,000 | | | 458,239 |
| | | | | |
| | | | | 5,651,247 |
| | | | | |
HONG KONG (72.8%) | | | | | |
Apparel (5.1%) | | | | | |
China Ting Group Holdings Ltd. (c) | | 1,850,000 | | | 427,664 |
LI Ning Co. Ltd. (c) | | 442,000 | | | 522,092 |
Prime Success International Group Ltd. (c) | | 720,000 | | | 589,456 |
| | | | | |
| | | | | 1,539,212 |
| | | | | |
Auto Parts & Equipment (2.6%) | | | | | |
Dongfeng Motor Corp. (b) (c) | | 998,000 | | | 445,691 |
Minth Group Ltd. (c) | | 462,000 | | | 326,088 |
| | | | | |
| | | | | 771,779 |
| | | | | |
Banks (1.4%) | | | | | |
CITIC International Financial Holdings Ltd. (c) | | 608,000 | | | 407,437 |
| | | | | |
| | | | | |
| | | Shares or
Principal Amount | | Value |
| | | | | |
HONG KONG (continued) | | | | | |
Chemicals (3.8%) | | | | | |
Kingboard Chemical Holdings Ltd. (c) | | 147,000 | | $ | 521,682 |
Sinochem Hong Kong Holdings Ltd. (c) | | 1,814,000 | | | 630,964 |
| | | | | |
| | | | | 1,152,646 |
| | | | | |
Consumer Products (2.3%) | | | | | |
Esprit Holdings Ltd. (c) | | 70,500 | | | 682,137 |
| | | | | |
Diversified Operations (1.8%) | | | | | |
Melco International Development Ltd. (c) | | 219,000 | | | 535,578 |
| | | | | |
Electric (3.5%) | | | | | |
China Resources Power Holdings Co. Ltd. (c) | | 410,000 | | | 510,546 |
Huaneng Power International, Inc. (c) | | 694,000 | | | 545,070 |
| | | | | |
| | | | | 1,055,616 |
| | | | | |
Food (5.3%) | | | | | |
China Mengniu Dairy Co. (c) | | 425,000 | | | 771,925 |
China Yurun Food Group Ltd. (c) | | 540,000 | | | 471,363 |
COFCO International Ltd. (c) | | 386,000 | | | 342,898 |
| | | | | |
| | | | | 1,586,186 |
| | | | | |
Food & Tobacco (2.1%) | | | | | |
Huabao International Holdings Ltd. (b) (c) | | 1,390,000 | | | 620,225 |
| | | | | |
Hotels, Restaurants & Leisure (2.0%) | | | |
Regal Hotels International Holdings Ltd. (c) | | 6,292,000 | | | 614,120 |
| | | | | |
Insurance (4.9%) | | | | | |
China Life Insurance Co. Ltd. (c) | | 472,000 | | | 995,436 |
Ping AN Insurance (Group) Co. of China Ltd. (c) | | 137,500 | | | 477,052 |
| | | | | |
| | | | | 1,472,488 |
| | | | | |
Manufacturing (1.1%) | | | | | |
GST Holdings Ltd. (c) | | 894,000 | | | 344,492 |
| | | | | |
Medical Products (4.8%) | | | | | |
China Shineway Pharmaceutical Group Ltd. (c) | | 446,000 | | | 275,284 |
Hengan International Group Co. Ltd. (c) | | 244,000 | | | 586,330 |
Shandong Weigao Group Medical Polymer Co. Ltd. | | 752,000 | | | 568,591 |
| | | | | |
| | | | | 1,430,205 |
| | | | | |
Statement of Investments (Continued)
October 31, 2006
Gartmore China Opportunities Fund (Continued)
Common Stocks (continued)
| | | | | |
| | | Shares or
Principal Amount | | Value |
| | | | | |
HONG KONG (continued) | | | | | |
Metal Frames (0.0%) | | | | | |
Moulin Global Eyecare Holdings Ltd. (b) (c) | | 272,000 | | $ | 0 |
| | | | | |
Motion Pictures & Services (0.2%) | | | |
Richie Multi — Media Holdings Ltd. (b) | | 3,170,000 | | | 62,367 |
| | | | | |
Oil & Gas (1.4%) | | | | | |
Xinao Gas Holdings Ltd. (c) | | 428,000 | | | 430,785 |
| | | | | |
Paper Products (4.5%) | | | | | |
Nine Dragons Paper Holdings Ltd. (c) | | 514,000 | | | 652,357 |
Vision Grande Group Holdings Ltd. (c) | | 822,000 | | | 705,780 |
| | | | | |
| | | | | 1,358,137 |
| | | | | |
Real Estate (9.0%) | | | | | |
Cheung Kong (Holdings) Ltd. (c) | | 58,000 | | | 630,260 |
Chinese Estates Holdings Ltd. (c) | | 414,568 | | | 497,058 |
Hysan Development Co. (c) | | 200,963 | | | 505,792 |
New World Development Co. Ltd. (c) | | 286,000 | | | 488,756 |
Shun Tak Holdings Ltd. (c) | | 466,000 | | | 614,868 |
| | | | | |
| | | | | 2,736,734 |
| | | | | |
Retail (2.7%) | | | | | |
Lifestyle International Holdings Ltd. (c) | | 273,500 | | | 529,935 |
Sa Sa International Holdings Ltd. (c) | | 772,000 | | | 273,838 |
| | | | | |
| | | | | 803,773 |
| | | | | |
Semiconductors (0.9%) | | | | | |
Advanced Semiconductor Manufacturing Corp. (b) (c) | | 1,752,000 | | | 265,368 |
| | | | | |
Steel (1.5%) | | | | | |
Maanshan Iron & Steel Co., Class H (c) | | 1,172,000 | | | 464,903 |
| | | | | |
Telecommunications (3.9%) | | | | | |
China Mobile Ltd. (c) | | 110,500 | | | 897,756 |
China Mobile Ltd. ADR | | 6,746 | | | 275,102 |
| | | | | |
| | | | | 1,172,858 |
| | | | | |
Transportation (6.7%) | | | | | |
Cosco Pacific Ltd. (c) | | 288,000 | | | 594,370 |
| | | | | |
| | | Shares or
Principal Amount | | Value |
| | | | | |
HONG KONG (continued) | | | | | |
Transportation (continued) | | | | | |
Hainan Meilan International Airport Co. Ltd. (b) (c) | | 320,000 | | $ | 141,826 |
Pacific Basin Shipping Ltd. (c) | | 1,034,000 | | | 664,589 |
Xiamen International Port Co. Ltd. (b) (c) | | 2,592,000 | | | 602,473 |
| | | | | |
| | | | | 2,003,258 |
| | | | | |
Water & Sewer (1.3%) | | | | | |
China Water Affairs Group Ltd. (b) (c) | | 1,290,000 | | | 380,516 |
| | | | | |
| | | | | 21,890,820 |
| | | | | |
MALAYSIA (1.4%) | | | | | |
Investment Companies (1.4%) | | | |
Lion Diversified Holdings Berhad (c) | | 282,700 | | | 406,106 |
| | | | | |
SINGAPORE (1.7%) | | | | | |
Education (1.7%) | | | | | |
Raffles Education Corp. Ltd. (c) | | 290,000 | | | 495,957 |
| | | | | |
UNITED KINGDOM (1.1%) | | | | | |
Building Products (1.1%) | | | | | |
Prosperity Minerals Holdings Ltd. (b) | | 157,594 | | | 336,649 |
| | | | | |
| | |
Total Common Stocks | | | | | 28,780,779 |
| | | | | |
|
Mutual Funds (2.2%) |
HONG KONG (2.2%) | | | | | |
iShares Asia Trust (b) (c) | | 73,200 | | | 649,371 |
| | | | | |
| | |
Total Mutual Funds | | | | | 649,371 |
| | | | | |
|
Participation Notes (0.4%) |
CHINA (0.4%) | | | | | |
Manufacturing (0.4%) | | | | | |
Sany Heavy Industry Co. Ltd., 0.00%, 10/27/09 (b) (c) | | 54,400 | | | 131,648 |
| | | | | |
| | |
Total Participation Notes | | | | | 131,648 |
| | | | | |
Repurchase Agreements (0.7%)
| | | | | | |
| | | Principal Amount | | Value |
| | | | | | |
CS First Boston, 5.17%, dated 10/31/06, due 11/01/06, repurchase price $107,895, collateralized by U.S. Government Agency Mortgages with a market value of $110,039 | | $ | 107,880 | | $ | 107,880 |
Nomura Securities, 5.17%, dated 10/31/06, due 11/01/06, repurchase price $103,017, collateralized by U.S. Government Agency Mortgages with a market value of $105,062 | | | 103,002 | | | 103,002 |
| | | | | | |
| | |
Total Repurchase Agreements | | | | | | 210,882 |
| | | | | | |
| |
Total Investments
(Cost $25,931,898) (a) — 99.1% | | | 29,772,680 |
| |
Other assets in excess of
liabilities — 0.9% | | | 275,095 |
| | | | | | |
| | |
NET ASSETS — 100.0% | | | | | $ | 30,047,775 |
| | | | | | |
| | (a) | See notes to financial statements for tax unrealized appreciation (depreciation) of securities. |
| | (b) | Denotes a non-income producing security. |
| | ADR | American Depository Receipt |
See notes to financial statements.
Gartmore Emerging Markets Fund
Effective June 26, 2006, Christopher Palmer, CFA became portfolio manager of the Fund, and is responsible for its day-to-day management, including selection of the Fund’s investments.
For the annual period ended Oct. 31, 2006, the Gartmore Emerging Markets Fund (Class A at NAV) returned 32.89% versus 35.42% for its benchmark, the Morgan Stanley Capital International Emerging Markets (MSCI EM) Index. For broader comparison, the average return for the Fund’s Lipper peer category of Emerging Markets Funds (consisting of 210 funds as of Oct. 31, 2006) was 34.70%.
Throughout late 2005 and early 2006, emerging equity markets outperformed on the global stage, underpinned by robust global growth and rising commodity prices. In a system awash with liquidity, investors found the potential returns in the emerging-market universe attractive relative to those offered by developed markets. Oil price inflation and rising U.S. interest rates constituted a lurking source of concern, which spilled over into May when emerging equities fell sharply amid a global stock market sell-off. The drop was triggered by, among other factors, higher-than-expected U.S. inflation and a depreciating U.S. dollar, raising the prospect of higher interest rates and a slowdown in global growth. For the remainder of the reporting period, emerging markets recovered broadly in line with developed markets, benefiting from the Federal Reserve Board’s decision in August to leave interest rates on hold, as well as growing hopes among investors that U.S. economic growth would moderate gradually rather than experience a sharp slowdown. The reaction to economic conditions varied among regions and countries. For example, Asia-Pacific markets, many of which are dependent on oil imports, benefited from a sharp decline in oil prices from August on. By contrast, falling oil and commodity prices had a negative impact on Russia and other countries that are major exporters of such resources.
Disappointing stock selection in the consumer staples sector hindered performance, principally due to the inclusion of overweights in South Korean beverage firm Hite Brewery Co. Ltd. and Russian convenience store operator X5 Retail Group (formerly Pyaterochka Holding N.V.). Hite Brewery was undermined by poor first-quarter results and by the decision of Carlsberg A/S to sell its 25% stake in the brewery. X5 Retail fell after the firm announced surprisingly disappointing sales growth numbers.
At the country level, our selection of stocks in Taiwan scored negatively. Taiwan’s technology-heavy market underperformed as the information technology sector lagged throughout much of the reporting period, with investors concerned about pricing power. Against that backdrop, the Fund’s overweight positions in Asustek Computer Inc. and Nan Ya Printed Circuit Board Corp., Ltd. were negative for returns. An overweight by the Fund in Inventec Appliances Corp. also registered among the bottom performers; the company, which is one of Apple Computer, Inc.’s key suppliers, was downgraded after Apple announced decreased iPod sales forecasts.
The biggest boost to Fund performance came from the materials sector, where our selection of stocks added considerable value to the Fund. Among the top-performing positions in the Fund’s portfolio were overweights in The India Cements Ltd., Korea Zinc Co., Ltd. and Brazilian mining firm Usinas Siderúrgicas de Minas Gerais S.A. (Usiminas). Stock selection by the Fund was notably strong in Brazil, where—in addition to Usiminas—Fund performance was enhanced by overweight positions in retailer Lojas Renner S.A. and life insurance company Porto Seguro, which benefited from the environment of declining interest rates and their positive implications for domestic consumer spending.
Looking ahead, we believe that the outlook for the emerging-markets asset class remains positive for the long term. We believe that certain emerging equity markets should be supported by the prospects of healthy economic growth as well as by continuing improvements in the regulatory environment and relatively attractive valuations. The pace of U.S. economic growth and the direction of interest rates, however, are likely to be key factors influencing markets in our Fund’s investment universe in the short term, as are the pace and direction of changes in the oil price. We continue to allocate overweights to Brazil, Mexico, and China, encouraged by the robust economic background and government policy measures implemented across all three countries.
Portfolio Manager:
Gartmore Global Partners—Christopher Palmer, CFA
| | |
Fund Performance | | Gartmore Emerging Markets Fund |
Average Annual Total Return
(For periods ended October 31, 2006)
| | | | | | | | |
| | | | | 1 Yr. | | 5 Yr. | | Inception1 |
| Class A | | w/o SC2 | | 32.89% | | 28.93% | | 13.07% |
| | | w/SC3 | | 25.25% | | 27.43% | | 11.99% |
| Class B | | w/o SC2 | | 31.97% | | 28.08% | | 12.33% |
| | | w/SC4 | | 26.97% | | 27.93% | | 12.33% |
| Class C5 | | w/o SC2 | | 31.92% | | 28.07% | | 12.56% |
| | | w/SC6 | | 30.92% | | 28.07% | | 12.56% |
| Class R7,9 | | | | 32.65% | | 28.46% | | 12.60% |
| Institutional Service Class9 | | 33.25% | | 29.34% | | 13.47% |
| Institutional Class8,9 | | 33.32% | | 29.35% | | 13.48% |
All figures showing the effect of a sales charge reflect the maximum charge possible, because it has the most dramatic effect on performance data.
| 1 | Fund commenced operations on August 30, 2000. |
| 2 | These returns do not reflect the effects of sales charges (SC). |
| 3 | A 5.75% front-end sales charge was deducted. |
| 4 | A 5.00% contingent deferred sales charge (CDSC) was deducted. The CDSC declines to 0% after 6 years. |
| 5 | These returns until the creation of Class C shares (3/1/01) include the performance of the Fund’s Class B shares. Excluding the effects of any fee waivers or reimbursements, such prior performance is substantially similar to what Class C shares would have produced because Class C shares invest in the same portfolio of securities as Class B shares and have the same expenses after any fee waivers or reimbursements. For Class C shares returns with sales charges, these returns have been restated for the applicable sales charges. |
| 6 | A CDSC of 1.00% was deducted from the one year return because it is charged when you sell Class C shares within the first year after purchase. |
| 7 | These returns until the creation of Class R shares (12/30/03) include the performance of the Fund’s Class B shares. The returns have been adjusted for the fact that Class R shares do not have any applicable sales charges but have not been adjusted for the lower expenses applicable to Class R shares. Excluding the effect of any fee waivers or reimbursements, such prior performance is similar to what Class R shares would have produced because the Class R shares invest in the same portfolio of securities as Class B shares. |
| 8 | These returns until the creation of Institutional Class shares (6/29/04) include the performance of the Fund’s Institutional Service shares. The returns have been adjusted for the fact that Institutional Class shares do not have any applicable sales charges but have not been adjusted for the lower expenses applicable to Institutional Class shares. Excluding the effect of any fee waivers or reimbursements, such prior performance is similar to what Institutional Class shares would have produced because the Institutional Class shares invest in the same portfolio of securities as Institutional Service shares. |
| 9 | Not subject to any sales charges. |
Performance of a $10,000 Investment
Investment return and principal value will fluctuate, and when redeemed, shares may be worth more or less than original cost. Past performance is no guarantee of future results and does not reflect the deduction of taxes that a shareholder would pay on fund distributions or the redemption of fund shares. Investing in mutual funds involves market risk, including loss of principal. Performance returns assume the reinvestment of all distributions.
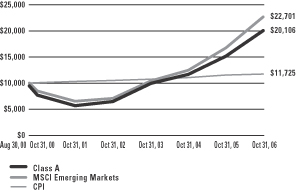
Comparative performance of $10,000 invested in Class A shares of the Gartmore Emerging Markets Fund, Morgan Stanley Capital International Emerging Markets Index (MSCI Emerging Markets)(a), and the Consumer Price Index (CPI)(b) since inception. Unlike the Fund, the returns for these unmanaged indexes do not reflect any fees, expenses, or sales charges. Investors cannot invest directly in market indexes.
| (a) | The MSCI Emerging Markets is a free float-adjusted market capitalization index that is designed to measure equity market performance in the global emerging markets. |
| (b) | The CPI represents changes in prices of a basket of goods and services purchased for consumption by urban households. |
| | |
Shareholder Expense Example | | Gartmore Emerging Markets Fund |
As a shareholder of the Fund, you incur two types of costs: (1) transaction costs, including sales charges (loads) paid on purchase payments and redemption fees; and (2) ongoing costs, including investment advisory fees, administration fees, distribution fees and other Fund expenses. The examples below are intended to help you understand your ongoing costs (in dollars) of investing in the Fund and to compare these costs with the ongoing costs of investing in other mutual funds. Per SEC requirements, the examples assume that you had a $1,000 investment in the Class at the beginning of the reporting period, May 1, 2006 and continued to hold your shares at the end of the reporting period, October 31, 2006.
Actual Expenses
For each Class of the Fund in the table below, the first line provides information about actual account values and actual expenses. You may use the information in this line, together with the amount you invested, to estimate the expenses that you paid over the period. Simply divide your account value by $1,000 (for example, an $8,600 account value divided by $1,000 = 8.6), then multiply the result by the number in the first line of each Class under the heading entitled “Expenses Paid During Period” to estimate the expenses you paid on your account during the period.
Hypothetical Example for Comparison Purposes
The second line of each Class in the table below provides information about hypothetical account values and hypothetical expenses based on the Class’ actual expense ratio and an assumed rate of return of 5% per year before expenses, which is not the Class’ actual return. The hypothetical account values and expenses may not be used to estimate the actual ending account balance or expenses you paid for the period. You may use this information to compare the ongoing costs of investing in the Class of the Fund and other funds. To do so, compare this 5% hypothetical example with the 5% hypothetical examples that appear in the shareholder reports of the other funds.
Please note that the expenses shown in the table are meant to highlight your ongoing costs only and do not reflect any transaction costs, such as sales charges (loads) or redemption fees. Therefore, the second line for each Class in the table is useful in comparing ongoing costs only, and will not help you determine the relative total costs of owning different funds. In addition, if these transaction costs were included, your costs would have been higher. The examples also assume all dividends and distributions have been reinvested.
Schedule of Shareholder Expenses
Expense Analysis of a $1,000 Investment
(October 31, 2006)
| | | | | | | | | | | | | | |
| Emerging Markets Fund | | | | | Beginning
Account Value,
5/1/06 | | Ending
Account Value,
10/31/06 | | Expenses Paid
During Period* | | Annualized
Expense Ratio* |
| Class A | | Actual | | | $ | 1,000.00 | | $ | 963.00 | | $ | 8.31 | | 1.68% |
| | | Hypothetical | 1 | | $ | 1,000.00 | | $ | 1,016.53 | | $ | 8.57 | | 1.68% |
| Class B | | Actual | | | $ | 1,000.00 | | $ | 960.10 | | $ | 11.36 | | 2.30% |
| | | Hypothetical | 1 | | $ | 1,000.00 | | $ | 1,013.41 | | $ | 11.74 | | 2.30% |
| Class C | | Actual | | | $ | 1,000.00 | | $ | 959.70 | | $ | 11.36 | | 2.30% |
| | | Hypothetical | 1 | | $ | 1,000.00 | | $ | 1,013.41 | | $ | 11.74 | | 2.30% |
| Class R | | Actual | | | $ | 1,000.00 | | $ | 962.10 | | $ | 9.20 | | 1.86% |
| | | Hypothetical | 1 | | $ | 1,000.00 | | $ | 1,015.62 | | $ | 9.49 | | 1.86% |
| Institutional Service Class | | Actual | | | $ | 1,000.00 | | $ | 965.00 | | $ | 6.69 | | 1.35% |
| | | Hypothetical | 1 | | $ | 1,000.00 | | $ | 1,018.19 | | $ | 6.89 | | 1.35% |
| Institutional Class | | Actual | | | $ | 1,000.00 | | $ | 965.50 | | $ | 6.39 | | 1.29% |
| | | Hypothetical | 1 | | $ | 1,000.00 | | $ | 1,018.50 | | $ | 6.58 | | 1.29% |
| * | Expenses are equal to the Fund’s annualized expense ratio multiplied by the average account value over the period multiplied by 184/365 (to reflect the one-half year period). The expense ratio presented represents a six-month, annualized ratio in accordance with SEC guidelines. |
| 1 | Represents the hypothetical 5% return before expenses. |
| | |
Portfolio Summary | | Gartmore Emerging Markets Fund |
October 31, 2006
The SEC adopted a requirement that Funds present their portfolio holdings in a table, chart or graph format in their annual and semiannual reports to shareholders, whether or not a statement of investments is utilized. The following tables, which present portfolio holdings as a percentage of net assets, are provided in compliance with this requirement.
| | |
| Asset Allocation | | |
| Common Stocks | | 92.3% |
| Participation Notes | | 7.1% |
| Rights | | 0.0% |
| Other assets in excess of liabilities | | 0.6% |
| | |
| | 100.0% |
| | |
| Top Countries | | |
| Korea | | 14.9% |
| Brazil | | 13.4% |
| Hong Kong | | 11.3% |
| Russia | | 10.3% |
| Taiwan | | 10.2% |
| India | | 7.8% |
| Mexico | | 7.4% |
| South Africa | | 5.8% |
| China | | 2.9% |
| Indonesia | | 2.8% |
| Other Assets | | 13.2% |
| | |
| | 100.0% |
| | |
| Top Industries | | |
| Telecommunications | | 14.3% |
| Banking | | 12.6% |
| Oil & Gas | | 11.6% |
| Mining | | 6.3% |
| Electronics | | 5.2% |
| Retail | | 5.1% |
| Financial Services | | 4.2% |
| Steel | | 3.8% |
| Semiconductors | | 3.2% |
| Electric | | 3.0% |
| Other Assets | | 30.7% |
| | |
| | 100.0% |
| | |
| Top Holdings* | | |
| Petroleo Brasileiro SA ADR | | 3.3% |
| OAO Gazprom GDR | | 3.1% |
| Bharti Airtel Ltd., 0.00%, 04/27/07 | | 2.7% |
| Samsung Electronics Co. Ltd. | | 2.7% |
| America Movil SA de CV ADR | | 2.5% |
| China Mobile Ltd. | | 2.5% |
| Companhia Vale do Rio Doce, Class A | | 2.3% |
| Shimao Property Holdings Ltd. | | 2.1% |
| Korea Zinc Co. | | 1.9% |
| Lojas Renner SA | | 1.8% |
| Other Assets | | 75.1% |
| | |
| | 100.0% |
| * | For purpose of listing top holdings, repurchase agreements are considered cash equivalents and are included as part of Other Assets. |
Statement of Investments
October 31, 2006
Gartmore Emerging Markets Fund
Common Stocks (92.3%)
| | | | | |
| | | Shares or
Principal Amount | | Value |
| | | | | |
ARGENTINA (1.1%) | | | | | |
Steel (1.1%) | | | | | |
Tenaris SA ADR | | 16,800 | | $ | 648,312 |
| | | | | |
BRAZIL (13.4%) | | | | | |
Banking (2.3%) | | | | | |
Banco Bradesco SA (c) (d) | | 21,600 | | | 767,832 |
Unibanco Holdings GDR | | 8,700 | | | 685,125 |
| | | | | |
| | | | | 1,452,957 |
| | | | | |
Food & Beverage (1.0%) | | | | | |
CIA Brasileira BEB | | 1,387,700 | | | 609,408 |
| | | | | |
Insurance (0.9%) | | | | | |
Porto Seguro SA | | 25,400 | | | 575,520 |
| | | | | |
Mining (2.3%) | | | | | |
Companhia Vale do Rio Doce, Class A | | 64,760 | | | 1,395,948 |
| | | | | |
Oil & Gas (3.2%) | | | | | |
Petroleo Brasileiro SA ADR | | 21,400 | | | 1,899,463 |
Petroleo Brasileiro SA ADR (c) | | 1,400 | | | 113,344 |
| | | | | |
| | | | | 2,012,807 |
| | | | | |
Retail (1.8%) | | | | | |
Lojas Renner SA | | 90,100 | | | 1,127,671 |
| | | | | |
Steel (0.8%) | | | | | |
Usinas Siderurgicas de Minas Gerais SA | | 14,800 | | | 503,359 |
| | | | | |
Telecommunications (1.1%) | | | | | |
Tim Participacoes SA ADR | | 19,900 | | | 668,640 |
| | | | | |
| | | | | 8,346,310 |
| | | | | |
CHINA (2.9%) | | | | | |
Banking (0.5%) | | | | | |
Industrial & Commercial Bank of China (b) | | 702,000 | | | 314,138 |
| | | | | |
Construction Materials (1.0%) | | | | | |
Anhui Conch Cement Co. Ltd. (d) | | 282,200 | | | 624,658 |
| | | | | |
Oil & Gas (1.4%) | | | | | |
PetroChina Co. Ltd. (d) | | 777,800 | | | 858,403 |
| | | | | |
| | | | | 1,797,199 |
| | | | | |
CZECH REPUBLIC (1.5%) | | | | | |
Electric (1.5%) | | | | | |
CEZ AS (d) | | 22,800 | | | 902,437 |
| | | | | |
| | | | | |
| | | Shares or
Principal Amount | | Value |
| | | | | |
EGYPT (1.2%) | | | | | |
Telecommunications (1.2%) | | | | | |
Orascom Telecom Holding SAE GDR (d) | | 12,900 | | $ | 723,951 |
| | | | | |
HONG KONG (11.3%) | | | | | |
Electric Utility (0.7%) | | | | | |
China Resources Power Holdings Co. Ltd. (d) | | 336,000 | | | 418,399 |
| | | | | |
Equipment Leasing (0.9%) | | | | | |
Cosco Pacific Ltd. (d) | | 257,000 | | | 530,393 |
| | | | | |
Food & Beverage (0.7%) | | | | | |
China Resources Enterprise Ltd. (d) | | 183,200 | | | 423,842 |
| | | | | |
Insurance (1.4%) | | | | | |
China Life Insurance Co. Ltd. (d) | | 411,700 | | | 868,265 |
| | | | | |
Oil & Gas (2.1%) | | | | | |
China Petroleum (d) | | 1,437,600 | | | 997,080 |
CNPC Hong Kong Ltd. (d) | | 564,200 | | | 282,286 |
| | | | | |
| | | | | 1,279,366 |
| | | | | |
Real Estate (2.1%) | | | | | |
Shimao Property Holdings Ltd. (b) | | 954,000 | | | 1,285,625 |
| | | | | |
Telecommunications (2.4%) | | | | | |
China Mobile Ltd. (d) | | 188,400 | | | 1,530,655 |
| | | | | |
Transportation (1.0%) | | | | | |
Pacific Basin Shipping Ltd. (d) | | 972,400 | | | 624,996 |
| | | | | |
| | | | | 6,961,541 |
| | | | | |
INDIA (1.4%) | | | | | |
Software & Computer Services (1.4%) | | | |
Satyam Computer Services Ltd. ADR | | 38,600 | | | 853,446 |
| | | | | |
INDONESIA (2.8%) | | | | | |
Automobile (1.2%) | | | | | |
PT Astra International, Inc. (d) | | 504,000 | | | 738,820 |
| | | | | |
Banking (1.0%) | | | | | |
PT Bank Internasional Indonesia (d) | | 27,504,900 | | | 615,449 |
| | | | | |
Telecommunications (0.6%) | | | | | |
PT Telekomunikasi Indonesia (d) | | 380,987 | | | 349,160 |
| | | | | |
| | | | | 1,703,429 |
| | | | | |
Common Stocks (continued)
| | | | | |
| | | Shares or
Principal Amount | | Value |
| | | | | |
ISRAEL (1.0%) | | | | | |
Banking (1.0%) | | | | | |
Bank Leumi Le-Israel (d) | | 145,800 | | $ | 604,614 |
| | | | | |
KAZAKHSTAN (1.0%) | | | | | |
Mining (1.0%) | | | | | |
KazakhGold Group Ltd. (b) | | 24,824 | | | 592,797 |
| | | | | |
KOREA (14.9%) | | | | | |
Banking (2.7%) | | | | | |
Industrial Bank of Korea (d) | | 63,500 | | | 1,110,435 |
Kookmin Bank ADR | | 7,500 | | | 595,200 |
| | | | | |
| | | | | 1,705,635 |
| | | | | |
Building – Residential & Commercial (2.0%) |
Hanjin Heavy Industries & Construction Co. Ltd. (d) | | 20,950 | | | 619,153 |
Hyundai Development Co. (d) | | 12,860 | | | 647,873 |
| | | | | |
| | | | | 1,267,026 |
| | | | | |
Electronics (2.6%) | | | | | |
Samsung Electronics Co. Ltd. (d) | | 2,532 | | | 1,640,161 |
| | | | | |
Financial Services (1.5%) | | | | | |
Hana Financial Group, Inc. (d) | | 19,659 | | | 905,200 |
| | | | | |
Metals & Mining (1.9%) | | | | | |
Korea Zinc Co. (d) | | 10,400 | | | 1,146,860 |
| | | | | |
Retail (1.2%) | | | | | |
Lotte Shopping Co. Ltd. GDR (b) | | 40,899 | | | 767,674 |
| | | | | |
Telecommunications (1.6%) | | | | | |
Samsung Electronics GDR | | 4,054 | | | 969,920 |
| | | | | |
Tobacco (1.4%) | | | | | |
KT&G Corp. (d) | | 13,700 | | | 846,439 |
| | | | | |
| | | | | 9,248,915 |
| | | | | |
LUXEMBOURG (1.2%) | | | | | |
Steel (1.2%) | | | | | |
Ternium SA ADR (b) | | 30,100 | | | 734,440 |
| | | | | |
MALAYSIA (2.0%) | | | | | |
Agricultural Operations (0.9%) | | | | | |
IOI Corp. Berhad (d) | | 124,300 | | | 585,021 |
| | | | | |
Banking (1.1%) | | | | | |
Bumiputra-Commerce Holdings Bhd (d) | | 338,100 | | | 638,352 |
| | | | | |
| | | | | 1,223,373 |
| | | | | |
| | | | | |
| | | Shares or
Principal Amount | | Value |
| | | | | |
MEXICO (7.4%) | | | | | |
Building Products (1.3%) | | | | | |
Cemex SA de CV ADR | | 25,200 | | $ | 774,648 |
| | | | | |
Financial Services (1.6%) | | | | | |
Grupo Financiero Banorte SA de CV | | 274,917 | | | 997,345 |
| | | | | |
Retail (1.3%) | | | | | |
Wal-Mart de Mexico SA de CV | | 235,100 | | | 817,906 |
| | | | | |
Steel (0.7%) | | | | | |
Industrias CH SA (b) | | 106,900 | | | 415,655 |
| | | | | |
Telecommunications (2.5%) | | | | | |
America Movil SA de CV ADR | | 35,800 | | | 1,534,747 |
| | | | | |
| | | | | 4,540,301 |
| | | | | |
PAKISTAN (0.1%) | | | | | |
Banking (0.1%) | | | | | |
MCB Bank Ltd. GDR (b) | | 2,804 | | | 52,126 |
| | | | | |
PERU (0.7%) | | | | | |
Metals & Mining (0.7%) | | | | | |
Compainia de Minas Buenaventura ADR | | 16,400 | | | 423,940 |
| | | | | |
RUSSIA (10.3%) | | | | | |
Automobile (0.6%) | | | | | |
JSC Severstal — Avto (d) | | 15,885 | | | 399,528 |
| | | | | |
Banking (1.1%) | | | | | |
Sberbank Rossi (d) | | 305 | | | 684,918 |
| | | | | |
Electric (1.5%) | | | | | |
RAO Unified Energy System GDR | | 12,200 | | | 918,660 |
| | | | | |
Mining (1.0%) | | | | | |
JSC MMC Norilsk Nickel ADR | | 4,000 | | | 591,000 |
| | | | | |
Oil & Gas (4.9%) | | | | | |
OAO Gazprom GDR (d) | | 45,000 | | | 1,907,100 |
Surgutneftegaz ADR | | 17,300 | | | 1,095,090 |
| | | | | |
| | | | | 3,002,190 |
| | | | | |
Telecommunications (1.2%) | | | | | |
Mobile Telesystems ADR | | 17,200 | | | 758,176 |
| | | | | |
| | | | | 6,354,472 |
| | | | | |
Statement of Investments (Continued)
October 31, 2006
Gartmore Emerging Markets Fund (Continued)
Common Stocks (continued)
| | | | | |
| | | Shares or
Principal Amount | | Value |
| | | | | |
SOUTH AFRICA (5.8%) | | | | | |
Banking (1.0%) | | | | | |
Standard Bank Group Ltd. (d) | | 50,000 | | $ | 588,330 |
| | | | | |
Diversified Operations (1.0%) | | | | | |
Barloworld Ltd. (d) | | 31,289 | | | 605,950 |
| | | | | |
Health Care (1.0%) | | | | | |
Network Healthcare Holdings Ltd. (b) (d) | | 355,600 | | | 604,101 |
| | | | | |
Mining (1.0%) | | | | | |
Impala Platinum Holdings Ltd. (d) | | 3,600 | | | 633,146 |
| | | | | |
Retail (0.8%) | | | | | |
Edgars Consolidated Stores Ltd. (d) | | 100,000 | | | 499,113 |
| | | | | |
Telecommunications (1.0%) | | | | | |
MTN Group Ltd. (d) | | 68,852 | | | 627,103 |
| | | | | |
| | | | | 3,557,743 |
| | | | | |
TAIWAN (10.2%) | | | | | |
Agricultural Products (0.7%) | | | | | |
Taiwan Fertilizer Co. Ltd. (d) | | 263,100 | | | 427,505 |
| | | | | |
Building Products (0.9%) | | | | | |
Taiwan Cement Corp. (d) | | 701,139 | | | 553,545 |
| | | | | |
Circuit Boards (0.9%) | | | | | |
Nan YA Printed Circuit Board Corp. (d) | | 88,400 | | | 570,136 |
| | | | | |
Computer Hardware (0.0%) | | | | | |
Asustek Computer, Inc. (d) | | 700 | | | 1,701 |
| | | | | |
Electronics (2.6%) | | | | | |
Delta Electronics, Inc. (d) | | 210,400 | | | 594,891 |
Hon Hai Precision Industry Co. Ltd. (d) | | 155,000 | | | 1,003,648 |
| | | | | |
| | | | | 1,598,539 |
| | | | | |
Financial Services (1.1%) | | | | | |
Shin Kong Financial Holding Co. Ltd. (d) | | 772,932 | | | 683,585 |
| | | | | |
Semiconductors (3.1%) | | | | | |
MediaTek, Inc. (d) | | 112,600 | | | 1,097,330 |
Siliconware Precision Industries Co. (d) | | 458,000 | | | 582,427 |
Taiwan Semiconductor Manufacturing Co. Ltd. (d) | | 144,000 | | | 263,723 |
| | | | | |
| | | | | 1,943,480 |
| | | | | |
| | | | | | |
| | | Shares or
Principal Amount | | Value |
| | | | | | |
TAIWAN (continued) | | | | | | |
Technology (0.9%) | | | | | | |
Unimicron Technology Corp. (d) | | | 476,110 | | $ | 539,820 |
| | | | | | |
| | | | | | 6,318,311 |
| | | | | | |
THAILAND (1.0%) | | | | | | |
Mining (1.0%) | | | | | | |
Banpu Public Co. Ltd. | | | 144,500 | | | 629,802 |
| | | | | | |
TURKEY (1.1%) | | | | | | |
Banking (1.1%) | | | | | | |
Turkiye Vakiflar Bankasi
T.A.O. (d) | | | 134,278 | | | 702,262 |
| | | | | | |
| | |
Total Common Stocks | | | | | | 56,919,721 |
| | | | | | |
|
Participation Notes (7.1%) |
|
INDIA (6.4%) |
Automobile (1.0%) | | | | | | |
Tata Motors Ltd.,
0.00%, 09/14/07 (b) (d) | | $ | 34,400 | | | 632,272 |
| | | | | | |
Building Materials (1.6%) | | | | | | |
India Cements Ltd.,
0.00%, 01/16/11 (b) (d) | | | 210,703 | | | 1,005,053 |
| | | | | | |
Chemicals (1.1%) | | | | | | |
Reliance Industries Ltd.,
0.00%, 03/09/09 (b) (d) | | | 24,151 | | | 657,632 |
| | | | | | |
Telecommunications (2.7%) | | | | | | |
Bharti Airtel Ltd.,
0.00%, 04/27/07 (b) (d) | | | 142,331 | | | 1,676,368 |
| | | | | | |
| | | | | | 3,971,325 |
| | | | | | |
PAKISTAN (0.7%) | | | | | | |
Banking (0.7%) | | | | | | |
Muslim Commercial Bank Ltd.,
0.00%, 09/22/09 (b) (d) | | | 95,100 | | | 430,803 |
| | | | | | |
| | |
Total Participation Notes | | | | | | 4,402,128 |
| | | | | | |
Rights (0.0%)
| | | | | | |
| | | Principal Amount | | Value |
| | | | | | |
BRAZIL (0.0%) |
Banking (0.0%) | | | | | | |
Banco Bradesco SA expiring 04/27/07 (b) | | $ | 460 | | $ | 4,573 |
| | | | | | |
| | |
Total Rights | | | | | | 4,573 |
| | | | | | |
| | |
Total Investments
(Cost $52,940,302) (a) — 99.4% | | | | | | 61,326,422 |
| | |
Other assets in excess of
liabilities — 0.6% | | | | | | 361,573 |
| | | | | | |
| | |
NET ASSETS — 100.0% | | | | | $ | 61,687,995 |
| | | | | | |
| | (a) | See notes to financial statements for tax unrealized appreciation (depreciation) of securities. |
| | (b) | Denotes a non-income producing security. |
| | ADR | American Depository Receipt |
| | GDR | Global Depository Receipt |
See notes to financial statements.
Gartmore International Growth Fund
For the annual period ended Oct. 31, 2006, the Gartmore International Growth Fund (Class A at NAV) returned 38.22% versus 28.91% for its benchmark, the Morgan Stanley Capital International (MSCI) All Country World excluding U.S. Index. For broader comparison, the average return for the Fund’s Lipper peer category of International Multi-Cap Core Funds (consisting of 316 funds as of Oct. 31, 2006) was 26.57%.
A constructive economic backdrop supported global stock markets throughout the final months of 2005 and the first quarter of 2006. U.S. growth continued at a solid pace, while both Japan and the Eurozone (the European Union member states that have adopted the euro as their official currency) showed increasingly convincing signs of recovery, and China’s economy accelerated at an outstanding rate. Robust global growth underpinned emerging markets, which outperformed during much of the reporting period; rising commodity prices were particularly supportive of countries such as Brazil. At the beginning of the second quarter of 2006, concerns about the impact of higher oil and other commodity prices on inflation sparked fears that U.S. interest rates might rise higher than expected. These concerns culminated in a significant correction in May that affected all markets.
In August, fears about the direction of the international economy began to dissipate as oil prices slid and U.S. stockpiles reached healthy levels. Also that month, the Federal Reserve Board left interest rates unchanged at 5.25%, pausing in its two-year cycle of rate increases. Furthermore, the Federal Reserve refrained from raising the federal funds rate for the remainder of the reporting period, raising hopes that interest rates had peaked in the current cycle and that the U.S. economy would experience a soft landing. Unsurprisingly in this environment, international equities rallied sharply from August onward, with emerging markets performing particularly well. The Japanese market underperformed, however, because investors apparently were unconvinced that the country’s economic recovery would prove sustainable.
Strong stock selection—particularly in Canada, Japan and the United Kingdom—lay behind the Fund’s outperformance during the reporting period. Our position in Vedanta Resources plc, a British miner that does the majority of its business in India, added the most relative value to performance since this is not held by the benchmark. Vedanta Resources reported record earnings on the back of soaring metal prices and strong demand. Our large overweight in C&C Group plc also proved profitable; the Irish snack and beverage company reported results that beat expectations and also benefited from analysts’ upgrades. An off-Index position held by the Fund in South Korea’s Hynix Semiconductor Inc. also boosted returns. The world’s second-largest memory chipmaker reported surging earnings driven by booming global demand for memory chips. Our considerable overweight in Anglo-Dutch steelmaker Corus Group plc also added value; merger-and-acquisition speculation supported the company’s share price, as did the bid for Corus Group later launched by India’s Tata Steel Ltd.
Inevitably, the Fund suffered some setbacks. Our underweight in the energy sector detracted from Fund performance, while various stocks exerted a negative impact. Our overweight in South African synthetic fuel producer Sasol Ltd. proved to be the largest detractor from Fund performance. Sasol’s stock plunged early in 2006 after the South African government announced that it was considering levying a windfall tax on synthetic fuel producers. In addition, Norwegian oil, gas and hydropower producer Norsk Hydro ASA, another of the Fund’s overweight positions, tumbled along with energy prices in the final months of the reporting period. Norsk Hydro reported a slightly worse-than-expected increase in third-quarter profits in the final week of October.
Looking ahead, we believe that the markets are likely to remain focused in the short term on the pace of global economic growth and the direction of interest rates. Over the medium term, we remain cautiously optimistic on the outlook for equity markets. Global economic growth is slowing, but it is maintaining a reasonable pace, valuations are generally supportive, and corporate activity looks set to pick up again in mid-2007.
Portfolio Managers:
Gartmore Global Partners—Brian O’Neill and Ben Walker
| | |
Fund Performance | | Gartmore International Growth Fund |
Average Annual Total Return
(For periods ended October 31, 2006)
| | | | | | | | |
| | | | | 1 Yr. | | 5 Yr. | | Inception1 |
| Class A | | w/o SC2 | | 38.22% | | 16.90% | | 5.00% |
| | | w/SC3 | | 30.29% | | 15.51% | | 4.00% |
| Class B | | w/o SC2 | | 37.37% | | 16.06% | | 4.25% |
| | | w/SC4 | | 32.37% | | 15.84% | | 4.25% |
| Class C5 | | w/o SC2 | | 37.49% | | 16.08% | | 4.35% |
| | | w/SC6 | | 36.49% | | 16.08% | | 4.35% |
| Class R7,9 | | | | 38.01% | | 16.39% | | 4.49% |
| Institutional Service Class9 | | 38.76% | | 17.22% | | 5.31% |
| Institutional Class8,9 | | 38.76% | | 17.22% | | 5.31% |
All figures showing the effect of a sales charge reflect the maximum charge possible, because it has the most dramatic effect on performance data.
| 1 | Fund commenced operations on August 30, 2000. |
| 2 | These returns do not reflect the effects of sales charges (SC). |
| 3 | A 5.75% front-end sales charge was deducted. |
| 4 | A 5.00% contingent deferred sales charge (CDSC) was deducted. The CDSC declines to 0% after 6 years. |
| 5 | These returns until the creation of Class C shares (3/1/01) include the performance of the Fund’s Class B shares. Excluding the effects of any fee waivers or reimbursements, such prior performance is substantially similar to what Class C shares would have produced because Class C shares invest in the same portfolio of securities as Class B shares and have the same expenses after any fee waivers or reimbursements. For Class C shares returns with sales charges, these returns have been restated for the applicable sales charges. |
| 6 | A CDSC of 1.00% was deducted from the one year return because it is charged when you sell Class C shares within the first year after purchase. |
| 7 | These returns until the creation of Class R shares (12/30/03) include the performance of the Fund’s Class B shares. The returns have been adjusted for the fact that Class R shares do not have any applicable sales charges but have not been adjusted for the lower expenses applicable to Class R shares. Excluding the effect of any fee waivers or reimbursements, such prior performance is similar to what Class R shares would have produced because the Class R shares invest in the same portfolio of securities as Class B shares. |
| 8 | These returns until the creation of Institutional Class shares (6/29/04) include the performance of the Fund’s Institutional Service shares. The returns have been adjusted for the fact that Institutional Class shares do not have any applicable sales charges but have not been adjusted for the lower expenses applicable to Institutional Class shares. Excluding the effect of any fee waivers or reimbursements, such prior performance is similar to what Institutional Class shares would have produced because the Institutional Class shares invest in the same portfolio of securities as Institutional Service shares. |
| 9 | Not subject to any sales charges. |
Performance of a $10,000 Investment
Investment return and principal value will fluctuate, and when redeemed, shares may be worth more or less than original cost. Past performance is no guarantee of future results and does not reflect the deduction of taxes that a shareholder would pay on fund distributions or the redemption of fund shares. Investing in mutual funds involves market risk, including loss of principal. Performance returns assume the reinvestment of all distributions.
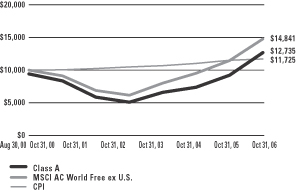
Comparative performance of $10,000 invested in Class A shares of the Gartmore International Growth Fund, Morgan Stanley Capital International All Country World Free ex U.S. Index (MSCI AC World Free ex U.S.)(a), and the Consumer Price Index (CPI)(b) since inception. Unlike the Fund, the returns for these unmanaged indexes do not reflect any fees, expenses, or sales charges. Investors cannot invest directly in market indexes.
| (a) | The MSCI EAFE is an unmanaged, market capitalization-weighted index that is designed to represent the performance of developed stock markets outside the United States and Canada. |
| (b) | The CPI represents changes in prices of a basket of goods and services purchased for consumption by urban households. |
| | |
Shareholder Expense Example | | Gartmore International Growth Fund |
As a shareholder of the Fund, you incur two types of costs: (1) transaction costs, including sales charges (loads) paid on purchase payments and redemption fees; and (2) ongoing costs, including investment advisory fees, administration fees, distribution fees and other Fund expenses. The examples below are intended to help you understand your ongoing costs (in dollars) of investing in the Fund and to compare these costs with the ongoing costs of investing in other mutual funds. Per SEC requirements, the examples assume that you had a $1,000 investment in the Class at the beginning of the reporting period, May 1, 2006 and continued to hold your shares at the end of the reporting period, October 31, 2006.
Actual Expenses
For each Class of the Fund in the table below, the first line provides information about actual account values and actual expenses. You may use the information in this line, together with the amount you invested, to estimate the expenses that you paid over the period. Simply divide your account value by $1,000 (for example, an $8,600 account value divided by $1,000 = 8.6), then multiply the result by the number in the first line of each Class under the heading entitled “Expenses Paid During Period” to estimate the expenses you paid on your account during the period.
Hypothetical Example for Comparison Purposes
The second line of each Class in the table below provides information about hypothetical account values and hypothetical expenses based on the Class’ actual expense ratio and an assumed rate of return of 5% per year before expenses, which is not the Class’ actual return. The hypothetical account values and expenses may not be used to estimate the actual ending account balance or expenses you paid for the period. You may use this information to compare the ongoing costs of investing in the Class of the Fund and other funds. To do so, compare this 5% hypothetical example with the 5% hypothetical examples that appear in the shareholder reports of the other funds.
Please note that the expenses shown in the table are meant to highlight your ongoing costs only and do not reflect any transaction costs, such as sales charges (loads) or redemption fees. Therefore, the second line for each Class in the table is useful in comparing ongoing costs only, and will not help you determine the relative total costs of owning different funds. In addition, if these transaction costs were included, your costs would have been higher. The examples also assume all dividends and distributions have been reinvested.
Schedule of Shareholder Expenses
Expense Analysis of a $1,000 Investment
(October 31, 2006)
| | | | | | | | | | | | | | |
| International Growth Fund | | | | | Beginning
Account Value,
5/1/06 | | Ending
Account Value,
10/31/06 | | Expenses Paid
During Period* | | Annualized
Expense Ratio* |
| Class A | | Actual | | | $ | 1,000.00 | | $ | 1,038.90 | | $ | 8.48 | | 1.65% |
| | | Hypothetical | 1 | | $ | 1,000.00 | | $ | 1,016.68 | | $ | 8.42 | | 1.65% |
| Class B | | Actual | | | $ | 1,000.00 | | $ | 1,035.50 | | $ | 12.26 | | 2.39% |
| | | Hypothetical | 1 | | $ | 1,000.00 | | $ | 1,012.95 | | $ | 12.20 | | 2.39% |
| Class C | | Actual | | | $ | 1,000.00 | | $ | 1,036.10 | | $ | 12.21 | | 2.38% |
| | | Hypothetical | 1 | | $ | 1,000.00 | | $ | 1,013.00 | | $ | 12.15 | | 2.38% |
| Class R | | Actual | | | $ | 1,000.00 | | $ | 1,037.00 | | $ | 10.42 | | 2.03% |
| | | Hypothetical | 1 | | $ | 1,000.00 | | $ | 1,014.77 | | $ | 10.36 | | 2.03% |
| Institutional Service Class | | Actual | | | $ | 1,000.00 | | $ | 1,041.30 | | $ | 7.15 | | 1.39% |
| | | Hypothetical | 1 | | $ | 1,000.00 | | $ | 1,017.99 | | $ | 7.09 | | 1.39% |
| Institutional Class | | Actual | | | $ | 1,000.00 | | $ | 1,041.30 | | $ | 7.15 | | 1.39% |
| | | Hypothetical | 1 | | $ | 1,000.00 | | $ | 1,017.99 | | $ | 7.09 | | 1.39% |
| * | Expenses are equal to the Fund’s annualized expense ratio multiplied by the average account value over the period multiplied by 184/365 (to reflect the one-half year period). The expense ratio presented represents a six-month, annualized ratio in accordance with SEC guidelines. |
| 1 | Represents the hypothetical 5% return before expenses. |
| | |
Portfolio Summary | | Gartmore International Growth Fund |
October 31, 2006
The SEC adopted a requirement that Funds present their portfolio holdings in a table, chart or graph format in their annual and semiannual reports to shareholders, whether or not a statement of investments is utilized. The following tables, which present portfolio holdings as a percentage of net assets, are provided in compliance with this requirement.
| | |
| Asset Allocation | | |
| Common Stocks | | 99.2% |
| Other assets in excess of liabilities | | 0.8% |
| | |
| | 100.0% |
| | |
| Top Countries | | |
| United Kingdom | | 29.3% |
| Japan | | 16.7% |
| France | | 11.7% |
| Canada | | 5.9% |
| Germany | | 5.9% |
| Switzerland | | 5.0% |
| Netherlands | | 4.7% |
| Italy | | 3.9% |
| Ireland | | 3.1% |
| Norway | | 2.1% |
| Other Assets | | 11.7% |
| | |
| | 100.0% |
| | |
| Top Industries | | |
| Banking | | 13.9% |
| Financial Services | | 9.0% |
| Automotive | | 8.2% |
| Mining | | 7.7% |
| Telecommunications | | 7.2% |
| Pharmaceuticals | | 6.0% |
| Retail | | 4.5% |
| Engineering | | 3.4% |
| Electronics | | 3.3% |
| Insurance | | 2.9% |
| Other Assets | | 33.9% |
| | |
| | 100.0% |
| | |
| Top Holdings* | | |
| Societe Generale | | 2.4% |
| Suzuki Motor Corp. | | 2.3% |
| C&C Group PLC | | 2.1% |
| MAN AG | | 2.1% |
| Toyota Motor Corp. | | 2.1% |
| Telenor ASA | | 2.1% |
| Antofagasta PLC | | 2.0% |
| Hudbay Minerals, Inc. | | 2.0% |
| Mitsui Fudosan Co. Ltd. | | 2.0% |
| Rolls-Royce Group PLC | | 2.0% |
| Other Assets | | 78.9% |
| | |
| | 100.0% |
| * | For purpose of listing top holdings, repurchase agreements are considered cash equivalents and are included as part of Other Assets. |
Statement of Investments
October 31, 2006
Gartmore International Growth Fund
Common Stocks (99.2%)
| | | | | |
| | | Shares | | Value |
| | | | | |
ARGENTINA (0.8%) | | | | | |
Steel (0.8%) | | | | | |
Tenaris SA (c) | | 21,670 | | $ | 419,897 |
| | | | | |
AUSTRALIA (1.6%) | | | | | |
Pharmaceuticals (1.6%) | | | | | |
CSL Ltd. (c) | | 19,150 | | | 830,347 |
| | | | | |
BRAZIL (1.7%) | | | | | |
Mining (1.7%) | | | | | |
Companhia Vale de Rio Doce ADR | | 38,900 | | | 844,908 |
| | | | | |
CANADA (5.9%) | | | | | |
Aluminum (1.9%) | | | | | |
Alcan, Inc. | | 20,810 | | | 980,359 |
| | | | | |
Computers (1.9%) | | | | | |
Research In Motion Ltd. (b) | | 8,210 | | | 964,511 |
| | | | | |
Mining (2.1%) | | | | | |
Hudbay Minerals, Inc. (b) | | 58,990 | | | 1,021,961 |
| | | | | |
| | | | | 2,966,831 |
| | | | | |
CHINA (0.3%) | | | | | |
Banking (0.3%) | | | | | |
Industrial & Commercial Bank of China (b) | | 342,000 | | | 153,042 |
| | | | | |
FRANCE (11.7%) | | | | | |
Banking (4.4%) | | | | | |
BNP Paribas SA (c) | | 8,969 | | | 984,878 |
Societe Generale (c) | | 7,259 | | | 1,204,983 |
| | | | | |
| | | | | 2,189,861 |
| | | | | |
Diversified Operations (1.7%) | | | | | |
LVMH Moet Hennessy SA (c) | | 8,115 | | | 845,086 |
| | | | | |
Engineering (1.5%) | | | | | |
Alstom SA (b) (c) | | 8,000 | | | 736,475 |
| | | | | |
Food Products & Services (1.9%) | | | | | |
Groupe Danone (c) | | 6,720 | | | 983,687 |
| | | | | |
Retail (0.9%) | | | | | |
Carrefour SA (c) | | 7,440 | | | 453,090 |
| | | | | |
Telecommunications (1.3%) | | | | | |
France Telecom SA (c) | | 26,000 | | | 676,979 |
| | | | | |
| | | | | 5,885,178 |
| | | | | |
| | | | | |
| | | Shares | | Value |
| | | | | |
GERMANY (5.9%) | | | | | |
Automotive (2.0%) | | | | | |
Porsche AG, Preferred Shares (c) | | 854 | | $ | 996,882 |
| | | | | |
Machinery (2.1%) | | | | | |
MAN AG (c) | | 12,050 | | | 1,070,582 |
| | | | | |
Pharmaceuticals (1.8%) | | | | | |
Merck KGaA (c) | | 8,510 | | | 898,829 |
| | | | | |
| | | | | 2,966,293 |
| | | | | |
IRELAND (3.1%) | | | | | |
Airlines (0.9%) | | | | | |
Aer Lingus Group PLC (b) | | 128,270 | | | 463,228 |
| | | | | |
Beverages (2.2%) | | | | | |
C&C Group PLC (c) | | 65,140 | | | 1,079,628 |
| | | | | |
| | | | | 1,542,856 |
| | | | | |
ITALY (3.9%) | | | | | |
Automotive (1.9%) | | | | | |
Fiat SpA (b) (c) | | 55,490 | | | 977,007 |
| | | | | |
Banking (2.0%) | | | | | |
UniCredito Italiano SpA (c) | | 119,230 | | | 987,872 |
| | | | | |
| | | | | 1,964,879 |
| | | | | |
JAPAN (16.7%) | | | | | |
Automotive (4.3%) | | | | | |
Suzuki Motor Corp. (c) | | 40,200 | | | 1,139,081 |
Toyota Motor Corp. (c) | | 17,900 | | | 1,057,050 |
| | | | | |
| | | | | 2,196,131 |
| | | | | |
Chemicals (1.7%) | | | | | |
Shin-Etsu Chemical Co. Ltd. (c) | | 13,100 | | | 858,863 |
| | | | | |
Electronics (1.9%) | | | | | |
Canon, Inc. (c) | | 17,900 | | | 956,095 |
| | | | | |
Financial Services (4.8%) | | | | | |
Mitsubishi UFJ Financial Group, Inc. (c) | | 60 | | | 761,148 |
Mizuho Financial Group, Inc. (c) | | 110 | | | 855,135 |
Sumitomo Mitsui Financial Group, Inc. (c) | | 76 | | | 830,656 |
| | | | | |
| | | | | 2,446,939 |
| | | | | |
Real Estate (2.0%) | | | | | |
Mitsui Fudosan Co. Ltd. (c) | | 41,000 | | | 1,008,810 |
| | | | | |
Common Stocks (continued)
| | | | | |
| | | Shares | | Value |
| | | | | |
JAPAN (continued) | | | | | |
Tobacco (2.0%) | | | | | |
Japan Tobacco, Inc. (c) | | 227 | | $ | 988,134 |
| | | | | |
| | | | | 8,454,972 |
| | | | | |
MEXICO (1.3%) | | | | | |
Financial Services (1.3%) | | | | | |
Grupo Financiero Banorte SA de CV | | 180,630 | | | 655,291 |
| | | | | |
NETHERLANDS (4.7%) | | | | | |
Brewery (1.2%) | | | | | |
Heineken NV (c) | | 13,180 | | | 596,800 |
| | | | | |
Semiconductors (1.7%) | | | | | |
ASML Holding NV (b) (c) | | 37,580 | | | 857,376 |
| | | | | |
Steel – Producers (1.8%) | | | | | |
Mittal Steel Co. NV (c) | | 21,580 | | | 924,243 |
| | | | | |
| | | | | 2,378,419 |
| | | | | |
NORWAY (2.1%) | | | | | |
Telecommunications (2.1%) | | | | | |
Telenor ASA (c) | | 66,290 | | | 1,049,090 |
| | | | | |
SOUTH KOREA (1.4%) | | | | | |
Electronics (1.4%) | | | | | |
Hynix Semiconductor, Inc. (b) (c) | | 19,770 | | | 716,639 |
| | | | | |
SPAIN (1.9%) | | | | | |
Telecommunications (1.9%) | | | | | |
Telefonica SA (c) | | 50,980 | | | 981,302 |
| | | | | |
SWEDEN (1.9%) | | | | | |
Banking (1.9%) | | | | | |
Skandiaviska Enskilda Banken AB (c) | | 33,610 | | | 938,301 |
| | | | | |
SWITZERLAND (5.0%) | | | | | |
Banking (1.9%) | | | | | |
Julius Baer Holding Ltd. (c) | | 9,110 | | | 961,542 |
| | | | | |
Engineering (1.9%) | | | | | |
ABB Ltd. (c) | | 65,940 | | | 980,985 |
| | | | | |
Pharmaceuticals (1.2%) | | | | | |
Novartis AG (c) | | 9,800 | | | 595,035 |
| | | | | |
| | | | | 2,537,562 |
| | | | | |
| | | | | |
| | | Shares | | Value |
| | | | | |
UNITED KINGDOM (29.3%) | | | | | |
Aerospace & Defense (2.0%) | | | | | |
Rolls-Royce Group PLC (c) | | 112,690 | | $ | 1,008,544 |
| | | | | |
Apparel Manufacturers (1.0%) | | | | | |
Burberry Group PLC (c) | | 45,980 | | | 489,333 |
| | | | | |
Banking (3.4%) | | | | | |
Barclays PLC (c) | | 66,060 | | | 889,952 |
Standard Chartered PLC (c) | | 29,070 | | | 817,685 |
| | | | | |
| | | | | 1,707,637 |
| | | | | |
Energy (1.8%) | | | | | |
Centrica PLC (c) | | 144,450 | | | 913,265 |
| | | | | |
Financial Services (2.9%) | | | | | |
Collins Stewart Tullett PLC (c) | | 45,700 | | | 747,960 |
Lloyds TSB Group PLC (c) | | 68,140 | | | 727,737 |
| | | | | |
| | | | | 1,475,697 |
| | | | | |
Insurance (2.9%) | | | | | |
Legal & General Group PLC (c) | | 323,080 | | | 890,643 |
Prudential PLC (c) | | 47,270 | | | 579,014 |
| | | | | |
| | | | | 1,469,657 |
| | | | | |
Metals (0.9%) | | | | | |
Corus Group PLC (c) | | 53,248 | | | 474,088 |
| | | | | |
Mining (3.9%) | | | | | |
Antofagasta PLC (c) | | 107,040 | | | 1,032,464 |
Xstrata PLC (c) | | 22,653 | | | 964,437 |
| | | | | |
| | | | | 1,996,901 |
| | | | | |
Pharmaceuticals (1.4%) | | | | | |
AstraZeneca PLC (c) | | 11,870 | | | 699,436 |
| | | | | |
Retail (3.6%) | | | | | |
DSG International PLC (c) | | 211,660 | | | 877,915 |
Marks & Spencer Group PLC (c) | | 75,820 | | | 948,334 |
| | | | | |
| | | | | 1,826,249 |
| | | | | |
Telecommunications (1.9%) | | | | | |
Vodafone Group PLC (c) | | 368,170 | | | 948,557 |
| | | | | |
Transportation (1.9%) | | | | | |
British Airways PLC (b) (c) | | 111,160 | | | 972,170 |
| | | | | |
Utilities (1.7%) | | | | | |
Pennon Group PLC (c) | | 84,886 | | | 836,282 |
| | | | | |
| | | | | 14,817,816 |
| | | | | |
| | |
Total Common Stocks | | | | | 50,103,623 |
| | | | | |
Statement of Investments (Continued)
October 31, 2006
Gartmore International Growth Fund (Continued)
| | | | | |
Total Investments
(Cost $43,983,472) (a) — 99.2% | | | | $ | 50,103,623 |
| | | | | |
| | |
Other assets in excess of liabilities — 0.8% | | | | | 391,381 |
| | | | | |
| | |
NET ASSETS — 100.0% | | | | $ | 50,495,004 |
| | | | | |
| | (a) | See notes to financial statements for tax unrealized appreciation (depreciation) of securities. |
| | (b) | Denotes a non-income producing security. |
| | ADR | American Depository Receipt |
See notes to financial statements.
Statements of Assets and Liabilities
October 31, 2006
| | | | | | | | | | | |
| | | Gartmore China
Opportunities
Fund | | Gartmore
Emerging Markets
Fund | | Gartmore
International Growth Fund |
Assets: | | | | | | | | | | | |
Investments, at value (cost $25,721,016; $52,940,302; and $43,983,472; respectively) | | $ | 29,561,798 | | $ | 61,326,422 | | $ | 50,103,623 | | |
Repurchase agreements, at cost and value | | | 210,882 | | | — | | | — | | |
| | | | | | | | | | | |
Total Investment | | | 29,772,680 | | | 61,326,422 | | | 50,103,623 | | |
| | | | | | | | | | | |
Foreign currency, at value (cost $375,649; $134,118 and $650,160; respectively) | | | 375,775 | | | 133,955 | | | 622,701 | | |
Interest and dividends receivable | | | 23,584 | | | 60,239 | | | 51,555 | | |
Receivable for capital shares issued | | | 42,539 | | | 90,972 | | | 294,701 | | |
Receivable for investments sold | | | 268,112 | | | 483,417 | | | 660,040 | | |
Unrealized appreciation on spot foreign currency contracts | | | 14 | | | — | | | 5,010 | | |
Reclaims receivable | | | — | | | — | | | 11,478 | | |
Prepaid expenses | | | 8,031 | | | 18,379 | | | 20,908 | | |
| | | | | | | | | | | |
Total Assets | | | 30,490,735 | | | 62,113,384 | | | 51,770,016 | | |
| | | | | | | | | | | |
| | | | |
Liabilities: | | | | | | | | | | | |
Payable to custodian | | | — | | | 200,253 | | | 187,915 | | |
Payable for investments purchased | | | 375,174 | | | 65,521 | | | 981,476 | | |
Payable for capital shares redeemed | | | 20,550 | | | 64,887 | | | 26,897 | | |
Accrued expenses and other payables | | | | | | | | | | | |
Investment advisory fees | | | 29,680 | | | 52,103 | | | 43,369 | | |
Fund administration and transfer agent fees | | | 1,540 | | | 508 | | | 3,639 | | |
Distribution fees | | | 8,053 | | | 18,592 | | | 17,828 | | |
Administrative servicing fees | | | 1,659 | | | 8,769 | | | 1,436 | | |
Trustee fees | | | 4 | | | 8 | | | 6 | | |
Compliance program fees (Note 3) | | | 168 | | | 498 | | | 344 | | |
Other | | | 6,132 | | | 14,250 | | | 12,102 | | |
| | | | | | | | | | | |
Total Liabilities | | | 442,960 | | | 425,389 | | | 1,275,012 | | |
| | | | | | | | | | | |
Net Assets | | $ | 30,047,775 | | $ | 61,687,995 | | $ | 50,495,004 | | |
| | | | | | | | | | | |
| | | | |
Represented by: | | | | | | | | | | | |
Capital | | $ | 24,145,770 | | $ | 43,552,279 | | $ | 41,962,444 | | |
Accumulated net investment income (loss) | | | 32,334 | | | — | | | 29,654 | | |
Accumulated net realized gains (losses) from investment and foreign currency transactions | | | 2,028,713 | | | 9,748,637 | | | 2,400,659 | | |
Net unrealized appreciation (depreciation) on investments and transactions of assets and liabilities denominated in foreign currencies | | | 3,840,958 | | | 8,387,079 | | | 6,102,247 | | |
| | | | | | | | | | | |
Net Assets | | $ | 30,047,775 | | $ | 61,687,995 | | $ | 50,495,004 | | |
| | | | | | | | | | | |
| | | | |
Net Assets: | | | | | | | | | | | |
Class A Shares | | $ | 14,469,788 | | $ | 34,046,710 | | $ | 26,564,505 | | |
Class B Shares | | | 1,209,649 | | | 6,012,832 | | | 6,031,417 | | |
Class C Shares | | | 5,247,243 | | | 7,716,085 | | | 9,566,492 | | |
Class R Shares | | | 6,855 | | | 456,012 | | | 1,809 | | |
Institutional Service Class Shares | | | 120,191 | | | 3,066,312 | | | 4,588,979 | | |
Institutional Class Shares | | | 8,994,049 | | | 10,390,044 | | | 3,741,802 | | |
| | | | | | | | | | | |
Total | | $ | 30,047,775 | | $ | 61,687,995 | | $ | 50,495,004 | | |
| | | | | | | | | | | | |
See notes to financial statements.
Statements of Assets and Liabilities (Continued)
October 31, 2006
| | | | | | | | | | | | | | |
| | | Gartmore China
Opportunities
Fund | | | Gartmore
Emerging Markets
Fund | | | Gartmore
International Growth Fund |
| | | | |
Shares Outstanding (unlimited number of shares authorized): | | | | | | | | | | | | | | |
Class A Shares | | | 912,324 | | | | 1,910,359 | | | | 1,989,120 | | | |
Class B Shares | | | 77,039 | | | | 349,422 | | | | 470,246 | | | |
Class C Shares | | | 334,276 | | | | 441,283 | | | | 741,812 | | | |
Class R Shares | | | 434 | | | | 26,327 | | | | 139 | | | |
Institutional Service Class Shares | | | 7,568 | | | | 169,067 | | | | 338,678 | | | |
Institutional Class Shares | | | 565,197 | | | | 572,899 | | | | 276,184 | | | |
| | | | | | | | | | | | | | |
Total | | | 1,896,838 | | | | 3,469,357 | | | | 3,816,179 | | | |
| | | | | | | | | | | | | | |
| | | | |
Net asset value and redemption price per share (net assets by class divided by shares outstanding by class, respectively): | | | | | | | | | | | | | | |
Class A Shares | | $ | 15.86 | | | $ | 17.82 | | | $ | 13.35 | | | |
Class B Shares (a) | | $ | 15.70 | | | $ | 17.21 | | | $ | 12.83 | | | |
Class C Shares (b) | | $ | 15.70 | | | $ | 17.49 | | | $ | 12.90 | | | |
Class R Shares | | $ | 15.79 | | | $ | 17.32 | | | $ | 12.95 | (c) | | |
Institutional Service Class Shares | | $ | 15.88 | | | $ | 18.14 | | | $ | 13.55 | | | |
Institutional Class Shares | | $ | 15.91 | | | $ | 18.14 | | | $ | 13.55 | | | |
| | | | |
Maximum Offering Price Per Share (100%/100%-maximum sales charge) of net asset value adjusted to the nearest cent): | | | | | | | | | | | | | | |
Class A Shares | | $ | 16.83 | | | $ | 18.91 | | | $ | 14.16 | | | |
| | | | | | | | | | | | | | |
Maximum Sales Charge — Class A Shares | | | 5.75 | % | | | 5.75 | % | | | 5.75 | % | | |
| | | | | | | | | | | | | | |
| | | | | | | | | | | | | | |
| | | | | | | | | | | | | | |
| | | | | | | | | | | | | | |
| | | | | | | | | | | | | | |
| | | | | | | | | | | | | | |
| | | | | | | | | | | | | | |
| | | | | | | | | | | | | | |
| | | | | | | | | | | | | | |
| | | | | | | | | | | | | | |
| | | | | | | | | | | | | | |
| | | | | | | | | | | | | | |
| | | | | | | | | | | | | | |
| | | | | | | | | | | | | | |
| | | | | | | | | | | | | | |
| | | | | | | | | | | | | | |
| | | | | | | | | | | | | | |
| | | | | | | | | | | | | | |
| | | | | | | | | | | | | | | |
| (a) | For Class B shares, the redemption price per share varies by length of time shares are held. |
| (b) | For Class C shares, the redemption price per share is reduced by 1.00% for shares held less than one year. |
| (c) | The NAV reported above represents the traded NAV at October 31, 2006. Due to the financial statement rounding of class assets and class shares above, the NAV results in a different NAV than the traded NAV. |
See notes to financial statements.
Statements of Operations
October 31, 2006
| | | | | | | | | | | | | | |
| | | China
Opportunities
Fund | | | Gartmore
Emerging Markets
Fund | | | Gartmore
International Growth Fund |
INVESTMENT INCOME: | | | | | | | | | | | | | | |
Interest income | | $ | 31,543 | | | $ | 51,866 | | | $ | 19,849 | | | |
Dividend income (net of foreign withholding tax of $646; $108,502; and $48,188; respectively) | | | 417,822 | | | | 1,317,648 | | | | 475,652 | | | |
| | | | | | | | | | | | | | |
Total Income | | | 449,365 | | | | 1,369,514 | | | | 495,501 | | | |
| | | | | | | | | | | | | | |
| | | | |
Expenses: | | | | | | | | | | | | | | |
Investment advisory fees | | | 254,379 | | | | 607,164 | | | | 291,065 | | | |
Fund administration and transfer agent fees | | | 42,652 | | | | 88,017 | | | | 50,799 | | | |
Distribution fees Class A | | | 20,740 | | | | 84,281 | | | | 36,178 | | | |
Distribution fees Class B | | | 6,385 | | | | 55,403 | | | | 47,465 | | | |
Distribution fees Class C | | | 29,494 | | | | 67,546 | | | | 42,159 | | | |
Distribution fees Class R | | | 19 | | | | 478 | | | | 7 | | | |
Administrative servicing fees Class A | | | 830 | | | | 30,062 | | | | 5,318 | | | |
Administrative servicing fees Class R | | | 7 | | | | 239 | | | | 2 | | | |
Administrative servicing fees Institutional Service Class | | | 5 | | | | — | | | | — | | | |
Registration and filing fees | | | 46,953 | | | | 54,231 | | | | 50,408 | | | |
Trustee fees | | | 613 | | | | 2,117 | | | | 956 | | | |
Compliance program fees (Note 3) | | | 391 | | | | 1,027 | | | | 669 | | | |
Other | | | 20,059 | | | | 53,982 | | | | 31,364 | | | |
| | | | | | | | | | | | | | |
Total expenses before reimbursed expenses | | | 422,527 | | | | 1,044,547 | | | | 556,390 | | | |
Earnings credit (Note 5) | | | (248 | ) | | | (2,997 | ) | | | (315 | ) | | |
Expenses reimbursed | | | (22,860 | ) | | | — | | | | (2,995 | ) | | |
Expenses voluntarily waived by administrator | | | (773 | ) | | | (4,498 | ) | | | (555 | ) | | |
| | | | | | | | | | | | | | |
Net Expenses | | | 398,646 | | | | 1,037,052 | | | | 552,525 | | | |
| | | | | | | | | | | | | | |
Net Investment Income (Loss) | | | 50,719 | | | | 332,462 | | | | (57,024 | ) | | |
| | | | | | | | | | | | | | |
| | | | |
REALIZED/UNREALIZED GAINS (LOSSES) FROM INVESTMENTS: | | | | | | | | | | | | | | |
Net realized gains (losses) on investment transactions | | | 2,076,524 | | | | 9,878,493 | | | | 3,225,127 | | | |
Net realized gains (losses) on foreign currency transactions | | | (1,313 | ) | | | (64,422 | ) | | | (508 | ) | | |
| | | | | | | | | | | | | | |
Net realized gains (losses) on investment and foreign currency transactions | | | 2,075,211 | | | | 9,814,071 | | | | 3,224,619 | | | |
Net change in unrealized appreciation/depreciation on investments and transaction of assets and liabilities denominated in foreign currencies | | | 4,195,223 | | | | 3,535,442 | | | | 4,964,753 | | | |
| | | | | | | | | | | | | | |
Net realized/unrealized gains (losses) on investments and foreign currencies | | | 6,270,434 | | | | 13,349,513 | | | | 8,189,372 | | | |
| | | | | | | | | | | | | | |
CHANGE IN NET ASSETS RESULTING FROM OPERATIONS | | $ | 6,321,153 | | | $ | 13,681,975 | | | $ | 8,132,348 | | | |
| | | | | | | | | | | | | | |
| | | | | | | | | | | | | | |
| | | | | | | | | | | | | | |
| | | | | | | | | | | | | | |
| | | | | | | | | | | | | | |
| | | | | | | | | | | | | | |
| | | | | | | | | | | | | | |
| | | | | | | | | | | | | | |
| | | | | | | | | | | | | | | |
See notes to financial statements.
Statements of Changes in Net Assets
| | | | | | | | | | | | | | | | | | |
| | | Gartmore China Opportunities Fund | | | Gartmore Emerging Markets Fund |
| | | Year Ended
October 31, 2006 | | | Year Ended
October 31, 2005 | | | Year Ended
October 31, 2006 | | | Year Ended
October 31, 2005 | | | |
FROM INVESTMENT ACTIVITIES: | | | | | | | | | | | | | | | | | | |
Operations: | | | | | | | | | | | | | | | | | | |
Net investment income (loss) | | $ | 50,719 | | | $ | 84,744 | | | $ | 332,462 | | | $ | 157,239 | | | |
Net realized gains (losses) on investment and foreign currency transactions | | | 2,075,211 | | | | 820,246 | | | | 9,814,071 | | | | 4,879,201 | | | |
Net change in unrealized appreciation/depreciation on investments and translation of assets and liabilities denominated in foreign currencies | | | 4,195,223 | | | | (800,447 | ) | | | 3,535,442 | | | | 2,879,080 | | | |
| | | | | | | | | | | | | | | | | | |
Change in net assets resulting from operations | | | 6,321,153 | | | | 104,543 | | | | 13,681,975 | | | | 7,915,520 | | | |
| | | | | | | | | | | | | | | | | | |
| | | | | |
Distributions to Class A Shareholders from: | | | | | | | | | | | | | | | | | | |
Net investment income | | | (32,955 | ) | | | (15,757 | ) | | | (204,816 | ) | | | (56,787 | ) | | |
Net realized gains on investments | | | (226,294 | ) | | | (44,331 | ) | | | (2,643,711 | ) | | | (975,437 | ) | | |
| | | | | |
Distributions to Class B Shareholders from: | | | | | | | | | | | | | | | | | | |
Net investment income | | | (342 | ) | | | (1,010 | ) | | | (7,688 | ) | | | (1,826 | ) | | |
Net realized gains on investments | | | (26,756 | ) | | | (3,240 | ) | | | (478,548 | ) | | | (207,463 | ) | | |
| | | | | |
Distributions to Class C Shareholders from: | | | | | | | | | | | | | | | | | | |
Net investment income | | | (2,772 | ) | | | (3,793 | ) | | | (9,893 | ) | | | (1,199 | ) | | |
Net realized gains on investments | | | (86,834 | ) | | | (23,795 | ) | | | (512,762 | ) | | | (173,966 | ) | | |
| | | | | |
Distributions to Class R Shareholders from: | | | | | | | | | | | | | | | | | | |
Net investment income | | | (12 | ) | | | (7 | ) | | | (1,629 | ) | | | (4 | ) | | |
Net realized gains on investments | | | (98 | ) | | | (36 | ) | | | (1,017 | ) | | | (76 | ) | | |
| | | | | |
Distributions to Institutional Service Class Shareholders from: | | | | | | | | | | | | | | | | | | |
Net investment income | | | (308 | ) | | | (9 | ) | | | (58,813 | ) | | | (41,434 | ) | | |
Net realized gains on investments | | | (98 | ) | | | (34 | ) | | | (942,919 | ) | | | (267,430 | ) | | |
| | | | | |
Distributions to Institutional Class Shareholders from: | | | | | | | | | | | | | | | | | | |
Net investment income | | | (33,815 | ) | | | (49,459 | ) | | | (59,502 | ) | | | (12,375 | ) | | |
Net realized gains on investments | | | (489,933 | ) | | | (169,694 | ) | | | (327,494 | ) | | | (58,885 | ) | | |
| | | | | | | | | | | | | | | | | | |
Change in net assets from shareholder distributions | | | (900,217 | ) | | | (311,165 | ) | | | (5,248,792 | ) | | | (1,796,882 | ) | | |
| | | | | | | | | | | | | | | | | | |
Change in net assets from capital transactions | | | 14,350,775 | | | | 3,757,800 | | | | 11,287,780 | | | | 12,859,182 | | | |
| | | | | | | | | | | | | | | | | | |
Change in net assets | | | 19,771,711 | | | | 3,551,178 | | | | 19,720,963 | | | | 18,977,820 | | | |
| | | | | |
Net Assets: | | | | | | | | | | | | | | | | | | |
Beginning of period | | | 10,276,064 | | | | 6,724,886 | | | | 41,967,032 | | | | 22,989,212 | | | |
| | | | | | | | | | | | | | | | | | |
End of period | | $ | 30,047,775 | | | $ | 10,276,064 | | | $ | 61,687,995 | | | $ | 41,967,032 | | | |
| | | | | | | | | | | | | | | | | | |
| | | | | |
Accumulated net investment income (loss) at end of period | | $ | 32,334 | | | $ | 13,173 | | | $ | — | | | $ | 79 | | | |
| | | | | | | | | | | | | | | | | | |
| | | | | | | | | | | | | | | | | | |
| | | | | | | | | | | | | | | | | | | |
See notes to financial statements.
Statements of Changes in Net Assets
| | | | | | | | | | |
| | | Gartmore International Growth Fund |
| | | Year Ended
October 31, 2006 | | | Year Ended
October 31, 2005 |
FROM INVESTMENT ACTIVITIES: | | | | | | | | | | |
Operations: | | | | | | | | | | |
Net investment income (loss) | | $ | (57,024 | ) | | $ | 78,087 | | | |
Net realized gains (losses) on investment and foreign currency transactions | | | 3,224,619 | | | | 1,829,068 | | | |
Net change in unrealized appreciation/depreciation on investments and translation of assets and liabilities denominated in foreign currencies | | | 4,964,753 | | | | 492,604 | | | |
| | | | | | | | | | | |
Change in net assets resulting from operations | | | 8,132,348 | | | | 2,399,759 | | | |
| | | | | | | | | | | |
| | | |
Distributions to Class A Shareholders from: | | | | | | | | | | |
Net investment income | | | (30,322 | ) | | | (31,300 | ) | | |
Net realized gains on investments | | | — | | | | — | | | |
| | | |
Distributions to Class B Shareholders from: | | | | | | | | | | |
Net investment income | | | (4,223 | ) | | | (19,754 | ) | | |
Net realized gains on investments | | | — | | | | — | | | |
| | | |
Distributions to Class C Shareholders from: | | | | | | | | | | |
Net investment income | | | (1,001 | ) | | | (735 | ) | | |
Net realized gains on investments | | | — | | | | — | | | |
| | | |
Distributions to Class R Shareholders from: | | | | | | | | | | |
Net investment income | | | (4 | ) | | | (11 | ) | | |
Net realized gains on investments | | | — | | | | — | | | |
| | | |
Distributions to Institutional Service Class Shareholders from: | | | | | | | | | | |
Net investment income | | | (17,521 | ) | | | (32,202 | ) | | |
Net realized gains on investments | | | — | | | | — | | | |
| | | |
Distributions to Institutional Class Shareholders from: | | | | | | | | | | |
Net investment income | | | (9,694 | ) | | | (6,631 | ) | | |
Net realized gains on investments | | | — | | | | — | | | |
| | | | | | | | | | | |
Change in net assets from shareholder distributions | | | (62,765 | ) | | | (90,633 | ) | | |
| | | | | | | | | | | |
Change in net assets from capital transactions | | | 26,050,671 | | | | 5,343,666 | | | |
| | | | | | | | | | | |
Change in net assets | | | 34,120,254 | | | | 7,652,792 | | | |
| | | |
Net Assets: | | | | | | | | | | |
Beginning of period | | | 16,374,750 | | | | 8,721,958 | | | |
| | | | | | | | | | | |
End of period | | $ | 50,495,004 | | | $ | 16,374,750 | | | |
| | | | | | | | | | | |
| | | |
Accumulated net investment income (loss) at end of period | | $ | 29,654 | | | $ | (2,346 | ) | | |
| | | | | | | | | | | |
| | | | | | | | | | | |
| | | | | | | | | | | |
| | | | | | | | | | | |
| | | | | | | | | | | |
| | | | | | | | | | | |
| | | | | | | | | | | |
See notes to financial statements.
Statements of Changes in Net Assets (Continued)
| | | | | | | | | | | | | | | | | | | | | | | | | | |
| | | Gartmore China Opportunities Fund | | | Gartmore Emerging Markets Fund | | | Gartmore International Growth Fund |
| | | Year Ended
October 31, 2006 | | | Year Ended
October 31, 2005 | | | Year Ended
October 31, 2006 | | | Year Ended
October 31, 2005 | | | Year Ended
October 31, 2006 | | | Year Ended
October 31, 2005 | | | |
CAPITAL TRANSACTIONS: | | | | | | | | | | | | | | | | | | | | | | | | | | |
Class A Shares | | | | | | | | | | | | | | | | | | | | | | | | | | |
Proceeds from shares issued | | $ | 11,829,177 | | | $ | 2,394,876 | | | $ | 29,684,205 | | | $ | 15,138,571 | | | $ | 25,071,033 | | | $ | 4,744,441 | | | |
Dividends reinvested | | | 182,052 | | | | 46,813 | | | | 2,277,560 | | | | 821,320 | | | | 24,151 | | | | 29,882 | | | |
Cost of shares redeemed (a) | | | (2,274,885 | ) | | | (517,891 | ) | | | (24,413,966 | ) | | | (10,965,121 | ) | | | (10,369,776 | ) | | | (713,183 | ) | | |
| | | | | | | | | | | | | | | | | | | | | | | | | | | |
| | | | 9,736,344 | | | | 1,923,798 | | | | 7,547,799 | | | | 4,994,770 | | | | 14,725,408 | | | | 4,061,140 | | | |
| | | | | | | | | | | | | | | | | | | | | | | | | | | |
| | | | | | | |
Class B Shares | | | | | | | | | | | | | | | | | | | | | | | | | | |
Proceeds from shares issued | | | 888,040 | | | | 356,379 | | | | 1,316,483 | | | | 480,941 | | | | 1,337,420 | | | | 100,394 | | | |
Dividends reinvested | | | 23,088 | | | | 3,448 | | | | 406,539 | | | | 179,085 | | | | 4,144 | | | | 19,435 | | | |
Cost of shares redeemed (a) | | | (209,763 | ) | | | (46,127 | ) | | | (631,039 | ) | | | (153,766 | ) | | | (120,928 | ) | | | (22,369 | ) | | |
| | | | | | | | | | | | | | | | | | | | | | | | | | | |
| | | | 701,365 | | | | 313,700 | | | | 1,091,983 | | | | 506,260 | | | | 1,220,636 | | | | 97,460 | | | |
| | | | | | | | | | | | | | | | | | | | | | | | | | | |
| | | | | | | |
Class C Shares | | | | | | | | | | | | | | | | | | | | | | | | | | |
Proceeds from shares issued | | | 4,408,219 | | | | 1,477,604 | | | | 4,556,324 | | | | 2,053,869 | | | | 9,260,123 | | | | 178,420 | | | |
Dividends reinvested | | | 45,437 | | | | 11,784 | | | | 123,976 | | | | 52,700 | | | | 574 | | | | 204 | | | |
Cost of shares redeemed (a) | | | (1,193,167 | ) | | | (189,410 | ) | | | (2,207,232 | ) | | | (582,201 | ) | | | (817,995 | ) | | | (46,799 | ) | | |
| | | | | | | | | | | | | | | | | | | | | | | | | | | |
| | | | 3,260,489 | | | | 1,299,978 | | | | 2,473,068 | | | | 1,524,368 | | | | 8,442,702 | | | | 131,825 | | | |
| | | | | | | | | | | | | | | | | | | | | | | | | | | |
| | | | | | | |
Class R Shares | | | | | | | | | | | | | | | | | | | | | | | | | | |
Proceeds from shares issued | | | 15,210 | | | | 245 | | | | 519,475 | | | | 7,959 | | | | 201 | | | | — | | | |
Dividends reinvested | | | 101 | | | | 40 | | | | 165 | | | | 80 | | | | 4 | | | | 11 | | | |
Cost of shares redeemed (a) | | | (9,124 | ) | | | (235 | ) | | | (108,013 | ) | | | — | | | | (202 | ) | | | — | | | |
| | | | | | | | | | | | | | | | | | | | | | | | | | | |
| | | | 6,187 | | | | 50 | | | | 411,627 | | | | 8,039 | | | | 3 | | | | 11 | | | |
| | | | | | | | | | | | | | | | | | | | | | | | | | | |
| | | | | | | |
Institutional Service Class Shares | | | | | | | | | | | | | | | | | | | | | | | | | | |
Proceeds from shares issued | | | 114,230 | | | | — | | | | 2,442 | | | | 3,589,734 | | | | 3,186 | | | | 235 | | | |
Dividends reinvested | | | 262 | | | | 43 | | | | 1,001,732 | | | | 308,864 | | | | 17,521 | | | | 32,201 | | | |
Cost of shares redeemed (a) | | | (29 | ) | | | — | | | | (8,049,749 | ) | | | (116,941 | ) | | | (171 | ) | | | (13 | ) | | |
| | | | | | | | | | | | | | | | | | | | | | | | | | | |
| | | | 114,463 | | | | 43 | | | | (7,045,575 | ) | | | 3,781,657 | | | | 20,536 | | | | 32,423 | | | |
| | | | | | | | | | | | | | | | | | | | | | | | | | | |
| | | | | | | |
Institutional Class Shares | | | | | | | | | | | | | | | | | | | | | | | | | | |
Proceeds from shares issued | | | 8,228 | | | | 1,972 | | | | 7,484,960 | | | | 2,730,614 | | | | 2,554,533 | | | | 1,460,894 | | | |
Dividends reinvested | | | 523,748 | | | | 219,153 | | | | 386,995 | | | | 71,261 | | | | 9,694 | | | | 6,631 | | | |
Cost of shares redeemed (a) | | | (49 | ) | | | (894 | ) | | | (1,063,077 | ) | | | (757,787 | ) | | | (922,841 | ) | | | (446,718 | ) | | |
| | | | | | | | | | | | | | | | | | | | | | | | | | | |
| | | | 531,927 | | | | 220,231 | | | | 6,808,878 | | | | 2,044,088 | | | | 1,641,386 | | | | 1,020,807 | | | |
| | | | | | | | | | | | | | | | | | | | | | | | | | | |
Change in net assets from capital transactions | | $ | 14,350,775 | | | $ | 3,757,800 | | | $ | 11,287,780 | | | $ | 12,859,182 | | | $ | 26,050,671 | | | $ | 5,343,666 | | | |
| | | | | | | | | | | | | | | | | | | | | | | | | | | |
| (a) | Amount includes redemption fees, if any. |
See notes to financial statements.
Statements of Changes in Net Assets
| | | | | | | | | | | | | | | | | | | | |
| | | Gartmore China Opportunities Fund | | | Gartmore Emerging Markets Fund | | | Gartmore International Growth Fund |
| | | Year Ended
October 31, 2006 | | | Year Ended
October 31, 2005 | | | Year Ended
October 31, 2006 | | | Year Ended
October 31, 2005 | | | Year Ended
October 31, 2006 | | | Year Ended
October 31, 2005 | | | |
SHARE TRANSACTIONS: | | | | | | | | | | | | | | | | | | | | |
Class A Shares | | | | | | | | | | | | | | | | | | | | |
Issued | | 808,649 | | | 200,989 | | | 1,743,733 | | | 1,101,653 | | | 2,088,339 | | | 506,034 | | | |
Reinvested | | 15,766 | | | 3,943 | | | 149,612 | | | 64,514 | | | 2,175 | | | 3,473 | | | |
Redeemed | | (165,077 | ) | | (43,439 | ) | | (1,458,588 | ) | | (822,792 | ) | | (924,966 | ) | | (83,344 | ) | | |
| | | | | | | | | | | | | | | | | | | | | |
| | | 659,338 | | | 161,493 | | | 434,757 | | | 343,375 | | | 1,165,548 | | | 426,163 | | | |
| | | | | | | | | | | | | | | | | | | | | |
| | | | | | | |
Class B Shares | | | | | | | | | | | | | | | | | | | | |
Issued | | 61,736 | | | 30,068 | | | 81,142 | | | 35,794 | | | 112,108 | | | 12,012 | | | |
Reinvested | | 2,036 | | | 291 | | | 27,723 | | | 14,516 | | | 391 | | | 2,333 | | | |
Redeemed | | (14,879 | ) | | (3,913 | ) | | (40,041 | ) | | (11,697 | ) | | (10,618 | ) | | (2,680 | ) | | |
| | | | | | | | | | | | | | | | | | | | | |
| | | 48,893 | | | 26,446 | | | 68,824 | | | 38,613 | | | 101,881 | | | 11,665 | | | |
| | | | | | | | | | | | | | | | | | | | | |
| | | | | | | |
Class C Shares | | | | | | | | | | | | | | | | | | | | |
Issued | | 307,310 | | | 124,492 | | | 272,823 | | | 150,512 | | | 782,252 | | | 19,844 | | | |
Reinvested | | 3,998 | | | 994 | | | 8,322 | | | 4,211 | | | 54 | | | 24 | | | |
Redeemed | | (89,411 | ) | | (16,502 | ) | | (132,707 | ) | | (44,446 | ) | | (69,457 | ) | | (5,614 | ) | | |
| | | | | | | | | | | | | | | | | | | | | |
| | | 221,897 | | | 108,984 | | | 148,438 | | | 110,277 | | | 712,849 | | | 14,254 | | | |
| | | | | | | | | | | | | | | | | | | | | |
| | | | | | | |
Class R Shares | | | | | | | | | | | | | | | | | | | | |
Issued | | 995 | | | 21 | | | 32,349 | | | 542 | | | 17 | | | — | | | |
Reinvested | | 9 | | | 3 | | | 11 | | | 7 | | | — | (b) | | 1 | | | |
Redeemed | | (674 | ) | | (20 | ) | | (6,671 | ) | | — | | | (17 | ) | | — | | | |
| | | | | | | | | | | | | | | | | | | | | |
| | | 330 | | | 4 | | | 25,689 | | | 549 | | | — | (b) | | 1 | | | |
| | | | | | | | | | | | | | | | | | | | | |
| | | | | | | |
Institutional Service Class Shares | | | | | | | | | | | | | | | | | | | | |
Issued | | 7,445 | | | — | | | — | (b) | | 275,886 | | | 83 | | | — | | | |
Reinvested | | 21 | | | 4 | | | 64,741 | | | 23,727 | | | 1,560 | | | 3,702 | | | |
Redeemed | | (2 | ) | | — | | | (487,136 | ) | | (8,771 | ) | | — | (b) | | — | | | |
| | | | | | | | | | | | | | | | | | | | | |
| | | 7,464 | | | 4 | | | (422,395 | ) | | 290,842 | | | 1,643 | | | 3,702 | | | |
| | | | | | | | | | | | | | | | | | | | | |
| | | | | | | |
Institutional Class Shares | | | | | | | | | | | | | | | | | | | | |
Issued | | 72 | | | — | | | 438,109 | | | 200,450 | | | 213,974 | | | 159,844 | | | |
Reinvested | | 45,631 | | | 18,432 | | | 24,868 | | | 5,453 | | | 860 | | | 759 | | | |
Redeemed | | — | (b) | | — | | | (63,861 | ) | | (51,111 | ) | | (78,547 | ) | | (44,689 | ) | | |
| | | | | | | | | | | | | | | | | | | | | |
| | | 45,703 | | | 18,432 | | | 399,116 | | | 154,792 | | | 136,287 | | | 115,914 | | | |
| | | | | | | | | | | | | | | | | | | | | |
Total change in shares | | 983,625 | | | 315,363 | | | 654,429 | | | 938,448 | | | 2,118,208 | | | 571,699 | | | |
| | | | | | | | | | | | | | | | | | | | | |
| (b) | Amount less than 1 share. |
See notes to financial statements.
Financial Highlights
Selected Data for Each Share of Capital Outstanding
Gartmore China Opportunities Fund
| | | | | | | | | | | | | | | | | | | | | | | | | | | | | | | | | | | | | | | | | | | | |
| | | | | Investment Activities | | Distributions | | | | | | Ratios/Supplemental Data |
| | | Net Asset
Value,
Beginning
of Period | | Net
Investment
Income
(Loss) | | | Net Realized
and
Unrealized
Gains
(Losses) on
Investments | | Total
from
Investment
Activities | | Net
Investment
Income | | | Net
Realized
Gains | | | Total
Distributions | | | Redemption
Fees | | Net
Asset
Value, End
of Period | | Total
Return (a) | | | Net Assets
at End of
Period
(000s) | | Ratio of
Expenses
to Average
Net Assets | | | Ratio of Net
Investment
Income
(Loss)
to Average
Net Assets | | | Ratio of
Expenses
(Prior to
Reimbursements)
to Average
Net Assets (b) | | | Ratio of Net
Investment
Income (Loss)
(Prior to
Reimbursements)
to Average
Net Assets (b) | | | Portfolio
Turnover (c) |
| | | | | | | | | | | | | | | | |
Class A Shares | | | | | | | | | | | | | | | | | | | | | | | | | | | | | | | | | | | | | | | | | | | | |
Period Ended October 31, 2004 (d) | | $ | 10.00 | | 0.01 | | | 1.25 | | 1.26 | | (0.02 | ) | | — | | | (0.02 | ) | | — | | $ | 11.24 | | 12.61% | (e) | | $ | 1,029 | | 1.95% | (f) | | 0.37% | (f) | | 5.57% | (f) | | (3.25% | )(f) | | 50.76% |
Year Ended October 31, 2005 | | $ | 11.24 | | 0.09 | | | 0.33 | | 0.42 | | (0.07 | ) | | (0.34 | ) | | (0.41 | ) | | — | | $ | 11.25 | | 3.58% | | | $ | 2,847 | | 2.01% | | | 0.95% | | | 2.68% | | | 0.28% | | | 130.48% |
Year Ended October 31, 2006 | | $ | 11.25 | | 0.05 | | | 5.54 | | 5.59 | | (0.05 | ) | | (0.94 | ) | | (0.99 | ) | | 0.01 | | $ | 15.86 | | 53.19% | | | $ | 14,470 | | 1.99% | | | 0.44% | | | 2.10% | | | 0.33% | | | 124.36% |
| | | | | | | | | | | | | | | | |
Class B Shares | | | | | | | | | | | | | | | | | | | | | | | | | | | | | | | | | | | | | | | | | | | | |
Period Ended October 31, 2004 (d) | | $ | 10.00 | | 0.01 | | | 1.23 | | 1.24 | | (0.01 | ) | | — | | | (0.01 | ) | | — | | $ | 11.23 | | 12.38% | (e) | | $ | 19 | | 2.65% | (f) | | (0.14% | )(f) | | 6.09% | (f) | | (3.57% | )(f) | | 50.76% |
Year Ended October 31, 2005 | | $ | 11.23 | | 0.03 | | | 0.31 | | 0.34 | | (0.04 | ) | | (0.34 | ) | | (0.38 | ) | | — | | $ | 11.19 | | 2.82% | | | $ | 315 | | 2.74% | | | 0.33% | | | 3.41% | | | (0.34% | ) | | 130.48% |
Year Ended October 31, 2006 | | $ | 11.19 | | (0.04 | ) | | 5.49 | | 5.45 | | (0.01 | ) | | (0.94 | ) | | (0.95 | ) | | 0.01 | | $ | 15.70 | | 52.07% | | | $ | 1,210 | | 2.73% | | | (0.47% | ) | | 2.85% | | | (0.59% | ) | | 124.36% |
| | | | | | | | | | | | | | | | |
Class C Shares | | | | | | | | | | | | | | | | | | | | | | | | | | | | | | | | | | | | | | | | | | | | |
Period Ended October 31, 2004 (d) | | $ | 10.00 | | (0.01 | ) | | 1.24 | | 1.23 | | — | | | — | | | — | | | — | | $ | 11.23 | | 12.30% | (e) | | $ | 38 | | 2.65% | (f) | | (1.42% | )(f) | | 6.93% | (f) | | (5.69% | )(f) | | 50.76% |
Year Ended October 31, 2005 | | $ | 11.23 | | 0.02 | | | 0.31 | | 0.33 | | (0.03 | ) | | (0.34 | ) | | (0.37 | ) | | — | | $ | 11.19 | | 2.79% | | | $ | 1,258 | | 2.73% | | | 0.24% | | | 3.42% | | | (0.45% | ) | | 130.48% |
Year Ended October 31, 2006 | | $ | 11.19 | | (0.03 | ) | | 5.48 | | 5.45 | | (0.01 | ) | | (0.94 | ) | | (0.95 | ) | | 0.01 | | $ | 15.70 | | 52.11% | | | $ | 5,247 | | 2.73% | | | (0.25% | ) | | 2.85% | | | (0.37% | ) | | 124.36% |
| | | | | | | | | | | | | | | | |
Class R Shares | | | | | | | | | | | | | | | | | | | | | | | | | | | | | | | | | | | | | | | | | | | | |
Period Ended October 31, 2004 (d) | | $ | 10.00 | | 0.01 | | | 1.24 | | 1.25 | | (0.01 | ) | | — | | | (0.01 | ) | | — | | $ | 11.24 | | 12.46% | (e) | | $ | 1 | | 2.40% | (f) | | (0.18% | )(f) | | 4.86% | (f) | | (2.64% | )(f) | | 50.76% |
Year Ended October 31, 2005 | | $ | 11.24 | | 0.06 | | | 0.33 | | 0.39 | | (0.06 | ) | | (0.34 | ) | | (0.40 | ) | | — | | $ | 11.23 | | 3.29% | | | $ | 1 | | 2.22% | | | 0.49% | | | 2.87% | | | (0.16% | ) | | 130.48% |
Year Ended October 31, 2006 | | $ | 11.23 | | 0.08 | | | 5.44 | | 5.52 | | (0.03 | ) | | (0.94 | ) | | (0.97 | ) | | 0.01 | | $ | 15.79 | | 52.68% | | | $ | 7 | | 2.28% | | | 0.68% | | | 2.36% | | | 0.61% | | | 124.36% |
| | | | | | | | | | | | | | | | |
Institutional Service Class Shares | | | | | | | | | | | | | | | | | | | | | | | | | | | | | | | | | | | | | | | | | | | | |
Period Ended October 31, 2004 (d) | | $ | 10.00 | | 0.02 | | | 1.25 | | 1.27 | | (0.02 | ) | | — | | | (0.02 | ) | | — | | $ | 11.25 | | 12.74% | (e) | | $ | 1 | | 1.70% | (f) | | 0.51% | (f) | | 3.97% | (f) | | (1.75% | )(f) | | 50.76% |
Year Ended October 31, 2005 | | $ | 11.25 | | 0.09 | | | 0.34 | | 0.43 | | (0.09 | ) | | (0.34 | ) | | (0.43 | ) | | — | | $ | 11.25 | | 3.63% | | | $ | 1 | | 1.82% | | | 0.84% | | | 2.48% | | | 0.18% | | | 130.48% |
Year Ended October 31, 2006 | | $ | 11.25 | | 0.11 | | | 5.51 | | 5.62 | | (0.06 | ) | | (0.94 | ) | | (1.00 | ) | | 0.01 | | $ | 15.88 | | 53.57% | | | $ | 120 | | 1.72% | | | 1.34% | | | 1.81% | | | 1.25% | | | 124.36% |
| | | | | | | | | | | | | | | | |
Institutional Class Shares | | | | | | | | | | | | | | | | | | | | | | | | | | | | | | | | | | | | | | | | | | | | |
Period Ended October 31, 2004 (d) | | $ | 10.00 | | 0.02 | | | 1.25 | | 1.27 | | (0.02 | ) | | — | | | (0.02 | ) | | — | | $ | 11.25 | | 12.74% | (e) | | $ | 5,637 | | 1.65% | (f) | | 0.59% | (f) | | 4.17% | (f) | | (1.93% | )(f) | | 50.76% |
Year Ended October 31, 2005 | | $ | 11.25 | | 0.12 | | | 0.34 | | 0.46 | | (0.10 | ) | | (0.34 | ) | | (0.44 | ) | | — | | $ | 11.27 | | 3.86% | | | $ | 5,854 | | 1.72% | | | 0.98% | | | 2.41% | | | 0.29% | | | 130.48% |
Year Ended October 31, 2006 | | $ | 11.27 | | 0.05 | | | 5.58 | | 5.63 | | (0.06 | ) | | (0.94 | ) | | (1.00 | ) | | 0.01 | | $ | 15.91 | | 53.57% | | | $ | 8,994 | | 1.74% | | | 0.31% | | | 1.88% | | | 0.17% | | | 124.36% |
| | | | | | | | | | | | | | | | | | | | | | | | | | | | | | | | | | | | | | | | | | | | |
| | | | | | | | | | | | | | | | | | | | | | | | | | | | | | | | | | | | | | | | | | | | |
| | | | | | | | | | | | | | | | | | | | | | | | | | | | | | | | | | | | | | | | | | | | |
| | | | | | | | | | | | | | | | | | | | | | | | | | | | | | | | | | | | | | | | | | | | |
| | | | | | | | | | | | | | | | | | | | | | | | | | | | | | | | | | | | | | | | | | | | |
| | | | | | | | | | | | | | | | | | | | | | | | | | | | | | | | | | | | | | | | | | | | |
| | | | | | | | | | | | | | | | | | | | | | | | | | | | | | | | | | | | | | | | | | | | |
| | | | | | | | | | | | | | | | | | | | | | | | | | | | | | | | | | | | | | | | | | | | | |
|
(a) Excludes sales charge. |
(b) During the period certain fees were waived and/or reimbursed. If such waivers/reimbursements had not occurred, the ratios would have been as indicated. |
(c) Portfolio turnover is calculated on the basis of the Fund as a whole without distinguishing among the classes of shares. |
(d) For period from June 29, 2004 (commencement of operations) through October 31, 2004. |
(e) Not annualized. |
(f) Annualized. |
See notes to financial statements.
Financial Highlights
Selected Data for Each Share of Capital Outstanding
Gartmore Emerging Markets Fund
| | | | | | | | | | | | | | | | | | | | | | | | | | | | | | | | | | | | | | | | | | | | |
| | | | | Investment Activities | | Distributions | | | | | | Ratios/Supplemental Data |
| | | Net Asset
Value,
Beginning
of Period | | Net
Investment
Income
(Loss) | | | Net Realized
and
Unrealized
Gains
(Losses) on
Investments | | Total
from
Investment
Activities | | Net
Investment
Income | | | Net
Realized
Gains | | | Total
Distributions | | | Redemption
Fees | | Net Asset
Value, End
of Period | | Total
Return (a) | | | Net Assets
at End of
Period
(000s) | | Ratio of
Expenses
to Average
Net Assets | | | Ratio of Net
Investment
Income (Loss) to Average
Net Assets | | | Ratio of
Expenses
(Prior to
Reimbursements)
to Average
Net Assets (b) | | | Ratio of Net
Investment
Income (Loss)
(Prior to
Reimbursements)
to Average
Net Assets (b) | | | Portfolio
Turnover (c) |
| | | | | | | | | | | | | | | | |
Class A Shares | | | | | | | | | | | | | | | | | | | | | | | | | | | | | | | | | | | | | | | | | | | | |
Year Ended October 31, 2002 | | $ | 5.98 | | (0.03 | ) | | 0.85 | | 0.82 | | — | | | — | | | — | | | — | | $ | 6.80 | | 13.71% | | | $ | 1,996 | | 2.01% | | | (0.49% | ) | | 2.41% | | | (0.89% | ) | | 57.86% |
Year Ended October 31, 2003 | | $ | 6.80 | | 0.03 | | | 3.71 | | 3.74 | | — | | | — | | | — | | | — | | $ | 10.54 | | 55.00% | | | $ | 9,070 | | 1.88% | | | 0.61% | | | 2.45% | | | 0.05% | | | 146.04% |
Year Ended October 31, 2004 | | $ | 10.54 | | 0.05 | | | 1.70 | | 1.75 | | (0.05 | ) | | — | | | (0.05 | ) | | 0.03 | | $ | 12.27 | | 16.97% | | | $ | 13,898 | | 1.88% | | | 0.41% | | | 1.99% | | | 0.31% | | | 134.11% |
Year Ended October 31, 2005 | | $ | 12.27 | | 0.08 | | | 3.47 | | 3.55 | | (0.05 | ) | | (0.85 | ) | | (0.90 | ) | | — | | $ | 14.92 | | 30.02% | | | $ | 22,009 | | 1.84% | | | 0.55% | | | | (h) | | | (h) | | 135.40% |
Year Ended October 31, 2006 | | $ | 14.92 | | 0.10 | | | 4.49 | | 4.59 | | (0.10 | ) | | (1.59 | ) | | (1.69 | ) | | — | | $ | 17.82 | | 32.89% | | | $ | 34,047 | | 1.65% | | | 0.60% | | | 1.66% | | | 0.59% | | | 141.70% |
| | | | | | | | | | | | | | | | |
Class B Shares | | | | | | | | | | | | | | | | | | | | | | | | | | | | | | | | | | | | | | | | | | | | |
Year Ended October 31, 2002 | | $ | 5.94 | | (0.08 | ) | | 0.85 | | 0.77 | | — | | | — | | | — | | | — | | $ | 6.71 | | 12.96% | | | $ | 1,443 | | 2.71% | | | (1.18% | ) | | 3.22% | | | (1.69% | ) | | 57.86% |
Year Ended October 31, 2003 | | $ | 6.71 | | — | | | 3.62 | | 3.62 | | — | | | — | | | — | | | — | | $ | 10.33 | | 53.95% | | | $ | 2,010 | | 2.55% | | | 0.07% | | | 3.18% | | | (0.56% | ) | | 146.04% |
Year Ended October 31, 2004 | | $ | 10.33 | | (0.03 | ) | | 1.67 | | 1.64 | | (0.02 | ) | | — | | | (0.02 | ) | | 0.03 | | $ | 11.98 | | 16.14% | | | $ | 2,900 | | 2.55% | | | (0.27% | ) | | 2.65% | | | (0.37% | ) | | 134.11% |
Year Ended October 31, 2005 | | $ | 11.98 | | (0.01 | ) | | 3.37 | | 3.36 | | (0.01 | ) | | (0.85 | ) | | (0.86 | ) | | — | | $ | 14.48 | | 29.30% | | | $ | 4,062 | | 2.52% | | | (0.11% | ) | | | (h) | | | (h) | | 135.40% |
Year Ended October 31, 2006 | | $ | 14.48 | | (0.01 | ) | | 4.35 | | 4.34 | | (0.02 | ) | | (1.59 | ) | | (1.61 | ) | | — | | $ | 17.21 | | 31.97% | | | $ | 6,013 | | 2.31% | | | (0.08% | ) | | 2.32% | | | (0.09% | ) | | 141.70% |
| | | | | | | | | | | | | | | | |
Class C Shares | | | | | | | | | | | | | | | | | | | | | | | | | | | | | | | | | | | | | | | | | | | | |
Year Ended October 31, 2002 | | $ | 6.02 | | (0.08 | ) | | 0.86 | | 0.78 | | — | | | — | | | — | | | — | | $ | 6.80 | | 12.96% | | | $ | 15 | | 2.72% | | | (1.12% | ) | | 3.28% | | | (1.68% | ) | | 57.86% |
Year Ended October 31, 2003 | | $ | 6.80 | | — | | | 3.67 | | 3.67 | | — | | | — | | | — | | | — | | $ | 10.47 | | 53.97% | | | $ | 1,398 | | 2.55% | | | (0.12% | ) | | 2.95% | | | (0.52% | ) | | 146.04% |
Year Ended October 31, 2004 | | $ | 10.47 | | (0.02 | ) | | 1.68 | | 1.66 | | (0.02 | ) | | — | | | (0.02 | ) | | 0.03 | | $ | 12.14 | | 16.21% | | | $ | 2,217 | | 2.55% | | | (0.16% | ) | | 2.64% | | | (0.25% | ) | | 134.11% |
Year Ended October 31, 2005 | | $ | 12.14 | | (0.01 | ) | | 3.42 | | 3.41 | | (0.01 | ) | | (0.85 | ) | | (0.86 | ) | | — | | $ | 14.69 | | 29.20% | | | $ | 4,302 | | 2.51% | | | (0.11% | ) | | | (h) | | | (h) | | 135.40% |
Year Ended October 31, 2006 | | $ | 14.69 | | (0.01 | ) | | 4.42 | | 4.41 | | (0.02 | ) | | (1.59 | ) | | (1.61 | ) | | — | | $ | 17.49 | | 31.92% | | | $ | 7,716 | | 2.31% | | | (0.07% | ) | | 2.32% | | | (0.08% | ) | | 141.70% |
| | | | | | | | | | | | | | | | |
Class R Shares | | | | | | | | | | | | | | | | | | | | | | | | | | | | | | | | | | | | | | | | | | | | |
Period Ended October 31, 2004 (d) | | $ | 11.20 | | 0.03 | | | 0.78 | | 0.81 | | (0.03 | ) | | — | | | (0.03 | ) | | 0.03 | | $ | 12.01 | | 7.50% | (f) | | $ | 1 | | 2.15% | (g) | | 0.26% | (g) | | 2.28% | (g) | | 0.13% | (g) | | 134.11% |
Year Ended October 31, 2005 | | $ | 12.01 | | 0.04 | | | 3.41 | | 3.45 | | (0.04 | ) | | (0.85 | ) | | (0.89 | ) | | — | | $ | 14.57 | | 30.11% | | | $ | 9 | | 1.82% | | | 0.16% | | | | (h) | | | (h) | | 135.40% |
Year Ended October 31, 2006 | | $ | 14.57 | | 0.05 | | | 4.40 | | 4.45 | | (0.11 | ) | | (1.59 | ) | | (1.70 | ) | | — | | $ | 17.32 | | 32.65% | | | $ | 456 | | 1.84% | | | (0.01% | ) | | 1.94% | | | (0.11% | ) | | 141.70% |
| | | | | | | | | | | | | | | | |
Institutional Service Class Shares | | | | | | | | | | | | | | | | | | | | | | | | | | | | | | | | | | | | | | | | | | | | |
Year Ended October 31, 2002 | | $ | 6.01 | | (0.02 | ) | | 0.87 | | 0.85 | | — | | | — | | | — | | | — | | $ | 6.86 | | 14.14% | | | $ | 1,145 | | 1.73% | | | (0.21% | ) | | 2.24% | | | (0.72% | ) | | 57.86% |
Year Ended October 31, 2003 | | $ | 6.86 | | 0.08 | | | 3.72 | | 3.80 | | — | | | — | | | — | | | — | | $ | 10.66 | | 55.39% | | | $ | 1,781 | | 1.55% | | | 1.07% | | | 2.18% | | | 0.44% | | | 146.04% |
Year Ended October 31, 2004 | | $ | 10.66 | | 0.09 | | | 1.72 | | 1.81 | | (0.07 | ) | | — | | | (0.07 | ) | | 0.03 | | $ | 12.43 | | 17.25% | | | $ | 3,737 | | 1.55% | | | 0.81% | | | 1.66% | | | 0.70% | | | 134.11% |
Year Ended October 31, 2005 | | $ | 12.43 | | 0.10 | | | 3.54 | | 3.64 | | (0.08 | ) | | (0.85 | ) | | (0.93 | ) | | — | | $ | 15.14 | | 30.60% | | | $ | 8,954 | | 1.50% | | | 0.83% | | | | (h) | | | (h) | | 135.40% |
Year Ended October 31, 2006 (i) | | $ | 15.14 | | 0.17 | | | 4.56 | | 4.73 | | (0.14 | ) | | (1.59 | ) | | (1.73 | ) | | — | | $ | 18.14 | | 33.25% | | | $ | 3,066 | | 1.34% | | | 1.01% | | | 1.34% | | | 1.00% | | | 141.70% |
| | | | | | | | | | | | | | | | |
Institutional Class Shares | | | | | | | | | | | | | | | | | | | | | | | | | | | | | | | | | | | | | | | | | | | | |
Period Ended October 31, 2004 (e) | | $ | 11.26 | | 0.03 | | | 1.15 | | 1.18 | | (0.04 | ) | | — | | | (0.04 | ) | | 0.03 | | $ | 12.43 | | 10.79% | (f) | | $ | 236 | | 1.55% | (g) | | 0.81% | (g) | | 1.71% | (g) | | 0.65% | (g) | | 134.11% |
Year Ended October 31, 2005 | | $ | 12.43 | | 0.11 | | | 3.53 | | 3.64 | | (0.08 | ) | | (0.85 | ) | | (0.93 | ) | | — | | $ | 15.14 | | 30.60% | | | $ | 2,631 | | 1.49% | | | 0.92% | | | | (h) | | | (h) | | 135.40% |
Year Ended October 31, 2006 | | $ | 15.14 | | 0.13 | | | 4.60 | | 4.73 | | (0.14 | ) | | (1.59 | ) | | (1.73 | ) | | — | | $ | 18.14 | | 33.32% | | | $ | 10,390 | | 1.30% | | | 0.88% | | | 1.33% | | | 0.85% | | | 141.70% |
| (a) | Excludes sales charge. |
| (b) | During the period certain fees were waived and/or reimbursed. If such waivers/reimbursements had not occurred, the ratios would have been as indicated. |
| (c) | Portfolio turnover is calculated on the basis of the Fund as a whole without distinguishing among the classes of shares. |
| (d) | For the period from December 30, 2003 (commencement of operations) through October 31, 2004. |
| (e) | For period from June 29, 2004 (commencement of operations) through October 31, 2004. |
| (h) | There were no fee reductions in this period. |
| (i) | Net investment income (loss) is based on average shares outstanding during the period. |
See notes to financial statements.
Financial Highlights
Selected Data for Each Share of Capital Outstanding
Gartmore International Growth Fund
| | | | | | | | | | | | | | | | | | | | | | | | | | | | | | | | | | | | | | | | | | | |
| | | | | Investment Activities | | | Dividends | | | | | | Ratios/Supplemental Data |
| | | Net Asset
Value,
Beginning
of Period | | Net
Investment
Income
(Loss) | | | Net Realized
and
Unrealized
Gains
(Losses) on
Investments | | | Total
from
Investment
Activities | | | Net
Investment
Income | | | Total
Distributions | | | Redemption
Fees | | Net
Asset
Value, End
of Period | | Total
Return (a) | | | Net Assets
at End of
Period
(000s) | | Ratio of
Expenses
to Average
Net Assets | | | Ratio of Net
Investment
Income
(Loss)
to Average
Net Assets | | | Ratio of
Expenses
(Prior to
Reimbursements)
to Average
Net Assets (b) | | | Ratio of Net
Investment
Income (Loss)
(Prior to
Reimbursements)
to Average
Net Assets (b) | | | Portfolio
Turnover (c) |
| | | | | | | | | | | | | | | |
Class A Shares | | | | | | | | | | | | | | | | | | | | | | | | | | | | | | | | | | | | | | | | | | | |
Year Ended October 31, 2002 | | $ | 6.19 | | 0.01 | | | (0.82 | ) | | (0.81 | ) | | — | | | — | | | — | | $ | 5.38 | | (13.09% | ) | | $ | 1,965 | | 1.76% | | | 0.20% | | | 2.10% | | | (0.14% | ) | | 226.70% |
Year Ended October 31, 2003 | | $ | 5.38 | | (0.01 | ) | | 1.58 | | | 1.57 | | | — | | | — | | | 0.03 | | $ | 6.98 | | 29.74% | | | $ | 2,592 | | 1.65% | | | 0.39% | | | 2.37% | | | (0.33% | ) | | 304.72% |
Year Ended October 31, 2004 | | $ | 6.98 | | 0.01 | | | 0.79 | | | 0.80 | | | — | | | — | | | 0.01 | | $ | 7.79 | | 11.60% | | | $ | 3,096 | | 1.65% | | | 0.06% | | | 2.10% | | | (0.38% | ) | | 262.09% |
Year Ended October 31, 2005 | | $ | 7.79 | | 0.08 | | | 1.90 | | | 1.98 | | | (0.08 | ) | | (0.08 | ) | | — | | $ | 9.69 | | 25.49% | | | $ | 7,980 | | 1.65% | | | 0.74% | | | 1.90% | | | 0.50% | | | 247.22% |
Year Ended October 31, 2006 | | $ | 9.69 | | 0.02 | | | 3.68 | | | 3.70 | | | (0.04 | ) | | (0.04 | ) | | — | | $ | 13.35 | | 38.22% | | | $ | 26,565 | | 1.69% | | | (0.04% | ) | | 1.70% | | | (0.05% | ) | | 175.91% |
| | | | | | | | | | | | | | | |
Class B Shares | | | | | | | | | | | | | | | | | | | | | | | | | | | | | | | | | | | | | | | | | | | |
Year Ended October 31, 2002 | | $ | 6.14 | | (0.03 | ) | | (0.81 | ) | | (0.84 | ) | | — | | | — | | | — | | $ | 5.30 | | (13.68% | ) | | $ | 1,840 | | 2.46% | | | (0.50% | ) | | 2.85% | | | (0.89% | ) | | 226.70% |
Year Ended October 31, 2003 | | $ | 5.30 | | (0.05 | ) | | 1.54 | | | 1.49 | | | — | | | — | | | 0.03 | | $ | 6.82 | | 28.68% | | | $ | 2,395 | | 2.40% | | | (0.36% | ) | | 3.12% | | | (1.08% | ) | | 304.72% |
Year Ended October 31, 2004 | | $ | 6.82 | | (0.05 | ) | | 0.78 | | | 0.73 | | | — | | | — | | | 0.01 | | $ | 7.56 | | 10.85% | | | $ | 2,695 | | 2.40% | | | (0.70% | ) | | 2.84% | | | (1.14% | ) | | 262.09% |
Year Ended October 31, 2005 | | $ | 7.56 | | 0.01 | | | 1.83 | | | 1.84 | | | (0.05 | ) | | (0.05 | ) | | — | | $ | 9.35 | | 24.49% | | | $ | 3,444 | | 2.40% | | | 0.12% | | | 2.81% | | | (0.30% | ) | | 247.22% |
Year Ended October 31, 2006 | | $ | 9.35 | | (0.08 | ) | | 3.57 | | | 3.49 | | | (0.01 | ) | | (0.01 | ) | | — | | $ | 12.83 | | 37.37% | | | $ | 6,031 | | 2.41% | | | (0.80% | ) | | 2.42% | | | (0.82% | ) | | 175.91% |
| | | | | | | | | | | | | | | |
Class C Shares | | | | | | | | | | | | | | | | | | | | | | | | | | | | | | | | | | | | | | | | | | | |
Year Ended October 31, 2002 | | $ | 6.17 | | (0.03 | ) | | (0.81 | ) | | (0.84 | ) | | — | | | — | | | — | | $ | 5.33 | | (13.61% | ) | | $ | 10 | | 2.46% | | | (0.53% | ) | | 2.95% | | | (1.02% | ) | | 226.70% |
Year Ended October 31, 2003 | | $ | 5.33 | | (0.05 | ) | | 1.55 | | | 1.50 | | | — | | | — | | | 0.03 | | $ | 6.86 | | 28.71% | | | $ | 16 | | 2.40% | | | (0.37% | ) | | 3.12% | | | (1.09% | ) | | 304.72% |
Year Ended October 31, 2004 | | $ | 6.86 | | (0.01 | ) | | 0.74 | | | 0.73 | | | — | | | — | | | 0.01 | | $ | 7.60 | | 10.79% | | | $ | 112 | | 2.40% | | | (0.23% | ) | | 2.87% | | | (0.70% | ) | | 262.09% |
Year Ended October 31, 2005 | | $ | 7.60 | | 0.03 | | | 1.82 | | | 1.85 | | | (0.05 | ) | | (0.05 | ) | | — | | $ | 9.40 | | 24.45% | | | $ | 272 | | 2.40% | | | 0.10% | | | 2.69% | | | (0.19% | ) | | 247.22% |
Year Ended October 31, 2006 | | $ | 9.40 | | (0.02 | ) | | 3.54 | | | 3.52 | | | (0.02 | ) | | (0.02 | ) | | — | | $ | 12.90 | | 37.49% | | | $ | 9,566 | | 2.40% | | | (0.62% | ) | | 2.40% | | | (0.62% | ) | | 175.91% |
| | | | | | | | | | | | | | | |
Class R Shares | | | | | | | | | | | | | | | | | | | | | | | | | | | | | | | | | | | | | | | | | | | |
Period Ended October 31, 2004 (d) | | $ | 7.25 | | 0.02 | | | 0.30 | | | 0.32 | | | — | | | — | | | 0.01 | | $ | 7.58 | | 4.55% | (f) | | $ | 1 | | 2.00% | (g) | | 0.31% | (g) | | 2.65% | (g) | | (0.33% | )(g) | | 262.09% |
Year Ended October 31, 2005 | | $ | 7.58 | | 0.07 | | | 1.86 | | | 1.93 | | | (0.10 | ) | | (0.10 | ) | | — | | $ | 9.41 | | 25.37% | | | $ | 1 | | 1.68% | | | 0.81% | | | 2.31% | | | 0.18% | | | 247.22% |
Year Ended October 31, 2006 | | $ | 9.41 | | (0.04 | ) | | 3.61 | | | 3.57 | | | (0.03 | ) | | (0.03 | ) | | — | | $ | 12.95 | | 38.01% | | | $ | 2 | | 1.94% | | | (0.38% | ) | | 1.96% | | | (0.39% | ) | | 175.91% |
| | | | | | | | | | | | | | | |
Institutional Service Class Shares | | | | | | | | | | | | | | | | | | | | | | | | | | | | | | | | | | | | | | | | | | | |
Year Ended October 31, 2002 | | $ | 6.22 | | 0.03 | | | (0.83 | ) | | (0.80 | ) | | — | | | — | | | — | | $ | 5.42 | | (12.86% | ) | | $ | 1,807 | | 1.48% | | | 0.48% | | | 1.85% | | | 0.11% | | | 226.70% |
Year Ended October 31, 2003 | | $ | 5.42 | | 0.01 | | | 1.59 | | | 1.60 | | | — | | | — | | | 0.03 | | $ | 7.05 | | 30.07% | | | $ | 2,350 | | 1.40% | | | 0.64% | | | 2.12% | | | (0.08% | ) | | 304.72% |
Year Ended October 31, 2004 | | $ | 7.05 | | 0.02 | | | 0.81 | | | 0.83 | | | — | | | — | | | 0.01 | | $ | 7.89 | | 11.91% | | | $ | 2,629 | | 1.40% | | | 0.30% | | | 1.84% | | | (0.14% | ) | | 262.09% |
Year Ended October 31, 2005 | | $ | 7.89 | | 0.11 | | | 1.91 | | | 2.02 | | | (0.10 | ) | | (0.10 | ) | | — | | $ | 9.81 | | 25.72% | | | $ | 3,306 | | 1.40% | | | 1.12% | | | 1.82% | | | 0.70% | | | 247.22% |
Year Ended October 31, 2006 | | $ | 9.81 | | 0.02 | | | 3.77 | | | 3.79 | | | (0.05 | ) | | (0.05 | ) | | — | | $ | 13.55 | | 38.76% | | | $ | 4,589 | | 1.41% | | | 0.17% | | | 1.42% | | | 0.15% | | | 175.91% |
| | | | | | | | | | | | | | | |
Institutional Class Shares | | | | | | | | | | | | | | | | | | | | | | | | | | | | | | | | | | | | | | | | | | | |
Period Ended October 31, 2004 (e) | | $ | 7.51 | | — | | | 0.37 | | | 0.37 | | | — | | | — | | | 0.01 | | $ | 7.89 | | 5.06% | (f) | | $ | 189 | | 1.40% | (g) | | 0.03% | (g) | | 1.94% | (g) | | (0.52% | )(g) | | 262.09% |
Year Ended October 31, 2005 | | $ | 7.89 | | 0.11 | | | 1.91 | | | 2.02 | | | (0.10 | ) | | (0.10 | ) | | — | | $ | 9.81 | | 25.72% | | | $ | 1,372 | | 1.40% | | | 1.11% | | | 1.61% | | | 0.90% | | | 247.22% |
Year Ended October 31, 2006 | | $ | 9.81 | | 0.03 | | | 3.76 | | | 3.79 | | | (0.05 | ) | | (0.05 | ) | | — | | $ | 13.55 | | 38.76% | | | $ | 3,742 | | 1.41% | | | 0.22% | | | 1.42% | | | 0.20% | | | 175.91% |
| | | | | | | | | | | | | | | | | | | | | | | | | | | | | | | | | | | | | | | | | | | | |
| | | | | | | | | | | | | | | | | | | | | | | | | | | | | | | | | | | | | | | | | | | | |
|
(a) Excludes sales charge. |
(b) During the period certain fees were waived and/or reimbursed. If such waivers/reimbursements had not occurred, the ratios would have been as indicated. |
(c) Portfolio turnover is calculated on the basis of the Fund as a whole without distinguishing among the classes of shares. |
(d) For the period from December 30, 2003 (commencement of operations) through October 31, 2004. |
(e) For period from June 29, 2004 (commencement of operations) through October 31, 2004. |
(f) Not annualized. |
(g) Annualized. |
See notes to financial statements.
Gartmore High Yield Bond Fund
For the annual period ended Oct. 31, 2006, the Gartmore High Yield Bond Fund (Class A at NAV) returned 9.83% versus 9.96% for its benchmark, the Citigroup High Yield Market Index. For broader comparison, the average return for the Fund’s Lipper peer category of High Current Yield Funds (consisting of 448 funds as of Oct. 31, 2006) was 9.18%.
The high-yield bond market benefited from a favorable backdrop that included strong corporate earnings growth, a low default rate, an expanding economy and benign inflation. As a result, the Fund was able to earn its average coupon rate while generating some capital gains as well. Despite further credit-tightening moves made by the Federal Reserve Board, both short-term and long-term interest rates remained low by historical standards. Another plus for the economy was declining energy prices in the final months of the reporting period. Initial estimates of third-quarter gross domestic product growth came in at a modest 1.6%, in part due to softness in the housing and auto industries. Consumers continued to spend, however, and corporate balance sheets remained solid.
The auto manufacturing industry was by far the largest detracting influence on the Fund’s results versus the benchmark. That industry posted the second-best performance in the benchmark, and the Fund suffered because of both a sizable underweighting and unfavorable security selection within it. In particular, underweighting by the Fund in General Motors Corp. and its financing arm, General Motors Acceptance Corp., held back Fund returns. Together, those securities accounted for a much larger percentage of the benchmark than we believe it is prudent to hold in only two names. In any case, we believe that the Fund’s weighting in auto manufacturing was roughly in line with that of its peers in its Lipper category.
The Fund was especially aided by its investments in the cable industry, an area in which our returns were boosted by an overweighting and strong security selection. Within that group, Fund holdings Charter Communications, Inc. and Cablevision Systems Corp. merit mention. The Fund’s performance also received a boost from an overweighting and rewarding security selection in the health-care sector. Standout holdings included Elan Corp., plc, an Ireland-based biotechnology company, and Warner Chilcott Ltd., a specialty pharmaceutical provider. The broadcast/outdoor industry contributed positively to the Fund as well, driven by a surge in political advertising during an election year. Security selection, such as radio company CMP Susquehanna, was once again instrumental in producing above-benchmark results for the Fund in that group.
Looking at credit quality, the Fund benefited from its overweighting in CCC-rated securities, as low default rates and a generally favorable economic environment led to strong performance in securities with lower quality ratings. Likewise, underweighting the BB-rated group, which is the highest-quality category of high-yield securities, boosted Fund results, given investors’ preference for the higher yields provided by lower-quality bonds.
We believe the stage is set for high-yield securities to perform well in 2007. With the Federal Reserve Board in a holding pattern on interest rates, the default rate low and the economy slowing but still vibrant in most respects, investors should be attracted by the generous yields this sector has to offer. Among non-core holdings, we might reduce Fund exposure to some of the issues with lower-credit quality ratings but overall we anticipate a continuation of many trends evident in 2006. As always, we will attempt to add value through careful attention to individual security selection.
Portfolio Manager:
Karen Bater, CFA
| | |
Fund Performance | | Gartmore High Yield Bond Fund |
Average Annual Total Return
(For periods ended October 31, 2006)
| | | | | | | | |
| | | | | 1 Yr. | | 5 Yr. | | Inception1 |
| Class A | | w/o SC2 | | 9.83% | | 8.29% | | 3.39% |
| | | w/SC3 | | 5.15% | | 7.36% | | 2.74% |
| Class B | | w/o SC2 | | 9.06% | | 7.51% | | 2.65% |
| | | w/SC4 | | 4.06% | | 7.21% | | 2.65% |
| Class C5 | | w/o SC2 | | 9.06% | | 7.51% | | 2.46% |
| | | w/SC6 | | 8.06% | | 7.51% | | 2.46% |
| Class R7,9 | | | | 9.67% | | 7.80% | | 2.85% |
| Institutional Service Class9 | | 10.16% | | 8.51% | | 3.73% |
| Institutional Class8,9 | | | | 10.05% | | 8.54% | | 3.75% |
All figures showing the effect of a sales charge reflect the maximum charge possible, because it has the most dramatic effect on performance data.
| 1 | Fund commenced operations on December 29, 1999. |
| 2 | These returns do not reflect the effects of sales charges (SC). |
| 3 | A 4.25% front-end sales charge was deducted. |
| 4 | A 5.00% contingent deferred sales charge (CDSC) was deducted. The CDSC declines to 0% after 6 years. |
| 5 | These returns until the creation of Class C shares (3/1/01) include the performance of the Fund’s Class B shares. Excluding the effects of any fee waivers or reimbursements, such prior performance is substantially similar to what Class C shares would have produced because Class C shares invest in the same portfolio of securities as Class B shares and have the same expenses after any fee waivers or reimbursements. For Class C shares returns with sales charges, these returns have been restated for the applicable sales charges. |
| 6 | A CDSC of 1.00% was deducted from the one year return because it is charged when you sell Class C shares within the first year after purchase. |
| 7 | These returns until the creation of Class R shares (02/27/04) include the performance of the Fund’s Class B shares. The returns have been adjusted for the fact that Class R shares do not have any applicable sales charges but have not been adjusted for the lower expenses applicable to Class R shares. Excluding the effect of any fee waivers or reimbursements, such prior performance is similar to what Class R shares would have produced because the Class R shares invest in the same portfolio of securities as Class B shares. |
| 8 | These returns until the creation of Institutional Class shares (6/29/04) include the performance of the Fund’s Institutional Service shares. The returns have been adjusted for the fact that Institutional Class shares do not have any applicable sales charges but have not been adjusted for the lower expenses applicable to Institutional Class shares. Excluding the effect of any fee waivers or reimbursements, such prior performance is similar to what Institutional Class shares would have produced because the Institutional Class shares invest in the same portfolio of securities as Institutional Service shares. |
| 9 | Not subject to any sales charges. |
Performance of a $10,000 Investment
Investment return and principal value will fluctuate, and when redeemed, shares may be worth more or less than original cost. Past performance is no guarantee of future results and does not reflect the deduction of taxes that a shareholder would pay on fund distributions or the redemption of fund shares. Investing in mutual funds involves market risk, including loss of principal. Performance returns assume the reinvestment of all distributions.
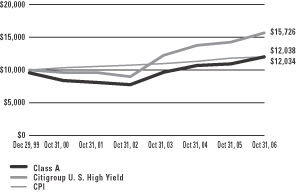
Comparative performance of $10,000 invested in Class A shares of the Gartmore High Yield Bond Fund, Citigroup U.S. High-Yield Market Index (a), and the Consumer Price Index (CPI)(b) since inception. Unlike the Fund, the returns for these unmanaged indexes do not reflect any fees, expenses, or sales charges. Investors cannot invest directly in market indexes.
| (a) | The Citigroup U.S. High-Yield Market is an unmanaged index of high-yield debt securities and is a broad market measure. |
| (b) | The CPI represents changes in prices of a basket of goods and services purchased for consumption by urban households. |
| | |
Shareholder Expense Example | | Gartmore High Yield Bond Fund |
As a shareholder of the Fund, you incur two types of costs: (1) transaction costs, including sales charges (loads) paid on purchase payments and redemption fees; and (2) ongoing costs, including investment advisory fees, administration fees, distribution fees and other Fund expenses. The examples below are intended to help you understand your ongoing costs (in dollars) of investing in the Fund and to compare these costs with the ongoing costs of investing in other mutual funds. Per SEC requirements, the examples assume that you had a $1,000 investment in the Class at the beginning of the reporting period, May 1, 2006 and continued to hold your shares at the end of the reporting period, October 31, 2006.
Actual Expenses
For each Class of the Fund in the table below, the first line provides information about actual account values and actual expenses. You may use the information in this line, together with the amount you invested, to estimate the expenses that you paid over the period. Simply divide your account value by $1,000 (for example, an $8,600 account value divided by $1,000 = 8.6), then multiply the result by the number in the first line of each Class under the heading entitled “Expenses Paid During Period” to estimate the expenses you paid on your account during the period.
Hypothetical Example for Comparison Purposes
The second line of each Class in the table below provides information about hypothetical account values and hypothetical expenses based on the Class’ actual expense ratio and an assumed rate of return of 5% per year before expenses, which is not the Class’ actual return. The hypothetical account values and expenses may not be used to estimate the actual ending account balance or expenses you paid for the period. You may use this information to compare the ongoing costs of investing in the Class of the Fund and other funds. To do so, compare this 5% hypothetical example with the 5% hypothetical examples that appear in the shareholder reports of the other funds.
Please note that the expenses shown in the table are meant to highlight your ongoing costs only and do not reflect any transaction costs, such as sales charges (loads) or redemption fees. Therefore, the second line for each Class in the table is useful in comparing ongoing costs only, and will not help you determine the relative total costs of owning different funds. In addition, if these transaction costs were included, your costs would have been higher. The examples also assume all dividends and distributions have been reinvested.
Schedule of Shareholder Expenses
Expense Analysis of a $1,000 Investment
(October 31, 2006)
| | | | | | | | | | | | | | |
| High Yield Bond Fund | | | | | Beginning
Account Value,
5/1/06 | | Ending
Account Value,
10/31/06 | | Expenses Paid
During Period* | | Annualized
Expense Ratio* |
| Class A | | Actual | | | $ | 1,000.00 | | $ | 1,040.30 | | $ | 5.66 | | 1.10% |
| | | Hypothetical | 1 | | $ | 1,000.00 | | $ | 1,019.45 | | $ | 5.61 | | 1.10% |
| Class B | | Actual | | | $ | 1,000.00 | | $ | 1,036.50 | | $ | 9.50 | | 1.85% |
| | | Hypothetical | 1 | | $ | 1,000.00 | | $ | 1,015.67 | | $ | 9.44 | | 1.85% |
| Class C | | Actual | | | $ | 1,000.00 | | $ | 1,035.00 | | $ | 9.49 | | 1.85% |
| | | Hypothetical | 1 | | $ | 1,000.00 | | $ | 1,015.67 | | $ | 9.44 | | 1.85% |
| Class R | | Actual | | | $ | 1,000.00 | | $ | 1,038.20 | | $ | 6.83 | | 1.33% |
| | | Hypothetical | 1 | | $ | 1,000.00 | | $ | 1,018.30 | | $ | 6.79 | | 1.33% |
| Institutional Service Class | | Actual | | | $ | 1,000.00 | | $ | 1,041.30 | | $ | 4.37 | | 0.85% |
| | | Hypothetical | 1 | | $ | 1,000.00 | | $ | 1,020.72 | | $ | 4.34 | | 0.85% |
| Institutional Class | | Actual | | | $ | 1,000.00 | | $ | 1,041.30 | | $ | 4.37 | | 0.85% |
| | | Hypothetical | 1 | | $ | 1,000.00 | | $ | 1,020.72 | | $ | 4.34 | | 0.85% |
| * | Expenses are equal to the Fund’s annualized expense ratio multiplied by the average account value over the period multiplied by 184/365 (to reflect the one-half year period). The expense ratio presented represents a six-month, annualized ratio in accordance with SEC guidelines. |
| 1 | Represents the hypothetical 5% return before expenses. |
| | |
Portfolio Summary | | Gartmore High Yield Bond Fund |
October 31, 2006
The SEC adopted a requirement that Funds present their portfolio holdings in a table, chart or graph format in their annual and semiannual reports to shareholders, whether or not a statement of investments is utilized. The following tables, which present portfolio holdings as a percentage of net assets, are provided in compliance with this requirement.
| | |
| Asset Allocation | | |
| Corporate Bonds | | 95.5% |
Repurchase Agreements | | 2.4% |
| Preferred Stocks | | 0.7% |
| Yankee Bond | | 0.5% |
| Warrants | | 0.0% |
| Other assets in excess of liabilities | | 0.9% |
| | |
| | 100.0% |
| | |
| Top Industries | | |
| Telecommunication Services | | 8.8% |
| Oil & Gas | | 7.5% |
| Cable & Satellite | | 6.7% |
| Chemicals | | 6.0% |
| Gaming | | 5.5% |
| Finance | | 5.3% |
| Utilities | | 4.4% |
| Medical | | 3.9% |
| Communication & Mobile | | 3.3% |
| Advertising Services | | 3.0% |
| Other Assets | | 45.6% |
| | |
| | 100.0% |
| | |
| Top Holdings* | | |
| R.H. Donnelley Corp., 8.88%, 01/15/16 | | 1.6% |
| EL Paso Corp., 7.75%, 06/15/10 | | 1.4% |
| Ford Motor Credit Co., 8.63%, 11/1/2010 | | 1.2% |
| General Motors, 7.13%, 07/15/13 | | 1.2% |
| Charter Communication Holdings, 10.25%, 10/01/13 | | 1.2% |
| Qwest Corp., 8.88%, 03/15/12 | | 1.1% |
| Rural Cellular Corp., 9.88%, 02/01/10 | | 1.1% |
| HCA, Inc., 6.50%, 02/15/16 | | 1.1% |
| Qwest Communication International, 7.25%, 02/15/11 | | 1.0% |
| AES Corp., 8.75%, 05/15/13 | | 1.0% |
| Other Assets | | 88.1% |
| | |
| | 100.0% |
| * | For purpose of listing top holdings, repurchase agreements are considered cash equivalents and are included as part of Other Assets. |
Gartmore High Yield Bond Fund
Corporate Bonds (95.5%)
Statement of Investments
October 31, 2006
| | | | | | |
| | | Shares or
Principal Amount | | Value |
| | | | | | |
| | | | | | |
Advertising Services (3.0%) | | | |
R.H. Donnelley Corp.,
6.88%, 01/15/13 | | $ | 100,000 | | $ | 94,125 |
R.H. Donnelley Corp. 144A,
6.88%, 01/15/13 (c) | | | 75,000 | | | 70,594 |
R.H. Donnelley Corp.,
8.88%, 01/15/16 | | | 370,000 | | | 381,562 |
WDAC Subsidiary Corp.,
8.38%, 12/01/14 (c) | | | 200,000 | | | 200,000 |
| | | | | | |
| | | | | | 746,281 |
| | | | | | |
Aerospace & Defense Equipment (1.2%) | | | |
K&F Acquisition, Inc.,
7.75%, 11/15/14 | | | 45,000 | | | 45,563 |
Sequa Corp., 9.00%, 08/01/09 | | | 125,000 | | | 131,875 |
Vought Aircraft Industries, Inc.,
8.00%, 07/15/11 | | | 125,000 | | | 118,125 |
| | | | | | |
| | | | | | 295,563 |
| | | | | | |
Apparel (1.2%) | | | |
Broder Bros Co., 11.25%, 10/15/10 | | | 120,000 | | | 117,300 |
Levi Strauss & Co., 9.75%, 01/15/15 | | | 165,000 | | | 174,900 |
| | | | | | |
| | | | | | 292,200 |
| | | | | | |
Auto (2.8%) | | | |
Ford Motor Co., 7.00%, 10/01/13 | | | 40,000 | | | 37,185 |
Ford Motor Co., 7.45%, 07/16/31 | | | 200,000 | | | 156,750 |
General Motors, 7.13%, 07/15/13 | | | 335,000 | | | 299,825 |
General Motors, 8.38%, 07/15/33 | | | 120,000 | | | 106,800 |
Hertz Corp., 8.88%, 01/01/14 (c) | | | 50,000 | | | 52,250 |
Hertz Corp., 10.50%, 01/01/16 (c) | | | 30,000 | | | 32,925 |
| | | | | | |
| | | | | | 685,735 |
| | | | | | |
Auto Parts & Equipment (3.0%) | | | |
Ashtead Capital, Inc.,
9.00%, 08/15/16 (c) | | | 50,000 | | | 52,625 |
Federal-Mogul Corp.,
7.50%, 01/15/09 (b) (d) | | | 150,000 | | | 96,750 |
Goodyear Tire & Rubber,
9.00%, 07/01/15 | | | 125,000 | | | 126,405 |
H&E Equipment, 8.38%, 07/15/16 (c) | | | 50,000 | | | 51,625 |
Lear Corp., 8.11%, 05/15/09 | | | 100,000 | | | 101,375 |
TRW Automotive, Inc.,
9.38%, 02/15/13 | | | 92,000 | | | 98,555 |
| | | | | | |
| | | Shares or
Principal Amount | | Value |
| | | | | | |
Auto Parts & Equipment (continued) | | | |
TRW Automotive, Inc.,
11.00%, 02/15/13 | | $ | 35,000 | | $ | 38,413 |
United Rentals North America, Inc.,
7.00%, 02/15/14 | | | 85,000 | | | 81,388 |
Visteon Corporation,
8.25%, 08/01/10 | | | 85,000 | | | 81,175 |
| | | | | | |
| | | | | | 728,311 |
| | | | | | |
Building & Construction (0.5%) | | | |
Owens Corning,
7.50%, 08/01/18 (b) (d) | | | 85,000 | | | 46,325 |
Ply Gem Industries, Inc.,
9.00%, 02/15/12 | | | 95,000 | | | 79,325 |
| | | | | | |
| | | | | | 125,650 |
| | | | | | |
Building Air Conditioning (0.7%) | | | |
Goodman Global Holdings,
7.88%, 12/15/12 | | | 175,000 | | | 168,000 |
| | | | | | |
Cable & Satellite (6.7%) | | | |
Adelphia Communications,
8.88%, 01/15/07 (b) (d) | | | 40,000 | | | 44,400 |
Adelphia Communications,
10.88%, 10/01/10 (b) (d) | | | 125,000 | | | 97,813 |
Cablevision Systems Corp.,
8.00%, 04/15/12 | | | 210,000 | | | 203,962 |
CCH I LLC, 11.00%, 10/01/15 | | | 165,000 | | | 159,019 |
Charter Communication Holdings,
10.25%, 10/01/13 (c) | | | 285,000 | | | 293,549 |
Charter Communication Holdings,
11.00%, 10/01/15 (c) | | | 15,000 | | | 14,400 |
Charter Communications Holdings LLC, 8.38%, 04/30/14 (c) | | | 85,000 | | | 87,338 |
Charter Communications Holdings, Series B, 10.25%, 01/15/10 | | | 175,000 | | | 161,875 |
DIRECTV Holdings Finance,
8.38%, 03/15/13 | | | 100,000 | | | 103,750 |
Intelsat Ltd., 7.63%, 04/15/12 | | | 185,000 | | | 166,963 |
Hughes Network Systems,
9.50%, 04/15/14 (c) | | | 105,000 | | | 108,675 |
Mediacom LLC, 9.50%, 01/15/13 | | | 200,000 | | | 205,249 |
| | | | | | |
| | | | | | 1,646,993 |
| | | | | | |
Statement of Investments (Continued)
October 31, 2006
Gartmore High Yield Bond Fund (Continued)
Corporate Bonds (continued)
| | | | | | |
| | | Shares or
Principal Amount | | Value |
| | | | | | |
Chemicals (6.0%) | | | |
BCP Crystal Holdings Corp.,
9.63%, 06/15/14 | | $ | 81,000 | | $ | 88,898 |
Equistar Chemical Funding,
10.13%, 09/01/08 | | | 105,000 | | | 111,300 |
Hexion Chemical Co.,
9.75%, 11/15/14 (c) | | | 125,000 | | | 124,687 |
Huntsman Corp., 10.13%, 07/01/09 | | | 100,000 | | | 101,500 |
Huntsman International LLC,
11.50%, 07/15/12 | | | 100,000 | | | 113,250 |
IMC Global, Inc., 11.25%, 06/01/11 | | | 70,000 | | | 73,938 |
Koppers Industry, Inc.,
9.88%, 10/15/13 | | | 86,000 | | | 92,880 |
Lyondell Chemical Co.,
9.50%, 12/15/08 | | | 112,000 | | | 114,940 |
Nalco Company, 8.88%, 11/15/13 | | | 115,000 | | | 121,038 |
Polyone Corp., 10.63%, 05/15/10 | | | 110,000 | | | 117,975 |
Reichhold Industries, Inc.,
9.00%, 08/15/14 (c) | | | 165,000 | | | 164,174 |
Solutia, Inc., 11.25%, 07/15/09 (b) | | | 80,000 | | | 79,600 |
Westlake Chemicals,
6.63%, 01/15/16 | | | 175,000 | | | 167,562 |
| | | | | | |
| | | | | | 1,471,742 |
| | | | | | |
Communication & Mobile (3.3%) | | | |
American Tower Corp.,
7.13%, 10/15/12 | | | 175,000 | | | 178,500 |
Intelsat Bermuda Ltd,
8.25%, 01/15/13 | | | 85,000 | | | 86,594 |
Intelsat Bermuda Ltd.,
11.25%, 06/15/16 (c) | | | 205,000 | | | 223,193 |
MetroPCS Wireless, Inc.,
9.25%, 11/01/14 (c) | | | 85,000 | | | 85,744 |
Rogers Wireless, Inc.,
8.00%, 12/15/12 | | | 60,000 | | | 63,450 |
Ubiquitel Operating Co.,
9.88%, 03/01/11 | | | 170,000 | | | 184,025 |
| | | | | | |
| | | | | | 821,506 |
| | | | | | |
Computer Services (0.9%) | | | |
Solar Capital Corp.,
10.25%, 08/15/15 | | | 40,000 | | | 41,900 |
Sungard Data Systems, Inc.,
9.13%, 08/15/13 | | | 50,000 | | | 51,875 |
| | | | | | |
| | | Shares or
Principal Amount | | Value |
| | | | | | |
Computer Services (continued) | | | |
Unigraphics Solutions, Inc.,
10.00%, 06/01/12 | | $ | 110,000 | | $ | 118,800 |
| | | | | | |
| | | | | | 212,575 |
| | | | | | |
Computer Software (0.3%) | | | |
UGS Capital Corp II,
10.38%, 06/01/11 (c) | | | 75,000 | | | 77,438 |
| | | | | | |
Construction Machinery (0.4%) | | | |
Case New Holland, Inc.,
9.25%, 08/01/11 | | | 85,000 | | | 90,206 |
| | | | | | |
Consumer Products & Services (0.7%) | | | |
Iron Mountain, Inc., 7.75%, 01/15/15 | | | 85,000 | | | 86,275 |
Sealy Mattress Co., 8.25%, 06/15/14 | | | 85,000 | | | 88,188 |
| | | | | | |
| | | | | | 174,463 |
| | | | | | |
Containers (2.4%) | | | |
Crown Americas, 7.63%, 11/15/13 | | | 85,000 | | | 87,125 |
Crown Cork & Seal, 8.00%, 04/15/23 | | | 175,000 | | | 168,000 |
Owens Brockway Glass Containers,
6.75%, 12/01/14 | | | 60,000 | | | 57,600 |
Owens Illinois, Inc., 7.50%, 05/15/10 | | | 105,000 | | | 106,575 |
Pliant Corp., 11.63%, 06/15/09 | | | 1,569 | | | 1,775 |
Silgan Holdings, Inc., 6.75%, 11/15/13 | | | 50,000 | | | 49,250 |
Stone Container Corp.,
9.75%, 02/01/11 | | | 64,000 | | | 66,000 |
Tekni-Plex, Inc., 10.88%, 08/15/12 (c) | | | 40,000 | | | 45,000 |
| | | | | | |
| | | | | | 581,325 |
| | | | | | |
Cosmetics & Toiletries (0.6%) | | | |
Del Laboratories, Inc.,
8.00%, 02/01/12 | | | 45,000 | | | 40,838 |
Elizabeth Arden, Inc.,
7.75%, 01/15/14 | | | 110,000 | | | 108,075 |
| | | | | | |
| | | | | | 148,913 |
| | | | | | |
Data Services (0.5%) | | | |
Seitel Inc., 11.75%, 07/15/11 | | | 95,000 | | | 112,813 |
| | | | | | |
Diversified Manufacturing Operations (0.2%) | | | |
Blount, Inc., 8.88%, 08/01/12 | | | 55,000 | | | 55,000 |
| | | | | | |
Corporate Bonds (continued)
| | | | | | |
| | | Shares or
Principal Amount | | Value |
| | | | | | |
E-Commerce (0.3%) | | | |
FTD, Inc., 7.75%, 02/15/14 | | $ | 73,000 | | $ | 72,635 |
| | | | | | |
Electric Services (0.4%) | | | |
Midwest Generation LLC,
8.75%, 05/01/34 | | | 95,000 | | | 102,719 |
| | | | | | |
Electronics (0.5%) | | | |
Amkor Technologies, Inc.,
9.25%, 06/01/16 | | | 75,000 | | | 69,750 |
Itron, Inc., 7.75%, 05/15/12 | | | 50,000 | | | 51,125 |
| | | | | | |
| | | | | | 120,875 |
| | | | | | |
Energy (1.0%) | | | |
NRG Energy, Inc., 7.38%, 02/01/16 | | | 235,000 | | | 237,644 |
| | | | | | |
Finance (5.3%) | | | |
Atlantic Broadband Finance,
9.38%, 01/15/14 | | | 175,000 | | | 174,125 |
E TRADE Financial Corp.,
7.88%, 12/01/15 | | | 50,000 | | | 52,875 |
Ford Motor Credit Co.,
8.63%, 11/01/10 | | | 302,000 | | | 300,648 |
General Motors Acceptance Corp.,
7.00%, 02/01/12 | | | 210,000 | | | 211,426 |
General Motors Acceptance Corp.,
8.00%, 11/01/31 | | | 140,000 | | | 150,006 |
Global Cash Accounting & Finance,
8.75%, 03/15/12 | | | 110,000 | | | 116,188 |
Ipayment, Inc., 9.75%, 05/15/14 (c) | | | 240,000 | | | 246,599 |
Labranche & Co., 9.50%, 05/15/09 | | | 60,000 | | | 63,150 |
| | | | | | |
| | | | | | 1,315,017 |
| | | | | | |
Food & Beverage (1.2%) | | | |
Pilgrims Pride Corp.,
9.63%, 09/15/11 | | | 150,000 | | | 157,125 |
Pilgrims Pride Corp.,
9.25%, 11/15/13 | | | 50,000 | | | 51,625 |
Stater Brothers Holdings,
8.13%, 06/15/12 | | | 75,000 | | | 75,563 |
| | | | | | |
| | | | | | 284,313 |
| | | | | | |
Forestry (0.2%) | | | |
Tembec Industries, Inc.,
8.50%, 02/01/11 | | | 75,000 | | | 40,500 |
| | | | | | |
| | | | | | |
| | | Shares or
Principal Amount | | Value |
| | | | | | |
Funeral Services (0.6%) | | | |
Service Corp. International,
7.63%, 10/01/18 (c) | | $ | 40,000 | | $ | 41,100 |
Stewart Enterprises,
6.25%, 02/15/13 | | | 125,000 | | | 117,813 |
| | | | | | |
| | | | | | 158,913 |
| | | | | | |
Gaming (5.5%) | | | |
American Casino & Entertainment,
7.85%, 02/01/12 | | | 100,000 | | | 101,750 |
Boyd Gaming Corp.,
6.75%, 04/15/14 | | | 105,000 | | | 102,769 |
Circus & Eldorado,
10.13%, 03/01/12 | | | 55,000 | | | 57,750 |
Hard Rock Hotel, Inc.,
8.88%, 06/01/13 (c) | | | 110,000 | | | 118,250 |
Herbst Gaming, Inc.,
8.13%, 06/01/12 (c) | | | 200,000 | | | 204,999 |
Jacobs Entertainment,
9.75%, 06/15/14 (c) | | | 105,000 | | | 104,213 |
MGM Mirage, Inc.,
9.75%, 06/01/07 | | | 170,000 | | | 173,399 |
Park Place Entertainment Corp.,
8.13%, 05/15/11 | | | 210,000 | | | 214,462 |
Pokagon Gaming Authority,
10.38%, 06/15/14 (c) | | | 105,000 | | | 112,613 |
Poster Financial Group,
8.75%, 12/01/11 | | | 60,000 | | | 62,550 |
Station Casinos, Inc.,
7.75%, 08/15/16 | | | 85,000 | | | 87,338 |
| | | | | | |
| | | | | | 1,340,093 |
| | | | | | |
Healthcare (1.5%) | | | |
Ameripath, Inc., 10.50%, 04/01/13 | | | 110,000 | | | 118,250 |
Iasis Healthcare Corp.,
8.75%, 06/15/14 | | | 150,000 | | | 144,938 |
Tenet Healthcare Corp.,
6.88%, 11/15/31 | | | 150,000 | | | 116,250 |
| | | | | | |
| | | | | | 379,438 |
| | | | | | |
Human Resources (0.7%) | | | |
Team Health Inc.,
11.25%, 12/01/13 | | | 175,000 | | | 178,938 |
| | | | | | |
Statement of Investments (Continued)
October 31, 2006
Gartmore High Yield Bond Fund (Continued)
Corporate Bonds (continued)
| | | | | | |
| | | Shares or
Principal Amount | | Value |
| | | | | | |
Leisure (1.7%) | | | |
Gaylord Entertainment Co.,
8.00%, 11/15/13 | | $ | 50,000 | | $ | 50,875 |
Host Marriott LP, 7.13%, 11/01/13 | | | 100,000 | | | 101,125 |
Six Flags, Inc., 8.88%, 02/01/10 | | | 165,000 | | | 160,050 |
Universal City Florida,
8.38%, 05/01/10 | | | 100,000 | | | 100,750 |
| | | | | | |
| | | | | | 412,800 |
| | | | | | |
Manufacturing (0.9%) | | | |
Reddy Ice Holdings, Inc.,
9.05%, 11/01/12 (f) | | | 260,000 | | | 228,150 |
| | | | | | |
Media (1.6%) | | | |
Canwest Media, Inc.,
8.00%, 09/15/12 | | | 190,000 | | | 192,138 |
LBI Media, Inc., 10.13%, 07/15/12 | | | 125,000 | | | 132,969 |
LBI Media, Inc., 10.24%, 10/15/13 (f) | | | 85,000 | | | 71,931 |
| | | | | | |
| | | | | | 397,038 |
| | | | | | |
Medical (3.9%) | | | |
Alliance Imaging, 7.25%, 12/15/12 | | | 50,000 | | | 46,750 |
CDRV Investors, Inc.,
9.625%, 01/01/15 | | | 155,000 | | | 120,125 |
Elan Fin PLC/Elan Fin CP,
7.75%, 11/15/11 | | | 95,000 | | | 93,338 |
Encore Medical Finance,
11.75%, 11/15/14 (c) | | | 85,000 | | | 85,000 |
HCA, Inc., 6.50%, 02/15/16 | | | 330,000 | | | 261,525 |
Medical Services Co.,
12.87%, 10/15/11 | | | 100,000 | | | 95,500 |
Triad Hospitals, Inc.,
7.00%, 11/15/13 | | | 100,000 | | | 97,250 |
Warner Chilcott Corp.,
8.75%, 02/01/15 | | | 162,000 | | | 167,265 |
| | | | | | |
| | | | | | 966,753 |
| | | | | | |
Metals & Mining (1.5%) | | | |
AK Steel Corp., 7.75%, 06/15/12 | | | 95,000 | | | 95,000 |
Century Aluminum Co.,
7.50%, 08/15/14 | | | 60,000 | | | 59,850 |
Chaparral Steel Co.,
10.00%, 07/15/13 | | | 55,000 | | | 61,600 |
Novelis, Inc., 8.25%, 02/15/15 (c) | | | 105,000 | | | 100,275 |
| | | | | | |
| | | Shares or
Principal Amount | | Value |
| | | | | | |
Metals & Mining (continued) | | | |
PNA Group, Inc.,
10.75%, 09/01/16 (c) | | $ | 50,000 | | $ | 51,500 |
| | | | | | |
| | | | | | 368,225 |
| | | | | | |
Oil & Gas (7.5%) | | | |
ANR Pipeline Co., 8.88%, 03/15/10 | | | 150,000 | | | 157,574 |
Chesapeake Energy Corp,
7.63%, 07/15/13 | | | 160,000 | | | 165,800 |
EL Paso Production Holdings,
7.75%, 06/01/13 | | | 200,000 | | | 204,999 |
Forest Oil Corp., 8.00%, 06/15/08 | | | 40,000 | | | 41,000 |
Giant Industries, 11.00%, 05/15/12 | | | 70,000 | | | 75,600 |
Giant Industries, 8.00%, 05/15/14 | | | 155,000 | | | 167,788 |
KCS Energy Inc., 7.13%, 04/01/12 | | | 65,000 | | | 62,400 |
Newfield Exploration Co.,
6.63%, 04/15/16 | | | 175,000 | | | 171,937 |
Ocean Rig Norway AS,
8.38%, 07/01/13 (c) | | | 115,000 | | | 121,181 |
Petrobras International Finance,
9.13%, 07/02/13 | | | 85,000 | | | 99,663 |
Southern Natural Gas,
8.88%, 03/15/10 | | | 125,000 | | | 131,312 |
Stone Energy Corp.,
8.12%, 07/15/10 (c) | | | 100,000 | | | 99,375 |
Whiting Petroleum Corp.,
7.00%, 02/01/14 | | | 50,000 | | | 49,250 |
Williams Cos., Inc., 8.13%, 03/15/12 | | | 85,000 | | | 91,163 |
Williams Cos., Inc. Series A,
7.50%, 01/15/31 | | | 210,000 | | | 213,149 |
| | | | | | |
| | | | | | 1,852,191 |
| | | | | | |
Paper & Forest Products (1.5%) | | | |
Appleton Papers, Inc.,
9.75%, 06/15/14 | | | 105,000 | | | 103,949 |
Boise Cascade LLC,
7.13%, 10/15/14 | | | 45,000 | | | 42,413 |
JSG Funding PLC, 7.75%, 04/01/15 | | | 85,000 | | | 80,113 |
Newpage Corp., 12.00%, 05/01/13 | | | 80,000 | | | 83,600 |
Verso Paper Holdings LLC,
9.13%, 08/01/14 (c) | | | 50,000 | | | 50,750 |
| | | | | | |
| | | | | | 360,825 |
| | | | | | |
Corporate Bonds (continued)
| | | | | | |
| | | Shares or
Principal Amount | | Value |
| | | | | | |
Physical Therapy (1.0%) | | | |
Healthsouth Corp.,
10.75%, 06/15/16 (c) | | $ | 170,000 | | $ | 174,250 |
Psychiatric Solutions,
7.75%, 07/15/15 | | | 75,000 | | | 74,250 |
| | | | | | |
| | | | | | 248,500 |
| | | | | | |
Pipelines (3.0%) | | | |
Atlas Pipeline Partners,
8.13%, 12/15/15 | | | 50,000 | | | 51,000 |
Dynegy Holdings, Inc.,
8.38%, 05/01/16 | | | 95,000 | | | 97,613 |
EL Paso Corp., 7.75%, 06/15/10 | | | 325,000 | | | 337,187 |
EL Paso Corp., 7.42%, 02/15/37 | | | 175,000 | | | 171,937 |
Targa Resources, Inc.,
8.50%, 11/01/13 (c) | | | 75,000 | | | 74,813 |
| | | | | | |
| | | | | | 732,550 |
| | | | | | |
Publishing (0.7%) | | | |
CBD Media Holdings,
9.25%, 07/15/12 | | | 175,000 | | | 174,344 |
| | | | | | |
Radio (0.5%) | | | |
CMP Susquehana,
9.88%, 05/15/14 (c) | | | 125,000 | | | 120,781 |
| | | | | | |
Retail (1.4%) | | | |
Finlay Fine Jewelry Corp.,
8.38%, 06/01/12 | | | 50,000 | | | 45,000 |
Inergy LP/Inergy Finance,
8.25%, 03/01/16 | | | 50,000 | | | 51,875 |
Neiman Marcus Group, Inc.,
10.38%, 10/15/15 | | | 105,000 | | | 114,844 |
Toys R Us, Inc., 7.63%, 08/01/11 | | | 155,000 | | | 134,075 |
| | | | | | |
| | | | | | 345,794 |
| | | | | | |
Storage (0.4%) | | | |
Mobile Services Group, Inc.,
9.75%, 08/01/14 (c) | | | 100,000 | | | 103,625 |
| | | | | | |
Technology (1.9%) | | | |
Lucent Technologies,
6.45%, 03/15/29 | | | 260,000 | | | 232,700 |
Sanmina Sci Corp.,
8.13%, 03/01/16 | | | 105,000 | | | 103,294 |
| | | | | | |
| | | Shares or
Principal Amount | | Value |
| | | | | | |
Technology (continued) | | | |
Xerox Corp., 7.63%, 06/15/13 | | $ | 125,000 | | $ | 130,625 |
| | | | | | |
| | | | | | 466,619 |
| | | | | | |
Telecommunication Services (8.8%) | | | |
Centennial Communication,
10.00%, 01/01/13 | | | 75,000 | | | 77,813 |
Centennial Communication,
8.13%, 02/01/14 | | | 175,000 | | | 175,219 |
Digicel Ltd., 9.25%, 09/01/12 (c) | | | 225,000 | | | 233,438 |
Insight Midwest, 10.50%, 11/01/10 | | | 125,000 | | | 129,375 |
Nextel Communications,
8.13%, 07/01/11 | | | 200,000 | | | 210,000 |
Nordic Telephone Co.,
8.88%, 05/01/16 (c) | | | 75,000 | | | 78,563 |
Nortel Networks Ltd.,
10.75%, 07/15/16 (c) | | | 105,000 | | | 112,350 |
Panamsat Corporation,
9.00%, 06/15/16 (c) | | | 55,000 | | | 57,475 |
Qwest Communication International, 7.25%, 02/15/11 | | | 250,000 | | | 253,749 |
Qwest Corp., 8.88%, 03/15/12 | | | 255,000 | | | 280,499 |
Rural Cellular Corp.,
9.75%, 01/15/10 | | | 160,000 | | | 162,000 |
Rural Cellular Corp.,
9.88%, 02/01/10 | | | 250,000 | | | 262,499 |
Windstream Corp.,
8.63%, 08/01/16 (c) | | | 125,000 | | | 134,844 |
| | | | | | |
| | | | | | 2,167,824 |
| | | | | | |
Theaters (0.3%) | | | |
AMC Entertainment Inc.,
9.88%, 02/01/12 | | | 75,000 | | | 77,531 |
| | | | | | |
Transportation Services (2.0%) | | | |
American Commercial Lines,
9.50%, 02/15/15 | | | 49,000 | | | 54,206 |
CHC Helicopter Corp.,
7.38%, 05/01/14 | | | 105,000 | | | 100,275 |
Greenbrier Companies, Inc.,
8.38%, 05/15/15 | | | 55,000 | | | 55,688 |
PHI, Inc., 7.13%, 04/15/13 (c) | | | 50,000 | | | 47,250 |
Quality Distribution,
9.00%, 11/15/10 | | | 240,000 | | | 231,900 |
| | | | | | |
| | | | | | 489,319 |
| | | | | | |
Statement of Investments (Continued)
October 31, 2006
Gartmore High Yield Bond Fund (Continued)
Corporate Bonds (continued)
| | | | | | |
| | | Shares or
Principal Amount | | Value |
| | | | | | |
Utilities (4.4%) | | | |
AES Corp., 8.75%, 05/15/13 (c) | | $ | 235,000 | | $ | 252,330 |
Allegheny Energy Supply,
8.25%, 04/15/12 (c) | | | 85,000 | | | 92,438 |
Aquila, Inc., 7.63%, 11/15/09 | | | 105,000 | | | 109,881 |
Calpine Corp,
8.75%, 07/15/13 (b) (c) (d) | | | 75,000 | | | 78,375 |
Calpine Corp.,
8.50%, 02/15/11 (b) (d) | | | 80,000 | | | 40,800 |
CMS Energy Corp.,
9.88%, 10/15/07 | | | 170,000 | | | 176,375 |
Edison Mission Energy,
7.73%, 06/15/09 | | | 70,000 | | | 72,800 |
Mission Energy Holding,
13.50%, 07/15/08 | | | 175,000 | | | 195,125 |
Reliant Resources, Inc.,
9.25%, 07/15/10 | | | 50,000 | | | 51,750 |
| | | | | | |
| | | | | | 1,069,874 |
| | | | | | |
Waste Management (0.9%) | | | |
Allied Waste North America,
7.25%, 03/15/15 | | | 210,000 | | | 210,000 |
| | | | | | |
| | |
Total Corporate Bonds | | | | | | 23,458,542 |
| | | | | | |
|
Yankee Bond (0.5%) |
Paper & Forest Products (0.5%) | | | |
Abitibi Consolidated, Inc.,
7.75%, 06/15/11 | | | 75,000 | | | 66,938 |
Abitibi Consolidated, Inc.,
6.00%, 06/20/13 | | | 85,000 | | | 67,575 |
| | | | | | |
| | |
Total Yankee Bond | | | | | | 134,513 |
| | | | | | |
|
Preferred Stocks (0.7%) |
Broadcasting (0.5%) | | | |
Spanish Broadcasting Systems, Inc., 10.75%, 10/15/13 | | | 102 | | | 111,837 |
| | | | | | |
Communication & ISP (0.0%) | | | |
Rhythms NetConnections, Inc.,
6.75%, 03/03/12 (c) (e) | | | 1,691 | | | 0 |
| | | | | | |
Pereferred Stocks (continued)
| | | | | | |
| | | Shares or
Principal Amount | | Value |
| | | | | | |
Real Estate Investment Trusts (0.2%) | | | |
iStar Financial, Inc.,
7.80%, 09/29/08 | | | 2,215 | | $ | 57,767 |
| | | | | | |
| | |
Total Preferred Stocks | | | | | | 169,604 |
| | | | | | |
|
Warrants (0.0%) |
Fixed Communications (0.0%) | | | |
Maxcom Telecommunications SA, 04/01/07 (c) (d) (e) | | | 46 | | | 0 |
| | | | | | |
| | |
Total Warrants | | | | | | 0 |
| | | | | | |
|
Repurchase Agreements (2.4%) |
CS First Boston, 5.17%, dated 10/31/06, due 11/01/06, repurchase price $303,206, collateralized by U.S. Government Agency Mortgages with a market value of $309,226 | | $ | 303,162 | | | 303,162 |
Nomura Securities, 5.17%, dated 10/31/06, due 11/01/06, repurchase price $289,493, collateralized by U.S. Government Agency Mortgages with a market value of $295,240 | | | 289,451 | | | 289,451 |
| | | | | | |
| | |
Total Repurchase Agreements | | | | | | 592,613 |
| | | | | | |
| |
Total Investments
(Cost $24,018,660) (a) — 99.1% | | | 24,355,272 |
| |
Other assets in excess of
liabilities — 0.9% | | | 232,668 |
| | | | | | |
| | |
NET ASSETS — 100.0% | | | | | $ | 24,587,940 |
| | | | | | |
| | (a) | See notes to financial statements for tax unrealized appreciation (depreciation) of securities. |
| | (c) | Represents a restricted security acquired and eligible for resale under rule 144A, which limits the resale to certain qualified buyers. These securities were deemed liquid pursuant to procedures approved by the Board of Trustees. |
| | (d) | Denotes a non-income producing security. |
| | (f) | Step up bonds. The rate reflected in the Statement of Investments is the yield to maturity as of October 31, 2006. |
See notes to financial statements.
Gartmore Micro Cap Equity Fund
On March 21, 2006, the Fund (Institutional Service Class) was recognized as the best “Small-Cap Core Fund” (among a field of 214 competitors) by Lipper, for the three-year period ended Dec. 31, 2005.
For the annual period ended Oct. 31, 2006, the Gartmore Micro Cap Equity Fund (Class A at NAV) returned 19.19% versus 16.97% for its benchmark, the Russell Microcap™ Index. For broader comparison, the average return for the Fund’s Lipper peer category of Small-Cap Core Funds (consisting of 689 funds as of Oct. 31, 2006) was 16.40%.
During the period, equity markets closely followed the flow of economic data. This data suggested that the economy is slowing and that the string of interest rate hikes by the Federal Reserve may be over. This large-cap environment could lead to future valuation multiple expansion for equities, thus investors pushed stocks higher; led by the large capitalization stocks. Fortunately, micro-cap stocks weathered this large-cap biased rally environment to end the period with solid performance. Also benefiting micro-cap equities was an active merger-and-acquisition environment driven by private equity firms flush with cash. These firms acquired companies at healthy premiums and pursued strategic growth opportunities across the equity spectrum.
Regardless of the market environment, our uncompromising focus on managing individual stock risk in the portfolio and finding high-quality stocks trading at attractive valuations continues to set us apart. As a result, the Fund outperformed its benchmark Index during the reporting period. The Fund’s best-performing holdings included Smith Micro Software, Inc. (communications software), NVE Corp. (electronic components) and Sirenza Microdevices, Inc. (radio-frequency components). We continue to own shares in Smith Microdevices and Sirenza; we sold NVE Corp., however, because the share price reached our valuation target.
Detractors from Fund performance during the reporting period included Allied Healthcare (nursing services), Tvia, Inc. (semiconductors) and Peerless Systems Corp. (software). Allied Healthcare and Tvia experienced temporary operational disruptions, but we expect solid future results. We believe that the growth prospects for these companies remain strong, so we continue to own these stocks. We sold our shares in Peerless, because the company has exhibited poor operational execution.
The Fund’s positioning remained relatively unchanged during the reporting period. As of Oct. 31, 2006, the Fund’s portfolio is underweight in health care, financials and materials, and it is overweight in information technology, consumer staples and industrials. Currently, the Fund’s largest positions are Imergent, Inc. (e-commerce software), Fuel Systems Solutions, Inc. (cleaner-burning fuel products) and Neogen Corp. (food safety and animal health products). The positioning of the portfolio is a direct result of our bottom-up, fundamental research process.
Our outlook for the micro-cap market remains upbeat, and we have several reasons for our optimism. First, increasingly we are finding companies with good earnings growth and solid balance sheets trading at attractive valuations. Second, the steep decline in the prices of energy and raw materials is likely to temper the degree of moderation in economic growth next year. Finally, the combination of a moderating economy and attractive valuations is likely to further fuel merger-and-acquisition activity, providing a solid underpinning for equity valuations through the better part of 2007.
Portfolio Manager:
Carl Wilk, CFP
Lipper, a wholly owned subsidiary of Reuters, is a leading global provider of mutual fund information and analysis to fund companies, financial intermediaries and media organizations.
Although Lipper makes reasonable efforts to ensure the accuracy and reliability of the data, the accuracy is not guaranteed by Lipper.
For the “Small-Cap Core Funds” award, Lipper determined the award winner by calculating the highest Consistent Return over the three-year time period ended Dec. 31, 2005. Gartmore competed among 214 small-cap core portfolios to win the award.
Award based on Institutional Services class shares of the Funds. Other share classes may have different performance characteristics. Fund performance may now be higher or lower than the performance that was calculated to win this award.
| | |
Fund Performance | | Gartmore Micro Cap Equity Fund |
Average Annual Total Return
(For periods ended October 31, 2006)
| | | | | | |
| | | | | 1 Yr. | | Inception1 |
| Class A | | w/o SC2 | | 19.19% | | 24.64% |
| | | w/SC3 | | 12.34% | | 22.96% |
| Class B | | w/o SC2 | | 18.41% | | 23.74% |
| | | w/SC4 | | 13.41% | | 23.51% |
| Class C | | w/o SC2 | | 18.39% | | 23.76% |
| | | w/SC5 | | 17.39% | | 23.76% |
| Class R6,7 | | | | 18.87% | | 24.12% |
| Institutional Service Class7 | | 19.62% | | 24.97% |
| Institutional Class7 | | 19.56% | | 24.97% |
All figures showing the effect of a sales charge reflect the maximum charge possible, because it has the most dramatic effect on performance data.
| 1 | Fund commenced operations on June 27, 2002. |
| 2 | These returns do not reflect the effects of sales charges (SC). |
| 3 | A 5.75% front-end sales charge was deducted. |
| 4 | A 5.00% contingent deferred sales charge (CDSC) was deducted. The CDSC declines to 0% after 6 years. |
| 5 | A CDSC of 1.00% was deducted from the one year return because it is charged when you sell Class C shares within the first year after purchase. |
| 6 | These returns until the creation of Class R shares (12/30/03) include the performance of the Fund’s Class B shares. The returns have been adjusted for the fact that Class R shares do not have any applicable sales charges but have not been adjusted for the lower expenses applicable to Class R shares. Excluding the effect of any fee waivers or reimbursements, such prior performance is similar to what Class R shares would have produced because the Class R shares invest in the same portfolio of securities as Class B shares. |
| 7 | Not subject to any sales charges. |
Performance of a $10,000 Investment
Investment return and principal value will fluctuate, and when redeemed, shares may be worth more or less than original cost. Past performance is no guarantee of future results and does not reflect the deduction of taxes that a shareholder would pay on fund distributions or the redemption of fund shares. Investing in mutual funds involves market risk, including loss of principal. Performance returns assume the reinvestment of all distributions.
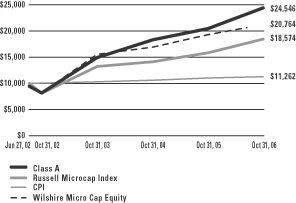
Comparative performance of $10,000 invested in Class A shares of the Gartmore Micro Cap Equity Fund, Wilshire Micro Cap Equity Index(old)(a), the Russell Microcap Index(new)(b), and the Consumer Price Index (CPI)(c) since inception. Unlike the Fund, the returns for these unmanaged indexes do not reflect any fees, expenses, or sales charges. Investors cannot invest directly in market indexes.
| (a) | The Wilshire Micro Cap Equity Index is a capitalization-weighted index that measures small-cap stocks in the bottom “half” of the Wilshire 5000 Index. The Index ceased to exist as of July 2006. |
| (b) | The Russell Microcap Index is an unmanaged index that measures the performance of the microcap segment, which represents less than 3% of the U.S. equity market; includes the smallest 1,000 securities in the small-cap Russell 2000 Index plus the next 1,000 companies below the Russell 2000 Index, based on a ranking of all U.S. equities by market capitalization. |
| (c) | The CPI represents changes in prices of a basket of goods and services purchased for consumption by urban households. |
| | |
Shareholder Expense Example | | Gartmore Micro Cap Equity Fund |
As a shareholder of the Fund, you incur two types of costs: (1) transaction costs, including sales charges (loads) paid on purchase payments and redemption fees; and (2) ongoing costs, including investment advisory fees, administration fees, distribution fees and other Fund expenses. The examples below are intended to help you understand your ongoing costs (in dollars) of investing in the Fund and to compare these costs with the ongoing costs of investing in other mutual funds. Per SEC requirements, the examples assume that you had a $1,000 investment in the Class at the beginning of the reporting period, May 1, 2006 and continued to hold your shares at the end of the reporting period, October 31, 2006.
Actual Expenses
For each Class of the Fund in the table below, the first line provides information about actual account values and actual expenses. You may use the information in this line, together with the amount you invested, to estimate the expenses that you paid over the period. Simply divide your account value by $1,000 (for example, an $8,600 account value divided by $1,000 = 8.6), then multiply the result by the number in the first line of each Class under the heading entitled “Expenses Paid During Period” to estimate the expenses you paid on your account during the period.
Hypothetical Example for Comparison Purposes
The second line of each Class in the table below provides information about hypothetical account values and hypothetical expenses based on the Class’ actual expense ratio and an assumed rate of return of 5% per year before expenses, which is not the Class’ actual return. The hypothetical account values and expenses may not be used to estimate the actual ending account balance or expenses you paid for the period. You may use this information to compare the ongoing costs of investing in the Class of the Fund and other funds. To do so, compare this 5% hypothetical example with the 5% hypothetical examples that appear in the shareholder reports of the other funds.
Please note that the expenses shown in the table are meant to highlight your ongoing costs only and do not reflect any transaction costs, such as sales charges (loads) or redemption fees. Therefore, the second line for each Class in the table is useful in comparing ongoing costs only, and will not help you determine the relative total costs of owning different funds. In addition, if these transaction costs were included, your costs would have been higher. The examples also assume all dividends and distributions have been reinvested.
Schedule of Shareholder Expenses
Expense Analysis of a $1,000 Investment
(October 31, 2006)
| | | | | | | | | | | | | | |
| Micro Cap Equity Fund | | | | | Beginning
Account Value,
5/1/06 | | Ending
Account Value,
10/31/06 | | Expenses Paid
During Period* | | Annualized
Expense Ratio* |
| Class A | | Actual | | | $ | 1,000.00 | | $ | 949.00 | | $ | 9.04 | | 1.84% |
| | | Hypothetical | 1 | | $ | 1,000.00 | | $ | 1,015.72 | | $ | 9.39 | | 1.84% |
| Class B | | Actual | | | $ | 1,000.00 | | $ | 946.20 | | $ | 12.36 | | 2.52% |
| | | Hypothetical | 1 | | $ | 1,000.00 | | $ | 1,012.30 | | $ | 12.86 | | 2.52% |
| Class C | | Actual | | | $ | 1,000.00 | | $ | 945.80 | | $ | 12.36 | | 2.52% |
| | | Hypothetical | 1 | | $ | 1,000.00 | | $ | 1,012.30 | | $ | 12.86 | | 2.52% |
| Class R | | Actual | | | $ | 1,000.00 | | $ | 948.40 | | $ | 10.26 | | 2.09% |
| | | Hypothetical | 1 | | $ | 1,000.00 | | $ | 1,014.46 | | $ | 10.67 | | 2.09% |
| Institutional Service Class | | Actual | | | $ | 1,000.00 | | $ | 951.10 | | $ | 7.48 | | 1.52% |
| | | Hypothetical | 1 | | $ | 1,000.00 | | $ | 1,017.34 | | $ | 7.76 | | 1.52% |
| Institutional Class | | Actual | | | $ | 1,000.00 | | $ | 951.10 | | $ | 7.43 | | 1.51% |
| | | Hypothetical | 1 | | $ | 1,000.00 | | $ | 1,017.39 | | $ | 7.71 | | 1.51% |
| * | Expenses are equal to the Fund’s annualized expense ratio multiplied by the average account value over the period multiplied by 184/365 (to reflect the one-half year period). The expense ratio presented represents a six-month, annualized ratio in accordance with SEC guidelines. |
| 1 | Represents the hypothetical 5% return before expenses. |
| | |
Portfolio Summary | | Gartmore Micro Cap Equity Fund |
October 31, 2006
The SEC adopted a requirement that Funds present their portfolio holdings in a table, chart or graph format in their annual and semiannual reports to shareholders, whether or not a statement of investments is utilized. The following tables, which present portfolio holdings as a percentage of net assets, are provided in compliance with this requirement.
| | |
| Asset Allocation | | |
| Common Stocks | | 97.0% |
Repurchase Agreements | | 2.5% |
| Other Investments* | | 28.3% |
| Liabilities in excess of other assets** | | -27.8% |
| | |
| | 100.0% |
| | |
| Top Industries | | |
| Healthcare | | 12.3% |
| Computer Software & Services | | 8.4% |
| Transportation Services | | 7.1% |
| Electronics | | 6.6% |
| Internet | | 6.4% |
| Semiconductors | | 4.6% |
| Retail | | 3.9% |
| Wireless Equipment | | 3.3% |
| Machinery | | 3.3% |
| Telecommunications | | 3.1% |
| Other Assets | | 41.0% |
| | |
| | 100.0% |
| | |
| Top Holdings*** | | |
| iMergent, Inc. | | 2.2% |
| International Display Works, Inc. | | 2.2% |
| Sun Hydraulics Corp. | | 2.1% |
| Kforce, Inc. | | 2.0% |
| Celadon Group, Inc. | | 2.0% |
| AngioDynamics, Inc. | | 1.9% |
| ThermoGenesis Corp. | | 1.9% |
| Radiant Systems, Inc. | | 1.8% |
| Medallion Financial Corp. | | 1.8% |
| RELM Wireless Corp. | | 1.7% |
| Other Assets | | 80.4% |
| | |
| | 100.0% |
| * | Includes value of collateral received from securities lending. |
| ** | Includes value of collateral owed from securities lending. |
| *** | For purpose of listing top holdings, repurchase agreements are considered cash equivalents and are included as part of Other Assets. |
Gartmore Micro Cap Equity Fund
Common Stocks (97.0%)
Statement of Investments
October 31, 2006
| | | | | |
| | | Shares or
Principal Amount | | Value |
| | | | | |
Advertising Services (1.0%) | | | |
24/7 Real Media, Inc. (b) (c) | | 120,600 | | $ | 1,193,940 |
| | | | | |
Bank Holding Companies (1.9%) | | | |
Royal Bancshares of Pennsylvania, Inc., Class A (c) | | 41,533 | | | 1,138,004 |
Vineyard National Bancorp Co. (c) | | 52,100 | | | 1,137,864 |
| | | | | |
| | | | | 2,275,868 |
| | | | | |
Business Services (2.4%) | | | |
Marlin Business Services, Inc. (b) | | 55,300 | | | 1,277,983 |
People Support, Inc. (b) | | 75,700 | | | 1,482,963 |
| | | | | |
| | | | | 2,760,946 |
| | | | | |
Commercial Services (1.7%) | | | |
Providence Service Corp. (b) (c) | | 71,000 | | | 1,951,790 |
| | | | | |
Computer Software & Services (8.4%) | | | |
MapInfo Corp. (b) | | 123,400 | | | 1,657,262 |
Radiant Systems, Inc. (b) | | 187,800 | | | 2,067,678 |
Smith Micro Software, Inc. (b) (c) | | 59,600 | | | 1,013,796 |
Think Partnership, Inc. (b) | | 608,854 | | | 1,850,916 |
Tumbleweed Communications Corp. (b) (c) | | 594,100 | | | 1,586,247 |
Website Pros, Inc. (b) | | 146,600 | | | 1,574,484 |
| | | | | |
| | | | | 9,750,383 |
| | | | | |
Consulting Services (2.5%) | | | |
Perficient, Inc. (b) | | 100,000 | | | 1,677,000 |
TRX, Inc. (b) | | 198,908 | | | 1,233,230 |
| | | | | |
| | | | | 2,910,230 |
| | | | | |
Cosmetics (1.5%) | | | |
CCA Industries, Inc. | | 175,000 | | | 1,802,500 |
| | | | | |
Diagnostic Substances (1.3%) | | | |
Trinity Biotech plc (b) (c) | | 164,400 | | | 1,507,548 |
| | | | | |
E-Commerce (0.8%) | | | |
eDiets.com, Inc. (b) (c) | | 274,000 | | | 923,380 |
| | | | | |
Electronics (6.6%) | | | |
CyberOptics Corp. (b) (c) | | 135,600 | | | 1,719,408 |
Directed Electronics, Inc. (b) | | 124,300 | | | 1,709,125 |
International Display Works, Inc. (b) (c) | | 393,300 | | | 2,521,053 |
| | | | | |
| | | Shares or
Principal Amount | | Value |
| | | | | |
Electronics (continued) | | | |
LaBarge, Inc. (b) | | 61,550 | | $ | 797,688 |
NovAtel, Inc. (b) | | 25,300 | | | 943,943 |
| | | | | |
| | | | | 7,691,217 |
| | | | | |
Engineering Services (1.2%) | | | |
ENGlobal Corp. (b) (c) | | 232,900 | | | 1,388,084 |
| | | | | |
Financial (3.1%) | | | |
FirstCity Financial Corp. (b) (c) | | 141,300 | | | 1,497,780 |
Medallion Financial Corp. | | 172,708 | | | 2,063,861 |
| | | | | |
| | | | | 3,561,641 |
| | | | | |
Food Products & Services (1.3%) | | | |
SunOpta, Inc. (b) (c) | | 153,700 | | | 1,513,945 |
| | | | | |
Healthcare (12.3%) | | | |
Allied Healthcare International, Inc. (b) | | 652,080 | | | 1,297,639 |
America Service Group, Inc. (b) (c) | | 8,900 | | | 138,039 |
AngioDynamics, Inc. (b) (c) | | 103,800 | | | 2,247,270 |
Bio-Reference Laboratories, Inc. (b) (c) | | 52,861 | | | 1,249,105 |
Cynosure, Inc. (b) | | 103,500 | | | 1,904,400 |
Lemaitre Vascular, Inc. (b) | | 215,270 | | | 1,302,384 |
NovaMed, Inc. (b) | | 150,000 | | | 1,147,500 |
Option Care, Inc. (c) | | 116,500 | | | 1,476,055 |
Rockwell Medical Technologies, Inc. (b) (c) | | 184,838 | | | 1,330,834 |
ThermoGenesis Corp. (b) | | 521,000 | | | 2,209,040 |
| | | | | |
| | | | | 14,302,266 |
| | | | | |
Household Appliances (1.6%) | | | |
Cybex International, Inc. (b) (c) | | 246,590 | | | 1,824,766 |
| | | | | |
Human Resources (2.0%) | | | |
Kforce, Inc. (b) | | 157,300 | | | 2,354,781 |
| | | | | |
Insurance Brokers (2.1%) | | | |
First Mercury Financial Corp. (b) | | 30,760 | | | 636,732 |
James River Group, Inc. (b) | | 59,600 | | | 1,786,808 |
| | | | | |
| | | | | 2,423,540 |
| | | | | |
Internet (6.4%) | | | |
Health Grades, Inc. (b) | | 366,500 | | | 1,740,875 |
iMergent, Inc. (b) | | 153,500 | | | 2,563,450 |
Statement of Investments (Continued)
October 31, 2006
Gartmore Micro Cap Equity Fund (Continued)
Common Stocks (continued)
| | | | | |
| | | Shares or
Principal Amount | | Value |
| | | | | |
Internet (continued) | | | | | |
TheStreet.com, Inc. (c) | | 187,100 | | $ | 1,702,610 |
Youbet.com, Inc. (b) (c) | | 340,000 | | | 1,438,200 |
| | | | | |
| | | | | 7,445,135 |
| | | | | |
Machinery (3.3%) | | | |
BTU International, Inc (b) (c) | | 181,500 | | | 1,805,925 |
Gehl Co. (b) (c) | | 69,468 | | | 1,982,617 |
| | | | | |
| | | | | 3,788,542 |
| | | | | |
Metal Processors (2.1%) | | | |
Sun Hydraulics Corp. (c) | | 111,500 | | | 2,395,020 |
| | | | | |
Motor Vehicle Parts & Accessories (3.0%) | | | |
Amerigon, Inc. (b) (c) | | 202,300 | | | 1,766,079 |
Fuel Systems Solutions, Inc. (b) (c) | | 133,650 | | | 1,753,488 |
| | | | | |
| | | | | 3,519,567 |
| | | | | |
Oil & Gas (1.2%) | | | |
TGC Industries, Inc. (b) (c) | | 184,000 | | | 1,444,400 |
| | | | | |
Pollution Control (0.1%) | | | |
Flanders Corp. (b) | | 11,600 | | | 116,464 |
| | | | | |
Printing (1.4%) | | | |
Multi-Color Corp. | | 50,020 | | | 1,608,143 |
| | | | | |
Research & Development (1.5%) | | | |
Kendle International, Inc. (b) | | 50,000 | | | 1,731,000 |
| | | | | |
Restaurants (1.6%) | | | |
Buffalo Wild Wings, Inc. (b) | | 35,500 | | | 1,835,350 |
| | | | | |
Retail (3.9%) | | | |
Collegiate Pacific, Inc. (c) | | 140,000 | | | 1,400,000 |
Lenox Group, Inc. (b) | | 235,371 | | | 1,414,580 |
United Retail Group, Inc. (b) | | 93,447 | | | 1,679,242 |
| | | | | |
| | | | | 4,493,822 |
| | | | | |
Semiconductors (4.6%) | | | |
FSI International, Inc. (b) (c) | | 311,400 | | | 1,824,804 |
Rudolph Technologies, Inc. (b) (c) | | 64,400 | | | 1,137,304 |
Tvia, Inc. (b) (c) | | 343,562 | | | 412,274 |
Ultra Clean Holdings (b) (c) | | 152,500 | | | 1,990,125 |
| | | | | |
| | | | | 5,364,507 |
| | | | | |
| | | | | |
| | | Shares or
Principal Amount | | Value |
| | | | | |
Technology (1.1%) | | | |
Merge Technologies, Inc. (b) (c) | | 165,800 | | $ | 1,278,318 |
| | | | | |
Telecommunications (3.1%) | | | |
Radyne, Inc. (b) | | 173,900 | | | 1,756,390 |
Sirenza Microdevices, Inc. (b) (c) | | 256,673 | | | 1,881,413 |
| | | | | |
| | | | | 3,637,803 |
| | | | | |
Transportation Services (7.1%) | | | |
Celadon Group, Inc. (b) (c) | | 122,400 | | | 2,296,224 |
Dynamex, Inc. (b) (c) | | 58,300 | | | 1,235,377 |
Marten Transport Ltd. (b) (c) | | 71,194 | | | 1,211,010 |
MC Shipping, Inc. (c) | | 182,000 | | | 1,783,600 |
Quality Distribution, Inc. (b) (c) | | 116,800 | | | 1,740,320 |
| | | | | |
| | | | | 8,266,531 |
| | | | | |
Veterinary Diagnostics (1.6%) | | | |
Neogen Corp. (b) | | 91,043 | | | 1,868,202 |
| | | | | |
Wireless Equipment (3.3%) | | | |
Globecomm Systems, Inc. (b) (c) | | 195,900 | | | 1,792,485 |
RELM Wireless Corp. (b) (c) | | 270,000 | | | 2,011,500 |
| | | | | |
| | | | | 3,803,985 |
| | | | | |
| | |
Total Common Stocks | | | | | 112,733,614 |
| | | | | |
|
Repurchase Agreements (2.5%) |
CS First Boston, 5.17%, dated 10/31/06, due 11/01/06, repurchase price $1,500,290, collateralized by U.S. Government Agency Mortgages with a market value of $ 1,530,079 | | 1,500,075 | | | 1,500,075 |
Nomura Securities, 5.17%, dated 10/31/06, due 11/01/06, repurchase price $1,432,435, collateralized by U.S. Government Agency Mortgages with a market value of $ 1,460,876 | | 1,432,229 | | | 1,432,229 |
| | | | | |
| | |
Total Repurchase Agreements | | | | | 2,932,304 |
| | | | | |
Short-Term Securities Held as Collateral for Securities on Loan (28.3%)
| | | | | | | |
| | | Shares or
Principal Amount | | Value | |
| | | | | | | |
Banc of America Securities LLC Repurchase Agreement, 5.32%, dated 10/31/06, due 11/01/06, repurchase price $22,386,734, collateralized by U.S. Government Agency Mortgages with a market value of $22,831,094 | | $ | 22,383,426 | | $ | 22,383,426 | |
Bank of America Corp. Master Note, 5.38%, 11/01/06 (d) | | | 2,000,000 | | | 2,000,000 | |
Citigroup Global Markets Inc. Master Note,
5.38%, 11/01/06 (d) | | | 3,000,000 | | | 3,000,000 | |
General Electric Capital Corp. Medium Term Note,
5.39%, 12/08/06 (d) | | | 1,500,043 | | | 1,500,043 | |
Islandsbanki HF Corp. Medium Term Note, 5.39%, 11/22/06 (d) | | | 1,000,000 | | | 1,000,000 | |
Unicredito Italiano Bank Plc Medium Term Note,
5.33%, 11/09/06 (d) | | | 3,000,000 | | | 3,000,000 | |
| | | | | | | |
| | |
Total Short-Term Securities Held as Collateral for Securities on Loan | | | | | | 32,883,469 | |
| | | | | | | |
| |
Total Investments
(Cost $139,649,275) (a) — 127.8% | | | 148,549,387 | |
| |
Liabilities in excess of other
assets — (27.8)% | | | (32,325,848 | ) |
| | | | | | | |
| | |
NET ASSETS — 100.0% | | | | | $ | 116,223,539 | |
| | | | | | | |
| | (a) | See notes to financial statements for tax unrealized appreciation (depreciation) of securities. |
| | (b) | Denotes a non-income producing security. |
| | (c) | All or part of security was on loan as of October 31, 2006. |
| | (d) | Variable Rate Security. The rate reflected in the Statement of Investments is the rate in effect on October 31, 2006. The maturity date represents the actual maturity date. |
See notes to financial statements.
Gartmore U.S. Growth Leaders Long-Short Fund
For the annual period ended Oct. 31, 2006, the Gartmore U.S. Growth Leaders Long-Short Fund (Class A at NAV) returned 5.27% versus 4.54% for its benchmark, the Citigroup 3-Month T-Bill Index. For broader comparison, the average return for the Fund’s Lipper peer category of Long/Short Equity Funds (consisting of 44 funds as of Oct. 31, 2006) was 10.02%.
Led by the small-capitalization sector, most broad based stock indexes posted healthy double-digit gains during the reporting period. Gains at the beginning and end of the period were interrupted by a correction that began shortly after the Federal Reserve Board raised short-term interest rates at its May 2006 Federal Open Market Committee meeting. Investors were driven out of technology and other economically sensitive names and into defensive investments due to inflation fears and concerns that the Federal Reserve might continue to tighten credit for a longer period than previously expected. By mid-July, however, the outlook for inflation had improved somewhat and further evidence of a slowing economy had emerged, giving the Fed the flexibility to hold interest rates steady at its August, September and October meetings. Falling energy prices in the final months of the reporting period added to investors’ optimism. As a result, stock markets advanced smartly to end the period near their 12-month highs.
The Fund benefited from its investments in the industrials, consumer discretionary and health-care sectors. In industrials, the Fund’s long positions in The Boeing Co., UAL Corp. and Rockwell Collins, Inc. helped Fund performance, while Fund holdings in Panera Bread Co. and Starwood Hotels and Resorts Worldwide, Inc. were standouts in the consumer discretionary sector. In health care, the Fund’s long positions in Adolor Corp., Myogen, Inc. and Gilead Sciences, Inc. provided performance boosts. On the short side, a sizable Fund position in enterprise software developer CA, Inc. was beneficial, as was our decision to sell short homebuilder M.D.C. Holdings, Inc.
Detractors from Fund performance in the technology sector included the Fund’s long positions in security software provider McAfee, Inc. and Linux distributor Red Hat, Inc. McAfee was one of a number of technology stocks to be hit with questions about its stock options pricing policies, whereas Red Hat made an acquisition that proved to be more difficult to integrate than anticipated. In health care, the Fund’s holdings in St. Jude Medical, Inc. hampered performance due to a lull in defibrillator sales. Among the Fund’s ETF (exchange-traded fund) holdings, short positions in the iShares Inc. Russell 2000® Growth Index Fund, the Merrill Lynch Oil Service HOLDRS Trust and the iShares Trust Russell 1000® Index Fund were counterproductive.
The Fund’s net long position averaged 27% during the reporting period, fluctuating within a range of 15% to 38%. The size of the bias to the long side reflects our belief that the market should continue to perform reasonably well through the end of the year due to an accommodative Fed, contained inflation and slow but healthy economic growth. Some sectors could experience volatility, as investors sort out the significance of the recent mid-term elections. Overall, though, we look for a constructive environment for stocks over the near term.
Portfolio Managers:
Christopher Baggini, CFA and Douglas Burtnick, CFA
| | |
Fund Performance | | Gartmore U.S. Growth Leaders Long-Short Fund |
Average Annual Total Return
(For periods ended October 31, 2006)
| | | | | | | | |
| | | | | 1 Yr. | | 5 Yr. | | Inception1 |
| Class A2 | | w/o SC3 | | 5.27% | | 5.58% | | 11.46% |
| | | w/SC4 | | -0.78% | | 4.33% | | 10.72% |
| Class B2 | | w/o SC3 | | 4.53% | | 4.91% | | 11.06% |
| | | w/SC5 | | -0.47% | | 4.61% | | 11.06% |
| Class C6 | | w/o SC3 | | 4.48% | | 4.77% | | 9.72% |
| | | w/SC7 | | 3.48% | | 4.77% | | 9.72% |
| Class R8,10 | | | | 4.91% | | 5.43% | | 11.37% |
| Institutional Class9,10 | | 5.60% | | 5.70% | | 11.53% |
All figures showing the effect of a sales charge reflect the maximum charge possible, because it has the most dramatic effect on performance data.
| 1 | The Fund’s predecessor Fund, the Montgomery Partners Long-Short Equity Plus Fund, commenced operations for its Class C shares and Class R shares on December 31, 1997, and commenced operations for its Class A shares and Class B shares on October 31, 2001. As of June 23, 2003, the Gartmore Long-Short Equity Plus Fund (which previously had not commenced operations) acquired all the assets, subject to stated liabilities, of the Montgomery Partners Long-Short Equity Plus Fund. At that time the Gartmore Long-Short Equity Plus Fund took on the performance of the Montgomery Partners Long-Short Equity Plus Fund. The Fund subsequently changed its name to the Gartmore U.S. Growth Leaders Long-Short Fund on July 1, 2004. |
| 2 | These returns through October 31, 2001 include the performance of the Class R shares of the Fund’s predecessor fund, and, for periods from November 1, 2001 to June 22, 2003, the returns for the Class A and Class B shares include the performance of the Class A and Class B shares, respectively, of the Fund’s predecessor fund. Excluding the effect of any fee waivers or reimbursements, such prior performance is similar to what Class A and Class B shares would have produced because all classes of the Fund’s shares invest in the same portfolio of securities and Class A shares had the same expenses after waivers and reimbursements. The performance for these classes has been restated to reflect differences in sales charges (where applicable), but does not reflect the differing levels of other fees (primarily Rule 12b-1 and/or administrative services fees) applicable to Class B shares; if these fees were reflected, the performance for Class B shares would have been lower. |
| 3 | These returns do not reflect the effects of sales charges (SC). |
| 4 | A 5.75% front-end sales charge was deducted. |
| 5 | A 5.00% contingent deferred sales charge (CDSC) was deducted. The CDSC declines to 0% after 6 years. |
| 6 | These returns through June 22, 2003 include the performance of the Class C shares of the Fund’s predecessor fund. |
| 7 | A CDSC of 1.00% was deducted from the one year return because it is charged when you sell Class C shares within the first year after purchase. |
| 8 | These returns for the period through October 31, 2001 include the performance of the Class R shares of the Fund’s predecessor fund, for the period from November 1, 2001 through June 22, 2003 include the performance of the Class B shares of the Fund’s predecessor fund and for the period from June 23, 2003 to December 31, 2003 (prior to the creation of the Fund’s Class R shares in February 27, 2004) include the performance of the Fund’s Class B shares. The returns have been adjusted for the fact that Class R shares do not have any applicable sales charges but have not been adjusted for the lower expenses applicable to Class R shares. Excluding the effect of any fee waivers or reimbursements, Class B shares’ average annual total returns are similar to what Class R shares would have produced because the Class R shares will invest in the same portfolio of securities as Class B shares. |
| 9 | These returns for the period through October 31, 2001 include the performance of the Institutional Class shares of the Fund’s predecessor fund, for the period from November 1, 2001 through June 22, 2003 include the performance of the Class B shares of the Fund’s predecessor fund and for the period from June 23, 2003 to December 31, 2003 (prior to the creation of the Fund’s Institutional Class shares on June 29, 2004) include the performance of the Fund’s Class B shares. The returns have been adjusted for the fact that Institutional Class shares do not have any applicable sales charges but have not been adjusted for the lower expenses applicable to Institutional Class shares. Excluding the effect of any fee waivers or reimbursements, Class B shares’ average annual total returns are similar to what Institutional Class shares would have produced because the Institutional Class shares will invest in the same portfolio of securities as Class B shares. |
| 10 | Not subject to any sales charges. |
| | |
Fund Performance (Continued) | | Gartmore U.S. Growth Leaders Long-Short Fund |
Performance of a $10,000 Investment
Investment return and principal value will fluctuate, and when redeemed, shares may be worth more or less than original cost. Past performance is no guarantee of future results and does not reflect the deduction of taxes that a shareholder would pay on fund distributions or the redemption of fund shares. Investing in mutual funds involves market risk, including loss of principal. Performance returns assume the reinvestment of all distributions.
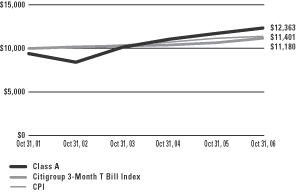
Comparative performance of $10,000 invested in Class A shares of the Gartmore U.S. Growth Leaders Long-Short Fund, the Citigroup U.S. Domestic 3-Month T Bill Index(a), and the Consumer Price Index (CPI)(b) since inception. Unlike the Fund, the returns for these unmanaged indexes do not reflect any fees, expenses, or sales charges. Investors cannot invest directly in market indexes.
| (a) | The Citigroup U.S. Domestic 3-Month T Bill Index is an average of the last 3-month treasury bill issues (excluding the current month-end bill). |
| (b) | The CPI represents changes in prices of a basket of goods and services purchased for consumption by urban households. |
| | |
Shareholder Expense Example | | Gartmore U.S. Growth Leaders Long-Short Fund |
As a shareholder of the Fund, you incur two types of costs: (1) transaction costs, including sales charges (loads) paid on purchase payments and redemption fees; and (2) ongoing costs, including investment advisory fees, administration fees, distribution fees and other Fund expenses. The examples below are intended to help you understand your ongoing costs (in dollars) of investing in the Fund and to compare these costs with the ongoing costs of investing in other mutual funds. Per SEC requirements, the examples assume that you had a $1,000 investment in the Class at the beginning of the reporting period, May 1, 2006 and continued to hold your shares at the end of the reporting period, October 31, 2006.
Actual Expenses
For each Class of the Fund in the table below, the first line provides information about actual account values and actual expenses. You may use the information in this line, together with the amount you invested, to estimate the expenses that you paid over the period. Simply divide your account value by $1,000 (for example, an $8,600 account value divided by $1,000 = 8.6), then multiply the result by the number in the first line of each Class under the heading entitled “Expenses Paid During Period” to estimate the expenses you paid on your account during the period.
Hypothetical Example for Comparison Purposes
The second line of each Class in the table below provides information about hypothetical account values and hypothetical expenses based on the Class’ actual expense ratio and an assumed rate of return of 5% per year before expenses, which is not the Class’ actual return. The hypothetical account values and expenses may not be used to estimate the actual ending account balance or expenses you paid for the period. You may use this information to compare the ongoing costs of investing in the Class of the Fund and other funds. To do so, compare this 5% hypothetical example with the 5% hypothetical examples that appear in the shareholder reports of the other funds.
Please note that the expenses shown in the table are meant to highlight your ongoing costs only and do not reflect any transaction costs, such as sales charges (loads) or redemption fees. Therefore, the second line for each Class in the table is useful in comparing ongoing costs only, and will not help you determine the relative total costs of owning different funds. In addition, if these transaction costs were included, your costs would have been higher. The examples also assume all dividends and distributions have been reinvested.
Schedule of Shareholder Expenses
Expense Analysis of a $1,000 Investment
(October 31, 2006)
| | | | | | | | | | | | | | |
| U.S. Growth Leaders Long-Short Fund | | | | | Beginning
Account Value,
5/1/06 | | Ending
Account Value,
10/31/06 | | Expenses Paid
During Period* | | Annualized
Expense Ratio* |
| Class A | | Actual | | | $ | 1,000.00 | | $ | 997.90 | | $ | 13.24 | | 2.63% |
| | | Hypothetical | 1 | | $ | 1,000.00 | | $ | 1,011.74 | | $ | 13.42 | | 2.63% |
| Class B | | Actual | | | $ | 1,000.00 | | $ | 994.50 | | $ | 16.94 | | 3.37% |
| | | Hypothetical | 1 | | $ | 1,000.00 | | $ | 1,008.01 | | $ | 17.20 | | 3.37% |
| Class C | | Actual | | | $ | 1,000.00 | | $ | 994.30 | | $ | 16.94 | | 3.37% |
| | | Hypothetical | 1 | | $ | 1,000.00 | | $ | 1,008.01 | | $ | 17.20 | | 3.37% |
| Class R | | Actual | | | $ | 1,000.00 | | $ | 995.60 | | $ | 16.05 | | 3.19% |
| | | Hypothetical | 1 | | $ | 1,000.00 | | $ | 1,008.92 | | $ | 16.28 | | 3.19% |
| Institutional Class | | Actual | | | $ | 1,000.00 | | $ | 999.20 | | $ | 11.94 | | 2.37% |
| | | Hypothetical | 1 | | $ | 1,000.00 | | $ | 1,013.05 | | $ | 12.10 | | 2.37% |
| * | Expenses are equal to the Fund’s annualized expense ratio multiplied by the average account value over the period multiplied by 184/365 (to reflect the one-half year period). The expense ratio presented represents a six-month, annualized ratio in accordance with SEC guidelines. |
| 1 | Represents the hypothetical 5% return before expenses. |
| | |
Portfolio Summary | | Gartmore U.S. Growth Leaders Long-Short Fund |
October 31, 2006 | Long Positions |
The SEC adopted a requirement that Funds present their portfolio holdings in a table, chart or graph format in their annual and semiannual reports to shareholders, whether or not a statement of investments is utilized. The following tables, which present portfolio holdings as a percentage of net assets, are provided in compliance with this requirement.
| | |
| Asset Allocation | | |
| Common Stocks | | 69.1% |
Repurchase Agreements | | 25.9% |
| Other assets in excess of liabilities | | 5.0% |
| | |
| | 100.0% |
| | |
| Top Industries | | |
| Technology | | 16.8% |
| Finance | | 9.1% |
| Health Care | | 8.2% |
| Consumer Staple | | 6.7% |
| Capital Goods & Defense | | 6.2% |
| Computer Software & Services | | 5.9% |
| Consumer Cyclical | | 5.8% |
| Energy | | 4.7% |
| Casinos & Gambling | | 1.4% |
| Multimedia | | 1.3% |
| Other Assets | | 33.9% |
| | |
| | 100.0% |
| | |
| Top Holdings* | | |
| PepsiCo, Inc. | | 2.5% |
| Altria Group, Inc. | | 2.1% |
| Intel Corp. | | 2.0% |
| Fortune Brands, Inc. | | 2.0% |
| Baxter International, Inc. | | 2.0% |
| Citrix Systems, Inc. | | 1.8% |
| State Street Corp. | | 1.8% |
| Integrated Device Technology, Inc. | | 1.8% |
| XTO Energy, Inc. | | 1.7% |
| Broadcom Corp. | | 1.5% |
| Other Assets | | 80.8% |
| | |
| | 100.0% |
| * | For purpose of listing top holdings, repurchase agreements are considered cash equivalents and are included as part of Other Assets. |
| | |
Portfolio Summary | | Gartmore U.S. Growth Leaders Long-Short Fund |
October 31, 2006 | Short Positions |
The SEC adopted a requirement that Funds present their portfolio holdings in a table, chart or graph format in their annual and semiannual reports to shareholders, whether or not a statement of investments is utilized. The following tables, which present portfolio holdings as a percentage of net assets, are provided in compliance with this requirement.
| | |
| Asset Allocation | | |
| Common Stocks | | 32.4% |
| Mutual Funds | | 10.3% |
| Other Assets | | 57.3% |
| | |
| | 100.0% |
| | |
| Top Industries | | |
| Consumer Cyclical | | 5.8% |
| Consumer Staple | | 5.1% |
| Energy | | 4.8% |
| Technology | | 4.7% |
| Capital Goods & Defense | | 3.7% |
| Construction | | 1.9% |
| Insurance | | 1.6% |
| Casinos & Gambling | | 1.6% |
| Health Care | | 1.3% |
| Business Services | | 1.0% |
| Other Assets | | 68.5% |
| | |
| | 100.0% |
| | |
| Top Holdings | | |
| iShares Russell 2000 Growth | | 10.5% |
| iShares Russell 1000 Index | | 9.1% |
| BP Amoco PLC ADR—GB | | 5.7% |
| Semiconductor HOLDRs Trust | | 4.6% |
| Bowater, Inc. | | 4.5% |
| Kraft Foods, Inc. | | 4.5% |
| Masco Corp. | | 4.5% |
| CA, Inc. | | 4.2% |
| Walgreen Co. | | 4.1% |
| SAFECO Corp. | | 3.8% |
| Other Assets | | 44.5% |
| | |
| | 100.0% |
Statement of Investments
October 31, 2006
Gartmore U.S. Growth Leaders Long-Short Fund
Common Stocks - Long Positions (c) (69.1%)
| | | | | |
| | | Shares or
Principal Amount | | Value |
| | | | | |
Airlines (0.8%) | | | | | |
UAL Corp. (b) | | 21,230 | | $ | 763,006 |
| | | | | |
Capital Goods & Defense (6.2%) | | | |
AMETEK, Inc. | | 20,940 | | | 977,479 |
Boeing Co. | | 18,610 | | | 1,486,195 |
Caterpillar, Inc. | | 13,980 | | | 848,726 |
Emerson Electric Co. | | 17,610 | | | 1,486,283 |
Rockwell Collins, Inc. | | 22,610 | | | 1,313,189 |
| | | | | |
| | | | | 6,111,872 |
| | | | | |
Casinos & Gambling (1.4%) | | | | | |
Boyd Gaming Corp. | | 34,030 | | | 1,343,164 |
| | | | | |
Computer Software & Services (5.9%) | | | |
ANSYS, Inc. (b) | | 14,000 | | | 644,000 |
Cisco Systems, Inc. (b) | | 42,840 | | | 1,033,729 |
Hyperion Solutions Corp. (b) | | 26,410 | | | 987,734 |
Internap Network Services Corp. (b) | | 63,270 | | | 1,042,690 |
Juniper Networks, Inc. (b) | | 86,380 | | | 1,487,463 |
SPSS, Inc. (b) | | 19,500 | | | 539,565 |
| | | | | |
| | | | | 5,735,181 |
| | | | | |
Consumer Cyclical (5.8%) | | | | | |
Abercrombie & Fitch Co., Class A | | 12,540 | | | 961,191 |
Best Buy Co., Inc. | | 15,530 | | | 858,033 |
Fortune Brands, Inc. | | 25,460 | | | 1,959,147 |
Pacific Sunwear of California, Inc. (b) | | 27,820 | | | 490,188 |
Panera Bread Co., Class A (b) | | 11,900 | | | 735,420 |
Standard Pacific Corp. | | 29,050 | | | 703,882 |
| | | | | |
| | | | | 5,707,861 |
| | | | | |
Consumer Staple (6.7%) | | | | | |
Altria Group, Inc. | | 25,310 | | | 2,058,462 |
Colgate-Palmolive Co. | | 16,500 | | | 1,055,505 |
CVS Corp. | | 31,140 | | | 977,173 |
PepsiCo, Inc. | | 38,930 | | | 2,469,719 |
| | | | | |
| | | | | 6,560,859 |
| | | | | |
Energy (4.7%) | | | | | |
Peabody Energy Corp. | | 17,200 | | | 721,884 |
Praxair, Inc. | | 16,470 | | | 992,318 |
Valero Energy Corp. | | 23,840 | | | 1,247,547 |
XTO Energy, Inc. | | 36,150 | | | 1,686,759 |
| | | | | |
| | | | | 4,648,508 |
| | | | | |
| | | | | |
| | | Shares or
Principal Amount | | Value |
| | | | | |
Finance (9.1%) | | | | | |
Capital One Financial Corp. | | 11,880 | | $ | 942,440 |
Chicago Mercantile Exchange Holdings, Inc. | | 1,970 | | | 986,970 |
E*TRADE Group, Inc. (b) | | 56,600 | | | 1,317,648 |
Goldman Sachs Group, Inc. | | 7,030 | | | 1,334,224 |
IntercontinentalExchange, Inc. (b) | | 12,840 | | | 1,083,953 |
State Street Corp. | | 26,970 | | | 1,732,283 |
Wachovia Corp. | | 27,070 | | | 1,502,385 |
| | | | | |
| | | | | 8,899,903 |
| | | | | |
Health Care (8.2%) | | | | | |
Baxter International, Inc. | | 41,640 | | | 1,914,190 |
BioMarin Pharmaceutical, Inc. (b) | | 32,360 | | | 518,731 |
Gilead Sciences, Inc. (b) | | 19,050 | | | 1,312,545 |
Human Genome Sciences, Inc. (b) | | 53,400 | | | 712,890 |
Pharmion Corp. (b) | | 27,250 | | | 666,263 |
Shire PLC ADR — GB | | 14,260 | | | 782,161 |
WellPoint, Inc. (b) | | 15,610 | | | 1,191,355 |
Wyeth | | 18,620 | | | 950,179 |
| | | | | |
| | | | | 8,048,314 |
| | | | | |
Hotels (1.2%) | | | | | |
Starwood Hotels & Resorts Worldwide, Inc. | | 19,170 | | | 1,145,216 |
| | | | | |
Internet (1.0%) | | | | | |
Google, Inc., Class A (b) | | 2,120 | | | 1,009,947 |
| | | | | |
Multimedia (1.3%) | | | | | |
Comcast Corp., Class A (b) | | 30,870 | | | 1,255,483 |
| | | | | |
Technology (16.8%) | | | | | |
Broadcom Corp. (b) | | 49,920 | | | 1,511,078 |
CheckFree Corp. (b) | | 32,100 | | | 1,267,308 |
Ciena Corp. (b) | | 45,808 | | | 1,076,946 |
Citrix Systems, Inc. (b) | | 58,740 | | | 1,734,592 |
Corning, Inc. (b) | | 70,040 | | | 1,430,917 |
Integrated Device Technology, Inc. (b) | | 108,230 | | | 1,715,446 |
Intel Corp. | | 93,020 | | | 1,985,047 |
KLA-Tencor Corp. | | 19,660 | | | 966,682 |
Motorola, Inc. | | 38,910 | | | 897,265 |
NovAtel, Inc. — CA (b) | | 11,980 | | | 446,974 |
NVIDIA Corp. (b) | | 33,970 | | | 1,184,534 |
Common Stocks - Long Positions (c) (continued)
| | | | | | |
| | | Shares or
Principal Amount | | Value |
| | | | | | |
Technology (continued) | | | | | | |
SiRF Technology Holdings, Inc. (b) | | | 34,700 | | $ | 975,764 |
Sun Microsystems, Inc. (b) | | | 217,150 | | | 1,179,125 |
| | | | | | |
| | | | | | 16,371,678 |
| | | | | | |
| |
Total Common Stocks - Long Positions (c) | | | 67,600,992 |
| | | | | | |
|
Repurchase Agreements (25.9%) |
CS First Boston, 5.17%, dated 10/31/06, due 11/01/06, repurchase price $12,977,483, collateralized by U.S. Government Agency Mortgages with a market value of $13,235,155 | | $ | 12,975,620 | | | 12,975,620 |
Nomura Securities, 5.17%, dated 10/31/06, due 11/01/06, repurchase price $12,390,530, collateralized by U.S. Government Agency Mortgages with a market value of $12,636,547 | | | 12,388,751 | | | 12,388,751 |
| | | | | | |
| | |
Total Repurchase Agreements | | | | | | 25,364,371 |
| | | | | | |
| |
Total Investments
(Cost $89,490,233) (a) — 95.0% | | | 92,965,363 |
| | |
Other assets in excess of
liabilities — 5.0% | | | | | | 4,910,103 |
| | | | | | |
| | |
NET ASSETS — 100.0% | | | | | $ | 97,875,466 |
| | | | | | |
| | (a) | See notes to financial statements for tax unrealized appreciation (depreciation) of securities. |
| | (b) | Denotes a non-income producing security. |
| | (c) | All long positions held as collateral for securities sold short. |
| | ADR | American Depository Receipt |
See notes to financial statements.
Statement of Securities Sold Short
October 31, 2006
Gartmore U.S. Growth Leaders Long-Short Fund
Common Stocks - Short Positions (32.4%)
| | | | | |
| | | Shares | | Value |
| | | | | |
Business Services (1.0%) | | | |
Monster Worldwide, Inc. (b) | | 23,420 | | $ | 948,744 |
| | | | | |
Capital Goods & Defense (3.7%) | | | |
American Standard Cos., Inc. | | 27,840 | | | 1,233,034 |
Cummins, Inc. | | 11,530 | | | 1,464,079 |
Terex Corp. (b) | | 18,360 | | | 950,314 |
| | | | | |
| | | | | 3,647,427 |
| | | | | |
Casinos & Gambling (1.6%) | | | |
Station Casinos, Inc. | | 25,440 | | | 1,534,032 |
| | | | | |
Construction (1.9%) | | | |
Masco Corp. | | 68,350 | | | 1,889,878 |
| | | | | |
Consumer Cyclical (5.8%) | | | |
Bowater, Inc. | | 90,900 | | | 1,900,718 |
Gap, Inc. (The) | | 47,650 | | | 1,001,603 |
International Paper Co. | | 35,480 | | | 1,183,258 |
P.F. Chang’s China Bistro, Inc. (b) | | 19,760 | | | 826,363 |
Urban Outfitters, Inc. (b) | | 37,860 | | | 662,550 |
| | | | | |
| | | | | 5,574,492 |
| | | | | |
Consumer Staple (5.1%) | | | |
Coca-Cola Enterprises, Inc. | | 70,160 | | | 1,405,305 |
Kraft Foods, Inc. | | 55,070 | | | 1,894,408 |
Walgreen Co. | | 38,950 | | | 1,701,336 |
| | | | | |
| | | | | 5,001,049 |
| | | | | |
Energy (4.8%) | | | |
BP Amoco PLC ADR — GB | | 35,530 | | | 2,384,063 |
EOG Resources, Inc. | | 23,080 | | | 1,535,512 |
Tidewater, Inc. | | 16,060 | | | 798,664 |
| | | | | |
| | | | | 4,718,239 |
| | | | | |
Finance (0.9%) | | | |
MasterCard, Inc. | | 12,110 | | | 897,351 |
| | | | | |
Health Care (1.3%) | | | |
Mylan Laboratories, Inc. | | 62,570 | | | 1,282,685 |
| | | | | |
Insurance (1.6%) | | | |
SAFECO Corp. | | 27,510 | | | 1,600,807 |
| | | | | |
Technology (4.7%) | | | |
Autodesk, Inc. (b) | | 37,960 | | | 1,395,030 |
CA, Inc. | | 70,260 | | | 1,739,637 |
| | | | | |
| | | Shares | | Value |
| | | | | |
Technology (continued) | | | |
Cabot Microelectronics Corp. (b) | | 15,810 | | $ | 451,376 |
Dell, Inc. (b) | | 41,560 | | | 1,011,155 |
| | | | | |
| | | | | 4,597,198 |
| | | | | |
| |
Total Common Stocks - Short Positions | | | 31,691,902 |
| | | | | |
|
Mutual Funds (10.3%) |
Equity Funds (10.3%) | | | |
iShares Russell 1000 Index | | 50,990 | | | 3,803,344 |
iShares Russell 2000 Growth | | 56,860 | | | 4,381,063 |
Semiconductor HOLDRs Trust | | 56,880 | | | 1,933,920 |
| | | | | |
| | |
Total Mutual Funds | | | | | 10,118,327 |
| | | | | |
| |
Total Securities Sold Short
(Proceeds $40,596,378) (a) — 42.7% | | $ | 41,810,229 |
| | | | | |
| | (a) | See notes to financial statements for tax unrealized appreciation (depreciation) of securities. |
| | (b) | Denotes a non-income producing security. |
| | ADR | American Depository Receipt |
| | HOLDR | Holding Company Depository Receipt |
See notes to financial statements.
Gartmore Value Opportunities Fund
For the annual period ended Oct. 31, 2006, the Gartmore Value Opportunities Fund (Class A at NAV) returned 17.79% versus 19.98% for its benchmark, the Russell 2000® Index. For broader comparison, the average return for the Fund’s Lipper peer category of Small-Cap Core Funds (consisting of 689 funds as of Oct. 31, 2006) was 16.40%.
Small-capitalization stocks continued their dominance over large- and mid-cap stocks during the reporting period. The exception to that trend occurred during May through July, when stocks declined sharply and investors became concerned about worsening inflation and the possibility that the Federal Reserve Board might increase interest rates further than expected. As the summer progressed, however, inflation remained in check and the economy appeared to be slowing, providing the Federal Reserve with the flexibility it needed to hold rates steady at its August, September and October Federal Open Market Committee meetings. Adding to the positive backdrop late in the reporting period were a relatively benign hurricane season and a sharp decline in crude oil and natural gas prices.
During the reporting period, stock selection for the Fund was weak in the financials and information technology sectors, and this contributed to Fund underperformance. The Fund’s holdings in financials name Scottish Re Group Ltd., a provider of reinsurance services, was affected by fears of insolvency; this surprise led to a dramatic decline in the company’s stock price. We sold the Fund’s position in Scottish Re because we were unable to confirm the company’s ability to remain solvent. The Fund’s holdings in information technology name SafeNet, Inc. faced issues with its business execution plan that ultimately led to the departure of the chief financial officer and an abandoned acquisition; this provider of infrastructure software products also was faced with a stock option expense investigation. In light of these developments, we eliminated the Fund’s position in SafeNet.
Conversely, our stock selection for the Fund was strong in the industrials and materials sectors, and this contributed to Fund performance. Industrials name Robbins & Myers, Inc. and materials name Allegheny Technologies Inc. were particularly strong performers for the Fund. Robbins & Myers, a manufacturer of pumps and processing equipment, benefited from strong oil, gas and chemical end markets, while vastly improving the pharmaceutical segment of its business. This relatively small market cap company increased its visibility with investors by delivering strong quarterly earnings that exceeded Wall Street expectations. Allegheny Technologies manufactures specialty metals, and the company’s earnings benefited from a strong global commodity environment.
The market currently is dealing with many uncertainties, including the direction of interest rates, the future of economic growth and the sustainability of consumer spending. In response to such an environment, we have positioned the Fund slightly more defensively, reflected by our overweight positions in the health-care and telecommunications sectors. We are optimistic about the overall market, however, because we continue to find individual companies with strong fundamental outlooks across all sectors. The steep decline in the prices of energy and raw materials is likely to temper any decline in economic growth. In addition, the combination of a moderating economy and attractive valuations is likely to further fuel merger-and-acquisition activity, providing a solid underpinning for equity valuations.
Our objective remains the same—to buy, at attractive valuations, well-positioned companies in which we see tangible evidence of fundamental improvement. As 2007 unfolds, we believe that: 1) investors will continue to pay attention to the fundamentals that we think are important for long-term investing success; and 2) our investment discipline and style can provide the potential for favorable results.
Portfolio Managers:
Jeffrey Petherick, CFA and Mary Champagne, CFA
| | |
Fund Performance | | Gartmore Value Opportunities Fund |
Average Annual Total Return
(For periods ended October 31, 2006)
| | | | | | | | |
| | | | | 1 Yr. | | 5 Yr. | | Inception1 |
| Class A | | w/o SC2 | | 17.79% | | 12.41% | | 12.31% |
| | | w/SC3 | | 10.99% | | 11.09% | | 11.34% |
| Class B | | w/o SC2 | | 17.02% | | 11.67% | | 11.60% |
| | | w/SC4 | | 12.02% | | 11.41% | | 11.60% |
| Class C5 | | w/o SC2 | | 16.99% | | 11.67% | | 11.59% |
| | | w/SC6 | | 15.99% | | 11.67% | | 11.59% |
| Class R7,9 | | | | 17.59% | | 12.01% | | 11.85% |
| Institutional Class8,9 | | 18.21% | | 12.69% | | 12.62% |
All figures showing the effect of a sales charge reflect the maximum charge possible, because it has the most dramatic effect on performance data.
| 1 | Fund commenced operations on December 29, 1999. |
| 2 | These returns do not reflect the effects of sales charges (SC). |
| 3 | A 5.75% front-end sales charge was deducted. |
| 4 | A 5.00% contingent deferred sales charge (CDSC) was deducted. The CDSC declines to 0% after 6 years. |
| 5 | These returns until the creation of Class C shares (3/1/01) include the performance of the Fund’s Class B shares. Excluding the effects of any fee waivers or reimbursements, such prior performance is substantially similar to what Class C shares would have produced because Class C shares invest in the same portfolio of securities as Class B shares and have the same expenses after any fee waivers or reimbursements. For Class C shares returns with sales charges, these returns have been restated for the applicable sales charges. |
| 6 | A CDSC of 1.00% was deducted from the one year return because it is charged when you sell Class C shares within the first year after purchase. |
| 7 | These returns until the creation of Class R shares (12/30/03) include the performance of the Fund’s Class B shares. The returns have been adjusted for the fact that Class R shares do not have any applicable sales charges but have not been adjusted for the lower expenses applicable to Class R shares. Excluding the effect of any fee waivers or reimbursements, such prior performance is similar to what Class R shares would have produced because the Class R shares invest in the same portfolio of securities as Class B shares. |
| 8 | These returns until the creation of Institutional Class shares (6/29/04) include the performance of the Fund’s Institutional Service shares. The returns have been adjusted for the fact that Institutional Class shares do not have any applicable sales charges but have not been adjusted for the lower expenses applicable to Institutional Class shares. Excluding the effect of any fee waivers or reimbursements, such prior performance is similar to what Institutional Class shares would have produced because the Institutional Class shares invest in the same portfolio of securities as Institutional Service shares. |
| 9 | Not subject to any sales charges. |
Performance of a $10,000 Investment
Investment return and principal value will fluctuate, and when redeemed, shares may be worth more or less than original cost. Past performance is no guarantee of future results and does not reflect the deduction of taxes that a shareholder would pay on fund distributions or the redemption of fund shares. Investing in mutual funds involves market risk, including loss of principal. Performance returns assume the reinvestment of all distributions.
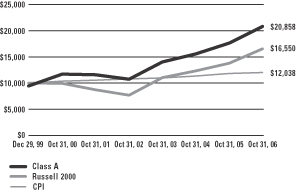
Comparative performance of $10,000 invested in Class A shares of the Gartmore Value Opportunities Fund, Russell 2000 Index (Russell 2000)(a), and the Consumer Price Index (CPI)(b) since inception. Unlike the Fund, the returns for these unmanaged indexes do not reflect any fees, expenses, or sales charges. Investors cannot invest directly in market indexes.
| (a) | The Russell 2000 is an unmanaged index of approximately 2,000 companies with small market capitalizations relative to the market capilizations of other U.S. companies. |
| (b) | The CPI represents changes in prices of a basket of goods and services purchased for consumption by urban households. |
| | |
Shareholder Expense Example | | Gartmore Value Opportunities Fund |
As a shareholder of the Fund, you incur two types of costs: (1) transaction costs, including sales charges (loads) paid on purchase payments and redemption fees; and (2) ongoing costs, including investment advisory fees, administration fees, distribution fees and other Fund expenses. The examples below are intended to help you understand your ongoing costs (in dollars) of investing in the Fund and to compare these costs with the ongoing costs of investing in other mutual funds. Per SEC requirements, the examples assume that you had a $1,000 investment in the Class at the beginning of the reporting period, May 1, 2006 and continued to hold your shares at the end of the reporting period, October 31, 2006.
Actual Expenses
For each Class of the Fund in the table below, the first line provides information about actual account values and actual expenses. You may use the information in this line, together with the amount you invested, to estimate the expenses that you paid over the period. Simply divide your account value by $1,000 (for example, an $8,600 account value divided by $1,000 = 8.6), then multiply the result by the number in the first line of each Class under the heading entitled “Expenses Paid During Period” to estimate the expenses you paid on your account during the period.
Hypothetical Example for Comparison Purposes
The second line of each Class in the table below provides information about hypothetical account values and hypothetical expenses based on the Class’ actual expense ratio and an assumed rate of return of 5% per year before expenses, which is not the Class’ actual return. The hypothetical account values and expenses may not be used to estimate the actual ending account balance or expenses you paid for the period. You may use this information to compare the ongoing costs of investing in the Class of the Fund and other funds. To do so, compare this 5% hypothetical example with the 5% hypothetical examples that appear in the shareholder reports of the other funds.
Please note that the expenses shown in the table are meant to highlight your ongoing costs only and do not reflect any transaction costs, such as sales charges (loads) or redemption fees. Therefore, the second line for each Class in the table is useful in comparing ongoing costs only, and will not help you determine the relative total costs of owning different funds. In addition, if these transaction costs were included, your costs would have been higher. The examples also assume all dividends and distributions have been reinvested.
Schedule of Shareholder Expenses
Expense Analysis of a $1,000 Investment
(October 31, 2006)
| | | | | | | | | | | | | | |
| Value Opportunities Fund | | | | | Beginning
Account Value,
5/1/06 | | Ending
Account Value,
10/31/06 | | Expenses Paid
During Period* | | Annualized
Expense Ratio* |
| Class A | | Actual | | | $ | 1,000.00 | | $ | 990.40 | | $ | 6.42 | | 1.28% |
| | | Hypothetical | 1 | | $ | 1,000.00 | | $ | 1,018.55 | | $ | 6.53 | | 1.28% |
| Class B | | Actual | | | $ | 1,000.00 | | $ | 987.50 | | $ | 9.92 | | 1.98% |
| | | Hypothetical | 1 | | $ | 1,000.00 | | $ | 1,015.02 | | $ | 10.11 | | 1.98% |
| Class C | | Actual | | | $ | 1,000.00 | | $ | 986.80 | | $ | 9.92 | | 1.98% |
| | | Hypothetical | 1 | | $ | 1,000.00 | | $ | 1,015.02 | | $ | 10.11 | | 1.98% |
| Class R | | Actual | | | $ | 1,000.00 | | $ | 989.00 | | $ | 7.72 | | 1.54% |
| | | Hypothetical | 1 | | $ | 1,000.00 | | $ | 1,017.24 | | $ | 7.86 | | 1.54% |
| Institutional Class | | Actual | | | $ | 1,000.00 | | $ | 991.80 | | $ | 5.07 | | 1.01% |
| | | Hypothetical | 1 | | $ | 1,000.00 | | $ | 1,019.91 | | $ | 5.16 | | 1.01% |
| * | Expenses are equal to the Fund’s annualized expense ratio multiplied by the average account value over the period multiplied by 184/365 (to reflect the one-half year period). The expense ratio presented represents a six-month, annualized ratio in accordance with SEC guidelines. |
| 1 | Represents the hypothetical 5% return before expenses. |
| | |
Portfolio Summary | | Gartmore Value Opportunities Fund |
October 31, 2006
The SEC adopted a requirement that Funds present their portfolio holdings in a table, chart or graph format in their annual and semiannual reports to shareholders, whether or not a statement of investments is utilized. The following tables, which present portfolio holdings as a percentage of net assets, are provided in compliance with this requirement.
| | |
| Asset Allocation | | |
| Common Stocks | | 96.5% |
| Repurchase Agreements | | 2.4% |
| Other Investments* | | 12.6% |
| Liabilities in excess of other assets** | | -11.5% |
| | |
| | 100.0% |
| | |
| Top Industries | | |
| Real Estate Investment Trusts | | 9.2% |
| Commercial Banks | | 7.4% |
| Specialty Retail | | 5.3% |
| Communications Equipment | | 5.0% |
| Machinery | | 4.8% |
| Insurance | | 3.8% |
| Chemicals | | 3.8% |
| Thrifts & Mortgage Finance | | 3.2% |
| Health Care Providers & Services | | 3.1% |
| Internet Software & Services | | 3.0% |
| Other Assets | | 51.4% |
| | |
| | 100.0% |
| | |
| Top Holdings*** | | |
| Trammell Crow Co. | | 1.5% |
| Advanta Corp., Class B | | 1.3% |
| BankUnited Financial Corp., Class A | | 1.3% |
| inVentiv Health, Inc. | | 1.3% |
| SVB Financial Group | | 1.3% |
| Triad Guaranty, Inc. | | 1.3% |
| Banner Corp. | | 1.2% |
| Per-Se Technologies, Inc. | | 1.2% |
| Perrigo Co. | | 1.2% |
| Colonial BancGroup, Inc. | | 1.2% |
| Other Assets | | 87.2% |
| | |
| | 100.0% |
| * | Includes value of collateral received from securities lending. |
| ** | Includes value of collateral owed from securities lending. |
| *** | For purpose of listing top holdings, repurchase agreements are considered cash equivalents and are included as part of Other Assets. |
Gartmore Value Opportunities Fund
Common Stocks (96.5%)
Statement of Investments
October 31, 2006
| | | | | |
| | | Shares or
Principal Amount | | Value |
| | | | | |
Aerospace & Defense (0.7%) | | | |
United Industrial Corp. | | 2,300 | | $ | 103,523 |
| | | | | |
Airlines (0.7%) | | | |
Continental Airlines, Inc. (b) | | 3,200 | | | 118,016 |
| | | | | |
Chemicals (3.8%) | | | |
Airgas, Inc. | | 2,400 | | | 90,744 |
Hercules, Inc. (b) | | 7,500 | | | 136,500 |
Minerals Technologies, Inc. | | 1,800 | | | 99,288 |
RPM International, Inc. | | 6,600 | | | 126,390 |
Sensient Technologies Corp. | | 4,100 | | | 94,505 |
Spartech Corp. | | 2,400 | | | 65,760 |
| | | | | |
| | | | | 613,187 |
| | | | | |
Commercial Banks (7.4%) | | | |
Banner Corp. | | 4,600 | | | 199,916 |
Colonial BancGroup, Inc. | | 7,900 | | | 188,336 |
First Indiana Corp. (c) | | 6,500 | | | 165,880 |
First Midwest Bancgroup, Inc. | | 3,400 | | | 129,302 |
Greene County Bancshares, Inc. | | 3,000 | | | 113,100 |
Security Bank Corp. (c) | | 7,666 | | | 185,747 |
SVB Financial Group (b) | | 4,400 | | | 202,488 |
| | | | | |
| | | | | 1,184,769 |
| | | | | |
Commercial Services & Supplies (2.5%) | | | |
Acco Brands Corp. (b) | | 4,100 | | | 99,630 |
Tetra Tech, Inc. (b) | | 6,800 | | | 123,624 |
Waste Connections, Inc. (b) | | 4,200 | | | 170,898 |
| | | | | |
| | | | | 394,152 |
| | | | | |
Communications Equipment (5.0%) | | | |
3Com Corp. (b) | | 18,900 | | | 91,854 |
Arris Group, Inc. (b) | | 10,100 | | | 135,340 |
C-COR, Inc. (b) | | 18,500 | | | 184,815 |
F5 Networks, Inc. (b) | | 1,500 | | | 99,285 |
Finisar Corp. (b) (c) | | 49,200 | | | 171,216 |
Mastec, Inc. (b) | | 10,900 | | | 119,355 |
| | | | | |
| | | | | 801,865 |
| | | | | |
Computers & Peripherals (1.7%) | | | |
Hutchinson Technology, Inc. (b) (c) | | 4,800 | | | 111,120 |
Komag, Inc. (b) | | 4,300 | | | 164,475 |
| | | | | |
| | | | | 275,595 |
| | | | | |
| | | | | |
| | | Shares or
Principal Amount | | Value |
| | | | | |
Consumer Finance (1.3%) | | | |
Advanta Corp., Class B | | 5,442 | | $ | 213,544 |
| | | | | |
Containers & Packaging (1.7%) | | | |
Caraustar Industries, Inc. (b) (c) | | 12,600 | | | 136,458 |
Silgan Holdings, Inc. | | 3,410 | | | 141,072 |
| | | | | |
| | | | | 277,530 |
| | | | | |
Diversified Telecommunication Services (2.2%) |
Cogent Communications Group, Inc. (b) | | 10,900 | | | 154,344 |
Covad Communications Group,
Inc. (b) (c) | | 74,700 | | | 99,351 |
Iowa Telecommunications Services, Inc. | | 4,800 | | | 95,712 |
| | | | | |
| | | | | 349,407 |
| | | | | |
Electric Utilities (2.9%) | | | |
ALLETE, Inc. | | 4,100 | | | 184,910 |
Cleco Corp. | | 5,900 | | | 151,630 |
IDACORP, Inc. | | 3,300 | | | 130,119 |
| | | | | |
| | | | | 466,659 |
| | | | | |
Electrical Equipment (1.1%) | | | |
General Cable Corp. (b) | | 2,400 | | | 90,240 |
Power-One, Inc. (b) | | 13,600 | | | 93,024 |
| | | | | |
| | | | | 183,264 |
| | | | | |
Electronic Equipment & Instruments (0.8%) | | | |
CalAmp Corp. (b) | | 8,900 | | | 59,185 |
Kemet Corp. (b) | | 10,300 | | | 75,705 |
| | | | | |
| | | | | 134,890 |
| | | | | |
Energy Equipment & Services (1.8%) | | | |
Hanover Compressor Co. (b) (c) | | 9,700 | | | 179,644 |
Hornbeck Offshore Services, Inc. (b) | | 2,877 | | | 103,831 |
| | | | | |
| | | | | 283,475 |
| | | | | |
Food & Staples Retailing (1.7%) | | | |
Casey’s General Stores, Inc. | | 5,600 | | | 135,912 |
The Andersons, Inc. | | 3,900 | | | 140,205 |
| | | | | |
| | | | | 276,117 |
| | | | | |
Food Products (0.3%) | | | |
Reddy Ice Holdings, Inc. | | 2,020 | | | 48,480 |
| | | | | |
Statement of Investments (Continued)
October 31, 2006
Gartmore Value Opportunities Fund (Continued)
Common Stocks (continued)
| | | | | |
| | | Shares or
Principal Amount | | Value |
| | | | | |
Gas Utilities (1.6%) | | | |
South Jersey Industries, Inc. | | 3,600 | | $ | 111,348 |
WGL Holdings, Inc. | | 4,300 | | | 139,535 |
| | | | | |
| | | | | 250,883 |
| | | | | |
Health Care Equipment & Supplies (0.8%) | | | |
IntraLase Corp. (b) (c) | | 6,700 | | | 131,722 |
| | | | | |
Health Care Providers & Services (3.1%) | | | |
AMN Healthcare Services, Inc. (b) | | 7,005 | | | 177,156 |
Chemed Corp. | | 3,200 | | | 113,568 |
inVentiv Health, Inc. (b) | | 7,200 | | | 205,920 |
| | | | | |
| | | | | 496,644 |
| | | | | |
Health Care Technology (1.2%) | | | |
Per-Se Technologies, Inc. (b) (c) | | 7,800 | | | 190,944 |
| | | | | |
Hotels Restaurants & Leisure (2.9%) | | | |
CEC Entertainment, Inc. (b) | | 2,100 | | | 72,387 |
Denny’s Corp. (b) | | 21,400 | | | 90,950 |
Jack in the Box, Inc. (b) | | 1,200 | | | 67,332 |
Rare Hospitality International, Inc. (b) | | 4,100 | �� | | 129,191 |
Vail Resorts, Inc. (b) | | 2,700 | | | 104,355 |
| | | | | |
| | | | | 464,215 |
| | | | | |
Household Durables (1.3%) | | | |
Jarden Corp. (b) (c) | | 2,550 | | | 91,749 |
Tupperware Corp. | | 5,200 | | | 110,396 |
| | | | | |
| | | | | 202,145 |
| | | | | |
Insurance (3.8%) | | | |
National Financial Partners Corp. (c) | | 4,700 | | | 185,180 |
Seabright Insurance Holdings, Inc. (b) | | 8,330 | | | 136,695 |
The Hanover Insurance Group, Inc. | | 3,600 | | | 163,260 |
Tower Group, Inc. (c) | | 3,650 | | | 129,028 |
| | | | | |
| | | | | 614,163 |
| | | | | |
Internet Software & Services (3.0%) | | | |
Internet Capital Group, Inc. (b) | | 14,200 | | | 148,816 |
Jupitermedia Corp. (b) | | 16,500 | | | 145,035 |
ValueClick, Inc. (b) | | 5,000 | | | 94,000 |
Website Pros, Inc. (b) | | 8,300 | | | 89,142 |
| | | | | |
| | | | | 476,993 |
| | | | | |
| | | | | |
| | | Shares or
Principal Amount | | Value |
| | | | | |
Leisure Equipment & Products (2.4%) | | | |
K2, Inc. (b) | | 7,400 | | $ | 101,084 |
MarineMax, Inc. (b) (c) | | 3,900 | | | 111,189 |
RC2 Corp. (b) | | 3,900 | | | 176,202 |
| | | | | |
| | | | | 388,475 |
| | | | | |
Life Sciences Tools & Services (1.8%) | | | |
Invitrogen Corp. (b) | | 1,900 | | | 110,219 |
Varian, Inc. (b) | | 3,800 | | | 178,182 |
| | | | | |
| | | | | 288,401 |
| | | | | |
Machinery (4.8%) | | | |
CLARCOR, Inc. (c) | | 5,400 | | | 175,932 |
ESCO Technologies, Inc. (b) | | 4,000 | | | 173,680 |
Federal Signal Corp. | | 5,100 | | | 77,826 |
Gardner Denver, Inc. (b) | | 2,000 | | | 67,980 |
Robbins & Myers, Inc. | | 4,500 | | | 173,205 |
Trinity Industries, Inc. | | 2,950 | | | 106,377 |
| | | | | |
| | | | | 775,000 |
| | | | | |
Marine Services (0.9%) | | | |
American Commercial Lines,
Inc. (b) | | 2,300 | | | 147,545 |
| | | | | |
Media (2.0%) | | | |
DreamWorks Animation SKG,
Inc. (b) | | 1,000 | | | 26,450 |
Gemstar-TV Guide International, Inc. (b) | | 42,800 | | | 148,944 |
Lions Gate Entertainment
Corp. — CA (b) (c) | | 12,600 | | | 127,638 |
Salem Communications Corp. | | 781 | | | 10,379 |
| | | | | |
| | | | | 313,411 |
| | | | | |
Metals & Mining (1.3%) | | | |
Royal Gold, Inc. | | 2,600 | | | 76,544 |
Stillwater Mining Co. (b) | | 12,300 | | | 132,225 |
| | | | | |
| | | | | 208,769 |
| | | | | |
Oil Gas & Consumable Fuels (2.0%) | | | |
CNX Gas Corp. (b) | | 4,100 | | | 107,215 |
Foundation Coal Holdings, Inc. | | 3,700 | | | 135,827 |
Warren Resources, Inc. (b) (c) | | 5,900 | | | 69,561 |
| | | | | |
| | | | | 312,603 |
| | | | | |
Common Stocks (continued)
| | | | | |
| | | Shares or
Principal Amount | | Value |
| | | | | |
Pharmaceuticals (1.9%) | | | |
K-V Pharmaceutical Co. (b) | | 5,500 | | $ | 122,760 |
Perrigo Co. | | 10,600 | | | 189,634 |
| | | | | |
| | | | | 312,394 |
| | | | | |
Real Estate Investment Trusts (9.2%) | | | |
American Campus Communities, Inc. | | 5,600 | | | 149,128 |
Annaly Mortgage Management, Inc. | | 14,270 | | | 187,223 |
BioMed Realty Trust, Inc. | | 3,920 | | | 126,342 |
Eagle Hospitality Properties Trust | | 10,840 | | | 101,679 |
First Industrial Realty Trust (c) | | 2,600 | | | 119,522 |
First Potomac Realty Trust | | 4,100 | | | 126,854 |
JER Investors Trust, Inc. | | 10,300 | | | 184,988 |
KKR Financial Corp. | | 4,900 | | | 131,467 |
Medical Properties Trust, Inc. | | 8,290 | | | 112,578 |
Newcastle Investment Corp. | | 3,400 | | | 100,878 |
Winston Hotels, Inc. | | 11,800 | | | 142,780 |
| | | | | |
| | | | | 1,483,439 |
| | | | | |
Real Estate Management &
Development (1.5%) | | | |
Trammell Crow Co. (b) | | 4,893 | | | 238,534 |
| | | | | |
Semiconductors & Semiconductor Equipment (1.8%) | | | |
Cirrus Logic, Inc. (b) | | 15,400 | | | 108,724 |
Cymer, Inc. (b) | | 2,100 | | | 97,293 |
Photronics, Inc. (b) | | 6,000 | | | 83,940 |
| | | | | |
| | | | | 289,957 |
| | | | | |
Software (2.5%) | | | |
Intergraph Corp. (b) | | 2,200 | | | 96,118 |
Parametric Technology Corp. (b) | | 3,420 | | | 66,827 |
Sonic Solutions (b) | | 7,400 | | | 119,436 |
THQ, Inc. (b) | | 3,800 | | | 114,266 |
| | | | | |
| | | | | 396,647 |
| | | | | |
Specialty Retail (5.3%) | | | |
Aeropostale, Inc. (b) | | 2,700 | | | 79,137 |
Hot Topic, Inc. (b) | | 5,200 | | | 52,572 |
Jos. A. Bank Clothiers, Inc. (b) (c) | | 3,200 | | | 95,008 |
New York & Co., Inc. (b) | | 7,800 | | | 101,400 |
Payless Shoesource, Inc. (b) | | 4,400 | | | 117,700 |
| | | | | | |
| | | Shares or
Principal Amount | | Value |
| | | | | | |
Specialty Retail (continued) | | | |
Sonic Automotive, Inc. (c) | | $ | 5,300 | | $ | 139,390 |
Tween Brands, Inc. (b) | | | 2,000 | | | 83,640 |
United Auto Group, Inc. | | | 4,000 | | | 91,920 |
United Retail Group, Inc. (b) | | | 5,000 | | | 89,850 |
| | | | | | |
| | | | | | 850,617 |
| | | | | | |
Textiles Apparel & Luxury Goods (0.9%) | | | |
Phillips-Van Heusen Corp. | | | 3,000 | | | 137,280 |
| | | | | | |
Thrifts & Mortgage Finance (3.2%) | | | |
BankUnited Financial Corp., Class A | | | 7,900 | | | 213,063 |
First Place Financial Corp. | | | 4,400 | | | 102,476 |
Triad Guaranty, Inc. (b) (c) | | | 3,900 | | | 200,889 |
| | | | | | |
| | | | | | 516,428 |
| | | | | | |
Trading Companies & Distributors (0.8%) | | | |
Interline Brands, Inc. (b) | | | 5,100 | | | 122,094 |
| | | | | | |
Wireless Telecommunication Services (0.9%) | | | |
Dobson Communications Corp. (b) | | | 18,100 | | | 140,456 |
| | | | | | |
| | |
Total Common Stocks | | | | | | 15,474,232 |
| | | | | | |
|
Repurchase Agreements (2.4%) |
CS First Boston, 5.17%, dated 10/31/06, due 11/01/06, repurchase price $197,740, collateralized by U.S. Government Agency Mortgages with a market value of $201,666 | | $ | 197,712 | | | 197,712 |
Nomura Securities, 5.17%, dated 10/31/06, due 11/01/06, repurchase price $188,796, collateralized by U.S. Government Agency Mortgages with a market value of $192,545 | | | 188,769 | | | 188,769 |
| | | | | | |
| | |
Total Repurchase Agreements | | | | | | 386,481 |
| | | | | | |
Statement of Investments (Continued)
October 31, 2006
Gartmore Value Opportunities Fund (Continued)
Short-Term Securities Held as Collateral for Securities on Loan (12.6%)
| | | | | | | |
| | | Shares or
Principal Amount | | Value | |
| | | | | | | |
Banc of America Securities LLC Repurchase Agreement, 5.32%, dated 10/31/06, due 11/01/06, repurchase price $625,967, collateralized by U.S. Government Agency Mortgages with a market value of $638,392 | | $ | 625,875 | | $ | 625,875 | |
Bank of America Note,
5.31%, 11/01/06 | | | 1,000,000 | | | 1,000,000 | |
Beta Finance, Inc. Medium Term Note, 5.37%, 11/01/06 | | | 200,000 | | | 200,000 | |
Unicredito Italiano Bank (IRE) PLC, 5.33%,11/09/06 | | | 200,000 | | | 200,000 | |
| | | | | | | |
| |
Total Short-Term Securities Held as Collateral for Securities on Loan | | | 2,025,875 | |
| | | | | | | |
| |
Total Investments
(Cost $16,709,718) (a) — 111.5% | | | 17,886,588 | |
| |
Liabilities in excess of other
assets — (11.5)% | | | (1,838,574 | ) |
| | | | | | | |
| | |
NET ASSETS — 100.0% | | | | | $ | 16,048,014 | |
| | | | | | | |
| | (a) | See notes to financial statements for tax unrealized appreciation (depreciation) of securities. |
| | (b) | Denotes a non-income producing security. |
| | (c) | All or part of security was on loan as of October 31, 2006. |
See notes to financial statements.
Statements of Assets and Liabilities
October 31, 2006
| | | | | | | | | | | | | | | | |
| | | Gartmore High
Yield Bond
Fund | | | Gartmore Micro
Cap Equity
Fund | | Gartmore U.S.
Growth Leaders
Long-Short Fund | | | Gartmore Value
Opportunities
Fund |
Assets: | | | | | | | | | | | | | | | | |
Investments, at value (cost $23,426,047; $114,333,545; $64,125,862; and $15,697,362; respectively)* | | $ | 23,762,659 | | | $ | 123,233,657 | | $ | 67,600,992 | | | $ | 16,874,232 | | |
Repurchase agreements, at cost and value** | | | 592,613 | | | | 25,315,730 | | | 25,364,371 | | | | 1,012,356 | | |
| | | | | | | | | | | | | | | | |
Total Investments | | | 24,355,272 | | | | 148,549,387 | | | 92,965,363 | | | | 17,886,588 | | |
| | | | | | | | | | | | | | | | |
Deposits with broker for securities sold short | | | — | | | | — | | | 41,280,861 | | | | — | | |
Interest and dividends receivable | | | 563,313 | | | | 52,986 | | | 316,460 | | | | 9,841 | | |
Receivable for capital shares issued | | | 11,687 | | | | 46,637 | | | 272,350 | | | | 20,581 | | |
Receivable for investments sold | | | — | | | | 2,251,960 | | | 11,385,790 | | | | 507,511 | | |
Receivable from administrator | | | — | | | | 19,596 | | | 7,272 | | | | — | | |
Prepaid expenses | | | 162 | | | | 2,030 | | | 367 | | | | 2,064 | | |
| | | | | | | | | | | | | | | | |
Total Assets | | | 24,930,434 | | | | 150,922,596 | | | 146,228,463 | | | | 18,426,585 | | |
| | | | | | | | | | | | | | | | |
| | | | | |
Liabilities | | | | | | | | | | | | | | | | |
Securities sold short, at value (proceeds $0; $0; $40,596,378; and $0; respectively) | | | — | | | | — | | | 41,810,229 | | | | — | | |
Payable to custodian | | | — | | | | — | | | — | | | | 3,750 | | |
Distributions payable | | | 11,114 | | | | — | | | — | | | | — | | |
Payable for investments purchased | | | 295,000 | | | | 1,427,796 | | | 6,223,119 | | | | 317,342 | | |
Payable for dividends on securities sold short | | | — | | | | — | | | — | | | | — | | |
Payable for capital shares redeemed | | | 3,658 | | | | 167,060 | | | 98,916 | | | | — | | |
Payable for return of collateral received for securities on loan | | | — | | | | 32,883,469 | | | — | | | | 2,025,875 | | |
Accrued expenses and other payables
Investment advisory fees | | | 9,194 | | | | 124,372 | | | 125,501 | | | | 6,474 | | |
Fund administration and transfer agent fees | | | 2,068 | | | | — | | | — | | | | 1,742 | | |
Distribution fees | | | 2,452 | | | | 49,168 | | | 42,607 | | | | 5,460 | | |
Administrative servicing fees | | | 6,245 | | | | 16,315 | | | 2,016 | | | | 9,307 | | |
Trustee fees | | | 3 | | | | 15 | | | 13 | | | | 2 | | |
Compliance program fees (Note 3) | | | 141 | | | | 935 | | | 842 | | | | 63 | | |
Other | | | 12,619 | | | | 29,927 | | | 49,754 | | | | 8,556 | | |
| | | | | | | | | | | | | | | | |
Total Liabilities | | | 342,494 | | | | 34,699,057 | | | 48,352,997 | | | | 2,378,571 | | |
| | | | | | | | | | | | | | | | |
Net Assets | | $ | 24,587,940 | | | $ | 116,223,539 | | $ | 97,875,466 | | | $ | 16,048,014 | | |
| | | | | | | | | | | | | | | | |
| | | | | |
Represented by: | | | | | | | | | | | | | | | | |
Capital | | $ | 59,881,579 | | | $ | 79,331,560 | | $ | 112,664,299 | | | $ | 12,727,307 | | |
Accumulated net investment income (loss) | | | 1 | | | | — | | | 418,264 | | | | — | | |
Accumulated net realized gains (losses) from investment transactions | | | (35,630,252 | ) | | | 27,991,867 | | | (17,468,376 | ) | | | 2,143,837 | | |
Net unrealized appreciation (depreciation) on investments | | | 336,612 | | | | 8,900,112 | | | 2,261,279 | | | | 1,176,870 | | |
| | | | | | | | | | | | | | | | |
Net Assets | | $ | 24,587,940 | | | $ | 116,223,539 | | $ | 97,875,466 | | | $ | 16,048,014 | | |
| | | | | | | | | | | | | | | | |
| | | | | | | | | | | | | | | | | |
| * | Includes securities held as collateral for securities on loan of $0; $10,500,043; $0; $1,400,000; respectively. |
| ** | Includes securities held as collateral for securities on loan of $0; $22,383,426; $0; $625,875; respectively. |
See notes to financial statements.
Statements of Assets and Liabilities
October 31, 2006
| | | | | | | | | | | | | | | | | | |
| | | Gartmore High
Yield Bond
Fund | | | Gartmore Micro
Cap Equity
Fund | | | Gartmore U.S.
Growth Leaders
Long-Short Fund | | | Gartmore Value
Opportunities
Fund |
Net Assets: | | | | | | | | | | | | | | | | | | |
Class A Shares | | $ | 3,248,960 | | | $ | 57,257,448 | | | $ | 48,717,366 | | | $ | 12,776,962 | | | |
Class B Shares | | | 749,496 | | | | 7,116,782 | | | | 1,033,461 | | | | 2,600,247 | | | |
Class C Shares | | | 1,393,958 | | | | 36,076,472 | | | | 36,585,660 | | | | 668,091 | | | |
Class R Shares | | | 1,184 | | | | 1,471 | | | | 1,138 | | | | 1,370 | | | |
Institutional Service Class Shares | | | 16,765,074 | | | | 320,199 | | | | — | | | | — | | | |
Institutional Class Shares | | | 2,429,268 | | | | 15,451,167 | | | | 11,537,841 | | | | 1,344 | | | |
| | | | | | | | | | | | | | | | | | |
Total | | $ | 24,587,940 | | | $ | 116,223,539 | | | $ | 97,875,466 | | | $ | 16,048,014 | | | |
| | | | | | | | | | | | | | | | | | |
| | | | | |
Shares outstanding (unlimited number of shares authorized) | | | | | | | | | | | | | | | | | | |
Class A Shares | | | 471,419 | | | | 2,384,495 | | | | 4,730,415 | | | | 824,295 | | | |
Class B Shares | | | 108,926 | | | | 306,684 | | | | 103,264 | | | | 173,274 | | | |
Class C Shares | | | 202,423 | | | | 1,553,153 | | | | 4,820,379 | | | | 44,656 | | | |
Class R Shares | | | 172 | | | | 63 | | | | 113 | | | | 90 | | | |
Institutional Service Class Shares | | | 2,413,007 | | | | 13,180 | | | | — | | | | — | | | |
Institutional Class Shares | | | 349,602 | | | | 635,996 | | | | 1,115,656 | | | | 85 | | | |
| | | | | | | | | | | | | | | | | | |
Total | | | 3,545,549 | | | | 4,893,571 | | | | 10,769,827 | | | | 1,042,400 | | | |
| | | | | | | | | | | | | | | | | | |
| | | | | |
Net asset value and redemption price per share (net assets by class divided by shares outstanding by class, respectively): | | | | | | | | | | | | | | | | | | |
Class A Shares | | $ | 6.89 | | | $ | 24.01 | | | $ | 10.30 | | | $ | 15.50 | | | |
Class B Shares (a) | | $ | 6.88 | | | $ | 23.21 | | | $ | 10.01 | | | $ | 15.01 | | | |
Class C Shares (b) | | $ | 6.89 | | | $ | 23.23 | | | $ | 7.59 | | | $ | 14.96 | | | |
Class R Shares | | $ | 6.88 | (c) | | $ | 23.53 | (c) | | $ | 10.11 | (c) | | $ | 15.25 | (c) | | |
Institutional Service Class Shares | | $ | 6.95 | | | $ | 24.29 | | | $ | — | | | $ | — | | | |
Institutional Class Shares | | $ | 6.95 | | | $ | 24.29 | | | $ | 10.34 | | | $ | 15.77 | (c) | | |
| | | | | |
Maximum offering price per share (100%/(100%-maximum sales charge) of net asset value adjusted to the nearest cent | | | | | | | | | | | | | | | | | | |
Class A Shares | | $ | 7.20 | | | $ | 25.47 | | | $ | 10.93 | | | $ | 16.45 | | | |
| | | | | | | | | | | | | | | | | | |
Maximum Sales Charge — Class A Shares | | | 4.25 | % | | | 5.75 | % | | | 5.75 | % | | | 5.75 | % | | |
| | | | | | | | | | | | | | | | | | |
| | | | | | | | | | | | | | | | | | |
| | | | | | | | | | | | | | | | | | |
| | | | | | | | | | | | | | | | | | |
| | | | | | | | | | | | | | | | | | |
| | | | | | | | | | | | | | | | | | | |
| (a) | For Class B Shares, the redemption price per share varies by the length of time shares are held. |
| (b) | For Class C Shares, the redemption price per share is reduced by 1.00% for shares held less than one year. |
| (c) | The NAV reported above represents the traded NAV at October 31, 2006. Due to the financial statement rounding of class assets and class shares above, the NAV results in a different NAV than the traded NAV. |
See notes to financial statements.
Statements of Operations
For the Year Ended October 31, 2006
| | | | | | | | | | | | | | | | | | |
| | | Gartmore High
Yield Bond Fund | | | Gartmore Micro
Cap Equity
Fund | | | Gartmore U.S.
Growth Leaders
Long-Short Fund | | | Gartmore Value
Opportunities
Fund |
INVESTMENT INCOME: | | | | | | | | | | | | | | | | | | |
Interest income | | $ | 1,931,795 | | | $ | 220,467 | | | $ | 2,593,130 | | | $ | 33,898 | | | |
Dividend income (net of foreign withholding tax of $0; $0; $6,449; and $0; respectively) | | | 15,820 | | | | 352,050 | | | | 496,715 | | | | 189,101 | | | |
Income from securities lending | | | — | | | | 451,205 | | | | — | | | | 8,387 | | | |
| | | | | | | | | | | | | | | | | | |
Total Income | | | 1,947,615 | | | | 1,023,722 | | | | 3,089,845 | | | | 231,386 | | | |
| | | | | | | | | | | | | | | | | | |
| | | | | |
Expenses: | | | | | | | | | | | | | | | | | | |
Investment advisory fees | | | 129,318 | | | | 1,519,635 | | | | 1,228,120 | | | | 112,006 | | | |
Fund administration and transfer agent fees | | | 49,970 | | | | 217,217 | | | | 145,480 | | | | 26,066 | | | |
Distribution fees Class A | | | 6,923 | | | | 158,154 | | | | 110,867 | | | | 31,675 | | | |
Distribution fees Class B | | | 6,769 | | | | 78,953 | | | | 9,465 | | | | 26,261 | | | |
Distribution fees Class C | | | 13,449 | | | | 379,172 | | | | 291,408 | | | | 7,022 | | | |
Distribution fees Class R | | | 4 | | | | 7 | | | | 4 | | | | 5 | | | |
Administrative servicing fees Class A | | | 781 | | | | 45,489 | | | | 6,454 | | | | 8,612 | | | |
Administrative servicing fees Class R | | | — | | | | 1 | | | | 2 | | | | 1 | | | |
Administrative servicing fees Institutional Service Class | | | 7,678 | | | | — | | | | — | | | | — | | | |
Dividend expense for securities sold short | | | — | | | | — | | | | 456,445 | | | | — | | | |
Registration and filing fees | | | 45,369 | | | | 63,199 | | | | 36,112 | | | | 51,151 | | | |
Printing fees | | | — | | | | — | | | | 47,450 | | | | 23,207 | | | |
Trustee fees | | | 808 | | | | 4,153 | | | | 2,705 | | | | 543 | | | |
Compliance program fees (Note 3) | | | 343 | | | | 1,977 | | | | 1,647 | | | | 205 | | | |
Other | | | 15,104 | | | | 88,548 | | | | 5,594 | | | | 921 | | | |
| | | | | | | | | | | | | | | | | | |
Total expenses before reimbursed expenses | | | 276,516 | | | | 2,556,505 | | | | 2,341,753 | | | | 287,675 | | | |
Earnings credit (Note 5) | | | (619 | ) | | | (2,883 | ) | | | — | | | | — | | | |
Expenses reimbursed | | | (39,379 | ) | | | — | | | | — | | | | (47,791 | ) | | |
Expenses voluntarily waived by administrator | | | (1,058 | ) | | | (39,544 | ) | | | (18,649 | ) | | | (304 | ) | | |
| | | | | | | | | | | | | | | | | | |
Net Expenses | | | 235,460 | | | | 2,514,078 | | | | 2,323,104 | | | | 239,580 | | | |
| | | | | | | | | | | | | | | | | | |
Net Investment Income (Loss) | | | 1,712,155 | | | | (1,490,356 | ) | | | 766,741 | | | | (8,194 | ) | | |
| | | | | | | | | | | | | | | | | | |
| | | | | |
REALIZED/UNREALIZED GAINS (LOSSES) FROM INVESTMENTS: | | | | | | | | | | | | | | | | | | |
Net realized gains (losses) on investment transactions | | | (12,102 | ) | | | 29,605,354 | | | | 1,579,895 | | | | 2,185,142 | | | |
Net change in unrealized appreciation/depreciation from investments | | | 560,256 | | | | (7,059,278 | ) | | | 1,122,335 | | | | 278,825 | | | |
| | | | | | | | | | | | | | | | | | |
Net realized/unrealized gains (losses) on investments | | | 548,154 | | | | 22,546,076 | | | | 2,702,230 | | | | 2,463,967 | | | |
| | | | | | | | | | | | | | | | | | |
CHANGE IN NET ASSETS RESULTING FROM OPERATIONS | | $ | 2,260,309 | | | $ | 21,055,720 | | | $ | 3,468,971 | | | $ | 2,455,773 | | | |
| | | | | | | | | | | | | | | | | | |
| | | | | | | | | | | | | | | | | | |
| | | | | | | | | | | | | | | | | | |
| | | | | | | | | | | | | | | | | | |
| | | | | | | | | | | | | | | | | | |
| | | | | | | | | | | | | | | | | | | |
See notes to financial statements.
Statements of Changes in Net Assets
| | | | | | | | | | | | | | | | | | |
| | | Gartmore High Yield Bond Fund | | | Gartmore Micro Cap Equity Fund |
| | | Year Ended
October 31, 2006 | | | Year Ended
October 31, 2005 | | | Year Ended
October 31, 2006 | | | Year Ended
October 31, 2005 |
FROM INVESTMENT ACTIVITIES: | | | | | | | | | | | | | | | | | | |
Operations: | | | | | | | | | | | | | | | | | | |
Net investment income (loss) | | $ | 1,712,155 | | | $ | 1,729,238 | | | $ | (1,490,356 | ) | | $ | (2,185,672 | ) | | |
Net realized gains (losses) on investment transactions | | | (12,102 | ) | | | 189,291 | | | | 29,605,354 | | | | 8,767,558 | | | |
Net change in unrealized appreciation/depreciation on investments | | | 560,256 | | | | (1,403,019 | ) | | | (7,059,278 | ) | | | 6,799,515 | | | |
| | | | | | | | | | | | | | | | | | |
Change in net assets resulting from operations | | | 2,260,309 | | | | 515,510 | | | | 21,055,720 | | | | 13,381,401 | | | |
| | | | | | | | | | | | | | | | | | |
| | | | | |
Distributions to Class A Shareholders from: | | | | | | | | | | | | | | | | | | |
Net investment income | | | (198,965 | ) | | | (239,415 | ) | | | — | | | | — | | | |
Net realized gains on investments | | | — | | | | — | | | | (4,008,351 | ) | | | (1,846,386 | ) | | |
| | | | | |
Distributions to Class B Shareholders from: | | | | | | | | | | | | | | | | | | |
Net investment income | | | (44,013 | ) | | | (49,100 | ) | | | — | | | | — | | | |
Net realized gains on investments | | | — | | | | — | | | | (498,374 | ) | | | (163,298 | ) | | |
| | | | | |
Distributions to Class C Shareholders from: | | | | | | | | | | | | | | | | | | |
Net investment income | | | (87,289 | ) | | | (95,312 | ) | | | — | | | | — | | | |
Net realized gains on investments | | | — | | | | — | | | | (2,424,646 | ) | | | (853,621 | ) | | |
| | | | | |
Distributions to Class R Shareholders from: | | | | | | | | | | | | | | | | | | |
Net investment income | | | (80 | ) | | | (77 | ) | | | — | | | | — | | | |
Net realized gains on investments | | | — | | | | — | | | | (82 | ) | | | (23 | ) | | |
| | | | | |
Distributions to Institutional Service Class Shareholders from: | | | | | | | | | | | | | | | | | | |
Net investment income | | | (1,254,113 | ) | | | (1,339,607 | ) | | | — | | | | — | | | |
Net realized gains on investments | | | — | | | | — | | | | (14,884 | ) | | | (2,437 | ) | | |
| | | | | |
Distributions to Institutional Class Shareholders from: | | | | | | | | | | | | | | | | | | |
Net investment income | | | (127,695 | ) | | | (5,727 | ) | | | — | | | | — | | | |
Net realized gains on investments | | | — | | | | — | | | | (556,450 | ) | | | (59,761 | ) | | |
| | | | | | | | | | | | | | | | | | |
Change in net assets from shareholder distributions | | | (1,712,155 | ) | | | (1,729,238 | ) | | | (7,502,787 | ) | | | (2,925,526 | ) | | |
| | | | | | | | | | | | | | | | | | |
Change in net assets from capital transactions | | | (13,222 | ) | | | 828,746 | | | | (19,671,238 | ) | | | (3,422,201 | ) | | |
| | | | | | | | | | | | | | | | | | |
Change in net assets | | | 534,932 | | | | (384,982 | ) | | | (6,118,305 | ) | | | 7,033,674 | | | |
| | | | | |
Net Assets: | | | | | | | | | | | | | | | | | | |
Beginning of period | | | 24,053,008 | | | | 24,437,990 | | | | 122,341,844 | | | | 115,308,170 | | | |
| | | | | | | | | | | | | | | | | | |
End of period | | $ | 24,587,940 | | | $ | 24,053,008 | | | $ | 116,223,539 | | | $ | 122,341,844 | | | |
| | | | | | | | | | | | | | | | | | |
Accumulated net investment income (loss) at end of period | | $ | 1 | | | $ | 1 | | | $ | — | | | $ | — | | | |
| | | | | | | | | | | | | | | | | | |
| | | | | | | | | | | | | | | | | | |
| | | | | | | | | | | | | | | | | | |
| | | | | | | | | | | | | | | | | | |
| | | | | | | | | | | | | | | | | | |
| | | | | | | | | | | | | | | | | | | |
See notes to financial statements.
Statements of Changes in Net Assets
| | | | | | | | | | | | | | | | | | |
| | | Gartmore U.S. Growth Leaders
Long-Short Fund | | | Gartmore Value
Opportunities Fund |
| | | Year Ended
October 31, 2006 | | | Year Ended
October 31, 2005 | | | Year Ended
October 31, 2006 | | | Year Ended
October 31, 2005 |
FROM INVESTMENT ACTIVITIES: | | | | | | | | | | | | | | | | | | |
Operations: | | | | | | | | | | | | | | | | | | |
Net investment income (loss) | | $ | 766,741 | | | $ | (159,372 | ) | | $ | (8,194 | ) | | $ | (7,088 | ) | | |
Net realized gains (losses) on investment transactions | | | 1,579,895 | | | | 2,626,065 | | | | 2,185,142 | | | | 5,310,694 | | | |
Net change in unrealized appreciation/depreciation on investments | | | 1,122,335 | | | | 488,936 | | | | 278,825 | | | | (2,049,777 | ) | | |
| | | | | | | | | | | | | | | | | | |
Change in net assets resulting from operations | | | 3,468,971 | | | | 2,955,629 | | | | 2,455,773 | | | | 3,253,829 | | | |
| | | | | | | | | | | | | | | | | | |
| | | | | |
Distributions to Class A Shareholders from: | | | | | | | | | | | | | | | | | | |
Net investment income | | | (222,323 | ) | | | (796,091 | ) | | | — | | | | (19,254 | ) | | |
Net realized gains on investments | | | — | | | | — | | | | (1,550,143 | ) | | | (2,094,330 | ) | | |
| | | | | |
Distributions to Class B Shareholders from: | | | | | | | | | | | | | | | | | | |
Net investment income | | | (1,537 | ) | | | (18,985 | ) | | | — | | | | — | | | |
Net realized gains on investments | | | — | | | | — | | | | (361,154 | ) | | | (468,923 | ) | | |
| | | | | |
Distributions to Class C Shareholders from: | | | | | | | | | | | | | | | | | | |
Net investment income | | | (123,499 | ) | | | (256,975 | ) | | | — | | | | — | | | |
Net realized gains on investments | | | — | | | | — | | | | (92,659 | ) | | | (121,288 | ) | | |
| | | | | |
Distributions to Class R Shareholders from: | | | | | | | | | | | | | | | | | | |
Net investment income | | | (5 | ) | | | (32 | ) | | | — | | | | (2 | ) | | |
Net realized gains on investments | | | — | | | | — | | | | (164 | ) | | | (187 | ) | | |
| | | | | |
Distributions to Institutional Service Class Shareholders from: | | | | | | | | | | | | | | | | | | |
Net investment income | | | — | | | | — | | | | — | | | | (6,938 | ) | | |
Net realized gains on investments | | | — | | | | — | | | | — | | | | (2,552,592 | ) | | |
| | | | | |
Distributions to Institutional Class Shareholders from: | | | | | | | | | | | | | | | | | | |
Net investment income | | | (58,083 | ) | | | (30,947 | ) | | | — | | | | (4 | ) | | |
Net realized gains on investments | | | — | | | | — | | | | (156 | ) | | | (178 | ) | | |
| | | | | | | | | | | | | | | | | | |
Change in net assets from shareholder distributions | | | (405,447 | ) | | | (1,103,030 | ) | | | (2,004,276 | ) | | | (5,263,696 | ) | | |
| | | | | | | | | | | | | | | | | | |
Change in net assets from capital transactions | | | 36,920,085 | | | | 28,002,160 | | | | 1,070,787 | | | | (15,490,924 | ) | | |
| | | | | | | | | | | | | | | | | | |
Change in net assets | | | 39,983,609 | | | | 29,854,759 | | | | 1,522,284 | | | | (17,500,791 | ) | | |
| | | | | |
Net Assets: | | | | | | | | | | | | | | | | | | |
Beginning of period | | | 57,891,857 | | | | 28,037,098 | | | | 14,525,730 | | | | 32,026,521 | | | |
| | | | | | | | | | | | | | | | | | |
End of period | | $ | 97,875,466 | | | $ | 57,891,857 | | | $ | 16,048,014 | | | $ | 14,525,730 | | | |
| | | | | | | | | | | | | | | | | | |
Accumulated net investment income (loss) at end of period | | $ | 418,264 | | | $ | (5,817 | ) | | $ | — | | | $ | — | | | |
| | | | | | | | | | | | | | | | | | |
| | | | | | | | | | | | | | | | | | |
| | | | | | | | | | | | | | | | | | |
| | | | | | | | | | | | | | | | | | |
| | | | | | | | | | | | | | | | | | | |
See notes to financial statements.
Statements of Changes in Net Assets (continued)
| | | | | | | | | | | | | | | | | | |
| | | Gartmore High Yield Bond Fund | | | Gartmore Micro Cap Equity Fund |
| | | Year Ended
October 31, 2006 | | | Year Ended
October 31, 2005 | | | Year Ended
October 31, 2006 | | | Year Ended
October 31, 2005 |
CAPITAL TRANSACTIONS: | | | | | | | | | | | | | | | | | | |
Class A Shares | | | | | | | | | | | | | | | | | | |
Proceeds from shares issued | | $ | 2,055,244 | | | $ | 3,267,190 | | | $ | 5,157,025 | | | $ | 29,351,797 | | | |
Dividends reinvested | | | 168,007 | | | | 210,984 | | | | 1,556,599 | | | | 903,175 | | | |
Cost of shares redeemed (a) | | | (1,732,220 | ) | | | (4,648,334 | ) | | | (25,285,415 | ) | | | (44,080,513 | ) | | |
| | | | | | | | | | | | | | | | | | |
| | | 491,031 | | | | (1,170,160 | ) | | | (18,571,791 | ) | | | (13,825,541 | ) | | |
| | | | | | | | | | | | | | | | | | |
| | | | | |
Class B Shares | | | | | | | | | | | | | | | | | | |
Proceeds from shares issued | | | 137,033 | | | | 148,663 | | | | 486,817 | | | | 2,228,445 | | | |
Dividends reinvested | | | 9,231 | | | | 14,767 | | | | 192,762 | | | | 66,705 | | | |
Cost of shares redeemed (a) | | | (173,654 | ) | | | (99,377 | ) | | | (2,048,919 | ) | | | (1,565,577 | ) | | |
| | | | | | | | | | | | | | | | | | |
| | | (27,390 | ) | | | 64,053 | | | | (1,369,340 | ) | | | 729,573 | | | |
| | | | | | | | | | | | | | | | | | |
| | | | | |
Class C Shares | | | | | | | | | | | | | | | | | | |
Proceeds from shares issued | | | 352,807 | | | | 293,017 | | | | 3,759,738 | | | | 17,384,877 | | | |
Dividends reinvested | | | 2,479 | | | | 4,614 | | | | 706,010 | | | | 231,756 | | | |
Cost of shares redeemed (a) | | | (308,964 | ) | | | (746,139 | ) | | | (10,472,077 | ) | | | (12,515,777 | ) | | |
| | | | | | | | | | | | | | | | | | |
| | | 46,322 | | | | (448,508 | ) | | | (6,006,329 | ) | | | 5,100,856 | | | |
| | | | | | | | | | | | | | | | | | |
| | | | | |
Class R Shares | | | | | | | | | | | | | | | | | | |
Proceeds from shares issued | | | 200 | | | | — | | | | — | | | | 2 | | | |
Dividends reinvested | | | 79 | | | | 83 | | | | 82 | | | | 23 | | | |
Cost of shares redeemed (a) | | | (200 | ) | | | — | | | | (102 | ) | | | — | | | |
| | | | | | | | | | | | | | | | | | |
| | | 79 | | | | 83 | | | | (20 | ) | | | 25 | | | |
| | | | | | | | | | | | | | | | | | |
| | | | | |
Institutional Service Class Shares | | | | | | | | | | | | | | | | | | |
Proceeds from shares issued | | | 1,026,070 | | | | 2,115,222 | | | | 68,365 | | | | 171,187 | | | |
Dividends reinvested | | | 1,244,688 | | | | 1,443,956 | | | | 14,884 | | | | 2,437 | | | |
Cost of shares redeemed (a) | | | (4,169,084 | ) | | | (2,210,266 | ) | | | (17,708 | ) | | | (4,201 | ) | | |
| | | | | | | | | | | | | | | | | | |
| | | (1,898,326 | ) | | | 1,348,912 | | | | 65,541 | | | | 169,423 | | | |
| | | | | | | | | | | | | | | | | | |
| | | | | |
Institutional Class Shares | | | | | | | | | | | | | | | | | | |
Proceeds from shares issued | | | 1,636,403 | | | | 1,030,831 | | | | 10,517,143 | | | | 10,111,244 | | | |
Dividends reinvested | | | 127,699 | | | | 5,738 | | | | 556,450 | | | | 59,761 | | | |
Cost of shares redeemed (a) | | | (389,040 | ) | | | (2,203 | ) | | | (4,862,892 | ) | | | (5,767,542 | ) | | |
| | | | | | | | | | | | | | | | | | |
| | | 1,375,062 | | | | 1,034,366 | | | | 6,210,701 | | | | 4,403,463 | | | |
| | | | | | | | | | | | | | | | | | |
Change in net assets from capital transactions | | $ | (13,222 | ) | | $ | 828,746 | | | $ | (19,671,238 | ) | | $ | (3,422,201 | ) | | |
| | | | | | | | | | | | | | | | | | |
| | | | | |
| | | | | | | | | | | | | | | | | | | |
| (a) | Amount includes redemption fees, if any. |
See notes to financial statements.
Statements of Changes in Net Assets
| | | | | | | | | | | | | | |
| | | Gartmore High Yield Bond Fund | | | Gartmore Micro Cap Equity Fund |
| | | Year Ended
October 31, 2006 | | | Year Ended
October 31, 2005 | | | Year Ended
October 31, 2006 | | | Year Ended
October 31, 2005 |
SHARE TRANSACTIONS: | | | | | | | | | | | | | | |
Class A Shares | | | | | | | | | | | | | | |
Issued | | 302,584 | | | 460,085 | | | 227,505 | | | 1,367,124 | | | |
Reinvested | | 24,664 | | | 30,036 | | | 73,286 | | | 40,070 | | | |
Redeemed | | (254,455 | ) | | (660,047 | ) | | (1,100,284 | ) | | (2,056,075 | ) | | |
| | | | | | | | | | | | | | |
| | 72,793 | | | (169,926 | ) | | (799,493 | ) | | (648,881 | ) | | |
| | | | | | | | | | | | | | |
| | | | | |
Class B Shares | | | | | | | | | | | | | | |
Issued | | 20,065 | | | 21,233 | | | 22,697 | | | 105,329 | | | |
Reinvested | | 1,358 | | | 2,111 | | | 9,339 | | | 3,017 | | | |
Redeemed | | (25,461 | ) | | (14,156 | ) | | (90,664 | ) | | (76,253 | ) | | |
| | | | | | | | | | | | | | |
| | (4,038 | ) | | 9,188 | | | (58,628 | ) | | 32,093 | | | |
| | | | | | | | | | | | | | |
| | | | | |
Class C Shares | | | | | | | | | | | | | | |
Issued | | 51,793 | | | 41,604 | | | 171,695 | | | 829,503 | | | |
Reinvested | | 364 | | | 653 | | | 34,173 | | | 10,472 | | | |
Redeemed | | (45,379 | ) | | (106,010 | ) | | (465,444 | ) | | (606,456 | ) | | |
| | | | | | | | | | | | | | |
| | 6,778 | | | (63,753 | ) | | (259,576 | ) | | 233,519 | | | |
| | | | | | | | | | | | | | |
| | | | | |
Class R Shares | | | | | | | | | | | | | | |
Issued | | 29 | | | — | | | — | | | — | | | |
Reinvested | | 13 | | | 12 | | | 4 | | | 1 | | | |
Redeemed | | (31 | ) | | — | | | — | (b) | | — | | | |
| | | | | | | | | | | | | | |
| | 11 | | | 12 | | | 4 | | | 1 | | | |
| | | | | | | | | | | | | | |
| | | | | |
Institutional Service Class Shares | | | | | | | | | | | | | | |
Issued | | 149,775 | | | 297,732 | | | 2,867 | | | 7,895 | | | |
Reinvested | | 181,357 | | | 204,404 | | | 695 | | | 107 | | | |
Redeemed | | (607,257 | ) | | (310,653 | ) | | (769 | ) | | (194 | ) | | |
| | | | | | | | | | | | | | |
| | (276,125 | ) | | 191,483 | | | 2,793 | | | 7,808 | | | |
| | | | | | | | | | | | | | |
| | | | | |
Institutional Class Shares | | | | | | | | | | | | | | |
Issued | | 238,579 | | | 148,699 | | | 441,685 | | | 464,797 | | | |
Reinvested | | 18,602 | | | 843 | | | 25,966 | | | 2,636 | | | |
Redeemed | | (56,950 | ) | | (319 | ) | | (206,432 | ) | | (270,264 | ) | | |
| | | | | | | | | | | | | | |
| | 200,231 | | | 149,223 | | | 261,219 | | | 197,169 | | | |
| | | | | | | | | | | | | | |
Total change in shares | | (350 | ) | | 116,227 | | | (853,681 | ) | | (178,291 | ) | | |
| | | | | | | | | | | | | | |
| | | | | |
| | | | | | | | | | | | | | | |
| (b) | Amount is less than 1 share |
See notes to financial statements.
Statements of Changes in Net Assets (continued)
| | | | | | | | | | | | | | | | | | |
| | | Gartmore U.S. Growth Leaders
Long-Short Fund | | | Gartmore Value Opportunities Fund |
| | | Year Ended
October 31, 2006 | | | Year Ended
October 31, 2005 | | | Year Ended
October 31, 2006 | | | Year Ended
October 31, 2005 | | | |
CAPITAL TRANSACTIONS: | | | | | | | | | | | | | | | | | | |
Class A Shares | | | | | | | | | | | | | | | | | | |
Proceeds from shares issued | | $ | 31,334,366 | | | $ | 19,462,563 | | | $ | 3,443,039 | | | $ | 2,251,626 | | | |
Dividends reinvested | | | 82,305 | | | | 553,213 | | | | 1,518,993 | | | | 2,042,734 | | | |
Cost of shares redeemed (a) | | | (18,390,405 | ) | | | (11,669,614 | ) | | | (3,835,243 | ) | | | (4,748,347 | ) | | |
| | | | | | | | | | | | | | | | | | |
| | | 13,026,266 | | | | 8,346,162 | | | | 1,126,789 | | | | (453,987 | ) | | |
| | | | | | | | | | | | | | | | | | |
| | | | | |
Class B Shares | | | | | | | | | | | | | | | | | | |
Proceeds from shares issued | | | 295,469 | | | | 357,674 | | | | 87,480 | | | | 100,473 | | | |
Dividends reinvested | | | 299 | | | | 864 | | | | 352,738 | | | | 455,669 | | | |
Cost of shares redeemed (a) | | | (117,793 | ) | | | (220,207 | ) | | | (480,647 | ) | | | (461,294 | ) | | |
| | | | | | | | | | | | | | | | | | |
| | | 177,975 | | | | 138,331 | | | | (40,429 | ) | | | 94,848 | | | |
| | | | | | | | | | | | | | | | | | |
| | | | | |
Class C Shares | | | | | | | | | | | | | | | | | | |
Proceeds from shares issued | | | 20,715,497 | | | | 18,472,048 | | | | 81,521 | | | | 245,563 | | | |
Dividends reinvested | | | 20,335 | | | | 9,370 | | | | 42,776 | | | | 51,746 | | | |
Cost of shares redeemed (a) | | | (4,455,751 | ) | | | (2,349,131 | ) | | | (140,187 | ) | | | (243,920 | ) | | |
| | | | | | | | | | | | | | | | | | |
| | | 16,280,081 | | | | 16,132,287 | | | | (15,890 | ) | | | 53,389 | | | |
| | | | | | | | | | | | | | | | | | |
| | | | | |
Class R Shares | | | | | | | | | | | | | | | | | | |
Proceeds from shares issued | | | 1 | | | | 1 | | | | 200 | | | | — | | | |
Dividends reinvested | | | 5 | | | | 32 | | | | 164 | | | | 189 | | | |
Cost of shares redeemed (a) | | | — | | | | — | | | | (203 | ) | | | — | | | |
| | | | | | | | | | | | | | | | | | |
| | | 6 | | | | 33 | | | | 161 | | | | 189 | | | |
| | | | | | | | | | | | | | | | | | |
| | | | | |
Institutional Service Class Shares | | | | | | | | | | | | | | | | | | |
Proceeds from shares issued | | | — | | | | — | | | | — | | | | 773,382 | | | |
Dividends reinvested | | | — | | | | — | | | | — | | | | 2,559,530 | | | |
Cost of shares redeemed (a) | | | — | | | | — | | | | — | | | | (18,518,457 | ) | | |
| | | | | | | | | | | | | | | | | | |
| | | — | | | | — | | | | — | | | | (15,185,545 | ) | | |
| | | | | | | | | | | | | | | | | | |
| | | | | |
Institutional Class Shares | | | | | | | | | | | | | | | | | | |
Proceeds from shares issued | | | 8,684,508 | | | | 3,980,265 | | | | — | | | | — | | | |
Dividends reinvested | | | 58,083 | | | | 30,947 | | | | 156 | | | | 182 | | | |
Cost of shares redeemed (a) | | | (1,306,834 | ) | | | (625,865 | ) | | | — | | | | — | | | |
| | | | | | | | | | | | | | | | | | |
| | | 7,435,757 | | | | 3,385,347 | | | | 156 | | | | 182 | | | |
| | | | | | | | | | | | | | | | | | |
Change in net assets from capital transactions | | $ | 36,920,085 | | | $ | 28,002,160 | | | $ | 1,070,787 | | | $ | (15,490,924 | ) | | |
| | | | | | | | | | | | | | | | | | |
| | | | | |
| | | | | | | | | | | | | | | | | | | |
| (a) | Amount includes redemption fees, if any. |
See notes to financial statements.
Statements of Changes in Net Assets
| | | | | | | | | | | | | | |
| | | Gartmore U.S. Growth Leaders
Long-Short Fund | | | Gartmore Value Opportunities Fund |
| | | Year Ended
October 31, 2006 | | | Year Ended
October 31, 2005 | | | Year Ended
October 31, 2006 | | | Year Ended
October 31, 2005 | | | |
SHARE TRANSACTIONS: | | | | | | | | | | | | | | |
Class A Shares | | | | | | | | | | | | | | |
Issued | | 3,073,002 | | | 2,069,240 | | | 229,105 | | | 146,961 | | | |
Reinvested | | 8,011 | | | 59,167 | | | 110,152 | | | 139,332 | | | |
Redeemed | | (1,793,212 | ) | | (1,239,751 | ) | | (257,542 | ) | | (308,654 | ) | | |
| | | | | | | | | | | | | | |
| | 1,287,801 | | | 888,656 | | | 81,715 | | | (22,361 | ) | | |
| | | | | | | | | | | | | | |
| | | | | |
Class B Shares | | | | | | | | | | | | | | |
Issued | | 30,073 | | | 38,825 | | | 5,987 | | | 6,890 | | | |
Reinvested | | 30 | | | 94 | | | 26,265 | | | 31,644 | | | |
Redeemed | | (11,736 | ) | | (23,682 | ) | | (33,672 | ) | | (30,561 | ) | | |
| | | | | | | | | | | | | | |
| | 18,367 | | | 15,237 | | | (1,420 | ) | | 7,973 | | | |
| | | | | | | | | | | | | | |
| | | | | |
Class C Shares | | | | | | | | | | | | | | |
Issued | | 2,750,438 | | | 2,627,135 | | | 5,826 | | | 16,605 | | | |
Reinvested | | 2,678 | | | 1,342 | | | 3,195 | | | 3,603 | | | |
Redeemed | | (591,306 | ) | | (336,177 | ) | | (9,584 | ) | | (16,413 | ) | | |
| | | | | | | | | | | | | | |
| | 2,161,810 | | | 2,292,300 | | | (563 | ) | | 3,795 | | | |
| | | | | | | | | | | | | | |
| | | | | |
Class R Shares | | | | | | | | | | | | | | |
Issued | | — | | | — | | | 14 | | | — | | | |
Reinvested | | 1 | | | 3 | | | 12 | | | 13 | | | |
Redeemed | | — | | | — | | | (14 | ) | | — | | | |
| | | | | | | | | | | | | | |
| | 1 | | | 3 | | | 12 | | | 13 | | | |
| | | | | | | | | | | | | | |
| | | | | |
Institutional Service Class Shares | | | | | | | | | | | | | | |
Issued | | — | | | — | | | — | | | 48,557 | | | |
Reinvested | | — | | | — | | | — | | | 172,941 | | | |
Redeemed | | — | | | — | | | — | | | (1,244,048 | ) | | |
| | | | | | | | | | | | | | |
| | — | | | — | | | — | | | (1,022,550 | ) | | |
| | | | | | | | | | | | | | |
| | | | | |
Institutional Class Shares | | | | | | | | | | | | | | |
Issued | | 845,703 | | | 420,898 | | | — | | | — | | | |
Reinvested | | 5,626 | | | 3,306 | | | 11 | | | 12 | | | |
Redeemed | | (129,077 | ) | | (65,381 | ) | | — | | | — | | | |
| | | | | | | | | | | | | | |
| | 722,252 | | | 358,823 | | | 11 | | | 12 | | | |
| | | | | | | | | | | | | | |
Total change in shares | | 4,190,231 | | | 3,555,019 | | | 79,755 | | | (1,033,118 | ) | | |
| | | | | | | | | | | | | | |
| | | | | |
| | | | | | | | | | | | | | | |
See notes to financial statements.
Financial Highlights
Selected Data for Each Share of Capital Outstanding
Gartmore High Yield Bond Fund
| | | | | | | | | | | | | | | | | | | | | | | | | | | | | | | | | | | | | | | | |
| | | | | Investment Activities | | | Distributions | | | | | | Ratios/Supplemental Data |
| | | Net Asset
Value,
Beginning
of Period | | Net
Investment
Income
(Loss) | | Net Realized
and
Unrealized
Gains
(Losses) on
Investments | | | Total
from
Investment
Activities | | | Net
Investment
Income | | | Total
Distributions | | | Net
Asset
Value, End
of Period | | Total
Return (a) | | | Net Assets
at End of
Period
(000s) | | Ratio of
Expenses
to Average
Net Assets | | | Ratio of Net
Investment
Income
(Loss)
to Average
Net Assets | | | Ratio of
Expenses
(Prior to
Reimbursements)
to Average
Net Assets (b) | | | Ratio of Net
Investment
Income (Loss)
(Prior to
Reimbursements)
to Average
Net Assets (b) | | | Portfolio
Turnover (c) |
| | | | | | | | | | | | | | |
Class A Shares | | | | | | | | | | | | | | | | | | | | | | | | | | | | | | | | | | | | | | | | |
Year Ended October 31, 2002 | | $ | 6.86 | | 0.61 | | (0.87 | ) | | (0.26 | ) | | (0.61 | ) | | (0.61 | ) | | $ | 5.99 | | (4.27% | ) | | $ | 2,002 | | 0.97% | | | 9.20% | | | 1.09% | | | 9.08% | | | 93.27% |
Year Ended October 31, 2003 | | $ | 5.99 | | 0.56 | | 0.89 | | | 1.45 | | | (0.56 | ) | | (0.56 | ) | | $ | 6.88 | | 25.18% | | | $ | 4,028 | | 1.02% | | | 8.47% | | | 1.10% | | | 8.39% | | | 104.54% |
Year Ended October 31, 2004 | | $ | 6.88 | | 0.51 | | 0.20 | | | 0.71 | | | (0.51 | ) | | (0.51 | ) | | $ | 7.08 | | 10.65% | | | $ | 4,027 | | 1.03% | | | 7.34% | | | 1.20% | | | 7.17% | | | 77.13% |
Year Ended October 31, 2005 | | $ | 7.08 | | 0.50 | | (0.34 | ) | | 0.16 | | | (0.50 | ) | | (0.50 | ) | | $ | 6.74 | | 2.23% | | | $ | 2,687 | | 1.13% | | | 7.13% | | | 1.35% | | | 6.92% | | | 72.82% |
Year Ended October 31, 2006 | | $ | 6.74 | | 0.49 | | 0.15 | | | 0.64 | | | (0.49 | ) | | (0.49 | ) | | $ | 6.89 | | 9.83% | | | $ | 3,249 | | 1.14% | | | 7.19% | | | 1.31% | | | 7.02% | | | 63.58% |
| | | | | | | | | | | | | | |
Class B Shares | | | | | | | | | | | | | | | | | | | | | | | | | | | | | | | | | | | | | | | | |
Year Ended October 31, 2002 | | $ | 6.86 | | 0.56 | | (0.88 | ) | | (0.32 | ) | | (0.56 | ) | | (0.56 | ) | | $ | 5.98 | | (5.11% | ) | | $ | 355 | | 1.70% | | | 8.46% | | | 1.83% | | | 8.33% | | | 93.27% |
Year Ended October 31, 2003 | | $ | 5.98 | | 0.52 | | 0.89 | | | 1.41 | | | (0.52 | ) | | (0.52 | ) | | $ | 6.87 | | 24.36% | | | $ | 764 | | 1.69% | | | 7.81% | | | 1.78% | | | 7.73% | | | 104.54% |
Year Ended October 31, 2004 | | $ | 6.87 | | 0.46 | | 0.20 | | | 0.66 | | | (0.46 | ) | | (0.46 | ) | | $ | 7.07 | | 9.92% | | | $ | 734 | | 1.70% | | | 6.63% | | | 1.89% | | | 6.45% | | | 77.13% |
Year Ended October 31, 2005 | | $ | 7.07 | | 0.45 | | (0.34 | ) | | 0.11 | | | (0.45 | ) | | (0.45 | ) | | $ | 6.73 | | 1.55% | | | $ | 760 | | 1.81% | | | 6.46% | | | 2.01% | | | 6.26% | | | 72.82% |
Year Ended October 31, 2006 | | $ | 6.73 | | 0.44 | | 0.15 | | | 0.59 | | | (0.44 | ) | | (0.44 | ) | | $ | 6.88 | | 9.06% | | | $ | 750 | | 1.86% | | | 6.50% | | | 2.03% | | | 6.33% | | | 63.58% |
| | | | | | | | | | | | | | |
Class C Shares | | | | | | | | | | | | | | | | | | | | | | | | | | | | | | | | | | | | | | | | |
Year Ended October 31, 2002 | | $ | 6.86 | | 0.56 | | (0.87 | ) | | (0.31 | ) | | (0.56 | ) | | (0.56 | ) | | $ | 5.99 | | (4.96% | ) | | $ | 53 | | 1.70% | | | 8.55% | | | 1.97% | | | 8.28% | | | 93.27% |
Year Ended October 31, 2003 | | $ | 5.99 | | 0.52 | | 0.89 | | | 1.41 | | | (0.52 | ) | | (0.52 | ) | | $ | 6.88 | | 24.32% | | | $ | 2,986 | | 1.71% | | | 7.45% | | | 1.77% | | | 7.39% | | | 104.54% |
Year Ended October 31, 2004 | | $ | 6.88 | | 0.46 | | 0.20 | | | 0.66 | | | (0.46 | ) | | (0.46 | ) | | $ | 7.08 | | 9.92% | | | $ | 1,836 | | 1.71% | | | 6.66% | | | 1.86% | | | 6.51% | | | 77.13% |
Year Ended October 31, 2005 | | $ | 7.08 | | 0.45 | | (0.35 | ) | | 0.10 | | | (0.45 | ) | | (0.45 | ) | | $ | 6.73 | | 1.40% | | | $ | 1,318 | | 1.80% | | | 6.47% | | | 2.02% | | | 6.26% | | | 72.82% |
Year Ended October 31, 2006 | | $ | 6.73 | | 0.44 | | 0.16 | | | 0.60 | | | (0.44 | ) | | (0.44 | ) | | $ | 6.89 | | 9.06% | | | $ | 1,394 | | 1.86% | | | 6.49% | | | 2.03% | | | 6.32% | | | 63.58% |
| | | | | | | | | | | | | | |
Class R Shares | | | | | | | | | | | | | | | | | | | | | | | | | | | | | | | | | | | | | | | | |
Period Ended October 31, 2004 (d) | | $ | 7.00 | | 0.32 | | 0.07 | | | 0.39 | | | (0.32 | ) | | (0.32 | ) | | $ | 7.07 | | 5.73% | (f) | | $ | 1 | | 1.32% | (g) | | 6.89% | (g) | | 1.55% | (g) | | 6.66% | (g) | | 77.13% |
Year Ended October 31, 2005 | | $ | 7.07 | | 0.50 | | (0.35 | ) | | 0.15 | | | (0.50 | ) | | (0.50 | ) | | $ | 6.72 | | 2.05% | | | $ | 1 | | 1.21% | | | 7.10% | | | 1.45% | | | 6.87% | | | 72.82% |
Year Ended October 31, 2006 | | $ | 6.72 | | 0.48 | | 0.16 | | | 0.64 | | | (0.48 | ) | | (0.48 | ) | | $ | 6.88 | | 9.67% | | | $ | 1 | | 1.33% | | | 7.05% | | | 1.33% | | | 7.05% | | | 63.58% |
| | | | | | | | | | | | | | |
Institutional Service Class Shares | | | | | | | | | | | | | | | | | | | | | | | | | | | | | | | | | | | | | | | | |
Year Ended October 31, 2002 | | $ | 6.92 | | 0.63 | | (0.88 | ) | | (0.25 | ) | | (0.63 | ) | | (0.63 | ) | | $ | 6.04 | | (4.12% | ) | | $ | 82,967 | | 0.70% | | | 9.38% | | | 0.79% | | | 9.29% | | | 93.27% |
Year Ended October 31, 2003 | | $ | 6.04 | | 0.58 | | 0.90 | | | 1.48 | | | (0.58 | ) | | (0.58 | ) | | $ | 6.94 | | 25.51% | | | $ | 106,278 | | 0.70% | | | 8.87% | | | 0.78% | | | 8.79% | | | 104.54% |
Year Ended October 31, 2004 | | $ | 6.94 | | 0.53 | | 0.20 | | | 0.73 | | | (0.53 | ) | | (0.53 | ) | | $ | 7.14 | | 10.90% | | | $ | 17,839 | | 0.71% | | | 7.60% | | | 0.77% | | | 7.53% | | | 77.13% |
Year Ended October 31, 2005 | | $ | 7.14 | | 0.52 | | (0.35 | ) | | 0.17 | | | (0.52 | ) | | (0.52 | ) | | $ | 6.79 | | 2.34% | | | $ | 18,272 | | 0.86% | | | 7.34% | | | 1.05% | | | 7.14% | | | 72.82% |
Year Ended October 31, 2006 | | $ | 6.79 | | 0.51 | | 0.16 | | | 0.67 | | | (0.51 | ) | | (0.51 | ) | | $ | 6.95 | | 10.16% | | | $ | 16,765 | | 0.90% | | | 7.39% | | | 1.07% | | | 7.21% | | | 63.58% |
| | | | | | | | | | | | | | |
Institutional Class Shares | | | | | | | | | | | | | | | | | | | | | | | | | | | | | | | | | | | | | | | | |
Period Ended October 31, 2004 (e) | | $ | 6.90 | | 0.18 | | 0.24 | | | 0.42 | | | (0.18 | ) | | (0.18 | ) | | $ | 7.14 | | 6.10% | (f) | | $ | 1 | | 0.71% | (g) | | 7.44% | (g) | | 1.24% | (g) | | 6.91% | (g) | | 77.13% |
Year Ended October 31, 2005 | | $ | 7.14 | | 0.52 | | (0.34 | ) | | 0.18 | | | (0.52 | ) | | (0.52 | ) | | $ | 6.80 | | 2.54% | | | $ | 1,015 | | 0.53% | | | 7.54% | | | 0.53% | | | 7.54% | | | 72.82% |
Year Ended October 31, 2006 | | $ | 6.80 | | 0.51 | | 0.15 | | | 0.66 | | | (0.51 | ) | | (0.51 | ) | | $ | 6.95 | | 10.05% | | | $ | 2,429 | | 0.85% | | | 7.36% | | | 1.02% | | | 7.18% | | | 63.58% |
| (a) | Excludes sales charge. |
| (b) | During the period certain fees were waived and/or reimbursed. If such waivers/reimbursements had not occurred, the ratios would have been as indicated. |
| (c) | Portfolio turnover is calculated on the basis of the Fund as whole without distinguishing among the classes of shares. |
| (d) | For the period from February 27, 2004 (commencement of operations) through October 31, 2004. |
| (e) | For the period from June 29, 2004 (commencement of operations) through October 31, 2004. |
See notes to financial statements.
Financial Highlights
Selected Data for Each Share of Capital Outstanding
Gartmore Micro Cap Equity Fund
| | | | | | | | | | | | | | | | | | | | | | | | | | | | | | | | | | | | | | | | | | | |
| | | | | Investment Activities | | | Distributions | | | | | | Ratios/Supplemental Data |
| | | Net Asset
Value,
Beginning
of Period | | Net
Investment
Income
(Loss) | | | Net Realized
and
Unrealized
Gains
(Losses) on
Investments | | | Total
from
Investment
Activities | | | Net
Realized
Gains | | | Total
Distributions | | | Redemption
Fees | | Net
Asset
Value, End
of Period | | Total
Return (a) | | | Net Assets
at End of
Period
(000s) | | Ratio of
Expenses
to Average
Net Assets | | | Ratio of Net
Investment
Income
(Loss)
to Average
Net Assets | | | Ratio of
Expenses
(Prior to
Reimbursements)
to Average
Net Assets (b) | | | Ratio of Net
Investment
Income (Loss)
(Prior to
Reimbursements)
to Average
Net Assets (b) | | | Portfolio
Turnover (c) |
| | | | | | | | | | | | | | | |
Class A Shares | | | | | | | | | | | | | | | | | | | | | | | | | | | | | | | | | | | | | | | | | | | |
Period Ended October 31, 2002 (d) (e) | | $ | 10.00 | | (0.04 | ) | | (1.32 | ) | | (1.36 | ) | | — | | | — | | | — | | $ | 8.64 | | (13.60% | )(g) | | $ | 310 | | 1.80% | (h) | | (1.32% | )(h) | | 8.73% | (h) | | (8.25% | )(h) | | 56.08% |
Year Ended October 31, 2003 | | $ | 8.64 | | (0.02 | ) | | 7.29 | | | 7.27 | | | — | | | — | | | — | | $ | 15.91 | | 84.14% | | | $ | 17,023 | | 1.82% | | | (1.32% | ) | | 2.26% | | | (1.76% | ) | | 104.50% |
Year Ended October 31, 2004 | | $ | 15.91 | | (0.18 | ) | | 3.81 | | | 3.63 | | | — | (i) | | — | (i) | | 0.02 | | $ | 19.56 | | 22.96% | | | $ | 74,983 | | 1.81% | | | (1.35% | ) | | 1.82% | | | (1.37% | ) | | 107.36% |
Year Ended October 31, 2005 | | $ | 19.56 | | (0.34 | ) | | 2.63 | | | 2.29 | | | (0.40 | ) | | (0.40 | ) | | 0.02 | | $ | 21.47 | | 11.69% | | | $ | 68,375 | | 1.86% | | | (1.31% | ) | | 1.87% | | | (1.32% | ) | | 108.54% |
Year Ended October 31, 2006 | | $ | 21.47 | | (0.27 | ) | | 4.22 | | | 3.95 | | | (1.41 | ) | | (1.41 | ) | | — | | $ | 24.01 | | 19.19% | | | $ | 57,257 | | 1.85% | | | (1.00% | ) | | 1.88% | | | (1.03% | ) | | 95.53% |
| | | | | | | | | | | | | | | |
Class B Shares | | | | | | | | | | | | | | | | | | | | | | | | | | | | | | | | | | | | | | | | | | | |
Period Ended October 31, 2002 (d) | | $ | 10.00 | | (0.06 | ) | | (1.33 | ) | | (1.39 | ) | | — | | | — | | | — | | $ | 8.61 | | (13.90% | )(g) | | $ | 43 | | 2.55% | (h) | | (2.04% | )(h) | | 8.46% | (h) | | (7.95% | )(h) | | 56.08% |
Year Ended October 31, 2003 | | $ | 8.61 | | (0.06 | ) | | 7.19 | | | 7.13 | | | — | | | — | | | — | | $ | 15.74 | | 82.81% | | | $ | 1,611 | | 2.54% | | | (2.08% | ) | | 2.99% | | | (2.52% | ) | | 104.50% |
Year Ended October 31, 2004 | | $ | 15.74 | | (0.26 | ) | | 3.72 | | | 3.46 | | | — | (i) | | — | (i) | | 0.02 | | $ | 19.22 | | 22.13% | | | $ | 6,403 | | 2.55% | | | (2.11% | ) | | 2.57% | | | (2.13% | ) | | 107.36% |
Year Ended October 31, 2005 | | $ | 19.22 | | (0.46 | ) | | 2.55 | | | 2.09 | | | (0.40 | ) | | (0.40 | ) | | 0.02 | | $ | 20.93 | | 10.84% | | | $ | 7,647 | | 2.61% | | | (2.04% | ) | | 2.62% | | | (2.06% | ) | | 108.54% |
Year Ended October 31, 2006 | | $ | 20.93 | | (0.43 | ) | | 4.12 | | | 3.69 | | | (1.41 | ) | | (1.41 | ) | | — | | $ | 23.21 | | 18.41% | | | $ | 7,117 | | 2.52% | | | (1.68% | ) | | 2.56% | | | (1.71% | ) | | 95.53% |
| | | | | | | | | | | | | | | |
Class C Shares | | | | | | | | | | | | | | | | | | | | | | | | | | | | | | | | | | | | | | | | | | | |
Period Ended October 31, 2002 (d) | | $ | 10.00 | | (0.06 | ) | | (1.33 | ) | | (1.39 | ) | | — | | | — | | | — | | $ | 8.61 | | (13.90% | )(g) | | $ | 43 | | 2.55% | (h) | | (2.04% | )(h) | | 8.46% | (h) | | (7.95% | )(h) | | 56.08% |
Year Ended October 31, 2003 | | $ | 8.61 | | (0.05 | ) | | 7.20 | | | 7.15 | | | — | | | — | | | — | | $ | 15.76 | | 83.04% | | | $ | 5,609 | | 2.54% | | | (2.04% | ) | | 2.90% | | | (2.40% | ) | | 104.50% |
Year Ended October 31, 2004 | | $ | 15.76 | | (0.24 | ) | | 3.70 | | | 3.46 | | | — | (i) | | — | (i) | | 0.02 | | $ | 19.24 | | 22.10% | | | $ | 30,377 | | 2.55% | | | (2.11% | ) | | 2.57% | | | (2.13% | ) | | 107.36% |
Year Ended October 31, 2005 | | $ | 19.24 | | (0.47 | ) | | 2.56 | | | 2.09 | | | (0.40 | ) | | (0.40 | ) | | 0.02 | | $ | 20.95 | | 10.83% | | | $ | 37,980 | | 2.61% | | | (2.05% | ) | | 2.62% | | | (2.06% | ) | | 108.54% |
Year Ended October 31, 2006 | | $ | 20.95 | | (0.41 | ) | | 4.10 | | | 3.69 | | | (1.41 | ) | | (1.41 | ) | | — | | $ | 23.23 | | 18.39% | | | $ | 36,076 | | 2.52% | | | (1.68% | ) | | 2.56% | | | (1.71% | ) | | 95.53% |
| | | | | | | | | | | | | | | |
Class R Shares | | | | | | | | | | | | | | | | | | | | | | | | | | | | | | | | | | | | | | | | | | | |
Period Ended October 31, 2004 (f) | | $ | 17.38 | | (0.27 | ) | | 2.14 | | | 1.87 | | | — | (i) | | — | (i) | | 0.02 | | $ | 19.27 | | 10.89% | (g) | | $ | 1 | | 2.17% | (h) | | (1.78% | )(h) | | 2.17% | (h) | | (1.78% | )(h) | | 107.36% |
Year Ended October 31, 2005 | | $ | 19.27 | | (0.29 | ) | | 2.53 | | | 2.24 | | | (0.40 | ) | | (0.40 | ) | | 0.02 | | $ | 21.13 | | 11.61% | | | $ | 1 | | 1.94% | | | (1.39% | ) | | 1.94% | | | (1.39% | ) | | 108.54% |
Year Ended October 31, 2006 | | $ | 21.13 | | (0.32 | ) | | 4.13 | | | 3.81 | | | (1.41 | ) | | (1.41 | ) | | — | | $ | 23.53 | | 18.87% | | | $ | 1 | | 2.01% | | | (1.23% | ) | | 2.05% | | | (1.26% | ) | | 95.53% |
| | | | | | | | | | | | | | | |
Institutional Service Class Shares | | | | | | | | | | | | | | | | | | | | | | | | | | | | | | | | | | | | | | | | | | | |
Period Ended October 31, 2002 (d) | | $ | 10.00 | | (0.03 | ) | | (1.33 | ) | | (1.36 | ) | | — | | | — | | | — | | $ | 8.64 | | (13.60% | )(g) | | $ | 43 | | 1.55% | (h) | | (1.04% | )(h) | | 7.45% | (h) | | (6.94% | )(h) | | 56.08% |
Year Ended October 31, 2003 | | $ | 8.64 | | (0.13 | ) | | 7.45 | | | 7.32 | | | — | | | — | | | — | | $ | 15.96 | | 84.72% | | | $ | 80 | | 1.55% | | | (1.15% | ) | | 2.40% | | | (2.00% | ) | | 104.50% |
Year Ended October 31, 2004 | | $ | 15.96 | | (0.28 | ) | | 3.97 | | | 3.69 | | | — | (i) | | — | (i) | | 0.02 | | $ | 19.67 | | 23.26% | | | $ | 51 | | 1.51% | | | (1.10% | ) | | 1.52% | | | (1.11% | ) | | 107.36% |
Year Ended October 31, 2005 | | $ | 19.67 | | (0.19 | ) | | 2.54 | | | 2.35 | | | (0.40 | ) | | (0.40 | ) | | 0.02 | | $ | 21.64 | | 11.93% | | | $ | 225 | | 1.62% | | | (1.05% | ) | | 1.64% | | | (1.07% | ) | | 108.54% |
Year Ended October 31, 2006 | | $ | 21.64 | | (0.15 | ) | | 4.21 | | | 4.06 | | | (1.41 | ) | | (1.41 | ) | | — | | $ | 24.29 | | 19.62% | | | $ | 320 | | 1.52% | | | (0.68% | ) | | 1.55% | | | (0.72% | ) | | 95.53% |
| | | | | | | | | | | | | | | |
Institutional Class Shares | | | | | | | | | | | | | | | | | | | | | | | | | | | | | | | | | | | | | | | | | | | |
Period Ended October 31, 2002 (d) | | $ | 10.00 | | (0.03 | ) | | (1.33 | ) | | (1.36 | ) | | — | | | — | | | — | | $ | 8.64 | | (13.60% | )(g) | | $ | 1,556 | | 1.55% | (h) | | (1.04% | )(h) | | 7.46% | (h) | | (6.95% | )(h) | | 56.08% |
Year Ended October 31, 2003 | | $ | 8.64 | | (0.13 | ) | | 7.45 | | | 7.32 | | | — | | | — | | | — | | $ | 15.96 | | 84.72% | | | $ | 2,873 | | 1.55% | | | (1.15% | ) | | 2.40% | | | (2.00% | ) | | 104.50% |
Year Ended October 31, 2004 | | $ | 15.96 | | (0.16 | ) | | 3.85 | | | 3.69 | | | — | (i) | | — | (i) | | 0.02 | | $ | 19.67 | | 23.26% | | | $ | 3,493 | | 1.52% | | | (1.14% | ) | | 1.54% | | | (1.15% | ) | | 107.36% |
Year Ended October 31, 2005 | | $ | 19.67 | | (0.22 | ) | | 2.58 | | | 2.36 | | | (0.40 | ) | | (0.40 | ) | | 0.02 | | $ | 21.65 | | 11.98% | | | $ | 8,113 | | 1.63% | | | (1.05% | ) | | 1.65% | | | (1.07% | ) | | 108.54% |
Year Ended October 31, 2006 | | $ | 21.65 | | (0.13 | ) | | 4.18 | | | 4.05 | | | (1.41 | ) | | (1.41 | ) | | — | | $ | 24.29 | | 19.56% | | | $ | 15,451 | | 1.51% | | | (0.69% | ) | | 1.55% | | | (0.72% | ) | | 95.53% |
| | |
(a) Excludes sales charge. (b) During the period certain fees were waived and/or reimbursed. If such waivers/reimbursements had not occurred, the ratios would have been as indicated. (c) Portfolio turnover is calculated on the basis of the Fund as whole without distinguishing among the classes of shares. (d) For the period from June 27, 2002 (commencement of operations) through October 31, 2002. (e) Net investment income (loss) is based on average shares outstanding during the period. | | (f) For the period from December 30, 2003 (commencement of operations) through October 31, 2004. (g) Not annualized. (h)Annualized. (i) Amount is less than $0.005. |
See notes to financial statements.
Financial Highlights
Selected Data for Each Share of Capital Outstanding
Gartmore U.S. Growth Leaders Long-Short Fund
| | | | | | | | | | | | | | | | | | | | | | | | | | | | | | | | | | | | | | | | | | | |
| | | | | Investment Activities | | | Distributions | | | | | | Ratios/Supplemental Data |
| | | Net Asset
Value,
Beginning
of Period | | Net
Investment
Income
(Loss) | | | Net Realized
and
Unrealized
Gains
(Losses) on
Investments | | | Total
from
Investment
Activities | | | Net
Investment
Income | | | Total
Distributions | | | Net
Asset
Value, End
of Period | | Total
Return (a) | | | Net Assets
at End of
Period
(000s) | | Ratio of
Expenses
to Average
Net Assets
(Includes
Dividend
Expense) | | | Ratio of Net
Investment
Income
(Loss)
to Average
Net Assets | | | Ratio of
Expenses
(Prior to
Reimbursements)
to Average
Net Assets
(Includes
Dividend
Expense) (b) | | | Ratio of Net
Investment
Income (Loss)
(Prior to
Reimbursements)
to Average
Net Assets (b) | | | Dividend
Expense (c) | | Portfolio
Turnover (d) |
| | | | | | | | | | | | | | | |
Class A Shares | | | | | | | | | | | | | | | | | | | | | | | | | | | | | | | | | | | | | | | | | | | |
Period Ended June 30, 2002 (e) | | $ | 11.14 | | 6.65 | | | (6.90 | ) | | (0.25 | ) | | — | | | — | | | $ | 10.89 | | (2.24% | )(j) | | $ | 144 | | 1.95% | (k) | | 122.95% | (k) | | 2.26% | (k) | | 122.64% | (k) | | 0.03% | | 425% |
Year Ended June 30, 2003 (g) | | $ | 10.89 | | (0.08 | ) | | 0.14 | | | 0.06 | | | — | | | — | | | $ | 10.95 | | 0.55% | | | $ | 29,561 | | 3.47% | | | (2.04% | ) | | 3.66% | | | (2.23% | ) | | 0.40% | | 424% |
Period Ended October 31, 2003 (f) | | $ | 10.95 | | (0.07 | ) | | 1.12 | | | 1.05 | | | — | | | — | | | $ | 12.00 | | 9.59% | (j) | | $ | 29,468 | | 3.23% | (k) | | (1.77% | )(k) | | (l | ) | | (l | ) | | 1.65% | | 126.69% |
Year Ended October 31, 2004 | | $ | 12.00 | | 0.11 | | | 0.77 | | | 0.88 | | | (3.32 | ) | | (3.32 | ) | | $ | 9.56 | | 9.03% | | | $ | 24,411 | | 3.27% | | | (1.65% | ) | | 3.33% | | | (1.70% | ) | | 1.06% | | 577.36% |
Year Ended October 31, 2005 | | $ | 9.56 | | (0.02 | ) | | 0.59 | | | 0.57 | | | (0.30 | ) | | (0.30 | ) | | $ | 9.83 | | 6.09% | | | $ | 33,828 | | 2.81% | | | (0.18% | ) | | 2.91% | | | (0.27% | ) | | 0.64% | | 827.26% |
Year Ended October 31, 2006 | | $ | 9.83 | | 0.11 | | | 0.41 | | | 0.52 | | | (0.05 | ) | | (0.05 | ) | | $ | 10.30 | | 5.27% | | | $ | 48,717 | | 2.59% | | | 1.16% | | | 2.61% | | | 1.14% | | | 0.56% | | 739.31% |
| | | | | | | | | | | | | | | |
Class B Shares | | | | | | | | | | | | | | | | | | | | | | | | | | | | | | | | | | | | | | | | | | | |
Period Ended June 30, 2002 (e) | | $ | 11.14 | | (0.07 | ) | | (0.17 | ) | | (0.24 | ) | | — | | | — | | | $ | 10.90 | | (2.15% | )(j) | | $ | 121 | | 2.74% | (k) | | (1.45% | )(k) | | 2.86% | (k) | | (1.57% | )(k) | | 0.03% | | 425% |
Year Ended June 30, 2003 (g) | | $ | 10.90 | | (0.23 | ) | | 0.19 | | | (0.04 | ) | | — | | | — | | | $ | 10.86 | | (0.37% | ) | | $ | 141 | | 3.73% | | | (2.31% | ) | | 4.54% | | | (3.12% | ) | | 0.40% | | 424% |
Period Ended October 31, 2003 (f) (g) | | $ | 10.86 | | (0.10 | ) | | 1.12 | | | 1.02 | | | — | | | — | | | $ | 11.88 | | 9.39% | (j) | | $ | 414 | | 3.98% | (k) | | (2.54% | )(k) | | (l | ) | | (l | ) | | 1.65% | | 126.69% |
Year Ended October 31, 2004 | | $ | 11.88 | | 0.22 | | | 0.58 | | | 0.80 | | | (3.30 | ) | | (3.30 | ) | | $ | 9.38 | | 8.22% | | | $ | 653 | | 3.89% | | | (2.30% | ) | | 3.96% | | | (2.36% | ) | | 1.06% | | 577.36% |
Year Ended October 31, 2005 | | $ | 9.38 | | (0.09 | ) | | 0.58 | | | 0.49 | | | (0.28 | ) | | (0.28 | ) | | $ | 9.59 | | 5.33% | | | $ | 814 | | 3.53% | | | (0.90% | ) | | 3.62% | | | (0.99% | ) | | 0.64% | | 827.26% |
Year Ended October 31, 2006 | | $ | 9.59 | | 0.03 | | | 0.40 | | | 0.43 | | | (0.01 | ) | | (0.01 | ) | | $ | 10.01 | | 4.53% | | | $ | 1,033 | | 3.33% | | | 0.42% | | | 3.35% | | | 0.40% | | | 0.56% | | 739.31% |
| | | | | | | | | | | | | | | |
Class C Shares | | | | | | | | | | | | | | | | | | | | | | | | | | | | | | | | | | | | | | | | | | | |
Year Ended June 30, 2002 | | $ | 10.02 | | (0.66 | ) | | (0.31 | ) | | (0.97 | ) | | — | | | — | | | $ | 9.05 | | (17.65% | ) | | $ | 1,819 | | 3.28% | | | (5.41% | ) | | 3.71% | | | (5.87% | ) | | 0.03% | | 425% |
Year Ended June 30, 2003 | | $ | 9.05 | | (0.19 | ) | | 0.17 | | | (0.02 | ) | | — | | | — | | | $ | 9.03 | | (0.22% | ) | | $ | 1,323 | | 3.72% | | | (2.31% | ) | | 4.54% | | | (3.13% | ) | | 0.40% | | 424% |
Period Ended October 31, 2003 (f) | | $ | 9.03 | | (0.08 | ) | | 0.93 | | | 0.85 | | | — | | | — | | | $ | 9.88 | | 9.41% | (j) | | $ | 1,487 | | 3.98% | (k) | | (2.52% | )(k) | | (l | ) | | (l | ) | | 1.65% | | 126.69% |
Year Ended October 31, 2004 | | $ | 9.88 | | 0.64 | | | (0.01 | ) | | 0.63 | | | (3.30 | ) | | (3.30 | ) | | $ | 7.21 | | 8.20% | | | $ | 2,641 | | 3.90% | | | (2.29% | ) | | 3.99% | | | (2.37% | ) | | 1.06% | | 577.36% |
Year Ended October 31, 2005 | | $ | 7.21 | | (0.05 | ) | | 0.42 | | | 0.37 | | | (0.29 | ) | | (0.29 | ) | | $ | 7.29 | | 5.35% | | | $ | 19,372 | | 3.55% | | | (0.81% | ) | | 3.65% | | | (0.91% | ) | | 0.64% | | 827.26% |
Year Ended October 31, 2006 | | $ | 7.29 | | 0.03 | | | 0.30 | | | 0.33 | | | (0.03 | ) | | (0.03 | ) | | $ | 7.59 | | 4.48% | | | $ | 36,586 | | 3.33% | | | 0.47% | | | 3.35% | | | 0.44% | | | 0.56% | | 739.31% |
| | | | | | | | | | | | | | | |
Class R Shares | | | | | | | | | | | | | | | | | | | | | | | | | | | | | | | | | | | | | | | | | | | |
Period Ended October 31, 2004 (h) | | $ | 9.21 | | (0.11 | ) | | 0.31 | | | 0.20 | | | — | | | — | | | $ | 9.41 | | 2.17% | (j) | | $ | 1 | | 3.32% | (k) | | (1.74% | )(k) | | 3.36% | (k) | | (1.78% | )(k) | | 1.06% | | 577.36% |
Year Ended October 31, 2005 | | $ | 9.41 | | (0.03 | ) | | 0.59 | | | 0.56 | | | (0.29 | ) | | (0.29 | ) | | $ | 9.68 | | 6.16% | | | $ | 1 | | 2.82% | | | (0.20% | ) | | 2.86% | | | (0.25% | ) | | 0.64% | | 827.26% |
Year Ended October 31, 2006 | | $ | 9.68 | | 0.08 | | | 0.40 | | | 0.48 | | | (0.05 | ) | | (0.05 | ) | | $ | 10.11 | | 4.91% | | | $ | 1 | | 2.96% | | | 0.77% | | | 2.99% | | | 0.74% | | | 0.56% | | 739.31% |
| | | | | | | | | | | | | | | |
Institutional Class Shares | | | | | | | | | | | | | | | | | | | | | | | | | | | | | | | | | | | | | | | | | | | |
Period Ended October 31, 2004 (i) | | $ | 9.28 | | (0.02 | ) | | 0.31 | | | 0.29 | | | — | | | — | | | $ | 9.57 | | 3.12% | (j) | | $ | 331 | | 2.24% | (k) | | (0.52% | )(k) | | 2.43% | (k) | | (0.72% | )(k) | | 1.06% | | 577.36% |
Year Ended October 31, 2005 | | $ | 9.57 | | (0.05 | ) | | 0.63 | | | 0.58 | | | (0.30 | ) | | (0.30 | ) | | $ | 9.85 | | 6.27% | | | $ | 3,877 | | 2.56% | | | 0.19% | | | 2.67% | | | 0.08% | | | 0.64% | | 827.26% |
Year Ended October 31, 2006 | | $ | 9.85 | | 0.11 | | | 0.44 | | | 0.55 | | | (0.06 | ) | | (0.06 | ) | | $ | 10.34 | | 5.60% | | | $ | 11,538 | | 2.33% | | | 1.50% | | | 2.35% | | | 1.48% | | | 0.56% | | 739.31% |
| | |
(a) Excludes sales charge. (b) During the period certain fees were waived and/or reimbursed. If such waivers/reimbursements had not occurred, the ratios would have been as indicated. (c) Indicates the dividend expense charged for the period to average net assets. (d) Portfolio turnover is calculated on the basis of the Fund as whole without distinguishing among the classes of shares. (e) For the period from October 31, 2001 (commencement of operations) through June 30, 2002. (f) For the period from July 1, 2003 through October 31, 2003. (g) Net investment income (loss) is based on average shares outstanding during the period. (h) For the period from February 27, 2004 (commencement of operations) through October 31, 2004. (i) For the period from June 29, 2004 (commencement of operations) through October 31, 2004. | | (j) Not annualized. (k) Annualized. (l) There were no fee reductions in this period. |
See notes to financial statements.
Financial Highlights
Selected Data for Each Share of Capital Outstanding
Gartmore Value Opportunities Fund
| | | | | | | | | | | | | | | | | | | | | | | | | | | | | | | | | | | | | | | | | | | | | | |
| | | | | Investment Activities | | | Distributions | | | | | | Ratios/Supplemental Data |
| | | Net Asset
Value,
Beginning
of Period | | Net
Investment
Income
(Loss) | | | Net Realized
and
Unrealized
Gains
(Losses) on
Investments | | | Total
from
Investment
Activities | | | Net
Investment
Income | | | Net
Realized
Gains | | | Total
Distributions | | | Redemption
Fees | | Net
Asset
Value, End
of Period | | Total
Return (a) | | | Net Assets
at End of
Period
(000s) | | Ratio of
Expenses
to Average
Net Assets | | | Ratio of Net
Investment
Income
(Loss)
to Average
Net Assets | | | Ratio of
Expenses
(Prior to
Reimbursements)
to Average
Net Assets (b) | | | Ratio of Net
Investment
Income (Loss)
(Prior to
Reimbursements)
to Average
Net Assets (b) | | | Portfolio
Turnover (c) |
| | | | | | | | | | | | | | | | |
Class A Shares | | | | | | | | | | | | | | | | | | | | | | | | | | | | | | | | | | | | | | | | | | | | | | |
Year Ended October 31, 2002 | | $ | 12.17 | | 0.05 | | | (0.98 | ) | | (0.93 | ) | | (0.05 | ) | | (0.15 | ) | | (0.20 | ) | | 0.01 | | $ | 11.05 | | (7.75% | ) | | $ | 9,766 | | 1.31% | | | 0.39% | | | 1.48% | | | 0.22% | | | 108.62% |
Year Ended October 31, 2003 | | $ | 11.05 | | 0.03 | | | 3.42 | | | 3.45 | | | (0.03 | ) | | — | | | (0.03 | ) | | — | | $ | 14.47 | | 31.32% | | | $ | 12,156 | | 1.30% | | | 0.20% | | | 1.41% | | | 0.09% | | | 90.02% |
Year Ended October 31, 2004 | | $ | 14.47 | | — | | | 1.55 | | | 1.55 | | | (0.01 | ) | | — | | | (0.01 | ) | | — | | $ | 16.01 | | 10.72% | | | $ | 12,244 | | 1.36% | | | (0.01% | ) | | 1.39% | | | (0.04% | ) | | 146.98% |
Year Ended October 31, 2005 | | $ | 16.01 | | — | | | 2.07 | | | 2.07 | | | (0.02 | ) | | (2.89 | ) | | (2.91 | ) | | — | | $ | 15.17 | | 13.59% | | | $ | 11,263 | | 1.49% | | | 0.02% | | | 1.85% | | | (0.34% | ) | | 187.36% |
Year Ended October 31, 2006 | | $ | 15.17 | | 0.01 | | | 2.43 | | | 2.44 | | | — | | | (2.11 | ) | | (2.11 | ) | | — | | $ | 15.50 | | 17.79% | | | $ | 12,777 | | 1.36% | | | 0.09% | | | 1.66% | | | (0.21% | ) | | 151.61% |
| | | | | | | | | | | | | | | | |
Class B Shares | | | | | | | | | | | | | | | | | | | | | | | | | | | | | | | | | | | | | | | | | | | | | | |
Year Ended October 31, 2002 | | $ | 12.16 | | (0.03 | ) | | (0.98 | ) | | (1.01 | ) | | (0.01 | ) | | (0.15 | ) | | (0.16 | ) | | 0.01 | | $ | 11.00 | | (8.39% | ) | | $ | 2,362 | | 1.98% | | | (0.28% | ) | | 2.22% | | | (0.52% | ) | | 108.62% |
Year Ended October 31, 2003 | | $ | 11.00 | | (0.06 | ) | | 3.40 | | | 3.34 | | | — | | | — | | | — | | | — | | $ | 14.34 | | 30.39% | | | $ | 2,641 | | 2.00% | | | (0.49% | ) | | 2.12% | | | (0.60% | ) | | 90.02% |
Year Ended October 31, 2004 | | $ | 14.34 | | (0.11 | ) | | 1.55 | | | 1.44 | | | — | | | — | | | — | | | — | | $ | 15.78 | | 10.04% | | | $ | 2,631 | | 2.01% | | | (0.66% | ) | | 2.04% | | | (0.69% | ) | | 146.98% |
Year Ended October 31, 2005 | | $ | 15.78 | | (0.10 | ) | | 2.05 | | | 1.95 | | | — | | | (2.89 | ) | | (2.89 | ) | | — | | $ | 14.84 | | 12.90% | | | $ | 2,592 | | 2.14% | | | (0.64% | ) | | 2.50% | | | (0.99% | ) | | 187.36% |
Year Ended October 31, 2006 | | $ | 14.84 | | (0.09 | ) | | 2.37 | | | 2.28 | | | — | | | (2.11 | ) | | (2.11 | ) | | — | | $ | 15.01 | | 17.02% | | | $ | 2,600 | | 2.04% | | | (0.59% | ) | | 2.34% | | | (0.90% | ) | | 151.61% |
| | | | | | | | | | | | | | | | |
Class C Shares | | | | | | | | | | | | | | | | | | | | | | | | | | | | | | | | | | | | | | | | | | | | | | |
Year Ended October 31, 2002 | | $ | 12.13 | | (0.03 | ) | | (0.97 | ) | | (1.00 | ) | | (0.01 | ) | | (0.15 | ) | | (0.16 | ) | | 0.01 | | $ | 10.98 | | (8.31% | ) | | $ | 133 | | 1.99% | | | (0.30% | ) | | 2.23% | | | (0.54% | ) | | 108.62% |
Year Ended October 31, 2003 | | $ | 10.98 | | (0.04 | ) | | 3.37 | | | 3.33 | | | — | | | — | | | — | | | — | | $ | 14.31 | | 30.35% | | | $ | 342 | | 2.00% | | | (0.56% | ) | | 2.09% | | | (0.65% | ) | | 90.02% |
Year Ended October 31, 2004 | | $ | 14.31 | | (0.09 | ) | | 1.53 | | | 1.44 | | | — | | | — | | | — | | | — | | $ | 15.75 | | 10.06% | | | $ | 652 | | 2.01% | | | (0.67% | ) | | 2.05% | | | (0.71% | ) | | 146.98% |
Year Ended October 31, 2005 | | $ | 15.75 | | (0.10 | ) | | 2.04 | | | 1.94 | | | — | | | (2.89 | ) | | (2.89 | ) | | — | | $ | 14.80 | | 12.86% | | | $ | 669 | | 2.14% | | | (0.62% | ) | | 2.51% | | | (0.99% | ) | | 187.36% |
Year Ended October 31, 2006 | | $ | 14.80 | | (0.09 | ) | | 2.36 | | | 2.27 | | | — | | | (2.11 | ) | | (2.11 | ) | | — | | $ | 14.96 | | 16.99% | | | $ | 668 | | 2.04% | | | (0.59% | ) | | 2.34% | | | (0.89% | ) | | 151.61% |
| | | | | | | | | | | | | | | | |
Class R Shares | | | | | | | | | | | | | | | | | | | | | | | | | | | | | | | | | | | | | | | | | | | | | | |
Period Ended October 31, 2004 (d) | | $ | 15.45 | | (0.05 | ) | | 0.43 | | | 0.38 | | | — | | | — | | | — | | | — | | $ | 15.83 | | 2.46% | (f) | | $ | 1 | | 1.60% | (g) | | (0.35% | )(g) | | 1.64% | (g) | | (0.39% | )(g) | | 146.98% |
Year Ended October 31, 2005 | | $ | 15.83 | | 0.01 | | | 2.06 | | | 2.07 | | | (0.03 | ) | | (2.89 | ) | | (2.92 | ) | | — | | $ | 14.98 | | 13.71% | | | $ | 1 | | 1.61% | | | 0.06% | | | 1.99% | | | (0.32% | ) | | 187.36% |
Year Ended October 31, 2006 | | $ | 14.98 | | (0.01 | ) | | 2.39 | | | 2.38 | | | — | | | (2.11 | ) | | (2.11 | ) | | — | | $ | 15.25 | | 17.59% | | | $ | 1 | | 1.50% | | | (0.07% | ) | | 1.84% | | | (0.41% | ) | | 151.61% |
| | | | | | | | | | | | | | | | |
Institutional Class Shares | | | | | | | | | | | | | | | | | | | | | | | | | | | | | | | | | | | | | | | | | | | | | | |
Year Ended October 31, 2004 (e) | | $ | 16.18 | | — | | | (0.04 | ) | | (0.04 | ) | | — | | | — | | | — | | | — | | $ | 16.14 | | (0.19% | )(f) | | $ | 1 | | 1.09% | (g) | | 0.09% | (g) | | 1.17% | (g) | | 0.01% | (g) | | 146.98% |
Year Ended October 31, 2005 | | $ | 16.14 | | 0.06 | | | 2.09 | | | 2.15 | | | (0.05 | ) | | (2.89 | ) | | (2.94 | ) | | — | | $ | 15.35 | | 13.96% | | | $ | 1 | | 1.08% | | | 0.39% | | | 1.30% | | | 0.17% | | | 187.36% |
Year Ended October 31, 2006 | | $ | 15.35 | | 0.05 | | | 2.48 | | | 2.53 | | | — | | | (2.11 | ) | | (2.11 | ) | | — | | $ | 15.77 | | 18.21% | | | $ | 1 | | 1.07% | | | 0.36% | | | 1.36% | | | 0.08% | | | 151.61% |
| (a) | Excludes sales charge. |
| (b) | During the period certain fees were waived and/or reimbursed. If such waivers/reimbursements had not occurred, the ratios would have been as indicated. |
| (c) | Portfolio turnover is calculated on the basis of the Fund as whole without distinguishing among the classes of shares. |
| (d) | For the period from December 30, 2003 (commencement of operations) through October 31, 2004. |
| (e) | For the period from June 29, 2004 (commencement of operations) through October 31, 2004. |
See notes to financial statements.
Notes to Financial Statements
October 31, 2006
1. Organization
Gartmore Mutual Funds (the “Trust”) is an open-end management investment company, organized under the laws of Delaware by an amended and restated Agreement and Declaration of Trust, dated October 28, 2004, as amended to date. Prior to January 25, 2002 the Trust was named Nationwide Mutual Funds. The Trust, originally created under the laws of Ohio as an Ohio business trust pursuant to a Declaration of Trust, dated as of October 30, 1997, as subsequently amended and redomesticated as a Delaware Statutory Trust on February 28, 2005: the redomestication was a change in statutory status and did not affect the operations of the Trust. The trust is registered under the Investment Company Act of 1940, as amended (the “1940 Act”). As of October 31, 2006, the Trust had authorized an unlimited number of shares of beneficial interest (“shares”) without par value. The Trust operates forty-nine (49) separate series, or mutual funds, each with its own investment objective(s) and strategies. This report contains the financial statements and financial highlights of the seventeen (17) funds listed below (individually, a “Fund”; collectively, the “Funds”):
- Gartmore Global Financial Services Fund (“Global Financial Services”)
- Gartmore Global Health Sciences Fund (“Global Health Sciences”)
- Gartmore Global Natural Resources Fund (“Global Natural Resources”)
- Gartmore Global Technology and Communications Fund (“Global Technology and Communications”)
- Gartmore Global Utilities Fund (“Global Utilities”)
- Gartmore Mid Cap Growth Leaders Fund (“Mid Cap Growth Leaders”)
- Gartmore Nationwide Leaders Fund (“Nationwide Leaders”)
- Gartmore Small Cap Leaders Fund (“Small Cap Leaders”)
- Gartmore U.S. Growth Leaders Fund (“U.S. Growth Leaders”)
- Gartmore Worldwide Leaders Fund (“Worldwide Leaders”)
- Gartmore China Opportunities Fund (“China Opportunities”)
- Gartmore Emerging Markets Fund (“Emerging Markets”)
- Gartmore International Growth Fund (“International Growth”)
- Gartmore High Yield Bond Fund (“High Yield Bond”)
- Gartmore Micro Cap Equity Fund (“Micro Cap Equity”)
- Gartmore U.S. Growth Leaders Long-Short Fund (“U.S. Growth Leaders Long-Short”)
- Gartmore Value Opportunities Fund (“Value Opportunities”)
2. Summary of Significant Accounting Policies
The following is a summary of significant accounting policies followed by the Funds in the preparation of their financial statements. The policies are in conformity with accounting principles generally accepted in the United States of America (“GAAP”). The preparation of financial statements requires management to make estimates and assumptions that affect the reported amounts of assets and liabilities, the disclosure of contingent assets and liabilities at the date of the financial statements, and the reported amounts of income and expenses for the period. Actual results could differ from those estimates.
Securities for which market quotations are readily available are valued at current market value as of “Valuation Time.” Valuation Time is as of the close of regular trading on the New York Stock Exchange (usually 4 p.m. Eastern time). Equity securities are valued at the last quoted sale price or, if there is no sale price, the last quoted bid price provided by an independent pricing service approved by the Trust’s Board of Trustees. Securities traded on NASDAQ are valued at the NASDAQ Official Closing Price. Prices are taken from the primary market or exchange in which each security trades.
Most securities listed on a foreign exchange are valued either at fair value (see description below) or at the last sale price at the close of the exchange on which the security is principally traded. Foreign securities, currencies, and other
assets and liabilities denominated in foreign currencies are translated into U.S. dollars at the exchange rate of said currencies against the U.S. dollar, as of Valuation Time, as provided by an independent pricing service approved by the Board of Trustees.
Debt and other fixed-income securities (other than short-term obligations) are valued at the last quoted bid price and/or by using a combination of daily quotes and matrix evaluations provided by an independent pricing service, the use of which has been approved by the Trust’s Board of Trustees. Short-term debt securities such as commercial paper and U.S. Treasury Bills having a remaining maturity of 60 days or less at the time of purchase are considered to be “short-term” and are valued at amortized cost which approximates market value.
Securities for which market quotations are not readily available, or for which an independent pricing service does not provide a value or provides a value that does not represent fair value in the judgment of the Funds’ investment adviser or designee, are valued at fair value under procedures approved by the Trust’s Board of Trustees. The “Fair Value” of these securities is determined in good faith by taking into account relevant factors and surrounding circumstances. Methods utilized to obtain a “Fair Value” may include the following non-exclusive list of acceptable methods: (i) a multiple of earnings; (ii) the discount from market value of a similar, freely traded security; (iii) the yield-to-maturity for debt issues; or (iv) a consolidation of the methods. The Gartmore Funds Fair Value Committee considers a non-exclusive list of factors to arrive at the appropriate method of determining “Fair Value.” For example, fair value determinations are required for securities whose value is affected by a “significant” event that materially affects the value of a domestic or foreign security which occurs subsequent to the time of the close of the principal market on which such domestic or foreign security trades and before the Valuation Time (i.e., a “subsequent event”). Typically, this will involve events occurring after the close of a foreign market on which a security trades and before the next Valuation Time.
The Funds holding foreign equity securities (the “Foreign Equity Funds”) value foreign securities at fair value in the circumstances described below. Generally, trading in foreign securities markets is completed each day at various times prior to the Valuation Time. Due to the time differences between the closings of the relevant foreign securities exchanges and the Valuation Time for the Foreign Equity Funds, the Foreign Equity Funds will fair value their foreign investments when it is determined that the market quotations for the foreign investments either are not readily available or are unreliable and, therefore, do not represent fair value. When the fair value prices are utilized, these prices will attempt to reflect the impact of the U.S. financial markets’ perceptions and trading activities on the Foreign Equity Funds’ foreign investments since the last closing prices of the foreign investments were calculated on their primary foreign securities markets or exchanges. For these purposes, the Board of Trustees of the Trust has determined that movements in relevant indices or other appropriate market indicators, after the close of the foreign securities exchanges, may demonstrate that market quotations are unreliable, and may trigger fair value pricing for certain securities. Consequently, fair valuation of portfolio securities may occur on a daily basis.
| (b) | | Repurchase Agreements |
The Funds may enter into repurchase agreements with an entity which is a member of the Federal Reserve System or which is a “primary dealer” (as designated by the Federal Reserve Bank of New York) in U.S. Government obligations. The repurchase price generally equals the price paid by a Fund plus interest negotiated on the basis of current short-term rates, which may be more or less than the rate on the underlying portfolio securities. The seller under a repurchase agreement is required to maintain the value of the collateral held pursuant to the agreement at a market value equal to or greater than the repurchase price (including accrued interest). Collateral subject to repurchase agreements is held by the Funds’ custodian or another qualified sub-custodian or in the Federal Reserve/Treasury book-entry system. If the counterparty defaults and the fair value of the collateral declines, realization of the collateral by the Funds may be delayed or limited. The Funds may transfer uninvested cash balances into a pooled cash account. These balances are invested in one or more repurchase agreements, which are fully collateralized by U.S. Government Agency Mortgages with the counterparties of CS First Boston and Nomura Securities.
Notes to Financial Statements (Continued)
October 31, 2006
| (c) | | Foreign Currency Transactions |
The accounting records of the Funds are maintained in U.S. dollars. Foreign currency amounts are translated into U.S. dollars at the current rate of exchange to determine the value of investments, assets and liabilities. Purchases and sales of securities, and income and expenses are translated at the prevailing rate of exchange on the respective date of these transactions. The Funds do not isolate that portion of the results of operations resulting from changes in foreign exchange rates on investments from fluctuations arising from changes in market prices of securities held. These fluctuations are included with the net realized and unrealized gain or loss from investments and foreign currencies.
| (d) | | Forward Foreign Currency Contracts |
Certain Funds may enter into forward foreign currency exchange contracts in connection with planned purchases or sales of securities or to hedge the U.S. dollar value of portfolio securities denominated in a particular currency. The Funds could be exposed to risks if the counterparties to the contracts are unable to meet the terms of their contracts and from unanticipated movements in the value of a foreign currency relative to the U.S. dollar. Forward foreign currency contracts are valued at the current cost of covering these contracts, as provided by an independent pricing service approved by the Board of Trustees. The forward foreign currency contracts are adjusted by the daily exchange rate of the underlying currency and any gains or losses are recorded for financial statement purposes as unrealized gains or losses until the contract settlement date.
Certain Funds may invest in financial futures contracts (“futures contracts”) for the purpose of hedging their existing portfolio securities or securities that the Funds intend to purchase against fluctuations in value caused by changes in prevailing market interest rates or prices. Futures contracts may also be entered into for non-hedging purposes.
Upon entering into a futures contract, these Funds are required to pledge to the broker an amount of cash and/or other assets equal to a certain percentage of the contract amount (initial margin deposit). Subsequent payments, known as “variation margin”, are made each day, depending on the daily fluctuations in the fair value/market value of the underlying assets. A gain or loss equal to the daily variation margin is recognized on a daily basis. Futures contracts are valued daily at their last quoted sale price.
A “sale” of a futures contract means a contractual obligation to deliver the securities or foreign currency called for by the contract at a fixed price at a specified time in the future. A “purchase” of a futures contract means a contractual obligation to acquire the securities or foreign currency at a fixed price at a specified time in the future.
Should market conditions change unexpectedly, a Fund may not achieve the anticipated benefits of the futures contracts and may realize a loss. The use of futures transactions for hedging purposes involves the risk of imperfect correlation in movements in the price of futures contracts, interest rates and the value/market value of the underlying hedged assets.
During the period, the U.S. Growth Leaders Long-Short Fund engaged in short-selling of portfolio securities. The Fund is authorized to engage in short-selling of portfolio securities, which obligates the Fund to replace any security that the Fund has borrowed by purchasing the security at current market value sometime in the future. The Fund will incur a loss if the price of the security increases between the date of the short sale and the date on which the Fund replaces the borrowed security. The Fund generally will realize a gain if the price of the security declines between these dates. Until the Fund replaces the borrowed security, the Fund will maintain a segregated account with cash, U.S. government securities and/or securities held long to sufficiently cover the Fund’s short position on a daily basis. Dividends declared on securities sold short are recorded as an expense on the ex-dividend date and paid to the counterparty on the dividend pay date. The collateral for securities sold short includes the deposits with brokers and securities held long as shown in the Statement of Investments for the Fund.
To generate additional income, each of the Funds may lend their respective portfolio securities, up to 33 1/3% of the Fund, to brokers, dealers and other financial institutions provided that (1) the borrower delivers cash or securities as collateral with respect to each new loan of U.S. securities, equal to at least 102% of the value of the portfolio securities loaned, and with respect to each new loan on non-U.S. securities, collateral of at least 105% of the value of the portfolio securities loaned; and (2) at all times thereafter shall require the borrower to mark-to-market the collateral on a daily basis so that the market value of such collateral does not fall below 100% of the value of securities loaned. The Funds receive payments from borrowers equivalent to the dividends and interest that would have been earned on securities loaned while simultaneously seeking to earn income on the investment of cash collateral. There may be risks of delay in recovery of the securities should the borrower of the securities fail financially. Loans will be made, however, only to borrowers deemed by the Funds’ investment adviser to be of good standing and creditworthy under guidelines established by the Board of Trustees and when, in judgment of the adviser, the consideration which can be earned currently from these securities loans justifies the attendant risks. Loans are subject to termination by the Funds or the borrower at any time, and, therefore, are not considered to be illiquid investments. JPMorgan Chase Bank serves as custodian for the securities lending program of the Funds. JPMorgan Chase Bank receives a fee based on the value of the collateral received from borrowers.
Information on the investment of cash collateral is shown in the Statement of Investments.
As of October 31, 2006, the following Funds had securities with the following values on loan:
| | | | | | |
| Fund | | Value of
Loaned Securities | | Value of
Collateral |
Global Health Sciences | | $ | 3,882,296 | | $ | 3,982,981 |
Global Technology and Communications | | | 1,252,958 | | | 1,316,483 |
Mid Cap Growth Leaders | | | 2,095,481 | | | 2,142,014 |
U.S. Growth Leaders | | | 5,895,557 | | | 6,017,804 |
Worldwide Leaders | | | 1,364,770 | | | 1,424,500 |
Micro Cap Equity | | | 31,650,008 | | | 32,883,469 |
Value Opportunities | | | 1,961,526 | | | 2,025,875 |
| (h) | | Security Transactions and Investment Income |
Security transactions are accounted for on the date the security is purchased or sold (“trade date”). Securities gains and losses are calculated on the identified cost basis. Interest income is recognized on the accrual basis and includes, where applicable, the amortization or accretion of premium or discount. Dividend income is recorded on the ex-dividend date.
| (i) | | Distributions to Shareholders |
Distributions from net investment income, if any, is declared daily and paid monthly for High Yield Bond and is declared and paid quarterly for all other Funds. For all Funds, distributions from net realized capital gains, if any, are declared and distributed at least annually.
Dividends and distributions to shareholders are determined in accordance with federal income tax regulations, which may differ from GAAP. These “book/tax” differences are considered either permanent or temporary in nature. In accordance with American Institute of Certified Public Accountants (the “AICPA”) Statement of Position 93-2, permanent differences (i.e., reclassification of market discounts, foreign exchange gain/loss, paydowns, and distributions from real estate investment trusts) are reclassified within the capital accounts based on their nature for federal income tax purposes; temporary differences do not require reclassification. These
Notes to Financial Statements (Continued)
October 31, 2006
reclassifications have no effect upon the net asset value of the respective Funds. To the extent distributions exceed current and accumulated earnings and profits for federal income tax purposes, these distributions are reported as distributions of paid-in-capital.
It is the policy of each Fund to qualify or continue to qualify as a “regulated investment company” by complying with the provisions available to certain investment companies, as defined in SubChapter M of the Internal Revenue Code, and to make distributions of net investment income and net realized capital gains sufficient to relieve the Fund from all, or substantially all, federal income taxes.
| (k) | | Allocation of Expenses, Income, and Gains and Losses |
Expenses directly attributable to a Fund are charged to that Fund. Expenses not directly attributable to a Fund are allocated proportionately among various or all Funds within the Trust. For each of the Funds, except High Yield Bond, the method for allocating income, fund level expenses, and realized and unrealized gains or losses is based on the fair value of shares outstanding relative to net assets. Under this method, each class of shares participates based on the total net asset value of that class’s shares in proportion to the total net assets of the Fund. For the High Yield Bond Fund, the allocation method used is based on the fair value of settled shares outstanding. Under this method, earnings are allocated based on the fair value of settled shares. Expenses specific to a class (such as Rule 12b-1 and administrative services fees) are charged to that class.
3. Transactions with Affiliates
Under the terms of the Trust’s Investment Advisory Agreements, Gartmore Mutual Fund Capital Trust (“GMF”) manages the investment of the assets and supervises the daily business affairs of their respective Funds (as shown in table below). GMF is a wholly-owned subsidiary of NWD Investment Management, Inc. (prior to November 30, 2006 known as “Gartmore Global Investments, Inc.” (“GGI”), a holding company. NWD Investment Management, Inc. is a majority-owned subsidiary of NWD Management & Research Trust, (prior to November 30, 2006 known as “Gartmore Global Asset Management Trust” (“GGAMT”). NWD Management & Research Trust is a wholly-owned subsidiary of Nationwide Corporation. All of the common stock of Nationwide Corporation is held by Nationwide Mutual Insurance Company (95.2%) and Nationwide Mutual Fire Insurance Company (4.8%), each of which is a mutual company owned by its policyholders. In addition, GMF provides investment management evaluation services in initially selecting subadvisers and monitoring, on an ongoing basis, the performance of the subadvisers, if applicable, for the Funds that GMF advises. The subadvisers manage each of their respective Fund’s investments and have the responsibility for making all investment decisions for the applicable Funds. The adviser and subadviser, if applicable, for each Fund is as follows:
| | | | |
| Fund | | Adviser | | Subadviser |
Global Financial Services | | GMF | | n/a (a) |
Global Health Sciences | | GMF | | n/a |
Global Natural Resources | | GMF | | n/a (a) |
Global Technology and Communications | | GMF | | n/a |
Global Utilities | | GMF | | Gartmore Global Partners (b) |
Mid Cap Growth Leaders | | GMF | | n/a |
Nationwide Leaders | | GMF | | n/a |
Small Cap Leaders | | GMF | | n/a |
U.S. Growth Leaders | | GMF | | n/a |
Worldwide Leaders | | GMF | | Gartmore Global Partners (b) |
China Opportunities | | GMF | | Gartmore Global Partners (b) |
| | | | |
| Fund | | Adviser | | Subadviser |
Emerging Markets | | GMF | | Gartmore Global Partners (b) |
International Growth | | GMF | | Gartmore Global Partners (b) |
High Yield Bond | | GMF | | n/a |
Micro Cap Equity | | GMF | | n/a |
U.S Growth Leaders Long-Short | | GMF | | n/a |
Value Opportunities | | GMF | | NorthPointe Capital, LLC (c) |
| (a) | Beginning September 29, 2006, Gartmore Global Partners is no longer the subadviser for the Fund. |
| (b) | Beginning September 29, 2006, Gartmore Global Partners is no longer an affiliate of GMF. |
Under the terms of the Investment Advisory Agreements, each Fund pays the Fund’s respective adviser an investment advisory fee based on that Fund’s average daily net assets. From these fees, pursuant to the subadvisory agreements, the adviser pays fees to the applicable subadviser, if any. Additional information regarding the investment advisory fees and subadvisory fees for GMF and the subadvisers, where applicable, is as follows for the year ended October 31, 2006:
| | | | | | | | |
| Fund | | Fee Schedule | | Total
Fees | | Fees
Retained | | Paid to
Subadviser |
Global Financial Services (1)(a) | | Up to $500 million | | 0.90% | | 0.45% | | 0.45% |
| | $500 million up to $2 billion | | 0.85% | | 0.425% | | 0.425% |
| | | On $2 billion and more | | 0.80% | | 0.40% | | 0.40% |
Global Health Sciences (1) | | Up to $500 million | | 0.90% | | 0.90% | | — |
| | $500 million up to $2 billion | | 0.85% | | 0.85% | | — |
| | | On $2 billion and more | | 0.80% | | 0.80% | | — |
Global Natural Resources (1)(a) | | Up to $500 million | | 0.70% | | 0.35% | | 0.35% |
| | $500 million up to $2 billion | | 0.65% | | 0.325% | | 0.325% |
| | | On $2 billion and more | | 0.60% | | 0.30% | �� | 0.30% |
Global Technology and Communications (1) | | Up to $500 million | | 0.88% | | 0.88% | | — |
| | $500 million up to $2 billion | | 0.83% | | 0.83% | | — |
| | | On $2 billion and more | | 0.78% | | 0.78% | | — |
Global Utilities (1) | | Up to $500 million | | 0.70% | | 0.35% | | 0.35% |
| | $500 million up to $2 billion | | 0.65% | | 0.325% | | 0.325% |
| | | On $2 billion and more | | 0.60% | | 0.30% | | 0.30% |
Mid Cap Growth Leaders | | Up to $250 million | | 0.80% | | 0.80% | | — |
| | $250 million up to $1 billion | | 0.77% | | 0.77% | | — |
| | $1 billion up to $2 billion | | 0.74% | | 0.74% | | — |
| | $2 billion up to $5 billion | | 0.71% | | 0.71% | | — |
| | | On $5 billion and more | | 0.68% | | 0.68% | | — |
Nationwide Leaders (1) | | Up to $500 million | | 0.80% | | 0.80% | | — |
| | $500 million up to $2 billion | | 0.70% | | 0.70% | | — |
| | | On $2 billion and more | | 0.65% | | 0.65% | | — |
Small Cap Leaders | | All Assets | | 0.95% | | 0.95% | | — |
U.S. Growth Leaders (2) | | Up to $500 million | | 0.90% | | 0.90% | | — |
| | $500 million up to $2 billion | | 0.80% | | 0.80% | | — |
| | | On $2 billion and more | | 0.75% | | 0.75% | | — |
Worldwide Leaders (1) | | Up to $500 million | | 0.90% | | 0.45% | | 0.45% |
| | $500 million up to $2 billion | | 0.85% | | 0.425% | | 0.425% |
| | | On $2 billion and more | | 0.80% | | 0.40% | | 0.40% |
Notes to Financial Statements (Continued)
October 31, 2006
| | | | | | | | |
| Fund | | Fee Schedule | | Total
Fees | | Fees
Retained | | Paid to
Subadviser |
China Opportunities (1) | | Up to $500 million | | 1.25% | | 0.625% | | 0.625% |
| | $500 million up to $2 billion | | 1.20% | | 0.60% | | 0.60% |
| | | On $2 billion and more | | 1.15% | | 0.575% | | 0.575% |
Emerging Markets (1) | | Up to $500 million | | 1.05% | | 0.525% | | 0.525% |
| | $500 million up to $2 billion | | 1.00% | | 0.50% | | 0.50% |
| | | On $2 billion and more | | 0.95% | | 0.475% | | 0.475% |
International Growth (1) | | Up to $500 million | | 0.90% | | 0.45% | | 0.45% |
| | $500 million up to $2 billion | | 0.85% | | 0.425% | | 0.425% |
| | | On $2 billion and more | | 0.80% | | 0.40% | | 0.40% |
High Yield Bond | | Up to $250 million | | 0.55% | | 0.55% | | — |
| | $250 million up to $1 billion | | 0.525% | | 0.525% | | — |
| | $1 billion up to $2 billion | | 0.50% | | 0.50% | | — |
| | $2 billion up to $5 billion | | 0.475% | | 0.475% | | — |
| | | On $5 billion and more | | 0.45% | | 0.45% | | — |
Micro Cap Equity | | All Assets | | 1.25% | | 1.25% | | — |
U.S. Growth Leaders Long-Short | | Up to $250 million | | 1.50% | | 1.50% | | — |
| | | On $250 million and more | | 1.25% | | 1.25% | | — |
Value Opportunities | | Up to $250 million | | 0.70% | | — | | 0.70% |
| | $250 million up to $1 billion | | 0.675% | | — | | 0.675% |
| | $1 billion up to $2 billion | | 0.65% | | — | | 0.65% |
| | $2 billion up to $5 billion | | 0.625% | | — | | 0.625% |
| | | On $5 billion and more | | 0.60% | | — | | 0.60% |
| (a) | Prior to September 29, 2006, Gartmore Global Partners was the Subadviser for the Fund. |
| (1) | Each Fund pays the Fund’s respective adviser a base management fee (as shown above) which may be adjusted upward or downward each quarter depending on the performance of Class A shares of each Fund relative to each Fund’s benchmark (see benchmark table below). The calculation of this fee is done in two separate steps. First, each Fund pays a base fee, as adjusted for any applicable breakpoints as described below. The base fee rate is an annual fee, calculated each quarter, and is applied to each such Fund’s average net assets over that quarter. Second, a performance adjustment percentage is applied to each Fund’s average net assets over the 12-month rolling performance period. The base fee and the performance adjustment percentage are then added (or subtracted, as applicable) to arrive at each Fund’s respective overall advisory fee for the current period. The table below shows the performance adjustment rate applicable to each Fund’s base fee (as such base fee may be adjusted by Base Fee Breakpoints, as described in the table above): |
| | |
| Out or Underperformance | | Change in Fees |
+/- 1 percentage point | | +/- 0.02% |
+/- 2 percentage point | | +/- 0.04% |
+/- 3 percentage point | | +/- 0.06% |
+/- 4 percentage point | | +/- 0.08% |
+/- 5 percentage point | | +/- 0.10% |
The table below lists the benchmarks used to measure against the performance of Class A shares of the Funds:
| | |
| Fund | | Benchmark |
Global Financial Services | | MSCI World Financials Index |
Global Health Sciences | | GS Healthcare Index |
Global Natural Resources | | GS Natural Resources Index |
Global Technology and Communications | | GS Technology Composite Index |
| | |
| Fund | | Benchmark |
Global Utilities | | 60% MSCI World Telecommunications Services Index 40% MSCI World Utilities Index |
Nationwide Leaders | | S&P 500 Index |
Worldwide Leaders | | MSCI World Index |
China Opportunities | | MSCI Zhong Hua Index |
Emerging Markets | | MSCI Emerging Markets Index |
International Growth | | MSCI All Country World Index |
| (2) | The U.S. Growth Leaders Fund pays GMF a base management fee (as shown above) which may be adjusted upward or downward each quarter depending on the performance of Class A shares of the Fund relative to its benchmark, the S&P 500. Thus, if Class A of the Fund outperform its benchmark by 12% or more over a 36-month period, the Fund will pay higher management fees. Conversely, if Class A shares of the Fund underperform its benchmark by 12% or more over a 36-month period, the Fund will pay lower management fees. No adjustment will take place if the under or overperformance is less than 12% and GMF will receive the applicable base fee. The adjustment described above will be phased in over a 24-month period beginning after the first year of operations. The base fee is either increased or decreased by the following amounts at each breakpoint: |
| | |
| Fee Schedule | | Fee Adjustment |
Up to $500 million | | +/-0.22% |
$500 million up to $2 billion | | +/-0.18% |
On $2 billion and more | | +/-0.16% |
On September 7, 2006, the Securities and Exchange Commission (the “SEC”) entered an administrative and cease-and-desist order against GMF. The SEC order finds that GMFCT willfully violated Section 205(a) of the Investment Advisers Act of 1940 (“Advisers Act”). Specifically, the Order finds that, from the implementation of advisory contracts with the Gartmore U.S. Growth Leaders Fund (the “Fund”) through August 2004, investment adviser GMFCT collected performance compensation from the Fund based on the Fund’s average net asset value for the quarter following the performance period and that as a result GMFCT charged the Fund approximately $209,000 more in the aggregate than it would have if its fee arrangements satisfied the relevant provisions of the Advisers Act. The Order further finds that, as a result of its conduct, GMFCT willfully violated Section 205(a) of the Advisers Act, which prohibits an investment adviser from entering into or performing an advisory contract with a registered investment company that provides for performance-based compensation unless, pursuant to Section 205(b) of the Advisers Act, the contract provides for performance-based compensation based on the asset value of the fund averaged over a specified period and increasing and decreasing proportionately with the investment performance of the fund over a specified period in relation to the investment record of an appropriate index of securities prices. The Order also acknowledges that upon notification by the Commission staff that GMFCT was charging the Fund a total fee based on a method that did not comply with Section 205 of the Advisers Act, GMFCT’s management discontinued the method and later reimbursed the Fund a total of $215,344. The Board of Trustees of the Fund approved the amount repaid. Based on these findings, the Order censured GMFCT and required that GMFCT cease and desist from committing or causing any violations and any future violations of Section 205(a).
GMF or NWD Management & Research Trust, where applicable, and the Funds have entered into written contracts (“Expense Limitation Agreements”) that limit operating expenses (excluding any taxes, interest, brokerage fees, extraordinary expenses, short sale dividend expenses, Rule 12b-1 fees, and administrative services fees) from exceeding the amounts listed in the table below until at least February 28, 2007:
| | | | |
| Fund | | Expense Caps | | Amount |
Global Financial Services | | All Classes | | 1.40% |
Global Health Sciences | | All Classes | | 1.40% |
Global Natural Resources | | All Classes | | 1.20% |
Notes to Financial Statements (Continued)
October 31, 2006
| | | | |
| Fund | | Expense Caps | | Amount |
Global Technology and Communications | | All Classes | | 1.38% |
Global Utilities | | All Classes | | 1.20% |
Mid Cap Growth Leaders | | All Classes | | 1.20% |
Nationwide Leaders | | All Classes | | 1.30% |
Small Cap Leaders | | All Classes | | 1.35% |
U.S. Growth Leaders | | All Classes | | 1.30% |
Worldwide Leaders | | All Classes | | 1.40% |
China Opportunities | | All Classes | | 1.75% |
Emerging Markets | | All Classes | | 1.55% |
International Growth | | All Classes | | 1.40% |
High Yield Bond | | All Classes | | 0.85% |
Micro Cap Equity | | All Classes | | 1.65% |
U.S. Growth Leaders Long-Short | | All Classes | | 1.90% |
Value Opportunities | | All Classes | | 1.10% |
GMF or NWD Management & Research Trust may request and receive reimbursement from a Fund of the advisory fees waived and other expenses reimbursed by GMF and NWD Management & Research Trust, respectively, pursuant to the Expense Limitation Agreements at a later date not to exceed (i) five fiscal years from commencement of operations or (ii) three years from the fiscal year in which the corresponding reimbursement to the Fund was made, depending on the Fund (as described below), if the Fund has reached a sufficient asset size to permit reimbursement to be made without causing the total annual operating expense ratio of the Fund to exceed the limits set forth above. No reimbursement will be made unless: (i) the Fund’s assets exceed $100 million; (ii) the total annual expense ratio of the Class making such reimbursement is less than the limit set forth above; and (iii) the payment of such reimbursement is approved by the Board of Trustees on a quarterly basis. Except as provided for in the Expense Limitation Agreements, reimbursement of amounts previously waived or assumed by GMF or NWD Management & Research Trust is not permitted.
As of October 31, 2006, the cumulative potential reimbursements of the following Funds based on expenses reimbursed by GMF or NWD Management & Research Trust within five years from commencement of operations of the Fund would be:
| | | | | |
| Fund | | Amount | | Expires |
Global Financial Services | | $ | 167,505 | | December 18, 2006 |
Global Utilities | | | 253,536 | | December 18, 2006 |
Nationwide Leaders | | | 218,796 | | December 28, 2006 |
Micro Cap Equity | | | 102,798 | | June 27, 2007 |
As of October 31, 2006, the cumulative potential reimbursements of the following Funds (unless otherwise indicated), based on reimbursements within three years from the fiscal year in which the corresponding reimbursement to the Fund was made for expenses reimbursed by GMF or NWD Management & Research Trust, would be:
| | | | | | | | | |
| Fund | | Amount
Fiscal Year
2004 | | Amount
Fiscal Year
2005 | | Amount
Fiscal Year
2006 |
Global Natural Resources | | $ | 21,945 | | $ | 37,587 | | $ | — |
Mid Cap Growth Leaders | | | 98,160 | | | 83,813 | | | 27,262 |
Small Cap Leaders | | | — | | | 62,315 | | | 9,303 |
| | | | | | |
| Fund | | Amount
Fiscal Year
2004 | | Amount
Fiscal Year
2005 | | Amount
Fiscal Year
2006 |
China Opportunities | | 50,098 | | 66,130 | | 22,860 |
U.S. Growth Leaders Long-Short | | 14,723 | | 43,113 | | — |
Under the terms of a Distribution Plan under Rule 12b-1 of the 1940 Act, Gartmore Distribution Services, Inc. (“GDSI”), the Funds’ principal underwriter, is compensated by the Funds for expenses associated with the distribution of Class A, Class B, Class C, and Class R shares of the Funds. GDSI is a majority-owned subsidiary of NWD Management & Research Trust. These fees are based on average daily net assets of the respective class of the Funds at an annual rate not to exceed 0.25% for Class A shares, 1.00% for Class B and Class C shares, and 0.50% for Class R shares.
Pursuant to an Underwriting Agreement, GDSI serves as principal underwriter of the Funds in the continuous distribution of their shares and receives commissions in the form of a front-end sales charge on the Class A and Class D shares. These fees are deducted from and are not included in proceeds from sales of Class A and Class D shares. From these fees, GDSI pays sales commissions, salaries and other expenses in connection with generating new sales of Class A and Class D shares of the Funds. GDSI also receives fees for services as principal underwriter for Class B shares of the Funds. These fees are contingent deferred sales charges (“CDSCs”) ranging from 1% to 5% imposed on redemptions of Class B shares which may cause the current value of a shareholder’s account to fall below the total purchase payments. The CDSC, if applicable, will be imposed on redemptions made within six years of the purchase. Class C shares have a CDSC of 1% imposed on redemptions of Class C shares made within one year of purchase. For the year ended October 31, 2006, GDSI received commissions of $1,641,694 from front-end sales charges of Class A and Class D shares and from CDSC fees from Class B and Class C shares of the Funds, of which $683,510 was reallowed to affiliated broker-dealers of the Funds.
Under the terms of a Fund Administration and Transfer Agency Agreement, Gartmore SA Capital Trust (“GSA”) provides various administrative and accounting services, and Gartmore Investors Services, Inc. (“GISI”), an indirect subsidiary of GSA, serves as Transfer Agent and Dividend Disbursing Agent for each of the Funds. The fees for the services provided under this agreement are calculated based on the Trust’s average daily net assets according to the fee schedule below. The fees are then allocated proportionately among all funds within the Trust in relation to the average daily net assets of each Fund and are paid to GSA. GSA pays GISI from these fees for GISI’s services.
| | |
| Combined Fee Schedule* | | |
Up to $1 billion | | 0.26% |
$1 billion up to $3 billion | | 0.19% |
$3 billion up to $4 billion | | 0.15% |
$4 billion up to $5 billion | | 0.08% |
$5 billion up to $10 billion | | 0.05% |
$10 billion up to $12 billion | | 0.03% |
$12 billion or more | | 0.02% |
| * | The assets of the Gartmore Investor Destinations Aggressive, Gartmore Investor Destinations Moderately Aggressive, Gartmore Investor Destinations Moderate, Gartmore Investor Destinations Moderately Conservative and Gartmore Investor Destinations Conservative Funds (collectively, the “Investor Destinations Funds”) and the Gartmore Optimal Allocations Fund: Aggressive, Gartmore Optimal Allocations Fund: Moderate, Gartmore Optimal Allocations Fund: Moderately Aggressive, and Gartmore Optimal Allocations Fund: Specialty (collectively, the “Optimal Funds”) are excluded from the Trust asset level amount in order to calculate this asset based fee. The Investor Destinations Funds and the Optimal Funds do not pay any part of this fee. |
GSA and GISI have entered into agreements with BISYS Fund Services Ohio, Inc. (“BISYS”), pursuant to which BISYS provides sub-administration and sub-transfer agency services, respectively, to the Funds.
Notes to Financial Statements (Continued)
October 31, 2006
GSA and BISYS have agreed to designate certain sub-transfer agency agreements GSA enters into with respect to the Funds as “Qualifying Sub-TA Agreements.” With respect to Qualifying Sub-TA Agreements, BISYS will credit to GSA an amount equal to the lesser of (i) the actual amount GSA is charged by the sub-transfer agent under the applicable Qualifying Sub-TA Agreement or (ii) $10 per investor account; however, the aggregate amount paid with regard to all Qualifying Sub-TA Agreements, regardless of whether option (i) or (ii) applies, shall not exceed $200,000 per annum. BISYS will calculate and credit such amounts to GSA’s fees on a monthly basis. All amounts will be credited to each applicable Fund on a monthly basis.
Under the terms of an Administrative Services Plan, the Funds may pay fees to servicing organizations, such as broker-dealers, including Nationwide Financial Services, Inc. (“Nationwide Financial Services”), an affiliate of NWD Management & Research Trust, and financial institutions, which agree to provide administrative support services to the shareholders of certain classes. These services include, but are not limited to, the following: establishing and maintaining shareholder accounts; processing purchase and redemption transactions; arranging bank wires; performing shareholder sub-accounting; answering inquiries regarding the Funds; and other such services. These fees are based on an annual rate of up to 0.25% of the average daily net assets of the Class A, Class D, Class R, and Institutional Service Class shares of each of the Funds.
For the year ended October 31, 2006, Nationwide Financial Services received the following amounts in Administrative Services Fees from each Fund:
| | | |
| Fund | | Amount |
Global Financial Services | | $ | 1,738 |
Global Health Sciences | | | 13,864 |
Global Technology and Communications | | | 4,622 |
Global Utilities | | | 621 |
Nationwide Leaders | | | 8,965 |
Small Cap Leaders | | | 9 |
U.S. Growth Leaders | | | 29,609 |
Worldwide Leaders | | | 5,522 |
China Opportunities | | | 4 |
Emerging Markets | | | 20,865 |
International Growth | | | 1,438 |
High Yield Bond | | | 3,482 |
Value Opportunities | | | 5,937 |
Under terms of a letter agreement dated September 12, 2006, by and among GSA and the Audit Committees of the Funds and Gartmore Variable Insurance Trust, the Funds have agreed to reimburse GSA their pro-rata portion of certain costs related to the Funds’ ongoing administration, monitoring and annual (audit) testing of the Funds’ Rule 38a-1 Compliance Program subject to the pre-approval of the Funds’ Audit Committee. Such costs include: (1) $160 per hour for services performed on behalf of the Funds by employees of GSA or GSA’s affiliates (other than the Fund CCO); (2) travel costs and other reasonable incidental expenses (without markup) incurred by employees of GSA or GSA’s affiliates in connection with performance of such services; and (3) in the event it becomes necessary to supplement the services of GSA’s (and GSA’s affiliates’) employees, in order to complete the Funds’ Rule 38a-1 annual compliance audit, the costs of a mutually-agreed upon independent contractor’s costs to provide such services.
As of October 31, 2006, GMF, NWD Management & Research Trust or their affiliates directly held the percentage indicated below of the shares outstanding of the applicable Fund:
| | | |
| Fund | | % of Shares Outstanding Owned | |
Global Financial Services | | 11 | % |
Global Health Sciences | | 11 | % |
Global Natural Resources | | 14 | % |
Global Technology and Communications | | 10 | % |
Global Utilities | | 25 | % |
Mid Cap Growth Leaders | | 40 | % |
Nationwide Leaders | | 14 | % |
Small Cap Leaders | | 13 | % |
U.S. Growth Leaders | | 2 | % |
China Opportunities | | 30 | % |
Emerging Markets | | 8 | % |
International Growth | | 27 | % |
High Yield Bond | | 68 | % |
4. Short-Term Trading Fees
The Funds assess a 2.00% redemption fee on all classes of shares that are purchased and are sold or exchanged within 90 calendar days of purchase (within 30 calendar days for the Nationwide Leaders and U.S. Growth Leaders Funds and within seven calendar days for the High Yield Bond Fund). The redemption fee, if any, is paid directly to the applicable Fund and is designed to offset brokerage commissions, market impact and other costs associated with short-term trading of Fund shares. For purposes of determining whether the redemption fee applies, the shares that were held the longest will be redeemed first. This redemption fee is in addition to any CDSCs that may be applicable at the time of sale. The redemption fee may not apply in certain circumstances, such as redemptions or exchanges of shares held in certain omnibus accounts or retirement plans that cannot implement the redemption fee. The fee does not apply to shares purchased through reinvested dividends or capital gains.
For the year ended October 31, 2006, the following Funds had contributions to capital due to collection of redemption fees:
| | | |
| Fund | | Amount |
Global Financial Services | | $ | 21,436 |
Global Health Sciences | | | 3,877 |
Global Natural Resources | | | 52,452 |
Global Utilities | | | 2,215 |
Mid Cap Growth Leaders | | | 1,850 |
Small Cap Leaders | | | 10,354 |
U.S. Growth Leaders | | | 10,272 |
China Opportunities | | | 15,545 |
Emerging Markets | | | 10,527 |
International Growth | | | 16,655 |
Micro Cap Equity | | | 16,563 |
U.S. Growth Leaders Long-Short | | | 46,641 |
Value Opportunities | | | 433 |
Notes to Financial Statements (Continued)
October 31, 2006
5. Bank Loans and Earnings Credit
The Trust has a credit agreement with JPMorgan Chase & Co., the Funds’ custodian bank, permitting the Trust to borrow up to $100,000,000. Borrowings under this arrangement bear interest at the Federal Funds rate plus 0.50%. The interest costs, if any, would be included in other fees in the Statement of Operations. No compensating balances were required under the terms of the line of credit. The line of credit is renewed annually, expiring on June 26, 2007, with a commitment fee of 0.08% per year on $100,000,000. There were no borrowings outstanding under this line of credit during the year ended October 31, 2006.
The Trust’s custodian bank has agreed to reduce the bank’s fees (earnings credits) when the Funds of the Trust maintain cash on deposit in non-interest-bearing custody and Demand Deposit Accounts. Earnings credits are a reduction of total expenses shown on the Statement of Operations.
6. Investment Transactions
Purchases and sales of securities (excluding short-term securities) for the year ended October 31, 2006 are summarized as follows:
| | | | | | |
| Fund | | Purchases | | Sales |
Global Financial Services | | $ | 89,734,298 | | $ | 59,108,202 |
Global Health Sciences | | | 72,196,490 | | | 69,759,106 |
Global Natural Resources | | | 111,827,082 | | | 96,051,895 |
Global Technology and Communications | | | 39,098,944 | | | 38,064,837 |
Global Utilities | | | 17,894,594 | | | 9,978,241 |
Mid Cap Growth Leaders | | | 61,286,489 | | | 67,037,328 |
Nationwide Leaders | | | 74,357,429 | | | 78,675,985 |
Small Cap Leaders | | | 123,434,636 | | | 106,260,747 |
U.S. Growth Leaders | | | 574,743,562 | | | 560,675,905 |
Worldwide Leaders | | | 126,649,609 | | | 127,121,368 |
China Opportunities | | | 37,136,000 | | | 23,680,519 |
Emerging Markets | | | 90,976,133 | | | 82,518,499 |
International Growth | | | 78,803,723 | | | 52,967,238 |
High Yield Bond | | | 15,705,110 | | | 13,804,956 |
Micro Cap Equity | | | 111,198,622 | | | 127,747,615 |
U.S. Growth Leaders Long-Short | | | 467,360,426 | | | 442,243,285 |
Value Opportunities | | | 23,247,661 | | | 23,979,401 |
Purchases and sales of U.S. Government securities for the year ended October 31, 2006, are summarized as follows:
| | | | | | |
| Fund | | Purchases | | Sales |
Mid Cap Growth Leaders | | $ | 157,980 | | $ | — |
7. Portfolio Investment Risks
Credit and Market Risk. Funds that invest in high yield and emerging market instruments are subject to certain additional credit and market risks. The yields of high yield and emerging market debt obligations reflect, among other things, perceived credit risk. The Funds’ investment in securities rated below investment grade typically involve risks not associated with higher rated securities including, among others, greater risk of not receiving timely and/or ultimate payment of interest and principal, greater market price volatility, and less liquid secondary market trading. The consequences of political, social, economic, or diplomatic changes may have disruptive effects on the market prices of emerging markets investments held by the Funds.
Risks Associated with Foreign Securities and Currencies. Investments in securities of foreign issuers carry certain risks not ordinarily associated with investments in securities of U.S. issuers. These risks include future political and economic developments, and the possible imposition of exchange controls or other foreign governmental laws and restrictions. In addition, with respect to certain countries, there is the possibility of expropriation of assets, confiscatory taxation, political or social instability or diplomatic developments, which could adversely affect investments in those countries.
Certain countries also may impose substantial restrictions on investments in their capital markets by foreign entities, including restrictions on investments in issuers of industries deemed sensitive to relevant national interests. These factors may limit the investment opportunities available and result in a lack of liquidity and a high price volatility with respect to securities of issuers from developing countries.
8. Indemnifications
Under the Trust’s organizational documents, certain of the Trust’s Officers and Trustees are indemnified against certain liabilities arising out of the performance of their duties to the Trust. In addition, the Trust has entered into Indemnification Agreements with its Trustees and certain of its Officers. Trust Officers receive no compensation from the Trust for serving as its Officers. In addition, in the normal course of business, the Trust enters into contracts with the Trust’s vendors and others that provide for general indemnifications. The Trust’s maximum liability under these arrangements is unknown, as this would involve future claims that may be made against the Trust. However, based on experience, the Trust expects that risk of loss to be remote.
9. Other
During the fiscal year ended October 31, 2006, the Nationwide Leaders Fund, Worldwide Leaders Fund, Global Health Sciences Fund and Global Technology and Communications Fund delivered securities of the Funds in exchange for the redemption of Institutional Service shares (redemptions in-kind). Cash and securities were transferred for redemptions at a market value of $7,399,624, $6,223,570, $4,860,311 and $2,939,887 for the Nationwide Leaders Fund, Worldwide Leaders Fund, Global Health Sciences Fund and Global Technology and Communications Fund, respectively. For financial reporting purposes, the Nationwide Leaders Fund, Worldwide Leaders Fund, Global Health Sciences Fund and Global Technology and Communications Fund recorded net realized gains of $216,518, $336,657, $382,460 and $143,928, respectively, in connection with the transactions. However, for tax purposes, the transactions received tax-free treatment. These permanent book to tax differences were reclassified within the components of net assets in accordance with the Funds’ accounting policies, more fully disclosed in note 2.
Notes to Financial Statements (Continued)
October 31, 2006
10. Federal Tax Information
The tax character of distributions paid during the fiscal year ended October 31, 2006, was as follows: (Total distributions paid may differ from the Statement of Changes in Net Assets because for tax purposes dividends are recognized when paid.)
| | | | | | | | | | | | |
| | | Distributions paid from | | | | |
| Fund | | Ordinary
Income | | Net Long
Term Capital
Gains | | Total Taxable
Distributions | | Total
Distributions
Paid |
Global Financial Services | | $ | 784,312 | | $ | 428,495 | | $ | 1,212,807 | | $ | 1,212,807 |
Global Health Sciences | | | 2,560,787 | | | — | | | 2,560,787 | | | 2,560,787 |
Global Natural Resources | | | 2,553,299 | | | 157,431 | | | 2,710,730 | | | 2,710,730 |
Global Technology and Communications | | | — | | | — | | | — | | | — |
Global Utilities | | | 1,611,767 | | | 49,352 | | | 1,661,119 | | | 1,661,119 |
Mid Cap Growth Leaders | | | — | | | — | | | — | | | — |
Nationwide Leaders | | | 1,677,808 | | | 187,009 | | | 1,864,817 | | | 1,864,817 |
Small Cap Leaders | | | 341,925 | | | — | | | 341,925 | | | 341,925 |
U.S. Growth Leaders | | | 8,591,263 | | | 201,192 | | | 8,792,455 | | | 8,792,455 |
Worldwide Leaders | | | 188,866 | | | — | | | 188,866 | | | 188,866 |
China Opportunities | | | 829,775 | | | 70,442 | | | 900,217 | | | 900,217 |
Emerging Markets | | | 3,034,643 | | | 2,214,149 | | | 5,248,792 | | | 5,248,792 |
International Growth | | | 62,765 | | | — | | | 62,765 | | | 62,765 |
High Yield Bond | | | 1,712,155 | | | — | | | 1,712,155 | | | 1,712,155 |
Micro Cap Equity | | | — | | | 7,502,787 | | | 7,502,787 | | | 7,502,787 |
U.S. Growth Leaders Long-Short | | | 405,447 | | | — | | | 405,447 | | | 405,447 |
Value Opportunities | | | 1,228,379 | | | 775,897 | | | 2,004,276 | | | 2,004,276 |
The tax character of distributions paid during the fiscal year ended October 31, 2005 was as follows: (Total distributions paid differ from the Statement of Changes in Net Assets because for tax purposes dividends are recognized when actually paid.)
| | | | | | | | | | | | |
| | | Distributions paid from | | | | |
| Fund | | Ordinary
Income | | Net Long
Term Capital
Gains | | Total Taxable
Distributions | | Total
Distributions
Paid |
Global Financial Services | | $ | 559,748 | | $ | 21,752 | | $ | 581,500 | | $ | 581,500 |
Global Health Sciences | | | 93,310 | | | — | | | 93,310 | | | 93,310 |
Global Natural Resources | | | 137,307 | | | — | | | 137,307 | | | 137,307 |
Global Technology and Communications | | | — | | | — | | | — | | | — |
Global Utilities | | | 186,261 | | | 111,800 | | | 298,061 | | | 298,061 |
Mid Cap Growth Leaders | | | — | | | — | | | — | | | — |
Nationwide Leaders | | | 319,593 | | | 68,858 | | | 388,451 | | | 388,451 |
Small Cap Leaders | | | — | | | — | | | — | | | — |
U.S. Growth Leaders | | | — | | | — | | | — | | | — |
Worldwide Leaders | | | 120,250 | | | — | | | 120,250 | | | 120,250 |
China Opportunities | | | 311,165 | | | — | | | 311,165 | | | 311,165 |
Emerging Markets | | | 686,019 | | | — | | | 686,019 | | | 686,019 |
International Growth | | | 90,633 | | | — | | | 90,633 | | | 90,633 |
High Yield Bond | | | 1,721,964 | | | — | | | 1,721,964 | | | 1,721,964 |
Micro Cap Equity | | | 2,041,683 | | | 883,843 | | | 2,925,526 | | | 2,925,526 |
Small Cap Growth | | | — | | | — | | | — | | | — |
U.S. Growth Leaders Long-Short | | | 1,103,030 | | | — | | | 1,103,030 | | | 1,103,030 |
Value Opportunities | | | 1,101,269 | | | 4,162,427 | | | 5,263,696 | | | 5,263,696 |
Notes to Financial Statements (Continued)
October 31, 2006
As of October 31, 2006, the components of accumulated earnings (deficit) on a tax basis was as follows:
| | | | | | | | | | | | | | | | | | | | | | | | |
| Fund | | Undistributed
Ordinary
Income | | Undistributed
Long-Term
Capital Gains | | Accumulated
Earnings | | Distributions
Payable | | | Accumulated
Capital and
Other Losses | | | Unrealized
Appreciation
(Depreciation)* | | Total
Accumulated
Earnings
(Deficit) | |
Global Financial Services | | $ | 1,573,951 | | $ | 634,869 | | $ | 2,208,820 | | $ | — | | | $ | — | | | $ | 3,856,403 | | $ | 6,065,223 | |
Global Health Sciences | | | — | | | — | | | — | | | — | | | | (265,562 | ) | | | 1,825,768 | | | 1,560,206 | |
Global Natural Resources | | | 6,250,425 | | | 405,153 | | | 6,655,578 | | | — | | | | — | | | | 1,247,047 | | | 7,902,625 | |
Global Technology and Communications | | | 87,227 | | | — | | | 87,227 | | | — | | | | (2,733,540 | ) | | | 805,178 | | | (1,841,135 | ) |
Global Utilities | | | 617,128 | | | 281,112 | | | 898,240 | | | — | | | | — | | | | 2,412,832 | | | 3,311,072 | |
Mid Cap Growth Leaders | | | — | | | — | | | — | | | — | | | | (28,940,738 | ) | | | 2,990,121 | | | (25,950,617 | ) |
Nationwide Leaders | | | 1,338,339 | | | 12,940 | | | 1,351,279 | | | — | | | | — | | | | 102,951 | | | 1,454,230 | |
Small Cap Leaders | | | 3,117,623 | | | 273,179 | | | 3,390,802 | | | — | | | | — | | | | 2,331,589 | | | 5,722,391 | |
U.S. Growth Leaders | | | — | | | — | | | — | | | — | | | | (5,402,374 | ) | | | 7,676,833 | | | 2,274,459 | |
Worldwide Leaders | | | — | | | — | | | — | | | — | | | | (31,352,417 | ) | | | 5,101,808 | | | (26,250,609 | ) |
China Opportunities | | | 475,220 | | | 1,613,781 | | | 2,089,001 | | | — | | | | — | | | | 3,813,004 | | | 5,902,005 | |
Emerging Markets | | | 4,646,713 | | | 5,302,202 | | | 9,948,915 | | | — | | | | — | | | | 8,186,801 | | | 18,135,716 | |
International Growth | | | 1,734,281 | | | 722,247 | | | 2,456,528 | | | — | | | | — | | | | 6,076,032 | | | 8,532,560 | |
High Yield Bond | | | 140,139 | | | — | | | 140,139 | | | (140,138 | ) | | | (35,614,725 | ) | | | 321,085 | | | (35,293,639 | ) |
Micro Cap Equity | | | 12,284,553 | | | 15,949,690 | | | 28,234,243 | | | — | | | | — | | | | 8,657,736 | | | 36,891,979 | |
U.S. Growth Leaders Long-Short | | | 424,081 | | | — | | | 424,081 | | | — | | | | (16,931,199 | ) | | | 1,724,102 | | | (14,783,016 | ) |
Value Opportunities | | | 1,294,682 | | | 884,994 | | | 2,179,676 | | | — | | | | — | | | | 1,141,031 | | | 3,320,707 | |
| * | The differences between the book-basis and tax-basis unrealized appreciation (depreciation) is attributable primarily to: tax deferral of losses on wash sales; the difference between book and tax amortization methods for premium and market discount; and the return of capital adjustments from real estate investment trusts. Excludes unrealized on short sales. |
As of October 31, 2006, the tax cost of securities and the breakdown of unrealized appreciation (depreciation) for each Fund were as follows:
| | | | | | | | | | | | | |
| Fund | | Tax Cost of
Securities | | Unrealized
Appreciation | | Unrealized
Depreciation | | | Net
Unrealized
Appreciation
(Depreciation) |
Global Financial Services | | $ | 47,255,544 | | $ | 3,959,588 | | $ | (104,377 | ) | | $ | 3,855,211 |
Global Health Sciences | | | 31,593,602 | | | 2,124,778 | | | (299,010 | ) | | | 1,825,768 |
Global Natural Resources | | | 48,295,083 | | | 2,584,946 | | | (1,337,914 | ) | | | 1,247,032 |
Global Technology and Communications | | | 12,796,296 | | | 980,710 | | | (175,499 | ) | | | 805,211 |
Global Utilities | | | 17,540,371 | | | 2,505,607 | | | (90,309 | ) | | | 2,415,298 |
Mid Cap Growth Leaders | | | 33,470,490 | | | 3,968,861 | | | (978,740 | ) | | | 2,990,121 |
Nationwide Leaders | | | 12,145,250 | | | 242,770 | | | (139,819 | ) | | | 102,951 |
Small Cap Leaders | | | 35,689,380 | | | 2,895,095 | | | (563,506 | ) | | | 2,331,589 |
U.S. Growth Leaders | | | 129,606,834 | | | 8,705,264 | | | (1,028,431 | ) | | | 7,676,833 |
Worldwide Leaders | | | 41,675,374 | | | 5,195,679 | | | (93,915 | ) | | | 5,101,764 |
China Opportunities | | | 25,959,851 | | | 4,662,436 | | | (849,606 | ) | | | 3,812,830 |
Emerging Markets | | | 53,140,580 | | | 8,961,756 | | | (775,919 | ) | | | 8,185,837 |
International Growth | | | 44,009,687 | | | 6,169,641 | | | (75,705 | ) | | | 6,093,936 |
High Yield Bond | | | 24,034,187 | | | 689,581 | | | (368,496 | ) | | | 321,085 |
Micro Cap Equity | | | 139,891,651 | | | 17,688,474 | | | (9,030,738 | ) | | | 8,657,736 |
U.S. Growth Leaders Long-Short | | | 90,027,410 | | | 4,076,783 | | | (2,352,681 | ) | | | 1,724,102 |
Value Opportunities | | | 16,736,199 | | | 1,486,628 | | | (345,597 | ) | | | 1,141,031 |
As of October 31, 2006, for Federal income tax purposes, the following Funds have capital loss carryforwards available to offset capital gains, if any, to the extent provided by the treasury regulations:
| | | | | |
| Fund | | Amount | | Expires |
Global Health Sciences | | $ | 265,562 | | 2014 |
Global Technology and Communications | | | 1,366,770 | | 2009 |
Global Technology and Communications | | | 455,590 | | 2010 |
Global Technology and Communications | | | 911,180 | | 2012 |
Mid Cap Growth Leaders | | | 24,171,359 | | 2009 |
Mid Cap Growth Leaders | | | 4,769,379 | | 2010 |
U.S. Growth Leaders | | | 5,402,373 | | 2014 |
Worldwide Leaders | | | 20,685,663 | | 2009 |
Worldwide Leaders | | | 7,814,294 | | 2010 |
High Yield Bond | | | 16,778,327 | | 2009 |
High Yield Bond | | | 18,798,827 | | 2010 |
High Yield Bond | | | 37,571 | | 2014 |
U.S. Growth Leaders Long-Short | | | 3,014,149 | | 2009 |
U.S. Growth Leaders Long-Short | | | 8,923,711 | | 2010 |
U.S. Growth Leaders Long-Short | | | 4,469,833 | | 2011 |
U.S. Growth Leaders Long-Short | | | 523,506 | | 2012 |
Notes to Financial Statements (Continued)
October 31, 2006
As of October 31, 2006, the following Funds have additional capital loss carryforwards, subject to any applicable limitations on availability, to offset future capital gains, if any, as the successor of a merger Funds:
| | | | | |
| Fund | | Amount | | Expires |
Worldwide Leaders | | $ | 1,115,404 | | 2008 |
Worldwide Leaders | | | 252,936 | | 2009 |
Worldwide Leaders | | | 557,702 | | 2009 |
Worldwide Leaders | | | 368,716 | | 2010 |
Worldwide Leaders | | | 557,702 | | 2010 |
Recently Issued Accounting Pronouncements – On July 13, 2006, the Financial Accounting Standards Board (“FASB”) released FASB Interpretation No. 48, Accounting for Uncertainty in Income Taxes (“FIN 48”). FIN 48 provides guidance for how uncertain tax positions should be recognized, measured, presented and disclosed in the financial statements. FIN 48 requires the affirmative evaluation of tax positions taken or expected to be taken in the course of preparing the Fund’s tax returns to determine whether it is more-likely-than-not (i.e., greater than 50-percent) that each tax position will be sustained upon examination by a taxing authority based on the technical merits of the position. A tax position that meets the more-likely-than-not recognition threshold is measured to determine the amount of benefit to recognize in the financial statements. Differences between tax positions taken in a tax return and amounts recognized in the financial statements will generally result in an increase in a liability for taxes payable (or a reduction of a tax refund receivable) and an increase in a deferred tax liability (or a reduction in a deferred tax asset). Adoption of FIN 48 is required for fiscal years beginning after December 15, 2006 and is to be applied to all open tax years as of the effective date. At this time, management is evaluating the implications of FIN 48. Its impact to the financial statements has not yet been determined.
Report of Independent Registered Public Accounting Firm
To the Board of Trustees and Shareholders of Gartmore Mutual Funds:
In our opinion, the accompanying statements of assets and liabilities, including the statements of investments of Gartmore Global Financial Services Fund, Gartmore Global Health Sciences Fund, Gartmore Global Natural Resources Fund, Gartmore Global Technology and Communications Fund, Gartmore Global Utilities Fund, Gartmore Mid Cap Growth Leaders Fund, Gartmore Nationwide Leaders Fund, Gartmore Small Cap Leaders Fund, Gartmore U.S. Growth Leaders Fund, Gartmore Worldwide Leaders Fund, Gartmore China Opportunities Fund, Gartmore Emerging Markets Fund, Gartmore International Growth Fund, Gartmore High Yield Bond Fund, Gartmore Micro Cap Equity Fund and Gartmore Value Opportunities Fund and the statement of investments and the statement of securities sold short of Gartmore U.S. Growth Leaders Long-Short Fund (seventeen series of Gartmore Mutual Funds, hereafter referred to as the “Funds”), and the related statements of operations and of changes in net assets and the financial highlights present fairly, in all material respects, the financial position of the Funds at October 31, 2006, the results of each of their operations for the year then ended and the changes in each of their net assets and the financial highlights for each of the periods indicated, in conformity with accounting principles generally accepted in the United States of America. These financial statements and financial highlights (hereafter referred to as “financial statements”) are the responsibility of the Funds’ management; our responsibility is to express an opinion on these financial statements based on our audits. We conducted our audits of these financial statements in accordance with the standards of the Public Company Accounting Oversight Board (United States). Those standards require that we plan and perform the audit to obtain reasonable assurance about whether the financial statements are free of material misstatement. An audit includes examining, on a test basis, evidence supporting the amounts and disclosures in the financial statements, assessing the accounting principles used and significant estimates made by management, and evaluating the overall financial statement presentation. We believe that our audits, which included confirmation of securities at October 31, 2006 by correspondence with the custodian and brokers, provide a reasonable basis for our opinion.
PricewaterhouseCoopers LLP
Philadelphia, Pennsylvania
December 20, 2006
Supplemental Information
1. Other Federal Tax Information (Unaudited):
For the period ended October 31, 2006, certain dividends paid by the Funds may be subject to a maximum tax rate of 15% as provided for by the Jobs and Growth Tax Relief Reconciliation Act of 2003. The Funds intend to designate the maximum amount allowable as taxed at a maximum rate of 15%. Complete information will be reported in conjunction with your 2006 Form 1099-DIV.
For the period ended October 31, 2006, the following Funds paid qualified dividend income:
| | | |
| Fund | | Qualified
Dividend
Income |
Global Financial Services | | $ | 255,728 |
Global Health Sciences | | | 145,453 |
Global Natural Resources | | | 77,453 |
Global Utilities | | | 355,096 |
Nationwide Leaders | | | 193,890 |
Small Cap Leaders | | | 90,465 |
U.S. Growth Leaders | | | 255,160 |
China Opportunities | | | 256,449 |
Emerging Markets | | | 763,336 |
International Growth | | | 516 |
High Yield Bond | | | 10,337 |
U.S. Growth Leaders Long-Short | | | 179,139 |
Value Opportunities | | | 162,883 |
For the taxable year ended October 31, 2006, the following percentage of income dividends paid by the Funds qualify for the dividends received deduction available to corporations:
| | |
| Fund | | Dividends
Received
Deduction |
Global Financial Services | | 17% |
Global Health Sciences | | 6% |
Global Natural Resources | | 3% |
Global Utilities | | 7% |
Nationwide Leaders | | 13% |
Small Cap Leaders | | 33% |
U.S. Growth Leaders | | 3% |
Emerging Markets | | 4% |
High Yield Bond | | 1% |
U.S. Growth Leaders Long-Short | | 47% |
Value Opportunities | | 13% |
The Funds designate the following amounts as long-term capital gain distributions qualifying for the maximum 15% income tax rate for individuals:
| | | |
| Fund | | Amount |
Global Financial Services | | $ | 428,495 |
Global Natural Resources | | | 157,431 |
Global Utilities | | | 49,352 |
Nationwide Leaders | | | 187,009 |
U.S. Growth Leaders | | | 201,192 |
China Opportunities | | | 70,442 |
Emerging Markets | | | 2,214,149 |
Micro Cap Equity | | | 7,502,788 |
Value Opportunities | | | 775,897 |
Certain Funds intend to elect to pass through to shareholders the income tax credit for taxes paid to foreign countries. As of October 31, 2006, foreign source income per share for each Fund was as follows:
| | | |
| Fund | | Foreign Source
Income Per Share |
Global Utilities | | $ | 0.20 |
Worldwide Leaders | | | 0.14 |
Emerging Markets | | | 0.38 |
International Growth | | | 0.13 |
Management Information (Unaudited)
October 31, 2006
Trustees who are not Interested Persons (as defined in the 1940 Act) and Officers of the Funds as of
October 31, 2006
| | | | | | | | |
Name, Address and Year of Birth | | Position(s) Held
with the Trust
and Length of
Time Served1 | | Principal Occupation(s) During Past 5 Years | | Number of Portfolios
in the Gartmore Fund
Complex Overseen
by Trustee | | Other Directorships Held by Trustee or
Nominee2 |
| | | | |
Charles E. Allen c/o NWD Investment Management, Inc. 1200 River Road, Suite 1000 Conshohocken, PA 19428 1948 | | Trustee since July 2000 | | Mr. Allen is Chairman, Chief Executive Officer and President of the Graimark Realty Advisors, Inc. (real estate development, investment and asset management). | | 97 | | None |
| | | | |
Paula H.J. Cholmondeley c/o NWD Investment Management, Inc. 1200 River Road, Suite 1000 Conshohocken, PA 19428 1947 | | Trustee since July 2000 | | Ms. Cholmondeley is an independent strategy consultant. Ms. Cholmondeley was Vice President and General Manager of Sappi Fine Paper North America from April 2000 through December 2003. | | 97 | | Director of Dentsply International, Inc., Ultralife Batteries, Inc., Terex Corporation, Minerals Technology, Inc. and Albany International Corp. |
| | | | |
C. Brent DeVore3 c/o NWD Investment Management, Inc. 1200 River Road, Suite 1000 Conshohocken, PA 19428 1940 | | Trustee since 1990 | | Dr. DeVore is President of Otterbein College. | | 97 | | None |
| | | | |
Phyllis K. Dryden c/o NWD Investment Management, Inc. 1200 River Road, Suite 1000 Conshohocken, PA 19428 1947 | | Trustee since December 2004 | | Beginning in February 2006 Ms. Dryden is employed by The Mitchell Madison Group, a management consulting company. Ms. Dryden was a former Managing Partner of marchFIRST, a global management consulting firm prior to February 2002. | | 97 | | None |
| | | | |
Barbara L. Hennigar c/o NWD Investment Management, Inc. 1200 River Road, Suite 1000 Conshohocken, PA 19428 1935 | | Trustee since July 2000 | | Retired. | | 97 | | None |
Trustees who are not Interested Persons (as defined in the 1940 Act) and Officers of the Funds as of
October 31, 2006 (Continued)
| | | | | | | | |
Name, Address and Year of Birth | | Position(s) Held
with the Trust
and Length of
Time Served1 | | Principal Occupation(s) During Past 5 Years | | Number of Portfolios
in the Gartmore Fund
Complex Overseen
by Trustee | | Other Directorships Held by Trustee or
Nominee2 |
| | | | |
Barbara I. Jacobs c/o NWD Investment Management, Inc. 1200 River Road, Suite 1000 Conshohocken, PA 19428 1950 | | Trustee since December 2004 | | Ms. Jacobs served as Chairman of the Board of Directors of KICAP Network Fund, a European (United Kingdom) hedge fund, from December 2000 through January 2006. Prior to 2004, Ms. Jacobs was also a Managing Director and European Portfolio Manager with Teachers Insurance and Annuity Association - College Retirement Equities Fund. | | 97 | | None |
| | | | |
Douglas F. Kridler c/o NWD Investment Management, Inc. 1200 River Road, Suite 1000 Conshohocken, PA 19428 1955 | | Trustee since September 1997 | | Mr. Kridler has served as the President and Chief Executive Officer of the Columbus Foundation (a Columbus, OH-based foundation which manages over 1,300 individual endowment funds) since February 2002. Prior to January 31, 2002, Mr. Kridler was the President of the Columbus Association for the Performing Arts and Chairman of the Greater Columbus Convention and Visitors Bureau. | | 97 | | None |
| | | | |
Michael D. McCarthy c/o NWD Investment Management, Inc. 1200 River Road, Suite 1000 Conshohocken, PA 19428 1947 | | Trustee since December 2004 | | Retired. Mr. McCarthy was Chairman of VMAC (commodity swaps) from October 2002 until June 2005; and a partner of Pineville Properties LLC (a commercial real estate development firm). | | 97 | | None |
| | | | |
David C. Wetmore c/o NWD Investment Management, Inc. 1200 River Road, Suite 1000 Conshohocken, PA 19428 1948 | | Trustee since 1995 and Chairman since February 2005 | | Retired. | | 97 | | None |
| 1 | Length of time served includes time served with the Trust’s predecessors. |
| 2 | Directorships held in (1) any other investment companies registered under the 1940 Act, (2) any company with a class of securities registered pursuant to Section 12 of the Securities Exchange Act of 1934, as amended (the “Exchange Act”), or (3) any company subject to the requirements of Section 15(d) of the Exchange Act. |
| 3 | Mr. DeVore has served as President of Otterbein College since 1984. Mark Thresher, President and Chief Operating Officer of Nationwide Financial Services, Inc. (“NFS”) has served as a member of the Board of Trustees of Otterbein College since 2000, currently serves as one of 30 of its trustees, and is currently one of two Vice Chairmen of the Board. NFS is under common control with each of the Gartmore companies that serve as investment advisers and principal underwriter to the Trust, as each is a majority-owned subsidiary of Nationwide Corporation (“NC”) and, through NC, of Nationwide Mutual Insurance Company (95.2%) and Nationwide Mutual Fire Insurance Company (4.8%). |
| | Additional information regarding the Trustees and Officers may be found in the Trust’s Statement of Additional Information, which is available without charge upon request, by calling 800-848-0920. |
Management Information (Unaudited)
October 31, 2006
Trustees who are Interested Persons (as defined in the 1940 Act) and/or Officers of the Funds as of
October 31, 2006
| | | | | | | | |
Name, Address and Year of Birth | | Position(s) Held
with the Trust
and Length of
Time Served1 | | Principal Occupation(s) During Past 5 Years | | Number of Portfolios
in the Gartmore Fund
Complex Overseen
by Trustee | | Other Directorships Held by Trustee2 |
| | | | |
Paul J. Hondros NWD Investment Management, Inc. 1200 River Road, Suite 1000 Conshohocken, PA 19428 1948 | | Trustee since July 2000 | | Mr. Hondros has been President and Chief Executive Officer of various NWD Investments Group entities, including Gartmore Distribution Services, Inc. (“GDSI”)3, Gartmore Investor Services, Inc. (“GISI”)3, Gartmore Morley Capital Management, Inc. (“GMCM”)3, Morley Financial Services, Inc. (“MFS”)3, NorthPointe Capital, LLC (“NorthPointe”)3, NWD Management & Research Trust (“NWDMRT”)3, NWD Investment Management, Inc. (“NWDIM”)3, Gartmore Mutual Fund Capital Trust (“GMFCT”)3 and Gartmore SA Capital Trust (“GSA”)3; and a Director of Nationwide Securities, Inc.,3 as well as several entities within Nationwide Financial Services, Inc. | | 97 | | None |
| | | | |
Arden L. Shisler c/o NWD Investment Management, Inc. 1200 River Road, Suite 1000 Conshohocken, PA 19428 1941 | | Trustee since February 2000 | | Retired. Mr. Shisler is the former President and Chief Executive Officer of K&B Transport, Inc., a trucking firm (2000 through 2002). He served as a consultant to K&B from January 2003 through December 2004. Since 1992, Mr. Shisler has also been Chairman of the Board for Nationwide Mutual Insurance Company.3 | | 97 | | Director of Nationwide Financial Services, Inc. |
| | | | |
Gerald J. Holland NWD Investment Management, Inc. 1200 River Road, Suite 1000 Conshohocken, PA 19428 1951 | | Treasurer since March 2001 | | Mr. Holland is Senior Vice President - Operations for NWDIM3, GMFCT3, and GSA3. | | N/A | | N/A |
| | | | |
Michael A. Krulikowski NWD Investment Management, Inc. 1200 River Road, Suite 1000 Conshohocken, PA 19428 1959 | | Chief Compliance Officer since June 2004 | | Since November 1999, Mr. Krulikowski has served as a Vice President and Chief Compliance Officer of NWDIM3. Since June 2004, Mr. Krulikowski has also served as Chief Compliance Officer of the Trust. | | N/A | | N/A |
Trustees who are Interested Persons (as defined in the 1940 Act) and/or Officers of the Funds as of
October 31, 2006 (Continued)
| | | | | | | | |
Name, Address and Year of Birth | | Position(s)
Held with the
Trust and
Length of Time
Served1 | | Principal Occupation(s) During Past 5 Years | | Number of Portfolios
in the Gartmore Fund
Complex Overseen
by Trustee | | Other Directorships Held by Trustee2 |
| | | | |
Eric E. Miller NWD Investment Management, Inc. 1200 River Road, Suite 1000 Conshohocken, PA 19428 1953 | | Secretary since December 2002 | | Mr. Miller is Senior Vice President, Chief Counsel for NWDIM3, GMFCT3 and GSA3 since August 2002. From August 2000 to August 2002, Mr. Miller was a Partner with Stradley Ronan Stevens & Young, LLP. | | N/A | | N/A |
| 1 | Length of time served includes time served with the Trust’s predecessors. |
| 2 | Directorships held in (1) any other investment companies registered under the 1940 Act, (2) any company with a class of securities registered pursuant to Section 12 of the Securities Exchange Act of 1934, as amended (the “Exchange Act”), or (3) any company subject to the requirements of Section 15(d) of the Exchange Act. |
| 3 | This position is held with an affiliated person or principal underwriter of the Trust. |
| | Federal law requires the Trust, each of its investment advisers and sub-advisers to adopt procedures for voting proxies (“Proxy Voting Guidelines”) and to provide a summary of those Proxy Voting Guidelines used to vote the securities held by the Funds. The Funds’ proxy voting policies and procedures are available without charge (i) upon request, by calling 800-848-0920, (ii) on the Fund’s website at www.nwdfunds.com, or (iii) on the Securities and Exchange Commission’s website at www.sec.gov. |
AnnualReport
| | |
| | |

| | October 31, 2006 |
International investing involves additional risks, including currency fluctuations, differences in accounting standards, political instability and foreign regulations, all of which are magnified in emerging markets.
Small-company stocks have higher risks than the stocks of larger, more established companies and have significant short-term price volatility.
Investing in mutual funds involves risk, including possible loss of principal. There is no assurance that the investment objective of any fund will be achieved.
Third-party information has been obtained from and is based on sources the Firm believes to be reliable.
Lipper Analytical Services, Inc. is an industry research firm whose rankings are based on total return performance and do not reflect the effect of sales charges. Each fund is ranked within a universe of funds similar in investment objective as determined by Lipper.
The Lipper scores listed are based on monthly data. Lipper scores are subject to change every month. The Lipper Average is a straight average of the specific Lipper Universe.
This information is provided for educational purposes only and should not be considered investment advice. Lipper ratings are not intended to predict future results, and Lipper does not guarantee the accuracy of this information.
The Funds’ adviser, one of its affiliated advisers, or its employees, may have a position in the securities named in this report.
Third-party information has been obtained from and is based on sources the Firm believes to be reliable.
Views expressed above are as of the date noted and are subject to change at any time.
PAST PERFORMANCE DOES NOT GUARANTEE FUTURE RESULTS. The investment return and principal value of an investment will fluctuate, so that an investor’s shares, when redeemed, may be worth more or less than their original cost. To obtain performance information current to the most recent month-end, which may be higher or lower than the performance shown, please call 800-848-0920 or visit www.nwdfunds.com.
Investors should carefully consider a fund’s investment objectives, risks, fees, charges and expenses before investing any money. To obtain this and other fund information, please call 800-848-0920 to request a prospectus, or download a prospectus at www.nwdfunds.com. Please read it carefully before investing any money.
Gartmore Funds distributed by Gartmore Distribution Services, Inc., Member NASD. 1200 River Road, Suite 1000, Conshohocken, PA 19428.
Commentary provided by Gartmore Mutual Fund Capital Trust and BlackRock Investment Management, LLC (the “Adviser and subadviser”), investment adviser and subadviser to Gartmore Funds. All opinions and estimates included in this report constitute the Advisers’ judgment as of the date of this report and are subject to change without notice.
Statement Regarding Availability of Quarterly Portfolio Schedule.
The Gartmore Funds file complete schedules of portfolio holdings for each Fund with the Securities and Exchange Commission (the “Commission”) for the first and third quarters of each fiscal year on Form N-Q. The Funds’ Forms N-Q are available on the Commission’s website at http://www.sec.gov. The Funds’ Forms N-Q may be reviewed and copied at the Commission’s Public Reference Room in Washington, DC, and information on the operation of the Public Reference Room may be obtained by calling 800-SEC-0330; and the Funds make the information on Form N-Q available to shareholders on www.nwdfunds.com or upon request without charge.
Statement Regarding Availability of Proxy Voting Record.
Information regarding how the Funds voted proxies relating to portfolio securities held during the most recent 12-month period ended June 30, 2006 is available without charge, upon request, by calling 800-848-0920, and on the Commission’s website at http://www.sec.gov.
Gartmore Bond Index Fund
Effective September 29, 2006, Merrill Lynch & Co., Inc. and BlackRock, Inc. completed a transaction to form a new asset management company involving Merrill Lynch’s asset management business, including Fund Asset Management, L.P. (the subadviser to each of the Gartmore Bond Index Fund, Gartmore International Index Fund, Gartmore Mid Cap Market Index Fund, Gartmore S&P 500 Index Fund and Gartmore Small Cap Index Fund) and BlackRock, Inc. The result of the transaction is a new subadviser known as BlackRock Investment Management, LLC.
For the annual period ended Oct. 31, 2006, the Gartmore Bond Index Fund (Class A at NAV) returned 4.59% versus 5.18% for its benchmark, the Lehman Brothers U.S. Aggregate Index. For broader comparison, the average return for the Fund’s Lipper peer category of Intermediate Investment Grade Debt Funds (consisting of 485 funds as of Oct. 31, 2006) was 4.62%. The underperformance of the Fund versus the Lehman Brothers US Aggregate Index was primarily due to the expenses of the Fund.
The U.S. fixed-income markets, as represented by the Lehman Brothers U.S. Aggregate Index, experienced a generally volatile environment during the reporting period, with the yield curve becoming slightly inverted. (That is, the yields on shorter-term securities were higher than those of securities with longer maturities, which is not typically the case.) At the beginning of the fiscal year, the 10-year U.S. Treasury note yield stood at 4.57%, which was 17 basis points (or 0.17%) above the 4.40% yield on the two-year U.S. Treasury note. At the end of the reporting period, the 10-year and two-year U.S. Treasury notes yielded 4.61% and 4.71%, respectively.
Short-term interest rates rose rather steadily between November 2005 and June 2006 before declining during most of the remainder of the fiscal year. The yield on the two-year U.S. Treasury note peaked at 5.27% in late June 2006, then dipped to a low of 4.60% in early October, while the 10-year U.S. Treasury note reached a high of 5.42% late in the second quarter of 2006 before falling to a low of 4.56% in late September. The Federal Reserve Board raised the target federal funds rate in six 0.25% increments, bringing the target rate from 3.75% to 5.25% during the reporting period. The Federal Open Market Committee, however, held the rate steady at its August, September and October 2006 meetings. The third quarter of 2006 was the first quarterly period not to include an increase in the federal funds target rate since the first quarter of 2004.
We evaluate three major sectors when analyzing the total returns of the benchmark Index: 1) government bonds (U.S. Treasuries and government agency bonds); 2) corporate credits (bonds issued by companies); and 3) securitized debt obligations (bonds backed by collateral, such as mortgages). During the reporting period, the government bond sector slightly underperformed the Index. The total returns of U.S. Treasury notes and U.S. government agency issues somewhat lagged that of the overall Lehman Brothers U.S. Aggregate Index; the credit and securitized sectors of the Index modestly outperformed Treasuries, posting virtually identical total returns of 5.40% and 5.39%, respectively, during the reporting period.
The rise in interest rates hurt the credit sector in the first half of the reporting period even as credit spreads versus U.S. Treasury notes continued to tighten. The sector rallied throughout the fourth quarter of the fiscal year, however, as interest rates declined across the yield curve. The financial and utility segments of the credit sector were the strongest performers during the period; the values of these securities typically are more sensitive to changes in interest rates.
The largest segment within the securitized sector of the Index, mortgage-backed securities (MBS), recorded a total return of 5.68% during the reporting period, benefiting from a combination of low volatility and confidence that the Federal Reserve is near the end of its tightening campaign. Commercial mortgage-backed securities (CMBS) enjoyed strong demand for new issues in the first and third quarters of 2006. The increase in demand during the first quarter resulted mainly from favorable relative valuations and new investors to the sector. In the third quarter, one trend that led to more issuance was the activity of borrowers defeasing their mortgages in order to execute cash-out refinancings (i.e., replacing the cash flows of their mortgages with a package of U.S. Treasury securities to release the liens on their properties). Finally, while the total return on asset-backed securities (ABS) slightly lagged that of the Lehman Brothers U.S. Aggregate Index, the sector’s performance was enhanced by strong demand as these securities remained attractively valued versus other non-treasury related sectors. The sector’s performance also benefited from strong demand for non-mortgage-related ABS (i.e., AAA-rated credit card securities and automobile loans).
The portfolio is positioned such that the risk characteristics are similar to those of the Lehman Brothers U.S. Aggregate Index. The portfolio seeks to perform in line with the benchmark on a gross return basis.
Portfolio Managers:
BlackRock Investment Management, LLC—Subadviser: Jeffrey Hewson, Michael Wildstein and Roy Hansen
| | |
Fund Performance | | Gartmore Bond Index Fund |
Average Annual Total Return
(For periods ended October 31, 2006)
| | | | | | | | |
| | | | | 1 Yr. | | 5 Yr. | | Inception1 |
| Class A | | w/o SC2 | | 4.59% | | 3.80% | | 5.97% |
| w/SC3 | | | | -1.45% | | 2.57% | | 5.32% |
| Class B4 | | w/o SC2 | | 3.96% | | 3.18% | | 5.64% |
| w/SC5 | | | | -1.04% | | 2.83% | | 5.64% |
| Class C7 | | w/o SC2 | | 3.98% | | 3.18% | | 5.64% |
| | | w/SC8 | | 2.98% | | 3.18% | | 5.64% |
| Institutional Class6 | | 4.91% | | 4.22% | | 6.29% |
All figures showing the effect of a sales charge reflect the maximum charge possible, because it has the most dramatic effect on performance data.
| 1 | These returns until the creation of Class A and Institutional shares (12/29/99) include the performance of the Master Aggregate Bond Index Series (the “Series”), which began operations on April 3, 1997. Excluding the effect of any fee waivers or reimbursements, such prior performance is similar to what Class A and Institutional Class shares would have produced because these classes of the Fund’s shares invested in the same portfolio of securities as the Series. The performance for these classes has been restated to reflect differences in sales charges (where applicable), but does not reflect the differing levels of other fees applicable to such classes; if these fees were reflected, the performance for Class A and Institutional Class shares would have been lower. |
| 2 | These returns do not reflect the effects of sales charges (SC). |
| 3 | A 5.75% front-end sales charge was deducted. |
| 4 | These returns until the creation of Class B shares (10/12/01) include performance based on the Series for the period through December 28, 1999 and the Fund’s Class A shares for the period from December 29, 1999 to October 11, 2001. Excluding the effect of any fee waivers or reimbursements, such prior performance is similar to what Class B shares would have produced because Class B shares invest in the same portfolio of securities as Class A shares. The performance for these classes has been restated to reflect differences in sales charges (where applicable), but does not reflect the differing levels of other fees (primarily Rule 12b-1 and/or administrative services fees) applicable to such classes; if these fees were reflected, the performance for Class B shares would have been lower. |
| 5 | A 5.00% maximum contingent deferred sales charge (CDSC) was deducted. The CDSC declines to 0% after 6 years. |
| 6 | Not subject to any sales charges. |
| 7 | These returns are based on the previous performance of the Fund for the period through December 28, 1999, the Class A shares from December 29, 1999 until October 11, 2001 and the Class B shares from October 12, 2001 to December 31, 2005. Excluding the effect of any fee waivers or reimbursements, such prior performance is similar to what Class C shares would have produced because all classes invest in the same portfolio of securities. The performance for these classes has been restated to reflect differences in sales charges ( where applicable), but does not reflect the differing levels of other fees (primarily Rule 12b-1 and administrative services fees) applicable to such classes. If these other fees were reflected, the performance for Class C would have been lower. |
| 8 | A CDSC of 1.00% was deducted from the one year return because it is charged when you sell Class C shares within the first year after purchase. |
Performance of a $10,000 Investment
Investment return and principal value will fluctuate, and when redeemed, shares may be worth more or less than original cost. Past performance is no guarantee of future results and does not reflect the deduction of taxes that a shareholder would pay on fund distributions or the redemption of fund shares. Investing in mutual funds involves market risk, including loss of principal. Performance returns assume the reinvestment of all distributions.
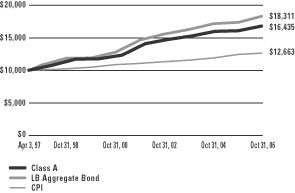
Comparative performance of $10,000 invested in Class A shares of the Gartmore Bond Index Fund, the Lehman Brothers Aggregate Bond Index (LB Aggregate Bond)(a), and the Consumer Price Index (CPI)(b) since inception. Unlike the Fund, the returns for these unmanaged indexes do not reflect any fees, expenses, or sales charges. Investors cannot invest directly in market indexes.
| (a) | The LB Aggregate Bond is an unmanaged index comprised of U.S. government securities and corporate debt securities and is generally representative of the bond market as a whole. |
| (b) | The CPI represents changes in prices of a basket of goods and services purchased for consumption by urban households. |
| | |
Shareholder Expense Example | | Gartmore Bond Index Fund |
As a shareholder of the Fund, you incur two types of costs: (1) transaction costs, including sales charges (loads) paid on purchase payments and redemption fees; and (2) ongoing costs, including investment advisory fees, administration fees, distribution fees and other Fund expenses. The examples below are intended to help you understand your ongoing costs (in dollars) of investing in the Fund and to compare these costs with the ongoing costs of investing in other mutual funds. Per SEC requirements, the examples assume that you had a $1,000 investment in the Class at the beginning of the reporting period, May 1, 2006 and continued to hold your shares at the end of the reporting period, October 31, 2006.
Actual Expenses
For each Class of the Fund in the table below, the first line provides information about actual account values and actual expenses. You may use the information in this line, together with the amount you invested, to estimate the expenses that you paid over the period. Simply divide your account value by $1,000 (for example, an $8,600 account value divided by $1,000 = 8.6), then multiply the result by the number in the first line of each Class under the heading entitled “Expenses Paid During Period” to estimate the expenses you paid on your account during the period.
Hypothetical Example for Comparison Purposes
The second line of each Class in the table below provides information about hypothetical account values and hypothetical expenses based on the Class’ actual expense ratio and an assumed rate of return of 5% per year before expenses, which is not the Class’ actual return. The hypothetical account values and expenses may not be used to estimate the actual ending account balance or expenses you paid for the period. You may use this information to compare the ongoing costs of investing in the Class of the Fund and other funds. To do so, compare this 5% hypothetical example with the 5% hypothetical examples that appear in the shareholder reports of the other funds.
Please note that the expenses shown in the table are meant to highlight your ongoing costs only and do not reflect any transaction costs, such as sales charges (loads) or redemption fees. Therefore, the second line for each Class in the table is useful in comparing ongoing costs only, and will not help you determine the relative total costs of owning different funds. In addition, if these transaction costs were included, your costs would have been higher. The examples also assume all dividends and distributions have been reinvested.
Schedule of Shareholder Expenses
Expense Analysis of a $1,000 Investment
(October 31, 2006)
| | | | | | | | | | | | | |
| Gartmore Bond Index Fund | | | | Beginning Account Value, 5/1/06 | | Ending Account Value, 10/31/06 | | Expenses Paid During Period* | | Annualized Expense Ratio* |
| Class A | | Actual | | $ | 1,000.00 | | $ | 1,042.90 | | $ | 3.71 | | 0.72% |
| | | Hypothetical1 | | $ | 1,000.00 | | $ | 1,021.37 | | $ | 3.67 | | 0.72% |
| Class B | | Actual | | $ | 1,000.00 | | $ | 1,039.80 | | $ | 6.79 | | 1.32% |
| | | Hypothetical1 | | $ | 1,000.00 | | $ | 1,018.35 | | $ | 6.74 | | 1.32% |
| Class C | | Actual | | $ | 1,000.00 | | $ | 1,038.90 | | $ | 6.73 | | 1.31% |
| | | Hypothetical1 | | $ | 1,000.00 | | $ | 1,018.40 | | $ | 6.69 | | 1.31% |
| Institutional Class | | Actual | | $ | 1,000.00 | | $ | 1,044.00 | | $ | 1.65 | | 0.32% |
| | | Hypothetical1 | | $ | 1,000.00 | | $ | 1,023.39 | | $ | 1.63 | | 0.32% |
| * | Expenses are equal to the Fund’s annualized expense ratio multiplied by the average account value over the period multiplied by 184/365 (to reflect the one-half year period). The expense ratio presented represents a six-month, annualized ratio in accordance with SEC guidelines. |
| 1 | Represents the hypothetical 5% return before expenses. |
| | |
Portfolio Summary | | Gartmore Bond Index Fund |
October 31, 2006
The SEC adopted a requirement that Funds present their portfolio holdings in a table, chart or graph format in their annual and semiannual reports to shareholders, whether or not a statement of investments is utilized. The following tables, which present portfolio holdings as a percentage of net assets, are provided in compliance with this requirement.
| | |
| Asset Allocation | | |
| U.S. Government & Agency Long-Term Obligations | | 64.7% |
| Corporate Bonds | | 30.3% |
| Treasury Notes | | 3.9% |
| Asset-Backed Securities | | 3.2% |
| Sovereign Bonds | | 1.8% |
| Repurchase Agreements | | 1.2% |
| Municipal Bonds | | 0.1% |
| Other Investments* | | 14.0% |
| Liabilites in excess of other assets** | | -19.2% |
| | |
| | 100.0% |
| | |
| Top Industries | | |
| Federal Home Loan Mortgage Corporation | | 38.7% |
| Federal National Mortgage Association | | 12.5% |
| Financial Services | | 9.6% |
| Government National Mortgage Association | | 7.0% |
| Banking | | 5.2% |
| U.S. Treasury Bonds | | 4.9% |
| Telecommunications | | 2.0% |
| Electric-Integrated | | 1.8% |
| U.S. Treasury Notes | | 1.4% |
| Oil & Gas | | 1.5% |
| Other Assets | | 15.4% |
| | |
| | 100.0% |
| | |
| Top Holdings*** | | |
Federal National Mortgage Association,
5.75%, 02/15/08 | | 3.2% |
Federal Home Loan Mortgage Corporation,
6.00%, 10/01/36 | | 2.7% |
Government National Mortgage Association,
5.25%, 01/15/09 | | 2.5% |
Federal Home Loan Mortgage Corporation, Gold,
5.50%, 06/01/36 | | 2.4% |
U.S. Treasury Notes, 4.88%, 08/15/16 | | 1.8% |
Federal Home Loan Mortgage Corporation,
5.00%, 05/01/36 | | 1.7% |
Federal Home Loan Mortgage Corporation,
6.63%, 09/15/09 | | 1.5% |
Federal National Mortgage Association,
6.00%, 05/15/11 | | 1.5% |
U.S. Treasury Bonds, 6.25%, 08/15/23 | | 1.4% |
U.S. Treasury Notes, 4.50%, 09/30/11 | | 1.2% |
Other Assets | | 80.1% |
| | |
| | 100.0% |
| * | Includes value of collateral received from securities lending. |
| ** | Includes value of collateral owed from securities lending. |
| *** | For purpose of listing top holdings, repurchase agreements are considered cash equivalents and are included as part of Other Assets. |
Statement of Investments
October 31, 2006
Gartmore Bond Index Fund
U.S. Government and Agency Long-Term Obligations (64.7%)
| | | | | | |
| | | Principal
Amount | | Value |
| | | | | | |
Federal Home Loan Mortgage Corporation (38.7%) |
3.25%, 08/15/08 | | $ | 12,445,000 | | $ | 12,092,097 |
4.88%, 02/17/09 | | | 3,640,000 | | | 3,641,696 |
5.75%, 03/15/09 | | | 25,235,000 | | | 25,729,226 |
5.25%, 05/21/09 (c) | | | 28,705,000 | | | 28,976,290 |
4.25%, 07/15/09 | | | 2,310,000 | | | 2,274,872 |
6.63%, 09/15/09 | | | 1,075,000 | | | 1,125,290 |
6.63%, 09/15/09 | | | 30,690,000 | | | 32,117,330 |
4.50%, 07/01/12 | | | 278,381 | | | 272,179 |
5.13%, 07/15/12 (c) | | | 10,325,000 | | | 10,438,048 |
4.88%, 11/15/13 (c) | | | 17,050,000 | | | 16,974,400 |
6.00%, 04/01/14 | | | 234,946 | | | 236,335 |
6.00%, 06/01/14 | | | 239,137 | | | 242,674 |
5.00%, 07/15/14 (c) | | | 6,000,000 | | | 6,018,582 |
4.38%, 07/17/15 (c) | | | 12,230,000 | | | 11,730,515 |
6.00%, 04/01/16 | | | 690,042 | | | 700,491 |
5.25%, 04/18/16 (c) | | | 6,830,000 | | | 6,980,793 |
6.00%, 05/01/17 | | | 323,672 | | | 328,585 |
5.00%, 09/01/18 | | | 320,082 | | | 315,811 |
5.50%, 04/01/19 | | | 288,499 | | | 289,011 |
5.50%, 11/01/19 | | | 675,293 | | | 676,491 |
4.50%, 12/01/19 | | | 1,723,225 | | | 1,666,396 |
5.50%, 12/01/19 | | | 355,132 | | | 355,762 |
5.00%, 01/01/20 | | | 881,867 | | | 869,133 |
4.00%, 03/01/20 | | | 399,551 | | | 377,860 |
4.00%, 03/01/20 | | | 48,146 | | | 45,617 |
4.50%, 03/01/20 | | | 509,610 | | | 492,392 |
4.00%, 04/01/20 | | | 116,782 | | | 110,441 |
4.00%, 04/01/20 | | | 52,883 | | | 50,106 |
4.00%, 04/01/20 | | | 443,085 | | | 419,030 |
4.50%, 04/01/20 | | | 10,310,282 | | | 9,961,930 |
5.00%, 04/01/20 | | | 417,164 | | | 410,696 |
5.50%, 05/01/20 | | | 334,949 | | | 335,165 |
5.00%, 06/01/20 | | | 736,399 | | | 724,980 |
6.00%, 06/01/20 | | | 331,462 | | | 336,289 |
4.50%, 07/01/20 | | | 400,000 | | | 386,486 |
4.50%, 07/01/20 | | | 455,024 | | | 439,650 |
5.50%, 07/01/20 | | | 981,978 | | | 982,977 |
4.00%, 08/01/20 | | | 10,998,326 | | | 10,401,229 |
4.50%, 08/01/20 | | | 4,598,860 | | | 4,447,197 |
4.50%, 08/01/20 | | | 1,917,737 | | | 1,852,943 |
4.50%, 09/01/20 | | | 551,054 | | | 532,436 |
4.50%, 09/01/20 | | | 1,828,385 | | | 1,766,610 |
4.50%, 10/01/20 | | | 377,445 | | | 364,692 |
| | | | | | |
| | | Principal
Amount | | Value |
| | | | | | |
Federal Home Loan Mortgage Corporation (continued) |
4.50%, 10/01/20 | | $ | 1,602,784 | | $ | 1,548,631 |
4.50%, 10/01/20 | | | 547,854 | | | 529,344 |
4.50%, 11/01/20 | | | 5,147,850 | | | 4,973,920 |
4.50%, 12/01/20 | | | 4,229,607 | | | 4,086,702 |
4.50%, 12/01/20 | | | 500,001 | | | 483,107 |
4.50%, 01/01/21 | | | 361,520 | | | 349,305 |
5.00%, 01/01/21 | | | 6,828,241 | | | 6,722,359 |
5.00%, 01/01/21 | | | 1,398,025 | | | 1,376,347 |
5.00%, 01/01/21 | | | 653,671 | | | 643,535 |
5.50%, 01/01/21 | | | 644,952 | | | 645,608 |
4.50%, 06/01/21 | | | 884,857 | | | 854,960 |
5.00%, 06/01/21 | | | 492,079 | | | 484,319 |
6.00%, 07/01/21 | | | 389,664 | | | 395,274 |
5.50%, 08/01/21 | | | 294,615 | | | 294,805 |
6.00%, 08/01/21 | | | 790,040 | | | 801,413 |
6.75%, 09/15/29 (c) | | | 945,000 | | | 1,151,113 |
6.50%, 05/01/31 | | | 60,918 | | | 62,468 |
6.50%, 09/15/31 | | | 443,884 | | | 457,187 |
6.50%, 03/15/32 | | | 1,257,553 | | | 1,295,028 |
7.00%, 04/15/32 | | | 258,454 | | | 267,338 |
7.00%, 05/15/32 | | | 227,644 | | | 235,445 |
7.00%, 06/15/32 | | | 205,321 | | | 212,357 |
6.25%, 07/15/32 (c) | | | 2,110,000 | | | 2,447,528 |
7.00%, 07/15/32 | | | 371,755 | | | 384,494 |
6.50%, 02/01/33 | | | 552,420 | | | 565,904 |
6.50%, 12/01/33 | | | 797,509 | | | 815,311 |
6.50%, 05/01/34 | | | 743,642 | | | 759,295 |
6.50%, 05/01/34 | | | 635,586 | | | 648,965 |
6.50%, 07/01/34 | | | 348,374 | | | 355,707 |
6.50%, 08/15/34 | | | 1,071,185 | | | 1,101,435 |
6.50%, 01/01/35 | | | 248,818 | | | 254,056 |
6.50%, 04/01/35 | | | 224,904 | | | 229,364 |
6.50%, 05/01/35 | | | 128,031 | | | 130,544 |
7.00%, 05/01/35 | | | 346,623 | | | 357,456 |
4.50%, 08/01/35 | | | 2,099,849 | | | 1,970,932 |
5.00%, 08/01/35 | | | 11,070,998 | | | 10,701,649 |
5.00%, 08/01/35 | | | 499,999 | | | 483,318 |
5.00%, 08/01/35 | | | 10,500,107 | | | 10,149,803 |
5.00%, 08/01/35 | | | 7,953,052 | | | 7,687,723 |
5.00%, 08/01/35 | | | 4,488,187 | | | 4,338,452 |
5.00%, 08/01/35 | | | 28,998,780 | | | 28,031,325 |
5.00%, 08/01/35 | | | 760,078 | | | 734,720 |
5.50%, 08/01/35 | | | 4,708,081 | | | 4,659,126 |
U.S. Government and Agency Long-Term Obligations (continued)
| | | | | | |
| | | Principal
Amount | | Value |
| | | | | | |
Federal Home Loan Mortgage Corporation (continued) |
4.50%, 09/01/35 | | $ | 571,281 | | $ | 536,208 |
4.50%, 09/01/35 | | | 8,361,703 | | | 7,848,351 |
4.50%, 09/01/35 | | | 669,584 | | | 628,476 |
5.00%, 09/01/35 | | | 6,972,411 | | | 6,739,798 |
5.00%, 09/01/35 | | | 8,349,284 | | | 8,070,736 |
5.00%, 09/01/35 | | | 609,157 | | | 588,834 |
5.50%, 09/01/35 | | | 8,503,398 | | | 8,414,979 |
5.00%, 10/01/35 | | | 1,409,928 | | | 1,362,890 |
5.50%, 10/01/35 | | | 7,075,087 | | | 7,001,520 |
5.50%, 10/01/35 | | | 8,603,817 | | | 8,514,354 |
5.50%, 10/01/35 | | | 6,451,427 | | | 6,384,345 |
6.50%, 10/01/35 | | | 2,122,432 | | | 2,164,522 |
4.50%, 11/01/35 | | | 682,019 | | | 640,147 |
5.00%, 11/01/35 | | | 5,070,489 | | | 4,901,328 |
5.00%, 11/01/35 | | | 6,040,804 | | | 5,839,272 |
5.00%, 11/01/35 | | | 385,175 | | | 372,325 |
5.00%, 11/01/35 | | | 674,639 | | | 652,132 |
5.50%, 11/01/35 | | | 1,415,021 | | | 1,400,308 |
5.50%, 11/01/35 | | | 479,799 | | | 474,810 |
6.50%, 11/01/35 | | | 686,446 | | | 700,059 |
5.00%, 12/01/35 | | | 733,776 | | | 709,296 |
5.00%, 12/01/35 | | | 562,061 | | | 543,309 |
5.50%, 01/01/36 | | | 17,433,446 | | | 17,252,172 |
5.50%, 01/01/36 | | | 15,499,745 | | | 15,338,578 |
5.50%, 01/01/36 | | | 2,387,835 | | | 2,363,006 |
5.50%, 01/01/36 | | | 781,699 | | | 773,570 |
6.50%, 02/01/36 | | | 298,948 | | | 304,816 |
5.00%, 05/01/36 | | | 35,749,173 | | | 34,556,512 |
5.50%, 07/01/36 | | | 1,199,881 | | | 1,186,840 |
6.00%, 07/01/36 | | | 19,799,999 | | | 19,934,964 |
5.00%, 08/01/36 | | | 498,627 | | | 481,770 |
5.50%, 08/01/36 | | | 599,999 | | | 593,478 |
6.50%, 08/01/36 | | | 4,100,001 | | | 4,180,480 |
6.50%, 08/01/36 | | | 584,056 | | | 595,520 |
6.50%, 08/01/36 | | | 1,887,996 | | | 1,925,055 |
6.50%, 09/01/36 | | | 599,489 | | | 611,256 |
6.50%, 09/01/36 | | | 2,200,000 | | | 2,243,183 |
5.00%, 10/01/36 | | | 2,800,052 | | | 2,705,386 |
5.50%, 10/01/36 | | | 2,200,000 | | | 2,176,088 |
5.50%, 10/01/36 | | | 3,000,000 | | | 2,967,393 |
6.00%, 10/01/36 | | | 9,800,000 | | | 9,866,801 |
6.00%, 10/01/36 | | | 56,359,000 | | | 56,743,165 |
6.00%, 10/01/36 | | | 7,000,000 | | | 7,047,715 |
| | | | | | |
| | | Principal
Amount | | Value |
| | | | | | |
Federal Home Loan Mortgage Corporation (continued) |
6.50%, 10/01/36 | | $ | 1,000,000 | | $ | 1,019,629 |
6.00%, 11/01/36 | | | 4,200,000 | | | 4,228,629 |
Gold, Pool #E00282,
6.50%, 03/01/09 | | | 120,386 | | | 122,779 |
Gold, Pool #G10399,
6.50%, 07/01/09 | | | 51,783 | | | 51,985 |
Gold, Pool #E00394,
7.50%, 09/01/10 | | | 96,020 | | | 97,916 |
Gold, Pool #M80898,
4.50%, 02/01/11 | | | 916,008 | | | 899,326 |
Gold, Pool #M80904,
4.50%, 03/01/11 | | | 596,667 | | | 580,477 |
Gold, Pool #M80917,
4.50%, 05/01/11 | | | 138,090 | | | 135,575 |
Gold, Pool #M80926,
4.50%, 07/01/11 | | | 575,740 | | | 565,255 |
Gold, Pool #M80934,
4.50%, 08/01/11 | | | 695,591 | | | 676,717 |
Gold, Pool #G10940,
6.50%, 11/01/11 | | | 36,899 | | | 37,569 |
Gold, Pool #G11130,
6.00%, 12/01/11 | | | 366,144 | | | 369,917 |
Gold, Pool #E00507,
7.50%, 09/01/12 | | | 7,377 | | | 7,606 |
Gold, Pool #G10749,
6.00%, 10/01/12 | | | 186,401 | | | 189,073 |
Gold, Pool #M81009,
4.50%, 02/01/13 | | | 301,367 | | | 293,189 |
Gold, Pool #E69050,
6.00%, 02/01/13 | | | 100,242 | | | 101,712 |
Gold, Pool #E72896,
7.00%, 10/01/13 | | | 39,277 | | | 40,308 |
Gold, Pool #E00802,
7.50%, 02/01/15 | | | 113,297 | | | 117,688 |
Gold, Pool #G11001,
6.50%, 03/01/15 | | | 92,160 | | | 94,158 |
Gold, Pool #G11003,
7.50%, 04/01/15 | | | 6,306 | | | 6,551 |
Gold, Pool #G11164,
7.00%, 05/01/15 | | | 22,228 | | | 22,812 |
Gold, Pool #E81396,
7.00%, 10/01/15 | | | 3,377 | | | 3,464 |
Statement of Investments (Continued)
October 31, 2006
Gartmore Bond Index Fund (Continued)
U.S. Government and Agency Long-Term Obligations (continued)
| | | | | | |
| | | Principal
Amount | | Value |
| | | | | | |
Federal Home Loan Mortgage Corporation (continued) |
Gold, Pool #E81394,
7.50%, 10/01/15 | | $ | 32,660 | | $ | 34,016 |
Gold, Pool #E84097,
6.50%, 12/01/15 | | | 12,394 | | | 12,664 |
Gold, Pool #E00938,
7.00%, 01/01/16 | | | 52,277 | | | 53,636 |
Gold, Pool #E82132,
7.00%, 01/01/16 | | | 8,989 | | | 9,221 |
Gold, Pool #E82815,
6.00%, 03/01/16 | | | 38,059 | | | 38,636 |
Gold, Pool #E83233,
6.00%, 04/01/16 | | | 29,853 | | | 30,306 |
Gold, Pool #E83231,
6.00%, 04/01/16 | | | 12,360 | | | 12,547 |
Gold, Pool #E83046,
7.00%, 04/01/16 | | | 5,687 | | | 5,833 |
Gold, Pool #E00975,
6.00%, 05/01/16 | | | 159,567 | | | 161,985 |
Gold, Pool #E83636,
6.00%, 05/01/16 | | | 78,627 | | | 79,821 |
Gold, Pool #E83355,
6.00%, 05/01/16 | | | 43,472 | | | 44,132 |
Gold, Pool #E83933,
6.50%, 05/01/16 | | | 2,577 | | | 2,632 |
Gold, Pool #E00985,
6.00%, 06/01/16 | | | 88,965 | | | 90,314 |
Gold, Pool #E84236,
6.50%, 06/01/16 | | | 19,773 | | | 20,196 |
Gold, Pool #E00987,
6.50%, 06/01/16 | | | 77,835 | | | 79,525 |
Gold, Pool #E00996,
6.50%, 07/01/16 | | | 9,624 | | | 9,833 |
Gold, Pool #E84912,
6.50%, 08/01/16 | | | 38,715 | | | 39,544 |
Gold, Pool #E85137,
6.50%, 08/01/16 | | | 28,372 | | | 28,980 |
Gold, Pool #E85387,
6.00%, 09/01/16 | | | 83,757 | | | 85,028 |
Gold, Pool #E85800,
6.50%, 10/01/16 | | | 17,437 | | | 17,810 |
Gold, Pool #E86183,
6.00%, 11/01/16 | | | 12,920 | | | 13,117 |
| | | | | | |
| | | Principal
Amount | | Value |
| | | | | | |
Federal Home Loan Mortgage Corporation (continued) |
Gold, Pool #G11207,
7.00%, 11/01/16 | | $ | 50,104 | | $ | 51,392 |
Gold, Pool #E01083,
7.00%, 11/01/16 | | | 16,827 | | | 17,260 |
Gold, Pool #E86746,
5.50%, 12/01/16 | | | 213,768 | | | 213,906 |
Gold, Pool #E86533,
6.00%, 12/01/16 | | | 28,247 | | | 28,676 |
Gold, Pool #E01095,
6.00%, 01/01/17 | | | 34,845 | | | 35,374 |
Gold, Pool #E87584,
6.00%, 01/01/17 | | | 29,354 | | | 29,800 |
Gold, Pool #E87446,
6.50%, 01/01/17 | | | 19,445 | | | 19,853 |
Gold, Pool #E87291,
6.50%, 01/01/17 | | | 84,236 | | | 86,038 |
Gold, Pool #E86995,
6.50%, 01/01/17 | | | 67,482 | | | 68,926 |
Gold, Pool #E88076,
6.00%, 02/01/17 | | | 22,010 | | | 22,347 |
Gold, Pool #E88106,
6.50%, 02/01/17 | | | 105,121 | | | 107,325 |
Gold, Pool #E88055,
6.50%, 02/01/17 | | | 159,067 | | | 162,402 |
Gold, Pool #E01127,
6.50%, 02/01/17 | | | 57,610 | | | 58,850 |
Gold, Pool #E88474,
6.00%, 03/01/17 | | | 51,657 | | | 52,449 |
Gold, Pool #E01137,
6.00%, 03/01/17 | | | 53,528 | | | 54,340 |
Gold, Pool #E88134,
6.00%, 03/01/17 | | | 6,544 | | | 6,645 |
Gold, Pool #E88768,
6.00%, 03/01/17 | | | 124,889 | | | 126,785 |
Gold, Pool #E01138,
6.50%, 03/01/17 | | | 29,709 | | | 30,344 |
Gold, Pool #E88729,
6.00%, 04/01/17 | | | 35,653 | | | 36,199 |
Gold, Pool #E89496,
6.00%, 04/01/17 | | | 53,740 | | | 54,564 |
Gold, Pool #E89149,
6.00%, 04/01/17 | | | 59,906 | | | 60,825 |
U.S. Government and Agency Long-Term Obligations (continued)
| | | | | | |
| | | Principal
Amount | | Value |
| | | | | | |
Federal Home Loan Mortgage Corporation (continued) |
Gold, Pool #E89222,
6.00%, 04/01/17 | | $ | 215,181 | | $ | 218,480 |
Gold, Pool #E89217,
6.00%, 04/01/17 | | | 32,637 | | | 33,137 |
Gold, Pool #E01139,
6.00%, 04/01/17 | | | 235,967 | | | 239,556 |
Gold, Pool #E89347,
6.00%, 04/01/17 | | | 11,294 | | | 11,467 |
Gold, Pool #E89151,
6.00%, 04/01/17 | | | 55,793 | | | 56,648 |
Gold, Pool #E89203,
6.50%, 04/01/17 | | | 23,915 | | | 24,417 |
Gold, Pool #E89909,
6.00%, 05/01/17 | | | 55,627 | | | 56,480 |
Gold, Pool #E01140,
6.00%, 05/01/17 | | | 208,918 | | | 212,100 |
Gold, Pool #E89788,
6.00%, 05/01/17 | | | 31,523 | | | 32,007 |
Gold, Pool #E89530,
6.00%, 05/01/17 | | | 142,762 | | | 144,951 |
Gold, Pool #E89746,
6.00%, 05/01/17 | | | 353,975 | | | 359,402 |
Gold, Pool #E89924,
6.50%, 05/01/17 | | | 150,918 | | | 154,082 |
Gold, Pool #E01156,
6.50%, 05/01/17 | | | 80,617 | | | 82,336 |
Gold, Pool #E90194,
6.00%, 06/01/17 | | | 42,123 | | | 42,769 |
Gold, Pool #E90313,
6.00%, 06/01/17 | | | 18,801 | | | 19,089 |
Gold, Pool #E90227,
6.00%, 06/01/17 | | | 32,331 | | | 32,827 |
Gold, Pool #B15071,
6.00%, 06/01/17 | | | 626,377 | | | 635,886 |
Gold, Pool #E01157,
6.00%, 06/01/17 | | | 145,776 | | | 147,998 |
Gold, Pool #E90591,
5.50%, 07/01/17 | | | 203,459 | | | 204,057 |
Gold, Pool #E90667,
6.00%, 07/01/17 | | | 34,880 | | | 35,415 |
Gold, Pool #E90594,
6.00%, 07/01/17 | | | 125,278 | | | 127,199 |
| | | | | | |
| | | Principal
Amount | | Value |
| | | | | | |
Federal Home Loan Mortgage Corporation (continued) |
Gold, Pool #E90645,
6.00%, 07/01/17 | | $ | 267,040 | | $ | 271,134 |
Gold, Pool #E01186,
5.50%, 08/01/17 | | | 460,943 | | | 462,417 |
Gold, Pool #E01205,
6.50%, 08/01/17 | | | 59,303 | | | 60,565 |
Gold, Pool #G11295,
5.50%, 09/01/17 | | | 306,632 | | | 307,532 |
Gold, Pool #G11458,
6.00%, 09/01/17 | | | 120,143 | | | 121,970 |
Gold, Pool #E93476,
5.00%, 01/01/18 | | | 384,743 | | | 379,639 |
Gold, Pool #G11434,
6.50%, 01/01/18 | | | 92,751 | | | 94,736 |
Gold, Pool #E01311,
5.50%, 02/01/18 | | | 4,664,774 | | | 4,678,536 |
Gold, Pool #E01344,
4.50%, 04/01/18 | | | 274,741 | | | 265,993 |
Gold, Pool #E98207,
5.00%, 04/01/18 | | | 114,789 | | | 113,257 |
Gold, Pool #G11399,
5.50%, 04/01/18 | | | 446,324 | | | 447,859 |
Gold, Pool #E96459,
5.00%, 05/01/18 | | | 159,499 | | | 157,371 |
Gold, Pool #E99869,
5.00%, 06/01/18 | | | 212,663 | | | 209,842 |
Gold, Pool #E97335,
5.00%, 07/01/18 | | | 3,148,494 | | | 3,106,481 |
Gold, Pool #E97702,
5.00%, 07/01/18 | | | 1,216,978 | | | 1,200,739 |
Gold, Pool #E98258,
5.00%, 07/01/18 | | | 594,979 | | | 587,040 |
Gold, Pool #E97366,
5.00%, 07/01/18 | | | 845,174 | | | 833,896 |
Gold, Pool #E99579,
5.00%, 09/01/18 | | | 270,823 | | | 267,209 |
Gold, Pool #E99498,
5.00%, 09/01/18 | | | 320,754 | | | 316,474 |
Gold, Pool #E99673,
5.00%, 10/01/18 | | | 153,971 | | | 151,916 |
Gold, Pool #E01488,
5.00%, 10/01/18 | | | 297,358 | | | 293,393 |
Statement of Investments (Continued)
October 31, 2006
Gartmore Bond Index Fund (Continued)
U.S. Government and Agency Long-Term Obligations (continued)
| | | | | | |
| | | Principal
Amount | | Value |
| | | | | | |
Federal Home Loan Mortgage Corporation (continued) |
Gold, Pool #E99675,
5.00%, 10/01/18 | | $ | 1,579,156 | | $ | 1,558,084 |
Gold, Pool #G11480,
5.00%, 11/01/18 | | | 1,556,936 | | | 1,536,160 |
Gold, Pool #B10650,
5.00%, 11/01/18 | | | 481,082 | | | 474,663 |
Gold, Pool #B10653,
5.50%, 11/01/18 | | | 600,752 | | | 602,391 |
Gold, Pool #B11186,
4.50%, 12/01/18 | | | 10,953,389 | | | 10,606,246 |
Gold, Pool #E01538,
5.00%, 12/01/18 | | | 1,950,454 | | | 1,924,432 |
Gold, Pool #B11548,
5.50%, 12/01/18 | | | 414,568 | | | 414,836 |
Gold, Pool #B13147,
5.00%, 01/01/19 | | | 1,324,659 | | | 1,306,983 |
Gold, Pool #B12214,
5.00%, 02/01/19 | | | 715,272 | | | 704,944 |
Gold, Pool #G11531,
5.50%, 02/01/19 | | | 191,379 | | | 191,901 |
Gold, Pool #B12737,
4.50%, 03/01/19 | | | 966,969 | | | 935,080 |
Gold, Pool #B12908,
5.50%, 03/01/19 | | | 370,795 | | | 371,453 |
Gold, Pool #E01604,
5.50%, 03/01/19 | | | 340,183 | | | 340,402 |
Gold, Pool #B13671,
5.00%, 04/01/19 | | | 268,687 | | | 264,808 |
Gold, Pool #B13600,
5.50%, 04/01/19 | | | 216,328 | | | 216,712 |
Gold, Pool #B14236,
5.00%, 05/01/19 | | | 834,542 | | | 822,492 |
Gold, Pool #B15172,
4.50%, 06/01/19 | | | 674,461 | | | 652,219 |
Gold, Pool #B15013,
5.00%, 06/01/19 | | | 462,056 | | | 455,384 |
Gold, Pool #B15396,
5.50%, 06/01/19 | | | 322,920 | | | 323,493 |
Gold, Pool #B15759,
4.50%, 07/01/19 | | | 981,769 | | | 949,391 |
Gold, Pool #B15503,
5.00%, 07/01/19 | | | 467,557 | | | 460,805 |
| | | | | | |
| | | Principal
Amount | | Value |
| | | | | | |
Federal Home Loan Mortgage Corporation (continued) |
Gold, Pool #G18002,
5.00%, 07/01/19 | | $ | 350,068 | | $ | 345,013 |
Gold, Pool #B15717,
5.00%, 07/01/19 | | | 698,260 | | | 688,177 |
Gold, Pool #B15872,
5.00%, 07/01/19 | | | 347,640 | | | 342,620 |
Gold, Pool #G18007,
6.00%, 07/01/19 | | | 177,846 | | | 180,480 |
Gold, Pool #G18005,
5.00%, 08/01/19 | | | 947,616 | | | 933,933 |
Gold, Pool #G18006,
5.50%, 08/01/19 | | | 329,402 | | | 329,986 |
Gold, Pool #B16087,
6.00%, 08/01/19 | | | 540,563 | | | 548,570 |
Gold, Pool #B16657,
5.00%, 09/01/19 | | | 458,541 | | | 451,920 |
Gold, Pool #B16626,
5.00%, 09/01/19 | | | 1,940,545 | | | 1,912,524 |
Gold, Pool #G18009,
5.00%, 09/01/19 | | | 1,671,368 | | | 1,647,234 |
Gold, Pool #B16648,
5.00%, 09/01/19 | | | 367,043 | | | 361,743 |
Gold, Pool #B16985,
5.00%, 10/01/19 | | | 281,955 | | | 277,884 |
Gold, Pool #B16826,
5.00%, 10/01/19 | | | 597,237 | | | 588,613 |
Gold, Pool #B17371,
5.00%, 12/01/19 | | | 646,271 | | | 636,939 |
Gold, Pool #B14668,
5.00%, 01/01/20 | | | 1,198,890 | | | 1,180,300 |
Gold, Pool #J02438,
4.50%, 08/01/20 | | | 374,466 | | | 361,814 |
Gold, Pool #B19834,
4.50%, 08/01/20 | | | 677,549 | | | 654,657 |
Gold, Pool #J0257,
4.50%, 09/01/20 | | | 2,101,918 | | | 2,030,901 |
Gold, Pool #J02551,
4.50%, 09/01/20 | | | 278,960 | | | 269,535 |
Gold, Pool #J05831,
4.50%, 11/01/20 | | | 378,696 | | | 365,901 |
Gold, Pool #G011880,
5.00%, 12/01/20 | | | 1,800,000 | | | 1,772,088 |
Gold, Pool #J00935,
5.00%, 12/01/20 | | | 285,760 | | | 281,329 |
U.S. Government and Agency Long-Term Obligations (continued)
| | | | | | |
| | | Principal
Amount | | Value |
| | | | | | |
Federal Home Loan Mortgage Corporation (continued) |
Gold, Pool #J00718,
5.00%, 12/01/20 | | $ | 3,082,027 | | $ | 3,034,236 |
Gold, Pool #G18096,
5.50%, 01/01/21 | | | 283,063 | | | 283,246 |
Gold, Pool #G18116,
4.50%, 02/01/21 | | | 378,962 | | | 366,158 |
Gold, Pool #J05986,
5.00%, 02/01/21 | | | 296,445 | | | 291,848 |
Gold, Pool #J01189,
5.00%, 02/01/21 | | | 386,905 | | | 380,803 |
Gold, Pool #J01279,
5.50%, 02/01/21 | | | 651,872 | | | 652,293 |
Gold, Pool #J01256,
5.00%, 03/01/21 | | | 375,386 | | | 369,466 |
Gold, Pool #J01414,
5.00%, 03/01/21 | | | 291,078 | | | 286,487 |
Gold, Pool #G11998,
4.50%, 04/01/21 | | | 2,331,417 | | | 2,252,645 |
Gold, Pool #J01576,
5.00%, 04/01/21 | | | 1,794,784 | | | 1,766,479 |
Gold, Pool #J01633,
5.50%, 04/01/21 | | | 1,835,927 | | | 1,837,112 |
Gold, Pool #J01570,
5.50%, 04/01/21 | | | 390,585 | | | 390,837 |
Gold, Pool #J01879,
5.00%, 05/01/21 | | | 576,379 | | | 567,289 |
Gold, Pool #J01833,
5.00%, 05/01/21 | | | 292,190 | | | 287,582 |
Gold, Pool #J06015,
5.00%, 05/01/21 | | | 589,726 | | | 580,425 |
Gold, Pool #J01771,
5.00%, 05/01/21 | | | 490,087 | | | 482,358 |
Gold, Pool #J01757,
5.00%, 05/01/21 | | | 673,501 | | | 662,879 |
Gold, Pool #G18123,
5.50%, 06/01/21 | | | 1,059,854 | | | 1,060,538 |
Gold, Pool #J01980,
6.00%, 06/01/21 | | | 985,847 | | | 1,000,039 |
Gold, Pool #J03074,
5.00%, 07/01/21 | | | 492,208 | | | 484,445 |
Gold, Pool #J03028,
5.50%, 07/01/21 | | | 592,575 | | | 592,957 |
Gold, Pool #C90559,
7.00%, 05/01/22 | | | 257,950 | | | 266,964 |
| | | | | | |
| | | Principal
Amount | | Value |
| | | | | | |
Federal Home Loan Mortgage Corporation (continued) |
Gold, Pool #C00351,
8.00%, 07/01/24 | | $ | 5,809 | | $ | 6,126 |
Gold, Pool #D60780,
8.00%, 06/01/25 | | | 10,426 | | | 10,992 |
Gold, Pool #D64617,
8.00%, 10/01/25 | | | 74,382 | | | 78,374 |
Gold, Pool #D82854,
7.00%, 10/01/27 | | | 14,982 | | | 15,515 |
Gold, Pool #C00566,
7.50%, 12/01/27 | | | 24,191 | | | 25,274 |
Gold, Pool #C00676,
6.50%, 11/01/28 | | | 131,937 | | | 135,585 |
Gold, Pool #C00678,
7.00%, 11/01/28 | | | 34,353 | | | 35,559 |
Gold, Pool #C18271,
7.00%, 11/01/28 | | | 21,348 | | | 22,097 |
Gold, Pool #C00836,
7.00%, 07/01/29 | | | 13,683 | | | 14,146 |
Gold, Pool #C30265,
6.50%, 08/01/29 | | | 29,506 | | | 30,302 |
Gold, Pool #A16201,
7.00%, 08/01/29 | | | 182,515 | | | 188,683 |
Gold, Pool #C31285,
7.00%, 09/01/29 | | | 30,494 | | | 31,525 |
Gold, Pool #C31282,
7.00%, 09/01/29 | | | 3,047 | | | 3,150 |
Gold, Pool #A18212,
7.00%, 11/01/29 | | | 458,444 | | | 473,937 |
Gold, Pool #C32914,
8.00%, 11/01/29 | | | 10,552 | | | 11,109 |
Gold, Pool #C37436,
8.00%, 01/01/30 | | | 18,845 | | | 19,840 |
Gold, Pool #C36306,
7.00%, 02/01/30 | | | 16,780 | | | 17,325 |
Gold, Pool #C36429,
7.00%, 02/01/30 | | | 22,184 | | | 22,904 |
Gold, Pool #C00921,
7.50%, 02/01/30 | | | 17,941 | | | 18,682 |
Gold, Pool #G01108,
7.00%, 04/01/30 | | | 11,813 | | | 12,212 |
Gold, Pool #C37703,
7.50%, 04/01/30 | | | 14,705 | | | 15,312 |
Gold, Pool #G01133,
6.50%, 07/01/30 | | | 89,998 | | | 92,486 |
Statement of Investments (Continued)
October 31, 2006
Gartmore Bond Index Fund (Continued)
U.S. Government and Agency Long-Term Obligations (continued)
| | | | | | |
| | | Principal
Amount | | Value |
| | | | | | |
Federal Home Loan Mortgage Corporation (continued) |
Gold, Pool #C41561,
8.00%, 08/01/30 | | $ | 7,814 | | $ | 8,219 |
Gold, Pool #C01051,
8.00%, 09/01/30 | | | 37,052 | | | 38,973 |
Gold, Pool #C43550,
7.00%, 10/01/30 | | | 34,401 | | | 35,518 |
Gold, Pool #C44017,
7.50%, 10/01/30 | | | 4,175 | | | 4,347 |
Gold, Pool #C43967,
8.00%, 10/01/30 | | | 91,017 | | | 95,734 |
Gold, Pool #C44978,
7.00%, 11/01/30 | | | 3,889 | | | 4,015 |
Gold, Pool #C44535,
7.50%, 11/01/30 | | | 15,020 | | | 15,641 |
Gold, Pool #C44957,
8.00%, 11/01/30 | | | 18,059 | | | 18,995 |
Gold, Pool #C01106,
7.00%, 12/01/30 | | | 184,567 | | | 190,560 |
Gold, Pool #C01103,
7.50%, 12/01/30 | | | 15,451 | | | 16,090 |
Gold, Pool #C46932,
7.50%, 01/01/31 | | | 31,430 | | | 32,728 |
Gold, Pool #C01116,
7.50%, 01/01/31 | | | 14,774 | | | 15,384 |
Gold, Pool #C47143,
8.00%, 01/01/31 | | | 87,150 | | | 91,668 |
Gold, Pool #C47287,
7.50%, 02/01/31 | | | 15,890 | | | 16,546 |
Gold, Pool #G01217,
7.00%, 03/01/31 | | | 148,145 | | | 152,955 |
Gold, Pool #C48851,
7.00%, 03/01/31 | | | 17,281 | | | 17,831 |
Gold, Pool #C48206,
7.50%, 03/01/31 | | | 27,968 | | | 29,124 |
Gold, Pool #C01172,
6.50%, 05/01/31 | | | 83,197 | | | 85,314 |
Gold, Pool #C52136,
7.00%, 05/01/31 | | | 37,088 | | | 38,270 |
Gold, Pool #C53589,
6.50%, 06/01/31 | | | 174,577 | | | 179,019 |
Gold, Pool #C53324,
7.00%, 06/01/31 | | | 31,930 | | | 32,948 |
Gold, Pool #C01209,
8.00%, 06/01/31 | | | 8,344 | | | 8,776 |
| | | | | | |
| | | Principal
Amount | | Value |
| | | | | | |
Federal Home Loan Mortgage Corporation (continued) |
Gold, Pool #C54897,
6.50%, 07/01/31 | | $ | 131,886 | | $ | 135,242 |
Gold, Pool #C54792,
7.00%, 07/01/31 | | | 170,953 | | | 176,401 |
Gold, Pool #C55071,
7.50%, 07/01/31 | | | 1,534 | | | 1,596 |
Gold, Pool #G01309,
7.00%, 08/01/31 | | | 39,895 | | | 41,166 |
Gold, Pool #C56769,
8.00%, 08/01/31 | | | 19,266 | | | 20,257 |
Gold, Pool #C58362,
6.50%, 09/01/31 | | | 56,786 | | | 58,231 |
Gold, Pool #C58215,
6.50%, 09/01/31 | | | 5,424 | | | 5,562 |
Gold, Pool #C01220,
6.50%, 09/01/31 | | | 21,552 | | | 22,100 |
Gold, Pool #G01311,
7.00%, 09/01/31 | | | 245,326 | | | 253,292 |
Gold, Pool #G01315,
7.00%, 09/01/31 | | | 9,572 | | | 9,883 |
Gold, Pool #C01222,
7.00%, 09/01/31 | | | 29,289 | | | 30,223 |
Gold, Pool #C01244,
6.50%, 10/01/31 | | | 121,093 | | | 124,174 |
Gold, Pool #C58961,
6.50%, 10/01/31 | | | 1,021,090 | | | 1,047,073 |
Gold, Pool #C58647,
7.00%, 10/01/31 | | | 5,940 | | | 6,129 |
Gold, Pool #C58694,
7.00%, 10/01/31 | | | 65,769 | | | 67,865 |
Gold, Pool #C60991,
6.50%, 11/01/31 | | | 21,713 | | | 22,266 |
Gold, Pool #C60012,
7.00%, 11/01/31 | | | 27,072 | | | 27,934 |
Gold, Pool #C61298,
8.00%, 11/01/31 | | | 29,122 | | | 30,619 |
Gold, Pool #C01271,
6.50%, 12/01/31 | | | 38,006 | | | 38,973 |
Gold, Pool #C61105,
7.00%, 12/01/31 | | | 19,496 | | | 20,117 |
Gold, Pool #C01305,
7.50%, 12/01/31 | | | 16,247 | | | 16,903 |
Gold, Pool #C62218,
7.00%, 01/01/32 | | | 51,067 | | | 52,695 |
U.S. Government and Agency Long-Term Obligations (continued)
| | | | | | |
| | | Principal
Amount | | Value |
| | | | | | |
Federal Home Loan Mortgage Corporation (continued) |
Gold, Pool #C63171,
7.00%, 01/01/32 | | $ | 83,908 | | $ | 86,582 |
Gold, Pool #C01355,
6.50%, 02/01/32 | | | 1,134,882 | | | 1,163,760 |
Gold, Pool #C64121,
7.50%, 02/01/32 | | | 34,026 | | | 35,400 |
Gold, Pool #C64668,
6.50%, 03/01/32 | | | 41,699 | | | 42,736 |
Gold, Pool #C65466,
6.50%, 03/01/32 | | | 275,786 | | | 282,645 |
Gold, Pool #C01310,
6.50%, 03/01/32 | | | 204,280 | | | 209,360 |
Gold, Pool #C66088,
6.50%, 04/01/32 | | | 30,928 | | | 31,697 |
Gold, Pool #C66192,
6.50%, 04/01/32 | | | 36,818 | | | 37,734 |
Gold, Pool #C01343,
6.50%, 04/01/32 | | | 183,164 | | | 187,719 |
Gold, Pool #C66191,
6.50%, 04/01/32 | | | 63,791 | | | 65,378 |
Gold, Pool #C01345,
7.00%, 04/01/32 | | | 125,511 | | | 129,434 |
Gold, Pool #G01391,
7.00%, 04/01/32 | | | 405,139 | | | 418,294 |
Gold, Pool #C66744,
7.00%, 04/01/32 | | | 10,319 | | | 10,641 |
Gold, Pool #C65717,
7.50%, 04/01/32 | | | 19,449 | | | 20,166 |
Gold, Pool #C01370,
8.00%, 04/01/32 | | | 33,850 | | | 35,590 |
Gold, Pool #C67097,
6.50%, 05/01/32 | | | 26,201 | | | 26,853 |
Gold, Pool #C01351,
6.50%, 05/01/32 | | | 120,108 | | | 123,095 |
Gold, Pool #C66919,
6.50%, 05/01/32 | | | 12,364 | | | 12,672 |
Gold, Pool #C67313,
6.50%, 05/01/32 | | | 8,257 | | | 8,463 |
Gold, Pool #C66758,
6.50%, 05/01/32 | | | 877,458 | | | 899,279 |
Gold, Pool #C67235,
7.00%, 05/01/32 | | | 240,883 | | | 248,412 |
Gold, Pool #C67259,
7.00%, 05/01/32 | | | 7,391 | | | 7,622 |
| | | | | | |
| | | Principal
Amount | | Value |
| | | | | | |
Federal Home Loan Mortgage Corporation (continued) |
Gold, Pool #C66916,
7.00%, 05/01/32 | | $ | 65,603 | | $ | 67,653 |
Gold, Pool #C01381,
8.00%, 05/01/32 | | | 139,632 | | | 146,813 |
Gold, Pool #C72497,
6.50%, 06/01/32 | | | 44,323 | | | 45,450 |
Gold, Pool #C72361,
6.50%, 06/01/32 | | | 64,958 | | | 66,610 |
Gold, Pool #C01364,
6.50%, 06/01/32 | | | 121,936 | | | 124,969 |
Gold, Pool #C67996,
6.50%, 06/01/32 | | | 27,370 | | | 28,050 |
Gold, Pool #C68290,
7.00%, 06/01/32 | | | 41,629 | | | 42,930 |
Gold, Pool #C68300,
7.00%, 06/01/32 | | | 192,429 | | | 198,443 |
Gold, Pool #C68307,
8.00%, 06/01/32 | | | 6,770 | | | 7,118 |
Gold, Pool #C71403,
6.50%, 07/01/32 | | | 153,360 | | | 157,263 |
Gold, Pool #G01433,
6.50%, 07/01/32 | | | 63,812 | | | 65,399 |
Gold, Pool #G01449,
7.00%, 07/01/32 | | | 286,734 | | | 296,045 |
Gold, Pool #C68988,
7.50%, 07/01/32 | | | 8,136 | | | 8,436 |
Gold, Pool #C74006,
6.50%, 08/01/32 | | | 32,001 | | | 32,796 |
Gold, Pool #G01444,
6.50%, 08/01/32 | | | 438,900 | | | 450,068 |
Gold, Pool #C01385,
6.50%, 08/01/32 | | | 173,790 | | | 178,111 |
Gold, Pool #C69951,
6.50%, 08/01/32 | | | 66,074 | | | 67,718 |
Gold, Pool #G01443,
6.50%, 08/01/32 | | | 433,513 | | | 444,293 |
Gold, Pool #C70211,
7.00%, 08/01/32 | | | 162,878 | | | 167,968 |
Gold, Pool #C69908,
7.00%, 08/01/32 | | | 177,614 | | | 183,165 |
Gold, Pool #C01396,
6.50%, 09/01/32 | | | 280,170 | | | 287,137 |
Gold, Pool #C71089,
7.50%, 09/01/32 | | | 62,291 | | | 64,587 |
Statement of Investments (Continued)
October 31, 2006
Gartmore Bond Index Fund (Continued)
U.S. Government and Agency Long-Term Obligations (continued)
| | | | | | |
| | | Principal
Amount | | Value |
| | | | | | |
Federal Home Loan Mortgage Corporation (continued) |
Gold, Pool #C01404,
6.50%, 10/01/32 | | $ | 672,801 | | $ | 689,533 |
Gold, Pool #C72160,
7.50%, 10/01/32 | | | 21,163 | | | 21,943 |
Gold, Pool #A14012,
6.50%, 11/01/32 | | | 192,250 | | | 197,031 |
Gold, Pool #C73984,
6.50%, 12/01/32 | | | 23,158 | | | 23,734 |
Gold, Pool #C77531,
6.50%, 02/01/33 | | | 187,553 | | | 192,218 |
Gold, Pool #G01536,
7.00%, 03/01/33 | | | 214,697 | | | 220,790 |
Gold, Pool #A10212,
6.50%, 06/01/33 | | | 67,715 | | | 69,226 |
Gold, Pool #A16419,
6.50%, 11/01/33 | | | 155,177 | | | 158,641 |
Gold, Pool #A17177,
6.50%, 12/01/33 | | | 100,950 | | | 103,203 |
Gold, Pool #A17262,
6.50%, 12/01/33 | | | 300,690 | | | 307,402 |
Gold, Pool #C01806,
7.00%, 01/01/34 | | | 213,506 | | | 219,565 |
Gold, Pool #564799,
6.00%, 03/15/34 | | | 1,636,595 | | | 1,660,505 |
Gold, Pool #A21356,
6.50%, 04/01/34 | | | 532,769 | | | 543,984 |
Gold, Pool #C01851,
6.50%, 04/01/34 | | | 541,522 | | | 552,921 |
Gold, Pool #788027,
6.50%, 09/01/34 | | | 438,576 | | | 447,688 |
Gold, Pool #G01741,
6.50%, 10/01/34 | | | 389,219 | | | 398,898 |
Gold, Pool #G08023,
6.50%, 11/01/34 | | | 593,771 | | | 606,270 |
Gold, Pool #804847,
4.50%, 01/01/35 | | | 659,967 | | | 620,292 |
Gold, Pool #G08064,
6.50%, 04/01/35 | | | 429,748 | | | 438,270 |
Gold, Pool #A46279,
5.00%, 07/01/35 | | | 1,431,931 | | | 1,384,159 |
Gold, Pool #A36407,
5.00%, 08/01/35 | | | 569,127 | | | 550,140 |
Gold, Pool #A46935,
6.50%, 09/01/35 | | | 642,567 | | | 655,310 |
| | | | | | |
| | | Principal
Amount | | Value |
| | | | | | |
Federal Home Loan Mortgage Corporation (continued) |
Gold, Pool #G02045,
4.50%, 10/01/35 | | $ | 483,597 | | $ | 453,907 |
Gold, Pool #G01890,
4.50%, 10/01/35 | | | 1,360,182 | | | 1,276,676 |
Gold, Pool #A47682,
6.50%, 11/01/35 | | | 1,625,991 | | | 1,658,236 |
Gold, Pool #A41041,
5.00%, 12/01/35 | | | 1,197,116 | | | 1,157,178 |
Gold, Pool #G01959,
5.00%, 12/01/35 | | | 6,497,805 | | | 6,281,026 |
Gold, Pool #A40376,
5.50%, 12/01/35 | | | 476,438 | | | 471,484 |
Gold, Pool #A42298,
4.50%, 01/01/36 | | | 791,759 | | | 743,151 |
Gold, Pool #A41864,
5.00%, 01/01/36 | | | 580,903 | | | 561,523 |
Gold, Pool #A42305,
5.50%, 01/01/36 | | | 3,803,094 | | | 3,761,757 |
Gold, Pool #A41548,
7.00%, 01/01/36 | | | 755,872 | | | 777,391 |
Gold, Pool #G08111,
5.50%, 02/01/36 | | | 12,836,343 | | | 12,696,823 |
Gold, Pool #A48303,
7.00%, 02/01/36 | | | 620,755 | | | 638,372 |
Gold, Pool #A43861,
5.50%, 03/01/36 | | | 9,948,491 | | | 9,840,359 |
Gold, Pool #A43757,
5.50%, 03/01/36 | | | 4,244,949 | | | 4,198,810 |
Gold, Pool #G08116,
5.50%, 03/01/36 | | | 2,434,767 | | | 2,408,303 |
Gold, Pool #A43452,
5.50%, 03/01/36 | | | 349,263 | | | 345,467 |
Gold, Pool #A43644,
6.50%, 03/01/36 | | | 463,772 | | | 472,875 |
Gold, Pool #A44743,
5.00%, 04/01/36 | | | 397,229 | | | 383,976 |
Gold, Pool #A44534,
5.00%, 04/01/36 | | | 498,255 | | | 481,410 |
Gold, Pool #A54580,
5.00%, 04/01/36 | | | 994,616 | | | 961,434 |
Gold, Pool #A48700,
4.50%, 05/01/36 | | | 298,838 | | | 280,386 |
Gold, Pool #A48976,
5.50%, 05/01/36 | | | 12,868,076 | | | 12,728,211 |
U.S. Government and Agency Long-Term Obligations (continued)
| | | | | | |
| | | Principal
Amount | | Value |
| | | | | | |
Federal Home Loan Mortgage Corporation (continued) |
Gold, Pool #A48911,
5.50%, 05/01/36 | | $ | 1,376,566 | | $ | 1,361,604 |
Gold, Pool #A48735,
5.50%, 05/01/36 | | | 994,731 | | | 983,919 |
Gold, Pool #G08130,
6.50%, 05/01/36 | | | 654,734 | | | 667,586 |
Gold, Pool #A49637,
5.00%, 06/01/36 | | | 1,890,530 | | | 1,826,614 |
Gold, Pool #G08134,
5.50%, 06/01/36 | | | 1,376,602 | | | 1,361,640 |
Gold, Pool #A49653,
5.50%, 06/01/36 | | | 49,560,957 | | | 49,022,270 |
Gold, Pool #A50139,
6.50%, 06/01/36 | | | 591,952 | | | 603,571 |
Gold, Pool #A99960,
7.00%, 06/01/36 | | | 211,027 | | | 217,016 |
Gold, Pool #A50832,
5.50%, 07/01/36 | | | 1,794,090 | | | 1,774,590 |
Gold, Pool #G08139,
5.50%, 07/01/36 | | | 2,784,073 | | | 2,753,813 |
Gold, Pool #A50714,
5.50%, 07/01/36 | | | 598,121 | | | 591,620 |
TBA, 5.50%, 11/01/18 | | | 800,000 | | | 800,250 |
TBA, 4.50%, 11/15/20 | | | 500,000 | | | 482,969 |
TBA, 6.50%, 11/01/33 | | | 3,600,000 | | | 3,669,750 |
TBA, 6.00%, 12/01/33 | | | 2,000,000 | | | 2,011,876 |
TBA, 4.50%, 12/01/34 | | | 400,000 | | | 375,125 |
TBA, 5.50%, 12/15/35 | | | 800,000 | | | 790,500 |
TBA, 5.00%, 11/15/36 | | | 500,000 | | | 482,969 |
TBA, 5.50%, 11/15/36 | | | 700,000 | | | 692,125 |
| | | | | | |
| | | | | | 804,674,321 |
| | | | | | |
Federal National Mortgage Association (12.5%) |
5.75%, 02/15/08 (c) | | | 66,745,000 | | | 67,330,553 |
2.50%, 06/15/08 | | | 16,840,000 | | | 16,208,332 |
4.88%, 04/15/09 (c) | | | 24,125,000 | | | 24,130,283 |
5.38%, 08/15/09 | | | 18,990,000 | | | 19,237,857 |
5.50%, 03/15/11 (c) | | | 21,905,000 | | | 22,432,582 |
5.13%, 04/15/11 (c) | | | 8,130,000 | | | 8,208,698 |
6.00%, 05/15/11 (c) | | | 30,460,000 | | | 31,833,258 |
5.38%, 11/15/11 (c) | | | 5,935,000 | | | 6,069,701 |
4.38%, 03/15/13 (c) | | | 19,695,000 | | | 19,103,973 |
4.63%, 10/15/14 | | | 3,015,000 | | | 2,956,618 |
5.00%, 04/15/15 (c) | | | 2,760,000 | | | 2,777,990 |
| | | | | | |
| | | Principal
Amount | | Value |
| | | | | | |
Federal National Mortgage Association (continued) |
4.75%, 01/19/16 (c) | | $ | 9,275,000 | | $ | 9,130,171 |
5.00%, 03/15/16 | | | 13,675,000 | | | 13,723,820 |
5.38%, 07/15/16 (c) | | | 6,635,000 | | | 6,849,118 |
5.25%, 09/15/16 (c) | | | 8,375,000 | | | 8,564,727 |
Pool #709921,
5.00%, 06/01/18 | | | 168,921 | | | 166,746 |
Pool #255315,
4.00%, 07/01/19 | | | 460,436 | | | 436,795 |
Pool #811970,
4.50%, 02/01/20 | | | 201,722 | | | 195,137 |
Pool #560868,
7.50%, 02/01/31 | | | 14,528 | | | 15,126 |
Pool #607212,
7.50%, 10/01/31 | | | 204,437 | | | 212,843 |
Pool #607632,
6.50%, 11/01/31 | | | 2,674 | | | 2,741 |
Pool #607559,
6.50%, 11/01/31 | | | 8,737 | | | 8,956 |
Pool #661664,
7.50%, 09/01/32 | | | 192,488 | | | 200,194 |
Pool #694846,
6.50%, 04/01/33 | | | 99,934 | | | 101,864 |
Pool #750229,
6.50%, 10/01/33 | | | 612,719 | | | 624,555 |
| | | | | | |
| | | | | | 260,522,638 |
| | | | | | |
Government National Mortgage Association (7.0%) |
4.50%, 10/15/08 (c) | | | 405,000 | | | 402,135 |
5.25%, 01/15/09 (c) | | | 51,660,000 | | | 52,041,458 |
4.25%, 08/15/10 (c) | | | 11,835,000 | | | 11,580,843 |
4.38%, 10/15/15 (c) | | | 200,000 | | | 193,026 |
4.75%, 11/17/15 (c) | | | 15,260,000 | | | 15,027,851 |
5.50%, 10/01/18 | | | 874,830 | | | 875,396 |
Pool #279461,
9.00%, 11/15/19 | | | 8,381 | | | 9,004 |
Pool #G11742,
5.00%, 07/01/20 | | | 2,099,165 | | | 2,068,854 |
Pool #376510,
7.00%, 05/15/24 | | | 20,310 | | | 21,005 |
Pool #457801,
7.00%, 08/15/28 | | | 29,109 | | | 30,106 |
Pool #490258,
6.50%, 02/15/29 | | | 7,489 | | | 7,720 |
Statement of Investments (Continued)
October 31, 2006
Gartmore Bond Index Fund (Continued)
U.S. Government and Agency Long-Term Obligations (continued)
| | | | | | |
| | | Principal
Amount | | Value |
| | | | | | |
Government National Mortgage Association (continued) |
Pool #486936,
6.50%, 02/15/29 | | $ | 22,237 | | $ | 22,921 |
Pool #502969,
6.00%, 03/15/29 | | | 63,740 | | | 64,778 |
Pool #487053,
7.00%, 03/15/29 | | | 27,643 | | | 28,598 |
Pool #781014,
6.00%, 04/15/29 | | | 62,605 | | | 63,633 |
Pool #509099,
7.00%, 06/15/29 | | | 12,867 | | | 13,311 |
Pool #470643,
7.00%, 07/15/29 | | | 51,354 | | | 53,129 |
Pool #434505,
7.50%, 08/15/29 | | | 4,578 | | | 4,775 |
Pool #416538,
7.00%, 10/15/29 | | | 10,436 | | | 10,797 |
Pool #524269,
8.00%, 11/15/29 | | | 18,832 | | | 19,978 |
Pool #781124,
7.00%, 12/15/29 | | | 120,042 | | | 124,173 |
Pool #525561,
8.00%, 01/15/30 | | | 12,851 | | | 13,620 |
Pool #531352,
7.50%, 09/15/30 | | | 24,383 | | | 25,423 |
Pool #507396,
7.50%, 09/15/30 | | | 292,926 | | | 305,419 |
Pool #536334,
7.50%, 10/15/30 | | | 4,162 | | | 4,340 |
Pool #540659,
7.00%, 01/15/31 | | | 2,068 | | | 2,139 |
Pool #486019,
7.50%, 01/15/31 | | | 14,482 | | | 15,095 |
Pool #535388,
7.50%, 01/15/31 | | | 10,460 | | | 10,904 |
Pool #537406,
7.50%, 02/15/31 | | | 10,672 | | | 11,124 |
Pool #528589,
6.50%, 03/15/31 | | | 161,955 | | | 166,809 |
Pool #508473,
7.50%, 04/15/31 | | | 40,154 | | | 41,855 |
Pool #533723,
7.50%, 04/15/31 | | | 3,678 | | | 3,834 |
Pool #544470,
8.00%, 04/15/31 | | | 7,826 | | | 8,296 |
| | | | | | |
| | | Principal
Amount | | Value |
| | | | | | |
Government National Mortgage Association (continued) |
Pool #781287,
7.00%, 05/15/31 | | $ | 71,730 | | $ | 74,211 |
Pool #781319,
7.00%, 07/15/31 | | | 23,238 | | | 24,039 |
Pool #549742,
7.00%, 07/15/31 | | | 26,492 | | | 27,403 |
Pool #485879,
7.00%, 08/15/31 | | | 71,192 | | | 73,640 |
Pool #555125,
7.00%, 09/15/31 | | | 9,169 | | | 9,485 |
Pool #781328,
7.00%, 09/15/31 | | | 65,611 | | | 67,881 |
Pool #550991,
6.50%, 10/15/31 | | | 30,671 | | | 31,590 |
Pool #571267,
7.00%, 10/15/31 | | | 9,779 | | | 10,115 |
Pool #547948,
6.50%, 11/15/31 | | | 17,356 | | | 17,876 |
Pool #574837,
7.50%, 11/15/31 | | | 11,606 | | | 12,098 |
Pool #555171,
6.50%, 12/15/31 | | | 11,374 | | | 11,715 |
Pool #781380,
7.50%, 12/15/31 | | | 21,648 | | | 22,563 |
Pool #781481,
7.50%, 01/15/32 | | | 113,930 | | | 118,798 |
Pool #580972,
6.50%, 02/15/32 | | | 20,050 | | | 20,646 |
Pool #781401,
7.50%, 02/15/32 | | | 56,518 | | | 58,922 |
Pool #552474,
7.00%, 03/15/32 | | | 37,147 | | | 38,420 |
Pool #781478,
7.50%, 03/15/32 | | | 36,058 | | | 37,599 |
Pool #781429,
8.00%, 03/15/32 | | | 53,334 | | | 56,532 |
Pool #583645,
8.00%, 07/15/32 | | | 27,702 | | | 29,375 |
Pool #595077,
6.00%, 10/15/32 | | | 198,117 | | | 201,166 |
Pool #596657,
7.00%, 10/15/32 | | | 12,726 | | | 13,162 |
Pool #552903,
6.50%, 11/15/32 | | | 1,137,621 | | | 1,171,426 |
U.S. Government and Agency Long-Term Obligations (continued)
| | | | | | |
| | | Principal
Amount | | Value |
| | | | | | |
Government National Mortgage Association (continued) |
Pool #552952,
6.00%, 12/15/32 | | $ | 208,682 | | $ | 211,894 |
Pool #612953,
7.00%, 12/15/32 | | | 62,614 | | | 64,760 |
Pool #602102,
6.00%, 02/15/33 | | | 290,944 | | | 295,305 |
Pool #588192,
6.00%, 02/15/33 | | | 106,156 | | | 107,747 |
Pool #603520,
6.00%, 03/15/33 | | | 240,756 | | | 244,364 |
Pool #553144,
5.50%, 04/15/33 | | | 694,925 | | | 692,869 |
Pool #604243,
6.00%, 04/15/33 | | | 422,280 | | | 428,609 |
Pool #631924,
6.00%, 05/15/33 | | | 259,138 | | | 263,022 |
Pool #611526,
6.00%, 05/15/33 | | | 163,379 | | | 165,828 |
Pool #553320,
6.00%, 06/15/33 | | | 527,867 | | | 535,779 |
Pool #572733,
6.00%, 07/15/33 | | | 109,806 | | | 111,451 |
Pool #573916,
6.00%, 11/15/33 | | | 403,631 | | | 409,680 |
Pool #604788,
6.50%, 11/15/33 | | | 736,672 | | | 757,954 |
Pool #781690,
6.00%, 12/15/33 | | | 323,539 | | | 328,485 |
Pool #604875,
6.00%, 12/15/33 | | | 878,011 | | | 891,171 |
Pool #781688,
6.00%, 12/15/33 | | | 760,033 | | | 771,576 |
Pool #781699,
7.00%, 12/15/33 | | | 130,564 | | | 135,058 |
Pool #621856,
6.00%, 01/15/34 | | | 384,293 | | | 389,907 |
Pool #486921,
5.50%, 02/15/35 | | | 401,307 | | | 399,629 |
Pool #781905,
5.00%, 04/15/35 | | | 2,350,378 | | | 2,293,560 |
Pool #646799,
4.50%, 07/15/35 | | | 423,465 | | | 401,781 |
Pool #645035,
5.00%, 07/15/35 | | | 453,994 | | | 442,860 |
| | | | | | |
| | | Principal
Amount | | Value |
| | | | | | |
Government National Mortgage Association (continued) |
Pool #641734,
4.50%, 09/15/35 | | $ | 2,608,811 | | $ | 2,475,228 |
Pool #641779,
5.00%, 09/15/35 | | | 9,474,660 | | | 9,242,288 |
Pool #649454,
5.50%, 09/15/35 | | | 3,522,924 | | | 3,509,128 |
Pool #649510,
5.50%, 10/15/35 | | | 5,450,373 | | | 5,429,030 |
Pool #649513,
5.50%, 10/15/35 | | | 6,812,672 | | | 6,785,994 |
Pool #602461,
5.00%, 12/15/35 | | | 386,287 | | | 376,813 |
Pool #650712,
5.00%, 01/15/36 | | | 1,086,523 | | | 1,059,572 |
Pool #648439,
5.00%, 01/15/36 | | | 763,656 | | | 744,713 |
Pool #652207,
5.50%, 03/15/36 | | | 6,193,641 | | | 6,167,754 |
Pool #652536,
5.00%, 05/15/36 | | | 488,588 | | | 495,344 |
Pool #65519,
5.00%, 05/15/36 | | | 895,748 | | | 873,529 |
Pool #606308,
5.50%, 05/15/36 | | | 1,194,837 | | | 1,189,843 |
Pool #606314,
5.50%, 05/15/36 | | | 497,121 | | | 495,043 |
Pool #653598,
5.50%, 05/15/36 | | | 1,690,835 | | | 1,683,768 |
Pool #655457,
6.00%, 05/15/36 | | | 499,037 | | | 505,938 |
Pool #656666,
6.00%, 06/15/36 | | | 2,973,342 | | | 3,014,457 |
Pool #635306,
6.00%, 06/15/36 | | | 3,030,096 | | | 3,071,996 |
TBA, 6.50%, 11/01/32 | | | 1,000,000 | | | 1,026,562 |
TBA, 6.00%, 12/15/35 | | | 3,100,000 | | | 3,139,717 |
| | | | | | |
| | | | | | 147,031,017 |
| | | | | | |
Tennessee Valley Authority (0.0%) |
6.25%, 12/15/17 | | | 85,000 | | | 94,063 |
| | | | | | |
Statement of Investments (Continued)
October 31, 2006
Gartmore Bond Index Fund (Continued)
U.S. Government and Agency Long-Term Obligations (continued)
| | | | | | |
| | | Principal
Amount | | Value |
| | | | | | |
U.S. Treasury Bonds (4.9%) |
8.75%, 05/15/17 (c) | | $ | 11,060,000 | | $ | 14,791,025 |
8.50%, 02/15/20 (c) | | | 7,185,000 | | | 9,806,404 |
6.25%, 08/15/23 | | | 24,950,000 | | | 29,035,562 |
6.88%, 08/15/25 | | | 7,990,000 | | | 10,007,475 |
6.38%, 08/15/27 (c) | | | 22,115,000 | | | 26,645,125 |
5.38%, 02/15/31 | | | 11,200,000 | | | 12,159,874 |
| | | | | | |
| | | | | | 102,445,465 |
| | | | | | |
U.S. Treasury Notes (1.6%) |
3.13%, 10/15/08 (c) | | | 1,325,000 | | | 1,286,648 |
4.00%, 11/15/12 (c) | | | 4,390,000 | | | 4,259,498 |
4.00%, 02/15/15 (c) | | | 18,510,000 | | | 17,751,516 |
4.13%, 05/15/15 (c) | | | 420,000 | | | 406,104 |
4.50%, 11/15/15 (c) | | | 630,000 | | | 625,226 |
4.50%, 02/15/36 (c) | | | 8,265,000 | | | 7,977,014 |
| | | | | | |
| | | | | | 32,306,006 |
| | | | | | |
| |
Total U.S. Government and Agency Long-Term Obligations | | | 1,347,073,510 |
| | | | | | |
|
Corporate Bonds (30.3%) |
Advertising (0.0%) |
Omnicom Group, Inc.,
5.90%, 04/15/16 | | | 300,000 | | | 305,203 |
| | | | | | |
Aerospace (0.4%) |
Bae Systems Holdings, Inc.,
4.75%, 08/15/10 (b) | | | 400,000 | | | 390,133 |
Boeing Co., 6.13%, 02/15/33 (c) | | | 500,000 | | | 546,066 |
General Dynamics Corp.,
3.00%, 05/15/08 | | | 425,000 | | | 411,073 |
Goodrich Corp., 6.29%, 01/01/16 | | | 600,000 | | | 620,101 |
Goodrich Corp.,
6.80%, 07/01/36 (c) | | | 314,000 | | | 334,921 |
Lockheed Martin Corp.,
7.65%, 05/01/16 | | | 300,000 | | | 348,779 |
Lockheed Martin Corp.,
6.15%, 09/01/36 (b) | | | 600,000 | | | 637,552 |
Northrop Grumman Corp.,
7.13%, 02/15/11 | | | 1,035,000 | | | 1,108,315 |
Northrop Grumman Corp.,
7.75%, 02/15/31 | | | 200,000 | | | 250,836 |
Raytheon Co., 8.30%, 03/01/10 | | | 250,000 | | | 272,711 |
Raytheon Co., 5.50%, 11/15/12 | | | 150,000 | | | 151,553 |
Corporate Bonds (continued)
| | | | | | |
| | | Principal
Amount | | Value |
| | | | | | |
Aerospace (continued) |
Raytheon Co., 6.40%, 12/15/18 | | $ | 350,000 | | $ | 376,086 |
Raytheon Co., 7.00%, 11/01/28 | | | 225,000 | | | 259,544 |
Rockwell Collins Corp.,
4.75%, 12/01/13 | | | 500,000 | | | 491,072 |
United Technologies Corp.,
6.35%, 03/01/11 | | | 675,000 | | | 705,474 |
United Technologies Corp.,
5.40%, 05/01/35 | | | 750,000 | | | 737,147 |
| | | | | | |
| | | | | | 7,641,363 |
| | | | | | |
Agricultural Products (0.0%) |
Bunge International Ltd.,
5.10%, 07/15/15 | | | 150,000 | | | 141,277 |
Potash Corp. of Saskatchewan, Inc.,
7.75%, 05/31/11 | | | 70,000 | | | 76,473 |
Potash Corp. of Saskatchewan, Inc.,
4.88%, 03/01/13 | | | 280,000 | | | 270,038 |
| | | | | | |
| | | | | | 487,788 |
| | | | | | |
Airlines (0.1%) |
Continental Airlines, Inc.,
6.56%, 08/15/13 | | | 395,000 | | | 411,130 |
Qantas Airways,
6.05%, 04/15/16 (b) | | | 300,000 | | | 301,918 |
Southwest Airlines Corp.,
7.88%, 09/01/07 | | | 24,000 | | | 24,431 |
Southwest Airlines Corp.,
5.13%, 03/01/17 | | | 250,000 | | | 237,751 |
| | | | | | |
| | | | | | 975,230 |
| | | | | | |
Apparel Manufacturers (0.0%) |
Jones Apparel Group Inc.,
6.13%, 11/15/34 | | | 160,000 | | | 142,189 |
| | | | | | |
Automobiles (1.1%) |
DaimlerChrysler AG,
4.05%, 06/04/08 | | | 1,100,000 | | | 1,075,565 |
DaimlerChrysler AG,
7.30%, 01/15/12 | | | 660,000 | | | 704,247 |
DaimlerChrysler AG,
6.50%, 11/15/13 (c) | | | 825,000 | | | 852,598 |
DaimlerChrysler AG,
8.50%, 01/18/31 | | | 625,000 | | | 751,033 |
DaimlerChrysler NA Holdings,
4.75%, 01/15/08 | | | 1,000,000 | | | 990,527 |
Corporate Bonds (continued)
| | | | | | |
| | | Principal
Amount | | Value |
| | | | | | |
Automobiles (continued) |
DaimlerChrysler NA Holdings,
5.88%, 03/15/11 | | $ | 1,250,000 | | $ | 1,259,210 |
Honda Auto Receivables Owner Trust, 5.12%, 10/15/10 | | | 15,975,000 | | | 15,986,342 |
Nissan Motor Acceptance,
4.63%, 03/08/10 (b) | | | 520,000 | | | 506,707 |
Toyota Motor Credit Corp.,
4.25%, 03/15/10 (c) | | | 570,000 | | | 555,015 |
| | | | | | |
| | | | | | 22,681,244 |
| | | | | | |
Banking (5.2%) |
American Express Centurion Bank,
4.38%, 07/30/09 (b) | | | 400,000 | | | 393,364 |
Anadarko Finance Co.,
6.75%, 05/01/11 | | | 200,000 | | | 210,729 |
Andina de Fomento Corp.,
6.88%, 03/15/12 | | | 400,000 | | | 426,027 |
Banco Nacional de Comercio Exterior, 3.88%, 01/21/09 (b) (c) | | | 100,000 | | | 96,750 |
Bank of America Corp.,
3.25%, 08/15/08 | | | 540,000 | | | 522,332 |
Bank of America Corp.,
4.50%, 08/01/10 (c) | | | 350,000 | | | 343,251 |
Bank of America Corp.,
4.38%, 12/01/10 | | | 1,000,000 | | | 973,499 |
Bank of America Corp.,
5.38%, 08/15/11 | | | 650,000 | | | 656,761 |
Bank of America Corp.,
4.88%, 09/15/12 | | | 490,000 | | | 482,521 |
Bank of America Corp.,
4.88%, 01/15/13 (c) | | | 1,100,000 | | | 1,082,079 |
Bank of America Corp.,
4.75%, 08/01/15 (c) | | | 1,050,000 | | | 1,009,741 |
Bank of America Corp.,
5.25%, 12/01/15 (c) | | | 1,250,000 | | | 1,236,915 |
Bank of America Corp.,
6.00%, 06/15/16 | | | 500,000 | | | 522,631 |
Bank of America Corp.,
4.93%, 07/10/45 | | | 4,720,000 | | | 4,603,572 |
Bank of New York Corp.,
5.20%, 07/01/07 (c) | | | 565,000 | | | 564,777 |
Bank of New York Corp.,
5.05%, 03/03/09 | | | 900,000 | | | 893,770 |
| | | | | | |
| | | Principal
Amount | | Value |
| | | | | | |
Banking (continued) |
Bank One Corp.,
4.13%, 09/01/07 (c) | | $ | 965,000 | | $ | 953,047 |
Bank One Corp.,
3.70%, 01/15/08 (c) | | | 500,000 | | | 490,277 |
Bank One Corp., 7.88%, 08/01/10 | | | 100,000 | | | 108,948 |
Bank One Corp., 5.25%, 01/30/13 | | | 250,000 | | | 249,223 |
Bank One Corp., 8.00%, 04/29/27 | | | 492,000 | | | 611,871 |
BB&T Corp., 6.50%, 08/01/11 | | | 800,000 | | | 843,835 |
BB&T Corp., 4.75%, 10/01/12 | | | 400,000 | | | 390,135 |
BHP Finance Corp.,
6.42%, 03/01/26 | | | 135,000 | | | 144,638 |
BSCH Issuances Ltd.,
7.63%, 11/03/09 | | | 600,000 | | | 640,042 |
BSCH Issuances Ltd.,
7.63%, 09/14/10 | | | 100,000 | | | 108,568 |
Citigroup, Inc., 5.50%, 11/30/07 | | | 1,500,000 | | | 1,503,890 |
Citigroup, Inc., 3.50%, 02/01/08 | | | 1,850,000 | | | 1,811,537 |
Citigroup, Inc., 6.38%, 11/15/08 | | | 275,000 | | | 281,433 |
Citigroup, Inc., 3.63%, 02/09/09 | | | 1,420,000 | | | 1,376,173 |
Citigroup, Inc., 4.13%, 02/22/10 | | | 900,000 | | | 874,976 |
Citigroup, Inc., 4.63%, 08/03/10 | | | 550,000 | | | 541,243 |
Citigroup, Inc., 6.50%, 01/18/11 | | | 225,000 | | | 236,496 |
Citigroup, Inc., 5.13%, 02/14/11 | | | 150,000 | | | 150,019 |
Citigroup, Inc., 6.00%, 2/21/12,
6.00%, 02/21/12 (c) | | | 250,000 | | | 259,526 |
Citigroup, Inc.,
5.63%, 08/27/12 (c) | | | 500,000 | | | 508,958 |
Citigroup, Inc.,
5.30%, 01/07/16 | | | 600,000 | | | 597,861 |
Citigroup, Inc.,
5.85%, 08/02/16 (c) | | | 700,000 | | | 724,341 |
Citigroup, Inc., 6.63%, 06/15/32 | | | 565,000 | | | 624,320 |
Citigroup, Inc.,
5.88%, 02/22/33 (c) | | | 200,000 | | | 201,452 |
Citigroup, Inc., 5.85%, 12/11/34 | | | 1,525,000 | | | 1,552,452 |
Comerica, Inc., 4.80%, 05/01/15 | | | 300,000 | | | 283,954 |
Deutsche Bank Financial LLC.,
7.50%, 04/25/09 | | | 100,000 | | | 105,083 |
Deutsche Bank Financial LLC.,
5.38%, 03/02/15 | | | 300,000 | | | 299,215 |
European Investment Bank,
3.38%, 03/16/09 (c) | | | 1,600,000 | | | 1,547,534 |
European Investment Bank,
4.63%, 05/15/14 | | | 525,000 | | | 516,376 |
Statement of Investments (Continued)
October 31, 2006
Gartmore Bond Index Fund (Continued)
Corporate Bonds (continued)
| | | | | | |
| | | Principal Amount | | Value |
| | | | | | |
Banking (continued) |
Fifth Third Bank,
3.38%, 08/15/08 | | $ | 280,000 | | $ | 271,431 |
Fifth Third Bank,
4.20%, 02/23/10 | | | 1,725,000 | | | 1,678,021 |
First Union National Bank,
6.14%, 03/15/33 | | | 5,380,577 | | | 5,546,771 |
HBOS PLC, 5.38%, 11/29/49 (b) | | | 600,000 | | | 592,328 |
HSBC Bank USA,
7.50%, 07/15/09 | | | 955,000 | | | 1,012,808 |
HSBC Bank USA,
3.88%, 09/15/09 | | | 1,775,000 | | | 1,720,362 |
HSBC Bank USA,
4.63%, 04/01/14 | | | 1,000,000 | | | 958,635 |
HSBC Bank USA,
5.88%, 11/01/34 | | | 1,215,000 | | | 1,224,172 |
Huntington National Bank,
5.50%, 02/15/16 | | | 300,000 | | | 294,923 |
Inter-American Development Bank,
5.75%, 02/26/08 | | | 250,000 | | | 252,288 |
Inter-American Development Bank,
6.80%, 10/15/25 | | | 700,000 | | | 838,705 |
International Bank for
Reconstruction & Development,
7.63%, 01/19/23 | | | 750,000 | | | 962,004 |
International Lease Finance Corp.,
5.75%, 02/15/07 | | | 415,000 | | | 415,321 |
International Lease Finance Corp.,
3.50%, 04/01/09 | | | 500,000 | | | 480,623 |
JP Morgan Chase & Co.,
6.25%, 01/15/09 | | | 100,000 | | | 101,827 |
JP Morgan Chase & Co.,
3.50%, 03/15/09 | | | 2,450,000 | | | 2,364,147 |
JP Morgan Chase & Co.,
4.50%, 11/15/10 | | | 2,750,000 | | | 2,686,530 |
JP Morgan Chase & Co.,
4.60%, 01/17/11 | | | 1,000,000 | | | 979,289 |
JP Morgan Chase & Co.,
6.63%, 03/15/12 | | | 1,090,000 | | | 1,158,100 |
| | | | | | |
| | | Principal Amount | | Value |
| | | | | | |
Banking (continued) |
JP Morgan Chase & Co.,
4.75%, 03/01/15 (c) | | $ | 430,000 | | $ | 409,756 |
JP Morgan Chase & Co.,
5.15%, 10/01/15 | | | 850,000 | | | 831,558 |
JP Morgan Chase & Co.,
5.88%, 06/13/16 | | | 750,000 | | | 770,380 |
JP Morgan Chase & Co.,
6.45%, 03/15/33 | | | 6,350,000 | | | 6,646,776 |
JP Morgan Chase & Co.,
6.47%, 11/15/35 | | | 5,520,000 | | | 5,827,266 |
JP Morgan Chase & Co.,
5.00%, 11/01/06 (d) | | | 3,770,000 | | | 3,679,650 |
JP Morgan Chase & Co.,
6.07%, 11/01/06 (c) (d) | | | 5,660,000 | | | 5,934,706 |
Key Bank NA, 5.70%, 08/15/12 | | | 450,000 | | | 460,646 |
Key Bank NA, 5.80%, 07/01/14 | | | 250,000 | | | 255,607 |
Key Bank NA, 6.95%, 02/01/28 | | | 225,000 | | | 252,341 |
M & T Bank Corp.,
3.85%, 04/01/13 | | | 300,000 | | | 294,714 |
Marshall & Ilsley Bank,
4.13%, 09/04/07 | | | 125,000 | | | 123,878 |
Marshall & Ilsley Bank,
3.80%, 02/08/08 | | | 600,000 | | | 588,244 |
Marshall & Ilsley Bank,
5.25%, 09/04/12 | | | 275,000 | | | 277,243 |
MBNA America Bank Corp.,
6.25%, 01/17/07 | | | 495,000 | | | 495,822 |
MBNA America Bank Corp.,
5.38%, 01/15/08 | | | 195,000 | | | 195,061 |
MBNA America Bank Corp.,
4.63%, 08/03/09 (b) | | | 2,130,000 | | | 2,103,652 |
MBNA America Bank Corp.,
5.00%, 05/04/10 | | | 550,000 | | | 548,081 |
MBNA America Bank Corp.,
7.13%, 11/15/12 (b) | | | 140,000 | | | 153,185 |
National Bank of Australia,
8.60%, 05/19/10 | | | 300,000 | | | 332,834 |
National City Bank of Indiana,
4.00%, 09/28/07 | | | 300,000 | | | 295,532 |
National City Corp.,
3.20%, 04/01/08 | | | 400,000 | | | 388,120 |
National City Corp.,
6.20%, 12/15/11 | | | 300,000 | | | 313,462 |
Corporate Bonds (continued)
| | | | | | |
| | | Principal
Amount | | Value |
| | | | | | |
Banking (continued) |
National City Corp.,
4.90%, 01/15/15 (c) | | $ | 600,000 | | $ | 578,044 |
Nationsbank Corp.,
6.60%, 05/15/10 | | | 200,000 | | | 208,658 |
Oester Kontroll Bank,
4.50%, 03/09/15 | | | 400,000 | | | 387,840 |
PNC Funding Corp.,
5.25%, 11/15/15 | | | 600,000 | | | 591,498 |
Popular North America, Inc.,
4.70%, 06/30/09 | | | 550,000 | | | 539,700 |
Regions Financial Corp.,
6.38%, 05/15/12 | | | 150,000 | | | 157,744 |
Sanwa Bank Ltd.,
7.40%, 06/15/11 (c) | | | 600,000 | | | 648,250 |
Sovereign Bancorp., Inc.,
5.13%, 03/15/13 | | | 200,000 | | | 196,340 |
St. George Bank Ltd.,
5.30%, 10/15/15 (b) | | | 400,000 | | | 395,503 |
State Street Bank and Trust,
5.30%, 01/15/16 | | | 200,000 | | | 199,199 |
SunTrust Banks, Inc.,
5.20%, 01/17/17 | | | 300,000 | | | 293,800 |
SunTrust Banks, Inc.,
5.45%, 12/01/17 | | | 310,000 | | | 309,810 |
U.S. Bancorp, 5.10%, 07/15/07 | | | 500,000 | | | 498,705 |
U.S. Bancorp, 4.50%, 07/29/10 (c) | | | 500,000 | | | 489,996 |
UBS AG Stamford CT,
5.88%, 07/15/16 | | | 400,000 | | | 412,164 |
Union Planters Corp.,
4.38%, 12/01/10 | | | 150,000 | | | 146,181 |
Unionbancal Corp.,
5.25%, 12/16/13 | | | 350,000 | | | 345,612 |
US Bank NA, 4.95%, 10/30/14 (c) | | | 450,000 | | | 439,563 |
US Bank NA, 4.80%, 04/15/15 | | | 225,000 | | | 216,857 |
US Bank NA Minnesota,
6.38%, 08/01/11 | | | 850,000 | | | 892,797 |
Wachovia Corp.,
5.72%, 11/01/06 (d) | | | 4,800,000 | | | 4,895,040 |
Wachovia Corp., 3.63%, 02/17/09 | | | 2,975,000 | | | 2,877,170 |
Wachovia Corp., 4.88%, 02/15/14 | | | 310,000 | | | 300,559 |
Wachovia Corp., 5.60%, 03/15/16 | | | 1,200,000 | | | 1,215,288 |
Wachovia Corp., 5.50%, 08/01/35 | | | 825,000 | | | 789,386 |
Wells Fargo & Co.,
3.50%, 04/04/08 (c) | | | 625,000 | | | 610,996 |
Wells Fargo & Co., 3.13%, 04/01/09 | | | 2,150,000 | | | 2,055,361 |
| | | | | | |
| | | Principal
Amount | | Value |
| | | | | | |
Banking (continued) |
Wells Fargo & Co., 4.20%, 01/15/10 | | $ | 800,000 | | $ | 778,058 |
Wells Fargo & Co., 6.45%, 02/01/11 | | | 1,440,000 | | | 1,510,759 |
Wells Fargo & Co., 5.13%, 09/15/16 | | | 350,000 | | | 343,441 |
Wells Fargo & Co.,
5.38%, 02/07/35 (c) | | | 775,000 | | | 741,291 |
Westpac Banking Corp.,
4.63%, 06/01/18 | | | 250,000 | | | 232,656 |
| | | | | | |
| | | | | | 111,571,207 |
| | | | | | |
Building & Construction (0.3%) | | | | | | |
Caterpillar, Inc., 7.30%, 05/01/31 | | | 170,000 | | | 206,445 |
Centex Corp., 7.88%, 02/01/11 | | | 250,000 | | | 270,798 |
Centex Corp., 7.50%, 01/15/12 | | | 100,000 | | | 107,313 |
Centex Corp., 6.50%, 05/01/16 | | | 600,000 | | | 614,931 |
D.R. Horton, Inc., 6.00%, 04/15/11 | | | 1,100,000 | | | 1,102,079 |
Hanson Australia Funding,
5.25%, 03/15/13 (c) | | | 450,000 | | | 437,926 |
Korea Development Bank Corp.,
4.25%, 11/13/07 | | | 250,000 | | | 247,215 |
Lafarge SA, 6.50%, 07/15/16 | | | 450,000 | | | 468,732 |
Lennar Corp., 5.95%, 03/01/13 | | | 90,000 | | | 89,486 |
Lennar Corp., 5.50%, 09/01/14 | | | 500,000 | | | 480,659 |
Masco Corp., 5.88%, 07/15/12 | | | 360,000 | | | 360,710 |
Masco Corp., 4.80%, 06/15/15 | | | 600,000 | | | 549,598 |
MDC Holdings, Inc.,
5.50%, 05/15/13 | | | 250,000 | | | 237,032 |
Pulte Homes, Inc., 4.88%, 07/15/09 | | | 575,000 | | | 566,278 |
Pulte Homes, Inc., 7.88%, 08/01/11 | | | 40,000 | | | 43,351 |
Pulte Homes, Inc., 6.25%, 02/15/13 | | | 105,000 | | | 107,079 |
Pulte Homes, Inc., 6.00%, 02/15/35 | | | 250,000 | | | 229,324 |
Ryland Group, 5.38%, 01/15/15 (c) | | | 400,000 | | | 370,312 |
Toll Brothers, Inc., 6.88%, 11/15/12 | | | 150,000 | | | 153,506 |
| | | | | | |
| | | | | | 6,642,774 |
| | | | | | |
Business Services (0.1%) | | | | | | |
First Data Corp., 3.38%, 08/01/08 | | | 600,000 | | | 581,304 |
Johnson Controls, Inc.,
5.25%, 01/15/11 | | | 300,000 | | | 298,082 |
Pitney Bowes, Inc.,
4.75%, 01/15/16 | | | 500,000 | | | 475,596 |
Pitney Bowes, Inc.,
4.75%, 05/15/18 | | | 150,000 | | | 140,971 |
| | | | | | |
| | | | | | 1,495,953 |
| | | | | | |
Statement of Investments (Continued)
October 31, 2006
Gartmore Bond Index Fund (Continued)
Corporate Bonds (continued)
| | | | | | |
| | | Principal
Amount | | Value |
| | | | | | |
Cable (0.4%) | | | | | | |
British Sky Broadcasting Group PLC, 8.20%, 07/15/09 | | $ | 375,000 | | $ | 401,375 |
Comcast Corp., 6.20%, 11/15/08 | | | 475,000 | | | 484,116 |
Comcast Corp., 6.88%, 06/15/09 | | | 800,000 | | | 831,694 |
Comcast Corp., 5.85%, 01/15/10 | | | 1,465,000 | | | 1,490,538 |
Comcast Corp., 8.38%, 03/15/13 | | | 400,000 | | | 456,925 |
Comcast Corp., 5.90%, 03/15/16 | | | 700,000 | | | 704,544 |
Comcast Corp., 6.50%, 01/15/17 | | | 700,000 | | | 734,066 |
Comcast Corp., 9.46%, 11/15/22 | | | 200,000 | | | 261,170 |
Comcast Corp., 7.05%, 03/15/33 | | | 500,000 | | | 541,755 |
Comcast Corp., 5.65%, 06/15/35 | | | 400,000 | | | 367,175 |
Comcast Corp., 6.50%, 11/15/35 (c) | | | 170,000 | | | 173,584 |
Comcast Corp., 6.45%, 03/15/37 | | | 580,000 | | | 587,708 |
Cox Communications, Inc.,
7.13%, 10/01/12 | | | 500,000 | | | 534,481 |
Cox Communications, Inc.,
5.45%, 12/15/14 | | | 600,000 | | | 586,136 |
Cox Enterprises,
4.38%, 05/01/08 (b) | | | 250,000 | | | 245,457 |
Harris Corp., 6.35%, 02/01/28 | | | 250,000 | | | 257,602 |
Teck Cominco Ltd.,
6.13%, 10/01/35 | | | 250,000 | | | 243,869 |
USA Interactive,
7.00%, 01/15/13 (c) | | | 300,000 | | | 308,957 |
| | | | | | |
| | | | | | 9,211,152 |
| | | | | | |
Chemicals (0.2%) | | | | | | |
Albemarle Corp.,
5.10%, 02/01/15 (c) | | | 200,000 | | | 190,783 |
Chevron Phillips Chemical,
5.38%, 06/15/07 | | | 100,000 | | | 99,874 |
Cytec Industries, Inc.,
6.00%, 10/01/15 | | | 275,000 | | | 272,927 |
Dow Chemical, 6.00%, 10/01/12 | | | 1,000,000 | | | 1,034,988 |
ICI North America,
8.88%, 11/15/06 | | | 300,000 | | | 300,302 |
Lubrizol Corp., 5.50%, 10/01/14 | | | 600,000 | | | 587,650 |
Lubrizol Corp., 6.50%, 10/01/34 | | | 250,000 | | | 254,526 |
Praxair, Inc., 3.95%, 06/01/13 (c) | | | 300,000 | | | 278,202 |
Rohm & Haas Co., 7.85%, 07/15/29 | | | 200,000 | | | 245,523 |
Yara International Asa,
5.25%, 12/15/14 (b) | | | 250,000 | | | 240,431 |
| | | | | | |
| | | | | | 3,505,206 |
| | | | | | |
| | | | | | |
| | | Principal
Amount | | Value |
| | | | | | |
Commercial Services (0.0%) | | | |
Donnelley (R.R) & Sons Co.,
4.95%, 04/01/14 | | $ | 200,000 | | $ | 180,101 |
First Data Corp.,
4.95%, 06/15/15 (c) | | | 250,000 | | | 241,814 |
| | | | | | |
| | | | | | 421,915 |
| | | | | | |
Computers (0.3%) | | | |
Cisco Systems, Inc.,
5.25%, 02/22/11 | | | 500,000 | | | 503,018 |
Cisco Systems, Inc.,
5.50%, 02/22/16 | | | 1,300,000 | | | 1,314,983 |
Dell Computer Corp.,
7.10%, 04/15/28 | | | 350,000 | | | 397,474 |
First Data Corp., 6.38%, 12/15/07 | | | 350,000 | | | 352,267 |
Hewlett Packard Co.,
3.63%, 03/15/08 (c) | | | 250,000 | | | 244,134 |
Hewlett Packard Co.,
6.50%, 07/01/12 (c) | | | 250,000 | | | 265,908 |
IBM Corp., 6.45%, 08/01/07 | | | 115,000 | | | 115,699 |
IBM Corp., 3.80%, 02/01/08 | | | 1,415,000 | | | 1,388,224 |
IBM Corp., 5.50%, 01/15/09 | | | 200,000 | | | 202,012 |
IBM Corp., 4.75%, 11/29/12 | | | 875,000 | | | 857,698 |
IBM Corp., 5.88%, 11/29/32 (c) | | | 565,000 | | | 584,564 |
Kern River Funding Corp.,
4.89%, 04/30/18 (b) (d) | | | 84,400 | | | 82,125 |
| | | | | | |
| | | | | | 6,308,106 |
| | | | | | |
Conglomerates (0.1%) | | | |
Fortune Brands, Inc.,
5.13%, 01/15/11 | | | 700,000 | | | 687,135 |
Fortune Brands, Inc.,
5.38%, 01/15/16 | | | 450,000 | | | 426,334 |
Procter & Gamble Co.,
6.88%, 09/15/09 (c) | | | 320,000 | | | 335,161 |
Procter & Gamble Co.,
4.95%, 08/15/14 (c) | | | 500,000 | | | 491,418 |
Procter & Gamble Co.,
4.85%, 12/15/15 | | | 300,000 | | | 291,351 |
Procter & Gamble Co.,
5.80%, 08/15/34 | | | 500,000 | | | 522,648 |
| | | | | | |
| | | | | | 2,754,047 |
| | | | | | |
Corporate Bonds (continued)
| | | | | | |
| | | Principal
Amount | | Value |
| | | | | | |
Containers (0.0%) | | | |
Newell Rubbermaid, Inc.,
4.00%, 05/01/10 | | $ | 150,000 | | $ | 143,854 |
Sealed Air Corp.,
5.38%, 04/15/08 (b) | | | 200,000 | | | 199,551 |
Sealed Air Corp.,
6.95%, 05/15/09 (b) | | | 55,000 | | | 56,866 |
| | | | | | |
| | | | | | 400,271 |
| | | | | | |
Department Stores (0.1%) | | | |
Federated Department Stores,
6.63%, 04/01/11 (c) | | | 1,070,000 | | | 1,108,476 |
Federated Department Stores,
6.90%, 04/01/29 (c) | | | 250,000 | | | 258,097 |
Kimberly-Clark Corp.,
7.10%, 08/01/07 | | | 106,000 | | | 107,417 |
Kimberly-Clark Corp.,
5.63%, 02/15/12 | | | 500,000 | | | 512,582 |
Kohl’s Corp., 6.30%, 03/01/11 | | | 50,000 | | | 51,867 |
| | | | | | |
| | | | | | 2,038,439 |
| | | | | | |
Electric – Integrated (1.8%) | | | |
Alabama Power Co.,
5.70%, 02/15/33 (c) | | | 550,000 | | | 552,187 |
Amerenenergy Generating Co.,
7.95%, 06/01/32 | | | 105,000 | | | 126,558 |
American Electric Power Co.,
5.25%, 06/01/15 | | | 325,000 | | | 317,363 |
Appalachian Power Co.,
5.80%, 10/01/35 | | | 350,000 | | | 333,516 |
Arizona Public Service Co.,
5.50%, 09/01/35 | | | 365,000 | | | 329,043 |
Cincinnati Gas & Electric Corp.,
5.70%, 09/15/12 | | | 70,000 | | | 70,801 |
Commonwealth Edison Corp.,
6.15%, 03/15/12 | | | 200,000 | | | 203,928 |
Consolidated Edison of N.Y.,
4.70%, 06/15/09 | | | 250,000 | | | 247,193 |
Consolidated Edison of N.Y.,
5.38%, 12/15/15 | | | 300,000 | | | 299,276 |
Consolidated Edison, Inc.,
7.15%, 12/01/09 | | | 60,000 | | | 63,246 |
Consolidated Edison, Inc.,
4.88%, 02/01/13 (c) | | | 210,000 | | | 205,640 |
| | | | | | |
| | | Principal
Amount | | Value |
| | | | | | |
Electric – Integrated (continued) | | | |
Consolidated Edison, Inc.,
5.88%, 04/01/33 | | $ | 200,000 | | $ | 201,462 |
Constellation Energy Group, Inc.,
6.13%, 09/01/09 | | | 530,000 | | | 541,687 |
Consumers Energy-ITC,
4.25%, 04/15/08 | | | 205,000 | | | 201,645 |
Consumers Energy-ITC,
4.00%, 05/15/10 | | | 200,000 | | | 191,297 |
Dominion Resources, Inc.,
4.13%, 02/15/08 | | | 250,000 | | | 246,242 |
Dominion Resources, Inc.,
5.70%, 09/17/12 | | | 275,000 | | | 278,561 |
Dominion Resources, Inc.,
6.30%, 03/15/33 (c) | | | 750,000 | | | 767,489 |
Dominion Resources, Inc.,
5.95%, 06/15/35 (c) | | | 425,000 | | | 419,787 |
DTE Energy Co., 6.35%, 06/01/16 | | | 700,000 | | | 728,053 |
Duke Energy Corp.,
3.75%, 03/05/08 (b) | | | 1,200,000 | | | 1,177,000 |
Duke Energy Corp.,
6.25%, 01/15/12 | | | 1,170,000 | | | 1,221,557 |
Emerson Electric Co.,
6.00%, 08/15/32 | | | 140,000 | | | 147,776 |
Entergy Gulf States, Inc.,
5.25%, 08/01/15 | | | 300,000 | | | 285,394 |
Entergy Mississippi, Inc.,
5.15%, 02/01/13 | | | 490,000 | | | 474,822 |
Exelon Corp., 4.90%, 06/15/15 | | | 700,000 | | | 661,879 |
Exelon Corp., 5.63%, 06/15/35 (c) | | | 400,000 | | | 380,098 |
Firstenergy Corp., 7.38%, 11/15/31 | | | 700,000 | | | 818,802 |
Florida Power & Light Co.,
4.85%, 02/01/13 | | | 250,000 | | | 244,871 |
Florida Power & Light Co.,
5.85%, 02/01/33 | | | 170,000 | | | 174,842 |
Florida Power & Light Co.,
5.90%, 03/01/33 | | | 115,000 | | | 116,221 |
Florida Power & Light Co.,
5.95%, 10/01/33 | | | 130,000 | | | 135,538 |
Florida Power & Light Co.,
5.40%, 09/01/35 | | | 220,000 | | | 212,503 |
General Electric Capital Corp.,
5.38%, 03/15/07 | | | 650,000 | | | 650,147 |
Statement of Investments (Continued)
October 31, 2006
Gartmore Bond Index Fund (Continued)
Corporate Bonds (continued)
| | | | | | |
| | | Principal
Amount | | Value |
| | | | | | |
Electric – Integrated (continued) | | | |
General Electric Capital Corp.,
4.63%, 09/15/09 | | $ | 1,075,000 | | $ | 1,063,170 |
General Electric Capital Corp.,
3.75%, 12/15/09 (c) | | | 1,400,000 | | | 1,347,471 |
General Electric Capital Corp.,
5.50%, 04/28/11 (c) | | | 700,000 | | | 710,882 |
General Electric Capital Corp.,
5.00%, 02/01/13 | | | 1,575,000 | | | 1,561,123 |
General Electric Capital Corp.,
5.00%, 01/08/16 (c) | | | 500,000 | | | 490,102 |
General Electric Capital Corp.,
4.35%, 06/10/48 | | | 6,000,000 | | | 5,872,042 |
Georgia Power Corp.,
5.13%, 11/15/12 | | | 180,000 | | | 178,956 |
Metropolitan Edison,
4.88%, 04/01/14 | | | 400,000 | | | 383,100 |
MidAmerican Energy Holdings Co.,
5.88%, 10/01/12 | | | 1,075,000 | | | 1,100,052 |
Midamerican Energy Holdings Co.,
6.13%, 04/01/36 (c) | | | 500,000 | | | 514,169 |
New York State Electric & Gas Corp., 5.75%, 05/01/23 | | | 100,000 | | | 97,201 |
NiSource Finance Corp.,
5.25%, 09/15/17 | | | 440,000 | | | 414,275 |
Oncor Electric Deliver,
6.38%, 01/15/15 | | | 750,000 | | | 778,836 |
Oncor, Inc., 6.38%, 05/01/12 | | | 165,000 | | | 171,228 |
Pacific Gas & Electric Co.,
3.60%, 03/01/09 | | | 1,100,000 | | | 1,061,774 |
Pacific Gas & Electric Co.,
4.80%, 03/01/14 | | | 800,000 | | | 772,241 |
Pacific Gas & Electric Co.,
4.20%, 03/01/11 | | | 1,200,000 | | | 1,152,696 |
PacifiCorp Corp., 5.25%, 06/15/35 | | | 300,000 | | | 279,441 |
Pepco Holdings, Inc.,
6.45%, 08/15/12 (c) | | | 180,000 | | | 187,109 |
Pepco Holdings, Inc.,
7.45%, 08/15/32 | | | 200,000 | | | 228,542 |
Progress Energy, Inc.,
5.85%, 10/30/08 | | | 105,000 | | | 106,876 |
Progress Energy, Inc.,
7.10%, 03/01/11 | | | 440,000 | | | 471,140 |
| | | | | | |
| | | Principal
Amount | | Value |
| | | | | | |
Electric – Integrated (continued) | | | |
Progress Energy, Inc.,
7.75%, 03/01/31 | | $ | 400,000 | | $ | 487,154 |
PSEG Power Corp.,
6.95%, 06/01/12 | | | 125,000 | | | 132,871 |
Public Service Co. of Colorado,
5.50%, 04/01/14 | | | 425,000 | | | 428,629 |
Public Service Electric & Gas,
5.13%, 09/01/12 | | | 330,000 | | | 326,819 |
Public Service New Mexico Corp.,
4.40%, 09/15/08 | | | 175,000 | | | 171,748 |
Puget Energy, Inc.,
5.48%, 06/01/35 | | | 250,000 | | | 230,823 |
Scana Corp., 6.88%, 05/15/11 | | | 875,000 | | | 927,777 |
Scana Corp., 6.25%, 02/01/12 | | | 250,000 | | | 260,054 |
Scottish Power, 5.81%, 03/15/25 | | | 200,000 | | | 197,320 |
Southern California Edison Co.,
6.00%, 01/15/34 | | | 300,000 | | | 310,643 |
Southern California Edison Co.,
5.55%, 01/15/36 | | | 400,000 | | | 389,258 |
Southern Power Co.,
6.25%, 07/15/12 | | | 425,000 | | | 441,678 |
Virginia Electric Power,
5.40%, 01/15/16 | | | 250,000 | | | 247,340 |
Westar Energy, Inc.,
6.00%, 07/01/14 | | | 450,000 | | | 463,647 |
Wisconsin Electric Power,
5.63%, 05/15/33 | | | 100,000 | | | 98,978 |
Xcel Energy, Inc., 7.00%, 12/01/10,
7.00%, 12/01/10 | | | 400,000 | | | 424,351 |
Xcel Energy, Inc., 6.50%, 07/01/36 | | | 300,000 | | | 320,639 |
| | | | | | |
| | | | | | 37,828,579 |
| | | | | | |
Electric Distribution (0.3%) |
Cincinnati Gas and Electric Co.,
5.40%, 06/15/33 | | | 125,000 | | | 114,464 |
Hydro Quebec Corp.,
8.40%, 01/15/22 | | | 373,000 | | | 487,061 |
Hydro Quebec Corp.,
8.88%, 03/01/26 | | | 265,000 | | | 374,607 |
Ohio Power Co.,
6.00%, 06/01/16 (c) | | | 850,000 | | | 877,566 |
Ohio Power Co., 6.60%, 02/15/33 | | | 400,000 | | | 430,383 |
Corporate Bonds (continued)
| | | | | | |
| | | Principal
Amount | | Value |
| | | | | | |
Electric Distribution (continued) |
PPL Electric Utility,
5.88%, 08/15/07 | | $ | 1,000,000 | | $ | 1,003,523 |
PSEG Power, 5.50%, 12/01/15 | | | 700,000 | | | 685,400 |
TXU Energy Co., 6.13%, 03/15/08 | | | 770,000 | | | 776,826 |
TXU Energy Co.,
6.15%, 11/15/13 (b) | | | 320,000 | | | 332,783 |
Wisconsin Energy Corp.,
5.50%, 12/01/08 | | | 300,000 | | | 301,755 |
| | | | | | |
| | | | | | 5,384,368 |
| | | | | | |
Financial Services (9.6%) | | | | | | |
Ace Ina Holdings,
5.88%, 06/15/14 (c) | | | 950,000 | | | 970,989 |
American Express Co.,
3.75%, 11/20/07 | | | 1,280,000 | | | 1,259,410 |
American Express Co.,
4.88%, 07/15/13 | | | 285,000 | | | 279,063 |
American General Finance,
4.50%, 11/15/07 | | | 900,000 | | | 893,123 |
American General Finance,
5.38%, 10/01/12 | | | 1,700,000 | | | 1,698,635 |
Associates Corp. of North America,
6.95%, 11/01/18 | | | 575,000 | | | 648,592 |
Axa Financial, Inc., 7.75%, 08/01/10 | | | 450,000 | | | 487,738 |
Axa Financial, Inc., 7.00%, 04/01/28 | | | 225,000 | | | 254,853 |
Bear Stearns Co., Inc.,
5.70%, 11/15/14 (c) | | | 625,000 | | | 636,568 |
Bear Stearns Co., Inc.,
5.30%, 10/30/15 | | | 300,000 | | | 296,837 |
Bear Stearns Co., Inc.,
4.65%, 07/02/18 | | | 600,000 | | | 554,350 |
Bear Stearns Co., Inc.,
4.75%, 06/11/41 | | | 3,375,000 | | | 3,231,348 |
Boeing Capital Corp.,
5.75%, 02/15/07 (c) | | | 1,200,000 | | | 1,201,877 |
Boeing Capital Corp.,
6.10%, 03/01/11 (c) | | | 85,000 | | | 88,179 |
BSkyB Finance UK LTD.,
5.63%, 10/15/15 (b) | | | 250,000 | | | 246,491 |
Capital One Bank, 4.88%, 05/15/08 | | | 1,300,000 | | | 1,292,620 |
Capital One Bank, 5.75%, 09/15/10 | | | 400,000 | | | 406,611 |
Capital One Financial,
5.50%, 06/01/15 | | | 750,000 | | | 744,868 |
Capital One Financial,
5.25%, 02/21/17 | | | 515,000 | | | 496,509 |
| | | | | | |
| | | Principal
Amount | | Value |
| | | | | | |
Financial Services (continued) | | | | | | |
Caterpillar Financial Services Corp.,
4.88%, 06/15/07 | | $ | 90,000 | | $ | 89,723 |
Caterpillar Financial Services Corp.,
2.70%, 07/15/08 | | | 700,000 | | | 671,647 |
Caterpillar Financial Services Corp.,
4.50%, 06/15/09 | | | 350,000 | | | 344,901 |
Caterpillar Financial Services Corp.,
5.05%, 12/01/10 | | | 1,000,000 | | | 997,380 |
Caterpillar Financial Services Corp.,
5.50%, 03/15/16 | | | 500,000 | | | 503,341 |
Caterpillar Financial Services Corp.,
6.05%, 08/15/36 | | | 300,000 | | | 314,486 |
CIT Group, Inc., 5.75%, 09/25/07 | | | 600,000 | | | 601,278 |
CIT Group, Inc.,
3.88%, 11/03/08 (c) | | | 780,000 | | | 760,917 |
CIT Group, Inc., 4.75%, 12/15/10 | | | 340,000 | | | 333,686 |
CIT Group, Inc., 5.13%, 09/30/14 | | | 425,000 | | | 413,457 |
CIT Group, Inc., 5.20%, 06/01/15 | | | 300,000 | | | 291,587 |
CIT Group, Inc., 5.40%, 01/30/16 | | | 300,000 | | | 295,430 |
CIT Group, Inc., 6.00%, 04/01/36 | | | 350,000 | | | 344,553 |
CitiFinancial Credit Co.,
10.00%, 05/15/09 | | | 100,000 | | | 111,815 |
Countrywide Financial Corp.,
5.63%, 07/15/09 | | | 950,000 | | | 959,272 |
Countrywide Home Loan,
3.25%, 05/21/08 | | | 305,000 | | | 296,099 |
Countrywide Home Loan,
4.00%, 03/22/11 | | | 900,000 | | | 851,759 |
Credit Suisse First Boston Mortgage Corp.,
5.73%, 11/15/19 (d) | | | 25,000,000 | | | 25,013,927 |
Credit Suisse First Boston USA, Inc., 5.75%, 04/15/07 | | | 300,000 | | | 300,382 |
Credit Suisse First Boston USA, Inc., 4.63%, 01/15/08 | | | 2,275,000 | | | 2,257,949 |
Credit Suisse First Boston USA, Inc., 4.13%, 01/15/10 | | | 675,000 | | | 654,043 |
Credit Suisse First Boston USA, Inc., 6.13%, 11/15/11 | | | 450,000 | | | 467,780 |
Credit Suisse First Boston USA, Inc., 6.50%, 01/15/12 | | | 600,000 | | | 633,454 |
Credit Suisse First Boston USA, Inc., 5.13%, 01/15/14 (c) | | | 290,000 | | | 286,127 |
Statement of Investments (Continued)
October 31, 2006
Gartmore Bond Index Fund (Continued)
Corporate Bonds (continued)
| | | | | | |
| | | Principal
Amount | | Value |
| | | | | | |
Financial Services (continued) | | | | | | |
Credit Suisse First Boston USA, Inc., 5.53%, 08/15/18 (d) | | $ | 1,714,721 | | $ | 1,714,843 |
Credit Suisse First Boston USA, Inc., 7.13%, 07/15/32 | | | 1,450,000 | | | 1,716,435 |
Eksportsfinans, 4.75%, 12/15/08 (c) | | | 700,000 | | | 697,432 |
Eksportsfinans, 5.50%, 05/25/16 | | | 650,000 | | | 671,545 |
Erp Operating LP, 5.25%, 09/15/14 | | | 800,000 | | | 787,808 |
ERP Operating LP, 5.38%, 08/01/16 | | | 500,000 | | | 494,717 |
Financing Corp., 9.80%, 11/30/17 | | | 30,000 | | | 42,093 |
General Electric Capital Corp.,
4.25%, 01/15/08 | | | 2,230,000 | | | 2,205,967 |
General Electric Capital Corp.,
5.88%, 02/15/12 (c) | | | 100,000 | | | 103,160 |
General Electric Capital Corp.,
6.00%, 06/15/12 | | | 445,000 | | | 462,888 |
General Electric Capital Corp.,
4.88%, 03/04/15 | | | 1,050,000 | | | 1,024,258 |
General Electric Capital Corp.,
6.75%, 03/15/32 | | | 2,145,000 | | | 2,476,782 |
Golden West Financial Corp.,
4.75%, 10/01/12 | | | 265,000 | | | 258,630 |
Goldman Sachs Group, Inc.,
4.13%, 01/15/08 | | | 1,060,000 | | | 1,046,402 |
Goldman Sachs Group, Inc.,
3.88%, 01/15/09 | | | 1,000,000 | | | 973,862 |
Goldman Sachs Group, Inc.,
6.65%, 05/15/09 | | | 700,000 | | | 725,479 |
Goldman Sachs Group, Inc.,
6.60%, 01/15/12 | | | 175,000 | | | 185,188 |
Goldman Sachs Group, Inc.,
5.25%, 04/01/13 (c) | | | 1,125,000 | | | 1,118,601 |
Goldman Sachs Group, Inc.,
5.25%, 10/15/13 | | | 1,475,000 | | | 1,465,017 |
Goldman Sachs Group, Inc.,
5.13%, 01/15/15 | | | 1,125,000 | | | 1,099,807 |
Goldman Sachs Group, Inc.,
5.35%, 01/15/16 | | | 750,000 | | | 740,904 |
Goldman Sachs Group, Inc.,
6.13%, 02/15/33 | | | 1,950,000 | | | 1,994,086 |
Harley Davidson Funding,
3.63%, 12/15/08 (b) | | | 600,000 | | | 581,467 |
Household Finance Corp.,
5.88%, 02/01/09 | | | 1,620,000 | | | 1,646,202 |
| | | | | | |
| | | Principal
Amount | | Value |
| | | | | | |
Financial Services (continued) | | | | | | |
Household Finance Corp.,
4.75%, 05/15/09 | | $ | 1,300,000 | | $ | 1,290,559 |
Household Finance Corp.,
7.00%, 05/15/12 | | | 1,375,000 | | | 1,488,432 |
HSBC Finance Corp.,
4.75%, 04/15/10 (c) | | | 600,000 | | | 592,235 |
HSBC Finance Corp.,
5.25%, 04/15/15 | | | 450,000 | | | 444,800 |
HSBC Finance Corp.,
5.00%, 06/30/15 | | | 850,000 | | | 825,568 |
International Lease Finance Corp., 5.00%, 04/15/10 | | | 1,000,000 | | | 992,147 |
J Paul Getty Trust Corp.,
5.88%, 10/01/33 | | | 500,000 | | | 505,103 |
Jefferies Group, Inc.,
6.25%, 01/15/36 (c) | | | 300,000 | | | 291,352 |
John Deere Capital Corp.,
3.90%, 01/15/08 | | | 1,000,000 | | | 983,929 |
John Deere Capital Corp.,
4.88%, 03/16/09 (c) | | | 600,000 | | | 596,623 |
John Deere Capital Corp.,
4.40%, 07/15/09 | | | 650,000 | | | 638,351 |
John Deere Capital Corp.,
6.95%, 04/25/14 | | | 270,000 | | | 297,128 |
John Hancock Financial Services, Inc., 5.63%, 12/01/08 | | | 100,000 | | | 100,896 |
JP Morgan Chase & Co.,
5.51%, 02/15/19 (d) | | | 24,369,000 | | | 24,378,920 |
JP Morgan Chase & Co.,
5.51%, 04/16/19 (d) | | | 18,768,219 | | | 18,774,601 |
Kaupthing Bank,
7.13%, 05/19/16 (b) (c) | | | 600,000 | | | 639,152 |
KFW International Finance,
3.25%, 03/30/09 (c) | | | 900,000 | | | 866,137 |
KFW International Finance,
5.13%, 05/13/09 | | | 1,500,000 | | | 1,508,555 |
KFW International Finance,
4.38%, 07/21/15 | | | 2,450,000 | | | 2,351,412 |
Korea Development Bank,
4.75%, 07/20/09 | | | 1,500,000 | | | 1,480,512 |
Lehman Brothers Holdings, Inc.,
3.50%, 08/07/08 | | | 1,200,000 | | | 1,166,468 |
Lehman Brothers Holdings, Inc.,
4.25%, 01/27/10 (c) | | | 775,000 | | | 753,293 |
Corporate Bonds (continued)
| | | | | | |
| | | Principal
Amount | | Value |
| | | | | | |
Financial Services (continued) | | | | | | |
Lehman Brothers Holdings, Inc.,
7.88%, 08/15/10 | | $ | 97,000 | | $ | 105,480 |
Lehman Brothers Holdings, Inc., 6.63%, 01/18/12 | | | 890,000 | | | 945,651 |
Lehman Brothers Holdings, Inc., 4.80%, 03/13/14 (c) | | | 1,250,000 | | | 1,204,003 |
Lehman Brothers Holdings, Inc., 5.50%, 10/15/17 (d) | | | 3,727,112 | | | 3,727,802 |
Lehman Brothers Holdings, Inc., 5.43%, 07/15/18 (d) | | | 4,266,169 | | | 4,266,155 |
Mellon Financial Corp.,
6.40%, 05/14/11 | | | 450,000 | | | 470,862 |
Mellon Financial Corp.,
5.00%, 12/01/14 | | | 450,000 | | | 439,661 |
Morgan Stanley, 3.63%, 04/01/08 | | | 1,750,000 | | | 1,709,652 |
Morgan Stanley, 6.60%, 04/01/12 | | | 850,000 | | | 900,182 |
Morgan Stanley, 5.30%, 03/01/13 | | | 1,125,000 | | | 1,126,520 |
Morgan Stanley, 4.75%, 04/01/14 | | | 1,000,000 | | | 956,811 |
Morgan Stanley, 6.32%, 11/15/31 | | | 10,998,500 | | | 11,212,738 |
Morgan Stanley, 6.71%, 12/15/31 | | | 4,467,310 | | | 4,568,243 |
Morgan Stanley,
7.25%, 04/01/32 (c) | | | 550,000 | | | 643,040 |
Morgan Stanley, 4.73%, 06/12/47 | | | 5,250,000 | | | 5,179,632 |
National Rural Utilities,
4.75%, 03/01/14 | | | 550,000 | | | 532,826 |
National Rural Utilities,
8.00%, 03/01/32 | | | 270,000 | | | 350,481 |
Prudential Financial, Inc.,
3.75%, 05/01/08 | | | 1,255,000 | | | 1,227,923 |
Prudential Financial, Inc.,
5.10%, 09/20/14 | | | 500,000 | | | 489,680 |
Prudential Financial, Inc.,
5.75%, 07/15/33 | | | 250,000 | | | 248,289 |
Residential Capital Corp.,
6.13%, 11/21/08 | | | 1,000,000 | | | 1,005,550 |
Residential Capital Corp.,
6.38%, 06/30/10 | | | 500,000 | | | 507,443 |
Residential Capital Corp.,
6.88%, 06/30/15 (c) | | | 900,000 | | | 941,971 |
Residential Capital Corp.,
5.67%, 08/25/35 (d) | | | 11,504,735 | | | 11,510,486 |
Royal Bank of Scotland Group,
5.00%, 11/12/13 | | | 400,000 | | | 392,304 |
| | | | | | |
| | | Principal
Amount | | Value |
| | | | | | |
Financial Services (continued) | | | | | | |
Royal Bank of Scotland Group,
5.05%, 01/08/15 | | $ | 535,000 | | $ | 523,072 |
Royal Bank of Scotland Group,
4.70%, 07/03/18 | | | 800,000 | | | 747,087 |
SLM Corp., 5.38%, 05/15/14 (c) | | | 1,850,000 | | | 1,845,843 |
Synovus Financial Corp.,
4.88%, 02/15/13 | | | 150,000 | | | 146,863 |
Textron Financial Corp.,
4.13%, 03/03/08 | | | 600,000 | | | 590,405 |
UFJ Finance Aruba AEC,
6.75%, 07/15/13 | | | 600,000 | | | 642,842 |
Washington Mutual, Inc.,
5.63%, 01/15/07 | | | 175,000 | | | 175,052 |
Washington Mutual, Inc.,
4.38%, 01/15/08 | | | 750,000 | | | 742,069 |
Washington Mutual, Inc.,
4.00%, 01/15/09 | | | 500,000 | | | 488,045 |
Washington Mutual, Inc.,
5.50%, 01/15/13 | | | 445,000 | | | 445,509 |
| | | | | | |
| | | | | | 199,693,572 |
| | | | | | |
Food & Related (0.9%) | | | | | | |
Anheuser-Busch Co., Inc.,
4.38%, 01/15/13 (c) | | | 50,000 | | | 47,589 |
Anheuser-Busch Co., Inc.,
5.00%, 03/01/19 | | | 400,000 | | | 378,124 |
Anheuser-Busch Co., Inc.,
5.75%, 04/01/36 | | | 550,000 | | | 548,419 |
Anheuser-Busch Co., Inc.,
6.00%, 11/01/41 | | | 250,000 | | | 252,939 |
Archer-Daniels-Midland,
5.94%, 10/01/32 (c) | | | 585,000 | | | 601,052 |
Archer-Daniels-Midland,
5.38%, 09/15/35 | | | 250,000 | | | 239,564 |
Bottling Group LLC,
4.63%, 11/15/12 | | | 700,000 | | | 680,030 |
Cadbury Schweppes PLC,
5.13%, 10/01/13 (b) | | | 300,000 | | | 291,450 |
Campbell Soup Co.,
4.88%, 10/01/13 | | | 400,000 | | | 388,056 |
Coca-Cola Bottling Co.,
5.00%, 11/15/12 | | | 150,000 | | | 146,706 |
Coca-Cola Enterprises, Inc.,
8.50%, 02/01/12 | | | 600,000 | | | 692,320 |
Statement of Investments (Continued)
October 31, 2006
Gartmore Bond Index Fund (Continued)
Corporate Bonds (continued)
| | | | | | |
| | | Principal
Amount | | Value |
| | | | | | |
Food & Related (continued) | | | | | | |
Coca-Cola Enterprises, Inc.,
6.95%, 11/15/26 (c) | | $ | 250,000 | | $ | 284,761 |
Coca-Cola Enterprises, Inc.,
6.75%, 09/15/28 (c) | | | 595,000 | | | 664,485 |
Conagra Foods, Inc.,
6.75%, 09/15/11 | | | 150,000 | | | 158,618 |
Conagra Foods, Inc.,
7.00%, 10/01/28 | | | 375,000 | | | 407,343 |
Diageo Capital PLC,
3.50%, 11/19/07 | | | 860,000 | | | 843,657 |
Diageo Capital PLC,
5.30%, 10/28/15 | | | 1,100,000 | | | 1,082,289 |
General Mills, Inc., 5.13%, 02/15/07 | | | 350,000 | | | 349,638 |
General Mills, Inc., 6.00%, 02/15/12 | | | 452,000 | | | 465,028 |
Hershey Co., 5.45%, 09/01/16 | | | 650,000 | | | 656,841 |
HJ Heinz Finance, 6.75%, 03/15/32 | | | 150,000 | | | 154,995 |
Kellogg Co., 2.88%, 06/01/08 (c) | | | 1,025,000 | | | 987,952 |
Kellogg Co., 7.45%, 04/01/31 | | | 250,000 | | | 303,113 |
Kraft Foods, Inc., 4.63%, 11/01/06 | | | 60,000 | | | 60,000 |
Kraft Foods, Inc., 4.13%, 11/12/09 | | | 1,000,000 | | | 970,216 |
Kraft Foods, Inc., 5.63%, 11/01/11 | | | 794,000 | | | 804,498 |
Kraft Foods, Inc.,
6.50%, 11/01/31 (c) | | | 320,000 | | | 347,584 |
Kroger Co., 6.80%, 04/01/11 | | | 340,000 | | | 355,865 |
Kroger Co., 6.20%, 06/15/12 | | | 400,000 | | | 410,093 |
Kroger Co., 7.50%, 04/01/31 (c) | | | 435,000 | | | 487,267 |
Miller Brewing Co.,
5.50%, 08/15/13 (b) | | | 250,000 | | | 247,421 |
Pepsi Bottling Group, Inc.,
7.00%, 03/01/29 | | | 350,000 | | | 406,049 |
PepsiAmericas, Inc.,
4.88%, 01/15/15 | | | 750,000 | | | 722,307 |
Safeway, Inc., 6.50%, 03/01/11 | | | 400,000 | | | 414,093 |
Safeway, Inc., 5.80%, 08/15/12 (c) | | | 350,000 | | | 352,174 |
Safeway, Inc., 5.63%, 08/15/14 | | | 300,000 | | | 297,258 |
Sara Lee Corp., 6.25%, 09/15/11 | | | 425,000 | | | 430,596 |
Sysco Corp., 5.38%, 09/21/35 | | | 180,000 | | | 173,227 |
Tricon Global Restaurant,
8.88%, 04/15/11 | | | 200,000 | | | 226,231 |
Unilever Capital Corp.,
7.13%, 11/01/10 | | | 550,000 | | | 588,072 |
Unilever Capital Corp.,
5.90%, 11/15/32 | | | 350,000 | | | 356,083 |
Wrigley JR Co., 4.65%, 07/15/15 | | | 365,000 | | | 348,362 |
| | | | | | |
| | | | | | 18,622,365 |
| | | | | | |
| | | | | | |
| | | Principal
Amount | | Value |
| | | | | | |
Healthcare Services (0.2%) | | | | | | |
Eli Lilly & Co., 6.00%, 03/15/12 (c) | | $ | 500,000 | | $ | 521,336 |
Eli Lilly & Co., 7.13%, 06/01/25 | | | 200,000 | | | 235,638 |
Health Care Property Investors, Inc., 6.45%, 06/25/12 | | | 95,000 | | | 98,098 |
UnitedHealth Group,
5.38%, 03/15/16 (c) | | | 500,000 | | | 498,329 |
UnitedHealth Group,
5.80%, 03/15/36 (c) | | | 1,200,000 | | | 1,196,543 |
WellPoint, Inc., 5.00%, 12/15/14 | | | 400,000 | | | 388,040 |
WellPoint, Inc., 5.25%, 01/15/16 | | | 550,000 | | | 541,687 |
WellPoint, Inc., 5.95%, 12/15/34 | | | 200,000 | | | 198,903 |
| | | | | | |
| | | | | | 3,678,574 |
| | | | | | |
Hotels (1.0%) | | | | | | |
TW Hotel Funding,
5.58%, 01/15/21 (d) | | | 20,000,000 | | | 20,004,058 |
| | | | | | |
Household Products (0.0%) | | | | | | |
Clorox Co., 4.20%, 01/15/10 | | | 530,000 | | | 514,702 |
| | | | | | |
Industrial Supplies (0.0%) | | | | | | |
Phillips Petroleum Co.,
6.65%, 07/15/18 | | | 200,000 | | | 219,450 |
| | | | | | |
Insurance (0.8%) | | | | | | |
Allstate Corp., 6.13%, 02/15/12 (c) | | | 430,000 | | | 446,879 |
Allstate Corp., 5.00%, 08/15/14 | | | 500,000 | | | 488,544 |
Allstate Corp., 6.13%, 12/15/32 | | | 200,000 | | | 207,780 |
Allstate Corp., 5.55%, 05/09/35 | | | 150,000 | | | 144,791 |
Allstate Corp., 5.95%, 04/01/36 | | | 200,000 | | | 204,125 |
American General Corp.,
7.50%, 07/15/25 (c) | | | 250,000 | | | 297,543 |
American International Group, Inc.,
5.05%, 10/01/15 (c) | | | 250,000 | | | 244,265 |
American International Group, Inc.,
6.25%, 05/01/36 | | | 400,000 | | | 427,948 |
Berkley Corp., 5.13%, 09/30/10 | | | 175,000 | | | 173,415 |
Berkshire Hathaway, Inc.,
4.13%, 01/15/10 | | | 1,400,000 | | | 1,362,254 |
Berkshire Hathaway, Inc.,
4.85%, 01/15/15 | | | 600,000 | | | 582,881 |
Farmers Insurance Exchange,
8.63%, 05/01/24 (b) | | | 400,000 | | | 480,035 |
Corporate Bonds (continued)
| | | | | | |
| | | Principal
Amount | | Value |
| | | | | | |
Insurance (continued) | | | | | | |
Genworth Financial, Inc.,
5.75%, 06/15/14 | | $ | 150,000 | | $ | 153,691 |
Genworth Financial, Inc.,
6.50%, 06/15/34 | | | 350,000 | | | 383,697 |
Hartford Financial Services Group,
4.75%, 03/01/14 | | | 200,000 | | | 191,731 |
Hartford Financial Services Group,
6.10%, 10/01/41 | | | 100,000 | | | 102,641 |
Infinity Property & Casualty,
5.50%, 02/18/14 | | | 200,000 | | | 194,660 |
ING Sec Life Institutional Fund,
4.25%, 01/15/10 (b) | | | 2,000,000 | | | 1,952,755 |
Marsh & McLennan Cos., Inc.,
6.25%, 03/15/12 | | | 175,000 | | | 178,552 |
Marsh & McLennan Cos., Inc.,
5.75%, 09/15/15 | | | 920,000 | | | 886,547 |
MetLife, Inc., 6.13%, 12/01/11 | | | 1,085,000 | | | 1,127,710 |
MetLife, Inc., 5.50%, 06/15/14 | | | 450,000 | | | 453,272 |
MetLife, Inc., 5.70%, 06/15/35 | | | 550,000 | | | 542,733 |
Montpelier RE Holdings,
6.13%, 08/15/13 | | | 125,000 | | | 121,354 |
Monumental Global Funding II,
4.38%, 07/30/09 (b) | | | 500,000 | | | 489,992 |
New York Life Insurance,
5.88%, 05/15/33 (b) (c) | | | 200,000 | | | 206,423 |
NLV Financial Corp.,
7.50%, 08/15/33 (b) | | | 125,000 | | | 134,795 |
North Front Pass,
5.81%, 12/15/24 (b) | | | 500,000 | | | 496,840 |
Principal Life Global Funding,
6.25%, 02/15/12 (b) | | | 150,000 | | | 156,990 |
Progressive Corp.,
6.25%, 12/01/32 (c) | | | 275,000 | | | 296,176 |
RLI Corp., 5.95%, 01/15/14 | | | 200,000 | | | 197,052 |
St. Paul Travelers Cos., Inc.,
5.01%, 08/16/07 | | | 225,000 | | | 223,753 |
Travelers Property Casualty Corp.,
6.38%, 03/15/33 (c) | | | 325,000 | | | 346,394 |
Western & Southern Finance,
5.75%, 07/15/33 (b) | | | 250,000 | | | 243,654 |
Willis Group North America, Inc.,
5.63%, 07/15/15 | | | 300,000 | | | 286,757 |
XL Capital Ltd., 5.25%, 09/15/14 | | | 1,320,000 | | | 1,297,931 |
| | | | | | |
| | | | | | 15,726,560 |
| | | | | | |
| | | | | | |
| | | Principal
Amount | | Value |
| | | | | | |
Manufacturing (0.2%) | | | | | | |
Cooper Industries, Inc.,
5.50%, 11/01/09 | | $ | 175,000 | | $ | 176,582 |
Dover, Corp., 4.88%, 10/15/15 | | | 380,000 | | | 366,499 |
Honeywell International,
5.40%, 03/15/16 (c) | | | 1,195,000 | | | 1,203,651 |
Honeywell International, Inc.,
6.13%, 11/01/11 (c) | | | 250,000 | | | 260,280 |
Norsk Hydro AS, 6.36%, 01/15/09 | | | 460,000 | | | 471,346 |
Tyco International Group SA,
6.13%, 01/15/09 | | | 635,000 | | | 645,939 |
Tyco International Group SA,
6.00%, 11/15/13 | | | 1,100,000 | | | 1,141,998 |
Tyco International Group SA,
6.88%, 01/15/29 | | | 125,000 | | | 140,295 |
| | | | | | |
| | | | | | 4,406,590 |
| | | | | | |
Medical Products (0.2%) | | | | | | |
Amgen, Inc., 4.00%, 11/18/09 | | | 475,000 | | | 460,934 |
Baxter International, Inc.,
4.63%, 03/15/15 | | | 130,000 | | | 122,862 |
Boston Scientific, 5.45%, 06/15/14 | | | 600,000 | | | 578,645 |
Johnson & Johnson,
4.95%, 05/15/33 (c) | | | 700,000 | | | 666,253 |
Medtronic, Inc., 4.38%, 09/15/10 | | | 315,000 | | | 306,575 |
Quest Diagnostic, Inc.,
5.45%, 11/01/15 | | | 550,000 | | | 534,406 |
Wyeth, 5.50%, 02/01/14 | | | 1,150,000 | | | 1,156,875 |
Wyeth, 6.50%, 02/01/34 | | | 350,000 | | | 383,304 |
| | | | | | |
| | | | | | 4,209,854 |
| | | | | | |
Metals & Minerals (0.2%) | | | | | | |
Alcan, Inc., 6.45%, 03/15/11 | | | 75,000 | | | 78,021 |
Alcan, Inc., 4.50%, 05/15/13 | | | 630,000 | | | 595,267 |
Alcan, Inc., 5.00%, 06/01/15 | | | 500,000 | | | 477,142 |
Alcan, Inc., 5.75%, 06/01/35 | | | 350,000 | | | 331,697 |
Alcoa, Inc., 6.00%, 01/15/12 | | | 1,060,000 | | | 1,094,415 |
Barrick Gold Finance, Inc.,
4.88%, 11/15/14 | | | 390,000 | | | 369,664 |
BHP Billiton Ltd., 4.80%, 04/15/13 | | | 400,000 | | | 388,598 |
Codelco, Inc., 6.38%, 11/30/12 (b) | | | 120,000 | | | 125,619 |
Inco Ltd., 7.75%, 05/15/12 | | | 300,000 | | | 327,948 |
Newmont Mining Corp.,
5.88%, 04/01/35 | | | 400,000 | | | 376,492 |
Statement of Investments (Continued)
October 31, 2006
Gartmore Bond Index Fund (Continued)
Corporate Bonds (continued)
| | | | | | |
| | | Principal
Amount | | Value |
| | | | | | |
Metals & Minerals (continued) | | | | | | |
Noranda, Inc., 6.20%, 06/15/35 | | $ | 300,000 | | $ | 292,528 |
Placer Dome, Inc.,
6.38%, 03/01/33 | | | 235,000 | | | 239,663 |
| | | | | | |
| | | | | | 4,697,054 |
| | | | | | |
Multimedia (0.6%) | | | | | | |
AOL Time Warner, Inc.,
6.88%, 05/01/12 | | | 1,545,000 | | | 1,640,208 |
AOL Time Warner, Inc.,
6.88%, 06/15/18 | | | 298,000 | | | 315,518 |
AOL Time Warner, Inc.,
7.63%, 04/15/31 | | | 300,000 | | | 338,240 |
AOL Time Warner, Inc.,
7.70%, 05/01/32 | | | 1,580,000 | | | 1,799,448 |
Belo Corp., 8.00%, 11/01/08 | | | 145,000 | | | 151,344 |
Gannett Co., Inc., 5.50%, 04/01/07 | | | 185,000 | | | 184,704 |
Johnson Controls, Inc.,
4.88%, 09/15/13 | | | 300,000 | | | 287,289 |
News America Holdings, Inc.,
9.25%, 02/01/13 | | | 200,000 | | | 236,742 |
News America Holdings, Inc.,
5.30%, 12/15/14 | | | 1,300,000 | | | 1,282,151 |
News America Holdings, Inc.,
8.00%, 10/17/16 | | | 200,000 | | | 231,985 |
News America Holdings, Inc.,
7.28%, 06/30/28 | | | 130,000 | | | 140,576 |
News America Holdings, Inc.,
6.20%, 12/15/34 (c) | | | 415,000 | | | 405,258 |
News America Holdings, Inc.,
6.40%, 12/15/35 (b) | | | 300,000 | | | 300,811 |
Viacom, Inc., 5.63%, 05/01/07 (c) | | | 1,000,000 | | | 1,000,741 |
Viacom, Inc., 5.63%, 08/15/12 | | | 1,000,000 | | | 993,184 |
Viacom, Inc., 6.25%, 04/30/16 | | | 1,100,000 | | | 1,101,706 |
Viacom, Inc., 7.88%, 07/30/30 | | | 135,000 | | | 147,891 |
Viacom, Inc., 5.50%, 05/15/33 | | | 200,000 | | | 170,906 |
Viacom, Inc., 6.88%, 04/30/36 | | | 550,000 | | | 553,816 |
Walt Disney Co., 5.38%, 06/01/07 | | | 725,000 | | | 725,436 |
Walt Disney Co., 6.38%, 03/01/12 | | | 236,000 | | | 248,589 |
Walt Disney Co., 6.20%, 06/20/14 | | | 700,000 | | | 737,559 |
| | | | | | |
| | | | | | 12,994,102 |
| | | | | | |
Natural Gas Transmission (0.0%) | | | |
Texas Gas Transmission Corp.,
4.60%, 06/01/15 | | | 300,000 | | | 278,612 |
| | | | | | |
| | | | | | |
| | | Principal
Amount | | Value |
| | | | | | |
Non-Hazardous Waste Disposal (0.0%) | | | |
Waste Management, Inc.,
7.38%, 08/01/10 | | $ | 250,000 | | $ | 267,819 |
Waste Management, Inc.,
6.38%, 11/15/12 | | | 350,000 | | | 366,059 |
Waste Management, Inc.,
7.00%, 7/15/28 | | | 275,000 | | | 302,763 |
| | | | | | |
| | | | | | 936,641 |
| | | | | | |
Oil & Gas (1.5%) | | | | | | |
AGL Capital Corp.,
4.45%, 04/15/13 (b) | | | 300,000 | | | 281,290 |
Amerada Hess Corp.,
7.30%, 08/15/31 | | | 600,000 | | | 680,438 |
Anadarko Petroleum Corp.,
7.50%, 05/01/31 | | | 505,000 | | | 585,034 |
Apache Corp., 6.25%, 04/15/12 | | | 390,000 | | | 407,123 |
Apache Corp., 7.63%, 07/01/19 | | | 100,000 | | | 116,099 |
Apache Finance Canada,
4.38%, 05/15/15 | | | 825,000 | | | 765,635 |
Atmos Energy Corp.,
4.00%, 10/15/09 | | | 700,000 | | | 671,343 |
Atmos Energy Corp.,
5.13%, 01/15/13 | | | 225,000 | | | 218,211 |
Atmos Energy Corp.,
4.95%, 10/15/14 | | | 450,000 | | | 426,501 |
BP Amoco PLC, 5.90%, 04/15/09 | | | 200,000 | | | 203,929 |
BP Capital Markets America,
4.20%, 06/15/18 | | | 250,000 | | | 225,454 |
Brascan Corp., 5.75%, 03/01/10 | | | 305,000 | | | 307,724 |
Burlington Resources Finance Co., 6.40%, 08/15/11 | | | 210,000 | | | 220,712 |
Burlington Resources, Inc.,
6.50%, 12/01/11 | | | 350,000 | | | 370,726 |
ChevronTexaco Capital Corp.,
3.50%, 09/17/07 | | | 90,000 | | | 88,685 |
ChevronTexaco Capital Corp.,
3.38%, 02/15/08 | | | 500,000 | | | 488,959 |
ChevronTexaco Capital Corp.,
8.63%, 06/30/10 | | | 120,000 | | | 134,955 |
Colonial Pipeline,
7.63%, 04/15/32 (b) | | | 365,000 | | | 457,849 |
Conoco Funding Co.,
6.35%, 10/15/11 | | | 1,300,000 | | | 1,367,935 |
Corporate Bonds (continued)
| | | | | | |
| | | Principal
Amount | | Value |
| | | | | | |
Oil & Gas (continued) | | | | | | |
Conoco Funding Co.,
4.75%, 10/15/12 | | $ | 1,145,000 | | $ | 1,123,425 |
Conoco, Inc., 6.95%, 04/15/29 | | | 370,000 | | | 427,116 |
ConocoPhillips, 5.50%, 04/15/13 | | | 550,000 | | | 558,215 |
ConocoPhillips, 5.90%, 10/15/32 (c) | | | 300,000 | | | 309,306 |
Consolidated Natural Gas, Inc.,
5.38%, 11/01/06 | | | 60,000 | | | 60,000 |
Consolidated Natural Gas, Inc.,
6.25%, 11/01/11 | | | 764,000 | | | 789,803 |
Consolidated Natural Gas, Inc.,
5.00%, 12/01/14 | | | 965,000 | | | 921,230 |
Devon Financing Corp.,
6.88%, 09/30/11 | | | 1,090,000 | | | 1,161,822 |
Duke Capital LLC,
6.75%, 02/15/32 (c) | | | 300,000 | | | 322,784 |
EnCana Corp., 4.75%, 10/15/13 | | | 575,000 | | | 547,226 |
EnCana Holdings Finance Corp.,
5.80%, 05/01/14 | | | 1,075,000 | | | 1,084,869 |
Enterprise Products,
5.60%, 10/15/14 | | | 1,600,000 | | | 1,578,922 |
Halliburton Co., 5.50%, 10/15/10 | | | 800,000 | | | 805,560 |
Kinder Morgan Energy Partners LP,
7.50%, 11/01/10 | | | 351,000 | | | 375,091 |
Kinder Morgan Energy Partners LP,
6.75%, 03/15/11 (c) | | | 155,000 | | | 161,990 |
Kinder Morgan Energy Partners LP,
5.80%, 03/15/35 (c) | | | 350,000 | | | 321,797 |
Marathon Oil Corp,
6.80%, 03/15/32 | | | 200,000 | | | 223,794 |
Marathon Oil Corp.,
5.38%, 06/01/07 (c) | | | 810,000 | | | 810,349 |
Motiva Enterprises Corp.,
5.20%, 09/15/12 (b) | | | 125,000 | | | 124,066 |
Murphy Oil Corp., 6.38%, 05/01/12 | | | 100,000 | | | 104,005 |
Nabors, Inc., 5.38%, 08/15/12 | | | 70,000 | | | 69,109 |
Nexen, Inc., 5.05%, 11/20/13 | | | 500,000 | | | 483,221 |
Nexen, Inc., 5.88%, 03/10/35 | | | 225,000 | | | 215,273 |
Occidental Petroleum,
6.75%, 01/15/12 | | | 450,000 | | | 480,992 |
Ocean Energy, Inc.,
7.25%, 10/01/11 | | | 980,000 | | | 1,053,305 |
Pemex Project Funding Master,
8.85%, 09/15/07 | | | 475,000 | | | 487,825 |
| | | | | | |
| | | Principal
Amount | | Value |
| | | | | | |
Oil & Gas (continued) | | | | | | |
Pemex Project Funding Master,
9.13%, 10/13/10 | | $ | 1,065,000 | | $ | 1,192,800 |
Pemex Project Funding Master,
7.38%, 12/15/14 | | | 625,000 | | | 685,938 |
Pemex Project Funding Master,
5.75%, 12/15/15 (c) | | | 1,300,000 | | | 1,283,750 |
Pemex Project Funding Master,
6.63%, 06/15/35 | | | 550,000 | | | 554,950 |
Phillips Petroleum Co.,
8.75%, 05/25/10 | | | 600,000 | | | 669,278 |
Praxair, Inc., 6.50%, 03/01/08 | | | 390,000 | | | 395,788 |
Ptt Public Co. Ltd.,
5.88%, 08/03/35 (b) | | | 300,000 | | | 279,750 |
South Carolina Electric & Gas Co.,
4.80%, 10/01/12 | | | 650,000 | | | 635,012 |
Talisman Energy, Inc.,
7.25%, 10/15/27 | | | 225,000 | | | 243,071 |
Transocean Sedco Forex, Inc.,
7.50%, 04/15/31 | | | 300,000 | | | 352,139 |
Valero Energy Corp.,
6.88%, 04/15/12 | | | 1,000,000 | | | 1,064,607 |
Valero Energy Corp.,
7.50%, 04/15/32 | | | 200,000 | | | 233,059 |
Weatherford International, Inc.,
5.50%, 02/15/16 (b) | | | 125,000 | | | 122,940 |
XTO Energy, Inc., 4.90%, 02/01/14 | | | 250,000 | | | 238,848 |
XTO Energy, Inc., 5.30%, 06/30/15 | | | 475,000 | | | 462,751 |
XTO Energy, Inc., 5.65%, 04/01/16 | | | 200,000 | | | 198,837 |
| | | | | | |
| | | | | | 31,233,215 |
| | | | | | |
Paper & Forest Products (0.2%) | | | |
Celulosa Arauco Constitucion SA,
5.13%, 07/09/13 | | | 300,000 | | | 288,758 |
International Paper Co.,
4.00%, 04/01/10 | | | 850,000 | | | 817,774 |
International Paper Co.,
5.85%, 10/30/12 | | | 300,000 | | | 308,219 |
International Paper Co.,
5.30%, 04/01/15 | | | 350,000 | | | 338,687 |
Inversiones CMPC SA,
4.88%, 06/18/13 (b) | | | 300,000 | | | 288,272 |
Westvaco Corp., 7.95%, 02/15/31 | | | 200,000 | | | 220,254 |
Weyerhaeuser Co.,
5.95%, 11/01/08 | | | 309,000 | | | 311,937 |
Statement of Investments (Continued)
October 31, 2006
Gartmore Bond Index Fund (Continued)
Corporate Bonds (continued)
| | | | | | |
| | | Principal
Amount | | Value |
| | | | | | |
Paper & Forest Products (continued) | | | |
Weyerhaeuser Co.,
6.75%, 03/15/12 | | $ | 1,325,000 | | $ | 1,387,489 |
Weyerhaeuser Co.,
7.38%, 03/15/32 | | | 375,000 | | | 393,992 |
| | | | | | |
| | | | | | 4,355,382 |
| | | | | | |
Pharmaceuticals (0.3%) | | | |
Abbott Laboratories,
5.40%, 09/15/08 | | | 250,000 | | | 251,138 |
Abbott Laboratories,
3.50%, 02/17/09 | | | 200,000 | | | 193,250 |
Abbott Laboratories,
5.88%, 05/15/16 | | | 815,000 | | | 847,226 |
Astrazeneca PLC, 5.40%, 06/01/14 | | | 500,000 | | | 504,368 |
Genentech, Inc.,
4.40%, 07/15/10 (c) | | | 280,000 | | | 273,523 |
Genentech, Inc., 5.25%, 07/15/35 | | | 150,000 | | | 141,920 |
GlaxoSmithKline PLC,
5.38%, 04/15/34 | | | 340,000 | | | 334,004 |
Merck & Co., Inc.,
4.75%, 03/01/15 (c) | | | 600,000 | | | 574,597 |
Merck & Co., Inc., 6.40%, 03/01/28 | | | 125,000 | | | 134,258 |
Merck & Co., Inc., 5.95%, 12/01/28 | | | 275,000 | | | 281,377 |
Pfizer, Inc., 4.65%, 03/01/18 | | | 450,000 | | | 426,397 |
Pharmacia Corp., 6.60%, 12/01/28 | | | 300,000 | | | 342,290 |
Teva Pharmaceutical Finance Llc,
6.15%, 02/01/36 | | | 240,000 | | | 234,875 |
Wyeth, 5.50%, 02/15/16 | | | 1,075,000 | | | 1,078,001 |
| | | | | | |
| | | | | | 5,617,224 |
| | | | | | |
Pipelines (0.1%) | | | |
CenterPoint Energy Resources,
7.88%, 04/01/13 | | | 600,000 | | | 669,969 |
Panhandle Eastern Pipelines,
2.75%, 03/15/07 | | | 400,000 | | | 395,879 |
Plains All American Pipeline,
5.63%, 12/15/13 | | | 560,000 | | | 554,834 |
TGT Pipelines LLC, 5.20%, 06/01/18 | | | 150,000 | | | 141,153 |
| | | | | | |
| | | | | | 1,761,835 |
| | | | | | |
Prepackaged Software (0.0%) | | | |
Oracle Corp., 5.25%, 01/15/16 | | | 970,000 | | | 956,716 |
| | | | | | |
| | | | | | |
| | | Principal
Amount | | Value |
| | | | | | |
Publishing & Newspapers (0.0%) | | | |
Gannett Co., 6.38%, 04/01/12 | | $ | 400,000 | | $ | 414,622 |
Thomson Corp., 4.25%, 08/15/09 | | | 425,000 | | | 413,434 |
| | | | | | |
| | | | | | 828,056 |
| | | | | | |
Real Estate Investment Trusts (0.4%) | | | |
AvalonBay Communities, Inc.,
6.63%, 09/15/11 | | | 150,000 | | | 158,254 |
Brandywine Operating Partners,
5.63%, 12/15/10 | | | 305,000 | | | 307,037 |
Camden Property Trust,
5.00%, 06/15/15 | | | 250,000 | | | 239,926 |
Camden Property Trust Corp.,
7.00%, 11/15/06 | | | 600,000 | | | 600,295 |
Developers Diversified Realty Corp., 6.63%, 01/15/08 | | | 250,000 | | | 253,114 |
Developers Diversified Realty Corp., 5.38%, 10/15/12 | | | 500,000 | | | 497,455 |
Duke Realty Corp., 5.25%, 01/15/10 | | | 300,000 | | | 299,227 |
EOP Operating LP, 4.65%, 10/01/10 | | | 300,000 | | | 291,860 |
EOP Operating LP, 6.75%, 02/15/12 | | | 200,000 | | | 211,053 |
Health Care REIT, Inc.,
6.00%, 11/15/13 | | | 300,000 | | | 299,461 |
HRPT Properties Trust Corp.,
5.75%, 02/15/14 | | | 300,000 | | | 300,147 |
Istar Financial, Inc.,
5.65%, 09/15/11 | | | 430,000 | | | 430,941 |
JDN Realty Corp., 6.95%, 08/01/07 | | | 20,000 | | | 20,128 |
Liberty Property LP,
7.25%, 03/15/11 | | | 65,000 | | | 69,253 |
Prologis, 5.25%, 11/15/10 (c) | | | 800,000 | | | 796,353 |
Simon Property Group LP,
4.60%, 06/15/10 | | | 400,000 | | | 391,669 |
Simon Property Group LP,
5.10%, 06/15/15 | | | 900,000 | | | 875,890 |
Simon Property Group LP,
6.10%, 05/01/16 | | | 700,000 | | | 729,425 |
Spieker Properties LP,
7.65%, 12/15/10 | | | 1,000,000 | | | 1,086,780 |
Vordano Realty LP,
5.60%, 02/15/11 | | | 350,000 | | | 350,324 |
Washington REIT, 5.25%, 01/15/14 | | | 200,000 | | | 196,970 |
Westfield Capital Corp.,
5.13%, 11/15/14 (b) | | | 260,000 | | | 252,779 |
| | | | | | |
| | | | | | 8,658,341 |
| | | | | | |
Corporate Bonds (continued)
| | | | | | |
| | | Principal
Amount | | Value |
| | | | | | |
Research & Development (0.0%) | | | |
Science Applications International,
5.50%, 07/01/33 | | $ | 300,000 | | $ | 270,115 |
| | | | | | |
Retail (0.5%) | | | |
CVS Corp., 4.00%, 09/15/09 | | | 200,000 | | | 193,236 |
Home Depot, Inc., 5.40%, 03/01/16 | | | 1,000,000 | | | 998,469 |
JC Penney Corp., Inc.,
8.00%, 03/01/10 | | | 1,270,000 | | | 1,364,007 |
Limited Brands, Inc.,
6.13%, 12/01/12 | | | 250,000 | | | 253,554 |
Lowe’s Cos., Inc., 6.50%, 03/15/29 | | | 400,000 | | | 437,654 |
May Department Stores Co.,
5.75%, 07/15/14 (c) | | | 750,000 | | | 741,169 |
Staples, Inc., 7.13%, 08/15/07 | | | 500,000 | | | 505,149 |
Target Corp., 10.00%, 01/01/11 | | | 112,000 | | | 130,931 |
Target Corp., 6.35%, 01/15/11 | | | 210,000 | | | 219,762 |
Target Corp., 7.00%, 07/15/31 | | | 295,000 | | | 346,463 |
Target Corp., 6.35%, 11/01/32 | | | 530,000 | | | 579,462 |
Wal-Mart Stores, Inc.,
6.88%, 08/10/09 | | | 1,390,000 | | | 1,454,491 |
Wal-Mart Stores, Inc.,
4.13%, 07/01/10 (c) | | | 700,000 | | | 678,639 |
Wal-Mart Stores, Inc.,
4.13%, 02/15/11 (c) | | | 650,000 | | | 627,195 |
Wal-Mart Stores, Inc.,
7.55%, 02/15/30 (c) | | | 200,000 | | | 246,907 |
Wal-Mart Stores, Inc.,
5.25%, 09/01/35 | | | 1,200,000 | | | 1,128,748 |
| | | | | | |
| | | | | | 9,905,836 |
| | | | | | |
Special Purpose Entity (0.4%) | | | |
Commercial Mortgage Pass Through, 5.43%, 04/15/17 (d) | | | 5,398,508 | | | 5,398,935 |
Morgan Stanley TRACERS,
5.87%, 03/01/07 (b) (d) | | | 1,162,910 | | | 1,163,829 |
Morgan Stanley TRACERS,
5.38%, 10/15/15 | | | 1,320,000 | | | 1,310,582 |
| | | | | | |
| | | | | | 7,873,346 |
| | | | | | |
Telecommunications (2.0%) | | | |
Alltel Corp., 7.00%, 07/01/12 (c) | | | 1,240,000 | | | 1,309,704 |
America Movil SA de CV,
5.75%, 01/15/15 (c) | | | 500,000 | | | 496,153 |
| | | | | | |
| | | Principal
Amount | | Value |
| | | | | | |
Telecommunications (continued) | | | |
America Movil SA de CV,
6.38%, 03/01/35 | | $ | 300,000 | | $ | 293,619 |
Ameritech Capital Funding,
6.45%, 01/15/18 | | | 150,000 | | | 151,270 |
AT&T Wireless Services, Inc.,
8.13%, 05/01/12 | | | 75,000 | | | 84,651 |
AT&T Wireless Services, Inc.,
8.75%, 03/01/31 | | | 545,000 | | | 714,139 |
Bellsouth Corp., 4.20%, 09/15/09 | | | 600,000 | | | 583,216 |
BellSouth Corp.,
6.00%, 10/15/11 (c) | | | 1,421,000 | | | 1,459,538 |
Bellsouth Corp., 5.20%, 09/15/14 | | | 850,000 | | | 828,124 |
Bellsouth Corp.,
6.55%, 06/15/34 (c) | | | 300,000 | | | 310,131 |
Bellsouth Corp.,
6.00%, 11/15/34 (c) | | | 850,000 | | | 823,122 |
British Telecom PLC,
8.38%, 12/15/10 | | | 2,170,000 | | | 2,437,200 |
British Telecom PLC,
8.88%, 12/15/30 | | | 100,000 | | | 135,484 |
Cingular Wireless LLC,
7.13%, 12/15/31 | | | 700,000 | | | 786,671 |
Clear Channel Communications, Inc., 4.25%, 05/15/09 | | | 600,000 | | | 578,749 |
Clear Channel Communications, Inc., 7.65%, 09/15/10 | | | 200,000 | | | 204,529 |
Clear Channel Communications, Inc., 4.40%, 05/15/11 | | | 200,000 | | | 178,245 |
Clear Channel Communications, Inc., 5.50%, 09/15/14 | | | 510,000 | | | 432,101 |
Cox Communications, Inc.,
5.50%, 10/01/15 | | | 650,000 | | | 628,214 |
Deutsche Telekom International Finance, 3.88%, 07/22/08 | | | 700,000 | | | 684,697 |
Deutsche Telekom International Finance, 5.25%, 07/22/13 | | | 1,250,000 | | | 1,223,070 |
Deutsche Telekom International Finance, 5.75%, 03/23/16 | | | 300,000 | | | 296,387 |
Deutsche Telekom International Finance, 8.25%, 06/15/30 | | | 625,000 | | | 776,371 |
Embarq Corp., 6.74%, 06/01/13 (c) | | | 1,300,000 | | | 1,336,167 |
Embarq Corp., 7.08%, 06/01/16 | | | 225,000 | | | 230,221 |
France Telecom, 8.00%, 03/01/11 | | | 650,000 | | | 714,009 |
Statement of Investments (Continued)
October 31, 2006
Gartmore Bond Index Fund (Continued)
Corporate Bonds (continued)
| | | | | | |
| | | Principal
Amount | | Value |
| | | | | | |
Telecommunications (continued) | | | |
France Telecom, 8.50%, 03/01/31 | | $ | 690,000 | | $ | 916,780 |
GTE Corp., 6.84%, 04/15/18 | | | 350,000 | | | 373,843 |
GTE Corp., 6.94%, 04/15/28 | | | 250,000 | | | 261,137 |
Koninklijke KPN NV,
8.00%, 10/01/10 | | | 525,000 | | | 569,282 |
Motorola Inc., 7.63%, 11/15/10 | | | 270,000 | | | 292,949 |
Motorola, Inc., 7.50%, 05/15/25 | | | 350,000 | | | 408,235 |
SBC Communications, Inc.,
4.13%, 09/15/09 | | | 1,250,000 | | | 1,213,215 |
SBC Communications, Inc.,
5.30%, 11/15/10 (c) | | | 650,000 | | | 650,967 |
SBC Communications, Inc.,
6.25%, 03/15/11 | | | 805,000 | | | 833,831 |
SBC Communications, Inc.,
5.88%, 08/15/12 (c) | | | 720,000 | | | 736,798 |
SBC Communications, Inc.,
5.10%, 09/15/14 | | | 1,700,000 | | | 1,656,086 |
SBC Communications, Inc.,
5.63%, 06/15/16 | | | 500,000 | | | 499,855 |
SBC Communications, Inc.,
6.15%, 09/15/34 (c) | | | 1,375,000 | | | 1,374,875 |
Sprint Capital Corp.,
6.13%, 11/15/08 | | | 850,000 | | | 863,052 |
Sprint Capital Corp.,
6.38%, 05/01/09 | | | 375,000 | | | 383,759 |
Sprint Capital Corp.,
8.38%, 03/15/12 | | | 2,060,000 | | | 2,316,748 |
Sprint Capital Corp.,
8.75%, 03/15/32 | | | 900,000 | | | 1,111,910 |
Tele-Communications, Inc.,
9.80%, 02/01/12 | | | 520,000 | | | 614,875 |
Telecom Italia Capital,
6.20%, 07/18/11 | | | 350,000 | | | 356,841 |
Telecom Italia Capital,
5.25%, 11/15/13 | | | 1,000,000 | | | 956,459 |
Telecom Italia Capital,
4.95%, 09/30/14 | | | 500,000 | | | 463,785 |
Telecom Italia Capital,
5.25%, 10/01/15 | | | 500,000 | | | 467,562 |
Telecom Italia Capital,
6.00%, 09/30/34 | | | 390,000 | | | 357,073 |
Verizon Global Funding Corp.,
7.25%, 12/01/10 | | | 910,000 | | | 976,738 |
| | | | | | |
| | | Principal
Amount | | Value |
| | | | | | |
Telecommunications (continued) | | | |
Verizon Global Funding Corp.,
6.88%, 06/15/12 | | $ | 500,000 | | $ | 536,333 |
Verizon Global Funding Corp.,
7.38%, 09/01/12 | | | 885,000 | | | 972,324 |
Verizon Global Funding Corp.,
4.38%, 06/01/13 (c) | | | 625,000 | | | 591,293 |
Verizon Global Funding Corp.,
4.90%, 09/15/15 | | | 1,000,000 | | | 954,379 |
Verizon Global Funding Corp.,
7.75%, 12/01/30 | | | 1,000,000 | | | 1,168,695 |
Verizon Global Funding Corp.,
5.85%, 09/15/35 | | | 200,000 | | | 191,924 |
| | | | | | |
| | | | | | 40,767,385 |
| | | | | | |
Tobacco (0.1%) | | | |
Altria Group, Inc., 7.00%, 11/04/13 | | | 1,000,000 | | | 1,095,888 |
| | | | | | |
Tools & Accessories (0.0%) | | | |
Black & Decker Corp.,
4.75%, 11/01/14 | | | 390,000 | | | 365,045 |
Stanley Works,
4.90%, 11/01/12 | | | 225,000 | | | 220,314 |
| | | | | | |
| | | | | | 585,359 |
| | | | | | |
Transportation & Shipping (0.5%) | | | |
Burlington Northern Santa Fe Corp., 6.75%, 07/15/11 | | | 365,000 | | | 387,506 |
Burlington Northern Santa Fe Corp., 7.95%, 08/15/30 | | | 350,000 | | | 444,243 |
Burlington Northern Santa Fe Corp., 6.20%, 08/15/36 | | | 600,000 | | | 631,140 |
Canadian National Railway Co., 6.90%, 07/15/28 | | | 410,000 | | | 473,022 |
Canadian National Railway Co., 6.20%, 06/01/36 | | | 400,000 | | | 431,422 |
Carnival Corp., 3.75%, 11/15/07 | | | 500,000 | | | 490,990 |
CSX Corp., 7.45%, 05/01/07 | | | 180,000 | | | 181,705 |
CSX Corp., 6.25%, 10/15/08 | | | 1,050,000 | | | 1,069,004 |
CSX Corp., 6.75%, 03/15/11 (c) | | | 225,000 | | | 237,551 |
CSX Corp., 5.50%, 08/01/13 | | | 240,000 | | | 241,285 |
FedEx Corp., 2.65%, 04/01/07 | | | 700,000 | | | 691,971 |
Norfolk Southern Corp.,
6.75%, 02/15/11 | | | 1,635,000 | | | 1,728,722 |
Corporate Bonds (continued)
| | | | | | |
| | | Principal
Amount | | Value |
| | | | | | |
Transportation & Shipping (continued) | | | |
Norfolk Southern Corp.,
5.59%, 05/17/25 | | $ | 143,000 | | $ | 140,888 |
Norfolk Southern Corp.,
7.25%, 02/15/31 | | | 457,000 | | | 543,838 |
TTX Co., 4.90%, 03/01/15 (b) | | | 375,000 | | | 359,858 |
Union Pacific Corp.,
5.75%, 10/15/07 | | | 545,000 | | | 545,401 |
Union Pacific Corp.,
3.63%, 06/01/10 | | | 410,000 | | | 388,212 |
Union Pacific Corp.,
5.38%, 06/01/33 | | | 105,000 | | | 98,747 |
Union Pacific Corp.,
6.25%, 05/01/34 | | | 400,000 | | | 423,448 |
United Parcel Service, Inc.,
8.38%, 04/01/20 | | | 200,000 | | | 254,913 |
United Parcel Service, Inc.,
8.38%, 04/01/30 | | | 300,000 | | | 403,471 |
| | | | | | |
| | | | | | 10,167,337 |
| | | | | | |
| | |
Total Corporate Bonds | | | | | | 629,853,203 |
| | | | | | |
|
Treasury Notes (3.9%) |
U.S. Treasury Notes,
4.88%, 08/15/09 (c) | | | 17,910,000 | | | 18,026,128 |
U.S. Treasury Notes,
4.50%, 09/30/11 | | | 25,850,000 | | | 25,760,120 |
U.S. Treasury Notes,
4.88%, 08/15/16 | | | 36,965,000 | | | 37,733,170 |
| | | | | | |
| | |
Total Treasury Notes | | | | | | 81,519,418 |
| | | | | | |
|
Asset Backed Securities (3.2%) |
Aegis Asset Backed Securities Trust, 5.49%, 01/25/37 (d) | | | 14,800,000 | | | 14,800,000 |
Fremont Home Loan Trust,
5.49%, 01/25/36 (d) | | | 14,900,000 | | | 14,905,275 |
HVMLT, 5.49%, 12/19/36 (d) | | | 18,425,000 | | | 18,425,000 |
Residential Accredit Loans, Inc.,
5.50%, 11/25/36 (d) | | | 17,850,000 | | | 17,850,000 |
| | | | | | |
| |
Total Asset Backed Securities | | | 65,980,275 |
| | | | | | |
Sovereign Bonds (1.8%)
| | | | | | |
| | | Principal
Amount | | Value |
| | | | | | |
CANADA (0.5%) | | | | | | |
Canadian Natural Resources,
4.90%, 12/01/14 | | $ | 475,000 | | $ | 448,945 |
Government of Canada,
5.25%, 11/05/08 | | | 1,630,000 | | | 1,643,334 |
Ontario Province,
5.50%, 10/01/08 | | | 350,000 | | | 353,065 |
Ontario Province,
4.38%, 02/15/13 (c) | | | 725,000 | | | 703,132 |
Petro-Canada, 5.95%, 05/15/35 | | | 460,000 | | | 443,497 |
Providence of Manitoba,
7.50%, 02/22/10 | | | 500,000 | | | 537,759 |
Province of British Columbia,
5.38%, 10/29/08 | | | 400,000 | | | 403,768 |
Province of British Columbia, 4.30%, 05/30/13 | | | 270,000 | | | 261,598 |
Province of Ontario,
3.38%, 01/15/08 | | | 1,000,000 | | | 979,241 |
Province of Ontario,
4.50%, 02/03/15 | | | 1,130,000 | | | 1,098,952 |
Province of Ontario,
4.75%, 01/19/16 | | | 500,000 | | | 492,349 |
Province of Quebec,
5.00%, 07/17/09 | | | 1,400,000 | | | 1,400,034 |
Quebec Province,
4.60%, 05/26/15 | | | 600,000 | | | 578,647 |
Quebec Province,
7.50%, 09/15/29 | | | 980,000 | | | 1,259,060 |
| | | | | | |
| | | | | | 10,603,381 |
| | | | | | |
CHILE (0.1%) | | | | | | |
Republic of Chile,
5.63%, 07/23/07 | | | 900,000 | | | 901,350 |
Republic of Chile,
5.50%, 01/15/13 (c) | | | 300,000 | | | 303,330 |
| | | | | | |
| | | | | | 1,204,680 |
| | | | | | |
CHINA (0.0%) | | | | | | |
People’s Republic of China,
4.75%, 10/29/13 (c) | | | 500,000 | | | 491,025 |
| | | | | | |
DENMARK (0.1%) | | | | | | |
KfW International Finance,
4.13%, 10/15/14 (c) | | | 1,200,000 | | | 1,143,312 |
| | | | | | |
Statement of Investments (Continued)
October 31, 2006
Gartmore Bond Index Fund (Continued)
Sovereign Bonds (continued)
| | | | | | |
| | | Principal
Amount | | Value |
| | | | | | |
GERMANY (0.1%) | | | | | | |
Landwirtsch. Rentenbank,
4.88%, 02/14/11 | | $ | 1,500,000 | | $ | 1,496,570 |
| | | | | | |
ITALY (0.4%) | | | |
Republic of Italy,
4.00%, 06/16/08 (c) | | | 1,400,000 | | | 1,377,457 |
Republic of Italy,
3.25%, 05/15/09 | | | 1,700,000 | | | 1,634,965 |
Republic of Italy,
4.38%, 06/15/13 | | | 950,000 | | | 916,437 |
Republic of Italy,
4.50%, 01/21/15 | | | 1,590,000 | | | 1,533,949 |
Republic of Italy,
4.75%, 01/25/16 | | | 700,000 | | | 684,207 |
Republic of Italy,
6.88%, 09/27/23 | | | 425,000 | | | 495,958 |
Republic of Italy,
5.38%, 06/15/33 | | | 1,425,000 | | | 1,423,907 |
| | | | | | |
| | | | | | 8,066,880 |
| | | | | | |
| | | | | | |
KOREA (0.1%) | | | |
Bank of Korea Corp.,
4.63%, 03/16/10 | | | 700,000 | | | 687,285 |
Bank of Korea Corp.,
5.13%, 02/14/11 | | | 600,000 | | | 597,154 |
Korea Developmental Bank,
5.75%, 09/10/13 (c) | | | 200,000 | | | 204,662 |
Republic of Korea,
4.25%, 06/01/13 (c) | | | 1,200,000 | | | 1,132,783 |
| | | | | | |
| | | | | | 2,621,884 |
| | | | | | |
MEXICO (0.4%) | | | |
Telefonos de Mexico SA,
5.50%, 01/27/15 | | | 400,000 | | | 389,694 |
United Mexican States,
9.88%, 02/01/10 | | | 2,750,000 | | | 3,141,875 |
United Mexican States,
6.38%, 01/16/13 | | | 1,938,000 | | | 2,036,838 |
United Mexican States,
7.50%, 04/08/33 | | | 775,000 | | | 909,075 |
United Mexican States,
6.75%, 09/27/34 | | | 2,885,000 | | | 3,108,588 |
| | | | | | |
| | | | | | 9,586,070 |
| | | | | | |
POLAND (0.0%) | | | |
Republic of Poland,
5.00%, 10/19/15 | | $ | 380,000 | | $ | 373,322 |
| | | | | | |
| | | | |
| | | Principal
Amount | | Value |
| | | | |
SOUTH AFRICA (0.0%) | | |
Republic of South Africa,
6.50%, 06/02/14 | | 350,000 | | 367,500 |
| | | | |
UNITED KINGDOM (0.1%) | | |
Vodafone Group PLC,
7.75%, 02/15/10 | | 650,000 | | 697,579 |
Vodafone Group PLC,
5.00%, 12/16/13 (c) | | 1,125,000 | | 1,089,073 |
Vodafone Group PLC,
7.88%, 02/15/30 | | 350,000 | | 417,774 |
| | | | |
| | | | 2,204,426 |
| | | | |
| | |
Total Sovereign Bonds | | | | 38,159,050 |
| | | | |
|
Municipal Bonds (0.1%) |
Illinois (0.1%) | | |
State Taxable Pension GO,
5.10%, 06/01/33 | | 1,700,000 | | 1,642,013 |
| | | | |
Texas (0.0%) | | |
City of Dallas, 5.25%, 02/15/24 | | 1,200,000 | | 1,186,608 |
| | | | |
| | |
Total Municipal Bonds | | | | 2,828,621 |
| | | | |
|
Repurchase Agreements (1.2%) |
CS First Boston,
5.17%, dated 10/31/06,
due 11/01/06, repurchase price $12,653,184 collateralized by U.S. Government Agency Mortgages with a market value of $ 12,904,416 | | 12,651,367 | | 12,651,367 |
Nomura Securities,
5.17%, dated 10/31/06,
due 11/01/06, repurchase price $12,080,899 collateralized by U.S. Government Agency Mortgages with a market value of $ 12,320,768 | | 12,079,164 | | 12,079,164 |
| | | | |
| | |
Total Repurchase Agreements | | | | 24,730,531 |
| | | | |
Short-Term Securities Held as Collateral for Securities on Loan (14.0%)
| | | | | | |
| | | Principal
Amount | | Value |
| | | | | | |
Alliance & Leicester Medium Term Note, 5.31%, 11/08/06 | | $ | 7,500,000 | | $ | 7,500,000 |
Banc of America Securities LLC Repurchase Agreement, 5.32%, dated 10/31/06, due 11/01/06, repurchase price $96,026,253, collateralized by U.S. Government Agency Mortgages with a market value of $ 97,932,306 | | | 96,012,065 | | | 96,012,065 |
Bank of America Note,
5.31%, 11/01/06 | | | 3,000,000 | | | 3,000,000 |
Bank of America Note,
5.38%, 11/01/06 | | | 5,000,000 | | | 5,000,000 |
Citigroup Global Markets Inc. Master Note,
5.38%, 11/01/06 | | | 25,000,000 | | | 25,000,000 |
Dorada Finance Medium Term Note, 5.37%, 11/01/06 | | | 5,000,000 | | | 5,000,000 |
GE Life & Annuity Funding Agreement, 5.42%, 11/14/06 | | | 6,000,000 | | | 6,000,000 |
Goldman Sachs Group Note, 5.38%, 11/02/06 | | | 25,000,000 | | | 25,000,000 |
Islandsbanki HF Note,
5.39%, 11/22/06 | | | 4,000,000 | | | 4,000,000 |
Lafayette Assets,
5.30%, 11/27/06 | | | 24,897,333 | | | 24,897,333 |
MBIA Global Funding Medium Term Note, 5.37%, 11/01/06 | | | 5,000,000 | | | 5,000,000 |
MBIA Global Funding Medium Term Note, 5.37%, 11/01/06 | | | 2,000,000 | | | 2,000,000 |
Morgan Stanley Master Note, 5.49%, 11/01/06 | | | 5,000,000 | | | 5,000,000 |
Pricoa Global Funding Medium Term Note, 5.37%, 11/01/06 | | | 25,000,000 | | | 25,000,000 |
Protective Life Insurance Co., 5.50%, 01/29/07 | | | 20,000,000 | | | 20,000,000 |
| | | | | | | |
| | | Principal
Amount | | Value | |
Royal Bank of Scotland Group Note, 5.37%, 12/29/06 | | $ | 25,000,000 | | $ | 25,000,000 | |
Sigma Finance Note,
5.34%, 11/01/06 | | | 4,600,667 | | | 4,600,667 | |
Tango Finance Note,
5.39%, 11/01/06 | | | 1,999,610 | | | 1,999,610 | |
West Corp. Fed Credit Union Medium Term Note,
5.38%, 11/01/06 | | | 1,000,000 | | | 1,000,000 | |
| | | | | | | |
| |
Total Short-Term Securities Held as Collateral for Securities on Loan | | | 291,009,675 | |
| | | | | | | |
| |
Total Investments
(Cost $2,486,971,046) (a) — 119.2% | | $ | 2,481,154,283 | |
| |
Liabilities in excess of other
assets — (19.2)% | | | (400,198,580 | ) |
| | | | | | | |
| | |
NET ASSETS — 100.0% | | | | | $ | 2,080,955,703 | |
| | | | | | | |
| | (a) | See notes to financial statements for unrealized appreciation (depreciation) of securities. |
| | (b) | Rule 144A, Section 4(2) or other security, which is restricted as to resale to institutional investors. The security has been deemed liquid pursuant to procedures approved by the Board of Trustees. |
| | (c) | All or part of security was on loan as of October 31, 2006. |
| | (d) | Variable rate security. The rate reflected in the Statement of Investments is the rate reflected in effect on October 31, 2006. |
| | TRACERS | Tradable Custodial Receipts |
See notes to financial statements.
Gartmore International Index Fund
Effective September 29, 2006, Merrill Lynch & Co., Inc. and BlackRock, Inc. completed a transaction to form a new asset management company involving Merrill Lynch’s asset management business, including Fund Asset Management, L.P. (the subadviser to each of the Gartmore Bond Index Fund, Gartmore International Index Fund, Gartmore Mid Cap Market Index Fund, Gartmore S&P 500 Index Fund and Gartmore Small Cap Index Fund) and BlackRock, Inc. The result of the transaction is a new subadviser known as BlackRock Investment Management, LLC.
For the annual period ended Oct. 31, 2006, the Gartmore International Index Fund (Class A at NAV) returned 26.89% versus 28.04% for its benchmark, the Morgan Stanley Capital International Europe, Australasia and Far East (MSCI EAFE®) Index. For broader comparison, the average return for the Fund’s Lipper peer category of International Multi-Cap Core Funds (consisting of 316 funds as of Oct. 31, 2006) was 26.57%. The underperformance of the Fund versus the MSCI EAFE Index was primarily due to the expenses of the Fund.
International equity markets generally posted strong returns during the reporting period. Spain, Germany and France were the strongest-performing major markets within the MSCI EAFE Index for the period. The rally that began in mid-June 2006 continued to the end of the Fund’s fiscal year; the gains during that period were strongest in Europe, with Japan slightly underperforming versus other markets. Strong growth in corporate earnings and significant upward revisions to earnings expectations have been major drivers of the global equity bull market since 2003. Although the rate of earnings upgrades slowed late in the reporting period from the exceptionally strong rates seen in previous years, news from the major corporate sectors was positive. Earnings generally came in ahead of expectations in the fourth quarter of the fiscal year in Europe, Japan and the United States, and supported the rally in equities.
European economic growth strengthened early in the reporting period, with both consumer and business confidence on the upswing and clearer signs of greater domestic demand surfacing. Germany, one of Europe’s largest economies, provided the bulk of positive news. Elsewhere, indications emerged of a recovery in industrial activity in France and Italy. Spain’s economic growth remained robust, although a high debt burden continued to weigh on the corporate sector.
In the second half of the reporting period, economic growth moderated somewhat in Asia. The slowdown in Europe, including the United Kingdom, however, was not as significant. In addition, late in the reporting period indications were that the slowdown was decelerating rather than intensifying. The evidence of this trend included the tone of recent macroeconomic data, such as signs of stabilization in some of the more cyclically sensitive economies in the Far East (e.g. South Korea); the absence of any decline in industrial metals prices, which represent the best real-time barometer of global business conditions; and robust corporate reports in the major economies. Lower oil prices also tilted the balance of risk away from a hard landing. At the end of the fiscal year, however, signs were few that any material rebound is under way in any of the major economies.
The substantial increase in oil prices during most of the reporting period led to a rise in inflation rates globally, but a subsequent decline in oil and overall energy prices late in the period muted some of this upward pressure. The previous rise in energy prices had a significant effect on inflation (excluding oil prices) and on wage growth in the United States, and yet the economic sensitivity was relatively low. Core inflation rates and wage growth in other markets were more stable.
The portfolio is positioned such that the risk characteristics are similar to those of the MSCI EAFE Index. The portfolio seeks to perform in line with the benchmark on a gross return basis.
Portfolio Managers:
BlackRock Investment Management, LLC—Subadviser: Debra L. Jelilian and Jeffery L. Russo, CFA
| | |
Fund Performance | | Gartmore International Index Fund |
Average Annual Total Return
(For periods ended October 31, 2006)
| | | | | | | | |
| | | | | 1 Yr. | | 5 Yr. | | Inception1 |
| Class A | | w/o SC2 | | 26.89% | | 13.31% | | 2.84% |
| | | w/SC3 | | 19.59% | | 11.97% | | 1.95% |
| Class B | | w/o SC2 | | 25.98% | | 12.63% | | 2.14% |
| | | w/SC4 | | 20.98% | | 12.38% | | 2.14% |
| Class C5 | | w/o SC2 | | 26.06% | | 12.34% | | 1.95% |
| | | w/SC7 | | 25.06% | | 12.34% | | 1.95% |
| Institutional Class6 | | 27.32% | | 13.74% | | 3.22% |
All figures showing the effect of a sales charge reflect the maximum charge possible, because it has the most dramatic effect on performance data.
| 1 | Fund commenced operations on December 29, 1999. |
| 2 | These returns do not reflect the effects of sales charges (SC). |
| 3 | A 5.75% front-end sales charge was deducted. |
| 4 | A 5.00% maximum contingent deferred sales charge (CDSC) was deducted. The CDSC declines to 0% after 6 years. |
| 5 | These returns until the creation of Class C shares (02/14/05) include the performance of the Fund’s Class B shares, which began operations on December 29, 1999 prior to the creation of the Class C. Excluding the effect of any fee waivers or reimbursements, such prior performance is similar to what Class C would have produced because Class C and invest in the same portfolio of securities as Class B shares. The performance for Class C has been restated for sales charges (where applicable), but does not reflect the differing levels of other fees (primarily Rule 12b-1 and/or administrative services fees) applicable to such classes. |
| 6 | Not subject to any sales charges. |
| 7 | A CDSC of 1.00% was deducted from the one year return because it is charged when you sell Class C shares within the first year after purchase. |
Performance of a $10,000 Investment
Investment return and principal value will fluctuate, and when redeemed, shares may be worth more or less than original cost. Past performance is no guarantee of future results and does not reflect the deduction of taxes that a shareholder would pay on fund distributions or the redemption of fund shares. Investing in mutual funds involves market risk, including loss of principal. Performance returns assume the reinvestment of all distributions.
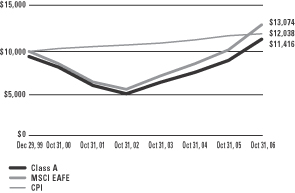
Comparative performance of $10,000 invested in Class A shares of the Gartmore International Index Fund, the Morgan Stanley Capital International–Europe, Australasia, and Far East Index (MSCI EAFE)(a), and the Consumer Price Index (CPI)(b) since inception. Unlike the Fund, the returns for these unmanaged indexes do not reflect any fees, expenses, or sales charges. Investors cannot invest directly in market indexes.
| (a) | The MSCI World- an unmanaged index of companies whose securities are listed on the stock exchanges of the U.S., Europe, Canada, Australia and the Far East- gives a broad look at how the stock prices of these companies have performed. |
| (b) | The CPI represents changes in prices of a basket of goods and services purchased for consumption by urban households. |
| | |
Shareholder Expense Example | | Gartmore International Index Fund |
As a shareholder of the Fund, you incur two types of costs: (1) transaction costs, including sales charges (loads) paid on purchase payments and redemption fees; and (2) ongoing costs, including investment advisory fees, administration fees, distribution fees and other Fund expenses. The examples below are intended to help you understand your ongoing costs (in dollars) of investing in the Fund and to compare these costs with the ongoing costs of investing in other mutual funds. Per SEC requirements, the examples assume that you had a $1,000 investment in the Class at the beginning of the reporting period, May 1, 2006 and continued to hold your shares at the end of the reporting period, October 31, 2006.
Actual Expenses
For each Class of the Fund in the table below, the first line provides information about actual account values and actual expenses. You may use the information in this line, together with the amount you invested, to estimate the expenses that you paid over the period. Simply divide your account value by $1,000 (for example, an $8,600 account value divided by $1,000 = 8.6), then multiply the result by the number in the first line of each Class under the heading entitled “Expenses Paid During Period” to estimate the expenses you paid on your account during the period.
Hypothetical Example for Comparison Purposes
The second line of each Class in the table below provides information about hypothetical account values and hypothetical expenses based on the Class’ actual expense ratio and an assumed rate of return of 5% per year before expenses, which is not the Class’ actual return. The hypothetical account values and expenses may not be used to estimate the actual ending account balance or expenses you paid for the period. You may use this information to compare the ongoing costs of investing in the Class of the Fund and other funds. To do so, compare this 5% hypothetical example with the 5% hypothetical examples that appear in the shareholder reports of the other funds.
Please note that the expenses shown in the table are meant to highlight your ongoing costs only and do not reflect any transaction costs, such as sales charges (loads) or redemption fees. Therefore, the second line for each Class in the table is useful in comparing ongoing costs only, and will not help you determine the relative total costs of owning different funds. In addition, if these transaction costs were included, your costs would have been higher. The examples also assume all dividends and distributions have been reinvested.
Schedule of Shareholder Expenses
Expense Analysis of a $1,000 Investment
(October 31, 2006)
| | | | | | | | | | | | | |
| Gartmore International Index Fund | | | | Beginning
Account Value, 5/1/06 | | Ending
Account Value,
10/31/06 | | Expenses Paid
During Period* | | Annualized
Expense Ratio* |
| Class A | | Actual | | $ | 1,000.00 | | $ | 1,034.50 | | $ | 3.90 | | 0.76% |
| | | Hypothetical1 | | $ | 1,000.00 | | $ | 1,021.17 | | $ | 3.88 | | 0.76% |
| Class B | | Actual | | $ | 1,000.00 | | $ | 1,030.70 | | $ | 7.01 | | 1.37% |
| | | Hypothetical1 | | $ | 1,000.00 | | $ | 1,018.09 | | $ | 6.99 | | 1.37% |
| Class C | | Actual | | $ | 1,000.00 | | $ | 1,031.20 | | $ | 7.01 | | 1.37% |
| | | Hypothetical1 | | $ | 1,000.00 | | $ | 1,018.09 | | $ | 6.99 | | 1.37% |
| Institutional Class | | Actual | | $ | 1,000.00 | | $ | 1,036.30 | | $ | 1.90 | | 0.37% |
| | | Hypothetical1 | | $ | 1,000.00 | | $ | 1,023.13 | | $ | 1.89 | | 0.37% |
| * | Expenses are equal to the Fund’s annualized expense ratio multiplied by the average account value over the period multiplied by 184/365 (to reflect the one-half year period). The expense ratio presented represents a six-month, annualized ratio in accordance with SEC guidelines. |
| 1 | Represents the hypothetical 5% return before expenses. |
| | |
Portfolio Summary | | Gartmore International Index Fund |
October 31, 2006
The SEC adopted a requirement that Funds present their portfolio holdings in a table, chart or graph format in their annual and semiannual reports to shareholders, whether or not a statement of investments is utilized. The following tables, which present portfolio holdings as a percentage of net assets, are provided in compliance with this requirement.
| | |
| Asset Allocation | | |
| Common Stocks | | 97.2% |
| Repurchase Agreements | | 1.7% |
| Exchange Traded Fund | | 0.0% |
| Preferred Stocks | | 0.0% |
| Rights | | 0.0% |
| Warrants | | 0.0% |
| Other Investments* | | 17.1% |
| Liabilities in excess of other assets** | | -16.0% |
| | |
| | 100.0% |
| | |
| Top Countries | | |
| United Kingdom | | 22.7% |
| Japan | | 22.4% |
| France | | 9.3% |
| Germany | | 7.0% |
| Switzerland | | 7.0% |
| Australia | | 5.1% |
| Netherlands | | 4.8% |
| Spain | | 4.1% |
| Italy | | 3.7% |
| Sweden | | 2.2% |
| Other Assets | | 11.7% |
| | |
| | 100.0% |
| | |
| Top Industries | | |
| Banks | | 17.1% |
| Pharmaceuticals | | 6.5% |
| Oil & Gas | | 6.4% |
| Telecommunications | | 6.3% |
| Insurance | | 5.3% |
| Electric | | 4.3% |
| Food | | 4.0% |
| Financial Services | | 3.7% |
| Auto Manufacturers | | 3.1% |
| Mining | | 2.7% |
| Other Assets | | 40.6% |
| | |
| | 100.0% |
| | |
| Top Holdings*** | | |
| BP PLC | | 1.8% |
| HSBC Holdings PLC | | 1.7% |
| Toyota Motor Corp. | | 1.4% |
| GlaxoSmithKline PLC | | 1.2% |
| Total SA | | 1.2% |
| Novartis AG | | 1.2% |
| Nestle SA | | 1.1% |
| Vodafone Group PLC | | 1.1% |
| Roche Holding AG | | 1.0% |
| UBS AG | | 1.0% |
| Other Assets | | 87.3% |
| | |
| | 100.0% |
| * | Includes value of collateral received from securities lending. |
| ** | Includes value of collateral owed from securities lending. |
| *** | For purpose of listing top holdings, repurchase agreements are considered cash equivalents and are included as part of Other Assets. |
Statement of Investments
October 31, 2006
Gartmore International Index Fund
Common Stocks (97.2%)
| | | | | |
| | | Shares or Principal Amount | | Value |
| | | | | |
AUSTRALIA (5.1%) | | | |
Airlines (0.0%) | | | | | |
Qantas Airways Ltd. (c) | | 232,852 | | $ | 762,862 |
| | | | | |
Apparel (0.0%) | | | | | |
Billabong International Ltd. (c) | | 6,586 | | | 79,963 |
| | | | | |
Banks (1.4%) | | | |
Australia & New Zealand Banking Group Ltd. (c) | | 297,357 | | | 6,657,842 |
Commonwealth Bank of Australia (c) | | 199,257 | | | 7,350,373 |
National Australia Bank Ltd. (c) | | 248,467 | | | 7,323,120 |
Westpac Banking Corp. (c) (d) | | 302,518 | | | 5,606,029 |
| | | | | |
| | | | | 26,937,364 |
| | | | | |
Beverages (0.1%) | | | |
Coca-Cola Amatil Ltd. (c) (d) | | 122,877 | | | 661,100 |
Foster’s Group Ltd. (c) | | 323,866 | | | 1,617,150 |
Lion Nathan Ltd. (c) | | 10,373 | | | 66,500 |
| | | | | |
| | | | | 2,344,750 |
| | | | | |
Building Materials (0.2%) | | | |
Boral Ltd. (c) (d) | | 84,614 | | | 476,199 |
CSR Ltd. (c) | | 227,744 | | | 571,145 |
Rinker Group Ltd. (c) (d) | | 163,586 | | | 2,339,750 |
| | | | | |
| | | | | 3,387,094 |
| | | | | |
Commercial Services (0.1%) | | | |
ABC Learning Centres Ltd. (c) (d) | | 11,292 | | | 61,572 |
Brambles Industries Ltd. (c) (d) | | 180,637 | | | 1,746,568 |
Transurban Group (c) (d) | | 152,343 | | | 852,439 |
| | | | | |
| | | | | 2,660,579 |
| | | | | |
Computers (0.0%) | | | |
Computershare Ltd. (c) | | 32,937 | | | 196,051 |
| | | | | |
Consumer Products (0.0%) | | | | | |
Pacific Brands Ltd. (c) | | 58,874 | | | 120,858 |
| | | | | |
Diversified (0.0%) | | | | | |
Futuris Corp. Ltd. (c) | | 73,471 | | | 100,033 |
| | | | | |
| | | | | |
| | | Shares or Principal Amount | | Value |
| | | | | |
AUSTRALIA (continued) | | | |
Engineering & Construction (0.1%) | | | |
Downer EDI Ltd. (c) (d) | | 95,482 | | $ | 475,852 |
Leighton Holdings Ltd. (c) | | 34,954 | | | 574,658 |
Macquarie Airports (c) | | 5,499 | | | 13,668 |
Multiplex Group (c) (d) | | 169,405 | | | 483,208 |
WorleyParsons Ltd. (c) (d) | | 8,333 | | | 117,485 |
| | | | | |
| | | | | 1,664,871 |
| | | | | |
Entertainment (0.1%) | | | |
Aristocrat Leisure Ltd. (c) (d) | | 58,082 | | | 625,915 |
TABCorp. Holdings Ltd. (c) (d) | | 76,074 | | | 971,201 |
| | | | | |
| | | | | 1,597,116 |
| | | | | |
Financial Services (0.2%) | | | |
Australian Stock Exchange Ltd. (c) (d) | | 25,094 | | | 688,011 |
Babcock & Brown Ltd. (c) (d) | | 22,428 | | | 377,913 |
Challenger Financial Services Group Ltd. (c) (d) | | 139,101 | | | 369,339 |
Macquarie Bank Ltd. (c) | | 42,970 | | | 2,476,009 |
Perpetual Ltd. (c) (d) | | 2,374 | | | 134,167 |
| | | | | |
| | | | | 4,045,439 |
| | | | | |
Food (0.1%) | | | |
Goodman Fielder Ltd. (c) | | 31,546 | | | 50,799 |
Woolworths Ltd. (c) | | 174,893 | | | 2,799,986 |
| | | | | |
| | | | | 2,850,785 |
| | | | | |
Forest Products & Paper (0.0%) | | | |
PaperlinX Ltd. (c) | | 37,727 | | | 120,093 |
| | | | | |
Healthcare (0.1%) | | | |
Cochlear Ltd. (c) | | 12,914 | | | 556,789 |
DCA Group Ltd. (c) (d) | | 159,318 | | | 420,464 |
Sonic Healthcare Ltd. (c) | | 19,331 | | | 196,681 |
| | | | | |
| | | | | 1,173,934 |
| | | | | |
Insurance (0.3%) | | | |
AMP Ltd. (c) (d) | | 270,965 | | | 1,988,982 |
AXA Asia Pacific Holdings Ltd. (c) (d) | | 165,197 | | | 849,896 |
Insurance Australia Group Ltd. (c) | | 232,273 | | | 996,940 |
QBE Insurance Group Ltd. (c) | | 115,715 | | | 2,210,475 |
| | | | | |
| | | | | 6,046,293 |
| | | | | |
Common Stocks (continued)
| | | | | |
| | | Shares or Principal Amount | | Value |
| | | | | |
AUSTRALIA (continued) | | | |
Investment Companies (0.1%) | | | |
Macquarie Communications | | 94,519 | | $ | 447,848 |
Infrastructure Group (c) (d) | | | | | |
Macquarie Infrastructure Group (c) | | 484,827 | | | 1,268,090 |
| | | | | |
| | | | | 1,715,938 |
| | | | | |
Iron & Steel (0.0%) | | | |
BlueScope Steel Ltd. (c) (d) | | 141,785 | | | 794,671 |
OneSteel Ltd. (c) (d) | | 122,061 | | | 397,373 |
| | | | | |
| | | | | 1,192,044 |
| | | | | |
Lottery (0.0%) | | | |
Tattersall’s Ltd. (c) (d) | | 88,927 | | | 250,368 |
| | | | | |
Media (0.1%) | | | |
John Fairfax Holdings Ltd. (c) | | 179,770 | | | 676,543 |
Publishing & Broadcasting Ltd. (c) | | 26,356 | | | 395,373 |
| | | | | |
| | | | | 1,071,916 |
| | | | | |
Mining (1.0%) | | | |
Alumina Ltd. (c) | | 152,773 | | | 800,050 |
BHP Billiton Ltd. (c) (d) | | 569,898 | | | 12,126,434 |
Iluka Resources Ltd. (c) (d) | | 69,336 | | | 398,611 |
Newcrest Mining Ltd. (c) | | 58,954 | | | 1,096,310 |
Paladin Resources Ltd. (b) (c) (d) | | 27,544 | | | 123,454 |
Rio Tinto Ltd. (c) (d) | | 49,863 | | | 3,030,862 |
Zinifex Ltd. (c) | | 102,230 | | | 1,209,984 |
| | | | | |
| | | | | 18,785,705 |
| | | | | |
Miscellaneous Manufacturing (0.1%) | | | |
Ansell Ltd. (c) (d) | | 21,361 | | | 183,446 |
Orica Ltd. (c) | | 36,332 | | | 684,490 |
Wesfarmers Ltd. (c) | | 53,128 | | | 1,418,719 |
| | | | | |
| | | | | 2,286,655 |
| | | | | |
Multi-Media (0.0%) | | | |
APN News & Media Ltd. (c) (d) | | 243 | | | 1,151 |
| | | | | |
Oil & Gas (0.2%) | | | |
AGL Energy Ltd. (b) | | 58,166 | | | 691,155 |
Alinta Ltd. | | 49,223 | | | 403,897 |
Caltex Australia Ltd. (c) | | 14,655 | | | 252,584 |
| | | | | |
| | | Shares or Principal Amount | | Value |
| | | | | |
AUSTRALIA (continued) | | | |
Oil & Gas (continued) | | | |
Origin Energy Ltd. (c) (d) | | 83,559 | | $ | 463,750 |
Santos Ltd. (c) | | 94,383 | | | 774,382 |
Woodside Petroleum Ltd. (c) (d) | | 82,581 | | | 2,424,927 |
| | | | | |
| | | | | 5,010,695 |
| | | | | |
Packaging & Containers (0.0%) | | | |
AmCor Ltd. (c) | | 137,252 | | | 733,911 |
| | | | | |
Pharmaceuticals (0.1%) | | | | | |
CSL Ltd. (c) (d) | | 26,462 | | | 1,147,396 |
Mayne Pharma Ltd. (c) (d) | | 159,872 | | | 540,846 |
Symbion Health Ltd. (c) (d) | | 101,664 | | | 257,582 |
| | | | | |
| | | | | 1,945,824 |
| | | | | |
Public Thoroughfares (0.0%) | | | | | |
Sydney Roads Group (b) (d) | | 418,240 | | | 369,087 |
| | | | | |
Real Estate (0.6%) | | | | | |
Centro Properties Group (c) (d) | | 92,962 | | | 555,580 |
CFS Retail Property Trust (c) | | 233,837 | | | 361,348 |
Commonwealth Property Office Fund (c) (d) | | 228,851 | | | 251,762 |
DB RREEF Trust (c) (d) | | 461,432 | | | 589,165 |
GPT Group (c) | | 317,289 | | | 1,159,325 |
Immoeast Immobilien Anlagen (b) (c) | | 50,862 | | | 638,768 |
ING Industrial Fund (c) (d) | | 8,525 | | | 15,620 |
Investa Property Group (c) (d) | | 220,036 | | | 408,577 |
Lend Lease Corp. Ltd. (c) (d) | | 66,298 | | | 864,959 |
Macquarie Goodman Group (c) (d) | | 262,731 | | | 1,346,964 |
Macquarie Office Trust (c) (d) | | 112,567 | | | 130,287 |
Mirvac Group (c) (d) | | 197,476 | | | 747,892 |
Stockland (c) (d) | | 191,897 | | | 1,125,217 |
Stockland (b) (d) | | 5,774 | | | 33,120 |
Westfield Group (c) (d) | | 238,496 | | | 3,438,592 |
| | | | | |
| | | | | 11,667,176 |
| | | | | |
Retail (0.1%) | | | | | |
Coles Myer Ltd. (c) (d) | | 209,151 | | | 2,198,045 |
Harvey Norman Holdings Ltd. (c) (d) | | 33,835 | | | 94,741 |
| | | | | |
| | | | | 2,292,786 |
| | | | | |
Statement of Investments (Continued)
October 31, 2006
Gartmore International Index Fund (Continued)
Common Stocks (continued)
| | | | | |
| | | Shares or Principal Amount | | Value |
| | | | | |
AUSTRALIA (continued) | | | |
Telecommunications (0.1%) | | | | | |
Telstra Corp. Ltd. (c) | | 406,546 | | $ | 1,248,151 |
| | | | | |
Transportation (0.0%) | | | | | |
Toll Holdings Ltd. (c) | | 64,963 | | | 777,427 |
| | | | | |
| | | | | 103,436,919 |
| | | | | |
AUSTRIA (0.5%) | | | | | |
Airports (0.0%) | | | | | |
Flughafen Wien AG (c) | | 72 | | | 6,451 |
| | | | | |
Banks (0.1%) | | | | | |
Erste Bank der Oesterreichischen Sparkassen AG (c) | | 26,818 | | | 1,824,077 |
Raiffeisen International Bank
Holding AG (c) | | 5,207 | | | 595,171 |
| | | | | |
| | | | | 2,419,248 |
| | | | | |
Building Materials (0.0%) | | | | | |
Wienerberger AG (c) | | 10,093 | | | 524,033 |
| | | | | |
Electric (0.0%) | | | | | |
Verbund-Oesterreichische Elektrizitaetswirtschafts AG (c) | | 16,292 | | | 812,680 |
| | | | | |
Entertainment (0.0%) | | | | | |
BetandWin.Com Interactive Entertainment AG (b) (c) (d) | | 3,680 | | | 74,909 |
| | | | | |
Insurance (0.0%) | | | | | |
Wiener Staedtische Versicherung AG (c) | | 1,616 | | | 103,916 |
| | | | | |
Iron & Steel (0.1%) | | | | | |
Boehler-Uddeholm AG (c) | | 10,163 | | | 628,552 |
Voestalpine AG (c) | | 11,552 | | | 543,085 |
| | | | | |
| | | | | 1,171,637 |
| | | | | |
Machinery – Diversified (0.0%) | | | |
Andritz AG (c) | | 2,841 | | | 513,353 |
| | | | | |
Miscellaneous Manufacturing (0.0%) | | | |
RHI AG (b) (c) (d) | | 8,936 | | | 382,370 |
| | | | | |
| | | | | |
| | | Shares or Principal Amount | | Value |
| | | | | |
AUSTRIA (continued) | | | | | |
Oil & Gas (0.1%) | | | | | |
OMV AG (c) | | 29,618 | | $ | 1,608,738 |
| | | | | |
Paper Products (0.0%) | | | | | |
Mayr-Melnhof Karton AG (c) | | 37 | | | 6,814 |
| | | | | |
Real Estate (0.1%) | | | | | |
IMMOFINANZ Immobilien
Anlagen AG (b) (c) | | 87,252 | | | 1,057,162 |
Meinl European Land Ltd. (b) (c) | | 12,983 | | | 286,449 |
| | | | | |
| | | | | 1,343,611 |
| | | | | |
Telecommunications (0.1%) | | | | | |
Telekom Austria AG (c) | | 53,229 | | | 1,327,143 |
| | | | | |
| | | | | 10,294,903 |
| | | | | |
BELGIUM (1.2%) | | | | | |
Banks (0.6%) | | | | | |
Dexia (c) (d) | | 87,541 | | | 2,360,930 |
Fortis (c) | | 190,925 | | | 8,004,674 |
KBC Groep NV (c) | | 32,262 | | | 3,522,294 |
| | | | | |
| | | | | 13,887,898 |
| | | | | |
Beverages (0.1%) | | | | | |
InBev NV (c) | | 25,871 | | | 1,456,298 |
| | | | | |
Chemicals (0.1%) | | | | | |
Solvay SA (c) | | 8,589 | | | 1,112,312 |
Umicore (c) | | 5,513 | | | 854,565 |
| | | | | |
| | | | | 1,966,877 |
| | | | | |
Consumer Cyclicals (0.0%) | | | | | |
D’ Ieteren NV (c) (d) | | 489 | | | 165,511 |
| | | | | |
Diversified Operations (0.0%) | | | | | |
Groupe Bruxelles Lambert SA (b) (c) | | 721 | | | 18 |
| | | | | |
Electrical Components & Equipment (0.0%) |
Bekaert SA (c) | | 98 | | | 10,451 |
| | | | | |
Electronics (0.0%) | | | | | |
BarCo NV (c) | | 2,478 | | | 203,565 |
| | | | | |
Common Stocks (continued)
| | | | | |
| | | Shares or Principal Amount | | Value |
| | | | | |
BELGIUM (continued) | | | | | |
Food (0.1%) | | | | | |
Colruyt SA (c) (d) | | 1,395 | | $ | 245,371 |
Delhaize Group (c) (d) | | 14,151 | | | 1,143,888 |
| | | | | |
| | | | | 1,389,259 |
| | | | | |
Holding Companies – Diversified (0.1%) | | | |
Groupe Bruxelles Lambert SA (c) | | 11,675 | | | 1,284,103 |
| | | | | |
Miscellaneous Manufacturing (0.0%) | | | |
AGFA-Gevaert NV (c) | | 23,280 | | | 587,004 |
| | | | | |
Pharmaceuticals (0.1%) | | | | | |
Omega Pharma SA (c) | | 2,941 | | | 192,570 |
UCB SA (c) (d) | | 13,884 | | | 858,574 |
| | | | | |
| | | | | 1,051,144 |
| | | | | |
Real Estate (0.0%) | | | | | |
Cofinimmo (c) | | 660 | | | 125,062 |
| | | | | |
Telecommunications (0.1%) | | | | | |
BelgaCom SA (c) | | 32,820 | | | 1,340,692 |
Mobistar SA (c) | | 2,400 | | | 198,755 |
| | | | | |
| | | | | 1,539,447 |
| | | | | |
Transportation (0.0%) | | | | | |
Compagnie Maritime Belge SA (c) | | 5,398 | | | 198,737 |
Euronav SA (c) | | 5,398 | | | 166,279 |
| | | | | |
| | | | | 365,016 |
| | | | | |
| | | | | 24,031,653 |
| | | | | |
DENMARK (0.7%) | | | | | |
Banks (0.2%) | | | | | |
Danske Bank (c) | | 70,020 | | | 2,933,078 |
Sydbank (c) | | 16,077 | | | 634,923 |
| | | | | |
| | | | | 3,568,001 |
| | | | | |
Beverages (0.0%) | | | |
Carlsberg (c) | | 7,141 | | | 613,333 |
| | | | | |
Biotechnology (0.0%) | | | | | |
Novozymes (c) | | 6,405 | | | 512,440 |
| | | | | |
Building Materials (0.0%) | | | | | |
FLSmidth & Co. (c) | | 2,013 | | | 105,853 |
| | | | | |
| | | | | |
| | | Shares or Principal Amount | | Value |
| | | | | |
DENMARK (continued) | | | | | |
Diversified (0.0%) | | | | | |
NKT Holding AS (c) | | 167 | | $ | 13,084 |
| | | | | |
Electrical Components & Equipment (0.1%) |
Vestas Wind Systems (b) (c) | | 35,953 | | | 1,008,915 |
| | | | | |
Food (0.0%) | | | | | |
Danisco AS (c) | | 11,007 | | | 884,287 |
East Asiatic Co. Ltd. (c) | | 216 | | | 10,864 |
| | | | | |
| | | | | 895,151 |
| | | | | |
Healthcare – Products (0.1%) | | | | | |
Coloplast (c) | | 3,108 | | | 262,998 |
GN Store Nord (c) (d) | | 51,904 | | | 727,574 |
William Demant Holding (b) (c) | | 2,009 | | | 166,314 |
| | | | | |
| | | | | 1,156,886 |
| | | | | |
Home Furnishings (0.0%) | | | | | |
Bang & Olufsen (c) (d) | | 3,808 | | | 441,366 |
| | | | | |
Insurance (0.0%) | | | | | |
Topdanmark (b) (c) | | 2,958 | | | 417,923 |
TrygVesta AS (c) (d) | | 927 | | | 59,782 |
| | | | | |
| | | | | 477,705 |
| | | | | |
Pharmaceuticals (0.2%) | | | | | |
H. Lunbeck AS (c) (d) | | 5,754 | | | 135,152 |
Novo-Nordisk (c) | | 42,718 | | | 3,218,146 |
| | | | | |
| | | | | 3,353,298 |
| | | | | |
Security Services (0.0%) | | | | | |
Group 4 Securicor PLC (c) | | 85,993 | | | 287,932 |
| | | | | |
Transportation (0.1%) | | | | | |
AP Moller — Maersk AS (c) (d) | | 161 | | | 1,454,614 |
Dak Sas AB (b) (c) | | 63 | | | 912 |
Dampskibsselskabet Torm AS (c) | | 13 | | | 703 |
DSV (c) | | 4,725 | | | 870,353 |
| | | | | |
| | | | | 2,326,582 |
| | | | | |
| | | | | 14,760,546 |
| | | | | |
FINLAND (1.4%) | | | | | |
Auto Parts & Equipment (0.0%) | | | |
Nokian Renkaat OYJ (c) (d) | | 21,180 | | | 406,005 |
| | | | | |
Statement of Investments (Continued)
October 31, 2006
Gartmore International Index Fund (Continued)
Common Stocks (continued)
| | | | | |
| | | Shares or Principal Amount | | Value |
| | | | | |
FINLAND (continued) | | | | | |
Banks (0.0%) | | | | | |
OKO Bank PLC (c) | | 1,583 | | $ | 26,742 |
| | | | | |
Computers (0.0%) | | | | | |
Tietoenator OYJ (c) (d) | | 19,939 | | | 551,448 |
| | | | | |
Electric (0.1%) | | | | | |
Fortum OYJ (c) | | 72,572 | | | 2,003,205 |
| | | | | |
Engineering & Construction (0.0%) | | | |
YIT OYJ (c) | | 20,591 | | | 511,678 |
| | | | | |
Financial Services (0.1%) | | | | | |
Sampo OYJ (c) | | 80,506 | | | 1,743,637 |
| | | | | |
Food (0.0%) | | | | | |
Kesko OYJ (c) | | 10,136 | | | 478,540 |
| | | | | |
Forest Products & Paper (0.3%) | | | |
Stora Enso OYJ (c) | | 98,148 | | | 1,585,832 |
UPM-Kymmene OYJ (c) | | 89,708 | | | 2,277,112 |
| | | | | |
| | | | | 3,862,944 |
| | | | | |
Hand & Machine Tools (0.0%) | | | |
KCI Konecranes OYJ (c) | | 19,638 | | | 423,208 |
| | | | | |
Iron & Steel (0.0%) | | | | | |
Outokumpu OYJ (c) (d) | | 10,677 | | | 329,585 |
Rautaruukki OYJ (c) | | 19,446 | | | 642,834 |
| | | | | |
| | | | | 972,419 |
| | | | | |
Leisure (0.0%) | | | | | |
Amer Sports OYJ (c) (d) | | 9,351 | | | 207,097 |
| | | | | |
Machinery – Diversified (0.1%) | | | |
Kone OYJ (c) (d) | | 12,144 | | | 574,576 |
Metso OYJ (c) | | 26,756 | | | 1,158,529 |
| | | | | |
| | | | | 1,733,105 |
| | | | | |
Media (0.0%) | | | | | |
Sanoma-WSOY OYJ (c) | | 1,540 | | | 39,742 |
| | | | | |
Medical – Drugs (0.0%) | | | | | |
Orion OYJ (b) | | 8,093 | | | 161,831 |
| | | | | |
| | | | | |
| | | Shares or Principal Amount | | Value |
| | | | | |
FINLAND (continued) | | | | | |
Miscellaneous Manufacturing (0.0%) | | | |
Uponor OYJ (c) (d) | | 9,334 | | $ | 282,980 |
Wartsila OYJ (c) | | 5,643 | | | 259,099 |
| | | | | |
| | | | | 542,079 |
| | | | | |
Oil & Gas (0.0%) | | | | | |
Neste Oil OYJ (c) | | 22,924 | | | 731,214 |
| | | | | |
Telecommunications (0.8%) | | | | | |
Elisa OYJ (c) | | 14,043 | | | 354,696 |
Nokia OYJ (c) (d) | | 672,239 | | | 13,359,810 |
| | | | | |
| | | | | 13,714,506 |
| | | | | |
Transportation (0.0%) | | | | | |
Cargotec Corp. (c) | | 6,072 | | | 276,152 |
| | | | | |
| | | | | 28,385,552 |
| | | | | |
FRANCE (9.3%) | | | | | |
Advertising (0.1%) | | | | | |
PagesJaunes Groupe SA | | 12,947 | | | 388,588 |
Publicis Groupe (c) | | 18,759 | | | 724,406 |
| | | | | |
| | | | | 1,112,994 |
| | | | | |
Aerospace & Defense (0.1%) | | | | | |
Safran SA (c) (d) | | 16,311 | | | 368,526 |
Thales SA (c) (d) | | 18,461 | | | 853,035 |
Zodiac SA (c) | | 9,973 | | | 622,643 |
| | | | | |
| | | | | 1,844,204 |
| | | | | |
Airlines (0.0%) | | | | | |
Air France-KLM (c) (d) | | 28,011 | | | 997,518 |
| | | | | |
Apparel (0.0%) | | | | | |
Hermes International (c) | | 8,231 | | | 892,638 |
| | | | | |
Auto Manufacturers (0.2%) | | | | | |
Peugeot SA (c) (d) | | 29,514 | | | 1,693,055 |
Renault SA (c) (d) | | 27,792 | | | 3,246,635 |
| | | | | |
| | | | | 4,939,690 |
| | | | | |
Auto Parts & Equipment (0.1%) | | | |
Compagnie Generale des Etablissements | | 26,681 | | | 2,174,401 |
Michelin (c) (d) | | | | | |
Common Stocks (continued)
| | | | | |
| | | Shares or Principal Amount | | Value |
| | | | | |
FRANCE (continued) | | | | | |
Auto Parts & Equipment (continued) | | | |
Valeo SA (c) (d) | | 18,163 | | $ | 683,412 |
| | | | | |
| | | | | 2,857,813 |
| | | | | |
Banks (1.5%) | | | | | |
BNP Paribas (c) | | 132,629 | | | 14,563,869 |
Credit Agricole SA (c) (d) | | 90,828 | | | 3,858,160 |
Societe Generale (c) (d) | | 59,919 | | | 9,945,774 |
| | | | | |
| | | | | 28,367,803 |
| | | | | |
Beverages (0.1%) | | | | | |
Pernod-Ricard SA (c) (d) | | 12,325 | | | 2,466,915 |
| | | | | |
Building Materials (0.4%) | | | | | |
Cie de Saint-Gobain (c) | | 50,038 | | | 3,686,470 |
Imerys SA (c) (d) | | 2,401 | | | 207,465 |
Lafarge SA (c) (d) | | 25,885 | | | 3,469,514 |
| | | | | |
| | | | | 7,363,449 |
| | | | | |
Chemicals (0.2%) | | | | | |
Air Liquide (c) (d) | | 19,390 | | | 4,120,531 |
| | | | | |
Commercial Services (0.0%) | | | | | |
Societe Des Autoroutes Paris-Rhin-Rhone (c) | | 1,006 | | | 78,060 |
| | | | | |
Computers (0.1%) | | | | | |
Atos Origin SA (b) (c) | | 13,577 | | | 773,709 |
Capgemini SA (c) (d) | | 24,750 | | | 1,403,699 |
| | | | | |
| | | | | 2,177,408 |
| | | | | |
Cosmetics & Personal Care (0.2%) | | | |
L’Oreal SA (c) (d) | | 43,994 | | | 4,274,631 |
| | | | | |
Electric (0.4%) | | | | | |
Suez SA (c) (d) | | 158,294 | | | 7,089,048 |
| | | | | |
Electrical Components & Equipment (0.2%) |
Schneider Electric SA (c) (d) | | 38,685 | | | 4,017,419 |
| | | | | |
Engineering & Construction (0.3%) | | | |
Bouygues (c) (d) | | 35,970 | | | 2,096,588 |
Vinci SA (c) (d) | | 37,228 | | | 4,193,335 |
| | | | | |
| | | | | 6,289,923 |
| | | | | |
| | | | | |
| | | Shares or Principal Amount | | Value |
| | | | | |
FRANCE (continued) | | | | | |
Food (0.6%) | | | | | |
Carrefour SA (c) (d) | | 92,931 | | $ | 5,659,422 |
Casino Guichard Perrachon SA (c) | | 9,269 | | | 786,346 |
Groupe Danone (c) (d) | | 39,160 | | | 5,732,320 |
| | | | | |
| | | | | 12,178,088 |
| | | | | |
Food Service (0.0%) | | | | | |
Sodexho Alliance SA (c) | | 15,200 | | | 815,538 |
| | | | | |
Gas (0.1%) | | | | | |
Gaz de France (c) (d) | | 28,885 | | | 1,161,025 |
| | | | | |
Healthcare – Products (0.1%) | | | | | |
Cie Generale d’Optique Essilor International SA (c) | | 17,012 | | | 1,782,760 |
| | | | | |
Holding Companies – Diversified (0.2%) | | | |
LVMH Moet Hennessy Louis
Vuitton SA (c) | | 37,240 | | | 3,878,127 |
| | | | | |
Home Furnishings (0.0%) | | | | | |
Thomson (c) (d) | | 53,336 | | | 919,849 |
| | | | | |
Household Products (0.0%) | | | | | |
Societe BIC SA (c) | | 1,214 | | | 77,990 |
| | | | | |
Insurance (0.6%) | | | | | |
AXA SA (c) | | 270,264 | | | 10,280,000 |
CNP Assurances (c) (d) | | 4,517 | | | 474,495 |
Scor (c) (d) | | 176,262 | | | 442,725 |
| | | | | |
| | | | | 11,197,220 |
| | | | | |
Lodging (0.1%) | | | | | |
Accor SA (c) (d) | | 37,389 | | | 2,593,085 |
| | | | | |
Machinery – Diversified (0.1%) | | | |
Alstom RGPT (b) (c) | | 16,307 | | | 1,501,213 |
| | | | | |
Manufacturing (0.1%) | | | | | |
Vallourec SA (c) (d) | | 7,100 | | | 1,764,557 |
| | | | | |
Media (0.5%) | | | | | |
Lagardere SCA (c) (d) | | 23,246 | | | 1,672,176 |
M6-Metropole Television (c) | | 3,504 | | | 108,400 |
Societe Television Francaise 1 (c) | | 24,263 | | | 823,015 |
Statement of Investments (Continued)
October 31, 2006
Gartmore International Index Fund (Continued)
Common Stocks (continued)
| | | | | |
| | | Shares or Principal Amount | | Value |
| | | | | |
FRANCE (continued) | | | | | |
Media (continued) | | | | | |
Vivendi SA (c) (d) | | 187,010 | | $ | 7,084,119 |
| | | | | |
| | | | | 9,687,710 |
| | | | | |
Office & Business Equipment (0.0%) | | | |
Neopost SA (c) | | 3,808 | | | 464,809 |
| | | | | |
Oil & Gas (1.2%) | | | | | |
Technip SA (c) | | 17,713 | | | 1,068,703 |
Total SA (c) (d) | | 353,092 | | | 23,881,231 |
| | | | | |
| | | | | 24,949,934 |
| | | | | |
Pharmaceuticals (0.7%) | | | | | |
Sanofi-Aventis (c) (d) | | 162,882 | | | 13,867,364 |
| | | | | |
Real Estate Investment Trusts (0.1%) | | | |
Gecina SA (c) | | 1,440 | | | 204,259 |
Klepierre (c) (d) | | 3,641 | | | 548,933 |
Unibail (c) (d) | | 7,270 | | | 1,581,809 |
| | | | | |
| | | | | 2,335,001 |
| | | | | |
Retail (0.1%) | | | | | |
PPR SA (c) (d) | | 11,503 | | | 1,715,104 |
| | | | | |
Semiconductors (0.1%) | | | | | |
STMicroelectronics NV (c) | | 121,785 | | | 2,106,681 |
| | | | | |
Software (0.1%) | | | | | |
Business Objects SA (b) (c) | | 22,196 | | | 818,307 |
Dassault Systemes SA (c) | | 5,273 | | | 286,158 |
| | | | | |
| | | | | 1,104,465 |
| | | | | |
Telecommunications (0.5%) | | | | | |
Alcatel SA (c) | | 222,473 | | | 2,823,732 |
France TeleCom SA (c) | | 264,717 | | | 6,892,609 |
| | | | | |
| | | | | 9,716,341 |
| | | | | |
Water (0.2%) | | | | | |
Veolia Environnement (c) (d) | | 50,860 | | | 3,111,913 |
| | | | | |
| | | | | 185,818,818 |
| | | | | |
GERMANY (7.0%) | | | | | |
Airlines (0.1%) | | | | | |
Deutsche Lufthansa AG (c) | | 46,074 | | | 1,062,812 |
| | | | | |
| | | | | |
| | | Shares or Principal Amount | | Value |
| | | | | |
GERMANY (continued) | | | | | |
Apparel (0.1%) | | | | | |
Adidas AG (c) | | 38,347 | | $ | 1,922,059 |
Puma AG Rudolf Dassler Sport (c) | | 2,321 | | | 825,502 |
| | | | | |
| | | | | 2,747,561 |
| | | | | |
Auto Manufacturers (0.7%) | | | | | |
DaimlerChrysler AG (c) | | 144,063 | | | 8,196,514 |
Porsche AG (c) | | 1,512 | | | 1,764,971 |
Volkswagen AG (c) | | 13,406 | | | 853,105 |
Volkswagen AG (c) (d) | | 30,176 | | | 2,963,845 |
| | | | | |
| | | | | 13,778,435 |
| | | | | |
Auto Parts & Equipment (0.1%) | | | |
Continental AG (c) | | 23,628 | | | 2,645,684 |
| | | | | |
Banks (0.8%) | | | | | |
Commerzbank AG (c) (d) | | 109,372 | | | 3,878,549 |
Deutsche Bank AG (c) | | 81,699 | | | 10,309,205 |
Deutsche Postbank AG (c) | | 8,311 | | | 618,320 |
Hypo Real Estate Holding AG (c) | | 23,885 | | | 1,504,633 |
Jyske Bank (b) (c) (d) | | 5,850 | | | 348,363 |
| | | | | |
| | | | | 16,659,070 |
| | | | | |
Chemicals (0.7%) | | | | | |
BASF AG (c) | | 84,242 | | | 7,409,252 |
Bayer AG (c) (d) | | 116,943 | | | 5,860,685 |
| | | | | |
| | | | | 13,269,937 |
| | | | | |
Computers (0.0%) | | | | | |
Wincor Nixdorf AG (c) | | 3,890 | | | 539,769 |
| | | | | |
Cosmetics & Personal Care (0.0%) | | | |
Beiersdorf AG (c) | | 3,962 | | | 224,997 |
| | | | | |
Electric (1.1%) | | | |
E. ON AG (c) | | 100,487 | | | 12,055,425 |
RWE AG (c) | | 73,947 | | | 7,302,908 |
| | | | | |
| | | | | 19,358,333 |
| | | | | |
Energy (0.0%) | | | |
Solarworld AG (c) (d) | | 8,096 | | | 437,862 |
| | | | | |
Common Stocks (continued)
| | | | | |
| | | Shares or Principal Amount | | Value |
| | | | | |
GERMANY (continued) | | | | | |
Engineering & Construction (0.1%) | | | |
Bilfinger Berger AG (c) | | 2,427 | | $ | 151,385 |
Hochtief AG (c) | | 9,600 | | | 626,156 |
Linde AG (c) (d) | | 19,278 | | | 1,910,811 |
| | | | | |
| | | | | 2,688,352 |
| | | | | |
Financial Services (0.2%) | | | |
Deutsche Boerse AG (c) | | 18,245 | | | 2,937,712 |
MLP AG (c) (d) | | 9,484 | | | 182,961 |
| | | | | |
| | | | | 3,120,673 |
| | | | | |
Food (0.1%) | | | |
Metro AG (c) | | 22,106 | | | 1,315,670 |
Suedzucker AG (c) (d) | | 1,963 | | | 48,507 |
| | | | | |
| | | | | 1,364,177 |
| | | | | |
Healthcare – Services (0.1%) | | | |
Fresenius Medical Care AG (c) | | 8,482 | | | 1,129,200 |
| | | | | |
Household Products (0.1%) | | | |
Henkel KGaA (c) (d) | | 9,163 | | | 1,227,573 |
| | | | | |
Insurance (0.9%) | | | |
Allianz AG (c) | | 64,179 | | | 11,884,576 |
Muenchener Rueckversicherungs AG (c) | | 32,925 | | | 5,336,853 |
| | | | | |
| | | | | 17,221,429 |
| | | | | |
Iron & Steel (0.1%) | | | |
Salzgitter AG (c) | | 4,404 | | | 472,587 |
ThyssenKrupp AG (c) | | 65,887 | | | 2,449,064 |
| | | | | |
| | | | | 2,921,651 |
| | | | | |
Leisure (0.0%) | | | |
TUI AG (c) (d) | | 45,721 | | | 998,839 |
| | | | | |
Machinery – Diversified (0.1%) | | | |
Heidelberger Druckmaschinen (c) | | 4,650 | | | 212,358 |
MAN AG (c) (d) | | 23,606 | | | 2,097,276 |
Rheinmetall AG (c) | | 2,706 | | | 195,524 |
| | | | | |
| | | | | 2,505,158 |
| | | | | |
| | | | | |
| | | Shares or Principal Amount | | Value |
| | | | | |
GERMANY (continued) | | | | | |
Media (0.0%) | | | |
Premiere AG (b) (c) (d) | | 23,917 | | $ | 362,577 |
| | | | | |
Miscellaneous Manufacturing (0.6%) | | | |
Siemens AG (c) | | 135,456 | | | 12,167,148 |
| | | | | |
Pharmaceuticals (0.1%) | | | |
Altana AG (c) | | 15,904 | | | 887,775 |
Celesio AG (c) | | 9,576 | | | 495,384 |
Merck KGaA (c) | | 10,775 | | | 1,138,059 |
| | | | | |
| | | | | 2,521,218 |
| | | | | |
Real Estate (0.0%) | | | |
IVG Immobilien AG (c) | | 11,079 | | | 402,136 |
| | | | | |
Retail (0.0%) | | | |
Douglas Holding AG (c) | | 2,452 | | | 118,615 |
KarstadtQuelle AG (b) (c) (d) | | 17,196 | | | 401,653 |
| | | | | |
| | | | | 520,268 |
| | | | | |
Semiconductors (0.1%) | | | |
Infineon Technologies AG (b) (c) | | 142,438 | | | 1,730,910 |
| | | | | |
Software (0.3%) | | | |
SAP AG (c) | | 34,664 | | | 6,883,120 |
| | | | | |
Telecommunications (0.4%) | | | |
Deutsche Telekom AG (c) (d) | | 448,335 | | | 7,794,644 |
| | | | | |
Transportation (0.2%) | | | |
Deutsche Post AG (c) | | 124,186 | | | 3,431,925 |
Frontline Ltd. (c) (d) | | 12,086 | | | 458,766 |
| | | | | |
| | | | | 3,890,691 |
| | | | | |
| | | | | 140,174,224 |
| | | | | |
GREECE (0.6%) | | | |
Banks (0.4%) | | | |
Alpha Bank AE (c) | | 67,364 | | | 1,957,264 |
EFG Eurobank Ergasias SA (c) | | 31,477 | | | 1,046,103 |
National Bank of Greece SA (c) | | 67,912 | | | 3,077,914 |
Piraeus Bank SA (c) | | 44,267 | | | 1,262,119 |
| | | | | |
| | | | | 7,343,400 |
| | | | | |
Statement of Investments (Continued)
October 31, 2006
Gartmore International Index Fund (Continued)
Common Stocks (continued)
| | | | | |
| | | Shares or Principal Amount | | Value |
| | | | | |
GREECE (continued) | | | |
Beverages (0.0%) | | | |
Coca Cola Hellenic Bottling Co. SA (c) | | 10,783 | | $ | 352,716 |
| | | | | |
Building & Construction (0.0%) | | | |
Technical Olympic SA (c) | | 12,941 | | | 45,160 |
| | | | | |
Building Materials (0.0%) | | | |
Titan Cement Co. SA (c) | | 4,893 | | | 256,535 |
| | | | | |
Electric (0.0%) | | | |
Public Power Corp. (c) | | 24,370 | | | 622,127 |
| | | | | |
Engineering & Construction (0.0%) | | | |
Hellenic Technodomiki Tev SA (c) | | 18,730 | | | 188,997 |
| | | | | |
Entertainment (0.1%) | | | |
OPAP SA (c) | | 40,394 | | | 1,439,002 |
| | | | | |
Financial Services (0.0%) | | | |
Hellenic Exchanges Holding SA (c) | | 195 | | | 3,421 |
| | | | | |
Holding Companies – Diversified (0.0%) | | | |
Viohal Co. (c) | | 644 | | | 7,447 |
| | | | | |
Oil & Gas (0.0%) | | | |
Hellenic Petroleum SA (c) | | 1,116 | | | 14,316 |
| | | | | |
Retail (0.0%) | | | |
Folli-Follie SA (c) | | 1,393 | | | 41,932 |
Germanos SA (c) | | 17,330 | | | 419,026 |
| | | | | |
| | | | | 460,958 |
| | | | | |
Telecommunications (0.1%) | | | |
Cosmote Mobile TeleCommunications SA (c) | | 17,456 | | | 430,184 |
Hellenic TeleCommunications Organization SA (b) (c) | | 51,551 | | | 1,334,222 |
Intracom SA (b) (c) | | 13,953 | | | 97,007 |
| | | | | |
| | | | | 1,861,413 |
| | | | | |
| | | | | 12,595,492 |
| | | | | |
| | | | | |
| | | Shares or Principal Amount | | Value |
| | | | | |
HONG KONG (1.6%) | | | |
Airlines (0.0%) | | | |
Cathay Pacific Airways Ltd. (c) (d) | | 95,000 | | $ | 207,418 |
| | | | | |
Apparel (0.0%) | | | |
Yue Yuen Industrial Holdings (c) | | 36,500 | | | 110,290 |
| | | | | |
Banks (0.3%) | | | |
Bank of East Asia Ltd. (c) | | 215,900 | | | 1,030,354 |
BOC Hong Kong Holdings Ltd. (c) | | 683,100 | | | 1,526,490 |
Hang Seng Bank Ltd. (c) (d) | | 106,400 | | | 1,354,239 |
Hkd Wing Hang Bank Ltd. (c) | | 6,500 | | | 63,196 |
SunCorp.-Metway Ltd. (c) | | 95,065 | | | 1,529,648 |
| | | | | |
| | | | | 5,503,927 |
| | | | | |
Broadcasting & Television (0.0%) | | | |
Television Broadcasts Ltd. (c) | | 16,000 | | | 91,682 |
| | | | | |
Building & Construction (0.0%) | | | |
Cheung Kong Infrastructure Holdings Ltd. (c) | | 2,500 | | | 7,495 |
| | | | | |
Chemicals (0.0%) | | | | | |
Kingboard Chemical Holdings Ltd. (c) | | 67,548 | | | 239,718 |
| | | | | |
Distribution & Wholesale (0.1%) | | | |
Esprit Holdings Ltd. (c) | | 182,500 | | | 1,765,817 |
Li & Fung Ltd. (c) (d) | | 445,600 | | | 1,163,299 |
| | | | | |
| | | | | 2,929,116 |
| | | | | |
Electric (0.1%) | | | | | |
CLP Holdings Ltd. (c) | | 269,000 | | | 1,708,649 |
HongKong Electric Holdings (c) | | 203,300 | | | 956,274 |
| | | | | |
| | | | | 2,664,923 |
| | | | | |
Electrical Components & Equipment (0.0%) |
Johnson Electric Holdings Ltd. (c) | | 205,500 | | | 161,842 |
| | | | | |
Financial Services (0.1%) | | | | | |
Hong Kong Exchanges & Clearing Ltd. (c) | | 204,000 | | | 1,611,464 |
| | | | | |
Common Stocks (continued)
| | | | | |
| | | Shares or Principal Amount | | Value |
| | | | | |
HONG KONG (continued) | | | |
Gas (0.1%) | | | | | |
Hong Kong & China Gas (c) | | 525,600 | | $ | 1,203,512 |
| | | | | |
Hand & Machine Tools (0.0%) | | | |
Techtronic Industries Co. (c) | | 45,310 | | | 64,118 |
| | | | | |
Holding Companies – Diversified (0.3%) | | | |
Hutchison Whampoa Ltd. (c) | | 365,500 | | | 3,240,254 |
MelCo International Development (c) | | 43,344 | | | 106,000 |
Swire Pacific Ltd. (c) | | 172,500 | | | 1,821,182 |
Wharf Holdings Ltd. (c) (d) | | 123,300 | | | 417,929 |
| | | | | |
| | | | | 5,585,365 |
| | | | | |
Lodging (0.0%) | | | | | |
ShanGri-La Asia Ltd. (c) | | 98,000 | | | 212,549 |
| | | | | |
Real Estate (0.5%) | | | | | |
Cheung Kong Holdings Ltd. (c) | | 263,000 | | | 2,857,903 |
Hang Lung Properties Ltd. (c) | | 380,000 | | | 826,352 |
Henderson Land Development Co. Ltd. (c) (d) | | 101,800 | | | 559,584 |
Hopewell Holdings (c) | | 75,569 | | | 224,385 |
Hysan Development Co. Ltd. (c) | | 22,673 | | | 57,064 |
Kerry Properties Ltd. (c) | | 20,500 | | | 75,478 |
New World Development Ltd. (c) | | 434,679 | | | 742,838 |
Sino Land Co. (c) (d) | | 306,000 | | | 532,004 |
Sun Hung Kai Properties Ltd. (c) | | 239,700 | | | 2,617,818 |
| | | | | |
| | | | | 8,493,426 |
| | | | | |
Real Estate Investment Trusts (0.0%) | | | |
Link REIT (The) (c) | | 433,051 | | | 889,617 |
| | | | | |
Retail (0.0%) | | | | | |
Giordano International Ltd. (c) | | 238,400 | | | 119,221 |
| | | | | |
Semiconductors (0.0%) | | | | | |
ASM Pacific Technology Ltd. (c) (d) | | 27,300 | | | 141,375 |
Solomon Systech International Ltd. (c) (d) | | 313,000 | | | 54,668 |
| | | | | |
| | | | | 196,043 |
| | | | | |
| | | | | |
| | | Shares or Principal Amount | | Value |
| | | | | |
HONG KONG (continued) | | | |
Telecommunications (0.1%) | | | | | |
FoxConn International Holdings Ltd. (b) (c) (d) | | 265,330 | | $ | 879,836 |
Hutchison TeleCommunications International Ltd. (b) (c) | | 149,642 | | | 287,907 |
PCCW Ltd. (c) (d) | | 531,200 | | | 325,902 |
| | | | | |
| | | | | 1,493,645 |
| | | | | |
Textiles (0.0%) | | | | | |
Texwinca Holdings Ltd. (c) | | 2,000 | | | 1,308 |
| | | | | |
Transportation (0.0%) | | | | | |
MTR Corp. (c) | | 114,714 | | | 275,174 |
Orient Overseas International (c) | | 34,438 | | | 149,990 |
| | | | | |
| | | | | 425,164 |
| | | | | |
| | | | | 32,211,843 |
| | | | | |
IRELAND (0.8%) | | | | | |
Airlines (0.0%) | | | | | |
Ryanair Holdings PLC (b) (c) | | 3,804 | | | 43,028 |
| | | | | |
Banks (0.4%) | | | | | |
Allied Irish Banks PLC (c) | | 149,896 | | | 4,054,954 |
Bank of Ireland (c) | | 834 | | | 16,677 |
Bank of Ireland (c) | | 159,160 | | | 3,182,618 |
Depfa Bank PLC (c) | | 45,452 | | | 764,271 |
| | | | | |
| | | | | 8,018,520 |
| | | | | |
Beverages (0.1%) | | | | | |
C&C Group PLC (c) | | 66,299 | | | 1,101,199 |
| | | | | |
Building Materials (0.2%) | | | | | |
CRH PLC (c) | | 95,292 | | | 3,365,480 |
Kingspan Group PLC (c) | | 23,738 | | | 503,573 |
| | | | | |
| | | | | 3,869,053 |
| | | | | |
Casino & Gambling (0.0%) | | | | | |
Paddy Power PLC (c) | | 10,418 | | | 194,624 |
| | | | | |
Consumer Products (0.0%) | | | | | |
Waterford Wedgewood PLC (b) (c) | | 357 | | | 35 |
| | | | | |
Statement of Investments (Continued)
October 31, 2006
Gartmore International Index Fund (Continued)
Common Stocks (continued)
| | | | | |
| | | Shares or Principal Amount | | Value |
| | | | | |
IRELAND (continued) | | | | | |
Financial Services (0.1%) | | | | | |
Irish Life & Permanent PLC (c) | | 43,029 | | $ | 1,057,279 |
| | | | | |
Food (0.0%) | | | | | |
GreenCore Group PLC (c) | | 43,087 | | | 219,423 |
Iaws Group PLC (c) | | 13,545 | | | 297,852 |
Kerry Group PLC (c) | | 18,897 | | | 456,163 |
| | | | | |
| | | | | 973,438 |
| | | | | |
Food Products (0.0%) | | | | | |
Fyffes PLC (c) | | 1,209 | | | 2,614 |
| | | | | |
Holding Companies – Diversified (0.0%) | | | |
DCC PLC (c) | | 4,050 | | | 109,552 |
| | | | | |
Media (0.0%) | | | | | |
Independent News & Media PLC (c) | | 18,427 | | | 61,868 |
| | | | | |
Pharmaceuticals (0.0%) | | | | | |
Elan Corp. PLC (b) (c) | | 60,965 | | | 880,579 |
| | | | | |
Retail (0.0%) | | | | | |
Grafton Group PLC (b) (c) | | 39,192 | | | 574,434 |
| | | | | |
| | | | | 16,886,223 |
| | | | | |
ITALY (3.7%) | | | | | |
Aerospace & Defense (0.1%) | | | | | |
Finmeccanica SpA (c) | | 47,130 | | | 1,130,500 |
| | | | | |
Apparel (0.0%) | | | | | |
Benetton Group SpA (c) | | 1,257 | | | 23,773 |
| | | | | |
Auto Manufacturers (0.1%) | | | | | |
Fiat SpA (b) (c) (d) | | 102,707 | | | 1,808,352 |
| | | | | |
Auto Parts & Equipment (0.0%) | | | |
Pirelli & C SpA (c) | | 741,037 | | | 676,249 |
| | | | | |
Banks (1.4%) | | | | | |
Banca Intesa SpA (c) | | 116,952 | | | 774,727 |
Banca Intesa SpA (c) (d) | | 628,751 | | | 4,294,408 |
Banca Monte dei Paschi di Siena SpA (c) (d) | | 143,234 | | | 878,225 |
| | | | | |
| | | Shares or Principal Amount | | Value |
| | | | | |
ITALY (continued) | | | | | |
Banks (continued) | | | | | |
Banca Popolare di Milano SCRL (c) (d) | | 84,161 | | $ | 1,244,897 |
Banca Popolare di Verona e Novara SCRL (c) (d) | | 70,262 | | | 1,890,040 |
Banche Popolari Unite SCPA (c) | | 60,475 | | | 1,659,909 |
Capitalia SpA (c) | | 267,571 | | | 2,363,684 |
Sanpaolo IMI SpA (c) (d) | | 190,663 | | | 4,067,238 |
UniCredito Italiano SpA (c) | | 1,232,515 | | | 10,211,922 |
| | | | | |
| | | | | 27,385,050 |
| | | | | |
Building Materials (0.0%) | | | |
Italcementi SpA (c) (d) | | 2,630 | | | 69,596 |
| | | | | |
Commercial Services (0.1%) | | | |
Autostrade SpA (c) | | 54,531 | | | 1,612,777 |
| | | | | |
Electric (0.4%) | | | |
Enel SpA (c) (d) | | 693,151 | | | 6,637,453 |
Terna SpA (c) (d) | | 240,435 | | | 729,803 |
| | | | | |
| | | | | 7,367,256 |
| | | | | |
Entertainment (0.0%) | | | |
Lottomatica SpA (c) | | 3,489 | | | 126,929 |
| | | | | |
Financial Services (0.1%) | | | |
Mediobanca SpA (c) (d) | | 83,276 | | | 1,932,227 |
| | | | | |
Gas (0.0%) | | | |
Snam Rete Gas SpA (c) (d) | | 196,021 | | | 998,047 |
| | | | | |
Healthcare-Products (0.0%) | | | |
Luxottica Group SpA (c) | | 14,796 | | | 457,181 |
| | | | | |
Insurance (0.4%) | | | |
Alleanza Assicurazioni SpA (c) (d) | | 86,104 | | | 1,019,174 |
Assicurazioni Generali SpA (c) (d) | | 160,117 | | | 6,348,790 |
Fondiaria-Sai SpA (c) | | 6,532 | | | 290,543 |
Mediolanum SpA (c) (d) | | 41,088 | | | 323,354 |
Unipol SpA (c) | | 70,153 | | | 215,386 |
| | | | | |
| | | | | 8,197,247 |
| | | | | |
Common Stocks (continued)
| | | | | |
| | | Shares or Principal Amount | | Value |
| | | | | |
ITALY (continued) | | | | | |
Media (0.1%) | | | |
Gruppo Editoriale L’Espresso SpA (c) (d) | | 7,002 | | $ | 35,199 |
Mediaset SpA (c) | | 147,950 | | | 1,658,092 |
Seat Pagine Gialle SpA (c) (d) | | 205,852 | | | 114,546 |
| | | | | |
| | | | | 1,807,837 |
| | | | | |
Oil & Gas (0.6%) | | | |
Eni SpA (c) (d) | | 420,281 | | | 12,711,310 |
Eni SpA ADR | | 200 | | | 12,142 |
| | | | | |
| | | | | 12,723,452 |
| | | | | |
Publishing (0.0%) | | | |
Mondadori (Arnoldo) Editore SpA (c) | | 1,017 | | | 9,900 |
| | | | | |
Retail (0.0%) | | | |
Autogrill SpA (c) (d) | | 28,866 | | | 495,718 |
Bulgari SpA (c) (d) | | 23,800 | | | 332,344 |
| | | | | |
| | | | | 828,062 |
| | | | | |
Telecommunications (0.4%) | | | |
TeleCom Italia SpA (c) | | 1,807,518 | | | 5,474,090 |
TeleCom Italia SpA (c) | | 894,770 | | | 2,259,745 |
Tiscali SpA (b) (c) (d) | | 91,354 | | | 276,801 |
| | | | | |
| | | | | 8,010,636 |
| | | | | |
| | | | | 75,165,071 |
| | | | | |
JAPAN (22.4%) | | | |
Advertising (0.0%) | | | |
Asatsu-DK, Inc. (c) (d) | | 200 | | | 5,862 |
Dentsu, Inc. (c) (d) | | 244 | | | 671,999 |
Hakuhodo DY Holdings, Inc. (c) | | 1,100 | | | 64,583 |
| | | | | |
| | | | | 742,444 |
| | | | | |
Agriculture (0.2%) | | | |
Japan Tobacco, Inc. (c) | | 742 | | | 3,229,937 |
| | | | | |
Airlines (0.0%) | | | |
All Nippon Airways Co. Ltd. (c) (d) | | 75,000 | | | 293,666 |
Japan Airlines Corp. (b) (c) (d) | | 280,000 | | | 533,786 |
| | | | | |
| | | | | 827,452 |
| | | | | |
| | | | | |
| | | Shares or Principal Amount | | Value |
| | | | | |
JAPAN (continued) | | | |
Apparel (0.0%) | | | |
Asics Corp. (c) (d) | | 8,000 | | $ | 107,225 |
Gunze Ltd. (c) | | 63,000 | | | 331,184 |
Onward Kashiyama Co. Ltd. (c) (d) | | 30,400 | | | 416,359 |
Wacoal Corp. (c) (d) | | 4,000 | | | 48,351 |
| | | | | |
| | | | | 903,119 |
| | | | | |
Auto Manufacturers (2.1%) | | | |
Hino Motors Ltd. (c) (d) | | 72,000 | | | 355,239 |
Honda Motor Co. Ltd. (c) | | 243,700 | | | 8,602,701 |
Nissan Motor Co. Ltd. (c) | | 343,600 | | | 4,107,745 |
Toyota Motor Corp. (c) | | 461,900 | | | 27,276,609 |
| | | | | |
| | | | | 40,342,294 |
| | | | | |
Auto Parts & Equipment (0.4%) | | | |
Aisin Seiki Co. Ltd. (c) (d) | | 32,800 | | | 1,007,967 |
Bridgestone Corp. (c) | | 103,400 | | | 2,153,930 |
Denso Corp. (c) | | 79,400 | | | 3,027,406 |
JTEKT Corp. (c) (d) | | 19,700 | | | 409,717 |
NGK Spark Plug Co. Ltd. (c) (d) | | 36,000 | | | 757,298 |
NOK Corp. (c) (d) | | 10,500 | | | 275,381 |
Sumitomo Rubber Industries, Inc. (c) (d) | | 48,300 | | | 553,998 |
Toyoda Gosei Co. Ltd. (c) | | 2,100 | | | 48,649 |
| | | | | |
| | | | | 8,234,346 |
| | | | | |
Automotive (0.0%) | | | |
NHK Spring Co. Ltd. (c) (d) | | 41,000 | | | 452,534 |
| | | | | |
Banks (2.7%) | | | |
77 Bank Ltd. (The) (c) | | 23,300 | | | 152,955 |
Bank of Fukuoka Ltd. (The) (c) (d) | | 84,600 | | | 673,441 |
Bank of Kyoto Ltd. (c) (d) | | 20,000 | | | 205,190 |
Bank of Yokohama Ltd. (The) (c) | | 207,000 | | | 1,595,099 |
Chiba Bank Ltd. (The) (c) | | 114,300 | | | 1,023,017 |
Gunma Bank Ltd. (The) (c) | | 30,000 | | | 209,367 |
Hokuhoku Financial Group, Inc. (c) (d) | | 128,900 | | | 479,628 |
Joyo Bank Ltd. (The) (c) | | 70,000 | | | 408,756 |
Mitsubishi UFJ Financial Group, Inc. (c) | | 1,356 | | | 17,201,943 |
Mitsui Trust Holdings, Inc. (c) | | 99,400 | | | 1,166,267 |
Mizuho Financial Group, Inc. (c) | | 1,503 | | | 11,684,253 |
Statement of Investments (Continued)
October 31, 2006
Gartmore International Index Fund (Continued)
Common Stocks (continued)
| | | | | |
| | | Shares or Principal Amount | | Value |
| | | | | |
JAPAN (continued) | | | |
Banks (continued) | | | |
Nishi-Nippon City Bank Ltd. (The) (c) | | 38,000 | | $ | 180,302 |
Resona Holdings, Inc. (c) (d) | | 647 | | | 1,964,015 |
Sapporo Hokuyo Holdings, Inc. (c) | | 28 | | | 280,685 |
Shinsei Bank Ltd. (c) | | 258,000 | | | 1,487,814 |
Shizuoka Bank Ltd. (The) (c) (d) | | 105,000 | | | 1,121,384 |
Sumitomo Mitsui Financial Group, Inc. (c) | | 965 | | | 10,547,144 |
Sumitomo Trust & Banking Co. Ltd. (The) (c) | | 189,000 | | | 2,027,797 |
Suruga Bank Ltd. (c) | | 15,000 | | | 186,633 |
| | | | | |
| | | | | 52,595,690 |
| | | | | |
Beverages (0.1%) | | | |
Asahi Breweries Ltd. (c) (d) | | 69,200 | | | 986,247 |
Ito En Ltd. (c) (d) | | 3,200 | | | 101,461 |
Kirin Brewery Co. Ltd. (c) (d) | | 108,000 | | | 1,436,547 |
Takara Shuzo Co. Ltd. (c) (d) | | 61,800 | | | 386,230 |
| | | | | |
| | | | | 2,910,485 |
| | | | | |
Brewery (0.0%) | | | |
Sapporo Holdings Ltd. (c) (d) | | 78,000 | | | 400,244 |
| | | | | |
Building & Construction (0.0%) | | | |
Central Glass Co. Ltd. (c) | | 5,000 | | | 27,717 |
Okumura Corp. (c) (d) | | 27,000 | | | 136,376 |
Toda Corp. (c) (d) | | 44,000 | | | 193,194 |
| | | | | |
| | | | | 357,287 |
| | | | | |
Building Materials (0.3%) | | | |
Asahi Glass Co. Ltd. (c) (d) | | 134,600 | | | 1,547,394 |
Daikin Industries Ltd. (c) (d) | | 41,600 | | | 1,172,954 |
JS Group Corp. (c) (d) | | 32,000 | | | 656,130 |
Matsushita Electric Works Ltd. (c) (d) | | 38,284 | | | 429,938 |
Nippon Sheet Glass Co. Ltd. (c) (d) | | 111,000 | | | 497,991 |
Sanwa Shutter Corp. (c) | | 39,000 | | | 223,299 |
Sumitomo Osaka Cement Co. Ltd. (c) | | 120,400 | | | 353,556 |
Taiheiyo Cement Corp. (c) | | 118,000 | | | 473,969 |
| | | | | |
| | | | | 5,355,231 |
| | | | | |
| | | | | |
| | | Shares or Principal Amount | | Value |
| | | | | |
JAPAN (continued) | | | |
Chemicals (0.8%) | | | |
Asahi Kasei Corp. (c) | | 160,200 | | $ | 1,020,759 |
Daicel Chemical Industries Ltd. (c) (d) | | 15,000 | | | 99,313 |
Dainippon Ink & Chemicals, Inc. (c) (d) | | 41,000 | | | 154,785 |
Denki Kagaku Kogyo KK (c) | | 25,000 | | | 94,994 |
Hitachi Chemical Co. Ltd. (c) (d) | | 7,700 | | | 198,921 |
JSR Corp. (c) (d) | | 31,300 | | | 786,150 |
Kaneka Corp. (c) | | 43,500 | | | 419,866 |
Kansai Paint Co. Ltd. (c) | | 30,000 | | | 250,895 |
Mitsubishi Chemical Holdings Corp. (c) | | 153,000 | | | 976,981 |
Mitsubishi Gas Chemical Co., Inc. (c) | | 41,000 | | | 390,402 |
Mitsui Chemicals, Inc. (c) | | 123,100 | | | 843,680 |
Nippon Kayaku Co. Ltd. (c) | | 21,000 | | | 169,481 |
Nippon Shokubai Co. Ltd. (c) (d) | | 16,200 | | | 173,319 |
Nissan Chemical Industries Ltd. (c) (d) | | 40,000 | | | 512,903 |
Nitto Denko Corp. (c) (d) | | 30,610 | | | 1,742,064 |
Shin-Etsu Chemical Co. Ltd. (c) | | 66,200 | | | 4,340,207 |
Showa Denko KK (c) (d) | | 224,000 | | | 974,983 |
Sumitomo Bakelite Co. Ltd. (c) | | 26,300 | | | 199,185 |
Sumitomo Chemical Co. Ltd. (c) | | 207,200 | | | 1,474,861 |
Tokuyama Corp. (c) (d) | | 49,000 | | | 614,573 |
Tosoh Corp. (c) | | 119,000 | | | 501,601 |
Ube Industries Ltd. (c) (d) | | 204,000 | | | 600,537 |
Zeon Corp. (c) | | 10,000 | | | 101,018 |
| | | | | |
| | | | | 16,641,478 |
| | | | | |
Commercial Services (0.3%) | | | |
Benesse Corp. (c) (d) | | 3,900 | | | 139,885 |
Dai Nippon Printing Co. Ltd. (c) (d) | | 113,700 | | | 1,691,988 |
Goodwill Group, Inc. (The) (c) (d) | | 433 | | | 250,336 |
KK Davinci Advisors (b) (c) (d) | | 351 | | | 383,395 |
Meitec Corp. (c) (d) | | 5,400 | | | 170,223 |
Park24 Co. Ltd. (c) (d) | | 25,800 | | | 374,949 |
Secom Co. Ltd. (c) | | 38,500 | | | 1,924,793 |
TIS, Inc. (c) (d) | | 5,600 | | | 123,951 |
Toppan Printing Co. Ltd. (c) (d) | | 99,000 | | | 1,083,893 |
| | | | | |
| | | | | 6,143,413 |
| | | | | |
Common Stocks (continued)
| | | | | |
| | | Shares or Principal Amount | | Value |
| | | | | |
JAPAN (continued) | | | |
Computers (0.3%) | | | |
Access Co. Ltd. (b) (c) (d) | | 51 | | $ | 339,339 |
CSK Holdings Corp. (c) (d) | | 14,100 | | | 627,785 |
Fujitsu Ltd. (c) | | 273,100 | | | 2,225,166 |
NEC Electronics Corp. (b) (c) (d) | | 5,200 | | | 165,943 |
NET One Systems Co. Ltd. (c) (d) | | 134 | | | 204,689 |
Obic Co. Ltd. (c) | | 100 | | | 21,209 |
Oracle Corp. (c) (d) | | 1,200 | | | 55,918 |
Otsuka Corp (c) (d) | | 600 | | | 65,799 |
TDK Corp. (c) | | 23,200 | | | 1,810,245 |
| | | | | |
| | | | | 5,516,093 |
| | | | | |
Cosmetics & Personal Care (0.2%) | | | |
Aderans Co. Ltd. (c) (d) | | 12,500 | | | 289,466 |
Kao Corp. (c) | | 81,200 | | | 2,132,797 |
Shiseido Co. Ltd. (c) | | 67,700 | | | 1,318,097 |
Uni-Charm Corp. (c) (d) | | 6,500 | | | 362,301 |
| | | | | |
| | | | | 4,102,661 |
| | | | | |
Distribution & Wholesale (0.7%) | | | |
Canon Marketing Japan, Inc. (c) | | 2,000 | | | 47,362 |
Hitachi High-Technologies Corp. (c) | | 2,200 | | | 65,343 |
Itochu Corp. (c) | | 261,000 | | | 2,077,115 |
Marubeni Corp. (c) (d) | | 259,000 | | | 1,325,890 |
Mitsubishi Corp. (c) | | 230,100 | | | 4,442,816 |
Mitsui & Co. Ltd. (c) (d) | | 268,000 | | | 3,654,668 |
Sojitz Corp. (b) (c) (d) | | 126,467 | | | 418,941 |
Sumitomo Corp. (c) | | 152,000 | | | 1,997,563 |
Toyota Tsusho Corp. (c) | | 23,200 | | | 681,959 |
| | | | | |
| | | | | 14,711,657 |
| | | | | |
Electric (0.8%) | | | |
Chubu Electric Power Co., Inc. (c) | | 110,500 | | | 3,060,411 |
Electric Power Development Co. (c) (d) | | 26,500 | | | 1,102,422 |
Hokkaido Electric Power Co, Inc. (c) | | 19,900 | | | 474,749 |
Kansai Electric Power Co., Inc. (The) (c) | | 113,700 | | | 2,682,948 |
Kyushu Electric Power Co., Inc. (c) | | 56,900 | | | 1,330,610 |
| | | | | |
| | | Shares or Principal Amount | | Value |
| | | | | |
JAPAN (continued) | | | |
Electric (continued) | | | |
Tohoku Electric Power Co., Inc. (c) | | 58,100 | | $ | 1,287,119 |
Tokyo Electric Power Co., Inc. (The) (c) (d) | | 203,400 | | | 5,912,504 |
| | | | | |
| | | | | 15,850,763 |
| | | | | |
Electrical Components & Equipment (0.8%) |
Casio Computer Co. Ltd. (c) (d) | | 47,800 | | | 965,587 |
Fujikura Ltd. (c) (d) | | 48,600 | | | 518,219 |
Furukawa Electric Co. Ltd. (c) (d) | | 124,300 | | | 884,729 |
Hitachi Ltd. (c) | | 501,800 | | | 2,869,304 |
Mitsubishi Electric Corp. (c) | | 283,600 | | | 2,469,652 |
Sanyo Electric Co. Ltd. (b) (c) (d) | | 333,200 | | | 637,304 |
Sharp Corp. (c) (d) | | 173,900 | | | 3,095,840 |
Stanley Electric Co. Ltd. (c) | | 23,500 | | | 465,485 |
Sumitomo Electric Industries Ltd. (c) (d) | | 99,900 | | | 1,412,309 |
Toshiba Corp. (c) (d) | | 502,700 | | | 3,172,920 |
Ushio, Inc. (c) (d) | | 7,500 | | | 156,046 |
| | | | | |
| | | | | 16,647,395 |
| | | | | |
Electronics (1.1%) | | | |
Advantest Corp. (c) (d) | | 30,200 | | | 1,514,992 |
Alps Electric Co. Ltd. (c) (d) | | 42,600 | | | 426,082 |
Dainippon Screen Manufacturing Co. Ltd. (c) (d) | | 45,000 | | | 374,517 |
Fanuc Ltd. (c) | | 25,800 | | | 2,238,507 |
Hirose Electric Co. Ltd. (c) (d) | | 3,700 | | | 493,136 |
Hoya Corp. (c) | | 70,900 | | | 2,739,855 |
Ibiden Co. Ltd. (c) | | 18,900 | | | 988,416 |
Keyence Corp. (c) (d) | | 4,980 | | | 1,101,294 |
Kyocera Corp. (c) | | 28,700 | | | 2,572,243 |
Minebea Co. Ltd. (c) | | 86,000 | | | 523,382 |
Mitsumi Electric Co. Ltd. (c) (d) | | 26,900 | | | 394,020 |
Murata Manufacturing Co. Ltd. (c) (d) | | 30,700 | | | 2,143,679 |
NEC Corp. (c) | | 367,000 | | | 1,890,488 |
NGK Insulators Ltd. (c) (d) | | 27,000 | | | 366,616 |
Nippon Electric Glass Co. Ltd. (c) | | 25,000 | | | 537,206 |
Omron Corp. (c) | | 26,700 | | | 687,882 |
Taiyo Yuden Co. Ltd. (c) (d) | | 32,000 | | | 492,799 |
Tokyo Seimitsu Co. Ltd. (c) (d) | | 10,000 | | | 482,464 |
Statement of Investments (Continued)
October 31, 2006
Gartmore International Index Fund (Continued)
Common Stocks (continued)
| | | | | |
| | | Shares or Principal Amount | | Value |
| | | | | |
JAPAN (continued) | | | |
Electronics (continued) | | | |
Yaskawa Electric Corp. (c) (d) | | 10,000 | | $ | 106,572 |
Yokogawa Electric Corp. (c) (d) | | 44,700 | | | 612,560 |
| | | | | |
| | | | | 20,686,710 |
| | | | | |
Electronics & Electrical Equipment (0.0%) | | | |
Mabuchi Motor Co. Ltd. (c) (d) | | 4,100 | | | 239,001 |
Uniden Corp. (c) (d) | | 18,000 | | | 173,086 |
| | | | | |
| | | | | 412,087 |
| | | | | |
Engineering (0.0%) | | | | | |
COMSYS Holdings Corp. (c) (d) | | 33,227 | | | 351,392 |
| | | | | |
Engineering & Construction (0.2%) | | | |
Chiyoda Corp. (c) (d) | | 35,000 | | | 633,385 |
JGC Corp. (c) (d) | | 43,000 | | | 669,089 |
Kajima Corp. (c) (d) | | 136,800 | | | 653,158 |
Nishimatsu Construction Co. Ltd. (c) (d) | | 91,600 | | | 316,184 |
Obayashi Corp. (c) | | 79,500 | | | 520,996 |
Shimizu Corp. (c) | | 57,000 | | | 337,657 |
Taisei Corp. (c) | | 196,000 | | | 666,468 |
| | | | | |
| | | | | 3,796,937 |
| | | | | |
Entertainment (0.2%) | | | | | |
Nintendo Co. Ltd. (c) | | 17,100 | | | 3,495,174 |
Oriental Land Co. Ltd. (c) (d) | | 4,000 | | | 226,430 |
Toho Co. Ltd. (c) | | 11,600 | | | 219,394 |
| | | | | |
| | | | | 3,940,998 |
| | | | | |
Environmental Control (0.0%) | | | |
Kurita Water Industries Ltd. (c) | | 6,800 | | | 138,877 |
| | | | | |
Financial Services (0.9%) | | | | | |
Acom Co. Ltd. (c) (d) | | 10,230 | | | 393,478 |
Aeon Credit Service Co. Ltd. (c) (d) | | 18,300 | | | 409,503 |
Aiful Corp. (c) | | 19,167 | | | 660,778 |
Credit Saison Co. Ltd. (c) | | 32,000 | | | 1,157,252 |
Daiwa Securities Group, Inc. (c) | | 223,500 | | | 2,527,340 |
Hitachi Capital Corp. (c) | | 200 | | | 3,950 |
Itochu Techno-Science Corp. (c) | | 600 | | | 33,541 |
Mitsubishi UFJ Securities Co. (c) | | 22,000 | | | 268,631 |
Nikko Cordial Corp. (c) | | 147,500 | | | 1,761,005 |
| | | | | |
| | | Shares or Principal Amount | | Value |
| | | | | |
JAPAN (continued) | | | |
Financial Services (continued) | | | | | |
Nomura Holdings, Inc. (c) | | 285,900 | | $ | 5,027,447 |
ORIX Corp. (c) | | 13,870 | | | 3,901,220 |
Promise Co. Ltd. (c) | | 11,000 | | | 397,465 |
SFCG Co. Ltd. (c) | | 10 | | | 1,848 |
Shinko Securities Co. Ltd. (c) (d) | | 27,700 | | | 106,966 |
Takefuji Corp. (c) (d) | | 16,430 | | | 595,642 |
| | | | | |
| | | | | 17,246,066 |
| | | | | |
Food (0.2%) | | | | | |
Ajinomoto Co., Inc. (c) | | 121,000 | | | 1,400,081 |
Katokichi Co. Ltd. (c) | | 40,253 | | | 315,286 |
Kikkoman Corp. (c) (d) | | 46,000 | | | 519,089 |
Meiji Dairies Corp. (c) | | 76,000 | | | 498,887 |
Nichirei Corp. (c) (d) | | 44,000 | | | 235,136 |
Nippon Meat Packers, Inc. (c) | | 30,000 | | | 331,558 |
Nisshin Seifun Group, Inc. (c) | | 28,900 | | | 303,266 |
Nissin Food Products Co. Ltd. (c) (d) | | 11,300 | | | 340,899 |
Toyo Suisan Kaisha Ltd. (c) (d) | | 5,400 | | | 78,909 |
Yakult Honsha Co. Ltd. (c) (d) | | 14,900 | | | 399,386 |
| | | | | |
| | | | | 4,422,497 |
| | | | | |
Food Products (0.0%) | | | | | |
House Foods Corp. (c) (d) | | 100 | | | 1,631 |
Kita Kyushu Coca-Cola (c) | | 200 | | | 3,732 |
Meiji Seika Kaisha Ltd. (c) (d) | | 8,000 | | | 40,603 |
Q.P. Corp. (c) | | 15,300 | | | 135,574 |
Yamazaki Baking Co. Ltd. (c) (d) | | 3,100 | | | 32,166 |
| | | | | |
| | | | | 213,706 |
| | | | | |
Forest Products & Paper (0.1%) | | | |
Nippon Paper Group, Inc. (c) (d) | | 180 | | | 644,752 |
OJI Paper Co. Ltd. (c) (d) | | 131,000 | | | 694,277 |
| | | | | |
| | | | | 1,339,029 |
| | | | | |
Furniture & Furnishings (0.0%) | | | |
Kokuyo Co. Ltd. (c) | | 1,000 | | | 15,438 |
| | | | | |
Gas (0.2%) | | | | | |
Osaka Gas Co. Ltd. (c) | | 358,900 | | | 1,293,698 |
Taiyo Nippon Sanso Corp. (c) | | 16,000 | | | 140,425 |
Tokyo Gas Co. Ltd. (c) (d) | | 405,400 | | | 2,069,663 |
| | | | | |
| | | | | 3,503,786 |
| | | | | |
Common Stocks (continued)
| | | | | |
| | | Shares or Principal Amount | | Value |
| | | | | |
JAPAN (continued) | | | |
Hand & Machine Tools (0.2%) | | | |
Fuji Electric Holdings Co. Ltd. (c) | | 45,200 | | $ | 245,298 |
Makita Corp. (c) | | 9,700 | | | 287,843 |
Nidec Corp. (c) (d) | | 14,400 | | | 1,101,574 |
OSG Corp. (c) (d) | | 1,400 | | | 20,622 |
SMC Corp. (c) | | 8,100 | | | 1,105,136 |
THK Co. Ltd. (c) | | 28,900 | | | 733,518 |
| | | | | |
| | | | | 3,493,991 |
| | | | | |
Healthcare – Products (0.1%) | | | | | |
Terumo Corp. (c) | | 25,200 | | | 1,018,395 |
| | | | | |
Home Builders (0.2%) | | | | | |
Daiwa House Industry Co. Ltd. (c) (d) | | 75,000 | | | 1,351,751 |
Haseko Corp. (b) (c) | | 79,000 | | | 271,264 |
Sekisui Chemical Co. Ltd. (c) | | 52,000 | | | 459,609 |
Sekisui House Ltd. (c) | | 100,300 | | | 1,585,247 |
| | | | | |
| | | | | 3,667,871 |
| | | | | |
Home Furnishings (0.7%) | | | | | |
Matsushita Electric Industrial Co. Ltd. (c) | | 304,502 | | | 6,348,361 |
Pioneer Corp. (c) (d) | | 38,800 | | | 616,428 |
Sony Corp. (c) | | 166,400 | | | 6,801,669 |
Yamaha Corp. (c) | | 31,600 | | | 675,052 |
| | | | | |
| | | | | 14,441,510 |
| | | | | |
Household Products (0.0%) | | | | | |
TOTO Ltd. (c) | | 57,200 | | | 566,044 |
| | | | | |
Insurance (0.5%) | | | | | |
Millea Holdings, Inc. (c) | | 115,000 | | | 4,330,820 |
Mitsui Sumitomo Insurance Co. Ltd. (c) | | 198,600 | | | 2,461,870 |
Sompo Japan Insurance, Inc. (c) | | 116,800 | | | 1,549,547 |
T&D Holdings, Inc. (c) | | 34,400 | | | 2,510,747 |
| | | | | |
| | | | | 10,852,984 |
| | | | | |
Internet (0.3%) | | | | | |
eAccess Ltd. (c) (d) | | 505 | | | 291,208 |
Index Holdings (c) (d) | | 393 | | | 271,190 |
Matsui Securities Co. Ltd. (c) (d) | | 36,100 | | | 317,077 |
Rakuten, Inc. (c) (d) | | 1,638 | | | 726,958 |
| | | | | |
| | | Shares or Principal Amount | | Value |
| | | | | |
JAPAN (continued) | | | |
Internet (continued) | | | | | |
SBI E*trade Securities Co. Ltd. (c) | | 446 | | $ | 467,458 |
SBI Holdings, Inc. (c) | | 2,145 | | | 781,838 |
Softbank Corp. (c) (d) | | 128,500 | | | 2,806,633 |
Trend Micro, Inc. (c) (d) | | 18,000 | | | 573,908 |
Yahoo! Japan Corp. (c) (d) | | 1,903 | | | 739,150 |
| | | | | |
| | | | | 6,975,420 |
| | | | | |
Iron & Steel (0.6%) | | | | | |
Daido Steel Co. Ltd. (c) (d) | | 77,000 | | | 501,050 |
JFE Holdings, Inc. (c) | | 94,100 | | | 3,779,158 |
Kobe Steel Ltd. (c) | | 450,000 | | | 1,375,568 |
Nippon Steel Corp. (c) (d) | | 1,041,000 | | | 4,231,303 |
Nisshin Steel Co. Ltd. (c) (d) | | 127,900 | | | 395,491 |
Sumitomo Metal Industries Ltd. (c) | | 594,000 | | | 2,232,708 |
Tokyo Steel Manufacturing Co. Ltd. (c) | | 6,700 | | | 102,451 |
| | | | | |
| | | | | 12,617,729 |
| | | | | |
Leisure (0.1%) | | | | | |
Namco Bandai Holdings, Inc. (c) (d) | | 36,749 | | | 584,145 |
Round One Corp. (c) | | 2 | | | 8,166 |
Sankyo Co. Ltd. (c) | | 4,800 | | | 244,747 |
Sega Sammy Holdings, Inc. (c) (d) | | 27,500 | | | 690,115 |
Shimano, Inc. (c) | | 3,800 | | | 105,914 |
Yamaha Motor Co. Ltd. (c) | | 24,600 | | | 672,334 |
| | | | | |
| | | | | 2,305,421 |
| | | | | |
Machinery – Construction & Mining (0.2%) |
Hitachi Construction Machinery Co. Ltd. (c) (d) | | 25,400 | | | 602,560 |
Komatsu Ltd. (c) | | 157,000 | | | 2,825,344 |
| | | | | |
| | | | | 3,427,904 |
| | | | | |
Machinery – Diversified (0.2%) | | | |
Amada Co. Ltd. (c) | | 37,000 | | | 366,951 |
Daifuku Co. Ltd. (c) | | 500 | | | 6,500 |
Ebara Corp. (c) (d) | | 112,900 | | | 441,118 |
Japan Steel Works Ltd. (The) (c) (d) | | 89,000 | | | 594,984 |
Statement of Investments (Continued)
October 31, 2006
Gartmore International Index Fund (Continued)
Common Stocks (continued)
| | | | | |
| | | Shares or Principal Amount | | Value |
| | | | | |
JAPAN (continued) | | | |
Machinery – Diversified (continued) | | | |
Kubota Corp. (c) | | 158,100 | | $ | 1,379,587 |
Okuma Corp. (c) | | 12,000 | | | 114,860 |
Sumitomo Heavy Industries Ltd. (c) | | 82,000 | | | 701,293 |
Toyota Industries Corp. (c) (d) | | 26,100 | | | 1,137,993 |
| | | | | |
| | | | | 4,743,286 |
| | | | | |
Manufacturing (0.0%) | | | | | |
Komori Corp. (c) | | 10,000 | | | 191,853 |
Rinnai Corp. (c) | | 200 | | | 5,672 |
| | | | | |
| | | | | 197,525 |
| | | | | |
Media (0.0%) | | | | | |
Fuji Television Network, Inc. (c) | | 151 | | | 314,718 |
| | | | | |
Metal Fabricate & Hardware (0.1%) | | | |
NSK Ltd. (c) | | 66,400 | | | 555,843 |
NTN Corp. (c) (d) | | 59,600 | | | 490,236 |
| | | | | |
| | | | | 1,046,079 |
| | | | | |
Metals & Mining (0.0%) | | | | | |
Nippon Light Metal Co. Ltd. (c) (d) | | 2,200 | | | 5,435 |
Sumitomo Titanium Corp. (c) (d) | | 4,900 | | | 580,464 |
| | | | | |
| | | | | 585,899 |
| | | | | |
Mining (0.2%) | | | | | |
Dowa Mining Co. Ltd. (c) | | 72,800 | | | 612,758 |
Mitsubishi Materials Corp. (c) (d) | | 192,000 | | | 755,939 |
Mitsui Mining & Smelting Co. Ltd. (c) | | 116,100 | | | 561,294 |
Sumitomo Metal Mining Co. Ltd. (c) | | 105,000 | | | 1,381,180 |
Toho Titanium Co. Ltd. (c) (d) | | 946 | | | 53,079 |
| | | | | |
| | | | | 3,364,250 |
| | | | | |
Miscellaneous Manufacturing (0.6%) | | | |
Amano Corp. (c) | | 22,400 | | | 301,287 |
Arrk Corp. (c) | | 25,800 | | | 344,687 |
Fuji Photo Film Co. Ltd. (c) | | 84,900 | | | 3,154,833 |
Ishikawajima-Harima Heavy Industries Co. Ltd. (c) | | 262,000 | | | 880,678 |
| | | | | |
| | | Shares or Principal Amount | | Value |
| | | | | |
JAPAN (continued) | | | |
Miscellaneous Manufacturing (continued) | | | |
Kawasaki Heavy Industries Ltd. (c) (d) | | 279,200 | | $ | 1,028,186 |
Konica Minolta Holdings, Inc. (c) | | 93,400 | | | 1,243,161 |
Mitsubishi Heavy Industries Ltd. (c) (d) | | 514,200 | | | 2,292,234 |
Nikon Corp. (c) (d) | | 58,000 | | | 1,190,768 |
Olympus Corp. (c) (d) | | 37,000 | | | 1,175,098 |
| | | | | |
| | | | | 11,610,932 |
| | | | | |
Multi – Media (0.0%) | | | | | |
Tokyo Broadcasting System, Inc. (c) | | 4,800 | | | 110,424 |
| | | | | |
Office & Business Equipment (0.6%) | | | |
Canon, Inc. (c) | | 166,200 | | | 8,877,262 |
Ricoh Co. Ltd. (c) | | 101,200 | | | 1,996,870 |
Seiko Epson Corp. (c) (d) | | 13,900 | | | 350,859 |
| | | | | |
| | | | | 11,224,991 |
| | | | | |
Oil & Gas (0.2%) | | | | | |
Inpex Holdings, Inc. (b) (c) | | 144 | | | 1,177,845 |
Nippon Mining Holdings, Inc. (c) | | 158,900 | | | 1,193,979 |
Nippon Oil Corp. (c) | | 195,400 | | | 1,460,035 |
Showa Shell Sekiyu KK (c) | | 49,100 | | | 551,936 |
TonenGeneral Sekiyu KK (c) (d) | | 24,000 | | | 229,060 |
| | | | | |
| | | | | 4,612,855 |
| | | | | |
Packaging & Containers (0.0%) | | | |
Toyo Seikan Kaisha Ltd. (c) (d) | | 19,200 | | | 372,518 |
| | | | | |
Pharmaceuticals (1.3%) | | | | | |
Alfresa Holdings Corp. (c) | | 3,900 | | | 228,542 |
Astellas Pharma, Inc. (c) | | 91,700 | | | 4,130,587 |
Chugai Pharmaceutical Co. Ltd. (c) (d) | | 52,200 | | | 1,070,643 |
Daiichi Sankyo Co. Ltd. (c) | | 119,400 | | | 3,548,475 |
Eisai Co. Ltd. (c) | | 45,000 | | | 2,302,084 |
Kaken Pharmaceutical Co. Ltd. (c) | | 40,000 | | | 273,042 |
Kyowa Hakko Kogyo Co. Ltd. (c) | | 21,000 | | | 161,529 |
Mediceo Paltac Holdings Co. Ltd. (c) | | 15,300 | | | 303,721 |
Common Stocks (continued)
| | | | | |
| | | Shares or Principal Amount | | Value |
| | | | | |
JAPAN (continued) | | | |
Pharmaceuticals (continued) | | | | | |
Santen Pharmaceutical Co. Ltd. (c) (d) | | 6,300 | | $ | 164,382 |
Shionogi & Co. Ltd. (c) (d) | | 50,400 | | | 1,009,939 |
Suzuken Co. Ltd. (c) | | 5,300 | | | 185,690 |
Taisho Pharmacuetical Co. Ltd. (c) (d) | | 19,900 | | | 357,142 |
Takeda Pharmaceutical Co. Ltd. (c) | | 146,900 | | | 9,432,398 |
Tanabe Seiyaku Co. Ltd. (c) (d) | | 19,000 | | | 234,165 |
| | | | | |
| | | | | 23,402,339 |
| | | | | |
Railroads (0.0%) | | | | | |
Keisei Electric Railway Co. Ltd. (c) (d) | | 72,000 | | | 438,121 |
| | | | | |
Real Estate (0.7%) | | | | | |
Daito Trust Construction Co. Ltd. (c) | | 11,400 | | | 601,261 |
Japan Prime Realty Investment Corp. (c) | | 3 | | | 9,472 |
Japan Retail Fund Investment Corp. (c) (d) | | 88 | | | 681,002 |
Leopalace21 Corp. (c) | | 24,975 | | | 937,997 |
Mitsubishi Estate Co. Ltd. (c) | | 176,600 | | | 4,224,253 |
Mitsui Fudosan Co. Ltd. (c) | | 144,700 | | | 3,560,362 |
Nomura Real Estate Office Fund, Inc. (c) | | 55 | | | 466,188 |
NTT Urban Development Corp. (c) | | 11 | | | 94,997 |
Sumitomo Realty & Development Co. Ltd. (c) | | 68,000 | | | 2,253,191 |
Tokyo Tatemono Co. Ltd. (c) | | 56,000 | | | 667,939 |
Tokyu Land Corp. (c) (d) | | 81,000 | | | 782,099 |
| | | | | |
| | | | | 14,278,761 |
| | | | | |
Real Estate Investment Trusts (0.1%) | | | |
Japan Real Estate Investment Corp. (c) (d) | | 70 | | | 640,620 |
Nippon Building Fund, Inc. (c) | | 95 | | | 1,023,338 |
| | | | | |
| | | | | 1,663,958 |
| | | | | |
| | | | | |
| | | Shares or Principal Amount | | Value |
| | | | | |
JAPAN (continued) | | | |
Retail (0.8%) | | | | | |
Aeon Co. Ltd. (c) | | 83,200 | | $ | 1,956,755 |
Aoyama Trading Co. Ltd. (c) | | 2,100 | | | 64,410 |
Autobacs Seven Co. Ltd. (c) | | 8,900 | | | 322,296 |
Circle K Sunkus Co. Ltd. (c) (d) | | 195 | | | 3,720 |
Citizen Watch Co. Ltd. (c) (d) | | 81,400 | | | 674,850 |
Daimaru, Inc. (c) (d) | | 18,000 | | | 215,584 |
EDION Corp. (c) | | 1,500 | | | 21,616 |
FamilyMart Co. Ltd. (c) | | 16,600 | | | 449,653 |
Fast Retailing Co. Ltd. (c) | | 6,100 | | | 576,995 |
Isetan Co. Ltd. (c) (d) | | 43,800 | | | 770,839 |
Lawson, Inc. (c) (d) | | 14,900 | | | 505,780 |
Marui Co. Ltd. (c) | | 66,600 | | | 895,746 |
Matsumotokiyoshi Co. Ltd. (c) (d) | | 6,200 | | | 149,643 |
Mitsukoshi Ltd. (c) | | 100,300 | | | 514,378 |
Nitori Co. Ltd. (c) (d) | | 1,450 | | | 58,804 |
Ryohin Keikaku Co. Ltd. (c) (d) | | 6,100 | | | 447,909 |
Seven & I Holdings Co. Ltd. (c) | | 126,000 | | | 4,042,826 |
Shimachu Co. Ltd. (c) | | 4,400 | | | 125,993 |
Shimamura Co. Ltd. (c) (d) | | 2,200 | | | 237,693 |
Takashimaya Co. Ltd. (c) (d) | | 57,000 | | | 836,561 |
Tokyo Style Co. (c) | | 5,000 | | | 55,406 |
UNY Co. Ltd. (c) | | 20,000 | | | 251,040 |
USS Co. Ltd. (c) (d) | | 6,520 | | | 413,487 |
Yamada Denki Co. Ltd. (c) (d) | | 15,600 | | | 1,550,140 |
| | | | | |
| | | | | 15,142,124 |
| | | | | |
Semiconductors (0.3%) | | | | | |
Elpida Memory, Inc. (b) (c) | | 20,500 | | | 955,931 |
Rohm Co. Ltd. (c) (d) | | 16,200 | | | 1,487,654 |
Sanken Electric Co. Ltd. (c) (d) | | 30,000 | | | 350,178 |
Shinko Electric Industries (c) | | 2,600 | | | 69,133 |
Sumco Corp. (c) (d) | | 10,700 | | | 759,484 |
Tokyo Electron Ltd. (c) (d) | | 29,100 | | | 2,170,778 |
| | | | | |
| | | | | 5,793,158 |
| | | | | |
Shipbuilding (0.0%) | | | | | |
Mitsui Engineering & Shipbuilding Co. Ltd. (c) (d) | | 180,000 | | | 669,729 |
| | | | | |
Statement of Investments (Continued)
October 31, 2006
Gartmore International Index Fund (Continued)
Common Stocks (continued)
| | | | | |
| | | Shares or Principal Amount | | Value |
| | | | | |
JAPAN (continued) | | | |
Software (0.0%) | | | | | |
FUJI SOFT, Inc. (c) | | 5,600 | | $ | 141,148 |
Konami Corp. (c) (d) | | 13,100 | | | 360,627 |
Nomura Research Institute Ltd. (c) (d) | | 2,600 | | | 379,067 |
| | | | | |
| | | | | 880,842 |
| | | | | |
Storage & Warehousing (0.0%) | | | |
Mitsubishi Logistics Corp. (c) (d) | | 29,400 | | | 480,372 |
| | | | | |
Telecommunications (0.6%) | | | | | |
Hikari Tsushin, Inc. (c) | | 3,200 | | | 168,399 |
KDDI Corp. (c) | | 386 | | | 2,405,489 |
Nippon TeleGraph & Telephone Corp. (c) | | 776 | | | 3,898,670 |
NTT Data Corp. (c) (d) | | 156 | | | 777,466 |
NTT DoCoMo, Inc. (c) | | 2,872 | | | 4,380,269 |
Oki Electric Industry Co. Ltd. (c) (d) | | 78,500 | | | 185,057 |
| | | | | |
| | | | | 11,815,350 |
| | | | | |
Textiles (0.2%) | | | | | |
Kuraray Co. Ltd. (c) (d) | | 63,500 | | | 719,531 |
Mitsubishi Rayon Co. Ltd. (c) | | 119,100 | | | 749,709 |
Nisshinbo Industries, Inc. (c) | | 23,100 | | | 234,649 |
Teijin Ltd. (c) | | 179,800 | | | 1,002,813 |
Toray Industries, Inc. (c) | | 247,300 | | | 1,780,611 |
Toyobo Co. Ltd. (c) | | 116,000 | | | 306,232 |
| | | | | |
| | | | | 4,793,545 |
| | | | | |
Transportation (1.0%) | | | | | |
Central Japan Railway Co. (c) | | 254 | | | 2,736,622 |
East Japan Railway Co. (c) | | 567 | | | 3,963,458 |
Hankyu Hanshin Holdings, Inc. (c) (d) | | 191,799 | | | 1,150,549 |
Kamigumi Co. Ltd. (c) (d) | | 14,000 | | | 114,668 |
Kawasaki Kisen Kaisha Ltd. (c) (d) | | 114,000 | | | 809,692 |
Keihin Electric Express Railway Co. Ltd. (c) (d) | | 37,000 | | | 263,665 |
Keio Corp. (c) | | 82,400 | | | 549,516 |
Kintetsu Corp. (c) | | 186,500 | | | 577,087 |
Mitsui OSK Lines Ltd. (c) (d) | | 205,000 | | | 1,707,335 |
Nippon Express Co. Ltd. (c) (d) | | 143,500 | | | 775,978 |
| | | | | |
| | | Shares or Principal Amount | | Value |
| | | | | |
JAPAN (continued) | | | |
Transportation (continued) | | | | | |
Nippon Yusen KK (c) (d) | | 196,400 | | $ | 1,273,252 |
Odakyu Electric Railway Co. Ltd. (c) (d) | | 94,100 | | | 577,362 |
Seino Transportation Co. Ltd. (c) | | 38,000 | | | 414,054 |
Tobu Railway Co. Ltd. (c) | | 85,000 | | | 418,664 |
Tokyu Corp. (c) (d) | | 137,900 | | | 933,224 |
West Japan Railway Co. (c) | | 303 | | | 1,294,039 |
Yamato Holdings Co. Ltd. (c) (d) | | 74,000 | | | 1,153,906 |
| | | | | |
| | | | | 18,713,071 |
| | | | | |
Venture Capital (0.0%) | | | | | |
Jafco Co. Ltd. (c) (d) | | 1,700 | | | 87,639 |
| | | | | |
| | | | | 447,741,801 |
| | | | | |
NETHERLANDS (4.8%) | | | | | |
Aerospace & Defense (0.1%) | | | | | |
European Aeronautic Defense and Space Co. NV (c) | | 52,925 | | | 1,433,165 |
| | | | | |
Banks (0.4%) | | | | | |
ABN AMRO Holding NV (c) | | 297,009 | | | 8,652,938 |
| | | | | |
Beverages (0.1%) | | | | | |
Heineken NV (c) | | 39,028 | | | 1,767,215 |
| | | | | |
Biotechnology (0.0%) | | | | | |
Qiagen NV (b) (c) (d) | | 10,451 | | | 164,926 |
| | | | | |
Building Materials (0.0%) | | | | | |
James Hardie Industries NV (c) | | 58,410 | | | 356,437 |
| | | | | |
Chemicals (0.2%) | | | | | |
Akzo Nobel NV (c) | | 46,327 | | | 2,597,483 |
Koninklijke DSM NV (c) | | 29,808 | | | 1,358,756 |
| | | | | |
| | | | | 3,956,239 |
| | | | | |
Commercial Services (0.0%) | | | | | |
Randstad Holdings NV (c) | | 3,657 | | | 229,853 |
Vedior NV (c) | | 35,484 | | | 648,867 |
| | | | | |
| | | | | 878,720 |
| | | | | |
Computers (0.0%) | | | | | |
Getronics NV (c) (d) | | 40,900 | | | 278,763 |
| | | | | |
Common Stocks (continued)
| | | | | |
| | | Shares or Principal Amount | | Value |
| | | | | |
NETHERLANDS (continued) | | | | | |
Distribution & Wholesale (0.0%) | | | |
Buhrmann NV (c) | | 6,381 | | $ | 98,944 |
Hagemeyer NV (b) (c) (d) | | 127,663 | | | 652,747 |
| | | | | |
| | | | | 751,691 |
| | | | | |
Electronics (0.4%) | | | | | |
Koninklijke Philips Electronics NV (c) | | 201,992 | | | 7,034,780 |
| | | | | |
Energy (1.0%) | | | | | |
Royal Dutch Shell PLC, Class A (c) | | 518,626 | | | 18,043,340 |
| | | | | |
Financial Services (0.1%) | | | | | |
Euronext NV (c) | | 15,953 | | | 1,592,717 |
| | | | | |
Food (0.5%) | | | | | |
Koninklijke Ahold NV (b) (c) | | 269,957 | | | 2,843,242 |
Royal NumiCo NV (c) (d) | | 23,081 | | | 1,030,827 |
Unilever NV (c) (d) | | 277,362 | | | 6,838,597 |
| | | | | |
| | | | | 10,712,666 |
| | | | | |
Insurance (0.9%) | | | | | |
Aegon NV (c) | | 232,300 | | | 4,267,781 |
ING Groep NV (c) | | 301,848 | | | 13,366,098 |
| | | | | |
| | | | | 17,633,879 |
| | | | | |
Media (0.2%) | | | | | |
Reed Elsevier NV (c) | | 117,899 | | | 2,012,871 |
Wolters Kluwer NV (c) | | 44,874 | | | 1,232,994 |
| | | | | |
| | | | | 3,245,865 |
| | | | | |
Office & Business Equipment (0.0%) | | | |
OCE NV (c) | | 538 | | | 8,203 |
| | | | | |
Oil & Gas (0.2%) | | | | | |
FuGro NV (c) | | 5,615 | | | 243,185 |
Royal Dutch Shell PLC (c) | | 97,190 | | | 3,379,963 |
SBM Offshore NV (c) | | 28,720 | | | 851,150 |
| | | | | |
| | | | | 4,474,298 |
| | | | | |
Real Estate Investment Trusts (0.1%) | | | |
Corio NV (c) | | 6,452 | | | 468,498 |
| | | | | |
| | | Shares or Principal Amount | | Value |
| | | | | |
NETHERLANDS (continued) | | | | | |
Real Estate Investment Trusts (continued) | | | |
RodamCo Europe NV (c) | | 7,664 | | $ | 886,457 |
Wereldhave NV (c) | | 1,772 | | | 203,463 |
| | | | | |
| | | | | 1,558,418 |
| | | | | |
Semiconductors (0.1%) | | | | | |
ASML Holding NV (b) (c) (d) | | 89,353 | | | 2,038,561 |
| | | | | |
Steel (0.2%) | | | | | |
Mittal Steel Co. NV | | 95,488 | | | 4,100,316 |
Mittal Steel Co. NV (c) (d) | | 16,800 | | | 719,522 |
| | | | | |
| | | | | 4,819,838 |
| | | | | |
Telecommunications (0.2%) | | | | | |
Royal KPN NV (c) | | 318,437 | | | 4,256,708 |
| | | | | |
Transportation (0.1%) | | | | | |
TNT NV (c) | | 68,022 | | | 2,612,890 |
| | | | | |
| | | | | 96,272,257 |
| | | | | |
NEW ZEALAND (0.1%) | | | | | |
Airports (0.0%) | | | | | |
Auckland International Airport Ltd. (c) | | 41,417 | | | 56,543 |
| | | | | |
Building Materials (0.0%) | | | | | |
Fletcher Building Ltd. (c) | | 38,791 | | | 246,610 |
| | | | | |
Electric (0.0%) | | | | | |
Contact Energy Ltd. (c) | | 2,557 | | | 12,752 |
| | | | | |
Entertainment (0.0%) | | | | | |
Sky Network Television Ltd. (c) | | 11,869 | | | 45,117 |
| | | | | |
Financial Services (0.0%) | | | | | |
Tower Ltd. (b) (c) (d) | | 45,600 | | | 105,588 |
| | | | | |
Healthcare – Products (0.0%) | | | | | |
Fisher & Paykel Healthcare Corp. (c) | | 122,813 | | | 343,474 |
| | | | | |
Household Products (0.0%) | | | | | |
Fisher & Paykel Appliances Holdings Ltd. (c) (d) | | 40,549 | | | 103,079 |
| | | | | |
Statement of Investments (Continued)
October 31, 2006
Gartmore International Index Fund (Continued)
Common Stocks (continued)
| | | | | |
| | | Shares or Principal Amount | | Value |
| | | | | |
NEW ZEALAND (continued) | | | | | |
Lodging (0.0%) | | | | | |
Sky City Entertainment Group Ltd. (c) (d) | | 71,747 | | $ | 247,278 |
| | | | | |
Real Estate (0.0%) | | | | | |
Kiwi Income Property Trust (c) | | 639 | | | 582 |
| | | | | |
Retail (0.0%) | | | | | |
Warehouse Group Ltd. (The) (c) (d) | | 73,313 | | | 315,156 |
| | | | | |
Telecommunications (0.1%) | | | | | |
Telecom Corp. of New Zealand Ltd. (c) (d) | | 404,901 | | | 1,257,003 |
| | | | | |
| | | | | 2,733,182 |
| | | | | |
NORWAY (0.8%) | | | | | |
Banks (0.1%) | | | | | |
DNB NOR ASA (c) | | 106,289 | | | 1,392,445 |
| | | | | |
Chemicals (0.0%) | | | | | |
Yara International ASA (c) | | 34,714 | | | 608,232 |
| | | | | |
Engineering & Construction (0.0%) | | | |
Aker Kvaerner ASA (c) | | 2,370 | | | 248,093 |
| | | | | |
Environmental Control (0.0%) | | | |
Tomra Systems ASA (c) (d) | | 50,188 | | | 337,573 |
| | | | | |
Fisheries (0.0%) | | | | | |
Pan Fish ASA (b) (c) | | 299,600 | | | 234,753 |
| | | | | |
Food (0.1%) | | | | | |
Orkla ASA (c) | | 30,396 | | | 1,558,729 |
| | | | | |
Forest Products & Paper (0.0%) | | | |
Norske Skogindustrier ASA (c) | | 17,308 | | | 272,966 |
| | | | | |
Insurance (0.0%) | | | | | |
Storebrand ASA (c) (d) | | 55,122 | | | 650,568 |
| | | | | |
Oil & Gas (0.5%) | | | | | |
DET Norske Oljeselskap (b) (c) (d) | | 294,289 | | | 495,428 |
Norsk Hydro ASA (c) | | 127,396 | | | 2,949,077 |
Ocean RIG ASA (b) (c) | | 3,586 | | | 23,692 |
| | | | | |
| | | Shares or Principal Amount | | Value |
| | | | | |
NORWAY (continued) | | | | | |
Oil & Gas (continued) | | | | | |
Petroleum Geo-Services ASA (b) (c) (d) | | 12,645 | | $ | 739,055 |
ProSafe ASA (c) (d) | | 6,332 | | | 406,746 |
SeaDrill Ltd. (b) (c) | | 53,626 | | | 767,665 |
Statoil ASA (c) | | 98,564 | | | 2,503,895 |
TGS Nopec Geophysical Co ASA (b) (c) | | 4,885 | | | 87,383 |
| | | | | |
| | | | | 7,972,941 |
| | | | | |
Printing & Publishing (0.0%) | | | | | |
Schibsted ASA (c) (d) | | 425 | | | 12,885 |
| | | | | |
Telecommunications (0.1%) | | | | | |
Tandberg ASA (c) | | 39,487 | | | 455,839 |
Tandberg Television
ASA (b) (c) (d) | | 37,550 | | | 389,240 |
Telenor ASA (c) | | 121,454 | | | 1,922,102 |
Telenor ASA ADR | | 300 | | | 14,301 |
| | | | | |
| | | | | 2,781,482 |
| | | | | |
Transportation (0.0%) | | | | | |
Stolt-Nielsen SA (c) | | 52 | | | 1,488 |
| | | | | |
| | | | | 16,072,155 |
| | | | | |
PORTUGAL (0.3%) | | | | | |
Banks (0.1%) | | | | | |
Banco BPI SA (c) (d) | | 43,246 | | | 328,406 |
Banco Comercial Portugues SA (c) | | 413,370 | | | 1,346,099 |
Banco Espirito Santo SA (c) (d) | | 17,819 | | | 282,412 |
| | | | | |
| | | | | 1,956,917 |
| | | | | |
Building Materials (0.0%) | | | | | |
Cimpor Cimentos de Portugal SA (c) (d) | | 28,237 | | | 199,187 |
Sonae Industria SGPS
SA (b) (c) (d) | | 12,824 | | | 124,685 |
| | | | | |
| | | | | 323,872 |
| | | | | |
Commercial Services (0.0%) | | | | | |
Brisa-Auto Estradas de Portugal SA (c) (d) | | 27,789 | | | 307,713 |
| | | | | |
Common Stocks (continued)
| | | | | |
| | | Shares or Principal Amount | | Value |
| | | | | |
PORTUGAL (continued) | | | | | |
Electric (0.1%) | | | | | |
Energias de Portugal SA (c) | | 348,843 | | $ | 1,568,596 |
| | | | | |
Food Products (0.0%) | | | | | |
Jeronimo Martins SGPS SA (c) | | 166 | | | 3,175 |
| | | | | |
Retail (0.0%) | | | | | |
Sonae SGPS SA (c) | | 199,384 | | | 379,256 |
| | | | | |
Telecommunications (0.1%) | | | | | |
Portugal TeleCom SGPS SA (c) | | 138,594 | | | 1,729,024 |
PT Multimedia Servicos SA (c) | | 5,548 | | | 67,322 |
| | | | | |
| | | | | 1,796,346 |
| | | | | |
| | | | | 6,335,875 |
| | | | | |
SINGAPORE (0.9%) | | | | | |
Airlines (0.0%) | | | | | |
Singapore Airlines Ltd. (c) | | 66,800 | | | 650,994 |
| | | | | |
Banks (0.4%) | | | | | |
DBS Group Holdings Ltd. (c) | | 189,700 | | | 2,480,820 |
Oversea-Chinese Banking Corp. (c) | | 427,600 | | | 1,920,811 |
United Overseas Bank Ltd. (c) | | 211,500 | | | 2,402,752 |
| | | | | |
| | | | | 6,804,383 |
| | | | | |
Brewery (0.0%) | | | | | |
Fraser & Neave Ltd. (c) | | 70,950 | | | 202,324 |
| | | | | |
Distribution & Wholesale (0.0%) | | | |
Jardine Cycle & Carriage Ltd. (c) | | 12,604 | | | 100,412 |
| | | | | |
Diversified (0.0%) | | | | | |
Haw Par Corp. Ltd. (c) | | 36,226 | | | 157,235 |
Noble Group Ltd. (c) (d) | | 636 | | | 474 |
| | | | | |
| | | | | 157,709 |
| | | | | |
Engineering & Construction (0.0%) | | | |
Sembcorp Industries Ltd. (c) | | 138,243 | | | 324,554 |
Singapore Technologies Engineering Ltd. (c) | | 92,000 | | | 174,838 |
| | | | | |
| | | | | 499,392 |
| | | | | |
| | | | | |
| | | Shares or Principal Amount | | Value |
| | | | | |
SINGAPORE (continued) | | | | | |
Financial Services (0.0%) | | | | | |
Creative Technology Ltd. (c) | | 4,950 | | $ | 33,058 |
Singapore Exchange Ltd. (c) | | 210,900 | | | 608,483 |
| | | | | |
| | | | | 641,541 |
| | | | | |
Healthcare (0.0%) | | | | | |
Parkway Holdings Ltd. (c) | | 217,000 | | | 386,759 |
| | | | | |
Holding Companies – Diversified (0.1%) | | | |
Keppel Corp. Ltd. (c) | | 116,000 | | | 1,178,168 |
| | | | | |
Manufacturing (0.0%) | | | | | |
Venture Manufacturing Ltd. (c) | | 38,200 | | | 350,662 |
| | | | | |
Media (0.0%) | | | | | |
Singapore Press Holdings Ltd. (c) | | 263,500 | | | 707,581 |
| | | | | |
Oil & Gas (0.0%) | | | | | |
Singapore Petroleum Co. Ltd. (c) | | 400 | | | 1,167 |
| | | | | |
Property Trust (0.0%) | | | | | |
CapitaMall Trust (c) | | 2,000 | | | 3,330 |
| | | | | |
Real Estate (0.2%) | | | | | |
Ascendas Real Estate Investment Trust (c) | | 600 | | | 838 |
CapitaLand Ltd. (c) | | 275,897 | | | 966,287 |
City Developments Ltd. (c) | | 109,000 | | | 769,645 |
Keppel Land Ltd. (c) (d) | | 56,300 | | | 199,196 |
UOL Group Ltd. (c) | | 166,120 | | | 426,884 |
Wing Tai Holdings Ltd. (c) | | 3,500 | | | 4,603 |
| | | | | |
| | | | | 2,367,453 |
| | | | | |
Semiconductors (0.0%) | | | | | |
Chartered Semiconductor Manufacturing Ltd. (b) (c) (d) | | 269,000 | | | 208,344 |
STATS ChipPAC Ltd. (b) (c) | | 123,000 | | | 78,060 |
| | | | | |
| | | | | 286,404 |
| | | | | |
Shipbuilding (0.0%) | | | | | |
Sembcorp Marine Ltd. (c) | | 86,000 | | | 188,829 |
| | | | | |
Statement of Investments (Continued)
October 31, 2006
Gartmore International Index Fund (Continued)
Common Stocks (continued)
| | | | | |
| | | Shares or Principal Amount | | Value |
| | | | | |
SINGAPORE (continued) | | | | | |
Shipping (0.0%) | | | | | |
Neptune Orient Lines Ltd. (c) | | 800 | | $ | 1,046 |
Singapore Post Ltd. (c) | | 332,221 | | | 213,710 |
| | | | | |
| | | | | 214,756 |
| | | | | |
Telecommunications (0.2%) | | | | | |
Singapore Telecommunications Ltd. (c) | | 1,024,003 | | | 1,744,648 |
| | | | | |
Transportation (0.0%) | | | | | |
ComfortDelGro Corp. Ltd. (c) | | 280,620 | | | 294,094 |
CosCo Corp. Singapore Ltd. (c) | | 332,066 | | | 409,273 |
| | | | | |
| | | | | 703,367 |
| | | | | |
| | | | | 17,189,879 |
| | | | | |
SPAIN (4.1%) | | | | | |
Agriculture (0.1%) | | | | | |
Altadis SA (c) | | 49,365 | | | 2,360,469 |
| | | | | |
Airlines (0.0%) | | | | | |
Iberia Lineas Aereas de Espana (c) | | 77,947 | | | 244,594 |
| | | | | |
Banks (1.7%) | | | | | |
Banco Bilbao Vizcaya Argentaria SA (c) | | 557,178 | | | 13,445,743 |
Banco Popular Espanol SA (c) (d) | | 154,033 | | | 2,668,528 |
Banco Santander Central Hispano SA | | 956,332 | | | 16,548,239 |
| | | | | |
| | | | | 32,662,510 |
| | | | | |
Biotechnology (0.0%) | | | | | |
Zeltia SA (b) (c) (d) | | 3,698 | | | 27,038 |
| | | | | |
Commercial Services (0.1%) | | | | | |
Abertis Infraestructuras SA (c) (d) | | 36,055 | | | 975,866 |
Cintra Concesiones de Infraestructuras de Transporte SA (c) | | 28,823 | | | 441,484 |
| | | | | |
| | | | | 1,417,350 |
| | | | | |
Computers (0.0%) | | | | | |
Indra Sistemas SA (c) (d) | | 23,720 | | | 526,164 |
| | | | | |
| | | | | |
| | | Shares or Principal Amount | | Value |
| | | | | |
SPAIN (continued) | | | | | |
Electric (0.8%) | | | | | |
Endesa SA (c) | | 159,813 | | $ | 7,010,434 |
Iberdrola SA (c) (d) | | 136,441 | | | 6,252,240 |
Union Fenosa SA (c) (d) | | 21,820 | | | 1,107,010 |
| | | | | |
| | | | | 14,369,684 |
| | | | | |
Electrical Components & Equipment (0.0%) |
Gamesa Corp. Tecnologica SA (c) | | 29,497 | | | 676,740 |
| | | | | |
Engineering & Construction (0.2%) | | | |
Acciona SA (c) | | 3,790 | | | 667,140 |
ACS, Actividades de Construccion y Servicios SA (c) (d) | | 40,410 | | | 2,027,990 |
Fomento de Construcciones y Contratas SA (c) | | 4,730 | | | 411,857 |
Grupo Ferrovial SA (c) (d) | | 13,155 | | | 1,215,476 |
Sacyr Vallehermoso SA (c) (d) | | 11,835 | | | 604,366 |
| | | | | |
| | | | | 4,926,829 |
| | | | | |
Food (0.0%) | | | | | |
Ebro Puleva SA (c) | | 12,781 | | | 283,400 |
| | | | | |
Gas (0.0%) | | | | | |
Gas Natural SDG SA (c) (d) | | 23,393 | | | 927,027 |
| | | | | |
Insurance (0.0%) | | | | | |
Corporacion Mapfre SA (c) | | 15,640 | | | 346,140 |
| | | | | |
Iron & Steel (0.0%) | | | | | |
Acerinox SA (c) (d) | | 40,880 | | | 958,547 |
| | | | | |
Lodging (0.0%) | | | | | |
NH Hoteles SA (c) (d) | | 21,318 | | | 439,539 |
| | | | | |
Media (0.0%) | | | | | |
Antena 3 Television SA (c) (d) | | 17,399 | | | 376,700 |
Promotora de Informaciones SA (c) (d) | | 1,759 | | | 28,687 |
Sogecable SA (b) (c) (d) | | 4,942 | | | 158,276 |
| | | | | |
| | | | | 563,663 |
| | | | | |
Common Stocks (continued)
| | | | | |
| | | Shares or Principal Amount | | Value |
| | | | | |
SPAIN (continued) | | | | | |
Oil & Gas (0.3%) | | | | | |
Repsol YPF SA (c) (d) | | 154,298 | | $ | 5,128,643 |
| | | | | |
Real Estate (0.0%) | | | | | |
Fadesa Inmobiliaria SA (c) (d) | | 2,917 | | | 129,427 |
| | | | | |
Retail (0.1%) | | | | | |
Inditex SA (c) | | 34,728 | | | 1,658,952 |
| | | | | |
Telecommunications (0.8%) | | | | | |
Telefonica SA (c) | | 720,397 | | | 13,866,756 |
| | | | | |
Water (0.0%) | | | | | |
Sociedad General de Aguas de Barcelona SA (c) | | 2,645 | | | 92,946 |
| | | | | |
| | | | | 81,606,418 |
| | | | | |
SWEDEN (2.2%) | | | | | |
Agriculture (0.0%) | | | | | |
Swedish Match AB (c) | | 47,028 | | | 751,619 |
| | | | | |
Airlines (0.0%) | | | | | |
SAS AB (b) (c) (d) | | 16,950 | | | 243,763 |
| | | | | |
Auto Manufacturers (0.1%) | | | | | |
Scania AB (c) | | 19,984 | | | 1,367,898 |
| | | | | |
Banks (0.5%) | | | | | |
Nordea Bank AB (c) | | 301,049 | | | 4,142,144 |
Skandinaviska Enskilda Banken AB (c) | | 76,779 | | | 2,143,465 |
Svenska Handelsbanken (c) | | 79,982 | | | 2,069,417 |
| | | | | |
| | | | | 8,355,026 |
| | | | | |
Commercial Services (0.0%) | | | |
Securitas AB (c) (d) | | 55,285 | | | 727,477 |
| | | | | |
Cosmetics & Personal Care (0.0%) | | | |
Oriflame Cosmetics SA (c) | | 12,368 | | | 447,301 |
| | | | | |
Engineering & Construction (0.0%) | | | |
Skanska AB (c) | | 53,856 | | | 959,220 |
| | | | | |
Financial Services (0.0%) | | | |
D Carnegie AB (c) | | 7,153 | | | 136,458 |
OMX AB (c) | | 644 | | | 11,679 |
| | | | | |
| | | | | 148,137 |
| | | | | |
| | | | | |
| | | Shares or Principal Amount | | Value |
| | | | | |
SWEDEN (continued) | | | | | |
Forest Products & Paper (0.1%) | | | |
Holmen AB (c) | | 2,619 | | $ | 115,111 |
Svenska Cellulosa AB (c) | | 31,774 | | | 1,455,927 |
| | | | | |
| | | | | 1,571,038 |
| | | | | |
Hand & Machine Tools (0.1%) | | | |
Sandvik AB (c) | | 170,451 | | | 2,080,177 |
| | | | | |
Healthcare – Products (0.0%) | | | |
Elekta AB (c) (d) | | 2,588 | | | 53,740 |
Getinge AB (c) | | 28,352 | | | 501,404 |
| | | | | |
| | | | | 555,144 |
| | | | | |
Healthcare – Services (0.0%) | | | |
Capio AB (b) (c) | | 15,098 | | | 349,573 |
| | | | | |
Home Furnishings (0.1%) | | | |
Electrolux AB (c) (d) | | 54,246 | | | 992,319 |
Nobia AB (c) | | 1,293 | | | 45,868 |
| | | | | |
| | | | | 1,038,187 |
| | | | | |
Household Products (0.0%) | | | |
Husqvarna AB (b) (d) | | 46,443 | | | 569,304 |
| | | | | |
Industrial (0.0%) | | | |
Trelleborg AB, Class B (c) (d) | | 8,108 | | | 170,487 |
| | | | | |
Iron & Steel (0.0%) | | | |
Ssab Svenskt Stal AB (c) | | 14,917 | | | 316,248 |
| | | | | |
Machinery – Construction & Mining (0.1%) |
Atlas Copco AB (c) | | 58,574 | | | 1,707,281 |
Atlas Copco AB, Class B (c) | | 23,160 | | | 659,180 |
| | | | | |
| | | | | 2,366,461 |
| | | | | |
Machinery – Diversified (0.1%) | | | |
Volvo AB (c) | | 11,936 | | | 769,601 |
Volvo AB, Class B (c) | | 35,373 | | | 2,205,709 |
| | | | | |
| | | | | 2,975,310 |
| | | | | |
Media (0.0%) | | | |
Eniro AB (c) (d) | | 43,866 | | | 524,266 |
Modern Times Group AB (b) (c) | | 8,062 | | | 462,628 |
| | | | | |
| | | | | 986,894 |
| | | | | |
Statement of Investments (Continued)
October 31, 2006
Gartmore International Index Fund (Continued)
Common Stocks (continued)
| | | | | |
| | | Shares or Principal Amount | | Value |
| | | | | |
SWEDEN (continued) | | | | | |
Metal Fabricate & Hardware (0.1%) | | | |
Assa Abloy AB (c) | | 56,448 | | $ | 1,085,126 |
SKF AB (c) | | 76,672 | | | 1,233,033 |
| | | | | |
| | | | | 2,318,159 |
| | | | | |
Metals (0.0%) | | | |
Hoganas AB (c) | | 168 | | | 4,316 |
| | | | | |
Mining (0.1%) | | | |
Boliden AB (c) (d) | | 55,002 | | | 1,209,652 |
| | | | | |
Miscellaneous Manufacturing (0.0%) | | | |
Alfa Laval AB (c) | | 7,766 | | | 287,035 |
| | | | | |
Oil & Gas (0.0%) | | | |
Lundin Petroleum AB (b) (c) | | 26,291 | | | 294,057 |
| | | | | |
Paper Products (0.0%) | | | |
Billerud (c) | | 13,413 | | | 208,851 |
| | | | | |
Real Estate (0.0%) | | | |
Castellum AB (c) | | 16,255 | | | 194,433 |
Fabege AB (c) | | 10,145 | | | 236,363 |
Kungsleden AB (c) | | 14,881 | | | 187,899 |
Wihlborgs Fastigheter AB (c) | | 4,305 | | | 76,062 |
| | | | | |
| | | | | 694,757 |
| | | | | |
Retail (0.3%) | | | |
Axfood AB (c) | | 66 | | | 2,163 |
Hennes & Mauritz AB (c) | | 71,090 | | | 3,062,647 |
| | | | | |
| | | | | 3,064,810 |
| | | | | |
Security Services (0.0%) | | | |
Securitas Direct AB, B Shares (b) | | 55,285 | | | 168,465 |
Securitas Systems AB, B Shares (b) | | 55,285 | | | 184,547 |
| | | | | |
| | | | | 353,012 |
| | | | | |
Software (0.0%) | | | |
Telelogic AB (b) (c) | | 1,000 | | | 1,857 |
| | | | | |
Telecommunications (0.6%) | | | |
Tele2 AB (c) (d) | | 44,799 | | | 470,596 |
Telefonaktiebolaget LM Ericsson (c) | | 2,197,624 | | | 8,309,807 |
TeliaSonera AB (c) | | 243,187 | | | 1,771,092 |
| | | | | |
| | | Shares or Principal Amount | | Value |
| | | | | |
SWEDEN (continued) | | | | | |
Telecommunications (continued) | | | |
Teliasonera AB (b) (c) | | 1,312 | | $ | 9,562 |
| | | | | |
| | | | | 10,561,057 |
| | | | | |
| | | | | 44,976,827 |
| | | | | |
SWITZERLAND (7.0%) | | | |
Building Materials (0.2%) | | | |
Geberit AG (c) | | 463 | | | 602,904 |
Holcim Ltd. (c) | | 35,149 | | | 3,027,569 |
| | | | | |
| | | | | 3,630,473 |
| | | | | |
Chemicals (0.3%) | | | |
Ciba Specialty Chemicals AG (c) | | 15,337 | | | 938,611 |
Clariant AG (c) | | 36,569 | | | 505,890 |
Givaudan (c) | | 1,100 | | | 911,442 |
Lonza Group AG (c) | | 6,080 | | | 469,114 |
Syngenta AG (c) | | 17,878 | | | 2,885,648 |
| | | | | |
| | | | | 5,710,705 |
| | | | | |
Commercial Services (0.1%) | | | |
Adecco SA (c) | | 24,676 | | | 1,522,133 |
SGS SA (c) | | 471 | | | 499,916 |
| | | | | |
| | | | | 2,022,049 |
| | | | | |
Computers (0.0%) | | | |
Logitech International SA (b) (c) | | 21,088 | | | 554,309 |
| | | | | |
Engineering & Construction (0.2%) | | | |
ABB Ltd. (c) | | 318,503 | | | 4,738,350 |
| | | | | |
Financial Services (1.7%) | | | |
Credit Suisse Group (c) | | 198,888 | | | 11,992,533 |
UBS AG (c) | | 336,367 | | | 20,090,956 |
| | | | | |
| | | | | 32,083,489 |
| | | | | |
Food (1.2%) | | | |
Nestle SA (c) | | 66,364 | | | 22,683,967 |
| | | | | |
Hand & Machine Tools (0.0%) | | | |
Schindler Holding AG (c) | | 4,236 | | | 243,089 |
| | | | | |
Healthcare – Products (0.1%) | | | |
Nobel Biocare Holding AG (c) | | 4,737 | | | 1,296,416 |
Phonak Holding AG (c) | | 7,957 | | | 507,576 |
Common Stocks (continued)
| | | | | |
| | | Shares or Principal Amount | | Value |
| | | | | |
SWITZERLAND (continued) | | | |
Healthcare – Products (continued) | | | |
Straumann Holding AG (c) | | 399 | | $ | 90,573 |
Synthes, Inc. (c) | | 6,520 | | | 739,438 |
| | | | | |
| | | | | 2,634,003 |
| | | | | |
Insurance (0.5%) | | | | | |
Swiss Reinsurance (c) | | 58,360 | | | 4,789,151 |
Zurich Financial Services AG (c) | | 24,795 | | | 6,127,323 |
| | | | | |
| | | | | 10,916,474 |
| | | | | |
Leisure (0.0%) | | | | | |
Kuoni Reisen Holding (c) | | 52 | | | 28,400 |
| | | | | |
Machinery – Diversified (0.0%) | | | |
Rieter Holding AG (c) | | 690 | | | 327,250 |
SIG Holding AG (b) (c) | | 1,820 | | | 532,012 |
| | | | | |
| | | | | 859,262 |
| | | | | |
Miscellaneous Manufacturing (0.0%) | | | |
Sulzer AG (c) | | 614 | | | 539,615 |
| | | | | |
Pharmaceuticals (2.3%) | | | | | |
Novartis AG (c) | | 382,607 | | | 23,231,078 |
Roche Holding AG (c) | | 116,893 | | | 20,472,426 |
Serono SA (c) | | 1,042 | | | 910,646 |
| | | | | |
| | | | | 44,614,150 |
| | | | | |
Real Estate (0.0%) | | | | | |
PSP Swiss Property AG (b) (c) | | 3,327 | | | 174,118 |
| | | | | |
Retail (0.3%) | | | | | |
Compagnie Financiere Richemont AG (c) | | 84,262 | | | 4,168,284 |
Swatch Group AG (c) | | 3,027 | | | 120,936 |
Swatch Group AG, B Shares (c) | | 5,213 | | | 1,028,907 |
| | | | | |
| | | | | 5,318,127 |
| | | | | |
Semiconductors (0.0%) | | | | | |
Micronas SemiConductor Holding AG (c) | | 5,772 | | | 116,665 |
Unaxis Holding AG (b) (c) (d) | | 1,705 | | | 647,403 |
| | | | | |
| | | | | 764,068 |
| | | | | |
| | | | | |
| | | Shares or Principal Amount | | Value |
| | | | | |
SWITZERLAND (continued) | | | |
Telecommunications (0.1%) | | | | | |
Kudelski SA (c) (d) | | 6,807 | | $ | 210,035 |
SwissCom AG (c) | | 3,443 | | | 1,204,035 |
| | | | | |
| | | | | 1,414,070 |
| | | | | |
Transportation (0.0%) | | | | | |
Kuehne & Nagel International AG (c) | | 7,590 | | | 520,443 |
| | | | | |
| | | | | 139,449,161 |
| | | | | |
UNITED KINGDOM (22.7%) | | | | | |
Advertising (0.2%) | | | | | |
Aegis Group PLC (c) | | 136,039 | | | 345,691 |
WPP Group PLC (c) | | 211,373 | | | 2,707,168 |
| | | | | |
| | | | | 3,052,859 |
| | | | | |
Aerospace & Defense (0.4%) | | | | | |
BAE Systems PLC (c) | | 532,707 | | | 4,258,679 |
Cobham PLC (c) | | 119,349 | | | 436,624 |
Meggitt PLC (c) | | 33,122 | | | 210,764 |
Rolls-Royce Group PLC (c) | | 300,830 | | | 2,692,345 |
| | | | | |
| | | | | 7,598,412 |
| | | | | |
Agriculture (0.6%) | | | | | |
British American Tobacco PLC (c) | | 244,406 | | | 6,655,462 |
Gallaher Group PLC (c) | | 113,221 | | | 1,921,466 |
Imperial Tobacco Group PLC (c) | | 113,951 | | | 4,035,756 |
| | | | | |
| | | | | 12,612,684 |
| | | | | |
Airlines (0.1%) | | | | | |
British Airways PLC (b) (c) | | 117,239 | | | 1,025,335 |
| | | | | |
Apparel (0.0%) | | | | | |
Burberry Group PLC (c) | | 80,246 | | | 854,002 |
| | | | | |
Auto Parts & Equipment (0.0%) | | | |
GKN PLC (c) | | 137,333 | | | 799,253 |
| | | | | |
Banks (4.4%) | | | | | |
Barclays PLC (c) | | 1,068,205 | | | 14,390,718 |
HBOS PLC (c) | | 603,817 | | | 12,507,577 |
HSBC Holdings PLC (c) | | 1,844,324 | | | 34,992,517 |
Statement of Investments (Continued)
October 31, 2006
Gartmore International Index Fund (Continued)
Common Stocks (continued)
| | | | | |
| | | Shares or Principal Amount | | Value |
| | | | | |
UNITED KINGDOM (continued) | | | | | |
Banks (continued) | | | | | |
Lloyds TSB Group PLC (c) | | 928,657 | | $ | 9,918,083 |
Royal Bank of Scotland Group PLC (c) | | 510,506 | | | 18,170,649 |
| | | | | |
| | | | | 89,979,544 |
| | | | | |
Beverages (0.6%) | | | | | |
Diageo PLC (c) | | 467,990 | | | 8,652,042 |
SABMiller PLC (c) | | 132,775 | | | 2,567,445 |
Scottish & Newcastle PLC (c) | | 125,060 | | | 1,344,709 |
| | | | | |
| | | | | 12,564,196 |
| | | | | |
Building Materials (0.1%) | | | | | |
CRH PLC (c) | | 35 | | | 1,234 |
Hanson PLC (c) | | 133,201 | | | 1,848,697 |
Travis Perkins PLC (c) | | 11,907 | | | 406,012 |
| | | | | |
| | | | | 2,255,943 |
| | | | | |
Chemicals (0.1%) | | | | | |
Imperial Chemical Industries PLC (c) | | 161,242 | | | 1,248,468 |
Johnson Matthey PLC (c) | | 43,515 | | | 1,191,222 |
| | | | | |
| | | | | 2,439,690 |
| | | | | |
Commercial Services (0.5%) | | | | | |
AgGreko PLC (c) | | 6,531 | | | 43,977 |
Brambles Industries PLC (c) | | 133,818 | | | 1,255,582 |
Bunzl PLC (c) | | 63,258 | | | 834,735 |
Capita Group PLC (c) | | 122,457 | | | 1,257,489 |
Davis Service Group PLC (c) | | 2,999 | | | 28,042 |
De La Rue PLC (c) | | 5,908 | | | 69,850 |
Experian Group Ltd. (b) (c) | | 185,791 | | | 2,043,068 |
Group 4 Securicor PLC (c) | | 116,110 | | | 386,356 |
Hays PLC (c) | | 296,932 | | | 840,144 |
Intertek Group PLC (c) | | 10,173 | | | 159,383 |
Michael Page International PLC (c) | | 24,639 | | | 189,643 |
Rank Group PLC (c) | | 148,014 | | | 710,986 |
Rentokil Initial PLC (c) | | 383,545 | | | 1,107,220 |
Serco Group PLC (c) | | 43,037 | | | 290,671 |
| | | | | |
| | | | | 9,217,146 |
| | | | | |
Computers (0.1%) | | | | | |
LogicaCMG PLC (c) | | 317,460 | | | 999,423 |
LogicaCMG PLC (b) | | 28,957 | | | 91,447 |
| | | | | |
| | | | | 1,090,870 |
| | | | | |
| | | | | |
| | | Shares or Principal Amount | | Value |
| | | | | |
UNITED KINGDOM (continued) | | | | | |
Distribution & Wholesale (0.2%) | | | |
Inchcape PLC (c) | | 51,094 | | $ | 503,209 |
Wolseley PLC (c) | | 116,678 | | | 2,750,583 |
| | | | | |
| | | | | 3,253,792 |
| | | | | |
Electric (0.7%) | | | | | |
International Power PLC (c) | | 242,155 | | | 1,545,621 |
National Grid PLC (c) | | 427,566 | | | 5,451,253 |
Scottish & Southern Energy PLC (c) | | 140,938 | | | 3,535,343 |
Scottish Power PLC (c) | | 249,907 | | | 3,114,480 |
| | | | | |
| | | | | 13,646,697 |
| | | | | |
Electronics (0.0%) | | | | | |
ElectroComponents PLC (c) | | 26,043 | | | 142,907 |
| | | | | |
Electronics & Electrical Equipment (0.0%) | | | |
Premier Farnell PLC (c) | | 2,460 | | | 8,739 |
| | | | | |
Engineering & Construction (0.0%) | | | |
Amec PLC (c) | | 88,483 | | | 627,899 |
Balfour Beatty PLC (c) | | 39,913 | | | 307,660 |
| | | | | |
| | | | | 935,559 |
| | | | | |
Entertainment (0.1%) | | | | | |
EMI Group PLC (c) | | 166,248 | | | 854,678 |
Ladbrokes PLC (c) | | 132,521 | | | 1,032,074 |
PartyGaming PLC (c) | | 55,820 | | | 32,501 |
Sportingbet PLC (c) | | 34,358 | | | 31,957 |
William Hill PLC (c) | | 75,616 | | | 936,792 |
| | | | | |
| | | | | 2,888,002 |
| | | | | |
Financial Services (0.4%) | | | | | |
3I Group PLC (c) | | 85,676 | | | 1,568,764 |
Amvescap PLC (c) | | 137,824 | | | 1,574,517 |
Cattles PLC (c) | | 22,979 | | | 164,754 |
Close Brothers Group PLC (c) | | 9,233 | | | 170,540 |
Collins Stewart Tullett PLC (c) | | 20,976 | | | 343,309 |
ICAP PLC (c) | | 53,590 | | | 518,949 |
Investec PLC (c) | | 32,466 | | | 327,712 |
London Stock Exchange Group PLC (c) | | 36,707 | | | 882,699 |
Man Group PLC (c) | | 309,937 | | | 2,879,533 |
Common Stocks (continued)
| | | | | |
| | | Shares or Principal Amount | | Value |
| | | | | |
UNITED KINGDOM (continued) | | | | | |
Financial Services (continued) | | | | | |
Provident Financial PLC (c) | | 22,696 | | $ | 267,433 |
Schroders PLC (c) | | 8,101 | | | 152,785 |
| | | | | |
| | | | | 8,850,995 |
| | | | | |
Food (1.1%) | | | | | |
Cadbury Schweppes PLC (c) | | 346,203 | | | 3,484,777 |
J Sainsbury PLC (c) | | 263,205 | | | 1,966,075 |
Tate & Lyle PLC (c) | | 95,584 | | | 1,435,886 |
Tesco PLC (c) | | 1,246,848 | | | 9,352,928 |
Unilever PLC (c) | | 200,971 | | | 4,990,021 |
| | | | | |
| | | | | 21,229,687 |
| | | | | |
Food Service (0.1%) | | | | | |
Compass Group PLC (c) | | 328,602 | | | 1,755,645 |
| | | | | |
Gas (0.2%) | | | | | |
Centrica PLC (c) | | 625,981 | | | 3,957,677 |
| | | | | |
Healthcare – Products (0.1%) | | | | | |
Smith & Nephew PLC (c) | | 177,381 | | | 1,732,328 |
| | | | | |
Holding Companies – Diversified (0.0%) | | | |
Tomkins PLC (c) | | 191,923 | | | 888,324 |
| | | | | |
Home Builders (0.2%) | | | | | |
Barratt Developments PLC (c) | | 48,750 | | | 1,005,448 |
Bellway PLC (c) | | 9,387 | | | 240,704 |
Berkeley Group Holdings PLC (b) (c) | | 6,076 | | | 166,332 |
Bovis Homes Group PLC (c) | | 6,840 | | | 123,169 |
George Wimpey PLC (c) | | 72,818 | | | 727,854 |
Persimmon PLC (c) | | 51,661 | | | 1,314,870 |
Taylor Woodrow PLC (c) | | 128,415 | | | 888,482 |
| | | | | |
| | | | | 4,466,859 |
| | | | | |
Household Products (0.2%) | | | | | |
Reckitt Benckiser PLC (c) | | 92,708 | | | 4,029,790 |
| | | | | |
Industrial (0.0%) | | | | | |
FKI PLC (c) | | 92,064 | | | 168,041 |
| | | | | |
| | | | | |
| | | Shares or Principal Amount | | Value |
| | | | | |
UNITED KINGDOM (continued) | | | | | |
Insurance (1.1%) | | | | | |
Aviva PLC (c) | | 395,992 | | $ | 5,848,534 |
Friends Provident PLC (c) | | 315,765 | | | 1,246,480 |
Legal & General Group PLC (c) | | 1,108,852 | | | 3,056,800 |
Old Mutual PLC (c) | | 837,666 | | | 2,710,959 |
Prudential PLC (c) | | 411,981 | | | 5,046,389 |
Resolution PLC (c) | | 91,471 | | | 1,083,041 |
Royal & Sun Alliance Insurance Group (c) | | 443,762 | | | 1,247,978 |
Standard Life PLC (b) | | 384,744 | | | 2,087,730 |
| | | | | |
| | | | | 22,327,911 |
| | | | | |
Iron & Steel (0.1%) | | | | | |
Corus Group PLC (c) | | 165,022 | | | 1,469,257 |
| | | | | |
Leisure (0.1%) | | | | | |
Carnival PLC (c) | | 29,502 | | | 1,435,628 |
First Choice Holidays PLC (c) | | 29,358 | | | 126,080 |
| | | | | |
| | | | | 1,561,708 |
| | | | | |
Lodging (0.1%) | | | | | |
InterContinental Hotels Group PLC (c) | | 73,147 | | | 1,407,176 |
| | | | | |
Media (0.7%) | | | | | |
British Sky Broadcasting PLC (c) | | 203,067 | | | 2,105,214 |
Daily Mail & General Trust (c) | | 29,755 | | | 380,849 |
EMAP PLC (c) | | 47,557 | | | 709,973 |
ITV PLC (c) | | 539,749 | | | 1,085,754 |
Pearson PLC (c) | | 137,613 | | | 2,030,469 |
Reed Elsevier PLC (c) | | 220,228 | | | 2,503,294 |
Reuters Group PLC (c) | | 212,978 | | | 1,815,661 |
Trinity Mirror PLC (c) | | 21,978 | | | 204,733 |
United Business Media PLC (c) | | 58,973 | | | 778,859 |
Yell Group PLC (c) | | 136,570 | | | 1,621,800 |
| | | | | |
| | | | | 13,236,606 |
| | | | | |
Medical Products (0.0%) | | | | | |
SSL International PLC (c) | | 6,642 | | | 42,532 |
| | | | | |
Mining (1.6%) | | | | | |
Anglo American PLC (c) | | 228,091 | | | 10,321,912 |
BHP Billiton PLC (c) | | 402,231 | | | 7,744,267 |
Statement of Investments (Continued)
October 31, 2006
Gartmore International Index Fund (Continued)
Common Stocks (continued)
| | | | | |
| | | Shares or Principal Amount | | Value |
| | | | | |
UNITED KINGDOM (continued) | | | |
Mining (continued) | | | | | |
Rio Tinto PLC (c) | | 167,466 | | $ | 9,264,660 |
Xstrata PLC (c) | | 93,470 | | | 3,979,425 |
| | | | | |
| | | | | 31,310,264 |
| | | | | |
Miscellaneous Manufacturing (0.2%) | | | |
BBA Group PLC (c) | | 34,239 | | | 174,230 |
Charter PLC (b) (c) | | 13,383 | | | 235,196 |
Cookson Group PLC (c) | | 11,169 | | | 123,365 |
IMI PLC (c) | | 43,571 | | | 436,881 |
Invensys PLC (b) (c) | | 126,108 | | | 548,018 |
Smiths Group PLC (c) | | 105,054 | | | 1,894,170 |
| | | | | |
| | | | | 3,411,860 |
| | | | | |
Oil & Gas (3.0%) | | | | | |
Acergy SA (b) (c) (d) | | 29,993 | | | 546,019 |
BG Group PLC (c) | | 584,701 | | | 7,758,435 |
BP PLC (c) | | 3,206,339 | | | 35,839,671 |
Royal Dutch Shell PLC (c) | | 439,792 | | | 15,800,438 |
| | | | | |
| | | | | 59,944,563 |
| | | | | |
Packaging & Containers (0.1%) | | | |
Rexam PLC (c) | | 89,256 | | | 1,004,131 |
| | | | | |
Pharmaceuticals (2.0%) | | | |
AstraZeneca PLC (c) | | 250,269 | | | 14,747,017 |
GlaxoSmithKline PLC (c) | | 932,352 | | | 24,844,423 |
| | | | | |
| | | | | 39,591,440 |
| | | | | |
Real Estate (0.5%) | | | |
British Land Co. PLC (c) | | 92,920 | | | 2,649,335 |
Brixton PLC (c) | | 18,735 | | | 191,871 |
Great Portland Estates PLC (c) | | 9,548 | | | 109,294 |
Hammerson PLC (c) | | 54,813 | | | 1,408,183 |
Land Securities Group PLC (c) | | 78,864 | | | 3,153,499 |
Liberty International PLC (c) | | 35,760 | | | 916,422 |
Slough Estates PLC (c) | | 75,662 | | | 988,579 |
| | | | | |
| | | | | 9,417,183 |
| | | | | |
Recycling (0.0%) | | | |
Biffa PLC (b) | | 52,906 | | | 268,919 |
| | | | | |
| | | | | |
| | | Shares or Principal Amount | | Value |
| | | | | |
UNITED KINGDOM (continued) | | | |
Retail (0.9%) | | | | | |
Boots Group PLC (c) | | 144,835 | | $ | 2,237,020 |
Carphone Warehouse Group PLC (c) | | 26,417 | | | 142,501 |
DSG International PLC (c) | | 332,902 | | | 1,380,798 |
Enterprise Inns PLC (c) | | 56,931 | | | 1,169,703 |
HMV Group PLC (c) | | 126,516 | | | 383,067 |
Home Retail Group (b) | | 147,639 | | | 1,129,186 |
Kesa Electricals PLC (c) | | 89,582 | | | 597,046 |
Kingfisher PLC (c) | | 405,676 | | | 2,034,719 |
Marks & Spencer Group PLC (c) | | 273,563 | | | 3,421,646 |
MFI Furniture Group PLC (b) (c) | | 151,283 | | | 291,428 |
Mitchells & Butlers PLC (c) | | 80,203 | | | 909,339 |
Next PLC (c) | | 44,681 | | | 1,601,133 |
Punch Taverns PLC (c) | | 30,911 | | | 605,575 |
Signet Group PLC (c) | | 276,237 | | | 633,042 |
Whitbread PLC (c) | | 43,010 | | | 1,148,495 |
| | | | | |
| | | | | 17,684,698 |
| | | | | |
Semiconductors (0.0%) | | | |
ARM Holdings PLC (c) | | 218,921 | | | 490,840 |
CSR PLC (b) (c) | | 34,633 | | | 499,851 |
| | | | | |
| | | | | 990,691 |
| | | | | |
Software (0.1%) | | | |
Misys PLC (c) | | 108,928 | | | 422,848 |
Sage Group PLC (c) | | 258,804 | | | 1,183,387 |
| | | | | |
| | | | | 1,606,235 |
| | | | | |
Telecommunications (1.5%) | | | |
BT Group PLC (c) | | 1,335,347 | | | 7,097,309 |
Cable & Wireless PLC (c) | | 430,736 | | | 1,203,972 |
Vodafone Group PLC (c) | | 8,422,561 | | | 21,699,975 |
| | | | | |
| | | | | 30,001,256 |
| | | | | |
Transportation (0.1%) | | | |
Arriva PLC (c) | | 13,979 | | | 190,259 |
FirstGroup PLC (c) | | 82,019 | | | 837,365 |
National Express Group PLC (c) | | 9,272 | | | 171,885 |
StageCoach Group PLC (c) | | 74,485 | | | 197,382 |
| | | | | |
| | | | | 1,396,891 |
| | | | | |
Common Stocks (continued)
| | | | | |
| | | Shares or Principal Amount | | Value |
| | | | | |
UNITED KINGDOM (continued) | | | |
Water (0.2%) | | | | | |
Kelda Group PLC (c) | | 56,923 | | $ | 939,876 |
Severn Trent PLC (c) | | 46,102 | | | 1,226,913 |
United Utilities PLC (c) | | 159,175 | | | 2,166,285 |
| | | | | |
| | | | | 4,333,074 |
| | | | | |
| | | | | 452,451,371 |
| | | | | |
| | |
Total Common Stocks | | | | | 1,948,590,170 |
| | | | | |
|
Exchange Traded Fund (0.0%) |
UNITED STATES (0.0%) | | | | | |
iShares MSCI EAFE Index Fund | | 11,200 | | | 787,248 |
| | | | | |
| |
Total Exchange Traded Fund | | | 787,248 |
| | | | | |
|
Preferred Stocks (0.0%) |
GERMANY (0.0%) | | | | | |
Electric (0.0%) | | | | | |
RWE AG (c) | | 3,765 | | | 333,585 |
| | | | | |
Media (0.0%) | | | | | |
ProSiebenSat.1 Media AG (c) | | 13,637 | | | 393,508 |
| | | | | |
| | |
Total Preferred Stocks | | | | | 727,093 |
| | | | | |
|
Rights (0.0%) |
SPAIN (0.0%) | | | | | |
Water (0.0%) | | | | | |
Sociedad General de Aguas de Barcelona | | 2,645 | | | 878 |
| | | | | |
UNITED KINGDOM (0.0%) | | | |
Real Estate (0.0%) | | | | | |
Meinl European Land Ltd Rights | | 12,983 | | | 166 |
| | | | | |
| | |
Total Rights | | | | | 1,044 |
| | | | | |
Warrant (0.0%)
| | | | | | |
| | | Shares or Principal Amount | | Value |
| | | | | | |
JAPAN (0.0%) | | | | | | |
Mining (0.0%) | | | | | | |
Dowa Mining Bonus Option (b) (c) | | | 67,800 | | $ | 0 |
| | | | | | |
| | |
Total Warrant | | | | | | 0 |
| | | | | | |
|
Repurchase Agreements (1.7%) |
| | |
CS First Boston, 5.17%, dated 10/31/06, due 11/01/06, repurchase price $15,938,351 collateralized by U.S. Government Agency Mortgages with a market value of $16,254,811 | | $ | 15,936,062 | | | 15,936,062 |
| | |
Nomura Securities, 5.17%, dated 10/31/06, due 11/01/06, repurchase price $15,217,482 collateralized by U.S. Government Agency Mortgages with a market value of $15,519,629 | | | 15,215,297 | | | 15,215,297 |
| | | | | | |
| |
Total Repurchase Agreements | | | 31,151,359 |
| | | | | | |
|
Short-Term Securities Held as Collateral for Securities
on Loan (17.1%) |
Alliance & Leicester PLC Medium Term Note, 5.31%, 11/08/06 | | | 2,500,000 | | | 2,500,000 |
Banc of America Securities LLC Repurchase Agreement, 5.32%, dated 10/31/06, due 11/01/06, repurchase price $80,731,088, collateralized by U.S. Government Agency Mortgages with a market value of $ 82,333,543 | | | 80,719,160 | | | 80,719,160 |
Bank of America Bank Note, 5.31%, 11/01/06 | | | 16,300,000 | | | 16,300,000 |
Beta Finance, Inc. Medium Term Note, 5.37%, 11/01/06 | | | 8,000,000 | | | 8,000,000 |
Statement of Investments (Continued)
October 31, 2006
Gartmore International Index Fund (Continued)
Short-Term Securities Held as Collateral for Securities on Loan (continued)
| | | | | | |
| | | Principal
Amount | | Value |
| | | | | | |
CC U.S.A., Inc. Medium Term Note, 5.38%, 11/01/06 | | $ | 7,997,593 | | $ | 7,997,593 |
Citigroup Global Markets, Inc. Master Note, 5.38%, 11/01/06 | | | 25,000,000 | | | 25,000,000 |
Dorada Finance, Inc. Medium Term Note, 5.37%, 11/01/06 | | | 3,000,000 | | | 3,000,000 |
Five Finance, Inc. Medium Term Note, 5.38%, 11/01/06 | | | 20,996,842 | | | 20,996,842 |
GE Life & Annuity Funding Agreement, 5.42%, 11/14/06 | | | 6,400,000 | | | 6,400,000 |
General Electric Capital Corp. Medium Term Note, 5.39%, 12/08/06 | | | 4,500,128 | | | 4,500,128 |
Genworth Life Insurance Co. Funding Agreement, 5.48%, 12/15/06 | | | 9,000,000 | | | 9,000,000 |
Goldman Sachs Group, Inc. Master Note, 5.38%, 11/02/06 | | | 25,000,000 | | | 25,000,000 |
Islandsbank Corp. Medium Term Note, 5.39%, 11/22/06 | | | 5,000,000 | | | 5,000,000 |
Lafayette Asset Commercial Paper, 5.30%, 11/27/06 | | | 5,010,339 | | | 5,010,339 |
MacQuarie Bank Ltd. Medium Term Note, 5.34%, 11/21/06 | | | 19,998,846 | | | 19,998,846 |
MBIA Global Funding LLC Medium Term Note, 5.37%, 11/01/06 | | | 10,000,000 | | | 10,000,000 |
Merrill Lynch Mortgage Capital Master Note, 5.41%, 11/01/06 | | | 10,000,000 | | | 10,000,000 |
Morgan Stanley Master Note, 5.49%, 11/01/06 | | | 5,000,000 | | | 5,000,000 |
Northern Rock PLC Medium Term Note, 5.46%, 12/11/06 | | | 3,000,000 | | | 3,000,000 |
Pacific Life Global Funding Medium Term Note, 5.45%, 01/26/07 | | | 10,000,000 | | | 10,000,000 |
| | | | | | | |
| | | Principal
Amount | | Value | |
| | | | | | | |
Pricoa Global Funding I Medium Term Note, 5.37%, 11/01/06 | | $ | 20,000,000 | | $ | 20,000,000 | |
Sigma Finance, Inc. Medium Term Note, 5.37%, 11/01/06 | | | 4,999,515 | | | 4,999,515 | |
Tango Finance Corp. Medium Term Note, 5.39%, 11/01/06 | | | 2,999,415 | | | 2,999,415 | |
Unicredito Italiano Bank PLC Medium Term Note, 5.33%, 11/09/06 | | | 15,900,000 | | | 15,900,000 | |
Wachovia Bank N.A. Bank Note, 5.37%, 11/01/06 | | | 16,000,000 | | | 16,000,000 | |
West Corp. Federal Credit Union Medium Term Note, 5.38%, 11/01/06 | | | 7,000,000 | | | 7,000,000 | |
| | | | | | | |
| |
Total Short-Term Securities Held as Collateral for Securities on Loan | | | 344,321,838 | |
| | | | | | | |
| |
Total Investments
(Cost $1,784,630,148) (a) — 116.0% | | | 2,325,578,752 | |
| | |
Liabilities in excess of other assets — (16.0)% | | | | | | (320,129,580 | ) |
| | | | | | | |
| | |
NET ASSETS — 100.0% | | | | | $ | 2,005,449,172 | |
| | | | | | | |
| | (a) | See notes to financial statements for tax unrealized appreciation (depreciation) of securities. |
| | (b) | Denotes a non-income producing security. |
| | (d) | All or part of the security was on loan as of October 31, 2006. |
| | ADR | American Depository Receipt |
Gartmore International Index Fund (Continued)
Statement of Investments (Continued)
October 31, 2006
At October 31, 2006, the Fund’s open forward foreign currency contracts were as follows:
| | | | | | | | | | | | | | |
Currency | | Delivery Date | | Contract Value | | | Market Value | | | Unrealized
Appreciation/
(Depreciation) | |
Short Contracts: | | | | | | | | | | | | | | |
Australian Dollar | | 11/10/06 | | $ | (5,468,777 | ) | | $ | (5,617,755 | ) | | $ | (148,978 | ) |
British Pound | | 11/10/06 | | | (21,436,014 | ) | | | (21,664,717 | ) | | | (228,703 | ) |
Euro | | 11/10/06 | | | (32,922,123 | ) | | | (33,073,733 | ) | | | (151,610 | ) |
Hong Kong Dollar | | 11/10/06 | | | (981,162 | ) | | | (980,395 | ) | | | 767 | |
Japanese Yen | | 11/10/06 | | | (24,110,731 | ) | | | (24,145,117 | ) | | | (34,386 | ) |
Singapore Dollar | | 11/10/06 | | | (418,018 | ) | | | (420,387 | ) | | | (2,369 | ) |
Swedish Krone | | 11/10/06 | | | (2,588,293 | ) | | | (2,611,740 | ) | | | (23,447 | ) |
Swiss Franc | | 11/10/06 | | | (7,034,618 | ) | | | (7,064,682 | ) | | | (30,064 | ) |
| | | | | | | | | | | | | | |
Total Short Contracts | | | | $ | (94,959,736 | ) | | $ | (95,578,526 | ) | | $ | (618,790 | ) |
| | | | | | | | | | | | | | |
| | | | |
Currency | | Delivery Date | | Contract Value | | | Market Value | | | Unrealized
Appreciation/
(Depreciation) | |
Long Contracts: | | | | | | | | | | | | | | |
Australian Dollar | | 11/10/06 | | $ | 6,573,332 | | | $ | 6,730,858 | | | $ | 157,526 | |
British Pound | | 11/10/06 | | | 27,132,592 | | | | 27,474,504 | | | | 341,912 | |
Euro | | 11/10/06 | | | 43,643,121 | | | | 43,691,470 | | | | 48,349 | |
Hong Kong Dollar | | 11/10/06 | | | 981,806 | | | | 980,395 | | | | (1,411 | ) |
Japanese Yen | | 11/10/06 | | | 34,207,128 | | | | 34,009,350 | | | | (197,778 | ) |
Singapore Dollar | | 11/10/06 | | | 417,934 | | | | 420,387 | | | | 2,453 | |
Swedish Krone | | 11/10/06 | | | 3,335,221 | | | | 3,335,284 | | | | 63 | |
Swiss Franc | | 11/10/06 | | | 10,530,161 | | | | 10,485,221 | | | | (44,940 | ) |
| | | | | | | | | | | | | | |
Total Long Contracts | | | | $ | 126,821,295 | | | $ | 127,127,469 | | | $ | 306,174 | |
| | | | | | | | | | | | | | |
At October 31, 2006, the Fund’s open long futures contracts were as follows:
| | | | | | | | | | | | | | | |
| | | Number of
Contracts | | Long Contracts* | | Expiration | | Market Value
Covered by
Contract
(denoted in
currencies of
respective
countries) | | Market Value
Covered by
Contract | | Unrealized
Appreciation/
(Depreciation) | |
Australia | | 42 | | S&P ASX 200 Index | | 12/21/06 | | 3,373,115 | | $ | 4,357,457 | | $ | 137,373 | |
Europe | | 234 | | DJ Euro Stoxx 50 | | 12/15/06 | | 15,287,751 | | | 11,980,093 | | | 61,604 | |
Hong Kong | | 18 | | Hang Seng Index | | 11/29/06 | | 272,930 | | | 2,122,494 | | | 20,761 | |
Japan | | 114 | | Topix Index | | 12/07/06 | | 134,508 | | | 15,729,348 | | | (88,935 | ) |
Sweden | | 310 | | OMX Index | | 11/24/06 | | 646,774 | | | 4,669,515 | | | (65,328 | ) |
United Kingdom | | 86 | | FTSE 100 Index | | 12/15/06 | | 19,210,668 | | | 10,072,153 | | | 31,354 | |
| | | | | | | | | | | | | | | |
| | | | | | | | | | $ | 48,931,060 | | $ | 96,829 | |
| | | | | | | | | | | | | | | |
See notes to financial statements.
Gartmore Mid Cap Market Index Fund
Effective September 29, 2006, Merrill Lynch & Co., Inc. and BlackRock, Inc. completed a transaction to form a new asset management company involving Merrill Lynch’s asset management business, including Fund Asset Management, L.P. (the subadviser to each of the Gartmore Bond Index Fund, Gartmore International Index Fund, Gartmore Mid Cap Market Index Fund, Gartmore S&P 500 Index Fund and Gartmore Small Cap Index Fund) and BlackRock, Inc. The result of the transaction is a new subadviser known as BlackRock Investment Management, LLC.
For the annual period ended Oct. 31, 2006, the Gartmore Mid Cap Market Index Fund (Class A at NAV) returned 12.57% versus 13.43% for its benchmark, the S&P MidCap 400 Index. For broader comparison, the average return for the Fund’s Lipper peer category of Mid-Cap Core Funds (consisting of 323 funds as of Oct. 31, 2006) was 14.46%. The underperformance of the Fund versus the S&P 400 MidCap 400 Index was primarily due to the expenses of the Fund.
The U.S. equity market posted strong gains during the reporting period. The positive returns resulted primarily from rallies in the first and third quarters of 2006, and in spite of a global equity market correction in the second quarter. Of particular note was the change of market capitalization leadership during the correction, with large-cap stocks leading small- and mid-cap stocks through the third-quarter rally. For the third quarter of 2006, the S&P 500® Index of large-cap U.S. stocks returned 5.67% versus -0.88% for the S&P SmallCap 600 Index and -1.08% for the S&P MidCap 400 Index.
Strong growth in corporate earnings and significant upward revisions to earnings expectations have been major drivers of the global equity bull market since 2003. Although the rate of earnings upgrades slowed late in the reporting period from the exceptionally strong rates seen in previous years, news from the major corporate sectors has been positive. Earnings generally came in ahead of expectations in the third quarter of 2006 and supported the rally in equities.
The recurring themes in the market environment throughout most of the period were rising short-term interest rates and higher energy prices. The Federal Reserve Board raised the target federal funds rate in six 0.25% increments, bringing the target rate from 3.75% to 5.25% during the reporting period. The Federal Open Market Committee, however, held the rate steady at its August, September and October 2006 meetings. The third quarter of 2006 was the first quarterly period not to include an increase in the federal funds target rate since the first quarter of 2004. Oil prices climbed above $78.00 per barrel early in the third quarter of 2006. Energy prices declined significantly in late summer and into October, however, amid slowing demand and weakness in both oil and natural gas futures. The price of oil stood at $58.73 per barrel on Oct. 31, 2006.
At the end of the reporting period, the U.S. economy exhibited some evidence of a slowdown. Gross domestic product (GDP) rose at an annual rate of just 1.6% in the third quarter of 2006, according to advance estimates released by the Bureau of Economic Analysis in late October. This followed a 2.6% annual GDP growth rate for the second quarter of the year. The moderating growth rate reflected sluggish income growth, a weaker housing market and a low savings ratio. In addition, prospects for U.S. consumer spending are uncertain, although consumption has held up well and most likely will be further supported by lower oil prices.
The portfolio is positioned such that the risk characteristics are similar to those of the S&P MidCap 400 Index. The portfolio seeks to perform in line with the benchmark on a gross return basis.
Portfolio Managers:
BlackRock Investment Management, LLC—Subadviser: Debra L. Jelilian and Jeffery L. Russo, CFA
| | |
Fund Performance | | Gartmore Mid Cap Market Index Fund |
Average Annual Total Return
(For periods ended October 31, 2006)
| | | | | | | | |
| | | | | 1 Yr. | | 5 Yr. | | Inception1 |
| Class A | | w/o SC2 | | 12.57% | | 12.14% | | 9.30% |
| | | w/SC3 | | 6.07% | | 10.81% | | 8.36% |
| Class B4 | | w/o SC2 | | 11.98% | | 11.50% | | 8.73% |
| | | w/SC5 | | 6.98% | | 11.24% | | 8.73% |
| Class C6 | | w/o SC2 | | 11.96% | | 11.48% | | 8.72% |
| | | w/SC7 | | 10.96% | | 11.48% | | 8.72% |
| Institutional Class8 | | 13.06% | | 12.60% | | 9.77% |
All figures showing the effect of a sales charge reflect the maximum charge possible, because it has the most dramatic effect on performance data.
| 1 | Fund commenced operations on December 29, 1999. |
| 2 | These returns do not reflect the effects of sales charges (SC). |
| 3 | A 5.75% front-end sales charge was deducted. |
| 4 | These returns until the creation of Class B shares (5/25/01) include performance based on the Fund’s Class A shares. Excluding the effect of any fee waivers or reimbursements, such prior performance is similar to what Class B shares would have produced because Class B shares invest in the same portfolio of securities as Class A shares. The performance for this class has been restated to reflect differences in sales charges (where applicable), but does not reflect the differing levels of other fees (primarily Rule 12b-1 and/or administrative services fees) applicable to such classes; if these fees were reflected, the performance for Class B shares would have been lower. |
| 5 | A 5.00% maximum contingent deferred sales charge (CDSC) was deducted. The CDSC declines to 0% after 6 years. |
| 6 | These returns until the creation of Class C shares (10/22/03) include the performance of the Fund’s Class A for the period through May 24, 2001 and the Fund’s Class B shares for the period from May 25, 2001 to October 21, 2003. Excluding the effect of any fee waivers or reimbursements, such prior performance is similar to what Class C shares would have produced because Class C shares invest in the same portfolio of securities as the Fund’s other classes. The performance for the Class C shares has been restated to reflect differences in sales charges (where applicable), but does not reflect the differing levels of other fees (primarily Rule 12b-1 and/or administrative services fees) applicable to such classes; if these fees were reflected, the performance for Class C shares would have been lower. |
| 7 | A CDSC of 1.00% was deducted from the one year return because it is charged when you sell Class C shares within the first year after purchase. |
| 8 | Not subject to any sales charges. |
Performance of a $10,000 Investment
Investment return and principal value will fluctuate, and when redeemed, shares may be worth more or less than original cost. Past performance is no guarantee of future results and does not reflect the deduction of taxes that a shareholder would pay on fund distributions or the redemption of fund shares. Investing in mutual funds involves market risk, including loss of principal. Performance returns assume the reinvestment of all distributions.
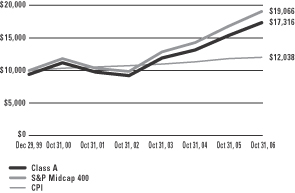
Comparative performance of $10,000 invested in Class A shares of the Gartmore Mid Cap Market Index Fund, the S&P MidCap 400 Index(a), and the Consumer Price Index (CPI)(b) since inception. Unlike the Fund, the returns for these unmanaged indexes do not reflect any fees, expenses, or sales charges. Investors cannot invest directly in market indexes.
| (a) | The S&P MidCap 400 Index is an unmanaged index that measures the performance of mid-sized U.S. companies. |
| (b) | The CPI represents changes in prices of a basket of goods and services purchased for consumption by urban households. |
| | |
Shareholder Expense Example | | Gartmore Mid Cap Market Index Fund |
As a shareholder of the Fund, you incur two types of costs: (1) transaction costs, including sales charges (loads) paid on purchase payments and redemption fees; and (2) ongoing costs, including investment advisory fees, administration fees, distribution fees and other Fund expenses. The examples below are intended to help you understand your ongoing costs (in dollars) of investing in the Fund and to compare these costs with the ongoing costs of investing in other mutual funds. Per SEC requirements, the examples assume that you had a $1,000 investment in the Class at the beginning of the reporting period, May 1, 2006 and continued to hold your shares at the end of the reporting period, October 31, 2006.
Actual Expenses
For each Class of the Fund in the table below, the first line provides information about actual account values and actual expenses. You may use the information in this line, together with the amount you invested, to estimate the expenses that you paid over the period. Simply divide your account value by $1,000 (for example, an $8,600 account value divided by $1,000 = 8.6), then multiply the result by the number in the first line of each Class under the heading entitled “Expenses Paid During Period” to estimate the expenses you paid on your account during the period.
Hypothetical Example for Comparison Purposes
The second line of each Class in the table below provides information about hypothetical account values and hypothetical expenses based on the Class’ actual expense ratio and an assumed rate of return of 5% per year before expenses, which is not the Class’ actual return. The hypothetical account values and expenses may not be used to estimate the actual ending account balance or expenses you paid for the period. You may use this information to compare the ongoing costs of investing in the Class of the Fund and other funds. To do so, compare this 5% hypothetical example with the 5% hypothetical examples that appear in the shareholder reports of the other funds.
Please note that the expenses shown in the table are meant to highlight your ongoing costs only and do not reflect any transaction costs, such as sales charges (loads) or redemption fees. Therefore, the second line for each Class in the table is useful in comparing ongoing costs only, and will not help you determine the relative total costs of owning different funds. In addition, if these transaction costs were included, your costs would have been higher. The examples also assume all dividends and distributions have been reinvested.
Schedule of Shareholder Expenses
Expense Analysis of a $1,000 Investment
(October 31, 2006)
| | | | | | | | | | | | | |
| Gartmore Mid Cap Market Index Fund | | | | Beginning
Account Value,
5/1/06 | | Ending
Account Value,
10/31/06 | | Expenses Paid
During Period* | | Annualized
Expense Ratio* |
| Class A | | Actual | | $ | 1,000.00 | | $ | 980.80 | | $ | 3.54 | | 0.71% |
| | | Hypothetical1 | | $ | 1,000.00 | | $ | 1,021.42 | | $ | 3.62 | | 0.71% |
| Class B | | Actual | | $ | 1,000.00 | | $ | 977.40 | | $ | 6.58 | | 1.32% |
| | | Hypothetical1 | | $ | 1,000.00 | | $ | 1,018.35 | | $ | 6.74 | | 1.32% |
| Class C | | Actual | | $ | 1,000.00 | | $ | 977.40 | | $ | 6.58 | | 1.32% |
| | | Hypothetical1 | | $ | 1,000.00 | | $ | 1,018.35 | | $ | 6.74 | | 1.32% |
| Institutional Class | | Actual | | $ | 1,000.00 | | $ | 982.90 | | $ | 1.60 | | 0.32% |
| | | Hypothetical1 | | $ | 1,000.00 | | $ | 1,023.39 | | $ | 1.63 | | 0.32% |
| * | Expenses are equal to the Fund’s annualized expense ratio multiplied by the average account value over the period multiplied by 184/365 (to reflect the one-half year period). The expense ratio presented represents a six-month, annualized ratio in accordance with SEC guidelines. |
| 1 | Represents the hypothetical 5% return before expenses. |
| | |
Portfolio Summary | | Gartmore Mid Cap Market Index Fund |
October 31, 2006
The SEC adopted a requirement that Funds present their portfolio holdings in a table, chart or graph format in their annual and semiannual reports to shareholders, whether or not a statement of investments is utilized. The following tables, which present portfolio holdings as a percentage of net assets, are provided in compliance with this requirement.
| | |
| Asset Allocation | | |
| Common Stocks | | 85.6% |
| Repurchase Agreements | | 12.7% |
| Other Investments* | | 19.4% |
| Liabilities in excess of other assets** | | -17.7% |
| | |
| | 100.0% |
| | |
| Top Industries | | |
| Utilities | | 7.4% |
| Retail | | 6.3% |
| Oil & Gas | | 6.0% |
| Healthcare | | 5.3% |
| Insurance | | 5.2% |
| Electronics | | 4.9% |
| Computer Software & Services | | 4.7% |
| Banks | | 3.9% |
| Real Estate Investment Trusts | | 3.6% |
| Manufacturing | | 3.2% |
| Other Assets | | 49.5% |
| | |
| | 100.0% |
| | |
| Top Holdings*** | | |
| Peabody Energy Corp. | | 0.9% |
| Cognizant Technology Solutions Corp. | | 0.8% |
| Expeditors International of Washington, Inc. | | 0.8% |
| Precision Castparts Corp. | | 0.7% |
| Noble Energy, Inc. | | 0.7% |
| ENSCO International, Inc. | | 0.6% |
| C.H. Robinson Worldwide, Inc. | | 0.6% |
| Varian Medical Systems, Inc. | | 0.6% |
| Microchip Technology, Inc. | | 0.5% |
| Questar Corp. | | 0.5% |
| Other Assets | | 93.4% |
| | |
| | 100.0% |
| * | Includes value of collateral received from securities lending. |
| ** | Includes value of collateral owed from securities lending. |
| *** | For purpose of listing top holdings, repurchase agreements are considered cash equivalents and are included as part of Other Assets. |
Statement of Investments
October 31, 2006
Gartmore Mid Cap Market Index Fund
Common Stocks (85.6%)
| | | | | |
| | | Shares or
Principal Amount | | Value |
| | | | | |
Aerospace & Defense (1.0%) | | | | | |
Alliant Techsystems, Inc. (b) (c) | | 36,300 | | $ | 2,802,723 |
Precision Castparts Corp. | | 135,659 | | | 9,232,951 |
Sequa Corp., Class A (b) (c) | | 5,960 | | | 632,416 |
| | | | | |
| | | | | 12,668,090 |
| | | | | |
Airlines (0.4%) | | | | | |
AirTran Holdings, Inc. (b) | | 85,500 | | | 852,435 |
Alaska Air Group, Inc. (b) (c) | | 40,700 | | | 1,634,105 |
JetBlue Airways Corp. (b) | | 167,225 | | | 2,100,346 |
| | | | | |
| | | | | 4,586,886 |
| | | | | |
Amusement & Recreation (0.3%) | | | |
Boyd Gaming Corp. (c) | | 43,300 | | | 1,709,051 |
Callaway Golf Co. (c) | | 61,100 | | | 820,573 |
International Speedway Corp. | | 33,200 | | | 1,723,412 |
| | | | | |
| | | | | 4,253,036 |
| | | | | |
Auto Parts & Equipment (1.1%) | | | |
Advance Auto Parts, Inc. | | 107,900 | | | 3,778,658 |
ArvinMeritor, Inc. | | 72,160 | | | 1,083,843 |
Bandag, Inc. | | 11,500 | | | 504,735 |
BorgWarner Automotive, Inc. | | 55,420 | | | 3,186,650 |
Gentex Corp. (c) | | 146,180 | | | 2,325,724 |
Lear Corp. | | 69,236 | | | 2,091,620 |
Modine Manufacturing Co. (c) | | 30,100 | | | 716,681 |
| | | | | |
| | | | | 13,687,911 |
| | | | | |
Automotive (0.5%) | | | | | |
Adesa, Inc. (c) | | 85,700 | | | 2,154,498 |
Carmax, Inc. (b) | | 104,500 | | | 4,629,350 |
| | | | | |
| | | | | 6,783,848 |
| | | | | |
Banks (3.9%) | | | | | |
Associated Banc Corp. | | 130,221 | | | 4,276,458 |
Astoria Financial Corp. | | 82,420 | | | 2,391,004 |
Cathay Bancorp, Inc. | | 48,100 | | | 1,657,045 |
City National Corp. | | 42,400 | | | 2,822,144 |
Colonial Bancgroup, Inc. | | 149,940 | | | 3,574,570 |
Cullen/Frost Bankers, Inc. | | 55,080 | | | 2,983,133 |
First Niagara Financial Group, Inc. (c) | | 104,400 | | | 1,495,008 |
FirstMerit Corp. (c) | | 81,780 | | | 1,898,932 |
Greater Bay Bancorp (c) | | 55,580 | | | 1,431,185 |
IndyMac Bancorp, Inc. | | 70,759 | | | 3,215,997 |
| | | | | |
| | | Shares or
Principal Amount | | Value |
| | | | | |
Banks (continued) | | | | | |
Mercantile Bankshare Corp. | | 122,075 | | $ | 5,503,140 |
New York Community Bancorp, Inc. | | 264,714 | | | 4,328,073 |
SVB Financial Group (b) (c) | | 37,399 | | | 1,721,102 |
TCF Financial Corp. | | 112,200 | | | 2,920,566 |
Texas Regional Bancshares, Inc., Class A | | 47,960 | | | 1,863,246 |
Washington Federal, Inc. (c) | | 81,712 | | | 1,898,987 |
Webster Financial Corp. | | 53,000 | | | 2,560,960 |
West America Bancorp | | 33,620 | | | 1,675,957 |
Wilmington Trust Corp. | | 65,800 | | | 2,735,964 |
| | | | | |
| | | | | 50,953,471 |
| | | | | |
Beverages (0.2%) | | | | | |
Hansen Natural Corp. (b) (c) | | 62,800 | | | 1,993,900 |
| | | | | |
Biotechnology (1.2%) | | | | | |
Millennium Pharmaceuticals, Inc. (b) | | 319,403 | | | 3,737,015 |
PDL Biopharma, Inc. (b) (c) | | 114,765 | | | 2,424,984 |
Pharmaceutical Product Development, Inc. | | 100,500 | | | 3,180,825 |
Valeant Pharmaceuticals International | | 94,800 | | | 1,770,864 |
Vertex Pharmaceuticals, Inc. (b) (c) | | 111,080 | | | 4,509,849 |
| | | | | |
| | | | | 15,623,537 |
| | | | | |
Broadcasting (0.1%) | | | | | |
Entercom Communications Corp. (c) | | 32,980 | | | 912,556 |
Westwood One, Inc. (c) | | 58,780 | | | 464,950 |
| | | | | |
| | | | | 1,377,506 |
| | | | | |
Building & Construction (0.1%) | | | |
M.D.C. Holdings, Inc. (c) | | 32,900 | | | 1,640,394 |
| | | | | |
Business Services (2.6%) | | | |
Acxiom Corp. | | 68,184 | | | 1,687,554 |
Catalina Marketing Corp. (c) | | 40,100 | | | 1,016,535 |
Ceridian Corp. (b) | | 134,240 | | | 3,164,037 |
CheckFree Corp. (b) | | 90,387 | | | 3,568,479 |
ChoicePoint, Inc. (b) | | 87,920 | | | 3,199,409 |
Copart, Inc. (b) (c) | | 67,300 | | | 1,946,989 |
Common Stocks (continued)
| | | | | |
| | | Shares or
Principal Amount | | Value |
| | | | | |
Business Services (continued) | | | |
Corporate Executive Board Co. | | 41,000 | | $ | 3,682,620 |
CSG Systems International, Inc. (b) | | 44,680 | | | 1,205,466 |
Fair Isaac Corp. | | 65,707 | | | 2,406,847 |
Gartner Group, Inc. (b) (c) | | 52,080 | | | 968,688 |
Harte-Hanks, Inc. | | 51,240 | | | 1,293,810 |
Kelly Services, Inc. (c) | | 18,775 | | | 540,345 |
Korn/Ferry International (b) (c) | | 40,300 | | | 891,033 |
Manpower, Inc. | | 88,460 | | | 5,994,934 |
MPS Group, Inc. (b) (c) | | 98,040 | | | 1,495,110 |
Navigant Consulting, Inc. (b) | | 49,200 | | | 876,252 |
| | | | | |
| | | | | 33,938,108 |
| | | | | |
Chemicals (2.4%) | | | | | |
Airgas, Inc. | | 74,400 | | | 2,813,064 |
Albemarle Corp. | | 38,800 | | | 2,523,164 |
Cabot Corp. (c) | | 65,200 | | | 2,578,660 |
Chemtura Corp. | | 232,200 | | | 1,992,276 |
Cytec Industries, Inc. | | 40,900 | | | 2,265,451 |
Ferro Corp. (c) | | 48,000 | | | 946,560 |
FMC Corp. | | 40,160 | | | 2,752,968 |
Lubrizol Corp. | | 65,680 | | | 2,955,600 |
Lyondell Chemical Co. | | 210,960 | | | 5,415,344 |
Minerals Technologies, Inc. | | 22,040 | | | 1,215,726 |
Olin Corp. | | 76,360 | | | 1,321,028 |
RPM, Inc. | | 112,200 | | | 2,148,630 |
Valspar Corp. (c) | | 100,500 | | | 2,692,395 |
| | | | | |
| | | | | 31,620,866 |
| | | | | |
Communication Equipment (1.6%) | | | |
Adtran, Inc. (c) | | 68,159 | | | 1,577,199 |
Cincinnati Bell, Inc. (b) (c) | | 233,600 | | | 1,095,584 |
CommScope, Inc. (b) (c) | | 57,620 | | | 1,838,654 |
Harris Corp. | | 134,039 | | | 5,710,061 |
Plantronics, Inc. | | 50,200 | | | 1,059,722 |
Polycom, Inc. (b) | | 86,802 | | | 2,378,375 |
Powerwave Technologies, Inc. (b) | | 114,701 | | | 746,704 |
Telephone & Data Systems, Inc. | | 60,100 | | | 2,935,885 |
Telephone & Data Systems, Inc., Special Shares | | 41,100 | | | 1,911,150 |
Utstarcom, Inc. (b) | | 98,800 | | | 1,064,076 |
| | | | | |
| | | | | 20,317,410 |
| | | | | |
| | | | | |
| | | Shares or
Principal Amount | | Value |
| | | | | |
Computer Hardware (0.4%) | | | |
National Instruments Corp. (c) | | 52,630 | | $ | 1,641,003 |
Western Digital Corp. (b) | | 216,800 | | | 3,963,104 |
| | | | | |
| | | | | 5,604,107 |
| | | | | |
Computer Software & Services (4.7%) | | | |
3COM Corp. (b) | | 410,705 | | | 1,996,026 |
Activision, Inc. (b) (c) | | 255,721 | | | 3,943,218 |
Advent Software, Inc. (b) | | 18,269 | | | 676,318 |
Avocent Corp. (b) | | 53,606 | | | 1,967,876 |
Cadence Design Systems, Inc. (b) | | 281,191 | | | 5,022,072 |
CDW Corp. | | 62,057 | | | 4,075,283 |
Cognizant Technology Solutions Corp. (b) | | 141,197 | | | 10,629,311 |
DST Systems, Inc. (b) | | 60,560 | | | 3,742,002 |
F5 Networks, Inc. (b) | | 41,712 | | | 2,760,917 |
Gamestop Corp. (b) | | 73,500 | | | 3,752,910 |
Henry (Jack) & Associates, Inc. | | 76,600 | | | 1,669,114 |
Ingram Micro, Inc. (b) | | 133,100 | | | 2,743,191 |
Macrovision Corp. (b) | | 56,220 | | | 1,496,014 |
McAfee, Inc. (b) | | 160,800 | | | 4,651,945 |
McData Corp. (b) | | 145,000 | | | 822,150 |
Mentor Graphics Corp. (b) (c) | | 76,700 | | | 1,293,929 |
Palm, Inc. (b) | | 102,000 | | | 1,565,700 |
SRA International, Inc., Class A (b) (c) | | 38,200 | | | 1,224,310 |
Sybase, Inc. (b) | | 85,300 | | | 2,077,055 |
Synopsys, Inc. (b) | | 143,981 | | | 3,241,012 |
Transaction Systems Architects, Inc. (b) | | 35,500 | | | 1,196,705 |
Wind River Systems, Inc. (b) | | 79,400 | | | 871,812 |
| | | | | |
| | | | | 61,418,870 |
| | | | | |
Construction (1.8%) | | | |
Beazer Homes USA, Inc. (c) | | 41,057 | | | 1,779,410 |
Dycom Industries, Inc. (b) (c) | | 36,900 | | | 860,139 |
Florida Rock Industries, Inc. | | 48,000 | | | 2,059,200 |
Granite Construction, Inc. (c) | | 35,660 | | | 1,857,886 |
Hovnanian Enterprises, Inc. (b) | | 36,020 | | | 1,111,217 |
Jacobs Engineering Group, Inc. (b) | | 58,880 | | | 4,447,796 |
Martin Marietta Materials, Inc. | | 46,794 | | | 4,117,872 |
Ryland Group, Inc. (The) (c) | | 45,367 | | | 2,083,706 |
Thor Industries, Inc. (c) | | 35,400 | | | 1,551,228 |
Toll Brothers, Inc. (b) | | 123,318 | | | 3,565,123 |
| | | | | |
| | | | | 23,433,577 |
| | | | | |
Statement of Investments (Continued)
October 31, 2006
Gartmore Mid Cap Market Index Fund (Continued)
Common Stocks (continued)
| | | | | |
| | | Shares or
Principal Amount | | Value |
| | | | | |
Consumer & Commercial Services (2.0%) | | | |
Alliance Data Systems Corp. (b) | | 67,900 | | $ | 4,122,888 |
Career Education Corp. (b) | | 98,249 | | | 2,188,988 |
Corinthian Colleges, Inc. (b) (c) | | 88,080 | | | 1,078,980 |
Deluxe Corp. (c) | | 51,973 | | | 1,178,228 |
DeVry, Inc. (b) | | 55,800 | | | 1,358,730 |
Dun & Bradstreet Corp. (b) | | 64,093 | | | 4,950,542 |
MoneyGram International, Inc. | | 86,500 | | | 2,959,165 |
Quanta Services, Inc. (b) (c) | | 114,700 | | | 2,099,010 |
Rent-A-Center, Inc. (b) (c) | | 71,247 | | | 2,049,064 |
Rollins, Inc. | | 27,865 | | | 602,999 |
Sotheby’s Holdings, Inc. | | 57,600 | | | 2,188,800 |
United Rentals, Inc. (b) (c) | | 67,700 | | | 1,603,813 |
| | | | | |
| | | | | 26,381,207 |
| | | | | |
Consumer Products (1.4%) | | | |
Blyth Industries, Inc. | | 21,740 | | | 520,021 |
Church & Dwight, Inc. (c) | | 64,800 | | | 2,628,936 |
Energizer Holdings, Inc. (b) | | 58,878 | | | 4,601,315 |
Furniture Brands International, Inc. | | 52,938 | | | 984,647 |
Lancaster Colony Corp. (c) | | 23,200 | | | 940,760 |
Mohawk Industries Co. (b) (c) | | 51,940 | | | 3,776,038 |
Scotts Miracle-Gro Co. (The) | | 47,920 | | | 2,370,123 |
Timberland Co., Class A (b) (c) | | 51,100 | | | 1,474,235 |
Tupperware Corp. | | 56,433 | | | 1,198,073 |
| | | | | |
| | | | | 18,494,148 |
| | | | | |
Containers & Packaging (0.4%) | | | |
Packaging Corp. of America | | 75,760 | | | 1,740,207 |
Sonoco Products Co. | | 95,500 | | | 3,388,340 |
| | | | | |
| | | | | 5,128,547 |
| | | | | |
Data Processing (0.2%) | | | |
Fidelity National Information Services, Inc. (c) | | 68,545 | | | 2,849,416 |
| | | | | |
Education (0.1%) | | | |
Strayer Education, Inc. (b) | | 14,940 | | | 1,690,013 |
| | | | | |
Electronics (4.9%) | | | |
Amphenol Corp., Class A | | 89,520 | | | 6,078,408 |
Arrow Electronics, Inc. (b) | | 118,533 | | | 3,538,210 |
Atmel Corp. (b) | | 440,300 | | | 2,531,725 |
Avnet, Inc. (b) | | 132,578 | | | 3,139,447 |
| | | | | |
| | | Shares or
Principal Amount | | Value |
| | | | | |
Electronics (continued) | | | |
Cree, Inc. (b) (c) | | 77,425 | | $ | 1,702,576 |
Cypress Semiconductor Corp. (b) (c) | | 135,569 | | | 2,276,204 |
DRS Technologies (c) | | 42,400 | | | 1,874,928 |
Hubbell, Inc. | | 58,100 | | | 2,877,112 |
Imation Corp. | | 35,933 | | | 1,644,653 |
Integrated Device Technology, Inc. (b) | | 198,087 | | | 3,139,679 |
International Rectifier Corp. (b) | | 71,800 | | | 2,582,646 |
Intersil Corp. | | 144,802 | | | 3,395,607 |
Kemet Corp. (b) | | 78,460 | | | 576,681 |
Lam Research Corp. (b) | | 142,065 | | | 7,025,114 |
Lattice Semiconductor Corp. (b) (c) | | 105,160 | | | 653,044 |
Micrel, Inc. (b) (c) | | 62,400 | | | 696,384 |
Microchip Technology, Inc. | | 215,164 | | | 7,085,350 |
Mine Safety Appliances Co. | | 27,200 | | | 1,028,704 |
Newport Corp. (b) (c) | | 43,060 | | | 930,957 |
Plexus Corp. (b) | | 44,500 | | | 975,440 |
RF Micro Devices, Inc. (b) | | 201,625 | | | 1,471,863 |
SPX Corp. | | 60,120 | | | 3,458,102 |
Thomas & Betts Corp. (b) | | 51,948 | | | 2,676,880 |
TriQuint Semiconductor, Inc. (b) (c) | | 125,905 | | | 566,573 |
Vishay Intertechnology, Inc. (b) (c) | | 178,230 | | | 2,404,323 |
| | | | | |
| | | | | 64,330,610 |
| | | | | |
Financial Services (2.5%) | | | |
AmeriCredit Corp. (b) | | 127,300 | | | 3,255,061 |
Bank of Hawaii Corp. | | 48,500 | | | 2,530,245 |
BISYS Group, Inc. (The) (b) | | 114,400 | | | 1,262,976 |
Eaton Vance Corp. | | 124,400 | | | 3,861,376 |
Edwards (A.G.), Inc. | | 77,600 | | | 4,427,080 |
Investors Financial Services Corp. (c) | | 63,326 | | | 2,489,978 |
Jefferies Group, Inc. | | 99,000 | | | 2,844,270 |
PMI Group, Inc. (c) | | 89,487 | | | 3,816,621 |
Raymond James Financial, Inc. (c) | | 86,380 | | | 2,752,067 |
SEI Investments Co. (c) | | 60,940 | | | 3,429,703 |
Waddell & Reed Financial, Inc. | | 89,800 | | | 2,289,900 |
| | | | | |
| | | | | 32,959,277 |
| | | | | |
Common Stocks (continued)
| | | | | |
| | | Shares or
Principal Amount | | Value |
| | | | | |
Food & Beverage (1.1%) | | | | | |
Hormel Foods Corp. | | 75,620 | | $ | 2,730,638 |
J.M. Smucker Co. | | 60,071 | | | 2,943,479 |
OSI Restaurant Partners, Inc. | | 71,300 | | | 2,372,151 |
PepsiAmericas, Inc. | | 55,000 | | | 1,124,750 |
Sensient Technologies Corp. (c) | | 51,680 | | | 1,191,224 |
Smithfield Foods, Inc. (b) | | 99,300 | | | 2,669,184 |
Tootsie Roll Industries, Inc. | | 24,244 | | | 770,474 |
Universal Corp. | | 27,240 | | | 1,002,977 |
| | | | | |
| | | | | 14,804,877 |
| | | | | |
Gaming & Leisure (0.1%) | | | | | |
Scientific Games Corp. (b) | | 66,900 | | | 1,875,207 |
| | | | | |
Healthcare (5.3%) | | | | | |
Apria Healthcare Group, Inc. (b) (c) | | 45,600 | | | 1,062,024 |
Beckman Coulter, Inc. | | 63,960 | | | 3,682,177 |
Cephalon, Inc. (b) | | 61,715 | | | 4,331,159 |
Community Health Systems, Inc. (b) | | 98,077 | | | 3,182,599 |
Covance, Inc. (b) | | 65,180 | | | 3,813,030 |
Cytyc Corp. (b) | | 110,340 | | | 2,915,183 |
Dentsply International, Inc. | | 158,172 | | | 4,947,620 |
Edwards Lifesciences Corp. (b) | | 60,600 | | | 2,601,558 |
Health Net, Inc. (b) | | 116,152 | | | 4,821,470 |
Henry Schein, Inc. (b) | | 85,774 | | | 4,262,110 |
LifePoint Hospitals, Inc. (b) | | 59,356 | | | 2,107,138 |
Lincare Holdings, Inc. (b) | | 95,433 | | | 3,202,731 |
Omnicare, Inc. (c) | | 121,500 | | | 4,602,420 |
Par Pharmaceutical Cos., Inc. (b) (c) | | 36,675 | | | 714,796 |
Perrigo Co. (c) | | 77,800 | | | 1,391,842 |
Sepracor, Inc. (b) (c) | | 109,532 | | | 5,669,376 |
Steris Corp. (c) | | 69,780 | | | 1,700,539 |
Triad Hospitals, Inc. (b) | | 85,205 | | | 3,155,141 |
Universal Health Services, Inc. | | 59,255 | | | 3,137,552 |
Varian Medical Systems, Inc. (b) | | 131,861 | | | 7,233,894 |
| | | | | |
| | | | | 68,534,359 |
| | | | | |
Insurance (5.2%) | | | | | |
American Financial Group, Inc. | | 44,000 | | | 2,105,840 |
AmerUs Group Co. (c) | | 43,993 | | | 3,012,641 |
Arthur J. Gallagher & Co. | | 99,200 | | | 2,762,720 |
Brown & Brown, Inc. | | 111,020 | | | 3,248,445 |
| | | | | |
| | | Shares or
Principal Amount | | Value |
| | | | | |
Insurance (continued) | | | | | |
Everest Re Group Ltd. | | 65,500 | | $ | 6,496,290 |
Fidelity National Financial, Inc. | | 176,814 | | | 3,942,952 |
Fidelity National Title Group, Inc., Class A (c) | | 214,954 | | | 4,731,131 |
First American Financial Corp. | | 98,453 | | | 4,019,836 |
Hanover Insurance Group Inc. | | 50,700 | | | 2,299,245 |
HCC Insurance Holdings, Inc. | | 107,490 | | | 3,618,113 |
Horace Mann Educators Corp. (c) | | 42,400 | | | 853,936 |
Leucadia National Corp. | | 161,860 | | | 4,268,248 |
Mercury General Corp. | | 33,100 | | | 1,713,587 |
Ohio Casualty Corp. (c) | | 64,900 | | | 1,780,207 |
Old Republic International Corp. | | 230,287 | | | 5,188,366 |
Protective Life Corp. | | 67,200 | | | 2,973,600 |
Radian Group, Inc. (c) | | 83,633 | | | 4,457,639 |
Stancorp Financial Group, Inc. | | 51,800 | | | 2,366,742 |
Unitrin, Inc. | | 42,200 | | | 1,811,646 |
W.R. Berkley Corp. | | 168,566 | | | 6,213,343 |
| | | | | |
| | | | | 67,864,527 |
| | | | | |
Machinery (0.8%) | | | | | |
AGCO Corp. (b) (c) | | 92,500 | | | 2,474,375 |
Graco, Inc. | | 65,270 | | | 2,660,405 |
Lincoln Electric Holdings, Inc. (c) | | 44,300 | | | 2,724,008 |
Zebra Technologies Corp., Class A (b) (c) | | 67,842 | | | 2,528,471 |
| | | | | |
| | | | | 10,387,259 |
| | | | | |
Manufacturing (3.2%) | | | | | |
Ametek, Inc. | | 67,900 | | | 3,169,572 |
Brink’s Co. (The) (c) | | 49,280 | | | 2,586,707 |
Carlisle Cos., Inc. | | 29,340 | | | 2,455,465 |
Crane Co. | | 48,466 | | | 1,887,266 |
Diebold, Inc. | | 68,733 | | | 3,002,257 |
Donaldson Co., Inc. (c) | | 67,880 | | | 2,548,894 |
Federal Signal Corp. (c) | | 42,900 | | | 654,654 |
Flowserve Corp. (b) | | 57,020 | | | 3,022,060 |
Harsco Corp. | | 40,500 | | | 3,306,015 |
Hillenbrand Industry, Inc. (c) | | 60,400 | | | 3,544,272 |
Nordson Corp. (c) | | 31,600 | | | 1,455,180 |
Pentair, Inc. | | 102,560 | | | 3,378,326 |
Roper Industries, Inc. (c) | | 86,550 | | | 4,141,419 |
Teleflex, Inc. | | 40,120 | | | 2,495,464 |
Statement of Investments (Continued)
October 31, 2006
Gartmore Mid Cap Market Index Fund (Continued)
Common Stocks (continued)
| | | | | |
| | | Shares or
Principal Amount | | Value |
| | | | | |
Manufacturing (continued) | | | | | |
Trinity Industries, Inc. (c) | | 76,850 | | $ | 2,771,211 |
Varian, Inc. (b) | | 28,860 | | | 1,353,245 |
| | | | | |
| | | | | 41,772,007 |
| | | | | |
Medical Products (1.0%) | | | | | |
Advanced Medical Optics, Inc. (b) | | 61,003 | | | 2,491,973 |
Affymetrix, Inc. (b) | | 68,210 | | | 1,739,355 |
Gen-Probe, Inc. (b) | | 50,000 | | | 2,393,500 |
Intuitive Surgical, Inc. (b) (c) | | 37,277 | | | 3,697,132 |
Techne Corp. (b) (c) | | 37,135 | | | 2,075,104 |
| | | | | |
| | | | | 12,397,064 |
| | | | | |
Medical Products & Services (0.5%) | | | |
ResMed, Inc. (b) (c) | | 77,400 | | | 3,404,826 |
VCA Antech, Inc. (b) | | 80,627 | | | 2,609,896 |
| | | | | |
| | | | | 6,014,722 |
| | | | | |
Medical Services (0.8%) | | | | | |
Charles River Laboratories International, Inc. (b) | | 70,582 | | | 3,029,379 |
Invitrogen Corp. (b) | | 54,618 | | | 3,168,391 |
Martek Biosciences Corp. (b) | | 32,800 | | | 778,016 |
Medicis pharmaceutical Corp. | | 57,100 | | | 2,000,784 |
Psychiatric Solutions INC. (b) | | 54,400 | | | 1,806,080 |
| | | | | |
| | | | | 10,782,650 |
| | | | | |
Metals (0.8%) | | | | | |
Commercial Metals Co. | | 118,400 | | | 3,150,624 |
Kennametal, Inc. | | 41,100 | | | 2,536,281 |
MSC Industrial Direct Co., Class A | | 53,800 | | | 2,201,496 |
Timken Co. (The) | | 91,000 | | | 2,734,550 |
| | | | | |
| | | | | 10,622,951 |
| | | | | |
Mining (1.6%) | | | | | |
Arch Coal, Inc. | | 142,394 | | | 4,931,104 |
Joy Global, Inc. | | 120,672 | | | 4,719,482 |
Peabody Energy Corp. | | 264,700 | | | 11,109,459 |
| | | | | |
| | | | | 20,760,045 |
| | | | | |
Office Equipment & Supplies (0.3%) | | | |
Herman Miller, Inc. (c) | | 63,900 | | | 2,190,492 |
HNI Corp. (c) | | 48,870 | | | 2,197,684 |
| | | | | |
| | | | | 4,388,176 |
| | | | | |
| | | | | |
| | | Shares or
Principal Amount | | Value |
| | | | | |
Oil & Gas (6.0%) | | | | | |
Cameron International Corp. (b) | | 114,518 | | $ | 5,737,352 |
Denbury Resources, Inc. (b) | | 115,600 | | | 3,322,344 |
ENSCO International, Inc. | | 153,635 | | | 7,523,506 |
FMC Technologies, Inc. (b) | | 68,562 | | | 4,144,573 |
Forest Oil Corp. (b) (c) | | 54,700 | | | 1,785,408 |
Grant Prideco, Inc. (b) | | 130,685 | | | 4,935,972 |
Hanover Compressor Co. (b) | | 99,139 | | | 1,836,054 |
Helmerich & Payne, Inc. | | 102,600 | | | 2,457,270 |
Newfield Exploration Co. (b) | | 130,884 | | | 5,338,758 |
Noble Energy, Inc. | | 176,867 | | | 8,601,043 |
Patterson-UTI Energy, Inc. | | 170,240 | | | 3,949,568 |
Pioneer Natural Resources Co. | | 127,948 | | | 5,211,322 |
Plains Exploration & Production Co. (b) | | 76,601 | | | 3,239,456 |
Pogo Producing Co. (c) | | 61,006 | | | 2,730,019 |
Pride International, Inc. (b) | | 161,228 | | | 4,451,505 |
Quicksilver Resources, Inc. (b) (c) | | 58,161 | | | 1,993,759 |
Southwestern Energy Co. (b) (c) | | 168,351 | | | 5,989,929 |
Tidewater, Inc. | | 61,277 | | | 3,047,305 |
| | | | | |
| | | | | 76,295,143 |
| | | | | |
Paper & Forest Products (0.6%) | | | |
Bowater, Inc. | | 59,986 | | | 1,254,307 |
Glatfelter | | 38,400 | | | 562,176 |
Longview Fibre Co. (c) | | 70,967 | | | 1,494,565 |
Potlatch Corp. (c) | | 40,756 | | | 1,654,694 |
Rayonier, Inc. | | 79,480 | | | 3,257,885 |
| | | | | |
| | | | | 8,223,627 |
| | | | | |
Passenger Car Rental (0.1%) | | | |
Avis Budget Group, Inc. | | 98,000 | | | 1,939,420 |
| | | | | |
Publishing & Printing (1.0%) | | | |
American Greetings Corp., Class A | | 61,114 | | | 1,461,236 |
Banta Corp. | | 25,800 | | | 1,142,424 |
Belo Corp., Class A (c) | | 83,120 | | | 1,456,262 |
Lee Enterprises, Inc. (c) | | 41,380 | | | 1,180,571 |
Media General, Inc. (c) | | 21,700 | | | 805,070 |
Reader’s Digest Association | | 88,000 | | | 1,265,440 |
Scholastic Corp. (b) (c) | | 29,255 | | | 919,192 |
Valassis Communications, Inc. (b) | | 43,800 | | | 657,438 |
Washington Post Co. | | 5,718 | | | 4,306,226 |
| | | | | |
| | | | | 13,193,859 |
| | | | | |
Common Stocks (continued)
| | | | | |
| | | Shares or
Principal Amount | | Value |
| | | | | |
Real Estate Investment Trusts (3.6%) | | | |
AMB Property Corp. | | 88,467 | | $ | 5,167,357 |
Developers Diversified Realty Corp. | | 109,910 | | | 6,693,519 |
Highwood Properties, Inc. | | 57,660 | | | 2,202,612 |
Hospitality Properties Trust | | 73,660 | | | 3,569,564 |
Liberty Property Trust | | 87,396 | | | 4,212,487 |
Macerich Co. (The) | | 71,900 | | | 5,777,165 |
Mack-Cali Realty Corp. | | 63,900 | | | 3,380,310 |
New Plan Excel Realty Trust (c) | | 103,660 | | | 2,985,408 |
Regency Centers Corp. | | 69,000 | | | 4,979,040 |
United Dominion Realty Trust, Inc. | | 137,815 | | | 4,461,072 |
Weingarten Realty Investors | | 76,000 | | | 3,534,000 |
| | | | | |
| | | | | 46,962,534 |
| | | | | |
Restaurants (0.9%) | | | |
Applebee’s International, Inc. (c) | | 72,634 | | | 1,657,508 |
Bob Evans Farms, Inc. (c) | | 37,829 | | | 1,282,781 |
Brinker International, Inc. | | 85,880 | | | 3,987,408 |
CBRL Group, Inc. | | 33,704 | | | 1,479,943 |
Cheesecake Factory, Inc. (The) (b) (c) | | 82,750 | | | 2,337,688 |
Ruby Tuesday, Inc. | | 55,800 | | | 1,548,450 |
| | | | | |
| | | | | 12,293,778 |
| | | | | |
Retail (6.3%) | | | |
99 Cents Only Stores (b) | | 44,033 | | | 527,956 |
Abercrombie & Fitch Co. | | 88,498 | | | 6,783,372 |
Aeropostale, Inc. (b) | | 54,373 | | | 1,593,673 |
American Eagle Outfitters Ltd. (c) | | 133,641 | | | 6,120,758 |
Anntaylor Stores Corp. (b) | | 73,669 | | | 3,242,909 |
Barnes & Noble, Inc. | | 53,873 | | | 2,225,494 |
BJ’s Wholesale Club, Inc. (b) | | 68,157 | | | 1,952,698 |
Borders Group, Inc. (c) | | 63,294 | | | 1,303,223 |
Charming Shoppes (b) (c) | | 127,800 | | | 1,891,440 |
Chico’s FAS, Inc. (b) (c) | | 172,343 | | | 4,124,168 |
Claire’s Stores, Inc. | | 98,660 | | | 2,797,011 |
Coldwater Creek, Inc. (b) (c) | | 61,500 | | | 1,875,135 |
Dollar Tree Stores, Inc. (b) (c) | | 105,228 | | | 3,271,539 |
Fastenal Co. (c) | | 125,454 | | | 5,048,269 |
Foot Locker, Inc. | | 152,400 | | | 3,534,156 |
Hanesbrands Inc. (b) | | 99,282 | | | 2,343,055 |
| | | | | |
| | | Shares or
Principal Amount | | Value |
| | | | | |
Retail (continued) | | | |
O’Reilly Automotive, Inc. (b) (c) | | 109,846 | | $ | 3,546,927 |
Pacific Sunwear of California, Inc. (b) | | 74,200 | | | 1,307,404 |
Payless ShoeSource, Inc. (b) | | 68,695 | | | 1,837,591 |
PETsMART, Inc. | | 136,076 | | | 3,916,267 |
Pier 1 Imports, Inc. | | 93,370 | | | 610,640 |
Polo Ralph Lauren Corp. | | 60,700 | | | 4,309,700 |
Regis Corp. (c) | | 46,920 | | | 1,761,846 |
Ross Stores, Inc. | | 145,354 | | | 4,277,768 |
Ruddick Corp. (c) | | 31,500 | | | 888,300 |
Saks, Inc. (c) | | 142,300 | | | 2,752,082 |
Tech Data Corp. (b) (c) | | 57,843 | | | 2,276,122 |
Urban Outfitters, Inc. (b) | | 111,416 | | | 1,949,780 |
Williams Sonoma, Inc. | | 111,940 | | | 3,807,079 |
| | | | | |
| | | | | 81,876,362 |
| | | | | |
Schools (0.4%) | | | |
ITT Educational Services, Inc. (b) | | 34,740 | | | 2,395,323 |
Laureate Education, Inc. (b) | | 49,580 | | | 2,613,858 |
| | | | | |
| | | | | 5,009,181 |
| | | | | |
Semiconductors (0.8%) | | | |
Fairchild Semiconductor International, Inc. (b) | | 117,920 | | | 1,899,691 |
MEMC Electronic Materials, Inc. (b) | | 168,500 | | | 5,981,750 |
Semtech Corp. (b) (c) | | 74,230 | | | 967,217 |
Silicon Laboratories, Inc. (b) | | 58,140 | | | 1,897,108 |
| | | | | |
| | | | | 10,745,766 |
| | | | | |
Shipping & Transportation (1.4%) | | | |
Alexander & Baldwin, Inc. (c) | | 41,401 | | | 1,905,688 |
C.H. Robinson Worldwide, Inc. | | 173,622 | | | 7,246,982 |
GATX Corp. | | 52,500 | | | 2,287,425 |
Overseas Shipholding Group, Inc. | | 28,300 | | | 1,770,165 |
Swift Transportation Co., Inc. (b) (c) | | 54,960 | | | 1,382,244 |
Werner Enterprises, Inc. | | 54,748 | | | 1,004,626 |
YRC Worldwide, Inc. (b) | | 59,162 | | | 2,291,936 |
| | | | | |
| | | | | 17,889,066 |
| | | | | |
Statement of Investments (Continued)
October 31, 2006
Gartmore Mid Cap Market Index Fund (Continued)
Common Stocks (continued)
| | | | | |
| | | Shares or
Principal Amount | | Value |
| | | | | |
Steel (0.5%) | | | |
Reliance Steel & Aluminum Co. | | 66,800 | | $ | 2,294,580 |
Steel Dynamics, Inc. | | 47,100 | | | 2,831,181 |
Worthington Industries, Inc. | | 68,387 | | | 1,181,727 |
| | | | | |
| | | | | 6,307,488 |
| | | | | |
Telecommunications (0.1%) | | | |
Andrew Corp. (b) | | 163,800 | | | 1,516,788 |
| | | | | |
Transportation (1.4%) | | | |
Con-Way, Inc. | | 49,140 | | | 2,317,934 |
Expeditors International of Washington, Inc. | | 214,360 | | | 10,162,807 |
J.B. Hunt Transport Services, Inc. | | 111,000 | | | 2,402,040 |
Oshkosh Truck Corp. | | 73,000 | | | 3,300,330 |
| | | | | |
| | | | | 18,183,111 |
| | | | | |
Utilities (7.4%) | | | | | |
AGL Resources, Inc. (c) | | 77,740 | | | 2,915,250 |
Alliant Energy Corp. | | 119,200 | | | 4,571,320 |
Aqua America, Inc. (c) | | 125,727 | | | 3,048,872 |
Aquila, Inc. (b) | | 353,137 | | | 1,620,899 |
Black Hills Corp. | | 35,300 | | | 1,218,203 |
DPL, Inc. (c) | | 119,057 | | | 3,419,317 |
Duquesne Light Holdings, Inc. | | 84,320 | | | 1,672,066 |
Energy East Corp. | | 142,375 | | | 3,461,136 |
Equitable Resources, Inc. | | 121,246 | | | 4,912,888 |
Great Plains Energy, Inc. (c) | | 84,500 | | | 2,749,630 |
Hawaiian Electric Industries, Inc. (c) | | 76,600 | | | 2,146,332 |
Idacorp, Inc. | | 46,300 | | | 1,825,609 |
MDU Resources Group, Inc. | | 174,825 | | | 4,489,506 |
National Fuel Gas Co. (c) | | 82,300 | | | 3,078,020 |
Northeast Utilities | | 151,603 | | | 3,791,591 |
NSTAR (c) | | 102,920 | | | 3,580,587 |
Oklahoma Gas & Electric Co. (c) | | 94,600 | | | 3,649,668 |
Oneok, Inc. | | 106,626 | | | 4,438,840 |
Pepco Holdings, Inc. | | 191,994 | | | 4,880,487 |
PNM, Inc. (c) | | 72,750 | | | 2,048,640 |
Puget Energy, Inc. (c) | | 116,800 | | | 2,789,184 |
Questar Corp. | | 86,612 | | | 7,057,145 |
Scana Corp. | | 112,879 | | | 4,510,645 |
Sierra Pacific Resources (b) | | 212,620 | | | 3,223,319 |
Vectren Corp. | | 71,460 | | | 2,076,628 |
| | | | | | |
| | | Shares or
Principal Amount | | Value |
| | | | | | |
Utilities (continued) | | | | | | |
Westar Energy, Inc. (c) | | | 81,850 | | $ | 2,072,442 |
WGL Holdings, Inc. | | | 53,000 | | | 1,719,850 |
Wisconsin Energy Corp. | | | 117,100 | | | 5,379,573 |
WPS Resources Corp. (c) | | | 45,100 | | | 2,399,771 |
| | | | | | |
| | | | | | 94,747,418 |
| | | | | | |
Waste Disposal (0.6%) | | | | | | |
Republic Services, Inc. | | | 118,282 | | | 4,850,745 |
Stericycle, Inc. (b) | | | 44,890 | | | 3,174,172 |
| | | | | | |
| | | | | | 8,024,917 |
| | | | | | |
| | |
Total Common Stocks | | | | | | 1,115,147,037 |
| | | | | | |
|
Repurchase Agreements (12.7%) |
| | |
CS First Boston, 5.17%, dated 10/31/06, due 11/01/06, repurchase price $84,333,878 collateralized by U.S. Government Agency Mortgages with a market value of $86,008,349 | | $ | 84,321,768 | | | 84,321,768 |
| | |
Nomura Securities, 5.17%, dated 10/31/06, due 11/01/06, repurchase price $80,519,577 collateralized by U.S. Government Agency Mortgages with a market value of $82,118,313 | | | 80,508,015 | | | 80,508,015 |
| | | | | | |
| |
Total Repurchase Agreements | | | 164,829,783 |
| | | | | | |
|
Short-Term Securities Held as Collateral for Securities
on Loan (19.4%) |
Protective Life Insurance Co. Funding Agreement,
5.50%, 01/29/07 | | | 20,000,000 | | | 20,000,000 |
Citigroup Global Markets, Inc. Master Note,
5.38%, 11/01/06 | | | 11,900,600 | | | 11,900,600 |
Citigroup Global Markets, Inc. Master Note,
5.38%, 11/01/06 | | | 3,000,000 | | | 3,000,000 |
Short-Term Securities Held as Collateral for Securities on Loan (continued)
| | | | | | |
| | | Principal
Amount | | Value |
| | | | | | |
Pacific Life Global Funding Medium Term Note,
5.45%, 01/26/07 | | $ | 10,000,000 | | $ | 10,000,000 |
Bank of America Corp. Master Note, 5.38%, 11/01/06 | | | 7,500,000 | | | 7,500,000 |
GE Life and Annuity Funding Agreement,
5.42%, 11/14/06 | | | 6,300,000 | | | 6,300,000 |
General Electric Capital Corp. Medium Term Note,
5.39%, 12/08/06 | | | 5,000,142 | | | 5,000,142 |
Islandsbanki HF Corp. Medium Term Note,
5.39%, 11/22/06 | | | 4,000,000 | | | 4,000,000 |
Tango Finance Corp. Medium Term Note,
5.39%, 11/01/06 | | | 11,997,659 | | | 11,997,659 |
Citigroup Global Markets, Inc. Master Note,
5.38%, 11/01/06 | | | 10,000,000 | | | 10,000,000 |
Bank of America Bank Note, 5.31%, 11/01/06 | | | 17,495,671 | | | 17,495,671 |
Alliance and Lester PLC Medium Term Note,
5.31%, 11/08/06 | | | 5,000,000 | | | 5,000,000 |
American Express Credit Corp. Medium Term Note,
5.32%, 11/13/06 | | | 5,000,000 | | | 5,000,000 |
American Express Credit Corp. Medium Term Note,
5.32%, 11/13/06 | | | 1,000,000 | | | 1,000,000 |
Dorada Finance, Inc. Medium Term Note,
5.37%, 11/01/06 | | | 2,500,000 | | | 2,500,000 |
CC USA, Inc. Medium Term Note, 5.38%, 11/01/06 | | | 7,997,593 | | | 7,997,593 |
MBIA Global Funding LLC Medium Term Note,
5.37%, 11/01/06 | | | 5,000,000 | | | 5,000,000 |
MBIA Global Funding LLC Medium Term Note,
5.37%, 11/01/06 | | | 2,000,000 | | | 2,000,000 |
Merrill Lynch Mortgage Capital Master Note,
5.41%, 11/01/06 | | | 20,000,000 | | | 20,000,000 |
Morgan Stanley Master Note, 5.49%, 11/01/06 | | | 5,000,000 | | | 5,000,000 |
| | | | | | | |
| | | Principal
Amount | | Value | |
| | | | | | | |
West Corp Fed Credit Union Medium Term Note,
5.38%, 11/01/06 | | $ | 1,000,000 | | $ | 1,000,000 | |
Wachovia Bank Bank Note, 5.37%, 11/01/06 | | | 12,000,000 | | | 12,000,000 | |
Banc of America Securities LLC Repurchase Agreement, 5.32%, dated 10/31/06, due 11/01/06, repurchase price $73,882,218, collateralized by U.S. Government Agency Mortgages with a market value of $ 75,348,727 | | | 73,871,301 | | | 73,871,301 | |
Citigroup Global Markets, Inc. Master Note,
5.38%, 11/01/06 | | | 99,400 | | | 99,400 | |
Bank of America Bank Note, 5.31%, 11/01/06 | | | 5,004,329 | | | 5,004,329 | |
| | | | | | | |
| |
Total Short-Term Securities Held as Collateral for Securities on Loan | | | 252,666,695 | |
| | | | | | | |
| |
Total Investments
(Cost $1,361,651,720) (a) — 117.7% | | | 1,532,643,515 | |
| | |
Liabilities in excess of other assets — (17.7)% | | | | | | (230,601,370 | ) |
| | | | | | | |
| | |
NET ASSETS — 100.0% | | | | | $ | 1,302,042,145 | |
| | | | | | | |
| | (a) | See notes to financial statements for tax unrealized appreciation (depreciation) of securities. |
| | (b) | Denotes a non-income producing security. |
| | (c) | All or part of the security was on loan as of October 31, 2006. |
At October 31, 2006, the Fund’s open long futures contracts were as follows:
| | | | | | | | | | |
Number of
Contracts | | Long
Contracts* | | Expiration | | Market Value
Covered By
Contracts | | Unrealized
Appreciation
(Depreciation) |
| 438 | | S&P 400 | | 12/14/06 | | $ | 172,725,300 | | $ | 7,859,745 |
| | * | Cash pledged as collateral. |
See notes to financial statements.
Gartmore S&P 500 Index Fund
Effective September 29, 2006, Merrill Lynch & Co., Inc. and BlackRock, Inc. completed a transaction to form a new asset management company involving Merrill Lynch’s asset management business, including Fund Asset Management, L.P. (the subadviser to each of the Gartmore Bond Index Fund, Gartmore International Index Fund, Gartmore Mid Cap Market Index Fund, Gartmore S&P 500 Index Fund and Gartmore Small Cap Index Fund) and BlackRock, Inc. The result of the transaction is a new subadviser known as BlackRock Investment Management, LLC.
For the annual period ended Oct. 31, 2006, the Gartmore S&P 500 Index Fund (Class A at NAV) returned 15.90% versus 16.34% for its benchmark, the S&P 500® Index. For broader comparison, the average return for the Fund’s Lipper peer category of S&P 500 Index Objective Funds (consisting of 176 funds as of Oct. 31, 2006) was 15.74%. The underperformance of the Fund versus the S&P 500 Index was primarily due to the expenses of the Fund.
The U.S. equity market posted strong gains during the reporting period. The positive returns resulted primarily from rallies in the first and third quarters of 2006. Shares of large-capitalization value companies significantly outperformed large-cap growth stocks during the reporting period, with the S&P 500/Citigroup Value Index advancing 20.92% versus 11.98% for the S&P 500/Citigroup Growth Index. Strong growth in corporate earnings and significant upward revisions to earnings expectations have been major drivers of the global equity bull market since 2003. Although the rate of earnings upgrades slowed late in the reporting period from the exceptionally strong rates seen in previous years, news from the major corporate sectors has been positive. Earnings generally came in ahead of expectations in the third quarter of 2006 and supported the rally in equities.
The recurring themes in the market environment throughout most of the reporting period were rising short-term interest rates and higher energy prices. The Federal Reserve Board raised the target federal funds rate in six 0.25% increments, bringing the target rate from 3.75% to 5.25% during the reporting period. The Federal Open Market Committee, however, held the rate steady at its August, September and October 2006 meetings. The third quarter of 2006 was the first quarterly period not to include an increase in the federal funds target rate since the first quarter of 2004. Oil prices climbed above $78.00 per barrel early in the third quarter of 2006. Energy prices declined significantly in late summer and into October, however, amid slowing demand and weakness in both oil and natural gas futures. The price of oil stood at $58.73 per barrel on Oct. 31, 2006.
At the end of the reporting period, the U.S. economy exhibited some evidence of a slowdown. Gross domestic product (GDP) rose at an annual rate of just 1.6% in the third quarter of 2006, according to advance estimates released by the Bureau of Economic Analysis in late October. This followed a 2.6% annual GDP growth rate for the second quarter of the year. The moderating growth rate reflected sluggish income growth, a weaker housing market and a low savings ratio. In addition, prospects for U.S. consumer spending are uncertain, although consumption has held up well and most likely will be further supported by lower oil prices.
The portfolio is positioned such that the risk characteristics are similar to those of the S&P 500 Index. The portfolio seeks to perform in line with the benchmark on a gross return basis.
Portfolio Managers:
BlackRock Investment Management, LLC—Subadviser: Debra L. Jelilian and Jeffery L. Russo, CFA
| | |
Fund Performance | | Gartmore S&P 500 Index Fund |
Average Annual Total Return
(For periods ended October 31, 2006)
| | | | | | | | |
| | | | | 1 Yr. | | 5 Yr. | | Inception1 |
| Class A2 | | w/o SC3 | | 15.90% | | 6.70% | | 3.44% |
| | | w/SC4 | | 9.26% | | 5.44% | | 2.70% |
| Class B2 | | w/o SC3 | | 15.01% | | 5.94% | | 2.86% |
| | | w/SC5 | | 10.01% | | 5.62% | | 2.86% |
| Class C6 | | w/o SC3 | | 15.06% | | 5.94% | | 2.86% |
| | | w/SC7 | | 14.06% | | 5.94% | | 2.86% |
| Institutional Class8,9 | | 16.12% | | 6.99% | | 3.71% |
| Service Class2,9 | | | | 15.74% | | 6.58% | | 3.26% |
| Institutional Service Class2,9 | | 15.85% | | 6.73% | | 3.43% |
| Local Fund Shares9 | | 16.10% | | 6.92% | | 3.59% |
All figures showing the effect of a sales charge reflect the maximum charge possible, because it has the most dramatic effect on performance data.
| 1 | Fund commenced operations on July 24, 1998. |
| 2 | These returns for the period prior to the creation of a particular class include the performance of the Fund’s Local Fund Shares. These returns were achieved prior to the creation of Class A and Class B shares (12/29/99) and Service Class and Institutional Service Class shares (11/2/98). Excluding the effect of any fee waivers or reimbursements, such prior performance is similar to what Class A, Class B, Service Class and Institutional Service Class shares would have produced because all classes of the Fund’s shares invest in the same portfolio of securities. The performance for these classes has been restated to reflect differences in sales charges (where applicable), but does not reflect the differing levels of other fees (primarily Rule 12b-1 and/or administrative services fees) applicable to such classes; if these fees were reflected, the performance for Class A, Class B, Service Class and Institutional Service Class would have been lower. |
| 3 | These returns do not reflect the effects of sales charges (SC). |
| 4 | A 5.75% front-end sales charge was deducted. |
| 5 | A 5.00% contingent deferred sales charge (CDSC) was deducted. The CDSC declines to 0% after 6 years. |
| 6 | These returns until the creation of Class C shares (10/22/03) include the performance of the Fund’s Local Fund Shares for the period through December 28, 1999 and the Fund’s Class B shares for the period from December 29, 1999 to October 21, 2003. Excluding the effect of any fee waivers or reimbursements, such prior performance is similar to what Class C shares would have produced because Class C shares invest in the same portfolio of securities as the Fund’s other classes. The performance for the Class C shares has been restated to reflect differences in sales charges (where applicable), but does not reflect the differing levels of other fees (primarily Rule 12b-1 and/or administrative services fees) applicable to such classes; if these fees were reflected, the performance for Class C shares would have been lower |
| 7 | A CDSC of 1.00% was deducted from the one year return because it is charged when you sell Class C shares within the first year after purchase. |
| 8 | These returns until the creation of the Institutional Class shares (12/29/99) include the performance of the Fund’s Local Fund shares. The returns have not been adjusted for the lower expenses applicable to Institutional Class shares. Excluding the effect of any fee waivers or reimbursements, such prior performance is similar to what Institutional Class shares would have produced because Institutional Class shares invest in the same portfolio of securities as Local Fund Shares. |
| 9 | Not subject to any sales charges. |
Performance of a $10,000 Investment
Investment return and principal value will fluctuate, and when redeemed, shares may be worth more or less than original cost. Past performance is no guarantee of future results and does not reflect the deduction of taxes that a shareholder would pay on fund distributions or the redemption of fund shares. Investing in mutual funds involves market risk, including loss of principal. Performance returns assume the reinvestment of all distributions.
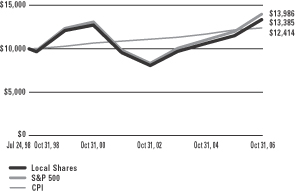
Comparative performance of $10,000 invested in Local Fund Shares of the Gartmore S&P 500 Index Fund, the S&P 500 Index(a), and the Consumer Price Index (CPI)(b) since inception. Unlike the Fund, the returns for these unmanaged indexes do not reflect any fees, expenses, or sales charges. Investors cannot invest directly in market indexes.
| (a) | The S&P 500 is an unmanaged index of 500 widely held stocks of large U.S. companies that gives a broad look at how the stock prices of large U.S. companies have performed. |
| (b) | The CPI represents changes in prices of a basket of goods and services purchased for consumption by urban households. |
| | |
Shareholder Expense Example | | Gartmore S&P 500 Index Fund |
As a shareholder of the Fund, you incur two types of costs: (1) transaction costs, including sales charges (loads) paid on purchase payments and redemption fees; and (2) ongoing costs, including investment advisory fees, administration fees, distribution fees and other Fund expenses. The examples below are intended to help you understand your ongoing costs (in dollars) of investing in the Fund and to compare these costs with the ongoing costs of investing in other mutual funds. Per SEC requirements, the examples assume that you had a $1,000 investment in the Class at the beginning of the reporting period, May 1, 2006 and continued to hold your shares at the end of the reporting period, October 31, 2006.
Actual Expenses
For each Class of the Fund in the table below, the first line provides information about actual account values and actual expenses. You may use the information in this line, together with the amount you invested, to estimate the expenses that you paid over the period. Simply divide your account value by $1,000 (for example, an $8,600 account value divided by $1,000 = 8.6), then multiply the result by the number in the first line of each Class under the heading entitled “Expenses Paid During Period” to estimate the expenses you paid on your account during the period.
Hypothetical Example for Comparison Purposes
The second line of each Class in the table below provides information about hypothetical account values and hypothetical expenses based on the Class’ actual expense ratio and an assumed rate of return of 5% per year before expenses, which is not the Class’ actual return. The hypothetical account values and expenses may not be used to estimate the actual ending account balance or expenses you paid for the period. You may use this information to compare the ongoing costs of investing in the Class of the Fund and other funds. To do so, compare this 5% hypothetical example with the 5% hypothetical examples that appear in the shareholder reports of the other funds.
Please note that the expenses shown in the table are meant to highlight your ongoing costs only and do not reflect any transaction costs, such as sales charges (loads) or redemption fees. Therefore, the second line for each Class in the table is useful in comparing ongoing costs only, and will not help you determine the relative total costs of owning different funds. In addition, if these transaction costs were included, your costs would have been higher. The examples also assume all dividends and distributions have been reinvested.
Schedule of Shareholder Expenses
Expense Analysis of a $1,000 Investment
(October 31, 2006)
| | | | | | | | | | | | | |
| Gartmore S&P 500 Index Fund | | | | Beginning Account Value, 5/1/06 | | Ending Account Value, 10/31/06 | | Expenses Paid During Period* | | Annualized Expense Ratio* |
| Class A | | Actual | | $ | 1,000.00 | | $ | 1,058.60 | | $ | 2.54 | | 0.49% |
| | | Hypothetical1 | | $ | 1,000.00 | | $ | 1,022.53 | | $ | 2.50 | | 0.49% |
| Class B | | Actual | | $ | 1,000.00 | | $ | 1,055.80 | | $ | 6.37 | | 1.23% |
| | | Hypothetical1 | | $ | 1,000.00 | | $ | 1,018.80 | | $ | 6.28 | | 1.23% |
| Class C | | Actual | | $ | 1,000.00 | | $ | 1,055.50 | | $ | 6.37 | | 1.23% |
| | | Hypothetical1 | | $ | 1,000.00 | | $ | 1,018.80 | | $ | 6.28 | | 1.23% |
| Institutional Service Class | | Actual | | $ | 1,000.00 | | $ | 1,059.40 | | $ | 2.49 | | 0.48% |
| | | Hypothetical1 | | $ | 1,000.00 | | $ | 1,022.58 | | $ | 2.45 | | 0.48% |
| Institutional Class | | Actual | | $ | 1,000.00 | | $ | 1,059.70 | | $ | 1.19 | | 0.23% |
| | | Hypothetical1 | | $ | 1,000.00 | | $ | 1,023.84 | | $ | 1.17 | | 0.23% |
| Local Fund Shares | | Actual | | $ | 1,000.00 | | $ | 1,060.10 | | $ | 1.56 | | 0.30% |
| | | Hypothetical1 | | $ | 1,000.00 | | $ | 1,023.49 | | $ | 1.53 | | 0.30% |
| Service Class | | Actual | | $ | 1,000.00 | | $ | 1,058.80 | | $ | 3.27 | | 0.63% |
| | | Hypothetical1 | | $ | 1,000.00 | | $ | 1,021.82 | | $ | 3.22 | | 0.63% |
| * | Expenses are equal to the Fund’s annualized expense ratio multiplied by the average account value over the period multiplied by 184/365 (to reflect the one-half year period). The expense ratio presented represents a six-month, annualized ratio in accordance with SEC guidelines. |
| 1 | Represents the hypothetical 5% return before expenses. |
| | |
Portfolio Summary | | Gartmore S&P 500 Index Fund |
October 31, 2006
The SEC adopted a requirement that Funds present their portfolio holdings in a table, chart or graph format in their annual and semiannual reports to shareholders, whether or not a statement of investments is utilized. The following tables, which present portfolio holdings as a percentage of net assets, are provided in compliance with this requirement.
| | |
| Asset Allocation | | |
| Common Stock | | 97.9% |
Repurchase Agreements | | 1.8% |
| Other Investments* | | 5.1% |
| Liabilities in excess of other assets** | | -4.8 % |
| | |
| | 100.0% |
| | |
| Top Industries | | |
| Oil & Gas | | 7.6% |
| Banks | | 7.0% |
| Healthcare | | 5.8% |
| Computer Software & Services | | 5.5% |
| Drugs | | 5.2% |
| Retail | | 4.9% |
| Insurance | | 4.8% |
| Electrical Equipment | | 3.6% |
| Telecommunications | | 3.2% |
| Financial | | 3.2% |
| Other Assets | | 49.2% |
| | |
| | 100.0% |
| | |
| Top Holdings*** | | |
| Exxon Mobil Corp. | | 3.3% |
| General Electric Co. | | 2.9% |
| Citigroup, Inc. | | 2.0% |
| Microsoft Corp. | | 2.0% |
| Bank of America Corp. | | 1.9% |
| Procter & Gamble Co. | | 1.6% |
| Johnson & Johnson Co. | | 1.6% |
| Pfizer, Inc. | | 1.5% |
| American International Group, Inc. | | 1.4% |
| Altria Group, Inc. | | 1.3% |
| Other Assets | | 80.6% |
| | |
| | 100.0% |
| * | Includes value of collateral received from securities lending. |
| ** | Includes value of collateral owed from securities lending. |
| *** | For purpose of listing top holdings, repurchase agreements are considered cash equivalents and are included as part of Other Assets. |
Statement of Investments
October 31, 2006
Gartmore S&P 500 Index Fund
Common Stocks (97.9%)
| | | | | |
| | | Shares or
Principal Amount | | Value |
| | | | | |
Advertising Services (0.0%) | | | |
Interpublic Group of Cos., Inc. (The) (b) (c) | | 101,578 | | $ | 1,108,216 |
| | | | | |
Aerospace & Defense (2.0%) | | | |
Boeing Co. (The) | | 218,371 | | | 17,439,108 |
General Dynamics Corp. | | 109,562 | | | 7,789,858 |
Goodrich Corp. | | 33,851 | | | 1,492,491 |
Lockheed Martin Corp. | | 99,322 | | | 8,634,061 |
Northrop Grumman Corp. | | 95,476 | | | 6,338,652 |
Raytheon Co. | | 121,887 | | | 6,088,256 |
Rockwell Collins, Inc. | | 46,541 | | | 2,703,101 |
United Technologies Corp. | | 274,756 | | | 18,056,964 |
| | | | | |
| | | | | 68,542,491 |
| | | | | |
Agriculture (0.2%) | | | |
Monsanto Co. | | 141,180 | | | 6,242,980 |
| | | | | |
Airlines (0.4%) | | | |
FedEx Corp. | | 80,402 | | | 9,209,245 |
Southwest Airlines Co. | | 213,576 | | | 3,210,047 |
| | | | | |
| | | | | 12,419,292 |
| | | | | |
Alcoholic Beverages (0.4%) | | | |
Anheuser-Busch Cos., Inc. | | 208,834 | | | 9,902,908 |
Brown-Forman Corp., Class B | | 25,571 | | | 1,845,970 |
Constellation Brands, Inc. (b) | | 50,900 | | | 1,399,241 |
Molson Coors Brewing Co. | | 15,970 | | | 1,136,745 |
| | | | | |
| | | | | 14,284,864 |
| | | | | |
Analytical Instruments (0.1%) | | | |
Applera Corp. | | 52,471 | | | 1,957,168 |
Waters Corp. (b) | | 30,771 | | | 1,532,396 |
| | | | | |
| | | | | 3,489,564 |
| | | | | |
Apparel & Accessories (0.4%) | | | |
Coach, Inc. (b) | | 100,000 | | | 3,964,000 |
Hanesbrands, Inc. (b) | | 1 | | | 21 |
Liz Claiborne, Inc. | | 28,511 | | | 1,202,309 |
Nike, Inc., Class B | | 53,436 | | | 4,909,699 |
V.F. Corp. (c) | | 26,206 | | | 1,991,918 |
| | | | | |
| | | | | 12,067,947 |
| | | | | |
Appliances & Household Durables (0.1%) | | | |
Newell Rubbermaid, Inc. | | 64,142 | | | 1,846,007 |
| | | | | |
| | | | | |
| | | Shares or
Principal Amount | | Value |
| | | | | |
Auto Parts & Equipment (0.2%) | | | |
AutoNation, Inc. (b) | | 53,780 | | $ | 1,078,289 |
Genuine Parts Co. | | 45,416 | | | 2,067,336 |
Ingersoll Rand Co. (c) | | 87,452 | | | 3,210,363 |
Snap-On, Inc. | | 15,770 | | | 741,663 |
| | | | | |
| | | | | 7,097,651 |
| | | | | |
Automobiles (0.4%) | | | |
Ford Motor Co. (c) | | 498,896 | | | 4,130,859 |
General Motors Corp. (c) | | 153,656 | | | 5,365,667 |
PACCAR, Inc. | | 67,694 | | | 4,008,162 |
| | | | | |
| | | | | 13,504,688 |
| | | | | |
Banks (7.0%) | | | |
AmSouth Bancorp | | 93,652 | | | 2,830,163 |
Bank of America Corp. | | 1,229,461 | | | 66,231,064 |
Bank of New York Co., Inc. | | 207,344 | | | 7,126,413 |
BB&T Corp. | | 145,873 | | | 6,348,393 |
Bear Stearns Cos., Inc. | | 30,267 | | | 4,580,910 |
Commerce Bancorp, Inc. (c) | | 58,000 | | | 2,025,360 |
Compass Bancshares, Inc. | | 33,033 | | | 1,858,437 |
Fifth Third Bancorp | | 149,404 | | | 5,953,749 |
Huntington Bancshares, Inc. | | 68,220 | | | 1,665,250 |
J.P. Morgan Chase & Co. | | 943,001 | | | 44,735,967 |
KeyCorp | | 109,572 | | | 4,069,504 |
M&T Bank Corp. (c) | | 23,761 | | | 2,894,327 |
Mellon Financial Corp. | | 111,722 | | | 4,334,814 |
National City Corp. | | 164,353 | | | 6,122,149 |
North Fork Bancorp, Inc. | | 118,566 | | | 3,388,616 |
Northern Trust Corp. | | 52,236 | | | 3,067,298 |
PNC Bank Corp. | | 77,701 | | | 5,441,401 |
Regions Financial Corp. (c) | | 123,507 | | | 4,687,091 |
State Street Corp. | | 89,977 | | | 5,779,223 |
SunTrust Banks, Inc. | | 98,326 | | | 7,766,771 |
Synovus Financial Corp. | | 83,917 | | | 2,465,481 |
U.S. Bancorp | | 488,603 | | | 16,534,326 |
Wachovia Corp. | | 525,748 | | | 29,179,014 |
Zions Bancorp | | 24,420 | | | 1,963,368 |
| | | | | |
| | | | | 241,049,089 |
| | | | | |
Broadcast Media & Cable Television (0.8%) |
Clear Channel Communications, Inc. | | 143,800 | | | 5,011,430 |
Comcast Corp. Special, Class A (b) | | 45,900 | | | 1,858,032 |
Comcast Corp., Class A (b) | | 518,275 | | | 21,078,244 |
| | | | | |
| | | | | 27,947,706 |
| | | | | |
Common Stocks (continued)
| | | | | |
| | | Shares or
Principal Amount | | Value |
| | | | | |
Business Services (0.3%) | | | |
Cintas Corp. | | 38,901 | | $ | 1,610,501 |
Compuware Corp. (b) | | 101,207 | | | 813,704 |
Convergys Corp. (b) | | 37,682 | | | 799,235 |
Monster Worldwide, Inc. (b) | | 34,831 | | | 1,411,004 |
NCR Corp. (b) | | 48,990 | | | 2,034,065 |
Pitney Bowes, Inc. | | 59,796 | | | 2,793,072 |
| | | | | |
| | | | | 9,461,581 |
| | | | | |
Chemicals (0.2%) | | | |
Millipore Corp. (b) | | 13,525 | | | 872,768 |
Praxair, Inc. | | 87,532 | | | 5,273,803 |
Sigma Aldrich Corp. (c) | | 18,125 | | | 1,361,369 |
| | | | | |
| | | | | 7,507,940 |
| | | | | |
Communications Equipment (1.7%) | | | |
Citizens Communications Co. | | 95,136 | | | 1,394,694 |
Corning, Inc. (b) | | 423,722 | | | 8,656,640 |
Harman International Industries, Inc. | | 17,400 | | | 1,780,890 |
Motorola, Inc. | | 665,528 | | | 15,347,076 |
Tellabs, Inc. (b) | | 132,452 | | | 1,396,044 |
Verizon Communications, Inc. | | 787,480 | | | 29,136,760 |
| | | | | |
| | | | | 57,712,104 |
| | | | | |
Computer Data Security (0.1%) | | | |
SanDisk Corp. (b) (c) | | 53,200 | | | 2,558,920 |
VeriSign, Inc. (b) | | 67,600 | | | 1,397,968 |
| | | | | |
| | | | | 3,956,888 |
| | | | | |
Computer Equipment (1.6%) | | | |
American Power Conversion Corp. (c) | | 46,931 | | | 1,418,724 |
Dell Computer Corp. (b) | | 602,858 | | | 14,667,535 |
EMC Corp. (b) | | 635,987 | | | 7,790,841 |
Hewlett Packard Co. | | 745,590 | | | 28,884,157 |
Network Appliance, Inc. (b) | | 101,184 | | | 3,693,216 |
| | | | | |
| | | | | 56,454,473 |
| | | | | |
Computer Integrated Systems Design (0.1%) |
Avaya, Inc. (b) | | 118,869 | | | 1,522,712 |
| | | | | |
| | | | | |
| | | Shares or
Principal Amount | | Value |
| | | | | |
Computer Software & Services (5.5%) | | | |
Adobe Systems, Inc. (b) | | 157,342 | | $ | 6,018,332 |
Affiliated Computer Services, Inc., Class A (b) (c) | | 33,541 | | | 1,793,773 |
Automatic Data Processing, Inc. | | 150,978 | | | 7,464,352 |
BMC Software, Inc. (b) | | 58,556 | | | 1,774,832 |
CA, Inc. (c) | | 127,838 | | | 3,165,269 |
Cisco Systems, Inc. (b) | | 1,658,309 | | | 40,014,997 |
Citrix Systems, Inc. (b) | | 45,571 | | | 1,345,712 |
Electronic Data Systems Corp. | | 137,512 | | | 3,483,179 |
First Data Corp. | | 206,852 | | | 5,016,161 |
Fiserv, Inc. (b) | | 49,066 | | | 2,423,860 |
Intuit, Inc. (b) | | 96,062 | | | 3,390,989 |
Microsoft Corp. | | 2,346,289 | | | 67,361,958 |
Novell, Inc. (b) | | 93,872 | | | 563,232 |
NVIDIA Corp. (b) | | 97,622 | | | 3,404,079 |
Oracle Corp. (b) | | 1,095,738 | | | 20,238,281 |
Parametric Technology Corp. (b) (c) | | 24,480 | | | 478,339 |
Sun Microsystems, Inc. (b) | | 953,282 | | | 5,176,321 |
Symantec Corp. (b) | | 276,974 | | | 5,495,164 |
Symbol Technologies, Inc. | | 63,636 | | | 950,085 |
Unisys Corp. (b) | | 89,662 | | | 586,389 |
Yahoo!, Inc. (b) | | 337,648 | | | 8,893,648 |
| | | | | |
| | | | | 189,038,952 |
| | | | | |
Computers & Hardware (1.7%) | | | |
Apple Computer, Inc. (b) | | 231,074 | | | 18,735,480 |
International Business Machines Corp. | | 414,010 | | | 38,225,543 |
Lexmark International, Inc. (b) (c) | | 30,401 | | | 1,933,200 |
| | | | | |
| | | | | 58,894,223 |
| | | | | |
Conglomerates (0.8%) | | | | | |
Illinois Tool Works, Inc. | | 115,994 | | | 5,559,592 |
ITT Industries, Inc. | | 44,960 | | | 2,445,374 |
Johnson Controls, Inc. | | 53,086 | | | 4,328,632 |
Tyco International Ltd. ADR — BM | | 547,300 | | | 16,107,040 |
| | | | | |
| | | | | 28,440,638 |
| | | | | |
Construction & Building Materials (0.3%) | | | |
Centex Corp. | | 35,481 | | | 1,855,656 |
Fluor Corp. | | 22,685 | | | 1,779,185 |
KB Home (c) | | 22,530 | | | 1,012,498 |
Statement of Investments (Continued)
October 31, 2006
Gartmore S&P 500 Index Fund (Continued)
Common Stocks (continued)
| | | | | |
| | | Shares or
Principal Amount | | Value |
| | | | | |
Construction & Building Materials (continued) |
Pulte Corp. (c) | | 59,982 | | $ | 1,858,842 |
Sherwin Williams Co. (c) | | 33,286 | | | 1,971,530 |
Vulcan Materials Co. (c) | | 26,776 | | | 2,181,708 |
| | | | | |
| | | | | 10,659,419 |
| | | | | |
Construction & Housing (0.1%) | | | |
Lennar Corp. (c) | | 41,667 | | | 1,978,349 |
Masco Corp. (c) | | 112,127 | | | 3,100,312 |
| | | | | |
| | | | | 5,078,661 |
| | | | | |
Construction Machinery (0.3%) | | | |
Caterpillar, Inc. | | 180,564 | | | 10,962,040 |
| | | | | |
Consumer Durable (0.3%) | | | | | |
Black & Decker Corp. (c) | | 20,465 | | | 1,716,604 |
Danaher Corp. (c) | | 66,847 | | | 4,797,609 |
Fortune Brands, Inc. | | 40,486 | | | 3,115,398 |
Whirlpool Corp. (c) | | 22,317 | | | 1,940,017 |
| | | | | |
| | | | | 11,569,628 |
| | | | | |
Consumer Finance (2.0%) | | | | | |
Citigroup, Inc. | | 1,342,988 | | | 67,364,278 |
| | | | | |
Consumer Non-Cyclical (2.5%) | | | |
Alberto Culver Co., Class B | | 18,020 | | | 915,596 |
Avon Products, Inc. | | 125,617 | | | 3,820,013 |
Clorox Co. (The) | | 39,686 | | | 2,562,128 |
Colgate-Palmolive Co. | | 140,308 | | | 8,975,503 |
Ecolab, Inc. | | 55,811 | | | 2,531,029 |
Estee Lauder Co., Inc. (The), Class A | | 32,800 | | | 1,324,792 |
International Flavor and Fragrances, Inc. (c) | | 21,140 | | | 898,027 |
Kimberly-Clark Corp. | | 125,687 | | | 8,360,699 |
Pall Corp. (c) | | 31,191 | | | 994,993 |
Procter & Gamble Co. | | 862,503 | | | 54,674,065 |
| | | | | |
| | | | | 85,056,845 |
| | | | | |
Containers (0.1%) | | | | | |
Ball Corp. | | 28,930 | | | 1,203,199 |
Bemis Co., Inc. | | 28,396 | | | 954,674 |
Sealed Air Corp. | | 21,997 | | | 1,309,261 |
| | | | | |
| | | | | 3,467,134 |
| | | | | |
| | | | | |
| | | Shares or
Principal Amount | | Value |
| | | | | |
Credit Reporting Services (0.1%) | | | |
Moody’s Corp. (c) | | 67,402 | | $ | 4,468,753 |
| | | | | |
Data Processing & Reproduction (0.1%) | | | |
Computer Sciences Corp. (b) | | 46,681 | | | 2,467,091 |
| | | | | |
Dental Supplies & Equipment (0.0%) | | | |
Patterson Companies, Inc. (b) (c) | | 36,900 | | | 1,212,165 |
| | | | | |
Distribution (0.2%) | | | | | |
SYSCO Corp. | | 168,033 | | | 5,877,794 |
| | | | | |
Diversified Chemicals (1.2%) | | | | | |
Air Products & Chemicals, Inc. | | 59,866 | | | 4,170,864 |
Ashland, Inc. | | 17,625 | | | 1,041,638 |
E.I. du Pont de Nemours and Co. | | 250,450 | | | 11,470,610 |
Eastman Chemical Co. (c) | | 20,660 | | | 1,258,607 |
Hercules, Inc. (b) | | 22,621 | | | 411,702 |
Occidental Petroleum Corp. | | 234,054 | | | 10,986,495 |
Rohm & Haas Co. | | 45,177 | | | 2,341,072 |
The Dow Chemical Co. | | 260,590 | | | 10,629,466 |
| | | | | |
| | | | | 42,310,454 |
| | | | | |
Drugs (5.2%) | | | | | |
AmeriSource Bergen Corp. | | 55,152 | | | 2,603,174 |
Amgen Corp. (b) | | 317,948 | | | 24,135,433 |
Biogen, Inc. (b) | | 92,172 | | | 4,387,387 |
Eli Lilly & Co. | | 270,391 | | | 15,144,600 |
Express Scripts, Inc. (b) | | 37,720 | | | 2,403,518 |
Forest Laboratories, Inc. (b) | | 89,732 | | | 4,391,484 |
Genzyme Corp. (b) | | 69,251 | | | 4,675,135 |
Gilead Sciences, Inc. (b) | | 124,100 | | | 8,550,490 |
Laboratory Corp. of America Holdings (b) | | 34,600 | | | 2,369,754 |
Medimmune, Inc. (b) | | 70,761 | | | 2,267,182 |
Merck & Co., Inc. | | 591,176 | | | 26,851,214 |
Mylan Laboratories, Inc. | | 59,351 | | | 1,216,696 |
Pfizer, Inc. | | 1,980,734 | | | 52,786,562 |
Schering Plough Corp. | | 402,427 | | | 8,909,734 |
Wyeth | | 365,572 | | | 18,655,139 |
| | | | | |
| | | | | 179,347,502 |
| | | | | |
Educational Services (0.0%) | | | | | |
Apollo Group, Inc. (b) (c) | | 40,826 | | | 1,508,929 |
| | | | | |
Common Stocks (continued)
| | | | | |
| | | Shares or
Principal Amount | | Value |
| | | | | |
Electric Services (0.3%) | | | | | |
Duke Energy Corp. | | 340,381 | | $ | 10,769,655 |
| | | | | |
Electrical Equipment (3.6%) | | | | | |
Agilent Technologies, Inc. (b) | | 116,476 | | | 4,146,546 |
Cooper Industries Ltd., Class A | | 24,480 | | | 2,189,736 |
Eaton Corp. | | 40,716 | | | 2,949,060 |
Emerson Electric Co. | | 110,782 | | | 9,350,000 |
Fisher Scientific International, Inc. (b) | | 31,000 | | | 2,654,220 |
General Electric Co. | | 2,804,332 | | | 98,460,096 |
Rockwell International Corp. | | 47,776 | | | 2,962,112 |
W.W. Grainger, Inc. | | 21,225 | | | 1,544,756 |
| | | | | |
| | | | | 124,256,526 |
| | | | | |
Electronics (2.2%) | | | | | |
Altera Corp. (b) | | 97,582 | | | 1,799,412 |
Broadcom Corp., Class A (b) | | 127,396 | | | 3,856,277 |
Intel Corp. | | 1,566,938 | | | 33,438,457 |
Jabil Circuit, Inc. | | 43,041 | | | 1,235,707 |
KLA-Tencor Corp. (c) | | 53,621 | | | 2,636,545 |
L-3 Communications Holdings, Inc. | | 29,638 | | | 2,386,452 |
Linear Technology Corp. (c) | | 83,467 | | | 2,597,493 |
LSI Logic Corp. (b) | | 98,882 | | | 993,764 |
Maxim Integrated Products, Inc. | | 88,314 | | | 2,650,303 |
Molex, Inc. (c) | | 44,521 | | | 1,553,783 |
National Semiconductor Corp. | | 89,277 | | | 2,168,538 |
PMC-Sierra, Inc. (b) (c) | | 83,911 | | | 556,330 |
QLogic Corp. (b) | | 50,090 | | | 1,030,852 |
RadioShack Corp. (c) | | 38,571 | | | 688,107 |
Sanmina Corp. (b) | | 194,939 | | | 770,009 |
Solectron Corp. (b) | | 236,576 | | | 790,164 |
Tektronix, Inc. | | 22,795 | | | 692,284 |
Teradyne, Inc. (b) (c) | | 51,001 | | | 715,034 |
Texas Instruments, Inc. | | 422,659 | | | 12,755,849 |
Xilinx, Inc. | | 92,322 | | | 2,355,134 |
| | | | | |
| | | | | 75,670,494 |
| | | | | |
Energy (0.0%) | | | | | |
Consol Energy, Inc. | | 47,200 | | | 1,670,408 |
| | | | | |
Entertainment (0.8%) | | | | | |
Electronic Arts, Inc. (b) | | 81,207 | | | 4,295,038 |
International Game Technology | | 91,032 | | | 3,869,770 |
Walt Disney Co. (The) | | 571,240 | | | 17,971,211 |
| | | | | |
| | | | | 26,136,019 |
| | | | | |
| | | | | |
| | | Shares or
Principal Amount | | Value |
| | | | | |
Farm Machinery (0.2%) | | | | | |
Deere & Co. | | 65,546 | | $ | 5,579,931 |
| | | | | |
Financial (3.2%) | | | | | |
American Express Co. | | 330,057 | | | 19,080,595 |
Capital One Financial Corp. (c) | | 83,186 | | | 6,599,145 |
Charles Schwab Corp. | | 285,387 | | | 5,199,751 |
Chicago Mercantile Exchange Holdings, Inc. | | 9,500 | | | 4,759,500 |
CIT Group, Inc. | | 54,000 | | | 2,810,700 |
Comerica, Inc. | | 44,826 | | | 2,608,425 |
Countrywide Credit Industries, Inc. | | 166,592 | | | 6,350,487 |
Fannie Mae | | 262,975 | | | 15,583,899 |
Federated Investors, Inc. | | 24,211 | | | 830,195 |
Goldman Sachs Group, Inc. | | 117,672 | | | 22,332,969 |
Lehman Brothers Holdings, Inc. | | 145,902 | | | 11,357,012 |
Washington Mutual, Inc. | | 266,411 | | | 11,269,185 |
| | | | | |
| | | | | 108,781,863 |
| | | | | |
Financial Services (1.9%) | | | | | |
AMBAC Financial Group, Inc. | | 28,801 | | | 2,404,595 |
Ameriprise Financial, Inc. | | 66,251 | | | 3,411,927 |
E*TRADE Financial Corp. (b) | | 116,722 | | | 2,717,288 |
First Horizon National Corp. | | 34,491 | | | 1,356,186 |
H&R Block, Inc. | | 87,372 | | | 1,909,952 |
Janus Capital Group, Inc. | | 59,831 | | | 1,201,406 |
Legg Mason, Inc. | | 35,600 | | | 3,204,712 |
Manulife Financial Corp. ADR — CA (c) | | 2 | | | 65 |
Marshall & Ilsley Corp. | | 69,066 | | | 3,311,024 |
SLM Corp. | | 112,222 | | | 5,462,967 |
Sovereign Bancorp, Inc. | | 95,195 | | | 2,271,353 |
Wells Fargo Co. | | 914,728 | | | 33,195,479 |
Western Union Co. (b) | | 206,852 | | | 4,561,087 |
| | | | | |
| | | | | 65,008,041 |
| | | | | |
Food & Drug Retail (0.6%) | | | | | |
Kroger Co. | | 195,309 | | | 4,392,499 |
Safeway, Inc. | | 120,782 | | | 3,546,160 |
Supervalu, Inc. (c) | | 53,879 | | | 1,799,559 |
Walgreen Co. | | 267,525 | | | 11,685,492 |
| | | | | |
| | | | | 21,423,710 |
| | | | | |
Statement of Investments (Continued)
October 31, 2006
Gartmore S&P 500 Index Fund (Continued)
Common Stocks (continued)
| | | | | |
| | | Shares or
Principal Amount | | Value |
| | | | | |
Food & Related (2.5%) | | | | | |
Altria Group, Inc. | | 568,743 | | $ | 46,255,869 |
Archer-Daniels Midland Co. | | 178,143 | | | 6,858,506 |
Campbell Soup Co. | | 58,532 | | | 2,187,926 |
ConAgra, Inc. | | 135,228 | | | 3,536,212 |
Dean Foods Co. (b) | | 36,700 | | | 1,537,363 |
General Mills, Inc. | | 90,862 | | | 5,162,779 |
H.J. Heinz Co. | | 90,057 | | | 3,796,803 |
Hershey Foods Corp. | | 50,522 | | | 2,673,119 |
Kellogg Co. | | 73,542 | | | 3,699,898 |
McCormick & Co. | | 35,346 | | | 1,321,940 |
Sara Lee Corp. | | 206,499 | | | 3,531,133 |
Tyson Foods, Inc., Class A | | 68,400 | | | 988,380 |
W.M. Wrigley Jr. Co. (c) | | 51,556 | | | 2,678,334 |
W.M. Wrigley Jr., Co., Class B | | 12,589 | | | 652,110 |
| | | | | |
| | | | | 84,880,372 |
| | | | | |
Furniture & Home Furnishings (0.0%) | | | |
Leggett & Platt, Inc. (c) | | 49,801 | | | 1,162,853 |
| | | | | |
Healthcare (5.8%) | | | |
Abbott Laboratories | | 415,063 | | | 19,719,643 |
Allergan, Inc. | | 40,916 | | | 4,725,798 |
Bard (C.R.), Inc. (c) | | 28,286 | | | 2,318,321 |
Bausch & Lomb, Inc. (c) | | 12,945 | | | 693,075 |
Baxter International, Inc. | | 177,273 | | | 8,149,240 |
Becton Dickinson & Co. | | 66,486 | | | 4,656,015 |
Biomet, Inc. | | 64,851 | | | 2,453,962 |
Boston Scientific Corp. (b) (c) | | 320,018 | | | 5,091,486 |
Bristol-Myers Squibb Co. | | 523,040 | | | 12,945,240 |
Cardinal Health, Inc. (c) | | 112,797 | | | 7,382,564 |
Coventry Health Care, Inc. (b) | | 45,700 | | | 2,145,615 |
HCA, Inc. | | 114,113 | | | 5,764,989 |
Health Management Associates, Inc., Class A (c) | | 63,341 | | | 1,247,818 |
Humana, Inc. (b) | | 44,861 | | | 2,691,660 |
Johnson & Johnson Co. | | 794,625 | | | 53,557,724 |
King Pharmaceuticals, Inc. (b) | | 66,023 | | | 1,104,565 |
Manor Care, Inc. | | 22,520 | | | 1,080,735 |
McKesson HBOC, Inc. | | 81,347 | | | 4,074,671 |
Medco Health Solutions, Inc. (b) | | 79,826 | | | 4,270,691 |
Medtronic, Inc. | | 315,106 | | | 15,339,360 |
Quest Diagnostics, Inc. | | 46,772 | | | 2,326,439 |
St. Jude Medical, Inc. (b) | | 96,522 | | | 3,315,531 |
Stryker Corp. | | 80,877 | | | 4,229,058 |
| | | | | |
| | | Shares or
Principal Amount | | Value |
| | | | | |
Healthcare (continued) |
Tenet Healthcare Corp. (b) (c) | | 124,387 | | $ | 878,172 |
UnitedHealth Group, Inc. | | 365,918 | | | 17,849,480 |
Watson Pharmaceutical, Inc. (b) | | 27,806 | | | 748,259 |
WellPoint, Inc. (b) | | 168,402 | | | 12,852,441 |
| | | | | |
| | | | | 201,612,552 |
| | | | | |
Hotels & Casinos (0.1%) | | | | | |
Harrah’s Entertainment, Inc. | | 49,821 | | | 3,703,195 |
| | | | | |
Hotels & Motels (0.4%) | | | | | |
Hilton Hotels Corp. | | 104,487 | | | 3,021,764 |
Marriott International, Inc., Class A | | 98,462 | | | 4,112,757 |
Starwood Hotels & Resorts Worldwide, Inc. | | 59,124 | | | 3,532,068 |
Wyndham Worldwide Corp. | | 55,129 | | | 1,626,306 |
| | | | | |
| | | | | 12,292,895 |
| | | | | |
Industrial Diversified (0.1%) | | | | | |
Parker Hannifin Corp. | | 31,556 | | | 2,639,028 |
Thermo Electron Corp. (b) | | 43,376 | | | 1,859,529 |
| | | | | |
| | | | | 4,498,557 |
| | | | | |
Insurance (4.8%) | | | | | |
ACE Ltd. | | 87,214 | | | 4,993,002 |
Aetna, Inc. | | 150,884 | | | 6,219,438 |
AFLAC, Inc. | | 133,313 | | | 5,988,420 |
Allstate Corp. (The) | | 175,414 | | | 10,763,403 |
American International Group, Inc. | | 705,966 | | | 47,419,737 |
AON Corp. | | 79,327 | | | 2,759,786 |
Chubb Corp. (The) | | 111,562 | | | 5,929,520 |
CIGNA Corp. | | 31,461 | | | 3,680,308 |
Cincinnati Financial Corp. | | 47,089 | | | 2,149,613 |
Genworth Financial Co. | | 123,600 | | | 4,133,184 |
Hartford Financial Services Group, Inc. | | 82,671 | | | 7,206,431 |
Lincoln National Corp. | | 78,556 | | | 4,973,380 |
Loews Corp. | | 124,213 | | | 4,834,370 |
MBIA, Inc. (c) | | 41,676 | | | 2,584,746 |
MetLife, Inc. | | 206,279 | | | 11,784,719 |
MGIC Investment Corp. | | 27,060 | | | 1,590,046 |
Principal Financial Group, Inc. | | 75,707 | | | 4,276,688 |
Progressive Corp. (The) | | 209,800 | | | 5,070,866 |
Common Stocks (continued)
| | | | | |
| | | Shares or
Principal Amount | | Value |
| | | | | |
Insurance (continued) | | | | | |
Prudential Financial, Inc. | | 135,443 | | $ | 10,419,630 |
SAFECO Corp. | | 33,151 | | | 1,929,057 |
St. Paul Cos., Inc. | | 187,715 | | | 9,597,868 |
Torchmark Corp. (c) | | 28,031 | | | 1,728,952 |
UnumProvident Corp. | | 83,649 | | | 1,654,577 |
XL Capital Ltd., Class A | | 50,046 | | | 3,530,745 |
| | | | | |
| | | | | 165,218,486 |
| | | | | |
Insurance Brokers (0.1%) | | | | | |
Marsh & McLennan Cos., Inc. | | 140,793 | | | 4,144,946 |
| | | | | |
Internet Services (0.9%) | | | | | |
Google, Inc. (b) | | 57,900 | | | 27,582,981 |
Juniper Networks, Inc. (b) | | 164,500 | | | 2,832,690 |
| | | | | |
| | | | | 30,415,671 |
| | | | | |
Investment Management (1.5%) | | | |
Franklin Resources, Inc. | | 45,271 | | | 5,159,083 |
Merrill Lynch & Co. | | 240,795 | | | 21,050,299 |
Morgan Stanley Dean Witter & Co. | | 291,242 | | | 22,259,627 |
T. Rowe Price Group, Inc. (c) | | 71,082 | | | 3,362,889 |
| | | | | |
| | | | | 51,831,898 |
| | | | | |
Leisure Products (0.3%) | | | | | |
Brunswick Corp. | | 25,640 | | | 807,660 |
Carnival Corp. ADR — PA (c) | | 120,863 | | | 5,900,532 |
Hasbro, Inc. | | 46,921 | | | 1,216,192 |
Mattel, Inc. | | 106,623 | | | 2,412,878 |
| | | | | |
| | | | | 10,337,262 |
| | | | | |
Manufacturing (1.1%) | | | | | |
3M Co. | | 203,389 | | | 16,035,189 |
American Standard Cos., Inc. | | 51,816 | | | 2,294,931 |
Cummins, Inc. | | 13,700 | | | 1,739,626 |
Dover Corp. | | 55,256 | | | 2,624,660 |
Honeywell International, Inc. | | 226,669 | | | 9,547,298 |
PPG Industries, Inc. | | 44,906 | | | 3,071,570 |
Stanley Works (The) (c) | | 19,380 | | | 923,457 |
Textron, Inc. | | 33,546 | | | 3,050,338 |
| | | | | |
| | | | | 39,287,069 |
| | | | | |
| | | | | |
| | | Shares or
Principal Amount | | Value |
| | | | | |
Medical Equipment & Supplies (0.1%) | | | |
Barr Laboratories, Inc. (b) | | 27,700 | | $ | 1,450,649 |
PerkinElmer, Inc. | | 28,096 | | | 600,131 |
| | | | | |
| | | | | 2,050,780 |
| | | | | |
Medical Products (0.1%) | | | |
Zimmer Holdings, Inc. (b) | | 65,946 | | | 4,748,771 |
| | | | | |
Metals & Mining (0.6%) | | | |
Alcoa, Inc. | | 235,526 | | | 6,809,056 |
Freeport-McMoRan Copper & Gold, Inc. | | 53,306 | | | 3,223,947 |
Newmont Mining Corp. | | 122,332 | | | 5,537,970 |
Phelps Dodge Corp. | | 55,086 | | | 5,529,533 |
| | | | | |
| | | | | 21,100,506 |
| | | | | |
Mortgage & Asset Backed Obligations (0.4%) |
Freddie Mac | | 187,738 | | | 12,952,045 |
| | | | | |
Motor Vehicles (0.2%) | | | |
Harley-Davidson, Inc. (c) | | 75,127 | | | 5,155,966 |
Navistar International Corp. (b) (c) | | 17,220 | | | 477,511 |
| | | | | |
| | | | | 5,633,477 |
| | | | | |
Multimedia (1.0%) | | | |
News Corp., Class A | | 646,000 | | | 13,469,100 |
Time Warner, Inc. | | 1,096,843 | | | 21,947,828 |
| | | | | |
| | | | | 35,416,928 |
| | | | | |
Natural Gas (0.1%) | | | |
NICOR, Inc. (c) | | 11,605 | | | 533,366 |
People’s Energy Corp. (c) | | 8,375 | | | 365,904 |
Sempra Energy | | 63,481 | | | 3,367,032 |
| | | | | |
| | | | | 4,266,302 |
| | | | | |
Non-Alcoholic Beverages (1.7%) | | | |
Coca-Cola Co. | | 553,617 | | | 25,864,986 |
Coca-Cola Enterprises, Inc. | | 89,257 | | | 1,787,818 |
Pepsi Bottling Group, Inc. (The) | | 45,521 | | | 1,439,374 |
PepsiCo, Inc. | | 447,874 | | | 28,413,127 |
| | | | | |
| | | | | 57,505,305 |
| | | | | |
Office Equipment & Supplies (0.2%) | | | |
Avery Dennison Corp. | | 26,916 | | | 1,699,476 |
Xerox Corp. (b) | | 253,054 | | | 4,301,918 |
| | | | | |
| | | | | 6,001,394 |
| | | | | |
Statement of Investments (Continued)
October 31, 2006
Gartmore S&P 500 Index Fund (Continued)
Common Stocks (continued)
| | | | | |
| | | Shares or
Principal Amount | | Value |
| | | | | |
Oil & Gas (7.6%) | | | |
Apache Corp. | | 85,524 | | $ | 5,586,428 |
BJ Services Co. | | 89,892 | | | 2,711,143 |
Chesapeake Energy Corp. (c) | | 104,900 | | | 3,402,956 |
ChevronTexaco Corp. | | 597,943 | | | 40,181,769 |
ConocoPhillips | | 447,656 | | | 26,966,796 |
Devon Energy Corp. | | 120,808 | | | 8,074,807 |
El Paso Corp. | | 174,213 | | | 2,386,718 |
EOG Resources, Inc. | | 65,882 | | | 4,383,129 |
Exxon Mobil Corp. | | 1,614,961 | | | 115,340,514 |
Hess Corp. | | 67,960 | | | 2,881,504 |
KeySpan Corp. | | 41,791 | | | 1,695,879 |
Kinder Morgan, Inc. | | 30,876 | | | 3,245,068 |
Marathon Oil Corp. | | 99,112 | | | 8,563,277 |
Murphy Oil Corp. | | 45,500 | | | 2,145,780 |
Nabors Industries Ltd. (b) (c) | | 85,854 | | | 2,651,172 |
Noble Corp. | | 37,231 | | | 2,609,893 |
Rowan Cos., Inc. | | 36,486 | | | 1,217,903 |
Smith International, Inc. | | 53,700 | | | 2,120,076 |
Sunoco, Inc. | | 38,020 | | | 2,514,263 |
Transocean Sedco Forex, Inc. (b) (c) | | 88,607 | | | 6,427,552 |
Valero Energy Corp. | | 166,484 | | | 8,712,108 |
Williams Cos., Inc. (The) | | 154,038 | | | 3,763,148 |
XTO Energy, Inc. | | 99,399 | | | 4,637,957 |
| | | | | |
| | | | | 262,219,840 |
| | | | | |
Oil Equipment & Services (1.4%) | | | |
Anadarko Petroleum Corp. | | 126,276 | | | 5,861,732 |
Baker Hughes, Inc. | | 88,647 | | | 6,121,075 |
Dynegy, Inc., Class A (b) | | 133,272 | | | 810,294 |
Halliburton Co. | | 280,124 | | | 9,062,011 |
National-Oilwell Varco, Inc. (b) | | 44,594 | | | 2,693,478 |
Schlumberger Ltd. ADR — AN | | 321,636 | | | 20,288,799 |
Weatherford International Ltd. (b) | | 94,000 | | | 3,861,520 |
| | | | | |
| | | | | 48,698,909 |
| | | | | |
Paper & Forest Products (0.4%) | | | |
International Paper Co. | | 127,258 | | | 4,244,054 |
Louisiana-Pacific Corp. | | 30,096 | | | 595,299 |
MeadWestvaco Corp. | | 49,447 | | | 1,360,781 |
Pactiv Corp. (b) | | 39,836 | | | 1,228,542 |
Temple Inland, Inc. | | 32,610 | | | 1,286,138 |
Weyerhaeuser Co. | | 66,901 | | | 4,254,236 |
| | | | | |
| | | | | 12,969,050 |
| | | | | |
| | | | | |
| | | Shares or
Principal Amount | | Value |
| | | | | |
Pharmacy Services (0.2%) | | | |
Caremark Rx, Inc. | | 118,920 | | $ | 5,854,432 |
Hospira, Inc. (b) | | 42,646 | | | 1,550,182 |
| | | | | |
| | | | | 7,404,614 |
| | | | | |
Photographic (0.1%) | | | |
Eastman Kodak Co. (c) | | 81,846 | | | 1,997,042 |
| | | | | |
Pollution Control (0.2%) | | | |
Allied Waste Industries, Inc. (b) (c) | | 66,607 | | | 809,275 |
Waste Management, Inc. | | 146,813 | | | 5,502,551 |
| | | | | |
| | | | | 6,311,826 |
| | | | | |
Printing & Publishing (0.5%) | | | |
Dow Jones & Company, Inc. (c) | | 18,380 | | | 644,954 |
E.W. Scripps Co., Class A | | 22,600 | | | 1,117,796 |
Gannett Co., Inc. | | 64,776 | | | 3,830,853 |
McGraw-Hill Cos., Inc. (The) | | 99,402 | | | 6,378,626 |
Meredith Corp. | | 11,735 | | | 616,088 |
New York Times Co., Class A (c) | | 39,206 | | | 947,609 |
R.R. Donnelley & Sons Co. | | 49,506 | | | 1,676,273 |
Tribune Co. (c) | | 60,209 | | | 2,006,766 |
| | | | | |
| | | | | 17,218,965 |
| | | | | |
Railroads (0.7%) | | | | | |
Burlington Northern Santa Fe Corp. (c) | | 99,452 | | | 7,710,514 |
CSX Corp. | | 120,512 | | | 4,298,663 |
Norfolk Southern Corp. | | 112,437 | | | 5,910,813 |
Union Pacific Corp. | | 73,216 | | | 6,635,566 |
| | | | | |
| | | | | 24,555,556 |
| | | | | |
Real Estate Investment Trusts (1.1%) | | | |
Apartment Investment & Management Co. | | 29,140 | | | 1,670,305 |
Archstone-Smith Trust (c) | | 51,500 | | | 3,100,815 |
Boston Properties, Inc. | | 27,600 | | | 2,948,508 |
Equity Office Properties Trust | | 103,182 | | | 4,385,235 |
Equity Residential Property Trust (c) | | 71,811 | | | 3,921,599 |
Kimco Realty Corp. (c) | | 52,800 | | | 2,345,904 |
Plum Creek Timber Co., Inc. | | 48,661 | | | 1,748,876 |
ProLogis Trust | | 71,951 | | | 4,552,340 |
Public Storage, Inc. (c) | | 32,900 | | | 2,951,459 |
Common Stocks (continued)
| | | | | |
| | | Shares or
Principal Amount | | Value |
| | | | | |
Real Estate Investment Trusts (continued) | | | |
Realogy Corp. (b) | | 60,715 | | $ | 1,565,233 |
Simon Property Group, Inc. | | 58,401 | | | 5,670,736 |
Vornado Realty Trust | | 34,000 | | | 4,054,500 |
| | | | | |
| | | | | 38,915,510 |
| | | | | |
Restaurants (0.6%) | | | |
Darden Restaurants, Inc. | | 39,676 | | | 1,662,424 |
McDonald’s Corp. | | 334,541 | | | 14,023,959 |
Wendy’s International, Inc. | | 29,736 | | | 1,028,866 |
YUM! Brands, Inc. | | 75,781 | | | 4,505,938 |
| | | | | |
| | | | | 21,221,187 |
| | | | | |
Retail (4.9%) | | | |
Amazon.com, Inc. (b) (c) | | 78,900 | | | 3,005,301 |
AutoZone, Inc. (b) | | 17,110 | | | 1,916,320 |
Bed Bath & Beyond, Inc. (b) | | 74,102 | | | 2,985,570 |
Best Buy Co., Inc. | | 110,415 | | | 6,100,429 |
Big Lots, Inc. (b) (c) | | 32,051 | | | 675,635 |
Circuit City Stores, Inc. | | 45,236 | | | 1,220,467 |
Costco Wholesale Corp. | | 125,257 | | | 6,686,219 |
CVS Corp. | | 223,134 | | | 7,001,945 |
Dillards, Inc., Class A (c) | | 19,790 | | | 597,064 |
Dollar General Corp. (c) | | 77,197 | | | 1,083,074 |
Family Dollar Stores, Inc. | | 42,006 | | | 1,237,077 |
Federated Department Stores, Inc. | | 147,652 | | | 6,483,399 |
Gap, Inc. (The) | | 158,540 | | | 3,332,511 |
Home Depot, Inc. | | 560,667 | | | 20,929,699 |
J.C. Penney Co., Inc. | | 63,981 | | | 4,813,291 |
Jones Apparel Group, Inc. | | 31,591 | | | 1,055,139 |
Kohl’s Corp. (b) | | 89,597 | | | 6,325,548 |
Limited, Inc. (The) | | 96,328 | | | 2,838,786 |
Lowe’s Cos., Inc. | | 415,098 | | | 12,511,054 |
Nordstrom, Inc. | | 61,892 | | | 2,930,586 |
Office Depot, Inc. (b) | | 77,662 | | | 3,261,027 |
OfficeMax, Inc. | | 24,410 | | | 1,161,428 |
Sears Holding Corp. (b) | | 24,061 | | | 4,197,923 |
Staples, Inc. | | 197,372 | | | 5,090,224 |
Starbucks Corp. (b) | | 207,624 | | | 7,837,806 |
Target Corp. | | 235,590 | | | 13,942,216 |
Tiffany & Co. | | 32,286 | | | 1,153,256 |
TJX Cos., Inc. | | 125,068 | | | 3,620,719 |
| | | | | |
| | | Shares or
Principal Amount | | Value |
| | | | | |
Retail (continued) | | | | | |
Wal-Mart Stores, Inc. | | 668,182 | | $ | 32,928,008 |
Whole Foods Market, Inc. (c) | | 38,400 | | | 2,451,456 |
| | | | | |
| | | | | 169,373,177 |
| | | | | |
Semiconductors (0.6%) | | | |
Advanced Micro Devices, Inc. (b) (c) | | 131,942 | | | 2,806,406 |
Analog Devices, Inc. | | 96,557 | | | 3,072,444 |
Applied Materials, Inc. | | 391,719 | | | 6,811,993 |
Freescale Semiconductor, Inc., Class B (b) | | 102,509 | | | 4,031,679 |
JDS Uniphase Corp. (b) (c) | | 64,594 | | | 938,551 |
Micron Technology, Inc. (b) | | 198,268 | | | 2,864,973 |
Novellus Systems, Inc. (b) | | 35,821 | | | 990,451 |
| | | | | |
| | | | | 21,516,497 |
| | | | | |
Services (1.1%) | | | |
Autodesk, Inc. (b) | | 60,162 | | | 2,210,954 |
eBay, Inc. (b) | | 319,176 | | | 10,255,125 |
Equifax, Inc. | | 34,951 | | | 1,329,187 |
Exelon Corp. | | 181,898 | | | 11,274,037 |
IMS Health, Inc. | | 54,774 | | | 1,525,456 |
Omnicom Group, Inc. | | 48,691 | | | 4,939,702 |
Paychex, Inc. | | 91,952 | | | 3,630,265 |
Robert Half International, Inc. | | 44,206 | | | 1,615,729 |
Ryder System, Inc. | | 16,805 | | | 884,783 |
Sabre Holdings, Inc. (c) | | 35,773 | | | 909,350 |
| | | | | |
| | | | | 38,574,588 |
| | | | | |
Shelter (0.1%) | | | |
D. R. Horton, Inc. | | 72,000 | | | 1,686,960 |
| | | | | |
Steel (0.3%) | | | | | |
Allegheny Teledyne, Inc. | | 30,075 | | | 2,367,805 |
Nucor Corp. | | 86,960 | | | 5,079,333 |
United States Steel Corp. | | 33,431 | | | 2,259,936 |
| | | | | |
| | | | | 9,707,074 |
| | | | | |
Telecommunications (3.2%) | | | |
ADC Telecommunications, Inc. (b) (c) | | 24,227 | | | 346,688 |
ALLTEL Corp. | | 100,667 | | | 5,366,558 |
AT&T, Inc. | | 1,055,149 | | | 36,138,854 |
BellSouth Corp. | | 493,224 | | | 22,244,402 |
Ciena Corp. (b) | | 29,158 | | | 685,501 |
Statement of Investments (Continued)
October 31, 2006
Gartmore S&P 500 Index Fund (Continued)
Common Stocks (continued)
| | | | | |
| | | Shares or
Principal Amount | | Value |
| | | | | |
Telecommunications (continued) | | | |
CenturyTel, Inc. | | 35,176 | | $ | 1,415,482 |
Comverse Technology, Inc. (b) (c) | | 57,206 | | | 1,245,375 |
Embarq Corp. | | 39,235 | | | 1,897,012 |
Lucent Technologies, Inc. (b) (c) | | 1,217,532 | | | 2,958,603 |
QUALCOMM, Inc. | | 448,778 | | | 16,331,031 |
Qwest Communications International, Inc. (b) | | 434,730 | | | 3,751,720 |
Sprint Corp. | | 811,514 | | | 15,167,197 |
Univision Communications, Inc., Class A (b) | | 68,117 | | | 2,388,182 |
Windstream Corp. | | 115,882 | | | 1,589,901 |
| | | | | |
| | | | | 111,526,506 |
| | | | | |
Television (0.4%) | | | |
CBS Corp. Class A (c) | | 100 | | | 2,897 |
CBS Corp., Class B (c) | | 207,737 | | | 6,011,909 |
Viacom, Inc., Class A (b) (c) | | 100 | | | 3,891 |
Viacom Inc., Class B (b) | | 193,837 | | | 7,544,136 |
| | | | | |
| | | | | 13,562,833 |
| | | | | |
Tire & Rubber (0.0%) | | | |
Goodyear Tire & Rubber Co. (b) (c) | | 60,221 | | | 923,188 |
| | | | | |
Tobacco (0.2%) | | | | | |
Reynolds American, Inc. | | 51,390 | | | 3,245,793 |
UST, Inc. (c) | | 43,681 | | | 2,339,554 |
| | | | | |
| | | | | 5,585,347 |
| | | | | |
Trucking (0.6%) | | | | | |
United Parcel Service, Inc.,
Class B | | 293,616 | | | 22,123,966 |
| | | | | |
Utilities (2.5%) | | | | | |
AES Corp. (The) (b) | | 179,693 | | | 3,951,449 |
Allegheny Energy, Inc. (b) | | 38,096 | | | 1,639,271 |
Ameren Corp. (c) | | 49,056 | | | 2,653,930 |
American Electric Power Co., Inc. | | 109,897 | | | 4,553,033 |
Centerpoint Energy, Inc. (c) | | 84,842 | | | 1,313,354 |
CMS Energy Corp. (b) | | 66,656 | | | 992,508 |
Consolidated Edison, Inc. (c) | | 70,026 | | | 3,385,757 |
| | | | | | |
| | | Shares or
Principal Amount | | Value |
| | | | | | |
Utilities (continued) | | | | | | |
Constellation Energy Group, Inc. | | | 47,286 | | $ | 2,950,646 |
Dominion Resources, Inc. | | | 92,294 | | | 7,474,891 |
DTE Energy Co. (c) | | | 50,491 | | | 2,293,806 |
Edison International | | | 88,532 | | | 3,934,362 |
Entergy Corp. | | | 58,176 | | | 4,993,246 |
FirstEnergy Corp. | | | 89,600 | | | 5,272,960 |
FPL Group, Inc. (c) | | | 109,832 | | | 5,601,432 |
NiSource, Inc. | | | 68,358 | | | 1,590,691 |
PG&E Corp. | | | 96,672 | | | 4,170,430 |
Pinnacle West Capital Corp. (c) | | | 34,425 | | | 1,645,859 |
PPL Corp. (c) | | | 96,662 | | | 3,336,772 |
Progress Energy, Inc. | | | 67,451 | | | 3,102,746 |
Public Service Enterprise Group, Inc. | | | 65,611 | | | 4,005,552 |
Southern Co. | | | 194,649 | | | 7,085,224 |
TECO Energy, Inc. (c) | | | 74,781 | | | 1,233,139 |
TXU Corp. | | | 128,944 | | | 8,140,234 |
Xcel Energy, Inc. (c) | | | 110,287 | | | 2,434,035 |
| | | | | | |
| | | | | | 87,755,327 |
| | | | | | |
| | |
Total Common Stocks | | | | | | 3,376,146,572 |
| | | | | | |
|
Repurchase Agreements (1.8%) |
| | |
CS First Boston, 5.17%, dated 10/31/06, due 11/01/06, repurchase price $31,774,317 collateralized by U.S. Government Agency Mortgages with a market value of $32,405,204 | | $ | 31,769,755 | | | 31,769,755 |
Nomura Securities, 5.17%, dated 10/31/06, due 11/01/06, repurchase price $30,337,210 collateralized by U.S. Government Agency Mortgages with a market value of $30,939,563 | | | 30,332,854 | | | 30,332,854 |
| | | | | | |
| |
Total Repurchase Agreements | | | 62,102,609 |
| | | | | | |
Short-Term Securities Held as Collateral for Securities on Loan (5.1%) |
| | | | | |
| | | Shares or
Principal Amount | | Value |
| | | | | |
ASIF Global Funding XV Medium Term Note, 5.38%, 11/01/06 (d) | | 13,006,059 | | $ | 13,006,059 |
Banc of America Securities LLC Repurchase Agreement, 5.32%, dated 10/31/06, due 11/01/06, repurchase price $41,878,689, collateralized by U.S. Government Agency Mortgages with a market value of $ 42,709,951 | | 41,872,501 | | | 41,872,501 |
Beta Finance Inc. Medium Term Note, 5.37%, 11/01/06 (d) | | 4,150,000 | | | 4,150,000 |
Comerica CD, 5.30%, 11/24/06 (d) | | 23,999,848 | | | 23,999,848 |
Deutsche Bank Financial Medium Term Note, 5.44%, 11/01/06 (d) | | 15,000,000 | | | 15,000,000 |
Dorada Finance Inc. Medium Term Note, 5.38%, 11/01/06 (d) | | 2,500,000 | | | 2,500,000 |
General Electric Capital Corp. Medium Term Note, 5.39%, 12/08/06 (d) | | 9,000,255 | | | 9,000,255 |
Islandsbanki HF Corp. Medium Term Note, 5.39%, 11/22/06 (d) | | 20,000,000 | | | 20,000,000 |
MacQuarie Bank Ltd. Medium Term Note, 5.34%, 11/21/06 (d) | | 19,998,846 | | | 19,998,846 |
Northern Rock Plc Medium Term Note, 5.46%, 12/11/06 (d) | | 1,000,000 | | | 1,000,000 |
Pacific Life Global Funding Medium Term Note, 5.45%, 01/26/07 (d) | | 20,000,000 | | | 20,000,000 |
Tango Finance Corp. Medium Term Note, 5.39%, 11/01/06 (d) | | 2,999,415 | | | 2,999,415 |
Unicredito Italiano Bank Plc Medium Term Note, 5.33%, 11/09/06 (d) | | 3,600,000 | | | 3,600,000 |
| | | | | |
| |
Total Short-Term Securities Held as Collateral for Securities on Loan | | | 177,126,924 |
| | | | | |
| | | | | | |
| |
Total Investments
(Cost $3,025,092,867) (a) —104.8% | | $ | 3,615,376,105 | |
| |
Liabilities in excess of other
assets — (4.8)% | | | (165,022,508 | ) |
| | | | | | |
| | |
NET ASSETS — 100.0% | | | | $ | 3,450,353,597 | |
| | | | | | |
| | (a) | See notes to financial statements for tax unrealized appreciation (depreciation) of securities. |
| | (b) | Denotes a non-income producing security. |
| | (c) | All or part of the security was on loan as of October 31, 2006. |
| | (d) | Variable Rate Security. The rate reflected in the Statement of Investments is the rate reflected in effect on October 31, 2006. The maturity date represents the actual maturity date. |
| | ADR | American Depositary Receipt |
As of October 31, 2006 the Fund’s open long future contracts were as follows:
| | | | | | | | | | |
Number of
Contracts | | Long
Contracts | | Expiration | | Market Value
Covered by
Securities | | Unrealized
Appreciation
(Depreciation) |
| 196 | | S&P 500 | | 12/15/06 | | $ | 67,776,800 | | $ | 1,878,523 |
See notes to financial statements.
Gartmore Small Cap Index Fund
Effective September 29, 2006, Merrill Lynch & Co., Inc. and BlackRock, Inc. completed a transaction to form a new asset management company involving Merrill Lynch’s asset management business, including Fund Asset Management, L.P. (the subadviser to each of the Gartmore Bond Index Fund, Gartmore International Index Fund, Gartmore Mid Cap Market Index Fund, Gartmore S&P 500 Index Fund and Gartmore Small Cap Index Fund) and BlackRock, Inc. The result of the transaction is a new subadviser known as BlackRock Investment Management, LLC.
For the annual period ended Oct. 31, 2006, the Gartmore Small Cap Index Fund (Class A at NAV) returned 19.14% versus 19.98% for its benchmark, the Russell 2000® Index. For broader comparison, the average return for the Fund’s Lipper peer category of Small-Cap Core Funds (consisting of 689 funds as of Oct. 31, 2006) was 16.40%. The underperformance of the Fund versus the Russell 2000 Index was primarily due to the expenses of the Fund.
The U.S. equity market posted strong gains during the reporting period. The positive returns resulted primarily from rallies in the first and third quarters of 2006, and in spite of a global equity market correction in the second quarter. Of particular note was the change of market capitalization leadership during the correction, with large-cap stocks leading small- and mid-cap stocks through the third-quarter rally. For the third quarter of 2006, the Russell 1000® Index of large-cap U.S. stocks returned 5.06% versus 0.44% for the Russell 2000® Index and 2.11% for the Russell MidCap® Index.
Strong growth in corporate earnings and significant upward revisions to earnings expectations have been major drivers of the global equity bull market since 2003. Although the rate of earnings upgrades slowed late in the reporting period from the exceptionally strong rates seen in previous years, news from the major corporate sectors has been positive. Earnings generally came in ahead of expectations in the third quarter of 2006 and supported the rally in equities.
The recurring themes in the market environment throughout most of the period were rising short-term interest rates and higher energy prices. The Federal Reserve Board raised the target federal funds rate in six 0.25% increments, bringing the target rate from 3.75% to 5.25% during the reporting period. The Federal Open Market Committee, however, held the rate steady at its August, September and October 2006 meetings. The third quarter of 2006 was the first quarterly period not to include an increase in the federal funds target rate since the first quarter of 2004. Oil prices climbed above $78.00 per barrel early in the third quarter of 2006. Energy prices declined significantly in late summer and into October, however, amid slowing demand and weakness in both oil and natural gas futures. The price of oil stood at $58.73 per barrel on Oct. 31, 2006.
At the end of the reporting period, the U.S. economy exhibited some evidence of a slowdown. Gross domestic product (GDP) rose at an annual rate of just 1.6% in the third quarter of 2006, according to advance estimates released by the Bureau of Economic Analysis in late October. This followed a 2.6% annual GDP growth rate for the second quarter of the year. The moderating growth rate reflected sluggish income growth, a weaker housing market and a low savings ratio. In addition, prospects for U.S. consumer spending are uncertain, although consumption has held up well and most likely will be further supported by lower oil prices.
The portfolio is positioned such that the risk characteristics are similar to those of the Russell 2000® Index. The portfolio seeks to perform in line with the benchmark on a gross return basis.
Portfolio Managers:
BlackRock Investment Management, LLC—Subadviser: Debra L. Jelilian and Jeffery L. Russo, CFA
| | |
Fund Performance | | Gartmore Small Cap Index Fund |
Average Annual Total Return
(For periods ended October 31, 2006)
| | | | | | | | |
| | | | | 1 Yr. | | 5 Yr. | | Inception1 |
| Class A | | w/o SC2 | | 19.14% | | 12.96% | | 9.44% |
| | | w/SC3 | | 12.26% | | 11.63% | | 8.76% |
| Class B4 | | w/o SC2 | | 18.38% | | 12.25% | | 9.08% |
| | | w/SC5 | | 13.38% | | 12.00% | | 9.08% |
| Class C6 | | w/o SC2 | | 18.40% | | 12.27% | | 9.09% |
| | | w/SC7 | | 17.40% | | 12.27% | | 9.09% |
| Institutional Class8 | | 19.60% | | 13.45% | | 9.79% |
All figures showing the effect of a sales charge reflect the maximum charge possible, because it has the most dramatic effect on performance data
| 1 | These returns until the creation of Class A and Institutional shares (12/29/99) include the performance of the Master Small Cap Series (the “Series”), which began operations on April 9, 1997. Excluding the effect of any fee waivers or reimbursements, such prior performance is similar to what Class A and Institutional Class shares would have produced because these classes of the Fund’s shares invested in the same portfolio of securities as the Series. The performance for these classes has been restated to reflect differences in sales charges (where applicable), but does not reflect the differing levels of other fees applicable to such classes; if these fees were reflected, the performance for Class A and Institutional Class shares would have been lower. |
| 2 | These returns do not reflect the effects of sales charges (SC). |
| 3 | A 5.75% front-end sales charge was deducted. |
| 4 | These returns until the creation of Class B shares (11/29/01) include performance based on the Series for the period through December 28, 1999 and the Fund’s Class A shares for the period from December 29, 1999 to November 28, 2001. Excluding the effect of any fee waivers or reimbursements, such prior performance is similar to what Class B shares would have produced because Class B shares invest in the same portfolio of securities as Class A shares. The performance for these classes has been restated to reflect differences in sales charges (where applicable), but does not reflect the differing levels of other fees (primarily Rule 12b-1 and/or administrative services fees) applicable to such classes; if these fees were reflected, the performance for Class B shares would have been lower. |
| 5 | A 5.00% maximum contingent deferred sales charge (CDSC) would be deducted. The CDSC declines to 0% after 6 years. |
| 6 | These returns until the creation of Class C shares (10/22/03) include the performance of the Series for the period through December 28, 1999 and the Fund’s Class A shares for the period from December 29, 1999 to November 28, 2001 and the Fund’s Class B shares for the period from November 29, 2001 to October 21, 2003. Excluding the effect of any fee waivers or reimbursements, such prior performance is similar to what Class C shares would have produced because Class C shares invest in the same portfolio of securities as the Fund’s other classes. The performance for the Class C shares has been restated to reflect differences in sales charges (where applicable), but does not reflect the differing levels of other fees (primarily Rule 12b-1 and/or administrative services fees) applicable to such classes; if these fees were reflected, the performance for Class C shares would have been lower. |
| 7 | A CDSC of 1.00% was deducted from the one year return because it is charged when you sell Class C shares within the first year after purchase. |
| 8 | Not subject to any sales charges. |
Performance of a $10,000 Investment
Investment return and principal value will fluctuate, and when redeemed, shares may be worth more or less than original cost. Past performance is no guarantee of future results and does not reflect the deduction of taxes that a shareholder would pay on fund distributions or the redemption of fund shares. Investing in mutual funds involves market risk, including loss of principal. Performance returns assume the reinvestment of all distributions.
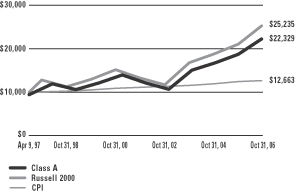
Comparative performance of $10,000 invested in Class A shares of the Gartmore Small Cap Index Fund, the Russell 2000 Index (Russell 2000)(a), and the Consumer Price Index (CPI)(b) since inception. Unlike the Fund, the returns for these unmanaged indexes do not reflect any fees, expenses, or sales charges. Investors cannot invest directly in market indexes.
| (a) | The Russell 2000 is an unmanaged index of approximately 2000 companies with small market capitalizations relative to the market capitalizations of other U.S. companies. |
| (b) | The CPI represents changes in prices of a basket of goods and services purchased for consumption by urban households. |
| | |
Shareholder Expense Example | | Gartmore Small Cap Index Fund |
As a shareholder of the Fund, you incur two types of costs: (1) transaction costs, including sales charges (loads) paid on purchase payments and redemption fees; and (2) ongoing costs, including investment advisory fees, administration fees, distribution fees and other Fund expenses. The examples below are intended to help you understand your ongoing costs (in dollars) of investing in the Fund and to compare these costs with the ongoing costs of investing in other mutual funds. Per SEC requirements, the examples assume that you had a $1,000 investment in the Class at the beginning of the reporting period, May 1, 2006 and continued to hold your shares at the end of the reporting period, October 31, 2006.
Actual Expenses
For each Class of the Fund in the table below, the first line provides information about actual account values and actual expenses. You may use the information in this line, together with the amount you invested, to estimate the expenses that you paid over the period. Simply divide your account value by $1,000 (for example, an $8,600 account value divided by $1,000 = 8.6), then multiply the result by the number in the first line of each Class under the heading entitled “Expenses Paid During Period” to estimate the expenses you paid on your account during the period.
Hypothetical Example for Comparison Purposes
The second line of each Class in the table below provides information about hypothetical account values and hypothetical expenses based on the Class’ actual expense ratio and an assumed rate of return of 5% per year before expenses, which is not the Class’ actual return. The hypothetical account values and expenses may not be used to estimate the actual ending account balance or expenses you paid for the period. You may use this information to compare the ongoing costs of investing in the Class of the Fund and other funds. To do so, compare this 5% hypothetical example with the 5% hypothetical examples that appear in the shareholder reports of the other funds.
Please note that the expenses shown in the table are meant to highlight your ongoing costs only and do not reflect any transaction costs, such as sales charges (loads) or redemption fees. Therefore, the second line for each Class in the table is useful in comparing ongoing costs only, and will not help you determine the relative total costs of owning different funds. In addition, if these transaction costs were included, your costs would have been higher. The examples also assume all dividends and distributions have been reinvested.
Schedule of Shareholder Expenses
Expense Analysis of a $1,000 Investment
(October 31, 2006)
| | | | | | | | | | | | | |
| Gartmore Small Cap Index Fund | | | | Beginning
Account Value,
5/1/06 | | Ending
Account Value,
10/31/06 | | Expenses Paid
During Period* | | Annualized
Expense Ratio* |
| Class A | | Actual | | $ | 1,000.00 | | $ | 1,004.00 | | $ | 3.54 | | 0.70% |
| | | Hypothetical1 | | $ | 1,000.00 | | $ | 1,021.47 | | $ | 3.57 | | 0.70% |
| Class B | | Actual | | $ | 1,000.00 | | $ | 1,001.50 | | $ | 6.56 | | 1.30% |
| | | Hypothetical1 | | $ | 1,000.00 | | $ | 1,018.45 | | $ | 6.64 | | 1.30% |
| Class C | | Actual | | $ | 1,000.00 | | $ | 1,000.60 | | $ | 6.56 | | 1.30% |
| | | Hypothetical1 | | $ | 1,000.00 | | $ | 1,018.45 | | $ | 6.64 | | 1.30% |
| Institutional Class | | Actual | | $ | 1,000.00 | | $ | 1,006.60 | | $ | 1.52 | | 0.30% |
| | | Hypothetical1 | | $ | 1,000.00 | | $ | 1,023.49 | | $ | 1.53 | | 0.30% |
| * | Expenses are equal to the Fund’s annualized expense ratio multiplied by the average account value over the period multiplied by 184/365 (to reflect the one-half year period). The expense ratio presented represents a six-month, annualized ratio in accordance with SEC guidelines. |
| 1 | Represents the hypothetical 5% return before expenses. |
| | |
Portfolio Summary | | Gartmore Small Cap Index Fund |
October 31, 2006
The SEC adopted a requirement that Funds present their portfolio holdings in a table, chart or graph format in their annual and semiannual reports to shareholders, whether or not a statement of investments is utilized. The following tables, which present portfolio holdings as a percentage of net assets, are provided in compliance with this requirement.
| | |
| Asset Allocation | | |
| Common Stocks | | 82.0% |
| Repurchase Agreements | | 17.3% |
| Other Investments* | | 17.7% |
| Liabilities in excess of other assets** | | -17.0% |
| | |
| | 100.0% |
| | |
| Top Industries | | |
| Bank Holding Companies | | 7.5% |
| Real Estate Investment Trusts | | 5.5% |
| Computer Software & Services | | 3.5% |
| Retail | | 3.0% |
| Financial | | 2.9% |
| Oil & Gas | | 2.8% |
| Business Services | | 2.7% |
| Pharmaceuticals | | 2.6% |
| Semiconductors | | 2.3% |
| Apparel & Accessories | | 2.1% |
| Other Assets | | 65.1% |
| | |
| | 100.0% |
| | |
| Top Holdings*** | | |
| Alexandria Real Estate Equities, Inc. | | 0.2% |
| Veritas DGC, Inc. | | 0.2% |
| Hologic, Inc. | | 0.2% |
| Time Warner Telecom, Inc. | | 0.2% |
| Polycom, Inc. | | 0.2% |
| Big Lots, Inc. | | 0.2% |
| Herman Miller, Inc. | | 0.1% |
| Phillips-Van Heusen Corp. | | 0.1% |
| Nationwide Health Properties, Inc. | | 0.1% |
| Acuity Brands, Inc. | | 0.1% |
| Other Assets | | 98.4% |
| | |
| | 100.0% |
| * | Includes value of collateral received from securities lending. |
| ** | Includes value of collateral owed from securities lending. |
| *** | For purpose of listing top holdings, repurchase agreements are considered cash equivalents and are included as part of Other Assets. |
Statement of Investments
October 31, 2006
Gartmore Small Cap Index Fund
Common Stocks (82.0%)
| | | | | |
| | | Shares or Principal Amount | | Value |
| | | | | |
Advertising Services (0.2%) | | | | | |
24/7 Real Media, Inc. (b) | | 15,200 | | $ | 150,480 |
Cross Media Marketing Corp. (b) (c) | | 100 | | | 0 |
Inventiv Health, Inc. (b) | | 11,600 | | | 331,760 |
Live Nation, Inc. (b) | | 27,000 | | | 574,020 |
SITEL Corp. (b) | | 13,200 | | | 56,760 |
| | | | | |
| | | | | 1,113,020 |
| | | | | |
Aerospace & Defense (0.9%) | | | | | |
AAR Corp. (b) (d) | | 15,768 | | | 410,599 |
ARGON ST., Inc. (b) (d) | | 5,040 | | | 119,045 |
BE Aerospace, Inc. (b) | | 31,462 | | | 795,360 |
Curtiss-Wright Corp. (d) | | 17,448 | | | 590,440 |
Esterline Technologies Corp. (b) (d) | | 8,261 | | | 311,440 |
Gencorp, Inc. (b) (d) | | 22,774 | | | 298,339 |
HEICO Corp. | | 9,448 | | | 342,773 |
Herley Industries, Inc. (b) | | 9,535 | | | 140,737 |
Hexcel Corp. (b) (d) | | 33,775 | | | 546,817 |
Innovative Solutions and Support, Inc. (b) (d) | | 6,602 | | | 105,236 |
iRobot Corp. (b) (d) | | 2,700 | | | 55,377 |
K&F Industries Holdings, Inc. (b) | | 6,000 | | | 116,640 |
Kaman Corp., Class A | | 8,308 | | | 169,400 |
Moog, Inc., Class A (b) | | 13,163 | | | 490,980 |
Sequa Corp., Class A (b) | | 1,871 | | | 198,532 |
Taser International, Inc. (b) (d) | | 24,316 | | | 226,382 |
Teledyne Technologies, Inc. (b) | | 14,663 | | | 611,740 |
Transdigm Group, Inc. (b) | | 2,100 | | | 50,442 |
United Industrial Corp. | | 4,400 | | | 198,044 |
| | | | | |
| | | | | 5,778,323 |
| | | | | |
Agricultural Products (0.3%) | | | | | |
Alico, Inc. (d) | | 1,300 | | | 80,600 |
Andersons, Inc. (The) | | 5,530 | | | 198,804 |
CF Industries Holdings, Inc. | | 18,300 | | | 362,706 |
Delta and Pine Land Co. | | 15,028 | | | 608,784 |
Maui Land & Pineapple Co., Inc. (b) (d) | | 637 | | | 19,524 |
UAP Holding Corp. | | 21,760 | | | 544,653 |
| | | | | |
| | | | | 1,815,071 |
| | | | | |
| | | | | |
| | | Shares or Principal Amount | | Value |
| | | | | |
Airlines (0.5%) | | | | | |
AirTran Holdings, Inc. (b) (d) | | 32,919 | | $ | 328,202 |
Alaska Air Group, Inc. (b) | | 14,588 | | | 585,708 |
ExpressJet Holdings, Inc. (b) | | 13,746 | | | 109,143 |
Frontier Airlines Holdings, Inc. (b) (d) | | 16,317 | | | 131,189 |
JetBlue Airways Corp. (b) (d) | | 71,100 | | | 893,017 |
Mesa Air Group, Inc. (b) | | 12,319 | | | 109,639 |
Republic Airways Holdings, Inc. (b) | | 9,600 | | | 171,552 |
SkyWest, Inc. | | 26,758 | | | 713,368 |
| | | | | |
| | | | | 3,041,818 |
| | | | | |
Analytical Instruments (0.6%) | | | | | |
ArthroCare Corp. (b) (d) | | 11,107 | | | 448,834 |
Datascope Corp. | | 6,508 | | | 233,442 |
Haemonetics Corp. (b) | | 11,315 | | | 515,964 |
Illumina, Inc. (b) | | 16,835 | | | 740,067 |
Inverness Medical Innovations, Inc. (b) (d) | | 9,551 | | | 359,977 |
Molecular Devices Corp. (b) | | 7,886 | | | 158,824 |
Oyo Geospace Corp. (b) | | 2,000 | | | 113,840 |
Thoratec Corp. (b) | | 22,667 | | | 357,005 |
Ventana Medical Systems, Inc. (b) (d) | | 10,536 | | | 425,549 |
West Pharmaceutical Services, Inc. | | 11,192 | | | 470,512 |
| | | | | |
| | | | | 3,824,014 |
| | | | | |
Apparel & Accessories (2.1%) | | | | | |
Aeropostale, Inc. (b) | | 20,566 | | | 602,789 |
Bebe Stores, Inc. | | 11,200 | | | 278,096 |
Brown Shoe Co., Inc. | | 10,503 | | | 409,197 |
Buckle, Inc. (The) | | 2,159 | | | 85,453 |
Charming Shoppes, Inc. (b) | | 51,110 | | | 756,428 |
Cherokee, Inc. | | 2,600 | | | 104,026 |
Columbia Sportswear Co. (b) | | 5,900 | | | 329,456 |
Crocs, Inc. (b) | | 5,100 | | | 202,062 |
Deb Shops, Inc. (d) | | 100 | | | 2,830 |
Deckers Outdoor Corp. (b) | | 4,578 | | | 243,412 |
dELiA*s, Inc. (b) (d) | | 7,407 | | | 67,256 |
DSW, Inc., Class A (b) (d) | | 7,465 | | | 258,289 |
Finish Line, Inc., Class A | | 16,974 | | | 219,983 |
G & K Services, Inc., Class A | | 7,322 | | | 279,041 |
Common Stocks (continued)
| | | | | |
| | | Shares or Principal Amount | | Value |
| | | | | |
Apparel & Accessories (continued) | | | |
Guess?, Inc. (b) | | 7,215 | | $ | 410,894 |
Hartmarx Corp. (b) | | 10,405 | | | 73,980 |
HOT Topic, Inc. (b) | | 18,738 | | | 189,441 |
Iconix Brand Group, Inc. (b) | | 15,900 | | | 296,376 |
J. Crew Group, Inc. (b) | | 10,090 | | | 311,176 |
Jos. A. Bank Clothiers, Inc. (b) | | 8,055 | | | 239,153 |
K-Swiss, Inc., Class A | | 11,781 | | | 416,105 |
Kellwood Co. (d) | | 10,867 | | | 332,530 |
Kenneth Cole Productions, Inc., Class A | | 5,070 | | | 128,930 |
Maidenform Brands, Inc. (b) | | 4,800 | | | 106,320 |
Oxford Industries, Inc. | | 5,528 | | | 291,768 |
Pacific Sunwear of California, Inc. (b) | | 30,960 | | | 545,515 |
Payless ShoeSource, Inc. (b) | | 24,914 | | | 666,450 |
Perry Ellis International, Inc. (b) | | 4,188 | | | 153,113 |
Phillips-Van Heusen Corp. | | 20,390 | | | 933,045 |
Shoe Carnival, Inc. (b) | | 4,300 | | | 123,066 |
Skechers U.S.A., Inc. (b) | | 4,985 | | | 149,002 |
Stage Stores, Inc. | | 9,901 | | | 320,891 |
Steven Madden Ltd. | | 8,998 | | | 388,174 |
Stride Rite Corp. (The) | | 12,712 | | | 187,502 |
Timberland Co, Class A (b) | | 18,000 | | | 519,300 |
True Religion Apparel, Inc. (b) (d) | | 6,100 | | | 132,248 |
Tween Brands, Inc. (b) | | 11,907 | | | 497,951 |
Under Armour, Inc. (b) (d) | | 9,130 | | | 423,176 |
UniFirst Corp. | | 5,043 | | | 181,800 |
Volcom, Inc. (b) (d) | | 6,700 | | | 219,492 |
Warnaco Group, Inc. (The) (b) | | 20,423 | | | 433,785 |
Wet Seal, Inc. (The) (b) | | 18,705 | | | 116,719 |
Weyco Group, Inc. | | 300 | | | 7,194 |
Wolverine World Wide, Inc. | | 20,346 | | | 577,013 |
| | | | | |
| | | | | 13,210,427 |
| | | | | |
Appliances & Household Durables (0.1%) | | | |
Color Kinetics, Inc. (b) (d) | | 6,100 | | | 119,682 |
Middleby Corp. (b) (d) | | 3,135 | | | 282,494 |
National Presto Industries, Inc. | | 1,581 | | | 96,805 |
| | | | | |
| | | | | 498,981 |
| | | | | |
Auto Parts & Equipment (1.0%) | | | |
A.S.V., Inc. (b) (d) | | 8,562 | | | 125,091 |
Accuride Corp. (b) | | 5,400 | | | 66,420 |
| | | | | |
| | | Shares or Principal Amount | | Value |
| | | | | |
Auto Parts & Equipment (continued) | | | |
Aftermarket Technology Corp. (b) | | 7,536 | | $ | 141,601 |
American Axle & Manufacturing Holdings, Inc. (d) | | 17,645 | | | 330,844 |
ArvinMeritor, Inc. | | 27,979 | | | 420,245 |
Commercial Vehicle Group, Inc. (b) | | 5,800 | | | 119,480 |
Dollar Thrifty Automotive Group, Inc. (b) | | 8,500 | | | 341,360 |
Electro Rent Corp. (b) | | 4,400 | | | 72,732 |
Hayes Lemmerz International, Inc. (b) (c) | | 110 | | | 0 |
Lear Corp. | | 27,300 | | | 824,732 |
Lithia Motors, Inc., Class A | | 8,073 | | | 205,862 |
LKQ Corp. (b) (d) | | 15,700 | | | 363,298 |
McGrath Rentcorp (d) | | 6,706 | | | 181,062 |
Midas, Inc. (b) | | 5,600 | | | 115,528 |
Miller Industries, Inc. (b) | | 2,100 | | | 42,000 |
Modine Manufacturing Co. | | 13,340 | | | 317,625 |
Monro Muffler, Inc. | | 6,150 | | | 233,270 |
Navistar International Corp. (b) | | 24,500 | | | 679,384 |
Noble International Ltd. | | 4,005 | | | 71,329 |
Pep Boys — Manny,
Moe & Jack (The) | | 17,883 | | | 253,581 |
Quantum Fuel Systems Technologies Worldwide, Inc. (b) (d) | | 15,000 | | | 26,100 |
Superior Industries International, Inc. (d) | | 11,985 | | | 202,547 |
Tenneco Automotive, Inc. (b) | | 16,670 | | | 378,409 |
Titan International, Inc. (d) | | 4,900 | | | 90,552 |
Visteon Corp. (b) | | 52,720 | | | 389,074 |
Wabash National Corp. (d) | | 11,940 | | | 167,518 |
| | | | | |
| | | | | 6,159,644 |
| | | | | |
Bank Holding Companies (7.5%) | | | |
1st Source Corp. (d) | | 3,740 | | | 118,034 |
Alabama National Bancorp (d) | | 5,941 | | | 403,097 |
AMCORE Financial, Inc. | | 10,195 | | | 319,205 |
AmericanWest Bancorp (d) | | 6,180 | | | 129,286 |
Ameris Bancorp | | 6,228 | | | 173,823 |
Arrow Financial Corp. (d) | | 5,614 | | | 142,708 |
BancFirst Corp. (d) | | 2,400 | | | 119,400 |
Bancorp, Inc. (The) (b) (d) | | 2,705 | | | 65,055 |
Statement of Investments (Continued)
October 31, 2006
Gartmore Small Cap Index Fund (Continued)
Common Stocks (continued)
| | | | | |
| | | Shares or Principal Amount | | Value |
| | | | | |
Bank Holding Companies (continued) | | | |
BancTrust Financial Group, Inc. | | 1,400 | | $ | 34,314 |
Bank Mutual Corp. (d) | | 25,060 | | | 303,727 |
Bank of Granite Corp. (d) | | 4,984 | | | 93,450 |
Bank of the Ozarks, Inc. (d) | | 5,516 | | | 172,816 |
BankAtlantic Bancorp, Inc., Class A (d) | | 21,912 | | | 287,047 |
BankUnited Financial Corp. | | 13,874 | | | 374,182 |
Banner Corp. | | 5,987 | | | 260,195 |
Berkshire Hills Bancorp, Inc. | | 4,840 | | | 175,014 |
BFC Financial Corp. (b) (d) | | 8,775 | | | 51,597 |
Boston Private Financial Holdings, Inc. | | 15,565 | | | 430,217 |
Brookline Bancorp, Inc. (d) | | 27,885 | | | 371,707 |
Cadence Financial Corp. (d) | | 5,609 | | | 114,985 |
Calamos Asset Management, Inc., Class A | | 9,800 | | | 286,356 |
Camden National Corp. (d) | | 1,530 | | | 67,932 |
Capital City Bank Group, Inc. (d) | | 3,437 | | | 115,277 |
Capital Corp of the West (d) | | 2,860 | | | 86,515 |
Capitol Bancorp Ltd. (d) | | 3,985 | | | 186,976 |
Cardinal Financial Corp. | | 8,400 | | | 86,520 |
Cascade Bancorp (d) | | 10,175 | | | 370,981 |
Cathay Bancorp, Inc. (d) | | 21,213 | | | 730,787 |
Centennial Bank Holdings, Inc. (b) (d) | | 27,800 | | | 266,880 |
Center Financial Corp. (d) | | 6,280 | | | 151,725 |
Centerstate Banks Of Florida, Inc. | | 1,000 | | | 21,130 |
Charter Financial, Inc. (d) | | 200 | | | 9,502 |
Chemical Financial Corp. (d) | | 7,671 | | | 229,440 |
Chittenden Corp. (d) | | 16,191 | | | 477,473 |
Citizens Banking Corp. (d) | | 18,455 | | | 479,276 |
Citizens First Bancorp, Inc. | | 4,900 | | | 143,913 |
City Bank | | 2,437 | | | 130,964 |
City Holding Co. | | 7,062 | | | 276,830 |
Clifton Savings Bancorp, Inc. (d) | | 1,000 | | | 11,680 |
Coastal Financial Corp. (d) | | 4,131 | | | 56,388 |
CoBiz, Inc. (d) | | 4,474 | | | 101,112 |
Columbia Bancorp (d) | | 5,700 | | | 144,039 |
Columbia Banking System, Inc. | | 7,909 | | | 250,557 |
Community Bancorp, Inc. (b) (d) | | 3,900 | | | 113,139 |
Community Bank System, Inc. (d) | | 13,309 | | | 330,729 |
Community Banks, Inc. (d) | | 7,907 | | | 212,461 |
Community Trust Bancorp, Inc. | | 7,311 | | | 280,596 |
| | | | | |
| | | Shares or Principal Amount | | Value |
| | | | | |
Bank Holding Companies (continued) | | | |
Corus Bankshares, Inc. (d) | | 17,240 | | $ | 353,937 |
CVB Financial Corp. (d) | | 20,037 | | | 291,138 |
Dime Community Bancshares (d) | | 12,764 | | | 178,058 |
Enterprise Financial Services Corp. (d) | | 1,500 | | | 50,805 |
F.N.B. Corp. (d) | | 22,489 | | | 380,739 |
Farmers Capital Bank Corp. (d) | | 720 | | | 25,963 |
Fidelity Bankshares, Inc. | | 10,671 | | | 423,425 |
First Bancorp | | 1,764 | | | 39,743 |
First Bancorp (d) | | 24,310 | | | 240,669 |
First Busey Corp. (d) | | 3,050 | | | 69,937 |
First Charter Corp. (d) | | 14,083 | | | 350,526 |
First Commonwealth Financial Corp. (d) | | 24,466 | | | 327,110 |
First Community Bancorp | | 10,617 | | | 567,691 |
First Community Bankshares, Inc. (d) | | 3,020 | | | 110,139 |
First Financial Bancorp (d) | | 15,746 | | | 255,715 |
First Financial Bankshares, Inc. | | 6,674 | | | 267,427 |
First Financial Corp. (d) | | 4,594 | | | 158,080 |
First Indiana Corp. | | 6,555 | | | 167,284 |
First Merchants Corp. (d) | | 5,855 | | | 145,263 |
First Midwest Bancorp, Inc. | | 20,652 | | | 785,395 |
First Niagara Financial Group, Inc. | | 46,190 | | | 661,441 |
First Place Financial Corp. | | 4,535 | | | 105,620 |
First Regional Bancorp (b) (d) | | 2,800 | | | 89,208 |
First Republic Bancorp, Inc. | | 9,538 | | | 371,410 |
First South Bancorp, Inc. (d) | | 1,660 | | | 51,875 |
First State Bancorp | | 8,481 | | | 211,262 |
FirstFed Financial Corp. (b) (d) | | 7,336 | | | 453,145 |
Firstmerit Corp. | | 32,900 | | | 763,937 |
Flag Financial Corp. | | 7,700 | | | 194,887 |
Flagstar Bancorp, Inc. (d) | | 11,695 | | | 175,776 |
Flushing Financial Corp. | | 10,350 | | | 182,057 |
FNB Corp. (d) | | 1,100 | | | 40,546 |
Franklin Bank Corp. (b) (d) | | 11,665 | | | 235,750 |
Frontier Financial Corp. (d) | | 16,014 | | | 464,566 |
GB&T Bancshares, Inc. (d) | | 3,325 | | | 73,416 |
Glacier Bancorp, Inc. (d) | | 10,842 | | | 378,603 |
Great Southern Bancorp, Inc. (d) | | 2,876 | | | 90,220 |
Greater Bay Bancorp | | 21,202 | | | 545,952 |
Greene County Bancshares, Inc. | | 3,000 | | | 113,100 |
Hancock Holding Co. | | 11,392 | | | 584,410 |
Common Stocks (continued)
| | | | | |
| | | Shares or Principal Amount | | Value |
| | | | | |
Bank Holding Companies (continued) | | | |
Hanmi Financial Corp. | | 16,628 | | $ | 355,340 |
Harbor Florida Bancshares, Inc. | | 8,319 | | | 377,766 |
Harleysville National Corp. (d) | | 10,075 | | | 215,202 |
Heartland Financial USA, Inc. (d) | | 3,350 | | | 96,011 |
Heritage Commerce Corp. (d) | | 6,200 | | | 151,776 |
HomeBanc Corp. (d) | | 16,847 | | | 88,447 |
Horizon Financial Corp. | | 3,750 | | | 87,300 |
Iberiabank Corp. (d) | | 3,825 | | | 225,063 |
Independent Bank Corp. | | 10,884 | | | 260,128 |
Independent Bank Corp. | | 5,110 | | | 171,134 |
Integra Bank Corp. | | 8,798 | | | 232,619 |
Interchange Financial Services Corp. (d) | | 4,375 | | | 99,838 |
International Bancshares Corp. | | 19,700 | | | 604,396 |
Intervest Bancshares Corp. (b) (d) | | 2,900 | | | 103,646 |
Investors Bancorp, Inc. (b) (d) | | 17,500 | | | 260,400 |
ITLA Capital Corp. | | 1,935 | | | 110,527 |
Kearny Financial Corp. (d) | | 6,500 | | | 104,000 |
KNBT Bancorp, Inc. | | 9,500 | | | 162,545 |
Lakeland Bancorp, Inc. (d) | | 3,811 | | | 50,915 |
Lakeland Financial Corp. | | 4,000 | | | 103,680 |
Macatawa Bank Corp. (d) | | 4,077 | | | 89,531 |
MAF Bancorp, Inc. | | 14,145 | | | 609,508 |
MB Financial, Inc. (d) | | 7,781 | | | 280,583 |
MBT Financial Corp. (d) | | 2,138 | | | 33,139 |
Mercantile Bank Corp. | | 4,060 | | | 161,060 |
MetroCorp Bancshares, Inc. | | 4,950 | | | 108,009 |
Mid-State Bancshares, Inc. (d) | | 7,800 | | | 233,922 |
Midwest Banc Holding, Inc. (d) | | 7,440 | | | 175,138 |
Nara Bancorp, Inc. | | 10,854 | | | 206,226 |
NASB Financial, Inc. | | 400 | | | 16,400 |
National Penn Bancshares, Inc. (d) | | 15,769 | | | 323,107 |
NBT Bancorp, Inc. | | 11,074 | | | 275,189 |
NewAlliance Bancshares, Inc. (d) | | 40,320 | | | 624,154 |
Northern Empire Bancshares (b) (d) | | 1,245 | | | 35,956 |
Northwest Bancorp, Inc. (d) | | 4,890 | | | 130,808 |
OceanFirst Financial Corp. | | 3,449 | | | 80,879 |
Old National Bancorp (d) | | 24,240 | | | 460,075 |
Old Second Bancorp, Inc. (d) | | 6,584 | | | 199,100 |
Omega Financial Corp. (d) | | 2,933 | | | 95,264 |
Oriental Financial Group, Inc. (d) | | 7,304 | | | 87,356 |
Pacific Capital Bancorp (d) | | 19,711 | | | 606,310 |
| | | | | |
| | | Shares or Principal Amount | | Value |
| | | | | |
Bank Holding Companies (continued) | | | |
Park National Corp. (d) | | 4,141 | | $ | 419,856 |
Partners Trust Financial Group, Inc. | | 15,972 | | | 180,004 |
PennFed Financial Services, Inc. | | 3,140 | | | 57,650 |
Peoples Bancorp, Inc. | | 4,135 | | | 121,486 |
PFF Bancorp, Inc. | | 10,706 | | | 331,978 |
Pinnacle Financial Partners, Inc. (b) (d) | | 4,400 | | | 146,256 |
Placer Sierra Bancshares | | 6,400 | | | 151,808 |
Preferred Bank | | 2,400 | | | 140,568 |
PremierWest Bancorp (d) | | 2,485 | | | 41,798 |
PrivateBancorp, Inc. | | 8,002 | | | 328,642 |
Prosperity Bancshares, Inc. (d) | | 11,270 | | | 390,956 |
Provident Bankshares Corp. | | 13,423 | | | 485,107 |
Provident Financial Services, Inc. | | 27,006 | | | 495,290 |
Provident New York Bancorp (d) | | 13,975 | | | 197,607 |
R&G Financial Corp., Class B (d) | | 10,498 | | | 80,835 |
Renasant Corp. (d) | | 4,293 | | | 137,333 |
Republic Bancorp, Inc. | | 29,823 | | | 399,032 |
Republic Bancorp, Inc., Class A (d) | | 2,732 | | | 58,410 |
Rockville Financial, Inc. | | 3,500 | | | 51,625 |
Royal Bancshares of Pennsylvania, Inc., Class A | | 828 | | | 22,687 |
S&T Bancorp, Inc. (d) | | 10,201 | | | 345,304 |
S.Y. Bancorp, Inc. (d) | | 2,930 | | | 86,289 |
Sandy Spring Bancorp, Inc. (d) | | 4,556 | | | 167,023 |
Santander BanCorp (d) | | 342 | | | 6,395 |
Seacoast Banking Corporation of Florida (d) | | 4,225 | | | 112,174 |
Security Bank Corp. | | 3,000 | | | 72,690 |
Shore Bancshares, Inc. (d) | | 5,100 | | | 151,980 |
Sierra Bancorp | | 400 | | | 12,404 |
Signature Bank (b) | | 12,813 | | | 388,618 |
Simmons First National Corp., Class A | | 4,143 | | | 127,190 |
Smithtown Bancorp, Inc. (d) | | 4,700 | | | 133,292 |
Southside Bancshares, Inc. (d) | | 5,823 | | | 151,049 |
Southwest Bancorp, Inc. | | 7,200 | | | 195,192 |
Sterling Bancorp | | 9,426 | | | 183,618 |
Sterling Bancshares, Inc. | | 20,095 | | | 367,939 |
Sterling Financial Corp. | | 15,120 | | | 502,891 |
Sterling Financial Corp. (d) | | 8,765 | | | 202,296 |
Suffolk Bancorp (d) | | 3,483 | | | 121,661 |
Statement of Investments (Continued)
October 31, 2006
Gartmore Small Cap Index Fund (Continued)
Common Stocks (continued)
| | | | | |
| | | Shares or Principal Amount | | Value |
| | | | | |
Bank Holding Companies (continued) | | | |
Summit Bancshares, Inc. | | 5,675 | | $ | 154,076 |
Sun Bancorp, Inc. (b) (d) | | 4,879 | | | 101,337 |
Superior Bancorp. (b) (d) | | 1,800 | | | 19,638 |
Susquehanna Bancshares, Inc. (d) | | 18,171 | | | 454,093 |
SVB Financial Group (b) | | 14,845 | | | 683,167 |
Taylor Capital Group, Inc. | | 2,000 | | | 69,700 |
Texas Capital Bancshares, Inc. (b) | | 11,320 | | | 226,853 |
Texas Regional Bancshares, Inc. | | 18,182 | | | 706,371 |
Texas United Bancshares, Inc. | | 4,800 | | | 162,000 |
Tierone Corp. | | 6,461 | | | 206,623 |
Tompkins Trustco, Inc. (d) | | 2,662 | | | 130,837 |
TriCo Bancshares | | 3,624 | | | 94,224 |
TrustCo Bank Corp. NY (d) | | 29,508 | | | 326,063 |
Trustmark Corp. (d) | | 19,620 | | | 621,169 |
U.S.B Holding Co., Inc. (d) | | 3,448 | | | 78,373 |
UCBH Holdings, Inc. (d) | | 39,375 | | | 674,888 |
UMB Financial Corp. | | 10,470 | | | 375,454 |
Umpqua Holdings Corp. | | 22,378 | | | 631,955 |
Union Bankshares Corp. | | 4,395 | | | 132,026 |
United Bankshares, Inc. (d) | | 14,765 | | | 563,875 |
United Community Banks, Inc. | | 11,476 | | | 360,805 |
United Community Financial Corp. | | 8,611 | | | 110,651 |
United Security Bancshares (d) | | 5,400 | | | 135,648 |
Univest Corporation of Pennsylvania (d) | | 2,580 | | | 78,226 |
Vineyard National Bancorp Co. | | 5,000 | | | 109,200 |
Virginia Commerce Bancorp, Inc. (b) (d) | | 7,879 | | | 160,416 |
Virginia Financial Group, Inc. | | 3,600 | | | 99,720 |
W Holding Co., Inc. (d) | | 37,680 | | | 214,399 |
Washington Trust Bancorp | | 4,240 | | | 114,819 |
Wauwatosa Holdings, Inc. (b) (d) | | 560 | | | 9,923 |
WesBanco, Inc. (d) | | 8,600 | | | 281,650 |
West America Bancorp, Inc. (d) | | 13,112 | | | 653,633 |
West Bancorp, Inc. (d) | | 5,512 | | | 100,980 |
West Coast Bancorp | | 4,800 | | | 157,920 |
Western Alliance Bancorp (b) (d) | | 3,600 | | | 122,328 |
Westfield Financial, Inc. (d) | | 100 | | | 3,356 |
Willow Grove Bancorp, Inc. | | 9,000 | | | 143,730 |
Wilshire Bancorp, Inc. (d) | | 7,996 | | | 158,161 |
Wintrust Financial Corp. (d) | | 10,897 | | | 525,889 |
Yardville National Bancorp (d) | | 3,468 | | | 138,234 |
| | | | | |
| | | | | 47,087,052 |
| | | | | |
| | | | | |
| | | Shares or Principal Amount | | Value |
| | | | | |
Beverages & Alcoholic (0.0%) | | | | | |
Boston Beer Co., Inc., Class A (b) | | 4,955 | | $ | 180,858 |
| | | | | |
Biotechnology (1.1%) | | | | | |
American Oriental Bioengineering, Inc. (b) (d) | | 10,800 | | | 82,512 |
Arena Pharmaceuticals, Inc. (b) (d) | | 21,200 | | | 323,300 |
Cambrex Corp. (d) | | 8,724 | | | 204,142 |
Coley Pharmaceutical Group, Inc. (b) | | 3,600 | | | 41,508 |
Cotherix, Inc. (b) (d) | | 3,500 | | | 26,250 |
Cypress Bioscience, Inc. (b) (d) | | 15,420 | | | 121,510 |
Digene Corp. (b) | | 7,571 | | | 351,522 |
Diversa Corp. (b) | | 7,733 | | | 71,994 |
Enzo Biochem, Inc. (b) (d) | | 11,464 | | | 163,935 |
Exelixis, Inc. (b) (d) | | 27,440 | | | 266,168 |
Genitope Corp. (b) (d) | | 9,100 | | | 33,761 |
Genomic Health, Inc. (b) | | 3,600 | | | 58,680 |
Genta, Inc. (b) (d) | | 47,700 | | | 38,637 |
GTx, Inc. (b) (d) | | 1,200 | | | 13,356 |
Human Genome Sciences, Inc. (b) (d) | | 54,065 | | | 721,767 |
Idenix Pharmaceuticals, Inc. (b) | | 6,515 | | | 55,443 |
Integra LifeSciences Holdings (b) (d) | | 7,580 | | | 279,929 |
Lexicon Genetics, Inc. (b) | | 19,306 | | | 77,031 |
Luminex Corp. (b) | | 11,960 | | | 192,795 |
Maxygen, Inc. (b) | | 5,609 | | | 47,789 |
Medarex, Inc. (b) (d) | | 45,242 | | | 584,527 |
Monogram Biosciences, Inc. (b) (d) | | 59,900 | | | 109,018 |
Myogen, Inc. (b) | | 15,981 | | | 835,805 |
Myriad Genetics, Inc. (b) (d) | | 16,844 | | | 452,935 |
Nabi Biopharmaceuticals (b) (d) | | 20,751 | | | 136,542 |
Novavax, Inc. (b) | | 26,400 | | | 118,008 |
Nuvasive, Inc. (b) | | 14,600 | | | 343,246 |
Palomar Medical Technologies, Inc. (b) (d) | | 7,535 | | | 354,823 |
Sangamo BioSciences, Inc. (b) (d) | | 15,500 | | | 86,955 |
Sirna Therapeutics, Inc. (b) | | 9,400 | | | 118,722 |
SonoSite, Inc. (b) (d) | | 7,390 | | | 210,615 |
Threshold Pharmaceuticals, Inc. (b) | | 100 | | | 333 |
Zymogenetics, Inc. (b) (d) | | 12,654 | | | 203,097 |
| | | | | |
| | | | | 6,726,655 |
| | | | | |
Common Stocks (continued)
| | | | | |
| | | Shares or Principal Amount | | Value |
| | | | | |
Broadcast Media & Cable Television (0.9%) | | | |
Belo Corp. Class A | | 38,100 | | $ | 667,511 |
Charter Communications, Inc., Class A (b) (d) | | 166,920 | | | 383,916 |
CKX, Inc. (b) (d) | | 15,200 | | | 208,240 |
Crown Media Holdings, Inc. (b) (d) | | 5,458 | | | 21,777 |
Cumulus Media, Inc. (b) (d) | | 20,594 | | | 220,768 |
Emmis Communications Corp. (b) (d) | | 13,047 | | | 161,000 |
Entravision Communications Corp. (b) | | 19,673 | | | 144,400 |
Fisher Companies, Inc. (b) | | 1,500 | | | 63,060 |
Journal Communications, Inc. (d) | | 12,620 | | | 147,654 |
Lee Enterprises, Inc. | | 19,900 | | | 567,747 |
Lin TV Corp., Class A (b) | | 14,100 | | | 115,902 |
Macrovision Corp. (b) | | 22,052 | | | 586,804 |
Martha Stewart Living Omnimedia, Inc. | | 9,508 | | | 201,570 |
Media General, Inc. | | 9,100 | | | 337,610 |
Mediacom Communications Corp. (b) (d) | | 19,741 | | | 164,837 |
Outdoor Channel Holdings, Inc. (b) (d) | | 1,800 | | | 25,164 |
Private Media Group, Inc. (b) (d) | | 2,600 | | | 9,750 |
Readers Digest Association, Inc. (The) (d) | | 38,810 | | | 558,088 |
Salem Communications Corp., Class A | | 3,200 | | | 42,528 |
Sinclair Broadcast Group, Inc., Class A | | 23,335 | | | 210,482 |
TiVo, Inc. (b) | | 30,479 | | | 194,761 |
ValueVision International, Inc., Class A (b) (d) | | 12,158 | | | 156,960 |
Westwood One, Inc. | | 32,800 | | | 259,448 |
| | | | | |
| | | | | 5,449,977 |
| | | | | |
Business Services (2.7%) | | | | | |
Aaron Rents, Inc. (d) | | 14,801 | | | 368,249 |
ABM Industries, Inc. (d) | | 15,078 | | | 299,449 |
Access Integrated Technologies, Inc., Classs A (b) (d) | | 3,400 | | | 36,176 |
Administaff, Inc. | | 8,419 | | | 290,035 |
Advisory Board Co. (The) (b) (d) | | 8,300 | | | 458,326 |
ADVO, Inc. | | 12,592 | | | 369,701 |
| | | | | |
| | | Shares or Principal Amount | | Value |
| | | | | |
Business Services (continued) | | | | | |
AMN Healthcare Services, Inc. (b) | | 14,166 | | $ | 358,258 |
BearingPoint, Inc. (b) (d) | | 68,315 | | | 569,064 |
CACI International, Inc., Class A (b) | | 10,700 | | | 615,677 |
Catalina Marketing Corp. | | 16,883 | | | 427,984 |
CBIZ, Inc. (b) | | 26,343 | | | 185,455 |
CDI Corp. (d) | | 6,521 | | | 154,156 |
Chemed Corp. | | 9,445 | | | 335,203 |
Ciber, Inc. (b) | | 18,854 | | | 129,150 |
Circor International, Inc. | | 4,285 | | | 141,276 |
Compass Diversified Trust | | 7,400 | | | 125,282 |
Comsys IT Partners, Inc. (b) | | 7,890 | | | 162,929 |
Consolidated Graphics, Inc. (b) | | 5,114 | | | 317,937 |
CoStar Group, Inc. (b) (d) | | 7,365 | | | 348,733 |
CRA International, Inc. (b) (d) | | 4,931 | | | 250,643 |
Dyncorp International, Inc. (b) | | 5,600 | | | 58,800 |
First Consulting Group, Inc. (b) | | 10,900 | | | 117,829 |
FTD Group, Inc. (b) | | 5,100 | | | 81,345 |
Gartner Group, Inc. (b) | | 19,726 | | | 366,904 |
Gevity HR, Inc. (d) | | 11,553 | | | 261,098 |
GSI Commerce, Inc. (b) (d) | | 12,123 | | | 218,578 |
Heartland Payment Systems, Inc. (d) | | 3,500 | | | 93,520 |
Heidrick & Struggles International, Inc. (b) | | 8,355 | | | 341,469 |
Hudson Highland Group, Inc. (b) (d) | | 12,550 | | | 146,710 |
Huron Consulting Group, Inc. (b) | | 7,700 | | | 307,692 |
Hypercom Corp. (b) | | 21,030 | | | 136,485 |
I2 Technologies, Inc. (b) | | 7,500 | | | 151,575 |
IHS, Inc. (b) | | 7,100 | | | 245,447 |
Infocrossing, Inc. (b) | | 8,635 | | | 109,060 |
Jack Henry & Associates, Inc. (d) | | 31,635 | | | 689,326 |
Kelly Services, Inc., Class A | | 9,240 | | | 265,927 |
Korn/Ferry International (b) | | 15,079 | | | 333,397 |
LECG Corp. (b) | | 6,800 | | | 133,892 |
Marchex, Inc., Class B (b) (d) | | 7,000 | | | 99,260 |
Marlin Business Services, Inc. (b) (d) | | 2,100 | | | 48,531 |
MAXIMUS, Inc. (d) | | 9,322 | | | 260,177 |
MicroStrategy, Inc. (b) | | 4,186 | | | 499,599 |
Modis Professional Services, Inc. (b) | | 38,526 | | | 587,521 |
Statement of Investments (Continued)
October 31, 2006
Gartmore Small Cap Index Fund (Continued)
Common Stocks (continued)
| | | | | |
| | | Shares or Principal Amount | | Value |
| | | | | |
Business Services (continued) | | | | | |
Navigant Consulting Co. (b) (d) | | 16,269 | | $ | 289,751 |
NCO Group, Inc. (b) | | 11,238 | | | 302,976 |
NetRatings, Inc. (b) | | 4,046 | | | 70,400 |
On Assignment, Inc. (b) | | 13,600 | | | 154,360 |
Online Resources Corp. (b) | | 7,400 | | | 77,404 |
Paxar Corp. (b) | | 12,816 | | | 256,576 |
PeopleSupport, Inc. (b) | | 9,300 | | | 182,187 |
Phase Forward (b) | | 11,200 | | | 155,456 |
Polycom, Inc. (b) | | 35,700 | | | 978,179 |
Portfolio Recovery Associates, Inc. (b) (d) | | 7,222 | | | 336,690 |
Prepaid Depot, Inc. (d) | | 3,550 | | | 150,698 |
PriceSmart, Inc. (b) | | 600 | | | 10,194 |
Resources Connection, Inc. (b) (d) | | 19,355 | | | 560,134 |
Spherion Corp. (b) | | 21,467 | | | 155,636 |
SRA International, Inc., Class A (b) | | 13,200 | | | 423,060 |
StarTek, Inc. | | 6,062 | | | 82,686 |
TeleTech Holdings, Inc. (b) | | 11,811 | | | 229,252 |
Terremark Worldwide, Inc. (b) (d) | | 8,790 | | | 46,851 |
Viad Corp. | | 7,085 | | | 261,791 |
Watson Wyatt & Co. Holdings | | 16,185 | | | 730,752 |
| | | | | |
| | | | | 16,952,858 |
| | | | | |
Capital Goods (0.6%) | | | | | |
American Greetings Corp., Class A (d) | | 22,800 | | | 545,148 |
Lawson Products, Inc. (d) | | 1,424 | | | 68,936 |
Lifetime Brands, Inc. (d) | | 5,738 | | | 117,572 |
Lindsay Manufacturing Co. (d) | | 5,528 | | | 181,816 |
Nu Skin Enterprises, Inc. | | 22,498 | | | 430,162 |
Parlux Fragrances, Inc. (b) (d) | | 7,050 | | | 48,857 |
Regal-Beloit Corp. | | 11,136 | | | 550,675 |
Robbins & Myers, Inc. | | 6,123 | | | 235,674 |
Technitrol, Inc. | | 14,031 | | | 353,862 |
Tecumseh Products Co. (b) (d) | | 8,801 | | | 147,857 |
Texas Industries, Inc. (d) | | 9,928 | | | 616,528 |
Vicor Corp. | | 5,888 | | | 70,067 |
Yankee Candle Co., Inc. | | 17,338 | | | 586,891 |
| | | | | |
| | | | | 3,954,045 |
| | | | | |
Chemicals (1.2%) | | | | | |
A. Schulman, Inc. (d) | | 12,208 | | | 295,556 |
American Vanguard Corp. (d) | | 4,133 | | | 65,384 |
| | | | | |
| | | Shares or Principal Amount | | Value |
| | | | | |
Chemicals (continued) | | | | | |
Arch Chemicals, Inc. (d) | | 9,530 | | $ | 318,874 |
Balchem Corp. (d) | | 2,210 | | | 49,416 |
Cabot Microelectronics Corp. (b) (d) | | 10,332 | | | 294,979 |
Ferro Corp. | | 19,617 | | | 386,847 |
Georgia Gulf Corp. | | 13,676 | | | 292,530 |
H.B. Fuller Co. | | 23,400 | | | 580,086 |
Hercules, Inc. (b) | | 42,668 | | | 776,557 |
Innospec, Inc. | | 3,772 | | | 126,287 |
MacDermid, Inc. | | 8,800 | | | 294,360 |
Minerals Technologies, Inc. | | 7,935 | | | 437,695 |
NewMarket Corp. | | 7,175 | | | 461,353 |
NL Industries, Inc. (d) | | 2,628 | | | 29,171 |
Olin Corp. | | 24,698 | | | 427,275 |
OM Group, Inc. (b) | | 10,300 | | | 587,099 |
Pioneer Cos., Inc. (b) | | 4,040 | | | 103,626 |
PolyOne Corp. (b) | | 33,388 | | | 273,782 |
Rockwood Holdings, Inc. (b) | | 11,300 | | | 263,403 |
Schawk, Inc., Class A (d) | | 7,145 | | | 134,683 |
Spartech Corp. | | 13,288 | | | 364,091 |
Symyx Technologies, Inc. (b) | | 13,959 | | | 342,693 |
Terra Industries, Inc. (b) (d) | | 32,600 | | | 302,854 |
Tronox, Inc. | | 2,700 | | | 35,370 |
Tronox, Inc., Class B | | 13,200 | | | 172,656 |
W.R. Grace & Co. (b) | | 23,500 | | | 314,900 |
Zoltek Cos., Inc. (b) (d) | | 6,800 | | | 170,476 |
| | | | | |
| | | | | 7,902,003 |
| | | | | |
Circuit Boards (0.2%) | | | | | |
Micrel, Inc. (b) | | 24,558 | | | 274,067 |
Park Electrochemical Corp. | | 9,563 | | | 293,775 |
RF Micro Devices, Inc. (b) (d) | | 78,856 | | | 575,649 |
| | | | | |
| | | | | 1,143,491 |
| | | | | |
Coal (0.1%) | | | | | |
Alpha Natural Resources, Inc. (b) (d) | | 18,500 | | | 294,335 |
International Coal Group, Inc (b) (d) | | 39,300 | | | 203,967 |
James River Coal Co. (b) | | 8,100 | | | 94,446 |
Westmoreland Coal Co. (b) | | 1,000 | | | 22,900 |
| | | | | |
| | | | | 615,648 |
| | | | | |
Common Stocks (continued)
| | | | | |
| | | Shares or Principal Amount | | Value |
| | | | | |
Commercial Services (0.0%) | | | | | |
Providence Service Corp. (b) | | 6,375 | | $ | 175,249 |
| | | | | |
Communications Equipment (0.5%) | | | |
Anixter International, Inc. (b) (d) | | 13,785 | | | 823,791 |
Audiovox Corp. (b) | | 6,488 | | | 85,123 |
Gray Television, Inc. (d) | | 21,258 | | | 137,114 |
Harmonic, Inc. (b) | | 25,684 | | | 208,297 |
Inter-Tel, Inc. (d) | | 8,351 | | | 172,782 |
LodgeNet Entertainment Corp. (b) | | 7,689 | | | 176,847 |
Oplink Communications, Inc. (b) | | 7,756 | | | 153,569 |
Sonus Networks, Inc. (b) (d) | | 94,650 | | | 495,020 |
Standard Microsystems Corp. (b) | | 9,861 | | | 304,015 |
Stratex Networks, Inc. (b) (d) | | 35,000 | | | 163,450 |
Superior Essex, Inc. (b) | | 8,645 | | | 324,101 |
| | | | | |
| | | | | 3,044,109 |
| | | | | |
Computer Equipment (0.5%) | | | | | |
Analogic Corp. | | 6,284 | | | 350,710 |
Avocent Corp. (b) | | 21,300 | | | 781,923 |
Gateway, Inc. (b) (d) | | 89,861 | | | 150,966 |
Hutchinson Technology, Inc. (b) | | 11,596 | | | 268,447 |
Komag, Inc. (b) (d) | | 12,706 | | | 486,005 |
McData Corp. (b) (d) | | 61,280 | | | 347,458 |
Palm, Inc. (b) (d) | | 37,485 | | | 575,395 |
Rackable Systems, Inc. (b) (d) | | 12,145 | | | 376,616 |
| | | | | |
| | | | | 3,337,520 |
| | | | | |
Computer Integrated Systems Design (0.9%) |
Adaptec, Inc. (b) | | 44,830 | | | 203,080 |
Brady Corp., Class A (d) | | 16,789 | | | 621,193 |
DealerTrack Holdings, Inc. (b) (d) | | 2,300 | | | 58,627 |
Digital River, Inc. (b) | | 15,288 | | | 884,411 |
Eclipsys Corp. (b) | | 20,037 | | | 424,584 |
eSPEED, Inc., Class A (b) (d) | | 8,611 | | | 84,904 |
Foundry Networks, Inc. (b) | | 59,100 | | | 748,206 |
Integral Systems, Inc. (d) | | 3,045 | | | 81,302 |
MTS Systems Corp. | | 7,956 | | | 264,855 |
Netscout Systems, Inc. (b) (d) | | 5,700 | | | 46,113 |
Parametric Technology Corp. (b) | | 45,695 | | | 892,879 |
RadiSys Corp. (b) | | 9,860 | | | 180,734 |
SafeNet, Inc. (b) | | 9,950 | | | 212,930 |
Sapient Corp. (b) | | 28,262 | | | 154,028 |
Tekelec (b) (d) | | 24,610 | | | 362,998 |
WebEx Communications, Inc. (b) | | 15,929 | | | 612,470 |
| | | | | |
| | | | | 5,833,314 |
| | | | | |
| | | | | |
| | | Shares or Principal Amount | | Value |
| | | | | |
Computer Software & Services (3.5%) | | | |
3Com Corp. (b) | | 159,290 | | $ | 774,149 |
3D Systems Corp. (b) (d) | | 2,800 | | | 47,068 |
Actuate Corp. (b) | | 13,500 | | | 70,470 |
Advent Software, Inc. (b) (d) | | 8,093 | | | 299,603 |
Agile Software Corp. (b) | | 20,196 | | | 136,121 |
Agilysys, Inc. | | 12,485 | | | 185,153 |
Altiris, Inc. (b) | | 10,369 | | | 233,406 |
Ansys, Inc. (b) | | 13,136 | | | 604,256 |
Aspen Technologies, Inc. (b) | | 17,939 | | | 179,749 |
Avid Technology, Inc. (b) (d) | | 17,300 | | | 624,876 |
Blackbaud, Inc. | | 14,994 | | | 374,850 |
Borland Software Corp. (b) | | 26,846 | | | 148,190 |
Bottomline Technologies, Inc. (b) | | 10,600 | | | 102,608 |
Chordiant Software, Inc. (b) | | 19,500 | | | 61,425 |
Cognet Communications Group, Inc. (b) | | 10,200 | | | 144,432 |
Computer Programs & Systems, Inc. | | 4,860 | | | 166,212 |
Covansys Corp. (b) | | 10,192 | | | 238,493 |
Cybersource Corp. (b) | | 10,600 | | | 108,650 |
Dendrite International, Inc. (b) | | 12,805 | | | 133,812 |
Digital Insight Corp. (b) | | 14,671 | | | 451,573 |
Digitas, Inc. (b) | | 38,036 | | | 401,660 |
Echelon Corp. (b) (d) | | 10,687 | | | 90,091 |
Electronics For Imaging, Inc. (b) | | 24,333 | | | 575,232 |
Emageon, Inc. (b) (d) | | 9,100 | | | 145,145 |
Epicor Software Corp. (b) | | 20,989 | | | 294,476 |
EPIQ Systems, Inc. (b) (d) | | 7,617 | | | 116,388 |
eResearch Technology, Inc. (b) (d) | | 19,589 | | | 161,022 |
Extreme Networks, Inc. (b) | | 55,062 | | | 209,236 |
FalconStor Software, Inc. (b) (d) | | 8,699 | | | 68,374 |
Hyperion Solutions Corp. (b) | | 24,300 | | | 908,820 |
iGATE Corp. (b) | | 3,100 | | | 17,515 |
Informatica Corp. (b) | | 30,753 | | | 381,030 |
Iris International, Inc. (b) (d) | | 8,200 | | | 98,318 |
JDA Software Group, Inc. (b) | | 10,429 | | | 153,411 |
Keane, Inc. (b) (d) | | 15,332 | | | 177,698 |
Kenexa Corp. (b) | | 7,400 | | | 237,762 |
L-1 Identity Solutions, Inc. (b) | | 27,048 | | | 387,057 |
Lawson Software, Inc. (b) | | 42,040 | | | 320,345 |
Magma Design Automation, Inc. (b) (d) | | 9,098 | | | 84,702 |
Statement of Investments (Continued)
October 31, 2006
Gartmore Small Cap Index Fund (Continued)
Common Stocks (continued)
| | | | | |
| | | Shares or Principal Amount | | Value |
| | | | | |
Computer Software & Services (continued) | | | |
ManTech International Corp., Class A (b) | | 5,096 | | $ | 173,570 |
MapInfo Corp. (b) | | 6,900 | | | 92,667 |
Maxwell Technologies, Inc. (b) (d) | | 7,700 | | | 138,215 |
Mentor Graphics Corp. (b) | | 31,900 | | | 538,153 |
Mercury Computer Systems, Inc. (b) | | 8,353 | | | 102,909 |
Neoware Systems, Inc. (b) (d) | | 9,200 | | | 110,124 |
NETGEAR, Inc. (b) (d) | | 14,430 | | | 386,724 |
Nuance Communications, Inc. (b) (d) | | 46,832 | | | 540,441 |
Open Solutions, Inc. (b) | | 9,400 | | | 351,278 |
Opnet Technologies, Inc. (b) | | 6,500 | | | 95,030 |
Packeteer, Inc. (b) | | 13,829 | | | 155,023 |
PDF Solutions, Inc. (b) (d) | | 5,400 | | | 76,410 |
PlxTech, Inc. (b) | | 7,300 | | | 90,593 |
QAD, Inc. | | 2,300 | | | 18,998 |
Quantum Corp. (b) | | 57,802 | | | 126,008 |
Quest Software, Inc. (b) | | 28,862 | | | 425,137 |
Radiant Systems, Inc. (b) (d) | | 12,035 | | | 132,505 |
RealNetworks, Inc. (b) | | 42,528 | | | 466,957 |
Renaissance Learning, Inc. (d) | | 1,365 | | | 20,257 |
Safeguard Scientifics, Inc. (b) (d) | | 30,100 | | | 73,444 |
SI International, Inc. (b) | | 5,128 | | | 170,044 |
Sigma Designs, Inc. (b) (d) | | 11,500 | | | 241,500 |
Smith Micro Software, Inc. (b) | | 9,100 | | | 154,791 |
SonicWall, Inc. (b) | | 27,051 | | | 284,036 |
SPSS, Inc. (b) | | 8,773 | | | 242,749 |
Stratasys, Inc. (b) (d) | | 5,500 | | | 153,340 |
Sybase, Inc. (b) | | 37,000 | | | 900,950 |
Sykes Enterprises, Inc. (b) | | 13,267 | | | 269,187 |
Synaptics, Inc. (b) (d) | | 9,957 | | | 282,381 |
SYNNEX Corp. (b) | | 2,800 | | | 62,860 |
Syntel, Inc. (d) | | 1,340 | | | 33,567 |
Take-Two Interactive Software, Inc. (b) (d) | | 28,700 | | | 401,513 |
Taleo Corp., Class A (b) | | 6,900 | | | 77,556 |
TALX Corp. (d) | | 14,320 | | | 348,262 |
THQ, Inc. (b) | | 26,441 | | | 795,081 |
Tibco Software, Inc. (b) | | 86,260 | | | 797,905 |
Tradestation Group, Inc. (b) | | 8,300 | | | 129,895 |
Transaction Systems Architects, Inc. (b) (d) | | 14,496 | | | 488,660 |
| | | | | |
| | | Shares or Principal Amount | | Value |
| | | | | |
Computer Software & Services (continued) | | | |
Trident Microsystems, Inc. (b) | | 22,673 | | $ | 479,307 |
Tyler Technologies, Inc. (b) (d) | | 10,800 | | | 153,252 |
Ulticom, Inc. (b) (d) | | 3,540 | | | 35,400 |
Ultimate Software Group, Inc. (The) (b) (d) | | 11,100 | | | 274,614 |
VA Software Corp. (b) | | 16,000 | | | 64,800 |
Vasco Data Security International, Inc. (b) (d) | | 8,600 | | | 99,674 |
Verint Systems, Inc. (b) | | 4,200 | | | 137,508 |
Vignette Corp. (b) | | 12,631 | | | 205,885 |
webMethods, Inc. (b) | | 24,660 | | | 185,443 |
WebSideStory, Inc. (b) (d) | | 8,300 | | | 108,315 |
Wind River Systems, Inc. (b) (d) | | 30,846 | | | 338,689 |
Witness Systems, Inc. (b) | | 15,300 | | | 271,422 |
Zoran Corp. (b) | | 17,859 | | | 248,597 |
| | | | | |
| | | | | 22,465,004 |
| | | | | |
Construction & Building Materials (1.1%) | | | |
AMCOL International Corp. (d) | | 10,250 | | | 269,678 |
Brookfield Homes Corp. (d) | | 5,947 | | | 192,980 |
Builders FirstSource, Inc. (b) | | 4,300 | | | 68,026 |
Cavco Industries, Inc. (b) | | 3,500 | | | 117,530 |
Ceradyne, Inc. (b) (d) | | 10,440 | | | 430,650 |
Comfort Systems USA, Inc. | | 12,075 | | | 140,191 |
Drew Industries, Inc. (b) (d) | | 5,798 | | | 157,416 |
ElkCorp (d) | | 8,644 | | | 217,137 |
Genlyte Group, Inc. (The) (b) | | 9,913 | | | 765,877 |
Granite Construction, Inc. | | 13,805 | | | 719,240 |
H&E Equipment Services, Inc. (b) (d) | | 4,900 | | | 131,467 |
Home Solutions Of America, Inc. (b) (d) | | 18,800 | | | 110,168 |
Hovnanian Enterprises, Inc., Class A (b) (d) | | 20,500 | | | 632,425 |
Infrasource Services, Inc. (b) | | 9,400 | | | 183,958 |
Integrated Electrical Services, Inc. (b) | | 5,000 | | | 85,650 |
Kronos Worldwide, Inc. | | 1,152 | | | 34,353 |
Layne Christensen Co. (b) (d) | | 4,740 | | | 139,688 |
LSI Industries, Inc. | | 6,575 | | | 118,021 |
Meritage Corp. (b) (d) | | 9,400 | | | 430,332 |
NCI Building Systems, Inc. (b) | | 8,794 | | | 526,321 |
Omnova Solutions, Inc. (b) (d) | | 8,900 | | | 38,982 |
Common Stocks (continued)
| | | | | |
| | | Shares or Principal Amount | | Value |
| | | | | |
Construction & Building Materials (continued) |
Orleans Homebuilders, Inc. (d) | | 600 | | $ | 6,936 |
Simpson Manufacturing Co., Inc. (d) | | 15,818 | | | 449,073 |
Sterling Construction Co., Inc. (b) | | 3,500 | | | 73,255 |
Technical Olympic USA, Inc. (d) | | 4,925 | | | 54,668 |
Trex Co., Inc. (b) (d) | | 4,500 | | | 118,890 |
U.S. Concrete, Inc. (b) | | 18,200 | | | 115,024 |
Universal Display Corp. (b) (d) | | 7,800 | | | 90,090 |
Washington Group International, Inc. | | 12,075 | | | 683,687 |
| | | | | |
| | | | | 7,101,713 |
| | | | | |
Consulting Services (0.0%) | | | | | |
Diamond Management & Technology Consultants, Inc. (b) (d) | | 14,500 | | | 157,180 |
Perficient, Inc. (b) | | 8,600 | | | 144,222 |
| | | | | |
| | | | | 301,402 |
| | | | | |
Consumer Durables (0.6%) | | | | | |
Blyth, Inc. | | 9,020 | | | 215,758 |
Central Garden & Pet Co. (b) (d) | | 9,345 | | | 466,970 |
Chattem, Inc. (b) | | 7,926 | | | 336,221 |
CNS, Inc. | | 6,300 | | | 233,415 |
Coca-Cola Bottling Co. | | 1,200 | | | 75,576 |
Elizabeth Arden, Inc. (b) | | 9,107 | | | 158,826 |
Greif Bros Corp., Class A | | 7,165 | | | 671,432 |
Pilgrim’s Pride Corp. | | 14,400 | | | 359,712 |
Playtex Products, Inc. (b) (d) | | 18,200 | | | 253,708 |
Prestige Brands Holdings, Inc. (b) | | 9,600 | | | 113,280 |
Revlon Co., Inc. (b) | | 78,410 | | | 104,285 |
Russ Berrie & Co., Inc. (b) (d) | | 4,057 | | | 61,504 |
Silgan Holdings, Inc. | | 7,696 | | | 318,384 |
Spectrum Brands, Inc. (b) | | 13,300 | | | 129,276 |
Tupperware Corp. | | 26,238 | | | 557,033 |
| | | | | |
| | | | | 4,055,380 |
| | | | | |
Data Processing & Reproduction (0.3%) | | | |
Convera Corp. (b) (d) | | 6,200 | | | 31,062 |
CSG Systems International, Inc. (b) | | 20,087 | | | 541,947 |
eFunds Corp. (b) (d) | | 16,593 | | | 411,506 |
Global Cash Access, Inc. (b) | | 10,100 | | | 161,095 |
| | | | | |
| | | Shares or Principal Amount | | Value |
| | | | | |
Data Processing & Reproduction (continued) |
infoUSA, Inc. | | 11,600 | | $ | 127,484 |
Intermec, Inc. (b) | | 18,891 | | | 426,937 |
Pegasystems, Inc. (d) | | 800 | | | 7,688 |
| | | | | |
| | | | | 1,707,719 |
| | | | | |
Distribution (0.6%) | | | | | |
Actuant Corp. | | 10,730 | | | 550,878 |
Brightpoint, Inc. (b) | | 20,560 | | | 248,776 |
Central European Distribution Corp. (b) (d) | | 13,795 | | | 350,117 |
Core-Mark Holding Co., Inc. (b) | | 2,400 | | | 76,800 |
Interline Brands, Inc. (b) | | 8,600 | | | 205,884 |
Keystone Automotive Industries, Inc. (b) (d) | | 7,645 | | | 294,027 |
Owens & Minor, Inc. | | 14,492 | | | 456,643 |
ScanSource, Inc. (b) (d) | | 8,420 | | | 264,304 |
United Stationers, Inc. (b) | | 13,201 | | | 630,348 |
Watsco, Inc. (d) | | 11,133 | | | 554,423 |
| | | | | |
| | | | | 3,632,200 |
| | | | | |
Drugs (1.0%) | | | | | |
ABIOMED, Inc. (b) (d) | | 6,311 | | | 89,616 |
Adolor Corp. (b) | | 18,962 | | | 259,969 |
Akorn, Inc. (b) | | 9,400 | | | 41,172 |
Alkermes, Inc. (b) | | 32,557 | | | 546,958 |
Alpharma, Inc. | | 14,548 | | | 321,074 |
ARIAD, Inc. (b) (d) | | 24,614 | | | 107,071 |
Bentley Pharmaceuticals, Inc. (b) (d) | | 6,649 | | | 83,445 |
Bio-Rad Laboratories, Inc., Class A (b) | | 6,415 | | | 470,989 |
BioCryst Pharmaceuticals, Inc. (b) (d) | | 9,800 | | | 116,326 |
Caraco Pharmaceutical Laboratories Ltd. (b) | | 800 | | | 9,152 |
Combinatorx, Inc. (b) (d) | | 5,700 | | | 43,776 |
Connetics Corp. (b) | | 16,034 | | | 273,219 |
CV Therapeutics, Inc. (b) (d) | | 19,844 | | | 256,980 |
Decode Genetics, Inc. (b) (d) | | 18,274 | | | 97,218 |
Hi-Tech Pharmacal Co., Inc. (b) (d) | | 4,500 | | | 67,860 |
Incyte Genomics, Inc. (b) (d) | | 33,329 | | | 158,646 |
InterMune, Inc. (b) | | 12,383 | | | 273,664 |
K-V Pharmaceutical Co., Class A (b) (d) | | 16,823 | | | 375,489 |
Statement of Investments (Continued)
October 31, 2006
Gartmore Small Cap Index Fund (Continued)
Common Stocks (continued)
| | | | | |
| | | Shares or Principal Amount | | Value |
| | | | | |
Drugs (continued) | | | | | |
Martek Biosciences Corp. (b) (d) | | 12,805 | | $ | 303,735 |
NBTY, Inc. (b) | | 21,960 | | | 610,927 |
NPS Pharmaceuticals, Inc. (b) | | 22,607 | | | 106,705 |
OSI Pharmaceuticals, Inc. (b) | | 22,900 | | | 876,612 |
Par Pharmaceutical Cos, Inc. (b) | | 14,795 | | | 288,355 |
Quidel Corp. (b) | | 7,700 | | | 119,504 |
Rigel Pharmaceuticals, Inc. (b) (d) | | 8,574 | | | 94,914 |
Tanox, Inc. (b) (d) | | 8,455 | | | 113,551 |
| | | | | |
| | | | | 6,106,927 |
| | | | | |
Educational Services (0.5%) | | | | | |
Ambassadors Groups, Inc. | | 6,000 | | | 164,340 |
Blackboard, Inc. (b) (d) | | 11,000 | | | 304,810 |
Bright Horizons Family Solutions, Inc. (b) (d) | | 10,356 | | | 397,878 |
Corinthian Colleges, Inc. (b) | | 34,300 | | | 420,175 |
DeVry, Inc. (b) (d) | | 21,890 | | | 533,022 |
Educate, Inc. (b) | | 3,200 | | | 24,480 |
INVESTools, Inc. (b) | | 14,000 | | | 179,200 |
Leapfrog Enterprises, Inc. (b) | | 9,340 | | | 90,038 |
Strayer Education, Inc. | | 6,004 | | | 679,171 |
Universal Technical Institute, Inc. (b) (d) | | 7,968 | | | 159,201 |
| | | | | |
| | | | | 2,952,315 |
| | | | | |
Electrical Equipment (0.8%) | | | | | |
ANADIGICS, Inc. (b) (d) | | 23,400 | | | 189,072 |
Avista Corp. | | 20,976 | | | 539,922 |
Bel Fuse, Inc., Class B (d) | | 3,249 | | | 115,729 |
Capstone Turbine Corp. (b) (d) | | 24,400 | | | 38,552 |
Cleco Corp. | | 20,132 | | | 517,392 |
DSP Group, Inc. (b) | | 12,048 | | | 261,683 |
El Paso Electric Co. (b) | | 17,631 | | | 411,860 |
EMCOR Group, Inc. (b) | | 11,960 | | | 707,435 |
Encore Wire Corp. (b) (d) | | 9,846 | | | 264,660 |
Energy Conversion Devices, Inc. (b) (d) | | 15,285 | | | 562,336 |
Evergreen Solar, Inc. (b) (d) | | 26,610 | | | 231,507 |
II-VI Corp. (b) | | 7,784 | | | 190,552 |
ITC Holdings Corp. | | 4,500 | | | 159,840 |
Lamson & Sessions Co. (b) (d) | | 6,100 | | | 133,468 |
Measurement Specialties, Inc. (b) (d) | | 3,631 | | | 79,410 |
| | | | | |
| | | Shares or Principal Amount | | Value |
| | | | | |
Electrical Equipment (continued) | | | |
Plug Power, Inc. (b) (d) | | 32,589 | | $ | 130,030 |
Power-One, Inc. (b) | | 24,200 | | | 165,528 |
RAE Systems, Inc. (b) (d) | | 7,100 | | | 27,406 |
Tripath Imaging, Inc. (b) (d) | | 10,357 | | | 94,663 |
Triumph Group, Inc. | | 7,205 | | | 346,921 |
| | | | | |
| | | | | 5,167,966 |
| | | | | |
Electronics (1.0%) | | | | | |
Aeroflex, Inc. (b) | | 26,114 | | | 282,031 |
American Science & Engineering, Inc. (b) (d) | | 4,130 | | | 217,362 |
Ansoft Corp. (b) | | 6,500 | | | 173,290 |
Badger Meter, Inc. (d) | | 3,500 | | | 88,305 |
Belden CDT, Inc. | | 15,652 | | | 566,602 |
Coherent, Inc. (b) | | 13,404 | | | 432,011 |
Comtech Group Inc. (b) | | 7,400 | | | 124,912 |
Daktronics, Inc. (d) | | 16,072 | | | 381,067 |
Directed Electronics, Inc. (b) | | 5,650 | | | 77,688 |
Eagle Test Systems, Inc. (b) (d) | | 4,500 | | | 79,200 |
EDO Corp. | | 6,479 | | | 154,913 |
Electro Scientific Industries, Inc. (b) | | 13,654 | | | 272,397 |
FLIR Systems, Inc. (b) (d) | | 28,200 | | | 900,708 |
Graftech International Ltd. (b) (d) | | 34,016 | | | 205,797 |
International DisplayWorks, Inc. (b) | | 20,500 | | | 131,405 |
Itron, Inc. (b) (d) | | 10,494 | | | 571,293 |
LoJack Corp. (b) (d) | | 8,900 | | | 177,644 |
Methode Electronics, Inc. | | 13,000 | | | 143,910 |
Mobility Electronics, Inc. (b) (d) | | 13,500 | | | 38,880 |
Multi-Fineline Electronix, Inc. (b) (d) | | 2,200 | | | 53,130 |
Rogers Corp. (b) | | 5,853 | | | 409,534 |
TTM Technologies, Inc. (b) | | 18,771 | | | 228,068 |
Watts Industries, Inc., Class A (d) | | 11,230 | | | 417,981 |
Zygo Corp. (b) | | 6,300 | | | 109,116 |
| | | | | |
| | | | | 6,237,244 |
| | | | | |
Engineering Services (0.0%) | | | | | |
ENGlobal Corp. (b) | | 2,100 | | | 12,516 |
| | | | | |
Entertainment (0.5%) | | | | | |
Carmike Cinemas, Inc. (d) | | 7,115 | | | 141,944 |
Dover Downs Entertainment, Inc. | | 7,143 | | | 101,216 |
Common Stocks (continued)
| | | | | |
| | | Shares or Principal Amount | | Value |
| | | | | |
Entertainment (continued) | | | | | |
Dover Motorsports, Inc. (d) | | 5,612 | | $ | 29,631 |
Gaylord Entertainment Co. (b) (d) | | 16,136 | | | 750,970 |
Gemstar-TV Guide International, Inc. (b) | | 82,600 | | | 287,448 |
Magna Entertainment Corp., Class A (b) | | 14,961 | | | 78,545 |
Marvel Entertainment, Inc. (b) (d) | | 18,750 | | | 475,313 |
Midway Games, Inc. (b) (d) | | 12,537 | | | 107,317 |
Multimedia Games, Inc. (b) (d) | | 12,143 | | | 114,023 |
Pinnacle Entertainment, Inc. (b) | | 18,666 | | | 564,833 |
Shuffle Master, Inc. (b) (d) | | 13,765 | | | 385,145 |
Six Flags, Inc. (b) (d) | | 28,400 | | | 161,880 |
Steinway Musical Instruments, Inc. (b) | | 2,300 | | | 68,218 |
World Wrestling Federation Entertainment, Inc. | | 10,269 | | | 171,184 |
| | | | | |
| | | | | 3,437,667 |
| | | | | |
Fiber Optics (0.2%) | | | | | |
Avanex Corp. (b) | | 51,600 | | | 82,044 |
C-Cor.net Corp. (b) (d) | | 19,100 | | | 190,809 |
MRV Communications, Inc. (b) (d) | | 52,295 | | | 178,849 |
Newport Corp. (b) | | 13,945 | | | 301,490 |
Sycamore Networks, Inc. (b) (d) | | 63,218 | | | 237,068 |
| | | | | |
| | | | | 990,260 |
| | | | | |
Financial (2.9%) | | | | | |
Accredited Home Lenders Holding Co. (b) | | 9,192 | | | 281,275 |
Advanta Corp., Class B | | 8,355 | | | 327,850 |
Anchor BanCorp Wisconsin, Inc. (d) | | 7,317 | | | 212,486 |
Anworth Mortgage Asset Corp. | | 15,700 | | | 142,556 |
Apollo Investment Corp. | | 33,772 | | | 728,124 |
Ares Capital Corp. (d) | | 22,271 | | | 412,685 |
Asset Acceptance Capital Corp. (b) | | 5,945 | | | 105,880 |
ASTA Funding, Inc. (d) | | 5,245 | | | 178,540 |
Aventine Renewable Energy Holdings, Inc. (b) (d) | | 14,010 | | | 344,646 |
BankFinancial Corp. (d) | | 8,100 | | | 146,853 |
Bankrate, Inc. (b) (d) | | 4,455 | | | 142,337 |
BISYS Group, Inc. (The) (b) | | 50,700 | | | 559,728 |
Capital Southwest Corp. (d) | | 515 | | | 61,723 |
Cass Information Systems, Inc. (d) | | 900 | | | 33,669 |
| | | | | |
| | | Shares or Principal Amount | | Value |
| | | | | |
Financial (continued) | | | | | |
Central Pacific Financial Corp. | | 13,105 | | $ | 482,133 |
Charter Municipal Mortgage Acceptance Co. (d) | | 18,121 | | | 368,762 |
Clayton Holdings, Inc. (b) | | 3,400 | | | 47,838 |
Cohen & Steers, Inc. (d) | | 3,150 | | | 109,872 |
CompuCredit Corp. (b) (d) | | 9,351 | | | 325,041 |
Credit Acceptance Corp. (b) (d) | | 2,168 | | | 72,541 |
Deluxe Corp. | | 22,000 | | | 498,740 |
Dollar Financial Corp. (b) | | 6,100 | | | 141,642 |
Doral Financial Corp. (d) | | 40,280 | | | 185,288 |
Downey Financial Corp. (d) | | 8,900 | | | 613,032 |
Euronet Worldwide, Inc. (b) (d) | | 14,738 | | | 438,013 |
Federal Agricultural Mortgage Corp. | | 5,200 | | | 136,760 |
Financial Federal Corp. (d) | | 10,223 | | | 281,337 |
First Cash Financial Services, Inc. (b) | | 12,005 | | | 259,428 |
First Financial Holdings, Inc. | | 4,200 | | | 151,746 |
Friedman, Billings, Ramsey Group, Inc. | | 54,900 | | | 418,887 |
GAMCO, Investors, Inc., Class A (d) | | 3,168 | | | 125,453 |
GFI Group, Inc. (b) | | 4,910 | | | 283,160 |
Gladstone Capital Corp. (d) | | 5,528 | | | 130,903 |
Gladstone Investment Corp. (d) | | 4,400 | | | 64,460 |
Greenhill & Co., Inc. (d) | | 7,000 | | | 475,580 |
Harris & Harris Group, Inc. (b) (d) | | 9,810 | | | 137,046 |
Interactive Data Corp. (b) | | 11,200 | | | 255,808 |
International Securities Exchange, Inc. (d) | | 14,230 | | | 730,711 |
Irwin Financial Corp. (d) | | 8,045 | | | 178,358 |
Jackson Hewitt Tax Service, Inc. | | 14,300 | | | 494,780 |
Knight Capital Group, Inc. (b) | | 41,575 | | | 775,374 |
Labranche & Co., Inc. (b) (d) | | 18,406 | | | 163,261 |
MainSource Financial Group, Inc. (d) | | 7,940 | | | 144,349 |
Marketaxess Holdings, Inc. (b) (d) | | 12,400 | | | 139,500 |
MCG Capital Corp. (d) | | 23,498 | | | 421,084 |
Medallion Financial Corp. | | 9,100 | | | 108,745 |
Morningstar, Inc. (b) | | 3,900 | | | 159,588 |
MVC Capital, Inc. (d) | | 3,400 | | | 44,472 |
National Financial Partners Corp. | | 15,601 | | | 614,679 |
Net 1 UEPS Technologies, Inc. (b) (d) | | 18,300 | | | 450,729 |
Statement of Investments (Continued)
October 31, 2006
Gartmore Small Cap Index Fund (Continued)
Common Stocks (continued)
| | | | | |
| | | Shares or Principal Amount | | Value |
| | | | | |
Financial (continued) | | | | | |
NGP Capital Resources Co. (d) | | 9,463 | | $ | 146,677 |
Novastar Financial, Inc. (d) | | 11,667 | | | 372,411 |
Ocwen Financial Corp. (b) (d) | | 15,360 | | | 240,384 |
optionsXpress Holdings, Inc. | | 7,100 | | | 220,668 |
Penson Worldwide, Inc. (b) | | 4,700 | | | 114,304 |
Piper Jaffray Companies, Inc. (b) (d) | | 7,979 | | | 551,748 |
Resource America, Inc., Class A | | 5,305 | | | 122,068 |
Rewards Network, Inc. (b) | | 5,500 | | | 31,130 |
Royal Gold, Inc. (d) | | 9,075 | | | 267,168 |
Sanders Morris Harris Group, Inc. (d) | | 4,153 | | | 48,839 |
SCBT Financial Corp. (d) | | 1,727 | | | 71,239 |
State National Bankshares, Inc. | | 2,545 | | | 97,168 |
Stifel Financial Corp. (b) (d) | | 3,033 | | | 109,036 |
SWS Group, Inc. | | 5,550 | | | 154,235 |
Technology Investment Capital Corp. | | 6,400 | | | 97,344 |
Thomas Weisel Partners Group, Inc. (b) (d) | | 4,230 | | | 67,722 |
TNS, Inc. (b) | | 11,900 | | | 196,588 |
United Panam Financial Corp. (b) (d) | | 5,700 | | | 74,100 |
Value Line, Inc. | | 100 | | | 5,343 |
Waddell & Reed Financial, Inc. | | 35,240 | | | 898,619 |
World Acceptance Corp. (b) | | 8,134 | | | 406,619 |
WSFS Financial Corp. | | 3,009 | | | 193,900 |
| | | | | |
| | | | | 18,594,762 |
| | | | | |
Firearms & Ammunition (0.0%) | | | |
Smith & Wesson Holding Corp. (b) (d) | | 12,000 | | | 164,400 |
| | | | | |
Food & Related (1.1%) | | | | | |
Aurora Foods, Inc. (b) (c) | | 100 | | | 0 |
Chiquita Brands International, Inc. | | 18,675 | | | 255,848 |
Darling International, Inc. (b) | | 18,900 | | | 80,892 |
Diamond Foods, Inc. (d) | | 7,200 | | | 122,616 |
Farmer Brothers Co. | | 1,100 | | | 24,816 |
Flowers Foods, Inc. | | 19,063 | | | 517,942 |
Gold Kist, Inc. (b) | | 20,985 | | | 415,713 |
Great Atlantic & Pacific Tea Co., Inc. | | 8,257 | | | 228,471 |
| | | | | |
| | | Shares or Principal Amount | | Value |
| | | | | |
Food & Related (continued) | | | | | |
Green Mountain Coffee, Inc. (b) (d) | | 800 | | $ | 31,656 |
Hain Celestial Group, Inc. (b) | | 13,793 | | | 389,376 |
Imperial Sugar Co. (d) | | 5,400 | | | 143,262 |
J & J Snack Foods Corp. | | 4,284 | | | 143,128 |
Jones Soda Co. (b) | | 11,000 | | | 108,240 |
Krispy Kreme Doughnuts, Inc. (b) (d) | | 18,963 | | | 203,852 |
Lance, Inc. (d) | | 11,816 | | | 230,648 |
MGP Ingredients, Inc. | | 4,500 | | | 101,025 |
National Beverage Corp. | | 2,810 | | | 32,175 |
NuCo2, Inc. (b) (d) | | 7,075 | | | 197,959 |
Peet’s Coffee & Tea, Inc. (b) (d) | | 7,082 | | | 189,444 |
Performance Food Group Co. (b) (d) | | 15,251 | | | 443,347 |
Premium Standard Farms, Inc. | | 8,300 | | | 159,692 |
Ralcorp Holding, Inc. (b) | | 10,523 | | | 520,361 |
Red Robin Gourmet Burgers (b) (d) | | 7,659 | | | 369,470 |
Ryan’s Restaurant Group, Inc. (b) | | 14,629 | | | 237,136 |
Sanderson Farms, Inc. (d) | | 7,859 | | | 208,499 |
Seaboard Corp. (d) | | 100 | | | 141,200 |
Sensient Technologies Corp. | | 17,154 | | | 395,400 |
Tejon Ranch Co. (b) (d) | | 3,143 | | | 152,436 |
Tootsie Roll Industries, Inc. (d) | | 11,774 | | | 374,178 |
Treehouse Foods, Inc. (b) | | 11,820 | | | 299,755 |
| | | | | |
| | | | | 6,718,537 |
| | | | | |
Furniture (0.4%) | | | | | |
American Woodmark Corp. (d) | | 5,535 | | | 204,740 |
Ethan Allen Interiors, Inc. (d) | | 13,500 | | | 480,869 |
Furniture Brands International, Inc. (d) | | 18,435 | | | 342,891 |
Hooker Furniture Corp. (d) | | 2,075 | | | 29,341 |
Kimball International, Inc., Class B | | 11,948 | | | 296,908 |
La-Z-Boy, Inc. (d) | | 20,600 | | | 252,350 |
Sealy Corp. | | 4,500 | | | 63,315 |
Select Comfort Corp. (b) (d) | | 21,404 | | | 457,618 |
Stanley Furniture Co., Inc. (d) | | 4,884 | | | 107,985 |
Tempur-Pedic International, Inc. (b) (d) | | 16,900 | | | 333,606 |
| | | | | |
| | | | | 2,569,623 |
| | | | | |
Common Stocks (continued)
| | | | | |
| | | Shares or Principal Amount | | Value |
| | | | | |
Gambling – Non-Hotel Casinos (0.1%) | | | |
Bally Technologies, Inc. (b) | | 17,757 | | $ | 352,477 |
Churchill Downs, Inc. | | 2,000 | | | 84,840 |
Isle of Capri Casinos, Inc. (b) (d) | | 7,251 | | | 182,000 |
Progressive Gaming International Corp. (b) (d) | | 15,200 | | | 116,128 |
| | | | | |
| | | | | 735,445 |
| | | | | |
Gas – Distribution (0.8%) | | | | | |
Cascade Natural Gas Corp. (d) | | 6,299 | | | 162,136 |
New Jersey Resources Corp. | | 11,158 | | | 578,654 |
Nicor, Inc. | | 16,587 | | | 762,339 |
Northwest Natural Gas Co. (d) | | 10,916 | | | 451,595 |
Pacific Ethanol, Inc. (b) (d) | | 11,500 | | | 192,625 |
Peoples Energy Corp. | | 15,245 | | | 666,054 |
Piedmont Natural Gas Co., Inc. (d) | | 31,400 | | | 847,799 |
South Jersey Industries, Inc. | | 9,704 | | | 300,145 |
Southwest Gas Corp. (d) | | 16,186 | | | 580,754 |
WGL Holdings, Inc. (d) | | 20,495 | | | 665,063 |
| | | | | |
| | | | | 5,207,164 |
| | | | | |
Healthcare (2.1%) | | | | | |
Advanced Magnetics, Inc. (b) (d) | | 3,600 | | | 149,400 |
Affymetrix, Inc. (b) (d) | | 27,500 | | | 701,250 |
Air Methods Corp. (b) | | 4,900 | | | 118,580 |
Amedisys, Inc. (b) (d) | | 7,241 | | | 293,767 |
American Medical Systems Holdings, Inc. (b) (d) | | 29,316 | | | 522,118 |
AMERIGROUP Corp. (b) | | 19,800 | | | 593,208 |
AmSurg Corp. (b) (d) | | 13,478 | | | 283,308 |
Angiodynamics, Inc. (b) | | 3,200 | | | 69,280 |
Apria Healthcare Group, Inc. (b) | | 16,200 | | | 377,298 |
Bio-Reference Laboratories, Inc. (b) | | 5,300 | | | 125,239 |
Capital Senior Living Corp. (b) | | 3,800 | | | 36,290 |
Centene Corp. (b) | | 18,334 | | | 432,499 |
Cerus Corp. (b) | | 6,100 | | | 43,920 |
CorVel Corp. (b) | | 2,100 | | | 90,825 |
Cross Country Healthcare, Inc. (b) (d) | | 15,185 | | | 293,982 |
DJ Orthopedics, Inc. (b) | | 7,787 | | | 313,271 |
Genesis HealthCare Corp. (b) | | 8,194 | | | 396,835 |
Gentiva Health Services, Inc. (b) | | 12,249 | | | 227,219 |
HealthExtras, Inc. (b) (d) | | 9,153 | | | 210,794 |
| | | | | |
| | | Shares or Principal Amount | | Value |
| | | | | |
Healthcare (continued) | | | | | |
Healthspring, Inc. (b) | | 5,200 | | $ | 104,728 |
Healthways, Inc. (b) | | 13,746 | | | 582,143 |
Horizon Health Corp. (b) (d) | | 8,375 | | | 129,561 |
Hythiam, Inc. (b) (d) | | 12,300 | | | 99,999 |
Immucor, Inc. (b) | | 26,046 | | | 717,047 |
Invacare Corp. | | 10,749 | | | 234,651 |
Kindred Healthcare, Inc. (b) | | 9,521 | | | 257,067 |
LCA-Vision, Inc. (d) | | 8,790 | | | 308,793 |
LHC Group, Inc. (b) (d) | | 6,600 | | | 162,492 |
Magellan Health Services, Inc. (b) | | 15,260 | | | 665,946 |
Matria Healthcare, Inc. (b) (d) | | 9,256 | | | 261,019 |
Medcath Corp. (b) | | 4,275 | | | 113,245 |
Medifast, Inc. (b) (d) | | 5,500 | | | 51,260 |
Molina Healthcare, Inc. (b) | | 4,234 | | | 166,100 |
Nighthawk Radiology Holdings, Inc. (b) (d) | | 500 | | | 10,175 |
Odyssey Healthcare, Inc. (b) | | 12,323 | | | 163,280 |
Option Care, Inc. | | 12,854 | | | 162,860 |
Per-Se Technologies, Inc. (b) | | 14,984 | | | 366,808 |
PolyMedica Corp. (d) | | 9,453 | | | 392,772 |
Psychiatric Solutions, Inc. (b) (d) | | 21,044 | | | 698,661 |
Quality Systems, Inc. | | 6,654 | | | 282,396 |
RehabCare Group, Inc. (b) (d) | | 7,160 | | | 92,078 |
Res-Care, Inc. (b) | | 6,445 | | | 124,646 |
Sun Healthcare Group, Inc. (b) (d) | | 11,700 | | | 153,036 |
Sunrise Assisted Living, Inc. (b) (d) | | 17,473 | | | 545,332 |
Symbion, Inc. (b) | | 5,940 | | | 98,604 |
ThermoGenesis Corp. (b) | | 26,045 | | | 110,431 |
United Surgical Partners International, Inc. (b) | | 18,543 | | | 460,237 |
USNA Health Sciences, Inc. (b) (d) | | 4,510 | | | 202,589 |
Vistacare, Inc. (b) | | 5,193 | | | 64,964 |
| | | | | |
| | | | | 13,062,003 |
| | | | | |
Hotels & Casinos (0.3%) | | | | | |
Ameristar Casinos, Inc. | | 11,492 | | | 282,818 |
Aztar Corp. (b) | | 13,652 | | | 731,338 |
Century Casinos, Inc. (b) | | 9,100 | | | 94,003 |
Lakes Entertainment, Inc. (b) | | 5,600 | | | 63,616 |
Monarch Casino & Resort, Inc. (b) (d) | | 2,230 | | | 49,461 |
MTR Gaming Group, Inc. (b) | | 9,300 | | | 98,859 |
Riviera Holdings Corp. (b) | | 2,200 | | | 43,340 |
Trump Entertainment Resorts, Inc. (b) | | 12,800 | | | 260,224 |
| | | | | |
| | | | | 1,623,659 |
| | | | | |
Statement of Investments (Continued)
October 31, 2006
Gartmore Small Cap Index Fund (Continued)
Common Stocks (continued)
| | | | | |
| | | Shares or Principal Amount | | Value |
| | | | | |
Hotels & Motels (0.1%) | | | | | |
Lodgian, Inc. (b) | | 6,120 | | $ | 87,210 |
Marcus Corp. | | 6,234 | | | 155,788 |
Morgans Hotel Group Co. (b) | | 8,000 | | | 104,000 |
| | | | | |
| | | | | 346,998 |
| | | | | |
Human Resources (0.0%) | | | | | |
Barrett Business Services, Inc. (b) (d) | | 4,200 | | | 89,712 |
Kforce, Inc. (b) | | 12,375 | | | 185,254 |
| | | | | |
| | | | | 274,966 |
| | | | | |
Insurance (1.7%) | | | | | |
21st Century Insurance Group (d) | | 10,000 | | | 157,800 |
Affirmative Insurance Holdings, Inc. | | 5,605 | | | 93,099 |
Alfa Corp. (d) | | 10,124 | | | 186,990 |
American Equity Investment Life Holding Co. (d) | | 25,485 | | | 325,189 |
American Physicians Capital, Inc. (b) | | 3,650 | | | 199,692 |
Argonaut Group, Inc. (b) | | 13,580 | | | 461,856 |
Baldwin & Lyons, Inc., Class B (d) | | 3,881 | | | 100,401 |
Bristol West Holdings, Inc. | | 4,500 | | | 62,640 |
CNA Surety Corp. (b) | | 3,600 | | | 73,224 |
Commerce Group, Inc. (The) | | 20,600 | | | 609,760 |
Darwin Professional Underwriters, Inc. (b) | | 4,100 | | | 92,250 |
Direct General Corp. (d) | | 5,841 | | | 77,043 |
Donegal Group, Inc., Class A | | 2,488 | | | 50,531 |
EMC Insurance Group, Inc. | | 3,670 | | | 112,559 |
Enstar Group, Inc. (The) (b) (d) | | 715 | | | 65,508 |
FBL Financial Group, Inc., Class A | | 3,747 | | | 132,456 |
First Acceptance Corp. (b) (d) | | 2,900 | | | 31,146 |
FPIC Insurance Group, Inc. (b) | | 4,750 | | | 169,765 |
Fremont General Corp. (d) | | 23,000 | | | 334,190 |
Harleysville Group, Inc. | | 5,258 | | | 189,709 |
Horace Mann Educators Corp. | | 17,859 | | | 359,680 |
Independence Holding Co. (d) | | 920 | | | 21,859 |
Infinity Property & Casualty Corp. | | 7,085 | | | 304,797 |
Kansas City Life Insurance Co. (d) | | 400 | | | 22,380 |
LandAmerica Financial Group, Inc. | | 7,423 | | | 468,317 |
Meadowbrook Insurance Group, Inc. (b) | | 13,400 | | | 161,470 |
| | | | | |
| | | Shares or Principal Amount | | Value |
| | | | | |
Insurance (continued) | | | | | |
Midland Co. (The) (d) | | 2,946 | | $ | 137,696 |
National Interstate Corp. (d) | | 4,400 | | | 123,992 |
Navigators Group, Inc. (b) (d) | | 4,092 | | | 192,610 |
Nymagic, Inc. | | 800 | | | 25,640 |
Odyssey Re Holdings Corp. (d) | | 2,760 | | | 97,842 |
Ohio Casualty Corp. | | 26,541 | | | 728,021 |
PICO Holdings, Inc. (b) (d) | | 2,100 | | | 67,893 |
PMA Capital Corp., Class A (b) | | 11,423 | | | 108,290 |
ProAssurance Corp. (b) | | 11,517 | | | 560,878 |
RLI Corp. | | 7,314 | | | 396,492 |
Safety Insurance Group, Inc. | | 6,405 | | | 320,314 |
SCPIE Holdings, Inc. (b) | | 1,900 | | | 53,295 |
Seabright Insurance Holdings (b) | | 8,900 | | | 146,049 |
Selective Insurance Group, Inc. | | 11,634 | | | 642,779 |
State Auto Financial Corp. | | 3,700 | | | 118,881 |
Stewart Information Services Corp. | | 8,002 | | | 296,554 |
Tower Group, Inc. | | 7,800 | | | 275,730 |
Triad Guaranty, Inc. (b) | | 5,434 | | | 279,905 |
U.S.I. Holdings Corp. (b) (d) | | 14,330 | | | 228,277 |
United Fire & Casualty Co. (d) | | 8,717 | | | 308,407 |
Zenith National Insurance Co. | | 14,752 | | | 686,263 |
| | | | | |
| | | | | 10,660,119 |
| | | | | |
Insurance & Life (0.3%) | | | | | |
Delphi Financial Group, Inc. | | 16,759 | | | 657,790 |
Great American Financial Resources, Inc. | | 3,120 | | | 72,103 |
National Western Life Insurance Co., Class A | | 669 | | | 160,460 |
Phoenix Co., Inc. (The) | | 40,976 | | | 649,060 |
Presidential Life Corp. | | 6,881 | | | 162,392 |
Universal American Financial Corp. (b) | | 17,590 | | | 326,998 |
| | | | | |
| | | | | 2,028,803 |
| | | | | |
Insurance Brokers (0.1%) | | | | | |
Crawford & Co., Class B | | 8,120 | | | 61,712 |
Hilb, Rogal & Hamilton Co. | | 14,449 | | | 576,804 |
James River Group, Inc. (b) | | 1,900 | | | 56,962 |
| | | | | |
| | | | | 695,478 |
| | | | | |
Internet (1.7%) | | | | | |
@Road, Inc. (b) (d) | | 28,500 | | | 179,265 |
Ariba, Inc. (b) | | 26,075 | | | 196,866 |
Common Stocks (continued)
| | | | | |
| | | Shares or Principal Amount | | Value |
| | | | | |
Internet (continued) | | | | | |
Art Technology Group, Inc. (b) | | 29,800 | | $ | 74,500 |
Audible, Inc. (b) (d) | | 8,500 | | | 63,580 |
Blue Coat Systems, Inc. (b) (d) | | 6,595 | | | 147,069 |
Blue Nile, Inc. (b) (d) | | 6,403 | | | 244,659 |
Brocade Communications Systems, Inc. (b) | | 110,777 | | | 898,400 |
CMGI, Inc. (b) | | 151,247 | | | 211,746 |
CNET Networks, Inc. (b) (d) | | 61,036 | | | 545,662 |
Cogent Communications Group, Inc. (b) (d) | | 13,800 | | | 158,700 |
Covad Communications Group, Inc. (b) | | 92,100 | | | 122,493 |
Drugstore.com, Inc. (b) | | 22,230 | | | 82,473 |
EarthLink, Inc. (b) | | 56,285 | | | 395,121 |
eCollege.com (b) (d) | | 7,965 | | | 137,795 |
Equinix, Inc. (b) (d) | | 11,660 | | | 797,544 |
Harris Interactive, Inc. (b) | | 16,300 | | | 108,884 |
Internap Network Services Corp. (b) (d) | | 8,850 | | | 145,848 |
Internet Capital Group, Inc. (b) | | 13,600 | | | 142,528 |
Interwoven, Inc. (b) | | 16,961 | | | 215,744 |
iPass, Inc. (b) (d) | | 17,171 | | | 91,521 |
j2 Global Communications, Inc. (b) (d) | | 19,780 | | | 542,763 |
Jupitermedia Corp. (b) (d) | | 6,600 | | | 58,014 |
Move, Inc. (b) | | 39,839 | | | 190,430 |
Net.B@nk, Inc. | | 24,102 | | | 127,982 |
Netflix, Inc. (b) (d) | | 16,880 | | | 466,901 |
NIC, Inc. (b) | | 10,200 | | | 49,266 |
Omicell, Inc. (b) | | 12,400 | | | 232,252 |
Openwave Systems, Inc. (b) (d) | | 40,214 | | | 347,047 |
Overstock.com, Inc. (b) (d) | | 5,300 | | | 96,937 |
Priceline.com, Inc. (b) (d) | | 10,799 | | | 435,092 |
Redback Networks, Inc. (b) | | 19,551 | | | 309,297 |
RightNow Technologies, Inc. (b) (d) | | 8,200 | | | 135,464 |
S1 Corp. (b) | | 28,278 | | | 139,693 |
Sohu.com, Inc. (b) | | 9,046 | | | 206,611 |
Stamps.com, Inc. (b) (d) | | 8,716 | | | 139,892 |
Stellent, Inc. | | 8,760 | | | 97,849 |
The Knot, Inc. (b) | | 7,500 | | | 179,775 |
TheStreet.com, Inc. | | 9,900 | | | 90,090 |
Travelzoo, Inc. (b) (d) | | 1,960 | | | 63,837 |
| | | | | |
| | | Shares or Principal Amount | | Value |
| | | | | |
Internet (continued) | | | | | |
TriZetto Group, Inc. (The) (b) | | 19,748 | | $ | 337,493 |
United Online, Inc. | | 22,270 | | | 301,090 |
ValueClick, Inc. (b) | | 38,534 | | | 724,439 |
Websense, Inc. (b) | | 17,150 | | | 469,396 |
| | | | | |
| | | | | 10,702,008 |
| | | | | |
Lasers (0.1%) | | | | | |
IntraLase Corp. (b) | | 9,600 | | | 188,736 |
Ionatron, Inc. (b) (d) | | 7,120 | | | 31,399 |
Metrologic Instruments, Inc. (b) | | 5,200 | | | 95,004 |
Rofin-Sinar Technologies, Inc. (b) | | 6,742 | | | 415,173 |
| | | | | |
| | | | | 730,312 |
| | | | | |
Leisure Products (0.5%) | | | | | |
Bally Total Fitness Holding Corp. (b) (d) | | 12,500 | | | 35,125 |
Callaway Golf Co. | | 26,969 | | | 362,194 |
Great Wolf Resorts, Inc. (b) (d) | | 9,200 | | | 121,072 |
JAKKS Pacific, Inc. (b) (d) | | 11,737 | | | 254,576 |
K2, Inc. (b) | | 13,430 | | | 183,454 |
LIFE TIME FITNESS, Inc. (b) (d) | | 10,500 | | | 541,064 |
Marine Products Corp. (d) | | 1,826 | | | 19,465 |
MarineMax, Inc. (b) | | 8,000 | | | 228,080 |
Nautilus Group, Inc. (The) (d) | | 13,030 | | | 184,114 |
RC2 Corp. (b) | | 9,265 | | | 418,593 |
Speedway Motorsports, Inc. | | 4,545 | | | 171,210 |
Topps Co., Inc. (d) | | 19,122 | | | 166,935 |
Vail Resorts, Inc. (b) | | 10,808 | | | 417,729 |
WMS Industries, Inc. (b) | | 10,585 | | | 373,968 |
| | | | | |
| | | | | 3,477,579 |
| | | | | |
Machinery (1.1%) | | | | | |
Advanced Energy Industries, Inc. (b) | | 10,545 | | | 165,767 |
Albany International Corp., Class A | | 10,667 | | | 358,518 |
Applied Industrial Technologies, Inc. | | 15,412 | | | 442,941 |
Astec Industries, Inc. (b) | | 5,659 | | | 180,466 |
Baldor Electric Co. | | 11,119 | | | 356,698 |
Blount International, Inc. (b) (d) | | 10,500 | | | 114,975 |
Briggs & Stratton Corp. (d) | | 21,580 | | | 550,074 |
Bucyrus International, Inc., Class A | | 12,921 | | | 541,390 |
Statement of Investments (Continued)
October 31, 2006
Gartmore Small Cap Index Fund (Continued)
Common Stocks (continued)
| | | | | |
| | | Shares or Principal Amount | | Value |
| | | | | |
Machinery (continued) | | | | | |
Cascade Corp. | | 4,346 | | $ | 222,515 |
Columbus McKinnon Corp. (b) | | 5,200 | | | 114,452 |
Cubic Corp. (d) | | 5,146 | | | 107,603 |
DXP Enterprises, Inc. (b) (d) | | 1,500 | | | 45,450 |
Flow International Corp. (b) | | 17,200 | | | 202,616 |
Franklin Electric Co., Inc. (d) | | 8,791 | | | 474,187 |
Gehl Co. (b) | | 4,695 | | | 133,995 |
Gorman-Rupp | | 1,775 | | | 67,024 |
Intermagnetics General Corp. (b) | | 16,552 | | | 452,697 |
Intevac, Inc. (b) | | 8,600 | | | 177,848 |
Kadant, Inc. (b) | | 7,203 | | | 196,642 |
NACCO Industries, Inc. | | 1,722 | | | 259,333 |
Nordson Corp. | | 11,797 | | | 543,252 |
Photon Dynamics, Inc. (b) (d) | | 8,242 | | | 97,833 |
Raser Technologies, Inc. (b) (d) | | 4,300 | | | 29,240 |
Sauer-Danfoss, Inc. | | 1,838 | | | 48,744 |
Tennant Co. | | 5,824 | | | 161,034 |
Turbochef Technologies, Inc. (b) (d) | | 4,600 | | | 57,040 |
Wabtec Corp. | | 18,078 | | | 567,467 |
| | | | | |
| | | | | 6,669,801 |
| | | | | |
Manufactured Housing (0.4%) | | | |
Aaon, Inc. | | 1,700 | | | 39,797 |
Apogee Enterprises, Inc. (d) | | 13,450 | | | 216,411 |
Fleetwood Enterprises, Inc. (b) (d) | | 22,161 | | | 158,230 |
Highwood Properties, Inc. | | 22,164 | | | 846,664 |
Levitt Corp., Class A (d) | | 9,282 | | | 119,459 |
Monaco Coach Corp. (d) | | 10,639 | | | 127,030 |
Palm Harbor Homes, Inc. (b) (d) | | 3,841 | | | 53,889 |
Skyline Corp. | | 2,318 | | | 91,538 |
WCI Communities, Inc. (b) (d) | | 14,798 | | | 238,544 |
Williams Scotsman International, Inc. (b) | | 13,235 | | | 311,420 |
Winnebago Industries, Inc. (d) | | 12,953 | | | 431,205 |
| | | | | |
| | | | | 2,634,187 |
| | | | | |
Manufacturing (0.8%) | | | | | |
American Superconductor Corp. (b) (d) | | 16,036 | | | 152,182 |
AptarGroup, Inc. | | 14,600 | | | 801,685 |
Champion Enterprises, Inc. (b) (d) | | 29,184 | | | 270,244 |
Checkpoint Systems, Inc. (b) | | 13,508 | | | 245,981 |
China Bak Battery, Inc. (b) | | 6,300 | | | 43,218 |
| | | | | |
| | | Shares or Principal Amount | | Value |
| | | | | |
Manufacturing (continued) | | | | | |
Cognex Corp. | | 16,079 | | $ | 370,299 |
CSS Industries, Inc. (d) | | 2,405 | | | 75,541 |
EnerSys (b) (d) | | 15,985 | | | 281,816 |
EnPro Industries, Inc. (b) | | 7,100 | | | 227,200 |
Freightcar America, Inc. (d) | | 5,330 | | | 283,396 |
GenTek, Inc. (b) (d) | | 4,800 | | | 155,520 |
Gerber Scientific, Inc. (b) | | 11,400 | | | 166,554 |
Goodman Global, Inc. (b) (d) | | 6,300 | | | 101,241 |
Insteel Industries, Inc. | | 6,200 | | | 111,228 |
Jacuzzi Brands, Inc. (b) | | 27,786 | | | 344,269 |
Mine Safety Appliances Co. (d) | | 10,987 | | | 415,528 |
Myers Industries, Inc. | | 9,200 | | | 166,704 |
Powell Industries, Inc. (b) (d) | | 2,469 | | | 59,182 |
PW Eagle, Inc. (d) | | 5,000 | | | 177,350 |
Raven Industries, Inc. (d) | | 6,780 | | | 217,570 |
Reddy Ice Holdings, Inc. | | 8,115 | | | 194,760 |
Woodward Governor Co. | | 9,950 | | | 355,315 |
Young Innovations, Inc. | | 500 | | | 18,045 |
| | | | | |
| | | | | 5,234,828 |
| | | | | |
Manufacturing & Diversified (0.8%) | | | |
A.O. Smith Corp. | | 8,109 | | | 285,112 |
Acuity Brands, Inc. | | 18,451 | | | 914,064 |
Barnes Group, Inc. (d) | | 17,514 | | | 351,156 |
CLARCOR, Inc. | | 18,994 | | | 618,825 |
ESCO Technologies, Inc. (b) (d) | | 9,553 | | | 414,791 |
Federal Signal Corp. | | 16,743 | | | 255,498 |
Griffon Corp. (b) (d) | | 11,860 | | | 291,637 |
Imation Corp. | | 12,900 | | | 590,433 |
Koppers Holdings, Inc. | | 2,700 | | | 55,647 |
Lancaster Colony Corp. | | 10,102 | | | 409,636 |
Matthews International Corp., Class A | | 10,932 | | | 420,007 |
Standex International Corp. | | 4,254 | | | 123,876 |
Tredegar Industries, Inc. | | 10,506 | | | 183,225 |
| | | | | |
| | | | | 4,913,907 |
| | | | | |
Medical Equipment & Supplies (1.7%) | | | |
Abaxis, Inc. (b) (d) | | 8,200 | | | 164,492 |
Adeza Biomedical Corp. (b) | | 6,900 | | | 96,186 |
Allscripts Healthcare Solution, Inc. (b) (d) | | 19,594 | | | 462,222 |
Arrow International, Inc. | | 7,104 | | | 253,968 |
Common Stocks (continued)
| | | | | |
| | | Shares or Principal Amount | | Value |
| | | | | |
Medical Equipment & Supplies (continued) | | | |
Aspect Medical Systems, Inc. (b) (d) | | 5,180 | | $ | 92,567 |
Bruker BioSciences Corp. (b) | | 8,413 | | | 66,967 |
Candela Corp. (b) | | 8,282 | | | 117,190 |
Cepheid, Inc. (b) (d) | | 18,890 | | | 155,087 |
Conceptus, Inc. (b) (d) | | 6,700 | | | 132,794 |
CONMED Corp. (b) | | 12,729 | | | 282,457 |
Cyberonics, Inc. (b) (d) | | 8,739 | | | 157,564 |
DexCom, Inc. (b) (d) | | 8,300 | | | 73,040 |
Durect Corp. (b) (d) | | 24,900 | | | 115,785 |
Encore Medical Corp. (b) | | 18,474 | | | 120,266 |
ev3, Inc. (b) (d) | | 3,800 | | | 65,132 |
Foxhollow Technologies, Inc. (b) (d) | | 6,200 | | | 217,062 |
Greatbatch, Inc. (b) (d) | | 6,720 | | | 151,133 |
Healthtronics Surgical Services, Inc. (b) | | 12,200 | | | 84,546 |
Hologic, Inc. (b) | | 21,495 | | | 1,034,984 |
I-Flow Corp. (b) (d) | | 11,669 | | | 180,986 |
ICU Medical, Inc. (b) | | 6,650 | | | 280,963 |
Kensey Nash Corp. (b) | | 5,282 | | | 160,626 |
Kyphon, Inc. (b) (d) | | 18,082 | | | 714,239 |
Landauer, Inc. (d) | | 2,737 | | | 149,905 |
Mannkind Corp. (b) (d) | | 7,800 | | | 157,950 |
Medical Action Industries, Inc. (b) | | 5,200 | | | 138,164 |
Mentor Corp. (d) | | 14,519 | | | 679,489 |
Meridian Bioscience, Inc. (d) | | 7,050 | | | 162,503 |
Merit Medical Systems, Inc. (b) (d) | | 12,232 | | | 193,388 |
MWI Veterinary Supply, Inc. (b) | | 1,300 | | | 43,563 |
Natus Medical, Inc. (b) (d) | | 9,000 | | | 149,490 |
Neurometrix, Inc. (b) (d) | | 5,275 | | | 85,930 |
Northstar Neuroscience, Inc. (b) (d) | | 1,600 | | | 24,032 |
NxStage Medical, Inc. (b) (d) | | 7,600 | | | 55,708 |
Oakley, Inc. | | 9,623 | | | 178,795 |
OraSure Technologies, Inc. (b) (d) | | 18,773 | | | 145,678 |
PSS World Medical, Inc. (b) | | 26,891 | | | 541,047 |
Radiation Therapy Services, Inc. (b) (d) | | 5,700 | | | 169,632 |
Sirona Dental Systems, Inc. (d) | | 7,200 | | | 266,400 |
Solexa, Inc. (b) (d) | | 5,600 | | | 57,344 |
Spectranetics Corp. (b) | | 13,900 | | | 172,638 |
Stereotaxis, Inc. (b) (d) | | 10,700 | | | 128,186 |
| | | | | |
| | | Shares or Principal Amount | | Value |
| | | | | |
Medical Equipment & Supplies (continued) | | | |
STERIS Corp. | | 24,990 | | $ | 609,006 |
Surmodics, Inc. (b) (d) | | 7,358 | | | 256,794 |
Symmetry Medical, Inc. (b) | | 10,600 | | | 165,360 |
Viasys Healthcare, Inc. (b) | | 10,825 | | | 310,136 |
Visicu, Inc. (b) | | 1,000 | | | 9,740 |
Vital Images, Inc. (b) | | 5,765 | | | 178,946 |
Vital Signs, Inc. | | 1,630 | | | 91,867 |
Wright Medical Group, Inc. (b) (d) | | 14,352 | | | 354,638 |
Zoll Medical Corp. (b) | | 4,706 | | | 182,122 |
| | | | | |
| | | | | 10,838,707 |
| | | | | |
Medical Laboratories (0.1%) | | | | | |
Alliance Imaging, Inc. (b) | | 3,500 | | | 29,610 |
Applera Corp. — Celera Genomics Group (b) | | 31,173 | | | 483,805 |
| | | | | |
| | | | | 513,415 |
| | | | | |
Metal Processors (0.6%) | | | | | |
A.M. Castle & Co. | | 2,700 | | | 90,288 |
Ampco-Pittsburgh Corp. | | 3,500 | | | 116,200 |
Dynamic Materials Corp. | | 5,130 | | | 165,391 |
Kaydon Corp. | | 11,248 | | | 470,166 |
L.B. Foster Co. (b) (d) | | 5,400 | | | 119,664 |
Ladish Co., Inc. (b) | | 6,300 | | | 196,686 |
Metal Management, Inc. | | 11,590 | | | 318,493 |
Mueller Industries, Inc. | | 14,625 | | | 536,299 |
NN, Inc. | | 7,585 | | | 85,635 |
Quanex Corp. | | 13,875 | | | 464,951 |
RBC Bearings, Inc. (b) | | 9,200 | | | 250,056 |
Steel Technologies, Inc. | | 5,605 | | | 107,560 |
Valmont Industries, Inc. | | 6,115 | | | 341,217 |
Worthington Industries, Inc. | | 30,175 | | | 521,424 |
| | | | | |
| | | | | 3,784,030 |
| | | | | |
Metals (0.6%) | | | | | |
Brush Engineered Materials, Inc. (b) (d) | | 8,936 | | | 300,786 |
Century Aluminum Co. (b) | | 9,727 | | | 378,575 |
Cleveland-Cliffs, Inc. (d) | | 18,038 | | | 762,827 |
Coeur d’Alene Mines Corp. (b) (d) | | 112,755 | | | 552,500 |
Compass Minerals International, Inc. | | 14,160 | | | 438,252 |
Gibraltar Industries, Inc. | | 7,778 | | | 164,194 |
Hecla Mining Co. (b) (d) | | 51,238 | | | 333,559 |
Statement of Investments (Continued)
October 31, 2006
Gartmore Small Cap Index Fund (Continued)
Common Stocks (continued)
| | | | | |
| | | Shares or Principal Amount | | Value |
| | | | | |
Metals (continued) | | | | | |
RTI International Metals, Inc. (b) (d) | | 9,510 | | $ | 583,153 |
Stepan Co. | | 3,700 | | | 116,402 |
Stillwater Mining Co. (b) (d) | | 12,435 | | | 133,676 |
USEC, Inc. (d) | | 29,813 | | | 332,713 |
| | | | | |
| | | | | 4,096,637 |
| | | | | |
Motor Vehicle Parts & Accessories (0.0%) | | | |
Fuel Systems Solutions, Inc. (b) | | 5,150 | | | 67,568 |
| | | | | |
Natural Gas (0.2%) | | | | | |
Aquila, Inc. (b) | | 134,485 | | | 617,286 |
EnergySouth, Inc. (d) | | 2,700 | | | 104,760 |
Laclede Group, Inc. (The) | | 9,200 | | | 327,796 |
Syntroleum Corp. (b) (d) | | 13,808 | | | 54,404 |
| | | | | |
| | | | | 1,104,246 |
| | | | | |
Office Equipment & Supplies (0.7%) | | | |
Acco Brands Corp. (b) | | 15,600 | | | 379,080 |
CompX International, Inc. | | 300 | | | 5,376 |
Ennis Business Forms, Inc. | | 10,100 | | | 231,997 |
Global Imaging Systems, Inc. (b) | | 22,358 | | | 486,734 |
Herman Miller, Inc. | | 27,400 | | | 939,273 |
IKON Office Solutions, Inc. | | 38,620 | | | 575,824 |
Interface, Inc. (b) | | 16,555 | | | 240,875 |
John H. Harland Co. | | 11,779 | | | 481,643 |
Knoll, Inc. | | 15,900 | | | 314,820 |
School Specialty, Inc. (b) (d) | | 9,808 | | | 384,081 |
Standard Register Co. | | 6,151 | | | 83,223 |
| | | | | |
| | | | | 4,122,926 |
| | | | | |
Oil & Gas (2.8%) | | | | | |
Allis-Chalmers Energy, Inc. (b) (d) | | 3,500 | | | 52,745 |
Alon USA Energy, Inc. | | 5,600 | | | 157,192 |
Arena Resources, Inc. (b) (d) | | 3,000 | | | 107,160 |
Atlas America, Inc. (b) | | 7,110 | | | 341,351 |
ATP Oil & Gas Corp. (b) (d) | | 8,900 | | | 382,611 |
Atwood Oceanics, Inc. (b) (d) | | 10,786 | | | 498,313 |
Aurora Oil and Gas Corp. (b) (d) | | 17,400 | | | 53,940 |
Berry Petroleum Co. (d) | | 15,080 | | | 450,138 |
Bill Barrett Corp. (b) (d) | | 9,500 | | | 271,035 |
Bois d’Arc Energy, Inc. (b) | | 3,300 | | | 53,064 |
Brigham Exploration Co. (b) | | 21,202 | | | 165,164 |
Bronco Drilling Co., Inc. (b) (d) | | 7,100 | | | 120,984 |
| | | | | |
| | | Shares or Principal Amount | | Value |
| | | | | |
Oil & Gas (continued) | | | | | |
Callon Petroleum Co. (b) | | 5,400 | | $ | 83,052 |
Carrizo Oil & Gas, Inc. (b) (d) | | 9,640 | | | 275,318 |
Clayton Williams Energy, Inc. (b) | | 2,200 | | | 86,614 |
Complete Production Services, Inc. (b) | | 9,000 | | | 173,610 |
Comstock Resources, Inc. (b) (d) | | 15,631 | | | 436,105 |
Crosstex Energy, Inc. | | 3,900 | | | 374,322 |
Dawson Geophysical Co. (b) (d) | | 4,400 | | | 132,176 |
Delek US Holdings, Inc. (b) | | 1,600 | | | 29,808 |
Delta Petroleum Corp. (b) (d) | | 22,580 | | | 580,306 |
Edge Petroleum Corp. (b) | | 8,136 | | | 148,157 |
Encore Acquisition Co. (b) (d) | | 22,075 | | | 552,758 |
Energy Partners Ltd. (b) | | 16,915 | | | 413,233 |
EXCO Resources, Inc. (b) | | 16,600 | | | 240,368 |
Gasco Energy, Inc. (b) (d) | | 21,700 | | | 58,373 |
Geoglobal Resources, Inc. (b) (d) | | 5,100 | | | 40,392 |
Giant Industries, Inc. (b) | | 5,860 | | | 474,543 |
Gmx Resources, Inc. (b) (d) | | 3,700 | | | 145,410 |
Goodrich Petroleum Corp. (b) (d) | | 6,095 | | | 208,510 |
Grey Wolf, Inc. (b) (d) | | 71,917 | | | 503,419 |
Gulfport Energy Corp. (b) (d) | | 3,600 | | | 42,912 |
Hanover Compressor Co. (b) | | 38,665 | | | 716,077 |
Harvest Natural Resources, Inc. (b) (d) | | 18,165 | | | 201,813 |
Houston Exploration Co. (The) (b) | | 12,003 | | | 650,082 |
Lufkin Industries, Inc. | | 6,364 | | | 384,004 |
Mariner Energy, Inc. (b) (d) | | 26,200 | | | 519,284 |
Markwest Hydrocarbon, Inc. | | 200 | | | 6,566 |
Matrix Service Co. (b) | | 11,000 | | | 158,070 |
McMoRan Exploration Co. (b) | | 10,107 | | | 152,818 |
Meridian Resource Corp. (The) (b) | | 30,200 | | | 101,472 |
Metretek Technologies, Inc. (b) (d) | | 4,200 | | | 54,768 |
NATCO Group, Inc. Class A (b) | | 6,800 | | | 225,352 |
Newpark Resources, Inc. (b) | | 30,984 | | | 182,186 |
Parallel Petroleum Corp. (b) | | 14,965 | | | 303,041 |
Parker Drilling Co. (b) | | 37,412 | | | 306,404 |
Penn Virginia Corp. | | 6,490 | | | 464,360 |
Petrohawk Energy Corp. (b) | | 52,619 | | | 596,173 |
Petroleum Development Corp. (b) | | 7,256 | | | 334,864 |
Petroquest Energy, Inc. (b) | | 15,800 | | | 179,804 |
Quest Resource Corp. (b) | | 9,400 | | | 97,290 |
Quiksilver Resources, Inc. (b) (d) | | 45,500 | | | 634,725 |
Rossetta Resources, Inc. (b) | | 17,005 | | | 307,450 |
Common Stocks (continued)
| | | | | |
| | | Shares or Principal Amount | | Value |
| | | | | |
Oil & Gas (continued) | | | | | |
RPC, Inc. (d) | | 7,301 | | $ | 158,578 |
Stone Energy Corp. (b) | | 9,459 | | | 368,617 |
Sulphco, Inc. (b) (d) | | 8,500 | | | 46,495 |
Swift Energy Co. (b) | | 10,620 | | | 496,166 |
T-3 Energy Services, Inc. (b) | | 300 | | | 6,579 |
The Exploration Co. of Delaware (b) | | 13,600 | | | 150,552 |
Toreador Resources Corp. (b) (d) | | 5,700 | | | 123,690 |
Transmeridian Exploration, Inc. (b) (d) | | 20,500 | | | 71,750 |
Trico Marine Services, Inc. (b) | | 6,000 | | | 204,600 |
Union Drilling, Inc. (b) | | 2,000 | | | 25,460 |
Vaalco Energy, Inc. (b) | | 25,500 | | | 211,395 |
Verasun Energy Corp. (b) (d) | | 8,490 | | | 156,131 |
Warren Resources, Inc. (b) | | 23,040 | | | 271,642 |
Warrior Energy Service Corp. (b) | | 2,300 | | | 65,297 |
Western Refining, Inc. | | 10,500 | | | 247,380 |
Whiting Petroleum Corp. (b) | | 13,255 | | | 591,306 |
World Fuel Services Corp. | | 10,920 | | | 469,778 |
| | | | | |
| | | | | 17,895,102 |
| | | | | |
Oil Equipment & Services (0.7%) | | | |
Basic Energy Services, Inc. (b) | | 3,200 | | | 78,208 |
CARBO Ceramics, Inc. (d) | | 8,899 | | | 299,896 |
Dril-Quip, Inc. (b) (d) | | 9,696 | | | 381,828 |
Evergreen Energy, Inc. (b) (d) | | 26,360 | | | 338,726 |
Hercules Offshore, Inc. (b) (d) | | 6,300 | | | 224,406 |
Hydril Co. (b) | | 7,570 | | | 454,579 |
Lone Star Technologies, Inc. (b) | | 12,799 | | | 617,936 |
Pioneer Drilling Co. (b) | | 16,545 | | | 217,236 |
SJW Corp. (d) | | 3,945 | | | 132,631 |
Veritas DGC, Inc. (b) | | 14,550 | | | 1,047,745 |
W-H Energy Services, Inc. (b) | | 11,745 | | | 550,018 |
WD-40 Co. | | 8,027 | | | 272,838 |
| | | | | |
| | | | | 4,616,047 |
| | | | | |
Oil Field Machinery & Equipment (0.2%) | | | |
Gulf Island Fabrication, Inc. | | 6,687 | | | 196,732 |
Oil States International, Inc. (b) | | 17,730 | | | 514,879 |
Superior Well Services, Inc. (b) (d) | | 2,500 | | | 60,350 |
Universal Compression Holdings, Inc. (b) | | 12,568 | | | 757,347 |
| | | | | |
| | | | | 1,529,308 |
| | | | | |
| | | | | |
| | | Shares or Principal Amount | | Value |
| | | | | |
Paper & Forest Products (0.6%) | | | |
AEP Industries, Inc. (b) | | 3,800 | | $ | 200,184 |
Bowater, Inc. (d) | | 23,620 | | | 493,894 |
Buckeye Technologies, Inc. (b) | | 7,890 | | | 81,977 |
Caraustar Industries, Inc. (b) | | 11,524 | | | 124,805 |
Chesapeake Corp. (d) | | 8,870 | | | 137,574 |
Deltic Timber Corp. (d) | | 3,556 | | | 181,036 |
Glatfelter & Co. (d) | | 14,910 | | | 218,282 |
Graphic Packaging Corp. (b) (d) | | 20,400 | | | 79,560 |
Longview Fibre Co. | | 32,676 | | | 688,157 |
Mercer International, Inc. (b) (d) | | 8,620 | | | 83,614 |
Neenah Paper, Inc. | | 5,100 | | | 187,833 |
Potlatch Corp. | | 15,341 | | | 622,845 |
Rock-Tenn Co. | | 9,733 | | | 200,889 |
Schweitzer-Mauduit International, Inc. | | 5,342 | | | 123,187 |
Universal Forest Products, Inc. | | 7,306 | | | 331,546 |
Wausau-Mosinee Paper Corp. | | 15,447 | | | 209,461 |
Xerium Technologies, Inc. | | 2,800 | | | 34,664 |
| | | | | |
| | | | | 3,999,508 |
| | | | | |
Pharmaceuticals (2.6%) | | | | | |
Acadia Pharmaceuticals, Inc. (b) | | 6,400 | | | 60,672 |
Adams Respiratory Therapeutics, Inc. (b) | | 12,100 | | | 521,510 |
Adventrx Pharmaceuticals, Inc. (b) (d) | | 12,200 | | | 41,114 |
Alexion Pharmaceuticals, Inc. (b) (d) | | 12,469 | | | 465,842 |
Alnylam Pharmaceuticals, Inc. (b) (d) | | 9,300 | | | 183,396 |
Altus Pharmaceuticals, Inc. (b) (d) | | 1,000 | | | 16,480 |
Anadys Pharmaceuticals, Inc. (b) | | 18,500 | | | 63,085 |
Andrx Corp (b) | | 27,735 | | | 682,004 |
Array BioPharma, Inc. (b) | | 17,300 | | | 169,886 |
AtheroGenics, Inc. (b) (d) | | 16,504 | | | 214,552 |
Auxilium Pharmaceuticals, Inc, (b) | | 4,200 | | | 52,920 |
Avanir Pharmaceuticals (b) (d) | | 14,750 | | | 58,705 |
AVI BioPharma, Inc. (b) | | 10,500 | | | 40,740 |
Bioenvision, Inc. (b) | | 15,500 | | | 79,670 |
BioMarin Pharmaceutical, Inc. (b) | | 35,368 | | | 566,949 |
Bradley Pharmaceuticals, Inc. (b) | | 7,400 | | | 128,760 |
Cell Genesys, Inc. (b) | | 21,717 | | | 95,120 |
Conor Medsystems, Inc. (b) (d) | | 12,005 | | | 294,843 |
Statement of Investments (Continued)
October 31, 2006
Gartmore Small Cap Index Fund (Continued)
Common Stocks (continued)
| | | | | |
| | | Shares or Principal Amount | | Value |
| | | | | |
Pharmaceuticals (continued) | | | | | |
Cubist Pharmaceuticals, Inc. (b) | | 22,620 | | $ | 503,747 |
Cytokinetics, Inc. (b) | | 4,700 | | | 34,263 |
Dendreon Corp. (b) (d) | | 30,778 | | | 155,121 |
Depomed, Inc. (b) (d) | | 21,100 | | | 91,574 |
Emisphere Technologies, Inc. (b) (d) | | 12,400 | | | 81,716 |
Encysive Pharmaceuticals, Inc. (b) | | 29,677 | | | 141,559 |
Enzon, Inc. (b) | | 21,405 | | | 183,227 |
Geron Corp. (b) (d) | | 22,817 | | | 182,992 |
Hana Biosciences, Inc. (b) (d) | | 7,100 | | | 59,427 |
ICOS Corp. (b) (d) | | 26,805 | | | 850,254 |
Indevus Pharmaceuticals, Inc. (b) (d) | | 26,100 | | | 178,263 |
Inter Parfums, Inc. | | 1,900 | | | 37,297 |
Isis Pharmaceuticals, Inc. (b) | | 26,380 | | | 226,340 |
Keryx Biopharmaceuticals, Inc. (b) (d) | | 19,341 | | | 271,548 |
LifeCell Corp. (b) (d) | | 14,060 | | | 329,426 |
Mannatech, Inc. (d) | | 5,100 | | | 80,070 |
Medical Co. (b) (d) | | 18,379 | | | 477,119 |
Medicis Pharmaceutical Corp. (d) | | 22,260 | | | 779,989 |
Metabasis Therapeutics, Inc. (b) | | 4,000 | | | 28,480 |
Momenta Pharmaceuticals, Inc. (b) (d) | | 6,400 | | | 95,360 |
Nastech Pharmaceutical Co., Inc. (b) (d) | | 10,300 | | | 181,177 |
Nektar Therapeutic (b) (d) | | 36,495 | | | 526,623 |
Neurocrine Biosciences, Inc. (b) | | 17,535 | | | 202,529 |
New River Pharmaceuticals, Inc. (b) (d) | | 4,630 | | | 235,482 |
Northfield Laboratories, Inc. (b) (d) | | 11,600 | | | 155,904 |
Noven Pharmaceuticals, Inc. (b) (d) | | 10,900 | | | 242,089 |
Nuvelo, Inc. (b) | | 18,658 | | | 344,054 |
Onyx Pharmaceuticals, Inc. (b) (d) | | 16,720 | | | 314,002 |
Pain Therapeutics, Inc. (b) (d) | | 15,510 | | | 129,664 |
Panacos Pharmaceuticals, Inc. (b) | | 12,700 | | | 87,122 |
Parexel International Corp. (b) | | 12,051 | | | 356,710 |
Penwest Pharmaceuticals Co. (b) (d) | | 10,340 | | | 183,225 |
Peregrine Pharmaceuticals, Inc. (b) (d) | | 82,000 | | | 111,520 |
| | | | | |
| | | Shares or Principal Amount | | Value |
| | | | | |
Pharmaceuticals (continued) | | | | | |
Perrigo Co. | | 31,311 | | $ | 560,154 |
Pharmion Corp. (b) | | 10,165 | | | 248,534 |
POZEN, Inc. (b) (d) | | 12,505 | | | 207,958 |
PRA International (b) (d) | | 8,900 | | | 262,550 |
Progenics Pharmaceuticals, Inc. (b) (d) | | 9,100 | | | 237,692 |
Regeneron Pharmaceuticals, Inc. (b) | | 15,377 | | | 308,309 |
Renovis, Inc. (b) (d) | | 9,200 | | | 32,292 |
Salix Pharmaceuticals, Inc. (b) | | 19,270 | | | 256,869 |
Santarus, Inc. (b) | | 22,600 | | | 173,794 |
Savient Pharmaceuticals, Inc. (b) | | 18,952 | | | 144,225 |
Sciele Pharma, Inc. (b) (d) | | 12,635 | | | 275,569 |
Somaxon Pharmaceuticals, Inc. (b) (d) | | 3,400 | | | 49,436 |
SuperGen, Inc. (b) | | 25,034 | | | 141,943 |
Telik, Inc. (b) (d) | | 21,106 | | | 399,959 |
United Therapeutics Corp. (b) (d) | | 9,812 | | | 587,248 |
Valeant Pharmaceuticals International | | 35,700 | | | 666,876 |
Viropharma, Inc. (b) | | 23,300 | | | 310,589 |
Xenport, Inc. (b) (d) | | 6,000 | | | 144,420 |
| | | | | |
| | | | | 16,602,538 |
| | | | | |
Pollution Control (0.3%) | | | | | |
Aleris International, Inc. (b) | | 11,745 | | | 604,985 |
Calgon Carbon Corp. (b) (d) | | 15,148 | | | 69,984 |
Casella Waste Systems, Inc., Class A (b) | | 8,237 | | | 93,408 |
Clean Harbors, Inc. (b) | | 6,400 | | | 273,856 |
Flanders Corp. (b) (d) | | 7,955 | | | 79,868 |
Waste Connections, Inc. (b) | | 17,756 | | | 722,491 |
Waste Industries USA, Inc. | | 1,400 | | | 40,348 |
Waste Services, Inc. (b) (d) | | 6,399 | | | 64,118 |
| | | | | |
| | | | | 1,949,058 |
| | | | | |
Printing & Publishing (0.4%) | | | | | |
Banta Corp. | | 9,507 | | | 420,970 |
Bowne & Co., Inc. | | 11,988 | | | 187,372 |
Cenveo, Inc. (b) | | 19,350 | | | 383,904 |
Courier Corp. | | 2,350 | | | 92,167 |
Journal Register Co. | | 15,761 | | | 124,197 |
Playboy Enterprises, Inc. (b) (d) | | 11,334 | | | 120,254 |
Common Stocks (continued)
| | | | | |
| | | Shares or Principal Amount | | Value |
| | | | | |
Printing & Publishing (continued) | | | |
Presstek, Inc. (b) (d) | | 12,985 | | $ | 79,858 |
PRIMEDIA, Inc. (b) (d) | | 54,800 | | | 92,612 |
ProQuest Co. (b) | | 10,079 | | | 128,910 |
Scholastic Corp. (b) | | 15,222 | | | 478,275 |
Sun-Times Media Group, Inc. | | 31,774 | | | 184,289 |
Valassis Communications, Inc. (b) | | 20,300 | | | 304,703 |
| | | | | |
| | | | | 2,597,511 |
| | | | | |
Radio (0.2%) | | | | | |
Citadel Broadcasting Co. | | 12,800 | | | 131,072 |
Cox Radio, Inc. (b) | | 20,590 | | | 346,736 |
Entercom Communications Corp. | | 14,600 | | | 403,982 |
Radio One, Inc. (b) | | 26,560 | | | 180,342 |
Spanish Broadcasting System, Inc. (b) | | 21,979 | | | 103,301 |
| | | | | |
| | | | | 1,165,433 |
| | | | | |
Railroads (0.1%) | | | | | |
American Railcar Industries, Inc. | | 1,900 | | | 58,710 |
Florida East Coast Industries, Inc. (d) | | 12,860 | | | 768,385 |
| | | | | |
| | | | | 827,095 |
| | | | | |
Real Estate (0.5%) | | | | | |
AMREP Corp. (d) | | 1,100 | | | 78,760 |
Avatar Holdings, Inc. (b) (d) | | 2,092 | | | 136,001 |
California Coastal Communities, Inc. (b) (d) | | 2,500 | | | 49,550 |
Consolidated-Tomoka Land Co. (d) | | 1,980 | | | 128,106 |
Crescent Real Estate Equities Co. | | 32,800 | | | 715,040 |
Franklin Street Properties Corp. (d) | | 16,400 | | | 337,020 |
Getty Realty Corp. (d) | | 5,335 | | | 170,720 |
HouseValues, Inc. (b) (d) | | 10,400 | | | 60,944 |
KKR Financial Corp. | | 33,100 | | | 888,072 |
Tarragon Realty Investors, Inc. | | 2,887 | | | 32,854 |
Trammell Crow Co. (b) | | 12,534 | | | 611,033 |
| | | | | |
| | | | | 3,208,100 |
| | | | | |
Real Estate Investment Trusts (5.5%) | | | |
Acadia Realty Trust | | 10,099 | | | 258,029 |
Affordable Residential Communities (b) | | 11,000 | | | 120,780 |
| | | | | |
| | | Shares or Principal Amount | | Value |
| | | | | |
Real Estate Investment Trusts (continued) | | | |
Agree Realty Corp. | | 4,100 | | $ | 143,746 |
Alexandria Real Estate Equities, Inc. | | 12,136 | | | 1,209,958 |
American Campus Communities, Inc. | | 7,950 | | | 211,709 |
American Financial Realty Trust | | 53,300 | | | 622,011 |
American Home Mortgage Investment Corp. (d) | | 16,680 | | | 569,956 |
Anthracite Capital, Inc. (d) | | 25,851 | | | 370,186 |
Arbor Realty Trust, Inc. | | 6,130 | | | 170,414 |
Ashford Hospitality Trust | | 22,100 | | | 284,648 |
BioMed Realty Trust, Inc. | | 24,303 | | | 783,286 |
Bluegreen Corp. (b) (d) | | 5,500 | | | 68,970 |
Capital Lease Funding, Inc. (d) | | 15,000 | | | 176,700 |
Capital Trust, Inc., Class A (d) | | 2,768 | | | 123,204 |
Cedar Shopping Centers, Inc. | | 8,900 | | | 148,719 |
CentraCore Properties Trust | | 3,800 | | | 123,120 |
Commercial Net Lease Realty (d) | | 19,940 | | | 448,052 |
Corporate Office Properties Trust | | 13,980 | | | 668,104 |
Cousins Properties, Inc. | | 13,902 | | | 497,275 |
Deerfield Triarc Capital Corp. (d) | | 24,100 | | | 358,126 |
DiamondRock Hospitality Co. | | 21,600 | | | 364,392 |
Digital Reality Trust, Inc. | | 12,210 | | | 407,692 |
EastGroup Properties, Inc. | | 8,710 | | | 463,633 |
Education Realty Trust, Inc. | | 12,200 | | | 188,734 |
Entertainment Properties Trust | | 10,514 | | | 578,270 |
Equity Inns, Inc. | | 18,836 | | | 316,068 |
Equity Lifestyle Properties, Inc. | | 8,636 | | | 425,496 |
Equity One, Inc. (d) | | 12,625 | | | 317,140 |
Extra Space Storage, Inc. | | 15,140 | | | 279,182 |
FelCor Lodging Trust, Inc. | | 25,800 | | | 535,608 |
Fieldstone Investment Co. (d) | | 24,550 | | | 199,592 |
First Industrial Realty Trust, Inc. | | 18,602 | | | 855,134 |
First Potomac Realty Trust | | 11,100 | | | 343,434 |
Five Star Quality Care (b) | | 8,600 | | | 88,666 |
Glenborough Realty Trust, Inc. | | 14,594 | | | 379,152 |
Glimcher Realty Trust | | 14,178 | | | 365,225 |
GMH Communities Trust | | 13,670 | | | 190,970 |
Gramercy Capital Corp. | | 5,300 | | | 147,870 |
Healthcare Realty Trust, Inc. (d) | | 19,800 | | | 801,900 |
Hersha Hospitality Trust | | 16,200 | | | 177,552 |
Highland Hospitality Corp. | | 19,310 | | | 266,864 |
Statement of Investments (Continued)
October 31, 2006
Gartmore Small Cap Index Fund (Continued)
Common Stocks (continued)
| | | | | |
| | | Shares or Principal Amount | | Value |
| | | | | |
Real Estate Investment Trusts (continued) | | | |
Home Properties of New York, Inc. | | 14,190 | | $ | 896,382 |
Impac Mortgage Holdings, Inc. | | 26,428 | | | 250,273 |
Inland Real Estate Corp. (d) | | 26,470 | | | 494,724 |
Innkeepers USA Trust | | 14,961 | | | 256,581 |
Investors Real Estate Trust (d) | | 16,097 | | | 161,936 |
Jer Investors Trust, Inc. | | 6,900 | | | 123,924 |
Kite Realty Group Trust | | 8,269 | | | 151,653 |
LaSalle Hotel Properties | | 16,686 | | | 704,984 |
Lexington Corporate Properties Trust (d) | | 22,985 | | | 489,581 |
LTC Properties, Inc. | | 7,740 | | | 209,754 |
Luminent Mortgage Capital, Inc. | | 18,057 | | | 191,585 |
Maguire Properties, Inc. | | 15,110 | | | 646,104 |
Medical Properties Trust, Inc. | | 19,510 | | | 264,946 |
MFA Mortgage Investments, Inc. | | 27,374 | | | 216,802 |
Mid-America Apartment Communities, Inc. | | 9,992 | | | 635,991 |
Mills Corp. | | 24,700 | | | 451,269 |
MortgageIT Holdings, Inc. | | 10,085 | | | 143,005 |
National Health Investors, Inc. | | 7,537 | | | 242,239 |
Nationwide Health Properties, Inc. | | 31,874 | | | 916,058 |
Newcastle Investment Corp. | | 15,897 | | | 471,664 |
Newkirk Realty Trust, Inc. | | 5,500 | | | 93,170 |
Northstar Realty Finance Corp. | | 16,020 | | | 242,703 |
Omega Healthcare Investors, Inc. | | 20,000 | | | 337,600 |
Parkway Properties, Inc. (d) | | 6,482 | | | 319,822 |
Pennsylvania Real Estate Investment Trust | | 13,167 | | | 567,498 |
Post Properties, Inc. | | 16,676 | | | 816,790 |
PS Business Parks, Inc. | | 7,045 | | | 463,913 |
Rait Investment Trust | | 11,933 | | | 358,706 |
Ramco-Gershenson Properties Trust (d) | | 7,639 | | | 250,636 |
Realty Income Corp. | | 34,100 | | | 900,239 |
Redwood Trust, Inc. (d) | | 7,320 | | | 402,380 |
Republic Property Trust (d) | | 13,755 | | | 171,112 |
Saul Centers, Inc. (d) | | 4,145 | | | 201,447 |
Saxon Capital, Inc. | | 16,000 | | | 226,400 |
Senior Housing Properties Trust (d) | | 23,097 | | | 529,614 |
Sizeler Property Investors (d) | | 5,225 | | | 79,420 |
| | | | | |
| | | Shares or Principal Amount | | Value |
| | | | | |
Real Estate Investment Trusts (continued) | | | |
Sovran Self Storage, Inc. | | 7,101 | | $ | 418,817 |
Spirit Finance Corp. | | 39,710 | | | 472,946 |
Strategic Hotel Capital, Inc. | | 29,132 | | | 619,638 |
Sun Communities, Inc. (d) | | 8,510 | | | 297,765 |
Sunstone Hotel Investors, Inc. | | 24,050 | | | 708,513 |
Tanger Factory Outlet Centers, Inc. | | 10,497 | | | 391,538 |
Trustreet Properties, Inc. (d) | | 22,727 | | | 385,677 |
U-Store-It Trust (d) | | 19,710 | | | 432,832 |
Universal Health Realty Income Trust | | 4,673 | | | 181,826 |
Urstadt Biddle Properties, Inc., Class A | | 6,580 | | | 125,875 |
Washington Real Estate Investment Trust (d) | | 18,684 | | | 787,531 |
Windrose Medical Properties Trust | | 11,300 | | | 210,858 |
Winston Hotels, Inc. | | 8,745 | | | 105,815 |
Winthrop Realty Trust (d) | | 2,100 | | | 13,041 |
| | | | | |
| | | | | 34,083,144 |
| | | | | |
Recreational Vehicles & Boats (0.1%) | | | |
Arctic Cat, Inc. | | 5,878 | | | 105,275 |
Polaris Industries, Inc. (d) | | 17,300 | | | 740,786 |
| | | | | |
| | | | | 846,061 |
| | | | | |
Research & Development (0.3%) | | | |
Albany Molecular Research, Inc. (b) | | 9,385 | | | 111,775 |
Biosite, Inc. (b) (d) | | 7,471 | | | 343,143 |
Exponet, Inc. (b) | | 8,400 | | | 152,040 |
Forrester Research, Inc. (b) | | 6,981 | | | 219,413 |
Kendle International, Inc. (b) | | 5,900 | | | 204,258 |
MGI PHARMA, Inc. (b) (d) | | 32,160 | | | 612,005 |
Pharmanet Development Group, Inc. (b) | | 8,725 | | | 163,158 |
Senomyx, Inc. (b) (d) | | 9,100 | | | 140,322 |
Trimeris, Inc. (b) (d) | | 6,468 | | | 49,286 |
| | | | | |
| | | | | 1,995,400 |
| | | | | |
Residential Building Construction (0.2%) | | | |
Ameron International Corp. | | 2,900 | | | 212,425 |
Beacon Roofing Supply, Inc. (b) (d) | | 18,870 | | | 373,626 |
BlueLinx Holdings, Inc. (d) | | 3,580 | | | 38,413 |
Common Stocks (continued)
| | | | | |
| | | Shares or Principal Amount | | Value |
| | | | | |
Residential Building Construction (continued) |
Dycom Industries, Inc. (b) | | 13,896 | | $ | 323,916 |
Insituform Technologies, Inc. (b) (d) | | 10,782 | | | 251,975 |
M/I Schottenstein Homes, Inc. (d) | | 5,792 | | | 208,049 |
| | | | | |
| | | | | 1,408,404 |
| | | | | |
Restaurants (1.3%) | | | | | |
AFC Enterprises, Inc. (b) (d) | | 12,575 | | | 204,973 |
Applebee’s International, Inc. | | 31,200 | | | 711,984 |
BJ’s Restaurants, Inc. (b) (d) | | 3,800 | | | 81,814 |
Bob Evans Farms, Inc. | | 15,759 | | | 534,388 |
Buffalo Wild Wings, Inc. (b) | | 4,015 | | | 207,576 |
California Pizza Kitchen, Inc. (b) | | 9,480 | | | 305,920 |
Chipotle Mexican Grill, Inc. (b) | | 10,300 | | | 601,520 |
CKE Restaurants, Inc. | | 19,997 | | | 390,741 |
Cosi, Inc. (b) (d) | | 16,100 | | | 70,035 |
Denny’s Corp. (b) | | 36,600 | | | 155,550 |
Domino’s Pizza, Inc. | | 12,460 | | | 338,663 |
IHOP Corp. | | 6,060 | | | 316,150 |
Jack in the Box, Inc. (b) | | 13,480 | | | 756,362 |
Landry’s Restaurants, Inc. (d) | | 6,814 | | | 199,650 |
Lone Star Steakhouse & Saloon, Inc. | | 8,521 | | | 232,623 |
Luby’s, Inc. (b) | | 7,400 | | | 74,074 |
McCormick & Schmick’s Seafood Restaurants, Inc. (b) | | 2,400 | | | 63,096 |
Morton’s Restaurant Group, Inc. (b) | | 3,300 | | | 53,427 |
O’Charley’s, Inc. (b) | | 10,925 | | | 217,298 |
P.F. Chang’s China Bistro, Inc. (b) (d) | | 11,385 | | | 476,121 |
Papa John’s International, Inc. (b) | | 9,624 | | | 353,201 |
Ruby Tuesday, Inc. | | 20,660 | | | 573,315 |
Ruth’s Chris Steak House, Inc. (b) | | 9,000 | | | 177,210 |
Sonic Corp. (b) | | 27,910 | | | 634,953 |
Steak n Shake Co. (The) (b) (d) | | 8,172 | | | 151,917 |
Texas Roadhouse, Inc., Class A (b) (d) | | 16,575 | | | 239,509 |
Triarc Cos., Inc. (d) | | 19,995 | | | 335,716 |
| | | | | |
| | | | | 8,457,786 |
| | | | | |
Retail (3.0%) | | | | | |
1-800-FLOWERS.COM (b) (d) | | 8,646 | | | 47,726 |
99 CENTS Only Stores (b) | | 13,816 | | | 165,654 |
| | | | | |
| | | Shares or Principal Amount | | Value |
| | | | | |
Retail (continued) | | | | | |
A.C. Moore Arts & Crafts, Inc. (b) (d) | | 8,180 | | $ | 179,387 |
Alexander’s, Inc. (b) (d) | | 600 | | | 218,850 |
America’s Car-Mart, Inc. (b) (d) | | 5,686 | | | 84,949 |
Asbury Automotive Group, Inc. | | 1,860 | | | 44,640 |
Big 5 Sporting Goods Corp. | | 10,600 | | | 254,824 |
Big Lots, Inc. (b) | | 45,800 | | | 965,463 |
Blockbuster, Inc. (b) (d) | | 68,980 | | | 270,402 |
Bon-Ton Stores, Inc. (The) (d) | | 3,760 | | | 134,082 |
Books-A-Million, Inc (d) | | 7,300 | | | 145,927 |
Borders Group, Inc. | | 27,500 | | | 566,225 |
Build-A-Bear-Workshop, Inc. (b) (d) | | 3,900 | | | 113,802 |
Building Materials Holding Corp. (d) | | 12,041 | | | 313,788 |
Cabela’s Inc. (b) (d) | | 10,005 | | | 236,118 |
Cache, Inc. (b) | | 4,200 | | | 90,090 |
Carter’s, Inc. (b) (d) | | 19,408 | | | 547,888 |
Casey’s General Stores, Inc. | | 20,080 | | | 487,342 |
Cash America International, Inc. | | 12,554 | | | 518,857 |
Casual Male Retail Group, Inc. (b) (d) | | 14,606 | | | 216,315 |
Cato Corp. | | 12,291 | | | 281,341 |
CBRL Group, Inc. | | 13,400 | | | 588,394 |
CEC Entertainment, Inc. (b) | | 11,448 | | | 394,613 |
Charlotte Russe Holding, Inc. (b) | | 6,836 | | | 189,015 |
Children’s Place Retail Store, Inc. (The) (b) | | 9,011 | | | 632,481 |
Christopher & Banks Corp. | | 14,439 | | | 389,709 |
Citi Trends, Inc. (b) | | 2,100 | | | 82,404 |
Conn’s, Inc. (b) (d) | | 2,400 | | | 57,648 |
Cost Plus, Inc. (b) (d) | | 11,285 | | | 134,856 |
CSK Auto Corp. (b) | | 15,100 | | | 235,560 |
Digital Theater Systems, Inc. (b) | | 5,212 | | | 111,485 |
Dress Barn, Inc. (b) (d) | | 19,029 | | | 413,310 |
EZCORP, Inc. (b) | | 5,300 | | | 239,401 |
Fossil, Inc. (b) (d) | | 17,845 | | | 389,735 |
Fred’s, Inc. (d) | | 18,460 | | | 241,457 |
Genesco, Inc. (b) | | 8,120 | | | 305,068 |
Group 1 Automotive, Inc. | | 10,363 | | | 593,904 |
Guitar Center, Inc. (b) | | 11,355 | | | 492,466 |
Gymboree Corp. (b) | | 13,002 | | | 604,073 |
Haverty Furniture Co., Inc. (d) | | 10,475 | | | 165,505 |
Statement of Investments (Continued)
October 31, 2006
Gartmore Small Cap Index Fund (Continued)
Common Stocks (continued)
| | | | | |
| | | Shares or Principal Amount | | Value |
| | | | | |
Retail (continued) | | | | | |
Hibbet Sporting Goods, Inc. (b) (d) | | 14,959 | | $ | 437,401 |
Insight Enterprises, Inc. (b) | | 19,962 | | | 428,983 |
Jo-Ann Stores, Inc. (b) (d) | | 8,783 | | | 159,851 |
Liquidity Services, Inc. (b) | | 4,635 | | | 78,563 |
M&F Worldwide Corp. (b) (d) | | 3,700 | | | 59,533 |
Men’s Wearhouse, Inc. | | 17,900 | | | 713,314 |
Movado Group, Inc. (d) | | 8,037 | | | 206,953 |
New York & Co., Inc. (b) (d) | | 6,000 | | | 78,000 |
Pantry, Inc. (The) (b) | | 9,575 | | | 522,604 |
Pier 1 Imports, Inc. (d) | | 28,600 | | | 187,044 |
RARE Hospitality International, Inc. (b) | | 14,871 | | | 468,585 |
Regis Corp. | | 18,975 | | | 712,510 |
Restoration Hardware, Inc. (b) (d) | | 14,020 | | | 133,611 |
Retail Ventures, Inc. (b) | | 8,805 | | | 150,742 |
Rush Enterprises, Inc. (b) | | 10,000 | | | 187,600 |
Smart & Final, Inc. (b) | | 4,204 | | | 75,714 |
Sonic Automotive, Inc. | | 9,552 | | | 251,218 |
Stein Mart, Inc. | | 7,733 | | | 126,589 |
Talbots, Inc. | | 9,600 | | | 269,184 |
Tuesday Morning Corp. (d) | | 13,342 | | | 220,143 |
Village Super Market, Inc., Class A (d) | | 1,300 | | | 89,700 |
Weis Markets, Inc. | | 4,283 | | | 173,890 |
West Marine, Inc. (b) (d) | | 8,962 | | | 151,637 |
Zale Corp. (b) | | 19,202 | | | 553,786 |
Zumiez, Inc. (b) (d) | | 6,900 | | | 226,734 |
| | | | | |
| | | | | 18,808,643 |
| | | | | |
Retail – Food & Drug (0.4%) | | | | | |
Arden Group, Inc., Class A | | 168 | | | 23,389 |
Ingles Markets, Inc., Class A | | 5,252 | | | 149,367 |
Longs Drug Stores Corp. | | 11,643 | | | 501,115 |
Nash-Finch Co. (d) | | 6,635 | | | 172,178 |
Pathmark Stores, Inc. (b) (d) | | 23,968 | | | 242,796 |
Ruddick Corp. | | 13,189 | | | 371,930 |
Spartan Stores, Inc. | | 10,400 | | | 215,072 |
United Natural Foods, Inc. (b) (d) | | 16,772 | | | 585,343 |
Wild Oats Markets, Inc. (b) | | 12,980 | | | 233,380 |
| | | | | |
| | | | | 2,494,570 |
| | | | | |
Semiconductors (2.3%) | | | | | |
Actel Corp. (b) (d) | | 11,909 | | | 195,189 |
Advanced Analogic Technologies, Inc. (b) | | 9,500 | | | 59,090 |
| | | | | |
| | | Shares or Principal Amount | | Value |
| | | | | |
Semiconductors (continued) | | | | | |
AMIS Holdings, Inc. (b) | | 12,875 | | $ | 123,471 |
Amkor Technology, Inc. (b) (d) | | 35,400 | | | 244,614 |
Applied Micro Circuits Corp. (b) | | 127,970 | | | 390,309 |
Asyst Technologies, Inc. (b) | | 18,409 | | | 136,779 |
ATMI, Inc. (b) | | 16,057 | | | 508,846 |
Axcelis Technologies, Inc. (b) | | 44,733 | | | 308,658 |
Bookham, Inc. (b) (d) | | 28,000 | | | 87,640 |
Brooks Automation, Inc. (b) | | 26,878 | | | 381,668 |
Cirrus Logic, Inc. (b) | | 30,297 | | | 213,897 |
COHU, Inc. | | 10,845 | | | 214,514 |
Conexant Systems, Inc. (b) | | 176,840 | | | 341,301 |
Credence Systems Corp. (b) | | 53,422 | | | 172,019 |
Cymer, Inc. (b) | | 16,038 | | | 743,040 |
Diodes, Inc. (b) | | 8,460 | | | 372,578 |
EMCORE Corp. (b) (d) | | 17,100 | | | 98,325 |
Emulex Corp. (b) | | 31,040 | | | 583,552 |
Entegris, Inc. (b) (d) | | 47,454 | | | 531,959 |
Exar Corp. (b) | | 15,564 | | | 201,865 |
FEI Co. (b) | | 11,068 | | | 253,014 |
FormFactor, Inc. (b) | | 18,437 | | | 703,925 |
Genesis Microchip, Inc. (b) | | 15,404 | | | 157,891 |
Hittite Microwave Corp. (b) | | 3,700 | | | 126,873 |
Ikanos Communications (b) (d) | | 5,400 | | | 45,360 |
Ixia (b) (d) | | 13,636 | | | 124,769 |
IXYS Corp. (b) | | 6,302 | | | 63,713 |
Kopin Corp. (b) (d) | | 23,607 | | | 84,277 |
LTX Corp. (b) | | 26,373 | | | 123,162 |
Mattson Technology, Inc. (b) | | 22,474 | | | 219,796 |
Microsemi Corp. (b) | | 26,608 | | | 521,517 |
Microtune, Inc. (b) (d) | | 16,350 | | | 84,039 |
Mindspeed Technologies, Inc. (b) (d) | | 61,300 | | | 107,275 |
MIPS Technologies, Inc. (b) (d) | | 19,574 | | | 144,260 |
MKS Instruments, Inc. (b) | | 11,823 | | | 255,968 |
Monolithic Power Systems (b) (d) | | 4,700 | | | 47,188 |
Mosys, Inc. (b) (d) | | 4,400 | | | 33,352 |
Netlogic Microsystems, Inc. (b) | | 5,100 | | | 101,133 |
Nextest Systems Corp. (b) | | 700 | | | 7,315 |
OmniVision Technologies, Inc. (b) | | 21,228 | | | 348,564 |
ON Semiconductor Corp. (b) | | 56,113 | | | 349,023 |
Optical Communication Products, Inc. (b) (d) | | 1,817 | | | 3,907 |
OSI Systems, Inc. (b) (d) | | 5,076 | | | 105,073 |
Common Stocks (continued)
| | | | | |
| | | Shares or Principal Amount | | Value |
| | | | | |
Semiconductors (continued) | | | | | |
Pericom Semiconductor Corp. (b) | | 10,500 | | $ | 100,905 |
Photronics Corp. (b) | | 12,692 | | | 177,561 |
PortalPlayer, Inc. (b) (d) | | 11,700 | | | 140,751 |
Rudolph Technologies, Inc. (b) | | 11,487 | | | 202,860 |
Semitool, Inc. (b) (d) | | 4,518 | | | 54,894 |
Semtech Corp. (b) | | 29,635 | | | 386,144 |
Silicon Image, Inc. (b) | | 29,906 | | | 353,788 |
Silicon Storage Technology, Inc. (b) (d) | | 31,284 | | | 131,080 |
SiRF Technology Holdings, Inc. (b) | | 18,875 | | | 530,765 |
Skyworks Solutions Co. (b) | | 68,837 | | | 456,389 |
SunPower Corp., Class A (b) (d) | | 4,845 | | | 163,034 |
Supertex, Inc. (b) (d) | | 5,780 | | | 256,690 |
Tessera Technologies, Inc. (b) (d) | | 19,328 | | | 674,740 |
Transmeta Corp. (b) (d) | | 51,700 | | | 61,006 |
Transwitch Corp. (b) (d) | | 39,500 | | | 58,065 |
TriQuint Semiconductor, Inc. (b) | | 58,239 | | | 262,076 |
Ultratech Stepper, Inc. (b) (d) | | 9,550 | | | 136,470 |
Veeco Instruments, Inc. (b) | | 12,042 | | | 225,065 |
Virage Logic Corp. (b) (d) | | 2,000 | | | 18,880 |
Volterra Semiconductor Corp. (b) (d) | | 4,600 | | | 79,396 |
X-Rite, Inc. (d) | | 15,141 | | | 171,245 |
| | | | | |
| | | | | 14,562,512 |
| | | | | |
Services (1.5%) | | | | | |
Advance America Cash Advance Centers, Inc. | | 23,580 | | | 353,464 |
Alderwoods Group, Inc. (b) | | 15,141 | | | 301,154 |
American Ecology Corp. | | 7,500 | | | 156,000 |
aQuantive, Inc. (b) (d) | | 30,799 | | | 837,117 |
Arbitron, Inc. (d) | | 12,253 | | | 514,626 |
Central Parking Corp. (d) | | 2,390 | | | 40,989 |
Clark, Inc. | | 5,300 | | | 66,303 |
Coinmach Service Corp. | | 6,200 | | | 62,000 |
Coinstar, Inc. (b) | | 9,738 | | | 295,840 |
Cornell Cos., Inc. (b) | | 6,700 | | | 119,930 |
First Advantage Corp., Class A (b) (d) | | 2,336 | | | 48,612 |
FTI Consulting, Inc. (b) | | 12,675 | | | 360,097 |
Gaiam, Inc. (b) | | 8,400 | | | 121,884 |
Geo Group, Inc. (The) (b) | | 8,573 | | | 325,755 |
Healthcare Services Group, Inc. (d) | | 13,000 | | | 353,340 |
| | | | | |
| | | Shares or Principal Amount | | Value |
| | | | | |
Services (continued) | | | | | |
ICT Group, Inc. (b) | | 1,200 | | $ | 38,040 |
Labor Ready, Inc. (b) | | 21,469 | | | 375,922 |
Manhattan Associates, Inc. (b) | | 9,540 | | | 281,716 |
MasTec, Inc. (b) | | 12,246 | | | 134,094 |
National Healthcare Corp. | | 1,500 | | | 83,175 |
Perini Corp. (b) | | 6,683 | | | 165,204 |
Perot Systems Corp., Class A (b) | | 29,648 | | | 437,308 |
PHH Corp. (b) | | 22,720 | | | 627,072 |
Rent-A-Center, Inc. (b) | | 28,250 | | | 812,470 |
Rollins, Inc. (d) | | 10,261 | | | 222,048 |
Secure Computing Corp. (b) | | 21,691 | | | 155,741 |
Sotheby’s Holdings, Inc. (d) | | 23,798 | | | 904,324 |
Source Interlink Cos., Inc. (b) (d) | | 15,989 | | | 144,541 |
Stewart Enterprises, Inc.,
Class A (d) | | 36,372 | | | 224,779 |
Team, Inc. (b) (d) | | 3,500 | | | 111,685 |
Tetra Tech, Inc. (b) | | 25,007 | | | 454,627 |
Vertrue, Inc. (b) (d) | | 3,655 | | | 164,365 |
Volt Information Sciences, Inc. (b) (d) | | 4,005 | | | 158,198 |
| | | | | |
| | | | | 9,452,420 |
| | | | | |
Steel (0.6%) | | | | | |
AK Steel Holding Corp. (b) | | 41,740 | | | 623,178 |
Chaparral Steel Co. | | 18,566 | | | 772,160 |
NS Group, Inc. (b) | | 8,341 | | | 545,168 |
Olympic Steel, Inc. | | 4,300 | | | 106,167 |
Oregon Steel Mills, Inc. (b) | | 14,221 | | | 773,622 |
Ryerson Tull, Inc. (d) | | 10,409 | | | 250,857 |
Schnitzer Steel Industries, Inc. | | 9,779 | | | 341,874 |
Wheeling-Pittsburgh Corp. (b) | | 5,140 | | | 101,618 |
| | | | | |
| | | | | 3,514,644 |
| | | | | |
Technology (1.8%) | | | | | |
Acacia Research — Acacia Technologies (b) | | 11,600 | | | 148,248 |
American Reprographics Co. (b) | | 8,700 | | | 308,850 |
Andrew Corp. (b) | | 60,400 | | | 559,304 |
Benchmark Electronics, Inc. (b) | | 23,865 | | | 633,616 |
Black Box Corp. | | 7,677 | | | 342,317 |
CommScope, Inc. (b) | | 21,767 | | | 694,585 |
Concur Technologies, Inc. (b) (d) | | 11,800 | | | 188,092 |
CTS Corp. (d) | | 12,337 | | | 174,198 |
Statement of Investments (Continued)
October 31, 2006
Gartmore Small Cap Index Fund (Continued)
Common Stocks (continued)
| | | | | |
| | | Shares or Principal Amount | | Value |
| | | | | |
Technology (continued) | | | | | |
Digi International, Inc. (b) (d) | | 7,600 | | $ | 106,552 |
Dionex Corp. (b) (d) | | 7,245 | | | 394,128 |
EMS Technologies, Inc. (b) | | 8,000 | | | 146,000 |
Excel Technology, Inc. (b) | | 4,019 | | | 101,922 |
Input/Output, Inc. (b) (d) | | 24,386 | | | 273,367 |
Intergraph Corp. (b) | | 12,483 | | | 545,382 |
Kanbay International, Inc. (b) (d) | | 10,875 | | | 308,850 |
KEMET Corp. (b) | | 28,706 | | | 210,989 |
Kronos, Inc. (b) (d) | | 13,397 | | | 454,158 |
Kulicke & Soffa Industries, Inc. (b) | | 24,668 | | | 221,519 |
Lattice Semiconductor Corp. (b) | | 49,975 | | | 310,345 |
Lionbridge Technologies, Inc. (b) (d) | | 19,100 | | | 129,307 |
Medis Technologies, Inc. (b) (d) | | 8,677 | | | 233,498 |
Merge Technologies, Inc. (b) | | 11,295 | | | 87,084 |
Micros Systems, Inc. (b) | | 15,434 | | | 766,761 |
MTC Technologies, Inc. (b) (d) | | 3,562 | | | 80,644 |
Ness Technologies, Inc. (b) | | 9,075 | | | 134,129 |
Opsware, Inc. (b) (d) | | 27,288 | | | 248,048 |
Orbital Sciences Corp. (b) | | 21,222 | | | 385,392 |
ParkerVision, Inc. (b) (d) | | 3,900 | | | 35,880 |
Plantronics, Inc. (d) | | 18,505 | | | 390,641 |
Plexus Corp. (b) | | 18,204 | | | 399,032 |
Progress Software Corp. (b) | | 17,135 | | | 493,317 |
Rentech, Inc. (b) (d) | | 47,800 | | | 203,150 |
Sonic Solutions (b) (d) | | 9,000 | | | 145,260 |
Symmetricom, Inc. (b) (d) | | 21,285 | | | 180,284 |
Synagro Technologies, Inc. (d) | | 34,900 | | | 150,768 |
Varian Semiconductor Equipment Associates, Inc. (b) | | 21,664 | | | 790,518 |
Varian, Inc. (b) | | 13,069 | | | 612,805 |
| | | | | |
| | | | | 11,588,940 |
| | | | | |
Telecommunications (1.8%) | | | | | |
ADTRAN, Inc. | | 28,405 | | | 657,292 |
Alaska Communications Systems | | 20,000 | | | 287,800 |
Holdings, Inc. | | | | | |
Align Technology, Inc. (b) | | 21,692 | | | 300,651 |
Anaren Microwave, Inc. (b) | | 8,493 | | | 170,794 |
Arris Group, Inc. (b) | | 39,733 | | | 532,422 |
Atlantic Tele-Network, Inc. | | 4,400 | | | 85,096 |
Broadwing Corp. (b) | | 27,151 | | | 406,722 |
Carrier Access Corp. (b) | | 11,600 | | | 72,616 |
| | | | | |
| | | Shares or Principal Amount | | Value |
| | | | | |
Telecommunications (continued) | | | |
Cbeyond, Inc. (b) (d) | | 7,575 | | $ | 229,826 |
Centennial Communications Corp. (d) | | 7,500 | | | 38,700 |
Cincinnati Bell, Inc. (b) | | 98,379 | | | 461,398 |
Commonwealth Telephone Enterprises, Inc. | | 9,648 | | | 403,865 |
Comtech Telecommunications Corp. (b) (d) | | 9,570 | | | 341,171 |
Consolidated Communications Holdings, Inc. | | 8,100 | | | 149,040 |
CPI International, Inc. (b) | | 300 | | | 4,212 |
CT Communications, Inc. | | 8,670 | | | 202,098 |
Ditech Networks, Inc. (b) | | 14,620 | | | 115,352 |
Dobson Communications Corp. (b) | | 61,380 | | | 476,309 |
Eschelon Telecom, Inc. (b) | | 5,800 | | | 102,776 |
Essex Corp (b) (d) | | 7,900 | | | 155,472 |
FairPoint Communications, Inc. | | 11,300 | | | 203,626 |
FiberTower Corp. (b) (d) | | 50,080 | | | 363,080 |
Finisar Corp. (b) | | 96,180 | | | 334,706 |
General Cable Corp. (b) | | 19,390 | | | 729,064 |
General Communication, Inc. (b) (d) | | 20,248 | | | 265,451 |
Golden Telecom, Inc. | | 6,975 | | | 258,145 |
IDT Corp. (b) (d) | | 18,335 | | | 238,172 |
InfoSpace, Inc. (b) | | 10,909 | | | 220,471 |
InterVoice-Brite, Inc. (b) | | 17,456 | | | 107,354 |
Iowa Telecommunications Services, Inc. (d) | | 13,300 | | | 265,202 |
iPCS, Inc. (b) (d) | | 7,500 | | | 404,625 |
Lightbridge, Inc. (b) | | 13,300 | | | 153,748 |
Loral Space and Communications, Inc. (b) (d) | | 2,600 | | | 75,504 |
Neon Communications, Inc. (b) (c) | | 125 | | | 0 |
North Pittsburgh Systems, Inc. | | 4,023 | | | 106,046 |
NTELOS Holdings Corp. (b) | | 7,360 | | | 103,261 |
Premiere Global Services, Inc. (b) | | 29,575 | | | 246,064 |
Radyne, Inc. (b) | | 10,000 | | | 101,000 |
RCN Corp. (b) | | 9,130 | | | 263,674 |
Savvis, Inc. (b) | | 14,530 | | | 451,738 |
Shenandoah Telecommunications Co. (d) | | 1,761 | | | 82,520 |
Sirenza Microdevices, Inc. (b) | | 9,400 | | | 68,902 |
SureWest Communications (d) | | 5,000 | | | 114,400 |
Talk America Holdings, Inc. (b) | | 16,820 | | | 134,896 |
Common Stocks (continued)
| | | | | |
| | | Shares or Principal Amount | | Value |
| | | | | |
Telecommunications (continued) | | | |
UTStarcom, Inc. (b) (d) | | 50,725 | | $ | 546,308 |
Vonage Holdings Corp. (b) | | 15,300 | | | 105,264 |
XO Communications, Inc. (b) (c) | | 5,400 | | | 0 |
Zhone Technologies, Inc. (b) (d) | | 36,540 | | | 51,887 |
| | | | | |
| | | | | 11,188,720 |
| | | | | |
Tire & Rubber (0.1%) | | | | | |
Bandag, Inc. (d) | | 3,887 | | | 170,600 |
Cooper Tire & Rubber Co. (d) | | 28,268 | | | 303,316 |
| | | | | |
| | | | | 473,916 |
| | | | | |
Tobacco (0.1%) | | | | | |
Alliance One International, Inc. (b) | | 40,911 | | | 197,191 |
Universal Corp. | | 11,232 | | | 413,562 |
Vector Group Ltd. | | 18,418 | | | 315,685 |
| | | | | |
| | | | | 926,438 |
| | | | | |
Transportation Services (1.4%) | | | |
Abx Air, Inc. (b) | | 17,200 | | | 98,900 |
Ambassadors International, Inc. | | 4,300 | | | 167,700 |
AMERCO, Inc. (b) | | 4,104 | | | 376,419 |
American Commercial Lines, Inc. (b) | | 12,200 | | | 782,631 |
Arkansas Best Corp. | | 10,925 | | | 447,707 |
Atlas Air Worldwide Holdings, Inc (b) | | 7,900 | | | 359,371 |
Bristow Group, Inc. (b) | | 8,100 | | | 268,920 |
Celadon Group, Inc. (b) | | 10,900 | | | 204,484 |
Dynamex, Inc. (b) | | 1,560 | | | 33,056 |
EGL, Inc. (b) | | 10,773 | | | 366,174 |
Forward Air Corp. | | 13,591 | | | 441,300 |
Genesee & Wyoming, Inc., Class A (b) | | 12,480 | | | 350,563 |
Greenbrier Cos., Inc. (d) | | 6,190 | | | 232,125 |
Gulfmark Offshore, Inc. (b) | | 7,640 | | | 263,809 |
Heartland Express, Inc. | | 20,946 | | | 342,048 |
Horizon Lines, Inc., Class A | | 4,700 | | | 109,745 |
Hornbeck Offshore Services, Inc. (b) | | 8,010 | | | 289,081 |
HUB Group, Inc., Class A (b) | | 14,115 | | | 383,363 |
Interpool, Inc. (d) | | 2,600 | | | 62,192 |
Knight Transportation, Inc. (d) | | 19,120 | | | 348,366 |
Maritrans, Inc. | | 4,000 | | | 149,160 |
| | | | | |
| | | Shares or Principal Amount | | Value |
| | | | | |
Transportation Services (continued) | | | |
Marten Transport Ltd. (b) | | 3,845 | | $ | 65,403 |
Old Dominion Freight Line, Inc. (b) (d) | | 12,179 | | | 336,871 |
P.A.M. Transportation Services, Inc. (b) | | 1,200 | | | 30,384 |
Pacer International, Inc. | | 16,424 | | | 504,053 |
Patriot Transportation Holding, Inc. (b) | | 100 | | | 8,074 |
PHI, Inc. (b) (d) | | 3,800 | | | 120,498 |
Quality Distribution, Inc. (b) | | 900 | | | 13,410 |
RailAmerica, Inc. (b) (d) | | 13,519 | | | 158,307 |
Saia, Inc. (b) | | 6,855 | | | 183,714 |
Sirva, Inc. (b) | | 13,300 | | | 44,422 |
Standard Parking Corp. (b) | | 900 | | | 31,293 |
Star Maritime Acquisition Corp. (b) | | 2,300 | | | 22,287 |
TAL International Group, Inc. | | 4,200 | | | 97,356 |
U.S. Xpress Enterprises, Inc. (b) | | 5,100 | | | 100,674 |
Universal Truckload Services, Inc. (b) | | 1,600 | | | 41,632 |
USA Truck, Inc. (b) (d) | | 4,600 | | | 79,856 |
Werner Enterprises, Inc. (d) | | 22,862 | | | 419,518 |
Wright Express Corp. (b) | | 13,975 | | | 382,496 |
| | | | | |
| | | | | 8,717,362 |
| | | | | |
Utilities (1.4%) | | | | | |
ALLETE, Inc. | | 10,760 | | | 485,276 |
Black Hills Corp. | | 13,180 | | | 454,842 |
CH Energy Group, Inc. (d) | | 5,463 | | | 284,185 |
Duquesne Light Holdings, Inc. (d) | | 35,704 | | | 708,010 |
Empire District Electric Co. (d) | | 13,776 | | | 327,042 |
FuelCell Energy, Inc. (b) | | 21,143 | | | 139,967 |
Headwaters, Inc. (b) (d) | | 16,844 | | | 416,889 |
IDACORP, Inc. (d) | | 17,914 | | | 706,349 |
Littlelfuse, Inc. (b) | | 10,166 | | | 344,221 |
MGE Energy, Inc. (d) | | 6,023 | | | 205,987 |
Northwestern Corp. | | 12,800 | | | 452,864 |
Ormat Technologies, Inc. (d) | | 1,930 | | | 74,112 |
Otter Tail Co. | | 9,540 | | | 285,628 |
Pike Electric Corp. (b) | | 4,800 | | | 88,560 |
PNM Resources, Inc. | | 28,300 | | | 796,928 |
Portland General Electric Co. | | 11,100 | | | 286,047 |
Time Warner Telecom, Inc. (b) | | 49,064 | | | 978,335 |
Statement of Investments (Continued)
October 31, 2006
Gartmore Small Cap Index Fund (Continued)
Common Stocks (continued)
| | | | | |
| | | Shares or Principal Amount | | Value |
Utilities (continued) | | | | | |
UIL Holdings Corp. | | 10,913 | | $ | 433,792 |
UniSource Energy Corp. | | 13,964 | | | 496,839 |
Westar Energy, Inc. | | 35,600 | | | 901,392 |
| | | | | |
| | | | | 8,867,265 |
| | | | | |
Veterinary Services (0.0%) | | | | | |
PetMed Express, Inc. (b) (d) | | 9,500 | | | 118,750 |
| | | | | |
Warehousing (0.1%) | | | | | |
Mobile Mini, Inc. (b) (d) | | 14,229 | | | 457,747 |
| | | | | |
Water (0.1%) | | | | | |
American States Water Co. (d) | | 7,446 | | | 312,733 |
Basin Water, Inc. (b) (d) | | 5,500 | | | 45,870 |
California Water Service Group (d) | | 5,297 | | | 206,053 |
Mueller Water Products, Inc. (b) (d) | | 12,500 | | | 199,625 |
Southwest Water Co. (d) | | 11,125 | | | 140,286 |
| | | | | |
| | | | | 904,567 |
| | | | | |
Wireless Equipment (0.4%) | | | | | |
Atheros Communications (b) (d) | | 21,565 | | | 468,607 |
CalAmp Corp. (b) | | 13,600 | | | 90,440 |
I.D. Systems, Inc. (b) (d) | | 5,600 | | | 117,824 |
InPhonic, Inc. (b) (d) | | 12,580 | | | 115,359 |
InterDigital Communications Corp. (b) (d) | | 21,850 | | | 781,356 |
Novatel Wireless, Inc. (b) (d) | | 13,004 | | | 109,494 |
Powerwave Technologies, Inc. (b) (d) | | 47,805 | | | 311,211 |
Syniverse Holdings, Inc. (b) | | 6,800 | | | 100,300 |
Universal Electronics, Inc. (b) (d) | | 4,156 | | | 89,894 |
USA Mobility, Inc. | | 11,724 | | | 297,555 |
ViaSat, Inc. (b) | | 7,323 | | | 198,746 |
Wireless Facilities, Inc. (b) (d) | | 19,760 | | | 48,412 |
| | | | | |
| | | | | 2,729,198 |
| | | | | |
| | |
Total Common Stocks | | | | | 519,570,685 |
| | | | | |
Repurchase Agreements (17.3%)
| | | | | | |
| | | Principal Amount | | Value |
CS First Boston, 5.17%, dated 10/31/06, due 11/01/06, repurchase price $55,929,153 collateralized by U.S. Government Agency Mortgages with a market value of $57,039,640 | | $ | 55,921,122 | | $ | 55,921,122 |
Nomura Securities, 5.17%, dated 10/31/06, due 11/01/06, repurchase price $53,399,557 collateralized by U.S. Government Agency Mortgages with a market value of $54,459,818 | | | 53,391,889 | | | 53,391,888 |
| | | | | | |
| | |
Total Repurchase Agreements | | | | | | 109,313,010 |
| | | | | | |
|
Short-Term Securities Held as Collateral for Securities
on Loan (17.7%) |
GE Life and Annuity Funding Agreement, 5.42%, 11/14/06 | | | 5,000,000 | | | 5,000,000 |
General Electric Capital Corp. Medium Term Note, 5.39%,12/08/06 | | | 2,000,057 | | | 2,000,057 |
Islandsbanki HF Corp. Medium Term Note, 5.39%, 11/22/06 | | | 2,500,000 | | | 2,500,000 |
Citigroup Global Markets, Inc. Master Note, 5.38%, 11/01/06 | | | 10,000,000 | | | 10,000,000 |
Citigroup Global Markets, Inc. Master Note, 5.38%, 11/01/06 | | | 5,000,000 | | | 5,000,000 |
Dorada Finance, Inc. Medium Term Note, 5.37%, 11/01/06 | | | 5,000,000 | | | 5,000,000 |
Bank of America Bank Note, 5.31%, 11/01/06 | | | 11,500,000 | | | 11,500,000 |
Alliance & Leicester Medium Term Note, 5.31%, 11/08/06 | | | 5,000,000 | | | 5,000,000 |
Merrill Lynch Mortgage Capital Master Note, 5.41%, 11/01/06 | | | 10,000,000 | | | 10,000,000 |
Morgan Stanley Master Note, 5.49%, 11/01/06 | | | 5,000,000 | | | 5,000,000 |
Wachovia Bank Bank Note,
5.37%, 11/01/06 | | | 5,000,000 | | | 5,000,000 |
Banc of America Securities LLC Repurchase Agreement, 5.32%, dated 10/31/06, due 11/01/06, repurchase price $45,986,338, collateralized by U.S. Government Agency Mortgages with a market value of $46,899,134 | | | 45,979,543 | | | 45,979,543 |
| | | | | | |
| |
Total Short-Term Securities Held as Collateral for Securities on Loan | | | 111,979,600 |
| | | | | | |
Gartmore Small Cap Index Fund (Continued)
| | | | | | |
Total Investments
(Cost $668,874,895) (a) — 117.0% | | $ | 740,863,295 | |
| | | | | | |
| | |
Liabilities in excess of other
assets — (17.0)% | | | | | (107,326,862 | ) |
| | | | | | |
| | |
NET ASSETS — 100.0% | | | | $ | 633,536,433 | |
| | | | | | |
| | (a) | See notes to financial statements for tax unrealized appreciation (depreciation) of securities. |
| | (b) | Denotes a non-income producing security. |
| | (d) | All or part of the security was on loan as of October 31, 2006. |
At October 31, 2006, the Fund’s open long futures contracts were as follows:
| | | | | | | | | | |
Number of Contracts | | Long Contracts* | | Expiration | | Market Value Covered By
Contracts | | Unrealized Appreciation (Depreciation) |
| 295 | | Russell 2000 | | 12/15/06 | | $ | 113,722,500 | | $ | 7,109,692 |
| | * | Cash pledged as collateral. |
See notes to financial statements.
Statements of Assets and Liabilities
October 31, 2006
| | | | | | | | | | | | | | | | | | | |
| | | Gartmore Bond Index Fund | | | Gartmore
International Index Fund | | Gartmore Mid Cap Market
Index Fund | | Gartmore S&P 500 Index Fund | | | Gartmore Small Cap Index Fund |
Assets: | | | | | | | | | | | | | | | | | | | |
Investments, at value
(cost $2,366,228,450; $1,672,759,629; $1,122,950,636; $2,921,117,757; and $513,582,342; respectively)* | | $ | 2,360,411,687 | | | $ | 2,213,708,233 | | $ | 1,293,942,431 | | $ | 3,511,400,995 | | | $ | 585,570,742 | | |
Repurchase agreements, at cost and value** | | | 120,742,596 | | | | 111,870,519 | | | 238,701,084 | | | 103,975,110 | | | | 155,292,553 | | |
| | | | | | | | | | | | | | | | | | | | |
Total Investments | | | 2,481,154,283 | | | | 2,325,578,752 | | | 1,532,643,515 | | | 3,615,376,105 | | | | 740,863,295 | | |
| | | | | | | | | | | | | | | | | | | | |
Cash | | | 4,826,227 | | | | 221,717 | | | 6,039,583 | | | — | | | | 502,691 | | |
Cash collateral pledged for futures | | | — | | | | 7,593,874 | | | 5,926,500 | | | 3,024,000 | | | | 3,969,000 | | |
Foreign currency, at value
(cost $0; $14,491,129; $0; $0 and $0; respectively) | | | — | | | | 11,468,305 | | | — | | | — | | | | — | | |
Interest and dividends receivable | | | 19,484,974 | | | | 2,862,557 | | | 1,314,530 | | | 3,188,638 | | | | 760,169 | | |
Receivable for capital shares issued | | | 5,370,999 | | | | 3,308,192 | | | 9,536,609 | | | 8,291,323 | | | | 272,756 | | |
Receivable for investments sold | | | 17,826,683 | | | | 159,648 | | | 2,248,000 | | | — | | | | 185,564 | | |
Unrealized appreciation on futures contracts | | | — | | | | 3,067,595 | | | — | | | 62 | | | | — | | |
Receivable for variation margin on futures contracts | | | — | | | | — | | | — | | | 2,986 | | | | — | | |
Reclaims receivable | | | — | | | | 337,202 | | | — | | | — | | | | — | | |
Prepaid expenses | | | 11,454 | | | | 9,778 | | | 4,310 | | | 19,254 | | | | 2,981 | | |
| | | | | | | | | | | | | | | | | | | | |
Total Assets | | | 2,528,674,620 | | | | 2,354,607,620 | | | 1,557,713,047 | | | 3,629,902,368 | | | | 746,556,456 | | |
| | | | | | | | | | | | | | | | | | | | |
Liabilities: | | | | | | | | | | | | | | | | | | | |
Payable to custodian | | | — | | | | — | | | — | | | 183,575 | | | | — | | |
Distributions payable | | | 2,187 | | | | — | | | — | | | — | | | | — | | |
Payable for investments purchased | | | 155,999,816 | | | | 105,595 | | | 1,689,490 | | | — | | | | 343,696 | | |
Payable for capital shares redeemed | | | 97,497 | | | | 3,619,993 | | | 58,313 | | | 1,334,274 | | | | 94,839 | | |
Unrealized depreciation on forward foreign currency contracts | | | — | | | | 312,616 | | | — | | | — | | | | — | | |
Payable for variation margin on futures contracts | | | — | | | | 92,461 | | | 812,755 | | | — | | | | 381,205 | | |
Payable for return of collateral received for securities on loan | | | 291,009,675 | | | | 344,321,838 | | | 252,666,695 | | | 177,126,924 | | | | 111,979,600 | | |
Accrued expenses and other payables | | | | | | | | | | | | | | | | | | | |
Investment advisory fees | | | 295,340 | | | | 367,241 | | | 171,445 | | | 237,812 | | | | 81,428 | | |
Fund administration and transfer agent fees | | | 192,720 | | | | 217,507 | | | 129,544 | | | 349,895 | | | | 62,233 | | |
Distribution fees | | | 9,512 | | | | 21,351 | | | 42,406 | | | 94,175 | | | | 24,184 | | |
Administrative servicing fees | | | 6,975 | | | | 11,721 | | | 20,080 | | | 105,065 | | | | 15,181 | | |
Trustee fees | | | 266 | | | | 252 | | | 168 | | | 443 | | | | 78 | | |
Compliance program fees (Note 3) | | | 18,425 | | | | 17,879 | | | 11,542 | | | 30,751 | | | | 5,416 | | |
Other | | | 86,504 | | | | 69,994 | | | 68,464 | | | 85,857 | | | | 32,163 | | |
| | | | | | | | | | | | | | | | | | | | |
Total Liabilities | | | 447,718,917 | | | | 349,158,448 | | | 255,670,902 | | | 179,548,771 | | | | 113,020,023 | | |
| | | | | | | | | | | | | | | | | | | | |
Net Assets | | $ | 2,080,955,703 | | | $ | 2,005,449,172 | | $ | 1,302,042,145 | | $ | 3,450,353,597 | | | $ | 633,536,433 | | |
| | | | | | | | | | | | | | | | | | | | |
Represented by: | | | | | | | | | | | | | | | | | | | |
Capital | | $ | 2,098,632,784 | | | $ | 1,399,221,151 | | $ | 1,062,798,121 | | $ | 2,877,489,033 | | | $ | 511,774,282 | | |
Accumulated net investment income (loss) | | | 1,666,162 | | | | 13,176,018 | | | 879,949 | | | 4,124,038 | | | | 656,748 | | |
Accumulated net realized gains (losses) from investment, futures and foreign currency transactions | | | (13,526,480 | ) | | | 52,122,176 | | | 59,512,535 | | | (23,421,235 | ) | | | 42,007,311 | | |
Net unrealized appreciation (depreciation) on investments, futures, and translation of assets and liabilities denominated in foreign currencies | | | (5,816,763 | ) | | | 540,929,827 | | | 178,851,540 | | | 592,161,761 | | | | 79,098,092 | | |
| | | | | | | | | | | | | | | | | | | | |
Net Assets | | $ | 2,080,955,703 | | | $ | 2,005,449,172 | | $ | 1,302,042,145 | | $ | 3,450,353,597 | | | $ | 633,536,433 | | |
| | | | | | | | | | | | | | | | | | | | |
| | | | | | | | | | | | | | | | | | | | |
| * | Includes securities held as collateral for securities on loan of $194,997,610; $263,602,678; $178,795,394; $135,254,423; and $66,000,057; respectively. |
| ** | Includes securities held as collateral for securities on loan of $96,012,065; $80,719,160; $73,871,301; $41,872,501; and $45,979,543; respectively. |
See notes to financial statements.
Statements of Assets and Liabilities (Continued)
October 31, 2006
| | | | | | | | | | | | | | | | | | | | | | |
| | | Gartmore Bond Index Fund | | | Gartmore
International Index Fund | | | Gartmore Mid Cap Market
Index Fund | | | Gartmore S&P 500 Index Fund | | | Gartmore Small Cap Index Fund |
Net Assets: | | | | | | | | | | | | | | | | | | | | | | |
Class A Shares | | $ | 44,444,115 | | | $ | 103,403,038 | | | $ | 192,273,970 | | | $ | 42,670,253 | | | $ | 114,280,835 | | | |
Class B Shares | | | 181,099 | | | | 604,517 | | | | 935,088 | | | | 6,296,167 | | | | 482,293 | | | |
Class C Shares | | | 5,172 | | | | 639,287 | | | | 794,122 | | | | 1,422,512 | | | | 534,348 | | | |
Institutional Class Shares | | | 2,036,325,317 | | | | 1,900,802,330 | | | | 1,108,038,965 | | | | 2,689,367,610 | | | | 518,238,957 | | | |
Service Class Shares | | | — | | | | — | | | | — | | | | 628,020,675 | | | | — | | | |
Institutional Service Class Shares | | | — | | | | — | | | | — | | | | 82,442,558 | | | | — | | | |
Local Fund Shares | | | — | | | | — | | | | — | | | | 133,822 | | | | — | | | |
| | | | | | | | | | | | | | | | | | | | | | | |
Total | | $ | 2,080,955,703 | | | $ | 2,005,449,172 | | | $ | 1,302,042,145 | | | $ | 3,450,353,597 | | | $ | 633,536,433 | | | |
| | | | | | | | | | | | | | | | | | | | | | | |
| | | | | | |
Shares outstanding (unlimited number of shares authorized): | | | | | | | | | | | | | | | | | | | | | | |
Class A Shares | | | 4,111,732 | | | | 9,764,215 | | | | 12,293,981 | | | | 3,631,498 | | | | 8,485,574 | | | |
Class B Shares | | | 16,756 | | | | 58,012 | | | | 60,540 | | | | 537,788 | | | | 36,087 | | | |
Class C Shares | | | 479 | | | | 62,374 | | | | 51,638 | | | | 122,116 | | | | 40,073 | | | |
Institutional Class Shares | | | 188,508,442 | | | | 179,122,234 | | | | 70,372,069 | | | | 227,828,076 | | | | 38,146,234 | | | |
Service Class Shares | | | — | | | | — | | | | — | | | | 53,458,223 | | | | — | | | |
Institutional Service Class Shares | | | — | | | | — | | | | — | | | | 6,991,213 | | | | — | | | |
Local Fund Shares | | | — | | | | — | | | | — | | | | 11,314 | | | | — | | | |
| | | | | | | | | | | | | | | | | | | | | | | |
Total | | | 192,637,409 | | | | 189,006,835 | | | | 82,778,228 | | | | 292,580,228 | | | | 46,707,968 | | | |
| | | | | | | | | | | | | | | | | | | | | | | |
| | | | | | |
Net asset value and redemption price per share: | | | | | | | | | | | | | | | | | | | | | | |
Class A Shares | | $ | 10.81 | | | $ | 10.59 | | | $ | 15.64 | | | $ | 11.75 | | | $ | 13.47 | | | |
Class B Shares (a) | | $ | 10.81 | | | $ | 10.42 | | | $ | 15.45 | | | $ | 11.71 | | | $ | 13.36 | (c) | | |
Class C Shares (b) | | $ | 10.81 | (c) | | $ | 10.25 | | | $ | 15.38 | | | $ | 11.65 | | | $ | 13.33 | | | |
Institutional Class Shares | | $ | 10.80 | | | $ | 10.61 | | | $ | 15.75 | | | $ | 11.80 | | | $ | 13.59 | | | |
Service Class Shares | | $ | — | | | $ | — | | | $ | — | | | $ | 11.75 | | | $ | — | | | |
Institutional Service Class Shares | | $ | — | | | $ | — | | | $ | — | | | $ | 11.79 | | | $ | — | | | |
Local Fund Shares | | $ | — | | | $ | — | | | $ | — | | | $ | 11.83 | | | $ | — | | | |
| | | | | | |
Maximum offering price per share (100%/100%-maximum sales charge) of net asset value adjusted to the nearest cent): | | | | | | | | | | | | | | | | | | | | | | |
Class A Shares | | $ | 11.47 | | | $ | 11.24 | | | $ | 16.59 | | | $ | 12.47 | | | $ | 14.29 | | | |
| | | | | | | | | | | | | | | | | | | | | | | |
Maximum Sales Charge — Class A Shares | | | 5.75 | % | | | 5.75 | % | | | 5.75 | % | | | 5.75 | % | | | 5.75 | % | | |
| | | | | | | | | | | | | | | | | | | | | | | |
| | | | | | | | | | | | | | | | | | | | | | | |
| (a) | For Class B Shares, the redemption price per share varies by length of time shares are held. |
| (b) | For Class C Shares, the redemption price per share is reduced by 1.00% for shares held less than one year. |
| (c) | The NAV reported above represents the traded NAV at October 31, 2006. Due to the financial statement rounding of class assets and class shares above, the NAV results in a different NAV than the traded NAV. |
See notes to financial statements.
Statements of Operations
For the Year Ended October 31, 2006
| | | | | | | | | | | | | | | | | | | | | | |
| | | Gartmore
Bond
Index Fund | | | Gartmore
International
Index Fund | | | Gartmore
Mid Cap Market
Index Fund | | | Gartmore
S&P 500
Index Fund | | | Gartmore
Small Cap
Index Fund |
INVESTMENT INCOME: | | | | | | | | | | | | | | | | | | | | | | |
Interest income | | $ | 85,660,991 | | | $ | 1,945,062 | | | $ | 7,443,859 | | | $ | 2,750,812 | | | $ | 4,325,665 | | | |
Dividend income (net of foreign withholding tax of $0; $3,212,425; $0; $0 and $0; respectively) | | | — | | | | 42,103,811 | | | | 13,384,640 | | | | 57,557,512 | | | | 4,863,368 | | | |
Income from securities lending | | | 564,208 | | | | 1,777,812 | | | | 530,854 | | | | 406,631 | | | | 734,881 | | | |
| | | | | | | | | | | | | | | | | | | | | | | |
Total Income | | | 86,225,199 | | | | 45,826,685 | | | | 21,359,353 | | | | 60,714,955 | | | | 9,923,914 | | | |
| | | | | | | | | | | | | | | | | | | | | | | |
| | | | | | |
Expenses: | | | | | | | | | | | | | | | | | | | | | | |
Investment advisory fees | | | 3,857,103 | | | | 4,540,332 | | | | 2,625,630 | | | | 3,841,921 | | | | 1,043,208 | | | |
Fund administration and transfer agent fees | | | 1,835,277 | | | | 1,761,490 | | | | 1,168,322 | | | | 2,966,541 | | | | 528,719 | | | |
Distribution fees Class A | | | 106,348 | | | | 155,547 | | | | 461,429 | | | | 83,822 | | | | 216,599 | | | |
Distribution fees Class B | | | 1,992 | | | | 5,322 | | | | 9,668 | | | | 60,052 | | | | 4,811 | | | |
Distribution fees Class C | | | 29 | | | | 3,583 | | | | 4,885 | | | | 11,867 | | | | 2,530 | | | |
Distribution fees Service Class | | | — | | | | — | | | | — | | | | 889,743 | | | | — | | | |
Distribution fees Local Class | | | — | | | | — | | | | — | | | | 87 | | | | — | | | |
Administrative servicing fees Class A | | | 60,698 | | | | 89,364 | | | | 258,454 | | | | 4,589 | | | | 125,181 | | | |
Administrative servicing fees Service Class | | | — | | | | — | | | | — | | | | 1,482,897 | | | | — | | | |
Administrative servicing fees Institutional Service Class | | | — | | | | — | | | | — | | | | 186,982 | | | | — | | | |
Registration and filing fees | | | 109,050 | | | | 88,909 | | | | 84,447 | | | | 116,623 | | | | 65,125 | | | |
Trustee fees | | | 59,048 | | | | 56,657 | | | | 40,385 | | | | 104,462 | | | | 17,319 | | | |
Compliance program fees (Note 3) | | | 35,060 | | | | 33,304 | | | | 22,183 | | | | 58,615 | | | | 10,178 | | | |
Other | | | 419,998 | | | | 399,457 | | | | 413,089 | | | | 830,162 | | | | 139,653 | | | |
| | | | | | | | | | | | | | | | | | | | | | | |
Total expenses before reimbursed expenses | | | 6,484,603 | | | | 7,133,965 | | | | 5,088,492 | | | | 10,638,363 | | | | 2,153,323 | | | |
Earnings credit (Note 5) | | | (32,092 | ) | | | (534 | ) | | | (19,587 | ) | | | (9,373 | ) | | | (17,753 | ) | | |
Expenses reimbursed | | | (663,758 | ) | | | (631,723 | ) | | | (509,553 | ) | | | (808,395 | ) | | | (222,353 | ) | | |
Expenses voluntarily waived by administrator | | | (496 | ) | | | (995 | ) | | | (10,376 | ) | | | (1,803 | ) | | | (1,423 | ) | | |
| | | | | | | | | | | | | | | | | | | | | | | |
Net Expenses | | | 5,788,257 | | | | 6,500,713 | | | | 4,548,976 | | | | 9,818,792 | | | | 1,911,794 | | | |
| | | | | | | | | | | | | | | | | | | | | | | |
Net Investment Income (Loss) | | | 80,436,942 | | | | 39,325,972 | | | | 16,810,377 | | | | 50,896,163 | | | | 8,012,120 | | | |
| | | | | | | | | | | | | | | | | | | | | | | |
| | | | | | |
REALIZED/UNREALIZED GAINS (LOSSES) FROM INVESTMENTS: | | | | | | | | | | | | | | | | | | | | | | |
Net realized gains (losses) on investment transactions | | | (9,447,814 | ) | | | 45,946,322 | | | | 50,651,726 | | | | (333,846 | ) | | | 38,067,773 | | | |
Net realized gains (losses) on future transactions | | | — | | | | 12,764,560 | | | | 6,882,462 | | | | 4,299,000 | | | | 1,981,626 | | | |
Net realized gains (losses) on foreign currency transactions | | | — | | | | 1,378,047 | | | | — | | | | — | | | | — | | | |
Net realized gains (losses) on swap transactions | | | (89,862 | ) | | | — | | | | — | | | | — | | | | — | | | |
| | | | | | | | | | | | | | | | | | | | | | | |
Net realized gains (losses) on investment, futures, swaps and foreign currency transactions | | | (9,537,676 | ) | | | 60,088,929 | | | | 57,534,188 | | | | 3,965,154 | | | | 40,049,399 | | | |
Net change in unrealized appreciation/depreciation on investments, futures, swaps and translation of assets and liabilities denominated in foreign currencies | | | 19,853,848 | | | | 302,297,060 | | | | 62,882,944 | | | | 401,817,283 | | | | 43,224,274 | | | |
| | | | | | | | | | | | | | | | | | | | | | | |
Net realized/unrealized gains (losses) on investments, futures and foreign currencies | | | 10,316,172 | | | | 362,385,989 | | | | 120,417,132 | | | | 405,782,437 | | | | 83,273,673 | | | |
| | | | | | | | | | | | | | | | | | | | | | | |
CHANGE IN NET ASSETS RESULTING FROM OPERATIONS | | $ | 90,753,114 | | | $ | 401,711,961 | | | $ | 137,227,509 | | | $ | 456,678,600 | | | $ | 91,285,793 | | | |
| | | | | | | | | | | | | | | | | | | | | | | |
See notes to financial statements.
Statements of Changes in Net Assets
| | | | | | | | | | | | | | | | | | |
| | | Gartmore Bond Index Fund | | | Gartmore International Index Fund |
| | | Year Ended
October 31, 2006 | | | Year Ended
October 31, 2005 | | | Year Ended
October 31, 2006 | | | Year Ended
October 31, 2005 |
FROM INVESTMENT ACTIVITIES: | | | | | | | | | | | | | | | | | | |
Operations: | | | | | | | | | | | | | | | | | | |
Net investment income (loss) | | $ | 80,436,942 | | | $ | 51,812,730 | (c) | | $ | 39,325,972 | | | $ | 24,637,588 | | | |
Net realized gains (losses) on investment, futures, swaps and foreign currency transactions | | | (9,537,676 | ) | | | (1,589,885 | )(d) | | | 60,088,929 | | | | 40,158,126 | | | |
Net change in unrealized appreciation/depreciation on investments, futures, swaps and translation of assets and liabilities denominated in foreign currencies | | | 19,853,848 | | | | (40,578,235 | ) | | | 302,297,060 | | | | 123,259,235 | | | |
| | | | | | | | | | | | | | | | | | |
Change in net assets resulting from operations | | | 90,753,114 | | | | 9,644,610 | | | | 401,711,961 | | | | 188,054,949 | | | |
| | | | | | | | | | | | | | | | | | |
| | | | | |
Distributions to Class A Shareholders from: | | | | | | | | | | | | | | | | | | |
Net investment income | | | (1,759,169 | ) | | | (1,589,869 | ) | | | (830,952 | ) | | | (887,978 | ) | | |
Net realized gains on investments | | | — | | | | (21,640 | ) | | | (1,248,104 | ) | | | (372,809 | ) | | |
| | | | | |
Distributions to Class B Shareholders from: | | | | | | | | | | | | | | | | | | |
Net investment income | | | (7,029 | ) | | | (8,494 | ) | | | (4,766 | ) | | | (6,059 | ) | | |
Net realized gains on investments | | | — | | | | (138 | ) | | | (12,143 | ) | | | (2,547 | ) | | |
| | | | | |
Distributions to Class C Shareholders from: | | | | | | | | | | | | | | | | | | |
Net investment income | | | (107 | )(b) | | | — | | | | (4,261 | ) | | | (1,839 | )(a) | | |
Net realized gains on investments | | | — | | | | — | | | | (4,617 | ) | | | — | | | |
| | | | | |
Distributions to Institutional Class Shareholders from: | | | | | | | | | | | | | | | | | | |
Net investment income | | | (78,361,327 | ) | | | (51,119,187 | ) | | | (25,682,212 | ) | | | (30,547,982 | ) | | |
Net realized gains on investments | | | — | | | | (539,426 | ) | | | (40,251,609 | ) | | | (10,207,889 | ) | | |
| | | | | | | | | | | | | | | | | | |
Change in net assets from shareholder distributions | | | (80,127,632 | ) | | | (53,278,754 | ) | | | (68,038,664 | ) | | | (42,027,103 | ) | | |
| | | | | | | | | | | | | | | | | | |
Change in net assets from capital transactions | | | 557,303,622 | | | | 563,405,652 | | | | 309,998,300 | | | | 326,357,828 | | | |
| | | | | | | | | | | | | | | | | | |
Change in net assets | | | 567,929,104 | | | | 519,771,508 | | | | 643,671,597 | | | | 472,385,674 | | | |
| | | | | |
Net Assets: | | | | | | | | | | | | | | | | | | |
Beginning of period | | | 1,513,026,599 | | | | 993,255,091 | | | | 1,361,777,575 | | | | 889,391,901 | | | |
| | | | | | | | | | | | | | | | | | |
End of period | | $ | 2,080,955,703 | | | $ | 1,513,026,599 | | | $ | 2,005,449,172 | | | $ | 1,361,777,575 | | | |
| | | | | | | | | | | | | | | | | | |
| | | | | |
Accumulated net investment income (loss) at end of period | | $ | 1,666,162 | | | $ | 866,187 | | | $ | 13,176,018 | | | $ | (2,108,220 | ) | | |
| | | | | | | | | | | | | | | | | | |
| | | | | | | | | | | | | | | | | | | |
| (a) | For the period from February 14, 2005 (commencement of operations) through October 31, 2005. |
| (b) | For the period from March 29, 2006 (commencement of operations) through October 31, 2006. |
| (c) | The amount reported as the “Net investment income (loss)” of $55,530,868 in the October 31, 2005 annual report contained a typographical error, and should have been $51,812,730. |
| (d) | The amount reported as the “Net realized gains (losses) on investment transactions” of $(1,589,985) in the October 31, 2005 annual report contained a typographical error, and should have been $(1,589,885). |
See notes to financial statements.
Statements of Changes in Net Assets
| | | | | | | | | | |
| | | Gartmore Mid Cap Market Index Fund |
| | | Year Ended
October 31, 2006 | | | Year Ended
October 31, 2005 |
FROM INVESTMENT ACTIVITIES: | | | | | | | | | | |
Operations: | | | | | | | | | | |
Net investment income (loss) | | $ | 16,810,377 | | | $ | 10,106,138 | | | |
Net realized gains (losses) on investment, futures, and foreign currency transactions | | | 57,534,188 | | | | 50,293,676 | | | |
Net change in unrealized appreciation/depreciation on investments, futures, and translation of assets and liabilities denominated in foreign currencies | | | 62,882,944 | | | | 59,756,849 | | | |
| | | | | | | | | | |
Change in net assets resulting from operations | | | 137,227,509 | | | | 120,156,663 | | | |
| | | | | | | | | | |
| | | |
Distributions to Class A Shareholders from: | | | | | | | | | | |
Net investment income | | | (2,125,880 | ) | | | (986,365 | ) | | |
Net realized gains on investments | | | (7,034,770 | ) | | | (1,521,298 | ) | | |
| | | |
Distributions to Class B Shareholders from: | | | | | | | | | | |
Net investment income | | | (5,600 | ) | | | (1,707 | ) | | |
Net realized gains on investments | | | (41,422 | ) | | | (13,730 | ) | | |
| | | |
Distributions to Class C Shareholders from: | | | | | | | | | | |
Net investment income | | | (3,491 | ) | | | (561 | ) | | |
Net realized gains on investments | | | (12,106 | ) | | | (530 | ) | | |
| | | |
Distributions to Institutional Class Shareholders from: | | | | | | | | | | |
Net investment income | | | (15,260,628 | ) | | | (8,089,901 | ) | | |
Net realized gains on investments | | | (39,843,686 | ) | | | (11,631,944 | ) | | |
| | | | | | | | | | |
Change in net assets from shareholder distributions | | | (64,327,583 | ) | | | (22,246,036 | ) | | |
| | | | | | | | | | |
Change in net assets from capital transactions | | | 220,254,346 | | | | 315,044,639 | | | |
| | | | | | | | | | |
Change in net assets | | | 293,154,272 | | | | 412,955,266 | | | |
| | | |
Net Assets: | | | | | | | | | | |
Beginning of period | | | 1,008,887,873 | | | | 595,932,607 | | | |
| | | | | | | | | | |
End of period | | $ | 1,302,042,145 | | | $ | 1,008,887,873 | | | |
| | | | | | | | | | |
| | | |
Accumulated net investment income (loss) at end of period | | $ | 879,949 | | | $ | 1,465,171 | | | |
| | | | | | | | | | |
| | | | | | | | | | | |
See notes to financial statements.
Statements of Changes in Net Assets (Continued)
| | | | | | | | | | | | | | | | | | |
| | | Gartmore S&P 500 Index Fund | | | Gartmore Small Cap Index Fund |
| | | Year Ended
October 31, 2006 | | | Year Ended
October 31, 2005 | | | Year Ended
October 31, 2006 | | | Year Ended
October 31, 2005 |
FROM INVESTMENT ACTIVITIES: | | | | | | | | | | | | | | | | | | |
Operations: | | | | | | | | | | | | | | | | | | |
Net investment income (loss) | | $ | 50,896,163 | | | $ | 40,844,963 | | | $ | 8,012,120 | | | $ | 4,288,843 | | | |
Net realized gains (losses) on investment and futures transactions | | | 3,965,154 | | | | 9,873,475 | | | | 40,049,399 | | | | 20,845,474 | | | |
Net change in unrealized appreciation/depreciation on investments and futures | | | 401,817,283 | | | | 116,601,416 | | | | 43,224,274 | | | | 12,196,781 | | | |
| | | | | | | | | | | | | | | | | | |
Change in net assets resulting from operations | | | 456,678,600 | | | | 167,319,854 | | | | 91,285,793 | | | | 37,331,098 | | | |
| | | | | | | | | | | | | | | | | | |
| | | | | |
Distributions to Class A Shareholders from: | | | | | | | | | | | | | | | | | | |
Net investment income | | | (479,284 | ) | | | (229,328 | ) | | | (1,021,182 | ) | | | (639,517 | ) | | |
Net realized gains on investments | | | (188,635 | ) | | | — | | | | (2,647,352 | ) | | | (2,760,397 | ) | | |
| | | | | |
Distributions to Class B Shareholders from: | | | | | | | | | | | | | | | | | | |
Net investment income | | | (43,651 | ) | | | (47,910 | ) | | | (2,648 | ) | | | (1,102 | ) | | |
Net realized gains on investments | | | (42,333 | ) | | | — | | | | (18,904 | ) | | | (14,014 | ) | | |
| | | | | |
Distributions to Class C Shareholders from: | | | | | | | | | | | | | | | | | | |
Net investment income | | | (9,504 | ) | | | (6,857 | ) | | | (2,368 | ) | | | (466 | ) | | |
Net realized gains on investments | | | (7,675 | ) | | | — | | | | (8,380 | ) | | | (1,577 | ) | | |
| | | | | |
Distributions to Institutional Class Shareholders from: | | | | | | | | | | | | | | | | | | |
Net investment income | | | (40,207,767 | ) | | | (30,571,334 | ) | | | (6,596,902 | ) | | | (3,706,523 | ) | | |
Net realized gains on investments | | | (15,461,423 | ) | | | — | | | | (14,705,614 | ) | | | (9,044,421 | ) | | |
| | | | | |
Distributions to Service Class Shareholders from: | | | | | | | | | | | | | | | | | | |
Net investment income | | | (7,751,049 | ) | | | (8,422,320 | ) | | | — | | | | — | | | |
Net realized gains on investments | | | (4,274,411 | ) | | | — | | | | — | | | | — | | | |
| | | | | |
Distributions to Institutional Service Class Shareholders from: | | | | | | | | | | | | | | | | | | |
Net investment income | | | (1,083,623 | ) | | | (1,169,535 | ) | | | — | | | | — | | | |
Net realized gains on investments | | | (515,810 | ) | | | — | | | | — | | | | — | | | |
| | | | | |
Distributions to Local Fund Shareholders from: | | | | | | | | | | | | | | | | | | |
Net investment income | | | (2,000 | ) | | | (2,026 | ) | | | — | | | | — | | | |
Net realized gains on investments | | | (850 | ) | | | — | | | | — | | | | — | | | |
| | | | | | | | | | | | | | | | | | |
Change in net assets from shareholder distributions | | | (70,068,015 | ) | | | (40,449,310 | ) | | | (25,003,350 | ) | | | (16,168,017 | ) | | |
| | | | | | | | | | | | | | | | | | |
Change in net assets from capital transactions | | | 376,896,621 | | | | 707,220,072 | | | | 152,349,944 | | | | 120,267,223 | | | |
| | | | | | | | | | | | | | | | | | |
Change in net assets | | | 763,507,206 | | | | 834,090,616 | | | | 218,632,387 | | | | 141,430,304 | | | |
| | | | | |
Net Assets: | | | | | | | | | | | | | | | | | | |
Beginning of period | | | 2,686,846,391 | | | | 1,852,755,775 | | | | 414,904,046 | | | | 273,473,742 | | | |
| | | | | | | | | | | | | | | | | | |
End of period | | $ | 3,450,353,597 | | | $ | 2,686,846,391 | | | $ | 633,536,433 | | | $ | 414,904,046 | | | |
| | | | | | | | | | | | | | | | | | |
| | | | | |
Accumulated net investment income (loss) at end of period | | $ | 4,124,038 | | | $ | 2,807,688 | | | $ | 656,748 | | | $ | 267,728 | | | |
| | | | | | | | | | | | | | | | | | |
| | | | | | | | | | | | | | | | | | | |
See notes to financial statements.
Statements of Changes in Net Assets (Continued)
| | | | | | | | | | | | | | | | | | |
| | | Gartmore Bond Index Fund | | | Gartmore International Index Fund |
| | | Year Ended October 31, 2006 | | | Year Ended October 31, 2005 | | | Year Ended October 31, 2006 | | | Year Ended October 31, 2005 |
CAPITAL TRANSACTIONS: | | | | | | | | | | | | | | | | | | |
Class A Shares | | | | | | | | | | | | | | | | | | |
Proceeds from shares issued | | $ | 10,928,815 | | | $ | 11,921,461 | | | $ | 71,352,954 | | | $ | 26,347,086 | | | |
Dividends reinvested | | | 1,752,822 | | | | 1,766,838 | | | | 2,056,199 | | | | 1,249,230 | | | |
Cost of shares redeemed (a) | | | (10,541,308 | ) | | | (10,926,951 | ) | | | (22,556,185 | ) | | | (26,127,338 | ) | | |
| | | | | | | | | | | | | | | | | | |
| | | 2,140,329 | | | | 2,761,348 | | | | 50,852,968 | | | | 1,468,978 | | | |
| | | | | | | | | | | | | | | | | | |
| | | | | |
Class B Shares | | | | | | | | | | | | | | | | | | |
Proceeds from shares issued | | | 50,623 | | | | 86,753 | | | | 118,923 | | | | 235,088 | | | |
Dividends reinvested | | | 4,151 | | | | 9,945 | | | | 14,530 | | | | 7,847 | | | |
Cost of shares redeemed (a) | | | (92,299 | ) | | | (326,869 | ) | | | (24,601 | ) | | | (46,512 | ) | | |
| | | | | | | | | | | | | | | | | | |
| | | (37,525 | ) | | | (230,171 | ) | | | 108,852 | | | | 196,423 | | | |
| | | | | | | | | | | | | | | | | | |
| | | | | |
Class C Shares | | | | | | | | | | | | | | | | | | |
Proceeds from shares issued | | | 5,000 | (c) | | | — | | | | 434,916 | | | | 150,474 | (b) | | |
Dividends reinvested | | | 107 | (c) | | | — | | | | 3,914 | | | | 945 | (b) | | |
Cost of shares redeemed (a) | | | — | | | | — | | | | (8,258 | ) | | | (2,509 | )(b) | | |
| | | | | | | | | | | | | | | | | | |
| | | 5,107 | | | | — | | | | 430,572 | | | | 148,910 | | | |
| | | | | | | | | | | | | | | | | | |
| | | | | |
Institutional Class Shares | | | | | | | | | | | | | | | | | | |
Proceeds from shares issued | | | 620,492,665 | | | | 561,634,706 | | | | 403,041,062 | | | | 477,687,940 | | | |
Dividends reinvested | | | 78,361,306 | | | | 55,627,987 | | | | 65,933,564 | | | | 40,755,707 | | | |
Cost of shares redeemed (a) | | | (143,658,260 | ) | | | (56,388,218 | ) | | | (210,368,718 | ) | | | (193,900,130 | ) | | |
| | | | | | | | | | | | | | | | | | |
| | | 555,195,711 | | | | 560,874,475 | | | | 258,605,908 | | | | 324,543,517 | | | |
| | | | | | | | | | | | | | | | | | |
Change in net assets from capital transactions | | $ | 557,303,622 | | | $ | 563,405,652 | | | $ | 309,998,300 | | | $ | 326,357,828 | | | |
| | | | | | | | | | | | | | | | | | |
| | | | | | | | | | | | | | | | | | | |
See notes to financial statements.
Statements of Changes in Net Assets (Continued)
| | | | | | | | | | | | | | |
| | | Gartmore Bond Index Fund | | | Gartmore International Index Fund |
| | | Year Ended October 31, 2006 | | | Year Ended October 31, 2005 | | | Year Ended October 31, 2006 | | | Year Ended October 31, 2005 |
SHARE TRANSACTIONS: | | | | | | | | | | | | | | |
Class A Shares | | | | | | | | | | | | | | |
Issued | | 1,023,062 | | | 1,083,235 | | | 7,159,582 | | | 3,186,846 | | | |
Reinvested | | 163,653 | | | 160,606 | | | 220,428 | | | 150,754 | | | |
Redeemed | | (985,531 | ) | | (994,100 | ) | | (2,284,547 | ) | | (3,149,382 | ) | | |
| | | | | | | | | | | | | | |
| | 201,184 | | | 249,741 | | | 5,095,463 | | | 188,218 | | | |
| | | | | | | | | | | | | | |
| | | | | |
Class B Shares | | | | | | | | | | | | | | |
Issued | | 4,768 | | | 7,897 | | | 12,737 | | | 29,541 | | | |
Reinvested | | 388 | | | 902 | | | 1,600 | | | 962 | | | |
Redeemed | | (8,592 | ) | | (29,622 | ) | | (2,522 | ) | | (5,414 | ) | | |
| | | | | | | | | | | | | | |
| | (3,436 | ) | | (20,823 | ) | | 11,815 | | | 25,089 | | | |
| | | | | | | | | | | | | | |
| | | | | |
Class C Shares | | | | | | | | | | | | | | |
Issued | | 469 | (c) | | — | | | 44,868 | | | 18,137 | (b) | | |
Reinvested | | 10 | (c) | | — | | | 436 | | | 118 | (b) | | |
Redeemed | | — | | | — | | | (877 | ) | | (308 | )(b) | | |
| | | | | | | | | | | | | | |
| | 479 | | | — | | | 44,427 | | | 17,947 | | | |
| | | | | | | | | | | | | | |
| | | | | |
Institutional Class Shares | | | | | | | | | | | | | | |
Issued | | 58,107,928 | | | 51,110,919 | | | 41,519,284 | | | 57,463,660 | | | |
Reinvested | | 7,321,978 | | | 5,061,735 | | | 7,070,045 | | | 4,907,293 | | | |
Redeemed | | (13,529,395 | ) | | (5,130,492 | ) | | (21,327,681 | ) | | (22,470,829 | ) | | |
| | | | | | | | | | | | | | |
| | 51,900,511 | | | 51,042,162 | | | 27,261,648 | | | 39,900,124 | | | |
| | | | | | | | | | | | | | |
Total change in shares | | 52,098,738 | | | 51,271,080 | | | 32,413,353 | | | 40,131,378 | | | |
| | | | | | | | | | | | | | |
| | | | | | | | | | | | | | | |
| (a) | Includes redemption fees, if any. |
| (b) | For the period from February 14, 2005 (commencement of operations) through October 31, 2005. |
| (c) | For the period from March 29, 2006 (commencement of operations) through October 31, 2006. |
See notes to financial statements.
Statements of Changes in Net Assets (Continued)
| | | | | | | | | | | | | | | | | | | | | | | | | | |
| | | Gartmore Mid Cap Market
Index Fund | | | Gartmore S&P 500 Index Fund | | | Gartmore Small Cap Index Fund |
| | | Year Ended
October 31, 2006 | | | Year Ended
October 31, 2005 | | | Year Ended
October 31, 2006 | | | Year Ended
October 31, 2005 | | | Year Ended
October 31, 2006 | | | Year Ended
October 31, 2005 |
CAPITAL TRANSACTIONS: | | | | | | | | | | | | | | | | | | | | | | | | | | |
Class A Shares | | | | | | | | | | | | | | | | | | | | | | | | | | |
Proceeds from shares issued | | $ | 52,229,794 | | | $ | 98,144,558 | | | $ | 20,767,054 | | | $ | 22,204,730 | | | $ | 57,590,171 | | | $ | 30,542,516 | | | |
Dividends reinvested | | | 8,725,557 | | | | 2,318,171 | | | | 592,590 | | | | 220,161 | | | | 3,652,313 | | | | 3,382,379 | | | |
Cost of shares redeemed (a) | | | (29,421,304 | ) | | | (28,200,639 | ) | | | (7,671,949 | ) | | | (5,798,251 | ) | | | (22,181,920 | ) | | | (35,279,663 | ) | | |
| | | | | | | | | | | | | | | | | | | | | | | | | | | |
| | | | 31,534,047 | | | | 72,262,090 | | | | 13,687,695 | | | | 16,626,640 | | | | 39,060,564 | | | | (1,354,768 | ) | | |
| | | | | | | | | | | | | | | | | | | | | | | | | | | |
| | | | | | | |
Class B Shares | | | | | | | | | | | | | | | | | | | | | | | | | | |
Proceeds from shares issued | | | 151,124 | | | | 227,014 | | | | 1,202,333 | | | | 1,517,492 | | | | 64,335 | | | | 83,965 | | | |
Dividends reinvested | | | 40,653 | | | | 14,359 | | | | 57,756 | | | | 35,761 | | | | 20,768 | | | | 14,247 | | | |
Cost of shares redeemed (a) | | | (194,136 | ) | | | (106,040 | ) | | | (1,421,341 | ) | | | (984,230 | ) | | | (107,139 | ) | | | (106,390 | ) | | |
| | | | | | | | | | | | | | | | | | | | | | | | | | | |
| | | | (2,359 | ) | | | 135,333 | | | | (161,252 | ) | | | 569,023 | | | | (22,036 | ) | | | (8,178 | ) | | |
| | | | | | | | | | | | | | | | | | | | | | | | | | | |
| | | | | | | |
Class C Shares | | | | | | | | | | | | | | | | | | | | | | | | | | |
Proceeds from shares issued | | | 671,812 | | | | 252,062 | | | | 722,455 | | | | 1,256,656 | | | | 346,652 | | | | 174,494 | | | |
Dividends reinvested | | | 3,330 | | | | 648 | | | | 3,526 | | | | 2,602 | | | | 2,186 | | | | 1,080 | | | |
Cost of shares redeemed (a) | | | (121,713 | ) | | | (61,173 | ) | | | (284,123 | ) | | | (693,175 | ) | | | (56,119 | ) | | | (18,545 | ) | | |
| | | | | | | | | | | | | | | | | | | | | | | | | | | |
| | | | 553,429 | | | | 191,537 | | | | 441,858 | | | | 566,083 | | | | 292,719 | | | | 157,029 | | | |
| | | | | | | | | | | | | | | | | | | | | | | | | | | |
| | | | | | | |
Institutional Class Shares | | | | | | | | | | | | | | | | | | | | | | | | | | |
Proceeds from shares issued | | | 201,216,467 | | | | 286,440,128 | | | | 439,976,727 | | | | 749,189,581 | | | | 132,966,196 | | | | 132,154,739 | | | |
Dividends reinvested | | | 55,104,248 | | | | 19,721,809 | | | | 55,591,859 | | | | 30,520,255 | | | | 21,302,466 | | | | 12,750,909 | | | |
Cost of shares redeemed (a) | | | (68,151,486 | ) | | | (63,706,258 | ) | | | (110,575,973 | ) | | | (106,627,479 | ) | | | (41,249,965 | ) | | | (23,432,508 | ) | | |
| | | | | | | | | | | | | | | | | | | | | | | | | | | |
| | | | 188,169,229 | | | | 242,455,679 | | | | 384,992,613 | | | | 673,082,357 | | | | 113,018,697 | | | | 121,473,140 | | | |
| | | | | | | | | | | | | | | | | | | | | | | | | | | |
| | | | | | | |
Service Class Shares | | | | | | | | | | | | | | | | | | | | | | | | | | |
Proceeds from shares issued | | | — | | | | — | | | | 46,605,280 | | | | 83,776,172 | | | | — | | | | — | | | |
Dividends reinvested | | | — | | | | — | | | | 12,025,424 | | | | 8,422,320 | | | | — | | | | — | | | |
Cost of shares redeemed (a) | | | — | | | | — | | | | (83,623,451 | ) | | | (71,764,682 | ) | | | — | | | | — | | | |
| | | | | | | | | | | | | | | | | | | | | | | | | | | |
| | | | — | | | | — | | | | (24,992,747 | ) | | | 20,433,810 | | | | — | | | | — | | | |
| | | | | | | | | | | | | | | | | | | | | | | | | | | |
| | | | | | | |
Institutional Service Class Shares | | | | | | | | | | | | | | | | | | | | | | | | | | |
Proceeds from shares issued | | | — | | | | — | | | | 13,588,613 | | | | 11,593,467 | | | | — | | | | — | | | |
Dividends reinvested | | | — | | | | — | | | | 1,599,428 | | | | 1,169,535 | | | | — | | | | — | | | |
Cost of shares redeemed (a) | | | — | | | | — | | | | (12,262,437 | ) | | | (16,822,870 | ) | | | — | | | | — | | | |
| | | | | | | | | | | | | | | | | | | | | | | | | | | |
| | | | — | | | | — | | | | 2,925,604 | | | | (4,059,868 | ) | | | — | | | | — | | | |
| | | | | | | | | | | | | | | | | | | | | | | | | | | |
| | | | | | | |
Local Fund Shares | | | | | | | | | | | | | | | | | | | | | | | | | | |
Dividends reinvested | | | — | | | | — | | | | 2,850 | | | | 2,026 | | | | — | | | | — | | | |
| | | | | | | | | | | | | | | | | | | | | | | | | | | |
| | | | — | | | | — | | | | 2,850 | | | | 2,026 | | | | — | | | | — | | | |
| | | | | | | | | | | | | | | | | | | | | | | | | | | |
Change in net assets from capital transactions | | $ | 220,254,346 | | | $ | 315,044,639 | | | $ | 376,896,621 | | | $ | 707,220,071 | | | $ | 152,349,944 | | | $ | 120,267,223 | | | |
| | | | | | | | | | | | | | | | | | | | | | | | | | | |
| (a) | Includes redemption fees, if any. |
See notes to financial statements.
Statements of Changes in Net Assets (Continued)
| | | | | | | | | | | | | | | | | | | | |
| | | Gartmore Mid Cap Market
Index Fund | | | Gartmore S&P 500 Index Fund | | | Gartmore Small Cap Index Fund |
| | | Year Ended
October 31, 2006 | | | Year Ended
October 31, 2005 | | | Year Ended
October 31, 2006 | | | Year Ended
October 31, 2005 | | | Year Ended
October 31, 2006 | | | Year Ended
October 31, 2005 |
SHARE TRANSACTIONS: | | | | | | | | | | | | | | | | | | | | |
Class A Shares | | | | | | | | | | | | | | | | | | | | |
Issued | | 3,399,326 | | | 6,977,286 | | | 1,883,540 | | | 2,132,450 | | | 4,422,849 | | | 2,585,251 | | | |
Reinvested | | 584,674 | | | 165,326 | | | 54,601 | | | 21,314 | | | 300,535 | | | 282,319 | | | |
Redeemed | | (1,932,121 | ) | | (1,947,668 | ) | | (700,153 | ) | | (563,477 | ) | | (1,761,202 | ) | | (2,964,492 | ) | | |
| | | | | | | | | | | | | | | | | | | | | |
| | | 2,051,879 | | | 5,194,944 | | | 1,237,988 | | | 1,590,287 | | | 2,962,182 | | | (96,922 | ) | | |
| | | | | | | | | | | | | | | | | | | | | |
| | | | | | | |
Class B Shares | | | | | | | | | | | | | | | | | | | | |
Issued | | 9,937 | | | 15,949 | | | 109,472 | | | 147,956 | | | 5,092 | | | 7,222 | | | |
Reinvested | | 2,758 | | | 1,041 | | | 5,357 | | | 3,473 | | | 1,730 | | | 1,193 | | | |
Redeemed | | (13,103 | ) | | (7,554 | ) | | (129,639 | ) | | (96,021 | ) | | (8,315 | ) | | (9,121 | ) | | |
| | | | | | | | | | | | | | | | | | | | | |
| | | (408 | ) | | 9,436 | | | (14,810 | ) | | 55,408 | | | (1,493 | ) | | (706 | ) | | |
| | | | | | | | | | | | | | | | | | | | | |
| | | | | | | |
Class C Shares | | | | | | | | | | | | | | | | | | | | |
Issued | | 44,053 | | | 17,885 | | | 66,874 | | | 124,173 | | | 27,224 | | | 14,919 | | | |
Reinvested | | 227 | | | 47 | | | 328 | | | 255 | | | 179 | | | 91 | | | |
Redeemed | | (8,184 | ) | | (4,400 | ) | | (25,920 | ) | | (69,473 | ) | | (4,232 | ) | | (1,637 | ) | | |
| | | | | | | | | | | | | | | | | | | | | |
| | | 36,096 | | | 13,532 | | | 41,282 | | | 54,955 | | | 23,171 | | | 13,373 | | | |
| | | | | | | | | | | | | | | | | | | | | |
| | | | | | | |
Institutional Class Shares | | | | | | | | | | | | | | | | | | | | |
Issued | | 13,057,804 | | | 20,219,151 | | | 39,970,919 | | | 72,560,117 | | | 10,459,738 | | | 11,224,475 | | | |
Reinvested | | 3,666,970 | | | 1,398,577 | | | 5,101,756 | | | 2,949,467 | | | 1,736,493 | | | 1,057,777 | | | |
Redeemed | | (4,422,132 | ) | | (4,452,655 | ) | | (10,082,673 | ) | | (10,263,495 | ) | | (3,093,122 | ) | | (1,952,254 | ) | | |
| | | | | | | | | | | | | | | | | | | | | |
| | | 12,302,642 | | | 17,165,073 | | | 34,990,002 | | | 65,246,089 | | | 9,103,109 | | | 10,329,998 | | | |
| | | | | | | | | | | | | | | | | | | | | |
| | | | | | | |
Service Class Shares | | | | | | | | | | | | | | | | | | | | |
Issued | | — | | | — | | | 4,205,297 | | | 8,170,050 | | | — | | | — | | | |
Reinvested | | — | | | — | | | 1,109,931 | | | 816,841 | | | — | | | — | | | |
Redeemed | | — | | | — | | | (7,652,029 | ) | | (6,956,564 | ) | | — | | | — | | | |
| | | | | | | | | | | | | | | | | | | | | |
| | | — | | | — | | | (2,336,801 | ) | | 2,030,327 | | | — | | | — | | | |
| | | | | | | | | | | | | | | | | | | | | |
| | | | | | | |
Institutional Service Class Shares | | | | | | | | | | | | | | | | | | | | |
Issued | | — | | | — | | | 1,229,813 | | | 1,125,943 | | | — | | | — | | | |
Reinvested | | — | | | — | | | 147,076 | | | 113,056 | | | — | | | — | | | |
Redeemed | | — | | | — | | | (1,116,484 | ) | | (1,632,706 | ) | | — | | | — | | | |
| | | | | | | | | | | | | | | | | | | | | |
| | | — | | | — | | | 260,405 | | | (393,707 | ) | | — | | | — | | | |
| | | | | | | | | | | | | | | | | | | | | |
| | | | | | | |
Local Fund Shares | | | | | | | | | | | | | | | | | | | | |
Reinvested | | — | | | — | | | 261 | | | 195 | | | — | | | — | | | |
| | | | | | | | | | | | | | | | | | | | | |
| | | — | | | — | | | 261 | | | 195 | | | — | | | — | | | |
| | | | | | | | | | | | | | | | | | | | | |
Total change in shares | | 14,390,209 | | | 22,382,985 | | | 34,178,327 | | | 68,583,554 | | | 12,086,969 | | | 10,245,743 | | | |
| | | | | | | | | | | | | | | | | | | | | |
| | | | | | | | | | | | | | | | | | | | | |
| | | | | | | | | | | | | | | | | | | | | |
See notes to financial statements.
Financial Highlights
Selected Data for Each Share of Capital Outstanding
Gartmore Bond Index Fund
| | | | | | | | | | | | | | | | | | | | | | | | | | | | | | | | | | | | | | | | | | |
| | | | | Investment Activities | | Distributions | | | | | | | | Ratios/Supplemental Data |
| | | Net Asset
Value,
Beginning
of Period | | Net
Investment
Income
(Loss) | | Net Realized
and
Unrealized
Gains
(Losses) on
Investments | | | Total
from
Investment
Activities | | Net
Investment
Income | | | Net
Realized
Gains | | | Total
Distributions | | | Net Asset
Value, End
of Period | | Total
Return (a) | | | Net Assets
at End of
Period
(000s) | | Ratio of
Expenses
to Average
Net Assets | | | Ratio of Net
Investment
Income
(Loss)
to Average
Net Assets | | | Ratio of
Expenses
(Prior to
Reimbursements)
to Average
Net Assets (b) | | | Ratio of Net
Investment
Income (Loss)
(Prior to
Reimbursements)
to Average
Net Assets (b) | | | Portfolio
Turnover (c) |
| | | | | | | | | | | | | | | |
Class A Shares | | | | | | | | | | | | | | | | | | | | | | | | | | | | | | | | | | | | | | | | | | |
Year Ended October 31, 2002 | | $ | 10.93 | | 0.47 | | 0.05 | | | 0.52 | | (0.48 | ) | | (0.01 | ) | | (0.49 | ) | | $ | 10.96 | | 5.01% | | | $ | 38,447 | | 0.72% | | | 4.29% | | | 0.84% | | | 4.17% | | | 124.75% |
Year Ended October 31, 2003 | | $ | 10.96 | | 0.34 | | 0.09 | | | 0.43 | | (0.40 | ) | | (0.01 | ) | | (0.41 | ) | | $ | 10.98 | | 3.96% | | | $ | 42,292 | | 0.71% | | | 3.07% | | | 0.82% | | | 2.96% | | | 139.66% |
Year Ended October 31, 2004 | | $ | 10.98 | | 0.36 | | 0.17 | | | 0.53 | | (0.38 | ) | | — | | | (0.38 | ) | | $ | 11.13 | | 4.94% | | | $ | 40,757 | | 0.71% | | | 3.25% | | | 0.77% | | | 3.19% | | | 151.56% |
Year Ended October 31, 2005 | | $ | 11.13 | | 0.41 | | (0.34 | ) | | 0.07 | | (0.42 | ) | | (0.01 | ) | | (0.43 | ) | | $ | 10.77 | | 0.56% | | | $ | 42,126 | | 0.71% | | | 3.74% | | | 0.77% | | | 3.69% | | | 153.31% |
Year Ended October 31, 2006 | | $ | 10.77 | | 0.44 | | 0.04 | | | 0.48 | | (0.44 | ) | | — | | | (0.44 | ) | | $ | 10.81 | | 4.59% | | | $ | 44,444 | | 0.71% | | | 4.15% | | | 0.75% | | | 4.11% | | | 113.91% |
| | | | | | | | | | | | | | | |
Class B Shares | | | | | | | | | | | | | | | | | | | | | | | | | | | | | | | | | | | | | | | | | | |
Year Ended October 31, 2002 | | $ | 10.93 | | 0.41 | | 0.05 | | | 0.46 | | (0.42 | ) | | (0.01 | ) | | (0.43 | ) | | $ | 10.96 | | 4.38% | | | $ | 28 | | 1.33% | | | 3.69% | | | 1.44% | | | 3.58% | | | 124.75% |
Year Ended October 31, 2003 | | $ | 10.96 | | 0.29 | | 0.07 | | | 0.36 | | (0.33 | ) | | (0.01 | ) | | (0.34 | ) | | $ | 10.98 | | 3.34% | | | $ | 256 | | 1.31% | | | 2.10% | | | 1.41% | | | 2.00% | | | 139.66% |
Year Ended October 31, 2004 | | $ | 10.98 | | 0.30 | | 0.17 | | | 0.47 | | (0.32 | ) | | — | | | (0.32 | ) | | $ | 11.13 | | 4.32% | | | $ | 457 | | 1.31% | | | 2.70% | | | 1.37% | | | 2.65% | | | 151.56% |
Year Ended October 31, 2005 | | $ | 11.13 | | 0.33 | | (0.33 | ) | | — | | (0.35 | ) | | (0.01 | ) | | (0.36 | ) | | $ | 10.77 | | (0.04% | ) | | $ | 218 | | 1.31% | | | 3.18% | | | 1.37% | | | 3.09% | | | 153.31% |
Year Ended October 31, 2006 | | $ | 10.77 | | 0.38 | | 0.04 | | | 0.42 | | (0.38 | ) | | — | | | (0.38 | ) | | $ | 10.81 | | 3.96% | | | $ | 181 | | 1.32% | | | 3.56% | | | 1.36% | | | 3.52% | | | 113.91% |
| | | | | | | | | | | | | | | |
Class C Shares | | | | | | | | | | | | | | | | | | | | | | | | | | | | | | | | | | | | | | | | | | |
Period Ended October 31, 2006 (f) | | $ | 10.68 | | 0.23 | | 0.13 | | | 0.36 | | (0.23 | ) | | — | | | (0.23 | ) | | $ | 10.81 | | 3.43% | (d) | | $ | 5 | | 1.31% | (e) | | 3.73% | (e) | | 1.38% | (e) | | 3.66% | (e) | | 113.91% |
| | | | | | | | | | | | | | | |
Institutional Class Shares | | | | | | | | | | | | | | | | | | | | | | | | | | | | | | | | | | | | | | | | | | |
Year Ended October 31, 2002 | | $ | 10.92 | | 0.52 | | 0.05 | | | 0.57 | | (0.53 | ) | | (0.01 | ) | | (0.54 | ) | | $ | 10.95 | | 5.46% | | | $ | 185,141 | | 0.31% | | | 4.67% | | | 0.45% | | | 4.53% | | | 124.75% |
Year Ended October 31, 2003 | | $ | 10.95 | | 0.39 | | 0.09 | | | 0.48 | | (0.44 | ) | | (0.01 | ) | | (0.45 | ) | | $ | 10.98 | | 4.47% | | | $ | 481,326 | | 0.31% | | | 3.34% | | | 0.42% | | | 3.23% | | | 139.66% |
Year Ended October 31, 2004 | | $ | 10.98 | | 0.41 | | 0.17 | | | 0.58 | | (0.43 | ) | | — | | | (0.43 | ) | | $ | 11.13 | | 5.36% | | | $ | 952,042 | | 0.31% | | | 3.69% | | | 0.37% | | | 3.63% | | | 151.56% |
Year Ended October 31, 2005 | | $ | 11.13 | | 0.45 | | (0.34 | ) | | 0.11 | | (0.46 | ) | | (0.01 | ) | | (0.47 | ) | | $ | 10.77 | | 0.97% | | | $ | 1,470,683 | | 0.31% | | | 4.14% | | | 0.37% | | | 4.09% | | | 153.31% |
Year Ended October 31, 2006 | | $ | 10.77 | | 0.48 | | 0.03 | | | 0.51 | | (0.48 | ) | | — | | | (0.48 | ) | | $ | 10.80 | | 4.91% | | | $ | 2,036,325 | | 0.32% | | | 4.57% | | | 0.36% | | | 4.53% | | | 113.91% |
| (a) | Excludes sales charge. |
| (b) | During the period certain fees were waived and/or reimbursed. If such waivers/reimbursements had not occurred, the ratios would have been as indicated. |
| (c) | Portfolio turnover is calculated on the basis of the Fund as a whole without distinguishing among the classes of shares. |
| (f) | For the period from March 29, 2006 (commencement of operations) through October 31, 2006. |
See notes to financial statements.
Financial Highlights
Selected Data for Each Share of Capital Outstanding
Financial Highlights
Selected Data for Each Share of Capital Outstanding
Gartmore International Index Fund
| | | | | | | | | | | | | | | | | | | | | | | | | | | | | | | | | | | | | | | | | | | |
| | | | | Investment Activities | | | Distributions | | | | | | Ratios/Supplemental Data |
| | | Net Asset
Value,
Beginning
of Period | | Net
Investment
Income
(Loss) | | Net Realized
and
Unrealized
Gains
(Losses) on
Investments | | | Total
from
Investment
Activities | | | Net
Investment
Income | | | Net
Realized
Gains | | | Total
Distributions | | | Net Asset
Value, End
of Period | | Total
Return (a) | | | Net Assets
at End of
Period
(000s) | | Ratio of
Expenses
to Average
Net Assets | | | Ratio of Net
Investment
Income
(Loss)
to Average
Net Assets | | | Ratio of
Expenses
(Prior to
Reimbursements)
to Average
Net Assets (b) | | | Ratio of Net
Investment
Income (Loss)
(Prior to
Reimbursements)
to Average
Net Assets (b) | | | Portfolio
Turnover (c) |
| | | | | | | | | | | | | | | |
Class A Shares | | | | | | | | | | | | | | | | | | | | | | | | | | | | | | | | | | | | | | | | | | | |
Year Ended October 31, 2002 | | $ | 6.37 | | 0.08 | | (1.06 | ) | | (0.98 | ) | | (0.08 | ) | | — | | | (0.08 | ) | | $ | 5.31 | | (15.65% | ) | | $ | 12,549 | | 0.79% | | | 1.15% | | | 0.96% | | | 0.98% | | | 32.45% |
Year Ended October 31, 2003 | | $ | 5.31 | | 0.09 | | 1.25 | | | 1.34 | | | (0.10 | ) | | — | | | (0.10 | ) | | $ | 6.55 | | 25.51% | | | $ | 16,404 | | 0.75% | | | 1.71% | | | 0.88% | | | 1.58% | | | 7.71% |
Year Ended October 31, 2004 | | $ | 6.55 | | 0.10 | | 1.07 | | | 1.17 | | | (0.09 | ) | | — | (g) | | (0.09 | ) | | $ | 7.63 | | 18.01% | | | $ | 34,183 | | 0.76% | | | 1.57% | | | 0.82% | | | 1.51% | | | 7.62% |
Year Ended October 31, 2005 | | $ | 7.63 | | 0.16 | | 1.18 | | | 1.34 | | | (0.20 | ) | | (0.08 | ) | | (0.28 | ) | | $ | 8.69 | | 17.83% | | | $ | 40,565 | | 0.76% | | | 1.81% | | | 0.83% | | | 1.75% | | | 12.24% |
Year Ended October 31, 2006 | | $ | 8.69 | | 0.16 | | 2.11 | | | 2.27 | | | (0.12 | ) | | (0.25 | ) | | (0.37 | ) | | $ | 10.59 | | 26.89% | | | $ | 103,403 | | 0.76% | | | 1.95% | | | 0.80% | | | 1.91% | | | 8.66% |
| | | | | | | | | | | | | | | |
Class B Shares | | | | | | | | | | | | | | | | | | | | | | | | | | | | | | | | | | | | | | | | | | | |
Year Ended October 31, 2002 | | $ | 6.32 | | 0.03 | | (1.04 | ) | | (1.01 | ) | | (0.05 | ) | | — | | | (0.05 | ) | | $ | 5.26 | | (16.12% | ) | | $ | 80 | | 1.39% | | | 0.64% | | | 1.72% | | | 0.31% | | | 32.45% |
Year Ended October 31, 2003 | | $ | 5.26 | | 0.06 | | 1.24 | | | 1.30 | | | (0.08 | ) | | — | | | (0.08 | ) | | $ | 6.48 | | 24.88% | | | $ | 105 | | 1.36% | | | 1.03% | | | 1.48% | | | 0.90% | | | 7.71% |
Year Ended October 31, 2004 | | $ | 6.48 | | 0.06 | | 1.05 | | | 1.11 | | | (0.05 | ) | | — | (g) | | (0.05 | ) | | $ | 7.54 | | 17.21% | | | $ | 159 | | 1.36% | | | 0.98% | | | 1.42% | | | 0.92% | | | 7.62% |
Year Ended October 31, 2005 | | $ | 7.54 | | 0.08 | | 1.19 | | | 1.27 | | | (0.16 | ) | | (0.08 | ) | | (0.24 | ) | | $ | 8.57 | | 17.17% | | | $ | 396 | | 1.36% | | | 1.14% | | | 1.43% | | | 1.07% | | | 12.24% |
Year Ended October 31, 2006 | | $ | 8.57 | | 0.13 | | 2.05 | | | 2.18 | | | (0.08 | ) | | (0.25 | ) | | (0.33 | ) | | $ | 10.42 | | 25.98% | | | $ | 605 | | 1.37% | | | 1.41% | | | 1.41% | | | 1.37% | | | 8.66% |
| | | | | | | | | | | | | | | |
Class C Shares | | | | | | | | | | | | | | | | | | | | | | | | | | | | | | | | | | | | | | | | | | | |
Period Ended October 31, 2005 (d) | | $ | 8.27 | | 0.09 | | 0.19 | | | 0.28 | | | (0.11 | ) | | — | | | (0.11 | ) | | $ | 8.44 | | 3.63% | (e) | | $ | 152 | | 1.36% | (f) | | 1.57% | (f) | | 1.43% | (f) | | 1.50% | (f) | | 12.24% |
Year Ended October 31, 2006 | | $ | 8.44 | | 0.11 | | 2.04 | | | 2.15 | | | (0.09 | ) | | (0.25 | ) | | (0.34 | ) | | $ | 10.25 | | 26.06% | | | $ | 639 | | 1.37% | | | 1.36% | | | 1.41% | | | 1.33% | | | 8.66% |
| | | | | | | | | | | | | | | |
Institutional Class Shares | | | | | | | | | | | | | | | | | | | | | | | | | | | | | | | | | | | | | | | | | | | |
Year Ended October 31, 2002 | | $ | 6.37 | | 0.09 | | (1.04 | ) | | (0.95 | ) | | (0.10 | ) | | — | | | (0.10 | ) | | $ | 5.32 | | (15.20% | ) | | $ | 119,502 | | 0.36% | | | 1.66% | | | 0.56% | | | 1.46% | | | 32.45% |
Year Ended October 31, 2003 | | $ | 5.32 | | 0.11 | | 1.25 | | | 1.36 | | | (0.12 | ) | | — | | | (0.12 | ) | | $ | 6.56 | | 25.90% | | | $ | 359,705 | | 0.36% | | | 1.99% | | | 0.48% | | | 1.87% | | | 7.71% |
Year Ended October 31, 2004 | | $ | 6.56 | | 0.12 | | 1.08 | | | 1.20 | | | (0.12 | ) | | — | (g) | | (0.12 | ) | | $ | 7.64 | | 18.43% | | | $ | 855,050 | | 0.36% | | | 1.99% | | | 0.42% | | | 1.93% | | | 7.62% |
Year Ended October 31, 2005 | | $ | 7.64 | | 0.18 | | 1.19 | | | 1.37 | | | (0.23 | ) | | (0.08 | ) | | (0.31 | ) | | $ | 8.70 | | 18.26% | | | $ | 1,320,858 | | 0.36% | | | 2.17% | | | 0.43% | | | 2.10% | | | 12.24% |
Year Ended October 31, 2006 | | $ | 8.70 | | 0.22 | | 2.09 | | | 2.31 | | | (0.15 | ) | | (0.25 | ) | | (0.40 | ) | | $ | 10.61 | | 27.32% | | | $ | 1,900,802 | | 0.37% | | | 2.34% | | | 0.41% | | | 2.30% | | | 8.66% |
| (a) | Excludes sales charge. |
| (b) | During the period certain fees were waived and/or reimbursed. If such waivers/reimbursements had not occurred, the ratios would have been as indicated. |
| (c) | Portfolio turnover is calculated on the basis of the Fund as a whole without distinguishing among the classes of shares. |
| (d) | For period from February 14, 2005 (commencement of operations) through October 31, 2005. |
| (g) | The amount is less than $0.005. |
See notes to financial statements.
Financial Highlights
Selected Data for Each Share of Capital Outstanding
Gartmore Mid Cap Market Index Fund
| | | | | | | | | | | | | | | | | | | | | | | | | | | | | | | | | | | | | | | | | | | | |
| | | | | Investment Activities | | | Distributions | | | | | | Ratios/Supplemental Data |
| | | Net Asset
Value,
Beginning
of Period | | Net
Investment
Income
(Loss) | | | Net Realized
and
Unrealized
Gains
(Losses) on
Investments | | | Total
from
Investment
Activities | | | Net
Investment
Income | | | Net
Realized
Gains | | | Total
Distributions | | | Net Asset
Value, End
of Period | | Total
Return (a) | | | Net Assets
at End of
Period
(000s) | | Ratio of
Expenses
to Average
Net Assets | | | Ratio of Net
Investment
Income
(Loss)
to Average
Net Assets | | | Ratio of
Expenses
(Prior to
Reimbursements)
to Average
Net Assets (b) | | | Ratio of Net
Investment
Income (Loss)
(Prior to
Reimbursements)
to Average
Net Assets (b) | | | Portfolio
Turnover (c) |
| | | | | | | | | | | | | | | |
Class A Shares | | | | | | | | | | | | | | | | | | | | | | | | | | | | | | | | | | | | | | | | | | | | |
Year Ended October 31, 2002 | | $ | 9.79 | | 0.04 | | | (0.59 | ) | | (0.55 | ) | | (0.05 | ) | | — | | | (0.05 | ) | | $ | 9.19 | | (5.67% | ) | | $ | 19,002 | | 0.73% | | | 0.42% | | | 0.83% | | | 0.32% | | | 15.82% |
Year Ended October 31, 2003 | | $ | 9.19 | | 0.04 | | | 2.68 | | | 2.72 | | | (0.04 | ) | | — | | | (0.04 | ) | | $ | 11.87 | | 29.72% | | | $ | 38,693 | | 0.71% | | | 0.48% | | | 0.82% | | | 0.37% | | | 8.26% |
Year Ended October 31, 2004 | | $ | 11.87 | | 0.05 | | | 1.13 | | | 1.18 | | | (0.04 | ) | | (0.12 | ) | | (0.16 | ) | | $ | 12.89 | | 10.07% | | | $ | 65,059 | | 0.70% | | | 0.50% | | | 0.77% | | | 0.44% | | | 15.75% |
Year Ended October 31, 2005 | | $ | 12.89 | | 0.12 | | | 2.04 | | | 2.16 | | | (0.11 | ) | | (0.26 | ) | | (0.37 | ) | | $ | 14.68 | | 16.94% | | | $ | 150,305 | | 0.70% | | | 0.90% | | | 0.77% | | | 0.84% | | | 18.44% |
Year Ended October 31, 2006 | | $ | 14.68 | | 0.17 | | | 1.63 | | | 1.80 | | | (0.18 | ) | | (0.66 | ) | | (0.84 | ) | | $ | 15.64 | | 12.57% | | | $ | 192,274 | | 0.71% | | | 1.09% | | | 0.76% | | | 1.05% | | | 15.59% |
| | | | | | | | | | | | | | | |
Class B Shares | | | | | | | | | | | | | | | | | | | | | | | | | | | | | | | | | | | | | | | | | | | | |
Year Ended October 31, 2002 | | $ | 9.74 | | (0.01 | ) | | (0.58 | ) | | (0.59 | ) | | (0.02 | ) | | — | | | (0.02 | ) | | $ | 9.13 | | (6.13% | ) | | $ | 86 | | 1.32% | | | (0.16% | ) | | 1.44% | | | (0.28% | ) | | 15.82% |
Year Ended October 31, 2003 | | $ | 9.13 | | (0.02 | ) | | 2.66 | | | 2.64 | | | — | | | — | | | — | | | $ | 11.77 | | 28.96% | | | $ | 295 | | 1.31% | | | (0.13% | ) | | 1.42% | | | (0.25% | ) | | 8.26% |
Year Ended October 31, 2004 | | $ | 11.77 | | (0.02 | ) | | 1.12 | | | 1.10 | | | — | | | (0.12 | ) | | (0.12 | ) | | $ | 12.75 | | 9.44% | | | $ | 657 | | 1.31% | | | (0.10% | ) | | 1.37% | | | (0.17% | ) | | 15.75% |
Year Ended October 31, 2005 | | $ | 12.75 | | 0.03 | | | 2.01 | | | 2.04 | | | (0.03 | ) | | (0.26 | ) | | (0.29 | ) | | $ | 14.50 | | 16.15% | | | $ | 884 | | 1.31% | | | 0.27% | | | 1.38% | | | 0.21% | | | 18.44% |
Year Ended October 31, 2006 | | $ | 14.50 | | 0.07 | | | 1.63 | | | 1.70 | | | (0.09 | ) | | (0.66 | ) | | (0.75 | ) | | $ | 15.45 | | 11.98% | | | $ | 935 | | 1.32% | | | 0.49% | | | 1.37% | | | 0.43% | | | 15.59% |
| | | | | | | | | | | | | | | |
Class C Shares | | | | | | | | | | | | | | | | | | | | | | | | | | | | | | | | | | | | | | | | | | | | |
Period Ended October 31, 2003 (d) | | $ | 11.43 | | — | | | 0.33 | | | 0.33 | | | — | | | — | | | — | | | $ | 11.76 | | 2.89% | (e) | | $ | 21 | | 1.31% | (f) | | 0.16% | (f) | | 1.71% | (f) | | (0.24% | )(f) | | 8.26% |
Year Ended October 31, 2004 | | $ | 11.76 | | (0.02 | ) | | 1.12 | | | 1.10 | | | — | | | (0.12 | ) | | (0.12 | ) | | $ | 12.74 | | 9.48% | | | $ | 26 | | 1.31% | | | (0.10% | ) | | 1.38% | | | (0.17% | ) | | 15.75% |
Year Ended October 31, 2005 | | $ | 12.74 | | 0.02 | | | 2.01 | | | 2.03 | | | (0.05 | ) | | (0.26 | ) | | (0.31 | ) | | $ | 14.46 | | 16.13% | | | $ | 225 | | 1.31% | | | 0.28% | | | 1.39% | | | 0.21% | | | 18.44% |
Year Ended October 31, 2006 | | $ | 14.46 | | 0.07 | | | 1.62 | | | 1.69 | | | (0.11 | ) | | (0.66 | ) | | (0.77 | ) | | $ | 15.38 | | 11.96% | | | $ | 794 | | 1.32% | | | 0.42% | | | 1.37% | | | 0.38% | | | 15.59% |
| | | | | | | | | | | | | | | |
Institutional Class Shares | | | | | | | | | | | | | | | | | | | | | | | | | | | | | | | | | | | | | | | | | | | | |
Year Ended October 31, 2002 | | $ | 9.84 | | 0.08 | | | (0.58 | ) | | (0.50 | ) | | (0.09 | ) | | — | | | (0.09 | ) | | $ | 9.25 | | (5.19% | ) | | $ | 84,128 | | 0.31% | | | 0.84% | | | 0.44% | | | 0.71% | | | 15.82% |
Year Ended October 31, 2003 | | $ | 9.25 | | 0.08 | | | 2.70 | | | 2.78 | | | (0.08 | ) | | — | | | (0.08 | ) | | $ | 11.95 | | 30.21% | | | $ | 247,960 | | 0.31% | | | 0.87% | | | 0.42% | | | 0.76% | | | 8.26% |
Year Ended October 31, 2004 | | $ | 11.95 | | 0.11 | | | 1.13 | | | 1.24 | | | (0.11 | ) | | (0.12 | ) | | (0.23 | ) | | $ | 12.96 | | 10.47% | | | $ | 530,191 | | 0.31% | | | 0.89% | | | 0.37% | | | 0.83% | | | 15.75% |
Year Ended October 31, 2005 | | $ | 12.96 | | 0.17 | | | 2.06 | | | 2.23 | | | (0.16 | ) | | (0.26 | ) | | (0.42 | ) | | $ | 14.77 | | 17.41% | | | $ | 857,475 | | 0.31% | | | 1.27% | | | 0.38% | | | 1.21% | | | 18.44% |
Year Ended October 31, 2006 | | $ | 14.77 | | 0.22 | | | 1.65 | | | 1.87 | | | (0.23 | ) | | (0.66 | ) | | (0.89 | ) | | $ | 15.75 | | 13.06% | | | $ | 1,108,039 | | 0.32% | | | 1.47% | | | 0.37% | | | 1.43% | | | 15.59% |
| (a) | Excludes sales charge. |
| (b) | During the period certain fees were waived and/or reimbursed. If such waivers/reimbursements had not occurred, the ratios would have been as indicated. |
| (c) | Portfolio turnover is calculated on the basis of the Fund as a whole without distinguishing among the classes of shares. |
| (d) | For the period from October 22, 2003 (commencement of operations) through October 31, 2003. |
See notes to financial statements.
Financial Highlights
Selected Data for Each Share of Capital Outstanding
Gartmore S&P 500 Index Fund
| | | | | | | | | | | | | | | | | | | | | | | | | | | | | | | | | | | | | | | | | | | |
| | | | | Investment Activities | | | Distributions | | | | | | Ratios/Supplemental Data |
| | | Net Asset
Value,
Beginning
of Period | | Net
Investment
Income
(Loss) | | Net Realized
and
Unrealized
Gains
(Losses) on
Investments | | | Total
from
Investment
Activities | | | Net
Investment
Income | | | Net
Realized
Gains | | | Total
Distributions | | | Net Asset
Value, End
of Period | | Total
Return (a) | | | Net Assets
at End of
Period
(000s) | | Ratio of
Expenses
to Average
Net Assets | | | Ratio of Net
Investment
Income
(Loss)
to Average
Net Assets | | | Ratio of
Expenses
(Prior to
Reimbursements)
to Average
Net Assets (b) | | | Ratio of Net
Investment
Income (Loss)
(Prior to
Reimbursements)
to Average
Net Assets (b) | | | Portfolio
Turnover (c) |
| | | | | | | | | | | | | | | |
Class A Shares | | | | | | | | | | | | | | | | | | | | | | | | | | | | | | | | | | | | | | | | | | | |
Year Ended October 31, 2002 | | $ | 9.12 | | 0.09 | | (1.50 | ) | | (1.41 | ) | | (0.09 | ) | | — | | | (0.09 | ) | | $ | 7.62 | | (15.62% | ) | | $ | 3,942 | | 0.52% | | | 1.06% | | | 0.61% | | | 0.97% | | | 3.06% |
Year Ended October 31, 2003 | | $ | 7.62 | | 0.10 | | 1.41 | | | 1.51 | | | (0.09 | ) | | — | | | (0.09 | ) | | $ | 9.04 | | 20.03% | | | $ | 5,795 | | 0.48% | | | 1.28% | | | 0.56% | | | 1.21% | | | 1.30% |
Year Ended October 31, 2004 | | $ | 9.04 | | 0.11 | | 0.70 | | | 0.81 | | | (0.11 | ) | | — | | | (0.11 | ) | | $ | 9.74 | | 8.99% | | | $ | 7,822 | | 0.50% | | | 1.18% | | | 0.54% | | | 1.13% | | | 1.71% |
Year Ended October 31, 2005 | | $ | 9.74 | | 0.15 | | 0.64 | | | 0.79 | | | (0.17 | ) | | — | | | (0.17 | ) | | $ | 10.36 | | 8.11% | | | $ | 24,805 | | 0.50% | | | 1.49% | | | 0.56% | | | 1.43% | | | 5.28% |
Year Ended October 31, 2006 | | $ | 10.36 | | 0.16 | | 1.47 | | | 1.63 | | | (0.16 | ) | | (0.08 | ) | | (0.24 | ) | | $ | 11.75 | | 15.90% | | | $ | 42,670 | | 0.49% | | | 1.46% | | | 0.52% | | | 1.43% | | | 2.63% |
| | | | | | | | | | | | | | | |
Class B Shares | | | | | | | | | | | | | | | | | | | | | | | | | | | | | | | | | | | | | | | | | | | |
Year Ended October 31, 2002 | | $ | 9.09 | | 0.03 | | (1.50 | ) | | (1.47 | ) | | (0.03 | ) | | — | | | (0.03 | ) | | $ | 7.59 | | (16.24% | ) | | $ | 2,423 | | 1.23% | | | 0.35% | | | 1.39% | | | 0.19% | | | 3.06% |
Year Ended October 31, 2003 | | $ | 7.59 | | 0.04 | | 1.41 | | | 1.45 | | | (0.04 | ) | | — | | | (0.04 | ) | | $ | 9.00 | | 19.14% | | | $ | 3,713 | | 1.23% | | | 0.54% | | | 1.30% | | | 0.47% | | | 1.30% |
Year Ended October 31, 2004 | | $ | 9.00 | | 0.05 | | 0.69 | | | 0.74 | | | (0.04 | ) | | — | | | (0.04 | ) | | $ | 9.70 | | 8.23% | | | $ | 4,820 | | 1.23% | | | 0.45% | | | 1.27% | | | 0.41% | | | 1.71% |
Year Ended October 31, 2005 | | $ | 9.70 | | 0.09 | | 0.63 | | | 0.72 | | | (0.09 | ) | | — | | | (0.09 | ) | | $ | 10.33 | | 7.45% | | | $ | 5,707 | | 1.23% | | | 0.90% | | | 1.28% | | | 0.86% | | | 5.28% |
Year Ended October 31, 2006 | | $ | 10.33 | | 0.08 | | 1.46 | | | 1.54 | | | (0.08 | ) | | (0.08 | ) | | (0.16 | ) | | $ | 11.71 | | 15.01% | | | $ | 6,296 | | 1.23% | | | 0.75% | | | 1.26% | | | 0.72% | | | 2.63% |
| | | | | | | | | | | | | | | |
Class C Shares | | | | | | | | | | | | | | | | | | | | | | | | | | | | | | | | | | | | | | | | | | | |
Period Ended October 31, 2003 (d) | | $ | 8.83 | | — | | 0.18 | | | 0.18 | | | — | | | — | | | — | | | $ | 9.01 | | 2.04% | (e) | | $ | 10 | | 1.23% | (f) | | 0.48% | (f) | | 1.23% | (f) | | 0.48% | (f) | | 1.30% |
Year Ended October 31, 2004 | | $ | 9.01 | | 0.05 | | 0.67 | | | 0.72 | | | (0.06 | ) | | — | | | (0.06 | ) | | $ | 9.67 | | 8.06% | | | $ | 250 | | 1.23% | | | 0.46% | | | 1.27% | | | 0.42% | | | 1.71% |
Year Ended October 31, 2005 | | $ | 9.67 | | 0.08 | | 0.64 | | | 0.72 | | | (0.11 | ) | | — | | | (0.11 | ) | | $ | 10.28 | | 7.44% | | | $ | 831 | | 1.23% | | | 0.71% | | | 1.28% | | | 0.65% | | | 5.28% |
Year Ended October 31, 2006 | | $ | 10.28 | | 0.08 | | 1.46 | | | 1.54 | | | (0.09 | ) | | (0.08 | ) | | (0.17 | ) | | $ | 11.65 | | 15.06% | | | $ | 1,423 | | 1.23% | | | 0.72% | | | 1.26% | | | 0.69% | | | 2.63% |
| | | | | | | | | | | | | | | |
Institutional Class Shares | | | | | | | | | | | | | | | | | | | | | | | | | | | | | | | | | | | | | | | | | | | |
Year Ended October 31, 2002 | | $ | 9.15 | | 0.11 | | (1.51 | ) | | (1.40 | ) | | (0.11 | ) | | — | | | (0.11 | ) | | $ | 7.64 | | (15.44% | ) | | $ | 235,333 | | 0.23% | | | 1.37% | | | 0.33% | | | 1.27% | | | 3.06% |
Year Ended October 31, 2003 | | $ | 7.64 | | 0.11 | | 1.43 | | | 1.54 | | | (0.11 | ) | | — | | | (0.11 | ) | | $ | 9.07 | | 20.39% | | | $ | 620,598 | | 0.23% | | | 1.52% | | | 0.30% | | | 1.45% | | | 1.30% |
Year Ended October 31, 2004 | | $ | 9.07 | | 0.13 | | 0.70 | | | 0.83 | | | (0.13 | ) | | — | | | (0.13 | ) | | $ | 9.77 | | 8.86% | | | $ | 1,247,061 | | 0.23% | | | 1.45% | | | 0.27% | | | 1.41% | | | 1.71% |
Year Ended October 31, 2005 | | $ | 9.77 | | 0.19 | | 0.64 | | | 0.83 | | | (0.19 | ) | | — | | | (0.19 | ) | | $ | 10.41 | | 8.55% | | | $ | 2,007,290 | | 0.23% | | | 1.86% | | | 0.28% | | | 1.81% | | | 5.28% |
Year Ended October 31, 2006 | | $ | 10.41 | | 0.19 | | 1.47 | | | 1.66 | | | (0.19 | ) | | (0.08 | ) | | (0.27 | ) | | $ | 11.80 | | 16.12% | | | $ | 2,689,368 | | 0.23% | | | 1.73% | | | 0.26% | | | 1.71% | | | 2.63% |
| | | | | | | | | | | | | | | |
Service Class Shares | | | | | | | | | | | | | | | | | | | | | | | | | | | | | | | | | | | | | | | | | | | |
Year Ended October 31, 2002 | | $ | 9.11 | | 0.08 | | (1.50 | ) | | (1.42 | ) | | (0.08 | ) | | — | | | (0.08 | ) | | $ | 7.61 | | (15.73% | ) | | $ | 266,515 | | 0.63% | | | 0.94% | | | 0.72% | | | 0.85% | | | 3.06% |
Year Ended October 31, 2003 | | $ | 7.61 | | 0.09 | | 1.41 | | | 1.50 | | | (0.08 | ) | | — | | | (0.08 | ) | | $ | 9.03 | | 19.89% | | | $ | 413,554 | | 0.63% | | | 1.14% | | | 0.70% | | | 1.06% | | | 1.30% |
Year Ended October 31, 2004 | | $ | 9.03 | | 0.11 | | 0.69 | | | 0.80 | | | (0.10 | ) | | — | | | (0.10 | ) | | $ | 9.73 | | 9.24% | | | $ | 523,127 | | 0.63% | | | 1.05% | | | 0.67% | | | 1.01% | | | 1.71% |
Year Ended October 31, 2005 | | $ | 9.73 | | 0.16 | | 0.62 | | | 0.78 | | | (0.15 | ) | | — | | | (0.15 | ) | | $ | 10.36 | | 8.06% | | | $ | 578,102 | | 0.63% | | | 1.51% | | | 0.67% | | | 1.47% | | | 5.28% |
Year Ended October 31, 2006 | | $ | 10.36 | | 0.15 | | 1.46 | | | 1.61 | | | (0.14 | ) | | (0.08 | ) | | (0.22 | ) | | $ | 11.75 | | 15.74% | | | $ | 628,021 | | 0.63% | | | 1.35% | | | 0.66% | | | 1.32% | | | 2.63% |
| | | | | | | | | | | | | | | |
Institutional Service Class Shares | | | | | | | | | | | | | | | | | | | | | | | | | | | | | | | | | | | | | | | | | | | |
Year Ended October 31, 2002 | | $ | 9.14 | | 0.09 | | (1.50 | ) | | (1.41 | ) | | (0.09 | ) | | — | | | (0.09 | ) | | $ | 7.64 | | (15.56% | ) | | $ | 41,498 | | 0.48% | | | 1.09% | | | 0.57% | | | 1.00% | | | 3.06% |
Year Ended October 31, 2003 | | $ | 7.64 | | 0.10 | | 1.42 | | | 1.52 | | | (0.09 | ) | | — | | | (0.09 | ) | | $ | 9.07 | | 20.11% | | | $ | 55,197 | | 0.48% | | | 1.29% | | | 0.55% | | | 1.21% | | | 1.30% |
Year Ended October 31, 2004 | | $ | 9.07 | | 0.12 | | 0.69 | | | 0.81 | | | (0.11 | ) | | — | | | (0.11 | ) | | $ | 9.77 | | 9.14% | | | $ | 69,569 | | 0.48% | | | 1.21% | | | 0.52% | | | 1.16% | | | 1.71% |
Year Ended October 31, 2005 | | $ | 9.77 | | 0.18 | | 0.62 | | | 0.80 | | | (0.17 | ) | | — | | | (0.17 | ) | | $ | 10.40 | | 8.29% | | | $ | 69,996 | | 0.48% | | | 1.68% | | | 0.52% | | | 1.63% | | | 5.28% |
Year Ended October 31, 2006 | | $ | 10.40 | | 0.17 | | 1.46 | | | 1.63 | | | (0.16 | ) | | (0.08 | ) | | (0.24 | ) | | $ | 11.79 | | 15.85% | | | $ | 82,443 | | 0.48% | | | 1.49% | | | 0.51% | | | 1.47% | | | 2.63% |
| | | | | | | | | | | | | | | |
Local Fund Shares | | | | | | | | | | | | | | | | | | | | | | | | | | | | | | | | | | | | | | | | | | | |
Year Ended October 31, 2002 | | $ | 9.17 | | 0.11 | | (1.52 | ) | | (1.41 | ) | | (0.10 | ) | | — | | | (0.10 | ) | | $ | 7.66 | | (15.47% | ) | | $ | 81 | | 0.31% | | | 1.25% | | | 0.39% | | | 1.17% | | | 3.06% |
Year Ended October 31, 2003 | | $ | 7.66 | | 0.12 | | 1.42 | | | 1.54 | | | (0.11 | ) | | — | | | (0.11 | ) | | $ | 9.09 | | 20.26% | | | $ | 97 | | 0.30% | | | 1.47% | | | 0.37% | | | 1.40% | | | 1.30% |
Year Ended October 31, 2004 | | $ | 9.09 | | 0.14 | | 0.69 | | | 0.83 | | | (0.13 | ) | | — | | | (0.13 | ) | | $ | 9.79 | | 8.85% | | | $ | 106 | | 0.30% | | | 1.38% | | | 0.34% | | | 1.34% | | | 1.71% |
Year Ended October 31, 2005 | | $ | 9.79 | | 0.20 | | 0.63 | | | 0.83 | | | (0.19 | ) | | — | | | (0.19 | ) | | $ | 10.43 | | 8.45% | | | $ | 115 | | 0.30% | | | 1.85% | | | 0.35% | | | 1.80% | | | 5.28% |
Year Ended October 31, 2006 | | $ | 10.43 | | 0.19 | | 1.47 | | | 1.66 | | | (0.18 | ) | | (0.08 | ) | | (0.26 | ) | | $ | 11.83 | | 16.10% | | | $ | 134 | | 0.30% | | | 1.67% | | | 0.33% | | | 1.65% | | | 2.63% |
| | |
(a) Excludes sales charge. (b) During the period certain fees were waived and/or reimbursed. If such waivers/reimbursements had not occurred, the ratios would have been as indicated. (c) Portfolio turnover is calculated on the basis of the Fund as a whole without distinguishing among the classes of shares. | | (d) For the period from October 22, 2003 (commencement of operations) through October 31, 2003. (e) Not annualized. (f) Annualized. |
See notes to financial statements.
Financial Highlights
Selected Data for Each Share of Capital Outstanding
Gartmore Small Cap Index Fund
| | | | | | | | | | | | | | | | | | | | | | | | | | | | | | | | | | | | | | | | | | | | |
| | | | | Investment Activities | | | Distributions | | | | | | Ratios/Supplemental Data |
| | | Net Asset
Value,
Beginning
of Period | | Net
Investment
Income
(Loss) | | | Net Realized
and
Unrealized
Gains
(Losses) on
Investments | | | Total
from
Investment
Activities | | | Net
Investment
Income | | | Net
Realized
Gains | | | Total
Distributions | | | Net Asset
Value, End
of Period | | Total
Return (a) | | | Net Assets
at End of
Period
(000s) | | Ratio of
Expenses
to Average
Net Assets | | | Ratio of Net
Investment
Income
(Loss) to
Average
Net Assets | | | Ratio of
Expenses
(Prior to
Reimbursements)
to Average
Net Assets (b) | | | Ratio of Net
Investment
Income (Loss)
(Prior to
Reimbursements)
to Average
Net Assets (b) | | | Portfolio
Turnover (c) |
| | | | | | | | | | | | | | | |
Class A Shares | | | | | | | | | | | | | | | | | | | | | | | | | | | | | | | | | | | | | | | | | | | | |
Year Ended October 31, 2002 | | $ | 8.34 | | 0.05 | | | (1.07 | ) | | (1.02 | ) | | (0.05 | ) | | — | | | (0.05 | ) | | $ | 7.27 | | (12.29% | ) | | $ | 11,079 | | 0.71% | | | 0.71% | | | 0.97% | | | 0.45% | | | 34.77% |
Year Ended October 31, 2003 | | $ | 7.27 | | 0.05 | | | 2.98 | | | 3.03 | | | (0.05 | ) | | — | | | (0.05 | ) | | $ | 10.25 | | 41.89% | | | $ | 42,343 | | 0.69% | | | 0.61% | | | 0.83% | | | 0.47% | | | 25.63% |
Year Ended October 31, 2004 | | $ | 10.25 | | 0.06 | | | 1.06 | | | 1.12 | | | (0.05 | ) | | (0.17 | ) | | (0.22 | ) | | $ | 11.15 | | 11.08% | | | $ | 62,688 | | 0.69% | | | 0.56% | | | 0.77% | | | 0.48% | | | 24.10% |
Year Ended October 31, 2005 | | $ | 11.15 | | 0.10 | | | 1.20 | | | 1.30 | | | (0.10 | ) | | (0.45 | ) | | (0.55 | ) | | $ | 11.90 | | 11.67% | | | $ | 65,751 | | 0.69% | | | 0.90% | | | 0.77% | | | 0.82% | | | 24.14% |
Year Ended October 31, 2006 | | $ | 11.90 | | 0.15 | | | 2.06 | | | 2.21 | | | (0.15 | ) | | (0.49 | ) | | (0.64 | ) | | $ | 13.47 | | 19.14% | | | $ | 114,281 | | 0.70% | | | 1.21% | | | 0.74% | | | 1.17% | | | 31.51% |
| | | | | | | | | | | | | | | |
Class B Shares | | | | | | | | | | | | | | | | | | | | | | | | | | | | | | | | | | | | | | | | | | | | |
Period Ended October 31, 2002 (d) | | $ | 8.84 | | 0.03 | | | (1.59 | ) | | (1.56 | ) | | (0.03 | ) | | — | | | (0.03 | ) | | $ | 7.25 | | (17.68% | )(f) | | $ | 89 | | 1.29% | (g) | | 0.15% | (g) | | 1.55% | (g) | | (0.11% | )(g) | | 34.77% |
Year Ended October 31, 2003 | | $ | 7.25 | | — | | | 2.97 | | | 2.97 | | | (0.01 | ) | | — | | | (0.01 | ) | | $ | 10.21 | | 40.98% | | | $ | 249 | | 1.29% | | | 0.04% | | | 1.44% | | | (0.11% | ) | | 25.63% |
Year Ended October 31, 2004 | | $ | 10.21 | | (0.01 | ) | | 1.05 | | | 1.04 | | | — | | | (0.17 | ) | | (0.17 | ) | | $ | 11.08 | | 10.28% | | | $ | 424 | | 1.29% | | | (0.04% | ) | | 1.37% | | | (0.12% | ) | | 24.10% |
Year Ended October 31, 2005 | | $ | 11.08 | | 0.03 | | | 1.19 | | | 1.22 | | | (0.03 | ) | | (0.45 | ) | | (0.48 | ) | | $ | 11.82 | | 10.98% | | | $ | 444 | | 1.29% | | | 0.28% | | | 1.37% | | | 0.21% | | | 24.14% |
Year Ended October 31, 2006 | | $ | 11.82 | | 0.08 | | | 2.02 | | | 2.10 | | | (0.07 | ) | | (0.49 | ) | | (0.56 | ) | | $ | 13.36 | | 18.38% | | | $ | 482 | | 1.30% | | | 0.62% | | | 1.35% | | | 0.57% | | | 31.51% |
| | | | | | | | | | | | | | | |
Class C Shares | | | | | | | | | | | | | | | | | | | | | | | | | | | | | | | | | | | | | | | | | | | | |
Period Ended October 31, 2003 (e) | | $ | 9.91 | | — | | | 0.29 | | | 0.29 | | | — | | | — | | | — | | | $ | 10.20 | | 2.93% | (f) | | $ | 21 | | 1.29% | (g) | | 0.07% | (g) | | 1.38% | (g) | | (0.02% | )(g) | | 25.63% |
Year Ended October 31, 2004 | | $ | 10.20 | | — | | | 1.06 | | | 1.06 | | | (0.01 | ) | | (0.17 | ) | | (0.18 | ) | | $ | 11.08 | | 10.48% | | | $ | 39 | | 1.29% | | | (0.04% | ) | | 1.37% | | | (0.12% | ) | | 24.10% |
Year Ended October 31, 2005 | | $ | 11.08 | | 0.03 | | | 1.19 | | | 1.22 | | | (0.05 | ) | | (0.45 | ) | | (0.50 | ) | | $ | 11.80 | | 10.99% | | | $ | 200 | | 1.29% | | | 0.23% | | | 1.37% | | | 0.16% | | | 24.14% |
Year Ended October 31, 2006 | | $ | 11.80 | | 0.06 | | | 2.05 | | | 2.11 | | | (0.09 | ) | | (0.49 | ) | | (0.58 | ) | | $ | 13.33 | | 18.40% | | | $ | 534 | | 1.30% | | | 0.53% | | | 1.35% | | | 0.49% | | | 31.51% |
| | | | | | | | | | | | | | | |
Institutional Class Shares | | | | | | | | | | | | | | | | | | | | | | | | | | | | | | | | | | | | | | | | | | | | |
Year Ended October 31, 2002 | | $ | 8.38 | | 0.08 | | | (1.06 | ) | | (0.98 | ) | | (0.08 | ) | | — | | | (0.08 | ) | | $ | 7.32 | | (11.80% | ) | | $ | 33,247 | | 0.29% | | | 1.14% | | | 0.58% | | | 0.85% | | | 34.77% |
Year Ended October 31, 2003 | | $ | 7.32 | | 0.08 | | | 3.00 | | | 3.08 | | | (0.08 | ) | | — | | | (0.08 | ) | | $ | 10.32 | | 42.49% | | | $ | 99,904 | | 0.29% | | | 1.04% | | | 0.44% | | | 0.89% | | | 25.63% |
Year Ended October 31, 2004 | | $ | 10.32 | | 0.10 | | | 1.09 | | | 1.19 | | | (0.10 | ) | | (0.17 | ) | | (0.27 | ) | | $ | 11.24 | | 11.51% | | | $ | 210,322 | | 0.29% | | | 0.97% | | | 0.37% | | | 0.88% | | | 24.10% |
Year Ended October 31, 2005 | | $ | 11.24 | | 0.15 | | | 1.21 | | | 1.36 | | | (0.15 | ) | | (0.45 | ) | | (0.60 | ) | | $ | 12.00 | | 12.11% | | | $ | 348,509 | | 0.29% | | | 1.28% | | | 0.37% | | | 1.21% | | | 24.14% |
Year Ended October 31, 2006 | | $ | 12.00 | | 0.20 | | | 2.07 | | | 2.27 | | | (0.19 | ) | | (0.49 | ) | | (0.68 | ) | | $ | 13.59 | | 19.60% | | | $ | 518,239 | | 0.30% | | | 1.61% | | | 0.35% | | | 1.57% | | | 31.51% |
| (a) | Excludes sales charge. |
| (b) | During the period certain fees were waived and/or reimbursed. If such waivers/reimbursements had not occurred, the ratios would have been as indicated. |
| (c) | Portfolio turnover is calculated on the basis of the Fund as a whole without distinguishing among the classes of shares. |
| (d) | For the period from November 29, 2001 (commencement of operations) through October 31, 2002. |
| (e) | For the period from October 22, 2003 (commencement of operations) through October 31, 2003. |
See notes to financial statements.
Notes to Financial Statements
October 31, 2006
1. Organization
Gartmore Mutual Funds (the “Trust”) is an open-end management investment company, organized under the laws of Delaware by an amended and restated Agreement and Declaration of Trust, dated October 28, 2004, as amended to date. Prior to January 25, 2002, the Trust was named “Nationwide Mutual Funds”. The Trust was originally created under the laws of Ohio as an Ohio business trust pursuant to a Declaration of Trust, dated as of October 30, 1997, as subsequently amended, and redomesticated as a Delaware Statutory Trust on February 28, 2005; the redomestication was a change in statutory status and did not affect the operations of the Trust. The Trust is registered under the Investment Company Act of 1940, as amended (the “1940 Act”). As of October 31, 2006, the Trust had authorized an unlimited number of shares of beneficial interest (“shares”) without par value. The Trust operates forty-nine (49) separate series, or mutual funds, each with its own investment objective(s) and strategies. This report contains the financial statements and financial highlights of the five (5) funds listed below (individually, a “Fund”; collectively, the “Funds”):
- Gartmore Bond Index Fund (“Bond Index”)
- Gartmore International Index Fund (“International Index”)
- Gartmore Mid Cap Market Index Fund (“Mid Cap Market Index”)
- Gartmore S&P 500 Index Fund (“S&P 500 Index”)
- Gartmore Small Cap Index Fund (“Small Cap Index”)
2. Summary of Significant Accounting Policies
The following is a summary of significant accounting policies followed by the Funds in the preparation of their financial statements. The policies are in conformity with accounting principles generally accepted in the United States of America (“GAAP”). The preparation of financial statements requires management to make estimates and assumptions that affect the reported amounts of assets and liabilities, disclosure of contingent assets and liabilities at the date of the financial statements, and the reported amounts of income and expenses for the period. Actual results could differ from those estimates.
Securities for which market quotations are readily available are valued at current market value as of “Valuation Time.” Valuation Time is as of the close of regular trading on the New York Stock Exchange (usually 4 p.m. Eastern time). Equity securities are valued at the last quoted sale price or, if there is no sale price, the last quoted bid price provided by an independent pricing service approved by the Trust’s Board of Trustees. Securities traded on NASDAQ are valued at the NASDAQ Official Closing Price. Prices are taken from the primary market or exchange in which each security trades.
Most securities listed on a foreign exchange are valued either at fair value (see description below) or at the last sale price at the close of the exchange on which the security is principally traded. Foreign securities, currencies, and other assets and liabilities denominated in foreign currencies are translated into U.S. dollars at the exchange rate of said currencies against the U.S. dollar, as of Valuation Time, as provided by an independent pricing service approved by the Board of Trustees.
Debt and other fixed-income securities (other than short-term obligations) are valued at the last quoted bid price and/or by using a combination of daily quotes and matrix evaluations provided by an independent pricing service, the use of which has been approved by the Trust’s Board of Trustees. Short-term debt securities such as commercial paper and U.S. Treasury Bills having a remaining maturity of 60 days or less at the time of purchase are considered to be “short-term” and are valued at amortized cost which approximates market value.
Securities for which market quotations are not readily available, or for which an independent pricing service does not provide a value or provides a value that does not represent fair value in the judgment of the Funds’ investment adviser or designee, are valued at fair value under procedures approved by the Trust’s Board of Trustees. The “Fair Value” of these securities is determined in good faith by taking into account relevant factors and surrounding
Notes to Financial Statements (Continued)
October 31, 2006
circumstances. Methods utilized to obtain a “Fair Value” may include the following non-exclusive list of acceptable methods: (i) a multiple of earnings; (ii) the discount from market value of a similar, freely traded security; (iii) the yield-to-maturity for debt issues; or (iv) a consolidation of the methods. The Gartmore Funds Fair Value Committee considers a non-exclusive list of factors to arrive at the appropriate method of determining “Fair Value.” For example, fair value determinations are required for securities whose value is affected by a “significant” event that materially affects the value of a domestic or foreign security which occurs subsequent to the time of the close of the principal market on which such domestic or foreign security trades and before the Valuation Time (i.e., a “subsequent event”). Typically, this will involve events occurring after the close of a foreign market on which a security trades and before the next Valuation Time.
The Funds holding foreign equity securities (the “Foreign Equity Funds”) value foreign securities at fair value in the circumstances described below. Generally, trading in foreign securities markets is completed each day at various times prior to the Valuation Time. Due to the time differences between the closings of the relevant foreign securities exchanges and the Valuation Time for the Foreign Equity Funds, the Foreign Equity Funds will fair value their foreign investments when it is determined that the market quotations for the foreign investments either are not readily available or are unreliable and, therefore, do not represent fair value. When the fair value prices are utilized, these prices will attempt to reflect the impact of the U.S. financial markets’ perceptions and trading activities on the Foreign Equity Funds’ foreign investments since the last closing prices of the foreign investments were calculated on their primary foreign securities markets or exchanges. For these purposes, the Board of Trustees of the Trust has determined that movements in relevant indices or other appropriate market indicators, after the close of the foreign securities exchanges, may demonstrate that market quotations are unreliable, and may trigger fair value pricing for certain securities. Consequently, fair valuation of portfolio securities may occur on a daily basis.
| (b) | | Repurchase Agreements |
The Funds may enter into repurchase agreements with an entity which is a member of the Federal Reserve System or which is a “primary dealer” (as designated by the Federal Reserve Bank of New York) in U.S. Government obligations. The repurchase price generally equals the price paid by a Fund plus interest negotiated on the basis of current short-term rates, which may be more or less than the rate on the underlying portfolio securities. The seller under a repurchase agreement is required to maintain the value of the collateral held pursuant to the agreement at a market value equal to or greater than the repurchase price (including accrued interest). Collateral subject to repurchase agreements is held by the Funds’ custodian or another qualified sub-custodian or in the Federal Reserve/Treasury book-entry system. If the counterparty defaults and the fair value of the collateral declines, realization of the collateral by the Funds may be delayed or limited. The Funds may transfer uninvested cash balances into a pooled cash account. These balances are invested in one or more repurchase agreements, which are fully collateralized by U.S. Government Agency Mortgages with the counterparties of CS First Boston and Nomura Securities.
| (c) | | Foreign Currency Transactions |
The accounting records of the Funds are maintained in U.S. dollars. Foreign currency amounts are translated into U.S. dollars at the current rate of exchange to determine the value of investments, assets and liabilities. Purchases and sales of securities, and income and expenses are translated at the prevailing rate of exchange on the respective date of these transactions. The Funds do not isolate that portion of the results of operations resulting from changes in foreign exchange rates on investments from fluctuations arising from changes in market prices of securities held. These fluctuations are included with the net realized and unrealized gain or loss from investments and foreign currencies.
| (d) | | Forward Foreign Currency Contracts |
Certain Funds may enter into forward foreign currency exchange contracts in connection with planned purchases or sales of securities or to hedge the U.S. dollar value of portfolio securities denominated in a particular currency. The
Funds could be exposed to risks if the counterparties to the contracts are unable to meet the terms of their contracts and from unanticipated movements in the value of a foreign currency relative to the U.S. dollar. The forward foreign currency contracts are adjusted by the daily exchange rate of the underlying currency and any gains or losses are recorded for financial statement purposes as unrealized gains or losses until the contract settlement date.
Certain Funds may invest in financial futures contracts (“futures contracts”) for the purpose of hedging their existing portfolio securities or securities that the Funds intend to purchase against fluctuations in value caused by changes in prevailing market interest rates or prices. Futures contracts may also be entered into for non-hedging purposes.
Upon entering into a futures contract, these Funds are required to pledge to the broker an amount of cash and/or other assets equal to a certain percentage of the contract amount (initial margin deposit). Subsequent payments, known as “variation margin”, are made each day, depending on the daily fluctuations in the fair value/market value of the underlying assets. A gain or loss equal to the daily variation margin is recognized on a daily basis. Future contracts are valued daily at their last quoted sale price.
A “sale” of a futures contract means a contractual obligation to deliver the securities or foreign currency called for by the contract at a fixed price at a specified time in the future. A “purchase” of a futures contract means a contractual obligation to acquire the securities or foreign currency at a fixed price at a specified time in the future.
Should market conditions change unexpectedly, a Fund may not achieve the anticipated benefits of the futures contracts and may realize a loss. The use of futures transactions for hedging purposes involves the risk of imperfect correlation in movements in the price of futures contracts, interest rates and the value of the underlying hedged assets.
The Funds may engage in swap contracts in order to obtain a desired return at a lower cost than if the Funds had invested directly in the asset that yielded the desired return. Unrealized gains are reported as an asset and unrealized losses are reported as a liability on the Statement of Assets and Liabilities. The change in unrealized gains or losses on swap contracts is reported as unrealized gains or losses in the Statement of Operations. A realized gain or loss is recorded upon termination of swap contracts. Swap contracts are stated at fair value. Notional principal amounts are used to express the extent of involvement in these contracts, but the amounts potentially subject to credit risk are much smaller. As of October 31, 2006, the Funds did not have any swap contracts outstanding.
| (g) | | Mortgage Dollar Rolls |
Certain Funds may enter into mortgage “dollar rolls” in which a Fund sells mortgage-backed securities for delivery in the current month and simultaneously contracts to repurchase substantially similar (same type, coupon and maturity) securities on a specified future date. Mortgage dollar rolls are referred to as TBA’s on the Statement of Investments of the applicable Funds. During the roll period, the Fund foregoes principal and interest paid on the mortgage-backed securities. The Fund is compensated by fee income or the difference between the current sales price and the lower forward price for the future purchase. Such compensation is amortized over the life of the dollar roll and included in investment income on the Statement of Operations. Mortgage dollar rolls are valued at the last quoted bid price and/or by using a combination of daily quotes and matrix evaluations provided by an independent pricing service, the use of which has been approved by the Fund’s Board of Trustees.
| (h) | | Security Transactions and Investment Income |
Security transactions are accounted for on the date the security is purchased or sold (“trade date”). Securities gains and losses are calculated on the identified cost basis. Interest income is recognized on the accrual basis and includes, where applicable, the amortization or accretion of premium or discount. Dividend income is recorded on the ex-dividend date.
Notes to Financial Statements (Continued)
October 31, 2006
To generate additional income, each of the Funds may lend their respective portfolio securities, up to 33 1/3% of the Fund, to brokers, dealers and other financial institutions provided that (1) the borrower delivers cash or securities as collateral with respect to each new loan of U.S. securities, equal to at least 102% of the value of the portfolio securities loaned, and with respect to each new loan on non-U.S. securities, collateral of at least 105% of the value of the portfolio securities loaned; and (2) at all times thereafter shall require the borrower to mark-to-market the collateral on a daily basis so that the market value of such collateral does not fall below 100% of the value of securities loaned. The Funds receive payments from borrowers equivalent to the dividends and interest that would have been earned on securities loaned while simultaneously seeking to earn income on the investment of cash collateral. There may be risks of delay in recovery of the securities should the borrower of the securities fail financially. Loans will be made, however, only to borrowers deemed by the Funds’ investment adviser to be of good standing and creditworthy under guidelines established by the Board of Trustees and when, in judgment of the adviser, the consideration which can be earned currently from these securities loans justifies the attendant risks. Loans are subject to termination by the Funds or the borrower at any time, and, therefore, are not considered to be illiquid investments. JPMorgan Chase Bank serves as custodian for the securities lending program of the Funds. JPMorgan Chase Bank receives a fee based on the value of the collateral received from borrowers.
Information on the investment of cash collateral is shown in the Statements of Investments.
As of October 31, 2006, the following Funds had securities with the following values on loan:
| | | | | | |
| Fund | | Value of
Loaned Securities | | Value of
Collateral |
Bond Index* | | $ | 385,201,778 | | $ | 390,402,991 |
International Index | | | 328,119,836 | | | 344,321,838 |
Mid Cap Market Index | | | 246,870,548 | | | 252,666,695 |
S&P 500 Index | | | 173,997,924 | | | 177,126,924 |
Small Cap Index | | | 108,943,781 | | | 111,979,600 |
| | * | Includes $99,393,316 of collateral in the form of U.S. Government Securities, interest rates ranging from 0.00% to 12.00% and maturity dates ranging from 11/15/06 to 01/25/48. |
| (j) | | Distributions to Shareholders |
Distributions from net investment income, if any, is declared daily and paid monthly for the Bond Index Fund and is declared and paid quarterly for all other Funds. For all Funds, distributed from net realized capital gains, if any, are declared and distributed at least annually.
Dividends and distributions to shareholders are determined in accordance with federal income tax regulations, which may differ from GAAP. These “book/tax” differences are considered either permanent or temporary in nature. In accordance with American Institute of Certified Public Accountants Statement of Position 93-2, permanent differences (i.e., reclassification of market discounts, foreign gain/loss, paydowns and real estate investment trusts) are reclassified within the capital accounts based on their nature for federal income tax purposes; temporary differences do not require reclassification. These reclassifications have no effect upon the net asset value of the respective Funds. To the extent distributions exceed current and accumulated earnings and profits for federal income tax purposes, these excesses are reported as distributions of paid-in-capital.
It is the policy of each Fund to qualify or continue to qualify as a regulated investment company by complying with the provisions available to certain investment companies, as defined in Subchapter M of the Internal Revenue Code, and to make distributions of net investment income and net realized capital gains sufficient to relieve the Fund from all, or substantially all, federal income taxes.
| (l) | | Allocation of Expenses, Income, and Gains and Losses |
Expenses directly attributable to a Fund are charged to that Fund. Expenses not directly attributable to a Fund are allocated proportionately among various or all Funds within the Trust. For each Fund, except Bond Index, the method for allocating income, fund level expenses, and realized and unrealized gains or losses is based on the fair value of shares outstanding relative to net assets. Under this method, each class of shares participates based on the total net asset value of that class’s shares in proportion to the total net assets of the Fund. For the Bond Index Funds, the allocation method used is based on the fair value of settled shares outstanding. Under this method, earnings are allocated based on the fair value of settled shares. Expenses specific to a class (such as Rule 12b-1 and administrative services fees) are charged to that class.
3. Transactions with Affiliates
Under the terms of the Trust’s Investment Advisory Agreement, Gartmore Mutual Fund Capital Trust (“GMF”) manages the investment of the assets and supervises the daily business affairs of the Funds (as shown in the table below). GMF is a wholly-owned subsidiary of NWD Investment Management, Inc. (prior to November 30, 2006 known as “Gartmore Global Investments, Inc.” (“GGI”), a holding company. NWD Investment Management, Inc. is a majority-owned subsidiary of NWD Management & Research Trust (prior to November 30, 2006 known as “Gartmore Global Asset Management Trust” (“GGAMT”). NWD Management & Research Trust is a wholly-owned subsidiary of Nationwide Corporation. All of the common stock of Nationwide Corporation is held by Nationwide Mutual Insurance Company (95.2%) and Nationwide Mutual Fire Insurance Company (4.8%), each of which is a mutual company owned by its policyholders. GMF provides investment management evaluation services in initially selecting and monitoring on an ongoing basis, the performance of the subadviser, BlackRock Investment Management, LLC, for the Funds that GMF advises. Effective September 29, 2006, Merrill Lynch & Co., Inc. (“Merrill Lynch”) and BlackRock, Inc. (“BlackRock”) completed a transaction involving Merrill Lynch’s asset management business, including Fund Asset Management, L.P. (“FAM”), to create a new BlackRock, an independent company. Prior to September 29, 2006, Fund Asset Management, L.P. was the subadviser for the Funds. The subadviser manages each of its respective Fund’s investments and has the responsibility for making all investment decisions for the applicable Funds.
Under the terms of the Investment Advisory Agreement, each Fund pays GMF an investment advisory fee based on that Fund’s average daily net assets. From these fees, pursuant to the subadvisory agreements, GMF pays fees to the subadviser. Additional information regarding the investment advisory fees and subadvisory fees for GMF and the subadviser is as follows for the year ended October 31, 2006:
| | | | | | | | |
| Fund | | Fee Schedule | | Total
Fees | | Fees
Retained | | Paid to
Subadviser |
Bond Index | | Up to $1.5 billion | | 0.22% | | 0.14% | | 0.0800% |
| | On the next $1.5 billion | | 0.21% | | 0.15% | | 0.0600% |
| | | On $3 billion and more | | 0.20% | | 0.15% | | 0.0500% |
International Index | | Up to $1.5 billion | | 0.27% | | 0.16% | | 0.1100% |
| | On the next $1.5 billion | | 0.26% | | 0.175% | | 0.0850% |
| | | On $3 billion and more | | 0.25% | | 0.175% | | 0.0750% |
Mid Cap Market Index | | Up to $1.5 billion | | 0.22% | | 0.145% | | 0.0750% |
| | On the next $1.5 billion | | 0.21% | | 0.15% | | 0.0600% |
| | | On $3 billion and more | | 0.20% | | 0.15% | | 0.0500% |
S&P 500 Index | | Up to $1.5 billion | | 0.13% | | 0.11% | | 0.0200% |
| | On the next $1.5 billion | | 0.12% | | 0.105% | | 0.0150% |
| | On the next $1.5 billion | | 0.11% | | 0.0975% | | 0.0125% |
| | | On $4.5 billion and more | | 0.10% | | 0.09% | | 0.0100% |
Small Cap Index | | Up to $1.5 billion | | 0.20% | | 0.13% | | 0.0700% |
| | On the next $1.5 billion | | 0.19% | | 0.13% | | 0.0600% |
| | | On $3 billion and more | | 0.18% | | 0.13% | | 0.0500% |
Notes to Financial Statements (Continued)
October 31, 2006
Prior to May 1, 2006, the Funds followed the fee schedule below:
| | | | | | | | |
| Fund | | Fee Schedule | | Total
Fees | | Fees
Retained | | Paid to
Subadviser |
Bond Index | | Up to $1.5 billion | | 0.22% | | 0.13% | | 0.09% |
| | On the next $1.5 billion | | 0.21% | | 0.12% | | 0.09% |
| | | On $3 billion and more | | 0.20% | | 0.11% | | 0.09% |
International Index | | Up to $1.5 billion | | 0.27% | | 0.15% | | 0.12% |
| | On the next $1.5 billion | | 0.26% | | 0.14% | | 0.12% |
| | | On $3 billion and more | | 0.25% | | 0.13% | | 0.12% |
Mid Cap Market Index | | Up to $1.5 billion | | 0.22% | | 0.13% | | 0.09% |
| | On the next $1.5 billion | | 0.21% | | 0.12% | | 0.09% |
| | | On $3 billion and more | | 0.20% | | 0.11% | | 0.09% |
S&P 500 Index | | Up to $1.5 billion | | 0.13% | | 0.11% | | 0.02% |
| | On the next $1.5 billion | | 0.12% | | 0.10% | | 0.02% |
| | | On $3 billion and more | | 0.11% | | 0.09% | | 0.02% |
Small Cap Index | | Up to $1.5 billion | | 0.20% | | 0.13% | | 0.07% |
| | On the next $1.5 billion | | 0.19% | | 0.12% | | 0.07% |
| | | On $3 billion and more | | 0.18% | | 0.11% | | 0.07% |
GMF and the Funds have entered into written contracts (“Expense Limitation Agreements”) that limit operating expenses (excluding any taxes, interest, brokerage fees, extraordinary expenses, short sale dividend expenses, Rule 12b-1 fees, and administrative services fees) from exceeding the amounts listed in the table below until at least February 28, 2007:
| | | | | | | | | | | | | | | | | | | | | | | | |
| | | Expense Caps | |
| Fund | | Class A
Shares | | | Class B
Shares | | | Class C
Shares | | | Class R
Shares | | | Institutional
Class Shares | | | Institutional
Service Class
Shares | | | Service Class
Shares | | | Local Fund
Shares | |
Bond Index (a) | | 0.32 | % | | 0.32 | % | | 0.32 | % | | 0.32 | % | | 0.32 | % | | n/a | | | n/a | | | n/a | |
International Index (a) | | 0.37 | % | | 0.37 | % | | 0.37 | % | | 0.37 | % | | 0.37 | % | | n/a | | | n/a | | | n/a | |
Mid Cap Market Index | | 0.32 | % | | 0.32 | % | | 0.32 | % | | 0.32 | % | | 0.32 | % | | n/a | | | n/a | | | n/a | |
S&P 500 Index | | 0.23 | % | | 0.23 | % | | 0.23 | % | | 0.23 | % | | 0.23 | % | | 0.23 | % | | 0.23 | % | | 0.23 | % |
Small Cap Index (a) | | 0.30 | % | | 0.30 | % | | 0.30 | % | | 0.30 | % | | 0.30 | % | | n/a | | | n/a | | | n/a | |
| (a) | The Expense Limitation Agreement for these Funds also states that the expense ratio for each class will not exceed 4.00% through March 1, 2011. |
Under the terms of a Distribution Plan under Rule 12b-1 of the 1940 Act, Gartmore Distribution Services, Inc. (“GDSI”), the Funds’ principal underwriter, is compensated by the Funds for expenses associated with the distribution of certain classes of shares of the Funds. GDSI is a majority-owned subsidiary of NWD Management & Research Trust. These fees are based on average daily net assets of the respective class of the Funds at an annual rate not to exceed the following:
| | | | | | | | | | | | | | | | | | |
| Fund | | Class A
Shares | | | Class B
Shares | | | Class C
Shares | | | Class R
Shares | | | Service Class
Shares | | | Local Fund
Shares | |
Bond Index | | 0.25 | % | | 1.00 | % | | 1.00 | % | | 0.50 | % | | n/a | | | n/a | |
International Index | | 0.25 | % | | 1.00 | % | | 1.00 | % | | 0.50 | % | | n/a | | | n/a | |
Mid Cap Market Index | | 0.25 | % | | 1.00 | % | | 1.00 | % | | 0.50 | % | | n/a | | | n/a | |
S&P 500 Index | | 0.25 | % | | 1.00 | % | | 1.00 | % | | 0.50 | % | | 0.15 | % | | 0.07 | % |
Small Cap Index | | 0.25 | % | | 1.00 | % | | 1.00 | % | | 0.50 | % | | n/a | | | n/a | |
Pursuant to an Underwriting Agreement, GDSI serves as principal underwriter of the Funds in the continuous distribution of their shares and receives commissions in the form of a front-end sales charge on the Class A shares. These fees are deducted from and are not included in proceeds from sales of Class A shares. From these fees, GDSI pays sales commissions, salaries and other expenses in connection with generating new sales of Class A shares of the Funds. GDSI also receives fees for services as principal underwriter for Class B shares of the Funds. These fees are contingent deferred sales charges (“CDSCs”) ranging from 1% to 5% imposed on redemptions of Class B shares which may cause the current value of a shareholder’s account to fall below the total purchase payments. The CDSC, if applicable, will be imposed on redemptions made within six years of the purchase. Class C shares have a CDSC fee of 1% imposed on redemptions of Class C shares made within one year of purchase. For the year ended October 31, 2006, GDSI received commissions of $94,943 from front-end sales charges of Class A shares and from CDSC fees from Class B and Class C shares of the Funds, of which $31,536 was re-allowed to affiliated broker-dealers of the Funds.
Under the terms of a Fund Administration and Transfer Agency Agreement, Gartmore SA Capital Trust (“GSA”) provides various administrative and accounting services for the Funds, and Gartmore Investor Services, Inc. (“GISI”), an indirect subsidiary of GSA, serves as Transfer Agent and Dividend Disbursing Agent for each of the Funds. The fees for the services provided under this agreement are calculated based on the Trust’s average daily net assets according to the fee
schedule below. The fees then are allocated proportionately among all Funds within the Trust in relation to the average daily net assets of each Fund and are paid to GSA. GSA pays GISI from these fees for GISI’s services.
| | |
| Combined Fee Schedule* | | |
Up to $1 billion | | 0.26% |
$1 billion up to $3 billion | | 0.19% |
$3 billion up to $4 billion | | 0.15% |
$4 billion up to $5 billion | | 0.08% |
$5 billion up to $10 billion | | 0.05% |
$10 billion up to $12 billion | | 0.03% |
$12 billion or more | | 0.02% |
| * | The assets of the Gartmore Investor Destinations Aggressive, Gartmore Investor Destinations Moderately Aggressive, Gartmore Investor Destinations Moderate, Gartmore Investor Destinations Moderately Conservative and Gartmore Investor Destinations Conservative Funds (collectively, the “Investor Destinations Funds”) and the Gartmore Optimal Allocations Fund: Aggressive, Gartmore Optimal Allocations Fund: Moderate, Gartmore Optimal Allocations Fund: Moderately Aggressive, and Gartmore Optimal Allocations Fund: Specialty (collectively, the “Optimal Funds”) are excluded from the Trust asset level amount in order to calculate this asset based fee. The Investor Destinations Funds and the Optimal Funds do not pay any part of this fee. |
GSA and GISI have entered into agreements with BISYS Fund Services Ohio, Inc. (“BISYS”), pursuant to which BISYS provides sub-administration and sub-transfer agency services, respectively, to the Funds.
GSA and BISYS have agreed to designate certain sub-transfer agency agreements GSA enters into with respect to the Funds as “Qualifying Sub-TA Agreements.” With respect to Qualifying Sub-TA Agreements, BISYS will credit to GSA an amount equal to the lesser of (i) the actual amount GSA is charged by the sub-transfer agent under the applicable Qualifying Sub-TA Agreement or (ii) $10 per investor account; however, the aggregate amount paid with regard to all Qualifying Sub-TA Agreements, regardless of whether option (i) or (ii) applies, shall not exceed $200,000 per annum. BISYS will calculate and credit such amounts to GSA’s fees on a monthly basis. All amounts will be credited to each, applicable Fund on a monthly basis.
Under the terms of an Administrative Services Plan, the Funds may pay fees to servicing organizations, such as broker-dealers, including Nationwide Financial Services, Inc. (“Nationwide Financial Services”), an affiliate of NWD Management & Research Trust, and financial institutions, which agree to provide administrative support services to the shareholders of certain classes. These services include, but are not limited, to the following: establishing and maintaining shareholder accounts; processing purchase and redemption transactions; arranging bank wires; performing shareholder
Notes to Financial Statements (Continued)
October 31, 2006
sub-accounting; answering inquiries regarding the Funds; and other such services. These fees are based on an annual rate of up to 0.25% of the average daily net assets of the Class A, Service Class, and Institutional Service Class shares of each of the Funds.
For the year ended October 31, 2006, Nationwide Financial Services received the following amounts in administrative services fees from each Fund:
| | | |
| Fund | | Amount |
Bond Index | | $ | 54,791 |
International Index | | | 78,412 |
Mid Cap Market Index | | | 234,755 |
S&P 500 Index | | | 1,521,531 |
Small Cap Index | | | 110,867 |
Under terms of a letter agreement dated September 12, 2006, by and among GSA and the Audit Committees of the Funds and Gartmore Variable Insurance Trust, the Funds have agreed to reimburse GSA their pro-rata portion of certain costs related to the Funds’ ongoing administration, monitoring and annual (audit) testing of the Funds’ Rule 38a-1 Compliance Program subject to the pre-approval of the Funds’ Audit Committee. Such costs include: (1) $160 per hour for services performed on behalf of the Funds by employees of GSA or GSA’s affiliates (other than the Fund CCO); (2) travel costs and other reasonable incidental expenses (without markup) incurred by employees of GSA or GSA’s affiliates in connection with performance of such services; and (3) in the event it becomes necessary to supplement the services of GSA’s (and GSA’s affiliates’) employees, in order to complete the Funds’ Rule 38a-1 annual compliance audit, the costs of a mutually-agreed upon independent contractor’s costs to provide such services.
4. Short-Term Trading Fees
The Funds assess a 2.00% redemption fee on all classes of shares that are purchased and are sold or exchanged within seven calendar days of purchase. The redemption fee, if any, is paid directly to the applicable Fund and is designed to offset brokerage commissions, market impact and other costs associated with short-term trading of Fund shares. For purposes of determining whether the redemption fee applies, the shares that were held the longest will be redeemed first. This redemption fee is in addition to any CDSCs that may be applicable at the time of sale. The redemption fee may not apply in certain circumstances, such as redemptions or exchanges of shares held in certain omnibus accounts or retirement plans that cannot implement the redemption fee. The fee does not apply to shares purchased through reinvested dividends or capital gains.
For the year ended October 31, 2006, the Funds had no contributions to capital due to collection of redemption fees.
5. Bank Loans and Earnings Credit
The Trust has a credit agreement with JPMorgan Chase & Co., the Funds’ custodian bank, permitting the Trust to borrow up to 100,000,000 Borrowings under this arrangement bear interest at the Federal Funds rate plus 0.50%. The interest costs, if any, would be included in other fees in the Statement of Operations. No compensating balances were required under the terms of the line of credit. The line of credit is renewed annually, expiring on June 26, 2007, with a commitment fee of 0.08% per year on $100,000,000. There were no borrowings outstanding under this line of credit during the year ended October 31, 2006.
The Trust’s custodian bank has agreed to reduce the bank’s fees (earnings credits) when the Funds of the Trust maintain cash on deposit in non-interest- bearing custody and Demand Deposit Accounts. Earnings credits are a reduction of total expenses shown on the Statement of Operations.
6. Investment Transactions
Purchases and sales of securities (excluding short-term securities) for the year ended October 31, 2006, are summarized as follows:
| | | | | | |
| Fund | | Purchases | | Sales |
Bond Index | | $ | 2,708,743,833 | | $ | 2,119,114,938 |
International Index | | | 433,559,110 | | | 140,596,558 |
Mid Cap Market Index | | | 328,012,966 | | | 160,058,287 |
S&P 500 Index | | | 478,332,102 | | | 79,320,111 |
Small Cap Index | | | 236,722,608 | | | 134,626,977 |
Purchases and sales of U.S. Government securities for the year ended October 31, 2006, are summarized as follows:
| | | | | | |
| Fund | | Purchases | | Sales |
Bond Index | | $ | 2,766,016,499 | | $ | 2,044,792,328 |
7. Portfolio Investment Risks
Risks Associated with Foreign Securities and Currencies. Investments in securities of foreign issuers carry certain risks not ordinarily associated with investments in securities of U.S. issuers. These risks include future political and economic developments, and the possible imposition of exchange controls or other foreign governmental laws and restrictions. In addition, with respect to certain countries, there is the possibility of expropriation of assets, confiscatory taxation, political or social instability or diplomatic developments, which could adversely affect investments in those countries.
Certain countries also may impose substantial restrictions on investments in their capital markets by foreign entities, including restrictions on investments in issuers of industries deemed sensitive to relevant national interests. These factors may limit the investment opportunities available and result in a lack of liquidity and a high price volatility with respect to securities of issuers from developing countries.
8. Indemnifications
Under the Trust’s organizational documents, certain of the Trust’s Officers and Trustees are indemnified against certain liabilities arising out of the performance of their duties to the Trust. In addition, the Trust has entered into Indemnification Agreements with its Trustees and certain of its Officers. Trust Officers receive no compensation from the Trust for serving as its Officers. In addition, in the normal course of business, the Trust enters into contracts with its vendors and others that provide for general indemnifications. The Trust’s maximum liability under these arrangements is unknown, as this would involve future claims that may be made against the Trust. Based on experience however, the Trust expects that risk of loss to be remote.
9. Federal Tax Information
The tax character of distributions paid during the fiscal year ended October 31, 2006, was as follows: (Total distributions paid differ from the Statement of Changes in Net Assets because for tax purposes dividends are recognized when actually paid.)
| | | | | | | | | | | | |
| | | Distributions paid from | | | | |
| Fund | | Ordinary
Income | | Net Long-
Term Capital
Gains | | Total Taxable
Distributions | | Total
Distributions
Paid |
Bond Index | | $ | 76,262,559 | | $ | — | | $ | 76,262,559 | | $ | 76,262,559 |
International Index | | | 49,068,624 | | | 18,970,040 | | | 68,038,664 | | | 68,038,664 |
Mid Cap Market Index | | | 27,079,493 | | | 37,248,090 | | | 64,327,583 | | | 64,327,583 |
S&P 500 Index | | | 49,576,878 | | | 20,491,137 | | | 70,068,015 | | | 70,068,015 |
Small Cap Index | | | 11,400,469 | | | 13,602,881 | | | 25,003,350 | | | 25,003,350 |
Notes to Financial Statements (Continued)
October 31, 2006
The tax character of distributions paid during the fiscal year ended October 31, 2005 was as follows: (Total distributions paid differ from the Statement of Changes in Net Assets because for tax purposes dividends are recognized when actually paid.)
| | | | | | | | | |
| | | Distributions paid from | | |
| Fund | | Ordinary
Income | | Net Long-
Term Capital
Gains | | Total
Distributions
Paid |
Bond Index | | $ | 52,182,582 | | $ | — | | $ | 52,182,582 |
International Index | | | 35,814,307 | | | 6,212,796 | | | 42,027,103 |
Mid Cap Market Index | | | 13,066,934 | | | 9,179,102 | | | 22,246,036 |
S&P 500 Index | | | 40,449,310 | | | — | | | 40,449,310 |
Small Cap Index | | | 9,500,597 | | | 6,667,420 | | | 16,168,017 |
As of October 31, 2006, the components of accumulated earnings (deficit) on a tax basis was as follows:
| | | | | | | | | | | | | | | | | | | | | | | | | |
| Fund | | Undistributed
Ordinary
Income | | Undistributed
Long-Term
Capital Gains | | Accumulated
Earnings | | Distributions
Payable | | | Accumulated
Capital and
Other Losses | | | Unrealized
Appreciation
(Depreciation)* | | | Total
Accumulated
Earnings
(Deficit) | |
Bond Index | | $ | 10,756,911 | | $ | — | | $ | 10,756,911 | | $ | (9,090,750 | ) | | $ | (12,469,542 | ) | | $ | (6,873,701 | ) | | $ | (17,677,082 | ) |
International Index | | | 36,893,010 | | | 38,892,202 | | | 75,785,212 | | | — | | | | — | | | | 530,442,809 | | | | 606,228,021 | |
Mid Cap Market Index | | | 13,119,253 | | | 56,807,152 | | | 69,926,405 | | | — | | | | — | | | | 169,317,618 | | | | 239,244,023 | |
S&P 500 Index | | | 7,942,104 | | | 10,738,408 | | | 18,680,512 | | | — | | | | — | | | | 554,184,052 | | | | 572,864,564 | |
Small Cap Index | | | 10,181,012 | | | 40,704,197 | | | 50,885,209 | | | — | | | | — | | | | 70,876,941 | | | | 121,762,150 | |
| * | The differences between the book-basis and tax-basis unrealized appreciation (depreciation) is attributable primarily to: tax deferral of losses on wash sales; the difference between book and tax amortization methods for premium and market discount; and the return of capital adjustments from real estate investment trusts. |
As of October 31, 2006, the tax cost of securities and the breakdown of unrealized appreciation (depreciation) for each Fund were as follows:
| | | | | | | | | | | | | |
| Fund | | Tax Cost of
Securities | | Unrealized
Appreciation | | Unrealized
Depreciation | | | Net
Unrealized
Appreciation
(Depreciation) | |
Bond Index | | $ | 2,488,027,984 | | $ | 11,340,000 | | $ | (18,213,701 | ) | | (6,873,701 | ) |
International Index | | | 1,795,117,166 | | | 543,603,190 | | | (13,064,256 | ) | | 530,538,934 | |
Mid Cap Market Index | | | 1,363,325,897 | | | 210,034,302 | | | (40,716,684 | ) | | 169,317,618 | |
S&P 500 Index | | | 3,061,192,053 | | | 629,776,415 | | | (75,592,363 | ) | | 554,184,052 | |
Small Cap Index | | | 669,986,354 | | | 93,522,510 | | | (22,645,569 | ) | | 70,876,941 | |
As of October 31, 2006, for Federal income tax purposes, the following Fund has capital loss carry forwards available to offset capital gains, if any, to the extent provided by the treasury regulations.
| | | | | |
| Fund | | Amount | | Expires |
Bond Index | | $ | 3,181,988 | | 2013 |
Bond Index | | $ | 9,287,554 | | 2014 |
Recently Issued Accounting Pronouncements – On July 13, 2006, the Financial Accounting Standards Board (“FASB”) released FASB Interpretation No. 48, Accounting for Uncertainty in Income Taxes (“FIN 48”). FIN 48 provides guidance for how uncertain tax positions should be recognized, measured, presented and disclosed in the financial statements. FIN 48 requires the affirmative evaluation of tax positions taken or expected to be taken in the course of preparing the Fund’s tax returns to determine whether it is more-likely-than-not (i.e., greater than 50-percent) that each tax position will be sustained upon examination by a taxing authority based on the technical merits of the position. A tax position that meets the more-likely-than-not recognition threshold is measured to determine the amount of benefit to recognize in the financial statements. Differences between tax positions taken in a tax return and amounts recognized in the financial statements will generally result in an increase in a liability for taxes payable (or a reduction of a tax refund receivable) and an increase in a deferred tax liability (or a reduction in a deferred tax asset). Adoption of FIN 48 is required for fiscal years beginning after December 15, 2006 and is to be applied to all open tax years as of the effective date. At this time, management is evaluating the implications of FIN 48. Its impact to the financial statements has not yet been determined.
Report of Independent Registered Public Accounting Firm
To the Board of Trustees and Shareholders of Gartmore Mutual Funds:
In our opinion, the accompanying statements of assets and liabilities, including the statements of investments, and the related statements of operations and of changes in net assets and the financial highlights present fairly, in all material respects, the financial position of Gartmore Bond Index Fund, Gartmore International Index Fund, Gartmore Mid Cap Market Index Fund, Gartmore S&P 500 Index Fund and Gartmore Small Cap Index Fund (five series of Gartmore Mutual Funds, hereafter referred to as the “Funds”) at October 31, 2006, the results of each of their operations for the year then ended, the changes in each of their net assets for each of the two years then ended and the financial highlights for each of the periods indicated, in conformity with accounting principles generally accepted in the United States of America. These financial statements and financial highlights (hereafter referred to as “financial statements”) are the responsibility of the Funds’ management; our responsibility is to express an opinion on these financial statements based on our audits. We conducted our audits of these financial statements in accordance with the standards of the Public Company Accounting Oversight Board (United States.) Those standards require that we plan and perform the audit to obtain reasonable assurance about whether the financial statements are free of material misstatement. An audit includes examining, on a test basis, evidence supporting the amounts and disclosures in the financial statements, assessing the accounting principles used and significant estimates made by management, and evaluating the overall financial statement presentation. We believe that our audits, which included confirmation of securities at October 31, 2006 by correspondence with the custodian and brokers, provide a reasonable basis for our opinion.
PricewaterhouseCoopers LLP
Philadelphia, Pennsylvania
December 20, 2006
Supplemental Information
1. Other Federal Tax Information (Unaudited):
For the period ended October 31, 2006, certain dividends paid by the Funds may be subject to a maximum tax rate of 15% as provided for by the Jobs and Growth Tax Relief Reconciliation Act of 2003. The Funds intend to designate the maximum amount allowable as taxed at a maximum rate of 15%. Complete information will be reported in conjunction with your 2006 Form 1099-DIV.
For the period ended October 31, 2006, the following Funds paid qualified dividend income:
| | | |
| Fund | | Qualified
Dividend
Income |
International Index | | $ | 33,971,411 |
Mid Cap Market Index | | | 12,931,552 |
S&P 500 Index | | | 49,576,879 |
Small Cap Index | | | 3,902,534 |
For the taxable year ended October 31, 2006, the following percentage of income dividends paid by the Funds qualify for the dividends received deduction available to corporations:
| | |
| Fund | | Dividends
Received
Deduction |
Mid Cap Market Index | | 48% |
S&P 500 Index | | 100% |
Small Cap Index | | 34% |
The Funds designate the following amounts as long term capital gain distributions qualifying for the maximum 15% income tax rate for individuals:
| | | |
| Fund | | Amount |
International Index | | $ | 18,970,040 |
Mid Cap Market Index | | | 37,248,090 |
S&P 500 Index | | | 20,491,137 |
Small Cap Index | | | 13,602,881 |
Certain Funds intend to elect to pass through to shareholders the income tax credit for taxes paid to foreign countries. As of October 31, 2006, foreign source income per share for each Fund was as follows:
| | | |
| Fund | | Foreign Source
Income Per Share |
International Index | | $ | 0.22 |
Management Information (Unaudited)
October 31, 2006
Trustees who are not Interested Persons (as defined in the 1940 Act) and Officers of the Funds as of
October 31, 2006
| | | | | | | | |
Name, Address and Year of Birth | | Position(s) Held
with the Trust
and Length of
Time Served1 | | Principal Occupation(s) During Past 5 Years | | Number of Portfolios
in the Gartmore Fund Complex Overseen by Trustee | | Other Directorships Held by Trustee or Nominee2 |
| | | | |
Charles E. Allen c/o NWD Investment Management, Inc. 1200 River Road, Suite 1000 Conshohocken, PA 19428 1948 | | Trustee
since
July 2000 | | Mr. Allen is Chairman, Chief Executive Officer and President of the Graimark Realty Advisors, Inc. (real estate development, investment and asset management). | | 97 | | None |
| | | | |
Paula H.J. Cholmondeley c/o NWD Investment Management, Inc. 1200 River Road, Suite 1000 Conshohocken, PA 19428 1947 | | Trustee
since
July 2000 | | Ms. Cholmondeley is an independent strategy consultant. Ms. Cholmondeley was Vice President and General Manager of Sappi Fine Paper North America from April 2000 through December 2003. | | 97 | | Director of Dentsply International, Inc., Ultralife Batteries, Inc., Terex Corporation, Minerals Technology, Inc. and Albany International Corp. |
| | | | |
C. Brent DeVore3 c/o NWD Investment Management, Inc. 1200 River Road, Suite 1000 Conshohocken, PA 19428 1940 | | Trustee
since
1990 | | Dr. DeVore is President of Otterbein College. | | 97 | | None |
| | | | |
Phyllis K. Dryden c/o NWD Investment Management, Inc. 1200 River Road, Suite 1000 Conshohocken, PA 19428 1947 | | Trustee
since December 2004 | | Beginning in February 2006 Ms. Dryden is employed by The Mitchell Madison Group, a management consulting company. Ms. Dryden was a former Managing Partner of marchFIRST, a global management consulting firm prior to February 2002. | | 97 | | None |
| | | | |
Barbara L. Hennigar c/o NWD Investment Management, Inc. 1200 River Road, Suite 1000 Conshohocken, PA 19428 1935 | | Trustee
since
July 2000 | | Retired. | | 97 | | None |
Trustees who are not Interested Persons (as defined in the 1940 Act) and Officers of the Funds as of
October 31, 2006 (Continued)
| | | | | | | | |
Name, Address and Year of Birth | | Position(s) Held
with the Trust
and Length of
Time Served1 | | Principal Occupation(s) During Past 5 Years | | Number of Portfolios
in the Gartmore Fund Complex Overseen by Trustee | | Other Directorships Held by Trustee or Nominee2 |
| | | | |
Barbara I. Jacobs c/o NWD Investment Management, Inc. 1200 River Road, Suite 1000 Conshohocken, PA 19428 1950 | | Trustee
since December 2004 | | Ms. Jacobs served as Chairman of the Board of Directors of KICAP Network Fund, a European (United Kingdom) hedge fund, from December 2000 through January 2006. Prior to 2004, Ms. Jacobs was also a Managing Director and European Portfolio Manager with Teachers Insurance and Annuity Association - College Retirement Equities Fund. | | 97 | | None |
| | | | |
Douglas F. Kridler c/o NWD Investment Management, Inc. 1200 River Road, Suite 1000 Conshohocken, PA 19428 1955 | | Trustee
since September 1997 | | Mr. Kridler has served as the President and Chief Executive Officer of the Columbus Foundation (a Columbus, OH-based foundation which manages over 1,300 individual endowment funds) since February 2002. Prior to January 31, 2002, Mr. Kridler was the President of the Columbus Association for the Performing Arts and Chairman of the Greater Columbus Convention and Visitors Bureau. | | 97 | | None |
| | | | |
Michael D. McCarthy c/o NWD Investment Management, Inc. 1200 River Road, Suite 1000 Conshohocken, PA 19428 1947 | | Trustee
since
December 2004 | | Retired. Mr. McCarthy was Chairman of VMAC (commodity swaps) from October 2002 until June 2005; and a partner of Pineville Properties LLC (a commercial real estate development firm). | | 97 | | None |
| | | | |
David C. Wetmore c/o NWD Investment Management, Inc. 1200 River Road, Suite 1000 Conshohocken, PA 19428 1948 | | Trustee since
1995
and Chairman
since
February 2005 | | Retired. | | 97 | | None |
| 1 | Length of time served includes time served with the Trust’s predecessors. |
| 2 | Directorships held in (1) any other investment companies registered under the 1940 Act, (2) any company with a class of securities registered pursuant to Section 12 of the Securities Exchange Act of 1934, as amended (the “Exchange Act”), or (3) any company subject to the requirements of Section 15(d) of the Exchange Act. |
| 3 | Mr. DeVore has served as President of Otterbein College since 1984. Mark Thresher, President and Chief Operating Officer of Nationwide Financial Services, Inc. (“NFS”) has served as a member of the Board of Trustees of Otterbein College since 2000, currently serves as one of 30 of its trustees, and is currently one of two Vice Chairmen of the Board. NFS is under common control with each of the Gartmore companies that serve as investment advisers and principal underwriter to the Trust, as each is a majority-owned subsidiary of Nationwide Corporation (“NC”) and, through NC, of Nationwide Mutual Insurance Company (95.2%) and Nationwide Mutual Fire Insurance Company (4.8%). |
Additional information regarding the Trustees and Officers may be found in the Trust’s Statement of Additional Information, which is available without charge upon request, by calling 800-848-0920.
Management Information (Unaudited)
October 31, 2006
Trustees who are Interested Persons (as defined in the 1940 Act) and/or Officers of the Funds as of
October 31, 2006
| | | | | | | | |
Name, Address and Year of Birth | | Position(s) Held
with the Trust
and Length of
Time Served1 | | Principal Occupation(s) During Past 5 Years | | Number of Portfolios
in the Gartmore Fund
Complex Overseen
by Trustee | | Other Directorships Held by Trustee2 |
| | | | |
Paul J. Hondros NWD Investment Management, Inc. 1200 River Road, Suite 1000 Conshohocken, PA 19428 1948 | | Trustee
since
July 2000 | | Mr. Hondros has been President and Chief Executive Officer of various NWD Investments Group entities, including Gartmore Distribution Services, Inc. (“GDSI”)3, Gartmore Investor Services, Inc. (“GISI”)3, Gartmore Morley Capital Management, Inc. (“GMCM”)3, Morley Financial Services, Inc. (“MFS”)3, NorthPointe Capital, LLC (“NorthPointe”)3, NWD Management & Research Trust (“NWDMRT”)3, NWD Investment Management, Inc. (“NWDIM”)3, Gartmore Mutual Fund Capital Trust (“GMFCT”)3 and Gartmore SA Capital Trust (“GSA”)3; and a Director of Nationwide Securities, Inc.3, as well as several entities within Nationwide Financial Services, Inc. | | 97 | | None |
| | | | |
Arden L. Shisler c/o NWD Investment Management, Inc. 1200 River Road, Suite 1000 Conshohocken, PA 19428 1941 | | Trustee
since
February 2000 | | Retired. Mr. Shisler is the former President and Chief Executive Officer of K&B Transport, Inc., a trucking firm (2000 through 2002). He served as a consultant to K&B from January 2003 through December 2004. Since 1992, Mr. Shisler has also been Chairman of the Board for Nationwide Mutual Insurance Company3. | | 97 | | Director of Nationwide Financial Services, Inc. |
| | | | |
Gerald J. Holland NWD Investment Management, Inc. 1200 River Road, Suite 1000 Conshohocken, PA 19428 1951 | | Treasurer
since
March 2001 | | Mr. Holland is Senior Vice President - Operations for NWDIM3, GMFCT3, and GSA3. | | N/A | | N/A |
| | | | |
Michael A. Krulikowski NWD Investment Management, Inc. 1200 River Road, Suite 1000 Conshohocken, PA 19428 1959 | | Chief Compliance Officer since
June 2004 | | Since November 1999, Mr. Krulikowski has served as a Vice President and Chief Compliance Officer of NWDIM3. Since June 2004, Mr. Krulikowski has also served as Chief Compliance Officer of the Trust. | | N/A | | N/A |
Trustees who are Interested Persons (as defined in the 1940 Act) and/or Officers of the Funds as of
October 31, 2006 (Continued)
| | | | | | | | |
SName, Address and Year of Birth | | Position(s) Held
with the Trust
and Length of
Time Served1 | | Principal Occupation(s) During Past 5 Years | | Number of Portfolios
in the Gartmore Fund
Complex Overseen
by Trustee | | Other Directorships Held by Trustee2 |
| | | | |
Eric E. Miller NWD Investment Management, Inc. 1200 River Road, Suite 1000 Conshohocken, PA 19428 1953 | | Secretary since December 2002 | | Mr. Miller is Senior Vice President, Chief Counsel for NWDIM3, GMFCT3 and GSA3 since August 2002. From August 2000 to August 2002, Mr. Miller was a Partner with Stradley Ronan Stevens & Young, LLP. | | N/A | | N/A |
| 1 | Length of time served includes time served with the Trust’s predecessors. |
| 2 | Directorships held in (1) any other investment companies registered under the 1940 Act, (2) any company with a class of securities registered pursuant to Section 12 of the Securities Exchange Act of 1934, as amended (the “Exchange Act”), or (3) any company subject to the requirements of Section 15(d) of the Exchange Act. |
| 3 | This position is held with an affiliated person or principal underwriter of the Trust. |
| | Federal law requires the Trust, each of its investment advisers and sub-advisers to adopt procedures for voting proxies (“Proxy Voting Guidelines”) and to provide a summary of those Proxy Voting Guidelines used to vote the securities held by the Funds. The Funds’ proxy voting policies and procedures are available without charge (i) upon request, by calling 800-848-0920, (ii) on the Fund’s website at www.nwdfunds.com, or (iii) on the Securities and Exchange Commission’s website at www.sec.gov. |
AnnualReport
| | |
| | |

| | October 31, 2006 |
Commentary provided by Gartmore Mutual Fund Capital Trust (the “Adviser”), investment adviser to Gartmore Funds. All opinions and estimates included in this report constitute the Adviser judgment as of the date of this report and are subject to change without notice.
As of September 29, 2006, Gartmore Funds and its U.S. operations, as well as the Funds’ Advisers, distributor, and other service providers, are no longer affiliated with Gartmore Investment Management plc (Gartmore U.K.) or other Gartmore international businesses. Certain Gartmore U.S. companies, and marketing materials related to them, will continue to carry the Gartmore name for the next several months under the terms of an agreement with Gartmore U.K. For more information call, 800-848-0920.
Statement Regarding Availability of Quarterly Portfolio Schedule.
The Gartmore Funds file complete schedules of portfolio holdings for each Fund with the Securities and Exchange Commission (the “Commission”) for the first and third quarters of each fiscal year on Form N-Q. The Funds’ Forms N-Q are available on the Commission’s website at http://www.sec.gov. The Funds’ Forms N-Q may be reviewed and copied at the Commission’s Public Reference Room in Washington, DC, and information on the operation of the Public Reference Room may be obtained by calling 800-SEC-0330; and the Funds make the information on Form N-Q available to shareholders on www.nwdfunds.com or upon request without charge.
Statement Regarding Availability of Proxy Voting Record.
Information regarding how the Funds voted proxies relating to portfolio securities held during the most recent 12-month period ended June 30, 2006 is available without charge, upon request, by calling 800-848-0920, and on the Commission’s website at http://www.sec.gov.
Message to Shareholders
December 15, 2006
This reporting period has been a time of change for our company. First, in September 2006, our parent company, Nationwide Mutual Insurance Company (Nationwide), completed the sale of the U.K.-based Gartmore Investment Management Ltd. (Gartmore U.K.). As a result of the sale, on November 30, 2006, Gartmore Global Investments, the U.S. division of Nationwide’s asset management business, changed its name to NWD Investments. All of the mutual funds advised by NWD Investments, however, will retain the Gartmore Funds name until May 2007. In addition, Gartmore U.K. will continue to act as subadviser for a number of Gartmore Funds, and, as a result, investors in those funds that include foreign exposure can expect “business as usual”. Nationwide has been examining how best to align NWD Investments as a part of its operations since the sale of Gartmore U.K. and on December 21, 2006, announced that it had reached a preliminary agreement of terms to sell NWD Investment’s retail operations to Nationwide Financial Services, Inc.
Second, I must report that this will be my final shareholder letter. Effective December 15, 2006, John Grady, who joined our firm in October as transition manager, was named as president of NWD Investments and was elected by the Gartmore Funds Board of Trustees to the role of president and chief executive officer. I’m confident that John’s extensive background in this industry will serve NWD Investments well as the company prepares for its next chapter of growth. I have enjoyed serving all of you, and I wish you much success in the years to come.
Market Overview
Global stock markets delivered strong gains for the year ended October 31, 2006, but the period was not without its share of volatility. During the first six months, the markets did a good job of advancing despite the headwinds of rising crude oil prices, interest-rate hikes by the Federal Reserve Board and the replacement of retiring Federal Reserve Chairman Alan Greenspan by Ben Bernanke. The central bank’s May 10 rate hike, however, marked a critical turning point. Disappointment that the Fed did not stand pat, together with concerns about inflationary pressures and the possibility of further rate hikes, triggered sharp declines in global stock markets. Small-capitalization stocks and growth sectors such as technology generally suffered the most during the sell-off.
Throughout the summer, inflation moderated a bit, and more evidence of a slowing U.S. economy emerged. The Fed reacted by leaving interest rates unchanged at its August, September and October meetings. Falling energy prices in the final months of the reporting period provided further fuel for the markets, sparking a rebound in stock prices. For the one-year reporting period, the S&P 500® Index
recorded a return of 16.34%. A weak U.S. dollar helped lift foreign markets to even better returns; the Morgan Stanley Capital International Europe, Australasia and Far East (MSCI EAFE®) Index posted a gain of 28.04%. Value stocks maintained a commanding lead over growth shares during the period, while small-cap issues topped larger caps.
It’s Official—We’re Lipper’s best “Overall Small Fund Family”
From the beginning, we’ve made it our mission to be good stewards of our investors’ money. Stewardship can be measured in various ways, but in the mutual fund business, investment performance is one obvious yardstick. That’s why we’re delighted to have been honored with the best “Overall Small Fund Family” award at the 2006 Lipper Fund Awards. Significantly, this award was not based on results tallied over just one year. According to Lipper, a key factor in the selection process was our consistent, strong risk-adjusted returns in several different asset classes relative to those of our peers for three years ended December 31, 2005. We appreciate this recognition of our commitment to delivering returns for our investors, and we consider the award a validation of our approach.
International Fund Highlights
Our confidence in our non-U.S. subadvised funds was amply rewarded during the one-year reporting period. For example, the Gartmore Worldwide Leaders Fund posted a gain of 26.22%*, compared with 21.91% for the MSCI World IndexSM. The Fund’s performance placed the Fund in the top 4% among its Lipper peer group, Global Large-Cap Core Funds (consisting of 59 funds as of October 31, 2006). In recognition of the Gartmore Worldwide Leaders Fund’s outstanding track record, it received the nod as Best Global Large-Cap Core Fund at the 2006 Lipper Fund Awards. Also meriting mention was the Gartmore International Growth Fund, whose 38.22% return went above and beyond the 28.91% return posted by the MSCI All Country World excluding U.S. Index and earned it a ranking in the top 1% among its Lipper peer group, International Multi-Cap Core Funds (consisting of 904 funds as of October 31, 2006).
Small-Cap Lineup Delivers Strong Results
Our commitment to small-cap investing remains an important theme. Offering several investment choices, including funds that invest in companies that may receive scant attention from the vast majority of Wall Street analysts, small caps typically are a much less efficient asset class than their large-cap and even mid-cap counterparts. This means that more opportunities may exist for our experienced portfolio managers to identify and potentially capitalize on mispriced stocks. Our success in this area was
Dear Shareholders:
reflected in strong performance during the past year across most of our small-cap products.
One of our newer entries, the Gartmore Small Cap Leaders Fund, offers exposure to both growth and value opportunities through two separate “sleeves” or subportfolios, each with its own management team. During the one-year reporting period, this Fund delivered a 30.65% return, far surpassing the 19.98% result of the Russell 2000® Index. The Fund also finished in the top 2% of Lipper Small-Cap Core Funds (consisting of 689 funds as of October 31, 2006). The Gartmore Small Cap Fund delivered comparable results, with a 30.98% return, beating the same benchmark, the Russell 2000 Index. Notably, this Fund also posted exceptionally strong performance over longer periods of time, placing in the top 2% of its peers among Lipper Small-Cap Core Funds (consisting of 689 funds as of October 31, 2006). for the five years ended October 31, 2006.
To further broaden investors’ choices in the small-cap area and to leverage the experience of our seasoned portfolio managers, we introduced three new funds near the end of September 2006: the Gartmore Small Cap Growth Opportunities Fund, the Gartmore Small Cap Core Fund and the Gartmore Small Cap Value Fund. At the same time, we debuted two absolute-return products: the Gartmore Market Neutral Fund and the Gartmore Hedged Core Equity Fund. These two products are designed for more conservative investors looking for a fund that offers a mix of long and short positions, as well as the potential for lower correlation with the broader equity markets.
Diversifying with Sector Funds
Once an investor has built a solid portfolio around a select group of core funds, sector funds may offer an effective way to enhance both long-term performance and diversification. In this category, several funds with a global scope performed well, including the Gartmore Global Natural Resources Fund, with a 22.87% gain that outdistanced the 17.96% return of its benchmark, the Goldman Sachs Natural Resources Index. Also finishing the period in fine form was the Gartmore Global Utilities Fund, with a return of 27.56%—performance that was good enough to surpass that of the Fund’s composite benchmark of 60% MSCI World Telecommunication Services IndexSM and 40% MSCI World Utilities IndexSM, which returned 25.61%. Last of all, amid considerable volatility for technology stocks, the Gartmore Global Technology and Communications Fund posted a 13.48% return, handily beating the 10.35% return of the Goldman Sachs Technology Composite Index (GSTI®), our benchmark for this Fund.
Strategically combining core equity and fixed-income funds with sector exposure is exhibited in our Gartmore Optimal Allocations “fund of funds” series. We now offer five variations on this theme, three of which are designed to be complete asset allocation solutions: these are the Aggressive, Moderately Aggressive and Moderate Funds within the Optimal Allocations series—each with different mixes of underlying funds—targeting specific risk levels fitting those descriptions. The Gartmore Optimal Allocations Fund: Specialty is intended for investors who already have core investments in place and seek to enhance their overall risk-adjusted returns by exposure to a select group of specialty funds. After the one-year reporting period closed, moreover, we launched the Gartmore Optimal Allocations Fund: Defensive. This new offering is designed for investors who have a lower tolerance for risk and want to complement a core holding by seeking sustainable real returns as a hedge against possible economic deterioration, including inflation, deflation or rising interest rates.
With asset allocation models designed by Ibbotson Associates, a leading authority on asset allocation, the Optimal Allocations Funds are designed to expand an average investor’s “efficient frontier”—that is, they seek to provide the most efficient combination of various asset classes to achieve the highest possible return for a given level of risk. The results to date have been gratifying: for the one-year reporting period, all four Optimal Allocations funds placed in the top quartile of their respective Lipper peer groups (consisting of 592 Mixed-Asset Target Allocation Growth Funds, 414 Mixed-Asset Target Allocation Moderate Funds, 904 Multi-Cap Core Funds and 104 Specialty/Miscellaneous Funds as of October 31, 2006).
Short-Term Shortfall from Long-Term Winner
Although the Gartmore U.S. Growth Leaders Fund, which is managed by one of our talented, veteran portfolio managers, Christopher Baggini, struggled during this reporting period with a return of 1.77%, the Fund’s longer-term record remained enviable: its five-year return of 10.98% was well ahead of the S&P 500 Index’s 7.26% gain, and the Fund occupied the 8th percentile versus other Lipper Multi-Cap Growth Funds (consisting of 332 funds as of Oct. 31, 2006).
We Appreciate Your Business
We take the charge of managing your assets very seriously. While other companies might make that same claim, we can point to our recent company-level and fund-specific Lipper awards as evidence that we have “walked the talk”. As we close the books on an eventful year—both for the markets and for our company—you can be sure that NWD Investments will continue its pursuit of superior long-term,
Message to Shareholders
Continued
risk-adjusted returns for the benefit of you, our valued shareholders.

Paul J. Hondros

John H. Grady
| * | All Gartmore Funds performance returns are Class A at NAV, except where noted. |
Lipper, a wholly owned subsidiary of Reuters, is a leading global provider of mutual fund information and analysis to fund companies, financial intermediaries and media organizations. The firm competed with 17 eligible small fund families, defined as groups with at least three equity, three bond and three mixed-equity portfolios that received Consistent Return scores as of Dec. 31, 2005. Consistent Return is a quantitative metric that incorporates two characteristics: risk-adjusted return and the strength of the fund’s performance trend. Lipper determined the award winner by averaging the decile rank of the three-year Consistent Return scores for all of the funds within the eligible groups. The fund family with the lowest average decile rank received the award. Although Lipper makes reasonable efforts to ensure the accuracy and reliability of the data, the accuracy is not guaranteed by Lipper.
For the “Global Large Cap Core Funds” award, Lipper determined the award winner by calculating the highest Consistent Return over the three-year time period ended Dec. 31, 2005. Gartmore Funds competed among 16 global large-cap core portfolios to win the award.
Funds that concentrate on specific sectors or a relatively small number of securities may be subject to greater volatility than that of other mutual funds.
International investing involves additional risks, including currency fluctuations, differences in accounting standards, political instability and foreign regulations, all of which are magnified in emerging markets.
Small-company stocks have higher risks than the stocks of larger, more established companies and have significant short-term price volatility.
Sophisticated investment strategies such as leverage, short selling, short-term trading and investing in derivatives, REITs and IPOs may cause a Fund to have greater risk and volatility and higher expenses than those of other investments.
The Gartmore Optimal Allocations Funds are designed to provide diversification and asset allocation across several types of investments and asset classes, primarily by investing in underlying Gartmore Funds. Each Fund is subject to different levels of risk, based on the size of its asset class allocations. Each Fund’s underlying funds may be subject to specific investment risks such as those associated with a concentrated number of securities (such as REITs), small companies, international stocks, initial public offerings, short selling, short-term trading, bonds and short-term instruments. There is no assurance that a diversified portfolio will produce better results than a nondiversified one.
Index returns do not include the effect of any sales charges or expenses. If sales charges and expenses were deducted, the actual returns of each Index would be lower. It is not possible to invest directly in an Index.
Goldman Sachs Natural Resources Index: An unmanaged, modified market capitalization-weighted sector index of U.S.-traded natural resource-related stocks; includes companies in the categories of extractive industries, energy companies, owners and operators of timber tracts, forestry services, producers of pulp and paper, and owners of plantations.
Morgan Stanley Capital International (MSCI) All Country World excluding U.S. Index: An unmanaged, free float-adjusted, market-capitalization weighted index that is designed to measure the performance of the stocks in companies in all countries except the United States.
Morgan Stanley Capital International Europe, Australasia and Far East (MSCI EAFE®) Index: An unmanaged, free float-adjusted, market capitalization-weighted index that is designed to measure the performance of stocks in developed markets outside the United States and Canada.
Morgan Stanley Capital International (MSCI) World IndexSM: An unmanaged, free float-adjusted, market capitalization-weighted index that is designed to measure the performance of global developed-market equities.
Morgan Stanley Capital International (MSCI) World Telecommunication Services IndexSM: An unmanaged index that is based on developed-market country indexes and is generally representative of the stocks in the global utilities sector.
Morgan Stanley Capital International (MSCI) World Utilities IndexSM: An unmanaged index that is based on developed-market country indexes and is generally representative of the stocks in the utilities sector, which includes industry groups such as electric, gas, multi-utilities, and unregulated power and water.
Russell 2000® Index: An unmanaged index that measures the performance of the stocks of U.S. companies.
Standard & Poor’s 500® (S&P 500) Index: An unmanaged, market capitalization-weighted index of 500 widely held stocks of large-cap U.S. companies that gives a broad look at how the stock prices of those companies have performed.
The Gartmore Investor Destinations Funds are designed to provide diversification and asset allocation across several types of investments and asset classes, primarily by investing in underlying funds. Therefore, in addition to the expenses of the Gartmore Investor Destinations Funds, you are indirectly paying a proportionate share of the applicable fees and expenses of the underlying funds. When discussing asset allocation theory and the three major asset classes, short-term investments typically are represented by an investment in 90-day Treasury bills. The short-term investments component of the Gartmore Investor Destinations Funds comprises an investment in one or a combination of the following: the Gartmore Enhanced Income Fund (a short-term fixed-income fund), the Gartmore Money Market Fund and/or the Nationwide Contract (a fixed-interest contract issued and guaranteed by the Nationwide Life Insurance Company). While there can be no guarantee, it is believed that this strategy will provide a return in excess of the 90-day T-bill without substantially increasing risk.
The Gartmore Optimal Allocations Funds are designed to provide diversification and asset allocation across several types of investments and asset classes, primarily by investing in underlying Gartmore funds.
Each Fund is subject to different levels of risk, based on the size of its asset class allocations. Each Fund’s underlying funds may be subject to specific investment risks such as those associated with a concentrated number of securities (such as REITs), small companies, international stocks, initial public offerings, short selling, short-term trading, bonds and short-term instruments.
There is no assurance that the investment objective of any fund will be achieved.
There is no assurance that a diversified portfolio will produce better results than a non-diversified one.
The Gartmore Investor Destinations Aggressive Fund benchmark consists of 95% S&P 500 Index and 5% Lehman Brothers U.S. Aggregate Index.
The Gartmore Investor Destinations Moderately Aggressive Fund benchmark consists of 80% S&P 500 Index, 15% Lehman Brothers U.S. Aggregate Index and 5% Citigroup 3-Month T-Bill Index.
The Gartmore Investor Destinations Moderate Fund benchmark consists of 60% S&P 500 Index, 25% Lehman Brothers U.S. Aggregate Index and 15% Citigroup 3-Month T-Bill Index.
The Gartmore Investor Destinations Moderately Conservative Fund benchmark consists of 40% S&P 500 Index, 35% Lehman Brothers U.S. Aggregate Index and 25% Citigroup 3-Month T-Bill Index.
The Gartmore Investor Destinations Conservative Fund benchmark consists of 45% Citigroup 3-Month T-Bill Index, 35% Lehman Brothers U.S. Aggregate Index and 20% S&P 500 Index.
The Gartmore Optimal Allocations Fund: Aggressive benchmark consists of 70% S&P 500 Index, 25% Morgan Stanley Capital International Europe, Australasia and Far East (MSCI EAFE) Index and 5% Lehman Brothers U.S. Aggregate Index.
The Gartmore Optimal Allocations Fund: Moderately Aggressive benchmark consists of 60% S&P 500 Index, 20% MSCI EAFE Index and 20% Lehman Brothers U.S. Aggregate Index.
The Gartmore Optimal Allocations Fund: Moderate benchmark consists of 40% S&P 500 Index, 20% MSCI EAFE Index and 40% Lehman Brothers U.S. Aggregate Index.
The Gartmore Optimal Allocations Fund: Specialty benchmark consists of 70& S&P 500 Index and 30% MSCI EAFE Index.
International investing involves additional risks, including currency fluctuations, differences in accounting standards, political instability and foreign regulations, all of which are magnified in emerging markets.
Lipper Analytical Services, Inc. is an industry research firm whose rankings are based on total return performance and do not reflect the effect of sales charges. Each fund is ranked within a universe of funds similar in investment objective as determined by Lipper.
PAST PERFORMANCE DOES NOT GUARANTEE FUTURE RESULTS.
Performance shown is for Class A shares of the Fund at NAV and the underlying funds. The investment return and principal value of an investment will fluctuate, so that an investor’s shares, when redeemed, may be worth more or less than their original cost. The indexes shown are unmanaged and do not reflect any fees or expenses. Investors cannot invest directly in market indexes. To obtain performance information current to the most recent month-end, which may be higher or lower than the performance shown, please call 800-848-0920 or visit www.nwdfunds.com.
Ibbotson Associates Advisors LLC is a registered investment advisor and wholly owned subsidiary of Morningstar, Inc.
Views expressed within are as if the date noted and are subject to change at any time.
The Funds’ adviser, one of its affiliated advisers, or its employees, may have a position in the securities named in this report.
This report is for informational purposes only, and is not intended as an offer or recommendation with respect to the purchase or sale of any security, option, future or other derivatives in such securities.
Third-party information has been obtained from and is based on sources the Firm believes to be reliable.
Investors should carefully consider a fund’s (and each of its underlying funds’) investment objectives, risks, fees, charges and expenses before investing any money. To obtain this and other information on Gartmore’s funds, please call 800-848-0920 to request a prospectus, or download a prospectus at www.gartmorefunds.com. Please read it carefully before investing any money.
Gartmore Funds distributed by Gartmore Distribution Services, Inc., Member NASD. 1200 River Road, Suite 1000, Conshohocken, Pa. 19428.
As of September 29, 2006, Gartmore Funds and its U.S. operations, as well as the Funds’ advisers, distributor, and other service providers, are no longer affiliated with Gartmore Investment Management plc (Gartmore U.K.) or other Gartmore international businesses. Certain Gartmore U.S. companies, and marketing materials related to them, will continue to carry the Gartmore name for the next several months under the terms of an agreement with Gartmore U.K. For more information call, 800-848-0920.
Key Investment Terminology
In an effort to help you better understand the many concepts involved in annual reports, we have defined the following terms:
Common stock—securities representing shares of ownership of a corporation.
Convertible securities—debt securities or preferred stocks that may be converted into common stock. While a convertible security is a fixed-income security that typically pays interest or dividend income, its market value also tends to correspond to market changes in the value of the underlying common stock.
Derivative—a contract whose value is based on the performance of an underlying financial asset, index or economic measure.
Emerging market countries—developing and low or middle income countries as identified by the International Finance Corporation or the World Bank. Emerging market countries may be found in regions such as Asia, Latin America, Eastern Europe, the Middle East and Africa.
Equity securities—securities including common stock, preferred stock, securities convertible into common stock or securities (or other investments) with prices linked to the value of common stocks, foreign investment funds or trusts and depositary receipts, that represent an ownership interest in the issuer.
Growth style—a style of investing in equity securities of companies that the Fund’s management believes have above-average rates of earnings growth and which therefore may experience above-average increases in stock price.
Large-cap companies—companies whose market capitalization is similar to those of companies included in the Russell 1000® Index, ranging from $563 million to $371.7 billion as of December 31, 2005.
Market capitalization—a common way of measuring the size of a company based on the price of its common stock times the number of outstanding shares.
Mid-cap companies—companies whose market capitalization is similar to those of companies included in the Russell Midcap® Index, ranging from $565 million to $18.4 billion as of December 31, 2005.
Small-cap companies—companies whose market capitalization similar to those of companies included in the Russell 2000® Index, ranging from $26 million to $4.4 billion as of December 31, 2005.
Total return—investment return that reflects both capital appreciation or depreciation (increase or decrease in the market value of a security) and income (i.e., interest or dividends).
Valuation—the process of determining the current worth of an asset or company.
Value style—a style of investing in equity securities that the Fund’s management believes are undervalued, which means that their prices are less than Fund management believes they are worth, based on such factors as price-to-book ratio, price-to-earnings ratio and cash flow. Companies issuing such securities may be currently out of favor or experiencing poor operating conditions that Fund management believes to be temporary.
Gartmore Investor Destinations Aggressive Fund
For the annual period ended Oct. 31, 2006, the Gartmore Investor Destinations Aggressive Fund (Class A at NAV) returned 18.13% versus 15.76% for its composite benchmark, which consists of 95% S&P 500® Index and 5% Lehman Brothers U.S. Aggregate Index. For broader comparison, the average return for the Fund’s Lipper peer category of Global Multi-Cap Core Funds (consisting of 94 funds as of Oct. 31, 2006) was 19.13%.
In general, the U.S. equity market (as measured by the S&P 500 Index) posted strong gains of 16.34% during the reporting period, which is almost double the return of 8.72% it generated during the one-year period ended Oct. 31, 2005. The positive one-year return resulted primarily from rallies in the first and third quarters of calendar year 2006, and in spite of a global equity market correction in the second quarter. Shares of value stocks significantly outperformed those of growth stocks across all capitalization ranges during the reporting period, and large caps led small and mid-caps in the rally back from the second-quarter correction.
Strong growth in corporate earnings and significant upward revisions to earnings expectations have been major drivers of the global equity bull market since 2003. Although the rate of earnings upgrades slowed late in the reporting period, news from the major corporate sectors has been positive. Earnings generally came in ahead of expectations in the third quarter of 2006 and supported the rally in equities.
The recurring themes in the market environment throughout most of the period were rising short-term interest rates and higher energy prices. The Federal Reserve Board raised the target federal funds rate in six increments of 0.25%, lifting the rate from 3.75% to 5.25% during the reporting period. The Federal Reserve held the rate steady, however, at its meetings in August, September and October 2006. The third quarter of 2006 was the first quarterly period not to include an increase in the target federal funds rate since the first quarter of 2004. Oil prices climbed above $78.00 per barrel early in the third quarter of 2006. Energy prices declined significantly by the end of the quarter and into October, however, amid slowing demand and weakness in both oil and natural gas futures. The price of oil stood at $58.73 per barrel on Oct. 31, 2006.
At the end of the reporting period, some evidence of a slowdown in the U.S. economy had emerged. Gross domestic product (GDP) growth rose at an annual rate of just 1.6% in the third quarter of 2006, according to advance estimates released by the Bureau of Economic Analysis in late October. This followed a 2.6% GDP growth rate for the second quarter of the year. The moderating growth rate reflected sluggish income growth, a weaker housing market and a low savings ratio. In addition, prospects for consumer spending in the United States remain uncertain, although consumption has held up well and may be supported further by lower oil prices.
The Fund is a diversified “fund of funds” designed to serve as an aggressive investor’s total asset allocation solution. Its design was developed by Ibbotson Associates Advisors, a leading asset allocation authority. The Fund invests in a diverse set of underlying funds with an allocation mix that has been designed to create a portfolio that lies on an average investor’s “efficient frontier”—the line on a risk-reward graph representing the most efficient combination of various asset classes to achieve the highest possible return for a given level of risk. In other words, by incorporating a combination of diverse asset classes that behave differently under various market conditions, we believe that it may be possible for the Fund to achieve higher risk-adjusted returns than those that could be achieved with a nondiversified portfolio over the long term.
The table below reflects the target allocation ranges for each of the Fund’s underlying investments, and how each of these underlying funds performed during the reporting period.
| | | | |
| Underlying Funds | | Target
Allocations* | | 1-Year
Returns of
Underlying
Funds* |
| Gartmore S&P 500 Index Fund | | 35-45% | | 16.12% |
| Gartmore International Index Fund | | 25-35% | | 27.32% |
| Gartmore Mid Cap Market Index Fund | | 10-20% | | 13.06% |
| Gartmore Small Cap Index Fund | | 5-15% | | 19.60% |
| Gartmore Bond Index Fund | | 0-10% | | 4.91% |
| * | Fund allocations and Institutional Share Class returns are as of Oct. 31, 2006. |
With a 30% allocation to the international stock markets, the Gartmore International Index Fund’s return of 27.32% provided the greatest positive contribution to the Fund during the period. While none of the Fund’s underlying funds posted negative returns during the reporting period, the Gartmore Bond Index Fund generated the least positive contribution, returning a relatively modest 4.91% (in line with the Lehman Brothers U.S. Aggregate Index return of 5.18%).
We believe that the Fund’s blend of predominantly equity-oriented allocations across the major asset classes will continue to position it well to deliver potentially higher long-term, risk-adjusted returns for the aggressive investor.
Portfolio Manager:
William H. Miller
| | |
Fund Performance | | Gartmore Investor Destinations Aggressive Fund |
Average Annual Total Return
(For periods ended October 31, 2006)
| | | | | | | | |
| | | | | 1 Yr. | | 5 Yr. | | Inception1 |
| Class A | | w/o SC2 | | 18.13% | | 9.96% | | 2.75% |
| | | w/SC3 | | 11.32% | | 8.67% | | 1.83% |
| Class B | | w/o SC2 | | 17.39% | | 9.19% | | 2.04% |
| | | w/SC4 | | 12.39% | | 8.91% | | 2.04% |
| Class C5 | | w/o SC2 | | 17.29% | | 9.18% | | 2.03% |
| | | w/SC6 | | 16.29% | | 9.18% | | 2.03% |
| Class R7,8 | | | | 17.93% | | 9.58% | | 2.31% |
| Institutional Class7,9 | | 18.54% | | 10.09% | | 2.86% |
| Service Class7 | | 18.04% | | 9.87% | | 2.70% |
All figures showing the effect of a sales charge reflect the maximum charge possible, because it has the most dramatic effect on performance data.
| 1 | Fund commenced operations on March 31, 2000. |
| 2 | These returns do not reflect the effects of sales charges (SC). |
| 3 | A 5.75% front-end sales charge was deducted. |
| 4 | A 5.00% contingent deferred sales charge (CDSC) was deducted. The CDSC declines to 0% after 6 years. |
| 5 | These returns until the creation of Class C shares (3/1/01) include the performance of the Fund’s Class B shares. Excluding the effect of any fee waivers or reimbursements, such prior performance is substantially similar to what Class C shares would have produced because Class C shares invest in the same portfolio of securities as Class B shares and have the same expenses after any fee waivers or reimbursements. For Class C shares returns with sales charges, these returns have been restated for the applicable sales charges. |
| 6 | A CDSC of 1.00% was deducted from the one year return because it is charged when you sell Class C shares within the first year after purchase. |
| 7 | Not subject to any sales charges. |
| 8 | These returns until the creation of Class R shares (10/1/03) include the performance of the Fund’s Class B shares. The returns have been adjusted for the fact that Class R shares do not have any applicable sales charges but have not been adjusted for the lower expenses applicable to Class R shares. Excluding the effect of any fee waivers or reimbursements, such prior performance is similar to what Class R shares would have produced because Class R shares invest in the same portfolio of securities as Class B shares. |
| 9 | These returns until the creation of Institutional Class shares (12/29/04) include the performance of the Fund’s Class B shares. The returns have been adjusted for the fact that Institutional Class shares do not have any applicable sales charges but have not been adjusted for the lower expenses applicable to Institutional Class shares. Excluding the effect of any fee waivers or reimbursements, such prior performance is similar to what Institutional Class shares would have produced because the Institutional Class shares invest in the same portfolio of securities as Class B shares. |
Performance of a $10,000 Investment
Investment return and principal value will fluctuate, and when redeemed, shares may be worth more or less than original cost. Past performance is no guarantee of future results and does not reflect the deduction of taxes that a shareholder would pay on fund distributions or the redemption of fund shares. Investing in mutual funds involves market risk, including loss of principal. Performance returns assume the reinvestment of all distributions.
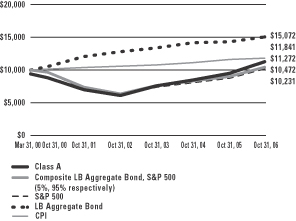
Comparative performance of $10,000 invested in Class A shares of the Gartmore Investor Destinations Aggressive Fund, Lehman Brothers U.S. Aggregate Bond Index (LB U.S. Aggregate Bond Index)(a), S&P 500 Index (S&P 500)(b), the Aggressive Composite Index (c), and the Consumer Price Index (CPI)(d) since inception. Unlike the Fund, the returns for these unmanaged indexes do not reflect any fees, expenses, or sales charges. Investors cannot invest directly in market indexes.
| (a) | LB U.S. Aggregate Bond Index is an unmanaged, market value-weighted index of investment-grade, fixed-rate debt issues including government, corporate, asset-backed, and mortgage-backed securities with maturities of one year or more. |
| (b) | The S&P 500 is an unmanaged index of 500 widely held stocks of large U.S. companies that gives a broad look at how the stock prices of large U.S. companies have performed. |
| (c) | The Aggressive Composite Index is an unmanaged, hypothetical representation of the performance of each of the Fund’s asset classes according to their respective weightings. The Aggressive Composite is a combination of the S&P 500 (95%) and the LB U.S. Aggregate Bond (5%). |
| (d) | The CPI represents changes in prices of a basket of goods and services purchased for consumption by urban households. |
| | |
Shareholder Expense Example | | Gartmore Investor Destinations Aggressive Fund |
As a shareholder of the Fund, you incur two types of costs: (1) transaction costs, including sales charges (loads) paid on purchase payments and redemption fees; and (2) ongoing costs, including investment advisory fees, administration fees, distribution fees and other Fund expenses. The examples below are intended to help you understand your ongoing costs (in dollars) of investing in the Fund and to compare these costs with the ongoing costs of investing in other mutual funds. Per SEC requirements, the examples assume that you had a $1,000 investment in the Class at the beginning of the reporting period, May 1, 2006, and continued to hold your shares at the end of the reporting period, October 31, 2006.
Actual Expenses
For each Class of the Fund in the table below, the first line provides information about actual account values and actual expenses. You may use the information in this line, together with the amount you invested, to estimate the expenses that you paid over the period. Simply divide your account value by $1,000 (for example, an $8,600 account value divided by $1,000 = 8.6), then multiply the result by the number in the first line of each Class under the heading entitled “Expenses Paid During Period” to estimate the expenses you paid on your account during the period.
Hypothetical Example for Comparison Purposes
The second line of each Class in the table below provides information about hypothetical account values and hypothetical expenses based on the Class’ actual expense ratio and an assumed rate of return of 5% per year before expenses, which is not the Class’ actual return. The hypothetical account values and expenses may not be used to estimate the actual ending account balance or expenses you paid for the period. You may use this information to compare the ongoing costs of investing in the Class of the Fund and other funds. To do so, compare this 5% hypothetical example with the 5% hypothetical examples that appear in the shareholder reports of the other funds.
Please note that the expenses shown in the table are meant to highlight your ongoing costs only and do not reflect any transaction costs, such as sales charges (loads) or redemption fees. Therefore, the second line for each Class in the table is useful in comparing ongoing costs only, and will not help you determine the relative total costs of owning different funds. In addition, if these transaction costs were included, your costs would have been higher. The examples also assume all dividends and distributions have been reinvested.
Schedule of Shareholder Expenses
Expense Analysis of a $1,000 Investment
October 31, 2006
| | | | | | | | | | | | | | |
Gartmore Investor Destinations
Aggressive Fund | | | | | Beginning
Account Value,
5/1/06 | | Ending
Account Value,
10/31/06 | | Expenses Paid
During Period* 2 | | Annualized
Expense Ratio* 2 |
| Class A | | Actual | | | $ | 1,000.00 | | $ | 1,032.40 | | $ | 2.31 | | 0.45% |
| | | Hypothetical | 1 | | $ | 1,000.00 | | $ | 1,022.73 | | $ | 2.30 | | 0.45% |
| Class B | | Actual | | | $ | 1,000.00 | | $ | 1,029.00 | | $ | 6.09 | | 1.19% |
| | | Hypothetical | 1 | | $ | 1,000.00 | | $ | 1,019.00 | | $ | 6.07 | | 1.19% |
| Class C | | Actual | | | $ | 1,000.00 | | $ | 1,029.00 | | $ | 6.09 | | 1.19% |
| | | Hypothetical | 1 | | $ | 1,000.00 | | $ | 1,019.00 | | $ | 6.07 | | 1.19% |
| Class R | | Actual | | | $ | 1,000.00 | | $ | 1,031.10 | | $ | 4.51 | | 0.88% |
| | | Hypothetical | 1 | | $ | 1,000.00 | | $ | 1,020.56 | | $ | 4.49 | | 0.88% |
| Institutional Class | | Actual | | | $ | 1,000.00 | | $ | 1,033.50 | | $ | 0.97 | | 0.19% |
| | | Hypothetical | 1 | | $ | 1,000.00 | | $ | 1,024.04 | | $ | 0.97 | | 0.19% |
| Service Class | | Actual | | | $ | 1,000.00 | | $ | 1,032.60 | | $ | 3.02 | | 0.59% |
| | | Hypothetical | 1 | | $ | 1,000.00 | | $ | 1,022.03 | | $ | 3.01 | | 0.59% |
| * | Expenses are equal to the Fund’s annualized expense ratio multiplied by the average account value over the period multiplied by 184/365 (to reflect the one-half year period). The expense ratio presented represents a six-month, annualized ratio in accordance with SEC guidelines. |
| 1 | Represents the hypothetical 5% return before expenses. |
| 2 | Expenses are based on the direct expenses of the Fund and do not include the effect of the underlying Funds’ expenses, which are disclosed in the Fee and Expense table and described more fully in a footnote to that table in your Fund prospectus. |
| | |
Portfolio Summary | | Gartmore Investor Destinations Aggressive Fund |
The SEC adopted a requirement that Funds present their portfolio holdings in a table, chart or graph format in their annual and semiannual reports to shareholders, whether or not a statement of investments is utilized. The following tables, which present portfolio holdings as a percentage of net assets, are provided in compliance with this requirement.
| | |
| Asset Allocation | | |
| Mutual Funds | | 100.0% |
| | |
| | 100.0% |
| | |
| Asset Allocation Detail | | |
| Equity Funds | | 95.0% |
| Fixed-Income Funds | | 5.0% |
| | |
| | 100.0% |
| | |
| Top Holdings | | |
| Gartmore S&P 500 Index Fund, Institutional Class | | 39.9% |
Gartmore International Index Fund, Institutional Class | | 29.8% |
Gartmore Mid Cap Market Index Fund, Institutional Class | | 15.4% |
Gartmore Small Cap Index Fund, Institutional Class | | 9.9% |
| Gartmore Bond Index Fund, Institutional Class | | 5.0% |
| | |
| | 100.0% |
Statement of Investments
October 31, 2006
Gartmore Investor Destinations Aggressive Fund
Mutual Funds (100.0%)
| | | | | | |
| | | Shares or
Principal Amount | | Value | |
| | | | | | |
| | | | | | |
Equity Funds (95.0%) | | | | | | |
Gartmore International Index Fund, Institutional Class (b) | | 23,882,898 | | $ | 253,397,546 | |
Gartmore Mid Cap Market Index Fund, Institutional Class (b) | | 8,348,697 | | | 131,491,977 | |
Gartmore S&P 500 Index Fund, Institutional Class (b) | | 28,774,592 | | | 339,540,183 | |
Gartmore Small Cap Index Fund, Institutional Class (b) | | 6,222,462 | | | 84,563,254 | |
| | | | | | |
| | | | | 808,992,960 | |
| | | | | | |
Fixed Income Funds (5.0%) | | | | | | |
Gartmore Bond Index Fund, Institutional Class (b) | | 3,970,392 | | | 42,880,230 | |
| | | | | | |
| | |
Total Mutual Funds | | | | | 851,873,190 | |
| | | | | | |
| |
Total Investments
(Cost $707,089,951) (a) — 100.0% | | | 851,873,190 | |
| |
Liabilities in excess of
other assets — 0.0% | | | (437,720 | ) |
| | | | | | |
| |
NET ASSETS — 100.0% | | $ | 851,435,470 | |
| | | | | | |
| | (a) | See notes to financial statements for tax unrealized appreciation (depreciation) of securities. |
| | (b) | Investment in affiliate. |
See notes to financial statements.
Gartmore Investor Destinations Moderately Aggressive Fund
For the annual period ended Oct. 31, 2006, the Gartmore Investor Destinations Moderately Aggressive Fund (Class A at NAV) returned 15.66% versus 14.02% for its composite benchmark, which consists of 80% S&P 500® Index, 15% Lehman Brothers U.S. Aggregate Index and 5% Citigroup 3-Month T-Bill Index. For broader comparison, the average return for the Fund’s Lipper peer category of Mixed-Asset Target Allocation Growth Funds (consisting of 592 funds as of Oct. 31, 2006) was 12.47%.
In general, the U.S. equity market (as measured by the S&P 500 Index) posted strong gains of 16.34% during the reporting period, which is almost double the return of 8.72% it generated for the one-year period ended Oct. 31, 2005. The positive one-year return resulted primarily from rallies in the first and third quarters of calendar year 2006, and in spite of a global equity market correction in the second quarter. Shares of value stocks significantly outperformed those of growth stocks across all capitalization ranges during the reporting period, and large caps led small and mid-caps in the rally back from the second-quarter correction.
Strong growth in corporate earnings and significant upward revisions to earnings expectations have been major drivers of the global equity bull market since 2003. Although the rate of earnings upgrades slowed late in the reporting period, news from the major corporate sectors has been positive. Earnings generally came in ahead of expectations in the third quarter of 2006 and supported the rally in equities.
The recurring themes in the market environment throughout most of the period were rising short-term interest rates and higher energy prices. The Federal Reserve Board raised the target federal funds rate in six increments of 0.25%, lifting the rate from 3.75% to 5.25% during the reporting period. The Federal Reserve held the rate steady, however, at its meetings in August, September and October 2006. The third quarter of 2006 was the first quarterly period not to include an increase in the target federal funds rate since the first quarter of 2004. Oil prices climbed above $78.00 per barrel early in the third quarter of 2006. Energy prices declined significantly by the end of the quarter and into October, however, amid slowing demand and weakness in both oil and natural gas futures. The price of oil stood at $58.73 per barrel on Oct. 31, 2006.
At the end of the reporting period, some evidence of a slowdown in the U.S. economy had emerged. Gross domestic product (GDP) growth rose at an annual rate of just 1.6% in the third quarter of 2006, according to advance estimates released by the Bureau of Economic Analysis in late October. This followed a 2.6% GDP growth rate for the second quarter of the year. The moderating growth rate reflected sluggish income growth, a weaker housing market and a low savings ratio. In addition, prospects for consumer spending in the United States remain uncertain, although consumption has held up well and may be supported further by lower oil prices.
The Fund is a diversified “fund of funds” designed to serve as a moderately aggressive investor’s total asset allocation solution. Its design was developed by Ibbotson Associates Advisors, a leading asset allocation authority. The Fund invests in a diverse set of underlying funds with an allocation mix that has been designed to create a portfolio that lies on an average investor’s “efficient frontier”—the line on a risk-reward graph representing the most efficient combination of various asset classes to achieve the highest possible return for a given level of risk. In other words, by incorporating a combination of diverse asset classes that behave differently under various market conditions, we believe it may be possible for the Fund to achieve higher risk-adjusted returns than those that could be achieved with a nondiversified portfolio over the long term.
The table below reflects the target allocation ranges for each of the Fund’s underlying investments, and how each of these underlying funds performed during the reporting period.
| | | | |
| Underlying Funds | | Target
Allocations* | | 1-Year
Returns of
Underlying
Funds** |
| Gartmore S&P 500 Index Fund | | 30-40% | | 16.12% |
| Gartmore International Index Fund | | 20-30% | | 27.32% |
| Gartmore Mid Cap Market Index Fund | | 10-20% | | 13.06% |
| Gartmore Bond Index Fund | | 10-20% | | 4.91% |
| Gartmore Small Cap Index Fund | | 0-10% | | 19.60% |
| Nationwide Contract | | 0-10% | | 3.90% |
| * | Fund allocations and Institutional Share Class returns are as of Oct. 31, 2006. |
Gartmore Investor Destinations Moderately Aggressive Fund
Continued
With a 25% allocation to the international stock markets, the Gartmore International Index Fund’s return of 27.32% provided the greatest positive contribution to the Fund during the period. While none of the Fund’s underlying funds posted negative returns during the reporting period, the 15% allocation to the Gartmore Bond Index Fund was the most significant drag on overall performance, returning a relatively modest 4.91% (in line with the Lehman Brothers U.S. Aggregate Index return of 5.18%).
We believe that the Fund’s blend of substantially equity-oriented allocations across the major asset classes will continue to position it well to deliver potentially higher long-term, risk-adjusted returns for the moderately aggressive investor.
Portfolio Manager:
William H. Miller
| | |
Fund Performance | | Gartmore Investor Destinations Moderately Aggressive Fund |
Average Annual Total Return
(For periods ended October 31, 2006)
| | | | | | | | |
| | | | | 1 Yr. | | 5 Yr. | | Inception1 |
| Class A | | w/o SC2 | | 15.66% | | 8.93% | | 3.23% |
| | | w/SC3 | | 9.01% | | 7.65% | | 2.31% |
| Class B | | w/o SC2 | | 14.83% | | 8.13% | | 2.49% |
| | | w/SC4 | | 9.83% | | 7.83% | | 2.49% |
| Class C5 | | w/o SC2 | | 14.83% | | 8.18% | | 2.53% |
| | | w/SC6 | | 13.83% | | 8.18% | | 2.53% |
| Class R7,8 | | | | 15.43% | | 8.50% | | 2.77% |
| Institutional Class7,9 | | 15.84% | | 8.97% | | 3.29% |
| Service Class7 | | 15.53% | | 8.80% | | 3.17% |
All figures showing the effect of a sales charge reflect the maximum charge possible, because it has the most dramatic effect on performance data.
| 1 | Fund commenced operations on March 31, 2000. |
| 2 | These returns do not reflect the effects of sales charges (SC). |
| 3 | A 5.75% front-end sales charge was deducted. |
| 4 | A 5.00% contingent deferred sales charge (CDSC) was deducted. The CDSC declines to 0% after 6 years. |
| 5 | These returns until the creation of Class C shares (3/1/01) include the performance of the Fund’s Class B shares. Excluding the effect of any fee waivers or reimbursements, such prior performance is substantially similar to what Class C shares would have produced because Class C shares invest in the same portfolio of securities as Class B shares and have the same expenses after any fee waivers or reimbursements. For Class C shares returns with sales charges, these returns have been restated for the applicable sales charges. |
| 6 | A CDSC of 1.00% was deducted from the one year return because it is charged when you sell Class C shares within the first year after purchase. |
| 7 | Not subject to any sales charges. |
| 8 | These returns until the creation of Class R shares (10/1/03) include the performance of the Fund’s Class B shares. The returns have been adjusted for the fact that Class R shares do not have any applicable sales charges but have not been adjusted for the lower expenses applicable to Class R shares. Excluding the effect of any fee waivers or reimbursements, such prior performance is similar to what Class R shares would have produced because the Class R shares invest in the same portfolio of securities as Class B shares. |
| 9 | These returns until the creation of Institutional Class shares (12/29/04) include the performance of the Fund’s Class B shares. The returns have been adjusted for the fact that Institutional Class shares do not have any applicable sales charges but have not been adjusted for the lower expenses applicable to Institutional Class shares. Excluding the effect of any fee waivers or reimbursements, such prior performance is similar to what Institutional Class shares would have produced because the Institutional Class shares invest in the same portfolio of securities as Class B shares. |
| | |
Fund Performance | | Gartmore Investor Destinations Moderately Aggressive Fund |
Continued
Performance of a $10,000 Investment
Investment return and principal value will fluctuate, and when redeemed, shares may be worth more or less than original cost. Past performance is no guarantee of future results and does not reflect the deduction of taxes that a shareholder would pay on fund distributions or the redemption of fund shares. Investing in mutual funds involves market risk, including loss of principal. Performance returns assume the reinvestment of all distributions.
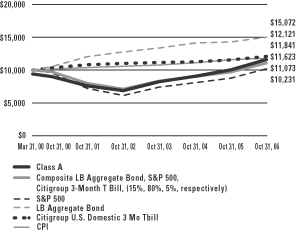
Comparative performance of $10,000 invested in Class A shares of the Gartmore Investor Destinations Moderately Aggressive Fund, Lehman Brothers Aggregate Bond Index (LB Aggregate Bond)(a), S&P 500 Index (S&P 500)(b), the Citigroup 3-Month T Bill Index(c), the Moderately Aggressive Composite Index(d), and the Consumer Price Index (CPI)(e) since inception. Unlike the Fund, the returns for these unmanaged indexes do not reflect any fees, expenses, or sales charges. Investors cannot invest directly in market indexes.
| (a) | LB U.S. Aggregate Bond Index is an unmanaged, market value-weighted index of investment-grade, fixed-rate debt issues including government, corporate, asset-backed, and mortgage-backed securities with maturities of one year or more. |
| (b) | The S&P 500 is an unmanaged index of 500 widely held stocks of large U.S. companies that gives a broad look at how the stock prices of large U.S. companies have performed. |
| (c) | The Citigroup 3-Month T Bill Index is an average of the last 3-month treasury bill issues (excluding the current month-end bill). |
| (d) | The Moderately Aggressive Composite is an unmanaged, hypothetical representation of the performance of each of the Fund’s asset classes according to their respective weightings. The Moderately Aggressive Composite is a combination of the S&P 500 (80%), the LB Aggregate Bond (15%) and the Citigroup 3-Month T Bill Index (5%). |
| (e) | The CPI represents changes in prices of a basket of goods and services purchased for consumption by urban households. |
| | |
Shareholder Expense Example | | Gartmore Investor Destinations Moderately Aggressive Fund |
As a shareholder of the Fund, you incur two types of costs: (1) transaction costs, including sales charges (loads) paid on purchase payments and redemption fees; and (2) ongoing costs, including investment advisory fees, administration fees, distribution fees and other Fund expenses. The examples below are intended to help you understand your ongoing costs (in dollars) of investing in the Fund and to compare these costs with the ongoing costs of investing in other mutual funds. Per SEC requirements, the examples assume that you had a $1,000 investment in the Class at the beginning of the reporting period, May 1, 2006, and continued to hold your shares at the end of the reporting period, October 31, 2006.
Actual Expenses
For each Class of the Fund in the table below, the first line provides information about actual account values and actual expenses. You may use the information in this line, together with the amount you invested, to estimate the expenses that you paid over the period. Simply divide your account value by $1,000 (for example, an $8,600 account value divided by $1,000 = 8.6), then multiply the result by the number in the first line of each Class under the heading entitled “Expenses Paid During Period” to estimate the expenses you paid on your account during the period.
Hypothetical Example for Comparison Purposes
The second line of each Class in the table below provides information about hypothetical account values and hypothetical expenses based on the Class’ actual expense ratio and an assumed rate of return of 5% per year before expenses, which is not the Class’ actual return. The hypothetical account values and expenses may not be used to estimate the actual ending account balance or expenses you paid for the period. You may use this information to compare the ongoing costs of investing in the Class of the Fund and other funds. To do so, compare this 5% hypothetical example with the 5% hypothetical examples that appear in the shareholder reports of the other funds.
Please note that the expenses shown in the table are meant to highlight your ongoing costs only and do not reflect any transaction costs, such as sales charges (loads) or redemption fees. Therefore, the second line for each Class in the table is useful in comparing ongoing costs only, and will not help you determine the relative total costs of owning different funds. In addition, if these transaction costs were included, your costs would have been higher. The examples also assume all dividends and distributions have been reinvested.
Schedule of Shareholder Expenses
Expense Analysis of a $1,000 Investment
October 31, 2006
| | | | | | | | | | | | | | |
Gartmore Investor Destinations
Moderately Aggressive Fund | | | | | Beginning
Account Value,
5/1/06 | | Ending
Account Value,
10/31/06 | | Expenses Paid
During Period*2 | | Annualized
Expense Ratio*2 |
| Class A | | Actual | | | $ | 1,000.00 | | $ | 1,032.70 | | $ | 2.36 | | 0.46% |
| | | Hypothetical | 1 | | $ | 1,000.00 | | $ | 1,022.68 | | $ | 2.35 | | 0.46% |
| Class B | | Actual | | | $ | 1,000.00 | | $ | 1,029.30 | | $ | 6.14 | | 1.20% |
| | | Hypothetical | 1 | | $ | 1,000.00 | | $ | 1,018.95 | | $ | 6.12 | | 1.20% |
| Class C | | Actual | | | $ | 1,000.00 | | $ | 1,028.30 | | $ | 6.13 | | 1.20% |
| | | Hypothetical | 1 | | $ | 1,000.00 | | $ | 1,018.95 | | $ | 6.12 | | 1.20% |
| Class R | | Actual | | | $ | 1,000.00 | | $ | 1,032.10 | | $ | 4.40 | | 0.86% |
| | | Hypothetical | 1 | | $ | 1,000.00 | | $ | 1,020.66 | | $ | 4.39 | | 0.86% |
| Institutional Class | | Actual | | | $ | 1,000.00 | | $ | 1,034.00 | | $ | 1.03 | | 0.20% |
| | | Hypothetical | 1 | | $ | 1,000.00 | | $ | 1,023.99 | | $ | 1.02 | | 0.20% |
| Service Class | | Actual | | | $ | 1,000.00 | | $ | 1,031.90 | | $ | 3.07 | | 0.60% |
| | | Hypothetical | 1 | | $ | 1,000.00 | | $ | 1,021.98 | | $ | 3.06 | | 0.60% |
| * | Expenses are equal to the Fund’s annualized expense ratio multiplied by the average account value over the period multiplied by 184/365 (to reflect the one-half year period). The expense ratio presented represents a six-month, annualized ratio in accordance with SEC guidelines. |
| 1 | Represents the hypothetical 5% return before expenses. |
| 2 | Expenses are based on the direct expenses of the Fund and do not include the effect of the underlying Funds’ expenses, which are disclosed in the Fee and Expense table and described more fully in a footnote to that table in your Fund prospectus. |
| | |
Portfolio Summary | | Gartmore Investor Destinations Moderately Aggressive Fund |
The SEC adopted a requirement that Funds present their portfolio holdings in a table, chart or graph format in their annual and semiannual reports to shareholders, whether or not a statement of investments is utilized. The following tables, which present portfolio holdings as a percentage of net assets, are provided in compliance with this requirement.
| | |
| Asset Allocation | | |
| Mutual Funds | | 95.9% |
| Fixed Contract | | 4.1% |
| | |
| | 100.0% |
| | |
| Asset Allocation Detail | | |
| Equity Funds | | 80.0% |
| Fixed-Income Funds | | 15.9% |
| Fixed Contract | | 4.1% |
| | |
| | 100.0% |
| | |
| Top Holdings | | |
Gartmore S&P 500 Index Fund, Institutional Class | | 35.0% |
Gartmore International Index Fund, Institutional Class | | 24.9% |
Gartmore Mid Cap Market Index Fund, Institutional Class | | 15.1% |
Gartmore Bond Index Fund, Institutional Class | | 15.0% |
Gartmore Small Cap Index Fund, Institutional Class | | 5.0% |
Nationwide Fixed Contract, 3.90% | | 4.1% |
Gartmore Enhanced Income Fund, Institutional Class | | 0.9% |
| | |
| | 100.0% |
Gartmore Investor Destinations Moderately Aggressive Fund
Statement of Investments
October 31, 2006
Mutual Funds (95.9%)
| | | | | | |
| | | Shares or
Principal Amount | | Value |
| | | | | | |
| | | | | | |
Equity Funds (80.0%) | | | | | | |
Gartmore International Index Fund, Institutional Class (b) | | | 32,861,095 | | $ | 348,656,222 |
Gartmore Mid Cap Market Index Fund, Institutional Class (b) | | | 13,394,345 | | | 210,960,926 |
Gartmore S&P 500 Index Fund, Institutional Class (b) | | | 41,522,370 | | | 489,963,961 |
Gartmore Small Cap Index Fund, Institutional Class (b) | | | 5,187,531 | | | 70,498,548 |
| | | | | | |
| | | | | | 1,120,079,657 |
| | | | | | |
Fixed Income Funds (15.9%) | | | |
Gartmore Bond Index Fund, Institutional Class (b) | | | 19,416,948 | | | 209,703,038 |
Gartmore Enhanced Income Fund, Institutional Class (b) | | | 1,363,800 | | | 12,451,488 |
| | | | | | |
| | | | | | 222,154,526 |
| | | | | | |
| | |
Total Mutual Funds | | | | | | 1,342,234,183 |
| | | | | | |
|
Fixed Contract (4.1%) |
Nationwide Fixed Contract, 3.90% (b) (c) | | $ | 56,904,222 | | | 56,904,222 |
| | | | | | |
| | |
Total Fixed Contract | | | | | | 56,904,222 |
| | | | | | |
| |
Total Investments
(Cost $1,194,761,161) (a) — 100.0% | | | 1,399,138,405 |
| |
Other assets in excess of
liabilities — 0.0% | | | 292,582 |
| | | | | | |
| |
NET ASSETS — 100.0% | | $ | 1,399,430,987 |
| | | | | | |
| | (a) | See notes to financial statements for tax unrealized appreciation (depreciation) of securities. |
| | (b) | Investment in affiliate. |
| | (c) | The Nationwide Fixed Contract rate changes quarterly. The security is restricted and as the affiliated counterparty is required by contract to redeem within five days upon request, it has been deemed liquid pursuant to procedures approved by the Board of Trustees. |
See notes to financial statements.
Gartmore Investor Destinations Moderate Fund
For the annual period ended Oct. 31, 2006, the Gartmore Investor Destinations Moderate Fund (Class A at NAV) returned 12.41% versus 11.70% for its composite benchmark, which consists of 60% S&P 500® Index, 25% Lehman Brothers U.S. Aggregate Index and 15% Citigroup 3-Month T-Bill Index. For broader comparison, the average return for the Fund’s Lipper peer category of Mixed-Asset Target Allocation Growth Funds (consisting of 592 funds as of Oct. 31, 2006) was 12.47%.
In general, the U.S. equity market (as measured by the S&P 500 Index) posted strong gains of 16.34% during the reporting period, which is almost double the return of 8.72% it generated for the one-year period ended Oct. 31, 2005. The positive one-year return resulted primarily from rallies in the first and third quarters of calendar year 2006, and in spite of a global equity market correction in the second quarter. Shares of value stocks significantly outperformed those of growth stocks across all capitalization ranges during the reporting period, and large caps led small and mid-caps in the rally back from the second-quarter correction.
Strong growth in corporate earnings and significant upward revisions to earnings expectations have been major drivers of the global equity bull market since 2003. Although the rate of earnings upgrades slowed late in the reporting period, news from the major corporate sectors has been positive. Earnings generally came in ahead of expectations in the third quarter of 2006 and supported the rally in equities.
The recurring themes in the market environment throughout most of the period were rising short-term interest rates and higher energy prices. The Federal Reserve Board raised the target federal funds rate in six increments of 0.25%, lifting the rate from 3.75% to 5.25% during the reporting period. The Federal Reserve held the rate steady, however, at its meetings in August, September and October 2006. The third quarter of 2006 was the first quarterly period not to include an increase in the target federal funds rate since the first quarter of 2004. Oil prices climbed above $78.00 per barrel early in the third quarter of 2006. Energy prices declined significantly by the end of the quarter and into October, however, amid slowing demand and weakness in both oil and natural gas futures. The price of oil stood at $58.73 per barrel on Oct. 31, 2006.
At the end of the reporting period, some evidence of a slowdown in the U.S. economy had emerged. Gross domestic product (GDP) growth rose at an annual rate of just 1.6% in the third quarter of 2006, according to advance estimates released by the Bureau of Economic Analysis in late October. This followed a 2.6% GDP growth rate for the second quarter of the year. The moderating growth rate reflected sluggish income growth, a weaker housing market and a low savings ratio. In addition, prospects for consumer spending in the United States remain uncertain, although consumption has held up well and may be supported further by lower oil prices.
The Fund is a diversified “fund of funds” designed to serve as a moderate investor’s total asset allocation solution. Its design was developed by Ibbotson Associates Advisors, a leading asset allocation authority. The Fund invests in a diverse set of underlying funds with an allocation mix that has been designed to create a portfolio that lies on an average investor’s “efficient frontier”—the line on a risk-reward graph representing the most efficient combination of various asset classes to achieve the highest possible return for a given level of risk. In other words, by incorporating a combination of diverse asset classes that behave differently under various market conditions, we believe that it may be possible for the Fund to achieve higher risk-adjusted returns than those that could be achieved with a nondiversified portfolio over the long term.
The table below reflects the target allocation ranges for each of the Fund’s underlying investments, and how each of these underlying funds performed during the reporting period.
| | | | |
| Underlying Funds | | Target
Allocations* | | 1-Year
Returns of
Underlying
Funds* |
| Gartmore S&P 500 Index Fund | | 25-35% | | 16.12% |
| Gartmore Bond Index Fund | | 20-30% | | 4.91% |
| Gartmore International Index Fund | | 10-20% | | 27.32% |
| Gartmore Mid Cap Market Index Fund | | 5-15% | | 13.06% |
| Nationwide Contract | | 5-15% | | 3.90% |
| Gartmore Small Cap Index Fund | | 0-10% | | 19.60% |
| Gartmore Enhanced Income Fund | | 0-10% | | 4.31% |
| * | Fund allocations and Institutional Share Class returns are as of Oct. 31, 2006. |
Gartmore Investor Destinations Moderate Fund
Continued
With allocations to the large-capitalization stock and international stock markets of 30% and 15%, respectively, the returns of the Gartmore S&P 500 Index Fund and the Gartmore International Index Fund provided the greatest positive contributions to the Fund during the period. While none of the Fund’s underlying funds posted negative returns during the reporting period, the 25% allocation to the Gartmore Bond Index Fund was the most significant drag on overall performance, returning a relatively modest 4.91% (in line with the Lehman Brothers U.S. Aggregate Index return of 5.18%). It is important, however, to note that the sizable presence of bonds in this Fund plays an important role in terms of diversification and risk management.
We believe that the Fund’s blend of equity and fixed income-oriented allocations across the major asset classes will continue to position it well to deliver potentially higher long-term, risk-adjusted returns for the moderate investor.
Portfolio Manager:
William H. Miller
| | |
Fund Performance | | Gartmore Investor Destinations Moderate Fund |
Average Annual Total Return
(For periods ended October 31, 2006)
| | | | | | | | |
| | | | | 1 Yr. | | 5 Yr. | | Inception1 |
| Class A | | w/o SC2 | | 12.41% | | 7.38% | | 3.61% |
| | | w/SC3 | | 5.91% | | 6.11% | | 2.68% |
| Class B | | w/o SC2 | | 11.61% | | 6.57% | | 2.88% |
| | | w/SC4 | | 6.61% | | 6.26% | | 2.88% |
| Class C5 | | w/o SC2 | | 11.65% | | 6.55% | | 2.87% |
| | | w/SC6 | | 10.65% | | 6.55% | | 2.87% |
| Class R7,8 | | | | 12.11% | | 6.90% | | 3.12% |
| Institutional Class7,9 | | 12.69% | | 7.43% | | 3.69% |
| Service Class7 | | 12.30% | | 7.23% | | 3.55% |
All figures showing the effect of a sales charge reflect the maximum charge possible, because it has the most dramatic effect on performance data.
| 1 | Fund commenced operations on March 31, 2000. |
| 2 | These returns do not reflect the effects of sales charges (SC). |
| 3 | A 5.75% front-end sales charge was deducted. |
| 4 | A 5.00% contingent deferred sales charge (CDSC) was deducted. The CDSC declines to 0% after 6 years. |
| 5 | These returns until the creation of Class C shares (3/1/01) include the performance of the Fund’s Class B shares. Excluding the effect of any fee waivers or reimbursements, such prior performance is substantially similar to what Class C shares would have produced because Class C shares invest in the same portfolio of securities as Class B shares and have the same expenses after any fee waivers or reimbursements. For Class C shares returns with sales charges, these returns have been restated for the applicable sales charges. |
| 6 | A CDSC of 1.00% was deducted from the one year return because it is charged when you sell Class C shares within the first year after purchase. |
| 7 | Not subject to any sales charges. |
| 8 | These returns until the creation of Class R shares (10/1/03) include the performance of the Fund’s Class B shares. The returns have been adjusted for the fact that Class R shares do not have any applicable sales charges but have not been adjusted for the lower expenses applicable to Class R shares. Excluding the effect of any fee waivers or reimbursements, such prior performance is similar to what Class R shares would have produced because the Class R shares invest in the same portfolio of securities as Class B shares. |
| 9 | These returns until the creation of Institutional Class shares (12/29/04) include the performance of the Fund’s Class B shares. The returns have been adjusted for the fact that Institutional Class shares do not have any applicable sales charges but have not been adjusted for the lower expenses applicable to Institutional Class shares. Excluding the effect of any fee waivers or reimbursements, such prior performance is similar to what Institutional Class shares would have produced because the Institutional Class shares invest in the same portfolio of securities as Class B shares. |
Performance of a $10,000 Investment
Investment return and principal value will fluctuate, and when redeemed, shares may be worth more or less than original cost. Past performance is no guarantee of future results and does not reflect the deduction of taxes that a shareholder would pay on fund distributions or the redemption of fund shares. Investing in mutual funds involves market risk, including loss of principal. Performance returns assume the reinvestment of all distributions.

Comparative performance of $10,000 invested in Class A shares of the Gartmore Investor Destinations Moderate Fund, Lehman Brothers Aggregate Bond Index (LB Aggregate Bond)(a), S&P 500 Index (S&P 500)(b), the Citigroup 3-Month T Bill Index(c), the Moderate Composite Index(d), and the Consumer Price Index (CPI)(e) since inception. Unlike the Fund, the returns for these unmanaged indexes do not reflect any fees, expenses, or sales charges. Investors cannot invest directly in market indexes.
| (a) | LB U.S. Aggregate Bond Index is an unmanaged, market value-weighted index of investment-grade, fixed-rate debt issues including government, corporate, asset-backed, and mortgage-backed securities with maturities of one year or more. |
| (b) | The S&P 500 is an unmanaged index of 500 widely held stocks of large U.S. companies that gives a broad look at how the stock prices of large U.S. companies have performed. |
| (c) | The Citigroup 3-Month T Bill Index is an average of the last 3-month treasury bill issues (excluding the current month-end bill). |
| (d) | The Moderate Composite is an unmanaged, hypothetical representation of the performance of each of the Fund’s asset classes according to their respective weightings. The Moderate Composite is a combination of S&P 500 (60%), LB Aggregate Bond (25%) and Citigroup 3-Month T Bill Index (15%). |
| (e) | The CPI represents changes in prices of a basket of goods and services purchased for consumption by urban households. |
| | |
Shareholder Expense Example | | Gartmore Investor Destinations Moderate Fund |
As a shareholder of the Fund, you incur two types of costs: (1) transaction costs, including sales charges (loads) paid on purchase payments and redemption fees; and (2) ongoing costs, including investment advisory fees, administration fees, distribution fees and other Fund expenses. The examples below are intended to help you understand your ongoing costs (in dollars) of investing in the Fund and to compare these costs with the ongoing costs of investing in other mutual funds. Per SEC requirements, the examples assume that you had a $1,000 investment in the Class at the beginning of the reporting period, May 1, 2006, and continued to hold your shares at the end of the reporting period, October 31, 2006.
Actual Expenses
For each Class of the Fund in the table below, the first line provides information about actual account values and actual expenses. You may use the information in this line, together with the amount you invested, to estimate the expenses that you paid over the period. Simply divide your account value by $1,000 (for example, an $8,600 account value divided by $1,000 = 8.6), then multiply the result by the number in the first line of each Class under the heading entitled “Expenses Paid During Period” to estimate the expenses you paid on your account during the period.
Hypothetical Example for Comparison Purposes
The second line of each Class in the table below provides information about hypothetical account values and hypothetical expenses based on the Class’ actual expense ratio and an assumed rate of return of 5% per year before expenses, which is not the Class’ actual return. The hypothetical account values and expenses may not be used to estimate the actual ending account balance or expenses you paid for the period. You may use this information to compare the ongoing costs of investing in the Class of the Fund and other funds. To do so, compare this 5% hypothetical example with the 5% hypothetical examples that appear in the shareholder reports of the other funds.
Please note that the expenses shown in the table are meant to highlight your ongoing costs only and do not reflect any transaction costs, such as sales charges (loads) or redemption fees. Therefore, the second line for each Class in the table is useful in comparing ongoing costs only, and will not help you determine the relative total costs of owning different funds. In addition, if these transaction costs were included, your costs would have been higher. The examples also assume all dividends and distributions have been reinvested.
Schedule of Shareholder Expenses
Expense Analysis of a $1,000 Investment
October 31, 2006
| | | | | | | | | | | | | | |
Gartmore Investor Destinations Moderate
Fund | | | | | Beginning
Account Value,
5/1/06 | | Ending
Account Value,
10/31/06 | | Expenses Paid
During Period*2 | | Annualized
Expense Ratio*2 |
| Class A | | Actual | | | $ | 1,000.00 | | $ | 1,034.10 | | $ | 2.36 | | 0.46% |
| | | Hypothetical | 1 | | $ | 1,000.00 | | $ | 1,022.68 | | $ | 2.35 | | 0.46% |
| Class B | | Actual | | | $ | 1,000.00 | | $ | 1,030.60 | | $ | 6.14 | | 1.20% |
| | | Hypothetical | 1 | | $ | 1,000.00 | | $ | 1,018.95 | | $ | 6.12 | | 1.20% |
| Class C | | Actual | | | $ | 1,000.00 | | $ | 1,030.70 | | $ | 6.14 | | 1.20% |
| | | Hypothetical | 1 | | $ | 1,000.00 | | $ | 1,018.95 | | $ | 6.12 | | 1.20% |
| Class R | | Actual | | | $ | 1,000.00 | | $ | 1,031.70 | | $ | 4.56 | | 0.89% |
| | | Hypothetical | 1 | | $ | 1,000.00 | | $ | 1,020.51 | | $ | 4.54 | | 0.89% |
| Institutional Class | | Actual | | | $ | 1,000.00 | | $ | 1,035.40 | | $ | 1.13 | | 0.22% |
| | | Hypothetical | 1 | | $ | 1,000.00 | | $ | 1,023.89 | | $ | 1.12 | | 0.22% |
| Service Class | | Actual | | | $ | 1,000.00 | | $ | 1,033.50 | | $ | 3.08 | | 0.60% |
| | | Hypothetical | 1 | | $ | 1,000.00 | | $ | 1,021.98 | | $ | 3.06 | | 0.60% |
| * | Expenses are equal to the Fund’s annualized expense ratio multiplied by the average account value over the period multiplied by 184/365 (to reflect the one-half year period). The expense ratio presented represents a six-month, annualized ratio in accordance with SEC guidelines. |
| 1 | Represents the hypothetical 5% return before expenses. |
| 2 | Expenses are based on the direct expenses of the Fund and do not include the effect of the underlying Funds’ expenses, which are disclosed in the Fee and Expense table and described more fully in a footnote to that table in your Fund prospectus. |
| | |
| Portfolio Summary | | Gartmore Investor Destinations Moderate Fund |
The SEC adopted a requirement that Funds present their portfolio holdings in a table, chart or graph format in their annual and semiannual reports to shareholders, whether or not a statement of investments is utilized. The following tables, which present portfolio holdings as a percentage of net assets, are provided in compliance with this requirement.
| | |
| Asset Allocation | | |
| Mutual Funds | | 90.4% |
| Fixed Contract | | 9.4% |
| Other assets in excess of liabilities | | 0.2% |
| | |
| | 100.0% |
| | |
| Asset Allocation Detail | | |
| Equity Funds | | 60.1% |
| Fixed-Income Funds | | 30.3% |
| Fixed Contract | | 9.4% |
| Other Assets | | 0.2% |
| | |
| | 100.0% |
| | |
| Top Holdings | | |
Gartmore S&P 500 Index Fund, Institutional Class | | 30.0% |
Gartmore Bond Index Fund, Institutional Class | | 24.9% |
Gartmore International Index Fund, Institutional Class | | 15.0% |
Gartmore Mid Cap Market Index Fund, Institutional Class | | 10.1% |
Nationwide Fixed Contract, 3.90% | | 9.4% |
Gartmore Enhanced Income Fund, Institutional Class | | 5.3% |
Gartmore Small Cap Index Fund, Institutional Class | | 5.1% |
Other Assets | | 0.2% |
| | |
| | 100.0% |
Statement of Investments
October 31, 2006
Gartmore Investor Destinations Moderate Fund
Mutual Funds (90.4%)
| | | | | | |
| | | Shares or
Principal Amount | | Value |
| | | | | | |
| | | | | | |
Equity Funds (60.1%) | | | | | | |
Gartmore International Index Fund, Institutional Class (b) | | | 20,497,031 | | $ | 217,473,494 |
Gartmore Mid Cap Market Index Fund, Institutional Class (b) | | | 9,270,863 | | | 146,016,096 |
Gartmore S&P 500 Index Fund, Institutional Class (b) | | | 36,701,134 | | | 433,073,378 |
Gartmore Small Cap Index Fund, Institutional Class (b) | | | 5,470,295 | | | 74,341,305 |
| | | | | | |
| | | | | | 870,904,273 |
| | | | | | |
Fixed Income Funds (30.3%) | | | |
Gartmore Bond Index Fund, Institutional Class (b) | | | 33,451,890 | | | 361,280,407 |
Gartmore Enhanced Income Fund, Institutional Class (b) | | | 8,472,367 | | | 77,352,713 |
| | | | | | |
| | | | | | 438,633,120 |
| | | | | | |
| | |
Total Mutual Funds | | | | | | 1,309,537,393 |
| | | | | | |
|
Fixed Contract (9.4%) |
Nationwide Fixed Contract, 3.90% (b) (c) | | $ | 135,958,598 | | | 135,958,598 |
| | | | | | |
| | |
Total Fixed Contract | | | | | | 135,958,598 |
| | | | | | |
| |
Total Investments
(Cost $1,293,254,979) (a) — 99.8% | | | 1,445,495,991 |
| |
Other assets in excess of
liabilities — 0.2% | | | 3,551,614 |
| | | | | | |
| |
NET ASSETS — 100.0% | | $ | 1,449,047,605 |
| | | | | | |
| | (a) | See notes to financial statements for tax unrealized appreciation (depreciation) of securities. |
| | (b) | Investment in affiliate. |
| | (c) | The Nationwide Fixed Contract rate changes quarterly. The security is restricted and as the affiliated counterparty is required by contract to redeem within five days upon request, it has been deemed liquid pursuant to procedures approved by the Board of Trustees. |
See notes to financial statements.
Gartmore Investor Destinations Moderately Conservative Fund
For the annual period ended Oct. 31, 2006, the Gartmore Investor Destinations Moderately Conservative Fund (Class A at NAV) returned 9.24% versus 9.40% for its composite benchmark, which consists of 40% S&P 500® Index, 35% Lehman Brothers U.S. Aggregate Index and 25% Citigroup 3-Month T-Bill Index. For broader comparison, the average return for the Fund’s Lipper peer category of Mixed-Asset Target Allocation Moderate Funds (consisting of 414 funds as of Oct. 31, 2006) was 11.45%.
In general, the U.S. equity market (as measured by the S&P 500 Index) posted strong gains of 16.34% during the reporting period, which is almost double the return of 8.72% it generated for the one-year period ended Oct. 31, 2005. The positive one-year return resulted primarily from rallies in the first and third quarters of calendar year 2006, and in spite of a global equity market correction in the second quarter. Shares of value stocks significantly outperformed those of growth stocks across all capitalization ranges during the reporting period, and large caps led small and mid-caps in the rally back from the second-quarter correction.
Strong growth in corporate earnings and significant upward revisions to earnings expectations have been major drivers of the global equity bull market since 2003. Although the rate of earnings upgrades slowed late in the reporting period, news from the major corporate sectors has been positive. Earnings generally came in ahead of expectations in the third quarter of 2006 and supported the rally in equities.
The recurring themes in the market environment throughout most of the period were rising short-term interest rates and higher energy prices. The Federal Reserve Board raised the target federal funds rate in six increments of 0.25%, lifting the rate from 3.75% to 5.25% during the reporting period. The Federal Reserve held the rate steady, however, at its meetings in August, September and October 2006. The third quarter of 2006 was the first quarterly period not to include an increase in the target federal funds rate since the first quarter of 2004. Oil prices climbed above $78.00 per barrel early in the third quarter of 2006. Energy prices declined significantly by the end of the quarter and into October, however, amid slowing demand and weakness in both oil and natural gas futures. The price of oil stood at $58.73 per barrel on Oct. 31, 2006.
At the end of the reporting period, some evidence of a slowdown in the U.S. economy had emerged. Gross domestic product (GDP) growth rose at an annual rate of just 1.6% in the third quarter of 2006, according to advance estimates released by the Bureau of Economic Analysis in late October. This followed a 2.6% GDP growth rate for the second quarter of the year. The moderating growth rate reflected sluggish income growth, a weaker housing market and a low savings ratio. In addition, prospects for consumer spending in the United States remain uncertain, although consumption has held up well and may be supported further by lower oil prices.
The Fund is a diversified “fund of funds” designed to serve as a moderately conservative investor’s total asset allocation solution. Its design was developed by Ibbotson Associates Advisors, a leading asset allocation authority. The Fund invests in a diverse set of underlying funds with an allocation mix that has been designed to create a portfolio that would lie on an average investor’s “efficient frontier”—the line on a risk-reward graph representing the most efficient combination of various asset classes to achieve the highest possible return for a given level of risk. In other words, by incorporating a combination of diverse asset classes that behave differently under various market conditions, we believe that it may be possible for the Fund to achieve higher risk-adjusted returns than those that could be achieved with a nondiversified portfolio over the long term.
The table below reflects the target allocation ranges for each of the Fund’s underlying investments, and how each of these underlying funds performed during the reporting period.
| | | | |
| Underlying Funds | | Target
Allocations* | | 1-Year
Returns of
Underlying
Funds* |
| Gartmore Bond Index Fund | | 30-40% | | 4.91% |
| Gartmore S&P 500 Index Fund | | 15-25% | | 16.12% |
| Nationwide Contract | | 10-20% | | 3.90% |
| Gartmore Mid Cap Market Index Fund | | 10-20% | | 13.06% |
| Gartmore International Index Fund | | 5-15% | | 27.32% |
| Gartmore Enhanced Income Fund | | 5-15% | | 4.31% |
| * | Fund allocations and Institutional Share Class returns are as of Oct. 31, 2006. |
With allocations to the large-capitalization stock and international stock markets of 20% and 10%, respectively,
Gartmore Investor Destinations Moderately Conservative Fund
Continued
the returns of the Gartmore S&P 500 Index Fund and the Gartmore International Index Fund provided the greatest positive contributions to the Fund during the reporting period. While none of the Fund’s underlying funds posted negative returns during the period, the 35% allocation to the Gartmore Bond Index Fund and the 15% allocation to the Nationwide Contract were the lowest contributors to overall performance, returning a relatively modest 4.91% (in line with the Lehman Brothers U.S. Aggregate Index return of 5.18%) and 3.65%, respectively. It is important to note, however, that the sizable presence of bonds in this Fund plays an important role in terms of diversification and risk management.
We believe that the Fund’s blend of fixed income and equity-oriented allocations across the major asset classes will continue to position it well to deliver potentially higher long-term, risk-adjusted returns for the moderately conservative investor.
Portfolio Manager:
William H. Miller
| | |
| Fund Performance | | Gartmore Investor Destinations Moderately Conservative Fund |
Average Annual Total Return
(For periods ended October 31, 2006)
| | | | | | | | |
| | | | | 1 Yr. | | 5 Yr. | | Inception1 |
| Class A | | w/o SC2 | | 9.24% | | 5.92% | | 3.82% |
| | | w/SC3 | | 2.97% | | 4.68% | | 2.89% |
| Class B | | w/o SC2 | | 8.49% | | 5.24% | | 3.16% |
| | | w/SC4 | | 3.49% | | 4.91% | | 3.16% |
| Class C5 | | w/o SC2 | | 8.50% | | 5.22% | | 3.14% |
| | | w/SC6 | | 7.50% | | 5.22% | | 3.14% |
| Class R7,8 | | | | 9.19% | | 5.63% | | 3.45% |
| Institutional Class7,9 | | 9.58% | | 6.06% | | 3.95% |
| Service Class7 | | 9.18% | | 5.86% | | 3.80% |
All figures showing the effect of a sales charge reflect the maximum charge possible, because it has the most dramatic effect on performance data.
| 1 | Fund commenced operations on March 31, 2000. |
| 2 | These returns do not reflect the effects of sales charges (SC). |
| 3 | A 5.75% front-end sales charge was deducted. |
| 4 | A 5.00% contingent deferred sales charge (CDSC) was deducted. The CDSC declines to 0% after 6 years. |
| 5 | These returns until the creation of Class C shares (3/1/01) include the performance of the Fund’s Class B shares. Excluding the effect of any fee waivers or reimbursements, such prior performance is substantially similar to what Class C shares would have produced because Class C shares invest in the same portfolio of securities as Class B shares and have the same expenses after any fee waivers or reimbursements. For Class C shares returns with sales charges, these returns have been restated for the applicable sales charges. |
| 6 | A CDSC of 1.00% was deducted from the one year return because it is charged when you sell Class C shares within the first year after purchase. |
| 7 | Not subject to any sales charges. |
| 8 | These returns until the creation of Class R shares (10/1/03) include the performance of the Fund’s Class B shares. The returns have been adjusted for the fact that Class R shares do not have any applicable sales charges but have not been adjusted for the lower expenses applicable to Class R shares. Excluding the effect of any fee waivers or reimbursements, such prior performance is similar to what Class R shares would have produced because the Class R shares invest in the same portfolio of securities as Class B shares. |
| 9 | These returns until the creation of Institutional Class shares (12/29/04) include the performance of the Fund’s Class B shares. The returns have been adjusted for the fact that Institutional Class shares do not have any applicable sales charges but have not been adjusted for the lower expenses applicable to Institutional Class shares. Excluding the effect of any fee waivers or reimbursements, such prior performance is similar to what Institutional Class shares would have produced because the Institutional Class shares invest in the same portfolio of securities as Class B shares. |
| | |
Fund Performance Continued | | Gartmore Investor Destinations Moderately Conservative Fund |
Performance of a $10,000 Investment
Investment return and principal value will fluctuate, and when redeemed, shares may be worth more or less than original cost. Past performance is no guarantee of future results and does not reflect the deduction of taxes that a shareholder would pay on fund distributions or the redemption of fund shares. Investing in mutual funds involves market risk, including loss of principal. Performance returns assume the reinvestment of all distributions.
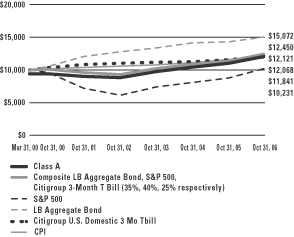
Comparative performance of $10,000 invested in Class A shares of the Gartmore Investor Destinations Moderately Conservative Fund, Lehman Brothers Aggregate Bond Index (LB Aggregate Bond)(a), S&P 500 Index (S&P 500)(b), the Citigroup 3-Month T Bill Index(c), the Moderately Conservative Composite Index(d), and the Consumer Price Index (CPI)(e) since inception. Unlike the Fund, the returns for these unmanaged indexes do not reflect any fees, expenses, or sales charges. Investors cannot invest directly in market indexes.
| (a) | LB U.S. Aggregate Bond Index is an unmanaged, market value-weighted index of investment-grade, fixed-rate debt issues including government, corporate, asset-backed, and mortgage-backed securities with maturities of one year or more. |
| (b) | The S&P 500 is an unmanaged index of 500 widely held stocks of large U.S. companies that gives a broad look at how the stock prices of large U.S. companies have performed. |
| (c) | The Citigroup 3-Month T Bill Index is an average of the last 3-month treasury bill issues (excluding the current month-end bill). |
| (d) | The Moderately Conservative Composite is an unmanaged, hypothetical representation of the performance of each of the Fund’s asset classes according to their respective weightings. The Moderate Composite is a combination of LB Aggregate Bond (35%), S&P 500 (40%), and Citigroup 3-Month T Bill Index (25%). |
| (e) | The CPI represents changes in prices of a basket of goods and services purchased for consumption by urban households. |
| | |
Shareholder Expense Example | | Gartmore Investor Destinations Moderately Conservative Fund |
As a shareholder of the Fund, you incur two types of costs: (1) transaction costs, including sales charges (loads) paid on purchase payments and redemption fees; and (2) ongoing costs, including investment advisory fees, administration fees, distribution fees and other Fund expenses. The examples below are intended to help you understand your ongoing costs (in dollars) of investing in the Fund and to compare these costs with the ongoing costs of investing in other mutual funds. Per SEC requirements, the examples assume that you had a $1,000 investment in the Class at the beginning of the reporting period, May 1, 2006, and continued to hold your shares at the end of the reporting period, October 31, 2006.
Actual Expenses
For each Class of the Fund in the table below, the first line provides information about actual account values and actual expenses. You may use the information in this line, together with the amount you invested, to estimate the expenses that you paid over the period. Simply divide your account value by $1,000 (for example, an $8,600 account value divided by $1,000 = 8.6), then multiply the result by the number in the first line of each Class under the heading entitled “Expenses Paid During Period” to estimate the expenses you paid on your account during the period.
Hypothetical Example for Comparison Purposes
The second line of each Class in the table below provides information about hypothetical account values and hypothetical expenses based on the Class’ actual expense ratio and an assumed rate of return of 5% per year before expenses, which is not the Class’ actual return. The hypothetical account values and expenses may not be used to estimate the actual ending account balance or expenses you paid for the period. You may use this information to compare the ongoing costs of investing in the Class of the Fund and other funds. To do so, compare this 5% hypothetical example with the 5% hypothetical examples that appear in the shareholder reports of the other funds.
Please note that the expenses shown in the table are meant to highlight your ongoing costs only and do not reflect any transaction costs, such as sales charges (loads) or redemption fees. Therefore, the second line for each Class in the table is useful in comparing ongoing costs only, and will not help you determine the relative total costs of owning different funds. In addition, if these transaction costs were included, your costs would have been higher. The examples also assume all dividends and distributions have been reinvested.
Schedule of Shareholder Expenses
Expense Analysis of a $1,000 Investment
October 31, 2006
| | | | | | | | | | | | | | |
Gartmore Investor Destinations
Moderately Conservative Fund | | | | | Beginning
Account Value,
5/1/06 | | Ending
Account Value,
10/31/06 | | Expenses Paid
During Period*2 | | Annualized
Expense Ratio*2 |
| Class A | | Actual | | | $ | 1,000.00 | | $ | 1,032.40 | | $ | 2.41 | | 0.47% |
| | | Hypothetical | 1 | | $ | 1,000.00 | | $ | 1,022.63 | | $ | 2.40 | | 0.47% |
| Class B | | Actual | | | $ | 1,000.00 | | $ | 1,028.70 | | $ | 6.19 | | 1.21% |
| | | Hypothetical | 1 | | $ | 1,000.00 | | $ | 1,018.88 | | $ | 6.20 | | 1.21% |
| Class C | | Actual | | | $ | 1,000.00 | | $ | 1,027.70 | | $ | 6.18 | | 1.21% |
| | | Hypothetical | 1 | | $ | 1,000.00 | | $ | 1,018.90 | | $ | 6.18 | | 1.21% |
| Class R | | Actual | | | $ | 1,000.00 | | $ | 1,031.20 | | $ | 4.20 | | 0.82% |
| | | Hypothetical | 1 | | $ | 1,000.00 | | $ | 1,020.87 | | $ | 4.19 | | 0.82% |
| Institutional Class | | Actual | | | $ | 1,000.00 | | $ | 1,033.50 | | $ | 1.08 | | 0.21% |
| | | Hypothetical | 1 | | $ | 1,000.00 | | $ | 1,023.94 | | $ | 1.07 | | 0.21% |
| Service Class | | Actual | | | $ | 1,000.00 | | $ | 1,031.50 | | $ | 3.12 | | 0.61% |
| | | Hypothetical | 1 | | $ | 1,000.00 | | $ | 1,021.92 | | $ | 3.11 | | 0.61% |
| * | Expenses are equal to the Fund’s annualized expense ratio multiplied by the average account value over the period multiplied by 184/365 (to reflect the one-half year period). The expense ratio presented represents a six-month, annualized ratio in accordance with SEC guidelines. |
| 1 | Represents the hypothetical 5% return before expenses. |
| 2 | Expenses are based on the direct expenses of the Fund and do not include the effect of the underlying Funds’ expenses, which are disclosed in the Fee and Expense table and described more fully in a footnote to that table in your Fund prospectus. |
| | |
Portfolio Summary | | Gartmore Investor Destinations Moderately Conservative Fund |
The SEC adopted a requirement that Funds present their portfolio holdings in a table, chart or graph format in their annual and semiannual reports to shareholders, whether or not a statement of investments is utilized. The following tables, which present portfolio holdings as a percentage of net assets, are provided in compliance with this requirement.
| | |
| Asset Allocation | | |
| Mutual Funds | | 86.2% |
| Fixed Contract | | 13.1% |
| Other assets in excess of liabilities | | 0.7% |
| | |
| | 100.0% |
| | |
| Asset Allocation Detail | | |
| Fixed-Income Funds | | 46.2% |
| Equity Funds | | 40.0% |
| Fixed Contract | | 13.1% |
| Other Assets | | 0.7% |
| | |
| | 100.0% |
| | |
| Top Holdings | | |
Gartmore Bond Index Fund, Institutional Class | | 35.0% |
| Gartmore S&P 500 Index Fund, Institutional Class | | 19.9% |
Nationwide Fixed Contract, 3.90% | | 13.1% |
Gartmore Enhanced Income Fund, Institutional Class | | 11.3% |
Gartmore Mid Cap Market Index Fund, Institutional Class | | 10.1% |
Gartmore International Index Fund, Institutional Class | | 9.9% |
Other Assets | | 0.7% |
| | |
| | 100.0% |
Statement of Investments
October 31, 2006
Gartmore Investor Destinations Moderately Conservative Fund
Mutual Funds (86.2%)
| | | | | | |
| | | Shares or
Principal Amount | | Value |
| | | | | | |
Equity Funds (40.0%) | | | | | | |
Gartmore International Index Fund, Institutional Class (b) | | | 2,988,263 | | $ | 31,705,474 |
Gartmore Mid Cap Market Index Fund, Institutional Class (b) | | | 2,047,789 | | | 32,252,669 |
Gartmore S&P 500 Index Fund, Institutional Class (b) | | | 5,390,686 | | | 63,610,095 |
| | | | | | |
| | | | | | 127,568,238 |
| | | | | | |
Fixed Income Funds (46.2%) | | | | | | |
Gartmore Bond Index Fund, Institutional Class (b) | | | 10,305,732 | | | 111,301,909 |
Gartmore Enhanced Income Fund, Institutional Class (b) | | | 3,962,360 | | | 36,176,345 |
| | | | | | |
| | | | | | 147,478,254 |
| | | | | | |
| | |
Total Mutual Funds | | | | | | 275,046,492 |
| | | | | | |
|
Fixed Contract (13.1%) |
Nationwide Fixed Contract, 3.90% (b) (c) | | $ | 41,705,650 | | | 41,705,650 |
| | | | | | |
| | |
Total Fixed Contract | | | | | | 41,705,650 |
| | | | | | |
| |
Total Investments
(Cost $296,686,305) (a) — 99.3% | | | 316,752,142 |
| |
Other assets in excess of
liabilities — 0.7% | | | 2,228,236 |
| | | | | | |
| | |
NET ASSETS — 100.0% | | | | | $ | 318,980,378 |
| | | | | | |
| | (a) | See notes to financial statements for tax unrealized appreciation (depreciation) of securities. |
| | (b) | Investment in affiliate. |
| | (c) | The Nationwide Fixed Contract rate changes quarterly. The security is restricted and as the affiliated counterparty is required by contract to redeem within five days upon request, it has been deemed liquid pursuant to procedures approved by the Board of Trustees. |
See notes to financial statements.
Gartmore Investor Destinations Conservative Fund
For the annual period ended Oct. 31, 2006, the Gartmore Investor Destinations Conservative Fund (Class A at NAV) returned 6.68% versus 7.07% for its composite benchmark, which consists of 45% Citigroup 3-Month T-Bill Index, 35% Lehman Brothers U.S. Aggregate Index and 20% S&P 500® Index. For broader comparison, the average return for the Fund’s Lipper peer category of Mixed-Asset Target Allocation Conservative Funds (consisting of 333 funds as of Oct. 31, 2006) was 7.62%.
In general, the U.S. equity market (as measured by the S&P 500 Index) posted strong gains of 16.34% during the reporting period, which is almost double the return of 8.72% it generated for the one-year period ended Oct. 31, 2005. The positive one-year return resulted primarily from rallies in the first and third quarters of calendar year 2006, and in spite of a global equity market correction in the second quarter. Shares of value stocks significantly outperformed those of growth stocks across all capitalization ranges during the reporting period, and large caps led small and mid-caps in the rally back from the second-quarter correction.
Strong growth in corporate earnings and significant upward revisions to earnings expectations have been major drivers of the global equity bull market since 2003. Although the rate of earnings upgrades slowed late in the reporting period, news from the major corporate sectors has been positive. Earnings generally came in ahead of expectations in the third quarter of 2006 and supported the rally in equities.
The recurring themes in the market environment throughout most of the period were rising short-term interest rates and higher energy prices. The Federal Reserve Board raised the target federal funds rate in six increments of 0.25%, lifting the rate from 3.75% to 5.25% during the reporting period. The Federal Reserve held the rate steady, however, at its meetings in August, September and October 2006. The third quarter of 2006 was the first quarterly period not to include an increase in the target federal funds rate since the first quarter of 2004. Oil prices climbed above $78.00 per barrel early in the third quarter of 2006. Energy prices declined significantly by the end of the quarter and into October, however, amid slowing demand and weakness in both oil and natural gas futures. The price of oil stood at $58.73 per barrel on Oct. 31, 2006.
At the end of the reporting period, some evidence of a slowdown in the U.S. economy had emerged. Gross domestic product (GDP) growth rose at an annual rate of just 1.6% in the third quarter of 2006, according to advance estimates released by the Bureau of Economic Analysis in late October. This followed a 2.6% GDP growth rate for the second quarter of the year. The moderating growth rate reflected sluggish income growth, a weaker housing market and a low savings ratio. In addition, prospects for consumer spending in the United States remain uncertain, although consumption has held up well and may be supported further by lower oil prices.
The Fund is a diversified “fund of funds” designed to serve as a conservative investor’s total asset allocation solution. Its design was developed by Ibbotson Associates Advisors, a leading asset allocation authority. The Fund invests in a diverse set of underlying funds with an allocation mix that has been designed to create a portfolio that lies on an average investor’s “efficient frontier”—the line on a risk-reward graph representing the most efficient combination of various asset classes to achieve the highest possible return for a given level of risk. In other words, by incorporating a combination of diverse asset classes that behave differently under various market conditions, we believe that it may be possible for the Fund to achieve higher risk-adjusted returns than those that could be achieved with a nondiversified portfolio over the long term.
The table below reflects the target allocation ranges for each of the Fund’s underlying investments, and how each of these underlying funds performed during the reporting period.
| | | | |
| Underlying Funds | | Target
Allocations | | 1-Year
Returns of
Underlying
Funds* |
| Gartmore Bond Index Fund | | 35-45% | | 4.91% |
| Nationwide Contract | | 20-30% | | 3.65% |
| Gartmore Enhanced Income Fund | | 5-15% | | 4.31% |
| Gartmore S&P 500 Index Fund | | 5-15% | | 16.12% |
| Gartmore International Index Fund | | 0-10% | | 27.32% |
| Gartmore Mid Cap Market Index Fund | | 0-10% | | 13.06% |
| * | Fund allocations and Institutional Share Class returns are as of Oct. 31, 2006. |
With a 40% allocation to the U.S. bond market, the returns of the Gartmore Bond Index Fund provided the greatest positive contribution to the Fund during the period. While
Gartmore Investor Destinations Conservative Fund
Continued
none of the Fund’s underlying funds posted negative returns during the reporting period, the 25% allocation to the Nationwide Contract and the 15% allocation to the Gartmore Enhanced Income Fund were the lowest contributors to overall performance, returning a relatively modest 3.65% and 4.31%, respectively. It is important to note, however, that the sizable presence of bonds and short-term investments in this Fund plays an important role in terms of overall diversification and risk management.
We believe that the Fund’s blend of predominantly fixed income-oriented allocations across the major asset classes will continue to position it well to deliver potentially higher long-term, risk-adjusted returns for the conservative investor.
Portfolio Manager:
William H. Miller
| | |
Fund Performance | | Gartmore Investor Destinations Conservative Fund |
Average Annual Total Return
(For periods ended October 31, 2006)
| | | | | | | | |
| | | | | 1 Yr. | | 5 Yr. | | Inception1 |
| Class A | | w/o SC2 | | 6.68% | | 4.48% | | 3.88% |
| | | w/SC3 | | 0.55% | | 3.24% | | 2.95% |
| Class B | | w/o SC2 | | 5.89% | | 3.74% | | 3.16% |
| | | w/SC4 | | 0.89% | | 3.39% | | 3.16% |
| Class C5 | | w/o SC2 | | 5.92% | | 3.73% | | 3.16% |
| | | w/SC6 | | 4.92% | | 3.73% | | 3.16% |
| Class R7,8 | | | | 6.46% | | 4.12% | | 3.45% |
| Institutional Class7,9 | | 6.91% | | 4.59% | | 3.98% |
| Service Class7 | | 6.52% | | 4.39% | | 3.83% |
All figures showing the effect of a sales charge reflect the maximum charge possible, because it has the most dramatic effect on performance data.
| 1 | Fund commenced operations on March 31, 2000. |
| 2 | These returns do not reflect the effects of sales charges (SC). |
| 3 | A 5.75% front-end sales charge was deducted. |
| 4 | A 5.00% contingent deferred sales charge (CDSC) was deducted. The CDSC declines to 0% after 6 years. |
| 5 | These returns until the creation of Class C shares (3/1/01) include the performance of the Fund’s Class B shares. Excluding the effect of any fee waivers or reimbursements, such prior performance is substantially similar to what Class C shares would have produced because Class C shares invest in the same portfolio of securities as Class B shares and have the same expenses after any fee waivers or reimbursements. For Class C shares returns with sales charges, these returns have been restated for the applicable sales charges. |
| 6 | A CDSC of 1.00% was deducted from the one year return because it is charged when you sell Class C shares within the first year after purchase. |
| 7 | Not subject to any sales charges. |
| 8 | These returns until the creation of Class R shares (10/1/03) include the performance of the Fund’s Class B shares. The returns have been adjusted for the fact that Class R shares do not have any applicable sales charges but have not been adjusted for the lower expenses applicable to Class R shares. Excluding the effect of any fee waivers or reimbursements, such prior performance is similar to what Class R shares would have produced because the Class R shares invest in the same portfolio of securities as Class B shares. |
| 9 | These returns until the creation of Institutional Class shares (12/29/04) include the performance of the Fund’s Class B shares. The returns have been adjusted for the fact that Institutional Class shares do not have any applicable sales charges but have not been adjusted for the lower expenses applicable to Institutional Class shares. Excluding the effect of any fee waivers or reimbursements, such prior performance is similar to what Institutional Class shares would have produced because the Institutional Class shares invest in the same portfolio of securities as Class B shares. |
Performance of a $10,000 Investment
Investment return and principal value will fluctuate, and when redeemed, shares may be worth more or less than original cost. Past performance is no guarantee of future results and does not reflect the deduction of taxes that a shareholder would pay on fund distributions or the redemption of fund shares. Investing in mutual funds involves market risk, including loss of principal. Performance returns assume the reinvestment of all distributions.

Comparative performance of $10,000 invested in Class A shares of the Gartmore Investor Destinations Conservative Fund, Lehman Brothers Aggregate Bond Index (LB Aggregate Bond)(a), S&P 500 Index (S&P 500)(b), the Citigroup 3-Month T Bill Index(c), the Conservative Composite Index(d), and the Consumer Price Index (CPI)(e) since inception. Unlike the Fund, the returns for these unmanaged indexes do not reflect any fees, expenses, or sales charges. Investors cannot invest directly in market indexes.
| (a) | LB U.S. Aggregate Bond Index is an unmanaged, market value-weighted index of investment-grade, fixed-rate debt issues including government, corporate, asset-backed, and mortgage-backed securities with maturities of one year or more. |
| (b) | The S&P 500 is an unmanaged index of 500 widely held stocks of large U.S. companies that gives a broad look at how the stock prices of large U.S. companies have performed. |
| (c) | The Citigroup 3-Month T Bill Index is an average of the last 3-month treasury bill issues (excluding the current month-end bill). |
| (d) | The Conservative Composite is an unmanaged, hypothetical representation of the performance of each of the Fund’s asset classes according to their respective weightings. The Conservative Composite is a combination of LB Aggregate Bond (35%), S&P 500 (20%), and Citigroup 3-Month T Bill Index (45%). |
| (e) | The CPI represents changes in prices of a basket of goods and services purchased for consumption by urban households. |
| | |
Shareholder Expense Example | | Gartmore Investor Destinations Conservative Fund |
As a shareholder of the Fund, you incur two types of costs: (1) transaction costs, including sales charges (loads) paid on purchase payments and redemption fees; and (2) ongoing costs, including investment advisory fees, administration fees, distribution fees and other Fund expenses. The examples below are intended to help you understand your ongoing costs (in dollars) of investing in the Fund and to compare these costs with the ongoing costs of investing in other mutual funds. Per SEC requirements, the examples assume that you had a $1,000 investment in the Class at the beginning of the reporting period, May 1, 2006, and continued to hold your shares at the end of the reporting period, October 31, 2006.
Actual Expenses
For each Class of the Fund in the table below, the first line provides information about actual account values and actual expenses. You may use the information in this line, together with the amount you invested, to estimate the expenses that you paid over the period. Simply divide your account value by $1,000 (for example, an $8,600 account value divided by $1,000 = 8.6), then multiply the result by the number in the first line of each Class under the heading entitled “Expenses Paid During Period” to estimate the expenses you paid on your account during the period.
Hypothetical Example for Comparison Purposes
The second line of each Class in the table below provides information about hypothetical account values and hypothetical expenses based on the Class’ actual expense ratio and an assumed rate of return of 5% per year before expenses, which is not the Class’ actual return. The hypothetical account values and expenses may not be used to estimate the actual ending account balance or expenses you paid for the period. You may use this information to compare the ongoing costs of investing in the Class of the Fund and other funds. To do so, compare this 5% hypothetical example with the 5% hypothetical examples that appear in the shareholder reports of the other funds.
Please note that the expenses shown in the table are meant to highlight your ongoing costs only and do not reflect any transaction costs, such as sales charges (loads) or redemption fees. Therefore, the second line for each Class in the table is useful in comparing ongoing costs only, and will not help you determine the relative total costs of owning different funds. In addition, if these transaction costs were included, your costs would have been higher. The examples also assume all dividends and distributions have been reinvested.
Schedule of Shareholder Expenses
Expense Analysis of a $1,000 Investment
October 31, 2006
| | | | | | | | | | | | | | |
Gartmore Investor Destinations
Conservative Fund | | | | | Beginning
Account Value,
5/1/06 | | Ending
Account Value,
10/31/06 | | Expenses Paid
During Period*2 | | Annualized
Expense Ratio*2 |
| Class A | | Actual | | | $ | 1,000.00 | | $ | 1,031.70 | | $ | 2.51 | | 0.49% |
| | | Hypothetical | 1 | | $ | 1,000.00 | | $ | 1,022.53 | | $ | 2.50 | | 0.49% |
| Class B | | Actual | | | $ | 1,000.00 | | $ | 1,027.70 | | $ | 6.24 | | 1.22% |
| | | Hypothetical | 1 | | $ | 1,000.00 | | $ | 1,018.85 | | $ | 6.23 | | 1.22% |
| Class C | | Actual | | | $ | 1,000.00 | | $ | 1,028.00 | | $ | 6.24 | | 1.22% |
| | | Hypothetical | 1 | | $ | 1,000.00 | | $ | 1,018.85 | | $ | 6.23 | | 1.22% |
| Class R | | Actual | | | $ | 1,000.00 | | $ | 1,030.40 | | $ | 4.40 | | 0.86% |
| | | Hypothetical | 1 | | $ | 1,000.00 | | $ | 1,020.66 | | $ | 4.39 | | 0.86% |
| Institutional Class | | Actual | | | $ | 1,000.00 | | $ | 1,031.80 | | $ | 1.18 | | 0.23% |
| | | Hypothetical | 1 | | $ | 1,000.00 | | $ | 1,023.84 | | $ | 1.17 | | 0.23% |
| Service Class | | Actual | | | $ | 1,000.00 | | $ | 1,030.80 | | $ | 3.17 | | 0.62% |
| | | Hypothetical | 1 | | $ | 1,000.00 | | $ | 1,021.87 | | $ | 3.16 | | 0.62% |
| * | Expenses are equal to the Fund’s annualized expense ratio multiplied by the average account value over the period multiplied by 184/365 (to reflect the one-half year period). The expense ratio presented represents a six-month, annualized ratio in accordance with SEC guidelines. |
| 1 | Represents the hypothetical 5% return before expenses. |
| 2 | Expenses are based on the direct expenses of the Fund and do not include the effect of the underlying Funds’ expenses, which are disclosed in the Fee and Expense table and described more fully in a footnote to that table in your Fund prospectus. |
| | |
Portfolio Summary | | Gartmore Investor Destinations Conservative Fund |
The SEC adopted a requirement that Funds present their portfolio holdings in a table, chart or graph format in their annual and semiannual reports to shareholders, whether or not a statement of investments is utilized. The following tables, which present portfolio holdings as a percentage of net assets, are provided in compliance with this requirement.
| | |
| Asset Allocation | | |
| Mutual Funds | | 73.6% |
| Fixed Contract | | 24.3% |
| Other assets in excess of liabilities | | 2.1% |
| | |
| | 100.0% |
| | |
| Asset Allocation Detail | | |
| Fixed-Income Funds | | 53.4% |
| Fixed Contract | | 24.3% |
| Equity Funds | | 20.2% |
| Other Assets | | 2.1% |
| | |
| | 100.0% |
| | |
| Top Holdings | | |
Gartmore Bond Index Fund, Institutional Class | | 39.2% |
Nationwide Fixed Contract, 3.90% | | 24.3% |
Gartmore Enhanced Income Fund, Institutional Class | | 14.2% |
Gartmore S&P 500 Index Fund, Institutional Class | | 10.0% |
Gartmore Mid Cap Market Index Fund, Institutional Class | | 5.1% |
Gartmore International Index Fund, Institutional Class | | 5.1% |
Other Assets | | 2.1% |
| | |
| | 100.0% |
Statement of Investments
October 31, 2006
Gartmore Investor Destinations Conservative Fund
Mutual Funds (73.6%)
| | | | | | |
| | | Shares or
Principal Amount | | Value |
| | | | | | |
Equity Funds (20.2%) | | | | | | |
Gartmore International Index Fund, Institutional Class (b) | | | 998,873 | | $ | 10,598,043 |
Gartmore Mid Cap Market Index Fund, Institutional Class (b) | | | 680,267 | | | 10,714,200 |
Gartmore S&P 500 Index Fund, Institutional Class (b) | | | 1,771,101 | | | 20,898,986 |
| | | | | | |
| | | | | | 42,211,229 |
| | | | | | |
Fixed Income Funds (53.4%) | | | | | | |
Gartmore Bond Index Fund, Institutional Class (b) | | | 7,582,239 | | | 81,888,177 |
Gartmore Enhanced Income Fund, Institutional Class (b) | | | 3,238,070 | | | 29,563,579 |
| | | | | | |
| | | | | | 111,451,756 |
| | | | | | |
| | |
Total Mutual Funds | | | | | | 153,662,985 |
| | | | | | |
|
Fixed Contract (24.3%) |
Nationwide Fixed Contract,
3.90% (b) (c) | | $ | 50,708,717 | | | 50,708,717 |
| | | | | | |
| | |
Total Fixed Contract | | | | | | 50,708,717 |
| | | | | | |
| |
Total Investments
(Cost $199,071,376) (a) — 97.9% | | | 204,371,702 |
| |
Other assets in excess of
liabilities — 2.1% | | | 4,487,194 |
| | | | | | |
| |
NET ASSETS — 100.0% | | $ | 208,858,896 |
| | | | | | |
| | (a) | See notes to financial statements for tax unrealized appreciation (depreciation) of securities. |
| | (b) | Investment in affiliate. |
| | (c) | The Nationwide Fixed Contract rate changes quarterly. The security is restricted and as the affiliated counterparty is required by contract to redeem within five days upon request, it has been deemed liquid pursuant to procedures approved by the Board of Trustees. |
See notes to financial statements.
Statements of Assets and Liabilities
October 31, 2006
| | | | | | | | | | | | | | | | | |
| | | Gartmore Investor
Destinations
Aggressive Fund | | Gartmore Investor
Destinations
Moderately
Aggressive Fund | | Gartmore Investor
Destinations
Moderate Fund | | Gartmore Investor
Destinations
Moderately
Conservative Fund | | Gartmore Investor
Destinations
Conservative Fund |
Assets: | | | | | | | | | | | | | | | | | |
Investments in affiliated securities at value (cost $707,089,951; $1,194,761,161; $1,293,254,979; $296,686,305 and $199,071,376; respectively) | | $ | 851,873,190 | | $ | 1,399,138,405 | | $ | 1,445,495,991 | | $ | 316,752,142 | | $ | 204,371,702 | | |
Cash | | | 54 | | | — | | | — | | | — | | | — | | |
Interest and dividends receivable | | | 169,288 | | | 889,914 | | | 1,810,992 | | | 579,467 | | | 443,075 | | |
Receivable for capital shares issued | | | 10,294,219 | | | 11,196,016 | | | 8,175,913 | | | 4,177,543 | | | 5,037,329 | | |
Receivable for investments sold | | | — | | | — | | | — | | | 70 | | | 13,766 | | |
Receivable from administrator | | | 46,615 | | | 93,615 | | | 87,891 | | | 21,092 | | | 10,900 | | |
Prepaid expenses | | | 3,934 | | | 18,682 | | | 24,129 | | | 2,968 | | | 1,012 | | |
| | | | | | | | | | | | | | | | | | |
Total Assets | | | 862,387,300 | | | 1,411,336,632 | | | 1,455,594,916 | | | 321,533,282 | | | 209,877,784 | | |
| | | | | | | | | | | | | | | | | | |
| | | | | | |
Liabilities: | | | | | | | | | | | | | | | | | |
Payable for investments purchased | | | 10,301,197 | | | 10,669,864 | | | 5,380,688 | | | 2,024,736 | | | 772,744 | | |
Payable for capital shares redeemed | | | 148,484 | | | 367,821 | | | 302,028 | | | 318,049 | | | 113,598 | | |
Accrued expenses and other payables | | | | | | | | | | | | | | | | | |
Investment advisory fees | | | 90,243 | | | 149,910 | | | 156,893 | | | 34,360 | | | 22,288 | | |
Distribution fees | | | 241,851 | | | 433,160 | | | 439,929 | | | 96,773 | | | 57,217 | | |
Administrative servicing fees | | | 107,880 | | | 195,336 | | | 182,543 | | | 56,150 | | | 34,346 | | |
Trustee fees | | | 104 | | | 175 | | | 187 | | | 42 | | | 27 | | |
Compliance program fees (Note 3) | | | 7,230 | | | 12,180 | | | 12,920 | | | 2,815 | | | 1,868 | | |
Other | | | 54,841 | | | 77,199 | | | 72,123 | | | 19,979 | | | 16,800 | | |
| | | | | | | | | | | | | | | | | | |
Total Liabilities | | | 10,951,830 | | | 11,905,645 | | | 6,547,311 | | | 2,552,904 | | | 1,018,888 | | |
| | | | | | | | | | | | | | | | | | |
Net Assets | | $ | 851,435,470 | | $ | 1,399,430,987 | | $ | 1,449,047,605 | | $ | 318,980,378 | | $ | 208,858,896 | | |
| | | | | | | | | | | | | | | | | | |
| | | | | | |
Represented by: | | | | | | | | | | | | | | | | | |
Capital | | $ | 692,893,096 | | $ | 1,166,592,910 | | $ | 1,268,660,972 | | $ | 291,539,029 | | $ | 200,872,910 | | |
Accumulated net investment income (loss) | | | — | | | 608,537 | | | 2,428,380 | | | 554,225 | | | 512,547 | | |
Accumulated net realized gains (losses) on investment transactions | | | 13,759,135 | | | 27,852,296 | | | 25,717,241 | | | 6,821,287 | | | 2,173,113 | | |
Net unrealized appreciation (depreciation) on investments | | | 144,783,239 | | | 204,377,244 | | | 152,241,012 | | | 20,065,837 | | | 5,300,326 | | |
| | | | | | | | | | | | | | | | | | |
Net Assets | | $ | 851,435,470 | | $ | 1,399,430,987 | | $ | 1,449,047,605 | | $ | 318,980,378 | | $ | 208,858,896 | | |
| | | | | | | | | | | | | | | | | | |
| | | | | | | | | | | | | | | | | | |
See notes to financial statements.
Statements of Assets and Liabilities (Continued)
October 31, 2006
| | | | | | | | | | | | | | | | | | | | | | |
| | | Gartmore Investor
Destinations
Aggressive Fund | | | Gartmore Investor
Destinations
Moderately
Aggressive Fund | | | Gartmore Investor
Destinations
Moderate Fund | | | Gartmore Investor
Destinations
Moderately
Conservative Fund | | | Gartmore Investor
Destinations
Conservative Fund |
Net Assets: | | | | | | | | | | | | | | | | | | | | | | |
Class A Shares | | $ | 61,216,843 | | | $ | 83,365,165 | | | $ | 68,921,688 | | | $ | 27,244,214 | | | $ | 18,383,603 | | | |
Class B Shares | | | 16,889,601 | | | | 39,398,958 | | | | 35,436,566 | | | | 7,375,951 | | | | 3,841,442 | | | |
Class C Shares | | | 93,557,002 | | | | 192,829,644 | | | | 184,788,048 | | | | 41,108,220 | | | | 18,473,790 | | | |
Class R Shares | | | 2,083,122 | | | | 2,847,424 | | | | 4,025,758 | | | | 620,222 | | | | 502,668 | | | |
Institutional Class Shares | | | 1,439,446 | | | | 3,863,570 | | | | 3,119,086 | | | | 905,330 | | | | 158,596 | | | |
Service Class Shares | | | 676,249,456 | | | | 1,077,126,226 | | | | 1,152,756,459 | | | | 241,726,441 | | | | 167,498,797 | | | |
| | | | | | | | | | | | | | | | | | | | | | | |
Total | | $ | 851,435,470 | | | $ | 1,399,430,987 | | | $ | 1,449,047,605 | | | $ | 318,980,378 | | | $ | 208,858,896 | | | |
| | | | | | | | | | | | | | | | | | | | | | | |
| | | | | | |
Shares outstanding (unlimited number of shares authorized): | | | | | | | | | | | | | | | | | | | | | | |
Class A Shares | | | 5,681,640 | | | | 7,581,246 | | | | 6,282,313 | | | | 2,559,548 | | | | 1,768,082 | | | |
Class B Shares | | | 1,583,946 | | | | 3,629,863 | | | | 3,254,077 | | | | 693,259 | | | | 369,994 | | | |
Class C Shares | | | 8,792,364 | | | | 17,762,115 | | | | 17,020,046 | | | | 3,875,791 | | | | 1,785,115 | | | |
Class R Shares | | | 194,802 | | | | 262,010 | | | | 369,689 | | | | 58,046 | | | | 48,321 | | | |
Institutional Class Shares | | | 132,753 | | | | 351,497 | | | | 284,131 | | | | 84,512 | | | | 15,169 | | | |
Service Class Shares | | | 62,616,319 | | | | 98,078,661 | | | | 105,294,951 | | | | 22,633,315 | | | | 16,079,429 | | | |
| | | | | | | | | | | | | | | | | | | | | | | |
Total | | | 79,001,824 | | | | 127,665,392 | | | | 132,505,207 | | | | 29,904,471 | | | | 20,066,110 | | | |
| | | | | | | | | | | | | | | | | | | | | | | |
| | | | | | |
Net asset value and redemption price per share (Net assets by class divided by shares outstanding by class, respectively): | | | | | | | | | | | | | | | | | | | | | | |
Class A Shares | | $ | 10.77 | | | $ | 11.00 | | | $ | 10.97 | | | $ | 10.64 | | | $ | 10.40 | | | |
Class B Shares (a) | | $ | 10.66 | | | $ | 10.85 | | | $ | 10.89 | | | $ | 10.64 | | | $ | 10.38 | | | |
Class C Shares (b) | | $ | 10.64 | | | $ | 10.86 | | | $ | 10.86 | | | $ | 10.61 | | | $ | 10.35 | | | |
Class R Shares | | $ | 10.69 | | | $ | 10.87 | | | $ | 10.89 | | | $ | 10.69 | | | $ | 10.40 | | | |
Institutional Class Shares | | $ | 10.84 | | | $ | 10.99 | | | $ | 10.98 | | | $ | 10.71 | | | $ | 10.46 | | | |
Service Class Shares | | $ | 10.80 | | | $ | 10.98 | | | $ | 10.95 | | | $ | 10.68 | | | $ | 10.42 | | | |
| | | | | | |
Maximum offering price per share (100%/100%-maximum sales charge of net asset charge of net asset value adjusted to the nearest cent): | | | | | | | | | | | | | | | | | | | | | | |
Class A Shares | | $ | 11.43 | | | $ | 11.67 | | | $ | 11.64 | | | $ | 11.29 | | | $ | 11.03 | | | |
| | | | | | | | | | | | | | | | | | | | | | | |
Maximum Sales Charge — Class A Shares | | | 5.75 | % | | | 5.75 | % | | | 5.75 | % | | | 5.75 | % | | | 5.75 | % | | |
| | | | | | | | | | | | | | | | | | | | | | | |
| | | | | | | | | | | | | | | | | | | | | | | |
| (a) | For Class B Shares, the redemption price per share varies by the length of time shares held. |
| (b) | For Class C Shares, the redemption price per share is reduced by 1.00% for shares held less than one year. |
See notes to financial statements.
Statements of Operations
For the Year Ended October 31, 2006
| | | | | | | | | | | | | | | | | | | | | | |
| | | Gartmore Investor
Destinations
Aggressive Fund | | | Gartmore Investor
Destinations
Moderately
Aggressive Fund | | | Gartmore Investor
Destinations
Moderate Fund | | | Gartmore Investor
Destinations
Moderately
Conservative Fund | | | Gartmore Investor
Destinations
Conservative Fund |
INVESTMENT INCOME: | | | | | | | | | | | | | | | | | | | | | | |
Dividend income from affiliates | | $ | 12,228,372 | | | $ | 24,251,837 | | | $ | 31,002,431 | | | $ | 7,794,239 | | | $ | 5,254,058 | | | |
Interest income from affiliates | | | — | | | | 1,140,746 | | | | 3,523,272 | | | | 1,301,749 | | | | 1,546,547 | | | |
| | | | | | | | | | | | | | | | | | | | | | | |
Total Income | | | 12,228,372 | | | | 25,392,583 | | | | 34,525,703 | | | | 9,095,988 | | | | 6,800,605 | | | |
| | | | | | | | | | | | | | | | | | | | | | | |
| | | | | | |
Expenses: | | | | | | | | | | | | | | | | | | | | | | |
Investment advisory fees | | | 904,652 | | | | 1,535,291 | | | | 1,698,138 | | | | 376,578 | | | | 248,596 | | | |
Distribution fees Class A | | | 119,468 | | | | 171,251 | | | | 155,876 | | | | 57,268 | | | | 46,727 | | | |
Distribution fees Class B | | | 142,437 | | | | 352,120 | | | | 327,418 | | | | 67,339 | | | | 38,884 | | | |
Distribution fees Class C | | | 826,839 | | | | 1,766,719 | | | | 1,675,492 | | | | 410,379 | | | | 189,061 | | | |
Distribution fees Class R | | | 3,306 | | | | 2,961 | | | | 9,635 | | | | 485 | | | | 385 | | | |
Distribution fees Service Class | | | 1,374,673 | | | | 2,245,897 | | | | 2,600,685 | | | | 546,124 | | | | 374,028 | | | |
Administrative servicing fees Class A | | | 7,790 | | | | 15,802 | | | | 13,364 | | | | 6,541 | | | | 3,482 | | | |
Administrative servicing fees Class R | | | 1,653 | | | | 1,480 | | | | 4,796 | | | | 242 | | | | 192 | | | |
Administrative servicing fees Service Class | | | 832,239 | | | | 1,371,761 | | | | 1,548,176 | | | | 331,297 | | | | 226,268 | | | |
Registration and filing fees | | | 81,114 | | | | 92,773 | | | | 104,362 | | | | 65,245 | | | | 65,801 | | | |
Trustee fees | | | 23,253 | | | | 39,641 | | | | 44,636 | | | | 9,806 | | | | 6,622 | | | |
Compliance program fees (Note 3) | | | 13,675 | | | | 23,035 | | | | 24,675 | | | | 5,440 | | | | 3,539 | | | |
Other | | | 337,032 | | | | 632,901 | | | | 631,237 | | | | 149,960 | | | | 92,581 | | | |
| | | | | | | | | | | | | | | | | | | | | | | |
Total expenses before reimbursed expenses | | | 4,668,131 | | | | 8,251,632 | | | | 8,838,490 | | | | 2,026,704 | | | | 1,296,166 | | | |
Earnings credit (Note 5) | | | (1,830 | ) | | | (3,852 | ) | | | (2,662 | ) | | | (788 | ) | | | (1,655 | ) | | |
Expenses voluntarily waived by administrator | | | (46,615 | ) | | | (93,615 | ) | | | (87,891 | ) | | | (21,092 | ) | | | (10,900 | ) | | |
| | | | | | | | | | | | | | | | | | | | | | | |
Net Expenses | | | 4,619,686 | | | | 8,154,165 | | | | 8,747,937 | | | | 2,004,824 | | | | 1,283,611 | | | |
| | | | | | | | | | | | | | | | | | | | | | | |
Net Investment Income (Loss) | | | 7,608,686 | | | | 17,238,418 | | | | 25,777,766 | | | | 7,091,164 | | | | 5,516,994 | | | |
| | | | | | | | | | | �� | | | | | | | | | | | | |
| | | | | | |
REALIZED/UNREALIZED GAINS (LOSSES) FROM INVESTMENTS: | | | | | | | | | | | | | | | | | | | | | | |
Realized gains (losses) on investment transactions with affiliates | | | 13,113,643 | | | | 17,016,636 | | | | 18,246,902 | | | | 6,284,624 | | | | 2,082,025 | | | |
Realized gain distributions from underlying funds | | | 13,053,321 | | | | 18,798,305 | | | | 15,491,707 | | | | 2,318,927 | | | | 846,643 | | | |
| | | | | | | | | | | | | | | | | | | | | | | |
Net realized gains (losses) on investment transactions | | | 26,166,964 | | | | 35,814,941 | | | | 33,738,609 | | | | 8,603,551 | | | | 2,928,668 | | | |
Net change in unrealized appreciation/depreciation on investments | | | 78,598,576 | | | | 113,544,708 | | | | 89,227,383 | | | | 9,254,631 | | | | 3,920,805 | | | |
| | | | | | | | | | | | | | | | | | | | | | | |
Net realized/unrealized gains (losses) on investment transactions | | | 104,765,540 | | | | 149,359,649 | | | | 122,965,992 | | | | 17,858,182 | | | | 6,849,473 | | | |
| | | | | | | | | | | | | | | | | | | | | | | |
CHANGE IN NET ASSETS RESULTING FROM OPERATIONS | | $ | 112,374,226 | | | $ | 166,598,067 | | | $ | 148,743,758 | | | $ | 24,949,346 | | | $ | 12,366,467 | | | |
| | | | | | | | | | | | | | | | | | | | | | | |
| | | | | | | | | | | | | | | | | | | | | | | |
See notes to financial statements.
Statements of Changes in Net Assets
| | | | | | | | | | | | | | | | | | |
| | | Gartmore Investor Destinations
Aggressive Fund | | | Gartmore Investor Destinations
Moderately Aggressive Fund |
| | | Year Ended
October 31, 2006 | | | Year Ended
October 31, 2005 | | | Year Ended
October 31, 2006 | | | Year Ended
October 31, 2005 | | | |
FROM INVESTMENT ACTIVITIES: | | | | | | | | | | | | | | | | | | |
Operations: | | | | | | | | | | | | | | | | | | |
Net investment income (loss) | | $ | 7,608,686 | | | $ | 8,085,607 | | | $ | 17,238,418 | | | $ | 15,284,024 | | | |
Net realized gains (losses) on investment transactions | | | 26,166,964 | | | | 13,256,286 | | | | 35,814,941 | | | | 14,465,616 | | | |
Net change in unrealized appreciation/depreciation on investments | | | 78,598,576 | | | | 27,349,928 | | | | 113,544,708 | | | | 42,163,334 | | | |
| | | | | | | | | | | | | | | | | | |
Change in net assets resulting from operations | | | 112,374,226 | | | | 48,691,821 | | | | 166,598,067 | | | | 71,912,974 | | | |
| | | | | | | | | | | | | | | | | | |
| | | | | |
Distributions to Class A Shareholders from: | | | | | | | | | | | | | | | | | | |
Net investment income | | | (912,258 | ) | | | (637,312 | ) | | | (1,448,695 | ) | | | (1,016,018 | ) | | |
Net realized gains on investments | | | (781,457 | ) | | | — | | | | (800,084 | ) | | | (3,210 | ) | | |
| | | | | |
Distributions to Class B Shareholders from: | | | | | | | | | | | | | | | | | | |
Net investment income | | | (174,557 | ) | | | (127,363 | ) | | | (512,943 | ) | | | (381,919 | ) | | |
Net realized gains on investments | | | (238,848 | ) | | | — | | | | (429,221 | ) | | | (1,783 | ) | | |
| | | | | |
Distributions to Class C Shareholders from: | | | | | | | | | | | | | | | | | | |
Net investment income | | | (1,032,677 | ) | | | (798,240 | ) | | | (2,583,761 | ) | | | (1,910,861 | ) | | |
Net realized gains on investments | | | (1,462,132 | ) | | | — | | | | (2,194,297 | ) | | | (8,792 | ) | | |
| | | | | |
Distributions to Class R Shareholders from: | | | | | | | | | | | | | | | | | | |
Net investment income | | | (12,361 | ) | | | (2,069 | ) | | | (17,302 | ) | | | (3,692 | ) | | |
Net realized gains on investments | | | (7,180 | ) | | | — | | | | (3,691 | ) | | | (10 | ) | | |
| | | | | |
Distributions to Institutional Class Shareholders from: | | | | | | | | | | | | | | | | | | |
Net investment income | | | (8,226 | ) | | | (13 | )(a) | | | (30,118 | ) | | | (15 | )(a) | | |
Net realized gains on investments | | | (21 | ) | | | — | | | | (14 | ) | | | — | | | |
| | | | | |
Distributions to Service Class Shareholders from: | | | | | | | | | | | | | | | | | | |
Net investment income | | | (9,782,007 | ) | | | (6,795,353 | ) | | | (17,974,642 | ) | | | (12,003,528 | ) | | |
Net realized gains on investments | | | (9,107,808 | ) | | | — | | | | (10,500,320 | ) | | | (39,082 | ) | | |
| | | | | | | | | | | | | | | | | | |
Change in net assets from shareholder distributions | | | (23,519,532 | ) | | | (8,360,350 | ) | | | (36,495,088 | ) | | | (15,368,910 | ) | | |
| | | | | | | | | | | | | | | | | | |
Change in net assets from capital transactions | | | 200,822,354 | | | | 168,084,375 | | | | 290,204,052 | | | | 316,106,723 | | | |
| | | | | | | | | | | | | | | | | | |
Change in net assets | | | 289,677,048 | | | | 208,415,846 | | | | 420,307,031 | | | | 372,650,787 | | | |
| | | | | |
Net Assets: | | | | | | | | | | | | | | | | | | |
Beginning of period | | | 561,758,422 | | | | 353,342,576 | | | | 979,123,956 | | | | 606,473,169 | | | |
| | | | | | | | | | | | | | | | | | |
End of period | | $ | 851,435,470 | | | $ | 561,758,422 | | | $ | 1,399,430,987 | | | $ | 979,123,956 | | | |
| | | | | | | | | | | | | | | | | | |
| | | | | |
Accumulated net investment income (loss) at end of period | | $ | — | | | $ | — | | | $ | 608,537 | | | $ | 63,952 | | | |
| | | | | | | | | | | | | | | | | | |
| | | | | | | | | | | | | | | | | | | |
| (a) | For the period from December 29, 2004 (commencement of operations) through October 31, 2005. |
See notes to financial statements.
Statements of Changes in Net Assets
| | | | | | | | | | | | | | | | | | |
| | | Gartmore Investor Destinations
Moderate Fund | | | Gartmore Investor Destinations
Moderately Conservative Fund |
| | | Year Ended
October 31, 2006 | | | Year Ended
October 31, 2005 | | | Year Ended
October 31, 2006 | | | Year Ended
October 31, 2005 | | | |
FROM INVESTMENT ACTIVITIES: | | | | | | | | | | | | | | | | | | |
Operations: | | | | | | | | | | | | | | | | | | |
Net investment income (loss) | | $ | 25,777,766 | | | $ | 18,471,761 | | | $ | 7,091,164 | | | $ | 5,370,528 | | | |
Net realized gains (losses) on investment transactions | | | 33,738,609 | | | | 14,147,690 | | | | 8,603,551 | | | | 4,325,497 | | | |
Net change in unrealized appreciation/depreciation on investments | | | 89,227,383 | | | | 22,070,381 | | | | 9,254,631 | | | | 1,502,325 | | | |
| | | | | | | | | | | | | | | | | | |
Change in net assets resulting from operations | | | 148,743,758 | | | | 54,689,832 | | | | 24,949,346 | | | | 11,198,350 | | | |
| | | | | | | | | | | | | | | | | | |
| | | | | |
Distributions to Class A Shareholders from: | | | | | | | | | | | | | | | | | | |
Net investment income | | | (1,520,632 | ) | | | (1,084,376 | ) | | | (617,512 | ) | | | (355,077 | ) | | |
Net realized gains on investments | | | (638,940 | ) | | | (31,242 | ) | | | (276,380 | ) | | | (11,948 | ) | | |
| | | | | |
Distributions to Class B Shareholders from: | | | | | | | | | | | | | | | | | | |
Net investment income | | | (574,177 | ) | | | (403,638 | ) | | | (142,172 | ) | | | (102,106 | ) | | |
Net realized gains on investments | | | (327,933 | ) | | | (17,393 | ) | | | (101,528 | ) | | | (4,988 | ) | | |
| | | | | |
Distributions to Class C Shareholders from: | | | | | | | | | | | | | | | | | | |
Net investment income | | | (2,962,072 | ) | | | (2,144,297 | ) | | | (859,958 | ) | | | (650,956 | ) | | |
Net realized gains on investments | | | (1,698,864 | ) | | | (91,232 | ) | | | (641,453 | ) | | | (30,548 | ) | | |
| | | | | |
Distributions to Class R Shareholders from: | | | | | | | | | | | | | | | | | | |
Net investment income | | | (56,299 | ) | | | (2,167 | ) | | | (2,743 | ) | | | (48 | ) | | |
Net realized gains on investments | | | (18,124 | ) | | | (35 | ) | | | (19 | ) | | | (2 | ) | | |
| | | | | |
Distributions to Institutional Class Shareholders from: | | | | | | | | | | | | | | | | | | |
Net investment income | | | (25,815 | ) | | | (17 | )(a) | | | (12,000 | ) | | | (20 | )(a) | | |
Net realized gains on investments | | | (11 | ) | | | — | | | | (17 | ) | | | — | | | |
| | | | | |
Distributions to Service Class Shareholders from: | | | | | | | | | | | | | | | | | | |
Net investment income | | | (24,180,962 | ) | | | (14,418,045 | ) | | | (5,806,545 | ) | | | (4,146,870 | ) | | |
Net realized gains on investments | | | (10,482,715 | ) | | | (422,661 | ) | | | (3,306,101 | ) | | | (149,433 | ) | | |
| | | | | | | | | | | | | | | | | | |
Change in net assets from shareholder distributions | | | (42,486,544 | ) | | | (18,615,103 | ) | | | (11,766,428 | ) | | | (5,451,996 | ) | | |
| | | | | | | | | | | | | | | | | | |
Change in net assets from capital transactions | | | 171,484,081 | | | | 491,340,279 | | | | 47,534,686 | | | | 73,623,254 | | | |
| | | | | | | | | | | | | | | | | | |
Change in net assets | | | 277,741,295 | | | | 527,415,008 | | | | 60,717,604 | | | | 79,369,608 | | | |
| | | | | |
Net Assets: | | | | | | | | | | | | | | | | | | |
Beginning of period | | | 1,171,306,310 | | | | 643,891,302 | | | | 258,262,774 | | | | 178,893,166 | | | |
| | | | | | | | | | | | | | | | | | |
End of period | | $ | 1,449,047,605 | | | $ | 1,171,306,310 | | | $ | 318,980,378 | | | $ | 258,262,774 | | | |
| | | | | | | | | | | | | | | | | | |
| | | | | |
Accumulated net investment income (loss) at end of period | | $ | 2,428,380 | | | $ | 999,525 | | | $ | 554,225 | | | $ | 405,565 | | | |
| | | | | | | | | | | | | | | | | | |
| | | | | | | | | | | | | | | | | | | |
| (a) | For the period from December 29, 2004 (commencement of operations) through October 31, 2005. |
See notes to financial statements.
Statements of Changes in Net Assets (Continued)
| | | | | | | | | | |
| | | Gartmore Investor Destinations
Conservative Fund |
| | | Year Ended
October 31, 2006 | | | Year Ended
October 31, 2005 | | | |
FROM INVESTMENT ACTIVITIES: | | | | | | | | | | |
Operations: | | | | | | | | | | |
Net investment income (loss) | | $ | 5,516,994 | | | $ | 4,167,684 | | | |
Net realized gains (losses) on investment transactions | | | 2,928,668 | | | | 2,328,097 | | | |
Net change in unrealized appreciation/depreciation on investments | | | 3,920,805 | | | | (1,460,973 | ) | | |
| | | | | | | | | | |
Change in net assets resulting from operations | | | 12,366,467 | | | | 5,034,808 | | | |
| | | | | | | | | | |
| | | |
Distributions to Class A Shareholders from: | | | | | | | | | | |
Net investment income | | | (534,666 | ) | | | (414,662 | ) | | |
Net realized gains on investments | | | (355,546 | ) | | | (25,251 | ) | | |
| | | |
Distributions to Class B Shareholders from: | | | | | | | | | | |
Net investment income | | | (91,990 | ) | | | (75,356 | ) | | |
Net realized gains on investments | | | (47,621 | ) | | | (19,666 | ) | | |
| | | |
Distributions to Class C Shareholders from: | | | | | | | | | | |
Net investment income | | | (454,268 | ) | | | (349,210 | ) | | |
Net realized gains on investments | | | (234,259 | ) | | | (80,722 | ) | | |
| | | |
Distributions to Class R Shareholders from: | | | | | | | | | | |
Net investment income | | | (2,710 | ) | | | (57 | ) | | |
Net realized gains on investments | | | (296 | ) | | | (8 | ) | | |
| | | |
Distributions to Institutional Class Shareholders from: | | | | | | | | | | |
Net investment income | | | (1,416 | ) | | | (21 | )(a) | | |
Net realized gains on investments | | | (12 | ) | | | — | | | |
| | | |
Distributions to Service Class Shareholders from: | | | | | | | | | | |
Net investment income | | | (4,480,724 | ) | | | (3,158,214 | ) | | |
Net realized gains on investments | | | (1,690,363 | ) | | | (586,594 | ) | | |
| | | | | | | | | | |
Change in net assets from shareholder distributions | | | (7,893,871 | ) | | | (4,709,761 | ) | | |
| | | | | | | | | | |
Change in net assets from capital transactions | | | 14,711,686 | | | | 65,959,285 | | | |
| | | | | | | | | | |
Change in net assets | | | 19,184,282 | | | | 66,284,332 | | | |
| | | |
Net Assets: | | | | | | | | | | |
Beginning of period | | | 189,674,614 | | | | 123,390,282 | | | |
| | | | | | | | | | |
End of period | | $ | 208,858,896 | | | $ | 189,674,614 | | | |
| | | | | | | | | | |
| | | |
Accumulated net investment income (loss) at end of period | | $ | 512,547 | | | $ | 438,220 | | | |
| | | | | | | | | | |
| | | | | | | | | | | |
| (a) | For the period from December 29, 2004 (commencement of operations) through October 31, 2005. |
See notes to financial statements.
Statements of Changes in Net Assets
| | | | | | | | | | | | | | | | | | |
| | | Gartmore Investor Destinations
Aggressive Fund | | | Gartmore Investor Destinations
Moderately Aggressive Fund |
| | | Year Ended
October 31, 2006 | | | Year Ended
October 31, 2005 | | | Year Ended
October 31, 2006 | | | Year Ended
October 31, 2005 |
CAPITAL TRANSACTIONS: | | | | | | | | | | | | | | | | | | |
Class A Shares | | | | | | | | | | | | | | | | | | |
Proceeds from shares issued | | $ | 27,714,603 | | | $ | 25,435,569 | | | $ | 33,150,434 | | | $ | 31,065,260 | | | |
Dividends reinvested | | | 939,400 | | | | 310,140 | | | | 1,272,400 | | | | 502,537 | | | |
Cost of shares redeemed | | | (12,201,217 | ) | | | (9,485,634 | ) | | | (15,742,265 | ) | | | (13,254,773 | ) | | |
| | | | | | | | | | | | | | | | | | |
| | | 16,452,786 | | | | 16,260,075 | | | | 18,680,569 | | | | 18,313,024 | | | |
| | | | | | | | | | | | | | | | | | |
| | | | | |
Class B Shares | | | | | | | | | | | | | | | | | | |
Proceeds from shares issued | | | 4,925,605 | | | | 4,421,894 | | | | 9,164,562 | | | | 11,375,463 | | | |
Dividends reinvested | | | 280,636 | | | | 81,988 | | | | 567,157 | | | | 221,234 | | | |
Cost of shares redeemed | | | (1,856,710 | ) | | | (994,302 | ) | | | (4,356,534 | ) | | | (2,779,236 | ) | | |
| | | | | | | | | | | | | | | | | | |
| | | 3,349,531 | | | | 3,509,580 | | | | 5,375,185 | | | | 8,817,461 | | | |
| | | | | | | | | | | | | | | | | | |
| | | | | |
Class C Shares | | | | | | | | | | | | | | | | | | |
Proceeds from shares issued | | | 27,813,326 | | | | 32,109,603 | | | | 47,176,142 | | | | 61,409,175 | | | |
Dividends reinvested | | | 505,724 | | | | 153,280 | | | | 1,081,650 | | | | 432,097 | | | |
Cost of shares redeemed | | | (16,443,310 | ) | | | (9,793,328 | ) | | | (29,899,638 | ) | | | (14,922,934 | ) | | |
| | | | | | | | | | | | | | | | | | |
| | | 11,875,740 | | | | 22,469,555 | | | | 18,358,154 | | | | 46,918,338 | | | |
| | | | | | | | | | | | | | | | | | |
| | | | | |
Class R Shares | | | | | | | | | | | | | | | | | | |
Proceeds from shares issued | | | 2,145,174 | | | | 175,195 | | | | 2,599,279 | | | | 187,261 | | | |
Dividends reinvested | | | 67 | | | | 24 | | | | 52 | | | | 25 | | | |
Cost of shares redeemed | | | (404,242 | ) | | | (11,594 | ) | | | (144,442 | ) | | | (9,790 | ) | | |
| | | | | | | | | | | | | | | | | | |
| | | 1,740,999 | | | | 163,625 | | | | 2,454,889 | | | | 177,496 | | | |
| | | | | | | | | | | | | | | | | | |
| | | | | |
Institutional Class Shares | | | | | | | | | | | | | | | | | | |
Proceeds from shares issued | | | 1,493,404 | | | | 1,000 | (a) | | | 4,036,455 | | | | 1,000 | (a) | | |
Dividends reinvested | | | 8,247 | | | | 13 | (a) | | | 30,132 | | | | 15 | (a) | | |
Cost of shares redeemed | | | (119,079 | ) | | | — | | | | (365,977 | ) | | | — | | | |
| | | | | | | | | | | | | | | | | | |
| | | 1,382,572 | | | | 1,013 | | | | 3,700,610 | | | | 1,015 | | | |
| | | | | | | | | | | | | | | | | | |
| | | | | |
Service Class Shares | | | | | | | | | | | | | | | | | | |
Proceeds from shares issued | | | 187,722,738 | | | | 147,958,245 | | | | 267,155,216 | | | | 259,286,178 | | | |
Dividends reinvested | | | 18,881,625 | | | | 6,795,353 | | | | 28,474,904 | | | | 12,042,601 | | | |
Cost of shares redeemed | | | (40,583,637 | ) | | | (29,073,071 | ) | | | (53,995,475 | ) | | | (29,449,390 | ) | | |
| | | | | | | | | | | | | | | | | | |
| | | 166,020,726 | | | | 125,680,527 | | | | 241,634,645 | | | | 241,879,389 | | | |
| | | | | | | | | | | | | | | | | | |
Change in net assets from capital transactions | | $ | 200,822,354 | | | $ | 168,084,375 | | | $ | 290,204,052 | | | $ | 316,106,723 | | | |
| | | | | | | | | | | | | | | | | | |
| | | | | | | | | | | | | | | | | | |
| | | | | | | | | | | | | | | | | | |
| | | | | | | | | | | | | | | | | | |
| | | | | | | | | | | | | | | | | | | |
| (a) | For the period from December 29, 2004 (commencement of operations) through October 31, 2005. |
See notes to financial statements.
Statements of Changes in Net Assets (Continued)
| | | | | | | | | | | | | | |
| | | Gartmore Investor Destinations
Aggressive Fund | | | Gartmore Investor Destinations
Moderately Aggressive Fund |
| | | Year Ended
October 31, 2006 | | | Year Ended
October 31, 2005 | | | Year Ended
October 31, 2006 | | | Year Ended
October 31, 2005 |
SHARE TRANSACTIONS: | | | | | | | | | | | | | | |
Class A Shares | | | | | | | | | | | | | | |
Issued | | 2,719,915 | | | 2,774,547 | | | 3,171,471 | | | 3,227,490 | | | |
Reinvested | | 95,359 | | | 33,465 | | | 124,384 | | | 51,942 | | | |
Redeemed | | (1,205,462 | ) | | (1,027,402 | ) | | (1,513,517 | ) | | (1,374,009 | ) | | |
| | | | | | | | | | | | | | |
| | 1,609,812 | | | 1,780,610 | | | 1,782,338 | | | 1,905,423 | | | |
| | | | | | | | | | | | | | |
| | | | | |
Class B Shares | | | | | | | | | | | | | | |
Issued | | 487,608 | | | 483,830 | | | 891,182 | | | 1,198,403 | | | |
Reinvested | | 28,923 | | | 8,935 | | | 56,302 | | | 23,153 | | | |
Redeemed | | (185,837 | ) | | (108,402 | ) | | (421,719 | ) | | (291,889 | ) | | |
| | | | | | | | | | | | | | |
| | 330,694 | | | 384,363 | | | 525,765 | | | 929,667 | | | |
| | | | | | | | | | | | | | |
| | | | | |
Class C Shares | | | | | | | | | | | | | | |
Issued | | 2,779,413 | | | 3,534,525 | | | 4,581,696 | | | 6,453,483 | | | |
Reinvested | | 52,240 | | | 16,745 | | | 107,399 | | | 45,210 | | | |
Redeemed | | (1,645,278 | ) | | (1,072,264 | ) | | (2,900,426 | ) | | (1,561,943 | ) | | |
| | | | | | | | | | | | | | |
| | 1,186,375 | | | 2,479,006 | | | 1,788,669 | | | 4,936,750 | | | |
| | | | | | | | | | | | | | |
| | | | | |
Class R Shares | | | | | | | | | | | | | | |
Issued | | 211,862 | | | 19,741 | | | 249,759 | | | 20,034 | | | |
Reinvested | | 7 | | | 3 | | | 5 | | | 3 | | | |
Redeemed | | (39,953 | ) | | (1,241 | ) | | (13,760 | ) | | (1,010 | ) | | |
| | | | | | | | | | | | | | |
| | 171,916 | | | 18,503 | | | 236,004 | | | 19,027 | | | |
| | | | | | | | | | | | | | |
| | | | | |
Institutional Class Shares | | | | | | | | | | | | | | |
Issued | | 143,317 | | | 108 | (a) | | 382,941 | | | 104 | (a) | | |
Reinvested | | 809 | | | 1 | (a) | | 2,889 | | | 1 | (a) | | |
Redeemed | | (11,482 | ) | | — | | | (34,438 | ) | | — | | | |
| | | | | | | | | | | | | | |
| | 132,644 | | | 109 | | | 351,392 | | | 105 | | | |
| | | | | | | | | | | | | | |
| | | | | |
Service Class Shares | | | | | | | | | | | | | | |
Issued | | 18,387,174 | | | 15,982,444 | | | 25,580,298 | | | 26,910,875 | | | |
Reinvested | | 1,914,640 | | | 731,650 | | | 2,789,924 | | | 1,246,322 | | | |
Redeemed | | (4,007,374 | ) | | (3,117,948 | ) | | (5,189,694 | ) | | (3,039,191 | ) | | |
| | | | | | | | | | | | | | |
| | 16,294,440 | | | 13,596,146 | | | 23,180,528 | | | 25,118,006 | | | |
| | | | | | | | | | | | | | |
Total change in shares | | 19,725,881 | | | 18,258,737 | | | 27,864,696 | | | 32,908,978 | | | |
| | | | | | | | | | | | | | |
| | | | | | | | | | | | | | |
| | | | | | | | | | | | | | |
| | | | | | | | | | | | | | |
| | | | | | | | | | | | | | | |
| (a) | For the period from December 29, 2004 (commencement of operations) through October 31, 2005. |
See notes to financial statements.
Statements of Changes in Net Assets
| | | | | | | | | | | | | | | | | | |
| | | Gartmore Investor Destinations
Moderate Fund | | | Gartmore Investor Destinations
Moderately Conservative Fund |
| | | Year Ended
October 31, 2006 | | | Year Ended
October 31, 2005 | | | Year Ended
October 31, 2006 | | | Year Ended
October 31, 2005 |
CAPITAL TRANSACTIONS: | | | | | | | | | | | | | | | | | | |
Class A Shares | | | | | | | | | | | | | | | | | | |
Proceeds from shares issued | | $ | 21,964,099 | | | $ | 29,173,832 | | | $ | 15,018,994 | | | $ | 8,559,550 | | | |
Dividends reinvested | | | 1,172,417 | | | | 552,154 | | | | 620,152 | | | | 231,436 | | | |
Cost of shares redeemed | | | (16,837,932 | ) | | | (9,510,032 | ) | | | (6,360,358 | ) | | | (3,385,621 | ) | | |
| | | | | | | | | | | | | | | | | | |
| | | 6,298,584 | | | | 20,215,954 | | | | 9,278,788 | | | | 5,405,365 | | | |
| | | | | | | | | | | | | | | | | | |
| | | | | |
Class B Shares | | | | | | | | | | | | | | | | | | |
Proceeds from shares issued | | | 7,414,786 | | | | 10,319,440 | | | | 1,762,972 | | | | 2,125,480 | | | |
Dividends reinvested | | | 452,500 | | | | 214,779 | | | | 124,566 | | | | 54,257 | | | |
Cost of shares redeemed | | | (3,967,295 | ) | | | (2,254,040 | ) | | | (820,207 | ) | | | (926,469 | ) | | |
| | | | | | | | | | | | | | | | | | |
| | | 3,899,991 | | | | 8,280,179 | | | | 1,067,331 | | | | 1,253,268 | | | |
| | | | | | | | | | | | | | | | | | |
| | | | | |
Class C Shares | | | | | | | | | | | | | | | | | | |
Proceeds from shares issued | | | 48,058,314 | | | | 66,651,045 | | | | 11,531,945 | | | | 19,736,585 | | | |
Dividends reinvested | | | 1,034,608 | | | | 503,535 | | | | 342,580 | | | | 167,458 | | | |
Cost of shares redeemed | | | (28,338,995 | ) | | | (24,653,412 | ) | | | (12,105,625 | ) | | | (7,937,298 | ) | | |
| | | | | | | | | | | | | | | | | | |
| | | 20,753,927 | | | | 42,501,168 | | | | (231,100 | ) | | | 11,966,745 | | | |
| | | | | | | | | | | | | | | | | | |
| | | | | |
Class R Shares | | | | | | | | | | | | | | | | | | |
Proceeds from shares issued | | | 5,442,745 | | | | 150,588 | | | | 633,459 | | | | 1,471 | | | |
Dividends reinvested | | | 44 | | | | 27 | | | | 52 | | | | 28 | | | |
Cost of shares redeemed | | | (1,756,949 | ) | | | (176 | ) | | | (32,411 | ) | | | (1,531 | ) | | |
| | | | | | | | | | | | | | | | | | |
| | | 3,685,840 | | | | 150,439 | | | | 601,100 | | | | (32 | ) | | |
| | | | | | | | | | | | | | | | | | |
| | | | | |
Institutional Class Shares | | | | | | | | | | | | | | | | | | |
Proceeds from shares issued | | | 3,227,393 | | | | 1,000 | (a) | | | 1,187,327 | | | | 1,000 | (a) | | |
Dividends reinvested | | | 25,826 | | | | 17 | (a) | | | 12,016 | | | | 20 | (a) | | |
Cost of shares redeemed | | | (223,543 | ) | | | — | | | | (312,936 | ) | | | — | | | |
| | | | | | | | | | | | | | | | | | |
| | | 3,029,676 | | | | 1,017 | | | | 886,407 | | | | 1,020 | | | |
| | | | | | | | | | | | | | | | | | |
| | | | | |
Service Class Shares | | | | | | | | | | | | | | | | | | |
Proceeds from shares issued | | | 188,611,032 | | | | 451,686,838 | | | | 69,469,334 | | | | 72,268,066 | | | |
Dividends reinvested | | | 34,663,623 | | | | 14,840,668 | | | | 9,112,618 | | | | 4,296,297 | | | |
Cost of shares redeemed | | | (89,458,592 | ) | | | (46,335,984 | ) | | | (42,649,792 | ) | | | (21,567,475 | ) | | |
| | | | | | | | | | | | | | | | | | |
| | | 133,816,063 | | | | 420,191,522 | | | | 35,932,160 | | | | 54,996,888 | | | |
| | | | | | | | | | | | | | | | | | |
Change in net assets from capital transactions | | $ | 171,484,081 | | | $ | 491,340,279 | | | $ | 47,534,686 | | | $ | 73,623,254 | | | |
| | | | | | | | | | | | | | | | | | |
| | | | | | | | | | | | | | | | | | |
| | | | | | | | | | | | | | | | | | |
| | | | | | | | | | | | | | | | | | |
| | | | | | | | | | | | | | | | | | | |
| (a) | For the period from December 29, 2004 (commencement of operations) through October 31, 2005. |
See notes to financial statements.
Statements of Changes in Net Assets (Continued)
| | | | | | | | | | | | | | |
| | | Gartmore Investor Destinations
Moderate Fund | | | Gartmore Investor Destinations
Moderately Conservative Fund |
| | | Year Ended
October 31, 2006 | | | Year Ended
October 31, 2005 | | | Year Ended
October 31, 2006 | | | Year Ended
October 31, 2005 |
SHARE TRANSACTIONS: | | | | | | | | | | | | | | |
Class A Shares | | | | | | | | | | | | | | |
Issued | | 2,086,694 | | | 2,917,469 | | | 1,450,396 | | | 845,183 | | | |
Reinvested | | 112,775 | | | 55,133 | | | 60,451 | | | 22,836 | | | |
Redeemed | | (1,603,833 | ) | | (946,237 | ) | | (614,064 | ) | | (334,580 | ) | | |
| | | | | | | | | | | | | | |
| | 595,636 | | | 2,026,365 | | | 896,783 | | | 533,439 | | | |
| | | | | | | | | | | | | | |
| | | | | |
Class B Shares | | | | | | | | | | | | | | |
Issued | | 710,439 | | | 1,039,051 | | | 170,625 | | | 210,031 | | | |
Reinvested | | 43,870 | | | 21,584 | | | 12,147 | | | 5,352 | | | |
Redeemed | | (378,512 | ) | | (225,675 | ) | | (79,246 | ) | | (91,866 | ) | | |
| | | | | | | | | | | | | | |
| | 375,797 | | | 834,960 | | | 103,526 | | | 123,517 | | | |
| | | | | | | | | | | | | | |
| | | | | |
Class C Shares | | | | | | | | | | | | | | |
Issued | | 4,616,097 | | | 6,733,517 | | | 1,119,386 | | | 1,951,694 | | | |
Reinvested | | 100,598 | | | 50,740 | | | 33,511 | | | 16,569 | | | |
Redeemed | | (2,724,921 | ) | | (2,479,989 | ) | | (1,175,596 | ) | | (786,262 | ) | | |
| | | | | | | | | | | | | | |
| | 1,991,774 | | | 4,304,268 | | | (22,699 | ) | | 1,182,001 | | | |
| | | | | | | | | | | | | | |
| | | | | |
Class R Shares | | | | | | | | | | | | | | |
Issued | | 518,240 | | | 15,362 | | | 61,004 | | | 145 | | | |
Reinvested | | 4 | | | 3 | | | 5 | | | 3 | | | |
Redeemed | | (168,299 | ) | | (17 | ) | | (3,075 | ) | | (149 | ) | | |
| | | | | | | | | | | | | | |
| | 349,945 | | | 15,348 | | | 57,934 | | | (1 | ) | | |
| | | | | | | | | | | | | | |
| | | | | |
Institutional Class Shares | | | | | | | | | | | | | | |
Issued | | 302,913 | | | 99 | (a) | | 113,317 | | | 98 | (a) | | |
Reinvested | | 2,447 | | | 2 | (a) | | 1,159 | | | 2 | (a) | | |
Redeemed | | (21,330 | ) | | — | | | (30,064 | ) | | — | | | |
| | | | | | | | | | | | | | |
| | 284,030 | | | 101 | | | 84,412 | | | 100 | | | |
| | | | | | | | | | | | | | |
| | | | | |
Service Class Shares | | | | | | | | | | | | | | |
Issued | | 17,922,478 | | | 44,901,627 | | | 6,686,101 | | | 7,110,668 | | | |
Reinvested | | 3,341,693 | | | 1,481,988 | | | 885,380 | | | 422,500 | | | |
Redeemed | | (8,531,691 | ) | | (4,620,580 | ) | | (4,114,250 | ) | | (2,117,234 | ) | | |
| | | | | | | | | | | | | | |
| | 12,732,480 | | | 41,763,035 | | | 3,457,231 | | | 5,415,934 | | | |
| | | | | | | | | | | | | | |
Total change in shares | | 16,329,662 | | | 48,944,077 | | | 4,577,187 | | | 7,254,990 | | | |
| | | | | | | | | | | | | | |
| | | | | | | | | | | | | | |
| | | | | | | | | | | | | | |
| | | | | | | | | | | | | | |
| | | | | | | | | | | | | | | |
| (a) | For the period from December 29, 2004 (commencement of operations) through October 31, 2005. |
See notes to financial statements.
Statements of Changes in Net Assets
| | | | | | | | | | |
| | | Gartmore Investor
Destinations Conservative Fund |
| | | Year Ended
October 31, 2006 | | | Year Ended
October 31, 2005 |
CAPITAL TRANSACTIONS: | | | | | | | | | | |
Class A Shares | | | | | | | | | | |
Proceeds from shares issued | | $ | 14,678,187 | | | $ | 27,118,931 | | | |
Dividends reinvested | | | 785,370 | | | | 367,592 | | | |
Cost of shares redeemed | | | (26,655,411 | ) | | | (3,403,087 | ) | | |
| | | | | | | | | | |
| | | (11,191,854 | ) | | | 24,083,436 | | | |
| | | | | | | | | | |
| | | |
Class B Shares | | | | | | | | | | |
Proceeds from shares issued | | | 575,258 | | | | 1,207,447 | | | |
Dividends reinvested | | | 72,239 | | | | 49,753 | | | |
Cost of shares redeemed | | | (897,400 | ) | | | (696,745 | ) | | |
| | | | | | | | | | |
| | | (249,903 | ) | | | 560,455 | | | |
| | | | | | | | | | |
| | | |
Class C Shares | | | | | | | | | | |
Proceeds from shares issued | | | 5,692,214 | | | | 9,315,568 | | | |
Dividends reinvested | | | 193,773 | | | | 122,219 | | | |
Cost of shares redeemed | | | (6,923,661 | ) | | | (4,060,443 | ) | | |
| | | | | | | | | | |
| | | (1,037,674 | ) | | | 5,377,344 | | | |
| | | | | | | | | | |
| | | |
Class R Shares | | | | | | | | | | |
Proceeds from shares issued | | | 498,912 | | | | 2,129 | | | |
Dividends reinvested | | | 48 | | | | 33 | | | |
Cost of shares redeemed | | | (5,581 | ) | | | (198 | ) | | |
| | | | | | | | | | |
| | | 493,379 | | | | 1,964 | | | |
| | | | | | | | | | |
| | | |
Institutional Class Shares | | | | | | | | | | |
Proceeds from shares issued | | | 159,605 | | | | 1,000 | (a) | | |
Dividends reinvested | | | 1,428 | | | | 21 | (a) | | |
Cost of shares redeemed | | | (5,456 | ) | | | — | | | |
| | | | | | | | | | |
| | | 155,577 | | | | 1,021 | | | |
| | | | | | | | | | |
| | | |
Service Class Shares | | | | | | | | | | |
Proceeds from shares issued | | | 48,128,529 | | | | 61,190,122 | | | |
Dividends reinvested | | | 6,171,080 | | | | 3,744,799 | | | |
Cost of shares redeemed | | | (27,757,448 | ) | | | (28,999,856 | ) | | |
| | | | | | | | | | |
| | | 26,542,161 | | | | 35,935,065 | | | |
| | | | | | | | | | |
Change in net assets from capital transactions | | $ | 14,711,686 | | | $ | 65,959,285 | | | |
| | | | | | | | | | |
| | | | | | | | | | |
| | | | | | | | | | |
| | | | | | | | | | |
| | | | | | | | | | | |
| (a) | For the period from December 29, 2004 (commencement of operations) through October 31, 2005. |
See notes to financial statements.
Statements of Changes in Net Assets (Continued)
| | | | | | | | |
| | | Gartmore Investor
Destinations Conservative Fund |
| | | Year Ended
October 31, 2006 | | | Year Ended
October 31, 2005 |
SHARE TRANSACTIONS: | | | | | | | | |
Class A Shares | | | | | | | | |
Issued | | 1,444,662 | | | 2,651,433 | | | |
Reinvested | | 77,287 | | | 36,071 | | | |
Redeemed | | (2,602,501 | ) | | (333,263 | ) | | |
| | | | | | | | |
| | (1,080,552 | ) | | 2,354,241 | | | |
| | | | | | | | |
| | | |
Class B Shares | | | | | | | | |
Issued | | 56,342 | | | 118,393 | | | |
Reinvested | | 7,114 | | | 4,895 | | | |
Redeemed | | (88,071 | ) | | (68,506 | ) | | |
| | | | | | | | |
| | (24,615 | ) | | 54,782 | | | |
| | | | | | | | |
| | | |
Class C Shares | | | | | | | | |
Issued | | 559,992 | | | 916,795 | | | |
Reinvested | | 19,140 | | | 12,062 | | | |
Redeemed | | (679,789 | ) | | (399,383 | ) | | |
| | | | | | | | |
| | (100,657 | ) | | 529,474 | | | |
| | | | | | | | |
| | | |
Class R Shares | | | | | | | | |
Issued | | 48,543 | | | 208 | | | |
Reinvested | | 5 | | | 3 | | | |
Redeemed | | (537 | ) | | (18 | ) | | |
| | | | | | | | |
| | 48,011 | | | 193 | | | |
| | | | | | | | |
| | | |
Institutional Class Shares | | | | | | | | |
Issued | | 15,466 | | | 98 | (a) | | |
Reinvested | | 139 | | | 2 | (a) | | |
Redeemed | | (536 | ) | | — | | | |
| | | | | | | | |
| | 15,069 | | | 100 | | | |
| | | | | | | | |
| | | |
Service Class Shares | | | | | | | | |
Issued | | 4,692,620 | | | 5,986,237 | | | |
Reinvested | | 605,780 | | | 367,413 | | | |
Redeemed | | (2,713,309 | ) | | (2,837,442 | ) | | |
| | | | | | | | |
| | 2,585,091 | | | 3,516,208 | | | |
| | | | | | | | |
Total change in shares | | 1,442,349 | | | 6,454,998 | | | |
| | | | | | | | |
| | | | | | | | |
| | | | | | | | |
| | | | | | | | |
| | | | | | | | | |
| (a) | For the period from December 29, 2004 (commencement of operations) through October 31, 2005. |
See notes to financial statements.
Financial Highlights
Selected Data for Each Share of Capital Outstanding
Gartmore Investor Destinations Aggressive Fund
| | | | | | | | | | | | | | | | | | | | | | | | | | | | | | | | | | | | | | | | | | | |
| | | | | Investment Activities | | | Distributions | | | | | | | | Ratios/Supplemental Data |
| | | Net Asset
Value,
Beginning
of Period | | Net
Investment
Income
(Loss) | | Net Realized
and
Unrealized
Gains
(Losses) on
Investments | | | Total
from
Investment
Activities | | | Net
Investment
Income | | | Net
Realized
Gains | | | Total
Distributions | | | Net Asset
Value,
End of
Period | | Total
Return (a) | | | Net Assets
at End of
Period
(000s) | | Ratio of
Expenses
to Average
Net Assets | | | Ratio of
Net
Investment
Income
(Loss) to
Average
Net Assets | | | Ratio of
Expenses
(Prior to
Reimbursements)
to Average
Net Assets (b) | | | Ratio of Net
Investment
Income (Loss)
(Prior to
Reimbursements)
to Average
Net Assets (b) | | | Portfolio
Turnover (c) |
| | | | | | | | | | | | | | | |
Class A Shares | | | | | | | | | | | | | | | | | | | | | | | | | | | | | | | | | | | | | | | | | | | |
Year Ended October 31, 2002 | | $ | 7.36 | | 0.07 | | (1.00 | ) | | (0.93 | ) | | (0.07 | ) | | — | | | (0.07 | ) | | $ | 6.36 | | (12.67% | ) | | $ | 247 | | 0.50% | | | 1.42% | | | 0.50% | | | 1.42% | | | 26.33% |
Year Ended October 31, 2003 | | $ | 6.36 | | 0.08 | | 1.45 | | | 1.53 | | | (0.08 | ) | | — | | | (0.08 | ) | | $ | 7.81 | | 24.34% | | | $ | 3,742 | | 0.52% | | | 1.04% | | | (h | ) | | (h | ) | | 44.11% |
Year Ended October 31, 2004 | | $ | 7.81 | | 0.10 | | 0.80 | | | 0.90 | | | (0.10 | ) | | — | | | (0.10 | ) | | $ | 8.61 | | 11.55% | | | $ | 19,737 | | 0.47% | | | 1.06% | | | (h | ) | | (h | ) | | 2.12% |
Year Ended October 31, 2005 | | $ | 8.61 | | 0.19 | | 0.87 | | | 1.06 | | | (0.19 | ) | | — | | | (0.19 | ) | | $ | 9.48 | | 12.36% | | | $ | 38,583 | | 0.49% | | | 1.87% | | | (h | ) | | (h | ) | | 6.51% |
Year Ended October 31, 2006 | | $ | 9.48 | | 0.15 | | 1.53 | | | 1.68 | | | (0.20 | ) | | (0.19 | ) | | (0.39 | ) | | $ | 10.77 | | 18.13% | | | $ | 61,217 | | 0.45% | | | 1.27% | | | 0.46% | | | 1.27% | | | 4.80% |
| | | | | | | | | | | | | | | |
Class B Shares | | | | | | | | | | | | | | | | | | | | | | | | | | | | | | | | | | | | | | | | | | | |
Year Ended October 31, 2002 | | $ | 7.31 | | 0.02 | | (0.99 | ) | | (0.97 | ) | | (0.02 | ) | | — | | | (0.02 | ) | | $ | 6.32 | | (13.30% | ) | | $ | 48 | | 1.24% | | | 0.04% | | | 1.27% | | | 0.01% | | | 26.33% |
Year Ended October 31, 2003 | | $ | 6.32 | | 0.04 | | 1.43 | | | 1.47 | | | (0.05 | ) | | — | | | (0.05 | ) | | $ | 7.74 | | 23.42% | | | $ | 1,557 | | 1.25% | | | 0.16% | | | (h | ) | | (h | ) | | 44.11% |
Year Ended October 31, 2004 | | $ | 7.74 | | 0.04 | | 0.80 | | | 0.84 | | | (0.05 | ) | | — | | | (0.05 | ) | | $ | 8.53 | | 10.86% | | | $ | 7,414 | | 1.20% | | | 0.35% | | | (h | ) | | (h | ) | | 2.12% |
Year Ended October 31, 2005 | | $ | 8.53 | | 0.11 | | 0.86 | | | 0.97 | | | (0.12 | ) | | — | | | (0.12 | ) | | $ | 9.38 | | 11.46% | | | $ | 11,761 | | 1.21% | | | 1.18% | | | (h | ) | | (h | ) | | 6.51% |
Year Ended October 31, 2006 | | $ | 9.38 | | 0.08 | | 1.52 | | | 1.60 | | | (0.13 | ) | | (0.19 | ) | | (0.32 | ) | | $ | 10.66 | | 17.39% | | | $ | 16,890 | | 1.19% | | | 0.64% | | | 1.19% | | | 0.64% | | | 4.80% |
| | | | | | | | | | | | | | | |
Class C Shares | | | | | | | | | | | | | | | | | | | | | | | | | | | | | | | | | | | | | | | | | | | |
Year Ended October 31, 2002 | | $ | 7.36 | | — | | (1.04 | ) | | (1.04 | ) | | — | | | — | | | — | | | $ | 6.32 | | (13.30% | ) | | $ | 48 | | 1.24% | | | (0.96% | ) | | 1.48% | | | (1.20% | ) | | 26.33% |
Year Ended October 31, 2003 | | $ | 6.32 | | 0.05 | | 1.42 | | | 1.47 | | | (0.06 | ) | | — | | | (0.06 | ) | | $ | 7.73 | | 23.41% | | | $ | 7,706 | | 1.26% | | | 0.22% | | | (h | ) | | (h | ) | | 44.11% |
Year Ended October 31, 2004 | | $ | 7.73 | | 0.04 | | 0.80 | | | 0.84 | | | (0.05 | ) | | — | | | (0.05 | ) | | $ | 8.52 | | 10.88% | | | $ | 43,668 | | 1.20% | | | 0.32% | | | (h | ) | | (h | ) | | 2.12% |
Year Ended October 31, 2005 | | $ | 8.52 | | 0.12 | | 0.86 | | | 0.98 | | | (0.13 | ) | | — | | | (0.13 | ) | | $ | 9.37 | | 11.49% | | | $ | 71,231 | | 1.21% | | | 1.16% | | | (h | ) | | (h | ) | | 6.51% |
Year Ended October 31, 2006 | | $ | 9.37 | | 0.07 | | 1.52 | | | 1.59 | | | (0.13 | ) | | (0.19 | ) | | (0.32 | ) | | $ | 10.64 | | 17.29% | | | $ | 93,557 | | 1.19% | | | 0.65% | | | 1.19% | | | 0.64% | | | 4.80% |
| | | | | | | | | | | | | | | |
Class R Shares | | | | | | | | | | | | | | | | | | | | | | | | | | | | | | | | | | | | | | | | | | | |
Period Ended October 31, 2003 (d) | | $ | 7.45 | | — | | 0.29 | | | 0.29 | | | — | | | — | | | — | | | $ | 7.74 | | 3.89% | (f) | | $ | 1 | | 0.82% | (g) | | (0.46% | )(g) | | 0.92% | (g) | | (0.56% | )(g) | | 44.11% |
Year Ended October 31, 2004 | | $ | 7.74 | | 0.07 | | 0.82 | | | 0.89 | | | (0.07 | ) | | — | | | (0.07 | ) | | $ | 8.56 | | 11.58% | | | $ | 38 | | 0.63% | | | 0.93% | | | (h | ) | | (h | ) | | 2.12% |
Year Ended October 31, 2005 | | $ | 8.56 | | 0.18 | | 0.86 | �� | | 1.04 | | | (0.18 | ) | | — | | | (0.18 | ) | | $ | 9.42 | | 12.19% | | | $ | 216 | | 0.63% | | | 1.47% | | | (h | ) | | (h | ) | | 6.51% |
Year Ended October 31, 2006 | | $ | 9.42 | | 0.16 | | 1.49 | | | 1.65 | | | (0.19 | ) | | (0.19 | ) | | (0.38 | ) | | $ | 10.69 | | 17.93% | | | $ | 2,083 | | 0.79% | | | 0.88% | | | 0.80% | | | 0.88% | | | 4.80% |
| | | | | | | | | | | | | | | |
Institutional Class Shares | | | | | | | | | | | | | | | | | | | | | | | | | | | | | | | | | | | | | | | | | | | |
Period Ended October 31, 2005 (e) | | $ | 9.31 | | 0.09 | | 0.25 | | | 0.34 | | | (0.12 | ) | | — | | | (0.12 | ) | | $ | 9.53 | | 3.66% | (f) | | $ | 1 | | 0.24% | (g) | | 1.39% | (g) | | (h | ) | | (h | ) | | 6.51% |
Year Ended October 31, 2006 | | $ | 9.53 | | 0.22 | | 1.50 | | | 1.72 | | | (0.22 | ) | | (0.19 | ) | | (0.41 | ) | | $ | 10.84 | | 18.54% | | | $ | 1,439 | | 0.18% | | | 1.74% | | | 0.19% | | | 1.73% | | | 4.80% |
| | | | | | | | | | | | | | | |
Service Class Shares | | | | | | | | | | | | | | | | | | | | | | | | | | | | | | | | | | | | | | | | | | | |
Year Ended October 31, 2002 | | $ | 7.36 | | 0.07 | | (0.99 | ) | | (0.92 | ) | | (0.07 | ) | | — | | | (0.07 | ) | | $ | 6.37 | | (12.64% | ) | | $ | 54,923 | | 0.61% | | | 0.91% | | | 0.67% | | | 0.85% | | | 26.33% |
Year Ended October 31, 2003 | | $ | 6.37 | | 0.07 | | 1.45 | | | 1.52 | | | (0.07 | ) | | — | | | (0.07 | ) | | $ | 7.82 | | 24.08% | | | $ | 129,717 | | 0.61% | | | 0.98% | | | 0.63% | | | 0.96% | | | 44.11% |
Year Ended October 31, 2004 | | $ | 7.82 | | 0.09 | | 0.81 | | | 0.90 | | | (0.09 | ) | | — | | | (0.09 | ) | | $ | 8.63 | | 11.50% | | | $ | 282,486 | | 0.59% | | | 0.94% | | | 0.60% | | | 0.94% | | | 2.12% |
Year Ended October 31, 2005 | | $ | 8.63 | | 0.18 | | 0.87 | | | 1.05 | | | (0.18 | ) | | — | | | (0.18 | ) | | $ | 9.50 | | 12.18% | | | $ | 439,966 | | 0.62% | | | 1.78% | | | (h | ) | | (h | ) | | 6.51% |
Year Ended October 31, 2006 | | $ | 9.50 | | 0.14 | | 1.54 | | | 1.68 | | | (0.19 | ) | | (0.19 | ) | | (0.38 | ) | | $ | 10.80 | | 18.04% | | | $ | 676,249 | | 0.59% | | | 1.16% | | | 0.60% | | | 1.15% | | | 4.80% |
| (a) | Excludes sales charge. |
| (b) | During the period certain fees were waived and/or reimbursed. If such waivers/reimbursements had not occurred, the ratios would have been as indicated. |
| (c) | Portfolio turnover is calculated on the basis of the Fund as a whole without distinguishing among the classes of shares. |
| (d) | For the period from October 1, 2003 (commencement of operations) through October 31, 2003. |
| (e) | For the period from December 29, 2004 (commencement of operations) through October 31, 2005. |
| (h) | There were no fee reductions in this period. |
See notes to financial statements.
Financial Highlights
Selected Data for Each Share of Capital Outstanding
Gartmore Investor Destinations Moderately Aggressive Fund
| | | | | | | | | | | | | | | | | | | | | | | | | | | | | | | | | | | | | | | | | | | |
| | | | | Investment Activities | | | Distributions | | | | | | | | Ratios/Supplemental Data |
| | | Net Asset
Value,
Beginning
of Period | | Net
Investment
Income
(Loss) | | Net Realized
and
Unrealized
Gains
(Losses) on
Investments | | | Total
from
Investment
Activities | | | Net
Investment
Income | | | Net
Realized
Gains | | | Total
Distributions | | | Net Asset
Value, End
of Period | | Total
Return (a) | | | Net Assets
at End of
Period
(000s) | | Ratio of
Expenses
to Average
Net Assets | | | Ratio of Net
Investment
Income
(Loss)
to Average
Net Assets | | | Ratio of
Expenses
(Prior to
Reimbursements)
to Average
Net Assets (b) | | | Ratio of Net
Investment
Income (Loss)
(Prior to
Reimbursements)
to Average
Net Assets (b) | | | Portfolio
Turnover (c) |
| | | | | | | | | | | | | | | |
Class A Shares | | | | | | | | | | | | | | | | | | | | | | | | | | | | | | | | | | | | | | | | | | | |
Year Ended October 31, 2002 | | $ | 7.92 | | 0.10 | | (0.87 | ) | | (0.77 | ) | | (0.11 | ) | | — | | | (0.11 | ) | | $ | 7.04 | | (9.78% | ) | | $ | 1,072 | | 0.49% | | | 1.69% | | | 0.49% | | | 1.69% | | | 28.41% |
Year Ended October 31, 2003 | | $ | 7.04 | | 0.11 | | 1.31 | | | 1.42 | | | (0.11 | ) | | — | | | (0.11 | ) | | $ | 8.35 | | 20.42% | | | $ | 9,729 | | 0.48% | | | 1.42% | | | | (h) | | | (h) | | 8.08% |
Year Ended October 31, 2004 | | $ | 8.35 | | 0.12 | | 0.75 | | | 0.87 | | | (0.12 | ) | | — | | | (0.12 | ) | | $ | 9.10 | | 10.48% | | | $ | 35,416 | | 0.47% | | | 1.37% | | | 0.47% | | | 1.37% | | | 2.74% |
Year Ended October 31, 2005 | | $ | 9.10 | | 0.21 | | 0.74 | | | 0.95 | | | (0.21 | ) | | — | (i) | | (0.21 | ) | | $ | 9.84 | | 10.47% | | | $ | 57,073 | | 0.49% | | | 2.10% | | | | (h) | | | (h) | | 5.51% |
Year Ended October 31, 2006 | | $ | 9.84 | | 0.18 | | 1.33 | | | 1.51 | | | (0.22 | ) | | (0.13 | ) | | (0.35 | ) | | $ | 11.00 | | 15.66% | | | $ | 83,365 | | 0.46% | | | 1.65% | | | 0.47% | | | 1.64% | | | 6.67% |
| | | | | | | | | | | | | | | |
Class B Shares | | | | | | | | | | | | | | | | | | | | | | | | | | | | | | | | | | | | | | | | | | | |
Year Ended October 31, 2002 | | $ | 7.88 | | 0.06 | | (0.88 | ) | | (0.82 | ) | | (0.07 | ) | | — | | | (0.07 | ) | | $ | 6.99 | | (10.46% | ) | | $ | 130 | | 1.25% | | | 1.39% | | | 1.26% | | | 1.38% | | | 28.41% |
Year Ended October 31, 2003 | | $ | 6.99 | | 0.07 | | 1.28 | | | 1.35 | | | (0.08 | ) | | — | | | (0.08 | ) | | $ | 8.26 | | 19.43% | | | $ | 5,740 | | 1.22% | | | 0.63% | | | | (h) | | | (h) | | 8.08% |
Year Ended October 31, 2004 | | $ | 8.26 | | 0.07 | | 0.73 | | | 0.80 | | | (0.07 | ) | | — | | | (0.07 | ) | | $ | 8.99 | | 9.66% | | | $ | 19,546 | | 1.19% | | | 0.67% | | | 1.19% | | | 0.67% | | | 2.74% |
Year Ended October 31, 2005 | | $ | 8.99 | | 0.14 | | 0.73 | | | 0.87 | | | (0.14 | ) | | — | (i) | | (0.14 | ) | | $ | 9.72 | | 9.74% | | | $ | 30,177 | | 1.21% | | | 1.40% | | | | (h) | | | (h) | | 5.51% |
Year Ended October 31, 2006 | | $ | 9.72 | | 0.11 | | 1.30 | | | 1.41 | | | (0.15 | ) | | (0.13 | ) | | (0.28 | ) | | $ | 10.85 | | 14.83% | | | $ | 39,399 | | 1.19% | | | 1.03% | | | 1.20% | | | 1.02% | | | 6.67% |
| | | | | | | | | | | | | | | |
Class C Shares | | | | | | | | | | | | | | | | | | | | | | | | | | | | | | | | | | | | | | | | | | | |
Year Ended October 31, 2002 | | $ | 7.91 | | — | | (0.91 | ) | | (0.91 | ) | | — | | | — | | | — | | | $ | 7.00 | | (10.33% | ) | | $ | 15 | | 1.25% | | | (0.21% | ) | | 3.34% | | | (2.30% | ) | | 28.41% |
Year Ended October 31, 2003 | | $ | 7.00 | | 0.08 | | 1.28 | | | 1.36 | | | (0.09 | ) | | — | | | (0.09 | ) | | $ | 8.27 | | 19.64% | | | $ | 17,804 | | 1.22% | | | 0.64% | | | | (h) | | | (h) | | 8.08% |
Year Ended October 31, 2004 | | $ | 8.27 | | 0.07 | | 0.72 | | | 0.79 | | | (0.07 | ) | | — | | | (0.07 | ) | | $ | 8.99 | | 9.58% | | | $ | 99,211 | | 1.19% | | | 0.66% | | | 1.19% | | | 0.66% | | | 2.74% |
Year Ended October 31, 2005 | | $ | 8.99 | | 0.14 | | 0.73 | | | 0.87 | | | (0.14 | ) | | — | (i) | | (0.14 | ) | | $ | 9.72 | | 9.74% | | | $ | 155,315 | | 1.21% | | | 1.39% | | | | (h) | | | (h) | | 5.51% |
Year Ended October 31, 2006 | | $ | 9.72 | | 0.11 | | 1.31 | | | 1.42 | | | (0.15 | ) | | (0.13 | ) | | (0.28 | ) | | $ | 10.86 | | 14.83% | | | $ | 192,830 | | 1.19% | | | 1.03% | | | 1.20% | | | 1.02% | | | 6.67% |
| | | | | | | | | | | | | | | |
Class R Shares | | | | | | | | | | | | | | | | | | | | | | | | | | | | | | | | | | | | | | | | | | | |
Period Ended October 31, 2003 (d) | | $ | 8.01 | | — | | 0.25 | | | 0.25 | | | — | | | — | | | — | | | $ | 8.26 | | 3.12% | (f) | | $ | 1 | | 0.75% | (g) | | (0.04% | )(g) | | 0.85% | (g) | | (0.14% | )(g) | | 8.08% |
Year Ended October 31, 2004 | | $ | 8.26 | | 0.10 | | 0.75 | | | 0.85 | | | (0.10 | ) | | — | | | (0.10 | ) | | $ | 9.01 | | 10.27% | | | $ | 63 | | 0.62% | | | 1.19% | | | | (h) | | | (h) | | 2.74% |
Year Ended October 31, 2005 | | $ | 9.01 | | 0.20 | | 0.74 | | | 0.94 | | | (0.20 | ) | | — | (i) | | (0.20 | ) | | $ | 9.75 | | 10.49% | | | $ | 253 | | 0.61% | | | 1.92% | | | | (h) | | | (h) | | 5.51% |
Year Ended October 31, 2006 | | $ | 9.75 | | 0.20 | | 1.27 | | | 1.47 | | | (0.22 | ) | | (0.13 | ) | | (0.35 | ) | | $ | 10.87 | | 15.43% | | | $ | 2,847 | | 0.80% | | | 1.73% | | | 0.80% | | | 1.72% | | | 6.67% |
| | | | | | | | | | | | | | | |
Institutional Class Shares | | | | | | | | | | | | | | | | | | | | | | | | | | | | | | | | | | | | | | | | | | | |
Period Ended October 31, 2005 (e) | | $ | 9.67 | | 0.12 | | 0.20 | | | 0.32 | | | (0.14 | ) | | — | | | (0.14 | ) | | $ | 9.85 | | 3.37% | (f) | | $ | 1 | | 0.24% | (g) | | 1.73% | (g) | | | (h) | | | (h) | | 5.51% |
Year Ended October 31, 2006 | | $ | 9.85 | | 0.25 | | 1.27 | | | 1.52 | | | (0.25 | ) | | (0.13 | ) | | (0.38 | ) | | $ | 10.99 | | 15.84% | | | $ | 3,864 | | 0.19% | | | 2.07% | | | 0.20% | | | 2.06% | | | 6.67% |
| | | | | | | | | | | | | | | |
Service Class Shares | | | | | | | | | | | | | | | | | | | | | | | | | | | | | | | | | | | | | | | | | | | |
Year Ended October 31, 2002 | | $ | 7.91 | | 0.11 | | (0.88 | ) | | (0.77 | ) | | (0.11 | ) | | — | | | (0.11 | ) | | $ | 7.03 | | (9.88% | ) | | $ | 90,512 | | 0.61% | | | 1.46% | | | 0.65% | | | 1.42% | | | 28.41% |
Year Ended October 31, 2003 | | $ | 7.03 | | 0.10 | | 1.31 | | | 1.41 | | | (0.10 | ) | | — | | | (0.10 | ) | | $ | 8.34 | | 20.26% | | | $ | 214,101 | | 0.61% | | | 1.36% | | | | (h) | | | (h) | | 8.08% |
Year Ended October 31, 2004 | | $ | 8.34 | | 0.11 | | 0.74 | | | 0.85 | | | (0.11 | ) | | — | | | (0.11 | ) | | $ | 9.08 | | 10.22% | | | $ | 452,237 | | 0.59% | | | 1.26% | | | 0.59% | | | 1.26% | | | 2.74% |
Year Ended October 31, 2005 | | $ | 9.08 | | 0.20 | | 0.75 | | | 0.95 | | | (0.20 | ) | | — | (i) | | (0.20 | ) | | $ | 9.83 | | 10.48% | | | $ | 736,304 | | 0.61% | | | 1.98% | | | | (h) | | | (h) | | 5.51% |
Year Ended October 31, 2006 | | $ | 9.83 | | 0.17 | | 1.32 | | | 1.49 | | | (0.21 | ) | | (0.13 | ) | | (0.34 | ) | | $ | 10.98 | | 15.53% | | | $ | 1,077,126 | | 0.59% | | | 1.54% | | | 0.60% | | | 1.54% | | | 6.67% |
| (a) | Excludes sales charge. |
| (b) | During the period certain fees were waived and/or reimbursed. If such waivers/reimbursements had not occurred, the ratios would have been as indicated. |
| (c) | Portfolio turnover is calculated on the basis of the Fund as a whole without distinguishing among the classes of shares. |
| (d) | For the period from October 1, 2003 (commencement of operations) through October 31, 2003. |
| (e) | For the period from December 29, 2004 (commencement of operations) through October 31, 2005. |
| (h) | There were no fee reductions in this period. |
| (i) | The amount is less than $0.005 |
See notes to financial statements.
Financial Highlights
Selected Data for Each Share of Capital Outstanding
Gartmore Investor Destinations Moderate Fund
| | | | | | | | | | | | | | | | | | | | | | | | | | | | | | | | | | | | | | | | | | | |
| | | | | Investment Activities | | | Distributions | | | | | | | | Ratios/Supplemental Data |
| | | Net Asset
Value,
Beginning
of Period | | Net
Investment
Income
(Loss) | | Net Realized
and
Unrealized
Gains
(Losses)
on
Investments | | | Total
from
Investment
Activities | | | Net
Investment
Income | | | Net
Realized
Gains | | | Total
Distributions | | | Net Asset
Value,
End of
Period | | Total Return (a) | | | Net Assets
at End of
Period
(000s) | | Ratio of
Expenses
to Average
Net Assets | | | Ratio of
Net
Investment
Income
(Loss) to
Average
Net Assets | | | Ratio of
Expenses
(Prior to
Reimbursements)
to Average
Net Assets (b) | | | Ratio of Net
Investment
Income (Loss)
(Prior to
Reimbursements)
to Average
Net Assets (b) | | | Portfolio
Turnover (c) |
| | | | | | | | | | | | | | | |
Class A Shares | | | | | | | | | | | | | | | | | | | | | | | | | | | | | | | | | | | | | | | | | | | |
Year Ended October 31, 2002 | | $ | 8.64 | | 0.17 | | (0.69 | ) | | (0.52 | ) | | (0.18 | ) | | — | | | (0.18 | ) | | $ | 7.94 | | (6.12% | ) | | $ | 1,186 | | 0.48% | | | 2.37% | | | 0.48% | | | 2.37% | | | 34.36% |
Year Ended October 31, 2003 | | $ | 7.94 | | 0.15 | | 1.08 | | | 1.23 | | | (0.16 | ) | | — | | | (0.16 | ) | | $ | 9.01 | | 15.75% | | | $ | 9,972 | | 0.47% | | | 1.88% | | | (h | ) | | (h | ) | | 13.50% |
Year Ended October 31, 2004 | | $ | 9.01 | | 0.17 | | 0.58 | | | 0.75 | | | (0.16 | ) | | — | | | (0.16 | ) | | $ | 9.60 | | 8.36% | | | $ | 35,157 | | 0.47% | | | 1.78% | | | 0.47% | | | 1.78% | | | 5.64% |
Year Ended October 31, 2005 | | $ | 9.60 | | 0.23 | | 0.52 | | | 0.75 | | | (0.23 | ) | | (0.01 | ) | | (0.24 | ) | | $ | 10.11 | | 7.86% | | | $ | 57,505 | | 0.48% | | | 2.35% | | | (h | ) | | (h | ) | | 5.91% |
Year Ended October 31, 2006 | | $ | 10.11 | | 0.23 | | 1.00 | | | 1.23 | | | (0.26 | ) | | (0.11 | ) | | (0.37 | ) | | $ | 10.97 | | 12.41% | | | $ | 68,922 | | 0.46% | | | 2.16% | | | 0.46% | | | 2.15% | | | 8.40% |
| | | | | | | | | | | | | | | |
Class B Shares | | | | | | | | | | | | | | | | | | | | | | | | | | | | | | | | | | | | | | | | | | | |
Year Ended October 31, 2002 | | $ | 8.64 | | 0.11 | | (0.71 | ) | | (0.60 | ) | | (0.12 | ) | | — | | | (0.12 | ) | | $ | 7.92 | | (6.96% | ) | | $ | 161 | | 1.23% | | | 1.33% | | | 1.24% | | | 1.32% | | | 34.36% |
Year Ended October 31, 2003 | | $ | 7.92 | | 0.11 | | 1.06 | | | 1.17 | | | (0.13 | ) | | — | | | (0.13 | ) | | $ | 8.96 | | 14.89% | | | $ | 6,229 | | 1.21% | | | 1.09% | | | (h | ) | | (h | ) | | 13.50% |
Year Ended October 31, 2004 | | $ | 8.96 | | 0.10 | | 0.59 | | | 0.69 | | | (0.10 | ) | | — | | | (0.10 | ) | | $ | 9.55 | | 7.72% | | | $ | 19,504 | | 1.19% | | | 1.07% | | | 1.19% | | | 1.07% | | | 5.64% |
Year Ended October 31, 2005 | | $ | 9.55 | | 0.16 | | 0.50 | | | 0.66 | | | (0.16 | ) | | (0.01 | ) | | (0.17 | ) | | $ | 10.04 | | 6.96% | | | $ | 28,907 | | 1.20% | | | 1.66% | | | (h | ) | | (h | ) | | 5.91% |
Year Ended October 31, 2006 | | $ | 10.04 | | 0.15 | | 0.99 | | | 1.14 | | | (0.18 | ) | | (0.11 | ) | | (0.29 | ) | | $ | 10.89 | | 11.61% | | | $ | 35,437 | | 1.18% | | | 1.51% | | | 1.19% | | | 1.50% | | | 8.40% |
| | | | | | | | | | | | | | | |
Class C Shares | | | | | | | | | | | | | | | | | | | | | | | | | | | | | | | | | | | | | | | | | | | |
Year Ended October 31, 2002 | | $ | 8.66 | | 0.04 | | (0.75 | ) | | (0.71 | ) | | (0.05 | ) | | — | | | (0.05 | ) | | $ | 7.90 | | (7.13% | ) | | $ | 416 | | 1.23% | | | 1.89% | | | 1.29% | | | 1.83% | | | 34.36% |
Year Ended October 31, 2003 | | $ | 7.90 | | 0.11 | | 1.06 | | | 1.17 | | | (0.13 | ) | | — | | | (0.13 | ) | | $ | 8.94 | | 14.98% | | | $ | 21,995 | | 1.22% | | | 0.98% | | | (h | ) | | (h | ) | | 13.50% |
Year Ended October 31, 2004 | | $ | 8.94 | | 0.10 | | 0.58 | | | 0.68 | | | (0.10 | ) | | — | | | (0.10 | ) | | $ | 9.52 | | 7.67% | | | $ | 102,058 | | 1.19% | | | 1.07% | | | 1.19% | | | 1.07% | | | 5.64% |
Year Ended October 31, 2005 | | $ | 9.52 | | 0.16 | | 0.50 | | | 0.66 | | | (0.16 | ) | | (0.01 | ) | | (0.17 | ) | | $ | 10.01 | | 6.98% | | | $ | 150,491 | | 1.20% | | | 1.66% | | | (h | ) | | (h | ) | | 5.91% |
Year Ended October 31, 2006 | | $ | 10.01 | | 0.16 | | 0.99 | | | 1.15 | | | (0.19 | ) | | (0.11 | ) | | (0.30 | ) | | $ | 10.86 | | 11.65% | | | $ | 184,788 | | 1.18% | | | 1.51% | | | 1.19% | | | 1.51% | | | 8.40% |
| | | | | | | | | | | | | | | |
Class R Shares | | | | | | | | | | | | | | | | | | | | | | | | | | | | | | | | | | | | | | | | | | | |
Period Ended October 31, 2003 (d) | | $ | 8.77 | | 0.01 | | 0.18 | | | 0.19 | | | — | | | — | | | — | | | $ | 8.96 | | 2.17% | (f) | | $ | 1 | | 0.74% | (g) | | 0.68% | (g) | | 0.84% | (g) | | 0.58% | (g) | | 13.50% |
Year Ended October 31, 2004 | | $ | 8.96 | | 0.13 | | 0.60 | | | 0.73 | | | (0.13 | ) | | — | | | (0.13 | ) | | $ | 9.56 | | 8.19% | | | $ | 42 | | 0.62% | | | 1.79% | | | (h | ) | | (h | ) | | 5.64% |
Year Ended October 31, 2005 | | $ | 9.56 | | 0.22 | | 0.51 | | | 0.73 | | | (0.22 | ) | | (0.01 | ) | | (0.23 | ) | | $ | 10.06 | | 7.68% | | | $ | 199 | | 0.61% | | | 2.09% | | | (h | ) | | (h | ) | | 5.91% |
Year Ended October 31, 2006 | | $ | 10.06 | | 0.22 | | 0.97 | | | 1.19 | | | (0.25 | ) | | (0.11 | ) | | (0.36 | ) | | $ | 10.89 | | 12.11% | | | $ | 4,026 | | 0.79% | | | 1.88% | | | 0.79% | | | 1.87% | | | 8.40% |
| | | | | | | | | | | | | | | |
Institutional Class Shares | | | | | | | | | | | | | | | | | | | | | | | | | | | | | | | | | | | | | | | | | | | |
Period Ended October 31, 2005 (e) | | $ | 10.02 | | 0.18 | | 0.09 | | | 0.27 | | | (0.17 | ) | | — | | | (0.17 | ) | | $ | 10.12 | | 2.71% | (f) | | $ | 1 | | 0.23% | (g) | | 2.45% | (g) | | (h | ) | | (h | ) | | 5.91% |
Year Ended October 31, 2006 | | $ | 10.12 | | 0.27 | | 0.99 | | | 1.26 | | | (0.29 | ) | | (0.11 | ) | | (0.40 | ) | | $ | 10.98 | | 12.69% | | | $ | 3,119 | | 0.21% | | | 2.55% | | | 0.21% | | | 2.54% | | | 8.40% |
| | | | | | | | | | | | | | | |
Service Class Shares | | | | | | | | | | | | | | | | | | | | | | | | | | | | | | | | | | | | | | | | | | | |
Year Ended October 31, 2002 | | $ | 8.63 | | 0.17 | | (0.71 | ) | | (0.54 | ) | | (0.17 | ) | | — | | | (0.17 | ) | | $ | 7.92 | | (6.35% | ) | | $ | 123,963 | | 0.61% | | | 2.13% | | | 0.65% | | | 2.09% | | | 34.36% |
Year Ended October 31, 2003 | | $ | 7.92 | | 0.15 | | 1.07 | | | 1.22 | | | (0.15 | ) | | — | | | (0.15 | ) | | $ | 8.99 | | 15.59% | | | $ | 247,424 | | 0.60% | | | 1.82% | | | (h | ) | | (h | ) | | 13.50% |
Year Ended October 31, 2004 | | $ | 8.99 | | 0.16 | | 0.59 | | | 0.75 | | | (0.15 | ) | | — | | | (0.15 | ) | | $ | 9.59 | | 8.34% | | | $ | 487,130 | | 0.59% | | | 1.66% | | | 0.59% | | | 1.66% | | | 5.64% |
Year Ended October 31, 2005 | | $ | 9.59 | | 0.22 | | 0.51 | | | 0.73 | | | (0.22 | ) | | (0.01 | ) | | (0.23 | ) | | $ | 10.09 | | 7.66% | | | $ | 934,203 | | 0.60% | | | 2.24% | | | (h | ) | | (h | ) | | 5.91% |
Year Ended October 31, 2006 | | $ | 10.09 | | 0.22 | | 1.00 | | | 1.22 | | | (0.25 | ) | | (0.11 | ) | | (0.36 | ) | | $ | 10.95 | | 12.30% | | | $ | 1,152,756 | | 0.58% | | | 2.05% | | | 0.59% | | | 2.04% | | | 8.40% |
| (a) | Excludes sales charge. |
| (b) | During the period certain fees were waived and/or reimbursed. If such waivers/reimbursements had not occurred, the ratios would have been as indicated. |
| (c) | Portfolio turnover is calculated on the basis of the Fund as a whole without distinguishing among the classes of shares. |
| (d) | For the period from October 1, 2003 (commencement of operations) through October 31, 2003. |
| (e) | For the period from December 29, 2004 (commencement of operations) through October 31, 2005. |
| (h) | There were no fee reductions in this period. |
See notes to financial statements.
Financial Highlights
Selected Data for Each Share of Capital Outstanding
Gartmore Investor Destinations Moderately Conservative Fund
| | | | | | | | | | | | | | | | | | | | | | | | | | | | | | | | | | | | | | | | | | | | |
| | | | | Investment Activities | | | Distributions | | | | | | | | Ratios/Supplemental Data |
| | | Net Asset
Value,
Beginning
of Period | | Net
Investment
Income
(Loss) | | Net Realized
and
Unrealized
Gains
(Losses) on
Investments | | | Total
from
Investment
Activities | | | Net
Investment
Income | | | Net
Realized
Gains | | | Total
Distributions | | | Net
Asset
Value, End
of Period | | Total
Return (a) | | | Net Assets
at End of
Period
(000s) | | Ratio of
Expenses
to Average
Net Assets | | | Ratio of Net
Investment
Income
(Loss)
to Average
Net Assets | | | Ratio of
Expenses
(Prior to
Reimbursements)
to Average
Net Assets (b) | | | Ratio of Net
Investment
Income (Loss)
(Prior to
Reimbursements)
to Average
Net Assets (b) | | | Portfolio
Turnover (c) |
| | | | | | | | | | | | | | | |
Class A Shares | | | | | | | | | | | | | | | | | | | | | | | | | | | | | | | | | | | | | | | | | | | | |
Year Ended October 31, 2002 (d) | | $ | 9.19 | | 0.26 | | (0.49 | ) | | (0.23 | ) | | (0.25 | ) | | — | | | (0.25 | ) | | $ | 8.71 | | (2.60% | ) | | $ | 898 | | 0.50% | | | 2.99% | | | 0.51% | | | | 2.98% | | | 49.00% |
Year Ended October 31, 2003 | | $ | 8.71 | | 0.20 | | 0.75 | | | 0.95 | | | (0.22 | ) | | — | | | (0.22 | ) | | $ | 9.44 | | 11.02% | | | $ | 4,482 | | 0.53% | | | 2.34% | | | | (i) | | | | (i) | | 19.93% |
Year Ended October 31, 2004 | | $ | 9.44 | | 0.19 | | 0.44 | | | 0.63 | | | (0.19 | ) | | — | | | (0.19 | ) | | $ | 9.88 | | 6.71% | | | $ | 11,157 | | 0.52% | | | 2.12% | | | 0.52% | | | | 2.12% | | | 6.66% |
Year Ended October 31, 2005 | | $ | 9.88 | | 0.26 | | 0.31 | | | 0.57 | | | (0.26 | ) | | (0.01 | ) | | (0.27 | ) | | $ | 10.18 | | 5.78% | | | $ | 16,923 | | 0.54% | | | 2.57% | | | 0.54% | | | | 2.57% | | | 8.37% |
Year Ended October 31, 2006 | | $ | 10.18 | | 0.28 | | 0.64 | | | 0.92 | | | (0.29 | ) | | (0.17 | ) | | (0.46 | ) | | $ | 10.64 | | 9.24% | | | $ | 27,244 | | 0.48% | | | 2.65% | | | 0.49% | | | | 2.65% | | | 12.64% |
| | | | | | | | | | | | | | | |
Class B Shares | | | | | | | | | | | | | | | | | | | | | | | | | | | | | | | | | | | | | | | | | | | | |
Year Ended October 31, 2002 (d) | | $ | 9.20 | | 0.20 | | (0.49 | ) | | (0.29 | ) | | (0.19 | ) | | — | | | (0.19 | ) | | $ | 8.72 | | (3.22% | ) | | $ | 83 | | 1.27% | | | 2.24% | | | 1.29% | | | | 2.22% | | | 49.00% |
Year Ended October 31, 2003 | | $ | 8.72 | | 0.14 | | 0.75 | | | 0.89 | | | (0.17 | ) | | — | | | (0.17 | ) | | $ | 9.44 | | 10.37% | | | $ | 2,453 | | 1.28% | | | 1.52% | | | | (i) | | | | (i) | | 19.93% |
Year Ended October 31, 2004 | | $ | 9.44 | | 0.13 | | 0.43 | | | 0.56 | | | (0.12 | ) | | — | | | (0.12 | ) | | $ | 9.88 | | 5.99% | | | $ | 4,606 | | 1.21% | | | 1.41% | | | | (i) | | | | (i) | | 6.66% |
Year Ended October 31, 2005 | | $ | 9.88 | | 0.20 | | 0.31 | | | 0.51 | | | (0.20 | ) | | (0.01 | ) | | (0.21 | ) | | $ | 10.18 | | 5.08% | | | $ | 6,002 | | 1.22% | | | 1.90% | | | 1.22% | | | | 1.90% | | | 8.37% |
Year Ended October 31, 2006 | | $ | 10.18 | | 0.20 | | 0.65 | | | 0.85 | | | (0.22 | ) | | (0.17 | ) | | (0.39 | ) | | $ | 10.64 | | 8.49% | | | $ | 7,376 | | 1.20% | | | 1.98% | | | 1.21% | | | | 1.97% | | | 12.64% |
| | | | | | | | | | | | | | | |
Class C Shares | | | | | | | | | | | | | | | | | | | | | | | | | | | | | | | | | | | | | | | | | | | | |
Year Ended October 31, 2002 | | $ | 9.22 | | — | | (0.44 | ) | | (0.44 | ) | | (0.06 | ) | | — | | | (0.06 | ) | | $ | 8.72 | | (3.14% | ) | | $ | 88 | | 1.27% | | | 2.48% | | | 1.33% | | | | 2.42% | | | 49.00% |
Year Ended October 31, 2003 | | $ | 8.72 | | 0.15 | | 0.73 | | | 0.88 | | | (0.18 | ) | | — | | | (0.18 | ) | | $ | 9.42 | | 10.26% | | | $ | 7,530 | | 1.29% | | | 1.45% | | | | (i) | | | | (i) | | 19.93% |
Year Ended October 31, 2004 | | $ | 9.42 | | 0.13 | | 0.43 | | | 0.56 | | | (0.13 | ) | | — | | | (0.13 | ) | | $ | 9.85 | | 5.99% | | | $ | 26,760 | | 1.22% | | | 1.42% | | | | (i) | | | | (i) | | 6.66% |
Year Ended October 31, 2005 | | $ | 9.85 | | 0.18 | | 0.31 | | | 0.49 | | | (0.19 | ) | | (0.01 | ) | | (0.20 | ) | | $ | 10.14 | | 5.01% | | | $ | 39,545 | | 1.22% | | | 1.90% | | | 1.22% | | | | 1.90% | | | 8.37% |
Year Ended October 31, 2006 | | $ | 10.14 | | 0.20 | | 0.66 | | | 0.86 | | | (0.22 | ) | | (0.17 | ) | | (0.39 | ) | | $ | 10.61 | | 8.50% | | | $ | 41,108 | | 1.20% | | | 1.97% | | | 1.21% | | | | 1.97% | | | 12.64% |
| | | | | | | | | | | | | | | |
Class R Shares | | | | | | | | | | | | | | | | | | | | | | | | | | | | | | | | | | | | | | | | | | | | |
Period Ended October 31, 2003 (e) | | $ | 9.33 | | 0.01 | | 0.11 | | | 0.12 | | | — | | | — | | | — | | | $ | 9.45 | | 1.29% | (g) | | $ | 1 | | 0.81% | (h) | | 1.34% | (h) | | 0.91% | (h) | | | 1.24% | (h) | | 19.93% |
Year Ended October 31, 2004 | | $ | 9.45 | | 0.20 | | 0.42 | | | 0.62 | | | (0.16 | ) | | — | | | (0.16 | ) | | $ | 9.91 | | 6.55% | | | $ | 1 | | 0.60% | | | 2.01% | | | | (i) | | | | (i) | | 6.66% |
Year Ended October 31, 2005 | | $ | 9.91 | | 0.25 | | 0.31 | | | 0.56 | | | (0.24 | ) | | (0.01 | ) | | (0.25 | ) | | $ | 10.22 | | 5.73% | | | $ | 1 | | 0.65% | | | 2.54% | | | 0.65% | | | | 2.54% | | | 8.37% |
Year Ended October 31, 2006 | | $ | 10.22 | | 0.28 | | 0.65 | | | 0.93 | | | (0.29 | ) | | (0.17 | ) | | (0.46 | ) | | $ | 10.69 | | 9.19% | | | $ | 620 | | 0.81% | | | 2.53% | | | 0.82% | | | | 2.52% | | | 12.64% |
| | | | | | | | | | | | | | | |
Institutional Class Shares | | | | | | | | | | | | | | | | | | | | | | | | | | | | | | | | | | | | | | | | | | | | |
Period Ended October 31, 2005 (f) | | $ | 10.17 | | 0.23 | | 0.04 | | | 0.27 | | | (0.20 | ) | | — | | | (0.20 | ) | | $ | 10.24 | | 3.70% | (g) | | $ | 1 | | 0.29% | (h) | | 3.17% | (h) | | | (i) | | | | (i) | | 8.37% |
Year Ended October 31, 2006 | | $ | 10.24 | | 0.31 | | 0.65 | | | 0.96 | | | (0.32 | ) | | (0.17 | ) | | (0.49 | ) | | $ | 10.71 | | 9.58% | | | $ | 905 | | 0.20% | | | 3.05% | | | 0.21% | | | | 3.04% | | | 12.64% |
| | | | | | | | | | | | | | | |
Service Class Shares | | | | | | | | | | | | | | | | | | | | | | | | | | | | | | | | | | | | | | | | | | | | |
Year Ended October 31, 2002 (d) | | $ | 9.20 | | 0.26 | | (0.50 | ) | | (0.24 | ) | | (0.24 | ) | | — | | | (0.24 | ) | | $ | 8.72 | | (2.70% | ) | | $ | 36,927 | | 0.61% | | | 2.82% | | | 0.69% | | | | 2.74% | | | 49.00% |
Year Ended October 31, 2003 | | $ | 8.72 | | 0.19 | | 0.76 | | | 0.95 | | | (0.20 | ) | | — | | | (0.20 | ) | | $ | 9.47 | | 11.09% | | | $ | 78,189 | | 0.61% | | | 2.28% | | | 0.65% | | | | 2.24% | | | 19.93% |
Year Ended October 31, 2004 | | $ | 9.47 | | 0.19 | | 0.43 | | | 0.62 | | | (0.18 | ) | | — | | | (0.18 | ) | | $ | 9.91 | | 6.59% | | | $ | 136,368 | | 0.61% | | | 2.01% | | | 0.61% | | | | 2.01% | | | 6.66% |
Year Ended October 31, 2005 | | $ | 9.91 | | 0.25 | | 0.31 | | | 0.56 | | | (0.25 | ) | | (0.01 | ) | | (0.26 | ) | | $ | 10.21 | | 5.67% | | | $ | 195,790 | | 0.62% | | | 2.49% | | | 0.62% | | | | 2.49% | | | 8.37% |
Year Ended October 31, 2006 | | $ | 10.21 | | 0.26 | | 0.66 | | | 0.92 | | | (0.28 | ) | | (0.17 | ) | | (0.45 | ) | | $ | 10.68 | | 9.18% | | | $ | 241,726 | | 0.60% | | | 2.53% | | | 0.61% | | | | 2.52% | | | 12.64% |
| (a) | Excludes sales charge. |
| (b) | During the period certain fees were waived and/or reimbursed. If such waivers/reimbursements had not occurred, the ratios would have been as indicated. |
| (c) | Portfolio turnover is calculated on the basis of the Fund as a whole without distinguishing among the classes of shares. |
| (d) | Net investment income (loss) is based on average shares outstanding during the period. |
| (e) | For the period from October 1, 2003 (commencement of operations) through October 31, 2003. |
| (f) | For the period from December 29, 2004 (commencement of operations) through October 31, 2005. |
| (i) | There were no fee reductions in this period. |
See notes to financial statements.
Financial Highlights
Selected Data for Each Share of Capital Outstanding
Gartmore Investor Destinations Conservative Fund
| | | | | | | | | | | | | | | | | | | | | | | | | | | | | | | | | | | | | | | | | | | |
| | | | | Investment Activities | | | Distributions | | | | | | | | Ratios/Supplemental Data |
| | | Net Asset
Value,
Beginning
of Period | | Net
Investment
Income
(Loss) | | Net Realized
and
Unrealized
Gains
(Losses) on
Investments | | | Total
from
Investment
Activities | | | Net
Investment
Income | | | Net
Realized
Gains | | | Total
Distributions | | | Net
Asset
Value, End
of Period | | Total
Return (a) | | | Net Assets
at End of
Period
(000s) | | Ratio of
Expenses
to Average
Net Assets | | | Ratio of
Net
Investment
Income
(Loss) to
Average
Net Assets | | | Ratio of
Expenses
(Prior to
Reimbursements)
to Average
Net Assets (b) | | | Ratio of Net
Investment
Income (Loss)
(Prior to
Reimbursements)
to Average
Net Assets (b) | | | Portfolio
Turnover (c) |
| | | | | | | | | | | | | | | |
Class A Shares | | | | | | | | | | | | | | | | | | | | | | | | | | | | | | | | | | | | | | | | | | | |
Year Ended October 31, 2002 | | $ | 9.78 | | 0.28 | | (0.24 | ) | | 0.04 | | | (0.31 | ) | | — | | | (0.31 | ) | | $ | 9.51 | | 0.45% | | | $ | 802 | | 0.50% | | | 3.62% | | | 0.50% | | | 3.62% | | | 46.89% |
Year Ended October 31, 2003 | | $ | 9.51 | | 0.26 | | 0.39 | | | 0.65 | | | (0.28 | ) | | — | | | (0.28 | ) | | $ | 9.88 | | 6.89% | | | $ | 1,798 | | 0.53% | | | 2.83% | | | | (h) | | | (h) | | 32.93% |
Year Ended October 31, 2004 | | $ | 9.88 | | 0.22 | | 0.25 | | | 0.47 | | | (0.22 | ) | | — | | | (0.22 | ) | | $ | 10.13 | | 4.84% | | | $ | 5,008 | | 0.50% | | | 2.43% | | | 0.51% | | | 2.43% | | | 11.67% |
Year Ended October 31, 2005 | | $ | 10.13 | | 0.24 | | 0.12 | | | 0.36 | | | (0.27 | ) | | (0.05 | ) | | (0.32 | ) | | $ | 10.17 | | 3.67% | | | $ | 28,965 | | 0.53% | | | 2.85% | | | 0.53% | | | 2.85% | | | 13.42% |
Year Ended October 31, 2006 | | $ | 10.17 | | 0.34 | | 0.32 | | | 0.66 | | | (0.31 | ) | | (0.12 | ) | | (0.43 | ) | | $ | 10.40 | | 6.68% | | | $ | 18,384 | | 0.48% | | | 2.98% | | | 0.48% | | | 2.97% | | | 36.51% |
| | | | | | | | | | | | | | | |
Class B Shares | | | | | | | | | | | | | | | | | | | | | | | | | | | | | | | | | | | | | | | | | | | |
Year Ended October 31, 2002 | | $ | 9.79 | | 0.24 | | (0.25 | ) | | (0.01 | ) | | (0.25 | ) | | — | | | (0.25 | ) | | $ | 9.53 | | (0.15% | ) | | $ | 75 | | 1.27% | | | 2.77% | | | 1.33% | | | 2.71% | | | 46.89% |
Year Ended October 31, 2003 | | $ | 9.53 | | 0.19 | | 0.38 | | | 0.57 | | | (0.23 | ) | | — | | | (0.23 | ) | | $ | 9.87 | | 6.05% | | | $ | 1,622 | | 1.29% | | | 1.96% | | | | (h) | | | (h) | | 32.93% |
Year Ended October 31, 2004 | | $ | 9.87 | | 0.15 | | 0.25 | | | 0.40 | | | (0.15 | ) | | — | | | (0.15 | ) | | $ | 10.12 | | 4.12% | | | $ | 3,437 | | 1.23% | | | 1.70% | | | | (h) | | | (h) | | 11.67% |
Year Ended October 31, 2005 | | $ | 10.12 | | 0.21 | | 0.08 | | | 0.29 | | | (0.20 | ) | | (0.05 | ) | | (0.25 | ) | | $ | 10.16 | | 3.02% | | | $ | 4,010 | | 1.22% | | | 2.10% | | | 1.22% | | | 2.10% | | | 13.42% |
Year Ended October 31, 2006 | | $ | 10.16 | | 0.24 | | 0.34 | | | 0.58 | | | (0.24 | ) | | (0.12 | ) | | (0.36 | ) | | $ | 10.38 | | 5.89% | | | $ | 3,841 | | 1.21% | | | 2.36% | | | 1.22% | | | 2.35% | | | 36.51% |
| | | | | | | | | | | | | | | |
Class C Shares | | | | | | | | | | | | | | | | | | | | | | | | | | | | | | | | | | | | | | | | | | | |
Year Ended October 31, 2002 | | $ | 9.79 | | 0.23 | | (0.25 | ) | | (0.02 | ) | | (0.26 | ) | | — | | | (0.26 | ) | | $ | 9.51 | | (0.21% | ) | | $ | 400 | | 1.27% | | | 2.75% | | | 1.29% | | | 2.73% | | | 46.89% |
Year Ended October 31, 2003 | | $ | 9.51 | | 0.20 | | 0.37 | | | 0.57 | | | (0.23 | ) | | — | | | (0.23 | ) | | $ | 9.85 | | 6.03% | | | $ | 3,592 | | 1.29% | | | 1.95% | | | | (h) | | | (h) | | 32.93% |
Year Ended October 31, 2004 | | $ | 9.85 | | 0.16 | | 0.24 | | | 0.40 | | | (0.16 | ) | | — | | | (0.16 | ) | | $ | 10.09 | | 4.10% | | | $ | 13,683 | | 1.24% | | | 1.69% | | | | (h) | | | (h) | | 11.67% |
Year Ended October 31, 2005 | | $ | 10.09 | | 0.21 | | 0.08 | | | 0.29 | | | (0.20 | ) | | (0.05 | ) | | (0.25 | ) | | $ | 10.13 | | 2.95% | | | $ | 19,106 | | 1.23% | | | 2.10% | | | 1.23% | | | 2.10% | | | 13.42% |
Year Ended October 31, 2006 | | $ | 10.13 | | 0.25 | | 0.34 | | | 0.59 | | | (0.25 | ) | | (0.12 | ) | | (0.37 | ) | | $ | 10.35 | | 5.92% | | | $ | 18,474 | | 1.21% | | | 2.36% | | | 1.22% | | | 2.36% | | | 36.51% |
| | | | | | | | | | | | | | | |
Class R Shares | | | | | | | | | | | | | | | | | | | | | | | | | | | | | | | | | | | | | | | | | | | |
Period Ended October 31, 2003 (d) | | $ | 9.83 | | 0.02 | | 0.02 | | | 0.04 | | | — | | | — | | | — | | | $ | 9.87 | | 0.41% | (f) | | $ | 1 | | 0.84% | (g) | | 2.03% | (g) | | 0.94% | (g) | | 1.93% | (g) | | 32.93% |
Year Ended October 31, 2004 | | $ | 9.87 | | 0.22 | | 0.24 | | | 0.46 | | | (0.18 | ) | | — | | | (0.18 | ) | | $ | 10.15 | | 4.73% | | | $ | 1 | | 0.62% | | | 2.30% | | | | (h) | | | (h) | | 11.67% |
Year Ended October 31, 2005 | | $ | 10.15 | | 0.22 | | 0.14 | | | 0.36 | | | (0.26 | ) | | (0.05 | ) | | (0.31 | ) | | $ | 10.20 | | 3.65% | | | $ | 3 | | 0.65% | | | 2.67% | | | 0.65% | | | 2.67% | | | 13.42% |
Year Ended October 31, 2006 | | $ | 10.20 | | 0.26 | | 0.38 | | | 0.64 | | | (0.32 | ) | | (0.12 | ) | | (0.44 | ) | | $ | 10.40 | | 6.46% | | | $ | 503 | | 0.83% | | | 3.03% | | | 0.83% | | | 3.02% | | | 36.51% |
| | | | | | | | | | | | | | | |
Institutional Class Shares | | | | | | | | | | | | | | | | | | | | | | | | | | | | | | | | | | | | | | | | | | | |
Period Ended October 31, 2005 (e) | | $ | 10.20 | | 0.27 | | (0.02 | ) | | 0.25 | | | (0.22 | ) | | — | | | (0.22 | ) | | $ | 10.23 | | 2.44% | (f) | | $ | 1 | | 0.28% | (g) | | 3.74% | (g) | | 0.28% | (g) | | 3.74% | (g) | | 13.42% |
Year Ended October 31, 2006 | | $ | 10.23 | | 0.33 | | 0.37 | | | 0.70 | | | (0.35 | ) | | (0.12 | ) | | (0.47 | ) | | $ | 10.46 | | 6.91% | | | $ | 159 | | 0.22% | | | 3.68% | | | 0.23% | | | 3.68% | | | 36.51% |
| | | | | | | | | | | | | | | |
Service Class Shares | | | | | | | | | | | | | | | | | | | | | | | | | | | | | | | | | | | | | | | | | | | |
Year Ended October 31, 2002 | | $ | 9.79 | | 0.31 | | (0.26 | ) | | 0.05 | | | (0.31 | ) | | — | | | (0.31 | ) | | $ | 9.53 | | 0.48% | | | $ | 28,253 | | 0.61% | | | 3.49% | | | 0.72% | | | 3.38% | | | 46.89% |
Year Ended October 31, 2003 | | $ | 9.53 | | 0.26 | | 0.38 | | | 0.64 | | | (0.27 | ) | | — | | | (0.27 | ) | | $ | 9.90 | | 6.76% | | | $ | 59,472 | | 0.61% | | | 2.73% | | | 0.67% | | | 2.68% | | | 32.93% |
Year Ended October 31, 2004 | | $ | 9.90 | | 0.23 | | 0.23 | | | 0.46 | | | (0.21 | ) | | — | | | (0.21 | ) | | $ | 10.15 | | 4.69% | | | $ | 101,261 | | 0.61% | | | 2.31% | | | 0.63% | | | 2.29% | | | 11.67% |
Year Ended October 31, 2005 | | $ | 10.15 | | 0.27 | | 0.09 | | | 0.36 | | | (0.26 | ) | | (0.05 | ) | | (0.31 | ) | | $ | 10.20 | | 3.62% | | | $ | 137,589 | | 0.62% | | | 2.70% | | | 0.63% | | | 2.70% | | | 13.42% |
Year Ended October 31, 2006 | | $ | 10.20 | | 0.31 | | 0.34 | | | 0.65 | | | (0.31 | ) | | (0.12 | ) | | (0.43 | ) | | $ | 10.42 | | 6.52% | | | $ | 167,499 | | 0.61% | | | 2.95% | | | 0.62% | | | 2.95% | | | 36.51% |
| (a) | Excludes sales charge. |
| (b) | During the period certain fees were waived and/or reimbursed. If such waivers/reimbursements had not occurred, the ratios would have been as indicated. |
| (c) | Portfolio turnover is calculated on the basis of the Fund as a whole without distinguishing among the classes of shares. |
| (d) | For the period from October 1, 2003 (commencement of operations) through October 31, 2003. |
| (e) | For the period from December 29, 2004 (commencement of operations) through October 31, 2005. |
| (h) | There were no fee reductions in this period. |
See notes to financial statements.
Gartmore Optimal Allocations Fund: Aggressive
Effective in April 2006, William H. Miller became the portfolio manager of the Fund and is responsible for the day-to-day management of the allocation of the Fund’s assets among the asset classes and underlying funds.
For the annual period ended Oct. 31, 2006, the Gartmore Optimal Allocations Fund: Aggressive (Class A at NAV) returned 17.79% versus 18.64% for its composite benchmark, which consists of 70% S&P 500® Index, 25% Morgan Stanley Capital International Europe, Australasia and Far East (MSCI EAFE®) Index, and 5% Lehman Brothers U.S. Aggregate Index. For broader comparison, the average return for the Fund’s Lipper peer category of Multi-Cap Core Funds (consisting of 904 funds as of Oct. 31, 2006) was 14.49%.
The annual reporting period ended Oct. 31, 2006, began with a broad rally, aided in part by favorable seasonal factors. The U.S. market continued to edge higher during the first four months of 2006, but the buying lacked conviction. Several factors kept investors off balance, including continuing hikes in short-term interest rates by the Federal Reserve Board, uncertainty due to the passing of the torch at the Federal Reserve from Alan Greenspan to Ben Bernanke, and persistent strength in crude oil prices. On the positive side, U.S. economic growth bounced back to a robust annualized rate of 5.6% in the first quarter of 2006 after a relatively tepid 1.8% pace in the final quarter of 2005, when the economy was still reeling from a punishing hurricane season.
In May, stocks experienced a sharp correction. An uptick in inflation and yet another rate hike by the Fed—accompanied by tough talk suggesting that the central bank’s credit-tightening campaign might persist for longer than investors had been expecting—prompted widespread selling, particularly in areas that were perceived to have higher risk, such as small-capitalization stocks, technology and biotechnology. During the summer, inflation fears moderated and further evidence of economic slowing appeared, particularly in the housing and auto markets. In response, the Fed kept interest rates steady in August, September and October, which helped stocks finish the period with a respectable rally. A sharp drop in energy prices also boosted share prices near the end of the reporting period. Against this backdrop, the S&P 500 Index posted a 16.34% return for the year ended Oct. 31, 2006.
International stocks generally were stronger than their U.S. counterparts, in part because of weakness in the U.S. dollar versus a number of foreign currencies. Foreign share prices also benefited from more attractive valuations and better growth prospects than those of comparable U.S. investments. In developed markets, strong gains were seen in the United Kingdom, Sweden and Norway, among others. Emerging markets such as China and India offered particularly strong share price appreciation.
U.S. investment-grade bonds ended the period with mixed results. Rising short-term interest rates limited gains for fixed-income securities at the short end of the yield curve (a plotted graph line of the yields, or interest rates, on long-term and short-term maturity bonds). Longer-term bonds also faced an uphill battle, as yields for the group began the period at historically low levels.
The Fund is a diversified “fund of funds” designed to serve as a total asset allocation solution to an investor with an “aggressive” risk profile. Its design was developed by Gartmore Funds with the assistance of its consultant, Ibbotson Associates Advisors, LLC, a leading asset allocation authority. The Fund invests in a diverse set of underlying funds with an allocation mix that has been designed to expand an average investor’s “efficient frontier”—the line on a risk-reward graph representing the most efficient combination of various asset classes to achieve the highest possible return for a given level of risk. In other words, by incorporating a combination of diverse asset classes that behave differently under various market conditions, we believe that it may be possible for the Fund to achieve higher risk-adjusted returns than those that could be achieved with a nondiversified portfolio over the long term.
The Fund’s allocations are reviewed quarterly by Ibbotson and Gartmore Funds, and are subject to change. Changes are implemented when an opportunity exists to enhance the overall diversification of the Fund and to actively manage the Fund’s risk-return profile. That said, during the reporting period no changes were made in the lineup of underlying funds held by the Fund. The Gartmore Optimal Allocations Fund: Aggressive is currently invested in a set of 13 underlying funds.
Gartmore Optimal Allocations Fund: Aggressive
Continued
| | | | |
Asset Classes and Underlying
Funds | | Target
Allocation
Ranges* | | 1-Year
Returns of
Underlying
Funds* |
| U.S. STOCKS | | 20% - 40% | | |
U.S. Large Cap | | 15% -30% | | |
Gartmore Nationwide Fund | | | | 15.01% |
Gartmore U.S. Growth Leaders Fund | | | | 2.16% |
U.S. Small/Mid-Cap | | 5% - 15% | | |
Gartmore Small Cap Fund | | | | 31.52% |
| INTERNATIONAL STOCKS | | 5% - 10% | | |
Gartmore International Growth Fund | | | | 38.76% |
| SPECIALTY ASSETS | | 50% - 70% | | |
Gartmore Global Financial Services Fund | | | | 24.19% |
Gartmore Global Health Sciences Fund | | | | 5.90% |
Gartmore Global Technology and Communications Fund | | | | 13.72% |
iShares Cohen & Steers Realty Majors Index Fund | | | | 41.25% |
Gartmore Global Natural Resources Fund | | | | 23.17% |
Gartmore U.S. Growth Leaders Long-Short Fund | | | | 5.60% |
Gartmore Emerging Markets Fund | | | | 33.32% |
Gartmore Micro Cap Equity Fund | | | | 19.56% |
Gartmore Global Utilities Fund | | | | 27.88% |
| * | Fund target allocation ranges and Institutional Share Class returns are as of Oct. 31, 2006. |
Among the underlying funds in the portfolio, those that contributed the least to the overall returns were the Gartmore U.S. Growth Leaders Fund and the Gartmore U.S. Growth Leaders Long-Short Fund, which finished with returns of 2.16% and 5.60%, respectively. The Gartmore U.S. Growth Leaders Fund is a concentrated portfolio of U.S. stocks normally holding roughly 25 to 35 positions. Given its concentrated structure, this Fund’s returns tend to vary significantly from those of its benchmark, the S&P 500 Index, relative to more diversified funds. While it is our expectation that there will be some periods when the Gartmore U.S. Growth Leaders Fund strongly outperforms its benchmark, during much of the reporting period this Fund’s growth mandate was out of step with prevailing market sentiment. The Gartmore U.S. Growth Leaders Long-Short Fund is an absolute-return product, and it finished modestly ahead of its benchmark, 3-month Treasury bills.
Conversely, those underlying funds that contributed the most to overall returns were the Gartmore Global Financial Services Fund and the iShares Cohen & Steers Realty Majors Index Fund. The former had a 16% allocation that returned 24.19%, and the latter, a 6% allocation that returned 41.25% during the reporting period. Financial services stocks generally performed well during the reporting period as relatively low levels of interest rates helped stimulate healthy loan growth for banks and otherwise created a relatively benign credit environment globally. Despite extensive evidence of a slowing U.S. residential real estate market, real estate stocks benefited from relatively low global interest rates and strong demand for apartments and office buildings.
Looking ahead, we believe that the Fund’s allocation to multiple asset classes continues to position it well to deliver the potential for higher long-term returns versus those of its blended benchmark at a marginally higher risk level. The returns are expected to be derived from greater diversification achieved by allocating assets across underlying funds representing a broad range of asset classes that are not highly correlated.
Portfolio Manager:
William H. Miller
| | |
Fund Performance | | Gartmore Optimal Allocations Fund: Aggressive |
Average Annual Total Return
(For periods ended October 31, 2006)
| | | | | | |
| | | | | 1 Yr. | | Inception1 |
| Class A | | w/o SC2 | | 17.79% | | 14.23% |
| | | w/SC3 | | 11.04% | | 11.38% |
| Class B | | w/o SC2 | | 16.94% | | 13.30% |
| | | w/SC4 | | 11.94% | | 12.21% |
| Class C | | w/o SC2 | | 16.91% | | 13.29% |
| | | w/SC5 | | 15.91% | | 12.29% |
| Class R6 | | | | 17.43% | | 13.82% |
| Institutional Service Class6 | | 17.91% | | 14.33% |
| Institutional Class6 | | 18.11% | | 14.48% |
All figures showing the effect of a sales charge reflect the maximum charge possible, because it has the most dramatic effect on performance data.
| 1 | Fund commenced operations on June 29, 2004. |
| 2 | These returns do not reflect the effects of sales charges (SC). |
| 3 | A 5.75% front-end sales charge was deducted. |
| 4 | A 5.00% contingent deferred sales charge (CDSC) was deducted. The CDSC declines to 0% after 6 years. |
| 5 | A CDSC of 1.00% was deducted from the one year return because it is charged when you sell Class C shares within the first year after purchase. |
| 6 | Not subject to any sales charges. |
Performance of a $10,000 Investment
Investment return and principal value will fluctuate, and when redeemed, shares may be worth more or less than original cost. Past performance is no guarantee of future results and does not reflect the deduction of taxes that a shareholder would pay on fund distributions or the redemption of fund shares. Investing in mutual funds involves market risk, including loss of principal. Performance returns assume the reinvestment of all distributions.
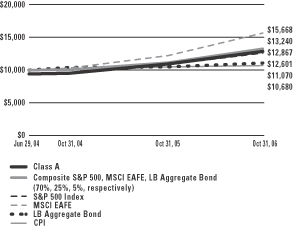
Comparative performance of $10,000 invested in Class A shares of the Gartmore Optimal Allocations Fund: Aggressive, the Optimal Allocations Aggressive Composite Index (Composite)(a), S&P 500 Index (S&P 500)(b), Morgan Stanley Capital International Europe, Australasia, and Far East Index (MSCI EAFE)(c), Lehman Brothers Aggregate Bond Index (LB Aggregate Bond)(d), and the Consumer Price Index (CPI)(e) since inception. Unlike the Fund, the returns for these unmanaged indexes do not reflect any fees, expenses, or sales charges. Investors cannot invest directly in market indexes.
| (a) | The Optimal Allocation Aggressive Composite is an unmanaged, hypothetical representation of the performance of each of the Fund’s asset classes according to their respective weightings. The composite is a combination of the S&P 500 (70%), the MSCI EAFE (25%) and the LB Aggregate Bond (5%). |
| (b) | The S&P 500 is an unmanaged index of 500 widely held stocks of large U.S. companies that gives a broad look at how the stock prices of large U.S. companies have performed. |
| (c) | The MSCI EAFE is an unmanaged, market capitalization-weighted index that is designed to represent the performance of developed stock markets outside the United States and Canada. |
| (d) | The LB Aggregate Bond is an unmanaged, market value-weighted index of investment grade fixed-rate debt issues including government, corporate, asset-backed and mortgage-backed securities with maturities of one year or more. |
| (e) | The CPI represents changes in prices of a basket of goods and services purchased for consumption by urban households. |
| | |
Shareholder Expense Example | | Gartmore Optimal Allocations Fund: Aggressive |
As a shareholder of the Fund, you incur two types of costs: (1) transaction costs, including sales charges (loads) paid on purchase payments and redemption fees; and (2) ongoing costs, including investment advisory fees, administration fees, distribution fees and other Fund expenses. The examples below are intended to help you understand your ongoing costs (in dollars) of investing in the Fund and to compare these costs with the ongoing costs of investing in other mutual funds. Per SEC requirements, the examples assume that you had a $1,000 investment in the Class at the beginning of the reporting period, May 1, 2006, and continued to hold your shares at the end of the reporting period, October 31, 2006.
Actual Expenses
For each Class of the Fund in the table below, the first line provides information about actual account values and actual expenses. You may use the information in this line, together with the amount you invested, to estimate the expenses that you paid over the period. Simply divide your account value by $1,000 (for example, an $8,600 account value divided by $1,000 = 8.6), then multiply the result by the number in the first line of each Class under the heading entitled “Expenses Paid During Period” to estimate the expenses you paid on your account during the period.
Hypothetical Example for Comparison Purposes
The second line of each Class in the table below provides information about hypothetical account values and hypothetical expenses based on the Class’ actual expense ratio and an assumed rate of return of 5% per year before expenses, which is not the Class’ actual return. The hypothetical account values and expenses may not be used to estimate the actual ending account balance or expenses you paid for the period. You may use this information to compare the ongoing costs of investing in the Class of the Fund and other funds. To do so, compare this 5% hypothetical example with the 5% hypothetical examples that appear in the shareholder reports of the other funds.
Please note that the expenses shown in the table are meant to highlight your ongoing costs only and do not reflect any transaction costs, such as sales charges (loads) or redemption fees. Therefore, the second line for each Class in the table is useful in comparing ongoing costs only, and will not help you determine the relative total costs of owning different funds. In addition, if these transaction costs were included, your costs would have been higher. The examples also assume all dividends and distributions have been reinvested.
Schedule of Shareholder Expenses
Expense Analysis of a $1,000 Investment
October 31, 2006
| | | | | | | | | | | | | | |
Gartmore Optimal Allocations:
Aggressive Fund | | | | | Beginning
Account Value,
5/1/06 | | Ending
Account Value,
10/31/06 | | Expenses Paid
During Period*2 | | Annualized
Expense Ratio*2 |
| Class A | | Actual | | | $ | 1,000.00 | | $ | 1,022.90 | | $ | 2.60 | | 0.51% |
| | | Hypothetical | 1 | | $ | 1,000.00 | | $ | 1,022.43 | | $ | 2.60 | | 0.51% |
| Class B | | Actual | | | $ | 1,000.00 | | $ | 1,019.00 | | $ | 6.36 | | 1.25% |
| | | Hypothetical | 1 | | $ | 1,000.00 | | $ | 1,018.70 | | $ | 6.38 | | 1.25% |
| Class C | | Actual | | | $ | 1,000.00 | | $ | 1,019.00 | | $ | 6.36 | | 1.25% |
| | | Hypothetical | 1 | | $ | 1,000.00 | | $ | 1,018.70 | | $ | 6.38 | | 1.25% |
| Class R | | Actual | | | $ | 1,000.00 | | $ | 1,021.30 | | $ | 4.43 | | 0.87% |
| | | Hypothetical | 1 | | $ | 1,000.00 | | $ | 1,020.61 | | $ | 4.44 | | 0.87% |
| Institutional Service Class | | Actual | | | $ | 1,000.00 | | $ | 1,024.60 | | $ | 1.43 | | 0.28% |
| | | Hypothetical | 1 | | $ | 1,000.00 | | $ | 1,023.59 | | $ | 1.43 | | 0.28% |
| Institutional Class | | Actual | | | $ | 1,000.00 | | $ | 1,024.50 | | $ | 1.79 | | 0.35% |
| | | Hypothetical | 1 | | $ | 1,000.00 | | $ | 1,023.24 | | $ | 1.79 | | 0.35% |
| * | Expenses are equal to the Fund’s annualized expense ratio multiplied by the average account value over the period multiplied by 184/365 (to reflect the one-half year period). The expense ratio presented represents a six-month, annualized ratio in accordance with SEC guidelines. |
| 1 | Represents the hypothetical 5% return before expenses. |
| 2 | Expenses are based on the direct expenses of the Fund and do not include the effect of the underlying Funds’ expenses, which are disclosed in the Fee and Expense table and described more fully in a footnote to that table in your Fund prospectus. |
| | |
Portfolio Summary | | Gartmore Optimal Allocations Fund: Aggressive |
October 31, 2006
The SEC adopted a requirement that Funds present their portfolio holdings in a table, chart or graph format in their annual and semiannual reports to shareholders, whether or not a statement of investments is utilized. The following tables, which present portfolio holdings as a percentage of net assets, are provided in compliance with this requirement.
| | |
| Asset Allocation | | |
| Mutual Funds | | 99.5% |
| Other assets in excess of liabilities | | 0.5% |
| | |
| | 100.0% |
| | |
| Asset Allocation Detail | | |
| Equity Funds | | 99.5% |
| Other Assets | | 0.5% |
| | |
| | 100.0% |
| | |
| Top Holdings | | |
Gartmore Global Financial Services Fund Institutional Class | | 16.0% |
Gartmore Nationwide Fund Institutional Class | | 14.9% |
Gartmore Global Health Sciences Fund Institutional Class | | 10.7% |
Gartmore Global Technology and Communications Fund Institutional Class | | 10.0% |
Gartmore U.S. Growth Leaders Fund Institutional Class | | 9.6% |
Gartmore Small Cap Fund Institutional Class | | 7.1% |
iShares Cohen & Steers Realty Majors Index Fund | | 6.0% |
Gartmore International Growth Fund Institutional Class | | 5.1% |
Gartmore Global Natural Resources Fund Institutional Class | | 5.1% |
Gartmore U.S. Growth Leaders Long-Short Fund Institutional Class | | 4.7% |
Other Assets | | 10.8% |
| | |
| | 100.00% |
Gartmore Optimal Allocations Fund: Aggressive
Statement of Investments
October 31, 2006
Mutual Funds (99.5%)
| | | | | |
| | | Shares | | Value |
Equity Funds (99.5%) | | | | | |
Gartmore Emerging Markets Fund,
Institutional Class (b) | | 25,549 | | $ | 463,457 |
Gartmore Global Financial Services Fund,
Institutional Class (b) | | 115,563 | | | 1,822,424 |
Gartmore Global Health Sciences Fund,
Institutional Class (b) | | 107,164 | | | 1,217,381 |
Gartmore Global Natural Resources Fund, Institutional Class (b) | | 28,606 | | | 583,852 |
Gartmore Global Technology and Communications Fund,
Institutional Class (b) | | 264,861 | | | 1,141,549 |
Gartmore Global Utilities Fund,
Institutional Class (b) | | 17,639 | | | 230,193 |
Gartmore International Growth Fund,
Institutional Class (b) | | 43,150 | | | 584,688 |
Gartmore Micro Cap Equity Fund,
Institutional Class (b) | | 18,492 | | | 449,179 |
Gartmore Nationwide Fund,
Institutional Class (b) | | 82,470 | | | 1,694,761 |
Gartmore Small Cap Fund,
Institutional Class (b) | | 37,231 | | | 809,036 |
Gartmore U.S. Growth Leaders Fund,
Institutional Class (b) | | 112,486 | | | 1,096,738 |
Gartmore U.S. Growth Leaders Long-Short Fund, Institutional Class (b) | | 52,214 | | | 539,890 |
iShares Cohen & Steers Realty Majors
Index Fund | | 6,925 | | | 677,611 |
| | | | | |
| | |
Total Mutual Funds | | | | | 11,310,759 |
| | | | | |
| |
Total Investments
(Cost $10,690,881) (a) — 99.5% | | | 11,310,759 |
| |
Other assets in excess of
liabilities — 0.5% | | | 59,303 |
| | | | | |
| | |
NET ASSETS — 100.0% | | | | $ | 11,370,062 |
| | | | | |
| | (a) | See notes to financial statements for tax unrealized appreciation (depreciation) of securities. |
| | (b) | Investment in affiliate. |
See notes to financial statements.
Gartmore Optimal Allocations Fund: Moderately Aggressive
Effective in April 2006, William H. Miller became the portfolio manager of the Fund and is responsible for the day-to-day management of the allocation of the Fund’s assets among the asset classes and underlying funds.
For the annual period ended Oct. 31, 2006, the Gartmore Optimal Allocations Fund: Moderately Aggressive (Class A at NAV) returned 15.79% versus 16.32% for its composite benchmark, which consists of 60% S&P 500® Index, 20% Morgan Stanley Capital International Europe, Australasia and Far East (MSCI EAFE®) Index and 20% Lehman Brothers U.S. Aggregate Index. For broader comparison, the average return for the Fund’s Lipper peer category of Mixed-Asset Target Allocation Growth Funds (consisting of 592 funds as of Oct. 31, 2006) was 12.47%.
The annual reporting period ended Oct. 31, 2006, began with a broad rally, aided in part by favorable seasonal factors. The U.S. market continued to edge higher during the first four months of 2006, but the buying lacked conviction. Several factors kept investors off balance, including continuing hikes in short-term interest rates by the Federal Reserve Board, uncertainty due to the passing of the torch at the Federal Reserve from Alan Greenspan to Ben Bernanke, and persistent strength in crude oil prices. On the positive side, U.S. economic growth bounced back to a robust annualized rate of 5.6% in the first quarter of 2006 after a relatively tepid 1.8% pace in the final quarter of 2005, when the economy was still reeling from a punishing hurricane season.
In May, stocks experienced a sharp correction. An uptick in inflation and yet another rate hike by the Fed—accompanied by tough talk suggesting that the central bank’s credit-tightening campaign might persist for longer than investors had been expecting—prompted widespread selling, particularly in areas that were perceived to have higher risk, such as small-capitalization stocks, technology and biotechnology. During the summer, inflation fears moderated and further evidence of economic slowing appeared, particularly in the housing and auto markets. In response, the Fed kept interest rates steady in August, September and October, which helped stocks finish the period with a respectable rally. A sharp drop in energy prices also boosted share prices near the end of the reporting period. Against this backdrop, the S&P 500 Index posted a 16.34% return for the year ended Oct. 31, 2006.
International stocks generally were stronger than their U.S. counterparts, in part because of weakness in the U.S. dollar versus a number of foreign currencies. Foreign share prices also benefited from more attractive valuations and better growth prospects than those of comparable U.S. investments. In developed markets, strong gains were seen in the United Kingdom, Sweden and Norway, among others. Emerging markets such as China and India offered particularly strong share price appreciation.
U.S. investment-grade bonds ended the period with mixed results. Rising short-term interest rates limited gains for fixed-income securities at the short end of the yield curve (a plotted graph line of the yields, or interest rates, on long-term and short-term maturity bonds). Longer-term bonds also faced an uphill battle, as yields for the group began the period at historically low levels.
The Fund is a diversified “fund of funds” designed to serve as a total asset allocation solution for an investor with a “moderately aggressive” risk profile. Its design was developed by Gartmore Funds with the assistance of its consultant, Ibbotson Associates Advisors, LLC, a leading asset allocation authority. The Fund invests in a diverse set of underlying funds with an allocation mix that has been designed to expand an average investor’s “efficient frontier”—the line on a risk-reward graph representing the most efficient combination of various asset classes to achieve the highest possible return for a given level of risk. In other words, by incorporating a combination of diverse asset classes that behave differently under various market conditions, we believe that it may be possible for the Fund to achieve higher risk-adjusted returns than those that could be achieved with a nondiversified portfolio.
The Fund’s allocations are reviewed quarterly by Ibbotson and Gartmore Funds, and are subject to change. Changes are implemented when an opportunity exists to enhance the overall diversification of the Fund and to actively manage the Fund’s risk-return profile. The Gartmore Convertible Fund was closed in late October 2006, and its 4% allocation within the Moderately Aggressive Fund was reallocated evenly between the Gartmore Nationwide Fund and the Gartmore Bond Fund. The Gartmore Optimal Allocations Fund: Moderately Aggressive is currently invested in a set of 15 underlying funds.
Gartmore Optimal Allocations Fund: Moderately Aggressive
Continued
| | | | |
Asset Classes and Underlying
Funds | | Target
Allocation
Ranges* | | 1-Year
Returns of
Underlying
Funds* |
| U.S. STOCKS | | 20% - 40% | | |
U.S. Large Cap | | 15% - 25% | | |
Gartmore Nationwide Fund | | | | 15.01% |
Gartmore U.S. Growth Leaders Fund | | | | 2.16% |
U.S. Small/Mid-Cap | | 5% - 15% | | |
Gartmore Small Cap Fund | | | | 31.52% |
Gartmore Mid Cap Growth Fund | | | | 13.80% |
| INTERNATIONAL STOCKS | | 5% - 15% | | |
Gartmore International Growth Fund | | | | 38.76% |
| BONDS and SHORT-TERM INVESTMENTS | | 15% - 25% | | |
Gartmore Bond Fund | | | | 5.45% |
Gartmore High Yield Bond Fund | | | | 10.05% |
| SPECIALTY ASSETS | | 40% - 60% | | |
Gartmore Global Financial Services Fund | | | | 24.19% |
Gartmore Global Health Sciences Fund | | | | 5.90% |
Gartmore U.S. Growth Leaders Long-Short Fund | | | | 5.60% |
Gartmore Global Technology and Communications Fund | | | | 13.72% |
Gartmore Global Natural Resources Fund | | | | 23.17% |
iShares Cohen & Steers Realty Majors Index Fund | | | | 41.25% |
Gartmore Global Utilities Fund | | | | 27.88% |
Gartmore Emerging Markets Fund | | | | 33.32% |
| * | Fund target allocation ranges and Institutional Share Class returns are as of Oct. 31, 2006. |
Among the underlying funds in the portfolio, those that contributed the least to the overall returns were the Gartmore U.S. Growth Leaders Fund and the Gartmore Bond Fund, which finished with returns of 2.16% and 5.45% on allocations of 8% and 15%, respectively. The Gartmore U.S. Growth Leaders Fund is a concentrated portfolio of U.S. stocks normally holding roughly 25 to 35 positions. Given its concentrated structure, this Fund’s returns tend to vary significantly from those of its benchmark, the S&P 500 Index, relative to more diversified funds. While it is our expectation that there will be some periods when the Gartmore U.S. Growth Leaders Fund strongly outperforms its benchmark, during much of the reporting period this Fund’s growth mandate was out of step with prevailing market sentiment.
Conversely, those underlying funds that contributed the most to overall returns were the Gartmore Global Financial Services Fund and the iShares Cohen & Steers Realty Majors Index Fund. The former had a 12% allocation that returned 24.19% and, the latter, a 5% allocation that returned 41.25% during the reporting period. Financial services stocks generally performed well during the reporting period as relatively low levels of interest rates helped stimulate healthy loan growth for banks and otherwise created a relatively benign credit environment globally. Despite extensive evidence of a slowing U.S. residential real estate market, real estate stocks benefited from relatively low global interest rates and strong demand for apartments and office buildings.
Looking ahead, we believe that the Fund’s allocation to multiple asset classes continues to position it well to deliver the potential for higher long-term returns versus those of its blended benchmark at a marginally higher risk level. The returns are expected to be derived from greater diversification achieved by allocating assets across underlying funds representing a broad range of asset classes that are not highly correlated.
Portfolio Manager:
William H. Miller
| | |
Fund Performance | | Gartmore Optimal Allocations Fund: Moderately Aggressive |
Average Annual Total Return
(For periods ended October 31, 2006)
| | | | | | |
| | | | | 1 Yr. | | Inception1 |
| Class A | | w/o SC2 | | 15.79% | | 13.08% |
| | | w/SC3 | | 9.17% | | 10.25% |
| Class B | | w/o SC2 | | 14.91% | | 12.22% |
| | | w/SC4 | | 9.91% | | 11.11% |
| Class C | | w/o SC2 | | 14.95% | | 12.20% |
| | | w/SC5 | | 13.95% | | 12.20% |
| Class R6 | | | | 15.55% | | 12.77% |
| Institutional Service Class6 | | 16.06% | | 13.29% |
| Institutional Class6 | | 16.05% | | 13.35% |
All figures showing the effect of a sales charge reflect the maximum charge possible, because it has the most dramatic effect on performance data.
| 1 | Fund commenced operations on June 29, 2004. |
| 2 | These returns do not reflect the effects of sales charges (SC). |
| 3 | A 5.75% front-end sales charge was deducted. |
| 4 | A 5.00% contingent deferred sales charge (CDSC) was deducted. The CDSC declines to 0% after 6 years. |
| 5 | A CDSC of 1.00% was deducted from the one year return because it is charged when you sell Class C shares within the first year after purchase. |
| 6 | Not subject to any sales charges. |
Performance of a $10,000 Investment
Investment return and principal value will fluctuate, and when redeemed, shares may be worth more or less than original cost. Past performance is no guarantee of future results and does not reflect the deduction of taxes that a shareholder would pay on fund distributions or the redemption of fund shares. Investing in mutual funds involves market risk, including loss of principal. Performance returns assume the reinvestment of all distributions.

Comparative performance of $10,000 invested in Class A shares of the Gartmore Optimal Allocations Fund: Moderately Aggressive, the Optimal Allocations Moderately Aggressive Composite Index (Composite)(a), S&P 500 Index (S&P 500)(b), Morgan Stanley Capital International Europe, Australasia, and Far East Index (MSCI EAFE)(c), Lehman Brothers Aggregate Bond Index (LB Aggregate Bond)(d), and the Consumer Price Index (CPI)(e) since inception. Unlike the Fund, the returns for these unmanaged indexes do not reflect any fees, expenses, or sales charges. Investors cannot invest directly in market indexes.
| (a) | The Optimal Allocation Moderately Aggressive Composite is an unmanaged, hypothetical representation of the performance of each of the Fund’s asset classes according to their respective weightings. The composite is a combination of the S&P 500 (60%), the MSCI EAFE (20%) and the LB Aggregate Bond (20%). |
| (b) | The S&P 500 is an unmanaged index of 500 widely held stocks of large U.S. companies that gives a broad look at how the stock prices of large U.S. companies have performed. |
| (c) | The MSCI EAFE is an unmanaged, market capitalization-weighted index that is designed to represent the performance of developed stock markets outside the United States and Canada. |
| (d) | The LB Aggregate Bond is an unmanaged, market value-weighted index of investment grade fixed-rate debt issues including government, corporate, asset-backed and mortgage-backed securities with maturities of one year or more. |
| (e) | The CPI represents changes in prices of a basket of goods and services purchased for consumption by urban households. |
| | |
Shareholder Expense Example | | Gartmore Optimal Allocations Fund: Moderately Aggressive |
As a shareholder of the Fund, you incur two types of costs: (1) transaction costs, including sales charges (loads) paid on purchase payments and redemption fees; and (2) ongoing costs, including investment advisory fees, administration fees, distribution fees and other Fund expenses. The examples below are intended to help you understand your ongoing costs (in dollars) of investing in the Fund and to compare these costs with the ongoing costs of investing in other mutual funds. Per SEC requirements, the examples assume that you had a $1,000 investment in the Class at the beginning of the reporting period, May 1, 2006, and continued to hold your shares at the end of the reporting period, October 31, 2006.
Actual Expenses
For each Class of the Fund in the table below, the first line provides information about actual account values and actual expenses. You may use the information in this line, together with the amount you invested, to estimate the expenses that you paid over the period. Simply divide your account value by $1,000 (for example, an $8,600 account value divided by $1,000 = 8.6), then multiply the result by the number in the first line of each Class under the heading entitled “Expenses Paid During Period” to estimate the expenses you paid on your account during the period.
Hypothetical Example for Comparison Purposes
The second line of each Class in the table below provides information about hypothetical account values and hypothetical expenses based on the Class’ actual expense ratio and an assumed rate of return of 5% per year before expenses, which is not the Class’ actual return. The hypothetical account values and expenses may not be used to estimate the actual ending account balance or expenses you paid for the period. You may use this information to compare the ongoing costs of investing in the Class of the Fund and other funds. To do so, compare this 5% hypothetical example with the 5% hypothetical examples that appear in the shareholder reports of the other funds.
Please note that the expenses shown in the table are meant to highlight your ongoing costs only and do not reflect any transaction costs, such as sales charges (loads) or redemption fees. Therefore, the second line for each Class in the table is useful in comparing ongoing costs only, and will not help you determine the relative total costs of owning different funds. In addition, if these transaction costs were included, your costs would have been higher. The examples also assume all dividends and distributions have been reinvested.
Schedule of Shareholder Expenses
Expense Analysis of a $1,000 Investment
October 31, 2006
| | | | | | | | | | | | | | |
Gartmore Optimal Allocations:
Moderately Aggressive Fund | | | | | Beginning
Account Value,
5/1/06 | | Ending
Account Value,
10/31/06 | | Expenses Paid
During Period*2 | | Annualized
Expense Ratio*2 |
| Class A | | Actual | | | $ | 1,000.00 | | $ | 1,030.20 | | $ | 2.66 | | 0.52% |
| | | Hypothetical | 1 | | $ | 1,000.00 | | $ | 1,022.38 | | $ | 2.65 | | 0.52% |
| Class B | | Actual | | | $ | 1,000.00 | | $ | 1,026.00 | | $ | 6.43 | | 1.26% |
| | | Hypothetical | 1 | | $ | 1,000.00 | | $ | 1,018.65 | | $ | 6.43 | | 1.26% |
| Class C | | Actual | | | $ | 1,000.00 | | $ | 1,026.20 | | $ | 6.43 | | 1.26% |
| | | Hypothetical | 1 | | $ | 1,000.00 | | $ | 1,018.65 | | $ | 6.43 | | 1.26% |
| Class R | | Actual | | | $ | 1,000.00 | | $ | 1,028.30 | | $ | 4.45 | | 0.87% |
| | | Hypothetical | 1 | | $ | 1,000.00 | | $ | 1,020.61 | | $ | 4.44 | | 0.87% |
| Institutional Service Class | | Actual | | | $ | 1,000.00 | | $ | 1,031.40 | | $ | 1.43 | | 0.28% |
| | | Hypothetical | 1 | | $ | 1,000.00 | | $ | 1,023.59 | | $ | 1.43 | | 0.28% |
| Institutional Class | | Actual | | | $ | 1,000.00 | | $ | 1,030.50 | | $ | 1.74 | | 0.34% |
| | | Hypothetical | 1 | | $ | 1,000.00 | | $ | 1,023.29 | | $ | 1.74 | | 0.34% |
| * | Expenses are equal to the Fund’s annualized expense ratio multiplied by the average account value over the period multiplied by 184/365 (to reflect the one-half year period). The expense ratio presented represents a six-month, annualized ratio in accordance with SEC guidelines. |
| 1 | Represents the hypothetical 5% return before expenses. |
| 2 | Expenses are based on the direct expenses of the Fund and do not include the effect of the underlying Funds’ expenses, which are disclosed in the Fee and Expense table and described more fully in a footnote to that table in your Fund prospectus. |
| | |
Portfolio Summary | | Gartmore Optimal Allocations Fund: Moderately Aggressive |
The SEC adopted a requirement that Funds present their portfolio holdings in a table, chart or graph format in their annual and semiannual reports to shareholders, whether or not a statement of investments is utilized. The following tables, which present portfolio holdings as a percentage of net assets, are provided in compliance with this requirement.
| | |
| Asset Allocation | | |
| Mutual Funds | | 99.6% |
| Other assets in excess of liabilities | | 0.4% |
| | |
| | 100.0% |
| | |
| Asset Allocation Detail | | |
| Equity Funds | | 82.0% |
| Fixed-Income Funds | | 17.6% |
| Other Assets | | 0.4% |
| | |
| | 100.0% |
| | |
| Top Holdings | | |
Gartmore Bond Fund Institutional Class | | 14.7% |
Gartmore Nationwide Fund Institutional Class | | 14.0% |
Gartmore Global Financial Services Fund Institutional Class | | 12.0% |
Gartmore U.S. Growth Leaders Fund Institutional Class | | 7.7% |
Gartmore Global Health Sciences Fund Institutional Class | | 6.8% |
Gartmore Small Cap Fund Institutional Class | | 6.1% |
Gartmore U.S. Growth Leaders Long-Short Fund Institutional Class | | 5.7% |
Gartmore International Growth Fund Institutional Class | | 5.2% |
Gartmore Global Natural Resources Fund Institutional Class | | 5.2% |
iShares Cohen & Steers Realty Majors Index Fund | | 5.1% |
Other Assets | | 17.5% |
| | |
| | 100.0% |
Statement of Investments
October 31, 2006
Gartmore Optimal Allocations Fund: Moderately Aggressive
Mutual Funds (99.6%)
| | | | | |
| | | Shares | | Value |
Equity Funds (82.0%) | | | | | |
Gartmore Emerging Markets Fund,
Institutional Class (b) | | 49,868 | | $ | 904,613 |
Gartmore Global Financial Services Fund,
Institutional Class (b) | | 223,911 | | | 3,531,072 |
Gartmore Global Health Sciences Fund,
Institutional Class (b) | | 177,389 | | | 2,015,142 |
Gartmore Global Natural Resources Fund, Institutional Class (b) | | 74,444 | | | 1,519,400 |
Gartmore Global Technology and Communications Fund,
Institutional Class (b) | | 344,640 | | | 1,485,398 |
Gartmore Global Utilities Fund,
Institutional Class (b) | | 68,859 | | | 898,614 |
Gartmore International Growth Fund,
Institutional Class (b) | | 112,337 | | | 1,522,169 |
Gartmore Mid Cap Growth Fund,
Institutional Class (b) | | 52,050 | | | 881,198 |
Gartmore Nationwide Fund,
Institutional Class (b) | | 200,303 | | | 4,116,232 |
Gartmore Small Cap Fund,
Institutional Class (b) | | 83,064 | | | 1,804,981 |
Gartmore U.S. Growth Leaders Fund,
Institutional Class (b) | | 234,066 | | | 2,282,142 |
Gartmore U.S. Growth Leaders Long-Short Fund, Institutional Class (b) | | 162,931 | | | 1,684,704 |
iShares Cohen & Steers Realty Majors Index Fund | | 15,414 | | | 1,508,260 |
| | | | | |
| | | | | 24,153,925 |
| | | | | |
Fixed Income Funds (17.6%) | | | | | |
Gartmore Bond Fund,
Institutional Class (b) | | 450,154 | | | 4,316,977 |
Gartmore High Yield Bond Fund, Institutional Class (b) | | 125,409 | | | 871,593 |
| | | | | |
| | | | | 5,188,570 |
| | | | | |
| | |
Total Mutual Funds | | | | | 29,342,495 |
| | | | | |
| | | | | |
| | | | | |
Total Investments
(Cost $27,813,193) (a) — 99.6% | | $ | 29,342,495 |
| |
Other assets in excess of
liabilities — 0.4% | | | 108,507 |
| | | | | |
| | |
NET ASSETS — 100.0% | | | | $ | 29,451,002 |
| | | | | |
| | (a) | See notes to financial statements for tax unrealized appreciation (depreciation) of securities. |
| | (b) | Investment in affiliate. |
See notes to financial statements.
Gartmore Optimal Allocations Fund: Moderate
Effective in April 2006, William H. Miller became the portfolio manager of the Fund and is responsible for the day-to-day management of the allocation of the Fund’s assets among the asset classes and underlying funds.
For the annual period ended Oct. 31, 2006, the Gartmore Optimal Allocations Fund: Moderate (Class A at NAV) returned 13.38% versus 14.02% for its composite benchmark, which consists of 40% S&P 500® Index, 20% Morgan Stanley Capital International Europe, Australasia and Far East (MSCI EAFE®) Index and 40% Lehman Brothers U.S. Aggregate Index. For broader comparison, the average return for the Fund’s Lipper peer category of Mixed-Asset Target Allocation Moderate Funds (consisting of 414 funds as of Oct. 31, 2006) was 11.45%.
The annual reporting period ended Oct. 31, 2006, began with a broad rally, aided in part by favorable seasonal factors. The U.S. market continued to edge higher during the first four months of 2006, but the buying lacked conviction. Several factors kept investors off balance, including continuing hikes in short-term interest rates by the Federal Reserve Board, uncertainty due to the passing of the torch at the Federal Reserve from Alan Greenspan to Ben Bernanke, and persistent strength in crude oil prices. On the positive side, U.S. economic growth bounced back to a robust annualized rate of 5.6% in the first quarter of 2006 after a relatively tepid 1.8% pace in the final quarter of 2005, when the economy was still reeling from a punishing hurricane season.
In May, stocks experienced a sharp correction. An uptick in inflation and yet another rate hike by the Fed—accompanied by tough talk suggesting that the central bank’s credit-tightening campaign might persist for longer than investors had been expecting—prompted widespread selling, particularly in areas that were perceived to have higher risk, such as small-capitalization stocks, technology and biotechnology. During the summer, inflation fears moderated and further evidence of economic slowing appeared, particularly in the housing and auto markets. In response, the Fed kept interest rates steady in August, September and October, which helped stocks finish the period with a respectable rally. A sharp drop in energy prices also boosted share prices near the end of the reporting period. Against this backdrop, the S&P 500 Index posted a 16.34% return for the year ended Oct. 31, 2006.
International stocks generally were stronger than their U.S. counterparts, in part because of weakness in the U.S. dollar versus a number of foreign currencies. Foreign share prices also benefited from more attractive valuations and better growth prospects than those of comparable U.S. investments. In developed markets, strong gains were seen in the United Kingdom, Sweden and Norway, among others. Emerging markets such as China and India offered particularly strong share price appreciation.
U.S. investment-grade bonds ended the period with mixed results. Rising short-term interest rates limited gains for fixed-income securities at the short end of the yield curve (a plotted graph line of the yields, or interest rates, on long-term and short-term maturity bonds). Longer-term bonds also faced an uphill battle, as yields for the group began the period at historically low levels.
The Fund is a diversified “fund of funds” designed to serve as a total asset allocation solution for an investor with a “moderate” risk profile. Its design was developed by Gartmore Funds with the assistance of its consultant, Ibbotson Associates Advisors, LLC, a leading asset allocation authority. The Fund invests in a diverse set of underlying funds with an allocation mix that has been designed to expand an average investor’s “efficient frontier”—the line on a risk-reward graph representing the most efficient combination of various asset classes to achieve the highest possible return for a given level of risk. In other words, by incorporating a combination of diverse asset classes that behave differently under various market conditions, we believe that it may be possible for the Fund to achieve higher risk-adjusted returns than those that could be achieved with a nondiversified portfolio over the long term.
The Fund’s allocations are reviewed quarterly by Ibbotson and Gartmore Funds, and are subject to change. Changes are implemented when an opportunity exists to enhance the overall diversification of the Fund and to actively manage the Fund’s risk-return profile. The Gartmore Convertible Fund was closed in late October 2006, and its 6% allocation within the Moderate Fund was reallocated evenly between the Gartmore Nationwide Fund and the Gartmore Bond Fund. The Gartmore Optimal Allocations Fund: Moderate is currently invested in a set of 16 underlying funds.
Gartmore Optimal Allocations Fund: Moderate
Continued
| | | | |
| Asset Classes and Underlying Funds | | Target
Allocation
Ranges* | | 1-Year
Returns of
Underlying
Funds* |
| U.S. STOCKS | | 15% - 30% | | |
U.S. Large Cap | | 10% - 20% | | |
Gartmore Nationwide Fund | | | | 15.01% |
Gartmore U.S. Growth Leaders Fund | | | | 2.16% |
U.S. Small/Mid-Cap | | 5% - 20% | | |
Gartmore Mid Cap Growth Fund | | | | 13.80% |
Gartmore Small Cap Fund | | | | 31.52% |
| INTERNATIONAL STOCKS | | 5% - 10% | | |
Gartmore International Growth Fund | | | | 38.76% |
| BONDS and SHORT-TERM INVESTMENTS | | 25% - 35% | | |
Gartmore Bond Fund | | | | 5.45% |
Gartmore High Yield Bond Fund | | | | 10.05% |
Gartmore Money Market Fund | | | | 4.40% |
Gartmore Short Duration Bond Fund | | | | 4.13% |
| SPECIALTY ASSETS | | 30% - 50% | | |
Gartmore Global Financial Services Fund | | | | 24.19% |
Gartmore U.S. Growth Leaders Long-Short Fund | | | | 5.60% |
iShares Cohen & Steers Realty Majors Index Fund | | | | 41.25% |
Gartmore Global Natural Resources Fund | | | | 23.17% |
Gartmore Global Utilities Fund | | | | 27.88% |
Gartmore Global Health Sciences Fund | | | | 5.90% |
Gartmore Global Technology and Communications Fund | | | | 13.72% |
| * | Fund target allocation ranges and Institutional Share Class returns are as of Oct. 31, 2006. |
Among the underlying funds in the portfolio, those that contributed the least to the overall returns were the Gartmore U.S. Growth Leaders Fund and the Gartmore Short Duration Bond Fund, which finished with returns of 2.16% and 4.11%, respectively. The Gartmore U.S. Growth Leaders Fund is a concentrated portfolio of U.S. stocks normally holding roughly 25 to 35 positions. Given its concentrated structure, this Fund’s returns tend to vary significantly from those of its benchmark, the S&P 500 Index, relative to more diversified funds. While it is our expectation that there will be some periods when the Gartmore U.S. Growth Leaders Fund strongly outperforms its benchmark, during much of the reporting period this Fund’s growth mandate was out of step with prevailing market sentiment. Though the return for the Gartmore Short Duration Bond Fund was low relative to that of the other underlying funds, it only slightly underperformed its benchmark, the Merrill Lynch 1-3 Year Treasury Index, by 0.04% during the reporting period.
Conversely, those underlying funds that contributed the most to overall returns were the iShares Cohen & Steers Realty Majors Index Fund and the Gartmore International Growth Fund, which had identical 5% allocations and which returned 41.25% and 38.76%, respectively, for the reporting period. Despite extensive evidence of a slowing U.S. residential real estate market, real estate stocks benefited from relatively low global interest rates and strong demand for apartments and office buildings. Strong stock selection—particularly in Canada, Japan and the United Kingdom—lay behind the Gartmore International Growth Fund’s solid performance.
Looking ahead, we believe that the Fund’s allocation to multiple asset classes continues to position it well to deliver the potential for higher long-term returns versus those of its blended benchmark at a marginally higher risk level. The returns are expected to be derived from greater diversification achieved by allocating assets across underlying funds representing a broad range of asset classes that are not highly correlated.
Portfolio Manager:
William H. Miller
| | |
Fund Performance | | Gartmore Optimal Allocation Fund: Moderate |
Average Annual Total Return
(For periods ended October 31, 2006)
| | | | | | |
| | | | | 1 Yr. | | Inception1 |
| Class A | | w/o SC2 | | 13.38% | | 11.57% |
| | | w/SC3 | | 6.90% | | 8.78% |
| Class B | | w/o SC2 | | 12.59% | | 10.41% |
| | | w/SC4 | | 7.59% | | 9.28% |
| Class C | | w/o SC2 | | 12.59% | | 10.57% |
| | | w/SC5 | | 11.59% | | 10.57% |
| Class R6 | | | | 13.15% | | 11.04% |
| Institutional Service Class6 | | 13.64% | | 11.58% |
| Institutional Class6 | | 13.74% | | 11.68% |
All figures showing the effect of a sales charge reflect the maximum charge possible, because it has the most dramatic effect on performance data.
| 1 | Fund commenced operations on June 29, 2004. |
| 2 | These returns do not reflect the effects of sales charges (SC). |
| 3 | A 5.75% front-end sales charge was deducted. |
| 4 | A 5.00% contingent deferred sales charge (CDSC) was deducted. The CDSC declines to 0% after 6 years. |
| 5 | A CDSC of 1.00% was deducted from the one year return because it is charged when you sell Class C shares within the first year after purchase. |
| 6 | Not subject to any sales charges. |
Performance of a $10,000 Investment
Investment return and principal value will fluctuate, and when redeemed, shares may be worth more or less than original cost. Past performance is no guarantee of future results and does not reflect the deduction of taxes that a shareholder would pay on fund distributions or the redemption of fund shares. Investing in mutual funds involves market risk, including loss of principal. Performance returns assume the reinvestment of all distributions.
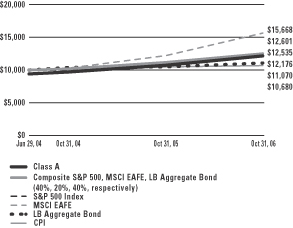
Comparative performance of $10,000 invested in Class A shares of the Gartmore Optimal Allocations Fund: Moderate, the Optimal Allocations Moderate Composite Index (Composite)(a), S&P 500 Index (S&P 500)(b), Morgan Stanley Capital International Europe, Australasia, and Far East Index (MSCI EAFE)(c), Lehman Brothers Aggregate Bond Index (LB Aggregate Bond)(d), and the Consumer Price Index (CPI)(e) since inception. Unlike the Fund, the returns for these unmanaged indexes do not reflect any fees, expenses, or sales charges. Investors cannot invest directly in market indexes.
| (a) | The Optimal Allocation Moderate Composite is an unmanaged, hypothetical representation of the performance of each of the Fund’s asset classes according to their respective weightings. The composite is a combination of the S&P 500 (40%), the MSCI EAFE (20%) and the LB Aggregate Bond (40%). |
| (b) | The S&P 500 is an unmanaged index of 500 widely held stocks of large U.S. companies that gives a broad look at how the stock prices of large U.S. companies have performed. |
| (c) | The MSCI EAFE is an unmanaged, market capitalization-weighted index that is designed to represent the performance of developed stock markets outside the United States and Canada. |
| (d) | The LB Aggregate Bond is an unmanaged, market value-weighted index of investment grade fixed-rate debt issues including government, corporate, asset-backed and mortgage-backed securities with maturities of one year or more. |
| (e) | The CPI represents changes in prices of a basket of goods and services purchased for consumption by urban households. |
| | |
Shareholder Expense Example | | Gartmore Optimal Allocations Fund: Moderate |
As a shareholder of the Fund, you incur two types of costs: (1) transaction costs, including sales charges (loads) paid on purchase payments and redemption fees; and (2) ongoing costs, including investment advisory fees, administration fees, distribution fees and other Fund expenses. The examples below are intended to help you understand your ongoing costs (in dollars) of investing in the Fund and to compare these costs with the ongoing costs of investing in other mutual funds. Per SEC requirements, the examples assume that you had a $1,000 investment in the Class at the beginning of the reporting period, May 1, 2006, and continued to hold your shares at the end of the reporting period, October 31, 2006.
Actual Expenses
For each Class of the Fund in the table below, the first line provides information about actual account values and actual expenses. You may use the information in this line, together with the amount you invested, to estimate the expenses that you paid over the period. Simply divide your account value by $1,000 (for example, an $8,600 account value divided by $1,000 = 8.6), then multiply the result by the number in the first line of each Class under the heading entitled “Expenses Paid During Period” to estimate the expenses you paid on your account during the period.
Hypothetical Example for Comparison Purposes
The second line of each Class in the table below provides information about hypothetical account values and hypothetical expenses based on the Class’ actual expense ratio and an assumed rate of return of 5% per year before expenses, which is not the Class’ actual return. The hypothetical account values and expenses may not be used to estimate the actual ending account balance or expenses you paid for the period. You may use this information to compare the ongoing costs of investing in the Class of the Fund and other funds. To do so, compare this 5% hypothetical example with the 5% hypothetical examples that appear in the shareholder reports of the other funds.
Please note that the expenses shown in the table are meant to highlight your ongoing costs only and do not reflect any transaction costs, such as sales charges (loads) or redemption fees. Therefore, the second line for each Class in the table is useful in comparing ongoing costs only, and will not help you determine the relative total costs of owning different funds. In addition, if these transaction costs were included, your costs would have been higher. The examples also assume all dividends and distributions have been reinvested.
Schedule of Shareholder Expenses
Expense Analysis of a $1,000 Investment
October 31, 2006
| | | | | | | | | | | | | | |
Gartmore Optimal Allocations:
Moderate Fund | | | | | Beginning
Account Value,
5/1/06 | | Ending
Account Value,
10/31/06 | | Expenses Paid
During Period*2 | | Annualized
Expense Ratio*2 |
| Class A | | Actual | | | $ | 1,000.00 | | $ | 1,036.70 | | $ | 2.67 | | 0.52% |
| | | Hypothetical | 1 | | $ | 1,000.00 | | $ | 1,022.38 | | $ | 2.65 | | 0.52% |
| Class B | | Actual | | | $ | 1,000.00 | | $ | 1,032.50 | | $ | 6.45 | | 1.26% |
| | | Hypothetical | 1 | | $ | 1,000.00 | | $ | 1,018.65 | | $ | 6.43 | | 1.26% |
| Class C | | Actual | | | $ | 1,000.00 | | $ | 1,033.00 | | $ | 6.46 | | 1.26% |
| | | Hypothetical | 1 | | $ | 1,000.00 | | $ | 1,018.65 | | $ | 6.43 | | 1.26% |
| Class R | | Actual | | | $ | 1,000.00 | | $ | 1,034.90 | | $ | 4.41 | | 0.86% |
| | | Hypothetical | 1 | | $ | 1,000.00 | | $ | 1,020.66 | | $ | 4.39 | | 0.86% |
| Institutional Service Class | | Actual | | | $ | 1,000.00 | | $ | 1,038.10 | | $ | 1.49 | | 0.29% |
| | | Hypothetical | 1 | | $ | 1,000.00 | | $ | 1,023.54 | | $ | 1.48 | | 0.29% |
| Institutional Class | | Actual | | | $ | 1,000.00 | | $ | 1,038.00 | | $ | 1.80 | | 0.35% |
| | | Hypothetical | 1 | | $ | 1,000.00 | | $ | 1,023.24 | | $ | 1.79 | | 0.35% |
| * | Expenses are equal to the Fund’s annualized expense ratio multiplied by the average account value over the period multiplied by 184/365 (to reflect the one-half year period). The expense ratio presented represents a six-month, annualized ratio in accordance with SEC guidelines. |
| 1 | Represents the hypothetical 5% return before expenses. |
| 2 | Expenses are based on the direct expenses of the Fund and do not include the effect of the underlying Funds’ expenses, which are disclosed in the Fee and Expense table and described more fully in a footnote to that table in your Fund prospectus. |
| | |
Portfolio Summary | | Gartmore Optimal Allocations Fund: Moderate |
The SEC adopted a requirement that Funds present their portfolio holdings in a table, chart or graph format in their annual and semiannual reports to shareholders, whether or not a statement of investments is utilized. The following tables, which present portfolio holdings as a percentage of net assets, are provided in compliance with this requirement.
| | |
| Asset Allocation | | |
| Mutual Funds | | 99.4% |
| Other assets in excess of liabilities | | 0.6% |
| | |
| | 100.0% |
| | |
| Asset Allocation Detail | | |
| Equity Funds | | 64.4% |
| Fixed-Income Funds | | 32.1% |
| Money Market Funds | | 2.9% |
| Other Assets | | 0.6% |
| | |
| | 100% |
| | |
| Top Holdings | | |
Gartmore Bond Fund Institutional Class | | 25.2% |
Gartmore Nationwide Fund Institutional Class | | 14.0% |
Gartmore Global Financial Services Fund Institutional Class | | 8.0% |
Gartmore U.S. Growth Leaders Long-Short Fund Institutional Class | | 6.7% |
iShares Cohen & Steers Realty Majors Index Fund | | 5.3% |
Gartmore International Growth Fund Institutional Class | | 5.2% |
Gartmore Global Natural Resources Fund Institutional Class | | 5.2% |
Gartmore High Yield Bond Fund Institutional Class | | 4.9% |
Gartmore Global Utilities Fund Institutional Class | | 4.1% |
Gartmore Mid Cap Growth Fund Institutional Class | | 4.0% |
Other Assets | | 17.4% |
| | |
| | 100.0% |
Statement of Investments
October 31, 2006
Gartmore Optimal Allocations Fund: Moderate
Mutual Funds (99.4%)
| | | | | |
| | | Shares | | Value |
| | | | | |
Equity Funds (64.4%) | | | | | |
Gartmore Global Financial Services Fund, Institutional Class (b) | | 159,406 | | $ | 2,513,827 |
Gartmore Global Health Sciences Fund, Institutional Class (b) | | 108,651 | | | 1,234,277 |
Gartmore Global Natural Resources Fund, Institutional Class (b) | | 79,890 | | | 1,630,564 |
Gartmore Global Technology and Communications Fund,
Institutional Class (b) | | 147,819 | | | 637,101 |
Gartmore Global Utilities Fund, Institutional Class (b) | | 98,482 | | | 1,285,190 |
Gartmore International Growth Fund, Institutional Class (b) | | 120,561 | | | 1,633,598 |
Gartmore Mid Cap Growth Fund, Institutional Class (b) | | 74,406 | | | 1,259,686 |
Gartmore Nationwide Fund,
Institutional Class (b) | | 214,832 | | | 4,414,788 |
Gartmore Small Cap Fund,
Institutional Class (b) | | 29,708 | | | 645,563 |
Gartmore U.S. Growth Leaders Fund, Institutional Class (b) | | 125,364 | | | 1,222,304 |
Gartmore U.S. Growth Leaders Long-Short Fund, Institutional Class (b) | | 203,418 | | | 2,103,339 |
iShares Cohen & Steers Realty Majors Index Fund | | 17,082 | | | 1,671,474 |
| | | | | |
| | | | | 20,251,711 |
| | | | | |
Fixed Income Funds (32.1%) | | | | | |
Gartmore Bond Fund,
Institutional Class (b) | | 825,404 | | | 7,915,624 |
Gartmore High Yield Bond Fund, Institutional Class (b) | | 224,021 | | | 1,556,946 |
Gartmore Short Duration Bond Fund, Institutional Class (b) | | 62,263 | | | 614,536 |
| | | | | |
| | | | | 10,087,106 |
| | | | | |
| | | | | |
| | | Shares | | Value |
Money Market Funds (2.9%) | | | | | |
Gartmore Money Market Fund, Institutional Class (b) | | 923,045 | | $ | 923,045 |
| | | | | |
| | |
Total Mutual Funds | | | | | 31,261,862 |
| | | | | |
| |
Total Investments
(Cost $29,733,971) (a) — 99.4% | | | 31,261,862 |
| |
Other assets in excess of
liabilities — 0.6% | | | 196,258 |
| | | | | |
| | |
NET ASSETS — 100.0% | | | | $ | 31,458,120 |
| | | | | |
| | (a) | See notes to financial statements for tax unrealized appreciation (depreciation) of securities. |
| | (b) | Investment in affiliate. |
See notes to financial statements.
Gartmore Optimal Allocations Fund: Specialty
Effective in April 2006, William H. Miller became the portfolio manager of the Fund and is responsible for the day-to-day management of the allocation of the Fund’s assets among the asset classes and underlying funds.
For the annual period ended Oct. 31, 2006, the Gartmore Optimal Allocations Fund: Specialty (Class A at NAV) returned 20.48% versus 19.80% for its composite benchmark, which consists of 70% S&P 500® Index and 30% Morgan Stanley Capital International Europe, Australasia and Far East (MSCI EAFE®) Index. For broader comparison, the average return for the Fund’s Lipper peer category of Specialty/Miscellaneous Funds (consisting of 104 funds as of Oct. 31, 2006) was 16.47%.
The annual reporting period ended Oct. 31, 2006, began with a broad rally, aided in part by favorable seasonal factors. The U.S. market continued to edge higher during the first four months of 2006, but the buying lacked conviction. Several factors kept investors off balance, including continuing hikes in short-term interest rates by the Federal Reserve Board, uncertainty due to the passing of the torch at the Federal Reserve from Alan Greenspan to Ben Bernanke, and persistent strength in crude oil prices. On the positive side, U.S. economic growth bounced back to a robust annualized rate of 5.6% in the first quarter of 2006 after a relatively tepid 1.8% pace in the final quarter of 2005, when the economy was still reeling from a punishing hurricane season.
In May, stocks experienced a sharp correction. An uptick in inflation and yet another rate hike by the Fed—accompanied by tough talk suggesting that the central bank’s credit-tightening campaign might persist for longer than investors had been expecting—prompted widespread selling, particularly in areas that were perceived to have higher risk, such as small-capitalization stocks, technology and biotechnology. During the summer, inflation fears moderated and further evidence of economic slowing appeared, particularly in the housing and auto markets. In response, the Fed kept interest rates steady in August, September and October, which helped stocks finish the period with a respectable rally. A sharp drop in energy prices also boosted share prices near the end of the reporting period. Against this backdrop, the S&P 500 Index posted a 16.34% return for the year ended Oct. 31, 2006.
International stocks generally were stronger than their U.S. counterparts, in part because of weakness in the U.S. dollar versus a number of foreign currencies. Foreign share prices also benefited from more attractive valuations and better growth prospects than those of comparable U.S. investments. In developed markets, strong gains were seen in the United Kingdom, Sweden and Norway, among others. Emerging markets such as China and India offered particularly strong share price appreciation.
U.S. investment-grade bonds ended the period with mixed results. Rising short-term interest rates limited gains for fixed-income securities at the short end of the yield curve (a plotted graph line of the yields, or interest rates, on long-term and short-term maturity bonds). Longer-term bonds also faced an uphill battle, as yields for the group began the period at historically low levels.
The Fund is a diversified “fund of funds” designed to serve as a total asset allocation solution for an investor with an “aggressive” risk profile or as a potential alpha-enhancing supplement to an investor’s core portfolio. Its design was developed by Gartmore Funds with the assistance of its consultant, Ibbotson Associates Advisors, LLC, a leading asset allocation authority. The Fund invests in a diverse set of underlying funds with an allocation mix that has been designed to expand an average investor’s “efficient frontier”—the line on a risk-reward graph representing the most efficient combination of various asset classes to achieve the highest possible return for a given level of risk. In other words, by incorporating a combination of diverse asset classes that behave differently under various market conditions, we believe that it may be possible for the Fund to achieve higher risk-adjusted returns than those that could be achieved with a nondiversified portfolio over the long term.
The Fund’s allocations are reviewed quarterly by Ibbotson and Gartmore Funds, and are subject to change. Changes are implemented when an opportunity exists to enhance the overall diversification of the Fund and to actively manage the Fund’s risk-return profile. That said, during the reporting period no changes were made in the lineup of underlying funds held by the Fund. The Gartmore Optimal Allocations Fund: Specialty is currently invested in a set of nine underlying funds.
Gartmore Optimal Allocations Fund: Specialty
Continued
| | | | |
| Asset Class and Underlying Funds | | Target
Allocation
Ranges* | | 1-Year
Returns of
Underlying
Funds* |
| SPECIALTY ASSETS | | 100% | | |
Gartmore Global Financial Services Fund | | | | 24.19% |
Gartmore Emerging Markets Fund | | | | 33.32% |
Gartmore Global Health Sciences Fund | | | | 5.90% |
Gartmore U.S. Growth Leaders Long-Short Fund | | | | 5.60% |
Gartmore Micro Cap Equity Fund | | | | 19.56% |
iShares Cohen & Steers Realty Majors Index Fund | | | | 41.25% |
Gartmore Global Technology and Communications Fund | | | | 13.72% |
Gartmore Global Natural Resources Fund | | | | 23.17% |
Gartmore Global Utilities Fund | | | | 27.88% |
| * | Fund target allocation ranges and Institutional Share Class returns are as of Oct. 31, 2006. |
Among the underlying funds in the portfolio, those which contributed the most to overall returns were the Gartmore Global Financial Services Fund and the Gartmore Emerging Markets Fund. The former had a 19% allocation that returned 24.19%, and the latter, a 14% allocation that returned 33.32% during the reporting period. Financial services stocks generally performed well during the reporting period as relatively low levels of interest rates helped stimulate healthy loan growth for banks and otherwise created a relatively benign credit environment globally. Throughout most of the reporting period, emerging equity markets outperformed on the global stage, underpinned by robust global growth and rising commodity prices.
Conversely, those underlying funds that contributed the least to overall returns were the Gartmore U.S. Growth Leaders Long-Short Fund and the Gartmore Global Health Sciences Fund, which finished with returns of 5.60% and 5.90% on allocations of 12% and 13%, respectively. The Gartmore U.S. Growth Leaders Long-Short Fund is an absolute-return product, and it finished modestly ahead of its benchmark, 3-month Treasury bills. The Gartmore Global Health Sciences Fund underperformed its benchmark, the Goldman Sachs Healthcare Index, by 3.57% due to unfavorable stock selection in biotechnology as well as in health-care equipment and supplies.
Looking ahead, we believe that the Fund’s allocation to multiple asset classes continues to position it well to deliver the potential for higher long-term returns versus those of its blended benchmark at a marginally higher risk level. The returns are expected to be derived from greater diversification achieved by allocating assets across underlying funds representing a broad range of asset classes that are not highly correlated.
Portfolio Manager:
William H. Miller
| | |
Fund Performance | | Gartmore Optimal Allocation Fund: Specialty |
Average Annual Total Return
(For periods ended October 31, 2006)
| | | | | | |
| | | | | 1 Yr. | | Inception1 |
| Class A | | w/o SC2 | | 20.48% | | 16.43% |
| | | w/SC3 | | 13.59% | | 13.52% |
| Class B | | w/o SC2 | | 19.67% | | 15.60% |
| | | w/SC4 | | 14.67% | | 14.54% |
| Class C | | w/o SC2 | | 19.59% | | 15.57% |
| | | w/SC5 | | 18.59% | | 15.57% |
| Class R6 | | | | 20.23% | | 16.13% |
| Institutional Service Class6 | | 20.63% | | 16.64% |
| Institutional Class6 | | 20.84% | | 16.79% |
All figures showing the effect of a sales charge reflect the maximum charge possible, because it has the most dramatic effect on performance data.
| 1 | Fund commenced operations on June 29, 2004. |
| 2 | These returns do not reflect the effects of sales charges (SC). |
| 3 | A 5.75% front-end sales charge was deducted. |
| 4 | A 5.00% contingent deferred sales charge (CDSC) was deducted. The CDSC declines to 0% after 6 years. |
| 5 | A CDSC of 1.00% was deducted from the one year return because it is charged when you sell Class C shares within the first year after purchase. |
| 6 | Not subject to any sales charges. |
Performance of a $10,000 Investment
Investment return and principal value will fluctuate, and when redeemed, shares may be worth more or less than original cost. Past performance is no guarantee of future results and does not reflect the deduction of taxes that a shareholder would pay on fund distributions or the redemption of fund shares. Investing in mutual funds involves market risk, including loss of principal. Performance returns assume the reinvestment of all distributions.
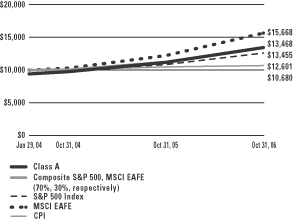
Comparative performance of $10,000 invested in Class A shares of the Gartmore Optimal Allocations Fund: Specialty, the Optimal Allocations Specialty Composite Index (Composite)(a), S&P 500 Index (S&P 500)(b), Morgan Stanley Capital International Europe, Australasia, and Far East Index (MSCI EAFE)(c), and the Consumer Price Index (CPI)(d) since inception. Unlike the Fund, the returns for these unmanaged indexes do not reflect any fees, expenses, or sales charges. Investors cannot invest directly in market indexes.
| (a) | The Optimal Allocation Specialty Composite is an unmanaged, hypothetical representation of the performance of each of the Fund’s asset classes according to their respective weightings. The composite is a combination of the S&P 500 (70%) and the MSCI EAFE (30%). |
| (b) | The S&P 500 is an unmanaged index of 500 widely held stocks of large U.S. companies that gives a broad look at how the stock prices of large U.S. companies have performed. |
| (c) | The MSCI EAFE is an unmanaged, market capitalization-weighted index that is designed to represent the performance of developed stock markets outside the United States and Canada. |
| (d) | The CPI represents changes in prices of a basket of goods and services purchased for consumption by urban households. |
| | |
Shareholder Expense Example | | Gartmore Optimal Allocations Fund: Specialty |
As a shareholder of the Fund, you incur two types of costs: (1) transaction costs, including sales charges (loads) paid on purchase payments and redemption fees; and (2) ongoing costs, including investment advisory fees, administration fees, distribution fees and other Fund expenses. The examples below are intended to help you understand your ongoing costs (in dollars) of investing in the Fund and to compare these costs with the ongoing costs of investing in other mutual funds. Per SEC requirements, the examples assume that you had a $1,000 investment in the Class at the beginning of the reporting period, May 1, 2006, and continued to hold your shares at the end of the reporting period, October 31, 2006.
Actual Expenses
For each Class of the Fund in the table below, the first line provides information about actual account values and actual expenses. You may use the information in this line, together with the amount you invested, to estimate the expenses that you paid over the period. Simply divide your account value by $1,000 (for example, an $8,600 account value divided by $1,000 = 8.6), then multiply the result by the number in the first line of each Class under the heading entitled “Expenses Paid During Period” to estimate the expenses you paid on your account during the period.
Hypothetical Example for Comparison Purposes
The second line of each Class in the table below provides information about hypothetical account values and hypothetical expenses based on the Class’ actual expense ratio and an assumed rate of return of 5% per year before expenses, which is not the Class’ actual return. The hypothetical account values and expenses may not be used to estimate the actual ending account balance or expenses you paid for the period. You may use this information to compare the ongoing costs of investing in the Class of the Fund and other funds. To do so, compare this 5% hypothetical example with the 5% hypothetical examples that appear in the shareholder reports of the other funds.
Please note that the expenses shown in the table are meant to highlight your ongoing costs only and do not reflect any transaction costs, such as sales charges (loads) or redemption fees. Therefore, the second line for each Class in the table is useful in comparing ongoing costs only, and will not help you determine the relative total costs of owning different funds. In addition, if these transaction costs were included, your costs would have been higher. The examples also assume all dividends and distributions have been reinvested.
Schedule of Shareholder Expenses
Expense Analysis of a $1,000 Investment
October 31, 2006
| | | | | | | | | | | | | | |
Gartmore Optimal Allocations:
Specialty Fund | | | | | Beginning
Account Value,
5/1/06 | | Ending
Account Value,
10/31/06 | | Expenses Paid
During Period*2 | | Annualized
Expense Ratio*2 |
| Class A | | Actual | | | $ | 1,000.00 | | $ | 1,026.60 | | $ | 2.61 | | 0.51% |
| | | Hypothetical | 1 | | $ | 1,000.00 | | $ | 1,022.43 | | $ | 2.60 | | 0.51% |
| Class B | | Actual | | | $ | 1,000.00 | | $ | 1,022.70 | | $ | 6.37 | | 1.25% |
| | | Hypothetical | 1 | | $ | 1,000.00 | | $ | 1,018.70 | | $ | 6.38 | | 1.25% |
| Class C | | Actual | | | $ | 1,000.00 | | $ | 1,022.70 | | $ | 6.37 | | 1.25% |
| | | Hypothetical | 1 | | $ | 1,000.00 | | $ | 1,018.70 | | $ | 6.38 | | 1.25% |
| Class R | | Actual | | | $ | 1,000.00 | | $ | 1,024.70 | | $ | 4.39 | | 0.86% |
| | | Hypothetical | 1 | | $ | 1,000.00 | | $ | 1,020.66 | | $ | 4.39 | | 0.86% |
| Institutional Service Class | | Actual | | | $ | 1,000.00 | | $ | 1,028.00 | | $ | 1.38 | | 0.27% |
| | | Hypothetical | 1 | | $ | 1,000.00 | | $ | 1,023.64 | | $ | 1.38 | | 0.27% |
| Institutional Class | | Actual | | | $ | 1,000.00 | | $ | 1,027.90 | | $ | 1.79 | | 0.35% |
| | | Hypothetical | 1 | | $ | 1,000.00 | | $ | 1,023.24 | | $ | 1.79 | | 0.35% |
| * | Expenses are equal to the Fund’s annualized expense ratio multiplied by the average account value over the period multiplied by 184/365 (to reflect the one-half year period). The expense ratio presented represents a six-month, annualized ratio in accordance with SEC guidelines. |
| 1 | Represents the hypothetical 5% return before expenses. |
| 2 | Expenses are based on the direct expenses of the Fund and do not include the effect of the underlying Funds’ expenses, which are disclosed in the Fee and Expense table and described more fully in a footnote to that table in your Fund prospectus. |
| | |
Portfolio Summary | | Gartmore Optimal Allocations Fund: Specialty |
The SEC adopted a requirement that Funds present their portfolio holdings in a table, chart or graph format in their annual and semiannual reports to shareholders, whether or not a statement of investments is utilized. The following tables, which present portfolio holdings as a percentage of net assets, are provided in compliance with this requirement.
| | |
| Asset Allocation | | |
| Mutual Funds | | 99.3% |
| Other assets in excess of liabilities | | 0.7% |
| | |
| | 100.0% |
| | |
| Asset Allocation Detail | | |
| Equity Funds | | 99.3% |
| Other Assets | | 0.7% |
| | |
| | 100.0% |
| | |
| Top Holdings | | |
Gartmore Global Financial Services Fund Institutional Class | | 18.8% |
Gartmore Emerging Markets Fund Institutional Class | | 14.2% |
Gartmore Global Health Sciences Fund Institutional Class | | 12.6% |
Gartmore Micro Cap Equity Fund Institutional Class | | 11.8% |
Gartmore U.S. Growth Leaders Long-Short Fund Institutional Class | | 11.4% |
iShares Cohen & Steers Realty Majors Index Fund | | 10.2% |
Gartmore Global Natural Resources Fund Institutional Class | | 7.2% |
Gartmore Global Technology and Communications Fund Institutional Class | | 7.0% |
Gartmore Global Utilities Fund Institutional Class | | 6.1% |
Other Assets | | 0.7% |
| | |
| | 100.0% |
Statement of Investments
October 31, 2006
Gartmore Optimal Allocations Fund: Specialty
Mutual Funds (99.3%)
| | | | | |
| | | Shares | | Value |
Equity Funds (99.3%) | | | | | |
Gartmore Emerging Markets Fund,
Institutional Class (b) | | 497,375 | | $ | 9,022,384 |
Gartmore Global Financial Services
Fund, Institutional Class (b) | | 754,469 | | | 11,897,971 |
Gartmore Global Health Sciences Fund,
Institutional Class (b) | | 704,506 | | | 8,003,184 |
Gartmore Global Natural Resources Fund, Institutional Class (b) | | 222,786 | | | 4,547,069 |
Gartmore Global Technology and Communications Fund,
Institutional Class (b) | | 1,031,013 | | | 4,443,666 |
Gartmore Global Utilities Fund,
Institutional Class (b) | | 294,372 | | | 3,841,560 |
Gartmore Micro Cap Equity Fund,
Institutional Class (b) | | 308,390 | | | 7,490,803 |
Gartmore U.S. Growth Leaders Long-Short Fund, Institutional Class (b) | | 697,094 | | | 7,207,952 |
iShares Cohen & Steers Realty Majors Index Fund | | 66,075 | | | 6,465,439 |
| | | | | |
| | |
Total Mutual Funds | | | | | 62,920,028 |
| | | | | |
| |
Total Investments
(Cost $57,899,980) (a) — 99.3% | | | 62,920,028 |
| |
Other assets in excess of
liabilities — 0.7% | | | 419,028 |
| | | | | |
| | |
NET ASSETS — 100.0% | | | | $ | 63,339,056 |
| | | | | |
| | (a) | See notes to financial statements for tax unrealized appreciation (depreciation) of securities. |
| | (b) | Investment in affiliate. |
See notes to financial statements.
Statements of Assets and Liabilities
October 31, 2006
| | | | | | | | | | | | | | |
| | | Gartmore Optimal
Allocations Fund:
Aggressive | | Gartmore Optimal
Allocations Fund:
Moderately
Aggressive | | Gartmore Optimal
Allocations Fund:
Moderate | | Gartmore Optimal
Allocations Fund:
Specialty |
Assets: | | | | | | | | | | | | | | |
Investments, at value (cost $588,388; $1,283,338; $1,315,906; $5,223,646, respectively) | | $ | 677,611 | | $ | 1,508,260 | | $ | 1,671,474 | | $ | 6,465,439 | | |
Investment in affiliates, at value (cost $10,102,493; $26,529,855; $28,418,065; $52,676,334 respectively) | | | 10,633,148 | | | 27,834,235 | | | 29,590,388 | | | 56,454,589 | | |
| | | | | | | | | | | | | | |
Total Investments | | | 11,310,759 | | | 29,342,495 | | | 31,261,862 | | | 62,920,028 | | |
| | | | | | | | | | | | | | |
Cash | | | 31,072 | | | 46,088 | | | 23,642 | | | 175,708 | | |
Interest and dividends receivable | | | — | | | 22,410 | | | 48,464 | | | — | | |
Receivable for capital shares issued | | | 169,073 | | | 92,131 | | | 312,307 | | | 623,498 | | |
Receivable from adviser | | | 4,857 | | | 5,093 | | | 4,748 | | | 3,909 | | |
Prepaid expenses and other assets | | | 15,829 | | | 23,993 | | | 21,270 | | | 20,920 | | |
| | | | | | | | | | | | | | |
Total Assets: | | | 11,531,590 | | | 29,532,210 | | | 31,672,293 | | | 63,744,063 | | |
| | | | | | | | | | | | | | |
| | | | | |
Liabilities | | | | | | | | | | | | | | |
Payable for investments purchased | | | 102,300 | | | 55,866 | | | 126,915 | | | 188,317 | | |
Payable for capital shares redeemed | | | 49,162 | | | 666 | | | 60,177 | | | 165,722 | | |
Accrued expenses and other payables | | | | | | | | | | | | | | |
Distribution fees | | | 6,567 | | | 16,856 | | | 19,899 | | | 36,218 | | |
Administrative servicing fees | | | 461 | | | 1,029 | | | 1,238 | | | 2,444 | | |
Trustee fees | | | 1 | | | 3 | | | 4 | | | 7 | | |
Compliance program fees (Note 3) | | | 12 | | | 161 | | | 204 | | | 407 | | |
Other | | | 3,025 | | | 6,627 | | | 5,736 | | | 11,892 | | |
| | | | | | | | | | | | | | |
Total Liabilities: | | | 161,528 | | | 81,208 | | | 214,173 | | | 405,007 | | |
| | | | | | | | | | | | | | |
Net Assets | | $ | 11,370,062 | | $ | 29,451,002 | | $ | 31,458,120 | | $ | 63,339,056 | | |
| | | | | | | | | | | | | | |
| | | | | |
Represented by: | | | | | | | | | | | | | | |
Capital | | $ | 10,396,544 | | $ | 27,359,858 | | $ | 29,439,360 | | $ | 57,595,888 | | |
Accumulated net investment income (loss) | | | — | | | 10,082 | | | 46,637 | | | — | | |
Accumulated net realized gains (losses) on investment transactions | | | 353,640 | | | 551,760 | | | 444,232 | | | 723,120 | | |
Net unrealized appreciation (depreciation) on investments | | | 619,878 | | | 1,529,302 | | | 1,527,891 | | | 5,020,048 | | |
| | | | | | | | | | | | | | |
Net Assets | | $ | 11,370,062 | | $ | 29,451,002 | | $ | 31,458,120 | | $ | 63,339,056 | | |
| | | | | | | | | | | | | | |
| | | | | | | | | | | | | | | |
See notes to financial statements.
Statements of Assets and Liabilities (Continued)
| | | | | | | | | | | | | | | | | | |
| | | Gartmore Optimal
Allocations Fund:
Aggressive | | | Gartmore Optimal
Allocations Fund:
Moderately
Aggressive | | | Gartmore Optimal
Allocations Fund:
Moderate | | | Gartmore Optimal
Allocations Fund:
Specialty |
Net Assets: | | | | | | | | | | | | | | | | | | |
Class A Shares | | $ | 3,999,270 | | | $ | 11,524,976 | | | $ | 9,797,217 | | | $ | 24,362,680 | | | |
Class B Shares | | | 715,124 | | | | 3,015,743 | | | | 2,629,846 | | | | 3,714,239 | | | |
Class C Shares | | | 6,651,844 | | | | 14,906,536 | | | | 19,027,409 | | | | 35,181,854 | | | |
Class R Shares | | | 1,367 | | | | 1,325 | | | | 1,278 | | | | 77,743 | | | |
Institutional Service Class Shares | | | 1,368 | | | | 1,339 | | | | 1,292 | | | | 1,434 | | | |
Institutional Class Shares | | | 1,089 | | | | 1,083 | | | | 1,078 | | | | 1,106 | | | |
| | | | | | | | | | | | | | | | | | |
Total | | $ | 11,370,062 | | | $ | 29,451,002 | | | $ | 31,458,120 | | | $ | 63,339,056 | | | |
| | | | | | | | | | | | | | | | | | |
| | | | | |
Shares outstanding (unlimited number of shares authorized) | | | | | | | | | | | | | | | | | | |
Class A Shares | | | 319,611 | | | | 943,929 | | | | 826,587 | | | | 1,844,579 | | | |
Class B Shares | | | 58,047 | | | | 249,027 | | | | 224,536 | | | | 284,380 | | | |
Class C Shares | | | 540,200 | | | | 1,231,769 | | | | 1,623,386 | | | | 2,695,388 | | | |
Class R Shares | | | 110 | | | | 109 | | | | 108 | | | | 5,894 | | | |
Institutional Service Class Shares | | | 109 | | | | 109 | | | | 109 | | | | 108 | | | |
Institutional Class Shares | | | 87 | | | | 88 | | | | 91 | | | | 83 | | | |
| | | | | | | | | | | | | | | | | | |
Total | | | 918,164 | | | | 2,425,031 | | | | 2,674,817 | | | | 4,830,432 | | | |
| | | | | | | | | | | | | | | | | | |
| | | | | |
Net asset value and redemption price per share (Net assets by class divided by shares outstanding by class, respectively): | | | | | | | | | | | | | | | | | | |
Class A Shares | | $ | 12.51 | | | $ | 12.21 | | | $ | 11.85 | | | $ | 13.21 | | | |
Class B Shares (a) | | $ | 12.32 | | | $ | 12.11 | | | $ | 11.71 | | | $ | 13.06 | | | |
Class C Shares (b) | | $ | 12.31 | | | $ | 12.10 | | | $ | 11.72 | | | $ | 13.05 | | | |
Class R Shares | | $ | 12.44 | (c) | | $ | 12.18 | (c) | | $ | 11.80 | (c) | | $ | 13.19 | | | |
Institutional Service Class Shares | | $ | 12.52 | (c) | | $ | 12.23 | (c) | | $ | 11.84 | (c) | | $ | 13.24 | (c) | | |
Institutional Class Shares | | $ | 12.55 | (c) | | $ | 12.24 | (c) | | $ | 11.86 | (c) | | $ | 13.27 | (c) | | |
| | | | | |
Maximum offering price per share (100%/(100%-maximum sales charge) of net asset value adjusted to the nearest cent | | | | | | | | | | | | | | | | | | |
Class A Shares | | $ | 13.27 | | | $ | 12.95 | | | $ | 12.57 | | | $ | 14.02 | | | |
| | | | | | | | | | | | | | | | | | |
Maximum Sales Charge — Class A Shares | | | 5.75 | % | | | 5.75 | % | | | 5.75 | % | | | 5.75 | % | | |
| | | | | | | | | | | | | | | | | | |
| | | | | | | | | | | | | | | | | | | |
| (a) | For Class B Shares, the redemption price per share varies by length of time shares are held. |
| (b) | For Class C Shares, the redemption price per share is reduced by 1.00% for shares held less than one year. |
| (c) | The NAV reported above represents the traded NAV at October 31, 2006. Due to the financial statement rounding of class assets and class shares above, the NAV results in a different NAV than the traded NAV. |
See notes to financial statements.
Statements of Operations
October 31, 2006
| | | | | | | | | | | | | | | | | | |
| | | Gartmore Optimal
Allocations Fund:
Aggressive | | | Gartmore Optimal
Allocations Fund:
Moderately
Aggressive | | | Gartmore Optimal
Allocations Fund:
Moderate | | | Gartmore Optimal
Allocations Fund:
Specialty |
INVESTMENT INCOME: | | | | | | | | | | | | | | | | | | |
Dividend income | | $ | 12,059 | | | $ | 29,584 | | | $ | 41,637 | | | $ | 121,187 | | | |
Dividend income from affiliates | | | 41,037 | | | | 286,818 | | | | 525,525 | | | | 233,584 | | | |
| | | | | | | | | | | | | | | | | | |
Total Income | | | 53,096 | | | | 316,402 | | | | 567,162 | | | | 354,771 | | | |
| | | | | | | | | | | | | | | | | | |
| | | | | |
Expenses: | | | | | | | | | | | | | | | | | | |
Investment advisory fees | | | 11,251 | | | | 29,229 | | | | 34,686 | | | | 54,260 | | | |
Accounting and transfer agent fees | | | 9,176 | | | | 18,263 | | | | 21,013 | | | | 38,935 | | | |
Distribution fees Class A | | | 7,643 | | | | 19,195 | | | | 21,185 | | | | 32,495 | | | |
Distribution fees Class B | | | 3,938 | | | | 22,522 | | | | 21,773 | | | | 19,632 | | | |
Distribution fees Class C | | | 37,669 | | | | 92,778 | | | | 122,013 | | | | 208,829 | | | |
Distribution fees Class R | | | 4 | | | | 4 | | | | 4 | | | | 165 | | | |
Administrative servicing fees Class A | | | 306 | | | | 768 | | | | 848 | | | | 1,300 | | | |
Administrative servicing fees Class B | | | — | | | | 4 | | | | — | | | | — | | | |
Administrative servicing fees Class R | | | 2 | | | | 2 | | | | 1 | | | | 82 | | | |
Administrative servicing fees Institutional Service Class | | | 1 | | | | 1 | | | | — | | | | 1 | | | |
Registration and filing fees | | | 54,224 | | | | 54,630 | | | | 55,040 | | | | 55,127 | | | |
Trustee fees | | | 235 | | | | 610 | | | | 748 | | | | 1,102 | | | |
Compliance program fees (note 3) | | | 90 | | | | 371 | | | | 446 | | | | 803 | | | |
Other | | | 4,963 | | | | 11,804 | | | | 12,171 | | | | 23,787 | | | |
| | | | | | | | | | | | | | | | | | |
Total expenses before reimbursed expenses | | | 129,502 | | | | 250,181 | | | | 289,928 | | | | 436,518 | | | |
Earning credit (Note 5) | | | (277 | ) | | | (712 | ) | | | (452 | ) | | | (1,263 | ) | | |
Expenses reimbursed | | | (59,804 | ) | | | (61,571 | ) | | | (61,040 | ) | | | (75,756 | ) | | |
Expenses voluntarily waived by Administrator | | | (1,169 | ) | | | (2,427 | ) | | | (3,064 | ) | | | (6,553 | ) | | |
| | | | | | | | | | | | | | | | | | |
Net Expenses | | | 68,252 | | | | 185,471 | | | | 225,372 | | | | 352,946 | | | |
| | | | | | | | | | | | | | | | | | |
Net Investment Income (Loss) | | | (15,156 | ) | | | 130,931 | | | | 341,790 | | | | 1,825 | | | |
| | | | | | | | | | | | | | | | | | |
| | | | | |
REALIZED/UNREALIZED GAINS
(LOSSES) FROM INVESTMENTS: | | | | | | | | | | | | | | | | | | |
Net realized gains (losses) on investment transactions | | | 292,141 | | | | 370,103 | | | | 231,981 | | | | 396,886 | | | |
Net realized gains (losses) on investment transactions from affiliates | | | 357,571 | | | | 662,596 | | | | 676,348 | | | | 1,112,417 | | | |
| | | | | | | | | | | | | | | | | | |
Net realized gains (losses) on investments | | | 649,712 | | | | 1,032,699 | | | | 908,329 | | | | 1,509,303 | | | |
Net change in unrealized appreciation/depreciation on investments | | | 449,195 | | | | 1,318,442 | | | | 1,409,027 | | | | 4,346,195 | | | |
| | | | | | | | | | | | | | | | | | |
Net realized/unrealized gains (losses) on investments | | | 1,098,907 | | | | 2,351,141 | | | | 2,317,356 | | | | 5,855,498 | | | |
| | | | | | | | | | | | | | | | | | |
CHANGE IN NET ASSETS RESULTING FROM OPERATIONS | | $ | 1,083,751 | | | $ | 2,482,072 | | | $ | 2,659,146 | | | $ | 5,857,323 | | | |
| | | | | | | | | | | | | | | | | | |
| | | | | | | | | | | | | | | | | | | |
See notes to financial statements.
Statements of Changes in Net Assets
| | | | | | | | | | | | | | | | | | |
| | | Gartmore Optimal Allocations Fund:
Aggressive | | | Gartmore Optimal Allocations Fund:
Moderately Aggressive |
| | | Year Ended
October 31, 2006 | | | Year Ended
October 31, 2005 | | | Year Ended
October 31, 2006 | | | Year Ended
October 31, 2005 | | | |
FROM INVESTMENT ACTIVITIES: | | | | | | | | | | | | | | | | | | |
Operations: | | | | | | | | | | | | | | | | | | |
Net investment income (loss) | | $ | (15,156 | ) | | $ | 20,930 | | | $ | 130,931 | | | $ | 50,376 | | | |
Net realized gains (losses) on investment transactions | | | 649,712 | | | | 91,818 | | | | 1,032,699 | | | | 172,012 | | | |
Net change in unrealized appreciation/depreciation on investment transactions | | | 449,195 | | | | 161,909 | | | | 1,318,442 | | | | 190,216 | | | |
| | | | | | | | | | | | | | | | | | |
Change in net assets resulting from operations | | | 1,083,751 | | | | 274,657 | | | | 2,482,072 | | | | 412,604 | | | |
| | | | | | | | | | | | | | | | | | |
| | | | | |
Distributions to Class A Shareholders from: | | | | | | | | | | | | | | | | | | |
Net investment income | | | (111,247 | ) | | | (5,583 | ) | | | (244,023 | ) | | | (17,194 | ) | | |
Net realized gains on investments | | | (29,636 | ) | | | — | | | | (58,581 | ) | | | — | | | |
| | | | | |
Distributions to Class B Shareholders from: | | | | | | | | | | | | | | | | | | |
Net investment income | | | (15,320 | ) | | | (2,024 | ) | | | (66,154 | ) | | | (2,886 | ) | | |
Net realized gains on investments | | | (4,201 | ) | | | — | | | | (19,360 | ) | | | — | | | |
| | | | | |
Distributions to Class C Shareholders from: | | | | | | | | | | | | | | | | | | |
Net investment income | | | (91,935 | ) | | | (3,950 | ) | | | (240,170 | ) | | | (13,117 | ) | | |
Net realized gains on investments | | | (25,404 | ) | | | — | | | | (68,242 | ) | | | — | | | |
| | | | | |
Distributions to Class R Shareholders from: | | | | | | | | | | | | | | | | | | |
Net investment income | | | (62 | ) | | | (23 | ) | | | (57 | ) | | | (26 | ) | | |
Net realized gains on investments | | | (17 | ) | | | — | | | | (16 | ) | | | — | | | |
| | | | | |
Distributions to Institutional Service Class Shareholders from: | | | | | | | | | | | | | | | | | | |
Net investment income | | | (62 | ) | | | (25 | ) | | | (60 | ) | | | (30 | ) | | |
Net realized gains on investments | | | (16 | ) | | | — | | | | (16 | ) | | | — | | | |
| | | | | |
Distributions to Institutional Class Shareholders from: | | | | | | | | | | | | | | | | | | |
Net investment income | | | (62,290 | ) | | | (25,377 | ) | | | (51,323 | ) | | | (30,095 | ) | | |
Net realized gains on investments | | | (16,459 | ) | | | — | | | | (15,737 | ) | | | — | | | |
| | | | | | | | | | | | | | | | | | |
Change in net assets from shareholder distributions | | | (356,649 | ) | | | (36,982 | ) | | | (763,739 | ) | | | (63,348 | ) | | |
| | | | | | | | | | | | | | | | | | |
Change in net assets from capital transactions | | | 6,775,878 | | | | 2,612,976 | | | | 18,371,052 | | | | 7,901,251 | | | |
| | | | | | | | | | | | | | | | | | |
Change in net assets | | | 7,502,980 | | | | 2,850,651 | | | | 20,089,385 | | | | 8,250,507 | | | |
| | | | | |
Net Assets: | | | | | | | | | | | | | | | | | | |
Beginning of period | | | 3,867,082 | | | | 1,016,431 | | | | 9,361,617 | | | | 1,111,110 | | | |
| | | | | | | | | | | | | | | | | | |
End of period | | $ | 11,370,062 | | | $ | 3,867,082 | | | $ | 29,451,002 | | | $ | 9,361,617 | | | |
| | | | | | | | | | | | | | | | | | |
| | | | | |
Accumulated net investment income (loss) at end of period | | $ | — | | | $ | — | | | $ | 10,082 | | | $ | — | | | |
| | | | | | | | | | | | | | | | | | |
| | | | | | | | | | | | | | | | | | | |
See notes to financial statements.
Statements of Changes in Net Assets (Continued)
| | | | | | | | | | | | | | | | | | |
| | | Gartmore Optimal Allocations Fund:
Moderate | | | Gartmore Optimal Allocations Fund:
Specialty |
| | | Year Ended
October 31, 2006 | | | Year Ended
October 31, 2005 | | | Year Ended
October 31, 2006 | | | Year Ended
October 31, 2005 | | | |
FROM INVESTMENT ACTIVITIES: | | | | | | | | | | | | | | | | | | |
Operations: | | | | | | | | | | | | | | | | | | |
Net investment income (loss) | | $ | 341,790 | | | $ | 95,971 | | | $ | 1,825 | | | $ | 126,254 | | | |
Net realized gains (losses) on investment transactions | | | 908,329 | | | | 170,683 | | | | 1,509,303 | | | | 269,621 | | | |
Net change in unrealized appreciation/depreciation on investment transactions | | | 1,409,027 | | | | 93,915 | | | | 4,346,195 | | | | 639,257 | | | |
| | | | | | | | | | | | | | | | | | |
Change in net assets resulting from operations | | | 2,659,146 | | | | 360,569 | | | | 5,857,323 | | | | 1,035,132 | | | |
| | | | | | | | | | | | | | | | | | |
| | | | | |
Distributions to Class A Shareholders from: | | | | | | | | | | | | | | | | | | |
Net investment income | | | (320,586 | ) | | | (26,920 | ) | | | (259,297 | ) | | | (75,274 | ) | | |
Net realized gains on investments | | | (61,019 | ) | | | (54 | ) | | | (67,018 | ) | | | (318 | ) | | |
| | | | | |
Distributions to Class B Shareholders from: | | | | | | | | | | | | | | | | | | |
Net investment income | | | (73,901 | ) | | | (5,442 | ) | | | (44,457 | ) | | | (6,754 | ) | | |
Net realized gains on investments | | | (17,765 | ) | | | (17 | ) | | | (12,662 | ) | | | (23 | ) | | |
| | | | | |
Distributions to Class C Shareholders from: | | | | | | | | | | | | | | | | | | |
Net investment income | | | (342,808 | ) | | | (27,797 | ) | | | (431,931 | ) | | | (71,934 | ) | | |
Net realized gains on investments | | | (71,809 | ) | | | (104 | ) | | | (122,959 | ) | | | (222 | ) | | |
| | | | | |
Distributions to Class R Shareholders from: | | | | | | | | | | | | | | | | | | |
Net investment income | | | (53 | ) | | | (27 | ) | | | (89 | ) | | | (27 | ) | | |
Net realized gains on investments | | | (12 | ) | | | (1 | ) | | | (13 | ) | | | — | | | |
| | | | | |
Distributions to Institutional Service Class Shareholders from: | | | | | | | | | | | | | | | | | | |
Net investment income | | | (56 | ) | | | (31 | ) | | | (51 | ) | | | (30 | ) | | |
Net realized gains on investments | | | (12 | ) | | | (1 | ) | | | (13 | ) | | | — | | | |
| | | | | |
Distributions to Institutional Class Shareholders from: | | | | | | | | | | | | | | | | | | |
Net investment income | | | (39,338 | ) | | | (31,883 | ) | | | (49,083 | ) | | | (30,997 | ) | | |
Net realized gains on investments | | | (11,572 | ) | | | (773 | ) | | | (13,203 | ) | | | (132 | ) | | |
| | | | | | | | | | | | | | | | | | |
Change in net assets from shareholder distributions | | | (938,931 | ) | | | (93,050 | ) | | | (1,000,776 | ) | | | (185,711 | ) | | |
| | | | | | | | | | | | | | | | | | |
Change in net assets from capital transactions | | | 15,086,201 | | | | 13,348,606 | | | | 41,976,799 | | | | 14,502,445 | | | |
| | | | | | | | | | | | | | | | | | |
Change in net assets | | | 16,806,416 | | | | 13,616,125 | | | | 46,833,346 | | | | 15,351,866 | | | |
| | | | | |
Net Assets: | | | | | | | | | | | | | | | | | | |
Beginning of period | | | 14,651,704 | | | | 1,035,579 | | | | 16,505,710 | | | | 1,153,844 | | | |
| | | | | | | | | | | | | | | | | | |
End of period | | $ | 31,458,120 | | | $ | 14,651,704 | | | $ | 63,339,056 | | | $ | 16,505,710 | | | |
| | | | | | | | | | | | | | | | | | |
| | | | | |
Accumulated net investment income (loss) at end of period | | $ | 46,637 | | | $ | 8,998 | | | $ | — | | | $ | — | | | |
| | | | | | | | | | | | | | | | | | |
| | | | | | | | | | | | | | | | | | | |
See notes to financial statements.
Statements of Changes in Net Assets
| | | | | | | | | | | | | | | | | | |
| | | Gartmore Optimal Allocations
Fund: Aggressive | | | Gartmore Optimal Allocations
Fund: Moderately Aggressive |
| | | Year Ended
October 31, 2006 | | | Year Ended
October 31, 2005 | | | Year Ended
October 31, 2006 | | | Year Ended
October 31, 2005 | | | |
CAPITAL TRANSACTIONS: | | | | | | | | | | | | | | | | | | |
Class A Shares | | | | | | | | | | | | | | | | | | |
Proceeds from shares issued | | $ | 3,609,066 | | | $ | 1,168,374 | | | $ | 8,484,493 | | | $ | 3,366,154 | | | |
Dividends reinvested | | | 62,681 | | | | 1,164 | | | | 169,680 | | | | 7,457 | | | |
Cost of shares redeemed | | | (948,056 | ) | | | (218,894 | ) | | | (1,217,903 | ) | | | (48,511 | ) | | |
| | | | | | | | | | | | | | | | | | |
| | | 2,723,691 | | | | 950,644 | | | | 7,436,270 | | | | 3,325,100 | | | |
| | | | | | | | | | | | | | | | | | |
| | | | | |
Class B Shares | | | | | | | | | | | | | | | | | | |
Proceeds from shares issued | | | 563,260 | | | | 253,499 | | | | 1,918,673 | | | | 1,148,412 | | | |
Dividends reinvested | | | 7,149 | | | | 46 | | | | 38,200 | | | | 1,690 | | | |
Cost of shares redeemed | | | (80,954 | ) | | | (77,752 | ) | | | (311,474 | ) | | | (4,741 | ) | | |
| | | | | | | | | | | | | | | | | | |
| | | 489,455 | | | | 175,793 | | | | 1,645,399 | | | | 1,145,361 | | | |
| | | | | | | | | | | | | | | | | | |
| | | | | |
Class C Shares | | | | | | | | | | | | | | | | | | |
Proceeds from shares issued | | | 5,295,529 | | | | 1,472,761 | | | | 13,410,388 | | | | 4,129,749 | | | |
Dividends reinvested | | | 26,675 | | | | 370 | | | | 75,871 | | | | 4,364 | | | |
Cost of shares redeemed | | | (579,852 | ) | | | (11,760 | ) | | | (3,027,115 | ) | | | (733,470 | ) | | |
| | | | | | | | | | | | | | | | | | |
| | | 4,742,352 | | | | 1,461,371 | | | | 10,459,144 | | | | 3,400,643 | | | |
| | | | | | | | | | | | | | | | | | |
| | | | | |
Class R Shares | | | | | | | | | | | | | | | | | | |
Proceeds from shares issued | | | 200 | | | | 238 | | | | 200 | | | | 249 | | | |
Dividends reinvested | | | 77 | | | | 21 | | | | 73 | | | | 24 | | | |
Cost of shares redeemed | | | (202 | ) | | | (229 | ) | | | (202 | ) | | | (250 | ) | | |
| | | | | | | | | | | | | | | | | | |
| | | 75 | | | | 30 | | | | 71 | | | | 23 | | | |
| | | | | | | | | | | | | | | | | | |
| | | | | |
Institutional Service Class Shares | | | | | | | | | | | | | | | | | | |
Dividends reinvested | | | 78 | | | | 25 | | | | 76 | | | | 30 | | | |
| | | | | | | | | | | | | | | | | | |
| | | | | |
Institutional Class Shares | | | | | | | | | | | | | | | | | | |
Proceeds from shares issued | | | 1,002 | | | | — | | | | 991 | | | | — | | | |
Dividends reinvested | | | 78,749 | | | | 25,113 | | | | 67,059 | | | | 30,094 | | | |
Cost of shares redeemed | | | (1,259,524 | ) | | | — | | | | (1,237,958 | ) | | | — | | | |
| | | | | | | | | | | | | | | | | | |
| | | (1,179,773 | ) | | | 25,113 | | | | (1,169,908 | ) | | | 30,094 | | | |
| | | | | | | | | | | | | | | | | | |
Change in net assets from capital transactions | | $ | 6,775,878 | | | $ | 2,612,976 | | | $ | 18,371,052 | | | $ | 7,901,251 | | | |
| | | | | | | | | | | | | | | | | | |
| | | | | | | | | | | | | | | | | | |
| | | | | | | | | | | | | | | | | | |
| | | | | | | | | | | | | | | | | | |
| | | | | | | | | | | | | | | | | | |
| | | | | | | | | | | | | | | | | | |
| | | | | | | | | | | | | | | | | | |
| | | | | | | | | | | | | | | | | | |
| | | | | | | | | | | | | | | | | | |
| | | | | | | | | | | | | | | | | | |
| | | | | | | | | | | | | | | | | | | |
See notes to financial statements.
Statements of Changes in Net Assets (Continued)
| | | | | | | | | | | | | | |
| | | Gartmore Optimal Allocations
Fund: Aggressive | | | Gartmore Optimal Allocations
Fund: Moderately Aggressive |
| | | Year Ended
October 31, 2006 | | | Year Ended
October 31, 2005 | | | Year Ended
October 31, 2006 | | | Year Ended
October 31, 2005 | | | |
SHARE TRANSACTIONS: | | | | | | | | | | | | | | |
Class A Shares | | | | | | | | | | | | | | |
Issued | | 304,491 | | | 107,133 | | | 728,211 | | | 308,600 | | | |
Reinvested | | 5,557 | | | 110 | | | 15,126 | | | 682 | | | |
Redeemed | | (78,494 | ) | | (19,602 | ) | | (104,371 | ) | | (4,419 | ) | | |
| | | | | | | | | | | | | | |
| | 231,554 | | | 87,641 | | | 638,966 | | | 304,863 | | | |
| | | | | | | | | | | | | | |
| | | | | |
Class B Shares | | | | | | | | | | | | | | |
Issued | | 47,527 | | | 23,680 | | | 165,938 | | | 105,682 | | | |
Reinvested | | 640 | | | 4 | | | 3,437 | | | 158 | | | |
Redeemed | | (6,955 | ) | | (6,949 | ) | | (26,450 | ) | | (437 | ) | | |
| | | | | | | | | | | | | | |
| | 41,212 | | | 16,735 | | | 142,925 | | | 105,403 | | | |
| | | | | | | | | | | | | | |
| | | | | |
Class C Shares | | | | | | | | | | | | | | |
Issued | | 451,935 | | | 136,132 | | | 1,161,596 | | | 382,131 | | | |
Reinvested | | 2,388 | | | 35 | | | 6,830 | | | 408 | | | |
Redeemed | | (49,294 | ) | | (1,096 | ) | | (260,093 | ) | | (66,934 | ) | | |
| | | | | | | | | | | | | | |
| | 405,029 | | | 135,071 | | | 908,333 | | | 315,605 | | | |
| | | | | | | | | | | | | | |
| | | | | |
Class R Shares | | | | | | | | | | | | | | |
Issued | | 17 | | | 22 | | | 18 | | | 23 | | | |
Reinvested | | 7 | | | 2 | | | 6 | | | 2 | | | |
Redeemed | | (17 | ) | | (21 | ) | | (17 | ) | | (23 | ) | | |
| | | | | | | | | | | | | | |
| | 7 | | | 3 | | | 7 | | | 2 | | | |
| | | | | | | | | | | | | | |
| | | | | |
Institutional Service Class Shares | | | | | | | | | | | | | | |
Reinvested | | 7 | | | 2 | | | 6 | | | 3 | | | |
| | | | | | | | | | | | | | |
| | 7 | | | 2 | | | 6 | | | 3 | | | |
| | | | | | | | | | | | | | |
| | | | | |
Institutional Class Shares | | | | | | | | | | | | | | |
Issued | | 87 | | | — | | | 88 | | | — | | | |
Reinvested | | 6,981 | | | 2,355 | | | 5,998 | | | 2,786 | | | |
Redeemed | | (109,336 | ) | | — | | | (108,784 | ) | | — | | | |
| | | | | | | | | | | | | | |
| | (102,268 | ) | | 2,355 | | | (102,698 | ) | | 2,786 | | | |
| | | | | | | | | | | | | | |
Total change in shares | | 575,541 | | | 241,807 | | | 1,587,539 | | | 728,662 | | | |
| | | | | | | | | | | | | | |
| | | | | | | | | | | | | | |
| | | | | | | | | | | | | | |
| | | | | | | | | | | | | | |
| | | | | | | | | | | | | | |
| | | | | | | | | | | | | | |
| | | | | | | | | | | | | | |
| | | | | | | | | | | | | | |
| | | | | | | | | | | | | | |
| | | | | | | | | | | | | | | |
See notes to financial statements.
Statements of Changes in Net Assets
| | | | | | | | | | | | | | | | | | |
| | | Gartmore Optimal Allocations
Fund: Moderate | | | Gartmore Optimal Allocations
Fund: Specialty |
| | | Year Ended
October 31, 2006 | | | Year Ended
October 31, 2005 | | | Year Ended
October 31, 2006 | | | Year Ended
October 31, 2005 | | | |
CAPITAL TRANSACTIONS: | | | | | | | | | | | | | | | | | | |
Class A Shares | | | | | | | | | | | | | | | | | | |
Proceeds from shares issued | | $ | 7,674,464 | | | $ | 4,646,233 | | | $ | 20,524,625 | | | $ | 6,859,908 | | | |
Dividends reinvested | | | 236,280 | | | | 13,909 | | | | 107,523 | | | | 20,239 | | | |
Cost of shares redeemed | | | (3,284,154 | ) | | | (154,670 | ) | | | (3,233,258 | ) | | | (2,083,851 | ) | | |
| | | | | | | | | | | | | | | | | | |
| | | 4,626,590 | | | | 4,505,472 | | | | 17,398,890 | | | | 4,796,296 | | | |
| | | | | | | | | | | | | | | | | | |
| | | | | |
Class B Shares | | | | | | | | | | | | | | | | | | |
Proceeds from shares issued | | | 1,482,320 | | | | 1,270,605 | | | | 2,589,951 | | | | 939,685 | | | |
Dividends reinvested | | | 42,544 | | | | 2,478 | | | | 12,195 | | | | 1,370 | | | |
Cost of shares redeemed | | | (315,800 | ) | | | (35,765 | ) | | | (147,688 | ) | | | (3,966 | ) | | |
| | | | | | | | | | | | | | | | | | |
| | | 1,209,064 | | | | 1,237,318 | | | | 2,454,458 | | | | 937,089 | | | |
| | | | | | | | | | | | | | | | | | |
| | | | | |
Class C Shares | | | | | | | | | | | | | | | | | | |
Proceeds from shares issued | | | 13,651,149 | | | | 7,925,581 | | | | 25,319,433 | | | | 9,304,238 | | | |
Dividends reinvested | | | 90,936 | | | | 3,367 | | | | 93,514 | | | | 8,344 | | | |
Cost of shares redeemed | | | (3,342,043 | ) | | | (355,846 | ) | | | (2,128,410 | ) | | | (573,314 | ) | | |
| | | | | | | | | | | | | | | | | | |
| | | 10,400,042 | | | | 7,573,102 | | | | 23,284,537 | | | | 8,739,268 | | | |
| | | | | | | | | | | | | | | | | | |
| | | | | |
Class R Shares | | | | | | | | | | | | | | | | | | |
Proceeds from shares issued | | | 200 | | | | 249 | | | | 102,337 | | | | 104,020 | | | |
Dividends reinvested | | | 64 | | | | 26 | | | | 62 | | | | 24 | | | |
Cost of shares redeemed | | | (201 | ) | | | (249 | ) | | | (26,486 | ) | | | (105,447 | ) | | |
| | | | | | | | | | | | | | | | | | |
| | | 63 | | | | 26 | | | | 75,913 | | | | (1,403 | ) | | |
| | | | | | | | | | | | | | | | | | |
| | | | | |
Institutional Service Class Shares | | | | | | | | | | | | | | | | | | |
Dividends reinvested | | | 68 | | | | 32 | | | | 64 | | | | 31 | | | |
| | | | | | | | | | | | | | | | | | |
| | | 68 | | | | 32 | | | | 64 | | | | 31 | | | |
| | | | | | | | | | | | | | | | | | |
| | | | | |
Institutional Class Shares | | | | | | | | | | | | | | | | | | |
Proceeds from shares issued | | | 992 | | | | — | | | | 1,000 | | | | 35 | | | |
Dividends reinvested | | | 50,910 | | | | 32,656 | | | | 62,286 | | | | 31,129 | | | |
Cost of shares redeemed | | | (1,201,528 | ) | | | — | | | | (1,300,349 | ) | | | — | | | |
| | | | | | | | | | | | | | | | | | |
| | | (1,149,626 | ) | | | 32,656 | | | | (1,237,063 | ) | | | 31,164 | | | |
| | | | | | | | | | | | | | | | | | |
Change in net assets from capital transactions | | $ | 15,086,201 | | | $ | 13,348,606 | | | $ | 41,976,799 | | | $ | 14,502,445 | | | |
| | | | | | | | | | | | | | | | | | |
| | | | | | | | | | | | | | | | | | |
| | | | | | | | | | | | | | | | | | |
| | | | | | | | | | | | | | | | | | |
| | | | | | | | | | | | | | | | | | |
| | | | | | | | | | | | | | | | | | |
| | | | | | | | | | | | | | | | | | |
| | | | | | | | | | | | | | | | | | |
| | | | | | | | | | | | | | | | | | |
| | | | | | | | | | | | | | | | | | | |
See notes to financial statements.
Statements of Changes in Net Assets (Continued)
| | | | | | | | | | | | | | |
| | | Gartmore Optimal Allocations
Fund: Moderate | | | Gartmore Optimal Allocations
Fund: Specialty |
| | | Year Ended
October 31, 2006 | | | Year Ended
October 31, 2005 | | | Year Ended
October 31, 2006 | | | Year Ended
October 31, 2005 | | | |
SHARE TRANSACTIONS: | | | | | | | | | | | | | | |
Class A Shares | | | | | | | | | | | | | | |
Issued | | 677,111 | | | 428,983 | | | 1,650,793 | | | 625,720 | | | |
Reinvested | | 21,313 | | | 1,273 | | | 9,233 | | | 1,855 | | | |
Redeemed | | (287,949 | ) | | (14,244 | ) | | (260,531 | ) | | (190,264 | ) | | |
| | | | | | | | | | | | | | |
| | 410,475 | | | 416,012 | | | 1,399,495 | | | 437,311 | | | |
| | | | | | | | | | | | | | |
| | | | | |
Class B Shares | | | | | | | | | | | | | | |
Issued | | 132,552 | | | 119,195 | | | 209,697 | | | 85,811 | | | |
Reinvested | | 3,890 | | | 232 | | | 1,055 | | | 127 | | | |
Redeemed | | (28,097 | ) | | (3,336 | ) | | (12,056 | ) | | (354 | ) | | |
| | | | | | | | | | | | | | |
| | 108,345 | | | 116,091 | | | 198,696 | | | 85,584 | | | |
| | | | | | | | | | | | | | |
| | | | | |
Class C Shares | | | | | | | | | | | | | | |
Issued | | 1,215,654 | | | 731,168 | | | 2,056,788 | | | 851,265 | | | |
Reinvested | | 8,283 | | | 312 | | | 8,096 | | | 770 | | | |
Redeemed | | (299,933 | ) | | (32,198 | ) | | (172,734 | ) | | (52,280 | ) | | |
| | | | | | | | | | | | | | |
| | 924,004 | | | 699,282 | | | 1,892,150 | | | 799,755 | | | |
| | | | | | | | | | | | | | |
| | | | | |
Class R Shares | | | | | | | | | | | | | | |
Issued | | 18 | | | 23 | | | 7,962 | | | 9,675 | | | |
Reinvested | | 6 | | | 2 | | | 5 | | | 2 | | | |
Redeemed | | (18 | ) | | (23 | ) | | (2,176 | ) | | (9,674 | ) | | |
| | | | | | | | | | | | | | |
| | 6 | | | 2 | | | 5,791 | | | 3 | | | |
| | | | | | | | | | | | | | |
| | | | | |
Institutional Service Class Shares | | | | | | | | | | | | | | |
Reinvested | | 6 | | | 3 | | | 5 | | | 3 | | | |
| | | | | | | | | | | | | | |
| | 6 | | | 3 | | | 5 | | | 3 | | | |
| | | | | | | | | | | | | | |
| | | | | |
Institutional Class Shares | | | | | | | | | | | | | | |
Issued | | 90 | | | — | | | 83 | | | — | (a) | | |
Reinvested | | 4,628 | | | 3,037 | | | 5,342 | | | 2,840 | | | |
Redeemed | | (107,664 | ) | | — | | | (108,182 | ) | | — | | | |
| | | | | | | | | | | | | | |
| | (102,946 | ) | | 3,037 | | | (102,757 | ) | | 2,840 | | | |
| | | | | | | | | | | | | | |
Total change in shares | | 1,339,890 | | | 1,234,427 | | | 3,393,380 | | | 1,325,496 | | | |
| | | | | | | | | | | | | | |
| | | | | | | | | | | | | | |
| | | | | | | | | | | | | | |
| | | | | | | | | | | | | | |
| | | | | | | | | | | | | | |
| | | | | | | | | | | | | | |
| | | | | | | | | | | | | | |
| | | | | | | | | | | | | | | |
See notes to financial statements.
Financial Highlights
Selected Data for Each Share of Capital Outstanding
Gartmore Optimal Allocations Fund: Aggressive
| | | | | | | | | | | | | | | | | | | | | | | | | | | | | | | | | | | | | | | | | | |
| | | | | Investment Activities | | Distributions | | | | | | Ratios/Supplemental Data |
| | | Net Asset
Value,
Beginning
of Period | | Net
Investment
Income
(Loss) | | | Net Realized
and
Unrealized
Gains
(Losses) on
Investments | | Total
from
Investment
Activities | | Net
Investment
Income | | | Net
Realized
Gains | | | Total
Distributions | | | Net
Asset
Value, End
of Period | | Total
Return (a) | | | Net Assets
at End of
Period
(000s) | | Ratio of
Expenses
to Average
Net Assets | | | Ratio of Net
Investment
Income
(Loss)
to Average
Net Assets | | | Ratio of
Expenses
(Prior to
Reimbursements)
to Average
Net Assets (b) | | | Ratio of Net
Investment
Income (Loss)
(Prior to
Reimbursements)
to Average
Net Assets (b) | | | Portfolio
Turnover (c) |
| | | | | | | | | | | | | | | |
Class A Shares | | | | | | | | | | | | | | | | | | | | | | | | | | | | | | | | | | | | | | | | | | |
Period Ended October 31, 2004 (d) | | $ | 10.00 | | — | | | 0.09 | | 0.09 | | — | | | — | | | — | | | $ | 10.09 | | 0.90% | (e) | | $ | 4 | | 0.56% | (f) | | (0.27% | )(f) | | 13.04% | (f) | | (12.75% | )(f) | | 7.82% |
Year Ended October 31, 2005 | | $ | 10.09 | | 0.17 | | | 1.31 | | 1.48 | | (0.24 | ) | | — | | | (0.24 | ) | | $ | 11.33 | | 14.87% | | | $ | 998 | | 0.53% | | | 0.41% | | | 3.91% | | | (2.97% | ) | | 31.16% |
Year Ended October 31, 2006 | | $ | 11.33 | | 0.27 | | | 1.67 | | 1.94 | | (0.60 | ) | | (0.16 | ) | | (0.76 | ) | | $ | 12.51 | | 17.79% | | | $ | 3,999 | | 0.51% | | | 0.17% | | | 1.32% | | | (0.64% | ) | | 47.77% |
| | | | | | | | | | | | | | | |
Class B Shares | | | | | | | | | | | | | | | | | | | | | | | | | | | | | | | | | | | | | | | | | | |
Period Ended October 31, 2004 (d) | | $ | 10.00 | | (0.03 | ) | | 0.07 | | 0.04 | | — | | | — | | | — | | | $ | 10.04 | | 0.40% | (e) | | $ | 1 | | 1.25% | (f) | | (0.85% | )(f) | | 13.48% | (f) | | (13.08% | )(f) | | 7.82% |
Year Ended October 31, 2005 | | $ | 10.04 | | 0.12 | | | 1.27 | | 1.39 | | (0.20 | ) | | — | | | (0.20 | ) | | $ | 11.23 | | 14.07% | | | $ | 189 | | 1.25% | | | 0.68% | | | 5.11% | | | (3.18% | ) | | 31.16% |
Year Ended October 31, 2006 | | $ | 11.23 | | 0.29 | | | 1.55 | | 1.84 | | (0.59 | ) | | (0.16 | ) | | (0.75 | ) | | $ | 12.32 | | 16.94% | | | $ | 715 | | 1.25% | | | (0.50% | ) | | 2.06% | | | (1.31% | ) | | 47.77% |
| | | | | | | | | | | | | | | |
Class C Shares | | | | | | | | | | | | | | | | | | | | | | | | | | | | | | | | | | | | | | | | | | |
Period Ended October 31, 2004 (d) | | $ | 10.00 | | (0.03 | ) | | 0.07 | | 0.04 | | — | | | — | | | — | | | $ | 10.04 | | 0.40% | (e) | | $ | 1 | | 1.25% | (f) | | (0.85% | )(f) | | 13.48% | (f) | | (13.08% | )(f) | | 7.82% |
Year Ended October 31, 2005 | | $ | 10.04 | | 0.13 | | | 1.26 | | 1.39 | | (0.21 | ) | | — | | | (0.21 | ) | | $ | 11.22 | | 14.07% | | | $ | 1,517 | | 1.25% | | | (0.71% | ) | | 4.35% | | | (3.82% | ) | | 31.16% |
Year Ended October 31, 2006 | | $ | 11.22 | | 0.37 | | | 1.46 | | 1.83 | | (0.58 | ) | | (0.16 | ) | | (0.74 | ) | | $ | 12.31 | | 16.91% | | | $ | 6,652 | | 1.25% | | | (0.51% | ) | | 2.05% | | | (1.31% | ) | | 47.77% |
| | | | | | | | | | | | | | | |
Class R Shares | | | | | | | | | | | | | | | | | | | | | | | | | | | | | | | | | | | | | | | | | | |
Period Ended October 31, 2004 (d) | | $ | 10.00 | | (0.01 | ) | | 0.07 | | 0.06 | | — | | | — | | | — | | | $ | 10.06 | | 0.50% | (e) | | $ | 1 | | 0.85% | (f) | | (0.45% | )(f) | | 13.07% | (f) | | (12.67% | )(f) | | 7.82% |
Year Ended October 31, 2005 | | $ | 10.06 | | 0.19 | | | 1.27 | | 1.46 | | (0.21 | ) | | — | | | (0.21 | ) | | $ | 11.31 | | 14.70% | | | $ | 1 | | 0.80% | | | 1.80% | | | 5.55% | | | (2.94% | ) | | 31.16% |
Year Ended October 31, 2006 | | $ | 11.31 | | 0.03 | | | 1.86 | | 1.89 | | (0.60 | ) | | (0.16 | ) | | (0.76 | ) | | $ | 12.44 | | 17.43% | | | $ | 1 | | 0.74% | | | (0.06% | ) | | 1.47% | | | (0.79% | ) | | 47.77% |
| | | | | | | | | | | | | | | |
Institutional Service Class Shares | | | | | | | | | | | | | | | | | | | | | | | | | | | | | | | | | | | | | | | | | | |
Period Ended October 31, 2004 (d) | | $ | 10.00 | | — | | | 0.07 | | 0.07 | | — | | | — | | | — | | | $ | 10.07 | | 0.80% | (e) | | $ | 1 | | 0.40% | (f) | | 0.00% | (f) | | 12.62% | (f) | | (12.22% | )(f) | | 7.82% |
Year Ended October 31, 2005 | | $ | 10.07 | | 0.24 | | | 1.28 | | 1.52 | | (0.25 | ) | | — | | | (0.25 | ) | | $ | 11.34 | | 15.10% | | | $ | 1 | | 0.30% | | | 2.30% | | | 5.78% | | | (3.15% | ) | | 31.16% |
Year Ended October 31, 2006 | | $ | 11.34 | | 0.07 | | | 1.88 | | 1.95 | | (0.61 | ) | | (0.16 | ) | | (0.77 | ) | | $ | 12.52 | | 17.91% | | | $ | 1 | | 0.35% | | | (0.28% | ) | | 1.51% | | | (0.88% | ) | | 47.77% |
| | | | | | | | | | | | | | | |
Institutional Class Shares | | | | | | | | | | | | | | | | | | | | | | | | | | | | | | | | | | | | | | | | | | |
Period Ended October 31, 2004 (d) | | $ | 10.00 | | — | | | 0.08 | | 0.08 | | — | | | — | | | — | | | $ | 10.08 | | 0.80% | (e) | | $ | 1,008 | | 0.25% | (f) | | 0.15% | (f) | | 12.47% | (f) | | (12.07% | )(f) | | 7.82% |
Year Ended October 31, 2005 | | $ | 10.08 | | 0.25 | | | 1.27 | | 1.52 | | (0.25 | ) | | — | | | (0.25 | ) | | $ | 11.35 | | 15.25% | | | $ | 1,160 | | 0.25% | | | 2.35% | | | 4.36% | | | (1.76% | ) | | 31.16% |
Year Ended October 31, 2006 (g) | | $ | 11.35 | | 0.04 | | | 1.93 | | 1.97 | | (0.61 | ) | | (0.16 | ) | | (0.77 | ) | | $ | 12.55 | | 18.11% | | | $ | 1 | | 0.25% | | | 0.33% | | | 1.34% | | | (0.75% | ) | | 47.77% |
| | | | | | | | | | | | | | | | | | | | | | | | | | | | | | | | | | | | | | | | | | | |
| | | | | | | | | | | | | | | | | | | | | | | | | | | | | | | | | | | | | | | | | | | |
| | | | | | | | | | | | | | | | | | | | | | | | | | | | | | | | | | | | | | | | | | | |
| | | | | | | | | | | | | | | | | | | | | | | | | | | | | | | | | | | | | | | | | | | |
| | | | | | | | | | | | | | | | | | | | | | | | | | | | | | | | | | | | | | | | | | | |
| | | | | | | | | | | | | | | | | | | | | | | | | | | | | | | | | | | | | | | | | | | |
| | | | | | | | | | | | | | | | | | | | | | | | | | | | | | | | | | | | | | | | | | | |
| (a) | Excludes sales charge. |
| (b) | During the period certain fees were waived and/or reimbursed. If such waivers/reimbursements had not occurred, the ratios would have been indicated. |
| (c) | Portfolio turnover is calculated on the basis of the Fund as a whole without distinguishing among the classes of shares. |
| (d) | For the period from June 29, 2004 (commencement of operations) through October 31, 2004. |
| (g) | Net investment income (loss) is based on average shares outstanding during the period |
See notes to financial statements.
Financial Highlights
Selected Data for Each Share of Capital Outstanding
Gartmore Optimal Allocations Fund: Moderately Aggressive
| | | | | | | | | | | | | | | | | | | | | | | | | | | | | | | | | | | | | | | | | |
| | | | | Investment Activities | | Distributions | | | | | | Ratios/Supplemental Data |
| �� | | Net Asset
Value,
Beginning
of Period | | Net
Investment
Income
(Loss) | | Net Realized
and
Unrealized
Gains
(Losses) on
Investments | | Total
from
Investment
Activities | | Net
Investment
Income | | | Net
Realized
Gains | | | Total
Distributions | | | Net
Asset
Value, End
of Period | | Total
Return (a) | | | Net Assets
at End of
Period
(000s) | | Ratio of
Expenses
to Average
Net Assets | | | Ratio of Net
Investment
Income
(Loss)
to Average
Net Assets | | | Ratio of
Expenses
(Prior to
Reimbursements)
to Average
Net Assets (b) | | | Ratio of Net
Investment
Income (Loss)
(Prior to
Reimbursements)
to Average
Net Assets (b) | | | Portfolio
Turnover (c) |
| | | | | | | | | | | | | | | |
Class A Shares | | | | | | | | | | | | | | | | | | | | | | | | | | | | | | | | | | | | | | | | | |
Period Ended October 31, 2004 (d) | | $ | 10.00 | | 0.02 | | 0.20 | | 0.22 | | — | | | — | | | — | | | $ | 10.22 | | 2.10% | (e) | | $ | 1 | | 0.56% | (f) | | (0.27% | )(f) | | 13.04% | (f) | | (12.75% | )(f) | | 9.79% |
Year Ended October 31, 2005 | | $ | 10.22 | | 0.23 | | 1.04 | | 1.27 | | (0.28 | ) | | — | | | (0.28 | ) | | $ | 11.21 | | 12.77% | | | $ | 3,419 | | 0.52% | | | 1.13% | | | 2.32% | | | (0.66% | ) | | 47.04% |
Year Ended October 31, 2006 | | $ | 11.21 | | 0.39 | | 1.32 | | 1.71 | | (0.56 | ) | | (0.15 | ) | | (0.71 | ) | | $ | 12.21 | | 15.79% | | | $ | 11,525 | | 0.52% | | | 1.05% | | | 0.85% | | | 0.72% | | | 32.64% |
| | | | | | | | | | | | | | | |
Class B Shares | | | | | | | | | | | | | | | | | | | | | | | | | | | | | | | | | | | | | | | | | |
Period Ended October 31, 2004 (d) | | $ | 10.00 | | — | | 0.17 | | 0.17 | | — | | | — | | | — | | | $ | 10.17 | | 1.70% | (e) | | $ | 7 | | 1.25% | (f) | | (0.85% | )(f) | | 13.48% | (f) | | (13.08% | )(f) | | 9.79% |
Year Ended October 31, 2005 | | $ | 10.17 | | 0.18 | | 1.04 | | 1.22 | | (0.23 | ) | | — | | | (0.23 | ) | | $ | 11.16 | | 12.07% | | | $ | 1,183 | | 1.25% | | | (0.09% | ) | | 3.00% | | | (1.84% | ) | | 47.04% |
Year Ended October 31, 2006 | | $ | 11.16 | | 0.27 | | 1.33 | | 1.60 | | (0.50 | ) | | (0.15 | ) | | (0.65 | ) | | $ | 12.11 | | 14.91% | | | $ | 3,016 | | 1.25% | | | 0.42% | | | 1.59% | | | 0.09% | | | 32.64% |
| | | | | | | | | | | | | | | |
Class C Shares | | | | | | | | | | | | | | | | | | | | | | | | | | | | | | | | | | | | | | | | | |
Period Ended October 31, 2004 (d) | | $ | 10.00 | | — | | 0.17 | | 0.17 | | — | | | — | | | — | | | $ | 10.17 | | 1.70% | (e) | | $ | 80 | | 1.25% | (f) | | (0.85% | )(f) | | 13.48% | (f) | | (13.08% | )(f) | | 9.79% |
Year Ended October 31, 2005 | | $ | 10.17 | | 0.18 | | 1.02 | | 1.20 | | (0.23 | ) | | — | | | (0.23 | ) | | $ | 11.14 | | 11.98% | | | $ | 3,604 | | 1.25% | | | 0.20% | | | 3.20% | | | (1.76% | ) | | 47.04% |
Year Ended October 31, 2006 | | $ | 11.14 | | 0.34 | | 1.27 | | 1.61 | | (0.50 | ) | | (0.15 | ) | | (0.65 | ) | | $ | 12.10 | | 14.95% | | | $ | 14,907 | | 1.25% | | | 0.41% | | | 1.59% | | | 0.09% | | | 32.64% |
| | | | | | | | | | | | | | | |
Class R Shares | | | | | | | | | | | | | | | | | | | | | | | | | | | | | | | | | | | | | | | | | |
Period Ended October 31, 2004 (d) | | $ | 10.00 | | 0.01 | | 0.18 | | 0.19 | | — | | | — | | | — | | | $ | 10.19 | | 1.90% | (e) | | $ | 1 | | 0.85% | (f) | | (0.45% | )(f) | | 13.07% | (f) | | (12.67% | )(f) | | 9.79% |
Year Ended October 31, 2005 | | $ | 10.19 | | 0.25 | | 1.01 | | 1.26 | | (0.24 | ) | | — | | | (0.24 | ) | | $ | 11.21 | | 12.50% | | | $ | 1 | | 0.80% | | | 2.16% | | | 4.28% | | | (1.32% | ) | | 47.04% |
Year Ended October 31, 2006 | | $ | 11.21 | | 0.13 | | 1.54 | | 1.67 | | (0.55 | ) | | (0.15 | ) | | (0.70 | ) | | $ | 12.18 | | 15.55% | | | $ | 1 | | 0.72% | | | 0.85% | | | 0.87% | | | 0.70% | | | 32.64% |
| | | | | | | | | | | | | | | |
Institutional Service Class Shares | | | | | | | | | | | | | | | | | | | | | | | | | | | | | | | | | | | | | | | | | |
Period Ended October 31, 2004 (d) | | $ | 10.00 | | 0.02 | | 0.19 | | 0.21 | | — | | | — | | | — | | | $ | 10.21 | | 2.10% | (e) | | $ | 1 | | 0.40% | (f) | | 0.00% | (f) | | 12.62% | (f) | | (12.22% | )(f) | | 9.79% |
Year Ended October 31, 2005 | | $ | 10.21 | | 0.31 | | 1.00 | | 1.31 | | (0.29 | ) | | — | | | (0.29 | ) | | $ | 11.23 | | 13.00% | | | $ | 1 | | 0.34% | | | 2.69% | | | 4.45% | | | (1.42% | ) | | 47.04% |
Year Ended October 31, 2006 | | $ | 11.23 | | 0.17 | | 1.56 | | 1.73 | | (0.58 | ) | | (0.15 | ) | | (0.73 | ) | | $ | 12.23 | | 16.06% | | | $ | 1 | | 0.36% | | | 1.19% | | | 0.91% | | | 0.64% | | | 32.64% |
| | | | | | | | | | | | | | | |
Institutional Class Shares | | | | | | | | | | | | | | | | | | | | | | | | | | | | | | | | | | | | | | | | | |
Period Ended October 31, 2004 (d) | | $ | 10.00 | | 0.03 | | 0.18 | | 0.21 | | — | | | — | | | — | | | $ | 10.21 | | 2.10% | (e) | | $ | 1,021 | | 0.25% | (f) | | 0.15% | (f) | | 12.47% | (f) | | (12.07% | )(f) | | 9.79% |
Year Ended October 31, 2005 | | $ | 10.21 | | 0.32 | | 1.00 | | 1.32 | | (0.30 | ) | | — | | | (0.30 | ) | | $ | 11.23 | | 13.16% | | | $ | 1,154 | | 0.25% | | | 2.73% | | | 3.33% | | | (0.36% | ) | | 47.04% |
Year Ended October 31, 2006 (g) | | $ | 11.23 | | 0.12 | | 1.62 | | 1.74 | | (0.58 | ) | | (0.15 | ) | | (0.73 | ) | | $ | 12.24 | | 16.05% | | | $ | 1 | | 0.25% | | | 1.05% | | | 0.71% | | | 0.59% | | | 32.64% |
| | | | | | | | | | | | | | | | | | | | | | | | | | | | | | | | | | | | | | | | | | |
| | | | | | | | | | | | | | | | | | | | | | | | | | | | | | | | | | | | | | | | | | |
| | | | | | | | | | | | | | | | | | | | | | | | | | | | | | | | | | | | | | | | | | |
| | | | | | | | | | | | | | | | | | | | | | | | | | | | | | | | | | | | | | | | | | |
| | | | | | | | | | | | | | | | | | | | | | | | | | | | | | | | | | | | | | | | | | |
| | | | | | | | | | | | | | | | | | | | | | | | | | | | | | | | | | | | | | | | | | |
| (a) | Excludes sales charge. |
| (b) | During the period certain fees were waived and/or reimbursed. If such waivers/reimbursements had not occurred, the ratios would have been indicated. |
| (c) | Portfolio turnover is calculated on the basis of the Fund as a whole without distinguishing among the classes of shares. |
| (d) | For the period from June 29, 2004 (commencement of operations) through October 31, 2004. |
| (g) | Net investment income (loss) is based on average shares outstanding during the period |
See notes to financial statements.
Financial Highlights
Selected Data for Each Share of Capital Outstanding
Gartmore Optimal Allocations Fund: Moderate
| | | | | | | | | | | | | | | | | | | | | | | | | | | | | | | | | | | | | | | | | |
| | | | | Investment Activities | | Distributions | | | | | | Ratios/Supplemental Data |
| | | Net Asset
Value,
Beginning
of Period | | Net
Investment
Income
(Loss) | | Net Realized
and
Unrealized
Gains
(Losses) on
Investments | | Total
from
Investment
Activities | | Net
Investment
Income | | | Net
Realized
Gains | | | Total
Distributions | | | Net
Asset
Value, End
of Period | | Total
Return (a) | | | Net Assets
at End of
Period
(000s) | | Ratio of
Expenses
to Average
Net Assets | | | Ratio of Net
Investment
Income
(Loss)
to Average
Net Assets | | | Ratio of
Expenses
(Prior to
Reimbursements)
to Average
Net Assets (b) | | | Ratio of Net
Investment
Income (Loss)
(Prior to
Reimbursements)
to Average
Net Assets (b) | | | Portfolio
Turnover (c) |
| | | | | | | | | | | | | | | |
Class A Shares | | | | | | | | | | | | | | | | | | | | | | | | | | | | | | | | | | | | | | | | | |
Period Ended October 31, 2004 (d) | | $ | 10.00 | | 0.04 | | 0.28 | | 0.32 | | — | | | — | | | — | | | $ | 10.32 | | 3.20% | (e) | | $ | 1 | | 0.56% | (f) | | 1.06% | (f) | | 12.40% | (f) | | (10.78% | )(f) | | 7.57% |
Year Ended October 31, 2005 | | $ | 10.32 | | 0.28 | | 0.77 | | 1.05 | | (0.32 | ) | | (0.01 | ) | | (0.33 | ) | | $ | 11.04 | | 10.41% | | | $ | 4,595 | | 0.52% | | | 1.73% | | | 1.88% | | | 0.38% | | | 61.59% |
Year Ended October 31, 2006 | | $ | 11.04 | | 0.31 | | 1.12 | | 1.43 | | (0.51 | ) | | (0.11 | ) | | (0.62 | ) | | $ | 11.85 | | 13.38% | | | $ | 9,797 | | 0.52% | | | 1.87% | | | 0.79% | | | 1.60% | | | 34.82% |
| | | | | | | | | | | | | | | |
Class B Shares | | | | | | | | | | | | | | | | | | | | | | | | | | | | | | | | | | | | | | | | | |
Period Ended October 31, 2004 (d) | | $ | 10.00 | | 0.01 | | 0.24 | | 0.25 | | — | | | — | | | — | | | $ | 10.25 | | 2.60% | (e) | | $ | 1 | | 1.25% | (f) | | 0.37% | (f) | | 13.50% | (f) | | (11.88% | )(f) | | 7.57% |
Year Ended October 31, 2005 | | $ | 10.25 | | 0.20 | | 0.74 | | 0.94 | | (0.25 | ) | | (0.01 | ) | | (0.26 | ) | | $ | 10.93 | | 9.13% | | | $ | 1,269 | | 1.25% | | | 0.65% | | | 2.70% | | | (0.80% | ) | | 61.59% |
Year Ended October 31, 2006 | | $ | 10.93 | | 0.22 | | 1.11 | | 1.33 | | (0.44 | ) | | (0.11 | ) | | (0.55 | ) | | $ | 11.71 | | 12.59% | | | $ | 2,630 | | 1.25% | | | 1.20% | | | 1.54% | | | 0.93% | | | 34.82% |
| | | | | | | | | | | | | | | |
Class C Shares | | | | | | | | | | | | | | | | | | | | | | | | | | | | | | | | | | | | | | | | | |
Period Ended October 31, 2004 (d) | | $ | 10.00 | | 0.01 | | 0.24 | | 0.25 | | — | | | — | | | — | | | $ | 10.25 | | 2.60% | (e) | | $ | 1 | | 1.25% | (f) | | 0.37% | (f) | | 13.50% | (f) | | (11.88% | )(f) | | 7.57% |
Year Ended October 31, 2005 | | $ | 10.25 | | 0.23 | | 0.74 | | 0.97 | | (0.28 | ) | | (0.01 | ) | | (0.29 | ) | | $ | 10.93 | | 9.50% | | | $ | 7,648 | | 1.25% | | | 0.72% | | | 2.51% | | | (0.54% | ) | | 61.59% |
Year Ended October 31, 2006 | | $ | 10.93 | | 0.32 | | 1.02 | | 1.34 | | (0.44 | ) | | (0.11 | ) | | (0.55 | ) | | $ | 11.72 | | 12.59% | | | $ | 19,027 | | 1.25% | | | 1.25% | | | 1.54% | | | 0.97% | | | 34.82% |
| | | | | | | | | | | | | | | |
Class R Shares | | | | | | | | | | | | | | | | | | | | | | | | | | | | | | | | | | | | | | | | | |
Period Ended October 31, 2004 (d) | | $ | 10.00 | | 0.03 | | 0.24 | | 0.27 | | — | | | — | | | — | | | $ | 10.27 | | 2.70% | (e) | | $ | 1 | | 0.85% | (f) | | 0.77% | (f) | | 12.85% | (f) | | (11.23% | )(f) | | 7.57% |
Year Ended October 31, 2005 | | $ | 10.27 | | 0.28 | | 0.73 | | 1.01 | | (0.25 | ) | | (0.01 | ) | | (0.26 | ) | | $ | 11.02 | | 9.94% | | | $ | 1 | | 0.81% | | | 2.35% | | | 3.85% | | | (0.37% | ) | | 61.59% |
Year Ended October 31, 2006 | | $ | 11.02 | | 0.20 | | 1.20 | | 1.40 | | (0.51 | ) | | (0.11 | ) | | (0.62 | ) | | $ | 11.80 | | 13.15% | | | $ | 1 | | 0.72% | | | 1.63% | | | 0.75% | | | 1.60% | | | 34.82% |
| | | | | | | | | | | | | | | |
Institutional Service Class Shares | | | | | | | | | | | | | | | | | | | | | | | | | | | | | | | | | | | | | | | | | |
Period Ended October 31, 2004 (d) | | $ | 10.00 | | 0.04 | | 0.26 | | 0.30 | | — | | | — | | | — | | | $ | 10.30 | | 3.00% | (e) | | $ | 1 | | 0.40% | (f) | | 1.22% | (f) | | 12.23% | (f) | | (10.61% | )(f) | | 7.57% |
Year Ended October 31, 2005 | | $ | 10.30 | | 0.35 | | 0.71 | | 1.06 | | (0.31 | ) | | (0.01 | ) | | (0.32 | ) | | $ | 11.04 | | 10.39% | | | $ | 1 | | 0.34% | | | 2.83% | | | 3.93% | | | (0.76% | ) | | 61.59% |
Year Ended October 31, 2006 | | $ | 11.04 | | 0.24 | | 1.21 | | 1.45 | | (0.54 | ) | | (0.11 | ) | | (0.65 | ) | | $ | 11.84 | | 13.64% | | | $ | 1 | | 0.33% | | | 1.99% | | | 0.85% | | | 1.47% | | | 34.82% |
| | | | | | | | | | | | | | | |
Institutional Class Shares | | | | | | | | | | | | | | | | | | | | | | | | | | | | | | | | | | | | | | | | | |
Period Ended October 31, 2004 (d) | | $ | 10.00 | | 0.05 | | 0.25 | | 0.30 | | — | | | — | | | — | | | $ | 10.30 | | 3.00% | (e) | | $ | 1,030 | | 0.25% | (f) | | 1.37% | (f) | | 12.08% | (f) | | (10.46% | )(f) | | 7.57% |
Year Ended October 31, 2005 | | $ | 10.30 | | 0.35 | | 0.72 | | 1.07 | | (0.32 | ) | | (0.01 | ) | | (0.33 | ) | | $ | 11.04 | | 10.54% | | | $ | 1,138 | | 0.25% | | | 2.90% | | | 2.94% | | | 0.20% | | | 61.59% |
Year Ended October 31, 2006 (g) | | $ | 11.04 | | 0.18 | | 1.29 | | 1.47 | | (0.54 | ) | | (0.11 | ) | | (0.65 | ) | | $ | 11.86 | | 13.74% | | | $ | 1 | | 0.25% | | | 1.58% | | | 0.58% | | | 1.25% | | | 34.82% |
| | | | | | | | | | | | | | | | | | | | | | | | | | | | | | | | | | | | | | | | | | |
| | | | | | | | | | | | | | | | | | | | | | | | | | | | | | | | | | | | | | | | | | |
| | | | | | | | | | | | | | | | | | | | | | | | | | | | | | | | | | | | | | | | | | |
| | | | | | | | | | | | | | | | | | | | | | | | | | | | | | | | | | | | | | | | | | |
| | | | | | | | | | | | | | | | | | | | | | | | | | | | | | | | | | | | | | | | | | |
| | | | | | | | | | | | | | | | | | | | | | | | | | | | | | | | | | | | | | | | | | |
| | | | | | | | | | | | | | | | | | | | | | | | | | | | | | | | | | | | | | | | | | |
| (a) | Excludes sales charge. |
| (b) | During the period certain fees were waived and/or reimbursed. If such waivers/reimbursements had not occurred, the ratios would have been indicated. |
| (c) | Portfolio turnover is calculated on the basis of the Fund as a whole without distinguishing among the classes of shares. |
| (d) | For the period from June 29, 2004 (commencement of operations) through October 31, 2004. |
| (g) | Net investment income (loss) is based on average shares outstanding during the period |
See notes to financial statements.
Financial Highlights
Selected Data for Each Share of Capital Outstanding
Gartmore Optimal Allocations Fund: Specialty
| | | | | | | | | | | | | | | | | | | | | | | | | | | | | | | | | | | | | | | | | | |
| | | | | Investment Activities | | Distributions | | | | | | Ratios/Supplemental Data |
| | | Net Asset
Value,
Beginning
of Period | | Net
Investment
Income
(Loss) | | | Net Realized
and
Unrealized
Gains
(Losses) on
Investments | | Total
from
Investment
Activities | | Net
Investment
Income | | | Net
Realized
Gains | | | Total
Distributions | | | Net
Asset
Value, End
of Period | | Total
Return (a) | | | Net Assets
at End of
Period
(000s) | | Ratio of
Expenses
to Average
Net Assets | | | Ratio of Net
Investment
Income
(Loss)
to Average
Net Assets | | | Ratio of
Expenses
(Prior to
Reimbursements)
to Average
Net Assets (b) | | | Ratio of Net
Investment
Income (Loss)
(Prior to
Reimbursements)
to Average
Net Assets (b) | | | Portfolio
Turnover (c) |
| | | | | | | | | | | | | | | |
Class A Shares | | | | | | | | | | | | | | | | | | | | | | | | | | | | | | | | | | | | | | | | | | |
Period Ended October 31, 2004 (d) | | $ | 10.00 | | — | | | 0.34 | | 0.34 | | — | | | — | | | — | | | $ | 10.34 | | 3.40% | (e) | | $ | 80 | | 0.56% | (f) | | 0.75% | (f) | | 12.49% | (f) | | (11.17% | )(f) | | 7.19% |
Year Ended October 31, 2005 | | $ | 10.34 | | 0.27 | | | 1.21 | | 1.48 | | (0.29 | ) | | — | (g) | | (0.29 | ) | | $ | 11.53 | | 14.59% | | | $ | 5,133 | | 0.53% | | | 2.31% | | | 1.54% | | | 1.30% | | | 28.77% |
Year Ended October 31, 2006 | | $ | 11.53 | | 0.37 | | | 1.92 | | 2.29 | | (0.48 | ) | | (0.13 | ) | | (0.61 | ) | | $ | 13.21 | | 20.48% | | | $ | 24,363 | | 0.51% | | | 0.43% | | | 0.74% | | | 0.21% | | | 13.76% |
| | | | | | | | | | | | | | | |
Class B Shares | | | | | | | | | | | | | | | | | | | | | | | | | | | | | | | | | | | | | | | | | | |
Period Ended October 31, 2004 (d) | | $ | 10.00 | | (0.02 | ) | | 0.32 | | 0.30 | | — | | | — | | | — | | | $ | 10.30 | | 3.00% | (e) | | $ | 1 | | 1.25% | (f) | | (0.58% | )(f) | | 12.98% | (f) | | (12.30% | )(f) | | 7.19% |
Year Ended October 31, 2005 | | $ | 10.30 | | 0.17 | | | 1.24 | | 1.41 | | (0.25 | ) | | — | (g) | | (0.25 | ) | | $ | 11.46 | | 13.89% | | | $ | 982 | | 1.25% | | | 0.27% | | | 2.22% | | | (0.70% | ) | | 28.77% |
Year Ended October 31, 2006 | | $ | 11.46 | | 0.28 | | | 1.90 | | 2.18 | | (0.45 | ) | | (0.13 | ) | | (0.58 | ) | | $ | 13.06 | | 19.67% | | | $ | 3,714 | | 1.25% | | | (0.23% | ) | | 1.48% | | | (0.46% | ) | | 13.76% |
| | | | | | | | | | | | | | | |
Class C Shares | | | | | | | | | | | | | | | | | | | | | | | | | | | | | | | | | | | | | | | | | | |
Period Ended October 31, 2004 (d) | | $ | 10.00 | | — | | | 0.30 | | 0.30 | | — | | | — | | | — | | | $ | 10.30 | | 3.00% | (e) | | $ | 36 | | 1.25% | (f) | | (1.04% | )(f) | | 12.92% | (f) | | (12.72% | )(f) | | 7.19% |
Year Ended October 31, 2005 | | $ | 10.30 | | 0.17 | | | 1.24 | | 1.41 | | (0.26 | ) | | — | (g) | | (0.26 | ) | | $ | 11.45 | | 13.90% | | | $ | 9,200 | | 1.25% | | | 0.25% | | | 2.22% | | | (0.72% | ) | | 28.77% |
Year Ended October 31, 2006 | | $ | 11.45 | | 0.27 | | | 1.91 | | 2.18 | | (0.45 | ) | | (0.13 | ) | | (0.58 | ) | | $ | 13.05 | | 19.59% | | | $ | 35,182 | | 1.25% | | | (0.24% | ) | | 1.48% | | | (0.47% | ) | | 13.76% |
| | | | | | | | | | | | | | | |
Class R Shares | | | | | | | | | | | | | | | | | | | | | | | | | | | | | | | | | | | | | | | | | | |
Period Ended October 31, 2004 (d) | | $ | 10.00 | | (0.01 | ) | | 0.33 | | 0.32 | | — | | | — | | | — | | | $ | 10.32 | | 3.20% | (e) | | $ | 1 | | 0.85% | (f) | | (0.18% | )(f) | | 12.57% | (f) | | (11.90% | )(f) | | 7.19% |
Year Ended October 31, 2005 | | $ | 10.32 | | (0.34 | ) | | 1.81 | | 1.47 | | (0.25 | ) | | — | (g) | | (0.25 | ) | | $ | 11.54 | | 14.36% | | | $ | 1 | | 0.84% | | | (0.55% | ) | | 1.90% | | | (1.62% | ) | | 28.77% |
Year Ended October 31, 2006 | | $ | 11.54 | | 0.48 | | | 1.78 | | 2.26 | | (0.48 | ) | | (0.13 | ) | | (0.61 | ) | | $ | 13.19 | | 20.23% | | | $ | 78 | | 0.85% | | | 0.15% | | | 1.07% | | | (0.07% | ) | | 13.76% |
| | | | | | | | | | | | | | | |
Institutional Service Class Shares | | | | | | | | | | | | | | | | | | | | | | | | | | | | | | | | | | | | | | | | | | |
Period Ended October 31, 2004 (d) | | $ | 10.00 | | 0.01 | | | 0.33 | | 0.34 | | — | | | — | | | — | | | $ | 10.34 | | 3.40% | (e) | | $ | 1 | | 0.40% | (f) | | 0.27% | (f) | | 12.12% | (f) | | (11.44% | )(f) | | 7.19% |
Year Ended October 31, 2005 | | $ | 10.34 | | 0.33 | | | 1.19 | | 1.52 | | (0.30 | ) | | — | (g) | | (0.30 | ) | | $ | 11.56 | | 14.92% | | | $ | 1 | | 0.33% | | | 2.98% | | | 1.94% | | | 1.38% | | | 28.77% |
Year Ended October 31, 2006 | | $ | 11.56 | | 0.08 | | | 2.22 | | 2.30 | | (0.49 | ) | | (0.13 | ) | | (0.62 | ) | | $ | 13.24 | | 20.63% | | | $ | 1 | | 0.34% | | | 0.50% | | | 0.70% | | | 0.14% | | | 13.76% |
| | | | | | | | | | | | | | | |
Institutional Class Shares | | | | | | | | | | | | | | | | | | | | | | | | | | | | | | | | | | | | | | | | | | |
Period Ended October 31, 2004 (d) | | $ | 10.00 | | 0.01 | | | 0.33 | | 0.34 | | — | | | — | | | — | | | $ | 10.34 | | 3.40% | (e) | | $ | 1,034 | | 0.25% | (f) | | 0.42% | (f) | | 11.97% | (f) | | (11.29% | )(f) | | 7.19% |
Year Ended October 31, 2005 | | $ | 10.34 | | 0.34 | | | 1.19 | | 1.53 | | (0.31 | ) | | — | (g) | | (0.31 | ) | | $ | 11.56 | | 15.07% | | | $ | 1,189 | | 0.25% | | | 3.04% | | | 1.41% | | | 1.87% | | | 28.77% |
Year Ended October 31, 2006 (h) | | $ | 11.56 | | 0.04 | | | 2.30 | | 2.34 | | (0.50 | ) | | (0.13 | ) | | (0.63 | ) | | $ | 13.27 | | 20.84% | | | $ | 1 | | 0.25% | | | 0.29% | | | 0.56% | | | (0.01% | ) | | 13.76% |
| | | | | | | | | | | | | | | | | | | | | | | | | | | | | | | | | | | | | | | | | | | |
| | | | | | | | | | | | | | | | | | | | | | | | | | | | | | | | | | | | | | | | | | | |
| | | | | | | | | | | | | | | | | | | | | | | | | | | | | | | | | | | | | | | | | | | |
| | | | | | | | | | | | | | | | | | | | | | | | | | | | | | | | | | | | | | | | | | | |
| | | | | | | | | | | | | | | | | | | | | | | | | | | | | | | | | | | | | | | | | | | |
| (a) | Excludes sales charge. |
| (b) | During the period certain fees were waived and/or reimbursed. If such waivers/reimbursements had not occurred, the ratios would have been indicated. |
| (c) | Portfolio turnover is calculated on the basis of the Fund as a whole without distinguishing among the classes of shares. |
| (d) | For the period from June 29, 2004 (commencement of operations) through October 31, 2004. |
| (g) | The amount is less than $0.005. |
| (h) | Net investment income (loss) is based on average shares outstanding during the period |
See notes to financial statements.
Notes to Financial Statements
October 31, 2006
1. Organization
Gartmore Mutual Funds (the “Trust”) is an open-end management investment company, organized under the laws of Delaware by an amended and restated Agreement and Declaration of Trust, dated October 28, 2004, as amended to date. Prior to January 25, 2002, the Trust was named “Nationwide Mutual Funds”. The Trust, originally created under the laws of Ohio as an Ohio business trust pursuant to a Declaration of Trust, dated as of October 30, 1997, was subsequently amended and redomesticated as a Delaware Statutory Trust on February 28, 2005; the redomestication was a change in statutory status and did not affect the operations of the Trust. The Trust is registered under the Investment Company Act of 1940, as amended (the “1940 Act”). As of October 31, 2006, the Trust had authorized an unlimited number of shares of beneficial interest (“shares”) without par value. The Trust operates forty-nine (49) separate series, or mutual funds, each with its own investment objective(s) and strategies. This report contains the financial statements and financial highlights of the nine (9) funds listed below (individually, a “Fund”; collectively, the “Funds”):
- Gartmore Investor Destinations Aggressive Fund (“Investor Destinations Aggressive”)
- Gartmore Investor Destinations Moderately Aggressive Fund (“Investor Destinations Moderately Aggressive”)
- Gartmore Investor Destinations Moderate Fund (“Investor Destinations Moderate”)
- Gartmore Investor Destinations Moderately Conservative Fund (“Investor Destinations Moderately Conservative”)
- Gartmore Investor Destinations Conservative Fund (“Investor Destinations Conservative”)
- Gartmore Optimal Allocations Fund: Aggressive (“Optimal Allocations Aggressive”)
- Gartmore Optimal Allocations Fund: Moderately Aggressive (“Optimal Allocations Moderately Aggressive”)
- Gartmore Optimal Allocations Fund: Moderate (“Optimal Allocations Moderate”)
- Gartmore Optimal Allocations Fund: Specialty (“Optimal Allocations Specialty”)
Each of the Funds is constructed as a “fund of funds,” which means that each of these Funds pursues its investment objective primarily by allocating its investments among other affiliated and unaffiliated mutual funds (“Underlying Funds”). The Underlying Funds typically invest, either directly or indirectly, in stocks, bonds, and other securities. The Investor Destinations Aggressive, the Investor Destinations Moderately Aggressive, the Investor Destinations Moderate, the Investor Destinations Moderately Conservative and the Investor Destinations Conservative Funds (collectively, the “Investor Destinations Funds”) may also invest in a non-registered Fixed Interest Contract issued by Nationwide Life Insurance Company (“Fixed Interest Contract”) up to each Fund’s designated limit.
2. Summary of Significant Accounting Policies:
The following is a summary of significant accounting policies followed by the Funds in the preparation of their financial statements. The policies are in conformity with accounting principles generally accepted in the United States of America (“GAAP”). The preparation of financial statements requires management to make estimates and assumptions that affect the reported amounts of assets and liabilities, disclosure of contingent assets and liabilities at the date of the financial statements, and the reported amounts of income and expenses for the period. Actual results could differ from those estimates.
Shares of the Underlying Funds in which the Funds invest are valued at their respective net asset values as reported by the Underlying Funds. The securities in the Underlying Funds are generally valued as of the close of business of the regular session of trading on the New York Stock Exchange. Underlying Funds generally value securities and assets at fair value.
Each of the Investor Destinations Funds (except the Investor Destinations Aggressive Fund) currently invests in the Nationwide Contract. The Nationwide Contract is a fixed interest contract issued and guaranteed by Nationwide Life Insurance Company (“Nationwide”). This contract has a stable principal value and will pay each such Fund a
Notes to Financial Statements (Continued)
October 31, 2006
fixed rate of interest. The fixed interest rate must be at least 3.50% (on an annualized basis), but may be higher and is currently adjusted on a quarterly basis. Nationwide will calculate the interest rate in the same way that it calculates guaranteed interest rates for similar contracts. Because the contract is guaranteed by Nationwide, assuming no default, the Funds receive no more or less than the guaranteed amount and will not directly participate in the actual experience of the assets underlying the contract. Although under certain market conditions a Fund’s performance may be hurt by its investment in the Nationwide Contract, Gartmore Mutual Fund Capital Trust (“GMF”) believes that the relatively stable nature of the Nationwide Contract should reduce a Fund’s volatility and overall risk, especially when the bond and stock markets decline simultaneously.
| (b) | | Security Transactions and Investment Income |
Security transactions are accounted for on the date the security is purchased or sold (“trade date”). Securities gains and losses are calculated on the identified cost basis. Interest income is recognized on the accrual basis and includes, where applicable, the amortization or accretion of premium or discount. Dividend income is recorded on the ex-dividend date.
| (c) | | Distributions to Shareholders |
Distributions from net investment income, if any, is declared daily and paid quarterly for the Funds. For all Funds, distributions from net realized capital gains, if any, are declared and distributed at least annually.
Dividends and distributions to shareholders are determined in accordance with federal income tax regulations, which may differ from GAAP. These “book/tax” differences are considered either permanent or temporary in nature. In accordance with American Institute of Certified Public Accountants (the “AICPA”) Statement of Position 93-2, permanent differences (i.e., reclassification of market discounts, foreign exchange gain/loss, paydowns and distributions from real estate investment trusts) are reclassified within the capital accounts based on their nature for federal income tax purposes; temporary differences do not require reclassification. These reclassifications have no effect upon the net asset value of the respective Funds. To the extent distributions exceed current and accumulated earnings and profits for federal income tax purposes, these excesses are reported as distributions of paid-in-capital.
It is the policy of each Fund to qualify or continue to qualify as a “regulated investment company” by complying with the provisions available to certain investment companies, as defined in SubChapter M of the Internal Revenue Code, and to make distributions of net investment income and net realized capital gains sufficient to relieve the Fund from all, or substantially all, federal income taxes.
| (e) | | Allocation of Expenses, Income, and Gains and Losses |
Expenses directly attributable to a Fund are charged to that Fund. Expenses not directly attributable to a Fund are allocated proportionately among various or all Funds within the Trust. For each Fund, the method for allocating income, fund level expenses, and realized and unrealized gains or losses is based on the fair value of shares outstanding relative to net assets. Under this method, each class of shares participates based on the total net asset value of that class’s shares in proportion to the total net assets of the Fund. Expenses specific to a class (such as Rule 12b-1 and administrative services fees) are charged to that class.
3. Transactions with Affiliates
Under the terms of the Trust’s Investment Advisory Agreement, Gartmore Mutual Fund Capital Trust (“GMF”) manages the investment of the assets and supervises the daily business affairs of the Funds. GMF is a wholly-owned subsidiary of NWD Investment Management, Inc., (prior to November 30, 2006 known as “Gartmore Global Investments, Inc.” (“GGI”)), a holding company. NWD Investment Management, Inc. is a majority-owned subsidiary of NWD Management & Research Trust (prior to November 30, 2006 known as “Gartmore Global Asset Management Trust” (“GGAMT”)). NWD Management & Research Trust is a wholly-owned subsidiary of Nationwide Corporation.
All of the common stock of Nationwide Corporation is held by Nationwide Mutual Insurance Company (95.2%) and Nationwide Mutual Fire Insurance Company (4.8%), each of which is a mutual company owned by its policyholders. Under the terms of the Investment Advisory Agreement, Optimal Allocations Aggressive, Optimal Allocations Moderately Aggressive, Optimal Allocations Moderate, and Optimal Allocations Specialty (collectively, the “Optimal Funds”) each pays GMF an investment advisory fee of 0.15% based on the Fund’s average daily net assets. The Investor Destinations Funds each pay GMF an investment advisory fee of 0.13% based on the Fund’s average daily net assets.
GMF and the Funds have entered into written contracts (“Expense Limitation Agreements”) that limits operating expenses (excluding any taxes, interest, brokerage fees, extraordinary expenses, short sale dividend expenses, Rule 12b-1 fees, and administrative services fees) from exceeding 0.25% for all share classes of the Funds, until at least February 28, 2007.
GMF may request and receive reimbursement from certain Funds of the advisory fees waived and other expenses reimbursed by GMF pursuant to the Expense Limitation Agreements at a later date not to exceed three fiscal years from commencement of operations if the Fund has reached a sufficient asset size to permit reimbursement to be made without causing the total annual operating expense ratio of the Fund to exceed the limits set forth above. No reimbursement will be made unless: (i) the Fund’s assets exceed $100 million; (ii) the total annual expense ratio of the class making such reimbursement is less than the limit set forth above; and (iii) the payment of such reimbursement is approved by the Board of Trustees on a quarterly basis. Except as provided for in the Expense Limitation Agreements, reimbursement of amounts previously waived or assumed by GMF is not permitted.
As of the year ended October 31, 2006, the cumulative potential reimbursements of the following Funds (unless otherwise indicated), based on reimbursements which expire within three years from the fiscal year in which the corresponding reimbursements to the Fund was made for expenses reimbursed by GMF, would be:
| | | | | | | | | |
| Fund | | Amount
Fiscal Year
2004 | | Amount
Fiscal Year
2005 | | Amount
Fiscal Year
2006 |
Optimal Allocations Aggressive | | $ | 40,836 | | $ | 88,800 | | $ | 59,804 |
Optimal Allocations Moderately Aggressive | | | 40,411 | | | 96,103 | | | 61,571 |
Optimal Allocations Moderate | | | 40,408 | | | 93,106 | | | 61,040 |
Optimal Allocations Specialty | | | 40,408 | | | 104,891 | | | 75,756 |
Under the terms of a Distribution Plan under Rule 12b-1 of the 1940 Act, Gartmore Distribution Services, Inc. (“GDSI”), the Funds’ distributor, is compensated by the Funds for expenses associated with the distribution of Class A, Class B, Class C, Class R, and Service Class shares of the Funds. GDSI is a majority-owned subsidiary of NWD Management & Research Trust. These fees are based on average daily net assets of the respective class of the Funds at an annual rate not to exceed 0.25% for Class A and Service Class shares, 1.00% for Class B and Class C shares, and 0.50% for Class R shares.
Pursuant to an Underwriting Agreement, GDSI serves as principal underwriter of the Funds in the continuous distribution of their shares and receives commissions in the form of a front-end sales charge on the Class A shares. These fees are deducted from and are not included in proceeds from sales of Class A shares. From these fees, GDSI pays sales commissions, salaries, and other expenses in connection with generating new sales of Class A shares of the Funds. GDSI also receives fees for services as principal underwriter for Class B shares of the Funds. These fees are contingent deferred sales charges (“CDSCs”) ranging from 1% to 5% imposed on redemptions of Class B shares which may cause the current value of a shareholder’s account to fall below the total purchase payments. The CDSC, if applicable, will be imposed on redemptions made within six years of the purchase. Class C shares have a CDSC fee of 1% imposed on redemptions of Class C shares made within one year of purchase. For the year ended October 31, 2006, GDSI received commissions of $2,715,255 from front-end sales charges of Class A shares and from CDSC fees from Class B and Class C shares of the Funds, of which $1,249,242 was re-allowed to affiliated broker-dealers of the Funds.
Notes to Financial Statements (Continued)
October 31, 2006
Under the terms of a Fund Administration and Transfer Agency Agreement, Gartmore SA Capital Trust (“GSA”) provides various administrative and accounting services for the Funds, and Gartmore Investor Services, Inc. (“GISI”), an indirect subsidiary of GSA, serves as Transfer Agent and Dividend Disbursing Agent for each of the Funds. The Funds do not pay a fee for these services.
Gartmore SA Capital Trust and GISI have entered into agreements with BISYS Fund Services Ohio, Inc. (“BISYS”), pursuant to which BISYS provides sub-administration and sub-transfer agency services, respectively, to the Funds.
GSA and BISYS have agreed to designate certain sub-transfer agency agreements GSA enters into with respect to the Funds as “Qualifying Sub-TA Agreements.” With respect to Qualifying Sub-TA Agreements, BISYS will credit to GSA an amount equal to the lesser of (i) the actual amount GSA is charged by the sub-transfer agent under the applicable Qualifying Sub-TA Agreement or (ii) $10 per investor account; however, the aggregate amount paid with regard to all Qualifying Sub-TA Agreements, regardless of whether option (i) or (ii) applies, shall not exceed $200,000 per annum. BISYS will calculate and credit such amounts to GSA’s fees on a monthly basis. All amounts will be credited to each applicable Fund on a monthly basis.
Under the terms of an Administrative Services Plan, the Funds may pay fees to servicing organizations, such as broker-dealers, including Nationwide Financial Services, Inc. (“Nationwide Financial Services”), an affiliate of NWD Management & Research Trust, and financial institutions, which agree to provide administrative support services to the shareholders of certain classes. These services include, but are not limited, to the following: establishing and maintaining shareholder accounts; processing purchase and redemption transactions; arranging bank wires; performing shareholder sub-accounting; answering inquiries regarding the Funds; and other such services. These fees are based on an annual rate of up to 0.25% of the average daily net assets of the Class A, Class R, Service Class, and Institutional Service Class shares of each of the Funds.
For the year ended October 31, 2006, Nationwide Financial Services received the following amounts in Administrative Services Fees from each Fund:
| | | |
| Fund | | Amount |
Investor Destinations Aggressive | | $ | 741,851 |
Investor Destinations Moderately Aggressive | | | 1,214,348 |
Investor Destinations Moderate | | | 1,415,906 |
Investor Destinations Moderately Conservative | | | 297,898 |
Investor Destinations Conservative | | | 203,664 |
Optimal Allocations Moderately Aggressive | | | 26 |
Under terms of a letter agreement dated September 12, 2006, by and among GSA and the Audit Committees of the Funds and Gartmore Variable Insurance Trust, the Funds have agreed to reimburse GSA their pro-rata portion of certain costs related to the Funds’ ongoing administration, monitoring and annual (audit) testing of the Funds’ Rule 38a-1 Compliance Program subject to the pre-approval of the Funds’ Audit Committee. Such costs include: (1) $160 per hour for services performed on behalf of the Funds by employees of GSA or GSA’s affiliates (other than the Fund CCO); (2) travel costs and other reasonable incidental expenses (without markup) incurred by employees of GSA or GSA’s affiliates in connection with performance of such services; and (3) in the event it becomes necessary to supplement the services of GSA’s (and GSA’s affiliates’) employees, in order to complete the Funds’ Rule 38a-1 annual compliance audit, the costs of a mutually-agreed upon independent contractor’s costs to provide such services.
4. Bank Loans and Earnings Credit
The Trust has a credit agreement with JPMorgan Chase & Co., the Funds’ custodian bank, permitting the Trust to borrow up to $100,000,000. Borrowings under this arrangement bear interest at the Federal Funds rate plus 0.50%. The interest costs, if any, would be included in other fees in the Statement of Operations. No compensating balances were
required under the terms of the line of credit. The line of credit is renewed annually, expiring on June 26, 2007, with a commitment fee of 0.08% per year on $100,000,000. There were no borrowings outstanding under this line of credit during the year ended October 31, 2006.
The Trust’s custodian bank has agreed to reduce the bank’s fees (earnings credits) when the Funds of the Trust maintain cash on deposit in non-interest-bearing custody and Demand Deposit Accounts. Earnings credits are shown as a reduction of total expenses on the Statement of Operations.
5. Investment Transactions
Purchases and sales of Underlying Funds for the year ended October 31, 2006, are summarized as follows:
| | | | | | |
| Fund | | Purchases | | Sales |
Investor Destinations Aggressive | | $ | 231,610,370 | | $ | 33,505,690 |
Investor Destinations Moderately Aggressive | | | 328,526,210 | | | 71,387,788 |
Investor Destinations Moderate | | | 213,669,029 | | | 94,186,093 |
Investor Destinations Moderately Conservative | | | 66,021,500 | | | 32,280,361 |
Investor Destinations Conservative | | | 56,120,525 | | | 55,244,222 |
Optimal Allocations Aggressive | | | 10,277,348 | | | 3,555,160 |
Optimal Allocations Moderately Aggressive | | | 24,608,482 | | | 6,322,726 |
Optimal Allocations Moderate | | | 23,016,896 | | | 8,015,527 |
Optimal Allocations Specialty | | | 46,642,337 | | | 4,980,235 |
6. Indemnifications
Under the Trust’s organizational documents, certain of the Trust’s Officers and Trustees are indemnified against certain liabilities arising out of the performance of their duties to the Trust. In addition, the Trust has entered into Indemnification Agreements with its Trustees and certain of its Officers. Trust Officers receive no compensation from the Trust for serving as its Officers. In addition, in the normal course of business, the Trust enters into contracts with its vendors and others that provide for general indemnifications. The Trust’s maximum liability under these arrangements is unknown, as this would involve future claims that may be made against the Trust. Based on experience, however, the Trust expects that risk of loss to be remote.
7. Federal Tax Information
The tax character of distributions paid during the fiscal year ended October 31, 2006, was as follows: (Total distributions paid differ from the Statement of Changes in Net Assets because for tax purposes dividends are recognized when actually paid.)
| | | | | | | | | | | | |
| | | Distributions paid from | | | | |
| Fund | | Ordinary
Income | | Net Long
Term Capital
Gains | | Total Taxable
Distributions | | Total
Distributions
Paid |
Investor Destinations Aggressive | | $ | 11,922,086 | | $ | 11,597,446 | | $ | 23,519,532 | | $ | 23,519,532 |
Investor Destinations Moderately Aggressive | | | 22,514,585 | | | 13,980,503 | | | 36,495,088 | | | 36,495,088 |
Investor Destinations Moderate | | | 28,757,394 | | | 13,729,150 | | | 42,486,544 | | | 42,486,544 |
Investor Destinations Moderately Conservative | | | 7,595,261 | | | 4,171,167 | | | 11,766,428 | | | 11,766,428 |
Investor Destinations Conservative | | | 5,680,995 | | | 2,212,876 | | | 7,893,871 | | | 7,893,871 |
Optimal Allocations Aggressive | | | 286,695 | | | 69,954 | | | 356,649 | | | 356,649 |
Optimal Allocations Moderately Aggressive | | | 681,552 | | | 82,187 | | | 763,739 | | | 763,739 |
Optimal Allocations Moderate | | | 870,160 | | | 68,771 | | | 938,931 | | | 938,931 |
Optimal Allocations Specialty | | | 936,397 | | | 64,379 | | | 1,000,776 | | | 1,000,776 |
Notes to Financial Statements (Continued)
October 31, 2006
The tax character of distributions paid during the fiscal year ended October 31, 2005 was as follows: (Total distributions paid differ from the Statement of Changes in Net Assets because for tax purposes dividends are recognized when actually paid.)
| | | | | | | | | | | | |
| | | Distributions paid from | | | | |
| Fund | | Ordinary
Income | | Net Long
Term Capital
Gains | | Total Taxable
Distributions | | Total
Distributions
Paid |
Investor Destinations Aggressive | | $ | 8,635,093 | | $ | — | | $ | 8,635,093 | | $ | 8,635,093 |
Investor Destinations Moderately Aggressive | | | 15,316,033 | | | 52,876 | | | 15,368,909 | | | 15,368,909 |
Investor Destinations Moderate | | | 18,052,540 | | | 562,563 | | | 18,615,103 | | | 18,615,103 |
Investor Destinations Moderately Conservative | | | 5,255,078 | | | 196,919 | | | 5,451,997 | | | 5,451,997 |
Investor Destinations Conservative | | | 3,997,520 | | | 712,241 | | | 4,709,761 | | | 4,709,761 |
Optimal Allocations Aggressive | | | 36,982 | | | — | | | 36,982 | | | 36,982 |
Optimal Allocations Moderately Aggressive | | | 63,348 | | | — | | | 63,348 | | | 63,348 |
Optimal Allocations Moderate | | | 93,050 | | | — | | | 93,050 | | | 93,050 |
Optimal Allocations Specialty | | | 185,711 | | | — | | | 185,711 | | | 185,711 |
As of October 31, 2006, the components of accumulated earnings (deficit) on a tax basis was as follows:
| | | | | | | | | | | | | | |
| Fund | | Undistributed
Ordinary
Income | | Undistributed
Long-Term
Capital Gains | | Accumulated
Earnings | | Unrealized
Appreciation
(Depreciation)* | | Total
Accumulated
Earnings
(Deficit) |
Investor Destinations Aggressive | | $ | 2,057,783 | | $ | 17,297,105 | | $ | 19,354,888 | | $ | 139,187,486 | | 158,542,374 |
Investor Destinations Moderately Aggressive | | | 608,537 | | | 30,036,361 | | | 30,644,898 | | | 202,193,179 | | 232,838,077 |
Investor Destinations Moderate | | | 2,428,380 | | | 29,220,688 | | | 31,649,068 | | | 148,737,565 | | 180,386,633 |
Investor Destinations Moderately Conservative | | | 554,225 | | | 7,873,900 | | | 8,428,125 | | | 19,013,224 | | 27,441,349 |
Investor Destinations Conservative | | | 512,547 | | | 3,108,475 | | | 3,621,022 | | | 4,364,964 | | 7,985,986 |
Optimal Allocations Aggressive | | | 141,610 | | | 239,293 | | | 380,903 | | | 592,615 | | 973,518 |
Optimal Allocations Moderately Aggressive | | | 223,901 | | | 372,920 | | | 596,821 | | | 1,494,323 | | 2,091,144 |
Optimal Allocations Moderate | | | 196,512 | | | 339,516 | | | 536,028 | | | 1,482,732 | | 2,018,760 |
Optimal Allocations Specialty | | | — | | | 749,117 | | | 749,117 | | | 4,994,051 | | 5,743,168 |
| * | The differences between the book-basis and tax-basis unrealized appreciation (depreciation) is attributable primarily to: tax deferral of losses on wash sales; the difference between book and tax amortization methods for premium and market discount. |
As of October 31, 2006, the tax cost of securities and the breakdown of unrealized appreciation (depreciation) for each Fund were as follows:
| | | | | | | | | | | | |
| Fund | | Tax Cost of
Securities | | Unrealized
Appreciation | | Unrealized
Depreciation | | | Net
Unrealized
Appreciation
(Depreciation) |
Investor Destinations Aggressive | | $ | 712,685,704 | | $ | 139,522,328 | | $ | (334,842 | ) | | 139,187,486 |
Investor Destinations Moderately Aggressive | | | 1,196,945,226 | | | 204,230,404 | | | (2,037,225 | ) | | 202,193,179 |
Investor Destinations Moderate | | | 1,296,758,426 | | | 153,345,111 | | | (4,607,546 | ) | | 148,737,565 |
Investor Destinations Moderately Conservative | | | 297,738,918 | | | 20,564,886 | | | (1,551,662 | ) | | 19,013,224 |
Investor Destinations Conservative | | | 200,006,738 | | | 4,678,271 | | | (313,307 | ) | | 4,364,964 |
Optimal Allocations Aggressive | | | 10,718,144 | | | 633,357 | | | (40,742 | ) | | 592,615 |
Optimal Allocations Moderately Aggressive | | | 27,848,172 | | | 1,569,602 | | | (75,279 | ) | | 1,494,323 |
Optimal Allocations Moderate | | | 29,779,130 | | | 1,522,289 | | | (39,557 | ) | | 1,482,732 |
Optimal Allocations Specialty | | | 57,925,977 | | | 4,994,051 | | | — | | | 4,994,051 |
Recently Issued Accounting Pronouncements–On July 13, 2006, the Financial Accounting Standards Board (“FASB”) released FASB Interpretation No. 48, Accounting for Uncertainty in Income Taxes (“FIN 48”). FIN 48 provides guidance for how uncertain tax positions should be recognized, measured, presented and disclosed in the financial statements. FIN 48 requires the affirmative evaluation of tax positions taken or expected to be taken in the course of preparing the Funds’ tax returns to determine whether it is more-likely-than-not (i.e., greater than 50 percent) that each tax position will be sustained upon examination by a taxing authority based on the technical merits of the position. A tax position that meets the more-likely-than-not recognition threshold is measured to determine the amount of benefit to recognize in the financial statements. Differences between tax positions taken in a tax return and amounts recognized in the financial statements will generally result in an increase in a liability for taxes payable (or a reduction of a tax refund receivable) and an increase in a deferred tax liability (or a reduction in a deferred tax asset). Adoption of FIN 48 is required for fiscal years beginning after December 15, 2006 and is to be applied to all open tax years as of the effective date. At this time, management is evaluating the implications of FIN 48. Its impact to the financial statements has not yet been determined.
Report of Independent Registered Public Accounting Firm
To the Board of Trustees and Shareholders of Gartmore Mutual Funds:
In our opinion, the accompanying statements of assets and liabilities, including the statements of investments, and the related statements of operations and of changes in net assets and the financial highlights present fairly, in all material respects, the financial position of Gartmore Investor Destinations Aggressive Fund, Gartmore Investor Destinations Moderately Aggressive Fund, Gartmore Investor Destinations Moderate Fund, Gartmore Investor Destinations Moderately Conservative Fund, Gartmore Investor Destinations Conservative Fund, Gartmore Optimal Allocations Fund: Aggressive, Gartmore Optimal Allocations Fund: Moderately Aggressive, Gartmore Optimal Allocations Fund: Moderate and Gartmore Optimal Allocations Fund: Specialty (nine series of Gartmore Mutual Funds, hereafter referred to as the “Funds”) at October 31, 2006, the results of each of their operations for the year then ended, the changes in each of their net assets each of the two years then ended and the financial highlights for each of the periods indicated, in conformity with accounting principles generally accepted in the United States of America. These financial statements and financial highlights (hereafter referred to as “financial statements”) are the responsibility of the Funds’ management; our responsibility is to express an opinion on these financial statements based on our audits. We conducted our audits of these financial statements in accordance with the standards of the Public Company Accounting Oversight Board (United States.) Those standards require that we plan and perform the audit to obtain reasonable assurance about whether the financial statements are free of material misstatement. An audit includes examining, on a test basis, evidence supporting the amounts and disclosures in the financial statements, assessing the accounting principles used and significant estimates made by management, and evaluating the overall financial statement presentation. We believe that our audits, which included confirmation of securities at October 31, 2006 by correspondence with the underlying funds’ transfer agent, provide a reasonable basis for our opinion.
PricewaterhouseCoopers LLP
Philadelphia, Pennsylvania
December 20, 2006
Supplemental Information
1. Other Federal Tax Information (Unaudited)
For the period ended October 31, 2006, certain dividends paid by the Funds may be subject to a maximum tax rate of 15% as provided for by the Jobs and Growth Tax Relief Reconciliation Act of 2003. The Funds intend to designate the maximum amount allowable as taxed at a maximum rate of 15%. Complete information will be reported in conjunction with your 2006 Form 1099-DIV.
For the period ended October 31, 2006, the following Funds paid qualified dividend income:
| | | |
| Fund | | Qualified
Dividend
Income |
Investor Destinations Aggressive | | $ | 8,697,990 |
Investor Destinations Moderately Aggressive | | | 14,617,849 |
Investor Destinations Moderate | | | 11,650,601 |
Investor Destinations Moderately Conservative | | | 1,854,911 |
Investor Destinations Conservative | | | 38,826 |
Optimal Allocations Aggressive | | | 19,702 |
Optimal Allocations Moderately Aggressive | | | 55,626 |
Optimal Allocations Moderate | | | 66,415 |
Optimal Allocations Specialty | | | 158,776 |
For the taxable year ended October 31, 2006, the following percentage of income dividends paid by the Funds qualify for the dividends received deduction available to corporations:
| | |
| Fund | | Dividend
Received
Deduction |
Investor Destinations Aggressive | | 12% |
Investor Destinations Moderately Aggressive | | 11% |
Investor Destinations Moderate | | 9% |
Investor Destinations Moderately Conservative | | 6% |
Investor Destinations Conservative | | 1% |
Optimal Allocations Aggressive | | 5% |
Optimal Allocations Moderately Aggressive | | 5% |
Optimal Allocations Moderate | | 5% |
Optimal Allocations Specialty | | 7% |
The Funds designate the following amounts as long term capital gain distributions qualifying for the maximum 15% income tax rate for individuals:
| | | |
| Fund | | Amount |
Investor Destinations Aggressive | | $ | 11,597,446 |
Investor Destinations Moderately Aggressive | | | 13,980,504 |
Investor Destinations Moderate | | | 13,729,150 |
Investor Destinations Moderately Conservative | | | 4,171,166 |
Investor Destinations Conservative | | | 2,212,875 |
Optimal Allocations Aggressive | | | 69,954 |
Optimal Allocations Moderately Aggressive | | | 82,186 |
Optimal Allocations Moderate | | | 68,770 |
Optimal Allocations Specialty | | | 64,380 |
Management Information (Unaudited)
Trustees who are not Interested Persons (as defined in the 1940 Act) and Officers of the Funds as of October 31, 2006
| | | | | | | | |
Name, Address and
Year of Birth | | Position(s) Held
with the Trust
and Length of
Time Served1 | | Principal Occupation(s) During Past 5 Years | | Number of
Portfolios in the
Gartmore Fund
Complex Overseen
by Trustee | | Other Directorships Held by Trustee or
Nominee2 |
| | | | |
Charles E. Allen c/o NWD Investment Management, Inc. 1200 River Road, Suite 1000 Conshohocken, PA 19428 1948 | | Trustee since July 2000 | | Mr. Allen is Chairman, Chief Executive Officer and President of the Graimark Realty Advisors, Inc. (real estate development, investment and asset management). | | 97 | | None |
| | | | |
Paula H.J. Cholmondeley c/o NWD Investment Management, Inc. 1200 River Road, Suite 1000 Conshohocken, PA 19428 1947 | | Trustee since July 2000 | | Ms. Cholmondeley is an independent strategy consultant. Ms. Cholmondeley was Vice President and General Manager of Sappi Fine Paper North America from April 2000 through December 2003. | | 97 | | Director of Dentsply International, Inc., Ultralife Batteries, Inc., Terex Corporation, Minerals Technology, Inc. and Albany International Corp. |
| | | | |
C. Brent DeVore3 c/o NWD Investment Management, Inc. 1200 River Road, Suite 1000 Conshohocken, PA 19428 1940 | | Trustee since 1990 | | Dr. DeVore is President of Otterbein College. | | 97 | | None |
| | | | |
Phyllis K. Dryden c/o NWD Investment Management, Inc. 1200 River Road, Suite 1000 Conshohocken, PA 19428 1947 | | Trustee since December 2004 | | Beginning in February 2006 Ms. Dryden is employed by The Mitchell Madison Group, a management consulting company. Ms. Dryden was a former Managing Partner of marchFIRST, a global management consulting firm prior to February 2002. | | 97 | | None |
| | | | |
Barbara L. Hennigar c/o NWD Investment Management, Inc. 1200 River Road, Suite 1000 Conshohocken, PA 19428 1935 | | Trustee since July 2000 | | Retired. | | 97 | | None |
Trustees who are not Interested Persons (as defined in the 1940 Act) and Officers of the Funds as of October 31, 2006 (Continued)
| | | | | | | | |
Name, Address
and Year of Birth | | Position(s) Held
with the Trust
and Length of
Time Served1 | | Principal Occupation(s)
During Past
5 Years | | Number of
Portfolios
in the
Gartmore Fund
Complex Overseen
by Trustee | | Other
Directorships
Held by Trustee or
Nominee2 |
| | | | |
Barbara I. Jacobs c/o NWD Investment Management, Inc. 1200 River Road, Suite 1000 Conshohocken, PA 19428 1950 | | Trustee since December 2004 | | Ms. Jacobs served as Chairman of the Board of Directors of KICAP Network Fund, a European (United Kingdom) hedge fund, from December 2000 through January 2006. Prior to 2004, Ms. Jacobs was also a Managing Director and European Portfolio Manager with Teachers Insurance and Annuity Association - College Retirement Equities Fund. | | 97 | | None |
| | | | |
Douglas F. Kridler c/o NWD Investment Management, Inc. 1200 River Road, Suite 1000 Conshohocken, PA 19428 1955 | | Trustee since September 1997 | | Mr. Kridler has served as the President and Chief Executive Officer of the Columbus Foundation (a Columbus, OH-based foundation which manages over 1,300 individual endowment funds) since February 2002. Prior to January 31, 2002, Mr. Kridler was the President of the Columbus Association for the Performing Arts and Chairman of the Greater Columbus Convention and Visitors Bureau. | | 97 | | None |
| | | | |
Michael D. McCarthy c/o NWD Investment Management, Inc. 1200 River Road, Suite 1000 Conshohocken, PA 19428 1947 | | Trustee since December 2004 | | Retired. Mr. McCarthy was Chairman of VMAC (commodity swaps) from October 2002 until June 2005; and a partner of Pineville Properties LLC (a commercial real estate development firm). | | 97 | | None |
| | | | |
David C. Wetmore c/o NWD Investment Management, Inc. 1200 River Road, Suite 1000 Conshohocken, PA 19428 1948 | | Trustee since 1995 and Chairman since February 2005 | | Retired. | | 97 | | None |
| 1 | Length of time served includes time served with the Trust’s predecessors. |
| 2 | Directorships held in (1) any other investment companies registered under the 1940 Act, (2) any company with a class of securities registered pursuant to Section 12 of the Securities Exchange Act of 1934, as amended (the “Exchange Act”), or (3) any company subject to the requirements of Section 15(d) of the Exchange Act. |
| 3 | Mr. DeVore has served as President of Otterbein College since 1984. Mark Thresher, President and Chief Operating Officer of Nationwide Financial Services, Inc. (“NFS”) has served as a member of the Board of Trustees of Otterbein College since 2000, currently serves as one of 30 of its trustees, and is currently one of two Vice Chairmen of the Board. NFS is under common control with each of the Gartmore companies that serve as investment advisers and principal underwriter to the Trust, as each is a majority-owned subsidiary of Nationwide Corporation (“NC”) and, through NC, of Nationwide Mutual Insurance Company (95.2%) and Nationwide Mutual Fire Insurance Company (4.8%). |
Additional information regarding the Trustees and Officers may be found in the Trust’s Statement of Additional Information, which is available without charge upon request, by calling 800-848-0920.
Management Information (Unaudited)
Trustees who are Interested Persons (as defined in the 1940 Act) and/or Officers of the Funds as of October 31, 2006
| | | | | | | | |
Name, Address and
Year of Birth | | Position(s) Held with the
Trust and
Length of Time Served1 | | Principal Occupation(s) During Past 5 Years | | Number of
Portfolios in the Gartmore Fund
Complex
Overseen by
Trustee | | Other Directorships Held by Trustee2 |
| | | | |
Paul J. Hondros NWD Investment Management, Inc. 1200 River Road, Suite 1000 Conshohocken, PA 19428 1948 | | Trustee since July 2000 | | Mr. Hondros has been President and Chief Executive Officer of various NWD Investments Group entities, including Gartmore Distribution Services, Inc. (“GDSI”),3 Gartmore Investor Services, Inc. (“GISI”),3 Gartmore Morley Capital Management, Inc. (“GMCM”),3 Morley Financial Services, Inc. (“MFS”), 3 NorthPointe Capital, LLC (“NorthPointe”),3 NWD Management & Research Trust (“NWDMRT”),3 NWD Investment Management, Inc. (“NWDIM”),3 Gartmore Mutual Fund Capital Trust (“GMFCT”)3 and Gartmore SA Capital Trust (“GSA”)3; and a Director of Nationwide Securities, Inc.,3 as well as several entities within Nationwide Financial Services, Inc. | | 97 | | None |
| | | | |
Arden L. Shisler c/o NWD Investment Management, Inc. 1200 River Road, Suite 1000 Conshohocken, PA 19428 1941 | | Trustee since February 2000 | | Retired. Mr. Shisler is the former President and Chief Executive Officer of K&B Transport, Inc., a trucking firm (2000 through 2002). He served as a consultant to K&B from January 2003 through December 2004. Since 1992, Mr. Shisler has also been Chairman of the Board for Nationwide Mutual Insurance Company.3 | | 97 | | Director of Nationwide Financial Services, Inc. |
| | | | |
Gerald J. Holland NWD Investment Management, Inc. 1200 River Road, Suite 1000 Conshohocken, PA 19428 1951 | | Treasurer since March 2001 | | Mr. Holland is Senior Vice President – Operations for NWDIM,3 GMFCT,3 and GSA.3 | | N/A | | N/A |
| | | | |
Michael A. Krulikowski NWD Investment Management, Inc. 1200 River Road, Suite 1000 Conshohocken, PA 19428 1959 | | Chief Compliance Officer since June 2004 | | Since November 1999, Mr. Krulikowski has served as a Vice President and Chief Compliance Officer of NWDIM3. Since June 2004, Mr. Krulikowski has also served as Chief Compliance Officer of the Trust. | | N/A | | N/A |
Trustees who are Interested Persons (as defined in the 1940 Act) and/or Officers of the Funds as of October 31, 2006 (Continued)
| | | | | | | | |
Name, Address and
Year of Birth | | Position(s) Held with the
Trust and
Length of Time Served1 | | Principal Occupation(s) During Past 5 Years | | Number of
Portfolios in the Gartmore Fund
Complex Overseen
by Trustee | | Other Directorships Held by Trustee2 |
| | | | |
Eric E. Miller NWD Investment Management, Inc. 1200 River Road, Suite 1000 Conshohocken, PA 19428 1953 | | Secretary since December 2002 | | Mr. Miller is Senior Vice President, Chief Counsel for NWDIM,3 GMFCT3 and GSA3 since August 2002. From August 2000 to August 2002, Mr. Miller was a Partner with Stradley Ronan Stevens & Young, LLP. | | N/A | | N/A |
| 1 | Length of time served includes time served with the Trust’s predecessors. |
| 2 | Directorships held in (1) any other investment companies registered under the 1940 Act, (2) any company with a class of securities registered pursuant to Section 12 of the Securities Exchange Act of 1934, as amended (the “Exchange Act”), or (3) any company subject to the requirements of Section 15(d) of the Exchange Act. |
| 3 | This position is held with an affiliated person or principal underwriter of the Trust. |
Federal law requires the Trust, each of its investment advisers and sub-advisers to adopt procedures for voting proxies (“Proxy Voting Guidelines”) and to provide a summary of those Proxy Voting Guidelines used to vote the securities held by the Funds. The Funds’ proxy voting policies and procedures are available without charge (i) upon request, by calling 800-848-0920, (ii) on the Fund’s website at www.nwdfunds.com, or (iii) on the Securities and Exchange Commission’s website at www.sec.gov.
AnnualReport
| | |
| | |

| | October 31, 2006 |
Commentary provided by Gartmore Mutual Fund Capital Trust (the “Adviser”), investment adviser to Gartmore Funds. All opinions and estimates included in this report constitute the Advisers’ judgment as of the date of this report and are subject to change without notice.
As of September 29, 2006, Gartmore Funds and its U.S. operations, as well as the Funds’ Advisers, distributor, and other service providers, are no longer affiliated with Gartmore Investment Management plc (Gartmore U.K.) or other Gartmore international businesses. Certain Gartmore U.S. companies, and marketing materials related to them, will continue to carry the Gartmore name for the next several months under the terms of an agreement with Gartmore U.K. For more information call, 800-848-0920.
Statement Regarding Availability of Quarterly Portfolio Schedule.
The Gartmore Funds file complete schedules of portfolio holdings for each Fund with the Securities and Exchange Commission (the “Commission”) for the first and third quarters of each fiscal year on Form N-Q. The Funds’ Forms N-Q are available on the Commission’s website at http://www.sec.gov. The Funds’ Forms N-Q may be reviewed and copied at the Commission’s Public Reference Room in Washington, DC, and information on the operation of the Public Reference Room may be obtained by calling 800-SEC-0330; and the Funds make the information on Form N-Q available to shareholders on www.nwdfunds.com or upon request without charge.
Statement Regarding Availability of Proxy Voting Record.
Information regarding how the Funds voted proxies relating to portfolio securities held during the most recent 12-month period ended June 30, 2006 is available without charge, upon request, by calling 800-848-0920, and on the Commission’s website at http://www.sec.gov.
Message to Shareholders
December 15, 2006
Dear Shareholders:
This reporting period has been a time of change for our company. First, in September 2006, our parent company, Nationwide Mutual Insurance Company (Nationwide), completed the sale of the U.K.-based Gartmore Investment Management Ltd. (Gartmore U.K.). As a result of the sale, on November 30, 2006, Gartmore Global Investments, the U.S. division of Nationwide’s asset management business, changed its name to NWD Investments. All of the mutual funds advised by NWD Investments, however, will retain the Gartmore Funds name until May 2007. In addition, Gartmore U.K. will continue to act as subadviser for a number of Gartmore Funds, and, as a result, investors in those funds that include foreign exposure can expect “business as usual”. Nationwide has been examining how best to align NWD Investments as a part of its operations since the sale of Gartmore U.K. and on December 21, 2006, announced that it had reached a preliminary agreement of terms to sell NWD Investment’s retail operations to Nationwide Financial Services, Inc.
Second, I must report that this will be my final shareholder letter. Effective December 15, 2006, John Grady, who joined our firm in October as transition manager, was named as president of NWD Investments and was elected by the Gartmore Funds Board of Trustees to the role of president and chief executive officer. I’m confident that John’s extensive background in this industry will serve NWD Investments well as the company prepares for its next chapter of growth. I have enjoyed serving all of you, and I wish you much success in the years to come.
Market Overview
Global stock markets delivered strong gains for the year ended October 31, 2006, but the period was not without its share of volatility. During the first six months, the markets did a good job of advancing despite the headwinds of rising crude oil prices, interest-rate hikes by the Federal Reserve Board and the replacement of retiring Federal Reserve Chairman Alan Greenspan by Ben Bernanke. The central bank’s May 10 rate hike, however, marked a critical turning point. Disappointment that the Fed did not stand pat, together with concerns about inflationary pressures and the possibility of further rate hikes, triggered sharp declines in global stock markets. Small-capitalization stocks and growth sectors such as technology generally suffered the most during the sell-off.
Throughout the summer, inflation moderated a bit, and more evidence of a slowing U.S. economy emerged. The Fed reacted by leaving interest rates unchanged at its August, September and October meetings. Falling energy prices in the final months of the reporting period provided further fuel for the markets, sparking a rebound in stock prices. For the one-year reporting period, the S&P 500® Index recorded a return of 16.34%. A weak U.S. dollar helped lift foreign markets to even better returns; the Morgan Stanley Capital International Europe, Australasia and Far East (MSCI EAFE®) Index posted a gain of 28.04%. Value stocks maintained a commanding lead over growth shares during the period, while small-cap issues topped larger caps.
It’s Official—We’re Lipper’s best “Overall Small Fund Family”
From the beginning, we’ve made it our mission to be good stewards of our investors’ money. Stewardship can be measured in various ways, but in the mutual fund business, investment performance is one obvious yardstick. That’s why we’re delighted to have been honored with the best “Overall Small Fund Family” award at the 2006 Lipper Fund Awards. Significantly, this award was not based on results tallied over just one year. According to Lipper, a key factor in the selection process was our consistent, strong risk-adjusted returns in several different asset classes relative to those of our peers for three years ended December 31, 2005. We appreciate this recognition of our commitment to delivering returns for our investors, and we consider the award a validation of our approach.
International Fund Highlights
Our confidence in our non-U.S. subadvised funds was amply rewarded during the one-year reporting period. For example, the Gartmore Worldwide Leaders Fund posted a gain of 26.22%*, compared with 21.91% for the MSCI World IndexSM. The Fund’s performance placed the Fund in the top 4% among its Lipper peer group, Global Large-Cap Core Funds (consisting of 59 funds as of October 31, 2006). In recognition of the Gartmore Worldwide Leaders Fund’s outstanding track record, it received the nod as Best Global Large-Cap Core Fund at the 2006 Lipper Fund Awards. Also meriting mention was the Gartmore International Growth Fund, whose 38.22% return went above and beyond the 28.91% return posted by the MSCI All Country World excluding U.S. Index and earned it a ranking in the top 1% among its Lipper peer group, International Multi-Cap Core Funds (consisting of 904 funds as of October 31, 2006).
Small-Cap Lineup Delivers Strong Results
Our commitment to small-cap investing remains an important theme. Offering several investment choices, including funds that invest in companies that may receive scant attention from the vast majority of Wall Street analysts, small caps typically are a much less efficient asset class than their large-cap and even mid-cap counterparts. This means that more
opportunities may exist for our experienced portfolio managers to identify and potentially capitalize on mispriced stocks. Our success in this area was reflected in strong performance during the past year across most of our small-cap products.
One of our newer entries, the Gartmore Small Cap Leaders Fund, offers exposure to both growth and value opportunities through two separate “sleeves” or subportfolios, each with its own management team. During the one-year reporting period, this Fund delivered a 30.65% return, far surpassing the 19.98% result of the Russell 2000® Index. The Fund also finished in the top 2% of Lipper Small-Cap Core Funds (consisting of 689 funds as of October 31, 2006). The Gartmore Small Cap Fund delivered comparable results, with a 30.98% return, beating the same benchmark, the Russell 2000 Index. Notably, this Fund also posted exceptionally strong performance over longer periods of time, placing in the top 2% of its peers among Lipper Small-Cap Core Funds (consisting of 689 funds as of October 31, 2006). for the five years ended October 31, 2006.
To further broaden investors’ choices in the small-cap area and to leverage the experience of our seasoned portfolio managers, we introduced three new funds near the end of September 2006: the Gartmore Small Cap Growth Opportunities Fund, the Gartmore Small Cap Core Fund and the Gartmore Small Cap Value Fund. At the same time, we debuted two absolute-return products: the Gartmore Market Neutral Fund and the Gartmore Hedged Core Equity Fund. These two products are designed for more conservative investors looking for a fund that offers a mix of long and short positions, as well as the potential for lower correlation with the broader equity markets.
Diversifying with Sector Funds
Once an investor has built a solid portfolio around a select group of core funds, sector funds may offer an effective way to enhance both long-term performance and diversification. In this category, several funds with a global scope performed well, including the Gartmore Global Natural Resources Fund, with a 22.87% gain that outdistanced the 17.96% return of its benchmark, the Goldman Sachs Natural Resources Index. Also finishing the period in fine form was the Gartmore Global Utilities Fund, with a return of 27.56%—performance that was good enough to surpass that of the Fund’s composite benchmark of 60% MSCI World Telecommunication Services IndexSM and 40% MSCI World Utilities IndexSM, which returned 25.61%. Last of all, amid considerable volatility for technology stocks, the Gartmore Global Technology and Communications Fund posted a 13.48% return, handily beating the 10.35% return of the Goldman Sachs Technology Composite Index (GSTI®), our benchmark for this Fund.
Strategically combining core equity and fixed-income funds with sector exposure is exhibited in our Gartmore Optimal Allocations “fund of funds” series. We now offer five variations on this theme, three of which are designed to be complete asset allocation solutions: these are the Aggressive, Moderately Aggressive and Moderate Funds within the Optimal Allocations series—each with different mixes of underlying funds—targeting specific risk levels fitting those descriptions. The Gartmore Optimal Allocations Fund: Specialty is intended for investors who already have core investments in place and seek to enhance their overall risk-adjusted returns by exposure to a select group of specialty funds. After the one-year reporting period closed, moreover, we launched the Gartmore Optimal Allocations Fund: Defensive. This new offering is designed for investors who have a lower tolerance for risk and want to complement a core holding by seeking sustainable real returns as a hedge against possible economic deterioration, including inflation, deflation or rising interest rates.
With asset allocation models designed by Ibbotson Associates, a leading authority on asset allocation, the Optimal Allocations Funds are designed to expand an average investor’s “efficient frontier”—that is, they seek to provide the most efficient combination of various asset classes to achieve the highest possible return for a given level of risk. The results to date have been gratifying: for the one-year reporting period, all four Optimal Allocations funds placed in the top quartile of their respective Lipper peer groups (consisting of 592 Mixed-Asset Target Allocation Growth Funds, 414 Mixed-Asset Target Allocation Moderate Funds, 904 Multi-Cap Core Funds and 104 Specialty/Miscellaneous Funds as of October 31, 2006).
Short-Term Shortfall from Long-Term Winner
Although the Gartmore U.S. Growth Leaders Fund, which is managed by one of our talented, veteran portfolio managers, Christopher Baggini, struggled during this reporting period with a return of 1.77%, the Fund’s longer-term record remained enviable: its five-year return of 10.98% was well ahead of the S&P 500 Index’s 7.26% gain, and the Fund occupied the 8th percentile versus other Lipper Multi-Cap Growth Funds (consisting of 332 funds as of Oct. 31, 2006).
Message to Shareholders
Continued
We Appreciate Your Business
We take the charge of managing your assets very seriously. While other companies might make that same claim, we can point to our recent company-level and fund-specific Lipper awards as evidence that we have “walked the talk”. As we close the books on an eventful year—both for the markets and for our company—you can be sure that NWD Investments will continue its pursuit of superior long-term, risk-adjusted returns for the benefit of you, our valued shareholders.

Paul J. Hondros

John H. Grady
| * | All Gartmore Funds performance returns are Class A at NAV, except where noted. |
Lipper, a wholly owned subsidiary of Reuters, is a leading global provider of mutual fund information and analysis to fund companies, financial intermediaries and media organizations. The firm competed with 17 eligible small fund families, defined as groups with at least three equity, three bond and three mixed-equity portfolios that received Consistent Return scores as of Dec. 31, 2005. Consistent Return is a quantitative metric that incorporates two characteristics: risk-adjusted return and the strength of the fund’s performance trend. Lipper determined the award winner by averaging the decile rank of the three-year Consistent Return scores for all of the funds within the eligible groups. The fund family with the lowest average decile rank received the award. Although Lipper makes reasonable efforts to ensure the accuracy and reliability of the data, the accuracy is not guaranteed by Lipper.
For the “Global Large Cap Core Funds” award, Lipper determined the award winner by calculating the highest Consistent Return over the three-year time period ended Dec. 31, 2005. Gartmore Funds competed among 16 global large-cap core portfolios to win the award.
Funds that concentrate on specific sectors or a relatively small number of securities may be subject to greater volatility than that of other mutual funds.
International investing involves additional risks, including currency fluctuations, differences in accounting standards, political instability and foreign regulations, all of which are magnified in emerging markets.
Small-company stocks have higher risks than the stocks of larger, more established companies and have significant short-term price volatility.
Sophisticated investment strategies such as leverage, short selling, short-term trading and investing in derivatives, REITs and IPOs may cause a Fund to have greater risk and volatility and higher expenses than those of other investments.
The Gartmore Optimal Allocations Funds are designed to provide diversification and asset allocation across several types of investments and asset classes, primarily by investing in underlying Gartmore Funds. Each Fund is subject to different levels of risk, based on the size of its asset class allocations. Each Fund’s underlying funds may be subject to specific investment risks such as those associated with a concentrated number of securities (such as REITs), small companies, international stocks, initial public offerings, short selling, short-term trading, bonds and short-term instruments. There is no assurance that a diversified portfolio will produce better results than a nondiversified one.
Index returns do not include the effect of any sales charges or expenses. If sales charges and expenses were deducted, the actual returns of each Index would be lower. It is not possible to invest directly in an Index.
Goldman Sachs Natural Resources Index: An unmanaged, modified market capitalization-weighted sector index of U.S.-traded natural resource-related stocks; includes companies in the categories of extractive industries, energy companies, owners and operators of timber tracts, forestry services, producers of pulp and paper, and owners of plantations.
Morgan Stanley Capital International (MSCI) All Country World excluding U.S. Index: An unmanaged, free float-adjusted, market-capitalization weighted index that is designed to measure the performance of the stocks in companies in all countries except the United States.
Morgan Stanley Capital International Europe, Australasia and Far East (MSCI EAFE®) Index: An unmanaged, free float-adjusted, market capitalization-weighted index that is designed to measure the performance of stocks in developed markets outside the United States and Canada.
Morgan Stanley Capital International (MSCI) World IndexSM: An unmanaged, free float-adjusted, market capitalization-weighted index that is designed to measure the performance of global developed-market equities.
Morgan Stanley Capital International (MSCI) World Telecommunication Services IndexSM: An unmanaged index that is based on developed-market country indexes and is generally representative of the stocks in the global utilities sector.
Morgan Stanley Capital International (MSCI) World Utilities IndexSM: An unmanaged index that is based on developed- market
country indexes and is generally representative of the stocks in the utilities sector, which includes industry groups such as electric, gas, multi-utilities, and unregulated power and water.
Russell 2000® Index: An unmanaged index that measures the performance of the stocks of U.S. companies.
Standard & Poor’s 500® (S&P 500) Index: An unmanaged, market capitalization-weighted index of 500 widely held stocks of large-cap U.S. companies that gives a broad look at how the stock prices of those companies have performed.
Lipper Analytical Services, Inc. is an industry research firm whose rankings are based on total return performance and do not reflect the effect of sales charges. Each fund is ranked within a universe of funds similar in investment objective as determined by Lipper.
The Lipper scores listed are based on monthly data. Lipper scores are subject to change every month. The Lipper Average is a straight average of the specific Lipper Universe.
This information is provided for educational purposes only and should not be considered investment advice. Lipper ratings are not intended to predict future results, and Lipper does not guarantee the accuracy of this information.
Investing in mutual funds involves risk, including possible loss of principal.
There is no assurance that the investment objective of any fund will be achieved.
Third-party information has been obtained from and is based on sources the Firm believes to be reliable. However, the Firm does not guarantee the accuracy of the information, and it may be incomplete or condensed.
Views expressed within are as of the date noted and are subject to change at any time.
The Funds’ adviser, one of its affiliated advisers, or its employees, may have a position in the securities named in this report.
This report is for informational purposes only, and is not intended as an offer or recommendation with respect to the purchase or sale of any security, option, future or other derivatives in such securities.
An investment in a money market fund is not insured or guaranteed by the FDIC or any other government agency. Although a money market fund seeks to preserve the value of your investment at $1.00 per share, it is possible to lose money by investing in the money market.
PAST PERFORMANCE DOES NOT GUARANTEE FUTURE RESULTS. To obtain performance information current to the most recent month-end, which may be higher or lower than the performance shown, please call 800-848-0920 or visit www.nwdfunds.com.
Investors should carefully consider a fund’s investment objectives, risks, fees, charges and expenses before investing any money. To obtain this and other fund information, please call 800-848-0920 to request a prospectus, or download a prospectus at www.nwdfunds.com. Please read it carefully before investing any money.
Gartmore Funds distributed by Gartmore Distribution Services, Inc., Member NASD. 1200 River Road, Suite 1000, Conshohocken, Pa. 19428.
As of September 29, 2006, Gartmore Funds and its U.S. operations, as well as the Funds’ advisers, distributor, and other service providers, are no longer affiliated with Gartmore Investment Management plc (Gartmore U.K.) or other Gartmore international businesses. Certain Gartmore U.S. companies, and marketing materials related to them, will continue to carry the Gartmore name for the next several months under the terms of an agreement with Gartmore U.K. For more information, please call 800-848-0920.
Key Investment Terminology
In an effort to help you better understand the many concepts involved in annual reports, we have defined the following terms:
Common stock—securities representing shares of ownership of a corporation.
Convertible securities—debt securities or preferred stocks that may be converted into common stock. While a convertible security is a fixed-income security that typically pays interest or dividend income, its market value also tends to correspond to market changes in the value of the underlying common stock.
Equity securities—securities including common stock, preferred stock, securities convertible into common stock or securities (or other investments) with prices linked to the value of common stocks, foreign investment funds or trusts and depositary receipts, that represent an ownership interest in the issuer.
Growth style—a style of investing in equity securities of companies that the Fund’s management believes have above-average rates of earnings growth and which therefore may experience above-average increases in stock price.
Large-cap companies—companies whose market capitalization is similar to those of companies included in the Russell 1000® Index, ranging from $563 million to $371.7 billion as of December 31, 2005.
Market capitalization—a common way of measuring the size of a company based on the price of its common stock times the number of outstanding shares.
Mid-cap companies—companies whose market capitalization is similar to those of companies included in the Russell Midcap® Index, ranging from $565 million to $18.4 billion as of December 31, 2005.
Small-cap companies—companies whose market capitalization similar to those of companies included in the Russell 2000® Index, ranging from $26 million to $4.4 billion as of December 31, 2005.
Total return—investment return that reflects both capital appreciation or depreciation (increase or decrease in the market value of a security) and income (i.e., interest or dividends).
Valuation—the process of determining the current worth of an asset or company.
Value style—a style of investing in equity securities that the Fund’s management believes are undervalued, which means that their prices are less than Fund management believes they are worth, based on such factors as price-to-book ratio, price-to-earnings ratio and cash flow. Companies issuing such securities may be currently out of favor or experiencing poor operating conditions that Fund management believes to be temporary.
Asset-backed securities—fixed-income securities issued by a trust or other legal entity established for the purpose of issuing securities and holding certain assets, such as credit card receivables or auto leases, that pay down over time and generate sufficient cash to pay holders of the securities.
Commercial paper—short-term debt instruments, usually unsecured, issued by banks and corporations by banks and corporations in order to finance their short-term credit needs, such as accounts receivable or inventory and is acquired at either a discount or is interest bearing.
Corporate bonds—debt securities issued by corporate issuers, as distinct from fixed-income securities issued by a government or its agencies or instrumentalities.
Duration—related in part to the remaining time until maturity of a bond, duration is a measure of how much the price of a bond would change compared to a change in market interest rates. A bond’s value drops when interest rates rise, and vice versa. Bonds with longer durations have higher risk and volatility.
Fixed-income securities—securities, including bonds and other debt securities, that represent an obligation by the issuer to pay a specified rate of interest or dividend at specified times.
Investment grade—the four highest rating categories of nationally recognized rating agencies, including Moody’s, Standard & Poor’s and Fitch.
High-yield bonds—fixed-income securities rated below investment grade by nationally recognized rating agencies, including Moody’s, Standard & Poor’s and Fitch, or unrated securities that Fund management believes are of comparable quality. These bonds are often referred to as “junk bonds”. They generally offer investors higher interest rates as a way to help compensate for the fact that the issuer is at greater risk of default.
Maturity—the time at which the principal amount of a bond is scheduled to be returned to investors.
Mortgage-backed securities—fixed-income securities that give the holder the right to receive a portion of principal and/or interest payments made on a pool of residential or commercial mortgage loans, which in some cases are guaranteed by government agencies.
Municipal obligations—fixed-income securities issued by, or on behalf of, states, cities and other local governmental entities, to pay for construction and other projects. They are loans that investors make to a governmental entity; the governmental entity gets the cash it needs to complete its project and the lenders earn interest payments and get their principal back. Municipal obligations that qualify pay interest that is generally exempt from federal income taxes, although certain investors may nonetheless be subject to federal alternative minimum tax.
Total return—investment return that reflects both capital appreciation or depreciation (increase or decrease in the market value of a security) and income (i.e., interest or dividends).
U.S. government agency securities—debt securities issued and/or guaranteed as to principal and interest by U.S. government agencies, U.S. government-sponsored enterprises and U.S. government instrumentalities that are not direct obligations of the United States. Such securities may not be supported by the full faith and credit of the United States.
U.S. government securities—debt securities issued and/or guaranteed as to principal and interest by the U.S. government that are supported by the full faith and credit of the United States.
Gartmore Growth Fund
For the annual period ended Oct. 31, 2006, the Gartmore Growth Fund (Class A at NAV) returned 7.62% versus 10.84% for its benchmark, the Russell 1000® Growth Index. For broader comparison, the average return for the Fund’s Lipper peer category of Multi-Cap Growth Funds (consisting of 495 funds as of Oct. 31, 2006) was 10.39%.
Although large-capitalization growth stocks posted respectable gains during the reporting period, these stocks trailed most other size and style groups. Within the large-cap segment, value outperformed growth by almost a two-to-one margin. Value stocks were especially attractive to investors during the late spring/early summer market correction, which developed in response to fears about intensifying inflationary pressures and signs that the Federal Reserve Board might hike interest rates more than expected. Those fears eased somewhat during the summer months as inflation data moderated and economic growth decelerated. The Federal Reserve responded by holding rates steady at its August, September and October Federal Open Market Committee (FOMC) meetings. Falling energy prices near the end of the period added to investors’ optimism. As a result, growth outpaced value in the large-cap space during the rally that occurred in the final three months of the reporting period.
Stock selection detracted from the Fund’s returns in health care, energy and information technology. Fund holding St. Jude Medical, Inc. hurt the Fund in the health care sector; the firm was one of several affected by slowing sales of defibrillators. Two biotechnology stocks held by the Fund, Celgene Corp. and Genzyme Corp. also were detrimental to the Fund’s results. We sold the Fund’s St. Jude Medical and Celgene holdings but added to our position in Genzyme, based on Genzyme’s favorable long-term prospects. In the energy sector, the Fund’s performance suffered due to holdings in refiner Tesoro Corp., which saw its profit margins erode versus expectations in the face of falling crude oil prices in the final months of the period. In technology, Fund holdings Marvell Technology Group Ltd. and McAfee, Inc. both fell prey to the controversy surrounding stock options pricing policies. We sold McAfee but held onto Marvell Technology.
On the positive side, stock selection in industrials, materials and consumer staples aided the Fund’s performance. Within industrials, defense contractors Textron Inc. and Rockwell Collins, Inc. were notable contributors to Fund performance. Textron reported favorable third-quarter earnings driven by strong performance at its Cessna and Bell divisions. Meanwhile, Rockwell Collins lifted its 2007 earnings guidance as a result of an accelerated share repurchase program. In materials, Fund holding Inco Ltd., a nickel producer, was acquired on favorable terms during the reporting period, while Fund holding Praxair, Inc. benefited from strong demand for its industrial gases. Meanwhile, consumer staples Fund holding CVS Corp. added value to the Fund, driven in part by robust same-store sales.
We believe that the market could continue to be helped by an accommodative Fed, relatively benign inflation and slow but healthy economic growth. Some sectors could experience volatility, however, as investors sort out the significance of the Democrats’ recent victories in the mid-term elections. Overall, though, we look for a constructive environment for stocks over the near term. In addition, we believe that the large-cap growth space is attractively valued relative to other size and style groups.
Portfolio Managers:
Christopher Baggini, CFA and Douglas Burtnick, CFA
| | |
| Fund Performance | | Gartmore Growth Fund |
Average Annual Total Return
(For periods ended October 31, 2006)
| | | | | | | | |
| | | | | 1 Yr. | | 5 Yr. | | 10 Yr. |
| Class A1 | | w/o SC2 | | 7.62% | | 4.13% | | 0.77% |
| | | w/SC3 | | 1.41% | | 2.90% | | 0.18% |
| Class B1 | | w/o SC2 | | 6.99% | | 3.50% | | -0.06% |
| | | w/SC4 | | 1.99% | | 3.15% | | -0.06% |
| Class C1 | | w/o SC2 | | 6.82% | | 3.46% | | 0.35% |
| | | w/SC5 | | 5.82% | | 3.46% | | 0.35% |
| Class D6 | | w/o SC2 | | 7.93% | | 4.43% | | 1.01% |
| | | w/SC7 | | 3.09% | | 3.47% | | 0.54% |
| Class R1,8 | | | | 7.39% | | 4.16% | | 0.88% |
| Institutional Service Class1,8 | | 7.92% | | 4.46% | | 1.02% |
| Institutional Class1,8 | | 7.94% | | 4.40% | | 0.99% |
All figures showing the effect of a sales charge reflect the maximum charge possible, because it has the most dramatic effect on performance data.
| 1 | These returns through May 11, 1998 include the performance of the Fund’s predecessor fund, and, for periods from May 11, 1998 to the creation of the class, include the performance of the Fund’s Class D shares. These returns were achieved prior to the creation of Class A and Class B shares (5/11/98), Class C shares (3/1/01), Institutional Service Class shares (1/2/02), Class R shares (10/1/03), and Institutional Class shares (6/29/04). Excluding the effect of any fee waivers or reimbursements, such prior performance is similar to what Class A, Class B, Class C, Institutional Service Class, Class R shares and Institutional Class shares would have produced during those periods because all classes of the Fund’s shares invest in the same portfolio of securities. The performance for these classes has been restated to reflect differences in sales charges (where applicable), but does not reflect the differing levels of other fees (primarily Rule 12b-1 and/or administrative services fees) applicable to such classes. If these other fees were reflected, the performance for Class A, Class B, Class C and Class R shares would have been lower. |
| 2 | These returns do not reflect the effects of sales charges (SC). |
| 3 | A 5.75% front-end sales charge was deducted. |
| 4 | A 5.00% contingent deferred sales charge (CDSC) was deducted. The CDSC declines to 0% after 6 years. |
| 5 | A CDSC of 1.00% was deducted from the one year return because it is charged when you sell Class C shares within the first year after purchase. |
| 6 | These returns through May 11, 1998 include the performance of the Fund’s predecessor fund. |
| 7 | A 4.50% front-end sales charge was deducted. |
| 8 | Not subject to any sales charges. |
Performance of a $10,000 Investment
Investment return and principal value will fluctuate, and when redeemed, shares may be worth more or less than original cost. Past performance is no guarantee of future results and does not reflect the deduction of taxes that a shareholder would pay on fund distributions or the redemption of fund shares. Investing in mutual funds involves market risk, including loss of principal. Performance returns assume the reinvestment of all distributions.
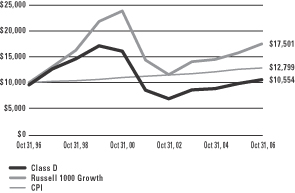
Comparative performance of $10,000 invested in Class D shares of the Gartmore Growth Fund, the Russell 1000 Growth Index (Russell 1000 Growth)(a), and the Consumer Price Index (CPI)(b) over a 10-year period ended 10/31/06. Unlike the Fund, the returns for these unmanaged indexes do not reflect any fees, expenses, or sales charges. Investors cannot invest directly in market indexes.
| (a) | The Russell 1000 Growth measures the performance of those companies in the Russell 1000 Index (the largest 1000 companies in the U.S.) with higher price-to-book ratios and higher forecasted growth values. |
| (b) | The CPI represents changes in prices of a basket of goods and services purchased for consumption by urban households. |
| | |
Shareholder Expense Example | | Gartmore Growth Fund |
As a shareholder of the Fund, you incur two types of costs: (1) transaction costs, including sales charges (loads) paid on purchase payments and redemption fees; and (2) ongoing costs, including investment advisory fees, administration fees, distribution fees and other Fund expenses. The examples below are intended to help you understand your ongoing costs (in dollars) of investing in the Fund and to compare these costs with the ongoing costs of investing in other mutual funds. Per SEC requirements, the examples assume that you had a $1,000 investment in the Class at the beginning of the reporting period, May 1, 2006 and continued to hold your shares at the end of the reporting period, October 31, 2006.
Actual Expenses
For each Class of the Fund in the table below, the first line provides information about actual account values and actual expenses. You may use the information in this line, together with the amount you invested, to estimate the expenses that you paid over the period. Simply divide your account value by $1,000 (for example, an $8,600 account value divided by $1,000 = 8.6), then multiply the result by the number in the first line of each Class under the heading entitled “Expenses Paid During Period” to estimate the expenses you paid on your account during the period.
Hypothetical Example for Comparison Purposes
The second line of each Class in the table below provides information about hypothetical account values and hypothetical expenses based on the Class’ actual expense ratio and an assumed rate of return of 5% per year before expenses, which is not the Class’ actual return. The hypothetical account values and expenses may not be used to estimate the actual ending account balance or expenses you paid for the period. You may use this information to compare the ongoing costs of investing in the Class of the Fund and other funds. To do so, compare this 5% hypothetical example with the 5% hypothetical examples that appear in the shareholder reports of the other funds.
Please note that the expenses shown in the table are meant to highlight your ongoing costs only and do not reflect any transaction costs, such as sales charges (loads) or redemption fees. Therefore, the second line for each Class in the table is useful in comparing ongoing costs only, and will not help you determine the relative total costs of owning different funds. In addition, if these transaction costs were included, your costs would have been higher. The examples also assume all dividends and distributions have been reinvested.
Schedule of Shareholder Expenses
Expense Analysis of a $1,000 Investment
(October 31, 2006)
| | | | | | | | | | | | | | |
| Growth Fund | | | | | Beginning
Account Value,
5/1/06 | | Ending
Account Value,
10/31/06 | | Expenses Paid
During Period* | | Annualized
Expense Ratio* |
| Class A | | Actual | | | $ | 1,000.00 | | $ | 1,000.00 | | $ | 5.34 | | 1.06% |
| | | Hypothetical | 1 | | $ | 1,000.00 | | $ | 1,019.66 | | $ | 5.41 | | 1.06% |
| Class B | | Actual | | | $ | 1,000.00 | | $ | 997.00 | | $ | 8.56 | | 1.70% |
| | | Hypothetical | 1 | | $ | 1,000.00 | | $ | 1,016.43 | | $ | 8.68 | | 1.70% |
| Class C | | Actual | | | $ | 1,000.00 | | $ | 995.50 | | $ | 8.45 | | 1.68% |
| | | Hypothetical | 1 | | $ | 1,000.00 | | $ | 1,016.53 | | $ | 8.57 | | 1.68% |
| Class D | | Actual | | | $ | 1,000.00 | | $ | 1,001.40 | | $ | 3.58 | | 0.71% |
| | | Hypothetical | 1 | | $ | 1,000.00 | | $ | 1,021.42 | | $ | 3.62 | | 0.71% |
| Class R | | Actual | | | $ | 1,000.00 | | $ | 997.30 | | $ | 7.05 | | 1.40% |
| | | Hypothetical | 1 | | $ | 1,000.00 | | $ | 1,017.94 | | $ | 7.15 | | 1.40% |
| Institutional Service Class | | Actual | | | $ | 1,000.00 | | $ | 1,001.40 | | $ | 3.73 | | 0.74% |
| | | Hypothetical | 1 | | $ | 1,000.00 | | $ | 1,021.27 | | $ | 3.78 | | 0.74% |
| Institutional Class | | Actual | | | $ | 1,000.00 | | $ | 1,001.40 | | $ | 3.73 | | 0.74% |
| | | Hypothetical | 1 | | $ | 1,000.00 | | $ | 1,021.27 | | $ | 3.78 | | 0.74% |
| * | Expenses are equal to the Fund’s annualized expense ratio multiplied by the average account value over the period multiplied by 184/365 (to reflect the one-half year period). The expense ratio presented represents a six-month, annualized ratio in accordance with SEC guidelines. |
| 1 | Represents the hypothetical 5% return before expenses. |
| | |
Portfolio Summary | | Gartmore Growth Fund |
The SEC adopted a requirement that Funds present their portfolio holdings in a table, chart or graph format in their annual and semiannual reports to shareholders, whether or not a statement of investments is utilized. The following tables, which present portfolio holdings as a percentage of net assets, are provided in compliance with this requirement.
| | |
| Asset Allocation | | |
| Common Stock | | 98.2% |
| Commercial Paper | | 0.4% |
| Other Investments* | | 8.8% |
| Liabilities in excess of other assets** | | –7.4% |
| | |
| | 100.0% |
| | |
| Top Industries | | |
| Computer Software & Services | | 11.1% |
| Healthcare | | 9.6% |
| Financial Services | | 9.2% |
| Retail | | 8.2% |
| Computer Equipment | �� | 6.8% |
| Semiconductors | | 6.4% |
| Pharmaceuticals | | 5.1% |
| Telecommunications | | 4.4% |
| Medical | | 4.0% |
| Energy | | 3.7% |
| Other Assets | | 31.5% |
| | |
| | 100.0% |
| | |
| Top Holdings | | |
| Cisco Systems, Inc. | | 3.1% |
| Microsoft Corp. | | 3.1% |
| Johnson & Johnson | | 2.8% |
| PepsiCo, Inc. | | 2.5% |
| Intel Corp. | | 2.1% |
| Baxter International, Inc. | | 2.0% |
| Amgen, Inc. | | 1.8% |
| Google, Inc. | | 1.8% |
| Boeing Co. (The) | | 1.8% |
| Gilead Sciences, Inc. | | 1.6% |
| Other Assets | | 77.4% |
| | |
| | 100.0% |
| * | Includes value of collateral received from securities lending. |
| ** | Includes value of collateral owed from securities lending. |
Statement of Investments
October 31, 2006
Gartmore Growth Fund
Common Stocks (98.2%)
| | | | | |
| | | Shares or
Principal Amount | | Value |
| | | | | |
Aerospace & Defense (2.9%) | | | |
Boeing Co. (The) | | 44,650 | | $ | 3,565,749 |
Rockwell Collins, Inc. | | 37,700 | | | 2,189,616 |
| | | | | |
| | | | | 5,755,365 |
| | | | | |
Airlines (0.8%) | | | | | |
UAL Corp. (b) | | 43,790 | | | 1,573,813 |
| | | | | |
Banks (1.0%) | | | | | |
Wachovia Corp. | | 37,090 | | | 2,058,495 |
| | | | | |
Computer Equipment (6.8%) | | | |
Apple Computer, Inc. (b) | | 32,570 | | | 2,640,776 |
EMC Corp. (b) | | 119,650 | | | 1,465,713 |
Hewlett-Packard Co. | | 78,220 | | | 3,030,242 |
Juniper Networks, Inc. (b) | | 118,340 | | | 2,037,815 |
Network Appliance, Inc. (b) | | 19,000 | | | 693,500 |
NVIDIA Corp. (b) | | 46,700 | | | 1,628,429 |
Sun Microsystems, Inc. (b) | | 379,740 | | | 2,061,988 |
| | | | | |
| | | | | 13,558,463 |
| | | | | |
Computer Software & Services (11.1%) | | | |
Cisco Systems, Inc. (b) | | 260,580 | | | 6,287,795 |
Citrix Systems, Inc. (b) | | 90,210 | | | 2,663,901 |
Cognizant Technology Solutions Corp., Class A (b) | | 16,100 | | | 1,212,008 |
Hyperion Solutions Corp. (b) | | 54,780 | | | 2,048,772 |
Microsoft Corp. | | 214,510 | | | 6,158,582 |
Oracle Corp. (b) | | 162,100 | | | 2,993,987 |
THQ, Inc. (b) (c) | | 33,310 | | | 1,001,632 |
| | | | | |
| | | | | 22,366,677 |
| | | | | |
Consumer Products (3.2%) | | | |
Altria Group, Inc. | | 20,680 | | | 1,681,904 |
Colgate-Palmolive Co. | | 33,940 | | | 2,171,142 |
Procter & Gamble Co. | | 41,560 | | | 2,634,489 |
| | | | | |
| | | | | 6,487,535 |
| | | | | |
Data Processing & Management (1.1%) | | | |
Paychex, Inc. | | 54,900 | | | 2,167,452 |
| | | | | |
E-Commerce & Services (2.2%) | | | |
Amazon.com, Inc. (b) | | 43,000 | | | 1,637,870 |
CheckFree Corp. (b) (c) | | 51,700 | | | 2,041,116 |
Shutterfly, Inc. (b) (c) | | 57,150 | | | 751,523 |
| | | | | |
| | | | | 4,430,509 |
| | | | | |
| | | | | |
| | | Shares or
Principal Amount | | Value |
| | | | | |
Electronics (2.5%) | | | |
AMETEK, Inc. | | 26,800 | | $ | 1,251,024 |
Emerson Electric Co. | | 35,450 | | | 2,991,980 |
Harman International Industries, Inc. | | 7,820 | | | 800,377 |
| | | | | |
| | | | | 5,043,381 |
| | | | | |
Energy (3.7%) | | | |
Exxon Mobil Corp. | | 22,400 | | | 1,599,808 |
Peabody Energy Corp. | | 23,660 | | | 993,010 |
Praxair, Inc. | | 33,650 | | | 2,027,413 |
Schlumberger Ltd. — NL | | 22,100 | | | 1,394,068 |
Valero Energy Corp. | | 28,310 | | | 1,481,462 |
| | | | | |
| | | | | 7,495,761 |
| | | | | |
Financial Services (9.2%) | | | |
Ameriprise Financial, Inc. | | 20,320 | | | 1,046,480 |
Capital One Financial Corp. | | 25,360 | | | 2,011,809 |
Chicago Mercantile Exchange Holdings, Inc. | | 3,990 | | | 1,998,990 |
E*TRADE Financial Corp. (b) | | 57,850 | | | 1,346,748 |
Franklin Resources, Inc. | | 9,280 | | | 1,057,549 |
Goldman Sachs Group, Inc. | | 14,550 | | | 2,761,444 |
InterContinental Exchange, Inc. (b) | | 20,550 | | | 1,734,831 |
Lehman Brothers Holdings, Inc. | | 17,900 | | | 1,393,336 |
Moody’s Corp. | | 24,200 | | | 1,604,460 |
Prudential Financial, Inc. | | 15,680 | | | 1,206,262 |
State Street Corp. | | 35,810 | | | 2,300,076 |
| | | | | |
| | | | | 18,461,985 |
| | | | | |
Food & Beverage (2.5%) | | | |
PepsiCo, Inc. | | 79,860 | | | 5,066,318 |
| | | | | |
Healthcare (9.6%) | | | |
Amgen, Inc. (b) | | 48,060 | | | 3,648,234 |
Baxter International, Inc. | | 85,370 | | | 3,924,458 |
Cardinal Health, Inc. | | 16,850 | | | 1,102,833 |
Gilead Sciences, Inc. (b) | | 46,360 | | | 3,194,204 |
Home Diagnostics, Inc. (b) | | 48,870 | | | 622,604 |
Manor Care, Inc. (c) | | 20,440 | | | 980,916 |
PSS World Medical, Inc. (b) (c) | | 49,400 | | | 993,928 |
UnitedHealth Group, Inc. | | 51,340 | | | 2,504,365 |
WellPoint, Inc. (b) | | 32,100 | | | 2,449,872 |
| | | | | |
| | | | | 19,421,414 |
| | | | | |
Common Stocks (continued)
| | | | | |
| | | Shares or
Principal Amount | | Value |
| | | | | |
Hotels & Casinos (2.1%) | | | |
Penn National Gaming, Inc. (b) (c) | | 25,410 | | $ | 929,244 |
Starwood Hotels & Resorts Worldwide | | 39,430 | | | 2,355,548 |
Wynn Resorts Ltd. (b) (c) | | 12,000 | | | 882,480 |
| | | | | |
| | | | | 4,167,272 |
| | | | | |
Instruments – Scientific (0.7%) | | | |
Thermo Electron Corp. (b) | | 31,930 | | | 1,368,839 |
| | | | | |
Internet (1.8%) | | | |
Google, Inc. (b) | | 7,640 | | | 3,639,620 |
| | | | | |
Manufacturing (3.7%) | | | |
Caterpillar, Inc. | | 20,360 | | | 1,236,056 |
Danaher Corp. | | 14,310 | | | 1,027,029 |
General Electric Corp. | | 42,620 | | | 1,496,388 |
Precision Castparts Corp. | | 25,700 | | | 1,749,142 |
WMS Industries, Inc. (b) (c) | | 53,060 | | | 1,874,609 |
| | | | | |
| | | | | 7,383,224 |
| | | | | |
Medical (4.0%) | | | |
Genzyme Corp. (b) | | 36,680 | | | 2,476,267 |
Johnson & Johnson | | 81,870 | | | 5,518,038 |
| | | | | |
| | | | | 7,994,305 |
| | | | | |
Multimedia (2.3%) | | | |
Comcast Corp., Class A (b) | | 62,940 | | | 2,559,770 |
Walt Disney Co. (The) | | 63,200 | | | 1,988,272 |
| | | | | |
| | | | | 4,548,042 |
| | | | | |
Pharmaceuticals (5.1%) | | | |
Biomarin Pharmaceutical, Inc. (b) (c) | | 33,022 | | | 529,343 |
Eli Lilly & Co. | | 32,170 | | | 1,801,841 |
Novartis AG ADR — CH | | 17,460 | | | 1,060,346 |
Pharmion Corp. (b) (c) | | 27,850 | | | 680,933 |
Schering-Plough Corp. | | 80,160 | | | 1,774,742 |
Shire PLC ADR — GB | | 29,270 | | | 1,605,460 |
Wyeth | | 53,290 | | | 2,719,388 |
| | | | | |
| | | | | 10,172,053 |
| | | | | |
Real Estate Investment Trusts (0.2%) | | | |
Douglas Emmett, Inc. (b) | | 12,920 | | | 308,142 |
| | | | | |
Restaurants (1.3%) | | | |
Panera Bread Co., Class A (b) | | 24,490 | | | 1,513,482 |
Starbucks Corp. (b) | | 26,400 | | | 996,600 |
| | | | | |
| | | | | 2,510,082 |
| | | | | |
| | | | | | |
| | | Shares or
Principal Amount | | Value |
| | | | | | |
Retail (8.2%) | | | | | | |
Abercrombie & Fitch Co. | | | 25,680 | | $ | 1,968,372 |
Bed, Bath & Beyond, Inc. (b) | | | 38,300 | | | 1,543,107 |
Best Buy Co., Inc. | | | 32,090 | | | 1,772,973 |
Circuit City Stores, Inc. | | | 50,400 | | | 1,359,792 |
Coach, Inc. (b) | | | 29,600 | | | 1,173,344 |
Gamestop Corp. (b) (c) | | | 40,540 | | | 2,069,971 |
Home Depot, Inc. (The) | | | 55,350 | | | 2,066,216 |
Pacific Sunwear of California, Inc. (b) (c) | | | 57,380 | | | 1,011,036 |
Penney (J.C.) Co., Inc. | | | 20,060 | | | 1,509,114 |
Target Corp. | | | 34,190 | | | 2,023,364 |
| | | | | | |
| | | | | | 16,497,289 |
| | | | | | |
Semiconductors (6.4%) | | | | | | |
Broadcom Corp., Class A (b) | | | 55,140 | | | 1,669,088 |
Integrated Device Technology, Inc. (b) | | | 139,410 | | | 2,209,649 |
Intel Corp. | | | 192,850 | | | 4,115,419 |
KLA-Tencor Corp. | | | 29,920 | | | 1,471,166 |
Lam Research Corp. (b) | | | 20,700 | | | 1,023,615 |
Marvell Technology Group
Ltd. — BM (b) | | | 72,040 | | | 1,316,891 |
SiRF Technology Holdings, Inc. (b) (c) | | | 35,550 | | | 999,666 |
| | | | | | |
| | | | | | 12,805,494 |
| | | | | | |
Telecommunications (4.4%) | | | | | | |
Comverse Technology, Inc. (b) | | | 50,220 | | | 1,093,289 |
Corning, Inc. (b) | | | 143,640 | | | 2,934,566 |
Motorola, Inc. | | | 79,990 | | | 1,844,569 |
QUALCOMM, Inc. | | | 80,640 | | | 2,934,490 |
| | | | | | |
| | | | | | 8,806,914 |
| | | | | | |
Transportation (0.7%) | | | | | | |
Canadian National Railway
Co. — CA | | | 28,900 | | | 1,376,796 |
| | | | | | |
Waste Management (0.7%) | | | | | | |
Republic Services, Inc. | | | 36,290 | | | 1,488,253 |
| | | | | | |
| | |
Total Common Stocks | | | | | | 196,953,493 |
| | | | | | |
|
Commercial Paper (0.4%) |
Financial Services (0.4%) | | | | | | |
Countrywide Financial Corp., 5.37%, 11/01/06 (d) | | $ | 798,000 | | | 798,000 |
| | | | | | |
| | |
Total Commercial Paper | | | | | | 798,000 |
| | | | | | |
Statement of Investments (Continued)
October 31, 2006
Gartmore Growth Fund (Continued)
Short-Term Securities Held as Collateral for Securities on Loan (8.8%)
| | | | | | | |
| | | Principal Amount | | Value | |
| | | | | | | |
Bank of America Bank Note, 5.31%, 11/01/06 | | $ | 2,500,000 | | $ | 2,500,000 | |
Banc of America Securities LLC Repurchase Agreement, 5.32%, dated 10/31/06, due 11/01/06, repurchase price $10,777,638, collateralized by U.S. Government Agency Mortgages with a market value of $10,991,567 | | | 10,776,046 | | | 10,776,046 | |
GE Life and Annuity Funding Agreement, 5.42%, 11/14/06 | | | 4,400,000 | | | 4,400,000 | |
| | | | | | | |
| |
Total Short-Term Securities Held as Collateral for Securities on Loan | | | 17,676,046 | |
| | | | | | | |
| |
Total Investments
(Cost $200,621,247) (a) — 107.4% | | | 215,427,539 | |
| |
Liabilities in excess of other
assets — (7.4%) | | | (14,866,703 | ) |
| | | | | | | |
| | |
NET ASSETS — 100.0% | | | | | $ | 200,560,836 | |
| | | | | | | |
| | (a) | See notes to financial statements for tax unrealized appreciation (depreciation) of securities. |
| | (b) | Denotes a non-income producing security. |
| | (c) | All or part of the security was on loan as of October 31, 2006. |
| | (d) | The rate reflected in the Statement of Investments is the effective yield as of October 31, 2006. |
| | ADR | American Depository Receipt |
See notes to financial statements.
Gartmore Nationwide Fund
For the annual period ended Oct. 31, 2006, the Gartmore Nationwide Fund (Class A at NAV) returned 14.65% versus 16.34% for its benchmark, the S&P 500® Index. For broader comparison, the average return for the Fund’s Lipper peer category of Large-Cap Core Funds (consisting of 810 funds as of Oct. 31, 2006) was 14.23%.
Despite concerns presented by rising interest rates, high energy prices and a steadily deteriorating housing market, most broadly based stock indexes managed solid gains. Strength at the beginning and end of the period was interrupted by a sharp correction from mid-May through early July, as investors fretted about worsening inflation and the possibility that the Federal Reserve Board might increase interest rates further than expected. As the summer progressed, however, inflation remained in check, and the economy appeared to be slowing, providing the Federal Open Market Committee with the flexibility it needed to hold rates steady at its August, September and October meetings. Adding to the positive backdrop late in the period were a relatively benign hurricane season and a sharp decline in crude oil and natural gas prices.
Energy was one sector that hampered the Fund’s performance versus its benchmark, with Fund holdings Exxon Mobil Corp. and Halliburton Co. both finishing the period as detractors. Although we had a sizable stake in Exxon Mobil and it posted a strong gain, the Fund was underweighted in its exposure to the stock. In Halliburton’s case, the company delayed the planned spin-off of its engineering and construction unit, and we liquidated the Fund’s position in this stock at a small loss. Within telecommunications services, not owning BellSouth Corp. hurt the Fund. The Baby Bells continued to report solid earnings growth while developing new markets, but we were put off by the possibility of a price war among the various phone and Internet providers in the telecom and cable industries.
Conversely, the Fund garnered comparatively good results in the consumer discretionary, consumer staples and materials sectors, in all three cases due mainly to favorable stock selection. In consumer discretionary, the Fund’s overweighting J.C. Penney Co., Inc. was timely, because investors were attracted by the retailer’s inroads into upscale markets as well as its decision to locate new stores in strip malls. In consumer staples, a large Fund overweighting in tobacco holding Reynolds American Inc. was rewarding for the Fund, given the company’s solid earnings growth, the stock’s valuation and the favorable resolution of some important smoking-related litigation. Meanwhile, our performance in materials was buoyed by Fund holdings in copper stocks Southern Copper Corp. and Phelps Dodge Corp., both of which benefited from strong demand and limited supply of the metal during the period.
With three consecutive stand-pat decisions by the Fed, we believe the odds are increasing that we have seen at least a temporary peak in short-term rates, although the recent upward revision in third-quarter economic growth from 1.6% to 2.2% likely lessens the chances of a rate cut any time soon. As long as the economy does not fall into a recession—a scenario we consider unlikely at present—we think the stock market will remain rewarding for the foreseeable future.
Portfolio Managers:
Gary Haubold, CFA and Joseph Cerniglia, CFA
| | |
Fund Performance | | Gartmore Nationwide Fund |
Average Annual Total Return
(For periods ended October 31, 2006)
| | | | | | | | |
| | | | | 1 Yr. | | 5 Yr. | | 10 Yr. |
| Class A1 | | w/o SC2 | | 14.65% | | 8.04% | | 8.29% |
| | | w/SC3 | | 8.04% | | 6.77% | | 7.65% |
| Class B1 | | w/o SC2 | | 13.83% | | 7.33% | | 7.59% |
| | | w/SC4 | | 8.90% | | 7.03% | | 7.59% |
| Class C1 | | w/o SC2 | | 13.89% | | 7.33% | | 7.90% |
| | | w/SC5 | | 12.90% | | 7.33% | | 7.90% |
| Class D6 | | w/o SC2 | | 14.95% | | 8.33% | | 8.48% |
| | | w/SC7 | | 9.77% | | 7.35% | | 7.99% |
| Class R1,8 | | | | 14.71% | | 8.14% | | 8.39% |
| Institutional Class1,8 | | | | 15.01% | | 8.36% | | 8.50% |
All figures showing the effect of a sales charge reflect the maximum charge possible, because it has the most dramatic effect on performance data.
| 1 | These returns through May 11, 1998 include the performance of the Fund’s predecessor fund, and, for periods from May 11, 1998 to the creation of the class, include the performance of the Fund’s Class D shares. These returns were achieved prior to the creation of Class A and Class B shares (5/11/98), Class C shares (3/1/01), Institutional Service Class shares (1/2/02), Class R shares (10/1/03), and Institutional Class shares (06/29/04). Excluding the effect of any fee waivers or reimbursements, such prior performance is similar to what Class A, Class B, Class C, Institutional Service Class, Class R shares and Institutional Class shares would have produced during those periods because all classes of the Fund’s shares invest in the same portfolio of securities. The performance for these classes has been restated to reflect differences in sales charges (where applicable), but does not reflect the differing levels of other fees (primarily Rule 12b-1 and/or administrative services fees) applicable to such classes. If these other fees were reflected, the performance for Class A, Class B, Class C and Class R shares would have been lower. |
| 2 | These returns do not reflect the effects of sales charges (SC). |
| 3 | A 5.75% front-end sales charge was deducted. |
| 4 | A 5.00% contingent deferred sales charge (CDSC) was deducted. The CDSC declines to 0% after 6 years. |
| 5 | A CDSC of 1.00% was deducted from the one year return because it is charged when you sell Class C shares within the first year after purchase. |
| 6 | These returns through May 11, 1998 include the performance of the Fund’s predecessor fund. |
| 7 | A 4.50% front-end sales charge was deducted. |
| 8 | Not subject to any sales charges. |
Performance of a $10,000 Investment
Investment return and principal value will fluctuate, and when redeemed, shares may be worth more or less than original cost. Past performance is no guarantee of future results and does not reflect the deduction of taxes that a shareholder would pay on fund distributions or the redemption of fund shares. Investing in mutual funds involves market risk, including loss of principal. Performance returns assume the reinvestment of all distributions.
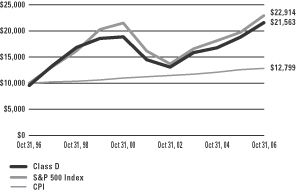
Comparative performance of $10,000 invested in Class D shares of the Gartmore Nationwide Fund, S&P 500 Index (S&P 500)(a), and the Consumer Price Index (CPI)(b) over a 10-year period ended 10/31/06. Unlike the Fund, the returns for these unmanaged indexes do not reflect any fees, expense, or sales charges. Investors cannot invest directly in market indexes.
| (a) | The S&P 500 is an unmanaged index of 500 widely held stocks of large U.S. companies that gives a broad look at how the stock prices of large U.S. companies have performed. |
| (b) | The CPI represents changes in prices of a basket of goods and services purchased for consumption by urban households. |
| | |
Shareholder Expense Example | | Gartmore Nationwide Fund |
As a shareholder of the Fund, you incur two types of costs: (1) transaction costs, including sales charges (loads) paid on purchase payments and redemption fees; and (2) ongoing costs, including investment advisory fees, administration fees, distribution fees and other Fund expenses. The examples below are intended to help you understand your ongoing costs (in dollars) of investing in the Fund and to compare these costs with the ongoing costs of investing in other mutual funds. Per SEC requirements, the examples assume that you had a $1,000 investment in the Class at the beginning of the reporting period, May 1, 2006 and continued to hold your shares at the end of the reporting period, October 31, 2006.
Actual Expenses
For each Class of the Fund in the table below, the first line provides information about actual account values and actual expenses. You may use the information in this line, together with the amount you invested, to estimate the expenses that you paid over the period. Simply divide your account value by $1,000 (for example, an $8,600 account value divided by $1,000 = 8.6), then multiply the result by the number in the first line of each Class under the heading entitled “Expenses Paid During Period” to estimate the expenses you paid on your account during the period.
Hypothetical Example for Comparison Purposes
The second line of each Class in the table below provides information about hypothetical account values and hypothetical expenses based on the Class’ actual expense ratio and an assumed rate of return of 5% per year before expenses, which is not the Class’ actual return. The hypothetical account values and expenses may not be used to estimate the actual ending account balance or expenses you paid for the period. You may use this information to compare the ongoing costs of investing in the Class of the Fund and other funds. To do so, compare this 5% hypothetical example with the 5% hypothetical examples that appear in the shareholder reports of the other funds.
Please note that the expenses shown in the table are meant to highlight your ongoing costs only and do not reflect any transaction costs, such as sales charges (loads) or redemption fees. Therefore, the second line for each Class in the table is useful in comparing ongoing costs only, and will not help you determine the relative total costs of owning different funds. In addition, if these transaction costs were included, your costs would have been higher. The examples also assume all dividends and distributions have been reinvested.
Schedule of Shareholder Expenses
Expense Analysis of a $1,000 Investment
(October 31, 2006)
| | | | | | | | | | | | | | |
| Nationwide Fund | | | | | Beginning
Account Value,
5/1/06 | | Ending
Account Value,
10/31/06 | | Expenses Paid
During Period* | | Annualized
Expense Ratio* |
| Class A | | Actual | | | $ | 1,000.00 | | $ | 1,039.20 | | $ | 5.04 | | 0.98% |
| | | Hypothetical | 1 | | $ | 1,000.00 | | $ | 1,020.06 | | $ | 5.00 | | 0.98% |
| Class B | | Actual | | | $ | 1,000.00 | | $ | 1,035.40 | | $ | 8.82 | | 1.72% |
| | | Hypothetical | 1 | | $ | 1,000.00 | | $ | 1,016.33 | | $ | 8.78 | | 1.72% |
| Class C | | Actual | | | $ | 1,000.00 | | $ | 1,035.70 | | $ | 8.83 | | 1.72% |
| | | Hypothetical | 1 | | $ | 1,000.00 | | $ | 1,016.33 | | $ | 8.78 | | 1.72% |
| Class D | | Actual | | | $ | 1,000.00 | | $ | 1,040.70 | | $ | 3.96 | | 0.77% |
| | | Hypothetical | 1 | | $ | 1,000.00 | | $ | 1,021.12 | | $ | 3.93 | | 0.77% |
| Class R | | Actual | | | $ | 1,000.00 | | $ | 1,039.40 | | $ | 5.40 | | 1.05% |
| | | Hypothetical | 1 | | $ | 1,000.00 | | $ | 1,019.71 | | $ | 5.36 | | 1.05% |
| Institutional Class | | Actual | | | $ | 1,000.00 | | $ | 1,041.00 | | $ | 3.65 | | 0.71% |
| | | Hypothetical | 1 | | $ | 1,000.00 | | $ | 1,021.42 | | $ | 3.62 | | 0.71% |
| * | Expenses are equal to the Fund’s annualized expense ratio multiplied by the average account value over the period multiplied by 184/365 (to reflect the one-half year period). The expense ratio presented represents a six-month, annualized ratio in accordance with SEC guidelines. |
| 1 | Represents the hypothetical 5% return before expenses. |
| | |
Portfolio Summary | | Gartmore Nationwide Fund |
The SEC adopted a requirement that Funds present their portfolio holdings in a table, chart or graph format in their annual and semiannual reports to shareholders, whether or not a statement of investments is utilized. The following tables, which present portfolio holdings as a percentage of net assets, are provided in compliance with this requirement.
| | |
| Asset Allocation | | |
| Common Stock | | 99.0% |
| Commercial Paper | | 0.6% |
| Other Investments* | | 7.8% |
| Liabilities in excess of other assets** | | –7.4% |
| | |
| | 100.0% |
| | |
| Top Industries | | |
| Retail | | 11.2% |
| Financial Services | | 10.0% |
| Semiconductors | | 7.2% |
| Banks | | 6.5% |
| Insurance | | 6.0% |
| Computer Software & Services | | 5.3% |
| Healthcare | | 5.3% |
| Telecommunications | | 5.1% |
| Manufacturing | | 4.4% |
| Oil & Gas | | 4.2% |
| Other Assets | | 34.8% |
| | |
| | 100.0% |
| | |
| Top Holdings | | |
| Bank of America Corp. | | 2.2% |
| Texas Instruments, Inc. | | 2.0% |
| Cisco Systems, Inc. | | 2.0% |
| Altria Group, Inc. | | 2.0% |
| Microsoft Corp. | | 2.0% |
| Johnson & Johnson | | 1.9% |
| Home Depot, Inc. (The) | | 1.9% |
| J.P. Morgan Chase & Co. | | 1.7% |
| International Business Machines Corp. | | 1.5% |
| Procter & Gamble Co. | | 1.5% |
| Other Assets | | 81.3% |
| | |
| | 100.0% |
| * | Includes value of collateral received from securities lending. |
| ** | Includes value of collateral owed from securities lending. |
Statement of Investments
October 31, 2006
Gartmore Nationwide Fund
Common Stocks (99.0%)
| | | | | |
| | | Shares or
Principal Amount | | Value |
| | | | | |
Aerospace & Defense (1.9%) | | | | | |
Boeing Co. (The) | | 91,425 | | $ | 7,301,201 |
General Dynamics Corp. | | 66,920 | | | 4,758,012 |
Northrop Grumman Corp. | | 119,858 | | | 7,957,372 |
United Technologies Corp. | | 58,500 | | | 3,844,620 |
| | | | | |
| | | | | 23,861,205 |
| | | | | |
Airlines (1.2%) | | | | | |
AMR Corp. (b) (c) | | 177,300 | | | 5,024,682 |
British Airways PLC ADR — GB (b) | | 1,510 | | | 131,974 |
Continental Airlines (b) (c) | | 56,200 | | | 2,072,656 |
UAL Corp. (b) (c) | | 101,510 | | | 3,648,269 |
U.S. Airways Group, Inc. (b) | | 80,450 | | | 4,011,237 |
| | | | | |
| | | | | 14,888,818 |
| | | | | |
Automotive (0.3%) | | | | | |
Autoliv, Inc. | | 64,650 | | | 3,676,646 |
O’Reilly Automotive, Inc. (b) | | 15,100 | | | 487,579 |
| | | | | |
| | | | | 4,164,225 |
| | | | | |
Banks (6.5%) | | | | | |
Bank of America Corp. | | 527,064 | | | 28,392,937 |
Bank of New York Co., Inc. (The) | | 67,100 | | | 2,306,227 |
Barclays PLC ADR — GB (c) | | 35,100 | | | 1,906,281 |
BB&T Corp. | | 34,400 | | | 1,497,088 |
Bear Stearns Cos., Inc. (The) | | 85,140 | | | 12,885,939 |
Deutsche Bank AG ADR — DE | | 9,500 | | | 1,200,325 |
ING Groep N.V. ADR — NL | | 58,200 | | | 2,580,006 |
J.P. Morgan Chase & Co. | | 451,132 | | | 21,401,701 |
NBT Bancorp, Inc. (c) | | 35,100 | | | 872,235 |
New York Community Bancorp, Inc. (c) | | 164,050 | | | 2,682,218 |
Sun Trust Banks, Inc. | | 51,540 | | | 4,071,145 |
Wachovia Corp. | | 61,693 | | | 3,423,962 |
| | | | | |
| | | | | 83,220,064 |
| | | | | |
Business Services (0.1%) | | | | | |
MPS Group, Inc. (b) | | 92,800 | | | 1,415,200 |
| | | | | |
Capital Goods (0.8%) | | | | | |
Cummins Engine, Inc. (c) | | 38,600 | | | 4,901,428 |
Parker Hannifin Corp. | | 71,900 | | | 6,012,997 |
| | | | | |
| | | | | 10,914,425 |
| | | | | |
| | | | | |
| | | Shares or
Principal Amount | | Value |
| | | | | |
Chemicals (0.8%) | | | | | |
Dow Chemical Co. | | 135,550 | | $ | 5,529,085 |
Rohm & Haas Co. (c) | | 102,700 | | | 5,321,914 |
| | | | | |
| | | | | 10,850,999 |
| | | | | |
Communication Equipment (0.0%) | | | |
Polycom, Inc. (b) (c) | | 15,300 | | | 419,220 |
| | | | | |
Computer Equipment (3.9%) | | | |
Hewlett-Packard Co. | | 306,010 | | | 11,854,827 |
International Business Machines Corp. | | 211,511 | | | 19,528,811 |
Juniper Networks, Inc. (b) | | 698,530 | | | 12,028,687 |
Sun Microsystems, Inc. (b) | | 1,271,400 | | | 6,903,702 |
| | | | | |
| | | | | 50,316,027 |
| | | | | |
Computer Software & Services (5.3%) | | | |
Affiliated Computer Services, Inc., Class A (b) | | 38,771 | | | 2,073,473 |
Automatic Data Processing, Inc. | | 25,900 | | | 1,280,496 |
Cisco Systems, Inc. (b) | | 1,080,016 | | | 26,060,787 |
Factset Research Systems, Inc. (c) | | 29,000 | | | 1,476,100 |
Infosys Technologies
SP ADR — IN (b) (c) | | 25,000 | | | 1,302,500 |
Microsoft Corp. | | 877,195 | | | 25,184,268 |
Oracle Corp. (b) | | 600,000 | | | 11,082,000 |
webMethods, Inc. (b) | | 40,000 | | | 300,800 |
| | | | | |
| | | | | 68,760,424 |
| | | | | |
Construction & Building Materials (0.5%) | | | |
Centex Corp. (c) | | 72,060 | | | 3,768,738 |
D.R. Horton, Inc. (c) | | 108,940 | | | 2,552,464 |
Interline Brands, Inc. (b) | | 23,500 | | | 562,590 |
| | | | | |
| | | | | 6,883,792 |
| | | | | |
Consumer Products (3.7%) | | | | | |
Altria Group, Inc. | | 316,586 | | | 25,747,938 |
Procter & Gamble Co. | | 306,440 | | | 19,425,232 |
Sherwin-Williams Co. | | 43,850 | | | 2,597,236 |
| | | | | |
| | | | | 47,770,406 |
| | | | | |
Data Processing & Reproduction (0.4%) | | | |
Alliance Data Systems Corp. (b) (c) | | 42,900 | | | 2,604,888 |
SEI Corporation | | 55,080 | | | 3,099,902 |
| | | | | |
| | | | | 5,704,790 |
| | | | | |
Statement of Investments (Continued)
October 31, 2006
Gartmore Nationwide Fund (Continued)
Common Stocks (continued)
| | | | | |
| | | Shares or
Principal Amount | | Value |
| | | | | |
Data Processing & Management (0.3%) | | | |
Paychex, Inc. | | 103,800 | | $ | 4,098,024 |
| | | | | |
Distribution & Wholesale (0.1%) | | | |
CDW Corp. (c) | | 28,500 | | | 1,871,595 |
| | | | | |
E-Commerce & Services (0.2%) | | | |
eBay, Inc. (b) | | 71,090 | | | 2,284,122 |
| | | | | |
Electric – Integrated (0.5%) | | | |
Edison International | | 140,250 | | | 6,232,710 |
| | | | | |
Electronics (1.5%) | | | |
Agilent Technologies, Inc. (b) | | 115,700 | | | 4,118,920 |
Arrow Electronics, Inc. (b) | | 179,920 | | | 5,370,612 |
Avnet, Inc. (b) | | 56,170 | | | 1,330,106 |
Benchmark Electronics, Inc. (b) (c) | | 50,500 | | | 1,340,775 |
Jabil Circuit, Inc. | | 91,400 | | | 2,624,094 |
L-3 Communications Holdings, Inc. | | 30,000 | | | 2,415,600 |
Microchip Technology, Inc. | | 51,700 | | | 1,702,481 |
Tektronix, Inc. | | 5,600 | | | 170,072 |
| | | | | |
| | | | | 19,072,660 |
| | | | | |
Entertainment & Leisure (0.1%) | | | |
Carnival Corp. — PA | | 25,900 | | | 1,264,438 |
Royal Caribbean Cruises Ltd. | | 13,900 | | | 562,950 |
| | | | | |
| | | | | 1,827,388 |
| | | | | |
Financial Services (9.4%) | | | |
Affiliated Managers Group, Inc. (b) (c) | | 18,900 | | | 1,892,646 |
Citigroup, Inc. | | 193,177 | | | 9,689,758 |
Credit Suisse Group ADR — CH | | 10,500 | | | 635,040 |
Federated Investors, Inc. (c) | | 72,025 | | | 2,469,737 |
First Horizon National Corp. (c) | | 9,500 | | | 373,540 |
Franklin Resources, Inc. | | 28,200 | | | 3,213,672 |
Goldman Sachs Group, Inc. | | 88,253 | | | 16,749,537 |
Hudson City Bancorp, Inc. | | 302,900 | | | 4,158,817 |
Investment Technology Group (b) | | 5,480 | | | 255,916 |
Jefferies Group, Inc. (c) | | 15,100 | | | 433,823 |
KKR Financial Corp. (c) | | 235,780 | | | 6,325,977 |
Legg Mason, Inc. | | 58,069 | | | 5,227,371 |
Lehman Brothers Holdings, Inc. | | 144,750 | | | 11,267,340 |
| | | | | |
| | | Shares or
Principal Amount | | Value |
| | | | | |
Financial Services (continued) | | | |
Merrill Lynch & Co., Inc. | | 54,601 | | $ | 4,773,219 |
Morgan Stanley | | 149,240 | | | 11,406,413 |
Morningstar, Inc. (b) (c) | | 21,500 | | | 879,780 |
Northern Trust Corp. | | 102,670 | | | 6,028,782 |
Nuveen Investments, Inc., Class A | | 167,450 | | | 8,255,285 |
Prudential Financial, Inc. | | 89,550 | | | 6,889,082 |
State Street Corp. | | 43,420 | | | 2,788,867 |
T. Rowe Price Group, Inc. | | 161,900 | | | 7,659,489 |
U.S. Bancorp | | 127,300 | | | 4,307,832 |
UBS AG ADR — CH | | 51,200 | | | 3,063,808 |
Wells Fargo & Co. | | 65,578 | | | 2,379,826 |
| | | | | |
| | | | | 121,125,557 |
| | | | | |
Food & Beverage (1.5%) | | | | | |
Coca-Cola Enterprises, Inc. | | 180,000 | | | 3,605,400 |
Constellation Brands, Inc., Class A (b) (c) | | 44,400 | | | 1,220,556 |
General Mills, Inc. | | 89,100 | | | 5,062,662 |
PepsiCo, Inc. | | 149,570 | | | 9,488,721 |
| | | | | |
| | | | | 19,377,339 |
| | | | | |
Healthcare (5.3%) | | | | | |
Aetna, Inc. | | 83,630 | | | 3,447,229 |
Amgen, Inc. (b) | | 155,648 | | | 11,815,240 |
Community Health Care, Inc. (b) | | 84,800 | | | 2,751,760 |
Covance, Inc. (b) | | 20,100 | | | 1,175,850 |
Coventry Health Care, Inc. (b) | | 70,000 | | | 3,286,500 |
Gilead Sciences, Inc. (b) | | 70,900 | | | 4,885,010 |
Humana, Inc. (b) | | 20,000 | | | 1,200,000 |
Manor Care, Inc. | | 35,500 | | | 1,703,645 |
Quest Diagnostics, Inc. | | 135,400 | | | 6,734,796 |
UnitedHealth Group, Inc. | | 361,381 | | | 17,628,165 |
WellPoint, Inc. (b) | | 175,920 | | | 13,426,214 |
| | | | | |
| | | | | 68,054,409 |
| | | | | |
Instruments – Scientific (0.3%) | | | |
Fisher Scientific International, Inc. (b) | | 44,850 | | | 3,840,057 |
| | | | | |
Insurance (6.0%) | | | |
Allstate Corp. (The) | | 24,900 | | | 1,527,864 |
American International Group, Inc. | | 149,915 | | | 10,069,790 |
Arthur J. Gallagher & Co. (c) | | 25,200 | | | 701,820 |
Common Stocks (continued)
| | | | | |
| | | Shares or
Principal Amount | | Value |
| | | | | |
Insurance (continued) | | | |
Aspen Insurance Holdings Ltd. (c) | | 60,000 | | $ | 1,489,200 |
Assurant, Inc. | | 14,479 | | | 762,464 |
Berkshire Hathaway, Inc., Class B (b) (c) | | 1,635 | | | 5,747,025 |
Chubb Corp. | | 144,350 | | | 7,672,203 |
Cincinnati Financial Corp. | | 100,000 | | | 4,565,000 |
Genworth Financial, Inc. | | 137,400 | | | 4,594,656 |
Hartford Financial Services Group, Inc. (The) | | 96,450 | | | 8,407,547 |
HCC Insurance Holdings, Inc. | | 10,800 | | | 363,528 |
Lincoln National Corp. (c) | | 81,450 | | | 5,156,600 |
Manulife Financial Corp. — CA | | 157,800 | | | 5,117,454 |
MetLife, Inc. | | 230,557 | | | 13,171,720 |
MGIC Investment Corp. | | 43,900 | | | 2,579,564 |
Principal Financial Group, Inc. | | 7,190 | | | 406,163 |
SAFECO Corp. (c) | | 78,250 | | | 4,553,368 |
| | | | | |
| | | | | 76,885,966 |
| | | | | |
Internet (0.7%) | | | | | |
Google, Inc. (b) | | 18,750 | | | 8,932,313 |
| | | | | |
Manufacturing (4.4%) | | | | | |
3M Co. | | 36,663 | | | 2,890,511 |
AptarGroup, Inc. | | 29,700 | | | 1,630,827 |
Belden CDT, Inc. | | 60,000 | | | 2,172,000 |
Brunswick Corp. | | 88,700 | | | 2,794,050 |
Cintas Corp. | | 22,000 | | | 910,800 |
Eaton Corp. | | 57,800 | | | 4,186,454 |
General Electric Corp. | | 200,650 | | | 7,044,822 |
Hasbro, Inc. | | 128,500 | | | 3,330,720 |
Illinois Tool Works, Inc. | | 77,200 | | | 3,700,196 |
Ingersoll-Rand Co., Class A | | 36,200 | | | 1,328,902 |
Knoll, Inc. (c) | | 120,690 | | | 2,389,662 |
Louisiana-Pacific Corp. | | 160,650 | | | 3,177,657 |
PACCAR, Inc. | | 53,050 | | | 3,141,091 |
Phillips-Van Heusen Corp. | | 19,100 | | | 874,016 |
VF Corp. | | 219,370 | | | 16,674,313 |
| | | | | |
| | | | | 56,246,021 |
| | | | | |
Medical (3.2%) | | | | | |
Abbott Laboratories | | 88,990 | | | 4,227,915 |
Bristol-Myers Squibb Co. | | 95,700 | | | 2,368,575 |
| | | | | |
| | | Shares or
Principal Amount | | Value |
| | | | | |
Medical (continued) | | | | | |
Genzyme Corp. (b) | | 49,300 | | $ | 3,328,243 |
Johnson & Johnson | | 364,801 | | | 24,587,587 |
Merck & Co., Inc. | | 150,200 | | | 6,822,084 |
| | | | | |
| | | | | 41,334,404 |
| | | | | |
Metals (1.1%) | | | | | |
Phelps Dodge Corp. | | 141,774 | | | 14,231,274 |
| | | | | |
Metals & Mining (0.8%) | | | | | |
Southern Copper Corp. (c) | | 130,666 | | | 6,713,619 |
Timken Co. (c) | | 116,600 | | | 3,503,830 |
| | | | | |
| | | | | 10,217,449 |
| | | | | |
Multimedia (1.9%) | | | | | |
Clear Channel Communications, Inc. | | 156,400 | | | 5,450,540 |
Liberty Media Corp. (b) | | 27,600 | | | 2,458,056 |
Time Warner, Inc. | | 848,460 | | | 16,977,685 |
| | | | | |
| | | | | 24,886,281 |
| | | | | |
Natural Gas (1.3%) | | | | | |
ONEOK, Inc. (c) | | 128,400 | | | 5,345,292 |
Sempra Energy | | 212,960 | | | 11,295,398 |
| | | | | |
| | | | | 16,640,690 |
| | | | | |
Oil & Gas (4.2%) | | | | | |
ChevronTexaco Corp. | | 149,482 | | | 10,045,190 |
ConocoPhillips | | 218,986 | | | 13,191,717 |
Exxon Mobil Corp. | | 201,633 | | | 14,400,630 |
Helmerich & Payne, Inc. | | 145,100 | | | 3,475,145 |
Marathon Oil Corp. | | 48,563 | | | 4,195,843 |
National-Oilwell, Inc. (b) | | 3,996 | | | 241,358 |
Occidental Petroleum Corp. | | 47,780 | | | 2,242,793 |
Tidewater, Inc. | | 113,900 | | | 5,664,247 |
| | | | | |
| | | | | 53,456,923 |
| | | | | |
Pharmaceuticals (2.1%) | | | | | |
IMS Health, Inc. | | 117,700 | | | 3,277,945 |
Pfizer, Inc. | | 689,812 | | | 18,383,490 |
Wyeth | | 102,200 | | | 5,215,266 |
| | | | | |
| | | | | 26,876,701 |
| | | | | |
Railroads (1.1%) | | | | | |
Burlington Northern Santa Fe Corp. | | 59,550 | | | 4,616,912 |
CSX Corp. | | 126,400 | | | 4,508,688 |
Norfolk Southern Corp. | | 93,600 | | | 4,920,552 |
| | | | | |
| | | | | 14,046,152 |
| | | | | |
Statement of Investments (Continued)
October 31, 2006
Gartmore Nationwide Fund (Continued)
Common Stocks (continued)
| | | | | |
| | | Shares or
Principal Amount | | Value |
| | | | | |
Raw Materials (0.0%) | | | | | |
Reliance Steel & Aluminum Co. | | 11,286 | | $ | 387,674 |
| | | | | |
Real Estate Investment Trusts (0.1%) | | | |
Hospitality Properties Trust (c) | | 15,900 | | | 770,514 |
Host Hotels & Resorts, Inc. (c) | | 35,000 | | | 807,100 |
| | | | | |
| | | | | 1,577,614 |
| | | | | |
Restaurants (0.0%) | | | | | |
Panera Bread Co. (b) (c) | | 6,190 | | | 382,542 |
| | | | | |
Retail (11.2%) | | | | | |
Abercrombie & Fitch Co. | | 20,100 | | | 1,540,665 |
American Eagle Outfitters, Inc. | | 56,900 | | | 2,606,020 |
AnnTaylor Stores Corp. (b) (c) | | 89,100 | | | 3,922,182 |
Best Buy Co., Inc. | | 124,800 | | | 6,895,200 |
Brinker International, Inc. | | 41,300 | | | 1,917,559 |
California Pizza Kitchen, Inc. (b) (c) | | 10,100 | | | 325,927 |
Circuit City Stores, Inc. (c) | | 222,570 | | | 6,004,939 |
Costco Wholesale Corp. | | 50,000 | | | 2,669,000 |
CVS Corp. | | 403,500 | | | 12,661,830 |
Darden Restaurants, Inc. | | 9,100 | | | 381,290 |
Federated Department Stores, Inc. | | 322,720 | | | 14,170,634 |
Home Depot, Inc. (The) | | 654,983 | | | 24,450,514 |
Insight Enterprises, Inc. (b) | | 2,690 | | | 57,808 |
J. Crew Group, Inc. (b) | | 25,000 | | | 771,000 |
Kroger Co. | | 186,600 | | | 4,196,634 |
Limited, Inc. (The) | | 99,600 | | | 2,935,212 |
Longs Drug Stores Corp. | | 89,920 | | | 3,870,157 |
Lowe’s Cos., Inc. | | 144,500 | | | 4,355,230 |
McDonald’s Corp. | | 281,850 | | | 11,815,152 |
Men’s Warehouse, Inc. (The) (c) | | 6,790 | | | 270,582 |
Penney (J.C.) Co., Inc. | | 96,790 | | | 7,281,512 |
Ruby Tuesday, Inc. (c) | | 22,800 | | | 632,700 |
Talbots, Inc. (The) | | 15,100 | | | 423,404 |
Target Corp. | | 102,200 | | | 6,048,196 |
TJX Cos., Inc. (The) | | 247,270 | | | 7,158,467 |
Wal-Mart Stores, Inc. | | 119,050 | | | 5,866,784 |
Walgreen Co. | | 228,700 | | | 9,989,616 |
| | | | | |
| | | | | 143,218,214 |
| | | | | |
Search & Navigation Equipment (0.6%) | | | |
Raytheon Co. | | 148,550 | | | 7,420,073 |
| | | | | |
| | | | | |
| | | Shares or
Principal Amount | | Value |
| | | | | |
Semiconductors (7.2%) | | | |
Analog Devices, Inc. | | 276,330 | | $ | 8,792,821 |
Applied Materials, Inc. | | 90,200 | | | 1,568,578 |
ATMI, Inc. (b) (c) | | 50,200 | | | 1,590,838 |
Brooks Automation, Inc. (b) | | 51,000 | | | 724,200 |
Intel Corp. | | 716,307 | | | 15,285,991 |
KLA-Tencor Corp. | | 17,148 | | | 843,167 |
Lam Research Corp. (b) | | 83,249 | | | 4,116,663 |
Lattice Semiconductor Corp. (b) | | 53,500 | | | 332,235 |
Marvell Technology Group Ltd. — BM (b) | | 435,546 | | | 7,961,781 |
Maxim Integrated Products, Inc. | | 249,860 | | | 7,498,299 |
MEMC Electronic Materials, Inc. (b) | | 31,700 | | | 1,125,350 |
National Semiconductor Corp. (c) | | 167,730 | | | 4,074,162 |
Novellus Systems, Inc. (b) (c) | | 225,000 | | | 6,221,250 |
Taiwan Semiconductor Manufacturing Co. Ltd. ADR — TW (c) | | 371,189 | | | 3,600,533 |
Texas Instruments, Inc. | | 871,464 | | | 26,300,783 |
Xilinx, Inc. | | 103,200 | | | 2,632,632 |
| | | | | |
| | | | | 92,669,283 |
| | | | | |
Services (0.0%) | | | | | |
Equifax, Inc. (c) | | 9,400 | | | 357,482 |
| | | | | |
Steel (0.2%) | | | | | |
Nucor Corp. | | 48,200 | | | 2,815,362 |
| | | | | |
Telecommunications (5.1%) | | | |
AT&T, Inc. | | 335,249 | | | 11,482,278 |
Comverse Technology, Inc. (b) | | 20,800 | | | 452,816 |
Embarq Corp. | | 61,600 | | | 2,978,360 |
Harris Corp. | | 258,560 | | | 11,014,656 |
Motorola, Inc. | | 249,380 | | | 5,750,703 |
Nokia Corp. ADR — FI | | 30,000 | | | 596,400 |
QUALCOMM, Inc. | | 124,300 | | | 4,523,277 |
Qwest Communications International, Inc. (b) (c) | | 230,800 | | | 1,991,804 |
Sprint Corp. | | 519,854 | | | 9,716,071 |
Verizon Communications, Inc. | | 258,772 | | | 9,574,564 |
Vodafone Group PLC
ADR — GB (c) | | 173,755 | | | 4,491,567 |
Common Stocks (continued)
| | | | | | |
| | | Shares or
Principal Amount | | Value |
| | | | | | |
Telecommunications (continued) | | | |
Windstream Corp. | | | 183,300 | | $ | 2,514,876 |
| | | | | | |
| | | | | | 65,087,372 |
| | | | | | |
Tobacco (0.8%) | | | | | | |
Carolina Group | | | 1,700 | | | 98,294 |
Reynolds American, Inc. (c) | | | 161,020 | | | 10,170,023 |
| | | | | | |
| | | | | | 10,268,317 |
| | | | | | |
Transportation (1.2%) | | | | | | |
FedEx Corp. | | | 34,630 | | | 3,966,520 |
Omega Navigation Enterprises, Inc. | | | 232,740 | | | 3,700,566 |
United Parcel Service, Inc., Class B | | | 96,605 | | | 7,279,187 |
| | | | | | |
| | | | | | 14,946,273 |
| | | | | | |
Utilities (1.2%) | | | | | | |
Dominion Resources, Inc. | | | 69,200 | | | 5,604,508 |
Exelon Corp. | | | 19,300 | | | 1,196,214 |
Progress Energy, Inc. (c) | | | 30,100 | | | 1,384,600 |
TXU Corp. | | | 85,300 | | | 5,384,989 |
Waste Management, Inc. | | | 41,200 | | | 1,544,176 |
| | | | | | |
| | | | | | 15,114,487 |
| | | | | | |
| | |
Total Common Stocks | | | | | | 1,274,952,323 |
| | | | | | |
|
Commercial Paper (0.6%) |
Financial Services (0.6%) | | | | | | |
Countrywide Financial Corp., 5.37%, 11/01/06 (d) | | $ | 7,486,000 | | | 7,486,000 |
| | | | | | |
| | |
Total Commercial Paper | | | | | | 7,486,000 |
| | | | | | |
Short-Term Securities Held as Collateral for Securities on Loan (7.8%)
| | | | | | | |
| | | Principal
Amount | | Value | |
Islandsbanki HF Corp. Medium Term Note, 5.39%, 11/22/06 | | $ | 2,500,000 | | $ | 2,500,000 | |
Citigroup Global Markets, Inc. Master Note, 5.38%, 11/01/06 | | | 2,000,000 | | | 2,000,000 | |
Bank of America Bank Note, 5.31%, 11/07/06 | | | 5,500,000 | | | 5,500,000 | |
ASIF Global Funding XV Medium Term Note, 5.38%, 12/01/06 | | | 10,004,661 | | | 10,004,661 | |
Morgan Stanley Master Note, 5.49%, 11/01/07 | | | 5,000,000 | | | 5,000,000 | |
West Corp Fed Credit Union Medium Term Note, 5.38%, 11/01/06 | | | 1,000,000 | | | 1,000,000 | |
Banc of America Securities LLC Repurchase Agreement, 5.32%, dated 10/31/06, due 11/01/06, repurchase price $74,647,048, collateralized by U.S. Government Agency Mortgages with a market value of $76,128,738 | | | 74,636,018 | | | 74,636,018 | |
| | | | | | | |
| |
Total Short-Term Securities Held as Collateral for Securities on Loan | | | 100,640,679 | |
| | | | | | | |
| |
Total Investments
(Cost $1,281,186,539) (a) — 107.4% | | | 1,383,079,002 | |
| |
Liabilities in excess of
other assets — (7.4)% | | | (95,775,945 | ) |
| | | | | | | |
| |
NET ASSETS — 100.0% | | $ | 1,287,303,057 | |
| | | | | | | |
| | (a) | See notes to financial statements for tax unrealized appreciation (depreciation) of securities. |
| | (b) | Denotes a non-income producing security. |
| | (c) | All or part of the security was on loan as of October 31, 2006. |
| | (d) | The rate reflected on the Statement of Investments is the effective yield as of October 31, 2006. |
| | ADR | American Depository Receipt |
See notes to financial statements.
Statements of Assets and Liabilities
October 31, 2006
| | | | | | | | | |
| | | Gartmore
Growth Fund | | | Gartmore
Nationwide Fund |
Assets: | | | | | | | | | |
Investments, at value (cost $189,845,201 and $1,206,550,521; respectively)* | | $ | 204,651,493 | | | $ | 1,308,442,984 | | |
Repurchase agreements, at cost and value** | | | 10,776,046 | | | | 74,636,018 | | |
| | | | | | | | | |
Total Investments | | | 215,427,539 | | | | 1,383,079,002 | | |
| | | | | | | | | |
Cash | | | — | | | | 826 | | |
Interest and dividends receivable | | | 62,638 | | | | 846,021 | | |
Receivable for capital shares issued | | | 7,240 | | | | 171,319 | | |
Receivable for investments sold | | | 13,851,777 | | | | 39,875,394 | | |
Prepaid expenses | | | 14,221 | | | | 7,409 | | |
| | | | | | | | | |
Total Assets: | | | 229,363,415 | | | | 1,423,979,971 | | |
| | | | | | | | | |
| | | |
Liabilities | | | | | | | | | |
Payable to custodian | | | 96,704 | | | | — | | |
Payable for investments purchased | | | 2,796,387 | | | | 33,858,805 | | |
Payable for capital shares redeemed | | | 7,929,252 | | | | 651,807 | | |
Payable for return of collateral received for securities on loan | | | 17,676,046 | | | | 100,640,679 | | |
Accrued expenses and other payables | | | | | | | | | |
Investment advisory fees | | | 106,654 | | | | 623,050 | | |
Fund administration and transfer agent fees | | | 34,542 | | | | 272,146 | | |
Distribution fees | | | 8,950 | | | | 42,887 | | |
Administrative servicing fees | | | 24,212 | | | | 258,940 | | |
Trustee fees | | | 28 | | | | 171 | | |
Compliance program fees (Note 3) | | | 1,850 | | | | 11,634 | | |
Other | | | 127,954 | | | | 316,795 | | |
| | | | | | | | | |
Total Liabilities: | | | 28,802,579 | | | | 136,676,914 | | |
| | | | | | | | | |
Net Assets | | $ | 200,560,836 | | | $ | 1,287,303,057 | | |
| | | | | | | | | |
| | | |
Represented by: | | | | | | | | | |
Capital | | $ | 434,490,869 | | | $ | 1,064,237,664 | | |
Accumulated net investment income (loss) | | | — | | | | 449,169 | | |
Accumulated net realized gains (losses) from investments, futures, and foreign currency transactions | | | (248,736,325 | ) | | | 120,723,761 | | |
Net unrealized appreciation (depreciation) on investments | | | 14,806,292 | | | | 101,892,463 | | |
| | | | | | | | | |
Net Assets | | $ | 200,560,836 | | | $ | 1,287,303,057 | | |
| | | | | | | | | |
Net Assets: | | | | | | | | | |
Class A Shares | | $ | 12,815,818 | | | $ | 117,938,002 | | |
Class B Shares | | | 4,444,688 | | | | 20,454,791 | | |
Class C Shares | | | 777,448 | | | | 865,856 | | |
Class D Shares | | | 182,519,298 | | | | 1,137,817,209 | | |
Class R Shares | | | 1,265 | | | | 1,398 | | |
Institutional Service Class Shares | | | 1,157 | | | | — | | |
Institutional Class Shares | | | 1,162 | | | | 10,225,801 | | |
| | | | | | | | | |
Total | | $ | 200,560,836 | | | $ | 1,287,303,057 | | |
| | | | | | | | | |
| | | | | | | | | | |
| * | Includes securities held as collateral for securities on loan of $6,900,000 and $26,004,661; respectively. |
| ** | Includes securities held as collateral for securities on loan of $10,776,046 and $74,636,018; respectively. |
See notes to financial statements.
Statements of Assets and Liabilities (Continued)
| | | | | | | | | | |
| | | Gartmore
Growth Fund | | | Gartmore
Nationwide Fund |
Shares outstanding (unlimited number of shares authorized) | | | | | | | | | | |
Class A Shares | | | 1,778,899 | | | | 5,683,172 | | | |
Class B Shares | | | 675,738 | | | | 1,019,964 | | | |
Class C Shares | | | 118,073 | | | | 43,233 | | | |
Class D Shares | | | 24,822,574 | | | | 55,378,374 | | | |
Class R Shares | | | 174 | | | | 68 | | | |
Institutional Service Class Shares | | | 158 | | | | — | | | |
Institutional Class Shares | | | 159 | | | | 497,668 | | | |
| | | | | | | | | | |
Total | | | 27,395,775 | | | | 62,622,479 | | | |
| | | | | | | | | | |
Net asset value and redemption price per share: | | | | | | | | | | |
Class A Shares | | $ | 7.20 | | | $ | 20.75 | | | |
Class B Shares (a) | | $ | 6.58 | | | $ | 20.05 | | | |
Class C Shares (b) | | $ | 6.58 | | | $ | 20.03 | | | |
Class D Shares | | $ | 7.35 | | | $ | 20.55 | | | |
Class R Shares | | $ | 7.27 | | | $ | 20.58 | (c) | | |
Institutional Service Class Shares | | $ | 7.36 | (c) | | $ | — | | | |
Institutional Class Shares | | $ | 7.34 | (c) | | $ | 20.55 | | | |
Maximum offering price per share (100%/(100%-maximum sales charge) of net asset value adjusted to the nearest cent): | | | | | | | | | | |
Class A Shares | | $ | 7.64 | | | $ | 22.02 | | | |
Class D Shares | | $ | 7.70 | | | $ | 21.52 | | | |
| | | | | | | | | | |
Maximum Sales Charge — Class A Shares | | | 5.75 | % | | | 5.75 | % | | |
| | | | | | | | | | |
Maximum Sales Charge — Class D Shares | | | 4.50 | % | | | 4.50 | % | | |
| | | | | | | | | | |
| | | | | | | | | | |
| | | | | | | | | | |
| | | | | | | | | | |
| | | | | | | | | | |
| | | | | | | | | | |
| | | | | | | | | | |
| | | | | | | | | | |
| | | | | | | | | | |
| | | | | | | | | | |
| | | | | | | | | | |
| | | | | | | | | | |
| | | | | | | | | | |
| | | | | | | | | | |
| | | | | | | | | | |
| | | | | | | | | | | |
| (a) | For Class B Shares, the redemption price per share varies by the length of time shares are held. |
| (b) | For Class C Shares, the redemption price per share is reduced by 1.00% for shares held less than one year. |
| (c) | The NAV reported above represents the traded NAV at October 31, 2006. Due to the financial statement rounding of class assets and class shares above, the NAV results in a different NAV than the traded NAV. |
See notes to financial statements.
Statements of Operations
For the Year Ended October 31, 2006
| | | | | | | | | | |
| | | Gartmore
Growth Fund | | | Gartmore
Nationwide Fund |
INVESTMENT INCOME: | | | | | | | | | | |
Interest income | | $ | 49,433 | | | $ | 1,065,881 | | | |
Dividend income (net of foreign withholding tax $0 and $6,403; respectively) | | | 1,812,673 | | | | 23,523,780 | | | |
Income from securities lending | | | 64,347 | | | | 312,980 | | | |
| | | | | | | | | | |
Total Income | | | 1,926,453 | | | | 24,902,641 | | | |
| | | | | | | | | | |
| | | |
Expenses: | | | | | | | | | | |
Investment advisory fees | | | 1,355,471 | | | | 7,369,230 | | | |
Fund administration and transfer agent fees | | | 293,338 | | | | 1,503,940 | | | |
Distribution fees Class A | | | 67,798 | | | | 289,813 | | | |
Distribution fees Class B | | | 49,065 | | | | 247,211 | | | |
Distribution fees Class C | | | 6,379 | | | | 8,767 | | | |
Distribution fees Class R | | | 4 | | | | 5 | | | |
Administrative servicing fees Class A | | | 27,674 | | | | 37,181 | | | |
Administrative servicing fees Class D | | | 22,495 | | | | 580,965 | | | |
Administrative servicing fees Class R | | | 2 | | | | 1 | | | |
Registration and filing fees | | | 52,177 | | | | 95,000 | | | |
Trustee fees | | | 7,853 | | | | 44,115 | | | |
Compliance program fees (Note 3) | | | 3,711 | | | | 22,568 | | | |
Other | | | 81,732 | | | | 660,904 | | | |
| | | | | | | | | | |
Total expenses before reimbursed expenses | | | 1,967,699 | | | | 10,859,700 | | | |
Earnings credit (Note 5) | | | — | | | | (26,526 | ) | | |
Expenses voluntarily waived by Administrator | | | (330 | ) | | | (492 | ) | | |
| | | | | | | | | | |
Net Expenses | | | 1,967,369 | | | | 10,832,682 | | | |
| | | | | | | | | | |
Net Investment Income (Loss) | | | (40,916 | ) | | | 14,069,959 | | | |
| | | | | | | | | | |
| | | |
REALIZED/UNREALIZED GAINS (LOSSES) FROM INVESTMENTS: | | | | | | | | | | |
Net realized gains (losses) on investment transactions | | | 9,715,964 | | | | 125,975,773 | | | |
Net realized gains (losses) on futures transactions | | | — | | | | 31,348 | | | |
Net realized gains (losses) on foreign currency transactions | | | — | | | | (1,081 | ) | | |
| | | | | | | | | | |
Net realized gains (losses) on investment, futures and foreign currency transactions | | | 9,715,964 | | | | 126,006,040 | | | |
Net change in unrealized appreciation/depreciation on investments | | | 7,798,333 | | | | 38,463,505 | | | |
| | | | | | | | | | |
Net realized/unrealized gains (losses) on investments, futures and foreign currencies | | | 17,514,297 | | | | 164,469,545 | | | |
| | | | | | | | | | |
CHANGE IN NET ASSETS RESULTING FROM OPERATIONS | | $ | 17,473,381 | | | $ | 178,539,504 | | | |
| | | | | | | | | | |
| | | | | | | | | | |
| | | | | | | | | | |
| | | | | | | | | | |
| | | | | | | | | | |
| | | | | | | | | | |
| | | | | | | | | | |
| | | | | | | | | | |
| | | | | | | | | | |
| | | | | | | | | | |
| | | | | | | | | | |
| | | | | | | | | | | |
See notes to financial statements.
Statements of Changes in Net Assets
| | | | | | | | | | | | | | | | | | |
| | | Gartmore Growth Fund | | | Gartmore Nationwide Fund |
| | | Year Ended
October 31, 2006 | | | Year Ended
October 31, 2005 | | | Year Ended
October 31, 2006 | | | Year Ended
October 31, 2005 |
FROM INVESTMENT ACTIVITIES: | | | | | | | | | | | | | | | | | | |
Operations: | | | | | | | | | | | | | | | | | | |
Net investment income (loss) | | $ | (40,916 | ) | | $ | 360,174 | | | $ | 14,069,959 | | | $ | 16,674,008 | | | |
Net realized gains (losses) on investment, futures, and foreign currency transactions | | | 9,715,964 | | | | 29,235,412 | | | | 126,006,040 | | | | 178,113,925 | | | |
Net change in unrealized appreciation/depreciation on investments | | | 7,798,333 | | | | (3,761,798 | ) | | | 38,463,505 | | | | (20,765,695 | ) | | |
| | | | | | | | | | | | | | | | | | |
Change in net assets resulting from operations | | | 17,473,381 | | | | 25,833,788 | | | | 178,539,504 | | | | 174,022,238 | | | |
| | | | | | | | | | | | | | | | | | |
| | | | | |
Distributions to Class A Shareholders from: | | | | | | | | | | | | | | | | | | |
Net investment income | | | — | | | | (52,234 | ) | | | (998,645 | ) | | | (1,816,560 | ) | | |
Net realized gains on investments | | | — | | | | — | | | | (15,547,435 | ) | | | (984,339 | ) | | |
| | | | | |
Distributions to Class B Shareholders from: | | | | | | | | | | | | | | | | | | |
Net investment income | | | — | | | | — | | | | (34,154 | ) | | | (189,801 | ) | | |
Net realized gains on investments | | | — | | | | — | | | | (3,901,458 | ) | | | (153,661 | ) | | |
| | | | | |
Distributions to Class C Shareholders from: | | | | | | | | | | | | | | | | | | |
Net investment income | | | — | | | | — | | | | (1,534 | ) | | | (5,099 | ) | | |
Net realized gains on investments | | | — | | | | — | | | | (119,900 | ) | | | (4,195 | ) | | |
| | | | | |
Distributions to Class D Shareholders from: | | | | | | | | | | | | | | | | | | |
Net investment income | | | — | | | | (741,746 | ) | | | (12,514,256 | ) | | | (15,158,855 | ) | | |
Net realized gains on investments | | | — | | | | — | | | | (150,621,311 | ) | | | (4,909,336 | ) | | |
| | | | | |
Distributions to Class R Shareholders from: | | | | | | | | | | | | | | | | | | |
Net investment income | | | — | | | | (2 | ) | | | (11 | ) | | | (12 | ) | | |
Net realized gains on investments | | | — | | | | — | | | | (165 | ) | | | (5 | ) | | |
| | | | | |
Distributions to Institutional Service Class Shareholders from: | | | | | | | | | | | | | | | | | | |
Net investment income | | | — | | | | (4 | ) | | | — | | | | (8 | ) | | |
Net realized gains on investments | | | — | | | | — | | | | — | | | | (4 | ) | | |
| | | | | |
Distributions to Institutional Class Shareholders from: | | | | | | | | | | | | | | | | | | |
Net investment income | | | — | | | | (4 | ) | | | (71,109 | ) | | | (13,953 | ) | | |
Net realized gains on investments | | | — | | | | — | | | | (536,929 | ) | | | (1,862 | ) | | |
| | | | | | | | | | | | | | | | | | |
Change in net assets from shareholder distributions | | | — | | | | (793,990 | ) | | | (184,346,907 | ) | | | (23,237,690 | ) | | |
| | | | | | | | | | | | | | | | | | |
Change in net assets from capital transactions | | | (54,939,533 | ) | | | (40,564,697 | ) | | | 7,041,515 | | | | (510,938,937 | ) | | |
| | | | | | | | | | | | | | | | | | |
Change in net assets | | | (37,466,152 | ) | | | (15,524,899 | ) | | | 1,234,112 | | | | (360,154,389 | ) | | |
| | | | | |
Net Assets: | | | | | | | | | | | | | | | | | | |
Beginning of period | | | 238,026,988 | | | | 253,551,887 | | | | 1,286,068,945 | | | | 1,646,223,334 | | | |
| | | | | | | | | | | | | | | | | | |
End of period | | $ | 200,560,836 | | | $ | 238,026,988 | | | $ | 1,287,303,057 | | | $ | 1,286,068,945 | | | |
| | | | | | | | | | | | | | | | | | |
Accumulated net investment income (loss) at end of period | | $ | — | | | $ | — | | | $ | 449,169 | | | $ | — | | | |
| | | | | | | | | | | | | | | | | | |
| | | | | | | | | | | | | | | | | | | |
See notes to financial statements.
Statements of Changes in Net Assets (Continued)
| | | | | | | | | | | | | | | | | | |
| | | Gartmore Growth Fund | | | Gartmore Nationwide Fund |
| | | Year Ended
October 31, 2006 | | | Year Ended
October 31, 2005 | | | Year Ended
October 31, 2006 | | | Year Ended
October 31, 2005 |
CAPITAL TRANSACTIONS: | | | | | | | | | | | | | | | | | | |
Class A Shares | | | | | | | | | | | | | | | | | | |
Proceeds from shares issued | | $ | 6,945,679 | | | $ | 7,735,517 | | | $ | 18,217,067 | | | $ | 25,695,566 | | | |
Dividends reinvested | | | — | | | | 51,958 | | | | 12,209,812 | | | | 1,886,839 | | | |
Cost of shares redeemed (a) | | | (25,529,945 | ) | | | (11,941,022 | ) | | | (31,700,701 | ) | | | (387,432,451 | ) | | |
| | | | | | | | | | | | | | | | | | |
| | | (18,584,266 | ) | | | (4,153,547 | ) | | | (1,273,822 | ) | | | (359,850,046 | ) | | |
| | | | | | | | | | | | | | | | | | |
| | | | | |
Class B Shares | | | | | | | | | | | | | | | | | | |
Proceeds from shares issued | | | 314,138 | | | | 438,258 | | | | 1,576,683 | | | | 1,971,460 | | | |
Dividends reinvested | | | — | | | | — | | | | 3,905,807 | | | | 340,027 | | | |
Cost of shares redeemed (a) | | | (1,532,582 | ) | | | (1,474,562 | ) | | | (14,328,852 | ) | | | (10,865,494 | ) | | |
| | | | | | | | | | | | | | | | | | |
| | | (1,218,444 | ) | | | (1,036,304 | ) | | | (8,846,362 | ) | | | (8,554,007 | ) | | |
| | | | | | | | | | | | | | | | | | |
| | | | | |
Class C Shares | | | | | | | | | | | | | | | | | | |
Proceeds from shares issued | | | 244,813 | | | | 446,463 | | | | 70,281 | | | | 204,882 | | | |
Dividends reinvested | | | — | | | | — | | | | 73,238 | | | | 4,842 | | | |
Cost of shares redeemed (a) | | | (64,806 | ) | | | (166,627 | ) | | | (240,654 | ) | | | (331,720 | ) | | |
| | | | | | | | | | | | | | | | | | |
| | | 180,007 | | | | 279,836 | | | | (97,135 | ) | | | (121,996 | ) | | |
| | | | | | | | | | | | | | | | | | |
| | | | | |
Class D Shares | | | | | | | | | | | | | | | | | | |
Proceeds from shares issued | | | 6,652,182 | | | | 6,887,357 | | | | 46,676,857 | | | | 43,291,189 | | | |
Dividends reinvested | | | 981 | | | | 721,641 | | | | 154,677,329 | | | | 18,992,305 | | | |
Cost of shares redeemed (a) | | | (41,969,991 | ) | | | (43,263,689 | ) | | | (190,742,773 | ) | | | (207,623,010 | ) | | |
| | | | | | | | | | | | | | | | | | |
| | | (35,316,828 | ) | | | (35,654,691 | ) | | | 10,611,413 | | | | (145,339,516 | ) | | |
| | | | | | | | | | | | | | | | | | |
| | | | | |
Class R Shares | | | | | | | | | | | | | | | | | | |
Proceeds from shares issued | | | 150 | | | | 175 | | | | 150 | | | | 175 | | | |
Dividends reinvested | | | — | | | | 2 | | | | 176 | | | | 17 | | | |
Cost of shares redeemed (a) | | | (152 | ) | | | (176 | ) | | | (151 | ) | | | (176 | ) | | |
| | | | | | | | | | | | | | | | | | |
| | | (2 | ) | | | 1 | | | | 175 | | | | 16 | | | |
| | | | | | | | | | | | | | | | | | |
| | | | | |
Institutional Service Class Shares | | | | | | | | | | | | | | | | | | |
Dividends reinvested | | | — | | | | 4 | | | | — | | | | 12 | | | |
Cost of shares redeemed (a) | | | — | | | | — | | | | — | | | | (1,052 | ) | | |
| | | | | | | | | | | | | | | | | | |
| | | — | | | | 4 | | | | — | | | | (1,040 | ) | | |
| | | | | | | | | | | | | | | | | | |
| | | | | |
Institutional Class Shares | | | | | | | | | | | | | | | | | | |
Proceeds from shares issued | | | — | | | | — | | | | 7,571,445 | | | | 3,055,202 | | | |
Dividends reinvested | | | — | | | | 4 | | | | 608,038 | | | | 15,815 | | | |
Cost of shares redeemed (a) | | | — | | | | — | | | | (1,532,237 | ) | | | (143,365 | ) | | |
| | | | | | | | | | | | | | | | | | |
| | | — | | | | 4 | | | | 6,647,246 | | | | 2,927,652 | | | |
| | | | | | | | | | | | | | | | | | |
Change in net assets from capital transactions | | $ | (54,939,533 | ) | | $ | (40,564,697 | ) | | $ | 7,041,515 | | | $ | (510,938,937 | ) | | |
| | | | | | | | | | | | | | | | | | | |
See notes to financial statements.
Statements of Changes in Net Assets
| | | | | | | | | | | | | | |
| | | Gartmore Growth Fund | | | Gartmore Nationwide Fund |
| | | Year Ended
October 31, 2006 | | | Year Ended
October 31, 2005 | | | Year Ended
October 31, 2006 | | | Year Ended
October 31, 2005 |
SHARE TRANSACTIONS: | | | | | | | | | | | | | | |
Class A Shares | | | | | | | | | | | | | | |
Issued | | 992,370 | | | 1,177,335 | | | 917,418 | | | 1,268,312 | | | |
Reinvested | | — | | | 7,944 | | | 638,706 | | | 92,206 | | | |
Redeemed | | (3,618,467 | ) | | (1,820,994 | ) | | (1,586,139 | ) | | (19,265,093 | ) | | |
| | | | | | | | | | | | | | | |
| | | (2,626,097 | ) | | (635,715 | ) | | (30,015 | ) | | (17,904,575 | ) | | |
| | | | | | | | | | | | | | | |
| | | | | |
Class B Shares | | | | | | | | | | | | | | |
Issued | | 49,039 | | | 72,386 | | | 81,775 | | | 99,512 | | | |
Reinvested | | — | | | — | | | 211,436 | | | 17,096 | | | |
Redeemed | | (239,296 | ) | | (242,627 | ) | | (747,747 | ) | | (542,265 | ) | | |
| | | | | | | | | | | | | | | |
| | | (190,257 | ) | | (170,241 | ) | | (454,536 | ) | | (425,657 | ) | | |
| | | | | | | | | | | | | | | |
| | | | | |
Class C Shares | | | | | | | | | | | | | | |
Issued | | 38,755 | | | 72,512 | | | 3,749 | | | 10,248 | | | |
Reinvested | | — | | | — | | | 3,969 | | | 244 | | | |
Redeemed | | (9,984 | ) | | (27,310 | ) | | (12,035 | ) | | (16,582 | ) | | |
| | | | | | | | | | | | | | | |
| | | 28,771 | | | 45,202 | | | (4,317 | ) | | (6,090 | ) | | |
| | | | | | | | | | | | | | | |
| | | | | |
Class D Shares | | | | | | | | | | | | | | |
Issued | | 928,766 | | | 1,036,633 | | | 2,358,326 | | | 2,138,657 | | | |
Reinvested | | 103 | | | 108,977 | | | 8,171,421 | | | 934,057 | | | |
Redeemed | | (5,883,831 | ) | | (6,492,159 | ) | | (9,690,309 | ) | | (10,243,564 | ) | | |
| | | | | | | | | | | | | | | |
| | | (4,954,962 | ) | | (5,346,549 | ) | | 839,438 | | | (7,170,850 | ) | | |
| | | | | | | | | | | | | | | |
| | | | | |
Class R Shares | | | | | | | | | | | | | | |
Issued | | 21 | | | 26 | | | 8 | | | 9 | | | |
Reinvested | | — | | | — | (b) | | 9 | | | 1 | | | |
Redeemed | | (21 | ) | | (26 | ) | | (8 | ) | | (9 | ) | | |
| | | | | | | | | | | | | | | |
| | | — | | | — | | | 9 | | | 1 | | | |
| | | | | | | | | | | | | | | |
| | | | | |
Institutional Service Class Shares | | | | | | | | | | | | | | |
Reinvested | | — | | | 1 | | | — | | | 1 | | | |
Redeemed | | — | | | — | | | — | | | (52 | ) | | |
| | | | | | | | | | | | | | | |
| | | — | | | 1 | | | — | | | (51 | ) | | |
| | | | | | | | | | | | | | | |
| | | | | |
Institutional Class Shares | | | | | | | | | | | | | | |
Issued | | — | | | — | | | 383,788 | | | 148,721 | | | |
Reinvested | | — | | | 1 | | | 32,099 | | | 774 | | | |
Redeemed | | — | | | — | | | (78,889 | ) | | (6,950 | ) | | |
| | | | | | | | | | | | | | | |
| | | — | | | 1 | | | 336,998 | | | 142,545 | | | |
| | | | | | | | | | | | | | | |
Total change in shares | | (7,742,545 | ) | | (6,107,301 | ) | | 687,577 | | | (25,364,677 | ) | | |
| | | | | | | | | | | | | | | |
| (a) | Includes redemption fees, if any. |
See notes to financial statements.
Financial Highlights
Selected Data for Each Share of Capital Outstanding
Gartmore Growth Fund
| | | | | | | | | | | | | | | | | | | | | | | | | | | | | | | | | | | | | | | | | | | |
| | | | | Investment Activities | | | Distributions | | | | | | Ratios / Supplemental Data | | |
| | | Net Asset Value, Beginning of Period | | Net Investment Income (Loss) | | | Net Realized and Unrealized Gains (Losses) on
Investments | | | Total
from
Investment
Activities | | | Net
Investment
Income | | | Total
Distributions | | | Net
Asset
Value, End
of Period | | Total
Return (a) | | | Net Assets at End of Period (000s) | | Ratio of Expenses to Average Net Assets | | | Ratio of Net Investment Income (Loss)
to Average
Net Assets | | | Ratio of Expenses (Prior to Reimbursements)
to Average Net Assets (b) | | | Ratio of Net
Investment Income (Loss) (Prior to Reimbursements) to Average Net Assets (b) | | | Portfolio
Turnover (c) | | |
| | | | | | | | | | | | | | | |
Class A Shares | | | | | | | | | | | | | | | | | | | | | | | | | | | | | | | | | | | | | | | | | | | |
Year Ended October 31, 2002 | | $ | 5.89 | | (0.02 | ) | | (1.13 | ) | | (1.15 | ) | | — | | | — | | | $ | 4.74 | | (19.52% | ) | | $ | 4,828 | | 1.17% | | | (0.34% | ) | | (i | ) | | (i | ) | | 241.95% | | |
Year Ended October 31, 2003 | | $ | 4.74 | | (0.01 | ) | | 1.19 | | | 1.18 | | | — | | | — | | | $ | 5.92 | | 24.89% | | | $ | 6,529 | | 1.13% | | | (0.22% | ) | | (i | ) | | (i | ) | | 281.63% | | |
Year Ended October 31, 2004 | | $ | 5.92 | | (0.02 | ) | | 0.18 | | | 0.16 | | | — | | | — | | | $ | 6.08 | | 2.70% | | | $ | 30,641 | | 1.19% | | | (0.36% | ) | | (i | ) | | (i | ) | | 286.06% | | |
Year Ended October 31, 2005 | | $ | 6.08 | | (0.01 | ) | | 0.63 | | | 0.62 | | | (0.01 | ) | | (0.01 | ) | | $ | 6.69 | | 10.22% | | | $ | 29,467 | | 1.34% | | | (0.14% | ) | | (i | ) | | (i | ) | | 281.51% | | |
Year Ended October 31, 2006 | | $ | 6.69 | | (0.04 | ) | | 0.55 | | | 0.51 | | | — | | | — | | | $ | 7.20 | | 7.62% | | | $ | 12,816 | | 1.15% | | | (0.29% | ) | | 1.15% | | | (0.29% | ) | | 284.67% | | |
| | | | | | | | | | | | | | | |
Class B Shares | | | | | | | | | | | | | | | | | | | | | | | | | | | | | | | | | | | | | | | | | | | |
Year Ended October 31, 2002 | | $ | 5.54 | | (0.06 | ) | | (1.04 | ) | | (1.10 | ) | | — | | | — | | | $ | 4.44 | | (19.86% | ) | | $ | 3,299 | | 1.90% | | | (1.08% | ) | | (i | ) | | (i | ) | | 241.95% | | |
Year Ended October 31, 2003 | | $ | 4.44 | | (0.04 | ) | | 1.11 | | | 1.07 | | | — | | | — | | | $ | 5.51 | | 24.10% | | | $ | 3,980 | | 1.84% | | | (0.93% | ) | | (i | ) | | (i | ) | | 281.63% | | |
Year Ended October 31, 2004 | | $ | 5.51 | | (0.05 | ) | | 0.15 | | | 0.10 | | | — | | | — | | | $ | 5.61 | | 1.81% | | | $ | 5,817 | | 1.84% | | | (1.00% | ) | | (i | ) | | (i | ) | | 286.06% | | |
Year Ended October 31, 2005 | | $ | 5.61 | | (0.05 | ) | | 0.59 | | | 0.54 | | | — | | | — | | | $ | 6.15 | | 9.63% | | | $ | 5,325 | | 1.98% | | | (0.78% | ) | | (i | ) | | (i | ) | | 281.51% | | |
Year Ended October 31, 2006 | | $ | 6.15 | | (0.07 | ) | | 0.50 | | | 0.43 | | | — | | | — | | | $ | 6.58 | | 6.99% | | | $ | 4,445 | | 1.80% | | | (0.94% | ) | | 1.80% | | | (0.94% | ) | | 284.67% | | |
| | | | | | | | | | | | | | | |
Class C Shares | | | | | | | | | | | | | | | | | | | | | | | | | | | | | | | | | | | | | | | | | | | |
Year Ended October 31, 2002 | | $ | 5.55 | | (0.06 | ) | | (1.05 | ) | | (1.11 | ) | | — | | | — | | | $ | 4.44 | | (20.00% | ) | | $ | 52 | | 1.90% | | | (1.08% | ) | | (i | ) | | (i | ) | | 241.95% | | |
Year Ended October 31, 2003 | | $ | 4.44 | | (0.04 | ) | | 1.11 | | | 1.07 | | | — | | | — | | | $ | 5.51 | | 24.10% | | | $ | 101 | | 1.84% | | | (0.95% | ) | | (i | ) | | (i | ) | | 281.63% | | |
Year Ended October 31, 2004 | | $ | 5.51 | | (0.05 | ) | | 0.16 | | | 0.11 | | | — | | | — | | | $ | 5.62 | | 2.00% | | | $ | 248 | | 1.84% | | | (1.01% | ) | | (i | ) | | (i | ) | | 286.06% | | |
Year Ended October 31, 2005 | | $ | 5.62 | | (0.04 | ) | | 0.58 | | | 0.54 | | | — | | | — | | | $ | 6.16 | | 9.61% | | | $ | 550 | | 2.03% | | | (0.96% | ) | | (i | ) | | (i | ) | | 281.51% | | |
Year Ended October 31, 2006 | | $ | 6.16 | | (0.05 | ) | | 0.47 | | | 0.42 | | | — | | | — | | | $ | 6.58 | | 6.82% | | | $ | 777 | | 1.77% | | | (0.93% | ) | | 1.77% | | | (0.93% | ) | | 284.67% | | |
| | | | | | | | | | | | | | | |
Class D Shares | | | | | | | | | | | | | | | | | | | | | | | | | | | | | | | | | | | | | | | | | | | |
Year Ended October 31, 2002 | | $ | 5.94 | | (0.01 | ) | | (1.14 | ) | | (1.15 | ) | | — | | | — | | | $ | 4.79 | | (19.36% | ) | | $ | 207,357 | | 0.93% | | | (0.10% | ) | | (i | ) | | (i | ) | | 241.95% | | |
Year Ended October 31, 2003 | | $ | 4.79 | | — | | | 1.21 | | | 1.21 | | | — | | | — | | | $ | 6.00 | | 25.26% | | | $ | 235,758 | | 0.86% | | | 0.05% | | | (i | ) | | (i | ) | | 281.63% | | |
Year Ended October 31, 2004 | | $ | 6.00 | | — | (j) | | 0.17 | | | 0.17 | | | — | (j) | | — | | | $ | 6.17 | | 2.87% | | | $ | 216,843 | | 0.85% | | | (0.01% | ) | | (i | ) | | (i | ) | | 286.06% | | |
Year Ended October 31, 2005 | | $ | 6.17 | | 0.01 | | | 0.65 | | | 0.66 | | | (0.02 | ) | | (0.02 | ) | | $ | 6.81 | | 10.74% | | | $ | 202,682 | | 0.99% | | | 0.21% | | | (i | ) | | (i | ) | | 281.51% | | |
Year Ended October 31, 2006 | | $ | 6.81 | | — | | | 0.54 | | | 0.54 | | | — | | | — | | | $ | 7.35 | | 7.93% | | | $ | 182,519 | | 0.80% | | | 0.05% | | | 0.80% | | | 0.05% | | | 284.67% | | |
| | | | | | | | | | | | | | | |
Class R Shares | | | | | | | | | | | | | | | | | | | | | | | | | | | | | | | | | | | | | | | | | | | |
Period Ending October 31, 2003 (e) | | $ | 5.76 | | (0.01 | ) | | 0.25 | | | 0.24 | | | — | | | — | | | $ | 6.00 | | 4.17% | (g) | | $ | 1 | | 1.42% | (h) | | (0.76% | )(h) | | 1.52% | (h) | | 0.86% | (h) | | 281.63% | | |
Year Ended October 31, 2004 | | $ | 6.00 | | (0.03 | ) | | 0.18 | | | 0.15 | | | — | | | — | | | $ | 6.15 | | 2.50% | | | $ | 1 | | 1.29% | | | (0.46% | ) | | (i | ) | | (i | ) | | 286.06% | | |
Year Ended October 31, 2005 | | $ | 6.15 | | (0.01 | ) | | 0.64 | | | 0.63 | | | (0.01 | ) | | (0.01 | ) | | $ | 6.77 | | 10.28% | | | $ | 1 | | 1.29% | | | (0.14% | ) | | (i | ) | | (i | ) | | 281.51% | | |
Year Ended October 31, 2006 | | $ | 6.77 | | (0.03 | ) | | 0.53 | | | 0.50 | | | — | | | — | | | $ | 7.27 | | 7.39% | | | $ | 1 | | 1.28% | | | (0.47% | ) | | 1.28% | | | (0.47% | ) | | 284.67% | | |
| | | | | | | | | | | | | | | |
Institutional Service Class Shares | | | | | | | | | | | | | | | | | | | | | | | | | | | | | | | | | | | | | | | | | | | |
Period Ended October 31, 2002 (d) | | $ | 6.59 | | (0.01 | ) | | (1.79 | ) | | (1.80 | ) | | — | | | — | | | $ | 4.79 | | (27.31% | )(g) | | $ | 59,307 | | 0.88% | (h) | | (0.11% | )(h) | | (i | ) | | (i | ) | | 241.95% | | |
Year Ended October 31, 2003 | | $ | 4.79 | | — | | | 1.22 | | | 1.22 | | | — | | | — | | | $ | 6.01 | | 25.47% | | | $ | 75,002 | | 0.84% | | | 0.06% | | | (i | ) | | (i | ) | | 281.63% | | |
Year Ended October 31, 2004 (k) | | $ | 6.01 | | 0.01 | | | 0.17 | | | 0.18 | | | — | (j) | | — | | | $ | 6.19 | | 3.03% | | | $ | 1 | | 0.84% | | | 0.22% | | | (i | ) | | (i | ) | | 286.06% | | |
Year Ended October 31, 2005 | | $ | 6.19 | | — | | | 0.65 | | | 0.65 | | | (0.02 | ) | | (0.02 | ) | | $ | 6.82 | | 10.55% | | | $ | 1 | | 1.04% | | | 0.11% | | | (i | ) | | (i | ) | | 281.51% | | |
Year Ended October 31, 2006 | | $ | 6.82 | | — | | | 0.54 | | | 0.54 | | | — | | | — | | | $ | 7.36 | | 7.92% | | | $ | 1 | | 0.80% | | | 0.02% | | | 0.80% | | | 0.02% | | | 284.67% | | |
| | | | | | | | | | | | | | | |
Institutional Class Shares | | | | | | | | | | | | | | | | | | | | | | | | | | | | | | | | | | | | | | | | | | | |
Period Ended October 31, 2004 (f) | | $ | 6.34 | | — | | | (0.17 | ) | | (0.17 | ) | | — | | | — | | | $ | 6.17 | | (2.68% | )(g) | | $ | 1 | | 0.80% | (h) | | (0.06% | )(h) | | (i | ) | | (i | ) | | 286.06% | | |
Year Ended October 31, 2005 | | $ | 6.17 | | — | | | 0.65 | | | 0.65 | | | (0.02 | ) | | (0.02 | ) | | $ | 6.80 | | 10.59% | | | $ | 1 | | 1.04% | | | 0.11% | | | (i | ) | | (i | ) | | 281.51% | | |
Year Ended October 31, 2006 | | $ | 6.80 | | — | | | 0.54 | | | 0.54 | | | — | | | — | | | $ | 7.34 | | 7.94% | | | $ | 1 | | 0.79% | | | 0.02% | | | 0.79% | | | 0.02% | | | 284.67% | | |
| | |
(a) Excludes sales charge. (b) During the period certain fees were waived and/or reimbursed. If such waivers/reimbursements had not occurred, the ratio would have been as indicated. | | (f) For the period from June 29, 2004 (commencement of operations) through October 31, 2004. (g) Not annualized. (h) Annualized. |
(c) Portfolio turnover is calculated on the basis of the Fund as a whole without distinguishing among the classes of shares. | | (i) There were no fee reductions during the period. (j) The amount is less than $0.005. |
(d) For the period from January 2, 2002 (commencement of operations) through October 31, 2002. (e) For the period from October 1, 2003 (commencement of operations) through October 31, 2003. | | (k) Net investment income (loss) is based on average shares outstanding during the period. |
See notes to financial statements.
Financial Highlights
Selected Data for Each Share of Capital Outstanding
Gartmore Nationwide Fund
| | | | | | | | | | | | | | | | | | | | | | | | | | | | | | | | | | | | | | | | | | | | |
| | | | | Investment Activities | | | Distributions | | | | | | Ratios/Supplemental Data |
| | | Net Asset
Value,
Beginning
of Period | | Net
Investment
Income
(Loss) | | | Net Realized
and
Unrealized
Gains
(Losses) on
Investments | | | Total
from
Investment
Activities | | | Net
Investment
Income | | | Net
Realized
Gains | | | Total
Distributions | | | Net
Asset
Value, End
of Period | | Total
Return (a) | | | Net Assets
at End of
Period
(000s) | | Ratio of
Expenses
to Average
Net Assets | | | Ratio of Net
Investment
Income
(Loss)
to Average
Net Assets | | | Ratio of
Expenses
(Prior to
Reimbursements)
to Average
Net Assets (b) | | | Ratio of Net
Investment
Income (Loss)
(Prior to
Reimbursements)
to Average
Net Assets (b) | | | Portfolio
Turnover (c) |
| | | | | | | | | | | | | | | |
Class A Shares | | | | | | | | | | | | | | | | | | | | | | | | | | | | | | | | | | | | | | | | | | | | |
Year Ended October 31, 2002 | | $ | 16.75 | | 0.07 | | | (1.68 | ) | | (1.61 | ) | | (0.08 | ) | | — | | | (0.08 | ) | | $ | 15.06 | | (9.64% | ) | | $ | 362,435 | | 1.14% | | | 0.46% | | | (h | ) | | (h | ) | | 25.51% |
Year Ended October 31, 2003 | | $ | 15.06 | | 0.09 | | | 3.02 | | | 3.11 | | | (0.09 | ) | | — | | | (0.09 | ) | | $ | 18.08 | | 20.74% | | | $ | 571,918 | | 1.13% | | | 0.57% | | | (h | ) | | (h | ) | | 120.02% |
Year Ended October 31, 2004 | | $ | 18.08 | | 0.07 | | | 0.87 | | | 0.94 | | | (0.06 | ) | | — | | | (0.06 | ) | | $ | 18.96 | | 5.22% | | | $ | 447,884 | | 1.10% | | | 0.35% | | | (h | ) | | (h | ) | | 144.61% |
Year Ended October 31, 2005 | | $ | 18.96 | | 0.38 | | | 1.86 | | | 2.24 | | | (0.18 | ) | | (0.08 | ) | | (0.26 | ) | | $ | 20.94 | | 11.88% | | | $ | 119,615 | | 1.14% | | | 1.64% | | | (h | ) | | (h | ) | | 145.66% |
Year Ended October 31, 2006 | | $ | 20.94 | | 0.18 | | | 2.61 | | | 2.79 | | | (0.17 | ) | | (2.81 | ) | | (2.98 | ) | | $ | 20.75 | | 14.65% | | | $ | 117,938 | | 1.04% | | | 0.91% | | | 1.04% | | | 0.91% | | | 245.80% |
| | | | | | | | | | | | | | | |
Class B Shares | | | | | | | | | | | | | | | | | | | | | | | | | | | | | | | | | | | | | | | | | | | | |
Year Ended October 31, 2002 | | $ | 16.40 | | (0.03 | ) | | (1.65 | ) | | (1.68 | ) | | — | | | — | | | — | | | $ | 14.72 | | (10.24% | ) | | $ | 31,267 | | 1.80% | | | (0.18% | ) | | (h | ) | | (h | ) | | 25.51% |
Year Ended October 31, 2003 | | $ | 14.72 | | — | | | 2.94 | | | 2.94 | | | (0.01 | ) | | — | | | (0.01 | ) | | $ | 17.65 | | 19.99% | | | $ | 35,564 | | 1.79% | | | (0.06% | ) | | (h | ) | | (h | ) | | 120.02% |
Year Ended October 31, 2004 | | $ | 17.65 | | (0.05 | ) | | 0.86 | | | 0.81 | | | — | | | — | | | — | | | $ | 18.46 | | 4.59% | | | $ | 35,073 | | 1.76% | | | (0.30% | ) | | (h | ) | | (h | ) | | 144.61% |
Year Ended October 31, 2005 | | $ | 18.46 | | 0.03 | | | 2.01 | | | 2.04 | | | (0.10 | ) | | (0.08 | ) | | (0.18 | ) | | $ | 20.32 | | 11.09% | | | $ | 29,960 | | 1.79% | | | 0.25% | | | (h | ) | | (h | ) | | 145.66% |
Year Ended October 31, 2006 | | $ | 20.32 | | 0.05 | | | 2.52 | | | 2.57 | | | (0.03 | ) | | (2.81 | ) | | (2.84 | ) | | $ | 20.05 | | 13.83% | | | $ | 20,455 | | 1.76% | | | 0.21% | | | 1.76% | | | 0.21% | | | 245.80% |
| | | | | | | | | | | | | | | |
Class C Shares | | | | | | | | | | | | | | | | | | | | | | | | | | | | | | | | | | | | | | | | | | | | |
Year Ended October 31, 2002 | | $ | 16.40 | | (0.03 | ) | | (1.65 | ) | | (1.68 | ) | | — | | | — | | | — | | | $ | 14.72 | | (10.24% | ) | | $ | 212 | | 1.80% | | | (0.20% | ) | | (h | ) | | (h | ) | | 25.51% |
Year Ended October 31, 2003 | | $ | 14.72 | | (0.01 | ) | | 2.95 | | | 2.94 | | | (0.01 | ) | | — | | | (0.01 | ) | | $ | 17.65 | | 20.00% | | | $ | 714 | | 1.79% | | | (0.16% | ) | | (h | ) | | (h | ) | | 120.02% |
Year Ended October 31, 2004 | | $ | 17.65 | | (0.06 | ) | | 0.87 | | | 0.81 | | | (0.01 | ) | | — | | | (0.01 | ) | | $ | 18.45 | | 4.58% | | | $ | 989 | | 1.76% | | | (0.32% | ) | | (h | ) | | (h | ) | | 144.61% |
Year Ended October 31, 2005 | | $ | 18.45 | | 0.04 | | | 1.99 | | | 2.03 | | | (0.10 | ) | | (0.08 | ) | | (0.18 | ) | | $ | 20.30 | | 11.04% | | | $ | 965 | | 1.79% | | | 0.27% | | | (h | ) | | (h | ) | | 145.66% |
Year Ended October 31, 2006 | | $ | 20.30 | | 0.04 | | | 2.53 | | | 2.57 | | | (0.03 | ) | | (2.81 | ) | | (2.84 | ) | | $ | 20.03 | | 13.89% | | | $ | 866 | | 1.75% | | | 0.20% | | | 1.75% | | | 0.20% | | | 245.80% |
| | | | | | | | | | | | | | | |
Class D Shares | | | | | | | | | | | | | | | | | | | | | | | | | | | | | | | | | | | | | | | | | | | | |
Year Ended October 31, 2002 | | $ | 16.64 | | 0.13 | | | (1.69 | ) | | (1.56 | ) | | (0.12 | ) | | — | | | (0.12 | ) | | $ | 14.96 | | (9.43% | ) | | $ | 1,125,402 | | 0.86% | | | 0.77% | | | (h | ) | | (h | ) | | 25.51% |
Year Ended October 31, 2003 | | $ | 14.96 | | 0.13 | | | 3.00 | | | 3.13 | | | (0.13 | ) | | — | | | (0.13 | ) | | $ | 17.96 | | 21.07% | | | $ | 1,240,520 | | 0.85% | | | 0.89% | | | (h | ) | | (h | ) | | 120.02% |
Year Ended October 31, 2004 | | $ | 17.96 | | 0.12 | | | 0.88 | | | 1.00 | | | (0.13 | ) | | — | | | (0.13 | ) | | $ | 18.83 | | 5.59% | | | $ | 1,161,934 | | 0.82% | | | 0.64% | | | (h | ) | | (h | ) | | 144.61% |
Year Ended October 31, 2005 | | $ | 18.83 | | 0.23 | | | 2.04 | | | 2.27 | | | (0.26 | ) | | (0.08 | ) | | (0.34 | ) | | $ | 20.76 | | 12.11% | | | $ | 1,132,192 | | 0.85% | | | 1.17% | | | (h | ) | | (h | ) | | 145.66% |
Year Ended October 31, 2006 | | $ | 20.76 | | 0.23 | | | 2.59 | | | 2.82 | | | (0.22 | ) | | (2.81 | ) | | (3.03 | ) | | $ | 20.55 | | 14.95% | | | $ | 1,137,817 | | 0.80% | | | 1.14% | | | 0.80% | | | 1.14% | | | 245.80% |
| | | | | | | | | | | | | | | |
Class R Shares | | | | | | | | | | | | | | | | | | | | | | | | | | | | | | | | | | | | | | | | | | | | |
Period Ended October 31, 2003 (d) | | $ | 17.32 | | — | | | 0.63 | | | 0.63 | | | — | | | — | | | — | | | $ | 17.95 | | 3.64% | (f) | | $ | 1 | | 1.52% | (g) | | 0.07% | (g) | | 1.62% | (g) | | (0.03% | )(g) | | 120.02% |
Year Ended October 31, 2004 | | $ | 17.95 | | 0.03 | | | 0.88 | | | 0.91 | | | (0.03 | ) | | — | | | (0.03 | ) | | $ | 18.83 | | 5.08% | | | $ | 1 | | 1.27% | | | 0.16% | | | (h | ) | | (h | ) | | 144.61% |
Year Ended October 31, 2005 | | $ | 18.83 | | 0.19 | | | 2.05 | | | 2.24 | | | (0.21 | ) | | (0.08 | ) | | (0.29 | ) | | $ | 20.78 | | 11.95% | | | $ | 1 | | 0.96% | | | 0.95% | | | (h | ) | | (h | ) | | 145.66% |
Year Ended October 31, 2006 | | $ | 20.78 | | 0.18 | | | 2.60 | | | 2.78 | | | (0.17 | ) | | (2.81 | ) | | (2.98 | ) | | $ | 20.58 | | 14.71% | | | $ | 1 | | 0.96% | | | 0.93% | | | 0.96% | | | 0.93% | | | 245.80% |
| | | | | | | | | | | | | | | |
Institutional Class Shares | | | | | | | | | | | | | | | | | | | | | | | | | | | | | | | | | | | | | | | | | | | | |
Period Ended October 31, 2004 (e) | | $ | 19.00 | | 0.03 | | | (0.17 | ) | | (0.14 | ) | | (0.03 | ) | | — | | | (0.03 | ) | | $ | 18.83 | | (0.74% | )(f) | | $ | 341 | | 0.78% | (g) | | 0.54% | (g) | | (h | ) | | (h | ) | | 144.61% |
Year Ended October 31, 2005 | | $ | 18.83 | | 0.24 | | | 2.04 | | | 2.28 | | | (0.27 | ) | | (0.08 | ) | | (0.35 | ) | | $ | 20.76 | | 12.19% | | | $ | 3,335 | | 0.81% | | | 0.81% | | | (h | ) | | (h | ) | | 145.66% |
Year Ended October 31, 2006 | | $ | 20.76 | | 0.22 | | | 2.61 | | | 2.83 | | | (0.23 | ) | | (2.81 | ) | | (3.04 | ) | | $ | 20.55 | | 15.01% | | | $ | 10,226 | | 0.74% | | | 1.11% | | | 0.74% | | | 1.11% | | | 245.80% |
| | | | | | | | | | | | | | | | | | | | | | | | | | | | | | | | | | | | | | | | | | | | | |
| (a) | Excludes sales charge. |
| (b) | During the period certain fees were waived and/or reimbursed. If such waivers/reimbursements had not occurred, the ratios would have been as indicated. |
| (c) | Portfolio turnover is calculated on the basis of the Fund as a whole without distinguishing among the classes of shares. |
| (d) | For the period from October 1, 2003 (commencement of operations) through October 31, 2003. |
| (e) | For the period from June 29, 2004 (commencement of operations) through October 31, 2004. |
| (h) | There were no fee reductions during the period. |
See notes to financial statements.
Gartmore Money Market Fund
For the annual period ended Oct. 31, 2006, the Gartmore Money Market Fund (Prime Shares) returned 4.35% versus 4.08% for its benchmark, the iMoneyNet First Tier Retail Index. For broader comparison, the average return for the Fund’s Lipper peer category of Money Market Funds (consisting of 349 funds as of Oct. 31, 2006) was 3.99%.
U.S. inflation, as measured by the Consumer Price Index (CPI), increased 2.7% for the 12 months ended Oct. 31, 2006. While this measure falls just outside the Federal Reserve Board’s known comfort zone, the trend in recent months has been downward; thus, we believe that it is unlikely the Federal Reserve will tighten interest rates further anytime soon. During the past year, the Fed raised the federal funds target rate by 25 basis points on six occasions, ultimately reaching 5.25% by late June 2006. The Fed is expected to remain on the sidelines for the remainder of this year, however, and into next year. The general assessment of the economy has been positive but moderating, while the economic expansion finally matures.
On Oct. 31, 2006, the Fund held 56% of its assets in asset-backed securities, with 29% in variable-rate securities. Variable-rate holdings allowed the Fund to benefit from rising interest rates; Fund returns were higher than previous returns during this reporting period than in previous periods as a result of the Fed’s movements. Asset-backed commercial paper supply remained strong throughout the reporting period and typically provided returns that were four basis points higher than those of corporate alternatives.
With the Fed’s stance appearing to be secure into the next year, the Fund has lengthened its weighted average maturity to take advantage of higher yields available on longer maturities. Future interest-rate moves will be dependent on the rate of inflation and other specific economic data. With a few exceptions, leading economic indicators currently suggest continued moderate growth, which, as always, will be monitored closely by the Fed. The Fund is well diversified and positioned to go forward into a stable interest-rate environment.
Portfolio Manager:
Dan Blevins, CFA
| | |
| Fund Performance | | Gartmore Money Market Fund |
Average Annual Total Return
(For periods ended October 31, 2006)
| | | | | | |
| | | 1 Yr. | | 5 Yr. | | 10 Yr. |
| Institutional Class Shares1 | | 4.40% | | 1.92% | | 3.43% |
| Service Class Shares1 | | 4.17% | | 1.71% | | 3.29% |
| Prime Shares | | 4.35% | | 1.85% | | 3.39% |
There is no sales charge on the shares of the Money Market Fund. Past performance is no guarantee of future results. An investment in this Fund is neither guaranteed nor insured by the FDIC or any other government agency. Although this Fund strives to maintain the value of your investment at $1.00 per share, it is possible to lose money by investing in this Fund.
| 1 | These returns through May 11, 1998 include the performance of the Fund’s predecessor fund, and, for periods from May 11, 1998 to the creation of the class, include the performance of the Fund’s Prime shares. These returns were achieved prior to the creation of Service Class shares (1/4/99), and Institutional Class shares (12/13/01). Excluding the effects of any fee waivers or reimbursements, such prior performance is similar to what Service Class and Institutional Class shares would have produced during those periods because all classes of the Fund’s shares invest in the same portfolio of securities. The performance does not reflect the differing levels of other fees (primarily Rule 12b-1 and/or administrative services fees) applicable to such classes. If these other fees were reflected, the performance for the Service Class shares would have been lower. |
Performance of a $10,000 Investment
Investment return and principal value will fluctuate, and when redeemed, shares may be worth more or less than original cost. Past performance is no guarantee of future results and does not reflect the deduction of taxes that a shareholder would pay on fund distributions or the redemption of fund shares. Investing in mutual funds involves market risk, including loss of principal. Performance returns assume the reinvestment of all distributions.
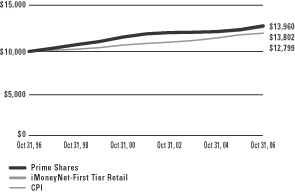
Comparative performance of $10,000 invested in Prime Shares of the Gartmore Money Market Fund, the iMoneyNet-First Tier Retail(a), and the Consumer Price Index (CPI)(b) over a 10-year period ended 10/31/06. Unlike the Fund, the returns for these unmanaged indexes does not reflect any fees or expenses. Investors cannot invest directly in market indexes.
| (a) | The iMoneyNet-First Tier Retail is an average of non-government retail money market mutual funds that do not invest in any second tier securities. Portfolio holdings of first tier money market mutual funds include U.S. Treasury, U.S. other, repurchase agreements, time deposits, domestic bank obligations, foreign bank obligations, first tier commercial paper, floating rate notes, and asset-backed commercial paper. |
| (b) | The CPI represents changes in prices of a basket of goods and services purchased for consumption by urban households. |
| | |
Shareholder Expense Example | | Gartmore Money Market Fund |
As a shareholder of the Fund, you incur two types of costs: (1) transaction costs, including sales charges (loads) paid on purchase payments and redemption fees; and (2) ongoing costs, including investment advisory fees, administration fees, distribution fees and other Fund expenses. The examples below are intended to help you understand your ongoing costs (in dollars) of investing in the Fund and to compare these costs with the ongoing costs of investing in other mutual funds. Per SEC requirements, the examples assume that you had a $1,000 investment in the Class at the beginning of the reporting period, May 1, 2006 and continued to hold your shares at the end of the reporting period, October 31, 2006.
Actual Expenses
For each Class of the Fund in the table below, the first line provides information about actual account values and actual expenses. You may use the information in this line, together with the amount you invested, to estimate the expenses that you paid over the period. Simply divide your account value by $1,000 (for example, an $8,600 account value divided by $1,000 = 8.6), then multiply the result by the number in the first line of each Class under the heading entitled “Expenses Paid During Period” to estimate the expenses you paid on your account during the period.
Hypothetical Example for Comparison Purposes
The second line of each Class in the table below provides information about hypothetical account values and hypothetical expenses based on the Class’ actual expense ratio and an assumed rate of return of 5% per year before expenses, which is not the Class’ actual return. The hypothetical account values and expenses may not be used to estimate the actual ending account balance or expenses you paid for the period. You may use this information to compare the ongoing costs of investing in the Class of the Fund and other funds. To do so, compare this 5% hypothetical example with the 5% hypothetical examples that appear in the shareholder reports of the other funds.
Please note that the expenses shown in the table are meant to highlight your ongoing costs only and do not reflect any transaction costs, such as sales charges (loads) or redemption fees. Therefore, the second line for each Class in the table is useful in comparing ongoing costs only, and will not help you determine the relative total costs of owning different funds. In addition, if these transaction costs were included, your costs would have been higher. The examples also assume all dividends and distributions have been reinvested.
Schedule of Shareholder Expenses
Expense Analysis of a $1,000 Investment
(October 31, 2006)
| | | | | | | | | | | | | | |
| Money Market Fund | | | | | Beginning
Account Value,
5/1/06 | | Ending
Account Value,
10/31/06 | | Expenses Paid
During Period* | | Annualized
Expense Ratio* |
| Institutional Class | | Actual | | | $ | 1,000.00 | | $ | 1,023.90 | | $ | 2.70 | | 0.53% |
| | | Hypothetical | 1 | | $ | 1,000.00 | | $ | 1,022.33 | | $ | 2.71 | | 0.53% |
| Prime | | Actual | | | $ | 1,000.00 | | $ | 1,023.60 | | $ | 3.01 | | 0.59% |
| | | Hypothetical | 1 | | $ | 1,000.00 | | $ | 1,022.03 | | $ | 3.01 | | 0.59% |
| Service Class | | Actual | | | $ | 1,000.00 | | $ | 1,022.70 | | $ | 3.87 | | 0.76% |
| | | Hypothetical | 1 | | $ | 1,000.00 | | $ | 1,021.17 | | $ | 3.88 | | 0.76% |
| * | Expenses are equal to the Fund’s annualized expense ratio multiplied by the average account value over the period multiplied by 184/365 (to reflect the one-half year period). The expense ratio presented represents a six-month, annualized ratio in accordance with SEC guidelines. |
| 1 | Represents the hypothetical 5% return before expenses. |
| | |
Portfolio Summary | | Gartmore Money Market Fund |
The SEC adopted a requirement that Funds present their portfolio holdings in a table, chart or graph format in their annual and semiannual reports to shareholders, whether or not a statement of investments is utilized. The following tables, which present portfolio holdings as a percentage of net assets, are provided in compliance with this requirement.
| | |
| Asset Allocation | | |
| Commercial Paper | | 61.4% |
| Floating Rate Notes | | 26.2% |
| Corporate Bonds | | 5.8% |
U.S. Government Sponsored and Agency Obligations | | 5.2% |
| Municipal Bond | | 1.2% |
| Other assets in excess of liabilities | | 0.2% |
| | |
| | 100.0% |
| | |
| Top Industries | | |
| Asset-Backed Securities — Yankee | | 18.2% |
| Asset-Backed Trade & Term Receivables | | 11.6% |
| Asset-Backed Home Loans | | 6.9% |
| Asset-Backed — Residential Mortgages | | 5.6% |
| Asset-Backed — Yankee | | 4.6% |
| Security Brokers & Dealers | | 4.4% |
| Mortgage Bankers & Brokers | | 4.4% |
| Financial Services | | 4.1% |
| Finance Lessors | | 3.9% |
| Asset-Backed CDO — Trust Preferred | | 3.9% |
| Other Assets | | 32.4% |
| | |
| | 100.0% |
| | |
| Top Holdings | | |
| Nationwide Building Society, 5.24%, 02/20/07 | | 2.4% |
| Greyhawk Funding LLC, 5.27%, 11/15/06 | | 2.2% |
| Thornburg Mortgage Capital, 5.30%, 11/07/06 | | 2.1% |
| PB Finance (Delaware), 5.29%, 11/21/06 | | 2.1% |
| Kitty Hawk Funding Corp., 5.27%, 11/09/06 | | 2.1% |
| Falcon Asset Securitization Corp., 5.27%, 11/06/06 | | 2.0% |
| KLIO II Funding Corp., 5.29%, 12/05/06 | | 2.0% |
| Yorkshire Building Society, 5.28%, 11/09/06 | | 2.0% |
| Countrywide Home Loans, 5.37%, 11/01/06 | | 2.0% |
| Golden Funding Corp., 5.26%, 01/31/07 | | 1.9% |
| Other Assets | | 79.2% |
| | |
| | 100.0% |
Statement of Investments
October 31, 2006
Gartmore Money Market Fund
Commercial Paper (61.4%)
| | | | | | |
| | | Principal
Amount | | Value |
| | | | | | |
AGRICULTURAL SERVICES (0.7%) | | | |
Cargill, Inc. (b) (0.7%) | | | | | | |
5.32%, 11/09/06 | | $ | 11,501,000 | | $ | 11,487,403 |
| | | | | | |
ASSET-BACKED CDO - TRUST PREFERRED (3.9%) | | | |
Lockhart Funding LLC (b) (3.9%) | | | |
5.28%, 11/01/06 | | | 9,393,000 | | | 9,393,000 |
5.27%, 11/17/06 | | | 9,462,000 | | | 9,439,772 |
5.27%, 11/20/06 | | | 25,000,000 | | | 24,930,465 |
5.28%, 12/04/06 | | | 20,000,000 | | | 19,903,200 |
| | | | | | |
| | | | | | 63,666,437 |
| | | | | | |
ASSET-BACKED SECURITIES - DOMESTIC (2.0%) |
CC USA, Inc. (b) (0.7%) | | | | | | |
5.24%, 02/26/07 | | | 12,500,000 | | | 12,287,328 |
| | | | | | |
Harrier Financial Funding US LLC (b) (1.3%) | | | |
5.26%, 01/11/07 | | | 15,000,000 | | | 14,844,392 |
5.25%, 01/30/07 | | | 5,000,000 | | | 4,934,375 |
| | | | | | |
| | | | | | 19,778,767 |
| | | | | | |
| | | | | | 32,066,095 |
| | | | | | |
ASSET-BACKED HOME LOANS (6.9%) | | | |
Georgetown Funding Co. (b) (2.9%) | | | |
5.31%, 12/04/06 | | | 20,000,000 | | | 19,902,650 |
5.30%, 12/06/06 | | | 28,000,000 | | | 27,855,722 |
| | | | | | |
| | | | | | 47,758,372 |
| | | | | | |
Thornburg Mortgage Capital (b) (4.0%) | | | |
5.30%, 11/07/06 | | | 35,000,000 | | | 34,969,083 |
5.30%, 11/20/06 | | | 10,000,000 | | | 9,972,028 |
5.30%, 11/27/06 | | | 10,000,000 | | | 9,961,722 |
5.29%, 12/18/06 | | | 9,900,000 | | | 9,831,627 |
| | | | | | |
| | | | | | 64,734,460 |
| | | | | | |
| | | | | | 112,492,832 |
| | | | | | |
ASSET-BACKED - REPURCHASE AGREEMENT (2.7%) | | | |
Liquid Funding (b) (2.7%) | | | |
5.27%, 11/06/06 | | | 15,000,000 | | | 14,989,021 |
5.27%, 11/09/06 | | | 20,000,000 | | | 19,976,578 |
5.27%, 02/07/07 | | | 10,000,000 | | | 9,856,539 |
| | | | | | |
| | | | | | 44,822,138 |
| | | | | | |
| | | | | | |
| | | Principal
Amount | | Value |
| | | | | | |
ASSET-BACKED - RESIDENTIAL MORTGAGES (5.6%) | | | |
KLIO II Funding Corp. (b) (2.6%) | | | |
5.28%, 11/22/06 | | $ | 10,000,000 | | $ | 9,969,200 |
5.29%, 12/05/06 | | | 32,500,000 | | | 32,337,626 |
| | | | | | |
| | | | | | 42,306,826 |
| | | | | | |
Ormond Quay Funding LLC (b) (3.0%) | | | |
5.27%, 11/06/06 | | | 10,000,000 | | | 9,992,681 |
5.30%, 11/10/06 | | | 25,000,000 | | | 24,966,875 |
5.26%, 01/22/07 | | | 15,000,000 | | | 14,820,283 |
| | | | | | |
| | | | | | 49,779,839 |
| | | | | | |
| | | | | | 92,086,665 |
| | | | | | |
ASSET-BACKED TRADE & TERM RECEIVABLES (11.6%) | | | |
Falcon Asset Securitization Corp. (b) (3.5%) | | | |
5.27%, 11/06/06 | | | 32,800,000 | | | 32,775,992 |
5.27%, 11/08/06 | | | 4,419,000 | | | 4,414,472 |
5.27%, 11/15/06 | | | 20,000,000 | | | 19,959,011 |
| | | | | | |
| | | | | | 57,149,475 |
| | | | | | |
Golden Funding Corp. (b) (1.9%) | | | |
5.26%, 01/31/07 | | | 31,277,000 | | | 30,861,138 |
| | | | | | |
Kitty Hawk Funding Corp. (b) (3.8%) | | | |
5.27%, 11/02/06 | | | 9,180,000 | | | 9,178,656 |
5.27%, 11/09/06 | | | 33,822,000 | | | 33,782,442 |
5.27%, 11/20/06 | | | 20,000,000 | | | 19,944,372 |
| | | | | | |
| | | | | | 62,905,470 |
| | | | | | |
Old Line Funding Corp. (b) (0.1%) | | | |
5.28%, 11/10/06 | | | 2,444,000 | | | 2,440,774 |
| | | | | | |
Preferred Receivables Funding (b) (2.3%) | | | |
5.27%, 11/03/06 | | | 6,359,000 | | | 6,357,138 |
5.26%, 11/07/06 | | | 24,370,000 | | | 24,348,602 |
5.26%, 11/15/06 | | | 7,600,000 | | | 7,584,454 |
| | | | | | |
| | | | | | 38,290,194 |
| | | | | | |
| | | | | | 191,647,051 |
| | | | | | |
ASSET-BACKED SECURITIES - YANKEE (9.2%) |
Giro Funding Corp. (b) (3.1%) | | | |
5.28%, 11/01/06 | | | 10,557,000 | | | 10,557,000 |
5.28%, 11/13/06 | | | 25,000,000 | | | 24,955,999 |
5.30%, 11/14/06 | | | 3,453,000 | | | 3,446,391 |
Commercial Paper (continued)
| | | | | | |
| | | Principal
Amount | | Value |
| | | | | | |
ASSET-BACKED SECURITIES - YANKEE (continued) |
Giro Funding Corp. (b) (continued) | | | |
5.28%, 11/17/06 | | $ | 1,412,000 | | $ | 1,408,687 |
5.26%, 01/16/07 | | | 10,478,000 | | | 10,361,648 |
| | | | | | |
| | | | | | 50,729,725 |
| | | | | | |
Greyhawk Funding LLC (b) (3.9%) | | | |
5.27%, 11/08/06 | | | 15,000,000 | | | 14,984,629 |
5.27%, 11/15/06 | | | 36,684,000 | | | 36,608,818 |
5.25%, 02/06/07 | | | 12,727,000 | | | 12,546,966 |
| | | | | | |
| | | | | | 64,140,413 |
| | | | | | |
K2 (USA) LLC (b) (0.4%) | | | |
5.28%, 11/08/06 | | | 6,690,000 | | | 6,683,132 |
| | | | | | |
Premier Asset Collateralized Entity LLC (b) (0.6%) |
5.28%, 12/06/06 | | | 10,000,000 | | | 9,948,667 |
| | | | | | |
Stanfield Victoria Funding LLC (b) (1.2%) | | | |
5.28%, 11/20/06 | | | 20,211,000 | | | 20,154,679 |
| | | | | | |
| | | | | | 151,656,616 |
| | | | | | |
BANKS - FOREIGN (3.0%) | | | | | | |
Barclays U.S. Funding Corp. (1.5%) | | | |
4.77%, 12/05/06 | | | 25,000,000 | | | 25,000,000 |
| | | | | | |
HBOS Treasury Services (1.4%) | | | |
5.26%, 11/22/06 | | | 4,600,000 | | | 4,585,886 |
5.46%, 09/20/07 | | | 18,000,000 | | | 18,000,000 |
| | | | | | |
| | | | | | 22,585,886 |
| | | | | | |
Westcap Capital Corp. (b) (0.1%) | | | |
5.27%, 01/03/07 | | | 1,960,000 | | | 1,941,924 |
| | | | | | |
| | | | | | 49,527,810 |
| | | | | | |
BUILDING SOCIETY (3.1%) | | | | | | |
Yorkshire Building Society (3.1%) | | | |
5.28%, 11/09/06 | | | 32,138,000 | | | 32,100,238 |
5.24%, 04/02/07 | | | 18,548,000 | | | 18,138,027 |
| | | | | | |
| | | | | | 50,238,265 |
| | | | | | |
FINANCE LESSORS (3.9%) | | | | | | |
PB Finance (Delaware) (3.9%) | | | |
5.29%, 11/21/06 | | | 35,000,000 | | | 34,897,139 |
5.27%, 12/11/06 | | | 10,000,000 | | | 9,941,444 |
5.28%, 01/22/07 | | | 20,000,000 | | | 19,759,467 |
| | | | | | |
| | | | | | 64,598,050 |
| | | | | | |
| | | | | | |
| | | Principal
Amount | | Value |
| | | | | | |
FINANCE, TAXATION, & MONETARY POLICY (0.3%) | | | |
Sunshine State Governmental Financing Commission (b) (0.3%) | | | |
5.30%, 11/06/06 | | $ | 4,181,000 | | $ | 4,177,922 |
| | | | | | |
FINANCIAL SERVICES (4.1%) | | | | | | |
Alliance & Leicester PLC (b) (0.2%) | | | |
5.28%, 11/06/06 | | | 3,000,000 | | | 2,997,800 |
| | | | | | |
Carrera Capital Finance LLC (b) (3.9%) | | | |
5.27%, 11/06/06 | | | 20,674,000 | | | 20,658,868 |
5.27%, 11/13/06 | | | 18,100,000 | | | 18,068,204 |
5.28%, 11/15/06 | | | 25,300,000 | | | 25,248,051 |
| | | | | | |
| | | | | | 63,975,123 |
| | | | | | |
| | | | | | 66,972,923 |
| | | | | | |
MORTGAGE BANKERS & BROKERS (4.4%) | | | |
Countrywide Home Loans (2.0%) | | | |
5.37%, 11/01/06 | | | 32,068,000 | | | 32,068,000 |
| | | | | | |
Nationwide Building Society (b) (2.4%) | | | |
5.24%, 02/20/07 | | | 40,000,000 | | | 39,353,733 |
| | | | | | |
| | | | | | 71,421,733 |
| | | | | | |
| | |
Total Commercial Paper | | | | | | 1,006,861,940 |
| | | | | | |
|
Floating Rate Notes (c) (26.2%) 
|
ASSET-BACKED CDO (1.5%) | | | | | | |
Commodore CDO I LTD (0.9%) | | | |
5.47%, 12/12/06 | | | 15,000,000 | | | 15,000,000 |
| | | | | | |
Newcastle CDO, Ltd. (b) (0.6%) | | | |
5.35%, 11/24/06 | | | 10,000,000 | | | 10,000,000 |
| | | | | | |
| | | | | | 25,000,000 |
| | | | | | |
ASSET-BACKED SECURITIES - DOMESTIC (3.4%) |
Harrier Financial Funding US LLC (b) (1.5%) | | | | | | |
5.29%, 09/13/07 | | | 25,000,000 | | | 24,998,918 |
| | | | | | |
Liquid Funding (b) (1.9%) | | | |
5.38%, 08/14/07 | | | 30,000,000 | | | 29,996,474 |
| | | | | | |
| | | | | | 54,995,392 |
| | | | | | |
Statement of Investments (Continued)
October 31, 2006
Gartmore Money Market Fund (Continued)
Floating Rate Notes (c) (continued)
| | | | | | |
| | | Principal
Amount | | Value |
| | | | | | |
ASSET-BACKED SECURITIES - YANKEE (9.0%) |
K2 (USA) LLC (b) (2.1%) | | | |
5.33%, 08/28/07 | | $ | 15,000,000 | | $ | 14,998,194 |
5.32%, 10/24/07 | | | 20,000,000 | | | 19,998,044 |
| | | | | | |
| | | | | | 34,996,238 |
| | | | | | |
Premier Asset Collateralized
Entity LLC (b) (3.3%) | | | |
5.30%, 02/08/07 | | | 15,000,000 | | | 14,999,905 |
5.34%, 06/25/07 | | | 20,000,000 | | | 19,998,991 |
5.33%, 09/17/07 | | | 20,000,000 | | | 19,999,128 |
| | | | | | |
| | | | | | 54,998,024 |
| | | | | | |
Sigma Finance Inc. (b) (1.3%) | | | |
5.32%, 10/02/07 | | | 15,000,000 | | | 14,998,623 |
5.37%, 11/21/07 | | | 6,000,000 | | | 6,001,612 |
| | | | | | |
| | | | | | 21,000,235 |
| | | | | | |
Stanfield Victoria Funding LLC (b) (2.3%) | | | |
5.29%, 08/15/07 | | | 17,000,000 | | | 16,997,995 |
5.30%, 10/25/07 | | | 20,000,000 | | | 19,998,604 |
| | | | | | |
| | | | | | 36,996,599 |
| | | | | | |
| | | | | | 147,991,096 |
| | | | | | |
BANKS - DOMESTIC (0.8%) | | | | | | |
Wells Fargo & Co. (0.8%) | | | |
5.37%, 01/02/08 | | | 13,000,000 | | | 13,000,000 |
| | | | | | |
BANKS - MORTGAGE (2.0%) | | | |
Northern Rock PLC (2.0%) | | | |
5.46%, 10/09/07 | | | 12,500,000 | | | 12,500,000 |
5.36%, 02/03/10 | | | 20,000,000 | | | 20,000,000 |
| | | | | | |
| | | | | | 32,500,000 |
| | | | | | |
INSURANCE (2.3%) | | | |
Allstate Life Global Funding (b) (2.3%) | | | |
5.31%, 12/27/06 | | | 10,000,000 | | | 10,000,000 |
5.37%, 10/05/07 | | | 15,000,000 | | | 15,000,000 |
5.33%, 11/27/07 | | | 12,500,000 | | | 12,500,000 |
| | | | | | |
| | | | | | 37,500,000 |
| | | | | | |
PERSONAL CREDIT INSTITUTIONS (2.8%) | | | |
General Electric Capital Corp. (1.6%) | | | |
5.45%, 07/09/07 | | | 19,000,000 | | | 19,000,000 |
5.45%, 10/17/07 | | | 7,000,000 | | | 7,000,000 |
| | | | | | |
| | | | | | 26,000,000 |
| | | | | | |
| | | | | | |
| | | Principal
Amount | | Value |
| | | | | | |
PERSONAL CREDIT INSTITUTIONS (continued) | | | |
HSBC Americas, Inc. (1.2%) | | | |
5.35%, 12/24/07 | | $ | 20,000,000 | | $ | 20,000,000 |
| | | | | | |
| | | | | | 46,000,000 |
| | | | | | |
SECURITY BROKERS & DEALERS (4.4%) |
Bear Stearns Cos., Inc. (2.4%) | | | |
5.30%, 01/12/07 | | | 20,000,000 | | | 20,000,000 |
5.31%, 10/12/07 | | | 20,000,000 | | | 20,000,000 |
| | | | | | |
| | | | | | 40,000,000 |
| | | | | | |
Goldman Sachs Group, Inc. (0.8%) | | | |
5.37%, 02/22/07 | | | 13,000,000 | | | 13,000,000 |
| | | | | | |
Morgan Stanley Dean Witter & Co. (1.2%) | | | |
5.34%, 12/03/07 | | | 20,000,000 | | | 20,000,000 |
| | | | | | |
| | | | | | 73,000,000 |
| | | | | | |
| | |
Total Floating Rate Notes | | | | | | 429,986,488 |
| | | | | | |
|
Corporate Bonds (5.8%)
|
ASSET-BACKED – DOMESTIC (1.2%) | | | |
Harrier Financial Funding
US LLC (b) (1.2%) | | | |
5.48%, 09/20/07 | | | 20,000,000 | | | 20,000,000 |
| | | | | | |
ASSET-BACKED - YANKEE (4.6%) | | | |
K2 (USA) LLC (b) (1.2%) | | | |
5.43%, 05/29/07 | | | 20,000,000 | | | 20,000,000 |
| | | | | | |
Sigma Finance Inc. (b) (2.8%) | | | |
4.85%, 01/26/07 | | | 20,000,000 | | | 20,000,000 |
5.25%, 05/04/07 | | | 15,000,000 | | | 15,000,000 |
5.50%, 06/05/07 | | | 10,000,000 | | | 10,000,000 |
| | | | | | |
| | | | | | 45,000,000 |
| | | | | | |
Stanfield Victoria Funding LLC (b) (0.6%) | | | |
5.72%, 06/25/07 | | | 10,000,000 | | | 10,000,000 |
| | | | | | |
| | |
Total Corporate Bonds | | | | | | 95,000,000 |
| | | | | | |
U.S. Government Sponsored & Agency Obligations (5.2%)
| | | | | | |
| | | Principal
Amount | | Value |
| | | | | | |
Federal Home Loan Bank (2.1%) | | | |
5.00%, 12/21/06 | | $ | 10,000,000 | | $ | 10,000,000 |
5.05%, 03/28/07 | | | 10,000,000 | | | 10,000,000 |
5.52%, 09/18/07 | | | 15,000,000 | | | 15,000,000 |
| | | | | | |
| | | | | | 35,000,000 |
| | | | | | |
Federal Home Loan Mortgage Corp. (3.1%) |
4.50%, 11/03/06 | | | 15,000,000 | | | 15,000,000 |
4.50%, 11/09/06 | | | 15,150,000 | | | 15,150,000 |
5.38%, 06/12/07 | | | 20,000,000 | | | 20,000,000 |
| | | | | | |
| | | | | | 50,150,000 |
| | | | | | |
| |
Total U.S. Government Sponsored & Agency Obligations | | | 85,150,000 |
| | | | | | |
Municipal Bond (1.2%)
| | | | | | |
| | | Principal
Amount | | Value |
| | | | | | |
FLORIDA (1.2%) | | | |
Florida Hurricane Catastrophe (1.2%) | | | |
5.33%, 11/15/07 | | $ | 20,000,000 | | $ | 20,000,000 |
| | | | | | |
| | |
Total Municipal Bond | | | | | | 20,000,000 |
| | | | | | |
| |
Total Investments
(Cost $1,636,998,428) (a) — 99.8% | | | 1,636,998,428 |
| | |
Other assets in excess of
liabilities — 0.2% | | | | | | 3,795,346 |
| | | | | | |
| | |
NET ASSETS — 100.0% | | | | | $ | 1,640,793,774 |
| | | | | | |
| | (a) | See notes to financial statements for tax unrealized appreciation (depreciation) of securities. |
| | (b) | Rule 144A, Section 4(2) or other security, which is restricted as to resale to institutional investors. The security has been deemed liquid pursuant to procedures approved by the Board of Trustees. |
| | (c) | Variable Rate Security. The rate reflected in the Statement of Investments is the rate in effect on October 31, 2006. The maturity date represents the actual maturity date. |
| | CDO | Collateralized Debt Obligation |
See notes to financial statements.
Statement of Assets and Liabilities
October 31, 2006
| | | | | | |
| | | Gartmore
Money Market Fund | | | |
Assets: | | | | | | |
Investments, at value (cost $1,636,998,428) | | $ | 1,636,998,428 | | | |
Cash | | | 623 | | | |
Interest and dividends receivable | | | 6,457,851 | | | |
Receivable for capital shares issued | | | 1,002,404 | | | |
Prepaid expenses | | | 3,414 | | | |
| | | | | | |
Total Assets | | | 1,644,462,720 | | | |
| | | | | | |
| | |
Liabilities | | | | | | |
Distributions payable | | | 51,175 | | | |
Payable for capital shares redeemed | | | 2,642,201 | | | |
Accrued expenses and other payables | | | | | | |
Investment advisory fees | | | 548,957 | | | |
Fund administration and transfer agent fees | | | 187,557 | | | |
Distribution fees | | | 750 | | | |
Administrative servicing fees | | | 31,399 | | | |
Trustee fees | | | 237 | | | |
Compliance program fees (Note 3) | | | 16,517 | | | |
Other | | | 190,153 | | | |
| | | | | | |
Total Liabilities | | | 3,668,946 | | | |
| | | | | | |
Net Assets | | $ | 1,640,793,774 | | | |
| | | | | | |
| | |
Represented by: | | | | | | |
Capital | | $ | 1,640,816,639 | | | |
Accumulated net investment income (loss) | | | (9,040 | ) | | |
Accumulated net realized gains (losses) on investment transactions | | | (13,825 | ) | | |
| | | | | | |
Net Assets | | $ | 1,640,793,774 | | | |
| | | | | | |
| | |
Net Assets: | | | | | | |
Institutional Class Shares | | $ | 1,271,826,097 | | | |
Service Class Shares | | | 9,900,895 | | | |
Prime Shares | | | 359,066,782 | | | |
| | | | | | |
Total | | $ | 1,640,793,774 | | | |
| | | | | | |
| | |
Shares outstanding (unlimited number of shares authorized): | | | | | | |
Institutional Class Shares | | | 1,271,894,015 | | | |
Service Class Shares | | | 9,901,058 | | | |
Prime Shares | | | 359,289,586 | | | |
| | | | | | |
Total | | | 1,641,084,659 | | | |
| | | | | | |
Net asset value and redemption price per share: | | | | | | |
Institutional Class Shares | | $ | 1.00 | | | |
Service Class Shares | | $ | 1.00 | | | |
Prime Shares | | $ | 1.00 | | | |
| | | | | | |
| | | | | | | |
See notes to financial statements.
Statement of Operations
For the Year Ended October 31, 2006
| | | | | | |
| | | Gartmore
Money Market Fund | | | |
INVESTMENT INCOME: | | | | | | |
Interest income | | $ | 77,825,974 | | | |
Dividend income | | | 244,592 | | | |
| | | | | | |
Total Income | | | 78,070,566 | | | |
| | | | | | |
| | |
Expenses: | | | | | | |
Investment advisory fees | | | 6,310,450 | | | |
Fund administration and transfer agent fees | | | 1,608,440 | | | |
Distribution fees Service Class | | | 10,000 | | | |
Administrative servicing fees Service Class | | | 8,114 | | | |
Administrative servicing fees Prime Shares | | | 168,259 | | | |
Registration and filing fees | | | 55,195 | | | |
Trustee fees | | | 55,072 | | | |
Compliance program fees (Note 3) | | | 31,383 | | | |
Other | | | 620,717 | | | |
| | | | | | |
Total expenses before reimbursed expenses | | | 8,867,630 | | | |
Distribution fees voluntarily waived — Service Class | | | (3,604 | ) | | |
Earnings credit (Note 5) | | | (49,476 | ) | | |
| | | | | | |
Net Expenses | | | 8,814,550 | | | |
| | | | | | |
Net investment income (Loss) | | | 69,256,016 | | | |
| | | | | | |
| | |
REALIZED/UNREALIZED GAINS (LOSSES) FROM INVESTMENTS: | | | | | | |
Net realized gains (losses) on investment transactions | | | (1,715 | ) | | |
| | | | | | |
CHANGE IN NET ASSETS RESULTING FROM OPERATIONS | | $ | 69,254,301 | | | |
| | | | | | |
| | | | | | |
| | | | | | |
| | | | | | |
| | | | | | |
| | | | | | |
| | | | | | |
| | | | | | |
| | | | | | |
| | | | | | |
| | | | | | |
| | | | | | |
| | | | | | |
| | | | | | |
| | | | | | |
| | | | | | |
| | | | | | |
| | | | | | |
| | | | | | |
| | | | | | |
| | | | | | |
| | | | | | | |
See notes to financial statements.
Statements of Changes in Net Assets
| | | | | | | | | | |
| | | Gartmore Money Market Fund |
| | | Year Ended
October 31, 2006 | | | Year Ended
October 31, 2005 |
FROM INVESTMENT ACTIVITIES: | | | | | | | | | | |
Operations: | | | | | | | | | | |
Net investment income | | $ | 69,256,016 | | | $ | 37,684,589 | | | |
Net realized gains (losses) on investment transactions | | | (1,715 | ) | | | (1,927 | ) | | |
| | | | | | | | | | |
Change in net assets from operations | | | 69,254,301 | | | | 37,682,662 | | | |
| | | | | | | | | | |
| | | |
Distributions to Institutional Class Shareholders from: | | | | | | | | | | |
Net investment income | | | (54,530,562 | ) | | | (29,469,125 | ) | | |
| | | |
Distributions to Service Class Shareholders from: | | | | | | | | | | |
Net investment income | | | (277,277 | ) | | | (125,918 | ) | | |
| | | |
Distributions to Prime Class Shareholders from: | | | | | | | | | | |
Net investment income | | | (14,457,219 | ) | | | (8,089,546 | ) | | |
| | | | | | | | | | |
Change in net assets from shareholder distributions | | | (69,265,058 | ) | | | (37,684,589 | ) | | |
| | | | | | | | | | |
Change in net assets from capital transactions | | | (226,383,585 | ) | | | 246,856,378 | | | |
| | | | | | | | | | |
Change in net assets | | | (226,394,342 | ) | | | 246,854,451 | | | |
| | | |
Net Assets: | | | | | | | | | | |
Beginning of period | | | 1,867,188,116 | | | | 1,620,333,665 | | | |
| | | | | | | | | | |
End of period | | $ | 1,640,793,774 | | | $ | 1,867,188,116 | | | |
| | | | | | | | | | |
Accumulated net investment income (loss) at end of period | | $ | (9,040 | ) | | $ | 2 | | | |
| | | | | | | | | | |
| | | | | | | | | | |
| | | | | | | | | | |
| | | | | | | | | | |
| | | | | | | | | | |
| | | | | | | | | | |
| | | | | | | | | | |
| | | | | | | | | | |
| | | | | | | | | | |
| | | | | | | | | | |
| | | | | | | | | | |
| | | | | | | | | | |
| | | | | | | | | | |
| | | | | | | | | | |
| | | | | | | | | | |
| | | | | | | | | | |
| | | | | | | | | | |
| | | | | | | | | | |
| | | | | | | | | | |
| | | | | | | | | | |
| | | | | | | | | | |
| | | | | | | | | | |
| | | | | | | | | | | |
See notes to financial statements.
Statements of Changes in Net Assets
| | | | | | | | | | |
| | | Gartmore Money Market Fund |
| | | Year Ended
October 31, 2006 | | | Year Ended
October 31, 2005 |
CAPITAL TRANSACTIONS: | | | | | | | | | | |
Institutional Class Shares | | | | | | | | | | |
Proceeds from shares issued | | $ | 727,791,142 | | | $ | 1,612,122,138 | | | |
Dividends reinvested | | | 54,550,726 | | | | 30,702,262 | | | |
Cost of shares redeemed | | | (1,035,994,303 | ) | | | (1,336,678,883 | ) | | |
| | | | | | | | | | |
| | | (253,652,435 | ) | | | 306,145,517 | | | |
| | | | | | | | | | |
| | | |
Service Class Shares | | | | | | | | | | |
Proceeds from shares issued | | | 11,225,616 | | | | 10,375,235 | | | |
Dividends reinvested | | | 276,130 | | | | 131,417 | | | |
Cost of shares redeemed | | | (8,309,404 | ) | | | (9,749,220 | ) | | |
| | | | | | | | | | |
| | | 3,192,342 | | | | 757,432 | | | |
| | | | | | | | | | |
| | | |
Prime Shares | | | | | | | | | | |
Proceeds from shares issued | | | 256,104,186 | | | | 240,503,800 | | | |
Dividends reinvested | | | 13,850,982 | | | | 8,075,815 | | | |
Cost of shares redeemed | | | (245,878,660 | ) | | | (308,626,186 | ) | | |
| | | | | | | | | | |
| | | 24,076,508 | | | | (60,046,571 | ) | | |
| | | | | | | | | | |
Change in net assets from capital transactions | | $ | (226,383,585 | ) | | $ | 246,856,378 | | | |
| | | | | | | | | | |
SHARE TRANSACTIONS: | | | | | | | | | | |
Institutional Class Shares | | | | | | | | | | |
Issued | | | 727,791,028 | | | | 1,612,122,138 | | | |
Reinvested | | | 54,550,726 | | | | 30,702,261 | | | |
Redeemed | | | (1,035,994,303 | ) | | | (1,336,678,882 | ) | | |
| | | | | | | | | | |
| | | (253,652,549 | ) | | | 306,145,517 | | | |
| | | | | | | | | | |
| | | |
Service Class Shares | | | | | | | | | | |
Issued | | | 11,225,616 | | | | 10,375,235 | | | |
Reinvested | | | 276,130 | | | | 131,417 | | | |
Redeemed | | | (8,309,404 | ) | | | (9,749,220 | ) | | |
| | | | | | | | | | |
| | | 3,192,342 | | | | 757,432 | | | |
| | | | | | | | | | |
| | | |
Prime Shares | | | | | | | | | | |
Issued | | | 256,104,087 | | | | 240,503,720 | | | |
Reinvested | | | 13,850,982 | | | | 8,075,815 | | | |
Redeemed | | | (245,878,660 | ) | | | (308,626,186 | ) | | |
| | | | | | | | | | |
| | | 24,076,409 | | | | (60,046,651 | ) | | |
| | | | | | | | | | |
Total change in shares | | | (226,383,798 | ) | | | 246,856,298 | | | |
| | | | | | | | | | | |
See notes to financial statements.
Financial Highlights
Selected Data for Each Share of Capital Outstanding
Gartmore Money Market Fund
| | | | | | | | | | | | | | | | | | | | | | | | | | | | | | | | | | |
| | | | | Investment Activities | | Distributions | | | | | | | | Ratios/Supplemental Data | |
| | | Net Asset
Value,
Beginning
of Period | | Net
Investment
Income | | Total from
Investment
Activities | | Net
Investment
Income | | | Total
Distributions | | | Net Asset
Value, End
of Period | | Total Return | | | Net Assets at End of Period (000s) | | Ratio of
Expenses
to Average
Net Assets | | | Ratio of Net
Investment
Income
to Average
Net Assets | | | Ratio of Expenses (Prior to
Reimbursements)
to Average
Net Assets (a) | | | Ratio of Net
Investment
Income (Prior to
Reimbursements)
to Average
Net Assets (a) | |
| | | | | | | | | | | | |
Institutional Class Shares | | | | | | | | | | | | | | | | | | | | | | | | | | | | | | | | | | |
Period Ended October 31, 2002 (b) | | $ | 1.00 | | 0.01 | | 0.01 | | (0.01 | ) | | (0.01 | ) | | $ | 1.00 | | 1.12% | (c) | | $ | 8,606 | | 0.59% | (d) | | 1.25% | (d) | | (e | ) | | (e | ) |
Year Ended October 31, 2003 | | $ | 1.00 | | 0.01 | | 0.01 | | (0.01 | ) | | (0.01 | ) | | $ | 1.00 | | 0.77% | | | $ | 1,214,406 | | 0.56% | | | 0.73% | | | (e | ) | | (e | ) |
Year Ended October 31, 2004 | | $ | 1.00 | | 0.01 | | 0.01 | | (0.01 | ) | | (0.01 | ) | | $ | 1.00 | | 0.73% | | | $ | 1,219,343 | | 0.54% | | | 0.73% | | | (e | ) | | (e | ) |
Year Ended October 31, 2005 | | $ | 1.00 | | 0.02 | | 0.02 | | (0.02 | ) | | (0.02 | ) | | $ | 1.00 | | 2.41% | | | $ | 1,525,487 | | 0.55% | | | 2.40% | | | (e | ) | | (e | ) |
Year Ended October 31, 2006 | | $ | 1.00 | | 0.04 | | 0.04 | | (0.04 | ) | | (0.04 | ) | | $ | 1.00 | | 4.40% | | | $ | 1,271,826 | | 0.54% | | | 4.32% | | | (e | ) | | (e | ) |
| | | | | | | | | | | | |
Service Class Shares | | | | | | | | | | | | | | | | | | | | | | | | | | | | | | | | | | |
Year Ended October 31, 2002 | | $ | 1.00 | | 0.01 | | 0.01 | | (0.01 | ) | | (0.01 | ) | | $ | 1.00 | | 1.11% | | | $ | 627,365 | | 0.80% | | | 1.09% | | | 0.96% | | | 0.93% | |
Year Ended October 31, 2003 | | $ | 1.00 | | 0.01 | | 0.01 | | (0.01 | ) | | (0.01 | ) | | $ | 1.00 | | 0.59% | | | $ | 8,473 | | 0.75% | | | 0.89% | | | 0.92% | | | 0.72% | |
Year Ended October 31, 2004 | | $ | 1.00 | | 0.01 | | 0.01 | | (0.01 | ) | | (0.01 | ) | | $ | 1.00 | | 0.52% | | | $ | 5,952 | | 0.75% | | | 0.51% | | | 0.78% | | | 0.48% | |
Year Ended October 31, 2005 | | $ | 1.00 | | 0.02 | | 0.02 | | (0.02 | ) | | (0.02 | ) | | $ | 1.00 | | 2.21% | | | $ | 6,710 | | 0.75% | | | 2.30% | | | 0.88% | | | 2.16% | |
Year Ended October 31, 2006 | | $ | 1.00 | | 0.04 | | 0.04 | | (0.04 | ) | | (0.04 | ) | | $ | 1.00 | | 4.17% | | | $ | 9,901 | | 0.75% | | | 4.14% | | | 0.80% | | | 4.09% | |
| | | | | | | | | | | | |
Prime Shares | | | | | | | | | | | | | | | | | | | | | | | | | | | | | | | | | | |
Year Ended October 31, 2002 | | $ | 1.00 | | 0.01 | | 0.01 | | (0.01 | ) | | (0.01 | ) | | $ | 1.00 | | 1.23% | | | $ | 1,177,541 | | 0.70% | | | 1.22% | | | (e | ) | | (e | ) |
Year Ended October 31, 2003 | | $ | 1.00 | | 0.01 | | 0.01 | | (0.01 | ) | | (0.01 | ) | | $ | 1.00 | | 0.69% | | | $ | 470,771 | | 0.64% | | | 0.73% | | | (e | ) | | (e | ) |
Year Ended October 31, 2004 | | $ | 1.00 | | 0.01 | | 0.01 | | (0.01 | ) | | (0.01 | ) | | $ | 1.00 | | 0.67% | | | $ | 395,038 | | 0.60% | | | 0.66% | | | (e | ) | | (e | ) |
Year Ended October 31, 2005 | | $ | 1.00 | | 0.02 | | 0.02 | | (0.02 | ) | | (0.02 | ) | | $ | 1.00 | | 2.36% | | | $ | 334,991 | | 0.60% | | | 2.31% | | | (e | ) | | (e | ) |
Year Ended October 31, 2006 | | $ | 1.00 | | 0.04 | | 0.04 | | (0.04 | ) | | (0.04 | ) | | $ | 1.00 | | 4.35% | | | $ | 359,067 | | 0.59% | | | 4.27% | | | (e | ) | | (e | ) |
| | | | | | | | | | | | | | | | | | | | | | | | | | | | | | | | | | | |
| | | | | | | | | | | | | | | | | | | | | | | | | | | | | | | | | | | |
| | | | | | | | | | | | | | | | | | | | | | | | | | | | | | | | | | | |
| | | | | | | | | | | | | | | | | | | | | | | | | | | | | | | | | | | |
| | | | | | | | | | | | | | | | | | | | | | | | | | | | | | | | | | | |
| | | | | | | | | | | | | | | | | | | | | | | | | | | | | | | | | | | |
| | | | | | | | | | | | | | | | | | | | | | | | | | | | | | | | | | | |
| | | | | | | | | | | | | | | | | | | | | | | | | | | | | | | | | | | |
| | | | | | | | | | | | | | | | | | | | | | | | | | | | | | | | | | | |
| | | | | | | | | | | | | | | | | | | | | | | | | | | | | | | | | | | |
| | | | | | | | | | | | | | | | | | | | | | | | | | | | | | | | | | | |
| | | | | | | | | | | | | | | | | | | | | | | | | | | | | | | | | | | |
| | | | | | | | | | | | | | | | | | | | | | | | | | | | | | | | | | | |
| | | | | | | | | | | | | | | | | | | | | | | | | | | | | | | | | | | |
| (a) | During the period certain fees were waived and/or reimbursed. If such waivers/reimbursements had not occurred, the ratios would have been as indicated. |
| (b) | For the period from December 13, 2001 (commencement of operations) through October 31, 2002. |
| (e) | There were no fee reductions in this period. |
See notes to financial statements.
Notes to Financial Statements
October 31, 2006
1. Organization
Gartmore Mutual Funds (the “Trust”) is an open-end management investment company, organized under the laws of Delaware by amended and restated Agreement and Declaration of Trust, dated October 28, 2004, as amended to date. Prior to January 25, 2002, the Trust was named “Nationwide Mutual Funds”. The Trust, originally created under the laws of Ohio as an Ohio business trust pursuant to a Declaration of Trust, dated as of October 30, 1997, as subsequently amended, and redomesticated as a Delaware Statutory Trust on February 28, 2005; the redomestication was a change in statutory status and did not affect the operations of the Trust. The Trust is registered under the Investment Company Act of 1940, as amended (the “1940 Act”). As of October 31, 2006, the Trust had authorized an unlimited number of shares of beneficial interest (“shares”) without par value. The Trust operates forty-nine (49) separate series, or mutual funds, each with its own investment objective(s) and strategies. This report contains the financial statements and financial highlights of the three (3) funds listed below (individually, a “Fund”; collectively, the “Funds”):
- Gartmore Growth Fund (“Growth”)
- Gartmore Nationwide Fund (“Nationwide”)
- Gartmore Money Market Fund (“Money Market”)
2. Summary of Significant Accounting Policies
The following is a summary of significant accounting policies followed by the Funds in the preparation of their financial statements. The policies are in conformity with accounting principles generally accepted in the United States of America (“GAAP”). The preparation of financial statements requires management to make estimates and assumptions that affect the reported amounts of assets and liabilities, the disclosure of contingent assets and liabilities at the date of the financial statements, and the reported amounts of income and expenses for the period. Actual results could differ from those estimates.
Securities for which market quotations are readily available are valued at current market value as of “Valuation Time.” Valuation Time is as of the close of regular trading on the New York Stock Exchange (usually 4 p.m. Eastern time). Equity securities are valued at the last quoted sale price or, if there is no sale price, the last quoted bid price provided by an independent pricing service approved by the Trust’s Board of Trustees. Securities traded on NASDAQ are valued at the NASDAQ official closing price. Prices are taken from the primary market or exchange in which each security trades.
Foreign securities, currencies, and other assets and liabilities denominated in foreign currencies are translated into U.S. dollars at the exchange rate of said currencies against the U.S. dollar, as of Valuation Time, as provided by an independent pricing service approved by the Board of Trustees.
Debt and other fixed-income securities (other than short-term obligations) in which the Growth and Nationwide Funds invest are valued at the last quoted bid price and/or by using a combination of daily quotes and matrix evaluations provided by an independent pricing service, the use of which has been approved by the Trust’s Board of Trustees. Short-term debt securities such as commercial paper and U.S. Treasury Bills, having a remaining maturity of 60 days or less at the time of purchase are considered to be “short-term” and are valued at amortized cost which approximates market value.
Investments of the Money Market Fund are valued at amortized cost, which approximates market value. Under the amortized cost method, premium or discount, if any, is amortized or accreted, respectively, on a constant (straight line) basis to the maturity of the security.
The Nationwide Fund is permitted to hold foreign equity securities and values the foreign securities at fair value in the circumstances described below. Generally, trading in foreign securities markets is completed each day at various times prior to the Valuation Time. Due to the time differences between the closings of the relevant foreign securities exchanges and the Valuation Time for the Nationwide Fund, the Nationwide Fund will fair value its foreign
Notes to Financial Statements (Continued)
October 31, 2006
investments when it is determined that the market quotations for the foreign investments either are not readily available or are unreliable and, therefore, do not represent fair value. When the fair value prices are utilized, these prices will attempt to reflect the impact of the U.S. financial markets’ perceptions and trading activities on the Nationwide Fund’s foreign investments since the last closing prices of the foreign investments were calculated on their primary foreign securities markets or exchanges. For these purposes, the Board of Trustees of the Trust has determined that movements in relevant indices or other appropriate market indicators, after the close of the foreign securities exchanges, may demonstrate that market quotations are unreliable, and may trigger fair value pricing for certain securities. Consequently, fair valuation of portfolio securities may occur on a daily basis.
| (b) | | Repurchase Agreements |
The Funds may enter into repurchase agreements with an entity which is a member of the Federal Reserve System or which is a “primary dealer” (as designated by the Federal Reserve Bank of New York) in U.S. Government obligations. The repurchase price generally equals the price paid by a Fund plus interest negotiated on the basis of current short-term rates, which may be more or less than the rate on the underlying portfolio securities. The seller under a repurchase agreement is required to maintain the value of the collateral held pursuant to the agreement at a market value equal to or greater than the repurchase price (including accrued interest). Collateral subject to repurchase agreements is held by the Funds’ custodian or another qualified sub-custodian or in the Federal Reserve/ Treasury book-entry system. If the counterparty defaults and the fair value of the collateral declines, realization of the collateral by the Funds may be delayed or limited. The Funds may transfer uninvested cash balances into a pooled cash account. These balances are invested in one or more repurchase agreements, with the counterparties of CS First Boston and Nomura Securities which are fully collateralized by U.S. Government Agency Mortgages with the counterparties of CS First Boston and Nomura Securities.
| (c) | | Foreign Currency Transactions |
The accounting records of the Funds are maintained in U.S. dollars. Foreign currency amounts are translated into U.S. dollars at the current rate of exchange to determine the value of investments, assets and liabilities. Purchases and sales of securities and income and expenses are translated at the prevailing rate of exchange on the respective date of these transactions. The Funds do not isolate that portion of the results of operations resulting from changes in foreign exchange rates on investments from fluctuations arising from changes in market prices of securities held. These fluctuations are included with the net realized and unrealized gain or loss from investments and foreign currencies.
Certain Funds may invest in financial futures contracts (“futures contracts”) for the purpose of hedging their existing portfolio securities or securities that the Funds intend to purchase against fluctuations in value caused by changes in prevailing market interest rates or prices. Futures contracts may also be entered into for non-hedging purposes.
Upon entering into a futures contract, these Funds are required to pledge to the broker an amount of cash and/or other assets equal to a certain percentage of the contract amount (initial margin deposit). Subsequent payments, known as “variation margin”, are made each day depending on the daily fluctuations in the fair value/market value of the underlying assets. A gain or loss equal to the daily variation margin is recognized on a daily basis. Futures contracts are valued daily at their last quoted sale price.
A “sale” of a futures contract means a contractual obligation to deliver the securities or foreign currency called for by the contract at a fixed price at a specified time in the future. A “purchase” of a futures contract means a contractual obligation to acquire the securities or foreign currency at a fixed price at a specified time in the future.
Should market conditions change unexpectedly, the Funds may not achieve the anticipated benefits of the futures contracts and may realize a loss. The use of futures transactions for hedging purposes involves the risk of imperfect correlation in movements in the price of futures contracts, interest rates and the value of the underlying hedged assets. As of October 31, 2006, the Funds did not have any open futures.
| (e) | | Security Transactions and Investment Income |
Security transactions are accounted for on the date the security is purchased or sold (i.e., the “trade date”). Securities gains and losses are calculated on the identified cost basis. Interest income is recognized on the accrual basis and includes, where applicable, the amortization or accretion of premium or discount. Dividend income is recorded on the ex-dividend date.
To generate additional income, each of the Funds with the exception of the Money Market Fund, may lend their respective portfolio securities, up to 33 1/3% of the Fund, to brokers, dealers and other financial institutions provided that (1) the borrower delivers cash or securities as collateral with respect to each new loan of U.S. securities, equal to at least 102% of the value of the portfolio securities loaned, and with respect to each new loan on non-U.S. securities, collateral of at least 105% of the value of the portfolio securities loaned; and (2) at all times thereafter shall require the borrower to mark-to-market the collateral on a daily basis so that the market value of such collateral does not fall below 100% of the value of securities loaned. The Funds receive payments from borrowers equivalent to the dividends and interest that would have been earned on securities loaned while simultaneously seeking to earn income on the investment of cash collateral. There may be risks of delay in recovery of the securities should the borrower of the securities fail financially. Loans will be made, however, only to borrowers deemed by the Funds’ investment adviser to be of good standing and creditworthy under guidelines established by the Board of Trustees and when, in judgment of the adviser, the consideration which can be earned currently from these securities loans justifies the attendant risks. Loans are subject to termination by the Funds or the borrower at any time, and, therefore, are not considered to be illiquid investments. JPMorgan Chase Bank serves as custodian for the securities lending program of the Funds. JPMorgan Chase Bank receives a fee based on the value of the collateral received from borrowers.
Information on the investment of cash collateral is shown in the Statement of Investments.
As of October 31, 2006, the following Funds had securities with the following market value on loan:
| | | | | | |
| Fund | | Market Value of
Loaned Securities | | Market Value of
Collateral* |
Growth | | $ | 17,433,934 | | $ | 17,676,046 |
Nationwide | | | 98,092,323 | | | 100,640,679 |
| | * | Includes securities and cash collateral. |
| (g) | | Distributions to Shareholders |
Distributions from net investment income, if any, are declared and paid quarterly for the Growth and Nationwide Funds and is declared daily and paid monthly for the Money Market Fund. For all Funds, distributions from net realized capital gains, if any, are declared and distributed at least annually.
Dividends and distributions to shareholders are determined in accordance with federal income tax regulations, which may differ from GAAP. These “book/tax” differences are considered either permanent or temporary in nature. In accordance with American Institute of Certified Public Accountants (the “AICPA”“) Statement of Position 93-2, permanent differences (i.e., reclassification of market discounts, foreign exchange gain/loss, paydowns and distributions from real estate investment trusts) are reclassified within the capital accounts based on their nature for federal income tax purposes; temporary differences do not require reclassification. These reclassifications have no effect upon the net asset value of the respective Funds. To the extent distributions exceed current and accumulated earnings and profits for federal income tax purposes, these excesses are reported as distributions of paid-in-capital.
It is the policy of each Fund to qualify or continue to qualify as a “regulated investment company” by complying with the provisions available to certain investment companies, as defined in SubChapter M of the Internal Revenue Code, and to make distributions of net investment income and net realized capital gains sufficient to relieve the Fund from all, or substantially all, federal income taxes.
Notes to Financial Statements (Continued)
October 31, 2006
| (i) | | Allocation of Expenses, Income, and Gains and Losses |
Expenses directly attributable to a Fund are charged to that Fund. Expenses not directly attributable to a Fund are allocated proportionately among various or all Funds within the Trust. For the Funds, the method for allocating income, fund level expenses, and realized and unrealized gains or losses is based on the fair value of shares outstanding relative to net assets. Under this method, each class of shares participates based on the total net asset value of that class’s shares in proportion to the total net assets of the Fund. Expenses specific to a class (such as Rule 12b-1 and administrative services fees) are charged to that class.
3. Transactions with Affiliates
Under the terms of the Trust’s Investment Advisory Agreement, Gartmore Mutual Fund Capital Trust (“GMF”) manages the investment of the assets and supervises the daily business affairs of the Funds. GMF is a wholly-owned subsidiary of NWD Investment Management, Inc., (prior to November 30, 2006 known as “Gartmore Global Investments, Inc.” (“GGI”)), a holding company. NWD Investment Management, Inc. is a majority-owned subsidiary of NWD Management & Research Trust (prior to November 30, 2006 known as “Gartmore Global Asset Management Trust” (“GGAMT”)). NWD Management & Research Trust is a wholly-owned subsidiary of Nationwide Corporation. All of the common stock of Nationwide Corporation is held by Nationwide Mutual Insurance Company (95.2%) and Nationwide Mutual Fire Insurance Company (4.8%), each of which is a mutual company owned by its policyholders.
Under the terms of the Investment Advisory Agreement, each Fund pays GMF an investment advisory fee based on that Fund’s average daily net assets. Additional information regarding the investment advisory fees for GMF is as follows for the year ended October 31, 2006:
| | | | |
| Fund | | Fee Schedule | | Total Fees |
Growth and Nationwide | | $0 up to $250 million | | 0.60% |
| | | $250 million up to $1 billion $1 billion up to $2 billion $2 billion up to $5 billion $5 billion or more | | 0.575%
0.55%
0.525%
0.50% |
Money Market | | $0 up to $1 billion | | 0.40% |
| | | On the next $1 billion On the next $3 billion On $5 billion and more | | 0.38%
0.36%
0.34% |
GMF and the Money Market Fund have entered into a written contract (“Expense Limitation Agreement”) that limits operating expenses (excluding any taxes, interest, brokerage fees, extraordinary expenses, short sale dividend expenses, Rule 12b-1 fees, and administrative services fees) from exceeding 0.59% for all share classes until at least February 28, 2007.
GMF may request and receive reimbursement from the Money Market Fund of the advisory fees waived and other expenses reimbursed by GMF pursuant to the Expense Limitation Agreement at a later date not to exceed three years from the fiscal year in which the corresponding reimbursement to the Fund was made, depending on the Fund (as described below), if the Fund has reached a sufficient asset size to permit reimbursement to be made without causing the total annual operating expense ratio of the Fund to exceed the limits set forth above. No reimbursement will be made unless: (i) the Fund’s assets exceed $100 million; (ii) the total annual expense ratio of the Class making such reimbursement is less than the limit set forth above; and (iii) the payment of such reimbursement is approved by the Board of Trustees on a quarterly basis. Except as provided for in the Expense Limitation Agreement, reimbursement of amounts previously waived or assumed by GMF is not permitted.
As of the year ended October 31, 2006, the cumulative potential reimbursements for the Money Market Fund, based on reimbursements which expire within three years from the fiscal year in which the corresponding reimbursements to the Fund was made for expenses reimbursed by GMF would be:
| | | | | | |
| Fund | | Amount
Fiscal Year
2004 | | Amount
Fiscal Year
2005 | | Amount
Fiscal Year
2006 |
Money Market | | $1,937 | | $1,938 | | $— |
Under the terms of a Distribution Plan under Rule 12b-1 of the 1940 Act, Gartmore Distribution Services, Inc. (“GDSI”), the Funds’ distributor, is compensated by the Funds for expenses associated with the distribution of certain classes of shares of the Funds. GDSI is a majority-owned subsidiary of NWD Management & Research Trust. These fees are based on average daily net assets of the respective class of the Funds at an annual rate not to exceed the following:
| | | | | | | | | | | | | | | |
| Fund | | Class A
Shares | | | Class B
Shares | | | Class C
Shares | | | Class R
Shares | | | Service Class
Shares | |
Growth | | 0.25 | % | | 1.00 | % | | 1.00 | % | | 0.50 | % | | n/a | |
Nationwide | | 0.25 | % | | 1.00 | % | | 1.00 | % | | 0.50 | % | | n/a | |
Money Market | | n/a | | | n/a | | | n/a | | | n/a | | | 0.15 | % |
Pursuant to an Underwriting Agreement, GDSI serves as principal underwriter of the Funds in the continuous distribution of their shares and receives commissions in the form of a front-end sales charge on the Class A and Class D shares. These fees are deducted from and are not included in proceeds from sales of Class A and Class D shares. From these fees, GDSI pays sales commissions, salaries, and other expenses in connection with generating new sales of Class A and Class D shares of the Funds. GDSI also receives fees for services as principal underwriter for Class B shares of the Funds. These fees are contingent deferred sales charges (“CDSCs”) ranging from 1% to 5% imposed on redemptions of Class B shares, which may cause the current value of a shareholder’s account to fall below the total purchase payments.
The CDSC, if applicable, will be imposed on redemptions made within six years of the purchase. Class C shares have a CDSC fee of 1% imposed on redemptions of Class C shares made within one year of purchase. For the year ended October 31, 2006, GDSI received commissions of $317,447 from front-end sales charges of Class A and Class D shares and from CDSC fees from Class B and Class C shares of the Funds, of which $257,898 was re-allowed to affiliated broker-dealers of the Funds.
Under the terms of a Fund Administration and Transfer Agency Agreement, Gartmore SA Capital Trust (“GSA”) provides various administrative and accounting services for the Funds, and Gartmore Investors Services, Inc. (“GISI”), an indirect subsidiary of GSA, serves as Transfer Agent and Dividend Disbursing Agent for each of the Funds. The fees for the services provided under this agreement are calculated based on the Trust’s average daily net assets according to the fee schedule below. The fees are then allocated proportionately among all funds within the Trust in relation to the average daily net assets of each fund and are paid to GSA. GSA pays GISI from these fees for GISI’s services.
| | |
| Combined Fee Schedule* | | |
Up to $1 billion | | 0.26% |
$ 1 billion up to $3 billion | | 0.19% |
$ 3 billion up to $4 billion | | 0.15% |
$ 4 billion up to $5 billion | | 0.08% |
$ 5 billion up to $10 billion | | 0.05% |
$ 10 billion up to $12 billion | | 0.03% |
$ 12 billion or more | | 0.02% |
| * | The assets of the Gartmore Investor Destinations Aggressive, Gartmore Investor Destinations Moderately Aggressive, Gartmore Investor Destinations Moderate, Gartmore Investor Destinations Moderately Conservative and Gartmore Investor Destinations Conservative Funds |
Notes to Financial Statements (Continued)
October 31, 2006
| | (collectively, the “Investor Destinations Funds”) and the Gartmore Optimal Allocations Fund: Aggressive, Gartmore Allocations Fund: Moderate, Gartmore Allocations Fund: Moderately Aggressive, and Gartmore Optimal Allocations Fund: Specialty (collectively, the “Optimal Funds”) are excluded from the Trust asset level amount in order to calculate this asset based fee. The Investor Destinations Funds and the Optimal Funds do not pay any part of this fee. |
GSA and GISI have entered into agreements with BISYS Fund Services Ohio, Inc. (“BISYS”), pursuant to which BISYS provides sub-administration and sub-transfer agency services, respectively, to the Funds.
GSA and BISYS have agreed to designate certain sub-transfer agency agreements GSA enters into with respect to the Funds as “Qualifying Sub-TA Agreements.” With respect to Qualifying Sub-TA Agreements, BISYS will credit to GSA an amount equal to the lesser of (i) the actual amount GSA is charged by the sub-transfer agent under the applicable Qualifying Sub-TA Agreement or (ii) $10 per investor account; however, the aggregate amount paid with regard to all Qualifying Sub-TA Agreements, regardless of whether option (i) or (ii) applies, shall not exceed $200,000 per annum. BISYS will calculate and credit such amounts to GSA’s fees on a monthly basis. All amounts will be credited to each applicable Fund on a monthly basis.
Under the terms of an Administrative Services Plan, the Funds may pay fees to servicing organizations, such as broker-dealers, including Nationwide Financial Services, Inc. (“Nationwide Financial Services”), an affiliate of NWD Management & Research Trust, and financial institutions, which agree to provide administrative support services to the shareholders of certain classes. These services include, but are not limited, to the following: establishing and maintaining shareholder accounts; processing purchase and redemption transactions; arranging bank wires; performing shareholder sub-accounting; answering inquiries regarding the Funds; and other such services. These fees are based on an annual rate of up to 0.25% of the average daily net assets of the Class A, Class D, Class R, Prime Shares, Service Class and Institutional Service Class shares of each of the Funds.
For the year ended October 31, 2006, Nationwide Financial Services received the following amounts in administrative services fees from each Fund:
| | | |
| Fund | | Amount |
Growth | | $ | 40,001 |
Nationwide | | | 580,521 |
Money Market | | | 169,050 |
Under terms of a letter agreement dated September 12, 2006, by and among GSA and the Audit Committees of the Funds and Gartmore Variable Insurance Trust, the Funds have agreed to reimburse GSA their pro-rata portion of certain costs related to the Funds’ ongoing administration, monitoring and annual (audit) testing of the Funds’ Rule 38a-1 Compliance Program subject to the pre-approval of the Funds’ Audit Committee. Such costs include: (1) $160 per hour for services performed on behalf of the Funds by employees of GSA or GSA’s affiliates (other than the Fund CCO); (2) travel costs and other reasonable incidental expenses (without markup) incurred by employees of GSA or GSA’s affiliates in connection with performance of such services; and (3) in the event it becomes necessary to supplement the services of GSA’s (and GSA’s affiliates’) employees, in order to complete the Funds’ Rule 38a-1 annual compliance audit, the costs of a mutually-agreed upon independent contractor’s costs to provide such services.
4. Short-Term Trading Fees
The Funds (except the Money Market Fund) assess a 2.00% redemption fee on all classes of shares that are purchased and are sold or exchanged within 30 calendar days of purchase. The redemption fee, if any, is paid directly to the applicable Fund and is designed to offset brokerage commissions, market impact, and other costs associated with short-term trading of Fund shares. For purposes of determining whether the redemption fee applies, the shares that were held the longest will be redeemed first. This redemption fee is in addition to any CDSCs that may be applicable at the time of sale. The redemption fee may not apply in certain circumstances, such as redemptions or exchanges of shares held in certain omnibus accounts or retirement plans that cannot implement the redemption fee. The fee does not apply to
shares purchased through reinvested dividends or capital gains. For the year ended October 31, 2006, the following Funds had contributions to capital due to collection of redemption fees:
| | | |
| Fund | | Amount |
Growth | | $ | 1,887 |
Nationwide | | | 4,591 |
Money Market | | | 798 |
5. Bank Loans and Earnings Credit
The Trust has a credit agreement with JPMorgan Chase & Co., the Funds’ custodian bank, permitting the Trust to borrow up to $100,000,000. Borrowings under this arrangement bear interest at the Federal Funds rate plus 0.50%. The interest costs, if any, would be included in other fees in the Statement of Operations. No compensating balances were required under the terms of the line of credit. The line of credit is renewed annually, expiring on June 26, 2007, with a commitment fee of 0.08% per year on $100,000,000. There were no borrowings outstanding under this line of credit during the year ended October 31, 2006.
The Trust’s custodian bank has agreed to reduce its fees (earnings credits) when the Funds of the Trust maintain cash on deposit in non-interest-bearing custody and Demand Deposit Accounts. Earnings credits are shown as a reduction of total expenses on the Statement of Operations.
6. Investment Transactions
Purchases and sales of securities (excluding short-term securities) for the year ended October 31, 2006, are summarized as follows:
| | | | | | |
| Fund | | Purchases | | Sales |
Growth | | $ | 637,200,685 | | $ | 692,503,118 |
Nationwide | | | 3,096,571,674 | | | 3,243,730,313 |
Purchases and sales of U.S. Government securities for the year ended October 31, 2006, are summarized as follows:
| | | | | | |
| Fund | | Purchases | | Sales |
Money Market | | $ | 88,000,000 | | $ | — |
7. Indemnifications
Under the Trust’s organizational documents, certain of the Trust’s Officers and Trustees are indemnified against certain liabilities arising out of the performance of their duties to the Trust. In addition, the Trust has entered into Indemnification Agreements with its Trustees and certain of its Officers. Trust Officers receive no compensation from the Trust for serving as its Officers. In addition, in the normal course of business, the Trust enters into contracts with the Trust’s vendors and others that provide for general indemnifications. The Trust’s maximum liability under these arrangements is unknown, as this would involve future claims that may be made against the Trust. Based on experience, however, the Trust expects that risk of loss to be remote.
Notes to Financial Statements (Continued)
October 31, 2006
8. Federal Tax Information
The tax character of distributions paid during the fiscal year ended October 31, 2006, was as follows: (Total distributions paid differ from the Statement of Changes in Net Assets because for tax purposes dividends are recognized when actually paid.)
| | | | | | | | | | | | |
| | | Distributions Paid from | | | | |
| Fund | | Ordinary
Income | | Net Long-
Term Capital
Gains | | Total Taxable
Distributions | | Total
Distributions
Paid |
Growth | | $ | — | | $ | — | | $ | — | | $ | — |
Nationwide | | | 116,125,526 | | | 68,221,381 | | | 184,346,907 | | | 184,346,907 |
Money Market | | | 67,418,306 | | | — | | | 67,418,306 | | | 67,418,306 |
The tax character of distributions paid during the fiscal year ended October 31, 2005 was as follows: (Total distributions paid differ from the Statement of Changes in Net Assets because for tax purposes dividends are recognized when actually paid.)
| | | | | | | | | | | | |
| | | Distributions Paid from | | | | |
| Fund | | Ordinary
Income | | Net Long-
Term Capital
Gains | | Total Taxable
Distributions | | Total
Distributions
Paid |
Growth | | $ | 793,990 | | $ | — | | $ | 793,990 | | $ | 793,990 |
Nationwide | | | 17,184,288 | | | 6,053,402 | | | 23,237,690 | | | 23,237,690 |
Money Market | | | 34,471,949 | | | — | | | 34,471,949 | | | 34,471,949 |
As of October 31, 2006, the components of accumulated earnings (deficit) on a tax basis was as follows:
| | | | | | | | | | | | | | | | | | | | | | | | |
| Fund | | Undistributed
Ordinary
Income | | Undistributed
Long-Term
Capital Gains | | Accumulated
Earnings | | Distributions
Payable | | | Accumulated
Capital and
Other Losses | | | Unrealized
Appreciation
(Depreciation)* | | Total
Accumulated
Earnings
(Deficit) | |
Growth | | $ | — | | $ | — | | $ | — | | $ | — | | | $ | (246,403,603 | ) | | $ | 12,473,570 | | $ | (233,930,033 | ) |
Nationwide | | | 67,067,724 | | | 70,707,148 | | | 137,774,872 | | | — | | | | — | | | | 85,290,521 | | | 223,065,393 | |
Money Market | | | 6,688,596 | | | — | | | 6,688,596 | | | (6,697,636 | ) | | | (13,825 | ) | | | — | | | (22,865 | ) |
| * | The differences between the book-basis and tax-basis unrealized appreciation (depreciation) is attributable primarily to: tax deferral of losses on wash sales; the difference between book and tax amortization methods for premium and market discount; and return of capital adjustments from real estate investment trusts. |
As of October 31, 2006, the tax cost of securities and the breakdown of unrealized appreciation (depreciation) for each Fund were as follows:
| | | | | | | | | | | | | |
| Fund | | Tax Cost of
Securities | | Unrealized
Appreciation | | Unrealized
Depreciation | | | Net
Unrealized
Appreciation
(Depreciation) |
Growth | | $ | 202,953,969 | | $ | 13,813,332 | | $ | (1,339,762 | ) | | $ | 12,473,570 |
Nationwide | | | 1,297,788,481 | | | 102,936,103 | | | (17,645,582 | ) | | | 85,290,521 |
Money Market | | | 1,636,998,428 | | | — | | | — | | | | — |
As of October 31, 2006, for Federal income tax purposes, the following Funds have capital loss carryforwards available to offset capital gains, if any, to the extent provided by the treasury regulations:
| | | | | |
| Fund | | Amount | | Expires |
Growth | | $ | 169,160,174 | | 2009 |
Growth | | | 71,971,609 | | 2010 |
Money Market | | | 1,238 | | 2008 |
Money Market | | | 7,994 | | 2010 |
Money Market | | | 951 | | 2012 |
Money Market | | | 1,927 | | 2013 |
Money Market | | | 1,715 | | 2014 |
As of October 31, 2006, the following Funds have additional capital loss carryforwards, subject to any applicable limitations on availability, to offset future capital gains, if any, as the successor of a merger Funds:
| | | | | |
| Fund | | Amount | | Expires |
Growth | | $ | 2,635,910 | | 2008 |
Growth | | | 1,317,955 | | 2009 |
Growth | | | 1,317,955 | | 2010 |
Recently Issued Accounting Pronouncements–On July 13, 2006, the Financial Accounting Standards Board (“FASB”) released FASB Interpretation No. 48, Accounting for Uncertainty in Income Taxes (“FIN 48”). FIN 48 provides guidance for how uncertain tax positions should be recognized, measured, presented and disclosed in the financial statements. FIN 48 requires the affirmative evaluation of tax positions taken or expected to be taken in the course of preparing the Fund’s tax returns to determine whether it is more-likely-than-not (i.e., greater than 50 percent) that each tax position will be sustained upon examination by a taxing authority based on the technical merits of the position. A tax position that meets the more-likely-than-not recognition threshold is measured to determine the amount of benefit to recognize in the financial statements. Differences between tax positions taken in a tax return and amounts recognized in the financial statements will generally result in an increase in a liability for taxes payable (or a reduction of a tax refund receivable) and an increase in a deferred tax liability (or a reduction in a deferred tax asset). Adoption of FIN 48 is required for fiscal years beginning after December 15, 2006 and is to be applied to all open tax years as of the effective date. At this time, management is evaluating the implications of FIN 48. Its impact to the financial statements has not yet been determined.
Report of Independent Registered Public
Accounting Firm
To the Board of Trustees and Shareholders of Gartmore Mutual Funds:
In our opinion, the accompanying statements of assets and liabilities, including the statements of investments, and the related statements of operations and of changes in net assets and the financial highlights present fairly, in all material respects, the financial position of Gartmore Growth Fund, Gartmore Nationwide Fund and Gartmore Money Market Fund (three series of Gartmore Mutual Funds, hereafter referred to as the “Funds”) at October 31, 2006, the results of each of their operations for the year then ended, the changes in each of their net assets each of the two years then ended and the financial highlights for each of the periods indicated, in conformity with accounting principles generally accepted in the United States of America. These financial statements and financial highlights (hereafter referred to as “financial statements”) are the responsibility of the Funds’ management; our responsibility is to express an opinion on these financial statements based on our audits. We conducted our audits of these financial statements in accordance with the standards of the Public Company Accounting Oversight Board (United States.) Those standards require that we plan and perform the audit to obtain reasonable assurance about whether the financial statements are free of material misstatement. An audit includes examining, on a test basis, evidence supporting the amounts and disclosures in the financial statements, assessing the accounting principles used and significant estimates made by management, and evaluating the overall financial statement presentation. We believe that our audits, which included confirmation of securities at October 31, 2006 by correspondence with the custodian and brokers, provide a reasonable basis for our opinion.
PricewaterhouseCoopers LLP
Philadelphia, Pennsylvania
December 20, 2006
Supplemental Information
1. Other Federal Tax Information (Unaudited)
For the period ended October 31, 2006, certain dividends paid by the Funds may be subject to a maximum tax rate of 15% as provided for by the Jobs and Growth Tax Relief Reconciliation Act of 2003. The Funds intend to designate the maximum amount allowable as taxed at a maximum rate of 15%. Complete information will be reported in conjunction with your 2006 Form 1099-DIV.
For the period ended October 31, 2006, the following Funds paid qualified dividend income:
| | | |
| Fund | | Qualified
Dividend
Income |
Nationwide | | $ | 3,181,052 |
For the taxable year ended October 31, 2006, the following percentage of income dividends paid by the Funds qualify for the dividends received deduction available to corporations:
| | |
| Fund | | Dividend
Received
Deduction |
Nationwide | | 3% |
The Funds designate the following amounts as long term capital gain distributions qualifying for the maximum 15% income tax rate for individuals:
| | | |
| Fund | | Amount |
Nationwide | | $ | 68,221,381 |
Management Information (Unaudited)
Trustees who are not Interested Persons (as defined in the 1940 Act) and Officers of the Funds as of October 31, 2006
| | | | | | | | |
Name, Address and Year of Birth | | Position(s) Held
with the Trust
and Length of
Time Served1 | | Principal Occupation(s) During Past 5 Years | | Number of Portfolios
in the Gartmore Fund
Complex Overseen
by Trustee | | Other Directorships Held by Trustee or
Nominee2 |
| | | | |
Charles E. Allen c/o NWD Investment Management, Inc. 1200 River Road, Suite 1000 Conshohocken, PA 19428 1948 | | Trustee since July 2000 | | Mr. Allen is Chairman, Chief Executive Officer and President of the Graimark Realty Advisors, Inc. (real estate development, investment and asset management). | | 97 | | None |
| | | | |
Paula H.J. Cholmondeley c/o NWD Investment Management, Inc. 1200 River Road, Suite 1000 Conshohocken, PA 19428 1947 | | Trustee since July 2000 | | Ms. Cholmondeley is an independent strategy consultant. Ms. Cholmondeley was Vice President and General Manager of Sappi Fine Paper North America from April 2000 through December 2003. | | 97 | | Director of Dentsply International, Inc., Ultralife Batteries, Inc., Terex Corporation, Minerals Technology, Inc. and Albany International Corp. |
| | | | |
C. Brent DeVore3 c/o NWD Investment Management, Inc. 1200 River Road, Suite 1000 Conshohocken, PA 19428 1940 | | Trustee since 1990 | | Dr. DeVore is President of Otterbein College. | | 97 | | None |
| | | | |
Phyllis K. Dryden c/o NWD Investment Management, Inc. 1200 River Road, Suite 1000 Conshohocken, PA 19428 1947 | | Trustee since December 2004 | | Beginning in February 2006 Ms. Dryden is employed by The Mitchell Madison Group, a management consulting company. Ms. Dryden was a former Managing Partner of marchFIRST, a global management consulting firm prior to February 2002. | | 97 | | None |
| | | | |
Barbara L. Hennigar c/o NWD Investment Management, Inc. 1200 River Road, Suite 1000 Conshohocken, PA 19428 1935 | | Trustee since July 2000 | | Retired. | | 97 | | None |
Trustees who are not Interested Persons (as defined in the 1940 Act) and Officers of the Funds as of October 31, 2006 (Continued)
| | | | | | | | |
Name, Address and Year of Birth | | Position(s) Held
with the Trust
and Length of
Time Served1 | | Principal Occupation(s) During Past 5 Years | | Number of Portfolios
in the Gartmore Fund
Complex Overseen
by Trustee | | Other Directorships Held by Trustee or
Nominee2 |
| | | | |
Barbara I. Jacobs c/o NWD Investment Management, Inc. 1200 River Road, Suite 1000 Conshohocken, PA 19428 1950 | | Trustee since December 2004 | | Ms. Jacobs served as Chairman of the Board of Directors of KICAP Network Fund, a European (United Kingdom) hedge fund, from December 2000 through January 2006. Prior to 2004, Ms. Jacobs was also a Managing Director and European Portfolio Manager with Teachers Insurance Annuity Association - College Retirement Equities Fund. | | 97 | | None |
| | | | |
Douglas F. Kridler c/o NWD Investment Management, Inc. 1200 River Road, Suite 1000 Conshohocken, PA 19428 1955 | | Trustee since September 1997 | | Mr. Kridler has served as the President and Chief Executive Officer of the Columbus Foundation (a Columbus, OH-based foundation which manages over 1,300 individual endowment funds) since February 2002. Prior to January 31, 2002, Mr. Kridler was the President of the Columbus Association for the Performing Arts and Chairman of the Greater Columbus Convention and Visitors Bureau. | | 97 | | None |
| | | | |
Michael D. McCarthy c/o NWD Investment Management, Inc. 1200 River Road, Suite 1000 Conshohocken, PA 19428 1947 | | Trustee since December 2004 | | Retired. Mr. McCarthy was Chairman of VMAC (commodity swaps) from October 2002 until June 2005; and a partner of Pineville Properties LLC (a commercial real estate development firm). | | 97 | | None |
| | | | |
David C. Wetmore c/o NWD Investment Management, Inc. 1200 River Road, Suite 1000 Conshohocken, PA 19428 1948 | | Trustee since 1995 and Chairman since February 2005 | | Retired. | | 97 | | None |
| 1 | Length of time served includes time served with the Trust’s predecessors. |
| 2 | Directorships held in (1) any other investment companies registered under the 1940 Act, (2) any company with a class of securities registered pursuant to Section 12 of the Securities Exchange Act of 1934, as amended (the “Exchange Act”), or (3) any company subject to the requirements of Section 15(d) of the Exchange Act. |
| 3 | Mr. DeVore has served as President of Otterbein College since 1984. Mark Thresher, President and Chief Operating Officer of Nationwide Financial Services, Inc. (“NFS”) has served as a member of the Board of Trustees of Otterbein College since 2000, currently serves as one of 30 of its trustees, and is currently one of two Vice Chairmen of the Board. NFS is under common control with each of the Gartmore companies that serve as investment advisers and principal underwriter to the Trust, as each is a majority-owned subsidiary of Nationwide Corporation (“NC”) and, through NC, of Nationwide Mutual Insurance Company (95.2%) and Nationwide Mutual Fire Insurance Company (4.8%). |
Additional information regarding the Trustees and Officers may be found in the Trust’s Statement of Additional Information, which is available without charge upon request, by calling 800-848-0920.
Management Information (Unaudited)
Trustees who are Interested Persons (as defined in the 1940 Act) and/or Officers of the Funds as of October 31, 2006
| | | | | | | | |
Name, Address
and Year of Birth | | Position(s) Held
with the Trust
and Length of
Time Served1 | | Principal Occupation(s)
During Past
5 Years | | Number of Portfolios
in the
Gartmore Fund
Complex Overseen
by Trustee | | Other
Directorships
Held by Trustee2 |
| | | | |
Paul J. Hondros NWD Investment Management, Inc. 1200 River Road, Suite 1000 Conshohocken, PA 19428 1948 | | Trustee since July 2000 | | Mr. Hondros has been President and Chief Executive Officer of various NWD Investments Group entities, including Gartmore Distribution Services, Inc. (“GDSI”),3 Gartmore Investor Services, Inc. (“GISI”),3 Gartmore Morley Capital Management, Inc. (“GMCM”),3 Morley Financial Services, Inc. (“MFS”),3 NorthPoint Capital, LLC (NorthPoint”),3 NWD Management & Research Trust (“NWDMRT”),3 NWD Investment Management, Inc. (“NWDIM”),3 Gartmore Mutual Fund Capital Trust (“GMFCT”)3 and Gartmore SA Capital Trust (“GSA”)3; and a Director of Nationwide Securities, Inc.,3 as well as several entities within Nationwide Financial Services, Inc. | | 97 | | None |
| | | | |
Arden L. Shisler c/o NWD Investment Management , Inc. 1200 River Road, Suite 1000 Conshohocken, PA 19428 1941 | | Trustee since February 2000 | | Retired. Mr. Shisler is the former President and Chief Executive Officer of K&B Transport, Inc., a trucking firm (2000 through 2002). He served as a consultant to K&B from January 2003 through December 2004. Since 1992, Mr. Shisler has also been Chairman of the Board for Nationwide Mutual Insurance Company.3 | | 97 | | Director of Nationwide Financial
Services, Inc. |
| | | | |
Gerald J. Holland NWD Investment Management, Inc.
1200 River Road, Suite 1000 Conshohocken, PA 19428 1951 | | Treasurer since March 2001 | | Mr. Holland is Senior Vice President — Operations for NWDIM,3 GMFCT,3 and GSA.3 | | N/A | | N/A |
Trustees who are Interested Persons (as defined in the 1940 Act) and/or Officers of the Funds as of October 31, 2006 (Continued)
| | | | | | | | |
Name, Address and Year of Birth | | Position(s) Held
with the Trust
and Length of
Time Served1 | | Principal Occupation(s) During Past 5 Years | | Number of Portfolios
in the Gartmore Fund
Complex Overseen
by Trustee | | Other Directorships Held by Trustee or
Nominee2 |
| | | | |
Michael A. Krulikowski NWD Investment Management, Inc. 1200 River Road, Suite 1000 Conshohocken, PA 19428 1959 | | Chief Compliance Officer since June 2004 | | Since November 1999, Mr. Krulikowski has served as a Vice President and Chief Compliance Officer of NWDIM3. Since June 2004, Mr. Krulikowski has also served as Chief Compliance Officer of the Trust. | | N/A | | N/A |
| | | | |
Eric E. Miller NWD Investment Management, Inc. 1200 River Road, Suite 1000 Conshohocken, PA 19428 1953 | | Secretary since December 2002 | | Mr. Miller is Senior Vice President, Chief Counsel for NWDIM,3 GMFCT3 and GSA3 since August 2002. From August 2000 to August 2002, Mr. Miller was a Partner with Stradley Ronan Stevens & Young, LLP. | | N/A | | N/A |
| 1 | Length of time served includes time served with the Trust’s predecessors. |
| 2 | Directorships held in (1) any other investment companies registered under the 1940 Act, (2) any company with a class of securities registered pursuant to Section 12 of the Securities Exchange Act of 1934, as amended (the “Exchange Act”), or (3) any company subject to the requirements of Section 15(d) of the Exchange Act. |
| 3 | This position is held with an affiliated person or principal underwriter of the Trust. |
Federal law requires the Trust, each of its investment advisers and sub-advisers to adopt procedures for voting proxies (“Proxy Voting Guidelines”) and to provide a summary of those Proxy Voting Guidelines used to vote the securities held by the Funds. The Funds’ proxy voting policies and procedures are available without charge (i) upon request, by calling 800-848-0920, (ii) on the Fund’s website at www.nwdfunds.com, or (iii) on the Securities and Exchange Commission’s website at www.sec.gov.
AnnualReport
| | |
| | |

| | October 31, 2006 |
| | | | |
| | | | Contents |
| | |
| 2 | | | | Message to Shareholders |
| | |
| 6 | | | | NorthPointe Small Cap Growth Fund |
| 12 | | | | NorthPointe Small Cap Value Fund |
| | |
| 27 | | | | Notes to Financial Statements |
Commentary provided by Gartmore Mutual Fund Capital Trust (the “Adviser”), investment adviser to Gartmore Funds. All opinions and estimates included in this report constitute the Advisers’ judgment as of the date of this report and are subject to change without notice.
As of September 29, 2006, Gartmore Funds and its U.S. operations, as well as the Funds’ Advisers, distributor, and other service providers, are no longer affiliated with Gartmore Investment Management plc (Gartmore U.K.) or other Gartmore international businesses. Certain Gartmore U.S. companies, and marketing materials related to them, will continue to carry the Gartmore name for the next several months under the terms of an agreement with Gartmore U.K. For more information call, 800-848-0920.
Statement Regarding Availability of Quarterly Portfolio Schedule.
The Gartmore Funds file complete schedules of portfolio holdings for each Fund with the Securities and Exchange Commission (the “Commission”) for the first and third quarters of each fiscal year on Form N-Q. The Funds’ Forms N-Q are available on the Commission’s website at http://www.sec.gov. The Funds’ Forms N-Q may be reviewed and copied at the Commission’s Public Reference Room in Washington, DC, and information on the operation of the Public Reference Room may be obtained by calling 800-SEC-0330; and the Funds make the information on Form N-Q available to shareholders on www.nwdfunds.com or upon request without charge.
Statement Regarding Availability of Proxy Voting Record.
Information regarding how the Funds voted proxies relating to portfolio securities held during the most recent 12-month period ended June 30, 2006 is available without charge, upon request, by calling 800-848-0920, and on the Commission’s website at http://www.sec.gov.
Message to Shareholders
December 15, 2006
Dear Shareholders:
This reporting period has been a time of change for our company. First, in September 2006, our parent company, Nationwide Mutual Insurance Company (Nationwide), completed the sale of the U.K.-based Gartmore Investment Management Ltd. (Gartmore U.K.). As a result of the sale, on November 30, 2006, Gartmore Global Investments, the U.S. division of Nationwide’s asset management business, changed its name to NWD Investments. All of the mutual funds advised by NWD Investments, however, will retain the Gartmore Funds name until May 2007. In addition, Gartmore U.K. will continue to act as subadviser for a number of Gartmore Funds, and, as a result, investors in those funds that include foreign exposure can expect “business as usual”. Nationwide has been examining how best to align NWD Investments as a part of its operations since the sale of Gartmore U.K. and on December 21, 2006, announced that it had reached a preliminary agreement of terms to sell NWD Investment’s retail operations to Nationwide Financial Services, Inc.
Second, I must report that this will be my final shareholder letter. Effective December 15, 2006, John Grady, who joined our firm in October as transition manager, was named as president of NWD Investments and was elected by the Gartmore Funds Board of Trustees to the role of president and chief executive officer. I’m confident that John’s extensive background in this industry will serve NWD Investments well as the company prepares for its next chapter of growth. I have enjoyed serving all of you, and I wish you much success in the years to come.
Market Overview
Global stock markets delivered strong gains for the year ended October 31, 2006, but the period was not without its share of volatility. During the first six months, the markets did a good job of advancing despite the headwinds of rising crude oil prices, interest-rate hikes by the Federal Reserve Board and the replacement of retiring Federal Reserve Chairman Alan Greenspan by Ben Bernanke. The central bank’s May 10 rate hike, however, marked a critical turning point. Disappointment that the Fed did not stand pat, together with concerns about inflationary pressures and the possibility of further rate hikes, triggered sharp declines in global stock markets. Small-capitalization stocks and growth sectors such as technology generally suffered the most during the sell-off.
Throughout the summer, inflation moderated a bit, and more evidence of a slowing U.S. economy emerged. The Fed reacted by leaving interest rates unchanged at its August, September and October meetings. Falling energy prices in the final months of the reporting period provided further fuel for the markets, sparking a rebound in stock prices. For the one-year reporting period, the S&P 500® Index recorded a return of 16.34%. A weak U.S. dollar helped lift foreign markets to even better returns; the Morgan Stanley Capital International Europe, Australasia and Far East (MSCI EAFE®) Index posted a gain of 28.04%. Value stocks maintained a commanding lead over growth shares during the period, while small-cap issues topped larger caps.
It’s Official—We’re Lipper’s best “Overall Small Fund Family”
From the beginning, we’ve made it our mission to be good stewards of our investors’ money. Stewardship can be measured in various ways, but in the mutual fund business, investment performance is one obvious yardstick. That’s why we’re delighted to have been honored with the best “Overall Small Fund Family” award at the 2006 Lipper Fund Awards. Significantly, this award was not based on results tallied over just one year. According to Lipper, a key factor in the selection process was our consistent, strong risk-adjusted returns in several different asset classes relative to those of our peers for three years ended December 31, 2005. We appreciate this recognition of our commitment to delivering returns for our investors, and we consider the award a validation of our approach.
International Fund Highlights
Our confidence in our non-U.S. subadvised funds was amply rewarded during the one-year reporting period. For example, the Gartmore Worldwide Leaders Fund posted a gain of 26.22%*, compared with 21.91% for the MSCI World IndexSM. The Fund’s performance placed the Fund in the top 4% among its Lipper peer group, Global Large-Cap Core Funds (consisting of 59 funds as of October 31, 2006). In recognition of the Gartmore Worldwide Leaders Fund’s outstanding track record, it received the nod as Best Global Large-Cap Core Fund at the 2006 Lipper Fund Awards. Also meriting mention was the Gartmore International Growth Fund, whose 38.22% return went above and beyond the 28.91% return posted by the MSCI All Country World excluding U.S. Index and earned it a ranking in the top 1% among its Lipper peer group, International Multi-Cap Core Funds (consisting of 904 funds as of October 31, 2006).
Small-Cap Lineup Delivers Strong Results
Our commitment to small-cap investing remains an important theme. Offering several investment choices, including funds that invest in companies that may receive scant attention from the vast majority of Wall Street analysts, small caps typically are a much less efficient asset class than their large-cap and even mid-cap counterparts. This means that more
opportunities may exist for our experienced portfolio managers to identify and potentially capitalize on mispriced stocks. Our success in this area was reflected in strong performance during the past year across most of our small-cap products.
One of our newer entries, the Gartmore Small Cap Leaders Fund, offers exposure to both growth and value opportunities through two separate “sleeves” or subportfolios, each with its own management team. During the one-year reporting period, this Fund delivered a 30.65% return, far surpassing the 19.98% result of the Russell 2000® Index. The Fund also finished in the top 2% of Lipper Small-Cap Core Funds (consisting of 689 funds as of October 31, 2006). The Gartmore Small Cap Fund delivered comparable results, with a 30.98% return, beating the same benchmark, the Russell 2000 Index. Notably, this Fund also posted exceptionally strong performance over longer periods of time, placing in the top 2% of its peers among Lipper Small-Cap Core Funds (consisting of 689 funds as of October 31, 2006). for the five years ended October 31, 2006.
To further broaden investors’ choices in the small-cap area and to leverage the experience of our seasoned portfolio managers, we introduced three new funds near the end of September 2006: the Gartmore Small Cap Growth Opportunities Fund, the Gartmore Small Cap Core Fund and the Gartmore Small Cap Value Fund. At the same time, we debuted two absolute-return products: the Gartmore Market Neutral Fund and the Gartmore Hedged Core Equity Fund. These two products are designed for more conservative investors looking for a fund that offers a mix of long and short positions, as well as the potential for lower correlation with the broader equity markets.
Diversifying with Sector Funds
Once an investor has built a solid portfolio around a select group of core funds, sector funds may offer an effective way to enhance both long-term performance and diversification. In this category, several funds with a global scope performed well, including the Gartmore Global Natural Resources Fund, with a 22.87% gain that outdistanced the 17.96% return of its benchmark, the Goldman Sachs Natural Resources Index. Also finishing the period in fine form was the Gartmore Global Utilities Fund, with a return of 27.56%—performance that was good enough to surpass that of the Fund’s composite benchmark of 60% MSCI World Telecommunication Services IndexSM and 40% MSCI World Utilities IndexSM, which returned 25.61%. Last of all, amid considerable volatility for technology stocks, the Gartmore Global Technology and Communications Fund posted a 13.48% return, handily beating the 10.35% return of the Goldman Sachs Technology Composite Index (GSTI®), our benchmark for this Fund.
Strategically combining core equity and fixed-income funds with sector exposure is exhibited in our Gartmore Optimal Allocations “fund of funds” series. We now offer five variations on this theme, three of which are designed to be complete asset allocation solutions: these are the Aggressive, Moderately Aggressive and Moderate Funds within the Optimal Allocations series—each with different mixes of underlying funds—targeting specific risk levels fitting those descriptions. The Gartmore Optimal Allocations Fund: Specialty is intended for investors who already have core investments in place and seek to enhance their overall risk-adjusted returns by exposure to a select group of specialty funds. After the one-year reporting period closed, moreover, we launched the Gartmore Optimal Allocations Fund: Defensive. This new offering is designed for investors who have a lower tolerance for risk and want to complement a core holding by seeking sustainable real returns as a hedge against possible economic deterioration, including inflation, deflation or rising interest rates.
With asset allocation models designed by Ibbotson Associates, a leading authority on asset allocation, the Optimal Allocations Funds are designed to expand an average investor’s “efficient frontier”—that is, they seek to provide the most efficient combination of various asset classes to achieve the highest possible return for a given level of risk. The results to date have been gratifying: for the one-year reporting period, all four Optimal Allocations funds placed in the top quartile of their respective Lipper peer groups (consisting of 592 Mixed-Asset Target Allocation Growth Funds, 414 Mixed-Asset Target Allocation Moderate Funds, 904 Multi-Cap Core Funds and 104 Specialty/Miscellaneous Funds as of October 31, 2006).
Short-Term Shortfall from Long-Term Winner
Although the Gartmore U.S. Growth Leaders Fund, which is managed by one of our talented, veteran portfolio managers, Christopher Baggini, struggled during this reporting period with a return of 1.77%, the Fund’s longer-term record remained enviable: its five-year return of 10.98% was well ahead of the S&P 500 Index’s 7.26% gain, and the Fund occupied the 8th percentile versus other Lipper Multi-Cap Growth Funds (consisting of 332 funds as of Oct. 31, 2006).
Message to Shareholders
Continued
We Appreciate Your Business
We take the charge of managing your assets very seriously. While other companies might make that same claim, we can point to our recent company-level and fund-specific Lipper awards as evidence that we have “walked the talk”. As we close the books on an eventful year—both for the markets and for our company—you can be sure that NWD Investments will continue its pursuit of superior long-term, risk-adjusted returns for the benefit of you, our valued shareholders.

Paul J. Hondros

John H. Grady
| * | All Gartmore Funds performance returns are Class A at NAV, except where noted. |
Lipper, a wholly owned subsidiary of Reuters, is a leading global provider of mutual fund information and analysis to fund companies, financial intermediaries and media organizations. The firm competed with 17 eligible small fund families, defined as groups with at least three equity, three bond and three mixed-equity portfolios that received Consistent Return scores as of Dec. 31, 2005. Consistent Return is a quantitative metric that incorporates two characteristics: risk-adjusted return and the strength of the fund’s performance trend. Lipper determined the award winner by averaging the decile rank of the three-year Consistent Return scores for all of the funds within the eligible groups. The fund family with the lowest average decile rank received the award. Although Lipper makes reasonable efforts to ensure the accuracy and reliability of the data, the accuracy is not guaranteed by Lipper.
For the “Global Large Cap Core Funds” award, Lipper determined the award winner by calculating the highest Consistent Return over the three-year time period ended Dec. 31, 2005. Gartmore Funds competed among 16 global large-cap core portfolios to win the award.
Funds that concentrate on specific sectors or a relatively small number of securities may be subject to greater volatility than that of other mutual funds.
International investing involves additional risks, including currency fluctuations, differences in accounting standards, political instability and foreign regulations, all of which are magnified in emerging markets.
Small-company stocks have higher risks than the stocks of larger, more established companies and have significant short-term price volatility.
Sophisticated investment strategies such as leverage, short selling, short-term trading and investing in derivatives, REITs and IPOs may cause a Fund to have greater risk and volatility and higher expenses than those of other investments.
The Gartmore Optimal Allocations Funds are designed to provide diversification and asset allocation across several types of investments and asset classes, primarily by investing in underlying Gartmore Funds. Each Fund is subject to different levels of risk, based on the size of its asset class allocations. Each Fund’s underlying funds may be subject to specific investment risks such as those associated with a concentrated number of securities (such as REITs), small companies, international stocks, initial public offerings, short selling, short-term trading, bonds and short-term instruments. There is no assurance that a diversified portfolio will produce better results than a nondiversified one.
Index returns do not include the effect of any sales charges or expenses. If sales charges and expenses were deducted, the actual returns of each Index would be lower. It is not possible to invest directly in an Index.
Goldman Sachs Natural Resources Index: An unmanaged, modified market capitalization-weighted sector index of U.S.-traded natural resource-related stocks; includes companies in the categories of extractive industries, energy companies, owners and operators of timber tracts, forestry services, producers of pulp and paper, and owners of plantations.
Morgan Stanley Capital International (MSCI) All Country World excluding U.S. Index: An unmanaged, free float-adjusted, market-capitalization weighted index that is designed to measure the performance of the stocks in companies in all countries except the United States.
Morgan Stanley Capital International Europe, Australasia and Far East (MSCI EAFE®) Index: An unmanaged, free float-adjusted, market capitalization-weighted index that is designed to measure the performance of stocks in developed markets outside the United States and Canada.
Morgan Stanley Capital International (MSCI) World IndexSM: An unmanaged, free float-adjusted, market capitalization-weighted index that is designed to measure the performance of global developed-market equities.
Morgan Stanley Capital International (MSCI) World Telecommunication Services IndexSM: An unmanaged index that is based on developed-market country indexes and is generally representative of the stocks in the global utilities sector.
Morgan Stanley Capital International (MSCI) World Utilities IndexSM: An unmanaged index that is based on developed- market
country indexes and is generally representative of the stocks in the utilities sector, which includes industry groups such as electric, gas, multi-utilities, and unregulated power and water.
Russell 2000® Index: An unmanaged index that measures the performance of the stocks of U.S. companies.
Standard & Poor’s 500® (S&P 500) Index: An unmanaged, market capitalization-weighted index of 500 widely held stocks of large-cap U.S. companies that gives a broad look at how the stock prices of those companies have performed.
Lipper Analytical Services, Inc. is an industry research firm whose rankings are based on total return performance and do not reflect the effect of sales charges. Each fund is ranked within a universe of funds similar in investment objective as determined by Lipper.
The Lipper scores listed are based on monthly data. Lipper scores are subject to change every month. The Lipper Average is a straight average of the specific Lipper Universe.
This information is provided for educational purposes only and should not be considered investment advice. Lipper ratings are not intended to predict future results, and Lipper does not guarantee the accuracy of this information.
Investing in mutual funds involves risk, including possible loss of principal.
There is no assurance that the investment objective of any fund will be achieved or that a diversified portfolio will produce better results than a non-diversified one.
Third-party information has been obtained from and is based on sources the Firm believes to be reliable.
Views expressed within are as of the date noted and are subject to change at any time.
The Funds’ adviser, one of its affiliated advisers, or its employees, may have a position in the securities named in this report.
This report is for informational purposes only, and is not intended as an offer or recommendation with respect to the purchase or sale of any security, option, future or other derivatives in such securities.
PAST PERFORMANCE DOES NOT GUARANTEE FUTURE RESULTS.
To obtain performance information current to the most recent month-end, which may be higher or lower than the performance shown, please call 800-848-0920 or visit www.nwdfunds.com.
Investors should carefully consider a fund’s investment objectives, risks, fees, charges and expenses before investing any money. To obtain this and other fund information, please call 800-848-0920 to request a prospectus, or download a prospectus at www.gartmorefunds.com. Please read it carefully before investing any money.
NorthPointe Capital is a federally registered service mark of Gartmore Global Investments, Inc
Gartmore Funds distributed by Gartmore Distribution Services, Inc., Member NASD. 1200 River Road, Suite 1000, Conshohocken, Pa. 19428.
As of September 29, 2006, Gartmore Funds and its U.S. operations, as well as the Funds’ advisers, distributor, and other service providers, are no longer affiliated with Gartmore Investment Management plc (Gartmore U.K.) or other Gartmore international businesses. Certain Gartmore U.S. companies, and marketing materials related to them, will continue to carry the Gartmore name for the next several months under the terms of an agreement with Gartmore U.K. For more information call, 800-848-0920.
NorthPointe Small Cap Growth Fund
For the annual period ended Oct. 31, 2006, the NorthPointe Small Cap Growth Fund (Institutional Service Class at NAV) returned 21.38% versus 17.07% for its benchmark, the Russell 2000® Growth Index. For broader comparison, the average return for the Fund’s Lipper peer category of Small-Cap Growth Funds (consisting of 561 funds as of Oct. 31, 2006) was 12.82%.
Small-capitalization stocks continued their dominance over large- and mid-cap stocks during the reporting period. The exception to that trend occurred during May through July, when stocks declined sharply and investors became concerned about worsening inflation and the possibility that the Federal Reserve Board might increase interest rates further than expected. As the summer progressed, however, inflation remained in check and the economy appeared to be slowing, providing the Federal Reserve with the flexibility it needed to hold rates steady at its August, September and October Federal Open Market Committee meetings. Adding to the positive backdrop late in the reporting period were a relatively benign hurricane season and a sharp decline in crude oil and natural gas prices.
Regardless of the market environment, our uncompromising focus on managing individual stock risk within the portfolio and finding high-quality stocks that are trading at attractive valuations continues to set us apart. As a result, the Fund outperformed its benchmark Index during the reporting period. The largest contributors to Fund performance during the reporting period included Crocs, Inc. (manufacturer of shoes), Rudolph Technologies, Inc. (supplier of equipment to semiconductor manufacturers), and Encore Medical Corp. (supplier of orthopedic devices). We continue to own shares in these companies.
Underperforming Fund holdings during the reporting period were Genesee & Wyoming Inc. (operator of short-line railroads), Sirenza Microdevices, Inc. (provider of technology products) and Parlux Fragrances, Inc. (maker of prestige fragrances). Genesee & Wyoming and Sirenza experienced temporary operational disruptions, but we expect solid future results. We believe that the growth prospects for these companies remain strong, thus we continue to own these stocks. We sold our shares in Parlux Fragrances due to concerns about the company’s strategic direction.
The Fund’s positioning remained relatively the same throughout the reporting period. The portfolio remains underweight in the health-care, energy and materials sectors, and it is overweight in the technology, consumer staples and financials sectors. Currently, the largest positions in the Fund are Celadon Group, Inc. (industrials), inVentiv Health, Inc. (health care) and SunOpta Inc. (consumer staples). The positioning of the Fund’s portfolio is a direct result of our bottom-up, fundamental research process.
Our outlook for the small-cap market remains upbeat, and we have several reasons for our optimism. First, increasingly we are finding good earnings growth companies with solid balance sheets trading at attractive valuations. Second, the steep decline in the prices of energy and raw materials is likely to have a marked effect on the level of economic growth in 2007.
Portfolio Managers:
Carl Wilk, CFP and Karl Knas, CFA
| | |
Fund Performance | | NorthPointe Small Cap Growth Fund |
Average Annual Total Return
(For periods ended October 31, 2006)
| | | | | | |
| | | | | 1 Yr. | | Inception1 |
| Class A | | w/o SC6 | | 20.98% | | 17.96% |
| | | w/SC3 | | 14.04% | | 14.66% |
| Class B | | w/o SC6 | | 20.22% | | 17.17% |
| | | w/SC4 | | 15.22% | | 15.96% |
| Class C | | w/o SC6 | | 20.22% | | 17.17% |
| | | w/SC5 | | 19.22% | | 17.17% |
| Class R2 | | | | 20.96% | | 17.76% |
| Institutional Service Class2 | | | | 21.38% | | 18.29% |
| Institutional Class2 | | | | 21.45% | | 18.38% |
| 1 | Fund commenced operations on September 29, 2004. |
| 2 | Not subject to any sales charges. |
| 3 | A 5.75% front-end sales charge was deducted. |
| 4 | A 5.00% contingent deferred sales charge (CDSC) was deducted. The CDSC declines to 0% after 6 years. |
| 5 | A CDSC of 1.00% was deducted because it is charged when you sell Class C shares within the first year after purchase. |
| 6 | These returns do not reflect the effects of sales charges (SC). |
Performance of a $10,000 Investment
Investment return and principal value will fluctuate, and when redeemed, shares may be worth more or less than original cost. Past performance is no guarantee of future results and does not reflect the deduction of taxes that a shareholder would pay on fund distributions or the redemption of fund shares. Investing in mutual funds involves market risk, including loss of principal. Performance returns assume the reinvestment of all distributions.
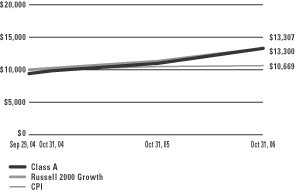
Comparative performance of $10,000 invested in the Class A of the NorthPointe Small Cap Growth Fund, Russell 2000 Growth Index (Russell 2000 Growth)(a), and the Consumer Price Index (CPI)(b) since inception. Unlike the Fund, the returns for these unmanaged indexes do not reflect any fees, expenses, or sales charges. Investors cannot invest directly in market indexes.
| (a) | The Russell 2000 Growth is an unmanaged index that measures the performance of small-cap stocks of U.S. companies that seem to offer a growth bias. |
| (b) | The CPI represents changes in prices of a basket of goods and services purchased for consumption by urban households. |
| | |
Shareholder Expense Example | | NorthPointe Small Cap Growth Fund |
As a shareholder of the Fund, you incur two types of costs: (1) transaction costs, including sales charges (loads) paid on purchase payments and redemption fees; and (2) ongoing costs, including investment advisory fees, administration fees, distribution fees and other Fund expenses. The examples below are intended to help you understand your ongoing costs (in dollars) of investing in the Fund and to compare these costs with the ongoing costs of investing in other mutual funds. Per SEC requirements, the examples assume that you had a $1,000 investment in the Class at the beginning of the reporting period, May 1, 2006 and continued to hold your shares at the end of the reporting period, October 31, 2006.
Actual Expenses
For each Class of the Fund in the table below, the first line provides information about actual account values and actual expenses. You may use the information in this line, together with the amount you invested, to estimate the expenses that you paid over the period. Simply divide your account value by $1,000 (for example, an $8,600 account value divided by $1,000 = 8.6), then multiply the result by the number in the first line of each Class under the heading entitled “Expenses Paid During Period” to estimate the expenses you paid on your account during the period.
Hypothetical Example for Comparison Purposes
The second line of each Class in the table below provides information about hypothetical account values and hypothetical expenses based on the Class’ actual expense ratio and an assumed rate of return of 5% per year before expenses, which is not the Class’ actual return. The hypothetical account values and expenses may not be used to estimate the actual ending account balance or expenses you paid for the period. You may use this information to compare the ongoing costs of investing in the Class of the Fund and other funds. To do so, compare this 5% hypothetical example with the 5% hypothetical examples that appear in the shareholder reports of the other funds.
Please note that the expenses shown in the table are meant to highlight your ongoing costs only and do not reflect any transaction costs, such as sales charges (loads) or redemption fees. Therefore, the second line for each Class in the table is useful in comparing ongoing costs only, and will not help you determine the relative total costs of owning different funds. In addition, if these transaction costs were included, your costs would have been higher. The examples also assume all dividends and distributions have been reinvested.
Schedule of Shareholder Expenses
Expense Analysis of a $1,000 Investment
(October 31, 2006)
| | | | | | | | | | | | | | |
| NorthPointe Small Cap Growth Fund | | | | | Beginning
Account Value,
5/1/06 | | Ending
Account Value,
10/31/06 | | Expenses Paid
During Period* | | Annualized
Expense Ratio* |
| Class A | | Actual | | | $ | 1,000 | | $ | 958 | | $ | 6.66 | | 1.35% |
| | | Hypothetical | 1 | | $ | 1,000 | | $ | 1,018 | | $ | 6.89 | | 1.35% |
| Class B | | Actual | | | $ | 1,000 | | $ | 954 | | $ | 10.34 | | 2.10% |
| | | Hypothetical | 1 | | $ | 1,000 | | $ | 1,014 | | $ | 10.72 | | 2.10% |
| Class C | | Actual | | | $ | 1,000 | | $ | 954 | | $ | 10.34 | | 2.10% |
| | | Hypothetical | 1 | | $ | 1,000 | | $ | 1,014 | | $ | 10.72 | | 2.10% |
| Class R | | Actual | | | $ | 1,000 | | $ | 958 | | $ | 7.50 | | 1.52% |
| | | Hypothetical | 1 | | $ | 1,000 | | $ | 1,017 | | $ | 7.76 | | 1.52% |
| Institutional Service Class | | Actual | | | $ | 1,000 | | $ | 960 | | $ | 5.33 | | 1.08% |
| | | Hypothetical | 1 | | $ | 1,000 | | $ | 1,020 | | $ | 5.51 | | 1.08% |
| Institutional Class | | Actual | | | $ | 1,000 | | $ | 960 | | $ | 5.44 | | 1.10% |
| | | Hypothetical | 1 | | $ | 1,000 | | $ | 1,019 | | $ | 5.61 | | 1.10% |
| * | Expenses are equal to the Fund’s annualized expense ratio multiplied by the average account value over the period multiplied by 184/365 (to reflect the one-half year period). The expense ratio presented represents a six-month, annualized ratio in accordance with SEC guidelines. |
| 1 | Represents the hypothetical 5% return before expenses. |
| | |
Portfolio Summary | | NorthPointe Small Cap Growth Fund |
The SEC adopted a requirement that Funds present their portfolio holdings in a table, chart or graph format in their annual and semiannual reports to shareholders, whether or not a statement of investments is utilized. The following tables, which present portfolio holdings as a percentage of net assets, are provided in compliance with this requirement.
| | |
| Asset Allocation | | |
| Common Stocks | | 96.6% |
| Repurchase Agreements | | 4.9% |
| Liabilities in excess of other assets | | –1.5% |
| | |
| | 100.0% |
| | |
| Top Industries | | |
| Semiconductors | | 10.1% |
| Transportation | | 9.6% |
| Business Services | | 6.2% |
| Computer Software & Services | | 5.4% |
| Distribution | | 5.0% |
| Financial Services | | 5.0% |
| Pharmaceuticals | | 4.2% |
| Retail | | 4.0% |
| Telecommunications | | 3.7% |
| Electronics | | 3.7% |
| Other Assets | | 43.1% |
| | |
| | 100.0% |
| | |
| Top Holdings* | | |
| Celadon Group, Inc. | | 2.0% |
| Kforce, Inc. | | 2.0% |
| Interwoven, Inc. | | 1.9% |
| InVentive Health, Inc. | | 1.8% |
| LKQ Corp. | | 1.8% |
| Penson Worldwide, Inc. | | 1.8% |
| World Acceptance Corp. | | 1.8% |
| Central European Distribution Corp. | | 1.7% |
| World Fuel Services Corp. | | 1.7% |
| Supertex, Inc. | | 1.7% |
| Other Assets | | 81.8% |
| | |
| | 100.0% |
| * | For purpose of listing top holdings, repurchase agreements are considered cash equivalents and are included as part of Other Assets. |
Statement of Investments
October 31, 2006
NorthPointe Small Cap Growth Fund
Common Stocks (96.6%)
| | | | | |
| | | Shares or
Principal Amount | | Value |
| | | | | |
Advertising (1.0%) | | | | | |
24/7 Real Media, Inc. (b) | | 66,200 | | $ | 655,380 |
| | | | | |
Aerospace & Defense (1.0%) | | | | | |
LMI Aerospace, Inc. (b) | | 32,977 | | | 669,103 |
| | | | | |
Banks (3.1%) | | | | | |
East West Bancorp, Inc. | | 19,100 | | | 697,341 |
Royal Bancshares of Pennsylvania, Inc., Class A | | 26,500 | | | 726,100 |
Vineyard National Bancorp Co. | | 25,000 | | | 546,000 |
| | | | | |
| | | | | 1,969,441 |
| | | | | |
Business Services (6.2%) | | | | | |
Barrett Business Services, Inc. (b) | | 27,400 | | | 585,264 |
InVentive Health, Inc. (b) | | 41,000 | | | 1,172,600 |
Kforce, Inc. (b) | | 85,900 | | | 1,285,923 |
Radiant Systems, Inc. (b) | | 84,800 | | | 933,648 |
| | | | | |
| | | | | 3,977,435 |
| | | | | |
Casino Services (2.3%) | | | | | |
Monarch Casino & Resort, Inc. (b) | | 36,500 | | | 809,570 |
Shuffle Master, Inc. (b) | | 23,000 | | | 643,540 |
| | | | | |
| | | | | 1,453,110 |
| | | | | |
Chemicals & Allied Products (0.6%) | | | |
American Vanguard Corp. | | 26,083 | | | 412,627 |
| | | | | |
Computer Software & Services (5.4%) | | | |
Electronics for Imaging, Inc. (b) | | 35,200 | | | 832,128 |
Interwoven, Inc. (b) | | 97,200 | | | 1,236,384 |
Smith Micro Software, Inc. (b) | | 32,900 | | | 559,629 |
Synchronoss Technologies, Inc. (b) | | 84,714 | | | 853,070 |
| | | | | |
| | | | | 3,481,211 |
| | | | | |
Consulting Services (1.7%) | | | |
CRA International, Inc. (b) | | 21,000 | | | 1,067,430 |
| | | | | |
Consumer Products (2.7%) | | | |
Central Garden & Pet Co. (b) | | 17,500 | | | 874,475 |
Jarden Corp. (b) | | 24,000 | | | 863,520 |
| | | | | |
| | | | | 1,737,995 |
| | | | | |
Distribution (5.0%) | | | |
Andersons, Inc. | | 26,700 | | | 959,865 |
| | | | | |
| | | Shares or
Principal Amount | | Value |
| | | | | |
Distribution (continued) | | | |
Central European Distribution Corp. (b) | | 44,400 | | $ | 1,126,872 |
LKQ Corp. (b) | | 50,100 | | | 1,159,314 |
| | | | | |
| | | | | 3,246,051 |
| | | | | |
Diversified Manufacturing (1.3%) | | | |
Actuant Corp. | | 16,800 | | | 862,512 |
| | | | | |
Electronics (3.7%) | | | | | |
Cyberoptics Corp. (b) | | 67,700 | | | 858,436 |
Novatel, Inc. — CA (b) | | 18,000 | | | 671,580 |
TTM Technologies, Inc. (b) | | 69,345 | | | 842,542 |
| | | | | |
| | | | | 2,372,558 |
| | | | | |
Energy (1.1%) | | | | | |
Verasun Energy Corp. (b) | | 38,600 | | | 709,854 |
| | | | | |
Financial Services (5.0%) | | | | | |
Medallion Financial Corp. | | 75,000 | | | 896,250 |
Penson Worldwide, Inc. (b) | | 47,325 | | | 1,150,944 |
World Acceptance Corp. (b) | | 22,900 | | | 1,144,771 |
| | | | | |
| | | | | 3,191,965 |
| | | | | |
Food (1.1%) | | | | | |
SunOpta, Inc. — CA (b) | | 71,600 | | | 705,260 |
| | | | | |
Healthcare (2.7%) | | | | | |
Healthspring, Inc. (b) | | 41,406 | | | 833,917 |
Option Care, Inc. | | 70,000 | | | 886,900 |
| | | | | |
| | | | | 1,720,817 |
| | | | | |
Industrial Products & Equipment (1.0%) | | | |
Brady Corp., Class A | | 17,700 | | | 654,900 |
| | | | | |
Insurance (3.0%) | | | | | |
Navigators Group, Inc. (The) (b) | | 19,700 | | | 927,279 |
ProAssurance Corp. (b) | | 20,000 | | | 974,000 |
| | | | | |
| | | | | 1,901,279 |
| | | | | |
Internet Content (1.2%) | | | | | |
TheStreet.com, Inc. | | 86,200 | | | 784,420 |
| | | | | |
Lasers (1.9%) | | | | | |
Cutera, Inc. (b) | | 10,398 | | | 296,239 |
Cymer, Inc. (b) | | 20,100 | | | 931,233 |
| | | | | |
| | | | | 1,227,472 |
| | | | | |
Common Stocks (continued)
| | | | | |
| | | Shares or
Principal Amount | | Value |
| | | | | |
Lottery Services (1.2%) | | | | | |
Scientific Games Corp. (b) | | 28,400 | | $ | 796,052 |
| | | | | |
Machinery & Equipment (3.6%) | | | |
Flow International Corp. (b) | | 55,000 | | | 647,900 |
Gehl Co. (b) | | 32,900 | | | 938,966 |
Lufkin Industries, Inc. | | 12,000 | | | 724,080 |
| | | | | |
| | | | | 2,310,946 |
| | | | | |
Medical Products (2.3%) | | | | | |
Angiodynamics, Inc. (b) | | 35,800 | | | 775,070 |
Bio Reference Laboratories, Inc. (b) | | 30,000 | | | 708,900 |
| | | | | |
| | | | | 1,483,970 |
| | | | | |
Multimedia (1.5%) | | | | | |
Sonic Solutions (b) | | 59,100 | | | 953,874 |
| | | | | |
Oil & Gas (3.0%) | | | | | |
TETRA Technologies, Inc. (b) | | 30,900 | | | 800,310 |
World Fuel Services Corp. | | 26,000 | | | 1,118,520 |
| | | | | |
| | | | | 1,918,830 |
| | | | | |
Pharmaceuticals (4.2%) | | | | | |
Noven Pharmaceuticals, Inc. (b) | | 34,700 | | | 770,687 |
Sciele Pharma, Inc. (b) | | 46,300 | | | 1,009,803 |
West Pharmaceutical Services, Inc. | | 22,000 | | | 924,880 |
| | | | | |
| | | | | 2,705,370 |
| | | | | |
Restaurants (1.5%) | | | | | |
Buffalo Wild Wings, Inc. (b) | | 19,000 | | | 982,300 |
| | | | | |
Retail (4.0%) | | | | | |
Crocs, Inc. (b) | | 25,200 | | | 998,424 |
Jos. A. Bank Clothiers, Inc. (b) | | 31,300 | | | 929,297 |
United Retail Group, Inc. (b) | | 35,000 | | | 628,950 |
| | | | | |
| | | | | 2,556,671 |
| | | | | |
Semiconductors (10.1%) | | | | | |
Diodes, Inc. (b) | | 23,400 | | | 1,030,536 |
ON Semiconductor Corp. (b) | | 161,500 | | | 1,004,530 |
Rudolph Technologies, Inc. (b) | | 44,000 | | | 777,040 |
Silicon Image, Inc. (b) | | 74,351 | | | 879,572 |
Silicon Motion Technology Corp. ADR — KY (b) | | 59,040 | | | 907,445 |
Supertex, Inc. (b) | | 25,100 | | | 1,114,691 |
Varian Semiconductor Equipment Associates, Inc. (b) | | 21,500 | | | 784,535 |
| | | | | |
| | | | | 6,498,349 |
| | | | | |
Telecommunications (3.7%) | | | | | |
J2 Global Communications, Inc. (b) | | 30,600 | | $ | 839,664 |
Radyne Corp. (b) | | 71,000 | | | 717,100 |
| | | | | | | |
| | | Shares or
Principal Amount | | Value | |
| | | | | | | |
Telecommunications (continued) | | | | | | | |
Sirenza Microdevices, Inc. (b) | | | 113,600 | | | 832,688 | |
| | | | | | | |
| | | | | | 2,389,452 | |
| | | | | | | |
Transportation (9.6%) | | | | �� | | | |
American Commercial Lines, Inc. (b) | | | 15,000 | | | 962,250 | |
Atlas Air Worldwide Holdings, Inc. (b) | | | 24,500 | | | 1,114,505 | |
Celadon Group, Inc. (b) | | | 69,400 | | | 1,301,944 | |
Genesee & Wyoming, Inc. Class A (b) | | | 38,800 | | | 1,089,892 | |
Greenbrier Cos., Inc. (The) | | | 26,200 | | | 982,500 | |
Marten Transport (b) | | | 42,800 | | | 728,028 | |
| | | | | | | |
| | | | | | 6,179,119 | |
| | | | | | | |
Veterinary Diagnostics (0.9%) | | | | | | | |
VCA Antech, Inc. (b) | | | 18,900 | | | 611,793 | |
| | | | | | | |
| | |
Total Common Stocks | | | | | | 62,187,546 | |
| | | | | | | |
|
Repurchase Agreements (4.9%) | |
| | |
CS First Boston, 5.17%, dated 10/31/06, due 11/01/06, repurchase price $1,623,054, collateralized by U.S. Government Agency Mortgages with a market value of $1,655,280 | | $ | 1,622,821 | | | 1,622,821 | |
| | |
Nomura Securities, 5.17%, dated 10/31/06, due 11/01/06, repurchase price $1,549,646, collateralized by U.S. Government Agency Mortgages with a market value of $1,580,414 | | | 1,549,423 | | | 1,549,423 | |
| | | | | | | |
| | |
Total Repurchase Agreements | | | | | | 3,172,244 | |
| | | | | | | |
| |
Total Investments
(Cost $58,462,033) (a) — 101.5% | | | 65,359,790 | |
| |
Liabilities in excess of other
assets — (1.5)% | | | (952,012 | ) |
| | | | | | | |
| | |
NET ASSETS — 100.0% | | | | | $ | 64,407,778 | |
| | | | | | | |
| | (a) | See notes to financial statements for tax unrealized appreciation (depreciation) of securities. |
| | (b) | Denotes a non-income producing security. |
| | ADR | American Depository Receipt |
See notes to financial statements.
NorthPointe Small Cap Value Fund
For the annual period ended Oct. 31, 2006, the NorthPointe Small Cap Value Fund (Institutional Class at NAV) returned 18.07% versus 19.98% for its benchmark, the Russell 2000® Index. For broader comparison, the average return for the Fund’s Lipper peer category of Small-Cap Core Funds (consisting of 689 funds as of Oct. 31, 2006) was 16.40%.
Small-capitalization stocks continued their dominance over large- and mid-cap stocks during the reporting period. The exception to that trend occurred during May through July, when stocks declined sharply and investors became concerned about worsening inflation and the possibility that the Federal Reserve Board might increase interest rates further than expected. As the summer progressed, however, inflation remained in check and the economy appeared to be slowing, providing the Federal Reserve with the flexibility it needed to hold rates steady at its August, September and October Federal Open Market Committee meetings. Adding to the positive backdrop late in the reporting period were a relatively benign hurricane season and a sharp decline in crude oil and natural gas prices.
During the reporting period, our stock selection for the Fund was the weakest in the financials and information technology sectors. One of the Fund’s financials sector holdings, Scottish Re Group Ltd., a provider of reinsurance services, was affected by fears of insolvency; this surprise led to a dramatic decline in the company’s stock. We sold the Fund’s position in Scottish Re because we were unable to confirm the company’s ability to remain solvent. Information technology sector Fund holding SafeNet, Inc. faced problems with its business plan execution that ultimately led to the departure of the firm’s chief financial officer and an abandoned acquisition; this provider of infrastructure software products also was faced with a stock option expense investigation. In light of these developments, we eliminated the Fund’s position in SafeNet.
Conversely, our stock selection for the Fund was strongest in the industrials and materials sectors. Industrials name Robbins & Myers, Inc. and materials name Allegheny Technologies Inc. were particularly strong performers for the Fund. Robbins & Myers, a manufacturer of pumps and processing equipment, benefited from strong oil and gas and chemical end markets, while vastly improving the pharmaceutical segment of its business. This relatively small market cap company increased its visibility with investors by delivering strong quarterly earnings that exceeded Wall Street expectations. Allegheny Technologies manufactures specialty metals, and the company’s earnings benefited from a strong global commodity environment.
The market currently is dealing with many uncertainties, including the direction of interest rates, the future of economic growth and the sustainability of consumer spending. In response to such an environment, we have positioned the Fund slightly more defensively, reflected by our overweight positions in the health-care and telecommunications sectors. We are optimistic about the overall market, however, because we continue to find individual companies with strong fundamental outlooks across all sectors. The steep decline in the prices of energy and raw materials is likely to temper any decline in economic growth. In addition, the combination of a moderating economy and attractive valuations is likely to further fuel merger-and-acquisition activity, providing a solid underpinning for equity valuations.
Our objective remains the same—to buy, at attractive valuations, well-positioned companies in which we see tangible evidence of fundamental improvement. As 2007 unfolds, we believe that: 1) investors will continue to pay attention to the fundamentals that we think are important for long-term investing success; and 2) our investment discipline and style can provide the potential for favorable results.
Portfolio Managers:
Jeffrey Petherick, CFA and Mary Champagne, CFA
| | |
Fund Performance | | NorthPointe Small Cap Value Fund |
Average Annual Total Return
(For periods ended October 31, 2006)
| | | | | | |
| | | 1 Yr. | | 5 Yr. | | Inception1 |
| Institutional Class | | 18.07% | | 14.70% | | 13.54% |
There are no sales charges on the shares of the NorthPointe Small Cap Value Fund.
| 1 | Fund commenced operations on June 29, 2000. |
Performance of a $10,000 Investment
Investment return and principal value will fluctuate, and when redeemed, shares may be worth more or less than original cost. Past performance is no guarantee of future results and does not reflect the deduction of taxes that a shareholder would pay on fund distributions or the redemption of fund shares. Investing in mutual funds involves market risk, including loss of principal. Performance returns assume the reinvestment of all distributions.
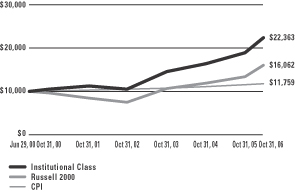
Comparative performance of $10,000 invested in the Institutional Class of the NorthPointe Small Cap Value Fund, Russell 2000 Index (Russell 2000)(a), and the Consumer Price Index (CPI)(b) since inception. Unlike the Fund, the returns for these unmanaged indexes do not reflect any fees, expenses, or sales charges. Investors cannot invest directly in market indexes.
| (a) | The Russell 2000 is an unmanaged index of approximately 2,000 companies with small market capitalizations relative to the market capitalizations of other U.S. companies. |
| (b) | The CPI represents changes in prices of a basket of goods and services purchased for consumption by urban households. |
| | |
Shareholder Expense Example | | NorthPointe Small Cap Value Fund |
As a shareholder of the Fund, you incur two types of costs: (1) transaction costs, including sales charges (loads) paid on purchase payments and redemption fees; and (2) ongoing costs, including investment advisory fees, administration fees, distribution fees and other Fund expenses. The examples below are intended to help you understand your ongoing costs (in dollars) of investing in the Fund and to compare these costs with the ongoing costs of investing in other mutual funds. Per SEC requirements, the examples assume that you had a $1,000 investment in the Class at the beginning of the reporting period, May 1, 2006 and continued to hold your shares at the end of the reporting period, October 31, 2006.
Actual Expenses
For each Class of the Fund in the table below, the first line provides information about actual account values and actual expenses. You may use the information in this line, together with the amount you invested, to estimate the expenses that you paid over the period. Simply divide your account value by $1,000 (for example, an $8,600 account value divided by $1,000 = 8.6), then multiply the result by the number in the first line of each Class under the heading entitled “Expenses Paid During Period” to estimate the expenses you paid on your account during the period.
Hypothetical Example for Comparison Purposes
The second line of each Class in the table below provides information about hypothetical account values and hypothetical expenses based on the Class’ actual expense ratio and an assumed rate of return of 5% per year before expenses, which is not the Class’ actual return. The hypothetical account values and expenses may not be used to estimate the actual ending account balance or expenses you paid for the period. You may use this information to compare the ongoing costs of investing in the Class of the Fund and other funds. To do so, compare this 5% hypothetical example with the 5% hypothetical examples that appear in the shareholder reports of the other funds.
Please note that the expenses shown in the table are meant to highlight your ongoing costs only and do not reflect any transaction costs, such as sales charges (loads) or redemption fees. Therefore, the second line for each Class in the table is useful in comparing ongoing costs only, and will not help you determine the relative total costs of owning different funds. In addition, if these transaction costs were included, your costs would have been higher. The examples also assume all dividends and distributions have been reinvested.
Schedule of Shareholder Expenses
Expense Analysis of a $1,000 Investment
(October 31, 2006)
| | | | | | | | | | | | | | |
| NorthPointe Small Cap Value Fund | | | | | Beginning
Account Value,
5/1/06 | | Ending
Account Value,
10/31/06 | | Expenses Paid
During Period* | | Annualized
Expense Ratio* |
| Institutional Class | | Actual | | | $ | 1,000.00 | | $ | 991.50 | | $ | 5.02 | | 1.00% |
| | | Hypothetical | 1 | | $ | 1,000.00 | | $ | 1,019.96 | | $ | 5.10 | | 1.00% |
| * | Expenses are equal to the Fund’s annualized expense ratio multiplied by the average account value over the period multiplied by 184/365 (to reflect the one-half year period). The expense ratio presented represents a six-month, annualized ratio in accordance with SEC guidelines. |
| 1 | Represents the hypothetical 5% return before expenses. |
| | |
Portfolio Summary | | NorthPointe Small Cap Value Fund |
October 31, 2006
The SEC adopted a requirement that Funds present their portfolio holdings in a table, chart or graph format in their annual and semiannual reports to shareholders, whether or not a statement of investments is utilized. The following tables, which present portfolio holdings as a percentage of net assets, are provided in compliance with this requirement.
| | |
| Asset Allocation | | |
| Common Stocks | | 95.4% |
| Repurchase Agreements | | 3.8% |
| Other assets in excess of liabilities | | 0.8% |
| | |
| | 100.0% |
| | |
| Top Industries | | |
| Real Estate | | 10.8% |
| Commercial Banks | | 8.8% |
| Telecommunications | | 7.3% |
| Health Care Providers & Services | | 5.0% |
| Insurance | | 3.8% |
| Chemicals | | 3.7% |
| Computers & Peripherals | | 3.7% |
| Machinery | | 3.7% |
| Specialty Retail | | 3.3% |
| Internet Software & Services | | 2.9% |
| Other Assets | | 47.0% |
| | |
| | 100.0% |
| | |
| Top Holdings* | | |
| Trammell Crow Co. | | 1.5% |
| Advanta Corp., Class B | | 1.3% |
| BankUnited Financial Corp., Class A | | 1.3% |
| Triad Guaranty, Inc. | | 1.3% |
| Banner Corp. | | 1.3% |
| SVB Financial Group | | 1.2% |
| InVentive Health, Inc. | | 1.2% |
| Per-Se Technologies, Inc. | | 1.2% |
| Perrigo Co. | | 1.2% |
| Colonial BancGroup, Inc. | | 1.2% |
| Other Assets | | 87.3% |
| | |
| | 100.0% |
| * | For purpose of listing top holdings, repurchase agreements are considered cash equivalents and are included as part of Other Assets. |
Statement of Investments
October 31, 2006
NorthPointe Small Cap Value Fund
Common Stocks (95.4%)
| | | | | |
| | | Shares or
Principal Amount | | Value |
| | | | | |
Aerospace & Defense (0.6%) | | | | | |
United Industrial, Corp. | | 4,600 | | $ | 207,046 |
| | | | | |
Agricultural Operations (0.8%) | | | | | |
The Andersons, Inc. | | 7,500 | | | 269,625 |
| | | | | |
Airlines (0.7%) | | | | | |
Continental Airlines, Inc. (b) | | 6,300 | | | 232,344 |
| | | | | |
Chemicals (3.7%) | | | | | |
Airgas, Inc. | | 4,700 | | | 177,707 |
Hercules, Inc. (b) | | 14,900 | | | 271,180 |
Minerals Technologies, Inc. | | 3,500 | | | 193,060 |
RPM International, Inc. | | 12,800 | | | 245,120 |
Sensient Technologies Corp. | | 8,200 | | | 189,010 |
Spartech Corp. | | 4,700 | | | 128,780 |
| | | | | |
| | | | | 1,204,857 |
| | | | | |
Coal (0.8%) | | | | | |
Foundation Coal Holdings, Inc. | | 7,400 | | | 271,654 |
| | | | | |
Commercial Banks (8.8%) | | | | | |
BankUnited Financial Corp., Class A | | 15,700 | | | 423,429 |
Banner Corp. | | 9,300 | | | 404,178 |
Colonial BancGroup, Inc. | | 15,800 | | | 376,672 |
First Indiana, Corp. | | 12,800 | | | 326,656 |
First Midwest Bancgroup, Inc. | | 6,740 | | | 256,322 |
Greene County Bancshares, Inc. | | 6,500 | | | 245,050 |
Security Bank Corp. | | 15,430 | | | 373,869 |
SVB Financial Group (b) | | 8,700 | | | 400,374 |
| | | | | |
| | | | | 2,806,550 |
| | | | | |
Commercial Services & Supplies (0.8%) | | | |
Tetra Tech, Inc. (b) | | 13,400 | | | 243,612 |
| | | | | |
Computers & Peripherals (3.7%) | | | |
F5 Networks, Inc. (b) | | 2,900 | | | 191,951 |
Hutchinson Technology, Inc. (b) | | 9,500 | | | 219,925 |
Komag, Inc. (b) | | 8,600 | | | 328,950 |
Sonic Solutions (b) | | 14,600 | | | 235,644 |
THQ, Inc. (b) | | 7,500 | | | 225,525 |
| | | | | |
| | | | | 1,201,995 |
| | | | | |
Consumer Finance (1.3%) | | | | | |
Advanta Corp., Class B | | 10,993 | | | 431,365 |
| | | | | |
| | | | | |
| | | Shares or
Principal Amount | | Value |
| | | | | |
Consumer Products (0.7%) | | | | | |
Tupperware Corp. | | 10,500 | | $ | 222,915 |
| | | | | |
Containers & Packaging (1.7%) | | | |
Caraustar Industries, Inc. (b) | | 24,600 | | | 266,418 |
Silgan Holdings, Inc. | | 6,510 | | | 269,319 |
| | | | | |
| | | | | 535,737 |
| | | | | |
Electric Utilities (2.9%) | | | | | |
Allete, Inc. | | 8,300 | | | 374,330 |
Cleco Corp. | | 11,800 | | | 303,260 |
IDACORP, Inc. | | 6,700 | | | 264,181 |
| | | | | |
| | | | | 941,771 |
| | | | | |
Electronic Equipment & Instruments (0.5%) | | | |
Kemet Corp. (b) | | 20,600 | | | 151,410 |
| | | | | |
Energy Equipment & Services (2.3%) | | | |
Hanover Compressor Co. (b) | | 19,500 | | | 361,140 |
Hornbeck Offshore Services, Inc. (b) | | 5,829 | | | 210,369 |
Power-One, Inc. (b) | | 27,200 | | | 186,048 |
| | | | | |
| | | | | 757,557 |
| | | | | |
Filtration & Separation Products (1.1%) | | | |
CLARCOR, Inc. | | 10,800 | | | 351,864 |
| | | | | |
Food & Staples Retailing (0.8%) | | | |
Casey’s General Stores, Inc. | | 11,000 | | | 266,970 |
| | | | | |
Food Products (0.3%) | | | | | |
Reddy Ice Holdings, Inc. | | 4,120 | | | 98,880 |
| | | | | |
Gas Utilities (0.7%) | | | | | |
South Jersey Industries, Inc. | | 7,100 | | | 219,603 |
| | | | | |
Health Care Providers & Services (5.0%) | | | |
AMN Healthcare Services, Inc. (b) | | 13,809 | | | 349,230 |
Chemed Corp. | | 5,900 | | | 209,391 |
IntraLase Corp. (b) | | 13,300 | | | 261,478 |
InVentive Health, Inc. (b) | | 13,900 | | | 397,540 |
Per-Se Technologies, Inc. (b) | | 15,600 | | | 381,888 |
| | | | | |
| | | | | 1,599,527 |
| | | | | |
Hotels Restaurants & Leisure (2.9%) | | | |
CEC Entertainment, Inc. (b) | | 4,100 | | | 141,327 |
Denny’s Corp. (b) | | 41,800 | | | 177,650 |
Common Stocks (continued)
| | | | | |
| | | Shares or
Principal Amount | | Value |
| | | | | |
Hotels Restaurants & Leisure (continued) | | | |
Jack in the Box, Inc. (b) | | 2,400 | | $ | 134,664 |
Rare Hospitality International, Inc. (b) | | 8,100 | | | 255,231 |
Vail Resorts, Inc. (b) | | 5,700 | | | 220,305 |
| | | | | |
| | | | | 929,177 |
| | | | | |
Household Durables (0.5%) | | | | | |
Jarden Corp. (b) | | 4,850 | | | 174,503 |
| | | | | |
Insurance (3.8%) | | | | | |
National Financial Partners Corp. | | 9,500 | | | 374,299 |
Seabright Insurance Holdings, Inc. (b) | | 16,570 | | | 271,914 |
The Hanover Insurance Group, Inc. | | 7,300 | | | 331,055 |
Tower Group, Inc. | | 7,330 | | | 259,116 |
| | | | | |
| | | | | 1,236,384 |
| | | | | |
Internet Software & Services (2.9%) | | | |
Internet Capital Group, Inc. (b) | | 27,960 | | | 293,021 |
Jupitermedia Corp. (b) | | 33,100 | | | 290,949 |
ValueClick, Inc. (b) | | 10,000 | | | 188,000 |
Website Pros, Inc. (b) | | 16,400 | | | 176,136 |
| | | | | |
| | | | | 948,106 |
| | | | | |
Leisure Equipment & Products (2.4%) | | | |
K2, Inc. (b) | | 14,700 | | | 200,802 |
MarineMax, Inc. (b) | | 7,900 | | | 225,229 |
RC2 Corp. (b) | | 7,700 | | | 347,886 |
| | | | | |
| | | | | 773,917 |
| | | | | |
Life Sciences Tools & Services (1.1%) | | | |
Varian, Inc. (b) | | 7,700 | | | 361,053 |
| | | | | |
Machinery (3.7%) | | | | | |
ESCO Technologies, Inc. (b) | | 8,100 | | | 351,702 |
Federal Signal, Corp. | | 9,700 | | | 148,022 |
Gardner Denver, Inc. (b) | | 3,900 | | | 132,561 |
Robbins & Myers, Inc. | | 8,900 | | | 342,561 |
Trinity Industries, Inc. | | 5,900 | | | 212,754 |
| | | | | |
| | | | | 1,187,600 |
| | | | | |
Media (1.7%) | | | | | |
Gemstar-TV Guide International, Inc. (b) | | 83,000 | | | 288,840 |
| | | | | |
| | | Shares or
Principal Amount | | Value |
| | | | | |
Media (continued) | | | | | |
Lions Gate Entertainment Corp. — CA (b) | | 23,700 | | $ | 240,081 |
Salem Communications Corp. | | 1,570 | | | 20,865 |
| | | | | |
| | | | | 549,786 |
| | | | | |
Medical (0.7%) | | | | | |
Invitrogen Corp. (b) | | 3,800 | | | 220,438 |
| | | | | |
Metals & Mining (1.3%) | | | | | |
Royal Gold, Inc. | | 5,300 | | | 156,032 |
Stillwater Mining Co. (b) | | 24,200 | | | 260,150 |
| | | | | |
| | | | | 416,182 |
| | | | | |
Motion Picture & Video Production (0.2%) | | | |
Dreamworks Animation SKG, Inc. (b) | | 2,000 | | | 52,900 |
| | | | | |
Office Supplies (0.6%) | | | | | |
Acco Brands Corp. (b) | | 8,100 | | | 196,830 |
| | | | | |
Oil & Gas (1.9%) | | | | | |
CNX Gas Corp. (b) | | 8,100 | | | 211,815 |
Warren Resources, Inc. (b) | | 11,000 | | | 129,690 |
WGL Holdings, Inc. | | 8,600 | | | 279,070 |
| | | | | |
| | | | | 620,575 |
| | | | | |
Pharmaceuticals (1.9%) | | | | | |
K-V Pharmaceutical Co. (b) | | 10,900 | | | 243,288 |
Perrigo Co. | | 21,100 | | | 377,479 |
| | | | | |
| | | | | 620,767 |
| | | | | |
Production Technology Equipment (0.6%) | | | |
Cymer, Inc. (b) | | 4,200 | | | 194,586 |
| | | | | |
Real Estate (10.8%) | | | | | |
American Campus Communities, Inc. | | 11,400 | | | 303,582 |
Annaly Mortgage Management, Inc. | | 28,150 | | | 369,328 |
BioMed Realty Trust, Inc. | | 7,980 | | | 257,195 |
Eagle Hospitality Properties Trust | | 21,440 | | | 201,107 |
First Industrial Realty Trust | | 5,200 | | | 239,044 |
First Potomac Realty Trust | | 8,300 | | | 256,802 |
JER Investors Trust, Inc. | | 20,700 | | | 371,772 |
KKR Financial Corp. | | 9,800 | | | 262,934 |
Medical Properties Trust, Inc. | | 16,390 | | | 222,576 |
Statement of Investments (Continued)
October 31, 2006
NorthPointe Small Cap Value Fund (Continued)
Common Stocks (continued)
| | | | | |
| | | Shares or
Principal Amount | | Value |
| | | | | |
Real Estate (continued) | | | | | |
Newcastle Investment Corp. | | 6,600 | | $ | 195,822 |
Trammell Crow Co. (b) | | 9,731 | | | 474,387 |
Winston Hotels, Inc. | | 23,500 | | | 284,350 |
| | | | | |
| | | | | 3,438,899 |
| | | | | |
Retail (2.7%) | | | | | |
New York & Co., Inc. (b) | | 15,400 | | | 200,200 |
Payless Shoesource, Inc. (b) | | 8,700 | | | 232,725 |
Phillips-Van Heusen Corp. | | 6,100 | | | 279,136 |
United Retail Group, Inc. (b) | | 9,200 | | | 165,324 |
| | | | | |
| | | | | 877,385 |
| | | | | |
Semiconductors & Semiconductor Equipment (1.2%) | | | |
Cirrus Logic, Inc. (b) | | 29,200 | | | 206,152 |
Photronics, Inc. (b) | | 12,000 | | | 167,880 |
| | | | | |
| | | | | 374,032 |
| | | | | |
Software (1.1%) | | | | | |
Intergraph Corp. (b) | | 4,300 | | | 187,867 |
Parametric Technology Corp. (b) | | 8,520 | | | 166,481 |
| | | | | |
| | | | | 354,348 |
| | | | | |
Specialty Retail (3.3%) | | | | | |
Aeropostale, Inc. (b) | | 5,500 | | | 161,205 |
Hot Topic, Inc. (b) | | 9,900 | | | 100,089 |
Jos. A. Bank Clothiers, Inc. (b) | | 6,400 | | | 190,016 |
Sonic Automotive, Inc. | | 10,800 | | | 284,040 |
Tween Brands, Inc. (b) | | 3,900 | | | 163,098 |
United Auto Group, Inc. | | 7,700 | | | 176,946 |
| | | | | |
| | | | | 1,075,394 |
| | | | | |
Telecommunications (7.3%) | | | | | |
3Com Corp. (b) | | 37,900 | | | 184,194 |
Arris Group, Inc. (b) | | 20,000 | | | 268,000 |
C-COR, Inc. (b) | | 37,000 | | | 369,630 |
Cogent Communications Group, Inc. (b) | | 21,800 | | | 308,688 |
Covad Communications Group, Inc. (b) | | 150,000 | | | 199,500 |
Dobson Communications Corp. (b) | | 35,700 | | | 277,032 |
Finisar Corp. (b) | | 97,000 | | | 337,560 |
Iowa Telecommunications Services, Inc. | | 9,500 | | | 189,430 |
Mastec, Inc. (b) | | 21,200 | | | 232,140 |
| | | | | |
| | | | | 2,366,174 |
| | | | | |
Thrifts & Mortgage Finance (1.9%) | | | |
First Place Financial Corp. | | 8,796 | | $ | 204,859 |
Triad Guaranty, Inc. (b) | | 7,900 | | | 406,929 |
| | | | | |
| | | | | 611,788 |
| | | | | |
| | | | | | |
| | | Shares or
Principal Amount | | Value |
| | | | | | |
Trading Companies & Distributors (0.7%) | | | |
Interline Brands, Inc. (b) | | | 9,500 | | | 227,430 |
| | | | | | |
Transportation (0.9%) | | | | | | |
American Commercial Lines, Inc. (b) | | | 4,500 | | | 288,675 |
| | | | | | |
Waste Disposal (1.1%) | | | | | | |
Waste Connections, Inc. (b) | | | 8,500 | | | 345,865 |
| | | | | | |
Wire & Cable Products (0.6%) | | | | | | |
General Cable Corp. (b) | | | 4,900 | | | 184,240 |
| | | | | | |
Wireless Equipment (0.4%) | | | | | | |
CalAmp Corp. (b) | | | 17,500 | | | 116,374 |
| | | | | | |
| | |
Total Common Stocks | | | | | | 30,758,690 |
| | | | | | |
|
Repurchase Agreements (3.8%) |
| | |
CS First Boston, 5.17%, dated 10/31/06, due 11/01/06, repurchase price $632,903, collateralized by U.S. Government Agency Mortgages with a market value of $645,470 | | $ | 632,812 | | | 632,812 |
| | |
Nomura Securities, 5.17%, dated 10/31/06, due 11/01/06, repurchase price $604,278, collateralized by U.S. Government Agency Mortgages with a market value of $616,276 | | | 604,191 | | | 604,191 |
| | | | | | |
| |
Total Repurchase Agreements | | | 1,237,003 |
| | | | | | |
| |
Total Investments
(Cost $29,718,635) (a) — 99.2% | | | 31,995,693 |
| |
Other assets in excess of
liabilities — 0.8% | | | 271,328 |
| | | | | | |
| |
NET ASSETS — 100.0% | | $ | 32,267,021 |
| | | | | | |
| | (a) | See notes to financial statements for tax unrealized appreciation (depreciation) of securities. |
| | (b) | Denotes a non-income producing security. |
See notes to financial statements.
Statements of Assets and Liabilities
October 31, 2006
| | | | | | | | |
| | | NorthPointe
Small Cap Growth
Fund | | NorthPointe
Small Cap Value
Fund |
Assets: | | | | | | | | |
Investments, at value (cost $55,289,789 and $28,481,632; respectively) | | $ | 62,187,546 | | $ | 30,758,690 | | |
Repurchase agreements, at cost and value | | | 3,172,244 | | | 1,237,003 | | |
| | | | | | | | |
Total Investments | | | 65,359,790 | | | 31,995,693 | | |
| | | | | | | | |
Interest and dividends receivable | | | 17,975 | | | 18,443 | | |
Receivable for investments sold | | | 737,933 | | | 932,728 | | |
Prepaid expenses | | | 353 | | | 220 | | |
| | | | | | | | |
Total Assets | | | 66,116,051 | | | 32,947,084 | | |
| | | | | | | | |
| | | |
Liabilities: | | | | | | | | |
Payable to custodian | | | — | | | 7,500 | | |
Payable for investments purchased | | | 1,642,991 | | | 641,370 | | |
Accrued expenses and other payables | | | | | | | | |
Investment advisory fees | | | 46,858 | | | 20,166 | | |
Fund administration and transfer agent fees | | | 6,965 | | | 3,206 | | |
Distribution fees | | | 7 | | | — | | |
Administrative servicing fees | | | 11 | | | — | | |
Trustee fees | | | 7 | | | 4 | | |
Compliance program fees (Note 3) | | | 412 | | | 165 | | |
Other | | | 11,022 | | | 7,652 | | |
| | | | | | | | |
Total Liabilities | | | 1,708,273 | | | 680,063 | | |
| | | | | | | | |
Net Assets | | $ | 64,407,778 | | $ | 32,267,021 | | |
| | | | | | | | |
| | | |
Represented by: | | | | | | | | |
Capital | | $ | 52,331,497 | | $ | 26,120,452 | | |
Accumulated net investment income (loss) | | | — | | | — | | |
Accumulated net realized gains (losses) from investment transactions | | | 5,178,524 | | | 3,869,511 | | |
Net unrealized appreciation (depreciation) on investments | | | 6,897,757 | | | 2,277,058 | | |
| | | | | | | | |
Net Assets | | $ | 64,407,778 | | $ | 32,267,021 | | |
| | | | | | | | |
| | | |
Net Assets: | | | | | | | | |
Class A Shares | | $ | 18,969 | | $ | — | | |
Class B Shares | | | 1,392 | | | — | | |
Class C Shares | | | 1,392 | | | — | | |
Class R Shares | | | 1,407 | | | — | | |
Institutional Service Class Shares | | | 1,420 | | | — | | |
Institutional Class Shares | | | 64,383,198 | | | 32,267,021 | | |
| | | | | | | | |
Total | | $ | 64,407,778 | | $ | 32,267,021 | | |
| | | | | | | | |
| | | | | | | | |
| | | | | | | | |
| | | | | | | | |
| | | | | | | | |
| | | | | | | | | |
See notes to financial statements.
Statements of Assets and Liabilities (Continued)
October 31, 2006
| | | | | | | | | |
| | | NorthPointe
Small Cap Growth
Fund | | | NorthPointe
Small Cap Value
Fund |
Shares outstanding (unlimited number of shares authorized): | | | | | | | | | |
Class A Shares | | | 1,463 | | | | — | | |
Class B Shares | | | 109 | | | | — | | |
Class C Shares | | | 109 | | | | — | | |
Class R Shares | | | 109 | | | | — | | |
Institutional Service Class Shares | | | 109 | | | | — | | |
Institutional Class Shares | | | 4,931,441 | | | | 2,754,088 | | |
| | | | | | | | | |
Total | | | 4,933,340 | | | | 2,754,088 | | |
| | | | | | | | | |
| | | |
Net asset value and redemption price per share (net assets by class divided by shares outstanding by class, respectively): | | | | | | | | | |
Class A Shares | | $ | 12.96 | | | $ | — | | |
Class B Shares (a) | | $ | 12.77 | | | $ | — | | |
Class C Shares (b) | | $ | 12.77 | | | $ | — | | |
Class R Shares | | $ | 12.91 | | | $ | — | | |
Institutional Service Class Shares | | $ | 13.04 | (c) | | $ | — | | |
Institutional Class Shares | | $ | 13.06 | | | $ | 11.72 | | |
| | | |
Maximum offering price per share (100%/(100%-maximum sales charge) of net asset value adjusted to the nearest cent): | | | | | | | | | |
Class A Shares | | $ | 13.75 | | | $ | — | | |
| | | | | | | | | |
Maximum Sales Charge — Class A Shares | | | 5.75 | % | | | | | |
| | | | | | | | | |
| | | | | | | | | |
| | | | | | | | | |
| | | | | | | | | |
| | | | | | | | | |
| | | | | | | | | |
| | | | | | | | | |
| | | | | | | | | |
| | | | | | | | | |
| | | | | | | | | |
| | | | | | | | | |
| | | | | | | | | |
| | | | | | | | | |
| | | | | | | | | |
| | | | | | | | | |
| | | | | | | | | |
| | | | | | | | | |
| | | | | | | | | |
| | | | | | | | | |
| | | | | | | | | | |
| (a) | For Class B shares, the redemption price per share varies by the length of time shares are held. |
| (b) | For Class C Shares, the redemption price per share is reduced by 1.00% for shares held less than one year. |
| (c) | The NAV reported above represents the traded NAV at October 31, 2006. Due to the financial statement rounding of class assets and class shares above, the NAV results in a different NAV than the traded NAV. |
See notes to financial statements.
Statements of Operations
For the Year Ended October 31, 2006
| | | | | | | | | | |
| | | NorthPointe
Small Cap Growth
Fund | | | NorthPointe
Small Cap Value
Fund |
INVESTMENT INCOME: | | | | | | | | | | |
Interest income | | $ | 85,484 | | | $ | 60,039 | | | |
Dividend income | | | 122,375 | | | | 331,429 | | | |
Income from securities lending | | | 231 | | | | 4 | | | |
| | | | | | | | | | |
Total Income | | | 208,090 | | | | 391,472 | | | |
| | | | | | | | | | |
| | | |
Expenses: | | | | | | | | | | |
Investment advisory fees | | | 480,852 | | | | 233,282 | | | |
Fund administration and transfer agent fees | | | 49,479 | | | | 29,495 | | | |
Distribution fees Class A | | | 35 | | | | — | | | |
Distribution fees Class B | | | 14 | | | | — | | | |
Distribution fees Class C | | | 14 | | | | — | | | |
Distribution fees Class R | | | 4 | | | | — | | | |
Administrative servicing fees Class A | | | 6 | | | | — | | | |
Administrative servicing fees Class R | | | 1 | | | | — | | | |
Administrative servicing fees Institutional Service Class | | | 1 | | | | — | | | |
Registration and filing fees | | | 23,876 | | | | — | | | |
Trustee fees | | | 1,627 | | | | 921 | | | |
Compliance program fees (Note 3) | | | 863 | | | | 403 | | | |
Other | | | 28,507 | | | | 28,232 | | | |
| | | | | | | | | | |
Total expenses before reimbursed expenses | | | 585,279 | | | | 292,333 | | | |
Earnings credit (Note 5) | | | (304 | ) | | | (130 | ) | | |
Expenses reimbursed | | | (28,148 | ) | | | (17,755 | ) | | |
Expenses voluntarily reduced by Administrator | | | (3 | ) | | | — | | | |
| | | | | | | | | | |
Net Expenses | | | 556,824 | | | | 274,448 | | | |
| | | | | | | | | | |
Net Investment Income (Loss) | | | (348,734 | ) | | | 117,024 | | | |
| | | | | | | | | | |
| | | |
REALIZED/UNREALIZED GAINS (LOSSES) FROM INVESTMENTS: | | | | | | | | | | |
Realized gains (losses) on investment transactions | | | 5,727,129 | | | | 3,959,515 | | | |
Net change in unrealized appreciation/depreciation on investments | | | 4,266,207 | | | | 584,739 | | | |
| | | | | | | | | | |
Net realized/unrealized gains (losses) on investments | | | 9,993,336 | | | | 4,544,254 | | | |
| | | | | | | | | | |
CHANGE IN NET ASSETS RESULTING FROM OPERATIONS | | $ | 9,644,602 | | | $ | 4,661,278 | | | |
| | | | | | | | | | |
| | | |
| | | | | | | | | | | |
See notes to financial statements.
Statements of Changes in Net Assets
| | | | | | | | | | | | | | | | | | |
| | | NorthPointe Small Cap Growth Fund | | | NorthPointe Small Cap Value Fund |
| | | Year Ended
October 31, 2006 | | | Year Ended
October 31, 2005 | | | Year Ended
October 31, 2006 | | | Year Ended
October 31, 2005 |
FROM INVESTMENT ACTIVITIES: | | | | | | | | | | | | | | | | | | |
Operations: | | | | | | | | | | | | | | | | | | |
Net investment income (loss) | | $ | (348,734 | ) | | $ | (406,466 | ) | | $ | 117,024 | | | $ | 173,761 | | | |
Net realized gains (losses) on investment transactions | | | 5,727,129 | | | | 3,804,514 | | | | 3,959,515 | | | | 5,765,598 | | | |
Net change in unrealized appreciation/depreciation on investments | | | 4,266,207 | | | | 2,824,368 | | | | 584,739 | | | | (1,593,752 | ) | | |
| | | | | | | | | | | | | | | | | | |
Change in net assets resulting from operations | | | 9,644,602 | | | | 6,222,416 | | | | 4,661,278 | | | | 4,345,607 | | | |
| | | | | | | | | | | | | | | | | | |
| | | | | |
Distributions to Class A Shareholders from: | | | | | | | | | | | | | | | | | | |
Net realized gains on investments | | | (101 | ) | | | — | | | | — | | | | — | | | |
| | | | | |
Distributions to Class B Shareholders from: | | | | | | | | | | | | | | | | | | |
Net realized gains on investments | | | (101 | ) | | | — | | | | — | | | | — | | | |
| | | | | |
Distributions to Class C Shareholders from: | | | | | | | | | | | | | | | | | | |
Net realized gains on investments | | | (101 | ) | | | — | | | | — | | | | — | | | |
| | | | | |
Distributions to Class R Shareholders from: | | | | | | | | | | | | | | | | | | |
Net realized gains on investments | | | (101 | ) | | | — | | | | — | | | | — | | | |
| | | | | |
Distributions to Institutional Service Class Shareholders from: | | | | | | | | | | | | | | | | | | |
Net realized gains on investments | | | (101 | ) | | | — | | | | — | | | | — | | | |
| | | | | |
Distributions to Institutional Class Shareholders from: | | | | | | | | | | | | | | | | | | |
Net investment income | | | — | | | | — | | | | (126,326 | ) | | | (177,262 | ) | | |
Net realized gains on investments | | | (3,594,886 | ) | | | — | | | | (5,340,226 | ) | | | (7,680,667 | ) | | |
| | | | | | | | | | | | | | | | | | |
Change in net assets from shareholder distributions | | | (3,595,391 | ) | | | — | | | | (5,466,552 | ) | | | (7,857,929 | ) | | |
| | | | | | | | | | | | | | | | | | |
Change in net assets from capital transactions | | | 17,279,218 | | | | (14,941,130 | ) | | | 8,003,425 | | | | (3,575,161 | ) | | |
| | | | | | | | | | | | | | | | | | |
Change in net assets | | | 23,328,429 | | | | (8,718,714 | ) | | | 7,198,151 | | | | (7,087,483 | ) | | |
| | | | | |
Net Assets: | | | | | | | | | | | | | | | | | | |
Beginning of period | | | 41,079,349 | | | | 49,798,063 | | | | 25,068,870 | | | | 32,156,353 | | | |
| | | | | | | | | | | | | | | | | | |
End of period | | $ | 64,407,778 | | | $ | 41,079,349 | | | $ | 32,267,021 | | | $ | 25,068,870 | | | |
| | | | | | | | | | | | | | | | | | |
Accumulated net investment income (loss) at end of period | | $ | — | | | $ | — | | | $ | — | | | $ | — | | | |
| | | | | | | | | | | | | | | | | | |
| | | | | | | | | | | | | | | | | | |
| | | | | | | | | | | | | | | | | | |
| | | | | | | | | | | | | | | | | | |
| | | | | | | | | | | | | | | | | | |
| | | | | | | | | | | | | | | | | | |
| | | | | | | | | | | | | | | | | | |
| | | | | | | | | | | | | | | | | | |
| | | | | | | | | | | | | | | | | | |
| | | | | | | | | | | | | | | | | | |
| | | | | | | | | | | | | | | | | | |
| | | | | | | | | | | | | | | | | | |
| | | | | | | | | | | | | | | | | | | |
See notes to financial statements.
Statements of Changes in Net Assets (Continued)
| | | | | | | | | | | | | | | | | | |
| | | NorthPointe Small Cap Growth Fund | | | NorthPointe Small Cap Value Fund |
| | | Year Ended
October 31, 2006 | | | Year Ended
October 31, 2005 | | | Year Ended
October 31, 2006 | | | Year Ended
October 31, 2005 |
CAPITAL TRANSACTIONS: | | | | | | | | | | | | | | | | | | |
Class A Shares | | | | | | | | | | | | | | | | | | |
Proceeds from shares issued | | $ | 16,884 | | | $ | — | | | $ | — | | | $ | — | | | |
Dividends reinvested | | | 101 | | | | — | | | | — | | | | — | | | |
| | | | | | | | | | | | | | | | | | |
| | | 16,985 | | | | — | | | | — | | | | — | | | |
| | | | | | | | | | | | | | | | | | |
| | | | | |
Class B Shares | | | | | | | | | | | | | | | | | | |
Dividends reinvested | | | 101 | | | | — | | | | — | | | | — | | | |
| | | | | | | | | | | | | | | | | | |
| | | 101 | | | | — | | | | — | | | | — | | | |
| | | | | | | | | | | | | | | | | | |
| | | | | |
Class C Shares | | | | | | | | | | | | | | | | | | |
Dividends reinvested | | | 101 | | | | — | | | | — | | | | — | | | |
| | | | | | | | | | | | | | | | | | |
| | | 101 | | | | — | | | | — | | | | — | | | |
| | | | | | | | | | | | | | | | | | |
| | | | | |
Class R Shares | | | | | | | | | | | | | | | | | | |
Dividends reinvested | | | 101 | | | | — | | | | — | | | | — | | | |
| | | | | | | | | | | | | | | | | | |
| | | 101 | | | | — | | | | — | | | | — | | | |
| | | | | | | | | | | | | | | | | | |
| | | | | |
Institutional Service Class | | | | | | | | | | | | | | | | | | |
Dividends reinvested | | | 101 | | | | — | | | | — | | | | — | | | |
| | | | | | | | | | | | | | | | | | |
| | | 101 | | | | — | | | | | | | | | | | |
| | | | | | | | | | | | | | | | | | |
| | | | | |
Institutional Class Shares | | | | | | | | | | | | | | | | | | |
Proceeds from shares issued | | | 13,893,471 | | | | 14,000,073 | | | | 5,874,998 | | | | 175,000 | | | |
Dividends reinvested | | | 3,594,883 | | | | — | | | | 4,503,637 | | | | 7,634,747 | | | |
Cost of shares redeemed (a) | | | (226,525 | ) | | | (28,941,203 | ) | | | (2,375,210 | ) | | | (11,384,908 | ) | | |
| | | | | | | | | | | | | | | | | | |
| | | 17,261,829 | | | | (14,941,130 | ) | | | 8,003,425 | | | | (3,575,161 | ) | | |
| | | | | | | | | | | | | | | | | | |
Change in net assets from capital transactions | | $ | 17,279,218 | | | $ | (14,941,130 | ) | | $ | 8,003,425 | | | $ | (3,575,161 | ) | | |
| | | | | | | | | | | | | | | | | | |
| | | | | | | | | | | | | | | | | | |
| | | | | | | | | | | | | | | | | | |
| | | | | | | | | | | | | | | | | | |
| | | | | | | | | | | | | | | | | | |
| | | | | | | | | | | | | | | | | | |
| | | | | | | | | | | | | | | | | | |
| | | | | | | | | | | | | | | | | | |
| | | | | | | | | | | | | | | | | | |
| | | | | | | | | | | | | | | | | | |
| | | | | | | | | | | | | | | | | | |
| | | | | | | | | | | | | | | | | | |
| | | | | | | | | | | | | | | | | | |
| | | | | | | | | | | | | | | | | | |
| | | | | | | | | | | | | | | | | | |
| | | | | | | | | | | | | | | | | | |
| | | | | | | | | | | | | | | | | | | |
| (a) | Includes redemption fees, if any. |
See notes to financial statements.
Statements of Changes in Net Assets (Continued)
| | | | | | | | | | | | | | |
| | | NorthPointe Small Cap Growth Fund | | | NorthPointe Small Cap Value Fund |
| | | Year Ended
October 31, 2006 | | | Year Ended
October 31, 2005 | | | Year Ended
October 31, 2006 | | | Year Ended
October 31, 2005 |
SHARE TRANSACTIONS: | | | | | | | | | | | | | | |
Class A Shares | | | | | | | | | | | | | | |
Issued | | 1,354 | | | — | | | — | | | — | | | |
Reinvested | | 9 | | | — | | | — | | | — | | | |
| | | | | | | | | | | | | | |
| | 1,363 | | | — | | | — | | | — | | | |
| | | | | | | | | | | | | | |
| | | | | |
Class B Shares | | | | | | | | | | | | | | |
Reinvested | | 9 | | | — | | | — | | | — | | | |
| | | | | | | | | | | | | | |
| | 9 | | | — | | | — | | | — | | | |
| | | | | | | | | | | | | | |
| | | | | |
Class C Shares | | | | | | | | | | | | | | |
Reinvested | | 9 | | | — | | | — | | | — | | | |
| | | | | | | | | | | | | | |
| | 9 | | | — | | | — | | | — | | | |
| | | | | | | | | | | | | | |
| | | | | |
Class R Shares | | | | | | | | | | | | | | |
Reinvested | | 9 | | | — | | | — | | | — | | | |
| | | | | | | | | | | | | | |
| | 9 | | | — | | | — | | | — | | | |
| | | | | | | | | | | | | | |
| | | | | |
Institutional Service Class Shares | | | | | | | | | | | | | | |
Reinvested | | 9 | | | — | | | — | | | — | | | |
| | | | | | | | | | | | | | |
| | 9 | | | — | | | — | | | — | | | |
| | | | | | | | | | | | | | |
| | | | | |
Institutional Class Shares | | | | | | | | | | | | | | |
Issued | | 1,126,102 | | | 1,211,225 | | | 532,778 | | | 15,138 | | | |
Reinvested | | 315,341 | | | — | | | 431,559 | | | 629,899 | | | |
Redeemed | | (18,821 | ) | | (2,458,373 | ) | | (214,373 | ) | | (870,005 | ) | | |
| | | | | | | | | | | | | | |
| | 1,422,622 | | | (1,247,148 | ) | | 749,964 | | | (224,968 | ) | | |
| | | | | | | | | | | | | | |
Total change in shares | | 1,424,021 | | | (1,247,148 | ) | | 749,964 | | | (224,968 | ) | | |
| | | | | | | | | | | | | | |
| | | | | | | | | | | | | | |
| | | | | | | | | | | | | | |
| | | | | | | | | | | | | | |
| | | | | | | | | | | | | | |
| | | | | | | | | | | | | | |
| | | | | | | | | | | | | | |
| | | | | | | | | | | | | | |
| | | | | | | | | | | | | | |
| | | | | | | | | | | | | | |
| | | | | | | | | | | | | | |
| | | | | | | | | | | | | | |
| | | | | | | | | | | | | | |
| | | | | | | | | | | | | | |
| | | | | | | | | | | | | | |
| | | | | | | | | | | | | | |
| | | | | | | | | | | | | | | |
See notes to financial statements.
Financial Highlights
Selected Data for Each Share of Capital Outstanding
NorthPointe Small Cap Growth Fund
| | | | | | | | | | | | | | | | | | | | | | | | | | | | | | | | | | | | | | | |
| | | | | Investment Activities | | Distributions | | | | | | Ratios/Supplemental Data |
| | | Net Asset
Value,
Beginning
of Period | | Net
Investment
Income
(Loss) | | | Net Realized
and
Unrealized
Gains
(Losses) on
Investments | | Total
from
Investment
Activities | | Net
Realized
Gains | | | Total
Distributions | | | Net
Asset
Value, End
of Period | | Total
Return (a) | | | Net Assets
at End of
Period
(000s) | | Ratio of
Expenses
to Average
Net Assets | | | Ratio of Net
Investment
Income
(Loss)
to Average
Net Assets | | | Ratio of
Expenses
(Prior to
Reimbursements)
to Average
Net Assets (b) | | | Ratio of Net
Investment
Income (Loss)
(Prior to
Reimbursements)
to Average
Net Assets (b) | | | Portfolio
Turnover (c) |
| | | | | | | | | | | | | | |
Class A Shares | | | | | | | | | | | | | | | | | | | | | | | | | | | | | | | | | | | | | | | |
Period Ended October 31, 2004 (d) | | $ | 10.00 | | (0.01 | ) | | 0.48 | | 0.47 | | — | | | — | | | $ | 10.47 | | 4.70% | (e) | | $ | 1 | | 1.50% | (f) | | (1.17% | )(f) | | 9.82% | (f) | | (9.48% | )(f) | | 0.48% |
Year Ended October 31, 2005 | | $ | 10.47 | | (0.13 | ) | | 1.33 | | 1.20 | | — | | | — | | | $ | 11.67 | | 11.46% | | | $ | 1 | | 1.58% | | | (1.11% | ) | | 1.69% | | | (1.22% | ) | | 144.08% |
Year Ended October 31, 2006 | | $ | 11.67 | | (0.09 | ) | | 2.39 | | 2.30 | | (1.01 | ) | | (1.01 | ) | | $ | 12.96 | | 20.98% | | | $ | 19 | | 1.40% | | | (0.97% | ) | | 1.45% | | | (1.02% | ) | | 98.72% |
| | | | | | | | | | | | | | |
Class B Shares | | | | | | | | | | | | | | | | | | | | | | | | | | | | | | | | | | | | | | | |
Period Ended October 31, 2004 (d) | | $ | 10.00 | | (0.01 | ) | | 0.47 | | 0.46 | | — | | | — | | | $ | 10.46 | | 4.60% | (e) | | $ | 1 | | 2.07% | (f) | | (1.78% | )(f) | | 9.13% | (f) | | (8.84% | )(f) | | 0.48% |
Year Ended October 31, 2005 | | $ | 10.46 | | (0.20 | ) | | 1.32 | | 1.12 | | — | | | — | | | $ | 11.58 | | 10.71% | | | $ | 1 | | 2.02% | | | (1.79% | ) | | 2.10% | | | (1.87% | ) | | 144.08% |
Year Ended October 31, 2006 | | $ | 11.58 | | (0.21 | ) | | 2.41 | | 2.20 | | (1.01 | ) | | (1.01 | ) | | $ | 12.77 | | 20.22% | | | $ | 1 | | 2.10% | | | (1.73% | ) | | 2.22% | | | (1.85% | ) | | 98.72% |
| | | | | | | | | | | | | | |
Class C Shares | | | | | | | | | | | | | | | | | | | | | | | | | | | | | | | | | | | | | | | |
Period Ended October 31, 2004 (d) | | $ | 10.00 | | (0.01 | ) | | 0.47 | | 0.46 | | — | | | — | | | $ | 10.46 | | 4.60% | (e) | | $ | 1 | | 2.07% | (f) | | (1.78% | )(f) | | 9.13% | (f) | | (8.84% | )(f) | | 0.48% |
Year Ended October 31, 2005 | | $ | 10.46 | | (0.20 | ) | | 1.32 | | 1.12 | | — | | | — | | | $ | 11.58 | | 10.71% | | | $ | 1 | | 2.02% | | | (1.79% | ) | | 2.11% | | | (1.87% | ) | | 144.08% |
Year Ended October 31, 2006 | | $ | 11.58 | | (0.21 | ) | | 2.41 | | 2.20 | | (1.01 | ) | | (1.01 | ) | | $ | 12.77 | | 20.22% | | | $ | 1 | | 2.10% | | | (1.73% | ) | | 2.14% | | | (1.77% | ) | | 98.72% |
| | | | | | | | | | | | | | |
Class R Shares | | | | | | | | | | | | | | | | | | | | | | | | | | | | | | | | | | | | | | | |
Period Ended October 31, 2004 (d) | | $ | 10.00 | | (0.01 | ) | | 0.47 | | 0.46 | | — | | | — | | | $ | 10.46 | | 4.60% | (e) | | $ | 1 | | 1.73% | (f) | | (1.17% | )(f) | | 8.65% | (f) | | (6.92% | )(f) | | 0.48% |
Year Ended October 31, 2005 | | $ | 10.46 | | (0.16 | ) | | 1.33 | | 1.17 | | — | | | — | | | $ | 11.63 | | 11.19% | | | $ | 1 | | 1.55% | | | (1.41% | ) | | 1.56% | | | (1.43% | ) | | 144.08% |
Year Ended October 31, 2006 | | $ | 11.63 | | (0.14 | ) | | 2.43 | | 2.29 | | (1.01 | ) | | (1.01 | ) | | $ | 12.91 | | 20.96% | | | $ | 1 | | 1.23% | | | (1.10% | ) | | 1.23% | | | (1.10% | ) | | 98.72% |
| | | | | | | | | | | | | | |
Institutional Service Class Shares | | | | | | | | | | | | | | | | | | | | | | | | | | | | | | | | | | | | | | | |
Period Ended October 31, 2004 (d) | | $ | 10.00 | | (0.01 | ) | | 0.48 | | 0.47 | | — | | | — | | | $ | 10.47 | | 4.70% | (e) | | $ | 1 | | 1.04% | (f) | | (0.74% | )(f) | | 8.22% | (f) | | (7.92% | )(f) | | 0.48% |
Year Ended October 31, 2005 | | $ | 10.47 | | (0.10 | ) | | 1.33 | | 1.23 | | — | | | — | | | $ | 11.70 | | 11.75% | | | $ | 1 | | 1.19% | | | (0.87% | ) | | 1.40% | | | (1.08% | ) | | 144.08% |
Year Ended October 31, 2006 | | $ | 11.70 | | (0.10 | ) | | 2.45 | | 2.35 | | (1.01 | ) | | (1.01 | ) | | $ | 13.04 | | 21.38% | | | $ | 1 | | 1.35% | | | (0.77% | ) | | 1.35% | | | (0.77% | ) | | 98.72% |
| | | | | | | | | | | | | | |
Institutional Class Shares | | | | | | | | | | | | | | | | | | | | | | | | | | | | | | | | | | | | | | | |
Period Ended October 31, 2004 (d) (g) | | $ | 10.00 | | (0.01 | ) | | 0.48 | | 0.47 | | — | | | — | | | $ | 10.47 | | 4.70% | (e) | | $ | 49,793 | | 1.07% | (f) | | (1.02% | )(f) | | 2.18% | (f) | | (2.14% | )(f) | | 0.48% |
Year Ended October 31, 2005 | | $ | 10.47 | | (0.12 | ) | | 1.36 | | 1.24 | | — | | | — | | | $ | 11.71 | | 11.84% | | | $ | 41,074 | | 1.10% | | | (0.81% | ) | | 1.19% | | | (0.89% | ) | | 144.08% |
Year Ended October 31, 2006 | | $ | 11.71 | | (0.07 | ) | | 2.43 | | 2.36 | | (1.01 | ) | | (1.01 | ) | | $ | 13.06 | | 21.45% | | | $ | 64,383 | | 1.10% | | | (0.69% | ) | | 1.16% | | | (0.74% | ) | | 98.72% |
| | | | | | | | | | | | | | | | | | | | | | | | | | | | | | | | | | | | | | | | |
| | | | | | | | | | | | | | | | | | | | | | | | | | | | | | | | | | | | | | | | |
| | | | | | | | | | | | | | | | | | | | | | | | | | | | | | | | | | | | | | | | |
| | | | | | | | | | | | | | | | | | | | | | | | | | | | | | | | | | | | | | | | |
| | | | | | | | | | | | | | | | | | | | | | | | | | | | | | | | | | | | | | | | |
| | | | | | | | | | | | | | | | | | | | | | | | | | | | | | | | | | | | | | | | |
| (a) | Excludes sales charges. |
| (b) | During the period certain fees were waived and/or reimbursed. If such waivers/reimbursements had not occurred, the ratios would have been as indicated. |
| (c) | Portfolio turnover is calculated on the basis of the Fund as a whole without distinguishing among the classes of shares. |
| (d) | For the period from September 29, 2004 (commencement of operations) through October 31, 2004. |
| (g) | Net investment income (loss) is based on average shares outstanding during the period. |
See notes to financial statements.
Financial Highlights
Selected Data for Each Share of Capital Outstanding
NorthPointe Small Cap Value Fund
| | | | | | | | | | | | | | | | | | | | | | | | | | | | | | | | | | | | | | | |
| | | | | Investment Activities | | | Distributions | | | | | | Ratios/Supplemental Data |
| | | Net Asset
Value,
Beginning
of Period | | Net
Investment
Income
(Loss) | | Net Realized
and
Unrealized
Gains
(Losses) on
Investments | | | Total
from
Investment
Activities | | | Net
Investment
Income | | | Net
Realized
Gains | | | Total
Distributions | | | Net
Asset
Value, End
of Period | | Total
Return | | | Net Assets
at End of
Period
(000s) | | Ratio of
Expenses
to Average
Net Assets | | Ratio of Net
Investment
Income
(Loss)
to Average
Net Assets | | Ratio of
Expenses
(Prior to
Reimbursements)
to Average
Net Assets (a) | | Ratio of Net
Investment
Income
(Prior to
Reimbursements)
to Average
Net Assets (a) | | Portfolio
Turnover |
| | | | | | | | | | | | | | | |
Institutional Class Shares | | | | | | | | | | | | | | | | | | | | | | | | | | | | | | | | | | | | | | | |
Year Ended October 31, 2002 | | $ | 11.14 | | 0.06 | | (0.69 | ) | | (0.63 | ) | | (0.06 | ) | | (0.63 | ) | | (0.69 | ) | | $ | 9.82 | | (6.43% | ) | | $ | 29,961 | | 1.00% | | 0.52% | | 1.06% | | 0.46% | | 105.59% |
Year Ended October 31, 2003 | | $ | 9.82 | | 0.03 | | 3.72 | | | 3.75 | | | (0.04 | ) | | — | | | (0.04 | ) | | $ | 13.53 | | 38.25% | | | $ | 39,328 | | 1.00% | | 0.25% | | 1.01% | | 0.23% | | 102.63% |
Year Ended October 31, 2004 | | $ | 13.53 | | 0.03 | | 1.64 | | | 1.67 | | | (0.03 | ) | | (0.74 | ) | | (0.77 | ) | | $ | 14.43 | | 12.65% | | | $ | 32,156 | | 0.99% | | 0.19% | | 1.00% | | 0.18% | | 135.45% |
Year Ended October 31, 2005 | | $ | 14.43 | | 0.08 | | 1.99 | | | 2.07 | | | (0.08 | ) | | (3.91 | ) | | (3.99 | ) | | $ | 12.51 | | 15.39% | | | $ | 25,069 | | 1.00% | | 0.61% | | 1.03% | | 0.59% | | 164.93% |
Year Ended October 31, 2006 | | $ | 12.51 | | 0.05 | | 1.86 | | | 1.91 | | | (0.05 | ) | | (2.65 | ) | | (2.70 | ) | | $ | 11.72 | | 18.07% | | | $ | 32,267 | | 1.00% | | 0.43% | | 1.07% | | 0.36% | | 154.88% |
| | | | | | | | | | | | | | | | | | | | | | | | | | | | | | | | | | | | | | | | |
| | | | | | | | | | | | | | | | | | | | | | | | | | | | | | | | | | | | | | | | |
| | | | | | | | | | | | | | | | | | | | | | | | | | | | | | | | | | | | | | | | |
| | | | | | | | | | | | | | | | | | | | | | | | | | | | | | | | | | | | | | | | |
| | | | | | | | | | | | | | | | | | | | | | | | | | | | | | | | | | | | | | | | |
| | | | | | | | | | | | | | | | | | | | | | | | | | | | | | | | | | | | | | | | |
| | | | | | | | | | | | | | | | | | | | | | | | | | | | | | | | | | | | | | | | |
| | | | | | | | | | | | | | | | | | | | | | | | | | | | | | | | | | | | | | | | |
| | | | | | | | | | | | | | | | | | | | | | | | | | | | | | | | | | | | | | | | |
| | | | | | | | | | | | | | | | | | | | | | | | | | | | | | | | | | | | | | | | |
| | | | | | | | | | | | | | | | | | | | | | | | | | | | | | | | | | | | | | | | |
| | | | | | | | | | | | | | | | | | | | | | | | | | | | | | | | | | | | | | | | |
| | | | | | | | | | | | | | | | | | | | | | | | | | | | | | | | | | | | | | | | |
| | | | | | | | | | | | | | | | | | | | | | | | | | | | | | | | | | | | | | | | |
| | | | | | | | | | | | | | | | | | | | | | | | | | | | | | | | | | | | | | | | |
| | | | | | | | | | | | | | | | | | | | | | | | | | | | | | | | | | | | | | | | |
| | | | | | | | | | | | | | | | | | | | | | | | | | | | | | | | | | | | | | | | |
| | | | | | | | | | | | | | | | | | | | | | | | | | | | | | | | | | | | | | | | |
| | | | | | | | | | | | | | | | | | | | | | | | | | | | | | | | | | | | | | | | |
| | | | | | | | | | | | | | | | | | | | | | | | | | | | | | | | | | | | | | | | |
| | | | | | | | | | | | | | | | | | | | | | | | | | | | | | | | | | | | | | | | |
| | | | | | | | | | | | | | | | | | | | | | | | | | | | | | | | | | | | | | | | |
| | | | | | | | | | | | | | | | | | | | | | | | | | | | | | | | | | | | | | | | |
| | | | | | | | | | | | | | | | | | | | | | | | | | | | | | | | | | | | | | | | |
| | | | | | | | | | | | | | | | | | | | | | | | | | | | | | | | | | | | | | | | |
| | | | | | | | | | | | | | | | | | | | | | | | | | | | | | | | | | | | | | | | |
| (a) | During the period certain fees were waived and/or reimbursed. If such waivers/reimbursements had not occurred, the ratios would have been as indicated. |
See notes to financial statements.
Notes to Financial Statements
October 31, 2006
1. Organization
Gartmore Mutual Funds (the “Trust”) is an open-end management investment company, organized under the laws of Delaware by an amended and restated Agreement and Declaration of Trust, dated October 28, 2004, as amended to date. Prior to January 25, 2002, the Trust was named “Nationwide Mutual Funds”. The Trust was originally created under the laws of Ohio as an Ohio business trust pursuant to a Declaration of Trust, dated as of October 30, 1997, as subsequently amended, and redomesticated as a Delaware Statutory Trust on February 28, 2005; the redomestication was a change in statutory status and did not affect the operations of the Trust. The Trust is registered under the Investment Company Act of 1940, as amended (the “1940 Act”). As of October 31, 2006, the Trust had authorized an unlimited number of shares of beneficial interest (“shares”) without par value. The Trust operates forty-nine (49) separate series, or mutual funds, each with its own investment objective(s) and strategies. This report contains the financial statements and financial highlights of the two (2) funds listed below (individually, a “Fund”; collectively, the “Funds”):
- NorthPointe Small Cap Growth Fund (“Small Cap Growth”)
- NorthPointe Small Cap Value Fund (“Small Cap Value”)
2. Summary of Significant Accounting Policies
The following is a summary of significant accounting policies followed by the Funds in the preparation of their financial statements. The policies are in conformity with accounting principles generally accepted in the United States of America (“GAAP”). The preparation of financial statements requires management to make estimates and assumptions that affect the reported amounts of assets and liabilities, disclosure of contingent assets and liabilities at the date of the financial statements, and the reported amounts of income and expenses for the period. Actual results could differ from those estimates.
Securities for which market quotations are readily available are valued at current market value as of “Valuation Time.” Valuation Time is as of the close of regular trading on the New York Stock Exchange (usually 4 p.m. Eastern time). Equity securities are valued at the last quoted sale price or, if there is no sale price, the last quoted bid price provided by an independent pricing service approved by the Trust’s Board of Trustees. Securities traded on NASDAQ are valued at the NASDAQ Official Closing Price. Prices are taken from the primary market or exchange in which each security trades.
Most securities listed on a foreign exchange are valued either at fair value (see description below) or at the last sale price at the close of the exchange on which the security is principally traded. Foreign securities, currencies, and other assets and liabilities denominated in foreign currencies are translated into U.S. dollars at the exchange rate of said currencies against the U.S. dollar, as of Valuation Time, as provided by an independent pricing service approved by the Board of Trustees.
Securities for which market quotations are not readily available, or for which an independent pricing service does not provide a value or provides a value that does not represent fair value in the judgment of the Funds’ investment adviser or designee, are valued at fair value under procedures approved by the Trust’s Board of Trustees. The “Fair Value” of these securities is determined in good faith by taking into account relevant factors and surrounding circumstances. Methods utilized to obtain a “Fair Value” may include the following non-exclusive list of acceptable methods: (i) a multiple of earnings; (ii) the discount from market value of a similar, freely traded security; (iii) the yield-to-maturity for debt issues; or (iv) a consolidation of the methods. The Gartmore Funds Fair Value Committee considers a non-exclusive list of factors to arrive at the appropriate method of determining “Fair Value.” For example, fair value determinations are required for securities whose value is affected by a “significant” event that materially affects the value of a domestic or foreign security which occurs subsequent to the time of the close of the principal market on which such domestic or foreign security trades and before the Valuation Time (i.e., a “subsequent event”). Typically, this will involve events occurring after the close of a foreign market on which a security trades and before the next Valuation Time.
Notes to Financial Statements (Continued)
October 31, 2006
The Funds holding foreign equity securities (the “Foreign Equity Funds”) may value foreign securities at fair value in the circumstances described below. Generally, trading in foreign securities markets is completed each day at various times prior to the Valuation Time. Due to the time differences between the closings of the relevant foreign securities exchanges and the Valuation Time for the Foreign Equity Funds, the Foreign Equity Funds will fair value their foreign investments when it is determined that the market quotations for the foreign investments either are not readily available or are unreliable and, therefore, do not represent fair value. When the fair value prices are utilized, these prices will attempt to reflect the impact of the U.S. financial markets’ perceptions and trading activities on the Foreign Equity Funds’ foreign investments since the last closing prices of the foreign investments were calculated on their primary foreign securities markets or exchanges. For these purposes, the Board of Trustees of the Trust has determined that movements in relevant indices or other appropriate market indicators, after the close of the foreign securities exchanges, may demonstrate that market quotations are unreliable, and may trigger fair value pricing for certain securities. Consequently, fair valuation of portfolio securities may occur on a daily basis.
| (b) | | Repurchase Agreements |
The Funds may enter into repurchase agreements with an entity which is a member of the Federal Reserve System or which is a “primary dealer” (as designated by the Federal Reserve Bank of New York) in U.S. Government obligations. The repurchase price generally equals the price paid by a Fund plus interest negotiated on the basis of current short-term rates, which may be more or less than the rate on the underlying portfolio securities. The seller under a repurchase agreement is required to maintain the value of the collateral held pursuant to the agreement at a market value equal to or greater than the repurchase price (including accrued interest). Collateral subject to repurchase agreements is held by the Funds’ custodian or another qualified sub-custodian or in the Federal Reserve/Treasury book-entry system. If the counterparty defaults and the fair value of the collateral declines, realization of the collateral by the Funds may be delayed or limited. The Funds may transfer uninvested cash balances into a pooled cash account. These balances are invested in one or more repurchase agreements, which are fully collateralized by U.S. Government Agency Mortgages with the counterparties of CS First Boston and Nomura Securities.
The Funds may invest in financial futures contracts (“futures contracts”) for the purpose of hedging their existing portfolio securities or securities that the Funds intend to purchase against fluctuations in value caused by changes in prevailing market interest rates or prices. Futures contracts may also be entered into for non-hedging purposes.
Upon entering into a futures contract, these Funds are required to pledge to the broker an amount of cash and/or other assets equal to a certain percentage of the contract amount (initial margin deposit). Subsequent payments, known as “variation margin”, are made each day, depending on the daily fluctuations in the fair value/market value of the underlying assets. A gain or loss equal to the daily variation margin is recognized on a daily basis. Future contracts are valued daily at their last quoted sale price.
A “sale” of a futures contract means a contractual obligation to deliver the securities or foreign currency called for by the contract at a fixed price at a specified time in the future. A “purchase” of a futures contract means a contractual obligation to acquire the securities or foreign currency at a fixed price at a specified time in the future.
Should market conditions change unexpectedly, a Fund may not achieve the anticipated benefits of the futures contracts and may realize a loss. The use of futures transactions for hedging purposes involves the risk of imperfect correlation in movements in the price of futures contracts, interest rates and the value of the underlying hedged assets. The Funds did not have any futures contracts during the year ended October 31, 2006.
| (d) | | Security Transactions and Investment Income |
Security transactions are accounted for on the date the security is purchased or sold (“trade date”). Securities gains and losses are calculated on the identified cost basis. Interest income is recognized on the accrual basis and includes, where applicable, the amortization or accretion of premium or discount. Dividend income is recorded on the ex-dividend date.
To generate additional income, each of the Funds may lend their respective portfolio securities, up to 33 1/3% of the Fund, to brokers, dealers and other financial institutions provided that (1) the borrower delivers cash or securities as collateral with respect to each new loan of U.S. securities, equal to at least 102% of the value of the portfolio securities loaned, and with respect to each new loan on non-U.S. securities, collateral of at least 105% of the value of the portfolio securities loaned; and (2) at all times thereafter shall require the borrower to mark-to-market the collateral on a daily basis so that the market value of such collateral does not fall below 100% of the value of securities loaned. The Funds receive payments from borrowers equivalent to the dividends and interest that would have been earned on securities loaned while simultaneously seeking to earn income on the investment of cash collateral. There may be risks of delay in recovery of the securities should the borrower of the securities fail financially. Loans will be made, however, only to borrowers deemed by the Funds’ investment adviser to be of good standing and creditworthy under guidelines established by the Board of Trustees and when, in judgment of the adviser, the consideration which can be earned currently from these securities loans justifies the attendant risks. Loans are subject to termination by the Funds or the borrower at any time, and, therefore, are not considered to be illiquid investments. JPMorgan Chase Bank serves as custodian for the securities lending program of the Funds. JPMorgan Chase Bank receives a fee based on the value of the collateral received from borrowers. As of October 31, 2006, the Funds did not have securities on loan.
| (f) | | Distributions to Shareholders |
Distributions from net investment income, if any, are declared and paid quarterly for the Funds. Distributions from net realized capital gains, if any, are declared and distributed at least annually.
Dividends and distributions to shareholders are determined in accordance with federal income tax regulations, which may differ from GAAP. These “book/tax” differences are considered either permanent or temporary in nature. In accordance with American Institute of Certified Public Accountants (the “AICPA”) Statement of Position 93-2, permanent differences (i.e., reclassification of market discounts, foreign exchange gain/loss, paydowns and distributions from Real Estate Investment Trusts) are reclassified within the capital accounts based on their nature for federal income tax purposes; temporary differences do not require reclassification. These reclassifications have no effect upon the net asset value of the respective Funds. To the extent distributions exceed current and accumulated earnings and profits for federal income tax purposes, these excesses are reported as distributions of paid-in-capital.
It is the policy of each Fund to qualify or continue to qualify as a regulated investment company by complying with the provisions available to certain investment companies, as defined in Subchapter M of the Internal Revenue Code, and to make distributions of net investment income and net realized capital gains sufficient to relieve the Fund from all, or substantially all, federal income taxes.
| (h) | | Allocation of Expenses, Income, and Gains and Losses |
Expenses directly attributable to a Fund are charged to that Fund. Expenses not directly attributable to a Fund are allocated proportionately among various or all Funds within the Trust. For each Fund, the method for allocating income, fund level expenses, and realized and unrealized gains or losses is based on the fair value of shares outstanding relative to net assets. Under this method, each class of shares participates based on the total net asset value of that class’s shares in proportion to the total net assets of the Fund. Expenses specific to a class (such as Rule 12b-1 and administrative services fees) are charged to that class.
3. Transactions with Affiliates
Under the terms of the Trust’s Investment Advisory Agreement, Gartmore Mutual Fund Capital Trust (“GMF”) manages the investment of the assets and supervises the daily business affairs of the Funds. GMF is a wholly-owned subsidiary of NWD Investment Management, Inc., (prior to November 30, 2006 known as “Gartmore Global Investments, Inc.” (“GGI”)), a holding company. NWD Investment Management, Inc. is a majority-owned subsidiary
Notes to Financial Statements (Continued)
October 31, 2006
of NWD Management & Research Trust (prior to November 30, 2006 known as “Gartmore Global Asset Management Trust” (“GGAMT”)). NWD Management & Research Trust is a wholly-owned subsidiary of Nationwide Corporation. All of the common stock of Nationwide Corporation is held by Nationwide Mutual Insurance Company (95.2%) and Nationwide Mutual Fire Insurance Company (4.8%), each of which is a mutual company owned by its policyholders. Among other services provided by GMF to the Funds, GMF provides investment management evaluation services in initially selecting and monitoring on an ongoing basis, the performance of the subadviser, NorthPointe Capital, LLC (“NorthPointe”), for the Funds. NorthPointe manages each of the Fund’s investments and has the responsibility for making all investment decisions for the Funds.
Under the terms of the Investment Advisory Agreement, each Fund pays GMF an investment advisory fee based on that Fund’s average daily net assets. From these fees, pursuant to the subadvisory agreement, GMF pays fees to NorthPointe. Additional information regarding the investment advisory fees and subadvisory fees for GMF and the subadvisers is as follows for the year ended October 31, 2006:
| | | | | | | | |
| Fund | | Fee Schedule | | Total
Fees | | Fees
Retained | | Paid to
Subadviser |
Small Cap Growth | | All Assets | | 0.95% | | — | | 0.95% |
Small Cap Value | | All Assets | | 0.85% | | — | | 0.85% |
GMF with respect to Small Cap Value and NorthPointe with respect to Small Cap Growth, and those respective Funds have entered into written contracts (“Expense Limitation Agreements”) that limit operating expenses (excluding any taxes, interest, brokerage fees, extraordinary expenses, short sale dividend expenses, Rule 12b-1 fees, and administrative services fees) from exceeding 1.10% for all classes of Small Cap Growth and 1.00% for the Institutional Class of Small Cap Value until at least February 28, 2007.
GMF may request and receive reimbursement from the Small Cap Value Fund and NorthPointe may request and receive reimbursement from the Small Cap Growth Fund of the advisory/subadvisory fees waived and other expenses reimbursed by GMF and/or NorthPointe pursuant to the Expense Limitation Agreements at a later date not to exceed three years from the fiscal year in which the fees were waived or expenses reimbursed if the Fund has reached a sufficient asset size to permit reimbursement to be made without causing the total annual operating expense ratio of the Fund to exceed the limits set forth above. No reimbursement will be made unless: (i) the Fund’s assets exceed $100 million; (ii) the total annual expense ratio of the class making such reimbursement is less than the limit set forth above; and (iii) the payment of such reimbursement is approved by the Board of Trustees on a quarterly basis. Except as provided for in the Expense Limitation Agreement, reimbursement of amounts previously waived or assumed by GMF or NorthPointe is not permitted.
For the year ended October 31, 2006, the cumulative potential reimbursements of the Small Cap Growth Fund, based on reimbursements which expire within three years from the fiscal year in which the corresponding reimbursements to the Fund was made for expenses reimbursed by NorthPointe would be:
| | | | | | | | | |
| Fund | | Amount
Fiscal Year
2004 | | Amount
Fiscal Year
2005 | | Amount
Fiscal Year
2006 |
Small Cap Growth | | $ | 7,391 | | $ | 44,324 | | $ | 28,148 |
Under the terms of a Distribution Plan under Rule 12b-1 of the 1940 Act, Gartmore Distribution Services, Inc. (“GDSI”), the Fund’s distributor, is compensated by the Fund for expenses associated with the distribution of certain classes of shares of the Fund. GDSI is a majority-owned subsidiary of NWD Management & Research Trust. These fees are based on average daily net assets of the respective class of the Fund at an annual rate not to exceed the following:
| | | | | | | | | | | | |
| Fund | | Class A
Shares | | | Class B
Shares | | | Class C
Shares | | | Class R
Shares | |
Small Cap Growth | | 0.25 | % | | 1.00 | % | | 1.00 | % | | 0.50 | % |
Pursuant to an Underwriting Agreement, GDSI serves as principal underwriter of the Funds in the continuous distribution of their shares and receives commissions in the form of a front-end sales charge on the Class A shares of the Small Cap Growth Fund. These fees are deducted from and are not included in proceeds from sales of Class A shares. From these fees, GDSI pays sales commissions, salaries, and other expenses in connection with generating new sales of Class A shares of the Small Cap Growth Fund. GDSI also receives fees for services as principal underwriter for Class B shares of the Small Cap Growth Fund. These fees are contingent deferred sales charges (“CDSCs”) ranging from 1% to 5% imposed on redemptions of Class B shares which may cause the current value of a shareholder’s account to fall below the total purchase payments. The CDSC, if applicable, will be imposed on redemptions made within six years of the purchase. Class C shares have a CDSC fee of 1% imposed on redemptions of Class C shares of the Small Cap Growth Fund made within one year of purchase. For the year ended October 31, 2006, GDSI received commissions of $0 from front-end sales charges of Class A shares and from CDSC fees from Class B and Class C shares of the Small Cap Growth Fund, of which $0 was re-allowed to affiliated broker-dealers of the Fund.
Under the terms of a Fund Administration and Transfer Agency Agreement, Gartmore SA Capital Trust (“GSA”) provides various administrative and accounting services for the Funds, and Gartmore Investors Services, Inc. (“GISI”), an indirect subsidiary of GSA, serves as Transfer Agent and Dividend Disbursing Agent for each of the Funds. The fees for the services provided under this agreement are calculated based on the Trust’s average daily net assets according to the fee schedule below. The fees then are allocated proportionately among all Funds within the Trust in relation to the average daily net assets of each Fund and are paid to GSA. GSA pays GISI from these fees for GISI’s services.
| | |
| Combined Fee Schedule* | | |
Up to $1 billion | | 0.26% |
$1 billion up to $3 billion | | 0.19% |
$3 billion up to $4 billion | | 0.15% |
$4 billion up to $5 billion | | 0.08% |
$5 billion up to $10 billion | | 0.05% |
$10 billion up to $12 billion | | 0.03% |
$12 billion or more | | 0.02% |
| * | The assets of the Gartmore Investor Destinations Aggressive, Gartmore Investor Destinations Moderately Aggressive, Gartmore Investor Destinations Moderate, Gartmore Investor Destinations Moderately Conservative and Gartmore Investor Destinations Conservative Funds (collectively, the “Investor Destinations Funds”) and the Gartmore Optimal Allocations Fund: Aggressive, Gartmore Optimal Allocations Fund: Moderate, Gartmore Optimal Allocations Fund: Moderately Aggressive, and Gartmore Optimal Allocations Fund: Specialty (collectively, the “Optimal Funds”) are excluded from the Trust asset level amount in order to calculate this asset based fee. The Investor Destinations Funds and the Optimal Funds do not pay any part of this fee. |
GSA and GISI have entered into agreements with BISYS Fund Services Ohio, Inc. (“BISYS”), pursuant to which BISYS provides sub-administration and sub-transfer agency services, respectively, to the Funds.
GSA and BISYS have agreed to designate certain sub-transfer agency agreements GSA enters into with respect to the Funds as “Qualifying Sub-TA Agreements.” With respect to Qualifying Sub-TA Agreements, BISYS will credit to GSA an amount equal to the lesser of (i) the actual amount GSA is charged by the sub-transfer agent under the applicable Qualifying Sub-TA Agreement or (ii) $10 per investor account; however, the aggregate amount paid with regard to all Qualifying Sub-TA Agreements, regardless of whether option (i) or (ii) applies, shall not exceed $200,000 per annum. BISYS will calculate and credit such amounts to GSA’s fees on a monthly basis. All amounts will be credited to each applicable Fund on a monthly basis.
Under the terms of an Administrative Services Plan, the Funds may pay fees to servicing organizations, such as broker-dealers, including Nationwide Financial Services, Inc. (“Nationwide Financial Services”), an affiliate of NWD Management & Research Trust, and financial institutions, which agree to provide administrative support services to the shareholders of certain classes. These services include, but are not limited to, the following: establishing and maintaining
Notes to Financial Statements (Continued)
October 31, 2006
shareholder accounts; processing purchase and redemption transactions; arranging bank wires; performing shareholder sub-accounting; answering inquiries regarding the Funds; and other such services. These fees are based on an annual rate of up to 0.25% of the average daily net assets of the Class A, Class R and Institutional Service Class shares of each of the Funds.
As of October 31, 2006, the advisers or affiliates of the advisers directly held 77% of the shares outstanding of the Small Cap Growth Fund.
Under terms of a letter agreement dated September 12, 2006, by and among GSA and the Audit Committees of the Funds and Gartmore Variable Insurance Trust, the Funds have agreed to reimburse GSA their pro-rata portion of certain costs related to the Funds’ ongoing administration, monitoring and annual (audit) testing of the Funds’ Rule 38a-1 Compliance Program subject to the pre-approval of the Funds’ Audit Committee. Such costs include: (1) $160 per hour for services performed on behalf of the Funds by employees of GSA or GSA’s affiliates (other than the Fund CCO); (2) travel costs and other reasonable incidental expenses (without markup) incurred by employees of GSA or GSA’s affiliates in connection with performance of such services; and (3) in the event it becomes necessary to supplement the services of GSA’s (and GSA’s affiliates’) employees, in order to complete the Funds’ Rule 38a-1 annual compliance audit, the costs of a mutually-agreed upon independent contractor’s costs to provide such services.
4. Short-Term Trading Fees
The Small Cap Growth Fund assesses a 2.00% redemption fee on all classes of shares that are purchased and are sold or exchanged within 90 calendar days of purchase. The redemption fee, if any, is paid directly to the Fund and is designed to offset brokerage commissions, market impact and other costs associated with short-term trading of Fund shares. For purposes of determining whether the redemption fee applies, the shares that were held the longest will be redeemed first. This redemption fee is in addition to any CDSCs that may be applicable at the time of sale. The redemption fee may not apply in certain circumstances, such as redemptions or exchanges of shares held in certain omnibus accounts or retirement plans that cannot implement the redemption fee. The fee does not apply to shares purchased through reinvested dividends or capital gains.
For the year ended October 31, 2006, the Fund had no contributions to capital due to collection of redemption fees.
5. Bank Loans and Earnings Credit
The Trust has a credit agreement with JPMorgan Chase & Co., the Funds’ custodian bank, permitting the Trust to borrow up to $100,000,000. Borrowings under this arrangement bear interest at the Federal Funds rate plus 0.50%. The interest costs, if any, would be included in other fees in the Statement of Operations. No compensating balances were required under the terms of the line of credit. The line of credit is renewed annually expiring on June 26, 2007, with a commitment fee of 0.08% per year on $100,000,000. There were no borrowings outstanding under this line of credit during the year ended October 31, 2006.
The Trust’s custodian bank has agreed to reduce the bank’s fees (earnings credits) when the Funds of the Trust maintain cash on deposit in non-interest-bearing custody and Demand Deposit Accounts. Earning credits are shown as a reduction of total expenses on the Statement of Operations.
6. Investment Transactions
Purchases and sales of securities (excluding short-term securities) for the year ended October 31, 2006, are summarized as follows:
| | | | | | |
| Fund | | Purchases | | Sales |
Small Cap Growth | | $ | 60,233,121 | | $ | 48,724,874 |
Small Cap Value | | | 43,933,169 | | | 40,962,985 |
7. Indemnifications
Under the Trust’s organizational documents, certain of the Trust’s Officers and Trustees are indemnified against certain liabilities arising out of the performance of their duties to the Trust. In addition, the Trust has entered into Indemnification Agreements with its Trustees and certain of its Officers. Trust Officers receive no compensation from the Trust for serving as its Officers. In addition, in the normal course of business, the Trust enters into contracts with its vendors and others that provide for general indemnifications. The Trust’s maximum liability under these arrangements is unknown, as this would involve future claims that may be made against the Trust. Based on experience, however, the Trust expects that risk of loss to be remote.
8. Federal Tax Information
The tax character of distributions paid during the fiscal year ended October 31, 2006, was as follows: (Total distributions paid differ from the Statement of Changes in Net Assets because for tax purposes dividends are recognized when actually paid.)
| | | | | | | | | | | | |
| | | Distributions Paid from | | | | |
| Fund | | Ordinary
Income | | Net Long-
Term Capital
Gains | | Total Taxable
Distributions | | Total
Distributions
Paid |
Small Cap Growth | | $ | 3,595,391 | | $ | — | | $ | 3,595,391 | | $ | 3,595,391 |
Small Cap Value | | | 2,908,566 | | | 2,557,986 | | | 5,466,552 | | | 5,466,552 |
The tax character of distributions paid during the fiscal year ended October 31, 2005 was as follows: (Total distributions paid differ from the Statement of Changes in Net Assets because for tax purposes dividends are recognized when actually paid.)
| | | | | | | | | | | | |
| | | Distributions Paid from | | | | |
| Fund | | Ordinary
Income | | Net Long-
Term Capital
Gains | | Total Taxable
Distributions | | Total
Distributions
Paid |
Small Cap Growth | | $ | — | | $ | — | | $ | — | | $ | — |
Small Cap Value | | | 1,994,975 | | | 5,862,954 | | | 7,857,929 | | | 7,857,929 |
As of October 31, 2006, the components of accumulated earnings (deficit) on a tax basis was as follows:
| | | | | | | | | | | | | | | |
| Fund | | Undistributed
Ordinary
Income | | Undistributed
Long-Term
Capital Gains | | Accumulated
Earnings | | Unrealized
Appreciation
(Depreciation)* | | Total
Accumulated
Earnings
(Deficit) |
Small Cap Growth | | $ | 2,171,148 | | $ | 3,138,064 | | $ | 5,309,212 | | $ | 6,767,069 | | $ | 12,076,281 |
Small Cap Value | | | 2,085,766 | | | 1,884,055 | | | 3,969,821 | | | 2,176,748 | | | 6,146,569 |
| * | The differences between the book-basis and tax-basis unrealized appreciation (depreciation) is attributable primarily to: tax deferral of losses on wash sales; the difference between book and tax amortization methods for premium and market discount; and the return of capital adjustments from real estate investment trusts. |
As of October 31, 2006, the tax cost of securities and the breakdown of unrealized appreciation (depreciation) for each Fund were as follows:
| | | | | | | | | | | | | |
| Fund | | Tax Cost of
Securities | | Unrealized
Appreciation | | Unrealized
Depreciation | | | Net
Unrealized
Appreciation
(Depreciation) |
Small Cap Growth | | $ | 58,592,721 | | $ | 7,851,434 | | $ | (1,084,365 | ) | | $ | 6,767,069 |
Small Cap Value | | | 29,818,945 | | | 2,723,678 | | | (546,930 | ) | | | 2,176,748 |
Notes to Financial Statements (Continued)
October 31, 2006
Recently Issued Accounting Pronouncements – On July 13, 2006, the Financial Accounting Standards Board (“FASB”) released FASB Interpretation No. 48, Accounting for Uncertainty in Income Taxes (“FIN 48”). FIN 48 provides guidance for how uncertain tax positions should be recognized, measured, presented and disclosed in the financial statements. FIN 48 requires the affirmative evaluation of tax positions taken or expected to be taken in the course of preparing the Fund’s tax returns to determine whether it is more-likely-than-not (i.e., greater than 50 percent) that each tax position will be sustained upon examination by a taxing authority based on the technical merits of the position. A tax position that meets the more-likely-than-not recognition threshold is measured to determine the amount of benefit to recognize in the financial statements. Differences between tax positions taken in a tax return and amounts recognized in the financial statements will generally result in an increase in a liability for taxes payable (or a reduction of a tax refund receivable) and an increase in a deferred tax liability (or a reduction in a deferred tax asset). Adoption of FIN 48 is required for fiscal years beginning after December 15, 2006 and is to be applied to all open tax years as of the effective date. At this time, management is evaluating the implications of FIN 48. Its impact to the financial statements has not yet been determined.
Report of Independent Registered Public Accounting Firm
To the Board of Trustees and Shareholders of Gartmore Mutual Funds:
In our opinion, the accompanying statements of assets and liabilities, including the statements of investments, and the related statements of operations and of changes in net assets and the financial highlights present fairly, in all material respects, the financial position of NorthPointe Small Cap Growth Fund and NorthPointe Small Cap Value Fund (two series of Gartmore Mutual Funds, hereafter referred to as the “Funds”) at October 31, 2006, the results of each of their operations for the year then ended, the changes in each of their net assets for each of the two years then ended and the financial highlights for each of the periods indicated in conformity with accounting principles generally accepted in the United States of America. These financial statements and financial highlights (hereafter referred to as “financial statements”) are the responsibility of the Funds’ management; our responsibility is to express an opinion on these financial statements based on our audits. We conducted our audits of these financial statements in accordance with the standards of the Public Company Accounting Oversight Board (United States.) Those standards require that we plan and perform the audit to obtain reasonable assurance about whether the financial statements are free of material misstatement. An audit includes examining, on a test basis, evidence supporting the amounts and disclosures in the financial statements, assessing the accounting principles used and significant estimates made by management, and evaluating the overall financial statement presentation. We believe that our audits, which included confirmation of securities at October 31, 2006 by correspondence with the custodian and brokers, provide a reasonable basis for our opinion.
PricewaterhouseCoopers LLP
Philadelphia, Pennsylvania
December 20, 2006
Supplemental Information
1. Other Federal Tax Information (Unaudited)
For the period ended October 31, 2006, certain dividends paid by the Funds may be subject to a maximum tax rate of 15% as provided for by the Jobs and Growth Tax Relief Reconciliation Act of 2003. The Funds intend to designate the maximum amount allowable as taxed at a maximum rate of 15%. Complete information will be reported in conjunction with your 2006 Form 1099-DIV.
For the period ended October 31, 2006, the following Funds paid qualified dividend income:
| | | |
| Fund | | Qualified
Dividend
Income |
Small Cap Growth | | $ | 80,822 |
Small Cap Value | | | 410,695 |
For the taxable year ended October 31, 2006, the following percentage of income dividends paid by the Funds qualify for the dividends received deduction available to corporations:
| | |
| Fund | | Dividends
Received
Deduction |
Small Cap Growth | | 2% |
Small Cap Value | | 14% |
The Funds designate the following amounts as long term capital gain distributions qualifying for the maximum 15% income tax rate for individuals:
| | | |
| Fund | | Amount |
Small Cap Value | | $ | 2,557,986 |
Management Information
October 31, 2006 (Unaudited)
Trustees who are not Interested Persons (as defined in the 1940 Act) and Officers of the Funds as of October 31, 2006
| | | | | | | | |
Name, Address and Year of Birth | | Position(s) Held
with the Trust
and Length of
Time Served1 | | Principal Occupation(s) During Past Five Years | | Number of Portfolios
in the Gartmore Fund Complex Overseen by Trustee | | Other Directorships Held by Trustee or
Nominee2 |
| | | | |
Charles E. Allen c/o NWD Investment Management, Inc. 1200 River Road, Suite 1000 Conshohocken, PA 19428 1948 | | Trustee since July 2000 | | Mr. Allen is Chairman, Chief Executive Officer and President of the Graimark Realty Advisors, Inc. (real estate development, investment and asset management). | | 97 | | None |
| | | | |
Paula H.J. Cholmondeley c/o NWD Investment Management, Inc. 1200 River Road, Suite 1000 Conshohocken, PA 19428 1947 | | Trustee since July 2000 | | Ms. Cholmondeley is an independent strategy consultant. Ms. Cholmondeley was Vice President and General Manager of Sappi Fine Paper North America from April 2000 through December 2003. | | 97 | | Director of Dentsply International, Inc., Ultralife Batteries, Inc., Terex Corporation, Minerals Technology, Inc. and Albany International Corp. |
| | | | |
C. Brent DeVore3 c/o NWD Investment Management, Inc. 1200 River Road, Suite 1000 Conshohocken, PA 19428 1940 | | Trustee since 1990 | | Dr. DeVore is President of Otterbein College. | | 97 | | None |
| | | | |
Phyllis K. Dryden c/o NWD Investment Management, Inc. 1200 River Road, Suite 1000 Conshohocken, PA 19428 1947 | | Trustee since December 2004 | | Beginning in February 2006 Ms. Dryden is employed by The Mitchell Madison Group, a management consulting company. Ms. Dryden was a former Managing Partner of marchFIRST, a global management consulting firm prior to February 2002. | | 97 | | None |
| | | | |
Barbara L. Hennigar c/o NWD Investment Management, Inc. 1200 River Road, Suite 1000 Conshohocken, PA 19428 1935 | | Trustee since July 2000 | | Retired. | | 97 | | None |
Management Information
October 31, 2006 (Unaudited)
Trustees who are not Interested Persons (as defined in the 1940 Act) and Officers of the Funds as of October 31, 2006 (Continued)
| | | | | | | | |
Name, Address and Year of Birth | | Position(s) Held
with the Trust
and Length of
Time Served1 | | Principal Occupation(s) During Past Five Years | | Number of Portfolios
in the Gartmore Fund Complex Overseen by Trustee | | Other Directorships Held by Trustee or
Nominee2 |
| | | | |
Barbara I. Jacobs c/o NWD Investment Management, Inc. 1200 River Road, Suite 1000 Conshohocken, PA 19428 1950 | | Trustee since December 2004 | | Ms. Jacobs served as Chairman of the Board of Directors of KICAP Network Fund, a European (United Kingdom) hedge fund, from December 2000 through January 2006. Prior to 2004, Ms. Jacobs was also a Managing Director and European Portfolio Manager with Teachers Insurance Annuity Association-College Retirement Equity Fund. | | 97 | | None |
| | | | |
Douglas F. Kridler c/o NWD Investment Management, Inc. 1200 River Road, Suite 1000 Conshohocken, PA 19428 1955 | | Trustee since September 1997 | | Mr. Kridler has served as the President and Chief Executive Officer of the Columbus Foundation (a Columbus, OH-based foundation which manages over 1,300 individual endowment funds) since February 2002. Prior to January 31, 2002, Mr. Kridler was the President of the Columbus Association for the Performing Arts and Chairman of the Greater Columbus Convention and Visitors Bureau. | | 97 | | None |
| | | | |
Michael D. McCarthy c/o NWD Investment Management, Inc. 1200 River Road, Suite 1000 Conshohocken, PA 19428 1947 | | Trustee since December 2004 | | Retired. Mr. McCarthy was Chairman of VMAC (commodity swaps) from October 2002 until June 2005; and a partner of Pineville Properties LLC (a commercial real estate development firm). | | 97 | | None |
| | | | |
David C. Wetmore c/o NWD Investment Management, Inc. 1200 River Road, Suite 1000 Conshohocken, PA 19428 1948 | | Trustee since 1995 and Chairman since February 2005 | | Retired. | | 97 | | None |
| 1 | Length of time served includes time served with the Trust’s predecessors. |
| 2 | Directorships held in (1) any other investment companies registered under the 1940 Act, (2) any company with a class of securities registered pursuant to Section 12 of the Securities Exchange Act of 1934, as amended (the “Exchange Act”), or (3) any company subject to the requirements of Section 15(d) of the Exchange Act. |
| 3 | Mr. DeVore has served as President of Otterbein College since 1984. Mark Thresher, President and Chief Operating Officer of Nationwide Financial Services, Inc. (“NFS”) has served as a member of the Board of Trustees of Otterbein College since 2000, currently serves as one of 30 of its trustees, and is currently one of two Vice Chairmen of the Board. NFS is under common control with each of the Gartmore companies that serve as investment advisers and principal underwriter to the Trust, as each is a majority-owned subsidiary of Nationwide Corporation (“NC”) and, through NC, of Nationwide Mutual Insurance Company (95.2%) and Nationwide Mutual Fire Insurance Company (4.8%). |
Additional information regarding the Trustees and Officers may be found in the Trust’s Statement of Additional Information, which is available without charge upon request, by calling 800-848-0920.
Trustees who are Interested Persons (as defined in the 1940 Act) and/or Officers of the Funds as of October 31, 2006
| | | | | | | | |
Name, Address and Year of Birth | | Position(s) Held with the Trust and Length of Time Served1 | | Principal Occupation(s) During Past Five Years | | Number of Portfolios
in the Gartmore Fund Complex Overseen by Trustee | | Other Directorships Held by Trustee2 |
| | | | |
Paul J. Hondros NWD Investment Management, Inc. 1200 River Road, Suite 1000 Conshohocken, PA 19428 1948 | | Trustee since July 2000 | | Mr. Hondros has been President and Chief Executive Officer of various NWD Investments Group entities, including Gartmore Distribution Services, Inc. (“GDSI”),3 Gartmore Investor Services, Inc. (“GISI”),3 Gartmore Morley Capital Management, Inc. (“GMCM”),3 Morley Financial Services, Inc. (“MFS”),3 NorthPointe Capital, LLC (“NorthPointe”),3 NWD Management & Research Trust (“NWDMRT”),3 NWD Investment Management, Inc. (“NWDIM”),3 Gartmore Mutual Fund Capital Trust (“GMFCT”)3 and Gartmore SA Capital Trust (“GSA”)3; and a Director of Nationwide Securities, Inc.,3 as well as several entities within Nationwide Financial Services, Inc. | | 97 | | None |
| | | | |
Arden L. Shisler c/o NWD Investment Management, Inc. 1200 River Road, Suite 1000 Conshohocken, PA 19428 1941 | | Trustee since February 2000 | | Retired. Mr. Shisler is the former President and Chief Executive Officer of K&B Transport, Inc., a trucking firm (2000 through 2002). He served as a consultant to K&B from January 2003 through December 2004. Since 1992, Mr. Shisler has also been Chairman of the Board for Nationwide Mutual Insurance Company.3 | | 97 | | Director of Nationwide Financial Services, Inc. |
| | | | |
Gerald J. Holland NWD Investment Management, Inc. 1200 River Road, Suite 1000 Conshohocken, PA 19428 1951 | | Treasurer since March 2001 | | Mr. Holland is Senior Vice President - Operations for NWDIM,3 GMFCT,3 and GSA.3 | | N/A | | N/A |
| | | | |
Michael A. Krulikowski NWD Investment Management, Inc. 1200 River Road, Suite 1000 Conshohocken, PA 19428 1959 | | Chief Compliance Officer since June 2004 | | Since November 1999, Mr. Krulikowski has served as a Vice President and Chief Compliance Officer of NWDIM3. Since June 2004, Mr. Krulikowski has also served as Chief Compliance Officer of the Trust. | | N/A | | N/A |
Management Information
October 31, 2006 (Unaudited)
Trustees who are Interested Persons (as defined in the 1940 Act) and/or Officers of the Funds as of October 31, 2006 (Continued)
| | | | | | | | |
Name, Address and Year of Birth | | Position(s) Held with the Trust and Length of Time Served1 | | Principal Occupation(s) During Past Five Years | | Number of Portfolios
in the Gartmore Fund Complex Overseen by Trustee | | Other Directorships Held by Trustee2 |
| | | | |
Eric E. Miller NWD Investment Management, Inc. 1200 River Road, Suite 1000 Conshohocken, PA 19428 1953 | | Secretary since December 2002 | | Mr. Miller is Senior Vice President, Chief Counsel for NWDIM,3 GMFCT3 and GSA3 since August 2002. From August 2000 to August 2002, Mr. Miller was a Partner with Stradley Ronan Stevens & Young, LLP. | | N/A | | N/A |
| 1 | Length of time served includes time served with the Trust’s predecessors. |
| 2 | Directorships held in (1) any other investment companies registered under the 1940 Act, (2) any company with a class of securities registered pursuant to Section 12 of the Securities Exchange Act of 1934, as amended (the “Exchange Act”), or (3) any company subject to the requirements of Section 15(d) of the Exchange Act. |
| 3 | This position is held with an affiliated person or principal underwriter of the Trust. |
Federal law requires the Trust, each of its investment advisers and sub-advisers to adopt procedures for voting proxies (“Proxy Voting Guidelines”) and to provide a summary of those Proxy Voting Guidelines used to vote the securities held by the Funds. The Funds’ proxy voting policies and procedures are available without charge (i) upon request, by calling 800-848-0920, (ii) on the Fund’s website at www.nwdfunds.com, or (iii) on the Securities and Exchange Commission’s website at www.sec.gov.
AnnualReport
| | |
| | |

| | October 31, 2006 |
Commentary provided by Gartmore Mutual Fund Capital Trust (the “Adviser”), investment adviser to Gartmore Funds. All opinions and estimates included in this report constitute the Advisers’ judgment as of the date of this report and are subject to change without notice.
As of September 29, 2006, Gartmore Funds and its U.S. operations, as well as the Funds’ Advisers, distributor, and other service providers, are no longer affiliated with Gartmore Investment Management plc (Gartmore U.K.) or other Gartmore international businesses. Certain Gartmore U.S. companies, and marketing materials related to them, will continue to carry the Gartmore name for the next several months under the terms of an agreement with Gartmore U.K. For more information call, 800-848-0920.
Statement Regarding Availability of Quarterly Portfolio Schedule.
The Gartmore Funds file complete schedules of portfolio holdings for each Fund with the Securities and Exchange Commission (the “Commission”) for the first and third quarters of each fiscal year on Form N-Q. The Funds’ Forms N-Q are available on the Commission’s website at http://www.sec.gov. The Funds’ Forms N-Q may be reviewed and copied at the Commission’s Public Reference Room in Washington, DC, and information on the operation of the Public Reference Room may be obtained by calling 800-SEC-0330; and the Funds make the information on Form N-Q available to shareholders on www.nwdfunds.com or upon request without charge.
Statement Regarding Availability of Proxy Voting Record.
Information regarding how the Funds voted proxies relating to portfolio securities held during the most recent 12-month period ended June 30, 2006 is available without charge, upon request, by calling 800-848-0920, and on the Commission’s website at http://www.sec.gov.
Message to Shareholders
December 15, 2006
This reporting period has been a time of change for our company. First, in September 2006, our parent company, Nationwide Mutual Insurance Company (Nationwide), completed the sale of the U.K.-based Gartmore Investment Management Ltd. (Gartmore U.K.). As a result of the sale, on November 30, 2006, Gartmore Global Investments, the U.S. division of Nationwide’s asset management business, changed its name to NWD Investments. All of the mutual funds advised by NWD Investments, however, will retain the Gartmore Funds name until May 2007. In addition, Gartmore U.K. will continue to act as subadviser for a number of Gartmore Funds, and, as a result, investors in those funds that include foreign exposure can expect “business as usual”. Nationwide has been examining how best to align NWD Investments as a part of its operations since the sale of Gartmore U.K. and on December 21, 2006, announced that it had reached a preliminary agreement of terms to sell NWD Investment’s retail operations to Nationwide Financial Services, Inc.
Second, I must report that this will be my final shareholder letter. Effective December 15, 2006, John Grady, who joined our firm in October as transition manager, was named as president of NWD Investments and was elected by the Gartmore Funds Board of Trustees to the role of president and chief executive officer. I’m confident that John’s extensive background in this industry will serve NWD Investments well as the company prepares for its next chapter of growth. I have enjoyed serving all of you, and I wish you much success in the years to come.
Market Overview
Global stock markets delivered strong gains for the year ended October 31, 2006, but the period was not without its share of volatility. During the first six months, the markets did a good job of advancing despite the headwinds of rising crude oil prices, interest-rate hikes by the Federal Reserve Board and the replacement of retiring Federal Reserve Chairman Alan Greenspan by Ben Bernanke. The central bank’s May 10 rate hike, however, marked a critical turning point. Disappointment that the Fed did not stand pat, together with concerns about inflationary pressures and the possibility of further rate hikes, triggered sharp declines in global stock markets. Small-capitalization stocks and growth sectors such as technology generally suffered the most during the sell-off.
Throughout the summer, inflation moderated a bit, and more evidence of a slowing U.S. economy emerged. The Fed reacted by leaving interest rates unchanged at its August, September and October meetings. Falling energy prices in the final months of the reporting period provided further fuel for the markets, sparking a rebound in stock prices. For the one-year reporting period, the S&P 500® Index recorded a return of 16.34%. A weak U.S. dollar helped lift foreign markets to even better returns; the Morgan Stanley Capital International Europe, Australasia and Far East (MSCI EAFE®) Index posted a gain of 28.04%. Value stocks maintained a commanding lead over growth shares during the period, while small-cap issues topped larger caps.
It’s Official—We’re Lipper’s best “Overall Small Fund Family”
From the beginning, we’ve made it our mission to be good stewards of our investors’ money. Stewardship can be measured in various ways, but in the mutual fund business, investment performance is one obvious yardstick. That’s why we’re delighted to have been honored with the best “Overall Small Fund Family” award at the 2006 Lipper Fund Awards. Significantly, this award was not based on results tallied over just one year. According to Lipper, a key factor in the selection process was our consistent, strong risk-adjusted returns in several different asset classes relative to those of our peers for three years ended December 31, 2005. We appreciate this recognition of our commitment to delivering returns for our investors, and we consider the award a validation of our approach.
International Fund Highlights
Our confidence in our non-U.S. subadvised funds was amply rewarded during the one-year reporting period. For example, the Gartmore Worldwide Leaders Fund posted a gain of 26.22%*, compared with 21.91% for the MSCI World IndexSM. The Fund’s performance placed the Fund in the top 4% among its Lipper peer group, Global Large-Cap Core Funds (consisting of 59 funds as of October 31, 2006). In recognition of the Gartmore Worldwide Leaders Fund’s outstanding track record, it received the nod as Best Global Large-Cap Core Fund at the 2006 Lipper Fund Awards. Also meriting mention was the Gartmore International Growth Fund, whose 38.22% return went above and beyond the 28.91% return posted by the MSCI All Country World excluding U.S. Index and earned it a ranking in the top 1% among its Lipper peer group, International Multi-Cap Core Funds (consisting of 904 funds as of October 31, 2006).
Small-Cap Lineup Delivers Strong Results
Our commitment to small-cap investing remains an important theme. Offering several investment choices, including funds that invest in companies that may receive scant attention from the vast majority of Wall Street analysts, small caps typically are a much less efficient asset
Dear Shareholders:
class than their large-cap and even mid-cap counterparts. This means that more opportunities may exist for our experienced portfolio managers to identify and potentially capitalize on mispriced stocks. Our success in this area was reflected in strong performance during the past year across most of our small-cap products.
One of our newer entries, the Gartmore Small Cap Leaders Fund, offers exposure to both growth and value opportunities through two separate “sleeves” or subportfolios, each with its own management team. During the one-year reporting period, this Fund delivered a 30.65% return, far surpassing the 19.98% result of the Russell 2000® Index. The Fund also finished in the top 2% of Lipper Small-Cap Core Funds (consisting of 689 funds as of October 31, 2006). The Gartmore Small Cap Fund delivered comparable results, with a 30.98% return, beating the same benchmark, the Russell 2000 Index. Notably, this Fund also posted exceptionally strong performance over longer periods of time, placing in the top 2% of its peers among Lipper Small-Cap Core Funds (consisting of 689 funds as of October 31, 2006). for the five years ended October 31, 2006.
To further broaden investors’ choices in the small-cap area and to leverage the experience of our seasoned portfolio managers, we introduced three new funds near the end of September 2006: the Gartmore Small Cap Growth Opportunities Fund, the Gartmore Small Cap Core Fund and the Gartmore Small Cap Value Fund. At the same time, we debuted two absolute-return products: the Gartmore Market Neutral Fund and the Gartmore Hedged Core Equity Fund. These two products are designed for more conservative investors looking for a fund that offers a mix of long and short positions, as well as the potential for lower correlation with the broader equity markets.
Diversifying with Sector Funds
Once an investor has built a solid portfolio around a select group of core funds, sector funds may offer an effective way to enhance both long-term performance and diversification. In this category, several funds with a global scope performed well, including the Gartmore Global Natural Resources Fund, with a 22.87% gain that outdistanced the 17.96% return of its benchmark, the Goldman Sachs Natural Resources Index. Also finishing the period in fine form was the Gartmore Global Utilities Fund, with a return of 27.56%—performance that was good enough to surpass that of the Fund’s composite benchmark of 60% MSCI World Telecommunication Services IndexSM and 40% MSCI World Utilities IndexSM, which returned 25.61%. Last of all, amid considerable volatility for technology stocks, the Gartmore Global Technology and Communications Fund posted a 13.48% return, handily beating the 10.35% return of the Goldman Sachs Technology Composite Index (GSTI®), our benchmark for this Fund.
Strategically combining core equity and fixed-income funds with sector exposure is exhibited in our Gartmore Optimal Allocations “fund of funds” series. We now offer five variations on this theme, three of which are designed to be complete asset allocation solutions: these are the Aggressive, Moderately Aggressive and Moderate Funds within the Optimal Allocations series—each with different mixes of underlying funds—targeting specific risk levels fitting those descriptions. The Gartmore Optimal Allocations Fund: Specialty is intended for investors who already have core investments in place and seek to enhance their overall risk-adjusted returns by exposure to a select group of specialty funds. After the one-year reporting period closed, moreover, we launched the Gartmore Optimal Allocations Fund: Defensive. This new offering is designed for investors who have a lower tolerance for risk and want to complement a core holding by seeking sustainable real returns as a hedge against possible economic deterioration, including inflation, deflation or rising interest rates.
With asset allocation models designed by Ibbotson Associates, a leading authority on asset allocation, the Optimal Allocations Funds are designed to expand an average investor’s “efficient frontier”—that is, they seek to provide the most efficient combination of various asset classes to achieve the highest possible return for a given level of risk. The results to date have been gratifying: for the one-year reporting period, all four Optimal Allocations funds placed in the top quartile of their respective Lipper peer groups (consisting of 592 Mixed-Asset Target Allocation Growth Funds, 414 Mixed-Asset Target Allocation Moderate Funds, 904 Multi-Cap Core Funds and 104 Specialty/Miscellaneous Funds as of October 31, 2006).
Short-Term Shortfall from Long-Term Winner
Although the Gartmore U.S. Growth Leaders Fund, which is managed by one of our talented, veteran portfolio managers, Christopher Baggini, struggled during this reporting period with a return of 1.77%, the Fund’s longer-term record remained enviable: its five-year return of 10.98% was well ahead of the S&P 500 Index’s 7.26% gain, and the Fund occupied the 8th percentile versus other Lipper Multi-Cap Growth Funds (consisting of 332 funds as of Oct. 31, 2006).
Message to Shareholders
Continued
We Appreciate Your Business
We take the charge of managing your assets very seriously. While other companies might make that same claim, we can point to our recent company-level and fund-specific Lipper awards as evidence that we have “walked the talk”. As we close the books on an eventful year—both for the markets and for our company—you can be sure that NWD Investments will continue its pursuit of superior long-term, risk-adjusted returns for the benefit of you, our valued shareholders.

Paul J. Hondros

John H. Grady
| * | All Gartmore Funds performance returns are Class A at NAV, except where noted. |
Lipper, a wholly owned subsidiary of Reuters, is a leading global provider of mutual fund information and analysis to fund companies, financial intermediaries and media organizations. The firm competed with 17 eligible small fund families, defined as groups with at least three equity, three bond and three mixed-equity portfolios that received Consistent Return scores as of Dec. 31, 2005. Consistent Return is a quantitative metric that incorporates two characteristics: risk-adjusted return and the strength of the fund’s performance trend. Lipper determined the award winner by averaging the decile rank of the three-year Consistent Return scores for all of the funds within the eligible groups. The fund family with the lowest average decile rank received the award. Although Lipper makes reasonable efforts to ensure the accuracy and reliability of the data, the accuracy is not guaranteed by Lipper.
For the “Global Large Cap Core Funds” award, Lipper determined the award winner by calculating the highest Consistent Return over the three-year time period ended Dec. 31, 2005. Gartmore Funds competed among 16 global large-cap core portfolios to win the award.
Funds that concentrate on specific sectors or a relatively small number of securities may be subject to greater volatility than that of other mutual funds.
International investing involves additional risks, including currency fluctuations, differences in accounting standards, political instability and foreign regulations, all of which are magnified in emerging markets.
Small-company stocks have higher risks than the stocks of larger, more established companies and have significant short-term price volatility.
Sophisticated investment strategies such as leverage, short selling, short-term trading and investing in derivatives, REITs and IPOs may cause a Fund to have greater risk and volatility and higher expenses than those of other investments.
The Gartmore Optimal Allocations Funds are designed to provide diversification and asset allocation across several types of investments and asset classes, primarily by investing in underlying Gartmore Funds. Each Fund is subject to different levels of risk, based on the size of its asset class allocations. Each Fund’s underlying funds may be subject to specific investment risks such as those associated with a concentrated number of securities (such as REITs), small companies, international stocks, initial public offerings, short selling, short-term trading, bonds and short-term instruments. There is no assurance that a diversified portfolio will produce better results than a nondiversified one.
Index returns do not include the effect of any sales charges or expenses. If sales charges and expenses were deducted, the actual returns of each Index would be lower. It is not possible to invest directly in an Index.
Goldman Sachs Natural Resources Index: An unmanaged, modified market capitalization-weighted sector index of U.S.-traded natural resource-related stocks; includes companies in the categories of extractive industries, energy companies, owners and operators of timber tracts, forestry services, producers of pulp and paper, and owners of plantations.
Morgan Stanley Capital International (MSCI) All Country World excluding U.S. Index: An unmanaged, free float-adjusted, market-capitalization weighted index that is designed to measure the performance of the stocks in companies in all countries except the United States.
Morgan Stanley Capital International Europe, Australasia and Far East (MSCI EAFE®) Index: An unmanaged, free float-adjusted, market capitalization-weighted index that is designed to measure the performance of stocks in developed markets outside the United States and Canada.
Morgan Stanley Capital International (MSCI) World IndexSM: An unmanaged, free float-adjusted, market capitalization-weighted index that is designed to measure the performance of global developed-market equities.
Morgan Stanley Capital International (MSCI) World Telecommunication Services IndexSM: An unmanaged index that is based on developed-market country indexes and is generally representative of the stocks in the global utilities sector.
Morgan Stanley Capital International (MSCI) World Utilities IndexSM: An unmanaged index that is based on developed-market country indexes and is generally representative of the stocks in the utilities sector, which includes industry groups such as electric, gas, multi-utilities, and unregulated power and water.
Russell 2000® Index: An unmanaged index that measures the performance of the stocks of U.S. companies.
Standard & Poor’s 500® (S&P 500) Index: An unmanaged, market capitalization-weighted index of 500 widely held stocks of large-cap U.S. companies that gives a broad look at how the stock prices of those companies have performed.
Each Fund may be subject to specific investment risks such as those associated with sophisticated investment strategies such as leverage, short selling, short-term trading and investing in derivatives, REITs, IPOs, and in smaller companies. These strategies may cause these Funds to have greater risk and volatility, and higher expenses, than those of other investments. The risks of investing in these Funds are more fully detailed within the Funds prospectus.
Investing in mutual funds involves risk, including possible loss of principal.
There is no assurance that the investment objective of any fund will be achieved.
The investment return and principal value of an investment will fluctuate, so that an investor’s shares, when redeemed, may be worth more or less than their original cost.
Third-party information has been obtained from and is based on sources the Firm believes to be reliable.
Views expressed above are as of the date noted and are subject to change at any time.
The Funds’ adviser, one of its affiliated advisers, or its employees, may have a position in the securities named in this report.
This report is for informational purposes only, and is not intended as an offer or recommendation with respect to the purchase or sale of any security, option, future or other derivatives in such securities.
PAST PERFORMANCE DOES NOT GUARANTEE FUTURE RESULTS. To obtain performance information current to the most recent month-end, which may be higher or lower than the performance shown, please call 800-848-0920 or visit www.nwdfunds.com.
Investors should carefully consider a fund’s investment objectives, risks, fees, charges and expenses before investing any money. To obtain this and other fund information, please call 800-848-0920 to request a prospectus, or download a prospectus at www.gartmorefunds.com. Please read it carefully before investing any money.
Gartmore Funds distributed by Gartmore Distribution Services, Inc., Member NASD. 1200 River Road, Suite 1000, Conshohocken, Pa. 19428.
As of September 29, 2006, Gartmore Funds and its U.S. operations, as well as the Funds’ advisers, distributor, and other service providers, are no longer affiliated with Gartmore Investment Management plc (Gartmore U.K.) or other Gartmore international businesses. Certain Gartmore U.S. companies, and marketing materials related to them, will continue to carry the Gartmore name for the next several months under the terms of an agreement with Gartmore U.K. For more information, please call 800-848-0920.
Gartmore Hedged Core Equity Fund
The Gartmore Hedged Core Equity Fund was launched Sept. 29, 2006, and, as of Oct. 31, 2006, the close of the annual reporting period, the Fund had existed for too limited a time to generate performance that could be analyzed and discussed in a meaningful manner. Accordingly, in place of an annual management commentary, set forth below is a description of the Fund’s investment objective.
The Fund’s primary goal is to seek long-term capital appreciation by establishing long and short positions in large-capitalization stocks.
Under normal circumstances, the Fund will have both long and short positions in equity securities, primarily common stocks of large-cap companies that are organized under the laws of the United States and have their principal places of business in the United States, or whose stock is traded primarily in the United States. The Fund follows a long/short strategy in seeking to achieve long-term capital appreciation and lessen downside volatility by selling stock short to protect its unrealized gains in certain securities and/or to produce capital gains. The portfolio manager targets an allocation of 80% to 100% in long positions and 30% to 35% in short sales as a percentage of net assets, generally resulting in a target net (i.e., combined long and short) position of 65%.
The Fund cannot guarantee that it will achieve its investment objective. As is true of nearly every fund, the value of the Fund’s investments—and, therefore, the value of Fund shares—may fluctuate.
Portfolio Manager:
Joseph A. Cerniglia, CFA
| | |
Fund Performance | | Gartmore Hedged Core Equity Fund |
Total Return
(For period ended October 31, 2006)
| | | | |
| | | | | Inception1 |
| Class A | | w/o SC6 | | 2.50% |
| | | w/SC3 | | -3.39% |
| Class B | | w/o SC6 | | 2.40% |
| | | w/SC4 | | -2.60% |
| Class C | | w/o SC6 | | 2.40% |
| | | w/SC5 | | 1.40% |
| Class R2 | | | | 2.40% |
| Institutional Service Class2 | | | | 2.50% |
| Institutional Class2 | | | | 2.50% |
| 1 | Fund commenced operations on September 29, 2006. |
| 2 | Not subject to any sales charges. |
| 3 | A 5.75% front-end sales charge was deducted. |
| 4 | A 5.00% contingent deferred sales charge (CDSC) was deducted. The CDSC declines to 0% after 6 years. |
| 5 | A CDSC of 1.00% was deducted because it is charged when you sell Class C shares within the first year after purchase. |
| 6 | These returns do not reflect the effects of sales charges (SC). |
Performance of a $10,000 Investment
Investment return and principal value will fluctuate, and when redeemed, shares may be worth more or less than original cost. Past performance is no guarantee of future results and does not reflect the deduction of taxes that a shareholder would pay on fund distributions or the redemption of fund shares. Investing in mutual funds involves market risk, including loss of principal. Performance returns assume the reinvestment of all distributions.
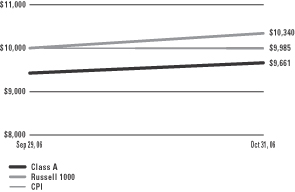
Comparative performance of $10,000 invested in Class A shares of the Gartmore Hedged Core Equity Fund, Russell 1000 Index (Russell 1000)(a), and the Consumer Price Index (CPI)(b) since inception. Unlike the Fund, the returns for these unmanaged indexes do not reflect any fees, expenses, or sales charges. Investors cannot invest directly in market indexes.
| (a) | The Russell 1000 is an unmanaged index of approximately 1,000 companies with small market capitalizations relative to the market capitalizations of other U.S. companies. |
| (b) | The CPI represents changes in prices of a basket of goods and services purchased for consumption by urban households. |
| | |
Shareholder Expense Example | | Gartmore Hedged Core Equity Fund |
As a shareholder of the Fund, you incur two types of costs: (1) transaction costs, including sales charges (loads) paid on purchase payments and redemption fees; and (2) ongoing costs, including investment advisory fees, administration fees, distribution fees and other Fund expenses. The examples below are intended to help you understand your ongoing costs (in dollars) of investing in the Fund and to compare these costs with the ongoing costs of investing in other mutual funds. Per SEC requirements, the examples assume that you had a $1,000 investment in the Class at the beginning of the reporting period, September 29, 2006, and continued to hold your shares at the end of the reporting period, October 31, 2006.
Actual Expenses
For each Class of the Fund in the table below, the first line provides information about actual account values and actual expenses. You may use the information in this line, together with the amount you invested, to estimate the expenses that you paid over the period. Simply divide your account value by $1,000 (for example, an $8,600 account value divided by $1,000 = 8.6), then multiply the result by the number in the first line of each Class under the heading entitled “Expenses Paid During Period” to estimate the expenses you paid on your account during the period.
Hypothetical Example for Comparison Purposes
The second line of each Class in the table below provides information about hypothetical account values and hypothetical expenses based on the Class’ actual expense ratio and an assumed rate of return of 5% per year before expenses, which is not the Class’ actual return. The hypothetical account values and expenses may not be used to estimate the actual ending account balance or expenses you paid for the period. You may use this information to compare the ongoing costs of investing in the Class of the Fund and other funds. To do so, compare this 5% hypothetical example with the 5% hypothetical examples that appear in the shareholder reports of the other funds.
Please note that the expenses shown in the table are meant to highlight your ongoing costs only and do not reflect any transaction costs, such as sales charges (loads) or redemption fees. Therefore, the second line for each Class in the table is useful in comparing ongoing costs only, and will not help you determine the relative total costs of owning different funds. In addition, if these transaction costs were included, your costs would have been higher. The examples also assume all dividends and distributions have been reinvested.
Schedule of Shareholder Expenses
Expense Analysis of a $1,000 Investment
(October 31, 2006)
| | | | | | | | | | | | | | | | |
| Hedged Core Equity Fund | | | | | Beginning
Account Value
9/29/06 | | Ending
Account Value
10/31/06 | | Expenses Paid
During Period | | | Annualized
Expense Ratio | |
| Class A | | Actual | | | $ | 1,000.00 | | $ | 1,025.00 | | $ | 2.11 | (a) | | 2.30% | (a) |
| | | Hypothetical | 1 | | $ | 1,000.00 | | $ | 1,002.42 | | $ | 2.08 | (b) | | 2.30% | (b) |
| Class B | | Actual | | | $ | 1,000.00 | | $ | 1,024.00 | | $ | 3.28 | (a) | | 3.59% | (a) |
| | | Hypothetical | 1 | | $ | 1,000.00 | | $ | 1,001.25 | | $ | 3.25 | (b) | | 3.59% | (b) |
| Class C | | Actual | | | $ | 1,000.00 | | $ | 1,024.00 | | $ | 3.28 | (a) | | 3.59% | (a) |
| | | Hypothetical | 1 | | $ | 1,000.00 | | $ | 1,001.25 | | $ | 3.25 | (b) | | 3.59% | (b) |
| Class R | | Actual | | | $ | 1,000.00 | | $ | 1,024.00 | | $ | 2.96 | (a) | | 3.23% | (a) |
| | | Hypothetical | 1 | | $ | 1,000.00 | | $ | 1,001.58 | | $ | 2.93 | (b) | | 3.23% | (b) |
| Institutional Service Class | | Actual | | | $ | 1,000.00 | | $ | 1,025.00 | | $ | 2.30 | (a) | | 2.51% | (a) |
| | | Hypothetical | 1 | | $ | 1,000.00 | | $ | 1,002.23 | | $ | 2.27 | (b) | | 2.51% | (b) |
| Institutional Class | | Actual | | | $ | 1,000.00 | | $ | 1,025.00 | | $ | 2.19 | (a) | | 2.39% | (a) |
| | | Hypothetical | 1 | | $ | 1,000.00 | | $ | 1,002.34 | | $ | 2.17 | (b) | | 2.39% | (b) |
| 1 | Represents the hypothetical 5% return before expenses. |
| (a) | Information shown reflects values using the expense ratios and rates of return for the period September 29, 2006 (commencement of operations) to October 31, 2006. |
| (b) | Information shown reflects values using the expense ratios from September 29, 2006 (commencement of operations) to October 31, 2006 and has been annualized to reflect for the period from September 29, 2006 to October 31, 2006. |
| | |
Portfolio Summary | | Gartmore Hedged Core Equity Fund |
October 31, 2006 | Long Positions |
The SEC adopted a requirement that Funds present their portfolio holdings in a table, chart or graph format in their annual and semiannual reports to shareholders, whether or not a statement of investments is utilized. The following tables, which present portfolio holdings as a percentage of net assets, are provided in compliance with this requirement.
| | |
| Asset Allocation | | |
| Common Stocks | | 96.4% |
| Repurchase Agreements | | 4.7% |
| Liabilities in excess of other assets | | -1.1% |
| | |
| | 100.0% |
| | |
| Top Industries | | |
| Financial Services | | 13.0% |
| Telecommunications | | 8.6% |
| Semiconductors | | 5.7% |
| Consumer Products | | 5.7% |
| Crude Petroleum & Natural Gas | | 5.5% |
| Pharmaceuticals | | 4.4% |
| Aerospace & Defense | | 4.3% |
| Banks | | 4.1% |
| Oil Company Exploration & Production | | 4.0% |
| Retail | | 3.8% |
Other Assets | | 40.9% |
| | |
| | 100.0% |
| | |
| Top Holdings* | | |
| Time Warner, Inc. | | 3.0% |
| Citigroup, Inc. | | 2.5% |
| New Plan Excel Realty Trust | | 2.3% |
| Johnson & Johnson | | 2.2% |
| Goldman Sachs Group, Inc. (The) | | 2.2% |
| Raytheon Co. | | 2.1% |
| International Business Machines Corp. | | 2.0% |
| Microsoft Corp. | | 2.0% |
| JPMorgan Chase & Co. | | 1.8% |
| Altria Group, Inc. | | 1.7% |
Other Assets | | 78.2% |
| | |
| | 100.0% |
| * | For purpose of listing top holdings, repurchase agreements are considered cash equivalents and are included as part of Other Assets. |
| | |
Portfolio Summary | | Gartmore Hedged Core Equity Fund |
October 31, 2006 | Short Positions |
The SEC adopted a requirement that Funds present their portfolio holdings in a table, chart or graph format in their annual and semiannual reports to shareholders, whether or not a statement of investments is utilized. The following tables, which present portfolio holdings as a percentage of net assets, are provided in compliance with this requirement.
| | |
| Asset Allocation | | |
| Common Stocks | | 28.5% |
| Other Assets | | 71.5% |
| | |
| | 100.0% |
| | |
| Top Industries | | |
| Medical | | 4.5% |
| Real Estate Investment Trusts | | 3.4% |
| Telecommunications | | 3.2% |
| Financial Services | | 3.1% |
| Consumer Products | | 1.8% |
| Computer Software | | 1.6% |
| Tobacco | | 1.6% |
| Photographic Equipment | | 1.6% |
| Business Services | | 1.4% |
| Oil Company Exploration & Production | | 1.0% |
| Other Assets | | 76.8% |
| | |
| | 100.0% |
| | |
| Top Holdings | | |
| Cablevision Systems Corp. | | 1.8% |
| General Growth Properties, Inc. | | 1.6% |
| Loews Corp. — Carolina Group | | 1.6% |
| United Dominion Realty Trust, Inc. | | 1.6% |
| Eastman Kodak Co. | | 1.6% |
| IMS Health, Inc. | | 1.5% |
| Clorox Co. | | 1.5% |
| Dun & Bradstreet Corp. (The) | | 1.5% |
| Pitney Bowes, Inc. | | 1.4% |
| Allergan, Inc. | | 1.4% |
| Other Assets | | 84.5% |
| | |
| | 100.0% |
Statement of Investments
October 31, 2006
Gartmore Hedged Core Equity Fund
Common Stocks - - Long Positions (c) (96.4%)
| | | | | |
| | | Shares or
Principal Amount | | Value |
| | | | | |
Aerospace & Defense (4.3%) | | | | | |
Goodrich Co. | | 1,200 | | $ | 52,908 |
Northrop Grumman Corp. | | 900 | | | 59,751 |
Raytheon Co. | | 2,200 | | | 109,890 |
| | | | | |
| | | | | 222,549 |
| | | | | |
Airlines (0.6%) | | | | | |
Southwest Airlines Co. | | 2,100 | | | 31,563 |
| | | | | |
Banks (4.1%) | | | | | |
Bank of America Corp. | | 1,600 | | | 86,192 |
Hudson City Bancorp, Inc. | | 4,700 | | | 64,531 |
Wachovia Corp. | | 1,100 | | | 61,050 |
| | | | | |
| | | | | 211,773 |
| | | | | |
Beverages (1.4%) | | | | | |
PepsiCo, Inc. | | 1,100 | | | 69,784 |
| | | | | |
Biotechnology (1.4%) | | | | | |
PerkinElmer, Inc. | | 3,300 | | | 70,488 |
| | | | | |
Brewery (0.7%) | | | | | |
Molson Coors Brewing Co., Class B | | 500 | | | 35,590 |
| | | | | |
Building & Construction (2.9%) | | | | | |
Lennar Corp. | | 1,000 | | | 47,480 |
Lowe’s Cos., Inc. | | 1,600 | | | 48,224 |
Martin Marietta Materials, Inc. | | 600 | | | 52,800 |
| | | | | |
| | | | | 148,504 |
| | | | | |
Business Services (0.9%) | | | | | |
Paychex, Inc. | | 1,200 | | | 47,376 |
| | | | | |
Computer Hardware (3.2%) | | | | | |
Hewlett-Packard Co. | | 1,600 | | | 61,984 |
International Business Machines Corp. | | 1,100 | | | 101,563 |
| | | | | |
| | | | | 163,547 |
| | | | | |
Computer Software (2.8%) | | | | | |
Cisco Systems, Inc. (b) | | 1,800 | | | 43,434 |
Microsoft Corp. | | 3,500 | | | 100,485 |
| | | | | |
| | | | | 143,919 |
| | | | | |
| | | | | |
| | | Shares or
Principal Amount | | Value |
| | | | | |
Consumer Products (5.7%) | | | | | |
Altria Group, Inc. | | 1,100 | | $ | 89,463 |
Johnson & Johnson | | 1,700 | | | 114,580 |
Procter & Gamble Co. | | 1,400 | | | 88,746 |
| | | | | |
| | | | | 292,789 |
| | | | | |
Crude Petroleum & Natural Gas (5.5%) |
Chevron Corp. | | 1,100 | | | 73,920 |
ConocoPhillips | | 1,200 | | | 72,288 |
Exxon Mobil Corp. | | 500 | | | 35,710 |
Marathon Oil Corp. | | 500 | | | 43,200 |
ONEOK, Inc. | | 1,400 | | | 58,282 |
| | | | | |
| | | | | 283,400 |
| | | | | |
Energy (2.9%) | | | | | |
Centerpoint Energy, Inc. | | 2,900 | | | 44,892 |
Constellation Energy Group | | 800 | | | 49,920 |
PPL Corp. | | 1,500 | | | 51,780 |
| | | | | |
| | | | | 146,592 |
| | | | | |
Financial Services (13.0%) | | | | | |
Ambac Financial Group, Inc. | | 500 | | | 41,745 |
American Capital Strategies, Ltd. | | 1,100 | | | 47,476 |
Citigroup, Inc. | | 2,600 | | | 130,416 |
Countrywide Financial Corp. | | 1,000 | | | 38,120 |
Goldman Sachs Group, Inc. (The) | | 600 | | | 113,874 |
IndyMac Bancorp, Inc. | | 800 | | | 36,360 |
JPMorgan Chase & Co. | | 1,900 | | | 90,136 |
Lehman Brothers Holding, Inc. | | 500 | | | 38,920 |
Morgan Stanley | | 800 | | | 61,144 |
Prudential Financial, Inc. | | 900 | | | 69,237 |
| | | | | |
| | | | | 667,428 |
| | | | | |
Health Care (3.6%) | | | | | |
Aetna, Inc. | | 900 | | | 37,098 |
Health Management Associates, Inc., Class A | | 2,100 | | | 41,370 |
UnitedHealth Group, Inc. | | 1,100 | | | 53,658 |
WellPoint, Inc. (b) | | 700 | | | 53,424 |
| | | | | |
| | | | | 185,550 |
| | | | | |
Hotels & Motels (0.9%) | | | | | |
Starwood Hotels & Resorts Worldwide, Inc. | | 800 | | | 47,792 |
| | | | | |
Statement of Investments (Continued)
October 31, 2006
Gartmore Hedged Core Equity Fund (Continued)
Common Stocks - Long Positions (c) (continued)
| | | | | |
| | | Shares or
Principal Amount | | Value |
| | | | | |
Manufacturing (3.2%) | | | | | |
Cummins, Inc. | | 500 | | $ | 63,490 |
Leggett & Platt, Inc. | | 2,000 | | | 46,700 |
Lincoln Electric Holdings, Inc. | | 900 | | | 55,341 |
| | | | | |
| | | | | 165,531 |
| | | | | |
Mining (0.8%) | | | | | |
Freeport-McMoRan Copper & Gold, Inc., Class B | | 700 | | | 42,336 |
| | | | | |
Oil Company Exploration & Production (4.0%) |
Seacor Holdings, Inc. (b) | | 400 | | | 35,792 |
Tidewater, Inc. | | 1,400 | | | 69,622 |
Unit Corp. (b) | | 900 | | | 41,751 |
XTO Energy, Inc. | | 1,200 | | | 55,992 |
| | | | | |
| | | | | 203,157 |
| | | | | |
Paper & Related Products (1.0%) |
MeadWestvaco Corp. | | 1,800 | | | 49,536 |
| | | | | |
Pharmaceuticals (4.4%) | | | | | |
Eli Lilly & Co. | | 800 | | | 44,808 |
Merck & Co, Inc. | | 1,300 | | | 59,046 |
Pfizer, Inc. | | 2,500 | | | 66,625 |
Schering-Plough Corp. | | 2,500 | | | 55,350 |
| | | | | |
| | | | | 225,829 |
| | | | | |
Property & Casualty Insurance (3.3%) |
Chubb Corp. | | 800 | | | 42,520 |
Cincinnati Financial Corp. | | 1,600 | | | 73,040 |
Hartford Financial Services Group, Inc. | | 600 | | | 52,302 |
| | | | | |
| | | | | 167,862 |
| | | | | |
Real Estate Investment Trusts (3.4%) |
Equity Residential | | 1,000 | | | 54,610 |
New Plan Excel Realty Trust | | 4,100 | | | 118,080 |
| | | | | |
| | | | | 172,690 |
| | | | | |
Retail (3.8%) | | | | | |
Home Depot, Inc. | | 1,700 | | | 63,461 |
Nike, Inc., Class B | | 500 | | | 45,940 |
Wal-Mart Stores, Inc. | | 1,700 | | | 83,776 |
| | | | | |
| | | | | 193,177 |
| | | | | |
| | | | | |
| | | Shares or
Principal Amount | | Value |
| | | | | |
Semiconductors (5.7%) | | | | | |
Analog Devices, Inc. | | 1,200 | | $ | 38,184 |
Intel Corp. | | 3,700 | | | 78,958 |
Intersil Corp. | | 1,700 | | | 39,865 |
Microchip Technology, Inc. | | 1,600 | | | 52,688 |
Texas Instruments, Inc. | | 2,800 | | | 84,504 |
| | | | | |
| | | | | 294,199 |
| | | | | |
Telecommunications (8.6%) | | | | | |
AT&T, Inc. | | 2,500 | | | 85,625 |
Clear Channel Communications, Inc. | | 2,000 | | | 69,700 |
QUALCOMM, Inc. | | 1,400 | | | 50,946 |
Sprint Nextel Corp. | | 2,500 | | | 46,725 |
Time Warner, Inc. | | 7,700 | | | 154,077 |
Verizon Communications, Inc. | | 900 | | | 33,300 |
| | | | | |
| | | | | 440,373 |
| | | | | |
Tobacco (0.7%) | | | | | |
Reynolds American, Inc. | | 600 | | | 37,896 |
| | | | | |
Transportation (3.6%) | | | | | |
CSX Corp. | | 1,700 | | | 60,639 |
Norfolk Southern Corp. | | 1,500 | | | 78,855 |
Overseas Shipholding Group, Inc. | | 700 | | | 43,785 |
| | | | | |
| | | | | 183,279 |
| | | | | |
| |
Total Common Stocks - Long Positions | | | 4,944,509 |
| | | | | |
Repurchase Agreements (4.7%)
| | | | | | | |
| | | Shares or
Principal Amount | | Value | |
CS First Boston, 5.17%, dated 10/31/06, due 11/01/06, repurchase price $124,604, collateralized by U.S. Government Agency Mortgages with a market value of $127,078 | | $ | 124,586 | | $ | 124,586 | |
Nomura Securities, 5.17%, dated 10/31/06, due 11/01/06, repurchase price $118,968, collateralized by U.S. Government Agency Mortgages with a market value of $121,330 | | | 118,951 | | | 118,951 | |
| | | | | | | |
| | |
Total Repurchase Agreements | | | | | | 243,537 | |
| | | | | | | |
| |
Total Investments
(Cost $4,997,338) (a) — 101.1% | | | 5,188,046 | |
| |
Liabilities in excess of
other assets — (1.1)% | | | (58,675 | ) |
| | | | | | | |
| | |
NET ASSETS — 100.0% | | | | | $ | 5,129,371 | |
| | | | | | | |
| | (a) | See notes to financial statements for tax unrealized appreciation (depreciation) of securities. |
| | (b) | Non-income producing securities. |
| | (c) | All long positions held as collateral for securities sold short. |
See notes to financial statements. |
Statement of Securities Sold Short
October 31, 2006
Gartmore Hedged Core Equity Fund
Common Stocks - Short Positions (28.5%)
| | | | | |
| | | Shares | | Value |
| | | | | |
Advertising (0.5%) | | | | | |
Clear Channel Outdoor Holdings, Inc. | | 1,100 | | $ | 27,005 |
| | | | | |
Airlines (0.3%) | | | | | |
US Airways Group, Inc. | | 300 | | | 14,958 |
| | | | | |
Business Services (1.4%) | | | | | |
Pitney Bowes, Inc. (b) | | 1,500 | | | 70,065 |
| | | | | |
Computer Hardware (0.5%) | | | | | |
Sun Microsystems, Inc. | | 5,000 | | | 27,150 |
| | | | | |
Computer Software (1.6%) | | | | | |
Bea Systems, Inc. | | 1,900 | | | 30,913 |
BMC Software, Inc. | | 300 | | | 9,093 |
Electronic Arts, Inc. | | 800 | | | 42,312 |
| | | | | |
| | | | | 82,318 |
| | | | | |
Consumer Products (1.8%) | | | | | |
Clorox Co. (b) | | 1,200 | | | 77,472 |
Weight Watchers International, Inc. | | 300 | | | 13,080 |
| | | | | |
| | | | | 90,552 |
| | | | | |
Financial Services (3.1%) | | | | | |
Dun & Bradstreet Corp. (The) | | 1,000 | | | 77,240 |
MasterCard, Inc., Class A | | 600 | | | 44,460 |
NYSE Group, Inc. | | 500 | | | 36,995 |
| | | | | |
| | | | | 158,695 |
| | | | | |
Food (0.2%) | | | | | |
Dean Foods Co. | | 300 | | | 12,567 |
| | | | | |
Gas & Natural Gas (0.8%) | | | | | |
El Paso Corp. | | 3,100 | | | 42,470 |
| | | | | |
Machinery (0.7%) | | | | | |
Flowserve Corp. (b) | | 700 | | | 37,100 |
| | | | | |
Medical (4.5%) | | | | | |
Allergan, Inc. (b) | | 600 | | | 69,300 |
Amylin Pharmaceuticals, Inc. | | 500 | | | 21,980 |
Brookdale Senior Living, Inc. | | 600 | | | 28,872 |
IMS Health, Inc. (b) | | 2,800 | | | 77,980 |
Tenet Healthcare Corp. (b) | | 4,000 | | | 28,240 |
| | | | | |
| | | | | 226,372 |
| | | | | |
| | | | | |
| | | Shares | | Value |
Oil Company Exploration & Production (1.0%) | | | |
Cheniere Energy, Inc. | | 600 | | $ | 15,792 |
Plains Exploration & Product | | 900 | | | 38,061 |
| | | | | |
| | | | | 53,853 |
| | | | | |
Paper & Related Products (1.0%) | | | | | |
International Paper Co. (b) | | 1,600 | | | 53,360 |
| | | | | |
Photographic Equipment (1.6%) | | | | | |
Eastman Kodak Co. (b) | | 3,300 | | | 80,520 |
| | | | | |
Real Estate Investment Trusts (3.4%) | | | | | |
Annaly Mortgage Management, Inc. | | 600 | | | 7,872 |
General Growth Properties, Inc. | | 1,600 | | | 83,040 |
United Dominion Realty Trust, Inc. | | 2,500 | | | 80,925 |
| | | | | |
| | | | | 171,837 |
| | | | | |
Semiconductors (0.3%) | | | | | |
Agere Systems, Inc. | | 400 | | | 6,792 |
Rambus, Inc (b) | | 500 | | | 8,280 |
| | | | | |
| | | | | 15,072 |
| | | | | |
Telecommunications (3.2%) | | | | | |
Cablevision Systems Corp. | | 3,300 | | | 91,707 |
EchoStar Communications Corp., Class A (b) | | 300 | | | 10,656 |
Embarq Corp. | | 1,300 | | | 62,855 |
| | | | | |
| | | | | 165,218 |
| | | | | |
Tobacco (1.6%) | | | | | |
Loews Corp.-Carolina Group | | 1,400 | | | 80,948 |
| | | | | |
Utilities (1.0%) | | | | | |
Northeast Utilities | | 2,000 | | | 50,020 |
| | | | | |
| | |
Total Common Stocks - Short Positions | | | | | 1,460,080 |
| | | | | |
| | |
Total Securities Sold Short
(Proceeds $1,398,688) (a) — 28.5% | | | | $ | 1,460,080 |
| | | | | |
| | (a) | See notes to financial statements for tax unrealized appreciation (depreciation) of securities. |
| | (b) | Non-income producing securities. |
See notes to financial statements.
Gartmore Market Neutral Fund
The Gartmore Market Neutral Fund was launched Sept. 29, 2006, and, as of Oct. 31, 2006, the close of the annual reporting period, the Fund had existed for too limited a time to generate performance that could be analyzed and discussed in a meaningful manner. Accordingly, in place of an annual management commentary, set forth below is a description of the Fund’s investment objective.
The Fund’s primary goal is to seek long-term appreciation from a broadly diversified portfolio of U.S. stocks while neutralizing the general risks associated with stock market investing.
The Fund takes long positions in common stocks of companies that the Fund’s manager believes will outperform the market. Simultaneously, the Fund intends to engage in short sales of stocks that the manager believes will underperform the market and decline in value. The Fund uses a multi-capitalization and multi-style approach, which means that it may invest across different industries, sectors and market-cap levels, targeting companies with growth as well as value styles. The Fund attempts to maintain approximately equal dollar value exposure in its long and short positions (to the extent permitted by the market) in order to neutralize the effects on Fund performance resulting from general U.S. stock market movements or sector swings. Regulatory requirements state that the current market value of the securities in which the Fund is short may not exceed the current market value of the Fund’s long holdings of liquid securities and other liquid assets.
The Fund cannot guarantee that it will achieve its investment objective. As is true of nearly every fund, the value of the Fund’s investments—and, therefore, the value of Fund shares—may fluctuate.
Portfolio Manager:
Joseph A. Cerniglia, CFA
| | |
Fund Performance | | Gartmore Market Neutral Fund |
Total Return
(For period ended October 31, 2006)
| | | | |
| | | | | Inception1 |
| Class A | | w/o SC6 | | 0.60% |
| | | w/SC3 | | -5.18% |
| Class B | | w/o SC6 | | 0.50% |
| | | w/SC4 | | -4.50% |
| Class C | | w/o SC6 | | 0.50% |
| | | w/SC5 | | -0.50% |
| Class R2 | | | | 0.50% |
| Institutional Service Class2 | | | | 0.60% |
| Institutional Class2 | | | | 0.60% |
| 1 | Fund commenced operations on September 29, 2006. |
| 2 | Not subject to any sales charges. |
| 3 | A 5.75% front-end sales charge was deducted. |
| 4 | A 5.00% contingent deferred sales charge (CDSC) was deducted. The CDSC declines to 0% after 6 years. |
| 5 | A CDSC of 1.00% was deducted because it is charged when you sell Class C shares within the first year after purchase. |
| 6 | These returns do not reflect the effects of sales charges (SC). |
Performance of a $10,000 Investment
Investment return and principal value will fluctuate, and when redeemed, shares may be worth more or less than original cost. Past performance is no guarantee of future results and does not reflect the deduction of taxes that a shareholder would pay on fund distributions or the redemption of fund shares. Investing in mutual funds involves market risk, including loss of principal. Performance returns assume the reinvestment of all distributions.
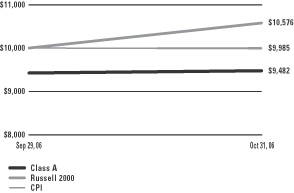
Comparative performance of $10,000 invested in Class A shares of the Gartmore Market Neutral Fund, Russell 2000 Index (Russell 2000)(a), and the Consumer Price Index (CPI)(b) since inception. Unlike the Fund, the returns for these unmanaged indexes do not reflect any fees, expenses, or sales charges. Investors cannot invest directly in market indexes.
| (a) | The Russell 2000 is an unmanaged index of approximately 2,000 companies with small market capitalizations relative to the market capitalizations of other U.S. companies. |
| (b) | The CPI represents changes in prices of a basket of goods and services purchased for consumption by urban households. |
| | |
Shareholder Expense Example | | Gartmore Market Neutral Fund |
As a shareholder of the Fund, you incur two types of costs: (1) transaction costs, including sales charges (loads) paid on purchase payments and redemption fees; and (2) ongoing costs, including investment advisory fees, administration fees, distribution fees and other Fund expenses. The examples below are intended to help you understand your ongoing costs (in dollars) of investing in the Fund and to compare these costs with the ongoing costs of investing in other mutual funds. Per SEC requirements, the examples assume that you had a $1,000 investment in the Class at the beginning of the reporting period, September 29, 2006, and continued to hold your shares at the end of the reporting period, October 31, 2006.
Actual Expenses
For each Class of the Fund in the table below, the first line provides information about actual account values and actual expenses. You may use the information in this line, together with the amount you invested, to estimate the expenses that you paid over the period. Simply divide your account value by $1,000 (for example, an $8,600 account value divided by $1,000 = 8.6), then multiply the result by the number in the first line of each Class under the heading entitled “Expenses Paid During Period” to estimate the expenses you paid on your account during the period.
Hypothetical Example for Comparison Purposes
The second line of each Class in the table below provides information about hypothetical account values and hypothetical expenses based on the Class’ actual expense ratio and an assumed rate of return of 5% per year before expenses, which is not the Class’ actual return. The hypothetical account values and expenses may not be used to estimate the actual ending account balance or expenses you paid for the period. You may use this information to compare the ongoing costs of investing in the Class of the Fund and other funds. To do so, compare this 5% hypothetical example with the 5% hypothetical examples that appear in the shareholder reports of the other funds.
Please note that the expenses shown in the table are meant to highlight your ongoing costs only and do not reflect any transaction costs, such as sales charges (loads) or redemption fees. Therefore, the second line for each Class in the table is useful in comparing ongoing costs only, and will not help you determine the relative total costs of owning different funds. In addition, if these transaction costs were included, your costs would have been higher. The examples also assume all dividends and distributions have been reinvested.
Schedule of Shareholder Expenses
Expense Analysis of a $1,000 Investment
(October 31, 2006)
| | | | | | | | | | | | | | | | |
| Market Neutral Fund | | | | | Beginning
Account Value
9/29/06 | | Ending
Account Value
10/31/06 | | Expenses Paid
During Period | | | Annualized
Expense Ratio | |
| Class A | | Actual | | | $ | 1,000.00 | | $ | 1,006.00 | | $ | 2.02 | (a) | | 2.23% | (a) |
| | | Hypothetical | 1 | | $ | 1,000.00 | | $ | 1,002.48 | | $ | 2.02 | (b) | | 2.23% | (b) |
| Class B | | Actual | | | $ | 1,000.00 | | $ | 1,005.00 | | $ | 3.13 | (a) | | 3.45% | (a) |
| | | Hypothetical | 1 | | $ | 1,000.00 | | $ | 1,001.38 | | $ | 3.13 | (b) | | 3.45% | (b) |
| Class C | | Actual | | | $ | 1,000.00 | | $ | 1,005.00 | | $ | 3.13 | (a) | | 3.45% | (a) |
| | | Hypothetical | 1 | | $ | 1,000.00 | | $ | 1,001.38 | | $ | 3.13 | (b) | | 3.45% | (b) |
| Class R | | Actual | | | $ | 1,000.00 | | $ | 1,005.00 | | $ | 2.80 | (a) | | 3.09% | (a) |
| | | Hypothetical | 1 | | $ | 1,000.00 | | $ | 1,001.71 | | $ | 2.80 | (b) | | 3.09% | (b) |
| Institutional Service Class | | Actual | | | $ | 1,000.00 | | $ | 1,006.00 | | $ | 2.14 | (a) | | 2.36% | (a) |
| | | Hypothetical | 1 | | $ | 1,000.00 | | $ | 1,002.37 | | $ | 2.14 | (b) | | 2.36% | (b) |
| Institutional Class | | Actual | | | $ | 1,000.00 | | $ | 1,006.00 | | $ | 2.03 | (a) | | 2.24% | (a) |
| | | Hypothetical | 1 | | $ | 1,000.00 | | $ | 1,002.47 | | $ | 2.03 | (b) | | 2.24% | (b) |
| 1 | Represents the hypothetical 5% return before expenses. |
| (a) | Information shown reflects values using the expense ratios and rates of return for the period September 29, 2006 (commencement of operations) to October 31, 2006. |
| (b) | Information shown reflects values using the expense ratios from September 29, 2006 (commencement of operations) to October 31, 2006 and has been annualized to reflect for the period from September 29, 2006 to October 31, 2006. |
| | |
Portfolio Summary | | Gartmore Market Neutral Fund |
October 31, 2006 | Long Positions |
The SEC adopted a requirement that Funds present their portfolio holdings in a table, chart or graph format in their annual and semiannual reports to shareholders, whether or not a statement of investments is utilized. The following tables, which present portfolio holdings as a percentage of net assets, are provided in compliance with this requirement.
| | |
| Asset Allocation | | |
| Common Stocks | | 92.4% |
| Repurchase Agreements | | 10.4% |
| Liabilities in excess of other assets | | -2.8% |
| | |
| | 100.0% |
| | |
| Top Industries | | |
| Financial Services | | 14.6% |
| Oil & Gas | | 9.5% |
| Telecommunications | | 5.0% |
| Transportation | | 4.8% |
| Semiconductors | | 4.5% |
| Retail | | 4.5% |
| Aerospace & Defense | | 3.8% |
| Real Estate Investment Trusts | | 3.7% |
| Capital Goods | | 3.4% |
| Utilities | | 3.3% |
Other Assets | | 42.9% |
| | |
| | 100.0% |
| | |
| Top Holdings* | | |
| Time Warner, Inc. | | 2.4% |
| Raytheon Co. | | 2.4% |
| Goldman Sachs Group, Inc. | | 2.3% |
| Cummins, Inc. | | 2.0% |
| IndyMac Mortgage Holdings, Inc. | | 1.6% |
| ConocoPhillips | | 1.4% |
| AT&T, Inc. | | 1.4% |
| Goodrich Corp. | | 1.4% |
| FedEx Corp. | | 1.4% |
| Telephone & Data Systems, Inc. | | 1.4% |
| Other Assets | | 82.3% |
| | |
| | 100.0% |
| * | For purpose of listing top holdings, repurchase agreements are considered cash equivalents and are included as part of Other Assets. |
| | |
Portfolio Summary | | Gartmore Market Neutral Fund |
October 31, 2006 | Short Positions |
The SEC adopted a requirement that Funds present their portfolio holdings in a table, chart or graph format in their annual and semiannual reports to shareholders, whether or not a statement of investments is utilized. The following tables, which present portfolio holdings as a percentage of net assets, are provided in compliance with this requirement.
| | |
| Asset Allocation | | |
Common Stocks | | 89.2% |
Other Assets | | 10.8% |
| | |
| | 100.0% |
| | |
| Top Industries | | |
Oil & Gas | | 8.2% |
Consumer Products | | 5.7% |
Electric | | 4.4% |
Manufacturing | | 4.3% |
Multimedia | | 4.3% |
Data Processing | | 4.2% |
Medical | | 4.0% |
Banking | | 4.0% |
Chemicals | | 3.5% |
Financial Services | | 3.4% |
Other Assets | | 54.0% |
| | |
| | 100.0% |
| | |
| Top Holdings | | |
Flowserve Corp. | | 2.5% |
Pitney Bowes, Inc. | | 2.5% |
Dun & Bradstreet Corp. | | 2.5% |
Clorox Co. | | 2.3% |
| Embarq Corp. | | 2.2% |
Plains Exploration & Product Co. | | 2.0% |
Weight Watchers International, Inc. | | 1.9% |
IMS Health, Inc. | | 1.9% |
Loews Corp. — Carolina Group | | 1.8% |
Capitol Federal Financial | | 1.8% |
Other Assets | | 78.6% |
| | |
| | 100.0% |
Statement of Investments
October 31, 2006
Gartmore Market Neutral Fund
Common Stocks - Long Positions (c) (92.4%)
| | | | | |
| | | Shares or
Principal Amount | | Value |
| | | | | |
Aerospace & Defense (3.8%) | | | | | |
Goodrich Corp. | | 1,600 | | $ | 70,544 |
Raytheon Co. | | 2,400 | | | 119,880 |
| | | | | |
| | | | | 190,424 |
| | | | | |
Airlines (0.3%) | | | | | |
Southwest Airlines Co. | | 1,100 | | | 16,533 |
| | | | | |
Appliances (0.3%) | | | | | |
Whirlpool Corp. | | 200 | | | 17,386 |
| | | | | |
Athletic Footwear (0.9%) | | | | | |
Nike, Inc., Class B | | 500 | | | 45,940 |
| | | | | |
Automotive (2.7%) | | | | | |
Cummins, Inc. | | 800 | | | 101,584 |
Thor Industries, Inc. | | 500 | | | 21,910 |
TRW Automotive Holdings Corp. (b) | | 500 | | | 12,825 |
| | | | | |
| | | | | 136,319 |
| | | | | |
Banks (1.3%) | | | | | |
Hudson City Bancorp, Inc. | | 4,700 | | | 64,531 |
| | | | | |
Beverages (0.4%) | | | | | |
Pepsi Bottling Group, Inc. (The) | | 600 | | | 18,972 |
| | | | | |
Business Services (2.2%) | | | | | |
Brinks Co. (The) | | 1,100 | | | 57,739 |
Corporate Executive Board Co. | | 300 | | | 26,946 |
Paychex, Inc. | | 600 | | | 23,688 |
| | | | | |
| | | | | 108,373 |
| | | | | |
Capital Goods (3.4%) | | | | | |
Bemis Co., Inc. | | 600 | | | 20,172 |
Eagle Materials, Inc. | | 500 | | | 18,350 |
Florida Rock Industries, Inc. | | 300 | | | 12,870 |
Harsco Corp. | | 200 | | | 16,326 |
Leggett & Platt, Inc. | | 900 | | | 21,015 |
Martin Marietta Materials, Inc. | | 400 | | | 35,200 |
Packaging Corp. of America | | 500 | | | 11,485 |
Timken Co. | | 300 | | | 9,015 |
Trinity Industries, Inc. | | 700 | | | 25,242 |
| | | | | |
| | | | | 169,675 |
| | | | | |
| | | | | |
| | | Shares or
Principal Amount | | Value |
| | | | | |
Casino Hotels (1.0%) | | | | | |
Harrah’s Entertainment, Inc. | | 300 | | $ | 22,299 |
Starwood Hotels & Resorts Worldwide, Inc. | | 500 | | | 29,870 |
| | | | | |
| | | | | 52,169 |
| | | | | |
Chemicals (1.9%) | | | | | |
Meadwestvaco Corp. | | 1,400 | | | 38,528 |
Valspar Corp. | | 2,200 | | | 58,938 |
| | | | | |
| | | | | 97,466 |
| | | | | |
Communication (1.6%) | | | | | |
Clear Channel Communications, Inc. | | 1,500 | | | 52,275 |
Discovery Holding Co., Class A (b) | | 700 | | | 10,388 |
Sirius Satellite Radio, Inc. (b) | | 2,300 | | | 8,809 |
XM Satellite Radio Holdings, Class A (b) | | 800 | | | 9,328 |
| | | | | |
| | | | | 80,800 |
| | | | | |
Computers (0.8%) | | | | | |
Hewlett-Packard Co. | | 1,100 | | | 42,614 |
| | | | | |
Electronics (2.0%) | | | | | |
Agilent Technologies, Inc. (b) | | 1,400 | | | 49,840 |
AVX Corp. | | 400 | | | 6,304 |
Gentex Corp. | | 1,000 | | | 15,910 |
Tektronix, Inc. | | 900 | | | 27,333 |
| | | | | |
| | | | | 99,387 |
| | | | | |
Energy (1.4%) | | | | | |
NRG Energy, Inc. (b) | | 800 | | | 38,520 |
TXU Corp. | | 500 | | | 31,565 |
| | | | | |
| | | | | 70,085 |
| | | | | |
Financial Services (14.6%) | | | | | |
Allied Capital Corp. | | 800 | | | 25,224 |
American Capital Strategies Ltd. | | 400 | | | 17,264 |
American Financial Group, Inc. | | 1,000 | | | 47,860 |
Bear Stearns Cos., Inc. | | 400 | | | 60,540 |
Cincinnati Financial Corp. | | 1,100 | | | 50,215 |
CIT Group, Inc. | | 800 | | | 41,640 |
Countrywide Financial Corp., Inc. | | 900 | | | 34,308 |
First American Financial Corp. | | 400 | | | 16,332 |
Genworth Financial, Inc., Class A | | 1,900 | | | 63,536 |
Goldman Sachs Group, Inc. | | 600 | | | 113,874 |
Common Stocks - Long Positions (c) (continued)
| | | | | |
| | | Shares or
Principal Amount | | Value |
| | | | | |
Financial Services (continued) | | | | | |
Hartford Financial Services Group, Inc. | | 600 | | $ | 52,302 |
IndyMac Mortgage Holdings, Inc. | | 1,800 | | | 81,810 |
Lehman Brothers Holding, Inc. | | 400 | | | 31,136 |
Morgan Stanley | | 600 | | | 45,858 |
Principal Financial Group, Inc. | | 600 | | | 33,894 |
Prudential Financial, Inc. | | 200 | | | 15,386 |
| | | | | |
| | | | | 731,179 |
| | | | | |
Food (2.5%) | | | | | |
General Mills, Inc. | | 800 | | | 45,456 |
Hormel Foods Corp. | | 1,600 | | | 57,776 |
McCormick & Co., Inc. | | 600 | | | 22,440 |
| | | | | |
| | | | | 125,672 |
| | | | | |
Health Services (0.7%) | | | | | |
Emdeon Corp. (b) | | 1,900 | | | 22,135 |
Lincare Holdings, Inc. (b) | | 400 | | | 13,424 |
| | | | | |
| | | | | 35,559 |
| | | | | |
Insurance (0.7%) | | | | | |
AFLAC, Inc. | | 200 | | | 8,984 |
AmerUs Group Co. | | 400 | | | 27,392 |
| | | | | |
| | | | | 36,376 |
| | | | | |
Manufacturing (3.2%) | | | | | |
Dade Behring Holdings, Inc. | | 700 | | | 25,501 |
Lennar Corp. | | 400 | | | 18,992 |
Lennox International, Inc. | | 1,000 | | | 26,960 |
Lincoln Electric Holdings, Inc. | | 600 | | | 36,894 |
Masco Corp. | | 700 | | | 19,355 |
MDC Holdings, Inc. | | 200 | | | 9,972 |
SPX Corp. | | 400 | | | 23,008 |
| | | | | |
| | | | | 160,682 |
| | | | | |
Medical (2.1%) | | | | | |
Cephalon, Inc. (b) | | 300 | | | 21,054 |
Cerner Corp. (b) | | 500 | | | 24,155 |
Community Health Systems, Inc. (b) | | 1,100 | | | 35,695 |
Health Management Associates, Inc., Class A | | 600 | | | 11,820 |
Manor Care, Inc. | | 300 | | | 14,397 |
| | | | | |
| | | | | 107,121 |
| | | | | |
| | | | | |
| | | Shares or
Principal Amount | | Value |
| | | | | |
Mining (0.8%) | | | | | |
Foundation Coal Holdings, Inc. | | 300 | | $ | 11,013 |
Freeport-McMoRan Copper & Gold, Inc., Class B | | 300 | | | 18,144 |
Newmont Mining Corp. | | 300 | | | 13,581 |
| | | | | |
| | | | | 42,738 |
| | | | | |
Multimedia (2.9%) | | | | | |
Liberty Media Interactive, Class A (b) | | 700 | | | 15,449 |
Regal Entertainment Group, Class A | | 400 | | | 8,292 |
Time Warner, Inc. | | 6,050 | | | 121,061 |
| | | | | |
| | | | | 144,802 |
| | | | | |
Networking (0.5%) | | | | | |
Cisco Systems, Inc. (b) | | 1,100 | | | 26,543 |
| | | | | |
Oil & Gas (9.5%) | | | | | |
Chesapeake Energy Corp. | | 800 | | | 25,952 |
ConocoPhillips | | 1,200 | | | 72,288 |
Helmerich & Payne, Inc. | | 900 | | | 21,555 |
Kinder Morgan, Inc. | | 100 | | | 10,510 |
ONEOK, Inc. | | 1,600 | | | 66,608 |
Patterson-UTI Energy, Inc. | | 1,700 | | | 39,440 |
Pioneer Natural Resources Co. | | 400 | | | 16,292 |
Questar Corp. | | 300 | | | 24,444 |
Rowan Cos., Inc. | | 400 | | | 13,352 |
Seacor Holdings, Inc. (b) | | 300 | | | 26,844 |
Sempra Energy | | 800 | | | 42,432 |
Tidewater, Inc. | | 1,100 | | | 54,703 |
Unit Corp. (b) | | 500 | | | 23,195 |
XTO Energy, Inc. | | 800 | | | 37,328 |
| | | | | |
| | | | | 474,943 |
| | | | | |
Pharmaceuticals (2.3%) | | | | | |
Merck & Co., Inc. | | 1,000 | | | 45,420 |
Millennium Pharmaceuticals, Inc. (b) | | 1,900 | | | 22,230 |
Schering-Plough Corp. | | 2,200 | | | 48,708 |
| | | | | |
| | | | | 116,358 |
| | | | | |
Publishing (0.7%) | | | | | |
Dow Jones & Co., Inc. | | 1,000 | | | 35,090 |
| | | | | |
Statement of Investments (Continued)
October 31, 2006
Gartmore Market Neutral Fund (Continued)
Common Stocks – Long Positions (c) (continued)
| | | | | |
| | | Shares or
Principal Amount | | Value |
| | | | | |
Real Estate Investment Trusts (3.7%) |
Corrections Corp of America (b) | | 600 | | $ | 27,414 |
Equity Residential | | 900 | | | 49,149 |
Health Care REIT, Inc. | | 500 | | | 20,640 |
Hospitality Properties Trust | | 700 | | | 33,922 |
New Plan Excel Realty Trust | | 1,900 | | | 54,720 |
| | | | | |
| | | | | 185,845 |
| | | | | |
Restaurants (0.3%) | | | | | |
Darden Restaurants, Inc. | | 400 | | | 16,760 |
| | | | | |
Retail (4.5%) | | | | | |
Dillard’s, Inc. | | 500 | | | 15,085 |
Federated Department Stores, Inc. | | 600 | | | 26,346 |
Home Depot, Inc. | | 800 | | | 29,864 |
J.C. Penney Co., Inc. | | 700 | | | 52,661 |
Kroger Co. | | 1,000 | | | 22,490 |
Lowe’s Cos., Inc. | | 1,400 | | | 42,196 |
MSC Industrial Direct Co., Class A | | 200 | | | 8,184 |
Rite Aid Corp. (b) | | 2,100 | | | 9,828 |
Steelcase, Inc., Class A | | 1,200 | | | 19,884 |
| | | | | |
| | | | | 226,538 |
| | | | | |
Scientific & Technical Instruments (1.0%) |
PerkinElmer, Inc. | | 2,300 | | | 49,128 |
| | | | | |
Semiconductors (4.5%) | | | | | |
Analog Devices, Inc. | | 900 | | | 28,638 |
Applied Materials, Inc. | | 2,100 | | | 36,519 |
Freescale Semiconductor, Inc. (b) | | 400 | | | 15,732 |
Intersil Corp., Class A | | 800 | | | 18,760 |
Maxim Integrated Products, Inc. | | 300 | | | 9,003 |
Microchip Technology, Inc. | | 600 | | | 19,758 |
Spansion, Inc., Class A (b) | | 1,000 | | | 14,260 |
Teradyne, Inc. (b) | | 1,500 | | | 21,030 |
Texas Instruments, Inc. | | 2,100 | | | 63,378 |
| | | | | |
| | | | | 227,078 |
| | | | | |
Telecommunications (5.0%) | | | | | |
AT&T, Inc. | | 2,100 | | | 71,925 |
CenturyTel, Inc. | | 600 | | | 24,144 |
Leap Wireless International, Inc. (b) | | 700 | | | 38,822 |
Level 3 Communications, Inc. (b) | | 3,300 | | | 17,457 |
Qualcomm, Inc. | | 200 | | | 7,278 |
Sprint Nextel Corp. | | 800 | | | 14,952 |
| | | | | |
| | | Shares or
Principal Amount | | Value |
| | | | | |
Telecommunications (continued) |
Telephone & Data Systems, Inc. | | 1,400 | | $ | 68,390 |
U.S. Cellular Corp. (b) | | 100 | | | 6,341 |
| | | | | |
| | | | | 249,309 |
| | | | | |
Tobacco (0.6%) | | | | | |
Reynolds American, Inc. | | 500 | | | 31,580 |
| | | | | |
Transportation (4.8%) | | | | | |
Burlington Northern Santa Fe Corp. | | 500 | | | 38,765 |
CSX Corp. | | 500 | | | 17,835 |
FedEx Corp. | | 600 | | | 68,724 |
GATX Corp. | | 700 | | | 30,499 |
Laidlaw International, Inc. | | 400 | | | 11,604 |
Norfolk Southern Corp. | | 500 | | | 26,285 |
Overseas Shipholding Group, Inc. | | 400 | | | 25,020 |
Ryder System, Inc. | | 400 | | | 21,060 |
| | | | | |
| | | | | 239,792 |
| | | | | |
Utilities (3.3%) | | | | | |
CenterPoint Energy, Inc. | | 3,100 | | | 47,988 |
Constellation Energy Group | | 600 | | | 37,440 |
OGE Energy Corp. | | 300 | | | 11,574 |
PPL Corp. | | 1,200 | | | 41,424 |
Sierra Pacific Resources (b) | | 1,700 | | | 25,772 |
| | | | | |
| | | | | 164,198 |
| | | | | |
Wholesale Distribution (0.2%) | | | | | |
Pool Corp. | | 300 | | | 12,294 |
| | | | | |
| |
Total Common Stocks - Long Positions | | | 4,650,259 |
| | | | | |
Repurchase Agreements (10.4%)
| | | | | | | |
| | | Shares or
Principal Amount | | Value | |
CS First Boston, 5.17%, dated 10/31/06, due 11/01/06, repurchase price $268,400, collateralized by U.S. Government Agency Mortgages with a market value of $273,730 | | $ | 268,362 | | $ | 268,362 | |
Nomura Securities, 5.17%, dated 10/31/06, due 11/01/06, repurchase price $256,260, collateralized by U.S. Government Agency Mortgages with a market value of $261,349 | | | 256,224 | | | 256,224 | |
| | | | | | | |
| | |
Total Repurchase Agreements | | | | | | 524,586 | |
| | | | | | | |
| |
Total Investments
(Cost $5,004,899) (a) — 102.8% | | | 5,174,845 | |
| | |
Liabilities in excess of
other assets — (2.8)% | | | | | | (140,309 | ) |
| | | | | | | |
| | |
NET ASSETS — 100.0% | | | | | $ | 5,034,536 | |
| | | | | | | |
| | (a) | See notes to financial statements for tax unrealized appreciation (depreciation) of securities. |
| | (b) | Represents non-income producing securities. |
| | (c) | All long positions held as collateral for securities sold short. |
See notes to financial statements.
Statement of Securities Sold Short
October 31, 2006
Gartmore Market Neutral Fund
Common Stocks – Short Positions (89.2%)
| | | | | |
| | | Shares | | Value |
| | | | | |
Advertising (1.1%) | | | | | |
Clear Channel Outdoor Holdings Inc., Class A | | 1,700 | | $ | 41,735 |
Interpublic Group of Cos., Inc. (b) | | 1,100 | | | 12,001 |
| | | | | |
| | | | | 53,736 |
| | | | | |
Aerospace (0.8%) | | | | | |
Alliant Techsystems, Inc. | | 500 | | | 38,605 |
| | | | | |
Airlines (1.1%) | | | | | |
US Airways Group, Inc. | | 1,100 | | | 54,846 |
| | | | | |
Automotive (0.3%) | | | | | |
General Motors Corp. (b) | | 500 | | | 17,460 |
| | | | | |
Banking (4.0%) | | | | | |
Astoria Financial Corp. | | 1,300 | | | 37,713 |
Capitol Federal Financial | | 2,400 | | | 90,960 |
Commerce Bancorp, Inc. (b) | | 1,000 | | | 34,920 |
Fifth Third Bancorp (b) | | 1,000 | | | 39,850 |
| | | | | |
| | | | | 203,443 |
| | | | | |
Banking & Insurance (2.1%) | | | | | |
Fulton Financial Corp. | | 1,700 | | | 27,217 |
People’s Bank | | 1,400 | | | 56,980 |
Wells Fargo & Co. (b) | | 600 | | | 21,774 |
| | | | | |
| | | | | 105,971 |
| | | | | |
Business Services (3.0%) | | | | | |
Pitney Bowes, Inc. (b) | | 2,700 | | | 126,117 |
ServiceMaster Co. | | 2,200 | | | 24,926 |
| | | | | |
| | | | | 151,043 |
| | | | | |
Casino Hotels (1.0%) | | | | | |
Station Casinos, Inc. (b) | | 800 | | | 48,240 |
| | | | | |
Chemicals (3.5%) | | | | | |
Cabot Corp. | | 200 | | | 7,910 |
Celanese Corp., Class A | | 900 | | | 18,549 |
Chemtura Corp. | | 1,200 | | | 10,296 |
Du Pont (E.I.) de Nemours (b) | | 1,000 | | | 45,800 |
FMC Corp. (b) | | 400 | | | 27,420 |
Mosaic Co. (The) | | 3,600 | | | 67,392 |
| | | | | |
| | | | | 177,367 |
| | | | | |
Commercial Services (0.4%) | | | | | |
Quanta Services, Inc. | | 1,100 | | | 20,130 |
| | | | | |
| | | | | |
| | | Shares | | Value |
| | | | | |
Computers (0.6%) | | | | | |
Lexmark International Group, Inc. | | 200 | | $ | 12,718 |
Sun Microsystems, Inc. | | 2,800 | | | 15,204 |
| | | | | |
| | | | | 27,922 |
| | | | | |
Construction Machinery (0.3%) | | | | | |
Terex Corp. (b) | | 300 | | | 15,528 |
| | | | | |
Consumer Products (5.7%) | | | | | |
Clorox Co. (b) | | 1,800 | | | 116,208 |
Energizer Holdings, Inc. | | 200 | | | 15,630 |
RPM, Inc. (b) | | 1,500 | | | 28,725 |
Vulcan Materials Co. (b) | | 400 | | | 32,592 |
Weight Watchers International, Inc. | | 2,200 | | | 95,920 |
| | | | | |
| | | | | 289,075 |
| | | | | |
Data Processing (4.2%) | | | | | |
Automatic Data Processing, Inc. (b) | | 400 | | | 19,776 |
Dun & Bradstreet Corp. | | 1,600 | | | 123,584 |
First Data Corp. (b) | | 1,500 | | | 36,375 |
Mastercard, Inc., Class A | | 400 | | | 29,640 |
| | | | | |
| | | | | 209,375 |
| | | | | |
Distribution (2.5%) | | | | | |
CDW Corp. | | 600 | | | 39,402 |
Fastenal Co. | | 1,000 | | | 40,240 |
Tech Data Corp. | | 1,200 | | | 47,220 |
| | | | | |
| | | | | 126,862 |
| | | | | |
Educational Services (0.4%) | | | | | |
Apollo Group, Inc., Class A | | 500 | | | 18,480 |
| | | | | |
Electric (4.4%) | | | | | |
Dominion Resources, Inc. | | 700 | | | 56,693 |
DPL, Inc. (b) | | 800 | | | 22,976 |
Exelon Corp. | | 1,200 | | | 74,376 |
Northeast Utilities | | 2,700 | | | 67,527 |
| | | | | |
| | | | | 221,572 |
| | | | | |
Electronics (0.9%) | | | | | |
Agere Systems, Inc. | | 1,100 | | | 18,678 |
Rambus, Inc. (b) | | 800 | | | 13,248 |
Synopsys, Inc. | | 500 | | | 11,255 |
| | | | | |
| | | | | 43,181 |
| | | | | |
Common Stocks – Short Positions (continued)
| | | | | |
| | | Shares | | Value |
| | | | | |
Farm Machinery & Equipment (0.2%) | | | | | |
AGCO Corp. | | 300 | | $ | 8,025 |
| | | | | |
Financial Services (3.4%) | | | | | |
Federal Home Loan Mortgage Corp. (b) | | 500 | | | 34,495 |
Federated Investors, Inc., Class B | | 1,300 | | | 44,577 |
NYSE Group, Inc. | | 500 | | | 36,995 |
TD Ameritrade Holding Corp. | | 600 | | | 9,882 |
Transatlantic Holdings, Inc. (b) | | 700 | | | 42,658 |
| | | | | |
| | | | | 168,607 |
| | | | | |
Food (1.0%) | | | | | |
Dean Foods Co. | | 300 | | | 12,567 |
Sysco Corp. (b) | | 800 | | | 27,984 |
Tyson Foods, Inc., Class A (b) | | 800 | | | 11,560 |
| | | | | |
| | | | | 52,111 |
| | | | | |
Forestry (1.3%) | | | | | |
Weyerhaeuser Co. (b) | | 1,000 | | | 63,590 |
| | | | | |
Hazardous Waste Disposal (1.4%) | | | | | |
Stericycle, Inc. (b) | | 1,000 | | | 70,710 |
| | | | | |
Health Care (1.9%) | | | | | |
Bausch & Lomb, Inc. (b) | | 300 | | | 16,062 |
Brookdale Senior Living, Inc. | | 300 | | | 14,436 |
Hillenbrand Industry, Inc. (b) | | 600 | | | 35,208 |
Tenet Healthcare Corp. (b) | | 1,800 | | | 12,708 |
WebMD Health Corp., Class A | | 500 | | | 18,230 |
| | | | | |
| | | | | 96,644 |
| | | | | |
Hotels & Motels (0.8%) | | | | | |
Choice Hotels International, Inc. | | 1,000 | | | 41,920 |
| | | | | |
Human Resources (0.2%) | | | | | |
Hewitt Associates, Inc. | | 400 | | | 10,012 |
| | | | | |
Insurance (2.6%) | | | | | |
CNA Financial Corp. | | 700 | | | 26,215 |
Erie Indemnity Co., Class A | | 500 | | | 25,325 |
Markel Corp. | | 200 | | | 79,900 |
| | | | | |
| | | | | 131,440 |
| | | | | |
Manufacturing (4.3%) | | | | | |
Flowserve Corp. (b) | | 2,400 | | | 127,200 |
General Electric Co. (b) | | 1,800 | | | 63,198 |
Owens-Illinois, Inc. (b) | | 1,700 | | | 28,220 |
| | | | | |
| | | | | 218,618 |
| | | | | |
| | | | | |
| | | Shares | | Value |
| | | | | |
Medical (4.0%) | | | | | |
Allergan, Inc. (b) | | 400 | | $ | 46,200 |
Celgene Corp. | | 800 | | | 42,752 |
IMS Health, Inc. (b) | | 3,400 | | | 94,690 |
Medimmune, Inc. | | 300 | | | 9,612 |
Sepracor, Inc. | | 200 | | | 10,352 |
| | | | | |
| | | | | 203,606 |
| | | | | |
Multimedia (4.3%) | | | | | |
Cablevision Systems Corp. | | 3,000 | | | 83,370 |
CBS Corp., Class B | | 500 | | | 14,470 |
DreamWorks Animation SKG, Inc. | | 1,200 | | | 31,740 |
EchoStar Communications Corp., Class A (b) | | 800 | | | 28,416 |
EW Scripps Co., Class A | | 1,200 | | | 59,352 |
| | | | | |
| | | | | 217,348 |
| | | | | |
Newspapers (1.5%) | | | | | |
Gannett Co., Inc. (b) | | 400 | | | 23,656 |
New York Times Co., Class A (b) | | 1,400 | | | 33,838 |
Tribune Co. (b) | | 600 | | | 19,998 |
| | | | | |
| | | | | 77,492 |
| | | | | |
Oil & Gas (8.2%) | | | | | |
Cabot Oil & Gas Corp. (b) | | 200 | | | 10,582 |
Cheniere Energy, Inc. | | 1,100 | | | 28,952 |
Diamond Offshore Drilling, Inc. (b) | | 400 | | | 27,692 |
Dresser-Rand Group, Inc. | | 2,200 | | | 47,718 |
El Paso Corp. | | 3,200 | | | 43,840 |
Forest Oil Corp. | | 1,000 | | | 32,640 |
Frontier Oil Corp. (b) | | 300 | | | 8,820 |
Plains Exploration & Product Co. | | 2,400 | | | 101,496 |
Quicksilver Resources, Inc. | | 1,000 | | | 34,280 |
Southern Union Co. (b) | | 1,300 | | | 35,984 |
Southwestern Energy Co. (b) | | 1,100 | | | 39,138 |
| | | | | |
| | | | | 411,142 |
| | | | | |
Paper & Related Products (1.5%) | | | | | |
International Paper Co. (b) | | 1,800 | | | 60,030 |
Smurfit-Stone Container Corp. | | 1,600 | | | 17,056 |
| | | | | |
| | | | | 77,086 |
| | | | | |
Pharmaceuticals (0.2%) | | | | | |
Amylin Pharmaceuticals, Inc. | | 200 | | | 8,792 |
| | | | | |
Photographic Equipment (1.4%) | | | | | |
Eastman Kodak Co. (b) | | 2,800 | | | 68,320 |
| | | | | |
Statement of Securities Sold Short (Continued)
October 31, 2006
Gartmore Market Neutral Fund (Continued)
Common Stocks – Short Positions (continued)
| | | | | |
| | | Shares | | Value |
| | | | | |
Real Estate (0.8%) | | | | | |
CB Richard Ellis Group, Inc., Class A | | 300 | | $ | 9,009 |
Forest City Enterprises, Class A | | 600 | | | 32,940 |
| | | | | |
| | | | | 41,949 |
| | | | | |
Real Estate Investment Trusts (1.1%) | | | | | |
General Growth Properties, Inc. | | 500 | | | 25,950 |
United Dominion Realty Trust, Inc. | | 900 | | | 29,133 |
| | | | | |
| | | | | 55,083 |
| | | | | |
Retail (2.4%) | | | | | |
AutoZone, Inc. (b) | | 100 | | | 11,200 |
Copart, Inc. | | 700 | | | 20,251 |
Office Depot, Inc. | | 400 | | | 16,796 |
OfficeMax, Inc. | | 300 | | | 14,274 |
Wendy’s International, Inc. (b) | | 1,700 | | | 58,820 |
| | | | | |
| | | | | 121,341 |
| | | | | |
Software (2.6%) | | | | | |
BEA Systems, Inc. | | 1,300 | | | 21,151 |
BMC Software, Inc. | | 500 | | | 15,155 |
Electronic Arts, Inc. | | 800 | | | 42,312 |
Microsoft Corp. | | 1,800 | | | 51,678 |
| | | | | |
| | | | | 130,296 |
| | | | | |
| | | | | |
| | | Shares | | Value |
Telecommunication (3.1%) | | | | | |
Embarq Corp. | | 2,300 | | $ | 111,205 |
Windstream Corp. | | 3,200 | | | 43,904 |
| | | | | |
| | | | | 155,109 |
| | | | | |
Tobacco (1.8%) | | | | | |
Loews Corp.-Carolina Group | | 1,600 | | | 92,512 |
| | | | | |
Transportation (1.8%) | | | | | |
Alexander & Baldwin, Inc. (b) | | 1,100 | | | 50,633 |
United Parcel Service, Inc., Class B | | 500 | | | 37,675 |
| | | | | |
| | | | | 88,308 |
| | | | | |
Wireless Equipment (1.1%) | | | | | |
Crown Castle International Corp. | | 1,200 | | | 40,380 |
SBA Communications Corp., Class A | | 600 | | | 16,026 |
| | | | | |
| | | | | 56,406 |
| | | | | |
| | |
Total Common Stocks - Short Positions | | | | | 4,489,303 |
| | | | | |
| | |
Total Securities Sold Short
(Proceeds $4,343,584) (a) — 89.2% | | | | $ | 4,489,303 |
| | | | | |
| | (a) | See notes to financial statements for tax unrealized appreciation (depreciation) of securities. |
| | (b) | Represents non-income producing securities. |
See notes to financial statements.
Gartmore Small Cap Core Fund
The Gartmore Small Cap Core Fund was launched Sept. 29, 2006, and, as of Oct. 31, 2006, the close of the annual reporting period, the Fund had existed for too limited a time to generate performance that could be analyzed and discussed in a meaningful manner. Accordingly, in place of an annual management commentary, set forth below is a description of the Fund’s investment objective.
The Fund seeks long-term capital appreciation. Under normal circumstances, the Fund invests at least 80% of the value of its net assets in equity securities issued by small-capitalization companies. The Fund invests primarily in the common stock of small-cap U.S. companies in an attempt to provide investors with potentially higher returns than a fund that invests primarily in larger, more established companies. The Fund does not specifically target either a growth or a value investment style, but rather focuses on the broader small-cap market, incorporating elements of growth as well as value styles.
The Fund cannot guarantee that it will achieve its investment objective. As is true of nearly every fund, the value of the Fund’s investments—and, therefore, the value of Fund shares—may fluctuate.
Portfolio Manager:
Joseph A. Cerniglia, CFA
| | |
Fund Performance | | Gartmore Small Cap Core Fund |
Total Return
(For period ended October 31, 2006)
| | | | |
| | | | | Inception1 |
| Class A | | w/o SC6 | | 3.90% |
| | | w/SC3 | | -2.07% |
| Class B | | w/o SC6 | | 3.80% |
| | | w/SC4 | | -1.20% |
| Class C | | w/o SC6 | | 3.80% |
| | | w/SC5 | | 2.80% |
| Class R2 | | | | 3.90% |
| Institutional Service Class2 | | | | 3.90% |
| Institutional Class2 | | | | 3.90% |
| 1 | Fund commenced operations on September 29, 2006. |
| 2 | Not subject to any sales charges. |
| 3 | A 5.75% front-end sales charge was deducted. |
| 4 | A 5.00% contingent deferred sales charge (CDSC) was deducted. The CDSC declines to 0% after 6 years. |
| 5 | A CDSC of 1.00% was deducted because it is charged when you sell Class C shares within the first year after purchase. |
| 6 | These returns do not reflect the effects of sales charges (SC). |
Performance of a $10,000 Investment
Investment return and principal value will fluctuate, and when redeemed, shares may be worth more or less than original cost. Past performance is no guarantee of future results and does not reflect the deduction of taxes that a shareholder would pay on fund distributions or the redemption of fund shares. Investing in mutual funds involves market risk, including loss of principal. Performance returns assume the reinvestment of all distributions.

Comparative performance of $10,000 invested in Class A shares of the Gartmore Small Cap Core Fund, Russell 2000 Index (Russell 2000)(a), and the Consumer Price Index (CPI)(b) since inception. Unlike the Fund, the returns for these unmanaged indexes do not reflect any fees, expenses, or sales charges. Investors cannot invest directly in market indexes.
| (a) | The Russell 2000 is an unmanaged index of approximately 2,000 companies with small market capitalizations relative to the market capitalizations of other U.S. companies. |
| (b) | The CPI represents changes in prices of a basket of goods and services purchased for consumption by urban households. |
| | |
Shareholder Expense Example | | Gartmore Small Cap Core Fund |
As a shareholder of the Fund, you incur two types of costs: (1) transaction costs, including sales charges (loads) paid on purchase payments and redemption fees; and (2) ongoing costs, including investment advisory fees, administration fees, distribution fees and other Fund expenses. The examples below are intended to help you understand your ongoing costs (in dollars) of investing in the Fund and to compare these costs with the ongoing costs of investing in other mutual funds. Per SEC requirements, the examples assume that you had a $1,000 investment in the Class at the beginning of the reporting period, September 29, 2006, and continued to hold your shares at the end of the reporting period, October 31, 2006.
Actual Expenses
For each Class of the Fund in the table below, the first line provides information about actual account values and actual expenses. You may use the information in this line, together with the amount you invested, to estimate the expenses that you paid over the period. Simply divide your account value by $1,000 (for example, an $8,600 account value divided by $1,000 = 8.6), then multiply the result by the number in the first line of each Class under the heading entitled “Expenses Paid During Period” to estimate the expenses you paid on your account during the period.
Hypothetical Example for Comparison Purposes
The second line of each Class in the table below provides information about hypothetical account values and hypothetical expenses based on the Class’ actual expense ratio and an assumed rate of return of 5% per year before expenses, which is not the Class’ actual return. The hypothetical account values and expenses may not be used to estimate the actual ending account balance or expenses you paid for the period. You may use this information to compare the ongoing costs of investing in the Class of the Fund and other funds. To do so, compare this 5% hypothetical example with the 5% hypothetical examples that appear in the shareholder reports of the other funds.
Please note that the expenses shown in the table are meant to highlight your ongoing costs only and do not reflect any transaction costs, such as sales charges (loads) or redemption fees. Therefore, the second line for each Class in the table is useful in comparing ongoing costs only, and will not help you determine the relative total costs of owning different funds. In addition, if these transaction costs were included, your costs would have been higher. The examples also assume all dividends and distributions have been reinvested.
Schedule of Shareholder Expenses
Expense Analysis of a $1,000 Investment
(October 31, 2006)
| | | | | | | | | | | | | | | | |
| Small Cap Core Fund | | | | | Beginning
Account Value
9/29/06 | | Ending
Account Value
10/31/06 | | Expenses Paid
During Period | | | Annualized
Expense Ratio | |
| Class A | | Actual | | | $ | 1,000.00 | | $ | 1,039.00 | | $ | 1.40 | (a) | | 1.52% | (a) |
| | | Hypothetical | 1 | | $ | 1,000.00 | | $ | 1,003.13 | | $ | 1.38 | (b) | | 1.52% | (b) |
| Class B | | Actual | | | $ | 1,000.00 | | $ | 1,038.00 | | $ | 2.07 | (a) | | 2.25% | (a) |
| | | Hypothetical | 1 | | $ | 1,000.00 | | $ | 1,002.47 | | $ | 2.04 | (b) | | 2.25% | (b) |
| Class C | | Actual | | | $ | 1,000.00 | | $ | 1,038.00 | | $ | 2.07 | (a) | | 2.25% | (a) |
| | | Hypothetical | 1 | | $ | 1,000.00 | | $ | 1,002.47 | | $ | 2.04 | (b) | | 2.25% | (b) |
| Class R | | Actual | | | $ | 1,000.00 | | $ | 1,039.00 | | $ | 1.83 | (a) | | 1.99% | (a) |
| | | Hypothetical | 1 | | $ | 1,000.00 | | $ | 1,002.70 | | $ | 1.80 | (b) | | 1.99% | (b) |
| Institutional Service Class | | Actual | | | $ | 1,000.00 | | $ | 1,039.00 | | $ | 1.17 | (a) | | 1.27% | (a) |
| | | Hypothetical | 1 | | $ | 1,000.00 | | $ | 1,003.35 | | $ | 1.15 | (b) | | 1.27% | (b) |
| Institutional Class | | Actual | | | $ | 1,000.00 | | $ | 1,039.00 | | $ | 1.15 | (a) | | 1.25% | (a) |
| | | Hypothetical | 1 | | $ | 1,000.00 | | $ | 1,003.37 | | $ | 1.13 | (b) | | 1.25% | (b) |
| 1 | Represents the hypothetical 5% return before expenses. |
| (a) | Information shown reflects values using the expense ratios and rates of return for the period September 29, 2006 (commencement of operations) to October 31, 2006. |
| (b) | Information shown reflects values using the expense ratios from September 29, 2006 (commencement of operations) to October 31, 2006 and has been annualized to reflect for the period from September 29, 2006 to October 31, 2006. |
| | |
Portfolio Summary | | Gartmore Small Cap Core Fund |
The SEC adopted a requirement that Funds present their portfolio holdings in a table, chart or graph format in their annual and semiannual reports to shareholders, whether or not a statement of investments is utilized. The following tables, which present portfolio holdings as a percentage of net assets, are provided in compliance with this requirement.
| | |
| Asset Allocation | | |
| Common Stocks | | 96.0% |
| Repurchase Agreements | | 4.0% |
| | |
| | 100.0% |
| | |
| Top Industries | | |
| Medical | | 9.5% |
| Electronic Components | | 8.8% |
| Retail | | 8.5% |
| Real Estate Investment Trusts | | 7.3% |
| Oil & Gas | | 5.7% |
| Banking | | 4.4% |
| Financial Services | | 4.2% |
| Restaurants | | 2.9% |
| Insurance | | 2.8% |
| Business Services | | 2.7% |
| Other Assets | | 43.2% |
| | |
| | 100.0% |
| | |
| Top Holdings* | | |
| Bob Evans Farms, Inc. | | 1.6% |
| Weis Markets, Inc. | | 1.2% |
| Longs Drug Stores Corp. | | 1.1% |
| Home Properties, Inc. | | 1.0% |
| Penn Virginia Corp. | | 1.0% |
| Oil States International, Inc. | | 0.9% |
| Anixter International, Inc. | | 0.9% |
| Benchmark Electronics, Inc. | | 0.9% |
| 21st Century Insurance Group | | 0.9% |
| Phillips-Van Heusen Corp. | | 0.9% |
| Other Assets | | 89.6% |
| | |
| | 100.0% |
| * | For purpose of listing top holdings, repurchase agreements are considered cash equivalents and are included as part of Other Assets. |
Gartmore Small Cap Core Fund
Common Stocks (96.0%)
Statement of Investments
October 31, 2006
| | | | | |
| | | Shares or
Principal Amount | | Value |
| | | | | |
Aerospace (0.8%) | | | | | |
Kaman Corp., Class A | | 1,300 | | $ | 26,507 |
Triumph Group, Inc. | | 300 | | | 14,445 |
| | | | | |
| | | | | 40,952 |
| | | | | |
Agriculture (0.3%) | | | | | |
The Andersons, Inc. | | 400 | | | 14,380 |
| | | | | |
Airlines (0.7%) | | | | | |
Alaska Air Group, Inc. (b) | | 900 | | | 36,135 |
| | | | | |
Apparel (1.6%) | | | | | |
Kellwood Co. | | 1,300 | | | 39,780 |
Phillips-Van Heusen Corp. | | 1,000 | | | 45,760 |
| | | | | |
| | | | | 85,540 |
| | | | | |
Automotive Rentals (0.2%) | | | | | |
Dollar Thrifty Automotive Group, Inc. (b) | | 300 | | | 12,048 |
| | | | | |
Banking (4.4%) | | | | | |
1st Source Corp. | | 500 | | | 15,780 |
Corus Bankshares, Inc. | | 1,100 | | | 22,583 |
Farmers Capital Bank Corp. | | 1,100 | | | 39,666 |
First Republic Bank | | 700 | | | 27,258 |
Greater Bay Bancorp | | 1,100 | | | 28,325 |
ITLA Capital Corp. | | 500 | | | 28,560 |
MetroCorp Bancshares, Inc. | | 800 | | | 17,456 |
Omega Financial Corp. | | 600 | | | 19,488 |
Virginia Financial Group, Inc. | | 1,100 | | | 30,470 |
| | | | | |
| | | | | 229,586 |
| | | | | |
Batteries & Battery Systems (0.3%) |
Greatbatch, Inc. (b) | | 700 | | | 15,743 |
| | | | | |
Building Materials (1.1%) | | | | | |
Apogee Enterprises, Inc. | | 1,100 | | | 17,699 |
Building Materials Holding Corp. | | 900 | | | 23,454 |
Universal Forest Products, Inc. | | 300 | | | 13,614 |
| | | | | |
| | | | | 54,767 |
| | | | | |
Business Services (2.7%) | | | | | |
Bowne & Co., Inc. | | 2,800 | | | 43,764 |
Crawford & Co., Class B | | 2,300 | | | 17,480 |
Heartland Payment Systems, Inc. | | 700 | | | 18,704 |
| | | | | |
| | | Shares or
Principal Amount | | Value |
Business Services (continued) | | | | | |
| | | | | |
IKON Office Solutions, Inc. | | 2,000 | | $ | 29,820 |
Rewards Network, Inc. (b) | | 3,000 | | | 16,980 |
The Standard Register Co. | | 1,100 | | | 14,883 |
| | | | | |
| | | | | 141,631 |
| | | | | |
Chemicals (1.7%) | | | | | |
A. Schulman, Inc. | | 1,800 | | | 43,578 |
Spartech Corp. | | 800 | | | 21,920 |
Stepan Co. | | 700 | | | 22,022 |
| | | | | |
| | | | | 87,520 |
| | | | | |
Coal (0.4%) | | | | | |
International Coal Group, Inc. (b) | | 3,600 | | | 18,684 |
| | | | | |
Computer Software (0.5%) | | | | | |
SYNNEX Corp. (b) | | 1,100 | | | 24,695 |
| | | | | |
Computers (1.4%) | | | | | |
Agilysys, Inc. | | 1,000 | | | 14,830 |
Integral Systems, Inc. | | 600 | | | 16,020 |
Mentor Graphics Corp. (b) | | 1,500 | | | 25,305 |
Palm, Inc. (b) | | 1,100 | | | 16,885 |
| | | | | |
| | | | | 73,040 |
| | | | | |
Construction (0.3%) | | | | | |
Granite Construction, Inc. | | 300 | | | 15,630 |
| | | | | |
Consumer Products (0.4%) | | | | | |
CSS Industries, Inc. | | 700 | | | 21,987 |
| | | | | |
Containers (0.5%) | | | | | |
Greif, Inc. | | 300 | | | 28,113 |
| | | | | |
Cutlery (0.4%) | | | | | |
Lifetime Brands, Inc. | | 1,100 | | | 22,539 |
| | | | | |
Direct Marketing (0.6%) | | | | | |
ValueVision Media, Inc. (b) | | 2,400 | | | 30,984 |
| | | | | |
Distribution (1.2%) | | | | | |
ScanSource, Inc. (b) | | 900 | | | 28,251 |
Watsco, Inc. | | 700 | | | 34,860 |
| | | | | |
| | | | | 63,111 |
| | | | | |
Statement of Investments (Continued)
October 31, 2006
Gartmore Small Cap Core Fund (Continued)
Common Stocks (continued)
| | | | | |
| | | Shares or
Principal Amount | | Value |
| | | | | |
Diversified Operations (1.2%) | | | | | |
Chemed Corp. | | 400 | | $ | 14,196 |
Enpro Industries, Inc. (b) | | 700 | | | 22,400 |
Viad Corp. | | 700 | | | 25,865 |
| | | | | |
| | | | | 62,461 |
| | | | | |
Electric Services (1.1%) | | | | | |
UIL Holdings Corp. | | 800 | | | 31,800 |
Westar Energy, Inc. | | 1,100 | | | 27,852 |
| | | | | |
| | | | | 59,652 |
| | | | | |
Electronic Components (8.8%) | | | | | |
Amkor Technology, Inc. (b) | | 2,700 | | | 18,657 |
Analogic Corp. | | 400 | | | 22,324 |
Applied Micro Circuits Corp. (b) | | 6,400 | | | 19,520 |
Belden CDT, Inc. | | 400 | | | 14,480 |
Benchmark Electronics, Inc. (b) | | 1,800 | | | 47,790 |
Brooks Automation, Inc. (b) | | 1,800 | | | 25,560 |
Conexant Systems, Inc. (b) | | 9,400 | | | 18,142 |
CTS Corp. | | 2,100 | | | 29,652 |
Imation Corp. | | 800 | | | 36,616 |
KEMET Corp. (b) | | 2,000 | | | 14,700 |
Komag, Inc. (b) | | 400 | | | 15,300 |
MKS Instruments, Inc. (b) | | 1,000 | | | 21,650 |
Omnivision Technologies, Inc. (b) | | 1,100 | | | 18,062 |
OSI Systems, Inc. (b) | | 1,300 | | | 26,910 |
Photronics Corp. (b) | | 1,100 | | | 15,389 |
Plexus Corp. (b) | | 1,100 | | | 24,112 |
PortalPlayer, Inc. (b) | | 1,400 | | | 16,842 |
Silicon Storage Technology, Inc. (b) | | 5,000 | | | 20,950 |
Technitrol, Inc. | | 1,200 | | | 30,264 |
Zoran Corp. (b) | | 1,300 | | | 18,096 |
| | | | | |
| | | | | 455,016 |
| | | | | |
Finance (0.8%) | | | | | |
CharterMac | | 2,100 | | | 42,735 |
| | | | | |
Financial Services (4.2%) | | | | | |
BankUnited Financial Corp. | | 1,300 | | | 35,061 |
Banner Corp. | | 700 | | | 30,422 |
Calamos Asset Management, Inc. | | 900 | | | 26,298 |
Greenhill & Co., Inc. | | 200 | | | 13,588 |
International Securities Exchange Holdings, Inc. | | 400 | | | 20,540 |
| | | | | |
| | | Shares or
Principal Amount | | Value |
| | | | | |
Financial Services (continued) | | | | | |
Knight Capital Group, Inc., Class A (b) | | 1,200 | | $ | 22,380 |
Ocwen Financial Corp. (b) | | 1,100 | | | 17,215 |
OptionsXpress Holdings, Inc. | | 600 | | | 18,648 |
Sanders Morris Harris Group, Inc. | | 1,200 | | | 14,112 |
SWS Group, Inc. | | 800 | | | 22,232 |
| | | | | |
| | | | | 220,496 |
| | | | | |
Help Supply Services (0.6%) | | | | | |
Modis Professional Services (b) | | 2,100 | | | 32,025 |
| | | | | |
Home Furnishings (2.0%) | | | | | |
Ethan Allen Interiors, Inc. | | 600 | | | 21,372 |
Furniture Brands International, Inc. | | 2,100 | | | 39,060 |
Kimball International, Inc., Class B | | 1,800 | | | 44,730 |
| | | | | |
| | | | | 105,162 |
| | | | | |
Hotels (0.3%) | | | | | |
Lodgian, Inc. (b) | | 1,200 | | | 17,100 |
| | | | | |
Human Resources (1.1%) | | | | | |
Administaff, Inc. | | 700 | | | 24,115 |
Amn Healthcare Services, Inc. (b) | | 600 | | | 15,174 |
Kelly Services, Inc., Class A | | 700 | | | 20,146 |
| | | | | |
| | | | | 59,435 |
| | | | | |
Information Technology (0.3%) | | | | | |
Insight Enterprises, Inc. (b) | | 700 | | | 15,043 |
| | | | | |
Instruments (0.8%) | | | | | |
Molecular Devices Corp. (b) | | 900 | | | 18,126 |
Watts Water Technologies, Inc. | | 700 | | | 26,054 |
| | | | | |
| | | | | 44,180 |
| | | | | |
Insurance (2.8%) | | | | | |
21st Century Insurance Group | | 3,000 | | | 47,340 |
Commerce Group, Inc. | | 800 | | | 23,680 |
LandAmerica Financial Group, Inc. | | 600 | | | 37,854 |
Phoenix Co., Inc. | | 1,000 | | | 15,840 |
Zenith National Insurance Corp. | | 400 | | | 18,608 |
| | | | | |
| | | | | 143,322 |
| | | | | |
Internet (1.8%) | | | | | |
CMGI, Inc. (b) | | 19,000 | | | 26,600 |
EarthLink, Inc. (b) | | 3,600 | | | 25,272 |
Stellent, Inc. | | 1,300 | | | 14,521 |
Common Stocks (continued)
| | | | | |
| | | Shares or
Principal Amount | | Value |
| | | | | |
Internet (continued) | | | | | |
United Online, Inc. | | 2,000 | | $ | 27,040 |
| | | | | |
| | | | | 93,433 |
| | | | | |
Machinery (2.5%) | | | | | |
Applied Industrial Technologies, Inc. | | 1,100 | | | 31,614 |
Bucyrus International., Inc. | | 300 | | | 12,570 |
NACCO Industries, Inc. | | 200 | | | 30,120 |
Regal-Beloit Corp. | | 500 | | | 24,725 |
Sauer-Danfoss, Inc. | | 1,100 | | | 29,172 |
| | | | | |
| | | | | 128,201 |
| | | | | |
Manufacturing (1.9%) | | | | | |
A.O. Smith Corp. | | 800 | | | 28,128 |
American Railcar Industries, Inc. | | 600 | | | 18,540 |
Barnes Group, Inc. | | 1,700 | | | 34,085 |
Standex International, Corp. | | 600 | | | 17,472 |
| | | | | |
| | | | | 98,225 |
| | | | | |
Medical (9.5%) | | | | | |
Alpharma, Inc. | | 1,600 | | | 35,312 |
Applera Corp.-Celera Genomics Group (b) | | 1,200 | | | 18,624 |
Computer Programs & Systems, Inc. | | 500 | | | 17,100 |
Genesis Healthcare Corp. (b) | | 400 | | | 19,372 |
Human Genome Sciences, Inc. (b) | | 1,500 | | | 20,025 |
Invacare Corp. | | 1,000 | | | 21,830 |
Lexicon Genetics, Inc. (b) | | 3,700 | | | 14,763 |
Magellan Health Services, Inc. (b) | | 600 | | | 26,184 |
Maxygen, Inc. (b) | | 2,200 | | | 18,744 |
Medarex, Inc. (b) | | 1,400 | | | 18,088 |
MedCath Corp. (b) | | 500 | | | 13,245 |
Molina Healthcare, Inc. (b) | | 600 | | | 23,538 |
National Healthcare Corp. | | 300 | | | 16,635 |
Perrigo Co. | | 1,400 | | | 25,046 |
PSS World Medical, Inc. (b) | | 1,400 | | | 28,168 |
Psychiatric Solutions, Inc. (b) | | 500 | | | 16,600 |
Quanex Corp. | | 1,100 | | | 36,861 |
Res-Care, Inc. (b) | | 1,400 | | | 27,076 |
Sun Healthcare Group, Inc. (b) | | 1,300 | | | 17,004 |
West Pharmaceutical Services, Inc. | | 1,000 | | | 42,040 |
Zoll Medical Corp. (b) | | 800 | | | 30,960 |
| | | | | |
| | | | | 487,215 |
| | | | | |
| | | | | |
| | | Shares or
Principal Amount | | Value |
| | | | | |
Metals (1.0%) | | | | | |
Mueller Industries, Inc. | | 400 | | $ | 14,668 |
USEC, Inc. | | 2,100 | | | 23,436 |
Worthington Industries, Inc. | | 800 | | | 13,824 |
| | | | | |
| | | | | 51,928 |
| | | | | |
Mobile Homes (0.5%) | | | | | |
Skyline Corp. | | 700 | | | 27,643 |
| | | | | |
Multimedia (0.4%) | | | | | |
Sinclair Broadcast Group, Inc., Class A | | 2,300 | | | 20,746 |
| | | | | |
Networking (1.8%) | | | | | |
Anixter International, Inc. (b) | | 800 | | | 47,808 |
Black Box Corp. | | 600 | | | 26,754 |
Broadwing Corp. (b) | | 1,400 | | | 20,972 |
| | | | | |
| | | | | 95,534 |
| | | | | |
Office Equipment (0.9%) | | | | | |
Ennis, Inc. | | 1,400 | | | 32,158 |
Global Imaging Systems, Inc. (b) | | 700 | | | 15,239 |
| | | | | |
| | | | | 47,397 |
| | | | | |
Oil & Gas (5.7%) | | | | | |
Grey Wolf, Inc. (b) | | 4,100 | | | 28,700 |
Lufkin Industries, Inc. | | 500 | | | 30,170 |
Nicor, Inc. | | 600 | | | 27,576 |
Oil States International, Inc. (b) | | 1,700 | | | 49,368 |
Penn Virginia Corp. | | 700 | | | 50,085 |
Southwest Gas Corp. | | 700 | | | 25,116 |
The Laclede Group, Inc. | | 1,200 | | | 42,756 |
W-H Energy Services, Inc. (b) | | 400 | | | 18,732 |
World Fuel Services Corp. | | 600 | | | 25,812 |
| | | | | |
| | | | | 298,315 |
| | | | | |
Oil Refining (0.3%) | | | | | |
Giant Industries, Inc. (b) | | 200 | | | 16,196 |
| | | | | |
Paper (0.4%) | | | | | |
Rock-Tenn Co. | | 1,000 | | | 20,640 |
| | | | | |
Statement of Investments (Continued)
October 31, 2006
Gartmore Small Cap Core Fund (Continued)
Common Stocks (continued)
| | | | | |
| | | Shares or
Principal Amount | | Value |
| | | | | |
Real Estate Investment Trusts (7.3%) |
Affordable Residential Communities (b) | | 1,700 | | $ | 18,666 |
American Home Mortgage Investment Corp. | | 1,100 | | | 37,587 |
Ashford Hospitality Trust | | 1,400 | | | 18,032 |
Deerfield Triarc Capital Corp. | | 1,800 | | | 26,748 |
Felcor Lodging Trust, Inc. | | 2,100 | | | 43,596 |
Home Properties, Inc. | | 800 | | | 50,536 |
HomeBanc Corp. | | 3,500 | | | 18,375 |
Investors Real Estate Trust | | 3,600 | | | 36,216 |
MortgageIT Holdings, Inc. | | 1,300 | | | 18,434 |
Potlatch Corp. | | 1,000 | | | 40,600 |
Sunstone Hotel Investors, Inc. | | 1,100 | | | 32,406 |
Windrose Medical Properties Trust | | 1,100 | | | 20,526 |
Winston Hotels, Inc. | | 1,500 | | | 18,150 |
| | | | | |
| | | | | 379,872 |
| | | | | |
Research & Development (0.5%) |
PAREXEL International Corp. (b) | | 800 | | | 23,680 |
| | | | | |
Restaurants (2.9%) | | | | | |
Bob Evans Farms, Inc. | | 2,400 | | | 81,384 |
CKE Restaurants, Inc. | | 1,300 | | | 25,402 |
McCormick & Schmick’s Seafood Restaurants, Inc. (b) | | 1,000 | | | 26,290 |
O’Charleys, Inc. (b) | | 1,000 | | | 19,890 |
| | | | | |
| | | | | 152,966 |
| | | | | |
Retail (8.5%) | | | | | |
Books-A-Million, Inc. | | 1,000 | | | 19,990 |
Brown Shoe Company, Inc. | | 900 | | | 35,064 |
Cash America International, Inc. | | 800 | | | 33,064 |
Charming Shoppes, Inc. (b) | | 1,000 | | | 14,800 |
Children’s Place Retail Stores, Inc. (b) | | 300 | | | 21,057 |
Fred’s, Inc. | | 1,200 | | | 15,696 |
Group 1 Automotive, Inc. | | 400 | | | 22,924 |
Haverty Furniture Cos., Inc. | | 1,200 | | | 18,960 |
Ingles Markets, Inc., Class A | | 500 | | | 14,220 |
Lithia Motors, Inc., Class A | | 800 | | | 20,400 |
Longs Drug Stores Corp. | | 1,300 | | | 55,952 |
MarineMax, Inc. (b) | | 600 | | | 17,106 |
Select Comfort Corp. (b) | | 900 | | | 19,242 |
The Cato Corporation, Class A | | 1,200 | | | 27,468 |
| | | | | |
| | | Shares or
Principal Amount | | Value |
| | | | | |
Retail (continued) | | | | | |
The Men’s Wearhouse, Inc. | | 500 | | $ | 19,925 |
The Pantry, Inc. (b) | | 400 | | | 21,832 |
Weis Markets, Inc. | | 1,500 | | | 60,900 |
| | | | | |
| | | | | 438,600 |
| | | | | |
Rubber & Plastic Products (0.4%) |
Myers Industries, Inc. | | 1,100 | | | 19,932 |
| | | | | |
Semiconductors & Related Devices (0.3%) |
Entegris, Inc (b) | | 1,500 | | | 16,815 |
| | | | | |
Steel (0.5%) | | | | | |
AK Steel Holding Corp. (b) | | 1,600 | | | 23,888 |
| | | | | |
Telecommunication (2.2%) | | | | | |
Commscope, Inc. (b) | | 500 | | | 15,955 |
Golden Telecom, Inc. | | 600 | | | 22,206 |
Loral Space & Communications, Inc. (b) | | 600 | | | 17,424 |
Surewest Communications | | 1,200 | | | 27,456 |
UTStarcom, Inc. (b) | | 2,900 | | | 31,233 |
| | | | | |
| | | | | 114,274 |
| | | | | |
Transportation (2.2%) | | | | | |
Arkansas Best Corp. | | 400 | | | 16,392 |
ArvinMeritor, Inc. | | 2,200 | | | 33,044 |
Pacer International, Inc. | | 800 | | | 24,552 |
PHI, Inc. (b) | | 700 | | | 22,197 |
U.S. Xpress Enterprises, Inc. (b) | | 800 | | | 15,792 |
| | | | | |
| | | | | 111,977 |
| | | | | |
Wire & Cable Products (0.4%) | | | | | |
General Cable Corp. (b) | | 600 | | | 22,560 |
| | | | | |
Wireless Communications (0.6%) |
Brightpoint, Inc. (b) | | 1,200 | | | 14,520 |
RF Micro Devices, Inc. (b) | | 2,100 | | | 15,330 |
| | | | | |
| | | | | 29,850 |
| | | | | |
| | |
Total Common Stocks | | | | | 4,993,599 |
| | | | | |
Repurchase Agreements (4.0%)
| | | | | | | |
| | | Shares or
Principal Amount | | Value | |
CS First Boston, 5.17%, dated 10/31/06, due 11/01/06, repurchase price $107,221, collateralized by U.S. Government Agency Mortgages with a market value of $109,350 | | $ | 107,206 | | $ | 107,206 | |
Nomura Securities, 5.17%, dated 10/31/06, due 11/01/06, repurchase price $102,372, collateralized by U.S. Government Agency Mortgages with a market value of $104,405 | | | 102,357 | | | 102,357 | |
| | | | | | | |
| | |
Total Repurchase Agreements | | | | | | 209,563 | |
| | | | | | | |
| |
Total Investments
(Cost $5,007,378) (a) —100.0% | | | 5,203,162 | |
| |
Liabilities in excess of
other assets — 0.0% | | | (1,452 | ) |
| | | | | | | |
| | |
NET ASSETS — 100.0% | | | | | $ | 5,201,710 | |
| | | | | | | |
| | (a) | See notes to financial statements for tax unrealized appreciation (depreciation) of securities. |
| | (b) | Non-income producing securities. |
See notes to financial statements.
| | |
Gartmore Small Cap Growth Opportunities Fund |
The Gartmore Small Cap Growth Opportunities Fund was launched Sept. 29, 2006, and, as of Oct. 31, 2006, the close of the annual reporting period, the Fund had existed for too limited a time to generate performance that could be analyzed and discussed in a meaningful manner Accordingly, in place of an annual management commentary, set forth below is a description of the Fund’s investment objective.
The Fund’s primary goal is to seek long-term capital appreciation. Under normal circumstances, the Fund invests at least 80% of the value of its net assets in equity securities issued by small-capitalization companies that, in the opinion of the portfolio managers, exhibit characteristics that are consistent with a growth style of investing. The Fund invests primarily in the common stock of small-cap U.S. companies in an attempt to provide investors with potentially higher returns than a fund that invests primarily in larger, more established companies.
The Fund cannot guarantee that it will achieve its investment objective. As is true of nearly every fund, the value of the Fund’s investments—and, therefore, the value of Fund shares—may fluctuate.
Portfolio Managers:
Jayne Stevlingson, CFA and Joseph Crivelli
| | |
Fund Performance | | Gartmore Small Cap Growth Opportunities Fund |
Total Return
(For period ended October 31, 2006)
| | | | |
| | | | | Inception1 |
| Class A | | w/o SC6 | | 6.60% |
| | | w/SC3 | | 0.47% |
| Class B | | w/o SC6 | | 6.50% |
| | | w/SC4 | | 1.50% |
| Class C | | w/o SC6 | | 6.50% |
| | | w/SC5 | | 5.50% |
| Class R2 | | | | 6.60% |
| Institutional Service Class2 | | | | 6.60% |
| Institutional Class2 | | | | 6.60% |
| 1 | Fund commenced operations on September 29, 2006. |
| 2 | Not subject to any sales charges. |
| 3 | A 5.75% front-end sales charge was deducted. |
| 4 | A 5.00% contingent deferred sales charge (CDSC) was deducted. The CDSC declines to 0% after 6 years. |
| 5 | A CDSC of 1.00% was deducted because it is charged when you sell Class C shares within the first year after purchase. |
| 6 | These returns do not reflect the effects of sales charges (SC). |
Performance of a $10,000 Investment
Investment return and principal value will fluctuate, and when redeemed, shares may be worth more or less than original cost. Past performance is no guarantee of future results and does not reflect the deduction of taxes that a shareholder would pay on fund distributions or the redemption of fund shares. Investing in mutual funds involves market risk, including loss of principal. Performance returns assume the reinvestment of all distributions.
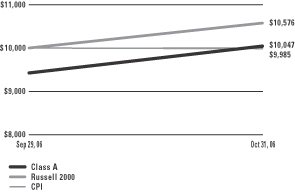
Comparative performance of $10,000 invested in Class A shares of the Gartmore Small Cap Growth Opportunities Fund, Russell 2000 Index (Russell 2000)(a), and the Consumer Price Index (CPI)(b) since inception. Unlike the Fund, the returns for these unmanaged indexes do not reflect any fees, expenses, or sales charges. Investors cannot invest directly in market indexes.
| (a) | The Russell 2000 is an unmanaged index of approximately 2,000 companies with small market capitalizations relative to the market capitalizations of other U.S. companies. |
| (b) | The CPI represents changes in prices of a basket of goods and services purchased for consumption by urban households. |
| | |
Shareholder Expense Example | | Gartmore Small Cap Growth Opportunities Fund |
As a shareholder of the Fund, you incur two types of costs: (1) transaction costs, including sales charges (loads) paid on purchase payments and redemption fees; and (2) ongoing costs, including investment advisory fees, administration fees, distribution fees and other Fund expenses. The examples below are intended to help you understand your ongoing costs (in dollars) of investing in the Fund and to compare these costs with the ongoing costs of investing in other mutual funds. Per SEC requirements, the examples assume that you had a $1,000 investment in the Class at the beginning of the reporting period, September 29, 2006, and continued to hold your shares at the end of the reporting period, October 31, 2006.
Actual Expenses
For each Class of the Fund in the table below, the first line provides information about actual account values and actual expenses. You may use the information in this line, together with the amount you invested, to estimate the expenses that you paid over the period. Simply divide your account value by $1,000 (for example, an $8,600 account value divided by $1,000 = 8.6), then multiply the result by the number in the first line of each Class under the heading entitled “Expenses Paid During Period” to estimate the expenses you paid on your account during the period.
Hypothetical Example for Comparison Purposes
The second line of each Class in the table below provides information about hypothetical account values and hypothetical expenses based on the Class’ actual expense ratio and an assumed rate of return of 5% per year before expenses, which is not the Class’ actual return. The hypothetical account values and expenses may not be used to estimate the actual ending account balance or expenses you paid for the period. You may use this information to compare the ongoing costs of investing in the Class of the Fund and other funds. To do so, compare this 5% hypothetical example with the 5% hypothetical examples that appear in the shareholder reports of the other funds.
Please note that the expenses shown in the table are meant to highlight your ongoing costs only and do not reflect any transaction costs, such as sales charges (loads) or redemption fees. Therefore, the second line for each Class in the table is useful in comparing ongoing costs only, and will not help you determine the relative total costs of owning different funds. In addition, if these transaction costs were included, your costs would have been higher. The examples also assume all dividends and distributions have been reinvested.
Schedule of Shareholder Expenses
Expense Analysis of a $1,000 Investment
(October 31, 2006)
| | | | | | | | | | | | | | | | |
| Small Cap Growth Opportunities Fund | | | | | Beginning
Account Value
9/29/06 | | Ending
Account Value
10/31/06 | | Expenses Paid
During Period | | | Annualized
Expense Ratio | |
| Class A | | Actual | | | $ | 1,000.00 | | $ | 1,066.00 | | $ | 1.34 | (a) | | 1.44% | (a) |
| | | Hypothetical | 1 | | $ | 1,000.00 | | $ | 1,003.20 | | $ | 1.30 | (b) | | 1.44% | (b) |
| Class B | | Actual | | | $ | 1,000.00 | | $ | 1,065.00 | | $ | 2.19 | (a) | | 2.35% | (a) |
| | | Hypothetical | 1 | | $ | 1,000.00 | | $ | 1,002.38 | | $ | 2.13 | (b) | | 2.35% | (b) |
| Class C | | Actual | | | $ | 1,000.00 | | $ | 1,065.00 | | $ | 2.19 | (a) | | 2.35% | (a) |
| | | Hypothetical | 1 | | $ | 1,000.00 | | $ | 1,002.38 | | $ | 2.13 | (b) | | 2.35% | (b) |
| Class R | | Actual | | | $ | 1,000.00 | | $ | 1,066.00 | | $ | 1.97 | (a) | | 2.11% | (a) |
| | | Hypothetical | 1 | | $ | 1,000.00 | | $ | 1,002.59 | | $ | 1.91 | (b) | | 2.11% | (b) |
| Institutional Service Class | | Actual | | | $ | 1,000.00 | | $ | 1,066.00 | | $ | 1.31 | (a) | | 1.40% | (a) |
| | | Hypothetical | 1 | | $ | 1,000.00 | | $ | 1,003.23 | | $ | 1.27 | (b) | | 1.40% | (b) |
| Institutional Class | | Actual | | | $ | 1,000.00 | | $ | 1,066.00 | | $ | 1.26 | (a) | | 1.35% | (a) |
| | | Hypothetical | 1 | | $ | 1,000.00 | | $ | 1,003.28 | | $ | 1.22 | (b) | | 1.35% | (b) |
| 1 | Represents the hypothetical 5% return before expenses. |
| (a) | Information shown reflects values using the expense ratios and rates of return for the period September 29, 2006 (commencement of operations) to October 31, 2006. |
| (b) | Information shown reflects values using the expense ratios from September 29, 2006 (commencement of operations) to October 31, 2006 and has been annualized to reflect for the period from September 29, 2006 to October 31, 2006. |
| | |
Portfolio Summary | | Gartmore Small Cap Growth Opportunities Fund |
The SEC adopted a requirement that Funds present their portfolio holdings in a table, chart or graph format in their annual and semiannual reports to shareholders, whether or not a statement of investments is utilized. The following tables, which present portfolio holdings as a percentage of net assets, are provided in compliance with this requirement.
| | |
| Asset Allocation |
| Common Stocks | | 92.8% |
| Repurchase Agreements | | 3.9% |
| Other assets in excess of liabilities | | 3.3% |
| | |
| | 100.0% |
| |
| Top Industries | | |
| Computer Software & Services | | 12.5% |
| Medical Products & Services | | 11.6% |
| Manufacturing | | 8.1% |
| Oil & Gas | | 6.5% |
| Semiconductors | | 5.4% |
| Retail | | 5.4% |
| Telecommunication Services & Equipment | | 5.1% |
| Real Estate Investment Trusts | | 4.1% |
| Commercial Services | | 3.7% |
| Pharmaceuticals | | 3.0% |
| Other Assets | | 34.6% |
| | |
| | 100.0% |
| | |
| Top Holdings* | | |
| WebEx Communications, Inc. | | 2.3% |
| Comtech Group, Inc. | | 1.8% |
| Sun Healthcare Group, Inc. | | 1.7% |
| Five Star Quality Care, Inc. | | 1.7% |
| Sirna Therapeutics, Inc. | | 1.4% |
| VistaPrint Ltd. | | 1.4% |
| GigaMedia Ltd. | | 1.3% |
| SBA Communications Corp. | | 1.2% |
| TriZetto Group, Inc. (The) | | 1.2% |
| Advanced Analogic Technologies, Inc. | | 1.1% |
| Other Assets | | 84.9% |
| | |
| | 100.0% |
| * | For purpose of listing top holdings, repurchase agreements are considered cash equivalents and are included as part of Other Assets. |
Statement of Investments (Continued)
October 31, 2006
Gartmore Small Cap Growth Opportunities Fund
Common Stocks (92.8%)
| | | | | |
| | | Shares or
Principal Amount | | Value |
| | | | | |
Aerospace (1.7%) | | | | | |
DRS Technologies, Inc. | | 700 | | $ | 30,954 |
HEICO Corp. | | 900 | | | 32,652 |
Hexcel Corp. (b) | | 1,800 | | | 29,142 |
| | | | | |
| | | | | 92,748 |
| | | | | |
Airlines (0.6%) | | | | | |
JetBlue Airways Corp. (b) | | 2,500 | | | 31,400 |
| | | | | |
Automotive (1.3%) | | | | | |
Keystone Automotive Industries, Inc. (b) | | 1,100 | | | 42,306 |
Midas, Inc. (b) | | 1,500 | | | 30,945 |
| | | | | |
| | | | | 73,251 |
| | | | | |
Banking (1.2%) | | | | | |
Colonial BancGroup, Inc. (The) | | 1,500 | | | 35,760 |
Yardville National Bancorp | | 700 | | | 27,902 |
| | | | | |
| | | | | 63,662 |
| | | | | |
Business Services (2.3%) | | | | | |
Answerthink, Inc. (b) | | 9,780 | | | 29,340 |
inVentiv Health, Inc. (b) | | 1,800 | | | 51,480 |
On Assignment, Inc. (b) | | 3,830 | | | 43,471 |
| | | | | |
| | | | | 124,291 |
| | | | | |
Chemicals (0.5%) | | | | | |
W.R. Grace & Co. (b) | | 2,000 | | | 26,800 |
| | | | | |
Commercial Services (3.7%) | | | | | |
American Reprographics Co. (b) | | 800 | | | 28,400 |
Chemed Corp. | | 1,400 | | | 49,686 |
DynCorp International, Inc. (b) | | 4,700 | | | 49,350 |
VistaPrint Ltd. (b) | | 2,400 | | | 75,072 |
| | | | | |
| | | | | 202,508 |
| | | | | |
Computer Software & Services (12.5%) | | | |
Ariba, Inc. (b) | | 3,500 | | | 26,425 |
Aspen Technology, Inc. (b) | | 5,800 | | | 58,116 |
CNET Networks, Inc. (b) | | 3,000 | | | 26,820 |
GigaMedia Ltd. (b) | | 7,100 | | | 68,657 |
i2 Technologies, Inc. (b) | | 1,500 | | | 30,315 |
Internap Network Services Corp. (b) | | 2,500 | | | 41,200 |
Lionbridge Technologies, Inc. (b) | | 6,100 | | | 41,297 |
| | | | | |
| | | Shares or
Principal Amount | | Value |
| | | | | |
Computer Software & Services (continued) |
LookSmart, Ltd. (b) | | 7,900 | | $ | 28,835 |
MICROS Systems, Inc. (b) | | 500 | | | 24,840 |
Palm, Inc. (b) | | 2,000 | | | 30,700 |
Shutterfly, Inc. (b) | | 3,000 | | | 39,450 |
SPSS, Inc. (b) | | 1,100 | | | 30,437 |
Unica Corp. (b) | | 700 | | | 8,029 |
WebEx Communications, Inc. (b) | | 3,300 | | | 126,884 |
webMethods, Inc. (b) | | 7,900 | | | 59,408 |
WebSideStory, Inc. (b) | | 2,700 | | | 35,235 |
| | | | | |
| | | | | 676,648 |
| | | | | |
Consulting Services (0.8%) | | | | | |
FTI Consulting, Inc. (b) | | 1,600 | | | 45,456 |
| | | | | |
Data Processing (1.1%) | | | | | |
HMS Holdings Corp. (b) | | 4,300 | | | 59,082 |
| | | | | |
Financial Services (2.9%) | | | | | |
CompuCredit Corp. (b) | | 490 | | | 17,032 |
GFI Group, Inc. (b) | | 500 | | | 28,835 |
Investment Technology Group, Inc. (b) | | 500 | | | 23,350 |
Nelnet, Inc. (b) | | 690 | | | 20,314 |
Online Resources Corp. (b) | | 3,000 | | | 31,380 |
Thomas Weisel Partners Group, Inc. (b) | | 2,200 | | | 35,222 |
| | | | | |
| | | | | 156,133 |
| | | | | |
Food & Beverages (1.2%) | | | | | |
Central European Distribution Corp. (b) | | 1,600 | | | 40,608 |
Lance, Inc. | | 1,400 | | | 27,328 |
| | | | | |
| | | | | 67,936 |
| | | | | |
Hotels & Casinos (2.7%) | | | | | |
Bally Technologies, Inc. (b) | | 2,790 | | | 55,382 |
Gaylord Entertainment Co. (b) | | 800 | | | 37,232 |
Shuffle Master, Inc. (b) | | 1,900 | | | 53,162 |
| | | | | |
| | | | | 145,776 |
| | | | | |
Insurance (0.7%) | | | | | |
Aspen Insurance Holdings Ltd. | | 1,300 | | | 32,266 |
eHealth, Inc. (b) | | 370 | | | 8,184 |
| | | | | |
| | | | | 40,450 |
| | | | | |
Common Stocks (continued)
| | | | | |
| | | Shares or
Principal Amount | | Value |
| | | | | |
Leasing (0.8%) | | | | | |
Williams Scotsman International, Inc. (b) | | 1,900 | | $ | 44,707 |
| | | | | |
Manufacturing (8.1%) | | | | | |
Callaway Golf Co. | | 3,700 | | | 49,691 |
Crown Holdings, Inc. (b) | | 2,700 | | | 52,488 |
ESCO Technologies, Inc. (b) | | 700 | | | 30,394 |
FEI Co. (b) | | 1,700 | | | 38,862 |
Flow International Corp. (b) | | 3,700 | | | 43,586 |
Force Protection, Inc. (b) | | 2,100 | | | 15,708 |
Gardner Denver, Inc. (b) | | 900 | | | 30,591 |
Goodman Global, Inc. (b) | | 1,800 | | | 28,926 |
Lindsay Manufacturing Co. | | 1,100 | | | 36,179 |
Owens-Illinois, Inc. (b) | | 1,600 | | | 26,560 |
Tempur-Pedic International, Inc. (b) | | 1,400 | | | 27,636 |
Trinity Industries, Inc. | | 800 | | | 28,848 |
Valmont Industries, Inc. | | 500 | | | 27,900 |
| | | | | |
| | | | | 437,369 |
| | | | | |
Medical Products & Services (11.6%) |
Advanced Magnetics, Inc. (b) | | 500 | | | 20,750 |
Alliance Imaging, Inc. (b) | | 4,700 | | | 39,762 |
Arcadia Resources, Inc. (b) | | 15,300 | | | 48,807 |
Cepheid, Inc. (b) | | 3,600 | | | 29,556 |
Dialysis Corporation of America (b) | | 2,600 | | | 35,022 |
ev3, Inc. (b) | | 2,900 | | | 49,706 |
Healthspring, Inc. (b) | | 1,500 | | | 30,210 |
Icon PLC ADR-IE (b) | | 1,400 | | | 50,232 |
Iris International, Inc. (b) | | 3,200 | | | 38,368 |
Neurometrix, Inc. (b) | | 1,330 | | | 21,666 |
PolyMedica, Corp. | | 800 | | | 33,240 |
QIAGEN N.V. (b) | | 3,600 | | | 56,916 |
Sirna Therapeutics, Inc. (b) | | 6,180 | | | 78,053 |
Sun Healthcare Group, Inc. (b) | | 7,240 | | | 94,698 |
| | | | | |
| | | | | 626,986 |
| | | | | |
Medical Software & Services (1.2%) |
TriZetto Group, Inc. (The) (b) | | 3,900 | | | 66,651 |
| | | | | |
Oil & Gas (6.5%) | | | | | |
Arena Resources, Inc. (b) | | 600 | | | 21,432 |
Bristow Group, Inc. (b) | | 1,200 | | | 39,840 |
Edge Petroleum Corp. (b) | | 1,600 | | | 29,136 |
Forest Oil Corp. (b) | | 500 | | | 16,320 |
| | | | | |
| | | Shares or
Principal Amount | | Value |
| | | | | |
Oil & Gas (continued) | | | | | |
Hanover Compressor Co. (b) | | 2,200 | | $ | 40,744 |
Hercules Offshore, Inc. (b) | | 1,300 | | | 46,306 |
Parallel Petroleum Corp. (b) | | 1,400 | | | 28,350 |
Petrohawk Energy Corp. (b) | | 3,700 | | | 41,921 |
Pioneer Drilling Co. (b) | | 2,800 | | | 36,764 |
T-3 Energy Services, Inc. (b) | | 900 | | | 19,737 |
TETRA Technologies, Inc. (b) | | 1,200 | | | 31,080 |
| | | | | |
| | | | | 351,630 |
| | | | | |
Pharmaceuticals (3.0%) | | | | | |
Array BioPharma, Inc. (b) | | 2,250 | | | 22,095 |
BioMarin Pharmaceutical, Inc. (b) | | 1,400 | | | 22,442 |
Hana Biosciences, Inc. (b) | | 3,400 | | | 28,458 |
MGI Pharma, Inc. (b) | | 1,150 | | | 21,885 |
Pharmion Corp. (b) | | 1,100 | | | 26,895 |
Progenics Pharmaceuticals, Inc. (b) | | 600 | | | 15,672 |
SONUS Pharmaceuticals, Inc. (b) | | 5,000 | | | 28,250 |
| | | | | |
| | | | | 165,697 |
| | | | | |
Publishing (0.5%) | | | | | |
Gatehouse Media, Inc. (b) | | 1,300 | | | 27,885 |
| | | | | |
Real Estate Investment Trusts (4.1%) |
Digital Reality Trust, Inc. | | 1,500 | | | 50,085 |
Five Star Quality Care, Inc. (b) | | 9,000 | | | 92,790 |
JER Investors Trust, Inc. | | 1,900 | | | 34,124 |
Redwood Trust, Inc. | | 800 | | | 43,976 |
| | | | | |
| | | | | 220,975 |
| | | | | |
Restaurants (2.4%) | | | | | |
AFC Enterprises, Inc. (b) | | 3,300 | | | 53,790 |
Buffalo Wild Wings, Inc. (b) | | 500 | | | 25,850 |
Morton’s Restaurant Group, Inc. (b) | | 3,300 | | | 53,427 |
| | | | | |
| | | | | 133,067 |
| | | | | |
Retail (5.4%) | | | | | |
99 Cents Only Stores (b) | | 4,200 | | | 50,358 |
bebe stores, Inc. | | 1,400 | | | 34,762 |
deLiA’s, Inc. (b) | | 4,600 | | | 41,768 |
Jarden Corp. (b) | | 800 | | | 28,784 |
Pacific Sunwear of California, Inc. (b) | | 1,800 | | | 31,716 |
Stride Rite Corp. (The) | | 1,400 | | | 20,650 |
United Retail Group, Inc. (b) | | 1,900 | | | 34,143 |
Statement of Investments (Continued)
October 31, 2006
Gartmore Small Cap Growth Opportunities Fund (Continued)
Common Stocks (continued)
| | | | | |
| | | Shares or
Principal Amount | | Value |
| | | | | |
Retail (continued) | | | | | |
Wet Seal, Inc. (The) (b) | | 8,100 | | $ | 50,544 |
| | | | | |
| | | | | 292,725 |
| | | | | |
Semiconductors (5.4%) | | | | | |
Advanced Analogic Technologies, Inc. (b) | | 9,900 | | | 61,578 |
Bookham, Inc. (b) | | 12,400 | | | 38,812 |
Cymer, Inc. (b) | | 600 | | | 27,798 |
FormFactor, Inc. (b) | | 300 | | | 11,454 |
Integrated Device Technology, Inc. (b) | | 1,060 | | | 16,801 |
Monolithic Power Systems, Inc. (b) | | 1,600 | | | 16,064 |
Nextest Systems Corp. (b) | | 1,050 | | | 10,973 |
PLX Technology, Inc. (b) | | 2,500 | | | 31,025 |
Power Integrations, Inc. (b) | | 1,800 | | | 39,492 |
SiRF Technology Holdings, Inc. (b) | | 1,400 | | | 39,368 |
| | | | | |
| | | | | 293,365 |
| | | | | |
Steel (0.6%) | | | | | |
Chaparral Steel Co. | | 800 | | | 33,272 |
| | | | | |
Storage (0.9%) | | | | | |
Mobile Mini, Inc. (b) | | 1,500 | | | 48,255 |
| | | | | |
Telecommunication Services & Equipment (5.1%) |
Comtech Group, Inc. (b) | | 5,700 | | | 96,216 |
Comtech Telecommunications Corp. (b) | | 1,100 | | | 39,215 |
Extreme Networks, Inc. (b) | | 8,600 | | | 32,680 |
Finisar Corp. (b) | | 11,800 | | | 41,064 |
SBA Communications Corp. (b) | | 2,500 | | | 66,775 |
| | | | | |
| | | | | 275,950 |
| | | | | |
Transportation Services (2.5%) | | | | | |
Aircastle Ltd. | | 900 | | | 28,989 |
Celadon Group, Inc. (b) | | 1,300 | | | 24,388 |
Greenbrier Cos., Inc. (The) | | 1,200 | | | 45,000 |
Kirby Corp. (b) | | 1,100 | | | 38,533 |
| | | | | |
| | | | | 136,910 |
| | | | | |
| | | | | | |
| | | Shares or
Principal Amount | | Value |
| | | | | | |
Utilities (1.5%) | | | | | | |
Aquila, Inc. (b) | | | 4,500 | | $ | 20,655 |
Cleco Corp. | | | 800 | | | 20,560 |
Infrasource Services, Inc. (b) | | | 2,100 | | | 41,098 |
| | | | | | |
| | | | | | 82,313 |
| | | | | | |
| | |
Total Common Stocks | | | | | | 5,043,898 |
| | | | | | |
|
Repurchase Agreements (3.9%) |
| | |
CS First Boston, 5.17%, dated 10/31/06, due 11/01/06, repurchase price $108,890, collateralized by U.S. Government Agency Mortgages with a market value of $111,052 | | $ | 108,874 | | | 108,874 |
| | |
Nomura Securities, 5.17%, dated 10/31/06, due 11/01/06, repurchase price $103,965, collateralized by U.S. Government Agency Mortgages with a market value of $106,029 | | | 103,950 | | | 103,950 |
| | | | | | |
| | |
Total Repurchase Agreements | | | | | | 212,824 |
| | | | | | |
| |
Total Investments
(Cost $5,002,691) (a) — 96.7% | | | 5,256,722 |
| | |
Other assets in excess of liabilities — 3.3% | | | | | | 180,471 |
| | | | | | |
| | |
NET ASSETS — 100.0% | | | | | $ | 5,437,193 |
| | | | | | |
| | (a) | See notes to financial statements for tax unrealized appreciation (depreciation) of securities. |
| | (b) | Denotes a non-income producing security. |
| | ADR | American Depository Receipt |
See notes to financial statements.
Gartmore Small Cap Value Fund
The Gartmore Small Cap Value Fund was launched Sept. 29, 2006, and, as of Oct. 31, 2006, the close of the annual reporting period, the Fund had existed for too limited a time to generate performance that could be analyzed and discussed in a meaningful manner. Accordingly, in place of an annual management commentary, below is a description of the Fund’s investment objective.
The Fund’s primary goal is to seek long-term capital appreciation. Under normal circumstances, the Fund invests at least 80% of the value of its net assets in equity securities issued by small-capitalization companies that, in the opinion of the portfolio managers, exhibit characteristics that are consistent with a value style of investing. The Fund invests primarily in the common stock of small-cap U.S. companies in an attempt to provide investors with potentially higher returns than a fund that invests primarily in larger, more established companies.
The Fund cannot guarantee that it will achieve its investment objective. As is true of nearly every fund, the value of the Fund’s investments—and, therefore, the value of Fund shares—may fluctuate.
Portfolio Managers:
Gary Haubold, CFA; William Gerlach, CFA; and Charles Purcell, CFA
| | |
Fund Performance | | Gartmore Small Cap Value Fund |
Total Return
(For period ended October 31, 2006)
| | | | |
| | | | | Inception1 |
| Class A | | w/o SC6 | | 4.50% |
| | | w/SC3 | | -1.51% |
| Class B | | w/o SC6 | | 4.40% |
| | | w/SC4 | | -0.60% |
| Class C | | w/o SC6 | | 4.40% |
| | | w/SC5 | | 3.40% |
| Class R2 | | | | 4.50% |
| Institutional Service Class2 | | | | 4.50% |
| Institutional Class2 | | | | 4.50% |
| 1 | Fund commenced operations on September 29, 2006. |
| 2 | Not subject to any sales charges. |
| 3 | A 5.75% front-end sales charge was deducted. |
| 4 | A 5.00% contingent deferred sales charge (CDSC) was deducted. The CDSC declines to 0% after 6 years. |
| 5 | A CDSC of 1.00% was deducted because it is charged when you sell Class C shares within the first year after purchase. |
| 6 | These returns do not reflect the effects of sales charges (SC). |
Performance of a $10,000 Investment
Investment return and principal value will fluctuate, and when redeemed, shares may be worth more or less than original cost. Past performance is no guarantee of future results and does not reflect the deduction of taxes that a shareholder would pay on fund distributions or the redemption of fund shares. Investing in mutual funds involves market risk, including loss of principal. Performance returns assume the reinvestment of all distributions.
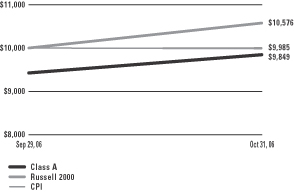
Comparative performance of $10,000 invested in Class A shares of the Gartmore Small Cap Value Fund, Russell 2000 Index (Russell 2000)(a), and the Consumer Price Index (CPI)(b) since inception. Unlike the Fund, the returns for these unmanaged indexes do not reflect any fees, expenses, or sales charges. Investors cannot invest directly in market indexes.
| (a) | The Russell 2000 is an unmanaged index of approximately 2,000 companies with small market capitalizations relative to the market capitalizations of other U.S. companies. |
| (b) | The CPI represents changes in prices of a basket of goods and services purchased for consumption by urban households. |
| | |
Shareholder Expense Example | | Gartmore Small Cap Value Fund |
As a shareholder of the Fund, you incur two types of costs: (1) transaction costs, including sales charges (loads) paid on purchase payments and redemption fees; and (2) ongoing costs, including investment advisory fees, administration fees, distribution fees and other Fund expenses. The examples below are intended to help you understand your ongoing costs (in dollars) of investing in the Fund and to compare these costs with the ongoing costs of investing in other mutual funds. Per SEC requirements, the examples assume that you had a $1,000 investment in the Class at the beginning of the reporting period, September 29, 2006, and continued to hold your shares at the end of the reporting period, October 31, 2006.
Actual Expenses
For each Class of the Fund in the table below, the first line provides information about actual account values and actual expenses. You may use the information in this line, together with the amount you invested, to estimate the expenses that you paid over the period. Simply divide your account value by $1,000 (for example, an $8,600 account value divided by $1,000 = 8.6), then multiply the result by the number in the first line of each Class under the heading entitled “Expenses Paid During Period” to estimate the expenses you paid on your account during the period.
Hypothetical Example for Comparison Purposes
The second line of each Class in the table below provides information about hypothetical account values and hypothetical expenses based on the Class’ actual expense ratio and an assumed rate of return of 5% per year before expenses, which is not the Class’ actual return. The hypothetical account values and expenses may not be used to estimate the actual ending account balance or expenses you paid for the period. You may use this information to compare the ongoing costs of investing in the Class of the Fund and other funds. To do so, compare this 5% hypothetical example with the 5% hypothetical examples that appear in the shareholder reports of the other funds.
Please note that the expenses shown in the table are meant to highlight your ongoing costs only and do not reflect any transaction costs, such as sales charges (loads) or redemption fees. Therefore, the second line for each Class in the table is useful in comparing ongoing costs only, and will not help you determine the relative total costs of owning different funds. In addition, if these transaction costs were included, your costs would have been higher. The examples also assume all dividends and distributions have been reinvested.
Schedule of Shareholder Expenses
Expense Analysis of a $1,000 Investment
(October 31, 2006)
| | | | | | | | | | | | | | | | |
| Small Cap Value Fund | | | | | Beginning
Account Value
9/29/06 | | Ending
Account Value
10/31/06 | | Expenses Paid
During Period | | | Annualized
Expense Ratio | |
| Class A | | Actual | | | $ | 1,000.00 | | $ | 1,045.00 | | $ | 1.29 | (a) | | 1.40% | (a) |
| | | Hypothetical | 1 | | $ | 1,000.00 | | $ | 1,003.23 | | $ | 1.27 | (b) | | 1.40% | (b) |
| Class B | | Actual | | | $ | 1,000.00 | | $ | 1,044.00 | | $ | 2.17 | (a) | | 2.35% | (a) |
| | | Hypothetical | 1 | | $ | 1,000.00 | | $ | 1,002.38 | | $ | 2.13 | (b) | | 2.35% | (b) |
| Class C | | Actual | | | $ | 1,000.00 | | $ | 1,044.00 | | $ | 2.17 | (a) | | 2.35% | (a) |
| | | Hypothetical | 1 | | $ | 1,000.00 | | $ | 1,002.38 | | $ | 2.13 | (b) | | 2.35% | (b) |
| Class R | | Actual | | | $ | 1,000.00 | | $ | 1,045.00 | | $ | 1.95 | (a) | | 2.11% | (a) |
| | | Hypothetical | 1 | | $ | 1,000.00 | | $ | 1,002.59 | | $ | 1.91 | (b) | | 2.11% | (b) |
| Institutional Service Class | | Actual | | | $ | 1,000.00 | | $ | 1,045.00 | | $ | 1.30 | (a) | | 1.41% | (a) |
| | | Hypothetical | 1 | | $ | 1,000.00 | | $ | 1,003.23 | | $ | 1.28 | (b) | | 1.41% | (b) |
| Institutional Class | | Actual | | | $ | 1,000.00 | | $ | 1,045.00 | | $ | 1.25 | (a) | | 1.35% | (a) |
| | | Hypothetical | 1 | | $ | 1,000.00 | | $ | 1,003.28 | | $ | 1.22 | (b) | | 1.35% | (b) |
| 1 | Represents the hypothetical 5% return before expenses. |
| (a) | Information shown reflects values using the expense ratios and rates of return for the period September 29, 2006 (commencement of operations) to October 31, 2006. |
| (b) | Information shown reflects values using the expense ratios from September 29, 2006 (commencement of operations) to October 31, 2006 and has been annualized to reflect for the period from September 29, 2006 to October 31, 2006. |
| | |
Portfolio Summary | | Gartmore Small Cap Value Fund |
The SEC adopted a requirement that Funds present their portfolio holdings in a table, chart or graph format in their annual and semiannual reports to shareholders, whether or not a statement of investments is utilized. The following tables, which present portfolio holdings as a percentage of net assets, are provided in compliance with this requirement.
| | |
| Asset Allocation | | |
| Common Stocks | | 95.8% |
| Repurchase Agreements | | 1.0% |
| Other assets in excess of liabilities | | 3.2% |
| | |
| | 100.0% |
| | |
| Top Industries | | |
| Real Estate Investment Trusts | | 13.6% |
| Banking | | 12.5% |
| Computer Software & Services | | 7.7% |
| Retail | | 5.4% |
| Financial Services | | 5.4% |
| Restaurants | | 5.1% |
| Health Care | | 4.3% |
| Consumer Products | | 4.3% |
| Electronics | | 3.5% |
| Machinery | | 3.1% |
| Other Assets | | 35.1% |
| | |
| | 100.0% |
| | |
| Top Holdings* | | |
| Sybase, Inc. | | 2.6% |
| Covance, Inc. | | 2.0% |
| CBRE Realty Finance, Inc. | | 2.0% |
| Interline Brands, Inc. | | 1.8% |
| Highland Hospitality Corp. | | 1.8% |
| TierOne Corp. | | 1.6% |
| Longs Drug Stores Corp. | | 1.6% |
| Alliant Techsystems, Inc. | | 1.6% |
| NBT Bancorp, Inc. | | 1.5% |
| Alaska Air Group, Inc. | | 1.4% |
| Other Assets | | 82.1% |
| | |
| | 100.0% |
| * | For purpose of listing top holdings, repurchase agreements are considered cash equivalents and are included as part of Other Assets. |
Gartmore Small Cap Value Fund
Common Stocks (95.8%)
Statement of Investments
October 31, 2006
| | | | | |
| | | Shares or
Principal Amount | | Value |
| | | | | |
Aerospace & Defense (2.8%) | | | | | |
Alliant Techsystems, Inc. (b) | | 1,100 | | $ | 84,931 |
Kaman Corp. | | 1,100 | | | 22,429 |
Teledyne Technologies, Inc. (b) | | 1,000 | | | 41,720 |
| | | | | |
| | | | | 149,080 |
| | | | | |
Airlines (2.7%) | | | | | |
Alaska Air Group, Inc. (b) | | 1,900 | | | 76,285 |
Continental Airlines, Inc. Class B (b) | | 1,200 | | | 44,256 |
JetBlue Airways Corp. (b) | | 1,700 | | | 21,352 |
| | | | | |
| | | | | 141,893 |
| | | | | |
Apparel (2.3%) | | | | | |
Kellwood Co. | | 1,800 | | | 55,080 |
Phillips-Van Heusen Corp. | | 740 | | | 33,862 |
Warnaco Group, Inc. (The) (b) | | 1,600 | | | 33,984 |
| | | | | |
| | | | | 122,926 |
| | | | | |
Banking (12.5%) | | | | | |
BancFirst Corp. | | 900 | | | 44,775 |
Bank of Granite Corp. | | 1,700 | | | 31,875 |
Chittenden Corp. | | 1,100 | | | 32,439 |
East West Bancorp, Inc. | | 1,100 | | | 40,161 |
F.N.B. Corp. | | 2,500 | | | 42,325 |
Glacier Bancorp, Inc. | | 1,100 | | | 38,412 |
Great Southern Bancorp, Inc. | | 1,000 | | | 31,370 |
NBT Bancorp, Inc. | | 3,200 | | | 79,520 |
Southwest Bancorp, Inc. | | 1,800 | | | 48,798 |
Suffolk Bancorp | | 1,900 | | | 66,367 |
TierOne Corp. | | 2,700 | | | 86,346 |
Trustmark Corp. | | 900 | | | 28,494 |
Washington Trust Bancorp, Inc. | | 1,600 | | | 43,328 |
Wilshire Bancorp, Inc. | | 2,400 | | | 47,472 |
| | | | | |
| | | | | 661,682 |
| | | | | |
Building & Construction (1.8%) | | | | | |
Interline Brands, Inc. (b) | | 4,100 | | | 98,154 |
| | | | | |
Chemicals (0.4%) | | | | | |
Quaker Chemical Corp. | | 1,100 | | | 20,933 |
| | | | | |
Computer Software & Services (7.7%) | | | |
Agile Software Corp. (b) | | 6,100 | | | 41,114 |
Ariba, Inc. (b) | | 6,300 | | | 47,565 |
Fair Issac Co. | | 600 | | | 21,978 |
Keane, Inc. (b) | | 3,200 | | | 37,088 |
| | | | | |
| | | Shares or
Principal Amount | | Value |
| | | | | |
Computer Software & Services (continued) | | | |
SumTotal Systems, Inc. (b) | | 1,900 | | $ | 12,084 |
Sybase, Inc. (b) | | 5,600 | | | 136,360 |
TIBCO Software, Inc. (b) | | 4,700 | | | 43,475 |
Unica Corp. (b) | | 2,700 | | | 30,969 |
webMethods, Inc. (b) | | 4,100 | | | 30,832 |
Wind River Systems, Inc. (b) | | 800 | | | 8,784 |
| | | | | |
| | | | | 410,249 |
| | | | | |
Consumer Products (4.3%) | | | | | |
Ceradyne, Inc. (b) | | 1,600 | | | 66,000 |
Ennis, Inc. | | 1,500 | | | 34,455 |
Fossil, Inc. (b) | | 1,200 | | | 26,208 |
Reddy Ice Holdings, Inc. | | 1,200 | | | 28,800 |
WD-40 Co. | | 1,030 | | | 35,010 |
Wolverine World Wide, Inc. | | 1,300 | | | 36,868 |
| | | | | |
| | | | | 227,341 |
| | | | | |
Electronics (3.5%) | | | | | |
Aeroflex, Inc. (b) | | 1,000 | | | 10,800 |
Anixter Int’l, Inc. (b) | | 200 | | | 11,952 |
Bel Fuse, Inc. | | 2,000 | | | 71,240 |
Directed Electronics, Inc. (b) | | 3,100 | | | 42,625 |
Epcos AG ADR—DE (b) | | 1,100 | | | 17,545 |
Technitrol, Inc. | | 1,200 | | | 30,264 |
| | | | | |
| | | | | 184,426 |
| | | | | |
Financial Services (5.4%) | | | | | |
Affiliated Managers Group, Inc. (b) | | 500 | | | 50,070 |
BankUnited Financial Corp. | | 1,100 | | | 29,667 |
Cowen Group, Inc. (b) | | 4,100 | | | 59,245 |
Morningstar, Inc. (b) | | 1,200 | | | 49,104 |
Sanders Morris Harris Group, Inc. | | 4,700 | | | 55,272 |
TradeStation Group, Inc. (b) | | 1,000 | | | 15,650 |
Wilmington Trust Corp. | | 700 | | | 29,106 |
| | | | | |
| | | | | 288,114 |
| | | | | |
Food Products (0.8%) | | | | | |
Ralcorp Holdings, Inc. (b) | | 900 | | | 44,505 |
| | | | | |
Health Care (4.3%) | | | | | |
Covance, Inc. (b) | | 1,800 | | | 105,300 |
Hythiam, Inc. (b) | | 9,200 | | | 74,796 |
Owens & Minor, Inc. | | 1,500 | | | 47,265 |
| | | | | |
| | | | | 227,361 |
| | | | | |
Statement of Investments (Continued)
October 31, 2006
Gartmore Small Cap Value Fund (Continued)
Common Stocks (continued)
| | | | | |
| | | Shares or
Principal Amount | | Value |
| | | | | |
Human Resources (0.8%) | | | | | |
MPS Group, Inc. (b) | | 2,800 | | $ | 42,700 |
| | | | | |
Insurance (2.1%) | | | | | |
CNA Surety Corp. (b) | | 2,700 | | | 54,918 |
Hilb Rogal & Hobbs Co. | | 600 | | | 23,952 |
Midland Co. (The) | | 700 | | | 32,718 |
| | | | | |
| | | | | 111,588 |
| | | | | |
Machinery (3.1%) | | | | | |
AptarGroup, Inc. | | 500 | | | 27,455 |
Baldor Electric Co. | | 2,100 | | | 67,368 |
Briggs & Stratton Corp. | | 1,000 | | | 25,490 |
IDEX Corp. | | 1,000 | | | 46,900 |
| | | | | |
| | | | | 167,213 |
| | | | | |
Metals (2.8%) | | | | | |
Metal Management, Inc. | | 1,900 | | | 52,212 |
Oregon Steel Mills, Inc. (b) | | 500 | | | 27,200 |
Steel Dynamics, Inc. | | 400 | | | 24,044 |
Valmont Industries, Inc. | | 800 | | | 44,640 |
| | | | | |
| | | | | 148,096 |
| | | | | |
Motion Pictures (0.4%) | | | | | |
Dreamworks Animation SKG, Inc. (b) | | 900 | | | 23,805 |
| | | | | |
Oil & Gas (2.1%) | | | | | |
Cabot Oil & Gas Corp. | | 1,300 | | | 68,783 |
Helix Energy Solutions Group, Inc. (b) | | 1,400 | | | 45,220 |
| | | | | |
| | | | | 114,003 |
| | | | | |
Real Estate Investment Trusts (13.6%) | | | |
Ashford Hospitality Trust | | 2,200 | | | 28,336 |
CBRE Realty Finance, Inc. (b) | | 6,800 | | | 104,312 |
Colonial Properties Trust | | 1,000 | | | 50,390 |
Equity Inns, Inc. | | 4,400 | | | 73,832 |
Highland Hospitality Corp. | | 6,800 | | | 93,976 |
KKR Financial Corp. | | 700 | | | 18,781 |
LaSalle Hotel Properties | | 1,400 | | | 59,150 |
Lexington Corporate Properties Trust | | 2,600 | | | 55,380 |
LTC Properties, Inc. | | 2,000 | | | 54,200 |
National Retail Properties, Inc. | | 2,300 | | | 51,681 |
| | | | | |
| | | Shares or
Principal Amount | | Value |
| | | | | |
Real Estate Investment Trusts (continued) | | | |
RAIT Investment Trust | | 1,000 | | $ | 30,060 |
Realty Income Corp. | | 1,800 | | | 47,520 |
Sunstone Hotel Investors, Inc. | | 1,810 | | | 53,323 |
| | | | | |
| | | | | 720,941 |
| | | | | |
Restaurants (5.1%) | | | | | |
California Pizza Kitchen, Inc. (b) | | 1,600 | | | 51,632 |
Panera Bread Co. Class A (b) | | 680 | | | 42,024 |
Papa John’s Int’l, Inc. (b) | | 1,800 | | | 66,060 |
Ruby Tuesday, Inc. | | 2,500 | | | 69,375 |
Ruth’s Chris Steak House, Inc. (b) | | 1,300 | | | 25,597 |
Sonic Corp. (b) | | 800 | | | 18,200 |
| | | | | |
| | | | | 272,888 |
| | | | | |
Retail (5.4%) | | | | | |
Big Lots, Inc. (b) | | 2,100 | | | 44,268 |
Dillard’s, Inc. | | 1,600 | | | 48,272 |
Dollar Tree Stores, Inc. (b) | | 1,400 | | | 43,526 |
Dress Barn, Inc. (The) (b) | | 400 | | | 8,688 |
Longs Drug Stores Corp. | | 2,000 | | | 86,080 |
Men’s Wearhouse, Inc. (The) | | 600 | | | 23,910 |
MSC Industrial Direct Co., Inc. | | 520 | | | 21,278 |
Pier 1 Imports, Inc. | | 2,000 | | | 13,080 |
| | | | | |
| | | | | 289,102 |
| | | | | |
Semiconductors (2.8%) | | | | | |
Atmel Corp. (b) | | 4,600 | | | 26,450 |
ATMI, Inc. (b) | | 1,000 | | | 31,690 |
Brooks Automation, Inc. (b) | | 2,000 | | | 28,400 |
Diodes, Inc. (b) | | 500 | | | 22,020 |
Rudolph Technologies, Inc. (b) | | 1,800 | | | 31,788 |
TriQuint Semiconductor, Inc. (b) | | 2,100 | | | 9,450 |
| | | | | |
| | | | | 149,798 |
| | | | | |
Technology (2.0%) | | | | | |
Benchmark Electronics, Inc. (b) | | 1,100 | | | 29,205 |
Ciena Corp. (b) | | 2,100 | | | 49,371 |
KEMET Corp. (b) | | 2,400 | | | 17,640 |
Rofin-Sinar Technologies, Inc. (b) | | 200 | | | 12,316 |
| | | | | |
| | | | | 108,532 |
| | | | | |
Telecommunications (2.6%) | | | | | |
Andrew Corp. (b) | | 4,400 | | | 40,744 |
Cincinnati Bell, Inc. (b) | | 5,100 | | | 23,919 |
Common Stocks (continued)
| | | | | |
| | | Shares or
Principal Amount | | Value |
| | | | | |
Telecommunications (continued) | | | | | |
Citizens Communications Co. | | 1,000 | | $ | 14,660 |
Sonus Networks, Inc. (b) | | 11,200 | | | 58,576 |
| | | | | |
| | | | | 137,899 |
| | | | | |
Theaters (0.6%) | | | | | |
Regal Entertainment Group, Class A | | 1,590 | | | 32,961 |
| | | | | |
Transportation (1.3%) | | | | | |
Greenbrier Cos., Inc. (The) | | 268 | | | 10,050 |
GulfMark Offshore, Inc. (b) | | 900 | | | 31,077 |
Omega Navigation Enterprises, Inc. | | 1,700 | | | 27,030 |
| | | | | |
| | | | | 68,157 |
| | | | | |
Utilities (1.6%) | | | | | |
IDACORP, Inc. | | 300 | | | 11,829 |
Otter Tail Corp. | | 800 | | | 23,952 |
Sierra Pacific Resources (b) | | 2,100 | | | 31,836 |
Southwest Gas Corp. | | 500 | | | 17,940 |
| | | | | |
| | | | | 85,557 |
| | | | | |
Waste Disposal (1.0%) | | | | | |
Clean Harbors, Inc. (b) | | 1,300 | | | 55,627 |
| | | | | |
| | |
Total Common Stocks | | | | | 5,105,531 |
| | | | | |
Repurchase Agreements (1.0%)
| | | | | | |
| | | Shares or
Principal Amount | | Value |
| | | | | | |
CS First Boston, 5.17%, dated 10/31/06, due 11/01/06, repurchase price $26,969, collateralized by U.S. Government Agency Mortgages with a market value of $27,505 | | $ | 26,965 | | $ | 26,965 |
Nomura Securities, 5.17%, dated 10/31/06, due 11/01/06, repurchase price $25,750, collateralized by U.S. Government Agency Mortgages with a market value of $26,261 | | | 25,746 | | | 25,746 |
| | | | | | |
| | |
Total Repurchase Agreements | | | | | | 52,711 |
| | | | | | |
| |
Total Investments
(Cost $5,131,736) (a) — 96.8% | | | 5,158,242 |
| | |
Other assets in excess of liabilities — 3.2% | | | | | | 172,406 |
| | | | | | |
| | |
NET ASSETS — 100.0% | | | | | $ | 5,330,648 |
| | | | | | |
| | (a) | See notes to financial statements for tax unrealized appreciation (depreciation) of securities. |
| | (b) | Denotes a non-income producing security. |
| | ADR | American Depository Receipt |
See notes to financial statements.
Statements of Assets and Liabilities
October 31, 2006
| | | | | | | | | | | | | | | | | | | |
| | | Gartmore Hedged
Core Equity Fund | | | Gartmore Market
Neutral Fund | | | Gartmore Small
Cap Core Fund | | Gartmore Small
Cap Growth
Opportunities
Fund | | Gartmore Small Cap
Value Fund |
Assets: | | | | | | | | | | | | | | | | | | | |
Investments, at value (cost $4,753,801; $4,480,313; $4,797,815; $4,789,867; and $5,079,025; respectively) | | $ | 4,944,509 | | | $ | 4,650,259 | | | $ | 4,993,599 | | $ | 5,043,898 | | $ | 5,105,531 | | |
Repurchase agreements, at cost and value | | | 243,537 | | | | 524,586 | | | | 209,563 | | | 212,824 | | | 52,711 | | |
| | | | | | | | | | | | | | | | | | | | |
Total Investments | | | 5,188,046 | | | | 5,174,845 | | | | 5,203,162 | | | 5,256,722 | | | 5,158,242 | | |
| | | | | | | | | | | | | | | | | | | | |
Cash | | | 862 | | | | 963 | | | | — | | | — | | | — | | |
Deposits with broker for securities sold short | | | 1,413,170 | | | | 4,376,516 | | | | — | | | — | | | — | | |
Interest and dividends receivable | | | 12,380 | | | | 24,495 | | | | 4,233 | | | 4,088 | | | 6,510 | | |
Receivable for investments sold | | | — | | | | — | | | | — | | | 239,039 | | | 803,280 | | |
Receivable from adviser | | | — | | | | — | | | | 778 | | | 243 | | | 236 | | |
Prepaid expenses and other assets | | | 2,976 | | | | — | | | | 79 | | | 79 | | | 79 | | |
| | | | | | | | | | | | | | | | | | | | |
Total Assets | | | 6,617,434 | | | | 9,576,819 | | | | 5,208,252 | | | 5,500,171 | | | 5,968,347 | | |
| | | | | | | | | | | | | | | | | | | | |
| | | | | | |
Liabilities: | | | | | | | | | | | | | | | | | | | |
Securities sold short, at value (proceeds $1,398,688; $4,343,584; $0; $0; and $0; respectively) | | | 1,460,080 | | | | 4,489,303 | | | | — | | | — | | | — | | |
Payable for investments purchased | | | 24,000 | | | | 44,000 | | | | — | | | 56,435 | | | 631,152 | | |
Accrued expenses and other payables | | | | | | | | | | | | | | | | | | | |
Investment advisory fees | | | 1,362 | | | | 1,294 | | | | — | | | — | | | — | | |
Fund administration and transfer agent fees | | | 706 | | | | 702 | | | | 914 | | | 919 | | | 919 | | |
Distribution fees | | | 3 | | | | 3 | | | | 3 | | | 3 | | | 3 | | |
Trustee fees | | | 24 | | | | 24 | | | | 29 | | | 29 | | | 29 | | |
Other | | | 1,888 | | | | 6,957 | | | | 5,596 | | | 5,592 | | | 5,596 | | |
| | | | | | | | | | | | | | | | | | | | |
Total Liabilities | | | 1,488,063 | | | | 4,542,283 | | | | 6,542 | | | 62,978 | | | 637,699 | | |
| | | | | | | | | | | | | | | | | | | | |
Net Assets | | $ | 5,129,371 | | | $ | 5,034,536 | | | $ | 5,201,710 | | $ | 5,437,193 | | $ | 5,330,648 | | |
| | | | | | | | | | | | | | | | | | | | |
| | | | | | |
Represented by: | | | | | | | | | | | | | | | | | | | |
Capital | | $ | 5,000,928 | | | $ | 5,000,928 | | | $ | 5,000,476 | | $ | 5,100,476 | | $ | 5,100,477 | | |
Accumulated net investment income (loss) | | | 7,144 | | | | 19,620 | | | | 5,450 | | | 2,578 | | | 5,763 | | |
Accumulated net realized gains (losses) from investment transactions | | | (8,017 | ) | | | (10,239 | ) | | | — | | | 80,108 | | | 197,902 | | |
Net unrealized appreciation (depreciation) on investments | | | 129,316 | | | | 24,227 | | | | 195,784 | | | 254,031 | | | 26,506 | | |
| | | | | | | | | | | | | | | | | | | | |
Net Assets | | $ | 5,129,371 | | | $ | 5,034,536 | | | $ | 5,201,710 | | $ | 5,437,193 | | $ | 5,330,648 | | |
| | | | | | | | | | | | | | | | | | | | |
| | | | | | | | | | | | | | | | | | | | |
| | | | | | | | | | | | | | | | | | | | |
| | | | | | | | | | | | | | | | | | | | |
| | | | | | | | | | | | | | | | | | | | |
| | | | | | | | | | | | | | | | | | | | |
See notes to financial statements.
Statements of Assets and Liabilities (Continued)
| | | | | | | | | | | | | | | | | | | | | | |
| | | Gartmore Hedged
Core Equity Fund | | | Gartmore Market
Neutral Fund | | | Gartmore Small
Cap Core Fund | | | Gartmore Small
Cap Growth
Opportunities
Fund | | | Gartmore Small Cap
Value Fund |
Net Assets: | | | | | | | | | | | | | | | | | | | | | | |
Class A Shares | | $ | 1,025 | | | $ | 1,006 | | | $ | 1,039 | | | $ | 1,066 | | | $ | 1,045 | | | |
Class B Shares | | | 1,024 | | | | 1,005 | | | | 1,038 | | | | 1,065 | | | | 1,044 | | | |
Class C Shares | | | 1,024 | | | | 1,005 | | | | 1,038 | | | | 1,065 | | | | 1,044 | | | |
Class R Shares | | | 1,024 | | | | 1,005 | | | | 1,039 | | | | 1,066 | | | | 1,045 | | | |
Institutional Service Class Shares | | | 1,025 | | | | 1,006 | | | | 1,039 | | | | 1,066 | | | | 1,045 | | | |
Institutional Class Shares | | | 5,124,249 | | | | 5,029,509 | | | | 5,196,517 | | | | 5,431,865 | | | | 5,325,425 | | | |
| | | | | | | | | | | | | | | | | | | | | | | |
Total | | $ | 5,129,371 | | | $ | 5,034,536 | | | $ | 5,201,710 | | | $ | 5,437,193 | | | $ | 5,330,648 | | | |
| | | | | | | | | | | | | | | | | | | | | | | |
| | | | | | |
Shares Outstanding (unlimited number of shares authorized): | | | | | | | | | | | | | | | | | | | | | | |
Class A Shares | | | 100 | | | | 100 | | | | 100 | | | | 100 | | | | 100 | | | |
Class B Shares | | | 100 | | | | 100 | | | | 100 | | | | 100 | | | | 100 | | | |
Class C Shares | | | 100 | | | | 100 | | | | 100 | | | | 100 | | | | 100 | | | |
Class R Shares | | | 100 | | | | 100 | | | | 100 | | | | 100 | | | | 100 | | | |
Institutional Service Class Shares | | | 100 | | | | 100 | | | | 100 | | | | 100 | | | | 100 | | | |
Institutional Class Shares | | | 500,000 | | | | 500,000 | | | | 500,000 | | | | 509,434 | | | | 509,461 | | | |
| | | | | | | | | | | | | | | | | | | | | | | |
Total | | | 500,500 | | | | 500,500 | | | | 500,500 | | | | 509,934 | | | | 509,961 | | | |
| | | | | | | | | | | | | | | | | | | | | | | |
| | | | | | |
Net asset value and redemption price per share (Net assets by class divided by shares outstanding by class, respectively): | | | | | | | | | | | | | | | | | | | | | | |
Class A Shares | | $ | 10.25 | | | $ | 10.06 | | | $ | 10.39 | | | $ | 10.66 | | | $ | 10.45 | | | |
Class B Shares (a) | | $ | 10.24 | | | $ | 10.05 | | | $ | 10.38 | | | $ | 10.65 | | | $ | 10.44 | | | |
Class C Shares (b) | | $ | 10.24 | | | $ | 10.05 | | | $ | 10.38 | | | $ | 10.65 | | | $ | 10.44 | | | |
Class R Shares | | $ | 10.24 | | | $ | 10.05 | | | $ | 10.39 | | | $ | 10.66 | | | $ | 10.45 | | | |
Institutional Service Class Shares | | $ | 10.25 | | | $ | 10.06 | | | $ | 10.39 | | | $ | 10.66 | | | $ | 10.45 | | | |
Institutional Class Shares | | $ | 10.25 | | | $ | 10.06 | | | $ | 10.39 | | | $ | 10.66 | | | $ | 10.45 | | | |
| | | | | | |
Maximum offering price per share (100%/(100%-maximum sales charge) of net asset value adjusted to the nearest cent): | | | | | | | | | | | | | | | | | | | | | | |
Class A Shares | | $ | 10.88 | | | $ | 10.67 | | | $ | 11.02 | | | $ | 11.31 | | | $ | 11.09 | | | |
| | | | | | | | | | | | | | | | | | | | | | | |
Maximum Sales Charge — Class A Shares | | | 5.75 | % | | | 5.75 | % | | | 5.75 | % | | | 5.75 | % | | | 5.75 | % | | |
| | | | | | | | | | | | | | | | | | | | | | | |
| | | | | | | | | | | | | | | | | | | | | | | |
| | | | | | | | | | | | | | | | | | | | | | | |
| | | | | | | | | | | | | | | | | | | | | | | |
| | | | | | | | | | | | | | | | | | | | | | | |
| | | | | | | | | | | | | | | | | | | | | | | |
| (a) | For Class B Shares, the redemption price per share varies by length of time shares are held. |
| (b) | For Class C Shares, the redemption price per share is reduced by 1.00% for shares held less than one year. |
See notes to financial statements.
Statements of Operations
For the Period Ended October 31, 2006
| | | | | | | | | | | | | | | | | | | | | | |
| | | Gartmore Hedged
Core Equity Fund | | | Gartmore Market
Neutral Fund | | | Gartmore Small
Cap Core Fund | | | Gartmore Small
Cap Growth
Opportunities
Fund | | | Gartmore Small Cap
Value Fund |
INVESTMENT INCOME: | | | | | | | | | | | | | | | | | | | | | | |
Interest income | | $ | 8,238 | | | $ | 20,700 | | | $ | 3,018 | | | $ | 3,398 | | | $ | 4,073 | | | |
Dividend income | | | 5,004 | | | | 4,758 | | | | 3,695 | | | | 978 | | | | 3,501 | | | |
| | | | | | | | | | | | | | | | | | | | | | | |
Total Income | | | 13,242 | | | | 25,458 | | | | 6,713 | | | | 4,376 | | | | 7,574 | | | |
| | | | | | | | | | | | | | | | | | | | | | | |
| | | | | | |
Expenses: | | | | | | | | | | | | | | | | | | | | | | |
Investment advisory fees | | | 5,725 | | | | 5,673 | | | | 3,933 | | | | 4,447 | | | | 4,455 | | | |
Fund administration and transfer agent fees | | | 706 | | | | 702 | | | | 914 | | | | 919 | | | | 919 | | | |
Distribution fees Class B | | | 1 | | | | 1 | | | | 1 | | | | 1 | | | | 1 | | | |
Distribution fees Class C | | | 1 | | | | 1 | | | | 1 | | | | 1 | | | | 1 | | | |
Dividend expense for securities sold short | | | 3,600 | | | | 2,887 | | | | — | | | | — | | | | — | | | |
Registration and filing fees | | | 4,069 | | | | 4,069 | | | | 4,521 | | | | 4,521 | | | | 4,521 | | | |
Trustee fees | | | 24 | | | | 24 | | | | 29 | | | | 29 | | | | 29 | | | |
Other | | | 1,195 | | | | 1,195 | | | | 1,099 | | | | 1,094 | | | | 1,099 | | | |
| | | | | | | | | | | | | | | | | | | | | | | |
Total expenses before reimbursed expenses | | | 15,321 | | | | 14,552 | | | | 10,498 | | | | 11,012 | | | | 11,025 | | | |
Expenses reimbursed | | | (4,363 | ) | | | (4,379 | ) | | | (4,711 | ) | | | (4,690 | ) | | | (4,691 | ) | | |
| | | | | | | | | | | | | | | | | | | | | | | |
Net Expenses | | | 10,958 | | | | 10,173 | | | | 5,787 | | | | 6,322 | | | | 6,334 | | | |
| | | | | | | | | | | | | | | | | | | | | | | |
Net Investment Income (Loss) | | | 2,284 | | | | 15,285 | | | | 926 | | | | (1,946 | ) | | | 1,240 | | | |
| | | | | | | | | | | | | | | | | | | | | | | |
| | | | | | |
REALIZED/UNREALIZED GAINS (LOSSES) FROM INVESTMENTS: | | | | | | | | | | | | | | | | | | | | | | |
Net realized gains (losses) on investment transactions | | | (7,229 | ) | | | (9,976 | ) | | | — | | | | 80,108 | | | | 197,902 | | | |
Net change in unrealized appreciation/depreciation on investments | | | 129,316 | | | | 24,227 | | | | 195,784 | | | | 254,031 | | | | 26,506 | | | |
| | | | | | | | | | | | | | | | | | | | | | | |
Net realized/unrealized gains (losses) on investments | | | 122,087 | | | | 14,251 | | | | 195,784 | | | | 334,139 | | | | 224,408 | | | |
| | | | | | | | | | | | | | | | | | | | | | | |
CHANGE IN NET ASSETS RESULTING FROM OPERATIONS | | $ | 124,371 | | | $ | 29,536 | | | $ | 196,710 | | | $ | 332,193 | | | $ | 225,648 | | | |
| | | | | | | | | | | | | | | | | | | | | | | |
| | | | | | | | | | | | | | | | | | | | | | | |
| | | | | | | | | | | | | | | | | | | | | | | |
| | | | | | | | | | | | | | | | | | | | | | | |
| | | | | | | | | | | | | | | | | | | | | | | |
| | | | | | | | | | | | | | | | | | | | | | | |
| | | | | | | | | | | | | | | | | | | | | | | |
| | | | | | | | | | | | | | | | | | | | | | | |
| | | | | | | | | | | | | | | | | | | | | | | |
| | | | | | | | | | | | | | | | | | | | | | | |
| | | | | | | | | | | | | | | | | | | | | | | |
| | | | | | | | | | | | | | | | | | | | | | | |
See notes to financial statements.
Statements of Changes in Net Assets
| | | | | | | | | | | | | | | | | | | | |
| | | Gartmore Hedged
Core Equity Fund | | | Gartmore Market
Neutral Fund | | | Gartmore Small Cap
Core Fund | | Gartmore Small Cap
Growth Opportunities
Fund | | | Gartmore Small
Cap Value Fund |
| | | Period Ended
October 31, 2006 (a) | | | Period Ended
October 31, 2006 (a) | | | Period Ended
October 31, 2006 (a) | | Period Ended
October 31, 2006 (a) | | | Period Ended
October 31, 2006 (a) | | |
FROM INVESTMENT ACTIVITIES: | | | | | | | | | | | | | | | | | | | | |
Operations: | | | | | | | | | | | | | | | | | | | | |
Net investment income (loss) | | $ | 2,284 | | | $ | 15,285 | | | $ | 926 | | $ | (1,946 | ) | | $ | 1,240 | | |
Net realized gains (losses) on investment transactions | | | (7,229 | ) | | | (9,976 | ) | | | — | | | 80,108 | | | | 197,902 | | |
Net change in unrealized appreciation/depreciation on investments | | | 129,316 | | | | 24,227 | | | | 195,784 | | | 254,031 | | | | 26,506 | | |
| | | | | | | | | | | | | | | | | | | | |
Change in net assets resulting from operations | | | 124,371 | | | | 29,536 | | | | 196,710 | | | 332,193 | | | | 225,648 | | |
| | | | | | | | | | | | | | | | | | | | |
Change in net assets from capital transactions | | | 5,005,000 | | | | 5,005,000 | | | | 5,005,000 | | | 5,105,000 | | | | 5,105,000 | | |
| | | | | | | | | | | | | | | | | | | | |
Change in net assets | | | 5,129,371 | | | | 5,034,536 | | | | 5,201,710 | | | 5,437,193 | | | | 5,330,648 | | |
| | | | | | |
Net Assets: | | | | | | | | | | | | | | | | | | | | |
Beginning of period | | | — | | | | — | | | | — | | | — | | | | — | | |
| | | | | | | | | | | | | | | | | | | | |
End of period | | $ | 5,129,371 | | | $ | 5,034,536 | | | $ | 5,201,710 | | $ | 5,437,193 | | | $ | 5,330,648 | | |
| | | | | | | | | | | | | | | | | | | | |
Accumulated net investment income (loss) at end of period | | $ | 7,144 | | | $ | 19,620 | | | $ | 5,450 | | $ | 2,578 | | | $ | 5,763 | | |
| | | | | | | | | | | | | | | | | | | | |
| | | | | | | | | | | | | | | | | | | | |
| | | | | | | | | | | | | | | | | | | | |
| | | | | | | | | | | | | | | | | | | | |
| | | | | | | | | | | | | | | | | | | | |
| | | | | | | | | | | | | | | | | | | | |
| | | | | | | | | | | | | | | | | | | | |
| | | | | | | | | | | | | | | | | | | | |
| | | | | | | | | | | | | | | | | | | | |
| | | | | | | | | | | | | | | | | | | | |
| | | | | | | | | | | | | | | | | | | | |
| | | | | | | | | | | | | | | | | | | | |
| | | | | | | | | | | | | | | | | | | | |
| | | | | | | | | | | | | | | | | | | | |
| | | | | | | | | | | | | | | | | | | | |
| | | | | | | | | | | | | | | | | | | | |
| | | | | | | | | | | | | | | | | | | | |
| | | | | | | | | | | | | | | | | | | | |
| | | | | | | | | | | | | | | | | | | | |
| | | | | | | | | | | | | | | | | | | | |
| | | | | | | | | | | | | | | | | | | | |
| | | | | | | | | | | | | | | | | | | | |
| | | | | | | | | | | | | | | | | | | | | |
| (a) | For the period from September 29, 2006 (commencement of operations) through October 31, 2006. |
See notes to financial statements.
Statements of Changes in Net Assets (Continued)
| | | | | | | | | | | | | | | | | |
| | | Gartmore Hedged
Core Equity Fund | | Gartmore Market
Neutral Fund | | Gartmore Small
Cap Core Fund | | Gartmore Small
Cap Growth
Opportunities
Fund | | Gartmore Small Cap
Value Fund |
| | | Period Ended
October 31, 2006 (a) | | Period Ended
October 31, 2006 (a) | | Period Ended
October 31, 2006 (a) | | Period Ended
October 31, 2006 (a) | | Period Ended
October 31, 2006 (a) | | |
CAPITAL TRANSACTIONS: | | | | | | | | | | | | | | | | | |
Class A Shares | | | | | | | | | | | | | | | | | |
Proceeds from shares issued | | $ | 1,000 | | $ | 1,000 | | $ | 1,000 | | $ | 1,000 | | $ | 1,000 | | |
| | | | | | | | | | | | | | | | | | |
| | | | 1,000 | | | 1,000 | | | 1,000 | | | 1,000 | | | 1,000 | | |
| | | | | | | | | | | | | | | | | | |
Class B Shares | | | | | | | | | | | | | | | | | |
Proceeds from shares issued | | | 1,000 | | | 1,000 | | | 1,000 | | | 1,000 | | | 1,000 | | |
| | | | | | | | | | | | | | | | | | |
| | | | 1,000 | | | 1,000 | | | 1,000 | | | 1,000 | | | 1,000 | | |
| | | | | | | | | | | | | | | | | | |
Class C Shares | | | | | | | | | | | | | | | | | |
Proceeds from shares issued | | | 1,000 | | | 1,000 | | | 1,000 | | | 1,000 | | | 1,000 | | |
| | | | | | | | | | | | | | | | | | |
| | | | 1,000 | | | 1,000 | | | 1,000 | | | 1,000 | | | 1,000 | | |
| | | | | | | | | | | | | | | | | | |
Class R Shares | | | | | | | | | | | | | | | | | |
Proceeds from shares issued | | | 1,000 | | | 1,000 | | | 1,000 | | | 1,000 | | | 1,000 | | |
| | | | | | | | | | | | | | | | | | |
| | | | 1,000 | | | 1,000 | | | 1,000 | | | 1,000 | | | 1,000 | | |
| | | | | | | | | | | | | | | | | | |
Institutional Service Class Shares | | | | | | | | | | | | | | | | | |
Proceeds from shares issued | | | 1,000 | | | 1,000 | | | 1,000 | | | 1,000 | | | 1,000 | | |
| | | | | | | | | | | | | | | | | | |
| | | | 1,000 | | | 1,000 | | | 1,000 | | | 1,000 | | | 1,000 | | |
| | | | | | | | | | | | | | | | | | |
Institutional Class Shares | | | | | | | | | | | | | | | | | |
Proceeds from shares issued | | | 5,000,000 | | | 5,000,000 | | | 5,000,000 | | | 5,100,000 | | | 5,100,000 | | |
| | | | | | | | | | | | | | | | | | |
| | | | 5,000,000 | | | 5,000,000 | | | 5,000,000 | | | 5,100,000 | | | 5,100,000 | | |
| | | | | | | | | | | | | | | | | | |
Change in net assets from capital transactions | | $ | 5,005,000 | | $ | 5,005,000 | | $ | 5,005,000 | | $ | 5,105,000 | | $ | 5,105,000 | | |
| | | | | | | | | | | | | | | | | | |
| (a) | For the period from September 29, 2006 (commencement of operations) through October 31, 2006. |
See notes to financial statements.
Statements of Changes in Net Assets (Continued)
| | | | | | | | | | | | |
| | | Gartmore Hedged
Core Equity Fund | | Gartmore Market
Neutral Fund | | Gartmore Small
Cap Core Fund | | Gartmore Small Cap
Growth Opportunities
Fund | | Gartmore Small
Cap Value Fund |
| | | Period Ended
October 31, 2006 (a) | | Period Ended
October 31, 2006 (a) | | Period Ended
October 31, 2006 (a) | | Period Ended
October 31, 2006 (a) | | Period Ended
October 31, 2006 (a) | | |
SHARE TRANSACTIONS: | | | | | | | | | | | | |
Class A Shares | | | | | | | | | | | | |
Issued | | 100 | | 100 | | 100 | | 100 | | 100 | | |
| | | | | | | | | | | | | |
| | | 100 | | 100 | | 100 | | 100 | | 100 | | |
| | | | | | | | | | | | | |
| | | | | | |
Class B Shares | | | | | | | | | | | | |
Issued | | 100 | | 100 | | 100 | | 100 | | 100 | | |
| | | | | | | | | | | | | |
| | | 100 | | 100 | | 100 | | 100 | | 100 | | |
| | | | | | | | | | | | | |
| | | | | | |
Class C Shares | | | | | | | | | | | | |
Issued | | 100 | | 100 | | 100 | | 100 | | 100 | | |
| | | | | | | | | | | | | |
| | | 100 | | 100 | | 100 | | 100 | | 100 | | |
| | | | | | | | | | | | | |
| | | | | | |
Class R Shares | | | | | | | | | | | | |
Issued | | 100 | | 100 | | 100 | | 100 | | 100 | | |
| | | | | | | | | | | | | |
| | | 100 | | 100 | | 100 | | 100 | | 100 | | |
| | | | | | | | | | | | | |
| | | | | | |
Institutional Service Class Shares | | | | | | | | | | | | |
Issued | | 100 | | 100 | | 100 | | 100 | | 100 | | |
| | | | | | | | | | | | | |
| | | 100 | | 100 | | 100 | | 100 | | 100 | | |
| | | | | | | | | | | | | |
| | | | | | |
Institutional Class Shares | | | | | | | | | | | | |
Issued | | 500,000 | | 500,000 | | 500,000 | | 509,434 | | 509,461 | | |
| | | | | | | | | | | | | |
| | | 500,000 | | 500,000 | | 500,000 | | 509,434 | | 509,461 | | |
| | | | | | | | | | | | | |
Total change in shares | | 500,500 | | 500,500 | | 500,500 | | 509,934 | | 509,961 | | |
| | | | | | | | | | | | | |
| (a) | For the period from September 29, 2006 (commencement of operations) through October 31, 2006. |
See notes to financial statements.
Financial Highlights
Selected Data for Each Share of Capital Outstanding
Gartmore Hedged Core Equity Fund
| | | | | | | | | | | | | | | | | | | | | | | | | | | | | | | | | | | | |
| | | | | Investment Activities | | | | | Ratios/Supplemental Data |
| | | Net Asset
Value,
Beginning
of Period | | Net
Investment
Income
(Loss) | | | Net Realized
and
Unrealized
Gains
(Losses) on
Investments | | Total
from
Investment
Activities | | Net
Asset
Value, End
of Period | | Total
Return (a) | | | Net Assets
at End of
Period
(000s) | | Ratio of
Expenses
to Average
Net Assets
(Includes
Dividend
Expense) | | | Ratio of Net
Investment
Income
(Loss)
to Average
Net Assets | | | Ratio of
Expenses
(Prior to
Reimbursements)
to Average
Net Assets (b) | | | Ratio of Net
Investment
Income (Loss)
(Prior to
Reimbursements)
to Average
Net Assets
(Includes Dividend
Expense) (b) | | | Dividend
Expense (c) | | | Portfolio
Turnover (d) |
| | | | | | | | | | | | | |
Class A Shares | | | | | | | | | | | | | | | | | | | | | | | | | | | | | | | | | | | | |
Period Ended October 31, 2006 (e) | | $ | 10.00 | | — | (f) | | 0.25 | | 0.25 | | $ | 10.25 | | 2.50% | (g) | | $ | 1 | | 2.30% | (h) | | 0.32% | (h) | | 2.85% | (h) | | (0.23% | )(h) | | 0.79% | (h) | | 0.00% |
| | | | | | | | | | | | | |
Class B Shares | | | | | | | | | | | | | | | | | | | | | | | | | | | | | | | | | | | | |
Period Ended October 31, 2006 (e) | | $ | 10.00 | | (0.01 | ) | | 0.25 | | 0.24 | | $ | 10.24 | | 2.40% | (g) | | $ | 1 | | 3.59% | (h) | | (0.62% | )(h) | | 4.62% | (h) | | (1.65% | )(h) | | 0.79% | (h) | | 0.00% |
| | | | | | | | | | | | | |
Class C Shares | | | | | | | | | | | | | | | | | | | | | | | | | | | | | | | | | | | | |
Period Ended October 31, 2006 (e) | | $ | 10.00 | | (0.01 | ) | | 0.25 | | 0.24 | | $ | 10.24 | | 2.40% | (g) | | $ | 1 | | 3.59% | (h) | | (0.62% | )(h) | | 4.69% | (h) | | (1.72% | )(h) | | 0.79% | (h) | | 0.00% |
| | | | | | | | | | | | | |
Class R Shares | | | | | | | | | | | | | | | | | | | | | | | | | | | | | | | | | | | | |
Period Ended October 31, 2006 (e) | | $ | 10.00 | | — | (f) | | 0.24 | | 0.24 | | $ | 10.24 | | 2.40% | (g) | | $ | 1 | | 3.23% | (h) | | (0.25% | )(h) | | 4.01% | (h) | | (1.03% | )(h) | | 0.79% | (h) | | 0.00% |
| | | | | | | | | | | | | |
Institutional Service Class Shares | | | | | | | | | | | | | | | | | | | | | | | | | | | | | | | | | | | | |
Period Ended October 31, 2006 (e) | | $ | 10.00 | | — | (f) | | 0.25 | | 0.25 | | $ | 10.25 | | 2.50% | (g) | | $ | 1 | | 2.51% | (h) | | 0.47% | (h) | | 3.61% | (h) | | (0.63% | )(h) | | 0.79% | (h) | | 0.00% |
| | | | | | | | | | | | | |
Institutional Class Shares | | | | | | | | | | | | | | | | | | | | | | | | | | | | | | | | | | | | |
Period Ended October 31, 2006 (e) | | $ | 10.00 | | — | (f) | | 0.25 | | 0.25 | | $ | 10.25 | | 2.50% | (g) | | $ | 5,124 | | 2.39% | (h) | | 0.50% | (h) | | 3.34% | (h) | | (0.45% | )(h) | | 0.79% | (h) | | 0.00% |
| | | | | | | | | | | | | | | | | | | | | | | | | | | | | | | | | | | | | |
| | | | | | | | | | | | | | | | | | | | | | | | | | | | | | | | | | | | | |
| | | | | | | | | | | | | | | | | | | | | | | | | | | | | | | | | | | | | |
| | | | | | | | | | | | | | | | | | | | | | | | | | | | | | | | | | | | | |
| | | | | | | | | | | | | | | | | | | | | | | | | | | | | | | | | | | | | |
| | | | | | | | | | | | | | | | | | | | | | | | | | | | | | | | | | | | | |
| | | | | | | | | | | | | | | | | | | | | | | | | | | | | | | | | | | | | |
| | | | | | | | | | | | | | | | | | | | | | | | | | | | | | | | | | | | | |
| | | | | | | | | | | | | | | | | | | | | | | | | | | | | | | | | | | | | |
| | | | | | | | | | | | | | | | | | | | | | | | | | | | | | | | | | | | | |
| | | | | | | | | | | | | | | | | | | | | | | | | | | | | | | | | | | | | |
| | | | | | | | | | | | | | | | | | | | | | | | | | | | | | | | | | | | | |
| | | | | | | | | | | | | | | | | | | | | | | | | | | | | | | | | | | | | |
| (a) | Excludes sales charge. |
| (b) | During the period certain fees were waived and/or reimbursed. If such waivers/reimbursements had not occurred, the ratios would have been as indicated. |
| (c) | Indicates the dividend expense charged for the period to average net assets. |
| (d) | Portfolio turnover is calculated on the basis of the Fund as a whole without distinguishing among the classes of shares. |
| (e) | For the period from September 29, 2006 (commencement of operations) through October 31, 2006. |
| (f) | Amount is less than $0.005. |
See notes to financial statements.
Financial Highlights
Selected Data for Each Share of Capital Outstanding
Gartmore Market Neutral Fund
| | | | | | | | | | | | | | | | | | | | | | | | | | | | | | | | | | | |
| | | | | Investment Activities | | | | | Ratios/Supplemental Data |
| | | Net Asset
Value,
Beginning
of Period | | Net
Investment
Income
(Loss) | | Net Realized
and
Unrealized
Gains
(Losses) on
Investments | | Total
from
Investment
Activities | | Net
Asset
Value, End
of Period | | Total
Return (a) | | | Net
Assets
at End of
Period
(000s) | | Ratio of
Expenses
to Average
Net Assets
(Includes
Dividend
Expense) | | | Ratio of Net
Investment
Income
(Loss)
to Average
Net Assets | | | Ratio of
Expenses
(Prior to
Reimbursements)
to Average
Net Assets
(Includes Dividend
Expense) (b) | | | Ratio of Net
Investment
Income (Loss)
(Prior to
Reimbursements)
to Average
Net Assets (b) | | | Dividend
Expense (c) | | | Portfolio
Turnover (d) |
| | | | | | | | | | | | | |
Class A Shares | | | | | | | | | | | | | | | | | | | | | | | | | | | | | | | | | | | |
Period Ended October 31, 2006 (e) | | $ | 10.00 | | 0.03 | | 0.03 | | 0.06 | | $ | 10.06 | | 0.60% | (f) | | $ | 1 | | 2.23% | (g) | | 3.56% | (g) | | 2.82% | (g) | | 2.97% | (g) | | 0.64% | (h) | | 0.00% |
| | | | | | | | | | | | | |
Class B Shares | | | | | | | | | | | | | | | | | | | | | | | | | | | | | | | | | | | |
Period Ended October 31, 2006 (e) | | $ | 10.00 | | 0.02 | | 0.03 | | 0.05 | | $ | 10.05 | | 0.50% | (f) | | $ | 1 | | 3.45% | (g) | | 2.10% | (g) | | 4.48% | (g) | | 1.07% | (g) | | 0.64% | (h) | | 0.00% |
| | | | | | | | | | | | | |
Class C Shares | | | | | | | | | | | | | | | | | | | | | | | | | | | | | | | | | | | |
Period Ended October 31, 2006 (e) | | $ | 10.00 | | 0.02 | | 0.03 | | 0.05 | | $ | 10.05 | | 0.50% | (f) | | $ | 1 | | 3.45% | (g) | | 2.10% | (g) | | 4.53% | (g) | | 1.02% | (g) | | 0.64% | (h) | | 0.00% |
| | | | | | | | | | | | | |
Class R Shares | | | | | | | | | | | | | | | | | | | | | | | | | | | | | | | | | | | |
Period Ended October 31, 2006 (e) | | $ | 10.00 | | 0.02 | | 0.03 | | 0.05 | | $ | 10.05 | | 0.50% | (f) | | $ | 1 | | 3.09% | (g) | | 2.46% | (g) | | 3.89% | (g) | | 1.65% | (g) | | 0.64% | (h) | | 0.00% |
| | | | | | | | | | | | | |
Institutional Service Class Shares | | | | | | | | | | | | | | | | | | | | | | | | | | | | | | | | | | | |
Period Ended October 31, 2006 (e) | | $ | 10.00 | | 0.03 | | 0.03 | | 0.06 | | $ | 10.06 | | 0.60% | (f) | | $ | 1 | | 2.36% | (g) | | 3.19% | (g) | | 3.45% | (g) | | 2.10% | (g) | | 0.64% | (h) | | 0.00% |
| | | | | | | | | | | | | |
Institutional Class Shares | | | | | | | | | | | | | | | | | | | | | | | | | | | | | | | | | | | |
Period Ended October 31, 2006 (e) | | $ | 10.00 | | 0.03 | | 0.03 | | 0.06 | | $ | 10.06 | | 0.60% | (f) | | $ | 5,030 | | 2.24% | (g) | | 3.37% | (g) | | 3.21% | (g) | | 2.40% | (g) | | 0.64% | (h) | | 0.00% |
| | | | | | | | | | | | | | | | | | | | | | | | | | | | | | | | | | | | |
| | | | | | | | | | | | | | | | | | | | | | | | | | | | | | | | | | | | |
| | | | | | | | | | | | | | | | | | | | | | | | | | | | | | | | | | | | |
| | | | | | | | | | | | | | | | | | | | | | | | | | | | | | | | | | | | |
| | | | | | | | | | | | | | | | | | | | | | | | | | | | | | | | | | | | |
| | | | | | | | | | | | | | | | | | | | | | | | | | | | | | | | | | | | |
| | | | | | | | | | | | | | | | | | | | | | | | | | | | | | | | | | | | |
| | | | | | | | | | | | | | | | | | | | | | | | | | | | | | | | | | | | |
| | | | | | | | | | | | | | | | | | | | | | | | | | | | | | | | | | | | |
| | | | | | | | | | | | | | | | | | | | | | | | | | | | | | | | | | | | |
| | | | | | | | | | | | | | | | | | | | | | | | | | | | | | | | | | | | |
| | | | | | | | | | | | | | | | | | | | | | | | | | | | | | | | | | | | |
| | | | | | | | | | | | | | | | | | | | | | | | | | | | | | | | | | | | |
| | | | | | | | | | | | | | | | | | | | | | | | | | | | | | | | | | | | |
| | | | | | | | | | | | | | | | | | | | | | | | | | | | | | | | | | | | |
| (a) | Excludes sales charge. |
| (b) | During the period certain fees were waived and/or reimbursed. If such waivers/reimbursements had not occurred, the ratios would have been as indicated. |
| (c) | Indicates the dividend expense charged for the period to average net assets. |
| (d) | Portfolio turnover is calculated on the basis of the Fund as a whole without distinguishing among the classes of shares. |
| (e) | For the period from September 29, 2006 (commencement of operations) through October 31, 2006. |
See notes to financial statements.
Financial Highlights
Selected Data for Each Share of Capital Outstanding
Gartmore Small Cap Core Fund
| | | | | | | | | | | | | | | | | | | | | | | | | | | | | | | | | |
| | | | | Investment Activities | | | | | Ratios/Supplemental Data |
| | | Net Asset
Value,
Beginning
of Period | | Net
Investment
Income
(Loss) | | | Net Realized
and
Unrealized
Gains
(Losses) on
Investments | | Total
from
Investment
Activities | | Net
Asset
Value, End
of Period | | Total
Return (a) | | | Net Assets
at End of
Period
(000s) | | Ratio of
Expenses
to Average
Net Assets | | | Ratio of Net
Investment
Income
(Loss)
to Average
Net Assets | | | Ratio of
Expenses
(Prior to
Reimbursements)
to Average
Net Assets (b) | | | Ratio of Net
Investment
Income (Loss)
(Prior to
Reimbursements)
to Average
Net Assets (b) | | | Portfolio
Turnover (c) |
| | | | | | | | | | | | |
Class A Shares | | | | | | | | | | | | | | | | | | | | | | | | | | | | | | | | | |
Period Ended October 31, 2006 (d) | | $ | 10.00 | | — | (e) | | 0.39 | | 0.39 | | $ | 10.39 | | 3.90% | (f) | | $ | 1 | | 1.52% | (g) | | (0.38% | )(g) | | 2.56% | (g) | | (1.42% | )(g) | | 0.00% |
| | | | | | | | | | | | |
Class B Shares | | | | | | | | | | | | | | | | | | | | | | | | | | | | | | | | | |
Period Ended October 31, 2006 (d) | | $ | 10.00 | | (0.01 | ) | | 0.39 | | 0.38 | | $ | 10.38 | | 3.80% | (f) | | $ | 1 | | 2.25% | (g) | | (0.81% | )(g) | | 3.17% | (g) | | (1.73% | )(g) | | 0.00% |
| | | | | | | | | | | | |
Class C Shares | | | | | | | | | | | | | | | | | | | | | | | | | | | | | | | | | |
Period Ended October 31, 2006 (d) | | $ | 10.00 | | (0.01 | ) | | 0.39 | | 0.38 | | $ | 10.38 | | 3.80% | (f) | | $ | 1 | | 2.25% | (g) | | (0.81% | )(g) | | 3.17% | (g) | | (1.73% | )(g) | | 0.00% |
| | | | | | | | | | | | |
Class R Shares | | | | | | | | | | | | | | | | | | | | | | | | | | | | | | | | | |
Period Ended October 31, 2006 (d) | | $ | 10.00 | | — | (e) | | 0.39 | | 0.39 | | $ | 10.39 | | 3.90% | (f) | | $ | 1 | | 1.99% | (g) | | (0.45% | )(g) | | 3.07% | (g) | | (1.53% | )(g) | | 0.00% |
| | | | | | | | | | | | |
Institutional Service Class Shares | | | | | | | | | | | | | | | | | | | | | | | | | | | | | | | | | |
Period Ended October 31, 2006 (d) | | $ | 10.00 | | — | (e) | | 0.39 | | 0.39 | | $ | 10.39 | | 3.90% | (f) | | $ | 1 | | 1.27% | (g) | | 0.26% | (g) | | 2.52% | (g) | | (0.98% | )(g) | | 0.00% |
| | | | | | | | | | | | |
Institutional Class Shares | | | | | | | | | | | | | | | | | | | | | | | | | | | | | | | | | |
Period Ended October 31, 2006 (d) | | $ | 10.00 | | — | (e) | | 0.39 | | 0.39 | | $ | 10.39 | | 3.90% | (f) | | $ | 5,197 | | 1.25% | (g) | | 0.20% | (g) | | 2.27% | (g) | | (0.82% | )(g) | | 0.00% |
| | | | | | | | | | | | | | | | | | | | | | | | | | | | | | | | | | |
| | | | | | | | | | | | | | | | | | | | | | | | | | | | | | | | | | |
| | | | | | | | | | | | | | | | | | | | | | | | | | | | | | | | | | |
| | | | | | | | | | | | | | | | | | | | | | | | | | | | | | | | | | |
| | | | | | | | | | | | | | | | | | | | | | | | | | | | | | | | | | |
| | | | | | | | | | | | | | | | | | | | | | | | | | | | | | | | | | |
| | | | | | | | | | | | | | | | | | | | | | | | | | | | | | | | | | |
| | | | | | | | | | | | | | | | | | | | | | | | | | | | | | | | | | |
| | | | | | | | | | | | | | | | | | | | | | | | | | | | | | | | | | |
| | | | | | | | | | | | | | | | | | | | | | | | | | | | | | | | | | |
| | | | | | | | | | | | | | | | | | | | | | | | | | | | | | | | | | |
| | | | | | | | | | | | | | | | | | | | | | | | | | | | | | | | | | |
| | | | | | | | | | | | | | | | | | | | | | | | | | | | | | | | | | |
| | | | | | | | | | | | | | | | | | | | | | | | | | | | | | | | | | |
| | | | | | | | | | | | | | | | | | | | | | | | | | | | | | | | | | |
| (a) | Excludes sales charge. |
| (b) | During the period certain fees were waived and/or reimbursed. If such waivers/reimbursements had not occurred, the ratios would have been as indicated. |
| (c) | Portfolio turnover is calculated on the basis of the Fund as a whole without distinguishing among the classes of shares. |
| (d) | For the period from September 29, 2006 (commencement of operations) through October 31, 2006. |
| (e) | Amount is less than $0.005. |
See notes to financial statements.
Financial Highlights
Selected Data for Each Share of Capital Outstanding
Gartmore Small Cap Growth Opportunities Fund
| | | | | | | | | | | | | | | | | | | | | | | | | | | | | | | | | |
| | | | | Investment Activities | | | | | Ratios/Supplemental Data |
| | | Net Asset
Value,
Beginning
of Period | | Net
Investment
Income
(Loss) | | | Net Realized
and
Unrealized
Gains
(Losses) on
Investments | | Total
from
Investment
Activities | | Net
Asset
Value, End
of Period | | Total
Return (a) | | | Net Assets
at End of
Period
(000s) | | Ratio of
Expenses
to Average
Net Assets | | | Ratio of Net
Investment
Income
(Loss)
to Average
Net Assets | | | Ratio of
Expenses
(Prior to
Reimbursements)
to Average
Net Assets (b) | | | Ratio of Net
Investment
Income (Loss)
(Prior to
Reimbursements)
to Average
Net Assets (b) | | | Portfolio
Turnover (c) |
| | | | | | | | | | | | |
Class A Shares | | | | | | | | | | | | | | | | | | | | | | | | | | | | | | | | | |
Period Ended October 31, 2006 (d) | | $ | 10.00 | | (0.01 | ) | | 0.67 | | 0.66 | | $ | 10.66 | | 6.60% | (e) | | $ | 1 | | 1.44% | (f) | | (0.54% | )(f) | | 2.15% | (f) | | (1.25% | )(f) | | 37.38% |
| | | | | | | | | | | | |
Class B Shares | | | | | | | | | | | | | | | | | | | | | | | | | | | | | | | | | |
Period Ended October 31, 2006 (d) | | $ | 10.00 | | (0.01 | ) | | 0.66 | | 0.65 | | $ | 10.65 | | 6.50% | (e) | | $ | 1 | | 2.35% | (f) | | (1.53% | )(f) | | 3.40% | (f) | | (2.58% | )(f) | | 37.38% |
| | | | | | | | | | | | |
Class C Shares | | | | | | | | | | | | | | | | | | | | | | | | | | | | | | | | | |
Period Ended October 31, 2006 (d) | | $ | 10.00 | | (0.01 | ) | | 0.66 | | 0.65 | | $ | 10.65 | | 6.50% | (e) | | $ | 1 | | 2.35% | (f) | | (1.53% | )(f) | | 3.40% | (f) | | (2.58% | )(f) | | 37.38% |
| | | | | | | | | | | | |
Class R Shares | | | | | | | | | | | | | | | | | | | | | | | | | | | | | | | | | |
Period Ended October 31, 2006 (d) | | $ | 10.00 | | (0.01 | ) | | 0.67 | | 0.66 | | $ | 10.66 | | 6.60% | (e) | | $ | 1 | | 2.11% | (f) | | (1.18% | )(f) | | 3.02% | (f) | | (2.09% | )(f) | | 37.38% |
| | | | | | | | | | | | |
Institutional Service Class Shares | | | | | | | | | | | | | | | | | | | | | | | | | | | | | | | | | |
Period Ended October 31, 2006 (d) | | $ | 10.00 | | — | (g) | | 0.66 | | 0.66 | | $ | 10.66 | | 6.60% | (e) | | $ | 1 | | 1.40% | (f) | | (0.47% | )(f) | | 2.46% | (f) | | (1.53% | )(f) | | 37.38% |
| | | | | | | | | | | | |
Institutional Class Shares | | | | | | | | | | | | | | | | | | | | | | | | | | | | | | | | | |
Period Ended October 31, 2006 (d) | | $ | 10.00 | | — | (g) | | 0.66 | | 0.66 | | $ | 10.66 | | 6.60% | (e) | | $ | 5,432 | | 1.35% | (f) | | (0.41% | )(f) | | 2.35% | (f) | | (1.41% | )(f) | | 37.38% |
| | | | | | | | | | | | | | | | | | | | | | | | | | | | | | | | | | |
| | | | | | | | | | | | | | | | | | | | | | | | | | | | | | | | | | |
| | | | | | | | | | | | | | | | | | | | | | | | | | | | | | | | | | |
| | | | | | | | | | | | | | | | | | | | | | | | | | | | | | | | | | |
| | | | | | | | | | | | | | | | | | | | | | | | | | | | | | | | | | |
| | | | | | | | | | | | | | | | | | | | | | | | | | | | | | | | | | |
| | | | | | | | | | | | | | | | | | | | | | | | | | | | | | | | | | |
| | | | | | | | | | | | | | | | | | | | | | | | | | | | | | | | | | |
| | | | | | | | | | | | | | | | | | | | | | | | | | | | | | | | | | |
| | | | | | | | | | | | | | | | | | | | | | | | | | | | | | | | | | |
| | | | | | | | | | | | | | | | | | | | | | | | | | | | | | | | | | |
| | | | | | | | | | | | | | | | | | | | | | | | | | | | | | | | | | |
| | | | | | | | | | | | | | | | | | | | | | | | | | | | | | | | | | |
| | | | | | | | | | | | | | | | | | | | | | | | | | | | | | | | | | |
| | | | | | | | | | | | | | | | | | | | | | | | | | | | | | | | | | |
| | | | | | | | | | | | | | | | | | | | | | | | | | | | | | | | | | |
| (a) | Excludes sales charge. |
| (b) | During the period certain fees were waived and/or reimbursed. If such waivers/reimbursements had not occurred, the ratios would have been as indicated. |
| (c) | Portfolio turnover is calculated on the basis of the Fund as a whole without distinguishing among the classes of shares. |
| (d) | For the period from September 29, 2006 (commencement of operations) through October 31, 2006. |
| (g) | Amount is less than $0.005. |
See notes to financial statements.
Financial Highlights
Selected Data for Each Share of Capital Outstanding
Gartmore Small Cap Value Fund
| | | | | | | | | | | | | | | | | | | | | | | | | | | | | | | | | |
| | | | | Investment Activities | | | | | Ratios/Supplemental Data |
| | | Net Asset
Value,
Beginning
of Period | | Net
Investment
Income
(Loss) | | | Net Realized
and
Unrealized
Gains
(Losses) on
Investments | | Total
from
Investment
Activities | | Net
Asset
Value, End
of Period | | Total
Return (a) | | | Net Assets
at End of
Period
(000s) | | Ratio of
Expenses
to Average
Net Assets | | | Ratio of Net
Investment
Income
(Loss)
to Average
Net Assets | | | Ratio of
Expenses
(Prior to
Reimbursements)
to Average
Net Assets (b) | | | Ratio of Net
Investment
Income (Loss)
(Prior to
Reimbursements)
to Average
Net Assets (b) | | | Portfolio
Turnover (c) |
| | | | | | | | | | | | |
Class A Shares | | | | | | | | | | | | | | | | | | | | | | | | | | | | | | | | | |
Period Ended October 31, 2006 (d) | | $ | 10.00 | | — | (e) | | 0.45 | | 0.45 | | $ | 10.45 | | 4.50% | (f) | | $ | 1 | | 1.40% | (g) | | 0.13% | (g) | | 2.08% | (g) | | (0.56% | )(g) | | 194.16% |
| | | | | | | | | | | | |
Class B Shares | | | | | | | | | | | | | | | | | | | | | | | | | | | | | | | | | |
Period Ended October 31, 2006 (d) | | $ | 10.00 | | (0.01 | ) | | 0.45 | | 0.44 | | $ | 10.44 | | 4.40% | (f) | | $ | 1 | | 2.35% | (g) | | (0.82% | )(g) | | 3.40% | (g) | | (1.87% | )(g) | | 194.16% |
| | | | | | | | | | | | |
Class C Shares | | | | | | | | | | | | | | | | | | | | | | | | | | | | | | | | | |
Period Ended October 31, 2006 (d) | | $ | 10.00 | | (0.01 | ) | | 0.45 | | 0.44 | | $ | 10.44 | | 4.40% | (f) | | $ | 1 | | 2.35% | (g) | | (0.82% | )(g) | | 3.40% | (g) | | (1.87% | )(g) | | 194.16% |
| | | | | | | | | | | | |
Class R Shares | | | | | | | | | | | | | | | | | | | | | | | | | | | | | | | | | |
Period Ended October 31, 2006 (d) | | $ | 10.00 | | — | (e) | | 0.45 | | 0.45 | | $ | 10.45 | | 4.50% | (f) | | $ | 1 | | 2.11% | (g) | | (0.47% | )(g) | | 3.10% | (g) | | (1.46% | )(g) | | 194.16% |
| | | | | | | | | | | | |
Institutional Service Class Shares | | | | | | | | | | | | | | | | | | | | | | | | | | | | | | | | | |
Period Ended October 31, 2006 (d) | | $ | 10.00 | | — | (e) | | 0.45 | | 0.45 | | $ | 10.45 | | 4.50% | (f) | | $ | 1 | | 1.41% | (g) | | 0.22% | (g) | | 2.47% | (g) | | (0.83% | )(g) | | 194.16% |
| | | | | | | | | | | | |
Institutional Class Shares | | | | | | | | | | | | | | | | | | | | | | | | | | | | | | | | | |
Period Ended October 31, 2006 (d) | | $ | 10.00 | | — | (e) | | 0.45 | | 0.45 | | $ | 10.45 | | 4.50% | (f) | | $ | 5,325 | | 1.35% | (g) | | 0.26% | (g) | | 2.35% | (g) | | (0.73% | )(g) | | 194.16% |
| | | | | | | | | | | | | | | | | | | | | | | | | | | | | | | | | | |
| | | | | | | | | | | | | | | | | | | | | | | | | | | | | | | | | | |
| | | | | | | | | | | | | | | | | | | | | | | | | | | | | | | | | | |
| | | | | | | | | | | | | | | | | | | | | | | | | | | | | | | | | | |
| | | | | | | | | | | | | | | | | | | | | | | | | | | | | | | | | | |
| | | | | | | | | | | | | | | | | | | | | | | | | | | | | | | | | | |
| | | | | | | | | | | | | | | | | | | | | | | | | | | | | | | | | | |
| | | | | | | | | | | | | | | | | | | | | | | | | | | | | | | | | | |
| | | | | | | | | | | | | | | | | | | | | | | | | | | | | | | | | | |
| | | | | | | | | | | | | | | | | | | | | | | | | | | | | | | | | | |
| | | | | | | | | | | | | | | | | | | | | | | | | | | | | | | | | | |
| | | | | | | | | | | | | | | | | | | | | | | | | | | | | | | | | | |
| | | | | | | | | | | | | | | | | | | | | | | | | | | | | | | | | | |
| | | | | | | | | | | | | | | | | | | | | | | | | | | | | | | | | | |
| | | | | | | | | | | | | | | | | | | | | | | | | | | | | | | | | | |
| (a) | Excludes sales charge. |
| (b) | During the period certain fees were waived and/or reimbursed. If such waivers/reimbursements had not occurred, the ratios would have been as indicated. ` |
| (c) | Portfolio turnover is calculated on the basis of the Fund as a whole without distinguishing among the classes of shares. |
| (d) | For the period from September 29, 2006 (commencement of operations) through October 31, 2006. |
| (e) | Amount is less than $0.005. |
See notes to financial statements.
Notes to Financial Statements
October 31, 2006
1. Organization
Gartmore Mutual Funds (the “Trust”) is an open-end management investment company, organized under the laws of Delaware by an amended and restated Agreement and Declaration of Trust, dated October 28, 2004, as amended to date. Prior to January 25, 2002 the Trust was named Nationwide Mutual Funds. The Trust, originally created under the laws of Ohio as an Ohio business trust pursuant to a Declaration of Trust, dated as of October 30, 1997, as subsequently amended, and redomesticated as a Delaware Statutory Trust on February 28, 2005: the redomestication was a change in statutory status and did not affect the operations of the Trust. The trust is registered under the Investment Company Act of 1940, as amended (the “1940 Act”). As of October 31, 2006, the Trust had authorized an unlimited number of shares of beneficial interest (“shares”) without par value. The Trust operates forty-nine (49) separate series, or mutual funds, each with its own investment objective(s) and strategies. This report contains the financial statements and financial highlights of the five (5) funds listed below (individually, a “Fund”; collectively, the “Funds”):
- Gartmore Hedged Core Equity Fund (“Hedged Core Equity”)
- Gartmore Market Neutral Fund (“Market Neutral”)
- Gartmore Small Cap Core Fund (“Small Cap Core”)
- Gartmore Small Cap Growth Opportunities Fund (“Small Cap Growth Opportunities”)
- Gartmore Small Cap Value Fund (“Small Cap Value”)
2. Summary of Significant Accounting Policies
The following is a summary of significant accounting policies followed by the Funds in the preparation of their financial statements. The policies are in conformity with accounting principles generally accepted in the United States of America (“GAAP”). The preparation of financial statements requires management to make estimates and assumptions that affect the reported amounts of assets and liabilities, the disclosure of contingent assets and liabilities at the date of the financial statements, and the reported amounts of income and expenses for the period. Actual results could differ from those estimates.
Securities for which market quotations are readily available are valued at current market value as of “Valuation Time.” Valuation Time is as of the close of regular trading on the New York Stock Exchange (usually 4 p.m. Eastern time). Equity securities are valued at the last quoted sale price or, if there is no sale price, the last quoted bid price provided by an independent pricing service approved by the Trust’s Board of Trustees. Securities traded on NASDAQ are valued at the NASDAQ Official Closing Price. Prices are taken from the primary market or exchange in which each security trades.
Most securities listed on a foreign exchange are valued either at fair value (see description below) or at the last sale price at the close of the exchange on which the security is principally traded. Foreign securities, currencies, and other assets and liabilities denominated in foreign currencies are translated into U.S. dollars at the exchange rate of said currencies against the U.S. dollar, as of Valuation Time, as provided by an independent pricing service approved by the Board of Trustees.
Securities for which market quotations are not readily available, or for which an independent pricing service does not provide a value or provides a value that does not represent fair value in the judgment of the Funds’ investment adviser or designee, are valued at fair value under procedures approved by the Trust’s Board of Trustees. The “Fair Value” of these securities is determined in good faith by taking into account relevant factors and surrounding circumstances. Methods utilized to obtain a “Fair Value” may include the following non-exclusive list of acceptable methods: (i) a multiple of earnings; (ii) the discount from market value of a similar, freely traded security; (iii) the yield-to-maturity for debt issues; or (iv) a consolidation of the methods. The Gartmore Funds Fair Value Committee considers a non-exclusive list of factors to arrive at the appropriate method of determining “Fair Value.” For example, fair value determinations are required for securities whose value is affected by a “significant” event that materially affects the value of a domestic or foreign security which occurs subsequent to the time of the close of the
Notes to Financial Statements (Continued)
October 31, 2006
principal market on which such domestic or foreign security trades and before the Valuation Time (i.e., a “subsequent event”). Typically, this will involve events occurring after the close of a foreign market on which a security trades and before the next Valuation Time.
The Funds holding foreign equity securities (the “Foreign Equity Funds”) value foreign securities at fair value in the circumstances described below. Generally, trading in foreign securities markets is completed each day at various times prior to the Valuation Time. Due to the time differences between the closings of the relevant foreign securities exchanges and the Valuation Time for the Foreign Equity Funds, the Foreign Equity Funds will fair value their foreign investments when it is determined that the market quotations for the foreign investments either are not readily available or are unreliable and, therefore, do not represent fair value. When the fair value prices are utilized, these prices will attempt to reflect the impact of the U.S. financial markets’ perceptions and trading activities on the Foreign Equity Funds’ foreign investments since the last closing prices of the foreign investments were calculated on their primary foreign securities markets or exchanges. For these purposes, the Board of Trustees of the Trust has determined that movements in relevant indices or other appropriate market indicators, after the close of the foreign securities exchanges, may demonstrate that market quotations are unreliable, and may trigger fair value pricing for certain securities. Consequently, fair valuation of portfolio securities may occur on a daily basis.
| (b) | | Repurchase Agreements |
The Funds may enter into repurchase agreements with an entity which is a member of the Federal Reserve System or which is a “primary dealer” (as designated by the Federal Reserve Bank of New York) in U.S. Government obligations. The repurchase price generally equals the price paid by a Fund plus interest negotiated on the basis of current short-term rates, which may be more or less than the rate on the underlying portfolio securities. The seller under a repurchase agreement is required to maintain the value of the collateral held pursuant to the agreement at a market value equal to or greater than the repurchase price (including accrued interest). Collateral subject to repurchase agreements is held by the Funds’ custodian or another qualified sub-custodian or in the Federal Reserve/Treasury book-entry system. If the counterparty defaults and the fair value of the collateral declines, realization of the collateral by the Funds may be delayed or limited. The Funds may transfer uninvested cash balances into a pooled cash account. These balances are invested in one or more repurchase agreements, which are fully collateralized by U.S. Government Agency Mortgages with the counterparties of CS First Boston and Nomura Securities.
| (c) | | Foreign Currency Transactions |
The accounting records of the Funds are maintained in U.S. dollars. Foreign currency amounts are translated into U.S. dollars at the current rate of exchange to determine the value of investments, assets and liabilities. Purchases and sales of securities, and income and expenses are translated at the prevailing rate of exchange on the respective date of these transactions. The Funds do not isolate that portion of the results of operations resulting from changes in foreign exchange rates on investments from fluctuations arising from changes in market prices of securities held. These fluctuations are included with the net realized and unrealized gain or loss from investments and foreign currencies.
| (d) | | Forward Foreign Currency Contracts |
Certain Funds may enter into forward foreign currency exchange contracts in connection with planned purchases or sales of securities or to hedge the U.S. dollar value of portfolio securities denominated in a particular currency. The Funds could be exposed to risks if the counterparties to the contracts are unable to meet the terms of their contracts and from unanticipated movements in the value of a foreign currency relative to the U.S. dollar. Forward foreign currency contracts are valued at the current cost of covering these contracts, as provided by an independent pricing service approved by the Board of Trustees. The forward foreign currency contracts are adjusted by the daily exchange rate of the underlying currency and any gains or losses are recorded for financial statement purposes as unrealized gains or losses until the contract settlement date.
Certain Funds may invest in financial futures contracts (“futures contracts”) for the purpose of hedging their existing portfolio securities or securities that the Funds intend to purchase against fluctuations in value caused by changes in prevailing market interest rates or prices. Futures contracts may also be entered into for non-hedging purposes.
Upon entering into a futures contract, these Funds are required to pledge to the broker an amount of cash and/or other assets equal to a certain percentage of the contract amount (initial margin deposit). Subsequent payments, known as “variation margin”, are made each day, depending on the daily fluctuations in the fair value/market value of the underlying assets. A gain or loss equal to the daily variation margin is recognized on a daily basis. Futures contracts are valued daily at their last quoted sale price.
A “sale” of a futures contract means a contractual obligation to deliver the securities or foreign currency called for by the contract at a fixed price at a specified time in the future. A “purchase” of a futures contract means a contractual obligation to acquire the securities or foreign currency at a fixed price at a specified time in the future.
Should market conditions change unexpectedly, a Fund may not achieve the anticipated benefits of the futures contracts and may realize a loss. The use of futures transactions for hedging purposes involves the risk of imperfect correlation in movements in the price of futures contracts, interest rates and the value/market value of the underlying hedged assets.
During the period, the Hedged Core Equity Fund and the Market Neutral Fund engaged in short-selling of portfolio securities. The Funds are authorized to engage in short-selling of portfolio securities, which obligates the Funds to replace any security that the Funds have borrowed by purchasing the security at current market value sometime in the future. The Funds will incur a loss if the price of the security increases between the date of the short sale and the date on which the Funds replace the borrowed security. The Funds generally will realize a gain if the price of the security declines between these dates. Until the Funds replace the borrowed security, the Funds will maintain a segregated account with cash, U.S. government securities and/or securities held long to sufficiently cover the Funds’ short position on a daily basis. Dividends declared on securities sold short are recorded as an expense on the ex-dividend date and paid to the counterparty on the dividend pay date. The collateral for securities sold short includes the deposits with brokers and securities held long as shown in the Statements of Investments for the Funds.
To generate additional income, each of the Funds may lend their respective portfolio securities, up to 33 1/3% of the Fund, to brokers, dealers and other financial institutions provided that (1) the borrower delivers cash or securities as collateral with respect to each new loan of U.S. securities, equal to at least 102% of the value of the portfolio securities loaned, and with respect to each new loan on non-U.S. securities, collateral of at least 105% of the value of the portfolio securities loaned; and (2) at all times thereafter shall require the borrower to mark-to-market the collateral on a daily basis so that the market value of such collateral does not fall below 100% of the value of securities loaned. The Funds receive payments from borrowers equivalent to the dividends and interest that would have been earned on securities loaned while simultaneously seeking to earn income on the investment of cash collateral. There may be risks of delay in recovery of the securities should the borrower of the securities fail financially. Loans will be made, however, only to borrowers deemed by the Funds’ investment adviser to be of good standing and creditworthy under guidelines established by the Board of Trustees and when, in judgment of the adviser, the consideration which can be earned currently from these securities loans justifies the attendant risks. Loans are subject to termination by the Funds or the borrower at any time, and, therefore, are not considered to be illiquid investments. JPMorgan Chase Bank serves as custodian for the securities lending program of the Funds. JPMorgan Chase Bank receives a fee based on the value of the collateral received from borrowers. As of October 31, 2006, the Funds did not have any securities on loan.
Notes to Financial Statements (Continued)
October 31, 2006
| (h) | | Security Transactions and Investment Income |
Security transactions are accounted for on the date the security is purchased or sold (“trade date”). Securities gains and losses are calculated on the identified cost basis. Interest income is recognized on the accrual basis and includes, where applicable, the amortization or accretion of premium or discount. Dividend income is recorded on the ex-dividend date.
| (i) | | Distributions to Shareholders |
Distributions from net investment income, if any, is declared and paid quarterly. For all Funds, distributions from net realized capital gains, if any, are declared and distributed at least annually.
Dividends and distributions to shareholders are determined in accordance with federal income tax regulations, which may differ from GAAP. These “book/tax” differences are considered either permanent or temporary in nature. In accordance with American Institute of Certified Public Accountants (the “AICPA”) Statement of Position 93-2, permanent differences (i.e., reclassification of market discounts, foreign exchange gain/loss, paydowns, and distributions from real estate investment trusts) are reclassified within the capital accounts based on their nature for federal income tax purposes; temporary differences do not require reclassification. These reclassifications have no effect upon the net asset value of the respective Funds. To the extent distributions exceed current and accumulated earnings and profits for federal income tax purposes, these distributions are reported as distributions of paid-in-capital.
It is the policy of each Fund to qualify or continue to qualify as a “regulated investment company” by complying with the provisions available to certain investment companies, as defined in Subchapter M of the Internal Revenue Code, and to make distributions of net investment income and net realized capital gains sufficient to relieve the Fund from all, or substantially all, federal income taxes.
| (k) | | Allocation of Expenses, Income, and Gains and Losses |
Expenses directly attributable to a Fund are charged to that Fund. Expenses not directly attributable to a Fund are allocated proportionately among various or all Funds within the Trust. The method for allocating income, fund level expenses, and realized and unrealized gains or losses is based on the fair value of shares outstanding relative to net assets. Under this method, each class of shares participates based on the total net asset value of that class’s shares in proportion to the total net assets of the Fund. Expenses specific to a class (such as Rule 12b-1 and administrative services fees) are charged to that class.
3. Transactions with Affiliates
Under the terms of the Trust’s Investment Advisory Agreements, Gartmore Mutual Fund Capital Trust (��GMF”) manages the investment of the assets and supervises the daily business affairs of the Funds. GMF is a wholly-owned subsidiary of NWD Investment Management, Inc., (prior to November 30, 2006 known as “Gartmore Global Investments, Inc.” (“GGI”)), a holding company. NWD Investment Management, Inc. is a majority-owned subsidiary of NWD Management & Research Trust (prior to November 30, 2006 known as “Gartmore Global Asset Management Trust” (“GGAMT”)). NWD Management & Research Trust is a wholly-owned subsidiary of Nationwide Corporation. All of the common stock of Nationwide Corporation is held by Nationwide Mutual Insurance Company (95.2%) and Nationwide Mutual Fire Insurance Company (4.8%), each of which is a mutual company owned by its policyholders.
Under the terms of the Investment Advisory Agreements, each Fund pays GMF an investment advisory fee based on that Fund’s average daily net assets. Additional information regarding the investment advisory fees for GMF is as follows for the period ended October 31, 2006:
| | | | |
| Fund | | Fee Schedule | | Fees |
Hedged Core Equity and | | | | |
Market Neutral | | All Assets | | 1.25% |
Small Cap Core | | Up to $500 million | | 0.85% |
| | $500 million up to $2 billion | | 0.75% |
| | | $2 billion and more | | 0.70% |
Small Cap Growth Opportunities and | | Up to $500 million | | 0.95% |
Small Cap Value | | $500 million up to $2 billion | | 0.85% |
| | | $2 billion and more | | 0.80% |
GMF and the Funds have entered into written contracts (“Expense Limitation Agreements”) that limit operating expenses (excluding any taxes, interest, brokerage fees, extraordinary expenses, short sale dividend expenses, Rule 12b-1 fees, and administrative services fees) from exceeding the amounts listed in the table below until at least February 28, 2008:
| | | | |
| Fund | | Expense Caps | | Amount |
Hedged Core Equity | | All Classes | | 1.65% |
Market Neutral | | All Classes | | 1.65% |
Small Cap Core | | All Classes | | 1.25% |
Small Cap Growth Opportunities | | All Classes | | 1.35% |
Small Cap Value | | All Classes | | 1.35% |
GMF may request and receive reimbursement from a Fund of the advisory fees waived and other expenses reimbursed by GMF pursuant to the Expense Limitation Agreements at a later date not to exceed (i) three years from the fiscal year in which the corresponding reimbursement to the Fund was made, if the Fund has reached a sufficient asset size to permit reimbursement to be made without causing the total annual operating expense ratio of the Fund to exceed the limits set forth above. No reimbursement will be made unless: (i) the Fund’s assets exceed $100 million; (ii) the total annual expense ratio of the Class making such reimbursement is less than the limit set forth above; and (iii) the payment of such reimbursement is approved by the Board of Trustees on a quarterly basis. Except as provided for in the Expense Limitation Agreements, reimbursement of amounts previously waived or assumed by GMF is not permitted.
As of the period ended October 31, 2006, the cumulative potential reimbursements of the following Funds (unless otherwise indicated), based on reimbursements within three years from the fiscal year in which the corresponding reimbursement to the Fund was made for expenses reimbursed by GMF would be:
| | | |
| Fund | | Amount
Period ended
October 31,
2006 |
Hedged Core Equity | | $ | 4,363 |
Market Neutral | | | 4,379 |
Small Cap Core | | | 4,711 |
Small Cap Growth Opportunities | | | 4,690 |
Small Cap Value | | | 4,691 |
Under the terms of a Distribution Plan under Rule 12b-1 of the 1940 Act, Gartmore Distribution Services, Inc. (“GDSI”), the Funds’ distributor, is compensated by the Funds for expenses associated with the distribution of Class A,
Notes to Financial Statements (Continued)
October 31, 2006
Class B, Class C, and Class R shares of the Funds. GDSI is a majority-owned subsidiary of NWD Management & Research Trust. These fees are based on average daily net assets of the respective class of the Funds at an annual rate not to exceed 0.25% for Class A shares, 1.00% for Class B and Class C shares, and 0.50% for Class R shares.
Pursuant to an Underwriting Agreement, GDSI serves as principal underwriter of the Funds in the continuous distribution of their shares and receives commissions in the form of a front-end sales charge on the Class A shares. These fees are deducted from and are not included in proceeds from sales of Class A shares. From these fees, GDSI pays sales commissions, salaries and other expenses in connection with generating new sales of Class A shares of the Funds. GDSI also receives fees for services as principal underwriter for Class B shares of the Funds. These fees are contingent deferred sales charges (“CDSCs”) ranging from 1% to 5% imposed on redemptions of Class B shares which may cause the current value of a shareholder’s account to fall below the total purchase payments.
The CDSC, if applicable, will be imposed on redemptions made within six years of the purchase. Class C shares have a CDSC of 1% imposed on redemptions of Class C shares made within one year of purchase. For the period ended October 31, 2006, GDSI received no commissions from front-end sales charges of Class A shares and from CDSC fees from Class B and Class C shares of the Funds.
Under the terms of a Fund Administration and Transfer Agency Agreement, Gartmore SA Capital Trust (“GSA”) provides various administrative and accounting services, and Gartmore Investors Services, Inc. (“GISI”), an indirect subsidiary of GSA, serves as Transfer Agent and Dividend Disbursing Agent for each of the Funds. The fees for the services provided under this agreement are calculated based on the Trust’s average daily net assets according to the fee schedule below. The fees are then allocated proportionately among all funds within the Trust in relation to the average daily net assets of each Fund and are paid to GSA. GSA pays GISI from these fees for GISI’s services.
| | |
| Combined Fee Schedule* | | |
Up to $1 billion | | 0.26% |
$1 billion up to $3 billion | | 0.19% |
$3 billion up to $4 billion | | 0.15% |
$4 billion up to $5 billion | | 0.08% |
$5 billion up to $10 billion | | 0.05% |
$10 billion up to $12 billion | | 0.03% |
$12 billion or more | | 0.02% |
| * | The assets of the Gartmore Investor Destinations Aggressive, Gartmore Investor Destinations Moderately Aggressive, Gartmore Investor Destinations Moderate, Gartmore Investor Destinations Moderately Conservative and Gartmore Investor Destinations Conservative Funds (collectively, the “Investor Destinations Funds”) and the Gartmore Optimal Allocations Fund: Aggressive, Gartmore Optimal Allocations Fund: Moderate, Gartmore Optimal Allocations Fund: Moderately Aggressive, and Gartmore Optimal Allocations Fund: Specialty (collectively, the “Optimal Funds”) are excluded from the Trust asset level amount in order to calculate this asset based fee. The Investor Destinations Funds and the Optimal Funds do not pay any part of this fee. |
GSA and GISI have entered into agreements with BISYS Fund Services Ohio, Inc. (“BISYS”), pursuant to which BISYS provides sub-administration and sub-transfer agency services, respectively, to the Funds.
GSA and BISYS have agreed to designate certain sub-transfer agency agreements GSA enters into with respect to the Funds as “Qualifying Sub-TA Agreements.” With respect to Qualifying Sub-TA Agreements, BISYS will credit to GSA an amount equal to the lesser of (i) the actual amount GSA is charged by the sub-transfer agent under the applicable Qualifying Sub-TA Agreement or (ii) $10 per investor account; however, the aggregate amount paid with regard to all Qualifying Sub-TA Agreements, regardless of whether option (i) or (ii) applies, shall not exceed $200,000 per annum. BISYS will calculate and credit such amounts to GSA’s fees on a monthly basis. All amounts will be credited to each applicable Fund on a monthly basis.
Under the terms of an Administrative Services Plan, the Funds may pay fees to servicing organizations, such as broker-dealers, including Nationwide Financial Services, Inc. (“Nationwide Financial Services”), an affiliate of NWD Management & Research Trust, and financial institutions, which agree to provide administrative support services to the
shareholders of certain classes. These services include, but are not limited to, the following: establishing and maintaining shareholder accounts; processing purchase and redemption transactions; arranging bank wires; performing shareholder sub-accounting; answering inquiries regarding the Funds; and other such services. These fees are based on an annual rate of up to 0.25% of the average daily net assets of the Class A, Class R, and Institutional Service Class shares of each of the Funds.
Under terms of a letter agreement dated September 12, 2006, by and among GSA and the Audit Committees of the Funds and Gartmore Variable Insurance Trust, the Funds have agreed to reimburse GSA their pro-rata portion of certain costs related to the Funds’ ongoing administration, monitoring and annual (audit) testing of the Funds’ Rule 38a-1 Compliance Program subject to the pre-approval of the Funds’ Audit Committee. Such costs include: (1) $160 per hour for services performed on behalf of the Funds by employees of GSA or GSA’s affiliates (other than the Fund CCO); (2) travel costs and other reasonable incidental expenses (without markup) incurred by employees of GSA or GSA’s affiliates in connection with performance of such services; and (3) in the event it becomes necessary to supplement the services of GSA’s (and GSA’s affiliates’) employees, in order to complete the Funds’ Rule 38a-1 annual compliance audit, the costs of a mutually-agreed upon independent contractor’s costs to provide such services.
As of October 31, 2006, GMF or its affiliates directly held the percentage indicated below of the shares outstanding of the applicable Fund:
| | | |
| Fund | | % of Shares
Outstanding
Owned | |
Hedged Core Equity | | 100 | % |
Market Neutral | | 100 | % |
Small Cap Core | | 100 | % |
Small Cap Growth Opportunities | | 98 | % |
Small Cap Value | | 98 | % |
4. Short-Term Trading Fees
The Funds assess a 2.00% redemption fee on all classes of shares that are purchased and are sold or exchanged within 90 calendar days of purchase. The redemption fee, if any, is paid directly to the applicable Fund and is designed to offset brokerage commissions, market impact and other costs associated with short-term trading of Fund shares. For purposes of determining whether the redemption fee applies, the shares that were held the longest will be redeemed first. This redemption fee is in addition to any CDSCs that may be applicable at the time of sale. The redemption fee may not apply in certain circumstances, such as redemptions or exchanges of shares held in certain omnibus accounts or retirement plans that cannot implement the redemption fee. The fee does not apply to shares purchased through reinvested dividends or capital gains.
For the period ended October 31, 2006, the Funds had no contributions to capital due to collection of redemption fees.
5. Bank Loans and Earnings Credit
The Trust has a credit agreement with JPMorgan Chase & Co., the Funds’ custodian bank, permitting the Trust to borrow up to $100,000,000. Borrowings under this arrangement bear interest at the Federal Funds rate plus 0.50%. The interest costs, if any, would be included in other fees in the Statement of Operations. No compensating balances were required under the terms of the line of credit. The line of credit is renewed annually, expiring on June 26, 2007, with a commitment fee of 0.08% per year on $100,000,000. There were no borrowings outstanding under this line of credit during the period ended October 31, 2006.
The Trust’s custodian bank has agreed to reduce the bank’s fees (earnings credits) when the Funds of the Trust maintain cash on deposit in non-interest-bearing custody and Demand Deposit Accounts. Earning credits are shown as a reduction of total expenses on the Statement of Operations.
Notes to Financial Statements (Continued)
October 31, 2006
6. Investment Transactions
Purchases and sales of securities (excluding short-term securities) for the period ended October 31, 2006 are summarized as follows:
| | | | | | |
| Fund | | Purchases | | Sales |
Hedged Core Equity | | $ | 4,753,801 | | $ | — |
Market Neutral | | | 2,218,658 | | | — |
Small Cap Core | | | 4,797,815 | | | — |
Small Cap Growth Opportunities | | | 6,089,777 | | | 1,380,018 |
Small Cap Value | | | 10,130,409 | | | 5,241,556 |
7. Portfolio Investment Risks
Credit and Market Risk. Funds that invest in high yield and emerging markets instruments are subject to certain additional credit and market risks. The yields of high yield and emerging markets debt obligations reflect, among other things, perceived credit risk. The Funds’ investment in securities rated below investment grade typically involve risks not associated with higher rated securities including, among others, greater risk of not receiving timely and/or ultimate payment of interest and principal, greater market price volatility, and less liquid secondary market trading. The consequences of political, social, economic, or diplomatic changes may have disruptive effects on the market prices of emerging markets investments held by the Funds.
Risks Associated with Foreign Securities and Currencies. Investments in securities of foreign issuers carry certain risks not ordinarily associated with investments in securities of U.S. issuers. These risks include future political and economic developments, and the possible imposition of exchange controls or other foreign governmental laws and restrictions. In addition, with respect to certain countries, there is the possibility of expropriation of assets, confiscatory taxation, political or social instability or diplomatic developments, which could adversely affect investments in those countries.
Certain countries also may impose substantial restrictions on investments in their capital markets by foreign entities, including restrictions on investments in issuers of industries deemed sensitive to relevant national interests. These factors may limit the investment opportunities available and result in a lack of liquidity and a high price volatility with respect to securities of issuers from developing countries.
8. Indemnifications
Under the Trust’s organizational documents, certain of the Trust’s Officers and Trustees are indemnified against certain liabilities arising out of the performance of their duties to the Trust. In addition, the Trust has entered into Indemnification Agreements with its Trustees and certain of its Officers. Trust Officers receive no compensation from the Trust for serving as its Officers. In addition, in the normal course of business, the Trust enters into contracts with the Trust’s vendors and others that provide for general indemnifications. The Trust’s maximum liability under these arrangements is unknown, as this would involve future claims that may be made against the Trust. However, based on experience, the Trust expects that risk of loss to be remote.
9. Federal Tax Information
As of October 31, 2006, the components of accumulated earnings (deficit) on a tax basis was as follows: (Total distributions paid differ from the Statement of Changes in Net Assets because for tax purposes dividends are recognized when actually paid.)
| | | | | | | | | | | | | | | | |
| Fund | | Undistributed
Ordinary
Income | | Accumulated
Earnings | | Accumulated
Capital and
Other Losses | | | Unrealized
Appreciation
(Depreciation)* | | Total
Accumulated
Earnings
(Deficit) |
Hedged Core Equity | | $ | 7,143 | | $ | 7,143 | | $ | (8,017 | ) | | $ | 129,316 | | $ | 128,442 |
Market Neutral | | | 19,620 | | | 19,620 | | | (6,845 | ) | | | 20,833 | | | 33,608 |
Small Cap Core | | | 5,450 | | | 5,450 | | | — | | | | 195,784 | | | 201,234 |
Small Cap Growth Opportunities | | | 82,686 | | | 82,686 | | | — | | | | 254,031 | | | 336,717 |
Small Cap Value | | | 204,735 | | | 204,735 | | | — | | | | 25,436 | | | 230,171 |
| * | The differences between the book-basis and tax-basis unrealized appreciation (depreciation) is attributable primarily to: tax deferral of losses on wash sales; the difference between book and tax amortization methods for premium and market discount; and return of capital adjustments from real estate investment trusts. |
As of October 31, 2006, the tax cost of securities and the breakdown of unrealized appreciation (depreciation) for each Fund were as follows:
| | | | | | | | | | | | | |
| Fund | | Tax Cost of
Securities | | Unrealized
Appreciation | | Unrealized
Depreciation | | | Net
Unrealized
Appreciation
(Depreciation) |
Hedged Core Equity | | $ | 4,997,338 | | $ | 238,745 | | $ | (109,429 | ) | | $ | 129,316 |
Market Neutral | | | 5,007,538 | | | 244,085 | | | (223,252 | ) | | | 20,833 |
Small Cap Core | | | 5,007,378 | | | 270,851 | | | (75,067 | ) | | | 195,784 |
Small Cap Growth Opportunities | | | 5,002,690 | | | 334,178 | | | (80,147 | ) | | | 254,031 |
Small Cap Value | | | 5,132,806 | | | 106,625 | | | (81,189 | ) | | | 25,436 |
As of October 31, 2006, for Federal income tax purposes, the following Funds have capital loss carryforwards available to offset capital gains, if any, to the extent provided by the treasury regulations:
| | | | | |
| Fund | | Amount | | Expires |
Hedged Core Equity | | $ | 8,017 | | 2014 |
Market Neutral | | | 7,600 | | 2014 |
Recently Issued Accounting Pronouncements–On July 13, 2006, the Financial Accounting Standards Board (“FASB”) released FASB Interpretation No. 48, Accounting for Uncertainty in Income Taxes (“FIN 48”). FIN 48 provides guidance for how uncertain tax positions should be recognized, measured, presented and disclosed in the financial statements. FIN 48 requires the affirmative evaluation of tax positions taken or expected to be taken in the course of preparing the Fund’s tax returns to determine whether it is more-likely-than-not (i.e., greater than 50-percent) that each tax position will be sustained upon examination by a taxing authority based on the technical merits of the position. A tax position that meets the more-likely-than-not recognition threshold is measured to determine the amount of benefit to recognize in the financial statements. Differences between tax positions taken in a tax return and amounts recognized in the financial statements will generally result in an increase in a liability for taxes payable (or a reduction of a tax refund receivable) and an increase in a deferred tax liability (or a reduction in a deferred tax asset). Adoption of FIN 48 is required for fiscal years beginning after December 15, 2006 and is to be applied to all open tax years as of the effective date. At this time, management is evaluating the implications of FIN 48. Its impact to the financial statements has not yet been determined.
Report of Independent Registered Public Accounting Firm
To the Board of Trustees and Shareholders of Gartmore Mutual Funds:
In our opinion, the accompanying statements of assets and liabilities, including the statements of investments, and statements of securities sold short of Gartmore Hedged Core Equity Fund and Gartmore Market Neutral Fund, and the statement of investments of Gartmore Small Cap Core Fund, Gartmore Growth Opportunities Fund and Gartmore Small Cap Value Fund (five series of Gartmore Mutual Funds, hereafter referred to as the "Funds") at October 31, 2006 and the results of each of their operations, changes in each of their net assets and financial highlights for the periods indicated, in conformity with accounting principles generally accepted in the United States of America. These financial statements and financial highlights (hereafter referred to as "financial statements") are the responsibility of the Funds’ management; our responsibility is to express an opinion on these financial statements based on our audits. We conducted our audits of these financial statements in accordance with the standards of the Public Company Accounting Oversight Board (United States.) Those standards require that we plan and perform the audit to obtain reasonable assurance about whether the financial statements are free of material misstatement. An audit includes examining, on a test basis, evidence supporting the amounts and disclosures in the financial statements, assessing the accounting principles used and significant estimates made by management, and evaluating the overall financial statement presentation. We believe that our audits, which included confirmation of securities at October 31, 2006 by correspondence with the custodian and brokers, provide a reasonable basis for our opinion.
PricewaterhouseCoopers LLP
Philadelphia, Pennsylvania
December 20, 2006
Supplemental Information
1. Approval of Investment Adviser Contract
The Board of Trustees (the “Board”) met on June 14, 2006, and on September 13, 2006, to consider, among other things, the creation of several new Funds, and to consider the proposed adviser, advisory services and advisory fees for such new Funds. At the June 14, 2006 meeting, the Board considered whether to approve an investment advisory agreement between Gartmore Mutual Fund Capital Trust (“GMFCT”) and Gartmore Mutual Funds (the “Trust”) on behalf of the Gartmore Hedged Core Equity Fund (“Hedged Core Equity”); and, at the September 13, 2006 meeting, the Board considered whether to also approve an investment advisory agreement between GMFCT and the Trust on behalf of five additional new Funds including: (1) Gartmore Market Neutral Fund (“Market Neutral”); (2) Gartmore Small Cap Core Fund (“Small Cap Core”); (3) Gartmore Small Cap Growth Opportunities Fund (“Small Cap Growth Opportunities”); (4) Gartmore Small Cap Value Fund (“Small Cap Value”); and (5) another new Fund that had not yet commenced operations as of the date of this report.
The Independent Trustees received assistance and advice from, and met separately with, independent counsel regarding their legal duties and responsibilities in considering each such Fund’s proposed investment advisory agreement. The Board considered all information it deemed relevant, including, but not limited to, the following information with respect to each new Fund:
1. the Fund’s proposed advisory fee and any anticipated ancillary benefits to GMFCT;
2. the Fund’s proposed advisory fee (including any breakpoints) in comparison to the advisory fees of each proposed new Fund’s Lipper and Morningstar peer groups; and
3. the Fund’s proposed total expenses (and any expense limitations/fee waivers proposed by GMFCT) in comparison to those of each new Fund’s peer groups.
Because these are new Funds, the Board could not consider comparative information regarding performance of the Fund, or the level of profitability (or lack thereof) that GMFCT would receive for investment management services to be provided to each such new Fund.
Following its review and discussions, a majority of the Board, including a majority of the Independent Trustees (as such term is defined in Section 2(a)(19) of the 1940 Act), determined it was appropriate to approve each new Fund’s proposed investment advisory agreement for an initial period to run through February 28, 2008 for the following reasons:
Market Neutral
The Board considered the Adviser’s recommendation to create a new Fund that will feature alternative investments that implement a long/short strategy. Specifically, the Board considered the Adviser’s proposed investment strategy in which the Fund will seek long-term capital appreciation from a broadly diversified portfolio of US stocks, while neutralizing the general risks associated with stock market investing. The Adviser noted that this Fund may also be offered as an underlying fund to one or more of the Gartmore Optimal Allocations Funds.
The Board considered the Adviser’s proposed investment process for the Fund which will seek to achieve its investment objective by purchasing and selling short equity securities of US companies that comprise the Russell 3000 Index. The Fund intends to take long positions the Adviser deems attractive according to the Advisers multi-factors quantitative model. The Fund will sell short those equity securities the Adviser deems unattractive according to the multi-factor quantitative model. The Adviser informed the Board that the Fund intends to maintain approximately equal value exposure in its long or short positions in order to seek to neutralize the effects on its performance resulting from general market movements or sector swings. The board also considered the Adviser’s recommendation to use the Citigroup 3-month T-bill Index as the Fund’s primary benchmark. Finally, the Board considered that the proposed Fund’s competitive peer groups would be the Morningstar Long-Short category and the Lipper Equity Market Neutral category.
Next, the Board considered the proposed contractual advisory fee of 1.25% on all assets (which is a reduction from the Adviser’s initial proposal of 1.50%) and the Fund’s anticipated total expenses (based on $10 million of assets). The Board noted that the proposed contractual advisory fee of 1.25% is higher than the Lipper Equity Market Neutral
Supplemental Information (Continued)
category and Morningstar Long-Short category average of 1.14% and the Lipper Equity Market Neutral category and
Morningstar Long-Short category median of 1.17%. The Board also noted, however, that the Fund’s contractual advisory fee is within the range of those of similarly managed funds. Further, the Board noted that the Adviser has agreed to waive fees and limit Fund expenses to 1.65% through at least February 28, 2008. The Board then considered that even with the expense limit in place, the Fund’s projected total expense ratio of 1.65% is higher than the Lipper Equity Market Neutral category and Morningstar Long-Short category average of 1.51% and the Lipper Equity Market Neutral category and Morningstar Long-Short category median of 1.48%. The Board noted, however, that the Fund’s total expense ratio is well within the range of similar funds’ total expenses. The Board and the Adviser then discussed at length the proposed contractual advisory fee and expense limit for the Fund. The Board considered the Adviser’s responses to its questions about the proposed fees and expense limit and also the marketing and distribution plans for the Fund.
The Board then considered the services to be provided to the Fund by the Adviser, including all anticipated ancillary benefits to be received by the Adviser, including fee income, if any, for performing other services, soft dollars, and affiliated brokerage commissions.
Hedged Core Equity
The Board considered the Adviser’s recommendation to create a new Fund that will have both long and short positions in equity securities, primarily of large cap U.S. companies. The Board considered the Adviser’s proposed investment process, and the Adviser’s recommendation that the Russell 1000 Index serve as the Fund’s benchmark. The Board also considered the Adviser’s proposed investment strategy for the Fund, with a target a portfolio allocation of 80-100% long positions and 30-35% short sales as a percentage of net assets, which will generally result in a target net position (combined long and short positions) of 65%. Therefore, the Board also considered the appropriateness of the use of a secondary benchmark for the Fund: a composite of [65% Russell 1000 and 35% T-bills]. Finally, the Board considered that the Funds’ competitive peer groups would be the Morningstar Long-Short category and the Lipper Long Short category.
Next, the Board considered the proposed contractual advisory fee (including breakpoints) and the Fund’s anticipated total expenses (based on $10 million of assets). The Board considered that the Fund’s contractual advisory fee of 1.50% is higher than the 1.25% median of its Morningstar Long-Short category and is also higher than the 1.36% median of its Lipper Long Short Equity category, but well within the range of its category peers. The Board also considered that the Fund will be a capacity-constrained product. The Board further noted, that the Adviser has agreed to waive fees and limit Fund expenses to 1.90% through at least February 28, 2008. The Board then noted that the Fund’s projected total expense ratio of 1.90% is below the 2.07% median of its Morningstar Long-Short category and below the 1.99% median of its Lipper Long-Short Equity category.
The Board considered the information and discussion with respect to the services proposed to be provided to the Fund by the Adviser, including any anticipated ancillary benefits anticipated to be received by the adviser, including fee income, if any, for performing other services, soft dollars, and affiliated brokerage commissions.
Finally, the Board considered the distribution plan that Gartmore Distribution Services, Inc. provided for the Fund.
Small Cap Value
The Board considered the Adviser’s recommendation to create a new Fund that will invest primarily in equity securities issued by U.S. and foreign small-cap companies the Adviser considers to be “value companies.” The Board considered the Adviser’s proposed investment process for this Fund and the Adviser’s recommendation that the Russell 2000 Value Index serve as the Fund’s benchmark. The Board also considered the Fund’s competitive peer groups, the Morningstar Small Cap Value category and the Lipper Small Cap Value category.
Next, the Board considered the proposed contractual advisory fee (including breakpoints) and the anticipated total expenses (based on $10 million in assets). The Board considered that the Fund’s proposed contractual advisory fee of 0.95% is higher than the Lipper Small Cap Value category median of 0.81% and its Lipper Small Cap Value category average of 0.82%. The Board also noted, however, that the Fund’s contractual advisory fee is well within the range of
fees for similarly managed funds. Moreover, the Board noted that the Adviser had contractually agreed to waive fees and limit the Fund’s total expenses through at least February 28, 2008. The Board considered that, at the capped amount of 1.35%, the Fund’s anticipated total expenses are above the Lipper Small Cap Value category median of 1.15% and the Lipper Small Cap Value average of 1.20%. The Board also noted that the Fund’s total expenses are within the range of the total expenses of its category peer funds. The Board then discussed with the Adviser and its affiliates, the proposed distribution plans for the new Fund, in particular, when the Adviser projects the first advisory fee breakpoint level may be reached, reducing the Fund’s proposed Advisory fee to 0.85%.
The Board considered the information and discussion with respect to the services proposed to be provided to the Fund by the Adviser, including all anticipated ancillary benefits to be received by the Adviser, including fee income, if any, for performing other services, soft dollars, and affiliated brokerage commissions.
Small Cap Growth Opportunities
The Board considered the Adviser’s recommendation to create a new Fund that will invest primarily in small cap equity securities of U.S. companies that the Adviser considers to be “growth-oriented” companies that potentially may provide investors with a higher return than funds that invest primarily in larger more established companies. The Board considered the Adviser’s proposed investment process for the Fund and the proposed benchmark for the Fund, the Russell 2000 Growth Index.
Next, the Board considered the new Fund’s proposed contractual advisory fee of 0.95% (including breakpoints) as compared to those of its proposed peer groups, the Morningstar Small Cap Growth category and the Lipper Small Cap Growth category median of 0.89% and average of 0.85%. The Board noted that the Fund’s proposed contractual advisory fee is above the median and average of its Morningstar Small Cap Growth and Lipper Small Cap Growth category peers. The Board also noted, however, that the fee is well within the range of the Fund’s category peers. The Board also considered that the Fund will be a capacity-constrained product. The Board considered that the Adviser has agreed to contractually waive fees and limit the Fund’s total expenses to 1.35% through at least February 28, 2008. The Board also noted that although the Fund’s anticipated total expenses, when capped at 1.35%, exceed the median (1.25%) and the average (1.30%) total expenses of its category peers it is well within the range of the total expenses of its category peers. The Board then discussed with the adviser and its affiliates, the distribution plan for the Fund, and the Adviser’s projection of when the Fund may reasonably be expected to reach its first advisory fee breakpoint level, which would result in a decrease in the contractual advisory fee.
The Board considered the information and discussion with respect to the services proposed to be provided to the Fund by the Adviser, including any anticipated ancillary benefits anticipated to be received by the Adviser, including fee income, if any, for performing other services, soft dollars, and affiliated brokerage commissions.
Small Cap Core
The Board considered the Adviser’s recommendation to create a new Fund that will invest primarily in equity securities issued by small cap companies but which will not specifically target growth or value style securities. As proposed, the Fund will focus on the broader small-cap market and invest in both growth and value style securities. The Board considered the Adviser’s proposed investment strategy and the quantitative techniques used to evaluate stocks in the Russell 2000 Index universe. The Board considered the proposed benchmark for the Fund.
Next, the Board considered the proposed contractual advisory fee of 0.85% (including breakpoints). The Board noted that the Fund’s proposed contractual advisory fee is above the Fund’s Lipper Small Cap Core category median and average which are both 0.77%. The Board also considered, however, that the proposed contractual advisory fee is well within the range of its category peers. The Board considered that the Fund will be a capacity-constrained product. The Board also considered that the Adviser had agreed to contractually limit the Fund’s total expenses to 1.25% through at least February 28, 2008. The Board noted that, even at the capped amount, the Fund’s anticipated total expenses are above the Lipper Small Cap Core category median of 1.15% and average of 1.16%. The Board also noted however, that
Supplemental Information (Continued)
the Fund’s total expenses are well within the range of its category peers. The Board discussed with the Adviser and its affiliates, the distribution plan for the Fund, and the Adviser’s projection of when the Fund may reasonably be expected to reach the first advisory fee breakpoint which will reduce the advisory fee.
The Board considered the information and discussion with respect to the services proposed to be provided to the Fund by the Adviser, including all anticipated ancillary benefits to be received by the Adviser, including fee income, if any, for performing other services, soft dollars, and affiliated brokerage commissions.
Whereupon, the Board including a majority of the Independent Trustees, having considered all of the information it deemed relevant and being satisfied with the Adviser’s, and its affiliates’ responses to the Board’s questions, determined to approve the investment advisory agreements for each new Fund for an initial period of two years and to undertake the Board’s first review and any consideration of reapproval of each Fund’s advisory agreement at its December 2007—January 2008 Annual 15(c) Contract Review Meetings.
Management Information (Unaudited)
Trustees who are not Interested Persons (as defined in the 1940 Act) and Officers of the Funds as of October 31, 2006
| | | | | | | | |
Name, Address
and Year of Birth | | Position(s) Held
with the Trust
and Length of
Time Served1 | | Principal Occupation(s) During Past 5 Years | | Number of Portfolios
in the
Gartmore Fund
Complex Overseen
by Trustee | | Other
Directorships
Held by Trustee or
Nominee2 |
| | | | |
Charles E. Allen c/o NWD Investment Management, Inc. 1200 River Road, Suite 1000 Conshohocken, PA 19428 1948 | | Trustee since July 2000 | | Mr. Allen is Chairman, Chief Executive Officer and President of the Graimark Realty Advisors, Inc. (real estate development, investment and asset management). | | 97 | | None |
| | | | |
Paula H.J. Cholmondeley c/o NWD Investment Management, Inc. 1200 River Road, Suite 1000 Conshohocken, PA 19428 1947 | | Trustee since July 2000 | | Ms. Cholmondeley is an independent strategy consultant. Ms. Cholmondeley was Vice President and General Manager of Sappi Fine Paper North America from April 2000 through December 2003. | | 97 | | Director of Dentsply International, Inc., Ultralife Batteries, Inc., Terex Corporation, Minerals Technology, Inc. and Albany International Corp. |
| | | | |
C. Brent DeVore3 c/o NWD Investment Management, Inc. 1200 River Road, Suite 1000 Conshohocken, PA 19428 1940 | | Trustee since 1990 | | Dr. DeVore is President of Otterbein College. | | 97 | | None |
| | | | |
Phyllis K. Dryden c/o NWD Investment Management, Inc. 1200 River Road, Suite 1000 Conshohocken, PA 19428 1947 | | Trustee since December 2004 | | Beginning in February 2006 Ms. Dryden is employed by The Mitchell Madison Group, a management consulting company. Ms. Dryden was a former Managing Partner of marchFIRST, a global management consulting firm prior to February 2002. | | 97 | | None |
| | | | |
Barbara L. Hennigar c/o NWD Investment Management, Inc. 1200 River Road, Suite 1000 Conshohocken, PA 19428 1935 | | Trustee since July 2000 | | Retired. | | 97 | | None |
Management Information (Unaudited) (Continued)
Trustees who are not Interested Persons (as defined in the 1940 Act) and Officers of the Funds as of October 31, 2006 (Continued)
| | | | | | | | |
Name, Address
and Year of Birth | | Position(s) Held
with the Trust
and Length of
Time Served1 | | Principal Occupation(s) During Past 5 Years | | Number of Portfolios
in the
Gartmore Fund
Complex Overseen
by Trustee | | Other
Directorships
Held by Trustee or
Nominee2 |
| | | | |
Barbara I. Jacobs c/o NWD Investment Management, Inc. 1200 River Road, Suite 1000 Conshohocken, PA 19428 1950 | | Trustee since December 2004 | | Ms. Jacobs served as Chairman of the Board of Directors of KICAP Network Fund, a European (United Kingdom) hedge fund, from December 2000 through January 2006. Prior to 2004, Ms. Jacobs was also a Managing Director and European Portfolio Manager with Teachers Insurance and Annuity Association - College Retirement Equities Fund. | | 97 | | None |
| | | | |
Douglas F. Kridler c/o NWD Investment Management, Inc. 1200 River Road, Suite 1000 Conshohocken, PA 19428 1955 | | Trustee since September 1997 | | Mr. Kridler has served as the President and Chief Executive Officer of the Columbus Foundation (a Columbus, OH-based foundation which manages over 1,300 individual endowment funds) since February 2002. Prior to January 31, 2002, Mr. Kridler was the President of the Columbus Association for the Performing Arts and Chairman of the Greater Columbus Convention and Visitors Bureau. | | 97 | | None |
| | | | |
Michael D. McCarthy c/o NWD Investment Management, Inc. 1200 River Road, Suite 1000 Conshohocken, PA 19428 1947 | | Trustee since December 2004 | | Retired. Mr. McCarthy was Chairman of VMAC (commodity swaps) from October 2002 until June 2005; and a partner of Pineville Properties LLC (a commercial real estate development firm). | | 97 | | None |
| | | | |
David C. Wetmore c/o NWD Investment Management, Inc. 1200 River Road, Suite 1000 Conshohocken, PA 19428 1948 | | Trustee since 1995 and Chairman since February 2005 | | Retired. | | 97 | | None |
| 1 | Length of time served includes time served with the Trust’s predecessors. |
| 2 | Directorships held in (1) any other investment companies registered under the 1940 Act, (2) any company with a class of securities registered pursuant to Section 12 of the Securities Exchange Act of 1934, as amended (the “Exchange Act”), or (3) any company subject to the requirements of Section 15(d) of the Exchange Act. |
| 3 | Mr. DeVore has served as President of Otterbein College since 1984. Mark Thresher, President and Chief Operating Officer of Nationwide Financial Services, Inc. (“NFS”) has served as a member of the Board of Trustees of Otterbein College since 2000, currently serves as one of 30 of its trustees, and is currently one of two Vice Chairmen of the Board. NFS is under common control with each of the Gartmore companies that serve as investment advisers and principal underwriter to the Trust, as each is a majority-owned subsidiary of Nationwide Corporation (“NC”) and, through NC, of Nationwide Mutual Insurance Company (95.2%) and Nationwide Mutual Fire Insurance Company (4.8%). |
Additional information regarding the Trustees and Officers may be found in the Trust’s Statement of Additional Information, which is available without charge upon request, by calling 800-848-0920.
Trustees who are Interested Persons (as defined in the 1940 Act) and/or Officers of the Funds as of October 31, 2006
| | | | | | | | |
Name, Address and Year of Birth | | Position(s) Held
with the Trust
and Length of
Time Served1 | | Principal Occupation(s) During Past 5 Years | | Number of Portfolios
in the Gartmore Fund
Complex Overseen
by Trustee | | Other Directorships
Held by Trustee2 |
| | | | |
Paul J. Hondros NWD Investment Management, Inc. 1200 River Road, Suite 1000 Conshohocken, PA 19428 1948 | | Trustee since July 2000 | | Mr. Hondros has been President and Chief Executive Officer of various NWD Investments Group entities, including Gartmore Distribution Services, Inc. (“GDSI”),3 Gartmore Investor Services, Inc. (“GISI”),3 Gartmore Morley Capital Management, Inc. (“GMCM”),3 Morley Financial Services, Inc. (“MFS”), 3 NorthPointe Capital, LLC (“NorthPointe”),3 NWD Management & Research Trust (“NWDMRT”),3 NWD Investment Management, Inc. (“NWDIM”),3 Gartmore Mutual Fund Capital Trust (“GMFCT”)3 and Gartmore SA Capital Trust (“GSA”)3; and a Director of Nationwide Securities, Inc.,3 as well as several entities within Nationwide Financial Services, Inc. | | 97 | | None |
| | | | |
Arden L. Shisler c/o NWD Investment Management, Inc. 1200 River Road, Suite 1000 Conshohocken, PA 19428 1941 | | Trustee
since
February 2000 | | Retired. Mr. Shisler is the former President and Chief Executive Officer of K&B Transport, Inc., a trucking firm (2000 through 2002). He served as a consultant to K&B from January 2003 through December 2004. Since 1992, Mr. Shisler has also been Chairman of the Board for Nationwide Mutual Insurance Company.3 | | 97 | | Director of Nationwide Financial Services, Inc. |
| | | | |
Gerald J. Holland NWD Investment Management, Inc. 1200 River Road, Suite 1000 Conshohocken, PA 19428 1951 | | Treasurer
since
March 2001 | | Mr. Holland is Senior Vice President – Operations for NWDIM,3 GMFCT,3 and GSA.3 | | N/A | | N/A |
| | | | |
Michael A. Krulikowski NWD Investment Management, Inc. 1200 River Road, Suite 1000 Conshohocken, PA 19428 1959 | | Chief Compliance Officer since June 2004 | | Since November 1999, Mr. Krulikowski has served as a Vice President and Chief Compliance Officer of NWDIM3. Since June 2004, Mr. Krulikowski has also served as Chief Compliance Officer of the Trust. | | N/A | | N/A |
| | | | |
Eric E. Miller NWD Investment Management, Inc. 1200 River Road, Suite 1000 Conshohocken, PA 19428 1953 | | Secretary since December 2002 | | Mr. Miller is Senior Vice President, Chief Counsel for NWDIM,3 GMFCT3 and GSA3 since August 2002. From August 2000 to August 2002, Mr. Miller was a Partner with Stradley Ronan Stevens & Young, LLP. | | N/A | | N/A |
Management Information (Unaudited) (Continued)
| 1 | Length of time served includes time served with the Trust’s predecessors. |
| 2 | Directorships held in (1) any other investment companies registered under the 1940 Act, (2) any company with a class of securities registered pursuant to Section 12 of the Securities Exchange Act of 1934, as amended (the “Exchange Act”), or (3) any company subject to the requirements of Section 15(d) of the Exchange Act. |
| 3 | This position is held with an affiliated person or principal underwriter of the Trust. |
Federal law requires the Trust, each of its investment advisers and sub-advisers to adopt procedures for voting proxies (“Proxy Voting Guidelines”) and to provide a summary of those Proxy Voting Guidelines used to vote the securities held by the Funds. The Funds’ proxy voting policies and procedures are available without charge (i) upon request, by calling 800-848-0920, (ii) on the Fund’s website at www.nwdfunds.com, or (iii) on the Securities and Exchange Commission’s website at www.sec.gov.
Item 2. Code of Ethics.
Disclose whether, as of the end of the period covered by the report, the registrant has adopted a code of ethics that applies to the registrant’s principal executive officer, principal financial officer, principal accounting officer or controller, or persons performing similar functions, regardless of whether these individuals are employed by the registrant or a third party. If the registrant has not adopted such a code of ethics, explain why it has not done so.
The registrant has adopted a code of ethics that applies to the registrant’s principal executive officer, principal financial officer, principal accounting officer or controller, or persons performing similar functions. This code of ethics is included as Exhibit 12 (a)(1).
The registrant must briefly describe the nature of any amendment, during the period covered by the report, to a provision of its code of ethics that applies to the registrant’s principal executive officer, principal financial officer, principal accounting officer or controller, or persons performing similar functions, regardless of whether these individuals are employed by the registrant or a third party, and that relates to any element of the code of ethics definition enumerated in paragraph (b) of this Item. The registrant must file a copy of any such amendment as an exhibit pursuant to Item 11(a)(1), unless the registrant has elected to satisfy paragraph (f) of this Item by posting its code of ethics on its website pursuant to paragraph (f)(2) of this Item, or by undertaking to provide its code of ethics to any person without charge, upon request, pursuant to paragraph (f)(3) of this Item.
If the registrant has, during the period covered by the report, granted a waiver, including an implicit waiver, from a provision of the code of ethics that applies to the registrant’s principal executive officer, principal financial officer, principal accounting officer or controller, or persons performing similar functions, regardless of whether these individuals are employed by the registrant or a third party, that relates to one or more items set forth in paragraph (b) of this Item, the registrant must briefly describe the nature of the waiver, the name of the person to whom the waiver was granted, and the date of the waiver.
During the period covered by the report, with respect to the registrant’s code of ethics that applies to the registrant’s principal executive officer, principal financial officer, principal accounting officer or controller, or persons performing similar functions, there have been no amendments to, nor any waivers granted from, a provision that relates to any element of the code of ethics definition enumerated in paragraph (b) of this Item 2.
Item 3. Audit Committee Financial Expert.
| | (a) | (1) Disclose that the registrant’s board of directors has determined that the registrant either: |
(i) Has at least one audit committee financial expert serving on its audit committee; or
(ii) Does not have an audit committee financial expert serving on its audit committee.
(2) If the registrant provides the disclosure required by paragraph (a)(1)(i) of this Item, it must disclose the name of the audit committee financial expert and whether that person is “independent.” In order to be considered “independent” for purposes of this Item, a member of an audit committee may not, other than in his or her capacity as a member of the audit committee, the board of directors, or any other board committee:
(i) Accept directly or indirectly any consulting, advisory, or other compensatory fee from the issuer; or
(ii) Be an “interested person” of the investment company as defined in Section 2(a)(19) of the Act (15 U.S.C. 80a- 2(a)(19)).
(3) If the registrant provides the disclosure required by paragraph (a)(1)(ii) of this Item, it must explain why it does not have an audit committee financial expert.
| | 3(a)(1) | The registrant’s board of trustees has determined that the registrant has at least one audit committee financial expert serving on board’s audit committee. |
| | 3(a)(2) | The audit committee financial expert of the registrant’s board of trustees is Paula Cholmondeley, who, for purposes of this Item 3 of Form N-CSR, is an “independent” trustee of the registrant. |
Item 4. Principal Accountant Fees and Services.
(a) Disclose, under the caption Audit Fees, the aggregate fees billed for each of the last two fiscal years for professional services rendered by the principal accountant for the audit of the registrant’s annual financial statements or services that are normally provided by the accountant in connection with statutory and regulatory filings or engagements for those fiscal years.
(b) Disclose, under the caption Audit-Related Fees, the aggregate fees billed in each of the last two fiscal years for assurance and related services by the principal accountant that are reasonably related to the performance of the audit of the registrant’s financial statements and are not reported under paragraph (a) of this Item. Registrants shall describe the nature of the services comprising the fees disclosed under this category.
(c) Disclose, under the caption Tax Fees, the aggregate fees billed in each of the last two fiscal years for professional services rendered by the principal accountant for tax compliance, tax advice, and tax planning. Registrants shall describe the nature of the services comprising the fees disclosed under this category.
(d) Disclose, under the caption All Other Fees, the aggregate fees billed in each of the last two fiscal years for products and services provided by the principal accountant, other than the services reported in paragraphs (a) through (c) of this Item. Registrants shall describe the nature of the services comprising the fees disclosed under this category.
4(a) through 4(d): The information in the table below is provided for services rendered to the registrant by the registrant’s principal accountant, PricewaterhouseCoopers LLP (“PwC”), for the registrant’s fiscal years ended October 31, 2005 and October 31, 2006.
| | | | | | |
| | | 2005 | | 2006 |
Audit Fees | | $ | 455,145 | | $ | 489,034 |
Audit-Related Fees1 | | $ | 0 | | $ | 0 |
Tax Fees2 | | $ | 211,750 | | $ | 151,427 |
All Other Fees | | $ | 0 | | $ | 0 |
| | | | | | |
Total | | $ | 666,895 | | $ | 640,461 |
| | | | | | |
| 1 | Services include security counts performed under Rule 17f-2 of the 1940 Act. |
| 2 | Tax services in connection with the Funds’ excise tax calculations and review of the Funds’ applicable tax returns. |
The information in the table below is provided with respect to non-audit services that directly relate to the registrant’s operations and financial reporting and that were rendered by PwC to the registrant’s investment advisers (i.e., Gartmore Mutual Fund Capital Trust, Gartmore Global Asset Management Trust, and Gartmore Morley Capital Management, Inc.) (hereinafter referred to collectively as “NWD Investment Management, Inc.” or “NWD”, prior to November 30, 2006, “Gartmore Global Investments”), and any service provider to the registrant controlling, controlled by, or under common control with NWD that provided ongoing services to the registrant (hereinafter referred to collectively as the “Covered Services Provider”), for the registrant’s fiscal years ended October 31, 2005 and October 31, 2006.
| | | | | | |
| | | 2005 | | 2006 | |
Audit-Related Fees | | None | | | None | |
Tax Fees | | None | | $ | 13,825 | (1) |
All Other Fees | | None | | | None | |
| | | | | | |
Total | | None | | $ | 13,825 | (1) |
| | | | | | |
| (1) | Relates to expatriate tax compliance and advisory services to Gartmore Global Investments, Inc. for employees on international assignment including local tax return preparation in overseas locations. |
(e)(1) Disclose the audit committee’s pre-approval policies and procedures described in paragraph (c)(7) of Rule 2-01 of Regulation S-X.
(2) Disclose the percentage of services described in each of paragraphs (b) through (d) of this Item that were approved by the audit committee pursuant to paragraph (c)(7)(i)(C) of Rule 2-01 of Regulation S-X.
4(e)(1) Pre-Approval Policies and Procedures. The Audit Committee (the “Committee”) of the registrant is responsible for pre-approving (i) all audit and permissible non-audit services to be provided by the independent auditors to the registrant and (ii) all permissible non-audit services to be provided by the independent auditors to NWD and any Covered Services Provider if the engagement relates directly to the operations and financial reporting of the registrant. The Committee may delegate the Committee’s responsibility to pre-approve any such audit and permissible non-audit
services to the Chairperson of the Committee, and the Chairperson shall report to the Committee, at the Committee’s next regularly-scheduled meeting after the Chairperson’s pre-approval of such services, his or her decision(s). The Committee also may establish detailed pre-approval policies and procedures for pre-approval of these services in accordance with applicable laws, including the delegation of some or all of the Committee’s pre-approval responsibilities to other persons (other than NWD or the registrant’s officers). Pre-approval by the Committee of any permissible non-audit services shall not be required so long as: (i) the aggregate amount of all said permissible non-audit services provided to the registrant, NWD, and any Covered Services Provider constitutes not more than five percent (5%) of the total amount of revenues paid by the registrant to the registrant’s independent auditors during the fiscal year in which the permissible non-audit services are provided; (ii) the permissible non-audit services were not recognized by the registrant at the time of the engagement to be non-audit services; and (iii) these services are promptly brought to the attention of the Committee and approved by the Committee (or the Committee’s delegate(s)) prior to the completion of the audit.
4(e)(2) The information in the table below sets forth the percentages of fees for services (other than audit, review, or attest services) rendered by PwC to the registrant for which the pre-approval requirement was waived pursuant to Rule 2-01(c)(7)(i)(C) of Regulation S-X, for the registrant’s fiscal years ended October 31, 2005 and October 31, 2006:
| | | | |
| | | 2005 | | 2006 |
Audit-Related Fees | | None | | None |
Tax Fees | | None | | None |
All Other Fees | | None | | None |
| | | | |
Total | | None | | None |
| | | | |
The information in the table below sets forth the percentages of fees for services (other than audit, review, or attest services) rendered by PwC to NWD and any Covered Services Provider required to be approved pursuant to Rule 2-01(c)(7)(ii)of Regulation S-X, for the registrant’s fiscal years ended October 31, 2005 and October 31, 2006:
| | | | |
| | | 2005 | | 2006 |
Audit-Related Fees | | N/A | | N/A |
Tax Fees | | N/A | | N/A |
All Other Fees | | N/A | | N/A |
| | | | |
Total | | N/A | | N/A |
| | | | |
(f) If greater than 50 percent, disclose the percentage of hours expended on the principal accountant’s engagement to audit the registrant’s financial statements for the most recent fiscal year that were attributed to work performed by persons other than the principal accountant’s full-time, permanent employees.
4(f) The percentage of hours expended to audit the registrant’s financial statements for the fiscal year ended October 31, 2006, that were attributed to work performed by persons other than PwC’s full-time, permanent employees was % [if over 50%]. Not Applicable
(g) Disclose the aggregate non-audit fees billed by the registrant’s accountant for services rendered to the registrant, and rendered to the registrant’s investment adviser (not including any sub-adviser whose role is primarily portfolio management and is subcontracted with or overseen by another investment adviser), and any entity controlling, controlled by, or under common control with the adviser that provides ongoing services to the registrant for each of the last two fiscal years of the registrant.
4(g) The aggregate fees billed by PwC for non-audit services rendered to the registrant and service affiliates for the fiscal years ended October 31, 2005, and October 31, 2006 were $3,984,969, and $0, respectively.
(h) Disclose whether the registrant’s audit committee of the board of directors has considered whether the provision of non-audit services that were rendered to the registrant’s investment adviser (not including any subadviser whose role is primarily portfolio management and is subcontracted with or overseen by another investment adviser), and any entity controlling, controlled by, or under common control with the investment adviser that provides ongoing services to the registrant that were not pre-approved pursuant to paragraph (c)(7)(ii) of Rule 2-01 of Regulation S-X is compatible with maintaining the principal accountant’s independence.
4(h) The registrant’s Audit Committee has considered whether the provision by PwC of non-audit services to NWD and Covered Services Providers that were not pre-approved pursuant to Rule 2-01(c)(7)(ii) of Regulation S-X because these services did not directly relate to the registrant’s operations and financial reporting is compatible with maintaining PwC’s independence. Not Applicable
Item 5. Audit Committee of Listed Registrants.
| | (a) | If the registrant is a listed issuer as defined in Rule 10A-3 under the Exchange Act (17CFR 240.10A-3), state whether or not the registrant has a separately-designated standing audit committee established in accordance with Section 3(a)(58)(A) of the Exchange Act (15 U.S.C. 78c(a)(58)(A)). If the registrant has such a committee, however designated, identify each committee member. If the entire board of directors is acting as the registrant’s audit committee as specified in Section 3(a)(58)(B) of the Exchange Act (15 U.S.C. 78c(a)(58)(B)), so state. |
Not applicable.
| | (b) | If applicable, provide the disclosure required by Rule 10A-3(d) under the Exchange Act (17CFR 240.10A-3(d)) regarding an exemption from the listing standards for all audit committees. |
Not applicable.
Item 6. Schedule of Investments.
File Schedule I – Investments in securities of unaffiliated issuers as of the close of the reporting period as set forth in § 210.12-12 of Regulation S-X, unless the schedule is included as part of the report to shareholders filed under Item 1 of this Form.
This schedule is included as part of the report to shareholders filed under Item 1 of this Form N-CSR.
Item 7. Disclosure of Proxy Voting Policies and Procedures for Closed-End Management Investment Companies.
A closed-end management investment company that is filing an annual report on this Form N-CSR must, unless it invests exclusively in non-voting securities, describe the policies and procedures that it uses to determine how to vote proxies relating to portfolio securities, including the procedures that the company uses when a vote presents a conflict between the interests of its shareholders, on the one hand, and those of the company’s investment adviser; principal underwriter; or any affiliated person (as defined in Section 2(a)(3) of the Investment Company Act of 1940 (15 U.S.C. 80a-2(a)(3)) and the rules thereunder) of the company, its investment adviser, or its principal underwriter, on the other. Include any policies and procedures of the company’s investment adviser, or any other third party, that the company uses, or that are used on the company’s behalf, to determine how to vote proxies relating to portfolio securities.
Not applicable
Item 8. Portfolio Managers of Closed-End Management Investment Companies.
If the registrant is a closed-end management investment company that is filing an annual report on this Form N-CSR, provide the information specified in paragraphs (a) and (b) of this Item with respect to portfolio managers.
Not applicable.
Item 9. Purchases of Equity Securities by Closed-End Management Investment Company and Affiliated Purchasers.
If the registrant is a closed-end management investment company, provide the information specified in paragraph (b) of this Item with respect to any purchase made by or on behalf of the registrant or any “affiliated purchaser,” as defined in Rule 10b-18(a)(3) under the Exchange Act (17 CFR 240.10b-18(a)(3)), of shares or other units of any class of the registrant’s equity securities that is registered by the registrant pursuant to Section 12 of the Exchange Act (15 U.S.C. 781).
Not applicable.
Item 10. Submission of Matters to a Vote of Security Holders.
Describe any material changes to the procedures by which shareholders may recommend nominees to the registrant’s board of directors, where those changes were implemented after the registrant last provided disclosure in response to the requirements of Item 7(d)(2)(ii)(G) of Schedule 14A (17 CFR 240.14a-101), or this Item.
The Independent Trustees and the Board of Trustees of the registrant adopted a formal, written “Policy Regarding Shareholder Submission of Trustee Candidates,” as well as a formal, written “Statement of Policy On Criteria For Selecting Trustees,” on June 9, 2004, and June 10, 2004, respectively. Neither this policy nor this statement of policy has been materially changed since the Board of Trustees adoption of the policy and the statement of policy, respectively. The Nominating and Fund Governance Committee of the Board of Trustees, however, on November 11, 2005, approved amendments to this policy and recommended that the Board of Trustees approve the amendments to the policy at the Board’s next regular meeting, to be held on January 12, 2006. The proposed Board amendments to the policy, though, concern the criteria for selecting candidates for Trustees and the characteristics expected of candidates for Trustees, as set forth in the Exhibit A, “Statement of Policy On Criteria For Selecting Trustees,” to the policy and, arguably, may not be deemed to be material changes to the policy.
Item 11. Controls and Procedures.
(a) Disclose the conclusions of the registrant’s principal executive and principal financial officers, or persons performing similar functions, regarding the effectiveness of the registrant’s disclosure controls and procedures (as defined in Rule 30a-3(c) under the Act (17 CFR 270.30a-3(c))) as of a date within 90 days of the filing date of the report that includes the disclosure required by this paragraph, based on the evaluation of these controls and procedures required by Rule 30a-3(b) under the Act (17 CFR 270.30a-3(b)) and Rules 13a-15(b) or 15d-15(b) under the Exchange Act (17 CFR 240.13a-15(b) or 240.15d-15(b)).
The registrant’s principal executive officer and principal financial officer have concluded, based on their evaluation of the registrant’s disclosure controls and procedures as conducted within ninety (90) days of the filing date of this report, that these disclosure controls and procedures are adequately designed and are operating effectively to ensure that information required to be disclosed by the registrant on Form N-CSR is: (i) accumulated and communicated to the investment company’s management, including the investment company’s certifying officers, to allow timely decisions regarding required disclosure; and (ii) recorded, processed, summarized, and reported within the time periods specified in the Securities and Exchange Commission’s rules and forms.
(b) Disclose any change in the registrant’s internal control over financial reporting (as defined in Rule 30a-3(d) under the Act (17 CFR 270.30a-3(d)) that occurred during the second fiscal quarter of the period covered by this report that has materially affected, or is reasonably likely to materially affect, the registrant’s internal control over financial reporting.
There were no changes in the registrant’s internal control over financial reporting that occurred during the second fiscal quarter of the period covered by this report that have materially affected or are reasonably likely to materially affect, the registrant’s internal control over financial reporting.
Item 12. Exhibits.
(a) File the exhibits listed below as part of this Form. Letter or number the exhibits in the sequence indicated.
(a)(1) Any code of ethics, or amendment thereto, that is the subject of the disclosure required by Item 2, to the extent that the registrant intends to satisfy the Item 2 requirements through filing of an exhibit.
(a)(2) A separate certification for each principal executive officer and principal financial officer of the registrant as required by Rule 30a-2(a) under the Act (17 CFR 270.30a-2).
Certifications executed pursuant to Rule 30a-2(a) are attached hereto.
(a)(3) Any written solicitation to purchase securities under Rule 23c-1 under the Act (17 CFR 270.23c-1) sent or given during the period covered by the report by or on behalf of the registrant to 10 or more persons.
Not applicable.
(b) If the report is filed under Section 13(a) or 15(d) of the Exchange Act, provide the certifications required by rule 30a-2(b) under the Act as an exhibit. A certification furnished pursuant to this paragraph will not be deemed “filed” for purposes of Section 18 of the Exchange Act, or otherwise subject to the liability of that section. Such certification will not be deemed to be incorporated by reference into any filing under the Securities Act of 1933 or the Exchange Act, except to the extent that the registrant incorporates it by reference.
Certifications executed pursuant to Rule 30a-2(b) are attached hereto.
SIGNATURES
Pursuant to the requirements of the Securities Exchange Act of 1934 and the Investment Company Act of 1940, the registrant has duly caused this report to be signed on its behalf by the undersigned, thereunto duly authorized.
| | | | |
| (Registrant) | | GARTMORE MUTUAL FUNDS |
| |
| By (Signature and Title) | | /s/ GERALD J. HOLLAND |
| | Name: | | Gerald J. Holland |
| | Title: | | Treasurer |
| | Date: | | January 8, 2007 |
Pursuant to the requirements of the Securities Exchange Act of 1934 and the Investment Company Act of 1940, this report has been signed below by the following persons on behalf of the registrant and in the capacities and on the dates indicated.
| | | | |
| By (Signature and Title) | | /s/ John H. Grady |
| | Name: | | John Grady |
| | Title: | | President |
| | Date: | | January 8, 2007 |
| |
| By (Signature and Title) | | /s/ GERALD J. HOLLAND |
| | Name: | | Gerald J. Holland |
| | Title: | | Treasurer |
| | Date: | | January 8, 2007 |