UNITED STATES
SECURITIES AND EXCHANGE COMMISSION
Washington, D. C. 20549
FORM N-CSR/A
CERTIFIED SHAREHOLDER REPORT OF REGISTERED
MANAGEMENT INVESTMENT COMPANIES
Investment Company Act File number: 811-08495
NATIONWIDE MUTUAL FUNDS
(Exact name of registrant as specified in charter)
1000 CONTINENTAL DRIVE, SUITE 400, KING OF PRUSSIA, PENNSYLVANIA 19406-2850
(Address of principal executive offices) (Zip code)
Eric E. Miller, Esq.
1000 Continental Drive
Suite 400
King of Prussia, Pennsylvania 19406-2850
(Name and address of agent for service)
Registrant’s telephone number, including area code: (610) 230-2839
Date of fiscal year end: October 31, 2014
Date of reporting period: November 1, 2013 through October 31, 2014
Form N-CSR is to be used by management investment companies to file reports with the Commission not later than ten (10) days after the transmission to stockholders of any report that is required to be transmitted to stockholders under Rule 30e-1 under the Investment Company Act of 1940 (17 C.F.R. § 270.30e-1). The Commission may use the information provided on Form N-CSR in the Commission’s regulatory, disclosure review, inspection, and policymaking roles.
A registrant is required to disclose the information specified by Form N-CSR, and the Commission will make this information public. A registrant is not required to respond to the collection of information contained in Form N-CSR unless the Form displays a currently valid Office of Management and Budget (“OMB”) control number. Please direct comments concerning the accuracy of the information collection burden estimate and any suggestions for reducing the burden to Secretary, Securities and Exchange Commission, 450 Fifth Street, NW, Washington, D. C. 20549-0609. The OMB has reviewed this collection of information under the clearance requirements of 44 U.S.C. § 3507.
Explanatory Note:
This Form N-CSR/A for Nationwide Mutual Funds (the “Registrant”) is being filed solely to reflect the addition of the Statement of Cash Flows for Nationwide Investor Destinations Conservative Fund (Investor Destinations Fund”) within Item 1 “Reports to Stockholders” which were caused by a technical correction. After issuing Investor Destinations Fund’s October 31, 2014 financial statements, fund management became aware of a technical correction that requires Investor Destinations Fund to present a Statement of Cash Flows in accordance with the Financial Accounting Standards Board Accounting Standards Codification Topic 230 (“ASC 230”). Prior to the technical correction, ASC 230 required that substantially all Investor Destinations Fund’s investments must be carried at fair value and classified as liquid to be exempt from having to provide a Statement of Cash Flows. The technical update to ASC 230 now requires that substantially all of Investor Destinations Fund’s investments must be carried at fair value and classified as level 1 or level 2 measurements, in accordance with the valuation hierarchy, in order to be exempt from presenting the Statement of Cash Flows. Investor Destinations Fund’s financial statements for the year ended October 31, 2014 did not present the Statement of Cash Flows. Fund Management has decided to restate the October 31, 2014 financial statements to include the Statement of Cash Flows because Investor Destinations Fund did not have substantially all of the Fund’s holdings classified as level 1 and level 2 securities in that it held a significant portion of its holdings in a level 3 security within the hierarchy. The annual reports for the other portfolios of the Registrant are contained in the Form N-CSR filed on December 29, 2014 (Accession Number 0001193125-14-455374) and are not amended or modified in any way by this Form N-CSR/A. Other than the aforementioned amendment, no other information or disclosures contained in the Registrant’s Form N-CSR filed on December 29, 2014 are being amended by this Form N-CSR/A.
Item 1. Reports to Stockholders.
Include a copy of the report transmitted to stockholders pursuant to Rule 30e-1 under the Act (17 C.F.R. § 270.30e-1).

Annual Report
October 31, 2014
Nationwide Mutual Funds
Investor Destinations Funds
Nationwide Investor Destinations Aggressive Fund
Nationwide Investor Destinations Moderately Aggressive Fund
Nationwide Investor Destinations Moderate Fund
Nationwide Investor Destinations Moderately Conservative Fund
Nationwide Investor Destinations Conservative Fund

Commentary in this report is provided by the portfolio manager(s) of each Fund as of the date of this report and is subject to change at any time based on market or other conditions.
Third-party information has been obtained from sources that Nationwide Fund Advisors (NFA), the investment adviser to the Funds, deems reliable. This report and the holdings provided are for informational purposes only and are not intended to be relied on as investment advice. Portfolio composition is accurate as of the date of this report and is subject to change at any time and without notice. NFA, one of its affiliated advisers or its employees may hold a position in the securities in this report.
Statement Regarding Availability of Quarterly Portfolio Holdings.
The Trust files complete schedules of portfolio holdings for each Fund with the Securities and Exchange Commission (SEC) for the first and third quarters of each fiscal year on Form N-Q. Additionally, the Trust files a schedule of portfolio holdings monthly for the Nationwide Money Market Fund on Form N-MFP. Forms N-Q and Forms N-MFP are available on the SEC’s website at http://www.sec.gov. Forms N-Q and Forms N-MFP may be reviewed and copied at the SEC’s Public Reference Room in Washington, DC, and information on the operation of the Public Reference Room may be obtained by calling 800-SEC-0330. The Trust also makes this information available to shareholders on nationwide.com/mutualfunds or upon request without charge.
Statement Regarding Availability of Proxy Voting Record.
Information regarding how the Funds voted proxies relating to portfolio securities held during the most recent 12-month period ended June 30 is available without charge, upon request, by calling 800-848-0920, and on the SEC’s website at http://www.sec.gov.
| | |
| Nationwide Funds® Annual Report | | |
Contents
Nationwide Funds®
Message to Investors
October 31, 2014
Dear Investor,
At Nationwide®, we pride ourselves on our dedication to helping America prepare for and live in retirement. Three-time Super Bowl-winning coach Joe Gibbs likes to say that “A winning effort begins with preparation.” We agree. It is satisfying to help investors work with financial advisors to begin to plan for a stable future. Even more gratifying is to watch investors progress through the years and ultimately reach retirement with the confidence and resources to thrive.
You may have noticed that the Nationwide logo has changed. Rest assured that we are still the same solid company with an 85-year history of looking out for our customers. During the past several months we have taken deliberate steps to more fully align as one company. As we begin the transition to one brand, we will be known as one business — one Nationwide — offering insurance, banking and financial services and products with operations in all 50 states. We believe that as one company we will be even better positioned to put you first.
During the one-year reporting period ended October 31, 2014, most Nationwide mutual funds performed well. The broad U.S. stock market performance as measured by the S&P 500® Index grew 17.27% for the period, with all sectors reporting positive returns. The Barclays U.S. Aggregate Bond Index, a broad measurement of U.S. fixed-income investment performance, returned 4.14% for the period.
This report brings you information about market trends during the one-year reporting period as well as your fund’s specific holdings and performance. You also can read insights from Nationwide’s portfolio management partners and analysts.
We are here for the long term, poised to help you prepare for your “winning effort.” As always, thank you for your investment in Nationwide funds.
Sincerely,

Michael S. Spangler
President & CEO
Nationwide Funds
1
During the fiscal-year reporting period ended October 31, 2014, most asset classes produced a positive investment return. Domestic equities experienced a broad-based rally, with the S&P 500® Index delivering a 17.27% return, and nearly all market sectors and capitalization ranges showing strong performance for the reporting period. The performance of international equities was mixed during the reporting period, with the MSCI EAFE® Index registering -0.60% as positive local market return was more than offset by the negative impact of the decline in local currencies relative to the U.S. dollar. Fixed-income investment returns were positive during the reporting period, driven by declining long-term interest rates and strong performance of credit-sensitive market segments.
In the United States, investment performance during the reporting period was affected positively by encouraging economic data and continued strong corporate earnings. With the exception of a weak report in the first calendar quarter of 2014 due to the impact of winter storms, each quarter experienced real gross domestic product (GDP) growth of greater than 3%. In addition, equity and fixed-income investment returns were supported during the reporting period by declining longer-term interest rates and the continuation of the accommodative Federal Reserve policy. The 10-year Treasury yield fell during the reporting period, and despite the end of the Quantitative Easing (QE) program, Fed officials remained committed to keeping the federal funds rate low for “a considerable time.”1
The S&P 500 Index produced positive performance in nine of the 12 months of the reporting period. The weakest month was January 2014, registering -3.46%, but the brief downturn was more than offset by a 4.57% return in February 2014.
All sectors of the S&P 500 Index posted positive returns for the reporting period. The best-performing sectors for the S&P 500 during the
reporting period were health care, up 30.1%; information technology, up 25.4%; and utilities, up 20.5%. Health care rallied in reaction to excitement surrounding new products; technology, due to strong earnings; and utilities, due to declining interest rates. While all sector returns were positive, the sectors with the lowest returns included energy, up 5.0%; telecommunication services, up 7.2%; and consumer discretionary, up 11.0%.
The strong performance of U.S. equities was broad based during the reporting period, with large-capitalization stocks outperforming small-cap stocks, and growth outperforming value.
U.S. economic growth was solid during the reporting period, with real GDP growth averaging 2.4% for the past four calendar quarters despite a -2.1% report for the first calendar quarter of 2014. The -2.1% figure stands as the only negative result reported since the end of the most recent economic recession in 2009 and was largely due to unusually disruptive winter weather. The one negative result does appear to be an anomaly, as expectations are for continued positive growth for the remainder of 2014 and through 2015. Inflation remained well controlled through the reporting period, with the U.S. Consumer Price Index (CPI) and the core CPI (excluding the volatile food and energy categories) below 2%. Despite job-creation levels coming in lower than those seen during many past economic recoveries, the unemployment rate continued to decline during the reporting period, falling from 7.2% to 5.8%.
Despite strong domestic equity performance during the reporting period, the performance of international stocks was relatively flat for the period. Investors’ focus was on uncertainty surrounding Russia and Ukraine, along with sluggish European economic growth; worries about a U.S. tapering (reduction of accommodative policy involving asset purchases)
2
depressed relative returns during the reporting period. The investment return in local currencies was positive in international markets during the reporting period, although largely offset by the negative impact of the stronger dollar. The MSCI EAFE Index registered -0.60%, while the MSCI Emerging Markets® Index returned 0.64% for the reporting period. Despite headline risks, emerging markets stocks slightly outperformed those of developed markets, reversing the trend of underperformance that had prevailed since the fourth quarter of 2010.
Performance in the fixed-income markets was driven by declining interest rates and falling credit spreads during the reporting period. Long-term Treasury yields fell during the reporting period, with the 10-year Treasury yield declining from 2.56% to 2.34%. Fixed-income investment returns were positive, as investors absorbed the news of the Fed’s tapering (reduce) the quantitative easing (QE) program. Long-term and credit-sensitive bonds delivered the strongest performance among fixed-income investments during the reporting period.
| | |
| Index | | Fiscal Year Total Return
(as of October 31, 2014) |
| Barclays U.S. 1-3 Year Government/Credit Bond | | 0.89% |
| Barclays U.S. 10-20 Year Treasury Bond | | 7.42% |
| Barclays Emerging Markets USD Aggregate Bond | | 6.86% |
| Barclays Municipal Bond | | 7.82% |
| Barclays U.S. Aggregate Bond | | 4.14% |
| Barclays U.S. Corporate High Yield | | 5.82% |
| MSCI EAFE® | | -0.60% |
| MSCI Emerging Markets® | | 0.64% |
| MSCI World ex USA | | -0.15% |
| Russell 1000® Growth | | 17.11% |
| Russell 1000® Value | | 16.46% |
| Russell 2000® | | 8.06% |
| S&P 500® | | 17.27% |
Source: Morningstar
| 1 | http://www.federalreserve.gov/newsevents/press/monetary/20141029a.htm |
3
| | |
| Fund Commentary | | Nationwide Investor Destinations Aggressive Fund |
For the annual period ended October 31, 2014, the Nationwide Investor Destinations Aggressive Fund (Service Class) returned 7.75% versus 9.69% for its composite benchmark, 60% Russell 3000® Index, 30% MSCI EAFE® Index and 10% Barclays U.S. Aggregate Bond Index. For broader comparison, the median return for the Fund’s closest Lipper peer category of Global Multi-Cap Core Funds (consisting of 127 funds as of October 31, 2014) was 7.36% for the same time period. Performance for the Fund’s other share classes versus the benchmark is stated in the Average Annual Total Return chart in this report’s Fund Performance section.
The Fund’s return for the 12-month period covered in this report was driven primarily by strong positive returns from domestic equities. Representing about 59% of the Fund’s allocations, the Fund’s exposure to the U.S. equity markets contributed significantly to the Fund’s positive performance. In general, U.S. equity markets led the way as large-, mid- and small-capitalization stocks posted gains far exceeding those of international markets during the reporting period. Specifically, the S&P 500® Index (representing large-cap U.S. stocks) rose more than 17%, the S&P MidCap 400® Index (mid-cap stocks) increased 11.7%, and the Russell 2000® Index (small-cap stocks) gained 8.1%. During the reporting period, the Federal Reserve ceased its purchases of assets citing “substantial improvement in the outlook for the labor market since the inception of [the Fed’s] currency asset purchase program” and noting that the Fed “continues to see sufficient underlying strength in the broader economy.”1
The equity markets within foreign developed countries (as distinguished from emerging market countries) posted near-zero returns during the reporting period. The MSCI EAFE® Index (representing developed international equity markets) registered -0.1% for the reporting period. Concerns about the health of Europe’s economy and heightened risk in emerging markets posed headwinds to the international markets.
The Fund’s return also was supported during the reporting period by positive returns from
intermediate-term, investment-grade, U.S. fixed-income investments. The Barclays U.S. Aggregate Bond Index (representing a broad spectrum of such bonds) posted a return of 4.1% during the reporting period, helped along by the drop in interest rates on the bellwether 10-year U.S. Treasury note from a high of 3.04% at the end of 2013 to its period low of 2.34% at the end of October 2014. The drop in rates in the latter part of the reporting period, combined with a flattening of the overall yield curve (a plotted graph line of the yields [or interest rates] on long-term and short-term maturity bonds), resulted in generally positive performance for intermediate-term bonds. Short-term, investment-grade, fixed-income rates remained range-bound near zero, effectively keeping returns for this asset class very low.
The return from the Fund’s investment in the Nationwide S&P 500 Index Fund, combined with this underlying fund’s sizable allocation within the Fund, made this underlying fund the largest contributor to the Fund’s return during the reporting period, as shown in the chart below.
All of the Fund’s underlying funds posted positive returns during the reporting period; however, the Fund’s investment in the Nationwide International Index Fund posted a 0.05% return (contributing 0.01% to the overall Fund performance), thus contributing the least to the Fund’s overall positive return.
| 1 | http://www.federalreserve.gov/newsevents/press/monetary/20141029a.htm |
Portfolio Managers:
Thomas R. Hickey Jr. and Benjamin A. Richer*, Nationwide Fund Advisors
The Fund is designed to provide diversification across a variety of asset classes, primarily by investing in underlying funds. Therefore, in addition to the expenses of the Fund, each investor is indirectly paying a proportionate share of the applicable fees and expenses of its underlying funds.
Investments in the Fund are subject to the risks of the Fund’s underlying funds. The Fund is subject to different levels of risk, based on the types and sizes of its underlying asset class allocations and its allocation strategy. In addition, the Fund’s underlying funds may be subject to specific investment risks, including but not limited to: stock market risk (equity securities); default risk and interest rate risk — if interest rates go up, bond prices go down and if interest rates go down, bond prices go up (bonds); and
4
| | |
Fund Commentary (con’t.) | | Nationwide Investor Destinations Aggressive Fund |
currency fluctuations, political risks, and differences in accounting and availability of information (international securities). Please refer to the most recent prospectus for a more detailed explanation of the Fund’s principal risks.
The Fund may invest in the Nationwide Fixed Contract, which is a fixed interest contract issued and guaranteed by Nationwide Life Insurance Company (Nationwide), an affiliate of the Fund’s investment adviser, Nationwide Fund Advisors. If Nationwide becomes unable to meet this guarantee, a Fund that invests in the Nationwide Fixed Contract may lose money from unpaid principal or unpaid or reduced interest.
Asset allocation is the process of spreading assets across several different investment styles and asset classes. The purpose is to potentially reduce long-term risk and capture potential profits across various asset classes.
Nationwide Asset Management, LLC (NWAM) provides asset allocation consulting services to Nationwide Fund Advisors (NFA), the Fund’s investment adviser. NWAM is a registered investment adviser and wholly owned subsidiary of Nationwide Mutual Insurance Company, and therefore is affiliated with NFA. NFA makes both the asset allocation and underlying fund selection decisions for the Fund. In addition, NWAM serves as the subadviser to certain other Nationwide Funds.
There is no assurance that the investment objective of any fund (or that of any underlying fund) will be achieved or that a diversified portfolio will produce better results than a nondiversified portfolio. Diversification does not guarantee returns or insulate an investor from potential losses, including the possible loss of principal.
A description of the benchmarks can be found on the Market Index Definitions page at the back of this book.
Nationwide Investor Destinations
Aggressive Fund
(October 31, 2014)
| | | | | | | | |
| Underlying Fund | | Actual
Allocation
to Fund | | | Contribution
to Fund
Performance | |
| Nationwide S&P 500 Index Fund Institutional Class | | | 32% | | | | 5.45% | |
| Nationwide International Index Fund Institutional Class | | | 27% | | | | 0.01% | |
| Nationwide Mid Cap Market Index Fund Institutional Class | | | 14% | | | | 1.59% | |
| Nationwide Small Cap Index Fund Institutional Class | | | 13% | | | | 1.05% | |
| Nationwide Portfolio Completion Fund Institutional Class | | | 10% | | | | 0.27% | |
| Nationwide Bond Index Fund Institutional Class | | | 2% | | | | 0.08% | |
| Nationwide Core Plus Bond Fund Institutional Class | | | 2% | | | | 0.08% | |
| | | | 100% | | | | | |
Actual underlying fund allocations are stated as a percentage of the Fund’s total net assets. Nationwide Fund Advisors (NFA), the investment adviser to the Fund, may add or delete asset classes or change allocations at any time and without notice in order for the Fund to meet its objective or due to market and/or economic conditions. NFA applies a long-term investment horizon with respect to the Fund, and allocation changes are not likely to be made in response to short-term market conditions.
The contribution of underlying funds to Fund performance is based on target underlying fund allocations through the reporting period. Returns reflect the impact of each underlying fund’s fees and expenses, but do not reflect the Nationwide Investor Destinations Aggressive Fund’s fees and expenses. Day-to-day market activity will likely cause the Fund’s target allocations to fluctuate. Under ordinary circumstances, NFA periodically will rebalance the assets of the Fund in order to conform its actual allocations to those stated in the then-current prospectus. For more information, refer to the Fund’s prospectus.
5
| | |
| Fund Overview | | Nationwide Investor Destinations Aggressive Fund |
Objective
The Fund seeks to maximize total investment return for an aggressive level of risk.
Highlights
| | Ÿ | | All of the Fund’s underlying funds posted positive returns during the reporting period | |
| | Ÿ | | The Fund’s investments in U.S. equity mutual funds accounted for 59% of its allocations and were the largest contributors to the returns of the Fund during the reporting period | |
Asset Allocation†
| | | | |
| Equity Funds | | | 86.3% | |
| Alternative Assets | | | 9.7% | |
| Fixed Income Funds | | | 4.1% | |
| Liabilities in excess of other assets | | | (0.1)% | |
| | | | 100.0% | |
Top Holdings††
| | | | |
| Nationwide S&P 500 Index Fund, Institutional Class | | | 32.3% | |
| Nationwide International Index Fund, Institutional Class | | | 26.4% | |
| Nationwide Mid Cap Market Index Fund, Institutional Class | | | 14.3% | |
| Nationwide Small Cap Index Fund, Institutional Class | | | 13.3% | |
| Nationwide Portfolio Completion Fund, Institutional Class | | | 9.7% | |
| Nationwide Core Plus Bond Fund, Institutional Class | | | 2.0% | |
| Nationwide Bond Index Fund, Institutional Class | | | 2.0% | |
| | | | 100.0% | |
| † | Percentages indicated are based upon net assets as of October 31, 2014. |
| †† | Percentages indicated are based upon total investments as of October 31, 2014. |
6
| | |
| Fund Performance | | Nationwide Investor Destinations Aggressive Fund |
Average Annual Total Return
(For periods ended October 31, 2014)
| | | | | | | | | | | | | | | | | | |
| | | 1 Yr. | | | 5 Yr. | | | 10 Yr. | | | Inception | |
| Class A | | w/o SC1 | | | 7.92% | | | | 12.49% | | | | 7.08% | | | | – | |
| | | w/ SC2 | | | 1.72% | | | | 11.15% | | | | 6.44% | | | | – | |
| Class C | | w/o SC1 | | | 7.21% | | | | 11.71% | | | | 6.32% | | | | – | |
| | | w/SC3 | | | 6.21% | | | | 11.71% | | | | 6.32% | | | | – | |
| Class R4,5 | | | | | 7.54% | | | | 12.10% | | | | 6.75% | | | | – | |
| Institutional Service Class4 | | | | | – | | | | – | | | | – | | | | 3.93%6* | |
| Institutional Class4,7 | | | | | 8.21% | | | | 12.83% | | | | 7.42% | | | | – | |
| Service Class4 | | | | | 7.75% | | | | 12.36% | | | | 6.96% | | | | – | |
| Russell 3000® Index | | | | | 16.07% | | | | 17.01% | | | | 8.55% | | | | – | |
| S&P 500® Index | | | | | 17.27% | | | | 16.69% | | | | 8.20% | | | | – | |
| Barclays U.S. Aggregate Bond Index | | | | | 4.14% | | | | 4.22% | | | | 4.64% | | | | – | |
| MSCI EAFE® Index | | | | | (0.60)% | | | | 6.52% | | | | 5.81% | | | | – | |
| Composite Index | | | | | 8.83% | | | | 11.69% | | | | 6.65% | | | | – | |
| CPI | | | | | 1.66% | | | | 1.89% | | | | 2.21% | | | | – | |
All figures showing the effect of a sales charge (SC) reflect the maximum charge possible, because it has the most significant effect on performance data.
| 1 | These returns do not reflect the effects of SCs. |
| 2 | A 5.75% front-end sales charge was deducted. |
| 3 | A 1.00% CDSC was deducted from the one year return because it is charged when you sell Class C shares within the first year after purchase. |
| 4 | Not subject to any SCs. |
| 5 | Effective February 21, 2014, Class R2 Shares were renamed Class R Shares. |
| 6 | Since inception date of March 3, 2014. |
| 7 | These returns until the creation of Institutional Class shares (12/29/04) include the performance of the Fund’s Class B shares. The returns have been adjusted for the fact that Institutional Class shares do not have any applicable SCs but have not been adjusted for the lower expenses applicable to Institutional Class shares. Excluding the effect of any fee waivers or reimbursements, such prior performance is similar to what Institutional Class shares would have produced because the Institutional Class shares invest in the same portfolio of securities as Class B shares. Effective February 21, 2014, Class B shares were converted into Class A shares. |
Expense Ratios
| | |
| | | Expense Ratio^ |
| Class A | | 0.83% |
| Class C | | 1.54% |
| Class R | | 1.12% |
| Institutional Service Class | | 0.58% |
| Institutional Class | | 0.47% |
| Service Class | | 0.88% |
| ^ | Current effective prospectus dated March 1, 2014 (as revised March 26, 2014). The expense ratio also includes indirect underlying fund expenses. Please see the Fund’s most recent prospectus for details. Please refer to the Financial Highlights for each respective share class’ actual results. |
7
| | |
| Fund Performance (con’t.) | | Nationwide Investor Destinations Aggressive Fund |
Performance of a $50,000 Investment
Investment return and principal value will fluctuate, and when redeemed, shares may be worth more or less than original cost. Past performance is no guarantee of future results and does not reflect the deduction of taxes that a shareholder would pay on fund distributions or the redemption of fund shares. Investing in mutual funds involves market risk, including loss of principal. Performance returns assume the reinvestment of all distributions.
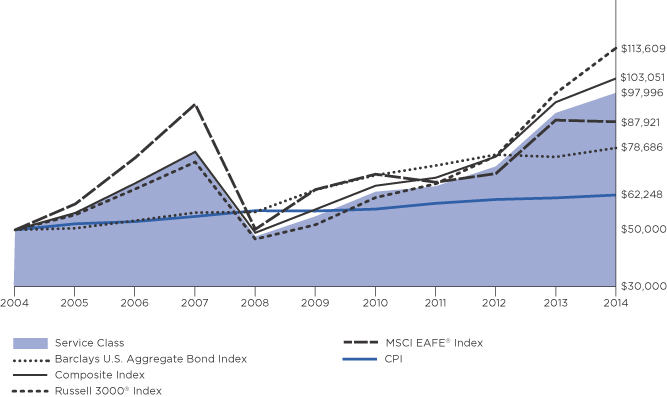
Comparative performance of $50,000 invested in Service Class shares of the Nationwide Investor Destinations Aggressive Fund versus the Russell 3000® Index, the Barclays U.S. Aggregate Bond Index, the MSCI EAFE® Index, the Composite Index* and the Consumer Price Index (CPI) over the 10-year period ended 10/31/14. Unlike the Fund, the performance for these unmanaged indexes does not reflect any fees, expenses, or sales charges. Investors cannot invest directly in market indexes. A description of the benchmarks can be found on the Market Index Definitions page at the back of this book.
| * | The Composite Index comprises 60% Russell 3000® Index, 30% MSCI EAFE® Index and 10% Barclays U.S. Aggregate Bond Index. |
8
| | |
| Shareholder Expense Example | | Nationwide Investor Destinations Aggressive Fund |
As a shareholder of the Fund, you incur two types of costs: (1) transaction costs, including sales charges (loads) paid on purchase payments and redemption fees; and (2) ongoing costs, including investment advisory fees, administration fees, distribution fees and other Fund expenses. The examples below are intended to help you understand your ongoing costs (in dollars) of investing in the Fund and to compare these costs with the ongoing costs of investing in other mutual funds. Per Securities and Exchange Commission (“SEC”) requirements, the examples assume that you had a $1,000 investment in the Class at the beginning of the reporting period (May 1, 2014) and continued to hold your shares at the end of the reporting period (October 31, 2014).
Actual Expenses
For each Class of the Fund in the table below, the first line provides information about actual account values and actual expenses. You may use the information in this line, together with the amount you invested, to estimate the expenses that you paid from May 1, 2014 through October 31, 2014. Simply divide your account value by $1,000 (for example, an $8,600 account value divided by $1,000 = 8.6), then multiply the result by the number in the first line of each Class under the heading entitled “Expenses Paid During Period” to estimate the expenses you paid on your account during this period.
Hypothetical Expenses for Comparison Purposes
The second line of each Class in the table below provides information about hypothetical account values and hypothetical expenses based on the Class’ actual expense ratio and an assumed rate of return of 5% per year before expenses, which is not the Class’ actual return. The hypothetical account values and expenses may not be used to estimate the actual ending account balance or expenses you paid for the period from May 1, 2014 through October 31, 2014. You may use this information to compare the ongoing costs of investing in the Class of the Fund and other funds. To do so, compare this 5% hypothetical example with the 5% hypothetical examples that appear in the shareholder reports of the other funds.
Please note that the expenses shown in the table are meant to highlight your ongoing costs only and do not reflect any transaction costs, such as sales charges (loads) or redemption fees. If these transaction costs were included, your costs would have been higher. Therefore, the second line for each Class in the table is useful in comparing ongoing costs only, and will not help you determine the relative total costs of owning different funds. The examples also assume all dividends and distributions are reinvested.
Schedule of Shareholder Expenses
Expense Analysis of a $1,000 Investment
| | | | | | | | | | | | |
Nationwide Investor Destinations
Aggressive Fund October 31, 2014 | | | Beginning
Account Value ($)
05/01/14 | | Ending
Account Value ($)
10/31/14 | | Expenses Paid
During Period ($)
05/01/14 - 10/31/14(a) | | Expense Ratio
During Period (%)
05/01/14 - 10/31/14(a) |
| Class A Shares | | | Actual | (b) | | 1,000.00 | | 1,025.30 | | 2.81 | | 0.55 |
| | | | Hypothetical | (b)(c) | | 1,000.00 | | 1,022.43 | | 2.80 | | 0.55 |
| Class C Shares | | | Actual | (b) | | 1,000.00 | | 1,021.40 | | 6.47 | | 1.27 |
| | | | Hypothetical | (b)(c) | | 1,000.00 | | 1,018.80 | | 6.46 | | 1.27 |
| Class R Shares(d) | | | Actual | (b) | | 1,000.00 | | 1,023.50 | | 4.23 | | 0.83 |
| | | | Hypothetical | (b)(c) | | 1,000.00 | | 1,021.02 | | 4.23 | | 0.83 |
| Institutional Service Class Shares | | | Actual | (b) | | 1,000.00 | | 1,027.00 | | 1.07 | | 0.21 |
| | | | Hypothetical | (b)(c) | | 1,000.00 | | 1,024.15 | | 1.07 | | 0.21 |
| Institutional Class Shares | | | Actual | (b) | | 1,000.00 | | 1,027.00 | | 0.92 | | 0.18 |
| | | | Hypothetical | (b)(c) | | 1,000.00 | | 1,024.30 | | 0.92 | | 0.18 |
| Service Class Shares | | | Actual | (b) | | 1,000.00 | | 1,024.30 | | 2.96 | | 0.58 |
| | | | Hypothetical | (b)(c) | | 1,000.00 | | 1,022.28 | | 2.96 | | 0.58 |
| (a) | Expenses are based on the direct expenses of the Fund and do not include the effect of the underlying Funds’ expenses, which are disclosed in the Fee and Expense table and described more fully in a footnote to that table in your Fund Prospectus. |
| (b) | Expenses are equal to the Fund’s annualized expense ratio multiplied by the average account value from May 1, 2014 through October 31, 2014 multiplied to reflect one-half year period. The expense ratio presented represents a six-month, annualized ratio in accordance with Securities and Exchange Commission guidelines. |
| (c) | Represents the hypothetical 5% return before expenses. |
| (d) | Effective March 3, 2014 Class R2 Shares were renamed Class R Shares. |
9
Statement of Investments
October 31, 2014
Nationwide Investor Destinations Aggressive Fund
| | | | | | | | | | |
| | | Mutual Funds 100.1% | |
| | | |
| | | | | Shares | | | Market
Value | |
| | | |
| | Alternative Assets 9.7% | |
| | Nationwide Portfolio Completion Fund, Institutional Class (a) | | | 12,174,003 | | | $ | 121,131,334 | |
| | | | | | | | | | |
| | |
| | Total Alternative Assets
(cost $118,089,637) | | | | 121,131,334 | |
| | | | | | | | | | |
| | | |
| | Equity Funds 86.3% | |
| | Nationwide International Index Fund, Institutional Class (a) | | | 40,238,019 | | | | 329,146,996 | |
| | Nationwide Mid Cap Market Index Fund, Institutional Class (a) | | | 8,967,629 | | | | 177,828,083 | |
| | Nationwide S&P 500 Index Fund, Institutional Class (a) | | | 25,905,496 | | | | 402,830,465 | |
| | Nationwide Small Cap Index Fund, Institutional Class (a) | | | 10,455,625 | | | | 165,930,765 | |
| | | | | | | | | | |
| | |
| | Total Equity Funds
(cost $786,180,161) | | | | 1,075,736,309 | |
| | | | | | | | | | |
| | | |
| | Fixed Income Funds 4.1% | |
| | Nationwide Bond Index Fund, Institutional Class (a) | | | 2,223,249 | | | | 25,100,478 | |
| | Nationwide Core Plus Bond Fund, Institutional Class (a) | | | 2,450,428 | | | | 25,214,901 | |
| | | | | | | | | | |
| | |
| | Total Fixed Income Funds
(cost $50,715,475) | | | | 50,315,379 | |
| | | | | | | | | | |
| | |
| | Total Mutual Funds
(cost $954,985,273) | | | | 1,247,183,022 | |
| | | | | | | | | | |
| | |
| | Total Investments
(cost $954,985,273) (b) — 100.1% | | | | 1,247,183,022 | |
| | |
| | Liabilities in excess of other
assets — (0.1)% | | | | (635,890 | ) |
| | | | | | | | | | |
| | |
| | NET ASSETS — 100.0% | | | $ | 1,246,547,132 | |
| | | | | | | | | | |
| | (a) | Investment in affiliate. |
| | (b) | See notes to financial statements for tax cost and unrealized appreciation/(depreciation) of securities. |
The accompanying notes are an integral part of these financial statements.
10
Statement of Assets and Liabilities
October 31, 2014
| | | | | | |
| | | Nationwide
Investor Destinations
Aggressive Fund |
Assets: | | | | | | |
Investments in affiliates, at value (cost $954,985,273) | | $ | 1,247,183,022 | | | |
Receivable for investments sold | | | 461,014 | | | |
Receivable for capital shares issued | | | 707,713 | | | |
Prepaid expenses | | | 30,353 | | | |
| | | | | | |
Total Assets | | | 1,248,382,102 | | | |
| | | | | | |
Liabilities: | | | | | | |
Payable for capital shares redeemed | | | 1,135,478 | | | |
Accrued expenses and other payables: | | | | | | |
Investment advisory fees | | | 132,947 | | | |
Fund administration fees | | | 29,105 | | | |
Distribution fees | | | 294,507 | | | |
Administrative servicing fees | | | 196,020 | | | |
Accounting and transfer agent fees | | | 7,948 | | | |
Trustee fees | | | 3,727 | | | |
Custodian fees | | | 3,849 | | | |
Compliance program costs (Note 3) | | | 367 | | | |
Professional fees | | | 20,059 | | | |
Printing fees | | | 7,066 | | | |
Other | | | 3,897 | | | |
| | | | | | |
Total Liabilities | | | 1,834,970 | | | |
| | | | | | |
Net Assets | | $ | 1,246,547,132 | | | |
| | | | | | |
| | |
Represented by: | | | | | | |
Capital | | $ | 949,736,755 | | | |
Accumulated net realized gains from affiliated investments | | | 4,612,628 | | | |
Net unrealized appreciation/(depreciation) from investments in affiliates | | | 292,197,749 | | | |
| | | | | | |
Net Assets | | $ | 1,246,547,132 | | | |
| | | | | | |
Net Assets: | | | | | | |
Class A Shares | | $ | 61,402,299 | | | |
Class C Shares | | | 76,857,144 | | | |
Class R Shares | | | 106,558,652 | | | |
Institutional Service Class Shares | | | 3,569,632 | | | |
Institutional Class Shares | | | 146,720,517 | | | |
Service Class Shares | | | 851,438,888 | | | |
| | | | | | |
Total | | $ | 1,246,547,132 | | | |
| | | | | | |
Shares Outstanding (unlimited number of shares authorized): | | | | | | |
Class A Shares | | | 5,335,143 | | | |
Class C Shares | | | 6,840,512 | | | |
Class R Shares | | | 9,410,492 | | | |
Institutional Service Class Shares | | | 309,897 | | | |
Institutional Class Shares | | | 12,623,756 | | | |
Service Class Shares | | | 73,879,402 | | | |
| | | | | | |
Total | | | 108,399,202 | | | |
| | | | | | |
| | | | | | |
| | | | | | |
| | |
| | | | | | |
11
Statement of Assets and Liabilities (Continued)
October 31, 2014
| | | | | | |
| | | Nationwide
Investor Destinations
Aggressive Fund |
Net asset value and redemption price per share (Net assets by class divided by shares outstanding by class, respectively): | | | | | | |
Class A Shares (a) | | $ | 11.51 | | | |
Class C Shares (b) | | $ | 11.24 | | | |
Class R Shares | | $ | 11.32 | | | |
Institutional Service Class Shares | | $ | 11.52 | | | |
Institutional Class Shares | | $ | 11.62 | | | |
Service Class Shares | | $ | 11.52 | | | |
Maximum offering price per share (100%/(100%-maximum sales charge) of net asset value adjusted to the nearest cent): | | | | | | |
Class A Shares | | $ | 12.21 | | | |
| | | | | | |
Maximum Sales Charge: | | | | | | |
Class A Shares | | | 5.75 | % | | |
| | | | | | |
| | | | | | |
| | | | | | |
| | | | | | |
| | | | | | |
| | | | | | |
| | | | | | |
| | | | | | |
| | | | | | |
| | | | | | |
| | | | | | |
| | | | | | |
| | | | | | |
| | | | | | |
| | | | | | |
| | | | | | |
| | | | | | |
| | | | | | |
| | | | | | |
| | | | | | |
| | | | | | |
| | | | | | |
| | | | | | |
| | | | | | |
| | | | | | |
| | | | | | |
| | | | | | |
| | | | | | |
| | | | | | | |
| (a) | For Class A Shares that were purchased without a sales charge because such purchase exceeded $1,000,000, a contingent deferred sales charge of 1.00% may apply to any redemption of such shares within 18 months of their purchase. |
| (b) | For Class C Shares, the redemption price per share is reduced by a contingent deferred sales charge of 1.00% for shares held less than one year. |
The accompanying notes are an integral part of these financial statements.
12
Statement of Operations
For the Period Ended October 31, 2014
| | | | | | |
| | | Nationwide
Investor Destinations
Aggressive Fund |
INVESTMENT INCOME: | | | | | | |
Dividend income from affiliates | | $ | 25,467,882 | | | |
| | | | | | |
Total Income | | | 25,467,882 | | | |
| | | | | | |
EXPENSES: | | | | | | |
Investment advisory fees | | | 1,625,106 | | | |
Fund administration fees | | | 346,574 | | | |
Distribution fees Class A | | | 159,324 | | | |
Distribution fees Class B (a) | | | 10,760 | | | |
Distribution fees Class C | | | 758,233 | | | |
Distribution fees Class R (b) | | | 541,769 | | | |
Distribution fees Service Class | | | 2,169,839 | | | |
Administrative servicing fees Class A | | | 66,857 | | | |
Administrative servicing fees Class C | | | 44,347 | | | |
Administrative servicing fees Class R (b) | | | 162,531 | | | |
Administrative servicing fees Institutional Service Class (c) | | | 90 | | | |
Administrative servicing fees Service Class | | | 1,301,910 | | | |
Registration and filing fees | | | 77,561 | | | |
Professional fees | | | 67,420 | | | |
Printing fees | | | 23,272 | | | |
Trustee fees | | | 39,186 | | | |
Custodian fees | | | 47,064 | | | |
Accounting and transfer agent fees | | | 66,195 | | | |
Compliance program costs (Note 3) | | | 3,564 | | | |
Other | | | 33,953 | | | |
| | | | | | |
Total expenses before earnings credit | | | 7,545,555 | | | |
| | | | | | |
Earnings credit (Note 5) | | | (17 | ) | | |
| | | | | | |
Net Expenses | | | 7,545,538 | | | |
| | | | | | |
NET INVESTMENT INCOME | | | 17,922,344 | | | |
| | | | | | |
REALIZED/UNREALIZED GAINS (LOSSES) FROM INVESTMENTS: | | | | | | |
Net realized gain distributions from underlying affiliated funds | | | 44,599,831 | | | |
Net realized gains from investment transactions with affiliates | | | 10,205,754 | | | |
| | | | | | |
Net realized gains from affiliated investments | | | 54,805,585 | | | |
| | | | | | |
Net change in unrealized appreciation/(depreciation) from investments in affiliates | | | 20,878,150 | | | |
| | | | | | |
Net realized/unrealized gains from affiliated investments | | | 75,683,735 | | | |
| | | | | | |
CHANGE IN NET ASSETS RESULTING FROM OPERATIONS | | $ | 93,606,079 | | | |
| | | | | | |
| | | | | | |
| | | | | | |
| | | | | | |
| | | | | | |
| | |
| | | | | | |
| | | | | | |
| | | | | | |
| | | | | | | |
| (a) | Effective February 21, 2014, Class B Shares were converted into Class A Shares. |
| (b) | Effective March 3, 2014, Class R2 Shares were renamed Class R Shares. |
| (c) | For the period from March 4, 2014 (commencement of operations) through October 31, 2014. |
The accompanying notes are an integral part of these financial statements.
13
Statements of Changes in Net Assets
| | | | | | | | | | | | |
| | | Nationwide Investor Destinations
Aggressive Fund |
| | | Year Ended
October 31, 2014 | | Year Ended
October 31, 2013 |
Operations: | | | | | | | | | | | | |
Net investment income | | $ | 17,922,344 | | | | | $ | 17,110,252 | | | |
Net realized gains from affiliated investments | | | 54,805,585 | | | | | | 11,460,772 | | | |
Net change in unrealized appreciation/(depreciation) from investments in affiliates | | | 20,878,150 | | | | | | 232,591,753 | | | |
| | | | | | | | | |
Change in net assets resulting from operations | | | 93,606,079 | | | | | | 261,162,777 | | | |
| | | | | | | | | |
| | | | |
Distributions to Shareholders From: | | | | | | | | | | | | |
Net investment income: | | | | | | | | | | | | |
Class A | | | (1,075,210 | ) | | | | | (968,045 | ) | | |
Class B (a) | | | (31,916 | ) | | | | | (55,790 | ) | | |
Class C | | | (812,641 | ) | | | | | (675,982 | ) | | |
Class R (b) | | | (1,595,494 | ) | | | | | (1,424,243 | ) | | |
Institutional Service Class | | | (1,087 | )(c) | | | | | – | | | |
Institutional Class | | | (2,659,351 | ) | | | | | (1,928,613 | ) | | |
Service Class | | | (14,506,612 | ) | | | | | (13,132,526 | ) | | |
Net realized gains: | | | | | | | | | | | | |
Class A | | | (804,434 | ) | | | | | (572,967 | ) | | |
Class B (a) | | | (46,855 | ) | | | | | (56,776 | ) | | |
Class C | | | (997,370 | ) | | | | | (637,640 | ) | | |
Class R (b) | | | (1,496,117 | ) | | | | | (1,028,497 | ) | | |
Institutional Service Class | | | – | (c) | | | | | – | | | |
Institutional Class | | | (1,621,624 | ) | | | | | (921,180 | ) | | |
Service Class | | | (11,566,034 | ) | | | | | (8,184,292 | ) | | |
| | | | | | | | | |
Change in net assets from shareholder distributions | | | (37,214,745 | ) | | | | | (29,586,551 | ) | | |
| | | | | | | | | |
Change in net assets from capital transactions | | | (35,017,401 | ) | | | | | (47,705,603 | ) | | |
| | | | | | | | | |
Change in net assets | | | 21,373,933 | | | | | | 183,870,623 | | | |
| | | | | | | | | |
| | | | |
Net Assets: | | | | | | | | | | | | |
Beginning of year | | | 1,225,173,199 | | | | | | 1,041,302,576 | | | |
| | | | | | | | | |
End of year | | $ | 1,246,547,132 | | | | | $ | 1,225,173,199 | | | |
| | | | | | | | | |
Accumulated undistributed net investment income at end of year | | $ | – | | | | | $ | 82,090 | | | |
| | | | | | | | | |
| | | | |
CAPITAL TRANSACTIONS: | | | | | | | | | | | | |
Class A Shares | | | | | | | | | | | | |
Proceeds from shares issued | | $ | 15,425,571 | | | | | $ | 15,322,388 | | | |
Proceeds from shares issued from class conversion | | | 2,574,611 | | | | | | – | | | |
Dividends reinvested | | | 1,345,536 | | | | | | 1,039,315 | | | |
Cost of shares redeemed | | | (20,237,535 | ) | | | | | (19,061,602 | ) | | |
| | | | | | | | | |
Total Class A Shares | | | (891,817 | ) | | | | | (2,699,899 | ) | | |
| | | | | | | | | |
Class B Shares (a) | | | | | | | | | | | | |
Proceeds from shares issued | | | 69,236 | | | | | | 175,032 | | | |
Dividends reinvested | | | 65,577 | | | | | | 86,638 | | | |
Cost of shares redeemed in class conversion | | | (2,574,611 | ) | | | | | – | | | |
Cost of shares redeemed | | | (1,533,001 | ) | | | | | (2,810,581 | ) | | |
| | | | | | | | | |
Total Class B Shares | | | (3,972,799 | ) | | | | | (2,548,911 | ) | | |
| | | | | | | | | |
| | | | | | | | | | | | |
| (a) | Effective February 21, 2014, Class B Shares were converted into Class A Shares. |
| (b) | Effective March 3, 2014, Class R2 Shares were renamed Class R Shares. |
(c) For the period from March 4, 2014 (commencement of operations) through October 31, 2014.
14
Statements of Changes in Net Assets (Continued)
| | | | | | | | | | | | |
| | | Nationwide Investor Destinations
Aggressive Fund |
| | | Year Ended
October 31, 2014 | | Year Ended
October 31, 2013 |
CAPITAL TRANSACTIONS: (continued) | | | | | | | | | | | | |
Class C Shares | | | | | | | | | | | | |
Proceeds from shares issued | | $ | 14,310,984 | | | | | $ | 11,975,603 | | | |
Dividends reinvested | | | 862,428 | | | | | | 572,226 | | | |
Cost of shares redeemed | | | (13,151,457 | ) | | | | | (11,464,078 | ) | | |
| | | | | | | | | |
Total Class C Shares | | | 2,021,955 | | | | | | 1,083,751 | | | |
| | | | | | | | | |
Class R Shares (b) | | | | | | | | | | | | |
Proceeds from shares issued | | | 10,382,606 | | | | | | 11,886,523 | | | |
Dividends reinvested | | | 2,999,821 | | | | | | 2,357,861 | | | |
Cost of shares redeemed | | | (20,342,495 | ) | | | | | (17,978,126 | ) | | |
| | | | | | | | | |
Total Class R Shares | | | (6,960,068 | ) | | | | | (3,733,742 | ) | | |
| | | | | | | | | |
Institutional Service Class Shares | | | | | | | | | | | | |
Proceeds from shares issued | | | 3,710,364 | (c) | | | | | – | | | |
Dividends reinvested | | | 1,087 | (c) | | | | | – | | | |
Cost of shares redeemed | | | (228,247 | )(c) | | | | | – | | | |
| | | | | | | | | |
Total Institutional Service Class Shares | | | 3,483,204 | (c) | | | | | – | | | |
| | | | | | | | | |
Institutional Class Shares | | | | | | | | | | | | |
Proceeds from shares issued | | | 35,279,465 | | | | | | 62,767,157 | | | |
Dividends reinvested | | | 4,280,948 | | | | | | 2,849,793 | | | |
Cost of shares redeemed | | | (17,585,600 | ) | | | | | (52,343,098 | ) | | |
| | | | | | | | | |
Total Institutional Class Shares | | | 21,974,813 | | | | | | 13,273,852 | | | |
| | | | | | | | | |
Service Class Shares | | | | | | | | | | | | |
Proceeds from shares issued | | | 69,876,145 | | | | | | 57,991,604 | | | |
Dividends reinvested | | | 26,072,627 | | | | | | 21,316,629 | | | |
Cost of shares redeemed | | | (146,621,461 | ) | | | | | (132,388,887 | ) | | |
| | | | | | | | | |
Total Service Class Shares | | | (50,672,689 | ) | | | | | (53,080,654 | ) | | |
| | | | | | | | | |
Change in net assets from capital transactions | | $ | (35,017,401 | ) | | | | $ | (47,705,603 | ) | | |
| | | | | | | | | |
SHARE TRANSACTIONS: | | | | | | | | | | | | |
Class A Shares | | | | | | | | | | | | |
Issued | | | 1,375,334 | | | | | | 1,559,786 | | | |
Issued in class conversion | | | 230,901 | | | | | | – | | | |
Reinvested | | | 121,713 | | | | | | 111,899 | | | |
Redeemed | | | (1,801,042 | ) | | | | | (1,969,347 | ) | | |
| | | | | | | | | |
Total Class A Shares | | | (73,094 | ) | | | | | (297,662 | ) | | |
| | | | | | | | | |
Class B Shares (a) | | | | | | | | | | | | |
Issued | | | 6,387 | | | | | | 18,323 | | | |
Reinvested | | | 6,100 | | | | | | 9,696 | | | |
Redeemed in class conversion | | | (235,131 | ) | | | | | – | | | |
Redeemed | | | (141,638 | ) | | | | | (292,860 | ) | | |
| | | | | | | | | |
Total Class B Shares | | | (364,282 | ) | | | | | (264,841 | ) | | |
| | | | | | | | | |
| | | | | | | | | | | | |
| | | | | | | | | | | | |
| | | | | | | | | | | | |
| (a) | Effective February 21, 2014, Class B Shares were converted into Class A Shares. |
| (b) | Effective March 3, 2014, Class R2 Shares were renamed Class R Shares. |
(c) For the period from March 4, 2014 (commencement of operations) through October 31, 2014.
15
Statements of Changes in Net Assets (Continued)
| | | | | | | | | | | | |
| | | Nationwide Investor Destinations
Aggressive Fund |
| | | Year Ended
October 31, 2014 | | Year Ended
October 31, 2013 |
SHARE TRANSACTIONS: (continued) | | | | | | | | | | | | |
Class C Shares | | | | | | | | | | | | |
Issued | | | 1,309,213 | | | | | | 1,223,229 | | | |
Reinvested | | | 80,407 | | | | | | 64,114 | | | |
Redeemed | | | (1,193,102 | ) | | | | | (1,178,718 | ) | | |
| | | | | | | | | |
Total Class C Shares | | | 196,518 | | | | | | 108,625 | | | |
| | | | | | | | | |
Class R Shares (b) | | | | | | | | | | | | |
Issued | | | 939,975 | | | | | | 1,229,532 | | | |
Reinvested | | | 276,629 | | | | | | 259,973 | | | |
Redeemed | | | (1,837,828 | ) | | | | | (1,816,307 | ) | | |
| | | | | | | | | |
Total Class R Shares | | | (621,224 | ) | | | | | (326,802 | ) | | |
| | | | | | | | | |
Institutional Service Class Shares | | | | | | | | | | | | |
Issued | | | 330,525 | (c) | | | | | – | | | |
Reinvested | | | 94 | (c) | | | | | – | | | |
Redeemed | | | (20,722 | )(c) | | | | | – | | | |
| | | | | | | | | |
Total Institutional Service Class Shares | | | 309,897 | (c) | | | | | – | | | |
| | | | | | | | | |
Institutional Class Shares | | | | | | | | | | | | |
Issued | | | 3,101,365 | | | | | | 6,223,977 | | | |
Reinvested | | | 382,190 | | | | | | 301,972 | | | |
Redeemed | | | (1,547,966 | ) | | | | | (5,214,478 | ) | | |
| | | | | | | | | |
Total Institutional Class Shares | | | 1,935,589 | | | | | | 1,311,471 | | | |
| | | | | | | | | |
Service Class Shares | | | | | | | | | | | | |
Issued | | | 6,147,981 | | | | | | 5,841,621 | | | |
Reinvested | | | 2,356,942 | | | | | | 2,299,608 | | | |
Redeemed | | | (12,950,073 | ) | | | | | (13,366,053 | ) | | |
| | | | | | | | | |
Total Service Class Shares | | | (4,445,150 | ) | | | | | (5,224,824 | ) | | |
| | | | | | | | | |
Total change in shares | | | (3,061,746 | ) | | | | | (4,694,033 | ) | | |
| | | | | | | | | |
| | | | | | | | | | | | |
| | | | | | | | | | | | |
| | | | | | | | | | | | |
| | | | | | | | | | | | |
| | | | | | | | | | | | |
| | | | | | | | | | | | |
| | | | | | | | | | | | |
| | | | | | | | | | | | |
| | | | | | | | | | | | |
| | | | | | | | | | | | |
| | | | | | | | | | | | |
| | | | |
| | | | | | | | | | | | |
| | | | | | | | | | | | |
| | | | | | | | | | | | |
| | | | | | | | | | | | | |
Amount designated as “–” is zero or has been rounded to zero.
| (b) | Effective March 3, 2014, Class R2 Shares were renamed Class R Shares. |
| (c) | For the period from March 4, 2014 (commencement of operations) through October 31, 2014. |
The accompanying notes are an integral part of these financial statements.
16
Financial Highlights
Selected data for each share of capital outstanding throughout the periods indicated
Nationwide Investor Destinations Aggressive Fund
| | | | | | | | | | | | | | | | | | | | | | | | | | | | | | | | | | | | | | | | | | | | | | | | | | | | | | | | |
| | | | | | Operations | | | Distributions | | | | | | Ratios/Supplemental Data | |
| | | Net Asset
Value,
Beginning
of Period | | | Net
Investment
Income | | | Net Realized
and
Unrealized
Gains
(Losses)
from
Investments | | | Total from
Operations | | | Net
Investment
Income | | | Net
Realized
Gains | | | Total
Distributions | | | Net Asset
Value, End
of Period | | | Total
Return (a)(b) | | | Net Assets
at End of
Period | | | Ratio of
Expenses
to Average Net Assets (c) | | | Ratio of Net
Investment
Income
to Average
Net Assets (c) | | | Ratio of Expenses
(Prior to
Reimbursements)
to Average
Net Assets (c) | | | Portfolio
Turnover (d) | |
| Class A Shares | | | | | | | | | | | | | | | | | | | | | | | | | | | | | | | | | | | | | | | | | | | | | | | | | | | | | | | | |
Year Ended October 31, 2014 (e) | | $ | 11.00 | | | | 0.17 | | | | 0.68 | | | | 0.85 | | | | (0.19 | ) | | | (0.15 | ) | | | (0.34 | ) | | $ | 11.51 | | | | 7.92% | | | $ | 61,402,299 | | | | 0.54% | | | | 1.47% | | | | 0.54% | | | | 8.41% | |
Year Ended October 31, 2013 (e) | | $ | 8.97 | | | | 0.17 | | | | 2.13 | | | | 2.30 | | | | (0.17 | ) | | | (0.10 | ) | | | (0.27 | ) | | $ | 11.00 | | | | 26.24% | | | $ | 59,507,180 | | | | 0.49% | | | | 1.69% | | | | 0.49% | | | | 22.52% | |
Year Ended October 31, 2012 (e) | | $ | 8.26 | | | | 0.13 | | | | 0.73 | | | | 0.86 | | | | (0.13 | ) | | | (0.02 | ) | | | (0.15 | ) | | $ | 8.97 | | | | 10.56% | | | $ | 51,210,338 | | | | 0.50% | | | | 1.44% | | | | 0.50% | | | | 11.55% | |
Year Ended October 31, 2011 (e) | | $ | 8.13 | | | | 0.13 | | | | 0.14 | | | | 0.27 | | | | (0.14 | ) | | | – | | | | (0.14 | ) | | $ | 8.26 | | | | 3.24% | | | $ | 51,388,289 | | | | 0.48% | | | | 1.54% | | | | 0.48% | | | | 9.70% | |
Year Ended October 31, 2010 (e) | | $ | 7.30 | | | | 0.11 | | | | 1.02 | | | | 1.13 | | | | (0.10 | ) | | | (0.20 | ) | | | (0.30 | ) | | $ | 8.13 | | | | 15.81% | | | $ | 49,682,066 | | | | 0.49% | | | | 1.44% | | | | 0.49% | | | | 8.89% | |
| | | | | | | | | | | | | | |
| Class C Shares | | | | | | | | | | | | | | | | | | | | | | | | | | | | | | | | | | | | | | | | | | | | | | | | | | | | | | | | |
Year Ended October 31, 2014 (e) | | $ | 10.75 | | | | 0.08 | | | | 0.68 | | | | 0.76 | | | | (0.12 | ) | | | (0.15 | ) | | | (0.27 | ) | | $ | 11.24 | | | | 7.21% | | | $ | 76,857,144 | | | | 1.24% | | | | 0.77% | | | | 1.24% | | | | 8.41% | |
Year Ended October 31, 2013 (e) | | $ | 8.78 | | | | 0.09 | | | | 2.09 | | | | 2.18 | | | | (0.11 | ) | | | (0.10 | ) | | | (0.21 | ) | | $ | 10.75 | | | | 25.26% | | | $ | 71,452,684 | | | | 1.19% | | | | 0.92% | | | | 1.19% | | | | 22.52% | |
Year Ended October 31, 2012 (e) | | $ | 8.08 | | | | 0.07 | | | | 0.72 | | | | 0.79 | | | | (0.07 | ) | | | (0.02 | ) | | | (0.09 | ) | | $ | 8.78 | | | | 9.90% | | | $ | 57,370,350 | | | | 1.20% | | | | 0.76% | | | | 1.20% | | | | 11.55% | |
Year Ended October 31, 2011 (e) | | $ | 7.97 | | | | 0.07 | | | | 0.12 | | | | 0.19 | | | | (0.08 | ) | | | – | | | | (0.08 | ) | | $ | 8.08 | | | | 2.36% | | | $ | 59,022,254 | | | | 1.21% | | | | 0.86% | | | | 1.21% | | | | 9.70% | |
Year Ended October 31, 2010 (e) | | $ | 7.17 | | | | 0.06 | | | | 1.01 | | | | 1.07 | | | | (0.07 | ) | | | (0.20 | ) | | | (0.27 | ) | | $ | 7.97 | | | | 15.15% | | | $ | 67,454,100 | | | | 1.20% | | | | 0.75% | | | | 1.20% | | | | 8.89% | |
| | | | | | | | | | | | | | |
| Class R Shares (f)(g) | | | | | | | | | | | | | | | | | | | | | | | | | | | | | | | | | | | | | | | | | | | | | | | | | | | | | | | | |
Year Ended October 31, 2014 (e) | | $ | 10.83 | | | | 0.13 | | | | 0.67 | | | | 0.80 | | | | (0.16 | ) | | | (0.15 | ) | | | (0.31 | ) | | $ | 11.32 | | | | 7.54% | | | $ | 106,558,652 | | | | 0.84% | | | | 1.22% | | | | 0.84% | | | | 8.41% | |
Year Ended October 31, 2013 (e) | | $ | 8.84 | | | | 0.12 | | | | 2.11 | | | | 2.23 | | | | (0.14 | ) | | | (0.10 | ) | | | (0.24 | ) | | $ | 10.83 | | | | 25.73% | | | $ | 108,654,200 | | | | 0.85% | | | | 1.27% | | | | 0.85% | | | | 22.52% | |
Year Ended October 31, 2012 (e) | | $ | 8.14 | | | | 0.09 | | | | 0.73 | | | | 0.82 | | | | (0.10 | ) | | | (0.02 | ) | | | (0.12 | ) | | $ | 8.84 | | | | 10.23% | | | $ | 91,551,218 | | | | 0.84% | | | | 1.10% | | | | 0.84% | | | | 11.55% | |
Year Ended October 31, 2011 (e) | | $ | 8.01 | | | | 0.10 | | | | 0.14 | | | | 0.24 | | | | (0.11 | ) | | | – | | | | (0.11 | ) | | $ | 8.14 | | | | 2.90% | | | $ | 88,524,201 | | | | 0.85% | | | | 1.18% | | | | 0.85% | | | | 9.70% | |
Year Ended October 31, 2010 (e) | | $ | 7.21 | | | | 0.08 | | | | 1.01 | | | | 1.09 | | | | (0.09 | ) | | | (0.20 | ) | | | (0.29 | ) | | $ | 8.01 | | | | 15.41% | | | $ | 84,348,618 | | | | 0.84% | | | | 1.07% | | | | 0.84% | | | | 8.89% | |
| | | | | | | | | | | | | | |
| Institutional Service Class Shares | | | | | | | | | | | | | | | | | | | | | | | | | | | | | | | | | | | | | | | | | | | | | | | | | | | | | | | | |
Period Ended October 31, 2014 (e)(h) | | $ | 11.18 | | | | 0.02 | | | | 0.42 | | | | 0.44 | | | | (0.10 | ) | | | – | | | | (0.10 | ) | | $ | 11.52 | | | | 3.93% | | | $ | 3,569,632 | | | | 0.21% | | | | 0.24% | | | | 0.21% | | | | 8.41% | |
| | | | | | | | | | | | | | |
| Institutional Class Shares | | | | | | | | | | | | | | | | | | | | | | | | | | | | | | | | | | | | | | | | | | | | | | | | | | | | | | | | |
Year Ended October 31, 2014 (e) | | $ | 11.11 | | | | 0.21 | | | | 0.68 | | | | 0.89 | | | | (0.23 | ) | | | (0.15 | ) | | | (0.38 | ) | | $ | 11.62 | | | | 8.21% | | | $ | 146,720,517 | | | | 0.19% | | | | 1.81% | | | | 0.19% | | | | 8.41% | |
Year Ended October 31, 2013 (e) | | $ | 9.06 | | | | 0.19 | | | | 2.16 | | | | 2.35 | | | | (0.20 | ) | | | (0.10 | ) | | | (0.30 | ) | | $ | 11.11 | | | | 26.57% | | | $ | 118,716,482 | | | | 0.19% | | | | 1.88% | | | | 0.19% | | | | 22.52% | |
Year Ended October 31, 2012 (e) | | $ | 8.34 | | | | 0.15 | | | | 0.75 | | | | 0.90 | | | | (0.16 | ) | | | (0.02 | ) | | | (0.18 | ) | | $ | 9.06 | | | | 11.05% | | | $ | 84,918,686 | | | | 0.20% | | | | 1.74% | | | | 0.20% | | | | 11.55% | |
Year Ended October 31, 2011 (e) | | $ | 8.20 | | | | 0.15 | | | | 0.15 | | | | 0.30 | | | | (0.16 | ) | | | – | | | | (0.16 | ) | | $ | 8.34 | | | | 3.49% | | | $ | 70,317,290 | | | | 0.21% | | | | 1.78% | | | | 0.21% | | | | 9.70% | |
Year Ended October 31, 2010 (e) | | $ | 7.36 | | | | 0.13 | | | | 1.04 | | | | 1.17 | | | | (0.13 | ) | | | (0.20 | ) | | | (0.33 | ) | | $ | 8.20 | | | | 16.19% | | | $ | 57,247,781 | | | | 0.20% | | | | 1.71% | | | | 0.20% | | | | 8.89% | |
| | | | | | | | | | | | | | |
| Service Class Shares | | | | | | | | | | | | | | | | | | | | | | | | | | | | | | | | | | | | | | | | | | | | | | | | | | | | | | | | |
Year Ended October 31, 2014 (e) | | $ | 11.02 | | | | 0.16 | | | | 0.68 | | | | 0.84 | | | | (0.19 | ) | | | (0.15 | ) | | | (0.34 | ) | | $ | 11.52 | | | | 7.75% | | | $ | 851,438,888 | | | | 0.59% | | | | 1.46% | | | | 0.59% | | | | 8.41% | |
Year Ended October 31, 2013 (e) | | $ | 8.99 | | | | 0.15 | | | | 2.14 | | | | 2.29 | | | | (0.16 | ) | | | (0.10 | ) | | | (0.26 | ) | | $ | 11.02 | | | | 26.04% | | | $ | 862,903,998 | | | | 0.60% | | | | 1.53% | | | | 0.60% | | | | 22.52% | |
Year Ended October 31, 2012 (e) | | $ | 8.27 | | | | 0.12 | | | | 0.74 | | | | 0.86 | | | | (0.12 | ) | | | (0.02 | ) | | | (0.14 | ) | | $ | 8.99 | | | | 10.56% | | | $ | 750,703,873 | | | | 0.60% | | | | 1.34% | | | | 0.60% | | | | 11.55% | |
Year Ended October 31, 2011 (e) | | $ | 8.14 | | | | 0.12 | | | | 0.13 | | | | 0.25 | | | | (0.12 | ) | | | – | | | | (0.12 | ) | | $ | 8.27 | | | | 3.09% | | | $ | 717,539,097 | | | | 0.61% | | | | 1.43% | | | | 0.61% | | | | 9.70% | |
Year Ended October 31, 2010 (e) | | $ | 7.32 | | | | 0.10 | | | | 1.03 | | | | 1.13 | | | | (0.11 | ) | | | (0.20 | ) | | | (0.31 | ) | | $ | 8.14 | | | | 15.66% | | | $ | 719,252,841 | | | | 0.59% | | | | 1.34% | | | | 0.59% | | | | 8.89% | |
| | | | | | | | | | | | | | | | | | | | | | | | | | | | | | | | | | | | | | | | | | | | | | | | | | | | | | | | | |
Amounts designated as “–” are zero or have been rounded to zero.
| (a) | Excludes sales charge. |
| (b) | Not annualized for periods less than one year. |
| (c) | Annualized for periods less than one year. |
| (d) | Portfolio turnover is calculated on the basis of the Fund as a whole without distinguishing among the classes of shares. |
| (e) | Per share calculations were performed using average shares method. |
| (f) | Effective February 28, 2009, Class R Shares were renamed Class R2 Shares. |
| (g) | Effective March 3, 2014, Class R2 Shares were renamed Class R Shares. |
| (h) | For the period from March 4, 2014 (commencement of operations) through October 31, 2014. Total return is calculated based on inception date of March 3, 2014 through October 31, 2014. |
The accompanying notes are an integral part of these financial statements.
17
| | |
| Fund Commentary | | Nationwide Investor Destinations Moderately Aggressive Fund |
For the annual period ended October 31, 2014, the Nationwide Investor Destinations Moderately Aggressive Fund (Service Class) returned 7.19% versus 9.20% for its composite benchmark, 55% Russell 3000® Index, 25% MSCI EAFE® Index, 15% Barclays U.S. Aggregate Bond Index and 5% Barclays U.S. 1-3 Year Government/Credit Bond Index. For broader comparison, the median return for the Fund’s closest Lipper peer category of Mixed-Asset Target Allocation Growth Funds (consisting of 561 funds as of October 31, 2014) was 8.65% for the same time period. Performance for the Fund’s other share classes versus the benchmark is stated in the Average Annual Total Return chart in this report’s Fund Performance section.
The Fund’s return for the 12-month period covered in this report was driven primarily by strong positive returns from domestic equities. Representing about 51% of the Fund’s allocations, the Fund’s exposure to the U.S. equity markets contributed significantly to the Fund’s positive performance. In general, U.S. equity markets led the way as large-, mid- and small-capitalization stocks posted gains far exceeding those of international markets during the reporting period. Specifically, the S&P 500® Index (representing large-cap U.S. stocks) rose more than 17%, the S&P MidCap 400® Index (mid-cap stocks) increased 11.7%, and the Russell 2000® Index (small-cap stocks) gained 8.1%. During the reporting period, the Federal Reserve ceased its purchases of assets citing “substantial improvement in the outlook for the labor market since the inception of [the Fed’s] currency asset purchase program” and noting that the Fed “continues to see sufficient underlying strength in the broader economy.”1
The equity markets within foreign developed countries (as distinguished from emerging market countries) posted near-zero returns during the reporting period. The MSCI EAFE Index (representing developed international equity markets) registered -0.1% for the reporting period. Concerns about the health of Europe’s economy and heightened risk in emerging markets posed headwinds to the international markets.
The Fund’s return also was supported by positive returns from intermediate-term, investment-grade, U.S. fixed-income investments. The Barclays U.S. Aggregate Bond Index (representing a broad spectrum of such bonds) posted a return of 4.1% during the reporting period, helped along by the drop in interest rates on the bellwether 10-year U.S. Treasury note from a high of 3.04% at the end of 2013 to its period low of 2.34% at the end of October 2014. The drop in rates in the latter part of the reporting period, combined with a flattening of the overall yield curve, resulted in generally positive performance for intermediate-term bonds. Short-term, investment-grade, fixed-income rates remained range-bound near zero, effectively keeping returns for this asset class very low.
The return from the Fund’s investment in the Nationwide S&P 500 Index Fund, combined with this underlying fund’s sizable allocation within the Fund, made this underlying fund the largest contributor to the Fund’s return during the reporting period, as shown in the chart below.
All of the Fund’s underlying allocations posted positive returns during the reporting period; however, the Fund’s investment in the Nationwide International Index Fund posted a 0.05% return (contributing 0.01% to the overall Fund performance), thus contributing the least to the Fund’s overall positive return.
| 1 | http://www.federalreserve.gov/newsevents/press/monetary/20141029a.htm |
Portfolio Managers:
Thomas R. Hickey Jr. and Benjamin A. Richer*, Nationwide Fund Advisors
Investments in the Fund are subject to the risks of the Fund’s underlying funds. The Fund is designed to provide diversification across a variety of asset classes, primarily by investing in underlying funds. Therefore, in addition to the expenses of the Fund, each investor is indirectly paying a proportionate share of the applicable fees and expenses of its underlying funds.
The Fund is subject to different levels of risk, based on the types and sizes of its underlying asset class allocations and its allocation strategy. In addition, the Fund’s underlying funds may be subject to specific investment risks, including but not limited to: stock market risk (equity securities); default risk and interest rate risk — if interest rates go up, bond prices go down and if interest rates go down, bond
18
| | |
| Fund Commentary (con’t.) | | Nationwide Investor Destinations Moderately Aggressive Fund |
prices go up (bonds); and currency fluctuations, political risks, and differences in accounting and availability of information (international securities). Please refer to the most recent prospectus for a more detailed explanation of the Fund’s principal risks.
The Fund may invest in the Nationwide Fixed Contract, which is a fixed interest contract issued and guaranteed by Nationwide Life Insurance Company (Nationwide), an affiliate of the Fund’s investment adviser, Nationwide Fund Advisors. If Nationwide becomes unable to meet this guarantee, a Fund that invests in the Nationwide Fixed Contract may lose money from unpaid principal or unpaid or reduced interest.
Asset allocation is the process of spreading assets across several different investment styles and asset classes. The purpose is to potentially reduce long-term risk and capture potential profits across various asset classes.
Nationwide Asset Management, LLC (NWAM) provides asset allocation consulting services to Nationwide Fund Advisors (NFA), the Fund’s investment adviser. NWAM is a registered investment adviser and wholly owned subsidiary of Nationwide Mutual Insurance Company, and therefore is affiliated with NFA. NFA makes both the asset allocation and underlying fund selection decisions for the Fund. In addition, NWAM serves as the subadviser to certain other Nationwide Funds.
There is no assurance that the investment objective of any fund (or that of any underlying fund) will be achieved or that a diversified portfolio will produce better results than a nondiversified portfolio. Diversification does not guarantee returns or insulate an investor from potential losses, including the possible loss of principal.
A description of the benchmarks can be found on the Market Index Definitions page at the back of this book.
Nationwide Investor Destinations Moderately Aggressive Fund
(October 31, 2014)
| | | | | | | | |
Underlying Fund or
Contract | | Actual
Allocation
to Fund | | | Contribution
to Fund
Performance | |
| Nationwide S&P 500 Index Fund Institutional Class | | | 28% | | | | 4.77% | |
| Nationwide International Index Fund Institutional Class | | | 24% | | | | 0.01% | |
| Nationwide Mid Cap Market Index Fund Institutional Class | | | 12% | | | | 1.36% | |
| Nationwide Portfolio Completion Fund Institutional Class | | | 12% | | | | 0.33% | |
| Nationwide Small Cap Index Fund Institutional Class | | | 10% | | | | 0.80% | |
| Nationwide Bond Index Fund Institutional Class | | | 5% | | | | 0.20% | |
| Nationwide Core Plus Bond Fund Institutional Class | | | 4% | | | | 0.15% | |
| Nationwide HighMark Short Term Bond Fund Institutional Class | | | 2% | | | | 0.02% | |
| Nationwide Fixed Contract | | | 2% | | | | 0.07% | |
| Nationwide Ziegler Equity Income Fund Institutional Class | | | 1% | | | | 0.14% | |
| | | | 100% | | | | | |
Actual underlying allocations are stated as a percentage of the Fund’s total net assets. Nationwide Fund Advisors (NFA), the investment adviser to the Fund, may add or delete asset classes or change allocations at any time and without notice in order for the Fund to meet its objective or due to market and/or economic conditions. NFA applies a long-term investment horizon with respect to the Fund, and allocation changes are not likely to be made in response to short-term market conditions.
The contribution of underlying funds to Fund performance is based on target underlying fund allocations through the reporting period. Returns reflect the impact of each underlying fund’s fees and expenses, but do not reflect the Nationwide Investor Destinations Moderately Aggressive Fund’s fees and expenses. Day-to-day market activity will likely cause the Fund’s target allocations to fluctuate. Under ordinary circumstances, NFA periodically will rebalance the assets of the Fund in order to conform its actual allocations to those stated in the then-current prospectus. For more information, refer to the Fund’s prospectus.
19
| | |
| Fund Overview | | Nationwide Investor Destinations Moderately Aggressive Fund |
Objective
The Fund seeks to maximize total investment return for a moderately aggressive level of risk.
Highlights
| | Ÿ | | All of the Fund’s underlying allocations posted positive returns during the reporting period | |
| | Ÿ | | The Fund’s investments in U.S. equity mutual funds accounted for 51% of its allocations and were the largest contributors to the returns of the Fund during the reporting period | |
| | Ÿ | | Although short-term bond interest rates remained low, the Fund’s 2% allocation to the Nationwide Fixed Contract contributed 0.07% to the Fund’s overall return during the reporting period | |
Asset Allocation†
| | | | |
| Equity Funds | | | 75.4% | |
| Asset Allocation Fund | | | 11.7% | |
| Fixed Income Funds | | | 10.9% | |
| Fixed Contract | | | 2.1% | |
| Liabilities in excess of other assets | | | (0.1)% | |
| | | | 100.0% | |
Top Holdings††
| | | | |
| Nationwide S&P 500 Index Fund, Institutional Class | | | 28.3% | |
| Nationwide International Index Fund, Institutional Class | | | 23.4% | |
| Nationwide Mid Cap Market Index Fund, Institutional Class | | | 12.2% | |
| Nationwide Portfolio Completion Fund, Institutional Class | | | 11.7% | |
| Nationwide Small Cap Index Fund, Institutional Class | | | 10.3% | |
| Nationwide Bond Index Fund, Institutional Class | | | 4.9% | |
| Nationwide Core Plus Bond Fund, Institutional Class | | | 4.0% | |
| Nationwide Fixed Contract | | | 2.1% | |
| Nationwide HighMark Short Term Bond Fund, Institutional Class | | | 2.0% | |
| Nationwide Ziegler Equity Income Fund, Institutional Class | | | 1.1% | |
| | | | 100.0% | |
| † | Percentages indicated are based upon net assets as of October 31, 2014. |
| †† | Percentages indicated are based upon total investments as of October 31, 2014. |
20
| | |
| Fund Performance | | Nationwide Investor Destinations Moderately Aggressive Fund |
Average Annual Total Return
(For periods ended October 31, 2014)
| | | | | | | | | | | | | | | | | | |
| | | | | 1 Yr. | | | 5 Yr. | | | 10 Yr. | | | Inception | |
| Class A | | w/o SC1 | | | 7.33% | | | | 11.09% | | | | 6.74% | | | | – | |
| | | w/ SC2 | | | 1.20% | | | | 9.77% | | | | 6.10% | | | | – | |
| Class C | | w/o SC1 | | | 6.55% | | | | 10.28% | | | | 5.98% | | | | – | |
| | | w/SC3 | | | 5.55% | | | | 10.28% | | | | 5.98% | | | | – | |
| Class R4,5 | | | | | 6.92% | | | | 10.67% | | | | 6.40% | | | | – | |
| Institutional Service Class4 | | | | | – | | | | – | | | | – | | | | 3.77%6* | |
| Institutional Class4,7 | | | | | 7.70% | | | | 11.40% | | | | 7.05% | | | | – | |
| Service Class4 | | | | | 7.19% | | | | 10.95% | | | | 6.62% | | | | – | |
| Russell 3000® Index | | | | | 16.07% | | | | 17.01% | | | | 8.55% | | | | – | |
| S&P 500® Index | | | | | 17.27% | | | | 16.69% | | | | 8.20% | | | | – | |
| Barclays U.S. Aggregate Bond Index | | | | | 4.14% | | | | 4.22% | | | | 4.64% | | | | – | |
| MSCI EAFE® Index | | | | | (0.60)% | | | | 6.52% | | | | 5.81% | | | | – | |
| Barclays U.S. 1-3 Year Gov’t/Credit Bond Index | | | | | 0.89% | | | | 1.45% | | | | 2.84% | | | | – | |
| Citigroup 3-Month T-Bill Index | | | | | 0.04% | | | | 0.07% | | | | 1.50% | | | | – | |
| Composite Index | | | | | 8.48% | | | | 11.00% | | | | 6.54% | | | | – | |
| CPI | | | | | 1.66% | | | | 1.89% | | | | 2.21% | | | | – | |
All figures showing the effect of a sales charge (SC) reflect the maximum charge possible, because it has the most significant effect on performance data.
| 1 | These returns do not reflect the effects of SCs. |
| 2 | A 5.75% front-end sales charge was deducted. |
| 3 | A 1.00% CDSC was deducted from the one year return because it is charged when you sell Class C shares within the first year after purchase. |
| 4 | Not subject to any SCs. |
| 5 | Effective February 28, 2009, Class R Shares were renamed Class R2 Shares. Effective March 3, 2014, Class R2 Shares were renamed Class R Shares. |
| 6 | Since inception date of March 3, 2014. |
| 7 | These returns until the creation of Institutional Class shares (12/29/04) include the performance of the Fund’s Class B shares. The returns have been adjusted for the fact that Institutional Class shares do not have any applicable SCs but have not been adjusted for the lower expenses applicable to Institutional Class shares. Excluding the effect of any fee waivers or reimbursements, such prior performance is similar to what Institutional Class shares would have produced because the Institutional Class shares invest in the same portfolio of securities as Class B shares. Effective February 21, 2014, Class B shares were converted into Class A shares. |
Expense Ratios
| | |
| | | Expense Ratio^ |
| Class A | | 0.86% |
| Class C | | 1.55% |
| Class R | | 1.14% |
| Institutional Service Class | | 0.61% |
| Institutional Class | | 0.49% |
| Service Class | | 0.89% |
| ^ | Current effective prospectus dated March 1, 2014 (as revised March 26, 2014). The expense ratio also includes indirect underlying fund expenses. Please see the Fund’s most recent prospectus for details. Please refer to the Financial Highlights for each respective share class’ actual results. |
21
| | |
| Fund Performance (con’t.) | | Nationwide Investor Destinations Moderately Aggressive Fund |
Performance of a $50,000 Investment
Investment return and principal value will fluctuate, and when redeemed, shares may be worth more or less than original cost. Past performance is no guarantee of future results and does not reflect the deduction of taxes that a shareholder would pay on fund distributions or the redemption of fund shares. Investing in mutual funds involves market risk, including loss of principal. Performance returns assume the reinvestment of all distributions.
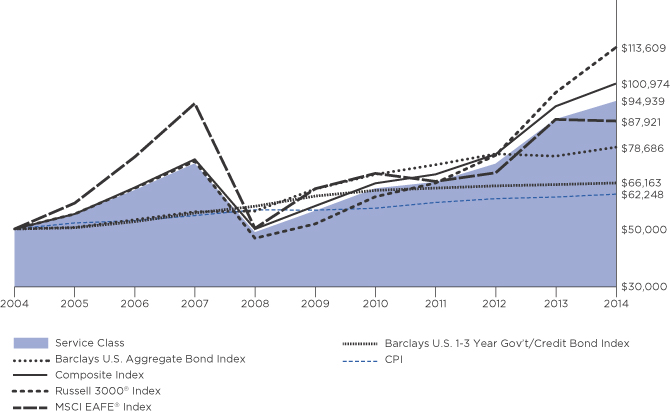
Comparative performance of $50,000 invested in Service Class shares of the Nationwide Investor Destinations Moderately Aggressive Fund versus the Russell 3000® Index, the Barclays U.S. Aggregate Bond Index, the MSCI EAFE® Index, the Barclays U.S. 1-3 Year Government/Credit Bond Index, the Composite Index* and the Consumer Price Index (CPI) over the 10-year period ended 10/31/14. Unlike the Fund, the performance for these unmanaged indexes does not reflect any fees, expenses, or sales charges. Investors cannot invest directly in market indexes. A description of the benchmarks can be found on the Market Index Definitions page at the back of this book.
| * | The Composite Index comprises 55% Russell 3000® Index, 15% Barclays U.S. Aggregate Bond Index, 25% MSCI EAFE® Index and 5% Barclays U.S. 1-3 Year Gov’t/Credit Bond Index. |
22
| | |
| Shareholder Expense Example | | Nationwide Investor Destinations Moderately Aggressive Fund |
As a shareholder of the Fund, you incur two types of costs: (1) transaction costs, including sales charges (loads) paid on purchase payments and redemption fees; and (2) ongoing costs, including investment advisory fees, administration fees, distribution fees and other Fund expenses. The examples below are intended to help you understand your ongoing costs (in dollars) of investing in the Fund and to compare these costs with the ongoing costs of investing in other mutual funds. Per Securities and Exchange Commission (“SEC”) requirements, the examples assume that you had a $1,000 investment in the Class at the beginning of the reporting period (May 1, 2014) and continued to hold your shares at the end of the reporting period (October 31, 2014).
Actual Expenses
For each Class of the Fund in the table below, the first line provides information about actual account values and actual expenses. You may use the information in this line, together with the amount you invested, to estimate the expenses that you paid from May 1, 2014 through October 31, 2014. Simply divide your account value by $1,000 (for example, an $8,600 account value divided by $1,000 = 8.6), then multiply the result by the number in the first line of each Class under the heading entitled “Expenses Paid During Period” to estimate the expenses you paid on your account during this period.
Hypothetical Expenses for Comparison Purposes
The second line of each Class in the table below provides information about hypothetical account values and hypothetical expenses based on the Class’ actual expense ratio and an assumed rate of return of 5% per year before expenses, which is not the Class’ actual return. The hypothetical account values and expenses may not be used to estimate the actual ending account balance or expenses you paid for the period from May 1, 2014 through October 31, 2014. You may use this information to compare the ongoing costs of investing in the Class of the Fund and other funds. To do so, compare this 5% hypothetical example with the 5% hypothetical examples that appear in the shareholder reports of the other funds.
Please note that the expenses shown in the table are meant to highlight your ongoing costs only and do not reflect any transaction costs, such as sales charges (loads) or redemption fees. If these transaction costs were included, your costs would have been higher. Therefore, the second line for each Class in the table is useful in comparing ongoing costs only, and will not help you determine the relative total costs of owning different funds. The examples also assume all dividends and distributions are reinvested.
Schedule of Shareholder Expenses
Expense Analysis of a $1,000 Investment
| | | | | | | | | | | | |
Nationwide Investor Destinations
Moderately Aggressive Fund October 31, 2014 | | | Beginning
Account Value ($)
05/01/14 | | Ending
Account Value ($)
10/31/14 | | Expenses Paid
During Period ($)
05/01/14 - 10/31/14(a) | | Expense Ratio
During Period (%)
05/01/14 - 10/31/14(a) |
| Class A Shares | | | Actual | (b) | | 1,000.00 | | 1,023.50 | | 2.75 | | 0.54 |
| | | | Hypothetical | (b)(c) | | 1,000.00 | | 1,022.48 | | 2.75 | | 0.54 |
| Class C Shares | | | Actual | (b) | | 1,000.00 | | 1,019.60 | | 6.41 | | 1.26 |
| | | | Hypothetical | (b)(c) | | 1,000.00 | | 1,018.85 | | 6.41 | | 1.26 |
| Class R Shares(d) | | | Actual | (b) | | 1,000.00 | | 1,020.90 | | 4.23 | | 0.83 |
| | | | Hypothetical | (b)(c) | | 1,000.00 | | 1,021.02 | | 4.23 | | 0.83 |
| Institutional Service Class Shares | | | Actual | (b) | | 1,000.00 | | 1,024.20 | | 1.02 | | 0.20 |
| | | | Hypothetical | (b)(c) | | 1,000.00 | | 1,024.20 | | 1.02 | | 0.20 |
| Institutional Class Shares | | | Actual | (b) | | 1,000.00 | | 1,025.50 | | 0.92 | | 0.18 |
| | | | Hypothetical | (b)(c) | | 1,000.00 | | 1,024.30 | | 0.92 | | 0.18 |
| Service Class Shares | | | Actual | (b) | | 1,000.00 | | 1,022.60 | | 2.96 | | 0.58 |
| | | | Hypothetical | (b)(c) | | 1,000.00 | | 1,022.28 | | 2.96 | | 0.58 |
| (a) | Expenses are based on the direct expenses of the Fund and do not include the effect of the underlying Funds’ expenses, which are disclosed in the Fee and Expense table and described more fully in a footnote to that table in your Fund Prospectus. |
| (b) | Expenses are equal to the Fund’s annualized expense ratio multiplied by the average account value from May 1, 2014 through October 31, 2014 multiplied to reflect one-half year period. The expense ratio presented represents a six-month, annualized ratio in accordance with Securities and Exchange Commission guidelines. |
| (c) | Represents the hypothetical 5% return before expenses. |
| (d) | Effective March 3, 2014 Class R2 Shares were renamed Class R Shares. |
23
Statement of Investments
October 31, 2014
Nationwide Investor Destinations Moderately Aggressive Fund
| | | | | | | | | | |
| | | Mutual Funds 98.0% | |
| | | |
| | | | | Shares | | | Market
Value | |
| | | |
| | Asset Allocation Fund 11.7% | |
| | Nationwide Portfolio Completion Fund, Institutional Class (a) | | | 24,567,317 | | | $ | 244,444,800 | |
| | | | | | | | | | |
| | |
| | Total Asset Allocation Fund
(cost $238,568,484) | | | | 244,444,800 | |
| | | | | | | | | | |
| | | |
| | Equity Funds 75.4% | | | | | | | | |
| | Nationwide International Index Fund, Institutional Class (a) | | | 59,493,556 | | | | 486,657,289 | |
| | Nationwide Mid Cap Market Index Fund, Institutional Class (a) | | | 12,866,461 | | | | 255,141,922 | |
| | Nationwide S&P 500 Index Fund, Institutional Class (a) | | | 37,890,753 | | | | 589,201,202 | |
| | Nationwide Small Cap Index Fund, Institutional Class (a) | | | 13,517,674 | | | | 214,525,486 | |
| | Nationwide Ziegler Equity Income Fund, Institutional Class (a) | | | 1,638,826 | | | | 22,812,462 | |
| | | | | | | | | | |
| | |
| | Total Equity Funds
(cost $1,131,221,611) | | | | 1,568,338,361 | |
| | | | | | | | | | |
| | | |
| | Fixed Income Funds 10.9% | | | | | | | | |
| | Nationwide Bond Index Fund, Institutional Class (a) | | | 9,010,486 | | | | 101,728,389 | |
| | Nationwide Core Plus Bond Fund, Institutional Class (a) | | | 8,023,819 | | | | 82,565,094 | |
| | Nationwide HighMark Short Term Bond Fund, Institutional Class (a) | | | 4,199,846 | | | | 42,082,458 | |
| | | | | | | | | | |
| | |
| | Total Fixed Income Funds
(cost $228,275,296) | | | | 226,375,941 | |
| | | | | | | | | | |
| | |
| | Total Mutual Funds
(cost $1,598,065,391) | | | | 2,039,159,102 | |
| | | | | | | | | | |
| | | | | | | | | | |
| | | Fixed Contract 2.1% | |
| | | |
| | | | | Principal
Amount | | | | |
| | | |
| | Nationwide Fixed Contract,
3.50% (a)(b)(c) | | $ | 42,824,351 | | | | 42,824,351 | |
| | | | | | | | | | |
| | |
| | Total Fixed Contract
(cost $42,824,351) | | | | 42,824,351 | |
| | | | | | | | | | |
| | |
| | Total Investments
(cost $1,640,889,742) (d) — 100.1% | | | | 2,081,983,453 | |
| | |
| | Liabilities in excess of other
assets — (0.1)% | | | | (1,156,740 | ) |
| | | | | | | | | | |
| | |
| | NET ASSETS — 100.0% | | | $ | 2,080,826,713 | |
| | | | | | | | | | |
| | (a) | Investment in affiliate. |
| | (c) | The Nationwide Fixed Contract interest rate changes quarterly. The contract is restricted and has been deemed liquid pursuant to procedures approved by the Board of Trustees. Please refer to Note 2(a) for additional information on the contract. |
| | (d) | See notes to financial statements for tax cost and unrealized appreciation/(depreciation) of securities. |
The accompanying notes are an integral part of these financial statements.
24
Statement of Assets and Liabilities
October 31, 2014
| | | | | | |
| | | Nationwide
Investor Destinations
Moderately
Aggressive Fund |
Assets: | | | | | | |
Investments in affiliates, at value (cost $1,640,889,742) | | $ | 2,081,983,453 | | | |
Receivable for investments sold | | | 1,750,051 | | | |
Receivable for capital shares issued | | | 735,012 | | | |
Prepaid expenses | | | 36,194 | | | |
| | | | | | |
Total Assets | | | 2,084,504,710 | | | |
| | | | | | |
Liabilities: | | | | | | |
Payable for capital shares redeemed | | | 2,619,094 | | | |
Accrued expenses and other payables: | | | | | | |
Investment advisory fees | | | 223,198 | | | |
Fund administration fees | | | 46,051 | | | |
Distribution fees | | | 489,780 | | | |
Administrative servicing fees | | | 226,195 | | | |
Accounting and transfer agent fees | | | 11,734 | | | |
Trustee fees | | | 6,247 | | | |
Custodian fees | | | 6,255 | | | |
Compliance program costs (Note 3) | | | 605 | | | |
Professional fees | | | 30,324 | | | |
Printing fees | | | 10,154 | | | |
Other | | | 8,360 | | | |
| | | | | | |
Total Liabilities | | | 3,677,997 | | | |
| | | | | | |
Net Assets | | $ | 2,080,826,713 | | | |
| | | | | | |
| | |
Represented by: | | | | | | |
Capital | | $ | 1,629,457,568 | | | |
Accumulated net realized gains from affiliated investments | | | 10,275,434 | | | |
Net unrealized appreciation/(depreciation) from investments in affiliates | | | 441,093,711 | | | |
| | | | | | |
Net Assets | | $ | 2,080,826,713 | | | |
| | | | | | |
Net Assets: | | | | | | |
Class A Shares | | $ | 123,408,650 | | | |
Class C Shares | | | 128,626,192 | | | |
Class R Shares | | | 242,451,059 | | | |
Institutional Service Class Shares | | | 2,589,232 | | | |
Institutional Class Shares | | | 341,959,809 | | | |
Service Class Shares | | | 1,241,791,771 | | | |
| | | | | | |
Total | | $ | 2,080,826,713 | | | |
| | | | | | |
Shares Outstanding (unlimited number of shares authorized): | | | | | | |
Class A Shares | | | 10,506,682 | | | |
Class C Shares | | | 11,187,197 | | | |
Class R Shares | | | 21,075,898 | | | |
Institutional Service Class Shares | | | 220,927 | | | |
Institutional Class Shares | | | 29,137,435 | | | |
Service Class Shares | | | 105,943,870 | | | |
| | | | | | |
Total | | | 178,072,009 | | | |
| | | | | | |
| | | | | | |
| | |
| | | | | | |
25
Statement of Assets and Liabilities (Continued)
October 31, 2014
| | | | | | |
| | | Nationwide
Investor Destinations
Moderately
Aggressive Fund |
Net asset value and redemption price per share (Net assets by class divided by shares outstanding by class, respectively): | | | | | | |
Class A Shares (a) | | $ | 11.75 | | | |
Class C Shares (b) | | $ | 11.50 | | | |
Class R Shares | | $ | 11.50 | | | |
Institutional Service Class Shares | | $ | 11.72 | | | |
Institutional Class Shares | | $ | 11.74 | | | |
Service Class Shares | | $ | 11.72 | | | |
Maximum offering price per share (100%/(100%-maximum sales charge) of net asset value adjusted to the nearest cent): | | | | | | |
Class A Shares | | $ | 12.47 | | | |
| | | | | | |
Maximum Sales Charge: | | | | | | |
Class A Shares | | | 5.75 | % | | |
| | | | | | |
| | | | | | |
| | | | | | |
| | | | | | |
| | | | | | |
| | | | | | |
| | | | | | |
| | | | | | |
| | | | | | |
| | | | | | |
| | | | | | |
| | | | | | |
| | | | | | |
| | | | | | |
| | | | | | |
| | | | | | |
| | | | | | |
| | | | | | |
| | | | | | |
| | | | | | |
| | | | | | |
| | | | | | |
| | | | | | |
| | | | | | |
| | | | | | |
| | | | | | |
| | | | | | |
| | | | | | |
| | | | | | |
| | | | | | |
| | | | | | | |
| (a) | For Class A Shares that were purchased without a sales charge because such purchase exceeded $1,000,000, a contingent deferred sales charge of 1.00% may apply to any redemption of such shares within 18 months of their purchase. |
| (b) | For Class C Shares, the redemption price per share is reduced by a contingent deferred sales charge of 1.00% for shares held less than one year. |
The accompanying notes are an integral part of these financial statements.
26
Statement of Operations
For the year Ended October 31, 2014
| | | | | | |
| | | Nationwide
Investor Destinations
Moderately
Aggressive Fund |
INVESTMENT INCOME: | | | | | | |
Dividend income from affiliates | | $ | 41,745,568 | | | |
Interest income from affiliates | | | 1,431,515 | | | |
| | | | | | |
Total Income | | | 43,177,083 | | | |
| | | | | | |
EXPENSES: | | | | | | |
Investment advisory fees | | | 2,705,173 | | | |
Fund administration fees | | | 544,639 | | | |
Distribution fees Class A | | | 302,298 | | | |
Distribution fees Class B (a) | | | 14,087 | | | |
Distribution fees Class C | | | 1,274,683 | | | |
Distribution fees Class R (b) | | | 1,231,919 | | | |
Distribution fees Service Class | | | 3,188,768 | | | |
Administrative servicing fees Class A | | | 115,841 | | | |
Administrative servicing fees Class C | | | 69,725 | | | |
Administrative servicing fees Class R (b) | | | 369,578 | | | |
Administrative servicing fees Institutional Service Class (c) | | | 58 | | | |
Administrative servicing fees Service Class | | | 1,913,270 | | | |
Registration and filing fees | | | 79,223 | | | |
Professional fees | | | 103,782 | | | |
Printing fees | | | 25,386 | | | |
Trustee fees | | | 65,596 | | | |
Custodian fees | | | 78,367 | | | |
Accounting and transfer agent fees | | | 107,107 | | | |
Compliance program costs (Note 3) | | | 5,955 | | | |
Other | | | 53,786 | | | |
| | | | | | |
Total expenses before earnings credit | | | 12,249,241 | | | |
| | | | | | |
Earnings credit (Note 5) | | | (1,644 | ) | | |
| | | | | | |
Net Expenses | | | 12,247,597 | | | |
| | | | | | |
NET INVESTMENT INCOME | | | 30,929,486 | | | |
| | | | | | |
REALIZED/UNREALIZED GAINS (LOSSES) FROM INVESTMENTS: | | | | | | |
Net realized gain distributions from underlying affiliated funds | | | 64,980,038 | | | |
Net realized gains from investment transactions with affiliates | | | 14,588,323 | | | |
| | | | | | |
Net realized gains from affiliated investments | | | 79,568,361 | | | |
| | | | | | |
Net change in unrealized appreciation/(depreciation) from investments in affiliates | | | 33,853,239 | | | |
| | | | | | |
Net realized/unrealized gains from affiliated investments | | | 113,421,600 | | | |
| | | | | | |
CHANGE IN NET ASSETS RESULTING FROM OPERATIONS | | $ | 144,351,086 | | | |
| | | | | | |
| | | | | | |
| | | | | | |
| | | | | | |
| | | | | | |
| | |
| | | | | | |
| | | | | | | |
| (a) | Effective February 21, 2014, Class B Shares were converted into Class A Shares. |
| (b) | Effective March 3, 2014, Class R2 Shares were renamed Class R Shares. |
| (c) | For the period from March 4, 2014 (commencement of operations) through October 31, 2014. |
The accompanying notes are an integral part of these financial statements.
27
Statements of Changes in Net Assets
| | | | | | | | | | | | |
| | | Nationwide Investor Destinations
Moderately Aggressive Fund |
| | | Year Ended
October 31, 2014 | | Year Ended
October 31, 2013 |
Operations: | | | | | | | | | | | | |
Net investment income | | $ | 30,929,486 | | | | | $ | 28,791,116 | | | |
Net realized gains from affiliated investments | | | 79,568,361 | | | | | | 38,521,404 | | | |
Net change in unrealized appreciation/(depreciation) from investments in affiliates | | | 33,853,239 | | | | | | 297,497,297 | | | |
| | | | | | | | | |
Change in net assets resulting from operations | | | 144,351,086 | | | | | | 364,809,817 | | | |
| | | | | | | | | |
| | | | |
Distributions to Shareholders From: | | | | | | | | | | | | |
Net investment income: | | | | | | | | | | | | |
Class A | | | (2,051,321 | ) | | | | | (1,662,703 | ) | | |
Class B (a) | | | (39,391 | ) | | | | | (78,781 | ) | | |
Class C | | | (1,458,768 | ) | | | | | (1,258,871 | ) | | |
Class R (b) | | | (3,712,820 | ) | | | | | (3,211,038 | ) | | |
Institutional Service Class | | | (684 | )(c) | | | | | – | | | |
Institutional Class | | | (6,196,668 | ) | | | | | (4,393,383 | ) | | |
Service Class | | | (21,395,325 | ) | | | | | (19,720,854 | ) | | |
Net realized gains: | | | | | | | | | | | | |
Class A | | | (2,417,686 | ) | | | | | (573,158 | ) | | |
Class B (a) | | | (96,165 | ) | | | | | (50,991 | ) | | |
Class C | | | (2,704,902 | ) | | | | | (730,521 | ) | | |
Class R (b) | | | (5,350,857 | ) | | | | | (1,380,636 | ) | | |
Institutional Service Class | | | – | (c) | | | | | – | | | |
Institutional Class | | | (5,912,957 | ) | | | | | (1,227,423 | ) | | |
Service Class | | | (26,972,426 | ) | | | | | (7,389,943 | ) | | |
| | | | | | | | | |
Change in net assets from shareholder distributions | | | (78,309,970 | ) | | | | | (41,678,302 | ) | | |
| | | | | | | | | |
Change in net assets from capital transactions | | | (19,473,923 | ) | | | | | (32,566,829 | ) | | |
| | | | | | | | | |
Change in net assets | | | 46,567,193 | | | | | | 290,564,686 | | | |
| | | | | | | | | |
| | | | |
Net Assets: | | | | | | | | | | | | |
Beginning of year | | | 2,034,259,520 | | | | | | 1,743,694,834 | | | |
| | | | | | | | | |
End of year | | $ | 2,080,826,713 | | | | | $ | 2,034,259,520 | | | |
| | | | | | | | | |
Accumulated undistributed net investment income at end of year | | $ | – | | | | | $ | 626,817 | | | |
| | | | | | | | | |
| | | | |
CAPITAL TRANSACTIONS: | | | | | | | | | | | | |
Class A Shares | | | | | | | | | | | | |
Proceeds from shares issued | | $ | 26,749,727 | | | | | $ | 26,002,812 | | | |
Proceeds from shares issued from class conversion | | | 3,915,904 | | | | | | – | | | |
Dividends reinvested | | | 3,127,547 | | | | | | 1,515,552 | | | |
Cost of shares redeemed | | | (26,513,481 | ) | | | | | (21,691,704 | ) | | |
| | | | | | | | | |
Total Class A Shares | | | 7,279,697 | | | | | | 5,826,660 | | | |
| | | | | | | | | |
Class B Shares (a) | | | | | | | | | | | | |
Proceeds from shares issued | | | 102,366 | | | | | | 229,017 | | | |
Dividends reinvested | | | 126,042 | | | | | | 107,509 | | | |
Cost of shares redeemed in class conversion | | | (3,915,904 | ) | | | | | – | | | |
Cost of shares redeemed | | | (1,190,364 | ) | | | | | (4,896,209 | ) | | |
| | | | | | | | | |
Total Class B Shares | | | (4,877,860 | ) | | | | | (4,559,683 | ) | | |
| | | | | | | | | |
| | | | | | | | | | | | |
| (a) | Effective February 21, 2014, Class B Shares were converted into Class A Shares. |
| (b) | Effective March 3, 2014, Class R2 Shares were renamed Class R Shares. |
| (c) | For the period from March 4, 2014 (commencement of operations) through October 31, 2014. |
28
Statements of Changes in Net Assets (Continued)
| | | | | | | | | | | | |
| | | Nationwide Investor Destinations
Moderately Aggressive Fund |
| | | Year Ended
October 31, 2014 | | Year Ended
October 31, 2013 |
CAPITAL TRANSACTIONS: (continued) | | | | | | | | | | | | |
Class C Shares | | | | | | | | | | | | |
Proceeds from shares issued | | $ | 16,465,882 | | | | | $ | 12,991,645 | | | |
Dividends reinvested | | | 1,889,835 | | | | | | 794,176 | | | |
Cost of shares redeemed | | | (18,884,806 | ) | | | | | (19,801,123 | ) | | |
| | | | | | | | | |
Total Class C Shares | | | (529,089 | ) | | | | | (6,015,302 | ) | | |
| | | | | | | | | |
Class R Shares (b) | | | | | | | | | | | | |
Proceeds from shares issued | | | 18,339,370 | | | | | | 21,793,440 | | | |
Dividends reinvested | | | 8,904,328 | | | | | | 4,506,550 | | | |
Cost of shares redeemed | | | (39,125,265 | ) | | | | | (26,930,614 | ) | | |
| | | | | | | | | |
Total Class R Shares | | | (11,881,567 | ) | | | | | (630,624 | ) | | |
| | | | | | | | | |
Institutional Service Class Shares | | | | | | | | | | | | |
Proceeds from shares issued | | | 2,665,534 | (c) | | | | | – | | | |
Dividends reinvested | | | 684 | (c) | | | | | – | | | |
Cost of shares redeemed | | | (134,084 | )(c) | | | | | – | | | |
| | | | | | | | | |
Total Institutional Service Class Shares | | | 2,532,134 | (c) | | | | | – | | | |
| | | | | | | | | |
Institutional Class Shares | | | | | | | | | | | | |
Proceeds from shares issued | | | 74,350,309 | | | | | | 150,731,613 | | | |
Dividends reinvested | | | 12,109,625 | | | | | | 5,620,806 | | | |
Cost of shares redeemed | | | (25,935,011 | ) | | | | | (111,178,853 | ) | | |
| | | | | | | | | |
Total Institutional Class Shares | | | 60,524,923 | | | | | | 45,173,566 | | | |
| | | | | | | | | |
Service Class Shares | | | | | | | | | | | | |
Proceeds from shares issued | | | 96,659,941 | | | | | | 84,075,133 | | | |
Dividends reinvested | | | 48,367,751 | | | | | | 27,110,797 | | | |
Cost of shares redeemed | | | (217,549,853 | ) | | | | | (183,547,376 | ) | | |
| | | | | | | | | |
Total Service Class Shares | | | (72,522,161 | ) | | | | | (72,361,446 | ) | | |
| | | | | | | | | |
Change in net assets from capital transactions | | $ | (19,473,923 | ) | | | | $ | (32,566,829 | ) | | |
| | | | | | | | | |
SHARE TRANSACTIONS: | | | | | | | | | | | | |
Class A Shares | | | | | | | | | | | | |
Issued | | | 2,321,321 | | | | | | 2,498,666 | | | |
Issued in class conversion | | | 343,539 | | | | | | – | | | |
Reinvested | | | 276,955 | | | | | | 152,350 | | | |
Redeemed | | | (2,297,264 | ) | | | | | (2,106,669 | ) | | |
| | | | | | | | | |
Total Class A Shares | | | 644,551 | | | | | | 544,347 | | | |
| | | | | | | | | |
Class B Shares (a) | | | | | | | | | | | | |
Issued | | | 9,181 | | | | | | 22,744 | | | |
Reinvested | | | 11,469 | | | | | | 11,235 | | | |
Redeemed in class conversion | | | (350,075 | ) | | | | | – | | | |
Redeemed | | | (107,145 | ) | | | | | (485,197 | ) | | |
| | | | | | | | | |
Total Class B Shares | | | (436,570 | ) | | | | | (451,218 | ) | | |
| | | | | | | | | |
| | | | | | | | | | | | |
| | | | | | | | | | | | |
| | | | | | | | | | | | |
| (a) | Effective February 21, 2014, Class B Shares were converted into Class A Shares. |
| (b) | Effective March 3, 2014, Class R2 Shares were renamed Class R Shares. |
| (c) | For the period from March 4, 2014 (commencement of operations) through October 31, 2014. |
29
Statements of Changes in Net Assets (Continued)
| | | | | | | | | | | | |
| | | Nationwide Investor Destinations
Moderately Aggressive Fund |
| | | Year Ended
October 31, 2014 | | Year Ended
October 31, 2013 |
SHARE TRANSACTIONS: (continued) | | | | | | | | | | | | |
Class C Shares | | | | | | | | | | | | |
Issued | | | 1,463,227 | | | | | | 1,271,094 | | | |
Reinvested | | | 171,499 | | | | | | 82,704 | | | |
Redeemed | | | (1,674,604 | ) | | | | | (1,948,208 | ) | | |
| | | | | | | | | |
Total Class C Shares | | | (39,878 | ) | | | | | (594,410 | ) | | |
| | | | | | | | | |
Class R Shares (b) | | | | | | | | | | | | |
Issued | | | 1,627,254 | | | | | | 2,139,310 | | | |
Reinvested | | | 806,449 | | | | | | 465,340 | | | |
Redeemed | | | (3,478,776 | ) | | | | | (2,608,574 | ) | | |
| | | | | | | | | |
Total Class R Shares | | | (1,045,073 | ) | | | | | (3,924 | ) | | |
| | | | | | | | | |
Institutional Service Class Shares | | | | | | | | | | | | |
Issued | | | 232,378 | (c) | | | | | – | | | |
Reinvested | | | 58 | (c) | | | | | – | | | |
Redeemed | | | (11,509 | )(c) | | | | | – | | | |
| | | | | | | | | |
Total Institutional Service Class Shares | | | 220,927 | (c) | | | | | – | | | |
| | | | | | | | | |
Institutional Class Shares | | | | | | | | | | | | |
Issued | | | 6,487,867 | | | | | | 14,394,144 | | | |
Reinvested | | | 1,070,657 | | | | | | 561,989 | | | |
Redeemed | | | (2,245,964 | ) | | | | | (10,611,639 | ) | | |
| | | | | | | | | |
Total Institutional Class Shares | | | 5,312,560 | | | | | | 4,344,494 | | | |
| | | | | | | | | |
Service Class Shares | | | | | | | | | | | | |
Issued | | | 8,320,769 | | | | | | 8,063,586 | | | |
Reinvested | | | 4,295,269 | | | | | | 2,739,801 | | | |
Redeemed | | | (18,851,693 | ) | | | | | (17,626,125 | ) | | |
| | | | | | | | | |
Total Service Class Shares | | | (6,235,655 | ) | | | | | (6,822,738 | ) | | |
| | | | | | | | | |
Total change in shares | | | (1,579,138 | ) | | | | | (2,983,449 | ) | | |
| | | | | | | | | |
| | | | | | | | | | | | |
| | | | | | | | | | | | |
| | | | | | | | | | | | |
| | | | | | | | | | | | |
| | | | | | | | | | | | |
| | | | | | | | | | | | |
| | | | | | | | | | | | |
| | | | | | | | | | | | |
| | | | | | | | | | | | |
| | | | | | | | | | | | |
| | | | | | | | | | | | |
| | | | | | | | | | | | |
| | | | | | | | | | | | |
| | | | | | | | | | | | |
| | | | | | | | | | | | | |
Amounts designated as “–” are zero or haves been rounded to zero.
| (b) | Effective March 3, 2014, Class R2 Shares were renamed Class R Shares. |
| (c) | For the period from March 4, 2014 (commencement of operations) through October 31, 2014. |
The accompanying notes are an integral part of these financial statements.
30
Financial Highlights
Selected data for each share of capital outstanding throughout the periods indicated
Nationwide Investor Destinations Moderately Aggressive Fund
| | | | | | | | | | | | | | | | | | | | | | | | | | | | | | | | | | | | | | | | | | | | | | | | | | | | | | | | |
| | | | | | Operations | | | Distributions | | | | | | Ratios/Supplemental Data | |
| | | Net Asset
Value,
Beginning
of Period | | | Net
Investment
Income | | | Net Realized
and
Unrealized
Gains
(Losses)
from
Investments | | | Total from
Operations | | | Net
Investment
Income | | | Net
Realized
Gains | | | Total
Distributions | | | Net Asset
Value, End
of Period | | | Total
Return (a)(b) | | | Net Assets
at End of
Period | | | Ratio of
Expenses
to Average
Net Assets (c) | | | Ratio of Net
Investment
Income
to Average
Net Assets (c) | | | Ratio of Expenses
(Prior to
Reimbursements)
to Average
Net
Assets (c) | | | Portfolio
Turnover (d) | |
| Class A Shares | | | | | | | | | | | | | | | | | | | | | | | | | | | | | | | | | | | | | | | | | | | | | | | | | | | | | | | | |
Year Ended October 31, 2014 (e) | | $ | 11.38 | | | | 0.18 | | | | 0.63 | | | | 0.81 | | | | (0.20 | ) | | | (0.24 | ) | | | (0.44 | ) | | $ | 11.75 | | | | 7.33% | | | $ | 123,408,650 | | | | 0.53% | | | | 1.53% | | | | 0.53% | | | | 9.54% | |
Year Ended October 31, 2013 (e) | | $ | 9.60 | | | | 0.17 | | | | 1.85 | | | | 2.02 | | | | (0.18 | ) | | | (0.06 | ) | | | (0.24 | ) | | $ | 11.38 | | | | 21.44% | | | $ | 112,242,046 | | | | 0.50% | | | | 1.62% | | | | 0.50% | | | | 29.31% | |
Year Ended October 31, 2012 (e) | | $ | 8.95 | | | | 0.15 | | | | 0.71 | | | | 0.86 | | | | (0.15 | ) | | | (0.06 | ) | | | (0.21 | ) | | $ | 9.60 | | | | 9.82% | | | $ | 89,406,859 | | | | 0.49% | | | | 1.59% | | | | 0.49% | | | | 13.11% | |
Year Ended October 31, 2011 (e) | | $ | 8.80 | | | | 0.16 | | | | 0.15 | | | | 0.31 | | | | (0.16 | ) | | | – | | | | (0.16 | ) | | $ | 8.95 | | | | 3.49% | | | $ | 84,467,234 | | | | 0.47% | | | | 1.72% | | | | 0.47% | | | | 13.88% | |
Year Ended October 31, 2010 (e) | | $ | 7.99 | | | | 0.14 | | | | 0.97 | | | | 1.11 | | | | (0.14 | ) | | | (0.16 | ) | | | (0.30 | ) | | $ | 8.80 | | | | 14.19% | | | $ | 79,563,235 | | | | 0.48% | | | | 1.72% | | | | 0.48% | | | | 8.57% | |
| | | | | | | | | | | | | | |
| Class C Shares | | | | | | | | | | | | | | | | | | | | | | | | | | | | | | | | | | | | | | | | | | | | | | | | | | | | | | | | |
Year Ended October 31, 2014 (e) | | $ | 11.16 | | | | 0.09 | | | | 0.62 | | | | 0.71 | | | | (0.13 | ) | | | (0.24 | ) | | | (0.37 | ) | | $ | 11.50 | | | | 6.55% | | | $ | 128,626,192 | | | | 1.24% | | | | 0.84% | | | | 1.24% | | | | 9.54% | |
Year Ended October 31, 2013 (e) | | $ | 9.41 | | | | 0.10 | | | | 1.82 | | | | 1.92 | | | | (0.11 | ) | | | (0.06 | ) | | | (0.17 | ) | | $ | 11.16 | | | | 20.72% | | | $ | 125,294,548 | | | | 1.19% | | | | 0.95% | | | | 1.19% | | | | 29.31% | |
Year Ended October 31, 2012 (e) | | $ | 8.79 | | | | 0.08 | | | | 0.69 | | | | 0.77 | | | | (0.09 | ) | | | (0.06 | ) | | | (0.15 | ) | | $ | 9.41 | | | | 8.87% | | | $ | 111,289,595 | | | | 1.19% | | | | 0.89% | | | | 1.19% | | | | 13.11% | |
Year Ended October 31, 2011 (e) | | $ | 8.64 | | | | 0.09 | | | | 0.15 | | | | 0.24 | | | | (0.09 | ) | | | – | | | | (0.09 | ) | | $ | 8.79 | | | | 2.81% | | | $ | 119,068,548 | | | | 1.20% | | | | 1.03% | | | | 1.20% | | | | 13.88% | |
Year Ended October 31, 2010 (e) | | $ | 7.86 | | | | 0.08 | | | | 0.95 | | | | 1.03 | | | | (0.09 | ) | | | (0.16 | ) | | | (0.25 | ) | | $ | 8.64 | | | | 13.31% | | | $ | 131,008,292 | | | | 1.19% | | | | 1.02% | | | | 1.19% | | | | 8.57% | |
| | | | | | | | | | | | | | |
| Class R Shares (f)(g) | | | | | | | | | | | | | | | | | | | | | | | | | | | | | | | | | | | | | | | | | | | | | | | | | | | | | | | | |
Year Ended October 31, 2014 (e) | | $ | 11.16 | | | | 0.14 | | | | 0.61 | | | | 0.75 | | | | (0.17 | ) | | | (0.24 | ) | | | (0.41 | ) | | $ | 11.50 | | | | 6.92% | | | $ | 242,451,059 | | | | 0.83% | | | | 1.26% | | | | 0.83% | | | | 9.54% | |
Year Ended October 31, 2013 (e) | | $ | 9.41 | | | | 0.13 | | | | 1.82 | | | | 1.95 | | | | (0.14 | ) | | | (0.06 | ) | | | (0.20 | ) | | $ | 11.16 | | | | 21.15% | | | $ | 246,852,482 | | | | 0.84% | | | | 1.28% | | | | 0.84% | | | | 29.31% | |
Year Ended October 31, 2012 (e) | | $ | 8.79 | | | | 0.11 | | | | 0.69 | | | | 0.80 | | | | (0.12 | ) | | | (0.06 | ) | | | (0.18 | ) | | $ | 9.41 | | | | 9.27% | | | $ | 208,283,759 | | | | 0.84% | | | | 1.23% | | | | 0.84% | | | | 13.11% | |
Year Ended October 31, 2011 (e) | | $ | 8.64 | | | | 0.12 | | | | 0.16 | | | | 0.28 | | | | (0.13 | ) | | | – | | | | (0.13 | ) | | $ | 8.79 | | | | 3.18% | | | $ | 192,888,041 | | | | 0.84% | | | | 1.34% | | | | 0.84% | | | | 13.88% | |
Year Ended October 31, 2010 (e) | | $ | 7.86 | | | | 0.11 | | | | 0.94 | | | | 1.05 | | | | (0.11 | ) | | | (0.16 | ) | | | (0.27 | ) | | $ | 8.64 | | | | 13.65% | | | $ | 176,660,604 | | | | 0.83% | | | | 1.34% | | | | 0.83% | | | | 8.57% | |
| | | | | | | | | | | | | | |
| Institutional Service Class Shares | | | | | | | | | | | | | | | | | | | | | | | | | | | | | | | | | | | | | | | | | | | | | | | | | | | | | | | | |
Period Ended October 31, 2014 (e)(h) | | $ | 11.39 | | | | 0.03 | | | | 0.40 | | | | 0.43 | | | | (0.10 | ) | | | – | | | | (0.10 | ) | | $ | 11.72 | | | | 3.77% | | | $ | 2,589,232 | | | | 0.20% | | | | 0.44% | | | | 0.20% | | | | 9.54% | |
| | | | | | | | | | | | | | |
| Institutional Class Shares | | | | | | | | | | | | | | | | | | | | | | | | | | | | | | | | | | | | | | | | | | | | | | | | | | | | | | | | |
Year Ended October 31, 2014 (e) | | $ | 11.37 | | | | 0.21 | | | | 0.64 | | | | 0.85 | | | | (0.24 | ) | | | (0.24 | ) | | | (0.48 | ) | | $ | 11.74 | | | | 7.70% | | | $ | 341,959,809 | | | | 0.18% | | | | 1.85% | | | | 0.18% | | | | 9.54% | |
Year Ended October 31, 2013 (e) | | $ | 9.59 | | | | 0.20 | | | | 1.85 | | | | 2.05 | | | | (0.21 | ) | | | (0.06 | ) | | | (0.27 | ) | | $ | 11.37 | | | | 21.83% | | | $ | 270,917,338 | | | | 0.19% | | | | 1.88% | | | | 0.19% | | | | 29.31% | |
Year Ended October 31, 2012 (e) | | $ | 8.95 | | | | 0.17 | | | | 0.71 | | | | 0.88 | | | | (0.18 | ) | | | (0.06 | ) | | | (0.24 | ) | | $ | 9.59 | | | | 10.03% | | | $ | 186,769,240 | | | | 0.19% | | | | 1.86% | | | | 0.19% | | | | 13.11% | |
Year Ended October 31, 2011 (e) | | $ | 8.79 | | | | 0.18 | | | | 0.16 | | | | 0.34 | | | | (0.18 | ) | | | – | | | | (0.18 | ) | | $ | 8.95 | | | | 3.89% | | | $ | 151,618,037 | | | | 0.20% | | | | 1.99% | | | | 0.20% | | | | 13.88% | |
Year Ended October 31, 2010 (e) | | $ | 7.99 | | | | 0.16 | | | | 0.97 | | | | 1.13 | | | | (0.17 | ) | | | (0.16 | ) | | | (0.33 | ) | | $ | 8.79 | | | | 14.39% | | | $ | 130,223,401 | | | | 0.19% | | | | 1.97% | | | | 0.19% | | | | 8.57% | |
| | | | | | | | | | | | | | |
| Service Class Shares | | | | | | | | | | | | | | | | | | | | | | | | | | | | | | | | | | | | | | | | | | | | | | | | | | | | | | | | |
Year Ended October 31, 2014 (e) | | $ | 11.36 | | | | 0.17 | | | | 0.62 | | | | 0.79 | | | | (0.19 | ) | | | (0.24 | ) | | | (0.43 | ) | | $ | 11.72 | | | | 7.19% | | | $ | 1,241,791,771 | | | | 0.58% | | | | 1.50% | | | | 0.58% | | | | 9.54% | |
Year Ended October 31, 2013 (e) | | $ | 9.58 | | | | 0.16 | | | | 1.85 | | | | 2.01 | | | | (0.17 | ) | | | (0.06 | ) | | | (0.23 | ) | | $ | 11.36 | | | | 21.37% | | | $ | 1,274,073,724 | | | | 0.59% | | | | 1.56% | | | | 0.59% | | | | 29.31% | |
Year Ended October 31, 2012 (e) | | $ | 8.94 | | | | 0.14 | | | | 0.70 | | | | 0.84 | | | | (0.14 | ) | | | (0.06 | ) | | | (0.20 | ) | | $ | 9.58 | | | | 9.60% | | | $ | 1,139,580,740 | | | | 0.59% | | | | 1.49% | | | | 0.59% | | | | 13.11% | |
Year Ended October 31, 2011 (e) | | $ | 8.78 | | | | 0.15 | | | | 0.16 | | | | 0.31 | | | | (0.15 | ) | | | – | | | | (0.15 | ) | | $ | 8.94 | | | | 3.47% | | | $ | 1,115,586,752 | | | | 0.60% | | | | 1.61% | | | | 0.60% | | | | 13.88% | |
Year Ended October 31, 2010 (e) | | $ | 7.98 | | | | 0.13 | | | | 0.96 | | | | 1.09 | | | | (0.13 | ) | | | (0.16 | ) | | | (0.29 | ) | | $ | 8.78 | | | | 13.96% | | | $ | 1,119,852,454 | | | | 0.58% | | | | 1.61% | | | | 0.58% | | | | 8.57% | |
| | | | | | | | | | | | | | | | | | | | | | | | | | | | | | | | | | | | | | | | | | | | | | | | | | | | | | | | | |
Amounts designated as “–” are zero or have been rounded to zero.
| (a) | Excludes sales charge. |
| (b) | Not annualized for periods less than one year. |
| (c) | Annualized for periods less than one year. |
| (d) | Portfolio turnover is calculated on the basis of the Fund as a whole without distinguishing among the classes of shares. |
| (e) | Per share calculations were performed using average shares method. |
| (f) | Effective February 28, 2009, Class R Shares were renamed Class R2 Shares. |
| (g) | Effective March 3, 2014, Class R2 Shares were renamed Class R Shares. |
| (h) | For the period from March 4, 2014 (commencement of operations) through October 31, 2014. Total return is calculated based on inception date of March 3, 2014 through October 31, 2014. |
The accompanying notes are an integral part of these financial statements.
31
| | |
| Fund Commentary | | Nationwide Investor Destinations Moderate Fund |
For the annual period ended October 31, 2014, the Nationwide Investor Destinations Moderate Fund (Service Class) returned 6.05% versus 8.20% for its composite benchmark, 45% Russell 3000® Index, 15% MSCI EAFE® Index, 25% Barclays U.S. Aggregate Bond Index and 15% Barclays U.S. 1-3 Year Government/Credit Bond Index. For broader comparison, the median return for the Fund’s closest Lipper peer category of Mixed-Asset Target Allocation Moderate Funds (consisting of 537 funds as of October 31, 2014) was 7.05% for the same time period. Performance for the Fund’s other share classes versus the benchmark is stated in the Average Annual Total Return chart in this report’s Fund Performance section.
The Fund’s return for the 12-month period covered in this report was driven primarily by strong positive returns from domestic equities. Representing about 38% of the Fund’s allocations, the Fund’s exposure to the U.S. equity markets contributed significantly to the Fund’s positive performance. In general, U.S. equity markets led the way as large-, mid- and small-capitalization stocks posted gains far exceeding those of international markets during the reporting period. Specifically, the S&P 500® Index (representing large-cap U.S. stocks) rose more than 17%, the S&P MidCap 400® Index (mid-cap stocks) increased 11.7%, and the Russell 2000® Index (small-cap stocks) gained 8.1%. During the reporting period, the Federal Reserve ceased its purchases of assets citing “substantial improvement in the outlook for the labor market since the inception of [the Fed’s] currency asset purchase program” and noting that the Fed “continues to see sufficient underlying strength in the broader economy.”1
The equity markets within foreign developed countries (as distinguished from emerging market countries) posted near-zero returns during the reporting period. The MSCI EAFE Index (representing developed international equity markets) registered -0.1% for the reporting period. Concerns about the health of Europe’s economy and heightened risk in emerging markets posed headwinds to the international markets.
The Fund’s return also was supported during the reporting period by positive returns from intermediate-term, investment-grade, U.S. fixed-income investments. The Barclays U.S. Aggregate Bond Index (representing a broad spectrum of such bonds) posted a return of 4.1% during the reporting period, helped along by the drop in interest rates on the bellwether 10-year U.S. Treasury note from a high of 3.04% at the end of 2013 to its period low of 2.34% at the end of October 2014. The drop in rates in the latter part of the reporting period, combined with a flattening of the overall yield curve (a plotted graph line of the yields [or interest rates] on long-term and short-term maturity bonds), resulted in generally positive performance for intermediate-term bonds. Short-term, investment-grade, fixed-income rates remained range-bound near zero, effectively keeping returns for this asset class very low.
The return from the Fund’s investment in the Nationwide S&P 500 Index Fund, combined with this underlying fund’s sizable allocation within the Fund, made this underlying fund the largest contributor to the Fund’s return during the reporting period, as shown in the chart below.
All of the Fund’s underlying allocations posted positive returns during the reporting period; however, the Fund’s investment in the Nationwide International Index Fund posted a 0.05% return (contributing 0.01% to the overall Fund performance), thus contributing the least to the Fund’s overall positive return.
Portfolio Managers:
Thomas R. Hickey Jr. and Benjamin A. Richer*, Nationwide Fund Advisors
| 1 | http://www.federalreserve.gov/newsevents/press/monetary/20141029a.htm |
The Fund is designed to provide diversification across a variety of asset classes, primarily by investing in underlying funds. Therefore, in addition to the expenses of the Fund, each investor is indirectly paying a proportionate share of the applicable fees and expenses of its underlying funds.
Investments in the Fund are subject to the risks of the Fund’s underlying funds. The Fund is subject to different levels of risk, based on the types and sizes of its underlying asset class allocations and its allocation strategy. In addition, the Fund’s underlying funds may be subject to
32
| | |
| Fund Commentary (con’t.) | | Nationwide Investor Destinations Moderate Fund |
specific investment risks, including but not limited to: stock market risk (equity securities); default risk and interest rate risk — if interest rates go up, bond prices go down and if interest rates go down, bond prices go up (bonds); and currency fluctuations, political risks, and differences in accounting and availability of information (international securities). Please refer to the most recent prospectus for a more detailed explanation of the Fund’s principal risks.
The Fund may invest in the Nationwide Fixed Contract, which is a fixed interest contract issued and guaranteed by Nationwide Life Insurance Company (Nationwide), an affiliate of the Fund’s investment adviser, Nationwide Fund Advisors. If Nationwide becomes unable to meet this guarantee, a Fund that invests in the Nationwide Fixed Contract may lose money from unpaid principal or unpaid or reduced interest.
Asset allocation is the process of spreading assets across several different investment styles and asset classes. The purpose is to potentially reduce long-term risk and capture potential profits across various asset classes.
Nationwide Asset Management, LLC (NWAM) provides asset allocation consulting services to Nationwide Fund Advisors (NFA), the Fund’s investment adviser. NWAM is a registered investment adviser and wholly owned subsidiary of Nationwide Mutual Insurance Company, and therefore is affiliated with NFA. NFA makes both the asset allocation and underlying fund selection decisions for the Fund. In addition, NWAM serves as the subadviser to certain other Nationwide Funds.
There is no assurance that the investment objective of any fund (or that of any underlying fund) will be achieved or that a diversified portfolio will produce better results than a nondiversified portfolio. Diversification does not guarantee returns or insulate an investor from potential losses, including the possible loss of principal.
A description of the benchmarks can be found on the Market Index Definitions page at the back of this book.
Nationwide Investor Destinations Moderate Fund
(October 31, 2014)
| | | | | | | | |
Underlying Fund or
Contract | | Actual
Allocation
to Fund | | | Contribution to Fund Performance | |
| Nationwide S&P 500 Index Fund Institutional Class | | | 20% | | | | 3.41% | |
| Nationwide International Index Fund Institutional Class | | | 17% | | | | 0.01% | |
| Nationwide Portfolio Completion Fund Institutional Class | | | 14% | | | | 0.38% | |
| Nationwide Mid Cap Market Index Fund Institutional Class | | | 10% | | | | 1.14% | |
| Nationwide Bond Index Fund Institutional Class | | | 10% | | | | 0.41% | |
| Nationwide Fixed Contract | | | 8% | | | | 0.28% | |
| Nationwide Small Cap Index Fund Institutional Class | | | 6% | | | | 0.48% | |
| Nationwide Core Plus Bond Fund Institutional Class | | | 5% | | | | 0.19% | |
| Nationwide HighMark Short Term Bond Fund Institutional Class | | | 5% | | | | 0.05% | |
| Nationwide Inflation-Protected Securities Fund Institutional Class | | | 3% | | | | 0.06% | |
| Nationwide Ziegler Equity Income Fund Institutional Class | | | 2% | | | | 0.28% | |
| | | | 100% | | | | | |
Actual underlying allocations are stated as a percentage of the Fund’s total net assets. Nationwide Fund Advisors (NFA), the investment adviser to the Fund, may add or delete asset classes or change allocations at any time and without notice in order for the Fund to meet its objective or due to market and/or economic conditions. NFA applies a long-term investment horizon with respect to the Fund, and allocation changes are not likely to be made in response to short-term market conditions.
The contribution of underlying funds to Fund performance is based on target underlying fund allocations through the reporting period. Returns reflect the impact of each underlying fund’s fees and expenses, but do not reflect the Nationwide Investor Destinations Moderate Fund’s fees and expenses. Day-to-day market activity will likely cause the Fund’s target allocations to fluctuate. Under ordinary circumstances, NFA periodically will rebalance the assets of the Fund in order to conform its actual allocations to those stated in the then-current prospectus. For more information, refer to the Fund’s prospectus.
33
| | |
| Fund Overview | | Nationwide Investor Destinations Moderate Fund |
Objective
The Fund seeks to maximize total investment return for a moderate level of risk.
Highlights
| | Ÿ | | All of the Fund’s underlying allocations posted positive returns during the reporting period | |
| | Ÿ | | The Fund’s investments in U.S. equity mutual funds accounted for 38% of its allocations and were the largest contributors to the return of the Fund during the reporting period | |
| | Ÿ | | Although short-term bond interest rates remained low, the Fund’s 8% allocation to the Nationwide Fixed Contract contributed 0.28% to the Fund’s overall return during the reporting period | |
Asset Allocation†
| | | | |
| Equity Funds | | | 55.3% | |
| Fixed Income Funds | | | 22.8% | |
| Asset Allocation Fund | | | 14.0% | |
| Fixed Contract | | | 8.0% | |
| Liabilities in excess of other assets | | | (0.1)% | |
| | | | 100.0% | |
Top Holdings††
| | | | |
| Nationwide S&P 500 Index Fund, Institutional Class | | | 20.3% | |
Nationwide International Index Fund,
Institutional Class | | | 16.6% | |
Nationwide Portfolio Completion Fund,
Institutional Class | | | 14.0% | |
Nationwide Mid Cap Market Index Fund,
Institutional Class | | | 10.2% | |
| Nationwide Bond Index Fund, Institutional Class | | | 9.8% | |
| Nationwide Fixed Contract | | | 8.0% | |
| Nationwide Small Cap Index Fund, Institutional Class | | | 6.0% | |
| Nationwide Core Plus Bond Fund, Institutional Class | | | 5.0% | |
| Nationwide HighMark Short Term Bond Fund, Institutional Class | | | 4.9% | |
| Nationwide Inflation-Protected Securities Fund, Institutional Class | | | 3.0% | |
| Nationwide Ziegler Equity Income Fund, Institutional Class | | | 2.2% | |
| | | | 100.0% | |
| † | Percentages indicated are based upon net assets as of October 31, 2014. |
| †† | Percentages indicated are based upon total investments as of October 31, 2014. |
34
| | |
| Fund Performance | | Nationwide Investor Destinations Moderate Fund |
Average Annual Total Return
(For periods ended October 31, 2014)
| | | | | | | | | | | | | | | | | | |
| | | | | 1 Yr. | | | 5 Yr. | | | 10 Yr. | | | Inception | |
| Class A | | w/o SC1 | | | 6.08% | | | | 9.11% | | | | 5.96% | | | | – | |
| | | w/ SC2 | | | (0.06)% | | | | 7.83% | | | | 5.33% | | | | – | |
| Class C | | w/o SC1 | | | 5.39% | | | | 8.35% | | | | 5.19% | | | | – | |
| | | w/SC3 | | | 4.39% | | | | 8.35% | | | | 5.19% | | | | – | |
| Class R4,5 | | | | | 5.80% | | | | 8.73% | | | | 5.61% | | | | – | |
| Institutional Service Class4 | | | | | – | | | | – | | | | – | | | | 3.35%6* | |
| Institutional Class4,7 | | | | | 6.47% | | | | 9.43% | | | | – | | | | 5.80%6 | |
| Service Class4 | | | | | 6.05% | | | | 9.00% | | | | 5.83% | | | | – | |
| Russell 3000® Index | | | | | 16.07% | | | | 17.01% | | | | 8.55% | | | | – | |
| S&P 500® Index | | | | | 17.27% | | | | 16.69% | | | | 8.20% | | | | – | |
| Barclays U.S. Aggregate Bond Index | | | | | 4.14% | | | | 4.22% | | | | 4.64% | | | | – | |
| MSCI EAFE® Index | | | | | (0.60)% | | | | 6.52% | | | | 5.81% | | | | – | |
| Barclays U.S. 1-3 Year Gov’t/Credit Bond Index | | | | | 0.89% | | | | 1.45% | | | | 2.84% | | | | – | |
| Citigroup 3-Month T-Bill Index | | | | | 0.04% | | | | 0.07% | | | | 1.50% | | | | – | |
| Composite Index | | | | | 7.77% | | | | 9.57% | | | | 6.22% | | | | – | |
| CPI | | | | | 1.66% | | | | 1.89% | | | | 2.21% | | | | – | |
All figures showing the effect of a sales charge (SC) reflect the maximum charge possible, because it has the most significant effect on performance data.
| 1 | These returns do not reflect the effects of SCs. |
| 2 | A 5.75% front-end sales charge was deducted. |
| 3 | A 1.00% CDSC was deducted from the one year return because it is charged when you sell Class C shares within the first year after purchase. |
| 4 | Not subject to any SCs. |
| 5 | Effective February 28, 2009, Class R Shares were renamed Class R2 Shares. Effective March 3, 2014, Class R2 Shares were renamed Class R Shares. |
| 6 | Since inception date of March 3, 2014. |
| 7 | These returns until the creation of Institutional Class shares (12/29/04) include the performance of the Fund’s Class B shares. The returns have been adjusted for the fact that Institutional Class shares do not have any applicable SCs but have not been adjusted for the lower expenses applicable to Institutional Class shares. Excluding the effect of any fee waivers or reimbursements, such prior performance is similar to what Institutional Class shares would have produced because the Institutional Class shares invest in the same portfolio of securities as Class B shares. Effective February 21, 2014, Class B shares were converted into Class A shares. |
Expense Ratios
| | |
| | | Expense Ratio^ |
| Class A | | 0.88% |
| Class C | | 1.56% |
| Class R | | 1.15% |
| Institutional Service Class | | 0.63% |
| Institutional Class | | 0.50% |
| Service Class | | 0.90% |
| ^ | Current effective prospectus dated March 1, 2014 (as revised March 26, 2014). The expense ratio also includes indirect underlying fund expenses. Please see the Fund’s most recent prospectus for details. Please refer to the Financial Highlights for each respective share class’ actual results. |
35
| | |
| Fund Performance (con’t.) | | Nationwide Investor Destinations Moderate Fund |
Performance of a $50,000 Investment
Investment return and principal value will fluctuate, and when redeemed, shares may be worth more or less than original cost. Past performance is no guarantee of future results and does not reflect the deduction of taxes that a shareholder would pay on fund distributions or the redemption of fund shares. Investing in mutual funds involves market risk, including loss of principal. Performance returns assume the reinvestment of all distributions.
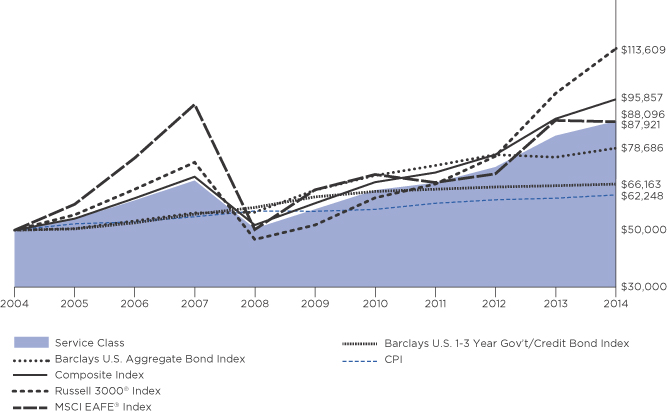
Comparative performance of $50,000 invested in Service Class shares of the Nationwide Investor Destinations Moderate Fund versus the Russell 3000® Index, the Barclays U.S. Aggregate Bond Index, the MSCI EAFE® Index, the Barclays U.S. 1-3 Year Government/Credit Bond Index, the Composite Index* and the Consumer Price Index (CPI) over the 10-year period ended 10/31/14. Unlike the Fund, the performance for these unmanaged indexes does not reflect any fees, expenses, or sales charges. Investors cannot invest directly in market indexes. A description of the benchmarks can be found on the Market Index Definitions page at the back of this book.
| * | The Composite Index comprises 45% Russell 3000® Index, 25% Barclays U.S. Aggregate Bond Index, 15% MSCI EAFE® Index and 15% Barclays U.S. 1-3 Year Gov’t/Credit Bond Index. |
36
| | |
| Shareholder Expense Example | | Nationwide Investor Destinations Moderate Fund |
As a shareholder of the Fund, you incur two types of costs: (1) transaction costs, including sales charges (loads) paid on purchase payments and redemption fees; and (2) ongoing costs, including investment advisory fees, administration fees, distribution fees and other Fund expenses. The examples below are intended to help you understand your ongoing costs (in dollars) of investing in the Fund and to compare these costs with the ongoing costs of investing in other mutual funds. Per Securities and Exchange Commission (“SEC”) requirements, the examples assume that you had a $1,000 investment in the Class at the beginning of the reporting period (May 1, 2014) and continued to hold your shares at the end of the reporting period (October 31, 2014).
Actual Expenses
For each Class of the Fund in the table below, the first line provides information about actual account values and actual expenses. You may use the information in this line, together with the amount you invested, to estimate the expenses that you paid from May 1, 2014 through October 31, 2014. Simply divide your account value by $1,000 (for example, an $8,600 account value divided by $1,000 = 8.6), then multiply the result by the number in the first line of each Class under the heading entitled “Expenses Paid During Period” to estimate the expenses you paid on your account during this period.
Hypothetical Expenses for Comparison Purposes
The second line of each Class in the table below provides information about hypothetical account values and hypothetical expenses based on the Class’ actual expense ratio and an assumed rate of return of 5% per year before expenses, which is not the Class’ actual return. The hypothetical account values and expenses may not be used to estimate the actual ending account balance or expenses you paid for the period from May 1, 2014 through October 31, 2014. You may use this information to compare the ongoing costs of investing in the Class of the Fund and other funds. To do so, compare this 5% hypothetical example with the 5% hypothetical examples that appear in the shareholder reports of the other funds.
Please note that the expenses shown in the table are meant to highlight your ongoing costs only and do not reflect any transaction costs, such as sales charges (loads) or redemption fees. If these transaction costs were included, your costs would have been higher. Therefore, the second line for each Class in the table is useful in comparing ongoing costs only, and will not help you determine the relative total costs of owning different funds. The examples also assume all dividends and distributions are reinvested.
Schedule of Shareholder Expenses
Expense Analysis of a $1,000 Investment
| | | | | | | | | | | | |
Nationwide Investor Destinations
Moderate Fund October 31, 2014 | | | Beginning
Account Value ($)
05/01/14 | | Ending
Account Value ($)
10/31/14 | | Expenses Paid
During Period ($)
05/01/14 - 10/31/14(a) | | Expense Ratio
During Period (%)
05/01/14 - 10/31/14(a) |
| Class A Shares | | | Actual | (b) | | 1,000.00 | | 1,019.80 | | 2.90 | | 0.57 |
| | | | Hypothetical | (b)(c) | | 1,000.00 | | 1,022.33 | | 2.91 | | 0.57 |
| Class C Shares | | | Actual | (b) | | 1,000.00 | | 1,016.80 | | 6.41 | | 1.26 |
| | | | Hypothetical | (b)(c) | | 1,000.00 | | 1,018.85 | | 6.41 | | 1.26 |
| Class R Shares(d) | | | Actual | (b) | | 1,000.00 | | 1,019.10 | | 4.22 | | 0.83 |
| | | | Hypothetical | (b)(c) | | 1,000.00 | | 1,021.02 | | 4.23 | | 0.83 |
| Institutional Service Class Shares | | | Actual | (b) | | 1,000.00 | | 1,021.60 | | 1.12 | | 0.22 |
| | | | Hypothetical | (b)(c) | | 1,000.00 | | 1,024.10 | | 1.12 | | 0.22 |
| Institutional Class Shares | | | Actual | (b) | | 1,000.00 | | 1,022.00 | | 0.92 | | 0.18 |
| | | | Hypothetical | (b)(c) | | 1,000.00 | | 1,024.30 | | 0.92 | | 0.18 |
| Service Class Shares | | | Actual | (b) | | 1,000.00 | | 1,020.00 | | 2.95 | | 0.58 |
| | | | Hypothetical | (b)(c) | | 1,000.00 | | 1,022.28 | | 2.96 | | 0.58 |
| (a) | Expenses are based on the direct expenses of the Fund and do not include the effect of the underlying Funds’ expenses, which are disclosed in the Fee and Expense table and described more fully in a footnote to that table in your Fund Prospectus. |
| (b) | Expenses are equal to the Fund’s annualized expense ratio multiplied by the average account value from May 1, 2014 through October 31, 2014 multiplied to reflect one-half year period. The expense ratio presented represents a six-month, annualized ratio in accordance with Securities and Exchange Commission guidelines. |
| (c) | Represents the hypothetical 5% return before expenses. |
| (d) | Effective March 3, 2014 Class R2 Shares were renamed Class R Shares. |
37
Statement of Investments
October 31, 2014
Nationwide Investor Destinations Moderate Fund
| | | | | | | | | | |
| | | Mutual Funds 92.1% | |
| | | |
| | | | | Shares | | | Market
Value | |
| | | | | | | | | | |
| | Asset Allocation Fund 14.0% | |
| | Nationwide Portfolio Completion Fund, Institutional Class (a) | | | 25,303,982 | | | $ | 251,774,619 | |
| | | | | | | | | | |
| | |
| | Total Asset Allocation Fund (cost $245,827,832) | | | | 251,774,619 | |
| | | | | | | | | | |
| | | |
| | Equity Funds 55.3% | |
| | Nationwide International Index Fund, Institutional Class (a) | | | 36,540,124 | | | | 298,898,216 | |
| | Nationwide Mid Cap Market Index Fund, Institutional Class (a) | | | 9,231,580 | | | | 183,062,237 | |
| | Nationwide S&P 500 Index Fund, Institutional Class (a) | | | 23,529,407 | | | | 365,882,282 | |
| | Nationwide Small Cap Index Fund, Institutional Class (a) | | | 6,818,251 | | | | 108,205,638 | |
| | Nationwide Ziegler Equity Income Fund, Institutional Class (a) | | | 2,792,855 | | | | 38,876,540 | |
| | | | | | | | | | |
| | |
| | Total Equity Funds
(cost $687,430,104) | | | | 994,924,913 | |
| | | | | | | | | | |
| | | |
| | Fixed Income Funds 22.8% | |
| | Nationwide Bond Index Fund, Institutional Class (a) | | | 15,716,386 | | | | 177,437,996 | |
| | Nationwide Core Plus Bond Fund, Institutional Class (a) | | | 8,807,468 | | | | 90,628,847 | |
| | Nationwide HighMark Short Term Bond Fund, Institutional Class (a) | | | 8,746,874 | | | | 87,643,680 | |
| | Nationwide Inflation-Protected Securities Fund, Institutional Class (a) | | | 5,750,432 | | | | 55,031,633 | |
| | | | | | | | | | |
| | |
| | Total Fixed Income Funds
(cost $417,461,227) | | | | 410,742,156 | |
| | | | | | | | | | |
| | |
| | Total Mutual Funds
(cost $1,350,719,163) | | | | 1,657,441,688 | |
| | | | | | | | | | |
| | | | | | | | | | |
| | | | | | | | | | |
| | | Fixed Contract 8.0% | |
| | | |
| | | | | Principal
Amount | | | Market
Value | |
| | | |
| | Nationwide Fixed Contract, 3.50% (a)(b)(c) | | $ | 143,734,124 | | | $ | 143,734,124 | |
| | | | | | | | | | |
| | |
| | Total Fixed Contract
(cost $143,734,124) | | | | 143,734,124 | |
| | | | | | | | | | |
| | |
| | Total Investments
(cost $1,494,453,287) (d) — 100.1% | | | | 1,801,175,812 | |
| | |
| | Liabilities in excess of other
assets — (0.1)% | | | | (917,880 | ) |
| | | | | | | | | | |
| | |
| | NET ASSETS — 100.0% | | | $ | 1,800,257,932 | |
| | | | | | | | | | |
| | (a) | Investment in affiliate. |
| | (c) | The Nationwide Fixed Contract interest rate changes quarterly. The contract is restricted and has been deemed liquid pursuant to procedures approved by the Board of Trustees. Please refer to Note 2(a) for additional information on the contract. |
| | (d) | See notes to financial statements for tax cost and unrealized appreciation/(depreciation) of securities. |
The accompanying notes are an integral part of these financial statements.
38
Statement of Assets and Liabilities
October 31, 2014
| | | | | | |
| | | Nationwide
Investor Destinations
Moderate Fund |
Assets: | | | | | | |
Investments in affiliates, at value (cost $1,494,453,287) | | $ | 1,801,175,812 | | | |
Receivable for investments sold | | | 784,573 | | | |
Receivable for capital shares issued | | | 1,155,211 | | | |
Prepaid expenses | | | 41,542 | | | |
| | | | | | |
Total Assets | | | 1,803,157,138 | | | |
| | | | | | |
Liabilities: | | | | | | |
Payable for capital shares redeemed | | | 1,953,506 | | | |
Accrued expenses and other payables: | | | | | | |
Investment advisory fees | | | 194,516 | | | |
Fund administration fees | | | 41,205 | | | |
Distribution fees | | | 431,999 | | | |
Administrative servicing fees | | | 207,352 | | | |
Accounting and transfer agent fees | | | 10,628 | | | |
Trustee fees | | | 5,361 | | | |
Custodian fees | | | 5,512 | | | |
Compliance program costs (Note 3) | | | 514 | | | |
Professional fees | | | 26,799 | | | |
Printing fees | | | 9,410 | | | |
Other | | | 12,404 | | | |
| | | | | | |
Total Liabilities | | | 2,899,206 | | | |
| | | | | | |
Net Assets | | $ | 1,800,257,932 | | | |
| | | | | | |
| | |
Represented by: | | | | | | |
Capital | | $ | 1,474,125,521 | | | |
Accumulated undistributed net investment income | | | 594,954 | | | |
Accumulated net realized gains from affiliated investments | | | 18,814,932 | | | |
Net unrealized appreciation/(depreciation) from investments in affiliates | | | 306,722,525 | | | |
| | | | | | |
Net Assets | | $ | 1,800,257,932 | | | |
| | | | | | |
Net Assets: | | | | | | |
Class A Shares | | $ | 143,271,556 | | | |
Class C Shares | | | 140,221,911 | | | |
Class R Shares | | | 195,865,740 | | | |
Institutional Service Class Shares | | | 4,576,528 | | | |
Institutional Class Shares | | | 343,231,738 | | | |
Service Class Shares | | | 973,090,459 | | | |
| | | | | | |
Total | | $ | 1,800,257,932 | | | |
| | | | | | |
Shares Outstanding (unlimited number of shares authorized): | | | | | | |
Class A Shares | | | 12,625,784 | | | |
Class C Shares | | | 12,558,877 | | | |
Class R Shares | | | 17,629,538 | | | |
Institutional Service Class Shares | | | 405,011 | | | |
Institutional Class Shares | | | 30,352,132 | | | |
Service Class Shares | | | 86,097,896 | | | |
| | | | | | |
Total | | | 159,669,238 | | | |
| | | | | | |
| | | | | | |
| | |
| | | | | | |
| | | | | | |
39
Statement of Assets and Liabilities (Continued)
October 31, 2014
| | | | | | |
| | | Nationwide
Investor Destinations
Moderate Fund |
Net asset value and redemption price per share (Net assets by class divided by shares outstanding by class, respectively): | | | | | | |
Class A Shares (a) | | $ | 11.35 | | | |
Class C Shares (b) | | $ | 11.17 | | | |
Class R Shares | | $ | 11.11 | | | |
Institutional Service Class Shares | | $ | 11.30 | | | |
Institutional Class Shares | | $ | 11.31 | | | |
Service Class Shares | | $ | 11.30 | | | |
Maximum offering price per share (100%/(100%-maximum sales charge) of net asset value adjusted to the nearest cent): | | | | | | |
Class A Shares | | $ | 12.04 | | | |
| | | | | | |
Maximum Sales Charge: | | | | | | |
Class A Shares | | | 5.75 | % | | |
| | | | | | |
| | | | | | |
| | | | | | |
| | | | | | |
| | | | | | |
| | | | | | |
| | | | | | |
| | | | | | |
| | | | | | |
| | | | | | |
| | | | | | |
| | | | | | |
| | | | | | |
| | | | | | |
| | | | | | |
| | | | | | |
| | | | | | |
| | | | | | |
| | | | | | |
| | | | | | |
| | | | | | |
| | | | | | |
| | | | | | |
| | | | | | |
| | | | | | |
| | | | | | |
| | | | | | |
| | | | | | |
| | | | | | |
| | | | | | |
| | | | | | |
| | | | | | | |
| (a) | For Class A Shares that were purchased without a sales charge because such purchase exceeded $1,000,000, a contingent deferred sales charge of 1.00% may apply to any redemption of such shares within 18 months of their purchase. |
| (b) | For Class C Shares, the redemption price per share is reduced by a contingent deferred sales charge of 1.00% for shares held less than one year. |
The accompanying notes are an integral part of these financial statements.
40
Statement of Operations
For the Period Ended October 31, 2014
| | | | | | |
| | | Nationwide
Investor Destinations
Moderate Fund |
INVESTMENT INCOME: | | | | | | |
Dividend income from affiliates | | $ | 31,917,752 | | | |
Interest income from affiliates | | | 4,941,659 | | | |
| | | | | | |
Total Income | | | 36,859,411 | | | |
| | | | | | |
EXPENSES: | | | | | | |
Investment advisory fees | | | 2,333,971 | | | |
Fund administration fees | | | 480,489 | | | |
Distribution fees Class A | | | 357,902 | | | |
Distribution fees Class B (a) | | | 5,858 | | | |
Distribution fees Class C | | | 1,399,266 | | | |
Distribution fees Class R (b) | | | 1,013,436 | | | |
Distribution fees Service Class | | | 2,488,007 | | | |
Administrative servicing fees Class A | | | 145,918 | | | |
Administrative servicing fees Class C | | | 76,599 | | | |
Administrative servicing fees Class R (b) | | | 304,032 | | | |
Administrative servicing fees Institutional Service Class (c) | | | 260 | | | |
Administrative servicing fees Service Class | | | 1,492,812 | | | |
Registration and filing fees | | | 80,435 | | | |
Professional fees | | | 91,183 | | | |
Printing fees | | | 21,865 | | | |
Trustee fees | | | 57,734 | | | |
Custodian fees | | | 67,341 | | | |
Accounting and transfer agent fees | | | 118,453 | | | |
Compliance program costs (Note 3) | | | 5,234 | | | |
Other | | | 47,833 | | | |
| | | | | | |
Total expenses before earnings credit | | | 10,588,628 | | | |
| | | | | | |
Earnings credit (Note 5) | | | (20 | ) | | |
| | | | | | |
Net Expenses | | | 10,588,608 | | | |
| | | | | | |
NET INVESTMENT INCOME | | | 26,270,803 | | | |
| | | | | | |
REALIZED/UNREALIZED GAINS (LOSSES) FROM INVESTMENTS: | | | | | | |
Net realized gain distributions from underlying affiliated funds | | | 42,721,452 | | | |
Net realized gains from investment transactions with affiliates | | | 28,610,711 | | | |
| | | | | | |
Net realized gains from affiliated investments | | | 71,332,163 | | | |
| | | | | | |
Net change in unrealized appreciation/(depreciation) from investments in affiliates | | | 6,783,028 | | | |
| | | | | | |
Net realized/unrealized gains from affiliated investments | | | 78,115,191 | | | |
| | | | | | |
CHANGE IN NET ASSETS RESULTING FROM OPERATIONS | | $ | 104,385,994 | | | |
| | | | | | |
| | | | | | |
| | | | | | |
| | | | | | |
| | | | | | |
| | |
| | | | | | |
| | | | | | | |
| (a) | Effective February 21, 2014, Class B Shares were converted into Class A Shares. |
| (b) | Effective March 3, 2014, Class R2 Shares were renamed Class R Shares. |
| (c) | For the period from March 4, 2014 (commencement of operations) through October 31, 2014. |
The accompanying notes are an integral part of these financial statements.
41
Statements of Changes in Net Assets
| | | | | | | | | | | | |
| | | Nationwide Investor Destinations
Moderate Fund |
| | | Year Ended
October 31, 2014 | | | | | Year Ended
October 31, 2013 | | | |
Operations: | | | | | | | | | | | | |
Net investment income | | $ | 26,270,803 | | | | | $ | 24,757,661 | | | |
Net realized gains from affiliated investments | | | 71,332,163 | | | | | | 55,343,871 | | | |
Net change in unrealized appreciation/(depreciation) from investments in affiliates | | | 6,783,028 | | | | | | 159,032,853 | | | |
| | | | | | | | | |
Change in net assets resulting from operations | | | 104,385,994 | | | | | | 239,134,385 | | | |
| | | | | | | | | |
| | | | |
Distributions to Shareholders From: | | | | | | | | | | | | |
Net investment income: | | | | | | | | | | | | |
Class A | | | (2,342,048 | ) | | | | | (2,105,107 | ) | | |
Class B (a) | | | (13,539 | ) | | | | | (39,206 | ) | | |
Class C | | | (1,431,978 | ) | | | | | (1,305,304 | ) | | |
Class R (b) | | | (2,845,110 | ) | | | | | (2,703,277 | ) | | |
Institutional Service Class | | | (5,932 | )(c) | | | | | – | | | |
Institutional Class | | | (6,170,928 | ) | | | | | (4,818,247 | ) | | |
Service Class | | | (16,041,966 | ) | | | | | (15,315,096 | ) | | |
Net realized gains: | | | | | | | | | | | | |
Class A | | | (4,253,649 | ) | | | | | (544,335 | ) | | |
Class B (a) | | | (59,199 | ) | | | | | (21,215 | ) | | |
Class C | | | (4,344,180 | ) | | | | | (570,539 | ) | | |
Class R (b) | | | (6,497,933 | ) | | | | | (874,892 | ) | | |
Institutional Service Class | | | – | (c) | | | | | – | | | |
Institutional Class | | | (9,048,933 | ) | | | | | (1,020,096 | ) | | |
Service Class | | | (30,895,590 | ) | | | | | (4,259,363 | ) | | |
| | | | | | | | | |
Change in net assets from shareholder distributions | | | (83,950,985 | ) | | | | | (33,576,677 | ) | | |
| | | | | | | | | |
Change in net assets from capital transactions | | | 20,859,062 | | | | | | (24,468,070 | ) | | |
| | | | | | | | | |
Change in net assets | | | 41,294,071 | | | | | | 181,089,638 | | | |
| | | | | | | | | |
| | | | |
Net Assets: | | | | | | | | | | | | |
Beginning of year | | | 1,758,963,861 | | | | | | 1,577,874,223 | | | |
| | | | | | | | | |
End of year | | $ | 1,800,257,932 | | | | | $ | 1,758,963,861 | | | |
| | | | | | | | | |
Accumulated undistributed net investment income at end of year | | $ | 594,954 | | | | | $ | 1,247,267 | | | |
| | | | | | | | | |
| | | | |
CAPITAL TRANSACTIONS: | | | | | | | | | | | | |
Class A Shares | | | | | | | | | | | | |
Proceeds from shares issued | | $ | 40,822,367 | | | | | $ | 42,432,527 | | | |
Proceeds from shares issued from class conversion | | | 1,477,480 | | | | | | – | | | |
Dividends reinvested | | | 4,423,056 | | | | | | 1,615,503 | | | |
Cost of shares redeemed | | | (39,387,604 | ) | | | | | (39,848,430 | ) | | |
| | | | | | | | | |
Total Class A Shares | | | 7,335,299 | | | | | | 4,199,600 | | | |
| | | | | | | | | |
Class B Shares (a) | | | | | | | | | | | | |
Proceeds from shares issued | | | 33,347 | | | | | | 84,241 | | | |
Dividends reinvested | | | 66,278 | | | | | | 43,343 | | | |
Cost of shares redeemed in class conversion | | | (1,477,480 | ) | | | | | – | | | |
Cost of shares redeemed | | | (672,906 | ) | | | | | (3,692,609 | ) | | |
| | | | | | | | | |
Total Class B Shares | | | (2,050,761 | ) | | | | | (3,565,025 | ) | | |
| | | | | | | | | |
| | | | | | | | | | | | |
| (a) | Effective February 21, 2014, Class B Shares were converted into Class A Shares. |
| (b) | Effective March 3, 2014, Class R2 Shares were renamed Class R Shares. |
| (c) | For the period from March 4, 2014 (commencement of operations) through October 31, 2014. |
42
Statements of Changes in Net Assets (Continued)
| | | | | | | | | | | | |
| | | Nationwide Investor Destinations
Moderate Fund |
| | | Year Ended
October 31, 2014 | | | | | Year Ended
October 31, 2013 | | | |
CAPITAL TRANSACTIONS: (continued) | | | | | | | | | | | | |
Class C Shares | | | | | | | | | | | | |
Proceeds from shares issued | | $ | 22,902,065 | | | | | $ | 24,614,959 | | | |
Dividends reinvested | | | 2,706,509 | | | | | | 809,225 | | | |
Cost of shares redeemed | | | (24,520,559 | ) | | | | | (28,142,283 | ) | | |
| | | | | | | | | |
Total Class C Shares | | | 1,088,015 | | | | | | (2,718,099 | ) | | |
| | | | | | | | | |
Class R Shares (b) | | | | | | | | | | | | |
Proceeds from shares issued | | | 15,367,094 | | | | | | 26,722,973 | | | |
Dividends reinvested | | | 8,971,795 | | | | | | 3,465,223 | | | |
Cost of shares redeemed | | | (38,306,310 | ) | | | | | (33,324,366 | ) | | |
| | | | | | | | | |
Total Class R Shares | | | (13,967,421 | ) | | | | | (3,136,170 | ) | | |
| | | | | | | | | |
Institutional Service Class Shares | | | | | | | | | | | | |
Proceeds from shares issued | | | 4,628,969 | (c) | | | | | – | | | |
Dividends reinvested | | | 5,932 | (c) | | | | | – | | | |
Cost of shares redeemed | | | (110,821 | )(c) | | | | | – | | | |
| | | | | | | | | |
Total Institutional Service Class Shares | | | 4,524,080 | (c) | | | | | – | | | |
| | | | | | | | | |
Institutional Class Shares | | | | | | | | | | | | |
Proceeds from shares issued | | | 79,027,163 | | | | | | 170,761,954 | | | |
Dividends reinvested | | | 15,218,911 | | | | | | 5,838,343 | | | |
Cost of shares redeemed | | | (39,981,794 | ) | | | | | (142,402,818 | ) | | |
| | | | | | | | | |
Total Institutional Class Shares | | | 54,264,280 | | | | | | 34,197,479 | | | |
| | | | | | | | | |
Service Class Shares | | | | | | | | | | | | |
Proceeds from shares issued | | | 99,229,155 | | | | | | 90,884,102 | | | |
Dividends reinvested | | | 46,936,868 | | | | | | 19,574,429 | | | |
Cost of shares redeemed | | | (176,500,453 | ) | | | | | (163,904,386 | ) | | |
| | | | | | | | | |
Total Service Class Shares | | | (30,334,430 | ) | | | | | (53,445,855 | ) | | |
| | | | | | | | | |
Change in net assets from capital transactions | | $ | 20,859,062 | | | | | $ | (24,468,070 | ) | | |
| | | | | | | | | |
SHARE TRANSACTIONS: | | | | | | | | | | | | |
Class A Shares | | | | | | | | | | | | |
Issued | | | 3,654,435 | | | | | | 4,038,405 | | | |
Issued in class conversion | | | 133,728 | | | | | | – | | | |
Reinvested | | | 403,947 | | | | | | 158,178 | | | |
Redeemed | | | (3,508,921 | ) | | | | | (3,760,039 | ) | | |
| | | | | | | | | |
Total Class A Shares | | | 683,189 | | | | | | 436,544 | | | |
| | | | | | | | | |
Class B Shares (a) | | | | | | | | | | | | |
Issued | | | 3,048 | | | | | | 8,173 | | | |
Reinvested | | | 6,126 | | | | | | 4,347 | | | |
Redeemed in class conversion | | | (134,543 | ) | | | | | – | | | |
Redeemed | | | (61,391 | ) | | | | | (355,894 | ) | | |
| | | | | | | | | |
Total Class B Shares | | | (186,760 | ) | | | | | (343,374 | ) | | |
| | | | | | | | | |
| | | | | | | | | | | | |
| | | | |
| | | | | | | | | | | | |
| (a) | Effective February 21, 2014, Class B Shares were converted into Class A Shares. |
| (b) | Effective March 3, 2014, Class R2 Shares were renamed Class R Shares. |
| (c) | For the period from March 4, 2014 (commencement of operations) through October 31, 2014. |
43
Statements of Changes in Net Assets (Continued)
| | | | | | | | | | | | |
| | | Nationwide Investor Destinations
Moderate Fund |
| | | Year Ended
October 31, 2014 | | | | | Year Ended
October 31, 2013 | | | |
SHARE TRANSACTIONS: (continued) | | | | | | | | | | | | |
Class C Shares | | | | | | | | | | | | |
Issued | | | 2,084,082 | | | | | | 2,372,525 | | | |
Reinvested | | | 251,756 | | | | | | 81,304 | | | |
Redeemed | | | (2,224,181 | ) | | | | | (2,708,625 | ) | | |
| | | | | | | | | |
Total Class C Shares | | | 111,657 | | | | | | (254,796 | ) | | |
| | | | | | | | | |
Class R Shares (b) | | | | | | | | | | | | |
Issued | | | 1,401,087 | | | | | | 2,591,531 | | | |
Reinvested | | | 837,637 | | | | | | 347,787 | | | |
Redeemed | | | (3,503,221 | ) | | | | | (3,215,310 | ) | | |
| | | | | | | | | |
Total Class R Shares | | | (1,264,497 | ) | | | | | (275,992 | ) | | |
| | | | | | | | | |
Institutional Service Class Shares | | | | | | | | | | | | |
Issued | | | 414,530 | (c) | | | | | – | | | |
Reinvested | | | 524 | (c) | | | | | – | | | |
Redeemed | | | (10,043 | )(c) | | | | | – | | | |
| | | | | | | | | |
Total Institutional Service Class Shares | | | 405,011 | (c) | | | | | – | | | |
| | | | | | | | | |
Institutional Class Shares | | | | | | | | | | | | |
Issued | | | 7,094,639 | | | | | | 16,149,599 | | | |
Reinvested | | | 1,392,407 | | | | | | 571,848 | | | |
Redeemed | | | (3,580,912 | ) | | | | | (13,469,400 | ) | | |
| �� | | | | | | | | |
Total Institutional Class Shares | | | 4,906,134 | | | | | | 3,252,047 | | | |
| | | | | | | | | |
Service Class Shares | | | | | | | | | | | | |
Issued | | | 8,847,176 | | | | | | 8,652,746 | | | |
Reinvested | | | 4,304,229 | | | | | | 1,928,700 | | | |
Redeemed | | | (15,786,774 | ) | | | | | (15,560,542 | ) | | |
| | | | | | | | | |
Total Service Class Shares | | | (2,635,369 | ) | | | | | (4,979,096 | ) | | |
| | | | | | | | | |
Total change in shares | | | 2,019,365 | | | | | | (2,164,667 | ) | | |
| | | | | | | | | |
| | | | | | | | | | | | |
| | | | | | | | | | | | |
| | | | | | | | | | | | |
| | | | | | | | | | | | |
| | | | | | | | | | | | |
| | | | | | | | | | | | |
| | | | | | | | | | | | |
| | | | | | | | | | | | |
| | | | | | | | | | | | |
| | | | | | | | | | | | |
| | | | | | | | | | | | |
| | | | | | | | | | | | |
| | | | | | | | | | | | |
| | | | | | | | | | | | |
| | | | | | | | | | | | | |
| Amounts | designated as “–” are zero or have been rounded to zero. |
| (b) | Effective March 3, 2014, Class R2 Shares were renamed Class R Shares. |
| (c) | For the period from March 4, 2014 (commencement of operations) through October 31, 2014. |
The accompanying notes are an integral part of these financial statements.
44
Financial Highlights
Selected data for each share of capital outstanding throughout the periods indicated
Nationwide Investor Destinations Moderate Fund
| | | | | | | | | | | | | | | | | | | | | | | | | | | | | | | | | | | | | | | | | | | | | | | | | | | | | | | | |
| | | | | | Operations | | | Distributions | | | | | | | | | Ratios/Supplemental Data | |
| | | Net Asset
Value,
Beginning
of Period | | | Net
Investment
Income | | | Net Realized
and
Unrealized
Gains
(Losses)
from
Investments | | | Total from
Operations | | | Net
Investment
Income | | | Net
Realized
Gains | | | Total
Distributions | | | Net Asset
Value, End
of Period | | | Total
Return (a)(b) | | | Net Assets
at End
of Period | | | Ratio of
Expenses
to Average
Net Assets (c) | | | Ratio of Net
Investment
Income
to Average
Net Assets (c) | | | Ratio of Expenses
(Prior to
Reimbursements)
to Average
Net Assets (c) | | | Portfolio
Turnover (d) | |
| Class A Shares | | | | | | | | | | | | | | | | | | | | | | | | | | | | | | | | | | | | | | | | | | | | | | | | | | | | | | | | |
Year Ended October 31, 2014 (e) | | $ | 11.23 | | | | 0.17 | | | | 0.49 | | | | 0.66 | | | | (0.19 | ) | | | (0.35 | ) | | | (0.54 | ) | | $ | 11.35 | | | | 6.08% | | | $ | 143,271,556 | | | | 0.54% | | | | 1.50% | | | | 0.54% | | | | 17.14% | |
Year Ended October 31, 2013 (e) | | $ | 9.93 | | | | 0.17 | | | | 1.36 | | | | 1.53 | | | | (0.18 | ) | | | (0.05 | ) | | | (0.23 | ) | | $ | 11.23 | | | | 15.56% | | | $ | 134,092,908 | | | | 0.50% | | | | 1.58% | | | | 0.50% | | | | 32.04% | |
Year Ended October 31, 2012 (e) | | $ | 9.43 | | | | 0.16 | | | | 0.61 | | | | 0.77 | | | | (0.22 | ) | | | (0.05 | ) | | | (0.27 | ) | | $ | 9.93 | | | | 8.38% | | | $ | 114,304,018 | | | | 0.49% | | | | 1.66% | | | | 0.49% | | | | 16.02% | |
Year Ended October 31, 2011 (e) | | $ | 9.23 | | | | 0.17 | | | | 0.20 | | | | 0.37 | | | | (0.17 | ) | | | – | | | | (0.17 | ) | | $ | 9.43 | | | | 4.06% | | | $ | 107,508,362 | | | | 0.48% | | | | 1.82% | | | | 0.48% | | | | 14.28% | |
Year Ended October 31, 2010 (e) | | $ | 8.37 | | | | 0.17 | | | | 0.82 | | | | 0.99 | | | | (0.10 | ) | | | (0.03 | ) | | | (0.13 | ) | | $ | 9.23 | | | | 11.86% | | | $ | 96,798,604 | | | | 0.47% | | | | 1.89% | | | | 0.47% | | | | 9.42% | |
| | | | | | | | | | | | | | |
| Class C Shares | | | | | | | | | | | | | | | | | | | | | | | | | | | | | | | | | | | | | | | | | | | | | | | | | | | | | | | | |
Year Ended October 31, 2014 (e) | | $ | 11.06 | | | | 0.09 | | | | 0.48 | | | | 0.57 | | | | (0.11 | ) | | | (0.35 | ) | | | (0.46 | ) | | $ | 11.17 | | | | 5.39% | | | $ | 140,221,911 | | | | 1.24% | | | | 0.81% | | | | 1.24% | | | | 17.14% | |
Year Ended October 31, 2013 (e) | | $ | 9.79 | | | | 0.09 | | | | 1.33 | | | | 1.42 | | | | (0.10 | ) | | | (0.05 | ) | | | (0.15 | ) | | $ | 11.06 | | | | 14.68% | | | $ | 137,680,905 | | | | 1.19% | | | | 0.89% | | | | 1.19% | | | | 32.04% | |
Year Ended October 31, 2012 (e) | | $ | 9.25 | | | | 0.09 | | | | 0.60 | | | | 0.69 | | | | (0.10 | ) | | | (0.05 | ) | | | (0.15 | ) | | $ | 9.79 | | | | 7.58% | | | $ | 124,362,072 | | | | 1.20% | | | | 0.97% | | | | 1.20% | | | | 16.02% | |
Year Ended October 31, 2011 (e) | | $ | 9.05 | | | | 0.11 | | | | 0.20 | | | | 0.31 | | | | (0.11 | ) | | | – | | | | (0.11 | ) | | $ | 9.25 | | | | 3.37% | | | $ | 129,312,497 | | | | 1.21% | | | | 1.13% | | | | 1.21% | | | | 14.28% | |
Year Ended October 31, 2010 (e) | | $ | 8.28 | | | | 0.10 | | | | 0.81 | | | | 0.91 | | | | (0.11 | ) | | | (0.03 | ) | | | (0.14 | ) | | $ | 9.05 | | | | 11.09% | | | $ | 142,313,710 | | | | 1.20% | | | | 1.21% | | | | 1.20% | | | | 9.42% | |
| | | | | | | | | | | | | | |
| Class R Shares(f)(g) | | | | | | | | | | | | | | | | | | | | | | | | | | | | | | | | | | | | | | | | | | | | | | | | | | | | | | | | |
Year Ended October 31, 2014 (e) | | $ | 11.00 | | | | 0.14 | | | | 0.47 | | | | 0.61 | | | | (0.15 | ) | | | (0.35 | ) | | | (0.50 | ) | | $ | 11.11 | | | | 5.80% | | | $ | 195,865,740 | | | | 0.83% | | | | 1.23% | | | | 0.83% | | | | 17.14% | |
Year Ended October 31, 2013 (e) | | $ | 9.74 | | | | 0.13 | | | | 1.32 | | | | 1.45 | | | | (0.14 | ) | | | (0.05 | ) | | | (0.19 | ) | | $ | 11.00 | | | | 15.06% | | | $ | 207,910,628 | | | | 0.84% | | | | 1.24% | | | | 0.84% | | | | 32.04% | |
Year Ended October 31, 2012 (e) | | $ | 9.20 | | | | 0.12 | | | | 0.60 | | | | 0.72 | | | | (0.13 | ) | | | (0.05 | ) | | | (0.18 | ) | | $ | 9.74 | | | | 7.96% | | | $ | 186,740,830 | | | | 0.85% | | | | 1.31% | | | | 0.85% | | | | 16.02% | |
Year Ended October 31, 2011 (e) | | $ | 9.01 | | | | 0.14 | | | | 0.19 | | | | 0.33 | | | | (0.14 | ) | | | – | | | | (0.14 | ) | | $ | 9.20 | | | | 3.67% | | | $ | 174,027,334 | | | | 0.85% | | | | 1.46% | | | | 0.85% | | | | 14.28% | |
Year Ended October 31, 2010 (e) | | $ | 8.24 | | | | 0.13 | | | | 0.81 | | | | 0.94 | | | | (0.14 | ) | | | (0.03 | ) | | | (0.17 | ) | | $ | 9.01 | | | | 11.56% | | | $ | 158,746,294 | | | | 0.83% | | | | 1.54% | | | | 0.83% | | | | 9.42% | |
| | | | | | | | | | | | | | |
| Institutional Service Class Shares | | | | | | | | | | | | | | | | | | | | | | | | | | | | | | | | | | | | | | | | | | | | | | | | | | | | | | | | |
Period Ended October 31, 2014 (e)(h) | | $ | 11.03 | | | | 0.09 | | | | 0.28 | | | | 0.37 | | | | (0.10 | ) | | | – | | | | (0.10 | ) | | $ | 11.30 | | | | 3.35% | | | $ | 4,576,528 | | | | 0.22% | | | | 1.16% | | | | 0.22% | | | | 17.14% | |
| | | | | | | | | | | | | | |
| Institutional Class Shares | | | | | | | | | | | | | | | | | | | | | | | | | | | | | | | | | | | | | | | | | | | | | | | | | | | | | | | | |
Year Ended October 31, 2014 (e) | | $ | 11.19 | | | | 0.21 | | | | 0.49 | | | | 0.70 | | | | (0.23 | ) | | | (0.35 | ) | | | (0.58 | ) | | $ | 11.31 | | | | 6.47% | | | $ | 343,231,738 | | | | 0.18% | | | | 1.84% | | | | 0.18% | | | | 17.14% | |
Year Ended October 31, 2013 (e) | | $ | 9.90 | | | | 0.20 | | | | 1.35 | | | | 1.55 | | | | (0.21 | ) | | | (0.05 | ) | | | (0.26 | ) | | $ | 11.19 | | | | 15.86% | | | $ | 284,753,727 | | | | 0.20% | | | | 1.86% | | | | 0.20% | | | | 32.04% | |
Year Ended October 31, 2012 (e) | | $ | 9.35 | | | | 0.19 | | | | 0.60 | | | | 0.79 | | | | (0.19 | ) | | | (0.05 | ) | | | (0.24 | ) | | $ | 9.90 | | | | 8.64% | | | $ | 219,767,806 | | | | 0.20% | | | | 1.95% | | | | 0.20% | | | | 16.02% | |
Year Ended October 31, 2011 (e) | | $ | 9.15 | | | | 0.19 | | | | 0.21 | | | | 0.40 | | | | (0.20 | ) | | | – | | | | (0.20 | ) | | $ | 9.35 | | | | 4.38% | | | $ | 176,900,980 | | | | 0.21% | | | | 2.06% | | | | 0.21% | | | | 14.28% | |
Year Ended October 31, 2010 (e) | | $ | 8.37 | | | | 0.19 | | | | 0.82 | | | | 1.01 | | | | (0.20 | ) | | | (0.03 | ) | | | (0.23 | ) | | $ | 9.15 | | | | 12.19% | | | $ | 131,966,219 | | | | 0.20% | | | | 2.18% | | | | 0.20% | | | | 9.42% | |
| | | | | | | | | | | | | | |
| Service Class Shares | | | | | | | | | | | | | | | | | | | | | | | | | | | | | | | | | | | | | | | | | | | | | | | | | | | | | | | | |
Year Ended October 31, 2014 (e) | | $ | 11.18 | | | | 0.16 | | | | 0.49 | | | | 0.65 | | | | (0.18 | ) | | | (0.35 | ) | | | (0.53 | ) | | $ | 11.30 | | | | 6.05% | | | $ | 973,090,459 | | | | 0.58% | | | | 1.48% | | | | 0.58% | | | | 17.14% | |
Year Ended October 31, 2013 (e) | | $ | 9.90 | | | | 0.16 | | | | 1.34 | | | | 1.50 | | | | (0.17 | ) | | | (0.05 | ) | | | (0.22 | ) | | $ | 11.18 | | | | 15.30% | | | $ | 992,441,693 | | | | 0.60% | | | | 1.50% | | | | 0.60% | | | | 32.04% | |
Year Ended October 31, 2012 (e) | | $ | 9.34 | | | | 0.15 | | | | 0.61 | | | | 0.76 | | | | (0.15 | ) | | | (0.05 | ) | | | (0.20 | ) | | $ | 9.90 | | | | 8.30% | | | $ | 927,470,622 | | | | 0.60% | | | | 1.56% | | | | 0.60% | | | | 16.02% | |
Year Ended October 31, 2011 (e) | | $ | 9.14 | | | | 0.16 | | | | 0.20 | | | | 0.36 | | | | (0.16 | ) | | | – | | | | (0.16 | ) | | $ | 9.34 | | | | 3.96% | | | $ | 897,059,520 | | | | 0.61% | | | | 1.71% | | | | 0.61% | | | | 14.28% | |
Year Ended October 31, 2010 (e) | | $ | 8.36 | | | | 0.16 | | | | 0.81 | | | | 0.97 | | | | (0.16 | ) | | | (0.03 | ) | | | (0.19 | ) | | $ | 9.14 | | | | 11.76% | | | $ | 891,324,745 | | | | 0.59% | | | | 1.81% | | | | 0.59% | | | | 9.42% | |
| | | | | | | | | | | | | | | | | | | | | | | | | | | | | | | | | | | | | | | | | | | | | | | | | | | | | | | | | |
Amounts designated as “–” are zero or have been rounded to zero.
| (a) | Excludes sales charge. |
| (b) | Not annualized for periods less than one year. |
| (c) | Annualized for periods less than one year. |
| (d) | Portfolio turnover is calculated on the basis of the Fund as a whole without distinguishing among the classes of shares. |
| (e) | Per share calculations were performed using average shares method. |
| (f) | Effective February 28, 2009, Class R Shares were renamed Class R2 Shares. |
| (g) | Effective March 3, 2014, Class R2 Shares were renamed Class R Shares. |
| (h) | For the period from March 4, 2014 (commencement of operations) through October 31, 2014. Total return is calculated based on inception date of March 3, 2014 through October 31, 2014. |
The accompanying notes are an integral part of these financial statements.
45
| | |
| Fund Commentary | | Nationwide Investor Destinations Moderately Conservative Fund |
For the annual period ended October 31, 2014, the Nationwide Investor Destinations Moderately Conservative Fund (Service Class) returned 4.88% versus 6.35% for its composite benchmark, 30% Russell 3000® Index, 10% MSCI EAFE® Index, 35% Barclays U.S. Aggregate Bond Index and 25% Barclays U.S. 1-3 Year Government/Credit Bond Index. For broader comparison, the median return for the Fund’s closest Lipper peer category of Mixed-Asset Target Allocation Moderate Funds (consisting of 537 funds as of October 31, 2014) was 7.05% for the same time period. Performance for the Fund’s other share classes versus the benchmark is stated in the Average Annual Total Return chart in this report’s Fund Performance section.
The Fund’s return for the 12-month period covered in this report was driven primarily by strong positive returns from domestic equities. Representing about 26% of the Fund’s allocations, the Fund’s exposure to the U.S. equity markets contributed significantly to the Fund’s positive performance. In general, U.S. equity markets led the way as large-, mid- and small-capitalization stocks posted gains far exceeding those of international markets during the reporting period. Specifically, the S&P 500® Index (representing large-cap U.S. stocks) rose more than 17%, the S&P MidCap 400® Index (mid-cap stocks) increased 11.7%, and the Russell 2000® Index (small-cap stocks) gained 8.1%. During the reporting period, the Federal Reserve ceased its purchases of assets citing “substantial improvement in the outlook for the labor market since the inception of [the Fed’s] currency asset purchase program” and noting that the Fed “continues to see sufficient underlying strength in the broader economy.”1
The equity markets within foreign developed countries (as distinguished from emerging market countries) posted near-zero returns during the reporting period. The MSCI EAFE Index (representing developed international equity markets) registered -0.1% for the reporting period. Concerns about the health of Europe’s economy and heightened risk in emerging markets posed headwinds to the international markets.
The Fund’s return also was supported by positive returns from intermediate-term, investment-grade, U.S. fixed-income investments. The Barclays U.S. Aggregate Bond Index (representing a broad spectrum of such bonds) posted a return of 4.1% during the reporting period, helped along by the drop in interest rates on the bellwether 10-year U.S. Treasury note from a high of 3.04% at the end of 2013 to its period low of 2.34% at the end of October 2014. The drop in rates in the latter part of the reporting period, combined with a flattening of the overall yield curve (a plotted graph line of the yields [or interest rates] on long-term and short-term maturity bonds), resulted in generally positive performance for intermediate-term bonds. Short-term, investment-grade, fixed-income rates remained range-bound near zero, effectively keeping returns for this asset class very low.
The return from the Fund’s investment in the Nationwide S&P 500 Index Fund, combined with this underlying fund’s allocation within the Fund, made this underlying fund the largest contributor to the Fund’s return during the reporting period, as shown in the chart below.
All of the Fund’s underlying allocations posted positive returns during the reporting period; however, the Fund’s investment in the Nationwide International Index Fund posted a 0.05% return (contributing 0.01% to the overall Fund performance), thus contributing the least to the Fund’s overall positive return.
| 1 | http://www.federalreserve.gov/newsevents/press/monetary/20141029a.htm |
Portfolio Managers:
Thomas R. Hickey Jr. and Benjamin Richer*, Nationwide Fund Advisors
Investments in the Fund are subject to the risks of the Fund’s underlying funds. The Fund is designed to provide diversification across a variety of asset classes, primarily by investing in underlying funds. Therefore, in addition to the expenses of the Fund, each investor is indirectly paying a proportionate share of the applicable fees and expenses of its underlying funds.
The Fund is subject to different levels of risk, based on the types and sizes of its underlying asset class allocations and its allocation strategy. In addition, the Fund’s underlying funds may be subject to specific investment risks, including
46
| | |
| Fund Commentary (con’t.) | | Nationwide Investor Destinations Moderately Conservative Fund |
but not limited to: stock market risk (equity securities); default risk and interest rate risk — if interest rates go up, bond prices go down and if interest rates go down, bond prices go up (bonds); and currency fluctuations, political risks, and differences in accounting and availability of information (international securities). Please refer to the most recent prospectus for a more detailed explanation of the Fund’s principal risks.
The Fund may invest in the Nationwide Fixed Contract, which is a fixed interest contract issued and guaranteed by Nationwide Life Insurance Company (Nationwide), an affiliate of the Fund’s investment adviser, Nationwide Fund Advisors. If Nationwide becomes unable to meet this guarantee, a Fund that invests in the Nationwide Fixed Contract may lose money from unpaid principal or unpaid or reduced interest.
Asset allocation is the process of spreading assets across several different investment styles and asset classes. The purpose is to potentially reduce long-term risk and capture potential profits across various asset classes.
Nationwide Asset Management, LLC (NWAM) provides asset allocation consulting services to Nationwide Fund Advisors (NFA), the Fund’s investment adviser. NWAM is a registered investment adviser and wholly owned subsidiary of Nationwide Mutual Insurance Company, and therefore is affiliated with NFA. NFA makes both the asset allocation and underlying fund selection decisions for the Fund. In addition, NWAM serves as the subadviser to certain other Nationwide Funds.
There is no assurance that the investment objective of any fund (or that of any underlying fund) will be achieved or that a diversified portfolio will produce better results than a nondiversified portfolio. Diversification does not guarantee returns or insulate an investor from potential losses, including the possible loss of principal.
A description of the benchmarks can be found on the Market Index Definitions page at the back of this book.
Nationwide Investor Destinations Moderately Conservative Fund
(October 31, 2014)
| | | | | | | | |
| Underlying Fund or Contract | | Actual
Allocation
to Fund | | | Contribution
to Fund
Performance | |
| Nationwide Bond Index Fund Institutional Class | | | 20% | | | | 0.81% | |
| Nationwide Fixed Contract | | | 15% | | | | 0.53% | |
| Nationwide S&P 500 Index Fund Institutional Class | | | 13% | | | | 2.21% | |
| Nationwide International Index Fund Institutional Class | | | 10% | | | | 0.01% | |
| Nationwide Portfolio Completion Fund Institutional Class | | | 10% | | | | 0.27% | |
| Nationwide HighMark Short Term Bond Fund Institutional Class | | | 10% | | | | 0.10% | |
| Nationwide Mid Cap Market Index Fund Institutional Class | | | 7% | | | | 0.79% | |
| Nationwide Inflation-Protected Securities Fund Institutional Class | | | 5% | | | | 0.10% | |
| Nationwide Core Plus Bond Fund Institutional Class | | | 4% | | | | 0.15% | |
| Nationwide Ziegler Equity Income Fund Institutional Class | | | 3% | | | | 0.42% | |
| Nationwide Small Cap Index Fund Institutional Class | | | 3% | | | | 0.24% | |
| | | | 100% | | | | | |
Actual underlying allocations are stated as a percentage of the Fund’s total net assets. Nationwide Fund Advisors (NFA), the investment adviser to the Fund, may add or delete asset classes or change allocations at any time and without notice in order for the Fund to meet its objective or due to market and/or economic conditions. NFA applies a long-term investment horizon with respect to the Fund, and allocation changes are not likely to be made in response to short-term market conditions.
The contribution of underlying funds to Fund performance is based on target underlying fund allocations through the reporting period. Returns reflect the impact of each underlying fund’s fees and expenses, but do not reflect the Nationwide Investor Destinations Moderately Conservative Fund’s fees and expenses. Day-to-day market activity will likely cause the Fund’s target allocations to fluctuate. Under ordinary circumstances, NFA periodically will rebalance the assets of the Fund in order to conform its actual allocations to those stated in the then-current prospectus. For more information, refer to the Fund’s prospectus.
47
| | |
| Fund Overview | | Nationwide Investor Destinations Moderately Conservative Fund |
Objective
The Fund seeks to maximize total investment return for a moderately conservative level of risk.
Highlights
| | Ÿ | | All of the Fund’s underlying allocations posted positive returns during the reporting period | |
| | Ÿ | | The Fund’s investments in U.S. equity mutual funds accounted for 26% of its allocations and were the largest contributors of the return of the Fund during the reporting period | |
| | Ÿ | | Although short-term bond interest rates remained low, the Fund’s 15% allocation to the Nationwide Fixed Contract contributed 0.53% to the Fund’s overall return during the reporting period | |
Asset Allocation†
| | | | |
| Fixed Income Funds | | | 38.8% | |
| Equity Funds | | | 36.2% | |
| Fixed Contract | | | 15.0% | |
| Asset Allocation Fund | | | 10.0% | |
| Liabilities in excess of other assets †† | | | 0.0% | |
| | | | 100.0% | |
Top Holdings†††
| | | | |
| Nationwide Bond Index Fund, Institutional Class | | | 19.8% | |
| Nationwide Fixed Contract | | | 15.0% | |
| Nationwide S&P 500 Index Fund, Institutional Class | | | 13.1% | |
| Nationwide HighMark Short Term Bond Fund, Institutional Class | | | 10.0% | |
| Nationwide Portfolio Completion Fund, Institutional Class | | | 10.0% | |
| Nationwide International Index Fund, Institutional Class | | | 9.9% | |
| Nationwide Mid Cap Market Index Fund, Institutional Class | | | 7.1% | |
| Nationwide Inflation-Protected Securities Fund, Institutional Class | | | 5.0% | |
| Nationwide Core Plus Bond Fund, Institutional Class | | | 4.0% | |
| Nationwide Ziegler Equity Income Fund, Institutional Class | | | 3.1% | |
| Nationwide Small Cap Index Fund, Institutional Class | | | 3.0% | |
| | | | 100.0% | |
| † | Percentages indicated are based upon net assets as of October 31, 2014. |
| †† | Amount rounds to less than 0.1%. |
| ††† | Percentages indicated are based upon total investments as of October 31, 2014. |
48
| | |
| Fund Performance | | Nationwide Investor Destinations Moderately Conservative Fund |
Average Annual Total Return
(For periods ended October 31, 2014)
| | | | | | | | | | | | | | | | | | |
| | | 1 Yr. | | | 5 Yr. | | | 10 Yr. | | | Inception | |
| Class A | | w/o SC1 | | | 4.95% | | | | 6.99% | | | | 5.17% | | | | – | |
| | | w/ SC2 | | | (1.10)% | | | | 5.73% | | | | 4.55% | | | | – | |
| Class C | | w/o SC1 | | | 4.17% | | | | 6.25% | | | | 4.43% | | | | – | |
| | | w/SC3 | | | 3.21% | | | | 6.25% | | | | 4.43% | | | | – | |
| Class R4,5 | | | | | 4.63% | | | | 6.63% | | | | 4.87% | | | | – | |
| Institutional Service Class4 | | | | | – | | | | – | | | | – | | | | 3.06%6* | |
| Institutional Class4,7 | | | | | 5.38% | | | | 7.33% | | | | – | | | | 5.23%6 | |
| Service Class4 | | | | | 4.88% | | | | 6.89% | | | | 5.06% | | | | – | |
| Barclays U.S. Aggregate Bond Index | | | | | 4.14% | | | | 4.22% | | | | 4.64% | | | | – | |
| Russell 3000® Index | | | | | 16.07% | | | | 17.01% | | | | 8.55% | | | | – | |
| MSCI EAFE® Index | | | | | (0.60)% | | | | 6.52% | | | | 5.81% | | | | – | |
| Barclays U.S. 1-3 Year Gov’t/Credit Bond Index | | | | | 0.89% | | | | 1.45% | | | | 2.84% | | | | – | |
| Citigroup 3-Month T-Bill Index | | | | | 0.04% | | | | 0.07% | | | | 1.50% | | | | – | |
| S&P 500® Index | | | | | 17.27% | | | | 16.69% | | | | 8.20% | | | | – | |
| Composite Index | | | | | 6.07% | | | | 7.42% | | | | 5.52% | | | | – | |
| CPI | | | | | 1.66% | | | | 1.89% | | | | 2.21% | | | | – | |
All figures showing the effect of a sales charge (SC) reflect the maximum charge possible, because it has the most significant effect on performance data.
| 1 | These returns do not reflect the effects of SCs. |
| 2 | A 5.75% front-end sales charge was deducted. |
| 3 | A 1.00% CDSC was deducted from the one year return because it is charged when you sell Class C shares within the first year after purchase. |
| 4 | Not subject to any SCs. |
| 5 | Effective February 28, 2009, Class R Shares were renamed Class R2 Shares. Effective March 3, 2014, Class R2 Shares were renamed Class R Shares. |
| 6 | Since inception date of March 3, 2014. |
| 7 | These returns until the creation of Institutional Class shares (12/29/04) include the performance of the Fund’s Class B shares. The returns have been adjusted for the fact that Institutional Class shares do not have any applicable SCs but have not been adjusted for the lower expenses applicable to Institutional Class shares. Excluding the effect of any fee waivers or reimbursements, such prior performance is similar to what Institutional Class shares would have produced because the Institutional Class shares invest in the same portfolio of securities as Class B shares. Effective February 21, 2014, Class B shares were converted into Class A shares. |
Expense Ratios
| | |
| | | Expense Ratio^ |
| Class A | | 0.88% |
| Class C | | 1.55% |
| Class R | | 1.15% |
| Institutional Service Class | | 0.63% |
| Institutional Class | | 0.50% |
| Service Class | | 0.90% |
| ^ | Current effective prospectus dated March 1, 2014 (as revised March 26, 2014). The expense ratio also includes indirect underlying fund expenses. Please see the Fund’s most recent prospectus for details. Please refer to the Financial Highlights for each respective share class’ actual results. |
49
| | |
| Fund Performance (con’t.) | | Nationwide Investor Destinations Moderately Conservative Fund |
Performance of a $50,000 Investment
Investment return and principal value will fluctuate, and when redeemed, shares may be worth more or less than original cost. Past performance is no guarantee of future results and does not reflect the deduction of taxes that a shareholder would pay on fund distributions or the redemption of fund shares. Investing in mutual funds involves market risk, including loss of principal. Performance returns assume the reinvestment of all distributions.
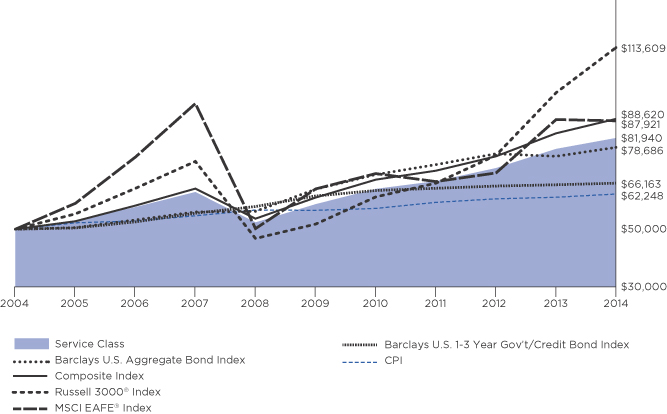
Comparative performance of $50,000 invested in Service Class shares of the Nationwide Investor Destinations Moderately Conservative Fund versus the Barclays U.S. Aggregate Bond Index, the Russell 3000® Index, the MSCI EAFE® Index, the Barclays U.S. 1-3 Year Government/Credit Bond Index, the Composite Index* and the Consumer Price Index (CPI) over the 10-year period ended 10/31/14. Unlike the Fund, the performance for these unmanaged indexes does not reflect any fees, expenses, or sales charges. Investors cannot invest directly in market indexes. A description of the benchmarks can be found on the Market Index Definitions page at the back of this book.
| * | The Composite Index comprises 30% Russell 3000® Index, 35% Barclays U.S. Aggregate Bond Index, 10% MSCI EAFE® Index and 25% Barclays U.S. 1-3 Year Gov’t/Credit Bond Index. |
50
| | |
| Shareholder Expense Example | | Nationwide Investor Destinations Moderately Conservative Fund |
As a shareholder of the Fund, you incur two types of costs: (1) transaction costs, including sales charges (loads) paid on purchase payments and redemption fees; and (2) ongoing costs, including investment advisory fees, administration fees, distribution fees and other Fund expenses. The examples below are intended to help you understand your ongoing costs (in dollars) of investing in the Fund and to compare these costs with the ongoing costs of investing in other mutual funds. Per Securities and Exchange Commission (“SEC”) requirements, the examples assume that you had a $1,000 investment in the Class at the beginning of the reporting period (May 1, 2014) and continued to hold your shares at the end of the reporting period (October 31, 2014).
Actual Expenses
For each Class of the Fund in the table below, the first line provides information about actual account values and actual expenses. You may use the information in this line, together with the amount you invested, to estimate the expenses that you paid from May 1, 2014 through October 31, 2014. Simply divide your account value by $1,000 (for example, an $8,600 account value divided by $1,000 = 8.6), then multiply the result by the number in the first line of each Class under the heading entitled “Expenses Paid During Period” to estimate the expenses you paid on your account during this period.
Hypothetical Expenses for Comparison Purposes
The second line of each Class in the table below provides information about hypothetical account values and hypothetical expenses based on the Class’ actual expense ratio and an assumed rate of return of 5% per year before expenses, which is not the Class’ actual return. The hypothetical account values and expenses may not be used to estimate the actual ending account balance or expenses you paid for the period from May 1, 2014 through October 31, 2014. You may use this information to compare the ongoing costs of investing in the Class of the Fund and other funds. To do so, compare this 5% hypothetical example with the 5% hypothetical examples that appear in the shareholder reports of the other funds.
Please note that the expenses shown in the table are meant to highlight your ongoing costs only and do not reflect any transaction costs, such as sales charges (loads) or redemption fees. If these transaction costs were included, your costs would have been higher. Therefore, the second line for each Class in the table is useful in comparing ongoing costs only, and will not help you determine the relative total costs of owning different funds. The examples also assume all dividends and distributions are reinvested.
Schedule of Shareholder Expenses
Expense Analysis of a $1,000 Investment
| | | | | | | | | | | | |
Nationwide Investor Destinations
Moderately Conservative Fund October 31, 2004 | | | Beginning
Account Value ($)
05/01/14 | | Ending
Account Value ($)
10/31/14 | | Expenses Paid
During Period ($)
05/01/14 - 10/31/14(a) | | Expense Ratio
During Period (%)
05/01/14 - 10/31/14(a) |
| Class A Shares | | | Actual | (b) | | 1,000.00 | | 1,017.90 | | 2.90 | | 0.57 |
| | | | Hypothetical | (b)(c) | | 1,000.00 | | 1,022.33 | | 2.91 | | 0.57 |
| Class C Shares | | | Actual | (b) | | 1,000.00 | | 1,014.50 | | 6.50 | | 1.28 |
| | | | Hypothetical | (b)(c) | | 1,000.00 | | 1,018.75 | | 6.51 | | 1.28 |
| Class R Shares(d) | | | Actual | (b) | | 1,000.00 | | 1,017.40 | | 4.32 | | 0.85 |
| | | | Hypothetical | (b)(c) | | 1,000.00 | | 1,020.92 | | 4.33 | | 0.85 |
| Institutional Service Class Shares | | | Actual | (b) | | 1,000.00 | | 1,020.10 | | 1.17 | | 0.23 |
| | | | Hypothetical | (b)(c) | | 1,000.00 | | 1,024.05 | | 1.17 | | 0.23 |
| Institutional Class Shares | | | Actual | (b) | | 1,000.00 | | 1,020.60 | | 1.02 | | 0.20 |
| | | | Hypothetical | (b)(c) | | 1,000.00 | | 1,024.20 | | 1.02 | | 0.20 |
| Service Class Shares | | | Actual | (b) | | 1,000.00 | | 1,018.60 | | 3.05 | | 0.60 |
| | | | Hypothetical | (b)(c) | | 1,000.00 | | 1,022.18 | | 3.06 | | 0.60 |
| (a) | Expenses are based on the direct expenses of the Fund and do not include the effect of the underlying Funds’ expenses, which are disclosed in the Fee and Expense table and described more fully in a footnote to that table in your Fund Prospectus. |
| (b) | Expenses are equal to the Fund’s annualized expense ratio multiplied by the average account value from May 1, 2014 through October 31, 2014 multiplied to reflect one-half year period. The expense ratio presented represents a six-month, annualized ratio in accordance with Securities and Exchange Commission guidelines. |
| (c) | Represents the hypothetical 5% return before expenses. |
| (d) | Effective March 3, 2014 Class R2 Shares were renamed Class R Shares. |
51
Statement of Investments
October 31, 2014
Nationwide Investor Destinations Moderately Conservative Fund
| | | | | | | | | | |
| | | Mutual Funds 85.0% | |
| | | |
| | | | | Shares | | | Market
Value | |
| | | |
| | | | | | | | | | |
| | Asset Allocation Fund 10.0% | |
| | Nationwide Portfolio Completion Fund, Institutional Class (a) | | | 5,987,241 | | | $ | 59,573,052 | |
| | | | | | | | | | |
| | |
| | Total Asset Allocation Fund
(cost $58,073,772) | | | | 59,573,052 | |
| | | | | | | | | | |
| | | |
| | Equity Funds 36.2% | |
| | Nationwide International Index Fund, Institutional Class (a) | | | 7,253,420 | | | | 59,332,974 | |
| | Nationwide Mid Cap Market Index Fund, Institutional Class (a) | | | 2,132,093 | | | | 42,279,411 | |
| | Nationwide S&P 500 Index Fund, Institutional Class (a) | | | 5,016,274 | | | | 78,003,054 | |
| | Nationwide Small Cap Index Fund, Institutional Class (a) | | | 1,127,051 | | | | 17,886,298 | |
| | Nationwide Ziegler Equity Income Fund, Institutional Class (a) | | | 1,326,412 | | | | 18,463,648 | |
| | | | | | | | | | |
| | |
| | Total Equity Funds
(cost $164,987,820) | | | | 215,965,385 | |
| | | | | | | | | | |
| | | |
| | Fixed Income Funds 38.8% | |
| | Nationwide Bond Index Fund, Institutional Class (a) | | | 10,441,133 | | | | 117,880,392 | |
| | Nationwide Core Plus Bond Fund, Institutional Class (a) | | | 2,315,382 | | | | 23,825,280 | |
| | Nationwide HighMark Short Term Bond Fund, Institutional Class (a) | | | 5,951,980 | | | | 59,638,836 | |
| | Nationwide Inflation-Protected Securities Fund, Institutional Class (a) | | | 3,100,565 | | | | 29,672,403 | |
| | | | | | | | | | |
| | |
| | Total Fixed Income Funds
(cost $234,781,175) | | | | 231,016,911 | |
| | | | | | | | | | |
| | |
| | Total Mutual Funds
(cost $457,842,767) | | | | 506,555,348 | |
| | | | | | | | | | |
| | | | | | | | | | |
| | | Fixed Contract 15.0% | |
| | | |
| | | | | Principal
Amount | | | | |
| | | |
| | Nationwide Fixed Contract, 3.50% (a)(b)(c) | | $ | 89,187,160 | | | | 89,187,160 | |
| | | | | | | | | | |
| | |
| | Total Fixed Contract
(cost $89,187,160) | | | | 89,187,160 | |
| | | | | | | | | | |
| | |
| | Total Investments
(cost $547,029,927) (d) — 100.0% | | | | 595,742,508 | |
| | |
| | Liabilities in excess of other
assets — 0.0%†† | | | | (230,406 | ) |
| | | | | | | | | | |
| | |
| | NET ASSETS — 100.0% | | | $ | 595,512,102 | |
| | | | | | | | | | |
| | (a) | Investment in affiliate. |
| | (c) | The Nationwide Fixed Contract interest rate changes quarterly. The contract is restricted and has been deemed liquid pursuant to procedures approved by the Board of Trustees. Please refer to Note 2(a) for additional information on the contract. |
| | (d) | See notes to financial statements for tax cost and unrealized appreciation/(depreciation) of securities. |
| | †† | Amount rounds to less than 0.1%. |
The accompanying notes are an integral part of these financial statements.
52
Statement of Assets and Liabilities
October 31, 2014
| | | | | | |
| | | Nationwide
Investor Destinations
Moderately
Conservative Fund |
Assets: | | | | | | |
Investments in affiliates, at value (cost $547,029,927) | | $ | 595,742,508 | | | |
Receivable for investments sold | | | 918,871 | | | |
Receivable for capital shares issued | | | 554,051 | | | |
Prepaid expenses | | | 38,702 | | | |
| | | | | | |
Total Assets | | | 597,254,132 | | | |
| | | | | | |
Liabilities: | | | | | | |
Payable for capital shares redeemed | | | 1,399,604 | | | |
Accrued expenses and other payables: | | | | | | |
Investment advisory fees | | | 64,914 | | | |
Fund administration fees | | | 17,079 | | | |
Distribution fees | | | 153,646 | | | |
Administrative servicing fees | | | 77,912 | | | |
Accounting and transfer agent fees | | | 5,983 | | | |
Trustee fees | | | 1,783 | | | |
Custodian fees | | | 1,809 | | | |
Compliance program costs (Note 3) | | | 165 | | | |
Professional fees | | | 13,427 | | | |
Printing fees | | | 3,923 | | | |
Other | | | 1,785 | | | |
| | | | | | |
Total Liabilities | | | 1,742,030 | | | |
| | | | | | |
Net Assets | | $ | 595,512,102 | | | |
| | | | | | |
| | |
Represented by: | | | | | | |
Capital | | $ | 545,267,845 | | | |
Accumulated undistributed net investment income | | | 500,233 | | | |
Accumulated net realized gains from affiliated investments | | | 1,031,443 | | | |
Net unrealized appreciation/(depreciation) from investments in affiliates | | | 48,712,581 | | | |
| | | | | | |
Net Assets | | $ | 595,512,102 | | | |
| | | | | | |
| | |
Net Assets: | | | | | | |
Class A Shares | | $ | 58,734,361 | | | |
Class C Shares | | | 55,313,487 | | | |
Class R Shares | | | 83,675,301 | | | |
Institutional Service Class Shares | | | 2,070,270 | | | |
Institutional Class Shares | | | 111,372,125 | | | |
Service Class Shares | | | 284,346,558 | | | |
| | | | | | |
Total | | $ | 595,512,102 | | | |
| | | | | | |
Shares Outstanding (unlimited number of shares authorized): | | | | | | |
Class A Shares | | | 5,497,597 | | | |
Class C Shares | | | 5,202,497 | | | |
Class R Shares | | | 7,821,691 | | | |
Institutional Service Class Shares | | | 192,539 | | | |
Institutional Class Shares | | | 10,326,129 | | | |
Service Class Shares | | | 26,475,687 | | | |
| | | | | | |
Total | | | 55,516,140 | | | |
| | | | | | |
| | | | | | |
| | | | | | |
53
Statement of Assets and Liabilities (Continued)
October 31, 2014
| | | | | | |
| | | Nationwide
Investor Destinations
Moderately
Conservative Fund |
Net asset value and redemption price per share (Net assets by class divided by shares outstanding by class, respectively): | | | | | | |
Class A Shares (a) | | $ | 10.68 | | | |
Class C Shares (b) | | $ | 10.63 | | | |
Class R Shares | | $ | 10.70 | | | |
Institutional Service Class Shares | | $ | 10.75 | | | |
Institutional Class Shares | | $ | 10.79 | | | |
Service Class Shares | | $ | 10.74 | | | |
Maximum offering price per share (100%/(100%-maximum sales charge) of net asset value adjusted to the nearest cent): | | | | | | |
Class A Shares | | $ | 11.33 | | | |
| | | | | | |
Maximum Sales Charge: | | | | | | |
Class A Shares | | | 5.75 | % | | |
| | | | | | |
| | | | | | |
| | | | | | |
| | | | | | |
| | | | | | |
| | | | | | |
| | | | | | |
| | | | | | |
| | | | | | |
| | | | | | |
| | | | | | |
| | | | | | |
| | | | | | |
| | | | | | |
| | | | | | |
| | | | | | |
| | | | | | |
| | | | | | |
| | | | | | |
| | | | | | |
| | | | | | |
| | | | | | |
| | | | | | |
| | | | | | |
| | | | | | |
| | | | | | |
| | | | | | |
| | | | | | |
| | | | | | |
| | | | | | | |
| (a) | For Class A Shares that were purchased without a sales charge because such purchase exceeded $1,000,000, a contingent deferred sales charge of 1.00% may apply to any redemption of such shares within 18 months of their purchase. |
| (b) | For Class C Shares, the redemption price per share is reduced by a contingent deferred sales charge of 1.00% for shares held less than one year. |
The accompanying notes are an integral part of these financial statements.
54
Statement of Operations
For the Period Ended October 31, 2014
| | | | | | |
| | | Nationwide
Investor Destinations
Moderately
Conservative Fund |
INVESTMENT INCOME: | | | | | | |
Dividend income from affiliates | | $ | 9,413,463 | | | |
Interest income from affiliates | | | 3,018,446 | | | |
| | | | | | |
Total Income | | | 12,431,909 | | | |
| | | | | | |
EXPENSES: | | | | | | |
Investment advisory fees | | | 764,286 | | | |
Fund administration fees | | | 197,533 | | | |
Distribution fees Class A | | | 136,841 | | | |
Distribution fees Class B (a) | | | 2,472 | | | |
Distribution fees Class C | | | 515,187 | | | |
Distribution fees Class R (b) | | | 431,949 | | | |
Distribution fees Service Class | | | 731,635 | | | |
Administrative servicing fees Class A | | | 60,533 | | | |
Administrative servicing fees Class C | | | 25,892 | | | |
Administrative servicing fees Class R (b) | | | 129,585 | | | |
Administrative servicing fees Institutional Service Class (c) | | | 106 | | | |
Administrative servicing fees Service Class | | | 438,983 | | | |
Registration and filing fees | | | 78,476 | | | |
Professional fees | | | 48,924 | | | |
Printing fees | | | 15,945 | | | |
Trustee fees | | | 19,196 | | | |
Custodian fees | | | 21,997 | | | |
Accounting and transfer agent fees | | | 45,925 | | | |
Compliance program costs (Note 3) | | | 1,727 | | | |
Other | | | 13,637 | | | |
| | | | | | |
Total expenses before earnings credit | | | 3,680,829 | | | |
| | | | | | |
Earnings credit (Note 5) | | | (17 | ) | | |
| | | | | | |
Net Expenses | | | 3,680,812 | | | |
| | | | | | |
NET INVESTMENT INCOME | | | 8,751,097 | | | |
| | | | | | |
REALIZED/UNREALIZED GAINS (LOSSES) FROM INVESTMENTS: | | | | | | |
Net realized gain distributions from underlying affiliated funds | | | 10,154,623 | | | |
Net realized gains from investment transactions with affiliates | | | 5,069,612 | | | |
| | | | | | |
Net realized gains from affiliated investments | | | 15,224,235 | | | |
| | | | | | |
Net change in unrealized appreciation/(depreciation) from investments in affiliates | | | 3,923,073 | | | |
| | | | | | |
Net realized/unrealized gains from affiliated investments | | | 19,147,308 | | | |
| | | | | | |
CHANGE IN NET ASSETS RESULTING FROM OPERATIONS | | $ | 27,898,405 | | | |
| | | | | | |
| | | | | | |
| | | | | | |
| | | | | | |
| | | | | | |
| | | | | | |
| | | | | | | |
| (a) | Effective February 21, 2014, Class B Shares were converted into Class A Shares. |
| (b) | Effective March 3, 2014, Class R2 Shares were renamed Class R Shares. |
| (c) | For the period from March 4, 2014 (commencement of operations) through October 31, 2014. |
The accompanying notes are an integral part of these financial statements.
55
Statements of Changes in Net Assets
| | | | | | | | | | | | |
| | | Nationwide Investor Destinations
Moderately Conservative Fund |
| | | Year Ended
October 31, 2014 | | Year Ended
October 31, 2013 |
Operations: | | | | | | | | | | | | |
Net investment income | | $ | 8,751,097 | | | | | $ | 8,373,672 | | | |
Net realized gains from affiliated investments | | | 15,224,235 | | | | | | 44,896,240 | | | |
Net change in unrealized appreciation/(depreciation) from investments in affiliates | | | 3,923,073 | | | | | | (1,962,287 | ) | | |
| | | | | | | | | |
Change in net assets resulting from operations | | | 27,898,405 | | | | | | 51,307,625 | | | |
| | | | | | | | | |
| | | | |
Distributions to Shareholders From: | | | | | | | | | | | | |
Net investment income: | | | | | | | | | | | | |
Class A | | | (903,512 | ) | | | | | (790,719 | ) | | |
Class B (a) | | | (4,766 | ) | | | | | (11,210 | ) | | |
Class C | | | (497,299 | ) | | | | | (442,720 | ) | | |
Class R (b) | | | (1,181,605 | ) | | | | | (1,172,443 | ) | | |
Institutional Service Class | | | (2,557 | )(c) | | | | | – | | | |
Institutional Class | | | (2,009,152 | ) | | | | | (1,593,164 | ) | | |
Service Class | | | (4,710,564 | ) | | | | | (4,898,835 | ) | | |
Net realized gains: | | | | | | | | | | | | |
Class A | | | (3,513,884 | ) | | | | | (626,934 | ) | | |
Class B (a) | | | (54,900 | ) | | | | | (18,026 | ) | | |
Class C | | | (3,262,285 | ) | | | | | (594,060 | ) | | |
Class R (b) | | | (5,946,445 | ) | | | | | (1,190,565 | ) | | |
Institutional Service Class | | | – | (c) | | | | | – | | | |
Institutional Class | | | (6,388,104 | ) | | | | | (1,028,081 | ) | | |
Service Class | | | (20,230,961 | ) | | | | | (4,228,483 | ) | | |
| | | | | | | | | |
Change in net assets from shareholder distributions | | | (48,706,034 | ) | | | | | (16,595,240 | ) | | |
| | | | | | | | | |
Change in net assets from capital transactions | | | 36,499,515 | | | | | | (2,485,220 | ) | | |
| | | | | | | | | |
Change in net assets | | | 15,691,886 | | | | | | 32,227,165 | | | |
| | | | | | | | | |
| | | | |
Net Assets: | | | | | | | | | | | | |
Beginning of year | | | 579,820,216 | | | | | | 547,593,051 | | | |
| | | | | | | | | |
End of year | | $ | 595,512,102 | | | | | $ | 579,820,216 | | | |
| | | | | | | | | |
Accumulated undistributed net investment income at end of year | | $ | 500,233 | | | | | $ | 661,891 | | | |
| | | | | | | | | |
| | | | |
CAPITAL TRANSACTIONS: | | | | | | | | | | | | |
Class A Shares | | | | | | | | | | | | |
Proceeds from shares issued | | $ | 23,332,546 | | | | | $ | 16,704,699 | | | |
Proceeds from shares issued from class conversion | | | 607,783 | | | | | | – | | | |
Dividends reinvested | | | 3,079,322 | | | | | | 1,013,536 | | | |
Cost of shares redeemed | | | (15,278,212 | ) | | | | | (16,171,370 | ) | | |
| | | | | | | | | |
Total Class A Shares | | | 11,741,439 | | | | | | 1,546,865 | | | |
| | | | | | | | | |
Class B Shares (a) | | | | | | | | | | | | |
Proceeds from shares issued | | | 3,131 | | | | | | 57,939 | | | |
Dividends reinvested | | | 58,311 | | | | | | 25,751 | | | |
Cost of shares redeemed in class conversion | | | (607,783 | ) | | | | | – | | | |
Cost of shares redeemed | | | (302,833 | ) | | | | | (739,852 | ) | | |
| | | | | | | | | |
Total Class B Shares | | | (849,174 | ) | | | | | (656,162 | ) | | |
| | | | | | | | | |
| | | | | | | | | | | | |
| (a) | Effective February 21, 2014, Class B Shares were converted into Class A Shares. |
| (b) | Effective March 3, 2014, Class R2 Shares were renamed Class R Shares. |
| (c) | For the period from March 4, 2014 (commencement of operations) through October 31, 2014. |
56
Statements of Changes in Net Assets (Continued)
| | | | | | | | | | | | |
| | | Nationwide Investor Destinations
Moderately Conservative Fund |
| | | Year Ended
October 31, 2014 | | Year Ended
October 31, 2013 |
CAPITAL TRANSACTIONS: (continued) | | | | | | | | | | | | |
Class C Shares | | | | | | | | | | | | |
Proceeds from shares issued | | $ | 17,151,764 | | | | | $ | 10,964,387 | | | |
Dividends reinvested | | | 2,120,357 | | | | | | 502,323 | | | |
Cost of shares redeemed | | | (9,165,457 | ) | | | | | (8,616,439 | ) | | |
| | | | | | | | | |
Total Class C Shares | | | 10,106,664 | | | | | | 2,850,271 | | | |
| | | | | | | | | |
Class R Shares (b) | | | | | | | | | | | | |
Proceeds from shares issued | | | 10,205,993 | | | | | | 9,853,636 | | | |
Dividends reinvested | | | 6,892,215 | | | | | | 2,282,342 | | | |
Cost of shares redeemed | | | (18,473,547 | ) | | | | | (15,025,660 | ) | | |
| | | | | | | | | |
Total Class R Shares | | | (1,375,339 | ) | | | | | (2,889,682 | ) | | |
| | | | | | | | | |
Institutional Service Class Shares | | | | | | | | | | | | |
Proceeds from shares issued | | | 2,130,820 | (c) | | | | | – | | | |
Dividends reinvested | | | 2,557 | (c) | | | | | – | | | |
Cost of shares redeemed | | | (85,693 | )(c) | | | | | – | | | |
| | | | | | | | | |
Total Institutional Service Class Shares | | | 2,047,684 | (c) | | | | | – | | | |
| | | | | | | | | |
Institutional Class Shares | | | | | | | | | | | | |
Proceeds from shares issued | | | 30,154,011 | | | | | | 59,582,114 | | | |
Dividends reinvested | | | 8,395,081 | | | | | | 2,620,089 | | | |
Cost of shares redeemed | | | (17,337,575 | ) | | | | | (44,476,814 | ) | | |
| | | | | | | | | |
Total Institutional Class Shares | | | 21,211,517 | | | | | | 17,725,389 | | | |
| | | | | | | | | |
Service Class Shares | | | | | | | | | | | | |
Proceeds from shares issued | | | 37,612,776 | | | | | | 39,820,384 | | | |
Dividends reinvested | | | 24,940,540 | | | | | | 9,127,318 | | | |
Cost of shares redeemed | | | (68,936,592 | ) | | | | | (70,009,603 | ) | | |
| | | | | | | | | |
Total Service Class Shares | | | (6,383,276 | ) | | | | | (21,061,901 | ) | | |
| | | | | | | | | |
Change in net assets from capital transactions | | $ | 36,499,515 | | | | | $ | (2,485,220 | ) | | |
| | | | | | | | | |
SHARE TRANSACTIONS: | | | | | | | | | | | | |
Class A Shares | | | | | | | | | | | | |
Issued | | | 2,193,771 | | | | | | 1,554,739 | | | |
Issued in class conversion | | | 58,209 | | | | | | – | | | |
Reinvested | | | 297,377 | | | | | | 97,016 | | | |
Redeemed | | | (1,443,682 | ) | | | | | (1,505,531 | ) | | |
| | | | | | | | | |
Total Class A Shares | | | 1,105,675 | | | | | | 146,224 | | | |
| | | | | | | | | |
Class B Shares (a) | | | | | | | | | | | | |
Issued | | | 296 | | | | | | 5,355 | | | |
Reinvested | | | 5,456 | | | | | | 2,473 | | | |
Redeemed in class conversion | | | (57,974 | ) | | | | | – | | | |
Redeemed | | | (28,426 | ) | | | | | (69,551 | ) | | |
| | | | | | | | | |
Total Class B Shares | | | (80,648 | ) | | | | | (61,723 | ) | | |
| | | | | | | | | |
| | | | | | | | | | | | |
| | | | | | | | | | | | |
| | | | | | | | | | | | |
| (a) | Effective February 21, 2014, Class B Shares were converted into Class A Shares. |
| (b) | Effective March 3, 2014, Class R2 Shares were renamed Class R Shares. |
| (c) | For the period from March 4, 2014 (commencement of operations) through October 31, 2014. |
57
Statements of Changes in Net Assets (Continued)
| | | | | | | | | | | | |
| | | Nationwide Investor Destinations
Moderately Conservative Fund |
| | | Year Ended
October 31, 2014 | | Year Ended
October 31, 2013 |
SHARE TRANSACTIONS: (continued) | | | | | | | | | | | | |
Class C Shares | | | | | | | | | | | | |
Issued | | | 1,624,684 | | | | | | 1,028,773 | | | |
Reinvested | | | 205,906 | | | | | | 48,420 | | | |
Redeemed | | | (864,577 | ) | | | | | (811,185 | ) | | |
| | | | | | | | | |
Total Class C Shares | | | 966,013 | | | | | | 266,008 | | | |
| | | | | | | | | |
Class R Shares (b) | | | | | | | | | | | | |
Issued | | | 964,420 | | | | | | 922,547 | | | |
Reinvested | | | 665,030 | | | | | | 218,515 | | | |
Redeemed | | | (1,742,612 | ) | | | | | (1,404,329 | ) | | |
| | | | | | | | | |
Total Class R Shares | | | (113,162 | ) | | | | | (263,267 | ) | | |
| | | | | | | | | |
Institutional Service Class Shares | | | | | | | | | | | | |
Issued | | | 200,465 | (c) | | | | | – | | | |
Reinvested | | | 239 | (c) | | | | | – | | | |
Redeemed | | | (8,165 | )(c) | | | | | – | | | |
| | | | | | | | | |
Total Institutional Service Class Shares | | | 192,539 | (c) | | | | | – | | | |
| | | | | | | | | |
Institutional Class Shares | | | | | | | | | | | | |
Issued | | | 2,821,603 | | | | | | 5,491,565 | | | |
Reinvested | | | 803,170 | | | | | | 248,037 | | | |
Redeemed | | | (1,621,254 | ) | | | | | (4,095,776 | ) | | |
| | | | | | | | | |
Total Institutional Class Shares | | | 2,003,519 | | | | | | 1,643,826 | | | |
| | | | | | | | | |
Service Class Shares | | | | | | | | | | | | |
Issued | | | 3,520,508 | | | | | | 3,699,770 | | | |
Reinvested | | | 2,398,310 | | | | | | 870,046 | | | |
Redeemed | | | (6,454,494 | ) | | | | | (6,484,136 | ) | | |
| | | | | | | | | |
Total Service Class Shares | | | (535,676 | ) | | | | | (1,914,320 | ) | | |
| | | | | | | | | |
Total change in shares | | | 3,538,260 | | | | | | (183,252 | ) | | |
| | | | | | | | | |
| | | | | | | | | | | | |
| | | | | | | | | | | | |
| | | | | | | | | | | | |
| | | | | | | | | | | | |
| | | | | | | | | | | | |
| | | | | | | | | | | | |
| | | | | | | | | | | | |
| | | | | | | | | | | | |
| | | | | | | | | | | | |
| | | | | | | | | | | | |
| | | | | | | | | | | | |
| | | | | | | | | | | | |
| | | | | | | | | | | | |
| | | | | | | | | | | | |
| | | | | | | | | | | | | |
Amount designated as “–” is zero or has been rounded to zero.
| (b) | Effective March 3, 2014, Class R2 Shares were renamed Class R Shares. |
| (c) | For the period from March 4, 2014 (commencement of operations) through October 31, 2014. |
The accompanying notes are an integral part of these financial statements.
58
Financial Highlights
Selected data for each share of capital outstanding throughout the periods indicated
Nationwide Investor Destinations Moderately Conservative Fund
| | | | | | | | | | | | | | | | | | | | | | | | | | | | | | | | | | | | | | | | | | | | | | | | | | | | | | | | |
| | | | | | Operations | | | Distributions | | | | | | Ratios/Supplemental Data | |
| | | Net Asset
Value,
Beginning
of Period | | | Net
Investment
Income | | | Net Realized
and
Unrealized
Gains
(Losses)
from
Investments | | | Total from
Operations | | | Net
Investment
Income | | | Net
Realized
Gains | | | Total
Distributions | | | Net Asset
Value, End
of Period | | | Total
Return (a)(b) | | | Net Assets
at End of
Period | | | Ratio of
Expenses
to Average
Net Assets (c) | | | Ratio of Net
Investment
Income
to Average
Net Assets (c) | | | Ratio of Expenses
(Prior to
Reimbursements)
to Average
Net Assets (c) | | | Portfolio
Turnover (d) | |
| Class A Shares | | | | | | | | | | | | | | | | | | | | | | | | | | | | | | | | | | | | | | | | | | | | | | | | | | | | | | | | |
Year Ended October 31, 2014 (e) | | $ | 11.11 | | | | 0.16 | | | | 0.35 | | | | 0.51 | | | | (0.18 | ) | | | (0.76 | ) | | | (0.94 | ) | | $ | 10.68 | | | | 4.95% | | | $ | 58,734,361 | | | | 0.57% | | | | 1.54% | | | | 0.57% | | | | 18.14% | |
Year Ended October 31, 2013 (e) | | $ | 10.46 | | | | 0.17 | | | | 0.81 | | | | 0.98 | | | | (0.18 | ) | | | (0.15 | ) | | | (0.33 | ) | | $ | 11.11 | | | | 9.59% | | | $ | 48,814,648 | | | | 0.52% | | | | 1.58% | | | | 0.52% | | | | 36.85% | |
Year Ended October 31, 2012 (e) | | $ | 10.08 | | | | 0.18 | | | | 0.49 | | | | 0.67 | | | | (0.19 | ) | | | (0.10 | ) | | | (0.29 | ) | | $ | 10.46 | | | | 6.81% | | | $ | 44,422,496 | | | | 0.51% | | | | 1.80% | | | | 0.51% | | | | 20.61% | |
Year Ended October 31, 2011 (e) | | $ | 9.86 | | | | 0.20 | | | | 0.22 | | | | 0.42 | | | | (0.20 | ) | | | – | | | | (0.20 | ) | | $ | 10.08 | | | | 4.31% | | | $ | 36,925,502 | | | | 0.49% | | | | 1.99% | | | | 0.49% | | | | 17.89% | |
Year Ended October 31, 2010 (e) | | $ | 9.21 | | | | 0.21 | | | | 0.64 | | | | 0.85 | | | | (0.20 | ) | | | – | | | | (0.20 | ) | | $ | 9.86 | | | | 9.38% | | | $ | 33,209,551 | | | | 0.50% | | | | 2.17% | | | | 0.50% | | | | 12.60% | |
| | | | | | | | | | | | | | |
| Class C Shares | | | | | | | | | | | | | | | | | | | | | | | | | | | | | | | | | | | | | | | | | | | | | | | | | | | | | | | | |
Year Ended October 31, 2014 (e) | | $ | 11.07 | | | | 0.09 | | | | 0.34 | | | | 0.43 | | | | (0.11 | ) | | | (0.76 | ) | | | (0.87 | ) | | $ | 10.63 | | | | 4.17% | | | $ | 55,313,487 | | | | 1.26% | | | | 0.84% | | | | 1.26% | | | | 18.14% | |
Year Ended October 31, 2013 (e) | | $ | 10.42 | | | | 0.10 | | | | 0.81 | | | | 0.91 | | | | (0.11 | ) | | | (0.15 | ) | | | (0.26 | ) | | $ | 11.07 | | | | 8.88% | | | $ | 46,881,793 | | | | 1.21% | | | | 0.90% | | | | 1.21% | | | | 36.85% | |
Year Ended October 31, 2012 (e) | | $ | 10.04 | | | | 0.11 | | | | 0.49 | | | | 0.60 | | | | (0.12 | ) | | | (0.10 | ) | | | (0.22 | ) | | $ | 10.42 | | | | 6.09% | | | $ | 41,368,353 | | | | 1.22% | | | | 1.10% | | | | 1.22% | | | | 20.61% | |
Year Ended October 31, 2011 (e) | | $ | 9.82 | | | | 0.13 | | | | 0.22 | | | | 0.35 | | | | (0.13 | ) | | | – | | | | (0.13 | ) | | $ | 10.04 | | | | 3.55% | | | $ | 38,970,245 | | | | 1.22% | | | | 1.27% | | | | 1.22% | | | | 17.89% | |
Year Ended October 31, 2010 (e) | | $ | 9.18 | | | | 0.14 | | | | 0.64 | | | | 0.78 | | | | (0.14 | ) | | | – | | | | (0.14 | ) | | $ | 9.82 | | | | 8.65% | | | $ | 40,700,682 | | | | 1.21% | | | | 1.46% | | | | 1.21% | | | | 12.60% | |
| | | | | | | | | | | | | | |
| Class R Shares(f)(g) | | | | | | | | | | | | | | | | | | | | | | | | | | | | | | | | | | | | | | | | | | | | | | | | | | | | | | | | |
Year Ended October 31, 2014 (e) | | $ | 11.13 | | | | 0.13 | | | | 0.35 | | | | 0.48 | | | | (0.15 | ) | | | (0.76 | ) | | | (0.91 | ) | | $ | 10.70 | | | | 4.63% | | | $ | 83,675,301 | | | | 0.86% | | | | 1.27% | | | | 0.86% | | | | 18.14% | |
Year Ended October 31, 2013 (e) | | $ | 10.47 | | | | 0.13 | | | | 0.83 | | | | 0.96 | | | | (0.15 | ) | | | (0.15 | ) | | | (0.30 | ) | | $ | 11.13 | | | | 9.30% | | | $ | 88,286,612 | | | | 0.86% | | | | 1.25% | | | | 0.86% | | | | 36.85% | |
Year Ended October 31, 2012 (e) | | $ | 10.09 | | | | 0.15 | | | | 0.48 | | | | 0.63 | | | | (0.15 | ) | | | (0.10 | ) | | | (0.25 | ) | | $ | 10.47 | | | | 6.43% | | | $ | 85,855,793 | | | | 0.86% | | | | 1.45% | | | | 0.86% | | | | 20.61% | |
Year Ended October 31, 2011 (e) | | $ | 9.87 | | | | 0.16 | | | | 0.23 | | | | 0.39 | | | | (0.17 | ) | | | – | | | | (0.17 | ) | | $ | 10.09 | | | | 3.92% | | | $ | 80,556,773 | | | | 0.87% | | | | 1.61% | | | | 0.87% | | | | 17.89% | |
Year Ended October 31, 2010 (e) | | $ | 9.22 | | | | 0.17 | | | | 0.65 | | | | 0.82 | | | | (0.17 | ) | | | – | | | | (0.17 | ) | | $ | 9.87 | | | | 9.00% | | | $ | 72,987,185 | | | | 0.85% | | | | 1.78% | | | | 0.85% | | | | 12.60% | |
| | | | | | | | | | | | | | |
| Institutional Service Class Shares | | | | | | | | | | | | | | | | | | | | | | | | | | | | | | | | | | | | | | | | | | | | | | | | | | | | | | | | |
Period Ended October 31, 2014 (e)(h) | | $ | 10.53 | | | | 0.10 | | | | 0.22 | | | | 0.32 | | | | (0.10 | ) | | | – | | | | (0.10 | ) | | $ | 10.75 | | | | 3.06% | | | $ | 2,070,270 | | | | 0.24% | | | | 1.37% | | | | 0.24% | | | | 18.14% | |
| | | | | | | | | | | | | | |
| Institutional Class Shares | | | | | | | | | | | | | | | | | | | | | | | | | | | | | | | | | | | | | | | | | | | | | | | | | | | | | | | | |
Year Ended October 31, 2014 (e) | | $ | 11.21 | | | | 0.20 | | | | 0.36 | | | | 0.56 | | | | (0.22 | ) | | | (0.76 | ) | | | (0.98 | ) | | $ | 10.79 | | | | 5.38% | | | $ | 111,372,125 | | | | 0.21% | | | | 1.89% | | | | 0.21% | | | | 18.14% | |
Year Ended October 31, 2013 (e) | | $ | 10.55 | | | | 0.20 | | | | 0.82 | | | | 1.02 | | | | (0.21 | ) | | | (0.15 | ) | | | (0.36 | ) | | $ | 11.21 | | | | 9.93% | | | $ | 93,302,759 | | | | 0.21% | | | | 1.88% | | | | 0.21% | | | | 36.85% | |
Year Ended October 31, 2012 (e) | | $ | 10.16 | | | | 0.22 | | | | 0.49 | | | | 0.71 | | | | (0.22 | ) | | | (0.10 | ) | | | (0.32 | ) | | $ | 10.55 | | | | 7.17% | | | $ | 70,457,429 | | | | 0.22% | | | | 2.09% | | | | 0.22% | | | | 20.61% | |
Year Ended October 31, 2011 (e) | | $ | 9.94 | | | | 0.23 | | | | 0.22 | | | | 0.45 | | | | (0.23 | ) | | | – | | | | (0.23 | ) | | $ | 10.16 | | | | 4.55% | | | $ | 54,326,098 | | | | 0.22% | | | | 2.21% | | | | 0.22% | | | | 17.89% | |
Year Ended October 31, 2010 (e) | | $ | 9.28 | | | | 0.23 | | | | 0.66 | | | | 0.89 | | | | (0.23 | ) | | | – | | | | (0.23 | ) | | $ | 9.94 | | | | 9.74% | | | $ | 38,719,904 | | | | 0.21% | | | | 2.39% | | | | 0.21% | | | | 12.60% | |
| | | | | | | | | | | | | | |
| Service Class Shares | | | | | | | | | | | | | | | | | | | | | | | | | | | | | | | | | | | | | | | | | | | | | | | | | | | | | | | | |
Year Ended October 31, 2014 (e) | | $ | 11.17 | | | | 0.16 | | | | 0.34 | | | | 0.50 | | | | (0.17 | ) | | | (0.76 | ) | | | (0.93 | ) | | $ | 10.74 | | | | 4.88% | | | $ | 284,346,558 | | | | 0.61% | | | | 1.52% | | | | 0.61% | | | | 18.14% | |
Year Ended October 31, 2013 (e) | | $ | 10.51 | | | | 0.16 | | | | 0.82 | | | | 0.98 | | | | (0.17 | ) | | | (0.15 | ) | | | (0.32 | ) | | $ | 11.17 | | | | 9.53% | | | $ | 301,635,705 | | | | 0.61% | | | | 1.50% | | | | 0.61% | | | | 36.85% | |
Year Ended October 31, 2012 (e) | | $ | 10.12 | | | | 0.17 | | | | 0.50 | | | | 0.67 | | | | (0.18 | ) | | | (0.10 | ) | | | (0.28 | ) | | $ | 10.51 | | | | 6.77% | | | $ | 303,997,111 | | | | 0.62% | | | | 1.70% | | | | 0.62% | | | | 20.61% | |
Year Ended October 31, 2011 (e) | | $ | 9.90 | | | | 0.19 | | | | 0.22 | | | | 0.41 | | | | (0.19 | ) | | | – | | | | (0.19 | ) | | $ | 10.12 | | | | 4.15% | | | $ | 290,405,875 | | | | 0.62% | | | | 1.86% | | | | 0.62% | | | | 17.89% | |
Year Ended October 31, 2010 (e) | | $ | 9.25 | | | | 0.20 | | | | 0.64 | | | | 0.84 | | | | (0.19 | ) | | | – | | | | (0.19 | ) | | $ | 9.90 | | | | 9.22% | | | $ | 283,720,301 | | | | 0.60% | | | | 2.05% | | | | 0.60% | | | | 12.60% | |
| | | | | | | | | | | | | | | | | | | | | | | | | | | | | | | | | | | | | | | | | | | | | | | | | | | | | | | | | |
Amounts designated as “–” are zero or have been rounded to zero.
| (a) | Excludes sales charge. |
| (b) | Not annualized for periods less than one year. |
| (c) | Annualized for periods less than one year. |
| (d) | Portfolio turnover is calculated on the basis of the Fund as a whole without distinguishing among the classes of shares. |
| (e) | Per share calculations were performed using average shares method. |
| (f) | Effective February 28, 2009, Class R Shares were renamed Class R2 Shares. |
| (g) | Effective March 3, 2014, Class R2 Shares were renamed Class R Shares. |
| (h) | For the period from March 4, 2014 (commencement of operations) through October 31, 2014. Total return is calculated based on inception date of March 3, 2014 through October 31, 2014. |
The accompanying notes are an integral part of these financial statements.
59
| | |
| Fund Commentary | | Nationwide Investor Destinations Conservative Fund |
For the annual period ended October 31, 2014, the Nationwide Investor Destinations Conservative Fund (Service Class) returned 3.52% versus 4.30% for its composite benchmark, 15% Russell 3000® Index, 5% MSCI EAFE® Index, 40% Barclays U.S. Aggregate Bond Index, 35% Barclays U.S. 1-3 Year Government/Credit Bond Index and 5% Citigroup 3-Month US Treasury Bill (T-Bill) Index. For broader comparison, the median return for the Fund’s closest Lipper peer category of Mixed-Asset Target Allocation Conservative Funds (consisting of 353 funds as of October 31, 2014) was 5.45% for the same time period. Performance for the Fund’s other share classes versus the benchmark is stated in the Average Annual Total Return chart in this report’s Fund Performance section.
The Fund’s return for the 12-month period covered in this report was driven primarily by positive returns from intermediate-term, investment-grade, U.S. fixed-income investments. The Barclays U.S. Aggregate Bond Index (representing a broad spectrum of such bonds) posted a return of 4.1% during the reporting period, helped along by the drop in interest rates on the bellwether 10-year U.S. Treasury note from a high of 3.04% at the end of 2013 to its period low of 2.34% at the end of October 2014. The drop in rates in the latter part of the reporting period, combined with a flattening of the overall yield curve, resulted in generally positive performance for intermediate-term bonds. Short-term, investment-grade, fixed-income rates remained range-bound near zero, effectively keeping returns for this asset class very low.
The Fund’s return also was supported during the reporting period by strong positive returns from domestic equities. Representing about 13% of the Fund’s allocations, the Fund’s exposure to the U.S. equity markets contributed significantly to the Fund’s positive performance. In general, U.S. equity markets led the way as large-, mid- and small-capitalization stocks posted gains far exceeding those of international markets during the reporting period. Specifically, the S&P 500® Index (representing large-cap U.S. stocks) rose more than 17%, the S&P MidCap 400® Index (mid-cap stocks) increased 11.7%, and the Russell 2000® Index (small-cap stocks) gained 8.1%.
During the reporting period, the Federal Reserve ceased its purchases of assets citing “substantial improvement in the outlook for the labor market since the inception of [the Fed’s] currency asset purchase program” and noting that the Fed “continues to see sufficient underlying strength in the broader economy.”1
The equity markets within foreign developed countries (as distinguished from emerging market countries) posted near-zero returns during the reporting period. The MSCI EAFE Index (representing developed international equity markets) registered -0.1% for the reporting period. Concerns about the health of Europe’s economy and heightened risk in emerging markets posed headwinds to the international markets.
The return from the Fund’s investment in the Nationwide Bond Index Fund, combined with this underlying fund’s sizable allocation within the Fund, made this underlying fund the largest contributor to the Fund’s return during the reporting period, as shown in the chart below.
Nearly all of the Fund’s underlying allocations posted positive returns during the reporting period; the Fund’s investment in the Nationwide Money Market Fund, while relatively small, posted a 0.00% return, thus contributing the least to the Fund’s overall positive return. While slightly positive on an absolute basis, the low allocation to the Nationwide International Index Fund had a 0.00% impact on fund performance.
| 1 | http://www.federalreserve.gov/newsevents/press/monetary/20141029a.htm |
Portfolio Managers:
Thomas R. Hickey Jr. and Benjamin A. Richer*, Nationwide Fund Advisors
The Fund is designed to provide diversification across a variety of asset classes, primarily by investing in underlying funds. Therefore, in addition to the expenses of the Fund, each investor is indirectly paying a proportionate share of the applicable fees and expenses of its underlying funds.
Investments in the Fund are subject to the risks of the Fund’s underlying funds. The Fund is subject to different levels of risk, based on the types and sizes of its underlying asset class allocations and its allocation strategy. In addition, the Fund’s underlying funds may be subject to
60
| | |
| Fund Commentary (con’t.) | | Nationwide Investor Destinations Conservative Fund |
specific investment risks, including but not limited to: stock market risk (equity securities); default risk and interest rate risk — if interest rates go up, bond prices go down and if interest rates go down, bond prices go up (bonds); and currency fluctuations, political risks, and differences in accounting and availability of information (international securities). Please refer to the most recent prospectus for a more detailed explanation of the Fund’s principal risks.
The Fund may invest in the Nationwide Fixed Contract, which is a fixed interest contract issued and guaranteed by Nationwide Life Insurance Company (Nationwide), an affiliate of the Fund’s investment adviser, Nationwide Fund Advisors. If Nationwide becomes unable to meet this guarantee, a Fund that invests in the Nationwide Fixed Contract may lose money from unpaid principal or unpaid or reduced interest.
Asset allocation is the process of spreading assets across several different investment styles and asset classes. The purpose is to potentially reduce long-term risk and capture potential profits across various asset classes.
Nationwide Asset Management, LLC (NWAM) provides asset allocation consulting services to Nationwide Fund Advisors (NFA), the Fund’s investment adviser. NWAM is a registered investment adviser and wholly owned subsidiary of Nationwide Mutual Insurance Company, and therefore is affiliated with NFA. NFA makes both the asset allocation and underlying fund selection decisions for the Fund. In addition, NWAM serves as the subadviser to certain other Nationwide Funds.
There is no assurance that the investment objective of any fund (or that of any underlying fund) will be achieved or that a diversified portfolio will produce better results than a nondiversified portfolio. Diversification does not guarantee returns or insulate an investor from potential losses, including the possible loss of principal.
A description of the benchmarks can be found on the Market Index Definitions page at the back of this book.
Nationwide Investor Destinations Conservative Fund
(October 31, 2014)
| | | | | | | | |
| Underlying Fund or Contract | | Actual
Allocation
to Fund | | | Contribution
to Fund
Performance | |
| Nationwide Bond Index Fund Institutional Class | | | 25% | | | | 1.02% | |
| Nationwide Fixed Contract | | | 22% | | | | 0.78% | |
| Nationwide HighMark Short Term Bond Fund Institutional Class | | | 14% | | | | 0.14% | |
| Nationwide Portfolio Completion Fund Institutional Class | | | 8% | | | | 0.22% | |
| Nationwide Inflation-Protected Securities Fund Institutional Class | | | 8% | | | | 0.15% | |
| Nationwide S&P 500 Index Fund Institutional Class | | | 5% | | | | 0.85% | |
| Nationwide Ziegler Equity Income Fund Institutional Class | | | 4% | | | | 0.55% | |
| Nationwide International Index Fund Institutional Class | | | 4% | | | | 0.00% | |
| Nationwide Core Plus Bond Fund Institutional Class | | | 4% | | | | 0.15% | |
| Nationwide Mid Cap Market Index Fund Institutional Class | | | 3% | | | | 0.34% | |
| Nationwide Money Market Fund Institutional Class | | | 2% | | | | 0.00% | |
| Nationwide Small Cap Index Fund Institutional Class | | | 1% | | | | 0.08% | |
| | | | 100% | | | | | |
Actual underlying allocations are stated as a percentage of the Fund’s total net assets. Nationwide Fund Advisors (NFA), the investment adviser to the Fund, may add or delete asset classes or change allocations at any time and without notice in order for the Fund to meet its objective or due to market and/or economic conditions. NFA applies a long-term investment horizon with respect to the Fund, and allocation changes are not likely to be made in response to short-term market conditions.
The contribution of underlying funds to Fund performance is based on target underlying fund allocations through the reporting period. Returns reflect the impact of each underlying fund’s fees and expenses, but do not reflect the Nationwide Investor Destinations Conservative Fund’s fees and expenses. Day-to-day market activity will likely cause the Fund’s target allocations to fluctuate. Under ordinary circumstances, NFA periodically will rebalance the assets of the Fund in order to conform its actual allocations to those stated in the then-current prospectus. For more information, refer to the Fund’s prospectus.
61
| | |
| Fund Overview | | Nationwide Investor Destinations Conservative Fund |
Objective
The Fund seeks to maximize total investment return for a conservative level of risk.
Highlights
| | Ÿ | | Nearly all of the Fund’s underlying allocations posted positive returns during the reporting period | |
| | Ÿ | | The Fund’s investments in U.S. equity mutual funds had the greatest absolute performance during the period. | |
| | Ÿ | | Although short-term bond interest rates remained low, the Fund’s 22% allocation to the Nationwide Fixed Contract contributed 0.78% to the Fund’s overall return during the reporting period. | |
Asset Allocation†
| | | | |
| Fixed Income Funds | | | 50.8% | |
| Fixed Contract | | | 21.9% | |
| Equity Funds | | | 17.2% | |
| Asset Allocation Fund | | | 8.0% | |
| Money Market Fund | | | 2.0% | |
| Other assets in excess of liabilities | | | 0.1% | |
| | | | 100.0% | |
Top Holdings††
| | | | |
| Nationwide Bond Index Fund, Institutional Class | | | 25.0% | |
| Nationwide Fixed Contract | | | 21.9% | |
| Nationwide HighMark Short Term Bond Fund, Institutional Class | | | 14.0% | |
| Nationwide Portfolio Completion Fund, Institutional Class | | | 8.0% | |
| Nationwide Inflation-Protected Securities Fund, Institutional Class | | | 8.0% | |
| Nationwide S&P 500 Index Fund, Institutional Class | | | 5.0% | |
| Nationwide Ziegler Equity Income Fund, Institutional Class | | | 4.0% | |
| Nationwide International Index Fund, Institutional Class | | | 4.0% | |
| Nationwide Core Plus Bond Fund, Institutional Class | | | 4.0% | |
| Nationwide Mid Cap Market Index Fund, Institutional Class | | | 3.1% | |
| Other Holdings | | | 3.0% | |
| | | | 100.0% | |
| † | Percentages indicated are based upon net assets as of October 31, 2014. |
| †† | Percentages indicated are based upon total investments as of October 31, 2014. |
62
| | |
| Fund Performance | | Nationwide Investor Destinations Conservative Fund |
Average Annual Total Return
(For periods ended October 31, 2014)
| | | | | | | | | | | | | | | | | | |
| | | | | 1 Yr. | | | 5 Yr. | | | 10 Yr. | | | Inception | |
| Class A | | w/o SC1 | | | 3.70% | | | | 4.58% | | | | 4.07% | | | | – | |
| | | w/ SC2 | | | (2.28)% | | | | 3.34% | | | | 3.45% | | | | – | |
| Class C | | w/o SC1 | | | 2.91% | | | | 3.82% | | | | 3.33% | | | | – | |
| | | w/SC3 | | | 1.94% | | | | 3.82% | | | | 3.33% | | | | – | |
| Class R4,5 | | | | | 3.28% | | | | 4.22% | | | | 3.77% | | | | – | |
| Institutional Service Class4 | | | | | – | | | | – | | | | – | | | | 2.51%6* | |
| Institutional Class4,7 | | | | | 4.04% | | | | 4.88% | | | | 4.40% | | | | – | |
| Service Class4 | | | | | 3.52% | | | | 4.45% | | | | 3.96% | | | | – | |
| Barclays U.S. Aggregate Bond Index | | | | | 4.14% | | | | 4.22% | | | | 4.64% | | | | – | |
| Russell 3000® Index | | | | | 16.07% | | | | 17.01% | | | | 8.55% | | | | – | |
| MSCI EAFE® Index | | | | | (0.60)% | | | | 6.52% | | | | 5.81% | | | | – | |
| Barclays U.S. 1-3 Year Gov’t/Credit Bond Index | | | | | 0.89% | | | | 1.45% | | | | 2.84% | | | | – | |
| Citigroup 3-Month T-Bill Index | | | | | 0.04% | | | | 0.07% | | | | 1.50% | | | | – | |
| S&P 500® Index | | | | | 17.27% | | | | 16.69% | | | | 8.20% | | | | – | |
| Composite Index | | | | | 4.16% | | | | 5.00% | | | | 4.57% | | | | – | |
| CPI | | | | | 1.66% | | | | 1.89% | | | | 2.21% | | | | – | |
All figures showing the effect of a sales charge (SC) reflect the maximum charge possible, because it has the most significant effect on performance data.
| 1 | These returns do not reflect the effects of SCs. |
| 2 | A 5.75% front-end sales charge was deducted. |
| 3 | A 1.00% CDSC was deducted from the one year return because it is charged when you sell Class C shares within the first year after purchase. |
| 4 | Not subject to any SCs. |
| 5 | Effective February 28, 2009, Class R Shares were renamed Class R2 Shares. Effective March 3, 2014, Class R2 Shares were renamed Class R Shares. |
| 6 | Since inception date of March 3, 2014. |
| 7 | These returns until the creation of Institutional Class shares (12/29/04) include the performance of the Fund’s Class B shares. The returns have been adjusted for the fact that Institutional Class shares do not have any applicable SCs but have not been adjusted for the lower expenses applicable to Institutional Class shares. Excluding the effect of any fee waivers or reimbursements, such prior performance is similar to what Institutional Class shares would have produced because the Institutional Class shares invest in the same portfolio of securities as Class B shares. Effective February 21, 2014, Class B shares were converted into Class A shares. |
Expense Ratios
| | |
| | | Expense Ratio^ |
| Class A | | 0.89% |
| Class C | | 1.55% |
| Class R | | 1.16% |
| Institutional Service Class | | 0.64% |
| Institutional Class | | 0.51% |
| Service Class | | 0.91% |
| ^ | Current effective prospectus dated March 1, 2014 (as revised March 26, 2014). The expense ratio also includes indirect underlying fund expenses. Please see the Fund’s most recent prospectus for details. Please refer to the Financial Highlights for each respective share class’ actual results. Please refer to the Financial Highlights for each respective share class’ actual results. |
63
| | |
| Fund Performance (con’t.) | | Nationwide Investor Destinations Conservative Fund |
Performance of a $50,000 Investment
Investment return and principal value will fluctuate, and when redeemed, shares may be worth more or less than original cost. Past performance is no guarantee of future results and does not reflect the deduction of taxes that a shareholder would pay on fund distributions or the redemption of fund shares. Investing in mutual funds involves market risk, including loss of principal. Performance returns assume the reinvestment of all distributions.
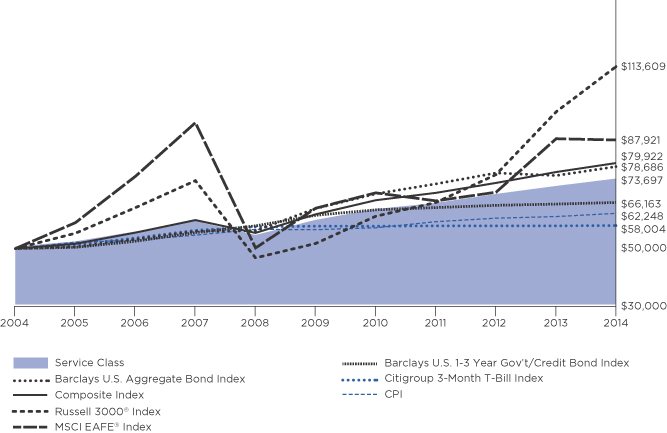
Comparative performance of $50,000 invested in Service Class shares of the Nationwide Investor Destinations Conservative Fund versus the Barclays U.S. Aggregate Bond Index, the Russell 3000® Index, the MSCI EAFE® Index, the Barclays U.S. 1-3 Year Government/Credit Bond Index, the Citigroup 3-Month Treasury Bill (T-Bill) Index, the Composite Index* and the Consumer Price Index (CPI) over the 10-year period ended 10/31/14. Unlike the Fund, the performance for these unmanaged indexes does not reflect any fees, expenses, or sales charges. Investors cannot invest directly in market indexes. A description of the benchmarks can be found on the Market Index Definitions page at the back of this book.
| * | The Composite Index comprises 15% Russell 3000® Index, 40% Barclays U.S. Aggregate Bond Index, 5% MSCI EAFE® Index, 35% Barclays U.S. 1-3 Year Gov’t/Credit Bond Index and 5% Citigroup 3-Month T-Bill Index. |
64
| | |
| Shareholder Expense Example | | Nationwide Investor Destinations Conservative Fund |
As a shareholder of the Fund, you incur two types of costs: (1) transaction costs, including sales charges (loads) paid on purchase payments and redemption fees; and (2) ongoing costs, including investment advisory fees, administration fees, distribution fees and other Fund expenses. The examples below are intended to help you understand your ongoing costs (in dollars) of investing in the Fund and to compare these costs with the ongoing costs of investing in other mutual funds. Per Securities and Exchange Commission (“SEC”) requirements, the examples assume that you had a $1,000 investment in the Class at the beginning of the reporting period (May 1, 2014) and continued to hold your shares at the end of the reporting period (October 31, 2014).
Actual Expenses
For each Class of the Fund in the table below, the first line provides information about actual account values and actual expenses. You may use the information in this line, together with the amount you invested, to estimate the expenses that you paid from May 1, 2014 through October 31, 2014. Simply divide your account value by $1,000 (for example, an $8,600 account value divided by $1,000 = 8.6), then multiply the result by the number in the first line of each Class under the heading entitled “Expenses Paid During Period” to estimate the expenses you paid on your account during this period.
Hypothetical Expenses for Comparison Purposes
The second line of each Class in the table below provides information about hypothetical account values and hypothetical expenses based on the Class’ actual expense ratio and an assumed rate of return of 5% per year before expenses, which is not the Class’ actual return. The hypothetical account values and expenses may not be used to estimate the actual ending account balance or expenses you paid for the period from May 1, 2014 through October 31, 2014. You may use this information to compare the ongoing costs of investing in the Class of the Fund and other funds. To do so, compare this 5% hypothetical example with the 5% hypothetical examples that appear in the shareholder reports of the other funds.
Please note that the expenses shown in the table are meant to highlight your ongoing costs only and do not reflect any transaction costs, such as sales charges (loads) or redemption fees. If these transaction costs were included, your costs would have been higher. Therefore, the second line for each Class in the table is useful in comparing ongoing costs only, and will not help you determine the relative total costs of owning different funds. The examples also assume all dividends and distributions are reinvested.
Schedule of Shareholder Expenses
Expense Analysis of a $1,000 Investment
| | | | | | | | | | | | |
Nationwide Investor Destinations
Conservative Fund October 31, 2014 | | | Beginning
Account Value ($)
05/01/14 | | Ending
Account Value ($)
10/31/14 | | Expenses Paid
During Period ($)
05/01/14 - 10/31/14(a) | | Expense Ratio
During Period (%)
05/01/14 - 10/31/14(a) |
| Class A Shares | | | Actual | (b) | | 1,000.00 | | 1,015.80 | | 2.95 | | 0.58 |
| | | | Hypothetical | (b)(c) | | 1,000.00 | | 1,022.28 | | 2.96 | | 0.58 |
| Class C Shares | | | Actual | (b) | | 1,000.00 | | 1,011.40 | | 6.54 | | 1.29 |
| | | | Hypothetical | (b)(c) | | 1,000.00 | | 1,018.70 | | 6.56 | | 1.29 |
| Class R Shares(d) | | | Actual | (b) | | 1,000.00 | | 1,014.30 | | 4.42 | | 0.87 |
| | | | Hypothetical | (b)(c) | | 1,000.00 | | 1,020.82 | | 4.43 | | 0.87 |
| Institutional Service Class Shares | | | Actual | (b) | | 1,000.00 | | 1,017.40 | | 1.27 | | 0.25 |
| | | | Hypothetical | (b)(c) | | 1,000.00 | | 1,023.95 | | 1.28 | | 0.25 |
| Institutional Class Shares | | | Actual | (b) | | 1,000.00 | | 1,017.60 | | 1.12 | | 0.22 |
| | | | Hypothetical | (b)(c) | | 1,000.00 | | 1,024.10 | | 1.12 | | 0.22 |
| Service Class Shares | | | Actual | (b) | | 1,000.00 | | 1,014.60 | | 3.15 | | 0.62 |
| | | | Hypothetical | (b)(c) | | 1,000.00 | | 1,022.08 | | 3.16 | | 0.62 |
| (a) | Expenses are based on the direct expenses of the Fund and do not include the effect of the underlying Funds’ expenses, which are disclosed in the Fee and Expense table and described more fully in a footnote to that table in your Fund Prospectus. |
| (b) | Expenses are equal to the Fund’s annualized expense ratio multiplied by the average account value from May 1, 2014 through October 31, 2014 multiplied to reflect one-half year period. The expense ratio presented represents a six-month, annualized ratio in accordance with Securities and Exchange Commission guidelines. |
| (c) | Represents the hypothetical 5% return before expenses. |
| (d) | Effective March 3, 2014, Class R2 Shares were renamed Class R Shares. |
65
Statement of Investments
October 31, 2014
Nationwide Investor Destinations Conservative Fund
| | | | | | | | | | |
| | | Mutual Funds 78.0% | |
| | | |
| | | | | Shares | | | Market
Value | |
| | | |
| | Asset Allocation Fund 8.0% | | | | | | | | |
| | Nationwide Portfolio Completion Fund, Institutional Class (a) | | | 3,807,686 | | | $ | 37,886,479 | |
| | | | | | | | | | |
| | |
| | Total Asset Allocation Fund
(cost $36,973,062) | | | | 37,886,479 | |
| | | | | | | | | | |
| | | |
| | Equity Funds 17.2% | | | | | | | | |
| | Nationwide International Index Fund, Institutional Class (a) | | | 2,332,635 | | | | 19,080,955 | |
| | Nationwide Mid Cap Market Index Fund, Institutional Class (a) | | | 724,294 | | | | 14,362,749 | |
| | Nationwide S&P 500 Index Fund, Institutional Class (a) | | | 1,530,493 | | | | 23,799,160 | |
| | Nationwide Small Cap Index Fund, Institutional Class (a) | | | 298,447 | | | | 4,736,347 | |
| | Nationwide Ziegler Equity Income Fund, Institutional Class (a) | | | 1,370,758 | | | | 19,080,955 | |
| | | | | | | | | | |
| | |
| | Total Equity Funds
(cost $66,558,544) | | | | 81,060,166 | |
| | | | | | | | | | |
| | | |
| | Fixed Income Funds 50.8% | | | | | | | | |
| | Nationwide Bond Index Fund, Institutional Class (a) | | | 10,440,333 | | | | 117,871,360 | |
| | Nationwide Core Plus Bond Fund, Institutional Class (a) | | | 1,829,217 | | | | 18,822,644 | |
| | Nationwide HighMark Short Term Bond Fund, Institutional Class (a) | | | 6,583,686 | | | | 65,968,529 | |
| | Nationwide Inflation-Protected Securities Fund, Institutional Class (a) | | | 3,927,680 | | | | 37,587,896 | |
| | | | | | | | | | |
| | |
| | Total Fixed Income Funds
(cost $244,313,420) | | | | 240,250,429 | |
| | | | | | | | | | |
| | | |
| | Money Market Fund 2.0% | |
| | Nationwide Money Market Fund, Institutional Class, 0.00% (a)(b) | | | 9,354,946 | | | | 9,354,946 | |
| | | | | | | | | | |
| | |
| | Total Money Market Fund
(cost $9,354,946) | | | | 9,354,946 | |
| | | | | | | | | | |
| | |
| | Total Mutual Funds
(cost $357,199,972) | | | | 368,552,020 | |
| | | | | | | | | | |
| | | | | | | | | | |
| | | | | | | | | | |
| | | Fixed Contract 21.9% | |
| | | |
| | | | | Principal
Amount | | | Market
Value | |
| | | |
| | Nationwide Fixed Contract,
3.50% (a)(c)(d) | | $ | 103,605,467 | | | $ | 103,605,467 | |
| | | | | | | | | | |
| | |
| | Total Fixed Contract
(cost $103,605,467) | | | | 103,605,467 | |
| | | | | | | | | | |
| | |
| | Total Investments
(cost $460,805,439) (e) — 99.9% | | | | 472,157,487 | |
| | |
| | Other assets in excess of liabilities — 0.1% | | | | 243,578 | |
| | | | | | | | | | |
| | | |
| | NET ASSETS — 100.0% | | | | | | $ | 472,401,065 | |
| | | | | | | | | | |
| | (a) | Investment in affiliate. |
| | (b) | Represents 7-day effective yield as of October 31, 2014. |
| | (c) | The Nationwide Fixed Contract interest rate changes quarterly. The contract is restricted and has been deemed liquid pursuant to procedures approved by the Board of Trustees. Please refer to Note 2(a) for additional information on the contract. |
| | (e) | See notes to financial statements for tax cost and unrealized appreciation/(depreciation) of securities. |
The accompanying notes are an integral part of these financial statements.
66
Statement of Assets and Liabilities
October 31, 2014
| | | | | | |
| | | Nationwide
Investor Destinations
Conservative Fund |
Assets: | | | | | | |
Investments in affiliates, at value (cost $460,805,439) | | $ | 472,157,487 | | | |
Cash | | | 46 | | | |
Receivable for investments sold | | | 387,208 | | | |
Receivable for capital shares issued | | | 1,054,125 | | | |
Prepaid expenses | | | 40,476 | | | |
| | | | | | |
Total Assets | | | 473,639,342 | | | |
| | | | | | |
Liabilities: | | | | | | |
Payable for capital shares redeemed | | | 946,645 | | | |
Accrued expenses and other payables: | | | | | | |
Investment advisory fees | | | 51,426 | | | |
Fund administration fees | | | 14,800 | | | |
Distribution fees | | | 135,972 | | | |
Administrative servicing fees | | | 60,262 | | | |
Accounting and transfer agent fees | | | 6,098 | | | |
Trustee fees | | | 1,387 | | | |
Custodian fees | | | 1,278 | | | |
Compliance program costs (Note 3) | | | 122 | | | |
Professional fees | | | 11,894 | | | |
Printing fees | | | 5,786 | | | |
Other | | | 2,607 | | | |
| | | | | | |
Total Liabilities | | | 1,238,277 | | | |
| | | | | | |
Net Assets | | $ | 472,401,065 | | | |
| | | | | | |
| | |
Represented by: | | | | | | |
Capital | | $ | 458,759,594 | | | |
Accumulated undistributed net investment income | | | 565,388 | | | |
Accumulated net realized gains from affiliated investments | | | 1,724,035 | | | |
Net unrealized appreciation/(depreciation) from investments in affiliates | | | 11,352,048 | | | |
| | | | | | |
Net Assets | | $ | 472,401,065 | | | |
| | | | | | |
Net Assets: | | | | | | |
Class A Shares | | $ | 81,289,282 | | | |
Class C Shares | | | 72,301,458 | | | |
Class R Shares | | | 51,948,486 | | | |
Institutional Service Class Shares | | | 13,465,257 | | | |
Institutional Class Shares | | | 69,248,334 | | | |
Service Class Shares | | | 184,148,248 | | | |
| | | | | | |
Total | | $ | 472,401,065 | | | |
| | | | | | |
Shares Outstanding (unlimited number of shares authorized): | | | | | | |
Class A Shares | | | 7,893,961 | | | |
Class C Shares | | | 7,050,873 | | | |
Class R Shares | | | 5,057,922 | | | |
Institutional Service Class Shares | | | 1,303,964 | | | |
Institutional Class Shares | | | 6,692,754 | | | |
Service Class Shares | | | 17,835,494 | | | |
| | | | | | |
Total | | | 45,834,968 | | | |
| | | | | | |
| | | | | | |
| | | | | | |
67
Statement of Assets and Liabilities (Continued)
October 31, 2014
| | | | | | |
| | | Nationwide
Investor Destinations
Conservative Fund |
Net asset value and redemption price per share (Net assets by class divided by shares outstanding by class, respectively): | | | | | | |
Class A Shares (a) | | $ | 10.30 | | | |
Class C Shares (b) | | $ | 10.25 | | | |
Class R Shares | | $ | 10.27 | | | |
Institutional Service Class Shares | | $ | 10.33 | | | |
Institutional Class Shares | | $ | 10.35 | | | |
Service Class Shares | | $ | 10.32 | | | |
Maximum offering price per share (100%/(100%-maximum sales charge) of net asset value adjusted to the nearest cent): | | | | | | |
Class A Shares | | $ | 10.93 | | | |
| | | | | | |
Maximum Sales Charge: | | | | | | |
Class A Shares | | | 5.75 | % | | |
| | | | | | |
| | | | | | |
| | | | | | |
| | | | | | |
| | | | | | |
| | | | | | |
| | | | | | |
| | | | | | |
| | | | | | |
| | | | | | |
| | | | | | |
| | | | | | |
| | | | | | |
| | | | | | |
| | | | | | |
| | | | | | |
| | | | | | |
| | | | | | |
| | | | | | |
| | | | | | |
| | | | | | |
| | | | | | |
| | | | | | |
| | | | | | |
| | | | | | |
| | | | | | |
| | | | | | |
| | | | | | |
| | | | | | |
| | | | | | |
| | | | | | |
| | | | | | | |
| (a) | For Class A Shares that were purchased without a sales charge because such purchase exceeded $1,000,000, a contingent deferred sales charge of 1.00% may apply to any redemption of such shares within 18 months of their purchase. |
| (b) | For Class C Shares, the redemption price per share is reduced by a contingent deferred sales charge of 1.00% for shares held less than one year. |
The accompanying notes are an integral part of these financial statements.
68
Statement of Operations
For the Period Ended October 31, 2014
| | | | | | |
| | | Nationwide
Investor Destinations
Conservative Fund |
INVESTMENT INCOME: | | | | | | |
Dividend income from affiliates | | $ | 5,955,748 | | | |
Interest income from affiliates | | | 3,321,629 | | | |
| | | | | | |
Total Income | | | 9,277,377 | | | |
| | | | | | |
EXPENSES: | | | | | | |
Investment advisory fees | | | 575,004 | | | |
Fund administration fees | | | 165,441 | | | |
Distribution fees Class A | | | 180,874 | | | |
Distribution fees Class B (a) | | | 1,107 | | | |
Distribution fees Class C | | | 567,208 | | | |
Distribution fees Class R (b) | | | 275,989 | | | |
Distribution fees Service Class | | | 467,574 | | | |
Administrative servicing fees Class A | | | 74,084 | | | |
Administrative servicing fees Class C | | | 29,766 | | | |
Administrative servicing fees Class R (b) | | | 82,797 | | | |
Administrative servicing fees Institutional Service Class (c) | | | 542 | | | |
Administrative servicing fees Service Class | | | 286,992 | | | |
Registration and filing fees | | | 85,438 | | | |
Professional fees | | | 42,546 | | | |
Printing fees | | | 22,376 | | | |
Trustee fees | | | 14,526 | | | |
Custodian fees | | | 16,417 | | | |
Accounting and transfer agent fees | | | 49,163 | | | |
Compliance program costs (Note 3) | | | 1,306 | | | |
Other | | | 10,695 | | | |
| | | | | | |
Total expenses before earnings credit | | | 2,949,845 | | | |
| | | | | | |
Earnings credit (Note 5) | | | (16 | ) | | |
| | | | | | |
Net Expenses | | | 2,949,829 | | | |
| | | | | | |
NET INVESTMENT INCOME | | | 6,327,548 | | | |
| | | | | | |
REALIZED/UNREALIZED GAINS (LOSSES) FROM INVESTMENTS: | | | | | | |
Net realized gain distributions from underlying affiliated funds | | | 4,257,614 | | | |
Net realized losses from investment transactions with affiliates | | | (234,765 | ) | | |
| | | | | | |
Net realized gains from affiliated investments | | | 4,022,849 | | | |
| | | | | | |
Net change in unrealized appreciation/(depreciation) from investments in affiliates | | | 4,923,880 | | | |
| | | | | | |
Net realized/unrealized gains from affiliated investments | | | 8,946,729 | | | |
| | | | | | |
CHANGE IN NET ASSETS RESULTING FROM OPERATIONS | | $ | 15,274,277 | | | |
| | | | | | |
| | | | | | |
| | | | | | |
| | | | | | |
| | | | | | |
| | | | | | | |
| (a) | Effective February 21, 2014, Class B Shares were converted into Class A Shares. |
| (b) | Effective March 3, 2014, Class R2 Shares were renamed Class R Shares. |
| (c) | For the period from March 4, 2014 (commencement of operations) through October 31, 2014. |
The accompanying notes are an integral part of these financial statements.
69
Statements of Changes in Net Assets
| | | | | | | | | | | | |
| | | Nationwide Investor Destinations
Conservative Fund |
| | | Year Ended
October 31, 2014 | | Year Ended
October 31, 2013 |
Operations: | | | | | | | | | | | | |
Net investment income | | $ | 6,327,548 | | | | | $ | 6,192,084 | | | |
Net realized gains from affiliated investments | | | 4,022,849 | | | | | | 25,904,687 | | | |
Net change in unrealized appreciation/(depreciation) from investments in affiliates | | | 4,923,880 | | | | | | (14,781,998 | ) | | |
| | | | | | | | | |
Change in net assets resulting from operations | | | 15,274,277 | | | | | | 17,314,773 | | | |
| | | | | | | | | |
| | | | |
Distributions to Shareholders From: | | | | | | | | | | | | |
Net investment income: | | | | | | | | | | | | |
Class A | | | (1,125,442 | ) | | | | | (896,263 | ) | | |
Class B (a) | | | (1,735 | ) | | | | | (4,868 | ) | | |
Class C | | | (504,991 | ) | | | | | (479,474 | ) | | |
Class R (b) | | | (711,860 | ) | | | | | (842,015 | ) | | |
Institutional Service Class | | | (18,248 | )(c) | | | | | – | | | |
Institutional Class | | | (1,319,073 | ) | | | | | (1,087,995 | ) | | |
Service Class | | | (2,847,468 | ) | | | | | (3,314,045 | ) | | |
Net realized gains: | | | | | | | | | | | | |
Class A | | | (3,043,206 | ) | | | | | (913,246 | ) | | |
Class B (a) | | | (18,499 | ) | | | | | (10,854 | ) | | |
Class C | | | (2,475,725 | ) | | | | | (794,205 | ) | | |
Class R (b) | | | (2,830,129 | ) | | | | | (1,134,899 | ) | | |
Institutional Service Class | | | – | (c) | | | | | – | | | |
Institutional Class | | | (3,270,104 | ) | | | | | (872,748 | ) | | |
Service Class | | | (9,367,981 | ) | | | | | (3,722,603 | ) | | |
| | | | | | | | | |
Change in net assets from shareholder distributions | | | (27,534,461 | ) | | | | | (14,073,215 | ) | | |
| | | | | | | | | |
Change in net assets from capital transactions | | | 55,988,226 | | | | | | (3,525,222 | ) | | |
| | | | | | | | | |
Change in net assets | | | 43,728,042 | | | | | | (283,664 | ) | | |
| | | | | | | | | |
| | | | |
Net Assets: | | | | | | | | | | | | |
Beginning of year | | | 428,673,023 | | | | | | 428,956,687 | | | |
| | | | | | | | | |
End of year | | $ | 472,401,065 | | | | | $ | 428,673,023 | | | |
| | | | | | | | | |
Accumulated undistributed net investment income at end of year | | $ | 565,388 | | | | | $ | 652,785 | | | |
| | | | | | | | | |
| | | | |
CAPITAL TRANSACTIONS: | | | | | | | | | | | | |
Class A Shares | | | | | | | | | | | | |
Proceeds from shares issued | | $ | 60,098,017 | | | | | $ | 35,486,527 | | | |
Proceeds from shares issued from class conversion | | | 253,391 | | | | | | – | | | |
Dividends reinvested | | | 2,961,550 | | | | | | 1,189,076 | | | |
Cost of shares redeemed | | | (41,736,036 | ) | | | | | (27,016,636 | ) | | |
| | | | | | | | | |
Total Class A Shares | | | 21,576,922 | | | | | | 9,658,967 | | | |
| | | | | | | | | |
Class B Shares (a) | | | | | | | | | | | | |
Proceeds from shares issued | | | 575 | | | | | | 122,678 | | | |
Dividends reinvested | | | 18,324 | | | | | | 11,564 | | | |
Cost of shares redeemed in class conversion | | | (253,391 | ) | | | | | – | | | |
Cost of shares redeemed | | | (147,348 | ) | | | | | (447,379 | ) | | |
| | | | | | | | | |
Total Class B Shares | | | (381,840 | ) | | | | | (313,137 | ) | | |
| | | | | | | | | |
| | | | | | | | | | | | |
| (a) | Effective February 21, 2014, Class B Shares were converted into Class A Shares. |
| (b) | Effective March 3, 2014, Class R2 Shares were renamed Class R Shares. |
| (c) | For the period from March 4, 2014 (commencement of operations) through October 31, 2014. |
70
Statements of Changes in Net Assets (Continued)
| | | | | | | | | | | | |
| | | Nationwide Investor Destinations
Conservative Fund |
| | | Year Ended
October 31, 2014 | | Year Ended
October 31, 2013 |
CAPITAL TRANSACTIONS: (continued) | | | | | | | | | | | | |
Class C Shares | | | | | | | | | | | | |
Proceeds from shares issued | | $ | 37,388,479 | | | | | $ | 19,103,463 | | | |
Dividends reinvested | | | 1,804,373 | | | | | | 712,048 | | | |
Cost of shares redeemed | | | (15,639,872 | ) | | | | | (13,093,639 | ) | | |
| | | | | | | | | |
Total Class C Shares | | | 23,552,980 | | | | | | 6,721,872 | | | |
| | | | | | | | | |
Class R Shares (b) | | | | | | | | | | | | |
Proceeds from shares issued | | | 6,253,476 | | | | | | 10,116,540 | | | |
Dividends reinvested | | | 3,462,123 | | | | | | 1,922,683 | | | |
Cost of shares redeemed | | | (14,803,137 | ) | | | | | (18,559,538 | ) | | |
| | | | | | | | | |
Total Class R Shares | | | (5,087,538 | ) | | | | | (6,520,315 | ) | | |
| | | | | | | | | |
Institutional Service Class Shares | | | | | | | | | | | | |
Proceeds from shares issued | | | 13,777,518 | (c) | | | | | – | | | |
Dividends reinvested | | | 18,248 | (c) | | | | | – | | | |
Cost of shares redeemed | | | (412,793 | )(c) | | | | | – | | | |
| | | | | | | | | |
Total Institutional Service Class Shares | | | 13,382,973 | (c) | | | | | – | | | |
| | | | | | | | | |
Institutional Class Shares | | | | | | | | | | | | |
Proceeds from shares issued | | | 34,078,911 | | | | | | 58,072,714 | | | |
Dividends reinvested | | | 4,588,443 | | | | | | 1,960,346 | | | |
Cost of shares redeemed | | | (31,475,093 | ) | | | | | (44,516,969 | ) | | |
| | | | | | | | | |
Total Institutional Class Shares | | | 7,192,261 | | | | | | 15,516,091 | | | |
| | | | | | | | | |
Service Class Shares | | | | | | | | | | | | |
Proceeds from shares issued | | | 38,286,740 | | | | | | 32,082,777 | | | |
Dividends reinvested | | | 12,214,017 | | | | | | 7,036,372 | | | |
Cost of shares redeemed | | | (54,748,289 | ) | | | | | (67,707,849 | ) | | |
| | | | | | | | | |
Total Service Class Shares | | | (4,247,532 | ) | | | | | (28,588,700 | ) | | |
| | | | | | | | | |
Change in net assets from capital transactions | | $ | 55,988,226 | | | | | $ | (3,525,222 | ) | | |
| | | | | | | | | |
SHARE TRANSACTIONS: | | | | | | | | | | | | |
Class A Shares | | | | | | | | | | | | |
Issued | | | 5,863,781 | | | | | | 3,381,795 | | | |
Issued in class conversion | | | 25,055 | | | | | | – | | | |
Reinvested | | | 294,189 | | | | | | 114,647 | | | |
Redeemed | | | (4,066,911 | ) | | | | | (2,575,432 | ) | | |
| | | | | | | | | |
Total Class A Shares | | | 2,116,114 | | | | | | 921,010 | | | |
| | | | | | | | | |
Class B Shares (a) | | | | | | | | | | | | |
Issued | | | 57 | | | | | | 11,562 | | | |
Reinvested | | | 1,812 | | | | | | 1,110 | | | |
Redeemed in class conversion | | | (24,865 | ) | | | | | – | | | |
Redeemed | | | (14,428 | ) | | | | | (42,395 | ) | | |
| | | | | | | | | |
Total Class B Shares | | | (37,424 | ) | | | | | (29,723 | ) | �� | |
| | | | | | | | | |
| | | | | | | | | | | | |
| | | | | | | | | | | | |
| | | | | | | | | | | | |
| (a) | Effective February 21, 2014, Class B Shares were converted into Class A Shares. |
| (b) | Effective March 3, 2014, Class R2 Shares were renamed Class R Shares. |
| (c) | For the period from March 4, 2014 (commencement of operations) through October 31, 2014. |
71
Statements of Changes in Net Assets (Continued)
| | | | | | | | | | | | |
| | | Nationwide Investor Destinations
Conservative Fund |
| | | Year Ended
October 31, 2014 | | Year Ended
October 31, 2013 |
SHARE TRANSACTIONS: (continued) | | | | | | | | | | | | |
Class C Shares | | | | | | | | | | | | |
Issued | | | 3,664,978 | | | | | | 1,827,122 | | | |
Reinvested | | | 180,084 | | | | | | 68,934 | | | |
Redeemed | | | (1,531,556 | ) | | | | | (1,254,646 | ) | | |
| | | | | | | | | |
Total Class C Shares | | | 2,313,506 | | | | | | 641,410 | | | |
| | | | | | | | | |
Class R Shares (b) | | | | | | | | | | | | |
Issued | | | 614,406 | | | | | | 967,846 | | | |
Reinvested | | | 345,144 | | | | | | 186,013 | | | |
Redeemed | | | (1,449,208 | ) | | | | | (1,774,803 | ) | | |
| | | | | | | | | |
Total Class R Shares | | | (489,658 | ) | | | | | (620,944 | ) | | |
| | | | | | | | | |
Institutional Service Class Shares | | | | | | | | | | | | |
Issued | | | 1,342,318 | (c) | | | | | – | | | |
Reinvested | | | 1,777 | (c) | | | | | – | | | |
Redeemed | | | (40,131 | )(c) | | | | | – | | | |
| | | | | | | | | |
Total Institutional Service Class Shares | | | 1,303,964 | (c) | | | | | – | | | |
| | | | | | | | | |
Institutional Class Shares | | | | | | | | | | | | |
Issued | | | 3,314,086 | | | | | | 5,509,774 | | | |
Reinvested | | | 454,057 | | | | | | 188,197 | | | |
Redeemed | | | (3,067,413 | ) | | | | | (4,216,114 | ) | | |
| | | | | | | | | |
Total Institutional Class Shares | | | 700,730 | | | | | | 1,481,857 | | | |
| | | | | | | | | |
Service Class Shares | | | | | | | | | | | | |
Issued | | | 3,720,256 | | | | | | 3,052,095 | | | |
Reinvested | | | 1,211,040 | | | | | | 677,319 | | | |
Redeemed | | | (5,317,159 | ) | | | | | (6,442,924 | ) | | |
| | | | | | | | | |
Total Service Class Shares | | | (385,863 | ) | | | | | (2,713,510 | ) | | |
| | | | | | | | | |
Total change in shares | | | 5,521,369 | | | | | | (319,900 | ) | | |
| | | | | | | | | |
| | | | | | | | | | | | |
| | | | | | | | | | | | |
| | | | | | | | | | | | |
| | | | | | | | | | | | |
| | | | | | | | | | | | |
| | | | | | | | | | | | |
| | | | | | | | | | | | |
| | | | | | | | | | | | |
| | | | | | | | | | | | |
| | | | | | | | | | | | |
| | | | | | | | | | | | |
| | | | | | | | | | | | |
| | | | | | | | | | | | |
| | | | | | | | | | | | |
| | | | | | | | | | | | |
| | | | | | | | | | | | |
| | | | | | | | | | |
Amount designated as “–” is zero or has been rounded to zero.
| (b) | Effective March 3, 2014, Class R2 Shares were renamed Class R Shares. |
| (c) | For the period from March 4, 2014 (commencement of operations) through October 31, 2014. |
The accompanying notes are an integral part of these financial statements.
72
Statement of Cash Flows
For the Year Ended October 31, 2014 (as restated) (a)
| | | | | | |
| | | Investor
Destination
Conservative
Fund |
DECREASE IN CASH | | | | | | |
Cash flows used in operating activities: | | | | | | |
Net increase in net assets from operations | | $ | 15,274,277 | | | |
Adjustments to reconcile net increase/decrease in net assets from operations to net cash used in operating activities: | | | | | | |
Purchase of affiliated investments | | | (136,282,389 | ) | | |
Proceeds from disposition of affiliated investments | | | 110,973,682 | | | |
Reinvestment of dividend income from affiliates | | | (5,955,748 | ) | | |
Reinvestment of interest income from affiliates | | | (3,321,629 | ) | | |
Change in unrealized (appreciation)/depreciation from investments in affiliates | | | (4,923,880 | ) | | |
Reinvestment of net realized gain distributions from underlying affiliated funds | | | (4,257,614 | ) | | |
Net realized loss from investment transactions with affiliates | | | 234,765 | | | |
Increase in receivable for investments sold | | | (387,208 | ) | | |
Decrease in prepaid expenses | | | 2,365 | | | |
Decrease in payable for investments purchased | | | (107,106 | ) | | |
Increase in investment advisory fees | | | 4,167 | | | |
Decrease in fund administration fees | | | (433 | ) | | |
Increase in administrative servicing fees | | | 18,813 | | | |
Increase in distribution fees | | | 14,350 | | | |
Decrease in accounting and transfer agent fees | | | (9,583 | ) | | |
Decrease in custodian fees | | | (201 | ) | | |
Increase in trustee fees | | | 1,351 | | | |
Decrease in compliance program costs | | | (106 | ) | | |
Decrease in professional fees | | | (2,420 | ) | | |
Increase in printing fees | | | 2,089 | | | |
Increase in other payables | | | 2,153 | | | |
| | | | | | |
Net cash used in operating activities | | | (28,720,305 | ) | | |
| | | | | | |
| | |
Cash flows provided by financing activities: | | | | | | |
Proceeds from shares issued | | | 190,359,700 | | | |
Cost of shares redeemed | | | (159,172,174 | ) | | |
Cash distributions paid to shareholders | | | (2,467,383 | ) | | |
| | | | | | |
Net cash provided by financing activities | | | 28,720,143 | | | |
| | | | | | |
Net decrease in cash | | | (162 | ) | | |
| | | | | | |
| | |
Cash: | | | | | | |
Beginning of period | | | 208 | | | |
| | | | | | |
End of period | | $ | 46 | | | |
| | | | | | |
| | | | | | |
| | | | | | |
| | | | | | |
| | | | | | |
| | | | | | |
| | | | | | | |
Supplemental disclosure of cash flow information:
Noncash financing activities not included herein consist of reinvestment of dividends and distributions of $25,067,078 and share class conversion of $253,391.
(a) Please refer to Note 12 for additional information.
The accompanying notes are an integral part of these financial statements.
73
Financial Highlights
Selected data for each share of capital outstanding throughout the periods indicated
Nationwide Investor Destinations Conservative Fund
| | | | | | | | | | | | | | | | | | | | | | | | | | | | | | | | | | | | | | | | | | | | | | | | | | | | | | | | |
| | | | | | Operations | | | Distributions | | | | | | Ratios/Supplemental Data | |
| | | Net Asset
Value,
Beginning
of Period | | | Net
Investment
Income | | | Net Realized
and
Unrealized
Gains
(Losses)
from
Investments | | | Total from
Operations | | | Net
Investment
Income | | | Net
Realized
Gains | | | Total
Distributions | | | Net Asset
Value, End of
Period | | | Total
Return (a)(b) | | | Net Assets
at End of
Period | | | Ratio of
Expenses
to Average
Net Assets (c) | | | Ratio of Net
Investment
Income
to Average
Net Assets (c) | | | Ratio of
Expenses
(Prior to
Reimbursements)
to Average
Net Assets (c) | | | Portfolio
Turnover (d) | |
| Class A Shares | | | | | | | | | | | | | | | | | | | | | | | | | | | | | | | | | | | | | | | | | | | | | | | | | | | | | | | | |
Year Ended October 31, 2014 (e) | | $ | 10.62 | | | | 0.15 | | | | 0.22 | | | | 0.37 | | | | (0.17 | ) | | | (0.52 | ) | | | (0.69 | ) | | $ | 10.30 | | | | 3.70% | | | $ | 81,289,282 | | | | 0.57% | | | | 1.51% | | | | 0.57% | | | | 25.03% | |
Year Ended October 31, 2013 (e) | | $ | 10.55 | | | | 0.16 | | | | 0.27 | | | | 0.43 | | | | (0.18 | ) | | | (0.18 | ) | | | (0.36 | ) | | $ | 10.62 | | | | 4.17% | | | $ | 61,383,390 | | | | 0.55% | | | | 1.57% | | | | 0.55% | | | | 39.16% | |
Year Ended October 31, 2012 (e) | | $ | 10.32 | | | | 0.19 | | | | 0.31 | | | | 0.50 | | | | (0.20 | ) | | | (0.07 | ) | | | (0.27 | ) | | $ | 10.55 | | | | 4.89% | | | $ | 51,231,565 | | | | 0.52% | | | | 1.87% | | | | 0.52% | | | | 15.75% | |
Year Ended October 31, 2011 (e) | | $ | 10.18 | | | | 0.21 | | | | 0.14 | | | | 0.35 | | | | (0.21 | ) | | | – | | | | (0.21 | ) | | $ | 10.32 | | | | 3.51% | | | $ | 34,889,691 | | | | 0.50% | | | | 2.04% | | | | 0.50% | | | | 17.28% | |
Year Ended October 31, 2010 (e) | | $ | 9.77 | | | | 0.23 | | | | 0.41 | | | | 0.64 | | | | (0.23 | ) | | | – | | | | (0.23 | ) | | $ | 10.18 | | | | 6.66% | | | $ | 22,095,197 | | | | 0.51% | | | | 2.33% | | | | 0.51% | | | | 15.48% | |
| | | | | | | | | | | | | | |
| Class C Shares | | | | | | | | | | | | | | | | | | | | | | | | | | | | | | | | | | | | | | | | | | | | | | | | | | | | | | | | |
Year Ended October 31, 2014 (e) | | $ | 10.58 | | | | 0.08 | | | | 0.21 | | | | 0.29 | | | | (0.10 | ) | | | (0.52 | ) | | | (0.62 | ) | | $ | 10.25 | | | | 2.91% | | | $ | 72,301,458 | | | | 1.27% | | | | 0.81% | | | | 1.27% | | | | 25.03% | |
Year Ended October 31, 2013 (e) | | $ | 10.51 | | | | 0.09 | | | | 0.27 | | | | 0.36 | | | | (0.11 | ) | | | (0.18 | ) | | | (0.29 | ) | | $ | 10.58 | | | | 3.49% | | | $ | 50,139,130 | | | | 1.23% | | | | 0.87% | | | | 1.23% | | | | 39.16% | |
Year Ended October 31, 2012 (e) | | $ | 10.28 | | | | 0.12 | | | | 0.30 | | | | 0.42 | | | | (0.12 | ) | | | (0.07 | ) | | | (0.19 | ) | | $ | 10.51 | | | | 4.17% | | | $ | 43,051,481 | | | | 1.23% | | | | 1.17% | | | | 1.23% | | | | 15.75% | |
Year Ended October 31, 2011 (e) | | $ | 10.15 | | | | 0.14 | | | | 0.13 | | | | 0.27 | | | | (0.14 | ) | | | – | | | | (0.14 | ) | | $ | 10.28 | | | | 2.63% | | | $ | 33,770,729 | | | | 1.24% | | | | 1.33% | | | | 1.24% | | | | 17.28% | |
Year Ended October 31, 2010 (e) | | $ | 9.74 | | | | 0.16 | | | | 0.41 | | | | 0.57 | | | | (0.16 | ) | | | – | | | | (0.16 | ) | | $ | 10.15 | | | | 5.92% | | | $ | 33,490,120 | | | | 1.23% | | | | 1.64% | | | | 1.23% | | | | 15.48% | |
| | | | | | | | | | | | | | |
| Class R Shares (f)(g) | | | | | | | | | | | | | | | | | | | | | | | | | | | | | | | | | | | | | | | | | | | | | | | | | | | | | | | | |
Year Ended October 31, 2014 (e) | | $ | 10.60 | | | | 0.13 | | | | 0.19 | | | | 0.32 | | | | (0.13 | ) | | | (0.52 | ) | | | (0.65 | ) | | $ | 10.27 | | | | 3.28% | | | $ | 51,948,486 | | | | 0.87% | | | | 1.23% | | | | 0.87% | | | | 25.03% | |
Year Ended October 31, 2013 (e) | | $ | 10.52 | | | | 0.13 | | | | 0.27 | | | | 0.40 | | | | (0.14 | ) | | | (0.18 | ) | | | (0.32 | ) | | $ | 10.60 | | | | 3.92% | | | $ | 58,782,811 | | | | 0.88% | | | | 1.24% | | | | 0.88% | | | | 39.16% | |
Year Ended October 31, 2012 (e) | | $ | 10.29 | | | | 0.16 | | | | 0.30 | | | | 0.46 | | | | (0.16 | ) | | | (0.07 | ) | | | (0.23 | ) | | $ | 10.52 | | | | 4.52% | | | $ | 64,893,180 | | | | 0.88% | | | | 1.52% | | | | 0.88% | | | | 15.75% | |
Year Ended October 31, 2011 (e) | | $ | 10.15 | | | | 0.17 | | | | 0.14 | | | | 0.31 | | | | (0.17 | ) | | | – | | | | (0.17 | ) | | $ | 10.29 | | | | 3.10% | | | $ | 60,593,403 | | | | 0.88% | | | | 1.67% | | | | 0.88% | | �� | | 17.28% | |
Year Ended October 31, 2010 (e) | | $ | 9.75 | | | | 0.19 | | | | 0.41 | | | | 0.60 | | | | (0.20 | ) | | | – | | | | (0.20 | ) | | $ | 10.15 | | | | 6.31% | | | $ | 53,173,161 | | | | 0.87% | | | | 1.96% | | | | 0.87% | | | | 15.48% | |
| | | | | | | | | | | | | | |
| Institutional Service Class Shares | | | | | | | | | | | | | | | | | | | | | | | | | | | | | | | | | | | | | | | | | | | | | | | | | | | | | | | | |
Period Ended October 31, 2014 (e)(h) | | $ | 10.18 | | | | 0.11 | | | | 0.14 | | | | 0.25 | | | | (0.10 | ) | | | – | | | | (0.10 | ) | | $ | 10.33 | | | | 2.51% | | | $ | 13,465,257 | | | | 0.25% | | | | 1.64% | | | | 0.25% | | | | 25.03% | |
| | | | | | | | | | | | | | |
| Institutional Class Shares | | | | | | | | | | | | | | | | | | | | | | | | | | | | | | | | | | | | | | | | | | | | | | | | | | | | | | | | |
Year Ended October 31, 2014 (e) | | $ | 10.67 | | | | 0.19 | | | | 0.21 | | | | 0.40 | | | | (0.20 | ) | | | (0.52 | ) | | | (0.72 | ) | | $ | 10.35 | | | | 4.04% | | | $ | 69,248,334 | | | | 0.22% | | | | 1.87% | | | | 0.22% | | | | 25.03% | |
Year Ended October 31, 2013 (e) | | $ | 10.59 | | | | 0.20 | | | | 0.27 | | | | 0.47 | | | | (0.21 | ) | | | (0.18 | ) | | | (0.39 | ) | | $ | 10.67 | | | | 4.58% | | | $ | 63,938,645 | | | | 0.23% | | | | 1.86% | | | | 0.23% | | | | 39.16% | |
Year Ended October 31, 2012 (e) | | $ | 10.36 | | | | 0.23 | | | | 0.30 | | | | 0.53 | | | | (0.23 | ) | | | (0.07 | ) | | | (0.30 | ) | | $ | 10.59 | | | | 5.16% | | | $ | 47,775,938 | | | | 0.23% | | | | 2.16% | | | | 0.23% | | | | 15.75% | |
Year Ended October 31, 2011 (e) | | $ | 10.22 | | | | 0.24 | | | | 0.14 | | | | 0.38 | | | | (0.24 | ) | | | – | | | | (0.24 | ) | | $ | 10.36 | | | | 3.75% | | | $ | 36,683,488 | | | | 0.24% | | | | 2.31% | | | | 0.24% | | | | 17.28% | |
Year Ended October 31, 2010 (e) | | $ | 9.81 | | | | 0.25 | | | | 0.42 | | | | 0.67 | | | | (0.26 | ) | | | – | | | | (0.26 | ) | | $ | 10.22 | | | | 6.94% | | | $ | 26,174,857 | | | | 0.23% | | | | 2.54% | | | | 0.23% | | | | 15.48% | |
| | | | | | | | | | | | | | |
| Service Class Shares | | | | | | | | | | | | | | | | | | | | | | | | | | | | | | | | | | | | | | | | | | | | | | | | | | | | | | | | |
Year Ended October 31, 2014 (e) | | $ | 10.65 | | | | 0.15 | | | | 0.20 | | | | 0.35 | | | | (0.16 | ) | | | (0.52 | ) | | | (0.68 | ) | | $ | 10.32 | | | | 3.52% | | | $ | 184,148,248 | | | | 0.63% | | | | 1.48% | | | | 0.63% | | | | 25.03% | |
Year Ended October 31, 2013 (e) | | $ | 10.57 | | | | 0.16 | | | | 0.27 | | | | 0.43 | | | | (0.17 | ) | | | (0.18 | ) | | | (0.35 | ) | | $ | 10.65 | | | | 4.16% | | | $ | 194,028,941 | | | | 0.63% | | | | 1.49% | | | | 0.63% | | | | 39.16% | |
Year Ended October 31, 2012 (e) | | $ | 10.34 | | | | 0.18 | | | | 0.30 | | | | 0.48 | | | | (0.18 | ) | | | (0.07 | ) | | | (0.25 | ) | | $ | 10.57 | | | | 4.75% | | | $ | 221,292,727 | | | | 0.63% | | | | 1.77% | | | | 0.63% | | | | 15.75% | |
Year Ended October 31, 2011 (e) | | $ | 10.20 | | | | 0.20 | | | | 0.14 | | | | 0.34 | | | | (0.20 | ) | | | – | | | | (0.20 | ) | | $ | 10.34 | | | | 3.35% | | | $ | 218,800,000 | | | | 0.64% | | | | 1.93% | | | | 0.64% | | | | 17.28% | |
Year Ended October 31, 2010 (e) | | $ | 9.79 | | | | 0.22 | | | | 0.41 | | | | 0.63 | | | | (0.22 | ) | | | – | | | | (0.22 | ) | | $ | 10.20 | | | | 6.52% | | | $ | 208,433,654 | | | | 0.62% | | | | 2.25% | | | | 0.62% | | | | 15.48% | |
| | | | | | | | | | | | | | | | | | | | | | | | | | | | | | | | | | | | | | | | | | | | | | | | | | | | | | | | | |
Amounts designated as “–” are zero or have been rounded to zero.
| (a) | Excludes sales charge. |
| (b) | Not annualized for periods less than one year. |
| (c) | Annualized for periods less than one year. |
| (d) | Portfolio turnover is calculated on the basis of the Fund as a whole without distinguishing among the classes of shares. |
| (e) | Per share calculations were performed using average shares method. |
| (f) | Effective February 28, 2009, Class R Shares were renamed Class R2 Shares. |
| (g) | Effective March 3, 2014, Class R2 Shares were renamed Class R Shares. |
| (h) | For the period from March 4, 2014 (commencement of operations) through October 31, 2014. Total return is calculated based on inception date of March 3, 2014 through October 31, 2014. |
The accompanying notes are an integral part of these financial statements.
74
Notes to Financial Statements
October 31, 2014
1. Organization
Nationwide Mutual Funds (the “Trust”) is registered under the Investment Company Act of 1940, as amended (the “1940 Act”), as an open-end management investment company, organized as a statutory trust under the laws of the State of Delaware. The Trust has authorized an unlimited number of shares of beneficial interest (“shares”), without par value. As of October 31, 2014, the Trust operates fifty-four (54) separate series, or mutual funds, each with its own investment objective(s) and strategies. This report contains the financial statements and financial highlights of the five (5) series listed below (each, a “Fund”; collectively, the “Funds”).
- Nationwide Investor Destinations Aggressive Fund (“Investor Destinations Aggressive”)
- Nationwide Investor Destinations Moderately Aggressive Fund (“Investor Destinations Moderately Aggressive”)
- Nationwide Investor Destinations Moderate Fund (“Investor Destinations Moderate”)
- Nationwide Investor Destinations Moderately Conservative Fund (“Investor Destinations Moderately Conservative”)
- Nationwide Investor Destinations Conservative Fund (“Investor Destinations Conservative”)
Each of the Funds operates as a “fund of funds,” which means that each of the Funds pursues its investment objective by allocating its investments primarily among other affiliated series of the Trust (“Underlying Funds”). The Underlying Funds typically invest, either directly or indirectly, in stocks, bonds, and other securities. Each of the Funds may also invest in an unregistered fixed interest contract (the “Nationwide Fixed Contract”) issued by Nationwide Life Insurance Company (“Nationwide Life”).
The Funds currently offer Class A, Class C, Class R, Service Class, Institutional Service Class and Institutional Class shares. Each class of a Fund represents interests in the same portfolio of investments of that Fund and the classes are identical except for differences in the sales charge structure, distribution or service fees, administrative services fees, class specific expenses, certain voting rights, conversion features, exchange privileges, and class names or designations.
Each of the Funds is a non-diversified fund, as defined in the 1940 Act.
2. Summary of Significant Accounting Policies
The following is a summary of significant accounting policies followed by the Funds in the preparation of their financial statements. The policies are in conformity with accounting principles generally accepted in the United States of America (“U.S. GAAP”). The preparation of financial statements requires Fund management to make estimates and assumptions that affect the reported amounts of assets and liabilities, the disclosure of contingent assets and liabilities at the date of the financial statements, and the reported amounts of income and expenses for the period. The Funds utilize various methods to measure the value of their investments on a recurring basis. Amounts received upon the sale of such investments could differ from those estimated values and those differences could be material.
U.S. GAAP defines fair market value as the price that a Fund would receive to sell an asset or pay to transfer a liability in an orderly transaction between market participants at the measurement date. The Trust’s investment adviser to the Funds, Nationwide Fund Advisors (“NFA”), assigns a fair value, as defined by U.S. GAAP, to a Fund’s investments in accordance with a hierarchy that prioritizes the various types of inputs used to measure fair value. The hierarchy gives the highest priority to readily available unadjusted quoted prices in active markets for identical assets (Level 1 measurements) and the lowest priority to unobservable inputs (Level 3 measurements) when market prices are not readily available or reliable.
75
Notes to Financial Statements (Continued)
October 31, 2014
The three levels of the hierarchy are summarized below.
| | — | | Level 1 — Quoted prices in active markets for identical assets |
| | — | | Level 2 — Other significant observable inputs (including quoted prices of similar securities, interest rates, prepayment speeds, credit risk, etc.) |
| | — | | Level 3 — Significant unobservable inputs (including a Fund’s own assumptions in determining the fair value of investments) |
Changes in valuation techniques may result in transfers into or out of an investment’s assigned level within the hierarchy.
An investment’s categorization within the hierarchy is based on the lowest level of any input that is significant to the fair valuation in its entirety. The inputs or methodology used to value investments are not intended to indicate the risk associated with investing in those investments.
Shares of registered open-end Underlying Funds in which a Fund invests are valued at their respective net asset value (“NAV”) as reported by such Underlying Fund. Investments valued in this manner are generally categorized as Level 1 investments within the hierarchy.
Each of the Funds (except Investor Destinations Aggressive) currently invests in the Nationwide Fixed Contract. The Nationwide Fixed Contract is a fixed interest rate contract issued and guaranteed by Nationwide Life. This contract has a stable principal value and pays a Fund a rate of interest, which is currently adjusted on a quarterly basis. During the year ended October 31, 2014, the rate was 3.50%, the minimum annual rate. Because the contract is guaranteed by Nationwide Life, assuming no default, a Fund receives no more or less than the guaranteed principal amount. NFA can redeem on a daily basis at par all or a portion of each Fund’s investment in the Nationwide Fixed Contract. The par value is calculated each day by the summation of the following factors: (i) prior day’s par value; (ii) prior day’s interest accrued (par multiplied by guaranteed fixed rate); and (iii) current day net purchase or redemption.
At October 31, 2014, 100% of the market value of Investor Destinations Aggressive was determined based on Level 1 inputs.
The following tables provide a summary of the inputs used to value the Funds’ net assets as of October 31, 2014. Please refer to the Statements of Investments for additional information on portfolio holdings.
Investor Destinations Moderately Aggressive
| | | | | | | | | | | | | | | | |
| | | Level 1 | | | Level 2 | | | Level 3 | | | Total | |
Assets: | | | | | | | | | | | | | | | | |
Fixed Contract | | $ | — | | | $ | — | | | $ | 42,824,351 | | | $ | 42,824,351 | |
Mutual Funds | | | 2,039,159,102 | | | | — | | | | — | | | | 2,039,159,102 | |
Total | | $ | 2,039,159,102 | | | $ | — | | | $ | 42,824,351 | | | $ | 2,081,983,453 | |
Investor Destinations Moderate
| | | | | | | | | | | | | | | | |
| | | Level 1 | | | Level 2 | | | Level 3 | | | Total | |
Assets: | | | | | | | | | | | | | | | | |
Fixed Contract | | $ | — | | | $ | — | | | $ | 143,734,124 | | | $ | 143,734,124 | |
Mutual Funds | | | 1,657,441,688 | | | | — | | | | — | | | | 1,657,441,688 | |
Total | | $ | 1,657,441,688 | | | $ | — | | | $ | 143,734,124 | | | $ | 1,801,175,812 | |
76
Notes to Financial Statements (Continued)
October 31, 2014
Investor Destinations Moderately Conservative
| | | | | | | | | | | | | | | | |
| | | Level 1 | | | Level 2 | | | Level 3 | | | Total | |
Assets: | | | | | | | | | | | | | | | | |
Fixed Contract | | $ | — | | | $ | — | | | $ | 89,187,160 | | | $ | 89,187,160 | |
Mutual Funds | | | 506,555,348 | | | | — | | | | — | | | | 506,555,348 | |
Total | | $ | 506,555,348 | | | $ | — | | | $ | 89,187,160 | | | $ | 595,742,508 | |
Investor Destinations Conservative
| | | | | | | | | | | | | | | | |
| | | Level 1 | | | Level 2 | | | Level 3 | | | Total | |
Assets: | | | | | | | | | | | | | | | | |
Fixed Contract | | $ | — | | | $ | — | | | $ | 103,605,467 | | | $ | 103,605,467 | |
Mutual Funds | | | 368,552,020 | | | | — | | | | — | | | | 368,552,020 | |
Total | | $ | 368,552,020 | | | $ | — | | | $ | 103,605,467 | | | $ | 472,157,487 | |
Amounts designated as “—” are zero or have been rounded to zero.
During the year ended October 31, 2014, Investor Destinations Aggressive had no transfers into or out of Level 1, Level 2 or Level 3. During the same period, Investor Destinations Moderately Aggressive, Investor Destinations Moderate, Investor Destinations Moderately Conservative, and Investor Destinations Conservative had one transfer from Level 2 to Level 3.
During an evaluation of the inputs used to fair value the Nationwide Fixed Contract, management transferred the Nationwide Fixed Contract from the Level 2 category to Level 3. While management utilizes judgment in determining the level of observable and the transparency of the inputs, management believes that placing the investment in the Level 3 category would be appropriate at this time due to the shifting of the significance of the unobservable inputs used at the reporting period.
The following is a reconciliation of assets for which Level 3 inputs were used in determining fair value:
Investor Destinations Moderately Aggressive
| | | | | | | | |
| | | Fixed Contract | | | Total | |
Balance as of 10/31/13 | | $ | — | | | $ | — | |
Interest Income from Affiliates | | | 1,431,515 | | | | 1,431,515 | |
Purchases | | | 1,492,869 | | | | 1,492,869 | |
Sales | | | (— | ) | | | (— | ) |
Change in Net Appreciation/(Depreciation) | | | — | | | | — | |
Transfers Into Level 3 | | | 39,899,967 | | | | 39,899,967 | |
Transfers Out of Level 3 | | | — | | | | — | |
Balance as of 10/31/14 | | $ | 42,824,351 | | | $ | 42,824,351 | |
The following table represents Investor Destinations Moderately Aggressive Level 3 financial instrument, the valuation technique used to measure the fair value of this financial instrument, and the significant unobservable inputs and the ranges of values for those inputs.
| | | | | | | | | | | | |
| Instrument | | Fair Value at
10/31/14 | | | Principal Valuation
Technique | | Unobservable Inputs | | Significant Input
Values* | |
| Nationwide Fixed Contract | | $ | 42,824,351 | | | Discounted Cash Flow | | Daily Transactions | | | daily | |
| | | | | | | | Interest Rate | | | 3.50 | % |
| | | | | | | | Redemption Feature | | | daily | |
| | | | | | | | Non Assignment Feature | | | daily | |
| | | | | | | | | Termination Feature | | | daily | |
77
Notes to Financial Statements (Continued)
October 31, 2014
Investor Destinations Moderate
| | | | | | | | |
| | | Fixed Contract | | | Total | |
Balance as of 10/31/13 | | $ | — | | | $ | — | |
Interest Income from Affiliates | | | 4,941,659 | | | | 4,941,659 | |
Purchases | | | 2,905,869 | | | | 2,905,869 | |
Sales | | | (3,589,101 | ) | | | (3,589,101 | ) |
Change in Net Appreciation/(Depreciation) | | | — | | | | — | |
Transfers Into Level 3 | | | 139,475,697 | | | | 139,475,697 | |
Transfers Out of Level 3 | | | — | | | | — | |
Balance as of 10/31/14 | | $ | 143,734,124 | | | $ | 143,734,124 | |
The following table represents Investor Destinations Moderate Level 3 financial instrument, the valuation technique used to measure the fair value of this financial instrument, and the significant unobservable inputs and the ranges of values for those inputs.
| | | | | | | | | | | | |
| Instrument | | Fair Value at
10/31/14 | | | Principal Valuation
Technique | | Unobservable Inputs | | Significant Input
Values* | |
| Nationwide Fixed Contract | | $ | 143,734,124 | | | Discounted Cash Flow | | Daily Transactions | | | daily | |
| | | | | | | | Interest Rate | | | 3.50 | % |
| | | | | | | | Redemption Feature | | | daily | |
| | | | | | | | Non Assignment Feature | | | daily | |
| | | | | | | | | Termination Feature | | | daily | |
Investor Destinations Moderately Conservative
| | | | | | | | |
| | | Fixed Contract | | | Total | |
Balance as of 10/31/13 | | $ | — | | | $ | — | |
Interest Income from Affiliates | | | 3,018,446 | | | | 3,018,446 | |
Purchases | | | 1,574,527 | | | | 1,574,527 | |
Sales | | | (2,411,229 | ) | | | (2,411,229 | ) |
Change in Net Appreciation/(Depreciation) | | | — | | | | — | |
Transfers Into Level 3 | | | 87,005,416 | | | | 87,005,416 | |
Transfers Out of Level 3 | | | — | | | | — | |
Balance as of 10/31/14 | | $ | 89,187,160 | | | $ | 89,187,160 | |
The following table represents Investor Destinations Moderately Conservative Level 3 financial instrument, the valuation technique used to measure the fair value of this financial instrument, and the significant unobservable inputs and the ranges of values for those inputs.
| | | | | | | | | | | | |
| Instrument | | Fair Value at
10/31/14 | | | Principal Valuation
Technique | | Unobservable Inputs | | Significant Input
Values* | |
| Nationwide Fixed Contract | | $ | 89,187,160 | | | Discounted Cash Flow | | Daily Transactions | | | daily | |
| | | | | | | | Interest Rate | | | 3.50 | % |
| | | | | | | | Redemption Feature | | | daily | |
| | | | | | | | Non Assignment Feature | | | daily | |
| | | | | | | | | Termination Feature | | | daily | |
78
Notes to Financial Statements (Continued)
October 31, 2014
Investor Destinations Conservative
| | | | | | | | |
| | | Fixed Contract | | | Total | |
Balance as of 10/31/13 | | $ | — | | | $ | — | |
Interest Income from Affiliates | | | 3,321,629 | | | | 3,321,629 | |
Purchases | | | 7,363,806 | | | | 7,363,806 | |
Sales | | | (1,363,163 | ) | | | (1,363,163 | ) |
Change in Net Appreciation/(Depreciation) | | | — | | | | — | |
Transfers Into Level 3 | | | 94,283,195 | | | | 94,283,195 | |
Transfers Out of Level 3 | | | — | | | | — | |
Balance as of 10/31/14 | | $ | 103,605,467 | | | $ | 103,605,467 | |
The following table represents Investor Destinations Conservative Level 3 financial instrument, the valuation technique used to measure the fair value of this financial instrument, and the significant unobservable inputs and the ranges of values for those inputs.
| | | | | | | | | | | | |
| Instrument | | Fair Value at
10/31/14 | | | Principal Valuation
Technique | | Unobservable Inputs | | Significant Input
Values* | |
| Nationwide Fixed Contract | | $ | 103,605,467 | | | Discounted Cash Flow | | Daily Transactions | | | daily | |
| | | | | | | | Interest Rate | | | 3.50 | % |
| | | | | | | | Redemption Feature | | | daily | |
| | | | | | | | Non Assignment Feature | | | daily | |
| | | | | | | | | Termination Feature | | | daily | |
Amounts designated as “—” are zero or have been rounded to zero.
| | * | NFA can increase or redeem all or a portion of each Funds’ investment in the Fixed Contract on a daily basis at par. The Funds cannot assign or transfer their interest in the Nationwide Fixed Contract to any party. If a Fund transferred its interest in the Nationwide Fixed Contract, the issuer would terminate the arrangement and pay the Fund the amount of its holding as of the termination date. The Funds or the issuer have the ability to terminate their investments in the Nationwide Fixed Contract at their discretion. The Fair Value Committee (“FVC”) continues to evaluate any information that could cause an adjustment to the fair value for this investment such as market news or the credit rating of the issuer. |
The following are the valuation policies of the affiliated Underlying Funds:
Securities for which market-based quotations are readily available are valued at current market value as of “Valuation Time.” Valuation Time is as of the close of regular trading on the New York Stock Exchange (usually 4:00 p.m. Eastern time). Equity securities are generally valued at the last quoted sale price or official closing price, or, if there is no such price, the last quoted bid price provided by an independent pricing service approved by the Trust’s Board of Trustees (the “Board of Trustees”). Prices are taken from the primary market or exchange on which each security trades. Shares of registered open-end management investment companies are valued at NAV as reported by such company. Investments valued in this manner are generally categorized as Level 1 investments within the hierarchy.
Debt and other fixed-income securities are generally valued at the bid evaluation price provided by an independent pricing service as approved by the Board of Trustees. Evaluations provided by independent pricing service providers may be determined without exclusive reliance on quoted prices and may use broker-dealer quotations, individual trading characteristics and other market data, reported trades or valuation estimates from their internal pricing models. The independent pricing service providers’ internal models use inputs that are observable such as issuer details, interest rates, yield curves, prepayment speeds, credit risks/spreads, default rates, anticipated timing of principal repayments, and quoted prices for similar assets and are generally categorized as Level 2 investments within the hierarchy. Debt obligations generally involve some risk of default with respect to interest and/or principal payments.
79
Notes to Financial Statements (Continued)
October 31, 2014
The Board of Trustees has delegated authority to NFA, and the Trust’s administrator, Nationwide Fund Management LLC (“NFM”), to assign a fair value under certain circumstances (e.g., pricing service does not provide a price as there may be no market-based quotations or price provided is deemed unreliable by NFA, NFM and/or designee), pursuant to valuation procedures approved by the Board of Trustees. NFA and NFM have established a FVC to assign these fair valuations.
The fair value of a security may differ from its quoted or published price. Fair valuation of portfolio securities may occur on a daily basis.
Securities may be fair valued in a variety of circumstances, such as where (i) market-based quotations are not readily available; (ii) an independent pricing service does not provide a value or the value provided by an independent pricing service is determined to be unreliable in the judgment of NFA or its designee; (iii) a significant event has occurred that affects the value of a Fund’s securities after trading has stopped (e.g., earnings announcements or news relating to natural disasters affecting an issuer’s operations); (iv) the securities are illiquid; (v) the securities have defaulted or been delisted from an exchange and are no longer trading; or (vi) any other circumstance in which the FVC believes that market-based quotations do not accurately reflect the value of a security.
The fair valuation of securities takes into account relevant factors and surrounding circumstances, including, but not limited to, the prices of related or comparable assets or liabilities, recent transactions, market multiples, anticipated cash flows, the nature and duration of any restrictions on transfer, book values, and other information relevant to the investment. Methods utilized to determine fair value may include, among others, the following: (i) a multiple of earnings; (ii) the discount from market value of a similar, freely traded security; (iii) the yield-to-maturity for debt issues; or (iv) a combination of these and other methods. Fair valuations may also take into account significant events that occur before Valuation Time but after the close of the principal market on which a security trades that materially affect the value of such security. The FVC monitors the results of fair valuation determinations and regularly reports the results to the Board of Trustees. That said, there can be no assurance that the fair value assigned to a security is the price at which a security could have been sold during the period in which the particular fair value was used to value the security. To the extent the inputs used are observable these securities are classified as Level 2 otherwise Level 3.
Securities held by the Nationwide Money Market Fund (“Money Market”) are valued at amortized cost, which approximates market value. Securities valued in this manner are generally categorized as Level 2 securities within the hierarchy. Under the amortized cost method, premium or discount, if any, is amortized or accreted, respectively, to the maturity of the security. Money Market’s use of amortized cost is subject to compliance with certain conditions as specified by Rule 2a-7 under the 1940 Act.
| (b) | Security Transactions and Investment Income |
Security transactions are accounted for on the date the security is purchased or sold. Security gains and losses are calculated on the identified cost basis. Dividend income received from the Underlying Funds is recognized on the ex-dividend date and is recorded as income on the Statement of Operations. Capital gain distributions received from the Underlying Funds are recognized on ex-dividend date and are recorded on the Statement of Operations as such. Interest income is recognized on the accrual basis and includes, where applicable, the amortization of premiums or accretion of discounts, and is recorded as such on a Fund’s Statement of Operations.
| (c) | Distributions to Shareholders |
Distributions from net investment income, if any, are declared and paid quarterly. Distributions from net realized capital gains, if any, are declared and distributed at least annually. All distributions are recorded on the ex-dividend date.
Dividends and distributions to shareholders are determined in accordance with federal income tax regulations, which may differ from U.S. GAAP. These “book/tax” differences are considered either permanent or temporary.
80
Notes to Financial Statements (Continued)
October 31, 2014
Permanent differences are reclassified within the capital accounts based on their nature for federal income tax purposes; temporary differences do not require reclassification. The permanent differences as of October 31, 2014 are primarily attributable to capital distributions from Underlying Funds and distribution redesignation. These reclassifications have no effect upon the NAV of a Fund. Any distribution in excess of current and accumulated earnings and profits for federal income tax purposes is reported as a return of capital distribution.
Reclassifications for the year ended October 31, 2014 were as follows:
| | | | | | | | | | | | |
| Fund | | Capital | | | Accumulated
undistributed net
investment income | | | Accumulated net
realized gains/(losses)
from investment
transactions | |
Investor Destinations Aggressive | | $ | — | | | $ | 2,677,877 | | | $ | (2,677,877 | ) |
Investor Destinations Moderately Aggressive | | | — | | | | 3,298,674 | | | | (3,298,674 | ) |
Investor Destinations Moderate | | | — | | | | 1,928,385 | | | | (1,928,385 | ) |
Investor Destinations Moderately Conservative | | | — | | | | 396,700 | | | | (396,700 | ) |
Investor Destinations Conservative | | | — | | | | 113,872 | | | | (113,872 | ) |
Each Fund elected to be treated as, and intends to qualify each year as, a “Regulated Investment Company” by complying with the provisions available to certain investment companies under Subchapter M of the U.S. Internal Revenue Code of 1986, as amended, and to make distributions of net investment income and net realized capital gains sufficient to relieve a Fund from all, or substantially all, federal income taxes. Therefore, no federal income tax provision is required.
A Fund recognizes a tax benefit from an uncertain position only if it is more likely than not that the position is sustainable, based solely on its technical merits and consideration of the relevant taxing authorities’ widely understood administrative practices and precedents. A Fund undertakes an affirmative evaluation of tax positions taken or expected to be taken in the course of preparing tax returns to determine whether it is more likely than not (i.e., greater than 50 percent) that each tax position will be sustained upon examination by a taxing authority based on the technical merits of the position. If such a tax position taken by a Fund is not sustained upon examination by a taxing authority that Fund could incur taxes and penalties related to that position, and those amounts could be material. A tax position that meets the more likely than not recognition threshold is measured to determine the amount of benefits to recognize in the financial statements. Differences result in an increase in a liability for taxes payable (or a reduction of a tax refund receivable) and an increase in a deferred tax liability (or a reduction in a deferred tax asset). Each Fund files U.S. federal income tax returns and, if applicable, returns in various foreign jurisdictions in which it invests. The last three tax year ends, or since inception (if shorter), and any interim tax period since then generally remain open for examination by taxing authorities.
Each Fund engages in ongoing monitoring and analysis; future conclusions reached by management could be different and result in adjustments to a Fund’s NAV and financial statements. The Funds are not aware of any tax positions for which it is reasonably possible that the total amounts of unrecognized tax benefits will significantly change in the next twelve months.
| (e) | Cash and Cash Equivalents |
For the purposes of the Statement of Cash Flows, the Funds define Cash and Cash Equivalents as cash, money market funds and other investments held in lieu of cash.
| (f) | Allocation of Expenses, Income, and Gains and Losses |
Expenses directly attributable to a Fund are charged to that Fund. Expenses not directly attributable to a Fund are allocated proportionally among various or all series of the Trust. Income, fund level expenses, and realized and unrealized gains or losses are allocated to each class of shares of a Fund based on the value of the outstanding
81
Notes to Financial Statements (Continued)
October 31, 2014
shares of that class relative to the total value of the outstanding shares of that Fund. Expenses specific to a class (such as Rule 12b-1 and administrative services fees) are charged to that specific class.
3. Transactions with Affiliates
Under the terms of the Trust’s Investment Advisory Agreement, NFA manages the investments of the assets and supervises the daily business affairs of the Funds in accordance with policies and procedures established by the Board of Trustees. NFA is a wholly owned subsidiary of Nationwide Financial Services, Inc. (“NFS”), a holding company which is a direct wholly owned subsidiary of Nationwide Corporation. Each Fund pays NFA an investment advisory fee of 0.13% per year based on the Fund’s average daily net assets. For the year ended October 31, 2014, the Funds effective advisory fee rate was 0.13%.
The Trust and NFA have entered into a written Expense Limitation Agreement that limits the Funds’ operating expenses (excluding any taxes, interest, brokerage commissions and other costs incurred in connection with the purchase and sale of portfolio securities, short sale dividend expenses, Rule 12b-1 fees, fees paid pursuant to an Administrative Services Plan, other expenditures which are capitalized in accordance with U.S. GAAP, expenses incurred by a Fund in connection with any merger or reorganization and may exclude other non-routine expenses not incurred in the ordinary course of a Fund’s business) from exceeding 0.25% for each share class until February 28, 2015.
NFA may request and receive reimbursement from a Fund for advisory fees waived and other expenses reimbursed by NFA pursuant to the Expense Limitation Agreement at a date not to exceed three years from the month in which the corresponding waiver or reimbursement to a Fund was made. However, no reimbursement may be made unless: (i) a Fund’s assets exceed $100 million and (ii) the total annual expense ratio of the class making such reimbursement is no higher than the amount of the expense limitation that was in place at the time NFA waived the fees or reimbursed the expenses and does not cause the expense ratio to exceed the current expense limitation. Reimbursement by a Fund of amounts previously waived or assumed by NFA is not permitted except as provided for in the Expense Limitation Agreement. The Expense Limitation Agreement may be changed or eliminated only with the consent of the Board of Trustees.
As of October 31, 2014, the Funds had no cumulative potential reimbursements, and no amounts were reimbursed to NFA pursuant to the Expense Limitation Agreement during the year ended October 31, 2014.
NFM, a wholly owned subsidiary of NFS Distributors, Inc. (“NFSDI”) (a wholly owned subsidiary of NFS), provides various administrative and accounting services for the Funds, and serves as Transfer and Dividend Disbursing Agent for the Funds. NFM has entered into an agreement with a third-party service provider to provide certain sub-administration and sub-transfer agency services to the Funds. NFM pays the service provider a fee for these services.
Under the terms of a Joint Fund Administration and Transfer Agency Agreement, the fees for such services are based on the sum of the following: (i) the amount payable by NFM to its sub-administrator and sub-transfer agent; and (ii) a percentage of the combined average daily net assets of the Trust and Nationwide Variable Insurance Trust (“NVIT Trust”), a Delaware statutory trust and registered investment company that is affiliated with the Trust, according to the fee schedule below.
| | | | |
| Combined Fee Schedule | | | |
Up to $25 billion | | | 0.025% | |
$25 billion and more | | | 0.020% | |
During the year ended October 31, 2014, NFM received $1,734,676 in fees from the Funds under the Joint Fund Administration and Transfer Agency Agreement.
In addition, the Trust pays out-of-pocket expenses reasonably incurred by NFM in providing services to the Funds and the Trust, including, but not limited to, the cost of pricing services that NFM utilizes and networking fees paid to broker-dealers that provide sub-accounting and sub-transfer agency services to their customers who are Fund shareholders. Such services, which are not otherwise provided by NFM, generally include individual account maintenance and recordkeeping, dividend disbursement, responding to shareholder calls and inquiries, providing statements and
82
Notes to Financial Statements (Continued)
October 31, 2014
transaction confirmations, tax reporting, and other shareholder services. Depending on the nature and quality of the services provided, fees for these services may range from $6 to $21 per customer per year.
Under the terms of the Joint Fund Administration and Transfer Agency Agreement and a letter agreement between NFM and the Trust, the Trust has agreed to reimburse NFM for certain costs related to the Funds’ portion of ongoing administration, monitoring and annual (compliance audit) testing of the Trust’s Rule 38a-1 Compliance Program subject to the pre-approval of the Trust’s Audit Committee. These costs are allocated among the series of the Trust based upon their relative net assets. For the year ended October 31, 2014, the Funds’ aggregate portion of such costs amounted to $17,786.
Under the terms of a Distribution Plan pursuant to Rule 12b-1 under the 1940 Act, Nationwide Fund Distributors LLC (“NFD”), the Funds’ principal underwriter, is compensated by the Funds for expenses associated with the distribution of certain classes of shares of the Funds. NFD is a wholly owned subsidiary of NFSDI. These fees are based on average daily net assets of the respective class of the Funds at an annual rate of 0.25% of Class A shares, 1.00% of Class C shares, and 0.50% of Class R shares, and 0.25% of Service Class shares of each Fund. Institutional Class and Institutional Service Class shares do not pay a distribution fee.
Pursuant to an Underwriting Agreement, NFD serves as principal underwriter of the Funds in the continuous distribution of their shares and receives commissions in the form of a front-end sales charge on Class A shares. These fees are deducted from, and are not included in, proceeds from sales of Class A shares of the Funds. From these fees, NFD pays sales commissions, salaries and other expenses in connection with generating new sales of Class A shares of the Funds. During the year ended October 31, 2014, the Fund’s Class A sales charges ranged from 0.00% to 5.75% based on the amount purchased. During the year ended October 31, 2014, the Funds imposed front-end sales charges of $1,773,003.
NFD also receives fees in the form of contingent deferred sales charges (“CDSCs”) on Class A, Class B and Class C shares. Any CDSC is based on the original purchase price or the current market value of the shares being redeemed, whichever is less. A CDSC is imposed on Class A shares for certain redemptions , Class B shares made within 6 years of purchase, and Class C shares made within 1 year of purchase. During the year ended October 31, 2014, applicable Class A CDSCs were 1.00% based on the original purchase price or the current market value of the shares being redeemed. Class B CDSCs ranged from 1.00% to 5.00% based on the original purchase price or the current market value of the shares being redeemed and depending on how long the shares were held before redemption. Class B shares converted to Class A shares on February 21, 2014. Class C CDSCs were 1.00% based on the original purchase price or the current market value of the shares being redeemed. During the year ended October 31, 2014, the Funds imposed CDSCs of $22,726.
Under the terms of an Administrative Services Plan, the Funds pay fees to servicing organizations, such as broker-dealers, including NFS, and financial institutions, that agree to provide administrative support services to the shareholders of certain classes. These services may include, but are not limited to, the following: (i) establishing and maintaining shareholder accounts; (ii) processing purchase and redemption transactions; (iii) arranging bank wires; (iv) performing shareholder sub-accounting; (v) answering inquiries regarding the Funds; and (vi) other such services. These fees are calculated at an annual rate of up to 0.25% of the average daily net assets of Class A, Class R, Institutional Service Class, and Service Class shares of each Fund. Effective March 1, 2014, Class C shares began charging administrative servicing fees. These fees are calculated at an annual rate of up to 0.25% of the average daily net assets of Class C shares of the Funds.
During the year ended October 31, 2014, the effective rate for administrative services fees that NFS earned was as follows:
| | | | | | | | | | | | | | | | | | | | |
| Fund | | Class A | | | Class C | | | Class R | | | Institutional
Service Class | | | Service Class | |
Investor Destinations Aggressive | | | 0.10 | % | | | 0.06 | % | | | 0.15 | % | | | 0.03 | % | | | 0.15 | % |
Investor Destinations Moderately Aggressive | | | 0.10 | | | | 0.05 | | | | 0.15 | | | | 0.03 | | | | 0.15 | |
Investor Destinations Moderate | | | 0.10 | | | | 0.05 | | | | 0.15 | | | | 0.04 | | | | 0.15 | |
Investor Destinations Moderately Conservative | | | 0.11 | | | | 0.05 | | | | 0.15 | | | | 0.04 | | | | 0.15 | |
Investor Destinations Conservative | | | 0.10 | | | | 0.05 | | | | 0.15 | | | | 0.03 | | | | 0.15 | |
83
Notes to Financial Statements (Continued)
October 31, 2014
During the year ended October 31, 2014, NFS earned the following amounts in administrative services fees from each Fund:
| | | | |
| Fund | | Amount | |
Investor Destinations Aggressive | | $ | 1,575,735 | |
Investor Destinations Moderately Aggressive | | | 2,468,472 | |
Investor Destinations Moderate | | | 2,019,621 | |
Investor Destinations Moderately Conservative | | | 655,099 | |
Investor Destinations Conservative | | | 474,181 | |
As of October 31, 2014, NFA or its affiliates directly held the percentage indicated below of the shares outstanding of the applicable Fund.
| | | | |
| Fund | | % of Shares
Outstanding
Owned | |
Investor Destinations Aggressive | | | 39.23 | % |
Investor Destinations Moderately Aggressive | | | 31.96 | |
Investor Destinations Moderate | | | 26.55 | |
Investor Destinations Moderately Conservative | | | 21.46 | |
Investor Destinations Conservative | | | 14.20 | |
Each Fund is a shareholder of its Underlying Funds. The Underlying Funds do not charge a Fund any sales charge for buying or selling Underlying Fund shares. However, a Fund indirectly pays a portion of the operating expenses of each Underlying Fund in which it invests, including management, administration and custodian fees of the Underlying Funds. These expenses are deducted from each Underlying Fund’s net assets before its share price is calculated and are in addition to the fees and expenses of the Fund. Actual indirect expenses vary depending on how a Fund’s assets are allocated among the Underlying Funds.
4. Investments in Affiliated Issuers
Each of the Funds invests in Institutional Class shares of the affiliated Underlying Funds, and each of the Funds (except Investor Destinations Aggressive) invests in the Nationwide Fixed Contract. The Funds’ transactions in the shares of Underlying Funds and in the Nationwide Fixed Contract during the year ended October 31, 2014 were as follows:
Investor Destinations Aggressive
| | | | | | | | | | | | | | | | | | | | | | | | | | | | |
| Affiliated Issuer | | Market
Value at
October 31,
2013 | | | Purchases
at Cost | | | Sales
Proceeds | | | Dividend
Income | | | Realized
Gain/
(Loss) | | | Capital Gain
Distributions | | | Market
Value at
October 31,
2014 | |
Nationwide Portfolio Completion Fund | | $ | 122,134,901 | | | $ | 7,529,523 | | | $ | 10,291,582 | | | $ | 1,682,207 | | | $ | 184,457 | | | $ | — | | | $ | 121,131,334 | |
Nationwide International Index Fund | | | 330,372,078 | | | | 26,136,985 | | | | 16,846,869 | | | | 11,002,235 | | | | (4,088,757 | ) | | | — | | | | 329,146,996 | |
Nationwide Mid Cap Market Index Fund | | | 172,329,310 | | | | 9,089,000 | | | | 13,547,619 | | | | 1,900,713 | | | | 2,092,525 | | | | 7,188,288 | | | | 177,828,083 | |
Nationwide S&P 500 Index Fund | | | 393,912,196 | | | | 38,207,579 | | | | 57,118,141 | | | | 7,503,324 | | | | 9,389,989 | | | | 28,001,993 | | | | 402,830,465 | |
Nationwide Small Cap Index Fund | | | 158,588,875 | | | | 20,928,005 | | | | 15,494,902 | | | | 2,034,455 | | | | 2,643,272 | | | | 8,949,614 | | | | 165,930,765 | |
Nationwide Bond Index Fund | | | 24,203,719 | | | | 1,905,978 | | | | 978,876 | | | | 630,733 | | | | (25,022 | ) | | | 414,805 | | | | 25,100,478 | |
Nationwide Core Plus Bond Fund | | | 24,091,538 | | | | 1,624,260 | | | | 676,839 | | | | 714,215 | | | | 9,290 | | | | 45,131 | | | | 25,214,901 | |
84
Notes to Financial Statements (Continued)
October 31, 2014
Investor Destinations Moderately Aggressive
| | | | | | | | | | | | | | | | | | | | | | | | | | | | |
| Affiliated Issuer | | Market
Value at
October 31,
2013 | | | Purchases
at Cost | | | Sales
Proceeds | | | Dividend/
Interest
Income | | | Realized
Gain/
(Loss) | | | Capital Gain
Distributions | | | Market
Value at
October 31,
2014 | |
Nationwide Portfolio Completion Fund | | $ | 202,018,670 | | | $ | 55,031,132 | | | $ | 16,360,110 | | | $ | 2,901,617 | | | $ | 328,465 | | | $ | — | | | $ | 244,444,800 | |
Nationwide International Index Fund | | | 510,006,859 | | | | 34,259,005 | | | | 42,365,307 | | | | 16,573,466 | | | | (9,069,660 | ) | | | — | | | | 486,657,289 | |
Nationwide Mid Cap Market Index Fund | | | 246,095,831 | | | | 13,264,866 | | | | 18,356,219 | | | | 2,719,839 | | | | 4,877,920 | | | | 10,319,866 | | | | 255,141,922 | |
Nationwide S&P 500 Index Fund | | | 571,664,464 | | | | 52,124,412 | | | | 75,204,300 | | | | 10,929,313 | | | | 11,086,052 | | | | 40,858,207 | | | | 589,201,202 | |
Nationwide Small Cap Index Fund | | | 203,217,452 | | | | 28,173,191 | | | | 19,529,062 | | | | 2,622,021 | | | | 8,290,994 | | | | 11,561,235 | | | | 214,525,486 | |
Nationwide Ziegler Equity Income Fund | | | 20,812,731 | | | | 354,543 | | | | 815,050 | | | | 354,542 | | | | 62,810 | | | | — | | | | 22,812,462 | |
Nationwide Bond Index Fund | | | 121,267,974 | | | | 7,191,121 | | | | 26,286,658 | | | | 2,781,823 | | | | (1,028,713 | ) | | | 2,090,197 | | | | 101,728,389 | |
Nationwide Core Plus Bond Fund | | | 80,356,242 | | | | 4,840,934 | | | | 3,212,975 | | | | 2,367,015 | | | | 40,455 | | | | 150,533 | | | | 82,565,094 | |
Nationwide HighMark Short Term Bond Fund | | | 39,907,971 | | | | 2,259,823 | | | | — | | | | 495,932 | | | | — | | | | — | | | | 42,082,458 | |
Nationwide Fixed Contract | | | 39,899,967 | | | | 1,492,869 | | | | — | | | | 1,431,515 | | | | — | | | | — | | | | 42,824,351 | |
Investor Destinations Moderate
| | | | | | | | | | | | | | | | | | | | | | | | | | | | |
| Affiliated Issuer | | Market
Value at
October 31,
2013 | | | Purchases
at Cost | | | Sales
Proceeds | | | Dividend/
Interest
Income | | | Realized
Gain/
(Loss) | | | Capital Gain
Distributions | | | Market
Value at
October 31,
2014 | |
Nationwide Portfolio Completion Fund | | $ | 174,792,995 | | | $ | 78,915,653 | | | $ | 5,915,536 | | | $ | 2,560,368 | | | $ | 170,684 | | | $ | — | | | $ | 251,774,619 | |
Nationwide International Index Fund | | | 317,475,542 | | | | 12,446,954 | | | | 21,651,138 | | | | 10,229,986 | | | | 4,541,879 | | | | — | | | | 298,898,216 | |
Nationwide Mid Cap Market Index Fund | | | 177,472,824 | | | | 9,354,114 | | | | 13,996,639 | | | | 1,952,973 | | | | 5,115,176 | | | | 7,401,141 | | | | 183,062,237 | |
Nationwide S&P 500 Index Fund | | | 353,759,541 | | | | 32,058,336 | | | | 45,188,499 | | | | 6,772,966 | | | | 18,773,712 | | | | 25,285,371 | | | | 365,882,282 | |
Nationwide Small Cap Index Fund | | | 105,759,431 | | | | 7,968,312 | | | | 6,622,558 | | | | 1,347,967 | | | | 2,277,636 | | | | 6,010,922 | | | | 108,205,638 | |
Nationwide Ziegler Equity Income Fund | | | 36,280,322 | | | | 607,778 | | | | 2,232,995 | | | | 607,778 | | | | 170,683 | | | | — | | | | 38,876,540 | |
Nationwide Bond Index Fund | | | 228,107,895 | | | | 8,830,574 | | | | 58,436,297 | | | | 4,937,356 | | | | (384,742 | ) | | | 3,893,220 | | | | 177,437,996 | |
Nationwide Core Plus Bond Fund | | | 69,821,494 | | | | 21,797,842 | | | | 1,559,104 | | | | 2,383,252 | | | | 22,985 | | | | 130,798 | | | | 90,628,847 | |
Nationwide Enhanced Income Fund | | | 104,149,878 | | | | 415,921 | | | | 104,486,365 | | | | 420,182 | | | | (2,075,456 | ) | | | — | | | | — | |
Nationwide Highmark Short Term Bond Fund | | | — | | | | 132,536,748 | | | | 44,696,852 | | | | 410,600 | | | | 3,777 | | | | — | | | | 87,643,680 | |
Nationwide Inflation-Protected Securities Fund | | | 52,220,847 | | | | 2,167,115 | | | | 106,183 | | | | 294,324 | | | | (5,623 | ) | | | — | | | | 55,031,633 | |
Nationwide Fixed Contract | | | 139,475,697 | | | | 2,905,869 | | | | 3,589,101 | | | | 4,941,659 | | | | — | | | | — | | | | 143,734,124 | |
85
Notes to Financial Statements (Continued)
October 31, 2014
Investor Destinations Moderately Conservative
| | | | | | | | | | | | | | | | | | | | | | | | | | | | |
| Affiliated Issuer | | Market
Value at
October 31,
2013 | | | Purchases
at Cost | | | Sales
Proceeds | | | Dividend/
Interest
Income | | | Realized
Gain/
(Loss) | | | Capital Gain
Distributions | | | Market
Value at
October 31,
2014 | |
Nationwide Portfolio Completion Fund | | $ | 57,845,236 | | | $ | 935,403 | | | $ | — | | | $ | 791,489 | | | $ | — | | | $ | — | | | $ | 59,573,052 | |
Nationwide International Index Fund | | | 58,008,986 | | | | 4,901,633 | | | | 1,737,961 | | | | 1,918,208 | | | | 787,295 | | | | — | | | | 59,332,974 | |
Nationwide Mid Cap Market Index Fund | | | 40,767,621 | | | | 2,157,372 | | | | 2,939,495 | | | | 448,322 | | | | 1,202,729 | | | | 1,709,050 | | | | 42,279,411 | |
Nationwide S&P 500 Index Fund | | | 75,357,231 | | | | 6,876,045 | | | | 9,571,825 | | | | 1,444,892 | | | | 3,472,580 | | | | 5,423,897 | | | | 78,003,054 | |
Nationwide Small Cap Index Fund | | | 17,469,881 | | | | 1,724,042 | | | | 1,485,716 | | | | 221,406 | | | | 523,018 | | | | 995,506 | | | | 17,886,298 | |
Nationwide Ziegler Equity Income Fund | | | 17,622,990 | | | | 296,890 | | | | 1,498,963 | | | | 296,890 | | | | 136,165 | | | | — | | | | 18,463,648 | |
Nationwide Bond Index Fund | | | 116,212,668 | | | | 7,168,710 | | | | 5,263,456 | | | | 2,936,829 | | | | 46,463 | | | | 1,982,808 | | | | 117,880,392 | |
Nationwide Core Plus Bond Fund | | | 23,147,099 | | | | 709,921 | | | | 193,290 | | | | 666,560 | | | | 1,697 | | | | 43,362 | | | | 23,825,280 | |
Nationwide Enhanced Income Fund | | | 57,868,703 | | | | 270,894 | | | | 58,082,276 | | | | 284,695 | | | | (1,092,716 | ) | | | — | | | | — | |
Nationwide HighMark Short Term Bond Fund | | | — | | | | 83,416,722 | | | | 23,693,177 | | | | 245,780 | | | | (7,619 | ) | | | — | | | | 59,638,836 | |
Nationwide Inflation-Protected Securities Fund | | | 28,836,937 | | | | 433,839 | | | | — | | | | 158,392 | | | | — | | | | — | | | | 29,672,403 | |
Nationwide Fixed Contract | | | 87,005,416 | | | | 1,574,527 | | | | 2,411,229 | | | | 3,018,446 | | | | — | | | | — | | | | 89,187,160 | |
Investor Destinations Conservative
| | | | | | | | | | | | | | | | | | | | | | | | | | | | |
| Affiliated Issuer | | Market
Value at
October 31,
2013 | | | Purchases
at Cost | | | Sales
Proceeds | | | Dividend/
Interest
Income | | | Realized
Gain/
(Loss) | | | Capital Gain
Distributions | | | Market
Value at
October 31,
2014 | |
Nationwide Porfolio Completion Fund | | $ | 34,217,041 | | | $ | 3,174,048 | | | $ | — | | | $ | 469,662 | | | $ | — | | | $ | — | | | $ | 37,886,479 | |
Nationwide International Index Fund | | | 17,084,155 | | | | 2,955,435 | | | | 456,508 | | | | 567,371 | | | | 49,181 | | | | — | | | | 19,080,955 | |
Nationwide Mid Cap Market Index Fund | | | 12,890,163 | | | | 1,636,038 | | | | 960,878 | | | | 142,698 | | | | 197,581 | | | | 540,975 | | | | 14,362,749 | |
Nationwide S&P 500 Index Fund | | | 21,395,946 | | | | 2,619,647 | | | | 1,813,986 | | | | 415,213 | | | | 534,304 | | | | 1,538,295 | | | | 23,799,160 | |
Nationwide Small Cap Index Fund | | | 4,285,359 | | | | 683,640 | | | | 313,527 | | | | 54,587 | | | | 11,269 | | | | 244,197 | | | | 4,736,347 | |
Nationwide Ziegler Equity Income Fund | | | 17,140,875 | | | | 780,789 | | | | 899,994 | | | | 292,962 | | | | 82,528 | | | | — | | | | 19,080,955 | |
Nationwide Bond Index Fund | | | 111,674,964 | | | | 11,014,164 | | | | 4,548,797 | | | | 2,793,685 | | | | 19,197 | | | | 1,909,924 | | | | 117,871,360 | |
Nationwide Core Plus Bond Fund | | | 12,930,405 | | | | 5,785,120 | | | | — | | | | 455,249 | | | | — | | | | 24,223 | | | | 18,822,644 | |
Nationwide Enhanced Income Fund | | | 59,954,344 | | | | 276,111 | | | | 60,173,125 | | | | 289,658 | | | | (1,105,689 | ) | | | — | | | | — | |
Nationwide Highmark Short Term Bond Fund | | | — | | | | 106,505,881 | | | | 40,443,704 | | | | 284,046 | | | | (23,136 | ) | | | — | | | | 65,968,529 | |
Nationwide Inflation-Protected Securities Fund | | | 34,217,041 | | | | 2,897,312 | | | | — | | | | 190,617 | | | | — | | | | — | | | | 37,587,896 | |
Nationwide Money Market Fund | | | 8,551,186 | | | | 803,760 | | | | — | | | | — | | | | — | | | | — | | | | 9,354,946 | |
Nationwide Fixed Contract | | | 94,283,195 | | | | 7,363,806 | | | | 1,363,163 | | | | 3,321,629 | | | | — | | | | — | | | | 103,605,467 | |
Amounts designated as “—” are zero or have been rounded to zero.
86
Notes to Financial Statements (Continued)
October 31, 2014
Further information about each affiliated Underlying Fund (excluding the Nationwide Fixed Contract, which is not a mutual fund) may be found in such Underlying Fund’s most recent annual report to shareholders, which is available at www.nationwide.com/mutualfunds.
5. Line of Credit and Earnings Credit
Effective July 17, 2014, the Trust and NVIT Trust (together, the “Trusts”) have renewed the credit agreement with JPMorgan, The Bank of New York Mellon, and Wells Fargo Bank National Association, permitting the Trusts, in the aggregate, to borrow up to $100,000,000. Advances taken by a Fund under this arrangement would be primarily for temporary or emergency purposes, including the meeting of redemption requests that otherwise might require the untimely disposition of securities, and are subject to the Fund’s borrowing restrictions. The line of credit requires a commitment fee of 0.07% per year on $100,000,000. Borrowings under this arrangement bear interest at a rate of 1.00% per annum plus the higher of (a) the one month London Interbank Offered Rate or (b) the Federal Funds Rate. Interest costs, if any, would be shown on the Statement of Operations. No compensating balances are required under the terms of the line of credit. The line of credit is renewed annually, and next expires on July 16, 2015.
JPMorgan provides earnings credits for cash balances maintained in a Fund’s custody accounts, which are used to offset custody fees of a Fund.
6. Investment Transactions
For the year ended October 31, 2014, purchases and sales of investments (excluding short-term securities) were as follows:
| | | | | | | | |
| Fund | | Purchases | | | Sales | |
Investor Destinations Aggressive | | $ | 105,421,330 | | | $ | 114,954,828 | |
Investor Destinations Moderately Aggressive | | | 198,991,896 | | | | 202,129,681 | |
Investor Destinations Moderate | | | 310,005,216 | | | | 308,481,267 | |
Investor Destinations Moderately Conservative | | | 110,465,998 | | | | 106,877,388 | |
Investor Destinations Conservative | | | 146,495,751 | | | | 110,973,682 | |
7. Portfolio Investment Risks from Underlying Funds
Information about the risks of an investment in each affiliated Underlying Fund may be found in such Underlying Fund’s annual report to shareholders, which is available at www.nationwide.com/mutualfunds. Additional information about derivatives-related risks, if applicable to the Fund, may also be found in each such Underlying Fund’s annual report to shareholders.
8. Indemnifications
Under the Trust’s organizational documents, the Trust’s Officers and Trustees are indemnified by the Trust against certain liabilities arising out of the performance of their duties to the Trust. In addition, the Trust has entered into indemnification agreements with its Trustees and certain of its Officers. Trust Officers receive no compensation from the Trust for serving as its Officers. In addition, in the normal course of business, the Trust enters into contracts with its vendors and others that provide for general indemnifications. The Trust’s maximum liability under these arrangements is unknown, as this would involve future claims made against the Trust. Based on experience, however, the Trust expects the risk of loss to be remote.
9. Money Market Reform
In July 2014, the Securities and Exchange Commission (“SEC”) adopted amendments to the rules that govern money market mutual funds under the 1940 Act that reform the structure and operations of these funds. Money Market, which
87
Notes to Financial Statements (Continued)
October 31, 2014
is an Underlying Fund, is required to comply with these amendments, and the compliance dates for the various amendments range from 9 months to 2 years. As a result of the amendments, Money Market may be required to take certain steps with respect to its structure and/or operations.
10. Other
As of October 31, 2014, the Funds had individual shareholder accounts and/or omnibus shareholder accounts (comprising a group of individual shareholders), which held more than 10% of the total shares outstanding of the Funds as detailed below.
| | | | | | | | |
| Fund | | % of Shares | | | Number of Accounts | |
Investor Destinations Aggressive | | | 46.82 | % | | | 3 | (a) |
Investor Destinations Moderately Aggressive | | | 65.81 | | | | 5 | (a) |
Investor Destinations Moderate | | | 61.05 | | | | 5 | (a) |
Investor Destinations Moderately Conservative | | | 44.90 | | | | 3 | |
Investor Destinations Conservative | | | 40.17 | | | | 3 | |
| (a) | Each such account is the account of an affiliated fund. |
11. Federal Tax Information
The tax character of distributions paid during the year ended October 31, 2014 was as follows:
| | | | | | | | | | | | | | | | | | | | |
| | | Distributions paid from | | | | | | | | | | |
| Fund | | Ordinary
Income* | | | Net Long-Term
Capital Gains | | | Total Taxable
Distributions | | | Return of
Capital | | | Total Distributions
Paid | |
Investor Destinations Aggressive Fund | | $ | 20,454,239 | | | $ | 16,760,506 | | | $ | 37,214,745 | | | $ | — | | | $ | 37,214,745 | |
Investor Destinations Moderately Aggressive Fund | | | 34,854,977 | | | | 43,454,993 | | | | 78,309,970 | | | | — | | | | 78,309,970 | |
Investor Destinations Moderate Fund | | | 28,851,501 | | | | 55,099,484 | | | | 83,950,985 | | | | — | | | | 83,950,985 | |
Investor Destinations Moderately Conservative Fund | | | 9,309,455 | | | | 39,396,579 | | | | 48,706,034 | | | | — | | | | 48,706,034 | |
Investor Destinations Conservative Fund | | | 6,554,859 | | | | 20,979,602 | | | | 27,534,461 | | | | — | | | | 27,534,461 | |
Amounts designated as “—” are zero or have been rounded to zero.
| * | Ordinary income amounts include net short-term capital gains, if any. |
The tax character of distributions paid during the year ended October 31, 2013 was as follows:
| | | | | | | | | | | | | | | | | | | | |
| | | Distributions paid from | | | | | | | | | | |
| Fund | | Ordinary
Income* | | | Net Long-Term
Capital Gains | | | Total Taxable
Distributions | | | Return of
Capital | | | Total Distributions
Paid | |
Investor Destinations Aggressive | | $ | 18,185,199 | | | $ | 11,401,352 | | | $ | 29,586,551 | | | $ | — | | | $ | 29,586,551 | |
Investor Destinations Moderately Aggressive | | | 30,325,630 | | | | 11,352,672 | | | | 41,678,302 | | | | — | | | | 41,678,302 | |
Investor Destinations Moderate | | | 26,286,237 | | | | 7,290,440 | | | | 33,576,677 | | | | — | | | | 33,576,677 | |
Investor Destinations Moderately Conservative | | | 8,909,091 | | | | 7,686,149 | | | | 16,595,240 | | | | — | | | | 16,595,240 | |
Investor Destinations Conservative | | | 6,624,660 | | | | 7,448,555 | | | | 14,073,215 | | | | — | | | | 14,073,215 | |
Amounts designated as “—” are zero or have been rounded to zero.
| * | Ordinary income amounts include net short-term capital gains, if any. |
88
Notes to Financial Statements (Continued)
October 31, 2014
As of October 31, 2014, the components of accumulated earnings/(deficit) on a tax basis were as follows:
| | | | | | | | | | | | | | | | | | | | | | | | | | | | |
| Fund | | Undistributed
Ordinary
Income | | | Undistributed
Long-Term
Capital Gains | | | Accumulated
Earnings | | | Distributions
Payable* | | | Accumulated
Capital and
Other Losses | | | Unrealized
Appreciation/
(Depreciation)** | | | Total
Accumulated
Earnings
(Deficit) | |
Investor Destinations Aggressive Fund | | $ | — | | | $ | 55,099,896 | | | $ | 55,099,896 | | | $ | — | | | $ | — | | | $ | 241,710,481 | | | $ | 296,810,377 | |
Investor Destinations Moderately Aggressive Fund | | | 225,205 | | | | 78,919,329 | | | | 79,144,534 | | | | — | | | | — | | | | 372,224,611 | | | | 451,369,145 | |
Investor Destinations Moderate Fund | | | 938,257 | | | | 64,360,108 | | | | 65,298,365 | | | | — | | | | — | | | | 260,834,046 | | | | 326,132,411 | |
Investor Destinations Moderately Conservative Fund | | | 567,513 | | | | 12,677,496 | | | | 13,245,009 | | | | — | | | | — | | | | 36,999,248 | | | | 50,244,257 | |
Investor Destinations Conservative Fund | | | 597,257 | | | | 3,163,853 | | | | 3,761,110 | | | | — | | | | — | | | | 9,880,361 | | | | 13,641,471 | |
Amounts designated as “—” are zero or have rounded to zero.
| * | Differences between financial statement distributions payable and tax-basis distributions payable are a result of accrual-based accounting and cash-basis accounting used for federal tax reporting purposes. |
| ** | The difference between book-basis and tax-basis unrealized appreciation/(depreciation) is primarily attributable to timing differences in recognizing certain gains and losses on investment transactions. |
As of October 31, 2014, the tax cost of securities and the breakdown of unrealized appreciation/(depreciation) was as follows:
| | | | | | | | | | | | | | | | |
| Fund | | Tax Cost of
Securities | | | Unrealized
Appreciation | | | Unrealized
Depreciation | | | Net
Unrealized
Appreciation/
(Depreciation) | |
Investor Destinations Aggressive Fund | | $ | 1,005,472,541 | | | $ | 247,384,868 | | | $ | (5,674,387 | ) | | $ | 241,710,481 | |
Investor Destinations Moderately Aggressive Fund | | | 1,709,758,842 | | | | 381,919,330 | | | | (9,694,719 | ) | | | 372,224,611 | |
Investor Destinations Moderate Fund | | | 1,540,341,766 | | | | 270,775,596 | | | | (9,941,550 | ) | | | 260,834,046 | |
Investor Destinations Moderately Conservative Fund | | | 558,743,260 | | | | 42,317,104 | | | | (5,317,856 | ) | | | 36,999,248 | |
Investor Destinations Conservative Fund | | | 462,277,126 | | | | 14,858,346 | | | | (4,977,985 | ) | | | 9,880,361 | |
Amounts designated as “—” are zero or have rounded to zero.
12. Restatement of Previously Issued Financial Statements
After issuing Investor Destinations Conservative’s October 31, 2014 financial statements, fund management became aware of a technical correction that requires Investor Destinations Conservative to present a Statement of Cash Flows in accordance with the Financial Accounting Standards Board (“FASB”) Accounting Standards Codification Topic 230 (“ASC 230”). Prior to the technical correction, FASB ASC 230 required that substantially all securities of Investor Destinations Conservative be carried at fair value and liquid to be exempt from having to provide a Statement of Cash Flows. The technical update to FASB ASC 230 now requires that substantially all of Investor Destinations Conservative investments must be carried at fair value and classified as level 1 or level 2 measurements in accordance with the fair value leveling hierarchy in order to be exempt from presenting the Statement of Cash Flows. Investor Destinations Conservative’s financial statements for the year ended October 31, 2014 did not present the Statement of Cash Flows. Fund Management has decided to restate the October 31, 2014 financial statements to include the Statement of Cash Flows.
13. Subsequent Events
Management has evaluated the impact of subsequent events on the Funds and has determined that there are no subsequent events requiring recognition or disclosure in the financial statements.
89
Report of Independent Registered Public Accounting Firm
To the Board of Trustees and Shareholders of Nationwide Mutual Funds:
In our opinion, the accompanying statements of assets and liabilities, including the statements of investments, and the related statements of operations and of changes in net assets and the financial highlights present fairly, in all material respects, the financial position of Nationwide Investor Destinations Aggressive Fund, Nationwide Investor Destinations Conservative Fund, Nationwide Investor Destinations Moderate Fund, Nationwide Investor Destinations Moderately Aggressive Fund and Nationwide Investor Destinations Moderately Conservative Fund (five series of Nationwide Mutual Funds, hereafter referred to as the “Funds”) at October 31, 2014, the results of each of their operations for the year then ended, the changes in each of their net assets for each of the two years in the period then ended and the financial highlights for each of the five years in the period then ended, in conformity with accounting principles generally accepted in the United States of America. These financial statements and financial highlights (hereafter referred to as “financial statements”) are the responsibility of the Funds’ management. Our responsibility is to express an opinion on these financial statements based on our audits. We conducted our audits of these financial statements in accordance with the standards of the Public Company Accounting Oversight Board (United States). Those standards require that we plan and perform the audit to obtain reasonable assurance about whether the financial statements are free of material misstatement. An audit includes examining, on a test basis, evidence supporting the amounts and disclosures in the financial statements, assessing the accounting principles used and significant estimates made by management, and evaluating the overall financial statement presentation. We believe that our audits, which included confirmation of securities at October 31, 2014 by correspondence with the underlying funds’ transfer agent and fixed contract issuer, provide a reasonable basis for our opinion.
As discussed in Note 12, the Nationwide Investor Destinations Conservative Fund has restated its October 31, 2014 financial statements to correct an error.
/s/ PricewaterhouseCoopers LLP
Philadelphia, Pennsylvania
December 22, 2014, except for Note 12 as to which the date is February 24, 2015
90
Supplemental Information
October 31, 2014 (Unaudited)
Other Federal Tax Information
For the year ended October 31, 2014, certain dividends paid by the Funds may be subject to a maximum tax rate of 20% as provided for by the Jobs and Growth Tax Relief Reconciliation Act of 2003. The Funds intend to designate the maximum amount allowable as taxed at a maximum rate of 15%. Complete information will be reported in conjunction with your 2014 Form 1099-DIV.
For the taxable year ended October 31, 2014, the following percentages of income dividends paid by the Funds qualify for the dividends received deduction available to corporations:
| | | | |
| Fund | | Dividends Received Deductions | |
Investor Destinations Aggressive | | | 55.69 | % |
Investor Destinations Moderately Aggressive | | | 48.04 | |
Investor Destinations Moderate | | | 37.74 | |
Investor Destinations Moderately Conservative | | | 27.24 | |
Investor Destinations Conservative | | | 15.16 | |
The Funds designate the following amounts, or the maximum amount allowable under the Internal Revenue Code, as long term capital gain distributions qualifying for the maximum 20% income tax rate for individuals:
| | | | |
| Fund | | Amount | |
Investor Destinations Aggressive | | $ | 16,760,506 | |
Investor Destinations Moderately Aggressive | | | 43,454,993 | |
Investor Destinations Moderate | | | 55,099,484 | |
Investor Destinations Moderately Conservative | | | 39,396,579 | |
Investor Destinations Conservative | | | 20,979,602 | |
Certain Funds have derived net income from sources within foreign countries. As of October 31, 2014, the foreign source income for each Fund was as follows:
| | | | | | | | |
| Fund | | Amount | | | Per Share | |
Investor Destinations Aggressive | | $ | 10,816,515 | | | $ | 0.0998 | |
Investor Destinations Moderately Aggressive | | | 16,293,948 | | | | 0.0915 | |
Investor Destinations Moderate | | | 10,057,466 | | | | 0.0630 | |
Investor Destinations Moderately Conservative | | | 1,885,857 | | | | 0.0340 | |
Investor Destinations Conservative | | | 557,802 | | | | 0.0122 | |
Certain Funds intend to elect to pass through to shareholders the income tax credit for taxes paid to foreign countries. As of October 31, 2014, the foreign tax credit for each Fund was as follows:
| | | | | | | | |
| Fund | | Amount | | | Per Share | |
Investor Destinations Aggressive | | $ | 476,109 | | | $ | 0.0044 | |
Investor Destinations Moderately Aggressive | | | 717,287 | | | | 0.0040 | |
Investor Destinations Moderate | | | 442,768 | | | | 0.0028 | |
Investor Destinations Moderately Conservative | | | 83,014 | | | | 0.0015 | |
Investor Destinations Conservative | | | 24,553 | | | | 0.0005 | |
91
Management Information
October 31, 2014
Trustees and Officers of the Trust
The address for each Trustee is: c/o Nationwide Funds Group, 1000 Continental Drive, Suite 400, King of Prussia, PA 19406.
| | | | | | | | | | |
Name and
Year of Birth | | Position(s) Held
with the Trust
and Length of
Time Served1,2 | | Principal Occupation(s)
During Past Five Years
(or longer)3 | | Number of
Portfolios in the
Nationwide Fund
Complex Overseen
by Trustee | | | Other
Directorships
Held by Trustee
During Past Five
Years4 |
Charles E. Allen
1948 | | Trustee since July 2000 | | Mr. Allen was Chairman, Chief Executive Officer and President of Graimark Realty Advisors, Inc. (real estate development, investment and asset management) from its founding in 1987 to 2012. | | | 117 | | | None |
Paula H.J. Cholmondeley
1947 | | Trustee since July 2000 | | Ms. Cholmondeley focuses full time on corporate governance. She sits on public company boards and is also on the faculty of the National Association of Corporate Directors. She has served as a Chief Executive Officer of Sorrel Group (management consulting company) since January 2004. From April 2000 through December 2003, Ms. Cholmondeley was Vice President and General Manager of Sappi Fine Paper North America. | | | 117 | | | Director of Dentsply International, Inc. (dental products) from 2002 to present, Ultralife Batteries, Inc. from 2004 to 2010, Albany International Corp. (paper industry) from 2005 to 2013, Terex Corporation (construction equipment) from 2004 to present, and Minerals Technology, Inc. (specialty chemicals) from 2005 to present. |
Phyllis Kay Dryden
1947 | | Trustee since December 2004 | | Ms. Dryden became CEO and President of Energy Dispute Solutions, LLC in January 2013, leading a company providing strategy consulting, arbitration and mediation services. She has been a management consultant since 1996, first as a partner of Mitchell Madison Group, then as a managing partner and head of west coast business development for marchFIRST, returning to Mitchell Madison Group in 2003 as an associated partner until January 2010 and thereafter as an independent strategy consultant through December 2012. Ms. Dryden was VP and General Counsel of Lucasfilm, Ltd. from 1981 to 1984, SVP and General Counsel of Charles Schwab and Co., Inc. from 1984 to 1992, and EVP and General Counsel of Del Monte Foods from 1992 to 1995. | | | 117 | | | None |
92
Management Information (Continued)
October 31, 2014
The address for each Trustee is: c/o Nationwide Funds Group, 1000 Continental Drive, Suite 400, King of Prussia, PA 19406.
| | | | | | | | | | |
Name and
Year of Birth | | Position(s) Held
with the Trust
and Length of
Time Served1,2 | | Principal Occupation(s)
During Past Five Years
(or longer)3 | | Number of
Portfolios in the
Nationwide Fund
Complex Overseen
by Trustee | | | Other
Directorships
Held by Trustee
During Past Five
Years4 |
Barbara L. Hennigar
1935 | | Trustee since July 2000 | | Ms. Hennigar was Executive Vice President of Oppenheimer Funds (an asset management company) from October 1992 until June 2000; Chairman of Oppenheimer Funds Services from October 1999 until June 2000; and President and CEO of Oppenheimer Funds Services from June 1992 until October 1999. She was previously Board Chair of a non-profit independent school, and is currently an independent trustee and endowment chair of St. Mary’s Academy, an independent school in Denver, CO. | | | 117 | | | None |
Barbara I. Jacobs
1950 | | Trustee since December 2004 | | Ms. Jacobs served as Chairman of the Board of Directors of KICAP Network Fund, a European (United Kingdom) hedge fund, from January 2001 through January 2006. From 1988 through 2003, Ms. Jacobs was also a Managing Director and European Portfolio Manager of CREF Investments (Teachers Insurance and Annuity Association-College Retirement Equities Fund). | | | 117 | | | None |
Keith F. Karlawish
1964 | | Trustee since March 2012 | | Mr. Karlawish has been a partner of Park Ridge Asset Management, LLC since December 2008, at which he also serves as a portfolio manager. From May 2002 until October 2008, Mr. Karlawish was the President of BB&T Asset Management, Inc., and was President of the BB&T Mutual Funds and BB&T Variable Insurance Funds from February 2005 until October 2008. | | | 117 | | | Trustee of the BB&T Mutual Funds and BB&T Variable Insurance Funds from June 2006 until December 2008. |
Carol A. Kosel
1963 | | Trustee since March 2013 | | Ms. Kosel was a consultant to the Evergreen Funds Board of Trustees from October 2005 to December 2007. She was Senior Vice President, Treasurer, and Head of Fund Administration of the Evergreen Funds from April 1997 to October 2005. | | | 117 | | | Trustee of Sun Capital Advisers Trust from April 2011 to December 2012 and Trustee of Evergreen Funds from January 2008 to July 2010. |
Douglas F. Kridler
1955 | | Trustee since September 1997 | | Mr. Kridler is the President and Chief Executive Officer of The Columbus Foundation, a $1.5 billion community foundation with 2,000 funds in 55 Ohio counties and 37 states in the U.S. | | | 117 | | | None |
93
Management Information (Continued)
October 31, 2014
The address for each Trustee is: c/o Nationwide Funds Group, 1000 Continental Drive, Suite 400, King of Prussia, PA 19406.
| | | | | | | | | | |
Name and
Year of Birth | | Position(s) Held
with the Trust
and Length of
Time Served1,2 | | Principal Occupation(s)
During Past Five Years
(or longer)3 | | Number of
Portfolios in the
Nationwide Fund
Complex Overseen
by Trustee | | | Other
Directorships
Held by Trustee
During Past Five
Years4 |
Lydia Micheaux Marshall5
1949 | | Trustee since June 2014 | | Ms. Marshall has been President of LM Marshall, LLC (investment and business consulting company) since 2007. | | | 117 | | | Director of Nationwide Corporation since 2001, Nationwide Financial Services, Inc. since 1997, Nationwide Foundation since 2002, Nationwide Life Insurance Company since 2002, Nationwide Life and Annuity Insurance Company since 2002, Nationwide Mutual Fire Insurance Company since 2001, Nationwide Mutual Insurance Company since 2002, and Scottsdale Insurance Company since 2001 (all financial services and insurance companies). Chair and CEO of Versura, Inc. (data processing) since 1999. Director of Seagate Technology (hard disk drive and storage manufacturer) since 2004. Director of Public Welfare Foundation (non- profit foundation) since 2009. |
94
Management Information (Continued)
October 31, 2014
The address for each Trustee is: c/o Nationwide Funds Group, 1000 Continental Drive, Suite 400, King of Prussia, PA 19406.
| | | | | | | | | | |
Name and
Year of Birth | | Position(s) Held
with the Trust
and Length of
Time Served1,2 | | Principal Occupation(s)
During Past Five Years
(or longer)3 | | Number of
Portfolios in the
Nationwide Fund
Complex Overseen
by Trustee | | | Other
Directorships
Held by Trustee
During Past Five
Years4 |
David C. Wetmore
1948 | | Trustee since 1995 and Chairman since February 2005 | | Mr. Wetmore was a Managing Director of Updata Capital, Inc. (a technology-oriented investment banking and venture capital firm) from 1995 through 2000. Prior to 1995, Mr. Wetmore served as the Chief Operating Officer, Chief Executive Officer and Chairman of the Board of several publicly- held software and services companies, and as the managing partner of a “big 8” public accounting firm. | | | 117 | | | None |
| 1 | Length of time served includes time served with predecessor of the Trust. |
| 2 | Each Trustee holds office for the lifetime of the Trust or until such Trustee’s earlier death, resignation, removal, retirement or inability otherwise to serve, or the election and qualification of his or her successor. |
| 3 | Unless otherwise noted, the information presented is the principal occupation of the Trustee during the past five years. |
| 4 | Directorships held in (i) any other investment companies registered under the 1940 Act, (ii) any company with a class of securities registered pursuant to Section 12 of the Securities Exchange Act of 1934, as amended (the “Exchange Act”) or (iii) any company subject to the requirements of Section 15(d) of the Exchange Act. |
| 5 | Ms. Marshall is considered an interested person of the Trust because she is a Director of the parent company of, and several affiliates of, the Trust’s investment adviser and distributor. |
95
Management Information (Continued)
October 31, 2014
The address for each Officer is: c/o Nationwide Funds Group, 1000 Continental Drive, Suite 400, King of Prussia, PA 19406.
| | | | |
Name and
Year of Birth | | Position(s) Held
with Fund and
Length of Time
Served1 | | Principal Occupation(s)
During Past Five Years2 |
Michael S. Spangler
1966 | | President and Chief Executive Officer since June 2008 | | Mr. Spangler is President and Chief Executive Officer of Nationwide Funds Group, which includes NFA3, Nationwide Fund Management LLC3 and Nationwide Fund Distributors LLC3, and is a Senior Vice President of NFS3. From May 2004 through May 2008, Mr. Spangler was Managing Director, Head of Americas Retail and Intermediary Product Management for Morgan Stanley Investment Management. |
Stephen T. Grugeon
1950 | | Executive Vice President and Chief Operating Officer since June 2008 | | Mr. Grugeon has been Executive Vice President and Chief Operating Officer of Nationwide Funds Group since May 20073. From February 2008 through June 2008, Mr. Grugeon also served as the acting President and Chief Executive Officer of the Trust and of Nationwide Funds Group. From December 2006 until January 2008, Mr. Grugeon was Executive Vice President of NWD Investments3. |
Joseph Finelli
1957 | | Treasurer since September 2007 | | Mr. Finelli is the Principal Financial Officer and Senior Vice President for Nationwide Funds Group3. From July 2001 until September 2007, Mr. Finelli was Assistant Treasurer and Vice President of Investment Accounting and Operations of NWD Investments3. |
Brian Hirsch
1956 | | Chief Compliance Officer since January 2012 | | Mr. Hirsch is Vice President of NFA and Chief Compliance Officer of NFA and the Trust. From January 2003 through January 2012, Mr. Hirsch was the Senior Vice President for Compliance and Fund Administration at IFS Financial Services, Inc., a subsidiary of the Western Southern Financial Group. |
Eric E. Miller
1953 | | Secretary since December 2002 | | Mr. Miller is Senior Vice President, General Counsel, and Assistant Secretary for Nationwide Funds Group and NWD Investments3. |
Jennifer Tiffany Grinstead
1976 | | Chief Marketing Officer since March 2014 | | Ms. Grinstead is Vice President of Nationwide Funds Marketing for NFS.3 From April 2012 through April 2014, Ms. Grinstead was Assistant Vice President, Life Marketing for NFS.3 From January 2009 through April 2012, Ms. Grinstead was Assistant Vice President, Retirement Plan Marketing for NFS.3 |
| 1 | Length of time served includes time served with the Trust’s predecessors. |
| 2 | Unless otherwise noted, the information presented is the principal occupation of the Officer during the past five years. |
| 3 | These positions are held with an affiliated person or principal underwriter of the Funds. |
Additional information regarding the Trustees and Officers may be found in the Trust’s Statement of Additional Information, which is available without charge upon request, by calling 800-848-0920.
Federal law requires the Trust and each of its investment advisers and subadvisers to adopt procedures for voting proxies (“Proxy Voting Guidelines”) and to provide a summary of those Proxy Voting Guidelines used to vote the securities held by the Fund. The Fund’s proxy voting policies and procedures are available without charge (i) upon request, by calling 800-848-0920, (ii) on the Trust’s website at nationwide.com/mutualfunds, and (iii) on the Securities and Exchange Commission’s website at www.sec.gov.
96
Barclays Global Aggregate Bond Index: An unmanaged index of fixed-rate, publicly issued, taxable bond market issues with a remaining maturity of at least one year; a broad-based measurement of the performance of the global investment-grade fixed-income markets.
Barclays U.S. 1-3 Year Government/Credit Bond Index: An unmanaged index of U.S. dollar-denominated, investment-grade, fixed-rate, publicly issued, taxable bond market issues (including Treasury, government and corporate securities) with a remaining maturity of one to three years.
Barclays 7-Year Municipal Bond Index: An unmanaged index that consists of a broad selection of investment-grade general obligation and revenue bonds with maturities of approximately seven years.
Barclays Municipal Bond Index: An unmanaged, market value-weighted index of investment-grade municipal bonds with a minimum credit rating of Baa and maturities of one year or more; serves as a broad market performance index for the tax-exempt bond market.
Barclays U.S. Aggregate Bond Index: An unmanaged, market value-weighted index of investment-grade, fixed-rate debt issues (including government, corporate, asset-backed, and mortgage-backed securities with maturities of one year or more) that is generally representative of the bond market as a whole.
Barclays U.S. Treasury Inflation-Protected Securities (TIPS) IndexSM: An unmanaged, market capitalization-weighted index that measures the performance of all U.S. dollar-denominated, investment-grade, fixed-rate, publicly issued U.S. TIPS with a remaining maturity of at least one year and $250 million or more in outstanding face value.
BofA Merrill Lynch (BofAML) AAA U.S. Treasury/Agency Master Index: An unmanaged index that gives a broad look at how fixed-rate U.S. government bonds with a remaining maturity of at least one year have performed.
BofA Merrill Lynch (BofAML) U.S. High Yield Cash Pay Constrained Index: An unmanaged, market value-weighted index that measures the performance of U.S. dollar-denominated, below-investment-grade, fixed-rate, publicly issued, non-convertible, coupon-bearing corporate debt with a remaining maturity of at least one year. Each issue represented must have an outstanding par value of at least $50 million, must be less than BBB/Baa3-rated but not in default, and is restricted to a maximum of 2% of the total index.
Consumer Price Index (CPI): Calculated by the U.S. Department of Labor’s Bureau of Labor Statistics, the CPI represents changes in prices of a basket of goods and services purchased for consumption by urban households.
iMoneyNet Prime Retail Index: An unmanaged index that is an average of non-government retail money market mutual funds. Portfolio holdings of prime money market mutual funds include U.S. Treasury, U.S. non-Treasury obligations, repurchase agreements, time deposits, domestic and foreign bank obligations, commercial paper, floating-rate notes and asset-backed commercial paper.
Lipper Analytical Services, Inc. (Lipper) is an industry research firm whose rankings are based on total return performance and do not reflect the effect of sales charges. Each fund is ranked within a universe of funds similar in investment objective as determined by Lipper.
Morningstar® (Mstar) Lifetime Allocation Indexes: A series of 13 unmanaged, multi-asset-class indexes designed to benchmark target-date investment products. Each index is available in three risk profiles: aggressive, moderate and conservative. The index asset allocations adjust over time, reducing equity
97
| | |
| Market Index Definitions (con’t.) | | |
exposure and shifting toward traditional income-producing investments. The strategic asset allocation of the indexes is based on Ibbotson Associates’ Lifetime Asset Allocation methodology.
MSCI ACWI: An unmanaged, free float-adjusted, market capitalization-weighted index that is designed to measure the performance of large-cap and mid-cap stocks in global developed and emerging markets.
MSCI EAFE® Index: An unmanaged, free float-adjusted, market capitalization-weighted index that is designed to measure the performance of large-cap and mid-cap stocks in developed markets outside the United States and Canada.
MSCI Emerging Markets® Index: An unmanaged, free float-adjusted, market capitalization-weighted index that is designed to measure the performance of large-cap and mid-cap stocks in emerging-country markets.
MSCI World ex USA Index: An unmanaged index that measures the equity market performance of developed-market countries excluding the United States; covers approximately 85% of the free float-adjusted market capitalization in each country, capturing large-cap and mid-cap representation.
MSCI World IndexSM Free: An unmanaged, free float-adjusted, market capitalization-weighted index that is designed to measure the performance of large-cap and mid-cap stocks in global developed markets. The “Free” suffix denotes an index with a somewhat different history but the same constituents and performance in relation to its counterpart index without the suffix.
NASDAQ-100 Index: An unmanaged index that includes 100 of the largest domestic and international nonfinancial securities listed on the Nasdaq Stock Market, based on market capitalization.
NYSE Arca Tech 100 Index®: An unmanaged, price-weighted index of at least 100 individual technology-related securities, consisting of stocks of companies from various industries that produce or deploy innovative technologies to conduct their business.
Russell 1000® Growth Index: An unmanaged index that measures the performance of the large-capitalization growth segment of the U.S. equity universe; includes those Russell 1000® Index companies with higher price-to-book ratios and higher forecasted growth values.
Russell 1000® Value Index: An unmanaged index that measures the performance of the large-capitalization value segment of the U.S. equity universe; includes those Russell 1000® Index companies with lower price-to-book ratios and lower forecasted growth values.
Russell 2000® Index: An unmanaged index that measures the performance of the small-capitalization segment of the U.S. equity universe.
Russell 2000® Growth Index: An unmanaged index that measures the performance of the small-capitalization growth segment of the U.S. equity universe; includes those Russell 2000® Index companies with higher price-to-book ratios and higher forecasted growth values.
Russell 2000® Value Index: An unmanaged index that measures the performance of the small-capitalization growth segment of the U.S. equity universe; includes those Russell 2000® Index companies with lower price-to-book ratios and lower forecasted growth values.
Russell 3000® Index: An unmanaged index that measures the performance of the 3,000 largest U.S. companies in the investable U.S. equity universe.
98
| | |
| Market Index Definitions (con’t.) | | |
Russell Midcap® Growth Index: An unmanaged index that measures the performance of the mid-capitalization growth segment of the U.S. equity universe; includes those Russell Midcap® Index companies with higher price-to-book ratios and higher forecasted growth values.
Russell Midcap® Value Index: An unmanaged index that measures the performance of the mid-capitalization value segment of the U.S. equity universe; includes those Russell Midcap Index companies with lower price-to-book ratios and lower forecasted growth values.
Note about Russell Indexes
Russell Investment Group is the source and owner of the trademarks, service marks and copyrights related to the Russell Indexes. Russell® is a trademark of Russell Investment Group.
S&P 500® Index: An unmanaged, market capitalization-weighted index of 500 stocks of leading large-cap U.S. companies in leading industries; gives a broad look at the U.S. equities market and those companies’ stock price performance.
S&P MidCap 400® (S&P 400) Index: An unmanaged index that measures the performance of 400 stocks of medium-sized U.S. companies (those with a market capitalization of $1 billion to $4.4 billion).
S&P North American Technology Sector IndexTM: An unmanaged, modified, market capitalization-weighted index that measures the performance of the technology sector of the U.S. equity market.
S&P SmallCap 600® Value Index: An unmanaged index comprising small-capitalization value stocks included in the S&P SmallCap 600® Index. Performance is measured based on the ratios of book value, earnings, and sales to price.
99
Definitions of some commonly used investment terms
Asset allocation: The process of spreading assets across several different investment styles and asset classes. The purpose is to potentially reduce long-term risk and capture potential profits across various asset classes.
Benchmark index: A broad-based securities index used as a comparison tool to measure the performance of a mutual fund.
Coefficient of correlation: A measure that determines the degree to which the movements of two variables are associated.
Derivative: A contract, security or investment with its value based on the performance of an underlying financial asset, index or economic measure.
Diversification: An investment strategy that seeks to reduce risk in a portfolio so that the positive performance of some investments will neutralize the negative performance of others.
Duration: A measure of how much the price of a bond would change compared to a change in market interest rates, based on the remaining time until a bond’s maturity together with other factors. A bond’s value drops when interest rates rise, and vice versa. Bonds with longer durations have higher risk and volatility.
Emerging market countries: Developing and low- or middle-income countries as identified by the International Finance Corporation or the World Bank. Emerging market countries may be found in regions such as Asia, Latin America, Eastern Europe, the Middle East and Africa.
Equity securities: Securities that represent an ownership interest in the issuer. Common stock is the most common type of equity securities.
Expense ratio: The percentage of fees paid by a fund to its adviser for management and operational costs. A fund’s expense ratio includes all administrative expenses and 12b-1 fees but excludes sales charges.
Fixed-income securities: Securities, including bonds and other debt securities, that represent an obligation by the issuer to pay a specified rate of interest or dividend at specified times.
Futures: Contracts that obligate the buyer to buy and the seller to sell a specified quantity of an underlying asset (or settle for cash the value of a contract based on the underlying asset) at a specified price on the contract’s maturity date.
Growth style: Investing in equity securities of companies that the Fund’s subadviser believes have above-average rates of earnings growth and which therefore may experience above-average increases in stock price.
High-yield bonds: Fixed-income securities that are rated below investment grade by nationally recognized statistical rating organizations. These bonds generally offer investors higher interest rates as a way to help compensate for the fact that the issuer is at greater risk of default.
Market capitalization: A common way of measuring the size of a company based on the price of its common stock multiplied by the number of outstanding shares.
100
Preferred stock: A class of stock that often pays dividends at a specified rate and has preference over common stocks in dividend payments and liquidation of assets.
Quantitative techniques: Mathematical and statistical methods used in the investment process to identify securities of issuers for possible purchase or sale by a mutual fund.
Sector: An industry or market that shares common characteristics. Sectors are used to group investments into categories such as energy, health, technology and utilities.
Value style: Investing in equity securities that a fund’s manager believes are undervalued, i.e., their stock prices are less than the manager believes they are intrinsically worth, based on such factors as a company’s stock price relative to its book value, earnings and cash flow.
Yield curve: A plotted graph line showing the interest rates of bonds, at a set point in time, that have equal credit quality but different maturity dates.
101
P.O. Box 701
Milwaukee, WI 53201-0701
nationwide.com/mutualfunds


Call 1-800-848-0920 to request a summary prospectus and/or a prospectus, or download prospectuses at nationwide.com/mutualfunds. These prospectuses outline investment objectives, risks, fees, charges and expenses, and other information that you should read and consider carefully before investing.
About Nationwide Funds Group (NFG)
NFG comprises Nationwide Fund Advisors, Nationwide Fund Distributors LLC and Nationwide Fund Management LLC. Together they provide advisory, distribution and administration services, respectively, to Nationwide Funds. Nationwide Fund Advisors (NFA) is the investment adviser to Nationwide Funds.
Distributor
Nationwide Funds distributed by Nationwide Fund Distributors LLC (NFD), member FINRA, King of Prussia, Pa. NFD is not affiliated with any subadviser contracted by Nationwide Fund Advisors (NFA), with the exception of Nationwide Asset Management, LLC (NWAM).
Nationwide, the Nationwide N and Eagle, Nationwide is on your side, Nationwide Funds Group and Nationwide Funds are service marks of Nationwide Mutual Insurance Company. © 2014
AR-ID 12/14
Item 2. Code of Ethics.
Disclose whether, as of the end of the period covered by the report, the registrant has adopted a code of ethics that applies to the registrant’s principal executive officer, principal financial officer, principal accounting officer or controller, or persons performing similar functions, regardless of whether these individuals are employed by the registrant or a third party. If the registrant has not adopted such a code of ethics, explain why it has not done so.
The registrant has adopted a code of ethics that applies to the registrant’s principal executive officer, principal financial officer, principal accounting officer or controller, or persons performing similar functions. This code of ethics is included as Exhibit 12 (a)(1).
The registrant must briefly describe the nature of any amendment, during the period covered by the report, to a provision of its code of ethics that applies to the registrant’s principal executive officer, principal financial officer, principal accounting officer or controller, or persons performing similar functions, regardless of whether these individuals are employed by the registrant or a third party, and that relates to any element of the code of ethics definition enumerated in paragraph (b) of this Item. The registrant must file a copy of any such amendment as an exhibit pursuant to Item 11(a)(1), unless the registrant has elected to satisfy paragraph (f) of this Item by posting its code of ethics on its website pursuant to paragraph (f)(2) of this Item, or by undertaking to provide its code of ethics to any person without charge, upon request, pursuant to paragraph (f)(3) of this Item.
If the registrant has, during the period covered by the report, granted a waiver, including an implicit waiver, from a provision of the code of ethics that applies to the registrant’s principal executive officer, principal financial officer, principal accounting officer or controller, or persons performing similar functions, regardless of whether these individuals are employed by the registrant or a third party, that relates to one or more items set forth in paragraph (b) of this Item, the registrant must briefly describe the nature of the waiver, the name of the person to whom the waiver was granted, and the date of the waiver.
During the period covered by the report, with respect to the registrant’s Code of Ethics that applies to the registrant’s principal executive officer, principal financial officer, principal accounting officer or controller, or persons performing similar functions, except as may be noted hereinbelow, there have been no amendments to, nor any waivers granted from, a provision that relates to any element of the Code of Ethics definition enumerated in paragraph (b) of this Item 2.
Item 3. Audit Committee Financial Expert.
(a) (1) Disclose that the registrant’s board of directors has determined that the registrant either:
(i) Has at least one audit committee financial expert serving on its audit committee; or
2
(ii) Does not have an audit committee financial expert serving on its audit committee.
| | (2) | If the registrant provides the disclosure required by paragraph (a)(1)(i) of this Item, it must disclose the name of the audit committee financial expert and whether that person is “independent.” In order to be considered “independent” for purposes of this Item, a member of an audit committee may not, other than in his or her capacity as a member of the audit committee, the board of directors, or any other board committee: |
(i) Accept directly or indirectly any consulting, advisory, or other compensatory fee from the issuer; or
(ii) Be an “interested person” of the investment company as defined in Section 2(a)(19) of the Act (15 U.S.C. § 80a-2(a)(19)).
(3) If the registrant provides the disclosure required by paragraph (a)(1)(ii) of this Item, it must explain why it does not have an audit committee financial expert.
| | 3(a)(1) | The registrant’s board of trustees has determined that the registrant has at least one audit committee financial expert serving on board’s audit committee. |
| | 3(a)(2) | The audit committee financial expert of the registrant’s board of trustees is Paula H.J. Cholmondeley, who, for purposes of this Item 3 of Form N-CSR, is an “independent” trustee of the registrant. |
Item 4. Principal Accountant Fees and Services.
(a) Disclose, under the caption Audit Fees, the aggregate fees billed for each of the last two fiscal years for professional services rendered by the principal accountant for the audit of the registrant’s annual financial statements or services that are normally provided by the accountant in connection with statutory and regulatory filings or engagements for those fiscal years.
(b) Disclose, under the caption Audit-Related Fees, the aggregate fees billed in each of the last two fiscal years for assurance and related services by the principal accountant that are reasonably related to the performance of the audit of the registrant’s financial statements and are not reported under paragraph (a) of this Item. Registrants shall describe the nature of the services comprising the fees disclosed under this category.
(c) Disclose, under the caption Tax Fees, the aggregate fees billed in each of the last two fiscal years for professional services rendered by the principal accountant for tax compliance, tax advice, and tax planning. Registrants shall describe the nature of the services comprising the fees disclosed under this category.
(d) Disclose, under the caption All Other Fees, the aggregate fees billed in each of the last two fiscal years for products and services provided by the principal accountant, other than the services reported in paragraphs (a) through (c) of this Item. Registrants shall describe the nature of the services comprising the fees disclosed under this category.
4(a) through 4(d): The information in the table below is provided for services rendered to the registrant by the registrant’s principal accountant, PricewaterhouseCoopers LLP (“PwC”), for the registrant’s fiscal years ended October 31, 2013, and October 31, 2014.
| | | | | | | | |
| | | 2013 | | | 2014 | |
Audit Fees | | $ | 709,889 | | | $ | 1,102,201 | |
Audit-Related Fees | | $ | 33,037 | | | $ | 1,730 | |
Tax Fees | | $ | 346,456 | | | $ | 358,389 | (a) |
All Other Fees | | $ | 0 | | | $ | 0 | |
Total | | $ | 1,089,382 | | | $ | 1,462,320 | |
3
| | (a) | Tax fee amount represents tax compliance for federal, state and international matters, general consulting as well as consulting as it relates to foreign tax reclaims. |
The information in the table below is provided with respect to non-audit services that directly relate to the registrant’s operations and financial reporting and that were rendered by PwC to the registrant’s investment adviser, Nationwide Fund Advisors (“NFA”), and any service provider to the registrant controlling, controlled by, or under common control with NFA that provided ongoing services to the registrant (hereinafter referred to collectively as the “Covered Services Provider”), for the registrant’s fiscal years ended October 31, 2013, and October 31, 2014.
| | | | |
| | | 2013 | | 2014 |
Audit-Related Fees | | None | | None |
Tax Fees | | None | | None |
All Other Fees | | None | | None |
Total | | None | | None |
(e)(1) Disclose the audit committee’s pre-approval policies and procedures described in paragraph (c)(7) of Rule 2-01 of Regulation S-X.
(2) Disclose the percentage of services described in each of paragraphs (b) through (d) of this Item that were approved by the audit committee pursuant to paragraph (c)(7)(i)(C) of Rule 2-01 of Regulation S-X.
4(e)(1) Pre-Approval Policies and Procedures. The Audit Committee (the “Committee”) of the registrant is responsible for pre-approving (i) all audit and permissible non-audit services to be provided by the independent auditors to the registrant and (ii) all permissible non-audit services to be provided by the independent auditors to NFA and any Covered Services Provider if the engagement relates directly to the operations and financial reporting of the registrant. The Committee may delegate the Committee’s responsibility to pre-approve any such audit and permissible non-audit services to the Chairperson of the Committee, and the Chairperson shall report to the Committee, at the Committee’s next regularly-scheduled meeting after the Chairperson’s pre-approval of such services, his or her decision(s).
The Committee also may establish detailed pre-approval policies and procedures for pre-approval of these services in accordance with applicable laws, including the delegation of some or all of the Committee’s pre-approval responsibilities to other persons (other than NFA or the registrant’s officers). Pre-approval by the Committee of any permissible non-audit services shall not be required so long as: (i) the aggregate amount of all said permissible non-audit services provided to the registrant, NFA, and any Covered Services Provider constitutes not more than five percent (5%) of the total amount of revenues paid by the registrant to the registrant’s independent auditors during the fiscal year in which the permissible non-audit services are provided; (ii) the permissible non-audit services were not recognized by the registrant at the time of the engagement to be non-audit services; and (iii) these services are promptly brought to the attention of the Committee and approved by the Committee (or the Committee’s delegate(s)) prior to the completion of the audit.
4(e)(2) The information in the table below sets forth the percentages of fees for services (other than audit, review, or attest services) rendered by PwC to the registrant for which the pre-approval requirement was waived pursuant to Rule 2-01(c)(7)(i)(C) of Regulation S-X, for the registrant’s fiscal-years ended October 31, 2013, and October 31, 2014:
| | | | | | | | |
| | | 2013 | | | 2014 | |
Audit-Related Fees | | | None | | | | None | |
Tax Fees (1) | | | None | | | | None | |
All Other Fees | | | None | | | | None | |
Total | | | None | | | | None | |
4
The information in the table below sets forth the percentages of fees for services (other than audit, review, or attest services) rendered by PwC to NFA and any Covered Services Provider required to be approved pursuant to Rule 2-01(c)(7)(ii) of Regulation S-X, for the registrant’s fiscal-years ended October 31, 2013, and October 31, 2014:
| | | | |
| | | 2013 | | 2014 |
Audit-Related Fees | | N/A | | N/A |
Tax Fees | | N/A | | N/A |
All Other Fees | | N/A | | N/A |
Total | | N/A | | N/A |
(f) If greater than 50 percent, disclose the percentage of hours expended on the principal accountant’s engagement to audit the registrant’s financial statements for the most recent fiscal year that were attributed to work performed by persons other than the principal accountant’s full-time, permanent employees.
4(f) Not Applicable: The percentage of hours expended to audit the registrant’s financial statements for the fiscal-year ended October 31, 2014, that were attributed to work performed by persons other than PwC’s full-time, permanent employees was not over fifty percent (50%).
(g) Disclose the aggregate non-audit fees billed by the registrant’s accountant for services rendered to the registrant, and rendered to the registrant’s investment adviser (not including any sub-adviser whose role is primarily portfolio management and is subcontracted with or overseen by another investment adviser), and any entity controlling, controlled by, or under common control with the adviser that provides ongoing services to the registrant for each of the last two fiscal years of the registrant.
4(g) The aggregate fees billed by PwC for non-audit services rendered to the registrant and service affiliates for the fiscal-years ended October 31, 2013, and October 31, 2014, were $0 and $0, respectively.
(h) Disclose whether the registrant’s audit committee of the board of directors has considered whether the provision of nonaudit services that were rendered to the registrant’s investment adviser (not including any subadviser whose role is primarily portfolio management and is subcontracted with or overseen by another investment adviser), and any entity controlling, controlled by, or under common control with the investment adviser that provides ongoing services to the registrant that were not pre-approved pursuant to paragraph (c)(7)(ii) of Rule 2-01 of Regulation S-X is compatible with maintaining the principal accountant’s independence.
4(h) The registrant’s Audit Committee has considered whether the provision by PwC of non-audit services to NFA and Covered Services Providers, that were not pre-approved pursuant to Rule 2-01(c)(7)(ii) of Regulation S-X because these services did not directly relate to the registrant’s operations and financial reporting, is compatible with maintaining PwC’s independence.
Item 5. Audit Committee of Listed Registrants.
| | (a) | If the registrant is a listed issuer as defined in Rule 10A-3 under the Exchange Act (17 C.F.R. § 240.10A-3), state whether or not the registrant has a separately-designated standing audit committee established in accordance with Section 3(a)(58)(A) of the Exchange Act (15 U.S.C. § 78c(a)(58)(A)). If the registrant has such a committee, however designated, identify each committee member. If the entire board of directors is acting as the registrant’s audit committee as specified in Section 3(a)(58)(B) of the Exchange Act (15 U.S.C. § 78c(a)(58)(B)), so state. |
Not Applicable: The registrant is not a listed issuer as defined in Rule 10A-3 under the
Exchange Act.
5
| | (b) | If applicable, provide the disclosure required by Rule 10A-3(d) under the Exchange Act (17 C.F.R. §240.10A-3(d)) regarding an exemption from the listing standards for all audit committees. |
Not Applicable: The registrant is not a listed issuer as defined in Rule 10A-3 under the
Exchange Act.
Item 6. Investments.
| | (a) | File Schedule I – Investments in securities of unaffiliated issuers as of the close of the reporting period as set forth in § 210.1212 of the Regulation S-X [17 C.F.R. § 210.12-12], unless the schedule is included as part of the report to shareholders filed under Item 1 of this Form. |
Instruction of paragraph (a)
Schedule I-Investments In Securities of unaffiliated issuers filed under this Item must be audited, except that in the case of a report on this Form N-CSR as of the end of a fiscal half-year Schedule I – Investments in securities of unaffiliated issuers need not be audited.
| | (b) | If the registrant has divested itself of securities in accordance with Section 13(c) of the Investment Company Act of 1940 following the filing of its last report on Form N-CSR and before filing of the current report, disclosed the following information for each such divested security: |
| | (2) | Exchange ticker symbol; |
| | (3) | Committee on Uniform Securities Identification Procedures (“CUSIP’) number; |
| | (4) | Total number of shares or, for debt securities, principal amount divested; |
| | (5) | Date(s) that the securities were divested; |
| | (6) | If the registrant holds any securities of the issuer on the date of filing, the exchange ticker symbol; CUSIP number; and the total number of shares or, for debt securities, principal amount held on the date of filing; and |
| | (7) | Name of the statute that added the provision of Section 13(c) in accordance with which the securities were divested. This Item 6(b) shall terminate one year after the first date on which all statutory provisions that underlie Section 13(c) of the Investment Company Act of 1940 have terminated. |
The Registrant made no divestments of securities in accordance with Section 13(c) of the
Investment Company Act of 1940.
Item 7. Disclosure of Proxy Voting Policies and Procedures for Closed-End Management Investment Companies.
A closed-end management investment company that is filing an annual report on this Form N-CSR must, unless it invests exclusively in non-voting securities, describe the policies and procedures that it uses to determine how to vote proxies relating to portfolio securities, including the procedures that the company uses when a vote presents a conflict between the interests of its shareholders, on the one hand, and those of the company’s investment adviser; principal underwriter; or any affiliated person (as defined in Section 2(a)(3) of the Investment Company Act of 1940 (15 U.S.C. § 80a-2(a)(3)) and the rules there under) of the company, its investment adviser, or its principal underwriter, on the other. Include any policies and procedures of the company’s investment adviser, or any other third party, that the company uses, or that are used on the company’s behalf, to determine how to vote proxies relating to portfolio securities.
6
Not Applicable. The registrant is an open-end management investment company, not a
closed-end management investment company.
Item 8. Portfolio Managers of Closed-End Management Investment Companies.
If the registrant is a closed-end management investment company that is filing an annual report on this Form N-CSR, provide the information specified in paragraphs (a) and (b) of this Item with respect to portfolio managers.
Not Applicable. The registrant is an open-end management investment company, not a
closed-end management investment company.
Item 9. Purchases of Equity Securities by Closed-End Management Investment Company and Affiliated Purchasers.
If the registrant is a closed-end management investment company, provide the information specified in paragraph (b) of this Item with respect to any purchase made by or on behalf of the registrant or any “affiliated purchaser,” as defined in Rule 10b-18(a)(3) under the Exchange Act (17 C.F.R. § 240.10b-18(a)(3)), of shares or other units of any class of the registrant’s equity securities that is registered by the registrant pursuant to Section 12 of the Exchange Act (15 U.S.C. § 781).
Not Applicable. The registrant is an open-end management investment company, not a closed-end management investment company.
Item 10. Submission of Matters to a Vote of Security Holders.
Describe any material changes to the procedures by which shareholders may recommend nominees to the registrant’s board of directors, where those changes were implemented after the registrant last provided disclosure in response to the requirements of Item 7(d)(2)(ii)(G) of Schedule 14A (17 C.F.R. § 240.14a-101), or this Item.
The Independent Trustees and the Board of Trustees of the registrant adopted a formal, written “Policy Regarding Shareholder Submission of Trustee Candidates,” as well as a formal, written “Statement of Policy On Criteria For Selecting Trustees,” on June 9, 2005, and June 10, 2005, respectively. Neither this policy nor this statement of policy has been materially changed since the Board of Trustees adoption of the policy and the statement of policy, respectively. The Nominating and Fund Governance Committee of the Board of Trustees (the “NFGC”) and the Board of Trustees, however, on November 11, 2005, and January 12, 2006, respectively, approved amendments to this policy; these amendments to the policy, though, concern the criteria for selecting candidates for Trustees and the characteristics expected of candidates for Trustees, as set forth in the Exhibit A, “Statement of Policy On Criteria For Selecting Trustees,” to the policy and, arguably, may not be deemed to be material changes to the policy.
{NOTE – THIS IS REQUIRED BEGINNING WITH THE FIRST REPORTING PERIOD ENDING AFTER JANUARY 1, 2004. For purposes of this Item, adoption of procedures by which shareholders may recommend nominees to the registrant’s board of directors, where the registrant’s most recent proxy disclosure (in response to the requirements of Item 7(d)(2)(ii)(G) of Schedule 14A (17 CFR § 240.14a-101)), or this Item, indicated that the registrant did not have in place such procedures, will constitute a material change.}
Item 11. Controls and Procedures.
(a) Disclose the conclusions of the registrant’s principal executive and principal financial officers, or persons performing similar functions, regarding the effectiveness of the registrant’s disclosure controls and procedures (as defined in Rule 30a-3(c) under the Act (17 C.F.R. § 270.30a-3(c))) as of a date within 90 days of the filing date of the report that includes the disclosure required by this paragraph, based on the evaluation of these controls and procedures required by Rule 30a-3(b) under the Act (17 C.F.R. § 270.30a-3(b)) and Rules 13a-15(b) or 15d-15(b) under the Exchange Act (17 C.F.R. § 240.13a-15(b) or § 240.15d-15(b)).
7
The registrant’s principal executive officer and principal financial officer have concluded, based on their evaluation of the registrant’s disclosure controls and procedures as conducted within ninety (90) days of the filing date of this report, that, except as discussed in the following paragraph, these disclosure controls and procedures, as most-recently amended effective as of June 11, 2014, are adequately designed and operating effectively to ensure that information required to be disclosed by the registrant on Form N-CSR is: (i) accumulated and communicated to the investment company’s management, including the investment company’s certifying officers, to allow timely decisions regarding required disclosure; and (ii) recorded, processed, summarized, and reported within the time periods specified in the Securities and Exchange Commission’s rules and forms. The registrant’s management, including its principal executive officer and principal financial officer, believes that any set of controls and procedures, no matter how well designed and operated, can provide only reasonable assurance of achieving the desired control objectives.
Management has determined that because the Nationwide Mutual Funds Investor Destinations Conservative Fund (the “Fund”) did not have substantially all of the Fund’s holdings classified as level 1 and level 2 securities in that it held a significant portion of its holdings in a level 3 security within the hierarchy, a Statement of Cash Flows should be presented in accordance with the a recent technical correction to Financial Accounting Standards Board Accounting Standards Codification Topic 230 (“ASC 230”). As a result, Management is amending this shareholder report (the “Amendment”). The Amendment does not change any of the existing financial statement information including the financial highlights and the notes to the financial statements, nor did any of the share class net asset values, net assets, or shares outstanding require any update. There was no impact to the net asset value of the Fund’s shares or the total return of the Fund’s shares for any period. The controls in place were insufficient to ensure that the technical correction described above, was appropriately incorporated into the Fund’s financial statements which resulted in a material weakness as of October 31, 2014. Management has subsequently modified controls to review such future technical corrections to ensure compliance with ASC 230.
(b) Disclose any change in the registrant’s internal control over financial reporting (as defined in Rule 30a-3(d) under the Act (17 C.F.R. § 270.30a-3(d)) that occurred during the second fiscal quarter of the period covered by this report that has materially affected, or is reasonably likely to materially affect, the registrant’s internal control over financial reporting.
Other than the modification of controls to review future technical corrections as noted above to ensure compliance with ASC 230, there were no changes in the registrant’s internal control over financial reporting that occurred during the registrant’s second fiscal half year covered by this report that have materially affected or are reasonably likely to materially affect, the registrant’s internal control over financial reporting.
Item 12. Exhibits.
(a) File the exhibits listed below as part of this Form. Letter or number the exhibits in the sequence indicated.
(a)(1) Any code of ethics, or amendment thereto, that is the subject of the disclosure required by Item 2, to the extent that the registrant intends to satisfy the Item 2 requirements through filing of an exhibit.
The code of ethics that is the subject of the disclosure required by Item 2 is attached hereto.
(a)(2) A separate certification for each principal executive officer and principal financial officer of the registrant as required by Rule 30a-2(a) under the Act (17 C.F.R. § 270.30a-2).
Certifications pursuant to Rule 30a-2(a) are attached hereto.
(a)(3) Any written solicitation to purchase securities under Rule 23c-1 under the Act (17 C.F.R. § 270.23c-1) sent or given during the period covered by the report by or on behalf of the registrant to 10 or more persons.
Not Applicable.
8
(b) If the report is filed under Section 13(a) or 15(d) of the Exchange Act, provide the certifications required by Rule 30a-2(b) under the Act as an exhibit. A certification furnished pursuant to this paragraph will not be deemed “filed” for purposes of Section 18 of the Exchange Act, or otherwise subject to the liability of that section. Such certification will not be deemed to be incorporated by reference into any filing under the Securities Act of 1933 or the Exchange Act, except to the extent that the registrant incorporates it by reference.
Certifications pursuant to Rule 30a-2(b) are furnished herewith.
9
SIGNATURES
Pursuant to the requirements of the Securities Exchange Act of 1934 and the Investment Company Act of 1940, the registrant has duly caused this report to be signed on its behalf by the undersigned, thereunto duly authorized.
| | | | | | |
| (Registrant) | | NATIONWIDE MUTUAL FUNDS |
| | |
| By (Signature and Title)* | | | | /s/ Joseph A. Finelli |
| | Name: | | Joseph A. Finelli |
| | Title: | | Principal Financial Officer |
| | Date: | | February 25, 2015 |
Pursuant to the requirements of the Securities Exchange Act of 1934 and the Investment Company Act of 1940, this report has been signed below by the following persons on behalf of the registrant and in the capacities and on the dates indicated.
| | | | | | |
| By (Signature and Title)* | | | | /s/ Michael S. Spangler |
| | Name: | | Michael S. Spangler |
| | Title: | | Principal Executive Officer |
| | Date: | | February 25, 2015 |
| | | | | | |
| By (Signature and Title)* | | | | /s/ Joseph A. Finelli |
| | Name: | | Joseph A. Finelli |
| | Title: | | Principal Financial Officer |
| | Date: | | February 25, 2015 |
| * | Print the name and title of each signing officer under his or her signature. |
10