Table of Contents
UNITED STATES
SECURITIES AND EXCHANGE COMMISSION
Washington, D.C. 20549
FORM N-CSRS
CERTIFIED SHAREHOLDER REPORT OF REGISTERED
MANAGEMENT INVESTMENT COMPANIES
Investment Company Act file number: 811-08549
Oak Associates Funds
(Exact name of registrant as specified in charter)
101 Federal Street, Boston, Massachusetts 02110
(Address of principal executive offices) (Zip code)
Leslie Manna
Oak Associates, ltd.
3875 Embassy Parkway, Suite 250
Akron, Ohio 44333-8334
(Name and address of agent for service)
Registrant’s telephone number, including area code: 1-888-462-5386
Date of fiscal year end: October 31
Date of reporting period: November 1, 2009 - April 30, 2010
Table of Contents
Item 1. Reports to Stockholders.
Table of Contents
SEMI-ANNUAL REPORT
APRIL 30‰2010
OAK ASSOCIATES FUNDS
OVER 25 YEARS OF GROWTH INVESTING
White Oak Select Growth
Pin Oak Equity
Rock Oak Core Growth
River Oak Discovery
Red Oak Technology Select
Black Oak Emerging Technology
Live Oak Health Sciences
Table of Contents

| 1 | ||
Performance Update | ||
| 2 | ||
| 3 | ||
| 4 | ||
| 5 | ||
| 6 | ||
| 7 | ||
| 8 | ||
| 9 | ||
| 11 | ||
Financial Statements | ||
| 13 | ||
| 30 | ||
| 32 | ||
| 34 | ||
| 38 | ||
| 52 | ||
Table of Contents
June 16, 2010
Dear Fellow Shareholder:
During the summer of 2009, as the market recovered from its lows, there were many skeptics. These skeptics wondered if the economy was really recovering and if the market rally was a head fake. With the benefit of hindsight, we know that the economy was indeed recovering and that the market would continue to rally.
Today, the skeptics again are out in force, but the lament is a different, though familiar, one: a double-dip. This fear early in a recovery that GDP growth is poised to decline is common, even though such an event is rare. Why is it so common? One explanation is that each cycle has unique characteristics that make it feel different than previous ones. Another possibility is that economic data never shows improvement in a perfectly linear fashion, so when there is a setback, investors get worried. We believe that is what is happening right now and that it explains the recent market correction. There have been some disappointing economic reports, which, when combined with the perception that this recovery is dependent on government stimulus, have led many to conclude that a slowdown is imminent. Despite some worrisome issues (increasing regulation, fiscal deficits at the federal and state level, lack of employment growth), we don’t share this bearish economic view. Given historical precedent, the upward sloping yield curve(1) which is auguring economic strength, not weakness), and our belief that people tend to underestimate the self-reinforcing nature of a recovery, we believe the possibility of a double-dip is lower than what investors seem to be pricing into the market. As a result, and because they are still trading at attractive valuations, we have maintained a healthy exposure to cyclical companies in our portfolios. That said, we remain long-term investors, focusing on compelling businesses that will prosper through an entire cycle.
Turning from the macro to the micro, corporate America is prospering. Profitability bodes well for the long-term. Balance sheets and cash flow(2) production are strong. The latter is the fundamental driver of enterprise value, and the low multiple that investors are putting on these cash flows is an indication that they don’t believe it is sustainable. Such skepticism is generally a positive, as it keeps expectations in check.
As a firm, we continue to adhere to a long-term investment approach, constructing portfolios that are concentrated in our best ideas. We believe this increasingly rare combination drives outperformance and gives investors the best chance to grow wealth over time.
Thank you for your investment with Oak Associates Funds.
| Best regards, |
 |
| Mark Oelschlager, CFA |
| Portfolio Manager |
| (1) | Yield Curve – A line that plots the interest rates, at a set point in time of bonds having equal credit quality, but differing maturity dates. |
| (2) | Cash Flows – A revenue or expense stream that changes a cash account over a specific period. The Price/Cash Flow ratio or P/CF, is a ratio used to compare a company’s market value to its cash flow. In theory, the lower a stock’s Price/Cash Flow Ratio is, the better value that stock is. |
The value of the Funds’ investments will vary from day to day in response to the activities of individual companies and general market and economic conditions.
| Semi-Annual Report | April 30, 2010 (Unaudited) | 1 |
Table of Contents
| White Oak Select Growth Fund | Performance Update |
| All data below as of April 30, 2010 (Unaudited) |
Fund Data | Top 10 Holdings^ | |||||||
Ticker Symbol | WOGSX | 1. Amazon.com, Inc. | 6.82% | |||||
Share Price | $35.45 | 2. ACE, Ltd. | 5.53% | |||||
Total Net Assets | $332M | 3. The Charles Schwab Corp. | 5.29% | |||||
Portfolio Turnover | 6% | 4. Salesforce.com, Inc. | 5.24% | |||||
2010 Distributions | None | 5. Cisco Systems, Inc. | 5.14% | |||||
6. Baker Hughes, Inc. | 5.13% | |||||||
Industry Weightings^ | 7. Google, Inc. - Class A | 5.07% | ||||||
Information Technology | 48.5% | 8. Cognizant Technology Solutions Corp. - Class A | 4.95% | |||||
Health Care | 19.5% | 9. International Business Machines Corp. | 4.67% | |||||
Financials | 10.8% | 10. Teva Pharmaceutical Industries, Ltd. ADR | 4.58% | |||||
Energy | 9.5% | |||||||
Consumer Discretionary | 6.8% | |||||||
Telecommunication Services | 1.4% | |||||||
Repurchase Agreement | 0.4% |
^ Percentages are based on net assets. Holdings are subject to change.
Growth of $10,000 Chart

The chart above represents historical performance of a hypothetical investment of $10,000 in the Fund over the past 10 years (or for the life of the Fund if shorter). Past performance does not guarantee future results. This chart does not reflect the deduction of taxes that a shareholder would pay on Fund distributions or the redemption of Fund shares. Fee waivers are in effect; if they had not been in effect, performance would have been lower.
| Average Annual Total Return | |||||||||||||||||||||||
| 1 Year Return | 3 Year Return | 5 year Return | 10 year Return | Inception to Date | |||||||||||||||||||
White Oak Select Growth Fund | 34.94% | 0.04% | 4.24% | -6.73% | 7.55% | * | |||||||||||||||||
S&P 500 Total Return Index | 38.84% | -5.05% | 2.63% | -0.19% | 8.06% | * | |||||||||||||||||
Lipper Large-Cap Growth Funds Average | 34.87% | -2.63% | 3.37% | -2.51% | 7.05% | ** | |||||||||||||||||
* Since 08/03/1992 ** Since 07/31/1992
The performance data quoted represents past performance. Past performance does not guarantee future results. The investment return and principal value of an investment will fluctuate so that an investor’s shares, when redeemed, may be worth more or less than their original cost and current performance may be lower or higher than the performance quoted. For performance data current to the most recent month end, please visit www.oakfunds.com or call 1-888-462-5386.
Lipper Inc. is the source and owner of the Lipper Classification data. See Page 9 for additional disclosure. Standard & Poor��s is the source and owner of the S&P Index data. See Page 9 for additional disclosure.
| 2 | 1-888-462-5386 | www.oakfunds.com |
Table of Contents
| Pin Oak Equity Fund | Performance Update |
| All data below as of April 30, 2010 (Unaudited) |
Fund Data | Top 10 Holdings^ | |||||||
Ticker Symbol | POGSX | 1. The Shaw Group, Inc. | 4.77% | |||||
Share Price | $26.98 | 2. Amdocs, Ltd. | 4.77% | |||||
Total Net Assets | $132M | 3. Garmin, Ltd. | 4.12% | |||||
Portfolio Turnover | 21% | 4. DISH Network Corp. - Class A | 3.88% | |||||
2010 Distributions | None | 5. The Charles Schwab Corp. | 3.80% | |||||
6. The Western Union Co. | 3.65% | |||||||
Industry Weightings^ | 7. Fair Isaac Corp. | 3.59% | ||||||
Information Technology | 38.5% | 8. Jacobs Engineering Group, Inc. | 3.55% | |||||
Consumer Discretionary | 22.5% | 9. Amazon.com, Inc. | 3.53% | |||||
Industrials | 14.2% | 10. eBay, Inc. | 3.48% | |||||
Energy | 11.8% | |||||||
Financials | 7.9% | |||||||
Utilities | 2.9% | |||||||
Health Care | 2.2% |
^ Percentages are based on net assets. Holdings are subject to change.
Growth of $10,000 Chart
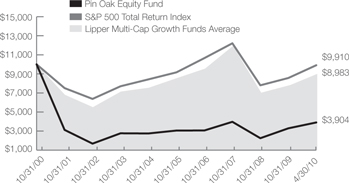
The chart above represents historical performance of a hypothetical investment of $10,000 in the Fund over the past 10 years (or for the life of the Fund if shorter). Past performance does not guarantee future results. This chart does not reflect the deduction of taxes that a shareholder would pay on Fund distributions or the redemption of Fund shares. Fee waivers are in effect; if they had not been in effect, performance would have been lower.
| Average Annual Total Return | |||||||||||||||||||||||
1 Year Return | 3 Year Return | 5 year Return | 10 year Return | Inception to Date | |||||||||||||||||||
Pin Oak Equity Fund | 53.56% | 3.72% | 7.61% | -8.55% | 5.97% | * | |||||||||||||||||
S&P 500 Total Return Index | 38.84% | -5.05% | 2.63% | -0.19% | 8.06% | * | |||||||||||||||||
Lipper Multi-Cap Growth Funds Average | 39.42% | -2.76% | 4.81% | -1.64% | 8.34% | ** | |||||||||||||||||
* Since 08/03/1992 ** Since 07/31/1992
The performance data quoted represents past performance. Past performance does not guarantee future results. The investment return and principal value of an investment will fluctuate so that an investor’s shares, when redeemed, may be worth more or less than their original cost and current performance may be lower or higher than the performance quoted. For performance data current to the most recent month end, please visit www.oakfunds.com or call 1-888-462-5386.
Lipper Inc. is the source and owner of the Lipper Classification data. See Page 9 for additional disclosure. Standard & Poor’s is the source and owner of the S&P Index data. See Page 9 for additional disclosure.
| Semi-Annual Report | April 30, 2010 (Unaudited) | 3 |
Table of Contents
| Rock Oak Core Growth Fund | Performance Update |
| All data below as of April 30, 2010 (Unaudited) |
Fund Data | Top 10 Holdings^ | |||||||
Ticker Symbol | RCKSX | 1. Cognizant Technology Solutions Corp. - Class A | 5.00% | |||||
Share Price | $10.35 | 2. Salesforce.com, Inc. | 4.84% | |||||
Total Net Assets | $6M | 3. Baidu, Inc. | 4.33% | |||||
Portfolio Turnover | 30% | 4. Weatherford International, Ltd. | 4.18% | |||||
2010 Distributions | None | 5. Archer Daniels Midland Co. | 3.85% | |||||
6. Teva Pharmaceutical Industries, Ltd. ADR | 3.78% | |||||||
Industry Weightings^ | 7. Broadcom Corp. - Class A | 3.63% | ||||||
Information Technology | 38.3% | 8. CME Group, Inc. | 3.61% | |||||
Health Care | 16.3% | 9. Mastercard, Inc. - Class A | 3.60% | |||||
Consumer Discretionary | 11.2% | 10. Dolby Laboratories, Inc. - Class A | 3.56% | |||||
Industrials | 9.1% | |||||||
Energy | 8.5% | |||||||
Financials | 8.0% | |||||||
Consumer Staples | 3.8% | |||||||
Materials | 3.5% |
^ Percentages are based on net assets. Holdings are subject to change.
Growth of $10,000 Chart
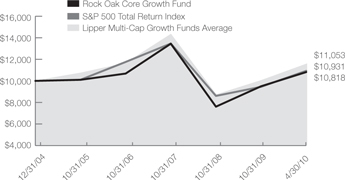
The chart above represents historical performance of a hypothetical investment of $10,000 in the Fund over the past 10 years (or for the life of the Fund if shorter). Past performance does not guarantee future results. This chart does not reflect the deduction of taxes that a shareholder would pay on Fund distributions or the redemption of Fund shares. Fee waivers are in effect; if they had not been in effect, performance would have been lower.
| Average Annual Total Return | ||||||||||||||||||||||
| 1 Year Return | 3 Year Return | 5 year Return | 10 year Return | Inception to Date* | ||||||||||||||||||
Rock Oak Core Growth Fund | 36.36% | -1.62% | 3.45% | – | 1.49% | |||||||||||||||||
S&P 500 Total Return Index | 38.84% | -5.05% | 2.63% | – | 1.68% | |||||||||||||||||
Lipper Multi-Cap Growth Funds Average | 39.42% | -2.76% | 4.81% | – | 2.90% | |||||||||||||||||
* Since 12/31/2004
The performance data quoted represents past performance. Past performance does not guarantee future results. The investment return and principal value of an investment will fluctuate so that an investor’s shares, when redeemed, may be worth more or less than their original cost and current performance may be lower or higher than the performance quoted. For performance data current to the most recent month end, please visit www.oakfunds.com or call 1-888-462-5386.
Lipper Inc. is the source and owner of the Lipper Classification data. See Page 9 for additional disclosure. Standard & Poor’s is the source and owner of the S&P Index data. See Page 9 for additional disclosure.
| 4 | 1-888-462-5386 | www.oakfunds.com |
Table of Contents
| River Oak Discovery Fund | Performance Update |
| All data below as of April 30, 2010 (Unaudited) |
Fund Data | Top 10 Holdings^ | |||||||
Ticker Symbol | RIVSX | 1. Asialnfo Holdings, Inc. | 5.19% | |||||
Share Price | $12.50 | 2. MercadoLibre, Inc. | 4.10% | |||||
Total Net Assets | $10M | 3. Oceaneering International, Inc. | 3.83% | |||||
Portfolio Turnover | 25% | 4. EMCOR Group, Inc. | 3.54% | |||||
2010 Distributions | None | 5. Coinstar, Inc. | 3.52% | |||||
6. Factset Research Systems, Inc. | 3.45% | |||||||
Industry Weightings^ | 7. F5 Networks, Inc. | 3.32% | ||||||
Information Technology | 34.0% | 8. Itron, Inc. | 3.24% | |||||
Consumer Discretionary | 18.8% | 9. WMS Industries, Inc. | 3.23% | |||||
Industrials | 14.8% | 10. CARBO Ceramics, Inc. | 3.21% | |||||
Energy | 9.9% | |||||||
Health Care | 7.2% | |||||||
Consumer Staples | 3.1% | |||||||
Materials | 2.1% | |||||||
Financials | 2.0% |
^ Percentages are based on net assets. Holdings are subject to change.
Growth of $10,000 Chart
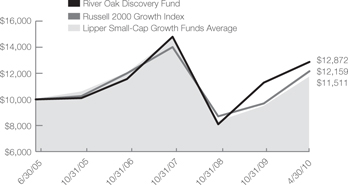
The chart above represents historical performance of a hypothetical investment of $10,000 in the Fund over the past 10 years (or for the life of the Fund if shorter). Past performance does not guarantee future results. This chart does not reflect the deduction of taxes that a shareholder would pay on Fund distributions or the redemption of Fund shares. Fee waivers are in effect; if they had not been in effect, performance would have been lower.
| Average Annual Total Return | ||||||||||||||||||||||
| 1 Year Return | 3 Year Return | 5 year Return | 10 year Return | Inception to Date* | ||||||||||||||||||
River Oak Discovery Fund | 43.19% | 2.11% | – | – | 5.36% | |||||||||||||||||
Russell 2000 Growth Index | 45.21% | -1.93% | – | – | 4.13% | |||||||||||||||||
Lipper Small-Cap Growth Funds Average | 46.22% | -3.13% | – | – | 3.00% | |||||||||||||||||
* Since 06/30/2005
The performance data quoted represents past performance. Past performance does not guarantee future results. The investment return and principal value of an investment will fluctuate so that an investor’s shares, when redeemed, may be worth more or less than their original cost and current performance may be lower or higher than the performance quoted. For performance data current to the most recent month end, please visit www.oakfunds.com or call 1-888-462-5386.
Lipper Inc. is the source and owner of the Lipper Classification data. See Page 9 for additional disclosure. Russell Investments is the source and owner of the Russell Index data. See Page 9 for additional disclosure.
| Semi-Annual Report | April 30, 2010 (Unaudited) | 5 |
Table of Contents
| Red Oak Technology Select Fund | Performance Update |
| All data below as of April 30, 2010 (Unaudited) |
Fund Data | Top 10 Holdings^ | |||||||
Ticker Symbol | ROGSX | 1. Accenture PLC - Class A | 5.38% | |||||
Share Price | $8.30 | 2. Western Digital Corp. | 5.14% | |||||
Total Net Assets | $68M | 3. Akamai Technologies, Inc. | 4.94% | |||||
Portfolio Turnover | 20% | 4. Amazon.com, Inc. | 4.79% | |||||
2010 Distributions | None | 5. Google, Inc. - Class A | 4.77% | |||||
6. International Business Machines Corp. | 4.32% | |||||||
Industry Weightings^ | 7. Computer Sciences Corp. | 4.22% | ||||||
Information Technology | 87.0% | 8. Check Point Software Technologies | 4.17% | |||||
Consumer Discretionary | 6.7% | 9. Xilinx, Inc. | 4.11% | |||||
Industrials | 3.7% | 10. Apple, Inc. | 4.01% | |||||
Telecommunication Services | 2.6% | |||||||
^ Percentages are based on net assets. Holdings are subject to change.
Growth of $10,000 Chart
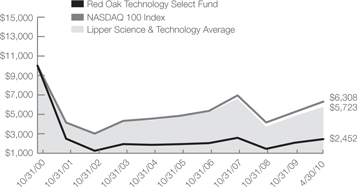
The chart above represents historical performance of a hypothetical investment of $10,000 in the Fund over the past 10 years (or for the life of the Fund if shorter). Past performance does not guarantee future results. This chart does not reflect the deduction of taxes that a shareholder would pay on Fund distributions or the redemption of Fund shares. Fee waivers are in effect; if they had not been in effect, performance would have been lower.
| Average Annual Total Return | ||||||||||||||||||||||
1 Year Return | 3 Year Return | 5 year Return | 10 year Return | Inception to Date* | ||||||||||||||||||
Red Oak Technology Select Fund | 49.28% | 2.31% | 6.81% | -12.39% | -1.63% | |||||||||||||||||
NASDAQ 100 Index | 44.44% | 2.93% | 7.66% | -5.82% | 1.07% | |||||||||||||||||
Lipper Science & Technology Average | 44.92% | 0.50% | 6.45% | -7.50% | 1.46% | |||||||||||||||||
* Since 12/31/1998
The performance data quoted represents past performance. Past performance does not guarantee future results. The investment return and principal value of an investment will fluctuate so that an investor’s shares, when redeemed, may be worth more or less than their original cost and current performance may be lower or higher than the performance quoted. For performance data current to the most recent month end, please visit www.oakfunds.com or call 1-888-462-5386.
Lipper Inc. is the source and owner of the Lipper Classification data. See Page 9 for additional disclosure. NASDAQ is the source and owner of the NASDAQ Index data. See Page 9 for additional disclosure.
| 6 | 1-888-462-5386 | www.oakfunds.com |
Table of Contents
| Black Oak Emerging Technology Fund | Performance Update |
| All data below as of April 30, 2010 (Unaudited) |
Fund Data | Top 10 Holdings^ | |||||||
Ticker Symbol | BOGSX | 1. Cognizant Technology Solutions Corp. - Class A | 6.57% | |||||
Share Price | $2.64 | 2. MercadoLibre, Inc. | 6.17% | |||||
Total Net Assets | $29M | 3. Apple, Inc. | 6.08% | |||||
Portfolio Turnover | 11% | 4. Salesforce.com, Inc. | 5.21% | |||||
2010 Distributions | None | 5. AsiaInfo Holdings, Inc. | 5.06% | |||||
6. Illumina, Inc. | 4.95% | |||||||
7. F5 Networks, Inc. | 4.76% | |||||||
Industry Weightings^ | 8. Dolby Laboratories, Inc. - Class A | 4.55% | ||||||
Information Technology | 80.9% | 9. Itron, Inc. | 4.31% | |||||
Health Care | 8.4% | 10. Qualcomm, Inc. | 4.22% | |||||
Consumer Discretionary | 7.6% | |||||||
Industrials | 3.2% |
^ Percentages are based on net assets. Holdings are subject to change.
Growth of $10,000 Chart
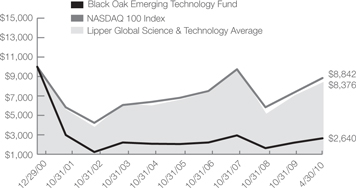
The chart above represents historical performance of a hypothetical investment of $10,000 in the Fund over the past 10 years (or for the life of the Fund if shorter). Past performance does not guarantee future results. This chart does not reflect the deduction of taxes that a shareholder would pay on Fund distributions or the redemption of Fund shares. Fee waivers are in effect; if they had not been in effect, performance would have been lower.
| Average Annual Total Return | |||||||||||||||||||||||
| 1 Year Return | 3 Year Return | 5 year Return | 10 year Return | Inception to Date* | |||||||||||||||||||
Black Oak Emerging Technology Fund | 45.86% | 3.96% | 6.25% | – | -13.30% | * | |||||||||||||||||
NASDAQ 100 Index | 44.44% | 2.93% | 7.66% | – | -1.31% | * | |||||||||||||||||
Lipper Global Science & Technology Average | 49.73% | 1.98% | 8.39% | – | -2.80% | ** | |||||||||||||||||
* Since 12/29/2000 **Since 12/31/2000
The performance data quoted represents past performance. Past performance does not guarantee future results. The investment return and principal value of an investment will fluctuate so that an investor’s shares, when redeemed, may be worth more or less than their original cost and current performance may be lower or higher than the performance quoted. For performance data current to the most recent month end, please visit www.oakfunds.com or call 1-888-462-5386.
Lipper Inc. is the source and owner of the Lipper Classification data. See Page 9 for additional disclosure. NASDAQ is the source and owner of the NASDAQ Index data. See Page 9 for additional disclosure.
| Semi-Annual Report | April 30, 2010 (Unaudited) | 7 |
Table of Contents
| Live Oak Health Sciences Fund | Performance Update |
| All data below as of April 30, 2010 (Unaudited) |
Fund Data | Top 10 Holdings^ | |||||||
Ticker Symbol | LOGSX | 1. AmerisourceBergen Corp. | 6.65% | |||||
Share Price | $12.41 | 2. Amgen, Inc. | 4.86% | |||||
Total Net Assets | $20M | 3. Waters Corp. | 4.72% | |||||
Portfolio Turnover | 14% | 4. Teva Pharmaceutical Industries, Ltd. ADR | 4.00% | |||||
2010 Distributions | None | 5. PharMerica Corp. | 3.93% | |||||
6. Johnson & Johnson | 3.92% | |||||||
Industry Weightings^ | 7. Biogen Idec, Inc. | 3.92% | ||||||
Pharmaceuticals | 40.4% | 8. Novartis AG ADR | 3.82% | |||||
Health Care Providers & Services | 29.6% | 9. Sanofi-Aventis SA ADR | 3.78% | |||||
Biotechnology | 10.5% | 10. GlaxoSmithKline PLC ADR | 3.78% | |||||
Life Sciences Tools & Services | 7.4% | |||||||
Health Care Equipment & Supplies | 7.1% | |||||||
Repurchase Agreement | 5.2% |
^ Percentages are based on net assets. Holdings are subject to change.
Growth of $10,000 Chart
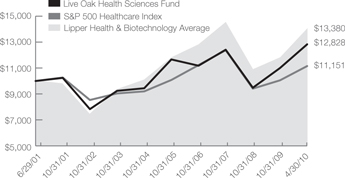
The chart above represents historical performance of a hypothetical investment of $10,000 in the Fund over the past 10 years (or for the life of the Fund if shorter). Past performance does not guarantee future results. This chart does not reflect the deduction of taxes that a shareholder would pay on Fund distributions or the redemption of Fund shares. Fee waivers are in effect; if they had not been in effect, performance would have been lower.
| Average Annual Total Return | |||||||||||||||||||||||
| 1 Year Return | 3 Year Return | 5 year Return | 10 year Return | Inception to Date | |||||||||||||||||||
Live Oak Health Sciences Fund | 39.59% | 2.25% | 4.23% | – | 2.86% | * | |||||||||||||||||
S&P 500 Healthcare Index | 30.34% | -3.12% | 1.86% | – | 1.24% | * | |||||||||||||||||
Lipper Health & Biotechnology Average | 38.16% | 0.35% | 4.89% | – | 2.88% | ** | |||||||||||||||||
* Since 06/29/2001 ** Since 06/30/2001
The performance data quoted represents past performance. Past performance does not guarantee future results. The investment return and principal value of an investment will fluctuate so that an investor’s shares, when redeemed, may be worth more or less than their original cost and current performance may be lower or higher than the performance quoted. For performance data current to the most recent month end, please visit www.oakfunds.com or call 1-888-462-5386.
Lipper Inc. is the source and owner of the Lipper Classification data. See Page 9 for additional disclosure. Standard & Poor’s is the source and owner of the S&P Index data. See Page 9 for additional disclosure.
| 8 | 1-888-462-5386 | www.oakfunds.com |
Table of Contents
As of April 30, 2010 (Unaudited)
Index Definitions and Disclosures
All indices are unmanaged and index performance figures include reinvestment of dividends but do not reflect any fees, expenses or taxes. Investors cannot invest directly in an index.
NASDAQ 100 Index – The NASDAQ-100 Index includes 100 of the largest domestic and international non-financial securities listed on The Nasdaq Stock Market based on market capitalization.
Russell 2000 Growth Index – The Russell 2000 Growth Index measures the performance of the small-cap growth segment of the U.S. equity universe. It includes those Russell 2000 companies with higher price-to-book ratios and higher forecasted growth values.
S&P 500 Healthcare Index – Is a capitalization-weighted index that encompasses two main industry groups. The first includes companies who manufacture health care equipment and supplies or provide health care related services, including distributors of health care products, providers of basic health-care services, and owners and operators of health care facilities and organizations. The second group consists of companies primarily involved in the research, development, production and marketing of pharmaceuticals and biotechnology products.
S&P 500 Index – The S&P 500 Index is a commonly recognized, market capitalization weighted index of 500 widely held equity securities, designed to measure broad U.S. equity performance.
LIPPER GLOBAL SCIENCE & TECHNOLOGY FUNDS – Funds that invest primarily in the equity securities of domestic and foreign companies engaged in science and technology.
LIPPER HEALTH/BIOTECHNOLOGY FUNDS – Funds that invest primarily in the equity securities of domestic companies engaged in healthcare, medicine, and biotechnology.
LIPPER LARGE-CAP GROWTH FUNDS – Funds that, by portfolio practice, invest at least 75% of their equity assets in companies with market capitalizations (on a three-year weighted basis) above Lipper’s USDE large-cap floor. Large-cap growth funds typically have an above-average price-to-earnings ratio, price-to-book ratio, and three-year sales-per-share growth value, compared to the S&P 500 Index.
LIPPER MULTI-CAP GROWTH FUNDS – Funds that, by portfolio practice, invest in a variety of market capitalization ranges without concentrating 75% of their equity assets in any one market capitalization range over an extended period of time. Multi-cap growth funds typically have an above-average price-to-earnings ratio, price-to-book ratio, and three-year sales per-share growth value, compared to the S&P SuperComposite 1500 Index.
LIPPER SCIENCE & TECHNOLOGY FUNDS – Funds that invest primarily in the equity securities of domestic companies engaged in science and technology.
LIPPER SMALL-CAP GROWTH FUNDS – Funds that, by portfolio practice, invest at least 75% of their equity assets in companies with market capitalizations (on a three-year weighted basis) below Lipper’s USDE small-cap ceiling. Small-cap growth funds typically have an above-average price-to-earnings ratio, price-to-book ratio, and three-year sales-per-share growth value, compared to the S&P SmallCap 600 Index.
| Semi-Annual Report | April 30, 2010 (Unaudited) | 9 |
Table of Contents
Important Disclosures
As of April 30, 2010 (Unaudited)
Index Definitions and Disclosures (continued)
Lipper Inc. is the source and owner of the Lipper Classification data contained in this material and all trademarks and copyrights related thereto. Any further dissemination or redistribution is strictly prohibited. Lipper Inc. is not responsible for the formatting or configuration of this material or for any inaccuracy in Oak Associates Funds presentation thereof.
NASDAQ is the source and owner of the NASDAQ Index data contained in this material and all trademarks and copyrights related thereto. Any further dissemination or redistribution is strictly prohibited. NASDAQ is not responsible for the formatting or configuration of this material or for any inaccuracy in Oak Associates Funds presentation thereof.
Russell Investments is the source and owner of the Russell Index data contained in this material and all trademarks and copyrights related thereto. Any further dissemination or redistribution is strictly prohibited. Russell Investments is not responsible for the formatting or configuration of this material or for any inaccuracy in Oak Associates Funds presentation thereof.
Standard & Poor’s is the source and owner of the S&P Index data contained in this material and all trademarks and copyrights related thereto. Any further dissemination or redistribution is strictly prohibited. Standard & Poor’s is not responsible for the formatting or configuration of this material or for any inaccuracy in Oak Associates Funds presentation thereof.
| 10 | 1-888-462-5386 | www.oakfunds.com |
Table of Contents
| Disclosure of Fund Expenses |
| As of April 30, 2010 (Unaudited) |
All mutual funds have operating expenses. As a shareholder of a fund, your investment is affected by these ongoing costs, which include (among others) costs for portfolio management, administrative services, and shareholder reports like this one. It is important for you to understand the impact of these costs on your investment returns.
Operating expenses such as these are deducted from the fund’s gross income and directly reduce your final investment return. These expenses are expressed as a percentage of the fund’s average net assets; this percentage is known as the fund’s expense ratio.
The following examples use the expense ratio and are intended to help you understand the ongoing costs (in dollars) of investing in your Fund and to compare these costs with those of other mutual funds. The examples are based on an investment of $1,000 made at the beginning of the period shown and held for the entire period.
The table on the next page illustrates your Fund’s costs in two ways:
Actual Fund Return. This section helps you to estimate the actual expenses after fee waivers that your Fund incurred over the period. The “Expenses Paid During Period” column shows the actual dollar expense cost incurred by a $1,000 investment in the Fund, and the “Ending Account Value” number is derived from deducting that expense cost from the Fund’s gross investment return.
You can use this information, together with the actual amount you invested in the Fund, to estimate the expenses you paid over that period. Simply divide your actual account value by $1,000 to arrive at a ratio (for example, an $8,600 account value divided by $1,000 = $8.6), then multiply that ratio by the number shown for your Fund under “Expenses Paid During Period”.
Hypothetical 5% Return. This section helps you compare your Fund’s costs with those of other mutual funds. It assumes that the Fund had an annual 5% return before expenses during the year, but that the expense ratio (Column 3) for the period is unchanged. This example is useful in making comparisons because the Securities and Exchange Commission requires all mutual funds to make this 5% calculation. You can assess your Fund’s comparative cost by comparing the hypothetical result for your Fund in the “Expense Paid During Period” column with those that appear in the same charts in the shareholder reports for other funds.
Note: Because the return is set at 5% for comparison purposes — NOT your Fund’s actual return — the account values shown may not apply to your specific investment.
| Semi-Annual Report | April 30, 2010 (Unaudited) | 11 |
Table of Contents
Disclosure of Fund Expenses
As of April 30, 2010 (Unaudited)
| Beginning Account Value 11/01/09 | Ending Account Value 04/30/10 | Annualized Expense Ratios | Expenses Paid During the Period(a) | |||||
White Oak Select Growth Fund | ||||||||
Actual Return | $ 1,000.00 | $ 1,127.50 | 1.25% | $ 6.59 | ||||
Hypothetical 5% Return | $ 1,000.00 | $ 1,018.60 | 1.25% | $ 6.26 | ||||
Pin Oak Equity Fund | ||||||||
Actual Return | $ 1,000.00 | $ 1,187.10 | 1.25% | $ 6.78 | ||||
Hypothetical 5% Return | $ 1,000.00 | $ 1,018.60 | 1.25% | $ 6.26 | ||||
Rock Oak Core Growth Fund | ||||||||
Actual Return | $ 1,000.00 | $ 1,138.60 | 1.25% | $ 6.63 | ||||
Hypothetical 5% Return | $ 1,000.00 | $ 1,018.60 | 1.25% | $ 6.26 | ||||
River Oak Discovery Fund | ||||||||
Actual Return | $ 1,000.00 | $ 1,140.50 | 1.35% | $ 7.16 | ||||
Hypothetical 5% Return | $ 1,000.00 | $ 1,018.10 | 1.35% | $ 6.76 | ||||
Red Oak Technology Select Fund | ||||||||
Actual Return | $ 1,000.00 | $ 1,179.00 | 1.35% | $ 7.29 | ||||
Hypothetical 5% Return | $ 1,000.00 | $ 1,018.10 | 1.35% | $ 6.76 | ||||
Black Oak Emerging Technology Fund | ||||||||
Actual Return | $ 1,000.00 | $ 1,205.50 | 1.35% | $ 7.38 | ||||
Hypothetical 5% Return | $ 1,000.00 | $ 1,018.10 | 1.35% | $ 6.76 | ||||
Live Oak Health Sciences Fund | ||||||||
Actual Return | $ 1,000.00 | $ 1,166.20 | 1.35% | $ 7.25 | ||||
Hypothetical 5% Return | $ 1,000.00 | $ 1,018.10 | 1.35% | $ 6.76 |
| (a) | Expenses are equal to the Fund’s annualized expense ratio multiplied by the average account value over the period, multiplied by 181/365 (to reflect the one-half year period). |
| 12 | 1-888-462-5386 | www.oakfunds.com |
Table of Contents
| White Oak Select Growth Fund | Statement of Investments |
| As of April 30, 2010 (Unaudited) |
Security Description | Shares | Value | ||||
COMMON STOCKS (96.5%) | ||||||
CONSUMER DISCRETIONARY (6.8%) | ||||||
Internet & Catalog Retail (6.8%) | ||||||
Amazon.com, Inc.(a) | 165,000 | $ 22,614,900 | ||||
ENERGY (9.5%) | ||||||
Energy Equipment & Services (9.5%) | ||||||
Baker Hughes, Inc. | 342,000 | 17,017,920 | ||||
Transocean, Ltd.(a) | 200,000 | 14,490,000 | ||||
| 31,507,920 | ||||||
FINANCIALS (10.8%) | ||||||
Capital Markets (5.3%) | ||||||
The Charles Schwab Corp. | 910,000 | 17,553,900 | ||||
Insurance (5.5%) | ||||||
ACE, Ltd. | 345,000 | 18,350,550 | ||||
HEALTH CARE (19.5%) | ||||||
Biotechnology (4.3%) | ||||||
Amgen, Inc.(a) | 245,000 | 14,053,200 | ||||
Health Care Equipment & Supplies (4.4%) | ||||||
Stryker Corp. | 255,000 | 14,647,200 | ||||
Health Care Providers & Services (6.2%) | ||||||
Express Scripts, Inc.(a) | 70,000 | 7,009,100 | ||||
UnitedHealth Group, Inc. | 450,000 | 13,639,500 | ||||
| 20,648,600 | ||||||
Pharmaceuticals (4.6%) | ||||||
Teva Pharmaceutical Industries, Ltd. ADR | 258,600 | 15,187,578 | ||||
INFORMATION TECHNOLOGY (48.5%) | ||||||
Communications Equipment (12.4%) | ||||||
Cisco Systems, Inc.(a) | 633,000 | 17,040,360 | ||||
Juniper Networks, Inc.(a) | 410,000 | 11,648,100 | ||||
Qualcomm, Inc. | 320,000 | 12,396,800 | ||||
| 41,085,260 | ||||||
Computers & Peripherals (4.7%) | ||||||
International Business Machines Corp. | 120,000 | 15,480,000 | ||||
Internet Software & Services (13.0%) | ||||||
eBay, Inc.(a) | 612,000 | 14,571,720 | ||||
Google, Inc. - Class A(a) | 32,000 | 16,814,080 | ||||
Yahoo!, Inc.(a) | 705,000 | 11,653,650 | ||||
| 43,039,450 | ||||||
| Semi-Annual Report | April 30, 2010 (Unaudited) | 13 |
Table of Contents
| Statement of Investments | White Oak Select Growth Fund |
| As of April 30, 2010 (Unaudited) |
Security Description | Shares | Value | |||||
IT Services (4.9%) | |||||||
Cognizant Technology Solutions Corp. - Class A(a) | 321,000 | $ 16,428,780 | |||||
Semiconductors & Semiconductor Equipment (8.3%) | |||||||
Broadcom Corp. - Class A | 400,000 | 13,796,000 | |||||
KLA-Tencor Corp. | 405,000 | 13,794,300 | |||||
| 27,590,300 | |||||||
Software (5.2%) | |||||||
Salesforce.com, Inc.(a) | 203,000 | 17,376,800 | |||||
TELECOMMUNICATION SERVICES (1.4%) | |||||||
Wireless Telecommunication Services (1.4%) | |||||||
Sprint Nextel Corp.(a) | 1,121,000 | 4,764,250 | |||||
TOTAL COMMON STOCKS (Cost $233,506,596) | 320,328,688 | ||||||
| Principal Amount | |||||||
REPURCHASE AGREEMENTS (0.4%) | |||||||
Tri-Party Repurchase Agreement with Morgan Stanley Co., 0.080%, dated 04/30/10 and maturing 05/03/10 with a repurchase amount of $1,211,855, collateralized by U.S. Government & Agency Securities with a collateral value of $1,236,086. | $ | 1,211,847 | 1,211,847 | ||||
TOTAL REPURCHASE AGREEMENTS (Cost $1,211,847) | 1,211,847 | ||||||
TOTAL INVESTMENTS - (96.9%) (Cost $234,718,443) | $ 321,540,535 | ||||||
Other assets and liabilities, net - (3.1%) | 10,242,089 | ||||||
NET ASSETS - (100.0%) | $ 331,782,624 | ||||||
| (a) | Non-income producing security. |
Common Abbreviations:
ADR - American Depositary Receipt
Ltd. - Limited
| 14 | 1-888-462-5386 | www.oakfunds.com |
Table of Contents
| Pin Oak Equity Fund | Statement of Investments |
| As of April 30, 2010 (Unaudited) |
Security Description | Shares | Value | ||||
COMMON STOCKS (100.0%) | ||||||
CONSUMER DISCRETIONARY (22.5%) | ||||||
Hotels, Restaurants & Leisure (2.8%) | ||||||
Interval Leisure Group, Inc.(a) | 249,222 | $ 3,685,993 | ||||
Household Durables (4.1%) | ||||||
Garmin, Ltd. | 145,400 | 5,435,052 | ||||
Internet & Catalog Retail (8.5%) | ||||||
Amazon.com, Inc.(a) | 34,000 | 4,660,040 | ||||
Blue Nile, Inc.(a) | 41,718 | 2,252,355 | ||||
HSN, Inc.(a) | 141,082 | 4,250,801 | ||||
| 11,163,196 | ||||||
Media (6.7%) | ||||||
DISH Network Corp. - Class A | 231,000 | 5,116,650 | ||||
Gannett Co., Inc. | 112,000 | 1,906,240 | ||||
Live Nation Entertainment, Inc.(a) | 116,000 | 1,820,040 | ||||
| 8,842,930 | ||||||
Specialty Retail (0.4%) | ||||||
Ann Taylor Stores Corp.(a) | 27,300 | 592,410 | ||||
ENERGY (11.8%) | ||||||
Energy Equipment & Services (7.2%) | ||||||
Ensco PLC ADR | 58,000 | 2,736,440 | ||||
Hercules Offshore, Inc.(a) | 140,000 | 554,400 | ||||
Nabors Industries, Ltd.(a) | 205,000 | 4,421,850 | ||||
Pioneer Drilling Co.(a) | 251,022 | 1,842,501 | ||||
| 9,555,191 | ||||||
Oil, Gas & Consumable Fuels (4.6%) | ||||||
Noble Corp. (a) | 87,832 | 3,468,486 | ||||
The Williams Cos., Inc. | 108,500 | 2,561,685 | ||||
| 6,030,171 | ||||||
FINANCIALS (7.9%) | ||||||
Capital Markets (4.7%) | ||||||
The Charles Schwab Corp. | 260,000 | 5,015,400 | ||||
Morgan Stanley | 42,000 | 1,269,240 | ||||
| 6,284,640 | ||||||
Insurance (3.2%) | ||||||
The Travelers Cos., Inc. | 82,900 | 4,206,346 | ||||
| Semi-Annual Report | April 30, 2010 (Unaudited) | 15 |
Table of Contents
| Statement of Investments | Pin Oak Equity Fund |
| As of April 30, 2010 (Unaudited) |
Security Description | Shares | Value | ||||
HEALTH CARE (2.2%) | ||||||
Biotechnology (2.2%) | ||||||
Biogen Idec, Inc.(a) | 54,000 | $ 2,875,500 | ||||
INDUSTRIALS (14.2%) | ||||||
Aerospace & Defense (2.7%) | ||||||
Lockheed Martin Corp. | 42,000 | 3,565,380 | ||||
Construction & Engineering (11.5%) | ||||||
Jacobs Engineering Group, Inc.(a) | 97,101 | 4,682,210 | ||||
KBR, Inc. | 189,700 | 4,188,576 | ||||
The Shaw Group, Inc.(a) | 164,400 | 6,293,232 | ||||
| 15,164,018 | ||||||
INFORMATION TECHNOLOGY (38.5%) | ||||||
Electronic Equipment & Instruments (2.4%) | ||||||
Jabil Circuit, Inc. | 201,000 | 3,079,320 | ||||
Internet Software & Services (10.8%) | ||||||
eBay, Inc.(a) | 193,000 | 4,595,330 | ||||
Google, Inc. - Class A(a) | 8,130 | 4,271,827 | ||||
IAC/InterActive Corp.(a) | 155,756 | 3,492,050 | ||||
Yahoo!, Inc.(a) | 116,000 | 1,917,480 | ||||
| 14,276,687 | ||||||
IT Services (10.9%) | ||||||
Amdocs, Ltd.(a) | 196,972 | 6,291,286 | ||||
Paychex, Inc. | 105,949 | 3,242,039 | ||||
The Western Union Co. | 264,000 | 4,818,000 | ||||
| 14,351,325 | ||||||
Semiconductors & Semiconductor Equipment (6.7%) | ||||||
ASM International N.V.(a) | 8,065 | 209,771 | ||||
Broadcom Corp. - Class A | 55,500 | 1,914,195 | ||||
KLA-Tencor Corp. | 66,700 | 2,271,802 | ||||
Xilinx, Inc. | 174,000 | 4,485,720 | ||||
| 8,881,488 | ||||||
Software (7.7%) | ||||||
BMC Software, Inc.(a) | 96,000 | 3,778,560 | ||||
Fair Isaac Corp. | 225,022 | 4,738,963 | ||||
Microsoft Corp. | 55,000 | 1,679,700 | ||||
| 10,197,223 | ||||||
UTILITIES (2.9%) | ||||||
Electric Utilities (2.9%) | ||||||
Edison International | 112,000 | 3,849,440 | ||||
| 16 | 1-888-462-5386 | www.oakfunds.com |
Table of Contents
| Pin Oak Equity Fund | Statement of Investments |
| As of April 30, 2010 (Unaudited) |
Security Description | Shares | Value | ||||
TOTAL COMMON STOCKS (Cost $103,669,639) | $ 132,036,310 | |||||
TOTAL INVESTMENTS - (100.0%) (Cost $103,669,639) | $ 132,036,310 | |||||
Other assets and liabilities, net - (-0.0%)(b) | (46,987) | |||||
NET ASSETS - (100.0%) | $ 131,989,323 | |||||
| (a) | Non-income producing security. |
| (b) | Less Than 0.01% |
Common Abbreviations:
ADR - American Depositary Receipt
Ltd. - Limited
N.V. - Naamloze Vennootschap is the Dutch term for a public limited liability corporation.
PLC - Public Limited Company
| Semi-Annual Report | April 30, 2010 (Unaudited) | 17 |
Table of Contents
| Statement of Investments | Rock Oak Core Growth Fund |
| As of April 30, 2010 (Unaudited) |
Security Description | Shares | Value | ||||
COMMON STOCKS (98.7%) | ||||||
CONSUMER DISCRETIONARY (11.2%) | ||||||
Hotels, Restaurants & Leisure (5.7%) | ||||||
Ctrip.com International, Ltd. ADR(a) | 6,000 | $ 219,120 | ||||
International Game Technology | 6,700 | 141,236 | ||||
| 360,356 | ||||||
Internet & Catalog Retail (3.4%) | ||||||
Amazon.com, Inc.(a) | 1,600 | 219,296 | ||||
Media (2.1%) | ||||||
DISH Network Corp. - Class A | 5,900 | 130,685 | ||||
CONSUMER STAPLES (3.8%) | ||||||
Food Products (3.8%) | ||||||
Archer Daniels Midland Co. | 8,775 | 245,174 | ||||
ENERGY (8.5%) | ||||||
Energy Equipment & Services (8.5%) | ||||||
National Oilwell Varco, Inc. | 2,900 | 127,687 | ||||
Transocean, Ltd.(a) | 2,000 | 144,900 | ||||
Weatherford International, Ltd.(a) | 14,700 | 266,217 | ||||
| 538,804 | ||||||
FINANCIALS (8.0%) | ||||||
Capital Markets (2.0%) | ||||||
Legg Mason, Inc. | 4,000 | 126,760 | ||||
Consumer Finance (2.4%) | ||||||
American Express Co. | 3,300 | 152,196 | ||||
Diversified Financial Services (3.6%) | ||||||
CME Group, Inc. | 700 | 229,887 | ||||
HEALTH CARE (16.3%) | ||||||
Biotechnology (5.1%) | ||||||
Genzyme Corp.(a) | 3,150 | 167,706 | ||||
Gilead Sciences, Inc.(a) | 4,000 | 158,680 | ||||
| 326,386 | ||||||
Health Care Equipment & Supplies (2.2%) | ||||||
Baxter International, Inc. | 1,400 | 66,108 | ||||
Intuitive Surgical, Inc.(a) | 200 | 72,112 | ||||
| 138,220 | ||||||
Health Care Providers & Services (2.9%) | ||||||
McKesson Corp. | 2,900 | 187,949 | ||||
| 18 | 1-888-462-5386 | www.oakfunds.com |
Table of Contents
| Rock Oak Core Growth Fund | Statement of Investments |
| As of April 30, 2010 (Unaudited) |
Security Description | Shares | Value | ||||
Health Care Technology (2.3%) | ||||||
Cerner Corp.(a) | 1,700 | $ 144,347 | ||||
Pharmaceuticals (3.8%) | ||||||
Teva Pharmaceutical Industries, Ltd. ADR | 4,100 | 240,793 | ||||
INDUSTRIALS (9.1%) | ||||||
Aerospace & Defense (2.9%) | ||||||
ITT Corp. | 3,300 | 183,381 | ||||
Air Freight & Logistics (3.2%) | ||||||
Expeditors International of Washington, Inc. | 5,100 | 207,774 | ||||
Construction & Engineering (2.8%) | ||||||
Jacobs Engineering Group, Inc.(a) | 3,700 | 178,414 | ||||
Electrical Equipment (0.2%) | ||||||
Rockwell Automation, Inc. | 200 | 12,144 | ||||
INFORMATION TECHNOLOGY (38.3%) | ||||||
Communications Equipment (5.8%) | ||||||
Juniper Networks, Inc.(a) | 7,300 | 207,393 | ||||
Qualcomm, Inc. | 4,100 | 158,834 | ||||
| 366,227 | ||||||
Electronic Equipment & Instruments (6.2%) | ||||||
Corning, Inc. | 8,600 | 165,550 | ||||
Dolby Laboratories, Inc. - Class A(a) | 3,300 | 226,776 | ||||
| 392,326 | ||||||
Internet Software & Services (9.3%) | ||||||
Baidu, Inc. ADR(a) | 400 | 275,720 | ||||
eBay, Inc.(a) | 7,200 | 171,432 | ||||
Yahoo!, Inc.(a) | 8,900 | 147,117 | ||||
| 594,269 | ||||||
IT Services (8.6%) | ||||||
Cognizant Technology Solutions Corp. - Class A(a) | 6,225 | 318,595 | ||||
Mastercard, Inc. - Class A | 925 | 229,437 | ||||
| 548,032 | ||||||
Semiconductors & Semiconductor Equipment (3.6%) | ||||||
Broadcom Corp. - Class A | 6,700 | 231,083 | ||||
Software (4.8%) | ||||||
Salesforce.com, Inc.(a) | 3,600 | 308,160 | ||||
| Semi-Annual Report | April 30, 2010 (Unaudited) | 19 |
Table of Contents
| Statement of Investments | Rock Oak Core Growth Fund |
| As of April 30, 2010 (Unaudited) |
Security Description | Shares | Value | ||||
MATERIALS (3.5%) | ||||||
Chemicals (2.7%) | ||||||
Sociedad Quimica y Minera de Chile SA ADR | 4,800 | $ 172,800 | ||||
Metals & Mining (0.8%) | ||||||
Nucor Corp. | 1,100 | 49,852 | ||||
TOTAL COMMON STOCKS (Cost $5,171,435) | 6,285,315 | |||||
TOTAL INVESTMENTS - (98.7%) (Cost $5,171,435) | $ 6,285,315 | |||||
Other assets and liabilities, net - (1.3%) | 83,053 | |||||
NET ASSETS - (100.0%) | $ 6,368,368 | |||||
| (a) | Non-income producing security. |
Common Abbreviations:
ADR - American Depositary Receipt
Ltd. - Limited
| 20 | 1-888-462-5386 | www.oakfunds.com |
Table of Contents
| River Oak Discovery Fund | Statement of Investments |
| As of April 30, 2010 (Unaudited) |
Security Description | Shares | Value | ||||
COMMON STOCKS (91.9%) | ||||||
CONSUMER DISCRETIONARY (18.8%) | ||||||
Diversified Consumer Services (3.5%) | ||||||
Coinstar, Inc.(a) | 7,600 | $ 337,136 | ||||
Hotels, Restaurants & Leisure (5.9%) | ||||||
Chipotle Mexican Grill, Inc.(a) | 1,900 | 256,329 | ||||
WMS Industries, Inc.(a) | 6,200 | 310,124 | ||||
| 566,453 | ||||||
Internet & Catalog Retail (1.7%) | ||||||
Blue Nile, Inc.(a) | 3,000 | 161,970 | ||||
Media (2.4%) | ||||||
Morningstar, Inc.(a) | 4,900 | 230,349 | ||||
Specialty Retail (2.8%) | ||||||
Gymboree Corp.(a) | 5,500 | 270,215 | ||||
Textiles, Apparel & Luxury Goods (2.5%) | ||||||
Carter’s, Inc.(a) | 7,400 | 238,428 | ||||
| �� | ||||||
CONSUMER STAPLES (3.1%) | ||||||
Food Products (3.1%) | ||||||
B&G Foods, Inc. | 28,325 | 292,597 | ||||
ENERGY (9.9%) | ||||||
Energy Equipment & Services (9.9%) | ||||||
CARBO Ceramics, Inc. | 4,200 | 307,650 | ||||
Dril-Quip, Inc.(a) | 4,800 | 278,064 | ||||
Oceaneering International, Inc.(a) | 5,600 | 366,800 | ||||
| 952,514 | ||||||
FINANCIALS (2.0%) | ||||||
Capital Markets (2.0%) | ||||||
Janus Capital Group, Inc. | 13,200 | 185,856 | ||||
HEALTH CARE (7.2%) | ||||||
Biotechnology (2.5%) | ||||||
Cubist Pharmaceuticals, Inc.(a) | 10,750 | 241,015 | ||||
Health Care Providers & Services (2.9%) | ||||||
BioScrip, Inc.(a) | 31,000 | 277,140 | ||||
Life Sciences Tools & Services (1.8%) | ||||||
Illumina, Inc.(a) | 4,200 | 175,854 | ||||
| Semi-Annual Report | April 30, 2010 (Unaudited) | 21 |
Table of Contents
| Statement of Investments | River Oak Discovery Fund |
| As of April 30, 2010 (Unaudited) |
Security Description | Shares | Value | ||||
INDUSTRIALS (14.8%) | ||||||
Aerospace & Defense (5.5%) | ||||||
Aerovironment, Inc.(a) | 7,700 | $ 201,586 | ||||
American Science & Engineering, Inc. | 3,800 | 285,570 | ||||
Orbital Sciences Corp.(a) | 2,000 | 36,760 | ||||
| 523,916 | ||||||
Commercial Services & Supplies (4.6%) | ||||||
EnergySolutions, Inc. | 30,600 | 221,850 | ||||
EnerNOC, Inc.(a) | 7,500 | 218,100 | ||||
| 439,950 | ||||||
Construction & Engineering (3.5%) | ||||||
EMCOR Group, Inc.(a) | 11,900 | 339,864 | ||||
Electrical Equipment (0.4%) | ||||||
Evergreen Solar, Inc.(a) | 33,700 | 37,744 | ||||
Industrial Conglomerates (0.8%) | ||||||
Raven Industries, Inc. | 2,500 | 75,900 | ||||
INFORMATION TECHNOLOGY (34.0%) | ||||||
Communications Equipment (3.7%) | ||||||
F5 Networks, Inc.(a) | 4,650 | 318,200 | ||||
Viasat, Inc.(a) | 1,100 | 38,995 | ||||
| 357,195 | ||||||
Electronic Equipment & Instruments (3.2%) | ||||||
Itron, Inc.(a) | 3,900 | 310,479 | ||||
Internet Software & Services (9.0%) | ||||||
MercadoLibre, Inc.(a) | 7,800 | 393,276 | ||||
NetEase.com, Inc. ADR(a) | 7,400 | 258,038 | ||||
VistaPrint N.V.(a) | 4,000 | 206,320 | ||||
| 857,634 | ||||||
IT Services (2.9%) | ||||||
Patni Computer Systems, Ltd. ADR | 6,900 | 163,806 | ||||
Yucheng Technologies, Ltd.(a) | 30,000 | 114,600 | ||||
| 278,406 | ||||||
Semiconductors & Semiconductor Equipment (4.8%) | ||||||
Formfactor, Inc.(a) | 10,900 | 163,609 | ||||
Varian Semiconductor Equipment Associates, Inc.(a) | 8,850 | 291,519 | ||||
| 455,128 | ||||||
| 22 | 1-888-462-5386 | www.oakfunds.com |
Table of Contents
| River Oak Discovery Fund | Statement of Investments |
| As of April 30, 2010 (Unaudited) |
| Security Description | Shares | Value | ||
Software (10.4%) | ||||
AsiaInfo Holdings, Inc.(a) | 17,500 | $ 497,175 | ||
Factset Research Systems, Inc. | 4,400 | 330,968 | ||
Longtop Financial Technologies, Ltd. ADR(a) | 5,000 | 172,050 | ||
| 1,000,193 | ||||
MATERIALS (2.1%) | ||||
Containers & Packaging (2.1%) | ||||
Greif, Inc. - Class A | 3,400 | 201,212 | ||
TOTAL COMMON STOCKS | ||||
(Cost $7,239,095) | 8,807,148 | |||
TOTAL INVESTMENTS - (91.9%) | ||||
(Cost $7,239,095) | $ 8,807,148 | |||
Other assets and liabilities, net - (8.1%) | 781,337 | |||
NET ASSETS - (100.0%) | $ 9,588,485 | |||
(a) Non-income producing security.
Common Abbreviations:
ADR - American Depositary Receipt
Ltd. - Limited
N.V. - Naamloze Vennootschap is the Dutch term for a public limited liability corporation.
| Semi-Annual Report | April 30, 2010 (Unaudited) | 23 |
Table of Contents
| Statement of Investments | Red Oak Technology Select Fund |
| As of April 30, 2010 (Unaudited) |
| Security Description | Shares | Value | ||
COMMON STOCKS (100.0%) | ||||
CONSUMER DISCRETIONARY (6.7%) | ||||
Internet & Catalog Retail (6.7%) | ||||
Amazon.com, Inc.(a) | 23,900 | $ 3,275,734 | ||
Blue Nile, Inc.(a) | 23,506 | 1,269,089 | ||
| 4,544,823 | ||||
INDUSTRIALS (3.7%) | ||||
Aerospace & Defense (3.7%) | ||||
Northrop Grumman Corp. | 37,000 | 2,509,710 | ||
INFORMATION TECHNOLOGY (87.0%) | ||||
Communications Equipment (1.6%) | ||||
Cisco Systems, Inc.(a) | 40,000 | 1,076,800 | ||
Computers & Peripherals (22.5%) | ||||
Apple, Inc.(a) | 10,500 | 2,741,760 | ||
EMC Corp.(a) | 94,000 | 1,786,940 | ||
International Business Machines Corp. | 22,900 | 2,954,100 | ||
Lexmark International, Inc. - Class A(a) | 64,000 | 2,371,200 | ||
Seagate Technology(a) | 109,000 | 2,002,330 | ||
Western Digital Corp.(a) | 85,500 | 3,513,195 | ||
| 15,369,525 | ||||
Internet Software & Services (18.2%) | ||||
Akamai Technologies, Inc.(a) | 87,000 | 3,378,210 | ||
eBay, Inc.(a) | 103,000 | 2,452,430 | ||
Google, Inc. - Class A(a) | 6,200 | 3,257,728 | ||
IAC/InterActive Corp.(a) | 84,000 | 1,883,280 | ||
Yahoo!, Inc.(a) | 88,100 | 1,456,293 | ||
| 12,427,941 | ||||
IT Services (9.6%) | ||||
Accenture PLC - Class A | 84,200 | 3,674,488 | ||
Computer Sciences Corp.(a) | 55,000 | 2,881,450 | ||
| 6,555,938 | ||||
Semiconductors & Semiconductor Equipment (20.5%) | ||||
Broadcom Corp. - Class A | 30,700 | 1,058,843 | ||
Integrated Device Technology, Inc.(a) | 188,000 | 1,242,680 | ||
KLA-Tencor Corp. | 70,000 | 2,384,200 | ||
Marvell Technology Group, Ltd.(a) | 34,500 | 712,425 | ||
National Semiconductor Corp. | 110,000 | 1,625,800 | ||
Novellus Systems, Inc.(a) | 51,000 | 1,336,200 | ||
Sigma Designs, Inc.(a) | 115,000 | 1,363,900 | ||
Texas Instruments, Inc. | 58,000 | 1,508,580 | ||
Xilinx, Inc. | 109,000 | 2,810,020 | ||
| 14,042,648 | ||||
| 24 | 1-888-462-5386 | www.oakfunds.com |
Table of Contents
| Red Oak Technology Select Fund | Statement of Investments |
| As of April 30, 2010 (Unaudited) |
| Security Description | Shares | Value | ||
Software (14.6%) | ||||
CA, Inc. | 112,000 | $ 2,554,720 | ||
Check Point Software Technologies(a) | 80,000 | 2,849,600 | ||
Symantec Corp.(a) | 129,000 | 2,163,330 | ||
Synopsys, Inc.(a) | 107,000 | 2,429,970 | ||
| 9,997,620 | ||||
TELECOMMUNICATION SERVICES (2.6%) | ||||
Wireless Telecommunication Services (2.6%) | ||||
Sprint Nextel Corp.(a) | 423,000 | 1,797,750 | ||
TOTAL COMMON STOCKS | ||||
(Cost $52,696,676) | 68,322,755 | |||
TOTAL INVESTMENTS - (100.0%) | ||||
(Cost $52,696,676) | $ 68,322,755 | |||
Other assets and liabilities, net - (0.0%)(b) | 9,278 | |||
NET ASSETS - (100.0%) | $ 68,332,033 | |||
(a) Non-income producing security.
(b) Less Than 0.01%
Common Abbreviations:
Ltd. - Limited
PLC - Public Limited Company
| Semi-Annual Report | April 30, 2010 (Unaudited) | 25 |
Table of Contents
| Statement of Investments | Black Oak Emerging Technology Fund |
| As of April 30, 2010 (Unaudited) |
| Security Description | Shares | Value | ||
COMMON STOCKS (100.1%) | ||||
CONSUMER DISCRETIONARY (7.6%) | ||||
Hotels, Restaurants & Leisure (7.6%) | ||||
Ctrip.com International, Ltd. ADR(a) | 30,850 | $ 1,126,642 | ||
WMS Industries, Inc.(a) | 21,600 | 1,080,432 | ||
| 2,207 074 | ||||
HEALTH CARE (8.4%) | ||||
Health Care Technology (3.4%) | ||||
Cerner Corp.(a) | 11,800 | 1,001,938 | ||
Life Sciences Tools & Services (5.0%) | ||||
Illumina, Inc.(a) | 34,500 | 1,444,515 | ||
INDUSTRIALS (3.2%) | ||||
Aerospace & Defense (3.2%) | ||||
American Science & Engineering, Inc. | 12,500 | 939,375 | ||
INFORMATION TECHNOLOGY (80.9%) | ||||
Communications Equipment (9.0%) | ||||
F5 Networks, Inc.(a) | 20,300 | 1,389,129 | ||
Qualcomm, Inc. | 31,750 | 1,229,995 | ||
| 2,619,124 | ||||
Computers & Peripherals (6.1%) | ||||
Apple, Inc.(a) | 6,800 | 1,775,616 | ||
Electronic Equipment & Instruments (12.2%) | ||||
Corning, Inc. | 51,400 | 989,450 | ||
Dolby Laboratories, Inc. - Class A(a) | 19,300 | 1,326,296 | ||
Itron, Inc.(a) | 15,800 | 1,257,838 | ||
| 3,573,584 | ||||
Internet Software & Services (11.5%) | ||||
MercadoLibre, Inc.(a) | 35,700 | 1,799,994 | ||
NetEase.com, Inc. ADR(a) | 29,100 | 1,014,717 | ||
Sohu.com, Inc.(a) | 11,050 | 532,058 | ||
| 3,346,769 | ||||
IT Services (10.3%) | ||||
Cognizant Technology Solutions Corp. - Class A(a) | 37,450 | 1,916,691 | ||
Wipro, Ltd. ADR | 32,000 | 718,720 | ||
Yucheng Technologies, Ltd ..(a) | 96,400 | 368,248 | ||
| 3,003,659 | ||||
| 26 | 1-888-462-5386 | www.oakfunds.com |
Table of Contents
| Black Oak Emerging Technology Fund | Statement of Investments |
| As of April 30, 2010 (Unaudited) |
| Security Description | Shares | Value | |||
Semiconductors & Semiconductor Equipment (6.2%) | |||||
NVIDIA Corp.(a) | 58,350 | $ | 917,262 | ||
Varian Semiconductor Equipment Associates, Inc.(a) | 27,300 | 899,262 | |||
| 1,816,524 | |||||
Software (25.6%) | |||||
Activision Blizzard, Inc. | 51,100 | 566,188 | |||
ANSYS, Inc.(a) | 24,200 | 1,089,000 | |||
AsiaInfo Holdings, Inc.(a) | 52,000 | 1,477,320 | |||
Citrix Systems, Inc.(a) | 23,300 | 1,095,100 | |||
Longtop Financial Technologies, Ltd. ADR(a) | 24,400 | 839,604 | |||
Red Hat, Inc.(a) | 30,000 | 896,100 | |||
Salesforce.com, Inc.(a) | 17,750 | 1,519,400 | |||
| 7,482,712 | |||||
TOTAL COMMON STOCKS | |||||
(Cost $18,883,332) | 29,210,890 | ||||
TOTAL INVESTMENTS - (100.1%) | |||||
(Cost $18,883,332) | $ | 29,210,890 | |||
Other assets and liabilities, net - (-0.1%) | (29,669) | ||||
NET ASSETS - (100.0%) | $ | 29,181,221 | |||
(a) Non-income producing security.
Common Abbreviations:
ADR - American Depositary Receipt
Ltd. - Limited
| Semi-Annual Report | April 30, 2010 (Unaudited) | 27 |
Table of Contents
| Statement of Investments | Live Oak Health Sciences Fund |
| As of April 30, 2010 (Unaudited) |
| Security Description | Shares | Value | |||
COMMON STOCKS (95.0%) | |||||
HEALTH CARE (95.0%) | |||||
Biotechnology (10.5%) | |||||
Amgen, Inc.(a) | 16,800 | $ | 963,648 | ||
Biogen Idec, Inc.(a) | 14,600 | 777,450 | |||
Genzyme Corp.(a) | 6,500 | 346,060 | |||
| 2,087,158 | |||||
Health Care Equipment & Supplies (7.1%) | |||||
Boston Scientific Corp.(a) | 33,000 | 227,040 | |||
CareFusion Corp.(a) | 21,200 | 584,696 | |||
Medtronic, Inc. | 13,500 | 589,815 | |||
| 1,401,551 | |||||
Health Care Providers & Services (29.6%) | |||||
AmerisourceBergen Corp. | 42,800 | 1,320,380 | |||
Cardinal Health, Inc. | 19,500 | 676,455 | |||
Centene Corp.(a) | 19,200 | 439,680 | |||
inVentiv Health, Inc.(a) | 15,000 | 345,450 | |||
McKesson Corp. | 10,200 | 661,062 | |||
Molina Healthcare, Inc.(a) | 18,750 | 546,937 | |||
PharMerica Corp.(a) | 40,442 | 780,531 | |||
UnitedHealth Group, Inc. | 17,800 | 539,518 | |||
WellPoint, Inc.(a) | 10,300 | 554,140 | |||
| 5,864,153 | |||||
Life Sciences Tools & Services (7.4%) | |||||
Affymetrix, Inc.(a) | 16,000 | 111,040 | |||
Techne Corp. | 6,500 | 430,625 | |||
Waters Corp.(a) | 13,000 | 935,870 | |||
| 1,477,535 | |||||
Pharmaceuticals (40.4%) | |||||
AstraZeneca PLC ADR | 16,800 | 743,064 | |||
Corcept Therapeutics, Inc.(a) | 45,444 | 153,601 | |||
Eli Lilly & Co. | 18,000 | 629,460 | |||
GlaxoSmithKline PLC ADR | 20,100 | 749,529 | |||
Johnson & Johnson | 12,100 | 778,030 | |||
King Pharmaceuticals, Inc.(a) | 45,000 | 441,000 | |||
Medicis Pharmaceutical Corp. - Class A | 10,400 | 263,952 | |||
Novartis AG ADR | 14,900 | 757,665 | |||
Par Pharmaceutical Cos., Inc.(a) | 23,000 | 624,220 | |||
Pfizer, Inc. | 38,000 | 635,360 | |||
Sanofi-Aventis ADR | 22,000 | 750,420 | |||
Teva Pharmaceutical Industries, Ltd. ADR | 13,500 | 792,855 | |||
Watson Pharmaceuticals, Inc.(a) | 16,100 | 689,402 | |||
| 8,008,558 | |||||
| 28 | 1-888-462-5386 | www.oakfunds.com |
Table of Contents
| Live Oak Health Sciences Fund | Statement of Investments |
| As of April 30, 2010 (Unaudited) |
| Security Description | Shares | Value | ||||
TOTAL COMMON STOCKS | ||||||
(Cost $15,140,517) | $ | 18,838,955 | ||||
| Principal Amount | ||||||
REPURCHASE AGREEMENTS (5.2%) | ||||||
Tri-Party Repurchase Agreement with Morgan Stanley Co., 0.080%, dated 04/30/10 and maturing 05/03/10 with a repurchase amount of $1,034,717, collateralized by U.S. Government & Agency Securities with a collateral value of $1,055,406. | $ | 1,034,710 | 1,034,710 | |||
TOTAL REPURCHASE AGREEMENTS | ||||||
(Cost $1,034,710) | 1,034,710 | |||||
TOTAL INVESTMENTS - (100.2%) | ||||||
(Cost $16,175,227) | $ | 19,873,665 | ||||
Other assets and liabilities, net - (-0.2%) | (32,637) | |||||
NET ASSETS - (100.0%) | $ | 19,841,028 | ||||
(a) Non-income producing security.
Common Abbreviations:
ADR - American Depositary Receipt
AG - - Aktiengesellschaft is a German term that refers to a corporation that is limited by shares, i.e., owned by shareholders.
Ltd. - Limited
PLC - Public Limited Company
| Semi-Annual Report | April 30, 2010 (Unaudited) | 29 |
Table of Contents
Statement of Assets and Liabilities
As of April 30, 2010 (Unaudited)
| White Oak Select Growth Fund | Pin Oak Equity Fund | |||||
Investments at cost | $ | 233,506,596 | $ | 103,669,639 | ||
Repurchase agreements at cost | 1,211,847 | – | ||||
ASSETS: | ||||||
Investment at market value | $ | 320,328,688 | $ | 132,036,310 | ||
Repurchase agreements at market value | 1,211,847 | – | ||||
Cash | – | 69,260 | ||||
Receivable for capital shares sold | 220,458 | 128,754 | ||||
Receivable for investment securities sold | 10,734,442 | 123,497 | ||||
Dividends and interest receivable | 3 | 253,189 | ||||
Prepaid expenses | 77,803 | 25,666 | ||||
Total Assets | 332,573,241 | 132,636,676 | ||||
LIABILITIES: | ||||||
Payable for fund shares redeemed | 241,890 | 454,935 | ||||
Investment advisory fees payable | 194,291 | 64,255 | ||||
Administration fees payable | 30,408 | 12,279 | ||||
Trustees’ fees payable | 24,889 | 11,811 | ||||
Payable for investment securities purchased | – | – | ||||
Other accrued expenses | 299,139 | 104,073 | ||||
Total Liabilities | 790,617 | 647,353 | ||||
Total Net Assets | $ | 331,782,624 | $ | 131,989,323 | ||
NET ASSETS: | ||||||
Paid-in capital (unlimited authorization — no par value) | $ | 2,241,792,355 | $ | 817,375,720 | ||
Undistributed net investment income (loss) | (1,225,535) | 304,880 | ||||
Accumulated net realized gain (loss) on investments | (1,995,606,288) | (714,057,948) | ||||
Net unrealized appreciation on investments | 86,822,092 | 28,366,671 | ||||
Total Net Assets | $ | 331,782,624 | $ | 131,989,323 | ||
PORTFOLIO SHARES: | ||||||
Net assets | $ | 331,782,624 | $ | 131,989,323 | ||
Total shares outstanding at end of year | 9,359,097 | 4,891,955 | ||||
Net asset value, offering and redemption price per share (net assets shares outstanding) | $ | 35.45 | $ | 26.98 | ||
The accompanying notes are an integral part of the financial statements.
| 30 | 1-888-462-5386 | www.oakfunds.com |
Table of Contents
| Rock Oak Core Growth Fund | River Oak Discovery Fund | Red Oak Technology Select Fund | Black Oak Emerging | Live Oak Health Sciences Fund | |||||||||
| $ | 5,171,435 | $ | 7,239,095 | $ | 52,696,676 | $ | 18,883,332 | $ | 15,140,517 | ||||
| – | – | – | – | 1,034,710 | |||||||||
| $ | 6,285,315 | $ | 8,807,148 | $ | 68,322,755 | $ | 29,210,889 | $ | 18,838,955 | ||||
| – | – | – | – | 1,034,710 | |||||||||
| 318,159 | 365,100 | 7,702 | 38,255 | – | |||||||||
| – | 6,050 | 4,094 | 3,255 | 210 | |||||||||
| 114,833 | 431,960 | 128,153 | – | – | |||||||||
| 1,129 | 756 | 38,535 | – | 2 | |||||||||
| 1,261 | 1,783 | 17,517 | 9,060 | 3,861 | |||||||||
| 6,720,697 | 9,612,797 | 68,518,756 | 29,261,459 | 19,877,738 | |||||||||
| – | 3,511 | 54,305 | 8,117 | – | |||||||||
| 2,670 | 4,721 | 30,487 | 10,327 | 10,953 | |||||||||
| 555 | 821 | 6,100 | 2,695 | 1,736 | |||||||||
| 452 | 770 | 5,360 | 2,803 | 1,395 | |||||||||
| 336,393 | – | – | – | – | |||||||||
| 12,259 | 14,489 | 90,471 | 56,296 | 22,626 | |||||||||
| 352,329 | 24,312 | 186,723 | 80,238 | 36,710 | |||||||||
| $ | 6,368,368 | $ | 9,588,485 | $ | 68,332,033 | $ | 29,181,221 | $ | 19,841,028 | ||||
| $ | 5,679,020 | $ | 8,179,867 | $ | 1,105,274,485 | $ | 248,691,717 | $ | 15,779,036 | ||||
| (17,165) | (52,794) | (298,910) | (202,830) | 2,729 | |||||||||
| (407,367) | (106,641) | (1,052,269,621) | (229,635,223) | 360,825 | |||||||||
| 1,113,880 | 1,568,053 | 15,626,079 | 10,327,557 | 3,698,438 | |||||||||
| $ | 6,368,368 | $ | 9,588,485 | $ | 68,332,033 | $ | 29,181,221 | $ | 19,841,028 | ||||
| $ | 6,368,368 | $ | 9,588,485 | $ | 68,332,033 | $ | 29,181,221 | $ | 19,841,028 | ||||
| 615,450 | 767,229 | 8,233,657 | 11,039,970 | 1,598,216 | |||||||||
| $ | 10.35 | $ | 12.50 | $ | 8.30 | $ | 2.64 | $ | 12.41 | ||||
| Semi-Annual Report | April 30, 2010 (Unaudited) | 31 |
Table of Contents
| Statement of Operations |
| For the Six Months Ended April 30, 2010 (Unaudited) | ||
| White Oak Select Growth Fund | Pin Oak Equity Fund | |||||
INVESTMENT INCOME: | ||||||
Dividends | $ | 931,857 | $ | 1,209,620 | ||
Interest | 268 | 1,807 | ||||
Less: Foreign withholding tax | (13,352) | – | ||||
Total Investment Income | 918,773 | 1,211,427 | ||||
EXPENSES: | ||||||
Investment advisory fees | 1,269,293 | 492,460 | ||||
Administration fees | 185,187 | 71,516 | ||||
Trustees’ fees | 65,136 | 24,341 | ||||
Transfer agent fees | 563,188 | 200,676 | ||||
Professional fees | 100,558 | 41,888 | ||||
Registration fees | 52,634 | 11,424 | ||||
Printing fees | 23,531 | 10,751 | ||||
Custodian fees | 10,967 | 4,188 | ||||
Insurance and other fees | 51,790 | 10,866 | ||||
Total Expenses | 2,322,284 | 868,110 | ||||
Less: Investment advisory fees waived | (178,209) | (36,251) | ||||
Net Expenses | 2,144,075 | 831,859 | ||||
Net Investment Income (Loss) | (1,225,302) | 379,568 | ||||
Net realized gain on securities sold | 21,731,357 | 10,294,457 | ||||
Net change in unrealized appreciation | 20,681,681 | 11,677,576 | ||||
Net Realized and Unrealized Gain on Investments | 42,413,038 | 21,972,033 | ||||
Net Increase in Net Assets Resulting | $ | 41,187,736 | $ | 22,351,601 | ||
The accompanying notes are an integral part of the financial statements.
| 32 | 1-888-462-5386 | www.oakfunds.com |
Table of Contents
| Rock Oak Core Growth Fund | River Oak Discovery Fund | Red Oak Technology Select Fund | Black Oak Emerging Technology Fund | Live Oak Health Sciences Fund | |||||||||
| $ | 21,412 | $ | 9,836 | $ | 209,061 | $ | 33,932 | $ | 134,795 | ||||
| – | 17 | 186 | 72 | 80 | |||||||||
| (212) | (122) | – | (702) | (4,128) | |||||||||
| 21,200 | 9,731 | 209,247 | 33,302 | 130,747 | |||||||||
| 22,712 | 41,661 | 278,645 | 129,435 | 70,173 | |||||||||
| 3,311 | 4,979 | 40,644 | 19,042 | 10,227 | |||||||||
| 1,151 | 1,717 | 14,853 | 7,501 | 3,528 | |||||||||
| 8,518 | 11,064 | 192,812 | 111,098 | 29,140 | |||||||||
| 9,303 | 10,058 | 29,750 | 18,054 | 12,735 | |||||||||
| 902 | 1,007 | 10,368 | 5,085 | 2,802 | |||||||||
| 367 | 720 | 4,502 | – | 1,285 | |||||||||
| 194 | 294 | 2,498 | 1,265 | 593 | |||||||||
| 933 | 1,236 | 9,895 | 4,878 | 2,880 | |||||||||
| 47,391 | 72,736 | 583,967 | 296,358 | 133,363 | |||||||||
| (9,026) | (10,245) | (75,628) | (60,226) | (5,312) | |||||||||
| 38,365 | 62,491 | 508,339 | 236,132 | 128,051 | |||||||||
| (17,165) | (52,760) | (299,092) | (202,830) | 2,696 | |||||||||
| 571,840 | 876,975 | 6,583,485 | 2,824,272 | 360,940 | |||||||||
| 234,025 | 354,702 | 5,562,185 | 3,564,568 | 2,357,150 | |||||||||
| 805,865 | 1,231,677 | 12,145,670 | 6,388,840 | 2,718,090 | |||||||||
| $ | 788,700 | $ | 1,178,917 | $ | 11,846,578 | $ | 6,186,010 | $ | 2,720,786 | ||||
| Semi-Annual Report | April 30, 2010 (Unaudited) | 33 |
Table of Contents
| Statement of Changes in Net Assets |
White Oak Select Growth Fund | Pin Oak Equity Fund | |||||||||||
| For The Six Months Ended April 30, 2010 (Unaudited) | For The Year Ended | For The Six Months Ended April 30, 2010 (Unaudited) | For The Year Ended | |||||||||
INVESTMENT ACTIVITIES: | ||||||||||||
Net investment income (loss) | $ | (1,225,302) | $ | (1,877,318) | $ | 379,568 | $ | (321,611) | ||||
Net realized gain (loss) on securities sold | 21,731,357 | (8,491,443) | 10,294,457 | 72,703 | ||||||||
Net unrealized appreciation (depreciation) of investment securities | 20,681,681 | 96,060,411 | 11,677,576 | 20,930,095 | ||||||||
Net Increase (Decrease) in Net Assets Resulting from Operations | 41,187,736 | 85,691,650 | 22,351,601 | 20,681,187 | ||||||||
DISTRIBUTIONS TO SHAREHOLDERS: | ||||||||||||
Net income | – | – | (74,687) | – | ||||||||
Realized capital gains | – | – | – | – | ||||||||
Total Distributions | – | – | (74,687) | – | ||||||||
CAPITAL SHARE TRANSACTIONS (IN DOLLARS): | ||||||||||||
Shares issued | 24,824,173 | 122,945,500 | 38,978,927 | 75,230,262 | ||||||||
Shares issued in lieu of cash distributions | – | – | 71,208 | – | ||||||||
Shares redeemed | (53,587,786) | (105,140,649) | (47,869,679) | (13,577,496) | ||||||||
Net Increase (Decrease) in Net Assets from Capital Share Transactions | (28,763,613) | 17,804,851 | (8,819,544) | 61,652,766 | ||||||||
Total Increase (Decrease) in Net Assets | 12,424,123 | 103,496,501 | 13,457,370 | 82,333,953 | ||||||||
NET ASSETS: | ||||||||||||
Beginning of Period | 319,358,501 | 215,862,000 | 118,531,953 | 36,198,000 | ||||||||
End of Period | $ | 331,782,624 | $ | 319,358,501 | $ | 131,989,323 | $ | 118,531,953 | ||||
Including accumulated net investment income (loss) | $ | (1,225,535) | $ | (233) | $ | 304,880 | $ | (1) | ||||
SHARES ISSUED AND REDEEMED: | ||||||||||||
Issued | 724,381 | 5,058,462 | 1,514,328 | 3,587,734 | ||||||||
Issued in lieu of cash distributions | – | – | 2,819 | – | ||||||||
Redeemed | (1,522,475) | (3,938,184) | (1,836,807) | (699,758) | ||||||||
Net Increase (Decrease) in Share Transactions | (798,094) | 1,120,278 | (319,660) | 2,887,976 | ||||||||
The accompanying notes are an integral part of the financial statements.
| 34 | 1-888-462-5386 | www.oakfunds.com |
Table of Contents
Rock Oak Core Growth Fund | River Oak Discovery Fund | Red Oak Technology Select Fund | ||||||||||||||
For The Six Months Ended April 30, 2010 (Unaudited) | For The Year Ended | For The Six (Unaudited) | For The Year Ended October 31, 2009 | For The Six (Unaudited) | For The Year Ended | |||||||||||
| $ | (17,165) | $ | (25,760) | $ | (52,760) | $ | (51,522) | $ | (299,092) | $ | (289,711) | |||||
|
571,840 | (783,207) | 876,975 | (868,499) | 6,583,485 | (4,423,023) | ||||||||||
|
234,025 | 1,834,855 | 354,702 | 2,579,351 | 5,562,185 | 24,484,894 | ||||||||||
|
788,700 | 1,025,888 | 1,178,917 | 1,659,330 | 11,846,578 | 19,772,160 | ||||||||||
| – | – | – | – | – | – | |||||||||||
| – | – | – | – | – | – | |||||||||||
| – | – | – | – | – | – | |||||||||||
| 457,370 | 618,919 | 1,207,275 | 2,933,231 | 7,088,646 | 18,671,976 | |||||||||||
|
– | – | – | – | – | – | ||||||||||
| (676,009) | (417,500) | (1,044,121) | (514,147) | (24,113,969) | (9,012,358) | |||||||||||
|
(218,639) | 201,419 | 163,154 | 2,419,084 | (17,025,323) | 9,659,618 | ||||||||||
|
570,061 | 1,227,307 | 1,342,071 | 4,078,414 | (5,178,745) | 29,431,778 | ||||||||||
| 5,798,307 | 4,571,000 | 8,246,414 | 4,168,000 | 73,510,778 | 44,079,000 | |||||||||||
| $ | 6,368,368 | $ | 5,798,307 | $ | 9,588,485 | $ | 8,246,414 | $ | 68,332,033 | $ | 73,510,778 | |||||
$ |
(17,165) | $ | – | $ | (52,794) | $ | (34) | $ | (298,910) | $ | 182 | |||||
| 45,005 | 67,508 | 100,731 | 277,185 | 916,220 | 3,024,664 | |||||||||||
| – | – | – | – | – | – | |||||||||||
| (67,478) | (57,821) | (86,260) | (54,447) | (3,127,742) | (1,530,910) | |||||||||||
|
(22,473) | 9,687 | 14,471 | 222,738 | (2,211,522) | 1,493,754 | ||||||||||
| Semi-Annual Report | April 30, 2010 (Unaudited) | 35 |
Table of Contents
Statement of Changes in Net Assets
Black Oak Emerging Technology Fund | Live Oak Health Sciences Fund | |||||||||||
| For The Six Months Ended April 30, 2010 (Unaudited) | For The Year Ended | For The Six Months Ended April 30, 2010 (Unaudited) | For The Year Ended | |||||||||
INVESTMENT ACTIVITIES: | ||||||||||||
Net investment income (loss) | $ | (202,830) | $ | (292,892) | $ | 2,696 | $ | (11,894) | ||||
Net realized gain (loss) on securities sold | 2,824,272 | (4,425,500) | 360,940 | 624,104 | ||||||||
Net unrealized appreciation (depreciation) of investment securities | 3,564,568 | 12,560,989 | 2,357,150 | 1,562,288 | ||||||||
Net Increase (Decrease) in Net Assets Resulting from Operations | 6,186,010 | 7,842,597 | 2,720,786 | 2,174,498 | ||||||||
DISTRIBUTIONS TO SHAREHOLDERS: | ||||||||||||
Net income | – | – | – | – | ||||||||
Realized capital gains | – | – | (593,292) | – | ||||||||
Total Distributions | – | – | (593,292) | – | ||||||||
CAPITAL SHARE TRANSACTIONS | ||||||||||||
Shares issued | 1,953,278 | 15,554,602 | 2,797,824 | 1,558,636 | ||||||||
Shares issued in lieu of cash distributions | – | – | 581,370 | – | ||||||||
Shares redeemed | (16,554,671) | (5,278,595) | (1,915,194) | (1,496,600) | ||||||||
Net Increase (Decrease) in Net Assets from Capital Share Transactions | (14,601,393) | 10,276,007 | 1,464,000 | 62,036 | ||||||||
Total Increase (Decrease) in Net Assets | (8,415,383) | 18,118,604 | 3,591,494 | 2,236,534 | ||||||||
NET ASSETS: | ||||||||||||
Beginning of Period | 37,596,604 | 19,478,000 | 16,249,534 | 14,013,000 | ||||||||
End of Period | $ | 29,181,221 | $ | 37,596,604 | $ | 19,841,028 | $ | 16,249,534 | ||||
Including accumulated net investment income (loss) | $ | (202,830) | $ | – | $ | 2,729 | $ | 33 | ||||
SHARES ISSUED AND REDEEMED: | ||||||||||||
Issued | 785,017 | 8,061,151 | 229,554 | 152,885 | ||||||||
Issued in lieu of cash distributions | – | – | 49,478 | – | ||||||||
Redeemed | (6,943,908) | (2,812,369) | (157,638) | (154,741) | ||||||||
Net Increase (Decrease) in Share Transactions | (6,158,891) | 5,248,782 | 121,394 | (1,856) | ||||||||
The accompanying notes are an integral part of the financial statements.
| 36 | 1-888-462-5386 | www.oakfunds.com |
Table of Contents
OAK ASSOCIATES FUNDS
This Page Intentionally Left Blank
Table of Contents
For a share outstanding throughout the years or periods ended
Six Months 2010 (Unaudited) | Year Ended October 31, 2009 | ||||||
WHITE OAK SELECT GROWTH FUND | |||||||
Net Asset Value Beginning of Period | $ | 31.44 | $ | 23.89 | |||
Income (Loss) From Operations | |||||||
Net Investment Income (Loss)(a) | (0.12) | (0.18) | |||||
Realized and Unrealized Gain or (Losses) in Securities(a) | 4.13 | 7.73 | |||||
Total From Operations | 4.01 | 7.55 | |||||
Less Distributions: | |||||||
Dividends from Net Investment Income | – | – | |||||
Distributions from Capital Gains | – | – | |||||
Total Dividends and Distributions | – | – | |||||
Net Asset Value End of Period | $ | 35.45 | $ | 31.44 | |||
Total Return(d) | 12.75% | (e) | 31.60% | ||||
Net Assets End of Period (000) | $ | 331,783 | $ | 319,359 | |||
Ratio of Expenses to Average Net Assets | 1.25% | (f) | 1.25% | ||||
Ratio of Net Investment Income (Loss) to Average Net Assets | (0.71)% | (f) | (0.70)% | ||||
Ratio of Expenses to Average Net Assets | 1.25% | (f) | 1.25% | ||||
Ratio of Expenses to Average Net Assets | 1.35% | (f) | 1.51% | ||||
Portfolio Turnover Rate | 6% | 31% | |||||
| (a) | Per share calculations were performed using average shares for the period. |
| (b) | Net investment income per share and the net investment income ratio include $0.13 and 0.40%, respectively, resulting from a special dividend from Microsoft in November 2004. |
| (c) | The amount shown for a share outstanding throughout the period does not accord with the aggregate net gains on investment for the period because of the sales and repurchases of fund shares in relation to fluctuating market value of the investments of the Fund. |
| (d) | Figures do not reflect the deduction of taxes the shareholder will pay on fund distributions or redemption of fund shares. |
| (e) | Not Annualized. |
| (f) | Annualized. |
The accompanying notes are an integral part of the financial statements.
| 38 | 1-888-462-5386 | www.oakfunds.com |
Table of Contents
Year Ended | Year Ended October 31, 2007 | Year Ended October 31, 2006 | Year Ended October 31, 2005 | |||||||
| $ | 39.49 | $ | 31.91 | $ | 31.35 | $ | 31.41 | |||
| (0.23) | (0.12) | (0.13) | 0.01 (b) | |||||||
|
(15.37) | 7.70 | 0.71 | (0.07) (C) | ||||||
| (15.60) | 7.58 | 0.58 | (0.06) | |||||||
| – | – | (0.02) | – | |||||||
| – | – | – | – | |||||||
| – | – | (0.02) | – | |||||||
| $ | 23.89 | $ | 39.49 | $ | 31.91 | $ | 31.35 | |||
| (39.50)% | 23.75% | 1.85% | (0.19)% | |||||||
| $ | 215,862 | $ | 439,978 | $ | 538,516 | $ | 878,709 | |||
| 1.25% | 1.25% | 1.19% | 1.14% | |||||||
|
(0.70)% | (0.34)% | (0.42)% | 0.04% (b) | ||||||
|
1.25% | 1.25% | 1.20% | 1.14% | ||||||
|
1.41% | 1.28% | 1.20% | 1.14% | ||||||
| 25% | 29% | 52% | 36% | |||||||
| Semi-Annual Report | April 30, 2010 (Unaudited) | 39 |
Table of Contents
Financial Highlights
For a share outstanding throughout the years or periods ended
Six Months Ended April 30, 2010 (Unaudited) | Year Ended October 31, 2009 | |||||
PIN OAK EQUITY FUND | ||||||
Net Asset Value Beginning of Period | $ | 22.74 | $ | 15.58 | ||
Income (Loss) From Operations | ||||||
Net Investment Income (Loss)(a) | 0.07 | (0.11) | ||||
Realized and Unrealized Gain or (Losses) | 4.18 | 7.27 | ||||
Total From Operations | 4.25 | 7.16 | ||||
Less Distributions: | ||||||
Dividends from Net Investment Income | (0.01) | – | ||||
Distributions from Capital Gains | – | – | ||||
Total Dividends and Distributions | (0.01) | – | ||||
Net Asset Value End of Period | $ | 26.98 | $ | 22.74 | ||
Total Return(b) | 18.71% (c) | 45.96% | ||||
Net Assets End of Period (000) | $ | 131,989 | $ | 118,532 | ||
Ratio of Expenses to Average Net Assets | 1.25% (d) | 1.25% | ||||
Ratio of Net Investment Income (Loss) to Average Net Assets | 0.57% (d) | (0.58)% | ||||
Ratio of Expenses to Average Net Assets | 1.25% (d) | 1.25% | ||||
Ratio of Expenses to Average Net Assets | 1.30% (d) | 1.60% | ||||
Portfolio Turnover Rate | 21% | 16% | ||||
| (a) | Per share calculations were performed using average shares for the period. |
| (b) | Figures do not reflect the deduction of taxes the shareholder will pay on fund distributions or redemption of fund shares. |
| (c) | Not Annualized. |
| (d) | Annualized. |
The accompanying notes are an integral part of the financial statements.
| 40 | 1-888-462-5386 | www.oakfunds.com |
Table of Contents
Year Ended October 31, 2008 | Year Ended October 31, 2007 | Year Ended October 31, 2006 | Year Ended October 31, 2005 | |||||||
| $ | 27.46 | $ | 21.18 | $ | 21.13 | $ | 19.02 | |||
| (0.08) | (0.12) | (0.16) | (0.16) | |||||||
|
(11.80) | 6.40 | 0.21 | 2.27 | ||||||
| (11.88) | 6.28 | 0.05 | 2.11 | |||||||
| – | – | – | – | |||||||
| – | – | – | – | |||||||
| – | – | – | – | |||||||
| $ | 15.58 | $ | 27.46 | �� $ | 21.18 | $ | 21.13 | |||
| (43.26)% | 29.65% | 0.24% | 11.09% | |||||||
| $ | 36,198 | $ | 90,901 | $ | 92,549 | $ | 139,379 | |||
| 1.25% | 1.25% | 1.21% | 1.15% | |||||||
|
(0.34)% | (0.50)% | (0.74)% | (0.78)% | ||||||
|
1.25% | 1.25% | 1.21% | 1.15% | ||||||
|
1.51% | 1.35% | 1.27% | 1.22% | ||||||
| 38% | 18% | 20% | 28% | |||||||
| Semi-Annual Report | April 30, 2010 (Unaudited) | 41 |
Table of Contents
Financial Highlights
For a share outstanding throughout the years or periods ended
| Six Months Ended April 30, 2010 (Unaudited) | Year Ended October 31, 2009 | |||||
ROCK OAK CORE GROWTH FUND | ||||||
Net Asset Value Beginning of Period | $ | 9.09 | $ | 7.28 | ||
Income (Loss) From Operations | ||||||
Net Investment Loss(b) | (0.03) | (0.04) | ||||
Realized and Unrealized Gain or (Losses) | 1.29 | 1.85 | ||||
Total From Operations | 1.26 | 1.81 | ||||
Less Distributions: | ||||||
Dividends from Net Investment Income | – | – | ||||
Distributions from Capital Gains | – | – | ||||
Total Dividends and Distributions | – | – | ||||
Net Asset Value End of Period | $ | 10.35 | $ | 9.09 | ||
Total Return(c) | 13.86% (d) | 24.86% | ||||
Net Assets End of Period (000) | $ | 6,368 | $ | 5,798 | ||
Ratio of Expenses to Average Net Assets | 1.25% (e) | 1.25% | ||||
Ratio of Net Investment Loss to Average Net Assets | (0.56)% (e) | (0.56)% | ||||
Ratio of Expenses to Average Net Assets | 1.25% (e) | 1.25% | ||||
Ratio of Expenses to Average Net Assets | 1.54% (e) | 1.82% | ||||
Portfolio Turnover Rate | 30% | 45% | ||||
| (a) | The Rock Oak Core Growth Fund commenced operations on December 31, 2004. |
| (b) | Per share calculations were performed using average shares for the period. |
| (c) | Figures do not reflect the deduction of taxes the shareholder will pay on fund distributions or redemption of fund shares. |
| (d) | Not Annualized. |
| (e) | Annualized. |
The accompanying notes are an integral part of the financial statements.
| 42 | 1-888-462-5386 | www.oakfunds.com |
Table of Contents
Year Ended October 31, 2008 | Year Ended October 31, 2007 | Year Ended October 31, 2006 | Period Ended October 31, 2005(a) | |||||||
| $ | 13.45 | $ | 10.68 | $ | 10.10 | $ | 10.00 | |||
| (0.06) | (0.07) | (0.06) | (0.05) | |||||||
|
(5.54) | 2.84 | 0.64 | 0.15 | ||||||
| (5.60) | 2.77 | 0.58 | 0.10 | |||||||
| – | – | – | – | |||||||
| (0.57) | – | – | – | |||||||
| (0.57) | – | – | – | |||||||
| $ | 7.28 | $ | 13.45 | $ | 10.68 | $ | 10.10 | |||
| (43.43)% | 25.94% | 5.74% | 1.00% (d) | |||||||
| $ | 4,571 | $ | 8,389 | $ | 9,688 | $ | 10,560 | |||
| 1.25% | 1.25% | 1.22% | 1.15% (e) | |||||||
| (0.53)% | (0.57)% | (0.54)% | (0.67)% (e) | |||||||
|
1.25% | 1.25% | 1.22% | 1.15% (e) | ||||||
|
1.56% | 1.46% | 1.44% | 1.89% (e) | ||||||
| 92% | 86% | 88% | 45% | |||||||
| Semi-Annual Report | April 30, 2010 (Unaudited) | 43 |
Table of Contents
Financial Highlights
For a share outstanding throughout the years or periods ended
Six Months Ended April 30, 2010 (Unaudited) | Year Ended October 31, 2009 | |||||
RIVER OAK DISCOVERY FUND | ||||||
Net Asset Value Beginning of Period | $ | 10.96 | $ | 7.86 | ||
Income (Loss) From Operations | ||||||
Net Investment Loss(b) | (0.07) | (0.09) | ||||
Realized and Unrealized Gain or (Losses) | 1.61 | 3.19 | ||||
Total From Operations | 1.54 | 3.10 | ||||
Less Distributions: | ||||||
Dividends from Net Investment Income | – | – | ||||
Distributions from Capital Gains | – | – | ||||
Total Dividends and Distributions | – | – | ||||
Net Asset Value End of Period | $ | 12.50 | $ | 10.96 | ||
Total Return(c) | 14.05% (d) | 39.44% | ||||
Net Assets End of Period (000) | $ | 9,588 | $ | 8,247 | ||
Ratio of Expenses to Average Net Assets | 1.35% (e) | 1.35% | ||||
Ratio of Net Investment Loss to Average Net Assets | (1.14)% (e) | (1.03)% | ||||
Ratio of Expenses to Average Net Assets | 1.35% (e) | 1.35% | ||||
Ratio of Expenses to Average Net Assets | 1.57% (e) | 1.92% | ||||
Portfolio Turnover Rate | 25% | 67% | ||||
| (a) | The River Oak Discovery Fund commenced operations on June 30, 2005. |
| (b) | Per share calculations were performed using average shares for the period. |
| (c) | Figures do not reflect the deduction of taxes the shareholder will pay on fund distributions or redemption of fund shares. |
| (d) | Not Annualized. |
| (e) | Annualized. |
The accompanying notes are an integral part of the financial statements.
| 44 | 1-888-462-5386 | www.oakfunds.com |
Table of Contents
Year Ended October 31, 2008 | Year Ended October 31, 2007 | Year Ended October 31, 2006 | Period Ended October 31, 2005(a) | |||||||
| $ | 14.80 | $ | 11.56 | $ | 10.10 | $ | 10.00 | |||
| (0.08) | (0.12) | (0.09) | (0.03) | |||||||
|
(6.46) | 3.36 | 1.55 | 0.13 | ||||||
| (6.54) | 3.24 | 1.46 | 0.10 | |||||||
| – | – | – | – | |||||||
| (0.40) | – | – | – | |||||||
| (0.40) | – | – | – | |||||||
| $ | 7.86 | $ | 14.80 | $ | 11.56 | $ | 10.10 | |||
| (45.31)% | 28.03% | 14.46% | 1.00% (d) | |||||||
| $ | 4,168 | $ | 7,823 | $ | 5,943 | $ | 3,063 | |||
| 1.35% | 1.35% | 1.35% | 1.35% (e) | |||||||
| (0.68)% | (0.92)% | (0.81)% | (0.79)% (e) | |||||||
|
1.35% | 1.35% | 1.35% | 1.35% (e) | ||||||
|
1.76% | 1.72% | 2.74% | 4.05% (e) | ||||||
| 145% | 148% | 72% | 16% | |||||||
| Semi-Annual Report | April 30, 2010 (Unaudited) | 45 |
Table of Contents
Financial Highlights
For a share outstanding throughout the years or periods ended
Six Months Ended April 30, | Year Ended October 31, 2009 | |||||
RED OAK TECHNOLOGY SELECT FUND | ||||||
Net Asset Value Beginning of Period | $ | 7.04 | $ | 4.92 | ||
Income (Loss) From Operations | ||||||
Net Investment Loss(a) | (0.03) | (0.03) | ||||
Realized and Unrealized Gain or (Losses) | 1.29 | 2.15 | ||||
Total From Operations | 1.26 | 2.12 | ||||
Less Distributions: | ||||||
Dividends from Net Investment Income | – | – | ||||
Distributions from Capital Gains | – | – | ||||
Total Dividends and Distributions | – | – | ||||
Net Asset Value End of Period | $ | 8.30 | $ | 7.04 | ||
Total Return(c) | 17.90% (d) | 43.09% | ||||
Net Assets End of Period (000) | $ | 68,332 | $ | 73,511 | ||
Ratio of Expenses to Average Net Assets | 1.35% (e) | 1.35% | ||||
Ratio of Net Investment Loss to Average Net Assets | (0.79)% (e) | (0.56)% | ||||
Ratio of Expenses to Average Net Assets | 1.35% (e) | 1.35% | ||||
Ratio of Expenses to Average Net Assets | 1.55% (e) | 1.82% | ||||
Portfolio Turnover Rate | 20% | 30% | ||||
| (a) | Per share calculations were performed using average shares for the period. |
| (b) | Net investment income per share and the net investment income ratio include $0.03 and 0.51%, respectively, resulting from a special dividend from Microsoft in November 2004. |
| (c) | Figures do not reflect the deduction of taxes the shareholder will pay on fund distributions or redemption of fund shares. |
| (d) | Not Annualized. |
| (e) | Annualized. |
The accompanying notes are an integral part of the financial statements.
| 46 | 1-888-462-5386 | www.oakfunds.com |
Table of Contents
Year Ended | Year Ended October 31, 2007 | Year Ended October 31, 2006 | Year Ended October 31, 2005 | |||||||
| $ | 8.75 | $ | 6.90 | $ | 6.55 | $ | 6.30 | |||
| (0.06) | (0.03) | (0.06) | (0.03) (b) | |||||||
|
(3.77) |
|
1.88 | 0.41 | 0.28 | |||||
| (3.83) | 1.85 | 0.35 | 0.25 | |||||||
| – | – | – | – | |||||||
| – | – | – | – | |||||||
| – | – | – | – | |||||||
| $ | 4.92 | $ | 8.75 | $ | 6.90 | $ | 6.55 | |||
| (43.77)% | 26.81% | 5.34% | 3.97% | |||||||
| $ | 44,079 | $ | 115,005 | $ | 116,449 | $ | 160,881 | |||
| 1.35% | 1.35% | 1.27% | 1.15% | |||||||
| (0.80)% | (0.40)% | (0.89)% | (0.50)% (b) | |||||||
|
1.35% | 1.35% | 1.27% | 1.15% | ||||||
|
1.58% | 1.40% | 1.34% | 1.27% | ||||||
| 17% | 11% | 93% | 40% | |||||||
| Semi-Annual Report | April 30, 2010 (Unaudited) | 47 |
Table of Contents
Financial Highlights
For a share outstanding throughout the years or periods ended
| Six Months Ended April 30, 2010 (Unaudited) | Year Ended October 31, 2009 | |||||
BLACK OAK EMERGING TECHNOLOGY FUND | ||||||
Net Asset Value Beginning of Period | $ | 2.19 | $ | 1.63 | ||
Income (Loss) From Operations | ||||||
Net Investment Loss(a) | (0.01) | (0.02) | ||||
Realized and Unrealized Gain or (Losses) | 0.46 | 0.58 | ||||
Total From Operations | 0.45 | 0.56 | ||||
Less Distributions: | ||||||
Dividends from Net Investment Income | – | – | ||||
Distributions from Capital Gains | – | – | ||||
Total Dividends and Distributions | – | – | ||||
Net Asset Value End of Period | $ | 2.64 | $ | 2.19 | ||
Total Return(c) | 20.55% (d) | 34.36% | ||||
Net Assets End of Period (000) | $ | 29,181 | $ | 37,596 | ||
Ratio of Expenses to Average Net Assets | 1.35% (e) | 1.35% | ||||
Ratio of Net Investment Loss to Average Net Assets | (1.16)% (e) | (1.15)% | ||||
Ratio of Expenses to Average Net Assets | 1.35% (e) | 1.35% | ||||
Ratio of Expenses to Average Net Assets | 1.69% (e) | 1.93% | ||||
Portfolio Turnover Rate | 11% | 49% | ||||
| (a) | Per share calculations were performed using average shares for the period. |
| (b) | The amount shown for a share outstanding throughout the period does not accord with the aggregate net gains on investment for the period because of the sales and repurchases of fund shares in relation to fluctuating market value of the investments of the Fund. |
| (c) | Figures do not reflect the deduction of taxes the shareholder will pay on fund distributions or redemption of fund shares. |
| (d) | Not Annualized. |
| (e) | Annualized. |
The accompanying notes are an integral part of the financial statements.
| 48 | 1-888-462-5386 | www.oakfunds.com |
Table of Contents
Year Ended | Year Ended October 31, 2007 | Year Ended October 31, 2006 | Year Ended October 31, 2005 | |||||||
| $ | 2.94 | $ | 2.21 | $ | 2.05 | $ | 2.08 | |||
| (0.02) | (0.03) | (0.02) | (0.02) (b) | |||||||
|
(1.29) | 0.76 | 0.18 | (0.01) | ||||||
| (1.31) | 0.73 | 0.16 | (0.03) | |||||||
| – | – | – | – | |||||||
| – | – | – | – | |||||||
| – | – | – | – | |||||||
| $ | 1.63 | $ | 2.94 | $ | 2.21 | $ | 2.05 | |||
| (44.56)% | 33.03% | 7.80% | (1.44)% | |||||||
| $ | 19,478 | $ | 39,810 | $ | 39,617 | $ | 48,901 | |||
| 1.35% | 1.35% | 1.28% | 1.15% | |||||||
| (0.94)% | (1.04)% | (1.13)% | (1.13)% | |||||||
|
1.35% | 1.35% | 1.28% | 1.15% | ||||||
|
1.76% | 1.62% | 1.53% | 1.41% | ||||||
| 79% | 76% | 97% | 30% | |||||||
| Semi-Annual Report | April 30, 2010 (Unaudited) | 49 |
Table of Contents
Financial Highlights
For a share outstanding throughout the years or periods ended
| Six Months Ended April 30, 2010 (Unaudited) | Year Ended October 31, 2009 | |||||
LIVE OAK HEALTH SCIENCES FUND | ||||||
Net Asset Value Beginning of Period | $ | 11.00 | $ | 9.48 | ||
Income (Loss) From Operations | ||||||
Net Investment Income (Loss)(a) | 0.00 (b) | (0.01) | ||||
Realized and Unrealized Gain or (Losses) in Securities(a) | 1.81 | 1.53 | ||||
Total From Operations | 1.81 | 1.52 | ||||
Less Distributions: | ||||||
Dividends from Net Investment Income | – | – | ||||
Distributions from Capital Gains | (0.40) | – | ||||
Total Dividends and Distributions | (0.40) | – | ||||
Net Asset Value End of Period | $ | 12.41 | $ | 11.00 | ||
Total Return(c) | 16.62% (d) | 16.03% | ||||
Net Assets End of Period (000) | $ | 19,841 | $ | 16,249 | ||
Ratio of Expenses to Average Net Assets | 1.35% (e) | 1.35% | ||||
Ratio of Net Investment Income (Loss) to Average Net Assets | 0.03% (e) | (0.08)% | ||||
Ratio of Expenses to Average Net Assets | 1.35% (e) | 1.35% | ||||
Ratio of Expenses to Average Net Assets | 1.41% (e) | 1.61% | ||||
Portfolio Turnover Rate | 14% | 31% | ||||
| (a) | Per share calculations were performed using average shares for the period. |
| (b) | Less than $0.005 per share. |
| (c) | Figures do not reflect the deduction of taxes the shareholder will pay on fund distributions or redemption of fund shares. |
| (d) | Not Annualized. |
| (e) | Annualized. |
The accompanying notes are an integral part of the financial statements.
| 50 | 1-888-462-5386 | www.oakfunds.com |
Table of Contents
Year Ended | Year Ended October 31, 2007 | Year Ended October 31, 2006 | Year Ended October 31, 2005 | |||||||
| $ | 12.41 | $ | 11.18 | $ | 11.66 | $ | 9.44 | |||
| (0.04) | (0.01) | (0.07) | (0.07) | |||||||
|
(2.89) | 1.24 | (0.41) | 2.29 | ||||||
| (2.93) | 1.23 | (0.48) | 2.22 | |||||||
| – | – | – | – | |||||||
| – | – | – | – | |||||||
| – | – | – | – | |||||||
| $ | 9.48 | $ | 12.41 | $ | 11.18 | $ | 11.66 | |||
| (23.61)% | 11.00% | (4.12)% | 23.52% | |||||||
| $ | 14,013 | $ | 21,354 | $ | 25,263 | $ | 36,304 | |||
| 1.35% | 1.35% | 1.21% | 1.15% | |||||||
|
(0.36)% | (0.11)% | (0.59)% | (0.66)% | ||||||
|
1.35% | 1.35% | 1.21% | 1.15% | ||||||
|
1.52% | 1.37% | 1.23% | 1.22% | ||||||
| 25% | 28% | 57% | 16% | |||||||
| Semi-Annual Report | April 30, 2010 (Unaudited) | 51 |
Table of Contents
As of April 30, 2010 (Unaudited)
1. ORGANIZATION:
The Oak Associates Funds (the “Trust”) is organized as a Massachusetts business trust under an Agreement and Declaration of Trust dated November 6, 1997. The Trust is registered under the Investment Company Act of 1940, as amended, as an open-end management investment company with seven funds: White Oak Select Growth Fund, Rock Oak Core Growth Fund, Pin Oak Equity Fund and River Oak Discovery Fund (diversified funds); Red Oak Technology Select Fund, Black Oak Emerging Technology Fund and Live Oak Health Sciences Fund (non-diversified funds) (collectively referred to as “Funds” and individually referred to as a “Fund”). The assets of each Fund are segregated, and a shareholder’s interest is limited to the Fund in which shares are held. The Funds’ prospectus provides a description of each Fund’s investment objectives, policies and strategies.
2. SIGNIFICANT ACCOUNTING POLICIES:
Use of Estimates—The preparation of financial statements in conformity with accounting principles generally accepted in the United States of America requires management to make estimates and assumptions that affect the reported amounts of assets and liabilities and disclosure of contingent assets and liabilities at the date of the financial statements and the reported amounts of increases and decreases in net assets from operations and expenses during the reporting period. Actual results could differ from those estimates, and could have a material impact to the Funds.
Security Valuation—Investments in equity securities, which are traded on a national exchange, are stated at the last quoted sales price if readily available for such equity securities on each business day. Investments in equity securities, which are reported on the NASDAQ national market system are valued at the official closing price; other equity securities traded in the over-the-counter market and listed equity securities for which no sale was reported on that date are stated at the last quoted bid price. Debt obligations exceeding sixty days to maturity for which market quotations are readily available are valued at the most recently quoted bid price. Debt obligations with sixty days or less remaining until maturity may be valued at their amortized cost, which approximates market value.
Securities for which market prices are not “readily available” (of which there were none as of April 30, 2010) are valued in accordance with Fair Value Procedures established by the Funds’ Board of Trustees. The Funds’ Fair Value Procedures are implemented through a Fair Value Committee (the “Committee”) designated by the Funds’ Board of Trustees. Some of the more common reasons that may necessitate that a security be valued using Fair Value Procedures include: the security’s trading has been halted or suspended; the security has been de-listed from a national exchange; the security’s primary trading market is temporarily closed at a time when under normal conditions it would be open; the security has not been traded for an extended period of time; the security’s primary pricing source is not able or willing to provide a price; a significant event with respect to a security or securities has occurred after the close of the market or exchange on which the security or securities principally trades and before the time the Fund calculates net asset value; or trading of the security is subject to local government-imposed restrictions. When a security is valued in accordance with the Fair Value Procedures, the Committee will determine the value after taking into consideration relevant information reasonably available to the Committee.
Security Transactions and Investment Income—Security transactions are accounted for on the date the security is purchased or sold (trade date). Dividend income is recognized on the ex-dividend date, and interest income is recognized on the accrual basis. Costs used in determining realized gains and losses on the sales of investment securities are those of the specific securities sold.
| 52 | 1-888-462-5386 | www.oakfunds.com |
Table of Contents
Notes to Financial Statements
As of April 30, 2010 (Unaudited)
Expenses—Expenses that are directly related to one of the Funds are charged to that Fund. Other operating expenses of the Trust are prorated to the Funds on the basis of relative daily net assets.
Repurchase Agreements—The Funds invest in tri-party repurchase agreements. Securities held as collateral for tri-party repurchase agreements are maintained by the broker’s custodian bank in a segregated account until maturity of the repurchase agreement. Provisions of the repurchase agreements and procedures adopted by the Board of Trustees require that the market value of the collateral, including accrued interest thereon, is sufficient in the event of default by the counterparty. If the counterparty defaults and the value of the collateral declines or if the counterparty enters an insolvency proceeding, realization of the collateral by the Funds may be delayed or limited.
Dividends and Distributions to Shareholders—Dividends from net investment income are declared and paid to shareholders on an annual basis, as applicable. Net realized capital gains on sales of securities, if any, are distributed to shareholders at least annually.
3. FAIR VALUE MEASUREMENTS
A three-tier hierarchy has been established to measure fair value based on the extent of use of “observable inputs” as compared to “unobservable inputs” for disclosure purposes and requires additional disclosures about these valuations measurements. Inputs refer broadly to the assumptions that market participants would use in pricing a security. Observable inputs are inputs that reflect the assumptions market participants would use in pricing the security developed based on market data obtained from sources independent of the reporting entity. Unobservable inputs are inputs that reflect the reporting entity’s own assumptions about the assumptions market participants would use in pricing the security developed based on the best information available in the circumstances.
The three-tier hierarchy is summarized as follows:
| Level 1: | quoted prices in active markets for identical securities | |
| Level 2: | other significant observable inputs (including quoted prices for similar securities, interest rates, prepayments speeds, credit risk, etc.) | |
| Level 3: | significant unobservable inputs (including the Fund’s own assumptions in determining the fair value of investments) | |
The following is a summary of the inputs used to value each Funds investments as of April 30, 2010.
| Level 1 | Level 2 | Level 3 | Total | |||||||||
WHITE OAK SELECT GROWTH FUND | ||||||||||||
Common Stocks | $ | 320,328,688 | $ | – | $ | – | $ | 320,328,688 | ||||
Repurchase Agreements | – | 1,211,847 | – | 1,211,847 | ||||||||
Total | $ | 320,328,688 | $ | 1,211,847 | $ | – | $ | 321,540,535 | ||||
| Semi-Annual Report | April 30, 2010 (Unaudited) | 53 |
Table of Contents
Notes to Financial Statements
As of April 30, 2010 (Unaudited)
| Level 1 | Level 2 | Level 3 | Total | |||||||||
PIN OAK EQUITY FUND | ||||||||||||
Common Stocks | $ | 132,036,310 | $ | – | $ | – | $ | 132,036,310 | ||||
Total | $ | 132,036,310 | $ | – | $ | – | $ | 132,036,310 | ||||
ROCK OAK CORE GROWTH FUND | ||||||||||||
Common Stocks | $ | 6,285,315 | $ | – | $ | – | $ | 6,285,315 | ||||
Total | $ | 6,285,315 | $ | – | $ | – | $ | 6,285,315 | ||||
RIVER OAK DISCOVER FUND | ||||||||||||
Common Stocks | $ | 8,807,148 | $ | – | $ | – | $ | 8,807,148 | ||||
Total | $ | 8,807,148 | $ | – | $ | – | $ | 8,807,148 | ||||
RED OAK TECHNOLOGY SELECT FUND | ||||||||||||
Common Stocks | $ | 68,322,755 | $ | – | $ | – | $ | 68,322,755 | ||||
Total | $ | 68,322,755 | $ | – | $ | – | $ | 68,322,755 | ||||
BLACK OAK EMERGING TECHNOLOGY FUND | ||||||||||||
Common Stocks | $ | 29,210,890 | $ | – | $ | – | $ | 29,210,890 | ||||
Total | $ | 29,210,890 | $ | – | $ | – | $ | 29,210,890 | ||||
LIVE OAK HEALTH SCIENCES FUND | ||||||||||||
Common Stocks | $ | 18,838,955 | $ | – | $ | – | $ | 18,838,955 | ||||
Repurchase Agreements | – | 1,034,710 | – | 1,034,710 | ||||||||
Total | $ | 18,838,955 | $ | 1,034,710 | $ | – | $ | 19,873,665 | ||||
The above tables are presented by levels of disaggregation for each asset class. For detailed descriptions of the underlying industries, see the accompanying Statements of Investments.
4. TRANSACTIONS WITH AFFILIATES:
Certain officers of the Trust are also officers of Oak Associates, ltd., SEI Investments Global Funds Services (the “Administrator”) and/or SEI Investments Distribution Co. (the “Distributor”). Such officers are paid no fees by the Trust for serving as officers of the Trust.
| 54 | 1-888-462-5386 | www.oakfunds.com |
Table of Contents
Notes to Financial Statements
As of April 30, 2010 (Unaudited)
5. ADMINISTRATION, TRANSFER AGENT AND DISTRIBUTION AGREEMENTS:
The Trust and the Administrator are parties to an Administration Agreement dated February 27, 1998, last amended May 2, 2007, under which the Administrator provides management and administration services for an annual fee of 0.04% of the average daily net assets of each of the Funds up to $2.5 billion, 0.03% on the next $2.5 billion, 0.02% on the next $5 billion, and 0.015% of such assets in excess of $10 billion. There is a minimum annual administration fee of $665,000 for the Trust.
DST Systems, Inc. serves as the transfer agent and dividend disbursing agent for the Funds under an Agency Agreement with the Trust dated February 27, 1998. During the period ended April 30, 2010, the following Funds reimbursed Oak Associates, ltd. (the “Adviser”) for amounts paid to third parties that provide sub-transfer agency and other administration services relating to the Funds:
| Amount | |||
White Oak Select Growth Fund | $ | 262,280 | |
Pin Oak Equity Fund | 90,889 | ||
Rock Oak Core Growth Fund | 901 | ||
River Oak Discovery Fund | 2,350 | ||
Red Oak Technology Select Fund | 46,876 | ||
Black Oak Emerging Technology Fund | 27,815 | ||
Live Oak Health Sciences Fund | 5,136 | ||
The Trust and the Distributor are parties to an Amended and Restated Distribution Agreement dated February 27, 1998. The Distributor receives no fees for its distribution services under this agreement.
6. INVESTMENT ADVISORY AND CUSTODIAN AGREEMENTS:
The Trust and the Adviser are parties to an Investment Advisory Agreement dated February 27, 1998, as last amended May 4, 2005, under which the Adviser receives an annual fee equal to 0.74% of the average daily net assets of each Fund, except for the River Oak Discovery Fund for which the Adviser receives 0.90% of the average daily net assets of the Fund. Effective February 28, 2008, the Adviser has agreed to contractually waive all or a portion of its fees (and to reimburse the Funds’ expenses if necessary) in order to limit operating expenses to not more than 1.25% of the average daily net assets of the White Oak Select Growth, Rock Oak Core Growth and Pin Oak Equity Funds, and 1.35% of the average daily net assets of the River Oak Discovery, Red Oak Technology Select, Black Oak Emerging Technology and Live Oak Health Sciences Funds for a period of one year. Effective March 1, 2009 the Adviser has contractually agreed to continue this arrangement for a period of one year. U.S. Bank N.A. acts as custodian (the “Custodian”) for the Funds. The Custodian plays no role in determining the investment policies of the Funds or which securities are to be purchased or sold by the Funds.
| Semi-Annual Report | April 30, 2010 (Unaudited) | 55 |
Table of Contents
Notes to Financial Statements
As of April 30, 2010 (Unaudited)
7. INVESTMENT TRANSACTIONS:
The cost of security purchases and the proceeds from security sales, other than short-term investments, for the six months ended April 30, 2010, were as follows:
| Purchases | Sales | |||||
White Oak Select Growth Fund | $ | 19,092,336 | $ | 57,362,308 | ||
Pin Oak Equity Fund | 29,126,031 | 25,719,298 | ||||
Rock Oak Core Growth Fund | 1,751,174 | 1,880,455 | ||||
River Oak Discovery Fund | 2,124,058 | 2,525,767 | ||||
Red Oak Technology Select Fund | 14,743,629 | 30,975,073 | ||||
Black Oak Emerging Technology Fund | 3,644,657 | 17,207,218 | ||||
Live Oak Health Sciences Fund | 2,475,427 | 2,385,999 | ||||
8. FEDERAL INCOME TAXES:
Each of the Funds is classified as a separate taxable entity for Federal income tax purposes. Each of the Funds intends to continue to qualify as a separate “regulated investment company” under Subchapter M of the Internal Revenue Code and make the requisite distributions to shareholders that will be sufficient to relieve it from Federal income tax and Federal excise tax. Therefore, no Federal tax provision is required.
To the extent that dividends from net investment income and distributions from net realized capital gains exceed amounts reported in the financial statements, such amounts are reported separately.
The amounts of dividends from net investment income and distributions from net realized capital gains are determined in accordance with Federal income tax regulations, which may differ from those amounts determined under accounting principles generally accepted in the United States of America. These book/tax differences are either temporary or permanent in nature. The character of dividends from net investment income or distributions from net realized gains made during the year, and the timing of dividends and distributions where the fiscal year in which the amounts are distributed may differ from the year that the income or realized gains (losses) were recorded by the Funds. To the extent these differences are permanent, adjustments are made to the appropriate equity accounts in the period that the differences arise. These differences are primarily due to the reclass of distributions on net operating losses, expiration of capital loss carryforwards, and the investment in master limited partnerships.
There were no dividends or distributions declared during the period ended April 30, 2010.
The amount and characteristics of tax basis distributions and composition of distributable earnings/ (accumulated losses) are finalized at fiscal year-end; accordingly, tax basis balances have not been determined as of April 30, 2010.
For Federal income tax purposes, capital loss carryforwards may be carried forward and applied against future capital gains.
| 56 | 1-888-462-5386 | www.oakfunds.com |
Table of Contents
Notes to Financial Statements
As of April 30, 2010 (Unaudited)
At October 31, 2009, the Funds had capital loss carryforwards available to offset future realized capital gains through the indicated expiration dates:
| Expiring October 31, | |||||||||||||||||||||||||||
| 2010 | 2011 | 2012 | 2013 | 2014 | 2015 | 2016 | 2017 | Total | |||||||||||||||||||
White Oak Select Growth Fund | $ | 712,973 | $ | 206,602 | $ | 744,256 | $ | 321,944 | $ | – | $ | – | $ | 22,546 | $ | 9,016 | $ | 2,017,337 | |||||||||
Pin Oak Equity Fund | 436,197 | 180,087 | 90,283 | 17,756 | – | – | – | – | 724,323 | ||||||||||||||||||
Rock Oak Core Growth Fund | – | – | – | – | – | – | 188 | 783 | 971 | ||||||||||||||||||
River Oak Discovery Fund | – | – | – | – | – | – | 50 | 786 | 836 | ||||||||||||||||||
Red Oak Technology Select Fund | 726,266 | 293,675 | 34,233 | – | – | – | – | 4,597 | 1,058,771 | ||||||||||||||||||
Black Oak Emerging Technology Fund | 212,845 | 15,085 | – | – | – | – | – | 4,526 | 232,456 | ||||||||||||||||||
At April 30, 2010, the total cost of securities for Federal income tax purposes and the aggregate gross unrealized appreciation and depreciation for securities held by the Funds is as follows:
| Federal Tax Cost | Aggregate Gross Appreciation | Aggregate Gross Depreciation | Net | ||||||||
White Oak Select Growth Fund | $ | 234,718,443 | $ | 104,448,067 | $ (17,625,975) | $ | 86,822,092 | ||||
Pin Oak Equity Fund | 103,677,776 | 32,007,297 | (3,648,763) | 28,358,534 | |||||||
Rock Oak Core Growth Fund | 5,179,706 | 1,380,945 | (275,336) | 1,105,609 | |||||||
River Oak Discovery Fund | 7,354,915 | 1,935,395 | (483,162) | 1,452,233 | |||||||
Red Oak Technology Select Fund | 53,704,133 | 18,155,777 | (3,537,155) | 14,618,622 | |||||||
Black Oak Emerging Technology Fund | 18,883,332 | 11,450,502 | (1,122,945) | 10,327,557 | |||||||
Live Oak Health Sciences Fund | 16,175,227 | 4,818,531 | (1,120,093) | 3,698,438 | |||||||
Management evaluates the Funds’ tax positions to determine if the tax positions taken meet the minimum recognition threshold in connection with accounting for uncertainties in income tax positions taken or expected to be taken for the purposes of measuring and recognizing tax liabilities in the financial statements. Recognition of tax benefits of an uncertain tax position is required only when the position is “more likely than not” to be sustained assuming examination by taxing authorities. The Funds recognize interest and penalties, if any, related to unrecognized tax benefits as income tax expense in the Statements of Operations. During the period, the Funds did not incur any interest or penalties.
Management has analyzed the Funds’ tax position taken on federal income tax returns for all open tax years (current and prior three tax years) and has concluded that as of April 30, 2010, no provision for income tax would be required in the Funds’ financial statements. The Funds’ federal and state income and federal excise tax returns for tax years for which the applicable statutes of limitations have not expired are subject to examination by the Internal Revenue Service and state departments of revenue.
| Semi-Annual Report | April 30, 2010 (Unaudited) | 57 |
Table of Contents
Notes to Financial Statements
As of April 30, 2010 (Unaudited)
9. CONCENTRATION OF CREDIT RISK AND OWNERSHIP
The Red Oak Technology Select Fund and the Black Oak Emerging Technology Fund invest a substantial portion of their assets in securities in the technology industry. The Live Oak Health Sciences Fund invests a substantial portion of its assets in securities in the health care, medicine and life sciences industries. Therefore, each of these Funds may be more affected by economic developments in those industries than a general equity fund would be.
In the normal course of business, the Funds enter into contracts that provide general indemnifications. The Funds’ maximum exposure under these arrangements is dependent on future claims that may be made against the Funds and, therefore, cannot be established; however based on experience, the risk of loss from such claims is considered remote.
From time to time, the Funds may have a concentration of several shareholders holding a significant percentage of shares outstanding. Investment activities of these shareholders could have a material impact on the Fund.
As of April 30, 2010, please refer to the below chart for Concentration of Ownership:
| Number of Shareholders | Percentage of Ownership | |||
Rock Oak Core Growth | 2 | 23%, 21% | ||
River Oak Discovery | 2 | 34%, 14% | ||
Black Oak Emerging Technology | 1 | 7% | ||
Live Oak Health Sciences | 2 | 14%, 7% | ||
10. RECENT ACCOUNTING PRONOUNCEMENT
In January 2010, the Financial Accounting Standards Board issued Accounting Standards Updated No. 2010-06, “Improving Disclosures About Fair Value Measurements” (“ASU”). The ASU requires enhanced disclosures about (1) transfers into and out of Levels 1 and 2 and (2) purchases, sales, issuances, and settlements on a gross basis relating to Level 3 measurements. The first disclosure is effective for the first reporting period (including interim periods) beginning after December 15, 2009, and the second disclosure will be effective for fiscal years beginning after December 15, 2010, and for interim periods within those fiscal years. Management is currently evaluating the impact the adoption of this ASU will have on the Fund’s financial statement disclosures. The implementation of the ASC did not have a material effect on the Company’s financial disclosures contained in this Report.
11. SUBSEQUENT EVENT
Effective May 17, 2010, ALPS Fund Services, Inc. assumed duties as Administrator and Transfer Agent and ALPS Distributors, Inc. was named distributor to the Trust.
Effective June 10, 2010, the name of the Pin Oak Aggressive Stock Fund was changed to the Pin Oak Equity Fund.
Management has evaluated whether any events or transactions occurred subsequent to April 30, 2010 through issuance date of the Funds’ financial statements, and determined that there were no other material events or transactions that would require recognition or disclosure in the Funds’ financial statements.
| 58 | 1-888-462-5386 | www.oakfunds.com |
Table of Contents
OAK ASSOCIATES FUNDS
This Page Intentionally Left Blank
Table of Contents

By Mail
Oak Associates Funds
P.O. Box 8233
Denver, CO 80201-8233
By Telephone 1-888-462-5386 Monday through Friday, 8:00 am - 8:30 pm
On The Web www.oakfunds.com
Click on the My Oak Account section to take advantage of these features:
| • | Trade Online |
| • | Access and Update Account Information |
| • | Go Paperless with e-Delivery |
| • | View and download account history |
| • | Establish a systematic investment plan |
The Trust files its complete schedule of portfolio holdings of each Fund with the Securities and Exchange Commission for the first and third quarters of each fiscal year on Form N-Q within sixty days after the end of the period. The Trust’s Forms N-Q is available on the Commission’s website at http://www.sec.gov, and may be reviewed and copied at the Commission’s Public Reference Room in Washington DC. Information on the operation of the Public Reference Room may be obtained by calling 1-800-SEC-0330.
A description of the policies and procedures that the Funds use to determine how to vote proxies relating to portfolio securities, as well as information relating to how a Fund voted proxies relating to portfolio securities during the most recent 12-month period ended June 30, is available (i) without charge, upon request, by calling 1-866462-5386; and (ii) on the Commission’s website at http://www.sec.gov.
This report has been prepared for Oak Associates Funds Shareholders and may be distributed to others only if preceded or accompanied by a prospectus.
Oak Associates Funds are distributed by ALPS Distributors, Inc.

Table of Contents

Table of Contents
Item 2. Code of Ethics.
Not applicable to semi-annual report.
Item 3. Audit Committee Financial Expert.
Not applicable to semi-annual report.
Item 4. Principal Accountant Fees and Services.
Not applicable to semi-annual report.
Item 5. Audit Committee of Listed Registrants.
Not applicable to open-end management investment companies.
Item 6. Schedule of Investments.
| (a) | Schedule of Investments in securities of unaffiliated issuers as of the close of the reporting period is included as part of the Report to Stockholders filed under Item 1 of this Form N-CSRS. |
| (b) | Not applicable. |
Item 7. Disclosure of Proxy Voting Policies and Procedures for Closed-End
Management Investment Companies.
Not applicable to open-end management investment companies.
Item 8. Portfolio Managers of Closed-End Management Investment Companies.
Not applicable to open-end management investment companies.
Item 9. Purchases of Equity Securities by Closed-End Management Investment
Companies and Affiliated Purchasers.
Not applicable to open-end management investment companies.
Item 10. Submission of Matters to a Vote of Security Holders.
Table of Contents
None.
Item 11. Controls and Procedures.
(a) The registrant’s principal executive and principal financial officers, or persons performing similar functions, regarding the effectiveness of the registrant’s disclosure controls and procedures (as defined in Rule 30a-3(c) under the Act (17 CFR 270.30a-3(c))) as of a date within 90 days of the filing date of the report that includes the disclosure required by this paragraph, based on the evaluation of these controls and procedures required by Rule 30a-3(b) under the Act (17 CFR 270.30a-3(b)) and Rules 13a-15(b) or 15d-15(b) under the Exchange Act (17 CFR 240.13a-15(b) or 240.15d-15(b)).
(b) There has been no change in the registrant’s internal control over financial reporting (as defined in Rule 30a-3(d) under the Act (17 CFR 270.30a-3(d)) that occurred during the second fiscal quarter of the period covered by this report that has materially affected, or is reasonably likely to materially affect, the registrant’s internal control over financial reporting.
Item 12. Exhibits.
(a)(1) Not applicable to semi-annual report.
(a)(2) A separate certification for the principal executive officer and the principal financial officer of the registrant as required by Rule 30a-2(a) under the Investment Company Act of 1940, as amended (17 CFR 270.30a-2(a)), are filed herewith.
(a)(3) None.
(b) Officer certifications as required by Rule 30a-2(b) under the Investment Company Act of 1940, as amended (17 CFR 270.30a-2(b)) also accompany this filing as an Exhibit.
Table of Contents
SIGNATURES
Pursuant to the requirements of the Securities Exchange Act of 1934 and the Investment Company Act of 1940, the Registrant has duly caused this report to be signed on its behalf by the undersigned, thereunto duly authorized.
OAK ASSOCIATES FUNDS
| By | /s/ Leslie Manna | |
| Leslie Manna | ||
| President | ||
| Date: | July 9, 2010 | |
Pursuant to the requirements of the Securities Exchange Act of 1934 and the Investment Company Act of 1940, this report has been signed below by the following persons on behalf of the Registrant and in the capacities and on the dates indicated.
| By | /s/ Leslie Manna | |
| Leslie Manna | ||
| President and Chief Executive Officer | ||
| Date: | July 9, 2010 | |
| By | /s/ Patrick Buchanan | |
| Patrick Buchanan | ||
| Treasurer and Chief Financial Officer | ||
| Date: | July 9, 2010 | |