Table of Contents
UNITED STATES
SECURITIES AND EXCHANGE COMMISSION
Washington, D.C. 20549
FORM N-CSRS
CERTIFIED SHAREHOLDER REPORT OF REGISTERED
MANAGEMENT INVESTMENT COMPANIES
Investment Company Act file number: 811-08549
Oak Associates Funds
(Exact name of registrant as specified in charter)
101 Federal Street, Boston, Massachusetts 02110
(Address of principal executive offices) (Zip code)
Leslie Manna
Oak Associates, ltd.
3875 Embassy Parkway, Suite 250
Akron, Ohio 44333-8334
(Name and address of agent for service)
Registrant’s telephone number, including area code: 1-888-462-5386
Date of fiscal year end: October 31
Date of reporting period: November 1, 2010 - April 30, 2011
Table of Contents
Item 1. Reports to Stockholders.
Table of Contents
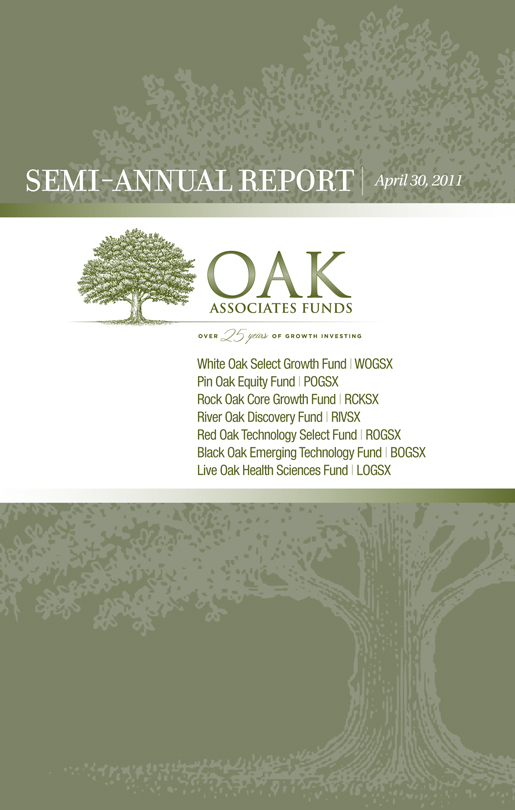
Table of Contents

| 1 | ||||
Performance Update | ||||
| 2 | ||||
| 3 | ||||
| 4 | ||||
| 5 | ||||
| 6 | ||||
| 7 | ||||
| 8 | ||||
| 9 | ||||
| 11 | ||||
Financial Statements | ||||
| 13 | ||||
| 30 | ||||
| 32 | ||||
| 34 | ||||
| 38 | ||||
| 52 | ||||
Table of Contents
| ||
June 15,2011
Dear Fellow Shareholder:
In what has become a rite of summer, stocks traded lower recently on worries about the economy. This summer selloff has happened three straight years. Each of the prior two times, the fears of an economic downturn proved unfounded, and the market rose. There is no guarantee things will play out the same way again this time, but there are some encouraging signs.
Corporate profitability remains high and growth in profits strong. This tends to lead to increases in capital spending (capex) and hiring. Capital spending has already picked up dramatically, and employment has been increasing, if not at the rate many would like to see. Research firm ISI conducts a semiannual survey of chief financial officers on their capex and hiring plans, and there has been a remarkably high correlation between the survey results and the subsequent economic data. The recent survey results indicate that corporations plan to ramp up their spending and employ more people. This bodes well. Capital spending and employment are keys to a sustainable economic recovery.
While the Federal Reserve’s quantitative easing program is set to end, monetary policy remains very accommodative. Along with this, the yield curve remains upward sloping, historically a sign that the economy will remain healthy.
One reason employment has been slow to return is that many of the jobs lost were in real estate, an industry that experienced a bubble. There was a misallocation (to that industry) not just of capital but of labor. It takes time for that to be worked off. In the case of employment, it takes time for those workers to develop skills in other areas. Additionally, employment is always slow to return in an economic recovery, as companies prefer to be sure that the economy is on sound footing before committing to the fixed expense of a new employee.
The recent economic pause may have been caused to a large degree by a few temporary factors. The Japan earthquake, which affected demand as well as the global supply chain; the spike in gasoline prices; and the unusually poor weather in the US have likely contributed to the recent slowdown. As these subside, economic activity may pick up. In our management of the funds, we are looking to take advantage of temporary dislocations in sectors and individual securities, but remain mindful of the risk that things won’t necessarily play out the way they have before. We maintain a long-term perspective, a willingness to go against the crowd, and a commitment to concentrating our portfolios in our best ideas.
Overall, we feel optimistic about the long-term prospects for domestic equities, thanks to strong corporate profits, American ingenuity and the back-drop of demand from international markets. One of our largest areas of concern, as it relates to the macroeconomic environment, is the federal budget deficit. Frankly, there are no actionable investment decisions that we would make immediately. But it’s a risk that we monitor and give a great deal of thought to. At Oak, our decisions are driven in part by our top-down view of the economy. If at any time we believe that the economic picture is fundamentally changing, we’ll adjust the portfolio in a way that we think will best serve shareholders. As always, we make portfolio management decisions with the intent of investing in a company for not just a few quarters, but for several years.
We extend a warm welcome to new shareholders and a “thank you” to our many longtime investors. We appreciate the opportunity to invest on your behalf.
Best regards,

Mark Oelschlager, CFA |
Portfolio Manager |
Oak Associates Funds |
This manager commentary represents an assessment of the market environment at a specific point in time and is not intended to be a forecast of future events, or a guarantee of future results. This information should not be relied upon by the reader as research or investment advice.
Investments are subject to market fluctuations and a fund’s share price can fall because of weakness in the broad market, a particular industry, or a specific holding.
Definition: Quantitative easing is a function carried out by a central bank, through the use of open market operations (buying and selling government securities), which have the affect of increasing the supply of money in the financial system.
Semi-Annual Report | April 30, 2011 (Unaudited) | 1 |
Table of Contents
| Performance Update
| |
All data below as of April 30, 2011 (Unaudited) |
| Fund Data | ||
Ticker Symbol | WOGSX | |
Share Price | $42.28 | |
Total Net Assets | $274.6M | |
Portfolio Turnover | 8.53% | |
2011 Distributions | None | |
| Industry Weightings^ | ||
Information Technology | 41.3% | |
Financials | 22.6% | |
Health Care | 19.8% | |
Consumer Discretionary | 6.0% | |
Energy | 4.4% | |
Materials | 4.0% | |
Telecommunication Service | 1.9% | |
Short Term Investments | 0.1% | |
| Top 10 Holdings^ | ||||
1. Amazon.com, Inc. | 5.97% | |||
2. ACE, Ltd. | 5.35% | |||
3. Qualcomm, Inc. | 5.17% | |||
4. Cognizant Technology Solutions Corp. - Class A | 5.10% | |||
5. UnitedHealth Group, Inc. | 5.02% | |||
6. JPMorgan Chase & Co. | 4.91% | |||
7. International Business Machines Corp. | 4.83% | |||
8. KLA-Tencor Corp. | 4.53% | |||
9. Transocean, Ltd. | 4.45% | |||
10. Stryker Corp. | 4.40% | |||
^ Percentages are based on net assets. Holdings are subject to change.
Growth of $10,000 chart
The chart above represents historical performance of a hypothetical investment of $10,000 in the Fund over the past 10 years (or for the life of the Fund if shorter). Past performance does not guarantee future results. This chart does not reflect the deduction of taxes that a shareholder would pay on Fund distributions or the redemption of Fund shares. Fee waivers are in effect; if they had not been in effect, performance would have been lower.
| Average Annual Total Return | ||||||||||
1Year Return | 3 Year Return | 5 year Return | 10 year Return | Inception to Date | ||||||
White Oak Select Growth Fund | 19.27% | 7.79% | 5.21% | -1.42% | 8.14%* | |||||
S&P 500 Total Return Index1 | 17.22% | 1.73% | 2.95% | 2.82% | 8.53%* | |||||
Lipper Large-Cap Growth Funds Average2 | 18.33% | 2.21% | 3.42% | 1.82% | 7.55%** | |||||
* Since 08/03/1992 ** Since 07/31/1992 | Gross Expense Ratio (Per the current prospectus): 1.34% | |||||||||
The performance data quoted represents past performance. Past performance does not guarantee future results. The investment return and principal value of an investment will fluctuate so that an investor’s shares, when redeemed, may be worth more or less than their original cost and current performance may be lower or higher than the performance quoted. For performance data current to the most recent month end, please visit www.oakfunds.com or call 1-888-462-5386.
1 Standard & Poor’s is the source and owner of the S&P Index data. See Pages 9 and 10 for additional disclosure. 2 Lipper Inc. is the source and owner of the Lipper Classification data. See Pages 9 and 10 for additional disclosure.
2 | 1-888-462-5386 | www.oakfunds.com |
Table of Contents
Performance Update
| ||
All data below as of April 30, 2011 (Unaudited) |
| Fund Data | ||
Ticker Symbol | POGSX | |
Share Price | $31.78 | |
Total Net Assets | $74.8M | |
Portfolio Turnover | 15.28% | |
2011 Distributions | 0.09/Share | |
| Industry Weightings^ | ||
Information Technology | 31.4% | |
Financials | 22.5% | |
Consumer Discretionary | 18.9% | |
Energy | 9.0% | |
Industrials | 7.2% | |
Health Care | 4.2% | |
Utilities | 3.4% | |
Short Term Investments | 3.2% | |
| Top 10 Holdings^ | ||||
1. The Charles Schwab Corp. | 4.82% | |||
2. BMC Software, Inc. | 4.76% | |||
3. Amdocs, Ltd. | 4.75% | |||
4. CIT Group, Inc. | 4.37% | |||
5. Fair Isaac Corp. | 4.27% | |||
6. Biogen Idec, Inc. | 4.25% | |||
7. Capital One Financial Corp. | 4.11% | |||
8. Amazon.com, Inc. | 4.07% | |||
9. Noble Corp. | 3.83% | |||
10. The Western Union Co. | 3.52% | |||
^ Percentages are based on net assets. Holdings are subject to change.
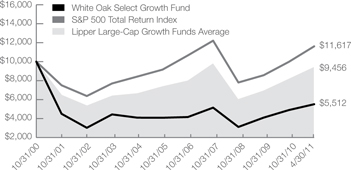
Growth of $10,000 Chart
The chart above represents historical performance of a hypothetical investment of $10,000 in the Fund over the past 10 years (or for the life of the Fund if shorter). Past performance does not guarantee future results. This chart does not reflect the deduction of taxes that a shareholder would pay on Fund distributions or the redemption of Fund shares. Fee waivers are in effect; if they had not been in effect, performance would have been lower.
| Average Annual Total Return | ||||||||||
1Year Return | 3 Year Return | 5 year Return | 10 year Return | Inception to Date | ||||||
Pin Oak Equity Fund | 18.16% | 11.67% | 8.32% | -0.56% | 6.59%* | |||||
S&P 500 Total Return Index1 | 17.22% | 1.73% | 2.95% | 2.82% | 8.53%* | |||||
Lipper Multi-Cap Growth Funds Average2 | 21.94% | 3.82% | 4.09% | 3.54% | 9.11%** | |||||
* Since08/03/1992 ** Since 07/31/1992 | Gross Expense Ratio (Per the current Prospectus): 1.33% | |||||||||
The performance data quoted represents past performance. Past performance does not guarantee future results. The investment return and principal value of an investment will fluctuate so that an investor’s shares, when redeemed, may be worth more or less than their original cost and current performance may be lower or higher than the performance quoted. For performance data current to the most recent month end, please visit www.oakfunds.com or call 1-888-462-5386.
1 Standard & Poor’s is the source and owner of the S&P Index data. See Pages 9 and 10 for additional disclosure. 2 Lipper Inc. is the source and owner of the Lipper Classification data. See Pages 9 and 10 for additional disclosure.
Semi-Annual Report | April 30, 2011 (Unaudited) | 3 |
Table of Contents
| Performance Update
| |
All data below as of April 30, 2011 (Unaudited) |
| Fund Data | ||
Ticker Symbol | RCKSX | |
Share Price | $12.97 | |
Total Net Assets | $7.7M | |
Portfolio Turnover | 13.61% | |
2011 Distributions | None | |
| Industry Weightings^ | ||
Information Technology | 33.1% | |
Health Care | 14.0% | |
Energy | 13.7% | |
Consumer Discretionary | 12.4% | |
Industrials | 9.1% | |
Financials | 7.0% | |
Materials | 5.1% | |
Consumer Staples | 2.5% | |
Short Term Investments | 2.1% | |
| Top 10 Holdings^ | ||||
1. Cognizant Technology Solutions Corp.- Class A | 5.86% | |||
2. VMware, Inc.- Class A | 4.48% | |||
3. Transocean, Ltd. | 4.27% | |||
4. Baidu, Inc. ADR | 4.07% | |||
5. Wynn Resorts, Ltd. | 4.03% | |||
6. Gilead Sciences, Inc. | 4.00% | |||
7. Ctrip.com International, Ltd. ADR | 3.81% | |||
8. Salesforce.com, Inc. | 3.52% | |||
9. Weatherford International, Ltd. | 3.40% | |||
10. Jacobs Engineering Group, Inc. | 3.23% | |||
^ Percentages are based on net assets. Holdings are subject to change.
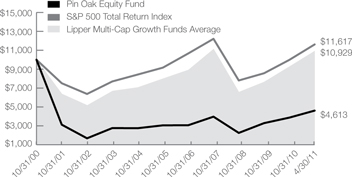
Growth of $10,000 Chart
The chart above represents historical performance of a hypothetical investment of $10,000 in the Fund over the past 10 years (or for the life of the Fund if shorter). Past performance does not guarantee future results. This chart does not reflect the deduction of taxes that a shareholder would pay on Fund distributions or the redemption of Fund shares. Fee waivers are in effect; if they had not been in effect, performance would have been lower.
| Average Annual Total Return | ||||||||||
1 year Return | 3 year Return | 5 year Return | 10 year Return | Inception to Date* | ||||||
Rock Oak Core Growth Fund | 25.31% | 3.61% | 3.95% | – | 4.93% | |||||
S&P 500 Total Return Index1 | 17.22% | 1.73% | 2.95% | – | 3.99% | |||||
Upper Large-Cap Growth Funds Average2 | 18.33% | 2.21% | 3.42% | – | 4.37% | |||||
* Since 12/31/2004 | Gross Expense Ratio (Per the current prospectus): 1.54% | |||||||||
The performance data quoted represents past performance. Past performance does not guarantee future results. The investment return and principal value of an investment will fluctuate so that an investor’s shares, when redeemed, may be worth more or less than their original cost and current performance may be lower or higher than the performance quoted. For performance data current to the most recent month end, please visit www.oakfunds.com or call 1-888-462-5386.
1 Standard & Poor’s is the source and owner of the S&P Index data. See Pages 9 and 10 for additional disclosure. 2 Lipper Inc. is the source and owner of the Lipper Classification data. See Pages 9 and 10 for additional disclosure.
4 | 1-888-462-5386 | www.oakfunds.com |
Table of Contents
| Performance Update
| |
All data below as of April 30, 2011 (Unaudited) |
| Fund Data | ||
Ticker Symbol | RIVSX | |
Share Price | $15.11 | |
Total Net Assets | $12.7M | |
Portfolio Turnover | 33.45% | |
2011 Distributions | 0.18/Share | |
| Industry Weightings^ | ||
Information Technology | 36.9% | |
Energy | 18.1% | |
Materials | 13.0% | |
Health Care | 9.1% | |
Industrials | 8.1% | |
Consumer Staples | 6.8% | |
Financials | 1.9% | |
Consumer Discretionary | 1.8% | |
Short Term Investments | 4.3% | |
| Top 10 Holdings^ | ||||
1. MercadoLibre, Inc. | 5.46% | |||
2. Veeco Instruments, Inc. | 4.71% | |||
3. Dril-Quip, Inc. | 4.52% | |||
4. CARBO Ceramics, Inc. | 4.18% | |||
5. Molycorp, Inc. | 4.15% | |||
6. Oceaneering International, Inc. | 3.85% | |||
7. The Medicines Co. | 3.74% | |||
8. The Boston Beer Co., Inc. - Class A | 3.49% | |||
9. B&G Foods, Inc. | 3.35% | |||
10. Terra Nitrogen Co., LP | 3.23% | |||
^ Percentages are based on net assets. Holdings are subject to change.
Growth of $10,000 Chart
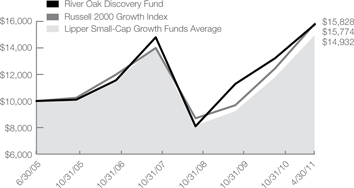
The chart above represents historical performance of a hypothetical investment of $10,000 in the Fund over the past 10 years (or for the life of the Fund if shorter). Past performance does not guarantee future results. This chart does not reflect the deduction of taxes that a shareholder would pay on Fund distributions or the redemption of Fund shares. Fee waivers are in effect; if they had not been in effect, performance would have been lower.
| Average Annual Total Return | ||||||||||
1Year Return | 3 Year Return | 5 year Return | 10 year Return | Inception to Date* | ||||||
River Oak Discovery Fund | 22.54% | 7.47% | 5.07% | – | 8.13% | |||||
Russell 2000 Growth Index1 | 30.29% | 9.62% | 5.14% | – | 8.19% | |||||
Lipper Small-Cap Growth Funds Average2 | 29.75% | 8.63% | 4.54% | – | 7.56% | |||||
* Since 06/30/2005 | Gross Expense Ratio (Per the current prospectus): 1.57% | |||||||||
The performance data quoted represents past performance. Past performance does not guarantee future results. The investment return and principal value of an investment will fluctuate so that an investor’s shares, when redeemed, may be worth more or less than their original cost and current performance may be lower or higher than the performance quoted. For performance data current to the most recent month end, please visit www.oakfunds.com or call 1-888-462-5386.
1 Russell Investments is the source and owner of the Russell Index data. See Pages 9 and 10 for additional disclosure.2 Lipper Inc. is the source and owner of the Lipper Classification data. See Pages 9 and 10 for additional disclosure.
Semi-Annual Report | April 30, 2011 (Unaudited) | 5 |
Table of Contents
| Performance Update
| |
All data below as of April 30, 2011 (Unaudited) |
| Fund Data | ||
Ticker Symbol | ROGSX | |
Share Price | $10.14 | |
Total Net Assets | $72.3M | |
Portfolio Turnover | 5.29% | |
2011 Distributions | None | |
| Industry Weightings^ | ||
Information Technology | 88.3% | |
Consumer Discretionary | 5.1% | |
Industrials | 3.6% | |
Telecommunication Services | 2.3% | |
Short term Investments | 0.6% | |
| Top 10 Holdings^ | ||||
1. Check Point Software Technologies, Ltd. | 6.08% | |||
2. Accenture PLC - Class A | 5.79% | |||
3. International Business Machines Corp. | 5.41% | |||
4. Amazon.com, Inc. | 5.08% | |||
5. Western Digital Corp. | 4.71% | |||
6. KLA-Tencor Corp. | 4.25% | |||
7. Symantec Corp. | 4.11% | |||
8. National Semiconductor Corp. | 3.97% | |||
9. Seagate Technology PLC | 3.95% | |||
10. CA, Inc. | 3.81% | |||
^ Percentages are based on net assets. Holdings are subject to change.
Growth of $10,000 Chart
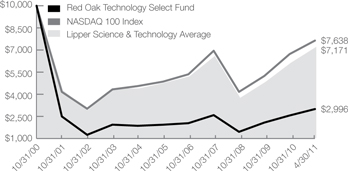
The chart above represents historical performance of a hypothetical investment of $10,000 in the Fund over the past 10 years (or for the life of the Fund if shorter). Past performance does not guarantee future results. This chart does not reflect the deduction of taxes that a shareholder would pay on Fund distributions or the redemption of Fund shares. Fee waivers are in effect; if they had not been in effect, performance would have been lower.
| Average Annual Total Return | ||||||||||
1Year Return | 3 Year Return | 5 year Return | 10 year Return | Inception to Date* | ||||||
Red Oak Technology Select Fund | 22.17% | 10.92% | 7.79% | -3.84% | 0.11% | |||||
NASDAQ 100 Index1 | 21.08% | 8.57% | 7.82% | 3.06% | 2.56% | |||||
Lipper Science & Technology Average2 | 25.07% | 8.72% | 5.83% | 1.49% | 3.63% | |||||
* Since 12/31/1988 | Gross Expense Ratio (Per the current prospectus): 1.53% | |||||||||
The performance data quoted represents past performance. Past performance does not guarantee future results. The investment return and principal value of an investment will fluctuate so that an investor’s shares, when redeemed, may be worth more or less than their original cost and current performance may be lower or higher than the performance quoted. For performance data current to the most recent month end, please visit www.oakfunds.com or call 1-888-462-5386.
1 NASDAQ is the source and owner of the NASDAQ Index data. See Pages 9 and 10 for additional disclosure. 2 Lipper Inc. is the source and owner of the Lipper Classification data. See Pages 9 and 10 for additional disclosure.
6 | 1-888-462-5386 | www.oakfunds.com |
Table of Contents
Black Oak Emerging Technology Fund
| Performance Update
| |
All data below as of April 30, 2011 (Unaudited) |
| Fund Data | ||
Ticker Symbol | BOGSX | |
Share Price | $3.45 | |
Total Net Assets | $37.8M | |
Portfolio Turnover | 37.97% | |
2011 Distributions | None | |
| Industry Weightings^ | ||
Information Technology | 73.6% | |
Health Care | 10.6% | |
Materials | 7.3% | |
Communications | 4.2% | |
Industrials | 3.8% | |
Short Term Investments | 0.6% | |
| Top 10 Holdings^ | ||||
1. Cognizant Technology Solutions Corp. - Class A | 7.05% | |||
2. MercadoLibre, Inc. | 5.94% | |||
3. Cerner Corp. | 5.81% | |||
4. Molycorp, Inc. | 5.54% | |||
5. VMware, Inc. - Class A | 5.40% | |||
6. Citrix Systems, Inc. | 5.20% | |||
7. Apple, Inc. | 4.97% | |||
8. Illumina, Inc. | 4.79% | |||
9. Qualcomm, Inc. | 4.77% | |||
10. Cavium Networks, Inc. | 4.74% | |||
^ Percentages are based on net assets. Holdings are subject to change.
Growth of $10,000 chart
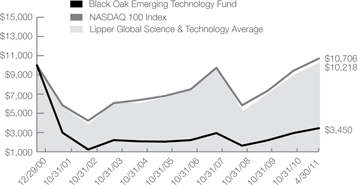
The chart above represents historical performance of a hypothetical investment of $10,000 in the Fund over the past 10 years (or for the life of the Fund if shorter). Past performance does not guarantee future results. This chart does not reflect the deduction of taxes that a shareholder would pay on Fund distributions or the redemption of Fund shares. Fee waivers are in effect; if they had not been in effect, performance would have been lower.
| Average Annual Total Return | ||||||||||
1Year Return | 3 Year Return | 5 year Return | 10 year Return | Inception to Date* | ||||||
Black Oak Emerging Technology Fund | 30.68% | 9.47% | 7.71% | -6.20% | -9.79%* | |||||
NASDAQ 100 Index1 | 21.08% | 8.57% | 7.82% | 3.06% | 0.66%* | |||||
Upper Global Science & Technology Average2 | 22.47% | 9.78% | 7.69% | 3.29% | 0.93%** | |||||
* Since 12/29/2000 ** Since 12/31/2000 | Gross Expense Ratio (Per the current prospectus): 1.55% | |||||||||
The performance data quoted represents past performance. Past performance does not guarantee future results. The investment return and principal value of an investment will fluctuate so that an investor’s shares, when redeemed, may be worth more or less than their original cost and current performance may be lower or higher than the performance quoted. For performance data current to the most recent month end, please visit www.oakfunds.com or call 1-888-462-5386.
1 NASDAQ is the source and owner of the NASDAQ Index data. See Pages 9 and 10 for additional disclosure.
2 Lipper Inc. is the source and owner of the Lipper Classification data. See Pages 9 and 10 for additional disclosure.
Semi-Annual Report | April 30, 2011 (Unaudited) | 7 |
Table of Contents
| Performance Update
| |
All data below as of April 30, 2011 (Unaudited) |
| Fund Data | ||
Ticker Symbol | LOGSX | |
Share Price | $14.49 | |
Total Net Assets | $24.3M | |
Portfolio Turnover | 8.70% | |
2011 Distributions | 0.62/Share | |
| Industry Weightings^ | ||
Pharmaceuticals | 33.8% | |
Health Care Providers & Services | 27.8% | |
Health Care Equipment & Supplies | 13.7% | |
Biotechnology | 10.5% | |
Life Sciences Tools & Services | 6.6% | |
Short Term Investments | 7.7% | |
| Top 10 Holdings^ | ||||
1. AmerisourceBergen Corp. | 6.28% | |||
2. Biogen Idee, Inc. | 6.26% | |||
3. Sanofi-Aventis SA ADR | 4.71% | |||
4. GlaxoSmithKline PLC ADR | 4.46% | |||
5. Novartis AG ADR | 4.29% | |||
6. Waters Corp. | 4.24% | |||
7. Cardinal Health, Inc. | 4.14% | |||
8. Amgen, Inc. | 3.94% | |||
9. PharMerica Corp. | 3.74% | |||
10. UnitedHealth Group, Inc. | 3.61% | |||
^ Percentages are based on net assets. Holdings are subject to change.
Growth of $10,000 chart
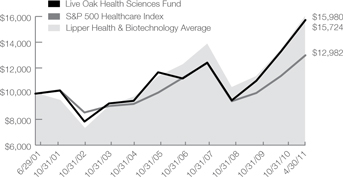
The chart above represents historical performance of a hypothetical investment of $10,000 in the Fund over the past 10 years (or for the life of the Fund if shorter). Past performance does not guarantee future results. This chart does not reflect the deduction of taxes that a shareholder would pay on Fund distributions or the redemption of Fund shares. Fee waivers are in effect; if they had not been in effect, performance would have been lower.
| Average Annual Total Return | ||||||||||
1 Year Return | 3 Year Return | 5 year Return | 10 year Return | Inception to Date | ||||||
Live Oak Health Sciences Fund | 22.57% | 11.74% | 6.60% | - | 4.71%* | |||||
S&P 500 Healthcare Index1 | 16.42% | 5.99% | 4.67% | - | 2.69%* | |||||
Lipper Health & Biotechnology Average2 | 19.98% | 9.34% | 6.11% | - | 4.59%** | |||||
* Since 06/29/2001 ** Since 06/30/2001 | Gross Expense Ratio (Per the current prospectus): 1.38% | |||||||||
The performance data quoted represents past performance. Past performance does not guarantee future results. The investment return and principal value of an investment will fluctuate so that an investor’s shares, when redeemed, may be worth more or less than their original cost and current performance may be lower or higher than the performance quoted. For performance data current to the most recent month end, please visit www.oakfunds.com or call 1-888-462-5386.
1 Standard & Poor’s is the source and owner of the S&P Index data. See Pages 9 and 10 for additional disclosure. 2 Lipper Inc. is the source and owner of the Lipper Classification data. See Pages 9 and 10 for additional disclosure.
8 | 1-888-462-5386 | www.oakfunds.com |
Table of Contents
| ||
As of April 30, 2011 (Unaudited)
|
Index Definitions and Disclosures
All indices are unmanaged and index performance figures include reinvestment of dividends but do not reflect any fees, expenses or taxes. Investors cannot invest directly in an index.
NASDAQ 100 Index – The NASDAQ 100 Index includes 100 of the largest domestic and international non-financial securities listed on The Nasdaq Stock Market based on market capitalization.
Russell 2000 Growth Index – The Russell 2000 Growth Index measures the performance of the small-cap growth segment of the U.S. equity universe. It includes those Russell 2000 companies with higher price-to-book ratios and higher forecasted growth values.
S&P 500 Healthcare Index – Is a capitalization-weighted index that encompasses two main industry groups. The first includes companies who manufacture health care equipment and supplies or provide health care related services, including distributors of health care products, providers of basic health-care services, and owners and operators of health care facilities and organizations. The second group consists of companies primarily involved in the research, development, production and marketing of Pharmaceuticals and biotechnology products.
S&P 500 Index – The S&P 500 Index is a commonly recognized, market capitalization weighted index of 500 widely held equity securities, designed to measure broad U.S. equity performance
Lipper Global Science & Technology Funds– Funds that invest primarily in the equity securities of domestic and foreign companies engaged in science and technology.
Lipper Health/Biotechnology Funds – Funds that invest primarily in the equity securities of domestic companies engaged in healthcare, medicine, and biotechnology.
Lipper Large-Cap Growth Funds – Funds that, by portfolio practice, invest at least 75% of their equity assets in companies with market capitalizations (on a three-year weighted basis) above Lipper’s USDE large-cap floor. Large-cap growth funds typically have an above-average price-to-earnings ratio, price-to-book ratio, and three-year sales-per-share growth value, compared to the S&P 500 Index.
Lipper Multi-Cap Growth Funds – Funds that, by portfolio practice, invest in a variety of market capitalization ranges without concentrating 75% of their equity assets in any one market capitalization range over an extended period of time. Multi-cap growth funds typically have an above-average price-to-earnings ratio, price-to-book ratio, and three-year sales per-share growth value, compared to the S&P SuperComposite 1500 Index.
Lipper Science & Technology Funds – Funds that invest primarily in the equity securities of domestic companies engaged in science and technology.
Lipper Small-Cap Growth Funds – Funds that, by portfolio practice, invest at least 75% of their equity assets in companies with market capitalizations (on a three-year weighted basis) below Lipper’s USDE small-cap ceiling. Small-cap growth funds typically have an above-average price-to-earnings ratio, price-to-book ratio, and three-year sales-per-share growth value, compared to the S&P Small-Cap 600 Index.
Semi-Annual Report | April 30, 2011 (Unaudited) | 9 |
Table of Contents
Important Disclosures
| ||
As of April 30, 2011 (Unaudited)
|
Lipper – A Thomson Reuters Company is the source and owner of the Lipper Classification data contained in this material and all trademarks and copyrights related thereto. Any further dissemination or redistribution is strictly prohibited. Lipper Inc. is not responsible for the formatting or configuration of this material or for any inaccuracy in Oak Associates Funds presentation thereof.
NASDAQ is the source and owner of the NASDAQ Index data contained in this material and all trademarks and copyrights related thereto. Any further dissemination or redistribution is strictly prohibited. NASDAQ is not responsible for the formatting or configuration of this material or for any inaccuracy in Oak Associates Funds presentation thereof.
Russell Investments is the source and owner of the Russell Index data contained in this material and all trademarks and copyrights related thereto. Any further dissemination or redistribution is strictly prohibited. Russell Investments is not responsible for the formatting or configuration of this material or for any inaccuracy in Oak Associates Funds presentation thereof.
Standard & Poor’s is the source and owner of the S&P Index data contained in this material and all trademarks and copyrights related thereto. Any further dissemination or redistribution is strictly prohibited. Standard & Poor’s is not responsible for the formatting or configuration of this material or for any inaccuracy in Oak Associates Funds presentation thereof.
10 | 1-888-462-5386 | www.oakfunds.com |
Table of Contents
| ||
As of April 30, 2011 (Unaudited)
|
All mutual funds have operating expenses. As a shareholder of a fund, your investment is affected by these ongoing costs, which include (among others) costs for portfolio management, administrative services, and shareholder reports like this one. It is important for you to understand the impact of these costs on your investment returns.
Operating expenses such as these are deducted from the fund’s gross income and directly reduce your final investment return. These expenses are expressed as a percentage of the fund’s average net assets; this percentage is known as the fund’s expense ratio.
The following examples use the expense ratio and are intended to help you understand the ongoing costs (in dollars) of investing in your Fund and to compare these costs with those of other mutual funds. The examples are based on an investment of $1,000 made at the beginning of the period shown and held for the entire period.
The table on the next page illustrates your Fund’s costs in two ways:
Actual Fund Return. This section helps you to estimate the actual expenses after fee waivers that your Fund incurred over the period. The “Expenses Paid During Period” column shows the actual dollar expense cost incurred by a $1,000 investment in the Fund, and the “Ending Account Value” number is derived from deducting that expense cost from the Fund’s gross investment return.
You can use this information, together with the actual amount you invested in the Fund, to estimate the expenses you paid over that period. Simply divide your actual account value by $1,000 to arrive at a ratio (for example, an $8,600 account value divided by $1,000 = $8.6), then multiply that ratio by the number shown for your Fund under “Expenses Paid During Period”.
Hypothetical 5% Return. This section helps you compare your Fund’s costs with those of other mutual funds. It assumes that the Fund had an annual 5% return before expenses during the year, but that the expense ratio (Column 3) for the period is unchanged. This example is useful in making comparisons because the Securities and Exchange Commission requires all mutual funds to make this 5% calculation. You can assess your Fund’s comparative cost by comparing the hypothetical result for your Fund in the “Expense Paid During Period” column with those that appear in the same charts in the shareholder reports for other funds.
Note: Because the return is set at 5% for comparison purposes — NOT your Fund’s actual return — the account values shown may not apply to your specific investment.
Semi-Annual Report | April 30, 2011 (Unaudited) | 11 |
Table of Contents
Disclosure of Fund Expenses
| ||
As of April 30, 2011 (Unaudited)
|
| Beginning Account Value 11/01/2010 | Ending Account Value 04/30/2011 | Annualized Expense Ratio | Expenses Paid During the Period(a) | |||||||||||||
White Oak Select Growth Fund | ||||||||||||||||
Actual Return | $ | 1,000.00 | $ | 1,125.70 | 1.14 | % | $ | 6.01 | ||||||||
Hypothetical 5% Return | $ | 1,000.00 | $ | 1,019.14 | 1.14 | % | $ | 5.71 | ||||||||
Pin Oak Equity Fund | ||||||||||||||||
Actual Return | $ | 1,000.00 | $ | 1,191.40 | 1.19 | % | $ | 6.47 | ||||||||
Hypothetical 5% Return | $ | 1,000.00 | $ | 1,018.89 | 1.19 | % | $ | 5.96 | ||||||||
Rock Oak Core Growth Fund | ||||||||||||||||
Actual Return | $ | 1,000.00 | $ | 1,162.20 | 1.25 | % | $ | 6.70 | ||||||||
Hypothetical 5% Return | $ | 1,000.00 | $ | 1,018.60 | 1.25 | % | $ | 6.26 | ||||||||
River Oak Discovery Fund | ||||||||||||||||
Actual Return | $ | 1,000.00 | $ | 1,193.00 | 1.35 | % | $ | 7.34 | ||||||||
Hypothetical 5% Return | $ | 1,000.00 | $ | 1,018.10 | 1.35 | % | $ | 6.76 | ||||||||
Red Oak Technology Select Fund | ||||||||||||||||
Actual Return | $ | 1,000.00 | $ | 1,169.50 | 1.31 | % | $ | 7.05 | ||||||||
Hypothetical 5% Return | $ | 1,000.00 | $ | 1,018.30 | 1.31 | % | $ | 6.56 | ||||||||
Black Oak Emerging Technology Fund | ||||||||||||||||
Actual Return | $ | 1,000.00 | $ | 1,173.50 | 1.30 | % | $ | 7.01 | ||||||||
Hypothetical 5% Return | $ | 1,000.00 | $ | 1,018.35 | 1.30 | % | $ | 6.51 | ||||||||
Live Oak Health Sciences Fund | ||||||||||||||||
Actual Return | $ | 1,000.00 | $ | 1,184.70 | 1.25 | % | $ | 6.77 | ||||||||
Hypothetical 5% Return | $ | 1,000.00 | $ | 1,018.60 | 1.25 | % | $ | 6.26 | ||||||||
| (a) | Expenses are equal to the Fund’s annualized expense ratio multiplied by the average account value over the period, multiplied by 181/365 (to reflect the one-half year period). |
12 | 1-888-462-5386 | www.oakfunds.com |
Table of Contents
| White Oak Select Growth Fund |
| |
As of April 30, 2011 (Unaudited)
|
| Security Description | Shares | Value | ||||||
COMMON STOCKS (100.0%) | ||||||||
CONSUMER DISCRETIONARY (6.0%) | ||||||||
Internet & Catalog Retail (6.0%) | ||||||||
Amazon.com, lnc.(a) | 83,400 | $ | 16,388,100 | |||||
ENERGY (4.4%) | ||||||||
Energy Equipment & Services (4.4%) | ||||||||
Transocean, Ltd.(a) | 168,000 | 12,222,000 | ||||||
FINANCIALS (22.6%) | ||||||||
Capital Markets (4.3%) | ||||||||
The Charles Schwab Corp. | 640,000 | 11,718,400 | ||||||
Commercial Banks (8.1%) | ||||||||
CIT Group, lnc.(a) | 280,400 | 11,905,784 | ||||||
M&T Bank Corp. | 60,000 | 5,302,200 | ||||||
TCF Financial Corp. | 325,000 | 5,066,750 | ||||||
| 22,274,734 | ||||||||
Diversified Financial Services (4.9%) | ||||||||
JPMorgan Chase & Co. | 295,400 | 13,479,102 | ||||||
Insurance (5.3%) | ||||||||
ACE, Ltd. | 218,300 | 14,680,675 | ||||||
HEALTH CARE (19.8%) | ||||||||
Biotechnology (4.1%) | ||||||||
Amgen, lnc.(a) | 196,500 | 11,171,025 | ||||||
Health Care Equipment & Supplies (4.4%) | ||||||||
Stryker Corp. | 205,000 | 12,095,000 | ||||||
Health Care Providers & Services (7.7%) | ||||||||
Express Scripts, lnc.(a) | 130,000 | 7,376,200 | ||||||
UnitedHealth Group, Inc. | 280,000 | 13,784,400 | ||||||
| 21,160,600 | ||||||||
Pharmaceuticals (3.6%) | ||||||||
Teva Pharmaceutical Industries, Ltd. ADR | 215,000 | 9,831,950 | ||||||
INFORMATION TECHNOLOGY (41.3%) | ||||||||
Communications Equipment (8.2%) | ||||||||
Cisco Systems, Inc. | 465,000 | 8,165,400 | ||||||
Qualcomm, Inc. | 250,000 | 14,210,000 | ||||||
| 22,375,400 | ||||||||
Semi-Annual Report | April 30, 2011 (Unaudited) | 13 |
Table of Contents
Schedules of Investments
| White Oak Select Growth Fund | |
As of April 30, 2011 (Unaudited)
|
| Security Description | Shares | Value | ||||||
Computers & Peripherals (4.8%) | ||||||||
International Business Machines Corp. | 77,700 | $ | 13,254,066 | |||||
Internet Software & Services (11.3%) | ||||||||
eBay, lnc.(a) | 321,500 | 11,059,600 | ||||||
Google, Inc. -Class A(a) | 20,600 | 11,208,460 | ||||||
Yahoo!, lnc.(a) | 492,000 | 8,733,000 | ||||||
| 31,001,060 | ||||||||
IT Services (5.1%) | ||||||||
Cognizant Technology Solutions | ||||||||
Corp. - Class A(a) | 169,000 | 14,010,100 | ||||||
Semiconductors & Semiconductor Equipment (8.1%) | ||||||||
Broadcom Corp. - Class A | 282,000 | 9,920,760 | ||||||
KLA-Tencor Corp. | 283,500 | 12,445,650 | ||||||
| 22,366,410 | ||||||||
Software (3.8%) | ||||||||
Salesforce.com, lnc.(a) | 75,000 | 10,395,000 | ||||||
MATERIALS (4.0%) | ||||||||
Metals & Mining (4.0%) | ||||||||
Goldcorp, Inc. | 198,000 | 11,054,340 | ||||||
TELECOMMUNICATION SERVICES (1.9%) | ||||||||
Wireless Telecommunication Services (1.9%) | ||||||||
Sprint Nextel Corp.(a) | 1,015,000 | 5,257,700 | ||||||
TOTAL COMMON STOCKS (Cost $189,222,982) | 274,735,662 | |||||||
SHORT TERM INVESTMENTS (0.1%) | ||||||||
Fidelity Institutional Money Market Government Portfolio - Class 1 (7 day yield 0.010%) | 208,947 | 208,947 | ||||||
TOTAL SHORT TERM INVESTMENTS (Cost $208,947) | 208,947 | |||||||
TOTAL INVESTMENTS - (100.1%) (Cost $189,431,929) | $ | 274,944,609 | ||||||
Liabilities in Excess of Other Assets - (-0.1%) | (300,045) | |||||||
NET ASSETS - (100.0%) | $ | 274,644,564 | ||||||
| (a) | Non-income producing security. |
Common Abbreviations:
ADR - American Depositary Receipt
Ltd. - Limited
14 | 1-888-462-5386 | www.oakfunds.com |
Table of Contents
Pin Oak Equity Fund
| Schedules of Investments
| |
As of April 30, 2011 (Unaudited)
|
| Security Description | Shares | Value | ||||||
COMMON STOCKS (96.6%) | ||||||||
CONSUMER DISCRETIONARY (18.9%) | ||||||||
Auto Components (1.9%) | ||||||||
Visteon Corp.(a) | 20,700 | $ 1,395,801 | ||||||
Hotels, Restaurants & Leisure (2.5%) | ||||||||
Interval Leisure Group, lnc.(a) | 116,882 | 1,878,294 | ||||||
Household Durables (3.3%) | ||||||||
Garmin, Ltd.(a) | 73,000 | 2,498,790 | ||||||
Internet & Catalog Retail (5.6%) | ||||||||
Amazon.com, lnc.(a) | 15,500 | 3,045,750 | ||||||
Blue Nile, lnc. (a) | 20,518 | 1,169,526 | ||||||
| 4,215,276 | ||||||||
Media (5.1%) | ||||||||
DISH Network Corp. - Class A(a) | 97,300 | 2,436,392 | ||||||
Gannett Co., Inc. | 62,700 | 944,262 | ||||||
News Corp. - Class A | 24,000 | 427,680 | ||||||
| 3,808,334 | ||||||||
Specialty Retail (0.5%) | ||||||||
The Pep Boys-Manny, Moe & Jack | 24,700 | 338,390 | ||||||
ENERGY (9.0%) | ||||||||
Energy Equipment & Services (9.0%) | ||||||||
Ensco PLC ADR | 7,500 | 447,150 | ||||||
Hercules Offshore, lnc.(a) | 90,100 | 565,378 | ||||||
Nabors Industries, Ltd.(a) | 68,400 | 2,095,776 | ||||||
Noble Corp. | 66,632 | 2,865,842 | ||||||
Pioneer Drilling Co.(a) | 48,200 | 747,100 | ||||||
| 6,721,246 | ||||||||
FINANCIALS (22.5%) | ||||||||
Capital Markets (6.3%) | ||||||||
The Charles Schwab Corp. | 197,000 | 3,607,070 | ||||||
Morgan Stanley | 42,000 | 1,098,300 | ||||||
| 4,705,370 | ||||||||
Commercial Banks (10.9%) | ||||||||
CIT Group, lnc.(a) | 77,000 | 3,269,420 | ||||||
First Bancorp | 41,032 | 572,807 | ||||||
Great Southern Bancorp, Inc. | 47,345 | 980,041 | ||||||
International Bancshares Corp. | 92,700 | 1,633,374 | ||||||
SunTrust Banks, Inc. | 60,000 | 1,691,400 | ||||||
West Bancorporation, Inc. | 6,000 | 46,740 | ||||||
| 8,193,782 | ||||||||
Semi-Annual Report | April 30, 2011 (Unaudited) | 15 |
Table of Contents
Schedules of Investments
| Pin Oak Equity Fund | |
As of April 30, 2011 (Unaudited)
|
| Security Description | Shares | Value | ||||||
Consumer Finance (4.1%) | ||||||||
Capital One Financial Corp. | 56,200 | $ 3,075,826 | ||||||
Insurance (1.2%) | ||||||||
The Travelers Cos., Inc. | 13,600 | 860,608 | ||||||
HEALTH CARE (4.2%) | ||||||||
Biotechnology (4.2%) | ||||||||
Biogen Idee, lnc.(a) | 32,700 | 3,183,345 | ||||||
INDUSTRIALS (7.2%) | ||||||||
Aerospace & Defense (4.1%) | ||||||||
Lockheed Martin Corp. | 16,000 | 1,268,000 | ||||||
Raytheon Co. | 37,200 | 1,806,060 | ||||||
| 3,074,060 | ||||||||
Construction & Engineering (3.1%) | ||||||||
KBR, Inc. | 29,700 | 1,139,589 | ||||||
The Shaw Group, lnc.(a) | 31,000 | 1,205,900 | ||||||
| 2,345,489 | ||||||||
INFORMATION TECHNOLOGY (31.4%) | ||||||||
Internet Software & Services (8.3%) | ||||||||
eBay, lnc.(a) | 47,000 | 1,616,800 | ||||||
Google, Inc. - Class A(a) | 4,800 | 2,611,680 | ||||||
IAC/lnterActiveCorp.(a) | 55,756 | 2,013,349 | ||||||
| 6,241,829 | ||||||||
IT Services (10.5%) | ||||||||
Amdocs, Ltd.(a) | 115,572 | 3,553,839 | ||||||
Paychex, Inc. | 49,949 | 1,633,832 | ||||||
The Western Union Co. | 124,000 | 2,635,000 | ||||||
| 7,822,671 | ||||||||
Semiconductors & Semiconductor Equipment (0.8%) | ||||||||
KLA-Tencor Corp. | 13,700 | 601,430 | ||||||
Software (11.8%) | ||||||||
BMC Software, lnc.(a) | 71,000 | 3,566,330 | ||||||
Fair Isaac Corp. | 107,022 | 3,197,818 | ||||||
Microsoft Corp. | 79,000 | 2,055,580 | ||||||
| 8,819,728 | ||||||||
UTILITIES (3.4%) | ||||||||
Electric Utilities (3.4%) | ||||||||
Edison International | 65,000 | 2,552,550 | ||||||
TOTAL COMMON STOCKS (Cost $51,682,748) | 72,332,819 | |||||||
16 | 1-888-462-5386 | www.oakfunds.com |
Table of Contents
Pin Oak Equity Fund
| Schedules of Investments
| |
As of April 30, 2011 (Unaudited) |
| Security Description | Shares | Value | ||||||
SHORT TERM INVESTMENTS (3.2%) | ||||||||
Fidelity Institutional Money Market Government Portfolio - Class I (7 day yield 0.010%) | 2,388,598 | $ | 2,388,598 | |||||
TOTAL SHORT TERM INVESTMENTS (Cost $2,388,598) | 2,388,598 | |||||||
TOTAL INVESTMENTS - (99.8%) (Cost $54,071,346) | $ | 74,721,417 | ||||||
Other Assets and Liabilities, net - (0.2%) | 123,233 | |||||||
NET ASSETS - (100.0%) | $ | 74,844,650 | ||||||
| (a) | Non-income producing security. |
Common Abbreviations:
ADR - American Depositary Receipt
Ltd. - Limited
PLC - Public Limited Company
Semi-Annual Report | April 30, 2011 (Unaudited) | 17 |
Table of Contents
Schedules of Investments
| Rock Oak Core Growth Fund
| |
As of April 30, 2011 (Unaudited) |
| Security Description | Shares | Value | ||||||
COMMON STOCKS (96.9%) | ||||||||
CONSUMER DISCRETIONARY (12.4%) | ||||||||
Hotels, Restaurants & Leisure (10.8%) | ||||||||
Ctrip.com International, Ltd. ADR(a) | 6,000 | $ | 292,320 | |||||
Las Vegas Sands Corp.(a) | 4,800 | 225,648 | ||||||
Wynn Resorts, Ltd. | 2,100 | 309,015 | ||||||
| 826,983 | ||||||||
Media (1.6%) | ||||||||
DISH Network Corp. - Class A(a) | 5,000 | 125,200 | ||||||
CONSUMER STAPLES (2.5%) | ||||||||
Food & Staples Retailing (2.5%) | ||||||||
Whole Foods Market, Inc. | 3,100 | 194,556 | ||||||
ENERGY (13.7%) | ||||||||
Energy Equipment & Services (13.7%) | ||||||||
National Oilwell Varco, Inc. | 2,900 | 222,401 | ||||||
Noble Corp. | 5,500 | 236,555 | ||||||
Transocean, Ltd.(a) | 4,500 | 327,375 | ||||||
Weatherford International, Ltd.(a) | 12,100 | 261,118 | ||||||
| 1,047,449 | ||||||||
FINANCIALS (7.0%) | ||||||||
Capital Markets (2.0%) | ||||||||
Legg Mason, Inc. | 4,000 | 148,600 | ||||||
Consumer Finance (3.1%) | ||||||||
American Express Co. | 4,900 | 240,492 | ||||||
Diversified Financial Services (1.9%) | ||||||||
CME Group, Inc. | 500 | 147,885 | ||||||
HEALTH CARE (14.0%) | ||||||||
Biotechnology (4.0%) | ||||||||
Gilead Sciences, lnc.(a) | 7,900 | 306,836 | ||||||
Health Care Providers & Services (7.3%) | ||||||||
AmerisourceBergen Corp. | 4,000 | 162,560 | ||||||
Express Scripts, lnc.(a) | 3,950 | 224,123 | ||||||
McKesson Corp. | 2,100 | 174,321 | ||||||
| 561,004 | ||||||||
Health Care Technology (2.7%) | ||||||||
Cerner Corp.(a) | 1,700 | 204,306 | ||||||
18 | 1-888-462-5386 | www.oakfunds.com |
Table of Contents
Rock Oak Core Growth Fund
| Schedules of Investments
| |
As of April 30, 2011 (Unaudited) |
| Security Description | Shares | Value | ||||||
INDUSTRIALS (9.1%) | ||||||||
Aerospace & Defense (2.5%) | ||||||||
ITT Corp. | 3,300 | $ | 190,707 | |||||
Air Freight & Logistics (3.1%) | ||||||||
Expeditors International of Washington, Inc. | 4,400 | 238,788 | ||||||
Construction & Engineering (3.3%) | ||||||||
Jacobs Engineering Group, lnc.(a) | 5,000 | 248,050 | ||||||
Electrical Equipment (0.2%) | ||||||||
Rockwell Automation, Inc. | 200 | $17,426 | ||||||
INFORMATION TECHNOLOGY (33.1%) | ||||||||
Communications Equipment (7.3%) | ||||||||
F5 Networks, lnc.(a) | 1,800 | 182,448 | ||||||
Juniper Networks, lnc.(a) | 5,175 | 198,358 | ||||||
Qualcomm, Inc. | 3,100 | 176,204 | ||||||
| 557,010 | ||||||||
Computers & Peripherals (2.5%) | ||||||||
NetApp, lnc.(a) | 3,700 | 192,326 | ||||||
Internet Software & Services (4.1%) | ||||||||
Baidu, Inc. ADR(a) | 2,100 | 311,892 | ||||||
IT Services (8.8%) | ||||||||
Cognizant Technology Solutions | ||||||||
Corp. - Class A(a) | 5,425 | 449,733 | ||||||
Mastercard, Inc. - Class A | 825 | 227,609 | ||||||
| 677,342 | ||||||||
Semiconductors & Semiconductor Equipment (2.4%) | ||||||||
Broadcom Corp. - Class A | 5,300 | 186,454 | ||||||
Software (8.0%) | ||||||||
Salesforce.com, lnc.(a) | 1,950 | 270,270 | ||||||
VMware, Inc. - Class A(a) | 3,600 | 343,548 | ||||||
| 613,818 | ||||||||
MATERIALS (5.1%) | ||||||||
Chemicals (2.1%) | ||||||||
Sociedad Quimica y Minera de | ||||||||
Chile SA ADR | 2,675 | 163,255 | ||||||
Semi-Annual Report | April 30, 2011 (Unaudited) | 19 |
Table of Contents
Schedules of Investments
| Rock Oak Core Growth Fund
| |
As of April 30, 2011 (Unaudited) |
| Security Description | Shares | Value | ||||||
Metals & Mining (3.0%) | ||||||||
Molycorp, lnc.(a) | 2,400 | $ | 175,920 | |||||
Nucor Corp. | 1,100 | 51,656 | ||||||
| 227,576 | ||||||||
TOTAL COMMON STOCKS (Cost $5,136,091) | 7,427,955 | |||||||
SHORT TERM INVESTMENTS (2.1%) | ||||||||
Fidelity Institutional Money Market Government Portfolio - Class I (7 day yield 0.010%) | 164,303 | 164,303 | ||||||
TOTAL SHORT TERM INVESTMENTS (Cost $164,303) | 164,303 | |||||||
TOTAL INVESTMENTS - (99.0%) (Cost $5,300,394) | $ | 7,592,258 | ||||||
Other Assets and Liabilities, net - (1.0%) | 78,886 | |||||||
NET ASSETS - (100.0%) | $ | 7,671,144 | ||||||
| (a) | Non-income producing security. |
Common Abbreviations:
ADR - American Depositary Receipt
Ltd. - Limited
SA - Generally designates corporations in various countries, mostly those employing the civil law.
20 | 1-888-462-5386 | www.oakfunds.com |
Table of Contents
River Oak Discovery Fund
| Schedules of Investments
| |
As of April 30, 2011 (Unaudited) |
| Security Description | Shares | Value | ||||||
COMMON STOCKS (95.7%) | ||||||||
CONSUMER DISCRETIONARY (1.8%) | ||||||||
Media (1.8%) | ||||||||
Morningstar, Inc. | 3,900 | $ | 224,640 | |||||
CONSUMER STAPLES (6.8%) | ||||||||
Beverages (3.5%) | ||||||||
The Boston Beer Co., Inc. - Class A(a) | 4,700 | 443,022 | ||||||
Food Products (3.3%) | ||||||||
B&G Foods, Inc. | 23,525 | 425,332 | ||||||
ENERGY (18.1%) | ||||||||
Energy Equipment & Services (17.9%) | ||||||||
Atwood Oceanics, lnc.(a) | 6,600 | 296,538 | ||||||
CARBO Ceramics, Inc. | 3,300 | 531,102 | ||||||
Dril-Quip, lnc.(a) | 7,500 | 574,200 | ||||||
Oceaneering International, lnc.(a) | 5,600 | 489,552 | ||||||
Tesco Corp.(a) | 20,100 | 378,081 | ||||||
| 2,269,473 | ||||||||
Oil, Gas & Consumable Fuels (0.2%) | ||||||||
USEC, lnc.(a) | 6,000 | 27,480 | ||||||
FINANCIALS (1.9%) | ||||||||
Capital Markets (1.9%) | ||||||||
Janus Capital Group, Inc. | 19,500 | 237,315 | ||||||
HEALTH CARE (9.1%) | ||||||||
Biotechnology (2.6%) | ||||||||
Cubist Pharmaceuticals, lnc.(a) | 9,850 | 333,422 | ||||||
Health Care Providers & Services (2.8%) | ||||||||
HMS Holdings Corp.(a) | 4,500 | 354,195 | ||||||
Pharmaceuticals (3.7%) | ||||||||
The Medicines Co.(a) | 30,300 | 475,710 | ||||||
INDUSTRIALS (8.1%) | ||||||||
Aerospace & Defense (1.8%) | ||||||||
American Science & Engineering, Inc. | 2,600 | 229,060 | ||||||
Commercial Services & Supplies (2.3%) | ||||||||
EnergySolutions, Inc. | 52,100 | 294,365 | ||||||
Semi-Annual Report | April 30, 2011 (Unaudited) | 21 |
Table of Contents
Schedules of Investments
| River Oak Discovery Fund
| |
As of April 30, 2011 (Unaudited) |
| Security Description | Shares | Value | ||||||
Construction & Engineering (2.9%) | ||||||||
EMCOR Group, lnc.(a) | 11,900 | $ | 368,543 | |||||
Industrial Conglomerates (1.1%) | ||||||||
Raven Industries, Inc. | 2,500 | 135,900 | ||||||
INFORMATION TECHNOLOGY (36.9%) | ||||||||
Computers & Peripherals (2.9%) | ||||||||
STEC, lnc.(a) | 17,700 | 370,284 | ||||||
Electronic Equipment & Instruments (2.7%) | ||||||||
Itron, lnc.(a) | 6,400 | 348,352 | ||||||
Internet Software & Services (7.5%) | ||||||||
MercadoLibre, Inc. | 7,600 | 694,640 | ||||||
Sohu.com, Inc.(a) | 2,400 | 253,824 | ||||||
| 948,464 | ||||||||
Semiconductors & Semiconductor Equipment (11.6%) | ||||||||
Cavium Networks, lnc.(a) | 7,400 | 349,428 | ||||||
Evergreen Solar, lnc.(a) | 3,985 | 5,778 | ||||||
Micrel, Inc. | 19,000 | 243,390 | ||||||
Varian Semiconductor Equipment Associates, lnc.(a) | 6,750 | 283,028 | ||||||
Veeco Instruments, lnc.(a) | 11,700 | 598,221 | ||||||
| 1,479,845 | ||||||||
Software (12.2%) | ||||||||
Asialnfo-Linkage, lnc.(a) | 12,100 | 228,690 | ||||||
Ebix, lnc.(a) | 13,100 | 299,335 | ||||||
Factset Research Systems, Inc. | 1,500 | 164,115 | ||||||
Fortinet, lnc.(a) | 7,400 | 360,380 | ||||||
Netscout Systems, lnc.(a) | 13,200 | 337,788 | ||||||
Verint Systems, lnc.(a) | 4,600 | 157,458 | ||||||
| 1,547,766 | ||||||||
MATERIALS (13.0%) | ||||||||
Chemicals (3.2%) | ||||||||
Terra Nitrogen Co., LP | 3,600 | 410,436 | ||||||
Containers & Packaging (2.5%) | ||||||||
Greif, Inc. - Class A | 5,100 | 316,710 | ||||||
Metals & Mining (7.3%) | ||||||||
Lynas Corp., Ltd. ADR(a) | 17,500 | 399,875 | ||||||
Molycorp, lnc.(a) | 7,200 | 527,760 | ||||||
| 927,635 | ||||||||
22 | 1-888-462-5386 | www.oakfunds.com |
Table of Contents
River Oak Discovery Fund
| Schedules of Investments
| |
As of April 30, 2011 (Unaudited)
|
| Security Description | Shares | Value | ||||||
TOTAL COMMON STOCKS (Cost $9,371,045) | $ | 12,167,949 | ||||||
SHORT TERM INVESTMENTS (4.3%) | ||||||||
Fidelity Institutional Money Market Government Portfolio - Class I (7 day yield 0.010%) | 541,487 | 541,487 | ||||||
TOTAL SHORT TERM INVESTMENTS (Cost $541,487) | 541,487 | |||||||
TOTAL INVESTMENTS - (100.0%) (Cost $9,912,532) | $ | 12,709,436 | ||||||
Other Assets and Liabilities, net - (0.0%) | 1,276 | |||||||
NET ASSETS - (100.0%) | $ | 12,710,712 | ||||||
| (a) | Non-income producing security. |
Common Abbreviations:
ADR - American Depositary Receipt
Ltd.- Limited
Semi-Annual Report | April 30, 2011 (Unaudited) | 23 |
Table of Contents
Schedules of Investments
| Red Oak Technology Select Fund
| |
As of April 30, 2011 (Unaudited) |
| Security Description | Shares | Value | ||||||
COMMON STOCKS (99.3%) | ||||||||
CONSUMER DISCRETIONARY (5.1%) | ||||||||
Internet & Catalog Retail (5.1%) | ||||||||
Amazon.com, lnc.(a) | 18,700 | $ | 3,674,550 | |||||
INDUSTRIALS (3.6%) | ||||||||
Aerospace & Defense (3.6%) | ||||||||
Huntington Ingalls Industries, lnc.(a) | 6,166 | 246,640 | ||||||
Northrop Grumman Corp. | 37,000 | 2,353,570 | ||||||
| 2,600,210 | ||||||||
INFORMATION TECHNOLOGY (88.3%) | ||||||||
Communications Equipment (0.5%) | ||||||||
Cisco Systems, Inc. | 22,000 | �� | 386,320 | |||||
Computers & Peripherals (21.6%) | ||||||||
Apple, lnc.(a) | 4,000 | 1,392,920 | ||||||
EMC Corp.(a) | 70,000 | 1,983,800 | ||||||
International Business Machines Corp. | 22,900 | 3,906,282 | ||||||
Lexmark International, Inc. - Class A(a) | 64,000 | 2,064,000 | ||||||
Seagate Technology PLC | 162,000 | 2,854,440 | ||||||
Western Digital Corp.(a) | 85,500 | 3,402,900 | ||||||
| 15,604,342 | ||||||||
Internet Software & Services (10.4%) | ||||||||
eBay, lnc.(a) | 44,000 | 1,513,600 | ||||||
Google, Inc. - Class A(a) | 4,700 | 2,557,270 | ||||||
lAC/lnterActive Corp.(a) | 71,000 | 2,563,810 | ||||||
Yahoo!, lnc.(a) | 51,100 | 907,025 | ||||||
| 7,541,705 | ||||||||
IT Services (14.2%) | ||||||||
Accenture PLC - Class A | 73,200 | 4,181,916 | ||||||
Alliance Data Systems Corp.(a) | 22,600 | 2,147,000 | ||||||
Computer Sciences Corp. | 52,000 | 2,650,960 | ||||||
Total System Services, Inc. | 68,500 | 1,291,225 | ||||||
| 10,271,101 | ||||||||
Semiconductors & Semiconductor Equipment (25.5%) | ||||||||
Broadcom Corp. - Class A | 28,700 | 1,009,666 | ||||||
Integrated Device Technology, lnc.(a) | 188,000 | 1,529,380 | ||||||
Intel Corp. | 56,000 | 1,298,640 | ||||||
KLA-Tencor Corp. | 70,000 | 3,073,000 | ||||||
Marvell Technology Group, Ltd.(a) | 89,000 | 1,373,270 | ||||||
National Semiconductor Corp. | 119,000 | 2,870,280 | ||||||
Novellus Systems, lnc.(a) | 27,000 | 866,700 | ||||||
Sigma Designs, lnc.(a) | 96,446 | 1,230,651 | ||||||
Spansion, Inc. - Class A(a) | 47,518 | 936,104 | ||||||
Texas Instruments, Inc. | 54,000 | 1,918,620 | ||||||
24 | 1-888-462-5386 | www.oakfunds.com |
Table of Contents
Red Oak Technology Select Fund
| Schedules of Investments
| |
As of April 30, 2011 (Unaudited)
|
| Security Description | Shares | Value | ||||||
Semiconductors & Semiconductor Equipment (continued) | ||||||||
Xilinx, Inc. | 66,000 | $ | 2,300,760 | |||||
| 18,407,071 | ||||||||
Software (16.1%) | ||||||||
CA, Inc. | 112,000 | 2,754,080 | ||||||
Check Point Software Technologies, Ltd.(a) | 80,000 | 4,394,400 | ||||||
Symantec Corp.(a) | 151,000 | 2,967,150 | ||||||
Synopsys, lnc.(a) | 54,000 | 1,479,060 | ||||||
| 11,594,690 | ||||||||
TELECOMMUNICATION SERVICES (2.3%) | ||||||||
Wireless Telecommunication Services (2.3%) | ||||||||
Sprint Nextel Corp.(a) | 322,000 | 1,667,960 | ||||||
TOTAL COMMON STOCKS (Cost $49,269,404) | 71,747,949 | |||||||
SHORT TERM INVESTMENTS (0.6%) | ||||||||
Fidelity Institutional Money Market Government Portfolio - Class I (7 day yield 0.010%) | 440,358 | 440,358 | ||||||
TOTAL SHORT TERM INVESTMENTS (Cost $440,358) | 440,358 | |||||||
TOTAL INVESTMENTS - (99.9%) (Cost $49,709,762) | $ | 72,188,307 | ||||||
Other Assets and Liabilities, net - (0.1%) | 76,813 | |||||||
NET ASSETS - (100.0%) | $ | 72,265,120 | ||||||
| (a) | Non-income producing security. |
Common Abbreviations:
ADR - American Depositary Receipt
Ltd. - Limited
PLC - Public Limited Company
Semi-Annual Report | April 30, 2011 (Unaudited) | 25 |
Table of Contents
Schedules of Investments
| Black Oak Emerging Technology Fund
| |
As of April 30, 2011 (Unaudited) |
| Security Description | Shares | Value | ||||||
COMMON STOCKS (99.5%) | ||||||||
COMMUNICATIONS (4.2%) | ||||||||
Telecommunications (4.2%) | ||||||||
Acme Packet, lnc.(a) | 19,200 | $ | 1,586,112 | |||||
HEALTH CARE (10.6%) | ||||||||
Health Care Technology (5.8%) | ||||||||
Cerner Corp.(a) | 18,300 | 2,199,294 | ||||||
Life Sciences Tools & Services (4.8%) | ||||||||
Illumina, lnc.(a) | 25,500 | 1,809,990 | ||||||
INDUSTRIALS (3.8%) | ||||||||
Aerospace & Defense (3.8%) | ||||||||
American Science & Engineering, Inc. | 16,378 | 1,442,902 | ||||||
INFORMATION TECHNOLOGY (73.6%) | ||||||||
Communications Equipment (4.8%) | ||||||||
Qualcomm, Inc. | 31,750 | 1,804,670 | ||||||
Computers & Peripherals (7.7%) | ||||||||
Apple, lnc.(a) | 5,400 | 1,880,442 | ||||||
NetApp, lnc.(a) | 20,000 | 1,039,600 | ||||||
| 2,920,042 | ||||||||
Electronic Equipment & Instruments (3.8%) | ||||||||
Corning, Inc. | 18,300 | 383,202 | ||||||
Itron, lnc.(a) | 18,900 | 1,028,727 | ||||||
| 1,411,929 | ||||||||
Internet Software & Services (11.7%) | ||||||||
MercadoLibre, Inc. | 24,600 | 2,248,440 | ||||||
NetEase.com, Inc. ADR(a) | 21,200 | 1,044,736 | ||||||
Sohu.com, lnc.(a) | 10,800 | 1,142,208 | ||||||
| 4,435,384 | ||||||||
IT Services (8.1%) | ||||||||
Cognizant Technology Solutions | ||||||||
Corp. - Class A(a) | 32,150 | 2,665,235 | ||||||
Yucheng Technologies, Ltd.(a) | 95,603 | 382,412 | ||||||
| 3,047,647 | ||||||||
Semiconductors & Semiconductor Equipment (10.9%) | ||||||||
Cavium Networks, lnc.(a) | 38,000 | 1,794,360 | ||||||
Micrel, Inc. | 97,800 | 1,252,818 | ||||||
NVIDIA Corp.(a) | 54,250 | 1,085,000 | ||||||
| 4,132,178 | ||||||||
26 | 1-888-462-5386 | www.oakfunds.com |
Table of Contents
Black Oak Emerging Technology Fund
| Schedules of Investments
| |
As of April 30, 2011 (Unaudited) |
| Security Description | Shares | Value | ||||||
Software (26.6%) | ||||||||
ANSYS, lnc.(a) | 24,200 | $ | 1,338,018 | |||||
Asialnfo-Linkage, lnc.(a) | 36,100 | 682,290 | ||||||
Citrix Systems, lnc.(a) | 23,300 | 1,965,122 | ||||||
Fortinet, lnc.(a) | 23,700 | 1,154,190 | ||||||
Red Hat, lnc.(a) | 25,800 | 1,224,726 | ||||||
Salesforce.com, lnc.(a) | 12,000 | 1,663,200 | ||||||
VMware, Inc. - Class A(a) | 21,400 | 2,042,202 | ||||||
| 10,069,748 | ||||||||
MATERIALS (7.3%) | ||||||||
Metals & Mining (7.3%) | ||||||||
Lynas Corp., Ltd. ADR(a) | 30,000 | 685,500 | ||||||
Molycorp, lnc.(a) | 28,600 | 2,096,380 | ||||||
| 2,781,880 | ||||||||
TOTAL COMMON STOCKS (Cost $30,788,858) | 37,641,776 | |||||||
SHORT TERM INVESTMENTS (0.6%) | ||||||||
Fidelity Institutional Money Market Government Portfolio - Class I (7 day yield 0.010%) | 210,488 | 210,488 | ||||||
TOTAL SHORT TERM INVESTMENTS (Cost $210,488) | 210,488 | |||||||
TOTAL INVESTMENTS - (100.1%) (Cost $30,999,346) | $ | 37,852,264 | ||||||
Liabilities in Excess of Other Assets - (-0.1%) | (30,532 | ) | ||||||
NET ASSETS - (100.0%) | $ | 37,821,732 | ||||||
| (a) | Non-income producing security. |
Common Abbreviations:
ADR - American Depositary Receipt
Ltd. - Limited
Semi-Annual Report | April 30, 2011 (Unaudited) | 27 |
Table of Contents
Schedules of Investments
| Live Oak Health Sciences Fund
| |
As of April 30, 2011 (Unaudited) |
| Security Description | Shares | Value | ||||||
COMMON STOCKS (92.3%) | ||||||||
HEALTH CARE (92.3%) | ||||||||
Biotechnology (10.5%) | ||||||||
Amgen, lnc.(a) | 16,800 | $ | 955,080 | |||||
Biogen Idec, lnc.(a) | 15,600 | 1,518,660 | ||||||
Targacept, lnc.(a) | 2,800 | 67,704 | ||||||
| 2,541,444 | ||||||||
Health Care Equipment & Supplies (13.7%) | ||||||||
Baxter International, Inc. | 7,000 | 398,300 | ||||||
Becton Dickinson and Co. | 7,300 | 627,362 | ||||||
Boston Scientific Corp.(a) | 29,500 | 220,955 | ||||||
CareFusion Corp.(a) | 24,000 | 704,880 | ||||||
CR Bard, Inc. | 5,900 | 629,825 | ||||||
Medtronic, Inc. | 17,900 | 747,325 | ||||||
| 3,328,647 | ||||||||
Health Care Providers & Services (27.8%) | ||||||||
AmerisourceBergen Corp. | 37,500 | 1,524,000 | ||||||
Cardinal Health, Inc. | 23,000 | 1,004,870 | ||||||
Centene Corp.(a) | 4,600 | 166,658 | ||||||
McKesson Corp. | 10,200 | 846,702 | ||||||
Molina Healthcare, lnc.(a) | 13,450 | 578,350 | ||||||
PharMerica Corp.(a) | 68,942 | 907,276 | ||||||
UnitedHealth Group, Inc. | 17,800 | 876,294 | ||||||
WellPoint, Inc. | 10,800 | 829,332 | ||||||
| 6,733,482 | ||||||||
Life Sciences Tools & Services (6.6%) | ||||||||
Affymetrix, lnc.(a) | 12,000 | 64,800 | ||||||
Techne Corp. | 6,500 | 505,115 | ||||||
Waters Corp.(a) | 10,500 | 1,029,000 | ||||||
| 1,598,915 | ||||||||
Pharmaceuticals (33.7%) | ||||||||
AstraZeneca PLC ADR | 16,800 | 837,144 | ||||||
Corcept Therapeutics, lnc.(a) | 10,570 | 46,508 | ||||||
Eli Lilly & Co. | 18,000 | 666,180 | ||||||
GlaxoSmithKline PLC ADR | 24,800 | 1,082,768 | ||||||
Johnson & Johnson | 13,100 | 860,932 | ||||||
Medicis Pharmaceutical Corp. - Class A | 6,600 | 234,036 | ||||||
Novartis AG ADR | 17,600 | 1,041,392 | ||||||
Par Pharmaceutical Cos., lnc.(a) | 23,000 | 792,120 | ||||||
Pfizer, Inc. | 38,000 | 796,480 | ||||||
Sanofi-Aventis SA ADR | 28,900 | 1,142,128 | ||||||
Teva Pharmaceutical Industries, Ltd. ADR | 15,000 | 685,950 | ||||||
| 8,185,638 | ||||||||
28 | 1-888-462-5386 | www.oakfunds.com |
Table of Contents
Live Oak Health Sciences Fund
| Schedules of Investments
| |
| As of April 30, 2011 (Unaudited) |
| Security Description | Shares | Value | ||||||
TOTAL COMMON STOCKS (Cost $15,546,786) | $ | 22,388,126 | ||||||
RIGHTS (0.1%) | ||||||||
HEALTH CARE (0.1%) | ||||||||
Pharmaceuticals (0.1%) | ||||||||
Sanofi-Aventis SA, Rights, (expiring 12/31/20)(a) | ||||||||
| 6,500 | 16,120 | |||||||
TOTAL RIGHTS (Cost $15,632) | 16,120 | |||||||
SHORT TERM INVESTMENTS (7.7%) | ||||||||
Fidelity Institutional Money Market Government Portfolio - Class 1 (7 day yield 0.010%) | 1,870,878 | 1,870,878 | ||||||
TOTAL SHORT TERM INVESTMENTS (Cost $1,870,878) | 1,870,878 | |||||||
TOTAL INVESTMENTS - (100.1%) (Cost $17,433,296) | $ | 24,275,124 | ||||||
Liabilities in Excess of Other Assets - (-0.1%) | (17,707 | ) | ||||||
NET ASSETS - (100.0%) | $ | 24,257,417 | ||||||
| (a) | Non - income producing security. |
Common Abbreviations:
ADR - American Depositary Receipt
AG - Aktiengesellschaft is a German term that refers to a corporation that is limited by shares, i.e., owned by shareholders.
Ltd. - Limited
PLC - Public Limited Company
SA - Generally designates corporations in various countries, mostly those employing the civil law.
Semi-Annual Report | April 30, 2011 (Unaudited) | 29 |
Table of Contents
Statements of Assets and Liabilities
| ||
As of April 30, 2011 (Unaudited) |
White Oak Select Growth Fund | Pin Oak Equity Fund | |||||||
Investments at cost | $ | 189,431,929 | $ | 54,071,346 | ||||
ASSETS: | ||||||||
Investments at market value | $ | 274,944,609 | $ | 74,721,417 | ||||
Receivable for capital shares sold | 9,501 | 27,683 | ||||||
Receivable for investment securities sold | – | 201,197 | ||||||
Receivable due from advisor | – | – | ||||||
Dividends and interest receivable | 90,102 | 39,040 | ||||||
Prepaid expenses | 31,532 | 21,907 | ||||||
Total Assets | 275,075,744 | 75,011,244 | ||||||
LIABILITIES: | ||||||||
Payable for fund shares redeemed | 115,136 | 48,466 | ||||||
Investment advisory fees payable | 165,127 | 46,490 | ||||||
Administration fees payable | 18,813 | 5,444 | ||||||
Trustees’ fees payable | 39,884 | 12,723 | ||||||
Payable for investment securities purchased | – | 18,254 | ||||||
Principal financial officer fees payable | 802 | 163 | ||||||
Other accrued expenses | 91,418 | 35,054 | ||||||
Total Liabilities | 431,180 | 166,594 | ||||||
Total Net Assets | $ | 274,644,564 | $ | 74,844,650 | ||||
NET ASSETS: | ||||||||
Paid-in capital (unlimited authorization - no par value) | $ | 1,473,437,245 | $ | 334,5890,336 | ||||
Accumulated undistributed (overdistributed) net investment income | (427,046) | (118,464) | ||||||
Accumulated net realized gain (loss) on investments | (1,283,878,315) | (280,577,293) | ||||||
Net unrealized appreciation on investments | 85,512,680 | 20,650,071 | ||||||
Total Net Assets | $ | 274,644,564 | $ | 74,844,650 | ||||
PORTFOLIO SHARES: | ||||||||
Net Assets | $ | 274,644,564 | $ | 74,844,650 | ||||
Total shares outstanding at end of period | 6,496,380 | 2,354,779 | ||||||
Net assets value, offering and redemption price per share (net assets ÷ shares outstanding) | $ | 42.28 | $ | 31.78 | ||||
The accompanying notes are an integral part of the financial statements.
30 | 1-888-462-5386 | www.oakfunds.com |
Table of Contents
| ||
| Rock Oak Core Growth Fund | River Oak Discovery Fund | Red Oak Technology Select Fund | Black Oak Emerging Technology Fund | Live Oak Health Sciences Fund | ||||||||||||||
| $ | 5,300,394 | $ | 9,912,532 | $ | 49,709,762 | $ | 30,999,346 | $ | 17,433,296 | |||||||||
| $ | 7,592,258 | $ | 12,709,436 | $ | 72,188,307 | $ | 37,852,264 | $ | 24,275,124 | |||||||||
| 76,402 | 300 | 680 | 15,000 | 110 | ||||||||||||||
| – | – | 118,840 | – | – | ||||||||||||||
| 860 | – | – | – | – | ||||||||||||||
| 2,455 | 6,581 | 69,125 | 3 | 1,073 | ||||||||||||||
| 11,883 | 15,030 | 17,179 | 14,496 | 15,749 | ||||||||||||||
| 7,683,858 | 12,731,347 | 72,394,131 | 37,881,763 | 24,292,056 | ||||||||||||||
| – | – | 34,869 | 7,121 | 3,005 | ||||||||||||||
| – | 6,782 | 42,618 | 22,009 | 13,735 | ||||||||||||||
| 785 | 1,139 | 5,084 | 2,658 | 1,828 | ||||||||||||||
| 921 | 1,449 | 9,544 | 3,872 | 2,840 | ||||||||||||||
| – | – | – | – | – | ||||||||||||||
| 49 | 29 | 203 | 135 | 54 | ||||||||||||||
| 10,959 | 11,236 | 36,693 | 24,236 | 13,177 | ||||||||||||||
| 12,714 | 20,635 | 129,011 | 60,031 | 34,639 | ||||||||||||||
| $7,671,144 | $ | 12,710,712 | $ | 72,265,120 | $ | 37,821,732 | $ | 24,257,417 | ||||||||||
| $ | 5,379,879 | $ | 9,325,067 | $ | 380,266,285 | $ | 49,122,432 | $ | 16,837,048 | |||||||||
| (11,106) | (42,633) | (165,381) | (238,892) | 49,114 | ||||||||||||||
| 10,507 | 631,374 | (330,314,329) | (17,914,726) | 529,427 | ||||||||||||||
| 2,291,864 | 2,796,904 | 22,478,545 | 6,852,918 | 6,841,828 | ||||||||||||||
| $7,671,144 | $ | 12,710,712 | $ | 72,265,120 | $ | 37,821,732 | $ | 24,257,417 | ||||||||||
| $ | 7,671,144 | $ | 12,710,712 | $ | 72,265,120 | $ | 37,821,732 | $ | 24,257,417 | |||||||||
| 591,616 | 841,151 | 7,125,235 | 10,955,896 | 1,673,581 | ||||||||||||||
| $12.97 | $ | 15.11 | $ | 10.14 | $ | 3.45 | $ | 14.49 | ||||||||||
Semi-Annual Report | April 30, 2011 (Unaudited) | 31 |
Table of Contents
| ||
For the Six Months Ended April 30, 2011 (Unaudited) |
White Oak Select | Pin Oak Equity Fund | |||||||
INVESTMENT INCOME: | ||||||||
Dividends | $ | 1,111,513 | $ | 298,595 | ||||
Interest | 54 | 265 | ||||||
Less: Foreign withholding tax | (7,926) | – | ||||||
Total Investment Income | 1,103,641 | 298,860 | ||||||
EXPENSES: | ||||||||
Investment advisory fees | 996,625 | 259,502 | ||||||
Administration fees | 112,257 | 29,733 | ||||||
Trustees’ fees | 60,129 | 13,663 | ||||||
Legal and audit fees | 54,518 | 17,944 | ||||||
Transfer agent fees | 224,239 | 65,771 | ||||||
Registration fees | 5,517 | 6,006 | ||||||
Printing fees | 28,892 | 6,660 | ||||||
Custodian fees | 6,129 | 4,125 | ||||||
Principal financial officer fees | 3,207 | 884 | ||||||
Insurance and other fees | 39,174 | �� | 13,037 | |||||
Total Expenses | 1,530,687 | 417,325 | ||||||
Less: Investment advisory fees waived | – | – | ||||||
Net Expenses | 1,530,687 | 417,325 | ||||||
Net Investment Income (Loss) | (427,046) | (118,465) | ||||||
Net realized gain on securities sold | 20,486,426 | 7,548,787 | ||||||
Net change in unrealized appreciation of investment securities | 11,781,148 | 4,825,535 | ||||||
Net Realized and Unrealized Gain on investments | 32 267 574 | 12 374 322 | ||||||
Net Increase in Net Assets Resulting from Operations | $ | 31,840,528 | $ | 12,255,857 | ||||
The accompanying notes are an integral part of the financial statements.
32 | 1-888-462-5386 | www.oakfunds.com |
Table of Contents
| ||
| Rock Oak Core Growth Fund | River Oak Discovery Fund | Red Oak Technology Select Fund | Black Oak Emerging Technology Fund | Live Oak Health Sciences Fund | ||||||||||||||
| $ 33,830 | $ | 27,379 | $ | 282,511 | $ | 40,529 | $ | 185,280 | ||||||||||
| 25 | 85 | 304 | 1,100 | 90 | ||||||||||||||
| (372) | – | – | – | (6,532) | ||||||||||||||
| 33,483 | 27,464 | 282,815 | 41,629 | 178,838 | ||||||||||||||
| 26,397 | 46,731 | 252,667 | 159,881 | 76,612 | ||||||||||||||
| 3,492 | 4,899 | 28,902 | 18,327 | 9,133 | ||||||||||||||
| 1,683 | 2,445 | 15,533 | 9,679 | 4,925 | ||||||||||||||
| 8,015 | 8,583 | 19,036 | 15,034 | 10,485 | ||||||||||||||
| 8,148 | 8,497 | 101,652 | 56,919 | 18,851 | ||||||||||||||
| 6,062 | 2,964 | 7,494 | 6,614 | 3,249 | ||||||||||||||
| 847 | 1,019 | 10,067 | 4,963 | 2,051 | ||||||||||||||
| 254 | 557 | 2,149 | 1,576 | 743 | ||||||||||||||
| 121 | 132 | 894 | 593 | 262 | ||||||||||||||
| 1,465 | 1,865 | 9,802 | 6,935 | 3,412 | ||||||||||||||
| 56,484 | 77,692 | 448,196 | 280,521 | 129,723 | ||||||||||||||
| (11,895) | (7,595) | – | – | – | ||||||||||||||
| 44,589 | 70,097 | 448,196 | 280,521 | 129,723 | ||||||||||||||
| (11,106) | (42,633) | (165,381) | (238,892) | 49,115 | ||||||||||||||
| 255,699 | 691,853 | 3,171,523 | 1,695,482 | 529,427 | ||||||||||||||
| 833,894 | 1,177,506 | 7,760,318 | 5,003,349 | 3,098,974 | ||||||||||||||
| 1,089,593 | 1,869,359 | 10,931,841 | 6,698,831 | 3,628,401 | ||||||||||||||
| $ 1,078,487 | $ | 1,826,726 | $ | 10,766,460 | $ | 6,459,939 | $ | 3,677,516 | ||||||||||
Semi-Annual Report | April 30, 2011 (Unaudited) | 33 |
Table of Contents
Statements of Changes in Net Assets
| ||
White Oak Select Growth Fund | Pin Oak Equity Fund | |||||||||||||||
For The Six Months Ended April 30, 2011 (Unaudited) | For The Year Ended October 31, 2010 | For The Six Months Ended April 30, 2011 (Unaudited) | For The Year Ended October 31, 2010 | |||||||||||||
INVESTMENT ACTIVITIES: |
| |||||||||||||||
Net investment income (loss) | $ | (427,046) | $ | (1,732,861) | $ | (118,465) | $ | 294,624 | ||||||||
Net realized gain on securities sold | 20,486,426 | 45,233,523 | 7,548,787 | 18,281,015 | ||||||||||||
Net change in unrealized appreciation (depreciation) of investment securities | 11,781,148 | 7,591,121 | 4,825,535 | (864,559) | ||||||||||||
Net Increase in Net Assets Resulting from Operations | 31,840,528 | 51,091,783 | 12,255,857 | 17,711,080 | ||||||||||||
DISTRIBUTIONS TO SHAREHOLDERS: |
| |||||||||||||||
Net income | – | – | (219,935) | (74,688) | ||||||||||||
Realized capital gains | – | – | – | – | ||||||||||||
Total Distributions | – | – | (219,935) | (74,688) | ||||||||||||
CAPITAL SHARE TRANSACTIONS (IN DOLLARS): |
| |||||||||||||||
Shares issued | 6,763,051 | 30,067,137 | 10,651,810 | 55,782,117 | ||||||||||||
Shares issued in lieu of cash distributions | – | – | 208,139 | 71,207 | ||||||||||||
Shares redeemed | (23,143,501) | (141,332,935) | (17,896,197) | (122,176,693) | ||||||||||||
Net Increase (Decrease) in Net Assets from Capital Share Transactions | (16,380,450) | (111,265,798) | (7,036,248) | (66,323,369) | ||||||||||||
Total Increase (Decrease) in Net Assets | 15,460,078 | (60,174,015) | 4,999,674 | (48,686,977) | ||||||||||||
NET ASSETS: |
| |||||||||||||||
Beginning of period | 259,184,486 | 319,358,501 | 69,844,976 | 118,531,953 | ||||||||||||
End of period | $ | 274,644,564 | $ | 259,184,486 | $ | 74,844,650 | $ | 69,844,976 | ||||||||
Including accumulated undistributed net investment income (loss) | $ | (427,046) | $ | – | $ | (118.464) | $ | 219,936 | ||||||||
SHARES ISSUED AND REDEEMED: |
| |||||||||||||||
Issued | 166,378 | 880,571 | 356,341 | 2,205,240 | ||||||||||||
Issued in lieu of cash distributions | – | – | 7,402 | 2,819 | ||||||||||||
Redeemed | (570,709) | (4,137,051) | (618,976) | (4,809,662) | ||||||||||||
Net Increase (Decrease) in Share Transactions | (404,331) | (3,256,480) | (255,233) | (2,601,603) | ||||||||||||
The accompanying notes are an integral part of the financial statements.
34 | 1-888-462-5386 | www.oakfunds.com |
Table of Contents
| ||
Rock Oak Core Growth Fund | River Oak Discovery Fund | Red Oak Technology Select Fund | ||||||||||||||||||||
For The Six Months Ended April 30, 2011 (Unaudited) | For The Year Ended October 31, 2010 | For The Six Months April 30, 2011 (Unaudited) | For The Year Ended October 31, 2010 | For The Six Months April 30, 2011 (Unaudited) | For The Year Ended October 31, 2010 | |||||||||||||||||
| $ (11,106) | $ | (36,213) | $ | (42,633) | $ | (75,100) | $ | (165,381) | $ | (476,368) | ||||||||||||
| 255,699 | 733,651 | 691,853 | 1,055,480 | 3,171,523 | 10,109,691 | |||||||||||||||||
| 833,894 | 578,115 | 1,177,506 | 406,047 | 7,760,318 | 4,654,333 | |||||||||||||||||
| 1,078,487 | 1,275,553 | 1,826,726 | 1,386,427 | 10,766,460 | 14,287,656 | |||||||||||||||||
| – | – | – | – | – | – | |||||||||||||||||
| – | – | (130,973) | – | – | – | |||||||||||||||||
| – | – | (130,973) | – | – | – | |||||||||||||||||
| 370,029 | 559,003 | 2,190,381 | 1,410,296 | 4,396,611 | 8,590,819 | |||||||||||||||||
| – | – | 128,699 | – | – | – | |||||||||||||||||
| (521,195) | (889,040) | (428,673) | (1,918,585) | (8,313,388) | (30,973,816) | |||||||||||||||||
| (151,166) | (330,037) | 1,890,407 | (508,289) | (3,916,777) | (22,382,997) | |||||||||||||||||
| 927,321 | 945,516 | 3,586,160 | 878,138 | 6,849,683 | (8,095,341) | |||||||||||||||||
| 6,743,823 | 5,798,307 | 9,124,552 | 8,246,414 | 65,415,437 | 73,510,778 | |||||||||||||||||
| $ 7,671,144 | $ | 6,743,823 | $ | 12,710,712 | $ | 9,124,552 | $ | 72,265,120 | $ | 65,415,437 | ||||||||||||
| $ (11,106) | $ | – | $ | (42,633) | $ | – | $ | (165,381) | $ | – | ||||||||||||
| 29,575 | 55,197 | 151,725 | 118,033 | 471,452 | 1,096,472 | |||||||||||||||||
| – | – | 9,662 | – | – | – | |||||||||||||||||
| (42,245) | (88,834) | (30,949) | (160,078) | (890,791) | (3,997,077) | |||||||||||||||||
| (12,670) | (33,637) | 130,438 | (42,045) | (419,339) | (2,900,605) | |||||||||||||||||
Semi-Annual Report | April 30, 2011 (Unaudited) | 35 |
Table of Contents
Statements of Changes in Net Assets
| ||
Black Oak Emerging Technology Fund | Live Oak Health Sciences Fund | |||||||||||||||
For The Six Months Ended April 30, 2011 | For The Year Ended October 31, 2010 | For The Six Months Ended April 30, 2011 | For The Year Ended October 31, 2010 | |||||||||||||
INVESTMENT ACTIVITIES: | ||||||||||||||||
Net investment income (loss) | $ | (238,892) | $ | (409,782) | $ | 49,115 | $ | 32,926 | ||||||||
Net realized gain on securities sold | 1,695,482 | 16,228,153 | 529,427 | 912,605 | ||||||||||||
Net change in unrealized appreciation (depreciation) of investment securities | 5,003,349 | (4,913,420) | 3,098,974 | 2,401,566 | ||||||||||||
Net Increase in Net Assets Resulting from Operations | 6,459,939 | 10,904,951 | 3,677,516 | 3,347,097 | ||||||||||||
DISTRIBUTIONS TO SHAREHOLDERS: | ||||||||||||||||
Net income | – | – | (32,927) | – | ||||||||||||
Realized capital gains | – | – | (912,476) | (593,292) | ||||||||||||
Total Distributions | – | – | (945,403) | (593,292) | ||||||||||||
CAPITAL SHARE TRANSACTIONS (IN DOLLARS): |
| |||||||||||||||
Shares issued | 5,805,207 | 15,446,028 | 2,728,622 | 3,595,743 | ||||||||||||
Shares issued in lieu of cash distributions | – | – | 923,428 | 581,370 | ||||||||||||
Shares redeemed | (18,157,657) | (20,233,340) | (1,722,200) | (3,584,998) | ||||||||||||
Net Increase (Decrease) in Net Assets from Capital Share Transactions | (12,352,450) | (4,787,312) | 1,929,850 | 592,115 | ||||||||||||
Total Increase (Decrease) in Net Assets | (5,892,511) | 6,117,639 | 4,661,963 | 3,345,920 | ||||||||||||
NET ASSETS: | ||||||||||||||||
Beginning of period | 43,714,243 | 37,596,604 | 19,595,454 | 16,249,534 | ||||||||||||
End of period | $ | 37,821,732 | $ | 43,714,243 | $ | 24,257,417 | $ | 19595,454 | ||||||||
Including accumulated undistributed net investment income (loss) | $ | (238,892) | $ | – | $ | 49,114 | $ | 32,926 | ||||||||
SHARES ISSUED AND REDEEMED: | ||||||||||||||||
Issued | 1,858,230 | 6,031,275 | 205,656 | 296,580 | ||||||||||||
Issued in lieu of cash distributions | – | – | 73,933 | 49,478 | ||||||||||||
Redeemed | (5,793,113) | (8,339,357) | (132,435) | (296,453) | ||||||||||||
Net Increase (Decrease) in Share Transactions | (3,934,883) | (2,308,082) | 147,154 | 49,605 | ||||||||||||
The accompanying notes are an integral part of the financial statements.
36 | 1-888-462-5386 | www.oakfunds.com |
Table of Contents
OAK ASSOCIATES FUNDS
This Page Intentionally Left Blank
Table of Contents
| ||
For a share outstanding throughout the years ended |
For the Six Months Ended | Year Ended October 31, 2010 | |||||||
WHITE OAK SELECT GROWTH FUND | ||||||||
Net Asset Value Beginning of Period | $ | 37.56 | $ | 31.44 | ||||
Income (Loss) From Operations | ||||||||
Net Investment Income (Loss)(a) | (0.06) | (0.20) | ||||||
Realized and Unrealized Gain or (Losses) in Securities(a) | 4.78 | 6.32 | ||||||
Total From Operations | 4.72 | 6.12 | ||||||
Less Distributions: | ||||||||
Dividends from Net Investment Income | – | – | ||||||
Distributions from Capital Gains | – | – | ||||||
Total Dividends and Distributions | – | – | ||||||
Net Asset Value End of Period | $ | 42.28 | $ | 37.56 | ||||
Total Return(b) | 12.57% | 19.47% | ||||||
Net Assets End of Period (000) | $ | 274,645 | $ | 259,184 | ||||
Ratio of Net Expenses to Average Net Assets | 1.14% | 1.25% | ||||||
Ratio of Net Investment Loss to Average Net Assets | (0.32)% | (0.58)% | ||||||
Ratio of Net Expenses to Average Net Assets (Excluding Fees Paid Indirectly) | 1.14% | 1.25% | ||||||
Ratio of Expenses to Average Net Assets (Excluding Waivers and/or Fees Paid Indirectly) | 1.14% | 1.34% | ||||||
Portfolio Turnover Rate | 9% | 14% | ||||||
| (a) | Per share calculations were performed using average shares for the period. |
| (b) | Figures do not reflect the deduction of taxes the shareholder will pay on fund distributions or redemption of fund shares. |
The accompanying notes are an integral part of the financial statements.
38 | 1-888-462-5386 | www.oakfunds.com |
Table of Contents
| ||
Year Ended | Year Ended October 31, 2008 | Year Ended October 31, 2007 | Year Ended October 31, 2006 | |||||||||||
| $ 23.89 | $ | 39.49 | $ | 31.91 | $ | 31.35 | ||||||||
| (0.18) | (0.23) | (0.12) | (0.13) | |||||||||||
| 7.73 | (15.37) | 7.70 | 0.71 | |||||||||||
| 7.55 | (15.60) | 7.58 | 0.58 | |||||||||||
| – | – | – | (0.02) | |||||||||||
| – | – | – | – | |||||||||||
| – | – | – | (0.02) | |||||||||||
| $ 31.44 | $ | 23.89 | $ | 39.49 | $ | 31.91 | ||||||||
| 31.60% | (39.50)% | 23.75% | 1.85% | |||||||||||
| $ 319,359 | $ | 215,862 | $ | 439,978 | $ | 538,516 | ||||||||
| 1.25% | 1.25% | 1.25% | 1.19% | |||||||||||
| (0.70)% | (0.70)% | (0.34)% | (0.42)% | |||||||||||
| 1.25% | 1.25% | 1.25% | 1.20% | |||||||||||
| 1.51% | 1.41% | 1.28% | 1.20% | |||||||||||
| 31% | 25% | 29% | 52% | |||||||||||
Semi-Annual Report | April 30, 2011 (Unaudited) | 39 |
Table of Contents
Financial Highlights
| ||
For a share outstanding throughout the years ended |
For the Six Months Ended April 30, 2011 (Unaudited) | Year Ended October 31, 2010 | |||||||
PIN OAK EQUITY FUND | ||||||||
Net Asset Value Beginning of Period | $ | 26.76 | $ | 22.74 | ||||
Income (Loss) From Operations | ||||||||
Net Investment Income (Loss)(a) | (0.05) | 0.07 | ||||||
Realized and Unrealized Gain or (Losses) in Securities(a) | 5.16 | 3.96 | ||||||
Total From Operations | 5.11 | 4.03 | ||||||
Less Distributions: | ||||||||
Dividends from Net Investment Income | (0.09) | (0.01) | ||||||
Distributions from Capital Gains | – | – | ||||||
Total Dividends and Distributions | (0.09) | (0.01) | ||||||
Net Asset Value End of Period | $ | 31.78 | $ | 26.76 | ||||
Total Return(b) | 19.14% | 17.74% | ||||||
Net Assets End of Period (000) | $ | 74,845 | $ | 69,845 | ||||
Ratio of Net Expenses to Average Net Assets | 1.19% | 1.25% | ||||||
Ratio of Net Investment lncome/(Loss) to Average Net Assets | (0.34)% | 0.27% | ||||||
Ratio of Net Expenses to Average Net Assets (Excluding Fees Paid Indirectly) | 1.19% | 1.25% | ||||||
Ratio of Expenses to Average Net Assets (Excluding Waivers and/or Fees Paid Indirectly) | 1.19% | 1.33% | ||||||
Portfolio Turnover Rate | 15% | 35% | ||||||
| (a) | Per share calculations were performed using average shares for the period. |
| (b) | Figures do not reflect the deduction of taxes the shareholder will pay on fund distributions or redemption of fund shares. |
The accompanying notes are an integral part of the financial statements.
40 | 1-888-462-5386 | www.oakfunds.com |
Table of Contents
| ||
|
Year Ended October 31, 2009 | Year Ended October 31, 2008 | Year Ended October 31, 2007 | Year Ended October 31, 2006 | |||||||||||
| $ | 15.58 | $ | 27.46 | $ | 21.18 | $ | 21.13 | |||||||
| (0.11) | (0.08) | (0.12) | (0.16) | |||||||||||
| 7.27 | (11.80) | 6.40 | 0.21 | |||||||||||
| 7.16 | (11.88) | 6.28 | 0.05 | |||||||||||
| – | – | – | – | |||||||||||
| – | – | – | – | |||||||||||
| – | – | – | – | |||||||||||
| $ | 22.74 | $ | 15.58 | $ | 27.46 | $ | 21.18 | |||||||
| 45.96% | (43.26)% | 29.65% | 0.24% | |||||||||||
| $ | 118,532 | $ | 36,198 | $ | 90,901 | $ | 92,549 | |||||||
| 1.25% | 1.25% | 1.25% | 1.21% | |||||||||||
| (0.58)% | (0.34)% | (0.50)% | (0.74)% | |||||||||||
| 1.25% | 1.25% | 1.25% | 1.21% | |||||||||||
| 1.60% | 1.51% | 1.35% | 1.27% | |||||||||||
| 16% | 38% | 18% | 20% | |||||||||||
Semi-Annual Report | April 30, 2011 (Unaudited) | 41 |
Table of Contents
Financial Highlights
| ||
For a share outstanding throughout the years ended |
For the Six Months Ended April 30, 2011 (Unaudited) | Year Ended October 31, 2010 | |||||||
ROCK OAK CORE GROWTH FUND | ||||||||
Net Asset Value Beginning of Period | $ | 11.16 | $ | 9.09 | ||||
Income (Loss) From Operations | ||||||||
Net Investment Loss(a) | (0.02) | (0.06) | ||||||
Realized and Unrealized Gain or (Losses) in Securities(a) | 1.83 | 2.13 | ||||||
Total From Operations | 1.81 | 2.07 | ||||||
Less Distributions: | ||||||||
Dividends from Net Investment Income | – | – | ||||||
Distributions from Capital Gains | – | – | ||||||
Total Dividends and Distributions | – | – | ||||||
Net Asset Value End of Period | $ | 12.97 | $ | 11.16 | ||||
Total Return(b) | 16.22% | 22.77% | ||||||
Net Assets End of Period (000) | $ | 7,671 | $ | 6,744 | ||||
Ratio of Net Expenses to Average Net Assets | 1.25% | 1.25% | ||||||
Ratio of Net Investment Loss to Average Net Assets | 0.31)% | (0.59)% | ||||||
Ratio of Net Expenses to Average Net Assets (Excluding Fees Paid Indirectly) | 1.25% | 1.25% | ||||||
Ratio of Expenses to Average Net Assets (Excluding Waivers and/or Fees Paid Indirectly) | 1.58% | 1.54% | ||||||
Portfolio Turnover Rate | 14% | 62% | ||||||
| (a) | Per share calculations were performed using average shares for the period. |
| (b) | Figures do not reflect the deduction of taxes the shareholder will pay on fund distributions or redemption of fund shares. |
The accompanying notes are an integral part of the financial statements.
42 | 1-888-462-5386 | www.oakfunds.com |
Table of Contents
| ||
Year Ended October 31, 2009 | Year Ended October 31, 2008 | Year Ended October 31, 2007 | Year Ended October 31, 2006 | |||||||||||
| $ | 7.28 | $ | 13.45 | $ | 10.68 | $ | 10.10 | |||||||
| (0.04) | (0.06) | (0.07) | (0.06) | |||||||||||
| 1.85 | (5.54) | 2.84 | 0.64 | |||||||||||
| 1.81 | (5.60) | 2.77 | 0.58 | |||||||||||
| – | – | – | – | |||||||||||
| – | (0.57) | – | – | |||||||||||
| – | (0.57) | – | – | |||||||||||
| $ | 9.09 | $ | 7.28 | $ | 13.45 | $ | 10.68 | |||||||
| 24.86% | (43.43)% | 25.94% | 5.74% | |||||||||||
| $ | 5,798 | $ | 4,571 | $ | 8,389 | $ | 9,688 | |||||||
| 1.25% | 1.25% | 1.25% | 1.22% | |||||||||||
| (0.56)% | (0.53)% | (0.57)% | (0.54)% | |||||||||||
| 1.25% | 1.25% | 1.25% | 1.22% | |||||||||||
| 1.82% | 1.56% | 1.46% | 1.44% | |||||||||||
| 45% | 92% | 86% | 88% | |||||||||||
Semi-Annual Report | April 30, 2011 (Unaudited) | 43 |
Table of Contents
Financial Highlights
| ||
For a share outstanding throughout the years ended |
For the Six Months Ended April 30, 2011 (Unaudited) | Year Ended October 31, 2010 | |||||||
RIVER OAK DISCOVERY FUND | ||||||||
Net Asset Value Beginning of Period | $ | 12.84 | $ | 10.96 | ||||
Income (Loss) From Operations | ||||||||
Net Investment Loss(a) | (0.06) | (0.10) | ||||||
Realized and Unrealized Gain or (Losses) in Securities(a) | 2.51 | 1.98 | ||||||
Total From Operations | 2.45 | 1.88 | ||||||
Less Distributions: | ||||||||
Dividends from Net Investment Income | – | – | ||||||
Distributions from Capital Gains | (0.18) | – | ||||||
Total Dividends and Distributions | (0.18) | – | ||||||
Net Asset Value End of Period | $ | 15.11 | $ | 12.84 | ||||
Total Return(b) | 19.30% | 17.15% | ||||||
Net Assets End of Period (000) | $ | 12,711 | $ | 9,125 | ||||
Ratio of Net Expenses to Average Net Assets | 1.35% | 1.35% | ||||||
Ratio of Net Investment Loss to Average Net Assets | (0.82)% | (0.83)% | ||||||
Ratio of Net Expenses to Average Net Assets (Excluding Fees Paid Indirectly) | 1.35% | 1.35% | ||||||
Ratio of Expenses to Average Net Assets (Excluding Waivers and/or Fees Paid Indirectly) | 1.50% | 1.57% | ||||||
Portfolio Turnover Rate | 33% | 56% | ||||||
| (a) | Per share calculations were performed using average shares for the period. |
| (b) | Figures do not reflect the deduction of taxes the shareholder will pay on fund distributions or redemption of fund shares. |
The accompanying notes are an integral part of the financial statements.
44 | 1-888-462-5386 | www.oakfunds.com |
Table of Contents
| ||
| Year Ended October 31, 2009 | Year Ended October 31, 2008 | Year Ended October 31, 2007 | Year Ended October 31, 2006 | |||||||||||
| $ | 7.86 | $ | 14.80 | $ | 11.56 | $ | 10.10 | |||||||
| (0.09) | (0.08) | (0.12) | (0.09) | |||||||||||
| 3.19 | (6.46) | 3.36 | 1.55 | |||||||||||
| 3.10 | (6.54) | 3.24 | 1.46 | |||||||||||
| – | – | – | – | |||||||||||
| – | (0.40) | – | – | |||||||||||
| – | (0.40) | – | – | |||||||||||
| $ | 10.96 | $ | 7.86 | $ | 14.80 | $ | 11.56 | |||||||
| 39.44% | (45.31)% | 28.03% | 14.46% | |||||||||||
| $ | 8,247 | $ | 4,168 | $ | 7,823 | $ | 5,943 | |||||||
| 1.35% | 1.35% | 1.35% | 1.35% | |||||||||||
| (1.03)% | (0.68)% | (0.92)% | (0.81)% | |||||||||||
| 1.35% | 1.35% | 1.35% | 1.35% | |||||||||||
| 1.92% | 1.76% | 1.72% | 2.74% | |||||||||||
| 67% | 145% | 148% | 72% | |||||||||||
Semi-Annual Report | April 30, 2011 (Unaudited) | 45 |
Table of Contents
Financial Highlights
| ||
For a share outstanding throughout the years ended
|
For the Six Months Ended April 30, 2011 (Unaudited) | Year Ended October 31, 2010 | |||||||
RED OAK TECHNOLOGY SELECT FUND | ||||||||
Net Asset Value Beginning of Period | $ | 8.67 | $ | 7.04 | ||||
Income (Loss) From Operations | ||||||||
Net Investment Loss(a) | (0.02) | (0.05) | ||||||
Realized and Unrealized Gain or (Losses) in Securities(a) | 1.49 | 1.68 | ||||||
Total From Operations | 1.47 | 1.63 | ||||||
Less Distributions: | ||||||||
Dividends from Net Investment Income | – | – | ||||||
Distributions from Capital Gains | – | – | ||||||
Total Dividends and Distributions | – | – | ||||||
Net Asset Value End of Period | $ | 10.14 | $ | 8.67 | ||||
Total Return(b) | 16.95% | 23.15% | ||||||
Net Assets End of Period (000) | $ | 72,265 | $ | 65,415 | ||||
Ratio of Net Expenses to Average Net Assets | 1.31% | 1.35% | ||||||
Ratio of Net Investment Loss to Average Net Assets | (0.48)% | (0.70)% | ||||||
Ratio of Net Expenses to Average Net Assets (Excluding Fees Paid Indirectly) | 1.31% | 1.35% | ||||||
Ratio of Expenses to Average Net Assets (Excluding Waivers and/or Fees Paid Indirectly) | 1.31% | 1.53% | ||||||
Portfolio Turnover Rate | 5% | 28% | ||||||
| (a) | Per share calculations were performed using average shares for the period. |
| (b) | Figures do not reflect the deduction of taxes the shareholder will pay on fund distributions or redemption of fund shares. |
The accompanying notes are an integral part of the financial statements.
46 | 1-888-462-5386 | www.oakfunds.com |
Table of Contents
| ||
Year Ended | Year Ended October 31, 2008 | Year Ended October 31, 2007 | Year Ended October 31, 2006 | |||||||||||
| $ 4.92 | $ | 8.75 | $ | 6.90 | $ | 6.55 | ||||||||
| (0.03) | (0.06) | (0.03) | (0.06) | |||||||||||
| 2.15 | (3.77) | 1.88 | 0.41 | |||||||||||
| 2.12 | (3.83) | 1.85 | 0.35 | |||||||||||
| – | – | – | – | |||||||||||
| – | – | – | – | |||||||||||
| – | – | – | – | |||||||||||
| $ 7.04 | $ | 4.92 | $ | 8.75 | $ | 6.90 | ||||||||
| 43.09% | (43.77)% | 26.81% | 5.34% | |||||||||||
| $ 73,511 | $ | 44,079 | $ | 115,005 | $ | 116,449 | ||||||||
| 1.35% | 1.35% | 1.35% | 1.27% | |||||||||||
| (0.56)% | (0.80)% | (0.40)% | (0.89)% | |||||||||||
| 1.35% | 1.35% | 1.35% | 1.27% | |||||||||||
| 1.82% | 1.58% | 1.40% | 1.34% | |||||||||||
| 30% | 17% | 11% | 93% | |||||||||||
Semi-Annual Report | April 30, 2011 (Unaudited) | 47 |
Table of Contents
Financial Highlights
| ||
For a share outstanding throughout the years ended. |
For the Six Months Ended | Year Ended October 31, 2010 | |||||||
BLACK OAK EMERGING TECHNOLOGY FUND | ||||||||
Net Asset Value Beginning of Period | $ | 2.94 | $ | 2.19 | ||||
Income (Loss) From Operations | ||||||||
Net Investment ) | (0.02) | (0.03) | ||||||
Realized and Unrealized Gain or (Losses) in Securities(a) | 0.53 | 0.78 | ||||||
Total From Operations | 0.51 | 0.75 | ||||||
Less Distributions: | ||||||||
Dividends from Net Investment Income | – | – | ||||||
Distributions from Capital Gains | – | – | ||||||
Total Dividends and Distributions | – | – | ||||||
Net Asset Value End of Period | $ | 3.45 | $ | 2.94 | ||||
Total Return(b) | 17.35% | 34.25% | ||||||
Net Assets End of Period (000) | $ | 37,822 | $ | 43,714 | ||||
Ratio of Net Expenses to Average Net Assets | 1.30% | 1.35% | ||||||
Ratio of Net Investment Loss to Average Net Assets | (1.11)% | (1.16)% | ||||||
Ratio of Net Expenses to Average Net Assets (Excluding Fees Paid Indirectly) | 1.30% | 1.35% | ||||||
Ratio of Expenses to Average Net Assets (Excluding Waivers and/or Fees Paid Indirectly) | 1.30% | 1.55% | ||||||
Portfolio Turnover Rate | 38% | 99% | ||||||
| (a) | Per share calculations were performed using average shares for the period. |
| (b) | Figures do not reflect the deduction of taxes the shareholder will pay on fund distributions or redemption of fund shares. |
The accompanying notes are an integral part of the financial statements.
48 | 1-888-462-5386 | www.oakfunds.com |
Table of Contents
| ||
Year Ended October 31, 2009 | Year Ended October 31, 2008 | Year Ended October 31, 2007 | Year Ended October 31, 2006 | |||||||||||
| $1.63 | $ | 2.94 | $ | 2.21 | $ | 2.05 | ||||||||
| (0.02) | (0.02) | (0.03) | (0.02) | |||||||||||
| 0.58 | (1.29) | 0.76 | 0.18 | |||||||||||
| 0.56 | (1.31) | 0.73 | 0.16 | |||||||||||
| – | – | – | – | |||||||||||
| – | – | – | – | |||||||||||
| – | – | – | – | |||||||||||
| $ | 2.19 | $ | 1.63 | $ | 2.94 | $ | 2.21 | |||||||
| 34.36% | (44.56)% | 33.03% | 7.80% | |||||||||||
| $ | 37,596 | $ | 19,478 | $ | 39,810 | $ | 39,617 | |||||||
| 1.35% | 1.35% | 1.35% | 1.28% | |||||||||||
| (1.15)% | (0.94)% | (1.04)% | (1.13)% | |||||||||||
| 1.35% | 1.35% | 1.35% | 1.28% | |||||||||||
| 1.93% | 1.76% | 1.62% | 1.53% | |||||||||||
| 49% | 79% | 76% | 97% | |||||||||||
Semi-Annual Report | April 30, 2011 (Unaudited) | 49 |
Table of Contents
Financial Highlights
| ||
For a share outstanding throughout the years ended |
For the Six Months Ended April 30, 2011 (Unaudited) | Year Ended October 31, 2010 | |||||||
LIVE OAK HEALTH SCIENCES FUND | ||||||||
Net Asset Value Beginning of Period | $ | 12.84 | $ | 11.00 | ||||
Income (Loss) From Operations | ||||||||
Net Investment Income (Loss)(a) | 0.03 | 0.02 | ||||||
Realized and Unrealized Gain or (Losses) in Securities(a) | 2.24 | 2.22 | ||||||
Total From Operations | 2.27 | 2.24 | ||||||
Less Distributions: | ||||||||
Dividends from Net Investment Income | (0.02 | ) | – | |||||
Distributions from Capital Gains | (0.60 | ) | (0.40 | ) | ||||
Total Dividends and Distributions | (0.62 | ) | (0.40 | ) | ||||
Net Asset Value End of Period | $ | 14.49 | $ | 12.84 | ||||
Total Return(b) | 18.47% | 20.66% | ||||||
Net Assets End of Period (000) | $ | 24,257 | $ | 19,595 | ||||
Ratio of Net Expenses to Average Net Assets | 1.25% | 1.35% | ||||||
Ratio of Net Investment Income (Loss) to Average Net Assets | 0.47% | 0.17% | ||||||
Ratio of Net Expenses to Average Net Assets (Excluding Fees Paid Indirectly) | 1.25% | 1.35% | ||||||
Ratio of Expenses to Average Net Assets (Excluding Waivers and/or Fees Paid Indirectly) | 1.25% | 1.38% | ||||||
Portfolio Turnover Rate | 9% | 22% | ||||||
| (a) | Per share calculations were performed using average shares for the period. |
| (b) | Figures do not reflect the deduction of taxes the shareholder will pay on fund distributions or redemption of fund shares. |
The accompanying notes are an integral part of the financial statements.
50 | 1-888-462-5386 | www.oakfunds.com |
Table of Contents
| ||
Year Ended | Year Ended October 31, 2008 | Year Ended October 31, 2007 | Year Ended October 31, 2006 | |||||||||||
| $ | 9.48 | $ | 12.41 | $ | 11.18 | $ | 11.66 | |||||||
| (0.01) | (0.04) | (0.01) | (0.07) | |||||||||||
| 1.53 | (2.89) | 1.24 | (0.41) | |||||||||||
| 1.52 | (2.93) | 1.23 | (0.48) | |||||||||||
| – | – | – | – | |||||||||||
| – | – | – | – | |||||||||||
| – | – | – | – | |||||||||||
| $ | 11.00 | $ | 9.48 | $ | 12.41 | $ | 11.18 | |||||||
| 16.03% | (23.61)% | 11.00% | (4.12)% | |||||||||||
| $ | 16,249 | $ | 14,013 | $ | 21,354 | $ | 25,263 | |||||||
| 1.35% | 1.35% | 1.35% | 1.21% | |||||||||||
| (0.08)% | (0.36)% | (0.11)% | (0.59)% | |||||||||||
| 1.35% | 1.35% | 1.35% | 1.21% | |||||||||||
| 1.61% | 1.52% | 1.37% | 1.23% | |||||||||||
| 31% | 25% | 28% | 57% | |||||||||||
Semi-Annual Report | April 30, 2011 (Unaudited) | 51 |
Table of Contents
| ||
As of April 30, 2011 (Unaudited)
|
1. ORGANIZATION:
The Oak Associates Funds (the “Trust”) is organized as a Massachusetts business trust under an Agreement and Declaration of Trust dated November 6, 1997. The Trust is registered under the Investment Company Act of 1940, as amended, as an open-end management investment company with seven funds: White Oak Select Growth Fund, Pin Oak Equity Fund, Rock Oak Core Growth Fund and River Oak Discovery Fund (diversified funds); Red Oak Technology Select Fund, Black Oak Emerging Technology Fund and Live Oak Health Sciences Fund (non-diversified funds) (collectively referred to as “Funds” and individually referred to as a “Fund”). The assets of each Fund are segregated, and a shareholder’s interest is limited to the Fund in which shares are held. The Funds’ prospectus provides a description of each Fund’s investment objectives, policies and strategies.
2. SIGNIFICANT ACCOUNTING POLICIES:
Use of Estimates – The preparation of financial statements in conformity with accounting principles generally accepted in the United States of America (GAAP) requires management to make estimates and assumptions that affect the reported amounts of assets and liabilities and disclosure of contingent assets and liabilities at the date of the financial statements and the reported amounts of increases and decreases in net assets from operations and expenses during the reporting period. Actual results could differ from those estimates, and could have a material impact to the Funds.
Security Valuation – Investments in equity securities, which are traded on a national exchange, are stated at the last quoted sales price if readily available for such equity securities on each business day. Investments in equity securities, which are reported on the NASDAQ national market system are valued at the official closing price; other equity securities traded in the over-the-counter market and listed equity securities for which no sale was reported on that date are stated at the last quoted bid price. Debt obligations exceeding sixty days to maturity for which market quotations are readily available are valued at the most recently quoted bid price. Debt obligations with sixty days or less remaining until maturity may be valued at their amortized cost, which approximates market value.
Redeemable securities issued by open-end registered investment companies are valued at the investment company’s applicable net asset value.
Securities for which market prices are not “readily available” (of which there were none as of April 30, 2011) are valued in accordance with Fair Value Procedures established by the Funds’ Board of Trustees. The Funds’ Fair Value Procedures are implemented through a Fair Value Committee (the “Committee”) designated by the Funds’ Board of Trustees. Some of the more common reasons that may necessitate that a security be valued using Fair Value Procedures include: the security’s trading has been halted or suspended; the security has been de-listed from a national exchange; the security’s primary trading market is temporarily closed at a time when under normal conditions it would be open; the security has not been traded for an extended period of time; the security’s primary pricing source is not able or willing to provide a price; a significant event with respect to a security or securities has occurred after the close of the market or exchange on which the security or securities principally trades and before the time the Fund calculates net asset value; or trading of the security is subject to local government-imposed restrictions. When a security is valued in accordance with the Fair Value Procedures, the Committee will determine the value after taking into consideration relevant information reasonably available to the Committee.
Security Transactions and Investment Income – Security transactions are accounted for on the date the security is purchased or sold (trade date). Dividend income is recognized on the ex-dividend date, and interest income is recognized on the actual basis. Costs used in determining realized gains and losses on the sales of investment securities are those of the specific securities sold.
52 | 1-888-462-5386 | www.oakfunds.com |
Table of Contents
Notes to Financial Statements
| ||
As of April 30,2011(Unaudited) |
Withholding taxes on foreign dividends have been provided for in accordance with the Funds’ understanding of the applicable country’s tax rules and rates.
Expenses – Expenses that are directly related to one of the Funds are charged to that Fund. Other operating expenses of the Trust are prorated to the Funds on the basis of relative daily net assets.
Repurchase Agreements – The Funds invest in tri-party repurchase agreements. Securities held as collateral for tri-party repurchase agreements are maintained by the broker’s custodian bank in a segregated account until maturity of the repurchase agreement. Provisions of the repurchase agreements and procedures adopted by the Board of Trustees require that the market value of the collateral, including accrued interest thereon, is sufficient in the event of default by the counterparty. If the counterparty defaults and the value of the collateral declines or if the counterparty enters an insolvency proceeding, realization of the collateral by the Funds may be delayed or limited.
Dividends and Distributions to Shareholders – Dividends from net investment income are declared and paid to shareholders on an annual basis, as applicable. Net realized capital gains on sales of securities, if any, are distributed to shareholders at least annually.
Income and capital gain distributions are determined in accordance with federal income tax regulations, which may differ from GAAP. Therefore, the source of the fund’s distributions may be shown in the accompanying financial statements as either from or in excess of net investment income or net realized gain, or from paid-in-capital, depending upon the type of book/tax differences that may exist.
3. FAIR VALUE MEASUREMENTS:
A three-tier hierarchy has been established for fair value measurement based on the extent of use of “observable inputs” as compared to “unobservable inputs” for disclosure purposes and requires additional disclosures about these valuations measurements. Inputs refer broadly to the assumptions that market participants would use in pricing a security. Observable inputs are inputs that reflect the assumptions market participants would use in pricing the security developed based on market data obtained from sources independent of the reporting entity. Unobservable inputs are inputs that reflect the reporting entity’s own assumptions about the assumptions market participants would use in pricing the security developed based on the best information available in the circumstances.
The three-tier hierarchy is summarized as follows:
| 1) | Level 1 – Quoted and Unadjusted prices in active markets for identical securities |
| 2) | Level 2 – Other Significant Observable Inputs (including quoted prices for similar securities, interest rates, prepayments speeds, credit risk, etc.) |
| 3) | Level 3 – Significant Unobservable Inputs (including the Fund’s own assumptions in determining the fair value of investments) |
The following is a summary of the inputs used to value each Fund’s investments as of April 30, 2011.
| Level 1 | Level 2 | Level 3 | Total | |||||||||||||
WHITE OAK SELECT GROWTH FUND | ||||||||||||||||
Common Stocks | $ | 274,735,662 | $ | – | $ | – | $ | 274,735,662 | ||||||||
Short Term Investments | 208,947 | – | – | 208,947 | ||||||||||||
Total | $ | 274,944,609 | $ | – | $ | – | $ | 274,944,609 | ||||||||
Semi-Annual Report | April 30, 2011 (Unaudited) | 53 |
Table of Contents
Notes to Financial Statements
| ||
As of April 30, 2011 (Unaudited) |
| Level 1 | Level 2 | Level 3 | Total | |||||||||||||
PIN OAK EQUITY FUND | ||||||||||||||||
Common Stocks | $ | 72,332,819 | $ | – | $ | – | $ | 72,332,819 | ||||||||
Short Term Investments | 2,388,598 | – | – | 2,388,598 | ||||||||||||
Total | $ | 74,721,417 | $ | – | $ | – | $ | 74,721,417 | ||||||||
ROCK OAK CORE GROWTH FUND | ||||||||||||||||
Common Stocks | $ | 7,427,955 | $ | – | $ | – | $ | 7,427,955 | ||||||||
Short Term Investments | 164,303 | – | – | 164,303 | ||||||||||||
Total | $ | 7,592,258 | $ | – | $ | – | $ | 7,592,258 | ||||||||
RIVER OAK DISCOVERY FUND | ||||||||||||||||
Common Stocks | $ | 12,167,949 | $ | – | $ | – | $ | 12,167,949 | ||||||||
Short Term Investments | 541,487 | – | – | 541,487 | ||||||||||||
Total | $ | 12,709,436 | $ | – | $ | – | $ | 12,709,436 | ||||||||
RED OAK TECHNOLOGY SELECT FUND | ||||||||||||||||
Common Stocks | $ | 71,747,949 | $ | – | $ | – | $ | 71,747,949 | ||||||||
Short Term Investments | 440,358 | – | – | 440,358 | ||||||||||||
Total | $ | 72,188,307 | $ | – | $ | – | $ | 72,188,307 | ||||||||
BLACK OAK EMERGING TECHNOLOGY FUND | ||||||||||||||||
Common Stocks | $ | 37,641,776 | $ | – | $ | – | $ | 37,641,776 | ||||||||
Short Term Investments | 210,488 | – | – | 210,488 | ||||||||||||
Total | $ | 37,852,264 | $ | – | $ | – | $ | 37,852,264 | ||||||||
LIVE OAK HEALTH SCIENCES FUND | ||||||||||||||||
Common Stocks | $ | 22,388,126 | $ | – | $ | – | $ | 22,388,126 | ||||||||
Rights | 16,120 | – | – | 16,120 | ||||||||||||
Short Term Investments | 1,870,878 | – | – | 1,870,878 | ||||||||||||
Total | $ | 24,275,124 | $ | – | $ | – | $ | 24,275,124 | ||||||||
The above tables are presented by levels of disaggregation for each asset class. For detailed descriptions of the underlying industries, see the accompanying Statements of Investments.
There were no significant transfers into or out of Level 1 and 2 during the period.
There were no Level 3 securities held during the period.
4. TRANSACTIONS WITH AFFILIATES:
Certain officers of the Trust are also officers of Oak Associates, Ltd., ALPS Fund Services, Inc. (the “Administrator”) and/or ALPS Distributors, Inc. (the “Distributor”). Such officers are paid no fees by the Trust for serving as officers of the Trust.
54 | 1-888-462-5386 | www.oakfunds.com |
Table of Contents
Notes to financial Statements
| ||
As of April 30,2011 (Unaudited) |
5. ADMINISTRATION, TRANSFER AGENT AND DISTRIBUTION AGREEMENTS:
Administration: ALPS Fund Services, Inc. (the “Administrator”) serves as administrator to the Trust. The Trust and the Administrator have entered into an administration agreement dated May 17, 2010 (the “Administration Agreement”). Under the Administration Agreement, the Administrator provides the Trust with administrative services, including regulatory reporting, fund accounting services, including calculating the Funds’ daily net asset value, and all necessary office space, equipment, personnel and facilities. The Administration Agreement provides that the Administrator shall not be liable for any error of judgment or mistake of law or for any loss suffered by the Trust in connection with the matters to which the Administration Agreement relates, except a loss resulting from willful misfeasance, bad faith or negligence on the part of the Administrator in the performance of its duties or from reckless disregard by it of its duties and obligations thereunder. The Administration Agreement shall remain in effect for a period of one year after the effective date of the agreement and shall continue in effect for successive periods of one year unless terminated by either party on not less than 60 days’ prior written notice to the other party.
Transfer Agent: As of May 17, 2010, ALPS Fund Services, Inc. (the “Transfer Agent”) serves as transfer agent, dividend paying agent and shareholder service agent for the Trust under a transfer agency services agreement with the Trust.
Distribution: The Trust and ALPS Distributors, Inc. (the “Distributor”), an affiliate of the Administrator, are parties to a distribution agreement dated May 17, 2010 (the “Distribution Agreement”) whereby the Distributor acts as principal underwriter for the Trust’s shares. The Distributor agreed to use its best efforts in distributing Fund shares but is not obligated to sell any particular number of shares. The Distributor does not receive compensation under the Distribution Agreement for distribution of Fund shares.
6. INVESTMENT ADVISORY AND CUSTODIAN AGREEMENTS:
The Trust and the Adviser are parties to an Investment Advisory Agreement dated February 27,1998, as last amended May 4, 2005, under which the Adviser receives an annual fee equal to 0.74% of the average daily net assets of each Fund, except for the River Oak Discovery Fund for which the Adviser receives 0.90% of the average daily net assets of the Fund. Effective February 28, 2008, the Adviser has agreed to contractually waive all or a portion of its fees (and to reimburse the Funds’ expenses if necessary) in order to limit operating expenses to not more than 1.25% of the average daily net assets of the White Oak Select Growth, Rock Oak Core Growth and Pin Oak Equity Funds, and 1.35% of the average daily net assets of the River Oak Discovery, Red Oak Technology Select, Black Oak Emerging Technology and Live Oak Health Sciences Funds for one year periods. Effective March 1, 2011 the Adviser contractually agreed to continue this arrangement through February 29, 2012.
U.S. Bank N.A. acts as custodian (the “Custodian”) for the Funds. The Custodian plays no role in determining the investment policies of the Funds or which securities are to be purchased or sold by the Funds.
7. INVESTMENT TRANSACTIONS:
The cost of security purchases and the proceeds from security sales, other than short-term investments, for the six months ended April 30, 2011, were as follows:
| Purchases | Sales | |||||||
White Oak Select Growth Fund | $ | 23,016,057 | $ | 39,101,618 | ||||
Pin Oak Equity Fund | 10,625,909 | 20,806,679 | ||||||
Rock Oak Core Growth Fund | 953,974 | 1,128,502 | ||||||
River Oak Discovery Fund | 5,183,192 | 3,396,184 | ||||||
Semi-Annual Report | April 30, 2011 (Unaudited) | 55 |
Table of Contents
Notes to Financial Statements
| ||
As of April 30, 2011 (Unaudited) |
| Purchases | Sales | |||||||
Red Oak Technology Select Fund | $ | 3,566,173 | $ | 6,658,822 | ||||
Black Oak Emerging Technology Fund | 15,460,307 | 23,443,741 | ||||||
Live Oak Health Sciences Fund | 1,756,381 | 2,372,831 | ||||||
8. FEDERAL INCOME TAXES:
Each of the Funds is classified as a separate taxable entity for Federal income tax purposes. Each of the Funds intends to continue to qualify as a separate “regulated investment company” under Sub-chapter M of the Internal Revenue Code and make the requisite distributions to shareholders that will be sufficient to relieve it from Federal income tax and Federal excise tax. Therefore, no Federal tax provision is required.
To the extent that dividends from net investment income and distributions from net realized capital gains exceed amounts reported in the financial statements, such amounts are reported separately.
The amounts of dividends from net investment income and distributions from net realized capital gains are determined in accordance with Federal income tax regulations, which may differ from those amounts determined under accounting principles generally accepted in the United States of America. These book/ tax differences are either temporary or permanent in nature. The character of dividends from net investment income or distributions from net realized gains made during the year, and the timing of dividends and distributions where the fiscal year in which the amounts are distributed may differ from the year that the income or realized gains (losses) were recorded by the Funds. To the extent these differences are permanent, adjustments are made to the appropriate equity accounts in the period that the differences arise. These differences are primarily due to the reclass of distributions on net operating losses and expiration of capital loss carryforwards.
Accordingly, the following permanent differences have been reclassified to/from the following accounts:
| Fund | (Over)/ Undistributed Net Investment Income | Accumulated Capital Gains/ (Losses) | Paid-in Capital | |||||||||
White Oak Select Growth Fund | $ | 1,733,094 | $ | 667,739,381 | $ | (669,472,475) | ||||||
Pin Oak Equity Fund | 1 | 417,945,310 | (417,945,311) | |||||||||
Rock Oak Core Growth Fund | 36,213 | 364 | (36,577) | |||||||||
River Oak Discovery Fund | 75,134 | (1,370) | (73,764) | |||||||||
Red Oak Technology Select Fund | 476,186 | 715,257,563 | (715,733,749) | |||||||||
Black Oak Emerging Technology Fund | 409,782 | 196,621,134 | (197,030,916) | |||||||||
Live Oak Health Sciences Fund | (33) | (14) | 47 | |||||||||
The tax character of the distributions paid by the Funds for the fiscal year ended October 31, 2010 is as follows:
| Fund | Ordinary Income | Long-Term Capital Gain | Total | |||||||||
Pin Oak Equity Fund | $ | 74,688 | $ | – | $ | 74,688 | ||||||
Live Oak Health Sciences Fund | 16,484 | 576,808 | 593,292 | |||||||||
56 | 1-888-462-5386 | www.oakfunds.com |
Table of Contents
Notes to Financial Statements
| ||
As of April 30, 2011 (Unaudited) |
As of October 31, 2010, the components of distributable earnings on a tax basis were as follows:
| Undistributed Net Investment Income | Accumulated Capital Gains/ (Losses) | Unrealized Appreciation | Total | |||||||||||||
White Oak Select Growth Fund | $ | – | $ | (1,304,364,741 | ) | $ | 73,731,532 | $ | (1,230,633,209 | ) | ||||||
Pin Oak Equity Fund | 219,936 | (288,126,080 | ) | 15,824,536 | (272,081,608 | ) | ||||||||||
Rock Oak Core Growth Fund | – | (236,921 | ) | 1,449,699 | 1,212,778 | |||||||||||
River Oak Discovery Fund | _ | 130,972 | 1,558,920 | 1,689,892 | ||||||||||||
Red Oak Technology Select Fund | _ | (332,505,406 | ) | 13,737,781 | (318,767,625 | ) | ||||||||||
Black Oak Emerging Technology Fund | _ | (19,610,208 | ) | 1,849,569 | (17,760,639 | ) | ||||||||||
Live Oak Health Sciences Fund | 442,159 | 503,243 | 3,742,854 | 4,688,256 | ||||||||||||
For Federal income tax purposes, capital loss carryforwards may be carried forward and applied against future capital gains.
At October 31, 2010, the Funds had capital loss carryforwards available to offset future realized capital gains through the indicated expiration dates:
| Expiring October 31, | ||||||||||||||||||||||||||||||||
| 2011 | 2012 | 2013 | 2014 | 2015 | 2016 | 2017 | Total | |||||||||||||||||||||||||
White Oak Select Growth Fund | $ | 206,601,681 | $ | 744,256,673 | $ | 321,944,019 | $ | – | $ | – | $ | 22,546,570 | $ | 9,015,798 | $ | 1,304,364,741 | ||||||||||||||||
Pin Oak Equity Fund | 180,086,547 | 90,283,407 | 17,756,126 | – | – | – | – | 288,126,080 | ||||||||||||||||||||||||
Rock Oak Core Growth Fund | – | – | – | – | – | – | 236,921 | 236,921 | ||||||||||||||||||||||||
Red Oak Technology Select Fund | 293,675,488 | 34,232,859 | – | – | – | – | 4,597,059 | 332,505,406 | ||||||||||||||||||||||||
Black Oak Emerging Technology Fund | 15,084,356 | – | – | – | – | – | 4,525,852 | 19,610,208 | ||||||||||||||||||||||||
At April 30, 2011, the total cost of securities for Federal income tax purposes and the aggregate gross unrealized appreciation and depreciation for securities held by the Funds is as follows:
| Federal Tax Cost | Aggregate Gross Appreciation | Aggregate Gross Depreciation | Net | |||||||||||||
White Oak Select Growth Fund | 189,431,929 | 97,083,100 | (11,570,420 | ) | 85,512,680 | |||||||||||
Pin Oak Equity Fund | 54,071,345 | 21,879,105 | (1,229,033 | ) | 20,650,072 | |||||||||||
Rock Oak Core Growth Fund | 5,300,394 | 2,386,047 | (94,183 | ) | 2,291,864 | |||||||||||
River Oak Discovery Fund | 9,948,318 | 3,017,933 | (256,815 | ) | 2,761,118 | |||||||||||
Red Oak Technology Select Fund | 49,709,762 | 23,836,983 | (1,358,438 | ) | 22,478,545 | |||||||||||
Black Oak Emerging Technology Fund | 31,024,185 | 7,768,632 | (940,553 | ) | 6,828,079 | |||||||||||
Live Oak Health Sciences Fund | 17,435,876 | 7,480,385 | (641,137 | ) | 6,839,248 | |||||||||||
Semi-Annual Report | April 30, 2011 (Unaudited) | 57 |
Table of Contents
Notes to Financial Statements
| ||
As of April 30, 2011 (Unaudited)
|
Management evaluates the Funds’ tax positions to determine if the tax positions taken meet the minimum recognition threshold in connection with accounting for uncertainties in income tax positions taken or expected to be taken for the purposes of measuring and recognizing tax liabilities in the financial statements. Recognition of tax benefits of an uncertain tax position is required only when the position is “more likely than not” to be sustained assuming examination by taxing authorities. The Funds recognize interest and penalties, if any, related to unrecognized tax benefits as income tax expense in the Statements of Operations. During the period, the Funds did not incur any interest or penalties.
Management has analyzed the Funds’ tax position taken on federal income tax returns for all open tax years (current and prior three tax years) and has concluded that as of April 30, 2011, no provision for income tax would be required in the Funds’ financial statements. The Funds’ federal and state income and federal excise tax returns for tax years for which the applicable statutes of limitations have not expired are subject to examination by the Internal Revenue Service and state departments of revenue.
9. CONCENTRATION OF CREDIT RISK AND OWNERSHIP:
The Red Oak Technology Select Fund and the Black Oak Emerging Technology Fund invest a substantial portion of their assets in securities in the technology industry. The Live Oak Health Sciences Fund invests a substantial portion of its assets in securities in the health care, medicine and life sciences industries. Therefore, each of these Funds may be more affected by economic developments in those industries than a general equity fund would be.
In the normal course of business, the Funds enter into contracts that provide general indemnifications. The Funds’ maximum exposure under these arrangements is dependent on future claims that may be made against the Funds and, therefore, cannot be established; however based on experience, the risk of loss from such claims is considered remote.
From time to time, the Funds may have a concentration of several shareholders holding a significant percentage of shares outstanding. Investment activities of these shareholders could have a material impact on the Fund.
As of April 30, 2011, the James D. Oelschlager Trust owned 33% of the River Oak Discovery Fund.
58 | 1-888-462-5386 | www.oakfunds.com |
Table of Contents
OAK ASSOCIATES FUNDS
This Page Intentionally Left Blank
Table of Contents

By Mail
Oak Associates Funds
P.O. Box 8233
Denver, CO 80201-8233
By Telephone 1-888-462-5386 Monday through Friday, 8:30 a.m. to 8:00 p.m. ET
On The Web www.oakfunds.com
Click on the My Oak Account section to take advantage of these features:
| • | Trade Online |
| • | Access and Update Account Information |
| • | Go Paperless with eDelivery |
| • | View and download account history |
| • | Establish a systematic investment plan |
The Trust files its complete schedule of portfolio holdings of each Fund with the Securities and Exchange Commission for the first and third quarters of each fiscal year on Form N-Q within sixty days after the end of the period. The Trust’s Forms N-Q is available on the Commission’s website at http://www.sec.gov, and may be reviewed and copied at the Commission’s Public Reference Room in Washington DC. Information on the operation of the Public Reference Room may be obtained by calling 1-800-SEC-0330.
A description of the policies and procedures that the Funds use to determine how to vote proxies relating to portfolio securities, as well as information relating to how a Fund voted proxies relating to portfolio securities during the most recent 12-month period ended June 30, is available (i) without charge, upon request, by calling 1-888-462-5386; and (ii) on the Commission’s website at http://www.sec.gov.
This report has been prepared for Oak Associates Funds Shareholders and may be distributed to others only if preceded or accompanied by a prospectus.
Oak Associates Funds are distributed by ALPS Distributors, Inc.

Table of Contents
Table of Contents
Item 2. | Code of Ethics. | |
Not applicable to semi-annual report. | ||
Item 3. | Audit Committee Financial Expert. | |
Not applicable to semi-annual report. | ||
Item 4. | Principal Accountant Fees and Services. | |
Not applicable to semi-annual report. | ||
Item 5. | Audit Committee of Listed Registrants. | |
Not applicable to open-end management investment companies. | ||
Item 6. | Schedule of Investments. | |
| (a) | Schedule of Investments in securities of unaffiliated issuers as of the close of the reporting period is included as part of the Report to Stockholders filed under Item 1 of this Form N-CSRS. | |
| (b) | Not applicable. | |
Item 7. | Disclosure of Proxy Voting Policies and Procedures for Closed-End Management Investment Companies. | |
Not applicable to open-end management investment companies. | ||
Item 8. | Portfolio Managers of Closed-End Management Investment Companies. | |
Not applicable to open-end management investment companies. | ||
Item 9. | Purchases of Equity Securities by Closed-End Management Investment Companies and Affiliated Purchasers. | |
Not applicable to open-end management investment companies. | ||
Item 10. | Submission of Matters to a Vote of Security Holders. | |
Table of Contents
There have been no material changes to the procedures by which shareholders may recommend nominees to the registrant’s board of trustees.
Item 11. Controls and Procedures.
(a) The registrant’s principal executive and principal financial officers, or persons performing similar functions, regarding the effectiveness of the registrant’s disclosure controls and procedures (as defined in Rule 30a-3(c) under the Act (17 CFR 270.30a-3(c))) as of a date within 90 days of the filing date of the report that includes the disclosure required by this paragraph, based on the evaluation of these controls and procedures required by Rule 30a-3(b) under the Act (17 CFR 270.30a-3(b)) and Rules 13a-15(b) or 15d-15(b) under the Exchange Act (17 CFR 240.13a-15(b) or 240.15d-15(b)).
(b) There has been no change in the registrant’s internal control over financial reporting (as defined in Rule 30a-3(d) under the Act (17 CFR 270.30a-3(d)) that occurred during the second fiscal quarter of the period covered by this report that has materially affected, or is reasonably likely to materially affect, the registrant’s internal control over financial reporting.
Item 12. Exhibits.
(a)(1) Not applicable to semi-annual report.
(a)(2) A separate certification for the principal executive officer and the principal financial officer of the registrant as required by Rule 30a-2(a) under the Investment Company Act of 1940, as amended (17 CFR 270.30a-2(a)), are filed herewith.
(a)(3) None.
(b) Officer certifications as required by Rule 30a-2(b) under the Investment Company Act of 1940, as amended (17 CFR 270.30a-2(b)) are filed herewith.
Table of Contents
SIGNATURES
Pursuant to the requirements of the Securities Exchange Act of 1934 and the Investment Company Act of 1940, the Registrant has duly caused this report to be signed on its behalf by the undersigned, thereunto duly authorized.
| OAK ASSOCIATES FUNDS | ||||
| By | /s/ Leslie Manna | |||
| Leslie Manna | ||||
| President | ||||
| Date: | July 7, 2011 | |||
Pursuant to the requirements of the Securities Exchange Act of 1934 and the Investment Company Act of 1940, this report has been signed below by the following persons on behalf of the Registrant and in the capacities and on the dates indicated.
| By | /s/ Leslie Manna | |||
| Leslie Manna | ||||
| President and Principal Executive Officer | ||||
| Date: | July 7, 2011 | |||
| By | /s/ Patrick Buchanan | |||
| Patrick Buchanan | ||||
| Treasurer and Principal Financial Officer | ||||
| Date: | July 7, 2011 | |||