UNITED STATES
SECURITIES AND EXCHANGE COMMISSION
Washington, D.C. 20549
FORM N-CSRS
CERTIFIED SHAREHOLDER REPORT OF REGISTERED
MANAGEMENT INVESTMENT COMPANIES
Investment Company Act file number: 811-08549
Oak Associates Funds
(Exact name of registrant as specified in charter)
101 Federal Street, Boston, Massachusetts 02110
(Address of principal executive offices) (Zip code)
Leslie Manna
Oak Associates, ltd.
3875 Embassy Parkway, Suite 250
Akron, Ohio 44333-8334
(Name and address of agent for service)
Registrant’s telephone number, including area code: 1-888-462-5386
Date of fiscal year end: October 31st
Date of reporting period: November 1, 2013 - April 30, 2014
| Item 1. | Reports to Stockholders. |

April 30, 2014
SEMI-ANNUAL REPORT
White Oak Select Growth Fund | WOGSX
Pin Oak Equity Fund | POGSX
Rock Oak Core Growth Fund | RCKSX
River Oak Discovery Fund | RIVSX
Red Oak Technology Select Fund | ROGSX
Black Oak Emerging Technology Fund | BOGSX
Live Oak Health Sciences Fund | LOGSX


| 1 | ||
Performance Update | ||
| 2 | ||
| 3 | ||
| 4 | ||
| 5 | ||
| 6 | ||
| 7 | ||
| 8 | ||
| 9 | ||
| 11 | ||
Financial Statements | ||
| 13 | ||
| 32 | ||
| 34 | ||
| 36 | ||
| 40 | ||
| 54 | ||
| 62 | ||
Dear Fellow Shareholder,
We are pleased to send you the Oak Associates Funds Semi-Annual Report which contains information on the holdings of each of the Funds, along with the Financial Highlights and Statements of Net Assets, Operations, and Changes in Net Assets for the six-month period ended April 30, 2014. We encourage you to read the report to help you stay informed about your investments.
We recognize that this is only a six-month snapshot of your portfolio, and we urge you to visit our website at www.oakfunds.com for more detailed fund information and market commentary.
As always, we appreciate the trust you have placed in us and thank you for your investment.
Sincerely,
Oak Associates Funds
| Semi-Annual Report | April 30, 2014 (Unaudited) | 1 |
| White Oak Select Growth Fund | Performance Update |
All data below as of April 30, 2014 (Unaudited)
| Fund Data | ||||
Ticker Symbol | WOGSX | |||
Share Price | $55.69 | |||
Total Net Assets | $249.3 M | |||
Portfolio Turnover | 0.89% | |||
| Industry Weightings^ | ||||
Information Technology | 34.3% | |||
Financials | 31.4% | |||
Health Care | 21.9% | |||
Energy | 7.4% | |||
Consumer Discretionary | 4.2% | |||
Materials | 0.1% | |||
Cash & Other Assets | 0.7% | |||
| Top 10 Holdings^ | ||||
1. JPMorgan Chase & Co. | 6.6 | % | ||
2. Cisco Systems, Inc. | 5.8 | % | ||
3. KLA-Tencor Corp. | 5.4 | % | ||
4. ACE, Ltd. | 5.3 | % | ||
5. US Bancorp | 5.2 | % | ||
6. The Charles Schwab Corp. | 5.2 | % | ||
7. CR Bard, Inc. | 5.1 | % | ||
8. Amgen, Inc. | 4.8 | % | ||
9. Stryker Corp. | 4.6 | % | ||
10. International Business Machines Corp. | 4.5 | % | ||
^ Percentages are based on net assets. Holdings are subject to change.
Growth of $10,000 Chart
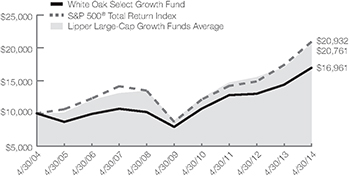
The chart above represents historical performance of a hypothetical investment of $10,000 in the Fund over the past 10 years (or for the life of the Fund if shorter). Past performance does not guarantee future results. This chart does not reflect the deduction of taxes that a shareholder would pay on Fund distributions or the redemption of Fund shares.
| Average Annual Total Return | |||||||||||||||||||||||||
1 Year Return | 3 Year Return | 5 Year Return | 10 Year Return | Inception to Date | |||||||||||||||||||||
White Oak Select Growth Fund | 17.99% | 9.89% | 16.39% | 5.43% | 8.38 | %* | |||||||||||||||||||
S&P 500® Total Return Index1 | 20.44% | 13.83% | 19.14% | 7.67% | 9.25 | %* | |||||||||||||||||||
Lipper Large-Cap Growth Funds Average2 | 20.17% | 11.39% | 17.25% | 7.20% | 8.14 | %** | |||||||||||||||||||
*Since 08/03/1992 **Since 07/31/1992 | Gross/Net Expense Ratio (per the current prospectus): 1.12% | |||||||||
The performance data quoted represents past performance. Past performance does not guarantee future results. The investment return and principal value of an investment will fluctuate so that an investor’s shares, when redeemed, may be worth more or less than their original cost and current performance may be lower or higher than the performance quoted. For performance data current to the most recent month-end, please visit www.oakfunds.com or call 1-888-462-5386.
1 Standard & Poor’s is the source and owner of the S&P Index data. 2 Lipper Inc. is the source and owner of the Lipper Classification data. See Pages 9 and 10 for additional disclosure.
| 2 | 1-888-462-5386 | www.oakfunds.com |
| Performance Update |
All data below as of April 30, 2014 (Unaudited)
| Fund Data | ||||
Ticker Symbol | POGSX | |||
Share Price | $46.53 | |||
Total Net Assets | $85.2 M | |||
Portfolio Turnover | 0.77% | |||
| Industry Weightings^ | ||||
Financials | 36.1% | |||
Information Technology | 27.0% | |||
Consumer Discretionary | 11.2% | |||
Energy | 9.1% | |||
Industrials | 8.6% | |||
Consumer Staples | 5.5% | |||
Materials | 1.0% | |||
Cash & Other Assets | 1.5% | |||
| Top 10 Holdings^ | ||||
1. Wells Fargo & Co. | 6.7 | % | ||
2. Amdocs, Ltd. | 5.5 | % | ||
3. Microsoft Corp. | 5.4 | % | ||
4. Raytheon Co. | 4.7 | % | ||
5. The Charles Schwab Corp. | 4.6 | % | ||
6. Capital One Financial Corp. | 4.5 | % | ||
7. Nabors Industries, Ltd. | 4.4 | % | ||
8. Twenty-First Century Fox, Inc. - Class A | 4.1 | % | ||
9. The Travelers Cos., Inc. | 3.3 | % | ||
10. Lockheed Martin Corp. | 3.2 | % | ||
^ Percentages are based on net assets. Holdings are subject to change.
Growth of $10,000 Chart

The chart above represents historical performance of a hypothetical investment of $10,000 in the Fund over the past 10 years (or for the life of the Fund if shorter). Past performance does not guarantee future results. This chart does not reflect the deduction of taxes that a shareholder would pay on Fund distributions or the redemption of Fund shares.
| Average Annual Total Return | |||||||||||||||||||||||||
1 Year Return | 3 Year Return | 5 Year Return | 10 Year Return | Inception to Date | |||||||||||||||||||||
Pin Oak Equity Fund | 26.17% | 14.04% | 21.89% | 9.83% | 7.59 | %* | |||||||||||||||||||
S&P 500® Total Return Index1 | 20.44% | 13.83% | 19.14% | 7.67% | 9.25 | %* | |||||||||||||||||||
Lipper Multi-Cap Core Funds Average2 | 20.10% | 11.46% | 17.85% | 7.44% | 9.29 | %** | |||||||||||||||||||
*Since 08/03/1992 **Since 07/31/1992 | Gross/Net Expense Ratio (per the current prospectus): 1.16% | |||||||||
The performance data quoted represents past performance. Past performance does not guarantee future results. The investment return and principal value of an investment will fluctuate so that an investor’s shares, when redeemed, may be worth more or less than their original cost and current performance may be lower or higher than the performance quoted. For performance data current to the most recent month-end, please visit www.oakfunds.com or call 1-888-462-5386.
1 Standard & Poor’s is the source and owner of the S&P Index data. 2 Lipper Inc. is the source and owner of the Lipper Classification data. See Pages 9 and 10 for additional disclosure.
| Semi-Annual Report | April 30, 2014 (Unaudited) | 3 |
| Performance Update |
All data below as of April 30, 2014 (Unaudited)
| Fund Data | ||||
Ticker Symbol | RCKSX | |||
Share Price | $13.51 | |||
Total Net Assets | $8.2 M | |||
Portfolio Turnover | 13.12% | |||
| Industry Weightings^ | ||||
Information Technology | 41.5% | |||
Financials | 14.5% | |||
Energy | 11.3% | |||
Consumer Discretionary | 9.3% | |||
Industrials | 8.2% | |||
Health Care | 7.5% | |||
Consumer Staples | 2.6% | |||
Materials | 2.1% | |||
Cash & Other Assets | 3.0% | |||
| Top 10 Holdings^ | ||||
1. Genworth Financial, Inc. - Class A | 4.8 | % | ||
2. Computer Sciences Corp. | 4.1 | % | ||
3. Wynn Resorts, Ltd. | 4.0 | % | ||
4. Western Digital Corp. | 3.9 | % | ||
5. CA, Inc. | 3.7 | % | ||
6. Weatherford International, Ltd. | 3.7 | % | ||
7. Comerica, Inc. | 3.5 | % | ||
8. SunTrust Banks, Inc. | 3.4 | % | ||
9. L-3 Communications Holdings, Inc. | 3.3 | % | ||
10. HollyFrontier Corp. | 3.3 | % | ||
^ Percentages are based on net assets. Holdings are subject to change.
Growth of $10,000 Chart

This chart represents historical performance of a hypothetical investment of $10,000 in the Fund over the past 10 years (or for the life of the Fund if shorter). Past performance does not guarantee future results. This chart does not reflect the deduction of taxes that a shareholder would pay on Fund distributions or the redemption of Fund shares. Fee waivers are in effect; if they had not been in effect, performance would have been lower.
| Average Annual Total Return | |||||||||||||||||||||||||
1 Year Return | 3 Year Return | 5 Year Return | 10 Year Return | Inception to Date* | |||||||||||||||||||||
Rock Oak Core Growth Fund | 26.49% | 9.03% | 17.24% | — | 6.23 | % | |||||||||||||||||||
S&P 500® Total Return Index1 | 20.44% | 13.83% | 19.14% | — | 7.06 | % | |||||||||||||||||||
Lipper Multi-Cap Growth Funds Average2 | 20.65% | 11.00% | 18.29% | — | 7.40 | % | |||||||||||||||||||
*Since 12/31/2004 | Gross/Net Expense Ratio (per the current prospectus): 1.66%/1.26% | |||||||||
The Adviser has contractually agreed through February 28, 2015, to waive all or a portion of its fee for the Fund (and to reimburse expenses to the extent necessary) in order to limit Fund total operating expenses (excluding Acquired Fund Fees and Expenses) to an annual rate of not more than 1.25% of average daily net assets. This contractual fee waiver may only be terminated subject to approval by the Board of Trustees of the Trust.
The performance data quoted represents past performance. Past performance does not guarantee future results. The investment return and principal value of an investment will fluctuate so that an investor’s shares, when redeemed, may be worth more or less than their original cost and current performance may be lower or higher than the performance quoted. For performance data current to the most recent month-end, please visit www.oakfunds.com or call 1-888-462-5386.
1 Standard & Poor’s is the source and owner of the S&P Index data. 2 Lipper Inc. is the source and owner of the Lipper Classification data. See Pages 9 and 10 for additional disclosure.
| 4 | 1-888-462-5386 | www.oakfunds.com |
| Performance Update |
All data below as of April 30, 2014 (Unaudited)
| Fund Data | ||||
Ticker Symbol | RIVSX | |||
Share Price | $17.54 | |||
Total Net Assets | $14.1 M | |||
Portfolio Turnover | 55.76% | |||
| Industry Weightings^ | ||||
Financials | 24.9% | |||
Information Technology | 19.7% | |||
Consumer Discretionary | 17.9% | |||
Health Care | 16.1% | |||
Industrials | 6.5% | |||
Energy | 6.3% | |||
Consumer Staples | 3.4% | |||
Materials | 2.2% | |||
Cash & Other Assets | 3.0% | |||
| Top 10 Holdings^ | ||||
1. Questcor Pharmaceuticals, Inc. | 4.1 | % | ||
2. Cirrus Logic, Inc. | 3.6 | % | ||
3. Assurant, Inc. | 3.5 | % | ||
4. ION Geophysical Corp. | 3.5 | % | ||
5. The Andersons, Inc. | 3.4 | % | ||
6. United Therapeutics Corp. | 3.2 | % | ||
7. Amsurg Corp. | 3.1 | % | ||
8. ICF International, Inc. | 2.9 | % | ||
9. Kulicke & Soffa Industries, Inc. | 2.8 | % | ||
10. Apollo Group, Inc. | 2.8 | % | ||
^ Percentages are based on net assets. Holdings are subject to change.
Growth of $10,000 Chart
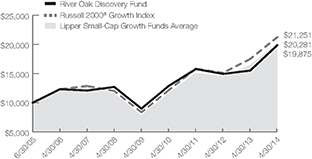
This chart represents historical performance of a hypothetical investment of $10,000 in the Fund over the past 10 years (or for the life of the Fund if shorter). Past performance does not guarantee future results. This chart does not reflect the deduction of taxes that a shareholder would pay on Fund distributions or the redemption of Fund shares. Fee waivers are in effect; if they had not been in effect, performance would have been lower.
| Average Annual Total Return | |||||||||||||||||||||||||
1 Year Return | 3 Year Return | 5 Year Return | 10 Year Return | Inception to Date* | |||||||||||||||||||||
River Oak Discovery Fund | 28.12% | 8.01% | 17.20% | — | 8.09 | % | |||||||||||||||||||
Russell 2000® Growth Index1 | 21.46% | 10.33% | 20.50% | — | 8.91 | % | |||||||||||||||||||
Lipper Small-Cap Growth Funds Average2 | 21.03% | 9.20% | 20.14% | — | 8.18 | % | |||||||||||||||||||
*Since 06/30/2005 | Gross/Net Expense Ratio (per the current prospectus): 1.53%/1.36% | |||||||||
The Adviser has contractually agreed through February 28, 2015, to waive all or a portion of its fee for the Fund (and to reimburse expenses to the extent necessary) in order to limit Fund total operating expenses (excluding Acquired Fund Fees and Expenses) to an annual rate of not more than 1.35% of average daily net assets. This contractual fee waiver may only be terminated subject to approval by the Board of Trustees of the Trust.
The performance data quoted represents past performance. Past performance does not guarantee future results. The investment return and principal value of an investment will fluctuate so that an investor’s shares, when redeemed, may be worth more or less than their original cost and current performance may be lower or higher than the performance quoted. For performance data current to the most recent month-end, please visit www.oakfunds.com or call 1-888-462-5386.
1 Russell Investments is the source and owner of the Russell Index data. 2 Lipper Inc. is the source and owner of the Lipper Classification data. See Pages 9 and 10 for additional disclosure.
| Semi-Annual Report | April 30, 2014 (Unaudited) | 5 |
| Performance Update |
All data below as of April 30, 2014 (Unaudited)
| Fund Data | ||||
Ticker Symbol | ROGSX | |||
Share Price | $15.23 | |||
Total Net Assets | $129.8 M | |||
Portfolio Turnover | 4.41% | |||
| Industry Weightings^ | ||||
Information Technology | 87.6% | |||
Industrials | 7.4% | |||
Consumer Discretionary | 1.5% | |||
Cash & Other Assets | 3.5% | |||
| Top 10 Holdings^ | ||||
1. Oracle Corp. | 4.9 | % | ||
2. Northrop Grumman Corp. | 4.3 | % | ||
3. Alliance Data Systems Corp. | 4.2 | % | ||
4. Cisco Systems, Inc. | 4.0 | % | ||
5. Western Digital Corp. | 3.9 | % | ||
6. Accenture PLC - Class A | 3.6 | % | ||
7. Microsoft Corp. | 3.5 | % | ||
8. KLA-Tencor Corp. | 3.3 | % | ||
9. Qualcomm, Inc. | 3.2 | % | ||
10. Arrow Electronics, Inc. | 3.2 | % | ||
^ Percentages are based on net assets. Holdings are subject to change.
Growth of $10,000 Chart
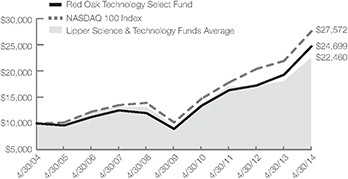
The chart above represents historical performance of a hypothetical investment of $10,000 in the Fund over the past 10 years (or for the life of the Fund if shorter). Past performance does not guarantee future results. This chart does not reflect the deduction of taxes that a shareholder would pay on Fund distributions or the redemption of Fund shares.
| Average Annual Total Return | |||||||||||||||||||||||||
1 Year Return | 3 Year Return | 5 Year Return | 10 Year Return | Inception to Date* | |||||||||||||||||||||
Red Oak Technology Select Fund | 28.09% | 14.79% | 22.50% | 9.46% | 2.83 | % | |||||||||||||||||||
NASDAQ 100 Index1 | 25.82% | 15.68% | 22.04% | 10.67% | 5.01 | % | |||||||||||||||||||
Lipper Science & Technology Funds Average2 | 25.94% | 8.44% | 17.99% | 8.09% | 4.39 | % | |||||||||||||||||||
*Since 12/31/1998 | Gross/Net Expense Ratio (per the current prospectus): 1.23% | |||||||||
The performance data quoted represents past performance. Past performance does not guarantee future results. The investment return and principal value of an investment will fluctuate so that an investor’s shares, when redeemed, may be worth more or less than their original cost and current performance may be lower or higher than the performance quoted. For performance data current to the most recent month-end, please visit www.oakfunds.com or call 1-888-462-5386.
1 NASDAQ is the source and owner of the NASDAQ Index data. 2 Lipper Inc. is the source and owner of the Lipper Classification data. See Pages 9 and 10 for additional disclosure.
| 6 | 1-888-462-5386 | www.oakfunds.com |
| Performance Update |
All data below as of April 30, 2014 (Unaudited)
| Fund Data | ||||
Ticker Symbol | BOGSX | |||
Share Price | $3.84 | |||
Total Net Assets | $32.0 M | |||
Portfolio Turnover | 12.74% | |||
| Industry Weightings^ | ||||
Information Technology | 92.0% | |||
Health Care | 4.8% | |||
Industrials | 2.5% | |||
Cash & Other Assets | 0.7% | |||
| Top 10 Holdings^ | ||||
1. Computer Sciences Corp. | 5.2 | % | ||
2. Qualcomm, Inc. | 5.2 | % | ||
3. Apple, Inc. | 4.8 | % | ||
4. Cirrus Logic, Inc. | 4.5 | % | ||
5. Salesforce.com, Inc. | 4.5 | % | ||
6. Western Digital Corp. | 4.4 | % | ||
7. CA, Inc. | 4.2 | % | ||
8. SanDisk Corp. | 4.2 | % | ||
9. Linear Technology Corp. | 4.2 | % | ||
10. Cognizant Technology Solutions Corp. - Class A | 4.1 | % | ||
^ Percentages are based on net assets. Holdings are subject to change.
Growth of $10,000 Chart
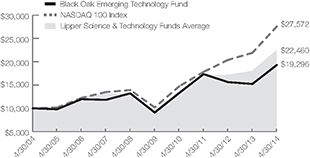
This chart represents historical performance of a hypothetical investment of $10,000 in the Fund over the past 10 years (or for the life of the Fund if shorter). Past performance does not guarantee future results. This chart does not reflect the deduction of taxes that a shareholder would pay on Fund distributions or the redemption of Fund shares. Fee waivers are in effect; if they had not been in effect, performance would have been lower.
| Average Annual Total Return | |||||||||||||||||||||||||
1 Year Return | 3 Year Return | 5 Year Return | 10 Year Return | Inception to Date | |||||||||||||||||||||
Black Oak Emerging Technology Fund | 26.73% | 3.63% | 16.23% | 6.79% | -6.93 | %* | |||||||||||||||||||
NASDAQ 100 Index1 | 25.82% | 15.68% | 22.04% | 10.67% | 3.86 | %* | |||||||||||||||||||
Lipper Science & Technology Funds Average2 | 25.94% | 8.44% | 17.99% | 8.09% | 2.03 | %** | |||||||||||||||||||
*Since 12/29/2000 | Gross/Net Expense Ratio (per the current prospectus): 1.40%/1.36% | |||||||||
**Since 12/31/2000 | ||||||||||
The Adviser has contractually agreed through February 28, 2015, to waive all or a portion of its fee for the Fund (and to reimburse expenses to the extent necessary) in order to limit Fund total operating expenses (excluding Acquired Fund Fees and Expenses) to an annual rate of not more than 1.35% of average daily net assets. This contractual fee waiver may only be terminated subject to approval by the Board of Trustees of the Trust.
The performance data quoted represents past performance. Past performance does not guarantee future results. The investment return and principal value of an investment will fluctuate so that an investor’s shares, when redeemed, may be worth more or less than their original cost and current performance may be lower or higher than the performance quoted. For performance data current to the most recent month-end, please visit www.oakfunds.com or call 1-888-462-5386.
1 NASDAQ is the source and owner of the NASDAQ Index data. 2 Lipper Inc. is the source and owner of the Lipper Classification data. See Pages 9 and 10 for additional disclosure.
| Semi-Annual Report | April 30, 2014 (Unaudited) | 7 |
| Performance Update |
All data below as of April 30, 2014 (Unaudited)
| Fund Data | ||||
Ticker Symbol | LOGSX | |||
Share Price | $19.90 | |||
Total Net Assets | $46.1 M | |||
Portfolio Turnover | 6.61% | |||
| Industry Weightings^ | ||||
Health Care | 98.0% | |||
Cash & Other Assets | 2.0% | |||
| Top 10 Holdings^ | ||||
1. Cardinal Health, Inc. | 5.8 | % | ||
2. CR Bard, Inc. | 5.6 | % | ||
3. McKesson Corp. | 5.2 | % | ||
4. AstraZeneca PLC ADR | 4.7 | % | ||
5. Becton Dickinson and Co. | 4.0 | % | ||
6. Merck & Co., Inc. | 3.9 | % | ||
7. Amgen, Inc. | 3.9 | % | ||
8. Medtronic, Inc. | 3.8 | % | ||
9. Agilent Technologies, Inc. | 3.8 | % | ||
10. WellPoint, Inc. | 3.4 | % | ||
^ Percentages are based on net assets. Holdings are subject to change.
Growth of $10,000 Chart
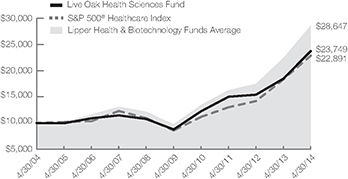
The chart above represents historical performance of a hypothetical investment of $10,000 in the Fund over the past 10 years (or for the life of the Fund if shorter). Past performance does not guarantee future results. This chart does not reflect the deduction of taxes that a shareholder would pay on Fund distributions or the redemption of Fund shares.
| Average Annual Total Return | |||||||||||||||||||||||||
| 1 Year Return | 3 Year Return | 5 Year Return | 10 Year Return | Inception to Date | |||||||||||||||||||||
Live Oak Health Sciences Fund | 28.56% | 16.51% | 22.03% | 9.03% | 7.35 | %* | |||||||||||||||||||
S&P 500® Healthcare Index1 | 24.98% | 20.72% | 21.70% | 8.63% | 6.65 | %* | |||||||||||||||||||
Lipper Health & Biotechnology Funds Average2 | 27.39% | 20.05% | 24.08% | 10.73% | 8.75 | %** | |||||||||||||||||||
*Since 06/29/2001 **Since 06/30/2001 | Gross/Net Expense Ratio (per the current prospectus): 1.15% | |||||||||
The performance data quoted represents past performance. Past performance does not guarantee future results. The investment return and principal value of an investment will fluctuate so that an investor’s shares, when redeemed, may be worth more or less than their original cost and current performance may be lower or higher than the performance quoted. For performance data current to the most recent month-end, please visit www.oakfunds.com or call 1-888-462-5386.
1 Standard & Poor’s is the source and owner of the S&P Index data. 2 Lipper Inc. is the source and owner of the Lipper Classification data. See Pages 9 and 10 for additional disclosure.
| 8 | 1-888-462-5386 | www.oakfunds.com |
| Important Disclosures |
As of April 30, 2014 (Unaudited)
Index Definitions and Disclosures
All indices are unmanaged and index performance figures include reinvestment of dividends but do not reflect any fees, expenses or taxes. Investors cannot invest directly in an index.
NASDAQ 100 Index – The NASDAQ 100 Index includes 100 of the largest domestic and international non-financial securities listed on The Nasdaq Stock Market based on market capitalization.
Russell 2000 Growth Index – The Russell 2000 Growth Index measures the performance of the small-cap growth segment of the U.S. equity universe. It includes those Russell 2000 companies with higher price-to-book ratios and higher forecasted growth values.
S&P 500 Health Care Index – The S&P 500 Health Care Index is a capitalization-weighted index that encompasses two main industry groups. The first includes companies who manufacture health care equipment and supplies or provide health care related services, including distributors of health care products, providers of basic health care services, and owners and operators of health care facilities and organizations. The second group consists of companies primarily involved in the research, development, production and marketing of pharmaceuticals and biotechnology products.
S&P 500 Index – The S&P 500 Index is a commonly recognized, market capitalization weighted index of 500 widely held equity securities, designed to measure broad U.S. equity performance.
Lipper Multi-Cap Core Funds – Funds that, by portfolio practice, invest in a variety of market-capitalization ranges without concentrating 75% of their equity assets in any one market-capitalization range over an extended period of time. Multi-cap core funds typically have average characteristics compared to the S&P SuperComposite 1500 Index.
Lipper Health/Biotechnology Funds – Funds that invest primarily in the equity securities of domestic companies engaged in health care, medicine, and biotechnology.
Lipper Large-Cap Growth Funds – Funds that, by portfolio practice, invest at least 75% of their equity assets in companies with market capitalizations (on a three-year weighted basis) above Lipper’s USDE large-cap floor. Large-cap growth funds typically have an above-average price-to-earnings ratio, price-to-book ratio, and three-year sales-per-share growth value, compared to the S&P 500 Index.
Lipper Multi-Cap Growth Funds – Funds that, by portfolio practice, invest in a variety of market capitalization ranges without concentrating 75% of their equity assets in any one market capitalization range over an extended period of time. Multi-cap growth funds typically have an above-average price-to-earnings ratio, price-to-book ratio, and three-year sales per-share growth value, compared to the S&P SuperComposite 1500 Index.
Lipper Science & Technology Funds – Funds that invest primarily in the equity securities of domestic companies engaged in science and technology.
Lipper Small-Cap Growth Funds – Funds that, by portfolio practice, invest at least 75% of their equity assets in companies with market capitalizations (on a three-year weighted basis) below Lipper’s USDE small-cap ceiling. Small-cap growth funds typically have an above-average price-to-earnings ratio, price-to-book ratio, and three-year sales-per-share growth value, compared to the S&P Small-Cap 600 Index.
| Semi-Annual Report | April 30, 2014 (Unaudited) | 9 |
| Important Disclosures |
As of April 30, 2014 (Unaudited)
Lipper, a Thomson Reuters Company, is the source and owner of the Lipper Classification data contained in this material and all trademarks and copyrights related thereto. Any further dissemination or redistribution is strictly prohibited. Lipper Inc. is not responsible for the formatting or configuration of this material or for any inaccuracy in Oak Associates Funds presentation thereof.
NASDAQ is the source and owner of the NASDAQ Index data contained in this material and all trademarks and copyrights related thereto. Any further dissemination or redistribution is strictly prohibited. NASDAQ is not responsible for the formatting or configuration of this material or for any inaccuracy in Oak Associates Funds’ presentation thereof.
Russell Investments is the source and owner of the Russell Index data contained in this material and all trademarks and copyrights related thereto. Any further dissemination or redistribution is strictly prohibited. Russell Investments is not responsible for the formatting or configuration of this material or for any inaccuracy in Oak Associates Funds’ presentation thereof.
Standard & Poor’s is the source and owner of the S&P Index data contained in this material and all trademarks and copyrights related thereto. Any further dissemination or redistribution is strictly prohibited. Standard & Poor’s is not responsible for the formatting or configuration of this material or for any inaccuracy in Oak Associates Funds’ presentation thereof.
| 10 | 1-888-462-5386 | www.oakfunds.com |
| Disclosure of Fund Expenses |
As of April 30, 2014 (Unaudited)
All mutual funds have operating expenses. As a shareholder of a fund, your investment is affected by these ongoing costs, which include (among others) costs for portfolio management, administrative services, and shareholder reports like this one. It is important for you to understand the impact of these costs on your investment returns.
Operating expenses such as these, are deducted from the Fund’s gross income and directly reduce your final investment return. These expenses are expressed as a percentage of the Fund’s average net assets; this percentage is known as the Fund’s expense ratio.
The following examples use the expense ratio and are intended to help you understand the ongoing costs (in dollars) of investing in your Fund and to compare these costs with those of other mutual funds. The examples are based on an investment of $1,000 made at the beginning of the period shown and held for the entire period.
The table on the next page illustrates your Fund’s costs in two ways:
Actual Fund Return. This section helps you to estimate the actual expenses after fee waivers that your Fund incurred over the period. The “Expenses Paid During Period” column shows the actual dollar expense cost incurred by a $1,000 investment in the Fund, and the “Ending Account Value” number is derived from deducting that expense cost from the Fund’s gross investment return.
You can use this information, together with the actual amount you invested in the Fund, to estimate the expenses you paid over that period. Simply divide your actual account value by $1,000 to arrive at a ratio (for example, an $8,600 account value divided by $1,000 = 8.6), then multiply that ratio by the number shown for your Fund under “Expenses Paid During Period”.
Hypothetical 5% Return. This section helps you compare your Fund’s costs with those of other mutual funds. It assumes that the Fund had an annual 5% return before expenses during the year, but that the expense ratio (Column 3) for the period is unchanged. This example is useful in making comparisons because the Securities and Exchange Commission requires all mutual funds to make this 5% calculation. You can assess your Fund’s comparative cost by comparing the hypothetical result for your Fund in the “Expense Paid During Period” column with those that appear in the same charts in the shareholder reports for other funds.
Note: Because the return is set at 5% for comparison purposes — NOT your Fund’s actual return — the account values shown may not apply to your specific investment.
| Semi-Annual Report | April 30, 2014 (Unaudited) | 11 |
| Disclosure of Fund Expenses |
As of April 30, 2014 (Unaudited)
| Beginning | Ending | Expenses Paid | ||||||
| Account Value | Account Value | Annualized | During the | |||||
| 11/01/2013 | 04/30/2014 | Expense Ratio | Period(a) | |||||
White Oak Select Growth Fund | ||||||||
Actual Return | $1,000.00 | $1,042.20 | 1.09% | $5.52 | ||||
Hypothetical 5% Return | $1,000.00 | $1,019.39 | 1.09% | $5.46 | ||||
Pin Oak Equity Fund | ||||||||
Actual Return | $1,000.00 | $1,087.10 | 1.13% | $5.85 | ||||
Hypothetical 5% Return | $1,000.00 | $1,019.19 | 1.13% | $5.66 | ||||
Rock Oak Core Growth Fund | ||||||||
Actual Return | $1,000.00 | $1,101.80 | 1.25% | $6.51 | ||||
Hypothetical 5% Return | $1,000.00 | $1,018.60 | 1.25% | $6.26 | ||||
River Oak Discovery Fund | ||||||||
Actual Return | $1,000.00 | $1,075.60 | 1.35% | $6.95 | ||||
Hypothetical 5% Return | $1,000.00 | $1,018.10 | 1.35% | $6.76 | ||||
Red Oak Technology Select Fund | ||||||||
Actual Return | $1,000.00 | $1,113.10 | 1.13% | $5.92 | ||||
Hypothetical 5% Return | $1,000.00 | $1,019.19 | 1.13% | $5.66 | ||||
Black Oak Emerging Technology Fund | ||||||||
Actual Return | $1,000.00 | $1,072.60 | 1.29% | $6.63 | ||||
Hypothetical 5% Return | $1,000.00 | $1,018.40 | 1.29% | $6.46 | ||||
Live Oak Health Sciences Fund | ||||||||
Actual Return | $1,000.00 | $1,103.40 | 1.12% | $5.84 | ||||
Hypothetical 5% Return | $1,000.00 | $1,019.24 | 1.12% | $5.61 |
| (a) | Expenses are equal to the Fund’s annualized expense ratio multiplied by the average account value over the period, multiplied by 181/365 (to reflect the one-half year period). |
| 12 | 1-888-462-5386 | www.oakfunds.com |
| White Oak Select Growth Fund | Schedules of Investments |
As of April 30, 2014 (Unaudited)
| Security Description | Shares | Value | ||||||
COMMON STOCKS (99.3%) | ||||||||
CONSUMER DISCRETIONARY (4.2%) | ||||||||
Internet & Catalog Retail (4.2%) | ||||||||
Amazon.com, Inc.(a) | 34,100 | $10,370,833 | ||||||
|
| |||||||
ENERGY (7.4%) | ||||||||
Energy Equipment & Services (3.4%) | ||||||||
Transocean, Ltd. | 195,000 | 8,398,650 | ||||||
|
| |||||||
Oil, Gas & Consumable Fuels (4.0%) | ||||||||
Exxon Mobil Corp. | 98,000 | 10,036,180 | ||||||
|
| |||||||
FINANCIALS (31.4%) | ||||||||
Capital Markets (10.4%) | ||||||||
The Charles Schwab Corp. | 485,000 | 12,876,750 | ||||||
US Bancorp | 320,000 | 13,049,600 | ||||||
|
| |||||||
| 25,926,350 | ||||||||
|
| |||||||
Commercial Banks (9.1%) | ||||||||
CIT Group, Inc. | 182,400 | 7,852,320 | ||||||
M&T Bank Corp. | 60,000 | 7,320,600 | ||||||
TCF Financial Corp. | 487,000 | 7,645,900 | ||||||
|
| |||||||
| 22,818,820 | ||||||||
|
| |||||||
Diversified Financial Services (6.6%) | ||||||||
JPMorgan Chase & Co. | 295,400 | 16,536,492 | ||||||
|
| |||||||
Insurance (5.3%) | ||||||||
ACE, Ltd. | 128,000 | 13,096,960 | ||||||
|
| |||||||
HEALTH CARE (21.9%) | ||||||||
Biotechnology (4.8%) | ||||||||
Amgen, Inc. | 108,000 | 12,069,000 | ||||||
|
| |||||||
Health Care Equipment & Supplies (9.7%) | ||||||||
CR Bard, Inc. | 92,200 | 12,661,826 | ||||||
Stryker Corp. | 149,000 | 11,584,750 | ||||||
|
| |||||||
| 24,246,576 | ||||||||
|
| |||||||
Health Care Providers & Services (3.5%) | ||||||||
Express Scripts Holding Co.(a) | 130,000 | 8,655,400 | ||||||
|
| |||||||
Pharmaceuticals (3.9%) | ||||||||
Teva Pharmaceutical Industries, Ltd. ADR | 197,000 | 9,625,420 | ||||||
|
| |||||||
| Semi-Annual Report | April 30, 2014 (Unaudited) | 13 |
| Schedules of Investments | White Oak Select Growth Fund |
As of April 30, 2014 (Unaudited)
Security Description | Shares | Value | ||||||
INFORMATION TECHNOLOGY (34.3%) | ||||||||
Communications Equipment (9.1%) | ||||||||
Cisco Systems, Inc. | 626,000 | $14,466,860 | ||||||
Qualcomm, Inc. | 103,100 | 8,115,001 | ||||||
|
| |||||||
| 22,581,861 | ||||||||
|
| |||||||
Computers & Peripherals (4.5%) | ||||||||
International Business Machines Corp. | 56,900 | 11,179,143 | ||||||
|
| |||||||
Internet Software & Services (7.0%) | ||||||||
Google, Inc. - Class A(a) | 16,450 | 8,798,776 | ||||||
Google, Inc. - Class C(a) | 16,450 | 8,663,557 | ||||||
|
| |||||||
| 17,462,333 | ||||||||
|
| |||||||
IT Services (4.0%) | ||||||||
Cognizant Technology Solutions Corp. - Class A(a) | 209,000 | 10,012,145 | ||||||
|
| |||||||
Semiconductors & Semiconductor Equipment (5.5%) | ||||||||
Broadcom Corp. - Class A | 6,000 | 184,860 | ||||||
KLA-Tencor Corp. | 211,800 | 13,553,082 | ||||||
|
| |||||||
| 13,737,942 | ||||||||
|
| |||||||
Software (4.2%) | ||||||||
Salesforce.com, Inc.(a) | 105,400 | 5,443,910 | ||||||
Symantec Corp. | 250,000 | 5,070,000 | ||||||
|
| |||||||
| 10,513,910 | ||||||||
|
| |||||||
MATERIALS (0.1%) | ||||||||
Metals & Mining (0.1%) | ||||||||
Goldcorp, Inc. | 13,000 | 321,360 | ||||||
|
| |||||||
TOTAL COMMON STOCKS (Cost $245,409,428) | 247,589,375 | |||||||
|
| |||||||
SHORT TERM INVESTMENTS (0.7%) | ||||||||
Fidelity Institutional Money Market Government | 1,712,872 | 1,712,872 | ||||||
|
| |||||||
TOTAL SHORT TERM INVESTMENTS (Cost $1,712,872) | 1,712,872 | |||||||
|
| |||||||
TOTAL INVESTMENTS - (100.0%) (Cost $247,122,300) | $249,302,247 | |||||||
Assets in Excess of Other Liabilities - (0.0%)(b) | 25,726 | |||||||
|
| |||||||
NET ASSETS - (100.0%) | $249,327,973 | |||||||
|
| |||||||
| 14 | 1-888-462-5386 | www.oakfunds.com |
| White Oak Select Growth Fund | Schedules of Investments |
As of April 30, 2014 (Unaudited)
| (a) | Non-income producing security. |
| (b) | Less than 0.05%. |
Common Abbreviations:
ADR - American Depositary Receipt.
Ltd. - Limited.
The accompanying notes are an integral part of the financial statements.
| Semi-Annual Report | April 30, 2014 (Unaudited) | 15 |
| Schedules of Investments | Pin Oak Equity Fund |
As of April 30, 2014 (Unaudited)
| Security Description | Shares | Value | ||||||
COMMON STOCKS (98.5%) | ||||||||
CONSUMER DISCRETIONARY (11.2%) | ||||||||
Auto Components (2.3%) | ||||||||
Visteon Corp.(a) | 22,300 | $1,935,863 | ||||||
|
| |||||||
Internet & Catalog Retail (2.0%) | ||||||||
Amazon.com, Inc.(a) | 5,550 | 1,687,921 | ||||||
|
| |||||||
Media (6.9%) | ||||||||
The Interpublic Group of Cos., Inc. | 135,000 | 2,351,700 | ||||||
News Corp. - Class A(a) | 4,250 | 72,335 | ||||||
Twenty-First Century Fox, Inc. - Class A | 109,000 | 3,490,180 | ||||||
|
| |||||||
| 5,914,215 | ||||||||
|
| |||||||
CONSUMER STAPLES (5.5%) | ||||||||
Beverages (3.1%) | ||||||||
PepsiCo, Inc. | 30,600 | 2,628,234 | ||||||
|
| |||||||
Household Products (2.4%) | ||||||||
Energizer Holdings, Inc. | 18,500 | 2,066,265 | ||||||
|
| |||||||
ENERGY (9.1%) | ||||||||
Energy Equipment & Services (6.7%) | ||||||||
Diamond Offshore Drilling, Inc. | 35,600 | 1,944,116 | ||||||
Nabors Industries, Ltd. | 146,600 | 3,741,232 | ||||||
|
| |||||||
| 5,685,348 | ||||||||
|
| |||||||
Oil, Gas & Consumable Fuels (2.4%) | ||||||||
Royal Dutch Shell PLC ADR | 25,681 | 2,022,122 | ||||||
|
| |||||||
FINANCIALS (36.1%) | ||||||||
Capital Markets (7.7%) | ||||||||
The Bank of New York Mellon Corp. | 77,000 | 2,607,990 | ||||||
The Charles Schwab Corp. | 147,551 | 3,917,479 | ||||||
|
| |||||||
| 6,525,469 | ||||||||
|
| |||||||
Commercial Banks (17.8%) | ||||||||
CIT Group, Inc. | 62,500 | 2,690,625 | ||||||
First Bancorp | 50,135 | 862,824 | ||||||
Great Southern Bancorp, Inc. | 55,845 | 1,601,076 | ||||||
International Bancshares Corp. | 99,500 | 2,284,520 | ||||||
SunTrust Banks, Inc. | 53,000 | 2,027,780 | ||||||
Wells Fargo & Co. | 115,000 | 5,708,600 | ||||||
|
| |||||||
| 15,175,425 | ||||||||
|
| |||||||
Consumer Finance (4.5%) | ||||||||
Capital One Financial Corp. | 52,400 | 3,872,360 | ||||||
|
| |||||||
| 16 | 1-888-462-5386 | www.oakfunds.com |
Pin Oak Equity Fund | Schedules of Investments |
As of April 30, 2014 (Unaudited)
| Security Description | Shares | Value | ||||||
| ||||||||
Insurance (6.1%) | ||||||||
Assurant, Inc. | 12,000 | $808,920 | ||||||
Everest Re Group, Ltd. | 10,100 | 1,596,103 | ||||||
The Travelers Cos., Inc. | 31,000 | 2,807,980 | ||||||
|
| |||||||
| 5,213,003 | ||||||||
|
| |||||||
INDUSTRIALS (8.6%) | ||||||||
Aerospace & Defense (7.9%) | ||||||||
Lockheed Martin Corp. | 16,400 | 2,691,896 | ||||||
Raytheon Co. | 42,000 | 4,010,160 | ||||||
|
| |||||||
| 6,702,056 | ||||||||
|
| |||||||
Machinery (0.7%) | ||||||||
Parker Hannifin Corp. | 5,000 | 634,400 | ||||||
|
| |||||||
INFORMATION TECHNOLOGY (27.0%) | ||||||||
Electronic Equipment & Instruments (2.2%) | ||||||||
Flextronics International, Ltd.(a) | 206,000 | 1,851,940 | ||||||
|
| |||||||
Internet Software & Services (7.4%) | ||||||||
Google, Inc. - Class A(a) | 3,500 | 1,872,080 | ||||||
Google, Inc. - Class C(a) | 3,500 | 1,843,310 | ||||||
IAC/InterActive Corp. | 39,156 | 2,595,259 | ||||||
|
| |||||||
| 6,310,649 | ||||||||
|
| |||||||
IT Services (10.4%) | ||||||||
Amdocs, Ltd. | 101,672 | 4,730,798 | ||||||
Paychex, Inc. | 43,049 | 1,799,879 | ||||||
The Western Union Co. | 147,000 | 2,332,890 | ||||||
|
| |||||||
| 8,863,567 | ||||||||
|
| |||||||
Semiconductors & Semiconductor Equipment (1.6%) | ||||||||
KLA-Tencor Corp. | 21,800 | 1,394,982 | ||||||
|
| |||||||
Software (5.4%) | ||||||||
Microsoft Corp. | 113,300 | 4,577,320 | ||||||
|
| |||||||
MATERIALS (1.0%) | ||||||||
Metals & Mining (1.0%) | ||||||||
Teck Resources, Ltd. - Class B | 38,814 | 883,795 | ||||||
|
| |||||||
TOTAL COMMON STOCKS (Cost $76,364,498) | 83,944,934 | |||||||
|
| |||||||
| Semi-Annual Report | April 30, 2014 (Unaudited) | 17 |
| Schedules of Investments | Pin Oak Equity Fund |
As of April 30, 2014 (Unaudited)
| Security Description | Shares | Value | ||||||
| ||||||||
SHORT TERM INVESTMENTS (1.5%) | ||||||||
Fidelity Institutional Money Market Government | 1,305,299 | $1,305,299 | ||||||
|
| |||||||
TOTAL SHORT TERM INVESTMENTS (Cost $1,305,299) | 1,305,299 | |||||||
|
| |||||||
TOTAL INVESTMENTS - (100.0%) (Cost $77,669,797) | $85,250,233 | |||||||
Liabilities in Excess of Other Assets - (0.0%)(b) | (7,283) | |||||||
|
| |||||||
NET ASSETS - (100.0%) | $85,242,950 | |||||||
|
| |||||||
| (a) | Non-income producing security. |
| (b) | Less than 0.05%. |
Common Abbreviations:
ADR - American Depositary Receipt.
Ltd. - Limited.
PLC - Public Limited Company.
The accompanying notes are an integral part of the financial statements.
| 18 | 1-888-462-5386 | www.oakfunds.com |
Rock Oak Core Growth Fund | Schedules of Investments |
As of April 30, 2014 (Unaudited)
| Security Description | Shares | Value | ||||||
COMMON STOCKS (97.0%) | ||||||||
CONSUMER DISCRETIONARY (9.3%) | ||||||||
Hotels, Restaurants & Leisure (7.1%) | ||||||||
Wyndham Worldwide Corp. | 3,550 | $253,257 | ||||||
Wynn Resorts, Ltd. | 1,600 | 326,224 | ||||||
|
| |||||||
| 579,481 | ||||||||
|
| |||||||
Specialty Retail (2.2%) | ||||||||
Staples, Inc. | 14,850 | 185,625 | ||||||
|
| |||||||
CONSUMER STAPLES (2.6%) | ||||||||
Beverages (2.6%) | ||||||||
Molson Coors Brewing Co. - Class B | 3,550 | 212,894 | ||||||
|
| |||||||
ENERGY (11.3%) | ||||||||
Energy Equipment & Services (8.0%) | ||||||||
National Oilwell Varco, Inc. | 2,500 | 196,325 | ||||||
Transocean, Ltd. | 3,600 | 155,052 | ||||||
Weatherford International, Ltd.(a) | 14,250 | 299,250 | ||||||
|
| |||||||
| 650,627 | ||||||||
|
| |||||||
Oil, Gas & Consumable Fuels (3.3%) | ||||||||
HollyFrontier Corp. | 5,150 | 270,839 | ||||||
|
| |||||||
FINANCIALS (14.5%) | ||||||||
Commercial Banks (6.9%) | ||||||||
Comerica, Inc. | 6,000 | 289,440 | ||||||
SunTrust Banks, Inc. | 7,200 | 275,472 | ||||||
|
| |||||||
| 564,912 | ||||||||
|
| |||||||
Insurance (7.6%) | ||||||||
Genworth Financial, Inc. - Class A(a) | 22,050 | 393,592 | ||||||
The Hartford Financial Services Group, Inc. | 6,400 | 229,568 | ||||||
|
| |||||||
| 623,160 | ||||||||
|
| |||||||
HEALTH CARE (7.5%) | ||||||||
Health Care Providers & Services (2.4%) | ||||||||
Quest Diagnostics, Inc. | 3,550 | 198,552 | ||||||
|
| |||||||
Life Sciences Tools & Services (5.1%) | ||||||||
Affymetrix, Inc.(a) | 20,000 | 148,600 | ||||||
Illumina, Inc.(a) | 1,950 | 264,907 | ||||||
|
| |||||||
| 413,507 | ||||||||
|
| |||||||
INDUSTRIALS (8.2%) | ||||||||
Aerospace & Defense (3.3%) | ||||||||
L-3 Communications Holdings, Inc. | 2,350 | 271,119 | ||||||
|
| |||||||
| Semi-Annual Report | April 30, 2014 (Unaudited) | 19 |
Schedules of Investments | Rock Oak Core Growth Fund |
As of April 30, 2014 (Unaudited)
| Security Description | Shares | Value | ||||||
Commercial Services & Supplies (2.0%) | ||||||||
The ADT Corp. | 5,400 | $163,296 | ||||||
|
| |||||||
Professional Services (2.9%) | ||||||||
Nielsen Holdings NV | 5,000 | 234,750 | ||||||
|
| |||||||
INFORMATION TECHNOLOGY (41.5%) | ||||||||
Communications Equipment (1.8%) | ||||||||
F5 Networks, Inc.(a) | 1,400 | 147,238 | ||||||
|
| |||||||
Computers & Peripherals (6.0%) | ||||||||
NetApp, Inc. | 4,800 | 170,928 | ||||||
Western Digital Corp. | 3,650 | 321,675 | ||||||
|
| |||||||
| 492,603 | ||||||||
|
| |||||||
Electronic Equipment & Instruments (2.0%) | ||||||||
Amphenol Corp. - Class A | 1,750 | 166,862 | ||||||
|
| |||||||
IT Services (9.5%) | ||||||||
Cognizant Technology Solutions Corp. - Class A(a) | 5,000 | 239,525 | ||||||
Computer Sciences Corp. | 5,650 | 334,367 | ||||||
Vantiv, Inc. - Class A(a) | 6,550 | 201,413 | ||||||
|
| |||||||
| 775,305 | ||||||||
|
| |||||||
Semiconductors & Semiconductor Equipment (5.0%) | ||||||||
Broadcom Corp. - Class A | 5,400 | 166,374 | ||||||
Linear Technology Corp. | 5,500 | 244,750 | ||||||
|
| |||||||
| 411,124 | ||||||||
|
| |||||||
Software (14.0%) | ||||||||
Autodesk, Inc.(a) | 4,200 | 201,684 | ||||||
CA, Inc. | 9,950 | 299,893 | ||||||
Salesforce.com, Inc.(a) | 5,000 | 258,250 | ||||||
Symantec Corp. | 9,700 | 196,716 | ||||||
Workday, Inc. - Class A(a) | 2,550 | 186,328 | ||||||
|
| |||||||
| 1,142,871 | ||||||||
|
| |||||||
Technology Hardware, Storage & Peripherals (3.2%) | ||||||||
Seagate Technology PLC | 4,900 | 257,642 | ||||||
|
| |||||||
MATERIALS (2.1%) | ||||||||
Chemicals (2.1%) | ||||||||
CF Industries Holdings, Inc. | 700 | 171,619 | ||||||
|
| |||||||
TOTAL COMMON STOCKS | ||||||||
(Cost $5,883,028) | 7,934,026 | |||||||
|
| |||||||
| 20 | 1-888-462-5386 | www.oakfunds.com |
Rock Oak Core Growth Fund | Schedules of Investments |
As of April 30, 2014 (Unaudited)
| Security Description | Shares | Value | ||||||
SHORT TERM INVESTMENTS (3.3%) | ||||||||
Fidelity Institutional Money Market Government | ||||||||
Portfolio - Class I (7 day yield 0.010%) | 269,517 | $269,517 | ||||||
|
| |||||||
TOTAL SHORT TERM INVESTMENTS | ||||||||
(Cost $269,517) | 269,517 | |||||||
|
| |||||||
TOTAL INVESTMENTS - (100.3%) | ||||||||
(Cost $6,152,545) | $8,203,543 | |||||||
Liabilities in Excess of Other Assets - (-0.3%) | (21,016) | |||||||
|
| |||||||
NET ASSETS - (100.0%) | $8,182,527 | |||||||
|
| |||||||
| (a) | Non-income producing security. |
Common Abbreviations:
Ltd. - Limited.
NV - Naamloze Vennootschap is the Dutch term for a public limited liability corporation. (Netherlands)
PLC - Public Limited Company.
The accompanying notes are an integral part of the financial statements.
| Semi-Annual Report | April 30, 2014 (Unaudited) | 21 |
Schedules of Investments | River Oak Discovery Fund |
As of April 30, 2014 (Unaudited)
| Security Description | Shares | Value | ||||||
COMMON STOCKS (97.0%) | ||||||||
CONSUMER DISCRETIONARY (17.9%) | ||||||||
Diversified Consumer Services (11.1%) | ||||||||
Apollo Group, Inc.(a) | 13,600 | $392,496 | ||||||
Capella Education Co. | 4,350 | 253,866 | ||||||
DeVry Education Group, Inc. | 7,700 | 346,731 | ||||||
K12, Inc.(a) | 10,000 | 236,800 | ||||||
Strayer Education, Inc.(a) | 8,000 | 341,040 | ||||||
|
| |||||||
| 1,570,933 | ||||||||
|
| |||||||
Household Durables (2.8%) | ||||||||
Skullcandy, Inc.(a) | 50,300 | 387,310 | ||||||
|
| |||||||
Leisure Equipment & Products (2.0%) | ||||||||
LeapFrog Enterprises, Inc.(a) | 41,250 | 282,563 | ||||||
|
| |||||||
Media (2.0%) | ||||||||
Sizmek, Inc.(a) | 29,500 | 282,610 | ||||||
|
| |||||||
CONSUMER STAPLES (3.4%) | ||||||||
Food & Staples Retailing (3.4%) | ||||||||
The Andersons, Inc. | 7,725 | 481,190 | ||||||
|
| |||||||
ENERGY (6.3%) | ||||||||
Energy Equipment & Services (3.5%) | ||||||||
ION Geophysical Corp.(a) | 112,550 | 495,220 | ||||||
|
| |||||||
Oil, Gas & Consumable Fuels (2.8%) | ||||||||
Renewable Energy Group, Inc.(a) | 32,850 | 386,645 | ||||||
|
| |||||||
FINANCIALS (24.9%) | ||||||||
Capital Markets (9.8%) | ||||||||
Calamos Asset Management, Inc. - Class A | 30,700 | 373,926 | ||||||
Cowen Group, Inc. - Class A(a) | 86,900 | 357,159 | ||||||
FBR & Co.(a) | 11,650 | 300,570 | ||||||
Janus Capital Group, Inc. | 29,400 | 356,622 | ||||||
|
| |||||||
| 1,388,277 | ||||||||
|
| |||||||
Commercial Banks (7.2%) | ||||||||
PrivateBancorp, Inc. | 12,300 | 339,111 | ||||||
Union First Market Bankshares Corp. | 14,050 | 359,540 | ||||||
Zions Bancorporation | 10,800 | 312,336 | ||||||
|
| |||||||
| 1,010,987 | ||||||||
|
| |||||||
Insurance (7.9%) | ||||||||
Assurant, Inc. | 7,350 | 495,463 | ||||||
CNO Financial Group, Inc. | 14,000 | 241,500 | ||||||
| 22 | 1-888-462-5386 | www.oakfunds.com |
River Oak Discovery Fund | Schedules of Investments |
As of April 30, 2014 (Unaudited)
| Security Description | Shares | Value | ||||||
Insurance (continued) | ||||||||
Symetra Financial Corp. | 18,250 | $377,045 | ||||||
|
| |||||||
| 1,114,008 | ||||||||
|
| |||||||
HEALTH CARE (16.1%) | ||||||||
Biotechnology (6.5%) | ||||||||
Cubist Pharmaceuticals, Inc.(a) | 2,200 | 154,132 | ||||||
PDL BioPharma, Inc. | 35,350 | 300,121 | ||||||
United Therapeutics Corp.(a) | 4,550 | 455,046 | ||||||
|
| |||||||
| 909,299 | ||||||||
|
| |||||||
Health Care Providers & Services (5.5%) | ||||||||
Alliance HealthCare Services, Inc.(a) | 12,300 | 350,058 | ||||||
Amsurg Corp.(a) | 9,950 | 430,934 | ||||||
|
| |||||||
| 780,992 | ||||||||
|
| |||||||
Pharmaceuticals (4.1%) | ||||||||
Questcor Pharmaceuticals, Inc. | 7,000 | 575,260 | ||||||
|
| |||||||
INDUSTRIALS (6.5%) | ||||||||
Machinery (1.7%) | ||||||||
Proto Labs, Inc.(a) | 4,000 | 242,160 | ||||||
|
| |||||||
Professional Services (2.9%) | ||||||||
ICF International, Inc.(a) | 10,271 | 400,261 | ||||||
|
| |||||||
Trading Companies & Distribution (1.9%) | ||||||||
CAI International, Inc.(a) | 12,450 | 270,787 | ||||||
|
| |||||||
INFORMATION TECHNOLOGY (19.7%) | ||||||||
Electronic Equipment & Instruments (5.8%) | ||||||||
Dolby Laboratories, Inc. - Class A(a) | 7,200 | 286,920 | ||||||
Hollysys Automation Technologies, Ltd.(a) | 15,500 | 331,855 | ||||||
Newport Corp.(a) | 10,258 | 191,619 | ||||||
|
| |||||||
| 810,394 | ||||||||
|
| |||||||
Internet Software & Services (3.1%) | ||||||||
MercadoLibre, Inc. | 1,900 | 177,213 | ||||||
Sohu.com, Inc.(a) | 4,650 | 256,541 | ||||||
|
| |||||||
| 433,754 | ||||||||
|
| |||||||
IT Services (2.3%) | ||||||||
MoneyGram International, Inc.(a) | 3,900 | 51,480 | ||||||
Unisys Corp.(a) | 11,400 | 277,818 | ||||||
|
| |||||||
| 329,298 | ||||||||
|
| |||||||
Semiconductors & Semiconductor Equipment (6.4%) | ||||||||
Cirrus Logic, Inc.(a) | 22,900 | 510,670 | ||||||
Kulicke & Soffa Industries, Inc.(a) | 26,800 | 394,228 | ||||||
|
| |||||||
| 904,898 | ||||||||
|
| |||||||
| Semi-Annual Report | April 30, 2014 (Unaudited) | 23 |
Schedules of Investments | River Oak Discovery Fund |
As of April 30, 2014 (Unaudited)
| Security Description | Shares | Value | ||||||
Software (2.1%) | ||||||||
Fortinet, Inc.(a) | 13,450 | $295,631 | ||||||
|
| |||||||
MATERIALS (2.2%) | ||||||||
Metals & Mining (2.2%) | ||||||||
AM Castle & Co.(a) | 25,550 | 313,754 | ||||||
|
| |||||||
TOTAL COMMON STOCKS | ||||||||
(Cost $10,524,600) | 13,666,231 | |||||||
|
| |||||||
SHORT TERM INVESTMENTS (3.1%) | ||||||||
Fidelity Institutional Money Market Government | ||||||||
Portfolio - Class I (7 day yield 0.010%) | 437,937 | 437,937 | ||||||
|
| |||||||
TOTAL SHORT TERM INVESTMENTS | ||||||||
(Cost $437,937) | 437,937 | |||||||
|
| |||||||
TOTAL INVESTMENTS - (100.1%) | ||||||||
(Cost $10,962,537) | $14,104,168 | |||||||
Liabilities in Excess of Other Assets - (-0.1%) | (11,394) | |||||||
|
| |||||||
NET ASSETS - (100.0%) | $14,092,774 | |||||||
|
| |||||||
| (a) | Non-income producing security. |
Common Abbreviations:
Ltd. - Limited.
The accompanying notes are an integral part of the financial statements.
| 24 | 1-888-462-5386 | www.oakfunds.com |
Red Oak Technology Select Fund | Schedules of Investments |
As of April 30, 2014 (Unaudited)
| Security Description | Shares | Value | ||||||
COMMON STOCKS (96.5%) | ||||||||
CONSUMER DISCRETIONARY (1.5%) | ||||||||
Internet & Catalog Retail (1.5%) | ||||||||
Amazon.com, Inc.(a) | 6,450 | $1,961,639 | ||||||
|
| |||||||
INDUSTRIALS (7.4%) | ||||||||
Aerospace & Defense (7.4%) | ||||||||
Huntington Ingalls Industries, Inc. | 38,466 | 3,961,998 | ||||||
Northrop Grumman Corp. | 46,000 | 5,589,460 | ||||||
|
| |||||||
| 9,551,458 | ||||||||
|
| |||||||
INFORMATION TECHNOLOGY (87.6%) | ||||||||
Communications Equipment (7.5%) | ||||||||
Blackberry, Ltd.(a) | 43,100 | 330,146 | ||||||
Cisco Systems, Inc. | 225,000 | 5,199,750 | ||||||
Qualcomm, Inc. | 53,300 | 4,195,243 | ||||||
|
| |||||||
| 9,725,139 | ||||||||
|
| |||||||
Computers & Peripherals (19.4%) | ||||||||
Apple, Inc. | 6,060 | 3,575,945 | ||||||
EMC Corp. | 135,200 | 3,488,160 | ||||||
Hewlett-Packard Co. | 118,500 | 3,917,610 | ||||||
International Business Machines Corp. | 17,000 | 3,339,990 | ||||||
Lexmark International, Inc. - Class A | 54,000 | 2,322,000 | ||||||
NetApp, Inc. | 97,000 | 3,454,170 | ||||||
Western Digital Corp. | 57,100 | 5,032,223 | ||||||
|
| |||||||
| 25,130,098 | ||||||||
|
| |||||||
Electronic Equipment & Instruments (8.8%) | ||||||||
Arrow Electronics, Inc.(a) | 73,900 | 4,193,825 | ||||||
Corning, Inc. | 170,000 | 3,554,700 | ||||||
Flextronics International, Ltd.(a) | 20,000 | 179,800 | ||||||
Ingram Micro, Inc. - Class A(a) | 131,600 | 3,547,936 | ||||||
|
| |||||||
| 11,476,261 | ||||||||
|
| |||||||
Internet Software & Services (6.9%) | ||||||||
Google, Inc. - Class A(a) | 5,100 | 2,727,888 | ||||||
Google, Inc. - Class C(a) | 5,800 | 3,054,628 | ||||||
IAC/InterActive Corp. | 48,600 | 3,221,208 | ||||||
|
| |||||||
| 9,003,724 | ||||||||
|
| |||||||
IT Services (12.2%) | ||||||||
Accenture PLC - Class A | 58,200 | 4,668,804 | ||||||
Alliance Data Systems Corp.(a) | 22,600 | 5,466,940 | ||||||
Computer Sciences Corp. | 51,000 | 3,018,180 | ||||||
CSG Systems International, Inc. | 52,129 | 1,374,120 | ||||||
Total System Services, Inc. | 43,000 | 1,366,110 | ||||||
|
| |||||||
| 15,894,154 | ||||||||
|
| |||||||
Semiconductors & Semiconductor Equipment (13.5%) | ||||||||
Intel Corp. | 140,500 | 3,749,945 | ||||||
| Semi-Annual Report | April 30, 2014 (Unaudited) | 25 |
Schedules of Investments | Red Oak Technology Select Fund |
As of April 30, 2014 (Unaudited)
| Security Description | Shares | Value | ||||||
Semiconductors & Semiconductor Equipment (continued) | ||||||||
KLA-Tencor Corp. | 66,600 | $4,261,734 | ||||||
Marvell Technology Group, Ltd. | 188,400 | 2,988,024 | ||||||
NVIDIA Corp. | 142,000 | 2,622,740 | ||||||
Spansion, Inc. - Class A(a) | 37,162 | 662,599 | ||||||
Xilinx, Inc. | 67,500 | 3,185,325 | ||||||
|
| |||||||
| 17,470,367 | ||||||||
|
| |||||||
Software (19.3%) | ||||||||
CA, Inc. | 116,000 | 3,496,240 | ||||||
Check Point Software Technologies, Ltd.(a) | 62,900 | 4,029,374 | ||||||
Microsoft Corp. | 113,000 | 4,565,200 | ||||||
Oracle Corp. | 154,000 | 6,295,520 | ||||||
Symantec Corp. | 168,000 | 3,407,040 | ||||||
Synopsys, Inc.(a) | 85,300 | 3,208,986 | ||||||
|
| |||||||
| 25,002,360 | ||||||||
|
| |||||||
TOTAL COMMON STOCKS | ||||||||
(Cost $99,912,181) | 125,215,200 | |||||||
|
| |||||||
SHORT TERM INVESTMENTS (4.2%) | ||||||||
Fidelity Institutional Money Market Government | ||||||||
Portfolio - Class I (7 day yield 0.010%) | 5,469,637 | 5,469,637 | ||||||
|
| |||||||
TOTAL SHORT TERM INVESTMENTS | ||||||||
(Cost $5,469,637) | 5,469,637 | |||||||
|
| |||||||
TOTAL INVESTMENTS - (100.7%) | ||||||||
(Cost $105,381,818) | $130,684,837 | |||||||
Liabilities in Excess of Other Assets - (-0.7%) | (914,950) | |||||||
|
| |||||||
NET ASSETS - (100.0%) | $129,769,887 | |||||||
|
| |||||||
| (a) | Non-income producing security. |
Common Abbreviations:
Ltd. - Limited.
PLC - Public Limited Company.
The accompanying notes are an integral part of the financial statements.
| 26 | 1-888-462-5386 | www.oakfunds.com |
Black Oak Emerging Technology Fund | Schedules of Investments |
As of April 30, 2014 (Unaudited)
| Security Description | Shares | Value | ||||||
COMMON STOCKS (99.3%) | ||||||||
HEALTH CARE (4.8%) | ||||||||
Biotechnology (2.3%) | ||||||||
PDL BioPharma, Inc. | 88,800 | $753,912 | ||||||
|
| |||||||
Life Sciences Tools & Services (2.5%) | ||||||||
Illumina, Inc.(a) | 5,800 | 787,930 | ||||||
|
| |||||||
INDUSTRIALS (2.5%) | ||||||||
Professional Services (2.5%) | ||||||||
ICF International, Inc.(a) | 20,451 | 796,975 | ||||||
|
| |||||||
INFORMATION TECHNOLOGY (92.0%) | ||||||||
Communications Equipment (10.9%) | ||||||||
F5 Networks, Inc.(a) | 7,150 | 751,965 | ||||||
Ixia(a) | 55,000 | 683,100 | ||||||
Palo Alto Networks, Inc.(a) | 5,900 | 375,122 | ||||||
Qualcomm, Inc. | 21,150 | 1,664,717 | ||||||
|
| |||||||
| 3,474,904 | ||||||||
|
| |||||||
Computers & Peripherals (19.6%) | ||||||||
3D Systems Corp.(a) | 11,600 | 549,144 | ||||||
Apple, Inc. | 2,600 | 1,534,234 | ||||||
EMC Corp. | 43,100 | 1,111,980 | ||||||
Fusion-io, Inc.(a) | 44,000 | 379,720 | ||||||
NetApp, Inc. | 18,800 | 669,468 | ||||||
Stratasys, Ltd.(a) | 6,300 | 610,281 | ||||||
Western Digital Corp. | 15,950 | 1,405,673 | ||||||
|
| |||||||
| 6,260,500 | ||||||||
|
| |||||||
Electronic Equipment & Instruments (4.6%) | ||||||||
Arrow Electronics, Inc.(a) | 18,000 | 1,021,500 | ||||||
Newport Corp.(a) | 24,142 | 450,973 | ||||||
|
| |||||||
| 1,472,473 | ||||||||
|
| |||||||
Internet Software & Services (5.7%) | ||||||||
MercadoLibre, Inc. | 6,900 | 643,563 | ||||||
NetEase.com, Inc. ADR | 10,400 | 708,136 | ||||||
Sohu.com, Inc.(a) | 8,700 | 479,979 | ||||||
|
| |||||||
| 1,831,678 | ||||||||
|
| |||||||
IT Services (13.7%) | ||||||||
Alliance Data Systems Corp.(a) | 2,450 | 592,655 | ||||||
Cognizant Technology Solutions Corp. - Class A(a) | 27,700 | 1,326,968 | ||||||
Computer Sciences Corp. | 28,200 | 1,668,876 | ||||||
Unisys Corp.(a) | 33,300 | 811,521 | ||||||
|
| |||||||
| 4,400,020 | ||||||||
|
| |||||||
Semiconductors & Semiconductor Equipment (16.5%) | ||||||||
Cirrus Logic, Inc.(a) | 64,700 | 1,442,810 | ||||||
| Semi-Annual Report | April 30, 2014 (Unaudited) | 27 |
Schedules of Investments | Black Oak Emerging Technology Fund |
As of April 30, 2014 (Unaudited)
| Security Description | Shares | Value | ||||||
Semiconductors & Semiconductor Equipment (continued) | ||||||||
Lam Research Corp.(a) | 21,200 | $1,221,332 | ||||||
Linear Technology Corp. | 30,200 | 1,343,900 | ||||||
Marvell Technology Group, Ltd. | 79,500 | 1,260,870 | ||||||
|
| |||||||
| 5,268,912 | ||||||||
|
| |||||||
Software (16.8%) | ||||||||
CA, Inc. | 45,100 | 1,359,314 | ||||||
Citrix Systems, Inc.(a) | 16,200 | 960,822 | ||||||
Fortinet, Inc.(a) | 22,700 | 498,946 | ||||||
Qualys, Inc.(a) | 31,100 | 599,919 | ||||||
Salesforce.com, Inc.(a) | 27,800 | 1,435,870 | ||||||
Workday, Inc. - Class A(a) | 7,050 | 515,144 | ||||||
|
| |||||||
| 5,370,015 | ||||||||
|
| |||||||
Technology Hardware, Storage & Peripherals (4.2%) | ||||||||
SanDisk Corp. | 15,850 | 1,346,775 | ||||||
|
| |||||||
TOTAL COMMON STOCKS | ||||||||
(Cost $24,812,061) | 31,764,094 | |||||||
|
| |||||||
SHORT TERM INVESTMENTS (0.8%) | ||||||||
Fidelity Institutional Money Market Government | ||||||||
Portfolio - Class I (7 day yield 0.010%) | 266,431 | 266,431 | ||||||
|
| |||||||
TOTAL SHORT TERM INVESTMENTS | ||||||||
(Cost $266,431) | 266,431 | |||||||
|
| |||||||
TOTAL INVESTMENTS - (100.1%) | ||||||||
(Cost $25,078,492) | $32,030,525 | |||||||
Liabilities in Excess of Other Assets - (-0.1%) | (33,721) | |||||||
|
| |||||||
NET ASSETS - (100.0%) | $31,996,804 | |||||||
|
| |||||||
| (a) | Non-income producing security. |
Common Abbreviations:
ADR - American Depositary Receipt.
Ltd. - Limited.
The accompanying notes are an integral part of the financial statements.
| 28 | 1-888-462-5386 | www.oakfunds.com |
Live Oak Health Sciences Fund | Schedules of Investments |
As of April 30, 2014 (Unaudited)
| Security Description | Shares | Value | ||||||
COMMON STOCKS (98.0%) | ||||||||
HEALTH CARE (98.0%) | ||||||||
Biotechnology (4.1%) | ||||||||
Amgen, Inc. | 15,900 | $1,776,825 | ||||||
Targacept, Inc.(a) | 23,881 | 106,032 | ||||||
|
| |||||||
| 1,882,857 | ||||||||
|
| |||||||
Health Care Equipment & Supplies (27.1%) | ||||||||
Becton Dickinson and Co. | 16,400 | 1,853,692 | ||||||
Boston Scientific Corp.(a) | 88,500 | 1,115,985 | ||||||
CareFusion Corp.(a) | 21,600 | 843,696 | ||||||
Covidien PLC | 16,000 | 1,140,000 | ||||||
CR Bard, Inc. | 18,800 | 2,581,804 | ||||||
Greatbatch, Inc.(a) | 12,684 | 583,844 | ||||||
Medtronic, Inc. | 29,500 | 1,735,190 | ||||||
Stryker Corp. | 17,000 | 1,321,750 | ||||||
Zimmer Holdings, Inc. | 13,600 | 1,316,480 | ||||||
|
| |||||||
| 12,492,441 | ||||||||
|
| |||||||
Health Care Providers & Services (29.2%) | ||||||||
Cardinal Health, Inc. | 38,800 | 2,696,988 | ||||||
McKesson Corp. | 14,050 | 2,377,120 | ||||||
Omnicare, Inc. | 17,900 | 1,060,933 | ||||||
Owens & Minor, Inc. | 45,080 | 1,511,983 | ||||||
Patterson Cos., Inc. | 28,400 | 1,155,880 | ||||||
PharMerica Corp.(a) | 45,516 | 1,237,580 | ||||||
UnitedHealth Group, Inc. | 12,000 | 900,480 | ||||||
VCA Antech, Inc.(a) | 31,600 | 967,908 | ||||||
WellPoint, Inc. | 15,700 | 1,580,676 | ||||||
|
| |||||||
| 13,489,548 | ||||||||
|
| |||||||
Life Sciences Tools & Services (8.5%) | ||||||||
Agilent Technologies, Inc. | 32,100 | 1,734,684 | ||||||
Techne Corp. | 8,900 | 794,859 | ||||||
Waters Corp.(a) | 14,000 | 1,379,560 | ||||||
|
| |||||||
| 3,909,103 | ||||||||
|
| |||||||
Pharmaceuticals (29.1%) | ||||||||
AstraZeneca PLC ADR | 27,700 | 2,189,685 | ||||||
Eli Lilly & Co. | 18,000 | 1,063,800 | ||||||
GlaxoSmithKline PLC ADR | 25,900 | 1,434,083 | ||||||
Johnson & Johnson | 14,700 | 1,488,963 | ||||||
Mallinckrodt PLC(a) | 1,887 | 134,411 | ||||||
Merck & Co., Inc. | 31,000 | 1,815,360 | ||||||
Novartis AG ADR | 16,700 | 1,451,898 | ||||||
Pfizer, Inc. | 50,154 | 1,568,817 | ||||||
Sanofi ADR | 22,892 | 1,231,590 | ||||||
| Semi-Annual Report | April 30, 2014 (Unaudited) | 29 |
| Schedules of Investments | Live Oak Health Sciences Fund |
As of April 30, 2014 (Unaudited)
| Security Description | Shares | Value | ||||||
Pharmaceuticals (continued) | ||||||||
Teva Pharmaceutical Industries, Ltd. ADR | 21,700 | $1,060,262 | ||||||
|
| |||||||
| 13,438,869 | ||||||||
|
| |||||||
TOTAL COMMON STOCKS | ||||||||
(Cost $27,478,772) | 45,212,818 | |||||||
|
| |||||||
SHORT TERM INVESTMENTS (2.0%) | ||||||||
Fidelity Institutional Money Market Government | ||||||||
Portfolio - Class I (7 day yield 0.010%) | 928,273 | 928,273 | ||||||
|
| |||||||
TOTAL SHORT TERM INVESTMENTS | ||||||||
(Cost $928,273) | 928,273 | |||||||
|
| |||||||
TOTAL INVESTMENTS - (100.0%) | ||||||||
(Cost $28,407,045) | $46,141,091 | |||||||
Assets in Excess of Other Liabilities - (0.0%)(b) | 907 | |||||||
|
| |||||||
NET ASSETS - (100.0%) | $46,141,998 | |||||||
|
| |||||||
| (a) | Non-income producing security. |
| (b) | Less than 0.05%. |
| Common | Abbreviations: |
| ADR | - American Depositary Receipt. |
| AG | - Aktiengesellschaft is a German term that refers to a corporation that is limited by shares, i.e., owned by shareholders. |
| Ltd. | - Limited. |
| PLC | - Public Limited Company. |
| The | accompanying notes are an integral part of the financial statements. |
| 30 | 1-888-462-5386 | www.oakfunds.com |
OAK ASSOCIATES FUNDS
This Page Intentionally Left Blank
As of April 30, 2014 (Unaudited)
| White Oak Select Growth Fund | Pin Oak Equity Fund | |||||||
Investments at cost | $ | 247,122,300 | $ | 77,669,797 | ||||
| ||||||||
ASSETS: | ||||||||
Investments at fair value | $ | 249,302,247 | $ | 85,250,233 | ||||
Receivable for capital shares sold | 3,660 | 30,738 | ||||||
Receivable for investment securities sold | 253,070 | – | ||||||
Dividends and interest receivable | 19,375 | 38,507 | ||||||
Prepaid expenses | 26,358 | 17,330 | ||||||
| ||||||||
Total Assets | 249,604,710 | 85,336,808 | ||||||
| ||||||||
LIABILITIES: | ||||||||
Payable for fund shares redeemed | 44,229 | 9,044 | ||||||
Investment advisory fees payable | 155,197 | 51,397 | ||||||
Administration fees payable | 17,179 | 6,009 | ||||||
Trustees’ fees payable | 20,946 | 6,723 | ||||||
Payable for investment securities purchased | – | – | ||||||
Principal financial officer fees payable | 397 | 137 | ||||||
Printing fees payable | 10,242 | 4,723 | ||||||
Transfer agent fees payable | 24,118 | 10,866 | ||||||
Legal and audit fees payable | 2,041 | 4,002 | ||||||
Other accrued expenses | 2,388 | 957 | ||||||
| ||||||||
Total Liabilities | 276,737 | 93,858 | ||||||
| ||||||||
Total Net Assets | $ | 249,327,973 | $ | 85,242,950 | ||||
| ||||||||
NET ASSETS: | ||||||||
Paid-in capital (unlimited authorization - no par value) | $ | 277,953,813 | $ | 77,397,004 | ||||
Accumulated undistributed net investment income (loss) | 760,589 | 298,574 | ||||||
Accumulated net realized gain (loss) on investments | (31,566,376) | (33,064) | ||||||
Net unrealized appreciation on investments | 2,179,947 | 7,580,436 | ||||||
| ||||||||
Total Net Assets | $ | 249,327,973 | $ | 85,242,950 | ||||
| ||||||||
PORTFOLIO SHARES: | ||||||||
Net Assets | $ | 249,327,973 | $ | 85,242,950 | ||||
Total shares outstanding at end of period | 4,477,479 | 1,831,868 | ||||||
Net assets value, offering and redemption price per share (net assets ÷ shares outstanding) | $ | 55.68 | $ | 46.53 | ||||
| ||||||||
The accompanying notes are an integral part of the financial statements.
| 32 | 1-888-462-5386 | www.oakfunds.com |
| Rock Oak Core Growth Fund | River Oak Discovery Fund | Red Oak Technology Select Fund | Black Oak Emerging Technology Fund | Live Oak Health Sciences Fund | ||||||||||||||
| $ | 6,152,545 | $ | 10,962,537 | $ | 105,381,818 | $ | 25,078,492 | $ | 28,407,045 | |||||||||
|
| |||||||||||||||||
| $ | 8,203,543 | $ | 14,104,168 | $ | 130,684,837 | $ | 32,030,525 | $ | 46,141,091 | |||||||||
| 30 | 25 | 69,100 | 6,240 | 32,749 | ||||||||||||||
| – | – | – | – | 66,186 | ||||||||||||||
| 1,084 | 3 | 54,158 | 3 | 8,498 | ||||||||||||||
| 11,864 | 8,914 | 15,732 | 12,642 | 10,555 | ||||||||||||||
|
| |||||||||||||||||
| 8,216,521 | 14,113,110 | 130,823,827 | 32,049,410 | 46,259,079 | ||||||||||||||
|
| |||||||||||||||||
| 20,518 | – | 54,823 | 11,026 | – | ||||||||||||||
| 970 | 6,988 | 78,586 | 20,041 | 27,940 | ||||||||||||||
| 986 | 1,360 | 8,953 | 2,494 | 3,502 | ||||||||||||||
| 698 | 1,193 | 10,023 | 2,804 | 3,700 | ||||||||||||||
| – | – | 888,112 | – | 68,962 | ||||||||||||||
| 10 | 20 | 96 | 38 | 70 | ||||||||||||||
| 711 | 955 | 534 | 1,701 | 2,432 | ||||||||||||||
| 1,625 | 1,707 | 11,000 | 7,609 | 4,124 | ||||||||||||||
| 8,352 | 8,030 | 947 | 6,504 | 5,921 | ||||||||||||||
| 124 | 83 | 866 | 389 | 430 | ||||||||||||||
|
| |||||||||||||||||
| 33,994 | 20,336 | 1,053,940 | 52,606 | 117,081 | ||||||||||||||
|
| |||||||||||||||||
| $ | 8,182,527 | $ | 14,092,774 | $ | 129,769,887 | $ | 31,996,804 | $ | 46,141,998 | |||||||||
|
| |||||||||||||||||
| $ | 5,664,124 | $ | 8,735,727 | $ | 107,915,222 | $ | 26,650,143 | $ | 25,790,203 | |||||||||
| 5,188 | (57,388) | 111,675 | (182,261) | 104,909 | ||||||||||||||
| 462,217 | 2,272,804 | (3,560,029) | (1,423,111) | 2,512,840 | ||||||||||||||
| 2,050,998 | 3,141,631 | 25,303,019 | 6,952,033 | 17,734,046 | ||||||||||||||
|
| |||||||||||||||||
| $ | 8,182,527 | $ | 14,092,774 | $ | 129,769,887 | $ | 31,996,804 | $ | 46,141,998 | |||||||||
|
| |||||||||||||||||
| $ | 8,182,527 | $ | 14,092,774 | $ | 129,769,887 | $ | 31,996,804 | $ | 46,141,998 | |||||||||
| 605,770 | 803,429 | 8,523,252 | 8,341,643 | 2,319,190 | ||||||||||||||
| $ | 13.51 | $ | 17.54 | $ | 15.23 | $ | 3.84 | $ | 19.90 | |||||||||
|
| |||||||||||||||||
| Semi-Annual Report | April 30, 2014 (Unaudited) | 33 |
For the Six Months Ended April 30, 2014 (Unaudited)
| White Oak Select Growth Fund | Pin Oak Equity Fund | |||||||
| ||||||||
INVESTMENT INCOME: | ||||||||
Dividends | $ | 2,182,751 | $ | 778,132 | ||||
Less: Foreign withholding tax | (20,968) | (8,924) | ||||||
| ||||||||
Total Investment Income | 2,161,783 | 769,208 | ||||||
| ||||||||
EXPENSES: | ||||||||
Investment advisory fees | 949,848 | 307,957 | ||||||
Administration fees | 103,617 | 34,458 | ||||||
Trustees’ fees | 51,131 | 16,520 | ||||||
Legal and audit fees | 64,086 | 22,452 | ||||||
Transfer agent fees | 156,733 | 53,792 | ||||||
Registration fees | 10,907 | 11,248 | ||||||
Printing fees | 19,699 | 7,770 | ||||||
Custodian fees | 6,718 | 3,274 | ||||||
Principal financial officer fees | 2,317 | 758 | ||||||
Insurance and other fees | 36,098 | 12,388 | ||||||
| ||||||||
Total Expenses | 1,401,154 | 470,617 | ||||||
| ||||||||
Less: Investment advisory fees waived | – | – | ||||||
| ||||||||
Net Expenses | 1,401,154 | 470,617 | ||||||
| ||||||||
Net Investment Income (Loss) | 760,629 | 298,591 | ||||||
| ||||||||
Net realized gain (loss) on securities sold | (4,008) | (33,064) | ||||||
Net change in unrealized appreciation (depreciation) of investment securities | 10,098,402 | 6,702,017 | ||||||
| ||||||||
Net Realized and Unrealized Gain on Investments | 10,094,394 | 6,668,953 | ||||||
| ||||||||
Net Increase in Net Assets Resulting From Operations | $ | 10,855,023 | $ | 6,967,544 | ||||
| ||||||||
The accompanying notes are an integral part of the financial statements.
| 34 | 1-888-462-5386 | www.oakfunds.com |
| Rock Oak Core Growth Fund | River Oak Discovery Fund | Red Oak Technology Select Fund | Black Oak Emerging Technology Fund | Live Oak Health Sciences Fund | ||||||||||||||
|
| |||||||||||||||||
| $ | 65,779 | $ | 36,843 | $ | 922,620 | $ | 166,307 | $ | 428,086 | |||||||||
| (300) | – | – | – | (8,756) | ||||||||||||||
|
| |||||||||||||||||
| 65,479 | 36,843 | 922,620 | 166,307 | 419,330 | ||||||||||||||
|
| |||||||||||||||||
| 29,657 | 62,783 | 438,476 | 120,219 | 165,527 | ||||||||||||||
| 4,231 | 6,802 | 48,526 | 13,853 | 19,058 | ||||||||||||||
| 1,619 | 2,810 | 23,240 | 6,503 | 8,799 | ||||||||||||||
| 8,196 | 9,315 | 28,695 | 12,598 | 14,990 | ||||||||||||||
| 7,253 | 7,583 | 92,923 | 38,401 | 20,820 | ||||||||||||||
| 9,483 | 8,893 | 10,714 | 9,829 | 9,166 | ||||||||||||||
| 972 | 1,341 | 8,036 | 3,036 | 3,914 | ||||||||||||||
| 317 | 410 | 2,949 | 713 | 1,246 | ||||||||||||||
| 70 | 124 | 983 | 281 | 401 | ||||||||||||||
| 1,830 | 2,632 | 16,742 | 4,889 | 6,688 | ||||||||||||||
|
| |||||||||||||||||
| 63,628 | 102,693 | 671,284 | 210,322 | 250,609 | ||||||||||||||
|
| |||||||||||||||||
| (13,460) | (8,462) | – | – | – | ||||||||||||||
|
| |||||||||||||||||
| 50,168 | 94,231 | 671,284 | 210,322 | 250,609 | ||||||||||||||
|
| |||||||||||||||||
| 15,311 | (57,388) | 251,336 | (44,015) | 168,721 | ||||||||||||||
|
| |||||||||||||||||
| 462,215 | 2,279,094 | 1,013,880 | 1,479,031 | 2,515,423 | ||||||||||||||
| 279,130 | (1,211,645) | 10,728,323 | 610,296 | 1,676,279 | ||||||||||||||
|
| |||||||||||||||||
| 741,345 | 1,067,449 | 11,742,203 | 2,089,327 | 4,191,702 | ||||||||||||||
|
| |||||||||||||||||
| $ | 756,656 | $ | 1,010,061 | $ | 11,993,539 | $ | 2,045,312 | $ | 4,360,423 | |||||||||
|
| |||||||||||||||||
| Semi-Annual Report | April 30, 2014 (Unaudited) | 35 |
White Oak Select Growth Fund | Pin Oak Equity Fund | |||||||||||||||
|
| |||||||||||||||
For The Six Months | For The Year Ended October 31, 2013 | For The Six Months April 30, 2014 (Unaudited) | For The Year Ended 2013 | |||||||||||||
| ||||||||||||||||
INVESTMENT ACTIVITIES: | ||||||||||||||||
Net investment income (loss) | $ | 760,629 | $ | 1,207,930 | $ | 298,591 | $ | 520,335 | ||||||||
Net realized gain (loss) on securities sold | (4,008) | 59,454,836 | (33,064) | 16,781,767 | ||||||||||||
Net change in unrealized appreciation (depreciation) of investment securities | 10,098,402 | (3,653,355) | 6,702,017 | 3,287,352 | ||||||||||||
| ||||||||||||||||
Net Increase in Net Assets Resulting from Operations | 10,855,023 | 57,009,411 | 6,967,544 | 20,589,454 | ||||||||||||
| ||||||||||||||||
DISTRIBUTIONS TO SHAREHOLDERS: | ||||||||||||||||
Net income | (1,123,336) | (731,035) | (520,352) | (458,987) | ||||||||||||
Realized capital gains | – | – | – | – | ||||||||||||
| ||||||||||||||||
Total Distributions | (1,123,336) | (731,035) | (520,352) | (458,987) | ||||||||||||
| ||||||||||||||||
CAPITAL SHARE TRANSACTIONS (IN DOLLARS): | ||||||||||||||||
Shares issued | 1,936,322 | 7,017,798 | 4,686,658 | 12,256,979 | ||||||||||||
Shares issued in lieu of cash distributions | 1,050,297 | 685,000 | 487,929 | 433,051 | ||||||||||||
Shares redeemed | (17,193,552) | (38,773,469) | (7,786,726) | (20,520,003) | ||||||||||||
| ||||||||||||||||
Net Increase (Decrease) in Net Assets from Capital Share Transactions | (14,206,933) | (31,070,671) | (2,612,139) | (7,829,973) | ||||||||||||
| ||||||||||||||||
Total Increase (Decrease) in Net Assets | (4,475,246) | 25,207,705 | 3,835,053 | �� | 12,300,494 | |||||||||||
| ||||||||||||||||
NET ASSETS: | ||||||||||||||||
Beginning of period | 253,803,219 | 228,595,514 | 81,407,897 | 69,107,403 | ||||||||||||
| ||||||||||||||||
End of period | $ | 249,327,973 | $ | 253,803,219 | $ | 85,242,950 | $ | 81,407,897 | ||||||||
| ||||||||||||||||
Including accumulated undistributed net investment income (loss) | $ | 760,589 | $ | 1,123,296 | $ | 298,574 | $ | 520,335 | ||||||||
| ||||||||||||||||
SHARES ISSUED AND REDEEMED: | ||||||||||||||||
Issued | 34,332 | 146,591 | 103,387 | 328,423 | ||||||||||||
Issued in lieu of cash distributions | 18,924 | 15,477 | 10,952 | 12,644 | ||||||||||||
Redeemed | (305,875) | (810,647) | (172,664) | (554,037) | ||||||||||||
| ||||||||||||||||
Net Increase (Decrease) in Share Transactions | (252,619) | (648,579) | (58,325) | (212,970) | ||||||||||||
| ||||||||||||||||
The accompanying notes are an integral part of the financial statements.
| 36 | 1-888-462-5386 | www.oakfunds.com |
Rock Oak Core Growth Fund | River Oak Discovery Fund | Red Oak Technology Select Fund | ||||||||||||||||||||
|
| |||||||||||||||||||||
For The Six Months | For The Year Ended October 31, 2013 | For The Six Months | For The Year Ended | For The Six Months | For The Year Ended October 31, 2013 | |||||||||||||||||
|
| |||||||||||||||||||||
| $ | 15,311 | $ | 35,899 | $ | (57,388) | $ | (62,188) | $ | 251,336 | $ | 402,074 | |||||||||||
| 462,215 | 1,438,328 | 2,279,094 | 1,113,957 | 1,013,880 | 1,014,538 | |||||||||||||||||
| 279,130 | 270,516 | (1,211,645) | 2,179,441 | 10,728,323 | 24,675,732 | |||||||||||||||||
|
| |||||||||||||||||||||
| 756,656 | 1,744,743 | 1,010,061 | 3,231,210 | 11,993,539 | 26,092,344 | |||||||||||||||||
|
| |||||||||||||||||||||
| (30,552) | (25,866) | – | – | (461,447) | (197,281) | |||||||||||||||||
| (1,437,716) | (65,870) | (1,077,940) | – | – | – | |||||||||||||||||
|
| |||||||||||||||||||||
| (1,468,268) | (91,736) | (1,077,940) | – | (461,447) | (197,281) | |||||||||||||||||
|
| |||||||||||||||||||||
| 180,772 | 112,974 | 304,484 | 263,324 | 27,326,268 | 41,532,457 | |||||||||||||||||
| 1,387,471 | 87,408 | 1,054,513 | – | 439,119 | 186,117 | |||||||||||||||||
| (169,220) | (870,562) | (502,431) | (956,908) | (15,119,239) | (26,903,724) | |||||||||||||||||
|
| |||||||||||||||||||||
| 1,399,023 | (670,180) | 856,566 | (693,584) | 12,646,148 | 14,814,850 | |||||||||||||||||
|
| |||||||||||||||||||||
| 687,411 | 982,827 | 788,687 | 2,537,626 | 24,178,240 | 40,709,913 | |||||||||||||||||
|
| |||||||||||||||||||||
| 7,495,116 | 6,512,289 | 13,304,087 | 10,766,461 | 105,591,647 | 64,881,734 | |||||||||||||||||
|
| |||||||||||||||||||||
| $ | 8,182,527 | $ | 7,495,116 | $ | 14,092,774 | $ | 13,304,087 | $ | 129,769,887 | $ | 105,591,647 | |||||||||||
|
| |||||||||||||||||||||
| $ | 5,188 | $ | 20,429 | $ | (57,388) | $ | – | $ | 111,675 | $ | 321,786 | |||||||||||
|
| |||||||||||||||||||||
| 12,706 | 8,369 | 17,159 | 16,787 | 1,830,975 | 3,311,368 | |||||||||||||||||
| 106,729 | 7,182 | 62,545 | – | 30,715 | 17,709 | |||||||||||||||||
| (11,961) | (69,897) | (28,089) | (64,570) | (1,021,145) | (2,272,235) | |||||||||||||||||
|
| |||||||||||||||||||||
| 107,474 | (54,346) | 51,615 | (47,783) | 840,545 | 1,056,842 | |||||||||||||||||
|
| |||||||||||||||||||||
| Semi-Annual Report | April 30, 2014 (Unaudited) | 37 |
Statements of Changes in Net Assets |
Black Oak Emerging Technology Fund | Live Oak Health Sciences Fund | |||||||||||||||
For The Six Months | For The Year Ended 2013 | For The Six Months | For The Year Ended October 31, 2013 | |||||||||||||
INVESTMENT ACTIVITIES: | ||||||||||||||||
Net investment income (loss) | $ | (44,015) | $ | (51,257) | $ | 168,721 | $ | 298,041 | ||||||||
Net realized gain on securities sold | 1,479,031 | 897,986 | 2,515,423 | 1,556,098 | ||||||||||||
Net change in unrealized appreciation of investment securities | 610,296 | 7,100,218 | 1,676,279 | 9,917,628 | ||||||||||||
Net Increase in Net Assets Resulting from Operations | 2,045,312 | 7,946,947 | 4,360,423 | 11,771,767 | ||||||||||||
DISTRIBUTIONS TO SHAREHOLDERS: | ||||||||||||||||
Net income | – | – | (296,848) | (278,532) | ||||||||||||
Realized capital gains | – | – | (1,556,100) | (1,642,727) | ||||||||||||
Total Distributions | – | – | (1,852,948) | (1,921,259) | ||||||||||||
CAPITAL SHARE TRANSACTIONS (IN DOLLARS): | ||||||||||||||||
Shares issued | 1,947,752 | 859,255 | 4,825,414 | 5,776,247 | ||||||||||||
Shares issued in lieu of cash distributions | – | – | 1,771,249 | 1,855,791 | ||||||||||||
Shares redeemed | (1,849,115) | (4,003,360) | (5,479,162) | (7,932,232) | ||||||||||||
Net Increase (Decrease) in Net Assets from Capital Share Transactions | 98,637 | (3,144,105) | 1,117,501 | (300,194) | ||||||||||||
Total Increase in Net Assets | 2,143,949 | 4,802,842 | 3,624,976 | 9,550,314 | ||||||||||||
NET ASSETS: | ||||||||||||||||
Beginning of period | 29,852,855 | 25,050,013 | 42,517,022 | 32,966,708 | ||||||||||||
End of period | $ | 31,996,804 | $ | 29,852,855 | $ | 46,141,998 | $ | 42,517,022 | ||||||||
Including accumulated undistributed net investment income (loss) | $ | (182,261) | $ | (138,246) | $ | 104,909 | $ | 233,036 | ||||||||
SHARES ISSUED AND REDEEMED: | ||||||||||||||||
Issued | 492,979 | 271,318 | 250,672 | 355,554 | ||||||||||||
Issued in lieu of cash distributions | – | – | 94,770 | 128,696 | ||||||||||||
Redeemed | (478,992) | (1,312,223) | (284,571) | (473,342) | ||||||||||||
Net Increase (Decrease) in Share Transactions | 13,987 | (1,040,905) | 60,871 | 10,908 | ||||||||||||
The accompanying notes are an integral part of the financial statements.
| 38 | 1-888-462-5386 | www.oakfunds.com |
OAK ASSOCIATES FUNDS
This Page Intentionally Left Blank
For a share outstanding throughout the periods ended
| For the Six Months Ended April 30, 2014 (Unaudited) | ||||
WHITE OAK SELECT GROWTH FUND | ||||
Net Asset Value Beginning of Period | $ | 53.66 | ||
Income (Loss) From Operations | ||||
Net Investment Income (Loss)(a) | 0.17 | |||
Realized and Unrealized Gain in Securities(a) | 2.09 | |||
Total From Operations | 2.26 | |||
Less Distributions: | ||||
Dividends from Net Investment Income | (0.24) | |||
Distributions from Capital Gains | – | |||
Total Dividends and Distributions | (0.24) | |||
Net Asset Value End of Period | $ | 55.68 | ||
Total Return(b) | 4.22% | |||
Net Assets End of Period (000) | $ | 249,328 | ||
Ratio of Net Expenses to Average Net Assets | 1.09% | |||
Ratio of Net Investment Income (Loss) to Average Net Assets | 0.59% | |||
Ratio of Net Expenses to Average Net Assets (Excluding Fees Paid Indirectly) | N/A | |||
Ratio of Expenses to Average Net Assets (Excluding Waivers and/or Fees Paid Indirectly) | 1.09% | |||
Portfolio Turnover Rate | 1% | |||
| (a) | Per share calculations were performed using average shares for the period. |
| (b) | Figures do not reflect the deduction of taxes the shareholder will pay on fund distributions or redemption of fund shares. |
The accompanying notes are an integral part of the financial statements.
| 40 | 1-888-462-5386 | www.oakfunds.com |
Year Ended October 31, 2013 | Year Ended October 31, 2012 | Year Ended October 31, 2011 | Year Ended October 31, 2010 | Year Ended October 31, 2009 | ||||||||||||||
| $ | 42.50 | $ | 39.09 | $ | 37.56 | $ | 31.44 | $ | 23.89 | |||||||||
| 0.24 | 0.11 | (0.03) | (0.20) | (0.18) | ||||||||||||||
| 11.06 | 3.30 | 1.56 | 6.32 | 7.73 | ||||||||||||||
| 11.30 | 3.41 | 1.53 | 6.12 | 7.55 | ||||||||||||||
| (0.14) | – | – | – | – | ||||||||||||||
| – | – | – | – | – | ||||||||||||||
| (0.14) | – | – | – | – | ||||||||||||||
| $ | 53.66 | $ | 42.50 | $ | 39.09 | $ | 37.56 | $ | 31.44 | |||||||||
| 26.65% | 8.72% | 4.07% | 19.47% | 31.60% | ||||||||||||||
| $ | 253,803 | $ | 228,596 | $ | 241,557 | $ | 259,184 | $ | 319,359 | |||||||||
| 1.12% | 1.16% | 1.14% | 1.25% | 1.25% | ||||||||||||||
| 0.50% | 0.28% | (0.08)% | (0.58)% | (0.70)% | ||||||||||||||
| N/A | N/A | N/A | N/A | 1.25% | ||||||||||||||
| 1.12% | 1.16% | 1.14% | 1.34% | 1.51% | ||||||||||||||
| 89% | 86% | 12% | 14% | 31% | ||||||||||||||
| Semi-Annual Report | April 30, 2014 (Unaudited) | 41 |
Financial Highlights |
For a share outstanding throughout the periods ended
| For the Six Months Ended April 30, 2014 (Unaudited) | ||||
PIN OAK EQUITY FUND | ||||
Net Asset Value Beginning of Period | $ | 43.07 | ||
Income (Loss) From Operations | ||||
Net Investment Income (Loss)(a) | 0.16 | |||
Realized and Unrealized Gain in Securities(a) | 3.58 | |||
Total From Operations | 3.74 | |||
Less Distributions: | ||||
Dividends from Net Investment Income | (0.28) | |||
Distributions from Capital Gains | – | |||
Total Dividends and Distributions | (0.28) | |||
Net Asset Value End of Period | $ | 46.53 | ||
Total Return(b) | 8.71% | |||
Net Assets End of Period (000) | $ | 85,243 | ||
Ratio of Net Expenses to Average Net Assets | 1.13% | |||
Ratio of Net Investment Income (Loss) to Average Net Assets | 0.72% | |||
Ratio of Net Expenses to Average Net Assets (Excluding Fees Paid Indirectly) | N/A | |||
Ratio of Expenses to Average Net Assets (Excluding Waivers and/or Fees Paid Indirectly) | 1.13% | |||
Portfolio Turnover Rate | 1% | |||
| (a) | Per share calculations were performed using average shares for the period. |
| (b) | Figures do not reflect the deduction of taxes the shareholder will pay on fund distributions or redemption of fund shares. |
The accompanying notes are an integral part of the financial statements.
| 42 | 1-888-462-5386 | www.oakfunds.com |
Year Ended October 31, 2013 | Year Ended October 31, 2012 | Year Ended October 31, 2011 | Year Ended October 31, 2010 | Year Ended October 31, 2009 | ||||||||||||||
| $ | 32.86 | $ | 28.52 | $ | 26.76 | $ | 22.74 | $ | 15.58 | |||||||||
| 0.26 | 0.21 | (0.05) | 0.07 | (0.11) | ||||||||||||||
| 10.18 | 4.13 | 1.90 | 3.96 | 7.27 | ||||||||||||||
| 10.44 | 4.34 | 1.85 | 4.03 | 7.16 | ||||||||||||||
| (0.23) | – | (0.09) | (0.01) | – | ||||||||||||||
| – | – | – | – | – | ||||||||||||||
| (0.23) | – | (0.09) | (0.01) | – | ||||||||||||||
| $ | 43.07 | $ | 32.86 | $ | 28.52 | $ | 26.76 | $ | 22.74 | |||||||||
| 31.94% | 15.22% | 6.92% | 17.74% | 45.96% | ||||||||||||||
| $ | 81,408 | $ | 69,107 | $ | 64,214 | $ | 69,845 | $ | 118,532 | |||||||||
| 1.16% | 1.21% | 1.20% | 1.25% | 1.25% | ||||||||||||||
| 0.70% | 0.68% | (0.16)% | 0.27% | (0.58)% | ||||||||||||||
| N/A | N/A | N/A | N/A | 1.25% | ||||||||||||||
| 1.16% | 1.21% | 1.20% | 1.33% | 1.60% | ||||||||||||||
| 117% | 98% | 27% | 35% | 16% | ||||||||||||||
| Semi-Annual Report | April 30, 2014 (Unaudited) | 43 |
Financial Highlights |
For a share outstanding throughout the periods ended
| For the Six Months Ended April 30, 2014 (Unaudited) | ||||
ROCK OAK CORE GROWTH FUND | ||||
Net Asset Value Beginning of Period | $ | 15.04 | ||
Income (Loss) From Operations | ||||
Net Investment Income (Loss)(a) | 0.03 | |||
Realized and Unrealized Gain in Securities(a) | 1.38 | |||
Total From Operations | 1.41 | |||
Less Distributions: | ||||
Dividends from Net Investment Income | (0.06) | |||
Distributions from Capital Gains | (2.88) | |||
Total Dividends and Distributions | (2.94) | |||
Net Asset Value End of Period | $ | 13.51 | ||
Total Return(b) | 10.18% | |||
Net Assets End of Period (000) | $ | 8,183 | ||
Ratio of Net Expenses to Average Net Assets | 1.25% | |||
Ratio of Net Investment Income (Loss) to Average Net Assets | 0.38% | |||
Ratio of Net Expenses to Average Net Assets (Excluding Fees Paid Indirectly) | N/A | |||
Ratio of Expenses to Average Net Assets (Excluding Waivers and/or Fees Paid Indirectly) | 1.59% | |||
Portfolio Turnover Rate | 13% | |||
| (a) | Per share calculations were performed using average shares for the period. |
| (b) | Figures do not reflect the deduction of taxes the shareholder will pay on fund distributions or redemption of fund shares. |
The accompanying notes are an integral part of the financial statements.
| 44 | 1-888-462-5386 | www.oakfunds.com |
Year Ended October 31, 2013 | Year Ended October 31, 2012 | Year Ended October 31, 2011 | Year Ended October 31, 2010 | Year Ended October 31, 2009 | ||||||||||||||
| $ | 11.78 | $ | 11.64 | $ | 11.16 | $ | 9.09 | $ | 7.28 | |||||||||
| 0.07 | 0.02 | (0.04) | (0.06) | (0.04) | ||||||||||||||
| 3.37 | 0.12 | 0.52 | 2.13 | 1.85 | ||||||||||||||
| 3.44 | 0.14 | 0.48 | 2.07 | 1.81 | ||||||||||||||
| (0.05) | – | – | – | – | ||||||||||||||
| (0.13) | – | – | – | – | ||||||||||||||
| (0.18) | – | – | – | – | ||||||||||||||
| $ | 15.04 | $ | 11.78 | $ | 11.64 | $ | 11.16 | $ | 9.09 | |||||||||
| 29.51% | 1.20% | 4.30% | 22.77% | 24.86% | ||||||||||||||
| $ | 7,495 | $ | 6,512 | $ | 6,890 | $ | 6,744 | $ | 5,798 | |||||||||
| 1.25% | 1.25% | 1.25% | 1.25% | 1.25% | ||||||||||||||
| 0.53% | 0.14% | (0.35)% | (0.59)% | (0.56)% | ||||||||||||||
| N/A | N/A | N/A | N/A | 1.25% | ||||||||||||||
| 1.65% | 1.79% | 1.65% | 1.54% | 1.82% | ||||||||||||||
| 65% | 56% | 40% | 62% | 45% | ||||||||||||||
| Semi-Annual Report | April 30, 2014 (Unaudited) | 45 |
Financial Highlights |
For a share outstanding throughout the periods ended
For the Six Months Ended | ||||
RIVER OAK DISCOVERY FUND | ||||
Net Asset Value Beginning of Period | $ | 17.70 | ||
Income (Loss) From Operations | ||||
Net Investment Income (Loss)(a) | (0.07) | |||
Realized and Unrealized Gain in Securities(a) | 1.35 | |||
Total From Operations | 1.28 | |||
Less Distributions: | ||||
Dividends from Net Investment Income | – | |||
Distributions from Capital Gains | (1.44) | |||
Total Dividends and Distributions | (1.44) | |||
Net Asset Value End of Period | $ | 17.54 | ||
Total Return(b) | 7.56% | |||
Net Assets End of Period (000) | $ | 14,093 | ||
Ratio of Net Expenses to Average Net Assets | 1.35% | |||
Ratio of Net Investment Loss to Average Net Assets | (0.82)% | |||
Ratio of Net Expenses to Average Net Assets (Excluding Fees Paid Indirectly) | N/A | |||
Ratio of Expenses to Average Net Assets (Excluding Waivers and/or Fees Paid Indirectly) | 1.47% | |||
Portfolio Turnover Rate | 56% | |||
| (a) | Per share calculations were performed using average shares for the period. |
| (b) | Figures do not reflect the deduction of taxes the shareholder will pay on fund distributions or redemption of fund shares. |
The accompanying notes are an integral part of the financial statements.
| 46 | 1-888-462-5386 | www.oakfunds.com |
Year Ended October 31, 2013 | Year Ended October 31, 2012 | Year Ended October 31, 2011 | Year Ended October 31, 2010 | Year Ended October 31, 2009 | ||||||||||||||
| $ | 13.46 | $ | 12.76 | $ | 12.84 | $ | 10.96 | $ | 7.86 | |||||||||
| (0.08) | (0.07) | (0.08) | (0.10) | (0.09) | ||||||||||||||
| 4.32 | 0.77 | 0.18 | 1.98 | 3.19 | ||||||||||||||
| 4.24 | 0.70 | 0.10 | 1.88 | 3.10 | ||||||||||||||
| – | – | – | – | – | ||||||||||||||
| – | – | (0.18) | – | – | ||||||||||||||
| – | – | (0.18) | – | – | ||||||||||||||
| $ | 17.70 | $ | 13.46 | $ | 12.76 | $ | 12.84 | $ | 10.96 | |||||||||
| 31.50% | 5.49% | 0.74% | 17.15% | 39.44% | ||||||||||||||
| $ | 13,304 | $ | 10,766 | $ | 10,315 | $ | 9,125 | $ | 8,247 | |||||||||
| 1.35% | 1.35% | 1.35% | 1.35% | 1.35% | ||||||||||||||
| (0.52)% | (0.54)% | (0.61)% | (0.83)% | (1.03)% | ||||||||||||||
| N/A | N/A | N/A | N/A | 1.35% | ||||||||||||||
| 1.52% | 1.62% | 1.52% | 1.57% | 1.92% | ||||||||||||||
| 63% | 72% | 92% | 56% | 67% | ||||||||||||||
| Semi-Annual Report | April 30, 2014 (Unaudited) | 47 |
| Financial Highlights |
For a share outstanding throughout the periods ended
| For the Six Months Ended April 30, 2014 (Unaudited) | |||
RED OAK TECHNOLOGY SELECT FUND | ||||
Net Asset Value Beginning of Period | $ | 13.74 | ||
Income (Loss) From Operations | ||||
Net Investment Income (Loss)(a) | 0.03 | |||
Realized and Unrealized Gain in Securities(a) | 1.52 | |||
Total From Operations | 1.55 | |||
Less Distributions: | ||||
Dividends from Net Investment Income | (0.06) | |||
Distributions from Capital Gains | – | |||
Total Dividends and Distributions | (0.06) | |||
Net Asset Value End of Period | $ | 15.23 | ||
Total Return(b) | 11.31% | |||
Net Assets End of Period (000) | $ | 129,770 | ||
Ratio of Net Expenses to Average Net Assets | 1.13% | |||
Ratio of Net Investment Income (Loss) to Average Net Assets | 0.42% | |||
Ratio of Net Expenses to Average Net Assets (Excluding Fees Paid Indirectly) | N/A | |||
Ratio of Expenses to Average Net Assets (Excluding Waivers and/or Fees Paid Indirectly) | 1.13% | |||
Portfolio Turnover Rate | 4% | |||
| (a) | Per share calculations were performed using average shares for the period. |
| (b) | Figures do not reflect the deduction of taxes the shareholder will pay on fund distributions or redemption of fund shares. |
The accompanying notes are an integral part of the financial statements.
| 48 | 1-888-462-5386 | www.oakfunds.com |
| Year Ended | | | Year Ended October 31, 2012 | | | Year Ended October 31, 2011 | | | Year Ended October 31, 2010 | | | Year Ended October 31, 2009 | | ||||
| $ | 9.79 | $ | 9.60 | $ | 8.67 | $ | 7.04 | $ | 4.92 | |||||||||
| 0.06 | 0.02 | (0.04) | (0.05) | (0.03) | ||||||||||||||
| 3.92 | 0.17 | 0.97 | 1.68 | 2.15 | ||||||||||||||
| 3.98 | 0.19 | 0.93 | 1.63 | 2.12 | ||||||||||||||
| (0.03) | – | – | – | – | ||||||||||||||
| – | – | – | – | – | ||||||||||||||
| (0.03) | – | – | – | – | ||||||||||||||
| $ | 13.74 | $ | 9.79 | $ | 9.60 | $ | 8.67 | $ | 7.04 | |||||||||
| 40.76% | 1.98% | 10.73% | 23.15% | 43.09% | ||||||||||||||
| $ | 105,592 | $ | 64,882 | $ | 72,111 | $ | 65,415 | $ | 73,511 | |||||||||
| 1.23% | 1.30% | 1.32% | 1.35% | 1.35% | ||||||||||||||
| 0.50% | 0.16% | (0.43)% | (0.70)% | (0.56)% | ||||||||||||||
| N/A | N/A | N/A | N/A | 1.35% | ||||||||||||||
| 1.23% | 1.30% | 1.32% | 1.53% | 1.82% | ||||||||||||||
| 15% | 83% | 24% | 28% | 30% | ||||||||||||||
| Semi-Annual Report | April 30, 2014 (Unaudited) | 49 |
Financial Highlights |
For a share outstanding throughout the periods ended
For the Six Months Ended | ||||
BLACK OAK EMERGING TECHNOLOGY FUND | ||||
Net Asset Value Beginning of Period | $ | 3.58 | ||
Income (Loss) From Operations | ||||
Net Investment Income (Loss)(a) | (0.01) | |||
Realized and Unrealized Gain or (Losses) in Securities(a) | 0.27 | |||
Total From Operations | 0.26 | |||
Less Distributions: | ||||
Dividends from Net Investment Income | – | |||
Distributions from Capital Gains | – | |||
Total Dividends and Distributions | – | |||
Net Asset Value End of Period | $ | 3.84 | ||
Total Return(b) | 7.26% | |||
Net Assets End of Period (000) | $ | 31,997 | ||
Ratio of Net Expenses to Average Net Assets | 1.29% | |||
Ratio of Net Investment Loss to Average Net Assets | (0.27)% | |||
Ratio of Net Expenses to Average Net Assets (Excluding Fees Paid Indirectly) | N/A | |||
Ratio of Expenses to Average Net Assets (Excluding Waivers and/or Fees Paid Indirectly) | 1.29% | |||
Portfolio Turnover Rate | 13% | |||
| (a) | Per share calculations were performed using average shares for the period. |
| (b) | Figures do not reflect the deduction of taxes the shareholder will pay on fund distributions or redemption of fund shares. |
The accompanying notes are an integral part of the financial statements.
| 50 | 1-888-462-5386 | www.oakfunds.com |
Year Ended October 31, 2013 | Year Ended October 31, 2012 | Year Ended October 31, 2011 | Year Ended October 31, 2010 | Year Ended October 31, 2009 | ||||||||||||||
| $ | 2.67 | $ | 2.78 | $ | 2.94 | $ | 2.19 | $ | 1.63 | |||||||||
| (0.01) | (0.03) | (0.04) | (0.03) | (0.02) | ||||||||||||||
| 0.92 | (0.08) | (0.12) | 0.78 | 0.58 | ||||||||||||||
| 0.91 | (0.11) | (0.16) | 0.75 | 0.56 | ||||||||||||||
| – | – | – | – | – | ||||||||||||||
| – | – | – | – | – | ||||||||||||||
| – | – | – | – | – | ||||||||||||||
| $ | 3.58 | $ | 2.67 | $ | 2.78 | $ | 2.94 | $ | 2.19 | |||||||||
| 34.08% | (3.96)% | (5.44)% | 34.25% | 34.36% | ||||||||||||||
| $ | 29,853 | $ | 25,050 | $ | 28,993 | $ | 43,714 | $ | 37,596 | |||||||||
| 1.35% | 1.35% | 1.35% | 1.35% | 1.35% | ||||||||||||||
| (0.19)% | (1.07)% | (1.16)% | (1.16)% | (1.15)% | ||||||||||||||
| N/A | N/A | N/A | N/A | 1.35% | ||||||||||||||
| 1.39% | 1.44% | 1.35% | 1.55% | 1.93% | ||||||||||||||
| 58% | 33% | 54% | 99% | 49% | ||||||||||||||
| Semi-Annual Report | April 30, 2014 (Unaudited) | 51 |
Financial Highlights |
For a share outstanding throughout the periods ended
For the Six Months Ended | ||||
LIVE OAK HEALTH SCIENCES FUND | ||||
Net Asset Value Beginning of Period | $ | 18.83 | ||
Income (Loss) From Operations | ||||
Net Investment Income (Loss)(a) | 0.07 | |||
Realized and Unrealized Gain in Securities(a) | 1.82 | |||
Total From Operations | 1.89 | |||
Less Distributions: | ||||
Dividends from Net Investment Income | (0.13) | |||
Distributions from Capital Gains | (0.69) | |||
Total Dividends and Distributions | (0.82) | |||
Net Asset Value End of Period | $ | 19.90 | ||
Total Return(b) | 10.34% | |||
Net Assets End of Period (000) | $ | 46,142 | ||
Ratio of Net Expenses to Average Net Assets | 1.12% | |||
Ratio of Net Investment Income to Average Net Assets | 0.75% | |||
Ratio of Net Expenses to Average Net Assets (Excluding Fees Paid Indirectly) | N/A | |||
Ratio of Expenses to Average Net Assets (Excluding Waivers and/or Fees Paid Indirectly) | 1.12% | |||
Portfolio Turnover Rate | 7% | |||
| (a) | Per share calculations were performed using average shares for the period. |
| (b) | Figures do not reflect the deduction of taxes the shareholder will pay on fund distributions or redemption of fund shares. |
The accompanying notes are an integral part of the financial statements.
| 52 | 1-888-462-5386 | www.oakfunds.com |
Year Ended October 31, 2013 | Year Ended October 31, 2012 | Year Ended October 31, 2011 | Year Ended October 31, 2010 | Year Ended October 31, 2009 | ||||||||||||||
| $ | 14.67 | $ | 14.00 | $ | 12.84 | $ | 11.00 | $ | 9.48 | |||||||||
| 0.13 | 0.10 | 0.06 | 0.02 | (0.01) | ||||||||||||||
| 4.90 | 1.09 | 1.72 | 2.22 | 1.53 | ||||||||||||||
| 5.03 | 1.19 | 1.78 | 2.24 | 1.52 | ||||||||||||||
| (0.13) | (0.07) | (0.02) | – | – | ||||||||||||||
| (0.74) | (0.45) | (0.60) | (0.40) | – | ||||||||||||||
| (0.87) | (0.52) | (0.62) | (0.40) | – | ||||||||||||||
| $ | 18.83 | $ | 14.67 | $ | 14.00 | $ | 12.84 | $ | 11.00 | |||||||||
| 36.07% | 9.02% | 14.46% | 20.66% | 16.03% | ||||||||||||||
| $ | 42,517 | $ | 32,967 | $ | 29,071 | $ | 19,595 | $ | 16,249 | |||||||||
| 1.15% | 1.24% | 1.25% | 1.35% | 1.35% | ||||||||||||||
| 0.77% | 0.73% | 0.47% | 0.17% | 0.08% | ||||||||||||||
| N/A | N/A | N/A | N/A | 1.35% | ||||||||||||||
| 1.15% | 1.24% | 1.25% | 1.38% | 1.61% | ||||||||||||||
| 12% | 16% | 17% | 22% | 31% | ||||||||||||||
| Semi-Annual Report | April 30, 2014 (Unaudited) | 53 |
As of April 30, 2014 (Unaudited)
1. ORGANIZATION:
The Oak Associates Funds (the “Trust”), a Massachusetts business trust, is registered under the Investment Company Act of 1940, as amended (“1940 Act”), as an open-end management investment company with seven diversified funds: White Oak Select Growth Fund, Pin Oak Equity Fund, Rock Oak Core Growth Fund, River Oak Discovery Fund, Red Oak Technology Select Fund, Black Oak Emerging Technology Fund, and Live Oak Health Sciences Fund (collectively referred to as “Funds” and individually referred to as a “Fund”). The investment objectives of the Funds are to seek long-term capital growth. The assets of each Fund are segregated, and a shareholder’s interest is limited to the Fund in which shares are held. The Funds’ prospectus provides a description of each Fund’s investment objectives, policies and strategies.
2. SIGNIFICANT ACCOUNTING POLICIES:
The following is a summary of significant accounting policies followed by the Funds.
Use of Estimates – These policies are in conformity with U.S. generally accepted accounting principles (“GAAP”). The preparation of financial statements in accordance with GAAP requires management to make estimates and assumptions that affect the reported amounts and disclosures in the financial statements during the reporting period. Management believes the estimates and security valuations are appropriate; however, actual results may differ from those estimates, and the security valuations reflected in the financial statements may differ from the value the Funds ultimately realize upon the sale of the securities.
Security Valuation – Investments in equity securities, which are traded on a national exchange, are stated at the last quoted sales price if readily available for such equity securities on each business day. Investments in equity securities, which are reported on the NASDAQ national market system are valued at the official closing price; other equity securities traded in the over-the-counter market and listed equity securities for which no sale was reported on that date are stated at the last quoted bid price. Debt obligations exceeding sixty days to maturity for which market quotations are readily available are valued at the most recently quoted bid price. Debt obligations with sixty days or less remaining until maturity may be valued at their amortized cost, which approximates market value.
Redeemable securities issued by open-end registered investment companies are valued at the investment company’s applicable net asset value.
Securities for which market prices are not “readily available” are valued in accordance with Fair Value Procedures established by the Funds’ Board of Trustees. The Funds’ Fair Value Procedures are implemented through a Fair Value Committee (the “Committee”) designated by the Funds’ Board of Trustees. Some of the more common reasons that may necessitate that a security be valued using Fair Value Procedures include: the security’s trading has been halted or suspended; the security has been de–listed from a national exchange; the security’s primary trading market is temporarily closed at a time when under normal conditions it would be open; the security has not been traded for an extended period of time; the security’s primary pricing source is not able or willing to provide a price; a significant event with respect to a security or securities has occurred after the close of the market or exchange on which the security or securities principally trades and before the time the Fund calculates net asset value; or trading of the security is subject to local government–imposed restrictions. When a security is valued in accordance with the Fair Value Procedures, the Committee will determine the value after taking into consideration relevant information reasonably available to the Committee.
| 54 | 1-888-462-5386 | www.oakfunds.com |
| Notes to Financial Statements |
As of April 30, 2014 (Unaudited)
Security Transactions and Investment Income – Security transactions are accounted for on the date the security is purchased or sold (trade date). Dividend income is recognized on the ex-dividend date. Interest income is recognized on the accrual basis. Withholding taxes on foreign dividends have been provided for in accordance with the Funds’ understanding of the applicable country’s tax rules and rates. Costs used in determining realized gains and losses on the sales of investment securities are those of the specific securities sold. If applicable, any foreign capital gains taxes are accrued, net of unrealized gains, and are payable upon the sale of such investments.
Expenses – Expenses that are directly related to one of the Funds are charged to that Fund. Other operating expenses of the Trust are prorated to the Funds on the basis of relative daily net assets.
Repurchase Agreements – The Funds invest in tri-party repurchase agreements. Securities held as collateral for tri-party repurchase agreements are maintained by the broker’s custodian bank in a segregated account until maturity of the repurchase agreement. Provisions of the repurchase agreements and procedures adopted by the Board of Trustees require that the market value of the collateral, including accrued interest thereon, is sufficient in the event of default by the counterparty. If the counterparty defaults and the value of the collateral declines or if the counterparty enters an insolvency proceeding, realization of the collateral by the Funds may be delayed or limited.
Dividends and Distributions to Shareholders – Dividends from net investment income are declared and paid to shareholders on an annual basis, as applicable. Net realized capital gains on sales of securities, if any, are distributed to shareholders at least annually. Distributions to shareholders are determined in accordance with income tax regulations and are recorded on the ex-dividend date.
Income and capital gain distributions are determined in accordance with federal income tax regulations, which may differ from GAAP. Therefore, the source of the Funds’ distributions may be shown in the accompanying financial statements as either from or in excess of net investment income or net realized gain, or from paid-in capital, depending upon the type of book/tax differences that may exist.
3. FAIR VALUE MEASUREMENTS:
A three-tier hierarchy has been established to classify fair value measurements for disclosure purposes. Inputs refer broadly to the assumptions that market participants would use in pricing the asset or liability including assumptions about risk. Inputs may be observable and unobservable. Observable inputs are inputs that reflect the assumptions market participants would use in pricing the asset or liability that are developed based on market data obtained from sources independent of the reporting entity. Unobservable inputs are inputs that reflect the reporting entity’s own assumptions about the assumptions market participants would use in pricing the asset or liability that are developed based on the best information available.
| Semi-Annual Report | April 30, 2014 (Unaudited) | 55 |
| Notes to Financial Statements |
As of April 30, 2014 (Unaudited)
Various inputs are used in determining the value of each Fund’s investments as of the reporting period end. The designated input levels are not necessarily an indication of the risk or liquidity associated with these investments. These inputs are categorized in the following hierarchy under applicable financial accounting standards:
The three-tier hierarchy is summarized as follows:
| 1) | Level 1 - Quoted and Unadjusted prices in active markets for identical securities |
| 2) | Level 2 - Other Significant Observable Inputs (including quoted prices for similar securities, interest rates, prepayments speeds, credit risk, etc.) |
| 3) | Level 3 - Significant Unobservable Inputs (including the Fund’s own assumptions in determining the fair value of investments) |
The following is a summary of the inputs used to value each Funds investments as of April 30, 2014.
| Level 1 | Level 2 | Level 3 | Total | |||||||||||||
WHITE OAK SELECT GROWTH FUND |
| |||||||||||||||
Common Stocks | $ | 247,589,375 | $ | – | $ | – | $ | 247,589,375 | ||||||||
Short Term Investments | 1,712,872 | – | – | 1,712,872 | ||||||||||||
Total | $ | 249,302,247 | $ | – | $ | – | $ | 249,302,247 | ||||||||
| Level 1 | Level 2 | Level 3 | Total | |||||||||||||
PIN OAK EQUITY FUND | ||||||||||||||||
Common Stocks | $ | 83,944,934 | $ | – | $ | – | $ | 83,944,934 | ||||||||
Short Term Investments | 1,305,299 | – | – | 1,305,299 | ||||||||||||
Total | $ | 85,250,233 | $ | – | $ | – | $ | 85,250,233 | ||||||||
| Level 1 | Level 2 | Level 3 | Total | |||||||||||||
ROCK OAK CORE GROWTH FUND | ||||||||||||||||
Common Stocks | $ | 7,934,026 | $ | – | $ | – | $ | 7,934,026 | ||||||||
Short Term Investments | 269,517 | – | – | 269,517 | ||||||||||||
Total | $ | 8,203,543 | $ | – | $ | – | $ | 8,203,543 | ||||||||
| Level 1 | Level 2 | Level 3 | Total | |||||||||||||
RIVER OAK DISCOVERY FUND | ||||||||||||||||
Common Stocks | $ | 13,666,231 | $ | – | $ | – | $ | 13,666,231 | ||||||||
Short Term Investments | 437,937 | – | – | 437,937 | ||||||||||||
Total | $ | 14,104,168 | $ | – | $ | – | $ | 14,104,168 | ||||||||
| Level 1 | Level 2 | Level 3 | Total | |||||||||||||
RED OAK TECHNOLOGY SELECT FUND | ||||||||||||||||
Common Stocks | $ | 125,215,200 | $ | – | $ | – | $ | 125,215,200 | ||||||||
Short Term Investments | 5,469,637 | – | – | 5,469,637 | ||||||||||||
Total | $ | 130,684,837 | $ | – | $ | – | $ | 130,684,837 | ||||||||
| 56 | 1-888-462-5386 | www.oakfunds.com |
| Notes to Financial Statements |
As of April 30, 2014 (Unaudited)
| Level 1 | Level 2 | Level 3 | Total | |||||||||||||
BLACK OAK EMERGING TECHNOLOGY FUND |
| |||||||||||||||
Common Stocks | $ | 31,764,094 | $ | – | $ | – | $ | 31,764,094 | ||||||||
Short Term Investments | 266,431 | – | – | 266,431 | ||||||||||||
Total | $ | 32,030,525 | $ | – | $ | – | $ | 32,030,525 | ||||||||
| Level 1 | Level 2 | Level 3 | Total | |||||||||||||
LIVE OAK HEALTH SCIENCES FUND | ||||||||||||||||
Common Stocks | $ | 45,212,818 | $ | – | $ | – | $ | 45,212,818 | ||||||||
Short Term Investments | 928,273 | – | – | 928,273 | ||||||||||||
Total | $ | 46,141,091 | $ | – | $ | – | $ | 46,141,091 | ||||||||
The above tables are presented by levels of disaggregation for each asset class. For detailed descriptions of the underlying industries, see the accompanying Schedules of Investments. There were no transfers into or out of Level I and 2 during the period. There were no Level 3 securities held during the period.
4. TRANSACTIONS WITH AFFILIATES:
Certain officers of the Trust are also officers of Oak Associates, ltd., investment adviser to the Funds (the “Adviser”), ALPS Fund Services, Inc. the administrator, fund accountant and transfer agent for the Funds (“ALPS”), and/or ALPS Distributors, Inc. the Funds’ distributor (the “Distributor”). Such officers are paid no fees by the Trust for serving as offices to the Trust. Pursuant to a PFO Services Agreement between ALPS and the Trust, ALPS provides a qualified person to serve as the Trust’s Principal Financial Officer (“PFO”). Principal financial officer fees payable pursuant to the terms of the PFO Services Agreement represent payments made by the Trust to ALPS and not to any individual employee of ALPS serving as PFO to the Trust.
5. ADMINISTRATION, TRANSFER AGENT AND DISTRIBUTION AGREEMENTS:
Administration: ALPS serves as administrator to the Trust. The Trust and ALPS have entered into an administration, bookkeeping and pricing services agreement (the “Administration Agreement”). Under the Administration Agreement, ALPS provides the Trust with administrative services, including regulatory reporting, fund accounting services, and calculating the Funds’ daily net asset value, and provides all necessary office space, equipment, personnel and facilities for annual fee. The Administration Agreement provides that ALPS shall not be liable for any error of judgment or mistake of law or for any loss suffered by the Trust in connection with the matters to which the Administration Agreement relates, except a loss resulting from willful misfeasance, bad faith or negligence on the part of ALPS in the performance of its duties or from reckless disregard by it of its duties and obligations there under. The Administration Agreement shall remain in effect for a period of one year after the effective date of the agreement and shall continue in effect for successive periods of one year unless terminated by either party on not less than 60 days’ prior written notice to the other party.
Administrative Fee: ALPS provides the Funds with certain administrative personnel and services. The fees paid to ALPS are based on an annual rate of 0.08% of the daily average aggregate net assets of the Trust for the period, subject to a $400,000 annual minimum (on the Trust level). Fees are allocated to each Fund based on daily net assets (each Fund’s net assets as a percentage of total Trust net assets).
| Semi-Annual Report | April 30, 2014 (Unaudited) | 57 |
| Notes to Financial Statements |
As of April 30, 2014 (Unaudited)
Transfer Agent: ALPS serves as transfer agent, dividend paying agent and shareholder service agent for the Trust under a transfer agency and services agreement with the Trust. As of August 7, 2013, the fees changed to $9,000 annually per fund and $10 annually per open account.
Distribution: The Trust and the Distributor, an affiliate of ALPS, are parties to a distribution agreement (the “Distribution Agreement”) whereby the Distributor acts as principal underwriter for the Trust’s shares. The Distributor has agreed to use its best efforts in distributing Fund shares but is not obligated to sell any particular number of shares. The Distributor does not receive compensation under the Distribution Agreement for distribution of Fund shares.
6. INVESTMENT ADVISORY AND CUSTODIAN AGREEMENTS:
The Trust and the Adviser are parties to an Investment Advisory Agreement, under which the Adviser receives an annual fee equal to 0.74% of the average daily net assets of each Fund, except for the River Oak Discovery Fund for which the Adviser receives 0.90% of the average daily net assets of the Fund. The Adviser has agreed to contractually waive all or a portion of its fees (and to reimburse the Funds’ expenses if necessary) in order to limit operating expenses to not more than 1.25% of the average daily net assets of the White Oak Select Growth, Rock Oak Core Growth and Pin Oak Equity Funds, and 1.35% of the average daily net assets of the River Oak Discovery, Red Oak Technology Select, Black Oak Emerging Technology and Live Oak Health Sciences Funds for one year periods. The Adviser contractually agreed to continue this arrangement through February 28, 2015.
U.S. Bank N.A. acts as custodian (the “Custodian”) for the Funds. The Custodian plays no role in determining the investment policies of the Funds or which securities are to be purchased or sold by the Funds.
7. INVESTMENT TRANSACTIONS:
The cost of security purchases and the proceeds from security sales, other than short–term investments, for the six months ended April 30, 2014, were as follows:
| Fund | Purchases | Sales | ||||||
White Oak Select Growth Fund | $ | 2,268,783 | $ | 7,247,751 | ||||
Pin Oak Equity Fund | 638,931 | 3,064,378 | ||||||
Rock Oak Core Growth Fund | 1,162,907 | 999,868 | ||||||
River Oak Discovery Fund | 7,586,184 | 7,564,336 | ||||||
Red Oak Technology Select Fund | 17,740,767 | 5,056,293 | ||||||
Black Oak Emerging Technology Fund | 4,611,956 | 4,050,703 | ||||||
Live Oak Health Sciences Fund | 2,913,283 | 4,468,394 | ||||||
8. FEDERAL INCOME TAXES AND TAX BASIS INFORMATION:
Each of the Funds is classified as a separate taxable entity for Federal income tax purposes. Each of the Funds intend to continue to qualify as a separate “regulated investment company” under Sub–chapter M of the Internal Revenue Code of 1986, as amended, and make the requisite distributions to shareholders that will be sufficient to relieve it from Federal income tax and Federal excise tax. Therefore, no Federal tax provision is required.
To the extent that dividends from net investment income and distributions from net realized capital gains exceed amounts reported in the financial statements, such amounts are reported separately.
| 58 | 1-888-462-5386 | www.oakfunds.com |
| Notes to Financial Statements |
As of April 30, 2014 (Unaudited)
The amounts of dividends from net investment income and distributions from net realized capital gains are determined in accordance with Federal income tax regulations, which may differ from those amounts determined under accounting principles generally accepted in the United States of America. These book/tax differences are either temporary or permanent in nature. The character of dividends from net investment income or distributions from net realized gains made during the year, and the timing of may differ from the year that the income or realized gains (losses) were recorded by the Funds. To the extent these differences are permanent, adjustments are made to the appropriate equity accounts in the period that the differences arise. These differences are primarily due to the reclass of distributions on net operating losses and expiration of capital loss carryforwards.
The amounts and characteristics of tax basis distributions and composition of distributable earnings/(accumulated losses) are finalized at fiscal year end: accordingly, tax basis balances have not been determined as of April 30, 2014.
The tax character of the distributions paid by the Funds for the fiscal year ended October 31, 2013 is as follows:
| Long-Term Capital | ||||||||||||
| Ordinary Income | Gain | Total | ||||||||||
White Oak Select Growth Fund | $ | 731,035 | $ | – | $ | 731,035 | | |||||
Pin Oak Equity Fund | 458,987 | – | 458,987 | |||||||||
Rock Oak Core Growth Fund | 24,848 | 66,888 | 91,736 | |||||||||
River Oak Discovery Fund | – | – | – | |||||||||
Red Oak Technology Select Fund | 197,281 | – | 197,281 | |||||||||
Black Oak Emerging Technology Fund | – | – | – | |||||||||
Live Oak Health Sciences Fund | 278,532 | 1,642,727 | 1,921,259 | |||||||||
For Federal income tax purposes, capital loss carryforwards may be carried forward and applied against future capital gains.
At October 31, 2013, the Funds had capital loss carryforwards available to offset future realized capital gains through the indicated expiration dates:
White Oak Fund | Pin Oak Equity | Rock Oak Core Growth Fund | River Oak Discovery Fund | Red Oak Technology | Black Oak Emerging Technology Fund | Live Oak Sciences | ||||||||||||||||||||||
2014 | $ | – | $ | – | $ | – | $ | – | $ | – | $ | – | $ | – | ||||||||||||||
2015 | $ | – | $ | – | $ | – | $ | – | $ | – | $ | – | $ | – | ||||||||||||||
2016 | $ | 22,546,570 | $ | – | $ | – | $ | – | $ | – | $ | – | $ | – | ||||||||||||||
2017 | $ | 9,015,798 | $ | – | $ | – | $ | – | $ | 3,582,521 | $ | 2,902,142 | $ | – | ||||||||||||||
Total | $ | 31,562,368 | $ | – | $ | – | $ | – | $ | 3,582,521 | $ | 2,902,142 | $ | – | ||||||||||||||
| Semi-Annual Report | April 30, 2014 (Unaudited) | 59 |
| Notes to Financial Statements |
As of April 30, 2014 (Unaudited)
The following Fund elected to defer to the period ending October 31, 2014, late year ordinary losses in the amount of:
| Amount | ||||
Black Oak Emerging Technology Fund | $ | 138,246 | ||
At April 30, 2014, the total cost of securities for Federal income tax purposes and the aggregate gross unrealized appreciation and depreciation for securities held by the Funds is as follows:
| Aggregate Gross Aggregate Gross | ||||||||||||||||
| Federal Tax Cost | Appreciation | Depreciation | Net | |||||||||||||
White Oak Select Growth Fund | $ | 247,122,300 | $ | 11,999,203 | $ | (9,819,256 | ) | $ | 2,179,947 | |||||||
Pin Oak Equity Fund | 77,669,797 | 9,634,829 | (2,054,393 | ) | 7,580,436 | |||||||||||
Rock Oak Core Growth Fund | 6,132,058 | 2,163,306 | (112,309 | ) | 2,050,997 | |||||||||||
River Oak Discovery Fund | 10,962,537 | 3,372,052 | (230,421 | ) | 3,141,631 | |||||||||||
Red Oak Technology Select Fund | 106,373,205 | 26,826,506 | (2,514,874 | ) | 24,311,632 | |||||||||||
Black Oak Emerging Technology Fund | 25,078,492 | 7,833,228 | (881,195 | ) | 6,952,033 | |||||||||||
Live Oak Health Sciences Fund | 28,409,624 | 17,842,039 | (110,572 | ) | 17,731,467 | |||||||||||
Management evaluates the Funds’ tax positions to determine if the taken tax positions meet the minimum recognition threshold by measuring and recognizing tax liabilities in the Financial Statements. The threshold is established by accounting for uncertainties in income tax positions, taken or expected. Recognition of tax benefits of an uncertain tax position is required only when the position is “more likely than not” to be sustained assuming examination by taxing authorities. The Funds recognize interest and penalties, if any, related to unrecognized tax benefits as income tax expense in the Statements of Operations. During the year, the Funds did not incur any interest or penalties.
Management has analyzed the Funds’ tax position taken on federal income tax returns for all open tax years (current and prior three tax years) and has concluded that as of and for the six months ended April 30, 2014, no provision for income tax would be required in the Funds’ financial statements. The Funds’ federal and state income and federal excise tax returns for tax years (current and prior three tax years) for which the applicable statutes of limitations have not expired are subject to examination by the Internal Revenue Service and state departments of revenue.
9. CONCENTRATION OF CREDIT RISK AND OWNERSHIP:
The Red Oak Technology Select Fund and the Black Oak Emerging Technology Fund invest a substantial portion of their assets in securities in the technology industry. The Live Oak Health Sciences Fund invests a substantial portion of its assets in securities in the health care, medicine and life sciences industries. Therefore, each of these Funds may be more affected by economic developments in those industries than a general equity fund would be.
In the normal course of business, the Funds enter into contracts that provide general indemnifications. The Funds’ maximum exposure under these arrangements is dependent on future claims that may be made against the Funds and, therefore, cannot be established; however based on experience, the risk of loss from such claims is considered remote.
| 60 | 1-888-462-5386 | www.oakfunds.com |
| Notes to Financial Statements |
As of April 30, 2014 (Unaudited)
From time to time, the Funds may have a concentration of several shareholders holding a significant percentage of shares outstanding. Investment activities of these shareholders could have a material impact on the Fund.
As of April 30, 2014, the James D. Oelschlager Trust owned 38.48% of the River Oak Discovery Fund.
10. TRUSTEE AND OFFICERS FEES:
As of April 30, 2014, there were seven Trustees, five of whom are not “interested persons” (within the meaning of the 1940 Act) of the Trust (the “Independent Trustees”). Each Independent Trustee receives a retainer of $30,000 per year. The chairperson of the Audit Committee receives an additional retainer of $500 per calendar quarter and the Lead Independent Trustee receives an additional retainer of $1,500 per calendar quarter. In addition, each Independent Trustee is also paid a fee of $2,000 for each meeting of the Board of Trustees attended or participated in, as the case may be. The Trustees are paid $1,000 per each telephonic board meeting. The Independent Trustees are not paid an additional fee from the Trust for attendance at and/or participation in meetings of the various committees of the Board. The Independent Trustees are also reimbursed for meeting-related expenses. Officers of the Trust and Trustees who are interested persons of the Trust receive no salary or fees from the Trust.
11. INDEMNIFICATIONS:
Under the Trust’s organizational documents, its officers and Trustees are indemnified against certain liability arising out of the performance of their duties to the Trust. Additionally, in the normal course of business, the Trust enters into contracts with service providers that may contain general indemnification clauses, which may permit indemnification to the extent permissible under applicable law. The Trust’s maximum exposure under these arrangements is unknown, as this would involve future claims that may be made against the Trust that have not yet occurred.
12. RECENT ACCOUNTING PRONOUNCEMENTS:
In June 2013, the FASB issued ASU 2013-08, Amendments to the Scope, Measurement and Disclosure Requirements (“ASU 2013-08”), modifying Accounting Standards Codification (“ASC”) 946. The modifications were a result of a joint effort by the FASB and the International Accounting Standards Board to develop a consistent approach for determining whether an entity is an investment company for which fair value of investments is the most relevant measurement. ASU 2013-08 requires a reporting entity to disclose that it is an investment company and is applying the guidance as set forth in ASC 946, to disclose any changes in, and the reasons for, its status as an investment company and to disclose information related to whether it has provided or is contractually required to provide financial support to any of its investees. The effective date of ASU 2013-08 is for interim and annual periods beginning after December 15, 2013. At this time, management is evaluating the implications of this requirement and the impact it will have to the financial statement amounts and footnote disclosures, if any.
| Semi-Annual Report | April 30, 2014 (Unaudited) | 61 |
As of April 30, 2014 (Unaudited)
BOARD CONSIDERATIONS IN APPROVING THE RENEWAL OF THE ADVISORY AGREEMENT
The advisory agreement between the Trust and the Adviser for each Fund of the Trust (the “Advisory Agreement”) was approved for an initial two-year term, and may be continued from year to year thereafter so long as such continuance is approved at least annually, (i) by the vote of the Board of Trustees (the “Board” or “Trustees”) or by a vote of the shareholders of the Fund, and (ii) by the vote of a majority of the Trustees who are not parties to the Advisory Agreement or “interested persons,” as such term is defined in the Investment Company Act of 1940, as amended (“1940 Act”), of any party thereto (the “Independent Trustees”), cast in person at a meeting called for the purpose of voting on such approval.
At an in-person meeting held on February 9-10, 2014, the Trustees, including a majority of the Independent Trustees, unanimously approved the continuation of the Advisory Agreement with respect to each Fund for an additional one-year term, effective February 27, 2014. In determining whether to approve the continuation of the Advisory Agreement, the Trustees considered a wide variety of information from the Adviser, including information provided by the Adviser in response to a request from counsel on behalf of the Trustees in accordance with Section 15(c) of the 1940 Act, to assist in their deliberations (the “Adviser Materials”). Prior to the in-person Board meeting held on February 9-10, 2014, the Independent Trustees held a special meeting on January 27, 2014 via teleconference to discuss the Adviser Materials. Following the January 27, 2014 meeting, the Independent Trustees, with the assistance of counsel, requested the Adviser to provide additional information to the Trustees for the February 9-10, 2014 meeting. In addition, the Independent Trustees discussed and considered the Adviser Materials and the renewal of the Advisory Agreement in an executive session of the Independent Trustees held during the February 9-10, 2014 in-person Board meeting, and received counsel from independent legal counsel.
The Trustees considered the nature, extent, and quality of the services provided to each of the Funds by the Adviser. In this regard, the Trustees considered presentations by Trust officers and representatives of the Adviser. The Trustees also reviewed and considered the Adviser Materials. These presentations and the Adviser Materials contained information that assisted the Trustees in assessing the Adviser’s investment advisory services, its investment process, and regulatory/compliance capabilities and record, as well as the Adviser’s investment philosophy, Fund performance records, and trade execution capabilities. The Independent Trustees concluded that the Adviser was committed to the success of the Funds and determined that they would continue to review the quality of the resources the Adviser devoted to the management of the investment operations of the Funds and the Adviser’s performance of the associated administrative and compliance duties related to the management of the Funds. Further, the Independent Trustees concluded that they were satisfied with the nature, extent and quality of the services provided to the Funds by the Adviser.
The Trustees considered the investment performance of each Fund. The Trustees reviewed presentations by the Adviser’s portfolio managers for each Fund as well as a report prepared by the Trust’s administrator that provided performance information as of December 31, 2013 for each of the Funds, including information comparing each Fund’s performance to that of various benchmarks and peer funds as categorized by Lipper Inc. (“Lipper”) and Morningstar, Inc. (“Morningstar”), both independent sources of investment company data.
| 62 | 1-888-462-5386 | www.oakfunds.com |
| Additional Information |
As of April 30, 2014 (Unaudited)
The Trustees also considered performance information in the Adviser Materials for each of the Funds as compared to each Fund’s benchmark, Lipper and Morningstar peer groups and any applicable comparable funds or accounts managed by the Adviser for various periods ending as of the Funds’ fiscal year ended on October 31, 2013. The Trustees evaluated the performance of the Adviser’s separate accounts relative to the White Oak Select Growth Fund (“White Oak Fund”), River Oak Discovery Fund, Pin Oak Equity Fund and Red Oak Technology Select Fund, and in the case of the Live Oak Health Sciences Fund (“Live Oak Fund”), to a similarly managed fund for which the Adviser serves as sub-adviser. The Trustees also reviewed the Adviser’s commentary regarding the performance data and the various factors contributing to each Fund’s short- and long-term performance. The Trustees took note of the various periods where each Fund outperformed, underperformed or performed in line with its respective Lipper and Morningstar peer groups and benchmark. The Trustees noted that the Funds’ relative performance was generally favorable, although some of the Funds significantly lagged their Lipper peer group, Morningstar peer group or benchmark for certain periods. With respect to the White Oak Fund and Live Oak Fund, the Trustees noted that while absolute performance was strong for the year ended December 31, 2013, such Funds’ relative performance lagged their respective Morningstar and Lipper peer group averages. The Trustees considered explanations provided by the Adviser regarding the various factors contributing to the relative underperformance of the White Oak Fund and Live Oak Fund, including, among other things, differences in such Funds’ respective investment strategies and portfolio construction in comparison to the peer funds included in their respective Morningstar and Lipper peer groups. The Board discussed with the Adviser the reasons behind such results for each applicable Fund, including the steps being undertaken by the Adviser to seek to improve such performance. In the case of each Fund with performance that lagged a relevant peer group or benchmark for certain periods (but not necessarily all periods), the Trustees considered other factors that supported the continuation of the Advisory Agreement, including the following: (i) that the Adviser’s investment decisions, such as security selection and sector allocation, contributing to such underperformance were consistent with the Fund’s investment objective and policies; (ii) that shorter-term or longer-term performance, as applicable, was competitive when compared to the performance of relevant peer groups or benchmarks; and (iii) that many of the Funds’ peers are larger in size than the corresponding Fund, and this factor may impact the relative performance of the Funds. Taking note of the Adviser’s discussion of (i) the various factors contributing to each Fund’s performance and (ii) its continuing commitment to each Fund’s current investment strategy, the Independent Trustees concluded that the recent investment performance of each Fund was satisfactory on a relative basis.
The Trustees considered the advisory fees paid to the Adviser, the total expense ratios of each Fund, and the Adviser’s commitment to continue to waive its advisory fees and/or reimburse Fund expenses in order to maintain stated caps on Fund operating expenses. The Trustees reviewed presentations by Trust officers, including information about the reported fees and expenses of each Fund’s peer funds compiled by the Trust’s administrator from data obtained from Lipper. The Trustees also received information from the Adviser regarding compensation arrangements for other accounts managed by the Adviser, and evaluated the explanations provided by the Adviser as to differences in fees charged to the Funds and such accounts. The Trustees noted that the Adviser waived a portion of its advisory fee with respect to each of the Rock Oak Core Growth Fund, River Oak Discovery Fund and Black Oak Emerging Technology Fund in order to maintain the stated cap on Fund operating expenses. The Independent Trustees further considered the Adviser’s profitability derived from its relationship with the Trust on a Fund-by-Fund basis, based on information reported by the Adviser. The Independent Trustees concluded that each Fund’s
| Semi-Annual Report | April 30, 2014 (Unaudited) | 63 |
| Additional Information |
As of April 30, 2014 (Unaudited)
advisory fee set forth in the Advisory Agreement was reasonable and did not result in an excessive profit to the Adviser in relation to the nature, extent and quality of services provided, The Independent Trustees also concluded that the overall expense ratio for each Fund is reasonable in comparison to the average expense ratio of funds in each Fund’s respective Lipper category, and in light of various factors, such as Fund size and quality of service.
The Trustees considered the information provided by Oak with respect to potential “fall out” benefits to the Adviser from its relationship with the Funds, such as benefits to the Adviser in selling other products and receipt of research paid for with Fund commissions (“soft dollars”) and the benefits to the Adviser in attracting and retaining other clients. The Trustees considered the information they were provided about the Adviser’s portfolio brokerage practices on behalf of the Funds, including its policies with respect to obtaining benefits from use of the Funds’ brokerage commissions to obtain research that also could be used for the Adviser’s other clients, and the Independent Trustees concluded that the Adviser’s portfolio brokerage practices appeared to be reasonably designed to achieve best execution on Fund trades.
The Trustees considered whether there were economies of scale in managing the Funds, and in light of the relatively small size of the Funds and the Adviser’s commitment to waive its advisory fees and/or reimburse Fund expenses in order to maintain stated caps on the Funds’ operating expenses, determined that such economies of scale were not present. As such, the Trustees did not consider whether any economies of scale were adequately shared with Fund shareholders.
In voting to approve the continuation of the Advisory Agreement, the Board considered all factors it deemed relevant, including the Adviser Materials. In arriving at its decision, the Board did not identify any single factor as being of paramount importance and each member of the Board gave varying weights to each factor according to his or her own judgment. The Board determined that the renewal of the Advisory Agreement would be in the best interests of each Fund and its shareholders. As a result, the Board, including a majority of the Independent Trustees, unanimously approved the continuation of the Advisory Agreement for each Fund.
| 64 | 1-888-462-5386 | www.oakfunds.com |

By Mail
Oak Associates Funds
P.O. Box 8233
Denver, CO 80201-8233
By Telephone 1-888-462-5386 Monday through Friday, 9:00 a.m. to 8:00 p.m. ET
On The Web www.oakfunds.com
Click on the My Oak Account section to take advantage of these features:
| • | Trade Online |
| • | Access and Update Account Information |
| • | Go Paperless with eDelivery |
| • | View and download account history |
| • | Establish a systematic investment plan |
The Trust files its complete schedule of portfolio holdings of each Fund with the Securities and Exchange Commission for the first and third quarters of each fiscal year on Form N-Q within sixty days after the end of the period. The Trust’s Forms N-Q is available on the Commission’s website at http://www.sec.gov, and may be reviewed and copied at the Commission’s Public Reference Room in Washington DC. Information on the operation of the Public Reference Room may be obtained by calling 1-800-SEC-0330.
A description of the policies and procedures that the Funds use to determine how to vote proxies relating to portfolio securities, as well as information relating to how a Fund voted proxies relating to portfolio securities during the most recent 12-month period ended June 30, is available (i) without charge, upon request, by calling 1-888-462-5386; and (ii) on the Commission’s website at http://www.sec.gov.
This report has been prepared for Oak Associates Funds Shareholders and may be distributed to others only if preceded or accompanied by a prospectus.
Oak Associates Funds are distributed by ALPS Distributors, Inc.

| P.O. Box 8233 Denver, CO 80201-8233 |

| Item 2. | Code of Ethics. |
Not applicable to semi-annual report.
| Item 3. | Audit Committee Financial Expert. |
Not applicable to semi-annual report.
| Item 4. | Principal Accountant Fees and Services. |
Not applicable to semi-annual report.
| Item 5. | Audit Committee of Listed Registrants. |
Not applicable to open-end management investment companies.
| Item 6. | Schedule of Investments. |
| (a) | Schedule of Investments in securities of unaffiliated issuers as of the close of the reporting period is included as part of the Report to Stockholders filed under Item 1 of this Form N-CSRS. |
| (b) | Not applicable. |
| Item 7. | Disclosure of Proxy Voting Policies and Procedures for Closed-End Management Investment Companies. |
Not applicable to open-end management investment companies.
| Item 8. | Portfolio Managers of Closed-End Management Investment Companies. |
Not applicable to open-end management investment companies.
| Item 9. | Purchases of Equity Securities by Closed-End Management Investment Companies and Affiliated Purchasers. |
Not applicable to open-end management investment companies.
| Item 10. | Submission of Matters to a Vote of Security Holders. |
There have been no material changes by which Shareholders may recommend nominees to the Board of Trustees.
| Item 11. | Controls and Procedures. |
(a) The registrant’s principal executive and principal financial officers, or persons performing similar functions, regarding the effectiveness of the registrant’s disclosure controls and procedures (as defined in Rule 30a-3(c) under the Act (17 CFR 270.30a-3(c))) have concluded that such controls and procedures are effective as of a date within 90 days of the filing date of the report that includes the disclosure required by this paragraph, based on the evaluation of these controls and procedures required by Rule 30a-3(b) under the Act (17 CFR 270.30a-3(b)) and Rules 13a-15(b) or 15d-15(b) under the Exchange Act (17 CFR 240.13a-15(b) or 240.15d-15(b)).
(b) There has been no change in the registrant’s internal control over financial reporting (as defined in Rule 30a-3(d) under the Act (17 CFR 270.30a-3(d)) that occurred during the second fiscal quarter of the period covered by this report that has materially affected, or is reasonably likely to materially affect, the registrant’s internal control over financial reporting.
| Item 12. | Exhibits. |
(a)(1) Not applicable to semi-annual report.
(a)(2) A separate certification for the principal executive officer and the principal financial officer of the registrant as required by Rule 30a-2(a) under the Investment Company Act of 1940, as amended (17 CFR 270.30a-2(a)), are filed herewith.
(a)(3) None.
(b) Officer certifications as required by Rule 30a-2(b) under the Investment Company Act of 1940, as amended (17 CFR 270.30a-2(b)) are filed herewith.
SIGNATURES
Pursuant to the requirements of the Securities Exchange Act of 1934 and the Investment Company Act of 1940, the Registrant has duly caused this report to be signed on its behalf by the undersigned, thereunto duly authorized.
| OAK ASSOCIATES FUNDS | ||
By | /s/ Leslie Manna | |
Leslie Manna | ||
President | ||
Date: | July 7, 2014 | |
Pursuant to the requirements of the Securities Exchange Act of 1934 and the Investment Company Act of 1940, this report has been signed below by the following persons on behalf of the Registrant and in the capacities and on the dates indicated.
By | /s/ Leslie Manna | |
Leslie Manna | ||
| President and Principal Executive Officer | ||
Date: | July 7, 2014 | |
By | /s/ Pete Greenly | |
Pete Greenly | ||
| Treasurer and Principal Financial Officer | ||
Date: | July 7, 2014 | |