
| Shareholder Letter | 1 |
| Performance Update | |
| White Oak Select Growth Fund | 2 |
| Pin Oak Equity Fund | 3 |
| Rock Oak Core Growth Fund | 4 |
| River Oak Discovery Fund | 5 |
| Red Oak Technology Select Fund | 6 |
| Black Oak Emerging Technology Fund | 7 |
| Live Oak Health Sciences Fund | 8 |
| Important Disclosures | 9 |
| Disclosure of Fund Expenses | 11 |
| Financial Statements | |
| Schedules of Investments | 13 |
| Statements of Assets and Liabilities | 30 |
| Statements of Operations | 32 |
| Statements of Changes in Net Assets | 34 |
| Financial Highlights | 38 |
| Notes to Financial Statements | 52 |
| Additional Information | 62 |
| Semi-Annual Report | April 30, 2016 (Unaudited) | 1 |
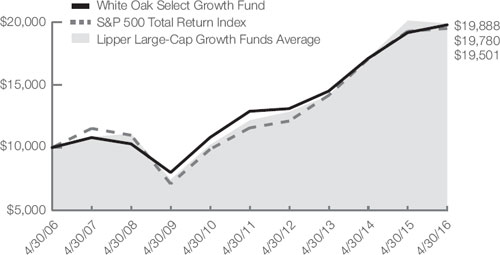
White Oak Select Growth Fund | Performance Update |
All data below as of April 30, 2016 (Unaudited)
| Fund Data | |
| Ticker Symbol | WOGSX |
| Share Price | $62.96 |
| Total Net Assets | $247.3 M |
| Portfolio Turnover | 10.35% |
| Sector Allocation^ | |
| Information Technology | 38.6% |
| Financials | 31.3% |
| Health Care | 18.2% |
| Consumer Discretionary | 6.8% |
| Industrials | 3.8% |
| Energy | 0.9% |
| Cash & Other Assets | 0.4% |
| Top 10 Holdings^ | ||
| 1. | Alphabet, Inc. | 9.1% |
| 2. | JPMorgan Chase & Co. | 7.4% |
| 3. | Amgen, Inc. | 6.9% |
| 4. | Amazon.com, Inc. | 6.8% |
| 5. | Cisco Systems, Inc. | 6.7% |
| 6. | The Charles Schwab Corp. | 5.6% |
| 7. | US Bancorp | 5.5% |
| 8. | KLA-Tencor Corp. | 5.1% |
| 9. | Teva Pharmaceutical Industries, Ltd. - Sponsored ADR | 4.2% |
| 10. | CR Bard, Inc. | 4.1% |
| ^ | Percentages are based on net assets. Holdings are subject to change. |
| Average Annual Total Return | ||||
| 1 Year Return | 3 Year Return | 5 Year Return | 10 Year Return | |
| White Oak Select Growth Fund | 3.22% | 10.91% | 8.94% | 7.06% |
S&P 500® Total Return Index1 | 1.21% | 11.26% | 11.02% | 6.91% |
Lipper Large-Cap Growth Funds Average2 | -1.85% | 11.20% | 9.69% | 6.82% |
1 | Standard & Poor’s is the source and owner of the S&P Index data. 2 Lipper Inc. is the source and owner of the Lipper Classification data. See Pages 9 and 10 for additional disclosure. |
| 2 | 1-888-462-5386 | www.oakfunds.com |
| Pin Oak Equity Fund | Performance Update |
All data below as of April 30, 2016 (Unaudited)
| Fund Data | |
| Ticker | POGSX |
| Share Price | $49.45 |
| Total Net Assets | $102.3 M |
| Portfolio Turnover | 0.80% |
Sector Allocation^ | |
| Financials | 38.9% |
| Information Technology | 32.3% |
| Consumer Discretionary | 9.7% |
| Industrials | 6.5% |
| Consumer Staples | 5.2% |
| Energy | 4.2% |
| Materials | 0.4% |
| Cash & Other Assets | 2.8% |
| Top 10 Holdings^ | ||
| 1. | Wells Fargo & Co. | 6.3% |
| 2. | Microsoft Corp. | 5.3% |
| 3. | PepsiCo, Inc. | 5.2% |
| 4. | The Charles Schwab Corp. | 5.1% |
| 5. | Amdocs, Ltd. | 5.0% |
| 6. | Alphabet, Inc. | 4.8% |
| 7. | The Bank of New York Mellon Corp. | 4.8% |
| 8. | Paychex, Inc. | 4.5% |
| 9. | Capital One Financial Corp. | 4.3% |
| 10. | Twenty-First Century Fox, Inc. | 3.8% |
| ^ | Percentages are based on net assets. Holdings are subject to change. |

| Average Annual Total Return | ||||
1 Year Return | 3 Year Return | 5 Year Return | 10 Year Return | |
| Pin Oak Equity Fund | 1.22% | 12.11% | 10.62% | 9.46% |
Russell 3000® Index TR1 | -0.18% | 10.77% | 10.50% | 6.85% |
Lipper Multi-Cap Core Funds Average2 | -3.47% | 8.99% | 8.54% | 5.69% |
1 | Russell Investments is the source and owner of the Russell Index data. 2 Lipper Inc. is the source and owner of the Lipper Classification data. See Pages 9 and 10 for additional disclosure. |
| Semi-Annual Report | April 30, 2016 (Unaudited) | 3 |
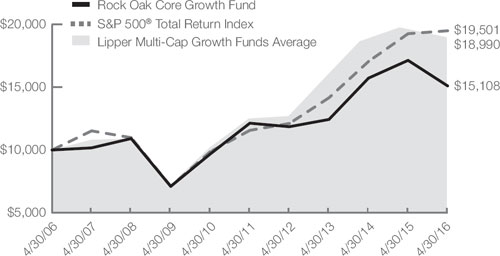
| Rock Oak Core Growth Fund | Performance Update |
All data below as of April 30, 2016 (Unaudited)
| Fund Data | |
| Ticker | RCKSX |
| Share Price | $11.65 |
| Total Net Assets | $6.9 M |
| Portfolio Turnover | 6.90% |
| Sector Allocation^ | |
| Information Technology | 49.3% |
| Financials | 12.2% |
| Consumer Discretionary | 10.1% |
| Industrials | 8.4% |
| Health Care | 6.0% |
| Consumer Staples | 3.3% |
| Energy | 2.6% |
| Cash & Other Assets | 8.1% |
| Top 10 Holdings^ | ||
| 1. | Salesforce.com, Inc. | 5.5% |
| 2. | Vantiv, Inc. | 5.2% |
| 3. | SunTrust Banks, Inc. | 4.4% |
| 4. | CA, Inc. | 4.3% |
| 5. | Nielsen NV | 4.3% |
| 6. | The Hartford Financial Services Group, Inc. | 4.1% |
| 7. | L-3 Communications Holdings, Inc. | 4.1% |
| 8. | Xilinx, Inc. | 3.9% |
| 9. | Synchrony Financial | 3.7% |
| 10. | Autodesk, Inc. | 3.7% |
| ^ | Percentages are based on net assets. Holdings are subject to change. |
| Average Annual Total Return | ||||
1 Year Return | 3 Year Return | 5 Year Return | 10 Year Return | |
| Rock Oak Core Growth Fund | -11.87% | 6.71% | 4.48% | 4.21% |
S&P 500® Total Return Index1 | 1.21% | 11.26% | 11.02% | 6.91% |
Lipper Multi-Cap Growth Funds Average2 | -4.40% | 9.87% | 8.38% | 6.35% |
1 | Standard & Poor’s is the source and owner of the S&P Index data. 2 Lipper Inc. is the source and owner of the Lipper Classification data. See Pages 9 and 10 for additional disclosure. |
| 4 | 1-888-462-5386 | www.oakfunds.com |
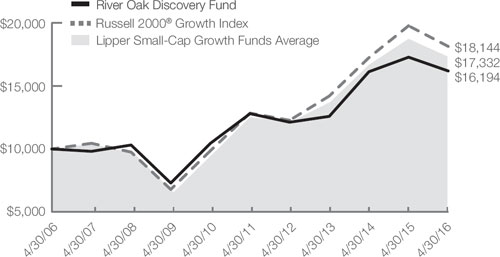
| River Oak Discovery Fund | Performance Update |
All data below as of April 30, 2016 (Unaudited)
Fund Data | |
| Ticker | RIVSX |
| Share Price | $13.83 |
| Total Net Assets | $12.1 M |
| Portfolio Turnover | 10.99% |
| Sector Allocation^ | |
| Information Technology | 37.3% |
| Financials | 26.2% |
| Health Care | 13.3% |
| Industrials | 7.7% |
| Consumer Discretionary | 7.3% |
| Cash & Other Assets | 8.2% |
| Top 10 Holdings^ | ||
| 1. | Fabrinet | 5.5% |
| 2. | Assurant, Inc. | 5.2% |
| 3. | Cirrus Logic, Inc. | 4.8% |
| 4. | Abercrombie & Fitch Co. | 4.5% |
| 5. | PrivateBancorp, Inc. | 4.2% |
| 6. | Fortinet, Inc. | 4.0% |
| 7. | Advanced Energy Industries, Inc. | 3.9% |
| 8. | Magellan Health, Inc. | 3.7% |
| 9. | Amsurg Corp. | 3.7% |
| 10. | Janus Capital Group, Inc. | 3.6% |
| ^ | Percentages are based on net assets. Holdings are subject to change. |
| Average Annual Total Return | ||||
1 Year Return | 3 Year Return | 5 Year Return | 10 Year Return | |
| River Oak Discovery Fund | -6.32% | 8.75% | 4.81% | 4.94% |
Russell 2000® Growth Index1 | -8.27% | 8.50% | 7.15% | 6.14% |
Lipper Small-Cap Growth Funds Average2 | -8.68% | 7.17% | 5.88% | 5.40% |
1 | Russell Investments is the source and owner of the Russell Index data. 2 Lipper Inc. is the source and owner of the Lipper Classification data. See Pages 9 and 10 for additional disclosure. |
| Semi-Annual Report | April 30, 2016 (Unaudited) | 5 |
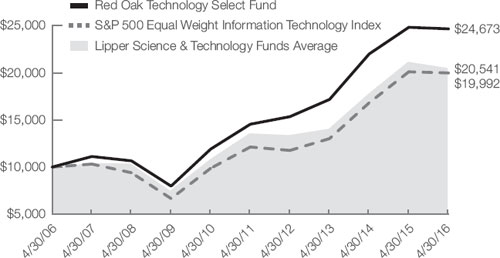
| Red Oak Technology Select Fund | Performance Update |
| All data below as of April 30, 2016 (Unaudited) |
| Fund Data | |
| Ticker | ROGSX |
| Share Price | $16.20 |
| Total Net Assets | $132.4 M |
| Portfolio Turnover | 4.96% |
| Sector Allocation^ | |
| Information Technology | 90.0% |
| Industrials | 5.7% |
| Consumer Discretionary | 3.0% |
| Cash & Other Assets | 1.3% |
| Top 10 Holdings^ | ||
| 1. | Alphabet, Inc. | 5.9% |
| 2. | Cisco Systems, Inc. | 5.0% |
| 3. | NVIDIA Corp. | 4.8% |
| 4. | Oracle Corp. | 4.7% |
| 5. | Huntington Ingalls Industries, Inc. | 4.2% |
| 6. | Microsoft Corp. | 4.1% |
| 7. | Ingram Micro, Inc. | 3.9% |
| 8. | Intel Corp. | 3.7% |
| 9. | KLA-Tencor Corp. | 3.6% |
| 10. | Check Point Software Technologies, Ltd. | 3.4% |
| ^ | Percentages are based on net assets. Holdings are subject to change. |
| Average Annual Total Return | ||||
| 1 Year Return | 3 Year Return | 5 Year Return | 10 Year Return | |
| Red Oak Technology Select Fund | -0.65% | 12.82% | 11.14% | 9.45% |
S&P 500 Equal Weight Information Technology Index1 | -0.60% | 15.37% | 10.51% | 7.17% |
Lipper Science & Technology Funds Average2 | -3.80% | 12.89% | 7.74% | 6.83% |
| 1 | Standard & Poor’s is the source and owner of the S&P Index data. 2 Lipper Inc. is the source and owner of the Lipper Classification data. See Pages 9 and 10 for additional disclosure. |
| 6 | 1-888-462-5386 | www.oakfunds.com |
| Black Oak Emerging Technology Fund | Performance Update |
| All data below as of April 30, 2016 (Unaudited) |
| Fund Data | |
| Ticker | BOGSX |
| Share Price | $3.97 |
| Total Net Assets | $29.4 M |
| Portfolio Turnover | 25.82% |
| Sector Allocation^ | |
| Information Technology | 89.6% |
| Health Care | 5.4% |
| Cash & Other Assets | 5.0% |
| Top 10 Holdings^ | ||
| 1. | Apple, Inc. | 5.8% |
| 2. | Salesforce.com, Inc. | 5.4% |
| 3. | Silicon Motion Technology Corp. - ADR | 5.4% |
| 4. | Cirrus Logic, Inc. | 4.7% |
| 5. | CA, Inc. | 4.6% |
| 6. | SanDisk Corp. | 4.1% |
| 7. | AVG Technologies NV | 4.0% |
| 8. | Fortinet, Inc. | 3.8% |
| 9. | EMC Corp. | 3.8% |
| 10. | Arrow Electronics, Inc. | 3.8% |
| ^ | Percentages are based on net assets. Holdings are subject to change. |
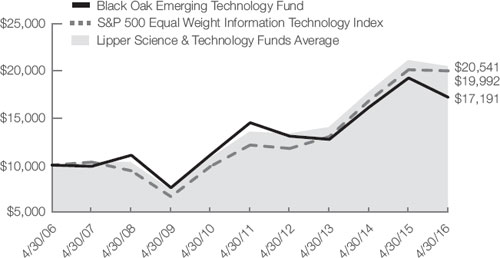
| Average Annual Total Return | ||||
| 1 Year Return | 3 Year Return | 5 Year Return | 10 Year Return | |
| Black Oak Emerging Technology Fund | -10.67% | 10.53% | 3.47% | 5.57% |
S&P 500 Equal Weight Information Technology Index1 | -0.60% | 15.37% | 10.51% | 7.17% |
Lipper Science & Technology Funds Average2 | -3.80% | 12.89% | 7.74% | 6.83% |
| 1 | Standard & Poor’s is the source and owner of the S&P Index data. 2 Lipper Inc. is the source and owner of the Lipper Classification data. See Pages 9 and 10 for additional disclosure. |
| Semi-Annual Report | April 30, 2016 (Unaudited) | 7 |
| Live Oak Health Sciences Fund | Performance Update |
| All data below as of April 30, 2016 (Unaudited) |
| Fund Data | |
| Ticker | LOGSX |
| Share Price | $19.15 |
| Total Net Assets | $54.8 M |
| Portfolio Turnover | 13.38% |
| Sector Allocation^ | |
| Health Care | 96.2% |
| Information Technology | 1.1% |
| Cash & Other Assets | 2.7% |
| Top 10 Holdings^ | ||
| 1. | Amgen, Inc. | 7.0% |
| 2. | Cardinal Health, Inc. | 5.3% |
| 3. | CR Bard, Inc. | 5.2% |
| 4. | Becton Dickinson and Co. | 4.6% |
| 5. | Stryker Corp. | 4.4% |
| 6. | Anthem, Inc. | 4.3% |
| 7. | Owens & Minor, Inc. | 4.2% |
| 8. | Waters Corp. | 4.0% |
| 9. | Merck & Co., Inc. | 3.9% |
| 10. | VCA, Inc. | 3.8% |
| ^ | Percentages are based on net assets. Holdings are subject to change. |
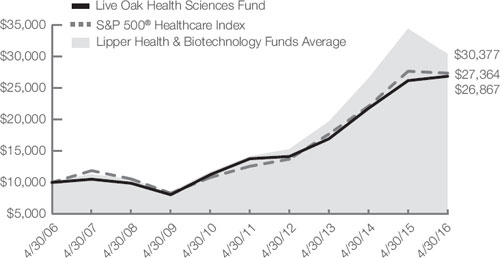
| Average Annual Total Return | ||||
| 1 Year Return | 3 Year Return | 5 Year Return | 10 Year Return | |
| Live Oak Health Sciences Fund | 2.64% | 16.63% | 14.31% | 10.39% |
S&P 500® Healthcare Index1 | -1.08% | 15.65% | 16.84% | 10.59% |
Lipper Health & Biotechnology Funds Average2 | -11.08% | 15.16% | 15.67% | 11.37% |
| 1 | Standard & Poor’s is the source and owner of the S&P Index data. 2 Lipper Inc. is the source and owner of the Lipper Classification data. See Pages 9 and 10 for additional disclosure. |
| 8 | 1-888-462-5386 | www.oakfunds.com |
Index Definitions and Disclosures
All indices are unmanaged and index performance figures include reinvestment of dividends but do not reflect any fees, expenses or taxes. Investors cannot invest directly in an index.
Lipper, a Thomson Reuters Company, is the source and owner of the Lipper Classification data contained in this material and all trademarks and copyrights related thereto. Any further dissemination or redistribution is strictly prohibited. Lipper Inc. is not responsible for the formatting or configuration of this material or for any inaccuracy in Oak Associates Funds presentation thereof.
Lipper Health/Biotechnology Funds – Funds that invest primarily in the equity securities of domestic companies engaged in health care, medicine, and biotechnology.
Lipper Large-Cap Growth Funds – Funds that, by portfolio practice, invest at least 75% of their equity assets in companies with market capitalizations (on a three-year weighted basis) above Lipper’s USDE large-cap floor. Large-cap growth funds typically have an above-average price-to-earnings ratio, price-to-book ratio, and three-year sales-per-share growth value, compared to the S&P 500 Index.
Lipper Multi-Cap Core Funds – Funds that, by portfolio practice, invest in a variety of market-capitalization ranges without concentrating 75% of their equity assets in any one market-capitalization range over an extended period of time. Multi-cap core funds typically have average characteristics compared to the S&P SuperComposite 1500 Index.
Lipper Multi-Cap Growth Funds – Funds that, by portfolio practice, invest in a variety of market capitalization ranges without concentrating 75% of their equity assets in any one market capitalization range over an extended period of time. Multi-cap growth funds typically have an above-average price-to-earnings ratio, price-to-book ratio, and three-year sales per-share growth value, compared to the S&P SuperComposite 1500 Index.
Lipper Science & Technology Funds – Funds that invest primarily in the equity securities of domestic companies engaged in science and technology.
Lipper Small-Cap Growth Funds – Funds that, by portfolio practice, invest at least 75% of their equity assets in companies with market capitalizations (on a three-year weighted basis) below Lipper’s USDE small-cap ceiling. Small-cap growth funds typically have an above-average price-to-earnings ratio, price-to-book ratio, and three-year sales-per-share growth value, compared to the S&P Small-Cap 600 Index.
NASDAQ is the source and owner of the NASDAQ Index data contained in this material and all trademarks and copyrights related thereto. Any further dissemination or redistribution is strictly prohibited. NASDAQ is not responsible for the formatting or configuration of this material or for any inaccuracy in Oak Associates Funds’ presentation thereof.
NASDAQ 100 Index – The NASDAQ 100 Index includes 100 of the largest domestic and international non-financial securities listed on The Nasdaq Stock Market based on market capitalization.
| Semi-Annual Report | April 30, 2016 (Unaudited) | 9 |
Russell Investments is the source and owner of the Russell Index data contained in this material and all trademarks and copyrights related thereto. Any further dissemination or redistribution is strictly prohibited. Russell Investments is not responsible for the formatting or configuration of this material or for any inaccuracy in Oak Associates Funds’ presentation thereof.
Russell 2000 Growth Index – The Russell 2000 Growth Index measures the performance of the small-cap growth segment of the U.S. equity universe. It includes those Russell 2000 companies with higher price-to-book ratios and higher forecasted growth values.
Russell 3000 Index – The Russell 3000 Index measures the performance of 3,000 publicly held US companies based on total market capitalization, which represents approximately 98% of the investable US equity market.
Standard & Poor’s is the source and owner of the S&P Index data contained in this material and all trademarks and copyrights related thereto. Any further dissemination or redistribution is strictly prohibited. Standard & Poor’s is not responsible for the formatting or configuration of this material or for any inaccuracy in Oak Associates Funds’ presentation thereof.
S&P 500 Equal Weight Information Technology Index – The S&P 500 Equal Weight Information Technology Index is an unmanaged equal weighted version of the S&P 500 Information Technology Index that consists of the common stocks of the following industries: internet equipment, computers and peripherals, electronic equipment, office electronics and instruments, semiconductor equipment and products, diversified telecommunication services, and wireless telecommunication services that comprise the Information Technology sector of the S&P
500 Index.
S&P 500 Health Care Index – The S&P 500 Health Care Index is a capitalization-weighted index that encompasses two main industry groups. The first includes companies who manufacture health care equipment and supplies or provide health care related services, including distributors of health care products, providers of basic health care services, and owners and operators of health care facilities and organizations. The second group consists of companies primarily involved in the research, development, production and marketing of pharmaceuticals and biotechnology products.
S&P 500 Total Return Index – The S&P 500 Total Return Index is a commonly recognized, market capitalization weighted index of 500 widely held equity securities, designed to measure broad U.S. equity performance.
| 10 | 1-888-462-5386 | www.oakfunds.com |
As of April 30, 2016 (Unaudited)
All mutual funds have operating expenses. As a shareholder of a fund, your investment is affected by these ongoing costs, which include (among others) costs for portfolio management, administrative services, and shareholder reports like this one. It is important for you to understand the impact of these costs on your investment returns.
Operating expenses such as these, are deducted from the Fund’s gross income and directly reduce your final investment return. These expenses are expressed as a percentage of the Fund’s average net assets; this percentage is known as the Fund’s expense ratio.
The following examples use the expense ratio and are intended to help you understand the ongoing costs (in dollars) of investing in your Fund and to compare these costs with those of other mutual funds. The examples are based on an investment of $1,000 made at the beginning of the period shown and held for the entire period.
The table on the next page illustrates your Fund’s costs in two ways:
Actual Fund Return. This section helps you to estimate the actual expenses after fee waivers that your Fund incurred over the period. The “Expenses Paid During Period” column shows the actual dollar expense cost incurred by a $1,000 investment in the Fund, and the “Ending Account Value” number is derived from deducting that expense cost from the Fund’s gross investment return.
You can use this information, together with the actual amount you invested in the Fund, to estimate the expenses you paid over that period. Simply divide your actual account value by $1,000 to arrive at a ratio (for example, an $8,600 account value divided by $1,000 = 8.6), then multiply that ratio by the number shown for your Fund under “Expenses Paid During Period”.
Hypothetical 5% Return. This section helps you compare your Fund’s costs with those of other mutual funds. It assumes that the Fund had an annual 5% return before expenses during the year, but that the expense ratio (Column 3) for the period is unchanged. This example is useful in making comparisons because the Securities and Exchange Commission requires all mutual funds to make this 5% calculation. You can assess your Fund’s comparative cost by comparing the hypothetical result for your Fund in the “Expense Paid During Period” column with those that appear in the same charts in the shareholder reports for other funds.
Note: Because the return is set at 5% for comparison purposes — NOT your Fund’s actual return—the account values shown may not apply to your specific investment.
| Semi-Annual Report | April 30, 2016 (Unaudited) | 11 |
| Beginning Account Value 11/01/2015 | Ending Account Value 04/30/2016 | Annualized Expense Ratio | Expenses Paid During the Period(a) | |
| White Oak Select Growth Fund | ||||
| Actual Return | $1,000.00 | $971.60 | 1.07% | $5.25 |
| Hypothetical 5% Return | $1,000.00 | $1,019.54 | 1.07% | $5.37 |
| Pin Oak Equity Fund | ||||
| Actual Return | $1,000.00 | $978.30 | 1.08% | $5.31 |
| Hypothetical 5% Return | $1,000.00 | $1,019.49 | 1.08% | $5.42 |
| Rock Oak Core Growth Fund | ||||
| Actual Return | $1,000.00 | $951.70 | 1.25% | $6.07 |
| Hypothetical 5% Return | $1,000.00 | $1,018.65 | 1.25% | $6.27 |
| River Oak Discovery Fund | ||||
| Actual Return | $1,000.00 | $1,006.20 | 1.35% | $6.73 |
| Hypothetical 5% Return | $1,000.00 | $1,018.15 | 1.35% | $6.77 |
| Red Oak Technology Select Fund | ||||
| Actual Return | $1,000.00 | $984.80 | 1.12% | $5.53 |
| Hypothetical 5% Return | $1,000.00 | $1,019.29 | 1.12% | $5.62 |
| Black Oak Emerging Technology Fund | ||||
| Actual Return | $1,000.00 | $960.40 | 1.32% | $6.43 |
| Hypothetical 5% Return | $1,000.00 | $1,018.30 | 1.32% | $6.62 |
| Live Oak Health Sciences Fund | ||||
| Actual Return | $1,000.00 | $1,021.70 | 1.10% | $5.53 |
| Hypothetical 5% Return | $1,000.00 | $1,019.39 | 1.10% | $5.52 |
(a) | Expenses are equal to the Fund's annualized expense ratio multiplied by the average account value over the period, multiplied by 182/366 (to reflect the one-half year period). |
| 12 | 1-888-462-5386 | www.oakfunds.com |
| White Oak Select Growth Fund | Schedules of Investments |
As of April 30, 2016 (Unaudited)
| Security Description | Shares | Value | ||||||
| COMMON STOCKS (99.6%) | ||||||||
| CONSUMER DISCRETIONARY (6.8%) | ||||||||
| Internet & Catalog Retail (6.8%) | ||||||||
| Amazon.com, Inc.(a) | 25,575 | $ | 16,869,014 | |||||
| ENERGY (0.9%) | ||||||||
| Energy Equipment & Services (0.9%) | ||||||||
| Transocean, Ltd. | 195,000 | 2,160,600 | ||||||
| FINANCIALS (31.3%) | ||||||||
| Capital Markets (5.6%) | ||||||||
| The Charles Schwab Corp. | 489,000 | 13,892,490 | ||||||
| Commercial Banks (14.7%) | ||||||||
| CIT Group, Inc. | 190,400 | 6,582,128 | ||||||
| TCF Financial Corp. | 512,000 | 6,983,680 | ||||||
| US Bancorp | 320,000 | 13,660,800 | ||||||
| Wells Fargo & Co. | 184,000 | 9,196,320 | ||||||
36,422,928 | ||||||||
| Diversified Financial Services (7.4%) | ||||||||
| JPMorgan Chase & Co. | 289,400 | 18,290,080 | ||||||
| Insurance (3.6%) | ||||||||
| Chubb, Ltd. | 74,700 | 8,804,142 | ||||||
| HEALTH CARE (18.2%) | ||||||||
| Biotechnology (6.9%) | ||||||||
| Amgen, Inc. | 108,000 | 17,096,400 | ||||||
| Health Care Equipment & Supplies (4.1%) | ||||||||
| CR Bard, Inc. | 47,850 | 10,152,335 | ||||||
| Health Care Providers & Services (3.0%) | ||||||||
| Express Scripts Holding Co.(a) | 100,000 | 7,373,000 | ||||||
| Pharmaceuticals (4.2%) | ||||||||
| Teva Pharmaceutical Industries, Ltd. - Sponsored ADR | 189,000 | 10,291,050 | ||||||
| INDUSTRIALS (3.8%) | ||||||||
| Air Freight & Logistics (3.8%) | ||||||||
| United Parcel Service, Inc. - Class B | 90,000 | 9,456,300 | ||||||
| Semi-Annual Report | April 30, 2016 (Unaudited) | 13 |
Schedules of Investments | White Oak Select Growth Fund |
As of April 30, 2016 (Unaudited)
| Security Description | Shares | Value | ||||||
| INFORMATION TECHNOLOGY (38.6%) | ||||||||
| Communications Equipment (8.7%) | ||||||||
| Cisco Systems, Inc. | 603,000 | $ | 16,576,470 | |||||
| Qualcomm, Inc. | 99,100 | 5,006,532 | ||||||
21,583,002 | ||||||||
| Internet Software & Services (12.2%) | ||||||||
| Alphabet, Inc. - Class A(a) | 15,550 | 11,007,534 | ||||||
| Alphabet, Inc. - Class C(a) | 16,495 | 11,431,200 | ||||||
| Facebook, Inc. - Class A(a) | 14,000 | 1,646,120 | ||||||
| Salesforce.com, Inc.(a) | 80,800 | 6,124,640 | ||||||
30,209,494 | ||||||||
| IT Services (7.1%) | ||||||||
| Cognizant Technology Solutions Corp. - Class A(a) | 146,700 | 8,562,879 | ||||||
| International Business Machines Corp. | 61,900 | 9,033,686 | ||||||
17,596,565 | ||||||||
| Semiconductors & Semiconductor Equipment (8.9%) | ||||||||
| KLA-Tencor Corp. | 179,800 | 12,575,212 | ||||||
| Xilinx, Inc. | 220,000 | 9,477,600 | ||||||
22,052,812 | ||||||||
| Software (1.7%) | ||||||||
| Symantec Corp. | 247,000 | 4,111,315 | ||||||
| TOTAL COMMON STOCKS | ||||||||
| (Cost $225,037,294) | 246,361,527 | |||||||
| SHORT TERM INVESTMENTS (0.4%) | ||||||||
| Tri-Party Repurchase Agreement with South Street Securities Wachovia Tri-Party, 0.15%, dated 04/29/16 and maturing 05/02/15, collateralized by U.S. Treasury Securities with rates ranging from 0.500% to 2.750% and maturity dates ranging from 11/30/16 to 05/15/24 with a par value of $904,028 and a collateral value of $952,702. | 934,021 | $ | 934,021 | |||||
| TOTAL SHORT TERM INVESTMENTS | ||||||||
| (Cost $934,021) | 934,021 | |||||||
| TOTAL INVESTMENTS - (100.0%) | ||||||||
| (Cost $225,971,315) | $ | 247,295,548 | ||||||
| Assets in Excess of Other Liabilities - (0.0%)(b) | 11,865 | |||||||
| NET ASSETS - (100.0%) | $ | 247,307,413 | ||||||
(a) | Non-income producing security. |
(b) | Less than 0.05%. |
The accompanying notes are an integral part of the financial statements.
| 14 | 1-888-462-5386 | www.oakfunds.com |
| Pin Oak Equity Fund | Schedules of Investments |
| As of April 30, 2016 (Unaudited) |
| Security Description | Shares | Value | ||||||
| COMMON STOCKS (97.2%) | ||||||||
| CONSUMER DISCRETIONARY (9.7%) | ||||||||
| Internet & Catalog Retail (3.0%) | ||||||||
| Amazon.com, Inc.(a) | 4,700 | $ | 3,100,073 | |||||
| Media (6.7%) | ||||||||
| The Interpublic Group of Cos., Inc. | 129,000 | 2,959,260 | ||||||
| Twenty-First Century Fox, Inc. - Class A | 34,000 | 1,028,840 | ||||||
| Twenty-First Century Fox, Inc. - Class B | 93,100 | 2,804,172 | ||||||
| 6,792,272 | ||||||||
| CONSUMER STAPLES (5.2%) | ||||||||
| Beverages (5.2%) | ||||||||
| PepsiCo, Inc. | 51,500 | 5,302,440 | ||||||
| ENERGY (4.2%) | ||||||||
| Energy Equipment & Services (2.1%) | ||||||||
| Nabors Industries, Ltd. | 189,100 | 1,853,180 | ||||||
| Transocean, Ltd. | 25,000 | 277,000 | ||||||
| 2,130,180 | ||||||||
| Oil, Gas & Consumable Fuels (2.1%) | ||||||||
| Royal Dutch Shell PLC - Sponsored ADR - Class A | 40,394 | 2,136,439 | ||||||
| FINANCIALS (38.9%) | ||||||||
| Capital Markets (9.9%) | ||||||||
| The Bank of New York Mellon Corp. | 121,500 | 4,889,160 | ||||||
| The Charles Schwab Corp. | 185,251 | 5,262,981 | ||||||
| 10,152,141 | ||||||||
| Commercial Banks (17.5%) | ||||||||
| CIT Group, Inc. | 65,500 | 2,264,335 | ||||||
| First Bancorp | 50,135 | 1,022,754 | ||||||
| Great Southern Bancorp, Inc. | 53,345 | 2,019,642 | ||||||
| International Bancshares Corp. | 99,500 | 2,605,905 | ||||||
| SunTrust Banks, Inc. | 85,500 | 3,568,770 | ||||||
| Wells Fargo & Co. | 128,200 | 6,407,436 | ||||||
| 17,888,842 | ||||||||
| Consumer Finance (4.4%) | ||||||||
| Capital One Financial Corp. | 61,400 | 4,444,746 | ||||||
| Insurance (7.1%) | ||||||||
| Assurant, Inc. | 13,500 | 1,141,695 | ||||||
| Everest Re Group, Ltd. | 14,800 | 2,736,520 | ||||||
| The Travelers Cos., Inc. | 31,000 | 3,406,900 | ||||||
| 7,285,115 | ||||||||
| Semi-Annual Report | April 30, 2016 (Unaudited) | 15 |
| Schedules of Investments | Pin Oak Equity Fund |
| As of April 30, 2016 (Unaudited) |
| Security Description | Shares | Value | ||||||
| INDUSTRIALS (6.5%) | ||||||||
| Aerospace & Defense (1.3%) | ||||||||
| Raytheon Co. | 10,500 | $ | 1,326,675 | |||||
| Electrical Equipment (1.8%) | ||||||||
| EnerSys | 31,617 | 1,845,484 | ||||||
| Machinery (3.4%) | ||||||||
| Parker-Hannifin Corp. | 30,500 | 3,538,610 | ||||||
| INFORMATION TECHNOLOGY (32.3%) | ||||||||
| Electronic Equipment & Instruments (3.3%) | ||||||||
| Flextronics International, Ltd.(a) | 277,000 | 3,365,550 | ||||||
| Internet Software & Services (6.3%) | ||||||||
| Alphabet, Inc. - Class A(a) | 3,500 | 2,477,580 | ||||||
| Alphabet, Inc. - Class C(a) | 3,509 | 2,431,772 | ||||||
| IAC/InterActive Corp. | 33,256 | 1,541,083 | ||||||
| 6,450,435 | ||||||||
| IT Services (12.5%) | ||||||||
| Amdocs, Ltd. | 89,772 | 5,075,709 | ||||||
| Paychex, Inc. | 88,549 | 4,615,174 | ||||||
| The Western Union Co. | 154,000 | 3,080,000 | ||||||
| 12,770,883 | ||||||||
| Semiconductors & Semiconductor Equipment (5.0%) | ||||||||
| KLA-Tencor Corp. | 32,400 | 2,266,056 | ||||||
| Xilinx, Inc. | 65,500 | 2,821,740 | ||||||
| 5,087,796 | ||||||||
| Software (5.2%) | ||||||||
| Microsoft Corp. | 108,100 | 5,390,947 | ||||||
| MATERIALS (0.4%) | ||||||||
| Metals & Mining (0.4%) | ||||||||
| Teck Resources, Ltd. - Class B | 38,814 | 475,471 | ||||||
| TOTAL COMMON STOCKS (Cost $86,881,336) | 99,484,099 | |||||||
| 16 | 1-888-462-5386 | www.oakfunds.com |
| Pin Oak Equity Fund | Schedules of Investments |
| As of April 30, 2016 (Unaudited) |
| Security Description | Shares | Value | ||||||
| SHORT TERM INVESTMENTS (2.8%) | ||||||||
| Tri-Party Repurchase Agreement with South Street Securities Wachovia Tri-Party, 0.15%, dated 04/29/16 and maturing 05/02/15, collateralized by U.S. Treasury Securities with rates ranging from 0.500% to 2.750% and with maturity dates ranging from 11/30/16 to 05/15/24 with a par value of $2,724,038 and a collateral value of $2,870,704. | 2,814,414 | $ | 2,814,414 | |||||
| TOTAL SHORT TERM INVESTMENTS (Cost $2,814,414) | 2,814,414 | |||||||
TOTAL INVESTMENTS - (100.0%) (Cost $89,695,750) | $ | 102,298,513 | ||||||
| Liabilities in Excess of Other Assets - (0.0%)(b) | (16,350 | ) | ||||||
| NET ASSETS - (100.0%) | $ | 102,282,163 | ||||||
(a) | Non-income producing security. |
(b) | Less than 0.05%. |
The accompanying notes are an integral part of the financial statements.
| Semi-Annual Report | April 30, 2016 (Unaudited) | 17 |
| Schedules of Investments | Rock Oak Core Growth Fund |
| As of April 30, 2016 (Unaudited) |
| Security Description | Shares | Value | ||||||
| COMMON STOCKS (91.9%) | ||||||||
| CONSUMER DISCRETIONARY (10.1%) | ||||||||
| Hotels, Restaurants & Leisure (3.1%) | ||||||||
| Wyndham Worldwide Corp. | 3,000 | $ | 212,850 | |||||
| Media (7.0%) | ||||||||
| Discovery Communications, Inc. - Class A(a) | 7,800 | 213,018 | ||||||
| Liberty Braves Group - Class A(a) | 690 | 10,792 | ||||||
| Liberty Media Corp. - Class A(a) | 1,725 | 31,567 | ||||||
| Liberty SiriusXM Group - Class A(a) | 6,900 | 226,113 | ||||||
| 481,490 | ||||||||
| CONSUMER STAPLES (3.3%) | ||||||||
| Beverages (3.3%) | ||||||||
| Molson Coors Brewing Co. - Class B | 2,400 | 229,512 | ||||||
| ENERGY (2.6%) | ||||||||
| Energy Equipment & Services (2.6%) | ||||||||
| Weatherford International PLC(a) | 21,590 | 175,527 | ||||||
| FINANCIALS (12.2%) | ||||||||
| Commercial Banks (4.4%) | ||||||||
| SunTrust Banks, Inc. | 7,200 | 300,528 | ||||||
| Consumer Finance (3.7%) | ||||||||
| Synchrony Financial(a) | 8,350 | 255,259 | ||||||
| Insurance (4.1%) | ||||||||
| The Hartford Financial Services Group, Inc. | 6,400 | 284,032 | ||||||
| HEALTH CARE (6.0%) | ||||||||
| Life Sciences Tools & Services (2.7%) | ||||||||
| Illumina, Inc.(a) | 1,400 | 188,986 | ||||||
| Pharmaceuticals (3.3%) | ||||||||
| Jazz Pharmaceuticals PLC(a) | 1,500 | 226,050 | ||||||
| INDUSTRIALS (8.4%) | ||||||||
| Aerospace & Defense (4.1%) | ||||||||
| L-3 Communications Holdings, Inc. | 2,150 | 282,789 | ||||||
| Professional Services (4.3%) | ||||||||
| Nielsen NV | 5,650 | 294,591 | ||||||
| 18 | 1-888-462-5386 | www.oakfunds.com |
| Rock Oak Core Growth Fund | Schedules of Investments |
| As of April 30, 2016 (Unaudited) |
| Security Description | Shares | Value | ||||||
| INFORMATION TECHNOLOGY (49.3%) | ||||||||
| Communications Equipment (3.3%) | ||||||||
| F5 Networks, Inc.(a) | 2,150 | $ | 225,213 | |||||
| Computers & Peripherals (1.8%) | ||||||||
| Western Digital Corp. | 3,000 | 122,595 | ||||||
| Internet Software & Services (5.5%) | ||||||||
| Salesforce.com, Inc.(a) | 5,000 | 379,000 | ||||||
| IT Services (12.4%) | ||||||||
| Cognizant Technology Solutions Corp. - Class A(a) | 2,800 | 163,436 | ||||||
| Computer Sciences Corp. | 5,650 | 187,184 | ||||||
| CSRA, Inc. | 5,650 | 146,674 | ||||||
| Vantiv, Inc. - Class A(a) | 6,550 | 357,237 | ||||||
| 854,531 | ||||||||
| Semiconductors & Semiconductor Equipment (7.7%) | ||||||||
| Broadcom, Ltd. | 130 | 18,948 | ||||||
| Linear Technology Corp. | 5,500 | 244,640 | ||||||
| Xilinx, Inc. | 6,150 | 264,942 | ||||||
| 528,530 | ||||||||
| Software (13.9%) | ||||||||
| Autodesk, Inc.(a) | 4,200 | 251,244 | ||||||
| CA, Inc. | 9,950 | 295,117 | ||||||
| Check Point Software Technologies, Ltd.(a) | 3,000 | 248,610 | ||||||
| Symantec Corp. | 9,700 | 161,456 | ||||||
| 956,427 | ||||||||
| Technology Hardware, Storage & Peripherals (4.7%) | ||||||||
| NetApp, Inc. | 6,400 | 151,296 | ||||||
| Seagate Technology PLC | 7,710 | 167,847 | ||||||
| 319,143 | ||||||||
| TOTAL COMMON STOCKS (Cost $5,077,546) | 6,317,053 | |||||||
| Semi-Annual Report | April 30, 2016 (Unaudited) | 19 |
| Schedules of Investments | Rock Oak Core Growth Fund |
| As of April 30, 2016 (Unaudited) |
| Security Description | Shares | Value | ||||||
| SHORT TERM INVESTMENTS (8.1%) | ||||||||
| Tri-Party Repurchase Agreement with South Street Securities Wachovia Tri-Party, 0.15%, dated 04/29/16 and maturing 05/02/15, collateralized by U.S. Treasury Securities with rates ranging from 0.500% to 2.750% and with maturity dates ranging from 11/30/16 to 05/15/24 with a par value of $539,596 and a collateral value of $568,648. | 557,498 | $ | 557,498 | |||||
| TOTAL SHORT TERM INVESTMENTS (Cost $557,498) | 557,498 | |||||||
| TOTAL INVESTMENTS - (100.0%) (Cost $5,635,044) | $ | 6,874,551 | ||||||
| Liabilities in Excess of Other Assets - (0.0%)(b) | (2,671 | ) | ||||||
| NET ASSETS - (100.0%) | $ | 6,871,880 | ||||||
(a) | Non-income producing security. |
(b) | Less than 0.05%. |
The accompanying notes are an integral part of the financial statements.
| 20 | 1-888-462-5386 | www.oakfunds.com |
| River Oak Discovery Fund | Schedules of Investments |
| Security Description | Shares | Value | ||||||
| COMMON STOCKS (91.8%) | ||||||||
| CONSUMER DISCRETIONARY (7.3%) | ||||||||
| Specialty Retail (7.3%) | ||||||||
| Abercrombie & Fitch Co. - Class A | 20,450 | $ | 546,628 | |||||
| Guess? Inc. | 17,950 | 329,383 | ||||||
876,011 | ||||||||
| FINANCIALS (26.2%) | ||||||||
| Capital Markets (9.1%) | ||||||||
| Calamos Asset Management, Inc. - Class A | 30,700 | 252,968 | ||||||
| Cowen Group, Inc. - Class A(a) | 86,900 | 302,847 | ||||||
| FBR & Co. | 6,400 | 118,400 | ||||||
| Janus Capital Group, Inc. | 29,400 | 429,240 | ||||||
1,103,455 | ||||||||
| Commercial Banks (9.8%) | ||||||||
| PrivateBancorp, Inc. | 12,300 | 511,803 | ||||||
| Union First Market Bankshares Corp. | 14,050 | 371,061 | ||||||
| Zions Bancorporation | 10,800 | 297,216 | ||||||
1,180,080 | ||||||||
| Insurance (7.3%) | ||||||||
| Assurant, Inc. | 7,350 | 621,589 | ||||||
| CNO Financial Group, Inc. | 14,000 | 257,180 | ||||||
878,769 | ||||||||
| HEALTH CARE (13.3%) | ||||||||
| Biotechnology (3.2%) | ||||||||
| United Therapeutics Corp.(a) | 3,650 | 383,980 | ||||||
| Health Care Providers & Services (7.3%) | ||||||||
| Amsurg Corp.(a) | 5,450 | 441,341 | ||||||
| Magellan Health, Inc.(a) | 6,350 | 447,421 | ||||||
888,762 | ||||||||
| Heath Care Technology (2.8%) | ||||||||
| Quality Systems, Inc. | 23,800 | 335,104 | ||||||
| INDUSTRIALS (7.7%) | ||||||||
| Aerospace & Defense (3.5%) | ||||||||
| TASER International, Inc.(a) | 23,420 | 427,649 | ||||||
| Construction & Engineering (2.2%) | ||||||||
| Argan, Inc. | 7,650 | 261,477 | ||||||
| Machinery (2.0%) | ||||||||
| Proto Labs, Inc.(a) | 4,000 | 239,320 | ||||||
Semi-Annual Report | April 30, 2016 (Unaudited) | 21 |
| Schedules of Investments | River Oak Discovery Fund |
| Security Description | Shares | Value | ||||||
| INFORMATION TECHNOLOGY (37.3%) | ||||||||
| Electronic Equipment & Instruments (10.8%) | ||||||||
| Dolby Laboratories, Inc. - Class A | 7,200 | $ | 342,792 | |||||
| Fabrinet(a) | 20,850 | 666,575 | ||||||
| Hollysys Automation Technologies, Ltd.(a) | 15,500 | 297,135 | ||||||
1,306,502 | ||||||||
| Internet (1.2%) | ||||||||
| AVG Technologies NV(a) | 7,000 | 138,600 | ||||||
| Internet Software & Services (2.6%) | ||||||||
| MercadoLibre, Inc. | 2,500 | 312,225 | ||||||
| Semiconductors & Semiconductor Equipment (12.2%) | ||||||||
| Advanced Energy Industries, Inc.(a) | 14,450 | 467,457 | ||||||
| Ambarella, Inc.(a) | 2,700 | 110,970 | ||||||
| Cirrus Logic, Inc.(a) | 15,900 | 573,990 | ||||||
| Kulicke & Soffa Industries, Inc.(a) | 29,700 | 318,384 | ||||||
1,470,801 | ||||||||
| Software (10.5%) | ||||||||
| FireEye, Inc.(a) | 13,640 | 236,654 | ||||||
| Fortinet, Inc.(a) | 14,950 | 486,024 | ||||||
| VASCO Data Security International, Inc.(a) | 21,035 | 364,537 | ||||||
| Verint Systems, Inc.(a) | 5,450 | 184,428 | ||||||
1,271,643 | ||||||||
| TOTAL COMMON STOCKS (Cost $8,523,963) | 11,074,378 | |||||||
| SHORT TERM INVESTMENTS (8.3%) | ||||||||
| Tri-Party Repurchase Agreement with South Street Securities Wachovia Tri-Party, 0.15%, dated 04/29/16 and maturing 05/02/15, collateralized by U.S. Treasury Securities with rates ranging from 0.500% to 2.750% and with maturity dates ranging from 11/30/16 to 05/15/24 with a par value of $963,762 and a collateral value of $1,015,652. | 995,736 | $ | 995,736 | |||||
| TOTAL SHORT TERM INVESTMENTS (Cost $995,736) | 995,736 | |||||||
TOTAL INVESTMENTS - (100.1%) (Cost $9,519,699) | $ | 12,070,114 | ||||||
| Liabilities in Excess of Other Assets - (-0.1%) | (13,687 | ) | ||||||
| NET ASSETS - (100.0%) | $ | 12,056,427 | ||||||
22 | 1-888-462-5386 | www.oakfunds.com |
| River Oak Discovery Fund | Schedules of Investments |
As of April 30, 2016 (Unaudited)
(a) | Non-income producing security. |
The accompanying notes are an integral part of the financial statements.
Semi-Annual Report | April 30, 2016 (Unaudited) | 23 |
| Schedules of Investments | Red Oak Technology Select Fund |
| Security Description | Shares | Value | ||||||
| COMMON STOCKS (98.7%) | ||||||||
| CONSUMER DISCRETIONARY (3.0%) | ||||||||
| Internet & Catalog Retail (3.0%) | ||||||||
| Amazon.com, Inc.(a) | 6,050 | $ | 3,990,520 | |||||
| INDUSTRIALS (5.7%) | ||||||||
| Aerospace & Defense (5.7%) | ||||||||
| Huntington Ingalls Industries, Inc. | 38,466 | 5,568,723 | ||||||
| Northrop Grumman Corp. | 9,850 | 2,031,661 | ||||||
7,600,384 | ||||||||
| INFORMATION TECHNOLOGY (90.0%) | ||||||||
| Communications Equipment (10.0%) | ||||||||
| Cisco Systems, Inc. | 243,000 | 6,680,070 | ||||||
| Juniper Networks, Inc. | 136,000 | 3,182,400 | ||||||
| Qualcomm, Inc. | 65,800 | 3,324,216 | ||||||
13,186,686 | ||||||||
| Computers & Peripherals (5.4%) | ||||||||
| Apple, Inc. | 39,420 | 3,695,231 | ||||||
| HP, Inc. | 133,500 | 1,638,045 | ||||||
| Western Digital Corp. | 45,000 | 1,838,925 | ||||||
7,172,201 | ||||||||
| Electronic Equipment & Instruments (9.5%) | ||||||||
| Arrow Electronics, Inc.(a) | 36,675 | 2,277,517 | ||||||
| Corning, Inc. | 170,000 | 3,173,900 | ||||||
| Flextronics International, Ltd.(a) | 75,000 | 911,250 | ||||||
| Ingram Micro, Inc. - Class A | 147,600 | 5,158,620 | ||||||
| Keysight Technologies, Inc.(a) | 43,000 | 1,121,440 | ||||||
12,642,727 | ||||||||
| Internet Software & Services (8.9%) | ||||||||
| Alphabet, Inc. - Class A(a) | 5,100 | 3,610,188 | ||||||
| Alphabet, Inc. - Class C(a) | 6,016 | 4,169,148 | ||||||
| Facebook, Inc. - Class A(a) | 13,725 | 1,613,786 | ||||||
| IAC/InterActive Corp. | 52,100 | 2,414,314 | ||||||
11,807,436 | ||||||||
| IT Services (12.8%) | ||||||||
| Accenture PLC - Class A | 39,100 | 4,415,172 | ||||||
| Alliance Data Systems Corp.(a) | 11,600 | 2,358,396 | ||||||
| Computer Sciences Corp. | 56,000 | 1,855,280 | ||||||
| CSG Systems International, Inc. | 15,519 | 688,733 | ||||||
| CSRA, Inc. | 56,000 | 1,453,760 | ||||||
| International Business Machines Corp. | 26,400 | 3,852,816 | ||||||
| Total System Services, Inc. | 43,500 | 2,224,590 | ||||||
| Visa, Inc. - Class A | 2,000 | 154,480 | ||||||
17,003,227 | ||||||||
24 | 1-888-462-5386 | www.oakfunds.com |
| Red Oak Technology Select Fund | Schedules of Investments |
| Security Description | Shares | Value | ||||||
| Semiconductors & Semiconductor Equipment (17.3%) | ||||||||
| Intel Corp. | 162,300 | $ | 4,914,444 | |||||
| KLA-Tencor Corp. | 67,600 | 4,727,944 | ||||||
| Marvell Technology Group, Ltd. | 258,400 | 2,578,832 | ||||||
| NVIDIA Corp. | 180,000 | 6,395,400 | ||||||
| Xilinx, Inc. | 98,900 | 4,260,612 | ||||||
22,877,232 | ||||||||
| Software (21.7%) | ||||||||
| CA, Inc. | 102,000 | 3,025,320 | ||||||
| Check Point Software Technologies, Ltd.(a) | 54,000 | 4,474,980 | ||||||
| Microsoft Corp. | 109,700 | 5,470,739 | ||||||
| Oracle Corp. | 156,100 | 6,222,146 | ||||||
| Red Hat, Inc.(a) | 45,100 | 3,308,987 | ||||||
| Symantec Corp. | 123,000 | 2,047,335 | ||||||
| Synopsys, Inc.(a) | 86,900 | 4,129,488 | ||||||
28,678,995 | ||||||||
| Technology Hardware, Storage & Peripherals (4.4%) | ||||||||
| EMC Corp. | �� | 59,700 | 1,558,767 | |||||
| Hewlett Packard Enterprise Co. | 127,500 | 2,124,150 | ||||||
| NetApp, Inc. | 89,500 | 2,115,780 | ||||||
5,798,697 | ||||||||
| TOTAL COMMON STOCKS | ||||||||
| (Cost $101,734,380) | 130,758,105 | |||||||
| SHORT TERM INVESTMENTS (1.7%) | ||||||||
| Tri-Party Repurchase Agreement with South Street Securities Wachovia Tri-Party, 0.15%, dated 04/29/16 and maturing 05/02/15, collateralized by U.S. Treasury Securities with rates ranging from 0.500% to 2.750% and with maturity dates ranging from 11/30/16 to 05/15/24 with a par value of $2,116,405 and collateral value of $2,230,355. | 2,186,621 | $ | 2,186,621 | |||||
| TOTAL SHORT TERM INVESTMENTS | ||||||||
| (Cost $2,186,621) | 2,186,621 | |||||||
| TOTAL INVESTMENTS - (100.4%) | ||||||||
| (Cost $103,921,001) | $ | 132,944,726 | ||||||
| Liabilities in Excess of Other Assets - (-0.4%) | (544,549 | ) | ||||||
| NET ASSETS - (100.0%) | $ | 132,400,177 | ||||||
(a) | Non-income producing security. |
The accompanying notes are an integral part of the financial statements.
Semi-Annual Report | April 30, 2016 (Unaudited) | 25 |
| Schedules of Investments | Black Oak Emerging Technology Fund |
| Security Description | Shares | Value | ||||||
| COMMON STOCKS (95.0%) | ||||||||
| HEALTH CARE (5.4%) | ||||||||
| Health Care Technology (2.7%) | ||||||||
| Computer Programs & Systems, Inc. | 15,695 | $ | 805,625 | |||||
| Life Sciences Tools & Services (2.7%) | ||||||||
| Illumina, Inc.(a) | 5,800 | 782,942 | ||||||
| INFORMATION TECHNOLOGY (89.6%) | ||||||||
| Communications Equipment (7.6%) | ||||||||
| F5 Networks, Inc.(a) | 7,150 | 748,962 | ||||||
| Palo Alto Networks, Inc.(a) | 5,900 | 890,133 | ||||||
| Qualcomm, Inc. | 11,400 | 575,928 | ||||||
2,215,023 | ||||||||
| Computers & Peripherals (7.8%) | ||||||||
| Apple, Inc. | 18,200 | 1,706,068 | ||||||
| Western Digital Corp. | 14,150 | 578,240 | ||||||
2,284,308 | ||||||||
| Electronic Equipment & Instruments (3.8%) | ||||||||
| Arrow Electronics, Inc.(a) | 18,000 | 1,117,800 | ||||||
| Internet (4.0%) | ||||||||
| AVG Technologies NV(a) | 59,350 | 1,175,130 | ||||||
| Internet Software & Services (11.6%) | ||||||||
| Blucora, Inc.(a) | 31,535 | 252,595 | ||||||
| MercadoLibre, Inc. | 6,900 | 861,741 | ||||||
| Salesforce.com, Inc.(a) | 21,085 | 1,598,243 | ||||||
| Shutterstock, Inc.(a) | 16,880 | 692,418 | ||||||
3,404,997 | ||||||||
| IT Services (10.4%) | ||||||||
| Alliance Data Systems Corp.(a) | 4,550 | 925,060 | ||||||
| Cognizant Technology Solutions Corp. - Class A(a) | 9,600 | 560,352 | ||||||
| Computer Sciences Corp. | 19,950 | 660,944 | ||||||
| CSRA, Inc. | 19,950 | 517,902 | ||||||
| Perficient, Inc.(a) | 19,165 | 400,165 | ||||||
3,064,423 | ||||||||
| Semiconductors & Semiconductor Equipment (14.8%) | ||||||||
| Ambarella, Inc.(a) | 6,900 | 283,590 | ||||||
| Cirrus Logic, Inc.(a) | 38,200 | 1,379,020 | ||||||
| Lam Research Corp. | 9,800 | 748,720 | ||||||
| PDF Solutions, Inc.(a) | 27,330 | 367,588 | ||||||
| Silicon Motion Technology Corp. - ADR | 41,000 | 1,580,550 | ||||||
4,359,468 | ||||||||
26 | 1-888-462-5386 | www.oakfunds.com |
| Black Oak Emerging Technology Fund | Schedules of Investments |
| Security Description | Shares | Value | ||||||
| Software (19.4%) | ||||||||
| Barracuda Networks, Inc.(a) | 33,345 | $ | 587,539 | |||||
| CA, Inc. | 45,100 | 1,337,666 | ||||||
| Citrix Systems, Inc.(a) | 9,800 | 802,032 | ||||||
| FireEye, Inc.(a) | 32,690 | 567,171 | ||||||
| Fortinet, Inc.(a) | 34,760 | 1,130,048 | ||||||
| QAD, Inc. - Class A | 12,380 | 242,772 | ||||||
| Qualys, Inc.(a) | 23,700 | 596,766 | ||||||
| VASCO Data Security International, Inc.(a) | 25,000 | 433,250 | ||||||
5,697,244 | ||||||||
| Technology Hardware, Storage & Peripherals (7.9%) | ||||||||
| EMC Corp. | 43,100 | 1,125,341 | ||||||
| SanDisk Corp. | 15,900 | 1,194,567 | ||||||
2,319,908 | ||||||||
| Telecommunications (2.3%) | ||||||||
| Infoblox, Inc.(a) | 39,750 | 665,018 | ||||||
| TOTAL COMMON STOCKS | ||||||||
| (Cost $21,105,568) | 27,891,886 | |||||||
| SHORT TERM INVESTMENTS (5.1%) | ||||||||
| Tri-Party Repurchase Agreement with South Street Securities Wachovia Tri-Party, 0.15%, dated 04/29/16 and maturing 05/02/15, collateralized by U.S. Treasury Securities with rates ranging from 0.500% to 2.750% and with maturity dates ranging from 11/30/16 to 02/15/24 with a par value of $1,460,217 and a collateral value of $1,538,837. | 1,508,662 | $ | 1,508,662 | |||||
| TOTAL SHORT TERM INVESTMENTS | ||||||||
| (Cost $1,508,662) | 1,508,662 | |||||||
| TOTAL INVESTMENTS - (100.1%) | ||||||||
| (Cost $22,614,230) | $ | 29,400,548 | ||||||
| Liabilities in Excess of Other Assets - (-0.1%) | (18,547 | ) | ||||||
| NET ASSETS - (100.0%) | $ | 29,382,001 | ||||||
(a) | Non-income producing security. |
The accompanying notes are an integral part of the financial statements.
Semi-Annual Report | April 30, 2016 (Unaudited) | 27 |
| Schedules of Investments | Live Oak Health Sciences Fund |
| Security Description | Shares | Value | ||||||
| COMMON STOCKS (97.3%) | ||||||||
| HEALTH CARE (96.2%) | ||||||||
| Biotechnology (7.7%) | ||||||||
| Amgen, Inc. | 24,300 | $ | 3,846,690 | |||||
| Biogen, Inc.(a) | 1,300 | 357,487 | ||||||
4,204,177 | ||||||||
| Health Care Equipment & Supplies (20.3%) | ||||||||
| Becton Dickinson and Co. | 15,500 | 2,499,530 | ||||||
| CR Bard, Inc. | 13,400 | 2,843,078 | ||||||
| Medtronic PLC | 21,096 | 1,669,748 | ||||||
| St Jude Medical, Inc. | 22,500 | 1,714,500 | ||||||
| Stryker Corp. | 21,900 | 2,387,319 | ||||||
11,114,175 | ||||||||
| Health Care Providers & Services (36.5%) | ||||||||
| Aetna, Inc. | 7,700 | 864,479 | ||||||
| Anthem, Inc. | 16,800 | 2,364,936 | ||||||
| Cardinal Health, Inc. | 37,100 | 2,910,866 | ||||||
| Cigna Corp. | 11,700 | 1,620,918 | ||||||
| DaVita HealthCare Partners, Inc.(a) | 19,900 | 1,470,610 | ||||||
| Express Scripts Holding Co.(a) | 23,100 | 1,703,163 | ||||||
| McKesson Corp. | 11,650 | 1,955,103 | ||||||
| Owens & Minor, Inc. | 63,880 | 2,324,593 | ||||||
| Quest Diagnostics, Inc. | 14,100 | 1,059,897 | ||||||
| UnitedHealth Group, Inc. | 12,700 | 1,672,336 | ||||||
| VCA, Inc.(a) | 33,300 | 2,096,901 | ||||||
20,043,802 | ||||||||
| Life Sciences Tools & Services (8.7%) | ||||||||
| Bio-Techne Corp. | 8,900 | 829,302 | ||||||
| Charles River Laboratories International, Inc.(a) | 22,200 | 1,759,794 | ||||||
| Waters Corp.(a) | 16,700 | 2,173,672 | ||||||
4,762,768 | ||||||||
| Pharmaceuticals (23.0%) | ||||||||
| AstraZeneca PLC - Sponsored ADR | 29,000 | 839,840 | ||||||
| Eli Lilly & Co. | 18,000 | 1,359,540 | ||||||
| GlaxoSmithKline PLC - Sponsored ADR | 47,900 | 2,055,389 | ||||||
| Johnson & Johnson | 14,700 | 1,647,576 | ||||||
| Merck & Co., Inc. | 39,400 | 2,160,696 | ||||||
| Novartis AG - Sponsored ADR | 9,200 | 698,924 | ||||||
| Sanofi - ADR | 43,592 | 1,791,631 | ||||||
| Teva Pharmaceutical Industries, Ltd. - Sponsored ADR | 37,700 | 2,052,765 | ||||||
12,606,361 | ||||||||
28 | 1-888-462-5386 | www.oakfunds.com |
| Live Oak Health Sciences Fund | Schedules of Investments |
| Security Description | Shares | Value | ||||||
| INFORMATION TECHNOLOGY (1.1%) | ||||||||
| Electronic Equipment & Instruments (1.1%) | ||||||||
| Keysight Technologies, Inc.(a) | 24,500 | $ | 638,960 | |||||
| TOTAL COMMON STOCKS (Cost $35,462,830) | 53,370,243 | |||||||
| SHORT TERM INVESTMENTS (3.7%) | ||||||||
| Tri-Party Repurchase Agreement with South Street Securities Wachovia Tri-Party, 0.15%, dated 04/29/16 and maturing 05/02/15, collateralized by U.S. Treasury Securities with rates ranging from 0.500% to 2.750% and with maturity dates ranging from 11/30/16 to 02/15/24 with a par value of $1,951,655 and with a collateral value of $2,056,734. | 2,016,405 | $ | 2,016,405 | |||||
| TOTAL SHORT TERM INVESTMENTS | ||||||||
| (Cost $2,016,405) | 2,016,405 | |||||||
| TOTAL INVESTMENTS - (101.0%) | ||||||||
| (Cost $37,479,235) | $ | 55,386,648 | ||||||
| Liabilities in Excess of Other Assets - (-1.0%) | (574,527 | ) | ||||||
| NET ASSETS - (100.0%) | $ | 54,812,121 | ||||||
(a) | Non-income producing security. |
The accompanying notes are an integral part of the financial statements.
Semi-Annual Report | April 30, 2016 (Unaudited) | 29 |
| White Oak Select Growth Fund | Pin Oak Equity Fund | |||||||
| Investments at cost | $ | 225,971,315 | $ | 89,695,750 | ||||
| ASSETS: | ||||||||
| Investments at fair value | $ | 247,295,548 | $ | 102,298,513 | ||||
| Cash | 127,336 | – | ||||||
| Receivable for capital shares sold | 16,503 | 157,316 | ||||||
| Receivable for investment securities sold | 131,431 | – | ||||||
| Dividends and interest receivable | 11,492 | 28,370 | ||||||
| Prepaid expenses | 27,975 | 19,763 | ||||||
| Total Assets | 247,610,285 | 102,503,962 | ||||||
| LIABILITIES: | ||||||||
| Payable for fund shares redeemed | 46,569 | 72,352 | ||||||
| Investment advisory fees payable | 150,726 | 61,585 | ||||||
| Administration fees payable | 15,740 | 7,161 | ||||||
| Trustees' fees payable | 17,387 | 6,465 | ||||||
| Payable for investment securities purchased | – | 45,908 | ||||||
| Principal financial officer fees payable | 367 | 108 | ||||||
| Printing fees payable | 13,309 | 4,483 | ||||||
| Transfer agent fees payable | 35,974 | 10,331 | ||||||
| Legal and audit fees payable | 12,453 | 8,324 | ||||||
| Other accrued expenses | 10,347 | 5,082 | ||||||
| Total Liabilities | 302,872 | 221,799 | ||||||
| Total Net Assets | $ | 247,307,413 | $ | 102,282,163 | ||||
| NET ASSETS: | ||||||||
| Paid-in capital (unlimited authorization - no par value) | $ | 245,335,179 | $ | 89,387,529 | ||||
| Accumulated undistributed net investment income (loss) | 1,552,102 | 213,960 | ||||||
| Accumulated net realized gain (loss) on investments | (20,904,101 | ) | 77,911 | |||||
| Net unrealized appreciation on investments | 21,324,233 | 12,602,763 | ||||||
| Total Net Assets | $ | 247,307,413 | $ | 102,282,163 | ||||
| PORTFOLIO SHARES: | ||||||||
| Net Assets | $ | 247,307,413 | $ | 102,282,163 | ||||
| Total shares outstanding at end of period | 3,927,959 | 2,068,472 | ||||||
| Net assets value, offering and redemption price per share (net assets ÷ shares outstanding) | $ | 62.96 | $ | 49.45 | ||||
| 30 | 1-888-462-5386 | www.oakfunds.com |
Rock Oak Core Growth Fund | River Oak Discovery Fund | Red Oak Technology Select Fund | Black Oak Emerging Technology Fund | Live Oak Health Sciences Fund | ||||||||||||||
| $ | 5,635,044 | $ | 9,519,699 | $ | 103,921,001 | $ | 22,614,230 | $ | 37,479,235 | |||||||||
| $ | 6,874,551 | $ | 12,070,114 | $ | 132,944,726 | $ | 29,400,548 | $ | 55,386,648 | |||||||||
| – | – | – | – | – | ||||||||||||||
| – | 100 | 168,407 | 25,290 | 76,191 | ||||||||||||||
| – | – | – | – | 84,067 | ||||||||||||||
| 5 | 8 | 43,028 | 904 | 3,233 | ||||||||||||||
| 10,415 | 6,714 | 15,743 | 11,411 | 9,353 | ||||||||||||||
| 6,884,971 | 12,076,936 | 133,171,904 | 29,438,153 | 55,559,492 | ||||||||||||||
| – | – | 90,456 | 14,029 | 39,937 | ||||||||||||||
| 2,047 | 7,554 | 82,162 | 18,246 | 32,723 | ||||||||||||||
| 1,574 | 2,045 | 9,237 | 2,777 | 4,488 | ||||||||||||||
| 535 | 924 | 8,399 | 2,372 | 3,682 | ||||||||||||||
| – | – | 533,258 | – | 648,763 | ||||||||||||||
| 16 | 21 | 159 | 55 | 83 | ||||||||||||||
| 657 | 893 | 7,880 | 2,040 | 2,831 | ||||||||||||||
| 1,575 | 1,626 | 24,901 | 7,876 | 4,888 | ||||||||||||||
| 6,687 | 6,924 | 8,797 | 7,512 | 7,892 | ||||||||||||||
| – | 522 | 6,478 | 1,245 | 2,084 | ||||||||||||||
| 13,091 | 20,509 | 771,727 | 56,152 | 747,371 | ||||||||||||||
| $ | 6,871,880 | $ | 12,056,427 | $ | 132,400,177 | $ | 29,382,001 | $ | 54,812,121 | |||||||||
| $ | 5,482,215 | $ | 9,572,485 | $ | 102,046,613 | $ | 22,430,126 | $ | 36,306,820 | |||||||||
| 35,656 | (78,263 | ) | 703,936 | (64,319 | ) | 101,047 | ||||||||||||
| 114,502 | 11,790 | 625,903 | 229,876 | 496,841 | ||||||||||||||
| 1,239,507 | 2,550,415 | 29,023,725 | 6,786,318 | 17,907,413 | ||||||||||||||
| $ | 6,871,880 | $ | 12,056,427 | $ | 132,400,177 | $ | 29,382,001 | $ | 54,812,121 | |||||||||
| $ | 6,871,880 | $ | 12,056,427 | $ | 132,400,177 | $ | 29,382,001 | $ | 54,812,121 | |||||||||
| 589,623 | 871,970 | 8,174,468 | 7,395,703 | 2,861,577 | ||||||||||||||
| $ | 11.65 | $ | 13.83 | $ | 16.20 | $ | 3.97 | $ | 19.15 | |||||||||
| Semi-Annual Report | April 30, 2016 (Unaudited) | 31 |
| White Oak Select Growth Fund | Pin Oak Equity Fund | |||||||
| INVESTMENT INCOME: | ||||||||
| Dividends | $ | 3,194,974 | $ | 961,223 | ||||
| Interest | 1,714 | 1,742 | ||||||
| Less: Foreign withholding tax | (19,941 | ) | (5,788 | ) | ||||
| Total Investment Income | 3,176,747 | 957,177 | ||||||
| EXPENSES: | ||||||||
| Investment advisory fees | 916,860 | 360,911 | ||||||
| Administration fees | 93,531 | 37,645 | ||||||
| Trustees' fees | 54,887 | 21,128 | ||||||
| Legal and audit fees | 44,089 | 20,764 | ||||||
| Transfer agent fees | 76,057 | 31,568 | ||||||
| Sub transfer agent fees | 71,499 | 22,805 | ||||||
| Registration fees | 6,989 | 8,386 | ||||||
| Printing fees | 20,978 | 7,804 | ||||||
| Custodian fees | 5,834 | 3,135 | ||||||
| Principal financial officer fees | 2,175 | 818 | ||||||
| Insurance and other fees | 31,766 | 12,328 | ||||||
| Total Expenses | 1,324,665 | 527,292 | ||||||
| Less: Investment advisory fees waived | – | – | ||||||
| Net Expenses | 1,324,665 | 527,292 | ||||||
| Net Investment Income (Loss) | 1,852,082 | 429,885 | ||||||
| Net realized gain on securities sold | 3,412,970 | 77,937 | ||||||
| Net change in unrealized appreciation (depreciation) of investment securities | (13,186,728 | ) | (2,693,687 | ) | ||||
| Net Realized and Unrealized Gain (Loss) on Investments | (9,773,758 | ) | (2,615,750 | ) | ||||
| Net Increase (Decrease) in Net Assets Resulting From Operations | $ | (7,921,676 | ) | $ | (2,185,865 | ) | ||
| 32 | 1-888-462-5386 | www.oakfunds.com |
Rock Oak Core Growth Fund | River Oak Discovery Fund | Red Oak Technology Select Fund | Black Oak Emerging Technology Fund | Live Oak Health Sciences Fund | ||||||||||||||
| $ | 145,251 | $ | 55,900 | $ | 2,223,294 | $ | 327,187 | $ | 482,058 | |||||||||
| 331 | 1,019 | 920 | 1,026 | 543 | ||||||||||||||
| – | – | – | (155 | ) | (9,679 | ) | ||||||||||||
| 145,582 | 56,919 | 2,224,214 | 328,058 | 472,922 | ||||||||||||||
| 26,858 | 54,892 | 471,709 | 110,198 | 190,459 | ||||||||||||||
| 3,918 | 5,905 | 48,843 | 12,174 | 20,555 | ||||||||||||||
| 1,632 | 2,730 | 27,268 | 6,807 | 11,368 | ||||||||||||||
| 7,596 | 8,437 | 24,893 | 11,236 | 14,333 | ||||||||||||||
| 7,354 | 7,381 | 47,711 | 30,016 | 14,675 | ||||||||||||||
| 337 | 383 | 51,441 | 7,341 | 7,242 | ||||||||||||||
| 8,929 | 9,096 | 9,617 | 8,769 | 9,827 | ||||||||||||||
| 947 | 1,223 | 12,591 | 3,107 | 4,087 | ||||||||||||||
| 634 | 856 | 3,651 | 1,432 | 2,366 | ||||||||||||||
| 69 | 109 | 1,082 | 271 | 452 | ||||||||||||||
| 1,432 | 2,259 | 16,121 | 4,596 | 7,370 | ||||||||||||||
| 59,706 | 93,271 | 714,927 | 195,947 | 282,734 | ||||||||||||||
| (14,361 | ) | (10,942 | ) | – | – | – | ||||||||||||
| 45,345 | 82,329 | 714,927 | 195,947 | 282,734 | ||||||||||||||
| 100,237 | (25,410 | ) | 1,509,287 | 132,111 | 190,188 | |||||||||||||
| 114,504 | 19,732 | 747,920 | 229,891 | 496,840 | ||||||||||||||
| (587,558 | ) | 72,873 | (4,348,689 | ) | (1,616,733 | ) | 463,994 | |||||||||||
| (473,054 | ) | 92,605 | (3,600,769 | ) | (1,386,842 | ) | 960,834 | |||||||||||
| $ | (372,817 | ) | $ | 67,195 | $ | (2,091,482 | ) | $ | (1,254,731 | ) | $ | 1,151,022 | ||||||
| Semi-Annual Report | April 30, 2016 (Unaudited) | 33 |
| Statements of Changes in Net Assets |
| White Oak Select Growth Fund | Pin Oak Equity Fund | |||||||||||||||
| For The Six Months Ended April 30, 2016 (Unaudited) | For The Year Ended October 31 2015 | For The Six Months Ended April 30, 2016 (Unaudited) | For The Year Ended October 31 2015 | |||||||||||||
| INVESTMENT ACTIVITIES: | ||||||||||||||||
| Net investment income (loss) | $ | 1,852,082 | $ | 3,854,520 | $ | 429,885 | $ | 1,002,982 | ||||||||
| Net realized gain (loss) on securities sold | 3,412,970 | 6,226,107 | 77,937 | 2,916,283 | ||||||||||||
| Net change in unrealized appreciation (depreciation) of investment securities | (13,186,728 | ) | 13,777,664 | (2,693,687 | ) | 2,140,163 | ||||||||||
| Net Increase (Decrease) in Net Assets Resulting from Operations | (7,921,676 | ) | 23,858,291 | (2,185,865 | ) | 6,059,428 | ||||||||||
| DISTRIBUTIONS TO SHAREHOLDERS: | ||||||||||||||||
| Net income | (1,677,212 | ) | (4,050,002 | ) | (762,856 | ) | (1,020,000 | ) | ||||||||
| Realized capital gains | – | – | (2,912,364 | ) | (170,590 | ) | ||||||||||
| Total Distributions | (1,677,212 | ) | (4,050,002 | ) | (3,675,220 | ) | (1,190,590 | ) | ||||||||
| CAPITAL SHARE TRANSACTIONS (IN DOLLARS): | ||||||||||||||||
| Shares issued | 15,893,880 | 8,533,677 | 21,203,065 | 18,248,411 | ||||||||||||
| Shares issued in lieu of cash distributions | – | 3,800,921 | – | 1,097,355 | ||||||||||||
| Shares redeemed | (16,639,867 | ) | (30,711,155 | ) | (12,035,677 | ) | (19,555,154 | ) | ||||||||
| Net Increase (Decrease) in Net Assets from Capital Share Transactions | (745,987 | ) | (18,376,557 | ) | 9,167,388 | (209,388 | ) | |||||||||
| Total Increase (Decrease) in Net Assets | (10,344,875 | ) | 1,431,732 | 3,306,303 | 4,659,450 | |||||||||||
| NET ASSETS: | ||||||||||||||||
| Beginning of period | 257,652,288 | 256,220,556 | 98,975,860 | 94,316,410 | ||||||||||||
| End of period | $ | 247,307,413 | $ | 257,652,288 | $ | 102,282,163 | $ | 98,975,860 | ||||||||
| Including accumulated undistributed net investment income (loss) | $ | 1,552,102 | $ | 1,377,232 | $ | 213,960 | $ | 546,931 | ||||||||
| SHARES ISSUED AND REDEEMED: | ||||||||||||||||
| Issued | 248,365 | 138,165 | 434,814 | 361,192 | ||||||||||||
| Issued in lieu of cash distributions | – | 64,499 | – | 22,809 | ||||||||||||
| Redeemed | (271,375 | ) | (497,768 | ) | (253,304 | ) | (392,476 | ) | ||||||||
| Net Increase (Decrease) in Share Transactions | (23,010 | ) | (295,104 | ) | 181,510 | (8,475 | ) | |||||||||
| 34 | 1-888-462-5386 | www.oakfunds.com |
| Rock Oak Core Growth Fund | River Oak Discovery Fund | Red Oak Technology Select Fund | ||||||||||||||||||||
For The Six Months Ended April 30, 2016 (Unaudited) | For The Year Ended October 31 2015 | For The Six Months Ended April 30, 2016 (Unaudited) | For The Year Ended October 31 2015 | For The Six Months Ended April 30, 2016 (Unaudited) | For The Year Ended October 31 2015 | |||||||||||||||||
| $ | 100,237 | $ | 2,697 | $ | (25,410 | ) | $ | (38,680 | ) | $ | 1,509,287 | $ | 1,673,092 | |||||||||
| 114,504 | 175,225 | 19,732 | (7,942 | ) | 747,920 | 7,072,248 | ||||||||||||||||
| (587,558 | ) | (509,020 | ) | 72,873 | (70,683 | ) | (4,348,689 | ) | 435,418 | |||||||||||||
| (372,817 | ) | (331,098 | ) | 67,195 | (117,305 | ) | (2,091,482 | ) | 9,180,758 | |||||||||||||
| (60,295 | ) | (26,752 | ) | (14,169 | ) | – | (1,455,611 | ) | (1,415,013 | ) | ||||||||||||
| (175,226 | ) | (588,577 | ) | – | (2,955,988 | ) | (4,075,253 | ) | – | |||||||||||||
| (235,521 | ) | (615,329 | ) | (14,169 | ) | (2,955,988 | ) | (5,530,864 | ) | (1,415,013 | ) | |||||||||||
| 229,805 | 136,959 | 68,142 | 349,028 | 19,305,923 | 18,931,396 | |||||||||||||||||
| – | 595,902 | – | 2,897,201 | – | 1,320,574 | |||||||||||||||||
| (556,923 | ) | (470,470 | ) | (646,638 | ) | (1,506,462 | ) | (10,284,724 | ) | (39,289,543 | ) | |||||||||||
| (327,118 | ) | 262,391 | (578,496 | ) | 1,739,767 | 9,021,199 | (19,037,573 | ) | ||||||||||||||
| (935,456 | ) | (684,036 | ) | (525,470 | ) | (1,333,526 | ) | 1,398,853 | (11,271,828 | ) | ||||||||||||
| 7,807,336 | 8,491,372 | 12,581,897 | 13,915,423 | 131,001,324 | 142,273,152 | |||||||||||||||||
| $ | 6,871,880 | $ | 7,807,336 | $ | 12,056,427 | $ | 12,581,897 | $ | 132,400,177 | $ | 131,001,324 | |||||||||||
| $ | 35,656 | $ | (4,286 | ) | $ | (78,263 | ) | $ | (38,684 | ) | $ | 703,936 | $ | 650,260 | ||||||||
| 19,016 | 10,383 | 5,024 | 23,634 | 1,186,026 | 1,131,253 | |||||||||||||||||
| – | 45,454 | – | 207,536 | – | 81,017 | |||||||||||||||||
| (47,203 | ) | (35,392 | ) | (47,152 | ) | (102,417 | ) | (639,310 | ) | (2,356,716 | ) | |||||||||||
| (28,187 | ) | 20,445 | (42,128 | ) | 128,753 | 546,716 | (1,144,446 | ) | ||||||||||||||
| Semi-Annual Report | April 30, 2016 (Unaudited) | 35 |
| Statements of Changes in Net Assets |
| Black Oak Emerging Technology Fund | Live Oak Health Sciences Fund | |||||||||||||||
For The Six Months Ended April 30, 2016 (Unaudited) | For The Year Ended October 31 2015 | For The Six Months Ended April 30, 2016 (Unaudited) | For The Year Ended October 31 2015 | |||||||||||||
| INVESTMENT ACTIVITIES: | ||||||||||||||||
| Net investment income (loss) | $ | 132,111 | $ | (211,377 | ) | $ | 190,188 | $ | 334,234 | |||||||
| Net realized gain on securities sold | 229,891 | 1,354,785 | 496,840 | 6,911,069 | ||||||||||||
| Net change in unrealized appreciation (depreciation) of investment securities | (1,616,733 | ) | (969,145 | ) | 463,994 | (3,297,151 | ) | |||||||||
| Net Increase (Decrease) in Net Assets Resulting from Operations | (1,254,731 | ) | 174,263 | 1,151,022 | 3,948,152 | |||||||||||
| DISTRIBUTIONS TO SHAREHOLDERS: | ||||||||||||||||
| Net income | – | – | (364,201 | ) | (292,377 | ) | ||||||||||
| Realized capital gains | (944,209 | ) | – | (6,908,453 | ) | (4,756,063 | ) | |||||||||
| Total Distributions | (944,209 | ) | – | (7,272,654 | ) | (5,048,440 | ) | |||||||||
| CAPITAL SHARE TRANSACTIONS (IN DOLLARS): | ||||||||||||||||
| Shares issued | 1,116,953 | 1,652,031 | 11,142,088 | 6,305,893 | ||||||||||||
| Shares issued in lieu of cash distributions | – | – | – | 4,812,062 | ||||||||||||
| Shares redeemed | (1,834,092 | ) | (3,667,021 | ) | (3,380,565 | ) | (7,093,921 | ) | ||||||||
| Net Increase (Decrease) in Net Assets from Capital Share Transactions | (717,139 | ) | (2,014,990 | ) | 7,761,523 | 4,024,034 | ||||||||||
| Total Increase (Decrease) in Net Assets | (2,916,079 | ) | (1,840,727 | ) | 1,639,891 | 2,923,746 | ||||||||||
| NET ASSETS: | ||||||||||||||||
| Beginning of period | 32,298,080 | 34,138,807 | 53,172,230 | 50,248,484 | ||||||||||||
| End of period | $ | 29,382,001 | $ | 32,298,080 | $ | 54,812,121 | $ | 53,172,230 | ||||||||
| Including accumulated undistributed net investment income (loss) | $ | (64,319 | ) | $ | (196,430 | ) | $ | 101,047 | $ | 275,060 | ||||||
| SHARES ISSUED AND REDEEMED: | ||||||||||||||||
| Issued | 275,289 | 367,563 | 581,330 | 289,675 | ||||||||||||
| Issued in lieu of cash distributions | – | – | – | 236,117 | ||||||||||||
| Redeemed | (466,356 | ) | (817,061 | ) | (176,250 | ) | (327,298 | ) | ||||||||
| Net Increase (Decrease) in Share Transactions | (191,067 | ) | (449,498 | ) | 405,080 | 198,494 | ||||||||||
| 36 | 1-888-462-5386 | www.oakfunds.com |
| Financial Highlights |
For the Six Months Ended April 30, 2016 (Unaudited) | ||||
| WHITE OAK SELECT GROWTH FUND | ||||
| Net Asset Value Beginning of Period | $ | 65.21 | ||
| Income (Loss) From Operations | ||||
Net Investment Income (Loss)(a) | 0.46 | |||
Realized and Unrealized Gain or (Losses) in Securities(a) | (2.29 | ) | ||
| Total From Operations | (1.83 | ) | ||
| Less Distributions: | ||||
| Dividends from Net Investment Income | (0.42 | ) | ||
| Distributions from Capital Gains | – | |||
| Total Dividends and Distributions | (0.42 | ) | ||
| Net Asset Value End of Period | $ | 62.96 | ||
Total Return(b) | (2.84 | )%(c) | ||
| Net Assets End of Period (000) | $ | 247,307 | ||
| Ratio of Net Expenses to Average Net Assets | 1.07 | %(d) | ||
| Ratio of Net Investment Income (Loss) to Average Net Assets | 1.49 | %(d) | ||
| Ratio of Expenses to Average Net Assets (Excluding Waivers and/or Fees Paid Indirectly) | 1.07 | %(d) | ||
| Portfolio Turnover Rate | 10 | %(d) | ||
(a) | Per share calculations were performed using average shares for the period. |
(b) | Figures do not reflect the deduction of taxes the shareholder will pay on fund distributions or redemption of fund shares. |
(c) | Not annualized. |
(d) | Annualized. |
| 38 | 1-888-462-5386 | www.oakfunds.com |
Year Ended October 31, 2015 | Year Ended October 31, 2014 | Year Ended October 31, 2013 | Year Ended October 31, 2012 | Year Ended October 31, 2011 | ||||||||||||||
| $ | 60.34 | $ | 53.66 | $ | 42.50 | $ | 39.09 | $ | 37.56 | |||||||||
| 0.94 | 0.35 | 0.24 | 0.11 | (0.03 | ) | |||||||||||||
| 4.90 | 6.57 | 11.06 | 3.30 | 1.56 | ||||||||||||||
| 5.84 | 6.92 | 11.30 | 3.41 | 1.53 | ||||||||||||||
| (0.97 | ) | (0.24 | ) | (0.14 | ) | – | – | |||||||||||
| – | – | – | – | – | ||||||||||||||
| (0.97 | ) | (0.24 | ) | (0.14 | ) | – | – | |||||||||||
| $ | 65.21 | $ | 60.34 | $ | 53.66 | $ | 42.50 | $ | 39.09 | |||||||||
| 9.84 | % | 12.94 | % | 26.65 | % | 8.72 | % | 4.07 | % | |||||||||
| $ | 257,652 | $ | 256,221 | $ | 253,803 | $ | 228,596 | $ | 241,557 | |||||||||
| 1.06 | % | 1.10 | % | 1.12 | % | 1.16 | % | 1.14 | % | |||||||||
| 1.52 | % | 0.61 | % | 0.50 | % | 0.28 | % | (0.08 | )% | |||||||||
| 1.06 | % | 1.10 | % | 1.12 | % | 1.16 | % | 1.14 | % | |||||||||
| 9 | % | 1 | % | 89 | % | 86 | % | 12 | % | |||||||||
| Semi-Annual Report | April 30, 2016 (Unaudited) | 39 |
For the Six Months Ended April 30, 2016 (Unaudited) | ||||
| PIN OAK EQUITY FUND | ||||
| Net Asset Value Beginning of Period | $ | 52.45 | ||
| Income (Loss) From Operations | ||||
Net Investment Income (Loss)(a) | 0.21 | |||
Realized and Unrealized Gain or (Losses) in Securities(a) | (1.30 | ) | ||
| Total From Operations | (1.09 | ) | ||
| Less Distributions: | ||||
| Dividends from Net Investment Income | (0.40 | ) | ||
| Distributions from Capital Gains | (1.51 | ) | ||
| Total Dividends and Distributions | (1.91 | ) | ||
| Net Asset Value End of Period | $ | 49.45 | ||
Total Return(b) | (2.17 | )%(c) | ||
| Net Assets End of Period (000) | $ | 102,282 | ||
| Ratio of Net Expenses to Average Net Assets | 1.08 | %(d) | ||
| Ratio of Net Investment Income (Loss) to Average Net Assets | 0.88 | %(d) | ||
| Ratio of Expenses to Average Net Assets (Excluding Waivers and/or Fees Paid Indirectly) | 1.08 | %(d) | ||
| Portfolio Turnover Rate | 1 | %(d) | ||
(a) | Per share calculations were performed using average shares for the period. |
(b) | Figures do not reflect the deduction of taxes the shareholder will pay on fund distributions or redemption of fund shares. |
(c) | Not annualized. |
(d) | Annualized. |
| 40 | 1-888-462-5386 | www.oakfunds.com |
Year Ended October 31, 2015 | Year Ended October 31, 2014 | Year Ended October 31, 2013 | Year Ended October 31, 2012 | Year Ended October 31, 2011 | ||||||||||||||
| $ | 49.76 | $ | 43.07 | $ | 32.86 | $ | 28.52 | $ | 26.76 | |||||||||
| 0.54 | 0.30 | 0.26 | 0.21 | (0.05 | ) | |||||||||||||
| 2.77 | 6.67 | 10.18 | 4.13 | 1.90 | ||||||||||||||
| 3.31 | 6.97 | 10.44 | 4.34 | 1.85 | ||||||||||||||
| (0.53 | ) | (0.28 | ) | (0.23 | ) | – | (0.09 | ) | ||||||||||
| (0.09 | ) | – | – | – | – | |||||||||||||
| (0.62 | ) | (0.28 | ) | (0.23 | ) | – | (0.09 | ) | ||||||||||
| $ | 52.45 | $ | 49.76 | $ | 43.07 | $ | 32.86 | $ | 28.52 | |||||||||
| 6.76 | % | 16.25 | % | 31.94 | % | 15.22 | % | 6.92 | % | |||||||||
| $ | 98,976 | $ | 94,316 | $ | 81,408 | $ | 69,107 | $ | 64,214 | |||||||||
| 1.10 | % | 1.13 | % | 1.16 | % | 1.21 | % | 1.20 | % | |||||||||
| 1.09 | % | 0.64 | % | 0.70 | % | 0.68 | % | (0.16 | )% | |||||||||
| 1.10 | % | 1.13 | % | 1.16 | % | 1.21 | % | 1.20 | % | |||||||||
| 15 | % | 5 | % | 117 | % | 98 | % | 27 | % | |||||||||
| Semi-Annual Report | April 30, 2016 (Unaudited) | 41 |
For the Six Months Ended April 30, 2016 (Unaudited) | ||||
| ROCK OAK CORE GROWTH FUND | ||||
| Net Asset Value Beginning of Period | $ | 12.64 | ||
| Income (Loss) From Operations | ||||
Net Investment Income (Loss)(a) | 0.16 | |||
Realized and Unrealized Gain or (Losses) in Securities(a) | (0.76 | ) | ||
| Total From Operations | (0.60 | ) | ||
| Less Distributions: | ||||
| Dividends from Net Investment Income | (0.10 | ) | ||
| Distributions from Capital Gains | (0.29 | ) | ||
| Total Dividends and Distributions | (0.39 | ) | ||
| Net Asset Value End of Period | $ | 11.65 | ||
Total Return(c) | (4.83 | )%(d) | ||
| Net Assets End of Period (000) | $ | 6,872 | ||
| Ratio of Net Expenses to Average Net Assets | 1.25 | %(e) | ||
| Ratio of Net Investment Income (Loss) to Average Net Assets | 2.76 | %(e) | ||
| Ratio of Expenses to Average Net Assets (Excluding Waivers and/or Fees Paid Indirectly) | 1.65 | %(e) | ||
| Portfolio Turnover Rate | 7 | %(e) | ||
(a) | Per share calculations were performed using average shares for the period. |
(b) | Less than $0.005 per share. |
(c) | Figures do not reflect the deduction of taxes the shareholder will pay on fund distributions or redemption of fund shares. |
(d) | Not annualized. |
(e) | Annualized. |
| 42 | 1-888-462-5386 | www.oakfunds.com |
Year Ended October 31, 2015 | Year Ended October 31, 2014 | Year Ended October 31, 2013 | Year Ended October 31, 2012 | Year Ended October 31, 2011 | ||||||||||||||
| $ | 14.21 | $ | 15.04 | $ | 11.78 | $ | 11.64 | $ | 11.16 | |||||||||
| 0.00 | (b) | 0.05 | 0.07 | 0.02 | (0.04 | ) | ||||||||||||
| (0.54 | ) | 2.06 | 3.37 | 0.12 | 0.52 | |||||||||||||
| (0.54 | ) | 2.11 | 3.44 | 0.14 | 0.48 | |||||||||||||
| (0.04 | ) | (0.06 | ) | (0.05 | ) | – | – | |||||||||||
| (0.99 | ) | (2.88 | ) | (0.13 | ) | – | – | |||||||||||
| (1.03 | ) | (2.94 | ) | (0.18 | ) | – | – | |||||||||||
| $ | 12.64 | $ | 14.21 | $ | 15.04 | $ | 11.78 | $ | 11.64 | |||||||||
| (4.04 | )% | 15.89 | % | 29.51 | % | 1.20 | % | 4.30 | % | |||||||||
| $ | 7,807 | $ | 8,491 | $ | 7,495 | $ | 6,512 | $ | 6,890 | |||||||||
| 1.25 | % | 1.25 | % | 1.25 | % | 1.25 | % | 1.25 | % | |||||||||
| 0.03 | % | 0.33 | % | 0.53 | % | 0.14 | % | (0.35 | )% | |||||||||
| 1.52 | % | 1.58 | % | 1.65 | % | 1.79 | % | 1.65 | % | |||||||||
| 32 | % | 29 | % | 65 | % | 56 | % | 40 | % | |||||||||
| Semi-Annual Report | April 30, 2016 (Unaudited) | 43 |
For the Six Months Ended April 30, 2016 (Unaudited) | ||||
| RIVER OAK DISCOVERY FUND | ||||
| Net Asset Value Beginning of Period | $ | 13.76 | ||
| Income (Loss) From Operations | ||||
Net Investment Loss(a) | (0.03 | ) | ||
Realized and Unrealized Gain or (Losses) in Securities(a) | 0.12 | |||
| Total From Operations | 0.09 | |||
| Less Distributions: | ||||
| Dividends from Net Investment Income | (0.02 | ) | ||
| Distributions from Capital Gains | – | |||
| Total Dividends and Distributions | (0.02 | ) | ||
| Net Asset Value End of Period | $ | 13.83 | ||
Total Return(b) | 0.62 | %(c) | ||
| Net Assets End of Period (000) | $ | 12,056 | ||
| Ratio of Net Expenses to Average Net Assets | 1.35 | %(d) | ||
| Ratio of Net Investment Loss to Average Net Assets | (0.42 | )%(d) | ||
| Ratio of Expenses to Average Net Assets (Excluding Waivers and/or Fees Paid Indirectly) | 1.53 | %(d) | ||
| Portfolio Turnover Rate | 11 | %(d) | ||
(a) | Per share calculations were performed using average shares for the period. |
(b) | Figures do not reflect the deduction of taxes the shareholder will pay on fund distributions or redemption of fund shares. |
(c) | Not annualized. |
(d) | Annualized. |
| 44 | 1-888-462-5386 | www.oakfunds.com |
Year Ended October 31, 2015 | Year Ended October 31, 2014 | Year Ended October 31, 2013 | Year Ended October 31, 2012 | Year Ended October 31, 2011 | ||||||||||||||
| $ | 17.72 | $ | 17.70 | $ | 13.46 | $ | 12.76 | $ | 12.84 | |||||||||
| (0.04 | ) | (0.13 | ) | (0.08 | ) | (0.07 | ) | (0.08 | ) | |||||||||
| (0.13 | ) | 1.59 | 4.32 | 0.77 | 0.18 | |||||||||||||
| (0.17 | ) | 1.46 | 4.24 | 0.70 | 0.10 | |||||||||||||
| – | – | – | – | – | ||||||||||||||
| (3.79 | ) | (1.44 | ) | – | – | (0.18 | ) | |||||||||||
| (3.79 | ) | (1.44 | ) | – | – | (0.18 | ) | |||||||||||
| $ | 13.76 | $ | 17.72 | $ | 17.70 | $ | 13.46 | $ | 12.76 | |||||||||
| (1.27 | )% | 8.69 | % | 31.50 | % | 5.49 | % | 0.74 | % | |||||||||
| $ | 12,582 | $ | 13,915 | $ | 13,304 | $ | 10,766 | $ | 10,315 | |||||||||
| 1.35 | % | 1.35 | % | 1.35 | % | 1.35 | % | 1.35 | % | |||||||||
| (0.28 | )% | (0.71 | )% | (0.52 | )% | (0.54 | )% | (0.61 | )% | |||||||||
| 1.45 | % | 1.48 | % | 1.52 | % | 1.62 | % | 1.52 | % | |||||||||
| 17 | % | 96 | % | 63 | % | 72 | % | 92 | % | |||||||||
| Semi-Annual Report | April 30, 2016 (Unaudited) | 45 |
For the Six Months Ended April 30, 2016 (Unaudited) | ||||
| RED OAK TECHNOLOGY SELECT FUND | ||||
| Net Asset Value Beginning of Period | $ | 17.17 | ||
| Income (Loss) From Operations | ||||
| Net Investment Income (Loss)(a) | 0.19 | |||
Realized and Unrealized Gain or (Losses) in Securities(a) | (0.44 | ) | ||
| Total From Operations | (0.25 | ) | ||
| Less Distributions: | ||||
| Dividends from Net Investment Income | (0.19 | ) | ||
| Distributions from Capital Gains | (0.53 | ) | ||
| Total Dividends and Distributions | (0.72 | ) | ||
| Net Asset Value End of Period | $ | 16.20 | ||
| Total Return(b) | (1.52 | )%(c) | ||
| Net Assets End of Period (000) | $ | 132,400 | ||
| Ratio of Net Expenses to Average Net Assets | 1.12 | %(d) | ||
Ratio of Net Investment Income (Loss) to Average Net Assets | 2.37 | %(d) | ||
Ratio of Expenses to Average Net Assets (Excluding Waivers and/or Fees Paid Indirectly) | 1.12 | %(d) | ||
| Portfolio Turnover Rate | 5 | %(d) | ||
(a) | Per share calculations were performed using average shares for the period. |
(b) | Figures do not reflect the deduction of taxes the shareholder will pay on fund distributions or redemption of fund shares. |
(c) | Not annualized. |
(d) | Annualized. |
The accompanying notes are an integral part of the financial statements.
| 46 | 1-888-462-5386 | www.oakfunds.com |
Year Ended October 31, 2015 | Year Ended October 31, 2014 | Year Ended October 31, 2013 | Year Ended October 31, 2012 | Year Ended October 31, 2011 | ||||||||||||||
| $ | 16.22 | $ | 13.74 | $ | 9.79 | $ | 9.60 | $ | 8.67 | |||||||||
| 0.20 | 0.06 | 0.06 | 0.02 | (0.04 | ) | |||||||||||||
| 0.91 | 2.48 | 3.92 | 0.17 | 0.97 | ||||||||||||||
| 1.11 | 2.54 | 3.98 | 0.19 | 0.93 | ||||||||||||||
| (0.16 | ) | (0.06 | ) | (0.03 | ) | – | – | |||||||||||
| – | – | – | – | – | ||||||||||||||
| (0.16 | ) | (0.06 | ) | (0.03 | ) | – | – | |||||||||||
| $ | 17.17 | $ | 16.22 | $ | 13.74 | $ | 9.79 | $ | 9.60 | |||||||||
| 6.91 | % | 18.54 | % | 40.76 | % | 1.98 | % | 10.73 | % | |||||||||
| $ | 131,001 | $ | 142,273 | $ | 105,592 | $ | 64,882 | $ | 72,111 | |||||||||
| 1.11 | % | 1.15 | % | 1.23 | % | 1.30 | % | 1.32 | % | |||||||||
1.19 | % | 0.41 | % | 0.50 | % | 0.16 | % | (0.43 | )% | |||||||||
| 1.11 | % | 1.15 | % | 1.23 | % | 1.30 | % | 1.32 | % | |||||||||
| 4 | % | 7 | % | 15 | % | 83 | % | 24 | % | |||||||||
| Semi-Annual Report | April 30, 2016 (Unaudited) | 47 |
Financial Highlights
For the Six Months Ended April 30, 2016 (Unaudited) | ||||
| BLACK OAK EMERGING TECHNOLOGY FUND | ||||
| Net Asset Value Beginning of Period | $ | 4.26 | ||
| Income (Loss) From Operations | ||||
| Net Investment Income (Loss)(a) | 0.02 | |||
Realized and Unrealized Gain or (Losses) in Securities(a) | (0.18 | ) | ||
| Total From Operations | (0.16 | ) | ||
| Less Distributions: | ||||
| Dividends from Net Investment Income | – | |||
| Distributions from Capital Gains | (0.13 | ) | ||
| Total Dividends and Distributions | (0.13 | ) | ||
| Net Asset Value End of Period | $ | 3.97 | ||
| Total Return(b) | (3.96 | )%(c) | ||
| Net Assets End of Period (000) | $ | 29,382 | ||
| Ratio of Net Expenses to Average Net Assets | 1.32 | %(d) | ||
Ratio of Net Investment Income (Loss) to Average Net Assets | 0.89 | %(d) | ||
Ratio of Expenses to Average Net Assets (Excluding Waivers and/or Fees Paid Indirectly) | 1.32 | %(d) | ||
| Portfolio Turnover Rate | 26 | %(d) | ||
(a) | Per share calculations were performed using average shares for the period. |
(b) | Figures do not reflect the deduction of taxes the shareholder will pay on fund distributions or redemption of fund shares. |
(c) | Not annualized. |
(d) | Annualized. |
The accompanying notes are an integral part of the financial statements.
| 48 | 1-888-462-5386 | www.oakfunds.com |
Year Ended October 31, 2015 | Year Ended October 31, 2014 | Year Ended October 31, 2013 | Year Ended October 31, 2012 | Year Ended October 31, 2011 | ||||||||||||||
| $ | 4.25 | $ | 3.58 | $ | 2.67 | $ | 2.78 | $ | 2.94 | |||||||||
| (0.03 | ) | (0.01 | ) | (0.01 | ) | (0.03 | ) | (0.04 | ) | |||||||||
| 0.04 | 0.68 | 0.92 | (0.08 | ) | (0.12 | ) | ||||||||||||
| 0.01 | 0.67 | 0.91 | (0.11 | ) | (0.16 | ) | ||||||||||||
| – | – | – | – | – | ||||||||||||||
| – | – | – | – | – | ||||||||||||||
| – | – | – | – | – | ||||||||||||||
| $ | 4.26 | $ | 4.25 | $ | 3.58 | $ | 2.67 | $ | 2.78 | |||||||||
| 0.24 | % | 18.72 | % | 34.08 | % | (3.96 | )% | (5.44 | )% | |||||||||
| $ | 32,298 | $ | 34,139 | $ | 29,853 | $ | 25,050 | $ | 28,993 | |||||||||
| 1.25 | % | 1.31 | % | 1.35 | % | 1.35 | % | 1.35 | % | |||||||||
(0.61 | )% | (0.32 | )% | (0.19 | )% | (1.07 | )% | (1.16 | )% | |||||||||
| 1.25 | % | 1.31 | % | 1.39 | % | 1.44 | % | 1.35 | % | |||||||||
| 17 | % | 41 | % | 58 | % | 33 | % | 54 | % | |||||||||
| Semi-Annual Report | April 30, 2016 (Unaudited) | 49 |
For the Six Months Ended April 30, 2016 (Unaudited) | ||||
| LIVE OAK HEALTH SCIENCES FUND | ||||
| Net Asset Value Beginning of Period | $ | 21.65 | ||
| Income (Loss) From Operations | ||||
| Net Investment Income(a) | 0.07 | |||
Realized and Unrealized Gain in Securities(a) | 0.41 | |||
| Total From Operations | 0.48 | |||
| Less Distributions: | ||||
| Dividends from Net Investment Income | (0.15 | ) | ||
| Distributions from Capital Gains | (2.83 | ) | ||
| Total Dividends and Distributions | (2.98 | ) | ||
| Net Asset Value End of Period | $ | 19.15 | ||
| Total Return(b) | 2.17 | %(c) | ||
| Net Assets End of Period (000) | $ | 54,812 | ||
| Ratio of Net Expenses to Average Net Assets | 1.10 | %(d) | ||
Ratio of Net Investment Income to Average Net Assets | 0.74 | %(d) | ||
Ratio of Expenses to Average Net Assets (Excluding Waivers and/or Fees Paid Indirectly) | 1.10 | %(d) | ||
| Portfolio Turnover Rate | 13 | %(d) | ||
(a) | Per share calculations were performed using average shares for the period. |
(b) | Figures do not reflect the deduction of taxes the shareholder will pay on fund distributions or redemption of fund shares. |
(c) | Not annualized. |
(d) | Annualized. |
The accompanying notes are an integral part of the financial statements.
| 50 | 1-888-462-5386 | www.oakfunds.com |
Year Ended October 31, 2015 | Year Ended October 31, 2014 | Year Ended October 31, 2013 | Year Ended October 31, 2012 | Year Ended October 31, 2011 | ||||||||||||||
| $ | 22.25 | $ | 18.83 | $ | 14.67 | $ | 14.00 | $ | 12.84 | |||||||||
| 0.14 | 0.13 | 0.13 | 0.10 | 0.06 | ||||||||||||||
| 1.51 | 4.11 | 4.90 | 1.09 | 1.72 | ||||||||||||||
| 1.65 | 4.24 | 5.03 | 1.19 | 1.78 | ||||||||||||||
| (0.13 | ) | (0.13 | ) | (0.13 | ) | (0.07 | ) | (0.02 | ) | |||||||||
| (2.12 | ) | (0.69 | ) | (0.74 | ) | (0.45 | ) | (0.60 | ) | |||||||||
| (2.25 | ) | (0.82 | ) | (0.87 | ) | (0.52 | ) | (0.62 | ) | |||||||||
| $ | 21.65 | $ | 22.25 | $ | 18.83 | $ | 14.67 | $ | 14.00 | |||||||||
| 8.02 | % | 23.36 | % | 36.07 | % | 9.02 | % | 14.46 | % | |||||||||
| $ | 53,172 | $ | 50,248 | $ | 42,517 | $ | 32,967 | $ | 29,071 | |||||||||
| 1.08 | % | 1.12 | % | 1.15 | % | 1.24 | % | 1.25 | % | |||||||||
0.62 | % | 0.64 | % | 0.77 | % | 0.73 | % | 0.47 | % | |||||||||
| 1.08 | % | 1.12 | % | 1.15 | % | 1.24 | % | 1.25 | % | |||||||||
| 28 | % | 15 | % | 12 | % | 16 | % | 17 | % | |||||||||
| Semi-Annual Report | April 30, 2016 (Unaudited) | 51 |
As of April 30, 2016 (Unaudited)
1. ORGANIZATION:
The Oak Associates Funds (the “Trust”), a Massachusetts business trust, is registered under the Investment Company Act of 1940, as amended, as an open-end management investment company with seven diversified funds: White Oak Select Growth Fund, Pin Oak Equity Fund, Rock Oak Core Growth Fund and River Oak Discovery Fund, Red Oak Technology Select Fund, Black Oak Emerging Technology Fund and Live Oak Health Sciences Fund (collectively referred to as “Funds” and individually referred to as a “Fund”). The investment objective of each Fund is to seek long-term capital growth. The assets of each Fund are segregated, and a shareholder’s interest is limited to the Fund in which shares are held. The Funds’ prospectus provides a description of each Fund’s investment objective, policies and strategies.
2. SIGNIFICANT ACCOUNTING POLICIES:
The following is a summary of significant accounting policies followed by the Funds.
Use of Estimates – These policies are in conformity with U.S. generally accepted accounting principles (“GAAP”). Each Fund is considered an investment company for financial reporting purposes under GAAP. The preparation of financial statements in accordance with GAAP requires management to make estimates and assumptions that affect the reported amounts and disclosures in the financial statements during the reporting period. Management believes the estimates and security valuations are appropriate; however, actual results may differ from those estimates, and the security valuations reflected in the financial statements may differ from the value the Funds ultimately realize upon the sale of the securities.
Security Valuation – Investments in equity securities, which are traded on a national exchange, are stated at the last quoted sales price if readily available for such equity securities on each business day. Investments in equity securities, which are reported on the NASDAQ national market system are valued at the official closing price; other equity securities traded in the over-the-counter market and listed equity securities for which no sale was reported on that date are stated at the last quoted bid price. Debt obligations exceeding sixty days to maturity for which market quotations are readily available are valued at the most recently quoted bid price. Debt obligations with sixty days or less remaining until maturity may be valued at their amortized cost, which approximates market value. Investments in repurchase agreements are generally valued at par each business day.
Redeemable securities issued by open-end registered investment companies are valued at the investment company’s applicable net asset value (“NAV”).
Securities for which market prices are not “readily available” are valued in accordance with Fair Value Procedures established by the Funds’ Board of Trustees. The Funds’ Fair Value Procedures are implemented through a Fair Value Committee (the “Committee”) designated by the Funds’ Board of Trustees. Some of the more common reasons that may necessitate that a security be valued using Fair Value Procedures include: the security’s trading has been halted or suspended; the security has been de–listed from a national exchange; the security’s primary trading market is temporarily closed at a time when under normal conditions it would be open; the security has not been traded for an extended period of time; the security’s primary pricing source is not able or willing to provide a price; a significant event with respect to a security or securities has occurred after the close of the market or exchange on which the security or securities principally trades and before the time the Fund calculates net asset value; or trading of the security is subject to local government–imposed restrictions. When a security is valued in accordance with the Fair Value Procedures, the Committee will determine the value after taking into consideration relevant information reasonably available to the Committee.
| 52 | 1-888-462-5386 | www.oakfunds.com |
Notes to Financial Statements
As of April 30, 2016 (Unaudited)
Security Transactions and Investment Income – Security transactions are accounted for on the date the security is purchased or sold (trade date). Dividend income is recognized on the ex-dividend date. Interest income is recognized on the accrual basis. Withholding taxes on foreign dividends have been provided for in accordance with the Funds’ understanding of the applicable country’s tax rules and rates. Costs used in determining realized gains and losses on the sales of investment securities are those of the specific securities sold. If applicable, any foreign capital gains taxes are accrued, net of unrealized gains, and are payable upon the sale of such investments.
Expenses – Expenses that are directly related to one of the Funds are charged to that Fund. Expenses not directly billed to a particular Fund are allocated proportionally among all Funds daily in relation to net assets of each Fund or another reasonable allocation method.
Repurchase Agreements – The Funds invest in tri-party repurchase agreements. Securities held as collateral for tri-party repurchase agreements are maintained by the broker's custodian bank in a segregated account until maturity of the repurchase agreement. Provisions of the repurchase agreements and procedures adopted by the Board of Trustees require that the market value of the collateral, including accrued interest thereon, is sufficient in the event of default by the counterparty. A custody agreement in connection with the Master Repurchase Agreement defines eligible securities for collateral in relation to each repurchase agreement. Under the Master Repurchase Agreement, if the counterparty defaults and the value of the collateral declines or if the counter-party enters an insolvency proceeding, realization of the collateral by the Funds may be delayed or limited. At the period end, certain Funds had investments in repurchase agreements. The gross value and related collateral received for those investments are presented in each applicable Fund’s Schedule of Investments. The value of the related collateral received exceeded the value of the repurchase agreements as of the period end.
Master Agreements and Netting Arrangements –Certain Funds may participate in various repurchase agreements, such as, but not limited to Master Repurchase Agreements, which govern the terms of certain transactions with select counterparties (collectively “Master Agreements”). These Master Agreements generally include provisions for general obligations, agreements, representations, collateral and provisions for events of default or termination. These Master Agreements also include provisions for netting arrangements that help reduce credit and counterparty risk associated with relevant transactions. The netting arrangements are generally tied to credit related events that if triggered, would cause an event of default or termination giving a Fund or counterparty the right to terminate early and cause settlement, on a net basis, of all transactions under the applicable Master Agreement. In the event of an early termination or default event, the total market value exposure would be offset against collateral exchanged to date, which would result in a net receivable or payable that would be due from or to the counterparty. Credit related events include, but are not limited to, bankruptcy, failure to make timely payments, restructuring, obligation acceleration, obligation default, a material decline in net assets, decline in credit rating or repudiation/moratorium. An election made by a counterparty to terminate a transaction early under a Master Agreement could have an adverse impact on a Fund’s financial statements. Master Agreements can also help limit counterparty risk by requiring collateral posting arrangements at pre-arranged exposure levels. Collateral under the Master Agreements is usually in the form of cash, U.S. Treasury or U.S. Government agency securities, but may include other types of securities. There can be no assurance that the Master Agreements will be successful in limiting credit or counterparty risk.
| Semi-Annual Report | April 30, 2016 (Unaudited) | 53 |
Notes to Financial Statements
As of April 30, 2016 (Unaudited)
Dividends and Distributions to Shareholders – Dividends from net investment income are declared and paid to shareholders on an annual basis, as applicable. Net realized capital gains on sales of securities, if any, are distributed to shareholders at least annually. Distributions to shareholders are determined in accordance with income tax regulations and are recorded on the ex-dividend date.
Income and capital gain distributions are determined in accordance with federal income tax regulations, which may differ from GAAP. Therefore, the source of the Funds’ distributions may be shown in the accompanying financial statements as either from or in excess of net investment income or net realized gain, or from paid-in capital, depending upon the type of book/tax differences that may exist.
3. FAIR VALUE MEASUREMENTS:
A three-tier hierarchy has been established to classify fair value measurements for disclosure purposes. Inputs refer broadly to the assumptions that market participants would use in pricing the asset or liability including assumptions about risk. Inputs may be observable and unobservable. Observable inputs are inputs that reflect the assumptions market participants would use in pricing the asset or liability that are developed based on market data obtained from sources independent of the reporting entity. Unobservable inputs are inputs that reflect the reporting entity’s own assumptions about the assumptions market participants would use in pricing the asset or liability that are developed based on the best information available.
Various inputs are used in determining the value of each Fund’s investments as of the reporting period end. The designated input levels are not necessarily an indication of the risk or liquidity associated with these investments. These inputs are categorized in the following hierarchy under applicable financial accounting standards:
The three-tier hierarchy is summarized as follows:
Level 1 – Unadjusted quoted prices in active markets for identical assets or liabilities that a Fund has the ability to access at the measurement date, including but not limited to:
Equity Securities – investments for which market quotations are readily available that are valued at the last reported sale price or official closing price as reported by an independent pricing service on the primary market or exchange on which they are traded.
Investment Companies – investments in open-end registered investment companies which are valued at their closing NAV.
| 54 | 1-888-462-5386 | www.oakfunds.com |
Notes to Financial Statements
As of April 30, 2016 (Unaudited)
Level 2 – Quoted prices which are not active, quoted prices for similar assets or liabilities in active markets or inputs other than quoted prices that are observable (either directly or indirectly) for substantially the full term of the asset or liability, including but not limited to:
Repurchase Agreements – investments in overnight tri-party repurchase agreements which are valued at par.
All Securities – quoted prices for similar securities, including matrix pricing; quoted prices based on recently executed transactions; adjusted quoted prices based on observable and formulaic inputs; or, prices using other observable correlated market inputs.
Level 3 – Significant unobservable prices or inputs (including the Fund's own assumptions in determining the fair value of investments) where there is little or no market activity for the asset and liability at the measurement date, including but not limited to:
All Securities – modeling or manual pricing based on the Adviser’s own assumptions in determining fair value of investments; or, the significant use of other unobservable or relatively stale inputs within fair valuation.
The following is a summary of the inputs used to value each Fund’s investments as of April 30, 2016.
| Level 1 | Level 2 | Level 3 | Total | |||||||||||||
| WHITE OAK SELECT GROWTH FUND | ||||||||||||||||
| Common Stocks | $ | 246,361,527 | $ | – | $ | – | $ | 246,361,527 | ||||||||
| Short Term Investments | – | 934,021 | – | 934,021 | ||||||||||||
| Total | $ | 246,361,527 | $ | 934,021 | $ | – | $ | 247,295,548 | ||||||||
| Level 1 | Level 2 | Level 3 | Total | |||||||||||||
| PIN OAK EQUITY FUND | ||||||||||||||||
| Common Stocks | $ | 99,484,099 | $ | – | $ | – | $ | 99,484,099 | ||||||||
| Short Term Investments | – | 2,814,414 | – | 2,814,414 | ||||||||||||
| Total | $ | 99,484,099 | $ | 2,814,414 | $ | – | $ | 102,298,513 | ||||||||
| Level 1 | Level 2 | Level 3 | Total | |||||||||||||
| ROCK OAK CORE GROWTH FUND | ||||||||||||||||
| Common Stocks | $ | 6,317,053 | $ | – | $ | – | $ | 6,317,053 | ||||||||
| Short Term Investments | – | 557,498 | – | 557,498 | ||||||||||||
| Total | $ | 6,317,053 | $ | 557,498 | $ | – | $ | 6,874,551 | ||||||||
| Level 1 | Level 2 | Level 3 | Total | |||||||||||||
| RIVER OAK DISCOVERY FUND | ||||||||||||||||
| Common Stocks | $ | 11,074,378 | $ | – | $ | – | $ | 11,074,378 | ||||||||
| Short Term Investments | – | 995,736 | – | 995,736 | ||||||||||||
| Total | $ | 11,074,378 | $ | 995,736 | $ | – | $ | 12,070,114 | ||||||||
| Semi-Annual Report | April 30, 2016 (Unaudited) | 55 |
Notes to Financial Statements
As of April 30, 2016 (Unaudited)
| Level 1 | Level 2 | Level 3 | Total | |||||||||||||
| RED OAK TECHNOLOGY SELECT FUND | ||||||||||||||||
| Common Stocks | $ | 130,758,105 | $ | – | $ | – | $ | 130,758,105 | ||||||||
| Short Term Investments | – | 2,186,621 | – | 2,186,621 | ||||||||||||
| Total | $ | 130,758,105 | $ | 2,186,621 | $ | – | $ | 132,944,726 | ||||||||
| Level 1 | Level 2 | Level 3 | Total | |||||||||||||
| BLACK OAK EMERGING TECHNOLOGY FUND | ||||||||||||||||
| Common Stocks | $ | 27,891,886 | $ | – | $ | – | $ | 27,891,886 | ||||||||
| Short Term Investments | – | 1,508,662 | – | 1,508,662 | ||||||||||||
| Total | $ | 27,891,886 | $ | 1,508,662 | $ | – | $ | 29,400,548 | ||||||||
| Level 1 | Level 2 | Level 3 | Total | |||||||||||||
| LIVE OAK HEALTH SCIENCES FUND | ||||||||||||||||
| Common Stocks | $ | 53,370,243 | $ | – | $ | – | $ | 53,370,243 | ||||||||
| Short Term Investments | – | 2,016,405 | – | 2,016,405 | ||||||||||||
| Total | $ | 53,370,243 | $ | 2,016,405 | $ | – | $ | 55,386,648 | ||||||||
The above tables are presented by levels of disaggregation for each asset class. For detailed descriptions of the underlying industries, see the accompanying Schedules of Investments. There were no transfers into or out of Level I and 2 during the period. There were no Level 3 securities held during the period. It is the Funds' policy to recognize transfers into and out of levels at the end of the reporting period.
4. TRANSACTIONS WITH AFFILIATES:
Certain officers of the Trust are also officers of Oak Associates, ltd., investment adviser to the Funds (the “Adviser”), ALPS Fund Services, Inc. the administrator, fund accountant and transfer agent for the Funds (“ALPS”), and/or ALPS Distributors, Inc. the Funds’ distributor (the “Distributor”). Such officers are paid no fees by the Trust for serving as officers to the Trust. Pursuant to a PFO Services Agreement between ALPS and the Trust, ALPS provides a qualified person to serve as the Trust’s Principal Financial Officer (“PFO”). Principal financial officer fees payable pursuant to the terms of the PFO Services Agreement represent payments made by the Trust to ALPS and not to any individual employee of ALPS serving as PFO to the Trust.
5. ADMINISTRATION, TRANSFER AGENT AND DISTRIBUTION AGREEMENTS:
Administration: ALPS Fund Services, Inc. (the “Administrator”) serves as administrator to the Trust. The Trust and the Administrator have entered into an administration, bookkeeping and pricing services agreement (the “Administration Agreement”). Under the Administration Agreement, the Administrator provides the Trust with administrative services, including regulatory reporting, fund accounting services, and calculating the Funds’ daily net asset value, and provides all necessary office space, equipment, personnel and facilities for annual fee. The Administration Agreement provides that the Administrator shall not be liable for any error of judgment or mistake of law or for any loss suffered by the Trust in connection with the matters to which the Administration Agreement relates, except a loss resulting from willful misfeasance, bad faith or negligence on the part of the Administrator in the performance of its duties or from reckless disregard by it of its duties and obligations there under. The Administration Agreement shall remain in effect for a period of two years after the effective date of the agreement and shall continue in effect for successive periods of one year unless terminated by either party on not less than 60 days’ prior written notice to the other party.
| 56 | 1-888-462-5386 | www.oakfunds.com |
Notes to Financial Statements
As of April 30, 2016 (Unaudited)
Administrative Fee: ALPS Fund Services, Inc. (“ALPS”) provides the Funds with certain administrative personnel and services. The fees paid to ALPS are based on an annual rate of the daily average aggregate net assets of the Trust for the period. Fees are allocated to each Fund based on daily net assets (each Fund’s net assets as a percentage of total Trust net assets).
Transfer Agent: ALPS Fund Services, Inc. (the “Transfer Agent”) serves as transfer agent, dividend paying agent and shareholder service agent for the Trust under a transfer agency and services agreement with the Trust.
Distribution: The Trust and ALPS Distributors, Inc. (the “Distributor”), an affiliate of the Administrator, are parties to a distribution agreement (the “Distribution Agreement”) whereby the Distributor acts as principal underwriter for the Trust’s shares. The Distributor has agreed to use its best efforts in distributing Fund shares but is not obligated to sell any particular number of shares. The Distributor does not receive compensation under the Distribution Agreement for distribution of Fund shares.
6. INVESTMENT ADVISORY AND CUSTODIAN AGREEMENTS:
The Trust and the Adviser are parties to an Investment Advisory Agreement, under which the Adviser receives an annual fee equal to 0.74% of the average daily net assets of each Fund, except for the River Oak Discovery Fund for which the Adviser receives 0.90% of the average daily net assets of the Fund. The Adviser has agreed to contractually waive all or a portion of its fees (and to reimburse the Funds’ expenses if necessary) in order to limit operating expenses to not more than 1.25% of the average daily net assets of the White Oak Select Growth, Rock Oak Core Growth and Pin Oak Equity Funds, and 1.35% of the average daily net assets of the River Oak Discovery, Red Oak Technology Select, Black Oak Emerging Technology and Live Oak Health Sciences Funds for one year periods. The Adviser contractually agreed to continue this arrangement through February 28, 2017.*
The following table lists the contractual advisory fees and fee waivers that were in effect during the six months ended April 30, 2016:
| Advisory Fees as a Percentage of Average Net Assets | |||
| Fund | Annual Rate | Fee Waiver* | Net Annual Rate |
| White Oak Select Growth Fund | 0.74% | 0.74% | |
| Pin Oak Equity Fund | 0.74% | 0.74% | |
| Rock Oak Core Growth Fund | 0.74% | (0.40%) | 0.34% |
| River Oak Discovery Fund | 0.90% | (0.18%) | 0.72% |
| Red Oak Technology Select Fund | 0.74% | 0.74% | |
| Black Oak Emerging Technology Fund | 0.74% | 0.74% | |
| Live Oak Health Sciences Fund | 0.74% | 0.74% | |
U.S. Bank N.A. acts as custodian (the “Custodian”) for the Funds.
| Semi-Annual Report | April 30, 2016 (Unaudited) | 57 |
Notes to Financial Statements
As of April 30, 2016 (Unaudited)
7. INVESTMENT TRANSACTIONS:
The cost of security purchases and the proceeds from security sales, other than short–term investments, for the six months ended April 30, 2016, were as follows:
| Fund | Purchases | Sales | ||||||
| White Oak Select Growth Fund | $ | 12,810,432 | $ | 12,787,752 | ||||
| Pin Oak Equity Fund | 8,188,801 | 383,371 | ||||||
| Rock Oak Core Growth Fund | 202,186 | 1,149,352 | ||||||
| River Oak Discovery Fund | 612,411 | 1,368,436 | ||||||
| Red Oak Technology Select Fund | 7,316,888 | 3,149,587 | ||||||
| Black Oak Emerging Technology Fund | 3,727,424 | 4,758,565 | ||||||
| Live Oak Health Sciences Fund | 4,485,568 | 3,407,302 | ||||||
8. FEDERAL INCOME TAXES AND TAX BASIS INFORMATION:
Each of the Funds is classified as a separate taxable entity for Federal income tax purposes. Each of the Funds intends to continue to qualify as a separate “regulated investment company” under Sub–chapter M of the Internal Revenue Code of 1986, as amended, and make the requisite distributions to shareholders that will be sufficient to relieve it from Federal income tax and Federal excise tax. Therefore, no Federal tax provision is required.
The amounts of dividends from net investment income and distributions from net realized capital gains are determined in accordance with Federal income tax regulations, which may differ from those amounts determined under accounting principles generally accepted in the United States of America. These book/tax differences are either temporary or permanent in nature. The character of dividends from net investment income or distributions from net realized gains made during the year, and the timing may differ from the year that the income or realized gains (losses) were recorded by the Funds. To the extent these differences are permanent, adjustments are made to the appropriate equity accounts in the period that the differences arise. These differences are primarily due to differences in the treatment of net operating losses and certain other investments.
The amounts and characteristics of tax basis distributions and composition of distributable earnings/(accumulated losses) are finalized at fiscal year-end. Accordingly, tax basis balances have not been determined as of April 30, 2016.
The tax character of the distributions paid by the Funds for the fiscal year ended October 31, 2015 is as follows:
Ordinary Income | Long-Term Capital Gain | Total | ||||||||||
| White Oak Select Growth Fund | $ | 4,050,002 | $ | – | $ | 4,050,002 | ||||||
| Pin Oak Equity Fund | 1,190,590 | – | 1,190,590 | |||||||||
| Rock Oak Core Growth Fund | 26,752 | 588,577 | 615,329 | |||||||||
| River Oak Discovery Fund | 647,427 | 2,308,561 | 2,955,988 | |||||||||
| Red Oak Technology Select Fund | 1,415,013 | – | 1,415,013 | |||||||||
| Black Oak Emerging Technology Fund | – | – | – | |||||||||
| Live Oak Health Sciences Fund | 329,908 | 4,718,532 | 5,048,440 | |||||||||
| 58 | 1-888-462-5386 | www.oakfunds.com |
| White Oak Select Growth Fund | Pin Oak Equity Fund | Rock Oak Core Growth Fund | River Oak Discovery Fund | Red Oak Technology Select Fund | Black Oak Emerging Technology Fund | Live Oak Health Sciences Fund | ||||||||||||||||||||||
| 2016 | $ | 15,301,273 | $ | – | $ | – | $ | – | $ | – | $ | – | $ | – | ||||||||||||||
| 2017 | $ | 9,015,798 | $ | – | $ | – | $ | – | $ | – | $ | – | $ | – | ||||||||||||||
| Total | $ | 24,317,071 | $ | – | $ | – | $ | – | $ | – | $ | – | $ | – | ||||||||||||||
| Amount | ||||
| Rock Oak Core Growth Fund | $ | 4,286 | ||
| River Oak Discovery Fund | 52,846 | |||
| Black Oak Emerging Technology Fund | 196,430 | |||
| Federal Tax Cost | Aggregate Gross Appreciation | Aggregate Gross Depreciation | Net Appreciation | |||||||||||||
| White Oak Select Growth Fund | $ | 225,971,315 | $ | 42,964,939 | $ | (21,640,706 | ) | $ | 21,324,233 | |||||||
| Pin Oak Equity Fund | 89,700,631 | 17,111,920 | (4,514,038 | ) | 12,597,882 | |||||||||||
| Rock Oak Core Growth Fund | 5,635,044 | 1,710,606 | (471,099 | ) | 1,239,507 | |||||||||||
| River Oak Discovery Fund | 9,519,699 | 3,309,595 | (759,180 | ) | 2,550,415 | |||||||||||
| Red Oak Technology Select Fund | 103,928,094 | 35,693,464 | (6,676,832 | ) | 29,016,632 | |||||||||||
| Black Oak Emerging Technology Fund | 22,614,230 | 7,326,788 | (540,470 | ) | 6,786,318 | |||||||||||
| Live Oak Health Sciences Fund | 37,479,235 | 18,723,793 | (816,380 | ) | 17,907,413 | |||||||||||
| Semi-Annual Report | April 30, 2016 (Unaudited) | 59 |
| 60 | 1-888-462-5386 | www.oakfunds.com |
| Semi-Annual Report | April 30, 2016 (Unaudited) | 61 |
| 62 | 1-888-462-5386 | www.oakfunds.com |
| Semi-Annual Report | April 30, 2016 (Unaudited) | 63 |
| 64 | 1-888-462-5386 | www.oakfunds.com |
| • | Trade Online |
| • | Access and Update Account Information |
| • | Go Paperless with eDelivery |
| • | View and download account history |
| • | Establish a systematic investment plan |
 | P.O. Box 8233 Denver, CO 80201-8233 |
| (a) | Schedule of Investments in securities of unaffiliated issuers as of the close of the reporting period is included as part of the Report to Stockholders filed under Item 1 of this Form N-CSRS. |
| (b) | Not applicable. |
| By | /s/ Charles A. Kiraly | |
Charles A. Kiraly | ||
President | ||
| Date: | July 5, 2016 |
| By | /s/ Charles A. Kiraly | |
Charles A. Kiraly | ||
President and Principal Executive Officer | ||
| Date: | July 5, 2016 |
| By | /s/ Pete Greenly | |
Pete Greenly | ||
Treasurer and Principal Financial Officer | ||
| Date: | July 5, 2016 |