UNITED STATES
SECURITIES AND EXCHANGE COMMISSION
Washington, D.C. 20549
FORMN-CSR
CERTIFIED SHAREHOLDER REPORT OF REGISTERED MANAGEMENT INVESTMENT COMPANIES
Investment Company Act file number:811-08603
Name of Fund: BlackRock Debt Strategies Fund, Inc. (DSU)
Fund Address: 100 Bellevue Parkway, Wilmington, DE 19809
Name and address of agent for service: John M. Perlowski, Chief Executive Officer, BlackRock Debt Strategies Fund, Inc., 55 East 52nd Street, New York, NY 10055
Registrant’s telephone number, including area code: (800)882-0052, Option 4
Date of fiscal year end: 02/28/2020
Date of reporting period: 08/31/2019
Item 1 – Report to Stockholders
AUGUST 31, 2019
| | |
SEMI-ANNUAL REPORT (UNAUDITED) | |  |
BlackRock Debt Strategies Fund, Inc. (DSU)
Beginning on January 1, 2021, as permitted by regulations adopted by the Securities and Exchange Commission, paper copies of the Fund’s shareholder reports will no longer be sent by mail, unless you specifically request paper copies of the reports from BlackRock or from your financial intermediary, such as a broker-dealer or bank. Instead, the reports will be made available on a website, and you will be notified by mail each time a report is posted and provided with a website link to access the report.
You may elect to receive all future reports in paper free of charge. If you hold accounts directly with BlackRock, you can call Computershare at(800) 699-1236 to request that you continue receiving paper copies of your shareholder reports. If you hold accounts through a financial intermediary, you can follow the instructions included with this disclosure, if applicable, or contact your financial intermediary to request that you continue to receive paper copies of your shareholder reports. Please note that not all financial intermediaries may offer this service. Your election to receive reports in paper will apply to all funds advised by BlackRock Advisors, LLC or its affiliates, or all funds held with your financial intermediary, as applicable.
If you already elected to receive shareholder reports electronically, you will not be affected by this change and you need not take any action. You may elect to receive electronic delivery of shareholder reports and other communications by contacting your financial intermediary, if you hold accounts through a financial intermediary. Please note that not all financial intermediaries may offer this service.
|
| Not FDIC Insured • May Lose Value • No Bank Guarantee |
Supplemental Information (unaudited)
Section 19(a) Notices
The amounts and sources of distributions reported are estimates and are being provided pursuant to regulatory requirements and are not being provided for tax reporting purposes. The actual amounts and sources for tax reporting purposes will depend upon the Fund’s investment experience during the year and may be subject to changes based on tax regulations. Shareholders will receive a Form1099-DIV each calendar year that will inform them how to report these distributions for federal income tax purposes.
August 31, 2019
| | | | | | | | | | | | | | | | | | | | | | | | | | | | | | | | | | | | | | | | |
| | | Total Cumulative Distributions
for the Fiscal Period | | | % Breakdown of the Total Cumulative
Distributions for the Fiscal Period | |
| | | Net
Investment
Income | | | Net Realized
Capital Gains
Short Term | | | Net Realized
Capital Gains
Long Term | | | Return of
Capital | | | Total Per
Common
Share | | | Net
Investment
Income | | | Net Realized
Capital Gains
Short Term | | | Net Realized
Capital Gains
Long Term | | | Return of
Capital | | | Total Per
Common
Share | |
DSU | | $ | 0.411000 | | | $ | — | | | $ | — | | | $ | — | | | $ | 0.411000 | | | | 100 | % | | | 0 | % | | | 0 | % | | | 0 | % | | | 100 | % |
Section 19(a) notices for the Fund, as applicable, are available on the BlackRock website athttp://www.blackrock.com.
Section 19(b) Disclosure
On September 5, 2019, the Fund, acting pursuant to a U.S. Securities and Exchange Commission (“SEC”) exemptive order and with the approval of each Fund’s Board of Directors (the “Board”), adopted a managed distribution plan, consistent with its investment objectives and policies to support a level distribution of income, capital gains and/or return of capital (the “Plan”). In accordance with the Plan, starting in October 2019, the Fund will distribute a fixed amount of $0.0711 per share on a monthly basis.
The fixed amount distributed per share is subject to change at the discretion of the Board. Under its Plan, the Fund will distribute all available investment income to its shareholders as required by the Internal Revenue Code of 1986, as amended (the “Code”). If sufficient income (inclusive of net investment income and short-term capital gains) is not earned on a monthly basis, the Fund will distribute long-term capital gains and/or return of capital to shareholders in order to maintain a level distribution. Each monthly distribution to shareholders is expected to be at the fixed amount established by the Board; however, the Fund may make additional distributions from time to time, including additional capital gain distributions at the end of the taxable year, if required to meet requirements imposed by the Code and/or the Investment Company Act of 1940, as amended (the “1940 Act”).
Shareholders should not draw any conclusions about the Fund’s investment performance from the amount of these distributions or from the terms of the Plan. The Fund’s total return performance is presented in its financial highlights table.
The Board may amend, suspend or terminate the Plan at any time without prior notice to the Fund’s shareholders if it deems such actions to be in the best interests of the Fund or its shareholders. The suspension or termination of the Plan could have the effect of creating a trading discount (if the Fund’s stock is trading at or above net asset value) or widening an existing trading discount. The Fund is subject to risks that could have an adverse impact on its ability to maintain level distributions. Examples of potential risks include, but are not limited to, economic downturns impacting the markets, changes in interest rates, decreased market volatility, companies suspending or decreasing corporate dividend distributions and changes in the Code.
| | |
| 2 | | 2019 BLACKROCK SEMI-ANNUAL REPORTTO SHAREHOLDERS |
The Markets in Review
Dear Shareholder,
Investment performance in the 12 months ended August 31, 2019 was a tale of two markets. The first half of the reporting period was characterized by restrictive monetary policy, deteriorating economic growth, equity market volatility, and rising fear of an imminent recession. During the second half of the reporting period, stocks and bonds rebounded sharply, as restrained inflation and weak economic growth led the U.S. Federal Reserve (the “Fed”) to stop raising interest rates, which led to broad-based optimism that stimulative monetary policy could help forestall a recession.
After the dust settled, the U.S. equity and bond markets posted mixed returns while weathering significant volatility. Less volatile U.S. large cap equities and U.S. bonds advanced, while equities at the high end of the risk spectrum — emerging markets, international developed, and U.S. small cap — posted negative returns.
Fixed-income securities delivered strong returns with relatively low volatility, as interest rates declined (and bond prices rose). Longer-term U.S. Treasury yields declined further than short-term Treasury yields. This led to positive returns for U.S. Treasuries across the maturity spectrum and a substantial flattening of the yield curve. Investment grade and high yield corporate bonds also posted positive returns, as the credit fundamentals in corporate markets remained relatively solid.
In the U.S. equity market, volatility spiked in late 2018, as a wide range of risks were brought to bear on markets, ranging from rising interest rates and slowing global growth to heightened trade tensions and political turmoil. These risks manifested in a broad-basedsell-off in December, leading to the worst December performance on record since 1931.
Volatility also rose in emerging markets, as the rising U.S. dollar and higher interest rates in the U.S. disrupted economic growth abroad. U.S.-China trade relations and debt concerns adversely affected the Chinese stock market, particularly in mainland China, while Turkey and Argentina became embroiled in currency crises, largely due to hyperinflation in both countries. An economic slowdown in Europe and ongoing uncertainty about Brexit led to modest performance for European equities.
As equity performance faltered and global economic growth slowed, the Fed shifted to a more patient perspective on the economy in January 2019. The Fed left interest rates unchanged for six months, then lowered interest rates for the first time in 11 years in July 2019. Similarly, the European Central Bank and the Bank of Japan signaled a continuation of accommodative monetary policy, while China committed to looser credit conditions and an increase in fiscal spending.
The outpouring of global economic stimulus led to a sharp rally in risk assets throughout the world. Hopes continued to remain high thereafter, as the current economic expansion became the longest in U.S. history. Looking ahead, markets are pricing in additional rate cuts by the Fed over the next year, as investors anticipate a steady shift toward more stimulative monetary policy.
We expect a slowing expansion with additional room to run, as opposed to an economic recession. However, escalating trade tensions and the resulting disruptions in global supply chains have become the greatest risk to the global expansion.
We believe U.S. and emerging market equities remain relatively attractive. Within U.S. equities, companies with high-quality earnings and strong balance sheets offer the most attractive risk/rewardtrade-off. For bonds, U.S. Treasuries are likely to help buffer against volatility in risk assets, while income from other types of bonds can continue to offer steady returns.
In this environment, investors need to think globally, extend their scope across a broad array of asset classes, and be nimble as market conditions change. We encourage you to talk with your financial advisor and visitblackrock.com for further insight about investing in today’s markets.
Sincerely,

Rob Kapito
President, BlackRock Advisors, LLC

Rob Kapito
President, BlackRock Advisors, LLC
| | | | |
| Total Returns as of August 31, 2019 |
| | | 6-month | | 12-month |
U.S. large cap equities
(S&P 500® Index) | | 6.15% | | 2.92% |
U.S. small cap equities
(Russell 2000® Index) | | (4.43) | | (12.89) |
International equities
(MSCI Europe, Australasia, Far East Index) | | 0.34 | | (3.26) |
Emerging market equities
(MSCI Emerging Markets Index) | | (4.68) | | (4.36) |
3-month Treasury bills
(ICE BofAML3-Month U.S. Treasury Bill Index) | | 1.25 | | 2.36 |
U.S. Treasury securities
(ICE BofAML10-Year U.S. Treasury Index) | | 12.18 | | 15.06 |
U.S. investment grade bonds
(Bloomberg Barclays U.S. Aggregate Bond Index) | | 8.02 | | 10.17 |
Tax-exempt municipal bonds
(S&P Municipal Bond Index) | | 5.92 | | 8.26 |
U.S. high yield bonds
(Bloomberg Barclays U.S. Corporate High Yield 2% Issuer Capped Index) | | 4.46 | | 6.56 |
| Past performance is no guarantee of future results. Index performance is shown for illustrative purposes only. You cannot invest directly in an index. |
| | | | |
| THIS PAGEISNOT PARTOF YOUR FUND REPORT | | | 3 | |
Table of Contents
| | |
| Fund Summary as of August 31, 2019 | | BlackRock Debt Strategies Fund, Inc. |
Fund Overview
BlackRock Debt Strategies Fund, Inc.’s (DSU) (the “Fund”) primary investment objective is to seek to provide current income by investing primarily in a diversified portfolio of U.S. companies’ debt instruments, including corporate loans, which are rated in the lower rating categories of the established rating services (BBB or lower by S&P Global Ratings or Baa or lower by Moody’s Investors Service, Inc. (“Moody’s”)) or unrated debt instruments, which are in the judgment of the investment adviser of equivalent quality. Corporate loans include senior and subordinated corporate loans, both secured and unsecured. The Fund may invest directly in debt instruments or synthetically through the use of derivatives. The Fund’s secondary investment objective is to provide capital appreciation.
No assurance can be given that the Fund’s investment objectives will be achieved.
Fund Information
| | |
Symbol on New York Stock Exchange (“NYSE”) | | DSU |
Initial Offering Date | | March 27, 1998 |
Current Distribution Rate on Closing Market Price as of August 31, 2019 ($10.70)(a) | | 7.68% |
Current Monthly Distribution per Common Share(b) | | $0.0685 |
Current Annualized Distribution per Common Share(b) | | $0.8220 |
Leverage as of August 31, 2019(c) | | 30% |
| | (a) | Current distribution rate on closing market price is calculated by dividing the current annualized distribution per share by the closing market price. The current distribution rate consists of income, net realized gains and/or a return of capital. Past performance does not guarantee future results. | |
| | (b) | The monthly distribution per Common Share, declared on October 1, 2019 was increased to $0.0711 per share. The current distribution rate on closing market price, current monthly distribution per Common Share, and current annualized distribution per Common Share do not reflect the new distribution rate. The new distribution rate is not constant and is subject to change in the future. | |
| | (c) | Represents bank borrowings outstanding as a percentage of total managed assets, which is the total assets of the Fund (including any assets attributable to borrowings) minus the sum of liabilities (other than borrowings representing financial leverage). Does not reflect derivatives or other instruments that may give rise to economic leverage. For a discussion of leveraging techniques utilized by the Fund, please see The Benefits and Risks of Leveraging and Derivative Financial Instruments on page 7. | |
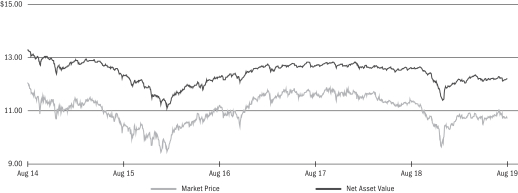
Market Price and Net Asset Value Per Share Summary
| | | | | | | | | | | | | | | | | | | | |
| | | 08/31/19 | | | 02/28/19 | | | Change | | | High | | | Low | |
Market Price | | $ | 10.70 | | | $ | 10.78 | | | | (0.74 | )% | | $ | 11.02 | | | $ | 10.46 | |
Net Asset Value | | | 12.18 | | | | 12.16 | | | | 0.16 | | | | 12.32 | | | | 12.03 | |
Market Price and Net Asset Value History For the Past Five Years
| | |
| Fund Summary as of August 31, 2019 (continued) | | BlackRock Debt Strategies Fund, Inc. |
Performance and Portfolio Management Commentary
Returns for the period ended August 31, 2019 were as follows:
| | | | | | | | | | | | | | | | | | | | |
| | | 6-Month
Total Returns | | | | | | Average Annual Total Returns | |
| | | | | | 1 Year | | | 3 Years | | | 5 Years | |
Fund at NAV(a)(b) | | | 4.04 | % | | | | | | | 4.56 | % | | | 7.36 | % | | | 5.76 | % |
Fund at Market Price(a)(b) | | | 3.10 | | | | | | | | 1.90 | | | | 6.13 | | | | 5.08 | |
Reference Benchmark(c) | | | 3.25 | | | | | | | | 4.95 | | | | 5.42 | | | | 4.32 | |
Bloomberg Barclays U.S. Corporate High Yield 2% Issuer Capped Index(d) | | | 4.46 | | | | | | | | 6.56 | | | | 6.17 | | | | 4.86 | |
S&P/LSTA Leveraged Loan Index(e) | | | 2.03 | | | | | | | | 3.33 | | | | 4.66 | | | | 3.76 | |
| | (a) | All returns reflect reinvestment of dividends and/or distributions at actual reinvestment prices. Performance results reflect the Fund’s use of leverage. | |
| | (b) | The Fund’s discount to NAV widened during the period, which accounts for the difference between performance based on market price and performance based on NAV. | |
| | (c) | The Reference Benchmark is comprised of the Bloomberg Barclays U.S. Corporate High Yield 2% Issuer Capped Index (50%) and the S&P/LSTA Leveraged Loan Index (50%). The Reference Benchmark’s index content and weightings may have varied over past periods. | |
| | (d) | An unmanaged index comprised of issuers that meet the following criteria: at least $150 million par value outstanding; maximum credit rating of Ba1; at least one year to maturity; and no issuer represents more than 2% of the index. | |
| | (e) | An unmanaged market value-weighted index designed to measure the performance of the U.S. leveraged loan market based upon market weightings, spreads and interest payments. | |
Performance results may include adjustments made for financial reporting purposes in accordance with U.S. generally accepted accounting principles.
Past performance is not indicative of future results.
DSU is presenting the Reference Benchmark to accompany fund performance. The Reference Benchmark is presented for informational purposes only, as the Fund is actively managed and does not seek to track or replicate the performance of the Reference Benchmark or any other index. The portfolio investments of the Fund may differ substantially from the securities that comprise the indices within the Reference Benchmark, which may cause the Fund’s performance to differ materially from that of the Reference Benchmark. The Fund employs leverage as part of its investment strategy, which may change over time at the discretion of BlackRock Advisors, LLC (the “Manager”) as market and other conditions warrant. In contrast, the Reference Benchmark is not adjusted for leverage. Therefore, leverage generally may result in the Fund outperforming the Reference Benchmark in rising markets and underperforming in declining markets. The Board considers additional factors to evaluate the Fund’s performance, such as the performance of the Fund relative to a peer group of funds, a leverage-adjusted benchmark and/or other information provided by the Manager.
More information about the historical performance can be found in the “Closed End Funds” section ofhttp://www.blackrock.com.
The following discussion relates to the Fund’s absolute performance based on NAV:
What factors influenced performance?
For the semi-annual period, the Fund’s positioning within floating rate loan interests (“bank loans”) made the largest contribution to the Fund’s return, followed by holdings in high yield bonds. Sector positioning within technology, chemicals and consumer cyclical services represented the three largest contributors, though holdings in most sectors added to Fund performance given strong overall market performance. All credit rating segments were positive throughout the period, withB-rated credits the largest contributors, followed byBB-rated issues.
During the period, the Fund’s equity holdings modestly weighed on Fund performance from an asset allocation perspective, followed by holdings in high yield credit default swaps. From a sector perspective, the Fund’s modest exposure to oil field services, independent energy and integrated energy issues detracted from the Fund’s return, as energy-related sectors came under pressure during the period.
Describe recent portfolio activity.
The Fund added to its bank loan positioning relative to both high yield bonds and collateralized loan obligations (“CLOs”) over the period. This brought the Fund’s total loan exposure to approximately 80% of the portfolio, with high yield bonds at approximately 17% and no exposure to CLOs by period end. Sector expressions remained broadly consistent over the past several quarters, though single-name positioning is arguably more important to portfolio performance. The Fund’stop-five issuer positions comprised approximately 8.5% of portfolio assets at the close of the period.
Describe portfolio positioning at period end.
At period end, bank loans remained the largest allocation in the portfolio, with high yield bonds also representing a meaningful position. The Fund’s largest positions were within the technology, consumer cyclical services and health care sectors. By contrast, the Fund had less exposure to communications names — specifically within wirelines and cable — as well as less exposure to retailers and home construction. Within energy, the Fund emphasized higher quality issuers within the independent energy sector, and approached more cyclical names within oil field services with caution. The Fund’s core positioning remained betweenBB-rated andB-rated issues, with a higher allocation toB-rated names at period end. The Fund also held a smallCCC-rated allocation.
The views expressed reflect the opinions of BlackRock as of the date of this report and are subject to change based on changes in market, economic or other conditions. These views are not intended to be a forecast of future events and are no guarantee of future results.
| | |
| 6 | | 2019 BLACKROCK SEMI-ANNUAL REPORTTO SHAREHOLDERS |
| | |
| Fund Summary as of August 31, 2019 (continued) | | BlackRock Debt Strategies Fund, Inc. |
Overview of the Fund’s Total Investments
PORTFOLIO COMPOSITION
| | | | | | | | |
| | | 08/31/19 | | | 02/28/19 | |
Floating Rate Loan Interests | | | 79 | % | | | 70 | % |
Corporate Bonds | | | 17 | | | | 26 | |
Investment Companies | | | 3 | | | | 1 | |
Preferred Securities | | | 1 | | | | 1 | |
Asset-Backed Securities | | | — | | | | 2 | |
Other | | | — | (a) | | | — | (a) |
| | (a) | Includes a less than 1% holding in each of the following investment types: Common Stocks, Options Purchased, Other Interests and Warrants. | |
CREDIT QUALITY ALLOCATION (b)
| | | | | | | | |
| | | 08/31/19 | | | 02/28/19 | |
BBB/Baa | | | 7 | % | | | 9 | % |
BB/Ba | | | 31 | | | | 33 | |
B | | | 56 | | | | 50 | |
CCC/Caa | | | 3 | | | | 5 | |
N/R | | | 3 | | | | 3 | |
| | (b) | For financial reporting purposes, credit quality ratings shown above reflect the highest rating assigned by either S&P Global Ratings or Moody’s if ratings differ. These rating agencies are independent, nationally recognized statistical rating organizations and are widely used. Investment grade ratings are credit ratings of BBB/Baa or higher. Below investment grade ratings are credit ratings of BB/Ba or lower. Investments designated N/R are not rated by either rating agency. Unrated investments do not necessarily indicate low credit quality. Credit quality ratings are subject to change. | |
The Benefits and Risks of Leveraging
The Fund may utilize leverage to seek to enhance the distribution rate on, and net asset value (“NAV”) of, its common shares (“Common Shares”). However, there is no guarantee that these objectives can be achieved in all interest rate environments.
In general, the concept of leveraging is based on the premise that the financing cost of leverage, which is based on short-term interest rates, is normally lower than the income earned by the Fund on its longer-term portfolio investments purchased with the proceeds from leverage. To the extent that the total assets of the Fund (including the assets obtained from leverage) are invested in higher-yielding portfolio investments, the Fund’s shareholders benefit from the incremental net income. The interest earned on securities purchased with the proceeds from leverage (after paying the leverage costs) is paid to shareholders in the form of dividends, and the value of these portfolio holdings (less the leverage liability) is reflected in the per share NAV.
To illustrate these concepts, assume the Fund’s capitalization is $100 million and it utilizes leverage for an additional $30 million, creating a total value of $130 million available for investment in longer-term income securities. If prevailing short-term interest rates are 3% and longer-term interest rates are 6%, the yield curve has a strongly positive slope. In this case, the Fund’s financing costs on the $30 million of proceeds obtained from leverage are based on the lower short-term interest rates. At the same time, the securities purchased by the Fund with the proceeds from leverage earn income based on longer-term interest rates. In this case, the Fund’s financing cost of leverage is significantly lower than the income earned on the Fund’s longer-term investments acquired from such leverage proceeds, and therefore the holders of Common Shares (“Common Shareholders”) are the beneficiaries of the incremental net income.
However, in order to benefit shareholders, the return on assets purchased with leverage proceeds must exceed the ongoing costs associated with the leverage. If interest and other costs of leverage exceed the Fund’s return on assets purchased with leverage proceeds, income to shareholders is lower than if the Fund had not used leverage. Furthermore, the value of the Fund’s portfolio investments generally varies inversely with the direction of long-term interest rates, although other factors can influence the value of portfolio investments. In contrast, the value of the Fund’s obligations under its leverage arrangement generally does not fluctuate in relation to interest rates. As a result, changes in interest rates can influence the Fund’s NAVs positively or negatively. Changes in the future direction of interest rates are very difficult to predict accurately, and there is no assurance that the Fund’s intended leveraging strategy will be successful.
The use of leverage also generally causes greater changes in the Fund’s NAV, market price and dividend rates than comparable portfolios without leverage. In a declining market, leverage is likely to cause a greater decline in the NAV and market price of the Fund’s shares than if the Fund were not leveraged. In addition, the Fund may be required to sell portfolio securities at inopportune times or at distressed values in order to comply with regulatory requirements applicable to the use of leverage or as required by the terms of leverage instruments, which may cause the Fund to incur losses. The use of leverage may limit the Fund’s ability to invest in certain types of securities or use certain types of hedging strategies. The Fund incurs expenses in connection with the use of leverage, all of which are borne by shareholders and may reduce income to the shareholders. Moreover, to the extent the calculation of the Fund’s investment advisory fees includes assets purchased with the proceeds of leverage, the investment advisory fees payable to the Fund’s investment adviser will be higher than if the Fund did not use leverage.
The Fund may utilize leverage through a credit facility as described in the Notes to Financial Statements.
Under the Investment Company Act of 1940, as amended (the “1940 Act”), the Fund is permitted to issue debt up to 331⁄3% of its total managed assets. The Fund may voluntarily elect to limit its leverage to less than the maximum amount permitted under the 1940 Act. In addition, the Fund may also be subject to certain asset coverage, leverage or portfolio composition requirements imposed by its credit facility, which may be more stringent than those imposed by the 1940 Act.
Derivative Financial Instruments
The Fund may invest in various derivative financial instruments. These instruments are used to obtain exposure to a security, commodity, index, market, and/or other assets without owning or taking physical custody of securities, commodities and/or other referenced assets or to manage market, equity, credit, interest rate, foreign currency exchange rate, commodity and/or other risks. Derivative financial instruments may give rise to a form of economic leverage and involve risks, including the imperfect correlation between the value of a derivative financial instrument and the underlying asset, possible default of the counterparty to the transaction or illiquidity of the instrument. The Fund’s successful use of a derivative financial instrument depends on the investment adviser’s ability to predict pertinent market movements accurately, which cannot be assured. The use of these instruments may result in losses greater than if they had not been used, may limit the amount of appreciation the Fund can realize on an investment and/or may result in lower distributions paid to shareholders. The Fund’s investments in these instruments, if any, are discussed in detail in the Notes to Financial Statements.
| | |
| 8 | | 2019 BLACKROCK SEMI-ANNUAL REPORTTO SHAREHOLDERS |
| | |
Schedule of Investments (unaudited) August 31, 2019 | | BlackRock Debt Strategies Fund, Inc. (DSU) (Percentages shown are based on Net Assets) |
| | | | | | | | | | | | |
| Security | | | Shares | | | Value | |
|
Common Stocks — 0.1% | |
|
Diversified Financial Services — 0.1% | |
Kcad Holdings I Ltd.(a)(b) | | | | | | | 1,075,282,733 | | | $ | 752,698 | |
| | | | | | | | |
|
| Health Care Management Services — 0.0% | |
New Millennium HoldCo, Inc.(b) | | | | | | | 10,718 | | | | 161 | |
| | | | | | | | |
|
| Media — 0.0% | |
Adelphia Communications Corp., Class A(a)(b)(c) | | | | | | | 400,000 | | | | 4 | |
Adelphia Recovery Trust(b) | | | | | | | 396,568 | | | | 40 | |
| | | | | | | | |
| | | | | | | | | | | 44 | |
|
| Metals & Mining — 0.0% | |
Ameriforge Group, Inc. | | | | | | | 1,664 | | | | 91,520 | |
Preferred Proppants LLC(a) | | | | | | | 14,576 | | | | 32,796 | |
| | | | | | | | |
| | | | | | | | | | | 124,316 | |
|
| Semiconductors & Semiconductor Equipment — 0.0% | |
SunPower Corp.(b) | | | | | | | 1,707 | | | | 21,372 | |
| | | | | | | | |
|
| Software — 0.0% | |
Avaya Holdings Corp.(b) | | | | | | | 37 | | | | 522 | |
| | | | | | | | |
| |
Total Common Stocks — 0.1%
(Cost — $12,497,578) | | | | 899,113 | |
| | | | | | | | |
| | | |
| | | | | | Par
(000) | | | | |
|
Corporate Bonds — 24.9% | |
|
Aerospace & Defense — 1.2% | |
Arconic, Inc., 5.13%, 10/01/24 | | | USD | | | | 753 | | | | 802,432 | |
BBA US Holdings, Inc., 5.38%, 05/01/26(d) | | | | | | | 42 | | | | 43,890 | |
Bombardier, Inc.(d): | | | | | | | | | | | | |
6.13%, 01/15/23 | | | | | | | 664 | | | | 660,680 | |
7.50%, 12/01/24 | | | | | | | 402 | | | | 400,533 | |
7.50%, 03/15/25 | | | | | | | 414 | | | | 403,132 | |
7.88%, 04/15/27 | | | | | | | 122 | | | | 118,188 | |
TransDigm UK Holdings PLC, 6.88%, 05/15/26 | | | | | | | 293 | | | | 306,917 | |
TransDigm, Inc.: | | | | | | | | | | | | |
6.50%, 05/15/25 | | | | | | | 184 | | | | 191,820 | |
6.25%, 03/15/26(d) | | | | | | | 4,263 | | | | 4,598,626 | |
| | | | | | | | |
| | | | | | | | | | | 7,526,218 | |
|
| Air Freight & Logistics — 0.0% | |
XPO Logistics, Inc., 6.75%, 08/15/24(d) | | | | | | | 19 | | | | 20,473 | |
| | | | | | | | |
|
| Airlines — 0.1% | |
US Airways Pass-Through Trust, Series2013-1, Class B, 5.38%, 05/15/21 | | | | | | | 408 | | | | 425,684 | |
| | | | | | | | |
|
| Auto Components — 0.3% | |
Allison Transmission, Inc., 5.88%, 06/01/29(d) | | | | | | | 315 | | | | 337,837 | |
GKN Holdings Ltd., 4.63%, 05/12/32 | | | GBP | | | | 100 | | | | 124,787 | |
Icahn Enterprises LP/Icahn Enterprises Finance Corp.: | | | | | | | | | | | | |
6.38%, 12/15/25 | | | USD | | | | 379 | | | | 401,266 | |
6.25%, 05/15/26(d) | | | | | | | 243 | | | | 253,631 | |
IHO Verwaltungs GmbH, (3.63% Cash 4.38% PIK), 3.63%, 05/15/25(e) | | | EUR | | | | 100 | | | | 112,378 | |
NM Holdings Co. LLC, Series B, 9.50%, 07/01/05(a)(b)(c) | | | USD | | | | 5,125 | | | | — | |
Panther BF Aggregator 2 LP/Panther Finance Co., Inc.: | | | | | | | | | | | | |
4.38%, 05/15/26 | | | EUR | | | | 134 | | | | 150,218 | |
6.25%, 05/15/26(d)(f) | | | USD | | | | 45 | | | | 46,687 | |
Tesla, Inc., 5.30%, 08/15/25(d) | | | | | | | 168 | | | | 149,940 | |
| | | | | | | | | | | | |
| Security | | | | | Par
(000) | | | Value | |
|
| Auto Components (continued) | |
Venture Holdings Co. LLC, 12.00%, 06/01/09(a)(b)(c) | | | USD | | | | 5,150 | | | $ | — | |
| | | | | | | | |
| | | | | | | | | | | 1,576,744 | |
|
| Banks — 0.0% | |
Allied Irish Banks PLC (5 year EUR Swap + 3.95%), 4.13%, 11/26/25(g) | | | EUR | | | | 100 | | | | 114,439 | |
Banco Espirito Santo SA(b)(c): | | | | | | | | | | | | |
2.63%, 05/08/17 | | | | | | | 100 | | | | 23,080 | |
4.75%, 01/15/18 | | | | | | | 200 | | | | 46,160 | |
4.00%, 01/21/19 | | | | | | | 100 | | | | 23,080 | |
| | | | | | | | |
| | | | | | | | | | | 206,759 | |
|
| Building Products — 0.2% | |
Beacon Roofing Supply, Inc., 4.88%, 11/01/25(d) | | | USD | | | | 35 | | | | 34,519 | |
CPG Merger Sub LLC, 8.00%, 10/01/21(d) | | | | | | | 446 | | | | 446,557 | |
Masonite International Corp., 5.38%, 02/01/28(d) | | | | | | | 198 | | | | 208,890 | |
Standard Industries, Inc.(d): | | | | | | | | | | | | |
5.50%, 02/15/23 | | | | | | | 4 | | | | 4,100 | |
5.38%, 11/15/24 | | | | | | | 550 | | | | 565,812 | |
6.00%, 10/15/25 | | | | | | | 238 | | | | 250,198 | |
| | | | | | | | |
| | | | | | | | | | | 1,510,076 | |
|
| Capital Markets — 0.0% | |
LABL Escrow Issuer LLC, 6.75%, 07/15/26(d) | | | | | | | 154 | | | | 158,235 | |
| | | | | | | | |
|
| Chemicals — 0.5% | |
Alpha 3 BV/Alpha US Bidco, Inc., 6.25%, 02/01/25(d) | | | | | | | 1,030 | | | | 1,022,275 | |
Axalta Coating Systems LLC, 4.88%, 08/15/24(d) | | | | | | | 440 | | | | 455,444 | |
Blue Cube Spinco LLC: | | | | | | | | | | | | |
9.75%, 10/15/23 | | | | | | | 313 | | | | 343,518 | |
10.00%, 10/15/25 | | | | | | | 355 | | | | 398,487 | |
GCP Applied Technologies, Inc., 5.50%, 04/15/26(d) | | | | | | | 134 | | | | 137,015 | |
PQ Corp., 5.75%, 12/15/25(d) | | | | | | | 507 | | | | 519,675 | |
| | | | | | | | |
| | | | | | | | | | | 2,876,414 | |
|
| Commercial Services & Supplies — 0.2% | |
ADT Security Corp.: | | | | | | | | | | | | |
3.50%, 07/15/22 | | | | | | | 32 | | | | 32,080 | |
4.88%, 07/15/32(d) | | | | | | | 583 | | | | 507,939 | |
Core & Main LP, 6.13%, 08/15/25(d) | | | | | | | 391 | | | | 396,865 | |
GFL Environmental, Inc., 8.50%, 05/01/27(d) | | | | | | | 231 | | | | 252,945 | |
| | | | | | | | |
| | | | | | | | | | | 1,189,829 | |
|
| Communications Equipment — 0.5% | |
ViaSat, Inc., 5.63%, 04/15/27(d) | | | | | | | 558 | | | | 592,875 | |
Zayo Group LLC/Zayo Capital, Inc.: | | | | | | | | | | | | |
6.00%, 04/01/23 | | | | | | | 1,311 | | | | 1,352,139 | |
6.38%, 05/15/25 | | | | | | | 92 | | | | 94,645 | |
5.75%, 01/15/27(d) | | | | | | | 1,187 | | | | 1,210,740 | |
| | | | | | | | |
| | | | | | | | | | | 3,250,399 | |
|
| Construction & Engineering — 0.1% | |
Brand Industrial Services, Inc., 8.50%, 07/15/25(d) | | | | | | | 224 | | | | 197,400 | |
SRS Distribution, Inc., 8.25%, 07/01/26(d) | | | | | | | 196 | | | | 192,080 | |
| | | | | | | | |
| | | | | | | | | | | 389,480 | |
|
| Construction Materials — 0.2% | |
HD Supply, Inc., 5.38%, 10/15/26(d) | | | | | | | 895 | | | | 953,354 | |
Williams Scotsman International, Inc., 6.88%, 08/15/23(d) | | | | | | | 531 | | | | 556,222 | |
| | | | | | | | |
| | | | | | | | | | | 1,509,576 | |
|
| Consumer Discretionary — 0.1% | |
Dun & Bradstreet Corp., 6.88%, 08/15/26(d) | | | | | | | 463 | | | | 501,776 | |
ServiceMaster Co. LLC, 5.13%, 11/15/24(d) | | | | | | | 134 | | | | 140,651 | |
| | | | | | | | |
| | | | | | | | | | | 642,427 | |
| | | | |
| SCHEDULE OF INVESTMENTS | | | 9 | |
| | |
Schedule of Investments (unaudited) (continued) August 31, 2019 | | BlackRock Debt Strategies Fund, Inc. (DSU) (Percentages shown are based on Net Assets) |
| | | | | | | | | | | | |
| Security | | | | | Par
(000) | | | Value | |
|
| Consumer Finance — 0.8% | |
Ally Financial, Inc.: | | | | | | | | | | | | |
3.88%, 05/21/24 | | | USD | | | | 158 | | | $ | 166,493 | |
8.00%, 11/01/31 | | | | | | | 709 | | | | 990,827 | |
Mulhacen Pte Ltd., (6.5% Cash or 7.25% PIK), 6.50%, 08/01/23(e) | | | EUR | | | | 100 | | | | 88,129 | |
Navient Corp.: | | | | | | | | | | | | |
6.63%, 07/26/21 | | | USD | | | | 177 | | | | 189,390 | |
5.50%, 01/25/23 | | | | | | | 267 | | | | 280,430 | |
7.25%, 09/25/23 | | | | | | | 10 | | | | 11,100 | |
6.13%, 03/25/24 | | | | | | | 96 | | | | 101,880 | |
5.88%, 10/25/24 | | | | | | | 278 | | | | 292,453 | |
Refinitiv US Holdings, Inc.: | | | | | | | | | | | | |
4.50%, 05/15/26 | | | EUR | | | | 100 | | | | 118,968 | |
4.50%, 05/15/26(d) | | | | | | | 855 | | | | 1,017,174 | |
Springleaf Finance Corp., 7.13%, 03/15/26 | | | USD | | | | 321 | | | | 366,101 | |
Verscend Escrow Corp., 9.75%, 08/15/26(d) | | | | | | | 977 | | | | 1,045,957 | |
| | | | | | | | |
| | | | | | | | | | | 4,668,902 | |
|
| Containers & Packaging — 0.5% | |
Ardagh Packaging Finance PLC/Ardagh Holdings USA, Inc.: | | | | | | | | | | | | |
4.13%, 08/15/26(d) | | | | | | | 200 | | | | 202,246 | |
4.75%, 07/15/27 | | | GBP | | | | 100 | | | | 122,948 | |
Berry Global, Inc., 4.88%, 07/15/26(d) | | | USD | | | | 338 | | | | 354,900 | |
BWAY Holding Co., 4.75%, 04/15/24 | | | EUR | | | | 100 | | | | 113,532 | |
Crown Americas LLC/Crown Americas Capital Corp., 4.25%, 09/30/26 | | | USD | | | | 107 | | | | 111,013 | |
Reynolds Group Issuer, Inc./Reynolds Group Issuer LLC/Reynolds Group Issuer Lu(d): | | | | | | | | | | | | |
5.13%, 07/15/23 | | | | | | | 165 | | | | 169,628 | |
7.00%, 07/15/24 | | | | | | | 467 | | | | 482,761 | |
Trivium Packaging Finance BV(d): | | | | | | | | | | | | |
5.50%, 08/15/26 | | | | | | | 548 | | | | 579,510 | |
8.50%, 08/15/27 | | | | | | | 954 | | | | 1,025,550 | |
| | | | | | | | |
| | | | | | | | | | | 3,162,088 | |
|
| Diversified Consumer Services — 0.3% | |
APX Group, Inc.: | | | | | | | | | | | | |
8.75%, 12/01/20 | | | | | | | 215 | | | | 204,250 | |
7.88%, 12/01/22 | | | | | | | 216 | | | | 205,470 | |
Ascend Learning LLC, 6.88%, 08/01/25(d) | | | | | | | 490 | | | | 507,762 | |
Laureate Education, Inc., 8.25%, 05/01/25(d) | | | | | | | 119 | | | | 129,561 | |
Prime Security Services Borrower LLC/Prime Finance, Inc.(d): | | | | | | | | | | | | |
5.25%, 04/15/24 | | | | | | | 186 | | | | 192,122 | |
5.75%, 04/15/26 | | | | | | | 116 | | | | 120,930 | |
Service Corp. International, 5.13%, 06/01/29 | | | | | | | 220 | | | | 235,400 | |
| | | | | | | | |
| | | | | | | | | | | 1,595,495 | |
|
| Diversified Financial Services — 0.4% | |
Allied Universal Holdco LLC/Allied Universal Finance Corp., 6.63%, 07/15/26(d) | | | | | | | 800 | | | | 850,000 | |
Barclays PLC(5 year EUR Swap + 2.45%), 2.63%, 11/11/25(g) | | | EUR | | | | 100 | | | | 111,391 | |
Cabot Financial Luxembourg II SA (3 mo. Euribor + 6.38%), 6.38%, 06/14/24(h) | | | | | | | 100 | | | | 113,321 | |
F-BrasileSpA/F-Brasile US LLC, Series XR, 7.38%, 08/15/26(d) | | | USD | | | | 200 | | | | 203,000 | |
Intrum AB, 2.75%, 07/15/22 | | | EUR | | | | 100 | | | | 111,738 | |
LHC3 PLC, (4.13% Cash or 4.88% PIK), 4.13%, 08/15/24(e) | | | | | | | 100 | | | | 113,477 | |
Tempo Acquisition LLC/Tempo Acquisition Finance Corp., 6.75%, 06/01/25(d) | | | USD | | | | 491 | | | | 504,404 | |
UniCredit SpA (5 year EUR Swap + 4.32%), 4.38%, 01/03/27(g) | | | EUR | | | | 100 | | | | 118,154 | |
| | | | | | | | |
| | | | | | | | | | | 2,125,485 | |
| | | | | | | | | | | | |
| Security | | | | | Par
(000) | | | Value | |
|
| Diversified Telecommunication Services — 0.4% | |
CenturyLink, Inc.: | | | | | | | | | | | | |
5.63%, 04/01/25 | | | USD | | | | 216 | | | $ | 220,860 | |
Series P, 7.60%, 09/15/39 | | | | | | | 132 | | | | 126,720 | |
Series U, 7.65%, 03/15/42 | | | | | | | 132 | | | | 126,060 | |
Embarq Corp., 8.00%, 06/01/36 | | | | | | | 623 | | | | 610,764 | |
Level 3 Financing, Inc., 5.25%, 03/15/26 | | | | | | | 62 | | | | 64,635 | |
SoftBank Group Corp.: | | | | | | | | | | | | |
4.00%, 04/20/23 | | | EUR | | | | 100 | | | | 119,768 | |
4.00%, 09/19/29 | | | | | | | 100 | | | | 119,290 | |
Telecom Italia Capital SA: | | | | | | | | | | | | |
6.38%, 11/15/33 | | | USD | | | | 58 | | | | 61,335 | |
6.00%, 09/30/34 | | | | | | | 195 | | | | 199,875 | |
7.20%, 07/18/36 | | | | | | | 14 | | | | 15,610 | |
7.72%, 06/04/38 | | | | | | | 51 | | | | 58,905 | |
Telecom Italia SpA: | | | | | | | | | | | | |
5.30%, 05/30/24(d) | | | | | | | 788 | | | | 843,160 | |
2.75%, 04/15/25 | | | EUR | | | | 100 | | | | 115,267 | |
| | | | | | | | |
| | | | | | | | | | | 2,682,249 | |
|
| Electric Utilities — 0.1% | |
AES Corp., 5.50%, 04/15/25 | | | USD | | | | 8 | | | | 8,350 | |
NextEra Energy Operating Partners LP(d): | | | | | | | | | | | | |
4.25%, 07/15/24 | | | | | | | 393 | | | | 403,807 | |
4.50%, 09/15/27 | | | | | | | 173 | | | | 177,758 | |
| | | | | | | | |
| | | | | | | | | | | 589,915 | |
|
| Electronic Equipment, Instruments & Components — 0.1% | |
CDW LLC/CDW Finance Corp., 5.50%, 12/01/24 | | | | | | | 185 | | | | 201,419 | |
Vertiv Group Corp., 9.25%, 10/15/24(d) | | | | | | | 618 | | | | 584,010 | |
| | | | | | | | |
| | | | | | | | | | | 785,429 | |
|
| Energy Equipment & Services — 0.2% | |
Archrock Partners LP/Archrock Partners Finance Corp., 6.88%, 04/01/27(d) | | | | | | | 107 | | | | 112,082 | |
Gates Global LLC/Gates Global Co., 6.00%, 07/15/22(d) | | | | | | | 160 | | | | 159,200 | |
USA Compression Partners LP/USA Compression Finance Corp.: | | | | | | | | | | | | |
6.88%, 04/01/26 | | | | | | | 344 | | | | 352,600 | |
6.88%, 09/01/27(d) | | | | | | | 362 | | | | 372,346 | |
| | | | | | | | |
| | | | | | | | | | | 996,228 | |
|
| Environmental, Maintenance, & Security Service — 0.2% | |
Advanced Disposal Services, Inc., 5.63%, 11/15/24(d) | | | | | | | 107 | | | | 112,082 | |
GFL Environmental, Inc., 7.00%, 06/01/26(d) | | | | | | | 242 | | | | 251,075 | |
Tervita Corp., 7.63%, 12/01/21(d) | | | | | | | 380 | | | | 385,700 | |
Waste Pro USA, Inc., 5.50%, 02/15/26(d) | | | | | | | 156 | | | | 162,240 | |
| | | | | | | | |
| | | | | | | | | | | 911,097 | |
|
| Equity Real Estate Investment Trusts (REITs) — 0.6% | |
Brookfield Property REIT, Inc./BPR Cumulus LLC/BPR Nimbus LLC/GGSI Sellco LL, 5.75%, 05/15/26(d) | | | | | | | 128 | | | | 134,720 | |
GLP Capital LP/GLP Financing II, Inc.: | | | | | | | | | | | | |
5.25%, 06/01/25 | | | | | | | 90 | | | | 98,953 | |
5.38%, 04/15/26 | | | | | | | 80 | | | | 87,813 | |
Iron Mountain, Inc., 4.88%, 09/15/27(d) | | | | | | | 302 | | | | 310,118 | |
Marriott Ownership Resorts, Inc./ILG LLC, 6.50%, 09/15/26 | | | | | | | 80 | | | | 86,336 | |
MGM Growth Properties Operating Partnership LP/MGP FinanceCo-Issuer, Inc.: | | | | | | | | | | | | |
4.50%, 09/01/26 | | | | | | | 655 | | | | 686,113 | |
4.50%, 01/15/28 | | | | | | | 697 | | | | 712,682 | |
MPT Operating Partnership LP/MPT Finance Corp., 4.63%, 08/01/29 | | | | | | | 329 | | | | 342,160 | |
| | |
| 10 | | 2019 BLACKROCK SEMI-ANNUAL REPORTTO SHAREHOLDERS |
| | |
Schedule of Investments (unaudited) (continued) August 31, 2019 | | BlackRock Debt Strategies Fund, Inc. (DSU) (Percentages shown are based on Net Assets) |
| | | | | | | | | | | | |
| Security | | | | | Par
(000) | | | Value | |
|
| Equity Real Estate Investment Trusts (REITs) (continued) | |
SBA Communications Corp., 4.88%, 09/01/24 | | | USD | | | | 950 | | | $ | 983,250 | |
VICI Properties 1 LLC/VICI FC, Inc., 8.00%, 10/15/23 | | | | | | | 99 | | | | 108,351 | |
| | | | | | | | |
| | | | | | | | | | | 3,550,496 | |
|
| Food & Staples Retailing — 0.1% | |
Albertsons Cos. LLC/Safeway, Inc./New Albertson’s, Inc./Albertson’s LLC, 6.63%, 06/15/24 | | | | | | | 58 | | | | 60,755 | |
Albertsons Cos. LLC/Safeway, Inc./New Albertsons LP/Albertson’s LLC, 5.88%, 02/15/28(d) | | | | | | | 271 | | | | 285,596 | |
B&M European Value Retail SA, 4.13%, 02/01/22 | | | GBP | | | | 100 | | | | 123,314 | |
Post Holdings, Inc., 5.50%, 12/15/29(d) | | | USD | | | | 183 | | | | 193,469 | |
Tesco Corporate Treasury Services PLC, 2.50%, 05/02/25 | | | GBP | | | | 100 | | | | 124,723 | |
| | | | | | | | |
| | | | | | | | | | | 787,857 | |
|
| Food Products — 0.5% | |
Chobani LLC/Chobani Finance Corp., Inc., 7.50%, 04/15/25(d) | | | USD | | | | 479 | | | | 441,878 | |
JBS USA LUX SA/JBS USA Finance, Inc.(d): | | | | | | | | | | | | |
5.88%, 07/15/24 | | | | | | | 59 | | | | 60,742 | |
5.75%, 06/15/25 | | | | | | | 834 | | | | 867,881 | |
6.75%, 02/15/28 | | | | | | | 43 | | | | 47,542 | |
JBS USA LUX SA/JBS USA Food Co./JBS USA Finance, Inc.(d): | | | | | | | | | | | | |
6.50%, 04/15/29 | | | | | | | 755 | | | | 836,162 | |
5.50%, 01/15/30 | | | | | | | 436 | | | | 462,160 | |
Simmons Foods, Inc., 7.75%, 01/15/24(d) | | | | | | | 174 | | | | 187,920 | |
| | | | | | | | |
| | | | | | | | | | | 2,904,285 | |
|
| Health Care Equipment & Supplies — 0.6% | |
Avantor, Inc.(d): | | | | | | | | | | | | |
6.00%, 10/01/24 | | | | | | | 1,377 | | | | 1,476,832 | |
9.00%, 10/01/25 | | | | | | | 631 | | | | 709,875 | |
Ortho-Clinical Diagnostics, Inc./Ortho-Clinical Diagnostics SA, 6.63%, 05/15/22(d) | | | | | | | 1,654 | | | | 1,596,110 | |
Teleflex, Inc., 4.63%, 11/15/27 | | | | | | | 12 | | | | 12,689 | |
| | | | | | | | |
| | | | | | | | | | | 3,795,506 | |
|
| Health Care Providers & Services — 1.4% | |
AHP Health Partners, Inc., 9.75%, 07/15/26(d) | | | | | | | 200 | | | | 214,825 | |
Centene Corp., 5.38%, 06/01/26(d) | | | | | | | 576 | | | | 615,773 | |
CHS/Community Health Systems, Inc., 8.63%, 01/15/24(d) | | | | | | | 599 | | | | 599,000 | |
Encompass Health Corp., 5.75%, 11/01/24 | | | | | | | 109 | | | | 110,363 | |
Envision Healthcare Crop., 8.75%, 10/15/26(d) | | | | | | | 262 | | | | 142,790 | |
HCA, Inc.: | | | | | | | | | | | | |
5.38%, 02/01/25 | | | | | | | 221 | | | | 245,310 | |
5.38%, 09/01/26 | | | | | | | 80 | | | | 89,200 | |
5.63%, 09/01/28 | | | | | | | 736 | | | | 837,430 | |
Molina Healthcare, Inc., 5.38%, 11/15/22 | | | | | | | 176 | | | | 188,107 | |
MPH Acquisition Holdings LLC, 7.13%, 06/01/24(d) | | | | | | | 410 | | | | 366,462 | |
NVA Holdings, Inc., 6.88%, 04/01/26 | | | | | | | 65 | | | | 69,407 | |
Polaris Intermediate Corp., (8.50% Cash), 8.50%, 12/01/22(d)(e) | | | | | | | 649 | | | | 545,160 | |
Sotera Health Holdings LLC, 6.50%, 05/15/23(d) | | | | | | | 106 | | | | 107,855 | |
Surgery Center Holdings, Inc., 10.00%, 04/15/27(d) | | | | | | | 193 | | | | 184,797 | |
Team Health Holdings, Inc., 6.38%, 02/01/25(d) | | | | | | | 348 | | | | 233,160 | |
Tenet Healthcare Corp.: | | | | | | | | | | | | |
8.13%, 04/01/22 | | | | | | | 1,183 | | | | 1,274,564 | |
4.63%, 09/01/24(d) | | | | | | | 272 | | | | 280,160 | |
4.88%, 01/01/26(d) | | | | | | | 1,083 | | | | 1,112,891 | |
5.13%, 11/01/27(d) | | | | | | | 724 | | | | 748,435 | |
| | | | | | | | | | | | |
| Security | | | | | Par
(000) | | | Value | |
|
| Health Care Providers & Services (continued) | |
WellCare Health Plans, Inc.: | | | | | | | | | | | | |
5.25%, 04/01/25 | | | USD | | | | 354 | | | $ | 370,656 | |
5.38%, 08/15/26(d) | | | | | | | 117 | | | | 124,751 | |
| | | | | | | | |
| | | | | | | | | | | 8,461,096 | |
|
| Health Care Technology — 0.2% | |
Change Healthcare Holdings LLC/Change Healthcare Finance, Inc., 5.75%, 03/01/25(d) | | | | | | | 229 | | | | 230,479 | |
IQVIA, Inc.(d): | | | | | | | | | | | | |
5.00%, 10/15/26 | | | | | | | 200 | | | | 211,000 | |
5.00%, 05/15/27 | | | | | | | 535 | | | | 565,094 | |
| | | | | | | | |
| | | | | | | | | | | 1,006,573 | |
|
| Hotels, Restaurants & Leisure — 1.0% | |
1011778 BC ULC/New Red Finance, Inc.(d): | | | | | | | | | | | | |
4.25%, 05/15/24 | | | | | | | 65 | | | | 67,097 | |
5.00%, 10/15/25 | | | | | | | 1,001 | | | | 1,033,532 | |
Cedar Fair LP, 5.25%, 07/15/29(d) | | | | | | | 176 | | | | 190,960 | |
Cirsa Finance International Sarl, 7.88%, 12/20/23(d) | | | | | | | 200 | | | | 211,300 | |
Eldorado Resorts, Inc., 6.00%, 09/15/26 | | | | | | | 124 | | | | 135,625 | |
Golden Nugget, Inc., 6.75%, 10/15/24(d) | | | | | | | 991 | | | | 1,013,297 | |
Hilton Domestic Operating Co., Inc.: | | | | | | | | | | | | |
4.25%, 09/01/24 | | | | | | | 42 | | | | 42,840 | |
5.13%, 05/01/26 | | | | | | | 100 | | | | 105,550 | |
4.88%, 01/15/30(d) | | | | | | | 785 | | | | 839,950 | |
IRB Holding Corp., 6.75%, 02/15/26(d) | | | | | | | 138 | | | | 138,690 | |
Lions Gate Capital Holdings LLC(d): | | | | | | | | | | | | |
6.38%, 02/01/24 | | | | | | | 26 | | | | 27,461 | |
5.88%, 11/01/24 | | | | | | | 86 | | | | 89,440 | |
MGM Resorts International, 7.75%, 03/15/22 | | | | | | | 308 | | | | 345,801 | |
Sabre GLBL, Inc., 5.25%, 11/15/23(d) | | | | | | | 221 | | | | 227,077 | |
Scientific Games International, Inc.(d): | | | | | | | | | | | | |
5.00%, 10/15/25 | | | | | | | 211 | | | | 218,014 | |
8.25%, 03/15/26 | | | | | | | 1,113 | | | | 1,179,780 | |
Station Casinos LLC, 5.00%, 10/01/25(d) | | | | | | | 99 | | | | 100,990 | |
Stonegate Pub Co. Financing PLC (3 mo. LIBOR GBP + 4.38%), 5.16%, 03/15/22(h) | | | GBP | | | | 100 | | | | 122,229 | |
Wyndham Destinations, Inc., 5.75%, 04/01/27 | | | USD | | | | 141 | | | | 150,518 | |
Yum! Brands, Inc., 5.35%, 11/01/43 | | | | | | | 14 | | | | 13,300 | |
| | | | | | | | |
| | | | | | | | | | | 6,253,451 | |
|
| Household Durables — 0.2% | |
Algeco Global Finance PLC, 8.00%, 02/15/23(d) | | | | | | | 300 | | | | 300,225 | |
Brookfield Residential Properties, Inc./Brookfield Residential US Corp., 6.13%, 07/01/22(d) | | | | | | | 7 | | | | 7,096 | |
Lennar Corp.: | | | | | | | | | | | | |
6.63%, 05/01/20 | | | | | | | 130 | | | | 133,484 | |
4.88%, 12/15/23 | | | | | | | 265 | | | | 284,213 | |
5.25%, 06/01/26 | | | | | | | 143 | | | | 155,691 | |
Mattamy Group Corp., 6.50%, 10/01/25(d) | | | | | | | 90 | | | | 95,400 | |
Tempur Sealy International, Inc., 5.50%, 06/15/26 | | | | | | | 2 | | | | 2,090 | |
| | | | | | | | |
| | | | | | | | | | | 978,199 | |
|
| Independent Power and Renewable Electricity Producers — 0.5% | |
Calpine Corp.: | | | | | | | | | | | | |
5.38%, 01/15/23 | | | | | | | 1,138 | | | | 1,153,556 | |
5.75%, 01/15/25 | | | | | | | 31 | | | | 31,465 | |
5.25%, 06/01/26(d) | | | | | | | 468 | | | | 473,850 | |
Clearway Energy Operating LLC: | | | | | | | | | | | | |
5.38%, 08/15/24 | | | | | | | 222 | | | | 227,550 | |
5.75%, 10/15/25(d) | | | | | | | 241 | | | | 251,247 | |
NRG Energy, Inc.: | | | | | | | | | | | | |
6.63%, 01/15/27 | | | | | | | 455 | | | | 491,400 | |
5.75%, 01/15/28 | | | | | | | 31 | | | | 33,403 | |
5.25%, 06/15/29(d) | | | | | | | 406 | | | | 433,230 | |
| | | | |
| SCHEDULE OF INVESTMENTS | | | 11 | |
| | |
Schedule of Investments (unaudited) (continued) August 31, 2019 | | BlackRock Debt Strategies Fund, Inc. (DSU) (Percentages shown are based on Net Assets) |
| | | | | | | | | | | | |
| Security | | | | | Par
(000) | | | Value | |
|
| Independent Power and Renewable Electricity Producers (continued) | |
TerraForm Power Operating LLC, 5.00%, 01/31/28(d) | | | USD | | | | 139 | | | $ | 144,737 | |
| | | | | | | | |
| | | | | | | | | | | 3,240,438 | |
|
| Industrial Conglomerates — 0.4% | |
Project Spring, (Aquired 05/09/19, cost $2,248,690), 10.00%, 06/30/24(a)(d)(i) | | | | | | | 2,314 | | | | 2,325,571 | |
| | | | | | | | |
| | | |
| Insurance — 0.3% | | | | | | | | | |
Alliant Holdings Intermediate LLC/Alliant HoldingsCo-Issuer, 8.25%, 08/01/23(d) | | | | | | | 989 | | | | 1,010,016 | |
Caisse Nationale de Reassurance Mutuelle Agricole Groupama, 6.00%, 01/23/27 | | | EUR | | | | 100 | | | | 141,006 | |
HUB International Ltd., 7.00%, 05/01/26(d) | | | USD | | | | 943 | | | | 957,145 | |
| | | | | | | | |
| | | | | | | | | | | 2,108,167 | |
|
| Interactive Media & Services — 0.3% | |
Go Daddy Operating Co. LLC/GD Finance Co., Inc., 5.25%, 12/01/27(d) | | | | | | | 230 | | | | 242,650 | |
Netflix, Inc.: | | | | | | | | | | | | |
4.88%, 04/15/28 | | | | | | | 213 | | | | 222,851 | |
5.88%, 11/15/28 | | | | | | | 141 | | | | 157,744 | |
3.88%, 11/15/29 | | | EUR | | | | 149 | | | | 176,942 | |
5.38%, 11/15/29(d) | | | USD | | | | 344 | | | | 374,100 | |
Symantec Corp., 5.00%, 04/15/25(d) | | | | | | | 115 | | | | 115,758 | |
Uber Technologies, Inc.(d): | | | | | | | | | | | | |
7.50%, 11/01/23 | | | | | | | 325 | | | | 339,625 | |
8.00%, 11/01/26 | | | | | | | 86 | | | | 90,461 | |
United Group BV, 4.38%, 07/01/22 | | | EUR | | | | 126 | | | | 141,590 | |
| | | | | | | | |
| | | | | | | | | | | 1,861,721 | |
|
| IT Services — 0.4% | |
Banff Merger Sub, Inc.: | | | | | | | | | | | | |
8.38%, 09/01/26 | | | | | | | 100 | | | | 98,914 | |
9.75%, 09/01/26(d) | | | USD | | | | 1,298 | | | | 1,181,180 | |
Harland Clarke Holdings Corp., 8.38%, 08/15/22(d) | | | | | | | 712 | | | | 564,260 | |
Outfront Media Capital LLC/Outfront Media Capital Corp., 5.00%, 08/15/27(d) | | | | | | | 568 | | | | 587,170 | |
Xerox Corp.: | | | | | | | | | | | | |
4.80%, 03/01/35 | | | | | | | 300 | | | | 260,250 | |
6.75%, 12/15/39 | | | | | | | 4 | | | | 4,038 | |
| | | | | | | | |
| | | | | | | | | | | 2,695,812 | |
|
| Machinery — 0.3% | |
Colfax Corp.(d): | | | | | | | | | | | | |
6.00%, 02/15/24 | | | | | | | 434 | | | | 462,752 | |
6.38%, 02/15/26 | | | | | | | 226 | | | | 245,775 | |
RBS Global, Inc./Rexnord LLC, 4.88%, 12/15/25(d) | | | | | | | 205 | | | | 211,150 | |
SPX FLOW, Inc., 5.88%, 08/15/26(d) | | | | | | | 209 | | | | 220,495 | |
Titan Acquisition Ltd./TitanCo-Borrower LLC, 7.75%, 04/15/26(d) | | | | | | | 699 | | | | 632,595 | |
| | | | | | | | |
| | | | | | | | | | | 1,772,767 | |
|
| Media — 4.2% | |
Altice Financing SA(d): | | | | | | | | | | | | |
6.63%, 02/15/23 | | | | | | | 1,051 | | | | 1,083,844 | |
7.50%, 05/15/26 | | | | | | | 200 | | | | 213,000 | |
Altice France SA: | | | | | | | | | | | | |
6.25%, 05/15/24(d) | | | | | | | 200 | | | | 206,184 | |
7.38%, 05/01/26(d) | | | | | | | 1,139 | | | | 1,215,882 | |
5.88%, 02/01/27 | | | EUR | | | | 100 | | | | 121,582 | |
8.13%, 02/01/27(d) | | | USD | | | | 534 | | | | 588,735 | |
Altice Luxembourg SA(d): | | | | | | | | | | | | |
7.75%, 05/15/22 | | | | | | | 304 | | | | 311,760 | |
7.63%, 02/15/25 | | | | | | | 940 | | | | 971,725 | |
10.50%, 05/15/27 | | | | | | | 761 | | | | 827,587 | |
| | | | | | | | | | | | |
| Security | | | | | Par
(000) | | | Value | |
|
| Media (continued) | |
AMC Networks, Inc., 4.75%, 08/01/25 | | | USD | | | | 121 | | | $ | 123,571 | |
CCO Holdings LLC/CCO Holdings Capital Corp.(d): | | | | | | | | | | | | |
4.00%, 03/01/23 | | | | | | | 79 | | | | 79,790 | |
5.13%, 05/01/27 | | | | | | | 1,033 | | | | 1,092,387 | |
5.00%, 02/01/28 | | | | | | | 211 | | | | 221,550 | |
5.38%, 06/01/29 | | | | | | | 1,344 | | | | 1,436,400 | |
Clear Channel International BV, 8.75%, 12/15/20(d) | | | | | | | 162 | | | | 165,543 | |
Clear Channel Worldwide Holdings, Inc.: | | | | | | | | | | | | |
6.50%, 11/15/22 | | | | | | | 910 | | | | 929,720 | |
9.25%, 02/15/24(d) | | | | | | | 1,035 | | | | 1,134,619 | |
5.13%, 08/15/27(d) | | | | | | | 1,341 | | | | 1,403,021 | |
Series B, 6.50%, 11/15/22 | | | | | | | 1,823 | | | | 1,862,504 | |
CSC Holdings LLC: | | | | | | | | | | | | |
5.25%, 06/01/24 | | | | | | | 344 | | | | 368,080 | |
7.75%, 07/15/25(d) | | | | | | | 462 | | | | 496,072 | |
10.88%, 10/15/25(d) | | | | | | | 1,357 | | | | 1,540,195 | |
5.50%, 05/15/26(d) | | | | | | | 390 | | | | 412,425 | |
6.50%, 02/01/29(d) | | | | | | | 288 | | | | 322,740 | |
Series 144S, 5.13%, 12/15/21(d) | | | | | | | 378 | | | | 378,473 | |
Diamond Sports Group LLC/Diamond Sports Finance Co., 5.38%, 08/15/26(d) | | | | | | | 518 | | | | 543,900 | |
DISH DBS Corp.: | | | | | | | | | | | | |
6.75%, 06/01/21 | | | | | | | 10 | | | | 10,533 | |
5.88%, 07/15/22 | | | | | | | 1,322 | | | | 1,368,270 | |
eircom Finance DAC, 3.50%, 05/15/26 | | | EUR | | | | 100 | | | | 117,324 | |
Entertainment One Ltd., 4.63%, 07/15/26 | | | GBP | | | | 100 | | | | 132,376 | |
Gray Television, Inc., 7.00%, 05/15/27(d) | | | USD | | | | 196 | | | | 214,316 | |
Hughes Satellite Systems Corp., 5.25%, 08/01/26 | | | | | | | 105 | | | | 111,300 | |
iHeartCommunications, Inc.: | | | | | | | | | | | | |
6.38%, 05/01/26 | | | | | | | 124 | | | | 133,428 | |
5.25%, 08/15/27(d) | | | | | | | 235 | | | | 247,086 | |
Intelsat Jackson Holdings SA: | | | | | | | | | | | | |
5.50%, 08/01/23 | | | | | | | 272 | | | | 247,520 | |
8.50%, 10/15/24(d) | | | | | | | 927 | | | | 920,047 | |
9.75%, 07/15/25(d) | | | | | | | 754 | | | | 773,792 | |
MDC Partners, Inc., 6.50%, 05/01/24(d) | | | | | | | 201 | | | | 182,910 | |
Radiate Holdco LLC/Radiate Finance, Inc., 6.63%, 02/15/25(d) | | | | | | | 252 | | | | 250,110 | |
Sirius XM Radio, Inc.(d): | | | | | | | | | | | | |
4.63%, 07/15/24 | | | | | | | 116 | | | | 121,075 | |
5.50%, 07/01/29 | | | | | | | 369 | | | | 402,103 | |
Telenet Finance VI Luxembourg SCA, 4.88%, 07/15/27 | | | EUR | | | | 70 | | | | 84,434 | |
Telesat Canada/Telesat LLC, 8.88%, 11/15/24(d) | | | USD | | | | 117 | | | | 126,579 | |
Tribune Media Co., 5.88%, 07/15/22 | | | | | | | 189 | | | | 191,776 | |
Univision Communications, Inc.(d): | | | | | | | | | | | | |
5.13%, 05/15/23 | | | | | | | 22 | | | | 21,725 | |
5.13%, 02/15/25 | | | | | | | 166 | | | | 160,172 | |
Videotron Ltd., 5.13%, 04/15/27(d) | | | | | | | 50 | | | | 52,625 | |
Virgin Media Finance PLC, 5.75%, 01/15/25(d) | | | | | | | 722 | | | | 750,671 | |
Virgin Media Secured Finance PLC, 4.88%, 01/15/27 | | | GBP | | | | 100 | | | | 126,993 | |
WMG Acquisition Corp., 4.13%, 11/01/24 | | | EUR | | | | 90 | | | | 102,504 | |
Ziggo Bond Co. BV, 6.00%, 01/15/27(d) | | | USD | | | | 309 | | | | 322,133 | |
Ziggo BV, 5.50%, 01/15/27(d) | | | | | | | 188 | | | | 198,331 | |
| | | | | | | | |
| | | | | | | | | | | 25,421,422 | |
|
| Metals & Mining — 0.9% | |
Big River Steel LLC/BRS Finance Corp., 7.25%, 09/01/25(d) | | | | | | | 317 | | | | 335,227 | |
Constellium SE(d): | | | | | | | | | | | | |
6.63%, 03/01/25 | | | | | | | 300 | | | | 314,063 | |
5.88%, 02/15/26 | | | | | | | 1,176 | | | | 1,225,980 | |
| | |
| 12 | | 2019 BLACKROCK SEMI-ANNUAL REPORTTO SHAREHOLDERS |
| | |
Schedule of Investments (unaudited) (continued) August 31, 2019 | | BlackRock Debt Strategies Fund, Inc. (DSU) (Percentages shown are based on Net Assets) |
| | | | | | | | | | | | |
| Security | | | | | Par
(000) | | | Value | |
|
| Metals & Mining (continued) | |
Freeport-McMoRan, Inc.: | | | | | | | | | | | | |
3.88%, 03/15/23 | | | USD | | | | 646 | | | $ | 652,718 | |
5.45%, 03/15/43 | | | | | | | 1,772 | | | | 1,616,950 | |
Grinding Media,Inc./Moly-Cop AltaSteel Ltd., 7.38%, 12/15/23(d) | | | | | | | 309 | | | | 293,164 | |
Novelis Corp.(d): | | | | | | | | | | | | |
6.25%, 08/15/24 | | | | | | | 682 | | | | 714,395 | |
5.88%, 09/30/26 | | | | | | | 251 | | | | 265,119 | |
Steel Dynamics, Inc.: | | | | | | | | | | | | |
5.50%, 10/01/24 | | | | | | | 138 | | | | 142,209 | |
4.13%, 09/15/25 | | | | | | | 51 | | | | 51,383 | |
thyssenkrupp AG, 2.88%, 02/22/24 | | | EUR | | | | 64 | | | | 72,864 | |
| | | | | | | | |
| | | | | | | | | | | 5,684,072 | |
|
| Oil, Gas & Consumable Fuels — 3.1% | |
Aker BP ASA, 4.75%, 06/15/24(d) | | | USD | | | | 233 | | | | 238,242 | |
Antero Resources Corp., 5.38%, 11/01/21 | | | | | | | 42 | | | | 40,793 | |
Ascent Resources Utica Holdings LLC/ARU Finance Corp., 10.00%, 04/01/22(d) | | | | | | | 324 | | | | 324,810 | |
Callon Petroleum Co., Series WI, 6.38%, 07/01/26 | | | | | | | 42 | | | | 40,740 | |
Carrizo Oil & Gas, Inc.: | | | | | | | | | | | | |
6.25%, 04/15/23 | | | | | | | 129 | | | | 123,389 | |
8.25%, 07/15/25 | | | | | | | 281 | | | | 272,570 | |
Cheniere Corpus Christi Holdings LLC: | | | | | | | | | | | | |
7.00%, 06/30/24 | | | | | | | 502 | | | | 579,182 | |
5.88%, 03/31/25 | | | | | | | 588 | | | | 655,620 | |
5.13%, 06/30/27 | | | | | | | 493 | | | | 544,149 | |
Cheniere Energy Partners LP: | | | | | | | | | | | | |
5.63%, 10/01/26 | | | | | | | 743 | | | | 783,865 | |
Series WI, 5.25%, 10/01/25 | | | | | | | 12 | | | | 12,405 | |
Chesapeake Energy Corp.: | | | | | | | | | | | | |
4.88%, 04/15/22 | | | | | | | 378 | | | | 313,267 | |
5.75%, 03/15/23 | | | | | | | 38 | | | | 30,400 | |
7.00%, 10/01/24 | | | | | | | 170 | | | | 129,625 | |
8.00%, 06/15/27 | | | | | | | 58 | | | | 41,906 | |
CNX Resources Corp., 5.88%, 04/15/22 | | | | | | | 1,522 | | | | 1,472,535 | |
CONSOL Energy, Inc., 11.00%, 11/15/25(d) | | | | | | | 573 | | | | 590,190 | |
Covey Park Energy LLC/Covey Park Finance Corp., 7.50%, 05/15/25(d) | | | | | | | 221 | | | | 156,910 | |
Crestwood Midstream Partners LP/Crestwood Midstream Finance Corp., 5.63%, 05/01/27(d) | | | | | | | 365 | | | | 364,883 | |
CrownRock LP/CrownRock Finance, Inc., 5.63%, 10/15/25(d) | | | | | | | 625 | | | | 618,750 | |
DCP Midstream Operating LP: | | | | | | | | | | | | |
5.38%, 07/15/25 | | | | | | | 22 | | | | 23,265 | |
5.13%, 05/15/29 | | | | | | | 137 | | | | 140,432 | |
6.45%, 11/03/36(d) | | | | | | | 250 | | | | 261,875 | |
6.75%, 09/15/37(d) | | | | | | | 226 | | | | 237,300 | |
eG Global Finance PLC: | | | | | | | | | | | | |
4.38%, 02/07/25 | | | EUR | | | | 111 | | | | 118,487 | |
6.75%, 02/07/25(d) | | | USD | | | | 303 | | | | 292,395 | |
Endeavor Energy Resources LP/EER Finance, Inc.(d): | | | | | | | | | | | | |
5.50%, 01/30/26 | | | | | | | 368 | | | | 382,260 | |
5.75%, 01/30/28 | | | | | | | 307 | | | | 321,582 | |
EnLink Midstream Partners LP: | | | | | | | | | | | | |
4.40%, 04/01/24 | | | | | | | 136 | | | | 134,640 | |
4.85%, 07/15/26 | | | | | | | 42 | | | | 41,160 | |
5.60%, 04/01/44 | | | | | | | 249 | | | | 210,405 | |
5.05%, 04/01/45 | | | | | | | 157 | | | | 129,525 | |
5.45%, 06/01/47 | | | | | | | 5 | | | | 4,225 | |
Extraction Oil & Gas, Inc., 7.38%, 05/15/24(d) | | | | | | | 314 | | | | 235,500 | |
Indigo Natural Resources LLC, 6.88%, 02/15/26(d) | | | | | | | 311 | | | | 256,575 | |
Matador Resources Co., 5.88%, 09/15/26 | | | | | | | 320 | | | | 310,000 | |
| | | | | | | | | | | | |
| Security | | | | | Par
(000) | | | Value | |
|
| Oil, Gas & Consumable Fuels (continued) | |
MEG Energy Corp.(d): | | | | | | | | | | | | |
6.38%, 01/30/23 | | | USD | | | | 37 | | | $ | 34,965 | |
7.00%, 03/31/24 | | | | | | | 31 | | | | 29,489 | |
6.50%, 01/15/25 | | | | | | | 637 | | | | 640,185 | |
Murphy Oil Corp., 5.75%, 08/15/25 | | | | | | | 105 | | | | 106,281 | |
Nabors Industries, Inc., 4.63%, 09/15/21 | | | | | | | 447 | | | | 425,767 | |
NGPL PipeCo LLC, 7.77%, 12/15/37(d) | | | | | | | 341 | | | | 444,589 | |
Noble Holding International Ltd.: | | | | | | | | | | | | |
7.75%, 01/15/24 | | | | | | | 20 | | | | 13,300 | |
7.88%, 02/01/26(d) | | | | | | | 184 | | | | 148,580 | |
Northern Oil and Gas, Inc., (8.50% Cash or 1.00% PIK), 9.50%, 05/15/23(e) | | | | | | | 35 | | | | 35,868 | |
NuStar Logistics LP, 6.00%, 06/01/26 | | | | | | | 124 | | | | 132,990 | |
Parsley Energy LLC/Parsley Finance Corp.(d): | | | | | | | | | | | | |
6.25%, 06/01/24 | | | | | | | 132 | | | | 136,950 | |
5.38%, 01/15/25 | | | | | | | 76 | | | | 77,520 | |
5.63%, 10/15/27 | | | | | | | 558 | | | | 574,740 | |
PDC Energy, Inc.: | | | | | | | | | | | | |
6.13%, 09/15/24 | | | | | | | 66 | | | | 65,835 | |
5.75%, 05/15/26 | | | | | | | 9 | | | | 8,797 | |
QEP Resources, Inc.: | | | | | | | | | | | | |
5.38%, 10/01/22 | | | | | | | 634 | | | | 570,600 | |
5.25%, 05/01/23 | | | | | | | 91 | | | | 79,625 | |
5.63%, 03/01/26 | | | | | | | 36 | | | | 29,160 | |
Range Resources Corp., 4.88%, 05/15/25 | | | | | | | 64 | | | | 52,480 | |
Rowan Cos., Inc., 4.88%, 06/01/22 | | | | | | | 599 | | | | 488,185 | |
SM Energy Co.: | | | | | | | | | | | | |
6.13%, 11/15/22 | | | | | | | 40 | | | | 37,200 | |
5.00%, 01/15/24 | | | | | | | 453 | | | | 396,375 | |
5.63%, 06/01/25 | | | | | | | 29 | | | | 24,650 | |
6.75%, 09/15/26 | | | | | | | 12 | | | | 10,200 | |
Southwestern Energy Co.: | | | | | | | | | | | | |
6.20%, 01/23/25 | | | | | | | 195 | | | | 170,625 | |
7.75%, 10/01/27 | | | | | | | 71 | | | | 61,770 | |
SRC Energy, Inc., 6.25%, 12/01/25 | | | | | | | 29 | | | | 28,746 | |
Sunoco LP/Sunoco Finance Corp.,: | | | | | | | | | | | | |
5.50%, 02/15/26 | | | | | | | 57 | | | | 59,138 | |
5.88%, 03/15/28 | | | | | | | 151 | | | | 157,040 | |
Tallgrass Energy Partners LP/Tallgrass Energy Finance Corp.(d): | | | | | | | | | | | | |
5.50%, 09/15/24 | | | | | | | 62 | | | | 60,450 | |
5.50%, 01/15/28 | | | | | | | 453 | | | | 426,386 | |
Targa Resources Partners LP/Targa Resources Partners Finance Corp.: | | | | | | | | | | | | |
5.13%, 02/01/25 | | | | | | | 75 | | | | 76,875 | |
5.38%, 02/01/27 | | | | | | | 17 | | | | 17,541 | |
6.50%, 07/15/27(d) | | | | | | | 165 | | | | 179,025 | |
6.88%, 01/15/29(d) | | | | | | | 533 | | | | 588,965 | |
Transocean Pontus Ltd., 6.13%, 08/01/25(d) | | | | | | | 85 | | | | 86,628 | |
Transocean Poseidon Ltd., 6.88%, 02/01/27(d) | | | | | | | 249 | | | | 259,894 | |
Transocean, Inc.: | | | | | | | | | | | | |
8.38%, 12/15/21 | | | | | | | 99 | | | | 102,341 | |
9.00%, 07/15/23(d) | | | | | | | 504 | | | | 521,000 | |
7.25%, 11/01/25(d) | | | | | | | 260 | | | | 236,600 | |
WPX Energy, Inc., 8.25%, 08/01/23 | | | | | | | 456 | | | | 507,300 | |
| | | | | | | | |
| | | | | | | | | | | 18,538,512 | |
|
| Paper & Forest Products — 0.0% | |
International Paper Co., 7.30%, 11/15/39 | | | | | | | 5 | | | | 6,987 | |
| | | | | | | | |
|
| Personal Products — 0.0% | |
Coty, Inc., 6.50%, 04/15/26(d) | | | | | | | 31 | | | | 29,295 | |
| | | | | | | | |
| | | | |
| SCHEDULE OF INVESTMENTS | | | 13 | |
| | |
Schedule of Investments (unaudited) (continued) August 31, 2019 | | BlackRock Debt Strategies Fund, Inc. (DSU) (Percentages shown are based on Net Assets) |
| | | | | | | | | | | | |
| Security | | | | | Par
(000) | | | Value | |
|
| Pharmaceuticals — 1.1% | |
Bausch Health Americas, Inc.(d): | | | | | | | | | | | | |
8.50%, 01/31/27 | | | USD | | | | 708 | | | $ | 785,866 | |
9.25%, 04/01/26 | | | | | | | 304 | | | | 344,280 | |
Bausch Health Cos., Inc.: | | | | | | | | | | | | |
4.50%, 05/15/23 | | | EUR | | | | 340 | | | | 378,348 | |
7.00%, 03/15/24(d) | | | USD | | | | 606 | | | | 640,033 | |
6.13%, 04/15/25(d) | | | | | | | 3 | | | | 3,090 | |
5.50%, 11/01/25(d) | | | | | | | 830 | | | | 870,446 | |
9.00%, 12/15/25(d) | | | | | | | 457 | | | | 512,411 | |
7.00%, 01/15/28(d) | | | | | | | 337 | | | | 353,152 | |
Catalent Pharma Solutions, Inc., 5.00%, 07/15/27(d) | | | | | | | 205 | | | | 214,760 | |
Charles River Laboratories International, Inc., 5.50%, 04/01/26(d) | | | | | | | 381 | | | | 407,632 | |
Eagle Holding Co. II LLC(d)(e): | | | | | | | | | | | | |
(7.63% Cash or 8.38% PIK), 7.63%, 05/15/22 | | | | | | | 114 | | | | 115,140 | |
(7.75% Cash), 7.75%, 05/15/22 | | | USD | | | | 262 | | | | 264,947 | |
Elanco Animal Health, Inc., 4.90%, 08/28/28 | | | | | | | 250 | | | | 272,430 | |
Jaguar Holding Co. II/Pharmaceutical Product Development LLC, 6.38%, 08/01/23(d) | | | | | | | 928 | | | | 958,160 | |
MEDNAX, Inc., 5.25%, 12/01/23(d) | | | | | | | 122 | | | | 122,610 | |
Rossini Sarl, 6.75%, 10/30/25 | | | EUR | | | | 168 | | | | 201,684 | |
Synlab Unsecured Bondco PLC, 8.25%, 07/01/23 | | | | | | | 100 | | | | 114,567 | |
| | | | | | | | |
| | | | | | | | | | | 6,559,556 | |
|
| Professional Services — 0.0% | |
Dun & Bradstreet Corp., 10.25%, 02/15/27(d) | | | USD | | | | 165 | | | | 180,263 | |
| | | | | | | | |
| | | |
| Real Estate Management & Development — 0.1% | | | | | | | | | |
ADLER Real Estate AG, 2.13%, 02/06/24 | | | EUR | | | | 100 | | | | 115,076 | |
Greystar Real Estate Partners LLC, 5.75%, 12/01/25(d) | | | USD | | | | 218 | | | | 223,526 | |
Unique Pub Finance Co. PLC, Series A4, 5.66%, 06/30/27 | | | GBP | | | | 51 | | | | 68,983 | |
| | | | | | | | |
| | | | | | | | | | | 407,585 | |
|
| Road & Rail — 0.3% | |
Avis Budget Finance PLC, 4.75%, 01/30/26 | | | EUR | | | | 100 | | | | 117,873 | |
Herc Holdings, Inc., 5.50%, 07/15/27(d) | | | USD | | | | 335 | | | | 346,725 | |
Hertz Corp., 7.63%, 06/01/22(d) | | | | | | | 474 | | | | 493,576 | |
Hertz Holdings Netherlands BV, 5.50%, 03/30/23 | | | EUR | | | | 100 | | | | 115,568 | |
United Rentals North America, Inc.: | | | | | | | | | | | | |
5.50%, 07/15/25 | | | USD | | | | 2 | | | | 2,085 | |
4.63%, 10/15/25 | | | | | | | 141 | | | | 145,011 | |
5.88%, 09/15/26 | | | | | | | 137 | | | | 146,933 | |
5.50%, 05/15/27 | | | | | | | 324 | | | | 347,655 | |
5.25%, 01/15/30 | | | | | | | 66 | | | | 70,538 | |
| | | | | | | | |
| | | | | | | | | | | 1,785,964 | |
|
| Semiconductors & Semiconductor Equipment — 0.0% | |
Sensata Technologies BV, 5.00%, 10/01/25(d) | | | | | | | 47 | | | | 49,820 | |
| | | | | | | | |
|
| Software — 1.2% | |
CDK Global, Inc.: | | | | | | | | | | | | |
4.88%, 06/01/27 | | | | | | | 505 | | | | 521,786 | |
5.25%, 05/15/29(d) | | | | | | | 105 | | | | 108,413 | |
Genesys Telecommunications Laboratories,
Inc./Greeneden Lux 3 Sarl/Greeneden US Ho,
10.00%, 11/30/24(d) | | | | | | | 579 | | | | 625,320 | |
Infor US, Inc., 6.50%, 05/15/22 | | | | | | | 1,223 | | | | 1,242,874 | |
MSCI, Inc., 4.75%, 08/01/26(d) | | | | | | | 77 | | | | 80,561 | |
Nuance Communications, Inc.,
6.00%, 07/01/24 | | | | | | | 169 | | | | 175,760 | |
RP Crown Parent LLC, 7.38%, 10/15/24(d) | | | | | | | 602 | | | | 627,410 | |
Solera LLC/Solera Finance, Inc.,
10.50%, 03/01/24(d) | | | | | | | 981 | | | | 1,039,860 | |
| | | | | | | | | | | | |
| Security | | | | | Par
(000) | | | Value | |
|
| Software (continued) | |
SS&C Technologies, Inc., 5.50%, 09/30/27(d) | | | USD | | | | 1,377 | | | $ | 1,445,850 | |
TIBCO Software, Inc., 11.38%, 12/01/21(d) | | | | | | | 871 | | | | 914,550 | |
Veritas US, Inc./Veritas Bermuda Ltd.,
7.50%, 02/01/23(d) | | | | | | | 369 | | | | 365,310 | |
| | | | | | | | |
| | | | | | | | | | | 7,147,694 | |
|
| Specialty Retail — 0.2% | |
Asbury Automotive Group, Inc.,
6.00%, 12/15/24 | | | | | | | 396 | | | | 409,365 | |
Group 1 Automotive, Inc., 5.25%, 12/15/23(d) | | | | | | | 69 | | | | 70,725 | |
IAA, Inc., 5.50%, 06/15/27(d) | | | | | | | 367 | | | | 390,855 | |
PetSmart, Inc., 7.13%, 03/15/23(d) | | | | | | | 133 | | | | 123,690 | |
| | | | | | | | |
| | | | | | | | | | | 994,635 | |
|
| Technology Hardware, Storage & Peripherals — 0.1% | |
NCR Corp.(d): | | | | | | | | | | | | |
5.75%, 09/01/27 | | | | | | | 159 | | | | 167,913 | |
6.13%, 09/01/29 | | | | | | | 159 | | | | 168,758 | |
Western Digital Corp., 4.75%, 02/15/26 | | | | | | | 306 | | | | 313,176 | |
| | | | | | | | |
| | | | | | | | | | | 649,847 | |
|
| Textiles, Apparel & Luxury Goods — 0.0% | |
William Carter Co., 5.63%, 03/15/27(d) | | | | | | | 162 | | | | 172,527 | |
| | | | | | | | |
|
| Thrifts & Mortgage Finance — 0.1% | |
Nationstar Mortgage Holdings, Inc.(d): | | | | | | | | | | | | |
8.13%, 07/15/23 | | | | | | | 174 | | | | 180,191 | |
9.13%, 07/15/26 | | | | | | | 139 | | | | 146,992 | |
| | | | | | | | |
| | | | | | | | | | | 327,183 | |
|
| Utilities — 0.1% | |
Orano SA, 3.38%, 04/23/26 | | | EUR | | | | 100 | | | | 119,863 | |
Vistra Operations Co. LLC(d): | | | | | | | | | | | | |
5.63%, 02/15/27 | | | USD | | | | 99 | | | | 104,816 | |
5.00%, 07/31/27 | | | | | | | 177 | | | | 182,753 | |
| | | | | | | | |
| | | | | | | | | | | 407,432 | |
|
| Wireless Telecommunication Services — 0.3% | |
Sprint Capital Corp.: | | | | | | | | | | | | |
6.88%, 11/15/28 | | | | | | | 47 | | | | 52,111 | |
8.75%, 03/15/32 | | | | | | | 293 | | | | 366,977 | |
Sprint Corp.: | | | | | | | | | | | | |
7.88%, 09/15/23 | | | | | | | 492 | | | | 553,500 | |
7.13%, 06/15/24 | | | | | | | 460 | | | | 508,512 | |
7.63%, 02/15/25 | | | | | | | 89 | | | | 99,569 | |
7.63%, 03/01/26 | | | | | | | 90 | | | | 101,137 | |
| | | | | | | | |
| | | | | | | | | | | 1,681,806 | |
| | | | | | | | |
| |
Total Corporate Bonds — 24.9%
(Cost — $155,592,526) | | | | 150,585,741 | |
| | | | | | | | |
|
Floating Rate Loan Interests(h) — 114.5% | |
|
Aerospace & Defense — 2.2% | |
1199169 B.C. Unlimited Liability Co., 2019 Term Loan B2, (3 mo. LIBOR + 4.00%), 6.33%, 04/06/26 | | | | | | | 1,965 | | | | 1,963,444 | |
Atlantic Aviation FBO, Inc., 2018 Term Loan B,
(1 mo. LIBOR + 3.75%), 5.87%, 12/06/25(a) | | | | | | | 1,368 | | | | 1,374,966 | |
Dynasty Acquisition Co., Inc., 2019 Term Loan B1,
(3 mo. LIBOR + 4.00%), 6.33%, 04/06/26 | | | | | | | 3,655 | | | | 3,652,006 | |
MRO Holdings, Inc., 2019 Term Loan B, (3 mo.
LIBOR + 5.00%), 7.48%, 06/04/26 | | | | | | | 1,245 | | | | 1,233,334 | |
Nordam Group Inc, The, Term Loan B, (6 mo.
LIBOR + 5.50%), 7.88%, 04/09/26(a) | | | | | | | 790 | | | | 788,045 | |
TransDigm, Inc., 2018 Term Loan F, (3 mo.
LIBOR + 2.50%), 4.83%, 06/09/23 | | | | | | | 4,526 | | | | 4,490,161 | |
| | | | | | | | |
| | | | | | | | | | | 13,501,956 | |
| | |
| 14 | | 2019 BLACKROCK SEMI-ANNUAL REPORTTO SHAREHOLDERS |
| | |
Schedule of Investments (unaudited) (continued) August 31, 2019 | | BlackRock Debt Strategies Fund, Inc. (DSU) (Percentages shown are based on Net Assets) |
| | | | | | | | | | | | |
| Security | | | | | Par
(000) | | | Value | |
|
| Air Freight & Logistics — 0.9% | |
Avolon TLB Borrower 1 (US) LLC, Term Loan B3, (1 mo. LIBOR + 1.75%), 3.92%, 01/15/25 | | | USD | | | | 1,980 | | | $ | 1,982,913 | |
WestJet Airlines Ltd., Term Loan B, 08/06/26(j) | | | | | | | 3,671 | | | | 3,679,040 | |
| | | | | | | | |
| | | | | | | | | | | 5,661,953 | |
|
| Airlines — 0.9% | |
Allegiant Travel Co., Term Loan B, (3 mo.
LIBOR + 4.50%), 6.71%, 02/05/24 | | | | | | | 1,776 | | | | 1,777,194 | |
American Airlines, Inc.: | | | | | | | | | | | | |
2017 Incremental Term Loan, (1mo. LIBOR + 2.00%), 4.20%, 12/14/23 | | | | | | | 2,125 | | | $ | 2,115,367 | |
Repriced TL B due 2023, (1 mo.
LIBOR + 2.00%), 4.12%, 04/28/23 | | | | | | | 1,257 | | | | 1,251,844 | |
| | | | | | | | |
| | | | | | | | | | | 5,144,405 | |
|
| Auto Components — 1.2% | |
Adient US LLC, Term Loan B, (3 mo. LIBOR + 4.25%), 6.46%, 05/06/24 | | | | | | | 448 | | | | 434,491 | |
Panther BF Aggregator 2 LP, USD Term Loan B,
(1 mo. LIBOR + 3.50%),
5.61%, 04/30/26 | | | | | | | 2,557 | | | | 2,518,645 | |
USI, Inc., 2017 Repriced Term Loan,
(3 mo. LIBOR + 3.00%),
5.33%, 05/16/24 | | | | | | | 2,940 | | | | 2,868,075 | |
Wand NewCo 3, Inc., 2019 1st Lien Term Loan,
(1 mo. LIBOR + 3.50%),
5.71%, 02/05/26 | | | | | | | 1,693 | | | | 1,697,233 | |
| | | | | | | | |
| | | | | | | | | | | 7,518,444 | |
|
| Banks — 0.3% | |
Capri Finance LLC, 2017 1st Lien Term Loan,
(3 mo. LIBOR + 3.25%),
5.51%, 11/01/24 | | | | | | | 2,083 | | | | 2,037,465 | |
| | | | | | | | |
|
| Building Materials — 1.0% | |
Allied Universal Holdco LLC, 2019 Term Loan B,
(3 mo. LIBOR + 4.25%),
6.51%, 07/10/26 | | | | | | | 5,808 | | | | 5,795,144 | |
| | | | | | | | |
|
| Building Products — 0.7% | |
CPG International, Inc., 2017 Term Loan,
(6 mo. LIBOR + 3.75%, 1.00% Floor),
5.93%, 05/05/24 | | | | | | | 1,429 | | | | 1,412,810 | |
Jeld-Wen, Inc., 2017 1st Lien Term Loan,
(3 mo. LIBOR + 2.00%),
4.33%, 12/14/24 | | | | | | | 931 | | | | 927,623 | |
Wilsonart LLC, 2017 Term Loan B, (3 mo. LIBOR + 3.25%, 1.00% Floor),
5.58%, 12/19/23 | | | | | | | 2,116 | | | | 2,059,693 | |
| | | | | | | | |
| | | | | | | | | | | 4,400,126 | |
|
| Capital Markets — 2.2% | |
Duff & Phelps Corp., 2017 Term Loan B,
(1 mo. LIBOR + 3.25%, 1.00% Floor),
5.36%, 02/13/25 | | | | | | | 2,229 | | | | 2,162,470 | |
EIG Management Co. LLC, 2018 Term Loan B,
(1 mo. LIBOR + 3.75%),
5.87%, 02/22/25 | | | | | | | 1,556 | | | | 1,554,740 | |
Fortress Investment Group LLC, 2018 Term Loan B, (1 mo. LIBOR + 2.00%),
4.11%, 12/27/22 | | | | | | | 1,250 | | | | 1,252,227 | |
Greenhill & Co., Inc., Term Loan B, (1 mo. LIBOR + 3.25%), 5.45%, 04/12/24 | | | | | | | 1,408 | | | | 1,393,329 | |
Jefferies Finance LLC, 2019 Term Loan,
(1 mo. LIBOR + 3.75%),
6.00%, 06/03/26 | | | | | | | 1,552 | | | | 1,547,639 | |
| | | | | | | | | | | | |
| Security | | | | | Par
(000) | | | Value | |
|
| Capital Markets (continued) | |
RPI Finance Trust, Term Loan B6, (1 mo. LIBOR + 2.00%), 4.11%, 03/27/23 | | | USD | | | | 1,950 | | | $ | 1,952,869 | |
Travelport Finance (Luxembourg) Sarl: | | | | | | | | | | | | |
2019 2nd Lien Term Loan, (3 mo.
LIBOR + 9.00%),
11.54%, 05/28/27(a) | | | | | | | 1,370 | | | | 1,191,900 | |
2019 Term Loan, (3 mo. LIBOR + 5.00%),
7.54%, 05/29/26 | | | | | | | 2,450 | | | | 2,250,131 | |
| | | | | | | | |
| | | | | | | | | | | 13,305,305 | |
|
| Chemicals — 4.6% | |
Alpha 3 BV, 2017 Term Loan B1, (3 mo. LIBOR + 3.00%, 1.00% Floor),
5.33%, 01/31/24 | | | | | | | 5,195 | | | | 5,036,083 | |
Axalta Coating Systems US Holdings, Inc., Term Loan, (3 mo. LIBOR + 1.75%), 4.08%, 06/01/24 | | | | | | | 971 | | | | 964,301 | |
Charter NEX US Holdings, Inc., 2017 Term Loan B, (1 mo. LIBOR + 3.00%, 1.00% Floor),
5.11%, 05/16/24 | | | | | | | 2,702 | | | | 2,653,608 | |
Charter NEX US, Inc., Incremental Term Loan,
(1 mo. LIBOR + 3.50%),
5.61%, 05/16/24 | | | | | | | 875 | | | | 873,364 | |
Chemours Co., 2018 Term Loan B, (1 mo. LIBOR + 1.75%), 3.87%, 04/03/25 | | | | | | | 1,151 | | | | 1,109,704 | |
Element Materials Technology Group US Holdings, Inc., 2017 Term Loan B,
(3 mo. LIBOR + 3.50%, 1.00% Floor),
6.15%, 06/28/24 | | | | | | | 650 | | | | 649,697 | |
Encapsys LLC, 1st Lien Term Loan, (1 mo. LIBOR + 3.50%, 1.00% Floor),
5.61%, 11/07/24 | | | | | | | 1,289 | | | | 1,288,223 | |
Invictus US LLC: | | | | | | | | | | | | |
1st Lien Term Loan, (2 mo. LIBOR + 3.00%), 5.15%, 03/28/25 | | | | | | | 1,907 | | | | 1,884,503 | |
2nd Lien Term Loan, (2 mo. LIBOR + 6.75%), 8.90%, 03/30/26 | | | | | | | 390 | | | | 386,588 | |
Messer Industries GmbH, 2018 USD Term Loan,
(3 mo. LIBOR + 2.50%),
4.83%, 03/01/26 | | | | | | | 3,665 | | | | 3,638,648 | |
Momentive Performance Materials, Inc., Term Loan B, (3 mo. LIBOR + 3.25%), 5.59%, 05/15/24 | | | | | | | 930 | | | | 910,237 | |
Oxea Holding Drei GmbH, 2017 Term Loan B2,
(1 mo. LIBOR + 3.50%), 5.75%, 10/14/24 | | | | | | | 2,438 | | | | 2,419,760 | |
Plaskolite LLC, 1st Lien Term Loan, (1 mo. LIBOR + 4.25%, 1.00% Floor), 6.43%, 12/15/25 | | | | | | | 1,224 | | | | 1,176,378 | |
PQ Corp., 2018 Term Loan B, (3 mo. LIBOR + 2.50%), 4.76%, 02/08/25 | | | | | | | 2,365 | | | | 2,362,462 | |
Starfruit Finco BV, 2018 USD Term Loan B, (1 mo.
LIBOR + 3.25%), 5.46%, 10/01/25 | | | | | | | 1,409 | | | | 1,359,544 | |
Tata Chemicals North America, Inc., Term Loan B,
(3 mo. LIBOR + 2.75%, 1.00% Floor),
5.13%, 08/07/20 | | | | | | | 526 | | | | 524,385 | |
Vectra Co., 1st Lien Term Loan, (1 mo. LIBOR + 3.25%), 5.36%, 03/08/25 | | | | | | | 895 | | | | 859,300 | |
| | | | | | | | |
| | | | | | | | | | | 28,096,785 | |
|
| Commercial Services & Supplies — 5.5% | |
Advanced Disposal Services, Inc., Term Loan B3,
(1 Week LIBOR + 2.25%), 4.39%, 11/10/23 | | | | | | | 1,857 | | | | 1,858,280 | |
Asurion LLC: | | | | | | | | | | | | |
2017 2nd Lien Term Loan, (1 mo.
LIBOR + 6.50%), 8.61%, 08/04/25 | | | | | | | 2,164 | | | | 2,193,885 | |
2017 Term Loan B4, (1 mo. LIBOR + 3.00%),
5.11%, 08/04/22 | | | | | | | 1,599 | | | | 1,599,081 | |
| | | | |
| SCHEDULE OF INVESTMENTS | | | 15 | |
| | |
Schedule of Investments (unaudited) (continued) August 31, 2019 | | BlackRock Debt Strategies Fund, Inc. (DSU) (Percentages shown are based on Net Assets) |
| | | | | | | | | | | | |
| Security | | | | | Par
(000) | | | Value | |
|
| Commercial Services & Supplies (continued) | |
2018 Term Loan B6, (1 mo. LIBOR + 3.00%),
5.11%, 11/03/23 | | | USD | | | | 1,642 | | | $ | 1,642,101 | |
2018 Term Loan B7, (1 mo. LIBOR + 3.00%),
5.11%, 11/03/24 | | | | | | | 1,945 | | | | 1,945,003 | |
Camelot UK Holdco Ltd., 2017 Repriced Term Loan, (1 mo. LIBOR + 3.25%, 1.00% Floor),
5.36%, 10/03/23 | | | | | | | 3,676 | | | | 3,684,734 | |
Creative Artists Agency LLC, 2018 Term Loan B,
(1 mo. LIBOR + 3.00%), 5.11%, 02/15/24 | | | | | | | 3,955 | | | | 3,952,251 | |
Diamond (BC) BV, Term Loan, (3 mo. LIBOR + 3.00%), 26%, 09/06/24 | | | | | | | 1,345 | | | | 1,227,312 | |
EnergySolutions LLC, 2018 Term Loan B,
(3 mo. LIBOR + 3.75%, 1.00% Floor),
6.08%, 05/09/25 | | | | | | | 484 | | | | 455,063 | |
GFL Environmental, Inc., 2018 USD Term Loan B,
(1 mo. LIBOR + 3.00%, 1.00% Floor),
5.11%, 05/30/25 | | | | | | | 2,622 | | | | 2,596,219 | |
Harland Clarke Holdings Corp., Term Loan B7,
(3 mo. LIBOR + 4.75%, 1.00% Floor),
7.08%, 11/03/23 | | | | | | | 558 | | | | 432,624 | |
KAR Auction Services, Inc., Term Loan B5, (3 mo.
LIBOR + 2.50%), 4.88%, 03/09/23 | | | | | | | 295 | | | $ | 294,479 | |
Prime Security Services Borrower LLC, 2016 1st Lien Term Loan, (1 mo. LIBOR + 2.75%, 1.00% Floor),
4.86%, 05/02/22 | | | | | | | 1,870 | | | | 1,867,904 | |
US Ecology, Inc., Term Loan B, 08/14/26(j) | | | | | | | 468 | | | | 469,755 | |
Verscend Holding Corp., 2018 Term Loan B, (1 mo.
LIBOR + 4.50%), 6.61%, 08/27/25 | | | | | | | 5,904 | | | | 5,912,862 | |
West Corp.: | | | | | | | | | | | | |
2017 Term Loan, (1 mo. LIBOR + 4.00%, 1.00% Floor), 6.11%, 10/10/24 | | | | | | | 2,152 | | | | 1,918,829 | |
2018 Term Loan B1, (1 mo. LIBOR + 3.50%, 1.00% Floor), 5.61%, 10/10/24 | | | | | | | 1,426 | | | | 1,259,874 | |
| | | | | | | | |
| | | | | | | | | | | 33,310,256 | |
|
| Communications Equipment — 0.6% | |
Avantor, Inc., 2017 1st Lien Term Loan,
(1 mo. LIBOR + 3.00%, 1.00% Floor),
5.11%, 11/21/24 | | | | | | | 1,878 | | | | 1,893,215 | |
Avaya, Inc., 2018 Term Loan B, (2 mo. LIBOR + 4.25%), 6.43%, 12/15/24 | | | | | | | 279 | | | | 273,455 | |
Ciena Corp., 2018 Term Loan B, (1 mo. LIBOR + 1.00%), 4.17%, 09/26/25 | | | | | | | 1,265 | | | | 1,268,369 | |
| | | | | | | | |
| | | | | | | | | | | 3,435,039 | |
|
| Construction & Engineering — 0.9% | |
Brand Energy & Infrastructure Services, Inc., 2017 Term Loan, (3 mo. LIBOR + 4.25%, 1.00% Floor),
6.51%, 06/21/24 | | | | | | | 3,359 | | | | 3,183,132 | |
Ply Gem Midco, Inc., 2018 Term Loan, (1 mo. LIBOR + 3.75%), 5.95%, 04/12/25 | | | | | | | 531 | | | | 514,883 | |
SRS Distribution, Inc., 2018 1st Lien Term Loan,
(1 mo. IBOR + 3.25%), 5.36%, 05/23/25 | | | | | | | 768 | | | | 744,337 | |
USIC Holdings, Inc., 2017 Term Loan B, (1 mo.
LIBOR + 3.00%, 1.00% Floor),
5.11%, 12/08/23 | | | | | | | 1,023 | | | | 1,008,306 | |
| | | | | | | | |
| | | | | | | | | | | 5,450,658 | |
|
| Construction Materials — 1.7% | |
Core & Main LP, 2017 Term Loan B, (2 mo. LIBOR + 2.75%, 1.00% Floor), 5.27%, 08/01/24 | | | | | | | 3,617 | | | | 3,606,348 | |
Filtration Group Corp., 2018 1st Lien Term Loan,
(1 mo. LIBOR + 3.00%), 5.11%, 03/29/25 | | | | | | | 4,385 | | | | 4,382,904 | |
Foundation Building Materials LLC, 2018 Term Loan B, (1 mo. LIBOR + 3.00%), 5.11%, 08/13/25 | | | | | | | 690 | | | | 687,655 | |
| | | | | | | | | | | | |
| Security | | | | | Par
(000) | | | Value | |
|
| Construction Materials (continued) | |
Tamko Building Products, Inc., Term Loan B, (3 mo. LIBOR + 3.25%), 5.37%, 06/01/26(a) | | | USD | | | | 661 | | | $ | 661,000 | |
Xella International GmbH, 2017 EUR Term Loan B, (Euribor + 3.75%), 3.75%, 04/11/24 | | | EUR | | | | 1,000 | | | | 1,083,938 | |
| | | | | | | | |
| | | | | | | | | | | 10,421,845 | |
|
| Containers & Packaging — 2.5% | |
Berry Global, Inc.: | | | | | | | | | | | | |
Term Loan Q, (1 mo. LIBOR + 2.25%),
4.45%, 10/01/22 | | | USD | | | | 5,590 | | | | 5,590,934 | |
USD Term Loan U, (1 mo. LIBOR + 2.50%), 4.70%, 07/01/26 | | | | | | | 2,830 | | | | 2,828,444 | |
BWAY Holding Co., 2017 Term Loan B,
(3 mo. LIBOR + 3.25%), 5.59%, 04/03/24 | | | | | | | 2,501 | | | | 2,428,761 | |
Flex Acquisition Co., Inc., 1st Lien Term Loan,
(3 mo. LIBOR + 3.00%, 1.00% Floor),
5.32%, 12/29/23 | | | | | | | 3,357 | | | | 3,192,220 | |
Pregis Corp., Term Loan, (3 mo. LIBOR + 4.00%), 6.25%, 07/31/26 | | | | | | | 959 | | | | 953,802 | |
| | | | | | | | |
| | | | | | | | | | | 14,994,161 | |
|
| Distributors — 1.2% | |
American Builders & Contractors Supply Co., Inc., 2018 Term Loan B, (1 mo. LIBOR + 2.00%), 4.11%, 10/31/23 | | | | | | | 4,510 | | | | 4,466,557 | |
TriMark USA LLC, 2017 1st Lien Term Loan, (6 mo. LIBOR + 3.50%), 5.70%, 08/28/24 | | | | | | | 3,321 | | | | 2,792,173 | |
| | | | | | | | |
| | | | | | | | | | | 7,258,730 | |
|
| Diversified Consumer Services — 3.4% | |
Ascend Learning LLC, 2017 Term Loan B,
(1 mo. LIBOR + 3.00%, 1.00% Floor),
5.11%, 07/12/24 | | | | | | | 811 | | | | 802,457 | |
Bright Horizons Family Solutions, Inc., 2017
Term Loan B, (1 mo. LIBOR + 0.75%),
3.86%, 11/07/23 | | | | | | | 2,045 | | | | 2,043,307 | |
Genuine Financial Holdings LLC, 2018 1st Lien
Term Loan, (1 mo. LIBOR + 3.75%),
5.86%, 07/12/25 | | | | | | | 1,490 | | | | 1,446,287 | |
J.D. Power and Associates, 1st Lien Term Loan,
(1 mo. LIBOR + 3.75%, 1.00% Floor),
5.86%, 09/07/23 | | | | | | | 1,940 | | | | 1,941,339 | |
Nomad Foods Europe Midco Ltd., 2017 Term Loan B4, (1 mo. LIBOR + 2.25%), 4.45%, 05/15/24 | | | | | | | 1,132 | | | | 1,124,421 | |
Serta Simmons Bedding LLC: | | | | | | | | | | | | |
1st Lien Term Loan, (1 mo. LIBOR + 3.50%, 1.00% Floor), 5.70%, 11/08/23 | | | | | | | 1,116 | | | | 741,135 | |
2nd Lien Term Loan, (1 mo. LIBOR + 8.00%, 1.00% Floor), 10.18%, 11/08/24 | | | | | | | 115 | | | | 50,068 | |
ServiceMaster Co., 2016 Term Loan B,
(1 mo. LIBOR + 2.50%), 4.61%, 11/08/23 | | | | | | | 244 | | | | 243,986 | |
ServPro Borrower LLC, Term Loan B,
(1 mo. LIBOR + 3.50%), 5.61%, 03/26/26 | | | | | | | 485 | | | | 483,272 | |
Spin Holdco, Inc., 2017 Term Loan B,
(3 mo. LIBOR + 3.25%, 1.00% Floor),
5.57%, 11/14/22 | | | | | | | 3,750 | | | | 3,664,125 | |
TruGreen LP, 2019 Term Loan, (1 mo. LIBOR + 3.75%, 1.00% Floor), 5.86%, 03/19/26 | | | | | | | 2,656 | | | | 2,664,480 | |
Uber Technologies, Inc.: | | | | | | | | | | | | |
2018 Incremental Term Loan, (1 mo. LIBOR + 3.50%), 5.65%, 07/13/23 | | | | | | | 3,839 | | | | 3,823,843 | |
2018 Term Loan, (1 mo. LIBOR + 4.00%, 1.00% Floor), 6.20%, 04/04/25 | | | | | | | 1,581 | | | | 1,580,841 | |
| | | | | | | | |
| | | | | | | | | | | 20,609,561 | |
| | |
| 16 | | 2019 BLACKROCK SEMI-ANNUAL REPORTTO SHAREHOLDERS |
| | |
Schedule of Investments (unaudited) (continued) August 31, 2019 | | BlackRock Debt Strategies Fund, Inc. (DSU) (Percentages shown are based on Net Assets) |
| | | | | | | | | | | | |
| Security | | | | | Par
(000) | | | Value | |
|
| Diversified Financial Services — 2.4% | |
Advisor Group, Inc., 2019 Term Loan,
(1 mo. LIBOR + 5.00%), 7.11%, 07/31/26 | | | USD | | | | 1,895 | | | $ | 1,866,575 | |
AlixPartners LLP, 2017 Term Loan B,
(1 mo. LIBOR + 2.75%, 1.00% Floor),
4.86%, 04/04/24 | | | | | | | 5,080 | | | | 5,082,681 | |
CRCI Longhorn Holdings, Inc., 2018 1st Lien Term Loan, (1 mo. LIBOR + 3.50%),
5.71%, 08/08/25(a) | | | | | | | 622 | | | | 605,184 | |
EG Finco Ltd., 2018 Term Loan, (3 mo. LIBOR + 4.00%), 6.33%, 02/07/25 | | | | | | | 2,435 | | | | 2,397,157 | |
Kingpin Intermediate Holdings LLC, 2018 Term Loan B, (1 mo. LIBOR + 3.50%, 1.00% Floor),
5.61%, 07/03/24 | | | | | | | 1,513 | | | | 1,509,383 | |
LTI Holdings, Inc., 2018 Add On 1st Lien Term Loan, (1 mo. LIBOR + 3.50%), 5.61%, 09/06/25 | | | | | | | 906 | | | | 853,366 | |
SSH Group Holdings, Inc., 2018 1st Lien Term Loan, (2 mo. LIBOR + 4.25%), 6.51%, 07/30/25 | | | | | | | 1,242 | | | | 1,229,330 | |
Starwood Property Trust, Inc., 2019 Term Loan B,
(2 mo. LIBOR + 2.50%), 4.78%, 07/27/26(a) | | | | | | | 697 | | | | 698,743 | |
Tank Holding Corp., 2019 Term Loan B, (1 Week LIBOR + 4.00%), 6.12%, 03/26/26 | | | | | | | 182 | | | | 180,821 | |
| | | | | | | | |
| | | | | | | | | | | 14,423,240 | |
|
| Diversified Telecommunication Services — 2.0% | |
CenturyLink, Inc., 2017 Term Loan B,
(1 mo. LIBOR + 2.75%), 4.86%, 01/31/25 | | | | | | | 1,901 | | | | 1,871,946 | |
Hargray Communications Group, Inc., 2017 Term Loan B, (1 mo. LIBOR + 3.00%, 1.00% Floor), 5.11%, 05/16/24 | | | | | | | 1,341 | | | | 1,331,039 | |
Level 3 Financing, Inc., 2017 Term Loan B,
(1 mo. LIBOR + 2.25%), 4.36%, 02/22/24 | | | | | | | 2,485 | | | | 2,485,807 | |
MTN Infrastructure TopCo, Inc., 1st Lien Term Loan B, (1 mo. LIBOR + 3.00%, 1.00% Floor),
5.11%, 11/15/24 | | | | | | | 1,809 | | | | 1,775,180 | |
Sprint Communications, Inc., 1st Lien Term Loan B, (1 mo. LIBOR + 2.50%), 4.63%, 02/02/24 | | | | | | | 928 | | | | 921,596 | |
Telenet Financing USD LLC, Term Loan AN,
(1 mo. LIBOR + 2.25%), 4.45%, 08/15/26 | | | | | | | 1,568 | | | | 1,563,127 | |
Telesat Canada, Term Loan B4,
(3 mo. LIBOR + 2.50%), 4.83%, 11/17/23 | | | | | | | 662 | | | | 661,049 | |
Virgin Media Investment Holdings Ltd., Term Loan L, (1 mo. LIBOR + 3.25%), 3.96%, 01/15/27 | | | GBP | | | | 1,400 | | | | 1,694,815 | |
| | | | | | | | |
| | | | | | | | | | | 12,304,559 | |
|
| Electric Utilities — 0.3% | |
Texas Competitive Electric Holdings Co. LLC/TCEH Finance, Inc., Term Loan, 1.00%, 11/10/19(a)(b)(c) | | | USD | | | | 2,375 | | | | — | |
Vistra Energy Corp., 1st Lien Term Loan B3,
(3 mo. LIBOR + 2.00%), 4.18%, 12/31/25 | | | | | | | 1,554 | | | | 1,554,829 | |
| | | | | | | | |
| | | | | | | | | | | 1,554,829 | |
|
| Electrical Equipment — 0.7% | |
Gates Global LLC, 2017 Repriced Term Loan B,
(1 mo. LIBOR + 2.75%, 1.00% Floor),
4.86%, 04/01/24 | | | | | | | 4,270 | | | | 4,159,052 | |
| | | | | | | | |
|
| Energy Equipment & Services — 0.5% | |
Gavilan Resources LLC, 2nd Lien Term Loan,
(1 mo. LIBOR + 6.00%, 1.00% Floor), 8.11%, 03/01/24 | | | | | | | 916 | | | | 389,360 | |
GrafTech Finance, Inc., 2018 Term Loan B,
(1 mo. LIBOR + 3.50%, 1.00% Floor),
5.61%, 02/12/25 | | | | | | | 1,849 | | | | 1,795,706 | |
Pioneer Energy Services Corp., Term Loan,
(1 mo. LIBOR + 7.75%, 1.00% Floor),
9.90%, 11/08/22(a) | | | | | | | 770 | | | | 731,500 | |
| | | | | | | | |
| | | | | | | | | | | 2,916,566 | |
| | | | | | | | | | | | |
| Security | | | | | Par
(000) | | | Value | |
|
| Equity Real Estate Investment Trusts (REITs) — 2.3% | |
Capital Automotive LP, 2017 1st Lien Term Loan,
(1 mo. LIBOR + 2.50%, 1.00% Floor),
4.62%, 03/24/24 | | | USD | | | | 404 | | | $ | 403,214 | |
Claros Mortgage Trust, Inc., Term Loan B,
(3 mo. LIBOR + 3.25%), 5.46%, 08/10/26(a) | | | | | | | 1,853 | | | | 1,850,684 | |
Iron Mountain, Inc., 2018 Term Loan B,
(1 mo. LIBOR + 1.75%), 3.86%, 01/02/26(a) | | | | | | | 2,283 | | | | 2,254,834 | |
MGM Growth Properties Operating Partnership LP, 2016 Term Loan B, (1 mo. LIBOR + 2.00%), 4.11%, 03/21/25 | | | | | | | 4,102 | | | | 4,100,184 | |
VICI Properties 1 LLC, Replacement Term Loan B,
(1 mo. LIBOR + 2.00%), 4.17%, 12/20/24 | | | | | | | 5,209 | | | | 5,216,850 | |
| | | | | | | | |
| | | | | | | | | | | 13,825,766 | |
|
| Food & Staples Retailing — 2.4% | |
Albertsons LLC: | | | | | | | | | | | | |
2019 Term Loan B7, (1 mo. LIBOR + 2.75%), 4.86%, 11/17/25 | | | | | | | 1,008 | | | | 1,010,739 | |
2019 Term Loan B8, (1 mo. LIBOR + 2.75%), 4.86%, 08/17/26 | | | | | | | 13 | | | | 13,231 | |
BCPE Empire Holdings, Inc., 2019 Term Loan B,
(1 mo. LIBOR + 4.00%), 6.11%, 06/11/26 | | | | | | | 1,220 | | | | 1,198,246 | |
Hearthside Food Solutions LLC: | | | | | | | | | | | | |
2018 Incremental Term Loan, (1 mo. LIBOR + 4.00%), 6.11%, 05/23/25 | | | | | | | 1,553 | | | | 1,506,599 | |
2018 Term Loan B, (1 mo. LIBOR + 3.68%), 5.80%, 05/23/25 | | | | | | | 694 | | | | 673,791 | |
Hostess Brands LLC, 2017 Repriced Term Loan,
(1 mo. LIBOR + 2.25%), 4.36%, 08/03/22 | | | | | | | 3,439 | | | | 3,430,707 | |
US Foods, Inc.: | | | | | | | | | | | | |
2016 Term Loan B, (1 mo. LIBOR + 2.00%), 4.11%, 06/27/23 | | | | | | | 3,057 | | | | 3,058,758 | |
2019 Term Loan B, 08/14/26(j) | | | | | | | 3,464 | | | | 3,469,785 | |
| | | | | | | | |
| | | | | | | | | | | 14,361,856 | |
|
| Food Products — 2.5% | |
8th Avenue Food & Provisions, Inc., 2018 1st Lien Term Loan, (1 mo. LIBOR + 3.75%),
5.96%, 10/01/25 | | | | | | | 685 | | | | 685,987 | |
Chobani LLC, 2017 Term Loan B, (1 mo. LIBOR + 3.50%, 1.00% Floor), 5.61%, 10/10/23 | | | | | | | 3,068 | | | | 3,014,022 | |
JBS USA LUX SA, 2019 Term Loan B,
(1 mo. LIBOR + 2.50%), 4.61%, 05/01/26 | | | | | | | 2,541 | | | | 2,543,808 | |
Post Holdings, Inc., 2017 Series A Incremental Term Loan, (1 mo. LIBOR + 2.00%), 4.15%, 05/24/24 | | | | | | | 1,875 | | | | 1,875,058 | |
Reynolds Group Holdings, Inc., 2017 Term Loan,
(1 mo. LIBOR + 2.75%), 4.86%, 02/05/23 | | | | | | | 7,126 | | | | 7,117,975 | |
| | | | | | | | |
| | | | | | | | | | | 15,236,850 | |
|
| Gas Utilities — 0.2% | |
AL Midcoast Holdings LLC, 2018 Term Loan B,
(3 mo. LIBOR + 5.50%), 7.83%, 07/31/25 | | | | | | | 1,460 | | | | 1,427,138 | |
| | | | | | | | |
|
| Health Care Equipment & Supplies — 1.7% | |
Agiliti Health, Inc., Term Loan, 5.25%, 01/04/26(a)(j) | | | | | | | 788 | | | | 789,010 | |
Immucor, Inc., Extended Term Loan B,
(3 mo. LIBOR + 5.00%, 1.00% Floor),
7.33%, 06/15/21 | | | | | | | 5,118 | | | | 5,092,254 | |
Ortho-Clinical Diagnostics SA, 2018 Term Loan B,
(3 mo. LIBOR + 3.25%), 5.56%, 06/30/25 | | | | | | | 4,499 | | | | 4,234,580 | |
| | | | | | | | |
| | | | | | | | | | | 10,115,844 | |
|
| Health Care Providers & Services — 6.0% | |
AHP Health Partners, Inc., 2018 Term Loan,
(1 mo. LIBOR + 4.50%, 1.00% Floor), 6.61%, 06/30/25 | | | | | | | 850 | | | | 850,257 | |
| | | | |
| SCHEDULE OF INVESTMENTS | | | 17 | |
| | |
Schedule of Investments (unaudited) (continued) August 31, 2019 | | BlackRock Debt Strategies Fund, Inc. (DSU) (Percentages shown are based on Net Assets) |
| | | | | | | | | | | | |
| Security | | | | | Par
(000) | | | Value | |
|
| Health Care Providers & Services (continued) | |
CHG Healthcare Services, Inc., 2017 1st Lien Term Loan B, (1 mo. LIBOR + 3.00%, 1.00% Floor), 5.11%, 06/07/23 | | | USD | | | | 4,808 | | | $ | 4,764,599 | |
Concentra, Inc.: | | | | | | | | | | | | |
2018 1st Lien Term Loan, (3 mo. LIBOR + 2.75%), 5.21%, 06/01/22 | | | | | | | 2,155 | | | | 2,154,250 | |
2018 2nd Lien Term Loan, (3 mo. LIBOR + 6.50%, 1.00% Floor), 8.96%, 06/01/23 | | | | | | | 1,650 | | | | 1,656,873 | |
DentalCorp Perfect Smile ULC, 1st Lien Term Loan, (1 mo. LIBOR + 3.75%, 1.00% Floor),
5.86%, 06/06/25 | | | | | | | 918 | | | | 895,732 | |
Diplomat Pharmacy, Inc., 2017 Term Loan B,
(1 mo. LIBOR + 4.50%, 1.00% Floor),
6.62%, 12/20/24 | | | | | | | 976 | | | | 902,622 | |
Envision Healthcare Corp., 2018 1st Lien Term Loan, (1 mo. LIBOR + 3.75%), 5.86%, 10/10/25 | | | | | | | 2,607 | | | | 2,011,913 | |
Femur Buyer, Inc., 1st Lien Term Loan,
(3 mo. LIBOR + 4.50%), 6.98%, 03/05/26(a) | | | | | | | 732 | | | | 732,000 | |
Gentiva Health Services, Inc., 2018 1st Lien Term Loan, (1 mo. LIBOR + 3.75%), 5.88%, 07/02/25 | | | | | | | 2,719 | | | | 2,717,224 | |
HC Group Holdings II, Inc., Term Loan B,
(1 mo. LIBOR + 4.50%), 6.61%, 05/21/26 | | | | | | | 1,340 | | | | 1,334,412 | |
HCA, Inc., 2018 Term Loan B10, (3 mo. LIBOR + 2.00%), 4.33%, 03/13/25 | | | | | | | 953 | | | | 955,472 | |
LGC Science Holdings Ltd., USD Term Loan B3,
(1 mo. LIBOR + 3.50%), 5.61%, 03/08/23 | | | | | | | 1,000 | | | | 984,170 | |
MPH Acquisition Holdings LLC, 2016 Term Loan B, (3 mo. LIBOR + 2.75%, 1.00% Floor),
5.08%, 06/07/23 | | | | | | | 4,241 | | | | 3,938,648 | |
nThrive, Inc., 2016 1st Lien Term Loan, (1 mo.
LIBOR + 4.50%, 1.00% Floor), 6.61%, 10/20/22 | | | | | | | 3,535 | | | | 3,287,213 | |
NVA Holdings, Inc., Term Loan B3, (1 mo. LIBOR + 2.75%, 1.00% Floor), 4.86%, 02/02/25 | | | | | | | 2,245 | | | | 2,242,276 | |
Radiology Partners, Inc., 2018 1st Lien Term Loan B, (3 mo. LIBOR + 4.75%), 7.39%, 07/09/25 | | | | | | | 906 | | | | 868,448 | |
Sotera Health Holdings LLC: | | | | | | | | | | | | |
2017 Term Loan, (1 mo. LIBOR + 3.00%, 1.00% Floor), 5.11%, 05/15/22 | | | | | | | 3,070 | | | | 3,008,612 | |
2019 Incremental Term Loan, (1 mo. LIBOR + 3.50%, 1.00% Floor), 5.74%, 05/15/22 | | | | | | | 1,354 | | | | 1,337,075 | |
Team Health Holdings, Inc., 1st Lien Term Loan,
(1 mo. LIBOR + 2.75%, 1.00% Floor),
4.86%, 02/06/24 | | | | | | | 1,105 | | | | 887,533 | |
Vizient, Inc., 2019 Term Loan B5, (1 mo. LIBOR + 2.50%), 4.61%, 05/06/26 | | | | | | | 991 | | | | 994,111 | |
| | | | | | | | |
| | | | | | | | | | | 36,523,440 | |
|
| Health Care Services — 0.6% | |
Emerald TopCo., Inc., Term Loan, (1 mo. LIBOR + 3.50%), 5.61%, 07/24/26 | | | | | | | 1,974 | | | | 1,962,491 | |
WP CityMD Bidco LLC, 2019 Term Loan B,
(3 mo. LIBOR + 4.50%, 1.00% Floor),
6.71%, 08/07/26 | | | | | | | 1,941 | | | | 1,917,553 | |
| | | | | | | | |
| | | | | | | | | | | 3,880,044 | |
|
| Health Care Technology — 1.8% | |
Athenahealth, Inc., 2019 Term Loan B,
(1 mo. LIBOR + 4.50%), 6.83%, 02/11/26 | | | | | | | 5,329 | | | | 5,298,698 | |
Change Healthcare Holdings, Inc., 2017 Term
Loan B, (1 mo. LIBOR + 2.50%, 1.00% Floor),
4.61%, 03/01/24 | | | | | | | 4,241 | | | | 4,191,380 | |
GoodRx, Inc., 1st Lien Term Loan, (1 mo. LIBOR + 2.75%), 4.93%, 10/10/25 | | | | | | | 1,071 | | | | 1,061,386 | |
| | | | | | | | | | | | |
| Security | | | | | Par
(000) | | | Value | |
|
| Health Care Technology (continued) | |
Quintiles IMS, Inc., 2017 Term Loan B,
(3 mo. LIBOR + 2.00%), 4.33%, 03/07/24 | | | USD | | | | 279 | | | $ | 279,608 | |
| | | | | | | | |
| | | | | | | | | | | 10,831,072 | |
|
| Hotels, Restaurants & Leisure — 8.2% | |
Aristocrat Technologies, Inc., 2018 1st Lien Term Loan, (3 mo. LIBOR + 1.75%),
4.03%, 10/19/24 | | | | | | | 1,173 | | | | 1,173,160 | |
Boyd Gaming Corp., Term Loan B3, (1 Week LIBOR + 2.25%), 4.39%, 09/15/23 | | | | | | | 1,892 | | | | 1,890,883 | |
Burger King Newco Unlimited Liability Co., Term Loan B3, (1 mo. LIBOR + 2.25%, 1.00% Floor), 4.36%, 02/16/24 | | | | | | | 4,615 | | | | 4,605,687 | |
Caesars Resort Collection LLC, 2017 1st Lien Term Loan B, (1 mo. LIBOR + 2.75%),
4.86%, 12/22/24 | | | | | | | 4,062 | | | | 3,998,706 | |
CCM Merger, Inc., Term Loan B, (1 mo. LIBOR + 2.25%), 4.36%, 08/08/21 | | | | | | | 629 | | | | 629,329 | |
ESH Hospitality, Inc., 2018 Term Loan B,
(1 mo. LIBOR + 2.00%), 4.11%, 08/30/23 | | | | | | | 2,622 | | | | 2,622,188 | |
Four Seasons Hotels Ltd., 1st Lien Term Loan,
(1 mo. LIBOR + 2.00%), 4.11%, 11/30/23 | | | | | | | 2,909 | | | | 2,911,679 | |
Golden Nugget LLC, 2017 Incremental Term Loan B, (1 mo. LIBOR + 2.75%), 4.93%, 10/04/23 | | | | | | | 1,158 | | | | 1,156,723 | |
Hilton Worldwide Finance LLC, 2019 Term Loan B2, (1 mo. LIBOR + 1.75%), 3.90%, 06/22/26 | | | | | | | 3,825 | | | | 3,832,631 | |
IRB Holding Corp., 1st Lien Term Loan,
(3 mo. LIBOR + 3.25%, 1.00% Floor),
5.56%, 02/05/25 | | | | | | | 4,308 | | | | 4,274,661 | |
KFC Holding Co., 2018 Term Loan B,
(1 mo. LIBOR + 1.75%), 3.93%, 04/03/25 | | | | | | | 885 | | | | 882,792 | |
Lakeland Tours LLC, 2017 1st Lien Term Loan B,
(3 mo. LIBOR + 4.00%, 1.00% Floor),
6.40%, 12/15/24 | | | | | | | 1,031 | | | | 1,033,199 | |
NASCAR Holdings, Inc., Term Loan B, 07/26/26(j) | | | | | | | 1,368 | | | | 1,374,553 | |
Penn National Gaming, Inc., 2018 1st Lien Term Loan B, (1 mo. LIBOR + 2.25%),
4.36%, 10/15/25 | | | | | | | 646 | | | | 647,208 | |
Playa Resorts Holding BV, 2017 Term Loan B,
(1 mo. LIBOR + 2.75%, 1.00% Floor),
4.86%, 04/29/24 | | | | | | | 1,605 | | | | 1,532,722 | |
Sabre GLBL, Inc., 2018 Term Loan B,
(1 mo. LIBOR + 2.00%), 4.11%, 02/22/24 | | | | | | | 1,202 | | | | 1,202,856 | |
Scientific Games International, Inc., 2018 Term Loan B5, (1 mo. LIBOR + 2.75%), 4.90%, 08/14/24 | | | | | | | 1,948 | | | | 1,923,238 | |
Stars Group Holdings BV, 2018 USD Incremental Term Loan, (3 mo. LIBOR + 3.50%),
5.83%, 07/10/25 | | | | | | | 6,552 | | | | 6,567,465 | |
Station Casinos LLC, 2016 Term Loan B,
(1 mo. LIBOR + 2.50%), 4.62%, 06/08/23 | | | | | | | 3,318 | | | | 3,321,596 | |
Whatabrands LLC, Term Loan B, (3 mo. LIBOR + 3.25%), 5.52%, 08/02/26 | | | | | | | 3,026 | | | | 3,036,409 | |
Wynn Resorts Ltd., Term Loan B, (1 mo. LIBOR + 2.25%), 4.37%, 10/30/24 | | | | | | | 1,066 | | | | 1,065,421 | |
| | | | | | | | |
| | | | | | | | | | | 49,683,106 | |
|
| Household Products — 0.3% | |
Sunshine Luxembourg VII Sarl, USD 1st Lien Term Loan, 07/16/26 (j) | | | | | | | 1,536 | | | | 1,534,848 | |
| | | | | | | | |
|
| Independent Power and Renewable Electricity Producers — 0.9% | |
Calpine Construction Finance Co. LP, 2017
Term Loan B, (1 mo. LIBOR + 2.50%),
4.61%, 01/15/25 | | | | | | | 497 | | | | 495,489 | |
| | |
| 18 | | 2019 BLACKROCK SEMI-ANNUAL REPORTTO SHAREHOLDERS |
| | |
Schedule of Investments (unaudited) (continued) August 31, 2019 | | BlackRock Debt Strategies Fund, Inc. (DSU) (Percentages shown are based on Net Assets) |
| | | | | | | | | | | | |
| Security | | | | | Par
(000) | | | Value | |
|
| Independent Power and Renewable Electricity Producers (continued) | |
Calpine Corp.: | | | | | | | | | | | | |
2019 Term Loan B10, (1 mo. LIBOR + 2.50%), 4.61%, 08/12/26 | | | USD | | | | 1,391 | | | $ | 1,386,362 | |
Term Loan B9, (3 mo. LIBOR + 2.75%),
5.08%, 04/05/26 | | | | | | | 1,952 | | | | 1,948,740 | |
Granite Acquisition, Inc.: | | | | | | | | | | | | |
Term Loan B, (3 mo. LIBOR + 3.50%, 1.00% Floor), 5.82%, 12/19/21 | | | | | | | 1,604 | | | | 1,607,496 | |
Term Loan C, (3 mo. LIBOR + 3.50%, 1.00% Floor), 5.83%, 12/19/21 | | | | | | | 197 | | | | 197,069 | |
| | | | | | | | |
| | | | | | | | | | | 5,635,156 | |
|
| Industrial Conglomerates — 1.4% | |
Cortes NP Acquisition Corp., 2017 Term Loan B,
(3 mo. LIBOR + 4.00%, 1.00% Floor),
6.33%, 11/30/23 | | | | | | | 4,494 | | | | 4,220,322 | |
Sequa Mezzanine Holdings LLC, 1st Lien Term Loan, (3 mo. LIBOR + 5.00%, 1.00% Floor),
7.19%, 11/28/21 | | | | | | | 1,943 | | | | 1,917,780 | |
Sundyne US Purchaser, Inc., Term Loan,
(1 mo. LIBOR + 4.00%), 6.11%, 05/15/26(a) | | | | | | | 2,362 | | | | 2,315,010 | |
| | | | | | | | |
| | | | | | | | | | | 8,453,112 | |
|
| Insurance — 4.3% | |
Alliant Holdings I, Inc., 2018 Term Loan B,
(1 mo. LIBOR + 3.00%), 5.15%, 05/09/25 | | | | | | | 2,844 | | | | 2,760,677 | |
Alliant Holdings Intermediate LLC, Term Loan B,
(1 mo. LIBOR + 3.25%), 5.45%, 05/09/25 | | | | | | | 1,970 | | | | 1,941,691 | |
AmWINS Group, Inc., 2017 Term Loan B,
(1 mo. LIBOR + 2.75%, 1.00% Floor),
4.86%, 01/25/24 | | | | | | | 3,751 | | | | 3,743,982 | |
AssuredPartners, Inc., 2017 1st LienAdd-On Term Loan, (1 mo. LIBOR + 3.50%),
5.61%, 10/22/24 | | | | | | | 3,098 | | | | 3,078,740 | |
Davis Vision, Inc., 1st Lien Term Loan B,
(1 mo. LIBOR + 3.00%, 1.00% Floor),
5.11%, 12/02/24 | | | | | | | 680 | | | | 660,538 | |
Hub International Ltd., 2018 Term Loan B,
(3 mo. LIBOR + 3.00%), 5.27%, 04/25/25 | | | | | | | 2,571 | | | | 2,517,701 | |
Sedgwick Claims Management Services, Inc.: | | | | | | | | | | | | |
2019 Incremental Term Loan B, 08/07/26(j) | | | | | | | 3,232 | | | | 3,218,523 | |
Term Loan B, (1 mo. LIBOR + 3.25%),
5.36%, 12/31/25 | | | | | | | 6,947 | | | | 6,729,505 | |
Stratose Intermediate Holdings II LLC, 1st Lien Term Loan, (1 mo. LIBOR + 3.25%, 1.00% Floor), 5.36%, 06/22/23 | | | | | | | 1,109 | | | | 1,098,325 | |
| | | | | | | | |
| | | | | | | | | | | 25,749,682 | |
|
| Interactive Media & Services — 0.8% | |
Go Daddy Operating Co. LLC, 2017 Repriced Term Loan, (1 mo. LIBOR + 2.00%), 4.11%, 02/15/24 | | | | | | | 1,947 | | | | 1,950,011 | |
Inmar Holdings, Inc., 2017 1st Lien Term Loan,
(3 mo. LIBOR + 4.00%, 1.00% Floor),
6.33%, 05/01/24 | | | | | | | 345 | | | | 326,094 | |
Rackspace Hosting, Inc., 2017 Incremental 1st Lien Term Loan, (3 mo. LIBOR + 3.00%, 1.00% Floor), 5.29%, 11/03/23 | | | | | | | 1,592 | | | | 1,472,731 | |
TierPoint LLC, 2017 1st Lien Term Loan,
(1 mo. LIBOR + 3.75%, 1.00% Floor),
5.86%, 05/06/24 | | | | | | | 1,362 | | | | 1,265,316 | |
| | | | | | | | |
| | | | | | | | | | | 5,014,152 | |
|
| IT Services — 2.2% | |
Altran Technologies SA, 1st Lien Term Loan,
(3 mo. LIBOR + 2.50%), 4.89%, 03/20/25 | | | | | | | 622 | | | | 621,540 | |
| | | | | | | | | | | | |
| Security | | | | | Par
(000) | | | Value | |
|
| IT Services (continued) | |
Epicor Software Corp., 1st Lien Term Loan,
(1 mo. LIBOR + 3.25%, 1.00% Floor),
5.37%, 06/01/22 | | | USD | | | | 1,417 | | | $ | 1,414,810 | |
Evertec Group LLC, 2018 Term Loan B,
(1 mo. LIBOR + 3.50%), 5.61%, 11/27/24 | | | | | | | 1,075 | | | | 1,076,620 | |
Global Payments, Inc.: | | | | | | | | | | | | |
2018 Term Loan B3, (1 mo. LIBOR + 1.75%), 3.86%, 04/21/23 | | | | | | | 968 | | | | 966,125 | |
2018 Term Loan B4, (1 mo. LIBOR + 1.75%), 3.86%, 10/17/25 | | | | | | | 323 | | | | 322,971 | |
Greeneden US Holdings II LLC, 2018 Term Loan B, (1 mo. LIBOR + 3.25%), 5.36%, 12/01/23 | | | | | | | 1,405 | | | | 1,388,244 | |
Optiv Security, Inc., 1st Lien Term Loan,
(1 mo. LIBOR + 3.25%, 1.00% Floor),
5.36%, 02/01/24 | | | | | | | 781 | | | | 640,564 | |
Outfront Media Capital LLC, 2017 Term Loan B,
(1 mo. LIBOR + 2.00%), 4.21%, 03/18/24 | | | | | | | 223 | | | | 223,790 | |
Peak 10 Holding Corp., 2nd Lien Term Loan,
(1 mo. LIBOR + 7.25%, 1.00% Floor),
9.48%, 08/01/25 | | | | | | | 1,246 | | | | 1,003,030 | |
Trans Union LLC: | | | | | | | | | | | | |
2018 Term Loan B4, (1 mo. LIBOR + 2.00%), 4.11%, 06/19/25 | | | | | | | 1,294 | | | | 1,294,629 | |
Term Loan B3, (1 mo. LIBOR + 2.00%),
4.11%, 04/10/23 | | | | | | | 2,095 | | | | 2,096,258 | |
WEX, Inc., Term Loan B3, (1 mo. LIBOR + 2.25%), 4.36%, 05/15/26 | | | | | | | 2,251 | | | | 2,255,099 | |
| | | | | | | | |
| | | | | | | | | | | 13,303,680 | |
|
| Leisure Products — 0.1% | |
MND Holdings III Corp., 2018 1st Lien Term Loan,
(3 mo. LIBOR + 3.50%, 1.00% Floor),
5.83%, 06/19/24(a) | | | | | | | 794 | | | | 771,971 | |
| | | | | | | | |
|
| Life Sciences Tools & Services — 0.1% | |
Albany Molecular Research, Inc.: | | | | | | | | | | | | |
2017 1st Lien Term Loan, (1 mo. LIBOR + 3.25%, 1.00% Floor), 5.36%, 08/30/24 | | | | | | | 292 | | | | 281,227 | |
2017 2nd Lien Term Loan, (1 mo. LIBOR + 7.00%, 1.00% Floor), 9.11%, 08/30/25(a) | | | | | | | 75 | | | | 74,062 | |
| | | | | | | | |
| | | | | | | | | | | 355,289 | |
|
| Machinery — 1.4% | |
Clark Equipment Co., 2018 Term Loan B,
(3 mo. LIBOR + 2.00%), 4.33%, 05/18/24 | | | | | | | 595 | | | | 594,553 | |
Gardner Denver, Inc., 2017 Term Loan B,
(1 mo. LIBOR + 2.75%), 4.86%, 07/30/24 | | | | | | | 2,307 | | | | 2,312,091 | |
Terex Corp., 2019 Term Loan B1, (1 mo. LIBOR + 2.75%), 4.86%, 01/31/24 | | | | | | | 388 | | | | 388,513 | |
Titan Acquisition Ltd., 2018 Term Loan B,
(1 mo. LIBOR + 3.00%), 5.11%, 03/28/25 | | | | | | | 4,156 | | | | 3,981,106 | |
Welbilt, Inc., 2018 Term Loan B, (1 mo. LIBOR + 2.50%), 4.61%, 10/23/25 | | | | | | | 1,166 | | | | 1,153,504 | |
| | | | | | | | |
| | | | | | | | | | | 8,429,767 | |
|
| Media — 9.8% | |
Altice Financing SA: | | | | | | | | | | | | |
2017 1st Lien Term Loan, (1 mo. LIBOR + 2.75%), 4.95%, 01/31/26 | | | | | | | 1,360 | | | | 1,311,697 | |
2017 Term Loan B, (1 mo. LIBOR + 2.75%), 4.95%, 07/15/25 | | | | | | | 256 | | | | 247,493 | |
Altice France SA, 2018 Term Loan B13,
(1 mo. LIBOR + 4.00%), 6.20%, 08/14/26 | | | | | | | 2,038 | | | | 2,018,435 | |
Charter Communications Operating LLC, 2017 Term Loan B, (3 mo. LIBOR + 2.00%),
4.33%, 04/30/25 | | | | | | | 3,645 | | | | 3,652,221 | |
| | | | |
| SCHEDULE OF INVESTMENTS | | | 19 | |
| | |
Schedule of Investments (unaudited) (continued) August 31, 2019 | | BlackRock Debt Strategies Fund, Inc. (DSU) (Percentages shown are based on Net Assets) |
| | | | | | | | | | | | |
| Security | | | | | Par
(000) | | | Value | |
|
| Media (continued) | |
Clear Channel Outdoor Holdings, Inc., Term
Loan B, 08/21/26(j) | | | USD | | | | 8,851 | | | $ | 8,839,936 | |
CSC Holdings LLC, 2018 Term Loan B,
(1 mo. LIBOR + 2.50%), 4.70%, 01/25/26 | | | | | | | 1,585 | | | | 1,582,291 | |
Cumulus Media New Holdings, Inc., Exit Term Loan, (1 mo. LIBOR + 4.50%, 1.00% Floor),
6.62%, 05/15/22 | | | | | | | 798 | | | | 799,492 | |
Diamond Sports Group LLC, Term Loan, 08/24/26(j) | | | | | | | 3,543 | | | | 3,543,000 | |
Gray Television, Inc., 2018 Term Loan C,
(3 mo. LIBOR + 2.50%), 4.83%, 01/02/26 | | | | | | | 1,711 | | | | 1,711,041 | |
iHeartCommunications, Inc., Exit Term Loan, 05/01/26(j) | | | | | | | 2,712 | | | | 2,718,365 | |
Intelsat Jackson Holdings SA, 2017 Term Loan B4, (1 mo. LIBOR + 4.50%, 1.00% Floor),
6.65%, 01/02/24 | | | | | | | 1,964 | | | | 1,972,866 | |
Learfield Communications LLC, 2016 1st Lien Term Loan, (1 mo. LIBOR + 3.25%, 1.00% Floor), 5.37%, 12/01/23 | | | | | | | 1,530 | | | | 1,532,660 | |
Lions Gate Capital Holdings LLC, 2018 Term Loan B, (1 mo. LIBOR + 2.25%), 4.36%, 03/24/25 | | | | | | | 1,710 | | | | 1,703,921 | |
Meredith Corp., 2018 Term Loan B, (1 mo. LIBOR + 2.75%), 4.86%, 01/31/25 | | | | | | | 847 | | | | 847,817 | |
MH Sub I LLC, 2017 1st Lien Term Loan,
(1 mo. LIBOR + 3.75%), 5.86%, 09/13/24 | | | | | | | 1,169 | | | | 1,157,926 | |
Midcontinent Communications, 2019 Term Loan B,
(3 mo. LIBOR + 2.25%), 4.45%, 07/16/26 | | | | | | | 848 | | | | 851,167 | |
Nexstar Broadcasting, Inc., 2019 Term Loan B4, 06/19/26(j) | | | | | | | 1,790 | | | | 1,790,000 | |
PCI Gaming Authority, Term Loan, (1 mo. LIBOR + 3.00%), 5.11%, 05/29/26 | | | | | | | 1,888 | | | | 1,896,553 | |
PSAV Holdings LLC, 2018 1st Lien Term Loan,
(1 Week LIBOR + 3.25%, 1.00% Floor),
5.48%, 03/01/25 | | | | | | | 1,166 | | | | 1,129,018 | |
Radiate Holdco LLC, 1st Lien Term Loan,
(1 mo. LIBOR + 3.00%), 5.11%, 02/01/24 | | | | | | | 2,481 | | | | 2,456,128 | |
Trader Corp., 2017 Term Loan B, (1 mo. LIBOR + 3.00%, 1.00% Floor), 5.15%, 09/28/23(a) | | | | | | | 4,109 | | | | 4,057,762 | |
Tribune Media Co., Term Loan C, (1 mo. LIBOR + 3.00%), 5.11%, 01/27/24 | | | | | | | 3,113 | | | | 3,107,300 | |
Univision Communications, Inc., Term Loan C5,
(1 mo. LIBOR + 2.75%, 1.00% Floor),
4.86%, 03/15/24 | | | | | | | 816 | | | | 778,802 | |
Virgin Media Bristol LLC, 2017 Term Loan,
(1 mo. LIBOR + 2.50%), 4.70%, 01/15/26 | | | | | | | 2,121 | | | | 2,119,367 | |
William Morris Endeavor Entertainment LLC, 2018 1st Lien Term Loan, (1 mo. LIBOR + 2.75%), 4.87%, 05/18/25 | | | | | | | 5,052 | | | | 4,900,231 | |
Ziggo Secured Finance Partnership, Term Loan E,
(1 mo. LIBOR + 2.50%), 4.70%, 04/15/25 | | | | | | | 2,578 | | | | 2,559,026 | |
| | | | | | | | |
| | | | 59,284,515 | |
|
| Metals & Mining — 0.6% | |
Ball Metalpack LLC, 2018 1st Lien Term Loan B,
(3 mo. LIBOR + 4.50%), 6.62%, 07/24/25 | | | | | | | 761 | | | | 735,610 | |
Equinox Holdings, Inc., 2017 1st Lien Term Loan,
(1 mo. LIBOR + 3.00%, 1.00% Floor),
5.11%, 03/08/24 | | | | | | | 3,040 | | | | 3,020,422 | |
| | | | | | | | |
| | | | 3,756,032 | |
|
| Multiline Retail — 0.5% | |
Eyemart Express LLC, 2017 Term Loan B,
(1 mo. LIBOR + 3.00%, 1.00% Floor),
5.15%, 08/04/24 | | | | | | | 919 | | | | 912,896 | |
| | | | | | | | | | | | |
| Security | | | | | Par
(000) | | | Value | |
|
| Multiline Retail (continued) | |
Harbor Freight Tools USA, Inc., 2018 Term Loan B, (1 mo. LIBOR + 2.50%), 4.61%, 08/18/23 | | | USD | | | | 1,471 | | | $ | 1,413,828 | |
Hudson’s Bay Co., 2015 Term Loan B,
(1 mo. LIBOR + 3.25%, 1.00% Floor),
5.49%, 09/30/22 | | | | | | | 574 | | | | 572,900 | |
Neiman Marcus Group Ltd. LLC, Cash Pay Extended Term Loan, (1 mo. LIBOR + 6.00%),
8.23%, 10/25/23 | | | | | | | 395 | | | | 321,973 | |
| | | | | | | | |
| | | | 3,221,597 | |
|
| Oil & Gas Equipment & Services — 0.2% | |
McDermott Technology Americas, Inc., 2018 1st Lien Term Loan, (1 mo. LIBOR + 5.00%, 1.00% Floor), 7.11%, 05/09/25 | | | | | | | 1,540 | | | | 1,410,147 | |
| | | | | | | | |
|
| Oil, Gas & Consumable Fuels — 0.9% | |
BCP Raptor II LLC, 1st Lien Term Loan,
(1 mo. LIBOR + 4.75%), 6.86%, 11/03/25 | | | | | | | 1,002 | | | | 885,097 | |
California Resources Corp., Second Out Term Loan, (1 mo. LIBOR + 10.37%, 1.00% Floor),
12.49%, 12/31/21 | | | | | | | 1,088 | | | | 962,728 | |
CONSOL Energy, Inc., 1st Lien Term Loan B,
(1 mo. LIBOR + 4.50%, 1.00% Floor),
6.62%, 09/27/24 | | | | | | | 1,249 | | | | 1,245,748 | |
Edgewater Generation LLC, Term Loan,
(1 mo. LIBOR + 3.75%), 5.86%, 12/13/25 | | | | | | | 1,518 | | | | 1,497,334 | |
EG Group Ltd., 2018 Term Loan B, (3 mo. LIBOR + 4.00%), 6.33%, 02/07/25 | | | | | | | 731 | | | | 719,336 | |
| | | | | | | | |
| | | | 5,310,243 | |
|
| Pharmaceuticals — 4.4% | |
Amneal Pharmaceuticals LLC, 2018 Term Loan B,
(1 mo. LIBOR + 3.50%), 5.63%, 05/04/25 | | | | | | | 1,225 | | | | 1,111,251 | |
Catalent Pharma Solutions, Inc., Term Loan B2,
(1 mo. LIBOR + 2.25%, 1.00% Floor),
4.36%, 05/18/26 | | | | | | | 2,365 | | | | 2,371,500 | |
Endo Luxembourg Finance Co. I Sarl, 2017
Term Loan B, (1 mo. LIBOR + 4.25%),
6.38%, 04/29/24 | | | | | | | 2,602 | | | | 2,371,230 | |
Grifols Worldwide Operations USA, Inc., 2017 Acquisition Term Loan, (1 Week LIBOR + 2.25%), 4.39%, 01/31/25 | | | | | | | 3,135 | | | | 3,136,815 | |
Jaguar Holding Co. II, 2018 Term Loan,
(1 mo. LIBOR + 2.50%, 1.00% Floor),
4.61%, 08/18/22 | | | | | | | 7,725 | | | | 7,676,209 | |
Valeant Pharmaceuticals International, Inc.,
2018 Term Loan B, (1 mo. LIBOR + 3.00%), 5.20%, 06/02/25 | | | | | | | 10,008 | | | | 10,019,071 | |
| | | | | | | | |
| | | | 26,686,076 | |
|
| Professional Services — 1.5% | |
Cast and Crew Payroll LLC, 2019 1st Lien Term Loan, (1 mo. LIBOR + 4.00%), 6.12%, 02/09/26 | | | | | | | 2,484 | | | | 2,490,754 | |
Dun & Bradstreet Corp., Term Loan, (1 mo. LIBOR + 5.00%), 7.15%, 02/06/26 | | | | | | | 4,557 | | | | 4,566,479 | |
ON Assignment, Inc., 2018 Term Loan B,
(1 mo. LIBOR + 2.00%), 4.11%, 04/02/25 | | | | | | | 1,012 | | | | 1,012,854 | |
SIRVA Worldwide, Inc., 2018 1st Lien Term Loan,
(3 mo. LIBOR + 5.50%), 7.83%, 08/04/25(a) | | | | | | | 956 | | | | 925,242 | |
| | | | | | | | |
| | | | 8,995,329 | |
|
| Real Estate Management & Development — 2.0% | |
CityCenter Holdings LLC, 2017 Term Loan B,
(1 mo. LIBOR + 2.25%), 4.36%, 04/18/24 | | | | | | | 4,009 | | | | 4,005,857 | |
DTZ US Borrower LLC, 2018 Add On Term Loan B, (1 mo. LIBOR + 3.25%), 5.36%, 08/21/25 | | | | | | | 3,518 | | | | 3,514,512 | |
| | |
| 20 | | 2019 BLACKROCK SEMI-ANNUAL REPORTTO SHAREHOLDERS |
| | |
Schedule of Investments (unaudited) (continued) August 31, 2019 | | BlackRock Debt Strategies Fund, Inc. (DSU) (Percentages shown are based on Net Assets) |
| | | | | | | | | | | | |
| Security | | | | | Par
(000) | | | Value | |
|
| Real Estate Management & Development (continued) | |
Forest City Enterprises LP, Term Loan B,
(1 mo. LIBOR + 4.00%), 6.11%, 12/07/25 | | | USD | | | | 2,512 | | | $ | 2,528,077 | |
Realogy Corp., 2018 Term Loan B, (1 mo. LIBOR + 2.25%), 4.42%, 02/08/25 | | | | | | | 856 | | | | 824,612 | |
SMG Holdings, Inc., 2017 1st Lien Term Loan,
(1 mo. LIBOR + 3.00%), 5.51%, 01/23/25 | | | | | | | 1,302 | | | | 1,290,988 | |
| | | | | | | | |
| | | | | | | | | | | 12,164,046 | |
|
| Road & Rail — 0.2% | |
Moda Ingleside Energy Center LLC, 2018
Term Loan B, (1 mo. LIBOR + 3.25%),
5.36%, 09/29/25 | | | | | | | 883 | | | | 879,811 | |
| | | | | | | | |
|
| Semiconductors & Semiconductor Equipment — 0.1% | |
Microchip Technology, Inc., 2018 Term Loan B,
(1 mo. LIBOR + 2.00%), 4.12%, 05/29/25 | | | | | | | 427 | | | | 426,784 | |
| | | | | | | | |
|
| Software — 15.3% | |
Applied Systems, Inc.: | | | | | | | | | | | | |
2017 1st Lien Term Loan, (3 mo. LIBOR + 3.00%, 1.00% Floor), 5.33%, 09/19/24 | | | | | | | 2,592 | | | | 2,581,827 | |
2017 2nd Lien Term Loan, (3 mo. LIBOR + 7.00%, 1.00% Floor), 9.33%, 09/19/25 | | | | | | | 470 | | | | 473,576 | |
BMC Software Finance, Inc., 2017 Term Loan,
(3 mo. LIBOR + 4.25%), 6.58%, 10/02/25 | | | | | | | 3,344 | | | | 3,153,921 | |
Cypress Intermediate Holdings III, Inc.: | | | | | | | | | | | | |
2017 1st Lien Term Loan, (1 mo. LIBOR + 2.75%, 1.00% Floor), 4.87%, 04/26/24 | | | | | | | 1,201 | | | | 1,189,996 | |
2017 2nd Lien Term Loan, (1 mo. LIBOR + 6.75%, 1.00% Floor), 8.86%, 04/27/25 | | | | | | | 740 | | | | 745,091 | |
Dell, Inc., 2017 1st Lien Term Loan, (1 mo. LIBOR + 2.00%), 4.12%, 09/07/23 | | | | | | | 1,968 | | | | 1,971,531 | |
Digicel International Finance Ltd., 2017 Term Loan B, (6 mo. LIBOR + 3.25%), 5.34%, 05/28/24 | | | | | | | 342 | | | | 289,713 | |
DTI Holdco, Inc., 2018 Term Loan B, (2 mo. LIBOR + 4.75%, 1.00% Floor), 7.01%, 09/30/23 | | | | | | | 1,095 | | | | 1,001,847 | |
Financial & Risk US Holdings, Inc.: | | | | | | | | | | | | |
2018 EUR Term Loan, (6 mo. EURIBOR + 4.00%), 4.00%, 10/01/25 | | | EUR | | | | 966 | | | | 1,069,829 | |
2018 USD Term Loan, (1 mo. LIBOR + 3.75%), 5.86%, 10/01/25 | | | USD | | | | 7,063 | | | | 7,094,429 | |
Infor (US), Inc., Term Loan B6, (3 mo. LIBOR + 2.75%, 1.00% Floor), 5.08%, 02/01/22 | | | | | | | 8,530 | | | | 8,520,625 | |
Informatica Corp., 2018 Term Loan, (1 mo. LIBOR + 3.25%), 5.36%, 08/05/22 | | | | | | | 5,161 | | | | 5,162,401 | |
Kronos, Inc.: | | | | | | | | | | | | |
2017 Term Loan B, (3 mo. LIBOR + 3.00%, 1.00% Floor), 5.25%, 11/01/23 | | | | | | | 6,130 | | | | 6,123,481 | |
2nd Lien Term Loan, (3 mo. LIBOR + 8.25%, 1.00% Floor), 10.50%, 11/01/24 | | | | | | | 2,510 | | | | 2,565,220 | |
McAfee LLC, 2018 Term Loan B, (1 mo. LIBOR + 3.75%), 5.87%, 09/30/24 | | | | | | | 4,885 | | | | 4,886,320 | |
Mitchell International, Inc.: | | | | | | | | | | | | |
2017 1st Lien Term Loan, (1 mo. LIBOR + 3.25%), 5.36%, 11/29/24 | | | | | | | 4,626 | | | | 4,327,865 | |
2017 2nd Lien Term Loan, (1 mo. LIBOR + 7.25%), 9.36%, 12/01/25 | | | | | | | 887 | | | | 826,817 | |
Renaissance Holding Corp., 2018 Add On Term Loan, (1 mo. LIBOR + 3.25%),
5.36%, 05/30/25 | | | | | | | 599 | | | | 585,623 | |
RP Crown Parent LLC, 2016 Term Loan B,
(1 mo. LIBOR + 2.75%, 1.00% Floor),
4.86%, 10/12/23 | | | | | | | 2,013 | | | | 2,006,613 | |
Severin Acquisition LLC, 2018 Term Loan B, (3 mo. LIBOR + 3.25%), 5.46%, 08/01/25 | | | | | | | 845 | | | | 828,561 | |
| | | | | | | | | | | | |
| Security | | | | | Par
(000) | | | Value | |
|
| Software (continued) | |
SolarWinds Holdings, Inc., 2018 Term Loan B,
(1 mo. LIBOR + 2.75%), 4.86%, 02/05/24 | | | USD | | | | 5,155 | | | $ | 5,146,562 | |
Solera LLC, Term Loan B, (1 mo. LIBOR + 2.75%), 4.86%, 03/03/23 | | | | | | | 3,510 | | | | 3,490,566 | |
Sophia LP, 2017 Term Loan B, (3 mo. LIBOR + 3.25%, 1.00% Floor), 5.58%, 09/30/22 | | | | | | | 6,834 | | | | 6,824,464 | |
SS&C Technologies Holdings Europe Sarl, 2018 Term Loan B4, (1 mo. LIBOR + 2.25%),
4.36%, 04/16/25 | | | | | | | 732 | | | | 733,063 | |
SS&C Technologies, Inc.: | | | | | | | | | | | | |
2017 Term Loan B1, (1 mo. LIBOR + 2.25%), 4.36%, 07/08/22 | | | | | | | 539 | | | | 539,890 | |
2018 Term Loan B3, (1 mo. LIBOR + 2.25%), 4.36%, 04/16/25 | | | | | | | 1,084 | | | | 1,085,277 | |
2018 Term Loan B5, (1 mo. LIBOR + 2.25%), 4.36%, 04/16/25 | | | | | | | 4,806 | | | | 4,805,538 | |
Tempo Acquisition LLC, Term Loan, (1 mo. LIBOR + 3.00%), 5.11%, 05/01/24 | | | | | | | 4,874 | | | | 4,870,131 | |
Tibco Software, Inc., 2019 Term Loan B,
(1 mo. LIBOR + 4.00%), 6.25%, 06/30/26 | | | | | | | 5,059 | | | | 5,054,309 | |
Ultimate Software Group, Inc., Term Loan B,
(3 mo. LIBOR + 3.75%), 6.08%, 05/04/26 | | | | | | | 2,883 | | | | 2,888,161 | |
Vertafore, Inc., 2018 1st Lien Term Loan,
(1 mo. LIBOR + 3.25%), 5.36%, 07/02/25 | | | | | | | 2,055 | | | | 1,981,931 | |
| | | | | | | | |
| | | | | | | | | | | 92,825,178 | |
|
| Specialty Retail — 1.8% | |
Belron Finance US LLC(a) : | | | | | | | | | | | | |
Term Loan B, (3 mo. LIBOR + 2.25%),
4.71%, 11/07/24 | | | | | | | 1,465 | | | | 1,466,645 | |
Term Loan B, (3 mo. LIBOR + 2.25%),
4.68%, 11/13/25 | | | | | | | 2,039 | | | | 2,041,303 | |
IAA, Inc., Term Loan B, (3 mo. LIBOR + 2.25%), 4.63%, 06/28/26 | | | | | | | 970 | | | | 974,215 | |
Leslie’s Poolmart, Inc., 2018 Term Loan,
(2 mo. LIBOR + 3.50%, 1.00% Floor),
5.76%, 08/16/23 | | | | | | | 1,188 | | | | 1,110,479 | |
MED ParentCo LP(j): | | | | | | | | | | | | |
1st Lien Delayed Draw Term Loan, 07/31/26 | | | | | | | 379 | | | | 374,783 | |
1st Lien Term Loan, 07/31/26 | | | | | | | 1,519 | | | | 1,500,908 | |
Midas Intermediate Holdco II LLC, Incremental Term Loan B, (3 mo. LIBOR + 2.75%, 1.00% Floor), 5.08%, 08/18/21 | | | | | | | 1,113 | | | | 1,073,028 | |
PetSmart, Inc., Term Loan B2, 03/11/22(j) | | | | | | | 1,250 | | | | 1,212,500 | |
Research Now Group, Inc., 2017 1st Lien Term Loan, (3 mo. LIBOR + 5.50%, 1.00% Floor),
7.75%, 12/20/24 | | | | | | | 1,162 | | | | 1,160,557 | |
| | | | | | | | |
| | | | | | | | | | | 10,914,418 | |
|
| Technology Hardware, Storage & Peripherals — 0.6% | |
Western Digital Corp., 2018 Term Loan B4,
(3 mo. LIBOR + 1.75%), 3.86%, 04/29/23 | | | | | | | 3,867 | | | | 3,852,896 | |
|
| Textiles, Apparel & Luxury Goods — 0.5% | |
Ascend Performance Materials Operations LLC,
2019 Term Loan B, 08/15/26(j) | | | | | | | 2,851 | | | | 2,847,436 | |
|
| Thrifts & Mortgage Finance — 0.7% | |
IG Investment Holdings LLC, 2018 1st Lien Term Loan, (3 mo. LIBOR + 4.00%, 1.00% Floor), 6.33%, 05/23/25 | | | | | | | 3,975 | | | | 3,936,428 | |
|
| Trading Companies & Distributors — 0.9% | |
Beacon Roofing Supply, Inc., 2017 Term Loan B,
(1 mo. LIBOR + 2.25%), 4.36%, 01/02/25 | | | | | | | 1,274 | | | | 1,264,358 | |
HD Supply, Inc., Term Loan B5, (1 mo. LIBOR + 1.75%), 3.86%, 10/17/23 | | | | | | | 4,147 | | | | 4,160,788 | |
| | | | |
| SCHEDULE OF INVESTMENTS | | | 21 | |
| | |
Schedule of Investments (unaudited) (continued) August 31, 2019 | | BlackRock Debt Strategies Fund, Inc. (DSU) (Percentages shown are based on Net Assets) |
| | | | | | | | | | | | |
| Security | | | | | Par
(000) | | | Value | |
|
| Trading Companies & Distributors (continued) | |
United Rentals, Inc., Term Loan B, (1 mo. LIBOR + 1.75%), 3.86%, 10/31/25 | | | USD | | | | 266 | | | $ | 266,050 | |
| | | | | | | | |
| | | | | | | | | | | 5,691,196 | |
|
| Transportation — 0.2% | |
Safe Fleet Holdings LLC, 2018 1st Lien Term Loan, (1 mo. LIBOR + 3.00%, 1.00% Floor), 5.21%, 02/01/25(a) | | | | | | | 985 | | | | 942,816 | |
| | | | | | | | |
|
| Utilities — 0.4% | |
ExGen Renewables IV LLC, Term Loan B, (3 mo. LIBOR + 3.00%, 1.00% Floor), 5.13%, 11/28/24 | | | | | | | 2,188 | | | | 2,106,013 | |
| | | | | | | | |
|
| Wireless Telecommunication Services — 1.0% | |
Geo Group, Inc., 2018 Term Loan B, (1 mo. LIBOR + 2.00%), 4.12%, 03/22/24 | | | | | | | 1,471 | | | | 1,368,893 | |
Ligado Networks LLC, PIK Exit Term Loan (9.75% PIK), 11.08%, 12/07/20(e) | | | | | | | 1,679 | | | | 1,450,794 | |
SBA Senior Finance II LLC, 2018 Term Loan B, (1 mo. LIBOR + 2.00%), 4.12%, 04/11/25 | | | | | | | 3,422 | | | | 3,399,906 | |
| | | | | | | | | | | | |
| | | | | | | | | | | 6,219,593 | |
| | | | | | | | | | | | |
| |
Total Floating Rate Loan Interests — 114.5%
(Cost — $700,343,198) | | | | 692,903,406 | |
| | | | | | | | | | | | |
| | | |
| | | | | | Shares | | | | |
|
Investment Companies — 3.8% | |
|
Diversified Financial Services — 3.8% | |
Invesco Senior Loan ETF | | | | | | | 1,003,368 | | | | 22,686,150 | |
| | | | | | | | | | | | |
| |
Total Investment Companies — 3.8%
(Cost — $22,737,011) | | | | 22,686,150 | |
| | | | | | | | | | | | |
| | | |
| | | | | | Beneficial Interest (000) | | | | |
|
Other Interests(a)(b)(k) — 0.0% | |
|
IT Services — 0.0% | |
Millennium Corp. | | | USD | | | | 1,156 | | | | — | |
Millennium Lender Claims | | | | | | | 1,084 | | | | — | |
| | | | | | | | | | | | |
| |
Total Other Interests — 0.0%
(Cost — $—) | | | | — | |
| | | | | | | | | | | | |
| | | |
| | | | | | Par
(000) | | | | |
|
Preferred Securities — 1.4% | |
|
Capital Trusts — 1.2% | |
|
Banks(l) — 0.3% | |
Banco de Sabadell SA, 6.50%(g) | | | EUR | | | | 200 | | | | 217,915 | |
Bankia SA, 6.38%(g) | | | | | | | 200 | | | | 227,839 | |
CaixaBank SA, 6.75%(g) | | | | | | | 200 | | | | 237,120 | |
Hongkong & Shanghai Banking Corp. Ltd., Series 3H, 2.50%(h) | | | USD | | | | 100 | | | | 71,500 | |
ING Groep NV, 6.75%(g) | | | | | | | 200 | | | | 209,884 | |
Wells Fargo & Co., Series U, 5.88%(g) | | | | | | | 840 | | | | 926,344 | |
| | | | | | | | | | | | |
| | | | | | | | | | | 1,890,602 | |
|
Building Materials — 0.0% | |
Holcim Finance Luxembourg SA, 3.00%(g)(l) | | | EUR | | | | 100 | | | | 115,618 | |
| | | | | | | | | | | | |
| | | | | | | | | | | | |
| | | |
| Security | | | | | Par
(000) | | | Value | |
|
| Capital Markets — 0.1% | |
Goldman Sachs Group, Inc., Series P, 5.00%(g)(l) | | | USD | | | | 182 | | | $ | 180,066 | |
| | | | | | | | | | | | |
|
Diversified Financial Services(l) — 0.8% | |
Bank of America Corp.,(g): | | | | | | | | | | | | |
Series AA, 6.10% | | | | | | | 752 | | | | 819,680 | |
Series DD, 6.30% | | | | | | | 155 | | | | 174,956 | |
Series X, 6.25% | | | | | | | 350 | | | | 381,500 | |
Series Z, 6.50% | | | | | | | 232 | | | | 259,840 | |
HBOS Capital Funding LP, 6.85% | | | | | | | 200 | | | | 203,363 | |
HSBC Holdings PLC, 6.00%(g) | | | | | | | 600 | | | | 601,500 | |
JPMorgan Chase & Co.,(g): | | | | | | | | | | | | |
Series 1, 5.74% | | | | | | | 76 | | | | 76,395 | |
Series FF, 5.00% | | | | | | | 865 | | | | 897,437 | |
Series V, 5.64% | | | | | | | 780 | | | | 778,440 | |
Royal Bank of Scotland Group PLC, 8.63%(g) | | | | | | | 246 | | | | 260,453 | |
Telefonica Europe BV, 4.38%(g) | | | EUR | | | | 100 | | | | 121,397 | |
| | | | | | | | | | | | |
| | | | | | | | | | | 4,574,961 | |
|
Electric Utilities(g) — 0.0% | |
Naturgy Finance BV, 3.38%(l) | | | | | | | 100 | | | | 117,162 | |
RWE AG, 2.75%, 04/21/75 | | | | | | | 10 | | | | 11,226 | |
| | | | | | | | | | | | |
| | | | | | | | | | | 128,388 | |
|
Electronic Equipment, Instruments & Components — 0.0% | |
Belden, Inc., 4.13%, 10/15/26 | | | | | | | 100 | | | | 116,216 | |
| | | | | | | | | | | | |
|
Media — 0.0% | |
SES SA, 5.63%(g)(l) | | | | | | | 100 | | | | 123,148 | |
| | | | | | | | | | | | |
|
Utilities — 0.0% | |
Electricite de France SA, 4.00%(g)(l) | | | | | | | 100 | | | | 120,483 | |
| | | | | | | | | | | | |
|
Wireless Telecommunication Services — 0.0% | |
Vodafone Group PLC, 3.10%, 01/03/79 | | | | | | | 100 | | | | 115,525 | |
| | | | | | | | | | | | |
| |
Total Capital Trusts — 1.2%
(Cost — $7,191,557) | | | | 7,365,007 | |
| | | | | | | | | | | | |
| | | |
| | | | | | Shares | | | | |
|
Preferred Stock — 0.1% | |
|
| Capital Markets — 0.1% | |
Goldman Sachs Group, Inc., Series J, 5.50%(g)(l) | | | | | | | 13,550 | | | | 354,604 | |
| | | | | | | | | | | | |
| |
Total Preferred Stocks — 0.1%
(Cost — $338,750) | | | | 354,604 | |
| | | | | | | | | | | | |
|
Trust Preferred — 0.1% | |
|
| Diversified Financial Services — 0.1% | |
GMAC Capital Trust I, Series 2, 7.94%, 2/15/40(g) | | | | | | | 29,219 | | | | 765,538 | |
| | | | | | | | | | | | |
| |
Total Trust Preferreds — 0.1%
(Cost — $753,579) | | | | 765,538 | |
| | | | | | | | | | | | |
| |
Total Preferred Securities— 1.4%
(Cost — $8,283,886) | | | | 8,485,149 | |
| | | | | | | | | | | | |
| | |
| 22 | | 2019 BLACKROCK SEMI-ANNUAL REPORTTO SHAREHOLDERS |
| | |
Schedule of Investments (unaudited) (continued) August 31, 2019 | | BlackRock Debt Strategies Fund, Inc. (DSU) (Percentages shown are based on Net Assets) |
| | | | | | | | | | | | |
| Security | | | | | Shares | | | Value | |
|
Warrants — 0.0% | |
|
| Metals & Mining — 0.0% | |
AFGlobal Corp. (Expires 12/20/20)(a) | | | | | | | 5,283 | | | $ | — | |
| | | | | | | | | | | | |
|
| Transportation Infrastructure — 0.0% | |
Turbo Cayman Ltd. (Strike Price $0.01)(a) | | | | | | | 1 | | | | — | |
| | | | | | | | | | | | |
| |
Total Warrants — 0.0%
(Cost — $ —) | | | | — | |
| | | | | | | | | | | | |
| |
Total Long-Term Investments — 144.7%
(Cost — $899,454,199) | | | | 875,559,559 | |
| |
Options Purchased — 0.0%
(Cost — $69,043) | | | | 29,568 | |
| | | | | | | | | | | | |
| |
Total Investments — 144.7%
(Cost — $899,523,242) | | | | 875,589,127 | |
| | | | | | | | | | | | |
| |
Liabilities in Excess of Other Assets — (44.7)% | | | | (270,442,106 | ) |
| | | | | | | | | | | | |
| |
Net Assets — 100.0% | | | $ | 605,147,021 | |
| | | | | | | | | | | | |
| (a) | Security is valued using significant unobservable inputs and is classified as Level 3 in the fair value hierarchy. |
| (b) | Non-income producing security. |
| (c) | Issuer filed for bankruptcy and/or is in default. |
| (d) | Security exempt from registration pursuant to Rule 144A under the Securities Act of 1933, as amended. These securities may be resold in transactions exempt from registration to qualified institutional investors. |
| (e) | Payment-in-kind security which may pay interest/dividends in additional par/shares and/or in cash. Rates shown are the current rate and possible payment rates. |
| (g) | Variable rate security. Security may be issued at a fixed coupon rate, which converts to a variable rate at a specified date. Rate shown is the rate in effect as of period end. |
| (h) | Variable rate security. Rate shown is the rate in effect as of period end. |
| (i) | Restricted security as to resale, excluding 144A securities. As of period end, the Fund held restricted securities with a current value of $2,325,571 and an original cost of $2,248,690 which was 0.38% of its net assets. |
| (j) | Represents an unsettled loan commitment at period end. Certain details associated with this purchase are not known prior to the settlement date, including coupon rate. |
| (k) | Other interests represent beneficial interests in liquidation trusts and other reorganization or private entities. |
| (l) | Perpetual security with no stated maturity date. |
During the six months ended August 31, 2019, investments in issuers considered to be an affiliate/affiliates of the Fund for purposes of Section 2(a)(3) of the Investment Company Act of 1940, as amended, were as follows:
| | | | | | | | | | | | | | | | | | | | | | | | | | | | |
| Affiliate | | Shares
Held at
02/28/19 | | | Net
Activity | | | Shares
Held at
08/31/19 | | | Value at
08/31/19 | | | Income | | | Net Realized Gain (Loss) (a) | | | Change in
Unrealized
Appreciation
(Depreciation) | |
BlackRock Liquidity Funds,T-Fund, Institutional Class(b) | | | 3,616,393 | | | | (3,616,393 | ) | | | — | | | $ | — | | | $ | 17,184 | | | $ | — | | | $ | — | |
| | | | | | | | | | | | | | | | | | | | | | | | | | | | |
| | (a) | Includes net capital gain distributions, if applicable. | |
| | (b) | As of period end, the entity is no longer held by the Fund. | |
For Fund compliance purposes, the Fund’s industry classifications refer to one or more of the industrysub-classifications used by one or more widely recognized market indexes or rating group indexes, and/or as defined by the investment adviser. These definitions may not apply for purposes of this report, which may combine such sectorsub-classifications for reporting ease.
Derivative Financial Instruments Outstanding as of Period End
Futures Contracts
| | | | | | | | | | | | | | | | |
| Description | | Number of
Contracts | | | Expiration
Date | | | Notional
Amount (000) | | | Value/
Unrealized
Appreciation
(Depreciation) | |
Long Contracts | | | | | | | | | | | | | | | | |
Euro Stoxx 50 Index | | | 1 | | | | 09/20/19 | | | $ | 38 | | | $ | 547 | |
Euro Stoxx 600 Index | | | 1 | | | | 09/20/19 | | | | 7 | | | | (507 | ) |
| | | | | | | | | | | | | | | | |
| | | | | | | | | | | | | | | 40 | |
| | | | | | | | | | | | | | | | |
Short Contracts | | | | | | | | | | | | | | | | |
Euro Bund | | | 1 | | | | 09/06/19 | | | | 197 | | | | (8,914 | ) |
Euro-BOBL | | | 1 | | | | 09/06/19 | | | | 150 | | | | (2,595 | ) |
Long Gilt | | | 1 | | | | 12/27/19 | | | | 163 | | | | (1,035 | ) |
| | | | | | | | | | | | | | | | |
| | | | | | | | | | | | | | | (12,544 | ) |
| | | | | | | | | | | | | | | | |
| | | | | | | | | | | | | | $ | (12,504 | ) |
| | | | | | | | | | | | | | | | |
| | | | |
| SCHEDULE OF INVESTMENTS | | | 23 | |
| | |
Schedule of Investments (unaudited) (continued) August 31, 2019 | | BlackRock Debt Strategies Fund, Inc. (DSU) (Percentages shown are based on Net Assets) |
Forward Foreign Currency Exchange Contracts
| | | | | | | | | | | | | | | | | | | | |
Currency
Purchased | | | Currency
Sold | | | Counterparty | | Settlement Date | | | Unrealized
Appreciation
(Depreciation) | |
| USD | | | 6,971,363 | | | EUR | | | 6,237,000 | | | BNP Paribas S.A. | | | 09/05/19 | | | $ | 116,074 | |
| USD | | | 22,282 | | | EUR | | | 20,000 | | | Goldman Sachs International | | | 09/05/19 | | | | 300 | |
| USD | | | 113,347 | | | EUR | | | 101,000 | | | Goldman Sachs International | | | 09/05/19 | | | | 2,334 | |
| USD | | | 3,120,688 | | | GBP | | | 2,556,000 | | | Goldman Sachs International | | | 09/05/19 | | | | 10,417 | |
| USD | | | 6,727,492 | | | EUR | | | 6,104,000 | | | State Street Bank and Trust Co. | | | 10/03/19 | | | | 3,501 | |
| USD | | | 3,245,237 | | | GBP | | | 2,658,000 | | | State Street Bank and Trust Co. | | | 10/03/19 | | | | 6,772 | |
| | | | | | | | | | | | | | | | | | | | |
| | | | | | | | | | | | | | | | | | | 139,398 | |
| | | | | | | | | | | | | | | | | | | | |
| EUR | | | 6,104,000 | | | USD | | | 6,712,466 | | | State Street Bank and Trust Co. | | | 09/05/19 | | | | (3,361 | ) |
| GBP | | | 2,658,000 | | | USD | | | 3,241,167 | | | State Street Bank and Trust Co. | | | 09/05/19 | | | | (6,777 | ) |
| USD | | | 124,035 | | | GBP | | | 102,000 | | | State Street Bank and Trust Co. | | | 09/05/19 | | | | (84 | ) |
| | | | | | | | | | | | | | | | | | | | |
| | | | | | | | | | | | | | | | | | | (10,222 | ) |
| | | | | | | | | | | | | | | | | | | | |
| | | Net Unrealized Appreciation | | | $ | 129,176 | |
| | | | | | | | | | | | | | | | | |
Exchange-Traded Options Purchased
| | | | | | | | | | | | | | | | | | | | | | | | |
| Description | | Number of
Contracts | | | Expiration
Date | | | Exercise
Price | | | Notional
Amount (000) | | | Value | |
| Call | |
SPDR S&P 500 ETF Trust | | | 195 | | | | 09/20/19 | | | USD | | | 315.00 | | | USD | | | 5,703 | | | $ | 293 | |
Euro Stoxx 50 Index | | | 4 | | | | 12/20/19 | | | EUR | | | 3,800.00 | | | EUR | | | 137 | | | | 169 | |
| | | | | | | | | | | | | | | | | | | | | | | | |
| | | | | | | | | | | | | | | | | | | | | | | 462 | |
| | | | | | | | | | | | | | | | | | | | | | | | |
| Put | | | | | | | | | | | | | | | | | | | |
iShares iBoxx USD High Yield Corporate Bond ETF | | | 200 | | | | 09/20/19 | | | USD | | | 86.00 | | | USD | | | 1,743 | | | | 5,500 | |
SPDR S&P 500 ETF Trust | | | 195 | | | | 09/20/19 | | | USD | | | 270.00 | | | USD | | | 5,703 | | | | 16,575 | |
10-Year U.S. Treasury Note | | | 50 | | | | 10/25/19 | | | USD | | | 128.50 | | | USD | | | 6,586 | | | | 7,031 | |
| | | | | | | | | | | | | | | | | | | | | | | | |
| | | | | | | | | | | | | | | | | | | | | | | 29,106 | |
| | | | | | | | | | | | | | | | | | | | | | | | |
| | | | | | | | | | | | | | | | | | | | | | $ | 29,568 | |
| | | | | | | | | | | | | | | | | | | | | | | | |
Centrally Cleared Credit Default Swaps — Sell Protection
| | | | | | | | | | | | | | | | | | | | | | | | | | | | | | | | | | | | |
| Reference Obligation/Index | | Financing
Rate Received
by the Fund | | | Payment
Frequency | | | Termination
Date | | | Credit
Rating (a) | | | Notional
Amount
(000) (b) | | | Value | | | Upfront
Premium
Paid
(Received) | | | Unrealized
Appreciation
(Depreciation) | |
iTraxx.XO.31.V1 | | | 5.00 | % | | | Quarterly | | | | 06/20/24 | | | | B | | | | EUR | | | | 60 | | | $ | 7,975 | | | $ | 6,584 | | | $ | 1,391 | |
| | | | | | | | | | | | | | | | | | | | | | | | | | | | | | | | | | | | |
| | (a) | Using the rating of the issuer or the underlying securities of the index, as applicable, provided by S&P Global Ratings. | |
| | (b) | The maximum potential amount the Fund may pay should a negative credit event take place as defined under the terms of the agreement. | |
OTC Credit Default Swaps — Buy Protection
| | | | | | | | | | | | | | | | | | | | | | | | | | | | | | | | | | |
| Reference Obligation/Index | | Financing
Rate Paid
by the Fund | | | Payment
Frequency | | | Counterparty | | Termination
Date | | | Notional
Amount
(000) | | | Value | | | Upfront
Premium
Paid
(Received) | | | Unrealized
Appreciation
(Depreciation) | |
UPC Holding BV | | | 5.00 | % | | | Quarterly | | | Bank of America N.A. | | | 06/20/24 | | | | EUR | | | | 10 | | | $ | (2,434 | ) | | $ | (2,375 | ) | | $ | (59 | ) |
UPC Holding BV | | | 5.00 | | | | Quarterly | | | BNP Paribas S.A. | | | 06/20/24 | | | | EUR | | | | 4 | | | | (1,005 | ) | | | (993 | ) | | | (12 | ) |
UPC Holding BV | | | 5.00 | | | | Quarterly | | | JPMorgan Chase Bank N.A. | | | 06/20/24 | | | | EUR | | | | 20 | | | | (4,869 | ) | | | (4,551 | ) | | | (318 | ) |
| | | | | | | | | | | | | | | | | | | | | | | | | | | | | | | | | | |
| | | | | | | | | | | | | | | | | | | | | | | | $ | (8,308 | ) | | $ | (7,919 | ) | | $ | (389 | ) |
| | | | | | | | | | | | | | | | | | | | | | | | | | | | | | | | | | |
| | |
| 24 | | 2019 BLACKROCK SEMI-ANNUAL REPORTTO SHAREHOLDERS |
| | |
Schedule of Investments (unaudited) (continued) August 31, 2019 | | BlackRock Debt Strategies Fund, Inc. (DSU) |
OTC Credit Default Swaps — Sell Protection
| | | | | | | | | | | | | | | | | | | | | | | | | | | | | | | | | | | | | | | | |
| Reference Obligation/Index | | Financing
Rate Received
by the Fund | | | Payment
Frequency | | | Counterparty | | | Termination
Date | | | Credit
Rating (a) | | | Notional
Amount
(000) (b) | | | Value | | | Upfront
Premium
Paid
(Received) | | | Unrealized
Appreciation
(Depreciation) | |
Casino Guichard Perrachon SA | | | 1.00 | % | | | Quarterly | | | | JPMorgan Chase Bank N.A. | | | | 06/20/23 | | | | B | | | | EUR | | | | 10 | | | $ | (2,211 | ) | | $ | (788 | ) | | $ | (1,423 | ) |
Casino Guichard Perrachon SA | | | 1.00 | | | | Quarterly | | | | Bank of America N.A. | | | | 06/20/23 | | | | B | | | | EUR | | | | 9 | | | | (2,045 | ) | | | (1,124 | ) | | | (921 | ) |
Casino Guichard Perrachon SA | | | 1.00 | | | | Quarterly | | | | JPMorgan Chase Bank N.A. | | | | 06/20/23 | | | | B | | | | EUR | | | | 5 | | | | (1,203 | ) | | | (566 | ) | | | (637 | ) |
Casino Guichard Perrachon SA | | | 1.00 | | | | Quarterly | | | | Citibank N.A. | | | | 06/20/23 | | | | B | | | | EUR | | | | 9 | | | | (2,004 | ) | | | (1,007 | ) | | | (997 | ) |
Casino Guichard Perrachon SA | | | 1.00 | | | | Quarterly | | | | JPMorgan Chase Bank N.A. | | | | 06/20/23 | | | | B | | | | EUR | | | | 9 | | | | (2,005 | ) | | | (1,008 | ) | | | (997 | ) |
Casino Guichard Perrachon SA | | | 1.00 | | | | Quarterly | | | | JPMorgan Chase Bank N.A. | | | | 06/20/23 | | | | B | | | | EUR | | | | 4 | | | | (803 | ) | | | (378 | ) | | | (425 | ) |
Casino Guichard Perrachon SA | | | 1.00 | | | | Quarterly | | | | Barclays Bank PLC | | | | 06/20/23 | | | | B | | | | EUR | | | | 6 | | | | (1,281 | ) | | | (579 | ) | | | (702 | ) |
CenturyLink, Inc. | | | 1.00 | | | | Quarterly | | | | Barclays Bank PLC | | | | 12/20/23 | | | | B+ | | | | USD | | | | 170 | | | | (9,101 | ) | | | (11,360 | ) | | | 2,259 | |
Chesapeake Energy Corp. | | | 5.00 | | | | Quarterly | | | | Barclays Bank PLC | | | | 12/20/23 | | | | B+ | | | | USD | | | | 168 | | | | (33,616 | ) | | | 279 | | | | (33,895 | ) |
Chesapeake Energy Corp. | | | 5.00 | | | | Quarterly | | | | Barclays Bank PLC | | | | 12/20/23 | | | | B+ | | | | USD | | | | 478 | | | | (95,644 | ) | | | 4,010 | | | | (99,654 | ) |
Garfunkelux Holdco 2 SA | | | 5.00 | | | | Quarterly | | | | JPMorgan Chase Bank N.A. | | | | 12/20/23 | | | | B+ | | | | EUR | | | | 9 | | | | (212 | ) | | | (55 | ) | | | (157 | ) |
Garfunkelux Holdco 2 SA | | | 5.00 | | | | Quarterly | | | | Credit Suisse International | | | | 12/20/23 | | | | B+ | | | | EUR | | | | 16 | | | | (402 | ) | | | 272 | | | | (674 | ) |
Tesco PLC | | | 1.00 | | | | Quarterly | | | | Citibank N.A. | | | | 12/20/23 | | | | B+ | | | | EUR | | | | 50 | | | | 303 | | | | (642 | ) | | | 945 | |
Telecom Italia SpA | | | 1.00 | | | | Quarterly | | | | Goldman Sachs International | | | | 06/20/24 | | | | B+ | | | | EUR | | | | 10 | | | | (327 | ) | | | (885 | ) | | | 558 | |
Telecom Italia SpA | | | 1.00 | | | | Quarterly | | | | Citibank N.A. | | | | 06/20/24 | | | | B+ | | | | EUR | | | | 3 | | | | (83 | ) | | | (86 | ) | | | 3 | |
Telecom Italia SpA | | | 1.00 | | | | Quarterly | | | | Bank of America N.A. | | | | 06/20/24 | | | | B+ | | | | EUR | | | | 3 | | | | (82 | ) | | | (84 | ) | | | 2 | |
Telecom Italia SpA | | | 1.00 | | | | Quarterly | | | | Citibank N.A. | | | | 06/20/24 | | | | B+ | | | | EUR | | | | 3 | | | | (83 | ) | | | (88 | ) | | | 5 | |
CenturyLink, Inc. | | | 1.00 | | | | Quarterly | | | | Barclays Bank PLC | | | | 06/20/25 | | | | B+ | | | | USD | | | | 185 | | | | (20,765 | ) | | | (28,935 | ) | | | 8,170 | |
Telecom Italia SpA | | | 1.00 | | | | Quarterly | | | | Citibank N.A. | | | | 06/20/26 | | | | B+ | | | | EUR | | | | 5 | | | | (458 | ) | | | (741 | ) | | | 283 | |
| | | | | | | | | | | | | | | | | | | | | | | | | | | | | | | | | | | | | | | | |
| | | | | | | | | | | | | | | | | | | | | | | | | | | | | | $ | (172,022 | ) | | $ | (43,765 | ) | | $ | (128,257 | ) |
| | | | | | | | | | | | | | | | | | | | | | | | | | | | | | | | | | | | | | | | |
| | (a) | Using S&P Global Ratings of the issuer or the underlying securities of the index, as applicable. | |
| | (b) | The maximum potential amount the Fund may pay should a negative credit event take place as defined under the terms of the agreement. | |
Balances Reported in the Statement of Assets and Liabilities for Centrally Cleared Swaps and OTC Swaps
| | | | | | | | | | | | | | | | |
| | | Swap Premiums Paid | | | Swap Premiums Received | | | Unrealized Appreciation | | | Unrealized Depreciation | |
Centrally Cleared Swaps(a) | | $ | 6,584 | | | $ | — | | | $ | 1,391 | | | $ | — | |
OTC Swaps | | | 4,561 | | | | (56,245 | ) | | | 12,225 | | | | (140,871 | ) |
| | (a) | Includes cumulative appreciation (depreciation) on centrally cleared swaps, as reported in the Schedule of Investments. Only current day’s variation margin is reported within the Statement of Assets and Liabilities and is net of any previously paid (received) swap premium amounts. | |
Derivative Financial Instruments Categorized by Risk Exposure
As of period end, the fair values of derivative financial instruments located in the Statement of Assets and Liabilities were as follows:
| | | | | | | | | | | | | | | | | | | | | | | | | | | | |
| | | Commodity
Contracts | | | Credit
Contracts | | | Equity
Contracts | | | Foreign
Currency
Exchange
Contracts | | | Interest
Rate
Contracts | | | Other
Contracts | | | Total | |
Assets — Derivative Financial Instruments | | | | | | | | | | | | | | | | | | | | | | | | | | | | |
Futures contracts | | | | | | | | | | | | | | | | | | | | | | | | | | | | |
Unrealized appreciation on futures contracts(a) | | $ | — | | | $ | — | | | $ | 547 | | | $ | — | | | $ | — | | | $ | — | | | $ | 547 | |
Forward foreign currency exchange contracts | | | | | | | | | | | | | | | | | | | | | | | | | | | | |
Unrealized appreciation on forward foreign currency exchange contracts | | | — | | | | — | | | | — | | | | 139,398 | | | | — | | | | — | | | | 139,398 | |
Options purchased | | | | | | | | | | | | | | | | | | | | | | | | | | | | |
Investments at value — unaffiliated(b) | | | — | | | | — | | | | 22,537 | | | | — | | | | 7,031 | | | | — | | | | 29,568 | |
Swaps — centrally cleared | | | | | | | | | | | | | | | | | | | | | | | | | | | | |
Unrealized appreciation on centrally cleared swaps(a) | | | — | | | | 1,391 | | | | — | | | | — | | | | — | | | | — | | | | 1,391 | |
Swaps — OTC | | | | | | | | | | | | | | | | | | | | | | | | | | | | |
Unrealized appreciation on OTC swaps;
Swap premiums paid | | | — | | | | 16,786 | | | | — | | | | — | | | | — | | | | — | | | | 16,786 | |
| | | | | | | | | | | | | | | | | | | | | | | | | | | | |
| | $ | — | | | $ | 18,177 | | | $ | 23,084 | | | $ | 139,398 | | | $ | 7,031 | | | $ | — | | | $ | 187,690 | |
| | | | | | | | | | | | | | | | | | | | | | | | | | | | |
| | | | |
| SCHEDULE OF INVESTMENTS | | | 25 | |
| | |
Schedule of Investments (unaudited) (continued) August 31, 2019 | | BlackRock Debt Strategies Fund, Inc. (DSU) (Percentages shown are based on Net Assets) |
Derivative Financial Instruments Categorized by Risk Exposure (continued)
| | | | | | | | | | | | | | | | | | | | | | | | | | | | |
| | | Commodity
Contracts | | | Credit
Contracts | | | Equity
Contracts | | | Foreign
Currency
Exchange
Contracts | | | Interest
Rate
Contracts | | | Other
Contracts | | | Total | |
Liabilities — Derivative Financial Instruments | | | | | | | | | | | | | | | | | | | | | | | | | | | | |
Futures contracts | | | | | | | | | | | | | | | | | | | | | | | | | | | | |
Unrealized depreciation on futures contracts(a) | | $ | — | | | $ | — | | | $ | 507 | | | $ | — | | | $ | 12,544 | | | $ | — | | | $ | 13,051 | |
Forward foreign currency exchange contracts | | | | | | | | | | | | | | | | | | | | | | | | | | | | |
Unrealized depreciation on forward foreign currency exchange contracts | | | — | | | | — | | | | — | | | | 10,222 | | | | — | | | | — | | | | 10,222 | |
Swaps — OTC | | | | | | | | | | | | | | | | | | | | | | | | | | | | |
Unrealized depreciation on OTC swaps;
Swap premiums received | | | — | | | | 197,116 | | | | — | | | | — | | | | — | | | | — | | | | 197,116 | |
| | | | | | | | | | | | | | | | | | | | | | | | | | | | |
| | $ | — | | | $ | 197,116 | | | $ | 507 | | | $ | 10,222 | | | $ | 12,544 | | | $ | — | | | $ | 220,389 | |
| | | | | | | | | | | | | | | | | | | | | | | | | | | | |
| | (a) | Net cumulative unrealized appreciation (depreciation) on futures contracts and centrally cleared swaps, if any, are reported in the Schedule of Investments. In the Statement of Assets and Liabilities, only current day’s variation margin is reported in receivables or payables and the net cumulative unrealized appreciation (depreciation) is included in accumulated earnings (loss). | |
| | (b) | Includes options purchased at value as reported in the Schedule of Investments. | |
For the six months ended August 31, 2019, the effect of derivative financial instruments in the Statement of Operations was as follows:
| | | | | | | | | | | | | | | | | | | | | | | | | | | | |
| | | Commodity
Contracts | | | Credit
Contracts | | | Equity
Contracts | | | Foreign
Currency
Exchange
Contracts | | | Interest Rate Contracts | | | Other Contracts | | | Total | |
Net Realized Gain (Loss) from: | | | | | | | | | | | | | | | | | | | | | | | | | | | | |
Futures contracts | | $ | — | | | $ | — | | | $ | 4,428 | | | $ | — | | | $ | (22,769 | ) | | $ | — | | | $ | (18,341 | ) |
Forward foreign currency exchange contracts | | | — | | | | — | | | | — | | | | 1,027,277 | | | | — | | | | — | | | | 1,027,277 | |
Options purchased(a) | | | — | | | | — | | | | (36,473 | ) | | | — | | | | (33,726 | ) | | | — | | | | (70,199 | ) |
Swaps | | | — | | | | (13,236 | ) | | | — | | | | — | | | | 600,330 | | | | — | | | | 587,094 | |
| | | | | | | | | | | | | | | | | | | | | | | | | | | | |
| | $ | — | | | $ | (13,236 | ) | | $ | (32,045 | ) | | $ | 1,027,277 | | | $ | 543,835 | | | $ | — | | | $ | 1,525,831 | |
| | | | | | | | | | | | | | | | | | | | | | | | | | | | |
| | | | | | | |
| Net Change in Unrealized Appreciation (Depreciation) on: | | | | | | | | | | | | | | | | | | | | | |
Futures contracts | | $ | — | | | $ | — | | | $ | (3,056 | ) | | $ | — | | | $ | (10,291 | ) | | $ | — | | | $ | (13,347 | ) |
Forward foreign currency exchange contracts | | | — | | | | — | | | | — | | | | (23,839 | ) | | | — | | | | — | | | | (23,839 | ) |
Options purchased(b) | | | — | | | | — | | | | (27,559 | ) | | | — | | | | (3,201 | ) | | | — | | | | (30,760 | ) |
Swaps | | | — | | | | (93,290 | ) | | | — | | | | — | | | | (569,000 | ) | | | — | | | | (662,290 | ) |
| | | | | | | | | | | | | | | | | | | | | | | | | | | | |
| | $ | — | | | $ | (93,290 | ) | | $ | (30,615 | ) | | $ | (23,839 | ) | | $ | (582,492 | ) | | $ | — | | | $ | (730,236 | ) |
| | | | | | | | | | | | | | | | | | | | | | | | | | | | |
| | (a) | Options purchased are included in net realized gain (loss) from investments — unaffiliated. | |
| | (b) | Options purchased are included in net change in unrealized appreciation (depreciation) on investments — unaffiliated. | |
Average Quarterly Balances of Outstanding Derivative Financial Instruments
| | | | |
Futures contracts: | | | | |
Average notional value of contracts — long | | $ | 44,073 | |
Average notional value of contracts — short | | $ | 505,767 | |
Forward foreign currency exchange contracts: | | | | |
Average amounts purchased — in USD | | $ | 28,408,229 | |
Average amounts sold — in USD | | $ | 14,769,764 | |
Options: | | | | |
Average value of option contracts purchased | | $ | 16,047 | |
Credit default swaps: | | | | |
Average notional value — buy protection | | $ | 18,755 | |
Average notional value — sell protection | | $ | 1,363,614 | |
Total return swaps: | | | | |
Average notional amount | | $ | — | (a) |
| | (a) | Derivative not held atquarter-end. The risk exposure table serves as an indicator of activity during the period. | |
For more information about the Fund’s investment risks regarding derivative financial instruments, refer to the Notes to Financial Statements.
| | |
| 26 | | 2019 BLACKROCK SEMI-ANNUAL REPORTTO SHAREHOLDERS |
| | |
Schedule of Investments (unaudited) (continued) August 31, 2019 | | BlackRock Debt Strategies Fund, Inc. (DSU) |
Derivative Financial Instruments — Offsetting as of Period End
The Fund’s derivative assets and liabilities (by type) were as follows:
| | | | | | | | |
| | | Assets | | | Liabilities | |
Derivative Financial Instruments: | | | | | | | | |
Futures contracts | | $ | 786 | | | $ | 275 | |
Forward foreign currency exchange contracts | | | 139,398 | | | | 10,222 | |
Options | | | 29,568 | (a) | | | — | |
Swaps — Centrally cleared | | | 242 | | | | — | |
Swaps — OTC(b) | | | 16,786 | | | | 197,116 | |
| | | | | | | | |
Total derivative assets and liabilities in the Statement of Assets and Liabilities | | $ | 186,780 | | | $ | 207,613 | |
Derivatives not subject to a Master Netting Agreement or similar agreement (“MNA”) | | | (30,596 | ) | | | (275 | ) |
| | | | | | | | |
Total derivative assets and liabilities subject to an MNA | | $ | 156,184 | | | $ | 207,338 | |
| | | | | | | | |
| | (a) | Includes options purchased at value which is included in Investments at value — unaffiliated in the Statement of Assets and Liabilities and reported in the Schedule of Investments. | |
| | (b) | Includes unrealized appreciation (depreciation) on OTC swaps and swap premiums (paid/received) in the Statement of Assets and Liabilities. | |
The following table presents the Fund’s derivative assets (and liabilities) by counterparty net of amounts available for offset under a MNA and net of the related collateral received (and pledged) by the Fund:
| | | | | | | | | | | | | | | | | | | | |
| Counterparty | | Derivative
Assets
Subject to
an MNA by
Counterparty | | | Derivatives
Available
for Offset (a) | | | Non-cash
Collateral
Received | | | Cash
Collateral
Received | | | Net
Amount of
Derivative
Assets (b) | |
Bank of America N.A. | | $ | 2 | | | $ | (2 | ) | | $ | — | | | $ | — | | | $ | — | |
Barclays Bank PLC | | | 14,718 | | | | (14,718 | ) | | | — | | | | — | | | | — | |
BNP Paribas S.A. | | | 116,074 | | | | (1,005 | ) | | | — | | | | — | | | | 115,069 | |
Citibank N.A. | | | 1,236 | | | | (1,236 | ) | | | — | | | | — | | | | — | |
Credit Suisse International | | | 272 | | | | (272 | ) | | | — | | | | — | | | | — | |
Goldman Sachs International | | | 13,609 | | | | (885 | ) | | | — | | | | — | | | | 12,724 | |
State Street Bank and Trust Co. | | | 10,273 | | | | (10,222 | ) | | | — | | | | — | | | | 51 | |
| | | | | | | | | | | | | | | | | | | | |
| | $ | 156,184 | | | $ | (28,340 | ) | | $ | — | | | $ | — | | | $ | 127,844 | |
| | | | | | | | | | | | | | | | | | | | |
| | | | | | | | | | | | | | | | | | | | |
| Counterparty | | Derivative
Liabilities
Subject to
an MNA by
Counterparty | | | Derivatives
Available
for Offset (a) | | | Non-cash
Collateral
Pledged | | | Cash
Collateral
Pledged | | | Net
Amount of
Derivative
Liabilities (c) | |
Bank of America N.A. | | $ | 4,563 | | | $ | (2 | ) | | $ | — | | | $ | — | | | $ | 4,561 | |
Barclays Bank PLC | | | 175,125 | | | | (14,718 | ) | | | — | | | | — | | | | 160,407 | |
BNP Paribas S.A. | | | 1,005 | | | | (1,005 | ) | | | — | | | | — | | | | — | |
Citibank N.A. | | | 3,561 | | | | (1,236 | ) | | | — | | | | — | | | | 2,325 | |
Credit Suisse International | | | 674 | | | | (272 | ) | | | — | | | | — | | | | 402 | |
Goldman Sachs International | | | 885 | | | | (885 | ) | | | — | | | | — | | | | — | |
JPMorgan Chase Bank N.A. | | | 11,303 | | | | — | | | | — | | | | — | | | | 11,303 | |
State Street Bank and Trust Co. | | | 10,222 | | | | (10,222 | ) | | | — | | | | — | | | | — | |
| | | | | | | | | | | | | | | | | | | | |
| | $ | 207,338 | | | $ | (28,340 | ) | | $ | — | | | $ | — | | | $ | 178,998 | |
| | | | | | | | | | | | | | | | | | | | |
| | (a) | The amount of derivatives available for offset is limited to the amount of derivative asset and/or liabilities that are subject to an MNA. | |
| | (b) | Net amount represents the net amount receivable from the counterparty in the event of default. | |
| | (c) | Net amount represents the net amount payable due to counterparty in the event of default. | |
Fair Value Hierarchy as of Period End
Various inputs are used in determining the fair value of investments and derivative financial instruments. For information about the Fund’s policy regarding valuation of investments and derivative financial instruments, refer to the Notes to Financial Statements.
| | | | |
| SCHEDULE OF INVESTMENTS | | | 27 | |
| | |
Schedule of Investments (unaudited) (continued) August 31, 2019 | | BlackRock Debt Strategies Fund, Inc. (DSU) |
Fair Value Hierarchy as of Period End (continued)
The following tables summarize the Fund’s investments and derivative financial instruments categorized in the disclosure hierarchy:
| | | | | | | | | | | | | | | | |
| | | Level 1 | | | Level 2 | | | Level 3 | | | Total | |
Assets: | | | | | | | | | | | | | | | | |
Investments: | | | | | | | | | | | | | | | | |
Long-Term Investments: | | | | | | | | | | | | | | | | |
Common Stocks | | $ | 21,894 | | | $ | 91,721 | | | $ | 785,498 | | | $ | 899,113 | |
Corporate Bonds | | | — | | | | 148,260,170 | | | | 2,325,571 | | | | 150,585,741 | |
Floating Rate Loan Interests | | | — | | | | 668,630,729 | | | | 24,272,677 | | | | 692,903,406 | |
Investment Companies | | | 22,686,150 | | | | — | | | | — | | | | 22,686,150 | |
Other Interests | | | — | | | | — | | | | — | (a) | | | — | (a) |
Preferred Securities | | | 1,120,142 | | | | 7,365,007 | | | | | | | | 8,485,149 | |
Warrants | | | — | | | | — | | | | — | (a) | | | — | (a) |
Options Purchased: | | | | | | | | | | | | | | | | |
Equity contracts | | | 22,537 | | | | — | | | | — | | | | 22,537 | |
Interest rate contracts | | | 7,031 | | | | — | | | | — | | | | 7,031 | |
Liabilities: | | | | | | | | | | | | | | | | |
Unfunded Floating Rate Loan Interests(b) | | | — | | | | (5,498 | ) | | | — | | | | (5,498 | ) |
| | | | | | | | | | | | | | | | |
| | $ | 23,857,754 | | | $ | 824,342,129 | | | $ | 27,383,746 | | | $ | 875,583,629 | |
| | | | | | | | | | | | | | | | |
Derivative Financial Instruments(c) | |
Assets: | |
Forward foreign currency contracts | | $ | — | | | $ | 139,398 | | | $ | — | | | $ | 139,398 | |
Credit contracts | | | — | | | | 13,616 | | | | — | | | | 13,616 | |
Equity contracts | | | 547 | | | | — | | | | — | | | | 547 | |
Liabilities: | |
Forward foreign currency contracts | | | — | | | | (10,222 | ) | | | — | | | | (10,222 | ) |
Credit contracts | | | — | | | | (140,871 | ) | | | — | | | | (140,871 | ) |
Equity contracts | | | (507 | ) | | | — | | | | | | | | (507 | ) |
Interest rate contracts | | | (12,544 | ) | | | — | | | | — | | | | (12,544 | ) |
| | | | | | | | | | | | | | | | |
| | $ | (12,504 | ) | | $ | 1,921 | | | $ | — | | | $ | (10,583 | ) |
| | | | | | | | | | | | | | | | |
| | (a) | Rounds to less than $1. | |
| | (b) | Unfunded floating rate loan interests are valued at the unrealized appreciation (depreciation) on the commitment. | |
| | (c) | Derivative financial instruments are swaps, futures contracts and forward foreign currency exchange contracts. Swaps, futures contracts and forward foreign currency exchange contracts are valued at the unrealized appreciation (depreciation). | |
The Fund may hold assets and/or liabilities in which the fair value approximates the carrying amount for financial statement purposes. As of period end, bank borrowings payable of $254,000,000 is categorized as Level 2 within the disclosure hierarchy.
A reconciliation of Level 3 investments is presented when the Fund had a significant amount of Level 3 investments at the beginning and/or end of the period in relation to net assets. The following table is a reconciliation of Level 3 investments for which significant unobservable inputs were used in determining fair value:
| | | | | | | | | | | | | | | | | | | | | | | | | | | | |
| | | Common
Stocks | | | Corporate
Bonds | | | Floating
Rate Loan
Interests | | | Other
Interests | | | Warrants | | | Purchased
Options | | | Total | |
Assets: | | | | | | | | | | | | | | | | | | | | | | | | | | | | |
Opening balance, as of February 28, 2019 | | $ | 3,075,400 | | | $ | 8,149,827 | | | $ | 42,349,614 | | | $ | — | (a) | | $ | — | | | $ | — | | | $ | 53,574,841 | |
Transfers into Level 3 | | | — | | | | — | | | | 2,413,865 | | | | — | | | | — | | | | — | | | | 2,413,865 | |
Transfers out of Level 3(b) | | | — | | | | — | | | | (23,364,327 | ) | | | — | | | | — | | | | — | | | | (23,364,327 | ) |
Accrued discounts/premiums | | | — | | | | 4,110 | | | | 7,583 | | | | — | | | | — | | | | — | | | | 11,693 | |
Net realized gain (loss) | | | (7,838,389 | ) | | | (1,581,795 | ) | | | 577 | | | | — | | | | (31 | ) | | | (5,867 | ) | | | (9,425,505 | ) |
Net change in unrealized appreciation (depreciation)(c)(d) | | | 6,568,328 | | | | 3,000,522 | | | | (234,038 | ) | | | — | | | | 31 | | | | 5,867 | | | | 9,340,710 | |
Purchases | | | 10,161,243 | | | | 2,448,686 | | | | 9,000,824 | | | | — | | | | — | | | | — | | | | 21,610,753 | |
Sales | | | (11,181,084 | ) | | | (9,695,779 | ) | | | (5,901,421 | ) | | | — | | | | — | | | | — | | | | (26,778,284 | ) |
| | | | | | | | | | | | | | | | | | | | | | | | | | | | |
Closing balance, as of August 31, 2019 | | $ | 785,498 | | | $ | 2,325,571 | | | $ | 24,272,677 | | | $ | — | (a) | | $ | — | | | $ | — | | | $ | 27,383,746 | |
| | | | | | | | | | | | | | | | | | | | | | | | | | | | |
Net change in unrealized appreciation (depreciation) on investments still held at August 31, 2019(d) | | $ | (1,315,489 | ) | | $ | 76,880 | | | $ | (223,317 | ) | | $ | — | (a) | | $ | — | | | $ | — | | | $ | (1,461,926 | ) |
| | | | | | | | | | | | | | | | | | | | | | | | | | | | |
| | (a) | Rounds to less than $1. | |
| | (b) | As of February 28, 2019, the Fund used significant unobservable inputs in determining the value of certain investments. As of August 31, 2019, the Fund used observable inputs in determining the value of the same investments. As a result, investments at the beginning of period value were transferred from Level 3 to Level 2 in the disclosure hierarchy. | |
| | (c) | Included in the related net change in unrealized appreciation (depreciation) in the Statement of Operations. | |
| | (d) | Any difference between net change in unrealized appreciation (depreciation) and net change in unrealized appreciation (depreciation) on investments still held at August 31, 2019 is generally due to investments no longer held or categorized as Level 3 at period end. | |
| | |
| 28 | | 2019 BLACKROCK SEMI-ANNUAL REPORTTO SHAREHOLDERS |
Statement of Assets and Liabilities (unaudited)
August 31, 2019
| | | | |
| | | DSU | |
|
ASSETS | |
Investments at value — unaffiliated (cost — $899,523,242) | | $ | 875,589,127 | |
Cash | | | 1,047,371 | |
Cash pledged: | |
Futures contracts | | | 10,000 | |
Centrally cleared swaps | | | 4,000 | |
Foreign currency at value (cost — $147,684) | | | 146,085 | |
Receivables: | |
Investments sold | | | 19,243,980 | |
Interest — unaffiliated | | | 4,874,105 | |
Dividends — affiliated | | | 2,535 | |
Variation margin on futures contracts | | | 786 | |
Variation margin on centrally cleared swaps | | | 242 | |
Swap premiums paid | | | 4,561 | |
Unrealized appreciation on: | |
Forward foreign currency exchange contracts | | | 139,398 | |
OTC swaps | | | 12,225 | |
Prepaid expenses | | | 9,117 | |
Other assets | | | 9,834 | |
| | | | |
Total assets | | | 901,093,366 | |
| | | | |
|
LIABILITIES | |
Payables: | |
Investments purchased | | | 40,012,569 | |
Bank borrowings | | | 254,000,000 | |
Income dividend distributions | | | 54,227 | |
Interest expense | | | 649,701 | |
Investment advisory fees | | | 397,401 | |
Directors’ and Officer’s fees | | | 339,059 | |
Other accrued expenses | | | 280,277 | |
Variation margin on futures contracts | | | 275 | |
Swap premiums received | | | 56,245 | |
Unrealized depreciation on: | |
Forward foreign currency exchange contracts | | | 10,222 | |
OTC swaps | | | 140,871 | |
Unfunded floating rate loan interests | | | 5,498 | |
| | | | |
Total liabilities | | | 295,946,345 | |
| | | | |
| |
NET ASSETS | | $ | 605,147,021 | |
| | | | |
|
NET ASSETS CONSIST OF | |
Paid-in capital | | $ | 701,158,837 | |
Accumulated loss | | | (96,011,816 | ) |
| | | | |
NET ASSETS | | $ | 605,147,021 | |
| | | | |
Net asset value, based on net assets of $605,147,021 and 49,697,581 shares outstanding, 400 million shares authorized, $0.10 par value | | $ | 12.18 | |
| | | | |
See notes to financial statements.
Statement of Operations (unaudited)
Six Months Ended August 31, 2019
| | | | |
| | | DSU | |
|
INVESTMENT INCOME | |
Interest — unaffiliated | | $ | 26,802,417 | |
Dividends — unaffiliated | | | 537,999 | |
Dividends — affiliated | | | 17,184 | |
Other income | | | 246,596 | |
| | | | |
Total investment income | | | 27,604,196 | |
| | | | |
|
EXPENSES | |
Investment advisory | | | 2,460,684 | |
Professional | | | 97,124 | |
Transfer agent | | | 95,635 | |
Accounting services | | | 67,208 | |
Custodian | | | 31,247 | |
Directors and Officer | | | 28,579 | |
Printing | | | 14,143 | |
Registration | | | 9,623 | |
Miscellaneous | | | 50,589 | |
| | | | |
Total expenses excluding interest expense | | | 2,854,832 | |
Interest expense | | | 4,481,659 | |
| | | | |
Total expenses | | | 7,336,491 | |
Less fees waived and/or reimbursed by the Manager | | | (797 | ) |
| | | | |
Total expenses after fees waived and/or reimbursed | | | 7,335,694 | |
| | | | |
Net investment income | | | 20,268,502 | |
| | | | |
|
REALIZED AND UNREALIZED GAIN (LOSS) | |
Net realized gain (loss) from: | |
Investments — unaffiliated | | | (12,308,573 | ) |
Futures contracts | | | (18,341 | ) |
Forward foreign currency exchange contracts | | | 1,027,277 | |
Foreign currency transactions | | | (25,797 | ) |
Swaps | | | 587,094 | |
| | | | |
| | | (10,738,340 | ) |
| | | | |
Net change in unrealized appreciation (depreciation) on: | |
Investments — unaffiliated | | | 12,028,943 | |
Futures contracts | | | (13,347 | ) |
Forward foreign currency exchange contracts | | | (23,839 | ) |
Foreign currency translations | | | (58,423 | ) |
Swaps | | | (662,290 | ) |
Unfunded floating rate loan interests | | | (4,899 | ) |
| | | | |
| | | 11,266,145 | |
| | | | |
Net realized and unrealized gain | | | 527,805 | |
| | | | |
NET INCREASE IN NET ASSETS RESULTING FROM OPERATIONS | | $ | 20,796,307 | |
| | | | |
See notes to financial statements.
| | |
| 30 | | 2019 BLACKROCK SEMI-ANNUAL REPORTTO SHAREHOLDERS |
Statement of Changes in Net Assets
| | | | | | | | |
| | | DSU | |
| | | Six Months Ended
08/31/19
(unaudited) | | | Year Ended
02/28/19 | |
|
INCREASE (DECREASE) IN NET ASSETS | |
|
OPERATIONS | |
Net investment income | | $ | 20,268,502 | | | $ | 42,457,853 | |
Net realized loss | | | (10,738,340 | ) | | | (7,363,476 | ) |
Net change in unrealized appreciation (depreciation) | | | 11,266,145 | | | | (16,979,647 | ) |
| | | | | | | | |
Net increase in net assets resulting from operations | | | 20,796,307 | | | | 18,114,730 | |
| | | | | | | | |
|
DISTRIBUTIONS TO SHAREHOLDERS(a) | |
Decrease in net assets resulting from distributions to shareholders | | | (20,897,002 | ) | | | (44,243,908 | ) |
| | | | | | | | |
|
CAPITAL SHARE TRANSACTIONS | |
Redemption of shares resulting from share repurchases (including transaction costs) | | | (35,972,306 | ) | | | (74,855,117 | ) |
| | | | | | | | |
|
NET ASSETS | |
Total decrease in net assets | | | (36,073,001 | ) | | | (100,984,295 | ) |
Beginning of period | | | 641,220,022 | | | | 742,204,317 | |
| | | | | | | | |
End of period | | $ | 605,147,021 | | | $ | 641,220,022 | |
| | | | | | | | |
| (a) | Distributions for annual periods determined in accordance with U.S. federal income tax regulations |
See notes to financial statements.
Statement of Cash Flows (unaudited)
Six Months Ended August 31, 2019
| | | | |
| | | DSU | |
|
CASH PROVIDED BY (USED FOR) OPERATING ACTIVITIES | |
Net increase in net assets resulting from operations | | $ | 20,796,307 | |
Adjustments to reconcile net increase in net assets resulting from operations to net cash provided by operating activities: | |
Proceeds from sales of long-term investments and principal paydowns | | | 359,377,523 | |
Purchases of long-term investments | | | (304,757,182 | ) |
Net proceeds from sales of short-term securities | | | 3,616,393 | |
Amortization of premium and accretion of discount on investments and other fees | | | (1,094,736 | ) |
Premiums paid on closing options written | | | (4,274 | ) |
Net realized loss on investments | | | 12,315,268 | |
Net unrealized depreciation on investments, swaps, forward foreign currency exchange contracts, foreign currency translations and unfunded floating rate loan interests | | | (11,336,524 | ) |
|
(Increase) Decrease in Assets: | |
Receivables: | |
Interest — unaffiliated | | | 1,353,132 | |
Dividends — affiliated | | | 8,855 | |
Variation margin on futures contracts | | | 326 | |
Variation margin on centrally cleared swaps | | | (242 | ) |
Swap premiums paid | | | 19,330 | |
Prepaid expenses | | | 9,602 | |
Other assets | | | 3,534 | |
|
Increase (Decrease) in Liabilities: | |
Payables: | |
Investment advisory fees | | | 17,965 | |
Interest expense and fees | | | (39,107 | ) |
Directors’ and Officer’s fees | | | 10,487 | |
Variation margin on futures contracts | | | 275 | |
Other accrued expenses | | | (146,968 | ) |
Swap premiums received | | | (7,165 | ) |
| | | | |
Net cash provided by operating activities | | | 80,142,799 | |
| | | | |
|
CASH PROVIDED BY (USED FOR) FINANCING ACTIVITIES | |
Proceeds from issuance of Common Shares | | | 645,000 | |
Payments on redemption of Common Shares | | | (36,617,306 | ) |
Proceeds from bank borrowings | | | 194,000,000 | |
Payments for bank borrowings | | | (218,000,000 | ) |
Cash dividends paid to Common Shareholders | | | (20,977,701 | ) |
| | | | |
Net cash used for financing activities | | | (80,950,007 | ) |
| | | | |
|
CASH IMPACT FROM FOREIGN EXCHANGE FLUCTUATIONS | |
Cash impact from foreign exchange fluctuations | | $ | (3,807 | ) |
| | | | |
|
CASH AND FOREIGN CURRENCY | |
Net decrease in restricted and unrestricted cash and foreign currency | | | (811,015 | ) |
Restricted and unrestricted cash and foreign currency at beginning of period | | | 2,018,471 | |
| | | | |
Restricted and unrestricted cash and foreign currency at end of period | | $ | 1,207,456 | |
| | | | |
|
SUPPLEMENTAL DISCLOSURE OF CASH FLOW INFORMATION | |
Cash paid during the period for interest expense | | $ | 4,520,766 | |
| | | | |
| |
RECONCILIATION OF RESTRICTED AND UNRESTRICTED CASH AND FOREIGN CURRENCY AT THE END OF PERIOD TO THE STATEMENT OF ASSETS AND LIABILITIES | | | | |
Cash | | | 1,047,371 | |
Cash pledged: | |
Futures contracts | | | 10,000 | |
Centrally cleared swaps | | | 4,000 | |
Foreign currency at value | | | 146,085 | |
| | | | |
| | $ | 1,207,456 | |
| | | | |
See notes to financial statements.
| | |
| 32 | | 2019 BLACKROCK SEMI-ANNUAL REPORTTO SHAREHOLDERS |
Statement of Cash Flows (unaudited) (continued)
Six Months Ended August 31, 2019
| | | | |
| | �� | DSU | |
| |
RECONCILIATION OF RESTRICTED AND UNRESTRICTED CASH AND FOREIGN CURRENCY AT THE BEGINNING OF YEAR TO THE STATEMENT OF ASSETS AND LIABILITIES | | | | |
Cash | | $ | 1,855,920 | |
Cash pledged for futures contracts | | | 11,000 | |
Foreign currency at value | | | 151,551 | |
| | | | |
| | $ | 2,018,471 | |
| | | | |
See notes to financial statements.
Financial Highlights
(For a share outstanding throughout each period)
| | | | | | | | | | | | | | | | | | | | | | | | | | | | | | | | |
| | | DSU | |
| | | Six Months Ended 08/31/19
(unaudited) | | | | | | Year Ended February 28, | | | | | | Year Ended
February 29, 2016 (a)(b) | | | Year Ended
February 28, 2015 (a)(b) | |
| | | | | | 2019 | | | 2018 | | | 2017 (a) | | | | |
| | | | | | | | | |
Net asset value, beginning of period | | $ | 12.16 | | | | | | | $ | 12.62 | | | $ | 12.70 | | | $ | 11.38 | | | | | | | $ | 12.87 | | | $ | 13.32 | |
| | | | | | | | | | | | | | | | | | | | | | | | | | | | | | | | |
Net investment income(c) | | | 0.40 | | | | | | | | 0.79 | | | | 0.78 | | | | 0.73 | | | | | | | | 0.77 | | | | 0.87 | |
Net realized and unrealized gain (loss) | | | 0.03 | | | | | | | | (0.43 | ) | | | (0.04 | ) | | | 1.34 | | | | | | | | (1.46 | ) | | | (0.43 | ) |
| | | | | | | | | | | | | | | | | | | | | | | | | | | | | | | | |
Net increase (decrease) from investment operations | | | 0.43 | | | | | | | | 0.36 | | | | 0.74 | | | | 2.07 | | | | | | | | (0.69 | ) | | | 0.44 | |
| | | | | | | | | | | | | | | | | | | | | | | | | | | | | | | | |
Distributions from net investment income(d) | | | (0.41 | ) | | | | | | | (0.82 | ) | | | (0.82 | ) | | | (0.75 | ) | | | | | | | (0.80 | ) | | | (0.89 | ) |
| | | | | | | | | | | | | | | | | | | | | | | | | | | | | | | | |
| | | | | | | | |
Net asset value, end of period | | $ | 12.18 | | | | | | | $ | 12.16 | | | $ | 12.62 | | | $ | 12.70 | | | | | | | $ | 11.38 | | | $ | 12.87 | |
| | | | | | | | | | | | | | | | | | | | | | | | | | | | | | | | |
| | | | | | | | |
Market price, end of period | | $ | 10.70 | | | | | | | $ | 10.78 | | | $ | 11.47 | | | $ | 11.68 | | | | | | | $ | 9.96 | | | $ | 11.43 | |
| | | | | | | | | | | | | | | | | | | | | | | | | | | | | | | | |
| |
Total Return(e) | | | | | |
Based on net asset value | | | 4.04 | %(f) | | | | | | | 3.86 | % | | | 6.60 | %(g) | | | 19.57 | % | | | | | | | (4.73 | )% | | | 4.15 | % |
| | | | | | | | | | | | | | | | | | | | | | | | | | | | | | | | |
Based on market price | | | 3.10 | %(f) | | | | | | | 1.30 | % | | | 5.35 | % | | | 25.53 | % | | | | | | | (6.03 | )% | | | 0.66 | % |
| | | | | | | | | | | | | | | | | | | | | | | | | | | | | | | | |
| |
Ratios to Average Net Assets | | | | | |
Total expenses | | | 2.37 | %(h)(i) | | | | | | | 2.23 | % | | | 1.86 | % | | | 1.36 | %(j) | | | | | | | 1.18 | %(k) | | | 1.24 | % |
| | | | | | | | | | | | | | | | | | | | | | | | | | | | | | | | |
Total expenses after fees waived and/or reimbursed and paid indirectly | | | 2.37 | %(h)(i) | | | | | | | 2.23 | % | | | 1.85 | % | | | 1.35 | %(j) | | | | | | | 1.18 | %(k) | | | 1.24 | % |
| | | | | | | | | | | | | | | | | | | | | | | | | | | | | | | | |
Total expenses after fees waived and/or reimbursed and paid indirectly and excluding interest expense | | | 0.92 | %(h)(i) | | | | | | | 0.96 | % | | | 0.94 | % | | | 0.87 | %(j) | | | | | | | 0.84 | %(k) | | | 0.89 | % |
| | | | | | | | | | | | | | | | | | | | | | | | | | | | | | | | |
Net investment income | | | 6.54 | %(h)(i) | | | | | | | 6.40 | % | | | 6.12 | % | | | 6.04 | % | | | | | | | 6.29 | % | | | 6.68 | % |
| | | | | | | | | | | | | | | | | | | | | | | | | | | | | | | | |
| |
Supplemental Data | | | | | |
Net assets, end of period (000) | | $ | 605,147 | | | | | | | $ | 641,220 | | | $ | 742,204 | | | $ | 780,810 | | | | | | | $ | 709,236 | | | $ | 801,887 | |
| | | | | | | | | | | | | | | | | | | | | | | | | | | | | | | | |
Borrowings outstanding, end of period (000) | | $ | 254,000 | | | | | | | $ | 278,000 | | | $ | 338,000 | | | $ | 318,000 | | | | | | | $ | 190,000 | | | $ | 295,000 | |
| | | | | | | | | | | | | | | | | | | | | | | | | | | | | | | | |
Asset coverage, end of period per $1,000 of bank borrowings | | $ | 3,383 | | | | | | | $ | 3,308 | | | $ | 3,196 | | | $ | 3,455 | | | | | | | $ | 4,733 | | | $ | 3,719 | |
| | | | | | | | | | | | | | | | | | | | | | | | | | | | | | | | |
Portfolio turnover rate | | | 33 | % | | | | | | | 62 | % | | | 59 | % | | | 55 | % | | | | | | | 41 | % | | | 54 | % |
| | | | | | | | | | | | | | | | | | | | | | | | | | | | | | | | |
| (a) | Consolidated Financial Highlights through November 30, 2017. |
| (b) | Per share operating performance amounts have been adjusted to reflect aone-for-three reverse stock split effective after the close of trading on November 15, 2016 for the shareholders of record on November 15, 2016. |
| (c) | Based on average shares outstanding. |
| (d) | Distributions for annual periods determined in accordance with U.S. federal income tax regulations. |
| (e) | Total returns based on market price, which can be significantly greater or less than the net asset value, may result in substantially different returns. Where applicable, excludes the effects of any sales charges and assumes the reinvestment of distributions at actual reinvestment prices. |
| (f) | Aggregate total return. |
| (g) | Includes payment received from an affiliate, which had no impact on the Fund’s total return. |
| (h) | Excludes 0.03% of expenses incurred indirectly as a result of investments in underlying funds. |
| (j) | Ratios do not include expenses incurred indirectly as a result of investments in underlying funds of approximately 0.02%. |
| (k) | Ratios do not include expenses incurred indirectly as a result of investments in underlying funds of approximately 0.01%. |
See notes to financial statements.
| | |
| 34 | | 2019 BLACKROCK SEMI-ANNUAL REPORTTO SHAREHOLDERS |
Notes to Financial Statements (unaudited)
BlackRock Debt Strategies Fund, Inc. (the “Fund”) is registered under the Investment Company Act of 1940, as amended (the “1940 Act”). The Fund is registered as a diversified,closed-end management investment company. The Fund is organized as a Maryland corporation. The Fund determines and makes available for publication the net asset value (“NAV”) of its Common Shares on a daily basis.
The Fund, together with certain other registered investment companies advised by BlackRock Advisors, LLC (the “Manager”) or its affiliates, is included in a complex of open-endnon-index fixed-income mutual funds and all BlackRock-advisedclosed-end funds referred to as the BlackRock Fixed-Income Complex.
| 2. | SIGNIFICANT ACCOUNTING POLICIES |
The financial statements are prepared in conformity with accounting principles generally accepted in the United States of America (“U.S. GAAP”), which may require management to make estimates and assumptions that affect the reported amounts of assets and liabilities in the financial statements, disclosure of contingent assets and liabilities at the date of the financial statements and the reported amounts of increases and decreases in net assets from operations during the reporting period. Actual results could differ from those estimates. The Fund is considered an investment company under U.S. GAAP and follows the accounting and reporting guidance applicable to investment companies. Below is a summary of significant accounting policies:
Investment Transactions and Income Recognition:For financial reporting purposes, investment transactions are recorded on the dates the transactions are executed. Realized gains and losses on investment transactions are determined on the identified cost basis. Dividend income is recorded on theex-dividend date. Dividends from foreign securities where theex-dividend date may have passed are subsequently recorded when the Fund is informed of theex-dividend date. Under the applicable foreign tax laws, a withholding tax at various rates may be imposed on capital gains, dividends and interest. Interest income, including amortization and accretion of premiums and discounts on debt securities is recognized on an accrual basis.
Foreign Currency Translation:The Fund’s books and records are maintained in U.S. dollars. Securities and other assets and liabilities denominated in foreign currencies are translated into U.S. dollars using exchange rates determined as of the close of trading on the New York Stock Exchange (“NYSE”). Purchases and sales of investments are recorded at the rates of exchange prevailing on the respective dates of such transactions. Generally, when the U.S. dollar rises in value against a foreign currency, the investments denominated in that currency will lose value; the opposite effect occurs if the U.S. dollar falls in relative value.
The Fund does not isolate the portion of the results of operations arising as a result of changes in the exchange rates from the changes in the market prices of investments held or sold for financial reporting purposes. Accordingly, the effects of changes in exchange rates on investments are not segregated in the Statement of Operations from the effects of changes in market prices of those investments, but are included as a component of net realized and unrealized gain (loss) from investments. The Fund reports realized currency gains (losses) on foreign currency related transactions as components of net realized gain (loss) for financial reporting purposes, whereas such components are generally treated as ordinary income for U.S. federal income tax purposes.
Segregation and Collateralization:In cases where the Fund enters into certain investments (e.g., futures contracts, forward foreign currency exchange contracts and swaps) that would be treated as “senior securities” for 1940 Act purposes, the Fund may segregate or designate on itsbooks and records cash or liquid assets having a market value at least equal to the amount of its future obligations under such investments. Doing so allows the investment to be excluded from treatment as a “senior security.” Furthermore, if required by an exchange or counterparty agreement, the Fund may be required to deliver/deposit cash and/or securities to/with an exchange, or broker-dealer or custodian as collateral for certain investments or obligations.
Distributions: Distributions from net investment income are declared monthly and paid monthly. Distributions of capital gains are recorded on theex-dividend date and made at least annually. The character and timing of distributions are determined in accordance with U.S. federal income tax regulations, which may differ from U.S. GAAP.
Deferred Compensation Plan:Under the Deferred Compensation Plan (the “Plan”) approved by the Fund’s Board, the directors who are not “interested persons” of the Fund, as defined in the 1940 Act (“Independent Directors”), may defer a portion of their annual complex-wide compensation. Deferred amounts earn an approximate return as though equivalent dollar amounts had been invested in common shares of certain funds in the BlackRock Fixed-Income Complex selected by the Independent Directors. This has the same economic effect for the Independent Directors as if the Independent Directors had invested the deferred amounts directly in certain funds in the other BlackRock Fixed-Income Complex.
The Plan is not funded and obligations thereunder represent general unsecured claims against the general assets of the Fund, as applicable. Deferred compensation liabilities are included in the Directors’ and Officer’s fees payable in the Statement of Assets and Liabilities and will remain as a liability of the Fund until such amounts are distributed in accordance with the Plan.
Recent Accounting Standards:The Fund has adopted Financial Accounting Standards Board Accounting Standards Update2017-08 to amend the amortization period for certain purchased callable debt securities held at a premium. Under the new standard, the Fund has changed the amortization period for the premium on certain purchased callable debt securities withnon-contingent call features to the earliest call date. In accordance with the transition provisions of the standard, the Fund applied the amendments on a modified retrospective basis beginning with the fiscal period ended August 31, 2019. The adjusted cost basis of securities at February 28, 2019 is $981,862,236.
Indemnifications:In the normal course of business, the Fund enters into contracts that contain a variety of representations that provide general indemnification. The Fund’s maximum exposure under these arrangements is unknown because it involves future potential claims against the Fund, which cannot be predicted with any certainty.
Other: Expenses directly related to the Fund are charged to the Fund. Other operating expenses shared by several funds, including other funds managed by the Manager, are prorated among those funds on the basis of relative net assets or other appropriate methods.
| | | | |
| NOTESTO FINANCIAL STATEMENTS | | | 35 | |
Notes to Financial Statements (unaudited) (continued)
| 3. | INVESTMENT VALUATION AND FAIR VALUE MEASUREMENTS |
Investment Valuation Policies: The Fund’s investments are valued at fair value (also referred to as “market value” within the financial statements) as of the close of trading on the NYSE (generally 4:00 p.m., Eastern time) (or if the reporting date falls on a day the NYSE is closed, investments are valued at fair value as of the period end). U.S. GAAP defines fair value as the price the Fund would receive to sell an asset or pay to transfer a liability in an orderly transaction between market participants at the measurement date. The Fund determines the fair values of its financial instruments using various independent dealers or pricing services under policies approved by the Board of Directors of the Fund (the “Board”). The BlackRock Global Valuation Methodologies Committee (the “Global Valuation Committee”) is the committee formed by management to develop global pricing policies and procedures and to oversee the pricing function for all financial instruments.
Fair Value Inputs and Methodologies: The following methods and inputs are used to establish the fair value of the Fund’s assets and liabilities:
| | • | | Equity investments traded on a recognized securities exchange are valued at the official closing price each day, if available. For equity investments traded on more than one exchange, the official closing price on the exchange where the stock is primarily traded is used. Equity investments traded on a recognized exchange for which there were no sales on that day may be valued at the last available bid (long positions) or ask (short positions) price. |
| | • | | Fixed-income securities for which market quotations are readily available are generally valued using the last available bid prices or current market quotations provided by independent dealers or third party pricing services. Floating rate loan interests are valued at the mean of the bid prices from one or more independent brokers or dealers as obtained from a third party pricing service. Pricing services generally value fixed-income securities assuming orderly transactions of an institutional round lot size, but a fund may hold or transact in such securities in smaller, odd lot sizes. Odd lots may trade at lower prices than institutional round lots. The pricing services may use matrix pricing or valuation models that utilize certain inputs and assumptions to derive values, including transaction data (e.g., recent representative bids and offers), credit quality information, perceived market movements, news, and other relevant information. Certain fixed-income securities, including asset-backed and mortgage related securities may be valued based on valuation models that consider the estimated cash flows of each tranche of the entity, establish a benchmark yield and develop an estimated tranche specific spread to the benchmark yield based on the unique attributes of the tranche. The amortized cost method of valuation may be used with respect to debt obligations with sixty days or less remaining to maturity unless the Manager determines such method does not represent fair value. |
Generally, trading in foreign instruments is substantially completed each day at various times prior to the close of trading on the NYSE. Occasionally, events affecting the values of such instruments may occur between the foreign market close and the close of trading on the NYSE that may not be reflected in the computation of the Fund’s net assets. Each business day, the Fund uses a pricing service to assist with the valuation of certain foreign exchange-traded equity securities and foreign exchange-traded andover-the-counter (“OTC”) options (the “Systematic Fair Value Price”). Using current market factors, the Systematic Fair Value Price is designed to value such foreign securities and foreign options at fair value as of the close of trading on the NYSE, which follows the close of the local markets.
| | • | | Investments inopen-end U.S. mutual funds are valued at NAV each business day. |
| | • | | Futures contracts traded on exchanges are valued at their last sale price. |
| | • | | Forward foreign currency exchange contracts are valued at the mean between the bid and ask prices and are determined as of the close of trading on the NYSE based on that day’s prevailing forward exchange rate for the underlying currencies. Interpolated values are derived when the settlement date of the contract is an interim date for which quotations are not available. |
| | • | | Exchange-traded options are valued at the mean between the last bid and ask prices at the close of the options market in which the options trade. An exchange-traded option for which there is no mean price is valued at the last bid (long positions) or ask (short positions) price. If no bid or ask price is available, the prior day’s price will be used, unless it is determined that the prior day’s price no longer reflects the fair value of the option. OTC options are valued by an independent pricing service using a mathematical model, which incorporates a number of market data factors, such as the trades and prices of the underlying instruments. |
| | • | | Swap agreements are valued utilizing quotes received daily by the Fund’s pricing service or through brokers, which are derived using daily swap curves and models that incorporate a number of market data factors, such as discounted cash flows, trades and values of the underlying reference instruments. |
If events (e.g., a company announcement, market volatility or a natural disaster) occur that are expected to materially affect the value of such investments, or in the event that the application of these methods of valuation results in a price for an investment that is deemed not to be representative of the market value of such investment, or if a price is not available, the investment will be valued by the Global Valuation Committee, or its delegate, in accordance with a policy approved by the Board as reflecting fair value (“Fair Valued Investments”). The fair valuation approaches that may be used by the Global Valuation Committee will include market approach, income approach and cost approach. Valuation techniques such as discounted cash flow, use of market comparables and matrix pricing are types of valuation approaches and are typically used in determining fair value. When determining the price for Fair Valued Investments, the Global Valuation Committee, or its delegate, seeks to determine the price that the Fund might reasonably expect to receive or pay from the current sale or purchase of that asset or liability in anarm’s-length transaction. Fair value determinations shall be based upon all available factors that the Global Valuation Committee, or its delegate, deems relevant and consistent with the principles of fair value measurement. The pricing of all Fair Valued Investments is subsequently reported to the Board or a committee thereof on a quarterly basis.
| | |
| 36 | | 2019 BLACKROCK SEMI-ANNUAL REPORTTO SHAREHOLDERS |
Notes to Financial Statements (unaudited) (continued)
For investments in equity or debt issued by privately held companies or funds (“Private Company” or collectively, the “Private Companies”) and other Fair Valued Investments, the fair valuation approaches that are used by the Global Valuation Committee and third party pricing services utilize one or a combination of, but not limited to, the following inputs.
| | |
| Standard Inputs Generally Considered By Third Party Pricing Services |
Market approach | | (i) recent market transactions, including subsequent rounds of financing, in the underlying investment or comparable issuers; (ii) recapitalizations and other transactions across the capital structure; and (iii) market multiples of comparable issuers. |
Income approach | | (i) future cash flows discounted to present and adjusted as appropriate for liquidity, credit, and/or market risks; (ii) quoted prices for similar investments or assets in active markets; and (iii) other risk factors, such as interest rates, yield curves, volatilities, prepayment speeds, loss severities, credit risks, recovery rates, liquidation amounts and/or default rates. |
Cost approach | | (i) audited or unaudited financial statements, investor communications and financial or operational metrics issued by the Private Company; (ii) changes in the valuation of relevant indices or publicly traded companies comparable to the Private Company; (iii) relevant news and other public sources; and (iv) known secondary market transactions in the Private Company’s interests and merger or acquisition activity in companies comparable to the Private Company. |
Investments in series of preferred stock issued by Private Companies are typically valued utilizing market approach in determining the enterprise value of the company. Such investments often contain rights and preferences that differ from other series of preferred and common stock of the same issuer. Valuation techniques such as an option pricing model (“OPM”), a probability weighted expected return model (“PWERM”) or a hybrid of those techniques are used in allocating enterprise value of the company, as deemed appropriate under the circumstances. The use of OPM and PWERM techniques involve a determination of the exit scenarios of the investment in order to appropriately allocate the enterprise value of the company among the various parts of its capital structure.
The Private Companies are not subject to the public company disclosure, timing, and reporting standards as other investments held by the Fund. Typically, the most recently available information by a Private Company is as of a date that is earlier than the date the Fund is calculating its NAV. This factor may result in a difference between the value of the investment and the price the Fund could receive upon the sale of the investment.
Fair Value Hierarchy: Various inputs are used in determining the fair value of investments and derivative financial instruments. These inputs to valuation techniques are categorized into a fair value hierarchy consisting of three broad levels for financial statement purposes as follows:
| | • | | Level 1 — Unadjusted price quotations in active markets/exchanges for identical assets or liabilities that the Fund has the ability to access |
| | • | | Level 2 — Other observable inputs (including, but not limited to, quoted prices for similar assets or liabilities in markets that are active, quoted prices for identical or similar assets or liabilities in markets that are not active, inputs other than quoted prices that are observable for the assets or liabilities (such as interest rates, yield curves, volatilities, prepayment speeds, loss severities, credit risks and default rates) or other market–corroborated inputs) |
| | • | | Level 3 — Unobservable inputs based on the best information available in the circumstances, to the extent observable inputs are not available (including the Global Valuation Committee’s assumptions used in determining the fair value of investments and derivative financial instruments) |
The hierarchy gives the highest priority to unadjusted quoted prices in active markets for identical assets or liabilities (Level 1 measurements) and the lowest priority to unobservable inputs (Level 3 measurements). Accordingly, the degree of judgment exercised in determining fair value is greatest for instruments categorized in Level 3. The inputs used to measure fair value may fall into different levels of the fair value hierarchy. In such cases, for disclosure purposes, the fair value hierarchy classification is determined based on the lowest level input that is significant to the fair value measurement in its entirety. Investments classified within Level 3 have significant unobservable inputs used by the Global Valuation Committee in determining the price for Fair Valued Investments. Level 3 investments include equity or debt issued by Private Companies. There may not be a secondary market, and/or there are a limited number of investors. There may not be a secondary market, and/or there are a limited number of investors. The categorization of a value determined for investments and derivative financial instruments is based on the pricing transparency of the investments and derivative financial instruments and is not necessarily an indication of the risks associated with investing in those securities.
| 4. | SECURITIES AND OTHER INVESTMENTS |
Asset-Backed and Mortgage-Backed Securities:Asset-backed securities are generally issued as pass-through certificates or as debt instruments. Asset-backed securities issued as pass-through certificates represent undivided fractional ownership interests in an underlying pool of assets. Asset-backed securities issued as debt instruments, which are also known as collateralized obligations, are typically issued as the debt of a special purpose entity organized solely for the purpose of owning such assets and issuing such debt. Asset-backed securities are often backed by a pool of assets representing the obligations of a number of different parties. The yield characteristics of certain asset-backed securities may differ from traditional debt securities. One such major difference is that all or a principal part of the obligations may be prepaid at any time because the underlying assets (i.e., loans) may be prepaid at any time. As a result, a decrease in interest rates in the market may result in increases in the level of prepayments as borrowers, particularly mortgagors, refinance and repay their loans. An increased prepayment rate with respect to an asset-backed security will have the effect of shortening the maturity of the security. In addition, a fund may subsequently have to reinvest the proceeds at lower interest rates. If a fund has purchased such an asset-backed security at a premium, a faster than anticipated prepayment rate could result in a loss of principal to the extent of the premium paid.
For mortgage pass-through securities (the “Mortgage Assets”) there are a number of important differences among the agencies and instrumentalities of the U.S. Government that issue mortgage-related securities and among the securities that they issue. For example, mortgage-related securities guaranteed by Ginnie Mae are
| | | | |
| NOTESTO FINANCIAL STATEMENTS | | | 37 | |
Notes to Financial Statements (unaudited) (continued)
guaranteed as to the timely payment of principal and interest by Ginnie Mae and such guarantee is backed by the full faith and credit of the United States. However, mortgage-related securities issued by Freddie Mac and Fannie Mae, including Freddie Mac and Fannie Mae guaranteed mortgage pass-through certificates, which are solely the obligations of Freddie Mac and Fannie Mae, are not backed by or entitled to the full faith and credit of the United States, but are supported by the right of the issuer to borrow from the U.S. Treasury.
Non-agency mortgage-backed securities are securities issued bynon-governmental issuers and have no direct or indirect government guarantees of payment and are subject to various risks.Non-agency mortgage loans are obligations of the borrowers thereunder only and are not typically insured or guaranteed by any other person or entity. The ability of a borrower to repay a loan is dependent upon the income or assets of the borrower. A number of factors, including a general economic downturn, acts of God, terrorism, social unrest and civil disturbances, may impair a borrower’s ability to repay its loans.
Collateralized Debt Obligations: Collateralized debt obligations (“CDOs”), including collateralized bond obligations (“CBOs”) and collateralized loan obligations (“CLOs”), are types of asset-backed securities. A CDO is an entity that is backed by a diversified pool of debt securities (CBOs) or syndicated bank loans (CLOs). The cash flows of the CDO can be split into multiple segments, called “tranches,” which will vary in risk profile and yield. The riskiest segment is the subordinated or “equity” tranche. This tranche bears the greatest risk of defaults from the underlying assets in the CDO and serves to protect the other, more senior, tranches from default in all but the most severe circumstances. Since it is shielded from defaults by the more junior tranches, a “senior” tranche will typically have higher credit ratings and lower yields than their underlying securities, and often receive investment grade ratings from one or more of the nationally recognized rating agencies. Despite the protection from the more junior tranches, senior tranches can experience substantial losses due to actual defaults, increased sensitivity to future defaults and the disappearance of one or more protecting tranches as a result of changes in the credit profile of the underlying pool of assets.
Capital Securities and Trust Preferred Securities: Capital securities, including trust preferred securities, are typically issued by corporations, generally in the form of interest-bearing notes with preferred securities characteristics. In the case of trust preferred securities, an affiliated business trust of a corporation issues these securities, generally in the form of beneficial interests in subordinated debentures or similarly structured securities. The securities can be structured with either a fixed or adjustable coupon that can have either a perpetual or stated maturity date. For trust preferred securities, the issuing bank or corporation pays interest to the trust, which is then distributed to holders of these securities as a dividend. Dividends can be deferred without creating an event of default or acceleration, although maturity cannot take place unless all cumulative payment obligations have been met. The deferral of payments does not affect the purchase or sale of these securities in the open market. These securities generally are rated below that of the issuing company’s senior debt securities and are freely callable at the issuer’s option.
Preferred Stocks:Preferred stock has a preference over common stock in liquidation (and generally in receiving dividends as well), but is subordinated to the liabilities of the issuer in all respects. As a general rule, the market value of preferred stock with a fixed dividend rate and no conversion element varies inversely with interest rates and perceived credit risk, while the market price of convertible preferred stock generally also reflects some element of conversion value. Because preferred stock is junior to debt securities and other obligations of the issuer, deterioration in the credit quality of the issuer will cause greater changes in the value of a preferred stock than in a more senior debt security with similar stated yield characteristics. Unlike interest payments on debt securities, preferred stock dividends are payable only if declared by the issuer’s board of directors. Preferred stock also may be subject to optional or mandatory redemption provisions.
Warrants:Warrants entitle a fund to purchase a specified number of shares of common stock and arenon-income producing. The purchase price and number of shares are subject to adjustment under certain conditions until the expiration date of the warrants, if any. If the price of the underlying stock does not rise above the strike price before the warrant expires, the warrant generally expires without any value and a Fund will lose any amount it paid for the warrant. Thus, investments in warrants may involve more risk than investments in common stock. Warrants may trade in the same markets as their underlying stock; however, the price of the warrant does not necessarily move with the price of the underlying stock.
Floating Rate Loan Interests: Floating rate loan interests are typically issued to companies (the “borrower”) by banks, other financial institutions, or privately and publicly offered corporations (the “lender”). Floating rate loan interests are generallynon-investment grade, often involve borrowers whose financial condition is troubled or uncertain and companies that are highly leveraged or in bankruptcy proceedings. In addition, transactions in floating rate loan interests may settle on a delayed basis, which may result in proceeds from the sale not being readily available for a fund to make additional investments or meet its redemption obligations. Floating rate loan interests may include fully funded term loans or revolving lines of credit. Floating rate loan interests are typically senior in the corporate capital structure of the borrower. Floating rate loan interests generally pay interest at rates that are periodically determined by reference to a base lending rate plus a premium. Since the rates reset only periodically, changes in prevailing interest rates (and particularly sudden and significant changes) can be expected to cause some fluctuations in the NAV of a fund to the extent that it invests in floating rate loan interests. The base lending rates are generally the lending rate offered by one or more European banks, such as the London Interbank Offered Rate (“LIBOR”), the prime rate offered by one or more U.S. banks or the certificate of deposit rate. Floating rate loan interests may involve foreign borrowers, and investments may be denominated in foreign currencies. These investments are treated as investments in debt securities for purposes of a fund’s investment policies.
When a fund purchases a floating rate loan interest, it may receive a facility fee and when it sells a floating rate loan interest, it may pay a facility fee. On an ongoing basis, a fund may receive a commitment fee based on the undrawn portion of the underlying line of credit amount of a floating rate loan interest. Facility and commitment fees are typically amortized to income over the term of the loan or term of the commitment, respectively. Consent and amendment fees are recorded to income as earned. Prepayment penalty fees, which may be received by a fund upon the prepayment of a floating rate loan interest by a borrower, are recorded as realized gains. A fund may invest in multiple series or tranches of a loan. A different series or tranche may have varying terms and carry different associated risks.
Floating rate loan interests are usually freely callable at the borrower’s option. A fund may invest in such loans in the form of participations in loans (“Participations”) or assignments (“Assignments”) of all or a portion of loans from third parties. Participations typically will result in a fund having a contractual relationship only with the lender, not with the borrower. A fund has the right to receive payments of principal, interest and any fees to which it is entitled only from the lender selling the Participation and only upon receipt by the lender of the payments from the borrower. In connection with purchasing Participations, a fund generally will have no right to enforce compliance by the borrower with the terms of the loan agreement, nor any rights of offset against the borrower. A fund may not benefit directly from any collateral supporting the loan in which it has purchased the Participation. As a result, a fund assumes the credit risk of both the borrower and the lender that is selling the Participation. A fund’s
| | |
| 38 | | 2019 BLACKROCK SEMI-ANNUAL REPORTTO SHAREHOLDERS |
Notes to Financial Statements (unaudited) (continued)
investment in loan participation interests involves the risk of insolvency of the financial intermediaries who are parties to the transactions. In the event of the insolvency of the lender selling the Participation, a fund may be treated as a general creditor of the lender and may not benefit from any offset between the lender and the borrower. Assignments typically result in a fund having a direct contractual relationship with the borrower, and a fund may enforce compliance by the borrower with the terms of the loan agreement.
In connection with floating rate loan interests, the fund may also enter into unfunded floating rate loan interests (“commitments”). In connection with these commitments, the fund earns a commitment fee, typically set as a percentage of the commitment amount. Such fee income, which is included in interest income in the Statement of Operations, is recognized ratably over the commitment period. Unfunded floating rate loan interests aremarked-to-market daily, and any unrealized appreciation (depreciation) is included in the Statement of Assets and Liabilities and Statement of Operations. As of period end, the Fund had the following unfunded floating rate loan interests:
| | | | | | | | | | | | | | | | |
| Borrower | | Par | | | Commitment Amount | | | Value | | | Unrealized
(Depreciation) | |
Allied Universal Holdco LLC | | $ | 575,071 | | | $ | 575,071 | | | $ | 573,777 | | | $ | (1,294 | ) |
BCPE Empire Holdings, Inc. | | | 240,222 | | | | 240,222 | | | | 236,018 | | | | (4,204 | ) |
Forward Commitments, When-Issued and Delayed Delivery Securities: The fund may purchase securities on a when-issued basis and may purchase or sell securities on a forward commitment basis. Settlement of such transactions normally occurs within a month or more after the purchase or sale commitment is made. The fund may purchase securities under such conditions with the intention of actually acquiring them, but may enter into a separate agreement to sell the securities before the settlement date. Since the value of securities purchased may fluctuate prior to settlement, the fund may be required to pay more at settlement than the security is worth. In addition, the fund is not entitled to any of the interest earned prior to settlement. When purchasing a security on a delayed delivery basis, the fund assumes the rights and risks of ownership of the security, including the risk of price and yield fluctuations. In the event of default by the counterparty, the fund’s maximum amount of loss is the unrealized appreciation of unsettled when-issued transactions.
| 5. | DERIVATIVE FINANCIAL INSTRUMENTS |
The Fund engages in various portfolio investment strategies using derivative contracts both to increase the returns of the Fund and/or to manage its exposure to certain risks such as credit risk, equity risk, interest rate risk, foreign currency exchange rate risk, commodity price risk or other risks (e.g., inflation risk). Derivative financial instruments categorized by risk exposure are included in the Schedule of Investments. These contracts may be transacted on an exchange or OTC.
Futures Contracts:Futures contracts are purchased or sold to gain exposure to, or manage exposure to, changes in interest rates (interest rate risk), and changes in the value of equity securities (equity risk) or foreign currencies (foreign currency exchange rate risk).
Futures contracts are agreements between the Fund and a counterparty to buy or sell a specific quantity of an underlying instrument at a specified price and on a specified date. Depending on the terms of a contract, it is settled either through physical delivery of the underlying instrument on the settlement date or by payment of a cash amount on the settlement date. Upon entering into a futures contract, the Fund is required to deposit initial margin with the broker in the form of cash or securities in an amount that varies depending on a contract’s size and risk profile. The initial margin deposit must then be maintained at an established level over the life of the contract. Amounts pledged, which are considered restricted, are included in cash pledged for futures contracts in the Statement of Assets and Liabilities.
Securities deposited as initial margin are designated in the Schedule of Investments and cash deposited, if any, are shown as cash pledged for futures contracts in the Statement of Assets and Liabilities. Pursuant to the contract, the Fund agrees to receive from or pay to the broker an amount of cash equal to the daily fluctuation in market value of the contract (“variation margin”). Variation margin is recorded as unrealized appreciation (depreciation) and, if any, shown as variation margin receivable (or payable) on futures contracts in the Statement of Assets and Liabilities. When the contract is closed, a realized gain or loss is recorded in the Statement of Operations equal to the difference between the notional amount of the contract at the time it was opened and the notional amount at the time it was closed. The use of futures contracts involves the risk of an imperfect correlation in the movements in the price of futures contracts and interest, foreign currency exchange rates or underlying assets.
Forward Foreign Currency Exchange Contracts: Forward foreign currency exchange contracts are entered into to gain or reduce exposure to foreign currencies (foreign currency exchange rate risk).
A forward foreign currency exchange contract is an agreement between two parties to buy and sell a currency at a set exchange rate on a specified date. These contracts help to manage the overall exposure to the currencies in which some of the investments held by the Fund are denominated and in some cases, may be used to obtain exposure to a particular market.
The contract ismarked-to-market daily and the change in market value is recorded as unrealized appreciation (depreciation) in the Statement of Assets and Liabilities. When a contract is closed, a realized gain or loss is recorded in the Statement of Operations equal to the difference between the value at the time it was opened and the value at the time it was closed.Non-deliverable forward foreign currency exchange contracts are settled with the counterparty in cash without the delivery of foreign currency. The use of forward foreign currency exchange contracts involves the risk that the value of a forward foreign currency exchange contract changes unfavorably due to movements in the value of the referenced foreign currencies, and such value may exceed the amount reflected in the Statement of Assets and Liabilities. Cash amounts pledged for forward foreign currency exchange contracts are considered restricted and are included in cash pledged as collateral for OTC derivatives in the Statement of Assets and Liabilities.
Options:The Fund purchases and writes call and put options to increase or decrease its exposure to the risks of underlying instruments, including equity risk, interest rate risk and/or commodity price risk and/or, in the case of options written, to generate gains from options premiums.
| | | | |
| NOTESTO FINANCIAL STATEMENTS | | | 39 | |
Notes to Financial Statements (unaudited) (continued)
A call option gives the purchaser (holder) of the option the right (but not the obligation) to buy, and obligates the seller (writer) to sell (when the option is exercised) the underlying instrument at the exercise or strike price at any time or at a specified time during the option period. A put option gives the holder the right to sell and obligates the writer to buy the underlying instrument at the exercise or strike price at any time or at a specified time during the option period.
Premiums paid on options purchased and premiums received on options written, as well as the daily fluctuation in market value, are included in investments at value — unaffiliated and options written at value, respectively, in the Statement of Assets and Liabilities. When an instrument is purchased or sold through the exercise of an option, the premium is offset against the cost or proceeds of the underlying instrument. When an option expires, a realized gain or loss is recorded in the Statement of Operations to the extent of the premiums received or paid. When an option is closed or sold, a gain or loss is recorded in the Statement of Operations to the extent the cost of the closing transaction exceeds the premiums received or paid. When the Fund writes a call option, such option is typically “covered,” meaning that it holds the underlying instrument subject to being called by the option counterparty. When the Fund writes a put option, such option is covered by cash in an amount sufficient to cover the obligation. These amounts, which are considered restricted, are included in cash pledged as collateral for options written in the Statement of Assets and Liabilities.
In purchasing and writing options, the Fund bears the risk of an unfavorable change in the value of the underlying instrument or the risk that it may not be able to enter into a closing transaction due to an illiquid market. Exercise of a written option could result in the Fund purchasing or selling a security when it otherwise would not, or at a price different from the current market value.
Swaps:Swap contracts are entered into to manage exposure to issuers, markets and securities. Such contracts are agreements between the Fund and a counterparty to make periodic net payments on a specified notional amount or a net payment upon termination. Swap agreements are privately negotiated in the OTC market and may be entered into as a bilateral contract (“OTC swaps”) or centrally cleared (“centrally cleared swaps”).
For OTC swaps, any upfront premiums paid and any upfront fees received are shown as swap premiums paid and swap premiums received, respectively, in the Statement of Assets and Liabilities and amortized over the term of the contract. The daily fluctuation in market value is recorded as unrealized appreciation (depreciation) on OTC Swaps in the Statement of Assets and Liabilities. Payments received or paid are recorded in the Statement of Operations as realized gains or losses, respectively. When an OTC swap is terminated, a realized gain or loss is recorded in the Statement of Operations equal to the difference between the proceeds from (or cost of) the closing transaction and the Fund’s basis in the contract, if any. Generally, the basis of the contract is the premium received or paid.
| | • | | Credit default swaps — Credit default swaps are entered into to manage exposure to the market or certain sectors of the market, to reduce risk exposure to defaults of corporate and/or sovereign issuers or to create exposure to corporate and/or sovereign issuers to which a fund is not otherwise exposed (credit risk). |
The Fund may either buy or sell (write) credit default swaps on single-name issuers (corporate or sovereign), a combination or basket of single-name issuers or traded indexes. Credit default swaps are agreements in which the protection buyer pays fixed periodic payments to the seller in consideration for a promise from the protection seller to make a specific payment should a negative credit event take place with respect to the referenced entity (e.g., bankruptcy, failure to pay, obligation acceleration, repudiation, moratorium or restructuring). As a buyer, if an underlying credit event occurs, the Fund will either (i) receive from the seller an amount equal to the notional amount of the swap and deliver the referenced security or underlying securities comprising the index, or (ii) receive a net settlement of cash equal to the notional amount of the swap less the recovery value of the security or underlying securities comprising the index. As a seller (writer), if an underlying credit event occurs, the Fund will either pay the buyer an amount equal to the notional amount of the swap and take delivery of the referenced security or underlying securities comprising the index or pay a net settlement of cash equal to the notional amount of the swap less the recovery value of the security or underlying securities comprising the index.
| | • | | Total return swaps — Total return swaps are entered into to obtain exposure to a security or market without owning such security or investing directly in such market or to exchange the risk/return of one security or market (e.g., fixed-income) with another security or market (e.g., equity or commodity prices) (equity risk, commodity price risk and/or interest rate risk). |
Total return swaps are agreements in which there is an exchange of cash flows whereby one party commits to make payments based on the total return (distributions plus capital gains/losses) of an underlying instrument, or basket of underlying instruments, in exchange for fixed or floating rate interest payments. If the total return of the instrument(s) or index underlying the transaction exceeds or falls short of the offsetting fixed or floating interest rate obligation, the Fund receives payment from or makes a payment to the counterparty.
Master Netting Arrangements: In order to define its contractual rights and to secure rights that will help it mitigate its counterparty risk, the Fund may enter into an International Swaps and Derivatives Association, Inc. Master Agreement (“ISDA Master Agreement”) or similar agreement with its counterparties. An ISDA Master Agreement is a bilateral agreement between the Fund and a counterparty that governs certain OTC derivatives and typically contains, among other things, collateral posting terms and netting provisions in the event of a default and/or termination event. Under an ISDA Master Agreement, the Fund may, under certain circumstances, offset with the counterparty certain derivative financial instruments’ payables and/or receivables with collateral held and/or posted and create one single net payment. The provisions of the ISDA Master Agreement typically permit a single net payment in the event of default including the bankruptcy or insolvency of the counterparty. When the Fund enters into an ISDA Master Agreement and an MRA and/or MSLA with the same counterparty, the agreements may contain aset-off provision allowing the Fund to offset a net amount payable with amounts due to the Fund upon default of the counterparty. Bankruptcy or insolvency laws of a particular jurisdiction may restrict or prohibit the right of offset in bankruptcy, insolvency or other events. For example, notwithstanding what contractual rights may be included in an ISDA Master Agreement, such laws may prohibit the Fund from setting off amounts owed to a defaulting counterparty under an ISDA Master Agreement against amounts owed to the Fund by affiliates of the defaulting counterparty. The insolvency regimes of many jurisdictions do, however, generally permitset-off of simultaneous payables and receivables under certain types of financial contracts between the same legal entity upon a default of the entity, regardless of the existence of a contractualset-off right in those contracts. Bankruptcy or insolvency laws of a particular jurisdiction may restrict or prohibit the right of offset in bankruptcy, insolvency or other events.
Collateral Requirements: For derivatives traded under an ISDA Master Agreement, the collateral requirements are typically calculated by netting themark-to-market amount for each transaction under such agreement and comparing that amount to the value of any collateral currently pledged by the Fund and the counterparty.
| | |
| 40 | | 2019 BLACKROCK SEMI-ANNUAL REPORTTO SHAREHOLDERS |
Notes to Financial Statements (unaudited) (continued)
Cash collateral that has been pledged to cover obligations of the Fund and cash collateral received from the counterparty, if any, is reported separately in the Statement of Assets and Liabilities as cash pledged as collateral and cash received as collateral, respectively.Non-cash collateral pledged by the Fund, if any, is noted in the Schedule of Investments. Generally, the amount of collateral due from or to a counterparty is subject to a certain minimum transfer amount threshold before a transfer is required, which is determined at the close of business of the Fund. Any additional required collateral is delivered to/pledged by the Fund on the next business day. Typically, the counterparty is not permitted to sell,re-pledge or use cash andnon-cash collateral it receives. The Fund generally agrees not to usenon-cash collateral that it receives but may, absent default or certain other circumstances defined in the underlying ISDA Master Agreement, be permitted to use cash collateral received. In such cases, interest may be paid pursuant to the collateral arrangement with the counterparty. To the extent amounts due to the Fund from its counterparties are not fully collateralized, it bears the risk of loss from counterpartynon-performance. Likewise, to the extent the Fund has delivered collateral to a counterparty and stands ready to perform under the terms of its agreement with such counterparty, it bears the risk of loss from a counterparty in the amount of the value of the collateral in the event the counterparty fails to return such collateral. Based on the terms of agreements, collateral may not be required for all derivative contracts.
For financial reporting purposes, the Fund does not offset derivative assets and derivative liabilities that are subject to netting arrangements, if any, in the Statement of Assets and Liabilities.
| 6. | INVESTMENT ADVISORY AGREEMENT AND OTHER TRANSACTIONS WITH AFFILIATES |
Investment Advisory:The Fund entered into an Investment Advisory Agreement with the Manager, the Fund’s investment adviser and an indirect, wholly-owned subsidiary of BlackRock, Inc. (“BlackRock”), to provide investment advisory and administrative services. The Manager is responsible for the management of the Fund’s portfolio and provides the personnel, facilities, equipment and certain other services necessary to the operations of the Fund.
For such services, the Fund pays the Manager a monthly fee at an annual rate equal to 0.55% of the average daily value of the Fund’s net assets, plus the proceeds of any debt securities or outstanding borrowings used for leverage. For purposes of calculating this fee, “net assets” means the total assets of the Fund minus the sum of its accrued liabilities.
Distribution Fees: The Fund had entered into a Distribution Agreement with BlackRock Investments, LLC (“BRIL”), an affiliate of the Manager, to provide for distribution of the Fund’s common shares on a reasonable best efforts basis through an equity shelf offering (a “Shelf Offering”) (the “Distribution Agreement”); however, the Fund is no longer actively engaged in a Shelf Offering, has no effective registration statement or current prospectus and the Distribution Agreement has been terminated.
Expense Waivers and Reimbursements:The Manager voluntarily agreed to waive its investment advisory fees by the amount of investment advisory fees the Fund pays to the Manager indirectly through its investment in affiliated money market funds (the “affiliated money market fund waiver”). This amount is included in fees waived and/or reimbursed by the Manager in the Statement of Operations. For the six months ended August 31, 2019, the amounts waived were $623.
The Manager contractually agreed to waive its investment advisory fee with respect to any portion of the Fund’s assets invested in affiliated equity and fixed-income mutual funds and affiliated exchange-traded funds that have a contractual management fee through June 30, 2020. The agreement can be renewed for annual periods thereafter, and may be terminated on 90 days’ notice, each subject to approval by a majority of the Fund’s Independent Directors. For the six months ended August 31, 2019, the Manager waived $174 in investment advisory fees pursuant to these arrangements.
Directors and Officers:Certain directors and/or officers of the Fund are directors and/or officers of BlackRock or its affiliates. The Fund reimburses the Manager for a portion of the compensation paid to the Fund’s Chief Compliance Officer, which is included in Directors and Officer in the Statement of Operations.
Other Transactions: The Fund may purchase securities from, or sell securities to, an affiliated fund provided the affiliation is due solely to having a common investment adviser, common officers, or common directors. For the six months ended August 31, 2019, the purchase and sale transactions and any net realized gains (losses) with an affiliated fund in compliance with Rule17a-7 under the 1940 Act were as follows:
| | | | | | | | | | | | | | |
| Purchases | | | | | Sales | | | | | Net Realized Gain | |
| $ | 1,559,119 | | | | | $ | — | | | | | $ | — | |
For the six months ended August 31, 2019, purchases and sales of investments including paydowns and excluding short-term securities were $294,639,747 and $362,251,993, respectively.
It is the Fund’s policy to comply with the requirements of the Internal Revenue Code of 1986, as amended, applicable to regulated investment companies, and to distribute substantially all of its taxable income to its shareholders. Therefore, no U.S. federal income tax provision is required.
The Fund files U.S. federal and various state and local tax returns. No income tax returns are currently under examination. The statute of limitations on the Fund’s U.S. federal tax returns generally remains open for each of the four years ended February 28, 2019. The statutes of limitations on the Fund’s state and local tax returns may remain open for an additional year depending upon the jurisdiction.
Management has analyzed tax laws and regulations and their application to the Fund as of August 31, 2019, inclusive of the open tax return years, and does not believe that there are any uncertain tax positions that require recognition of a tax liability in the Fund’s financial statements.
| | | | |
| NOTESTO FINANCIAL STATEMENTS | | | 41 | |
Notes to Financial Statements (unaudited) (continued)
As of February 28, 2019, the Fund hadnon-expiring capital loss carryforwards available to offset future realized capital gains of $60,338,372.
As of August 31, 2019, gross unrealized appreciation and depreciation for investments and derivatives based on cost for U.S. federal income tax purposes were as follows:
| | | | |
Tax cost | | $ | 900,066,402 | |
| | | | |
Gross unrealized appreciation | | | 9,344,459 | |
Gross unrealized depreciation | | | (33,832,317 | ) |
| | | | |
Net unrealized depreciation | | $ | (24,487,858 | ) |
| | | | |
The Fund is party to a senior committed secured,360-day rolling line of credit facility and a separate security agreement (the “SSB Agreement”) with State Street Bank and Trust Company (“SSB”). SSB may elect to terminate its commitment upon360-days written notice to the Fund. As of period end, the Fund has not received any notice to terminate. The Fund has granted a security interest in substantially all of its assets to SSB.
The SSB Agreement allows for the maximum commitment amount of $340,000,000.
Advances will be made by SSB to the Fund, at the Fund’s option of (a) the higher of (i) 0.80% above the Fed Funds rate and (ii) 0.80% above Overnight LIBOR or (b) 0.80% above7-day,30-day,60-day or90-day LIBOR. Overnight LIBOR and LIBOR rates are subject to a 0% floor.
In addition, the Fund paid a commitment fee (based on the daily unused portion of the commitments). The fees associated with each of the agreements are included in the Statement of Operations as borrowing costs, if any. Advances to the Fund as of period end, if any, are shown in the Statement of Assets and Liabilities as bank borrowings payable. Based on the short-term nature of the borrowings under the line of credit and the variable interest rate, the carrying amount of the borrowings approximates fair value.
The Fund may not declare dividends or make other distributions on shares or purchase any such shares if, at the time of the declaration, distribution or purchase, asset coverage with respect to the outstanding short-term borrowings is less than 300%.
For the six months ended August 31, 2019, the average amount of bank borrowings and the daily weighted average interest rates for the Fund for loans under the revolving credit agreement were $273,016,304 and 3.27%, respectively.
In the normal course of business, the Fund invests in securities or other instruments and may enter into certain transactions, and such activities subject the Fund to various risks, including among others, fluctuations in the market (market risk) or failure of an issuer to meet all of its obligations. The value of securities or other instruments may also be affected by various factors, including, without limitation: (i) the general economy; (ii) the overall market as well as local, regional or global political and/or social instability; (iii) regulation, taxation or international tax treaties between various countries; or (iv) currency, interest rate and price fluctuations.
The Fund may be exposed to prepayment risk, which is the risk that borrowers may exercise their option to prepay principal earlier than scheduled during periods of declining interest rates, which would force the Fund to reinvest in lower yielding securities. The Fund may also be exposed to reinvestment risk, which is the risk that income from the Fund’s portfolio will decline if the Fund invests the proceeds from matured, traded or called fixed-income securities at market interest rates that are below the Fund portfolio’s current earnings rate.
Illiquidity Risk:The Fund may invest without limitation in illiquid or less liquid investments or investments in which no secondary market is readily available or which are otherwise illiquid, including private placement securities. The Fund may not be able to readily dispose of such investments at prices that approximate those at which the Fund could sell such investments if they were more widely traded and, as a result of such illiquidity, the Fund may have to sell other investments or engage in borrowing transactions if necessary to raise funds to meet its obligations. Limited liquidity can also affect the market price of investments, thereby adversely affecting the Fund’s net asset value and ability to make dividend distributions. Privately issued debt securities are often of below investment grade quality, frequently are unrated and present many of the same risks as investing in below investment grade public debt securities.
Valuation Risk: The market values of equities, such as common stocks and preferred securities or equity related investments, such as futures and options, may decline due to general market conditions which are not specifically related to a particular company. They may also decline due to factors which affect a particular industry or industries. The Fund may invest in illiquid investments. An illiquid investment is any investment that the Fund reasonably expects cannot be sold or disposed of in current market conditions in seven calendar days or less without the sale or disposition significantly changing the market value of the investment. The Fund may experience difficulty in selling illiquid investments in a timely manner at the price that it believes the investments are worth. Prices may fluctuate widely over short or extended periods in response to company, market or economic news. Markets also tend to move in cycles, with periods of rising and falling prices. This volatility may cause the Fund’s NAV to experience significant increases or decreases over short periods of time. If there is a general decline in the securities and other markets, the NAV of the Fund may lose value, regardless of the individual results of the securities and other instruments in which the Fund invests.
The price the Fund could receive upon the sale of any particular portfolio investment may differ from the Fund’s valuation of the investment, particularly for securities that trade in thin or volatile markets or that are valued using a fair valuation technique or a price provided by an independent pricing service. Changes to significant unobservable inputs and assumptions (i.e., publicly traded company multiples, growth rate, time to exit) due to the lack of observable inputs may significantly impact the resulting fair value and therefore the Fund’s results of operations. As a result, the price received upon the sale of an investment may be less than the value ascribed by the
| | |
| 42 | | 2019 BLACKROCK SEMI-ANNUAL REPORTTO SHAREHOLDERS |
Notes to Financial Statements (unaudited) (continued)
Fund, and the Fund could realize a greater than expected loss or lesser than expected gain upon the sale of the investment. The Fund’s ability to value its investments may also be impacted by technological issues and/or errors by pricing services or other third party service providers.
Counterparty Credit Risk:The Fund may be exposed to counterparty credit risk, or the risk that an entity may fail to or be unable to perform on its commitments related to unsettled or open transactions. The Fund manages counterparty credit risk by entering into transactions only with counterparties that the Manager believes have the financial resources to honor their obligations and by monitoring the financial stability of those counterparties. Financial assets, which potentially expose the Fund to market, issuer and counterparty credit risks, consist principally of financial instruments and receivables due from counterparties. The extent of the Fund’s exposure to market, issuer and counterparty credit risks with respect to these financial assets is approximately their value recorded in the Statement of Assets and Liabilities, less any collateral held by the Fund.
A derivative contract may suffer amark-to-market loss if the value of the contract decreases due to an unfavorable change in the market rates or values of the underlying instrument. Losses can also occur if the counterparty does not perform under the contract.
The Fund’s risk of loss from counterparty credit risk on OTC derivatives is generally limited to the aggregate unrealized gain less the value of any collateral held by the Fund.
For OTC options purchased, the Fund bears the risk of loss in the amount of the premiums paid plus the positive change in market values net of any collateral held by the Fund should the counterparty fail to perform under the contracts. Options written by the Fund do not typically give rise to counterparty credit risk, as options written generally obligate the Fund, and not the counterparty, to perform. The Fund may be exposed to counterparty credit risk with respect to options written to the extent the Fund deposits collateral with its counterparty to a written option.
With exchange-traded options purchased and futures and centrally cleared swaps, there is less counterparty credit risk to the Fund since the exchange or clearinghouse, as counterparty to such instruments, guarantees against a possible default. The clearinghouse stands between the buyer and the seller of the contract; therefore, credit risk is limited to failure of the clearinghouse. While offset rights may exist under applicable law, the Fund does not have a contractual right of offset against a clearing broker or clearinghouse in the event of a default (including the bankruptcy or insolvency). Additionally, credit risk exists inexchange-traded futures and centrally cleared swaps with respect to initial and variation margin that is held in a clearing broker’s customer accounts. While clearing brokers are required to segregate customer margin from their own assets, in the event that a clearing broker becomes insolvent or goes into bankruptcy and at that time there is a shortfall in the aggregate amount of margin held by the clearing broker for all its clients, typically the shortfall would be allocated on a pro rata basis across all the clearing broker’s customers, potentially resulting in losses to the Fund.
Concentration Risk:The Fund may invest in securities that are rated below investment grade quality (sometimes called “junk bonds”), which are predominantly speculative, have greater credit risk and generally are less liquid than, and have more volatile prices than, higher quality securities.
The Fund invests a significant portion of its assets in fixed-income securities and/or uses derivatives tied to the fixed-income markets. Changes in market interest rates or economic conditions may affect the value and/or liquidity of such investments. Interest rate risk is the risk that prices of bonds and other fixed-income securities will increase as interest rates fall and decrease as interest rates rise. The Funds may be subject to a greater risk of rising interest rates due to the current period of historically low rates.
| 11. | CAPITAL SHARE TRANSACTIONS |
The Fund is authorized to issue 400 million shares, all of which were initially classified as Common Shares. The Board is authorized, however, to reclassify any unissued Common Shares to Preferred Shares without the approval of Common Shareholders.
Open Market Share Repurchase Program: The Fund participates in an open market share repurchase program (the “Repurchase Program”). From December 1, 2017 through November 30, 2018, the Fund was permitted to repurchase up to 5% of its outstanding common shares under the Repurchase Program, based on common shares outstanding as of the close of business on November 30, 2017, subject to certain conditions. From December 1, 2018 through November 30, 2019, the Fund may repurchase up to 5% of its outstanding common shares under the Repurchase Program, based on common shares outstanding as of the close of business on November 30, 2018, subject to certain conditions. There is no assurance that the Fund will purchase shares in any particular amounts.
The total cost of the shares repurchased is reflected in Fund’s Statement of Changes in Net Assets. For the periods shown, shares repurchased and cost, including transaction costs were as follows:
| | | | | | | | |
| | | Shares | | | Amount | |
Six Months Ended August 31, 2019 | | | 404,644 | | | $ | 4,367,298 | |
Year Ended February 28, 2019 | | | 173,552 | | | | 1,913,158 | |
Discount Management Program: The Fund’s three-year discount management program (the “Program”) is expected to end in 2020. Under the Program, the Fund intends to offer to repurchase its common shares based on three3-month measurement periods if the Fund’s common shares trade at an average daily discount to net asset value (“NAV”) of more than 7.5% during a measurement period (the “discount trigger”).
The discount trigger was met for the first measurement period, which began on December 1, 2017 and ended on February 28, 2018. As a result, the Fund conducted a tender offer for 10% of its outstanding shares of common stock. The tender offer expired on April 17, 2018 and the number of shares tendered was 26,225,806 (45% of the Fund’s then outstanding shares). The Fund purchased 5,879,192 common shares (10% of the Fund’s then outstanding shares) on a pro rata basis at a purchase price of $12.4068 per share, for a total amount of $72,941,959.
| | | | |
| NOTESTO FINANCIAL STATEMENTS | | | 43 | |
Notes to Financial Statements (unaudited) (continued)
The discount trigger was met for the second measurement period, which began on December 1, 2018 and ended on February 28, 2019. As a result, the Fund conducted a tender offer for 5% of its outstanding shares of common stock. The tender offer expired on April 15, 2019 and the number of shares tendered was 21,792,955 (41% of the Fund’s then outstanding shares). The Fund purchased 2,636,959 common shares (5% of the Fund’s then outstanding shares) on a pro rata basis at a purchase price of $11.9854 per share, for a total amount of $31,605,008.
The results of the third measurement period, and any action approved by the Board as a result, will be announced promptly after the end of the measurement period. There is no guarantee that shareholders will be able to sell all of the shares that they desire to sell in any particular repurchase that is executed.
Management’s evaluation of the impact of all subsequent events on the Fund’s financial statements was completed through the date the financial statements were issued and the following items were noted:
On September 5, 2019, the Fund announced a continuation of its open market share repurchase program. Commencing on December 1, 2019, the Fund may repurchase through November 30, 2020, up to 5% of its common shares outstanding as of the close of business on November 30, 2019, subject to certain conditions. There is no assurance that the Fund will purchase shares in any particular amounts.
On September 5, 2019, the Board approved a change in the fiscal year end (“FYE”) of DSU, effective as of December 31, 2019, as follows:
| | | | | | | | |
| | | Current FYE | | | Approved FYE | |
DSU | | | February 28 | | | | December 31 | |
The Fund paid a net investment income dividend of $0.0685 per share on September 30, 2019 to Common Shareholders of record on September 16, 2019.
Additionally, DSU declared a net investment income dividend of $0.0711 per share on October 1, 2019, payable to Common Shareholders of record on October 15, 2019.
| | |
| 44 | | 2019 BLACKROCK SEMI-ANNUAL REPORTTO SHAREHOLDERS |
Disclosure of Investment Advisory Agreement
The Board of Directors (the “Board,” the members of which are referred to as “Board Members”) of BlackRock Debt Strategies Fund, Inc. (the “Fund”) met in person on May 1, 2019 (the “May Meeting”) and June5-6, 2019 (the “June Meeting”) to consider the approval of the investment advisory agreement (the “Advisory Agreement” or the “Agreement”) between the Fund and BlackRock Advisors, LLC (the “Manager” or “BlackRock”), the Fund’s investment advisor.
Activities and Composition of the Board
On the date of the June Meeting, the Board consisted of eleven individuals, nine of whom were not “interested persons” of the Fund as defined in the Investment Company Act of 1940, as amended (the “1940 Act”) (the “Independent Board Members”). The Board Members are responsible for the oversight of the operations of the Fund and perform the various duties imposed on the directors of investment companies by the 1940 Act. The Independent Board Members have retained independent legal counsel to assist them in connection with their duties. TheCo-Chairs of the Board are Independent Board Members. The Board has established five standing committees: an Audit Committee, a Governance and Nominating Committee, a Compliance Committee, a Performance Oversight Committee and an Executive Committee, each of which is chaired by an Independent Board Member and composed of Independent Board Members (except for the Executive Committee, which also has one interested Board Member).
The Agreement
Consistent with the requirements of the 1940 Act, the Board considers the continuation of the Agreement on an annual basis. The Board has four quarterly meetings per year, each typically extending for two days, and additionalin-person and telephonic meetings throughout the year, as needed. While the Board also has a fifthone-day meeting to consider specific information surrounding the renewal of the Agreement, the Board’s consideration entails a year-long deliberative process whereby the Board and its committees assess BlackRock’s services to the Fund. In particular, the Board assessed, among other things, the nature, extent and quality of the services provided to the Fund by BlackRock, BlackRock’s personnel and affiliates, including (as applicable): investment management; accounting, administrative and shareholder services; oversight of the Fund’s service providers; risk management and oversight; legal and compliance services; and ability to meet applicable legal and regulatory requirements. Throughout the year, including during the contract renewal process, the Independent Board Members were advised by independent legal counsel, and met with independent legal counsel in various executive sessions outside of the presence of management.
During the year, the Board, acting directly and through its committees, considers information that is relevant to its annual consideration of the renewal of the Agreement, including the services and support provided by BlackRock to the Fund and its shareholders. BlackRock also furnished additional information to the Board in response to specific questions from the Board. This additional information is discussed further below in the section titled “Board Considerations in Approving the Agreement.” Among the matters the Board considered were: (a) investment performance forone-year, three-year, five-year,ten-year, and/or since inception periods, as applicable, against peer funds, applicable benchmarks, and performance metrics, as applicable, as well as senior management’s and portfolio managers’ analyses of the reasons for any over-performance or underperformance relative to its peers, benchmarks, and other performance metrics, as applicable; (b) leverage management, as applicable; (c) fees, including advisory, administration, if applicable, and other amounts paid to BlackRock and its affiliates by the Fund for services; (d) Fund operating expenses and how BlackRock allocates expenses to the Fund; (e) the resources devoted to, risk oversight of, and compliance reports relating to, implementation of the Fund’s investment objective, policies and restrictions, and meeting regulatory requirements; (f) BlackRock and the Fund’s adherence to applicable compliance policies and procedures; (g) the nature, character and scope ofnon-investment management services provided by BlackRock and its affiliates and the estimated cost of such services; (h) BlackRock’s and other service providers’ internal controls and risk and compliance oversight mechanisms; (i) BlackRock’s implementation of the proxy voting policies approved by the Board; (j) execution quality of portfolio transactions; (k) BlackRock’s implementation of the Fund’s valuation and liquidity procedures; (l) an analysis of management fees for products with similar investment mandates across theopen-end fund,closed-end fund,sub-advised mutual fund, collective investment trust, and institutional separate account product channels, as applicable, and the similarities and differences between these products and the services provided as compared to the Fund; (m) BlackRock’s compensation methodology for its investment professionals and the incentives and accountability it creates, along with investment professionals’ investments in the fund(s) they manage; (n) periodic updates on BlackRock’s business; and (o) the Fund’s market discount/premium compared to peer funds.
Board Considerations in Approving the Agreement
The Approval Process: Prior to the May Meeting, the Board requested and received materials specifically relating to the Agreement. The Independent Board Members are continuously engaged in a process with their independent legal counsel and BlackRock to review the nature and scope of the information provided to better assist its deliberations. The materials provided in connection with the May Meeting included, among other things: (a) information independently compiled and prepared by Broadridge Financial Solutions, Inc. (“Broadridge”), based on Lipper classifications, regarding the Fund’s fees and expenses as compared with a peer group of funds as determined by Broadridge (“Expense Peers”), the investment performance of the Fund as compared with a peer group of funds (“Performance Peers”) and other metrics, as applicable; (b) information on the composition of the Expense Peers and Performance Peers, and a description of Broadridge’s methodology; (c) information on the estimated profits realized by BlackRock and its affiliates pursuant to the Agreement and a discussion offall-out benefits to BlackRock and its affiliates; (d) a general analysis provided by BlackRock concerning investment management fees received in connection with other types of investment products, such as institutional accounts,sub-advised mutual funds,closed-end funds, andopen-end funds, under similar investment mandates, as applicable; (e) review ofnon-management fees; (f) the existence, impact and sharing of potential economies of scale, if any, with the Fund; (g) a summary of aggregate amounts paid by the Fund to BlackRock; and (h) various additional information requested by the Board as appropriate regarding BlackRock’s and the Fund’s operations.
At the May Meeting, the Board reviewed materials relating to its consideration of the Agreement. As a result of the discussions that occurred during the May Meeting, and as a culmination of the Board’s year-long deliberative process, the Board presented BlackRock with questions and requests for additional information. BlackRock responded to these requests with additional written information in advance of the June Meeting. Topics covered included: (a) the methodology for measuring estimated fund profitability; (b) fund expenses and potential fee waivers; (c) differences in services provided and management fees betweenclosed-end funds and other product channels; and (d) BlackRock’s option overwrite strategy.
| | | | |
| DISCLOSUREOF INVESTMENT ADVISORY AGREEMENT | | | 45 | |
Disclosure of Investment Advisory Agreement (continued)
At the June Meeting, the Board concluded its assessment of, among other things: (a) the nature, extent and quality of the services provided by BlackRock; (b) the investment performance of the Fund as compared with Performance Peers and other metrics, as applicable; (c) the advisory fee and the estimated cost of the services and estimated profits realized by BlackRock and its affiliates from their relationship with the Fund; (d) the Fund’s fees and expenses compared to Expense Peers; (e) the sharing of potential economies of scale;(f) fall-out benefits to BlackRock and its affiliates as a result of BlackRock’s relationship with the Fund; and (g) other factors deemed relevant by the Board Members.
The Board also considered other matters it deemed important to the approval process, such as other payments made to BlackRock or its affiliates relating to securities lending and cash management, and BlackRock’s services related to the valuation and pricing of Fund portfolio holdings. The Board noted the willingness of BlackRock personnel to engage in open, candid discussions with the Board. The Board did not identify any particular information as determinative, and each Board Member may have attributed different weights to the various items considered.
A. Nature, Extent and Quality of the Services Provided by BlackRock: The Board, including the Independent Board Members, reviewed the nature, extent and quality of services provided by BlackRock, including the investment advisory services and the resulting performance of the Fund. Throughout the year, the Board compared Fund performance to the performance of a comparable group ofclosed-end funds, relevant benchmarks, and performance metrics, as applicable. The Board met with BlackRock’s senior management personnel responsible for investment activities, including the senior investment officers. The Board also reviewed the materials provided by the Fund’s portfolio management team discussing the Fund’s performance and the Fund’s investment objective, strategies and outlook.
The Board considered, among other factors, with respect to BlackRock: the number, education and experience of investment personnel generally and the Fund’s portfolio management team; BlackRock’s research capabilities; investments by portfolio managers in the funds they manage; portfolio trading capabilities; use of technology; commitment to compliance; credit analysis capabilities; risk analysis and oversight capabilities; and the approach to training and retaining portfolio managers and other research, advisory and management personnel. The Board also considered BlackRock’s overall risk management program, including the continued efforts of BlackRock and its affiliates to address cybersecurity risks and the role of BlackRock’s Risk & Quantitative Analysis Group. The Board engaged in a review of BlackRock’s compensation structure with respect to the Fund’s portfolio management team and BlackRock’s ability to attract and retain high-quality talent and create performance incentives.
In addition to investment advisory services, the Board considered the nature and quality of the administrative and othernon-investment advisory services provided to the Fund. BlackRock and its affiliates provide the Fund with certain administrative, shareholder and other services (in addition to any such services provided to the Fund by third parties) and officers and other personnel as are necessary for the operations of the Fund. In particular, BlackRock and its affiliates provide the Fund with administrative services including, among others: (i) responsibility for disclosure documents, such as the prospectus and the statement of additional information in connection with the initial public offering and periodic shareholder reports; (ii) preparing communications with analysts to support secondary market trading of the Fund; (iii) oversight of daily accounting and pricing; (iv) responsibility for periodic filings with regulators and stock exchanges; (v) overseeing and coordinating the activities of other service providers including, among others, the Fund’s custodian, fund accountant, transfer agent, and auditor; (vi) organizing Board meetings and preparing the materials for such Board meetings; (vii) providing legal and compliance support; (viii) furnishing analytical and other support to assist the Board in its consideration of strategic issues such as the merger, consolidation or repurposing of certainclosed-end funds; and (ix) performing or managing administrative functions necessary for the operation of the Fund, such as tax reporting, expense management, fulfilling regulatory filing requirements, and shareholder call center and other services. The Board reviewed the structure and duties of BlackRock’s fund administration, shareholder services, and legal & compliance departments and considered BlackRock’s policies and procedures for assuring compliance with applicable laws and regulations.
B. The Investment Performance of the Fund and BlackRock: The Board, including the Independent Board Members, also reviewed and considered the performance history of the Fund. In preparation for the May Meeting, the Board was provided with reports independently prepared by Broadridge, which included a comprehensive analysis of the Fund’s performance as of December 31, 2018. The performance information is based on net asset value (NAV), and utilizes Lipper data. Lipper’s methodology calculates a fund’s total return assuming distributions are reinvested on theex-date at a fund’sex-date NAV. Broadridge ranks funds in quartiles, ranging from first to fourth, where first is the most desirable quartile position and fourth is the least desirable. In connection with its review, the Board received and reviewed information regarding the investment performance of the Fund as compared to its Performance Peers and a custom peer group of funds as defined by BlackRock (“Customized Peer Group”). The Board and its Performance Oversight Committee regularly review, and meet with Fund management to discuss, the performance of the Fund throughout the year.
In evaluating performance, the Board focused particular attention on funds with less favorable performance records. The Board also noted that while it found the data provided by Broadridge generally useful, it recognized the limitations of such data, including in particular, that notable differences may exist between a fund and the Performance Peer funds (for example, the investment objective(s) and investment strategies). Further, the Board recognized that the performance data reflects a snapshot of a period as of a particular date and that selecting a different performance period could produce significantly different results. The Board also acknowledged that long-term performance could be impacted by even one period of significant outperformance or underperformance, and that a single investment theme could have the ability to affect long-term performance disproportionately.
The Board noted that for each of theone-, three- and five-year periods reported, the Fund ranked in the third, third, and second quartiles, respectively, against its Customized Peer Group. The Board noted that BlackRock believes that the Customized Peer Group is an appropriate performance metric for the Fund, and that BlackRock has explained its rationale for this belief to the Board. The Board and BlackRock reviewed the Fund’s underperformance during the applicable periods.
C. Consideration of the Advisory/Management Fees and the Estimated Cost of the Services and Estimated Profits Realized by BlackRock and its Affiliates from their Relationship with the Fund: The Board, including the Independent Board Members, reviewed the Fund’s contractual management fee rate compared with those of its Expense Peers. The contractual management fee rate represents a combination of the advisory fee and any administrative fees, before taking into account any reimbursements or fee waivers. The Board also compared the Fund’s total expense ratio, as well as its actual management fee rate as a percentage of total assets, to those of its Expense Peers. The total expense ratio represents a fund’s total net operating expenses, excluding any investment related expenses. The total expense ratio gives effect to any expense reimbursements or fee waivers that benefit a fund, and the actual management fee rate gives effect to any management fee reimbursements or waivers that benefit a fund. The Board considered the services provided and the fees charged by BlackRock and its affiliates to other types of clients with similar investment mandates, as applicable, including institutional accounts andsub-advised mutual funds (including mutual funds sponsored by third parties).
| | |
| 46 | | 2019 BLACKROCK SEMI-ANNUAL REPORTTO SHAREHOLDERS |
Disclosure of Investment Advisory Agreement (continued)
The Board received and reviewed statements relating to BlackRock’s financial condition. The Board reviewed BlackRock’s profitability methodology and was also provided with an estimated profitability analysis that detailed the revenues earned and the expenses incurred by BlackRock for services provided to the Fund. The Board reviewed BlackRock’s estimated profitability with respect to the Fund and other funds the Board currently oversees for the year ended December 31, 2018 compared to available aggregate estimated profitability data provided for the prior two years. The Board reviewed BlackRock’s estimated profitability with respect to certain other U.S. fund complexes managed by the Manager and/or its affiliates. The Board reviewed BlackRock’s assumptions and methodology of allocating expenses in the estimated profitability analysis, noting the inherent limitations in allocating costs among various advisory products. The Board recognized that profitability may be affected by numerous factors including, among other things, fee waivers and expense reimbursements by the Manager, the types of funds managed, precision of expense allocations and business mix. The Board thus recognized that calculating and comparing profitability at individual fund levels is difficult.
The Board noted that, in general, individual fund or product line profitability of other advisors is not publicly available. The Board reviewed BlackRock’s overall operating margin, in general, compared to that of certain other publicly-traded asset management firms. The Board considered the differences between BlackRock and these other firms, including the contribution of technology at BlackRock, BlackRock’s expense management, and the relative product mix.
In addition, the Board considered the estimated cost of the services provided to the Fund by BlackRock, and BlackRock’s and its affiliates’ estimated profits relating to the management of the Fund and the other funds advised by BlackRock and its affiliates. As part of its analysis, the Board reviewed BlackRock’s methodology in allocating its costs of managing the Fund, to the Fund. The Board considered whether BlackRock has the financial resources necessary to attract and retain high quality investment management personnel to perform its obligations under the Agreement and to continue to provide the high quality of services that is expected by the Board. The Board further considered factors including but not limited to BlackRock’s commitment of time, assumption of risk, and liability profile in servicing the Fund, including in contrast to what is required of BlackRock with respect to other products with similar investment mandates across theopen-end fund,closed-end fund,sub-advised mutual fund, collective investment trust, and institutional separate account product channels, as applicable.
The Board noted that the Fund’s contractual management fee rate ranked in the first quartile, and that the actual management fee rate and total expense ratio each ranked in first quartile, relative to the Expense Peers.
D. Economies of Scale: The Board, including the Independent Board Members, considered the extent to which economies of scale might be realized as the assets of the Fund increase. The Board also considered the extent to which the Fund benefits from such economies in a variety of ways, and whether there should be changes in the advisory fee rate or breakpoint structure in order to enable the Fund to more fully participate in these economies of scale. The Board considered the Fund’s asset levels and whether the current fee was appropriate.
Based on the Board’s review and consideration of the issue, the Board concluded that mostclosed-end funds do not have fund level breakpoints becauseclosed-end funds generally do not experience substantial growth after the initial public offering. They are typically priced at scale at a fund’s inception.
E. Other Factors Deemed Relevant by the Board Members: The Board, including the Independent Board Members, also took into account other ancillary or“fall-out” benefits that BlackRock or its affiliates may derive from BlackRock’s respective relationships with the Fund, both tangible and intangible, such as BlackRock’s ability to leverage its investment professionals who manage other portfolios and risk management personnel, an increase in BlackRock’s profile in the investment advisory community, and the engagement of BlackRock’s affiliates as service providers to the Fund, including for administrative, securities lending and cash management services. The Board also considered BlackRock’s overall operations and its efforts to expand the scale of, and improve the quality of, its operations. The Board also noted that, subject to applicable law, BlackRock may use and benefit from third party research obtained by soft dollars generated by certain registered fund transactions to assist in managing all or a number of its other client accounts.
In connection with its consideration of the Agreement, the Board also received information regarding BlackRock’s brokerage and soft dollar practices. The Board received reports from BlackRock which included information on brokerage commissions and trade execution practices throughout the year.
The Board noted the competitive nature of theclosed-end fund marketplace, and that shareholders are able to sell their Fund shares in the secondary market if they believe that the Fund’s fees and expenses are too high or if they are dissatisfied with the performance of the Fund.
The Board also considered the various notable initiatives and projects BlackRock performed in connection with itsclosed-end fund product line. These initiatives included developing equity shelf programs; efforts to eliminate product overlap with fund mergers; ongoing services to manage leverage that has become increasingly complex; periodic evaluation of share repurchases and other support initiatives for certain BlackRock funds; and continued communications efforts with shareholders, fund analysts and financial advisers. With respect to the latter, the Independent Board Members noted BlackRock’s continued commitment to supporting the secondary market for the common shares of itsclosed-end funds through a comprehensive secondary market communication program designed to raise investor and analyst awareness and understanding ofclosed-end funds. BlackRock’s support services included, among other things: sponsoring and participating in conferences; communicating withclosed-end fund analysts covering the BlackRock funds throughout the year; providing marketing and product updates for theclosed-end funds; and maintaining and enhancing itsclosed-end fund website.
Conclusion
The Board, including the Independent Board Members, approved the continuation of the Advisory Agreement between the Manager and the Fund for aone-year term ending June 30, 2020. Based upon its evaluation of all of the aforementioned factors in their totality, as well as other information, the Board, including the Independent Board Members, was satisfied that the terms of the Agreement were fair and reasonable and in the best interest of the Fund and its shareholders. In arriving at its decision to approve the Agreement, the Board did not identify any single factor or group of factors asall-important or controlling, but considered all factors together, and different Board Members may have attributed different weights to the various factors considered. The Independent Board Members were also assisted by the advice of independent legal counsel in making this determination.
| | | | |
| DISCLOSUREOF INVESTMENT ADVISORY AGREEMENT | | | 47 | |
Director and Officer Information
Richard E. Cavanagh, Co-Chair of the Board and Director
Karen P. Robards, Co-Chair of the Board and Director
Michael J. Castellano, Director
Cynthia L. Egan, Director
Frank J. Fabozzi, Director
Henry Gabbay, Director
R. Glenn Hubbard, Director
W. Carl Kester, Director
Catherine A. Lynch, Director
Robert Fairbairn, Director
John M. Perlowski, Director, President and Chief Executive Officer
Jonathan Diorio, Vice President
Neal J. Andrews, Chief Financial Officer
Jay M. Fife, Treasurer
Charles Park, Chief Compliance Officer
Janey Ahn, Secretary
Investment Adviser
BlackRock Advisors, LLC
Wilmington, DE 19809
Transfer Agent
Computershare Trust Company, N.A.
Canton, MA 02021
Accounting Agent and Custodian
State Street Bank and Trust Company
Boston, MA 02111
Independent Registered Public Accounting Firm
Deloitte & Touche LLP
Boston, MA 02116
Legal Counsel
Willkie Farr & Gallagher LLP
New York, NY 10019
Address of the Fund
100 Bellevue Parkway
Wilmington, DE 19809
| | |
| 48 | | 2019 BLACKROCK SEMI-ANNUAL REPORTTO SHAREHOLDERS |
Additional Information
Proxy Results
The Annual Meeting of Shareholders was held on July 29, 2019 for shareholders of record on May 30, 2019, to elect director nominees for the Fund. There were no broker non-votes with regard to the Fund.
Shareholders elected the Class III Directors as follows:
| | | | | | | | | | | | | | | | | | | | | | | | | | | | | | | | |
| | | Richard E. Cavanagh | | | Frank J. Fabozzi | | | Robert Fairbairn | | | Henry Gabbay | |
| | | Votes For | | | Votes Withheld | | | Votes For | | | Votes Withheld | | | Votes For | | | Votes Withheld | | | Votes For | | | Votes Withheld | |
DSU | | | 26,394,703 | | | | 19,440,687 | | | | 26,487,039 | | | | 19,348,351 | | | | 27,013,158 | | | | 18,822,232 | | | | 38,914,732 | | | | 6,920,658 | |
For the Fund listed above, Directors whose term of office continued after the Annual Meeting of Shareholders because they were not up for election are Karen P. Robards, Michael J. Castellano, Cynthia L. Egan, R. Glenn Hubbard, W. Carl Kester, Catherine A. Lynch and John M. Perlowski.
Fund Certification
The Fund is listed for trading on the NYSE and has filed with the NYSE its annual chief executive officer certification regarding compliance with the NYSE’s listing standards. The Fund filed with the SEC the certification of its chief executive officer and chief financial officer required by section 302 of the Sarbanes-Oxley Act.
Dividend Policy
The Fund’s policy is to make monthly distributions to shareholders. In order to provide shareholders with a more stable level of dividend distributions, the Fund employs a managed distribution plan (the “Plan”), the goal of which is to provide shareholders with consistent and predictable cash flows by setting distribution rates based on expected long-term returns of the Fund.
The distributions paid by the Fund for any particular month may be more or less than the amount of net investment income earned by the Fund during such month. Furthermore, the final tax characterization of distributions is determined after the year-end of the Fund and is reported in the Fund’s annual report to shareholders. Distributions can be characterized as ordinary income, capital gains and/or return of capital. The Fund’s taxable net investment income and net realized capital gains (“taxable income”) may not be sufficient to support the level of distributions paid. To the extent that distributions exceed the Fund’s current and accumulated earnings and profits, the excess may be treated as anon-taxable return of capital.
A return of capital is a return of a portion of an investor’s original investment. A return of capital is not expected to be taxable, but it reduces a shareholder’s tax basis in his or her shares, thus reducing any loss or increasing any gain on a subsequent disposition by the shareholder of his or her shares. It is possible that a substantial portion of the distributions paid during a calendar year may ultimately be classified as return of capital for U.S. federal income tax purposes when the final determination of the source and character of the distributions is made.
Such distributions, under certain circumstances, may exceed the Fund’s total return performance. When total distributions exceed total return performance for the period, the difference reduces the Fund’s total assets and net asset value per share (“NAV”) and, therefore, could have the effect of increasing the Fund’s expense ratio and reducing the amount of assets the Fund has available for long term investment.
General Information
During the period there were no material changes in the Fund’s investment objectives or policies or to the Fund’s charter orby-laws that would delay or prevent a change of control of the Fund that were not approved by the shareholders or in the principal risk factors associated with investment in the Fund. There have been no changes in the persons who are primarily responsible for theday-to-day management of the Fund’s portfolio.
In accordance with Section 23(c) of the Investment Company Act of 1940, the Fund may from time to time purchase shares of its common stock in the open market or in private transactions.
Quarterly performance, semi-annual and annual reports, current net asset value and other information regarding the Fund may be found on BlackRock’s website, which can be accessed athttp://www.blackrock.com. Any reference to BlackRock’s website in this report is intended to allow investors public access to information regarding the Fund and does not, and is not intended to, incorporate BlackRock’s website in this report.
Electronic Delivery
Shareholders can sign up for e-mail notifications of quarterly statements, annual and semi-annual shareholder reports by enrolling in the electronic delivery program. Electronic copies of shareholder reports are available on BlackRock’s website.
To enroll in electronic delivery:
Shareholders Who Hold Accounts with Investment Advisers, Banks or Brokerages:
Please contact your financial advisor. Please note that not all investment advisers, banks or brokerages may offer this service.
| | | | |
| ADDITIONAL INFORMATION | | | 49 | |
Additional Information (continued)
Householding
The Fund will mail only one copy of shareholder documents, annual and semi-annual reports and proxy statements, to shareholders with multiple accounts at the same address. This practice is commonly called “householding” and is intended to reduce expenses and eliminate duplicate mailings of shareholder documents. Mailings of your shareholder documents may be householded indefinitely unless you instruct us otherwise. If you do not want the mailing of these documents to be combined with those for other members of your household, please call the Fund at(800) 882-0052.
Availability of Quarterly Schedule of Investments
The Fund files its complete schedule of portfolio holdings with the SEC for the first and third quarters of each fiscal year as an exhibit to its reports on Form N-PORT, and for reporting periods ended prior to March 31, 2019, filed such information on Form N-Q. The Fund’s Forms N-PORT andN-Q are available on the SEC’s website at http://www.sec.gov. The Fund’s Forms N-PORT and N-Q may also be obtained upon request and without charge by calling (800) 882-0052.
Availability of Proxy Voting Policies and Procedures
A description of the policies and procedures that the Fund uses to determine how to vote proxies relating to portfolio securities is available upon request and without charge (1) by calling (800) 882-0052; (2) athttp://www.blackrock.com; and (3) on the SEC’s website at http://www.sec.gov.
Availability of Proxy Voting Record
Information about how the Fund voted proxies relating to securities held in the Fund’s portfolio during the most recent 12-month period ended June 30 is available upon request and without charge (1) athttp://www.blackrock.com; or by calling (800) 882-0052 and (2) on the SEC’s website at http://www.sec.gov.
Availability of Fund Updates
BlackRock will update performance and certain other data for the Fund on a monthly basis on its website in the“Closed-end Funds” section ofhttp://www.blackrock.comas well as certain other material information as necessary from time to time. Investors and others are advised to check the website for updated performance information and the release of other material information about the Fund. This reference to BlackRock’s website is intended to allow investors public access to information regarding the Fund and does not, and is not intended to, incorporate BlackRock’s website in this report.
BlackRock Privacy Principles
BlackRock is committed to maintaining the privacy of its current and former fund investors and individual clients (collectively, “Clients”) and to safeguarding theirnon-public personal information. The following information is provided to help you understand what personal information BlackRock collects, how we protect that information and why in certain cases we share such information with select parties.
If you are located in a jurisdiction where specific laws, rules or regulations require BlackRock to provide you with additional or different privacy-related rights beyond what is set forth below, then BlackRock will comply with those specific laws, rules or regulations.
BlackRock obtains or verifies personalnon-public information from and about you from different sources, including the following: (i) information we receive from you or, if applicable, your financial intermediary, on applications, forms or other documents; (ii) information about your transactions with us, our affiliates, or others; (iii) information we receive from a consumer reporting agency; and (iv) from visits to our websites.
BlackRock does not sell or disclose tonon-affiliated third parties anynon-public personal information about its Clients, except as permitted by law or as is necessary to respond to regulatory requests or to service Client accounts. Thesenon-affiliated third parties are required to protect the confidentiality and security of this information and to use it only for its intended purpose.
We may share information with our affiliates to service your account or to provide you with information about other BlackRock products or services that may be of interest to you. In addition, BlackRock restricts access to non-public personal information about its Clients to those BlackRock employees with a legitimate business need for the information. BlackRock maintains physical, electronic and procedural safeguards that are designed to protect thenon-public personal information of its Clients, including procedures relating to the proper storage and disposal of such information.
| | |
| 50 | | 2019 BLACKROCK SEMI-ANNUAL REPORTTO SHAREHOLDERS |
Glossary of Terms Used in this Report
| | |
| Currency |
| |
| EUR | | Euro |
| |
| GBP | | British Pound |
| |
| USD | | U.S. Dollar |
| | |
| Portfolio Abbreviations |
| |
| CLO | | Collateralized Loan Obligation |
| |
| EURIBOR | | Euro Interbank Offered Rate |
| |
| LIBOR | | London Interbank Offered Rate |
| |
| PIK | | Payment-In-Kind |
| |
| S&P | | Standard & Poor’s |
| | | | |
| GLOSSARYOF TERMS USEDINTHIS REPORT | | | 51 | |
This report is intended for current holders. It is not a prospectus. Past performance results shown in this report should not be considered a representation of future performance. The Fund has leveraged its Common Shares, which creates risks for Common Shareholders, including the likelihood of greater volatility of net asset value and market price of the Common Shares, and the risk that fluctuations in short-term interest rates may reduce the Common Shares’ yield. Statements and other information herein are as dated and are subject to change.

| | |
| CEFDSU-8/19-SAR | |  |
| | | | |
| Item 2 | | – | | Code of Ethics – Not Applicable to this semi-annual report |
| | |
| Item 3 | | – | | Audit Committee Financial Expert – Not Applicable to this semi-annual report |
| | |
| Item 4 | | – | | Principal Accountant Fees and Services – Not Applicable to this semi-annual report |
| | |
| Item 5 | | – | | Audit Committee of Listed Registrants – Not Applicable to this semi-annual report |
| | |
| Item 6 | | – | | Investments |
| | |
| | | | (a) The registrant’s Schedule of Investments is included as part of the Report to Stockholders filed under Item 1 of this Form. |
| | |
| | | | (b) Not Applicable due to no such divestments during the semi-annual period covered since the previous Form N-CSR filing. |
| | |
| Item 7 | | – | | Disclosure of Proxy Voting Policies and Procedures for Closed-End Management Investment Companies – Not Applicable to this semi-annual report |
| | |
| Item 8 | | – | | Portfolio Managers of Closed-End Management Investment Companies |
| | |
| | | | (a) Not Applicable to this semi-annual report |
| | |
| | | | (b) As of the date of this filing, there have been no changes in any of the portfolio managers identified in the most recent annual report on Form N-CSR. |
| | |
| | |
| Item 9 | | – | | Purchases of Equity Securities by Closed-End Management Investment Company and Affiliated Purchasers |
| | | | | | | | | | |
| | | Period | | (a) Total
Number of
Shares
Purchased | | (b) Average
Price Paid per
Share | | (c) Total Number of
Shares Purchased as Part
of Publicly Announced
Plans or Programs | | (d) Maximum Number of
Shares that May Yet Be
Purchased Under the Plans
or Programs3 |
| | | March 1-31, 2019 | | 01 | | $01 | | 01 | | 2,636,959 |
| | April1-30, 2019 | | 2,636,9592 | | $11.98542 | | 2,636,9592 | | 2,636,959 |
| | May1-31, 2019 | | 153,0321 | | $10.73921 | | 153,03211 | | 2,483,927 |
| | June1-30, 2019 | | 110,8451 | | $10.74351 | | 110,8451 | | 2,373,082 |
| | July1-31, 2019 | | 140,7671 | | $10.86151 | | 140,7671 | | 2,232,315 |
| | August 1-31, 2019 | | 01 | | $01 | | 01 | | 2,232,315 |
| | Total: | | 3,041,603 | | $11.0824 | | 3,041,603 | | 2,232,315 |
| | |
| | 1On September 7, 2018, the Fund announced a continuation of its open market share repurchase program. Commencing on December 1, 2018, the Fund may repurchase through November 30, 2019, up to 5% of its common shares outstanding as of the close of business on November 30, 2018, subject to certain conditions. On September 5, 2019, the Fund announced a further continuation of its open market share repurchase program. Commencing on December 1, 2019, the Fund may repurchase through November 30, 2020, up to 5% of its common shares outstanding as of the close of business on November 30, 2019, subject to certain conditions. 2On February 16, 2018, the Fund announced the adoption of a three-year discount management program that is expected to end in 2020. Under the program, the Fund intends to offer to repurchase its common shares based on three3-month measurement periods if the Fund’s common shares trade at an average daily discount to net asset value (“NAV”) of more than 7.5% during a measurement period. The Board approved the Fund offering to repurchase 5% of its outstanding common shares for the second measurement period, which began on December 1, 2018 and ended on February 28, 2019, as the discount trigger was met. This |
2
| | | | |
| | | | repurchase was conducted via a tender offer that commenced on March 15, 2019 and expired on April 15, 2019. There were no shares purchased under the open market repurchase program during that time. 3Represents shares that may yet be purchased under the Fund’s open market share repurchase program. |
| | |
| Item 10 | | – | | Submission of Matters to a Vote of Security Holders – There have been no material changes to these procedures. |
| | |
| Item 11 | | – | | Controls and Procedures |
| | |
| | | | (a) – The registrant’s principal executive and principal financial officers, or persons performing similar functions, have concluded that the registrant’s disclosure controls and procedures (as defined in Rule 30a-3(c) under the Investment Company Act of 1940, as amended (the “1940 Act”)) are effective as of a date within 90 days of the filing of this report based on the evaluation of these controls and procedures required by Rule 30a-3(b) under the 1940 Act and Rule 13a-15(b) under the Securities Exchange Act of 1934, as amended. |
| | |
| | | | (b) – There were no changes in the registrant’s internal control over financial reporting (as defined in Rule 30a-3(d) under the 1940 Act) that occurred during the period covered by this report that have materially affected, or are reasonably likely to materially affect, the registrant’s internal control over financial reporting. |
| | |
| Item 12 | | – | | Disclosure of Securities Lending Activities for Closed-End Management Investment Companies – Not Applicable to this semi-annual report |
| | |
| Item 13 | | – | | Exhibits attached hereto |
| | |
| | | | (a)(1) – Code of Ethics – See Item 2 |
| | |
| | | | (a)(2) – Certifications – Attached hereto |
| | |
| | | | (a)(3) – Not Applicable |
| | |
| | | | (a)(4) – Not Applicable |
| | |
| | | | (b) – Certifications – Attached hereto |
3
Pursuant to the requirements of the Securities Exchange Act of 1934 and the Investment Company Act of 1940, the registrant has duly caused this report to be signed on its behalf by the undersigned, thereunto duly authorized.
| | | | |
| | BlackRock Debt Strategies Fund, Inc. |
| | |
| | By: | | /s/ John M. Perlowski |
| | | | John M. Perlowski |
| | | | Chief Executive Officer (principal executive officer) of |
| | | | BlackRock Debt Strategies Fund, Inc. |
Date: November 5, 2019
Pursuant to the requirements of the Securities Exchange Act of 1934 and the Investment Company Act of 1940, this report has been signed below by the following persons on behalf of the registrant and in the capacities and on the dates indicated.
| | | | |
| | By: | | /s/ John M. Perlowski |
| | | | John M. Perlowski |
| | | | Chief Executive Officer (principal executive officer) of |
| | | | BlackRock Debt Strategies Fund, Inc. |
Date: November 5, 2019
| | | | |
| | By: | | /s/ Neal J. Andrews |
| | | | Neal J. Andrews |
| | | | Chief Financial Officer (principal financial officer) of |
| | | | BlackRock Debt Strategies Fund, Inc. |
Date: November 5, 2019
4