UNITED STATES
SECURITIES AND EXCHANGE COMMISSION
Washington, D.C. 20549
FORM N-CSR
CERTIFIED SHAREHOLDER REPORT OF REGISTERED MANAGEMENT INVESTMENT
COMPANIES
Investment Company Act file number: 811-08603
Name of Fund: BlackRock Debt Strategies Fund, Inc. (DSU)
Fund Address: 100 Bellevue Parkway, Wilmington, DE 19809
Name and address of agent for service: John M. Perlowski, Chief Executive Officer, BlackRock Debt Strategies Fund, Inc., 55 East 52nd Street, New York, NY 10055
Registrant’s telephone number, including area code: (800) 882-0052, Option 4
Date of fiscal year end: 12/31/2020
Date of reporting period: 06/30/2020
Item 1 – Report to Stockholders
| | |
 | | JUNE 30, 2020 |
| | |
| |
| | 2020 Semi-Annual Report (Unaudited) |
BlackRock Debt Strategies Fund, Inc. (DSU)
BlackRock Floating Rate Income Strategies Fund, Inc. (FRA)
BlackRock Limited Duration Income Trust (BLW)
Beginning on January 1, 2021, as permitted by regulations adopted by the Securities and Exchange Commission, paper copies of the Fund’s shareholder reports will no longer be sent by mail, unless you specifically request paper copies of the reports from BlackRock or from your financial intermediary, such as a broker-dealer or bank. Instead, the reports will be made available on a website, and you will be notified by mail each time a report is posted and provided with a website link to access the report.
You may elect to receive all future reports in paper free of charge. If you hold accounts directly with BlackRock, you can call (800) 441-7762 to inform BlackRock that you wish to continue receiving paper copies of your shareholder reports. If you hold accounts through a financial intermediary, you can follow the instructions included with this disclosure, if applicable, or contact your financial intermediary to request that you continue to receive paper copies of your shareholder reports. Please note that not all financial intermediaries may offer this service. Your election to receive reports in paper will apply to all funds advised by BlackRock Advisors, LLC, BlackRock Fund Advisors or their affiliates, or all funds held with your financial intermediary, as applicable.
If you already elected to receive shareholder reports electronically, you will not be affected by this change and you need not take any action. You may elect to receive electronic delivery of shareholder reports and other communications by: (i) accessing the BlackRock website at www.blackrock.com/edelivery and logging into your accounts, if you hold accounts directly with BlackRock, or (ii) contacting your financial intermediary, if you hold accounts through a financial intermediary. Please note that not all financial intermediaries may offer this service.
|
| Not FDIC Insured • May Lose Value • No Bank Guarantee |
Supplemental Information
Section 19(a)
BlackRock Debt Strategies Fund, Inc.’s (DSU), BlackRock Floating Rate Income Strategies Fund, Inc.’s (FRA) and BlackRock Limited Duration Income Trust’s (BLW) (each, a “Fund” and collectively, the “Funds”) amounts and sources of distributions reported are estimates and are being provided to you pursuant to regulatory requirements and are not being provided for tax reporting purposes. The actual amounts and sources for tax reporting purposes will depend upon each Fund’s investment experience during the remainder of its fiscal year and may be subject to changes based on tax regulations. Each Fund will provide a Form 1099-DIV each calendar year that will tell you how to report these distributions for U.S. federal income tax purposes.
June 30, 2020
| | | | | | | | | | | | | | | | | | | | | | | | | | | | | | | | | | | | | | | | |
| | | Total Fiscal Year to Date
Cumulative Distributions by Character | | | Percentage of Fiscal Year to Date
Cumulative Distributions by Character | |
| Ticker | | Net
Investment
Income | | | Net Realized
Capital Gains
Short Term | | | Net Realized
Capital Gains
Long Term | | | Return of
Capital (a) | | | Total Per
Common
Share | | | Net
Investment
Income | | | Net Realized
Capital Gains
Short Term | | | Net Realized Capital Gains
Long Term | | | Return of
Capital | | | Total Per
Common
Share | |
DSU | | $ | 0.325001 | | | $ | — | | | $ | — | | | $ | 0.030499 | | | $ | 0.355500 | | | | 91 | % | | | — | % | | | — | % | | | 9 | % | | | 100 | % |
FRA | | | 0.331737 | | | | — | | | | — | | | | 0.062263 | | | | 0.394000 | | | | 84 | | | | — | | | | — | | | | 16 | | | | 100 | |
BLW | | | 0.458511 | | | | — | | | | — | | | | 0.031989 | | | | 0.490500 | | | | 93 | | | | — | | | | — | | | | 7 | | | | 100 | |
| | (a) | Each Fund estimates that it has distributed more than its net investment income and net realized capital gains; therefore, a portion of the distribution may be a return of capital. A return of capital may occur, for example, when some or all of the shareholder’s investment in a Fund is returned to the shareholder. A return of capital does not necessarily reflect a Fund’s investment performance and should not be confused with “yield” or “income.” When distributions exceed total return performance, the difference will reduce a Fund’s net asset value per share. | |
Section 19(a) notices for each Fund, as applicable, are available on the BlackRock website at blackrock.com.
Section 19(b) Disclosure
On September 5, 2019, the Funds, acting pursuant to a U.S. Securities and Exchange Commission (“SEC”) exemptive order and with the approval of each Fund’s Board of Directors/Trustees (the “Board”), each have adopted a managed distribution plan, consistent with its investment objectives and policies to support a level distribution of income, capital gains and/or return of capital (the “Plan”). In accordance with the Plans, starting in October 2019, DSU will distribute a fixed amount of $0.0711 per share on a monthly basis, FRA will distribute a fixed amount of $0.0788 per share on a monthly basis and BLW will distribute a fixed amount of $0.0981 per share on a monthly basis.
The fixed amounts distributed per share are subject to change at the discretion of each Fund’s Board. Under its Plan, each Fund will distribute all available investment income to its shareholders as required by the Internal Revenue Code of 1986, as amended (the “Code”). If sufficient income (inclusive of net investment income and short-term capital gains) is not earned on a monthly basis, the Funds will distribute long-term capital gains and/or return of capital to shareholders in order to maintain a level distribution. Each monthly distribution to shareholders is expected to be at the fixed amount established by the Board; however, each Fund may make additional distributions from time to time, including additional capital gain distributions at the end of the taxable year, if required to meet requirements imposed by the Code and/or the Investment Company Act of 1940, as amended (the “1940 Act”).
Shareholders should not draw any conclusions about each Fund’s investment performance from the amount of these distributions or from the terms of the Plan. Each Fund’s total return performance is presented in its financial highlights table.
The Board may amend, suspend or terminate a Fund’s Plan at any time without prior notice to the Fund’s shareholders if it deems such actions to be in the best interests of the Fund or its shareholders. The suspension or termination of the Plan could have the effect of creating a trading discount (if the Fund’s stock is trading at or above net asset value) or widening an existing trading discount. The Funds are subject to risks that could have an adverse impact on their ability to maintain level distributions. Examples of potential risks include, but are not limited to, economic downturns impacting the markets, changes in interest rates, decreased market volatility, companies suspending or decreasing corporate dividend distributions and changes in the Code.
| | |
| 2 | | 2020 BLACKROCK SEMI-ANNUAL REPORTTO SHAREHOLDERS |
The Markets in Review
Dear Shareholder,
The last 12 months have been a time of sudden change in global financial markets, as a long period of growth and positive returns was interrupted in early 2020 by the emergence and spread of the coronavirus. For the first part of the reporting period, U.S. equities and bonds both delivered impressive returns, despite fears and doubts about the economy that were ultimately laid to rest with unprecedented monetary stimulus and a sluggish yet resolute performance from the U.S. economy. But as the threat from the coronavirus became more apparent throughout February and March 2020, leading countries around the world took economically disruptive countermeasures, causing equity prices to fall sharply. While markets have since recovered some of these losses as countries around the world begin reopening, there is still significant uncertainty surrounding the course of the pandemic, and an uptick in U.S. infection rates caused concern late in the reporting period.
Returns for most securities were robust for the first part of the reporting period, as investors began to realize that the U.S. economy was maintaining the modest yet steady growth that had characterized this economic cycle. However, once stay-at-home orders and closures of non-essential businesses became widespread, many workers were laid off and unemployment claims spiked. With large portions of the global economy on hold, all types of international equities ended the 12-month reporting period with negative performance, while in the United States large-capitalization stocks, which investors saw as more resilient than smaller companies, delivered solid returns.
The performance of different types of fixed-income securities diverged substantially due to a reduced investor appetite for risk. Treasuries benefited from the risk-off environment, and posted healthy returns, as the 10-year U.S. Treasury yield (which is inversely related to bond prices) fell to an all-time low. Investment-grade corporate bonds also delivered a solid return, while high-yield corporate returns were flat due to credit concerns.
The U.S. Federal Reserve (the “Fed”) reduced interest rates three times in 2019, to support slowing economic growth. After the coronavirus outbreak, the Fed instituted two emergency rate cuts, pushing short-term interest rates close to zero. To stabilize credit markets, the Fed also announced a new bond-buying program, as did several other central banks around the world, including the European Central Bank and the Bank of Japan.
Looking ahead, while coronavirus-related disruption has clearly hindered worldwide economic growth, we believe that the global expansion is likely to continue once the impact of the outbreak subsides. Several risks remain, however, including a potential resurgence of the virus amid loosened restrictions, policy fatigue among governments already deep into deficit spending, and structural damage to the financial system from lengthy economic interruptions.
Overall, we favor a moderately positive stance toward risk, and in particular toward credit given the extraordinary central bank measures taken in recent months. This support extends beyond investment-grade corporates and into high-yield, leading to attractive opportunities throughout the credit market. We believe that both U.S. Treasuries and sustainable investments can help provide portfolio resilience, and the disruption created by the coronavirus appears to be accelerating the shift toward sustainable investments. We remain neutral on equities overall while favoring European stocks, which are poised for a cyclical upside as re-openings continue.
In this environment, our view is that investors need to think globally, extend their scope across a broad array of asset classes, and be nimble as market conditions change. We encourage you to talk with your financial advisor and visit blackrock.com for further insight about investing in today’s markets.
Sincerely,

Rob Kapito
President, BlackRock Advisors, LLC

Rob Kapito
President, BlackRock Advisors, LLC
| | | | |
| Total Returns as of June 30, 2020 |
| | | 6-month | | 12-month |
U.S. large cap equities
(S&P 500® Index) | | (3.08)% | | 7.51% |
U.S. small cap equities
(Russell 2000® Index) | | (12.98) | | (6.63) |
International equities
(MSCI Europe, Australasia, Far East Index) | | (11.34) | | (5.13) |
Emerging market equities
(MSCI Emerging Markets Index) | | (9.78) | | (3.39) |
3-month Treasury bills
(ICE BofA 3-Month U.S. Treasury Bill Index) | | 0.60 | | 1.63 |
U.S. Treasury securities
(ICE BofA 10-Year U.S. Treasury Index) | | 12.68 | | 14.21 |
U.S. investment grade bonds
(Bloomberg Barclays U.S. Aggregate Bond Index) | | 6.14 | | 8.74 |
Tax-exempt municipal bonds
(S&P Municipal Bond Index) | | 1.97 | | 4.23 |
U.S. high yield bonds
(Bloomberg Barclays U.S. Corporate High Yield 2% Issuer Capped Index) | | (3.83) | | 0.00 |
| Past performance is no guarantee of future results. Index performance is shown for illustrative purposes only. You cannot invest directly in an index. |
| | | | |
| THIS PAGEISNOT PARTOF YOUR FUND REPORT | | | 3 | |
Table of Contents
| | |
| Fund Summary as of June 30, 2020 | | BlackRock Debt Strategies Fund, Inc. |
Fund Overview
BlackRock Debt Strategies Fund, Inc.’s (DSU) (the “Fund”) primary investment objective is to seek to provide current income by investing primarily in a diversified portfolio of U.S. companies’ debt instruments, including corporate loans, which are rated in the lower rating categories of the established rating services (BBB or lower by S&P Global Ratings or Baa or lower by Moody’s Investors Service, Inc. (“Moody’s”)) or unrated debt instruments, which are in the judgment of the investment adviser of equivalent quality. Corporate loans include senior and subordinated corporate loans, both secured and unsecured. The Fund may invest directly in debt instruments or synthetically through the use of derivatives. The Fund’s secondary investment objective is to provide capital appreciation.
No assurance can be given that the Fund’s investment objectives will be achieved.
Fund Information
| | |
Symbol on New York Stock Exchange (“NYSE”) | | DSU |
Initial Offering Date | | March 27, 1998 |
Current Distribution Rate on Closing Market Price as of June 30, 2020 ($9.33)(a) | | 9.14% |
Current Monthly Distribution per Common Share(b) | | $0.0711 |
Current Annualized Distribution per Common Share(b) | | $0.8532 |
Leverage as of June 30, 2020(c) | | 29% |
| | (a) | Current distribution rate on closing market price is calculated by dividing the current annualized distribution per share by the closing market price. The current distribution rate consists of income, net realized gains and/or a return of capital. Past performance does not guarantee future results. | |
| | (b) | The distribution rate is not constant and is subject to change. A portion of the distribution may be deemed a return of capital or net realized gain. | |
| | (c) | Represents bank borrowings outstanding as a percentage of total managed assets, which is the total assets of the Fund (including any assets attributable to borrowings), minus the sum of liabilities (other than borrowings representing financial leverage). Does not reflect derivatives or other instruments that may give rise to economic leverage. For a discussion of leveraging techniques utilized by the Fund, please see The Benefits and Risks of Leveraging on page 14. | |
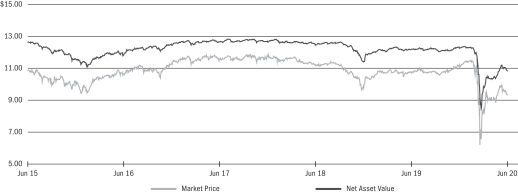
Market Price and Net Asset Value Per Share Summary
| | | | | | | | | | | | | | | | | | | | |
| | | 06/30/20 | | | 12/31/19 | | | Change | | | High | | | Low | |
Market Price | | $ | 9.33 | | | $ | 11.20 | | | | (16.70 | )% | | $ | 11.50 | | | $ | 5.92 | |
Net Asset Value | | | 10.83 | | | | 12.25 | | | | (11.59 | ) | | | 12.35 | | | | 8.46 | |
Market Price and Net Asset Value History For the Past Five Years
| | |
| Fund Summary as of June 30, 2020 (continued) | | BlackRock Debt Strategies Fund, Inc. |
Performance and Portfolio Management Commentary
Returns for the period ended June 30, 2020 were as follows:
| | | | | | | | | | | | | | | | | | | | |
| | | | | | | | | Average Annual Total Returns | |
| | | 6-Months | | | | | | 1 Year | | | 3 Years | | | 5 Years | |
Fund at NAV(a)(b) | | | (8.23 | )% | | | | | | | (3.34 | )% | | | 2.49 | % | | | 4.43 | % |
Fund at Market Price(a)(b) | | | (13.53 | ) | | | | | | | (5.98 | ) | | | 0.55 | | | | 4.47 | |
Reference Benchmark(c) | | | (4.22 | ) | | | | | | | (1.00 | ) | | | 2.70 | | | | 3.85 | |
Bloomberg Barclays U.S. Corporate High Yield 2% Issuer Capped Index(d) | | | (3.83 | ) | | | | | | | (0.00 | )(f) | | | 3.32 | | | | 4.79 | |
S&P/LSTA Leveraged Loan Index(e) | | | (4.61 | ) | | | | | | | (1.99 | ) | | | 2.07 | | | | 2.89 | |
| | (a) | All returns reflect reinvestment of dividends and/or distributions at actual reinvestment prices. Performance results reflect the Fund’s use of leverage. | |
| | (b) | The Fund’s discount to NAV widened during the period, which accounts for the difference between performance based on market price and performance based on NAV. | |
| | (c) | The Reference Benchmark is comprised of the Bloomberg Barclays U.S. Corporate High Yield 2% Issuer Capped Index (50%) and the S&P/LSTA Leveraged Loan Index (50%). The Reference Benchmark’s index content and weightings may have varied over past periods. | |
| | (d) | An unmanaged index comprised of issuers that meet the following criteria: at least $150 million par value outstanding; maximum credit rating of Ba1; at least one year to maturity; and no issuer represents more than 2% of the index. | |
| | (e) | An unmanaged market value-weighted index designed to measure the performance of the U.S. leveraged loan market based upon market weightings, spreads and interest payments. | |
| | (f) | Amount is greater than (0.005)%. | |
Performance results may include adjustments made for financial reporting purposes in accordance with U.S. generally accepted accounting principles.
Past performance is not indicative of future results.
DSU is presenting the Reference Benchmark to accompany fund performance. The Reference Benchmark is presented for informational purposes only, as the Fund is actively managed and does not seek to track or replicate the performance of the Reference Benchmark or any other index. The portfolio investments of the Fund may differ substantially from the securities that comprise the indices within the Reference Benchmark, which may cause the Fund’s performance to differ materially from that of the Reference Benchmark. The Fund employs leverage as part of its investment strategy, which may change over time at the discretion of BlackRock Advisors, LLC (the “Manager”) as market and other conditions warrant. In contrast, the Reference Benchmark is not adjusted for leverage. Therefore, leverage generally may result in the Fund outperforming the Reference Benchmark in rising markets and underperforming in declining markets. The Board considers additional factors to evaluate the Fund’s performance, such as the performance of the Fund relative to a peer group of funds, a leverage-adjusted benchmark and/or other information provided by the Manager.
More information about the historical performance can be found in the “Closed-End Funds” section of http://www.blackrock.com.
The following discussion relates to the Fund’s absolute performance based on NAV:
What factors influenced performance?
The bank loan and high yield corporate bond markets dropped sharply in March as coronavirus concerns and an oil price war weighed heavily on each asset class. While these asset classes recovered a substantial portion of their losses in the second quarter of 2020 on the back of policy support for credit markets, they nonetheless finished the six months in notably negative territory.
By sector, the Fund’s allocations to the energy, technology and aerospace & defense were the largest detractors. By credit rating, BB, B and CCC-rated credits detracted from performance as the entire credit market was down during the period. From an asset allocation perspective, the strategy’s allocations to bank loans, high yield corporate bonds, equities and collateralized loan obligations all detracted from performance.
Given the severe market dislocation during the period, only the Fund’s allocation to investment grade corporate bonds contributed to performance on an absolute basis.
Describe recent portfolio activity.
From an asset allocation perspective, the Fund increased its allocation to investment grade corporate bonds during the period on the back of supportive technical factors including Fed bond purchases and robust new issuance, along with attractive relative value. The investment adviser’s credit rating view has remained relatively consistent over the past several quarters, with a focus on issuers rate BB and B while avoiding the higher beta, stressed CCC area of the market. The investment adviser has tactically managed sector-level exposures, though arguably the Fund’s single-name positioning remains more important to portfolio composition. The Fund slightly increased its allocation to sectors more sensitive to the coronavirus by participating in new issues within the gaming and airline sectors.
Describe portfolio positioning at period end.
The Fund remained predominately invested in bank loans, with the balance invested mostly in high yield and investment grade corporate bonds. From a credit rating perspective, the Fund’s core positioning remained between issues rated BB and B, with a higher allocation to B-rated names at period end. The Fund also held a smaller CCC-rated allocation. The largest sector exposures included technology, where the Fund was largely focused on enterprise software companies, along with health care, pharmaceutical and cable & satellite companies. The investment adviser maintained a low exposure to the more consumer cyclical sectors (retailers and leisure in particular) and energy on the view that these market segments continue to face significant headwinds.
The views expressed reflect the opinions of BlackRock as of the date of this report and are subject to change based on changes in market, economic or other conditions. These views are not intended to be a forecast of future events and are no guarantee of future results.
| | |
| 6 | | 2020 BLACKROCK SEMI-ANNUAL REPORTTO SHAREHOLDERS |
| | |
| Fund Summary as of June 30, 2020 (continued) | | BlackRock Debt Strategies Fund, Inc. |
Overview of the Fund’s Total Investments
PORTFOLIO COMPOSITION
| | | | | | | | |
| | | 06/30/20 | | | 12/31/19 | |
Floating Rate Loan Interests | | | 82 | % | | | 81 | % |
Corporate Bonds | | | 14 | | | | 15 | |
Investment Companies | | | 3 | | | | 3 | |
Preferred Securities | | | 1 | | | | 1 | |
Other | | | — | (a) | | | — | (b) |
| | (a) | Includes a less than 1% holding in each of the following investment types: Common Stocks, Options Purchased, Other Interests, Short-Term Securities and Warrants. | |
| | (b) | Includes a less than 1% holding in each of the following investment types: Common Stocks, Options Purchased, Other Interests and Warrants. | |
CREDIT QUALITY ALLOCATION (c)(d)
| | | | | | | | |
| | | 06/30/20 | | | 12/31/19 | |
BBB/Baa | | | 9 | % | | | 7 | % |
BB/Ba | | | 21 | | | | 27 | |
B | | | 63 | | | | 59 | |
CCC/Caa | | | 5 | | | | 3 | |
N/R | | | 2 | | | | 4 | |
| | (c) | For financial reporting purposes, credit quality ratings shown above reflect the highest rating assigned by either S&P Global Ratings or Moody’s Investors Service (“Moody’s”) if ratings differ. These rating agencies are independent, nationally recognized statistical rating organizations and are widely used. Investment grade ratings are credit ratings of BBB/Baa or higher. Below investment grade ratings are credit ratings of BB/Ba or lower. Investments designated N/R are not rated by either rating agency. Unrated investments do not necessarily indicate low credit quality. Credit quality ratings are subject to change. | |
| | (d) | Excludes Options Purchased. | |
| | |
| Fund Summary as of June 30, 2020 | | BlackRock Floating Rate Income Strategies Fund, Inc. |
Fund Overview
BlackRock Floating Rate Income Strategies Fund, Inc.’s (FRA) (the “Fund”) investment objective is to provide shareholders with high current income and such preservation of capital as is consistent with investment in a diversified, leveraged portfolio consisting primarily of floating rate debt securities and instruments. The Fund seeks to achieve its investment objective by investing, under normal market conditions, at least 80% of its managed assets in floating rate debt securities, including floating or variable rate debt securities that pay interest at rates that adjust whenever a specified interest rate changes and/or which reset on predetermined dates (such as the last day of a month or calendar quarter). The Fund invests a substantial portion of its investments in floating rate debt securities consisting of secured or unsecured senior floating rate loans that are rated below investment grade at the time of investment or, if unrated, are considered by the investment adviser to be of comparable quality. The Fund may invest directly in floating rate debt securities or synthetically through the use of derivatives.
No assurance can be given that the Fund’s investment objective will be achieved.
Fund Information
| | |
Symbol on NYSE | | FRA |
Initial Offering Date | | October 31, 2003 |
Current Distribution Rate on Closing Market Price as of June 30, 2020 ($11.18)(a) | | 8.46% |
Current Monthly Distribution per Common Share(b) | | $0.0788 |
Current Annualized Distribution per Common Share(b) | | $0.9456 |
Leverage as of June 30, 2020(c) | | 29% |
| | (a) | Current Distribution Rate on closing market price is calculated by dividing the current annualized distribution per share by the closing market price. The current distribution rate may consist of income, net realized gains and/or a return of capital. Past performance does not guarantee future results. | |
| | (b) | The distribution rate is not constant and is subject to change. A portion of the distribution may be deemed a return of capital or net realized gain. | |
| | (c) | Represents bank borrowings outstanding as a percentage of total managed assets, which is the total assets of the Fund (including any assets attributable to borrowings), minus the sum of liabilities (other than borrowings representing financial leverage). Does not reflect derivatives or other instruments that may give rise to economic leverage. For a discussion of leveraging techniques utilized by the Fund, please see The Benefits and Risks of Leveraging on page 14. | |
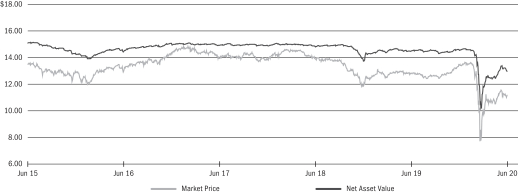
Market Price and Net Asset Value Per Share Summary
| | | | | | | | | | | | | | | | | | | | |
| | | 06/30/20 | | | 12/31/19 | | | Change | | | High | | | Low | |
Market Price | | $ | 11.18 | | | $ | 13.44 | | | | (16.82 | )% | | $ | 13.66 | | | $ | 6.72 | |
Net Asset Value | | | 12.97 | | | | 14.55 | | | | (10.86 | ) | | | 14.66 | | | | 10.16 | |
Market Price and Net Asset Value History For the Past Five Years
| | |
| 8 | | 2020 BLACKROCK SEMI-ANNUAL REPORTTO SHAREHOLDERS |
| | |
| Fund Summary as of June 30, 2020 (continued) | | BlackRock Floating Rate Income Strategies Fund, Inc. |
Performance and Portfolio Management Commentary
Returns for the period ended June 30, 2020 were as follows:
| | | | | | | | | | | | | | | | | | | | |
| | | | | | | | | Average Annual Total Returns | |
| | | 6-Months | | | | | | 1 Year | | | 3 Years | | | 5 Years | |
Fund at NAV(a)(b) | | | (7.67 | )% | | | | | | | (3.48 | )% | | | 1.74 | % | | | 3.19 | % |
Fund at Market Price(a)(b) | | | (13.84 | ) | | | | | | | (6.03 | ) | | | (1.24 | ) | | | 2.41 | |
S&P/LSTA Leveraged Loan Index(c) | | | (4.61 | ) | | | | | | | (1.99 | ) | | | 2.07 | | | | 2.89 | |
| | (a) | All returns reflect reinvestment of dividends and/or distributions at actual reinvestment prices. Performance results reflect the Fund’s use of leverage. | |
| | (b) | The Fund’s discount to NAV widened during the period, which accounts for the difference between performance based on market price and performance based on NAV. | |
| | (c) | An unmanaged market value-weighted index (the “Reference Benchmark”) designed to measure the performance of the U.S. leveraged loan market based upon market weightings, spreads and interest payments. | |
Performance results may include adjustments made for financial reporting purposes in accordance with U.S. generally accepted accounting principles.
Past performance is not indicative of future results.
The following discussion relates to the Fund’s absolute performance based on NAV:
What factors influenced performance?
The bank loan market dropped sharply in March as coronavirus concerns and an oil price war weighed heavily on the asset class. While loans recovered a substantial portion of their losses in the second quarter of 2020 on the back of policy support for credit markets, they nonetheless finished the six months in notably negative territory.
By sector, the Fund’s allocations to the technology, aerospace & defense and health care sectors were the largest detractors. By credit rating, BB, B, and CCC-rated loans detracted from performance as the entire credit market was down during the period. From an asset allocation perspective, the strategy’s allocations to bank loans, high yield corporate bonds, equities and collateralized loan obligations all detracted from performance.
Given the severe market dislocation during the period, only the Fund’s allocation to investment grade corporate bonds contributed to performance on an absolute basis.
Describe recent portfolio activity.
From an asset allocation perspective, the Trust increased its allocation to high yield and investment grade corporate bonds during the period on the back of supportive technical factors including Fed bond purchases and robust new issuance, along with attractive relative value. The investment adviser’s credit rating views have remained relatively consistent over the past several quarters, with a focus on B1 issues while avoiding the higher beta, stressed CCC area of the loan market. The investment adviser has tactically managed sector-level exposures, though arguably the Fund’s single-name positioning remains more important to portfolio composition. The Fund slightly increased its allocation to sectors more sensitive to the coronavirus by participating in new issues within the gaming and airline sectors. The investment adviser is an active user of liquid products within the loan market and tactically shifted these exposures throughout the period.
Describe portfolio positioning at period end
The Fund remained predominately invested in bank loans, with the balance invested mostly in high yield and investment grade corporate bonds. By credit rating, B-rated loans were the Fund’s largest position. The Fund had very little exposure to the stressed, higher beta B3 and CCC-rated cohort of the market. Within the single B rating, the Fund similarly was focused on the higher quality portion. Also reflecting a focus on relative quality, the Fund had a clear preference for loans with spreads in the 200-300 basis point range over the London Inter-bank Offered Rate reference rate as opposed to positions offering spreads in the 400 basis point or higher range.
The largest sector exposures included technology, where the investment adviser has largely focused on enterprise software companies, along with health care, pharmaceutical and cable & satellite companies. The Fund maintained low exposures to the more consumer cyclical sectors (retailers and leisure in particular) and energy as the investment adviser believes these market segments continue to face significant headwinds. Additionally, the Fund had a bias toward larger loan tranches and loan/bond capital structures relative to the loan-only segment. From a vintage year perspective, the investment adviser had a more cautious stance on transactions initiated since 2017, given the arguably more aggressive lending standards and weaker protections for loan holders seen in recent years.
The views expressed reflect the opinions of BlackRock as of the date of this report and are subject to change based on changes in market, economic or other conditions. These views are not intended to be a forecast of future events and are no guarantee of future results.
| | |
| Fund Summary as of June 30, 2020 (continued) | | BlackRock Floating Rate Income Strategies Fund, Inc. |
Overview of the Fund’s Total Investments
PORTFOLIO COMPOSITION
| | | | | | | | |
| | | 06/30/20 | | | 12/31/19 | |
Floating Rate Loan Interests | | | 91 | % | | | 94 | % |
Investment Companies | | | 5 | | | | 5 | |
Corporate Bonds | | | 4 | | | | 1 | |
Other | | | — | (a)(b) | | | — | (a)(c) |
| | (a) | Representing less than 1% of the Fund’s total investments. | |
| | (b) | Includes a less than 1% holding in each of the following investment types: Common Stocks and Other Interests. | |
| | (c) | Includes a less than 1% holding in each of the following investment types: Common Stocks, Options Purchased, Other Interests and Warrants. | |
CREDIT QUALITY ALLOCATION (d)(e)
| | | | | | | | |
| | | 06/30/20 | | | 12/31/19 | |
A | | | — | %(a) | | | — | % |
BBB/Baa | | | 9 | | | | 8 | |
BB/Ba | | | 20 | | | | 27 | |
B | | | 64 | | | | 58 | |
CCC/Caa | | | 4 | | | | 2 | |
N/R | | | 3 | | | | 5 | |
| | (d) | For financial reporting purposes, credit quality ratings shown above reflect the highest rating assigned by either S&P Global Ratings or Moody’s if ratings differ. These rating agencies are independent, nationally recognized statistical rating organizations and are widely used. Investment grade ratings are credit ratings of BBB/Baa or higher. Below investment grade ratings are credit ratings of BB/Ba or lower. Investments designated N/R are not rated by either rating agency. Unrated investments do not necessarily indicate low credit quality. Credit quality ratings are subject to change. | |
| | (e) | Excludes Short-Term Securities and Options Purchased. | |
| | |
| 10 | | 2020 BLACKROCK SEMI-ANNUAL REPORTTO SHAREHOLDERS |
| | |
| Fund Summary as of June 30, 2020 | | BlackRock Limited Duration Income Trust |
Fund Overview
BlackRock Limited Duration Income Trust’s (BLW) (the “Fund”) investment objective is to provide current income and capital appreciation. The Fund seeks to achieve its investment objective by investing primarily in three distinct asset classes:
| | • | | intermediate duration, investment grade corporate bonds, mortgage-related securities, asset-backed securities and U.S. Government and agency securities; |
| | • | | senior, secured floating rate loans made to corporate and other business entities; and |
| | • | | U.S. dollar-denominated securities of U.S. and non-U.S. issuers rated below investment grade at the time of investment or unrated and deemed by the investment adviser to be of comparable quality and, to a limited extent, non-U.S. dollar denominated securities of non-U.S. issuers rated below investment grade or unrated and deemed by the investment adviser to be of comparable quality. |
The Fund’s portfolio normally has an average portfolio duration of less than five years (including the effect of anticipated leverage), although it may be longer from time to time depending on market conditions. The Fund may invest directly in securities or synthetically through the use of derivatives.
No assurance can be given that the Fund’s investment objective will be achieved.
Fund Information
| | |
Symbol on NYSE | | BLW |
Initial Offering Date | | July 30, 2003 |
Current Distribution Rate on Closing Market Price as of June 30, 2020 ($13.93)(a) | | 8.45% |
Current Monthly Distribution per Common Share(b) | | $0.0981 |
Current Annualized Distribution per Common Share(b) | | $1.1772 |
Leverage as of June 30, 2020(c) | | 33% |
| | (a) | Current Distribution Rate on closing market price is calculated by dividing the current annualized distribution per share by the closing market price. The current distribution rate may consist of income, net realized gains and/or a return of capital. Past performance does not guarantee future results. | |
| | (b) | The distribution rate is not constant and is subject to change. A portion of the distribution may be deemed a return of capital or net realized gain. | |
| | (c) | Represents reverse repurchase agreements as a percentage of total managed assets, which is the total assets of the Fund (including any assets attributable to borrowing) minus the sum of liabilities (other than borrowings representing financial leverage). Does not reflect derivatives or other instruments that may give rise to economic leverage. For a discussion of leveraging techniques utilized by the Fund, please see The Benefits and Risks of Leveraging and Derivative Financial Instruments on page 14. | |
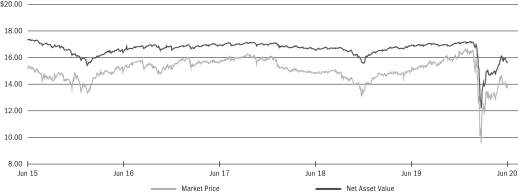
Market Price and Net Asset Value Per Share Summary
| | | | | | | | | | | | | | | | | | | | |
| | | 06/30/20 | | | 12/31/19 | | | Change | | | High | | | Low | |
Market Price | | $ | 13.93 | | | $ | 16.39 | | | | (15.01 | )% | | $ | 16.70 | | | $ | 9.52 | |
Net Asset Value | | | 15.65 | | | | 17.05 | | | | (8.21 | ) | | | 17.22 | | | | 12.19 | |
Market Price and Net Asset Value History For the Past Five Years
| | |
| Fund Summary as of June 30, 2020 (continued) | | BlackRock Limited Duration Income Trust |
Performance and Portfolio Management Commentary
Returns for the period ended June 30, 2020 were as follows:
| | | | | | | | | | | | | | | | | | | | |
| | | | | | | | | Average Annual Total Returns | |
| | | 6-Months | | | | | | 1 Year | | | 3 Years | | | 5 Years | |
Fund at NAV(a)(b) | | | (4.90 | )% | | | | | | | (0.18 | )% | | | 4.16 | % | | | 5.56 | % |
Fund at Market Price(a)(b) | | | (11.94 | ) | | | | | | | 0.11 | | | | 2.59 | | | | 5.95 | |
Reference Benchmark(c) | | | (1.76 | ) | | | | | | | 0.95 | | | | 2.98 | | | | 3.51 | |
Bloomberg Barclays U.S. Corporate High Yield 2% Issuer Capped Index(d) | | | (3.83 | ) | | | | | | | (0.00 | )(g) | | | 3.32 | | | | 4.79 | |
S&P/LSTA Leveraged Loan Index(e) | | | (4.61 | ) | | | | | | | (1.99 | ) | | | 2.07 | | | | 2.89 | |
BATS S Benchmark(f) | | | 2.85 | | | | | | | | 4.46 | | | | 3.34 | | | | 2.68 | |
| | (a) | All returns reflect reinvestment of dividends and/or distributions at actual reinvestment prices. Performance results reflect the Fund’s use of leverage. | |
| | (b) | The Fund’s discount to NAV widened during the period, which accounts for the difference between performance based on market price and performance based on NAV. | |
| | (c) | The Reference Benchmark is comprised of the Bloomberg Barclays U.S. Corporate High Yield 2% Issuer Capped Index (33.33%), the S&P/LSTA Leveraged Loan Index (33.33%), and the BATS S Benchmark (33.34%). The Reference Benchmark’s index content and weightings may have varied over past periods. | |
| | (d) | An unmanaged index comprised of issuers that meet the following criteria: at least $150 million par value outstanding; maximum credit rating of Ba1; at least one year to maturity; and no issuer represents more than 2% of the index. | |
| | (e) | An unmanaged market value-weighted index designed to measure the performance of the U.S. leveraged loan market based upon market weightings, spreads and interest payments. | |
| | (f) | A composite index comprised of Bloomberg Barclays ABS 1-3 Year AAA Rated ex Home Equity Index, Bloomberg Barclays Corporate 1-5 year Index, Bloomberg Barclays CMBS Investment Grade 1-3.5 Yr. Index, Bloomberg Barclays MBS 15 Yr Index and Bloomberg Barclays Credit Ex-Corporate 1-5 Yr Index. | |
| | (g) | Amount is greater than (0.005)%. | |
Performance results may include adjustments made for financial reporting purposes in accordance with U.S. generally accepted accounting principles.
Past performance is not indicative of future results.
The following discussion relates to the Fund’s absolute performance based on NAV:
What factors influenced performance?
Positive contributions to the Fund’s performance over the period came from allocations to U.S. Treasuries, corporate credit and 30-year pass-through mortgage-backed securities (“MBS”), as well as non-agency adjustable-rate MBS and collateralized mortgage obligations.
The largest detractors from the Fund’s performance were exposures to high yield corporate credit, bank loans, commercial mortgage-backed securities (“CMBS”), equities, municipal bonds and asset-backed securities (“ABS”).
Describe recent portfolio activity.
Over the period, the Fund increased its allocation to corporate credit and emerging markets. In addition, the Fund significantly trimmed exposure to U.S. Treasuries and increased its short position in municipal bonds.
Describe portfolio positioning at period end.
At period end, the Fund maintained a diversified exposure to non-government spread sectors including high yield credit, investment grade corporate credit, emerging market debt, CMBS and ABS.
The views expressed reflect the opinions of BlackRock as of the date of this report and are subject to change based on changes in market, economic or other conditions. These views are not intended to be a forecast of future events and are no guarantee of future results.
| | |
| 12 | | 2020 BLACKROCK SEMI-ANNUAL REPORTTO SHAREHOLDERS |
| | |
| Fund Summary as of June 30, 2020 (continued) | | BlackRock Limited Duration Income Trust |
Overview of the Fund’s Total Investments
PORTFOLIO COMPOSITION
| | | | | | | | |
| | | 06/30/20 | | | 12/31/19 | |
Corporate Bonds | | | 51 | % | | | 48 | % |
Floating Rate Loan Interests | | | 29 | | | | 31 | |
Capital Trusts | | | 5 | | | | 6 | |
U.S. Government Sponsored Agency Securities | | | 4 | | | | 4 | |
Asset-Backed Securities | | | 3 | | | | 3 | |
Foreign Agency Obligations | | | 3 | | | | 2 | |
U.S. Treasury Obligations | | | 2 | | | | 2 | |
Non-Agency Mortgage-Backed Securities | | | 1 | | | | 1 | |
Preferred Stocks | | | 1 | | | | 1 | |
Investment Companies | | | 1 | | | | 2 | |
Short Term Securities | | | — | (a) | | | — | (a) |
Other | | | — | (a)(b) | | | — | (a)(c) |
| | (a) | Representing less than 1% of the Fund’s total investments. | |
| | (b) | Includes a less than 1% holding in each of the following investment types: Common Stocks, Other Interests and Trust Preferred. | |
| | (c) | Includes a less than 1% holding in each of the following investment types: Common Stocks, Other Interests, Options Purchased, Trust Preferred and Warrants. | |
CREDIT QUALITY ALLOCATION (d)(e)
| | | | | | | | |
| | | 06/30/20 | | | 12/31/19 | |
AAA/Aaa | | | 9 | % | | | 1 | % |
AA/Aa | | | — | (a) | | | 3 | |
A | | | 4 | | | | 7 | |
BBB/Baa | | | 15 | | | | 15 | |
BB/Ba | | | 31 | | | | 35 | |
B | | | 32 | | | | 34 | |
CCC/Caa | | | 6 | | | | 4 | |
N/R | | | 3 | | | | 1 | |
| | (d) | For financial reporting purposes, credit quality ratings shown above reflect the highest rating assigned by either S&P Global Ratings or Moody’s if ratings differ. These rating agencies are independent, nationally recognized statistical rating organizations and are widely used. Investment grade ratings are credit ratings of BBB/Baa or higher. Below investment grade ratings are credit ratings of BB/Ba or lower. Investments designated N/R are not rated by either rating agency. Unrated investments do not necessarily indicate low credit quality. Credit quality ratings are subject to change. | |
| | (e) | Excludes Short-Term Securities, Options Purchased and Options Written. | |
The Benefits and Risks of Leveraging
The Funds may utilize leverage to seek to enhance the distribution rate on, and net asset value (“NAV”) of, their common shares (“Common Shares”). However, there is no guarantee that these objectives can be achieved in all interest rate environments.
In general, the concept of leveraging is based on the premise that the financing cost of leverage, which is based on short-term interest rates, is normally lower than the income earned by a Fund on its longer-term portfolio investments purchased with the proceeds from leverage. To the extent that the total assets of each Fund (including the assets obtained from leverage) are invested in higher-yielding portfolio investments, each Fund’s shareholders benefit from the incremental net income. The interest earned on securities purchased with the proceeds from leverage (after paying the leverage costs) is paid to shareholders in the form of dividends, and the value of these portfolio holdings (less the leverage liability) is reflected in the per share NAV.
To illustrate these concepts, assume a Fund’s capitalization is $100 million and it utilizes leverage for an additional $30 million, creating a total value of $130 million available for investment in longer-term income securities. If prevailing short-term interest rates are 3% and longer-term interest rates are 6%, the yield curve has a strongly positive slope. In this case, a Fund’s financing costs on the $30 million of proceeds obtained from leverage are based on the lower short-term interest rates. At the same time, the securities purchased by a Fund with the proceeds from leverage earn income based on longer-term interest rates. In this case, a Fund’s financing cost of leverage is significantly lower than the income earned on a Fund’s longer-term investments acquired from such leverage proceeds, and therefore the holders of Common Shares (“Common Shareholders”) are the beneficiaries of the incremental net income.
However, in order to benefit shareholders, the return on assets purchased with leverage proceeds must exceed the ongoing costs associated with the leverage. If interest and other costs of leverage exceed the Fund’s return on assets purchased with leverage proceeds, income to shareholders is lower than if the Fund had not used leverage. Furthermore, the value of the Funds’ portfolio investments generally varies inversely with the direction of long-term interest rates, although other factors can influence the value of portfolio investments. In contrast, the value of each Fund’s obligations under its respective leverage arrangement generally does not fluctuate in relation to interest rates. As a result, changes in interest rates can influence the Funds’ NAVs positively or negatively. Changes in the future direction of interest rates are very difficult to predict accurately, and there is no assurance that a Fund’s intended leveraging strategy will be successful.
The use of leverage also generally causes greater changes in each Fund’s NAV, market price and dividend rates than comparable portfolios without leverage. In a declining market, leverage is likely to cause a greater decline in the NAV and market price of a Fund’s shares than if the Fund were not leveraged. In addition, each Fund may be required to sell portfolio securities at inopportune times or at distressed values in order to comply with regulatory requirements applicable to the use of leverage or as required by the terms of leverage instruments, which may cause the Fund to incur losses. The use of leverage may limit a Fund’s ability to invest in certain types of securities or use certain types of hedging strategies. Each Fund incurs expenses in connection with the use of leverage, all of which are borne by shareholders and may reduce income to the shareholders. Moreover, to the extent the calculation of each Fund’s investment advisory fees includes assets purchased with the proceeds of leverage, the investment advisory fees payable to the Funds’ investment adviser will be higher than if the Funds did not use leverage.
Each Fund may utilize leverage through a credit facility or reverse repurchase agreements as described in the Notes to Financial Statements.
Under the Investment Company Act of 1940, as amended (the “1940 Act”), each Fund is permitted to issue debt up to 331⁄3% of its total managed assets. A Fund may voluntarily elect to limit its leverage to less than the maximum amount permitted under the 1940 Act. In addition, a Fund may also be subject to certain asset coverage, leverage or portfolio composition requirements imposed by its credit facility, which may be more stringent than those imposed by the 1940 Act.
If a Fund segregates or designates on its books and records cash or liquid assets having a value not less than the value of a Fund’s obligations under a reverse repurchase agreement (including accrued interest) then such transaction is not considered a senior security and is not subject to the foregoing limitations and requirements imposed by the 1940 Act.
Derivative Financial Instruments
The Funds may invest in various derivative financial instruments. These instruments are used to obtain exposure to a security, commodity, index, market, and/or other assets without owning or taking physical custody of securities, commodities and/or other referenced assets or to manage market, equity, credit, interest rate, foreign currency exchange rate, commodity and/or other risks. Derivative financial instruments may give rise to a form of economic leverage and involve risks, including the imperfect correlation between the value of a derivative financial instrument and the underlying asset, possible default of the counterparty to the transaction or illiquidity of the instrument. The Funds’ successful use of a derivative financial instrument depends on the investment adviser’s ability to predict pertinent market movements accurately, which cannot be assured. The use of these instruments may result in losses greater than if they had not been used, may limit the amount of appreciation a Fund can realize on an investment and/or may result in lower distributions paid to shareholders. The Funds’ investments in these instruments, if any, are discussed in detail in the Notes to Financial Statements.
| | |
| 14 | | 2020 BLACKROCK SEMI-ANNUAL REPORTTO SHAREHOLDERS |
| | |
Schedule of Investments (unaudited) June 30, 2020 | | BlackRock Debt Strategies Fund, Inc. (DSU) (Percentages shown are based on Net Assets) |
| | | | | | | | | | | | |
Security | | | Shares | | | Value | |
| |
Common Stocks — 0.1% | | | | | |
| |
| Diversified Financial Services — 0.0% | | | | |
Kcad Holdings I Ltd.(a)(b) | | | | | | | 1,075,282,733 | | | $ | 10,753 | |
| | | | | | | | | | | | |
|
| Energy Equipment & Services — 0.0% | |
McDermott International, Inc.(b) | | | | | | | 12,276 | | | | 884 | |
Pioneer Energy Services Corp.(a)(b) | | | | | | | 809 | | | | 31,416 | |
| | | | | | | | | | | | |
| | | | | | | | | | | 32,300 | |
|
| Health Care Management Services — 0.0% | |
New Millennium HoldCo, Inc.(b) | | | | | | | 10,718 | | | | 11 | |
| | | | | | | | | | | | |
|
| Media — 0.0% | |
Adelphia Communications Corp., Class A(a)(b)(c) | | | | | | | 400,000 | | | | 4 | |
Adelphia Recovery Trust(b) | | | | | | | 396,568 | | | | 198 | |
| | | | | | | | | | | | |
| | | | | | | | | | | 202 | |
|
| Metals & Mining — 0.1% | |
Ameriforge Group, Inc. | | | | | | | 1,664 | | | | 41,600 | |
Preferred Proppants LLC(a) | | | | | | | 14,576 | | | | 58,304 | |
| | | | | | | | | | | | |
| | | | | | | | | | | 99,904 | |
|
| Semiconductors & Semiconductor Equipment — 0.0% | |
SunPower Corp.(b) | | | | | | | 1,707 | | | | 13,076 | |
| | | | | | | | | | | | |
|
| Software — 0.0% | |
Avaya Holdings Corp.(b) | | | | | | | 40 | | | | 494 | |
| | | | | | | | | | | | |
| |
Total Common Stocks — 0.1%
(Cost — $12,508,362) | | | | 156,740 | |
| | | | | | | | | | | | |
| | |
| | | | Par
(000) | | | | |
|
Corporate Bonds — 21.2% | |
|
| Aerospace & Defense — 0.6% | |
Bombardier, Inc.(d): | | | | | | | | | | | | |
8.75%, 12/01/21 | | | USD | | | | 13 | | | | 10,563 | |
6.13%, 01/15/23 | | | | | | | 664 | | | | 456,699 | |
7.50%, 12/01/24 | | | | | | | 58 | | | | 37,990 | |
7.50%, 03/15/25 | | | | | | | 14 | | | | 9,136 | |
7.88%, 04/15/27 | | | | | | | 32 | | | | 20,960 | |
Global Aircraft Leasing Co. Ltd., (6.5% Cash or 7.25% PIK), 6.50%, 09/15/24(d)(e) | | | | | | | 23 | | | | 16,330 | |
Howmet Aerospace, Inc., 5.13%, 10/01/24 | | | | | | | 22 | | | | 22,789 | |
Signature Aviation US Holdings,
Inc.(d): | | | | | | | | | | | | |
5.38%, 05/01/26 | | | | | | | 42 | | | | 42,029 | |
4.00%, 03/01/28 | | | | | | | 196 | | | | 177,135 | |
TransDigm, Inc.(d): | | | | | | | | | | | | |
8.00%, 12/15/25 | | | | | | | 656 | | | | 689,450 | |
6.25%, 03/15/26 | | | | | | | 1,173 | | | | 1,170,091 | |
Wolverine Escrow LLC, 9.00%, 11/15/26(d) | | | | | | | 501 | | | | 360,720 | |
| | | | | | | | | | | | |
| | | | | | | | | | | 3,013,892 | |
|
| Air Freight & Logistics — 0.0% | |
XPO Logistics, Inc.,
6.25%, 05/01/25(d) | | | | | | | 35 | | | | 36,663 | |
| | | | | | | | | | | | |
|
| Airlines — 0.8% | |
American Airlines, Inc., 11.75%, 07/15/25(d) | | | | | | | 2,133 | | | | 2,020,356 | |
Mileage Plus Holdings LLC/Mileage Plus Intellectual Property Assets Ltd., 6.50%, 06/20/27(d)(f) | | | | | | | 2,158 | | | | 2,163,395 | |
| | | | | | | | | | | | |
| | | | | | | | | | | 4,183,751 | |
|
| Auto Components — 0.4% | |
Allison Transmission, Inc.(d): | | | | | | | | | | | | |
5.00%, 10/01/24 | | | | | | | 23 | | | | 22,942 | |
5.88%, 06/01/29 | | | | | | | 145 | | | | 150,800 | |
Clarios Global LP, 6.75%, 05/15/25(d) | | | | | | | 621 | | | | 645,840 | |
| | | | | | | | | | | | |
| Security | | | Par
(000) | | | Value | |
|
| Auto Components (continued) | |
Clarios Global LP/Clarios US Finance Co., 6.25%, 05/15/26(d) | | | USD | | | | 122 | | | $ | 125,812 | |
FCE Bank PLC, 1.62%, 05/11/23 | | | EUR | | | | 100 | | | | 105,479 | |
General Motors Co., 6.80%, 10/01/27 | | | USD | | | | 296 | | | | 344,917 | |
Goodyear Tire & Rubber Co., 9.50%, 05/31/25 | | | | | | | 65 | | | | 69,550 | |
Harley-Davidson Financial Services, Inc., 3.35%, 06/08/25(d) | | | | | | | 15 | | | | 15,339 | |
Icahn Enterprises LP/Icahn Enterprises Finance Corp.: | | | | | | | | | | | | |
4.75%, 09/15/24 | | | | | | | 153 | | | | 143,851 | |
6.38%, 12/15/25 | | | | | | | 3 | | | | 2,970 | |
5.25%, 05/15/27 | | | | | | | 138 | | | | 133,170 | |
NM Holdings Co. LLC, Series B, 9.50%, 07/01/05(a)(b)(c) | | | | | | | 5,125 | | | | 1 | |
Tesla, Inc., 5.30%, 08/15/25(d) | | | | | | | 130 | | | | 130,000 | |
Venture Holdings Co. LLC, 12.00%, 06/01/09(a)(b)(c)(g) | | | | | | | 5,150 | | | | 1 | |
| | | | | | | | | | | | |
| | | | | | | | | | | 1,890,672 | |
|
| Automobiles — 0.4% | |
Ford Motor Co.: | | | | | | | | | | | | |
8.50%, 04/21/23 | | | | | | | 169 | | | | 178,717 | |
4.35%, 12/08/26 | | | | | | | 9 | | | | 8,395 | |
4.75%, 01/15/43 | | | | | | | 176 | | | | 138,653 | |
5.29%, 12/08/46 | | | | | | | 78 | | | | 64,139 | |
Ford Motor Credit Co. LLC: | | | | | | | | | | | | |
3.81%, 01/09/24 | | | | | | | 200 | | | | 192,060 | |
4.06%, 11/01/24 | | | | | | | 200 | | | | 191,006 | |
5.13%, 06/16/25 | | | | | | | 423 | | | | 423,169 | |
General Motors Co.: | | | | | | | | | | | | |
6.13%, 10/01/25 | | | | | | | 623 | | | | 700,055 | |
5.00%, 10/01/28 | | | | | | | 19 | | | | 20,211 | |
Rolls-Royce PLC, 0.88%, 05/09/24 | | | EUR | | | | 100 | | | | 101,505 | |
Winnebago Industries, Inc., 6.25%, 07/15/28(d)(f) | | | USD | | | | 32 | | | | 32,000 | |
| | | | | | | | | | | | |
| | | | | | | | | | | 2,049,910 | |
|
| Banks — 0.0% | |
Banca Monte dei Paschi di Siena SpA,
2.63%, 04/28/25 | | | EUR | | | | 100 | | | | 109,921 | |
Banco Espirito Santo SA(b)(c)(g): | | | | | | | | | | | | |
2.63%, 05/08/17 | | | | | | | 100 | | | | 17,976 | |
4.75%, 01/15/21 | | | | | | | 200 | | | | 35,952 | |
4.00%, 01/21/21 | | | | | | | 100 | | | | 17,976 | |
| | | | | | | | |
| | | | | | | | | | | 181,825 | |
|
| Banks: Diversified — 0.0% | |
Encompass Health Corp.: | | | | | | | | | | | | |
4.50%, 02/01/28 | | | USD | | | | 14 | | | | 13,428 | |
4.75%, 02/01/30 | | | | | | | 19 | | | | 18,145 | |
| | | | | | | | |
| | | | | | | | | | | 31,573 | |
|
| Beverage: Soft Drinks — 0.0% | |
Energizer Holdings, Inc., 4.75%, 06/15/28(d)(f) | | | | | | | 65 | | | | 63,763 | |
| | | | | | | | |
|
| Beverages — 0.1% | |
Ardagh Packaging Finance PLC/Ardagh Holdings USA, Inc.(d): | | | | | | | | | | | | |
5.25%, 04/30/25 | | | | | | | 244 | | | | 250,098 | |
5.25%, 08/15/27 | | | | | | | 208 | | | | 204,335 | |
| | | | | | | | |
| | | | | | | | | | | 454,433 | |
|
| Building Products — 0.1% | |
Griffon Corp., 5.75%, 03/01/28(d) | | | | | | | 28 | | | | 27,650 | |
Jeld-Wen, Inc.(d): | | | | | | | | | | | | |
4.63%, 12/15/25 | | | | | | | 21 | | | | 20,160 | |
4.88%, 12/15/27 | | | | | | | 2 | | | | 1,920 | |
| | |
SCHEDULES OF INVESTMENTS | | 15 |
| | |
Schedule of Investments (unaudited) (continued) June 30, 2020 | | BlackRock Debt Strategies Fund, Inc. (DSU) (Percentages shown are based on Net Assets) |
| | | | | | | | | | | | |
| Security | | | Par
(000) | | | Value | |
|
| Building Products (continued) | |
Masonite International Corp.,
5.38%, 02/01/28(d) | | | USD | | | | 198 | | | $ | 202,455 | |
Standard Industries, Inc.(d): | | | | | | | | | | | | |
6.00%, 10/15/25 | | | | | | | 238 | | | | 244,966 | |
5.00%, 02/15/27 | | | | | | | 44 | | | | 44,550 | |
4.38%, 07/15/30 | | | | | | | 154 | | | | 153,615 | |
| | | | | | | | | | | | |
| | | | | | | | | | | 695,316 | |
|
| Cable Television Services — 0.0% | |
ViaSat, Inc., 6.50%, 07/15/28(d) | | | | | | | 102 | | | | 102,021 | |
| | | | | | | | | | | | |
|
| Capital Markets — 0.0% | |
LABL Escrow Issuer LLC, 6.75%, 07/15/26(d) | | | | | | | 116 | | | | 120,676 | |
NFP Corp., 7.00%, 05/15/25(d) | | | | | | | 31 | | | | 32,550 | |
| | | | | | | | | | | | |
| | | | | | | | | | | 153,226 | |
|
| Chemicals — 0.6% | |
Atotech Alpha 2 BV, (8.75% Cash or 9.50% PIK), 8.75%, 06/01/23(d)(e) | | | | | | | 400 | | | | 399,000 | |
Atotech Alpha 3 BV/Alpha US Bidco, Inc., 6.25%, 02/01/25(d) | | | | | | | 636 | | | | 629,640 | |
Blue Cube Spinco LLC: | | | | | | | | | | | | |
9.75%, 10/15/23 | | | | | | | 133 | | | | 136,990 | |
10.00%, 10/15/25 | | | | | | | 283 | | | | 295,028 | |
Element Solutions, Inc., 5.88%, 12/01/25(d) | | | | | | | 49 | | | | 49,475 | |
GCP Applied Technologies, Inc., 5.50%, 04/15/26(d) | | | | | | | 134 | | | | 133,665 | |
Illuminate Buyer LLC/Illuminate Holdings IV, Inc., 9.00%, 07/01/28(d) | | | | | | | 140 | | | | 145,950 | |
Minerals Technologies, Inc., 5.00%, 07/01/28(d) | | | | | | | 55 | | | | 55,825 | |
PQ Corp., 5.75%, 12/15/25(d) | | | | | | | 307 | | | | 309,302 | |
Valvoline, Inc., 4.25%, 02/15/30(d) | | | | | | | 128 | | | | 126,080 | |
WESCO Distribution, Inc.(d): | | | | | | | | | | | | |
7.13%, 06/15/25 | | | | | | | 217 | | | | 228,529 | |
7.25%, 06/15/28 | | | | | | | 198 | | | | 209,385 | |
WR Grace & Co-Conn, 4.88%, 06/15/27(d) | | | | | | | 92 | | | | 93,199 | |
| | | | | | | | | | | | |
| | | | | | | | | | | 2,812,068 | |
|
| Commercial Services & Supplies — 0.0% | |
Allied Universal Holdco LLC/Allied Universal Finance Corp., 9.75%, 07/15/27(d) | | | | | | | 72 | | | | 75,870 | |
United Rentals North America, Inc., 5.88%, 09/15/26 | | | | | | | 46 | | | | 48,208 | |
| | | | | | | | | | | | |
| | | | | | | | | | | 124,078 | |
|
| Communications Equipment — 0.1% | |
CommScope Technologies LLC, 6.00%, 06/15/25(d) | | | | | | | 110 | | | | 106,227 | |
CommScope, Inc.(d): | | | | | | | | | | | | |
5.50%, 06/15/24 | | | | | | | 13 | | | | 13,238 | |
6.00%, 03/01/26 | | | | | | | 32 | | | | 32,800 | |
ViaSat, Inc., 5.63%, 04/15/27(d) | | | | | | | 258 | | | | 264,128 | |
| | | | | | | | | | | | |
| | | | | | | | | | | 416,393 | |
|
| Construction & Engineering — 0.1% | |
Brand Industrial Services, Inc., 8.50%, 07/15/25(d) | | | | | | | 314 | | | | 282,600 | |
SRS Distribution, Inc., 8.25%, 07/01/26(d) | | | | | | | 403 | | | | 409,045 | |
| | | | | | | | | | | | |
| | | | | | | | | | | 691,645 | |
|
| Construction Materials — 0.5% | |
American Builders & Contractors Supply Co., Inc., 4.00%, 01/15/28(d) | | | | | | | 1,209 | | | | 1,174,870 | |
Core & Main LP, 6.13%, 08/15/25(d) | | | | | | | 797 | | | | 794,330 | |
HD Supply, Inc., 5.38%, 10/15/26(d) | | | | | | | 219 | | | | 223,654 | |
Williams Scotsman International, Inc., 6.88%, 08/15/23(d) | | | | | | | 531 | | | | 545,050 | |
| | | | | | | | | | | | |
| | | | | | | | | | | 2,737,904 | |
| | | | | | | | | | | | |
| Security | | | Par
(000) | | | Value | |
|
| Consumer Discretionary — 0.1% | |
Carnival Corp., 11.50%, 04/01/23(d) | | | USD | | | | 25 | | | $ | 27,125 | |
RELX Capital, Inc., 3.00%, 05/22/30 | | | | | | | 25 | | | | 26,945 | |
Royal Caribbean Cruises Ltd.(d): | | | | | | | | | | | | |
10.88%, 06/01/23 | | | | | | | 45 | | | | 46,240 | |
9.13%, 06/15/23 | | | | | | | 54 | | | | 53,527 | |
11.50%, 06/01/25 | | | | | | | 95 | | | | 99,128 | |
| | | | | | | | | | | | |
| | | | | | | | | | | 252,965 | |
|
| Consumer Finance — 0.6% | |
Global Payments, Inc., 2.90%, 05/15/30 | | | | | | | 64 | | | | 67,159 | |
Husky III Holding Ltd., (13.00% Cash or 13.00% PIK), 13.00%, 02/15/25(d)(e) | | | | | | | 434 | | | | 417,725 | |
Navient Corp.: | | | | | | | | | | | | |
7.25%, 09/25/23 | | | | | | | 5 | | | | 4,887 | |
6.13%, 03/25/24 | | | | | | | 96 | | | | 91,200 | |
5.88%, 10/25/24 | | | | | | | 77 | | | | 72,332 | |
5.00%, 03/15/27 | | | | | | | 2 | | | | 1,680 | |
OneMain Finance Corp.: | | | | | | | | | | | | |
8.88%, 06/01/25 | | | | | | | 27 | | | | 28,864 | |
6.63%, 01/15/28 | | | | | | | 8 | | | | 7,920 | |
5.38%, 11/15/29 | | | | | | | 14 | | | | 13,090 | |
PayPal Holdings, Inc., 1.65%, 06/01/25 | | | | | | | 257 | | | | 265,673 | |
Refinitiv US Holdings, Inc.(d): | | | | | | | | | | | | |
4.50%, 05/15/26 | | | EUR | | | | 855 | | | | 999,903 | |
6.25%, 05/15/26 | | | USD | | | | 15 | | | | 15,900 | |
Verscend Escrow Corp., 9.75%, 08/15/26(d) | | | | | | | 851 | | | | 914,272 | |
| | | | | | | | | | | | |
| | | | | | | | | | | 2,900,605 | |
|
| Containers & Packaging — 0.4% | |
ARD Finance SA, (6.50% Cash or 7.25% PIK), 6.50%, 06/30/27(d)(e) | | | | | | | 441 | | | | 436,314 | |
Ardagh Packaging Finance PLC/Ardagh Holdings USA, Inc., 4.13%, 08/15/26(d) | | | | | | | 200 | | | | 196,770 | |
Reynolds Group Issuer, Inc./Reynolds Group Issuer LLC/Reynolds Group Issuer Lu, 7.00%, 07/15/24(d) | | | | | | | 223 | | | | 223,627 | |
Trivium Packaging Finance BV: | | | | | | | | | | | | |
3.75%, 08/15/26 | | | EUR | | | | 100 | | | | 110,264 | |
8.50%, 08/15/27(d) | | | USD | | | | 814 | | | | 869,962 | |
| | | | | | | | | | | | |
| | | | | | | | | | | 1,836,937 | |
|
| County/City/Special District/School District — 0.0% | |
Hanesbrands, Inc., 5.38%, 05/15/25(d) | | | | | | | 71 | | | | 71,798 | |
William Carter Co., 5.50%, 05/15/25(d) | | | | | | | 23 | | | | 23,719 | |
| | | | | | | | | | | | |
| | | | | | | | | | | 95,517 | |
|
| Diversified Consumer Services — 0.1% | |
APX Group, Inc., 7.88%, 12/01/22 | | | | | | | 163 | | | | 162,185 | |
Ascend Learning LLC, 6.88%, 08/01/25(d) | | | | | | | 340 | | | | 341,959 | |
Brink’s Co., 5.50%, 07/15/25(d) | | | | | | | 36 | | | | 36,667 | |
| | | | | | | | | | | | |
| | | | | | | | | | | 540,811 | |
|
| Diversified Financial Services — 1.0% | |
Allied Universal Holdco LLC/Allied Universal Finance Corp., 6.63%, 07/15/26(d) | | | | | | | 797 | | | | 836,850 | |
Ally Financial, Inc., 3.05%, 06/05/23 | | | | | | | 1,225 | | | | 1,239,721 | |
Altice France Holding SA: | | | | | | | | | | | | |
8.00%, 05/15/27 | | | EUR | | | | 100 | | | | 118,402 | |
10.50%, 05/15/27(d) | | | USD | | | | 539 | | | | 593,735 | |
6.00%, 02/15/28(d) | | | | | | | 272 | | | | 256,871 | |
Arrow Global Finance PLC, 5.13%, 09/15/24 | | | GBP | | | | 100 | | | | 113,606 | |
Citigroup, Inc., Series V, (Secured Overnight Financing Rate + 3.23%), 4.70%(h)(i) | | | USD | | | | 410 | | | | 364,387 | |
F-Brasile SpA/F-Brasile US LLC, Series XR, 7.38%, 08/15/26(d) | | | | | | | 200 | | | | 153,440 | |
| | |
| 16 | | 2020 BLACKROCK SEMI-ANNUAL REPORTTO SHAREHOLDERS |
| | |
Schedule of Investments (unaudited) (continued) June 30, 2020 | | BlackRock Debt Strategies Fund, Inc. (DSU) (Percentages shown are based on Net Assets) |
| | | | | | | | | | | | |
| Security | | | Par
(000) | | | Value | |
|
| Diversified Financial Services (continued) | |
General Motors Financial Co., Inc.: | | | | | | | | | | | | |
2.75%, 06/20/25 | | | USD | | | | 574 | | | $ | 566,943 | |
5.65%, 01/17/29 | | | | | | | 21 | | | | 23,632 | |
Level 3 Financing, Inc., 4.25%, 07/01/28(d) | | | | | | | 264 | | | | 263,696 | |
Murphy Oil USA, Inc., 4.75%, 09/15/29 | | | | | | | 119 | | | | 121,678 | |
Picasso Finance Sub, Inc., 6.13%, 06/15/25(d) | | | | | | | 159 | | | | 162,578 | |
Spectrum Brands, Inc., 5.50%, 07/15/30(d) | | | | | | | 50 | | | | 50,063 | |
Tempo Acquisition LLC/Tempo Acquisition Finance Corp., 6.75%, 06/01/25(d) | | | | | | | 211 | | | | 213,638 | |
WMG Acquisition Corp., 3.88%, 07/15/30(d) | | | | | | | 65 | | | | 65,653 | |
| | | | | | | | | | | | |
| | | | | | | | | | | 5,144,893 | |
|
| Diversified Telecommunication Services — 0.4% | |
CenturyLink, Inc.:
5.13%, 12/15/26(d) | | | | | | | 638 | | | | 636,405 | |
Series P, 7.60%, 09/15/39 | | | | | | | 177 | | | | 190,496 | |
Frontier Communications Corp., 8.00%, 04/01/27(d) | | | | | | | 39 | | | | 39,552 | |
Northwest Fiber LLC/Northwest Fiber Finance Sub, Inc., 10.75%, 06/01/28(d) | | | | | | | 30 | | | | 31,200 | |
Oi SA, (10% Cash or 8.00% Cash + 4.00% PIK), 10.00%, 07/27/25(e) | | | | | | | 20 | | | | 16,675 | |
SoftBank Group Corp., 4.00%, 09/19/29 | | | EUR | | | | 100 | | | | 110,103 | |
Telecom Italia Capital SA: | | | | | | | | | | | | |
6.38%, 11/15/33 | | | USD | | | | 58 | | | | 65,395 | |
6.00%, 09/30/34 | | | | | | | 134 | | | | 145,658 | |
7.20%, 07/18/36 | | | | | | | 14 | | | | 16,660 | |
7.72%, 06/04/38 | | | | | | | 51 | | | | 64,170 | |
Telecom Italia SpA, 5.30%, 05/30/24(d) | | | | | | | 314 | | | | 327,681 | |
Telesat Canada/Telesat LLC,
4.88%, 06/01/27(d) | | | | | | | 131 | | | | 128,380 | |
| | | | | | | | | | | | |
| | | | | | | | | | | 1,772,375 | |
|
| Electric Utilities — 0.0% | |
PG&E Corp., 5.25%, 07/01/30 | | | | | | | 118 | | | | 118,673 | |
| | | | | | | | | | | | |
|
| Electronic Equipment, Instruments & Components — 0.0% | |
CDW LLC/CDW Finance Corp., 4.13%, 05/01/25 | | | | | | | 133 | | | | 133,166 | |
Energizer Holdings, Inc., 6.38%, 07/15/26(d) | | | | | | | 55 | | | | 56,868 | |
| | | | | | | | | | | | |
| | | | | | | | | | | 190,034 | |
|
| Energy Equipment & Services — 0.3% | |
Archrock Partners LP/Archrock Partners Finance Corp.(d): | | | | | | | | | | | | |
6.88%, 04/01/27 | | | | | | | 107 | | | | 100,794 | |
6.25%, 04/01/28 | | | | | | | 29 | | | | 26,390 | |
Gates Global LLC/Gates Global Co., 6.25%, 01/15/26(d) | | | | | | | 280 | | | | 275,100 | |
Pioneer Energy Services Corp.(d)(e): | | | | | | | | | | | | |
(11% Cash), 11.00%, 05/15/25 | | | | | | | 332 | | | | 265,203 | |
(5.00% PIK), 5.00%, 11/15/25(j) | | | | | | | 226 | | | | 122,141 | |
USA Compression Partners LP/USA Compression Finance Corp.: | | | | | | | | | | | | |
6.88%, 04/01/26 | | | | | | | 331 | | | | 319,829 | |
6.88%, 09/01/27 | | | | | | | 254 | | | | 243,840 | |
| | | | | | | | | | | | |
| | | | | | | | | | | 1,353,297 | |
|
| Environmental, Maintenance, & Security Service — 0.1% | |
Tervita Corp., 7.63%, 12/01/21(d) | | | | | | | 380 | | | | 298,300 | |
Waste Pro USA, Inc., 5.50%, 02/15/26(d) | | | | | | | 71 | | | | 67,769 | |
| | | | | | | | | | | | |
| | | | | | | | | | | 366,069 | |
|
| Equity Real Estate Investment Trusts (REITs) — 0.6% | |
Brookfield Property REIT, Inc./BPR Cumulus LLC/BPR Nimbus LLC/GGSI Sellco LL, 5.75%, 05/15/26(d) | | | | | | | 128 | | | | 108,160 | |
Diversified Healthcare Trust, 9.75%, 06/15/25 | | | | | | | 70 | | | | 75,162 | |
| | | | | | | | | | | | |
| Security | | | Par
(000) | | | Value | |
|
| Equity Real Estate Investment Trusts (REITs) (continued) | |
GLP Capital LP/GLP Financing II, Inc.: | | | | | | | | | | | | |
5.25%, 06/01/25 | | | USD | | | | 162 | | | $ | 176,159 | |
5.38%, 04/15/26 | | | | | | | 80 | | | | 87,407 | |
Hilton Domestic Operating Co., Inc.(d): | | | | | | | | | | | | |
5.38%, 05/01/25 | | | | | | | 127 | | | | 127,000 | |
5.75%, 05/01/28 | | | | | | | 163 | | | | 164,630 | |
Iron Mountain, Inc.(d): | | | | | | | | | | | | |
5.25%, 07/15/30 | | | | | | | 134 | | | | 131,990 | |
5.63%, 07/15/32 | | | | | | | 163 | | | | 162,658 | |
Marriott International, Inc., Series EE, 5.75%, 05/01/25 | | | | | | | 393 | | | | 426,938 | |
MGM Growth Properties Operating Partnership LP/MGP Finance Co-Issuer, Inc.: | | | | | | | | | | | | |
4.50%, 09/01/26 | | | | | | | 139 | | | | 137,652 | |
4.50%, 01/15/28 | | | | | | | 420 | | | | 399,000 | |
MPT Operating Partnership LP/MPT Finance Corp., 4.63%, 08/01/29 | | | | | | | 329 | | | | 330,645 | |
Ryman Hospitality Properties, Inc., 4.75%, 10/15/27(d) | | | | | | | 500 | | | | 445,000 | |
Service Properties Trust: | | | | | | | | | | | | |
4.50%, 06/15/23 | | | | | | | 15 | | | | 14,361 | |
4.35%, 10/01/24 | | | | | | | 12 | | | | 10,816 | |
7.50%, 09/15/25 | | | | | | | 108 | | | | 113,782 | |
VICI Properties LP/VICI Note Co., Inc., 4.63%, 12/01/29(d) | | | | | | | 356 | | | | 347,100 | |
| | | | | | | | | | | | |
| | | | | | | | | | | 3,258,460 | |
|
| Food & Staples Retailing — 0.1% | |
Lamb Weston Holdings, Inc., 4.88%, 05/15/28(d) | | | | | | | 99 | | | | 104,891 | |
Post Holdings, Inc., 4.63%, 04/15/30(d) | | | | | | | 146 | | | | 142,905 | |
| | | | | | | | | | | | |
| | | | | | | | | | | 247,796 | |
|
| Food Products — 0.6% | |
Aramark Services, Inc., 6.38%, 05/01/25(d) | | | | | | | 99 | | | | 102,230 | |
Chobani LLC/Chobani Finance Corp., Inc., 7.50%, 04/15/25(d) | | | | | | | 261 | | | | 251,865 | |
JBS USA LUX SA/JBS USA Finance, Inc., 6.75%, 02/15/28(d) | | | | | | | 118 | | | | 124,416 | |
JBS USA LUX SA/JBS USA Food Co./JBS USA Finance, Inc.(d): | | | | | | | | | | | | |
6.50%, 04/15/29 | | | | | | | 311 | | | | 330,049 | |
5.50%, 01/15/30 | | | | | | | 37 | | | | 37,925 | |
Kraft Heinz Foods Co.: | | | | | | | | | | | | |
3.88%, 05/15/27(d) | | | | | | | 16 | | | | 16,720 | |
4.25%, 03/01/31(d) | | | | | | | 411 | | | | 435,781 | |
5.00%, 07/15/35 | | | | | | | 100 | | | | 110,028 | |
6.88%, 01/26/39 | | | | | | | 164 | | | | 202,742 | |
4.63%, 10/01/39(d) | | | | | | | 88 | | | | 88,366 | |
6.50%, 02/09/40 | | | | | | | 125 | | | | 150,457 | |
5.20%, 07/15/45 | | | | | | | 101 | | | | 109,531 | |
4.38%, 06/01/46 | | | | | | | 217 | | | | 213,331 | |
4.88%, 10/01/49(d) | | | | | | | 208 | | | | 211,810 | |
5.50%, 06/01/50(d) | | | | | | | 406 | | | | 432,779 | |
Simmons Foods, Inc., 7.75%, 01/15/24(d) | | | | | | | 174 | | | | 181,517 | |
| | | | | | | | | | | | |
| | | | | | | | | | | 2,999,547 | |
|
| Gas Utilities — 0.0% | |
Ferrellgas LP/Ferrellgas Finance Corp., 10.00%, 04/15/25(d) | | | | | | | 44 | | | | 47,410 | |
| | | | | | | | | | | | |
|
| Health Care Equipment & Supplies — 0.2% | |
Avantor, Inc.(d): | | | | | | | | | | | | |
6.00%, 10/01/24 | | | | | | | 626 | | | | 654,170 | |
9.00%, 10/01/25 | | | | | | | 192 | | | | 206,400 | |
DENTSPLY SIRONA, Inc., 3.25%, 06/01/30 | | | | | | | 45 | | | | 47,309 | |
| | | | |
| SCHEDULES OF INVESTMENTS | | | 17 | |
| | |
Schedule of Investments (unaudited) (continued) June 30, 2020 | | BlackRock Debt Strategies Fund, Inc. (DSU) (Percentages shown are based on Net Assets) |
| | | | | | | | | | | | |
| Security | | | Par
(000) | | | Value | |
|
| Health Care Equipment & Supplies (continued) | |
Ortho-Clinical Diagnostics, Inc./Ortho-Clinical Diagnostics SA(d): | | | | | | | | | | | | |
7.38%, 06/01/25 | | | USD | | | | 189 | | | $ | 192,307 | |
7.25%, 02/01/28 | | | | | | | 72 | | | | 73,187 | |
| | | | | | | | | | | | |
| | | | | | | | | | | 1,173,373 | |
|
| Health Care Providers & Services — 1.0% | |
Acadia Healthcare Co., Inc., 5.50%, 07/01/28(d) | | | | | | | 66 | | | | 66,165 | |
AHP Health Partners, Inc., 9.75%, 07/15/26(d) | | | | | | | 200 | | | | 205,500 | |
Centene Corp.: | | | | | | | | | | | | |
5.38%, 08/15/26(d) | | | | | | | 117 | | | | 121,705 | |
4.25%, 12/15/27 | | | | | | | 285 | | | | 294,094 | |
3.38%, 02/15/30 | | | | | | | 145 | | | | 146,408 | |
CHS/Community Health Systems, Inc.(d): | | | | | | | | | | | | |
8.63%, 01/15/24 | | | | | | | 354 | | | | 346,170 | |
6.63%, 02/15/25 | | | | | | | 205 | | | | 192,700 | |
8.00%, 03/15/26 | | | | | | | 441 | | | | 416,833 | |
Encompass Health Corp., 5.75%, 11/01/24 | | | | | | | 69 | | | | 69,000 | |
HCA, Inc., 3.50%, 09/01/30 | | | | | | | 528 | | | | 508,555 | |
LifePoint Health, Inc.(d): | | | | | | | | | | | | |
6.75%, 04/15/25 | | | | | | | 116 | | | | 119,770 | |
4.38%, 02/15/27 | | | | | | | 135 | | | | 127,575 | |
MEDNAX, Inc., 6.25%, 01/15/27(d) | | | | | | | 50 | | | | 50,000 | |
Molina Healthcare, Inc., 4.38%, 06/15/28(d) | | | | | | | 83 | | | | 82,896 | |
MPH Acquisition Holdings LLC, 7.13%, 06/01/24(d) | | | | | | | 388 | | | | 360,840 | |
Polaris Intermediate Corp., (8.50% Cash or 9.25% PIK), 8.50%, 12/01/22(d)(e) | | | | | | | 302 | | | | 265,327 | |
Surgery Center Holdings, Inc.(d): | | | | | | | | | | | | |
6.75%, 07/01/25 | | | | | | | 145 | | | | 130,863 | |
10.00%, 04/15/27 | | | | | | | 220 | | | | 220,000 | |
Team Health Holdings, Inc., 6.38%, 02/01/25(d) | | | | | | | 103 | | | | 59,740 | |
Teleflex, Inc., 4.25%, 06/01/28(d) | | | | | | | 130 | | | | 133,250 | |
Tenet Healthcare Corp.(d): | | | | | | | | | | | | |
7.50%, 04/01/25 | | | | | | | 110 | | | | 117,013 | |
4.88%, 01/01/26 | | | | | | | 582 | | | | 566,722 | |
5.13%, 11/01/27 | | | | | | | 385 | | | | 379,879 | |
4.63%, 06/15/28 | | | | | | | 46 | | | | 44,813 | |
| | | | | | | | | | | | |
| | | | | | | | | | | 5,025,818 | |
|
| Health Care Technology — 0.1% | |
Change Healthcare Holdings LLC/Change Healthcare Finance, Inc., 5.75%, 03/01/25(d) | | | | | | | 229 | | | | 226,137 | |
| | | | | | | | | | | | |
|
| Hotels, Restaurants & Leisure — 1.1% | |
1011778 BC ULC/New Red Finance, Inc.(d): | | | | | | | | | | | | |
5.75%, 04/15/25 | | | | | | | 225 | | | | 236,250 | |
4.38%, 01/15/28 | | | | | | | 218 | | | | 213,681 | |
Boyd Gaming Corp.: | | | | | | | | | | | | |
8.63%, 06/01/25(d) | | | | | | | 48 | | | | 50,160 | |
6.38%, 04/01/26 | | | | | | | 15 | | | | 14,250 | |
Boyne USA, Inc., 7.25%, 05/01/25(d) | | | | | | | 19 | | | | 19,903 | |
Cedar Fair LP/Canada’s Wonderland Co./Magnum Management Corp./Millennium Op, 5.50%, 05/01/25(d) | | | | | | | 292 | | | | 293,460 | |
Colt Merger Sub, Inc.(d)(f): | | | | | | | | | | | | |
5.75%, 07/01/25 | | | | | | | 617 | | | | 620,517 | |
6.25%, 07/01/25 | | | | | | | 530 | | | | 526,687 | |
8.13%, 07/01/27 | | | | | | | 282 | | | | 272,483 | |
GLP Capital LP/GLP Financing II, Inc., 5.30%, 01/15/29 | | | | | | | 25 | | | | 27,052 | |
Golden Nugget, Inc., 6.75%, 10/15/24(d) | | | | | | | 476 | | | | 342,125 | |
Hilton Domestic Operating Co., Inc., 4.88%, 01/15/30 | | | | | | | 484 | | | | 476,740 | |
IRB Holding Corp., 7.00%, 06/15/25(d) | | | | | | | 284 | | | | 292,719 | |
| | | | | | | | | | | | |
| Security | | | Par
(000) | | | Value | |
|
| Hotels, Restaurants & Leisure (continued) | |
Las Vegas Sands Corp.: | | | | | | | | | | | | |
3.50%, 08/18/26 | | | USD | | | | 31 | | | $ | 30,912 | |
3.90%, 08/08/29 | | | | | | | 28 | | | | 27,622 | |
Lions Gate Capital Holdings LLC(d): | | | | | | | | | | | | |
6.38%, 02/01/24 | | | | | | | 26 | | | | 25,350 | |
5.88%, 11/01/24 | | | | | | | 21 | | | | 20,055 | |
MGM Resorts International, 5.75%, 06/15/25 | | | | | | | 73 | | | | 72,180 | |
Sabre GLBL, Inc.(d): | | | | | | | | | | | | |
5.25%, 11/15/23 | | | | | | | 10 | | | | 9,200 | |
9.25%, 04/15/25 | | | | | | | 287 | | | | 302,426 | |
Scientific Games International, Inc.(d): | | | | | | | | | | | | |
8.63%, 07/01/25(f) | | | | | | | 65 | | | | 60,756 | |
8.25%, 03/15/26 | | | | | | | 483 | | | | 433,191 | |
Six Flags Theme Parks, Inc., 7.00%, 07/01/25(d) | | | | | | | 505 | | | | 522,044 | |
Unique Pub Finance Co. PLC, Series N, 6.46%, 03/30/32 | | | GBP | | | | 100 | | | | 128,843 | |
Vail Resorts, Inc., 6.25%, 05/15/25(d) | | | USD | | | | 89 | | | | 93,116 | |
Wynn Resorts Finance LLC/Wynn Resorts Capital Corp., 5.13%, 10/01/29(d) | | | | | | | 103 | | | | 92,056 | |
Yum! Brands, Inc.: | | | | | | | | | | | | |
7.75%, 04/01/25(d) | | | | | | | 296 | | | | 319,310 | |
4.75%, 01/15/30(d) | | | | | | | 182 | | | | 184,730 | |
5.35%, 11/01/43 | | | | | | | 14 | | | | 13,440 | |
| | | | | | | | | | | | |
| | | | | | | | | | | 5,721,258 | |
|
| Household Durables — 0.1% | |
Brookfield Residential Properties, Inc./Brookfield Residential US Corp., 4.88%, 02/15/30(d) | | | | | | | 237 | | | | 198,037 | |
CD&R Smokey Buyer, Inc., 6.75%, 07/15/25(d)(f) | | | | | | | 75 | | | | 77,978 | |
Lennar Corp.: | | | | | | | | | | | | |
4.75%, 05/30/25 | | | | | | | 25 | | | | 26,688 | |
5.25%, 06/01/26 | | | | | | | 143 | | | | 154,440 | |
Mattamy Group Corp., 4.63%, 03/01/30(d) | | | | | | | 102 | | | | 97,920 | |
Newell Brands, Inc., 4.88%, 06/01/25 | | | | | | | 46 | | | | 48,175 | |
PulteGroup, Inc.: | | | | | | | | | | | | |
5.00%, 01/15/27 | | | | | | | 44 | | | | 47,080 | |
7.88%, 06/15/32 | | | | | | | 23 | | | | 29,389 | |
Tempur Sealy International, Inc., 5.50%, 06/15/26 | | | | | | | 2 | | | | 2,020 | |
TRI Pointe Group, Inc., 5.70%, 06/15/28 | | | | | | | 18 | | | | 18,270 | |
| | | | | | | | | | | | |
| | | | | | | | | | | 699,997 | |
|
| Independent Power and Renewable Electricity Producers — 0.2% | |
Calpine Corp.: | | | | | | | | | | | | |
5.75%, 01/15/25 | | | | | | | 31 | | | | 31,304 | |
5.25%, 06/01/26(d) | | | | | | | 100 | | | | 100,971 | |
4.50%, 02/15/28(d) | | | | | | | 5 | | | | 4,875 | |
5.13%, 03/15/28(d) | | | | | | | 679 | | | | 665,420 | |
Clearway Energy Operating LLC, 4.75%, 03/15/28(d) | | | | | | | 46 | | | | 46,917 | |
TerraForm Power Operating LLC, 4.75%, 01/15/30(d) | | | | | | | 125 | | | | 126,875 | |
| | | | | | | | | | | | |
| | | | | | | | | | | 976,362 | |
|
| Industrial Conglomerates — 0.1% | |
BWX Technologies, Inc., 4.13%, 06/30/28(d) | | | | | | | 81 | | | | 80,797 | |
Vertical US Newco, Inc., 5.25%, 07/15/27(d)(f) | | | | | | | 200 | | | | 200,000 | |
| | | | | | | | | | | | |
| | | | | | | | | | | 280,797 | |
|
| Insurance — 0.2% | |
Alliant Holdings Intermediate LLC/Alliant Holdings Co-Issuer, 6.75%, 10/15/27(d) | | | | | | | 657 | | | | 654,779 | |
HUB International Ltd., 7.00%, 05/01/26(d) | | | | | | | 467 | | | | 466,019 | |
Willis North America, Inc., 2.95%, 09/15/29 | | | | | | | 10 | | | | 10,586 | |
| | | | | | | | | | | | |
| | | | | | | | | | | 1,131,384 | |
| | |
| 18 | | 2020 BLACKROCK SEMI-ANNUAL REPORTTO SHAREHOLDERS |
| | |
Schedule of Investments (unaudited) (continued) June 30, 2020 | | BlackRock Debt Strategies Fund, Inc. (DSU) (Percentages shown are based on Net Assets) |
| | | | | | | | | | | | |
| Security | | | Par
(000) | | | Value | |
|
| Interactive Media & Services — 0.3% | |
Match Group, Inc., 4.13%, 08/01/30(d) | | | USD | | | | 160 | | | $ | 156,650 | |
Netflix, Inc.: | | | | | | | | | | | | |
4.88%, 04/15/28 | | | | | | | 213 | | | | 227,754 | |
5.88%, 11/15/28 | | | | | | | 36 | | | | 40,995 | |
3.63%, 06/15/30 | | | EUR | | | | 100 | | | | 115,440 | |
4.88%, 06/15/30(d) | | | USD | | | | 248 | | | | 265,980 | |
Twitter, Inc., 3.88%, 12/15/27(d) | | | | | | | 88 | | | | 88,009 | |
Uber Technologies, Inc.(d): | | | | | | | | | | | | |
7.50%, 11/01/23 | | | | | | | 145 | | | | 146,450 | |
7.50%, 05/15/25 | | | | | | | 230 | | | | 231,725 | |
8.00%, 11/01/26 | | | | | | | 33 | | | | 33,577 | |
7.50%, 09/15/27 | | | | | | | 70 | | | �� | 70,175 | |
| | | | | | | | | | | | |
| | | | | | | | | | | 1,376,755 | |
|
| Internet & Direct Marketing Retail — 0.1% | |
Booking Holdings, Inc., 4.10%, 04/13/25 | | | | | | | 271 | | | | 304,165 | |
Expedia Group, Inc., 6.25%, 05/01/25(d) | | | | | | | 275 | | | | 292,950 | |
| | | | | | | | | | | | |
| | | | | | | | | | | 597,115 | |
|
| Internet Software & Services — 0.0% | |
Match Group Inc/old, 4.63%, 06/01/28(d) | | | | | | | 60 | | | | 60,525 | |
| | | | | | | | | | | | |
|
| IT Services — 0.5% | |
Banff Merger Sub, Inc., 9.75%, 09/01/26(d) | | | | | | | 460 | | | | 462,875 | |
Camelot Finance SA, 4.50%, 11/01/26(d) | | | | | | | 287 | | | | 287,000 | |
Fiserv, Inc., 2.25%, 06/01/27 | | | | | | | 1,385 | | | | 1,448,287 | |
Gartner, Inc., 4.50%, 07/01/28(d) | | | | | | | 110 | | | | 111,287 | |
Leidos, Inc., 4.38%, 05/15/30(d) | | | | | | | 105 | | | | 118,277 | |
WEX, Inc., 4.75%, 02/01/23(d) | | | | | | | 8 | | | | 7,943 | |
Xerox Corp., 4.80%, 03/01/35 | | | | | | | 181 | | | | 168,744 | |
| | | | | | | | | | | | |
| | | | | | | | | | | 2,604,413 | |
|
| Leisure Products — 0.0% | |
Mattel, Inc.: | | | | | | | | | | | | |
5.88%, 12/15/27(d) | | | | | | | 34 | | | | 35,020 | |
6.20%, 10/01/40 | | | | | | | 23 | | | | 19,895 | |
5.45%, 11/01/41 | | | | | | | 97 | | | | 80,479 | |
| | | | | | | | | | | | |
| | | | | | | | | | | 135,394 | |
|
| Machinery — 0.2% | |
Clark Equipment Co., 5.88%, 06/01/25(d) | | | | | | | 284 | | | | 290,390 | |
Colfax Corp., 6.38%, 02/15/26(d) | | | | | | | 161 | | | | 168,245 | |
Platin 1426 GmbH, 5.38%, 06/15/23 | | | EUR | | | | 100 | | | | 103,751 | |
RBS Global, Inc./Rexnord LLC, 4.88%, 12/15/25(d) | | | USD | | | | 205 | | | | 206,025 | |
Titan Acquisition Ltd./Titan Co-Borrower LLC, 7.75%, 04/15/26(d) | | | | | | | 126 | | | | 119,227 | |
| | | | | | | | | | | | |
| | | | | | | | | | | 887,638 | |
|
| Media — 2.1% | |
Altice France SA(d): | | | | | | | | | | | | |
7.38%, 05/01/26 | | | | | | | 391 | | | | 407,735 | |
8.13%, 02/01/27 | | | | | | | 334 | | | | 365,312 | |
CCO Holdings LLC/CCO Holdings Capital Corp.(d): | | | | | | | | | | | | |
5.13%, 05/01/27 | | | | | | | 309 | | | | 319,691 | |
5.00%, 02/01/28 | | | | | | | 34 | | | | 35,105 | |
5.38%, 06/01/29 | | | | | | | 144 | | | | 151,920 | |
4.50%, 08/15/30 | | | | | | | 484 | | | | 493,680 | |
4.50%, 05/01/32 | | | | | | | 554 | | | | 560,925 | |
Clear Channel Worldwide Holdings, Inc.: | | | | | | | | | | | | |
9.25%, 02/15/24 | | | | | | | 363 | | | | 336,719 | |
5.13%, 08/15/27(d) | | | | | | | 626 | | | | 600,960 | |
Connect Finco Sarl/Connect US Finco LLC, 6.75%, 10/01/26(d) | | | | | | | 1,488 | | | | 1,409,880 | |
CSC Holdings LLC: | | | | | | | | | | | | |
5.25%, 06/01/24 | | | | | | | 344 | | | | 362,060 | |
4.13%, 12/01/30(d) | | | | | | | 200 | | | | 198,250 | |
| | | | | | | | | | | | |
| Security | | | Par
(000) | | | Value | |
|
| Media (continued) | |
DISH DBS Corp.: | | | | | | | | | | | | |
5.88%, 07/15/22 | | | USD | | | | 689 | | | $ | 700,575 | |
7.75%, 07/01/26 | | | | | | | 181 | | | | 191,860 | |
Dolya Holdco 18 DAC, 5.00%, 07/15/28(d) | | | | | | | 242 | | | | 238,902 | |
Hughes Satellite Systems Corp., 5.25%, 08/01/26 | | | | | | | 20 | | | | 20,684 | |
Intelsat Jackson Holdings SA,
8.00%, 02/15/24(d) | | | | | | | 155 | | | | 157,198 | |
Lamar Media Corp.(d): | | | | | | | | | | | | |
4.88%, 01/15/29 | | | | | | | 24 | | | | 24,120 | |
4.00%, 02/15/30 | | | | | | | 90 | | | | 86,148 | |
LCPR Senior Secured Financing DAC, 6.75%, 10/15/27(d) | | | | | | | 200 | | | | 204,000 | |
Live Nation Entertainment, Inc., 6.50%, 05/15/27(d) | | | | | | | 318 | | | | 327,540 | |
Radiate Holdco LLC/Radiate Finance, Inc.(d): | | | | | | | | | | | | |
6.88%, 02/15/23 | | | | | | | 95 | | | | 96,188 | |
6.63%, 02/15/25 | | | | | | | 148 | | | | 147,291 | |
SES SA, (5 year EUR Swap + 5.40%),
5.63%(h)(i) | | | EUR | | | | 100 | | | | 115,149 | |
Sirius XM Radio, Inc.(d): | | | | | | | | | | | | |
5.50%, 07/01/29 | | | USD | | | | 124 | | | | 130,525 | |
4.13%, 07/01/30 | | | | | | | 144 | | | | 142,410 | |
Univision Communications, Inc.(d): | | | | | | | | | | | | |
5.13%, 02/15/25 | | | | | | | 107 | | | | 100,781 | |
6.63%, 06/01/27 | | | | | | | 421 | | | | 402,055 | |
Virgin Media Secured Finance PLC, 4.50%, 08/15/30(d) | | | | | | | 200 | | | | 200,250 | |
Zayo Group Holdings Inc.(d): | | | | | | | | | | | | |
4.00%, 03/01/27 | | | | | | | 1,226 | | | | 1,166,613 | |
6.13%, 03/01/28 | | | | | | | 450 | | | | 437,625 | |
Ziggo Bond Co. BV, 5.13%, 02/28/30(d) | | | | | | | 200 | | | | 198,440 | |
Ziggo BV(d): | | | | | | | | | | | | |
5.50%, 01/15/27 | | | | | | | 169 | | | | 171,123 | |
4.88%, 01/15/30 | | | | | | | 200 | | | | 201,084 | |
| | | | | | | | | | | | |
| | | | | | | | | | | 10,702,798 | |
|
| Metals & Mining — 0.7% | |
Arconic Corp.(d): | | | | | | | | | | | | |
6.00%, 05/15/25 | | | | | | | 212 | | | | 219,155 | |
6.13%, 02/15/28 | | | | | | | 106 | | | | 105,974 | |
Big River Steel LLC/BRS Finance Corp., 7.25%, 09/01/25(d) | | | | | | | 23 | | | | 21,965 | |
Constellium SE(d): | | | | | | | | | | | | |
6.63%, 03/01/25 | | | | | | | 300 | | | | 303,381 | |
5.88%, 02/15/26 | | | | | | | 321 | | | | 321,857 | |
Freeport-McMoRan, Inc.: | | | | | | | | | | | | |
4.25%, 03/01/30 | | | | | | | 267 | | | | 258,990 | |
5.45%, 03/15/43 | | | | | | | 1,229 | | | | 1,204,420 | |
Grinding Media, Inc./Moly-Cop AltaSteel Ltd., 7.38%, 12/15/23(d) | | | | | | | 96 | | | | 95,520 | |
Kaiser Aluminum Corp., 4.63%, 03/01/28(d) | | | | | | | 100 | | | | 95,632 | |
New Gold, Inc., 7.50%, 07/15/27(d) | | | | | | | 99 | | | | 102,137 | |
Novelis Corp.(d): | | | | | | | | | | | | |
5.88%, 09/30/26 | | | | | | | 51 | | | | 50,936 | |
4.75%, 01/30/30 | | | | | | | 589 | | | | 562,495 | |
thyssenkrupp AG, 2.88%, 02/22/24 | | | EUR | | | | 64 | | | | 69,173 | |
United States Steel Corp., 12.00%, 06/01/25(d) | | | USD | | | | 156 | | | | 159,900 | |
| | | | | | | | | | | | |
| | | | | | | | | | | 3,571,535 | |
|
| Multiline Retail — 0.1% | |
Macy’s, Inc., 8.38%, 06/15/25(d) | | | | | | | 202 | | | | 201,089 | |
Nordstrom, Inc., 8.75%, 05/15/25(d) | | | | | | | 75 | | | | 80,711 | |
| | | | | | | | | | | | |
| | | | | | | | | | | 281,800 | |
| | | | |
| SCHEDULES OF INVESTMENTS | | | 19 | |
| | |
Schedule of Investments (unaudited) (continued) June 30, 2020 | | BlackRock Debt Strategies Fund, Inc. (DSU) (Percentages shown are based on Net Assets) |
| | | | | | | | | | | | |
| Security | | | Par
(000) | | | Value | |
|
| Oil, Gas & Consumable Fuels — 2.6% | |
Apache Corp.: | | | | | | | | | | | | |
5.25%, 02/01/42 | | | USD | | | | 10 | | | $ | 8,161 | |
4.75%, 04/15/43 | | | | | | | 103 | | | | 82,924 | |
4.25%, 01/15/44 | | | | | | | 134 | | | | 101,884 | |
5.35%, 07/01/49 | | | | | | | 23 | | | | 18,353 | |
Ascent Resources Utica Holdings LLC/ARU Finance Corp., 10.00%, 04/01/22(d) | | | | | | | 391 | | | | 333,327 | |
Buckeye Partners LP: | | | | | | | | | | | | |
4.13%, 03/01/25(d) | | | | | | | 5 | | | | 4,796 | |
3.95%, 12/01/26 | | | | | | | 34 | | | | 32,038 | |
4.50%, 03/01/28(d) | | | | | | | 61 | | | | 57,035 | |
Callon Petroleum Co.: | | | | | | | | | | | | |
6.25%, 04/15/23 | | | | | | | 170 | | | | 64,391 | |
6.13%, 10/01/24 | | | | | | | 9 | | | | 3,377 | |
8.25%, 07/15/25 | | | | | | | 281 | | | | 98,350 | |
Series WI, 6.38%, 07/01/26 | | | | | | | 65 | | | | 21,450 | |
Cenovus Energy, Inc.: | | | | | | | | | | | | |
3.00%, 08/15/22 | | | | | | | 26 | | | | 25,284 | |
3.80%, 09/15/23 | | | | | | | 15 | | | | 14,105 | |
5.40%, 06/15/47 | | | | | | | 10 | | | | 8,585 | |
Cheniere Corpus Christi Holdings LLC, 5.13%, 06/30/27 | | | | | | | 116 | | | | 127,469 | |
Cheniere Energy Partners LP: | | | | | | | | | | | | |
5.63%, 10/01/26 | | | | | | | 151 | | | | 150,245 | |
Series WI, 5.25%, 10/01/25 | | | | | | | 12 | | | | 11,960 | |
Cheniere Energy, Inc., (4.88% PIK), 4.88%, 05/28/21(d)(e)(f)(j) | | | | | | | 123 | | | | 124,193 | |
CITGO Petroleum Corp., 7.00%, 06/15/25(d) | | | | | | | 90 | | | | 90,112 | |
Comstock Resources, Inc.: | | | | | | | | | | | | |
7.50%, 05/15/25(d) | | | | | | | 278 | | | | 251,937 | |
9.75%, 08/15/26 | | | | | | | 82 | | | | 76,470 | |
Continental Resources, Inc., 4.90%, 06/01/44 | | | | | | | 124 | | | | 98,735 | |
Crestwood Midstream Partners LP/Crestwood Midstream Finance Corp., 5.63%, 05/01/27(d) | | | | | | | 356 | | | | 296,794 | |
CrownRock LP/CrownRock Finance, Inc., 5.63%, 10/15/25(d) | | | | | | | 677 | | | | 606,761 | |
CVR Energy, Inc.(d): | | | | | | | | | | | | |
5.25%, 02/15/25 | | | | | | | 164 | | | | 150,880 | |
5.75%, 02/15/28 | | | | | | | 54 | | | | 47,250 | |
DCP Midstream Operating LP: | | | | | | | | | | | | |
5.38%, 07/15/25 | | | | | | | 22 | | | | 21,835 | |
5.63%, 07/15/27 | | | | | | | 65 | | | | 65,406 | |
5.13%, 05/15/29 | | | | | | | 118 | | | | 113,207 | |
6.45%, 11/03/36(d) | | | | | | | 250 | | | | 225,000 | |
6.75%, 09/15/37(d) | | | | | | | 226 | | | | 202,788 | |
Diamondback Energy, Inc.: | | | | | | | | | | | | |
4.75%, 05/31/25 | | | | | | | 60 | | | | 64,202 | |
3.50%, 12/01/29 | | | | | | | 497 | | | | 481,379 | |
eG Global Finance PLC, 6.25%, 10/30/25 | | | EUR | | | | 142 | | | | 154,751 | |
Endeavor Energy Resources LP/EER Finance, Inc.(d): | | | | | | | | | | | | |
6.63%, 07/15/25 | | | USD | | | | 66 | | | | 66,516 | |
5.50%, 01/30/26 | | | | | | | 410 | | | | 392,575 | |
5.75%, 01/30/28 | | | | | | | 338 | | | | 324,480 | |
EnLink Midstream Partners LP: | | | | | | | | | | | | |
4.40%, 04/01/24 | | | | | | | 136 | | | | 112,948 | |
4.85%, 07/15/26 | | | | | | | 39 | | | | 28,872 | |
5.60%, 04/01/44 | | | | | | | 249 | | | | 151,890 | |
5.05%, 04/01/45 | | | | | | | 20 | | | | 12,456 | |
EQM Midstream Partners LP: | | | | | | | | | | | | |
6.00%, 07/01/25(d) | | | | | | | 103 | | | | 104,331 | |
4.13%, 12/01/26 | | | | | | | 17 | | | | 15,587 | |
6.50%, 07/01/27(d) | | | | | | | 115 | | | | 117,785 | |
| | | | | | | | | | | | |
| Security | | | Par
(000) | | | Value | |
|
| Oil, Gas & Consumable Fuels (continued) | |
EQT Corp.: | | | | | | | | | | | | |
3.90%, 10/01/27 | | | USD | | | | 120 | | | $ | 97,475 | |
7.00%, 02/01/30 | | | | | | | 33 | | | | 33,991 | |
Extraction Oil & Gas, Inc.(b)(c)(d): | | | | | | | | | | | | |
7.38%, 05/15/24 | | | | | | | 383 | | | | 73,727 | |
5.63%, 02/01/26 | | | | | | | 133 | | | | 25,603 | |
Indigo Natural Resources LLC, 6.88%, 02/15/26(d) | | | | | | | 21 | | | | 19,530 | |
Matador Resources Co., 5.88%, 09/15/26 | | | | | | | 489 | | | | 361,860 | |
MEG Energy Corp.(d): | | | | | | | | | | | | |
7.00%, 03/31/24 | | | | | | | 166 | | | | 142,345 | |
6.50%, 01/15/25 | | | | | | | 316 | | | | 294,866 | |
7.13%, 02/01/27 | | | | | | | 107 | | | | 88,944 | |
Murphy Oil Corp., 5.75%, 08/15/25 | | | | | | | 55 | | | | 49,225 | |
Nabors Industries Ltd., 7.25%, 01/15/26(d) | | | | | | | 103 | | | | 63,345 | |
Neptune Energy Bondco PLC, 6.63%, 05/15/25(d) | | | | | | | 200 | | | | 174,000 | |
NGPL PipeCo LLC, 7.77%, 12/15/37(d) | | | | | | | 186 | | | | 227,012 | |
NuStar Logistics LP, 6.00%, 06/01/26 | | | | | | | 124 | | | | 120,280 | |
Occidental Petroleum Corp.: | | | | | | | | | | | | |
4.85%, 03/15/21 | | | | | | | 8 | | | | 7,940 | |
2.60%, 08/13/21 | | | | | | | 37 | | | | 36,160 | |
2.70%, 08/15/22 | | | | | | | 138 | | | | 128,471 | |
2.90%, 08/15/24 | | | | | | | 60 | | | | 51,269 | |
3.20%, 08/15/26 | | | | | | | 10 | | | | 8,125 | |
3.00%, 02/15/27 | | | | | | | 7 | | | | 5,426 | |
3.50%, 08/15/29 | | | | | | | 15 | | | | 10,974 | |
4.30%, 08/15/39 | | | | | | | 174 | | | | 120,010 | |
6.20%, 03/15/40 | | | | | | | 274 | | | | 229,475 | |
4.50%, 07/15/44 | | | | | | | 72 | | | | 49,680 | |
4.63%, 06/15/45 | | | | | | | 190 | | | | 133,000 | |
6.60%, 03/15/46 | | | | | | | 7 | | | | 6,093 | |
4.40%, 04/15/46 | | | | | | | 120 | | | | 83,702 | |
4.10%, 02/15/47 | | | | | | | 17 | | | | 11,454 | |
4.20%, 03/15/48 | | | | | | | 75 | | | | 50,790 | |
4.40%, 08/15/49 | | | | | | | 35 | | | | 24,150 | |
Series 1, 4.10%, 02/01/21 | | | | | | | 25 | | | | 25,100 | |
Parsley Energy LLC/Parsley Finance Corp., 5.63%, 10/15/27(d) | | | | | | | 477 | | | | 469,845 | |
PBF Holding Co. LLC/PBF Finance Corp., 9.25%, 05/15/25(d) | | | | | | | 212 | | | | 226,310 | |
PDC Energy, Inc.: | | | | | | | | | | | | |
6.25%, 12/01/25 | | | | | | | 29 | | | | 24,433 | |
6.13%, 09/15/24 | | | | | | | 187 | | | | 173,910 | |
5.75%, 05/15/26 | | | | | | | 16 | | | | 14,560 | |
Plains All American Pipeline LP/PAA Finance Corp., 3.55%, 12/15/29 | | | | | | | 23 | | | | 22,408 | |
QEP Resources, Inc.: | | | | | | | | | | | | |
5.38%, 10/01/22 | | | | | | | 675 | | | | 513,000 | |
5.25%, 05/01/23 | | | | | | | 165 | | | | 108,900 | |
5.63%, 03/01/26 | | | | | | | 86 | | | | 54,610 | |
Range Resources Corp.: | | | | | | | | | | | | |
5.88%, 07/01/22 | | | | | | | 69 | | | | 63,480 | |
5.00%, 08/15/22 | | | | | | | 199 | | | | 181,090 | |
5.00%, 03/15/23 | | | | | | | 363 | | | | 312,180 | |
Sabine Pass Liquefaction LLC, 4.50%, 05/15/30(d) | | | | | | | 281 | | | | 311,967 | |
SM Energy Co., 10.00%, 01/15/25(d) | | | | | | | 475 | | | | 450,955 | |
Southwestern Energy Co.: | | | | | | | | | | | | |
4.10%, 03/15/22 | | | | | | | 158 | | | | 150,827 | |
6.20%, 01/23/25 | | | | | | | 54 | | | | 46,237 | |
7.50%, 04/01/26 | | | | | | | 63 | | | | 55,144 | |
Sunoco Logistics Partners Operations LP: | | | | | | | | | | | | |
4.00%, 10/01/27 | | | | | | | 35 | | | | 35,855 | |
5.30%, 04/01/44 | | | | | | | 115 | | | | 110,141 | |
| | |
| 20 | | 2020 BLACKROCK SEMI-ANNUAL REPORTTO SHAREHOLDERS |
| | |
Schedule of Investments (unaudited) (continued) June 30, 2020 | | BlackRock Debt Strategies Fund, Inc. (DSU) (Percentages shown are based on Net Assets) |
| | | | | | | | | | | | |
| Security | | | Par
(000) | | | Value | |
|
| Oil, Gas & Consumable Fuels (continued) | |
Sunoco LP/Sunoco Finance Corp., : | | | | | | | | | | | | |
5.50%, 02/15/26 | | | USD | | | | 8 | | | $ | 7,760 | |
5.88%, 03/15/28 | | | | | | | 151 | | | | 149,892 | |
Tallgrass Energy Partners LP/Tallgrass Energy Finance Corp., 5.50%, 09/15/24(d) | | | | | | | 9 | | | | 8,128 | |
Targa Resources Partners LP/Targa Resources Partners Finance Corp.: | | | | | | | | | | | | |
5.13%, 02/01/25 | | | | | | | 75 | | | | 72,187 | |
5.38%, 02/01/27 | | | | | | | 17 | | | | 16,405 | |
5.50%, 03/01/30(d) | | | | | | | 255 | | | | 246,233 | |
Transocean, Inc.: | | | | | | | | | | | | |
8.38%, 12/15/21 | | | | | | | 99 | | | | 69,300 | |
8.00%, 02/01/27(d) | | | | | | | 218 | | | | 120,309 | |
Viper Energy Partners LP, 5.38%, 11/01/27(d) | | | | | | | 88 | | | | 86,321 | |
Western Midstream Operating LP: | | | | | | | | | | | | |
4.00%, 07/01/22 | | | | | | | 36 | | | | 35,885 | |
4.65%, 07/01/26 | | | | | | | 176 | | | | 168,573 | |
4.75%, 08/15/28 | | | | | | | 95 | | | | 90,962 | |
5.30%, 03/01/48 | | | | | | | 54 | | | | 43,808 | |
5.50%, 08/15/48 | | | | | | | 6 | | | | 4,860 | |
5.25%, 02/01/50 | | | | | | | 99 | | | | 85,665 | |
WPX Energy, Inc.: | | | | | | | | | | | | |
8.25%, 08/01/23 | | | | | | | 261 | | | | 289,710 | |
5.75%, 06/01/26 | | | | | | | 28 | | | | 27,160 | |
5.25%, 10/15/27 | | | | | | | 78 | | | | 72,867 | |
5.88%, 06/15/28 | | | | | | | 66 | | | | 63,423 | |
4.50%, 01/15/30 | | | | | | | 93 | | | | 81,840 | |
| | | | | | | | | | | | |
| | | | | | | | | | | 13,384,036 | |
|
| Oil: Crude Producers — 0.1% | |
MGM Growth Properties Operating Partnership LP/MGP Finance Co-Issuer, Inc., 4.63%, 06/15/25(d) | | | | | | | 287 | | | | 280,651 | |
| | | | | | | | | | | | |
|
| Paper & Forest Products — 0.0% | |
International Paper Co., 7.30%, 11/15/39 | | | | | | | 5 | | | | 7,022 | |
| | | | | | | | | | | | |
|
| Personal Products — 0.0% | |
Edgewell Personal Care Co.,
5.50%, 06/01/28(d) | | | | | | | 57 | | | | 58,568 | |
| | | | | | | | | | | | |
|
| Pharmaceuticals — 0.5% | |
Bausch Health Americas, Inc., 8.50%, 01/31/27(d) | | | | | | | 173 | | | | 183,596 | |
Bausch Health Cos., Inc.: | | | | | | | | | | | | |
4.50%, 05/15/23 | | | EUR | | | | 140 | | | | 155,489 | |
6.13%, 04/15/25(d) | | | USD | | | | 3 | | | | 3,043 | |
9.00%, 12/15/25(d) | | | | | | | 382 | | | | 411,494 | |
7.00%, 01/15/28(d) | | | | | | | 185 | | | | 190,550 | |
6.25%, 02/15/29(d) | | | | | | | 168 | | | | 168,840 | |
Catalent Pharma Solutions, Inc., 5.00%, 07/15/27(d) | | | | | | | 134 | | | | 139,110 | |
Charles River Laboratories International, Inc., 4.25%, 05/01/28(d) | | | | | | | 110 | | | | 109,944 | |
Elanco Animal Health, Inc., 5.65%, 08/28/28 | | | | | | | 69 | | | | 76,507 | |
Endo Dac/Endo Finance LLC/Endo Finco, Inc.(d): | | | | | | | | | | | | |
9.50%, 07/31/27 | | | | | | | 102 | | | | 107,885 | |
6.00%, 06/30/28 | | | | | | | 91 | | | | 58,695 | |
Jaguar Holding Co. II/PPD Development LP(d): | | | | | | | | | | | | |
4.63%, 06/15/25 | | | | | | | 172 | | | | 175,044 | |
5.00%, 06/15/28 | | | | | | | 161 | | | | 164,824 | |
MEDNAX, Inc., 5.25%, 12/01/23(d) | | | | | | | 122 | | | | 121,390 | |
Par Pharmaceutical, Inc., 7.50%, 04/01/27(d) | | | | | | | 229 | | | | 235,000 | |
Synlab Unsecured Bondco PLC, 8.25%, 07/01/23 | | | EUR | | | | 100 | | | | 114,597 | |
West Street Merger Sub, Inc.,
6.38%, 09/01/25(d) | | | USD | | | | 114 | | | | 110,295 | |
| | | | | | | | | | | | |
| | | | | | | | | | | 2,526,303 | |
| | | | | | | | | | | | |
| Security | | | Par
(000) | | | Value | |
|
| Producer Durables: Miscellaneous — 0.1% | |
Boxer Parent Co., Inc.(d): | | | | | | | | | | | | |
7.13%, 10/02/25 | | | USD | | | | 124 | | | $ | 130,014 | |
9.13%, 03/01/26 | | | | | | | 191 | | | | 197,685 | |
Open Text Corp., 3.88%, 02/15/28(d) | | | | | | | 287 | | | | 276,326 | |
Open Text Holdings, Inc., 4.13%, 02/15/30(d) | | | | | | | 87 | | | | 85,478 | |
| | | | | | | | | | | | |
| | | | | | | | | | | 689,503 | |
|
| Professional Services — 0.2% | |
ASGN, Inc., 4.63%, 05/15/28(d) | | | | | | | 89 | | | | 86,919 | |
Dun & Bradstreet Corp.(d): | | | | | | | | | | | | |
6.88%, 08/15/26 | | | | | | | 192 | | | | 202,380 | |
10.25%, 02/15/27 | | | | | | | 386 | | | | 428,460 | |
| | | | | | | | | | | | |
| | | | | | | | | | | 717,759 | |
|
| Real Estate Management & Development — 0.4% | |
Consus Real Estate AG, 9.63%, 05/15/24 | | | EUR | | | | 100 | | | | 121,900 | |
Cushman & Wakefield US Borrower LLC, 6.75%, 05/15/28(d) | | | USD | | | | 1,609 | | | | 1,677,382 | |
Greystar Real Estate Partners LLC, 5.75%, 12/01/25(d) | | | | | | | 24 | | | | 24,125 | |
Realogy Group LLC/Realogy Co-Issuer Corp., 7.63%, 06/15/25(d) | | | | | | | 171 | | | | 171,034 | |
Unique Pub Finance Co. PLC, Series A4, 5.66%, 06/30/27 | | | GBP | | | | 48 | | | | 59,841 | |
| | | | | | | | | | | | |
| | | | | | | | | | | 2,054,282 | |
|
| Road & Rail — 0.1% | |
Herc Holdings, Inc., 5.50%, 07/15/27(d) | | | USD | | | | 253 | | | | 253,544 | |
United Rentals North America, Inc.: | | | | | | | | | | | | |
5.50%, 05/15/27 | | | | | | | 74 | | | | 76,220 | |
5.25%, 01/15/30 | | | | | | | 2 | | | | 2,065 | |
4.00%, 07/15/30 | | | | | | | 61 | | | | 59,001 | |
| | | | | | | | | | | | |
| | | | | | | | | | | 390,830 | |
|
| Semiconductors & Semiconductor Equipment — 1.0% | |
Broadcom, Inc.(d): | | | | | | | | | | | | |
4.70%, 04/15/25 | | | | | | | 910 | | | | 1,025,365 | |
3.15%, 11/15/25 | | | | | | | 639 | | | | 680,102 | |
4.15%, 11/15/30 | | | | | | | 225 | | | | 244,503 | |
4.30%, 11/15/32 | | | | | | | 350 | | | | 384,013 | |
Microchip Technology, Inc.(d): | | | | | | | | | | | | |
2.67%, 09/01/23 | | | | | | | 1,638 | | | | 1,685,964 | |
4.25%, 09/01/25 | | | | | | | 680 | | | | 684,327 | |
Qorvo, Inc., 4.38%, 10/15/29(d) | | | | | | | 76 | | | | 77,830 | |
Seagate HDD Cayman, 4.13%, 01/15/31(d) | | | | | | | 30 | | | | 31,523 | |
| | | | | | | | | | | | |
| | | | | | | | | | | 4,813,627 | |
|
| Software — 0.6% | |
CDK Global, Inc., 5.25%, 05/15/29(d) | | | | | | | 105 | | | | 109,034 | |
Genesys Telecommunications Laboratories, Inc./Greeneden Lux 3 Sarl/Greeneden US Ho, 10.00%, 11/30/24(d) | | | | | | | 287 | | | | 298,480 | |
MSCI, Inc.(d): | | | | | | | | | | | | |
4.00%, 11/15/29 | | | | | | | 58 | | | | 59,160 | |
3.88%, 02/15/31 | | | | | | | 229 | | | | 233,580 | |
PTC, Inc.(d): | | | | | | | | | | | | |
3.63%, 02/15/25 | | | | | | | 88 | | | | 87,340 | |
4.00%, 02/15/28 | | | | | | | 80 | | | | 79,210 | |
RP Crown Parent LLC, 7.38%, 10/15/24(d) | | | | | | | 602 | | | | 600,495 | |
Solera LLC/Solera Finance, Inc., 10.50%, 03/01/24(d) | | | | | | | 1,315 | | | | 1,338,012 | |
Tempo Acquisition LLC/Tempo Acquisition Finance Corp., 5.75%, 06/01/25(d) | | | | | | | 190 | | | | 194,750 | |
| | | | | | | | | | | | |
| | | | | | | | | | | 3,000,061 | |
| | | | |
| SCHEDULES OF INVESTMENTS | | | 21 | |
| | |
Schedule of Investments (unaudited) (continued) June 30, 2020 | | BlackRock Debt Strategies Fund, Inc. (DSU) (Percentages shown are based on Net Assets) |
| | | | | | | | | | | | |
| Security | | | Par
(000) | | | Value | |
|
| Specialty Retail — 0.2% | |
Asbury Automotive Group, Inc.(d): | | | | | | | | | | | | |
4.50%, 03/01/28 | | | USD | | | | 61 | | | $ | 59,170 | |
4.75%, 03/01/30 | | | | | | | 59 | | | | 57,525 | |
AutoNation, Inc., 4.75%, 06/01/30 | | | | | | | 153 | | | | 165,786 | |
Gap, Inc., 8.88%, 05/15/27(d) | | | | | | | 105 | | | | 112,342 | |
IAA, Inc., 5.50%, 06/15/27(d) | | | | | | | 159 | | | | 164,027 | |
L Brands, Inc.(d): | | | | | | | | | | | | |
6.88%, 07/01/25 | | | | | | | 120 | | | | 123,900 | |
9.38%, 07/01/25 | | | | | | | 3 | | | | 3,004 | |
PetSmart, Inc., 7.13%, 03/15/23(d) | | | | | | | 185 | | | | 182,388 | |
| | | | | | | | | | | | |
| | | | | | | | | | | 868,142 | |
|
| Technology Hardware, Storage & Peripherals — 0.1% | |
Dell International LLC/EMC Corp., 5.85%, 07/15/25(d) | | | | | | | 134 | | | | 153,993 | |
NCR Corp.(d): | | | | | | | | | | | | |
5.75%, 09/01/27 | | | | | | | 92 | | | | 92,000 | |
6.13%, 09/01/29 | | | | | | | 88 | | | | 87,780 | |
Western Digital Corp., 4.75%, 02/15/26 | | | | | | | 236 | | | | 243,894 | |
| | | | | | | | | | | | |
| | | | | | | | | | | 577,667 | |
|
| Textiles, Apparel & Luxury Goods — 0.0% | |
Levi Strauss & Co., 5.00%, 05/01/25 | | | | | | | 40 | | | | 40,150 | |
Wolverine World Wide, Inc., 6.38%, 05/15/25(d) | | | | | | | 24 | | | | 25,140 | |
| | | | | | | | | | | | |
| | | | | | | | | | | 65,290 | |
|
| Thrifts & Mortgage Finance — 0.0% | |
Nationstar Mortgage Holdings, Inc., 6.00%, 01/15/27(d) | | | | | | | 58 | | | | 55,100 | |
| | | | | | | | | | | | |
|
| Utilities — 0.0% | |
Vistra Operations Co. LLC,
5.63%, 02/15/27(d) | | | | | | | 99 | | | | 101,609 | |
| | | | | | | | | | | | |
|
| Wireless Telecommunication Services — 0.3% | |
GLP Capital LP/GLP Financing II, Inc., 4.00%, 01/15/31 | | | | | | | 341 | | | | 338,528 | |
SBA Communications Corp., 3.88%, 02/15/27(d) | | | | | | | 650 | | | | 647,563 | |
Uniti Group LP/Uniti Group Finance, Inc./CSL Capital LLC, 8.25%, 10/15/23 | | | | | | | 36 | | | | 34,020 | |
VICI Properties LP/VICI Note Co., Inc., 4.25%, 12/01/26(d) | | | | | | | 693 | | | | 663,547 | |
| | | | | | | | | | | | |
| | | | | | | | | | | 1,683,658 | |
| | | | | | | | | | | | |
| |
Total Corporate Bonds — 21.2%
(Cost — $118,432,163) | | | | 107,491,729 | |
| | | | | | | | | | | | |
|
Floating Rate Loan Interests(k) — 117.9% | |
|
Aerospace & Defense — 2.6% | |
Bleriot US Bidco, Inc.: | | | | | | | | | | | | |
Delayed Draw Term Loan,
(3 mo. LIBOR + 4.75%), 5.06%, 10/31/26 | | | | | | | 112 | | | | 107,358 | |
Term Loan B,
(3 mo. LIBOR + 4.75%), 5.06%, 10/31/26 | | | | | | | 716 | | | | 687,094 | |
Dynasty Acquisition Co., Inc.: | | | | | | | | | | | | |
2020 CAD Term Loan B2,
(3 mo. LIBOR + 3.50%), 3.81%, 04/06/26 | | | | | | | 2,967 | | | | 2,525,993 | |
2020 Term Loan B1,
(3 mo. LIBOR + 3.50%), 3.81%, 04/06/26 | | | | | | | 5,519 | | | | 4,698,347 | |
Nordam Group, Inc., Term Loan B,
(1 mo. LIBOR + 4.50%), 5.89%, 04/09/26(a) | | | | | | | 782 | | | | 594,396 | |
TransDigm, Inc.: | | | | | | | | | | | | |
2020 Term Loan F,
(1 mo. LIBOR + 2.25%), 2.43%, 12/09/25 | | | | | | | 4,239 | | | | 3,802,644 | |
2020 Term Loan G,
(1 mo. LIBOR + 2.25%), 2.43%, 08/22/24 | | | | | | | 823 | | | | 742,414 | |
| | | | | | | | | | | | |
| | | | 13,158,246 | |
| | | | | | | | | | | | |
| Security | | | Par
(000) | | | Value | |
|
| Air Freight & Logistics — 0.6% | |
WestJet Airlines Ltd., Term Loan B,
(6 mo. LIBOR + 3.00%, 1.00% Floor), 4.00%, 12/11/26 | | | USD | | | | 3,653 | | | $ | 2,919,084 | |
| | | | | | | | | | | | |
|
| Airlines — 1.2% | |
American Airlines, Inc.: | | | | | | | | | | | | |
2017 1st Lien Term Loan,
(1 mo. LIBOR + 1.75%), 1.93%, 01/29/27 | | | | | | | 455 | | | | 341,930 | |
2017 Incremental Term Loan,
(1 mo. LIBOR + 2.00%), 2.18%, 12/14/23 | | | | | | | 2,278 | | | | 1,812,657 | |
Repriced TL B due 2023,
(1 mo. LIBOR + 2.00%), 2.18%, 04/28/23 | | | | | | | 1,588 | | | | 1,250,203 | |
JetBlue Airways Corp., Term Loan,
(3 mo. LIBOR + 5.25%, 1.00% Floor), 6.25%, 06/12/24 | | | | | | | 687 | | | | 671,543 | |
Mileage Plus Holdings LLC, 2020
Term Loan B, 06/25/27(l) | | | | | | | 2,112 | | | | 2,095,273 | |
| | | | | | | | | | | | |
| | | | | | | | | | | 6,171,606 | |
|
| Auto Components — 2.6% | |
Dealer Tire LLC, 2020 Term Loan B,
(1 mo. LIBOR + 4.25%), 4.43%, 12/12/25 | | | | | | | 2,721 | | | | 2,594,321 | |
Panther BF Aggregator 2 LP, USD Term Loan B,
(1 mo. LIBOR + 3.50%), 3.68%, 04/30/26 | | | | | | | 5,636 | | | | 5,354,477 | |
USI, Inc.: | | | | | | | | | | | | |
2017 Repriced Term Loan,
(3 mo. LIBOR + 3.00%), 3.31%, 05/16/24 | | | | | | | 4,416 | | | | 4,181,774 | |
2019 Incremental Term Loan B,
(3 mo. LIBOR + 4.00%), 4.31%, 12/02/26 | | | | | | | 252 | | | | 243,974 | |
Wand NewCo 3, Inc., 2020 Term Loan, (3 mo. LIBOR + 3.00%), 4.07%, 02/05/26 | | | | | | | 1,082 | | | | 1,025,287 | |
| | | | | | | | | | | | |
| | | | | | | | | | | 13,399,833 | |
|
| Banks — 0.7% | |
Capri Finance LLC, 2017 1st Lien Term Loan,
(3 mo. LIBOR + 3.00%), 3.76%, 11/01/24 | | | | | | | 3,805 | | | | 3,638,131 | |
| | | | | | | | | | | | |
|
| Building Materials — 0.4% | |
Allied Universal Holdco LLC, 2019 Term Loan B,
(1 mo. LIBOR + 4.25%), 4.43%, 07/10/26 | | | | | | | 2,096 | | | | 2,032,979 | |
| | | | | | | | | | | | |
|
| Building Products — 1.2% | |
CPG International, Inc., 2017 Term Loan, 05/05/24(l) | | | | | | | 1,327 | | | | 1,312,086 | |
LSF10 XL Bidco SCA, EUR Term Loan B3, (EURIBOR + 4.00%), 4.00%, 10/12/26 | | | EUR | | | | 1,000 | | | | 1,046,574 | |
Wilsonart LLC, 2017 Term Loan B,
(3 mo. LIBOR + 3.25%, 1.00% Floor), 4.25%, 12/19/23 | | | USD | | | | 3,771 | | | | 3,628,427 | |
| | | | | | | | | | | | |
| | | | | | | | | | | 5,987,087 | |
|
| Capital Markets — 1.4% | |
Deerfield Dakota Holding LLC, 2020 USD
Term Loan B, 04/09/27(l) | | | | | | | 3,499 | | | | 3,393,708 | |
Fortress Investment Group LLC, 2018 Term Loan B,
(1 mo. LIBOR + 2.00%), 2.18%, 12/27/22 | | | | | | | — | (m) | | | 266 | |
Greenhill & Co., Inc., Term Loan B,
(1 mo. LIBOR + 3.25%),
3.44%, 04/12/24(a) | | | | | | | 570 | | | | 536,168 | |
Jefferies Finance LLC, 2019 Term Loan,
(1 mo. LIBOR + 3.00%), 3.19%, 06/03/26 | | | | | | | 1,317 | | | | 1,242,044 | |
Travelport Finance (Luxembourg) Sarl, : | | | | | | | | | | | | |
2019 2nd Lien Term Loan,
(3 mo. LIBOR + 9.00%), 9.31%, 05/28/27 | | | | | | | 1,370 | | | | 389,080 | |
2019 Term Loan,
(3 mo. LIBOR + 5.00%), 6.07%, 05/29/26 | | | | | | | 2,721 | | | | 1,779,770 | |
| | | | | | | | | | | | |
| | | | | | | | | | | 7,341,036 | |
| | |
| 22 | | 2020 BLACKROCK SEMI-ANNUAL REPORTTO SHAREHOLDERS |
| | |
Schedule of Investments (unaudited) (continued) June 30, 2020 | | BlackRock Debt Strategies Fund, Inc. (DSU) (Percentages shown are based on Net Assets) |
| | | | | | | | | | | | |
| Security | | | Par
(000) | | | Value | |
|
| Chemicals — 4.3% | |
Alpha 3 BV, 2017 Term Loan B1,
(3 mo. LIBOR + 3.00%, 1.00% Floor), 4.00%, 01/31/24 | | | USD | | | | 2,752 | | | $ | 2,643,624 | |
Ascend Performance Materials Operations LLC, 2019 Term Loan B, (3 mo. LIBOR + 5.25%, 1.00% Floor), 6.25%, 08/27/26 | | | | | | | 2,974 | | | | 2,911,612 | |
Axalta Coating Systems US Holdings, Inc., Term Loan, (3 mo. LIBOR + 1.75%), 2.06%, 06/01/24 | | | | | | | 386 | | | | 369,111 | |
Charter NEX US, Inc.: 2017 Term Loan B, (1 mo. LIBOR + 2.75%, 1.00% Floor), 3.75%, 05/16/24 | | | | | | | 2,580 | | | | 2,463,970 | |
Incremental Term Loan,
(1 mo. LIBOR + 3.25%), 3.43%, 05/16/24 | | | | | | | 713 | | | | 680,097 | |
Chemours Co., 2018 Term Loan B,
(1 mo. LIBOR + 1.75%), 1.93%, 04/03/25 | | | | | | | 747 | | | | 703,202 | |
Element Materials Technology Group US Holdings, Inc., 2017 Term Loan B,
(3 mo. LIBOR + 3.50%, 1.00% Floor), 4.50%, 06/28/24 | | | | | | | 1,357 | | | | 1,253,005 | |
Encapsys LLC, 2020 Term Loan B2,
(1 mo. LIBOR + 3.25%, 1.00% Floor), 4.25%, 11/07/24(a) | | | | | | | 1,276 | | | | 1,218,607 | |
Illuminate Buyer LLC, Term Loan, 06/16/27(l) | | | | | | | 2,003 | | | | 1,970,208 | |
Invictus US LLC.: | | | | | | | | | | | | |
1st Lien Term Loan, (3 mo. LIBOR + 3.00%), 4.78%, 03/28/25 | | | | | | | 682 | | | | 628,611 | |
2nd Lien Term Loan, (3 mo. LIBOR + 6.75%), 8.53%, 03/30/26 | | | | | | | 390 | | | | 308,751 | |
Messer Industries GmbH, 2018 USD Term Loan,
(3 mo. LIBOR + 2.50%), 2.81%, 03/01/26 | | | | | | | 3,311 | | | | 3,149,858 | |
Minerals Technologies Inc., 2017 Term Loan B, 02/14/24(a)(l) | | | | | | | 454 | | | | 440,729 | |
Momentive Performance Materials, Inc., Term Loan B, (1 mo. LIBOR + 3.25%), 3.43%, 05/15/24 | | | | | | | 921 | | | | 859,704 | |
Oxea Holding Drei GmbH, 2017 Term Loan B2,
(1 mo. LIBOR + 3.50%), 3.69%, 10/14/24 | | | | | | | 2,418 | | | | 2,218,521 | |
Starfruit Finco BV, 2018 USD Term Loan B, 10/01/25(l) | | | | | | | 183 | | | | 170,813 | |
| | | | | | | | | | | | |
| | | | | | | | | | | 21,990,423 | |
|
| Commercial Services & Supplies — 3.9% | |
Advanced Disposal Services, Inc., Term Loan B3,
(1 Week LIBOR + 2.25%), 3.00%, 11/10/23 | | | | | | | 1,811 | | | | 1,787,552 | |
Asurion LLC,: | | | | | | | | | | | | |
2017 2nd Lien Term Loan,
(1 mo. LIBOR + 6.50%), 6.68%, 08/04/25 | | | | | | | 1,839 | | | | 1,825,208 | |
2018 Term Loan B6,
(1 mo. LIBOR + 3.00%), 3.18%, 11/03/23 | | | | | | | 1,886 | | | | 1,821,497 | |
2018 Term Loan B7,
(1 mo. LIBOR + 3.00%), 3.18%, 11/03/24 | | | | | | | 930 | | | | 896,128 | |
Creative Artists Agency LLC.: | | | | | | | | | | | | |
2019 Term Loan B,
(1 mo. LIBOR + 3.75%), 3.93%, 11/27/26 | | | | | | | 746 | | | | 703,976 | |
2020 Incremental Term Loan B1,
(1 mo. LIBOR + 4.25%, 1.00% Floor), 5.25%, 11/27/26 | | | | | | | 1,737 | | | | 1,638,566 | |
Diamond (BC) BV, Term Loan,
(3 mo. LIBOR + 3.00%), 3.76%, 09/06/24 | | | | | | | 1,678 | | | | 1,538,150 | |
EnergySolutions LLC, 2018 Term Loan B,
(3 mo. LIBOR + 3.75%, 1.00% Floor), 4.75%, 05/09/25 | | | | | | | 479 | | | | 440,082 | |
| | | | | | | | | | | | |
| Security | | | Par
(000) | | | Value | |
|
| Commercial Services & Supplies (continued) | |
GFL Environmental, Inc., 2018 USD Term Loan B,
(3 mo. LIBOR + 3.00%, 1.00% Floor), 4.00%, 05/30/25 | | | USD | | | | 538 | | | $ | 522,110 | |
Harland Clarke Holdings Corp., Term Loan B7,
(3 mo. LIBOR + 4.75%, 1.00% Floor), 5.75%, 11/03/23 | | | | | | | 524 | | | | 379,710 | |
KAR Auction Services, Inc., 2019 Term Loan B6,
(1 mo. LIBOR + 2.25%), 2.50%, 09/19/26 | | | | | | | 723 | | | | 684,023 | |
Prime Security Services Borrower LLC, 2019 Term Loan B1, (1 mo. LIBOR + 3.25%, 1.00% Floor), 4.25%, 09/23/26 | | | | | | | 1,672 | | | | 1,604,398 | |
Verscend Holding Corp., 2018 Term Loan B,
(1 mo. LIBOR + 4.50%), 4.68%, 08/27/25 | | | | | | | 2,926 | | | | 2,821,449 | |
West Corp.: | | | | | | | | | | | | |
2017 Term Loan,
(3 mo. LIBOR + 4.00%, 1.00% Floor), 5.00%, 10/10/24 | | | | | | | 2,131 | | | | 1,810,116 | |
2018 Term Loan B1,
(3 mo. LIBOR + 3.50%, 1.00% Floor), 4.50%, 10/10/24 | | | | | | | 1,411 | | | | 1,177,759 | |
| | | | | | | | | | | | |
| | | | | | | | | | | 19,650,724 | |
|
| Communications Equipment — 0.2% | |
Avantor, Inc., 2017 1st Lien Term Loan,
(1 mo. LIBOR + 2.25%, 1.00% Floor), 3.25%, 11/21/24 | | | | | | | 1,118 | | | | 1,086,782 | |
| | | | | | | | | | | | |
|
| Construction & Engineering — 1.0% | |
Brand Energy & Infrastructure Services, Inc., 2017 Term Loan, (3 mo. LIBOR + 4.25%, 1.00% Floor), 5.45%, 06/21/24 | | | | | | | 2,499 | | | | 2,280,224 | |
Ply Gem Midco, Inc., 2018 Term Loan,
(1 mo. LIBOR + 3.75%), 3.94%, 04/12/25 | | | | | | | 526 | | | | 498,676 | |
SRS Distribution, Inc., 2018 1st Lien Term Loan,
(3 mo. LIBOR + 3.25%), 4.32%, 05/23/25 | | | | | | | 2,284 | | | | 2,153,681 | |
| | | | | | | | | | | | |
| | | | | | | | | | | 4,932,581 | |
|
| Construction Materials — 2.1% | |
American Builders & Contractors Supply Co., Inc., 2019 Term Loan,
(1 mo. LIBOR + 2.00%), 2.18%, 01/15/27 | | | | | | | 1,615 | | | | 1,537,173 | |
Core & Main LP, 2017 Term Loan B,
(3 mo. LIBOR + 2.75%, 1.00% Floor), 3.75%, 08/01/24 | | | | | | | 4,830 | | | | 4,589,767 | |
Filtration Group Corp., 2018 1st Lien Term Loan,
(1 mo. LIBOR + 3.00%), 3.18%, 03/29/25(a) | | | | | | | 2,503 | | | | 2,377,424 | |
Forterra Finance LLC, 2017 Term Loan B, 10/25/23(l) | | | | | | | 2,149 | | | | 2,084,488 | |
| | | | | | | | | | | | |
| | | | | | | | | | | 10,588,852 | |
|
| Containers & Packaging — 2.3% | |
Berry Global, Inc.,: | | | | | | | | | | | | |
2019 Term Loan Y,
(1 mo. LIBOR + 2.00%), 2.18%, 07/01/26 | | | | | | | 1,800 | | | | 1,716,522 | |
Term Loan W,
(1 mo. LIBOR + 2.00%), 2.18%, 10/01/22 | | | | | | | 5,590 | | | | 5,434,647 | |
BWAY Holding Co., 2017 Term Loan B,
(3 mo. LIBOR + 3.25%), 4.56%, 04/03/24 | | | | | | | 2,265 | | | | 2,028,463 | |
Flex Acquisition Co., Inc., 1st Lien Term Loan,
(3 mo. LIBOR + 3.00%, 1.00% Floor), 4.43%, 12/29/23 | | | | | | | 2,040 | | | | 1,945,214 | |
Pregis TopCo Corp., 1st Lien Term Loan, (1 mo. LIBOR + 4.00%), 4.18%, 07/31/26 | | | | | | | 554 | | | | 533,194 | |
| | | | | | | | | | | | |
| | | | | | | | | | | 11,658,040 | |
| | | | |
| SCHEDULES OF INVESTMENTS | | | 23 | |
| | |
Schedule of Investments (unaudited) (continued) June 30, 2020 | | BlackRock Debt Strategies Fund, Inc. (DSU) (Percentages shown are based on Net Assets) |
| | | | | | | | | | | | |
| Security | | | Par
(000) | | | Value | |
|
| Distributors — 0.5% | |
TriMark USA LLC, 2017 1st Lien Term Loan,
(6 mo. LIBOR + 3.50%), 4.58%, 08/28/24 | | | USD | | | | 3,287 | | | $ | 2,455,344 | |
| | | | | | | | | | | | |
|
| Diversified Consumer Services — 3.1% | |
Amentum Government Services Holdings LLC, Term Loan B, (1 mo. LIBOR + 4.00%), 4.18%, 02/01/27 | | | | | | | 642 | | | | 628,890 | |
Ascend Learning LLC, 2017 Term Loan B,
(1 mo. LIBOR + 3.00%, 1.00% Floor), 4.00%, 07/12/24 | | | | | | | 1,201 | | | | 1,140,429 | |
BidFair MergerRight, Inc., Term Loan B,
(1 mo. LIBOR + 5.50%, 1.00% Floor), 6.50%, 01/15/27 | | | | | | | 3,088 | | | | 2,876,899 | |
Bright Horizons Family Solutions, Inc., 2017 Term Loan B, (PRIME + 1.75%), 2.50%, 11/07/23 | | | | | | | 1,776 | | | | 1,718,966 | |
Genuine Financial Holdings LLC, 2018 1st Lien Term Loan, (1 mo. LIBOR + 3.75%), 3.93%, 07/12/25 | | | | | | | 3,027 | | | | 2,702,856 | |
Nomad Foods Europe Midco Ltd., 2017 Term Loan B4, (1 mo. LIBOR + 2.25%), 2.43%, 05/15/24 | | | | | | | 1,121 | | | | 1,077,734 | |
Serta Simmons Bedding, LLC,: | | | | | | | | | | | | |
2020 Super Priority First Out Term Loan, 08/10/23(l) | | | | | | | 422 | | | | 413,886 | |
2020 Super Priority Second Out Term Loan,
(2 mo. LIBOR + 7.50%), 8.50%, 08/10/23 | | | | | | | 865 | | | | 720,527 | |
TruGreen LP, 2019 Term Loan, (1 mo. LIBOR + 3.75%), 3.93%, 03/19/26 | | | | | | | 2,027 | | | | 1,961,184 | |
Uber Technologies, Inc., 2018 Incremental Term Loan, (1 mo. LIBOR + 3.50%), 3.68%, 07/13/23 | | | | | | | 2,438 | | | | 2,315,668 | |
| | | | | | | | | | | | |
| | | | | | | | | | | 15,557,039 | |
|
| Diversified Financial Services — 3.1% | |
Advisor Group, Inc., 2019 Term Loan,
(1 mo. LIBOR + 5.00%), 5.18%, 07/31/26 | | | | | | | 1,617 | | | | 1,492,782 | |
AlixPartners LLP, 2017 Term Loan B,
(1 mo. LIBOR + 2.50%, 1.00% Floor), 3.50%, 04/04/24 | | | | | | | 5,028 | | | | 4,849,878 | |
Allsup’s Convenience Stores, Inc., Term Loan,
(1 mo. LIBOR + 6.25%), 6.43%, 11/18/24 | | | | | | | 875 | | | | 841,127 | |
EG Finco Ltd., 2018 Term Loan, (3 mo. LIBOR + 4.00%), 5.07%, 02/07/25 | | | | | | | 1,411 | | | | 1,321,967 | |
Kingpin Intermediate Holdings LLC, 2018 Term Loan B, (1 mo. LIBOR + 3.50%, 1.00% Floor), 4.50%, 07/03/24 | | | | | | | 1,349 | | | | 1,148,063 | |
SMG US Midco 2, Inc., 2020 Term Loan,
(1 mo. LIBOR + 2.50%), 3.27%, 01/23/25(a) | | | | | | | 1,743 | | | | 1,534,022 | |
SSH Group Holdings, Inc., 2018 1st Lien Term Loan, (3 mo. LIBOR + 4.25%), 4.56%, 07/30/25(a) | | | | | | | 560 | | | | 518,246 | |
VS Buyer LLC, Term Loan B, (1 mo. LIBOR + 3.25%), 3.43%, 02/28/27 | | | | | | | 2,465 | | | | 2,372,392 | |
Ziggo Financing Partnership, USD Term Loan I,
(1 mo. LIBOR + 2.50%), 2.68%, 04/30/28 | | | | | | | 1,876 | | | | 1,766,179 | |
| | | | | | | | | | | | |
| | | | | | | | | | | 15,844,656 | |
|
| Diversified Telecommunication Services — 1.8% | |
Hargray Communications Group, Inc., 2017 Term Loan B, (1 mo. LIBOR + 3.00%, 1.00% Floor), 4.00%, 05/16/24 | | | | | | | 1,657 | | | | 1,582,766 | |
Iridium Satellite LLC, Term Loan, 11/04/26(l) | | | | | | | 1,554 | | | | 1,522,120 | |
Level 3 Financing, Inc., 2019 Term Loan B, (1 mo. LIBOR + 1.75%), 1.93%, 03/01/27 | | | | | | | 1,676 | | | | 1,582,366 | |
| | | | | | | | | | | | |
| Security | | | Par
(000) | | | Value | |
|
| Diversified Telecommunication Services (continued) | |
MTN Infrastructure TopCo, Inc., 1st Lien
Term Loan B, (1 mo. LIBOR + 3.00%, 1.00% Floor), 4.00%, 11/15/24 | | | USD | | | | 1,791 | | | $ | 1,711,879 | |
Northwest Fiber LLC, Term Loan B, (3 mo. LIBOR + 5.50%), 5.67%, 05/21/27(a) | | | | | | | 846 | | | | 837,540 | |
Virgin Media Investment Holdings Ltd., Term Loan L, (LIBOR—GBP + 3.25%), 3.34%, 01/15/27 | | | GBP | | | | 1,400 | | | | 1,668,612 | |
| | | | | | | | | | | | |
| | | | | | | | | | | 8,905,283 | |
|
| Electric Utilities — 0.5% | |
Pacific Gas & Electric Co., 2020 Exit Term Loan B, (3 mo. LIBOR + 4.50%, 1.00% Floor), 5.50%, 06/23/25 | | | USD | | | | 2,645 | | | | 2,595,406 | |
Texas Competitive Electric Holdings Co. LLC/TCEH Finance, Inc., Term Loan, 1.00%, 11/10/20(a)(b)(c) | | | | | | | 2,375 | | | | — | |
| | | | | | | | | | | | |
| | | | | | | | | | | 2,595,406 | |
|
| Energy Equipment & Services — 1.2% | |
Gates Global LLC, 2017 Repriced Term Loan B, 04/01/24(l) | | | | | | | 4,300 | | | | 4,131,671 | |
GrafTech Finance, Inc., 2018 Term Loan B,
(1 mo. LIBOR + 3.50%, 1.00% Floor), 4.50%, 02/12/25 | | | | | | | 1,776 | | | | 1,726,046 | |
| | | | | | | | | | | | |
| | | | | | | | | | | 5,857,717 | |
|
| Equity Real Estate Investment Trusts (REITs) — 1.3% | |
Claros Mortgage Trust, Inc., Term Loan B,
(1 mo. LIBOR + 3.25%), 3.44%, 08/09/26(a) | | | | | | | 839 | | | | 776,099 | |
Cushman & Wakefield U.S. Borrower LLC, 2020 Term Loan B, (1 mo. LIBOR + 2.75%), 2.93%, 08/21/25 | | | | | | | 1,917 | | | | 1,801,402 | |
VICI Properties 1 LLC, Replacement Term Loan B, (1 mo. LIBOR + 1.75%), 1.94%, 12/20/24 | | | | | | | 4,219 | | | | 3,923,537 | |
| | | | | | | | | | | | |
| | | | | | | | | | | 6,501,038 | |
|
| Food & Staples Retailing — 1.2% | |
Hearthside Food Solutions LLC,: | | | | | | | | | | | | |
2018 Incremental Term Loan,
(1 mo. LIBOR + 4.00%), 4.18%, 05/23/25 | | | | | | | 1,036 | | | | 987,007 | |
2018 Term Loan B, (1 mo. LIBOR + 3.68%), 3.87%, 05/23/25 | | | | | | | 1,409 | | | | 1,336,483 | |
2020 Incremental Term Loan B3, (1 mo. LIBOR + 5.00%, 1.00% Floor), 6.00%, 05/23/25 | | | | | | | 180 | | | | 175,050 | |
US Foods, Inc.,: | | | | | | | | | | | | |
2016 Term Loan B, (1 mo. LIBOR + 1.75%), 1.93%, 06/27/23 | | | | | | | 3,025 | | | | 2,836,781 | |
2019 Term Loan B, (3 mo. LIBOR + 2.00%), 3.07%, 09/13/26 | | | | | | | 751 | | | | 697,221 | |
| | | | | | | | | | | | |
| | | | | | | | | | | 6,032,542 | |
|
| Food Products — 3.6% | |
8th Avenue Food & Provisions, Inc., 2018 1st Lien Term Loan, (1 mo. LIBOR + 3.50%), 3.68%, 10/01/25 | | | | | | | 1,116 | | | | 1,080,082 | |
B&G Foods, Inc., 2019 Term Loan B4,
(1 mo. LIBOR + 2.50%), 2.68%, 10/10/26 | | | | | | | 203 | | | | 199,782 | |
Chobani LLC, 2017 Term Loan B, (1 mo. LIBOR + 3.50%, 1.00% Floor), 4.50%, 10/10/23 | | | | | | | 3,550 | | | | 3,406,270 | |
Froneri International Ltd.,: | | | | | | | | | | | | |
2020 USD 2nd Lien Term Loan, (1 mo. LIBOR + 5.75%), 5.93%, 01/31/28 | | | | | | | 259 | | | | 245,402 | |
2020 USD Term Loan, (1 mo. LIBOR + 2.25%), 2.43%, 01/29/27 | | | | | | | 5,513 | | | | 5,171,911 | |
Hostess Brands LLC, 2019 Term Loan, (3 mo. LIBOR + 2.25%), 3.01%, 08/03/25 | | | | | | | 1,221 | | | | 1,175,902 | |
| | |
| 24 | | 2020 BLACKROCK SEMI-ANNUAL REPORTTO SHAREHOLDERS |
| | |
Schedule of Investments (unaudited) (continued) June 30, 2020 | | BlackRock Debt Strategies Fund, Inc. (DSU) (Percentages shown are based on Net Assets) |
| | | | | | | | | | | | |
| Security | | | Par
(000) | | | Value | |
|
| Food Products (continued) | |
JBS USA LUX SA, 2019 Term Loan B, (2 mo. LIBOR + 2.00%), 3.07%, 05/01/26 | | | USD | | | | 601 | | | $ | 572,453 | |
Pathway Vet Alliance LLC,(l): | | | | | | | | | | | | |
2020 Delayed Draw Term Loan, 03/31/27 | | | | | | | 39 | | | | 37,914 | |
2020 Term Loan, 03/31/27 | | | | | | | 481 | | | | 466,504 | |
Reynolds Group Holdings, Inc., 2017 Term Loan,
(1 mo. LIBOR + 2.75%), 2.93%, 02/05/23 | | | | | | | 6,244 | | | | 5,949,549 | |
| | | | | | | | | | | | |
| | | | | | | | | | | 18,305,769 | |
|
| Health Care Equipment & Supplies — 1.5% | |
Immucor, Inc., Extended Term Loan B, (3 mo. LIBOR + 5.00%, 1.00% Floor), 6.00%, 06/15/21 | | | | | | | 3,144 | | | | 3,018,366 | |
Ortho-Clinical Diagnostics SA,: | | | | | | | | | | | | |
2018 Term Loan B, (1 mo. LIBOR + 3.25%), 3.43%, 06/30/25 | | | | | | | 3,872 | | | | 3,612,998 | |
EUR Term Loan B, (EURIBOR + 3.50%), 3.50%, 06/30/25 | | | EUR | | | | 998 | | | | 1,047,846 | |
| | | | | | | | | | | | |
| | | | | | | | | | | 7,679,210 | |
|
| Health Care Providers & Services — 3.1% | |
AHP Health Partners, Inc., 2018 Term Loan,
(1 mo. LIBOR + 4.50%, 1.00% Floor), 5.50%, 06/30/25 | | | USD | | | | 830 | | | | 797,063 | |
CHG Healthcare Services, Inc., 2017 1st Lien Term Loan B, (3 mo. LIBOR + 3.00%, 1.00% Floor), 4.07%, 06/07/23 | | | | | | | 2,189 | | | | 2,105,725 | |
Da Vinci Purchaser Corp., 2019 Term Loan,
(6 mo. LIBOR + 4.00%, 1.00% Floor), 5.24%, 01/08/27 | | | | | | | 1,120 | | | | 1,087,800 | |
DentalCorp Perfect Smile ULC, 1st Lien Term Loan, (1 mo. LIBOR + 3.75%, 1.00% Floor), 4.75%, 06/06/25 | | | | | | | 519 | | | | 461,489 | |
Envision Healthcare Corp., 2018 1st Lien Term Loan, (1 mo. LIBOR + 3.75%), 3.93%, 10/10/25 | | | | | | | 2,046 | | | | 1,334,953 | |
EyeCare Partners LLC,: | | | | | | | | | | | | |
2020 2nd Lien Term Loan, (3 mo. LIBOR + 8.25%), 8.56%, 02/18/28 | | | | | | | 1,460 | | | | 1,241,000 | |
2020 Term Loan, (3 mo. LIBOR + 3.75%), 4.06%, 02/05/27 | | | | | | | 1,607 | | | | 1,442,353 | |
Gentiva Health Services, Inc., 2020 Term Loan, (1 mo. LIBOR + 3.25%), 3.44%, 07/02/25 | | | | | | | 2,698 | | | | 2,607,376 | |
HC Group Holdings II, Inc., Term Loan B, (1 mo. LIBOR + 4.50%), 4.68%, 08/06/26 | | | | | | | 2,660 | | | | 2,579,846 | |
MPH Acquisition Holdings LLC, 2016 Term Loan B, (3 mo. LIBOR + 2.75%, 1.00% Floor), 3.75%, 06/07/23 | | | | | | | 222 | | | | 210,334 | |
nThrive, Inc., 2016 1st Lien Term Loan,
(1 mo. LIBOR + 4.50%, 1.00% Floor), 5.50%, 10/20/22 | | | | | | | 1,177 | | | | 964,950 | |
Team Health Holdings, Inc., 1st Lien Term Loan,
(1 mo. LIBOR + 2.75%, 1.00% Floor), 3.75%, 02/06/24 | | | | | | | 930 | | | | 708,343 | |
| | | | | | | | | | | | |
| | | | | | | | | | | 15,541,232 | |
|
| Health Care Services — 0.8% | |
Emerald TopCo., Inc., Term Loan,
(3 mo. LIBOR + 3.50%), 4.26%, 07/24/26(a) | | | | | | | 2,424 | | | | 2,345,223 | |
WP CityMD Bidco LLC, 2019 Term Loan B,
(6 mo. LIBOR + 4.50%, 1.00% Floor), 5.15%, 08/13/26 | | | | | | | 1,901 | | | | 1,869,384 | |
| | | | | | | | | | | | |
| | | | | | | | | | | 4,214,607 | |
| | | | | | | | | | | | |
| Security | | | Par
(000) | | | Value | |
|
| Health Care Technology — 0.8% | |
Change Healthcare Holdings, Inc., 2017 Term Loan B, (3 mo. LIBOR + 2.50%, 1.00% Floor), 3.50%, 03/01/24 | | | USD | | | | 3,444 | | | $ | 3,301,219 | |
GoodRx, Inc., 1st Lien Term Loan, (1 mo. LIBOR + 2.75%), 2.93%, 10/10/25 | | | | | | | 540 | | | | 514,196 | |
Quintiles IMS, Inc., 2017 Term Loan B,
(1 mo. LIBOR + 1.75%), 2.50%, 03/07/24 | | | | | | | 279 | | | | 270,126 | |
| | | | | | | | | | | | |
| | | | | | | | | | | 4,085,541 | |
|
| Hotels, Restaurants & Leisure — 5.5% | |
1011778 B.C. Unlimited Liability Co., Term Loan B4, (1 mo. LIBOR + 1.75%), 1.93%, 11/19/26 | | | | | | | 3,282 | | | | 3,104,483 | |
Aimbridge Acquisition Co., Inc., 2019 Term Loan B, (1 mo. LIBOR + 3.75%), 3.93%, 02/02/26 | | | | | | | 498 | | | | 431,012 | |
Aristocrat Leisure Ltd., 2020 Incremental Term Loan B, (3 mo. LIBOR + 3.75%, 1.00% Floor), 4.75%, 10/19/24 | | | | | | | 889 | | | | 880,110 | |
Aristocrat Technologies, Inc., 2018 1st Lien Term Loan, (3 mo. LIBOR + 1.75%), 2.86%, 10/19/24 | | | | | | | 1,085 | | | | 1,028,201 | |
Boyd Gaming Corp., Term Loan B3, (1 Week LIBOR + 2.25%), 2.36%, 09/15/23 | | | | | | | 1,096 | | | | 1,027,791 | |
Caesars Resort Collection LLC.: | | | | | | | | | | | | |
2017 1st Lien Term Loan B, (1 mo. LIBOR + 2.75%), 2.93%, 12/23/24 | | | | | | | 3,738 | | | | 3,314,209 | |
2020 Term Loan, 06/19/25(l) | | | | | | | 3,289 | | | | 3,085,510 | |
CCM Merger, Inc., Term Loan B,
(1 mo. LIBOR + 2.25%), 3.00%, 08/08/21 | | | | | | | 592 | | | | 572,787 | |
Four Seasons Hotels Ltd., 1st Lien Term Loan,
(1 mo. LIBOR + 2.00%), 2.18%, 11/30/23 | | | | | | | 907 | | | | 857,326 | |
Golden Nugget LLC, 2017 Incremental Term Loan B, 10/04/23(l) | | | | | | | 1,628 | | | | 1,286,210 | |
Golden Nugget, Inc., 2020 Initial Term Loan, 10/04/23(a)(l) | | | | | | | 201 | | | | 201,219 | |
IRB Holding Corp, 2020 Term Loan B, (1 mo. LIBOR + 2.75%, 1.00% Floor), 3.75%, 02/05/25 | | | | | | | 2,227 | | | | 2,051,001 | |
KFC Holding Co., 2018 Term Loan B, (1 mo. LIBOR + 1.75%), 1.94%, 04/03/25 | | | | | | | 876 | | | | 837,892 | |
Playa Resorts Holding BV, 2017 Term Loan B, (1 mo. LIBOR + 2.75%, 1.00% Floor), 3.75%, 04/29/24 | | | | | | | 687 | | | | 576,153 | |
Playtika Holding Corp., Term Loan B, (3 mo. LIBOR + 6.00%, 1.00% Floor), 7.07%, 12/10/24 | | | | | | | 1,685 | | | | 1,680,516 | |
Scientific Games International, Inc., 2018 Term Loan B5, (1 mo. LIBOR + 2.75%), 3.48%, 08/14/24 | | | | | | | 1,150 | | | | 1,014,163 | |
Stars Group Holdings BV, 2018 USD Incremental Term Loan, (3 mo. LIBOR + 3.50%), 3.81%, 07/10/25 | | | | | | | 1,228 | | | | 1,219,395 | |
Station Casinos LLC, 2020 Term Loan B, (1 mo. LIBOR + 2.25%), 2.50%, 02/08/27 | | | | | | | 2,001 | | | | 1,815,784 | |
Whatabrands LLC, 2020 Term Loan B, (1 mo. LIBOR + 2.75%), 2.93%, 07/31/26 | | | | | | | 2,771 | | | | 2,647,698 | |
| | | | | | | | | | | | |
| | | | | | | | | | | 27,631,460 | |
|
| Independent Power and Renewable Electricity Producers — 0.7% | |
Calpine Construction Finance Co. LP, 2017 Term Loan B, (1 mo. LIBOR + 2.00%), 2.18%, 01/15/25 | | | | | | | 672 | | | | 646,207 | |
Calpine Corp.: | | | | | | | | | | | | |
2019 Term Loan B10, (1 mo. LIBOR + 2.00%), 2.18%, 08/12/26 | | | | | | | 1,067 | | | | 1,024,148 | |
| | | | |
| SCHEDULES OF INVESTMENTS | | | 25 | |
| | |
Schedule of Investments (unaudited) (continued) June 30, 2020 | | BlackRock Debt Strategies Fund, Inc. (DSU) (Percentages shown are based on Net Assets) |
| | | | | | | | | | | | |
| Security | | | Par
(000) | | | Value | |
|
| Independent Power and Renewable Electricity Producers (continued) | |
Term Loan B9, (1 mo. LIBOR + 2.25%), 2.43%, 04/05/26 | | | USD | | | | 1,932 | | | $ | 1,860,553 | |
| | | | | | | | | | | | |
| | | | | | | | | | | 3,530,908 | |
|
| Industrial Conglomerates — 2.1% | |
Sequa Mezzanine Holdings LLC, 1st Lien Term Loan, (3 mo. LIBOR + 5.00%, 1.00% Floor), 6.00%, 11/28/21 | | | | | | | 1,454 | | | | 1,323,008 | |
Vertical US Newco Inc, USD Term Loan B, 07/01/27(a)(l) | | | | | | | 1,712 | | | | 1,686,320 | |
Vertiv Group Corp., Term Loan B, (1 mo. LIBOR + 3.00%), 3.18%, 03/02/27 | | | | | | | 7,996 | | | | 7,536,192 | |
| | | | | | | | | | | | |
| | | | | | | | | | | 10,545,520 | |
|
| Insurance — 3.7% | |
Alliant Holdings I, Inc., 2018 Term Loan B, (1 mo. LIBOR + 2.75%), 2.93%, 05/09/25 | | | | | | | 2,453 | | | | 2,319,572 | |
Alliant Holdings Intermediate LLC, Term Loan B, (1 mo. LIBOR + 3.25%), 3.44%, 05/09/25 | | | | | | | 1,196 | | | | 1,137,708 | |
AmWINS Group, Inc., 2017 Term Loan B, (1 mo. LIBOR + 2.75%, 1.00% Floor), 3.75%, 01/25/24 | | | | | | | 3,259 | | | | 3,160,469 | |
AssuredPartners Capital, Inc., 2020 Incremental Term Loan B, (3 mo. LIBOR + 4.50%, 1.00% Floor), 5.50%, 02/12/27 | | | | | | | 605 | | | | 593,373 | |
AssuredPartners, Inc., 2020 Term Loan B, (1 mo. LIBOR + 3.50%), 3.68%, 02/12/27 | | | | | | | 1,566 | | | | 1,494,516 | |
Hub International Ltd.: | | | | | | | | | | | | |
2018 Term Loan B, (3 mo. LIBOR + 3.00%), 4.02%, 04/25/25 | | | | | | | 2,291 | | | | 2,174,269 | |
2019 Incremental Term Loan B, (3 mo. LIBOR + 4.00%, 1.00% Floor), 5.00%, 04/25/25 | | | | | | | 1,427 | | | | 1,399,920 | |
Sedgwick Claims Management Services, Inc.: | | | | | | | | | | | | |
2019 Term Loan B, (1 mo. LIBOR + 4.00%), 4.18%, 09/03/26 | | | | | | | 2,088 | | | | 1,999,357 | |
2020 Term Loan B3, (1 mo. LIBOR + 4.25%, 1.00% Floor), 5.25%, 09/03/26 | | | | | | | 1,169 | | | | 1,131,978 | |
Term Loan B, (1 mo. LIBOR + 3.25%), 3.43%, 12/31/25 | | | | | | | 3,416 | | | | 3,217,314 | |
| | | | | | | | | | | | |
| | | | | | | | | | | 18,628,476 | |
|
| Interactive Media & Services — 1.2% | |
Ancestry.com Operations, Inc. | | | | | | | | | | | | |
2019 Extended Term Loan B, (1 mo. LIBOR + 4.25%), 5.25%, 08/27/26 | | | | | | | 920 | | | | 870,875 | |
Non-Extended Term Loan B, (1 mo. LIBOR + 3.75%, 1.00% Floor), 4.75%, 10/19/23(a) | | | | | | | 3,768 | | | | 3,598,636 | |
Rackspace Hosting, Inc., 2017 Incremental 1st Lien Term Loan, (3 mo. LIBOR + 3.00%, 1.00% Floor), 4.00%, 11/03/23 | | | | | | | 335 | | | | 318,371 | |
TierPoint LLC, 2017 1st Lien Term Loan, (1 mo. LIBOR + 3.75%, 1.00% Floor), 4.75%, 05/06/24 | | | | | | | 1,348 | | | | 1,279,758 | |
| | | | | | | | | | | | |
| | | | | | | | | | | 6,067,640 | |
|
| IT Services — 4.2% | |
Camelot U.S. Acquisition 1 Co., Term Loan B, (1 mo. LIBOR + 3.00%), 3.18%, 10/30/26 | | | | | | | 3,555 | | | | 3,437,389 | |
Epicor Software Corp., 1st Lien Term Loan, (1 mo. LIBOR + 3.25%), 3.43%, 06/01/22 | | | | | | | 2,988 | | | | 2,920,710 | |
Evertec Group LLC, 2018 Term Loan B, (1 mo. LIBOR + 3.50%), 3.68%, 11/27/24 | | | | | | | 1,023 | | | | 986,712 | |
Flexential Intermediate Corp., 2nd Lien Term Loan, (3 mo. LIBOR + 7.25%, 1.00% Floor), 7.59%, 08/01/25 | | | | | | | 1,121 | | | | 478,757 | |
| | | | | | | | | | | | |
| Security | | | Par
(000) | | | Value | |
|
| IT Services (continued) | |
Greeneden US Holdings II LLC, 2018 Term Loan B, 12/01/23(l) | | | USD | | | | 3,608 | | | $ | 3,465,618 | |
GreenSky Holdings LLC, 2020 Term Loan B2, (3 mo. LIBOR + 4.50%), 5.50%, 03/29/25(a) | | | | | | | 1,386 | | | | 1,344,420 | |
Presidio, Inc., 2020 Term Loan B, (3 mo. LIBOR + 3.50%), 4.27%, 01/22/27 | | | | | | | 789 | | | | 759,162 | |
PUG LLC, USD Term Loan, (1 mo. LIBOR + 3.50%), 3.68%, 02/12/27 | | | | | | | 2,852 | | | | 2,470,358 | |
Trans Union LLC, 2019 Term Loan B5, (1 mo. LIBOR + 1.75%), 1.93%, 11/16/26 | | | | | | | 3,347 | | | | 3,194,900 | |
WEX, Inc., Term Loan B3, (1 mo. LIBOR + 2.25%), 2.43%, 05/15/26 | | | | | | | 2,228 | | | | 2,129,441 | |
| | | | | | | | | | | | |
| | | | | | | | | | | 21,187,467 | |
|
| Leisure Products — 0.1% | |
MND Holdings III Corp., 2018 1st Lien Term Loan, (3 mo. LIBOR + 3.50%, 1.00% Floor), 4.50%, 06/19/24 | | | | | | | 786 | | | | 585,346 | |
| | | | | | | | | | | | |
|
| Life Sciences Tools & Services — 1.9% | |
Albany Molecular Research, Inc., 2017 2nd Lien Term Loan, (3 mo. LIBOR + 7.00%, 1.00% Floor), 8.00%, 08/30/25 | | | | | | | 75 | | | | 71,288 | |
eResearchTechnology, Inc., 2020 1st Lien Term Loan, (1 mo. LIBOR + 4.50%, 1.00% Floor), 4.68%, 02/04/27 | | | | | | | 2,482 | | | | 2,426,775 | |
Sotera Health Holdings LLC, 2019 Term Loan, (1 mo. LIBOR + 4.50%, 1.00% Floor), 5.50%, 12/11/26 | | | | | | | 7,093 | | | | 6,913,760 | |
| | | | | | | | | | | | |
| | | | | | | | | | | 9,411,823 | |
|
| Machinery — 1.7% | |
Ingersoll-Rand Global Holding Co. Ltd., 2020 USD Spinco Term Loan, (1 mo. LIBOR + 1.75%), 1.93%, 03/01/27 | | | | | | | 2,645 | | | | 2,511,461 | |
Terex Corp., 2019 Term Loan B1, (3 mo. LIBOR + 2.75%), 3.50%, 01/31/24(a) | | | | | | | 384 | | | | 376,455 | |
Titan Acquisition Ltd., 2018 Term Loan B, (3 mo. LIBOR + 3.00%), 3.36%, 03/28/25 | | | | | | | 6,062 | | | | 5,529,416 | |
| | | | | | | | | | | | |
| | | | | | | | | | | 8,417,332 | |
|
| Media — 14.1% | |
Altice Financing SA,(l): | | | | | | | | | | | | |
2017 Term Loan B, 07/15/25 | | | | | | | 663 | | | | 625,931 | |
USD 2017 1st Lien Term Loan, 01/31/26 | | | | | | | 1,768 | | | | 1,664,890 | |
Altice France SA, 2018 Term Loan B13,
(1 mo. LIBOR + 4.00%), 4.18%, 08/14/26 | | | | | | | 2,846 | | | | 2,730,326 | |
Charter Communications Operating LLC, 2019 Term Loan B1, (1 mo. LIBOR + 1.75%), 1.93%, 04/30/25 | | | | | | | 3,608 | | | | 3,470,436 | |
Clear Channel Outdoor Holdings, Inc., Term Loan B, (3 mo. LIBOR + 3.50%), 4.26%, 08/21/26 | | | | | | | 5,641 | | | | 5,099,833 | |
Connect Finco Sarl, Term Loan B, (1 mo. LIBOR + 4.50%, 1.00% Floor), 5.50%, 12/11/26 | | | | | | | 10,491 | | | | 9,842,283 | |
CSC Holdings LLC.: | | | | | | | | | | | | |
2017 1st Lien Term Loan, (1 mo. LIBOR + 2.25%), 2.43%, 07/17/25 | | | | | | | 591 | | | | 557,831 | |
2019 Term Loan B5, (1 mo. LIBOR + 2.50%), 2.68%, 04/15/27 | | | | | | | 1,986 | | | | 1,879,904 | |
Diamond Sports Group LLC, Term Loan,
(3 mo. LIBOR + 3.25%), 3.43%, 08/24/26 | | | | | | | 455 | | | | 368,769 | |
Gray Television, Inc., 2018 Term Loan C, (1 mo. LIBOR + 2.50%), 2.67%, 01/02/26 | | | | | | | 1,461 | | | | 1,411,333 | |
| | |
| 26 | | 2020 BLACKROCK SEMI-ANNUAL REPORTTO SHAREHOLDERS |
| | |
Schedule of Investments (unaudited) (continued) June 30, 2020 | | BlackRock Debt Strategies Fund, Inc. (DSU) (Percentages shown are based on Net Assets) |
| | | | | | | | | | | | |
| Security | | | Par
(000) | | | Value | |
|
| Media (continued) | |
Intelsat Jackson Holdings SA: | | | | | | | | | | | | |
2017 Term Loan B3, (PRIME + 4.75%), 8.00%, 11/27/23 | | | USD | | | | 455 | | | $ | 451,874 | |
2020 DIP Term Loan, 07/14/21(l) | | | | | | | 80 | | | | 81,092 | |
Learfield Communications LLC, 2016 1st Lien Term Loan, 12/01/23(l) | | | | | | | 3,879 | | | | 2,887,574 | |
Liberty Latin America Ltd., Term Loan B,
(1 mo. LIBOR + 5.00%), 5.19%, 10/15/26 | | | | | | | 1,488 | | | | 1,473,120 | |
Lions Gate Capital Holdings LLC, 2018 Term Loan B, (1 mo. LIBOR + 2.25%), 2.43%, 03/24/25 | | | | | | | 1,569 | | | | 1,479,654 | |
Live Nation Entertainment, Inc., Term Loan B4, 10/17/26(l) | | | | | | | 2,012 | | | | 1,843,136 | |
MH Sub I LLC: | | | | | | | | | | | | |
2017 1st Lien Term Loan, (3 mo. LIBOR + 3.75%), 4.57%, 09/13/24 | | | | | | | 3,623 | | | | 3,479,780 | |
2020 Incremental Term Loan, (3 mo. LIBOR + 3.75%, 1.00% Floor), 4.06%, 09/13/24 | | | | | | | 719 | | | | 692,037 | |
Midcontinent Communications, 2019 Term Loan B, (1 mo. LIBOR + 1.75%), 1.93%, 08/15/26(a) | | | | | | | 842 | | | | 804,091 | |
Nexstar Broadcasting, Inc., 2019 Term Loan B4, (1 mo. LIBOR + 2.75%), 2.92%, 09/18/26 | | | | | | | 1,720 | | | | 1,632,013 | |
PSAV Holdings LLC, 2018 1st Lien Term Loan, (1 mo. LIBOR + 3.25%, 1.00% Floor), 4.25%, 03/03/25 | | | | | | | 4,429 | | | | 3,166,833 | |
Radiate Holdco LLC, 1st Lien Term Loan, (1 mo. LIBOR + 3.00%), 3.75%, 02/01/24 | | | | | | | 2,270 | | | | 2,162,345 | |
Terrier Media Buyer, Inc., Term Loan B, (1 mo. LIBOR + 4.25%), 4.43%, 12/17/26 | | | | | | | 2,618 | | | | 2,491,077 | |
Trader Corp., 2017 Term Loan B, (1 mo. LIBOR + 3.00%, 1.00% Floor), 4.00%, 09/28/23(a) | | | | | | | 4,338 | | | | 4,175,446 | |
UFC Holdings LLC, 2019 Term Loan, 04/29/26(l) | | | | | | | 650 | | | | 619,961 | |
Virgin Media Bristol LLC, USD Term Loan N, 01/31/28(l) | | | | | | | 2,578 | | | | 2,456,412 | |
William Morris Endeavor Entertainment LLC, 2018 1st Lien Term Loan, (1 mo. LIBOR + 2.75%), 2.93%, 05/18/25 | | | | | | | 3,172 | | | | 2,576,336 | |
Zayo Group Holdings, Inc., USD Term Loan, (1 mo. LIBOR + 3.00%), 3.18%, 03/09/27 | | | | | | | 11,701 | | | | 11,079,856 | |
| | | | | | | | | | | | |
| | | | | | | | | | | 71,204,173 | |
|
| Metals & Mining — 0.9% | |
Ball Metalpack LLC, 2018 1st Lien Term Loan B, (3 mo. LIBOR + 4.50%), 4.86%, 07/31/25 | | | | | | | 2,061 | | | | 1,885,454 | |
Equinox Holdings, Inc., 2017 1st Lien Term Loan, (6 mo. LIBOR + 3.00%, 1.00% Floor), 4.07%, 03/08/24 | | | | | | | 3,672 | | | | 2,816,472 | |
| | | | | | | | | | | | |
| | | | | | | | | | | 4,701,926 | |
|
| Multiline Retail — 0.2% | |
Eyemart Express LLC, 2017 Term Loan B, (1 mo. LIBOR + 3.00%, 1.00% Floor), 4.00%, 08/04/24 | | | | | | | 909 | | | | 825,178 | |
Neiman Marcus Group Ltd LLC,: | | | | | | | | | | | | |
2020 DIP Term Loan, (1 mo. LIBOR + 12.75%), 13.87%, 10/07/20 | | | | | | | 79 | | | | 80,355 | |
2020 Exit Term Loan, 05/08/25(a)(l) | | | | | | | 115 | | | | 115,987 | |
Cash Pay Extended Term Loan, (PRIME + 5.00%), 8.25%, 10/25/23 | | | | | | | 392 | | | | 99,231 | |
| | | | | | | | | | | | |
| | | | | | | | | | | 1,120,751 | |
|
| Oil & Gas Equipment & Services — 0.3% | |
McDermott Technology Americas, Inc.,: | | | | | | | | | | | | |
2018 1st Lien Term Loan, (PRIME + 4.00%), 7.25%, 05/09/25 | | | | | | | 1,961 | | | | 672,760 | |
| | | | | | | | | | | | |
| Security | | | Par
(000) | | | Value | |
|
| Oil & Gas Equipment & Services (continued) | |
2020 SP DIP Roll Up Term Loan, 10/21/20(l) | | | USD | | | | 853 | | | $ | 845,160 | |
| | | | | | | | | | | | |
| | | | | | | | | | | 1,517,920 | |
|
| Oil, Gas & Consumable Fuels — 0.5% | |
California Resources Corp., Second Out Term Loan, (3 mo. LIBOR + 10.37%, 1.00% Floor), 11.38%, 12/31/21 | | | | | | | 2,002 | | | | 90,087 | |
Chesapeake Energy Corp., 2019 Last Out Term Loan, (1 mo. LIBOR + 8.00%, 1.00% Floor), 9.00%, 06/24/24 | | | | | | | 465 | | | | 266,971 | |
Edgewater Generation LLC, Term Loan, (1 mo. LIBOR + 3.75%), 3.93%, 12/13/25 | | | | | | | 1,756 | | | | 1,674,440 | |
EG Group Ltd., 2018 Term Loan B, (6 mo. LIBOR + 4.00%), 5.07%, 02/07/25 | | | | | | | 723 | | | | 677,540 | |
| | | | | | | | | | | | |
| | | | | | | | | | | 2,709,038 | |
|
| Personal Products — 0.8% | |
Sunshine Luxembourg VII Sarl, USD 1st Lien Term Loan, 10/01/26(l) | | | | | | | 4,287 | | | | 4,095,676 | |
| | | | | | | | | | | | |
|
| Pharmaceuticals — 3.4% | |
Amneal Pharmaceuticals LLC, 2018 Term Loan B, (1 mo. LIBOR + 3.50%), 3.69%, 05/04/25 | | | | | | | 2,293 | | | | 2,089,585 | |
Catalent Pharma Solutions, Inc., Term Loan B2, (1 mo. LIBOR + 2.25%, 1.00% Floor), 3.25%, 05/18/26 | | | | | | | 2,341 | | | | 2,309,686 | |
Elanco Animal Health Incorporated, Term Loan B, 02/04/27(l) | | | | | | | 1,079 | | | | 1,026,959 | |
Grifols Worldwide Operations USA, Inc., USD 2019 Term Loan B, (1 Week LIBOR + 2.00%), 2.11%, 11/15/27 | | | | | | | 1,895 | | | | 1,820,978 | |
Jaguar Holding Co. II, 2018 Term Loan, (1 mo. LIBOR + 2.50%, 1.00% Floor), 3.50%, 08/18/22 | | | | | | | 3,799 | | | | 3,747,747 | |
Valeant Pharmaceuticals International, Inc., 2018 Term Loan B, (1 mo. LIBOR + 3.00%), 3.19%, 06/02/25 | | | | | | | 6,605 | | | | 6,409,436 | |
| | | | | | | | | | | | |
| | | | | | | | | | | 17,404,391 | |
|
| Professional Services — 1.5% | |
Cast and Crew Payroll LLC, 2019 1st Lien Term Loan, (1 mo. LIBOR + 3.75%), 3.93%, 02/09/26 | | | | | | | 1,011 | | | | 919,326 | |
Dun & Bradstreet Corp., Term Loan, (1 mo. LIBOR + 4.00%), 4.18%, 02/06/26 | | | | | | | 4,546 | | | | 4,420,603 | |
SIRVA Worldwide, Inc., 2018 1st Lien Term Loan, (3 mo. LIBOR + 5.50%), 5.81%, 08/04/25 | | | | | | | 1,418 | | | | 1,025,894 | |
STG-Fairway Holdings LLC, Term Loan B, (3 mo. LIBOR + 3.50%), 4.57%, 01/31/27 | | | | | | | 1,454 | | | | 1,351,609 | |
| | | | | | | | | | | | |
| | | | | | | | | | | 7,717,432 | |
|
| Real Estate Management & Development — 0.4% | |
CityCenter Holdings LLC, 2017 Term Loan B, (1 mo. LIBOR + 2.25%), 3.00%, 04/18/24 | | | | | | | 2,247 | | | | 2,038,195 | |
| | | | | | | | | | | | |
|
| Road & Rail — 1.3% | |
Lineage Logistics Holdings LLC, 2018 Term Loan, (1 mo. LIBOR + 3.00%, 1.00% Floor), 4.00%, 02/27/25 | | | | | | | 4,424 | | | | 4,276,476 | |
Moda Ingleside Energy Center LLC, 2018 Term Loan B, (1 mo. LIBOR + 3.25%), 3.43%, 09/29/25 | | | | | | | 874 | | | | 847,047 | |
Road Infrastructure Investment LLC, 2016 1st Lien Term Loan, (PRIME + 2.50%), 4.50%, 06/13/23 | | | | | | | 1,553 | | | | 1,356,021 | |
| | | | | | | | | | | | |
| | | | | | | | | | | 6,479,544 | |
| | | | |
| SCHEDULES OF INVESTMENTS | | | 27 | |
| | |
Schedule of Investments (unaudited) (continued) June 30, 2020 | | BlackRock Debt Strategies Fund, Inc. (DSU) (Percentages shown are based on Net Assets) |
| | | | | | | | | | | | |
| Security | | | Par
(000) | | | Value | |
|
| Semiconductors & Semiconductor Equipment — 0.0% | |
Microchip Technology, Inc., 2018 Term Loan B, (1 mo. LIBOR + 2.00%), 2.18%, 05/29/25 | | | USD | | | | 27 | | | $ | 26,454 | |
ON Semiconductor Corp., 2019 Term Loan B,
(1 mo. LIBOR + 2.00%), 2.18%, 09/19/26 | | | | | | | — | (m) | | | 30 | |
| | | | | | | | | | | | |
| | | | | | | | | | | 26,484 | |
|
| Software — 19.2% | |
Applied Systems, Inc.: | | | | | | | | | | | | |
2017 1st Lien Term Loan, (3 mo. LIBOR + 3.25%, 1.00% Floor), 4.25%, 09/19/24 | | | | | | | 3,589 | | | | 3,482,606 | |
2017 2nd Lien Term Loan, (3 mo. LIBOR + 7.00%, 1.00% Floor), 8.00%, 09/19/25 | | | | | | | 764 | | | | 760,426 | |
BMC Software Finance, Inc., 2017 Term Loan, 10/02/25(l) | | | | | | | 2,326 | | | | 2,194,781 | |
Castle US Holding Corp., USD Term Loan B, (3 mo. LIBOR + 3.75%), 4.06%, 01/29/27 | | | | | | | 3,168 | | | | 2,883,231 | |
Cornerstone OnDemand, Inc., Term Loan B, (2 mo. LIBOR + 4.25%), 5.35%, 04/22/27 | | | | | | | 1,061 | | | | 1,043,101 | |
Cypress Intermediate Holdings III, Inc., 2017 1st Lien Term Loan, (1 mo. LIBOR + 3.00%, 1.00% Floor), 4.00%, 04/29/24 | | | | | | | 1,353 | | | | 1,304,900 | |
Digicel International Finance Ltd., 2017 Term Loan B, (6 mo. LIBOR + 3.25%), 4.25%, 05/28/24 | | | | | | | 339 | | | | 283,377 | |
DTI Holdco, Inc., 2018 Term Loan B, (3 mo. LIBOR + 4.75%, 1.00% Floor), 5.75%, 09/30/23 | | | | | | | 1,084 | | | | 863,458 | |
Ellie Mae, Inc., Term Loan, (3 mo. LIBOR + 3.75%), 4.06%, 04/17/26 | | | | | | | 3,050 | | | | 2,947,922 | |
Financial & Risk US Holdings, Inc.,: | | | | | | | | | | | | |
2018 EUR Term Loan, (EURIBOR + 3.25%), 3.25%, 10/01/25 | | | EUR | | | | 956 | | | | 1,050,909 | |
2018 USD Term Loan, (1 mo. LIBOR + 3.25%), 3.43%, 10/01/25 | | | USD | | | | 6,523 | | | | 6,364,331 | |
Informatica LLC: | | | | | | | | | | | | |
2020 USD 2nd Lien Term Loan, 7.13%, 02/25/25 | | | | | | | 1,502 | | | | 1,500,122 | |
2020 USD Term Loan B, (1 mo. LIBOR + 3.25%), 3.43%, 02/25/27 | | | | | | | 7,862 | | | | 7,508,559 | |
Kronos, Inc.,: | | | | | | | | | | | | |
2017 Term Loan B, 11/01/23(l) | | | | | | | 6,746 | | | | 6,731,414 | |
2nd Lien Term Loan, (1 mo. LIBOR + 8.25%, 1.00% Floor), 9.25%, 11/01/24 | | | | | | | 2,743 | | | | 2,741,735 | |
McAfee LLC, 2018 Term Loan B, (1 mo. LIBOR + 3.75%), 3.93%, 09/30/24 | | | | | | | 3,487 | | | | 3,387,387 | |
Mitchell International, Inc.,: | | | | | | | | | | | | |
2017 1st Lien Term Loan, (1 mo. LIBOR + 3.25%), 3.43%, 11/29/24 | | | | | | | 2,506 | | | | 2,332,233 | |
2017 2nd Lien Term Loan, (1 mo. LIBOR + 7.25%), 7.43%, 12/01/25 | | | | | | | 887 | | | | 784,700 | |
Renaissance Holding Corp., 2018 Add On Term Loan, (3 mo. LIBOR + 3.25%), 4.01%, 05/30/25 | | | | | | | 593 | | | | 569,380 | |
RP Crown Parent LLC, 2016 Term Loan B, (1 mo. LIBOR + 2.75%, 1.00% Floor), 3.75%, 10/12/23 | | | | | | | 3,168 | | | | 3,069,337 | |
Severin Acquisition LLC, 2018 Term Loan B, (1 mo. LIBOR + 3.25%), 3.43%, 08/01/25 | | | | | | | 3,348 | | | | 3,205,749 | |
SolarWinds Holdings, Inc., 2018 Term Loan B, (1 mo. LIBOR + 2.75%), 2.93%, 02/05/24 | | | | | | | 3,798 | | | | 3,676,197 | |
Solera LLC, Term Loan B, (1 mo. LIBOR + 2.75%), 2.93%, 03/03/23 | | | | | | | 2,317 | | | | 2,231,726 | |
Sophia LP, 2017 Term Loan B, (3 mo. LIBOR + 3.25%, 1.00% Floor), 4.25%, 09/30/22 | | | | | | | 4,694 | | | | 4,576,820 | |
| | | | | | | | | | | | |
| Security | | | Par
(000) | | | Value | |
|
| Software (continued) | |
SS&C Technologies Holdings Europe Sarl, 2018 Term Loan B4, (1 mo. LIBOR + 1.75%), 1.93%, 04/16/25 | | | USD | | | | 406 | | | $ | 387,515 | |
SS&C Technologies, Inc.: | | | | | | | | | | | | |
2018 Term Loan B3, (1 mo. LIBOR + 1.75%), 1.93%, 04/16/25 | | | | | | | 578 | | | | 551,939 | |
2018 Term Loan B5, (1 mo. LIBOR + 1.75%), 1.93%, 04/16/25 | | | | | | | 1,757 | | | | 1,673,227 | |
Tempo Acquisition LLC, Term Loan, (1 mo. LIBOR + 2.75%), 2.93%, 05/01/24 | | | | | | | 5,256 | | | | 4,980,157 | |
Tibco Software Inc.: | | | | | | | | | | | | |
2020 2nd Lien Term Loan, (1 mo. LIBOR + 7.25%), 7.43%, 03/03/28 | | | | | | | 3,674 | | | | 3,519,996 | |
2020 Term Loan B, (1 mo. LIBOR + 3.75%), 3.93%, 06/30/26(a) | | | | | | | 5,178 | | | | 4,880,365 | |
Ultimate Software Group, Inc.(l): | | | | | | | | | | | | |
2020 2nd Lien Incremental Term Loan, 05/03/27 | | | | | | | 1,767 | | | | 1,793,505 | |
2020 Incremental Term Loan B, 05/04/26 | | | | | | | 5,439 | | | | 5,365,084 | |
Term Loan B, 05/04/26(l) | | | | | | | 5,184 | | | | 5,013,615 | |
Vertafore, Inc., 2018 1st Lien Term Loan, (1 mo. LIBOR + 3.25%), 3.43%, 07/02/25 | | | | | | | 3,939 | | | | 3,705,090 | |
| | | | | | | | | | | | |
| | | | | | | | | | | 97,364,894 | |
|
| Specialty Retail — 2.2% | |
Belron Finance US LLC,: | | | | | | | | | | | | |
2019 USD Term Loan B, (3 mo. LIBOR + 2.50%), 3.26%, 10/30/26 | | | | | | | 1,157 | | | | 1,113,790 | |
Term Loan B, (3 mo. LIBOR + 2.50%), 2.93%, 11/13/25 | | | | | | | 2,018 | | | | 1,945,103 | |
USD Term Loan B, (3 mo. LIBOR + 2.50%), 2.97%, 11/07/24 | | | | | | | 1,450 | | | | 1,397,383 | |
Pathway Vet ParentCo LP: | | | | | | | | | | | | |
1st Lien Delayed Draw Term Loan, (3 mo. LIBOR + 4.25%), 4.61%, 08/31/26 | | | | | | | 264 | | | | 238,670 | |
1st Lien Term Loan, (3 mo. LIBOR + 4.25%), 4.61%, 08/31/26 | | | | | | | 1,507 | | | | 1,360,285 | |
Midas Intermediate Holdco II LLC, Incremental Term Loan B, (3 mo. LIBOR + 2.75%, 1.00% Floor), 3.75%, 08/18/21 | | | | | | | 1,410 | | | | 1,266,859 | |
PetSmart, Inc., Term Loan B2, 03/11/22(l) | | | | | | | 2,934 | | | | 2,891,455 | |
Research Now Group, Inc., 2017 1st Lien Term Loan, (3 mo. LIBOR + 5.50%, 1.00% Floor), 6.50%, 12/20/24 | | | | | | | 1,151 | | | | 1,054,145 | |
| | | | | | | | | | | | |
| | | | | | | | | | | 11,267,690 | |
|
| Technology Hardware, Storage & Peripherals — 0.6% | |
Electronics for Imaging, Inc., Term Loan, 07/23/26(a)(l) | | | | | | | 1,620 | | | | 1,263,750 | |
Western Digital Corp., 2018 Term Loan B4, (3 mo. LIBOR + 1.75%), 1.92%, 04/29/23 | | | | | | | 2,085 | | | | 2,024,020 | |
| | | | | | | | | | | | |
| | | | | | | | | | | 3,287,770 | |
|
| Thrifts & Mortgage Finance — 0.5% | |
IG Investment Holdings LLC, 2018 1st Lien Term Loan, 05/23/25(l) | | | | | | | 2,953 | | | | 2,734,711 | |
| | | | | | | | | | | | |
|
| Trading Companies & Distributors — 0.7% | |
HD Supply, Inc., Term Loan B5, (1 mo. LIBOR + 1.75%), 1.93%, 10/17/23 | | | | | | | 3,767 | | | | 3,635,075 | |
| | | | | | | | | | | | |
|
| Utilities — 0.5% | |
ExGen Renewables IV LLC, Term Loan B, (3 mo. LIBOR + 3.00%, 1.00% Floor), 4.00%, 11/28/24 | | | | | | | 2,474 | | | | 2,393,514 | |
| | | | | | | | | | | | |
| | |
| 28 | | 2020 BLACKROCK SEMI-ANNUAL REPORTTO SHAREHOLDERS |
| | |
Schedule of Investments (unaudited) (continued) June 30, 2020 | | BlackRock Debt Strategies Fund, Inc. (DSU) (Percentages shown are based on Net Assets) |
| | | | | | | | | | | | |
| Security | | | Par
(000) | | | Value | |
|
| Wireless Telecommunication Services — 2.7% | |
Ligado Networks LLC, PIK Exit Term Loan (9.75% PIK), 0.00%, 12/07/20(e) | | | USD | | | | 197 | | | $ | 173,473 | |
SBA Senior Finance II LLC, 2018 Term Loan B, (1 mo. LIBOR + 1.75%), 1.93%, 04/11/25 | | | | | | | 3,387 | | | | 3,253,011 | |
T-Mobile USA, Inc., 2020 Term Loan, (1 mo. LIBOR + 3.00%), 3.18%, 04/01/27 | | | | | | | 7,195 | | | | 7,179,459 | |
Xplornet Communications, Inc., 2020 Term Loan B, 05/29/27(l) | | | | | | | 3,372 | | | | 3,211,830 | |
| | | | | | | | | | | | |
| | | | | | | | | | | 13,817,773 | |
| | | | | | | | | | | | |
| |
Total Floating Rate Loan Interests — 117.9%
(Cost — $634,801,470) | | | | 597,653,717 | |
| | | | | | | | | | | | |
| | | |
| | | | | | Shares | | | | |
|
Investment Companies — 3.6% | |
|
| Equity Fund — 0.1% | |
SPDR S&P Oil & Gas Exploration & Production ETF | | | | | | | 4,875 | | | | 254,378 | |
| | | | | | | | | | | | |
|
| Fixed Income Funds — 3.5% | |
Invesco Senior Loan ETF | | | | | | | 60,000 | | | | 1,281,000 | |
iShares iBoxx $ High Yield Corporate Bond ETF(p) | | | | | | | 142,000 | | | | 11,590,040 | |
iShares iBoxx $ Investment Grade Corporate Bond ETF(p) | | | | | | | 39,000 | | | | 5,245,500 | |
| | | | | | | | | | | | |
| | | | | | | | | | | 18,116,540 | |
| | | | | | | | | | | | |
| |
Total Investment Companies — 3.6%
(Cost — $18,486,648) | | | | 18,370,918 | |
| | | | | | | | | | | | |
| | | |
| | | | | | Beneficial Interest (000) | | | | |
|
Other Interests(n) — 0.0% | |
|
| IT Services — 0.0% | |
Millennium Corp.(a)(b) | | | | | | | 1,156 | | | | — | |
Millennium Lender Claims(a)(b) | | | | | | | 1,084 | | | | — | |
| | | | | | | | | | | | |
| |
Total Other Interests — 0.0%
(Cost — $—) | | | | — | |
| | | | | | | | | | | | |
| | | |
| | | | | | Par
(000) | | | | |
|
Preferred Securities—1.3% | |
|
| Capital Trusts — 1.2% | |
|
| Banks — 0.3% | |
Banco de Sabadell SA, 6.50%(h)(i) | | | EUR | | | | 200 | | | | 183,602 | |
Banco Santander SA, 4.38%(h)(i) | | | | | | | 200 | | | | 202,776 | |
Bankia SA, 6.38%(h)(i) | | | | | | | 200 | | | | 212,026 | |
CaixaBank SA, 6.75%(h)(i) | | | | | | | 200 | | | | 224,700 | |
Wells Fargo & Co., Series U, 5.88%(h)(i) | | | USD | | | | 775 | | | | 805,512 | |
| | | | | | | | | | | | |
| | | | | | | | | | | 1,628,616 | |
|
| Diversified Financial Services — 0.9% | |
Bank of America Corp.,(h)(i): | | | | | | | | | | | | |
Series AA, 6.10% | | | | | | | 657 | | | | 693,135 | |
Series DD, 6.30% | | | | | | | 55 | | | | 61,035 | |
Series X, 6.25% | | | | | | | 350 | | | | 362,274 | |
Series Z, 6.50% | | | | | | | 232 | | | | 249,321 | |
BNP Paribas SA, 4.50%(d)(h)(i) | | | | | | | 200 | | | | 175,250 | |
HBOS Capital Funding LP, 6.85%(i) | | | | | | | 200 | | | | 202,180 | |
HSBC Holdings PLC, 6.00%(h)(i) | | | | | | | 600 | | | | 596,250 | |
| | | | | | | | | | | | |
| Security | | | Par
(000) | | | Value | |
|
| Diversified Financial Services (continued) | |
JPMorgan Chase & Co.,(h)(i): | | | | | | | | | | | | |
Series 1, 4.23% | | | USD | | | | 52 | | | $ | 47,336 | |
Series FF, 5.00% | | | | | | | 865 | | | | 827,372 | |
Series HH, 4.60% | | | | | | | 374 | | | | 333,795 | |
Series V, 3.62% | | | | | | | 780 | | | | 688,350 | |
Royal Bank of Scotland Group PLC, 8.63%(h)(i) | | | | | | | 246 | | | | 255,779 | |
| | | | | | | | | | | | |
| | | | | | | | | | | 4,492,077 | |
| | | | | | | | | | | | |
| |
Total Capital Trusts — 1.2% | | | | 6,120,693 | |
| | | | | | | | | | | | |
| | | |
| | | | | | Shares | | | | |
|
Preferred Stock — 0.1% | |
|
Capital Markets — 0.1% | |
Goldman Sachs Group, Inc., Series J, 5.50%(h)(i) | | | | | | | 13,550 | | | | 344,170 | |
| | | | | | | | | | | | |
| |
Total Preferred Stock — 0.1% | | | | 344,170 | |
| | | | | | | | | | | | |
| |
Total Preferred Securities — 1.3%
(Cost — $6,744,032) | | | | 6,464,863 | |
| | | | | | | | | | | | |
|
Warrants — 0.0% | |
|
Metals & Mining — 0.0% | |
AFGlobal Corp. (Expires 12/20/20)(a) | | | | | | | 5,283 | | | | — | |
| | | | | | | | | | | | |
|
| Oil, Gas & Consumable Fuels — 0.0% | |
SM Energy Co. (Expires 06/30/23)(b) | | | | | | | 11,411 | | | | 42,677 | |
| | | | | | | | | | | | |
|
| Transportation Infrastructure — 0.0% | |
Turbo Cayman Ltd. (Strike Price $0.01)(a) | | | | | | | 1 | | | | — | |
| | | | | | | | | | | | |
| |
Total Warrants — 0.0%
(Cost — $48,949) | | | | 42,677 | |
| | | | | | | | | | | | |
| |
Total Long-Term Investments — 144.1%
(Cost — $791,021,624) | | | | 730,180,644 | |
| | | | | | | | | | | | |
|
Short-Term Securities — 0.4% | |
BlackRock Liquidity Funds, T-Fund, Institutional Class, 0.11%(o)(p) | | | | 1,975,816 | | | | 1,975,816 | |
| | | | | | | | | | | | |
| |
Total Short-Term Securities — 0.4%
(Cost — $1,975,816) | | | | 1,975,816 | |
| | | | | | | | | | | | |
| |
Total Investments — 144.5%
(Cost — $792,997,440) | | | | 732,156,460 | |
| |
Liabilities in Excess of Other Assets — (44.5)% | | | | (225,332,824 | ) |
| | | | | | | | | | | | |
| |
Net Assets — 100.0% | | | $ | 506,823,636 | |
| | | | | | | | | | | | |
| (a) | Security is valued using significant unobservable inputs and is classified as Level 3 in the fair value hierarchy. |
| (b) | Non-income producing security. |
| (c) | Issuer filed for bankruptcy and/or is in default. |
| (d) | Security exempt from registration pursuant to Rule 144A under the Securities Act of 1933, as amended. These securities may be resold in transactions exempt from registration to qualified institutional investors. |
| (e) | Payment-in-kind security which may pay interest/dividends in additional par/shares and/or in cash. Rates shown are the current rate and possible payment rates. |
| (f) | When-issued security. |
| (g) | Variable or floating rate security, which interest rate adjusts periodically based on changes in current interest rates and prepayments on the underlying pool of assets. Rate shown is the rate in effect as of period end. |
| (h) | Variable rate security. Security may be issued at a fixed coupon rate, which converts to a variable rate at a specified date. Rate shown is the rate in effect as of period end. |
| (i) | Perpetual security with no stated maturity date. |
| | | | |
| SCHEDULES OF INVESTMENTS | | | 29 | |
| | |
Schedule of Investments (unaudited) (continued) June 30, 2020 | | BlackRock Debt Strategies Fund, Inc. (DSU) |
| (j) | Convertible security. |
| (k) | Variable rate security. Rate shown is the rate in effect as of period end. |
| (l) | Represents an unsettled loan commitment at period end. Certain details associated with this purchase are not known prior to the settlement date, including coupon rate. |
| (m) | Amount is less than 500. |
| (n) | Other interests represent beneficial interests in liquidation trusts and other reorganization or private entities. |
| (o) | Annualized 7-day yield as of period end. |
| (p) | Investments in issuers considered to be an affiliate/affiliates of the Fund during the six months ended June 30, 2020 for purposes of Section 2(a)(3) of the Investment Company Act of 1940, as amended, were as follows: |
| | | | | | | | | | | | | | | | | | | | | | | | | | | | | | | | |
| Affiliated Issuer | | Shares
Held at
12/31/19 | | | Shares
Purchased | | | Shares
Sold | | | Shares
Held at
06/30/20 | | | Value at
06/30/20 | | | Income | | | Net
Realized
Gain (Loss) (a) | | | Change in
Unrealized
Appreciation
(Depreciation) | |
BlackRock Liquidity Funds, T-Fund, Institutional Class | | | — | | | | 1,975,816 | (b) | | | — | | | | 1,975,816 | | | $ | 1,975,816 | | | $ | 8,435 | | | $ | — | | | $ | — | |
iShares iBoxx $ High Yield Corporate Bond ETF | | | — | | | | 155,500 | | | | (13,500 | ) | | | 142,000 | | | | 11,590,040 | | | | 72,002 | | | | (5,935 | ) | | | (100,280 | ) |
iShares iBoxx $ Investment Grade Corporate Bond ETF | | | — | | | | 39,000 | | | | — | | | | 39,000 | | | | 5,245,500 | | | | 22,159 | | | | — | | | | 188,124 | |
| | | | | | | | | | | | | | | | | | | | | | | | | | | | | | | | |
| | | $ | 18,811,356 | | | $ | 102,596 | | | $ | (5,935 | ) | | $ | 87,844 | |
| | | | | | | | | | | | | | | | | |
| | (a) | Includes net capital gain distributions, if applicable. | |
| | (b) | Represents net shares purchased (sold). | |
For Fund compliance purposes, the Fund’s industry classifications refer to one or more of the industry sub-classifications used by one or more widely recognized market indexes or rating group indexes, and/or as defined by the investment adviser. These definitions may not apply for purposes of this report, which may combine such industry sub-classifications for reporting ease.
Derivative Financial Instruments Outstanding as of Period End
Forward Foreign Currency Exchange Contracts
| | | | | | | | | | | | | | | | | | | | |
Currency
Purchased | | | Currency
Sold | | | Counterparty | | Settlement Date | | | Unrealized
Appreciation
(Depreciation) | |
| EUR | | | 2,296,000 | | | USD | | | 2,573,816 | | | Goldman Sachs International | | | 07/06/20 | | | $ | 5,949 | |
| EUR | | | 2,709,000 | | | USD | | | 3,036,789 | | | Goldman Sachs International | | | 07/06/20 | | | | 7,019 | |
| GBP | | | 76,000 | | | USD | | | 93,504 | | | Barclays Bank PLC | | | 07/06/20 | | | | 669 | |
| GBP | | | 1,500,000 | | | USD | | | 1,846,021 | | | State Street Bank and Trust Co. | | | 07/06/20 | | | | 12,672 | |
| USD | | | 125,177 | | | GBP | | | 99,000 | | | Goldman Sachs International | | | 07/06/20 | | | | 2,504 | |
| | | | | | | | | | | | | | | | | | | | |
| | | | | | | | | | | | | | | | | | | 28,813 | |
| | | | | | | | | | | | | | | | | | | | |
| EUR | | | 1,755,000 | | | USD | | | 1,988,446 | | | Morgan Stanley & Co. International PLC | | | 07/06/20 | | | | (16,543 | ) |
| GBP | | | 203,000 | | | USD | | | 256,223 | | | Morgan Stanley & Co. International PLC | | | 07/06/20 | | | | (4,680 | ) |
| USD | | | 110,269 | | | EUR | | | 100,000 | | | Bank of America N.A. | | | 07/06/20 | | | | (2,090 | ) |
| USD | | | 97,938 | | | EUR | | | 88,000 | | | Morgan Stanley & Co. International PLC | | | 07/06/20 | | | | (938 | ) |
| USD | | | 7,162,331 | | | EUR | | | 6,438,000 | | | Morgan Stanley & Co. International PLC | | | 07/06/20 | | | | (71,348 | ) |
| USD | | | 2,579,037 | | | EUR | | | 2,317,000 | | | UBS AG | | | 07/06/20 | | | | (24,324 | ) |
| USD | | | 467,616 | | | GBP | | | 380,000 | | | BNP Paribas S.A. | | | 07/06/20 | | | | (3,253 | ) |
| USD | | | 1,850,774 | | | GBP | | | 1,504,000 | | | BNP Paribas S.A. | | | 07/06/20 | | | | (12,876 | ) |
| USD | | | 2,575,478 | | | EUR | | | 2,296,000 | | | Goldman Sachs International | | | 08/05/20 | | | | (5,981 | ) |
| USD | | | 3,038,750 | | | EUR | | | 2,709,000 | | | Goldman Sachs International | | | 08/05/20 | | | | (7,057 | ) |
| USD | | | 93,520 | | | GBP | | | 76,000 | | | Barclays Bank PLC | | | 08/05/20 | | | | (672 | ) |
| USD | | | 1,846,353 | | | GBP | | | 1,500,000 | | | State Street Bank and Trust Co. | | | 08/05/20 | | | | (12,707 | ) |
| | | | | | | | | | | | | | | | | | | | |
| | | | | | | | | | | | | | | $ | (162,469 | ) |
| | | | | | | | | | | | | | | | | | | | |
| | |
| 30 | | 2020 BLACKROCK SEMI-ANNUAL REPORTTO SHAREHOLDERS |
| | |
Schedule of Investments (unaudited) (continued) June 30, 2020 | | BlackRock Debt Strategies Fund, Inc. (DSU) |
OTC Credit Default Swaps — Buy Protection
| | | | | | | | | | | | | | | | | | | | | | | | | | | | | | | | | | | | |
| Reference Obligation/Index | | Financing
Rate Paid
by the Fund | | | Payment
Frequency | | | Counterparty | | | Termination
Date | | | Notional
Amount (000) | | | Value | | | Upfront
Premium
Paid
(Received) | | | Unrealized
Appreciation
(Depreciation) | |
Altice Finco SA | | | 5.00 | % | | | Quarterly | | | | BNP Paribas S.A. | | | | 12/20/24 | | | | EUR | | | | 30 | | | $ | (2,130 | ) | | $ | (3,610 | ) | | $ | 1,480 | |
SES SA | | | 1.00 | | | | Quarterly | | | | Barclays Bank PLC | | | | 06/20/25 | | | | EUR | | | | 30 | | | | 401 | | | | 791 | | | | (390 | ) |
| | | | | | | | | | | | | | | | | | | | | | | | | | | | | | | | | | | | |
| | | | | | | | | | | | | | | | | | | | | | | | | | $ | (1,729 | ) | | $ | (2,819 | ) | | $ | 1,090 | |
| | | | | | | | | | | | | | | | | | | | | | | | | | | | | | | | | | | | |
OTC Credit Default Swaps — Sell Protection
| | | | | | | | | | | | | | | | | | | | | | | | | | | | | | | | | | | | |
| Reference Obligation/Index | | Financing
Rate Received
by the Fund | | | Payment
Frequency | | | Counterparty | | Termination
Date | | | Credit
Rating (a) | | Notional
Amount (000) (b) | | | Value | | | Upfront
Premium
Paid
(Received) | | | Unrealized
Appreciation
(Depreciation) | |
Casino Guichard Perrachon SA | | | 1.00 | % | | | Quarterly | | | Bank of America N.A. | | | 06/20/23 | | | B | | | EUR | | | | 9 | | | $ | (1,406 | ) | | $ | (908 | ) | | $ | (498 | ) |
Casino Guichard Perrachon SA | | | 1.00 | | | | Quarterly | | | Barclays Bank PLC | | | 06/20/23 | | | B | | | EUR | | | | 6 | | | | (880 | ) | | | (466 | ) | | | (414 | ) |
Casino Guichard Perrachon SA | | | 1.00 | | | | Quarterly | | | Citibank N.A. | | | 06/20/23 | | | B | | | EUR | | | | 9 | | | | (1,378 | ) | | | (814 | ) | | | (564 | ) |
Casino Guichard Perrachon SA | | | 1.00 | | | | Quarterly | | | JPMorgan Chase Bank N.A. | | | 06/20/23 | | | B | | | EUR | | | | 4 | | | | (551 | ) | | | (305 | ) | | | (246 | ) |
Casino Guichard Perrachon SA | | | 1.00 | | | | Quarterly | | | JPMorgan Chase Bank N.A. | | | 06/20/23 | | | B | | | EUR | | | | 5 | | | | (827 | ) | | | (457 | ) | | | (370 | ) |
Casino Guichard Perrachon SA | | | 1.00 | | | | Quarterly | | | JPMorgan Chase Bank N.A. | | | 06/20/23 | | | B | | | EUR | | | | 9 | | | | (1,379 | ) | | | (815 | ) | | | (564 | ) |
Casino Guichard Perrachon SA | | | 1.00 | | | | Quarterly | | | JPMorgan Chase Bank N.A. | | | 06/20/23 | | | B | | | EUR | | | | 10 | | | | (1,520 | ) | | | (639 | ) | | | (881 | ) |
CenturyLink, Inc. | | | 1.00 | | | | Quarterly | | | Barclays Bank PLC | | | 12/20/23 | | | NR | | | USD | | | | 170 | | | | (11,169 | ) | | | (9,295 | ) | | | (1,874 | ) |
Tesco PLC | | | 1.00 | | | | Quarterly | | | Citibank N.A. | | | 12/20/23 | | | BBB- | | | EUR | | | | 50 | | | | 874 | | | | (529 | ) | | | 1,403 | |
Garfunkelux Holdco 2 SA | | | 5.00 | | | | Quarterly | | | Credit Suisse International | | | 12/20/24 | | | B- | | | EUR | | | | 10 | | | | (1,941 | ) | | | (120 | ) | | | (1,821 | ) |
Garfunkelux Holdco 2 SA | | | 5.00 | | | | Quarterly | | | Credit Suisse International | | | 12/20/24 | | | B- | | | EUR | | | | 20 | | | | (3,882 | ) | | | — | | | | (3,882 | ) |
CenturyLink, Inc. | | | 1.00 | | | | Quarterly | | | Barclays Bank PLC | | | 06/20/25 | | | NR | | | USD | | | | 185 | | | | (21,181 | ) | | | (25,119 | ) | | | 3,938 | |
| | | | | | | | | | | | | | | | | | | | | | | | | | | | | | | | | | | | |
| | | | | | | | | | | | | | | | | | | | | | | | | | $ | (45,240 | ) | | $ | (39,467 | ) | | $ | (5,773 | ) |
| | | | | | | | | | | | | | | | | | | | | | | | | | | | | | | | | | | | |
| | (a) | Using the rating of the issuer or the underlying securities of the index, as applicable, provided by S&P Global Ratings. | |
| | (b) | The maximum potential amount the Fund may pay should a negative credit event take place as defined under the terms of the agreement. | |
Balances Reported in the Statement of Assets and Liabilities for OTC Swaps
| | | | | | | | | | | | | | | | |
| | | Swap
Premiums
Paid | | | Swap
Premiums
Received | | | Unrealized
Appreciation | | | Unrealized
Depreciation | |
OTC Swaps | | $ | 791 | | | $ | (43,077 | ) | | $ | 6,821 | | | $ | (11,504 | ) |
Derivative Financial Instruments Categorized by Risk Exposure
As of period end, the fair values of derivative financial instruments located in the Statements of Assets and Liabilities were as follows:
| | | | | | | | | | | | | | | | | | | | | | | | | | | | |
| | | Commodity
Contracts | | | Credit
Contracts | | | Equity
Contracts | | | Foreign
Currency
Exchange
Contracts | | | Interest
Rate
Contracts | | | Other
Contracts | | | Total | |
Assets — Derivative Financial Instruments | | | | | | | | | | | | | | | | | | | | | | | | | | | | |
Forward foreign currency exchange contracts | | | | | | | | | | | | | | | | | | | | | | | | | | | | |
Unrealized appreciation on forward foreign currency exchange contracts | | $ | — | | | $ | — | | | $ | — | | | $ | 28,813 | | | $ | — | | | $ | — | | | $ | 28,813 | |
Swaps — OTC | | | | | | | | | | | | | | | | | | | | | | | | | | | | |
Unrealized appreciation on OTC swaps; Swap premiums paid | | | — | | | | 7,612 | | | | — | | | | — | | | | — | | | | — | | | | 7,612 | |
| | | | | | | | | | | | | | | | | | | | | | | | | | | | |
| | $ | — | | | $ | 7,612 | | | $ | — | | | $ | 28,813 | | | $ | — | | | $ | — | | | $ | 36,425 | |
| | | | | | | | | | | | | | | | | | | | | | | | | | | | |
Liabilities — Derivative Financial Instruments | | | | | | | | | | | | | | | | | | | | | | | | | | | | |
Forward foreign currency exchange contracts | | | | | | | | | | | | | | | | | | | | | | | | | | | | |
Unrealized depreciation on forward foreign currency exchange contracts | | $ | — | | | $ | — | | | $ | — | | | $ | 162,469 | | | $ | — | | | $ | — | | | $ | 162,469 | |
Swaps — OTC | | | | | | | | | | | | | | | | | | | | | | | | | | | | |
Unrealized depreciation on OTC swaps; Swap premiums received | | | — | | | | 54,581 | | | | — | | | | — | | | | — | | | | — | | | | 54,581 | |
| | | | | | | | | | | | | | | | | | | | | | | | | | | | |
| | $ | — | | | $ | 54,581 | | | $ | — | | | $ | 162,469 | | | $ | — | | | $ | — | | | $ | 217,050 | |
| | | | | | | | | | | | | | | | | | | | | | | | | | | | |
| | | | |
| SCHEDULES OF INVESTMENTS | | | 31 | |
| | |
Schedule of Investments (unaudited) (continued) June 30, 2020 | | BlackRock Debt Strategies Fund, Inc. (DSU) |
Derivative Financial Instruments Categorized by Risk Exposure (continued)
For the six months ended June 30, 2020, the effect of derivative financial instruments in the Statements of Operations was as follows:
| | | | | | | | | | | | | | | | | | | | | | | | | | | | |
| | | Commodity
Contracts | | | Credit
Contracts | | | Equity
Contracts | | | Foreign
Currency
Exchange
Contracts | | | Interest Rate Contracts | | | Other Contracts | | | Total | |
Net Realized Gain (Loss) from: | | | | | | | | | | | | | | | | | | | | | | | | | | | | |
Futures contracts | | $ | — | | | $ | — | | | $ | (4,436 | ) | | $ | — | | | $ | — | | | $ | — | | | $ | (4,436 | ) |
Forward foreign currency exchange contracts | | | — | | | | — | | | | — | | | | 68,925 | | | | — | | | | — | | | | 68,925 | |
Options purchased(a) | | | — | | | | — | | | | (105,819 | ) | | | — | | | | — | | | | — | | | | (105,819 | ) |
Swaps | | | — | | | | (598,438 | ) | | | — | | | | — | | | | — | | | | — | | | | (598,438 | ) |
| | | | | | | | | | | | | | | | | | | | | | | | | | | | |
| | $ | — | | | $ | (598,438 | ) | | $ | (110,255 | ) | | $ | 68,925 | | | $ | — | | | $ | — | | | $ | (639,768 | ) |
| | | | | | | | | | | | | | | | | | | | | | | | | | | | |
| | (a) | Options purchased are included in net realized gain (loss) from investments — unaffiliated. | |
| | | | | | | | | | | | | | | | | | | | | | | | | | | | |
| | | Commodity
Contracts | | | Credit
Contracts | | | Equity
Contracts | | | Foreign
Currency
Exchange
Contracts | | | Interest Rate Contracts | | | Other Contracts | | | Total | |
Net Change in Unrealized Appreciation (Depreciation) on: | | | | | | | | | | | | | | | | | | | | | | | | | | | | |
Futures contracts | | $ | — | | | $ | — | | | $ | 228 | | | $ | — | | | $ | — | | | $ | — | | | $ | 228 | |
Forward foreign currency exchange contracts | | | — | | | | — | | | | — | | | | 66,031 | | | | — | | | | — | | | | 66,031 | |
Options purchased(a) | | | — | | | | — | | | | (75,874 | ) | | | — | | | | — | | | | — | | | | (75,874 | ) |
Swaps | | | — | | | | 223,805 | | | | — | | | | — | | | | — | | | | — | | | | 223,805 | |
| | | | | | | | | | | | | | | | | | | | | | | | | | | | |
| | $ | — | | | $ | 223,805 | | | $ | (75,646 | ) | | $ | 66,031 | | | $ | — | | | $ | — | | | $ | 214,190 | |
| | | | | | | | | | | | | | | | | | | | | | | | | | | | |
| | (a) | Options purchased are included in net change in unrealized appreciation (depreciation) on investments — unaffiliated. | |
Average Quarterly Balances of Outstanding Derivative Financial Instruments
| | | | | | | | |
Futures contracts: | |
Average notional value of contracts — long | | $ | | | | | — | (a) |
Forward foreign currency exchange contracts: | |
Average amounts purchased — in USD | | | | | | | 20,765,508 | |
Average amounts sold — in USD | | | | | | | 10,231,847 | |
Options: | |
Average value of option contracts purchased | | | | | | | — | (a) |
Credit default swaps: | |
Average notional value — buy protection | | | | | | | 50,248 | |
Average notional value — sell protection | | | | | | | 913,448 | |
| | (a) | Derivative not held at any quarter-end. The risk exposure table serves as an indicator of activity during the period. | |
For more information about the Fund’s investment risks regarding derivative financial instruments, refer to the Notes to Financial Statements.
Derivative Financial Instruments — Offsetting as of Period End
The Fund’s derivative assets and liabilities (by type) were as follows:
| | | | | | | | |
| | | Assets | | | Liabilities | |
Derivative Financial Instruments: | | | | | | | | |
Forward foreign currency exchange contracts | | $ | 28,813 | | | $ | 162,469 | |
Swaps — OTC(a) | | | 7,612 | | | | 54,581 | |
| | | | | | | | |
Total derivative assets and liabilities in the Statements of Assets and Liabilities | | $ | 36,425 | | | $ | 217,050 | |
Derivatives not subject to a Master Netting Agreement or similar agreement (“MNA”) | | | — | | | | — | |
| | | | | | | | |
Total derivative assets and liabilities subject to an MNA | | $ | 36,425 | | | $ | 217,050 | |
| | | | | | | | |
| | (a) | Includes unrealized appreciation (depreciation) on OTC swaps and swap premiums paid/received in the Statements of Assets and Liabilities. | |
| | |
| 32 | | 2020 BLACKROCK SEMI-ANNUAL REPORTTO SHAREHOLDERS |
| | |
Schedule of Investments (unaudited) (continued) June 30, 2020 | | BlackRock Debt Strategies Fund, Inc. (DSU) |
Derivative Financial Instruments — Offsetting as of Period End (continued)
The following table presents the Fund’s derivative assets (and liabilities) by counterparty net of amounts available for offset under an MNA and net of the related collateral received (and pledged) by the Fund:
| | | | | | | | | | | | | | | | | | | | |
| Counterparty | | Derivative
Assets
Subject to
an MNA by
Counterparty | | | Derivatives
Available
for Offset (a) | | | Non-cash
Collateral
Received | | | Cash
Collateral
Received | | | Net Amount
of Derivative
Assets (b) | |
Barclays Bank PLC | | $ | 5,398 | | | $ | (5,398 | ) | | $ | — | | | $ | — | | | $ | — | |
BNP Paribas S.A. | | | 1,480 | | | | (1,480 | ) | | | — | | | | — | | | | — | |
Citibank N.A. | | | 1,403 | | | | (1,403 | ) | | | — | | | | — | | | | — | |
Goldman Sachs International | | | 15,472 | | | | (13,038 | ) | | | — | | | | — | | | | 2,434 | |
State Street Bank and Trust Co. | | | 12,672 | | | | (12,672 | ) | | | — | | | | — | | | | — | |
| | | | | | | | | | | | | | | | | | | | |
| | $ | 36,425 | | | $ | (33,991 | ) | | $ | — | | | $ | — | | | $ | 2,434 | |
| | | | | | | | | | | | | | | | | | | | |
| | | | | | | | | | | | | | | | | | | | |
| Counterparty | | Derivative
Liabilities
Subject to
an MNA by
Counterparty | | | Derivatives
Available
for Offset (a) | | | Non-cash
Collateral
Pledged | | | Cash
Collateral
Pledged | | | Net Amount
of Derivative
Liabilities (c) | |
Bank of America N.A. | | $ | 3,496 | | | $ | — | | | $ | — | | | $ | — | | | $ | 3,496 | |
Barclays Bank PLC | | | 38,230 | | | | (5,398 | ) | | | — | | | | (30,000 | ) | | | 2,832 | |
BNP Paribas S.A. | | | 19,739 | | | | (1,480 | ) | | | — | | | | — | | | | 18,259 | |
Citibank N.A. | | | 1,907 | | | | (1,403 | ) | | | — | | | | — | | | | 504 | |
Credit Suisse International | | | 5,823 | | | | — | | | | — | | | | — | | | | 5,823 | |
Goldman Sachs International | | | 13,038 | | | | (13,038 | ) | | | — | | | | — | | | | — | |
JPMorgan Chase Bank N.A. | | | 4,277 | | | | — | | | | — | | | | — | | | | 4,277 | |
Morgan Stanley & Co. International PLC | | | 93,509 | | | | — | | | | — | | | | — | | | | 93,509 | |
State Street Bank and Trust Co. | | | 12,707 | | | | (12,672 | ) | | | — | | | | — | | | | 35 | |
UBS AG | | | 24,324 | | | | — | | | | — | | | | — | | | | 24,324 | |
| | | | | | | | | | | | | | | | | | | | |
| | $ | 217,050 | | | $ | (33,991 | ) | | $ | — | | | $ | (30,000 | ) | | $ | 153,059 | |
| | | | | | | | | | | | | | | | | | | | |
| | (a) | The amount of derivatives available for offset is limited to the amount of derivative asset and/or liabilities that are subject to an MNA. | |
| | (b) | Net amount represents the net amount receivable from the counterparty in the event of default. | |
| | (c) | Net amount represents the net amount payable due to counterparty in the event of default. | |
Fair Value Hierarchy as of Period End
Various inputs are used in determining the fair value of investments and derivative financial instruments. For information about the Fund’s policy regarding valuation of investments and derivative financial instruments, refer to the Notes to Financial Statements.
The following tables summarize the Fund’s investments and derivative financial instruments categorized in the disclosure hierarchy:
| | | | | | | | | | | | | | | | |
| | | Level 1 | | | Level 2 | | | Level 3 | | | Total | |
Assets: | |
Investments: | |
Long-Term Investments: | |
Common Stocks | | $ | 14,652 | | | $ | 41,611 | | | $ | 100,477 | | | $ | 156,740 | |
Corporate Bonds | | | — | | | | 107,491,727 | | | | 2 | | | | 107,491,729 | |
Floating Rate Loan Interests | | | — | | | | 568,028,574 | | | | 29,625,143 | | | | 597,653,717 | |
Investment Companies | | | 18,370,918 | | | | — | | | | — | | | | 18,370,918 | |
Preferred Securities | | | 344,170 | | | | 6,120,693 | | | | — | | | | 6,464,863 | |
Warrants | | | — | | | | 42,677 | | | | — | | | | 42,677 | |
Short-Term Securities | | | 1,975,816 | | | | — | | | | — | | | | 1,975,816 | |
Unfunded floating rate loan interests(a) | | | — | | | | 1,487 | | | | — | | | | 1,487 | |
Liabilities: | |
Unfunded floating rate loan interests(a) | | | — | | | | (48,335 | ) | | | — | | | | (48,335 | ) |
| | | | | | | | | | | | | | | | |
| | $ | 20,705,556 | | | $ | 681,678,434 | | | $ | 29,725,622 | | | $ | 732,109,612 | |
| | | | | | | | | | | | | | | | |
| | | | |
| SCHEDULES OF INVESTMENTS | | | 33 | |
| | |
Schedule of Investments (unaudited) (continued) June 30, 2020 | | BlackRock Debt Strategies Fund, Inc. (DSU) |
Fair Value Hierarchy as of Period End (continued)
| | | | | | | | | | | | | | | | |
| | | Level 1 | | | Level 2 | | | Level 3 | | | Total | |
Derivative Financial Instruments(b) | |
Assets: | |
Credit contracts | | $ | — | | | $ | 6,821 | | | $ | — | | | $ | 6,821 | |
Foreign currency exchange contracts | | | — | | | | 28,813 | | | | — | | | | 28,813 | |
Liabilities: | |
Credit contracts | | | — | | | | (11,504 | ) | | | — | | | | (11,504 | ) |
Foreign currency exchange contracts | | | — | | | | (162,469 | ) | | | — | | | | (162,469 | ) |
| | | | | | | | | | | | | | | | |
| | $ | — | | | $ | (138,339 | ) | | $ | — | | | $ | (138,339 | ) |
| | | | | | | | | | | | | | | | |
The breakdown of the Fund’s investments into major categories is disclosed in the Schedule of Investments above.
| | (a) | Unfunded floating rate loan interests are valued at the unrealized appreciation (depreciation) on the commitment. | |
| | (b) | Derivative financial instruments are swaps and forward foreign currency exchange contracts. Swaps and forward foreign currency exchange contracts are valued at the unrealized appreciation (depreciation) on the instrument. | |
The Fund may hold assets and/or liabilities in which the fair value approximates the carrying amount for financial statement purposes. As of period end, bank borrowings
payable of $206,000,000 is categorized as Level 2 within the disclosure hierarchy.
A reconciliation of Level 3 investments is presented when the Fund had a significant amount of Level 3 investments at the beginning and/or end of the period in relation to net assets. The following table is a reconciliation of Level 3 investments for which significant unobservable inputs were used in determining fair value:
| | | | | | | | | | | | | | | | |
| | | Common
Stocks | | | Corporate
Bonds | | | Floating
Rate Loan
Interests | | | Total | |
Assets: | | | | | | | | | | | | | | | | |
Opening balance, as of December 31, 2019 | | $ | 763,992 | | | $ | 2 | | | $ | 30,343,623 | | | $ | 31,107,617 | |
Transfers into Level 3(a) | | | — | | | | — | | | | 12,055,652 | | | | 12,055,652 | |
Transfers out of Level 3(b) | | | — | | | | — | | | | (16,224,278 | ) | | | (16,224,278 | ) |
Accrued discounts/premiums | | | — | | | | — | | | | 28,561 | | | | 28,561 | |
Net realized gain (loss) | | | 2,513 | | | | — | | | | (491,600 | ) | | | (489,087 | ) |
Net change in unrealized appreciation (depreciation)(c)(d) | | | (674,300 | ) | | | — | | | | (1,736,131 | ) | | | (2,410,431 | ) |
Purchases | | | 10,784 | | | | — | | | | 17,509,745 | | | | 17,520,529 | |
Sales | | | (2,512 | ) | | | — | | | | (11,860,429 | ) | | | (11,862,941 | ) |
| | | | | | | | | | | | | | | | |
Closing balance, as of June 30, 2020 | | $ | 100,477 | | | $ | 2 | | | $ | 29,625,143 | | | $ | 29,725,622 | |
| | | | | | | | | | | | | | | | |
Net change in unrealized appreciation (depreciation) on investments still held at June 30, 2020(d) | | $ | (674,300 | ) | | $ | — | | | $ | (1,678,393 | ) | | $ | (2,352,693 | ) |
| | | | | | | | | | | | | | | | |
| | (a) | As of December 31, 2019, the Fund used observable inputs in determining the value of certain investments. As of June 30, 2020, the Fund used significant unobservable inputs in determining the value of the same investments. As a result, investments at beginning of period value were transferred from Level 2 to Level 3 in the disclosure hierarchy. | |
| | (b) | As of December 31, 2019, the Fund used significant unobservable inputs in determining the value of certain investments. As of June 30, 2020, the Fund used observable inputs in determining the value of the same investments. As a result, investments at beginning of period value were transferred from Level 3 to Level 2 in the disclosure hierarchy. | |
| | (c) | Included in the related net change in unrealized appreciation (depreciation) in the Statements of Operations. | |
| | (d) | Any difference between net change in unrealized appreciation (depreciation) and net change in unrealized appreciation (depreciation) on investments still held at June 30, 2020 is generally due to investments no longer held or categorized as Level 3 at period end. | |
The Fund’s investments that are categorized as Level 3 were valued utilizing third party pricing information without adjustment. Such valuations are based on unobservable inputs. A significant change in third party information could result in a significantly lower or higher value of such Level 3 investments.
See notes to financial statements.
| | |
| 34 | | 2020 BLACKROCK SEMI-ANNUAL REPORTTO SHAREHOLDERS |
| | |
Schedule of Investments (unaudited) June 30, 2020 | | BlackRock Floating Rate Income Strategies Fund, Inc. (FRA) (Percentages shown are based on Net Assets) |
| | | | | | | | | | | | |
Security | | | Shares | | | Value | |
|
| Common Stocks — 0.1% | |
|
Diversified Financial Services — 0.0% | |
Kcad Holdings I Ltd.(a)(b) | | | | | | | 309,827,230 | | | $ | 3,098 | |
| | | | | | | | |
|
| Energy Equipment & Services — 0.0% | |
McDermott International, Inc.(b) | | | | | | | 10,754 | | | | 774 | |
Pioneer Energy Services Corp.(a)(b) | | | | | | | 887 | | | | 34,445 | |
| | | | | | | | |
| | | | | | | | | | | 35,219 | |
|
| Health Care Management Services — 0.0% | |
New Millennium HoldCo, Inc.(b) | | | | | | | 14,906 | | | | 15 | |
| | | | | | | | |
|
| Media — 0.1% | |
Clear Channel Outdoor Holdings, Inc.(b) | | | | | | | 114,650 | | | | 119,236 | |
| | | | | | | | |
|
| Metals & Mining — 0.0% | |
Preferred Proppants LLC(a)(b) | | | | | | | 12,198 | | | | 48,792 | |
| | | | | | | | |
|
| Semiconductors & Semiconductor Equipment — 0.0% | |
SunPower Corp.(b) | | | | | | | 1,860 | | | | 14,248 | |
| | | | | | | | |
|
| Software — 0.0% | |
Avaya Holdings Corp.(b) | | | | | | | 66 | | | | 816 | |
| | | | | | | | |
| |
Total Common Stocks — 0.1%
(Cost — $4,418,597) | | | | 221,424 | |
| | | | | | | | |
| | | |
| | | | | | Par
(000) | | | | |
|
| Corporate Bonds — 7.3% | |
|
Aerospace & Defense — 0.3% | |
TransDigm, Inc., 8.00%, 12/15/25(c) | | | USD | | | | 318 | | | | 333,819 | |
Wolverine Escrow LLC, 9.00%, 11/15/26(c) | | | | | | | 1,555 | | | | 1,119,600 | |
| | | | | | | | |
| | | | | | | | | | | 1,453,419 | |
|
| Air Freight & Logistics — 0.2% | |
FedEx Corp., 3.80%, 05/15/25 | | | | | | | 669 | | | | 743,668 | |
| | | | | | | | |
|
| Airlines — 1.0% | |
American Airlines, Inc., 11.75%, 07/15/25(c) | | | | | | | 2,362 | | | | 2,237,263 | |
Mileage Plus Holdings LLC/Mileage Plus Intellectual Property Assets Ltd., 6.50%, 06/20/27(c) | | | | | | | 2,453 | | | | 2,459,132 | |
| | | | | | | | |
| | | | | | | | | | | 4,696,395 | |
|
| Auto Components — 0.6% | |
Clarios Global LP, 6.75%, 05/15/25(c) | | | | | | | 496 | | | | 515,840 | |
Ford Motor Co., 8.50%, 04/21/23 | | | | | | | 2,029 | | | | 2,145,667 | |
Ford Motor Credit Co. LLC, 5.13%, 06/16/25 | | | | | | | 209 | | | | 209,084 | |
| | | | | | | | |
| | | | | | | | | | | 2,870,591 | |
|
| Automobiles — 0.2% | |
General Motors Co., 6.13%, 10/01/25 | | | | | | | 661 | | | | 742,756 | |
| | | | | | | | |
|
| Chemicals — 0.0% | |
Illuminate Buyer LLC/Illuminate Holdings IV, Inc., 9.00%, 07/01/28(c) | | | | | | | 51 | | | | 53,168 | |
| | | | | | | | |
|
| Construction Materials — 0.3% | |
American Builders & Contractors Supply Co., Inc., 4.00%, 01/15/28(c) | | | | | | | 1,335 | | | | 1,297,313 | |
Core & Main LP, 6.13%, 08/15/25(c) | | | | | | | 227 | | | | 226,240 | |
| | | | | | | | |
| | | | | | | | | | | 1,523,553 | |
|
| Consumer Finance — 0.3% | |
Equifax, Inc., 2.60%, 12/15/25 | | | | | | | 136 | | | | 144,870 | |
Husky III Holding Ltd., (13.00% Cash or 13.00% PIK), 13.00%, 02/15/25(c)(d) | | | | | | | 905 | | | | 871,063 | |
PayPal Holdings, Inc., 1.65%, 06/01/25 | | | | | | | 424 | | | | 438,308 | |
| | | | | | | | |
| | | | | | | | | | | 1,454,241 | |
| | | | | | | | | | | | |
Security | | | Par
(000) | | | Value | |
|
| Diversified Financial Services — 0.5% | |
Ally Financial, Inc., 3.05%, 06/05/23 | | | USD | | | | 1,395 | | | $ | 1,411,763 | |
General Motors Financial Co., Inc., 2.75%, 06/20/25 | | | | | | | 925 | | | | 913,628 | |
| | | | | | | | |
| | | | | | | | | | | 2,325,391 | |
|
| Electric Utilities — 0.0% | |
Texas Competitive Electric Holdings Co. LLC/TCEH Finance, Inc., 11.50%, 10/01/20(a) | | | | | | | 1,061 | | | | — | |
| | | | | | | | |
|
| Energy Equipment & Services — 0.1% | |
Pioneer Energy Services Corp. (c)(d): | | | | | | | | | | | | |
11.00%, 05/15/25 | | | | | | | 364 | | | | 291,034 | |
(5.00% PIK), 5.00%, 11/15/25(e) | | | | | | | 248 | | | | 134,031 | |
| | | | | | | | |
| | | | | | | | | | | 425,065 | |
|
| Equity Real Estate Investment Trusts (REITs) — 0.1% | |
Marriott International, Inc., Series EE, 5.75%, 05/01/25 | | | | | | | 376 | | | | 408,470 | |
| | | | | | | | |
|
| Hotels, Restaurants & Leisure — 0.2% | |
Colt Merger Sub, Inc., 5.75%, 07/01/25(c)(f) | | | | | | | 433 | | | | 435,468 | |
IRB Holding Corp., 7.00%, 06/15/25(c) | | | | | | | 207 | | | | 213,355 | |
| | | | | | | | |
| | | | | | | | | | | 648,823 | |
|
| Internet & Direct Marketing Retail — 0.5% | |
Booking Holdings, Inc., 4.10%, 04/13/25 | | | | | | | 1,290 | | | | 1,447,869 | |
Expedia Group, Inc., 6.25%, 05/01/25(c) | | | | | | | 767 | | | | 817,064 | |
| | | | | | | | |
| | | | | | | | | | | 2,264,933 | |
|
| IT Services — 0.4% | |
Fiserv, Inc., 2.25%, 06/01/27 | | | | | | | 1,575 | | | | 1,646,969 | |
| | | | | | | | |
|
| Machinery — 0.0% | |
Clark Equipment Co., 5.88%, 06/01/25(c) | | | | | | | 119 | | | | 121,678 | |
| | | | | | | | |
|
| Media — 0.3% | |
Connect Finco Sarl/Connect US Finco LLC, 6.75%, 10/01/26(c) | | | | | | | 350 | | | | 331,625 | |
Univision Communications, Inc., 6.63%, 06/01/27(c) | | | | | | | 227 | | | | 216,785 | |
Zayo Group Holdings Inc, 6.13%, 03/01/28(c) | | | | | | | 281 | | | | 273,272 | |
Zayo Group Holdings, Inc., 4.00%, 03/01/27(c) | | | | | | | 750 | | | | 713,670 | |
| | | | | | | | |
| | | | | | | | | | | 1,535,352 | |
|
| Metals & Mining — 0.1% | |
Freeport-McMoRan, Inc., 3.88%, 03/15/23 | | | | | | | 625 | | | | 625,000 | |
| | | | | | | | |
|
| Oil: Crude Producers — 0.0% | |
MGM Growth Properties Operating Partnership LP/MGP Finance Co-Issuer, Inc., 4.63%, 06/15/25(c) | | | | | | | 138 | | | | 134,947 | |
| | | | | | | | |
|
| Real Estate Management & Development — 0.4% | |
Cushman & Wakefield US Borrower LLC, 6.75%, 05/15/28(c) | | | | | | | 1,669 | | | | 1,739,932 | |
Realogy Group LLC/Realogy Co-Issuer Corp., 7.63%, 06/15/25(c) | | | | | | | 123 | | | | 123,025 | |
| | | | | | | | |
| | | | | | | | | | | 1,862,957 | |
|
| Semiconductors & Semiconductor Equipment — 1.2% | |
Broadcom, Inc.(c): | | | | | | | | | | | | |
4.70%, 04/15/25 | | | | | | | 1,771 | | | | 1,995,517 | |
3.15%, 11/15/25 | | | | | | | 660 | | | | 702,453 | |
Microchip Technology, Inc.(c): | | | | | | | | | | | | |
2.67%, 09/01/23 | | | | | | | 2,531 | | | | 2,605,113 | |
4.25%, 09/01/25 | | | | | | | 348 | | | | 350,215 | |
NXP BV/NXP Funding LLC/NXP USA, Inc., 2.70%, 05/01/25(c) | | | | | | | 75 | | | | 78,621 | |
| | | | | | | | |
| | | | | | | | | | | 5,731,919 | |
| | | | |
| SCHEDULES OF INVESTMENTS | | | 35 | |
| | |
Schedule of Investments (unaudited) (continued) June 30, 2020 | | BlackRock Floating Rate Income Strategies Fund, Inc. (FRA) (Percentages shown are based on Net Assets) |
| | | | | | | | | | | | |
Security | | | Par
(000) | | | Value | |
|
| Software — 0.3% | |
Castle US Holding Corp., 9.50%, 02/15/28(c) | | | USD | | | | 647 | | | $ | 598,475 | |
Solera LLC/Solera Finance, Inc., 10.50%, 03/01/24(c) | | | | | | | 666 | | | | 677,655 | |
Tempo Acquisition LLC/Tempo Acquisition Finance Corp., 5.75%, 06/01/25(c) | | | | | | | 76 | | | | 77,900 | |
| | | | | | | | |
| | | | | | | | | | | 1,354,030 | |
|
| Specialty Retail — 0.0% | |
AutoNation, Inc., 4.75%, 06/01/30 | | | | | | | 141 | | | | 152,783 | |
| | | | | | | | |
|
| Technology Hardware, Storage & Peripherals — 0.2% | |
Dell International LLC/EMC Corp., 5.85%, 07/15/25(c) | | | | | | | 719 | | | | 826,275 | |
| | | | | | | | |
|
| Wireless Telecommunication Services — 0.1% | |
GLP Capital LP/GLP Financing II, Inc., 4.00%, 01/15/31 | | | | | | | 408 | | | | 405,042 | |
| | | | | | | | |
| |
Total Corporate Bonds — 7.3%
(Cost — $33,387,032) | | | | 34,007,425 | |
| | | | | | | | |
|
| Floating Rate Loan Interests(g) — 135.0% | |
|
Aerospace & Defense — 2.6% | |
Bleriot US Bidco, Inc.,: | | | | | | | | | | | | |
Delayed Draw Term Loan, (3 mo. LIBOR + 4.75%), 5.06%, 10/31/26 | | | | | | | 98 | | | | 94,010 | |
Term Loan B, (3 mo. LIBOR + 4.75%), 5.06%, 10/31/26 | | | | | | | 627 | | | | 601,663 | |
Dynasty Acquisition Co., Inc.,: | | | | | | | | | | | | |
2020 CAD Term Loan B2, (3 mo. LIBOR + 3.50%), 3.81%, 04/06/26 | | | | | | | 2,561 | | | | 2,180,214 | |
2020 Term Loan B1, (3 mo. LIBOR + 3.50%), 3.81%, 04/06/26 | | | | | | | 4,764 | | | | 4,055,199 | |
Nordam Group, Inc., Term Loan B, (1 mo. LIBOR + 5.50%), 5.88%, 04/09/26(a) | | | | | | | 782 | | | | 594,396 | |
TransDigm, Inc.,: | | | | | | | | | | | | |
2020 Term Loan F, (1 mo. LIBOR + 2.25%), 2.43%, 12/09/25 | | | | | | | 4,372 | | | | 3,922,526 | |
2020 Term Loan G, (1 mo. LIBOR + 2.25%), 2.43%, 08/22/24 | | | | | | | 754 | | | | 680,131 | |
| | | | | | | | |
| | | | | | | | | | | 12,128,139 | |
|
| Air Freight & Logistics — 0.6% | |
WestJet Airlines Ltd., Term Loan B, 12/11/26(h) | | | | | | | 3,335 | | | | 2,664,911 | |
| | | | | | | | |
|
| Airlines — 1.3% | |
American Airlines, Inc.,: | | | | | | | | | | | | |
2017 1st Lien Term Loan, (1 mo. LIBOR + 1.75%), 1.93%, 01/29/27 | | | | | | | 392 | | | | 294,899 | |
2017 Incremental Term Loan, (1 mo. LIBOR + 2.00%), 2.18%, 12/14/23 | | | | | | | 1,988 | | | | 1,581,307 | |
Repriced TL B due 2023, (1 mo. LIBOR + 2.00%), 2.18%, 04/28/23 | | | | | | | 1,369 | | | | 1,078,452 | |
JetBlue Airways Corp., Term Loan, (3 mo. LIBOR + 5.25%, 1.00% Floor), 6.25%, 06/17/24 | | | | | | | 778 | | | | 760,495 | |
Mileage Plus Holdings LLC, 2020 Term Loan B, 1.00%, 06/25/27 | | | | | | | 2,394 | | | | 2,375,039 | |
| | | | | | | | |
| | | | | | | | | | | 6,090,192 | |
|
| Auto Components — 2.8% | |
Dealer Tire LLC, 2020 Term Loan B, (1 mo. LIBOR + 4.25%), 4.43%, 12/12/25 | | | | | | | 2,346 | | | | 2,236,712 | |
Panther BF Aggregator 2 LP, USD Term Loan B, (1 mo. LIBOR + 3.50%), 3.68%, 04/30/26 | | | | | | | 6,517 | | | | 6,191,120 | |
USI, Inc.,: | | | | | | | | | | | | |
2017 Repriced Term Loan, (3 mo. LIBOR + 3.00%), 3.31%, 05/16/24 | | | | | | | 3,829 | | | | 3,625,724 | |
| | | | | | | | | | | | |
Security | | | Par
(000) | | | Value | |
|
| Auto Components (continued) | |
2019 Incremental Term Loan B, (3 mo. LIBOR + 4.00%), 4.31%, 12/02/26 | | | USD | | | | 219 | | | $ | 212,151 | |
Wand NewCo 3, Inc., 2020 Term Loan, (3 mo. LIBOR + 3.00%), 4.07%, 02/05/26 | | | | | | | 934 | | | | 885,146 | |
| | | | | | | | |
| | | | | | | | | | | 13,150,853 | |
|
| Banks — 0.7% | |
Capri Finance LLC, 2017 1st Lien Term Loan, (3 mo. LIBOR + 3.00%), 3.76%, 11/01/24 | | | | | | | 3,546 | | | | 3,390,873 | |
| | | | | | | | |
|
| Building Materials — 0.5% | |
Allied Universal Holdco LLC, 2019 Term Loan B, (1 mo. LIBOR + 4.25%), 4.43%, 07/12/26 | | | | | | | 2,388 | | | | 2,316,242 | |
| | | | | | | | |
|
| Building Products — 1.3% | |
CPG International, Inc., 2017 Term Loan, 05/05/24(h) | | | | | | | 1,405 | | | | 1,388,506 | |
LSF10 XL Bidco SCA, EUR Term Loan B3, (EURIBOR + 4.00%), 4.00%, 10/12/26 | | | EUR | | | | 1,000 | | | | 1,046,573 | |
Wilsonart LLC, 2017 Term Loan B, (3 mo. LIBOR + 3.25%, 1.00% Floor), 4.25%, 12/19/23 | | | USD | | | | 3,604 | | | | 3,468,108 | |
| | | | | | | | |
| | | | | | | | | | | 5,903,187 | |
|
| Capital Markets — 1.9% | |
Deerfield Dakota Holding LLC, 2020 USD
Term Loan B, 04/09/27(h) | | | | | | | 3,919 | | | | 3,801,890 | |
Fortress Investment Group LLC, 2018 Term Loan B, (1 mo. LIBOR + 2.00%), 2.18%, 12/27/22 | | | | | | | 918 | | | | 883,946 | |
Greenhill & Co., Inc., Term Loan B, (1 mo. LIBOR + 3.25%), 3.44%, 04/12/24(a) | | | | | | | 1,259 | | | | 1,183,735 | |
Jefferies Finance LLC, 2019 Term Loan, (1 mo. LIBOR + 3.00%), 3.19%, 06/03/26 | | | | | | | 1,159 | | | | 1,092,542 | |
Travelport Finance (Luxembourg) Sarl,: | | | | | | | | | | | | |
2019 2nd Lien Term Loan, (3 mo. LIBOR + 9.00%), 9.31%, 05/28/27 | | | | | | | 1,145 | | | | 325,180 | |
2019 Term Loan, (3 mo. LIBOR + 5.00%), 6.07%, 05/29/26 | | | | | | | 2,345 | | | | 1,533,521 | |
| | | | | | | | |
| | | | | | | | | | | 8,820,814 | |
|
| Chemicals — 5.1% | |
Alpha 3 BV, 2017 Term Loan B1, (3 mo. LIBOR + 3.00%, 1.00% Floor), 4.00%, 01/31/24 | | | | | | | 3,031 | | | | 2,912,239 | |
Ascend Performance Materials Operations LLC, 2019 Term Loan B, (3 mo. LIBOR + 5.25%, 1.00% Floor), 6.25%, 08/27/26 | | | | | | | 2,579 | | | | 2,524,885 | |
Axalta Coating Systems US Holdings, Inc., Term Loan, (3 mo. LIBOR + 1.75%), 2.06%, 06/01/24 | | | | | | | 1,870 | | | | 1,787,477 | |
Charter NEX US Holdings, Inc., 2017 Term Loan B, (1 mo. LIBOR + 2.75%, 1.00% Floor), 3.75%, 05/16/24 | | | | | | | 2,849 | | | | 2,720,313 | |
Charter NEX US, Inc., Incremental Term Loan, (1 mo. LIBOR + 3.25%), 3.43%, 05/16/24 | | | | | | | 616 | | | | 588,124 | |
Chemours Co., 2018 Term Loan B, (1 mo. LIBOR + 1.75%), 1.93%, 04/03/25 | | | | | | | 652 | | | | 614,138 | |
Element Materials Technology Group US Holdings, Inc., 2017 Term Loan B, (3 mo. LIBOR + 3.50%, 1.00% Floor), 4.50%, 06/28/24 | | | | | | | 1,169 | | | | 1,079,559 | |
Encapsys LLC, 2020 Term Loan B2, (1 mo. LIBOR + 3.25%, 1.00% Floor), 4.25%, 11/07/24(a) | | | | | | | 1,252 | | | | 1,195,562 | |
Illuminate Buyer LLC, Term Loan, 06/30/27(h) | | | | | | | 2,259 | | | | 2,221,964 | |
Invictus US LLC,: | | | | | | | | | | | | |
1st Lien Term Loan, (3 mo. LIBOR + 3.00%), 4.78%, 03/28/25 | | | | | | | 777 | | | | 716,266 | |
2nd Lien Term Loan, (3 mo. LIBOR + 6.75%), 8.53%, 03/30/26 | | | | | | | 430 | | | | 340,418 | |
| | |
| 36 | | 2020 BLACKROCK SEMI-ANNUAL REPORTTO SHAREHOLDERS |
| | |
Schedule of Investments (unaudited) (continued) June 30, 2020 | | BlackRock Floating Rate Income Strategies Fund, Inc. (FRA) (Percentages shown are based on Net Assets) |
| | | | | | | | | | | | |
Security | | | Par
(000) | | | Value | |
|
| Chemicals (continued) | |
Messer Industries GmbH, 2018 USD Term Loan, (3 mo. LIBOR + 2.50%), 2.81%, 03/02/26 | | | USD | | | | 2,876 | | | $ | 2,735,746 | |
Minerals Technologies Inc., 2017 Term Loan B, 02/14/24(a)(h) | | | | | | | 517 | | | | 501,821 | |
Momentive Performance Materials, Inc., Term Loan B, (1 mo. LIBOR + 3.25%), 3.43%, 05/15/24 | | | | | | | 1,054 | | | | 984,499 | |
Oxea Holding Drei GmbH, 2017 Term Loan B2, (1 mo. LIBOR + 3.50%), 3.69%, 10/14/24 | | | | | | | 2,603 | | | | 2,388,413 | |
Starfruit Finco BV, 2018 USD Term Loan B, 10/01/25(h) | | | | | | | 207 | | | | 194,148 | |
| | | | | | | | |
| | | | | | | | | | | 23,505,572 | |
|
| Commercial Services & Supplies — 5.1% | |
Advanced Disposal Services, Inc., Term Loan B3, (1 Week LIBOR + 2.25%), 3.00%, 11/10/23 | | | | | | | 3,046 | | | | 3,006,411 | |
Aramark Services, Inc., 2018 Term Loan B3, (1 mo. LIBOR + 1.75%), 1.93%, 03/11/25 | | | | | | | 155 | | | | 145,831 | |
Asurion LLC,: | | | | | | | | | | | | |
2017 2nd Lien Term Loan, (1 mo. LIBOR + 6.50%), 6.68%, 08/04/25 | | | | | | | 1,600 | | | | 1,588,000 | |
2018 Term Loan B6, (1 mo. LIBOR + 3.00%), 3.18%, 11/03/23 | | | | | | | 3,166 | | | | 3,057,387 | |
2018 Term Loan B7, (1 mo. LIBOR + 3.00%), 3.18%, 11/03/24 | | | | | | | 1,156 | | | | 1,113,763 | |
Creative Artists Agency LLC,: | | | | | | | | | | | | |
2019 Term Loan B, (1 mo. LIBOR + 3.75%), 3.93%, 11/26/26 | | | | | | | 851 | | | | 802,694 | |
2020 Incremental Term Loan B1, (1 mo. LIBOR + 4.25%, 1.00% Floor), 5.25%, 11/26/26 | | | | | | | 2,000 | | | | 1,887,269 | |
Diamond (BC) BV, Term Loan, (3 mo. LIBOR + 3.00%), 3.76%, 09/06/24 | | | | | | | 1,859 | | | | 1,703,906 | |
EnergySolutions LLC, 2018 Term Loan B, (3 mo. LIBOR + 3.75%, 1.00% Floor), 4.75%, 05/09/25 | | | | | | | 572 | | | | 525,579 | |
GFL Environmental, Inc., 2018 USD Term Loan B, (3 mo. LIBOR + 3.00%, 1.00% Floor), 4.00%, 05/30/25 | | | | | | | 469 | | | | 455,310 | |
Harland Clarke Holdings Corp., Term Loan B7, (3 mo. LIBOR + 4.75%, 1.00% Floor), 5.75%, 11/03/23 | | | | | | | 455 | | | | 329,594 | |
KAR Auction Services, Inc., 2019 Term Loan B6, (1 mo. LIBOR + 2.25%), 2.50%, 09/19/26 | | | | | | | 1,000 | | | | 946,423 | |
Prime Security Services Borrower LLC, 2019 Term Loan B1, (1 mo. LIBOR + 3.25%, 1.00% Floor), 4.25%, 09/23/26 | | | | | | | 2,179 | | | | 2,090,871 | |
Verisure Holding AB, EUR Term Loan B1E, (EURIBOR + 3.00%), 3.00%, 10/20/22 | | | EUR | | | | 1,000 | | | | 1,091,199 | |
Verscend Holding Corp., 2018 Term Loan B, (1 mo. LIBOR + 4.50%), 4.68%, 08/27/25 | | | USD | | | | 2,698 | | | | 2,601,154 | |
West Corp., 2017 Term Loan, (3 mo. LIBOR + 4.00%, 1.00% Floor), 5.00%, 10/10/24 | | | | | | | 2,506 | | | | 2,128,878 | |
| | | | | | | | |
| | | | | | | | | | | 23,474,269 | |
|
| Communications Equipment — 0.3% | |
Avantor, Inc., 2017 1st Lien Term Loan, (1 mo. LIBOR + 2.25%, 1.00% Floor), 3.25%, 11/21/24 | | | | | | | 1,416 | | | | 1,377,230 | |
| | | | | | | | |
|
| Construction & Engineering — 1.1% | |
Brand Energy & Infrastructure Services, Inc., 2017 Term Loan, (3 mo. LIBOR + 4.25%, 1.00% Floor), 5.45%, 06/21/24 | | | | | | | 2,836 | | | | 2,587,564 | |
Ply Gem Midco, Inc., 2018 Term Loan, (1 mo. LIBOR + 3.75%), 3.94%, 04/12/25 | | | | | | | 447 | | | | 424,108 | |
SRS Distribution, Inc., 2018 1st Lien Term Loan, (3 mo. LIBOR + 3.25%), 4.32%, 05/23/25 | | | | | | | 2,248 | | | | 2,119,427 | |
| | | | | | | | |
| | | | | | | | | | | 5,131,099 | |
| | | | | | | | | | | | |
Security | | | Par
(000) | | | Value | |
|
| Construction Materials — 2.4% | |
American Builders & Contractors Supply Co., Inc., 2019 Term Loan, (1 mo. LIBOR + 2.00%), 2.18%, 01/15/27 | | | USD | | | | 1,455 | | | $ | 1,384,913 | |
Core & Main LP, 2017 Term Loan B, (3 mo. LIBOR + 2.75%, 1.00% Floor), 3.75%, 08/01/24 | | | | | | | 5,098 | | | | 4,844,637 | |
Filtration Group Corp., 2018 1st Lien Term Loan, (1 mo. LIBOR + 3.00%), 3.18%, 03/29/25(a) | | | | | | | 2,844 | | | | 2,701,503 | |
Forterra Finance LLC, 2017 Term Loan B, 10/25/23(h) | | | | | | | 2,424 | | | | 2,351,711 | |
| | | | | | | | |
| | | | | | | | | | | 11,282,764 | |
|
| Containers & Packaging — 2.4% | |
Berry Global, Inc.,: | | | | | | | | | | | | |
2019 Term Loan Y, (1 mo. LIBOR + 2.00%), 2.18%, 07/01/26 | | | | | | | 1,553 | | | | 1,481,132 | |
Term Loan W, (1 mo. LIBOR + 2.00%), 2.18%, 10/01/22 | | | | | | | 4,782 | | | | 4,649,646 | |
BWAY Holding Co., 2017 Term Loan B, (3 mo. LIBOR + 3.25%), 4.56%, 04/03/24 | | | | | | | 2,430 | | | | 2,175,570 | |
Flex Acquisition Co., Inc., 1st Lien Term Loan, (3 mo. LIBOR + 3.00%, 1.00% Floor), 4.43%, 12/29/23 | | | | | | | 2,159 | | | | 2,058,420 | |
Pregis TopCo Corp., 1st Lien Term Loan, (1 mo. LIBOR + 4.00%), 4.18%, 08/01/26 | | | | | | | 631 | | | | 607,384 | |
| | | | | | | | |
| | | | | | | | | | | 10,972,152 | |
|
| Distributors — 0.5% | |
TriMark USA LLC, 2017 1st Lien Term Loan, (6 mo. LIBOR + 3.50%), 4.58%, 08/28/24 | | | | | | | 3,119 | | | | 2,330,255 | |
| | | | | | | | |
|
| Diversified Consumer Services — 3.3% | |
Amentum Government Services Holdings LLC, Term Loan B, (1 mo. LIBOR + 4.00%), 4.18%, 02/01/27 | | | | | | | 554 | | | | 542,687 | |
Ascend Learning LLC, 2017 Term Loan B, (1 mo. LIBOR + 3.00%, 1.00% Floor), 4.00%, 07/12/24 | | | | | | | 1,572 | | | | 1,492,787 | |
BidFair MergerRight, Inc., Term Loan B, (1 mo. LIBOR + 5.50%, 1.00% Floor), 6.50%, 01/15/27 | | | | | | | 3,030 | | | | 2,822,878 | |
Bright Horizons Family Solutions, Inc., 2017 Term Loan B, (1 mo. LIBOR + 0.75%), 2.50%, 11/07/23 | | | | | | | 1,876 | | | | 1,815,626 | |
Genuine Financial Holdings LLC, 2018 1st Lien Term Loan, (1 mo. LIBOR + 3.75%), 3.93%, 07/11/25 | | | | | | | 2,610 | | | | 2,330,371 | |
Nomad Foods Europe Midco Ltd., 2017 Term Loan B4, (1 mo. LIBOR + 2.25%), 2.43%, 05/15/24 | | | | | | | 1,142 | | | | 1,098,138 | |
Serta Simmons Bedding, LLC,: | | | | | | | | | | | | |
2020 Super Priority First Out Term Loan, 08/10/23(h) | | | | | | | 476 | | | | 466,115 | |
2020 Super Priority Second Out Term Loan, (2 mo. LIBOR + 7.50%), 8.50%, 08/10/23 | | | | | | | 745 | | | | 620,942 | |
TruGreen LP, 2019 Term Loan, (1 mo. LIBOR + 3.75%), 3.93%, 03/19/26 | | | | | | | 1,869 | | | | 1,808,532 | |
Uber Technologies, Inc., 2018 Incremental Term Loan, (1 mo. LIBOR + 3.50%), 3.68%, 07/13/23 | | | | | | | 2,139 | | | | 2,031,681 | |
| | | | | | | | |
| | | | | | | | | | | 15,029,757 | |
|
| Diversified Financial Services — 3.2% | |
Advisor Group, Inc., 2019 Term Loan, (1 mo. LIBOR + 5.00%), 5.18%, 08/01/26 | | | | | | | 1,836 | | | | 1,694,711 | |
AlixPartners LLP, 2017 Term Loan B, (1 mo. LIBOR + 2.50%, 1.00% Floor), 3.50%, 04/04/24 | | | | | | | 4,473 | | | | 4,314,297 | |
Allsup’s Convenience Stores, Inc., Term Loan, (1 mo. LIBOR + 6.25%), 6.43%, 11/18/24 | | | | | | | 806 | | | | 774,435 | |
EG Finco Ltd., 2018 Term Loan, (6 mo. LIBOR + 4.00%), 5.07%, 02/07/25 | | | | | | | 1,211 | | | | 1,134,546 | |
| | | | |
| SCHEDULES OF INVESTMENTS | | | 37 | |
| | |
Schedule of Investments (unaudited) (continued) June 30, 2020 | | BlackRock Floating Rate Income Strategies Fund, Inc. (FRA) (Percentages shown are based on Net Assets) |
| | | | | | | | | | | | |
Security | | | Par
(000) | | | Value | |
|
| Diversified Financial Services (continued) | |
Kingpin Intermediate Holdings LLC, 2018 Term Loan B, (1 mo. LIBOR + 3.50%, 1.00% Floor), 4.50%, 07/03/24 | | | USD | | | | 1,716 | | | $ | 1,461,062 | |
SMG US Midco 2, Inc., 2020 Term Loan, (3 mo. LIBOR + 2.50%), 3.27%, 01/23/25(a) | | | | | | | 1,564 | | | | 1,375,903 | |
SSH Group Holdings, Inc., 2018 1st Lien Term Loan, (3 mo. LIBOR + 4.25%), 4.56%, 07/30/25(a) | | | | | | | 516 | | | | 476,893 | |
VS Buyer LLC, Term Loan B, (1 mo. LIBOR + 3.25%), 3.43%, 02/28/27 | | | | | | | 2,124 | | | | 2,044,039 | |
Ziggo Financing Partnership, USD Term Loan I, (1 mo. LIBOR + 2.50%), 2.68%, 04/30/28 | | | | | | | 1,617 | | | | 1,522,341 | |
| | | | | | | | |
| | | | | | | | | | | 14,798,227 | |
|
| Diversified Telecommunication Services — 2.2% | |
Hargray Communications Group, Inc., 2017 Term Loan B, (1 mo. LIBOR + 3.00%, 1.00% Floor), 4.00%, 05/16/24 | | | | | | | 1,437 | | | | 1,373,125 | |
Iridium Satellite LLC, Term Loan, 11/04/26(h) | | | | | | | 1,766 | | | | 1,729,069 | |
Level 3 Financing, Inc., 2019 Term Loan B, (1 mo. LIBOR + 1.75%), 1.93%, 03/01/27 | | | | | | | 1,931 | | | | 1,822,584 | |
MTN Infrastructure TopCo, Inc., 1st Lien Term Loan B, (1 mo. LIBOR + 3.00%, 1.00% Floor), 4.00%, 11/15/24 | | | | | | | 2,322 | | | | 2,219,896 | |
Northwest Fiber LLC, Term Loan B, (3 mo. LIBOR + 5.50%), 5.67%, 04/30/27(a) | | | | | | | 965 | | | | 955,350 | |
TDC A/S, EUR Term Loan, (EURIBOR + 3.00%), 3.00%, 06/04/25 | | | EUR | | | | 819 | | | | 890,540 | |
Virgin Media Investment Holdings Ltd., Term Loan L, (LIBOR – GBP + 3.25%), 3.34%, 01/15/27 | | | GBP | | | | 1,000 | | | | 1,191,866 | |
| | | | | | | | |
| | | | | | | | | | | 10,182,430 | |
|
| Electric Utilities — 0.6% | |
Pacific Gas & Electric Co., 2020 Exit Term Loan B, (3 mo. LIBOR + 4.50%, 1.00% Floor), 5.50%, 06/23/25 | | | USD | | | | 2,980 | | | | 2,924,125 | |
Texas Competitive Electric Holdings Co. LLC/TCEH Finance, Inc., Term Loan, 1.00%, 11/10/20(a) | | | | | | | 1,710 | | | | — | |
| | | | | | | | |
| | | | | | | | | | | 2,924,125 | |
|
| Energy Equipment & Services — 1.1% | |
Gates Global LLC, 2017 Repriced Term Loan B, 04/01/24(h) | | | | | | | 3,852 | | | | 3,701,374 | |
GrafTech Finance, Inc., 2018 Term Loan B, (1 mo. LIBOR + 3.50%, 1.00% Floor), 4.50%, 02/12/25 | | | | | | | 1,544 | | | | 1,500,463 | |
| | | | | | | | |
| | | | | | | | | | | 5,201,837 | |
|
| Equity Real Estate Investment Trusts (REITs) — 1.6% | |
Claros Mortgage Trust, Inc., Term Loan B, (1 mo. LIBOR + 3.25%), 3.44%, 08/09/26(a) | | | | | | | 731 | | | | 675,998 | |
Cushman & Wakefield U.S. Borrower LLC, 2020 Term Loan B, (1 mo. LIBOR + 2.75%), 2.93%, 08/21/25 | | | | | | | 2,181 | | | | 2,049,205 | |
RHP Hotel Properties LP, 2017 Term Loan B, (1 mo. LIBOR + 2.00%), 2.18%, 05/11/24 | | | | | | | 737 | | | | 690,698 | |
VICI Properties 1 LLC, Replacement Term Loan B, (1 mo. LIBOR + 1.75%), 1.94%, 12/20/24 | | | | | | | 4,359 | | | | 4,053,799 | |
| | | | | | | | |
| | | | | | | | | | | 7,469,700 | |
|
| Food & Staples Retailing — 1.1% | |
Hearthside Food Solutions LLC,: | | | | | | | | | | | | |
2018 Incremental Term Loan, (1 mo. LIBOR + 4.00%), 4.18%, 05/23/25 | | | | | | | 954 | | | | 909,289 | |
2018 Term Loan B, (1 mo. LIBOR + 3.68%), 3.87%, 05/23/25 | | | | | | | 844 | | | | 801,210 | |
2020 Incremental Term Loan B3, (1 mo. LIBOR + 5.00%, 1.00% Floor), 6.00%, 05/23/25 | | | | | | | 167 | | | | 162,408 | |
| | | | | | | | | | | | |
Security | | | Par
(000) | | | Value | |
|
| Food & Staples Retailing (continued) | |
US Foods, Inc.,: | | | | | | | | | | | | |
2016 Term Loan B, (1 mo. LIBOR + 1.75%), 1.93%, 06/27/23 | | | USD | | | | 2,639 | | | $ | 2,474,803 | |
2019 Term Loan B, (3 mo. LIBOR + 2.00%), 3.07%, 09/13/26 | | | | | | | 650 | | | | 604,023 | |
| | | | | | | | |
| | | | | | | | | | | 4,951,733 | |
|
| Food Products — 3.9% | |
8th Avenue Food & Provisions, Inc., 2018 1st Lien Term Loan, (1 mo. LIBOR + 3.50%), 3.68%, 10/01/25 | | | | | | | 1,099 | | | | 1,063,802 | |
B&G Foods, Inc., 2019 Term Loan B4, (1 mo. LIBOR + 2.50%), 2.68%, 10/10/26 | | | | | | | 165 | | | | 162,416 | |
Chobani LLC, 2017 Term Loan B, (1 mo. LIBOR + 3.50%, 1.00% Floor), 4.50%, 10/10/23 | | | | | | | 3,769 | | | | 3,615,639 | |
Froneri International Ltd.,: | | | | | | | | | | | | |
2020 USD 2nd Lien Term Loan, (1 mo. LIBOR + 5.75%), 5.93%, 01/29/28 | | | | | | | 224 | | | | 212,240 | |
2020 USD Term Loan, (1 mo. LIBOR + 2.25%), 2.43%, 01/29/27 | | | | | | | 5,215 | | | | 4,892,348 | |
Hostess Brands LLC, 2019 Term Loan, (3 mo. LIBOR + 2.25%), 3.01%, 08/03/25 | | | | | | | 1,391 | | | | 1,339,832 | |
JBS USA LUX SA, 2019 Term Loan B, (2 mo. LIBOR + 2.00%), 3.07%, 05/01/26 | | | | | | | 519 | | | | 494,362 | |
Pathway Vet Alliance LLC,(h): | | | | | | | | | | | | |
2020 Delayed Draw Term Loan, 03/31/27 | | | | | | | 44 | | | | 42,749 | |
2020 Term Loan, 03/31/27 | | | | | | | 542 | | | | 525,994 | |
Reynolds Group Holdings, Inc., 2017 Term Loan, (1 mo. LIBOR + 2.75%), 2.93%, 02/05/23 | | | | | | | 5,934 | | | | 5,654,906 | |
| | | | | | | | |
| | | | | | | | | | | 18,004,288 | |
|
| Health Care Equipment & Supplies — 1.7% | |
Immucor, Inc., Extended Term Loan B, (3 mo. LIBOR + 5.00%, 1.00% Floor), 6.00%, 06/15/21 | | | | | | | 2,897 | | | | 2,781,516 | |
Mallinckrodt International Finance SA, Term Loan B, (3 mo. LIBOR + 2.75%), 3.50%, 09/24/24 | | | | | | | 795 | | | | 592,260 | |
Ortho-Clinical Diagnostics SA,: | | | | | | | | | | | | |
2018 Term Loan B, (1 mo. LIBOR + 3.25%), 3.43%, 06/30/25 | | | | | | | 3,569 | | | | 3,330,427 | |
EUR Term Loan B, (EURIBOR + 3.50%), 3.50%, 06/30/25 | | | EUR | | | | 998 | | | | 1,047,846 | |
| | | | | | | | |
| | | | | | | | | | | 7,752,049 | |
|
| Health Care Providers & Services — 3.1% | |
AHP Health Partners, Inc., 2018 Term Loan, (1 mo. LIBOR + 4.50%, 1.00% Floor), 5.50%, 06/30/25 | | | USD | | | | 800 | | | | 768,299 | |
CHG Healthcare Services, Inc., 2017 1st Lien Term Loan B, (3 mo. LIBOR + 3.00%, 1.00% Floor), 4.07%, 06/07/23 | | | | | | | 1,905 | | | | 1,831,923 | |
Da Vinci Purchaser Corp., 2019 Term Loan, (6 mo. LIBOR + 4.00%, 1.00% Floor), 5.24%, 01/08/27 | | | | | | | 968 | | | | 940,170 | |
DentalCorp Perfect Smile ULC, 1st Lien Term Loan, (1 mo. LIBOR + 3.75%, 1.00% Floor), 4.75%, 06/06/25 | | | | | | | 701 | | | | 623,321 | |
Envision Healthcare Corp., 2018 1st Lien Term Loan, (1 mo. LIBOR + 3.75%), 3.93%, 10/10/25 | | | | | | | 2,185 | | | | 1,425,770 | |
EyeCare Partners LLC, : | | | | | | | | | | | | |
2020 2nd Lien Term Loan, (3 mo. LIBOR + 8.25%), 8.56%, 02/18/28 | | | | | | | 1,260 | | | | 1,071,000 | |
2020 Term Loan, (3 mo. LIBOR + 3.75%), 4.06%, 02/18/27 | | | | | | | 1,386 | | | | 1,243,890 | |
Gentiva Health Services, Inc., 2020 Term Loan, (1 mo. LIBOR + 3.25%), 3.44%, 07/02/25 | | | | | | | 2,333 | | | | 2,254,694 | |
HC Group Holdings II, Inc., Term Loan B, (1 mo. LIBOR + 4.50%), 4.68%, 08/06/26 | | | | | | | 2,293 | | | | 2,224,671 | |
| | |
| 38 | | 2020 BLACKROCK SEMI-ANNUAL REPORTTO SHAREHOLDERS |
| | |
Schedule of Investments (unaudited) (continued) June 30, 2020 | | BlackRock Floating Rate Income Strategies Fund, Inc. (FRA) (Percentages shown are based on Net Assets) |
| | | | | | | | | | | | |
Security | | | Par
(000) | | | Value | |
|
| Health Care Providers & Services (continued) | |
HCA, Inc., Term Loan B13, (1 mo. LIBOR + 1.75%), 1.93%, 03/18/26 | | | USD | | | | — | (i) | | $ | 434 | |
MPH Acquisition Holdings LLC, 2016 Term Loan B, (3 mo. LIBOR + 2.75%, 1.00% Floor), 3.75%, 06/07/23 | | | | | | | 365 | | | | 346,261 | |
nThrive, Inc., 2016 1st Lien Term Loan, (1 mo. LIBOR + 4.50%, 1.00% Floor), 5.50%, 10/20/22 | | | | | | | 1,337 | | | | 1,096,610 | |
Team Health Holdings, Inc., 1st Lien Term Loan, (1 mo. LIBOR + 2.75%, 1.00% Floor), 3.75%, 02/06/24 | | | | | | | 855 | | | | 651,047 | |
| | | | | | | | |
| | | | | | | | | | | 14,478,090 | |
|
| Health Care Services — 0.8% | |
Emerald TopCo., Inc., Term Loan, (3 mo. LIBOR + 3.50%), 4.26%, 07/25/26(a) | | | | | | | 2,096 | | | | 2,027,472 | |
WP CityMD Bidco LLC, 2019 Term Loan B, (3 mo. LIBOR + 4.50%, 1.00% Floor), 5.13%, 08/13/26 | | | | | | | 1,753 | | | | 1,724,027 | |
| | | | | | | | |
| | | | | | | | | | | 3,751,499 | |
|
| Health Care Technology — 1.1% | |
Change Healthcare Holdings, Inc., 2017 Term Loan B, (1 mo. LIBOR + 2.50%, 1.00% Floor), 3.50%, 03/01/24 | | | | | | | 3,614 | | | | 3,464,167 | |
GoodRx, Inc., 1st Lien Term Loan, (1 mo. LIBOR + 2.75%), 2.93%, 10/10/25 | | | | | | | 1,054 | | | | 1,003,476 | |
Quintiles IMS, Inc., 2017 Term Loan B, (1 mo. LIBOR + 1.75%), 2.50%, 03/07/24 | | | | | | | 499 | | | | 483,005 | |
| | | | | | | | |
| | | | | | | | | | | 4,950,648 | |
|
| Hotels, Restaurants & Leisure — 6.7% | |
1011778 B.C. Unlimited Liability Co., Term Loan B4, (1 mo. LIBOR + 1.75%), 1.93%, 11/19/26 | | | | | | | 3,094 | | | | 2,927,178 | |
Aimbridge Acquisition Co., Inc., 2019 Term Loan B, (1 mo. LIBOR + 3.75%), 3.93%, 02/02/26 | | | | | | | 433 | | | | 374,584 | |
Aristocrat Leisure Ltd., 2020 Incremental Term Loan B, (3 mo. LIBOR + 3.75%, 1.00% Floor), 4.75%, 10/19/24 | | | | | | | 1,010 | | | | 999,900 | |
Aristocrat Technologies, Inc., 2018 1st Lien Term Loan, (3 mo. LIBOR + 1.75%), 2.86%, 10/19/24 | | | | | | | 1,396 | | | | 1,323,105 | |
Boyd Gaming Corp., Term Loan B3, (1 Week LIBOR + 2.25%), 2.36%, 09/15/23 | | | | | | | 1,151 | | | | 1,079,870 | |
Caesars Resort Collection LLC,: | | | | | | | | | | | | |
2017 1st Lien Term Loan B, (1 mo. LIBOR + 2.75%), 2.93%, 12/23/24 | | | | | | | 3,443 | | | | 3,052,138 | |
2020 Term Loan, 06/17/25(h) | | | | | | | 3,705 | | | | 3,475,772 | |
CCM Merger, Inc., Term Loan B, (1 mo. LIBOR + 2.25%), 3.00%, 08/06/21 | | | | | | | 1,308 | | | | 1,266,721 | |
Four Seasons Hotels Ltd., 1st Lien Term Loan, (1 mo. LIBOR + 2.00%), 2.18%, 11/30/23 | | | | | | | 1,355 | | | | 1,280,903 | |
Gateway Casinos & Entertainment Ltd., 2018 Term Loan B, (3 mo. LIBOR + 3.00%), 3.31%, 12/01/23 | | | | | | | 147 | | | | 118,519 | |
Golden Nugget LLC, 2017 Incremental Term Loan B, 10/04/23(h) | | | | | | | 1,846 | | | | 1,458,556 | |
Golden Nugget, Inc., 2020 Initial Term Loan, 10/04/23(a)(h) | | | | | | | 177 | | | | 176,954 | |
IRB Holding Corp, 2020 Term Loan B, (1 mo. LIBOR + 2.75%, 1.00% Floor), 3.75%, 02/05/25 | | | | | | | 2,565 | | | | 2,362,602 | |
KFC Holding Co., 2018 Term Loan B, (1 mo. LIBOR + 1.75%), 1.94%, 04/03/25 | | | | | | | 1,401 | | | | 1,339,706 | |
Playa Resorts Holding BV, 2017 Term Loan B, (1 mo. LIBOR + 2.75%, 1.00% Floor), 3.75%, 04/29/24 | | | | | | | 603 | | | | 505,848 | |
| | | | | | | | | | | | |
Security | | | Par
(000) | | | Value | |
|
| Hotels, Restaurants & Leisure (continued) | |
Playtika Holding Corp., Term Loan B, (3 mo. LIBOR + 6.00%, 1.00% Floor), 7.07%, 12/10/24 | | | USD | | | | 1,467 | | | $ | 1,463,442 | |
Scientific Games International, Inc., 2018 Term Loan B5, (6 mo. LIBOR + 2.75%), 3.48%, 08/14/24 | | | | | | | 1,059 | | | | 934,348 | |
Stars Group Holdings BV, 2018 USD Incremental Term Loan, (3 mo. LIBOR + 3.50%), 3.81%, 07/10/25 | | | | | | | 1,074 | | | | 1,066,451 | |
Station Casinos LLC, 2020 Term Loan B, 02/08/27(h) | | | | | | | 2,094 | | | | 1,900,414 | |
Tackle Sarl, 2017 EUR Term Loan, (EURIBOR + 3.50%), 3.50%, 08/08/22 | | | EUR | | | | 975 | | | | 1,056,176 | |
Whatabrands LLC, 2020 Term Loan B, (1 mo. LIBOR + 2.75%), 2.93%, 08/02/26 | | | USD | | | | 2,405 | | | | 2,298,335 | |
Wyndham Hotels & Resorts, Inc., Term Loan B, (1 mo. LIBOR + 1.75%), 1.93%, 05/30/25 | | | | | | | 553 | | | | 521,219 | |
| | | | | | | | |
| | | | | | | | | | | 30,982,741 | |
|
| Household Durables — 0.4% | |
Reynolds Consumer Products LLC, Term Loan, (1 mo. LIBOR + 1.75%), 1.93%, 02/04/27 | | | | | | | 1,748 | | | | 1,681,141 | |
| | | | | | | | |
|
| Independent Power and Renewable Electricity Producers — 1.0% | |
Calpine Construction Finance Co. LP, 2017 Term Loan B, (1 mo. LIBOR + 2.00%), 2.18%, 01/15/25 | | | | | | | 514 | | | | 494,507 | |
Calpine Corp.,: | | | | | | | | | | | | |
2019 Term Loan B10, (1 mo. LIBOR + 2.00%), 2.18%, 08/12/26 | | | | | | | 721 | | | | 691,886 | |
Term Loan B9, (1 mo. LIBOR + 2.25%), 2.43%, 04/06/26 | | | | | | | 3,656 | | | | 3,519,916 | |
| | | | | | | | |
| | | | | | | | | | | 4,706,309 | |
|
| Industrial Conglomerates — 2.4% | |
Sequa Mezzanine Holdings LLC, 1st Lien Term Loan, (3 mo. LIBOR + 5.00%, 1.00% Floor), 6.00%, 11/28/21 | | | | | | | 1,340 | | | | 1,219,706 | |
Vertical US Newco Inc, USD Term Loan B, 1.00%, 07/01/27(a)(h) | | | | | | | 1,939 | | | | 1,909,915 | |
Vertiv Group Corp., Term Loan B, (1 mo. LIBOR + 3.00%), 3.18%, 03/02/27 | | | | | | | 8,642 | | | | 8,145,405 | |
| | | | | | | | |
| | | | | | | | | | | 11,275,026 | |
|
| Insurance — 4.2% | |
Alliant Holdings I, Inc., 2018 Term Loan B, (1 mo. LIBOR + 2.75%), 2.93%, 05/09/25 | | | | | | | 3,265 | | | | 3,087,760 | |
Alliant Holdings Intermediate LLC, Term Loan B, (1 mo. LIBOR + 3.25%), 3.44%, 05/09/25 | | | | | | | 1,040 | | | | 988,914 | |
AmWINS Group, Inc., 2017 Term Loan B, (1 mo. LIBOR + 2.75%, 1.00% Floor), 3.75%, 01/25/24 | | | | | | | 2,816 | | | | 2,730,282 | |
AssuredPartners Capital, Inc., 2020 Incremental Term Loan B, (3 mo. LIBOR + 4.50%, 1.00% Floor), 5.50%, 02/13/27 | | | | | | | 687 | | | | 673,532 | |
AssuredPartners, Inc., 2020 Term Loan B, (1 mo. LIBOR + 3.50%), 3.68%, 02/13/27 | | | | | | | 1,440 | | | | 1,374,374 | |
Davis Vision, Inc., 1st Lien Term Loan B, (1 mo. LIBOR + 3.00%, 1.00% Floor), 4.00%, 12/02/24 | | | | | | | 939 | | | | 897,493 | |
Hub International Ltd.,: | | | | | | | | | | | | |
2018 Term Loan B, (3 mo. LIBOR + 3.00%), 4.02%, 04/25/25 | | | | | | | 3,141 | | | | 2,980,999 | |
2019 Incremental Term Loan B, (3 mo. LIBOR + 4.00%, 1.00% Floor), 5.00%, 04/25/25 | | | | | | | 882 | | | | 865,593 | |
| | | | |
| SCHEDULES OF INVESTMENTS | | | 39 | |
| | |
Schedule of Investments (unaudited) (continued) June 30, 2020 | | BlackRock Floating Rate Income Strategies Fund, Inc. (FRA) (Percentages shown are based on Net Assets) |
| | | | | | | | | | | | |
Security | | | Par
(000) | | | Value | |
|
| Insurance (continued) | |
Sedgwick Claims Management Services, Inc., : | | | | | | | | | | | | |
2019 Term Loan B, (1 mo. LIBOR + 4.00%), 4.18%, 09/03/26 | | | USD | | | | 1,810 | | | $ | 1,732,802 | |
2020 Term Loan B3, (1 mo. LIBOR + 4.25%, 1.00% Floor), 5.25%, 09/03/26 | | | | | | | 1,329 | | | | 1,286,911 | |
Term Loan B, (1 mo. LIBOR + 3.25%), 3.43%, 12/31/25 | | | | | | | 3,151 | | | | 2,967,598 | |
| | | | | | | | |
| | | | | | | | | | | 19,586,258 | |
|
| Interactive Media & Services — 1.2% | |
Ancestry.com Operations Inc., 2019 Extended Term Loan B, (1 mo. LIBOR + 4.25%), 5.25%, 08/27/26 | | | | | | | 796 | | | | 753,189 | |
Ancestry.com Operations, Inc., Non-Extended Term Loan B, (1 mo. LIBOR + 3.75%, 1.00% Floor), 4.75%, 10/19/23(a) | | | | | | | 3,257 | | | | 3,110,202 | |
Rackspace Hosting, Inc., 2017 Incremental 1st Lien Term Loan, (2 mo. LIBOR + 3.00%, 1.00% Floor), 4.00%, 11/03/23 | | | | | | | 381 | | | | 362,289 | |
TierPoint LLC, 2017 1st Lien Term Loan, (1 mo. LIBOR + 3.75%, 1.00% Floor), 4.75%, 05/06/24 | | | | | | | 1,221 | | | | 1,158,907 | |
| | | | | | | | |
| | | | | | | | | | | 5,384,587 | |
|
| IT Services — 5.3% | |
Camelot US Acquisition 1 Co., Term Loan B, (1 mo. LIBOR + 3.00%), 3.18%, 10/31/26 | | | | | | | 3,853 | | | | 3,725,708 | |
Epicor Software Corp., 1st Lien Term Loan, (1 mo. LIBOR + 3.25%), 3.43%, 06/01/22 | | | | | | | 2,797 | | | | 2,734,584 | |
Evertec Group LLC, 2018 Term Loan B, (1 mo. LIBOR + 3.50%), 3.68%, 11/27/24 | | | | | | | 874 | | | | 843,273 | |
Flexential Intermediate Corp., 2nd Lien Term Loan, (3 mo. LIBOR + 7.25%, 1.00% Floor), 7.59%, 08/01/25 | | | | | | | 975 | | | | 416,403 | |
Greeneden US Holdings II LLC, 2018 Term Loan B, 12/01/23(h) | | | | | | | 4,038 | | | | 3,878,447 | |
GreenSky Holdings, LLC, 2020 Term Loan B2, (3 mo. LIBOR + 4.50%), 5.50%, 03/29/25(a) | | | | | | | 1,575 | | | | 1,527,750 | |
Presidio, Inc., 2020 Term Loan B, (3 mo. LIBOR + 3.50%), 4.27%, 01/22/27 | | | | | | | 842 | | | | 809,726 | |
PUG LLC, USD Term Loan, (1 mo. LIBOR + 3.50%), 3.68%, 02/12/27 | | | | | | | 3,244 | | | | 2,810,264 | |
Trans Union LLC, 2019 Term Loan B5, (1 mo. LIBOR + 1.75%), 1.93%, 11/16/26 | | | | | | | 3,325 | | | | 3,174,687 | |
WEX, Inc., Term Loan B3, (1 mo. LIBOR + 2.25%), 2.43%, 05/15/26 | | | | | | | 4,795 | | | | 4,582,662 | |
| | | | | | | | |
| | | | | | | | | | | 24,503,504 | |
|
| Leisure Products — 0.2% | |
MND Holdings III Corp., 2018 1st Lien Term Loan, (3 mo. LIBOR + 3.50%, 1.00% Floor), 4.50%, 06/19/24 | | | | | | | 1,005 | | | | 748,886 | |
| | | | | | | | |
|
| Life Sciences Tools & Services — 1.9% | |
Albany Molecular Research, Inc., 2017 2nd Lien Term Loan, (3 mo. LIBOR + 7.00%, 1.00% Floor), 8.00%, 08/30/25 | | | | | | | 395 | | | | 375,447 | |
eResearchTechnology, Inc., 2020 1st Lien Term Loan, (1 mo. LIBOR + 4.50%, 1.00% Floor), 4.68%, 02/04/27 | | | | | | | 2,155 | | | | 2,107,051 | |
Sotera Health Holdings LLC, 2019 Term Loan, (1 mo. LIBOR + 4.50%, 1.00% Floor), 5.50%, 12/11/26 | | | | | | | 6,535 | | | | 6,369,897 | |
| | | | | | | | | | | | |
| | | | | | | | | | | 8,852,395 | |
| | | | | | | | | | | | |
Security | | | Par
(000) | | | Value | |
|
| Machinery — 1.7% | |
Columbus McKinnon Corp., 2018 Term Loan B, (3 mo. LIBOR + 2.50%, 1.00% Floor), 3.50%, 01/31/24(a) | | | USD | | | | 133 | | | $ | 127,668 | |
Ingersoll-Rand Global Holding Co. Ltd., 2020 USD Spinco Term Loan, (1 mo. LIBOR + 1.75%), 1.93%, 02/28/27 | | | | | | | 2,281 | | | | 2,165,804 | |
Terex Corp., 2019 Term Loan B1, (1 mo. LIBOR + 2.75%), 3.50%, 01/31/24(a) | | | | | | | 321 | | | | 314,519 | |
Titan Acquisition Ltd., 2018 Term Loan B, (3 mo. LIBOR + 3.00%), 3.36%, 03/28/25 | | | | | | | 5,597 | | | | 5,104,872 | |
| | | | | | | | |
| | | | | | | | | | | 7,712,863 | |
|
| Media — 16.5% | |
Altice Financing SA,: | | | | | | | | | | | | |
2017 Term Loan B, 07/15/25(h) | | | | | | | 1,113 | | | | 1,050,250 | |
USD 2017 1st Lien Term Loan, (1 mo. LIBOR + 2.75%), 2.93%, 01/31/26 | | | | | | | 1,596 | | | | 1,502,856 | |
Altice France SA, 2018 Term Loan B13, (1 mo. LIBOR + 4.00%), 4.18%, 08/14/26 | | | | | | | 3,555 | | | | 3,410,841 | |
Charter Communications Operating LLC, 2019 Term Loan B1, (1 mo. LIBOR + 1.75%), 1.93%, 04/30/25 | | | | | | | 4,373 | | | | 4,206,960 | |
Clear Channel Outdoor Holdings, Inc., Term Loan B, (3 mo. LIBOR + 3.50%), 4.26%, 08/21/26 | | | | | | | 6,593 | | | | 5,960,214 | |
Connect Finco Sarl, Term Loan B, (1 mo. LIBOR + 4.50%), 5.50%, 12/12/26 | | | | | | | 11,057 | | | | 10,373,145 | |
CSC Holdings LLC,: | | | | | | | | | | | | |
2017 1st Lien Term Loan, (1 mo. LIBOR + 2.25%), 2.43%, 07/17/25 | | | | | | | 2,181 | | | | 2,057,912 | |
2019 Term Loan B5, (1 mo. LIBOR + 2.50%), 2.68%, 04/15/27 | | | | | | | 2,144 | | | | 2,029,758 | |
Diamond Sports Group LLC, Term Loan, (3 mo. LIBOR + 3.25%), 3.43%, 08/24/26 | | | | | | | 517 | | | | 419,456 | |
Gray Television, Inc.,: | | | | | | | | | | | | |
2017 Term Loan B, (1 mo. LIBOR + 2.25%), 2.42%, 02/07/24 | | | | | | | 607 | | | | 586,450 | |
2018 Term Loan C, (1 mo. LIBOR + 2.50%), 2.67%, 01/02/26 | | | | | | | 821 | | | | 792,457 | |
Intelsat Jackson Holdings SA,: | | | | | | | | | | | | |
2017 Term Loan B3, (PRIME + 4.75%), 8.00%, 11/27/23 | | | | | | | 395 | | | | 392,286 | |
2020 DIP Term Loan, 07/13/21(h) | | | | | | | 69 | | | | 70,398 | |
Learfield Communications LLC, 2016 1st Lien Term Loan, (1 mo. LIBOR + 3.25%, 1.00% Floor), 3.43%, 12/01/23 | | | | | | | 4,328 | | | | 3,222,391 | |
Liberty Latin America Ltd., Term Loan B, (1 mo. LIBOR + 5.00%), 5.19%, 10/15/26 | | | | | | | 1,291 | | | | 1,278,090 | |
Lions Gate Capital Holdings LLC, 2018 Term Loan B, (1 mo. LIBOR + 2.25%), 2.43%, 03/24/25 | | | | | | | 1,363 | | | | 1,285,699 | |
Live Nation Entertainment, Inc., Term Loan B4, 10/19/26(h) | | | | | | | 2,264 | | | | 2,074,252 | |
MCC Iowa LLC, Term Loan N, (1 Week LIBOR + 1.75%), 1.86%, 02/15/24 | | | | | | | 714 | | | | 693,023 | |
MH Sub I LLC,: | | | | | | | | | | | | |
2017 1st Lien Term Loan, (3 mo. LIBOR + 3.75%), 4.57%, 09/13/24 | | | | | | | 3,571 | | | | 3,430,102 | |
2020 Incremental Term Loan, (3 mo. LIBOR + 3.75%, 1.00% Floor), 4.06%, 09/15/24 | | | | | | | 815 | | | | 784,438 | |
Midcontinent Communications, 2019 Term Loan B, (1 mo. LIBOR + 1.75%), 1.93%, 08/15/26(a) | | | | | | | 735 | | | | 701,524 | |
Nexstar Broadcasting, Inc., 2019 Term Loan B4, (1 mo. LIBOR + 2.75%), 2.92%, 09/19/26 | | | | | | | 1,497 | | | | 1,420,489 | |
PSAV Holdings LLC, 2018 1st Lien Term Loan, (1 mo. LIBOR + 3.25%, 1.00% Floor), 4.25%, 03/03/25 | | | | | | | 3,818 | | | | 2,729,526 | |
| | |
| 40 | | 2020 BLACKROCK SEMI-ANNUAL REPORTTO SHAREHOLDERS |
| | |
Schedule of Investments (unaudited) (continued) June 30, 2020 | | BlackRock Floating Rate Income Strategies Fund, Inc. (FRA) (Percentages shown are based on Net Assets) |
| | | | | | | | | | | | |
Security | | | Par
(000) | | | Value | |
|
| Media (continued) | |
Radiate Holdco LLC, 1st Lien Term Loan, (1 mo. LIBOR + 3.00%), 3.75%, 02/01/24 | | | USD | | | | 2,281 | | | $ | 2,172,858 | |
Sinclair Television Group, Inc., Term Loan B2, (1 mo. LIBOR + 2.25%), 2.43%, 01/03/24 | | | | | | | 189 | | | | 179,950 | |
Terrier Media Buyer, Inc., Term Loan B, (1 mo. LIBOR + 4.25%), 4.43%, 12/17/26 | | | | | | | 3,159 | | | | 3,006,118 | |
Trader Corp., 2017 Term Loan B, (1 mo. LIBOR + 3.00%, 1.00% Floor), 4.00%, 09/28/23(a) | | | | | | | 3,761 | | | | 3,619,794 | |
UFC Holdings LLC, 2019 Term Loan, 04/29/26(h) | | | | | | | 736 | | | | 701,735 | |
Virgin Media Bristol LLC, USD Term Loan N, 01/31/28(h) | | | | | | | 2,375 | | | | 2,262,986 | |
William Morris Endeavor Entertainment LLC, 2018 1st Lien Term Loan, (1 mo. LIBOR + 2.75%), 2.93%, 05/18/25 | | | | | | | 3,006 | | | | 2,441,064 | |
Zayo Group Holdings, Inc., USD Term Loan, 03/09/27(h) | | | | | | | 12,280 | | | | 11,627,734 | |
| | | | | | | | |
| | | | | | | | | | | 76,484,756 | |
|
| Metals & Mining — 1.0% | |
Ball Metalpack LLC, 2018 1st Lien Term Loan B, (3 mo. LIBOR + 4.50%), 4.86%, 07/31/25 | | | | | | | 1,782 | | | | 1,630,114 | |
Equinox Holdings, Inc., 2017 1st Lien Term Loan, (6 mo. LIBOR + 3.00%, 1.00% Floor), 4.07%, 03/08/24 | | | | | | | 3,917 | | | | 3,004,244 | |
| | | | | | | | |
| | | | | | | | | | | 4,634,358 | |
|
| Multiline Retail — 0.3% | |
Eyemart Express LLC, 2017 Term Loan B, (1 mo. LIBOR + 3.00%, 1.00% Floor), 4.00%, 08/04/24 | | | | | | | 958 | | | | 869,306 | |
Neiman Marcus Group Ltd LLC,: | | | | | | | | | | | | |
2020 DIP Term Loan, (3 mo. LIBOR + 12.75%), 10.79%, 10/07/20 | | | | | | | 193 | | | | 196,542 | |
2020 Exit Term Loan, 05/08/25(a)(h) | | | | | | | 281 | | | | 283,697 | |
Neiman Marcus Group Ltd. LLC, Cash Pay Extended Term Loan, (PRIME + 5.00%), 8.25%, 10/25/23 | | | | | | | 959 | | | | 242,712 | |
| | | | | | | | |
| | | | | | | | | | | 1,592,257 | |
|
| Oil & Gas Equipment & Services — 0.3% | |
McDermott Technology Americas, Inc.,: | | | | | | | | | | | | |
2018 1st Lien Term Loan, (PRIME + 4.00%), 7.25%, 05/12/25 | | | | | | | 1,717 | | | | 589,307 | |
2020 SP DIP Roll Up Term Loan, 10/21/20(h) | | | | | | | 746 | | | | 739,020 | |
| | | | | | | | |
| | | | | | | | | | | 1,328,327 | |
|
| Oil, Gas & Consumable Fuels — 0.5% | |
California Resources Corp., Second Out Term Loan, (3 mo. LIBOR + 10.37%, 1.00% Floor), 11.38%, 12/31/21 | | | | | | | 1,737 | | | | 78,143 | |
Edgewater Generation LLC, Term Loan, (1 mo. LIBOR + 3.75%), 3.93%, 12/13/25 | | | | | | | 1,512 | | | | 1,441,945 | |
EG Group Ltd., 2018 Term Loan B, (6 mo. LIBOR + 4.00%), 5.07%, 02/07/25 | | | | | | | 787 | | | | 737,054 | |
| | | | | | | | |
| | | | | | | | | | | 2,257,142 | |
|
| Personal Products — 1.0% | |
Sunshine Luxembourg VII Sarl, USD 1st Lien Term Loan, 09/25/26(h) | | | | | | | 4,859 | | | | 4,642,777 | |
| | | | | | | | |
|
| Pharmaceuticals — 3.6% | |
Amneal Pharmaceuticals LLC, 2018 Term Loan B, (1 mo. LIBOR + 3.50%), 3.69%, 05/04/25 | | | | | | | 1,980 | | | | 1,804,580 | |
Catalent Pharma Solutions, Inc., Term Loan B2, (1 mo. LIBOR + 2.25%, 1.00% Floor), 3.25%, 05/18/26 | | | | | | | 2,060 | | | | 2,032,954 | |
| | | | | | | | | | | | |
Security | | | Par
(000) | | | Value | |
|
| Pharmaceuticals (continued) | |
Elanco Animal Health Incorporated, Term Loan B, 02/04/27(h) | | | USD | | | | 1,216 | | | $ | 1,157,609 | |
Grifols Worldwide Operations USA, Inc., USD 2019 Term Loan B, (1 Week LIBOR + 2.00%), 2.11%, 11/15/27 | | | | | | | 2,203 | | | | 2,116,930 | |
Jaguar Holding Co. II, 2018 Term Loan, (1 mo. LIBOR + 2.50%, 1.00% Floor), 3.50%, 08/18/22 | | | | | | | 3,396 | | | | 3,350,556 | |
Valeant Pharmaceuticals International, Inc., 2018 Term Loan B, (1 mo. LIBOR + 3.00%), 3.19%, 06/02/25 | | | | | | | 6,460 | | | | 6,268,805 | |
| | | | | | | | |
| | | | | | | | | | | 16,731,434 | |
|
| Professional Services — 1.7% | |
Cast and Crew Payroll LLC, 2019 1st Lien Term Loan, (1 mo. LIBOR + 3.75%), 3.93%, 02/07/26 | | | | | | | 1,139 | | | | 1,036,201 | |
Dun & Bradstreet Corp., Term Loan, 02/06/26(h) | | | | | | | 4,810 | | | | 4,677,264 | |
SIRVA Worldwide, Inc., 2018 1st Lien Term Loan, (3 mo. LIBOR + 5.50%), 5.81%, 08/04/25 | | | | | | | 1,257 | | | | 909,258 | |
STG-Fairway Holdings LLC, Term Loan B, 01/31/27(h) | | | | | | | 1,566 | | | | 1,455,722 | |
| | | | | | | | |
| | | | | | | | | | | 8,078,445 | |
|
| Real Estate Management & Development — 0.5% | |
CityCenter Holdings LLC, 2017 Term Loan B, (1 mo. LIBOR + 2.25%), 3.00%, 04/18/24 | | | | | | | 2,551 | | | | 2,314,758 | |
| | | | | | | | |
|
| Road & Rail — 1.3% | |
Lineage Logistics Holdings LLC, 2018 Term Loan, (1 mo. LIBOR + 3.00%, 1.00% Floor), 4.00%, 02/27/25 | | | | | | | 4,101 | | | | 3,963,916 | |
Moda Ingleside Energy Center LLC, 2018 Term Loan B, (1 mo. LIBOR + 3.25%), 3.43%, 09/25/25 | | | | | | | 730 | | | | 707,623 | |
Road Infrastructure Investment LLC, 2016 1st Lien Term Loan, (3 mo. LIBOR + 3.50%, 1.00% Floor), 4.50%, 06/13/23 | | | | | | | 1,343 | | | | 1,172,052 | |
| | | | | | | | |
| | | | | | | | | | | 5,843,591 | |
|
| Semiconductors & Semiconductor Equipment — 0.3% | |
Microchip Technology, Inc., 2018 Term Loan B, (1 mo. LIBOR + 2.00%), 2.18%, 05/29/25 | | | | | | | 848 | | | | 816,310 | |
ON Semiconductor Corp., 2019 Term Loan B, (1 mo. LIBOR + 2.00%), 2.18%, 09/19/26 | | | | | | | 637 | | | | 609,511 | |
| | | | | | | | |
| | | | | | | | | | | 1,425,821 | |
|
| Software — 22.3% | |
Applied Systems, Inc.,: | | | | | | | | | | | | |
2017 1st Lien Term Loan, (3 mo. LIBOR + 3.25%, 1.00% Floor), 4.25%, 09/19/24 | | | | | | | 3,815 | | | | 3,701,423 | |
2017 2nd Lien Term Loan, (3 mo. LIBOR + 7.00%, 1.00% Floor), 8.00%, 09/19/25 | | | | | | | 726 | | | | 722,352 | |
BMC Software Finance, Inc., 2017 Term Loan, 10/02/25(h) | | | | | | | 2,349 | | | | 2,216,853 | |
Castle US Holding Corp., USD Term Loan B, (3 mo. LIBOR + 3.75%), 4.06%, 01/31/27 | | | | | | | 2,992 | | | | 2,722,496 | |
Cornerstone OnDemand, Inc., Term Loan B, (2 mo. LIBOR + 4.25%), 5.35%, 04/22/27 | | | | | | | 1,206 | | | | 1,185,655 | |
Cypress Intermediate Holdings III, Inc., 2017 1st Lien Term Loan, (1 mo. LIBOR + 3.00%, 1.00% Floor), 4.00%, 04/29/24 | | | | | | | 1,896 | | | | 1,828,510 | |
Digicel International Finance Ltd., 2017 Term Loan B, (6 mo. LIBOR + 3.25%), 4.25%, 05/27/24 | | | | | | | 1,163 | | | | 972,808 | |
DTI Holdco, Inc., 2018 Term Loan B, (3 mo. LIBOR + 4.75%, 1.00% Floor), 5.75%, 09/29/23 | | | | | | | 1,631 | | | | 1,299,744 | |
Ellie Mae, Inc., Term Loan, (3 mo. LIBOR + 3.75%), 4.06%, 04/17/26 | | | | | | | 4,294 | | | | 4,149,815 | |
| | | | |
| SCHEDULES OF INVESTMENTS | | | 41 | |
| | |
Schedule of Investments (unaudited) (continued) June 30, 2020 | | BlackRock Floating Rate Income Strategies Fund, Inc. (FRA) (Percentages shown are based on Net Assets) |
| | | | | | | | | | | | |
Security | | | Par
(000) | | | Value | |
|
| Software (continued) | |
Financial & Risk US Holdings, Inc., 2018 USD Term Loan, (1 mo. LIBOR + 3.25%), 3.43%, 10/01/25 | | | USD | | | | 5,967 | | | $ | 5,822,182 | |
Informatica LLC,: | | | | | | | | | | | | |
2020 USD 2nd Lien Term Loan, (Fixed + 7.12%), 7.13%, 02/25/25 | | | | | | | 1,294 | | | | 1,292,383 | |
2020 USD Term Loan B, (1 mo. LIBOR + 3.25%), 3.43%, 02/25/27 | | | | | | | 8,257 | | | | 7,884,968 | |
Kronos, Inc.,: | | | | | | | | | | | | |
2017 Term Loan B, 11/01/23(h) | | | | | | | 7,263 | | | | 7,247,089 | |
2nd Lien Term Loan, (1 mo. LIBOR + 8.25%, 1.00% Floor), 9.25%, 11/01/24 | | | | | | | 2,339 | | | | 2,338,026 | |
McAfee LLC, 2018 Term Loan B, (1 mo. LIBOR + 3.75%), 3.93%, 09/30/24 | | | | | | | 3,506 | | | | 3,405,646 | |
Mitchell International, Inc.,: | | | | | | | | | | | | |
2017 1st Lien Term Loan, (1 mo. LIBOR + 3.25%), 3.43%, 11/29/24 | | | | | | | 2,197 | | | | 2,044,202 | |
2017 2nd Lien Term Loan, (1 mo. LIBOR + 7.25%), 7.43%, 12/01/25 | | | | | | | 850 | | | | 752,250 | |
Renaissance Holding Corp., 2018 Add On Term Loan, (3 mo. LIBOR + 3.25%), 4.01%, 05/30/25 | | | | | | | 691 | | | | 663,492 | |
RP Crown Parent LLC, 2016 Term Loan B, (1 mo. LIBOR + 2.75%, 1.00% Floor), 3.75%, 10/12/23 | | | | | | | 3,876 | | | | 3,755,174 | |
Severin Acquisition LLC, 2018 Term Loan B, (1 mo. LIBOR + 3.25%), 3.43%, 08/01/25 | | | | | | | 3,706 | | | | 3,548,895 | |
SolarWinds Holdings, Inc., 2018 Term Loan B, (1 mo. LIBOR + 2.75%), 2.93%, 02/05/24 | | | | | | | 3,352 | | | | 3,243,983 | |
Solera LLC, Term Loan B, (1 mo. LIBOR + 2.75%), 2.93%, 03/03/23 | | | | | | | 2,935 | | | | 2,827,400 | |
Sophia LP, 2017 Term Loan B, (3 mo. LIBOR + 3.25%, 1.00% Floor), 4.25%, 09/30/22 | | | | | | | 5,115 | | | | 4,986,887 | |
SS&C Technologies Holdings Europe Sarl, 2018 Term Loan B4, (1 mo. LIBOR + 1.75%), 1.93%, 04/16/25 | | | | | | | 917 | | | | 876,091 | |
SS&C Technologies, Inc.,: | | | | | | | | | | | | |
2018 Term Loan B3, (1 mo. LIBOR + 1.75%), 1.93%, 04/16/25 | | | | | | | 1,305 | | | | 1,246,638 | |
2018 Term Loan B5, (1 mo. LIBOR + 1.75%), 1.93%, 04/16/25 | | | | | | | 1,622 | | | | 1,543,844 | |
Tempo Acquisition LLC, Term Loan, (1 mo. LIBOR + 2.75%), 2.93%, 05/01/24 | | | | | | | 5,286 | | | | 5,008,491 | |
Tibco Software Inc.,: | | | | | | | | | | | | |
2020 2nd Lien Term Loan, (1 mo. LIBOR + 7.25%), 7.43%, 03/04/28 | | | | | | | 3,410 | | | | 3,267,379 | |
2020 Term Loan B, (1 mo. LIBOR + 3.75%), 3.93%, 06/30/26(a) | | | | | | | 4,773 | | | | 4,498,261 | |
Ultimate Software Group, Inc.,: | | | | | | | | | | | | |
2020 2nd Lien Incremental Term Loan, 1.00%, 05/03/27 | | | | | | | 1,992 | | | | 2,021,880 | |
2020 Incremental Term Loan B, 05/04/26(h) | | | | | | | 6,129 | | | | 6,045,707 | |
Term Loan B, 05/03/26(h) | | | | | | | 5,842 | | | | 5,650,326 | |
Vertafore, Inc., 2018 1st Lien Term Loan, (1 mo. LIBOR + 3.25%), 3.43%, 07/02/25 | | | | | | | 4,568 | | | | 4,297,134 | |
| | | | | | | | |
| | | | | | | | | | | 103,067,984 | |
|
| Specialty Retail — 2.8% | |
Belron Finance US LLC,: | | | | | | | | | | | | |
2019 USD Term Loan B, (3 mo. LIBOR + 2.50%), 3.26%, 10/30/26 | | | | | | | 889 | | | | 855,215 | |
Term Loan B, (3 mo. LIBOR + 2.50%), 2.93%, 11/13/25 | | | | | | | 446 | | | | 430,030 | |
USD Term Loan B, (3 mo. LIBOR + 2.50%), 2.97%, 11/07/24 | | | | | | | 2,914 | | | | 2,808,025 | |
CD&R Firefly Bidco Ltd., 2018 GBP Term Loan B1, (LIBOR – GBP + 4.50%), 5.18%, 06/23/25 | | | GBP | | | | 1,000 | | | | 1,193,874 | |
| | | | | | | | | | | | |
Security | | | Par
(000) | | | Value | |
|
| Specialty Retail (continued) | |
IAA, Inc., Term Loan B, (1 mo. LIBOR + 2.25%), 2.44%, 06/28/26 | | | USD | | | | 824 | | | $ | 785,506 | |
MED ParentCo LP,: | | | | | | | | | | | | |
1st Lien Delayed Draw Term Loan, (3 mo. LIBOR + 4.25%), 4.61%, 08/31/26 | | | | | | | 245 | | | | 220,982 | |
1st Lien Term Loan, (3 mo. LIBOR + 4.25%), 4.61%, 08/31/26 | | | | | | | 1,396 | | | | 1,259,477 | |
Midas Intermediate Holdco II LLC, Incremental Term Loan B, (3 mo. LIBOR + 2.75%, 1.00% Floor), 3.75%, 08/18/21 | | | | | | | 1,231 | | | | 1,106,128 | |
PetSmart, Inc., Term Loan B2, 03/11/22(h) | | | | | | | 3,252 | | | | 3,204,266 | |
Research Now Group, Inc., 2017 1st Lien Term Loan, (3 mo. LIBOR + 5.50%, 1.00% Floor), 6.50%, 12/20/24 | | | | | | | 1,233 | | | | 1,130,080 | |
| | | | | | | | |
| | | | 12,993,583 | |
|
| Technology Hardware, Storage & Peripherals — 0.7% | |
Electronics for Imaging, Inc., Term Loan, 07/23/26(a)(h) | | | | | | | 1,397 | | | | 1,089,918 | |
Western Digital Corp., 2018 Term Loan B4, (3 mo. LIBOR + 1.75%), 1.92%, 04/29/23 | | | | | | | 1,964 | | | | 1,907,347 | |
| | | | | | | | |
| | | | 2,997,265 | |
|
| Thrifts & Mortgage Finance — 0.6% | |
IG Investment Holdings LLC, 2018 1st Lien Term Loan, 05/23/25(h) | | | | | | | 3,029 | | | | 2,804,676 | |
| | | | | | | | |
|
| Trading Companies & Distributors — 0.8% | |
HD Supply, Inc., Term Loan B5, (1 mo. LIBOR + 1.75%), 1.93%, 10/17/23 | | | | | | | 3,800 | | | | 3,667,133 | |
| | | | | | | | |
|
| Utilities — 0.4% | |
ExGen Renewables IV LLC, Term Loan B, (3 mo. LIBOR + 3.00%, 1.00% Floor), 4.00%, 11/28/24 | | | | | | | 2,132 | | | | 2,062,841 | |
| | | | | | | | |
|
| Wireless Telecommunication Services — 3.1% | |
Ligado Networks LLC, PIK Exit Term Loan (12.20% Cash or 9.75% PIK), 0.00%, 12/07/20 | | | | | | | 172 | | | | 151,983 | |
SBA Senior Finance II LLC, 2018 Term Loan B, (1 mo. LIBOR + 1.75%), 1.93%, 04/11/25 | | | | | | | 4,282 | | | | 4,112,836 | |
T-Mobile USA, Inc., 2020 Term Loan, (1 mo. LIBOR + 3.00%), 3.18%, 04/01/27 | | | | | | | 6,638 | | | | 6,623,662 | |
Xplornet Communications, Inc., 2020 Term Loan B, 05/29/27(h) | | | | | | | 3,823 | | | | 3,641,407 | |
| | | | | | | | |
| | | | 14,529,888 | |
| | | | | | | | |
| |
Total Floating Rate Loan Interests — 135.0%
(Cost — $662,944,598) | | | | 624,923,681 | |
| | | | | | | | |
| | |
| | | | Shares | | | | |
|
Investment Companies — 5.3% | |
|
| Fixed Income Funds — 5.3% | |
Invesco Senior Loan ETF | | | | | | | 53,000 | | | | 1,131,550 | |
iShares iBoxx USD High Yield Corporate Bond ETF(l) | | | | | | | 206,000 | | | | 16,813,720 | |
iShares iBoxx $ Investment Grade Corporate Bond ETF(l) | | | | | | | 49,000 | | | | 6,590,500 | |
| | | | | | | | |
| |
Total Investment Companies — 5.3%
(Cost — $24,235,027) | | | | 24,535,770 | |
| | | | | | | | |
| | |
| 42 | | 2020 BLACKROCK SEMI-ANNUAL REPORTTO SHAREHOLDERS |
| | |
Schedule of Investments (unaudited) (continued) June 30, 2020 | | BlackRock Floating Rate Income Strategies Fund, Inc. (FRA) (Percentages shown are based on Net Assets) |
| | | | | | | | | | | | |
Security | | | Investment
Value
(000) | | | Value | |
|
Other Interests(a)(b)(j) — 0.0% | |
|
| IT Services — 0.0% | |
Millennium Corp. | | | USD | | | | 1,607 | | | $ | — | |
Millennium Lender Claims | | | | | | | 1,508 | | | | — | |
| | | | | | | | |
| |
Total Other Interests — 0.0%
(Cost — $—) | | | | — | |
| | | | | | | | |
| |
Total Long-Term Investments — 147.7%
(Cost — $724,985,254) | | | | 683,688,300 | |
| | | | | | | | |
| | |
| | | | Shares | | | | |
|
Short-Term Securities — 0.4% | |
BlackRock Liquidity Funds, T-Fund, Institutional Class, 0.11%(k)(l) | | | | | | | 1,722,056 | | | | 1,722,056 | |
| | | | | | | | |
| |
Total Short-Term Securities — 0.4%
(Cost — $1,722,056) | | | | 1,722,056 | |
| | | | | | | | |
| |
Total Investments — 148.1%
(Cost — $726,707,310) | | | | 685,410,356 | |
| |
Liabilities in Excess of Other Assets — (48.1)% | | | | (222,561,082 | ) |
| | | | | | | | |
| |
Net Assets — 100.0% | | | $ | 462,849,274 | |
| | | | | | | | |
| (a) | Security is valued using significant unobservable inputs and is classified as Level 3 in the fair value hierarchy. |
| (b) | Non-income producing security. |
| (c) | Security exempt from registration pursuant to Rule 144A under the Securities Act of 1933, as amended. These securities may be resold in transactions exempt from registration to qualified institutional investors. |
| (d) | Payment-in-kind security which may pay interest/dividends in additional par/shares and/or in cash. Rates shown are the current rate and possible payment rates. |
| (e) | Convertible security. |
| (f) | When-issued security. |
| (g) | Variable rate security. Rate shown is the rate in effect as of period end. |
| (h) | Represents an unsettled loan commitment at period end. Certain details associated with this purchase are not known prior to the settlement date, including coupon rate. |
| (i) | Amount is less than 500. |
| (j) | Other interests represent beneficial interests in liquidation trusts and other reorganization or private entities. |
| (k) | Annualized 7-day yield as of period end. |
| (l) | Investments in issuers considered to be an affiliate/affiliates of the Fund during the six months ended June 30, 2020 for purposes of Section 2(a)(3) of the Investment Company Act of 1940, as amended, were as follows: |
| | | | | | | | | | | | | | | | | | | | | | | | | | | | | | | | |
| Affiliated Issuer | | Shares
Held at
12/31/19 | | | Shares
Purchased | | | Shares
Sold | | | Shares
Held at
06/30/20 | | | Value at
06/30/20 | | | Income | | | Net
Realized
Gain (Loss) (a) | | | Change in
Unrealized
Appreciation
(Depreciation) | |
BlackRock Liquidity Funds, T-Fund, Institutional Class | | | — | | | | 1,722,056 | (b) | | | — | | | | 1,722,056 | | | $ | 1,722,056 | | | $ | 6,382 | | | $ | — | | | $ | — | |
iShares iBoxx $ Investment Grade Corporate Bond ETF | | | — | | | | 49,000 | | | | — | | | | 49,000 | | | | 6,590,500 | | | | 22,487 | | | | — | | | | 251,493 | |
iShares iBoxx USD High Yield Corporate Bond ETF | | | — | | | | 236,500 | | | | (30,500 | ) | | | 206,000 | | | | 16,813,720 | | | | 118,448 | | | | (161,570 | ) | | | 63,898 | |
| | | | | | | | | | | | | | | | | | | | | | | | | | | | | | | | |
| | | $ | 25,126,276 | | | $ | 147,317 | | | $ | (161,570 | ) | | $ | 315,391 | |
| | | | | | | | | | | | | | | | | |
| | (a) | Includes net capital gain distributions, if applicable. | |
| | (b) | Represents net shares purchased (sold). | |
For Fund compliance purposes, the Fund’s industry classifications refer to one or more of the industry sub-classifications used by one or more widely recognized market indexes or rating group indexes, and/or as defined by the investment adviser. These definitions may not apply for purposes of this report, which may combine such industry sub-classifications for reporting ease.
Derivative Financial Instruments Outstanding as of Period End
Forward Foreign Currency Exchange Contracts
| | | | | | | | | | | | | | | | | | | | |
Currency
Purchased | | | Currency
Sold | | | Counterparty | | Settlement
Date | | | Unrealized
Appreciation
(Depreciation) | |
| EUR | | | 3,683,000 | | | USD | | | 4,135,676 | | | State Street Bank and Trust Co. | | | 07/06/20 | | | $ | 2,510 | |
| GBP | | | 1,556,000 | | | USD | | | 1,913,988 | | | BNP Paribas S.A. | | | 07/06/20 | | | | 14,097 | |
| | | | | | | | | | | | | | | | | | | | |
| | | | | | | | | | | | | | | | | | | 16,607 | |
| | | | | | | | | | | | | | | | | | | | |
| USD | | | 4,125,123 | | | EUR | | | 3,706,000 | | | UBS AG | | | 07/06/20 | | | | (38,905 | ) |
| USD | | | 1,920,261 | | | GBP | | | 1,559,000 | | | Standard Chartered Bank | | | 07/06/20 | | | | (11,542 | ) |
| USD | | | 4,138,372 | | | EUR | | | 3,683,000 | | | State Street Bank and Trust Co. | | | 08/05/20 | | | | (2,531 | ) |
| USD | | | 1,914,335 | | | GBP | | | 1,556,000 | | | BNP Paribas S.A. | | | 08/05/20 | | | | (14,129 | ) |
| | | | | | | | | | | | | | | | | | | | |
| | | | | | | | | | | | | | | | | | $ | (67,107 | ) |
| | | | | | | | | | | | | | | | | | | | |
| | |
SCHEDULES OF INVESTMENTS | | 43 |
| | |
Schedule of Investments (unaudited) (continued) June 30, 2020 | | BlackRock Floating Rate Income Strategies Fund, Inc. (FRA) |
Centrally Cleared Credit Default Swaps — Sell Protection
| | | | | | | | | | | | | | | | | | | | | | | | | | | | | | | | | | | | |
| Reference Obligation/Index | | Financing Rate
Received by the
Fund | | | Payment
Frequency | | | Termination
Date | | | Credit
Rating (a) | | | Notional
Amount (000) (b) | | | Value | | | Upfront
Premium
Paid
(Received) | | | Unrealized
Appreciation
(Depreciation) | |
CDX.NA.HY.34.V6 | | | 5.00 | % | | | Quarterly | | | | 06/20/25 | | | | B | | | | USD | | | | 12,873 | | | $ | (72,704 | ) | | $ | (500 | ) | | $ | (72,204 | ) |
| | | | | | | | | | | | | | | | | | | | | | | | | | | | | | | | | | | | |
| | (a) | Using the rating of the issuer or the underlying securities of the index, as applicable, provided by S&P Global Ratings. | |
| | (b) | The maximum potential amount the Fund may pay should a negative credit event take place as defined under the terms of the agreement. | |
Balances Reported in the Statements of Assets and Liabilities for Centrally Cleared Swaps
| | | | | | | | | | | | | | | | |
| | | Swap
Premiums Paid | | | Swap
Premiums Received | | | Unrealized
Appreciation | | | Unrealized
Depreciation | |
Centrally Cleared Swaps(a) | | $ | 33,250 | | | $ | (33,750 | ) | | $ | — | | | $ | (72,204 | ) |
| | (a) | Includes cumulative appreciation (depreciation) on centrally cleared swaps, as reported in the Schedule of Investments. Only current day’s variation margin is reported within the Statements of Assets and Liabilities and is net of any previously paid (received) swap premium amounts. | |
Derivative Financial Instruments Categorized by Risk Exposure
As of period end, the fair values of derivative financial instruments located in the Statements of Assets and Liabilities were as follows:
| | | | | | | | | | | | | | | | | | | | | | | | | | | | |
| | | Commodity
Contracts | | | Credit
Contracts | | | Equity
Contracts | | | Foreign
Currency
Exchange
Contracts | | | Interest
Rate
Contracts | | | Other
Contracts | | | Total | |
Assets — Derivative Financial Instruments | | | | | | | | | | | | | | | | | | | | | | | | | | | | |
Forward foreign currency exchange contracts | | | | | | | | | | | | | | | | | | | | | | | | | | | | |
Unrealized appreciation on forward foreign currency exchange contracts | | $ | — | | | $ | — | | | $ | — | | | $ | 16,607 | | | $ | — | | | $ | — | | | $ | 16,607 | |
| | | | | | | | | | | | | | | | | | | | | | | | | | | | |
Liabilities — Derivative Financial Instruments | | | | | | | | | | | | | | | | | | | | | | | | | | | | |
Forward foreign currency exchange contracts | | | | | | | | | | | | | | | | | | | | | | | | | | | | |
Unrealized depreciation on forward foreign currency exchange contracts | | $ | — | | | $ | — | | | $ | — | | | $ | 67,107 | | | $ | — | | | $ | — | | | $ | 67,107 | |
Swaps — centrally cleared | | | | | | | | | | | | | | | | | | | | | | | | | | | | |
Unrealized depreciation on centrally cleared swaps(a) | | | — | | | | 72,204 | | | | — | | | | — | | | | — | | | | — | | | | 72,204 | |
| | | | | | | | | | | | | | | | | | | | | | | | | | | | |
| | $ | — | | | $ | 72,204 | | | $ | — | | | $ | 67,107 | | | $ | — | | | $ | — | | | $ | 139,311 | |
| | | | | | | | | | | | | | | | | | | | | | | | | | | | |
| | (a) | Net cumulative appreciation (depreciation) on future contracts and centrally cleared swaps, if any, are reported in the Schedule of Investments. In the Statements of Assets and Liabilities, only current day’s variation margin is reported in receivables or payables and the net cumulative unrealized appreciation (depreciation) is included in accumulated earnings (loss). | |
For the six months ended June 30, 2020, the effect of derivative financial instruments in the Statements of Operations was as follows:
| | | | | | | | | | | | | | | | | | | | | | | | | | | | |
| | | Commodity
Contracts | | | Credit
Contracts | | | Equity
Contracts | | | Foreign
Currency
Exchange
Contracts | | | Interest
Rate
Contracts | | | Other
Contracts | | | Total | |
Net Realized Gain (Loss) from: | | | | | | | | | | | | | | | | | | | | | | | | | | | | |
Forward foreign currency exchange contracts | | $ | — | | | $ | — | | | $ | — | | | $ | 147,719 | | | $ | — | | | $ | — | | | $ | 147,719 | |
Options purchased(a) | | | — | | | | — | | | | (105,539 | ) | | | — | | | | — | | | | — | | | | (105,539 | ) |
Swaps | | | — | | | | (124,196 | ) | | | — | | | | — | | | | — | | | | — | | | | (124,196 | ) |
| | | | | | | | | | | | | | | | | | | | | | | | | | | | |
| | $ | — | | | $ | (124,196 | ) | | $ | (105,539 | ) | | $ | 147,719 | | | $ | — | | | $ | — | | | $ | (82,016 | ) |
| | | | | | | | | | | | | | | | | | | | | | | | | | | | |
| | (a) | Options purchased are included in net realized gain (loss) from investments. | |
| | |
| 44 | | 2020 BLACKROCK SEMI-ANNUAL REPORTTO SHAREHOLDERS |
| | |
Schedule of Investments (unaudited) (continued) June 30, 2020 | | BlackRock Floating Rate Income Strategies Fund, Inc. (FRA) |
Derivative Financial Instruments Categorized by Risk Exposure (continued)
| | | | | | | | | | | | | | | | | | | | | | | | | | | | |
| | | Commodity
Contracts | | | Credit
Contracts | | | Equity
Contracts | | | Foreign
Currency
Exchange
Contracts | | | Interest
Rate
Contracts | | | Other
Contracts | | | Total | |
Net Change in Unrealized Appreciation (Depreciation) on: | | | | | | | | | | | | | | | | | | | | | | | | | | | | |
Forward foreign currency exchange contracts | | $ | — | | | $ | — | | | $ | — | | | $ | 96,287 | | | $ | — | | | $ | — | | | $ | 96,287 | |
Options purchased(b) | | | — | | | | — | | | | (65,439 | ) | | | — | | | | — | | | | — | | | | (65,439 | ) |
Swaps | | | — | | | | (72,204 | ) | | | — | | | | — | | | | — | | | | — | | | | (72,204 | ) |
| | | | | | | | | | | | | | | | | | | | | | | | | | | | |
| | $ | — | | | $ | (72,204 | ) | | $ | (65,439 | ) | | $ | 96,287 | | | $ | — | | | $ | — | | | $ | (41,356 | ) |
| | | | | | | | | | | | | | | | | | | | | | | | | | | | |
| | (b) | Options purchased are included in net change in unrealized appreciation (depreciation) on investments. | |
Average Quarterly Balances of Outstanding Derivative Financial Instruments:
| | | | | | | | |
Forward foreign currency exchange contracts: | |
Average amounts purchased — in USD | | | | | | $ | 12,751,033 | |
Average amounts sold — in USD | | | | | | $ | 6,612,056 | |
Options: | |
Average value of option contracts purchased | | | | | | $ | — | (a) |
Credit default swaps: | |
Average notional value — sell protection | | | | | | $ | 6,436,250 | |
| | (a) | Derivative not held at any quarter-end. The risk exposure table serves as an indicator of activity during the period. | |
For more information about the Fund’s investment risks regarding derivative financial instruments, refer to the Notes to Financial Statements.
Derivative Financial Instruments — Offsetting as of Period End
The Trust’s derivative assets and liabilities (by type) are as follows:
| | | | | | | | |
| | | Assets | | | Liabilities | |
Derivative Financial Instruments: | | | | | | | | |
Forward foreign currency exchange contracts | | $ | 16,607 | | | $ | 67,107 | |
Swaps — Centrally cleared | | | 116,971 | | | | — | |
| | | | | | | | |
Total derivative assets and liabilities in the Statements of Assets and Liabilities | | $ | 133,578 | | | $ | 67,107 | |
Derivatives not subject to a Master Netting Agreement or similar agreement (“MNA”) | | | (116,971 | ) | | | — | |
| | | | | | | | |
Total derivative assets and liabilities subject to an MNA | | $ | 16,607 | | | $ | 67,107 | |
| | | | | | | | |
The following table presents the Fund’s derivative assets and liabilities by counterparty net of amounts available for offset under an MNA and net of the related collateral received and pledged by the Fund:
| | | | | | | | | | | | | | | | | | | | |
| Counterparty | | Derivative
Assets
Subject to
an MNA by
Counterparty | | | Derivatives
Available
for Offset (a) | | | Non-cash
Collateral
Received | | | Cash
Collateral
Received | | | Net Amount
of Derivative
Assets | |
BNP Paribas S.A. | | $ | 14,097 | | | $ | (14,097 | ) | | $ | — | | | $ | — | | | $ | — | |
State Street Bank and Trust Co. | | | 2,510 | | | | (2,510 | ) | | | — | | | | — | | | | — | |
| | | | | | | | | | | | | | | | | | | | |
| | $ | 16,607 | | | $ | (16,607 | ) | | $ | — | | | $ | — | | | $ | — | |
| | | | | | | | | | | | | | | | | | | | |
| | | | | |
| Counterparty | | Derivative
Liabilities
Subject to
an MNA by
Counterparty | | | Derivatives
Available
for Offset (a) | | | Non-cash
Collateral
Pledged | | | Cash
Collateral
Pledged | | | Net Amount
of Derivative
Liabilities (b)(c) | |
BNP Paribas S.A. | | $ | 14,129 | | | $ | (14,097 | ) | | $ | — | | | $ | — | | | $ | 32 | |
Standard Chartered Bank | | | 11,542 | | | | — | | | | — | | | | — | | | | 11,542 | |
State Street Bank and Trust Co. | | | 2,531 | | | | (2,510 | ) | | | — | | | | — | | | | 21 | |
UBS AG | | | 38,905 | | | | — | | | | — | | | | — | | | | 38,905 | |
| | | | | | | | | | | | | | | | | | | | |
| | $ | 67,107 | | | $ | (16,607 | ) | | $ | — | | | $ | — | | | $ | 50,500 | |
| | | | | | | | | | | | | | | | | | | | |
| | (a) | The amount of derivatives available for offset is limited to the amount of derivative asset and/or liabilities that are subject to an MNA. | |
| | (b) | Net amount represents the net amount payable due to counterparty in the event of default | �� |
| | (c) | Net amount may also include forward foreign currency exchange contracts that are not required to be collateralized. | |
| | | | |
| SCHEDULES OF INVESTMENTS | | | 45 | |
| | |
Schedule of Investments (unaudited) (continued) June 30, 2020 | | BlackRock Floating Rate Income Strategies Fund, Inc. (FRA) |
Fair Value Hierarchy as of Period End
Various inputs are used in determining the fair value of investments and derivative financial instruments. For information about the Fund’s policy regarding valuation of investments, refer to the Notes to Financial Statements.
The following tables summarize the Fund’s investments and derivative financial instruments categorized in the disclosure hierarchy:
| | | | | | | | | | | | | | | | |
| | | Level 1 | | | Level 2 | | | Level 3 | | | Total | |
Assets: | |
Investments: | |
Long-Term Investments: | |
Common Stocks | | $ | 135,074 | | | $ | 15 | | | $ | 86,335 | | | $ | 221,424 | |
Corporate Bonds | | | — | | | | 34,007,425 | | | | — | | | | 34,007,425 | |
Floating Rate Loan Interests | | | — | | | | 595,874,846 | | | | 29,048,835 | | | | 624,923,681 | |
Investment Companies | | | 24,535,770 | | | | — | | | | — | | | | 24,535,770 | |
Short-Term Securities | | | 1,722,056 | | | | — | | | | — | | | | 1,722,056 | |
Unfunded floating rate loan interests(a) | | | — | | | | 2,001 | | | | — | | | | 2,001 | |
Liabilities: | |
Unfunded floating rate loan interests(a) | | | — | | | | (42,005 | ) | | | — | | | | (42,005 | ) |
| | | | | | | | | | | | | | | | |
| | $ | 26,392,900 | | | $ | 629,842,282 | | | $ | 29,135,170 | | | $ | 685,370,352 | |
| | | | | | | | | | | | | | | | |
Derivative Financial Instruments(b) | |
Assets: | |
Foreign currency exchange contracts | | $ | — | | | $ | 16,607 | | | $ | — | | | $ | 16,607 | |
Liabilities: | |
Credit contracts | | | — | | | | (72,204 | ) | | | — | | | | (72,204 | ) |
Foreign currency exchange contracts | | | — | | | | (67,107 | ) | | | — | | | | (67,107 | ) |
| | | | | | | | | | | | | | | | |
| | $ | — | | | $ | (122,704 | ) | | $ | — | | | $ | (122,704 | ) |
| | | | | | | | | | | | | | | | |
The breakdown of the Fund’s investments into major categories is disclosed in the Schedule of Investments above.
| | (a) | Unfunded floating rate loan interests are valued at the unrealized appreciation (depreciation) on the commitment. | |
| | (b) | Derivative financial instruments are swaps, futures contracts, forward foreign currency exchange contracts. Swaps, futures contracts and forward foreign currency exchange contracts are valued at the unrealized appreciation (depreciation) on the instrument and options written are shown at value. | |
The Fund may hold assets and/or liabilities in which the fair value approximates the carrying amount for financial statement purposes. As of period end, bank borrowings payable of $191,000,000 is categorized as Level 2 within the disclosure hierarchy.
A reconciliation of Level 3 investments is presented when the Trust had a significant amount of Level 3 investments at the beginning and/or end of the period in relation to net assets. The following table is a reconciliation of Level 3 investments for which significant unobservable inputs were used in determining fair value:
| | | | | | | | | | | | |
| | | Common
Stocks | | | Floating
Rate Loan
Interests | | | Total | |
Assets: | | | | | | | | | | | | |
Opening Balance, as of December 31, 2019 | | $ | 556,399 | | | $ | 29,886,699 | | | $ | 30,443,098 | |
Transfers into Level 3(a) | | | — | | | | 10,494,015 | | | | 10,494,015 | |
Transfers out of Level 3(b) | | | — | | | | (15,885,220 | ) | | | (15,885,220 | ) |
Accrued discounts/premiums | | | — | | | | 25,019 | | | | 25,019 | |
Net realized gain (loss) | | | (17,042 | ) | | | (275,682 | ) | | | (292,724 | ) |
Net change in unrealized appreciation (depreciation)(c)(d) | | | (216,131 | ) | | | (1,641,137 | ) | | | (1,857,268 | ) |
Purchases | | | 11,824 | | | | 17,071,614 | | | | 17,083,438 | |
Sales | | | (248,715 | ) | | | (10,626,473 | ) | | | (10,875,188 | ) |
| | | | | | | | | | | | |
Closing Balance, as of June 30, 2020 | | $ | 86,335 | | | $ | 29,048,835 | | | $ | 29,135,170 | |
| | | | | | | | | | | | |
Net change in unrealized appreciation (depreciation) on investments still held at June 30, 2020(d) | | $ | (163,617 | ) | | $ | (1,579,489 | ) | | $ | (1,743,106 | ) |
| | | | | | | | | | | | |
| | (a) | As of December 31, 2019, the Fund used observable inputs in determining the value of certain investments. As of June 30, 2020, the Fund used significant unobservable inputs in determining the value of the same investments. As a result, investments at beginning of period value were transferred from Level 2 to Level 3 in the disclosure hierarchy. | |
| | (b) | As December 31, 2019, the Fund used significant unobservable inputs in determining the value of certain investments. As of June 30, 2020, the Fund used observable inputs in determining the value of the same investments. As a result, investments at beginning of period value were transferred from Level 3 to Level 2 in the disclosure hierarchy. | |
| | (c) | Included in the related net change in unrealized appreciation (depreciation) in the Statements of Operations. | |
| | (d) | Any difference between net change in unrealized appreciation (depreciation) and net change in unrealized appreciation (depreciation) on investments still held at June 30, 2020 is generally due to investments no longer held or categorized as Level 3 at period end. | |
See notes to financial statements.
| | |
| 46 | | 2020 BLACKROCK SEMI-ANNUAL REPORTTO SHAREHOLDERS |
| | |
Schedule of Investments (unaudited) June 30, 2020 | | BlackRock Limited Duration Income Trust (BLW) (Percentages shown are based on Net Assets) |
| | | | | | | | | | | | |
| Security | | |
Shares | | | Value | |
|
| Common Stocks — 0.0% | |
|
Diversified Financial Services — 0.0% | |
Arrow Global Group PLC | | | | | | | 2,735 | | | $ | 3,013 | |
Kcad Holdings I Ltd.(a)(b) | | | | | | | 546,753,936 | | | | 5,467 | |
| | | | | | | | | | | | |
| | | | | | | | | | | 8,480 | |
|
| Energy Equipment & Services — 0.0% | |
McDermott International, Inc.(b) | | | | | | | 4,151 | | | | 299 | |
Pioneer Energy Services Corp.(a)(b) | | | | | | | 273 | | | | 10,601 | |
| | | | | | | | | | | | |
| | | | | | | | | | | 10,900 | |
|
| Health Care Management Services — 0.0% | |
New Millennium HoldCo, Inc.(b) | | | | | | | 8,511 | | | | 9 | |
| | | | | | | | | | | | |
|
| Household Durables — 0.0% | |
Berkline Benchcraft Equity LLC(a)(b) | | | | | | | 3,155 | | | | — | |
| | | | | | | | | | | | |
|
| Media — 0.0% | |
Clear Channel Outdoor Holdings, Inc.(b) | | | | | | | 38,911 | | | | 40,467 | |
| | | | | | | | | | | | |
|
| Metals & Mining — 0.0% | |
Ameriforge Group, Inc. | | | | | | | 801 | | | | 20,025 | |
Preferred Proppants LLC(a)(b) | | | | | | | 5,738 | | | | 22,952 | |
| | | | | | | | | | | | |
| | | | | | | | | | | 42,977 | |
|
| Software — 0.0% | |
Avaya Holdings Corp.(b) | | | | | | | 19 | | | | 235 | |
| | | | | | | | | | | | |
| |
Total Common Stocks — 0.0%
(Cost — $6,442,271) | | | | 103,068 | |
| | | | | | | | | | | | |
| | | |
| | | | | | Par
(000) | | | | |
|
| Asset-Backed Securities — 5.1% | |
522 Funding Clo I Ltd., Series 2019-1A, Class E, (3 mo. LIBOR US + 7.34%), 7.62%, 01/15/33(c)(d) | | | USD | | | | 250 | | | | 226,927 | |
AIMCO CLO, Series 2017-AA, Class C, 3.59%, 07/20/29 | | | | | | | 1,000 | | | | 976,064 | |
Allegro CLO II-S Ltd., Series 2014-1RA, Class C, (3 mo. LIBOR US + 3.00%), 4.11%, 10/21/28(c)(d) | | | | | | | 1,000 | | | | 900,645 | |
ALM XVI Ltd./ALM XVI LLC, Series 2015-16A, Class CR2, (3 mo. LIBOR US + 2.70%), 2.98%, 07/15/27(c)(d) | | | | | | | 270 | | | | 253,283 | |
Anchorage Capital CLO Ltd.(c)(d): | | | | | | | | | | | | |
Series 2014-3RA, Class E, (3 mo. LIBOR US + 5.50%), 6.39%, 01/28/31 | | | | | | | 850 | | | | 706,624 | |
Series 2014-4RA, Class D, (3 mo. LIBOR US + 2.60%), 3.49%, 01/28/31 | | | | | | | 250 | | | | 219,742 | |
Series 2015-7A, Class D1R2, (3 mo. LIBOR US + 3.50%), 4.52%, 01/28/31 | | | | | | | 1,000 | | | | 934,532 | |
Series 2016-8A, Class ER, (3 mo. LIBOR US + 5.75%), 6.64%, 07/28/28 | | | | | | | 1,000 | | | | 807,339 | |
Ares LV CLO Ltd., Series 2020-55A, Class D, (3 mo. LIBOR US + 4.83%), 5.20%, 04/15/31(c)(d) | | | | | | | 1,000 | | | | 999,971 | |
Argent Securities Trust, Series 2006-W5, Class A1A, (1 mo. LIBOR US + 0.15%), 0.33%, 06/25/36(d) | | | | | | | 5,421 | | | | 3,824,280 | |
Bain Capital Credit CLO Ltd., Series 2020-2A, Class D, (3 mo. LIBOR US + 4.81%), 5.17%, 07/19/31(a)(c)(d) | | | | | | | 300 | | | | 294,000 | |
Benefit Street Partners CLO VII Ltd., Series 2015-VIIA, Class CR, 3.54%, 07/18/27(c)(e) | | | | | | | 250 | | | | 224,759 | |
| | | | | | | | | | | | |
| Security | | | | | Par
(000) | | | Value | |
|
| Asset-Backed Securities (continued) | |
Benefit Street Partners CLO XX Ltd., Series 2020-20A, Class C, (3 mo. LIBOR US + 2.60%), 2.75%, 07/15/31(a)(c)(d) | | | USD | | | | 250 | | | $ | 250,000 | |
BlueMountain CLO XXVI Ltd., Series 2019-26A, Class E, (3 mo. LIBOR US + 7.70%), 8.84%, 10/20/32(c)(d) | | | | | | | 250 | | | | 239,345 | |
CarVal CLO II Ltd., Series 2019-1A, Class C, 4.39%, 04/20/32(c)(e) | | | | | | | 250 | | | | 247,245 | |
CarVal CLO III Ltd., Series 2019-2A, Class E, (3 mo. LIBOR US + 6.44%), 7.58%, 07/20/32(c)(d) | | | | | | | 500 | | | | 437,508 | |
CarVal CLO Ltd., Series 2018-1A, Class E, 6.04%, 07/16/31(c)(e) | | | | | | | 500 | | | | 394,461 | |
Cedar Funding IV CLO Ltd., Series 2014-4A, Class DR, (3 mo. LIBOR US + 3.65%), 4.69%, 07/23/30(c)(d) | | | | | | | 500 | | | | 461,300 | |
Citigroup Mortgage Loan Trust, Series 2006-FX1, Class A7, 5.78%, 10/25/36(f) | | | | | | | 459 | | | | 380,624 | |
Clear Creek CLO, Series 2015-1A, Class DR, 4.09%, 10/20/30(c)(e) | | | | | | | 250 | | | | 218,680 | |
Countrywide Asset-Backed Certificates, Series 2006-26, Class 1A, (1 mo. LIBOR US + 0.14%), 0.32%, 06/25/37(d) | | | | | | | 796 | | | | 702,448 | |
Credit Suisse ABS Repackaging Trust, Series 2013-A, Class B, 2.50%, 01/25/30(c) | | | | | | | 369 | | | | 367,373 | |
Dryden 36 Senior Loan Fund, Series 2014-36A, Class DR2, (3 mo. LIBOR US + 3.70%), 3.98%, 04/15/29(c)(d) | | | | | | | 250 | | | | 232,653 | |
Dryden CLO Ltd., Series 2018-64A, Class D, (3 mo. LIBOR US + 2.65%), 3.79%, 04/18/31(c)(d) | | | | | | | 250 | | | | 225,060 | |
Elmwood CLO III Ltd., Series 2019-3A, Class E, (3 mo. LIBOR US + 7.00%), 7.28%, 10/15/32(c)(d) | | | | | | | 950 | | | | 919,679 | |
Elmwood CLO V Ltd., Series 2020-2A, Class C, (3 mo. LIBOR US + 2.75%),
1.00%, 07/24/31(c)(d)(g) | | | | | | | 500 | | | | 500,000 | |
Litigation Fee Residual Funding, 4.00%, 10/30/27(a) | | | | | | | 671 | | | | 669,719 | |
Madison Park Funding X Ltd., Series 2012-10A, Class ER2, (3 mo. LIBOR US + 6.40%), 7.54%, 01/20/29(c)(d) | | | | | | | 500 | | | | 422,688 | |
Madison Park Funding XV Ltd., Series 2014-15A, Class B1R, (3 mo. LIBOR US + 2.20%), 3.19%, 01/27/26(c)(d) | | | | | | | 1,500 | | | | 1,446,319 | |
Madison Park Funding XVI Ltd., Series 2015-16A, Class C, (3 mo. LIBOR US + 3.70%), 4.84%, 04/20/26(c)(d) | | | | | | | 300 | | | | 283,908 | |
Neuberger Berman CLO XX Ltd., Series 2015-20A, Class ER, (3 mo. LIBOR US + 5.00%), 5.28%, 01/15/28(c)(d) | | | | | | | 790 | | | | 612,393 | |
Oaktree CLO Ltd., Series 2015-1A, Class DR, (3 mo. LIBOR US + 5.20%), 6.34%, 10/20/27(c)(d) | | | | | | | 500 | | | | 361,467 | |
Octagon Investment Partners LLC, Series 2017-1A, Class E, (3 mo. LIBOR US + 6.30%), 7.44%, 07/20/30(c)(d) | | | | | | | 500 | | | | 421,877 | |
OZLM VIII Ltd., Series 2014-8A(c)(d): | | | | | | | | | | | | |
Class BRR, (3 mo. LIBOR US + 2.20%), 2.47%, 10/17/29 | | | | | | | 2,500 | | | | 2,385,814 | |
Class CRR, (3 mo. LIBOR US + 3.15%), 3.42%, 10/17/29 | | | | | | | 250 | | | | 226,155 | |
| | |
SCHEDULES OF INVESTMENTS | | 47 |
| | |
Schedule of Investments (unaudited) (continued) June 30, 2020 | | BlackRock Limited Duration Income Trust (BLW) (Percentages shown are based on Net Assets) |
| | | | | | | | | | | | |
| Security | | | | | Par
(000) | | | Value | |
|
| Asset-Backed Securities (continued) | |
OZLM XXI Ltd., Series 2017-21A, Class D, (3 mo. LIBOR US + 5.54%), 6.68%, 01/20/31(c)(d) | | | USD | | | | 250 | | | $ | 175,038 | |
Palmer Square CLO Ltd., Series 2020-1A, Class C, (3 mo. LIBOR US + 3.00%), 3.29%, 04/20/29(c)(d) | | | | | | | 250 | | | | 230,174 | |
Park Avenue Institutional Advisers CLO Ltd., Series 2017-1A, Class D, (3 mo. LIBOR US + 6.22%), 6.64%, 11/14/29(c)(d) | | | | | | | 1,750 | | | | 1,510,724 | |
Rockford Tower CLO Ltd.(c)(d): | | | | | | | | | | | | |
Series 2017-1A, Class DR, (3 mo. LIBOR US + 2.65%), 2.93%, 04/15/29 | | | | | | | 250 | | | | 222,929 | |
Series 2017-2A, Class DR, (3 mo. LIBOR US + 2.85%), 3.13%, 10/15/29 | | | | | | | 500 | | | | 450,817 | |
Sterling Coofs Trust(a)(c): | | | | | | | | | | | | |
Series 2004-1, Class A, 2.36%, 04/15/29 | | | | | | | 1,486 | | | | 26,010 | |
Series 2004-2, Class Note, 2.08%, 03/30/30 | | | | | | | 2,168 | | | | 37,938 | |
Symphony CLO XVIII Ltd., Series 2016-18A, Class D, (3 mo. LIBOR US + 4.00%), 5.04%, 01/23/28(c)(d) | | | | | | | 1,000 | | | | 910,016 | |
TICP CLO VII Ltd., Series 2017-7A, Class ER, (3 mo. LIBOR US + 7.05%), 7.33%, 04/15/33(c)(d) | | | | | | | 250 | | | | 201,668 | |
Voya CLO Ltd., Series 2014-3A, Class CR, (3 mo. LIBOR US + 2.65%), 3.64%, 07/25/26(c)(d) | | | | | | | 250 | | | | 217,497 | |
Wellfleet CLO Ltd., Series 2017-3A, Class B, (3 mo. LIBOR US + 1.95%), 3.08%, 01/17/31(c)(d) | | | | | | | 500 | | | | 466,020 | |
Westcott Park CLO Ltd., Series 2016-1A, Class DR, (3 mo. LIBOR US + 3.25%), 4.39%, 07/20/28(c)(d) | | | | | | | 500 | | | | 463,607 | |
York CLO Ltd.(c)(d): | | | | | | | | | | | | |
Series 2016-1A, Class DR, (3 mo. LIBOR US + 3.60%), 4.74%, 10/20/29 | | | | | | | 250 | | | | 233,767 | |
Series 2016-2A, Class ER, (3 mo. LIBOR US + 6.75%), 7.89%, 04/20/32 | | | | | | | 1,000 | | | | 787,794 | |
| | | | | | | | | | | | |
| |
Total Asset-Backed Securities — 5.1%
(Cost — $30,865,885) | | | | 28,708,881 | |
| | | | | | | | | | | | |
|
Corporate Bonds — 79.0% | |
|
| Aerospace & Defense — 2.1% | |
Amsted Industries, Inc., 5.63%, 07/01/27(c) | | | | 156 | | | | 160,875 | |
Bombardier, Inc.(c): | | | | | | | | | | | | |
8.75%, 12/01/21(h) | | | | | | | 1,003 | | | | 814,937 | |
5.75%, 03/15/22 | | | | | | | 108 | | | | 79,709 | |
6.00%, 10/15/22 | | | | | | | 8 | | | | 5,600 | |
6.13%, 01/15/23(h) | | | | | | | 338 | | | | 232,476 | |
7.50%, 12/01/24 | | | | | | | 135 | | | | 88,425 | |
7.50%, 03/15/25 | | | | | | | 33 | | | | 21,536 | |
7.88%, 04/15/27(h) | | | | | | | 972 | | | | 636,660 | |
Global Aircraft Leasing Co. Ltd., (6.5% Cash or 7.25% PIK), 6.50%, 09/15/24(c)(i) | | | | | | | 208 | | | | 147,680 | |
Howmet Aerospace, Inc.: | | | | | | | | | | | | |
5.87%, 02/23/22(h) | | | | | | | 730 | | | | 766,500 | |
5.13%, 10/01/24 | | | | | | | 138 | | | | 142,949 | |
Kratos Defense & Security Solutions, Inc., 6.50%, 11/30/25(c) | | | | | | | 378 | | | | 392,175 | |
moog, Inc., 4.25%, 12/15/27(c) | | | | | | | 156 | | | | 151,320 | |
Signature Aviation US Holdings, Inc.(c): | | | | | | | | | | | | |
5.38%, 05/01/26 | | | | | | | 271 | | | | 271,190 | |
4.00%, 03/01/28 | | | | | | | 234 | | | | 211,478 | |
| | | | | | | | | | | | |
| Security | | | | | Par
(000) | | | Value | |
|
| Aerospace & Defense (continued) | |
TransDigm, Inc.(c)(h): | | | | | | | | | | | | |
8.00%, 12/15/25 | | | USD | | | | 815 | | | $ | 856,557 | |
6.25%, 03/15/26 | | | | | | | 6,032 | | | | 6,017,041 | |
Wolverine Escrow LLC(c): | | | | | | | | | | | | |
8.50%, 11/15/24 | | | | | | | 256 | | | | 194,560 | |
9.00%, 11/15/26 | | | | | | | 913 | | | | 657,360 | |
| | | | | | | | | | | | |
| | | | | | | | | | | 11,849,028 | |
|
| Air Freight & Logistics — 0.1% | |
FedEx Corp., 3.80%, 05/15/25 | | | | | | | 324 | | | | 360,162 | |
XPO Logistics, Inc., 6.75%, 08/15/24(c) | | | | | | | 18 | | | | 18,857 | |
| | | | | | | | | | | | |
| | | | | | | | | | | 379,019 | |
|
| Airlines — 1.2% | |
American Airlines Pass-Through Trust, Series 2013-2, Class A, 4.95%, 01/15/23(h) | | | | | | | 1,823 | | | | 1,476,290 | |
American Airlines, Inc., 11.75%, 07/15/25(c) | | | | | | | 945 | | | | 895,095 | |
Avianca Holdings SA, 9.00%, 05/10/23(b)(c)(j) | | | | | | | 239 | | | | 47,920 | |
Gol Finance SA, 7.00%, 01/31/25(c) | | | | | | | 200 | | | | 112,500 | |
Latam Finance Ltd., 6.88%, 04/11/24(b)(c)(j) | | | | | | | 203 | | | | 55,317 | |
Mileage Plus Holdings LLC/Mileage Plus Intellectual Property Assets Ltd., 6.50%, 06/20/27(c)(g) | | | | | | | 1,973 | | | | 1,977,932 | |
United Airlines Pass-Through Trust, Series 2015-1, Class A, 3.70%, 12/01/22(h) | | | | | | | 2,430 | | | | 2,259,902 | |
| | | | | | | | | | | | |
| | | | | | | | | | | 6,824,956 | |
|
| Auto Components — 1.4% | |
Allison Transmission, Inc.(c): | | | | | | | | | | | | |
5.00%, 10/01/24 | | | | | | | 100 | | | | 99,750 | |
5.88%, 06/01/29(h) | | | | | | | 451 | | | | 469,040 | |
Aptiv PLC, 4.40%, 10/01/46 | | | | | | | 240 | | | | 231,787 | |
Clarios Global LP, 6.75%, 05/15/25(c) | | | | | | | 540 | | | | 561,600 | |
Clarios Global LP/Clarios US Finance Co.: | | | | | | | | | | | | |
4.38%, 05/15/26 | | | EUR | | | | 100 | | | | 110,718 | |
8.50%, 05/15/27(c)(h) | | | USD | | | | 1,778 | | | | 1,786,801 | |
Dealer Tire LLC/DT Issuer LLC, 8.00%, 02/01/28(c) | | | | | | | 258 | | | | 238,972 | |
FCE Bank PLC, 1.62%, 05/11/23 | | | EUR | | | | 100 | | | | 105,479 | |
Ford motor Credit Co. LLC, 5.11%, 05/03/29(h) | | | USD | | | | 526 | | | | 511,183 | |
Icahn Enterprises LP/Icahn Enterprises Finance Corp.: | | | | | | | | | | | | |
6.25%, 02/01/22 | | | | | | | 299 | | | | 299,747 | |
6.75%, 02/01/24 | | | | | | | 314 | | | | 316,355 | |
4.75%, 09/15/24 | | | | | | | 93 | | | | 87,439 | |
6.38%, 12/15/25 | | | | | | | 120 | | | | 118,800 | |
6.25%, 05/15/26 | | | | | | | 366 | | | | 366,256 | |
5.25%, 05/15/27 | | | | | | | 489 | | | | 471,885 | |
Panther BF Aggregator 2 LP/Panther Finance Co., Inc., 6.25%, 05/15/26(c)(h) | | | | | | | 1,526 | | | | 1,573,687 | |
Tesla, Inc., 5.30%, 08/15/25(c) | | | | | | | 404 | | | | 404,000 | |
| | | | | | | | | | | | |
| | | | | | | | | | | 7,753,499 | |
|
| Automobiles — 0.4% | |
Ford motor Co.: | | | | | | | | | | | | |
8.50%, 04/21/23 | | | | | | | 982 | | | | 1,038,465 | |
4.35%, 12/08/26 | | | | | | | 11 | | | | 10,261 | |
5.29%, 12/08/46 | | | | | | | 48 | | | | 39,470 | |
General motors Co.: | | | | | | | | | | | | |
6.13%, 10/01/25 | | | | | | | 380 | | | | 427,000 | |
6.80%, 10/01/27(h) | | | | | | | 534 | | | | 622,249 | |
5.00%, 10/01/28 | | | | | | | 61 | | | | 64,887 | |
Rolls-Royce PLC, 0.88%, 05/09/24 | | | EUR | | | | 100 | | | | 101,505 | |
Winnebago Industries, Inc.,
6.25%, 07/15/28(c)(g) | | | USD | | | | 98 | | | | 98,000 | |
| | | | | | | | | | | | |
| | | | | | | | | | | 2,401,837 | |
| | |
| 48 | | 2020 BLACKROCK SEMI-ANNUAL REPORTTO SHAREHOLDERS |
| | |
Schedule of Investments (unaudited) (continued) June 30, 2020 | | BlackRock Limited Duration Income Trust (BLW) (Percentages shown are based on Net Assets) |
| | | | | | | | | | | | |
| Security | | | | | Par
(000) | | | Value | |
|
| Banks — 2.7% | |
Al Ahli Bank of Kuwait KSCP(5 year USD Swap + 4.17%), 7.25%(k)(l) | | | USD | | | | 200 | | | $ | 197,188 | |
Banca monte dei Paschi di Siena SpA, 2.63%, 04/28/25 | | | EUR | | | | 100 | | | | 109,921 | |
Banco de Sabadell SA(5 year EUR Swap + 2.20%), 2.00%, 01/17/30(k) | | | | | | | 100 | | | | 93,854 | |
Banco Espirito Santo SA(b)(e)(j): | | | | | | | | | | | | |
4.75%, 01/15/21 | | | | | | | 100 | | | | 17,976 | |
4.00%, 01/21/21 | | | | | | | 100 | | | | 17,976 | |
Bancolombia SA(5 year CMT + 2.94%), 4.63%, 12/18/29(k) | | | USD | | | | 200 | | | | 187,966 | |
Banistmo SA, 3.65%, 09/19/22 | | | | | | | 200 | | | | 200,437 | |
Bank Tabungan Negara Persero Tbk PT, 4.20%, 01/23/25 | | | | | | | 200 | | | | 192,688 | |
Barclays PLC(h): | | | | | | | | | | | | |
4.38%, 09/11/24 | | | | | | �� | 580 | | | | 619,129 | |
3.65%, 03/16/25 | | | | | | | 3,600 | | | | 3,902,796 | |
5.20%, 05/12/26 | | | | | | | 200 | | | | 222,480 | |
BBVA Bancomer SA, 6.75%, 09/30/22(c) | | | | | | | 192 | | | | 204,720 | |
Chong Hing Bank Ltd.(5 year CMT + 3.86%), 5.70%(k)(l) | | | | | | | 250 | | | | 232,332 | |
CIT Group, Inc., 5.00%, 08/01/23 | | | | | | | 382 | | | | 389,602 | |
Commerzbank AG(5 year EUR Swap + 4.35%), 4.00%, 12/05/30(k) | | | EUR | | | | 100 | | | | 112,776 | |
Emirates NBD Bank PJSC(6 year USD Swap + 3.66%), 6.13%(k)(l) | | | USD | | | | 250 | | | | 248,828 | |
Grupo Aval Ltd., 4.38%, 02/04/30(c) | | | | | | | 200 | | | | 189,500 | |
HSBC Holdings PLC, 4.38%, 11/23/26(h) | | | | | | | 395 | | | | 439,988 | |
Intesa Sanpaolo SpA, 5.02%, 06/26/24(c)(h) | | | | | | | 2,442 | | | | 2,502,225 | |
Itau Unibanco Holding SA, 5.13%, 05/13/23(c) | | | | | | | 200 | | | | 208,980 | |
Santander Holdings USA, Inc., 4.50%, 07/17/25(h) | | | | | | | 1,750 | | | | 1,892,408 | |
Santander UK Group Holdings PLC, 2.88%, 08/05/21(h) | | | | | | | 950 | | | | 970,759 | |
Standard Chartered PLC(3 mo. LIBOR US + 1.08%), 3.89%, 03/15/24(c)(h)(k) | | | | | | | 1,500 | | | | 1,580,271 | |
Unione di Banche Italiane SpA(5 year EUR Swap + 5.75%), 5.88%, 03/04/29(k) | | | EUR | | | | 100 | | | | 121,138 | |
| | | | | | | | | | | | |
| | | | | | | | | | | 14,855,938 | |
|
| Beverages — 0.2% | |
Anheuser-Busch Cos. LLC/Anheuser-Busch InBev Worldwide, Inc., 4.90%, 02/01/46(h) | | | USD | | | | 800 | | | | 978,948 | |
Central American Bottling Corp., 5.75%, 01/31/27(c) | | | | | | | 176 | | | | 176,605 | |
Crown Cork & Seal Co., Inc., 7.38%, 12/15/26 | | | | | | | 34 | | | | 39,780 | |
| | | | | | | | | | | | |
| | | | | | | | | | | 1,195,333 | |
|
| Building Materials — 0.1% | |
CEMEX Finance LLC, 4.63%, 06/15/24 | | | EUR | | | | 100 | | | | 110,805 | |
James Hardie International Finance DAC, 5.00%, 01/15/28(c) | | | USD | | | | 200 | | | | 204,000 | |
| | | | | | | | | | | | |
| | | | | | | | | | | 314,805 | |
|
| Building Products — 0.4% | |
Advanced Drainage Systems, Inc., 5.00%, 09/30/27(c) | | | | | | | 262 | | | | 263,965 | |
Griffon Corp., 5.75%, 03/01/28(c) | | | | | | | 87 | | | | 85,913 | |
Jeld-Wen, Inc.(c): | | | | | | | | | | | | |
6.25%, 05/15/25 | | | | | | | 146 | | | | 151,475 | |
4.63%, 12/15/25 | | | | | | | 35 | | | | 33,600 | |
4.88%, 12/15/27 | | | | | | | 3 | | | | 2,880 | |
Masonite International Corp.(c): | | | | | | | | | | | | |
5.75%, 09/15/26 | | | | | | | 86 | | | | 88,580 | |
5.38%, 02/01/28 | | | | | | | 120 | | | | 122,700 | |
| | | | | | | | | | | | |
| Security | | | | | Par
(000) | | | Value | |
|
| Building Products (continued) | |
Standard Industries, Inc.: | | | | | | | | | | | | |
6.00%, 10/15/25(c)(h) | | | USD | | | | 600 | | | $ | 617,562 | |
2.25%, 11/21/26 | | | EUR | | | | 100 | | | | 105,531 | |
5.00%, 02/15/27(c) | | | USD | | | | 174 | | | | 176,175 | |
4.75%, 01/15/28(c) | | | | | | | 46 | | | | 46,633 | |
4.38%, 07/15/30(c) | | | | | | | 479 | | | | 477,802 | |
| | | | | | | | | | | | |
| | | | | | | | | | | 2,172,816 | |
|
| Capital Markets — 0.5% | |
CFLD Cayman Investment Ltd., 6.90%, 01/13/23 | | | | | | | 200 | | | | 196,581 | |
Goldman Sachs Group, Inc., Series R, (5 year CMT + 3.22%), 4.95%(h)(k)(l) | | | | | | | 730 | | | | 693,500 | |
Intercorp Peru Ltd., 3.88%, 08/15/29(c) | | | | | | | 225 | | | | 219,094 | |
Intertrust Group BV, 3.38%, 11/15/25 | | | EUR | | | | 100 | | | | 111,617 | |
LABL Escrow Issuer LLC, 6.75%, 07/15/26(c) | | | USD | | | | 380 | | | | 395,318 | |
morgan Stanley, 4.00%, 07/23/25(h) | | | | | | | 965 | | | | 1,094,162 | |
Owl Rock Capital Corp., 5.25%, 04/15/24(h) | | | | | | | 88 | | | | 91,975 | |
Stevens Holding Co., Inc., 6.13%, 10/01/26(c) | | | | | | | 167 | | | | 174,515 | |
| | | | | | | | | | | | |
| | | | | | | | | | | 2,976,762 | |
|
| Chemicals — 2.0% | |
Atotech Alpha 2 BV, (8.75% Cash or 9.50% PIK), 8.75%, 06/01/23(c)(i) | | | | | | | 656 | | | | 654,360 | |
Atotech Alpha 3 BV/Alpha US Bidco, Inc., 6.25%, 02/01/25(c)(h) | | | | | | | 1,830 | | | | 1,811,700 | |
Axalta Coating Systems LLC, 4.88%, 08/15/24(c) | | | | | | | 608 | | | | 615,600 | |
Axalta Coating Systems LLC/Axalta Coating Systems Dutch Holding B BV, 4.75%, 06/15/27(c) | | | | | | | 170 | | | | 170,884 | |
Blue Cube Spinco LLC: | | | | | | | | | | | | |
9.75%, 10/15/23 | | | | | | | 596 | | | | 613,880 | |
10.00%, 10/15/25 | | | | | | | 380 | | | | 396,150 | |
Chemours Co.: | | | | | | | | | | | | |
6.63%, 05/15/23 | | | | | | | 259 | | | | 248,640 | |
7.00%, 05/15/25 | | | | | | | 20 | | | | 19,119 | |
Cydsa SAB de CV, 6.25%, 10/04/27(c) | | | | | | | 252 | | | | 246,645 | |
Element Solutions, Inc., 5.88%, 12/01/25(c)(h) | | | | | | | 1,447 | | | | 1,461,018 | |
ENN Clean Energy International Investment Ltd., 7.50%, 02/27/21 | | | | | | | 200 | | | | 201,250 | |
Equate Petrochemical BV, 4.25%, 11/03/26(c) | | | | | | | 211 | | | | 224,187 | |
GCP Applied Technologies, Inc., 5.50%, 04/15/26(c) | | | | | | | 165 | | | | 164,588 | |
Illuminate Buyer LLC/Illuminate Holdings IV, Inc., 9.00%, 07/01/28(c) | | | | | | | 236 | | | | 246,030 | |
Minerals Technologies, Inc., 5.00%, 07/01/28(c) | | | | | | | 169 | | | | 171,535 | |
monitchem HoldCo 3 SA, 5.25%, 03/15/25 | | | EUR | | | | 100 | | | | 113,614 | |
NOVA Chemicals Corp., 4.88%, 06/01/24(c) | | | USD | | | | 67 | | | | 62,478 | |
Orbia Advance Corp SAB de CV, 5.50%, 01/15/48(c) | | | | | | | 200 | | | | 207,250 | |
PQ Corp.(c): | | | | | | | | | | | | |
6.75%, 11/15/22(h) | | | | | | | 463 | | | | 471,612 | |
5.75%, 12/15/25 | | | | | | | 543 | | | | 547,072 | |
Valvoline, Inc.(c): | | | | | | | | | | | | |
4.38%, 08/15/25 | | | | | | | 130 | | | | 130,650 | |
4.25%, 02/15/30 | | | | | | | 260 | | | | 256,100 | |
Vedanta Resources Finance II PLC, 9.25%, 04/23/26 | | | | | | | 282 | | | | 201,454 | |
WESCO Distribution, Inc.(c)(h): | | | | | | | | | | | | |
7.13%, 06/15/25 | | | | | | | 676 | | | | 711,916 | |
7.25%, 06/15/28 | | | | | | | 616 | | | | 651,420 | |
WR Grace & Co-Conn(c): | | | | | | | | | | | | |
5.63%, 10/01/24 | | | | | | | 216 | | | | 227,340 | |
4.88%, 06/15/27 | | | | | | | 283 | | | | 286,687 | |
Yingde Gases Investment Ltd., 6.25%, 01/19/23 | | | | | | | 200 | | | | 204,312 | |
| | | | | | | | | | | | |
| | | | | | | | | | | 11,317,491 | |
| | |
SCHEDULES OF INVESTMENTS | | 49 |
| | |
Schedule of Investments (unaudited) (continued) June 30, 2020 | | BlackRock Limited Duration Income Trust (BLW) (Percentages shown are based on Net Assets) |
| | | | | | | | | | | | |
| Security | | | | | Par
(000) | | | Value | |
|
| Commercial Services & Supplies — 1.1% | |
ADT Security Corp.: | | | | | | | | | | | | |
6.25%, 10/15/21 | | | USD | | | | 139 | | | $ | 142,475 | |
4.13%, 06/15/23 | | | | | | | 9 | | | | 9,023 | |
4.88%, 07/15/32(c)(h) | | | | | | | 575 | | | | 523,250 | |
Advanced Disposal Services, Inc., 5.63%, 11/15/24(c) | | | | | | | 147 | | | | 152,512 | |
Allied Universal Holdco LLC/Allied Universal Finance Corp., 9.75%, 07/15/27(c)(h) | | | | | | | 520 | | | | 547,950 | |
Booz Allen Hamilton, Inc., 5.13%, 05/01/25(c) | | | | | | | 383 | | | | 388,745 | |
Clean Harbors, Inc.(c)(h): | | | | | | | | | | | | |
4.88%, 07/15/27 | | | | | | | 250 | | | | 256,875 | |
5.13%, 07/15/29 | | | | | | | 172 | | | | 178,392 | |
Garda World Security Corp.(c): | | | | | | | | | | | | |
4.63%, 02/15/27 | | | | | | | 267 | | | | 262,995 | |
9.50%, 11/01/27(h) | | | | | | | 136 | | | | 143,820 | |
GFL Environmental, Inc.(c): | | | | | | | | | | | | |
4.25%, 06/01/25 | | | | | | | 86 | | | | 86,753 | |
7.00%, 06/01/26 | | | | | | | 566 | | | | 585,810 | |
5.13%, 12/15/26(h) | | | | | | | 458 | | | | 474,030 | |
8.50%, 05/01/27 | | | | | | | 233 | | | | 253,387 | |
KAR Auction Services, Inc., 5.13%, 06/01/25(c) | | | | | | | 380 | | | | 374,300 | |
mobile Mini, Inc., 5.88%, 07/01/24(h) | | | | | | | 499 | | | | 513,621 | |
Ritchie Bros Auctioneers, Inc., 5.38%, 01/15/25(c) | | | | | | | 187 | | | | 192,376 | |
Summer BC Holdco B Sarl, 5.75%, 10/31/26 | | | EUR | | | | 100 | | | | 106,508 | |
United Rentals North America, Inc.: | | | | | | | | | | | | |
4.63%, 10/15/25 | | | USD | | | | 269 | | | | 270,345 | |
5.88%, 09/15/26 | | | | | | | 17 | | | | 17,816 | |
5.50%, 05/15/27 | | | | | | | 339 | | | | 349,170 | |
3.88%, 11/15/27 | | | | | | | 200 | | | | 199,500 | |
5.25%, 01/15/30 | | | | | | | 161 | | | | 166,232 | |
4.00%, 07/15/30 | | | | | | | 152 | | | | 147,019 | |
| | | | | | | | | | | | |
| | | | | | | | | | | 6,342,904 | |
|
| Communications Equipment — 0.6% | |
CommScope Technologies LLC, 6.00%, 06/15/25(c) | | | | | | | 394 | | | | 380,486 | |
CommScope, Inc.(c): | | | | | | | | | | | | |
5.50%, 03/01/24(h) | | | | | | | 749 | | | | 756,490 | |
5.50%, 06/15/24 | | | | | | | 82 | | | | 83,503 | |
6.00%, 03/01/26 | | | | | | | 358 | | | | 366,950 | |
motorola Solutions, Inc., 3.75%, 05/15/22(h) | | | | | | | 843 | | | | 884,407 | |
Nokia OYJ: | | | | | | | | | | | | |
3.38%, 06/12/22 | | | | | | | 106 | | | | 108,116 | |
4.38%, 06/12/27 | | | | | | | 149 | | | | 157,437 | |
ViaSat, Inc.(c): | | | | | | | | | | | | |
5.63%, 04/15/27 | | | | | | | 535 | | | | 547,706 | |
6.50%, 07/15/28 | | | | | | | 316 | | | | 316,066 | |
| | | | | | | | | | | | |
| | | | | | | | | | | 3,601,161 | |
|
| Construction & Engineering — 0.3% | |
Brand Industrial Services, Inc., 8.50%, 07/15/25(c) | | | | | | | 498 | | | | 448,200 | |
Delhi International Airport Ltd., 6.45%, 06/04/29 | | | | | | | 200 | | | | 194,500 | |
frontdoor, Inc., 6.75%, 08/15/26(c)(h) | | | | | | | 473 | | | | 502,563 | |
SPIE SA, 2.63%, 06/18/26 | | | EUR | | | | 100 | | | | 108,721 | |
SRS Distribution, Inc., 8.25%, 07/01/26(c)(h) | | | USD | | | | 466 | | | | 472,990 | |
| | | | | | | | | | | | |
| | | | | | | | | | | 1,726,974 | |
|
| Construction Materials — 1.0% | |
American Builders & Contractors Supply Co., Inc.(c): | | | | | | | | | | | | |
5.88%, 05/15/26 | | | | | | | 412 | | | | 407,880 | |
4.00%, 01/15/28 | | | | | | | 581 | | | | 564,598 | |
Core & Main LP, 6.13%, 08/15/25(c)(h) | | | | | | | 1,743 | | | | 1,737,161 | |
HD Supply, Inc., 5.38%, 10/15/26(c)(h) | | | | | | | 1,956 | | | | 1,997,565 | |
New Enterprise Stone & Lime Co., Inc.(c): | | | | | | | | | | | | |
10.13%, 04/01/22 | | | | | | | 136 | | | | 135,320 | |
6.25%, 03/15/26 | | | | | | | 74 | | | | 74,370 | |
| | | | | | | | | | | | |
| Security | | | | | Par
(000) | | | Value | |
|
| Construction Materials (continued) | |
Williams Scotsman International, Inc.(c): | | | | | | | | | | | | |
7.88%, 12/15/22 | | | USD | | | | 98 | | | $ | 101,859 | |
6.88%, 08/15/23 | | | | | | | 391 | | | | 401,346 | |
| | | | | | | | | | | | |
| | | | | | | | | | | 5,420,099 | |
|
| Consumer Discretionary — 0.0% | |
Carnival Corp., 11.50%, 04/01/23(c) | | | | | | | 45 | | | | 48,825 | |
Nielsen Co. Luxembourg Sarl, 5.00%, 02/01/25(c) | | | | | | | 135 | | | | 132,637 | |
| | | | | | | | | | | | |
| | | | | | | | | | | 181,462 | |
|
| Consumer Finance — 2.0% | |
Ally Financial, Inc., 8.00%, 11/01/31(h) | | | | | | | 1,543 | | | | 1,990,971 | |
Equifax, Inc., 2.60%, 12/15/25 | | | | | | | 59 | | | | 62,848 | |
Ford motor Credit Co. LLC: | | | | | | | | | | | | |
5.13%, 06/16/25 | | | | | | | 690 | | | | 690,276 | |
4.39%, 01/08/26(h) | | | | | | | 400 | | | | 380,872 | |
Husky III Holding Ltd., (13.00% Cash or 13.00% PIK), 13.00%, 02/15/25(c)(i) | | | | | | | 524 | | | | 504,350 | |
Muthoot Finance Ltd.: | | | | | | | | | | | | |
6.13%, 10/31/22(c) | | | | | | | 427 | | | | 431,804 | |
4.40%, 09/02/23 | | | | | | | 200 | | | | 190,624 | |
Navient Corp.: | | | | | | | | | | | | |
5.00%, 10/26/20 | | | | | | | 310 | | | | 308,720 | |
7.25%, 09/25/23 | | | | | | | 129 | | | | 126,083 | |
6.13%, 03/25/24 | | | | | | | 86 | | | | 81,700 | |
5.88%, 10/25/24 | | | | | | | 82 | | | | 77,029 | |
5.00%, 03/15/27 | | | | | | | 258 | | | | 216,720 | |
OneMain Finance Corp.: | | | | | | | | | | | | |
6.13%, 05/15/22 | | | | | | | 70 | | | | 71,287 | |
6.88%, 03/15/25 | | | | | | | 226 | | | | 231,862 | |
7.13%, 03/15/26 | | | | | | | 374 | | | | 387,086 | |
6.63%, 01/15/28 | | | | | | | 221 | | | | 218,790 | |
5.38%, 11/15/29 | | | | | | | 78 | | | | 72,930 | |
PayPal Holdings, Inc., 1.65%, 06/01/25 | | | | | | | 162 | | | | 167,467 | |
Refinitiv US Holdings, Inc.(c): | | | | | | | | | | | | |
4.50%, 05/15/26 | | | EUR | | | | 400 | | | | 467,791 | |
6.25%, 05/15/26(h) | | | USD | | | | 1,668 | | | | 1,768,080 | |
8.25%, 11/15/26(h) | | | | | | | 972 | | | | 1,052,647 | |
Verscend Escrow Corp., 9.75%, 08/15/26(c)(h) | | | | | | | 1,758 | | | | 1,888,707 | |
| | | | | | | | | | | | |
| | | | | | | | | | | 11,388,644 | |
|
| Containers & Packaging — 1.6% | |
ARD Finance SA, (6.50% Cash or 7.25% PIK), 6.50%, 06/30/27(c)(i) | | | | | | | 891 | | | | 881,533 | |
Ardagh Packaging Finance PLC/Ardagh Holdings USA, Inc.: | | | | | | | | | | | | |
5.25%, 04/30/25(c) | | | | | | | 244 | | | | 250,097 | |
4.13%, 08/15/26(c)(h) | | | | | | | 676 | | | | 665,082 | |
4.75%, 07/15/27(c) | | | GBP | | | | 100 | | | | 120,193 | |
4.75%, 07/15/27 | | | | | | | 100 | | | | 120,193 | |
5.25%, 08/15/27(c)(h) | | | USD | | | | 652 | | | | 640,512 | |
Ball Corp., 4.88%, 03/15/26 | | | | | | | 86 | | | | 93,525 | |
Berry Global, Inc., 4.88%, 07/15/26(c) | | | | | | | 395 | | | | 400,925 | |
Celulosa Arauco y Constitucion SA,
4.20%, 01/29/30 | | | | | | | 200 | | | | 203,937 | |
Crown Americas LLC/Crown Americas Capital Corp. V, 4.25%, 09/30/26 | | | | | | | 196 | | | | 200,410 | |
Crown Americas LLC/Crown Americas Capital Corp. VI, 4.75%, 02/01/26(h) | | | | | | | 523 | | | | 532,953 | |
Graphic Packaging International LLC, 3.50%, 03/15/28(c) | | | | | | | 118 | | | | 117,080 | |
Intertape Polymer Group, Inc., 7.00%, 10/15/26(c) | | | | | | | 201 | | | | 206,568 | |
Mauser Packaging Solutions Holding Co., 5.50%, 04/15/24(c)(h) | | | | | | | 794 | | | | 779,857 | |
OI European Group BV, 2.88%, 02/15/25 | | | EUR | | | | 100 | | | | 108,103 | |
| | |
| 50 | | 2020 BLACKROCK SEMI-ANNUAL REPORTTO SHAREHOLDERS |
| | |
Schedule of Investments (unaudited) (continued) June 30, 2020 | | BlackRock Limited Duration Income Trust (BLW) (Percentages shown are based on Net Assets) |
| | | | | | | | | | | | |
| Security | | | | | Par
(000) | | | Value | |
|
| Containers & Packaging (continued) | |
Reynolds Group Issuer, Inc./Reynolds Group Issuer LLC/Reynolds Group Issuer Lu(c): | | | | | | | | | | | | |
(3 mo. LIBOR US + 3.50%), 3.78%, 07/15/21(d) | | | USD | | | | 433 | | | $ | 429,752 | |
7.00%, 07/15/24(h) | | | | | | | 344 | | | | 344,967 | |
Sealed Air Corp.(c): | | | | | | | | | | | | |
5.13%, 12/01/24 | | | | | | | 46 | | | | 49,105 | |
6.88%, 07/15/33 | | | | | | | 44 | | | | 52,030 | |
Silgan Holdings, Inc., 4.13%, 02/01/28(c) | | | | | | | 228 | | | | 226,005 | |
Trivium Packaging Finance BV: | | | | | | | | | | | | |
3.75%, 08/15/26 | | | EUR | | | | 100 | | | | 110,264 | |
5.50%, 08/15/26(c)(h) | | | USD | | | | 1,004 | | | | 1,012,785 | |
8.50%, 08/15/27(c)(h) | | | | | | | 1,367 | | | | 1,460,981 | |
| | | | | | | | | | | | |
| | | | | | | | | | | 9,006,857 | |
|
| Diversified Consumer Services — 0.6% | |
APX Group, Inc.: | | | | | | | | | | | | |
7.88%, 12/01/22(h) | | | | | | | 252 | | | | 250,740 | |
8.50%, 11/01/24 | | | | | | | 60 | | | | 58,500 | |
Ascend Learning LLC(c): | | | | | | | | | | | | |
6.88%, 08/01/25 | | | | | | | 317 | | | | 319,338 | |
6.88%, 08/01/25(h) | | | | | | | 690 | | | | 693,450 | |
Graham Holdings Co., 5.75%, 06/01/26(c) | | | | | | | 211 | | | | 218,201 | |
Laureate Education, Inc., 8.25%, 05/01/25(c) | | | | | | | 114 | | | | 118,275 | |
Pinnacle Bidco PLC, 6.38%, 02/15/25 | | | GBP | | | | 100 | | | | 104,654 | |
Prime Security Services Borrower LLC/Prime Finance, Inc.(c): | | | | | | | | | | | | |
5.25%, 04/15/24 | | | USD | | | | 141 | | | | 144,173 | |
5.75%, 04/15/26(h) | | | | | | | 320 | | | | 331,840 | |
Service Corp. International, 5.13%, 06/01/29 | | | | | | | 238 | | | | 256,088 | |
ServiceMaster Co. LLC, 5.13%, 11/15/24(c)(h) | | | | | | | 598 | | | | 606,222 | |
| | | | | | | | | | | | |
| | | | | | | | | | | 3,101,481 | |
|
| Diversified Financial Services — 2.6% | |
Allied Universal Holdco LLC/Allied Universal Finance Corp., 6.63%, 07/15/26(c)(h) | | | | | | | 1,783 | | | | 1,872,150 | |
Ally Financial, Inc., 3.05%, 06/05/23 | | | | | | | 530 | | | | 536,369 | |
Alpha Holding SA de CV, 9.00%, 02/10/25(c) | | | | | | | 200 | | | | 178,563 | |
Altice France Holding SA: | | | | | | | | | | | | |
8.00%, 05/15/27 | | | EUR | | | | 100 | | | | 118,402 | |
10.50%, 05/15/27(c)(h) | | | USD | | | | 1,473 | | | | 1,622,583 | |
6.00%, 02/15/28(c) | | | | | | | 382 | | | | 360,753 | |
Arrow Global Finance PLC, 5.13%, 09/15/24 | | | GBP | | | | 100 | | | | 113,606 | |
CFLD Cayman Investment Ltd.: | | | | | | | | | | | | |
8.63%, 02/28/21 | | | USD | | | | 200 | | | | 202,750 | |
8.60%, 04/08/24 | | | | | | | 200 | | | | 197,188 | |
Citigroup, Inc., Series V, (Secured Overnight Financing Rate + 3.23%), 4.70%(h)(k)(l) | | | | | | | 620 | | | | 551,025 | |
F-Brasile SpA/F-Brasile US LLC, Series XR, 7.38%, 08/15/26(c) | | | | | | | 423 | | | | 324,526 | |
Ford motor Credit Co. LLC: | | | | | | | | | | | | |
5.88%, 08/02/21(h) | | | | | | | 522 | | | | 527,063 | |
2.98%, 08/03/22(h) | | | | | | | 449 | | | | 430,344 | |
3.35%, 11/01/22 | | | | | | | 215 | | | | 205,923 | |
3.81%, 01/09/24(h) | | | | | | | 629 | | | | 604,029 | |
4.06%, 11/01/24 | | | | | | | 200 | | | | 191,006 | |
4.13%, 08/04/25 | | | | | | | 411 | | | | 389,813 | |
Garfunkelux Holdco 3 SA, 7.50%, 08/01/22 | | | EUR | | | | 100 | | | | 105,978 | |
General motors Financial Co., Inc.: | | | | | | | | | | | | |
4.38%, 09/25/21(h) | | | USD | | | | 530 | | | | 544,326 | |
2.75%, 06/20/25 | | | | | | | 352 | | | | 347,672 | |
5.65%, 01/17/29 | | | | | | | 67 | | | | 75,396 | |
Greenko Dutch BV, 5.25%, 07/24/24 | | | | | | | 200 | | | | 197,813 | |
Greenko Mauritius Ltd., 6.25%, 02/21/23 | | | | | | | 200 | | | | 200,416 | |
Intrum AB, 3.00%, 09/15/27 | | | EUR | | | | 100 | | | | 93,812 | |
| | | | | | | | | | | | |
| Security | | | | | Par
(000) | | | Value | |
|
| Diversified Financial Services (continued) | |
Ladder Capital Finance Holdings LLLP/Ladder Capital Finance Corp.(c): | | | | | | | | | | | | |
5.25%, 03/15/22 | | | USD | | | | 23 | | | $ | 21,850 | |
4.25%, 02/01/27(h) | | | | | | | 315 | | | | 252,000 | |
LHC3 PLC, (4.13% Cash or 4.88% PIK), 4.13%, 08/15/24(i) | | | EUR | | | | 100 | | | | 112,350 | |
Lloyds Banking Group PLC(5 year CMT + 4.82%), 6.75%(k)(l) | | | USD | | | | 450 | | | | 459,000 | |
Manappuram Finance Ltd., 5.90%, 01/13/23 | | | | | | | 200 | | | | 187,250 | |
mong Doung Finacial Holdings BV, 5.13%, 05/07/29 | | | | | | | 250 | | | | 248,984 | |
Murphy Oil USA, Inc., 4.75%, 09/15/29 | | | | | | | 163 | | | | 166,668 | |
Picasso Finance Sub, Inc., 6.13%, 06/15/25(c) | | | | | | | 499 | | | | 510,227 | |
Scenery Journey Ltd.: | | | | | | | | | | | | |
11.00%, 11/06/20 | | | | | | | 200 | | | | 201,562 | |
11.50%, 10/24/22 | | | | | | | 219 | | | | 207,645 | |
13.00%, 11/06/22 | | | | | | | 200 | | | | 195,375 | |
Spectrum Brands, Inc.(c): | | | | | | | | | | | | |
5.00%, 10/01/29 | | | USD | | | | 162 | | | | 159,975 | |
5.50%, 07/15/30 | | | | | | | 154 | | | | 154,193 | |
Tempo Acquisition LLC/Tempo Acquisition Finance Corp., 6.75%, 06/01/25(c)(h) | | | | | | | 752 | | | | 761,400 | |
Usiminas International Sarl, 5.88%, 07/18/26(c) | | | | | | | 200 | | | | 182,250 | |
Vertical Midco GmbH, 4.38%, 07/15/27(g) | | | EUR | | | | 100 | | | | 112,350 | |
VZ Vendor Financing BV, 2.50%, 01/31/24 | | | | | | | 100 | | | | 109,771 | |
Wanda Group Overseas Ltd., 7.50%, 07/24/22 | | | USD | | | | 200 | | | | 186,246 | |
WMG Acquisition Corp.(c): | | | | | | | | | | | | |
5.50%, 04/15/26 | | | | | | | 166 | | | | 171,760 | |
3.88%, 07/15/30 | | | | | | | 200 | | | | 202,010 | |
| | | | | | | | | | | | |
| | | | | | | | | | | 14,594,372 | |
|
| Diversified Telecommunication Services — 1.9% | |
Axtel SAB de CV, 6.38%, 11/14/24(c) | | | | | | | 200 | | | | 207,704 | |
CenturyLink, Inc.: | | | | | | | | | | | | |
5.13%, 12/15/26(c)(h) | | | | | | | 1,082 | | | | 1,079,295 | |
4.00%, 02/15/27(c) | | | | | | | 466 | | | | 452,602 | |
Series P, 7.60%, 09/15/39 | | | | | | | 308 | | | | 331,485 | |
Series U, 7.65%, 03/15/42 | | | | | | | 391 | | | | 419,348 | |
Series W, 6.75%, 12/01/23(h) | | | | | | | 512 | | | | 550,292 | |
Series Y, 7.50%, 04/01/24(h) | | | | | | | 516 | | | | 566,991 | |
Cincinnati Bell, Inc., 7.00%, 07/15/24(c) | | | | | | | 82 | | | | 83,640 | |
Frontier Communications Corp., 8.00%, 04/01/27(c)(h) | | | | | | | 1,598 | | | | 1,620,596 | |
GCI LLC, 6.63%, 06/15/24(c) | | | | | | | 153 | | | | 160,108 | |
Level 3 Financing, Inc.: | | | | | | | | | | | | |
5.38%, 08/15/22 | | | | | | | 155 | | | | 155,140 | |
5.63%, 02/01/23(m) | | | | | | | 17 | | | | 17,012 | |
5.38%, 05/01/25 | | | | | | | 90 | | | | 91,913 | |
5.25%, 03/15/26(h) | | | | | | | 865 | | | | 888,787 | |
4.63%, 09/15/27(c) | | | | | | | 143 | | | | 144,073 | |
4.25%, 07/01/28(c)(h) | | | | | | | 820 | | | | 819,057 | |
Oi SA, (10% Cash or 8.00% Cash + 4.00% PIK), 10.00%, 07/27/25(i) | | | | | | | 220 | | | | 183,425 | |
SoftBank Group Corp.: | | | | | | | | | | | | |
4.50%, 04/20/25 | | | EUR | | | | 100 | | | | 114,597 | |
4.75%, 07/30/25 | | | | | | | 100 | | | | 115,670 | |
5.00%, 04/15/28 | | | | | | | 100 | | | | 116,282 | |
Telecom Italia Capital SA: | | | | | | | | | | | | |
6.38%, 11/15/33 | | | USD | | | | 137 | | | | 154,468 | |
6.00%, 09/30/34 | | | | | | | 423 | | | | 459,801 | |
7.20%, 07/18/36 | | | | | | | 90 | | | | 107,100 | |
7.72%, 06/04/38 | | | | | | | 163 | | | | 205,093 | |
Telecom Italia SpA: | | | | | | | | | | | | |
4.00%, 04/11/24 | | | EUR | | | | 150 | | | | 176,142 | |
5.30%, 05/30/24(c)(h) | | | USD | | | | 600 | | | | 626,142 | |
| | |
SCHEDULES OF INVESTMENTS | | 51 |
| | |
Schedule of Investments (unaudited) (continued) June 30, 2020 | | BlackRock Limited Duration Income Trust (BLW) (Percentages shown are based on Net Assets) |
| | | | | | | | | | | | |
| Security | | | | | Par
(000) | | | Value | |
|
| Diversified Telecommunication Services (continued) | |
Telesat Canada/Telesat LLC, 4.88%, 06/01/27(c) | | | USD | | | | 332 | | | $ | 325,360 | |
Verizon Communications, Inc., 3.38%, 02/15/25(h) | | | | | | | 156 | | | | 173,572 | |
| | | | | | | | | | | | |
| | | | | | | | | | | 10,345,695 | |
|
| Electric Utilities — 0.7% | |
Adani Green Energy UP Ltd./Prayatna Developers Pvt Ltd./Parampujya Solar Energ, 6.25%, 12/10/24 | | | | | | | 200 | | | | 208,000 | |
Black Hills Corp., 3.15%, 01/15/27(h) | | | | | | | 305 | | | | 320,531 | |
Empresas Publicas de Medellin ESP, 4.25%, 07/18/29(c) | | | | | | | 275 | | | | 274,742 | |
Enel Finance International NV, 3.63%, 05/25/27(c)(h) | | | | | | | 900 | | | | 982,623 | |
Energuate Trust, 5.88%, 05/03/27(c) | | | | | | | 200 | | | | 196,938 | |
Exelon Corp., 3.40%, 04/15/26(h) | | | | | | | 140 | | | | 155,905 | |
Inkia Energy Ltd., 5.88%, 11/09/27(c) | | | | | | | 377 | | | | 371,345 | |
NextEra Energy Operating Partners LP(c): | | | | | | | | | | | | |
4.25%, 07/15/24(h) | | | | | | | 528 | | | | 533,940 | |
4.25%, 09/15/24 | | | | | | | 101 | | | | 101,602 | |
4.50%, 09/15/27 | | | | | | | 39 | | | | 40,768 | |
PG&E Corp., 5.25%, 07/01/30 | | | | | | | 365 | | | | 367,080 | |
ReNew Power Synthetic, 6.67%, 03/12/24 | | | | | | | 200 | | | | 201,313 | |
Texas Competitive Electric Holdings Co. LLC/TCEH Finance, Inc., 11.50%, 10/01/20(a) | | | | | | | 300 | | | | — | |
| | | | | | | | | | | | |
| | | | | | | | | | | 3,754,787 | |
|
| Electronic Equipment, Instruments & Components — 0.2% | |
CDW LLC/CDW Finance Corp.: | | | | | | | | | | | | |
5.50%, 12/01/24(h) | | | | | | | 655 | | | | 712,175 | |
4.13%, 05/01/25 | | | | | | | 221 | | | | 221,277 | |
5.00%, 09/01/25 | | | | | | | 107 | | | | 110,076 | |
Itron, Inc., 5.00%, 01/15/26(c) | | | | | | | 25 | | | | 24,906 | |
| | | | | | | | | | | | |
| | | | | | | | | | | 1,068,434 | |
|
| Energy Equipment & Services — 0.4% | |
Archrock Partners LP/Archrock Partners Finance Corp.(c): | | | | | | | | | | | | |
6.88%, 04/01/27 | | | | | | | 147 | | | | 138,474 | |
6.25%, 04/01/28 | | | | | | | 28 | | | | 25,480 | |
ChampionX Corp., 6.38%, 05/01/26 | | | | | | | 239 | | | | 222,095 | |
Gates Global LLC/Gates Global Co., 6.25%, 01/15/26(c) | | | | | | | 316 | | | | 310,470 | |
Halliburton Co., 3.80%, 11/15/25(h) | | | | | | | 7 | | | | 7,561 | |
Odebrecht Oil & Gas Finance Ltd., 0.00%(c)(l)(n) | | | BRL | | | | 43 | | | | 43 | |
Pattern Energy Group, Inc., 5.88%, 02/01/24(c) | | | USD | | | | 299 | | | | 300,495 | |
Pioneer Energy Services Corp.(c)(i): | | | | | | | | | | | | |
(11% Cash), 11.00%, 05/15/25 | | | | | | | 112 | | | | 89,549 | |
(5.00% PIK), 5.00%, 11/15/25(o) | | | | | | | 76 | | | | 41,074 | |
Transocean, Inc.: | | | | | | | | | | | | |
8.38%, 12/15/21 | | | | | | | 51 | | | | 35,700 | |
8.00%, 02/01/27(c) | | | | | | | 324 | | | | 178,807 | |
USA Compression Partners LP/USA Compression Finance Corp.: | | | | | | | | | | | | |
6.88%, 04/01/26 | | | | | | | 336 | | | | 324,660 | |
6.88%, 09/01/27(h) | | | | | | | 503 | | | | 482,880 | |
| | | | | | | | | | | | |
| | | | | | | | | | | 2,157,288 | |
|
| Environmental, Maintenance, & Security Service — 0.1% | |
Tervita Corp., 7.63%, 12/01/21(c) | | | | | | | 343 | | | | 269,255 | |
Waste Pro USA, Inc., 5.50%, 02/15/26(c) | | | | | | | 471 | | | | 449,565 | |
| | | | | | | | | | | | |
| | | | | | | | | | | 718,820 | |
|
| Equity Real Estate Investment Trusts (REITs) — 2.1% | |
AvalonBay Communities, Inc., 3.45%, 06/01/25(h) | | | | | | | 1,245 | | | | 1,388,623 | |
Brookfield Property REIT, Inc./BPR Cumulus LLC/BPR Nimbus LLC/GGSI Sellco LL, 5.75%, 05/15/26(c) | | | | | | | 141 | | | | 119,145 | |
| | | | | | | | | | | | |
| Security | | | | | Par
(000) | | | Value | |
|
| Equity Real Estate Investment Trusts (REITs) (continued) | |
ERP Operating LP, 3.38%, 06/01/25(h) | | | USD | | | | 1,015 | | | $ | 1,114,447 | |
Five Point Operating Co. LP/Five Point Capital Corp., 7.88%, 11/15/25(c) | | | | | | | 389 | | | | 367,605 | |
Fortune Star BVI Ltd.: | | | | | | | | | | | | |
6.88%, 01/31/21 | | | | | | | 200 | | | | 202,000 | |
5.95%, 01/29/23 | | | | | | | 200 | | | | 199,000 | |
6.75%, 07/02/23 | | | | | | | 250 | | | | 252,500 | |
Iron mountain, Inc.(c): | | | | | | | | | | | | |
4.88%, 09/15/27 | | | | | | | 349 | | | | 339,992 | |
4.88%, 09/15/29 | | | | | | | 2 | | | | 1,945 | |
5.25%, 07/15/30 | | | | | | | 417 | | | | 410,745 | |
5.63%, 07/15/32(h) | | | | | | | 507 | | | | 505,935 | |
LMIRT Capital Pte Ltd., 7.25%, 06/19/24 | | | | | | | 229 | | | | 203,810 | |
MAF Sukuk Ltd., 4.64%, 05/14/29 | | | | | | | 275 | | | | 286,258 | |
Marriott International, Inc., Series EE,
5.75%, 05/01/25 | | | | | | | 178 | | | | 193,372 | |
Marriott Ownership Resorts, Inc./ILG LLC, 6.50%, 09/15/26 | | | | | | | 40 | | | | 40,300 | |
MGM Growth Properties Operating Partnership LP/MGP Finance Co-Issuer, Inc.: | | | | | | | | | | | | |
5.63%, 05/01/24(h) | | | | | | | 1,334 | | | | 1,380,717 | |
4.63%, 06/15/25(c) | | | | | | | 513 | | | | 501,652 | |
4.50%, 09/01/26(h) | | | | | | | 637 | | | | 630,821 | |
5.75%, 02/01/27 | | | | | | | 27 | | | | 27,675 | |
4.50%, 01/15/28 | | | | | | | 432 | | | | 410,400 | |
MPT Operating Partnership LP/MPT Finance Corp.(h): | | | | | | | | | | | | |
5.00%, 10/15/27 | | | | | | | 1,045 | | | | 1,073,738 | |
4.63%, 08/01/29 | | | | | | | 456 | | | | 458,280 | |
Ryman Hospitality Properties, Inc., 4.75%, 10/15/27(c) | | | | | | | 542 | | | | 482,380 | |
Starwood Property Trust, Inc., 5.00%, 12/15/21 | | | | | | | 234 | | | | 226,980 | |
Trust F/1401, 6.95%, 01/30/44 | | | | | | | 200 | | | | 216,125 | |
Ventas Realty LP, 4.13%, 01/15/26(h) | | | | | | | 650 | | | | 697,565 | |
| | | | | | | | | | | | |
| | | | | | | | | | | 11,732,010 | |
|
| Food & Staples Retailing — 0.4% | |
Albertsons Cos., Inc./Safeway, Inc./New Albertsons LP/Albertson’s LLC: | | | | | | | | | | | | |
6.63%, 06/15/24 | | | | | | | 186 | | | | 190,650 | |
5.75%, 03/15/25 | | | | | | | 70 | | | | 71,532 | |
7.50%, 03/15/26(c)(h) | | | | | | | 107 | | | | 115,560 | |
4.63%, 01/15/27(c)(h) | | | | | | | 731 | | | | 731,000 | |
5.88%, 02/15/28(c) | | | | | | | 320 | | | | 330,166 | |
4.88%, 02/15/30(c) | | | | | | | 246 | | | | 251,690 | |
BRF GmbH, 4.35%, 09/29/26 | | | | | | | 200 | | | | 193,000 | |
Health & Happiness H&H International Holdings Ltd., 5.63%, 10/24/24 | | | | | | | 200 | | | | 203,687 | |
Lamb Weston Holdings, Inc., 4.88%, 05/15/28(c) | | | | | | | 313 | | | | 331,627 | |
| | | | | | | | | | | | |
| | | | | | | | | | | 2,418,912 | |
|
| Food Products — 2.3% | |
Aramark Services, Inc.(c): | | | | | | | | | | | | |
5.00%, 04/01/25(h) | | | | | | | 623 | | | | 613,655 | |
6.38%, 05/01/25 | | | | | | | 243 | | | | 250,929 | |
5.00%, 02/01/28(h) | | | | | | | 558 | | | | 530,100 | |
Chobani LLC/Chobani Finance Corp., Inc., 7.50%, 04/15/25(c)(h) | | | | | | | 416 | | | | 401,440 | |
Darling Ingredients, Inc., 5.25%, 04/15/27(c) | | | | | | | 254 | | | | 261,056 | |
Graphic Packaging International LLC, 4.75%, 07/15/27(c) | | | | | | | 89 | | | | 93,895 | |
Grupo Bimbo SAB de CV(5 year CMT + 3.28%), 5.95%(c)(k)(l) | | | | | | | 200 | | | | 205,594 | |
JBS USA LUX SA/JBS USA Finance, Inc.(c): | | | | | | | | | | | | |
5.88%, 07/15/24 | | | | | | | 412 | | | | 417,665 | |
5.75%, 06/15/25(h) | | | | | | | 1,006 | | | | 1,014,802 | |
6.75%, 02/15/28 | | | | | | | 361 | | | | 380,629 | |
| | |
| 52 | | 2020 BLACKROCK SEMI-ANNUAL REPORTTO SHAREHOLDERS |
| | |
Schedule of Investments (unaudited) (continued) June 30, 2020 | | BlackRock Limited Duration Income Trust (BLW) (Percentages shown are based on Net Assets) |
| | | | | | | | | | | | |
| Security | | | | | Par
(000) | | | Value | |
|
| Food Products (continued) | |
JBS USA LUX SA/JBS USA Food Co./JBS USA Finance, Inc.(c)(h): | | | | | | | | | | | | |
6.50%, 04/15/29 | | | USD | | | | 735 | | | $ | 780,019 | |
5.50%, 01/15/30 | | | | | | | 675 | | | | 691,875 | |
Kraft Heinz Foods Co.: | | | | | | | | | | | | |
3.88%, 05/15/27(c) | | | | | | | 57 | | | | 59,564 | |
4.25%, 03/01/31(c)(h) | | | | | | | 1,299 | | | | 1,377,321 | |
5.00%, 07/15/35 | | | | | | | 127 | | | | 139,736 | |
6.88%, 01/26/39 | | | | | | | 233 | | | | 288,041 | |
4.63%, 10/01/39(c) | | | | | | | 77 | | | | 77,320 | |
6.50%, 02/09/40 | | | | | | | 155 | | | | 186,567 | |
5.00%, 06/04/42 | | | | | | | 129 | | | | 135,915 | |
5.20%, 07/15/45 | | | | | | | 351 | | | | 380,649 | |
4.38%, 06/01/46 | | | | | | | 377 | | | | 370,626 | |
4.88%, 10/01/49(c)(h) | | | | | | | 1,029 | | | | 1,047,847 | |
5.50%, 06/01/50(c)(h) | | | | | | | 1,280 | | | | 1,364,428 | |
MHP Lux SA, 6.25%, 09/19/29(c) | | | | | | | 200 | | | | 190,750 | |
Minerva Luxembourg SA, 6.50%, 09/20/26(c) | | | | | | | 200 | | | | 201,000 | |
Post Holdings, Inc.(c): | | | | | | | | | | | | |
5.75%, 03/01/27 | | | | | | | 253 | | | | 261,223 | |
5.63%, 01/15/28 | | | | | | | 73 | | | | 75,555 | |
5.50%, 12/15/29 | | | | | | | 230 | | | | 237,848 | |
4.63%, 04/15/30(h) | | | | | | | 491 | | | | 480,591 | |
Simmons Foods, Inc., 7.75%, 01/15/24(c) | | | | | | | 270 | | | | 281,664 | |
| | | | | | | | | | | | |
| | | | | | | | | | | 12,798,304 | |
|
| Health Care Equipment & Supplies — 1.0% | |
Avantor, Inc.(c)(h): | | | | | | | | | | | | |
6.00%, 10/01/24 | | | | | | | 1,767 | | | | 1,846,515 | |
9.00%, 10/01/25 | | | | | | | 1,092 | | | | 1,173,900 | |
Hologic, Inc.(c): | | | | | | | | | | | | |
4.38%, 10/15/25 | | | | | | | 57 | | | | 57,558 | |
4.63%, 02/01/28 | | | | | | | 206 | | | | 213,725 | |
Ortho-Clinical Diagnostics, Inc./Ortho-Clinical Diagnostics SA(c): | | | | | | | | | | | | |
7.38%, 06/01/25 | | | | | | | 589 | | | | 599,308 | |
7.25%, 02/01/28(h) | | | | | | | 1,177 | | | | 1,196,397 | |
Teleflex, Inc.: | | | | | | | | | | | | |
4.88%, 06/01/26 | | | | | | | 87 | | | | 89,610 | |
4.63%, 11/15/27 | | | | | | | 58 | | | | 61,318 | |
4.25%, 06/01/28(c) | | | | | | | 413 | | | | 423,325 | |
| | | | | | | | | | | | |
| | | | | | | | | | | 5,661,656 | |
|
| Health Care Providers & Services — 3.8% | |
Acadia Healthcare Co., Inc.: | | | | | | | | | | | | |
5.13%, 07/01/22 | | | | | | | 213 | | | | 213,064 | |
5.63%, 02/15/23 | | | | | | | 33 | | | | 33,012 | |
5.50%, 07/01/28(c) | | | | | | | 204 | | | | 204,510 | |
AHP Health Partners, Inc., 9.75%, 07/15/26(c) | | | | | | | 213 | | | | 218,858 | |
Centene Corp.: | | | | | | | | | | | | |
5.25%, 04/01/25(c) | | | | | | | 310 | | | | 319,198 | |
5.38%, 06/01/26(c)(h) | | | | | | | 336 | | | | 348,318 | |
5.38%, 08/15/26(c) | | | | | | | 343 | | | | 356,792 | |
4.25%, 12/15/27(h) | | | | | | | 657 | | | | 677,965 | |
4.63%, 12/15/29(h) | | | | | | | 1,782 | | | | 1,880,010 | |
3.38%, 02/15/30 | | | | | | | 452 | | | | 456,389 | |
CHS/Community Health Systems, Inc.(c): | | | | | | | | | | | | |
8.63%, 01/15/24(h) | | | | | | | 680 | | | | 664,958 | |
6.63%, 02/15/25 | | | | | | | 255 | | | | 239,700 | |
8.00%, 03/15/26(h) | | | | | | | 971 | | | | 917,789 | |
Encompass Health Corp., 5.75%, 11/01/24 | | | | | | | 46 | | | | 46,000 | |
HCA, Inc.: | | | | | | | | | | | | |
5.38%, 02/01/25(h) | | | | | | | 490 | | | | 524,912 | |
5.88%, 02/15/26 | | | | | | | 46 | | | | 50,428 | |
| | | | | | | | | | | | |
| Security | | | | | Par
(000) | | | Value | |
|
| Health Care Providers & Services (continued) | |
5.38%, 09/01/26(h) | | | USD | | | | 430 | | | $ | 468,162 | |
5.63%, 09/01/28(h) | | | | | | | 692 | | | | 772,445 | |
5.88%, 02/01/29(h) | | | | | | | 547 | | | | 618,980 | |
3.50%, 09/01/30(h) | | | | | | | 1,478 | | | | 1,423,568 | |
5.50%, 06/15/47(h) | | | | | | | 650 | | | | 791,565 | |
LifePoint Health, Inc.(c): | | | | | | | | | | | | |
6.75%, 04/15/25 | | | | | | | 190 | | | | 196,175 | |
4.38%, 02/15/27 | | | | | | | 217 | | | | 205,065 | |
MEDNAX, Inc.(c): | | | | | | | | | | | | |
5.25%, 12/01/23 | | | | | | | 168 | | | | 167,160 | |
6.25%, 01/15/27 | | | | | | | 90 | | | | 90,000 | |
molina Healthcare, Inc.: | | | | | | | | | | | | |
5.38%, 11/15/22 | | | | | | | 172 | | | | 175,440 | |
4.88%, 06/15/25(c) | | | | | | | 168 | | | | 168,840 | |
4.38%, 06/15/28(c) | | | | | | | 258 | | | | 257,677 | |
MPH Acquisition Holdings LLC,
7.13%, 06/01/24(c)(h) | | | | | | | 714 | | | | 664,020 | |
Polaris Intermediate Corp., (8.50% Cash or 9.25% PIK), 8.50%, 12/01/22(c)(h)(i) | | | | | | | 433 | | | | 380,660 | |
Surgery Center Holdings, Inc.(c): | | | | | | | | | | | | |
6.75%, 07/01/25(h) | | | | | | | 611 | | | | 551,427 | |
10.00%, 04/15/27 | | | | | | | 294 | | | | 294,000 | |
Tenet Healthcare Corp.: | | | | | | | | | | | | |
8.13%, 04/01/22(h) | | | | | | | 615 | | | | 645,750 | |
4.63%, 07/15/24(h) | | | | | | | 514 | | | | 503,612 | |
4.63%, 09/01/24(c) | | | | | | | 367 | | | | 358,742 | |
7.50%, 04/01/25(c) | | | | | | | 181 | | | | 192,539 | |
4.88%, 01/01/26(c)(h) | | | | | | | 1,605 | | | | 1,562,869 | |
6.25%, 02/01/27(c)(h) | | | | | | | 169 | | | | 167,733 | |
5.13%, 11/01/27(c)(h) | | | | | | | 959 | | | | 946,245 | |
4.63%, 06/15/28(c) | | | | | | | 143 | | | | 139,311 | |
UnitedHealth Group, Inc., 3.75%, 07/15/25(h) | | | | | | | 1,470 | | | | 1,674,810 | |
Vizient, Inc., 6.25%, 05/15/27(c) | | | | | | | 407 | | | | 426,332 | |
| | | | | | | | | | | | |
| | | | | | | | | | | 20,995,030 | |
|
| Health Care Technology — 0.4% | |
Change Healthcare Holdings LLC/Change Healthcare Finance, Inc., 5.75%, 03/01/25(c)(h) | | | | | | | 791 | | | | 781,112 | |
IQVIA, Inc.: | | | | | | | | | | | | |
3.25%, 03/15/25 | | | EUR | | | | 148 | | | | 167,433 | |
5.00%, 10/15/26(c)(h) | | | USD | | | | 463 | | | | 476,288 | |
5.00%, 05/15/27(c)(h) | | | | | | | 637 | | | | 652,726 | |
| | | | | | | | | | | | |
| | | | | | | | | | | 2,077,559 | |
|
| Hotels, Restaurants & Leisure — 4.7% | |
1011778 BC ULC/New Red Finance, Inc.(c): | | | | | | | | | | | | |
4.25%, 05/15/24 | | | | | | | 10 | | | | 10,018 | |
5.75%, 04/15/25 | | | | | | | 236 | | | | 247,800 | |
5.00%, 10/15/25(h) | | | | | | | 1,384 | | | | 1,375,848 | |
3.88%, 01/15/28 | | | | | | | 423 | | | | 410,382 | |
4.38%, 01/15/28 | | | | | | | 302 | | | | 296,017 | |
Boyd Gaming Corp.: | | | | | | | | | | | | |
6.38%, 04/01/26 | | | | | | | 95 | | | | 90,250 | |
6.00%, 08/15/26 | | | | | | | 112 | | | | 104,686 | |
Boyne USA, Inc., 7.25%, 05/01/25(c) | | | | | | | 254 | | | | 266,065 | |
Cedar Fair LP/Canada’s Wonderland Co./Magnum Management Corp./Millennium Op, 5.50%, 05/01/25(c)(h) | | | | | | | 504 | | | | 506,520 | |
Churchill Downs, Inc.(c): | | | | | | | | | | | | |
5.50%, 04/01/27(h) | | | | | | | 899 | | | | 879,941 | |
4.75%, 01/15/28 | | | | | | | 358 | | | | 345,470 | |
Cirsa Finance International Sarl, 4.75%, 05/22/25 | | | EUR | | | | 100 | | | | 97,745 | |
Colt Merger Sub, Inc.(c)(g): | | | | | | | | | | | | |
5.75%, 07/01/25 | | | USD | | | | 723 | | | | 727,121 | |
6.25%, 07/01/25 | | | | | | | 1,645 | | | | 1,634,719 | |
8.13%, 07/01/27 | | | | | | | 876 | | | | 846,435 | |
| | |
SCHEDULES OF INVESTMENTS | | 53 |
| | |
Schedule of Investments (unaudited) (continued) June 30, 2020 | | BlackRock Limited Duration Income Trust (BLW) (Percentages shown are based on Net Assets) |
| | | | | | | | | | | | |
| Security | | | | | Par
(000) | | | Value | |
|
| Hotels, Restaurants & Leisure (continued) | |
Eldorado Resorts, Inc.: | | | | | | | | | | | | |
6.00%, 04/01/25 | | | USD | | | | 91 | | | $ | 95,186 | |
6.00%, 09/15/26(m) | | | | | | | 76 | | | | 82,104 | |
GLP Capital LP/GLP Financing II, Inc.: | | | | | | | | | | | | |
5.25%, 06/01/25 | | | | | | | 333 | | | | 362,104 | |
5.38%, 04/15/26 | | | | | | | 174 | | | | 190,111 | |
5.30%, 01/15/29 | | | | | | | 45 | | | | 48,694 | |
4.00%, 01/15/31 | | | | | | | 155 | | | | 153,876 | |
Golden Nugget, Inc., 6.75%, 10/15/24(c)(h) | | | | | | | 1,529 | | | | 1,098,969 | |
Hilton Domestic Operating Co., Inc.: | | | | | | | | | | | | |
4.25%, 09/01/24 | | | | | | | 337 | | | | 326,957 | |
5.38%, 05/01/25(c) | | | | | | | 145 | | | | 145,000 | |
5.13%, 05/01/26(h) | | | | | | | 697 | | | | 693,954 | |
5.75%, 05/01/28(c) | | | | | | | 99 | | | | 99,990 | |
4.88%, 01/15/30(h) | | | | | | | 1,077 | | | | 1,060,845 | |
Hilton Worldwide Finance LLC/Hilton Worldwide Finance Corp., 4.63%, 04/01/25 | | | | | | | 30 | | | | 29,331 | |
IRB Holding Corp., 7.00%, 06/15/25(c) | | | | | | | 128 | | | | 131,930 | |
KFC Holding Co./Pizza Hut Holdings LLC/Taco Bell of America LLC(c): | | | | | | | | | | | | |
5.00%, 06/01/24 | | | | | | | 35 | | | | 35,656 | |
5.25%, 06/01/26 | | | | | | | 368 | | | | 377,200 | |
Las Vegas Sands Corp.: | | | | | | | | | | | | |
2.90%, 06/25/25 | | | | | | | 52 | | | | 50,507 | |
3.50%, 08/18/26 | | | | | | | 47 | | | | 46,867 | |
3.90%, 08/08/29 | | | | | | | 43 | | | | 42,419 | |
Lions Gate Capital Holdings LLC(c): | | | | | | | | | | | | |
6.38%, 02/01/24 | | | | | | | 25 | | | | 24,375 | |
5.88%, 11/01/24 | | | | | | | 171 | | | | 163,305 | |
McDonald’s Corp., 3.70%, 01/30/26(h) | | | | | | | 405 | | | | 459,143 | |
Melco Resorts Finance Ltd., 5.25%, 04/26/26 | | | | | | | 250 | | | | 252,109 | |
MGM China Holdings Ltd., 5.88%, 05/15/26 | | | | | | | 250 | | | | 257,500 | |
MGM Resorts International: | | | | | | | | | | | | |
7.75%, 03/15/22(h) | | | | | | | 575 | | | | 586,500 | |
6.00%, 03/15/23 | | | | | | | 416 | | | | 420,160 | |
5.75%, 06/15/25 | | | | | | | 29 | | | | 28,674 | |
Scientific Games International, Inc.: | | | | | | | | | | | | |
8.63%, 07/01/25(c)(g) | | | | | | | 203 | | | | 189,744 | |
5.00%, 10/15/25(c)(h) | | | | | | | 867 | | | | 800,466 | |
3.38%, 02/15/26 | | | EUR | | | | 100 | | | | 103,362 | |
8.25%, 03/15/26(c)(h) | | | USD | | | | 495 | | | | 443,953 | |
7.00%, 05/15/28(c) | | | | | | | 174 | | | | 139,200 | |
7.25%, 11/15/29(c) | | | | | | | 51 | | | | 40,800 | |
Six Flags Theme Parks, Inc., 7.00%, 07/01/25(c)(h) | | | | | | | 753 | | | | 778,414 | |
Spirit Issuer PLC, Series A5, 5.47%, 12/28/28 | | | GBP | | | | 4,500 | | | | 5,673,152 | |
Studio City Finance Ltd., 7.25%, 02/11/24 | | | USD | | | | 250 | | | | 257,109 | |
Unique Pub Finance Co. PLC: | | | | | | | | | | | | |
Series A4, 5.66%, 06/30/27 | | | GBP | | | | 48 | | | | 59,841 | |
Series N, 6.46%, 03/30/32 | | | | | | | 100 | | | | 128,843 | |
Vail Resorts, Inc., 6.25%, 05/15/25(c) | | | USD | | | | 154 | | | | 161,123 | |
Wynn Las Vegas LLC/Wynn Las Vegas Capital Corp., 5.25%, 05/15/27(c) | | | | | | | 192 | | | | 165,984 | |
Wynn Macau Ltd., 5.50%, 10/01/27 | | | | | | | 200 | | | | 196,875 | |
Wynn Resorts Finance LLC / Wynn Resorts Capital Corp., 7.75%, 04/15/25(c) | | | | | | | 239 | | | | 240,721 | |
Wynn Resorts Finance LLC/Wynn Resorts Capital Corp., 5.13%, 10/01/29(c) | | | | | | | 446 | | | | 398,613 | |
Yum! Brands, Inc.: | | | | | | | | | | | | |
7.75%, 04/01/25(c) | | | | | | | 426 | | | | 459,548 | |
4.75%, 01/15/30(c)(h) | | | | | | | 597 | | | | 605,955 | |
5.35%, 11/01/43 | | | | | | | 71 | | | | 68,160 | |
| | | | | | | | | | | | |
| | | | | | | | | | | 26,014,346 | |
| | | | | | | | | | | | |
| Security | | | | | Par
(000) | | | Value | |
|
| Household Durables — 0.9% | |
Brookfield Residential Properties, Inc./Brookfield Residential US Corp.(c): | | | | | | | | | | | | |
6.25%, 09/15/27 | | | USD | | | | 217 | | | $ | 207,519 | |
4.88%, 02/15/30 | | | | | | | 340 | | | | 284,104 | |
CD&R Smokey Buyer, Inc., 6.75%, 07/15/25(c)(g) | | | | | | | 232 | | | | 241,210 | |
Controladora Mabe SA de CV, 5.60%, 10/23/28(c) | | | | | | | 200 | | | | 208,063 | |
Global Prime Capital Pte Ltd., 5.50%, 10/18/23 | | | | | | | 200 | | | | 192,125 | |
K Hovnanian Enterprises, Inc., 7.75%, 02/15/26(c) | | | | | | | 307 | | | | 302,395 | |
Lennar Corp.: | | | | | | | | | | | | |
8.38%, 01/15/21 | | | | | | | 134 | | | | 138,188 | |
4.88%, 12/15/23 | | | | | | | 122 | | | | 128,710 | |
4.75%, 05/30/25 | | | | | | | 313 | | | | 334,127 | |
5.25%, 06/01/26 | | | | | | | 28 | | | | 30,240 | |
4.75%, 11/29/27 | | | | | | | 497 | | | | 539,245 | |
Mattamy Group Corp., 4.63%, 03/01/30(c) | | | | | | | 233 | | | | 223,680 | |
MDC Holdings, Inc., 6.00%, 01/15/43 | | | | | | | 122 | | | | 128,405 | |
Meritage Homes Corp., 5.13%, 06/06/27 | | | | | | | 50 | | | | 51,500 | |
PulteGroup, Inc.: | | | | | | | | | | | | |
5.00%, 01/15/27 | | | | | | | 24 | | | | 25,680 | |
7.88%, 06/15/32 | | | | | | | 21 | | | | 26,834 | |
6.38%, 05/15/33(h) | | | | | | | 469 | | | | 548,730 | |
Shui On Development Holding Ltd., 5.75%, 11/12/23 | | | | | | | 200 | | | | 195,958 | |
Taylor morrison Communities, Inc., 5.88%, 06/15/27(c) | | | | | | | 264 | | | | 273,435 | |
Tempur Sealy International, Inc., 5.50%, 06/15/26 | | | | | | | 180 | | | | 181,800 | |
Theta Capital Pte Ltd., 8.13%, 01/22/25 | | | | | | | 200 | | | | 177,863 | |
Toll Brothers Finance Corp., 4.35%, 02/15/28 | | | | | | | 12 | | | | 12,450 | |
TRI Pointe Group, Inc., 5.25%, 06/01/27 | | | | | | | 15 | | | | 14,925 | |
TRI Pointe Group, Inc./TRI Pointe Homes, Inc., 5.88%, 06/15/24 | | | | | | | 11 | | | | 11,297 | |
Yanlord Land HK Co. Ltd.: | | | | | | | | | | | | |
6.75%, 04/23/23 | | | | | | | 200 | | | | 201,625 | |
6.80%, 02/27/24 | | | | | | | 200 | | | | 197,063 | |
| | | | | | | | | | | | |
| | | | | | | | | | | 4,877,171 | |
|
| Household Products �� 0.1% | |
ACCO Brands Corp., 5.25%, 12/15/24(c) | | | | | | | 85 | | | | 86,063 | |
Berkline Benchcraft LLC, 4.50%, 06/01/21(a)(b)(d) | | | | | | | 200 | | | | — | |
Energizer Holdings, Inc.(c): | | | | | | | | | | | | |
6.38%, 07/15/26 | | | | | | | 90 | | | | 93,056 | |
7.75%, 01/15/27(h) | | | | | | | 121 | | | | 129,019 | |
4.75%, 06/15/28(g) | | | | | | | 318 | | | | 311,948 | |
| | | | | | | | | | | | |
| | | | | | | | | | | 620,086 | |
|
| Independent Power and Renewable Electricity Producers — 1.3% | |
Azure Power Solar Energy Pvt Ltd., 5.65%, 12/24/24 | | | | | | | 200 | | | | 201,062 | |
Calpine Corp.(h) : | | | | | | | | | | | | |
5.75%, 01/15/25 | | | | | | | 608 | | | | 613,952 | |
5.25%, 06/01/26(c) | | | | | | | 718 | | | | 724,972 | |
4.50%, 02/15/28(c) | | | | | | | 581 | | | | 566,475 | |
5.13%, 03/15/28(c) | | | | | | | 1,354 | | | | 1,326,920 | |
Clearway Energy Operating LLC: | | | | | | | | | | | | |
5.75%, 10/15/25 | | | | | | | 214 | | | | 220,955 | |
4.75%, 03/15/28(c)(h) | | | | | | | 453 | | | | 462,033 | |
Genneia SA, 8.75%, 01/20/22(c) | | | | | | | 200 | | | | 160,250 | |
Greenko Solar Mauritius Ltd., 5.95%, 07/29/26 | | | | | | | 200 | | | | 196,313 | |
NRG Energy, Inc.: | | | | | | | | | | | | |
6.63%, 01/15/27(h) | | | | | | | 898 | | | | 937,287 | |
5.75%, 01/15/28 | | | | | | | 63 | | | | 66,465 | |
5.25%, 06/15/29(c)(h) | | | | | | | 856 | | | | 898,800 | |
TerraForm Power Operating LLC(c): | | | | | | | | | | | | |
4.25%, 01/31/23 | | | | | | | 184 | | | | 186,300 | |
5.00%, 01/31/28 | | | | | | | 228 | | | | 237,690 | |
4.75%, 01/15/30 | | | | | | | 334 | | | | 339,010 | |
| | | | | | | | | | | | |
| | | | | | | | | | | 7,138,484 | |
| | |
| 54 | | 2020 BLACKROCK SEMI-ANNUAL REPORTTO SHAREHOLDERS |
| | |
Schedule of Investments (unaudited) (continued) June 30, 2020 | | BlackRock Limited Duration Income Trust (BLW) (Percentages shown are based on Net Assets) |
| | | | | | | | | | | | |
| Security | | | | | Par
(000) | | | Value | |
|
| Industrial Conglomerates — 0.2% | |
BWX Technologies, Inc.(c): | | | | | | | | | | | | |
5.38%, 07/15/26 | | | USD | | | | 209 | | | $ | 215,349 | |
4.13%, 06/30/28 | | | | | | | 251 | | | | 250,372 | |
Grupo KUO SAB de CV, 5.75%, 07/07/27(c) | | | | | | | 200 | | | | 183,103 | |
Vertical US Newco, Inc., 5.25%, 07/15/27(c)(g) | | | | | | | 394 | | | | 394,000 | |
| | | | | | | | | | | | |
| | | | | | | | | | | 1,042,824 | |
|
| Insurance — 1.6% | |
Acrisure LLC/Acrisure Finance, Inc., 8.13%, 02/15/24(c) | | | | | | | 84 | | | | 87,335 | |
Alliant Holdings Intermediate LLC/Alliant Holdings Co-Issuer, 6.75%, 10/15/27(c)(h) | | | | | | | 1,289 | | | | 1,284,643 | |
Allied World Assurance Co. Holdings Ltd., 4.35%, 10/29/25(h) | | | | | | | 360 | | | | 376,744 | |
AmWINS Group, Inc., 7.75%, 07/01/26(c) | | | | | | | 221 | | | | 232,050 | |
Aon PLC, 3.88%, 12/15/25(h) | | | | | | | 1,115 | | | | 1,265,944 | |
Asahi Mutual Life Insurance Co.(5 year USD Swap + 4.59%), 6.50%(k)(l) | | | | | | | 306 | | | | 325,091 | |
Assicurazioni Generali SpA(3 mo. Euribor + 5.35%), 5.50%, 10/27/47(k) | | | EUR | | | | 100 | | | | 127,857 | |
Global Atlantic Fin Co., 8.63%, 04/15/21(c)(h) | | | USD | | | | 750 | | | | 784,818 | |
GTCR AP Finance, Inc., 8.00%, 05/15/27(c) | | | | | | | 355 | | | | 365,426 | |
HUB International Ltd., 7.00%, 05/01/26(c)(h) | | | | | | | 1,418 | | | | 1,415,022 | |
Lincoln National Corp., 3.35%, 03/09/25(h) | | | | | | | 845 | | | | 919,720 | |
Muenchener Rueckversicherungs-Gesellschaft AG in Muenchen(3 mo. Euribor + 3.50%), 6.00%, 05/26/41(k) | | | EUR | | | | 400 | | | | 469,106 | |
Nationstar Mortgage Holdings, Inc., 8.13%, 07/15/23(c)(h) | | | USD | | | | 498 | | | | 511,048 | |
Nationwide Building Society(5 year USD ICE Swap + 1.85%), 4.13%, 10/18/32(c)(h)(k) | | | | | | | 595 | | | | 644,151 | |
| | | | | | | | | | | | |
| | | | | | | | | | | 8,808,955 | |
|
| Interactive Media & Services — 1.0% | |
Go Daddy Operating Co. LLC/GD Finance Co., Inc., 5.25%, 12/01/27(c) | | | | | | | 303 | | | | 308,302 | |
Match Group Holdings II LLC(c): | | | | | | | | | | | | |
4.63%, 06/01/28 | | | | | | | 186 | | | | 187,628 | |
5.63%, 02/15/29 | | | | | | | 177 | | | | 186,581 | |
4.13%, 08/01/30 | | | | | | | 230 | | | | 225,184 | |
Netflix, Inc.: | | | | | | | | | | | | |
3.63%, 06/15/25(c) | | | | | | | 96 | | | | 96,720 | |
4.88%, 04/15/28 | | | | | | | 109 | | | | 116,550 | |
5.88%, 11/15/28(h) | | | | | | | 754 | | | | 858,617 | |
5.38%, 11/15/29(c)(h) | | | | | | | 793 | | | | 868,494 | |
3.63%, 06/15/30 | | | EUR | | | | 100 | | | | 115,440 | |
4.88%, 06/15/30(c)(h) | | | USD | | | | 515 | | | | 552,337 | |
Rackspace Hosting, Inc., 8.63%, 11/15/24(c)(h) | | | | | | | 262 | | | | 263,310 | |
Sabre GLBL, Inc., 5.25%, 11/15/23(c) | | | | | | | 43 | | | | 39,560 | |
Twitter, Inc., 3.88%, 12/15/27(c) | | | | | | | 129 | | | | 129,013 | |
Uber Technologies, Inc.(c)(h): | | | | | | | | | | | | |
7.50%, 11/01/23 | | | | | | | 280 | | | | 282,800 | |
7.50%, 05/15/25 | | | | | | | 724 | | | | 729,430 | |
8.00%, 11/01/26 | | | | | | | 129 | | | | 131,258 | |
7.50%, 09/15/27 | | | | | | | 229 | | | | 229,572 | |
| | | | | | | | | | | | |
| | | | | | | | | | | 5,320,796 | |
|
| Internet & Direct Marketing Retail — 0.3% | |
Booking Holdings, Inc., 4.10%, 04/13/25 | | | | | | | 493 | | | | 553,333 | |
Expedia Group, Inc., 6.25%, 05/01/25(c)(h) | | | | | | | 1,067 | | | | 1,136,646 | |
| | | | | | | | | | | | |
| | | | | | | | | | | 1,689,979 | |
|
| IT Services — 0.9% | |
21Vianet Group, Inc., 7.88%, 10/15/21 | | | | | | | 200 | | | | 201,952 | |
Banff Merger Sub, Inc., 9.75%, 09/01/26(c)(h) | | | | | | | 1,511 | | | | 1,520,444 | |
| | | | | | | | | | | | |
| Security | | | | | Par
(000) | | | Value | |
|
| IT Services (continued) | |
Camelot Finance SA, 4.50%, 11/01/26(c)(h) | | | USD | | | | 679 | | | $ | 679,000 | |
Fair Isaac Corp., 4.00%, 06/15/28(c) | | | | | | | 169 | | | | 169,422 | |
Fiserv, Inc., 2.25%, 06/01/27 | | | | | | | 644 | | | | 673,427 | |
Gartner, Inc.(c): | | | | | | | | | | | | |
5.13%, 04/01/25 | | | | | | | 174 | | | | 178,185 | |
4.50%, 07/01/28 | | | | | | | 341 | | | | 344,990 | |
Leidos, Inc., 4.38%, 05/15/30(c) | | | | | | | 325 | | | | 366,096 | |
Outfront Media Capital LLC/Outfront Media Capital Corp., 5.00%, 08/15/27(c) | | | | | | | 413 | | | | 371,700 | |
Science Applications International Corp., 4.88%, 04/01/28(c) | | | | | | | 254 | | | | 252,491 | |
WEX, Inc., 4.75%, 02/01/23(c) | | | | | | | 203 | | | | 201,551 | |
Xerox Corp., 4.80%, 03/01/35 | | | | | | | 203 | | | | 189,255 | |
| | | | | | | | | | | | |
| | | | | | | | | | | 5,148,513 | |
|
| Leisure Products — 0.2% | |
Mattel, Inc.: | | | | | | | | | | | | |
6.75%, 12/31/25(c)(h) | | | | | | | 638 | | | | 661,925 | |
5.88%, 12/15/27(c) | | | | | | | 293 | | | | 301,790 | |
6.20%, 10/01/40 | | | | | | | 24 | | | | 20,760 | |
5.45%, 11/01/41 | | | | | | | 110 | | | | 91,265 | |
| | | | | | | | | | | | |
| | | | | | | | | | | 1,075,740 | |
|
| Machinery — 0.5% | |
Colfax Corp.(c): | | | | | | | | | | | | |
6.00%, 02/15/24 | | | | | | | 432 | | | | 445,500 | |
6.38%, 02/15/26 | | | | | | | 170 | | | | 177,650 | |
Mueller Water Products, Inc., 5.50%, 06/15/26(c) | | | | | | | 336 | | | | 347,760 | |
Navistar International Corp., 6.63%, 11/01/25(c) | | | | | | | 362 | | | | 342,995 | |
RBS Global, Inc./Rexnord LLC, 4.88%, 12/15/25(c) | | | | | | | 353 | | | | 354,765 | |
SPX FLOW, Inc., 5.63%, 08/15/24(c) | | | | | | | 206 | | | | 210,635 | |
Terex Corp., 5.63%, 02/01/25(c)(h) | | | | | | | 324 | | | | 294,840 | |
Titan Acquisition Ltd./Titan Co-Borrower LLC, 7.75%, 04/15/26(c)(h) | | | | | | | 659 | | | | 623,579 | |
Wabash National Corp., 5.50%, 10/01/25(c) | | | | | | | 241 | | | | 221,117 | |
| | | | | | | | | | | | |
| | | | | | | | | | | 3,018,841 | |
|
| Media — 8.8% | |
Altice Financing SA: | | | | | | | | | | | | |
7.50%, 05/15/26(c)(h) | | | | | | | 1,143 | | | | 1,197,292 | |
3.00%, 01/15/28 | | | EUR | | | | 100 | | | | 103,081 | |
5.00%, 01/15/28(c) | | | USD | | | | 378 | | | | 375,490 | |
Altice France SA: | | | | | | | | | | | | |
7.38%, 05/01/26(c)(h) | | | | | | | 2,104 | | | | 2,194,051 | |
5.88%, 02/01/27 | | | EUR | | | | 100 | | | | 118,012 | |
8.13%, 02/01/27(c)(h) | | | USD | | | | 707 | | | | 773,281 | |
5.50%, 01/15/28(c)(h) | | | | | | | 581 | | | | 586,810 | |
AMC Networks, Inc., 4.75%, 08/01/25 | | | | | | | 222 | | | | 218,714 | |
Block Communications, Inc., 4.88%, 03/01/28(c) | | | | | | | 128 | | | | 126,437 | |
Cable Onda SA, 4.50%, 01/30/30 | | | | | | | 215 | | | | 218,548 | |
CCO Holdings LLC/CCO Holdings Capital Corp.(c): | | | | | | | | | | | | |
4.00%, 03/01/23(h) | | | | | | | 670 | | | | 671,675 | |
5.13%, 05/01/27(h) | | | | | | | 1,008 | | | | 1,042,877 | |
5.88%, 05/01/27 | | | | | | | 349 | | | | 364,164 | |
5.00%, 02/01/28 | | | | | | | 34 | | | | 35,105 | |
5.38%, 06/01/29(h) | | | | | | | 1,248 | | | | 1,316,640 | |
4.75%, 03/01/30 | | | | | | | 147 | | | | 150,409 | |
4.50%, 08/15/30(h) | | | | | | | 1,354 | | | | 1,381,080 | |
4.50%, 05/01/32(h) | | | | | | | 1,260 | | | | 1,275,750 | |
Charter Communications Operating LLC/Charter Communications Operating Capital, 4.91%, 07/23/25(h) | | | | | | | 2,425 | | | | 2,779,252 | |
Clear Channel Worldwide Holdings, Inc.(h): | | | | | | | | | | | | |
9.25%, 02/15/24 | | | | | | | 811 | | | | 752,284 | |
5.13%, 08/15/27(c) | | | | | | | 1,774 | | | | 1,703,040 | |
| | |
SCHEDULES OF INVESTMENTS | | 55 |
| | |
Schedule of Investments (unaudited) (continued) June 30, 2020 | | BlackRock Limited Duration Income Trust (BLW) (Percentages shown are based on Net Assets) |
| | | | | | | | | | | | |
| Security | | | | | Par
(000) | | | Value | |
|
| Media (continued) | |
Comcast Corp., 3.95%, 10/15/25(h) | | | USD | | | | 3,000 | | | $ | 3,437,843 | |
Connect Finco Sarl/Connect US Finco LLC, 6.75%, 10/01/26(c)(h) | | | | | | | 1,866 | | | | 1,768,035 | |
CSC Holdings LLC: | | | | | | | | | | | | |
6.75%, 11/15/21 | | | | | | | 187 | | | | 196,296 | |
5.38%, 07/15/23(c)(h) | | | | | | | 1,109 | | | | 1,124,748 | |
5.25%, 06/01/24 | | | | | | | 123 | | | | 129,458 | |
7.75%, 07/15/25(c) | | | | | | | 202 | | | | 210,100 | |
6.63%, 10/15/25(c)(h) | | | | | | | 235 | | | | 244,106 | |
10.88%, 10/15/25(c)(h) | | | | | | | 1,614 | | | | 1,735,050 | |
5.50%, 05/15/26(c)(h) | | | | | | | 200 | | | | 205,274 | |
5.38%, 02/01/28(c) | | | | | | | 200 | | | | 209,000 | |
6.50%, 02/01/29(c)(h) | | | | | | | 865 | | | | 946,094 | |
5.75%, 01/15/30(c)(h) | | | | | | | 862 | | | | 897,773 | |
4.13%, 12/01/30(c)(h) | | | | | | | 597 | | | | 591,776 | |
4.63%, 12/01/30(c) | | | | | | | 318 | | | | 308,892 | |
Diamond Sports Group LLC/Diamond Sports Finance Co., 5.38%, 08/15/26(c)(h) | | | | | | | 590 | | | | 427,013 | |
Discovery Communications LLC(h): | | | | | | | | | | | | |
3.25%, 04/01/23 | | | | | | | 1,490 | | | | 1,565,615 | |
3.45%, 03/15/25 | | | | | | | 170 | | | | 185,543 | |
DISH DBS Corp.: | | | | | | | | | | | | |
6.75%, 06/01/21(h) | | | | | | | 627 | | | | 638,756 | |
5.88%, 07/15/22(h) | | | | | | | 1,396 | | | | 1,419,453 | |
5.00%, 03/15/23 | | | | | | | 358 | | | | 357,141 | |
7.75%, 07/01/26 | | | | | | | 471 | | | | 499,260 | |
DISH Network Corp.(o): | | | | | | | | | | | | |
2.38%, 03/15/24 | | | | | | | 312 | | | | 279,192 | |
3.38%, 08/15/26 | | | | | | | 385 | | | | 353,667 | |
Dolya Holdco 18 DAC, 5.00%, 07/15/28(c) | | | | | | | 754 | | | | 744,349 | |
Entercom Media Corp., 6.50%, 05/01/27(c) | | | | | | | 286 | | | | 256,685 | |
Hughes Satellite Systems Corp., 5.25%, 08/01/26 | | | | | | | 177 | | | | 183,053 | |
iHeartCommunications, Inc.: | | | | | | | | | | | | |
6.38%, 05/01/26 | | | | | | | 264 | | | | 261,529 | |
5.25%, 08/15/27(c) | | | | | | | 122 | | | | 116,815 | |
4.75%, 01/15/28(c) | | | | | | | 78 | | | | 71,955 | |
Intelsat Jackson Holdings SA, 8.00%, 02/15/24(c)(h) | | | | | | | 476 | | | | 482,750 | |
Lamar Media Corp.: | | | | | | | | | | | | |
5.75%, 02/01/26 | | | | | | | 124 | | | | 127,921 | |
4.88%, 01/15/29(c) | | | | | | | 75 | | | | 75,375 | |
4.00%, 02/15/30(c) | | | | | | | 126 | | | | 120,607 | |
LCPR Senior Secured Financing DAC, 6.75%, 10/15/27(c)(h) | | | | | | | 600 | | | | 612,000 | |
Live Nation Entertainment, Inc.,
6.50%, 05/15/27(c)(h) | | | | | | | 947 | | | | 975,410 | |
Meredith Corp., 6.88%, 02/01/26 | | | | | | | 56 | | | | 46,565 | |
Midcontinent Communications/Midcontinent Finance Corp., 5.38%, 08/15/27(c) | | | | | | | 177 | | | | 179,722 | |
Network i2i Ltd.(5 year CMT + 4.27%), 5.65%(k)(l) | | | | | | | 250 | | | | 241,797 | |
Qualitytech LP/QTS Finance Corp.,
4.75%, 11/15/25(c) | | | | | | | 146 | | | | 148,994 | |
Radiate Holdco LLC/Radiate Finance, Inc.(c): | | | | | | | | | | | | |
6.88%, 02/15/23 | | | | | | | 113 | | | | 114,413 | |
6.63%, 02/15/25 | | | | | | | 137 | | | | 136,344 | |
Sable International Finance Ltd., 5.75%, 09/07/27(c) | | | | | | | 200 | | | | 203,576 | |
Sirius XM Radio, Inc.(c): | | | | | | | | | | | | |
5.00%, 08/01/27 | | | | | | | 322 | | | | 329,107 | |
5.50%, 07/01/29(h) | | | | | | | 887 | | | | 933,674 | |
4.13%, 07/01/30 | | | | | | | 449 | | | | 444,043 | |
TEGNA, Inc., 5.50%, 09/15/24(c) | | | | | | | 66 | | | | 66,660 | |
Telenet Finance Luxembourg Notes Sarl, 5.50%, 03/01/28(c) | | | | | | | 200 | | | | 208,500 | |
| | | | | | | | | | | | |
| Security | | | | | Par
(000) | | | Value | |
|
| Media (continued) | |
Terrier Media Buyer, Inc., 8.88%, 12/15/27(c) | | | USD | | | | 490 | | | $ | 469,787 | |
Tower Bersama Infrastructure Tbk PT, 4.25%, 01/21/25 | | | | | | | 200 | | | | 198,692 | |
United Group BV, 3.63%, 02/15/28 | | | EUR | | | | 100 | | | | 105,103 | |
Univision Communications, Inc.(c): | | | | | | | | | | | | |
5.13%, 05/15/23(h) | | | USD | | | | 366 | | | | 369,367 | |
5.13%, 02/15/25 | | | | | | | 133 | | | | 125,270 | |
6.63%, 06/01/27 | | | | | | | 132 | | | | 126,060 | |
Videotron Ltd., 5.13%, 04/15/27(c) | | | | | | | 439 | | | | 455,520 | |
Virgin Media Secured Finance PLC(c): | | | | | | | | | | | | |
5.50%, 08/15/26 | | | | | | | 200 | | | | 204,588 | |
5.50%, 05/15/29 | | | | | | | 400 | | | | 418,000 | |
4.50%, 08/15/30 | | | | | | | 346 | | | | 346,433 | |
Zayo Group Holdings Inc, 6.13%, 03/01/28(c)(h) | | | | | | | 1,204 | | | | 1,170,890 | |
Zayo Group Holdings, Inc., 4.00%, 03/01/27(c)(h) | | | | | | | 2,044 | | | | 1,944,989 | |
Ziggo Bond Co. BV(c): | | | | | | | | | | | | |
6.00%, 01/15/27 | | | | | | | 199 | | | | 201,985 | |
5.13%, 02/28/30 | | | | | | | 225 | | | | 223,245 | |
Ziggo BV: | | | | | | | | | | | | |
4.25%, 01/15/27 | | | EUR | | | | 90 | | | | 104,007 | |
5.50%, 01/15/27(c)(h) | | | USD | | | | 599 | | | | 606,523 | |
4.88%, 01/15/30(c) | | | | | | | 200 | | | | 201,084 | |
| | | | | | | | | | | | |
| | | | | | | | | | | 49,467,464 | |
|
| Metals & Mining — 2.0% | |
ABJA Investment Co. Pte Ltd., 5.95%, 07/31/24 | | | | | | | 250 | | | | 247,031 | |
ArcelorMittal SA, 1.75%, 11/19/25 | | | EUR | | | | 100 | | | | 106,836 | |
Arconic Corp.(c): | | | | | | | | | | | | |
6.00%, 05/15/25 | | | USD | | | | 360 | | | | 372,150 | |
6.13%, 02/15/28 | | | | | | | 222 | | | | 221,945 | |
Big River Steel LLC/BRS Finance Corp., 7.25%, 09/01/25(c) | | | | | | | 244 | | | | 233,020 | |
Constellium SE(c): | | | | | | | | | | | | |
5.75%, 05/15/24(h) | | | | | | | 506 | | | | 506,000 | |
6.63%, 03/01/25(h) | | | | | | | 1,269 | | | | 1,283,302 | |
5.88%, 02/15/26(h) | | | | | | | 838 | | | | 840,237 | |
5.63%, 06/15/28 | | | | | | | 250 | | | | 245,000 | |
Freeport-McMoRan, Inc.: | | | | | | | | | | | | |
3.55%, 03/01/22 | | | | | | | 91 | | | | 91,000 | |
3.88%, 03/15/23 | | | | | | | 1,119 | | | | 1,119,000 | |
4.25%, 03/01/30 | | | | | | | 386 | | | | 374,420 | |
5.40%, 11/14/34 | | | | | | | 161 | | | | 159,138 | |
5.45%, 03/15/43 | | | | | | | 1,990 | | | | 1,950,200 | |
Gold Fields Orogen Holdings BVI Ltd., 5.13%, 05/15/24(c) | | | | | | | 200 | | | | 214,625 | |
Grinding Media, Inc./Moly-Cop AltaSteel Ltd., 7.38%, 12/15/23(c) | | | | | | | 371 | | | | 369,145 | |
Joseph T Ryerson & Son, Inc., 11.00%, 05/15/22(c) | | | | | | | 135 | | | | 137,871 | |
JSW Steel Ltd., 5.95%, 04/18/24 | | | | | | | 200 | | | | 191,750 | |
Kaiser Aluminum Corp.(c): | | | | | | | | | | | | |
6.50%, 05/01/25 | | | | | | | 103 | | | | 106,476 | |
4.63%, 03/01/28 | | | | | | | 143 | | | | 136,754 | |
New Gold, Inc., 7.50%, 07/15/27(c) | | | | | | | 308 | | | | 317,761 | |
Nexa Resources SA, 5.38%, 05/04/27(c) | | | | | | | 237 | | | | 229,031 | |
Novelis Corp.(c): | | | | | | | | | | | | |
5.88%, 09/30/26(h) | | | | | | | 502 | | | | 501,372 | |
4.75%, 01/30/30 | | | | | | | 881 | | | | 841,355 | |
thyssenkrupp AG: | | | | | | | | | | | | |
1.88%, 03/06/23 | | | EUR | | | | 43 | | | | 46,328 | |
2.88%, 02/22/24 | | | | | | | 84 | | | | 90,790 | |
Vale Overseas Ltd., 6.25%, 08/10/26(h) | | | USD | | | | 188 | | | | 221,018 | |
Vedanta Resources Finance II PLC,
8.00%, 04/23/23 | | | | | | | 313 | | | | 228,247 | |
| | | | | | | | | | | | |
| | | | | | | | | | | 11,381,802 | |
| | |
| 56 | | 2020 BLACKROCK SEMI-ANNUAL REPORTTO SHAREHOLDERS |
| | |
Schedule of Investments (unaudited) (continued) June 30, 2020 | | BlackRock Limited Duration Income Trust (BLW) (Percentages shown are based on Net Assets) |
| | | | | | | | | | | | |
| Security | | | | | Par
(000) | | | Value | |
|
| Multi-Utilities — 0.3% | |
Brooklyn Union Gas Co., 3.41%, 03/10/26(c)(h) | | | USD | | | | 1,475 | | | $ | 1,620,387 | |
| | | | | | | | | | | | |
|
| Multiline Retail — 0.1% | |
Dufry One BV, 2.00%, 02/15/27 | | | EUR | | | | 100 | | | | 87,024 | |
Future Retail Ltd., 5.60%, 01/22/25 | | | USD | | | | 200 | | | | 132,000 | |
Nordstrom, Inc., 8.75%, 05/15/25(c) | | | | | | | 136 | | | | 146,356 | |
| | | | | | | | | | | | |
| | | | | | | | | | | 365,380 | |
|
| Oil, Gas & Consumable Fuels — 7.0% | |
Apache Corp.: | | | | | | | | | | | | |
3.25%, 04/15/22 | | | | | | | 10 | | | | 9,677 | |
5.25%, 02/01/42 | | | | | | | 30 | | | | 24,484 | |
4.75%, 04/15/43 | | | | | | | 321 | | | | 258,433 | |
4.25%, 01/15/44 | | | | | | | 421 | | | | 320,097 | |
5.35%, 07/01/49 | | | | | | | 72 | | | | 57,451 | |
Ascent Resources Utica Holdings LLC/ARU Finance Corp., 10.00%, 04/01/22(c) | | | | | | | 489 | | | | 416,873 | |
Bioceanico Sovereign Certificate Ltd.,
0.00%, 06/05/34(n) | | | | | | | 149 | | | | 106,969 | |
Buckeye Partners LP: | | | | | | | | | | | | |
4.13%, 03/01/25(c) | | | | | | | 262 | | | | 251,329 | |
4.50%, 03/01/28(c) | | | | | | | 362 | | | | 338,470 | |
5.85%, 11/15/43 | | | | | | | 130 | | | | 112,814 | |
5.60%, 10/15/44 | | | | | | | 146 | | | | 116,800 | |
Callon Petroleum Co.: | | | | | | | | | | | | |
6.13%, 10/01/24 | | | | | | | 208 | | | | 78,052 | |
8.25%, 07/15/25 | | | | | | | 243 | | | | 85,050 | |
Series WI, 6.38%, 07/01/26 | | | | | | | 192 | | | | 63,360 | |
Carrizo Oil & Gas, Inc., 6.25%, 04/15/23 | | | | | | | 372 | | | | 140,902 | |
Cenovus Energy, Inc.: | | | | | | | | | | | | |
3.00%, 08/15/22 | | | | | | | 84 | | | | 81,685 | |
3.80%, 09/15/23 | | | | | | | 48 | | | | 45,136 | |
5.40%, 06/15/47 | | | | | | | 34 | | | | 29,188 | |
Centennial Resource Production LLC, 6.88%, 04/01/27(c) | | | | | | | 255 | | | | 135,150 | |
Cheniere Corpus Christi Holdings LLC, 5.13%, 06/30/27(h) | | | | | | | 518 | | | | 569,215 | |
Cheniere Energy Partners LP: | | | | | | | | | | | | |
5.63%, 10/01/26 | | | | | | | 173 | | | | 172,135 | |
Series WI, 5.25%, 10/01/25 | | | | | | | 48 | | | | 47,842 | |
Cheniere Energy, Inc., (4.88% PIK), 4.88%, 05/28/21(c)(i)(o) | | | | | | | 512 | | | | 516,966 | |
Citgo Holding, Inc., 9.25%, 08/01/24(c) | | | | | | | 228 | | | | 226,860 | |
CNX Resources Corp.: | | | | | | | | | | | | |
5.88%, 04/15/22(h) | | | | | | | 762 | | | | 884,218 | |
7.25%, 03/14/27(c) | | | | | | | 44 | | | | 40,480 | |
Comstock Resources, Inc.: | | | | | | | | | | | | |
7.50%, 05/15/25(c) | | | | | | | 466 | | | | 422,313 | |
9.75%, 08/15/26 | | | | | | | 386 | | | | 360,290 | |
Continental Resources, Inc.: | | | | | | | | | | | | |
5.00%, 09/15/22 | | | | | | | 428 | | | | 420,510 | |
4.50%, 04/15/23 | | | | | | | 142 | | | | 135,922 | |
4.90%, 06/01/44 | | | | | | | 233 | | | | 185,526 | |
Crestwood Midstream Partners LP/Crestwood Midstream Finance Corp.: | | | | | | | | | | | | |
6.25%, 04/01/23 | | | | | | | 21 | | | | 18,690 | |
5.63%, 05/01/27(c) | | | | | | | 361 | | | | 300,962 | |
CrownRock LP/CrownRock Finance, Inc., 5.63%, 10/15/25(c)(h) | | | | | | | 1,188 | | | | 1,064,745 | |
CVR Energy, Inc.(c): | | | | | | | | | | | | |
5.25%, 02/15/25 | | | | | | | 231 | | | | 212,520 | |
5.75%, 02/15/28 | | | | | | | 77 | | | | 67,375 | |
DCP Midstream Operating LP: | | | | | | | | | | | | |
5.38%, 07/15/25(h) | | | | | | | 188 | | | | 186,590 | |
5.63%, 07/15/27 | | | | | | | 201 | | | | 202,256 | |
| | | | | | | | | | | | |
| Security | | | | | Par
(000) | | | Value | |
|
| Oil, Gas & Consumable Fuels (continued) | |
5.13%, 05/15/29 | | | USD | | | | 99 | | | $ | 94,979 | |
6.45%, 11/03/36(c) | | | | | | | 226 | | | | 203,400 | |
6.75%, 09/15/37(c)(h) | | | | | | | 392 | | | | 351,738 | |
Diamondback Energy, Inc., 3.50%, 12/01/29 | | | | | | | 440 | | | | 426,171 | |
eG Global Finance PLC: | | | | | | | | | | | | |
6.75%, 02/07/25(c) | | | | | | | 396 | | | | 386,595 | |
6.25%, 10/30/25 | | | EUR | | | | 142 | | | | 154,751 | |
8.50%, 10/30/25(c) | | | USD | | | | 252 | | | | 258,300 | |
Enbridge, Inc.(3 mo. LIBOR US + 3.64%), 6.25%, 03/01/78(h)(k) | | | | | | | 1,565 | | | | 1,541,525 | |
Endeavor Energy Resources LP/EER Finance, Inc.(c): | | | | | | | | | | | | |
6.63%, 07/15/25 | | | | | | | 206 | | | | 207,611 | |
5.50%, 01/30/26(h) | | | | | | | 779 | | | | 745,892 | |
5.75%, 01/30/28 | | | | | | | 408 | | | | 391,680 | |
Energy Transfer Operating LP: | | | | | | | | | | | | |
3.75%, 05/15/30 | | | | | | | 75 | | | | 74,494 | |
5.00%, 05/15/50 | | | | | | | 196 | | | | 186,154 | |
Series 30Y, 6.00%, 06/15/48 | | | | | | | 136 | | | | 141,056 | |
EnLink Midstream LLC, 5.38%, 06/01/29 | | | | | | | 82 | | | | 61,500 | |
EnLink Midstream Partners LP: | | | | | | | | | | | | |
4.40%, 04/01/24 | | | | | | | 240 | | | | 199,320 | |
4.15%, 06/01/25 | | | | | | | 17 | | | | 13,090 | |
4.85%, 07/15/26 | | | | | | | 99 | | | | 73,290 | |
5.60%, 04/01/44 | | | | | | | 176 | | | | 107,360 | |
5.05%, 04/01/45 | | | | | | | 28 | | | | 17,438 | |
EQM Midstream Partners LP: | | | | | | | | | | | | |
6.00%, 07/01/25(c) | | | | | | | 320 | | | | 324,134 | |
4.13%, 12/01/26 | | | | | | | 100 | | | | 91,687 | |
6.50%, 07/01/27(c) | | | | | | | 356 | | | | 364,622 | |
EQT Corp.: | | | | | | | | | | | | |
3.90%, 10/01/27 | | | | | | | 325 | | | | 263,994 | |
7.00%, 02/01/30 | | | | | | | 197 | | | | 202,916 | |
Extraction Oil & Gas, Inc.(b)(c)(j): | | | | | | | | | | | | |
7.38%, 05/15/24 | | | | | | | 302 | | | | 58,135 | |
5.63%, 02/01/26 | | | | | | | 572 | | | | 110,110 | |
Genesis Energy LP/Genesis Energy Finance Corp.: | | | | | | | | | | | | |
6.00%, 05/15/23 | | | | | | | 141 | | | | 126,900 | |
5.63%, 06/15/24 | | | | | | | 169 | | | | 147,030 | |
6.50%, 10/01/25 | | | | | | | 46 | | | | 39,330 | |
7.75%, 02/01/28 | | | | | | | 118 | | | | 105,020 | |
Geopark Ltd., 6.50%, 09/21/24(c) | | | | | | | 200 | | | | 182,938 | |
GMR Hyderabad International Airport Ltd., 4.25%, 10/27/27 | | | | | | | 200 | | | | 176,625 | |
Great Western Petroleum LLC/Great Western Finance, Inc., 9.00%, 09/30/21(c) | | | | | | | 484 | | | | 290,400 | |
Hess Corp.: | | | | | | | | | | | | |
4.30%, 04/01/27 | | | | | | | 50 | | | | 51,778 | |
5.80%, 04/01/47 | | | | | | | 36 | | | | 39,127 | |
Hess Midstream Operations LP, 5.63%, 02/15/26(c) | | | | | | | 210 | | | | 207,793 | |
Hilong Holding Ltd., 8.25%, 09/26/22 | | | | | | | 200 | | | | 75,000 | |
HPCL-Mittal Energy Ltd., 5.45%, 10/22/26 | | | | | | | 200 | | | | 189,438 | |
Impulsora Pipeline LLC, 6.05%, 12/31/42(a) | | | | | | | 1,452 | | | | 1,548,685 | |
Indigo Natural Resources LLC,
6.88%, 02/15/26(c)(h) | | | | | | | 514 | | | | 478,020 | |
Matador Resources Co., 5.88%, 09/15/26(h) | | | | | | | 563 | | | | 416,620 | |
Medco Bell Pte Ltd., 6.38%, 01/30/27 | | | | | | | 250 | | | | 210,391 | |
MEG Energy Corp.(c): | | | | | | | | | | | | |
7.00%, 03/31/24 | | | | | | | 290 | | | | 248,675 | |
6.50%, 01/15/25(h) | | | | | | | 635 | | | | 592,531 | |
7.13%, 02/01/27 | | | | | | | 9 | | | | 7,481 | |
MPLX LP, 4.25%, 12/01/27 | | | | | | | 185 | | | | 200,571 | |
| | |
SCHEDULES OF INVESTMENTS | | 57 |
| | |
Schedule of Investments (unaudited) (continued) June 30, 2020 | | BlackRock Limited Duration Income Trust (BLW) (Percentages shown are based on Net Assets) |
| | | | | | | | | | | | |
| Security | | | | | Par
(000) | | | Value | |
|
| Oil, Gas & Consumable Fuels (continued) | |
Murphy Oil Corp.: | | | | | | | | | | | | |
5.75%, 08/15/25 | | | USD | | | | 119 | | | $ | 106,505 | |
6.38%, 12/01/42 | | | | | | | 29 | | | | 22,501 | |
Nabors Industries Ltd.(c): | | | | | | | | | | | | |
7.25%, 01/15/26 | | | | | | | 101 | | | | 62,115 | |
7.50%, 01/15/28 | | | | | | | 78 | | | | 47,970 | |
Neptune Energy Bondco PLC, 6.63%, 05/15/25(c) | | | | | | | 200 | | | | 174,000 | |
NGPL PipeCo LLC, 7.77%, 12/15/37(c) | | | | | | | 227 | | | | 277,053 | |
NuStar Logistics LP, 6.00%, 06/01/26 | | | | | | | 163 | | | | 158,110 | |
Occidental Petroleum Corp.: | | | | | | | | | | | | |
4.85%, 03/15/21 | | | | | | | 54 | | | | 53,595 | |
2.60%, 08/13/21(h) | | | | | | | 613 | | | | 599,079 | |
2.70%, 08/15/22 | | | | | | | 450 | | | | 418,928 | |
2.90%, 08/15/24 | | | | | | | 260 | | | | 222,165 | |
3.20%, 08/15/26 | | | | | | | 40 | | | | 32,500 | |
3.00%, 02/15/27 | | | | | | | 17 | | | | 13,178 | |
3.50%, 08/15/29 | | | | | | | 64 | | | | 46,822 | |
4.30%, 08/15/39 | | | | | | | 482 | | | | 332,440 | |
6.20%, 03/15/40(h) | | | | | | | 714 | | | | 597,975 | |
4.50%, 07/15/44 | | | | | | | 196 | | | | 135,240 | |
4.63%, 06/15/45 | | | | | | | 464 | | | | 324,800 | |
6.60%, 03/15/46 | | | | | | | 26 | | | | 22,632 | |
4.40%, 04/15/46 | | | | | | | 455 | | | | 317,372 | |
4.10%, 02/15/47 | | | | | | | 48 | | | | 32,340 | |
4.20%, 03/15/48 | | | | | | | 324 | | | | 219,413 | |
4.40%, 08/15/49 | | | | | | | 104 | | | | 71,760 | |
Series 1, 4.10%, 02/01/21(h) | | | | | | | 455 | | | | 456,820 | |
Odebrecht Offshore Drilling Finance Ltd.(c): | | | | | | | | | | | | |
6.72%, 12/01/22 | | | BRL | | | | 57 | | | | 46,788 | |
(7.72% PIK), 7.72%, 12/01/26(i) | | | | | | | 9 | | | | 724 | |
Parsley Energy LLC/Parsley Finance Corp.(c): | | | | | | | | | | | | |
5.38%, 01/15/25 | | | USD | | | | 251 | | | | 244,173 | |
5.25%, 08/15/25 | | | | | | | 59 | | | | 56,661 | |
5.63%, 10/15/27 | | | | | | | 271 | | | | 266,935 | |
4.13%, 02/15/28 | | | | | | | 281 | | | | 254,305 | |
PDC Energy, Inc.: | | | | | | | | | | | | |
6.25%, 12/01/25 | | | | | | | 122 | | | | 102,785 | |
1.13%, 09/15/21(o) | | | | | | | 922 | | | | 844,535 | |
6.13%, 09/15/24 | | | | | | | 151 | | | | 140,430 | |
5.75%, 05/15/26 | | | | | | | 133 | | | | 121,030 | |
Pertamina Persero PT, 4.30%, 05/20/23 | | | | | | | 200 | | | | 210,750 | |
Petrobras Global Finance BV: | | | | | | | | | | | | |
5.30%, 01/27/25 | | | | | | | 500 | | | | 518,281 | |
6.00%, 01/27/28 | | | | | | | 189 | | | | 197,382 | |
5.60%, 01/03/31 | | | | | | | 321 | | | | 322,445 | |
7.25%, 03/17/44 | | | | | | | 212 | | | | 229,821 | |
Petroleos Mexicanos, 6.88%, 08/04/26 | | | | | | | 375 | | | | 354,281 | |
Puma International Financing SA,
5.13%, 10/06/24(c) | | | | | | | 200 | | | | 171,500 | |
QEP Resources, Inc.: | | | | | | | | | | | | |
6.88%, 03/01/21 | | | | | | | 456 | | | | 435,480 | |
5.38%, 10/01/22 | | | | | | | 178 | | | | 135,280 | |
5.25%, 05/01/23 | | | | | | | 138 | | | | 91,080 | |
5.63%, 03/01/26(h) | | | | | | | 164 | | | | 104,140 | |
Range Resources Corp.: | | | | | | | | | | | | |
5.88%, 07/01/22 | | | | | | | 44 | | | | 40,480 | |
5.00%, 08/15/22 | | | | | | | 252 | | | | 229,320 | |
5.00%, 03/15/23(h) | | | | | | | 290 | | | | 249,400 | |
Sabine Pass Liquefaction LLC, 4.50%, 05/15/30(c) | | | | | | | 112 | | | | 124,343 | |
Saudi Arabian Oil Co., 3.50%, 04/16/29 | | | | | | | 400 | | | | 431,750 | |
SM Energy Co., 10.00%, 01/15/25(c) | | | | | | | 502 | | | | 476,589 | |
Southwestern Energy Co.: | | | | | | | | | | | | |
4.10%, 03/15/22 | | | | | | | 252 | | | | 240,559 | |
6.20%, 01/23/25 | | | | | | | 125 | | | | 107,031 | |
7.50%, 04/01/26 | | | | | | | 88 | | | | 77,026 | |
| | | | | | | | | | | | |
| Security | | | | | Par
(000) | | | Value | |
|
| Oil, Gas & Consumable Fuels (continued) | |
Sunoco Logistics Partners Operations LP: | | | | | | | | | | | | |
3.90%, 07/15/26(h) | | | USD | | | | 235 | | | $ | 246,836 | |
5.40%, 10/01/47 | | | | | | | 93 | | | | 93,048 | |
Sunoco LP/Sunoco Finance Corp.: | | | | | | | | | | | | |
6.00%, 04/15/27 | | | | | | | 63 | | | | 62,370 | |
Series WI, 4.88%, 01/15/23 | | | | | | | 213 | | | | 209,805 | |
Series WI, 5.50%, 02/15/26 | | | | | | | 33 | | | | 32,010 | |
Series WI, 5.88%, 03/15/28 | | | | | | | 124 | | | | 123,090 | |
Tallgrass Energy Partners LP/Tallgrass Energy Finance Corp., 5.50%, 09/15/24(c)(h) | | | | | | | 462 | | | | 417,218 | |
Targa Resources Partners LP/Targa Resources Partners Finance Corp.: | | | | | | | | | | | | |
5.13%, 02/01/25 | | | | | | | 118 | | | | 113,575 | |
5.88%, 04/15/26 | | | | | | | 304 | | | | 300,960 | |
5.38%, 02/01/27 | | | | | | | 2 | | | | 1,930 | |
6.50%, 07/15/27 | | | | | | | 195 | | | | 195,488 | |
5.00%, 01/15/28 | | | | | | | 359 | | | | 337,596 | |
6.88%, 01/15/29(h) | | | | | | | 696 | | | | 729,060 | |
5.50%, 03/01/30(c) | | | | | | | 364 | | | | 351,486 | |
Transcontinental Gas Pipe Line Co. LLC, 4.00%, 03/15/28(h) | | | | | | | 280 | | | | 313,473 | |
Viper Energy Partners LP, 5.38%, 11/01/27(c) | | | | | | | 123 | | | | 120,653 | |
Western Midstream Operating LP: | | | | | | | | | | | | |
4.00%, 07/01/22 | | | | | | | 43 | | | | 42,862 | |
3.95%, 06/01/25 | | | | | | | 181 | | | | 169,546 | |
4.65%, 07/01/26 | | | | | | | 131 | | | | 125,472 | |
3.10%, 02/01/25 | | | | | | | 77 | | | | 72,958 | |
4.75%, 08/15/28 | | | | | | | 66 | | | | 63,195 | |
4.05%, 02/01/30 | | | | | | | 171 | | | | 164,603 | |
5.45%, 04/01/44 | | | | | | | 329 | | | | 273,991 | |
5.30%, 03/01/48 | | | | | | | 372 | | | | 301,785 | |
5.50%, 08/15/48 | | | | | | | 63 | | | | 51,030 | |
5.25%, 02/01/50 | | | | | | | 318 | | | | 275,165 | |
WPX Energy, Inc.: | | | | | | | | | | | | |
8.25%, 08/01/23 | | | | | | | 100 | | | | 111,000 | |
5.25%, 09/15/24 | | | | | | | 84 | | | | 82,740 | |
5.75%, 06/01/26 | | | | | | | 61 | | | | 59,170 | |
5.25%, 10/15/27 | | | | | | | 104 | | | | 97,156 | |
5.88%, 06/15/28 | | | | | | | 204 | | | | 196,034 | |
4.50%, 01/15/30(h) | | | | | | | 499 | | | | 439,120 | |
YPF SA: | | | | | | | | | | | | |
8.75%, 04/04/24(c) | | | | | | | 400 | | | | 322,200 | |
8.50%, 07/28/25 | | | | | | | 250 | | | | 185,784 | |
| | | | | | | | | | | | |
| | | | | | | | | | | 39,346,656 | |
|
| Paper & Forest Products — 0.0% | |
Norbord, Inc., 6.25%, 04/15/23(c) | | | | | | | 152 | | | | 159,632 | |
| | | | | | | | | | | | |
|
| Personal Products — 0.0% | |
Edgewell Personal Care Co., 5.50%, 06/01/28(c) | | | | | | | 176 | | | | 180,840 | |
| | | | | | | | | | | | |
|
| Pharmaceuticals — 2.9% | |
AbbVie, Inc.(h): | | | | | | | | | | | | |
3.45%, 03/15/22(c) | | | | | | | 2,460 | | | | 2,558,548 | |
3.60%, 05/14/25 | | | | | | | 695 | | | | 768,512 | |
Bausch Health Americas, Inc., 8.50%, 01/31/27(c)(h) | | | | | | | 1,109 | | | | 1,176,926 | |
Bausch Health Cos., Inc.: | | | | | | | | | | | | |
5.50%, 03/01/23(c) | | | | | | | 150 | | | | 150,000 | |
4.50%, 05/15/23 | | | EUR | | | | 346 | | | | 384,280 | |
5.88%, 05/15/23(c) | | | USD | | | | 33 | | | | 32,917 | |
6.13%, 04/15/25(c)(h) | | | | | | | 813 | | | | 824,602 | |
5.50%, 11/01/25(c)(h) | | | | | | | 152 | | | | 155,800 | |
9.00%, 12/15/25(c)(h) | | | | | | | 501 | | | | 539,682 | |
5.75%, 08/15/27(c) | | | | | | | 145 | | | | 153,700 | |
| | |
| 58 | | 2020 BLACKROCK SEMI-ANNUAL REPORTTO SHAREHOLDERS |
| | |
Schedule of Investments (unaudited) (continued) June 30, 2020 | | BlackRock Limited Duration Income Trust (BLW) (Percentages shown are based on Net Assets) |
| | | | | | | | | | | | |
| Security | | | | | Par
(000) | | | Value | |
|
| Pharmaceuticals (continued) | |
7.00%, 01/15/28(c) | | | USD | | | | 366 | | | $ | 376,980 | |
5.00%, 01/30/28(c) | | | | | | | 214 | | | | 201,479 | |
6.25%, 02/15/29(c)(h) | | | | | | | 529 | | | | 531,645 | |
7.25%, 05/30/29(c)(h) | | | | | | | 498 | | | | 522,900 | |
5.25%, 01/30/30(c) | | | | | | | 260 | | | | 246,675 | |
Catalent Pharma Solutions, Inc.: | | | | | | | | | | | | |
4.88%, 01/15/26(c) | | | | | | | 324 | | | | 328,925 | |
5.00%, 07/15/27(c) | | | | | | | 495 | | | | 513,874 | |
2.38%, 03/01/28 | | | EUR | | | | 100 | | | | 106,265 | |
Charles River Laboratories International, Inc.(c): | | | | | | | | | | | | |
5.50%, 04/01/26 | | | USD | | | | 365 | | | | 379,600 | |
4.25%, 05/01/28 | | | | | | | 188 | | | | 187,904 | |
CVS Health Corp.(h): | | | | | | | | | | | | |
4.75%, 12/01/22 | | | | | | | 165 | | | | 178,487 | |
4.10%, 03/25/25 | | | | | | | 2,355 | | | | 2,663,369 | |
Elanco Animal Health, Inc., 5.65%, 08/28/28 | | | | | | | 176 | | | | 195,149 | |
Endo Dac/Endo Finance LLC/Endo Finco, Inc.(c): | | | | | | | | | | | | |
9.50%, 07/31/27 | | | | | | | 163 | | | | 172,405 | |
6.00%, 06/30/28 | | | | | | | 182 | | | | 117,390 | |
Jaguar Holding Co. II/PPD Development LP(c): | | | | | | | | | | | | |
4.63%, 06/15/25 | | | | | | | 536 | | | | 545,487 | |
5.00%, 06/15/28(h) | | | | | | | 501 | | | | 512,899 | |
Nidda BondCo GmbH, 7.25%, 09/30/25 | | | EUR | | | | 100 | | | | 114,323 | |
Nidda Healthcare Holding GmbH, 3.50%, 09/30/24 | | | | | | | 100 | | | | 110,523 | |
Par Pharmaceutical, Inc., 7.50%, 04/01/27(c)(h) | | | USD | | | | 1,253 | | | | 1,285,829 | |
Synlab Bondco PLC(3 mo. Euribor + 4.75%), 4.75%, 07/01/25(d) | | | EUR | | | | 100 | | | | 112,125 | |
| | | | | | | | | | | | |
| | | | | | | | | | | 16,149,200 | |
|
| Producer Durables: Miscellaneous — 0.3% | |
Boxer Parent Co., Inc.: | | | | | | | | | | | | |
6.50%, 10/02/25 | | | | | | | 100 | | | | 115,608 | |
7.13%, 10/02/25(c) | | | USD | | | | 388 | | | | 406,818 | |
9.13%, 03/01/26(c)(h) | | | | | | | 601 | | | | 622,035 | |
Open Text Corp., 3.88%, 02/15/28(c) | | | | | | | 411 | | | | 395,715 | |
Open Text Holdings, Inc., 4.13%, 02/15/30(c) | | | | | | | 411 | | | | 403,807 | |
| | | | | | | | | | | | |
| | | | | | | | | | | 1,943,983 | |
|
| Professional Services — 0.3% | |
ASGN, Inc., 4.63%, 05/15/28(c) | | | | | | | 109 | | | | 106,451 | |
Dun & Bradstreet Corp.(c)(h): | | | | | | | | | | | | |
6.88%, 08/15/26 | | | | | | | 1,062 | | | | 1,119,412 | |
10.25%, 02/15/27 | | | | | | | 497 | | | | 551,670 | |
| | | | | | | | | | | | |
| | | | | | | | | | | 1,777,533 | |
|
| Real Estate — 0.4% | |
China Aoyuan Group Ltd., 7.95%, 02/19/23 | | | | | | | 450 | | | | 466,969 | |
China SCE Group Holdings Ltd., 7.25%, 04/19/23 | | | | | | | 200 | | | | 198,500 | |
Country Garden Holdings Co. Ltd., 6.15%, 09/17/25 | | | | | | | 200 | | | | 211,593 | |
Easy Tactic Ltd., 9.13%, 07/28/22 | | | | | | | 200 | | | | 190,793 | |
Kaisa Group Holdings Ltd., 11.95%, 10/22/22 | | | | | | | 200 | | | | 208,437 | |
Logan Property Holdings Co. Ltd., 6.50%, 07/16/23 | | | | | | | 200 | | | | 204,750 | |
Powerlong Real Estate Holdings Ltd., 7.13%, 11/08/22 | | | | | | | 200 | | | | 202,042 | |
Prologis LP, 3.75%, 11/01/25(h) | | | | | | | 255 | | | | 292,699 | |
Ronshine China Holdings Ltd., 8.95%, 01/22/23 | | | | | | | 200 | | | | 208,875 | |
Zhenro Properties Group Ltd., 9.15%, 03/08/22 | | | | | | | 200 | | | | 204,250 | |
| | | | | | | | | | | | |
| | | | | | | | | | | 2,388,908 | |
|
| Real Estate Management & Development — 2.4% | |
ADLER Real Estate AG, 3.00%, 04/27/26 | | | EUR | | | | 100 | | | | 111,181 | |
Agile Group Holdings Ltd.: | | | | | | | | | | | | |
(5 year CMT + 11.29%), 7.88%(k)(l) | | | USD | | | | 200 | | | | 196,438 | |
6.70%, 03/07/22 | | | | | | | 250 | | | | 256,297 | |
| | | | | | | | | | | | |
| Security | | | | | Par
(000) | | | Value | |
|
| Real Estate Management & Development (continued) | |
Central China Real Estate Ltd.: | | | | | | | | | | | | |
6.88%, 08/08/22 | | | USD | | | | 200 | | | $ | 197,750 | |
7.25%, 04/24/23 | | | | | | | 200 | | | | 197,412 | |
7.65%, 08/27/23 | | | | | | | 245 | | | | 242,261 | |
China Aoyuan Group Ltd., 7.50%, 05/10/21 | | | | | | | 200 | | | | 202,486 | |
China Evergrande Group: | | | | | | | | | | | | |
8.25%, 03/23/22 | | | | | | | 200 | | | | 184,125 | |
9.50%, 04/11/22 | | | | | | | 200 | | | | 187,810 | |
11.50%, 01/22/23 | | | | | | | 450 | | | | 425,416 | |
12.00%, 01/22/24 | | | | | | | 250 | | | | 229,422 | |
China SCE Group Holdings Ltd., 7.38%, 04/09/24 | | | | | | | 200 | | | | 196,438 | |
CIFI Holdings Group Co. Ltd.: | | | | | | | | | | | | |
7.63%, 03/02/21 | | | | | | | 200 | | | | 203,250 | |
7.63%, 02/28/23 | | | | | | | 200 | | | | 210,110 | |
6.55%, 03/28/24 | | | | | | | 200 | | | | 205,586 | |
6.45%, 11/07/24 | | | | | | | 200 | | | | 203,000 | |
Consus Real Estate AG, 9.63%, 05/15/24 | | | EUR | | | | 100 | | | | 121,900 | |
Country Garden Holdings Co. Ltd.: | | | | | | | | | | | | |
8.00%, 01/27/24 | | | USD | | | | 200 | | | | 215,804 | |
6.50%, 04/08/24 | | | | | | | 200 | | | | 212,125 | |
5.13%, 01/14/27 | | | | | | | 200 | | | | 200,501 | |
Cushman & Wakefield US Borrower LLC, 6.75%, 05/15/28(c) | | | | | | | 647 | | | | 674,497 | |
Easy Tactic Ltd.: | | | | | | | | | | | | |
8.75%, 01/10/21 | | | | | | | 200 | | | | 198,500 | |
8.13%, 02/27/23 | | | | | | | 200 | | | | 182,312 | |
Fantasia Holdings Group Co. Ltd.: | | | | | | | | | | | | |
8.38%, 03/08/21 | | | | | | | 200 | | | | 200,063 | |
11.75%, 04/17/22 | | | | | | | 200 | | | | 206,746 | |
Greenland Global Investment Ltd.: | | | | | | | | | | | | |
7.25%, 03/12/22 | | | | | | | 200 | | | | 203,408 | |
5.60%, 11/13/22 | | | | | | | 200 | | | | 196,472 | |
6.25%, 12/16/22 | | | | | | | 200 | | | | 200,750 | |
Greystar Real Estate Partners LLC, 5.75%, 12/01/25(c) | | | | | | | 100 | | | | 100,520 | |
Heimstaden Bostad AB(5 year EUR Swap + 3.67%), 3.25%(k)(l) | | | EUR | | | | 100 | | | | 107,047 | |
Hopson Development Holdings Ltd., 7.50%, 06/27/22 | | | USD | | | | 200 | | | | 200,302 | |
Howard Hughes Corp., 5.38%, 03/15/25(c) | | | | | | | 281 | | | | 261,499 | |
Kaisa Group Holdings Ltd.: | | | | | | | | | | | | |
11.25%, 04/09/22 | | | | | | | 200 | | | | 207,688 | |
11.50%, 01/30/23 | | | | | | | 200 | | | | 204,442 | |
10.88%, 07/23/23 | | | | | | | 400 | | | | 399,375 | |
KWG Group Holdings Ltd.: | | | | | | | | | | | | |
7.88%, 08/09/21 | | | | | | | 200 | | | | 204,688 | |
7.88%, 09/01/23 | | | | | | | 200 | | | | 207,184 | |
7.40%, 03/05/24 | | | | | | | 200 | | | | 203,776 | |
Logan Group Co. Ltd.: | | | | | | | | | | | | |
7.50%, 08/25/22 | | | | | | | 200 | | | | 207,013 | |
6.90%, 06/09/24 | | | | | | | 200 | | | | 207,052 | |
5.75%, 01/14/25 | | | | | | | 200 | | | | 198,924 | |
New Metro Global Ltd.: | | | | | | | | | | | | |
6.50%, 04/23/21 | | | | | | | 200 | | | | 200,402 | |
6.80%, 08/05/23 | | | | | | | 200 | | | | 201,014 | |
Realogy Group LLC/Realogy Co-Issuer Corp., 7.63%, 06/15/25(c) | | | | | | | 69 | | | | 69,014 | |
Redsun Properties Group Ltd., 9.95%, 04/11/22 | | | | | | | 200 | | | | 200,600 | |
RKPF Overseas A Ltd., Class A, 6.70%, 09/30/24 | | | | | | | 513 | | | | 519,573 | |
Ronshine China Holdings Ltd.: | | | | | | | | | | | | |
11.25%, 08/22/21 | | | | | | | 200 | | | | 209,765 | |
10.50%, 03/01/22 | | | | | | | 200 | | | | 212,312 | |
Seazen Group Ltd., 6.45%, 06/11/22 | | | | | | | 200 | | | | 201,243 | |
| | |
SCHEDULES OF INVESTMENTS | | 59 |
| | |
Schedule of Investments (unaudited) (continued) June 30, 2020 | | BlackRock Limited Duration Income Trust (BLW) (Percentages shown are based on Net Assets) |
| | | | | | | | | | | | |
| Security | | | | | Par
(000) | | | Value | |
|
| Real Estate Management & Development (continued) | |
Shimao Group Holdings Ltd.: | | | | | | | | | | | | |
6.13%, 02/21/24 | | | USD | | | | 200 | | | $ | 211,000 | |
5.60%, 07/15/26 | | | | | | | 200 | | | | 210,687 | |
Sunac China Holdings Ltd.: | | | | | | | | | | | | |
7.25%, 06/14/22 | | | | | | | 200 | | | | 202,301 | |
7.95%, 10/11/23 | | | | | | | 200 | | | | 204,375 | |
7.50%, 02/01/24 | | | | | | | 200 | | | | 199,875 | |
Times China Holdings Ltd., 6.75%, 07/16/23 | | | | | | | 313 | | | | 317,597 | |
Yango Justice International Ltd., 10.00%, 02/12/23 | | | | | | | 200 | | | | 206,313 | |
Yuzhou Group Holdings Co. Ltd.: | | | | | | | | | | | | |
8.63%, 01/23/22 | | | | | | | 200 | | | | 206,679 | |
8.50%, 02/04/23 | | | | | | | 200 | | | | 208,000 | |
8.50%, 02/26/24 | | | | | | | 200 | | | | 204,250 | |
8.38%, 10/30/24 | | | | | | | 200 | | | | 201,813 | |
Zhenro Properties Group Ltd., 8.70%, 08/03/22 | | | | | | | 200 | | | | 201,000 | |
| | | | | | | | | | | | |
| | | | | | | | | | | 13,359,383 | |
|
| Road & Rail — 0.5% | |
Autostrade per l’Italia SpA, 5.88%, 06/09/24 | | | EUR | | | | 200 | | | | 246,589 | |
Herc Holdings, Inc., 5.50%, 07/15/27(c) | | | USD | | | | 383 | | | | 383,824 | |
Lima Metro Line 2 Finance Ltd., 5.88%, 07/05/34(c) | | | | | | | 1,615 | | | | 1,905,630 | |
| | | | | | | | | | | | |
| | | | | | | | | | | 2,536,043 | |
|
| Semiconductors & Semiconductor Equipment — 2.4% | |
AMS AG, 6.00%, 07/31/25(g) | | | XXX | | | | 100 | | | | 111,226 | |
Analog Devices, Inc.(h) : | | | | | | | | | | | | |
3.90%, 12/15/25 | | | | | | | 375 | | | | 426,895 | |
3.50%, 12/05/26 | | | | | | | 275 | | | | 307,248 | |
Applied Materials, Inc., 3.90%, 10/01/25(h) | | | | | | | 285 | | | | 328,156 | |
Broadcom, Inc.(c): | | | | | | | | | | | | |
4.70%, 04/15/25 | | | | | | | 941 | | | | 1,060,295 | |
3.15%, 11/15/25 | | | | | | | 271 | | | | 288,431 | |
3.46%, 09/15/26(h) | | | | | | | 578 | | | | 619,865 | |
4.11%, 09/15/28(h) | | | | | | | 1,594 | | | | 1,736,700 | |
4.15%, 11/15/30(h) | | | | | | | 695 | | | | 755,244 | |
4.30%, 11/15/32(h) | | | | | | | 1,105 | | | | 1,212,382 | |
Entegris, Inc.(c): | | | | | | | | | | | | |
4.63%, 02/10/26 | | | | | | | 190 | | | | 192,850 | |
4.38%, 04/15/28 | | | | | | | 231 | | | | 235,042 | |
Microchip Technology, Inc.: | | | | | | | | | | | | |
2.67%, 09/01/23(c) | | | | | | | 1,038 | | | | 1,068,395 | |
1.63%, 02/15/25(o) | | | | | | | 86 | | | | 191,841 | |
4.25%, 09/01/25(c)(h) | | | | | | | 1,145 | | | | 1,152,286 | |
NXP BV/NXP Funding LLC/NXP USA, Inc., 2.70%, 05/01/25(c) | | | | | | | 33 | | | | 34,593 | |
ON Semiconductor Corp., 1.00%, 12/01/20(o) | | | | | | | 274 | | | | 318,500 | |
Qorvo, Inc.: | | | | | | | | | | | | |
5.50%, 07/15/26 | | | | | | | 234 | | | | 243,360 | |
4.38%, 10/15/29(c) | | | | | | | 320 | | | | 327,706 | |
Qualcomm, Inc., 3.45%, 05/20/25(h) | | | | | | | 1,570 | | | | 1,749,906 | |
Sensata Tech, Inc., 4.38%, 02/15/30(c) | | | | | | | 190 | | | | 188,100 | |
Sensata Technologies BV(c): | | | | | | | | | | | | |
5.63%, 11/01/24 | | | | | | | 229 | | | | 242,740 | |
5.00%, 10/01/25(h) | | | | | | | 324 | | | | 344,963 | |
| | | | | | | | | | | | |
| | | | | | | | | | | 13,136,724 | |
|
| Software — 1.8% | |
ACI Worldwide, Inc., 5.75%, 08/15/26(c)(h) | | | | | | | 696 | | | | 725,058 | |
Castle US Holding Corp., 9.50%, 02/15/28(c) | | | | | | | 534 | | | | 493,950 | |
CDK Global, Inc.: | | | | | | | | | | | | |
4.88%, 06/01/27(h) | | | | | | | 627 | | | | 643,271 | |
5.25%, 05/15/29(c) | | | | | | | 138 | | | | 143,302 | |
Genesys Telecommunications Laboratories, Inc./Greeneden Lux 3 Sarl/Greeneden US Ho, 10.00%, 11/30/24(c)(h) | | | | | | | 1,047 | | | | 1,088,880 | |
| | | | | | | | | | | | |
| Security | | | | | Par
(000) | | | Value | |
|
| Software (continued) | |
MSCI, Inc.(c): | | | | | | | | | | | | |
4.00%, 11/15/29 | | | USD | | | | 83 | | | $ | 84,660 | |
3.63%, 09/01/30 | | | | | | | 84 | | | | 83,580 | |
3.88%, 02/15/31(h) | | | | | | | 717 | | | | 731,340 | |
Nuance Communications, Inc., 5.63%, 12/15/26 | | | | | | | 303 | | | | 315,120 | |
PTC, Inc.(c): | | | | | | | | | | | | |
3.63%, 02/15/25 | | | | | | | 164 | | | | 162,770 | |
4.00%, 02/15/28 | | | | | | | 187 | | | | 185,152 | |
RP Crown Parent LLC, 7.38%, 10/15/24(c)(h) | | | | | | | 758 | | | | 756,105 | |
Solera LLC/Solera Finance, Inc.,
10.50%, 03/01/24(c)(h) | | | | | | | 2,213 | | | | 2,251,727 | |
Sophia LP/Sophia Finance, Inc., 9.00%, 09/30/23(c) | | | | | | | 292 | | | | 294,920 | |
SS&C Technologies, Inc., 5.50%, 09/30/27(c)(h) | | | | | | | 1,814 | | | | 1,840,557 | |
Tempo Acquisition LLC/Tempo Acquisition Finance Corp., 5.75%, 06/01/25(c) | | | | | | | 243 | | | | 249,075 | |
Veritas US, Inc./Veritas Bermuda Ltd., 7.50%, 02/01/23(c) | | | | | | | 200 | | | | 197,000 | |
| | | | | | | | | | | | |
| | | | | | | | | | | 10,246,467 | |
|
| Specialty Retail — 0.6% | |
Asbury Automotive Group, Inc.(c): | | | | | | | | | | | | |
4.50%, 03/01/28 | | | | | | | 87 | | | | 84,390 | |
4.75%, 03/01/30 | | | | | | | 85 | | | | 82,875 | |
Gap, Inc., 8.88%, 05/15/27(c) | | | | | | | 160 | | | | 171,187 | |
Group 1 Automotive, Inc., 5.00%, 06/01/22 | | | | | | | 155 | | | | 154,034 | |
IAA, Inc., 5.50%, 06/15/27(c) | | | | | | | 372 | | | | 383,763 | |
L Brands, Inc.: | | | | | | | | | | | | |
6.88%, 07/01/25(c) | | | | | | | 277 | | | | 286,003 | |
6.88%, 11/01/35 | | | | | | | 401 | | | | 333,592 | |
6.75%, 07/01/36 | | | | | | | 71 | | | | 58,220 | |
Penske Automotive Group, Inc., 5.50%, 05/15/26 | | | | | | | 32 | | | | 31,920 | |
PetSmart, Inc.(c)(h): | | | | | | | | | | | | |
7.13%, 03/15/23 | | | | | | | 328 | | | | 323,369 | |
5.88%, 06/01/25 | | | | | | | 903 | | | | 904,693 | |
Staples, Inc., 7.50%, 04/15/26(c)(h) | | | | | | | 583 | | | | 458,092 | |
| | | | | | | | | | | | |
| | | | | | | | | | | 3,272,138 | |
|
| Technology Hardware, Storage & Peripherals — 0.5% | |
Dell International LLC/EMC Corp.(c): | | | | | | | | | | | | |
7.13%, 06/15/24(h) | | | | | | | 638 | | | | 660,928 | |
5.85%, 07/15/25 | | | | | | | 384 | | | | 441,293 | |
Hewlett Packard Enterprise Co., 4.90%, 10/15/25(h) | | | | | | | 375 | | | | 432,852 | |
NCR Corp.(c): | | | | | | | | | | | | |
5.75%, 09/01/27 | | | | | | | 220 | | | | 220,000 | |
6.13%, 09/01/29 | | | | | | | 105 | | | | 104,737 | |
Presidio Holdings, Inc., 4.88%, 02/01/27(c) | | | | | | | 278 | | | | 271,745 | |
Western Digital Corp., 4.75%, 02/15/26(h) | | | | | | | 459 | | | | 474,354 | |
| | | | | | | | | | | | |
| | | | | | | | | | | 2,605,909 | |
|
| Textiles, Apparel & Luxury Goods — 0.1% | |
Hanesbrands, Inc., 5.38%, 05/15/25(c) | | | | | | | 123 | | | | 124,384 | |
Levi Strauss & Co.: | | | | | | | | | | | | |
5.00%, 05/01/25(c) | | | | | | | 184 | | | | 184,692 | |
5.00%, 05/01/25 | | | | | | | 49 | | | | 49,184 | |
William Carter Co., 5.63%, 03/15/27(c) | | | | | | | 160 | | | | 164,800 | |
| | | | | | | | | | | | |
| | | | | | | | | | | 523,060 | |
|
| Thrifts & Mortgage Finance — 0.0% | |
Nationstar Mortgage Holdings, Inc.,
6.00%, 01/15/27(c) | | | | | | | 149 | | | | 141,550 | |
| | | | | | | | | | | | |
|
| Transportation Infrastructure — 0.2% | |
Aeropuertos Dominicanos Siglo XXI SA, 6.75%, 03/30/29(c) | | | | | | | 200 | | | | 177,840 | |
| | |
| 60 | | 2020 BLACKROCK SEMI-ANNUAL REPORTTO SHAREHOLDERS |
| | |
Schedule of Investments (unaudited) (continued) June 30, 2020 | | BlackRock Limited Duration Income Trust (BLW) (Percentages shown are based on Net Assets) |
| | | | | | | | | | | | |
| Security | | | | | Par
(000) | | | Value | |
|
| Transportation Infrastructure (continued) | |
Ferrovial Netherlands BV(5 year EUR Swap + 2.13%), 2.12%(k)(l) | | | EUR | | | | 100 | | | $ | 105,045 | |
Heathrow Finance PLC, 4.13%, 09/01/29 | | | GBP | | | | 100 | | | | 115,422 | |
Rumo Luxembourg Sarl, 5.88%, 01/18/25(c) | | | USD | | | | 241 | | | | 254,255 | |
Transurban Finance Co. Property Ltd., 4.13%, 02/02/26(c)(h) | | | | | | | 435 | | | | 476,069 | |
| | | | | | | | | | | | |
| | | | | | | | | | | 1,128,631 | |
|
| Utilities — 0.2% | |
Centrais Eletricas Brasileiras SA, 4.63%, 02/04/30(c) | | | | | | | 240 | | | | 228,145 | |
ContourGlobal Power Holdings SA, 4.13%, 08/01/25 | | | EUR | | | | 100 | | | | 114,906 | |
Vistra Operations Co. LLC(c): | | | | | | | | | | | | |
3.55%, 07/15/24 | | | USD | | | | 6 | | | | 6,192 | |
5.50%, 09/01/26 | | | | | | | 8 | | | | 8,164 | |
5.63%, 02/15/27 | | | | | | | 422 | | | | 433,120 | |
5.00%, 07/31/27 | | | | | | | 158 | | | | 159,777 | |
| | | | | | | | | | | | |
| | | | | | | | | | | 950,304 | |
|
| Wireless Telecommunication Services — 2.3% | |
Comunicaciones Celulares SA Via Comcel Trust, 6.88%, 02/06/24(c) | | | USD | | | | 300 | | | | 306,801 | |
Iron mountain, Inc., 3.00%, 01/15/25 | | | EUR | | | | 100 | | | | 109,332 | |
Millicom International Cellular SA, 5.13%, 01/15/28 | | | USD | | | | 275 | | | | 275,687 | |
Rogers Communications, Inc.,
5.00%, 03/15/44(h) | | | | | | | 545 | | | | 695,894 | |
SBA Communications Corp.(h): | | | | | | | | | | | | |
4.88%, 09/01/24 | | | | | | | 1,195 | | | | 1,223,381 | |
3.88%, 02/15/27(c) | | | | | | | 1,248 | | | | 1,243,320 | |
Sprint Capital Corp.: | | | | | | | | | | | | |
6.88%, 11/15/28(h) | | | | | | | 805 | | | | 980,087 | |
8.75%, 03/15/32 | | | | | | | 243 | | | | 347,794 | |
Sprint Corp.(h): | | | | | | | | | | | | |
7.88%, 09/15/23 | | | | | | | 519 | | | | 584,524 | |
7.13%, 06/15/24 | | | | | | | 626 | | | | 706,842 | |
7.63%, 02/15/25 | | | | | | | 159 | | | | 183,446 | |
7.63%, 03/01/26 | | | | | | | 552 | | | | 651,564 | |
Sprint Spectrum Co. LLC/Sprint Spectrum Co. II LLC/Sprint Spectrum Co. III LLC, 3.36%, 09/20/21(c)(h) | | | | | | | 163 | | | | 164,479 | |
T-Mobile USA, Inc.: | | | | | | | | | | | | |
6.38%, 03/01/25(h) | | | | | | | 282 | | | | 289,755 | |
6.50%, 01/15/26 | | | | | | | 227 | | | | 237,240 | |
4.50%, 02/01/26(h) | | | | | | | 498 | | | | 503,956 | |
4.75%, 02/01/28(h) | | | | | | | 479 | | | | 506,016 | |
Uniti Group LP/Uniti Group Finance, Inc./CSL Capital LLC, 8.25%, 10/15/23 | | | | | | | 112 | | | | 105,840 | |
VICI Properties LP/VICI Note Co., Inc.(c): | | | | | | | | | | | | |
3.50%, 02/15/25 | | | | | | | 387 | | | | 363,780 | |
4.25%, 12/01/26(h) | | | | | | | 1,246 | | | | 1,193,045 | |
3.75%, 02/15/27 | | | | | | | 411 | | | | 386,340 | |
4.63%, 12/01/29 | | | | | | | 498 | | | | 485,550 | |
4.13%, 08/15/30(h) | | | | | | | 1,102 | | | | 1,051,032 | |
Vodafone Group PLC(5 year EUR Swap + 2.67%), 3.10%, 01/03/79(k) | | | EUR | | | | 100 | | | | 112,350 | |
VTR Comunicaciones SpA,
5.13%, 01/15/28(c)(g) | | | USD | | | | 205 | | | | 209,203 | |
| | | | | | | | | | | | |
| | | | | | | | | | | 12,917,258 | |
| | | | | | | | | | | | |
| |
Total Corporate Bonds — 79.0%
(Cost — $440,053,265) | | | | 441,488,920 | |
| | | | | | | | | | | | |
| | | | | | | | | | | | |
| Security | | | | | Par
(000) | | | Value | |
|
Floating Rate Loan Interests(d) — 44.8% | |
|
Aerospace & Defense — 0.9% | |
Bleriot US Bidco, Inc.,: | | | | | | | | | | | | |
Delayed Draw Term Loan, (3 mo. LIBOR + 4.75%), 5.06%, 10/31/26 | | | USD | | | | 39 | | | $ | 37,675 | |
Term Loan B, (3 mo. LIBOR + 4.75%), 5.06%, 10/31/26 | | | | | | | 251 | | | | 241,114 | |
Dynasty Acquisition Co., Inc.,: | | | | | | | | | | | | |
2020 CAD Term Loan B2, (3 mo. LIBOR + 3.50%), 3.81%, 04/06/26 | | | | | | | 977 | | | | 831,557 | |
2020 Term Loan B1, (3 mo. LIBOR + 3.50%), 3.81%, 04/06/26 | | | | | | | 1,817 | | | | 1,546,698 | |
TransDigm, Inc.,: | | | | | | | | | | | | |
2020 Term Loan F, (1 mo. LIBOR + 2.25%), 2.43%, 12/09/25 | | | | | | | 2,113 | | | | 1,895,323 | |
2020 Term Loan G, (1 mo. LIBOR + 2.25%), 2.43%, 08/22/24 | | | | | | | 409 | | | | 368,638 | |
| | | | | | | | | | | | |
| | | | | | | | | | | 4,921,005 | |
|
| Air Freight & Logistics — 0.2% | |
WestJet Airlines Ltd., Term Loan B,
0.00%, 12/11/26(p) | | | | | | | 1,339 | | | | 1,070,468 | |
| | | | | | | | | | | | |
|
| Airlines — 0.4% | |
American Airlines, Inc.,: | | | | | | | | | | | | |
2017 1st Lien Term Loan, (1 mo. LIBOR + 1.75%), 1.93%, 01/29/27 | | | | | | | 65 | | | | 48,697 | |
2017 Incremental Term Loan, (1 mo. LIBOR + 2.00%), 2.18%, 12/14/23 | | | | | | | 973 | | | | 774,361 | |
Repriced TL B due 2023, (1 mo. LIBOR + 2.00%), 2.18%, 04/28/23 | | | | | | | 415 | | | | 326,769 | |
JetBlue Airways Corp., Term Loan, (3 mo. LIBOR + 5.25%, 1.00% Floor), 6.25%, 06/12/24 | | | | | | | 294 | | | | 287,385 | |
Mileage Plus Holdings LLC, 2020 Term Loan B, 1.00%, 06/25/27 | | | | | | | 1,003 | | | | 995,056 | |
| | | | | | | | | | | | |
| | | | | | | | | | | 2,432,268 | |
|
| Auto Components — 0.9% | |
Dealer Tire LLC, 2020 Term Loan B, (1 mo. LIBOR + 4.25%), 4.43%, 12/12/25 | | | | | | | 849 | | | | 809,124 | |
Panther BF Aggregator 2 LP, USD Term Loan B, (1 mo. LIBOR + 3.50%), 3.68%, 04/30/26 | | | | | | | 2,350 | | | | 2,232,035 | |
USI, Inc.,: | | | | | | | | | | | | |
2017 Repriced Term Loan, (3 mo. LIBOR + 3.00%), 3.31%, 05/16/24 | | | | | | | 1,506 | | | | 1,425,778 | |
2019 Incremental Term Loan B, (3 mo. LIBOR + 4.00%), 4.31%, 12/02/26 | | | | | | | 85 | | | | 81,968 | |
Wand NewCo 3, Inc., 2020 Term Loan, (3 mo. LIBOR + 3.00%), 4.07%, 02/05/26 | | | | | | | 615 | | | | 582,672 | |
| | | | | | | | | | | | |
| | | | | | | | | | | 5,131,577 | |
|
| Banks — 0.3% | |
Capri Finance LLC, 2017 1st Lien Term Loan, (3 mo. LIBOR + 3.00%), 3.76%, 11/01/24 | | | | | | | 1,457 | | | | 1,393,342 | |
| | | | | | | | | | | | |
|
| Building Materials — 0.1% | |
Allied Universal Holdco LLC, 2019 Term Loan B, (1 mo. LIBOR + 4.25%), 4.43%, 07/10/26 | | | | | | | 819 | | | | 794,362 | |
| | | | | | | | | | | | |
|
| Building Products — 0.4% | |
CPG International, Inc., 2017 Term Loan, 0.00%, 05/05/24(p) | | | | | | | 590 | | | | 583,097 | |
Wilsonart LLC, 2017 Term Loan B, (3 mo. LIBOR + 3.25%, 1.00% Floor), 4.25%, 12/19/23 | | | | | | | 1,625 | | | | 1,563,184 | |
| | | | | | | | | | | | |
| | | | | | | | | | | 2,146,281 | |
| | |
SCHEDULES OF INVESTMENTS | | 61 |
| | |
Schedule of Investments (unaudited) (continued) June 30, 2020 | | BlackRock Limited Duration Income Trust (BLW) (Percentages shown are based on Net Assets) |
| | | | | | | | | | | | |
| Security | | | | | Par
(000) | | | Value | |
|
| Capital Markets — 0.5% | |
Deerfield Dakota Holding LLC, 2020 USD Term Loan B, 0.00%, 04/09/27(p) | | | USD | | | | 1,422 | | | $ | 1,379,021 | |
Greenhill & Co., Inc., Term Loan B, (1 mo. LIBOR + 3.25%), 3.44%, 04/12/24(a) | | | | | | | 286 | | | | 268,409 | |
Jefferies Finance LLC, 2019 Term Loan, (1 mo. LIBOR + 3.00%), 3.19%, 06/03/26 | | | | | | | 465 | | | | 437,960 | |
Travelport Finance (Luxembourg) Sarl,: | | | | | | | | | | | | |
2019 2nd Lien Term Loan, (3 mo. LIBOR + 9.00%), 9.31%, 05/28/27 | | | | | | | 410 | | | | 116,440 | |
2019 Term Loan, (3 mo. LIBOR + 5.00%), 6.07%, 05/29/26 | | | | | | | 894 | | | | 584,628 | |
| | | | | | | | | | | | |
| | | | | | | | | | | 2,786,458 | |
|
| Chemicals — 1.7% | |
Alpha 3 BV, 2017 Term Loan B1, (3 mo. LIBOR + 3.00%, 1.00% Floor), 4.00%, 01/31/24 | | | | | | | 1,364 | | | | 1,310,587 | |
Ascend Performance Materials Operations LLC, 2019 Term Loan B, (3 mo. LIBOR + 5.25%, 1.00% Floor), 6.25%, 08/27/26 | | | | | | | 1,057 | | | | 1,034,587 | |
Axalta Coating Systems US Holdings, Inc., Term Loan, (3 mo. LIBOR + 1.75%), 2.06%, 06/01/24 | | | | | | | 730 | | | | 697,211 | |
Charter NEX US Holdings, Inc., 2017 Term Loan B, (1 mo. LIBOR + 2.75%, 1.00% Floor), 3.75%, 05/16/24 | | | | | | | 1,369 | | | | 1,307,137 | |
Charter NEX US, Inc., Incremental Term Loan, (1 mo. LIBOR + 3.25%), 3.43%, 05/16/24 | | | | | | | 260 | | | | 248,406 | |
Chemours Co., 2018 Term Loan B, (1 mo. LIBOR + 1.75%), 1.93%, 04/03/25 | | | | | | | 342 | | | | 322,255 | |
Element Materials Technology Group US Holdings, Inc., 2017 Term Loan B, (3 mo. LIBOR + 3.50%, 1.00% Floor), 4.50%, 06/28/24 | | | | | | | 350 | | | | 323,106 | |
Encapsys LLC, 2020 Term Loan B2, (1 mo. LIBOR + 3.25%, 1.00% Floor), 4.25%, 11/07/24(a) | | | | | | | 563 | | | | 537,892 | |
Illuminate Buyer LLC, Term Loan, 1.00%, 06/16/27(p) | | | | | | | 892 | | | | 876,978 | |
Invictus US LLC,: | | | | | | | | | | | | |
1st Lien Term Loan, (3 mo. LIBOR + 3.00%), 4.78%, 03/28/25 | | | | | | | 344 | | | | 316,880 | |
2nd Lien Term Loan, (3 mo. LIBOR + 6.75%), 8.53%, 03/30/26 | | | | | | | 135 | | | | 106,875 | |
Messer Industries GmbH, 2018 USD Term Loan, (3 mo. LIBOR + 2.50%), 2.81%, 03/01/26 | | | | | | | 800 | | | | 761,303 | |
momentive Performance Materials, Inc., Term Loan B, (1 mo. LIBOR + 3.25%), 3.43%, 05/15/24 | | | | | | | 431 | | | | 402,877 | |
Oxea Holding Drei GmbH, 2017 Term Loan B2, (1 mo. LIBOR + 3.50%), 3.69%, 10/14/24 | | | | | | | 998 | | | | 915,651 | |
Starfruit Finco BV, 2018 USD Term Loan B, 1.00%, 10/01/25(p) | | | | | | | 118 | | | | 110,142 | |
| | | | | | | | |
| | | | | | | | | | | 9,271,887 | |
|
| Commercial Services & Supplies — 1.7% | |
Advanced Disposal Services, Inc., Term Loan B3, (1 Week LIBOR + 2.25%), 3.00%, 11/10/23 | | | | | | | 1,037 | | | | 1,023,574 | |
Aramark Services, Inc., 2018 Term Loan B3, (1 mo. LIBOR + 1.75%), 1.93%, 03/11/25 | | | | | | | 375 | | | | 352,989 | |
Asurion LLC,: | | | | | | | | | | | | |
2017 2nd Lien Term Loan, (1 mo. LIBOR + 6.50%), 6.68%, 08/04/25 | | | | | | | 570 | | | | 565,725 | |
2017 Term Loan B4, (1 mo. LIBOR + 3.00%), 3.18%, 08/04/22 | | | | | | | 221 | | | | 214,490 | |
2018 Term Loan B6, (1 mo. LIBOR + 3.00%), 3.18%, 11/03/23 | | | | | | | 1,765 | | | | 1,704,833 | |
2018 Term Loan B7, (1 mo. LIBOR + 3.00%), 3.18%, 11/03/24 | | | | | | | 384 | | | | 369,996 | |
| | | | | | | | | | | | |
| Security | | | | | Par
(000) | | | Value | |
|
| Commercial Services & Supplies (continued) | |
Creative Artists Agency LLC, 2019 Term Loan B, (1 mo. LIBOR + 3.75%), 3.93%, 11/27/26 | | | USD | | | | 858 | | | $ | 809,866 | |
Diamond (BC) BV, Term Loan, (3 mo. LIBOR + 3.00%), 3.76%, 09/06/24 | | | | | | | 829 | | | | 760,030 | |
EnergySolutions LLC, 2018 Term Loan B, (3 mo. LIBOR + 3.75%, 1.00% Floor), 4.75%, 05/09/25 | | | | | | | 189 | | | | 173,693 | |
GFL Environmental, Inc., 2018 USD Term Loan B, (1 mo. LIBOR + 3.00%, 1.00% Floor), 4.00%, 05/30/25 | | | | | | | 309 | | | | 299,599 | |
Harland Clarke Holdings Corp., Term Loan B7, (3 mo. LIBOR + 4.75%, 1.00% Floor), 5.75%, 11/03/23 | | | | | | | 166 | | | | 120,282 | |
KAR Auction Services, Inc., 2019 Term Loan B6, (1 mo. LIBOR + 2.25%), 2.50%, 09/19/26 | | | | | | | 448 | | | | 424,102 | |
Prime Security Services Borrower LLC, 2019 Term Loan B1, (1 mo. LIBOR + 3.25%, 1.00% Floor), 4.25%, 09/23/26 | | | | | | | 868 | | | | 832,570 | |
US Ecology, Inc., Term Loan B, (1 mo. LIBOR + 2.50%), 2.68%, 11/01/26(a) | | | | | | | 157 | | | | 152,494 | |
Verscend Holding Corp., 2018 Term Loan B, (1 mo. LIBOR + 4.50%), 4.68%, 08/27/25 | | | | | | | 1,086 | | | | 1,046,838 | |
West Corp.,: | | | | | | | | | | | | |
2017 Term Loan, (3 mo. LIBOR + 4.00%, 1.00% Floor), 5.00%, 10/10/24 | | | | | | | 974 | | | | 827,082 | |
2018 Term Loan B1, (3 mo. LIBOR + 3.50%, 1.00% Floor), 4.50%, 10/10/24 | | | | | | | 98 | | | | 81,789 | |
| | | | | | | | |
| | | | | | | | | | | 9,759,952 | |
|
| Communications Equipment — 0.1% | |
Avantor, Inc., 2017 1st Lien Term Loan, (1 mo. LIBOR + 2.25%, 1.00% Floor), 3.25%, 11/21/24 | | | | | | | 689 | | | | 669,760 | |
| | | | | | | | |
|
| Construction & Engineering — 0.4% | |
Brand Energy & Infrastructure Services, Inc., 2017 Term Loan, (3 mo. LIBOR + 4.25%, 1.00% Floor), 5.37%, 06/21/24 | | | | | | | 1,116 | | | | 1,018,314 | |
Ply Gem Midco, Inc., 2018 Term Loan, (1 mo. LIBOR + 3.75%), 3.94%, 04/12/25 | | | | | | | 128 | | | | 121,174 | |
SRS Distribution, Inc., 2018 1st Lien Term Loan, 0.00%, 05/23/25(p) | | | | | | | 867 | | | | 817,251 | |
| | | | | | | | |
| | | | | | | | | | | 1,956,739 | |
|
| Construction Materials — 0.8% | |
American Builders & Contractors Supply Co., Inc., 2019 Term Loan, (1 mo. LIBOR + 2.00%), 2.18%, 01/15/27 | | | | | | | 656 | | | | 624,103 | |
Core & Main LP, 2017 Term Loan B, (3 mo. LIBOR + 2.75%, 1.00% Floor), 3.75%, 08/01/24 | | | | | | | 2,007 | | | | 1,907,040 | |
Filtration Group Corp., 2018 1st Lien Term Loan, (1 mo. LIBOR + 3.00%), 3.18%, 03/29/25(a) | | | | | | | 950 | | | | 902,292 | |
Forterra Finance LLC, 2017 Term Loan B, 0.00%, 10/25/23(p) | | | | | | | 837 | | | | 812,029 | |
| | | | | | | | |
| | | | | | | | | | | 4,245,464 | |
|
| Containers & Packaging — 0.7% | |
Berry Global, Inc., Term Loan W, (1 mo. LIBOR + 2.00%), 2.18%, 10/01/22 | | | | | | | 1,595 | | | | 1,550,427 | |
BWAY Holding Co., 2017 Term Loan B, (3 mo. LIBOR + 3.25%), 4.56%, 04/03/24 | | | | | | | 1,071 | | | | 958,634 | |
Flex Acquisition Co., Inc., 1st Lien Term Loan, (3 mo. LIBOR + 3.00%, 1.00% Floor), 4.43%, 12/29/23 | | | | | | | 1,050 | | | | 1,001,514 | |
Pregis TopCo Corp., 1st Lien Term Loan, (1 mo. LIBOR + 4.00%), 4.18%, 07/31/26 | | | | | | | 139 | | | | 133,632 | |
| | | | | | | | |
| | | | | | | | | | | 3,644,207 | |
| | |
| 62 | | 2020 BLACKROCK SEMI-ANNUAL REPORTTO SHAREHOLDERS |
| | |
Schedule of Investments (unaudited) (continued) June 30, 2020 | | BlackRock Limited Duration Income Trust (BLW) (Percentages shown are based on Net Assets) |
| | | | | | | | | | | | |
| Security | | | | | Par
(000) | | | Value | |
|
| Distributors — 0.2% | |
TriMark USA LLC, 2017 1st Lien Term Loan, (6 mo. LIBOR + 3.50%), 4.58%, 08/28/24 | | | USD | | | | 1,334 | | | $ | 996,308 | |
| | | | | | | | |
|
| Diversified Consumer Services — 1.1% | |
Amentum Government Services Holdings LLC, Term Loan B, (1 mo. LIBOR + 4.00%), 4.18%, 02/01/27 | | | | | | | 204 | | | | 199,834 | |
APX Group, Inc., 2020 Term Loan, (PRIME + 4.00%), 6.21%, 12/31/25 | | | | | | | 62 | | | | 57,752 | |
Ascend Learning LLC, 2017 Term Loan B, (1 mo. LIBOR + 3.00%, 1.00% Floor), 4.00%, 07/12/24 | | | | | | | 773 | | | | 734,139 | |
BidFair MergerRight, Inc., Term Loan B, (1 mo. LIBOR + 5.50%, 1.00% Floor), 6.50%, 01/15/27 | | | | | | | 1,161 | | | | 1,081,776 | |
Bright Horizons Family Solutions, Inc., 2017 Term Loan B, (PRIME + 0.75%), 3.25%, 11/07/23 | | | | | | | 786 | | | | 760,932 | |
Genuine Financial Holdings LLC, 2018 1st Lien Term Loan, (1 mo. LIBOR + 3.75%), 3.93%, 07/12/25 | | | | | | | 968 | | | | 864,265 | |
Nomad Foods Europe Midco Ltd., 2017 Term Loan B4, (1 mo. LIBOR + 2.25%), 2.43%, 05/15/24 | | | | | | | 410 | | | | 394,428 | |
Serta Simmons Bedding, LLC, : | | | | | | | | | | | | |
2020 Super Priority First Out Term Loan, 1.00%, 08/10/23(p) | | | | | | | 190 | | | | 186,249 | |
2020 Super Priority Second Out Term Loan, (2 mo. LIBOR + 7.50%), 8.50%, 08/10/23 | | | | | | | 255 | | | | 212,621 | |
TruGreen LP, 2019 Term Loan, (1 mo. LIBOR + 3.75%), 3.93%, 03/19/26 | | | | | | | 670 | | | | 647,825 | |
Uber Technologies, Inc., 2018 Incremental Term Loan, (1 mo. LIBOR + 3.50%), 3.68%, 07/13/23 | | | | | | | 852 | | | | 809,657 | |
| | | | | | | | |
| | | | | | | | | | | 5,949,478 | |
|
| Diversified Financial Services — 1.0% | |
Advisor Group, Inc., 2019 Term Loan, (1 mo. LIBOR + 5.00%), 5.18%, 07/31/26 | | | | | | | 623 | | | | 574,768 | |
AlixPartners LLP, 2017 Term Loan B, (1 mo. LIBOR + 2.50%, 1.00% Floor), 3.50%, 04/04/24 | | | | | | | 1,728 | | | | 1,666,343 | |
Allsup’s Convenience Stores, Inc., Term Loan, (1 mo. LIBOR + 6.25%), 6.43%, 11/18/24 | | | | | | | 344 | | | | 330,856 | |
Credito Real SAB de CV, Term Loan B, (3 mo. LIBOR + 3.75%), 4.12%, 02/17/23(a) | | | | | | | 35 | | | | 31,150 | |
EG Finco Ltd., 2018 Term Loan, (3 mo. LIBOR + 4.00%), 5.07%, 02/07/25 | | | | | | | 610 | | | | 571,398 | |
Kingpin Intermediate Holdings LLC, 2018 Term Loan B, (1 mo. LIBOR + 3.50%, 1.00% Floor), 4.50%, 07/03/24 | | | | | | | 693 | | | | 589,820 | |
SMG US Midco 2, Inc., 2020 Term Loan, (1 mo. LIBOR + 2.50%), 6.20%, 01/23/25(a) | | | | | | | 540 | | | | 474,912 | |
SSH Group Holdings, Inc., 2018 1st Lien Term Loan, (3 mo. LIBOR + 4.25%), 4.56%, 07/30/25(a) | | | | | | | 147 | | | | 136,279 | |
VS Buyer LLC, Term Loan B, (1 mo. LIBOR + 3.25%), 3.43%, 02/28/27 | | | | | | | 897 | | | | 863,749 | |
Ziggo Financing Partnership, USD Term Loan I, (1 mo. LIBOR + 2.50%), 2.68%, 04/30/28 | | | | | | | 600 | | | | 564,876 | |
| | | | | | | | |
| | | | | | | | | | | 5,804,151 | |
|
| Diversified Telecommunication Services — 0.7% | |
Hargray Communications Group, Inc., 2017 Term Loan B, (1 mo. LIBOR + 3.00%, 1.00% Floor), 4.00%, 05/16/24 | | | | | | | 657 | | | | 627,211 | |
Iridium Satellite LLC, Term Loan, 0.00%, 11/04/26(p) | | | | | | | 728 | | | | 712,692 | |
| | | | | | | | | | | | |
| Security | | | | | Par
(000) | | | Value | |
|
| Diversified Telecommunication Services (continued) | |
Level 3 Financing, Inc., 2019 Term Loan B, (1 mo. LIBOR + 1.75%), 1.93%, 03/01/27 | | | USD | | | | 566 | | | $ | 534,470 | |
MTN Infrastructure TopCo, Inc., 1st Lien Term Loan B, (1 mo. LIBOR + 3.00%, 1.00% Floor), 4.00%, 11/15/24 | | | | | | | 1,006 | | | | 961,697 | |
Northwest Fiber LLC, Term Loan B, (3 mo. LIBOR + 5.50%), 5.67%, 05/21/27(a) | | | | | | | 369 | | | | 365,310 | |
TDC A/S, EUR Term Loan, (EURIBOR + 3.00%), 3.00%, 06/04/25 | | | EUR | | | | 819 | | | | 890,540 | |
| | | | | | | | |
| | | | | | | | | | | 4,091,920 | |
|
| Electric Utilities — 0.3% | |
Pacific Gas & Electric Co., 2020 Exit Term Loan B, (3 mo. LIBOR + 4.50%, 1.00% Floor), 5.50%, 06/23/25 | | | USD | | | | 1,228 | | | | 1,204,975 | |
Texas Competitive Electric Holdings Co. LLC/TCEH Finance, Inc., Term Loan, 1.00%, 11/10/20(a) | | | | | | | 780 | | | | — | |
Vistra Energy Corp., 1st Lien Term Loan B3, (1 mo. LIBOR + 1.75%), 1.94%, 12/31/25 | | | | | | | 602 | | | | 580,388 | |
| | | | | | | | |
| | | | | | | | | | | 1,785,363 | |
|
| Energy Equipment & Services — 0.3% | |
Gates Global LLC, 2017 USD Repriced Term Loan B, 0.00%, 04/01/24(p) | | | | | | | 1,476 | | | | 1,418,371 | |
GrafTech Finance, Inc., 2018 Term Loan B, (1 mo. LIBOR + 3.50%, 1.00% Floor), 4.50%, 02/12/25 | | | | | | | 527 | | | | 512,239 | |
| | | | | | | | |
| | | | | | | | | | | 1,930,610 | |
|
| Equity Real Estate Investment Trusts (REITs) — 0.5% | |
Claros Mortgage Trust, Inc., Term Loan B, (1 mo. LIBOR + 3.25%), 3.44%, 08/09/26(a) | | | | | | | 262 | | | | 242,086 | |
Cushman & Wakefield U.S. Borrower LLC, 2020 Term Loan B, (1 mo. LIBOR + 2.75%), 2.93%, 08/21/25 | | | | | | | 839 | | | | 787,861 | |
RHP Hotel Properties LP, 2017 Term Loan B, (1 mo. LIBOR + 2.00%), 2.18%, 05/11/24 | | | | | | | 248 | | | | 232,650 | |
VICI Properties 1 LLC, Replacement Term Loan B, (1 mo. LIBOR + 1.75%), 1.94%, 12/20/24 | | | | | | | 1686 | | | | 1,567,520 | |
| | | | | | | | |
| | | | | | | | | | | 2,830,117 | |
|
| Food & Staples Retailing — 0.4% | |
Hearthside Food Solutions LLC,: | | | | | | | | | | | | |
2018 Incremental Term Loan,
0.00%, 05/23/25(p) | | | | | | | 506 | | | | 482,179 | |
2018 Term Loan B, (1 mo. LIBOR + 3.68%), 3.87%, 05/23/25 | | | | | | | 269 | | | | 255,043 | |
US Foods, Inc.,: | | | | | | | | | | | | |
2016 Term Loan B, (1 mo. LIBOR + 1.75%), 1.93%, 06/27/23 | | | | | | | 1,080 | | | | 1,012,978 | |
2019 Term Loan B, (3 mo. LIBOR + 2.00%), 3.07%, 09/13/26 | | | | | | | 404 | | | | 375,673 | |
| | | | | | | | |
| | | | | | | | | | | 2,125,873 | |
|
| Food Products — 1.2% | |
8th Avenue Food & Provisions, Inc., 2018 1st Lien Term Loan, (1 mo. LIBOR + 3.50%), 3.68%, 10/01/25 | | | | | | | 463 | | | | 447,690 | |
B&G Foods, Inc., 2019 Term Loan B4, (1 mo. LIBOR + 2.50%), 2.68%, 10/10/26 | | | | | | | 73 | | | | 72,117 | |
Chobani LLC, 2017 Term Loan B, (1 mo. LIBOR + 3.50%, 1.00% Floor), 4.50%, 10/10/23 | | | | | | | 1,627 | | | | 1,560,765 | |
Froneri International Ltd., : | | | | | | | | | | | | |
2020 USD 2nd Lien Term Loan, (1 mo. LIBOR + 5.75%), 5.93%, 01/31/28 | | | | | | | 87 | | | | 82,433 | |
2020 USD Term Loan, (1 mo. LIBOR + 2.25%), 2.43%, 01/29/27 | | | | | | | 2,140 | | | | 2,007,420 | |
| | |
SCHEDULES OF INVESTMENTS | | 63 |
| | |
Schedule of Investments (unaudited) (continued) June 30, 2020 | | BlackRock Limited Duration Income Trust (BLW) (Percentages shown are based on Net Assets) |
| | | | | | | | | | | | |
| Security | | | | | Par
(000) | | | Value | |
|
| Food Products (continued) | |
Hostess Brands LLC, 2019 Term Loan, (3 mo. LIBOR + 2.25%), 3.01%, 08/03/25 | | | USD | | | | 427 | | | $ | 411,068 | |
JBS USA LUX SA, 2019 Term Loan B, (2 mo. LIBOR + 2.00%), 3.07%, 05/01/26 | | | | | | | 115 | | | | 109,311 | |
Pathway Vet Alliance LLC,(p): | | | | | | | | | | | | |
2020 Delayed Draw Term Loan, 1.00%, 03/31/27 | | | | | | | 18 | | | | 17,056 | |
2020 Term Loan, 1.00%, 03/31/27 | | | | | | | 216 | | | | 209,863 | |
Reynolds Group Holdings, Inc., 2017 Term Loan, (1 mo. LIBOR + 2.75%), 2.93%, 02/05/23 | | | | | | | 2,122 | | | | 2,021,749 | |
| | | | | | | | |
| | | | | | | | | | | 6,939,472 | |
|
| Health Care Equipment & Supplies — 0.5% | |
Immucor, Inc., Extended Term Loan B, (3 mo. LIBOR + 5.00%, 1.00% Floor), 6.00%, 06/15/21 | | | | | | | 1,167 | | | | 1,120,162 | |
Mallinckrodt International Finance SA, Term Loan B, (3 mo. LIBOR + 2.75%), 3.50%, 09/24/24 | | | | | | | 264 | | | | 196,641 | |
Ortho-Clinical Diagnostics SA, 2018 Term Loan B, (1 mo. LIBOR + 3.25%), 3.43%, 06/30/25 | | | | | | | 1,462 | | | | 1,364,364 | |
| | | | | | | | |
| | | | | | | | | | | 2,681,167 | |
|
| Health Care Providers & Services — 1.2% | |
AHP Health Partners, Inc., 2018 Term Loan, (1 mo. LIBOR + 4.50%, 1.00% Floor), 5.50%, 06/30/25 | | | | | | | 334 | | | | 320,183 | |
CHG Healthcare Services, Inc., 2017 1st Lien Term Loan B, (3 mo. LIBOR + 3.00%, 1.00% Floor), 4.07%, 06/07/23 | | | | | | | 961 | | | | 923,918 | |
Da Vinci Purchaser Corp., 2019 Term Loan, (6 mo. LIBOR + 4.00%, 1.00% Floor), 5.24%, 01/08/27 | | | | | | | 547 | | | | 531,263 | |
DentalCorp Perfect Smile ULC, 1st Lien Term Loan, (1 mo. LIBOR + 3.75%, 1.00% Floor), 4.75%, 06/06/25 | | | | | | | 286 | | | | 254,287 | |
Envision Healthcare Corp., 2018 1st Lien Term Loan, (1 mo. LIBOR + 3.75%), 3.93%, 10/10/25 | | | | | | | 904 | | | | 589,542 | |
EyeCare Partners LLC,: | | | | | | | | | | | | |
2020 Delayed Draw Term Loan, 1.00%, 02/18/27 | | | | | | | — | | | | — | |
2020 Term Loan, (3 mo. LIBOR + 3.75%), 4.06%, 02/05/27 | | | | | | | 520 | | | | 466,830 | |
Gentiva Health Services, Inc., 2020 Term Loan, (1 mo. LIBOR + 3.25%), 3.44%, 07/02/25 | | | | | | | 817 | | | | 789,677 | |
HC Group Holdings II, Inc., Term Loan B, (1 mo. LIBOR + 4.50%), 4.68%, 08/06/26 | | | | | | | 862 | | | | 835,820 | |
HCA, Inc.,: | | | | | | | | | | | | |
Term Loan B12, (1 mo. LIBOR + 1.75%), 1.93%, 03/13/25 | | | | | | | 262 | | | | 256,623 | |
Term Loan B13, (1 mo. LIBOR + 1.75%), 1.93%, 03/18/26 | | | | | | | 763 | | | | 745,059 | |
MPH Acquisition Holdings LLC, 2016 Term Loan B, (3 mo. LIBOR + 2.75%, 1.00% Floor), 3.75%, 06/07/23 | | | | | | | 147 | | | | 139,125 | |
nThrive, Inc., 2016 1st Lien Term Loan, (1 mo. LIBOR + 4.50%, 1.00% Floor), 5.50%, 10/20/22 | | | | | | | 521 | | | | 427,541 | |
Team Health Holdings, Inc., 1st Lien Term Loan, (1 mo. LIBOR + 2.75%, 1.00% Floor), 3.75%, 02/06/24 | | | | | | | 350 | | | | 266,899 | |
| | | | | | | | |
| | | | | | | | | | | 6,546,767 | |
|
| Health Care Services — 0.3% | |
Emerald TopCo., Inc., Term Loan, (3 mo. LIBOR + 3.50%), 4.26%, 07/24/26(a) | | | | | | | 1,147 | | | | 1,109,443 | |
| | | | | | | | | | | | |
| Security | | | | | Par
(000) | | | Value | |
|
| Health Care Services (continued) | |
WP CityMD Bidco LLC, 2019 Term Loan B, (6 mo. LIBOR + 4.50%, 1.00% Floor), 5.15%, 08/13/26 | | | USD | | | | 681 | | | $ | 669,230 | |
| | | | | | | | |
| | | | | | | | | | | 1,778,673 | |
|
| Health Care Technology — 0.3% | |
Change Healthcare Holdings, Inc., 2017 Term Loan B, (3 mo. LIBOR + 2.50%, 1.00% Floor), 3.50%, 03/01/24 | | | | | | | 1,597 | | | | 1,530,505 | |
GoodRx, Inc., 1st Lien Term Loan, (1 mo. LIBOR + 2.75%), 2.93%, 10/10/25 | | | | | | | 271 | | | | 257,905 | |
| | | | | | | | |
| | | | | | | | | | | 1,788,410 | |
|
| Hotels, Restaurants & Leisure — 2.0% | |
1011778 B.C. Unlimited Liability Co., Term Loan B4, (1 mo. LIBOR + 1.75%), 1.93%, 11/19/26 | | | | | | | 1,008 | | | | 953,422 | |
Aimbridge Acquisition Co., Inc., 2019 Term Loan B, (1 mo. LIBOR + 3.75%), 3.93%, 02/02/26 | | | | | | | 282 | | | | 243,671 | |
Aristocrat Leisure Ltd., 2020 Incremental Term Loan B, (3 mo. LIBOR + 3.75%, 1.00% Floor), 4.75%, 10/19/24 | | | | | | | 434 | | | | 429,660 | |
Aristocrat Technologies, Inc., 2018 1st Lien Term Loan, (3 mo. LIBOR + 1.75%), 2.86%, 10/19/24 | | | | | | | 367 | | | | 347,888 | |
Boyd Gaming Corp., Term Loan B3, (1 Week LIBOR + 2.25%), 2.36%, 09/15/23 | | | | | | | 398 | | | | 373,402 | |
Caesars Resort Collection LLC,: | | | | | | | | | | | | |
2017 1st Lien Term Loan B, (1 mo. LIBOR + 2.75%), 2.93%, 12/23/24 | | | | | | | 1,363 | | | | 1,208,350 | |
2020 Term Loan, 1.00%, 06/19/25(p) | | | | | | | 1,448 | | | | 1,358,412 | |
CCM Merger, Inc., Term Loan B, (1 mo. LIBOR + 2.25%), 3.00%, 08/08/21 | | | | | | | 432 | | | | 418,306 | |
Four Seasons Hotels Ltd., 1st Lien Term Loan, (1 mo. LIBOR + 2.00%), 2.18%, 11/30/23 | | | | | | | 553 | | | | 522,999 | |
Gateway Casinos & Entertainment Ltd., 2018 Term Loan B, (3 mo. LIBOR + 3.00%), 3.31%, 03/13/25 | | | | | | | 49 | | | | 39,506 | |
Golden Nugget LLC, 2017 Incremental Term Loan B, 0.00%, 10/04/23(p) | | | | | | | 749 | | | | 591,563 | |
Golden Nugget, Inc., 2020 Initial Term Loan, (3 mo. LIBOR + 12.00%, 1.00% Floor), 13.00%, 10/04/23(a) | | | | | | | 80 | | | | 79,699 | |
IRB Holding Corp, 2020 Term Loan B, (1 mo. LIBOR + 2.75%, 1.00% Floor), 3.75%, 02/05/25 | | | | | | | 880 | | | | 810,828 | |
KFC Holding Co., 2018 Term Loan B, (1 mo. LIBOR + 1.75%), 1.94%, 04/03/25 | | | | | | | 501 | | | | 478,795 | |
Playa Resorts Holding BV, 2017 Term Loan B, (1 mo. LIBOR + 2.75%, 1.00% Floor), 3.75%, 04/29/24 | | | | | | | 163 | | | | 136,981 | |
Playtika Holding Corp., Term Loan B, (3 mo. LIBOR + 6.00%, 1.00% Floor), 7.07%, 12/10/24 | | | | | | | 488 | | | | 487,190 | |
Scientific Games International, Inc., 2018 Term Loan B5, (1 mo. LIBOR + 2.75%), 3.20%, 08/14/24 | | | | | | | 364 | | | | 320,898 | |
Stars Group Holdings BV, 2018 USD Incremental Term Loan, (3 mo. LIBOR + 3.50%), 3.81%, 07/10/25 | | | | | | | 631 | | | | 626,277 | |
Station Casinos LLC, 2020 Term Loan B, 0.00%, 02/08/27(p) | | | | | | | 848 | | | | 769,663 | |
Whatabrands LLC, 2020 Term Loan B, (1 mo. LIBOR + 2.75%), 2.93%, 07/31/26 | | | | | | | 1,018 | | | | 973,278 | |
Wyndham Hotels & Resorts, Inc., Term Loan B, (1 mo. LIBOR + 1.75%), 1.93%, 05/30/25 | | | | | | | 204 | | | | 191,720 | |
| | | | | | | | |
| | | | | | | | | | | 11,362,508 | |
| | |
| 64 | | 2020 BLACKROCK SEMI-ANNUAL REPORTTO SHAREHOLDERS |
| | |
Schedule of Investments (unaudited) (continued) June 30, 2020 | | BlackRock Limited Duration Income Trust (BLW) (Percentages shown are based on Net Assets) |
| | | | | | | | | | | | |
| Security | | | | | Par
(000) | | | Value | |
|
| Household Durables — 0.1% | |
Reynolds Consumer Products LLC, Term Loan, (1 mo. LIBOR + 1.75%), 1.93%, 02/04/27 | | | USD | | | | 704 | | | $ | 677,446 | |
| | | | | | | | |
|
| Independent Power and Renewable Electricity Producers — 0.4% | |
Calpine Construction Finance Co. LP, 2017 Term Loan B, (1 mo. LIBOR + 2.00%), 2.18%, 01/15/25 | | | | | | | 897 | | | | 862,322 | |
Calpine Corp.,: | | | | | | | | | | | | |
2019 Term Loan B10, (1 mo. LIBOR + 2.00%), 2.18%, 08/12/26 | | | | | | | 993 | | | | 953,415 | |
Term Loan B9, (1 mo. LIBOR + 2.25%), 2.43%, 04/05/26 | | | | | | | 273 | | | | 263,070 | |
| | | | | | | | |
| | | | | | | | | | | 2,078,807 | |
|
| Industrial Conglomerates — 0.7% | |
Sequa Mezzanine Holdings LLC, 1st Lien Term Loan, (3 mo. LIBOR + 5.00%, 1.00% Floor), 6.00%, 11/28/21 | | | | | | | 461 | | | | 419,902 | |
Vertical US Newco Inc, USD Term Loan B, 1.00%, 07/01/27(a)(p) | | | | | | | 744 | | | | 732,840 | |
Vertiv Group Corp., Term Loan B, (1 mo. LIBOR + 3.00%), 3.18%, 03/02/27 | | | | | | | 3,171 | | | | 2,988,717 | |
| | | | | | | | |
| | | | | | | | | | | 4,141,459 | |
|
| Insurance — 1.4% | |
Alliant Holdings I, Inc., 2018 Term Loan B, (1 mo. LIBOR + 2.75%), 2.93%, 05/09/25 | | | | | | | 1,341 | | | | 1,268,578 | |
Alliant Holdings Intermediate LLC, Term Loan B, (1 mo. LIBOR + 3.25%), 3.44%, 05/09/25 | | | | | | | 287 | | | | 273,045 | |
AmWINS Group, Inc., 2017 Term Loan B, (1 mo. LIBOR + 2.75%, 1.00% Floor), 3.75%, 01/25/24 | | | | | | | 1,186 | | | | 1,149,827 | |
AssuredPartners Capital, Inc., 2020 Incremental Term Loan B, (3 mo. LIBOR + 4.50%, 1.00% Floor), 5.50%, 02/12/27 | | | | | | | 169 | | | | 165,206 | |
AssuredPartners, Inc., 2020 Term Loan B, (1 mo. LIBOR + 3.50%), 3.68%, 02/12/27 | | | | | | | 547 | | | | 522,404 | |
Davis Vision, Inc., 1st Lien Term Loan B, (1 mo. LIBOR + 3.00%, 1.00% Floor), 4.00%, 12/02/24 | | | | | | | 866 | | | | 828,012 | |
Hub International Ltd.,: | | | | | | | | | | | | |
2018 Term Loan B, (3 mo. LIBOR + 3.00%), 4.02%, 04/25/25 | | | | | | | 1,101 | | | | 1,045,058 | |
2019 Incremental Term Loan B, (3 mo. LIBOR + 4.00%, 1.00% Floor), 5.00%, 04/25/25 | | | | | | | 705 | | | | 692,051 | |
Sedgwick Claims Management Services, Inc.,: | | | | | | | | | | | | |
2019 Term Loan B, (1 mo. LIBOR + 4.00%), 4.18%, 09/03/26 | | | | | | | 626 | | | | 599,749 | |
2020 Term Loan B3, (1 mo. LIBOR + 4.25%, 1.00% Floor), 5.25%, 09/03/26 | | | | | | | 382 | | | | 369,902 | |
Term Loan B, (1 mo. LIBOR + 3.25%), 3.43%, 12/31/25 | | | | | | | 1,250 | | | | 1,177,549 | |
| | | | | | | | |
| | | | | | | | | | | 8,091,381 | |
|
| Interactive Media & Services — 0.3% | |
Ancestry.com Operations Inc., 2019 Extended Term Loan B, (1 mo. LIBOR + 4.25%), 5.25%, 08/27/26 | | | | | | | 294 | | | | 277,738 | |
Ancestry.com Operations, Inc., Non-Extended Term Loan B, (1 mo. LIBOR + 3.75%, 1.00% Floor), 4.75%, 10/19/23(a) | | | | | | | 951 | | | | 908,189 | |
Rackspace Hosting, Inc., 2017 Incremental 1st Lien Term Loan, (2 mo. LIBOR + 3.00%, 1.00% Floor), 4.00%, 11/03/23 | | | | | | | 136 | | | | 129,445 | |
| | | | | | | | | | | | |
| Security | | | | | Par
(000) | | | Value | |
|
| Interactive Media & Services (continued) | |
TierPoint LLC, 2017 1st Lien Term Loan, (1 mo. LIBOR + 3.75%, 1.00% Floor), 4.75%, 05/06/24 | | | USD | | | | 440 | | | $ | 417,802 | |
| | | | | | | | |
| | | | | | | | | | | 1,733,174 | |
|
| IT Services — 1.6% | |
Camelot U.S. Acquisition 1 Co., Term Loan B, (1 mo. LIBOR + 3.00%), 3.18%, 10/30/26 | | | | | | | 1,809 | | | | 1,749,557 | |
Epicor Software Corp., 1st Lien Term Loan, (1 mo. LIBOR + 3.25%), 3.43%, 06/01/22 | | | | | | | 874 | | | | 854,648 | |
Evertec Group LLC, 2018 Term Loan B, (1 mo. LIBOR + 3.50%), 3.68%, 11/27/24 | | | | | | | 374 | | | | 360,881 | |
Flexential Intermediate Corp., 2nd Lien Term Loan, (3 mo. LIBOR + 7.25%, 1.00% Floor), 7.59%, 08/01/25 | | | | | | | 273 | | | | 116,593 | |
Greeneden US Holdings II LLC, 2018 Term Loan B, (1 mo. LIBOR + 3.25%), 3.43%, 12/01/23 | | | | | | | 1,661 | | | | 1,595,366 | |
Presidio, Inc., 2020 Term Loan B, (3 mo. LIBOR + 3.50%), 4.27%, 01/22/27 | | | | | | | 320 | | | | 307,734 | |
PUG LLC, USD Term Loan, (1 mo. LIBOR + 3.50%), 3.68%, 02/12/27 | | | | | | | 1,241 | | | | 1,075,208 | |
Trans Union LLC, 2019 Term Loan B5, (1 mo. LIBOR + 1.75%), 1.93%, 11/16/26 | | | | | | | 1,440 | | | | 1,374,403 | |
WEX, Inc., Term Loan B3, (1 mo. LIBOR + 2.25%), 2.43%, 05/15/26 | | | | | | | 1,599 | | | | 1,528,090 | |
| | | | | | | | |
| | | | | | | | | | | 8,962,480 | |
|
| Life Sciences Tools & Services — 0.7% | |
Albany molecular Research, Inc., 2017 2nd Lien Term Loan, (3 mo. LIBOR + 7.00%, 1.00% Floor), 8.00%, 08/30/25 | | | | | | | 130 | | | | 123,565 | |
eResearchTechnology, Inc., 2020 1st Lien Term Loan, (1 mo. LIBOR + 4.50%, 1.00% Floor), 5.50%, 02/04/27 | | | | | | | 1,063 | | | | 1,039,348 | |
Sotera Health Holdings LLC, 2019 Term Loan, (1 mo. LIBOR + 4.50%, 1.00% Floor), 5.50%, 12/11/26 | | | | | | | 2,676 | | | | 2,608,216 | |
| | | | | | | | |
| | | | | | | | | | | 3,771,129 | |
|
| Machinery — 0.5% | |
Columbus McKinnon Corp., 2018 Term Loan B, (3 mo. LIBOR + 2.50%, 1.00% Floor), 3.50%, 01/31/24(a) | | | | | | | 59 | | | | 56,638 | |
Ingersoll-Rand Global Holding Co. Ltd., 2020 USD Spinco Term Loan, (1 mo. LIBOR + 1.75%), 1.93%, 03/01/27 | | | | | | | 873 | | | | 828,631 | |
Terex Corp., 2019 Term Loan B1, (3 mo. LIBOR + 2.75%), 3.50%, 01/31/24(a) | | | | | | | 116 | | | | 113,227 | |
Titan Acquisition Ltd., 2018 Term Loan B, (3 mo. LIBOR + 3.00%), 3.36%, 03/28/25 | | | | | | | 2,189 | | | | 1,996,360 | |
| | | | | | | | |
| | | | | | | | | | | 2,994,856 | |
|
| Media — 5.3% | |
Altice Financing SA,(p): | | | | | | | | | | | | |
2017 Term Loan B, 1.00%, 07/15/25 | | | | | | | 447 | | | | 422,376 | |
USD 2017 1st Lien Term Loan,
0.00%, 01/31/26 | | | | | | | 539 | | | | 507,234 | |
Altice France SA, 2018 Term Loan B13, (1 mo. LIBOR + 4.00%), 4.18%, 08/14/26 | | | | | | | 1,352 | | | | 1,297,341 | |
Cable One, Inc., 2017 Term Loan B, (1 mo. LIBOR + 1.75%), 1.93%, 05/01/24 | | | | | | | 126 | | | | 122,705 | |
Charter Communications Operating LLC, 2019 Term Loan B1, (1 mo. LIBOR + 1.75%), 1.93%, 04/30/25 | | | | | | | 1,626 | | | | 1,563,873 | |
Clear Channel Outdoor Holdings, Inc., Term Loan B, (3 mo. LIBOR + 3.50%), 4.26%, 08/21/26 | | | | | | | 2,352 | | | | 2,126,199 | |
| | |
SCHEDULES OF INVESTMENTS | | 65 |
| | |
Schedule of Investments (unaudited) (continued) June 30, 2020 | | BlackRock Limited Duration Income Trust (BLW) (Percentages shown are based on Net Assets) |
| | | | | | | | | | | | |
| Security | | | | | Par
(000) | | | Value | |
|
| Media (continued) | |
Connect Finco Sarl, Term Loan B, (1 mo. LIBOR + 4.50%, 1.00% Floor), 5.50%, 12/11/26 | | | USD | | | | 3,968 | | | $ | 3,722,196 | |
CSC Holdings LLC,: | | | | | | | | | | | | |
2017 1st Lien Term Loan, (1 mo. LIBOR + 2.25%), 2.43%, 07/17/25 | | | | | | | 661 | | | | 623,455 | |
2019 Term Loan B5, (1 mo. LIBOR + 2.50%), 2.68%, 04/15/27 | | | | | | | 1,018 | | | | 963,627 | |
Diamond Sports Group LLC, Term Loan, (3 mo. LIBOR + 3.25%), 3.43%, 08/24/26 | | | | | | | 166 | | | | 134,322 | |
Gray Television, Inc., 2017 Term Loan B, (1 mo. LIBOR + 2.25%), 2.42%, 02/07/24 | | | | | | | 684 | | | | 660,213 | |
Intelsat Jackson Holdings SA,: | | | | | | | | | | | | |
2017 Term Loan B3, (PRIME + 4.75%), 8.00%, 11/27/23 | | | | | | | 145 | | | | 144,004 | |
2020 DIP Term Loan, (UNFND + 3.60%), 5.05%, 07/14/21(p) | | | | | | | 36 | | | | 36,887 | |
Learfield Communications LLC, 2016 1st Lien Term Loan, (1 mo. LIBOR + 3.25%, 1.00% Floor), 3.43%, 12/01/23 | | | | | | | 1,795 | | | | 1,336,026 | |
Liberty Latin America Ltd., Term Loan B, (1 mo. LIBOR + 5.00%), 5.19%, 10/15/26 | | | | | | | 409 | | | | 404,910 | |
Lions Gate Capital Holdings LLC, 2018 Term Loan B, (1 mo. LIBOR + 2.25%), 2.43%, 03/24/25 | | | | | | | 529 | | | | 498,747 | |
Live Nation Entertainment, Inc., Term Loan B4, 0.00%, 10/17/26(p) | | | | | | | 1,005 | | | | 920,993 | |
MH Sub I LLC,: | | | | | | | | | | | | |
2017 1st Lien Term Loan, (3 mo. LIBOR + 3.75%), 4.57%, 09/13/24 | | | | | | | 1,641 | | | | 1,576,347 | |
2020 Incremental Term Loan, (3 mo. LIBOR + 3.75%, 1.00% Floor), 4.06%, 09/13/24 | | | | | | | 289 | | | | 278,162 | |
Midcontinent Communications, 2019 Term Loan B, (PRIME + 1.75%), 2.96%, 08/15/26(a) | | | | | | | 262 | | | | 249,761 | |
Nexstar Broadcasting, Inc., 2019 Term Loan B4, (1 mo. LIBOR + 2.75%), 2.92%, 09/18/26 | | | | | | | 511 | | | | 485,045 | |
PSAV Holdings LLC, 2018 1st Lien Term Loan, (1 mo. LIBOR + 3.25%, 1.00% Floor), 4.25%, 03/03/25 | | | | | | | 1,317 | | | | 941,370 | |
Radiate Holdco LLC, 1st Lien Term Loan, (1 mo. LIBOR + 3.00%), 3.75%, 02/01/24 | | | | | | | 953 | | | | 907,359 | |
Sinclair Television Group, Inc., Term Loan B2, (1 mo. LIBOR + 2.25%), 2.43%, 01/03/24 | | | | | | | 227 | | | | 215,930 | |
Terrier Media Buyer, Inc., Term Loan B, (1 mo. LIBOR + 4.25%), 4.43%, 12/17/26 | | | | | | | 1,025 | | | | 975,062 | |
Trader Corp., 2017 Term Loan B, (1 mo. LIBOR + 3.00%, 1.00% Floor), 4.00%, 09/28/23(a) | | | | | | | 1,480 | | | | 1,424,044 | |
UFC Holdings LLC, 2019 Term Loan, 0.00%, 04/29/26(p) | | | | | | | 277 | | | | 264,339 | |
Virgin Media Bristol LLC, USD Term Loan N, 0.00%, 01/31/28(p) | | | | | | | 953 | | | | 908,053 | |
William morris Endeavor Entertainment LLC, 2018 1st Lien Term Loan, (1 mo. LIBOR + 2.75%), 2.93%, 05/18/25 | | | | | | | 1,210 | | | | 982,859 | |
Zayo Group Holdings, Inc., USD Term Loan, 0.00%, 03/09/27(p) | | | | | | | 5,204 | | | | 4,928,335 | |
| | | | | | | | |
| | | | | | | | | | | 29,621,774 | |
|
| Metals & Mining — 0.3% | |
Ball Metalpack LLC, 2018 1st Lien Term Loan B, (3 mo. LIBOR + 4.50%), 4.86%, 07/31/25 | | | | | | | 673 | | | | 615,473 | |
Equinox Holdings, Inc., 2017 1st Lien Term Loan, (6 mo. LIBOR + 3.00%, 1.00% Floor), 4.07%, 03/08/24 | | | | | | | 1,560 | | | | 1,196,579 | |
| | | | | | | | |
| | | | | | | | | | | 1,812,052 | |
| | | | | | | | | | | | |
| Security | | | | | Par
(000) | | | Value | |
|
| Multiline Retail — 0.1% | |
Neiman Marcus Group Ltd LLC,: | | | | | | | | | | | | |
2020 DIP Term Loan, (1 mo. LIBOR + 12.75%), 13.88%, 10/07/20 | | | USD | | | | 71 | | | $ | 72,291 | |
2020 Exit Term Loan, 1.00%, 05/08/25(a)(p) | | | | | | | 103 | | | | 104,349 | |
Neiman Marcus Group Ltd. LLC, Cash Pay Extended Term Loan, (PRIME + 5.00%), 8.25%, 10/25/23 | | | | | | | 353 | | | | 89,274 | |
| | | | | | | | |
| | | | | | | | | | | 265,914 | |
|
| Oil & Gas Equipment & Services — 0.1% | |
McDermott Technology Americas, Inc.,: | | | | | | | | | | | | |
2018 1st Lien Term Loan, (PRIME + 4.00%), 7.25%, 05/09/25 | | | | | | | 663 | | | | 227,467 | |
2020 SP DIP Roll Up Term Loan, 0.00%, 10/21/20(p) | | | | | | | 292 | | | | 289,705 | |
| | | | | | | | |
| | | | | | | | | | | 517,172 | |
|
| Oil, Gas & Consumable Fuels — 0.1% | |
California Resources Corp., Second Out Term Loan, (3 mo. LIBOR + 10.37%, 1.00% Floor), 11.38%, 12/31/21 | | | | | | | 600 | | | | 27,016 | |
CITGO Holding, Inc., 2019 Term Loan B, (3 mo. LIBOR + 7.00%, 1.00% Floor), 8.00%, 08/01/23 | | | | | | | 2 | | | | 1,881 | |
Edgewater Generation LLC, Term Loan, (1 mo. LIBOR + 3.75%), 3.93%, 12/13/25 | | | | | | | 446 | | | | 425,021 | |
EG Group Ltd., 2018 Term Loan B, (6 mo. LIBOR + 4.00%), 5.07%, 02/07/25 | | | | | | | 249 | | | | 233,477 | |
| | | | | | | | | | | | |
| | | | | | | | | | | 687,395 | |
|
| Personal Products — 0.4% | |
Sunshine Luxembourg VII Sarl, USD 1st Lien Term Loan, 0.00%, 10/01/26(p) | | | | | | | 2,069 | | | | 1,976,507 | |
| | | | | | | | | | | | |
|
| Pharmaceuticals — 1.7% | |
Amneal Pharmaceuticals LLC, 2018 Term Loan B, (1 mo. LIBOR + 3.50%), 3.69%, 05/04/25 | | | | | | | 860 | | | | 783,691 | |
Catalent Pharma Solutions, Inc., Term Loan B2, (1 mo. LIBOR + 2.25%, 1.00% Floor), 3.25%, 05/18/26 | | | | | | | 990 | | | | 976,498 | |
Elanco Animal Health Incorporated, Term Loan B, 1.00%, 02/04/27(p) | | | | | | | 955 | | | | 908,504 | |
Grifols Worldwide Operations USA, Inc., USD 2019 Term Loan B, (1 Week LIBOR + 2.00%), 2.11%, 11/15/27 | | | | | | | 885 | | | | 850,975 | |
Jaguar Holding Co. II, 2018 Term Loan, (1 mo. LIBOR + 2.50%, 1.00% Floor), 3.50%, 08/18/22 | | | | | | | 3,168 | | | | 3,125,207 | |
Valeant Pharmaceuticals International, Inc., 2018 Term Loan B, (1 mo. LIBOR + 3.00%), 3.19%, 06/02/25 | | | | | | | 2,949 | | | | 2,861,935 | |
| | | | | | | | |
| | | | | | | | | | | 9,506,810 | |
|
| Professional Services — 0.6% | |
Cast and Crew Payroll LLC, 2019 1st Lien Term Loan, (1 mo. LIBOR + 3.75%), 3.93%, 02/09/26 | | | | | | | 443 | | | | 403,014 | |
Dun & Bradstreet Corp., Term Loan, 0.00%, 02/06/26(p) | | | | | | | 2,057 | | | | 2,000,329 | |
SIRVA Worldwide, Inc., 2018 1st Lien Term Loan, (3 mo. LIBOR + 5.50%), 5.86%, 08/04/25 | | | | | | | 396 | | | | 286,602 | |
STG-Fairway Holdings LLC, Term Loan B, (3 mo. LIBOR + 3.50%), 4.57%, 01/31/27 | | | | | | | 473 | | | | 439,691 | |
| | | | | | | | |
| | | | | | | | | | | 3,129,636 | |
|
| Real Estate Management & Development — 0.2% | |
CityCenter Holdings LLC, 2017 Term Loan B, (1 mo. LIBOR + 2.25%), 3.00%, 04/18/24 | | | | | | | 1,022 | | | | 926,954 | |
| | |
| 66 | | 2020 BLACKROCK SEMI-ANNUAL REPORTTO SHAREHOLDERS |
| | |
Schedule of Investments (unaudited) (continued) June 30, 2020 | | BlackRock Limited Duration Income Trust (BLW) (Percentages shown are based on Net Assets) |
| | | | | | | | | | | | |
| Security | | | | | Par
(000) | | | Value | |
|
| Road & Rail — 0.4% | |
Lineage Logistics Holdings LLC, 2018 Term Loan, 0.00%, 02/27/25(p) | | | USD | | | | 1,930 | | | $ | 1,865,792 | |
Road Infrastructure Investment LLC, 2016 1st Lien Term Loan, (3 mo. LIBOR + 3.50%, 1.00% Floor), 4.50%, 06/13/23 | | | | | | | 656 | | | | 573,031 | |
| | | | | | | | |
| | | | | | | | | | | 2,438,823 | |
|
| Semiconductors & Semiconductor Equipment — 0.1% | |
Cabot Microelectronics Corp., 2019 Term Loan B1, (1 mo. LIBOR + 2.00%), 2.19%, 11/17/25 | | | | | | | 467 | | | | 452,121 | |
Microchip Technology, Inc., 2018 Term Loan B, (1 mo. LIBOR + 2.00%), 2.18%, 05/29/25 | | | | | | | 346 | | | | 333,125 | |
| | | | | | | | |
| | | | | | | | | | | 785,246 | |
|
| Software — 7.9% | |
Applied Systems, Inc.,: | | | | | | | | | | | | |
2017 1st Lien Term Loan, (3 mo. LIBOR + 3.25%, 1.00% Floor), 4.25%, 09/19/24 | | | | | | | 1,607 | | | | 1,559,272 | |
2017 2nd Lien Term Loan, (3 mo. LIBOR + 7.00%, 1.00% Floor), 8.00%, 09/19/25 | | | | | | | 250 | | | | 248,436 | |
BMC Software Finance, Inc., 2017 Term Loan, 0.00%, 10/02/25(p) | | | | | | | 866 | | | | 817,040 | |
Castle US Holding Corp., USD Term Loan B, (3 mo. LIBOR + 3.75%), 4.06%, 01/29/27 | | | | | | | 1,168 | | | | 1,062,482 | |
Cornerstone OnDemand, Inc., Term Loan B, (2 mo. LIBOR + 4.25%), 5.35%, 04/22/27 | | | | | | | 495 | | | | 486,649 | |
Cypress Intermediate Holdings III, Inc., 2017 1st Lien Term Loan, (1 mo. LIBOR + 3.00%, 1.00% Floor), 4.00%, 04/29/24 | | | | | | | 1,871 | | | | 1,804,856 | |
Digicel International Finance Ltd., 2017 Term Loan B, (6 mo. LIBOR + 3.25%), 4.25%, 05/28/24 | | | | | | | 496 | | | | 415,126 | |
DTI Holdco, Inc., 2018 Term Loan B, (3 mo. LIBOR + 4.75%, 1.00% Floor), 5.75%, 09/30/23 | | | | | | | 492 | | | | 392,114 | |
Ellie Mae, Inc., Term Loan, (3 mo. LIBOR + 3.75%), 4.06%, 04/17/26 | | | | | | | 1,929 | | | | 1,864,511 | |
Financial & Risk US Holdings, Inc., 2018 USD Term Loan, (1 mo. LIBOR + 3.25%), 3.43%, 10/01/25 | | | | | | | 2,656 | | | | 2,591,980 | |
Informatica LLC,: | | | | | | | | | | | | |
2020 USD 2nd Lien Term Loan, (Fixed + 7.12%), 7.13%, 02/25/25(q) | | | | | | | 487 | | | | 486,391 | |
2020 USD Term Loan B, (1 mo. LIBOR + 3.25%), 3.43%, 02/25/27 | | | | | | | 3,256 | | | | 3,109,479 | |
Kronos, Inc.,: | | | | | | | | | | | | |
2017 Term Loan B, 0.00%, 11/01/23(p) | | | | | | | 3,667 | | | | 3,658,471 | |
2nd Lien Term Loan, (1 mo. LIBOR + 8.25%, 1.00% Floor), 9.25%, 11/01/24 | | | | | | | 772 | | | | 771,766 | |
McAfee LLC, 2018 Term Loan B, (1 mo. LIBOR + 3.75%), 3.93%, 09/30/24 | | | | | | | 1,607 | | | | 1,561,067 | |
Mitchell International, Inc.,: | | | | | | | | | | | | |
2017 1st Lien Term Loan, (1 mo. LIBOR + 3.25%), 3.43%, 11/29/24 | | | | | | | 738 | | | | 686,775 | |
2017 2nd Lien Term Loan, (1 mo. LIBOR + 7.25%), 7.43%, 12/01/25 | | | | | | | 267 | | | | 236,000 | |
Renaissance Holding Corp., 2018 Add On Term Loan, (3 mo. LIBOR + 3.25%), 4.01%, 05/30/25 | | | | | | | 32 | | | | 30,449 | |
RP Crown Parent LLC, 2016 Term Loan B, (1 mo. LIBOR + 2.75%, 1.00% Floor), 3.75%, 10/12/23 | | | | | | | 1,653 | | | | 1,601,002 | |
Severin Acquisition LLC, 2018 Term Loan B, (1 mo. LIBOR + 3.25%), 3.43%, 08/01/25 | | | | | | | 1,414 | | | | 1,353,591 | |
SolarWinds Holdings, Inc., 2018 Term Loan B, (1 mo. LIBOR + 2.75%), 2.93%, 02/05/24 | | | | | | | 1,525 | | | | 1,476,392 | |
Solera LLC, Term Loan B, (1 mo. LIBOR + 2.75%), 2.93%, 03/03/23 | | | | | | | 1,338 | | | | 1,289,224 | |
| | | | | | | | | | | | |
| Security | | | | | Par
(000) | | | Value | |
|
| Software (continued) | |
Sophia LP, 2017 Term Loan B, (3 mo. LIBOR + 3.25%, 1.00% Floor), 4.25%, 09/30/22 | | | USD | | | | 1,882 | | | $ | 1,835,356 | |
SS&C Technologies Holdings Europe Sarl, 2018 Term Loan B4, (1 mo. LIBOR + 1.75%), 1.93%, 04/16/25 | | | | | | | 582 | | | | 555,835 | |
SS&C Technologies, Inc.,: | | | | | | | | | | | | |
2018 Term Loan B3, (1 mo. LIBOR + 1.75%), 1.93%, 04/16/25 | | | | | | | 829 | | | | 791,605 | |
2018 Term Loan B5, (1 mo. LIBOR + 1.75%), 1.93%, 04/16/25 | | | | | | | 531 | | | | 505,563 | |
Tempo Acquisition LLC, Term Loan, (1 mo. LIBOR + 2.75%), 2.93%, 05/01/24 | | | | | | | 2,422 | | | | 2,295,165 | |
Tibco Software Inc.,: | | | | | | | | | | | | |
2020 2nd Lien Term Loan, (1 mo. LIBOR + 7.25%), 7.43%, 03/03/28 | | | | | | | 1,429 | | | | 1,369,257 | |
2020 Term Loan B, (1 mo. LIBOR + 3.75%), 3.93%, 06/30/26(a) | | | | | | | 1,774 | | | | 1,672,026 | |
Ultimate Software Group, Inc.,: | | | | | | | | | | | | |
2020 2nd Lien Incremental Term Loan, 1.00%, 05/03/27 | | | | | | | 794 | | | | 805,910 | |
2020 Incremental Term Loan B, 1.00%, 05/04/26(p) | | | | | | | 2,457 | | | | 2,423,609 | |
Term Loan B, 0.00%, 05/04/26(p) | | | | | | | 2,364 | | | | 2,286,198 | |
Vertafore, Inc., 2018 1st Lien Term Loan, (1 mo. LIBOR + 3.25%), 3.43%, 07/02/25 | | | | | | | 1,974 | | | | 1,856,802 | |
| | | | | | | | |
| | | | | | | | | | | 43,900,399 | |
|
| Specialty Retail — 1.1% | |
Belron Finance US LLC,: | | | | | | | | | | | | |
2019 USD Term Loan B, (3 mo. LIBOR + 2.50%), 3.26%, 10/30/26 | | | | | | | 418 | | | | 402,229 | |
Term Loan B, (3 mo. LIBOR + 2.50%), 2.93%, 11/13/25 | | | | | | | 183 | | | | 176,569 | |
USD Term Loan B, (3 mo. LIBOR + 2.50%), 2.97%, 11/07/24 | | | | | | | 743 | | | | 716,018 | |
CD&R Firefly Bidco Ltd., 2018 GBP Term Loan B1, (LIBOR - GBP + 4.50%), 5.18%, 06/23/25 | | | GBP | | | | 1,000 | | | | 1,193,873 | |
IAA, Inc., Term Loan B, (1 mo. LIBOR + 2.25%), 2.44%, 06/28/26 | | | USD | | | | 287 | | | | 273,287 | |
MED ParentCo LP,: | | | | | | | | | | | | |
1st Lien Delayed Draw Term Loan, (3 mo. LIBOR + 4.25%), 4.61%, 08/31/26 | | | | | | | 118 | | | | 106,512 | |
1st Lien Term Loan, (3 mo. LIBOR + 4.25%), 4.61%, 08/31/26 | | | | | | | 673 | | | | 607,061 | |
Midas Intermediate Holdco II LLC, Incremental Term Loan B, (3 mo. LIBOR + 2.75%, 1.00% Floor), 3.75%, 08/18/21 | | | | | | | 538 | | | | 483,621 | |
PetSmart, Inc., Term Loan B2, (3 mo. LIBOR + 4.00%, 1.00% Floor), 5.00%, 03/11/22 | | | | | | | 1,877 | | | | 1,849,473 | |
Research Now Group, Inc., 2017 1st Lien Term Loan, (3 mo. LIBOR + 5.50%, 1.00% Floor), 6.50%, 12/20/24 | | | | | | | 385 | | | | 352,871 | |
| | | | | | | | |
| | | | | | | | | | | 6,161,514 | |
|
| Technology Hardware, Storage & Peripherals — 0.2% | |
Electronics for Imaging, Inc., Term Loan, 0.00%, 07/23/26(a)(p) | | | | | | | 531 | | | | 414,420 | |
Western Digital Corp., 2018 Term Loan B4, (3 mo. LIBOR + 1.75%), 1.92%, 04/29/23 | | | | | | | 822 | | | | 798,469 | |
| | | | | | | | |
| | | | | | | | | | | 1,212,889 | |
|
| Thrifts & Mortgage Finance — 0.2% | |
IG Investment Holdings LLC, 2018 1st Lien Term Loan, 0.00%, 05/23/25(p) | | | | | | | 1,172 | | | | 1,085,062 | |
| | | | | | | | |
| | |
SCHEDULES OF INVESTMENTS | | 67 |
| | |
Schedule of Investments (unaudited) (continued) June 30, 2020 | | BlackRock Limited Duration Income Trust (BLW) (Percentages shown are based on Net Assets) |
| | | | | | | | | | | | |
| Security | | | | | Par
(000) | | | Value | |
|
| Trading Companies & Distributors — 0.2% | |
HD Supply, Inc., Term Loan B5, (1 mo. LIBOR + 1.75%), 1.93%, 10/17/23 | | | USD | | | | 1,077 | | | $ | 1,038,855 | |
| | | | | | | | |
|
| Utilities — 0.1% | |
ExGen Renewables IV LLC, Term Loan B, (3 mo. LIBOR + 3.00%, 1.00% Floor), 4.00%, 11/28/24 | | | | | | | 786 | | | | 760,299 | |
| | | | | | | | | | | | |
|
| Wireless Telecommunication Services — 1.0% | |
Ligado Networks LLC, PIK Exit Term Loan (12.20% Cash or 9.75% PIK), 0.00%, 12/07/20(i) | | | | | | | 102 | | | | 90,282 | |
SBA Senior Finance II LLC, 2018 Term Loan B, 0.00%, 04/11/25(p) | | | | | | | 1,080 | | | | 1,037,280 | |
T-Mobile USA, Inc., 2020 Term Loan, (1 mo. LIBOR + 3.00%), 3.18%, 04/01/27 | | | | | | | 2,874 | | | | 2,867,792 | |
Xplornet Communications, Inc., 2020 Term Loan B, 0.00%, 05/29/27(p) | | | | | | | 1,550 | | | | 1,476,375 | |
| | | | | | | | |
| | | | | | | | | | | 5,471,729 | |
| | | | | | | | | | | | |
| |
Total Floating Rate Loan Interests — 44.8%
(Cost — $263,780,758) | | | | 250,584,349 | |
| | | | | | | | | | | | |
|
Foreign Agency Obligations — 4.0% | |
|
Bahrain — 0.1% | |
CBB International Sukuk Co. 7 SPC, 6.88%, 10/05/25 | | | | | | | 400 | | | | 445,000 | |
| | | | | | | | | | | | |
|
| Colombia — 0.4% | |
Colombia Government International Bond: | | | | | | | | | | | | |
8.13%, 05/21/24 | | | | | | | 238 | | | | 285,674 | |
4.50%, 01/28/26(h) | | | | | | | 1,354 | | | | 1,474,591 | |
3.88%, 04/25/27 | | | | | | | 200 | | | | 211,938 | |
| | | | | | | | | | | | |
| | | | | | | | | | | 1,972,203 | |
|
| Dominican Republic — 0.1% | |
Dominican Republic International Bond: | | | | | | | | | | | | |
5.50%, 01/27/25 | | | | | | | 159 | | | | 160,690 | |
5.95%, 01/25/27 | | | | | | | 491 | | | | 493,915 | |
| | | | | | | | | | | | |
| | | | | | | | | | | 654,605 | |
|
| Egypt — 0.3% | |
Egypt Government International Bond: | | | | | | | | | | | | |
5.75%, 05/29/24(c) | | | | | | | 215 | | | | 215,941 | |
5.88%, 06/11/25 | | | | | | | 335 | | | | 337,931 | |
7.60%, 03/01/29 | | | | | | | 816 | | | | 830,790 | |
8.50%, 01/31/47(c) | | | | | | | 321 | | | | 313,777 | |
| | | | | | | | | | | | |
| | | | | | | | | | | 1,698,439 | |
|
| Iceland — 0.6% | |
Iceland Government International Bond, 5.88%, 05/11/22 | | | | | | | 3,030 | | | | 3,266,369 | |
| | | | | | | | | | | | |
|
| Indonesia — 0.3% | |
Indonesia Government International Bond: | | | | | | | | | | | | |
4.75%, 01/08/26 | | | | | | | 595 | | | | 671,048 | |
4.10%, 04/24/28(h) | | | | | | | 650 | | | | 720,891 | |
5.35%, 02/11/49(h) | | | | | | | 200 | | | | 259,313 | |
| | | | | | | | | | | | |
| | | | | | | | | | | 1,651,252 | |
|
| Mexico — 0.2% | |
Mexico Government International Bond, 4.15%, 03/28/27(h) | | | | | | | 1,052 | | | | 1,128,796 | |
| | | | | | | | | | | | |
|
| mongolia — 0.1% | |
mongolia Government International Bond, 8.75%, 03/09/24 | | | | | | | 250 | | | | 269,375 | |
| | | | | | | | | | | | |
| | | | | | | | | | | | |
| Security | | | | | Par
(000) | | | Value | |
|
| Panama — 0.1% | |
Panama Government International Bond, 3.16%, 01/23/30(h) | | | USD | | | | 699 | | | $ | 752,736 | |
| | | | | | | | | | | | |
|
| Paraguay — 0.1% | |
Paraguay Government International Bond(c): | | | | | | | | | | | | |
4.95%, 04/28/31 | | | | | | | 300 | | | | 333,000 | |
5.40%, 03/30/50 | | | | | | | 200 | | | | 226,812 | |
| | | | | | | | | | | | |
| | | | | | | | | | | 559,812 | |
|
| Peru — 0.1% | |
Peruvian Government International Bond, 2.78%, 01/23/31 | | | | | | | 609 | | | | 649,651 | |
| | | | | | | | | | | | |
|
| Portugal — 0.7% | |
Portugal Government International Bond, 5.13%, 10/15/24(c) | | | | | | | 3,190 | | | | 3,709,077 | |
| | | | | | | | | | | | |
|
| Qatar — 0.3% | |
Qatar Government International Bond: | | | | | | | | | | | | |
4.50%, 04/23/28 | | | | | | | 690 | | | | 813,337 | |
4.00%, 03/14/29(c)(h) | | | | | | | 710 | | | | 816,500 | |
| | | | | | | | | | | | |
| | | | | | | | | | | 1,629,837 | |
|
| Russia — 0.2% | |
Russian Foreign Bond - Eurobond: | | | | | | | | | | | | |
4.75%, 05/27/26 | | | | | | | 600 | | | | 682,800 | |
4.25%, 06/23/27 | | | | | | | 600 | | | | 669,600 | |
| | | | | | | | | | | | |
| | | | | | | | | | | 1,352,400 | |
|
| Saudi Arabia — 0.2% | |
Saudi Government International Bond, 4.50%, 04/17/30 | | | | | | | 1,035 | | | | 1,220,265 | |
| | | | | | | | | | | | |
|
| South Africa — 0.0% | |
Republic of South Africa Government International Bond, 5.88%, 05/30/22 | | | | | | | 200 | | | | 211,687 | |
| | | | | | | | | | | | |
|
| Sri Lanka — 0.1% | |
Sri Lanka Government International Bond: | | | | | | | | | | | | |
6.85%, 03/14/24 | | | | | | | 200 | | | | 138,000 | |
6.35%, 06/28/24 | | | | | | | 200 | | | | 138,000 | |
7.85%, 03/14/29 | | | | | | | 400 | | | | 260,000 | |
7.55%, 03/28/30 | | | | | | | 200 | | | | 128,500 | |
| | | | | | | | | | | | |
| | | | | | | | | | | 664,500 | |
|
| Ukraine — 0.1% | |
Ukraine Government International Bond: | | | | | | | | | | | | |
7.75%, 09/01/22 | | | | | | | 118 | | | | 123,015 | |
8.99%, 02/01/24 | | | | | | | 200 | | | | 215,000 | |
9.75%, 11/01/28 | | | | | | | 236 | | | | 269,630 | |
| | | | | | | | | | | | |
| | | | | | | | | | | 607,645 | |
| |
Total Foreign Agency Obligations — 4.0%
(Cost — $21,575,614) | | | 22,443,649 | |
| | | | | | | | |
| | | |
| | | | | | Shares | | | | |
|
Investment Companies — 1.3% | |
|
Fixed Income Funds — 1.3% | |
Invesco Senior Loan ETF | | | | | | | 197,601 | | | | 4,218,781 | |
iShares iBoxx $ Investment Grade Corporate Bond ETF(u) | | | | | | | 20,000 | | | | 2,690,000 | |
| | | | | | | | | | | | |
| |
Total Investment Companies — 1.3%
(Cost — $6,966,023) | | | | 6,908,781 | |
| | | | | | | | |
| | |
| 68 | | 2020 BLACKROCK SEMI-ANNUAL REPORTTO SHAREHOLDERS |
| | |
Schedule of Investments (unaudited) (continued) June 30, 2020 | | BlackRock Limited Duration Income Trust (BLW) (Percentages shown are based on Net Assets) |
| | | | | | | | | | | | |
| | | |
| Security | | | | | Par (000) | | | Value | |
|
Non-Agency Mortgage-Backed Securities — 1.8% | |
|
Collateralized Mortgage Obligations — 0.9% | |
Alternative Loan Trust, Series 2007-19, Class 1A1, 6.00%, 08/25/37 | | | USD | | | | 695 | | | $ | 514,041 | |
Countrywide Alternative Loan Trust: | | | | | | | | | | | | |
Series 2005-54CB, Class 3A4, 5.50%, 11/25/35 | | | | | | | 1,646 | | | | 1,328,731 | |
Series 2006-J8, Class A5, 6.00%, 02/25/37 | | | | | | | 2,282 | | | | 1,458,731 | |
Countrywide Home Loan Mortgage Pass-Through Trust: | | | | | | | | | | | | |
Series 2005-17, Class 1A6, 5.50%, 09/25/35 | | | | | | | 23 | | | | 234,345 | |
Series 2006-17, Class A2, 6.00%, 12/25/36 | | | | | | | 863 | | | | 573,398 | |
Series 2007-HY5, Class 3A1, 3.85%, 09/25/37(e) | | | | | | | 595 | | | | 528,773 | |
GSR Mortgage Loan Trust, Series 2005-AR5, Class 2A3, 3.87%, 10/25/35(e) | | | | | | | 460 | | | | 339,659 | |
| | | | | | | | |
| | | | | | | | | | | 4,977,678 | |
|
| Commercial Mortgage-Backed Securities — 0.9% | |
Banc of America Merrill Lynch Commercial Mortgage Securities Trust, Series 2015-200P, Class C, 3.60%, 04/14/33(c)(e) | | | | | | | 4,830 | | | | 5,118,081 | |
| | | | | | | | |
| |
Total Non-Agency Mortgage-Backed Securities — 1.8%
(Cost — $10,061,360) | | | 10,095,759 | |
| | | | | | | | |
| | | |
| | | | | | Beneficial Interest
(000) | | | | |
|
Other Interests(r) — 0.0% | |
|
| Auto Components — 0.0% | |
Lear Corp. Escrow(a)(b)(j) | | | | | | | 1,000 | | | | 10 | |
| | | | | | | | | | | | |
|
| IT Services — 0.0% | |
Millennium Corp.(a)(b) | | | | | | | 918 | | | | — | |
Millennium Lender Claims(a)(b) | | | | | | | 861 | | | | — | |
| | | | | | | | | | | | |
| |
Total Other Interests — 0.0%
(Cost — $—) | | | 10 | |
| | | | | | | | | | | | |
| | | |
| | | | | | Par
(000) | | | | |
|
Preferred Securities | |
|
| Capital Trusts — 6.9% | |
|
| Banks — 1.2% | |
Banco Mercantil del Norte SA, 6.75%(c)(d)(k)(l) | | | USD | | | | 396 | | | | 373,787 | |
Bank of East Asia Ltd., 5.88%(k)(l) | | | HKD | | | | 250 | | | | 241,050 | |
Bankia SA, 6.38%(k)(l) | | | EUR | | | | 200 | | | | 212,026 | |
Burgan Bank SAK, 5.75%(k)(l) | | | KWD | | | | 250 | | | | 242,031 | |
Capital One Financial Corp., Series E, 4.15%(d)(h)(l) | | | USD | | | | 3,000 | | | | 2,445,000 | |
CIT Group, Inc., Series A, 5.80%(k)(l) | | | | | | | 235 | | | | 180,804 | |
Nanyang Commercial Bank Ltd., 5.00%(k)(l) | | | EUR | | | | 200 | | | | 194,813 | |
TMB Bank PCL, 4.90%(k)(l) | | | USD | | | | 250 | | | | 231,094 | |
Wells Fargo & Co.,(h)(k)(l): | | | | | | | | | | | | |
Series S, 5.90% | | | | | | | 1,500 | | | | 1,481,363 | |
Series U, 5.88% | | | | | | | 968 | | | | 1,006,110 | |
| | | | | | | | | | | | |
| | | | | | | | | | | 6,608,078 | |
|
| Capital Markets — 0.7% | |
China Cinda Asset Management Co. Ltd., 4.45%(k)(l) | | | CNY | | | | 200 | | | | 200,625 | |
Goldman Sachs Group, Inc., Series M, 4.37%(h)(k)(l) | | | USD | | | | 1,730 | | | | 1,585,891 | |
morgan Stanley, Series H, 3.89%(h)(k)(l) | | | | | | | 2,546 | | | | 2,291,282 | |
| | | | | | | | | | | | |
| | | | | | | | | | | 4,077,798 | |
| | | | | | | | | | | | |
| | | |
| Security | | | | | Par (000) | | | Value | |
|
| Diversified Financial Services — 3.8% | |
Bank of America Corp.,(h)(k)(l): | | | | | | | | | | | | |
Series AA, 6.10% | | | USD | | | | 1,038 | | | $ | 1,095,090 | |
Series DD, 6.30% | | | | | | | 215 | | | | 238,590 | |
Series U, 5.20% | | | | | | | 1,250 | | | | 1,205,090 | |
Series X, 6.25% | | | | | | | 1,929 | | | | 1,996,650 | |
Series Z, 6.50% | | | | | | | 143 | | | | 153,676 | |
BNP Paribas SA, 4.50%(c)(k)(l) | | | | | | | 205 | | | | 179,631 | |
Credit Agricole SA, 6.50%(k)(l) | | | EUR | | | | 100 | | | | 114,228 | |
Credit Suisse Group AG(k)(l): | | | | | | | | | | | | |
5.10%(c) | | | USD | | | | 200 | | | | 189,500 | |
6.25% | | | | | | | 200 | | | | 208,336 | |
6.38%(c)(h) | | | | | | | 495 | | | | 502,673 | |
HBOS Capital Funding LP, 6.85%(l) | | | | | | | 100 | | | | 101,090 | |
HSBC Holdings PLC(h)(k)(l): | | | | | | | | | | | | |
6.00% | | | | | | | 415 | | | | 412,406 | |
6.25%(d) | | | | | | | 695 | | | | 689,788 | |
JPMorgan Chase & Co.,(h)(k)(l): | | | | | | | | | | | | |
Series 1, 4.23% | | | | | | | 146 | | | | 132,904 | |
Series FF, 5.00% | | | | | | | 1,345 | | | | 1,286,493 | |
Series HH, 4.60% | | | | | | | 570 | | | | 508,725 | |
Series R, 6.00% | | | | | | | 120 | | | | 120,900 | |
Series S, 6.75% | | | | | | | 160 | | | | 172,000 | |
Series U, 6.13% | | | | | | | 6,690 | | | | 6,827,145 | |
Series V, 3.62% | | | | | | | 4,060 | | | | 3,582,950 | |
Royal Bank of Scotland Group PLC(h)(k)(l): | | | | | | | | | | | | |
6.00% | | | | | | | 1,185 | | | | 1,200,405 | |
8.63% | | | | | | | 200 | | | | 207,950 | |
Woori Bank, 4.25%(k)(l) | | | KRW | | | | 250 | | | | 249,531 | |
| | | | | | | | | | | | |
| | | | | | | | | | | 21,375,751 | |
|
| Diversified Telecommunication Services — 0.1% | |
Telefonica Europe BV(k)(l): | | | | | | | | | | | | |
4.38% | | | EUR | | | | 100 | | | | 115,720 | |
5.88% | | | | | | | 100 | | | | 121,066 | |
| | | | | | | | | | | | |
| | | | | | | | | | | 236,786 | |
|
| Electric Utilities — 0.4% | |
NextEra Energy Capital Holdings, Inc.,
5.65%, 05/01/79(h)(k) | | | USD | | | | 1,750 | | | | 1,907,142 | |
| | | | | | | | | | | | |
|
| Electronic Equipment, Instruments & Components — 0.0% | |
Belden, Inc., 4.13%, 10/15/26 | | | EUR | | | | 100 | | | | 111,784 | |
| | | | | | | | | | | | |
|
| Insurance — 0.7% | |
Achmea BV, 4.63%(k)(l) | | | | | | | 200 | | | | 217,307 | |
Heungkuk Life Insurance Co. Ltd., 4.48%(k)(l) | | | | | | | 200 | | | | 188,125 | |
Voya Financial, Inc., 5.65%, 05/15/53(h)(k) | | | | | | | 3,500 | | | | 3,526,250 | |
| | | | | | | | | | | | |
| | | | | | | | | | | 3,931,682 | |
|
| Oil, Gas & Consumable Fuels — 0.0% | |
BP Capital Markets PLC, 3.25%(k)(l) | | | | | | | 100 | | | | 112,814 | |
Naturgy Finance BV, 3.38%(k)(l) | | | | | | | 100 | | | | 112,631 | |
| | | | | | | | | | | | |
| | | | | | | | | | | 225,445 | |
|
| Utilities — 0.0% | |
Electricite de France SA, 3.00%(k)(l) | | | | | | | 200 | | | | 214,067 | |
| | | | | | | | | | | | |
| |
Total Capital Trusts — 6.9% | | | | 38,688,533 | |
| | | | | | | | | | | | |
| | | |
| | | | | | Shares | | | | |
|
Preferred Stocks — 1.8% | |
|
Banks — 0.0% | |
CF-B L2 (D) LLC, (Aquired 04/08/15,
cost $132,662), 0.00%(c)(s) | | | | | | | 135,568 | | | | 13,123 | |
| | | | | | | | | | | | |
| | |
SCHEDULES OF INVESTMENTS | | 69 |
| | |
Schedule of Investments (unaudited) (continued) June 30, 2020 | | BlackRock Limited Duration Income Trust (BLW) (Percentages shown are based on Net Assets) |
| | | | | | | | | | | | |
| | | |
| Security | | | | | Shares | | |
Value | |
|
| Capital Markets — 1.8% | |
Goldman Sachs Group, Inc., Series J, 5.50%(k)(l) | | | | | | | 202,526 | | | $ | 5,144,161 | |
morgan Stanley,(k)(l): | | | | | | | | | | | | |
Series F, 6.88% | | | | | | | 120 | | | | 3,189,600 | |
Series K, 5.85% | | | | | | | 53 | | | | 1,370,732 | |
| | | | | | | | | | | | |
| | | | | | | | | | | 9,704,493 | |
| | | | | | | | | | | | |
| |
| Total Preferred Stocks — 1.8% | | | 9,717,616 | |
| | | | | | | | | | | | |
|
Trust Preferred — 0.4% | |
|
Diversified Financial Services — 0.4% | |
GMAC Capital Trust I, Series 2, 6.18%, 02/15/40(k) | | | | | | | 105,753 | | | | 2,370,982 | |
| | | | | | | | | | | | |
| |
| Total Trust Preferreds — 0.4% | | | 2,370,982 | |
| | | | | | | | | | | | |
| |
Total Preferred Securities — 9.1%
(Cost — $52,343,714) | | | | 50,777,131 | |
| | | | | | | | | | | | |
| | | |
| | | | | | Par
(000) | | | | |
|
U.S. Government Sponsored Agency Securities — 10.9% | |
|
Collateralized Mortgage Obligations — 0.3% | |
Fannie Mae Connecticut Avenue Securities, Series 2017-C03, Class 1M2, (1 mo. LIBOR US + 3.00%), 3.18%, 10/25/29(d) | | | USD | | | | 1,600 | | | | 1,609,149 | |
| | | | | | | | | | | | |
|
| Interest Only Collateralized Mortgage Obligations — 0.2% | |
Freddie Mac Mortgage-Backed Securities, Series K042, Class X1, 1.17%, 12/25/24(e) | | | | | | | 33,605 | | | | 1,336,286 | |
| | | | | | | | | | | | |
|
| Mortgage-Backed Securities — 10.4% | |
Fannie Mae Mortgage-Backed Securities, 5.00%, 07/01/20 - 08/01/23(h) | | | | | | | 24 | | | | 24,886 | |
Freddie Mac Mortgage-Backed Securities, 3.50%, 07/01/49(h) | | | | | | | 3,810 | | | | 4,078,582 | |
Uniform Mortgage-Backed Securities, 2.50%, 07/01/50 - 08/01/50(t) | | | | | | | 52,000 | | | | 54,066,287 | |
| | | | | | | | | | | | |
| | | | | | | | | | | 58,169,755 | |
| | | | | | | | | | | | |
| |
Total U.S. Government Sponsored Agency Securities — 10.9%
(Cost — $60,767,217) | | | | 61,115,190 | |
| | | | | | | | | | | | |
|
| U.S. Treasury Obligations — 3.1% | |
U.S. Treasury Bonds, 2.88%, 05/15/49(h) | | | | | | | 1,350 | | | | 1,826,402 | |
U.S. Treasury Notes(h): | | | | | | | | | | | | |
2.75%, 04/30/23 | | | | | | | 8,000 | | | | 8,580,000 | |
2.75%, 08/31/25 | | | USD | | | | 6,150 | | | | 6,916,588 | |
| | | | | | | | | | | | |
| |
Total U.S. Treasury Obligations — 3.1%
(Cost — $15,441,361) | | | | 17,322,990 | |
| | | | | | | | | | | | |
| | |
| | | | Shares | | | | |
|
Warrants — 0.0% | |
|
Metals & Mining — 0.0% | |
AFGlobal Corp. (Expires 12/20/20)(a) | | | | | | | 2,542 | | | | — | |
| | | | | | | | | | | | |
|
| Oil, Gas & Consumable Fuels — 0.0% | |
SM Energy Co., (Expires 06/30/23) (b) | | | | | | | 12,030 | | | | 44,992 | |
| | | | | | | | | | | | |
| |
Total Warrants — 0.0%
(Cost — $51,609) | | | | 44,992 | |
| | | | | | | | | | | | |
| |
Total Long-Term Investments — 159.1%
(Cost — $908,349,077) | | | | 889,593,720 | |
| | | | | | | | | | | | |
| | | | | | | | | | | | |
| | | |
| Security | | | | | Par
(000) | | |
Value | |
|
Short-Term Securities — 0.3% | |
|
U.S. Treasury Obligations— 0.3% | |
U.S. Treasury Bills, 2.75%, 09/30/20(h) | | | USD | | | | 1,600 | | | $ | 1,610,214 | |
| | | | | | | | | | | | |
| |
Total Short-Term Securities — 0.3%
(Cost — $1,599,462) | | | 1,610,214 | |
| | | | | | | | | | | | |
| |
Total Investments Before TBA Sale Commitments — 159.4%
(Cost — $909,948,539) | | | | 891,203,934 | |
| | | | | | | | | | | | |
| | |
| | | | Shares | | | | |
|
TBA Sale Commitments — (4.8%) | |
|
Mortgage-Backed Securities — (4.8%) | |
Uniform Mortgage-Backed Securities, 2.50%, 08/01/50(t) | | | USD | | | | 26,000 | | | | (27,003,437 | ) |
| | | | | | | | | | | | |
| |
Total TBA Sale Commitments—(4.8)%
(Proceeds — $26,838,848) | | | | (27,003,437 | ) |
| | | | | | | | | | | | |
| |
Total Investments, Net of TBA Sale Commitments — 154.6%
(Cost — $883,109,691) | | | | 864,200,497 | |
| | | | | | | | | | | | |
| |
Liabilities in Excess of Other Assets — (54.6)% | | | | (305,053,973 | ) |
| | | | | | | | | | | | |
| |
Net Assets — 100.0% | | | $ | 559,146,524 | |
| | | | | | | | | | | | |
| (a) | Security is valued using significant unobservable inputs and is classified as Level 3 in the fair value hierarchy. |
| (b) | Non-income producing security. |
| (c) | Security exempt from registration pursuant to Rule 144A under the Securities Act of 1933, as amended. These securities may be resold in transactions exempt from registration to qualified institutional investors. |
| (d) | Variable rate security. Rate shown is the rate in effect as of period end. |
| (e) | Variable or floating rate security, which interest rate adjusts periodically based on changes in current interest rates and prepayments on the underlying pool of assets. Rate shown is the rate in effect as of period end. |
| (f) | Step-up bond that pays an initial coupon rate for the first period and then a higher coupon rate for the following periods. Rate as of period end. |
| (h) | All or a portion of the security has been pledged as collateral in connection with outstanding reverse repurchase agreements. |
| (i) | Payment-in-kind security which may pay interest/dividends in additional par/shares and/or in cash. Rates shown are the current rate and possible payment rates. |
| (j) | Issuer filed for bankruptcy and/or is in default. |
| (k) | Variable rate security. Security may be issued at a fixed coupon rate, which converts to a variable rate at a specified date. Rate shown is the rate in effect as of period end. |
| (l) | Perpetual security with no stated maturity date. |
| (m) | All or a portion of the security has been pledged and/or segregated as collateral in connection with outstanding exchange-traded options written. |
| (p) | Represents an unsettled loan commitment at period end. Certain details associated with this purchase are not known prior to the settlement date, including coupon rate. |
| (r) | Other interests represent beneficial interests in liquidation trusts and other reorganization or private entities. |
| (s) | Restricted security as to resale, excluding 144A securities. The Fund held restricted securities with a current value of $13,123, representing less than 0.00% of its net assets as of period end, and an original cost of $132,662. |
| (t) | Represents or includes a TBA transaction. |
| | |
| 70 | | 2020 BLACKROCK SEMI-ANNUAL REPORTTO SHAREHOLDERS |
| | |
Schedule of Investments (unaudited) (continued) June 30, 2020 | | BlackRock Limited Duration Income Trust (BLW) |
| (u) | Investments in issuers considered to be an affiliate/affiliates of the Fund during the six months ended June 30, 2020 for purposes of Section 2(a)(3) of the Investment Company Act of 1940, as amended, were as follows: |
| | | | | | | | | | | | | | | | | | | | | | | | | | | | | | | | |
| Affiliated Issuer | | Par/ Shares
Held at
12/31/19 | | | Par/
Shares
Purchased | | | Par/
Shares
Sold | | | Par/
Shares
Held at
06/30/20 | | | Value at
06/30/20 | | | Income | | | Net
Realized
Gain (Loss) (a) | | | Change in
Unrealized
Appreciation
(Depreciation) | |
BlackRock Liquidity Funds, T-Fund, Institutional Class(b) | | | 1,358,645 | | | | — | | | | (1,358,645 | )(c) | | | — | | | $ | — | | | $ | 18,063 | | | $ | — | | | $ | — | |
iShares iBoxx $ Investment Grade Corporate Bond ETF | | | — | | | | 20,000 | | | | — | | | | 20,000 | | | | 2,690,000 | | | | 6,438 | | | | — | | | | 150,612 | |
| | | | | | | | | | | | | | | | | | | | | | | | | | | | | | | | |
| | | | | | | | | | | | | | | | | | $ | 2,690,000 | | | $ | 24,501 | | | $ | — | | | $ | 150,612 | |
| | | | | | | | | | | | | | | | | | | | | | | | | | | | | | | | |
| | (a) | Includes net capital gain distributions, if applicable. | |
| | (b) | As of period end, the entity is no longer held by the Fund. | |
| | (c) | Represents net shares purchased (sold). | |
Reverse Repurchase Agreements
| | | | | | | | | | | | | | | | | | | | | | | | |
| Counterparty | | Interest
Rate | | | Trade
Date | | | Maturity
Date (a) | | | Face Value | | | Face Value
Including
Accrued Interest | | | Type of Non-Cash
Underlying Collateral | | Remaining Contractual
Maturity of the Agreements (a) |
BNP Paribas S.A. | | | 0.95 | % | | | 06/21/19 | | | | Open | | | $ | 2,902,500 | | | $ | 2,962,517 | | | Capital Trusts | | Open/Demand |
BNP Paribas S.A. | | | 0.95 | | | | 06/21/19 | | | | Open | | | | 1,483,125 | | | | 1,513,793 | | | Capital Trusts | | Open/Demand |
BNP Paribas S.A. | | | 0.95 | | | | 06/21/19 | | | | Open | | | | 581,788 | | | | 593,589 | | | Corporate Bonds | | Open/Demand |
BNP Paribas S.A. | | | 1.15 | | | | 06/21/19 | | | | Open | | | | 226,188 | | | | 231,299 | | | Corporate Bonds | | Open/Demand |
BNP Paribas S.A. | | | 1.15 | | | | 06/21/19 | | | | Open | | | | 993,200 | | | | 1,015,645 | | | Corporate Bonds | | Open/Demand |
BNP Paribas S.A. | | | 1.15 | | | | 06/21/19 | | | | Open | | | | 944,843 | | | | 965,956 | | | Corporate Bonds | | Open/Demand |
BNP Paribas S.A. | | | 1.15 | | | | 06/21/19 | | | | Open | | | | 590,008 | | | | 603,341 | | | Corporate Bonds | | Open/Demand |
BNP Paribas S.A. | | | 1.15 | | | | 06/21/19 | | | | Open | | | | 2,421,969 | | | | 2,475,099 | | | Corporate Bonds | | Open/Demand |
RBC Capital Markets, LLC | | | 0.45 | | | | 06/21/19 | | | | Open | | | | 1,776,250 | | | | 1,813,210 | | | Corporate Bonds | | Open/Demand |
RBC Capital Markets, LLC | | | 0.45 | | | | 06/21/19 | | | | Open | | | | 993,431 | | | | 1,014,102 | | | Corporate Bonds | | Open/Demand |
RBC Capital Markets, LLC | | | 0.45 | | | | 06/21/19 | | | | Open | | | | 392,531 | | | | 400,699 | | | Corporate Bonds | | Open/Demand |
RBC Capital Markets, LLC | | | 0.45 | | | | 06/21/19 | | | | Open | | | | 1,455,000 | | | | 1,485,275 | | | Corporate Bonds | | Open/Demand |
RBC Capital Markets, LLC | | | 0.45 | | | | 06/21/19 | | | | Open | | | | 1,434,125 | | | | 1,463,966 | | | Corporate Bonds | | Open/Demand |
RBC Capital Markets, LLC | | | 0.45 | | | | 06/21/19 | | | | Open | | | | 1,493,888 | | | | 1,524,972 | | | Corporate Bonds | | Open/Demand |
RBC Capital Markets, LLC | | | 0.45 | | | | 06/21/19 | | �� | | Open | | | | 654,063 | | | | 667,672 | | | Corporate Bonds | | Open/Demand |
RBC Capital Markets, LLC | | | 0.45 | | | | 06/21/19 | | | | Open | | | | 1,528,788 | | | | 1,560,598 | | | Corporate Bonds | | Open/Demand |
RBC Capital Markets, LLC | | | 0.45 | | | | 06/21/19 | | | | Open | | | | 407,531 | | | | 416,011 | | | Corporate Bonds | | Open/Demand |
RBC Capital Markets, LLC | | | 0.45 | | | | 06/21/19 | | | | Open | | | | 154,635 | | | | 157,853 | | | Corporate Bonds | | Open/Demand |
RBC Capital Markets, LLC | | | 0.45 | | | | 06/21/19 | | | | Open | | | | 256,275 | | | | 261,608 | | | Corporate Bonds | | Open/Demand |
RBC Capital Markets, LLC | | | 0.45 | | | | 06/21/19 | | | | Open | | | | 386,250 | | | | 394,287 | | | Corporate Bonds | | Open/Demand |
RBC Capital Markets, LLC | | | 0.45 | | | | 06/21/19 | | | | Open | | | | 288,563 | | | | 294,567 | | | Corporate Bonds | | Open/Demand |
RBC Capital Markets, LLC | | | 0.45 | | | | 06/21/19 | | | | Open | | | | 680,231 | | | | 694,385 | | | Corporate Bonds | | Open/Demand |
RBC Capital Markets, LLC | | | 0.45 | | | | 06/21/19 | | | | Open | | | | 1,110,819 | | | | 1,133,932 | | | Corporate Bonds | | Open/Demand |
RBC Capital Markets, LLC | | | 0.45 | | | | 06/21/19 | | | | Open | | | | 275,224 | | | | 281,240 | | | Corporate Bonds | | Open/Demand |
RBC Capital Markets, LLC | | | 0.45 | | | | 06/21/19 | | | | Open | | | | 263,313 | | | | 268,791 | | | Corporate Bonds | | Open/Demand |
RBC Capital Markets, LLC | | | 0.45 | | | | 06/21/19 | | | | Open | | | | 285,938 | | | | 291,887 | | | Corporate Bonds | | Open/Demand |
RBC Capital Markets, LLC | | | 0.45 | | | | 06/21/19 | | | | Open | | | | 1,218,544 | | | | 1,243,899 | | | Corporate Bonds | | Open/Demand |
RBC Capital Markets, LLC | | | 0.45 | | | | 06/21/19 | | | | Open | | | | 430,650 | | | | 439,611 | | | Corporate Bonds | | Open/Demand |
RBC Capital Markets, LLC | | | 0.45 | | | | 06/21/19 | | | | Open | | | | 370,781 | | | | 378,496 | | | Corporate Bonds | | Open/Demand |
RBC Capital Markets, LLC | | | 0.45 | | | | 06/21/19 | | | | Open | | | | 843,750 | | | | 861,307 | | | Corporate Bonds | | Open/Demand |
RBC Capital Markets, LLC | | | 0.45 | | | | 06/21/19 | | | | Open | | | | 162,350 | | | | 165,728 | | | Corporate Bonds | | Open/Demand |
RBC Capital Markets, LLC | | | 0.45 | | | | 06/21/19 | | | | Open | | | | 134,925 | | | | 137,732 | | | Corporate Bonds | | Open/Demand |
RBC Capital Markets, LLC | | | 0.45 | | | | 06/21/19 | | | | Open | | | | 343,350 | | | | 350,494 | | | Corporate Bonds | | Open/Demand |
BNP Paribas S.A. | | | 1.15 | | | | 07/16/19 | | | | Open | | | | 569,250 | | | | 580,283 | | | Corporate Bonds | | Open/Demand |
HSBC Securities (USA), Inc. | | | 0.15 | | | | 07/17/19 | | | | Open | | | | 6,512,000 | | | | 6,602,224 | | | U.S. Treasury Obligations | | Open/Demand |
HSBC Securities (USA), Inc. | | | 0.15 | | | | 07/17/19 | | | | Open | | | | 8,316,000 | | | | 8,431,218 | | | U.S. Treasury Obligations | | Open/Demand |
RBC Capital Markets, LLC | | | 1.30 | | | | 08/26/19 | | | | Open | | | | 1,682,738 | | | | 1,713,284 | | | Corporate Bonds | | Open/Demand |
HSBC Securities (USA), Inc. | | | 0.15 | | | | 08/27/19 | | | | Open | | | | 1,636,000 | | | | 1,659,221 | | | U.S. Treasury Obligations_ST | | Open/Demand |
RBC Capital Markets, LLC | | | 0.10 | | | | 08/29/19 | | | | Open | | | | 264,128 | | | | 266,146 | | | Corporate Bonds | | Open/Demand |
RBC Capital Markets, LLC | | | 1.15 | | | | 08/29/19 | | | | Open | | | | 643,125 | | | | 653,779 | | | Corporate Bonds | | Open/Demand |
RBC Capital Markets, LLC | | | 1.30 | | | | 08/29/19 | | | | Open | | | | 419,543 | | | | 427,028 | | | Corporate Bonds | | Open/Demand |
RBC Capital Markets, LLC | | | 1.30 | | | | 08/29/19 | | | | Open | | | | 535,301 | | | | 544,852 | | | Corporate Bonds | | Open/Demand |
RBC Capital Markets, LLC | | | 1.30 | | | | 08/29/19 | | | | Open | | | | 1,561,573 | | | | 1,589,434 | | | Corporate Bonds | | Open/Demand |
Barclays Capital, Inc. | | | 1.00 | | | | 09/03/19 | | | | Open | | | | 1,437,188 | | | | 1,458,033 | | | Capital Trusts | | Open/Demand |
| | |
SCHEDULES OF INVESTMENTS | | 71 |
| | |
Schedule of Investments (unaudited) (continued) June 30, 2020 | | BlackRock Limited Duration Income Trust (BLW) |
Reverse Repurchase Agreements (continued)
| | | | | | | | | | | | | | | | | | | | | | | | |
| Counterparty | | Interest
Rate | | | Trade
Date | | | Maturity
Date (a) | | | Face Value | | | Face Value
Including
Accrued Interest | | | Type of Non-Cash
Underlying Collateral | | Remaining Contractual
Maturity of the Agreements (a) |
Barclays Capital, Inc. | | | 1.00 | % | | | 09/03/19 | | | | Open | | | $ | 1,068,750 | | | $ | 1,084,722 | | | Capital Trusts | | Open/Demand |
Barclays Capital, Inc. | | | 1.00 | | | | 09/03/19 | | | | Open | | | | 1,622,771 | | | | 1,647,023 | | | Capital Trusts | | Open/Demand |
Barclays Capital, Inc. | | | 1.25 | | | | 09/03/19 | | | | Open | | | | 1,327,775 | | | | 1,350,393 | | | Capital Trusts | | Open/Demand |
Barclays Capital, Inc. | | | 1.25 | | | | 09/03/19 | | | | Open | | | | 1,081,978 | | | | 1,100,409 | | | Capital Trusts | | Open/Demand |
Barclays Capital, Inc. | | | 1.25 | | | | 09/03/19 | | | | Open | | | | 509,469 | | | | 518,147 | | | Corporate Bonds | | Open/Demand |
Barclays Capital, Inc. | | | 1.25 | | | | 09/03/19 | | | | Open | | | | 2,310,000 | | | | 2,349,350 | | | Capital Trusts | | Open/Demand |
Barclays Capital, Inc. | | | 1.25 | | | | 09/03/19 | | | | Open | | | | 1,226,569 | | | | 1,247,463 | | | Corporate Bonds | | Open/Demand |
Barclays Capital, Inc. | | | 1.25 | | | | 09/04/19 | | | | Open | | | | 392,201 | | | | 398,852 | | | Corporate Bonds | | Open/Demand |
BNP Paribas S.A. | | | 0.95 | | | | 09/04/19 | | | | Open | | | | 908,438 | | | | 921,540 | | | Corporate Bonds | | Open/Demand |
BNP Paribas S.A. | | | 0.95 | | | | 09/04/19 | | | | Open | | | | 3,172,500 | | | | 3,218,259 | | | Corporate Bonds | | Open/Demand |
BNP Paribas S.A. | | | 0.95 | | | | 09/04/19 | | | | Open | | | | 6,781,988 | | | | 6,880,044 | | | Capital Trusts | | Open/Demand |
BNP Paribas S.A. | | | 0.95 | | | | 09/04/19 | | | | Open | | | | 1,504,500 | | | | 1,526,200 | | | Corporate Bonds | | Open/Demand |
BNP Paribas S.A. | | | 0.95 | | | | 09/04/19 | | | | Open | | | | 3,555,000 | | | | 3,606,276 | | | Corporate Bonds | | Open/Demand |
BNP Paribas S.A. | | | 0.95 | | | | 09/04/19 | | | | Open | | | | 838,785 | | | | 850,883 | | | Corporate Bonds | | Open/Demand |
BNP Paribas S.A. | | | 0.95 | | | | 09/04/19 | | | | Open | | | | 1,002,394 | | | | 1,016,852 | | | Corporate Bonds | | Open/Demand |
BNP Paribas S.A. | | | 0.95 | | | | 09/04/19 | | | | Open | | | | 526,025 | | | | 533,619 | | | Corporate Bonds | | Open/Demand |
BNP Paribas S.A. | | | 0.95 | | | | 09/04/19 | | | | Open | | | | 3,812,057 | | | | 3,867,040 | | | Corporate Bonds | | Open/Demand |
BNP Paribas S.A. | | | 0.95 | | | | 09/04/19 | | | | Open | | | | 849,225 | | | | 861,474 | | | Corporate Bonds | | Open/Demand |
BNP Paribas S.A. | | | 0.95 | | | | 09/04/19 | | | | Open | | | | 288,400 | | | | 292,564 | | | Corporate Bonds | | Open/Demand |
BNP Paribas S.A. | | | 0.95 | | | | 09/04/19 | | | | Open | | | | 169,744 | | | | 172,192 | | | Corporate Bonds | | Open/Demand |
BNP Paribas S.A. | | | 1.15 | | | | 09/04/19 | | | | Open | | | | 2,289,375 | | | | 2,326,291 | | | Corporate Bonds | | Open/Demand |
BNP Paribas S.A. | | | 1.15 | | | | 09/09/19 | | | | Open | | | | 446,500 | | | | 453,548 | | | Corporate Bonds | | Open/Demand |
Barclays Capital, Inc. | | | 1.25 | | | | 09/11/19 | | | | Open | | | | 986,798 | | | | 1,003,004 | | | Corporate Bonds | | Open/Demand |
Barclays Capital, Inc. | | | 1.25 | | | | 09/16/19 | | | | Open | | | | 1,105,561 | | | | 1,123,381 | | | Corporate Bonds | | Open/Demand |
Barclays Capital, Inc. | | | 1.25 | | | | 09/16/19 | | | | Open | | | | 778,500 | | | | 790,988 | | | Corporate Bonds | | Open/Demand |
Barclays Capital, Inc. | | | 1.00 | | | | 09/17/19 | | | | Open | | | | 806,925 | | | | 818,200 | | | Capital Trusts | | Open/Demand |
Barclays Capital, Inc. | | | 1.05 | | | | 09/17/19 | | | | Open | | | | 181,750 | | | | 184,362 | | | Corporate Bonds | | Open/Demand |
Barclays Capital, Inc. | | | 1.05 | | | | 09/17/19 | | | | Open | | | | 292,370 | | | | 296,572 | | | Corporate Bonds | | Open/Demand |
Barclays Capital, Inc. | | | 1.25 | | | | 09/17/19 | | | | Open | | | | 103,853 | | | | 105,301 | | | Corporate Bonds | | Open/Demand |
Barclays Capital, Inc. | | | 1.25 | | | | 09/17/19 | | | | Open | | | | 728,850 | | | | 740,486 | | | Corporate Bonds | | Open/Demand |
Barclays Capital, Inc. | | | 1.25 | | | | 09/17/19 | | | | Open | | | | 597,690 | | | | 607,232 | | | Corporate Bonds | | Open/Demand |
Barclays Capital, Inc. | | | 1.25 | | | | 09/17/19 | | | | Open | | | | 855,400 | | | | 869,057 | | | Capital Trusts | | Open/Demand |
Barclays Capital, Inc. | | | 1.25 | | | | 09/17/19 | | | | Open | | | | 412,539 | | | | 419,125 | | | Corporate Bonds | | Open/Demand |
Barclays Capital, Inc. | | | 1.25 | | | | 09/17/19 | | | | Open | | | | 143,696 | | | | 145,990 | | | Corporate Bonds | | Open/Demand |
Barclays Capital, Inc. | | | 1.25 | | | | 09/17/19 | | | | Open | | | | 788,880 | | | | 801,475 | | | Capital Trusts | | Open/Demand |
Barclays Capital, Inc. | | | 1.25 | | | | 09/17/19 | | | | Open | | | | 430,320 | | | | 437,190 | | | Corporate Bonds | | Open/Demand |
Barclays Capital, Inc. | | | 1.25 | | | | 09/20/19 | | | | Open | | | | 575,920 | | | | 584,867 | | | Corporate Bonds | | Open/Demand |
BNP Paribas S.A. | | | 1.15 | | | | 09/20/19 | | | | Open | | | | 512,513 | | | | 520,073 | | | Corporate Bonds | | Open/Demand |
RBC Capital Markets, LLC | | | 1.30 | | | | 10/01/19 | | | | Open | | | | 264,600 | | | | 268,752 | | | Corporate Bonds | | Open/Demand |
RBC Capital Markets, LLC | | | 1.30 | | | | 10/01/19 | | | | Open | | | | 844,828 | | | | 858,084 | | | Corporate Bonds | | Open/Demand |
J.P. morgan Securities LLC | | | 0.75 | | | | 10/11/19 | | | | Open | | | | 200,430 | | | | 202,514 | | | Corporate Bonds | | Open/Demand |
J.P. morgan Securities LLC | | | 1.10 | | | | 10/11/19 | | | | Open | | | | 446,400 | | | | 451,835 | | | Corporate Bonds | | Open/Demand |
J.P. morgan Securities LLC | | | 1.10 | | | | 10/11/19 | | | | Open | | | | 862,875 | | | | 873,830 | | | Corporate Bonds | | Open/Demand |
RBC Capital Markets, LLC | | | 1.30 | | | | 11/12/19 | | | | Open | | | | 450,640 | | | | 456,139 | | | Corporate Bonds | | Open/Demand |
Barclays Capital, Inc. | | | 1.25 | | | | 11/15/19 | | | | Open | | | | 109,385 | | | | 110,671 | | | Corporate Bonds | | Open/Demand |
RBC Capital Markets, LLC | | | 1.30 | | | | 11/15/19 | | | | Open | | | | 1,247,063 | | | | 1,261,882 | | | Corporate Bonds | | Open/Demand |
RBC Capital Markets, LLC | | | 1.30 | | | | 11/15/19 | | | | Open | | | | 380,190 | | | | 384,781 | | | Corporate Bonds | | Open/Demand |
Barclays Capital, Inc. | | | 1.25 | | | | 11/21/19 | | | | Open | | | | 310,030 | | | | 313,539 | | | Corporate Bonds | | Open/Demand |
Barclays Capital, Inc. | | | 1.25 | | | | 12/05/19 | | | | Open | | | | 553,465 | | | | 559,246 | | | Corporate Bonds | | Open/Demand |
BNP Paribas S.A. | | | 1.15 | | | | 12/17/19 | | | | Open | | | | 1,048,005 | | | | 1,057,594 | | | Corporate Bonds | | Open/Demand |
BNP Paribas S.A. | | | 1.15 | | | | 12/17/19 | | | | Open | | | | 2,048,770 | | | | 2,067,516 | | | Corporate Bonds | | Open/Demand |
BNP Paribas S.A. | | | 1.15 | | | | 12/18/19 | | | | Open | | | | 1,143,000 | | | | 1,153,390 | | | Corporate Bonds | | Open/Demand |
BNP Paribas S.A. | | | 1.15 | | | | 12/18/19 | | | | Open | | | | 917,975 | | | | 926,320 | | | Corporate Bonds | | Open/Demand |
RBC Capital Markets, LLC | | | 1.30 | | | | 12/18/19 | | | | Open | | | | 321,722 | | | | 324,908 | | | Corporate Bonds | | Open/Demand |
RBC Capital Markets, LLC | | | 1.30 | | | | 12/18/19 | | | | Open | | | | 1,041,074 | | | | 1,051,383 | | | Corporate Bonds | | Open/Demand |
BNP Paribas S.A. | | | 1.35 | | | | 12/19/19 | | | | Open | | | | 903,858 | | | | 912,994 | | | Corporate Bonds | | Open/Demand |
RBC Capital Markets, LLC | | | 1.30 | | | | 12/19/19 | | | | Open | | | | 149,425 | | | | 150,905 | | | Corporate Bonds | | Open/Demand |
RBC Capital Markets, LLC | | | 1.30 | | | | 12/19/19 | | | | Open | | | | 165,205 | | | | 166,841 | | | Corporate Bonds | | Open/Demand |
RBC Capital Markets, LLC | | | 1.30 | | | | 12/19/19 | | | | Open | | | | 334,670 | | | | 337,984 | | | Corporate Bonds | | Open/Demand |
RBC Capital Markets, LLC | | | 1.30 | | | | 12/19/19 | | | | Open | | | | 285,600 | | | | 288,410 | | | Corporate Bonds | | Open/Demand |
RBC Capital Markets, LLC | | | 1.30 | | | | 12/20/19 | | | | Open | | | | 1,726,231 | | | | 1,742,885 | | | Corporate Bonds | | Open/Demand |
BNP Paribas S.A. | | | 0.17 | | | | 01/02/20 | | | | Open | | | | 1,498,500 | | | | 1,504,932 | | | U.S. Treasury Obligations | | Open/Demand |
| | |
| 72 | | 2020 BLACKROCK SEMI-ANNUAL REPORTTO SHAREHOLDERS |
| | |
Schedule of Investments (unaudited) (continued) June 30, 2020 | | BlackRock Limited Duration Income Trust (BLW) |
Reverse Repurchase Agreements (continued)
| | | | | | | | | | | | | | | | | | | | | | | | |
| Counterparty | | Interest
Rate | | | Trade
Date | | | Maturity
Date (a) | | | Face Value | | | Face Value
Including
Accrued Interest | | | Type of Non-Cash
Underlying Collateral | | Remaining Contractual
Maturity of the Agreements (a) |
BNP Paribas S.A. | | | 1.12 | % | | | 01/08/20 | | | | Open | | | $ | 837,533 | | | $ | 843,974 | | | Corporate Bonds | | Open/Demand |
BNP Paribas S.A. | | | 1.22 | | | | 01/08/20 | | | | Open | | | | 1,640,138 | | | | 1,653,545 | | | Corporate Bonds | | Open/Demand |
BNP Paribas S.A. | | | 1.15 | | | | 01/14/20 | | | | Open | | | | 760,598 | | | | 766,285 | | | Corporate Bonds | | Open/Demand |
BNP Paribas S.A. | | | 1.15 | | | | 01/14/20 | | | | Open | | | | 5,976,413 | | | | 6,021,103 | | | Corporate Bonds | | Open/Demand |
RBC Capital Markets LLC | | | 1.30 | | | | 01/14/20 | | | | Open | | | | 1,009,775 | | | | 1,018,033 | | | Corporate Bonds | | Open/Demand |
RBC Capital Markets LLC | | | 1.50 | | | | 01/14/20 | | | | Open | | | | 1,155,131 | | | | 1,164,091 | | | Corporate Bonds | | Open/Demand |
BNP Paribas S.A. | | | 1.10 | | | | 01/15/20 | | | | Open | | | | 1,665,343 | | | | 1,677,310 | | | Corporate Bonds | | Open/Demand |
Barclays Capital, Inc. | | | 1.25 | | | | 01/16/20 | | | | Open | | | | 1,019,655 | | | | 1,027,628 | | | Corporate Bonds | | Open/Demand |
BNP Paribas S.A. | | | 1.15 | | | | 01/16/20 | | | | Open | | | | 1,696,500 | | | | 1,708,983 | | | Corporate Bonds | | Open/Demand |
RBC Capital Markets LLC | | | 1.30 | | | | 01/16/20 | | | | Open | | | | 210,938 | | | | 212,636 | | | Corporate Bonds | | Open/Demand |
RBC Capital Markets LLC | | | 1.30 | | | | 01/16/20 | | | | Open | | | | 1,348,200 | | | | 1,359,053 | | | Corporate Bonds | | Open/Demand |
RBC Capital Markets LLC | | | 1.30 | | | | 01/16/20 | | | | Open | | | | 765,475 | | | | 771,637 | | | Corporate Bonds | | Open/Demand |
Barclays Capital, Inc. | | | 0.25 | | | | 01/21/20 | | | | Open | | | | 168,670 | | | | 169,017 | | | Corporate Bonds | | Open/Demand |
Barclays Capital, Inc. | | | 1.00 | | | | 01/21/20 | | | | Open | | | | 1,673,415 | | | | 1,684,106 | | | Corporate Bonds | | Open/Demand |
Barclays Capital, Inc. | | | 1.25 | | | | 01/21/20 | | | | Open | | | | 581,819 | | | | 586,186 | | | Corporate Bonds | | Open/Demand |
Barclays Capital, Inc. | | | 1.25 | | | | 01/21/20 | | | | Open | | | | 1,549,083 | | | | 1,560,711 | | | Corporate Bonds | | Open/Demand |
Barclays Capital, Inc. | | | 1.25 | | | | 01/21/20 | | | | Open | | | | 396,664 | | | | 399,641 | | | Corporate Bonds | | Open/Demand |
BNP Paribas S.A. | | | 1.15 | | | | 01/21/20 | | | | Open | | | | 443,438 | | | | 446,568 | | | Corporate Bonds | | Open/Demand |
BNP Paribas S.A. | | | 1.15 | | | | 01/21/20 | | | | Open | | | | 536,130 | | | | 539,915 | | | Corporate Bonds | | Open/Demand |
BNP Paribas S.A. | | | 1.15 | | | | 01/21/20 | | | | Open | | | | 570,000 | | | | 574,024 | | | Corporate Bonds | | Open/Demand |
BNP Paribas S.A. | | | 1.30 | | | | 01/21/20 | | | | Open | | | | 1,186,868 | | | | 1,196,043 | | | Corporate Bonds | | Open/Demand |
BNP Paribas S.A. | | | 1.38 | | | | 01/21/20 | | | | Open | | | | 835,728 | | | | 842,487 | | | Corporate Bonds | | Open/Demand |
Barclays Capital, Inc. | | | 1.25 | | | | 01/22/20 | | | | Open | | | | 882,000 | | | | 888,566 | | | Corporate Bonds | | Open/Demand |
BNP Paribas S.A. | | | 1.15 | | | | 01/22/20 | | | | Open | | | | 313,600 | | | | 315,795 | | | Corporate Bonds | | Open/Demand |
RBC Capital Markets LLC | | | 1.30 | | | | 01/23/20 | | | | Open | | | | 636,380 | | | | 641,218 | | | Corporate Bonds | | Open/Demand |
RBC Capital Markets LLC | | | 1.30 | | | | 01/24/20 | | | | Open | | | | 1,079,520 | | | | 1,087,520 | | | Corporate Bonds | | Open/Demand |
BNP Paribas S.A. | | | 1.15 | | | | 01/27/20 | | | | Open | | | | 869,938 | | | | 875,767 | | | Corporate Bonds | | Open/Demand |
Barclays Capital, Inc. | | | 0.50 | | | | 01/31/20 | | | | Open | | | | 446,985 | | | | 448,618 | | | Corporate Bonds | | Open/Demand |
BNP Paribas S.A. | | | 1.09 | | | | 01/31/20 | | | | Open | | | | 393,335 | | | | 395,709 | | | Corporate Bonds | | Open/Demand |
BNP Paribas S.A. | | | 1.09 | | | | 01/31/20 | | | | Open | | | | 267,890 | | | | 269,507 | | | Corporate Bonds | | Open/Demand |
BNP Paribas S.A. | | | 1.09 | | | | 01/31/20 | | | | Open | | | | 275,220 | | | | 276,881 | | | Corporate Bonds | | Open/Demand |
Barclays Capital, Inc. | | | 1.25 | | | | 02/06/20 | | | | Open | | | | 983,678 | | | | 990,078 | | | Corporate Bonds | | Open/Demand |
BNP Paribas S.A. | | | 1.05 | | | | 02/11/20 | | | | Open | | | | 159,568 | | | | 160,432 | | | Corporate Bonds | | Open/Demand |
BNP Paribas S.A. | | | 1.05 | | | | 02/11/20 | | | | Open | | | | 178,351 | | | | 179,317 | | | Corporate Bonds | | Open/Demand |
BNP Paribas S.A. | | | 1.05 | | | | 02/11/20 | | | | Open | | | | 874,278 | | | | 879,013 | | | Corporate Bonds | | Open/Demand |
BNP Paribas S.A. | | | 1.05 | | | | 02/11/20 | | | | Open | | | | 590,094 | | | | 593,290 | | | Corporate Bonds | | Open/Demand |
BNP Paribas S.A. | | | 1.05 | | | | 02/11/20 | | | | Open | | | | 1,193,688 | | | | 1,200,153 | | | Corporate Bonds | | Open/Demand |
BNP Paribas S.A. | | | 1.05 | | | | 02/11/20 | | | | Open | | | | 1,021,138 | | | | 1,026,669 | | | Corporate Bonds | | Open/Demand |
BNP Paribas S.A. | | | 1.05 | | | | 02/11/20 | | | | Open | | | | 580,583 | | | | 583,727 | | | Corporate Bonds | | Open/Demand |
BNP Paribas S.A. | | | 1.09 | | | | 02/11/20 | | | | Open | | | | 270,338 | | | | 271,844 | | | Corporate Bonds | | Open/Demand |
BNP Paribas S.A. | | | 1.10 | | | | 02/11/20 | | | | Open | | | | 158,400 | | | | 159,289 | | | Corporate Bonds | | Open/Demand |
BNP Paribas S.A. | | | 1.10 | | | | 02/11/20 | | | | Open | | | | 879,675 | | | | 884,611 | | | Corporate Bonds | | Open/Demand |
BNP Paribas S.A. | | | 1.10 | | | | 02/11/20 | | | | Open | | | | 938,210 | | | | 943,474 | | | Corporate Bonds | | Open/Demand |
BNP Paribas S.A. | | | 1.30 | | | | 02/11/20 | | | | Open | | | | 350,400 | | | | 352,522 | | | Corporate Bonds | | Open/Demand |
Barclays Capital, Inc. | | | 1.25 | | | | 02/12/20 | | | | Open | | | | 548,368 | | | | 551,730 | | | Corporate Bonds | | Open/Demand |
BNP Paribas S.A. | | | 1.35 | | | | 02/12/20 | | | | Open | | | | 718,815 | | | | 723,500 | | | Corporate Bonds | | Open/Demand |
BNP Paribas S.A. | | | 1.05 | | | | 02/13/20 | | | | Open | | | | 879,056 | | | | 883,718 | | | Corporate Bonds | | Open/Demand |
BNP Paribas S.A. | | | 1.05 | | | | 02/13/20 | | | | Open | | | | 799,939 | | | | 804,181 | | | Corporate Bonds | | Open/Demand |
BNP Paribas S.A. | | | 1.05 | | | | 02/13/20 | | | | Open | | | | 574,291 | | | | 577,337 | | | Corporate Bonds | | Open/Demand |
BNP Paribas S.A. | | | 1.05 | | | | 02/13/20 | | | | Open | | | | 806,575 | | | | 810,852 | | | Corporate Bonds | | Open/Demand |
BNP Paribas S.A. | | | 1.05 | | | | 02/13/20 | | | | Open | | | | 878,130 | | | | 882,787 | | | Corporate Bonds | | Open/Demand |
BNP Paribas S.A. | | | 1.05 | | | | 02/13/20 | | | | Open | | | | 678,510 | | | | 682,108 | | | Corporate Bonds | | Open/Demand |
BNP Paribas S.A. | | | 1.05 | | | | 02/13/20 | | | | Open | | | | 844,760 | | | | 849,240 | | | Corporate Bonds | | Open/Demand |
BNP Paribas S.A. | | | 1.05 | | | | 02/13/20 | | | | Open | | | | 749,875 | | | | 753,851 | | | Corporate Bonds | | Open/Demand |
BNP Paribas S.A. | | | 1.10 | | | | 02/13/20 | | | | Open | | | | 707,783 | | | | 711,671 | | | Corporate Bonds | | Open/Demand |
BNP Paribas S.A. | | | 1.15 | | | | 02/25/20 | | | | Open | | | | 727,635 | | | | 731,251 | | | Corporate Bonds | | Open/Demand |
RBC Capital Markets LLC | | | 1.30 | | | | 02/26/20 | | | | Open | | | | 128,060 | | | | 128,755 | | | Corporate Bonds | | Open/Demand |
BNP Paribas S.A. | | | 1.05 | | | | 02/28/20 | | | | Open | | | | 611,100 | | | | 613,853 | | | Corporate Bonds | | Open/Demand |
BNP Paribas S.A. | | | 1.05 | | | | 02/28/20 | | | | Open | | | | 654,309 | | | | 657,257 | | | Corporate Bonds | | Open/Demand |
BNP Paribas S.A. | | | 1.05 | | | | 02/28/20 | | | | Open | | | | 646,905 | | | | 649,820 | | | Corporate Bonds | | Open/Demand |
BNP Paribas S.A. | | | 1.05 | | | | 02/28/20 | | | | Open | | | | 669,030 | | | | 672,044 | | | Corporate Bonds | | Open/Demand |
BNP Paribas S.A. | | | 1.05 | | | | 02/28/20 | | | | Open | | | | 549,780 | | | | 552,257 | | | Corporate Bonds | | Open/Demand |
| | |
SCHEDULES OF INVESTMENTS | | 73 |
| | |
Schedule of Investments (unaudited) (continued) June 30, 2020 | | BlackRock Limited Duration Income Trust (BLW) |
Reverse Repurchase Agreements (continued)
| | | | | | | | | | | | | | | | | | | | | | | | |
| Counterparty | | Interest
Rate | | | Trade
Date | | | Maturity
Date (a) | | | Face Value | | | Face Value
Including
Accrued Interest | | | Type of Non-Cash
Underlying Collateral | | Remaining Contractual
Maturity of the Agreements (a) |
BNP Paribas S.A. | | | 1.05 | % | | | 02/28/20 | | | | Open | | | $ | 657,510 | | | $ | 660,472 | | | Corporate Bonds | | Open/Demand |
BNP Paribas S.A. | | | 1.05 | | | | 02/28/20 | | | | Open | | | | 660,630 | | | | 663,607 | | | Corporate Bonds | | Open/Demand |
Credit Suisse Securities (USA) LLC | | | 0.50 | | | | 03/02/20 | | | | Open | | | | 225,000 | | | | 225,559 | | | Foreign Agency Obligations | | Open/Demand |
Credit Suisse Securities (USA) LLC | | | 1.00 | | | | 03/02/20 | | | | Open | | | | 222,430 | | | | 223,612 | | | Foreign Agency Obligations | | Open/Demand |
Goldman Sachs & Co. | | | 0.25 | | | | 03/02/20 | | | | Open | | | | 176,587 | | | | 176,931 | | | Corporate Bonds | | Open/Demand |
Goldman Sachs & Co. | | | 0.25 | | | | 03/02/20 | | | | Open | | | | 397,350 | | | | 398,125 | | | Corporate Bonds | | Open/Demand |
Goldman Sachs & Co. | | | 0.25 | | | | 03/02/20 | | | | Open | | | | 288,576 | | | | 289,139 | | | Corporate Bonds | | Open/Demand |
Goldman Sachs & Co. | | | 0.25 | | | | 03/02/20 | | | | Open | | | | 253,869 | | | | 254,364 | | | Corporate Bonds | | Open/Demand |
Goldman Sachs & Co. | | | 0.50 | | | | 03/02/20 | | | | Open | | | | 221,038 | | | | 221,652 | | | Foreign Agency Obligations | | Open/Demand |
Goldman Sachs & Co. | | | 0.55 | | | | 03/02/20 | | | | Open | | | | 531,421 | | | | 532,985 | | | Corporate Bonds | | Open/Demand |
Goldman Sachs & Co. | | | 0.55 | | | | 03/02/20 | | | | Open | | | | 553,155 | | | | 554,783 | | | Capital Trusts | | Open/Demand |
Goldman Sachs & Co. | | | 0.60 | | | | 03/02/20 | | | | Open | | | | 391,957 | | | | 393,175 | | | Corporate Bonds | | Open/Demand |
Goldman Sachs & Co. | | | 0.60 | | | | 03/02/20 | | | | Open | | | | 1,270,074 | | | | 1,274,022 | | | Corporate Bonds | | Open/Demand |
RBC Capital Markets LLC | | | 0.45 | | | | 03/09/20 | | | | Open | | | | 7,341 | | | | 7,367 | | | Corporate Bonds | | Open/Demand |
BNP Paribas S.A. | | | 1.15 | | | | 03/13/20 | | | | Open | | | | 231,840 | | | | 232,713 | | | Corporate Bonds | | Open/Demand |
BoFA Securities, Inc. | | | (1.25 | ) | | | 03/17/20 | | | | Open | | | | 101,490 | | | | 101,116 | | | Corporate Bonds | | Open/Demand |
Barclays Capital, Inc. | | | 1.60 | | | | 03/18/20 | | | | Open | | | | 940,275 | | | | 944,663 | | | Corporate Bonds | | Open/Demand |
Barclays Capital, Inc. | | | 1.60 | | | | 03/18/20 | | | | Open | | | | 971,480 | | | | 976,014 | | | Corporate Bonds | | Open/Demand |
Barclays Capital, Inc. | | | 3.25 | | | | 03/23/20 | | | | Open | | | | 80,360 | | | | 81,085 | | | Corporate Bonds | | Open/Demand |
Barclays Capital, Inc. | | | 3.25 | | | | 03/23/20 | | | | Open | | | | 68,693 | | | | 69,313 | | | Corporate Bonds | | Open/Demand |
Barclays Capital, Inc. | | | 3.25 | | | | 03/23/20 | | | | Open | | | | 231,400 | | | | 233,489 | | | Corporate Bonds | | Open/Demand |
Barclays Capital, Inc. | | | 3.25 | | | | 03/23/20 | | | | Open | | | | 71,570 | | | | 72,216 | | | Corporate Bonds | | Open/Demand |
Barclays Capital, Inc. | | | 3.25 | | | | 03/23/20 | | | | Open | | | | 123,840 | | | | 124,958 | | | Corporate Bonds | | Open/Demand |
Barclays Capital, Inc. | | | 3.25 | | | | 03/23/20 | | | | Open | | | | 150,590 | | | | 151,949 | | | Corporate Bonds | | Open/Demand |
HSBC Securities (USA), Inc. | | | 0.45 | | | | 03/23/20 | | | | Open | | | | 85,000 | | | | 85,153 | | | Corporate Bonds | | Open/Demand |
BNP Paribas S.A. | | | 1.05 | | | | 03/24/20 | | | | Open | | | | 361,950 | | | | 362,985 | | | Corporate Bonds | | Open/Demand |
RBC Capital Markets LLC | | | 1.04 | | | | 03/25/20 | | | | Open | | | | 178,600 | | | | 179,100 | | | Corporate Bonds | | Open/Demand |
HSBC Securities (USA), Inc. | | | 0.45 | | | | 03/26/20 | | | | Open | | | | 118,000 | | | | 118,204 | | | Capital Trusts | | Open/Demand |
HSBC Securities (USA), Inc. | | | 0.45 | | | | 03/26/20 | | | | Open | | | | 151,000 | | | | 151,261 | | | Capital Trusts | | Open/Demand |
HSBC Securities (USA), Inc. | | | 0.45 | | | | 03/26/20 | | | | Open | | | | 458,000 | | | | 458,792 | | | Capital Trusts | | Open/Demand |
HSBC Securities (USA), Inc. | | | 0.45 | | | | 03/26/20 | | | | Open | | | | 110,000 | | | | 110,190 | | | Capital Trusts | | Open/Demand |
HSBC Securities (USA), Inc. | | | 0.45 | | | | 03/26/20 | | | | Open | | | | 201,000 | | | | 201,348 | | | Capital Trusts | | Open/Demand |
HSBC Securities (USA), Inc. | | | 0.45 | | | | 03/26/20 | | | | Open | | | | 194,000 | | | | 194,335 | | | Corporate Bonds | | Open/Demand |
HSBC Securities (USA), Inc. | | | 0.45 | | | | 03/26/20 | | | | Open | | | | 139,000 | | | | 139,240 | | | Capital Trusts | | Open/Demand |
HSBC Securities (USA), Inc. | | | 0.45 | | | | 03/26/20 | | | | Open | | | | 529,000 | | | | 529,915 | | | Corporate Bonds | | Open/Demand |
BNP Paribas S.A. | | | 1.10 | | | | 04/01/20 | | | | Open | | | | 536,705 | | | | 538,181 | | | Corporate Bonds | | Open/Demand |
Barclays Capital, Inc. | | | 1.25 | | | | 04/03/20 | | | | Open | | | | 47,765 | | | | 47,908 | | | Corporate Bonds | | Open/Demand |
Barclays Capital, Inc. | | | 1.25 | | | | 04/06/20 | | | | Open | | | | 120,201 | | | | 120,556 | | | Corporate Bonds | | Open/Demand |
Barclays Capital, Inc. | | | 1.25 | | | | 04/06/20 | | | | Open | | | | 389,003 | | | | 390,151 | | | Corporate Bonds | | Open/Demand |
BNP Paribas S.A. | | | 1.10 | | | | 04/07/20 | | | | Open | | | | 555,900 | | | | 557,327 | | | Corporate Bonds | | Open/Demand |
BNP Paribas S.A. | | | 1.10 | | | | 04/14/20 | | | | Open | | | | 922,000 | | | | 924,197 | | | Corporate Bonds | | Open/Demand |
BNP Paribas S.A. | | | 1.55 | | | | 04/14/20 | | | | Open | | | | 672,513 | | | | 674,771 | | | Corporate Bonds | | Open/Demand |
BNP Paribas S.A. | | | 1.55 | | | | 04/14/20 | | | | Open | | | | 937,485 | | | | 940,633 | | | Corporate Bonds | | Open/Demand |
J.P. morgan Securities LLC | | | 0.75 | | | | 04/14/20 | | | | Open | | | | 100,430 | | | | 100,591 | | | Corporate Bonds | | Open/Demand |
Barclays Capital, Inc. | | | 1.00 | | | | 04/15/20 | | | | Open | | | | 2,897,438 | | | | 2,903,554 | | | Foreign Agency Obligations | | Open/Demand |
Barclays Capital, Inc. | | | 1.00 | | | | 04/15/20 | | | | Open | | | | 2,243,138 | | | | 2,247,873 | | | Corporate Bonds | | Open/Demand |
Barclays Capital, Inc. | | | 1.00 | | | | 04/15/20 | | | | Open | | | | 2,191,031 | | | | 2,195,656 | | | Corporate Bonds | | Open/Demand |
Barclays Capital, Inc. | | | 1.00 | | | | 04/15/20 | | | | Open | | | | 678,750 | | | | 680,183 | | | Corporate Bonds | | Open/Demand |
Barclays Capital, Inc. | | | 1.00 | | | | 04/15/20 | | | | Open | | | | 349,966 | | | | 350,705 | | | Capital Trusts | | Open/Demand |
Barclays Capital, Inc. | | | 1.10 | | | | 04/15/20 | | | | Open | | | | 182,440 | | | | 182,864 | | | Foreign Agency Obligations | | Open/Demand |
Barclays Capital, Inc. | | | 1.25 | | | | 04/17/20 | | | | Open | | | | 1,011,051 | | | | 1,013,579 | | | Corporate Bonds | | Open/Demand |
Barclays Capital, Inc. | | | 2.00 | | | | 04/17/20 | | | | Open | | | | 1,384,540 | | | | 1,390,078 | | | Capital Trusts | | Open/Demand |
Barclays Capital, Inc. | | | 1.25 | | | | 04/20/20 | | | | Open | | | | 3,110,250 | | | | 3,118,026 | | | Foreign Agency Obligations | | Open/Demand |
BNP Paribas S.A. | | | 1.05 | | | | 04/22/20 | | | | Open | | | | 438,863 | | | | 439,746 | | | Corporate Bonds | | Open/Demand |
BNP Paribas S.A. | | | 1.05 | | | | 04/22/20 | | | | Open | | | | 581,160 | | | | 582,330 | | | Corporate Bonds | | Open/Demand |
BNP Paribas S.A. | | | 1.05 | | | | 04/24/20 | | | | Open | | | | 352,715 | | | | 353,384 | | | Corporate Bonds | | Open/Demand |
BNP Paribas S.A. | | | 1.05 | | | | 04/27/20 | | | | Open | | | | 204,750 | | | | 205,132 | | | Corporate Bonds | | Open/Demand |
RBC Capital Markets LLC | | | 1.30 | | | | 04/27/20 | | | | Open | | | | 241,380 | | | | 241,938 | | | Corporate Bonds | | Open/Demand |
BNP Paribas S.A. | | | 1.15 | | | | 04/29/20 | | | | Open | | | | 662,990 | | | | 664,303 | | | Corporate Bonds | | Open/Demand |
Barclays Capital, Inc. | | | 0.45 | | | | 04/30/20 | | | | Open | | | | 506,606 | | | | 506,993 | | | Corporate Bonds | | Open/Demand |
Barclays Capital, Inc. | | | 1.25 | | | | 04/30/20 | | | | Open | | | | 644,831 | | | | 646,197 | | | Corporate Bonds | | Open/Demand |
Barclays Capital, Inc. | | | 1.25 | | | | 04/30/20 | | | | Open | | | | 966,219 | | | | 968,265 | | | Corporate Bonds | | Open/Demand |
| | |
| 74 | | 2020 BLACKROCK SEMI-ANNUAL REPORTTO SHAREHOLDERS |
| | |
Schedule of Investments (unaudited) (continued) June 30, 2020 | | BlackRock Limited Duration Income Trust (BLW) |
Reverse Repurchase Agreements (continued)
| | | | | | | | | | | | | | | | | | | | | | | | |
| Counterparty | | Interest
Rate | | | Trade
Date | | | Maturity
Date (a) | | | Face Value | | | Face Value
Including
Accrued Interest | | | Type of Non-Cash
Underlying Collateral | | Remaining Contractual
Maturity of the Agreements (a) |
BNP Paribas S.A. | | | 0.75 | % | | | 04/30/20 | | | | Open | | | $ | 106,198 | | | $ | 106,332 | | | Corporate Bonds | | Open/Demand |
BNP Paribas S.A. | | | 0.75 | | | | 04/30/20 | | | | Open | | | | 185,000 | | | | 185,235 | | | Capital Trusts | | Open/Demand |
BNP Paribas S.A. | | | 0.75 | | | | 04/30/20 | | | | Open | | | | 263,318 | | | | 263,652 | | | Corporate Bonds | | Open/Demand |
Barclays Capital, Inc. | | | 1.40 | | | | 05/08/20 | | | | Open | | | | 437,876 | | | | 438,795 | | | Corporate Bonds | | Open/Demand |
BNP Paribas S.A. | | | 1.05 | | | | 05/08/20 | | | | Open | | | | 1,746,360 | | | | 1,749,111 | | | Corporate Bonds | | Open/Demand |
BNP Paribas S.A. | | | 1.55 | | | | 05/08/20 | | | | Open | | | | 1,385,693 | | | | 1,388,914 | | | Corporate Bonds | | Open/Demand |
BNP Paribas S.A. | | | 1.55 | | | | 05/08/20 | | | | Open | | | | 970,323 | | | | 972,579 | | | Corporate Bonds | | Open/Demand |
BNP Paribas S.A. | | | 1.55 | | | | 05/08/20 | | | | Open | | | | 869,678 | | | | 871,700 | | | Corporate Bonds | | Open/Demand |
BNP Paribas S.A. | | | 1.10 | | | | 05/11/20 | | | | Open | | | | 774,368 | | | | 775,551 | | | Corporate Bonds | | Open/Demand |
BNP Paribas S.A. | | | 1.10 | | | | 05/11/20 | | | | Open | | | | 613,319 | | | | 614,274 | | | Corporate Bonds | | Open/Demand |
Barclays Capital, Inc. | | | 0.65 | | | | 05/12/20 | | | | Open | | | | 578,588 | | | | 579,110 | | | Capital Trusts | | Open/Demand |
Barclays Capital, Inc. | | | 0.65 | | | | 05/12/20 | | | | Open | | | | 1,091,131 | | | | 1,092,116 | | | Capital Trusts | | Open/Demand |
Barclays Capital, Inc. | | | 1.40 | | | | 05/12/20 | | | | Open | | | | 822,429 | | | | 824,028 | | | Corporate Bonds | | Open/Demand |
Barclays Capital, Inc. | | | 1.40 | | | | 05/12/20 | | | | Open | | | | 1,207,860 | | | | 1,210,209 | | | Corporate Bonds | | Open/Demand |
Barclays Capital, Inc. | | | 1.40 | | | | 05/12/20 | | | | Open | | | | 1,366,845 | | | | 1,369,503 | | | Corporate Bonds | | Open/Demand |
Barclays Capital, Inc. | | | 1.40 | | | | 05/12/20 | | | | Open | | | | 1,015,985 | | | | 1,017,961 | | | Corporate Bonds | | Open/Demand |
Barclays Capital, Inc. | | | 1.40 | | | | 05/12/20 | | | | Open | | | | 814,196 | | | | 815,779 | | | Corporate Bonds | | Open/Demand |
Barclays Capital, Inc. | | | 1.40 | | | | 05/12/20 | | | | Open | | | | 625,625 | | | | 626,841 | | | Corporate Bonds | | Open/Demand |
BNP Paribas S.A. | | | 1.55 | | | | 05/12/20 | | | | Open | | | | 1,287,563 | | | | 1,290,279 | | | Corporate Bonds | | Open/Demand |
BNP Paribas S.A. | | | 1.75 | | | | 05/12/20 | | | | Open | | | | 796,080 | | | | 798,015 | | | Corporate Bonds | | Open/Demand |
BNP Paribas S.A. | | | 1.75 | | | | 05/12/20 | | | | Open | | | | 670,313 | | | | 671,942 | | | Corporate Bonds | | Open/Demand |
BNP Paribas S.A. | | | 1.75 | | | | 05/12/20 | | | | Open | | | | 568,688 | | | | 570,070 | | | Corporate Bonds | | Open/Demand |
BNP Paribas S.A. | | | 1.75 | | | | 05/12/20 | | | | Open | | | | 574,893 | | | | 576,290 | | | Corporate Bonds | | Open/Demand |
BNP Paribas S.A. | | | 1.75 | | | | 05/12/20 | | | | Open | | | | 644,963 | | | | 646,530 | | | Corporate Bonds | | Open/Demand |
BNP Paribas S.A. | | | 1.75 | | | | 05/12/20 | | | | Open | | | | 473,688 | | | | 474,839 | | | Corporate Bonds | | Open/Demand |
BNP Paribas S.A. | | | 1.75 | | | | 05/12/20 | | | | Open | | | | 638,711 | | | | 640,264 | | | Corporate Bonds | | Open/Demand |
BNP Paribas S.A. | | | 1.75 | | | | 05/12/20 | | | | Open | | | | 508,524 | | | | 509,760 | | | Corporate Bonds | | Open/Demand |
BNP Paribas S.A. | | | 1.75 | | | | 05/12/20 | | | | Open | | | | 524,288 | | | | 525,562 | | | Corporate Bonds | | Open/Demand |
BNP Paribas S.A. | | | 1.75 | | | | 05/12/20 | | | | Open | | | | 469,391 | | | | 470,532 | | | Corporate Bonds | | Open/Demand |
BNP Paribas S.A. | | | 1.75 | | | | 05/12/20 | | | | Open | | | | 529,031 | | | | 530,317 | | | Corporate Bonds | | Open/Demand |
BNP Paribas S.A. | | | 1.75 | | | | 05/12/20 | | | | Open | | | | 547,393 | | | | 548,723 | | | Corporate Bonds | | Open/Demand |
BNP Paribas S.A. | | | 1.75 | | | | 05/12/20 | | | | Open | | | | 641,933 | | | | 643,493 | | | Corporate Bonds | | Open/Demand |
RBC Capital Markets LLC | | | 1.30 | | | | 05/15/20 | | | | Open | | | | 1,169,136 | | | | 1,170,994 | | | Corporate Bonds | | Open/Demand |
Barclays Capital, Inc. | | | 0.65 | | | | 05/21/20 | | | | Open | | | | 677,119 | | | | 677,620 | | | Corporate Bonds | | Open/Demand |
Barclays Capital, Inc. | | | 1.40 | | | | 05/21/20 | | | | Open | | | | 467,940 | | | | 468,686 | | | Corporate Bonds | | Open/Demand |
Barclays Capital, Inc. | | | 1.40 | | | | 05/21/20 | | | | Open | | | | 461,213 | | | | 461,948 | | | Corporate Bonds | | Open/Demand |
Barclays Capital, Inc. | | | 1.40 | | | | 05/21/20 | | | | Open | | | | 461,125 | | | | 461,860 | | | Corporate Bonds | | Open/Demand |
BNP Paribas S.A. | | | 1.40 | | | | 05/21/20 | | | | Open | | | | 429,660 | | | | 430,345 | | | Corporate Bonds | | Open/Demand |
BNP Paribas S.A. | | | 1.40 | | | | 05/21/20 | | | | Open | | | | 484,270 | | | | 485,042 | | | Corporate Bonds | | Open/Demand |
BNP Paribas S.A. | | | 1.40 | | | | 05/21/20 | | | | Open | | | | 503,291 | | | | 504,094 | | | Corporate Bonds | | Open/Demand |
BNP Paribas S.A. | | | 1.40 | | | | 05/21/20 | | | | Open | | | | 922,930 | | | | 924,402 | | | Corporate Bonds | | Open/Demand |
BNP Paribas S.A. | | | 1.40 | | | | 05/22/20 | | | | Open | | | | 778,365 | | | | 779,576 | | | Corporate Bonds | | Open/Demand |
RBC Capital Markets LLC | | | 0.45 | | | | 05/27/20 | | | | Open | | | | 1,556,143 | | | | 1,556,947 | | | Corporate Bonds | | Open/Demand |
BNP Paribas S.A. | | | 1.75 | | | | 05/28/20 | | | | Open | | | | 354,149 | | | | 354,717 | | | Corporate Bonds | | Open/Demand |
Barclays Capital, Inc. | | | 0.65 | | | | 06/01/20 | | | | Open | | | | 301,394 | | | | 301,557 | | | Capital Trusts | | Open/Demand |
Barclays Capital, Inc. | | | 1.40 | | | | 06/01/20 | | | | Open | | | | 317,000 | | | | 317,370 | | | Corporate Bonds | | Open/Demand |
Barclays Capital, Inc. | | | 1.40 | | | | 06/01/20 | | | | Open | | | | 412,070 | | | | 412,551 | | | Corporate Bonds | | Open/Demand |
Barclays Capital, Inc. | | | 1.40 | | | | 06/01/20 | | | | Open | | | | 381,769 | | | | 382,214 | | | Capital Trusts | | Open/Demand |
Barclays Capital, Inc. | | | 1.40 | | | | 06/01/20 | | | | Open | | | | 387,296 | | | | 387,748 | | | Corporate Bonds | | Open/Demand |
Barclays Capital, Inc. | | | 1.40 | | | | 06/01/20 | | | | Open | | | | 426,883 | | | | 427,381 | | | Corporate Bonds | | Open/Demand |
Barclays Capital, Inc. | | | 1.40 | | | | 06/01/20 | | | | Open | | | | 328,188 | | | | 328,570 | | | Corporate Bonds | | Open/Demand |
Barclays Capital, Inc. | | | 1.40 | | | | 06/01/20 | | | | Open | | | | 375,375 | | | | 375,813 | | | Corporate Bonds | | Open/Demand |
Barclays Capital, Inc. | | | 1.40 | | | | 06/01/20 | | | | Open | | | | 492,240 | | | | 492,814 | | | Corporate Bonds | | Open/Demand |
Barclays Capital, Inc. | | | 1.40 | | | | 06/01/20 | | | | Open | | | | 415,063 | | | | 415,547 | | | Corporate Bonds | | Open/Demand |
Barclays Capital, Inc. | | | 1.40 | | | | 06/01/20 | | | | Open | | | | 370,178 | | | | 370,609 | | | Corporate Bonds | | Open/Demand |
Barclays Capital, Inc. | | | 1.40 | | | | 06/01/20 | | | | Open | | | | 406,568 | | | | 407,042 | | | Corporate Bonds | | Open/Demand |
Barclays Capital, Inc. | | | 1.40 | | | | 06/01/20 | | | | Open | | | | 394,129 | | | | 394,589 | | | Corporate Bonds | | Open/Demand |
BNP Paribas S.A. | | | 1.10 | | | | 06/01/20 | | | | Open | | | | 435,870 | | | | 436,270 | | | Corporate Bonds | | Open/Demand |
BNP Paribas S.A. | | | 1.20 | | | | 06/01/20 | | | | Open | | | | 482,813 | | | | 483,295 | | | Corporate Bonds | | Open/Demand |
BNP Paribas S.A. | | | 1.25 | | | | 06/01/20 | | | | Open | | | | 402,620 | | | | 403,039 | | | Corporate Bonds | | Open/Demand |
BNP Paribas S.A. | | | 1.25 | | | | 06/01/20 | | | | Open | | | | 400,514 | | | | 400,931 | | | Corporate Bonds | | Open/Demand |
BNP Paribas S.A. | | | 1.45 | | | | 06/01/20 | | | | Open | | | | 375,445 | | | | 375,899 | | | Corporate Bonds | | Open/Demand |
| | |
SCHEDULES OF INVESTMENTS | | 75 |
| | |
Schedule of Investments (unaudited) (continued) June 30, 2020 | | BlackRock Limited Duration Income Trust (BLW) |
Reverse Repurchase Agreements (continued)
| | | | | | | | | | | | | | | | | | | | | | | | |
| Counterparty | | Interest
Rate | | | Trade
Date | | | Maturity
Date (a) | | | Face Value | | | Face Value
Including
Accrued Interest | | | Type of Non-Cash
Underlying Collateral | | Remaining Contractual
Maturity of the Agreements (a) |
Barclays Capital, Inc. | | | 0.65 | % | | | 06/04/20 | | | | Open | | | $ | 1,051,131 | | | $ | 1,051,644 | | | Corporate Bonds | | Open/Demand |
Barclays Capital, Inc. | | | 1.40 | | | | 06/04/20 | | | | Open | | | | 1,182,090 | | | | 1,183,331 | | | Corporate Bonds | | Open/Demand |
Barclays Capital, Inc. | | | 1.40 | | | | 06/04/20 | | | | Open | | | | 1,126,400 | | | | 1,127,583 | | | Corporate Bonds | | Open/Demand |
Barclays Capital, Inc. | | | 1.40 | | | | 06/04/20 | | | | Open | | | | 821,023 | | | | 821,885 | | | Corporate Bonds | | Open/Demand |
Credit Agricole Corporate And Inves | | | 0.23 | | | | 06/09/20 | | | | 7/14/20 | | | | 3,977,684 | | | | 3,978,192 | | | U.S. Government Sponsored Agency Securities | | Up to 30 Days |
Credit Agricole Corporate And Inves | | | 0.23 | | | | 06/09/20 | | | | 7/14/20 | | | | 23,662 | | | | 23,665 | | | U.S. Government Sponsored Agency Securities | | Up to 30 Days |
BNP Paribas S.A. | | | 1.05 | | | | 06/09/20 | | | | Open | | | | 685,204 | | | | 685,623 | | | Corporate Bonds | | Open/Demand |
BNP Paribas S.A. | | | 1.05 | | | | 06/09/20 | | | | Open | | | | 360,938 | | | | 361,159 | | | Corporate Bonds | | Open/Demand |
BNP Paribas S.A. | | | 1.05 | | | | 06/09/20 | | | | Open | | | | 107,200 | | | | 107,266 | | | Corporate Bonds | | Open/Demand |
BNP Paribas S.A. | | | 1.05 | | | | 06/09/20 | | | | Open | | | | 603,750 | | | | 604,120 | | | Corporate Bonds | | Open/Demand |
RBC Capital Markets LLC | | | 0.45 | | | | 06/10/20 | | | | Open | | | | 580,168 | | | | 580,320 | | | Corporate Bonds | | Open/Demand |
Barclays Capital, Inc. | | | 0.50 | | | | 06/16/20 | | | | Open | | | | 515,100 | | | | 515,207 | | | Foreign Agency Obligations | | Open/Demand |
Barclays Capital, Inc. | | | 0.55 | | | | 06/16/20 | | | | Open | | | | 571,380 | | | | 571,511 | | | Corporate Bonds | | Open/Demand |
Barclays Capital, Inc. | | | 1.20 | | | | 06/16/20 | | | | Open | | | | 582,168 | | | | 582,459 | | | Corporate Bonds | | Open/Demand |
Barclays Capital, Inc. | | | 1.20 | | | | 06/16/20 | | | | Open | | | | 476,499 | | | | 476,737 | | | Corporate Bonds | | Open/Demand |
Barclays Capital, Inc. | | | 1.20 | | | | 06/16/20 | | | | Open | | | | 520,020 | | | | 520,280 | | | Corporate Bonds | | Open/Demand |
Barclays Capital, Inc. | | | 1.20 | | | | 06/16/20 | | | | Open | | | | 462,223 | | | | 462,454 | | | Corporate Bonds | | Open/Demand |
Barclays Capital, Inc. | | | 1.20 | | | | 06/16/20 | | | | Open | | | | 617,210 | | | | 617,519 | | | Corporate Bonds | | Open/Demand |
Barclays Capital, Inc. | | | 1.20 | | | | 06/16/20 | | | | Open | | | | 448,476 | | | | 448,700 | | | Corporate Bonds | | Open/Demand |
Barclays Capital, Inc. | | | 1.20 | | | | 06/16/20 | | | | Open | | | | 472,938 | | | | 473,174 | | | Corporate Bonds | | Open/Demand |
Barclays Capital, Inc. | | | 1.20 | | | | 06/16/20 | | | | Open | | | | 367,133 | | | | 367,316 | | | Corporate Bonds | | Open/Demand |
Barclays Capital, Inc. | | | 0.50 | | | | 06/19/20 | | | | Open | | | | 792,743 | | | | 792,842 | | | Foreign Agency Obligations | | Open/Demand |
Barclays Capital, Inc. | | | 0.50 | | | | 06/19/20 | | | | Open | | | | 660,555 | | | | 660,638 | | | Foreign Agency Obligations | | Open/Demand |
Barclays Capital, Inc. | | | 0.55 | | | | 06/19/20 | | | | Open | | | | 2,330,850 | | | | 2,331,170 | | | Corporate Bonds | | Open/Demand |
Barclays Capital, Inc. | | | 0.55 | | | | 06/19/20 | | | | Open | | | | 689,788 | | | | 689,882 | | | Corporate Bonds | | Open/Demand |
Barclays Capital, Inc. | | | 0.60 | | | | 06/19/20 | | | | Open | | | | 1,078,870 | | | | 1,079,032 | | | Foreign Agency Obligations | | Open/Demand |
Barclays Capital, Inc. | | | 1.00 | | | | 06/19/20 | | | | Open | | | | 604,073 | | | | 604,224 | | | Corporate Bonds | | Open/Demand |
Barclays Capital, Inc. | | | 1.00 | | | | 06/19/20 | | | | Open | | | | 472,536 | | | | 472,654 | | | Corporate Bonds | | Open/Demand |
Barclays Capital, Inc. | | | 1.00 | | | | 06/19/20 | | | | Open | | | | 514,973 | | | | 515,101 | | | Corporate Bonds | | Open/Demand |
BNP Paribas S.A. | | | 1.10 | | | | 06/19/20 | | | | Open | | | | 611,780 | | | | 611,948 | | | Corporate Bonds | | Open/Demand |
RBC Capital Markets LLC | | | 1.30 | | | | 06/19/20 | | | | Open | | | | 530,338 | | | | 530,510 | | | Corporate Bonds | | Open/Demand |
BNP Paribas S.A. | | | 1.15 | | | | 06/23/20 | | | | Open | | | | 408,375 | | | | 408,479 | | | Corporate Bonds | | Open/Demand |
Barclays Capital, Inc. | | | 0.50 | | | | 06/29/20 | | | | Open | | | | 720,188 | | | | 720,197 | | | Foreign Agency Obligations | | Open/Demand |
Barclays Capital, Inc. | | | 0.50 | | | | 06/29/20 | | | | Open | | | | 1,058,288 | | | | 1,058,302 | | | Foreign Agency Obligations | | Open/Demand |
Barclays Capital, Inc. | | | 0.55 | | | | 06/29/20 | | | | Open | | | | 615,081 | | | | 615,091 | | | Foreign Agency Obligations | | Open/Demand |
Barclays Capital, Inc. | | | 0.55 | | | | 06/29/20 | | | | Open | | | | 637,813 | | | | 637,822 | | | Foreign Agency Obligations | | Open/Demand |
Barclays Capital, Inc. | | | 0.90 | | | | 06/29/20 | | | | Open | | | | 956,888 | | | | 956,911 | | | Capital Trusts | | Open/Demand |
Barclays Capital, Inc. | | | 0.90 | | | | 06/29/20 | | | | Open | | | | 906,395 | | | | 906,418 | | | Corporate Bonds | | Open/Demand |
Barclays Capital, Inc. | | | 1.00 | | | | 06/29/20 | | | | Open | | | | 368,153 | | | | 368,163 | | | Corporate Bonds | | Open/Demand |
Barclays Capital, Inc. | | | 1.00 | | | | 06/29/20 | | | | Open | | | | 525,140 | | | | 525,155 | | | Corporate Bonds | | Open/Demand |
Barclays Capital, Inc. | | | 1.00 | | | | 06/29/20 | | | | Open | | | | 390,930 | | | | 390,941 | | | Corporate Bonds | | Open/Demand |
Barclays Capital, Inc. | | | 1.00 | | | | 06/29/20 | | | | Open | | | | 334,954 | | | | 334,963 | | | Corporate Bonds | | Open/Demand |
Barclays Capital, Inc. | | | 1.00 | | | | 06/29/20 | | | | Open | | | | 473,869 | | | | 473,882 | | | Corporate Bonds | | Open/Demand |
Barclays Capital, Inc. | | | 1.00 | | | | 06/29/20 | | | | Open | | | | 400,640 | | | | 400,651 | | | Foreign Agency Obligations | | Open/Demand |
Barclays Capital, Inc. | | | 1.00 | | | | 06/29/20 | | | | Open | | | | 402,855 | | | | 402,866 | | | Corporate Bonds | | Open/Demand |
Barclays Capital, Inc. | | | 1.00 | | | | 06/29/20 | | | | Open | | | | 509,375 | | | | 509,389 | | | Corporate Bonds | | Open/Demand |
Barclays Capital, Inc. | | | 1.00 | | | | 06/29/20 | | | | Open | | | | 397,843 | | | | 397,854 | | | Corporate Bonds | | Open/Demand |
Barclays Capital, Inc. | | | 1.00 | | | | 06/29/20 | | | | Open | | | | 668,300 | | | | 668,319 | | | Corporate Bonds | | Open/Demand |
Barclays Capital, Inc. | | | 1.00 | | | | 06/29/20 | | | | Open | | | | 406,868 | | | | 406,879 | | | Corporate Bonds | | Open/Demand |
Barclays Capital, Inc. | | | 1.00 | | | | 06/29/20 | | | | Open | | | | 411,446 | | | | 411,458 | | | Corporate Bonds | | Open/Demand |
Barclays Capital, Inc. | | | 1.00 | | | | 06/29/20 | | | | Open | | | | 472,028 | | | | 472,041 | | | Corporate Bonds | | Open/Demand |
BNP Paribas S.A. | | | 1.00 | | | | 06/29/20 | | | | Open | | | | 441,183 | | | | 441,195 | | | Corporate Bonds | | Open/Demand |
BNP Paribas S.A. | | | 1.00 | | | | 06/29/20 | | | | Open | | | | 529,500 | | | | 529,515 | | | Corporate Bonds | | Open/Demand |
BNP Paribas S.A. | | | 1.05 | | | | 06/29/20 | | | | Open | | | | 454,611 | | | | 454,671 | | | Corporate Bonds | | Open/Demand |
BNP Paribas S.A. | | | 1.05 | | | | 06/29/20 | | | | Open | | | | 523,500 | | | | 523,515 | | | Corporate Bonds | | Open/Demand |
BNP Paribas S.A. | | | 1.05 | | | | 06/29/20 | | | | Open | | | | 501,839 | | | | 501,853 | | | Corporate Bonds | | Open/Demand |
BNP Paribas S.A. | | | 1.05 | | | | 06/29/20 | | | | Open | | | | 454,279 | | | | 454,292 | | | Corporate Bonds | | Open/Demand |
BNP Paribas S.A. | | | 1.20 | | | | 06/29/20 | | | | Open | | | | 468,000 | | | | 468,016 | | | Corporate Bonds | | Open/Demand |
BNP Paribas S.A. | | | 1.20 | | | | 06/29/20 | | | | Open | | | | 332,170 | | | | 332,181 | | | Corporate Bonds | | Open/Demand |
| | |
| 76 | | 2020 BLACKROCK SEMI-ANNUAL REPORTTO SHAREHOLDERS |
| | |
Schedule of Investments (unaudited) (continued) June 30, 2020 | | BlackRock Limited Duration Income Trust (BLW) |
Reverse Repurchase Agreements (continued)
| | | | | | | | | | | | | | | | | | | | | | | | |
| Counterparty | | Interest
Rate | | | Trade
Date | | | Maturity
Date (a) | | | Face Value | | | Face Value
Including
Accrued Interest | | | Type of Non-Cash
Underlying Collateral | | Remaining Contractual
Maturity of the Agreements (a) |
RBC Capital Markets, LLC | | | 1.30 | % | | | 06/29/20 | | | | Open | | | $ | 590,818 | | | $ | 590,860 | | | Corporate Bonds | | Open/Demand |
| | | | | | | | | | | | | | | | | | | | | | | | |
| | | | | | | | | | | | | | $ | 277,450,711 | | | $ | 279,746,784 | | | | | |
| | | | | | | | | | | | | | | | | | | | | | | | |
| | (a) | Certain agreements have no stated maturity and can be terminated by either party at any time. | |
Derivative Financial Instruments Outstanding as of Period End
Futures Contracts
| | | | | | | | | | | | | | | | |
| Description | | Number of
Contracts | | | Expiration
Date | | | Notional
Amount (000) | | | Value/
Unrealized
Appreciation
(Depreciation) | |
Long Contracts 10-Year U.S. Ultra Note | | | 4 | | | | 09/21/20 | | | $ | 630 | | | $ | 1,134 | |
2-Year US Treasury Notes | | | 12 | | | | 09/30/20 | | | | 2,650 | | | | 77 | |
90-Day Euro-Dollar | | | 165 | | | | 12/14/20 | | | | 41,130 | | | | 7,147 | |
| | | | | | | | | | | | | | | | |
| | | | | | | | | | | | | | | 8,358 | |
| | | | | | | | | | | | | | | | |
Short Contracts | | | | | | | | | | | | | | | | |
10-Year U.S. Treasury Note | | | 106 | | | | 09/21/20 | | | | 14,752 | | | | (46,749 | ) |
Long U.S. Treasury Bond | | | 17 | | | | 09/21/20 | | | | 3,036 | | | | 4,160 | |
U.S. Treasury Ultra Bond | | | 109 | | | | 09/21/20 | | | | 23,779 | | | | (119,044 | ) |
5-Year U.S. Treasury Note | | | 484 | | | | 09/30/20 | | | | 60,859 | | | | (147,923 | ) |
90-Day Euro-Dollar | | | 165 | | | | 12/19/22 | | | | 41,143 | | | | (45,040 | ) |
| | | | | | | | | | | | | | | | |
| | | | | | | | | | | | | | | (354,596 | ) |
| | | | | | | | | | | | | | | | |
| | | | | | | | | | | | | | $ | (346,238 | ) |
| | | | | | | | | | | | | | | | |
Forward Foreign Currency Exchange Contracts
| | | | | | | | | | | | | | | | | | | | |
Currency
Purchased | | | Currency
Sold | | | Counterparty | | Settlement Date | | | Unrealized
Appreciation
(Depreciation) | |
| EUR | | | 7,251,000 | | | USD | | | 8,141,949 | | | BNP Paribas S.A. | | | 07/06/20 | | | $ | 5,209 | |
| EUR | | | 265,000 | | | USD | | | 297,065 | | | Goldman Sachs International | | | 07/06/20 | | | | 687 | |
| EUR | | | 832,000 | | | USD | | | 934,217 | | | HSBC Bank USA N.A. | | | 07/06/20 | | | | 611 | |
| GBP | | | 4,498,000 | | | USD | | | 5,535,329 | | | JPMorgan Chase Bank N.A. | | | 07/06/20 | | | | 38,274 | |
| GBP | | | 880,000 | | | USD | | | 1,082,346 | | | Standard Chartered Bank | | | 07/06/20 | | | | 8,087 | |
| GBP | | | 655,000 | | | USD | | | 805,696 | | | State Street Bank and Trust Co. | | | 07/06/20 | | | | 5,933 | |
| NZD | | | 86,000 | | | USD | | | 55,303 | | | Bank of America N.A. | | | 07/06/20 | | | | 194 | |
| USD | | | 126,442 | | | GBP | | | 100,000 | | | Deutsche Bank AG | | | 07/06/20 | | | | 2,529 | |
| AUD | | | 6,150,000 | | | NZD | | | 6,567,136 | | | Bank of America N.A. | | | 09/16/20 | | | | 7,731 | |
| | | | | | | | | | | | | | | | | | | | |
| | | | | | | | | | | | | | | | | | | 69,255 | |
| | | | | | | | | | | | | | | | | | | | |
| USD | | | 97,935 | | | EUR | | | 88,000 | | | BNP Paribas S.A. | | | 07/06/20 | | | | (941 | ) |
| USD | | | 110,272 | | | EUR | | | 100,000 | | | JPMorgan Chase Bank N.A. | | | 07/06/20 | | | | (2,088 | ) |
| USD | | | 294,970 | | | EUR | | | 265,000 | | | UBS AG | | | 07/06/20 | | | | (2,782 | ) |
| USD | | | 929,433 | | | EUR | | | 835,000 | | | UBS AG | | | 07/06/20 | | | | (8,766 | ) |
| USD | | | 9,033,864 | | | EUR | | | 8,116,000 | | | UBS AG | | | 07/06/20 | | | | (85,201 | ) |
| USD | | | 5,535,095 | | | GBP | | | 4,498,000 | | | BNP Paribas S.A. | | | 07/06/20 | | | | (38,508 | ) |
| USD | | | 1,083,919 | | | GBP | | | 880,000 | | | Standard Chartered Bank | | | 07/06/20 | | | | (6,515 | ) |
| USD | | | 1,059,198 | | | GBP | | | 860,000 | | | UBS AG | | | 07/06/20 | | | | (6,453 | ) |
| USD | | | 53,340 | | | NZD | | | 86,000 | | | Westpac Banking Corp. | | | 07/06/20 | | | | (2,157 | ) |
| USD | | | 8,147,246 | | | EUR | | | 7,251,000 | | | BNP Paribas S.A. | | | 08/05/20 | | | | (5,263 | ) |
| USD | | | 297,257 | | | EUR | | | 265,000 | | | Goldman Sachs International | | | 08/05/20 | | | | (690 | ) |
| USD | | | 934,823 | | | EUR | | | 832,000 | | | HSBC Bank USA N.A. | | | 08/05/20 | | | | (618 | ) |
| USD | | | 5,536,309 | | | GBP | | | 4,498,000 | | | JPMorgan Chase Bank N.A. | | | 08/05/20 | | | | (38,391 | ) |
| USD | | | 1,082,539 | | | GBP | | | 880,000 | | | Standard Chartered Bank | | | 08/05/20 | | | | (8,109 | ) |
| USD | | | 805,841 | | | GBP | | | 655,000 | | | State Street Bank and Trust Co. | | | 08/05/20 | | | | (5,949 | ) |
| USD | | | 55,305 | | | NZD | | | 86,000 | | | Bank of America N.A. | | | 08/05/20 | | | | (195 | ) |
| NOK | | | 41,000,000 | | | SEK | | | 39,956,509 | | | Morgan Stanley & Co. International PLC | | | 09/16/20 | | | | (31,147 | ) |
| | | | | | | | | | | | | | | | | | | | |
| | | | | | | | | | | | | | | | | | $ | (243,773 | ) |
| | | | | | | | | | | | | | | | | | | | |
| | | | | | | | | | | | | | | $ | (174,518 | ) |
| | | | | | | | | | | | | | | | | | | | |
| | |
SCHEDULES OF INVESTMENTS | | 77 |
| | |
Schedule of Investments (unaudited) (continued) June 30, 2020 | | BlackRock Limited Duration Income Trust (BLW) |
Centrally Cleared Credit Default Swaps — Buy Protection
| | | | | | | | | | | | | | | | | | | | | | | | | | | | | | |
| Reference Obligation/Index | | Financing
Rate Paid
by the Fund | | | Payment
Frequency | | | Termination
Date | | Notional
Amount (000) | | | Value | | | Upfront
Premium
Paid
(Received) | | | Unrealized
Appreciation
(Depreciation) | |
CDX.NA.HY.34.V6 | | | 5.00 | % | | | Quarterly | | | 06/20/25 | | | USD | | | | 1,330 | | | $ | 7,512 | | | $ | 72,564 | | | $ | (65,052 | ) |
CDX.NA.IG.34.V1 | | | 1.00 | | | | Quarterly | | | 06/20/25 | | | USD | | | | 11,250 | | | | (134,303 | ) | | | (130,982 | ) | | | (3,321 | ) |
| | | | | | | | | | | | | | | | | | | | | | | | | | | |
| | | | | | | | | | | | | | | | | | | | $ | (126,791 | ) | | $ | (58,418 | ) | | $ | (68,373 | ) |
| | | | | | | | | | | | | | | | | | | | | | | | | | | | | | |
Centrally Cleared Interest Rate Swaps
| | | | | | | | | | | | | | | | | | | | | | | | | | | | | | | | | | |
| | | Paid by the Fund | | Received by the Fun | | Termination
Date | | Notional
Amount (000) | | | Value | | | Upfront
Premium
Paid
(Received) | | | Unrealized
Appreciation
(Depreciation) | |
| Rate | | Frequency | | | Rate | | Frequency | | | Effective
Date |
3-Month LIBOR, 0.30% | | | Quarterly | | | 1.57% | | | Semi-Annual | | | 02/11/20 | | 02/11/30 | | | USD | | | | 5 | | | $ | 480 | | | $ | 202 | | | $ | 278 | |
| | | | | | | | | | | | | | | | | | | | | | | | | | | | | | | | | | |
OTC Credit Default Swaps — Buy Protection
| | | | | | | | | | | | | | | | | | | | | | | | | | | | | | | | |
| Reference Obligation/Index | | Financing
Rate Paid
by the Fund | | | Payment
Frequency | | | Counterparty | | Termination
Date | | | Notional
Amount
(000) | | | Value | | | Upfront
Premium
Paid
(Received) | | | Unrealized
Appreciation
(Depreciation) | |
Altice Finco SA | | | 5.00 | % | | | Quarterly | | | Credit Suisse International | | | 12/20/24 | | | EUR | | | 40 | | | $ | (2,840 | ) | | $ | (4,910 | ) | | $ | 2,070 | |
Altice Finco SA | | | 5.00 | | | | Quarterly | | | Credit Suisse International | | | 12/20/24 | | | EUR | | | 30 | | | | (2,130 | ) | | | (3,043 | ) | | | 913 | |
SES SA | | | 1.00 | | | | Quarterly | | | Credit Suisse International | | | 06/20/25 | | | EUR | | | 20 | | | | 273 | | | | 488 | | | | (215 | ) |
SES SA | | | 1.00 | | | | Quarterly | | | Credit Suisse International | | | 06/20/25 | | | EUR | | | 20 | | | | 262 | | | | 516 | | | | (254 | ) |
| | | | | | | | | | | | | | | | | | | | | | | | | | | | | | | | |
| | | $ | (4,435 | ) | | $ | (6,949 | ) | | $ | 2,514 | |
| | | | | | | | | | | | | | | | | | | | | | | | | | | | | | | | |
OTC Credit Default Swaps — Sell Protection
| | | | | | | | | | | | | | | | | | | | | | | | | | | | | | | | | | | | | | |
| Reference Obligation/Index | | Financing
Rate Received
by the Fund | | | Payment
Frequency | | | Counterparty | | | Termination
Date | | | Credit
Rating (a) | | Notional
Amount
(000) (b) | | | Value | | | Upfront
Premium
Paid
(Received) | | | Unrealized
Appreciation
(Depreciation) | |
Casino Guichard Perrachon SA | | | 1.00 | % | | | Quarterly | | | | Citibank N.A. | | | | 06/20/23 | | | B | | | EUR | | | | 11 | | | $ | (1,634 | ) | | $ | (995 | ) | | $ | (639 | ) |
Casino Guichard Perrachon SA | | | 1.00 | | | | Quarterly | | | | Barclays Bank PLC | | | | 12/20/23 | | | B | | | EUR | | | | 40 | | | | (7,239 | ) | | | (4,600 | ) | | | (2,639 | ) |
Broadcom, Inc. | | | 1.00 | | | | Quarterly | | | | Citibank N.A. | | | | 06/20/24 | | | B | | | USD | | | | 1,185 | | | | 9,483 | | | | (72,650 | ) | | | 82,133 | |
Garfunkelux Holdco 2 SA | | | 5.00 | | | | Quarterly | | | | Credit Suisse International | | | | 12/20/24 | | | B+ | | | EUR | | | | 10 | | | | (1,941 | ) | | | (120 | ) | | | (1,821 | ) |
Garfunkelux Holdco 2 SA | | | 5.00 | | | | Quarterly | | | | Credit Suisse International | | | | 12/20/24 | | | B+ | | | EUR | | | | 30 | | | | (5,824 | ) | | | — | | | | (5,824 | ) |
Garfunkelux Holdco 2 SA | | | 5.00 | | | | Quarterly | | | | Credit Suisse International | | | | 12/20/24 | | | B+ | | | EUR | | | | 10 | | | | (1,941 | ) | | | 558 | | | | (2,499 | ) |
Intrum Justitia AB | | | 5.00 | | | | Quarterly | | | | Credit Suisse International | | | | 12/20/24 | | | B+ | | | EUR | | | | 20 | | | | (1,706 | ) | | | 598 | | | | (2,304 | ) |
Rolls-Royce PLC | | | 1.00 | | | | Quarterly | | | | Citibank N.A. | | | | 06/20/25 | | | BB | | | EUR | | | | 6 | | | | (985 | ) | | | (1,129 | ) | | | 144 | |
Rolls-Royce PLC | | | 1.00 | | | | Quarterly | | | | Citibank N.A. | | | | 06/20/25 | | | BB | | | EUR | | | | 14 | | | | (2,160 | ) | | | (2,484 | ) | | | 324 | |
Rolls-Royce PLC | | | 1.00 | | | | Quarterly | | | | JPMorgan Chase Bank N.A. | | | | 06/20/25 | | | BB | | | EUR | | | | 20 | | | | (3,145 | ) | | | (2,943 | ) | | | (202 | ) |
Tesco PLC | | | 1.00 | | | | Quarterly | | |
| morgan Stanley & Co.
International PLC |
| | | 12/20/28 | | | BBB- | | | EUR | | | | 60 | | | | (2,365 | ) | | | (5,271 | ) | | | 2,906 | |
CMBX.NA.8 | | | 3.00 | | | | monthly | | | | Barclays Bank PLC | | | | 10/17/57 | | | NR | | | USD | | | | 5,000 | | | | (1,136,028 | ) | | | (499,645 | ) | | | (636,383 | ) |
CMBX.NA.8 | | | 3.00 | | | | monthly | | | | Credit Suisse International | | | | 10/17/57 | | | NR | | | USD | | | | 2,500 | | | | (568,014 | ) | | | (247,129 | ) | | | (320,885 | ) |
CMBX.NA.8 | | | 3.00 | | | | monthly | | |
| morgan Stanley & Co.
International PLC |
| | | 10/17/57 | | | NR | | | USD | | | | 4,450 | | | | (1,011,065 | ) | | | (583,841 | ) | | | (427,224 | ) |
CDX.NA.HY.34.V6 | | | 3.00 | | | | monthly | | |
| morgan Stanley & Co.
International PLC |
| | | 09/17/58 | | | NR | | | USD | | | | 5,545 | | | | (1,075,265 | ) | | | (1,495,697 | ) | | | 420,432 | |
CMBX.NA.9 | | | 3.00 | | | | monthly | | |
| morgan Stanley & Co.
International PLC |
| | | 09/17/58 | | | NR | | | USD | | | | 7,550 | | | | (1,463,992 | ) | | | (916,761 | ) | | | (547,231 | ) |
CMBX.NA.9 | | | 3.00 | | | | monthly | | | | Credit Suisse International | | | | 09/17/58 | | | NR | | | USD | | | | 5,000 | | | | (969,531 | ) | | | (535,164 | ) | | | (434,367 | ) |
CMBX.NA.9 | | | 3.00 | | | | monthly | | | | Credit Suisse International | | | | 09/17/58 | | | NR | | | USD | | | | 5,000 | | | | (969,531 | ) | | | (535,164 | ) | | | (434,367 | ) |
CMBX.NA.9 | | | 3.00 | | | | monthly | | | | Credit Suisse International | | | | 09/17/58 | | | NR | | | USD | | | | 5,000 | | | | (969,531 | ) | | | (529,318 | ) | | | (440,213 | ) |
| | | | | | | | | | | | | | | | | | | | | | | | | | | | | | | | | | | | | | |
| | | | | | | | | | | | | | | | | | | | | | | | | | | | $ | (8,182,414 | ) | | $ | (5,431,755 | ) | | $ | (2,750,659 | ) |
| | | | | | | | | | | | | | | | | | | | | | | | | | | | | | | | | | | | | | |
| | (a) | Using the rating of the issuer or the underlying securities of the index, as applicable, provided by S&P Global Ratings. | |
| | (b) | The maximum potential amount the Fund may pay should a negative credit event take place as defined under the terms of the agreement. | |
| | |
| 78 | | 2020 BLACKROCK SEMI-ANNUAL REPORTTO SHAREHOLDERS |
| | |
Schedule of Investments (unaudited) (continued) June 30, 2020 | | BlackRock Limited Duration Income Trust (BLW) |
Balances Reported in the Statements of Assets and Liabilities for Centrally Cleared Swaps, OTC Swaps
| | | | | | | | | | | | | | | | |
| | | Swap
Premiums
Paid | | | Swap
Premiums
Received | | | Unrealized
Appreciation | | | Unrealized
Depreciation | |
Centrally Cleared Swaps(a) | | $ | 72,766 | | | $ | (130,982 | ) | | $ | 278 | | | $ | (68,373 | ) |
OTC Swaps | | | 2,160 | | | | (5,440,864 | ) | | | 508,922 | | | | (3,257,067 | ) |
| | (a) | Includes cumulative appreciation (depreciation) on centrally cleared swaps, as reported in the Schedule of Investments. Only current day’s variation margin is reported within the Statements of Assets and Liabilities and is net of any previously paid (received) swap premium amounts. | |
Derivative Financial Instruments Categorized by Risk Exposure
As of period end, the fair values of derivative financial instruments located in the Statements of Assets and Liabilities were as follows:
| | | | | | | | | | | | | | | | | | | | | | | | | | | | |
| | | Commodity
Contracts | | | Credit
Contracts | | | Equity
Contracts | | | Foreign
Currency
Exchange
Contracts | | | Interest
Rate
Contracts | | | Other
Contracts | | | Total | |
Assets — Derivative Financial Instruments | | | | | | | | | | | | | | | | | | | | | | | | | | | | |
Futures contracts | | | | | | | | | | | | | | | | | | | | | | | | | | | | |
Unrealized appreciation on futures contracts(a) | | $ | — | | | $ | — | | | $ | — | | | $ | — | | | $ | 12,518 | | | $ | — | | | $ | 12,518 | |
Forward foreign currency exchange contracts | | | | | | | | | | | | | | | | | | | | | | | | | | | | |
Unrealized appreciation on forward foreign currency exchange contracts | | | — | | | | — | | | | — | | | | 69,255 | | | | — | | | | — | | | | 69,255 | |
Swaps — centrally cleared | | | | | | | | | | | | | | | | | | | | | | | | | | | | |
Unrealized appreciation on centrally cleared swaps(a) | | | — | | | | | | | | — | | | | — | | | | 278 | | | | — | | | | 278 | |
Swaps — OTC | | | | | | | | | | | | | | | | | | | | | | | | | | | | |
Unrealized appreciation on OTC swaps; Swap premiums paid | | | — | | | | 511,082 | | | | — | | | | — | | | | — | | | | — | | | | 511,082 | |
| | | | | | | | | | | | | | | | | | | | | | | | | | | | |
| | $ | — | | | $ | 511,082 | | | $ | — | | | | 69,255 | | | $ | 12,796 | | | $ | — | | | $ | 593,133 | |
| | | | | | | | | | | | | | | | | | | | | | | | | | | | |
Liabilities — Derivative Financial Instruments | | | | | | | | | | | | | | | | | | | | | | | | | | | | |
Futures contracts | | | | | | | | | | | | | | | | | | | | | | | | | | | | |
Unrealized depreciation on futures contracts(a) | | $ | — | | | $ | — | | | $ | — | | | $ | — | | | $ | 358,756 | | | $ | — | | | $ | 358,756 | |
Forward foreign currency exchange contracts | | | | | | | | | | | | | | | | | | | | | | | | | | | | |
Unrealized depreciation on forward foreign currency exchange contracts | | | — | | | | — | | | | — | | | | 243,773 | | | | — | | | | — | | | | 243,773 | |
Swaps — centrally cleared | | | | | | | | | | | | | | | | | | | | | | | | | | | | |
Unrealized depreciation on centrally cleared swaps(a) | | | — | | | | 68,373 | | | | — | | | | — | | | | — | | | | — | | | | 68,373 | |
Swaps — OTC | | | | | | | | | | | | | | | | | | | | | | | | | | | | |
Unrealized depreciation on OTC swaps; Swap premiums received | | | — | | | | 8,697,931 | | | | — | | | | — | | | | — | | | | — | | | | 8,697,931 | |
| | | | | | | | | | | | | | | | | | | | | | | | | | | | |
| | $ | — | | | $ | 8,766,304 | | | $ | — | | | $ | 243,773 | | | $ | 358,756 | | | $ | — | | | $ | 9,368,833 | |
| | | | | | | | | | | | | | | | | | | | | | | | | | | | |
| | (a) | Net cumulative unrealized appreciation (depreciation) on futures contracts and centrally cleared swaps, if any, are reported in the Schedule of Investments. In the Statements of Assets and Liabilities, only current day’s variation margin is reported in receivables or payables and the net cumulative unrealized appreciation (depreciation) is included in accumulated earnings (loss). For the six months ended June 30, 2020, the effect of derivative financial instruments in the Statements of Operations was as follows: | |
| | | | | | | | | | | | | | | | | | | | | | | | | | | | |
| | | Commodity
Contracts | | | Credit
Contracts | | | Equity
Contracts | | | Foreign
Currency
Exchange
Contracts | | | Interest
Rate
Contracts | | | Other
Contracts | | | Total | |
Net Realized Gain (Loss) from: | | | | | | | | | | | | | | | | | | | | | | | | | | | | |
Futures contracts | | $ | — | | | $ | — | | | $ | (718 | ) | | $ | — | | | $ | 1,476,076 | | | $ | — | | | $ | 1,475,358 | |
Forward foreign currency exchange contracts | | | — | | | | — | | | | — | | | | 634,606 | | | | — | | | | — | | | | 634,606 | |
Options purchased(a) | | | — | | | | — | | | | — | | | | — | | | | 4,265 | | | | — | | | | 4,265 | |
Options written | | | — | | | | — | | | | — | | | | — | | | | (2,737 | ) | | | — | | | | (2,737 | ) |
Swaps | | | — | | | | 497,855 | | | | — | | | | — | | | | (416,752 | ) | | | — | | | | 81,103 | |
| | | | | | | | | | | | | | | | | | | | | | | | | | | | |
| | $ | — | | | $ | 497,855 | | | $ | (718 | ) | | $ | 634,606 | | | $ | 1,060,852 | | | $ | — | | | $ | 2,192,595 | |
| | | | | | | | | | | | | | | | | | | | | | | | | | | | |
| | (a) | Options purchased are included in net realized gain (loss) from investments. | |
| | |
SCHEDULES OF INVESTMENTS | | 79 |
| | |
Schedule of Investments (unaudited) (continued) June 30, 2020 | | BlackRock Limited Duration Income Trust (BLW) |
Derivative Financial Instruments Categorized by Risk Exposure (continued)
| | | | | | | | | | | | | | | | | | | | | | | | | | | | |
| | | Commodity
Contracts | | | Credit
Contracts | | | Equity
Contracts | | | Foreign
Currency
Exchange
Contracts | | | Interest
Rate
Contracts | | | Other
Contracts | | | Total | |
| | | | | | | |
| Net Change in Unrealized Appreciation (Depreciation) on: | | | | | | | | | | | | | | | | | | | | | |
Futures contracts | | $ | — | | | $ | — | | | $ | 35 | | | $ | — | | | $ | (506,107 | ) | | $ | — | | | $ | (506,072 | ) |
Forward foreign currency exchange contracts | | | — | | | | — | | | | — | | | | 274,957 | | | | — | | | | — | | | | 274,957 | |
Options purchased(a) | | | — | | | | — | | | | — | | | | — | | | | 135,662 | | | | — | | | | 135,662 | |
Options written | | | — | | | | — | | | | — | | | | — | | | | (57,323 | ) | | | — | | | | (57,323 | ) |
Swaps | | | — | | | | (5,672,071 | ) | | | — | | | | — | | | | 278 | | | | — | | | | (5,671,793 | ) |
| | | | | | | | | | | | | | | | | | | | | | | | | | | | |
| | $ | — | | | $ | (5,672,071 | ) | | $ | 35 | | | $ | 274,957 | | | $ | (427,490 | ) | | $ | — | | | $ | (5,824,569 | ) |
| | | | | | | | | | | | | | | | | | | | | | | | | | | | |
| | (a) | Options purchased are included in net change in unrealized appreciation (depreciation) on investments. | |
Average Quarterly Balances of Outstanding Derivative Financial Instruments
| | | | |
Futures contracts: | |
Average notional value of contracts — long | | $ | 149,400,395 | |
Average notional value of contracts — short | | $ | 111,809,258 | |
Forward foreign currency exchange contracts: | |
Average amounts purchased — in USD | | $ | 57,532,819 | |
Average amounts sold — in USD | | $ | 37,503,564 | |
Options: | | | | |
Average notional amount of swaption contracts purchased | | $ | — | (a) |
Average notional amount of swaption contracts written | | $ | — | (a) |
Credit default swaps: | |
Average notional value — buy protection | | $ | 6,390,394 | |
Average notional value — sell protection | | $ | 38,812,484 | |
Interest rate swaps: | |
Average notional amount-pays fixed rate | | $ | — | (a) |
Average notional value — receives fixed rate | | $ | 5,000 | |
| | (a) | Derivative not held at quarter-end. The risk exposure table serves as an indicator of activity during the period. | |
For more information about the Fund’s investment risks regarding derivative financial instruments, refer to the Notes to Financial Statements.
Derivative Financial Instruments — Offsetting as of Period End
The Fund’s derivative assets and liabilities (by type) were as follows:
| | | | | | | | |
| | | Assets | | | Liabilities | |
Futures contracts | | $ | 156,375 | | | $ | 1,016 | |
Forward foreign currency exchange contracts | | | 69,255 | | | | 243,773 | |
Swaps — Centrally cleared | | | 4,318 | | | | — | |
Swaps — OTC(a) | | | 511,082 | | | | 8,697,931 | |
| | | | | | | | |
Total derivative assets and liabilities in the Statements of Assets and Liabilities | | $ | 741,030 | | | $ | 8,942,720 | |
Derivatives not subject to a Master Netting Agreement or similar agreement (“MNA”) | | | (160,693 | ) | | | (1,016 | ) |
| | | | | | | | |
Total derivative assets and liabilities subject to an MNA | | $ | 580,337 | | | $ | 8,941,704 | |
| | | | | | | | |
| | (a) | Includes unrealized appreciation (depreciation) on OTC swaps and swap premiums paid/received in the Statements of Assets and Liabilities. | |
| | |
| 80 | | 2020 BLACKROCK SEMI-ANNUAL REPORTTO SHAREHOLDERS |
| | |
Schedule of Investments (unaudited) (continued) June 30, 2020 | | BlackRock Limited Duration Income Trust (BLW) |
Derivative Financial Instruments — Offsetting as of Period End (continued)
The following table presents the Fund’s derivative assets (and liabilities) by counterparty net of amounts available for offset under an MNA and net of the related collateral received (and pledged) by the Fund:
| | | | | | | | | | | | | | | | | | | | |
| Counterparty | | Derivative
Assets
Subject to
an MNA by
Counterparty | | | Derivatives
Available
for Offset (a) | | | Non-cash
Collateral
Received | | | Cash
Collateral
Received | | | Net Amount
of Derivative
Assets (b)(c) | |
Bank of America N.A. | | $ | 7,925 | | | $ | (195 | ) | | $ | — | | | $ | — | | | $ | 7,730 | |
BNP Paribas S.A. | | | 5,209 | | | | (5,209 | ) | | | — | | | | — | | | | — | |
Citibank N.A. | | | 82,601 | | | | (77,897 | ) | | | — | | | | — | | | | 4,704 | |
Credit Suisse International | | | 5,143 | | | | (5,143 | ) | | | — | | | | — | | | | — | |
Deutsche Bank AG | | | 2,529 | | | | — | | | | — | | | | — | | | | 2,529 | |
Goldman Sachs International | | | 687 | | | | (687 | ) | | | — | | | | — | | | | — | |
HSBC Bank USA N.A. | | | 611 | | | | (611 | ) | | | — | | | | — | | | | — | |
JPMorgan Chase Bank N.A. | | | 38,274 | | | | (38,274 | ) | | | — | | | | — | | | | — | |
morgan Stanley & Co. International PLC | | | 423,338 | | | | (423,338 | ) | | | — | | | | — | | | | — | |
Standard Chartered Bank | | | 8,087 | | | | (8,087 | ) | | | — | | | | — | | | | — | |
State Street Bank and Trust Co. | | | 5,933 | | | | (5,933 | ) | | | — | | | | — | | | | — | |
| | | | | | | | | | | | | | | | | | | | |
| | $ | 580,337 | | | $ | (565,374 | ) | | $ | — | | | $ | — | | | $ | 14,963 | |
| | | | | | | | | | | | | | | | | | | | |
| | | | | | | | | | | | | | | | | | | | |
| Counterparty | | Derivative
Liabilities
Subject to
an MNA by
Counterparty | | | Derivatives
Available
for Offset (a) | | | Non-cash
Collateral
Pledged | | | Cash
Collateral
Pledged (d) | | | Net Amount
of Derivative
Liabilities (c)(e) | |
Bank of America N.A. | | $ | 195 | | | $ | (195 | ) | | $ | — | | | $ | — | | | $ | — | |
Barclays Bank PLC | | | 1,143,267 | | | | — | | | | — | | | | (1,080,000 | ) | | | 63,267 | |
BNP Paribas S.A. | | | 44,712 | | | | (5,209 | ) | | | — | | | | — | | | | 39,503 | |
Citibank N.A. | | | 77,897 | | | | (77,897 | ) | | | — | | | | — | | | | — | |
Credit Suisse International | | | 3,497,597 | | | | (5,143 | ) | | | — | | | | (3,460,000 | ) | | | 32,454 | |
Goldman Sachs International | | | 690 | | | | (687 | ) | | | — | | | | — | | | | 3 | |
HSBC Bank USA N.A. | | | 618 | | | | (611 | ) | | | — | | | | — | | | | 7 | |
JPMorgan Chase Bank N.A. | | | 43,624 | | | | (38,274 | ) | | | — | | | | — | | | | 5,350 | |
morgan Stanley & Co. International PLC | | | 4,007,172 | | | | (423,338 | ) | | | — | | | | (3,520,000 | ) | | | 63,834 | |
Standard Chartered Bank | | | 14,624 | | | | (8,087 | ) | | | — | | | | — | | | | 6,537 | |
State Street Bank and Trust Co. | | | 5,949 | | | | (5,933 | ) | | | — | | | | — | | | | 16 | |
UBS AG | | | 103,202 | | | | — | | | | — | | | | — | | | | 103,202 | |
Westpac Banking Corp. | | | 2,157 | | | | — | | | | — | | | | — | | | | 2,157 | |
| | | | | | | | | | | | | | | | | | | | |
| | $ | 8,941,704 | | | $ | (565,374 | ) | | $ | — | | | $ | (8,060,000 | ) | | $ | 316,330 | |
| | | | | | | | | | | | | | | | | | | | |
| | (a) | The amount of derivatives available for offset is limited to the amount of derivative asset and/or liabilities that are subject to an MNA. | |
| | (b) | Net amount represents the net amount receivable from the counterparty in the event of default. | |
| | (c) | Net amount may also include forward foreign currency exchange contracts and currency options that are not required to be collateralized. | |
| | (d) | Excess of collateral pledged to the individual counterparty is not shown for financial reporting purposes. | |
| | (e) | Net amount represents the net amount payable due to counterparty in the event of default. | |
| | |
SCHEDULES OF INVESTMENTS | | 81 |
| | |
Schedule of Investments (unaudited) (continued) June 30, 2020 | | BlackRock Limited Duration Income Trust (BLW) |
Fair Value Hierarchy as of Period End
Various inputs are used in determining the fair value of investments and derivative financial instruments. For information about the Fund’s policy regarding valuation of investments and derivative financial instruments, refer to the Notes to Financial Statements.
The following tables summarize the Fund’s investments and derivative financial instruments categorized in the disclosure hierarchy:
| | | | | | | | | | | | | | | | |
| | | Level 1 | | | Level 2 | | | Level 3 | | | Total | |
Assets: | | | | | | | | | | | | | | | | |
Investments: | | | | | | | | | | | | | | | | |
Long-Term Investments: | | | | | | | | | | | | | | | | |
Common Stocks | | $ | 44,014 | | | $ | 20,034 | | | $ | 39,020 | | | $ | 103,068 | |
Asset-Backed Securities | | | — | | | | 27,431,214 | | | | 1,277,667 | | | | 28,708,881 | |
Corporate Bonds | | | — | | | | 439,940,235 | | | | 1,548,685 | | | | 441,488,920 | |
Floating Rate Loan Interests | | | — | | | | 240,608,889 | | | | 9,975,460 | | | | 250,584,349 | |
Foreign Agency Obligations | | | — | | | | 22,443,649 | | �� | | — | | | | 22,443,649 | |
Investment Companies | | | 6,908,781 | | | | — | | | | — | | | | 6,908,781 | |
Non-Agency Mortgage-Backed Securities | | | — | | | | 10,095,759 | | | | — | | | | 10,095,759 | |
Other Interests | | | — | | | | — | | | | 10 | | | | 10 | |
Preferred Securities | | | 12,075,475 | | | | 38,688,533 | | | | — | | | | 50,764,008 | |
U.S. Government Sponsored Agency Securities | | | — | | | | 61,115,190 | | | | — | | | | 61,115,190 | |
U.S. Treasury Obligations | | | — | | | | 17,322,990 | | | | — | | | | 17,322,990 | |
Warrants | | | — | | | | 44,992 | | | | — | | | | 44,992 | |
Short-Term Securities: | | | | | | | | | | | | | | | | |
U.S. Treasury Obligations | | | — | | | | 1,610,214 | | | | — | | | | 1,610,214 | |
Unfunded floating rate loan interests(a) | | | — | | | | 800 | | | | — | | | | 800 | |
Liabilities: | | | | | | | | | | | | | | | | |
Investments: | | | | | | | | | | | | | | | | |
TBA Sale Commitments | | | — | | | | (27,003,437 | ) | | | — | | | | (27,003,437 | ) |
Unfunded floating rate loan interests(a) | | | — | | | | (16,036 | ) | | | — | | | | (16,036 | ) |
| | | | | | | | | | | | | | | | |
| | $ | 19,028,270 | | | $ | 832,303,026 | | | $ | 12,840,842 | | | $ | 864,172,138 | |
| | | | | | | | | | | | | | | | |
Investments Valued at NAV(b) | | | | | | | | | | | | | | | 13,123 | |
| | | | | | | | | | | | | | | | |
| | | | | | | | | | | | | | $ | 864,185,261 | |
| | | | | | | | | | | | | | | | |
Derivative Financial Instruments(c) | |
Assets: | | | | | | | | | | | | | | | | |
Credit contracts | | $ | — | | | $ | 426,789 | | | $ | 82,133 | | | $ | 508,922 | |
Forward foreign currency contracts | | | — | | | | 69,255 | | | | — | | | | 69,255 | |
Interest rate contracts | | | 12,518 | | | | 278 | | | | — | | | | 12,796 | |
Liabilities: | | | | | | | | | | | | | | | | |
Credit contracts | | | — | | | | (3,325,440 | ) | | | — | | | | (3,325,440 | ) |
Forward foreign currency contracts | | | — | | | | (243,773 | ) | | | — | | | | (243,773 | ) |
Interest rate contracts | | | (358,756 | ) | | | — | | | | — | | | | (358,756 | ) |
| | | | | | | | | | | | | | | | |
| | $ | (346,238 | ) | | $ | (3,072,891 | ) | | $ | 82,133 | | | $ | (3,336,996 | ) |
| | | | | | | | | | | | | | | | |
The breakdown of the Fund’s investments into major categories is disclosed in the Schedule of Investments above.
| | (a) | Unfunded floating rate loan interests are valued at the unrealized appreciation (depreciation) on the commitment. | |
| | (b) | Certain investments of the Fund were fair valued using NAV per share as no quoted market value is available and therefore have been excluded from the fair value hierarchy. | |
| | (c) | Derivative financial instruments are swaps, futures contracts, forward foreign currency exchange contracts. Swaps, futures contracts and forward foreign currency exchange contracts are valued at the unrealized appreciation (depreciation) on the instrument. | |
The Fund may hold assets and/or liabilities in which the fair value approximates the carrying amount or face value, including accrued interest, for financial statement purposes. As of period end, reverse repurchase agreements of $279,746,784 are categorized within as Level 2 the disclosure hierarchy.
| | |
| 82 | | 2020 BLACKROCK SEMI-ANNUAL REPORTTO SHAREHOLDERS |
| | |
Schedule of Investments (unaudited) (continued) June 30, 2020 | | BlackRock Limited Duration Income Trust (BLW) |
Fair Value Hierarchy as of Period End (continued)
A reconciliation of Level 3 Investments is presented when the Fund had a significant amount of Level 3 investments at the beginning and/or end of the period in relation to net assets. The following table is a reconciliation of Level 3 investments for which significant unobservable inputs were used in determining fair value:
| | | | | | | | | | | | | | | | | | | | | | | | |
| | | Asset-Backed
Securities | | | Common
Stocks | | | Corporate
Bonds | | | Floating Rate
Loan Interests | | | Other
Interests | | | Grand Total | |
Assets: | | | | | | | | | | | | | | | | | | | | | | | | |
Opening balance, as of December 31, 2019 | | $ | 1,015,603 | | | $ | 522,907 | | | $ | 1,561,152 | | | $ | 8,974,479 | | | $ | 10 | | | $ | 12,074,151 | |
Transfers into Level 3(a) | | | — | | | | — | | | | — | | | | 4,223,836 | | | | — | | | | 4,223,836 | |
Transfers out of Level 3(b) | | | — | | | | — | | | | — | | | | (5,495,853 | ) | | | — | | | | (5,495,853 | ) |
Accrued discounts/premiums | | | (51,552 | ) | | | — | | | | — | | | | 7,787 | | | | — | | | | (43,765 | ) |
Net realized gain (loss) | | | — | | | | (7,400 | ) | | | 251 | | | | (138,220 | ) | | | — | | | | (145,369 | ) |
Net change in unrealized appreciation (depreciation)(c)(d) | | | (43,614 | ) | | | (372,126 | ) | | | 4,324 | | | | (525,664 | ) | | | — | | | | (937,080 | ) |
Purchases | | | 544,000 | | | | 3,639 | | | | — | | | | 5,662,800 | | | | — | | | | 6,210,439 | |
Sales | | | (186,770 | ) | | | (108,000 | ) | | | (17,042 | ) | | | (2,733,705 | ) | | | — | | | | (3,045,517 | ) |
| | | | | | | | | | | | | | | | | | | | | | | | |
Closing balance, as of June 30, 2020 | | $ | 1,277,667 | | | $ | 39,020 | | | $ | 1,548,685 | | | $ | 9,975,460 | | | $ | 10 | | | $ | 12,840,842 | |
| | | | | | | | | | | | | | | | | | | | | | | | |
Net change in unrealized appreciation (depreciation) on investments still held at June 30, 2020(b) | | $ | (43,614 | ) | | $ | (349,323 | ) | | $ | 4,324 | | | $ | (523,689 | ) | | $ | — | | | $ | (912,302 | ) |
| | | | | | | | | | | | | | | | | | | | | | | | |
| | (a) | As of December 31, 2019, the Fund used observable inputs in determining the value of certain investments. As of June 30, 2020, the Fund used significant unobservable inputs in determining the value of the same investments. As a result, investments at beginning of period value were transferred from Level 2 to Level 3 in the disclosure hierarchy. | |
| | (b) | As December 31, 2019, the Fund used significant unobservable inputs in determining the value of certain investments. As of June 30, 2020, the Fund used observable inputs in determining the value of the same investments. As a result, investments at beginning of period value were transferred from Level 3 to Level 2 in the disclosure hierarchy. | |
| | (c) | Included in the related net change in unrealized appreciation (depreciation) in the Statements of Operations. | |
| | (d) | Any difference between net change in unrealized appreciation (depreciation) and net change in unrealized appreciation (depreciation) on investments still held at June 30, 2020 is generally due to investments no longer held or categorized as Level 3 at period end. | |
| | | | | | | | |
| | | Credit
Contracts | | | Grand
Total | |
Assets: | | | | | | | | |
Opening balance, as of December 31, 2019 | | $ | 84,334 | | | $ | 84,334 | |
Transfers into Level 3 | | | — | | | | — | |
Transfers out of Level 3 | | | — | | | | — | |
Accrued discounts/premiums | | | — | | | | — | |
Net realized gain (loss) | | | — | | | | — | |
Net change in unrealized appreciation (depreciation)(a)(b) | | | (2,201 | ) | | | (2,201 | ) |
Purchases | | | — | | | | — | |
Sales | | | — | | | | — | |
| | | | | | | | |
Closing balance, as of June 30, 2020 | | $ | 82,133 | | | $ | 82,133 | |
| | | | | | | | |
Net change in unrealized appreciation (depreciation) on derivative financial instruments held at June 30, 2020(a) | | $ | (2,201 | ) | | $ | (2,201 | ) |
| | | | | | | | |
| | (a) | Any difference between net change in unrealized appreciation (depreciation) and net change in unrealized appreciation (depreciation) on derivative financial instruments still held at June 30, 2020 is generally due to derivative financial instruments no longer held or categorized as Level 3 at period end. | |
| | (b) | Included in the related net change in unrealized appreciation (depreciation) in the Statements of Operations. | |
The Fund’s investments and derivative financial instruments that are categorized as Level 3 were valued utilizing third party pricing information without adjustment. Such valuations are based on unobservable inputs. A significant change in third party information could result in a significantly lower or higher value of such Level 3 investments and derivative financial instruments.
See notes to financial statements.
| | |
SCHEDULES OF INVESTMENTS | | 83 |
Statements of Assets and Liabilities (unaudited)
June 30, 2020
| | | | | | | | | | | | |
| | | DSU | | | FRA | | | BLW | |
|
ASSETS | |
Investments at value — unaffiliated(a) | | $ | 713,345,104 | | | $ | 660,284,080 | | | $ | 888,513,934 | |
Investments at value — affiliated(b) | | | 18,811,356 | | | | 25,126,276 | | | | 2,690,000 | |
Cash | | | 902,660 | | | | 330,950 | | | | — | |
Cash Pledged: | |
Collateral — reverse repurchase agreements | | | — | | | | — | | | | 3,793,685 | |
Collateral — OTC derivatives | | | 30,000 | | | | — | | | | 8,060,000 | |
Futures contracts | | | — | | | | — | | | | 1,825,470 | |
Centrally cleared swaps | | | — | | | | 1,801,000 | | | | 338,000 | |
Foreign currency at value(c) | | | 2,691,992 | | | | 12,861 | | | | 2,866,594 | |
Receivables: | | | | | | | | |
Investments sold | | | 13,024,708 | | | | 8,301,500 | | | | 20,341,062 | |
TBA sale commitments | | | — | | | | — | | | | 26,986,828 | |
Dividends — affiliated | | | 139 | | | | 60 | | | | 263 | |
Dividends — unaffiliated | | | — | | | | — | | | | 71,034 | |
Interest — unaffiliated | | | 2,815,837 | | | | 1,553,259 | | | | 8,352,452 | |
Variation margin on futures contracts | | | — | | | | — | | | | 156,375 | |
Variation margin on centrally cleared swaps | | | — | | | | 116,971 | | | | 4,318 | |
Swap premiums paid | | | 791 | | | | — | | | | 2,160 | |
Unrealized appreciation on: | |
Forward foreign currency exchange contracts | | | 28,813 | | | | 16,607 | | | | 69,255 | |
OTC swaps | | | 6,821 | | | | — | | | | 508,922 | |
Unfunded floating rate loan interests | | | 1,487 | | | | 2,001 | | | | 800 | |
Prepaid expenses | | | 9,777 | | | | 7,476 | | | | 7,831 | |
Other assets | | | 3,887 | | | | — | | | | — | |
| | | | | | | | | | | | |
Total assets | | | 751,673,372 | | | | 697,553,041 | | | | 964,588,983 | |
| | | | | | | | | | | | |
|
LIABILITIES | |
Bank overdraft | | | — | | | | — | | | | 6,620,930 | |
Collateral — reverse repurchase agreements | | | — | | | | — | | | | 738,206 | |
TBA sale commitments at value(d) | | | — | | | | — | | | | 27,003,437 | |
Reverse repurchase agreements at value | | | — | | | | — | | | | 279,746,784 | |
Payables: | | | | | | | | | | | | |
Investments purchased | | | 37,507,423 | | | | 42,361,286 | | | | 81,123,425 | |
Bank borrowings | | | 206,000,000 | | | | 191,000,000 | | | | — | |
Capital shares redeemed | | | — | | | | 278,599 | | | | — | |
Income dividend distributions | | | 86,392 | | | | 95,299 | | | | 126,921 | |
Interest expense | | | 199,000 | | | | 169,288 | | | | — | |
Investment advisory fees | | | 311,942 | | | | 384,833 | | | | 370,422 | |
Directors’ and Officer’s fees | | | 319,949 | | | | 500 | | | | 399,119 | |
Other accrued expenses | | | 159,645 | | | | 304,850 | | | | 354,459 | |
Variation margin on futures contracts | | | — | | | | — | | | | 1,016 | |
Swap premiums received | | | 43,077 | | | | — | | | | 5,440,864 | |
Unrealized depreciation on: | |
Forward foreign currency exchange contracts | | | 162,469 | | | | 67,107 | | | | 243,773 | |
OTC swaps | | | 11,504 | | | | — | | | | 3,257,067 | |
Unfunded floating rate loan interests | | | 48,335 | | | | 42,005 | | | | 16,036 | |
| | | | | | | | | | | | |
Total liabilities | | | 244,849,736 | | | | 234,703,767 | | | | 405,442,459 | |
| | | | | | | | | | | | |
| | | |
NET ASSETS | | $ | 506,823,636 | | | $ | 462,849,274 | | | $ | 559,146,524 | |
| | | | | | | | | | | | |
|
NET ASSETS CONSIST OF | |
Paid-in capital(e)(f)(g) | | $ | 670,147,198 | | | $ | 556,806,365 | | | $ | 635,115,466 | |
Accumulated loss | | | (163,323,562 | ) | | | (93,957,091 | ) | | | (75,968,942 | ) |
| | | | | | | | | | | | |
NET ASSETS | | $ | 506,823,636 | | | $ | 462,849,274 | | | $ | 559,146,524 | |
| | | | | | | | | | | | |
| | | |
Net asset value | | $ | 10.83 | | | $ | 12.97 | | | $ | 15.65 | |
| | | | | | | | | | | | |
| | | |
(a) Investments at cost — unaffiliated | | $ | 774,273,928 | | | $ | 701,896,425 | | | $ | 907,409,151 | |
(b) Investments at cost — affiliated | | $ | 18,723,512 | | | $ | 24,810,885 | | | $ | 2,539,388 | |
(c) Foreign currency at cost | | $ | 2,688,354 | | | $ | 12,833 | | | $ | 2,824,884 | |
(d) Proceeds from TBA sale commitments | | $ | — | | | $ | — | | | $ | 26,838,848 | |
(e) Par value | | $ | 0.100 | | | $ | 0.100 | | | $ | 0.001 | |
(f) Shares outstanding | | | 46,783,244 | | | | 35,681,231 | | | | 35,739,063 | |
(g) Shares authorized | | | 400 million | | | | 200 million | | | | unlimited | |
See notes to financial statements.
| | |
| 84 | | 2020 BLACKROCK SEMI-ANNUAL REPORTTO SHAREHOLDERS |
Statements of Operations (unaudited)
Six Months Ended June 30, 2020
| | | | | | | | | | | | |
| | | DSU | | | FRA | | | BLW | |
|
INVESTMENT INCOME | |
Dividends — affiliated | | $ | 102,596 | | | $ | 147,317 | | | $ | 24,501 | |
Dividends — unaffiliated | | | 219,821 | | | | 292,491 | | | | 568,129 | |
Interest — unaffiliated | | | 19,637,122 | | | | 16,176,993 | | | | 20,680,728 | |
Other income | | | 259,754 | | | | 260,832 | | | | 136,692 | |
Foreign taxes withheld | | | (259 | ) | | | — | | | | (3,682 | ) |
| | | | | | | | | | | | |
Total investment income | | | 20,219,034 | | | | 16,877,633 | | | | 21,406,368 | |
| | | | | | | | | | | | |
|
EXPENSES | |
Investment advisory | | | 2,077,214 | | | | 2,486,997 | | | | 2,179,184 | |
Professional | | | 114,865 | | | | 94,013 | | | | 87,076 | |
Transfer agent | | | 98,453 | | | | 24,642 | | | | 37,202 | |
Accounting services | | | 59,755 | | | | 53,632 | | | | 59,143 | |
Custodian | | | 12,017 | | | | 14,883 | | | | 43,159 | |
Registration | | | 9,422 | | | | 6,699 | | | | 6,598 | |
Printing | | | 7,733 | | | | 6,035 | | | | 8,438 | |
Directors and Officer | | | — | | | | 15,456 | | | | — | |
Miscellaneous | | | 15,157 | | | | 13,710 | | | | 26,045 | |
| | | | | | | | | | | | |
Total expenses excluding interest expense and fees | | | 2,394,616 | | | | 2,716,067 | | | | 2,446,845 | |
Interest expense and fees | | | 1,891,975 | | | | 1,574,517 | | | | 1,752,210 | |
| | | | | | | | | | | | |
Total expenses | | | 4,286,591 | | | | 4,290,584 | | | | 4,199,055 | |
Less fees waived and/or reimbursed by the Manager | | | (16,555 | ) | | | (30,166 | ) | | | (3,400 | ) |
| | | | | | | | | | | | |
Total expenses after fees waived and/or reimbursed | | | 4,270,036 | | | | 4,260,418 | | | | 4,195,655 | |
| | | | | | | | | | | | |
Net investment income | | | 15,948,998 | | | | 12,617,215 | | | | 17,210,713 | |
| | | | | | | | | | | | |
|
REALIZED AND UNREALIZED GAIN (LOSS) | |
Net realized gain (loss) from: | |
Futures contracts | | | (4,436 | ) | | | — | | | | 1,475,358 | |
Forward foreign currency exchange contracts | | | 68,925 | | | | 147,719 | | | | 634,606 | |
Foreign currency transactions | | | 12,750 | | | | (3,251 | ) | | | (157,798 | ) |
Investments — affiliated | | | (5,935 | ) | | | (161,570 | ) | | | — | |
Investments — unaffiliated | | | (24,434,657 | ) | | | (18,769,010 | ) | | | (13,518,713 | ) |
Options written | | | — | | | | — | | | | (2,737 | ) |
Swaps | | | (598,438 | ) | | | (124,196 | ) | | | 81,103 | |
| | | | | | | | | | | | |
| | | (24,961,791 | ) | | | (18,910,308 | ) | | | (11,488,181 | ) |
| | | | | | | | | | | | |
Net change in unrealized appreciation (depreciation) on: | | | | | | | | | | | | |
Futures contracts | | | 228 | | | | — | | | | (506,072 | ) |
Forward foreign currency exchange contracts | | | 66,031 | | | | 96,287 | | | | 274,957 | |
Foreign currency translations | | | 608 | | | | (12,449 | ) | | | 8,715 | |
Investments — affiliated | | | 87,844 | | | | 315,391 | | | | 150,612 | |
Investments — unaffiliated | | | (45,647,369 | ) | | | (36,914,911 | ) | | | (32,942,149 | ) |
Options written | | | — | | | | — | | | | (57,323 | ) |
Swaps | | | 223,805 | | | | (72,204 | ) | | | (5,671,793 | ) |
Unfunded floating rate loan interests | | | (214,138 | ) | | | (189,332 | ) | | | (70,521 | ) |
| | | | | | | | | | | | |
| | | (45,482,991 | ) | | | (36,777,218 | ) | | | (38,813,574 | ) |
| | | | | | | | | | | | |
Net realized and unrealized loss | | | (70,444,782 | ) | | | (55,687,526 | ) | | | (50,301,755 | ) |
| | | | | | | | | | | | |
NET DECREASE IN NET ASSETS RESULTING FROM OPERATIONS | | $ | (54,495,784 | ) | | $ | (43,070,311 | ) | | $ | (33,091,042 | ) |
| | | | | | | | | | | | |
See notes to financial statements.
Statements of Changes in Net Assets
| | | | | | | | | | | | | | | | | | | | | | | | | | | | |
| | | DSU | | | | | | FRA | |
| | | Six Months Ended
06/30/20 (unaudited) | | | Period from 03/01/19 to 12/31/19 | | | Year Ended 02/28/19 | | | | | | Six Months Ended 06/30/20 (unaudited) | | | Period from 09/01/19 to 12/31/19 | | | Year Ended
08/31/19 | |
| | | | | | | |
INCREASE (DECREASE) IN NET ASSETS | | | | | | | | | | | | | | | | | | | | | | | | | | | | |
| | | | | | | |
OPERATIONS | | | | | | | | | | | | | | | | | | | | | | | | | | | | |
Net investment income | | $ | 15,948,998 | | | $ | 32,028,542 | | | $ | 42,457,853 | | | | | | | $ | 12,617,215 | | | $ | 9,182,798 | | | $ | 30,775,188 | |
Net realized loss | | | (24,961,791 | ) | | | (10,374,472 | ) | | | (7,363,476 | ) | | | | | | | (18,910,308 | ) | | | (1,960,481 | ) | | | (9,782,691 | ) |
Net change in unrealized appreciation (depreciation) | | | (45,482,991 | ) | | | 19,737,256 | | | | (16,979,647 | ) | | | | | | | (36,777,218 | ) | | | 8,098,171 | | | | (6,388,475 | ) |
| | | | | | | | | | | | | | | | | | | | | | | | | | | | |
Net increase (decrease) in net assets resulting from operations | | | (54,495,784 | ) | | | 41,391,326 | | | | 18,114,730 | | | | | | | | (43,070,311 | ) | | | 15,320,488 | | | | 14,604,022 | |
| | | | | | | | | | | | | | | | | | | | | | | | | | | | |
| | | | | | | |
DISTRIBUTIONS TO SHAREHOLDERS(a) | | | | | | | | | | | | | | | | | | | | | | | | | | | | |
From net investment income | | | (17,204,477 | )(b) | | | (37,103,506 | ) | | | (44,243,908 | ) | | | | | | | (14,139,194 | )(b) | | | (13,875,793 | ) | | | (32,025,983 | ) |
From return of capital | | | — | | | | (1,264,429 | ) | | | — | | | | | | | | — | | | | — | | | | — | |
| | | | | | | | | | | | | | | | | | | | | | | | | | | | |
Decrease in net assets resulting from distributions to shareholders | | | (17,204,477 | ) | | | (38,367,935 | ) | | | (44,243,908 | ) | | | | | | | (14,139,194 | ) | | | (13,875,793 | ) | | | (32,025,983 | ) |
| | | | | | | | | | | | | | | | | | | | | | | | | | | | |
| | | | | | | |
CAPITAL SHARE TRANSACTIONS | | | | | | | | | | | | | | | | | | | | | | | | | | | | |
Redemption of shares resulting from share repurchase program (including transaction costs) | | | (26,716,257 | ) | | | (39,003,259 | ) | | | (74,855,117 | ) | | | | | | | (2,485,930 | ) | | | (5,346,886 | ) | | | (11,500,788 | ) |
| | | | | | | | | | | | | | | | | | | | | | | | | | | | |
| | | | | | | |
NET ASSETS | | | | | | | | | | | | | | | | | | | | | | | | | | | | |
Total increase (decrease) in net assets | | | (98,416,518 | ) | | | (35,979,868 | ) | | | (100,984,295 | ) | | | | | | | (59,695,435 | ) | | | (3,902,191 | ) | | | (28,922,749 | ) |
Beginning of period | | | 605,240,154 | | | | 641,220,022 | | | | 742,204,317 | | | | | | | | 522,544,709 | | | | 526,446,900 | | | | 555,369,649 | |
| | | | | | | | | | | | | | | | | | | | | | | | | | | | |
End of period | | $ | 506,823,636 | | | $ | 605,240,154 | | | $ | 641,220,022 | | | | | | | $ | 462,849,274 | | | $ | 522,544,709 | | | $ | 526,446,900 | |
| | | | | | | | | | | | | | | | | | | | | | | | | | | | |
| (a) | Distributions for annual periods determined in accordance with U.S. federal income tax regulations. |
| (b) | A portion of the distributions from net investment income may be deemed a return of capital or net realized gain at fiscal year end. |
See notes to financial statements.
| | |
| 86 | | 2020 BLACKROCK SEMI-ANNUAL REPORTTO SHAREHOLDERS |
Statements of Changes in Net Assets (continued)
| | | | | | | | | | | | |
| | | BLW | |
| | | Six Months Ended 06/30/20 (unaudited) | | | Period from 09/01/19 to 12/31/19 | | | Year Ended 08/31/19 | |
| | | |
INCREASE (DECREASE) IN NET ASSETS | | | | | | | | | | | | |
| | | |
OPERATIONS | | | | | | | | | | | | |
Net investment income | | $ | 17,210,713 | | | $ | 10,824,978 | | | $ | 34,113,194 | |
Net realized loss | | | (11,488,181 | ) | | | (1,710,596 | ) | | | (4,073,290 | ) |
Net change in unrealized appreciation (depreciation) | | | (38,813,574 | ) | | | 8,611,334 | | | | 14,386,640 | |
| | | | | | | | | | | | |
Net increase (decrease) in net assets resulting from operations | | | (33,091,042 | ) | | | 17,725,716 | | | | 44,426,544 | |
| | | | | | | | | | | | |
| | | |
DISTRIBUTIONS TO SHAREHOLDERS(a) | | | | | | | | | | | | |
Decrease in net assets resulting from distributions to Common shareholders | | | (17,566,737 | )(b) | | | (16,909,431 | ) | | | (34,575,364 | ) |
| | | | | | | | | | | | |
| | | |
CAPITAL SHARE TRANSACTIONS | | | | | | | | | | | | |
Redemption of shares resulting from share repurchase program (including transaction costs) | | | (1,263,289 | ) | | | — | | | | (11,648,172 | ) |
| | | | | | | | | | | | |
| | | |
NET ASSETS | | | | | | | | | | | | |
Total increase (decrease) in net assets | | | (51,921,068 | ) | | | 816,285 | | | | (1,796,992 | ) |
Beginning of period | | | 611,067,592 | | | | 610,251,307 | | | | 612,048,299 | |
| | | | | | | | | | | | |
End of period | | $ | 559,146,524 | | | $ | 611,067,592 | | | $ | 610,251,307 | |
| | | | | | | | | | | | |
| (a) | Distributions for annual periods determined in accordance with U.S. federal income tax regulations. |
| (b) | A portion of the distributions from net investment income may be deemed a return of capital or net realized gain at fiscal year end. |
See notes to financial statements.
Statements of Cash Flows (unaudited)
Six Months Ended June 30, 2020
| | | | | | | | | | | | |
| | | DSU | | | FRA | | | BLW | |
|
CASH PROVIDED BY (USED FOR) OPERATING ACTIVITIES | |
Net decrease in net assets resulting from operations | | $ | (54,495,784 | ) | | $ | (43,070,311 | ) | | $ | (33,091,042 | ) |
Adjustments to reconcile net decrease in net assets resulting from operations to net cash used for operating activities: | |
Proceeds from sales of long-term investments and principal paydowns | | | 384,256,260 | | | | 268,125,318 | | | | 238,293,763 | |
Purchases of long-term investments | | | (291,743,790 | ) | | | (235,867,762 | ) | | | (300,929,687 | ) |
Net proceeds from sales (purchases) of short-term securities | | | (2,155,360 | ) | | | (2,007,779 | ) | | | 326,782 | |
Amortization of premium and accretion of discount on investments and other fees | | | (476,660 | ) | | | (346,068 | ) | | | 86,280 | |
Paid-in-kind income | | | (618,474 | ) | | | (606,209 | ) | | | (223,178 | ) |
Premiums paid on closing options written | | | — | | | | — | | | | (91,590 | ) |
Net realized loss on investments | | | 24,443,540 | | | | 18,935,602 | | | | 13,521,450 | |
Net unrealized depreciation on investments | | | 45,483,827 | | | | 36,692,565 | | | | 38,933,819 | |
|
(Increase) Decrease in Assets: | |
Receivables: | |
Dividends — affiliated | | | 1,899 | | | | 1,394 | | | | 4,991 | |
Dividends | | | — | | | | — | | | | 4 | |
Interest — unaffiliated | | | 813,596 | | | | 103,070 | | | | (751,615 | ) |
Variation margin on futures contracts | | | — | | | | — | | | | 7,171 | |
Variation margin on centrally cleared swaps | | | — | | | | (116,971 | ) | | | 3,541 | |
Swap premiums paid | | | 5,626 | | | | — | | | | 3,323 | |
Prepaid expenses | | | (5,016 | ) | | | (3,526 | ) | | | (3,206 | ) |
Other assets | | | 4,740 | | | | — | | | | — | |
|
Increase (Decrease) in Liabilities: | |
Cash received for reverse repurchase agreements | | | — | | | | — | | | | 678,918 | |
Payables: | |
Investment advisory fees | | | (466,353 | ) | | | (519,078 | ) | | | (376,017 | ) |
Interest expense and fees | | | (340,565 | ) | | | (274,240 | ) | | | 568,956 | |
Directors’ and Officer’s fees | | | (42,749 | ) | | | (67 | ) | | | (55,285 | ) |
Variation margin on futures contracts | | | — | | | | — | | | | (39,519 | ) |
Other accrued expenses | | | (217,817 | ) | | | (60,382 | ) | | | (63,030 | ) |
Swap premiums received | | | (10,520 | ) | | | — | | | | 1,457,581 | |
Other liabilities | | | (575,071 | ) | | | (568,672 | ) | | | (205,327 | ) |
| | | | | | | | | | | | |
Net cash provided by (used for) operating activities | | | 103,861,329 | | | | 40,416,884 | | | | (41,942,917 | ) |
| | | | | | | | | | | | |
|
CASH PROVIDED BY (USED FOR) FINANCING ACTIVITIES | |
Cash dividends paid to Common Shareholders | | | (20,631,550 | ) | | | (16,873,213 | ) | | | (20,955,000 | ) |
Payments for bank borrowings | | | (236,000,000 | ) | | | (174,000,000 | ) | | | — | |
Payments on redemption of Common Shares | | | (26,716,257 | ) | | | (2,207,331 | ) | | | (1,263,289 | ) |
Proceeds from bank borrowings | | | 180,000,000 | | | | 151,000,000 | | | | — | |
Increase in bank overdraft | | | — | | | | — | | | | 6,620,930 | |
Net borrowing of reverse repurchase agreements | | | — | | | | — | | | | 65,778,381 | |
| | | | | | | | | | | | |
Net cash (provided by) used for financing activities | | | (103,347,807 | ) | | | (42,080,544 | ) | | | 50,181,022 | |
| | | | | | | | | | | | |
|
CASH IMPACT FROM FOREIGN EXCHANGE FLUCTUATIONS | |
Cash impact from foreign exchange fluctuations | | $ | 1,847 | | | $ | (12,455 | ) | | $ | 9,542 | |
| | | | | | | | | | | | |
| | | |
CASH AND FOREIGN CURRENCY | | | | | | | | | | | | |
Net increase (decrease) in restricted and unrestricted cash and foreign currency | | | 515,369 | | | | (1,676,115 | ) | | | 8,247,647 | |
Restricted and unrestricted cash and foreign currency at beginning of period | | | 3,109,283 | | | | 3,820,926 | | | | 8,636,102 | |
| | | | | | | | | | | | |
Restricted and unrestricted cash and foreign currency at end of period | | $ | 3,624,652 | | | $ | 2,144,811 | | | $ | 16,883,749 | |
| | | | | | | | | | | | |
|
SUPPLEMENTAL DISCLOSURE OF CASH FLOW INFORMATION | |
Cash paid during the period for interest expense | | $ | 2,232,540 | | | $ | 1,848,757 | | | $ | 1,183,254 | |
| | | | | | | | | | | | |
See notes to financial statements.
| | |
| 88 | | 2020 BLACKROCK SEMI-ANNUAL REPORTTO SHAREHOLDERS |
Statements of Cash Flows (unaudited) (continued)
Six Months Ended June 30, 2020
| | | | | | | | | | | | |
| | | DSU | | | FRA | | | BLW | |
| | | |
RECONCILIATION OF RESTRICTED AND UNRESTRICTED CASH AND FOREIGN CURRENCY AT THE END OF PERIOD TO THE STATEMENTS OF ASSETS AND LIABILITIES | | | | | | | | | | | | |
Cash | | $ | 902,660 | | | $ | 330,950 | | | $ | — | |
Cash pledged: | |
Collateral — reverse repurchase agreements | | | — | | | | — | | | | 3,793,685 | |
Collateral — OTC derivatives | | | 30,000 | | | | — | | | | 8,060,000 | |
Futures contracts | | | — | | | | — | | | | 1,825,470 | |
Centrally cleared swaps | | | — | | | | 1,801,000 | | | | 338,000 | |
Foreign currency at value | | | 2,691,992 | | | | 12,861 | | | | 2,866,594 | |
| | | | | | | | | | | | |
| | $ | 3,624,652 | | | $ | 2,144,811 | | | $ | 16,883,749 | |
| | | | | | | | | | | | |
| | | |
RECONCILIATION OF RESTRICTED AND UNRESTRICTED CASH AND FOREIGNCURRENCY AT THE BEGINNING OF PERIOD TO THE STATEMENTS OF ASSETS AND LIABILITIES | | | | | | | | | | | | |
Cash | | $ | 2,941,945 | | | $ | 2,708,544 | | | $ | 1,806,397 | |
Cash pledged: | |
Collateral — reverse repurchase agreements | | | — | | | | — | | | | 2,088,865 | |
Collateral — OTC derivatives | | | — | | | | — | | | | 1,510,000 | |
Futures contracts | | | 4,000 | | | | — | | | | 822,592 | |
Centrally cleared swaps | | | — | | | | — | | | | 662,000 | |
Foreign currency at value | | | 163,338 | | | | 1,112,382 | | | | 1,746,248 | |
| | | | | | | | | | | | |
| | $ | 3,109,283 | | | $ | 3,820,926 | | | $ | 8,636,102 | |
| | | | | | | | | | | | |
See notes to financial statements.
Financial Highlights
(For a share outstanding throughout each period)
| | | | | | | | | | | | | | | | | | | | | | | | | | | | | | | | | | | | |
| | | DSU | |
| | | Six Months Ended
06/30/20
(unaudited) | | | Period from 03/01/19
to 12/31/19 | | | | | | Year Ended February 28, | | | | | | Year Ended February 29, 2016 (a)(b) | | | Year Ended February 28, 2015 (a)(b) | |
| | | 2019 | | | 2018 (a) | | | 2017 (a) | | | | |
| | | | | | | | | | |
Net asset value, beginning of period | | $ | 12.25 | | | $ | 12.16 | | | | | | | $ | 12.62 | | | $ | 12.70 | | | $ | 11.38 | | | | | | | $ | 12.87 | | | $ | 13.32 | |
| | | | | | | | | | | | | | | | | | | | | | | | | | | | | | | | | | | | |
Net investment income(c) | | | 0.33 | | | | 0.64 | | | | | | | | 0.79 | | | | 0.78 | | | | 0.73 | | | | | | | | 0.77 | | | | 0.87 | |
Net realized and unrealized gain (loss) | | | (1.39 | ) | | | 0.21 | | | | | | | | (0.43 | ) | | | (0.04 | ) | | | 1.34 | | | | | | | | (1.46 | ) | | | (0.43 | ) |
| | | | | | | | | | | | | | | | | | | | | | | | | | | | | | | | | | | | |
Net increase (decrease) from investment operations | | | (1.06 | ) | | | 0.85 | | | | | | | | 0.36 | | | | 0.74 | | | | 2.07 | | | | | | | | (0.69 | ) | | | 0.44 | |
| | | | | | | | | | | | | | | | | | | | | | | | | | | | | | | | | | | | |
|
Distributions(d) | |
From net investment income | | | (0.36 | )(e) | | | (0.73 | ) | | | | | | | (0.82 | ) | | | (0.82 | ) | | | (0.75 | ) | | | | | | | (0.80 | ) | | | (0.89 | ) |
From return of capital | | | — | | | | (0.03 | ) | | | | | | | — | | | | — | | | | — | | | | | | | | — | | | | — | |
| | | | | | | | | | | | | | | | | | | | | | | | | | | | | | | | | | | | |
Total distributions | | | (0.36 | ) | | | (0.76 | ) | | | | | | | (0.82 | ) | | | (0.82 | ) | | | (0.75 | ) | | | | | | | (0.80 | ) | | | (0.89 | ) |
| | | | | | | | | | | | | | | | | | | | | | | | | | | | | | | | | | | | |
| | | | | | | | | |
Net asset value, end of period | | $ | 10.83 | | | $ | 12.25 | | | | | | | $ | 12.16 | | | $ | 12.62 | | | $ | 12.70 | | | | | | | $ | 11.38 | | | $ | 12.87 | |
| | | | | | | | | | | | | | | | | | | | | | | | | | | | | | | | | | | | |
| | | | | | | | | |
Market price, end of period | | $ | 9.33 | | | $ | 11.20 | | | | | | | $ | 10.78 | | | $ | 11.47 | | | $ | 11.68 | | | | | | | $ | 9.96 | | | $ | 11.43 | |
| | | | | | | | | | | | | | | | | | | | | | | | | | | | | | | | | | | | |
|
Total Return(f) | |
Based on net asset value | | | (8.23 | )%(g) | | | 8.03 | %(g) | | | | | | | 3.86 | % | | | 6.60 | %(h) | | | 19.57 | % | | | | | | | (4.73 | )% | | | 4.15 | % |
| | | | | | | | | | | | | | | | | | | | | | | | | | | | | | | | | | | | |
Based on market price | | | (13.53 | )%(g) | | | 11.42 | %(g) | | | | | | | 1.30 | % | | | 5.35 | % | | | 25.53 | % | | | | | | | (6.03 | )% | | | 0.66 | % |
| | | | | | | | | | | | | | | | | | | | | | | | | | | | | | | | | | | | |
|
Ratios to Average Net Assets(i) | |
Total expenses | | | 1.60 | %(j) | | | 2.21 | %(j)(k) | | | | | | | 2.23 | % | | | 1.86 | % | | | 1.36 | % | | | | | | | 1.18 | % | | | 1.24 | % |
| | | | | | | | | | | | | | | | | | | | | | | | | | | | | | | | | | | | |
Total expenses after fees waived and/or reimbursed | | | 1.60 | %(j) | | | 2.21 | %(j)(k) | | | | | | | 2.23 | % | | | 1.85 | % | | | 1.35 | % | | | | | | | 1.18 | % | | | 1.24 | % |
| | | | | | | | | | | | | | | | | | | | | | | | | | | | | | | | | | | | |
Total expenses after fees waived and/or reimbursed and excluding interest expense | | | 0.89 | %(j) | | | 0.92 | %(j) | | | | | | | 0.96 | % | | | 0.94 | % | | | 0.87 | % | | | | | | | 0.84 | % | | | 0.89 | % |
| | | | | | | | | | | | | | | | | | | | | | | | | | | | | | | | | | | | |
Net investment income | | | 5.97 | %(j) | | | 6.25 | %(j) | | | | | | | 6.40 | % | | | 6.12 | % | | | 6.04 | % | | | | | | | 6.29 | % | | | 6.68 | % |
| | | | | | | | | | | | | | | | | | | | | | | | | | | | | | | | | | | | |
|
Supplemental Data | |
Net assets, end of period (000) | | $ | 506,824 | | | $ | 605,240 | | | | | | | $ | 641,220 | | | $ | 742,204 | | | $ | 780,810 | | | | | | | $ | 709,236 | | | $ | 801,887 | |
| | | | | | | | | | | | | | | | | | | | | | | | | | | | | | | | | | | | |
Borrowings outstanding, end of period (000) | | $ | 206,000 | | | $ | 262,000 | | | | | | | $ | 278,000 | | | $ | 338,000 | | | $ | 318,000 | | | | | | | $ | 190,000 | | | $ | 295,000 | |
| | | | | | | | | | | | | | | | | | | | | | | | | | | | | | | | | | | | |
Asset coverage, end of period per $1,000 of bank borrowings | | $ | 3,461 | | | $ | 3,310 | | | | | | | $ | 3,308 | | | $ | 3,196 | | | $ | 3,455 | | | | | | | $ | 4,733 | | | $ | 3,719 | |
| | | | | | | | | | | | | | | | | | | | | | | | | | | | | | | | | | | | |
Portfolio turnover rate | | | 40 | % | | | 53 | % | | | | | | | 62 | % | | | 59 | % | | | 55 | % | | | | | | | 41 | % | | | 54 | % |
| | | | | | | | | | | | | | | | | | | | | | | | | | | | | | | | | | | | |
| (a) | Consolidated Financial Highlights through November 30, 2017. |
| (b) | Per share operating performance amounts have been adjusted to reflect a one-for-three reverse stock split effective after the close of trading on November 15, 2016 for the shareholders of record on November 15, 2016. |
| (c) | Based on average shares outstanding. |
| (d) | Distributions for annual periods determined in accordance with U.S. federal income tax regulations. |
| (e) | A portion of the distributions from net investment income may be deemed a return of capital or net realized gain at fiscal year end. |
| (f) | Total returns based on market price, which can be significantly greater or less than the net asset value, may result in substantially different returns. Where applicable, excludes the effects of any sales charges and assumes the reinvestment of distributions at actual reinvestment prices. |
| (g) | Aggregate total return. |
| (h) | Includes payment received from an affiliate, which had no impact on the Fund’s total return. |
| (i) | Excludes expenses incurred indirectly as a result of investments in underlying funds as follows: |
| | | | | | | | | | | | | | | | | | | | | | | | | | | | | | | | | | | | |
| | | Six Months Ended
06/30/20
(unaudited) | | | Period from 03/01/19
to 12/31/19 | | | | | | Year Ended February 28, | | | | | | Year Ended February 29, 2016 (a)(b) | | | Year Ended February 28, 2015 (a)(b) | |
| | 2019 | | | 2018 (a) | | | 2017 (a) | | | | |
Investments in underlying funds | | | 0.03 | % | | | 0.03 | % | | | | | | | — | % | | | — | % | | | 0.02 | % | | | | | | | 0.01 | % | | | — | % |
| | | | | | | | | | | | | | | | | | | | | | | | | | | | | | | | | | | | |
| (k) | Audit costs were not annualized in the calculation of the expense ratios. If these expenses were annualized, the total expenses and total expenses after fees waived and/or reimbursed would have been 2.23%. |
See notes to financial statements.
| | |
| 90 | | 2020 BLACKROCK SEMI-ANNUAL REPORTTO SHAREHOLDERS |
Financial Highlights (continued)
(For a share outstanding throughout each period)
| | | | | | | | | | | | | | | | | | | | | | | | | | | | | | | | |
| | | FRA | |
| | | Six Months Ended
06/30/20
(Unaudited) | | | Period from 09/01/19 to 12/31/19 | | | | | | Year Ended August 31, | |
| | | 2019 | | | 2018 (a) | | | 2017 (a) | | | 2016 (a) | | | 2015 (a) | |
| | | | | | | | | |
Net asset value, beginning of period | | $ | 14.55 | | | $ | 14.49 | | | | | | | $ | 14.92 | | | $ | 14.93 | | | $ | 14.78 | | | $ | 14.91 | | | $ | 15.38 | |
| | | | | | | | | | | | | | | | | | | | | | | | | | | | | | | | |
Net investment income(b) | | | 0.35 | | | | 0.25 | | | | | | | | 0.84 | | | | 0.79 | | | | 0.76 | | | | 0.76 | | | | 0.81 | |
Net realized and unrealized gain (loss) | | | (1.54 | ) | | | 0.19 | | | | | | | | (0.40 | ) | | | (0.06 | ) | | | 0.20 | | | | (0.14 | ) | | | (0.47 | ) |
| | | | | | | | | | | | | | | | | | | | | | | | | | | | | | | | |
Net increase (decrease) from investment operations | | | (1.19 | ) | | | 0.44 | | | | | | | | 0.44 | | | | 0.73 | | | | 0.96 | | | | 0.62 | | | | 0.34 | |
| | | | | | | | | | | | | | | | | | | | | | | | | | | | | | | | |
| | | | | | | | |
Distributions from net investment income(c) | | | (0.39 | )(d) | | | (0.38 | ) | | | | | | | (0.87 | ) | | | (0.74 | ) | | | (0.81 | ) | | | (0.75 | ) | | | (0.81 | ) |
| | | | | | | | | | | | | | | | | | | | | | | | | | | | | | | | |
| | | | | | | | |
Net asset value, end of period | | $ | 12.97 | | | $ | 14.55 | | | | | | | $ | 14.49 | | | $ | 14.92 | | | $ | 14.93 | | | $ | 14.78 | | | $ | 14.91 | (e) |
| | | | | | | | | | | | | | | | | | | | | | | | | | | | | | | | |
| | | | | | | | |
Market price, end of period | | $ | 11.18 | | | $ | 13.44 | | | | | | | $ | 12.46 | | | $ | 13.80 | | | $ | 14.10 | | | $ | 13.70 | | | $ | 12.94 | |
| | | | | | | | | | | | | | | | | | | | | | | | | | | | | | | | |
| | | | | | | | |
Total Return(f) | | | | | | | | | | | | | | | | | | | | | | | | | | | | | | | | |
Based on net asset value | | | (7.67 | )%(g) | | | 3.41 | %(g) | | | | | | | 3.94 | % | | | 5.28 | % | | | 6.93 | % | | | 5.00 | % | | | 2.88 | %(e) |
| | | | | | | | | | | | | | | | | | | | | | | | | | | | | | | | |
Based on market price | | | (13.84 | )%(g) | | | 11.08 | %(g) | | | | | | | (3.37 | )% | | | 3.11 | % | | | 8.95 | % | | | 12.14 | % | | | (3.71 | )% |
| | | | | | | | | | | | | | | | | | | | | | | | | | | | | | | | |
| | | | | | | | |
Ratios to Average Net Assets(h) | | | | | | | | | | | | | | | | | | | | | | | | | | | | | | | | |
Total expenses | | | 1.81 | %(i) | | | 2.20 | %(i)(j) | | | | | | | 2.45 | % | | | 2.23 | % | | | 1.88 | % | | | 1.54 | % | | | 1.56 | % |
| | | | | | | | | | | | | | | | | | | | | | | | | | | | | | | | |
Total expenses after fees waived and/or reimbursed | | | 1.80 | %(i) | | | 2.20 | %(i)(j) | | | | | | | 2.45 | % | | | 2.22 | % | | | 1.88 | % | | | 1.54 | % | | | 1.56 | % |
| | | | | | | | | | | | | | | | | | | | | | | | | | | | | | | | |
Total expenses after fees waived and/or reimbursed | | | 1.13 | %(i) | | | 1.19 | %(i) | | | | | | | 1.16 | % | | | 1.20 | % | | | 1.21 | % | | | 1.14 | % | | | 1.19 | % |
| | | | | | | | | | | | | | | | | | | | | | | | | | | | | | | | |
Net investment income | | | 5.35 | %(i) | | | 5.26 | %(i) | | | | | | | 5.74 | % | | | 5.27 | % | | | 5.08 | % | | | 5.27 | % | | | 5.39 | % |
| | | | | | | | | | | | | | | | | | | | | | | | | | | | | | | | |
| | | | | | | | |
Supplemental Data | | | | | | | | | | | | | | | | | | | | | | | | | | | | | | | | |
Net assets, end of period (000) | | $ | 462,849 | | | $ | 522,545 | | | | | | | $ | 526,447 | | | $ | 555,370 | | | $ | 555,972 | | | $ | 550,271 | | | $ | 555,104 | |
| | | | | | | | | | | | | | | | | | | | | | | | | | | | | | | | |
Borrowings outstanding, end of period (000) | | $ | 191,000 | | | $ | 214,000 | | | | | | | $ | 204,000 | | | $ | 233,000 | | | $ | 237,000 | | | $ | 225,000 | | | $ | 196,000 | |
| | | | | | | | | | | | | | | | | | | | | | | | | | | | | | | | |
Asset coverage, end of period per $1,000 of bank borrowings | | $ | 3,424 | | | $ | 3,442 | | | | | | | $ | 3,582 | | | $ | 3,385 | | | $ | 3,346 | | | | 3,446 | | | $ | 3,832 | |
| | | | | | | | | | | | | | | | | | | | | | | | | | | | | | | | |
Portfolio turnover rate | | | 38 | % | | | 16 | % | | | | | | | 53 | % | | | 57 | % | | | 64 | % | | | 48 | % | | | 43 | % |
| | | | | | | | | | | | | | | | | | | | | | | | | | | | | | | | |
| (a) | Consolidated Financial Highlights through November 30, 2017. |
| (b) | Based on average shares outstanding. |
| (c) | Distributions for annual periods determined in accordance with U.S. federal income tax regulations. |
| (d) | A portion of the distributions from net investment income may be deemed a return of capital or net realized gain at fiscal year end. |
| (e) | For financial reporting purposes, the market value of certain investments were adjusted as of report date. Accordingly, the net asset value per share and total return performance presented herein are different than the information previously published on August 31, 2015. |
| (f) | Total returns based on market price, which can be significantly greater or less than the net asset value, may result in substantially different returns. Where applicable, excludes the effects of any sales charges and assumes the reinvestment of distributions at actual reinvestment prices. |
| (g) | Aggregate total return. |
| (h) | Excludes expenses incurred indirectly as a result of investments in underlying funds as follows: |
| | | | | | | | | | | | | | | | | | | | | | | | | | | | | | | | |
| | | Six Months Ended
06/30/20 (Unaudited) | | | Period from
09/01/19 to
12/31/19 | | | | | | Year Ended August 31, | |
| | | 2019 | | | 2018 (a) | | | 2017 (a) | | | 2016 (a) | | | 2015 (a) | |
Investments in underlying funds | | | 0.04 | % | | | 0.04 | % | | | | | | | 0.03 | % | | | 0.01 | % | | | — | % | | | — | % | | | — | % |
| | | | | | | | | | | | | | | | | | | | | | | | | | | | | | | | |
| (j) | Audit costs were not annualized in the calculation of the expense ratios. If these expenses were annualized, the total expenses and total expenses after fees waived and/or reimbursed would have been 2.23%. |
See notes to financial statements.
Financial Highlights (continued)
(For a share outstanding throughout each period)
| | | | | | | | | | | | | | | | | | | | | | | | | | | | | | | | |
| | | BLW | |
| | | Six Months Ended
06/30/20
(Unaudited) | | | Period from 09/01/19 to 12/31/19 | | | | | | Year Ended August 31, | |
| | | 2019 | | | 2018 | | | 2017 | | | 2016 | | | 2015 (a) | |
| | | | | | | | | |
Net asset value, beginning of period | | $ | 17.05 | | | $ | 17.03 | | | | | | | $ | 16.71 | | | $ | 17.02 | | | $ | 16.84 | | | $ | 17.04 | | | $ | 18.09 | |
| | | | | | | | | | | | | | | | | | | | | | | | | | | | | | | | |
Net investment income(b) | | | 0.48 | | | | 0.31 | | | | | | | | 0.94 | | | | 0.95 | | | | 1.01 | | | | 1.32 | | | | 1.16 | |
Net realized and unrealized gain (loss) | | | (1.39 | ) | | | 0.18 | | | | | | | | 0.33 | | | | (0.31 | ) | | | 0.44 | | | | (0.22 | ) | | | (0.92 | ) |
| | | | | | | | | | | | | | | | | | | | | | | | | | | | | | | | |
Net increase (decrease) from investment operations | | | (0.91 | ) | | | 0.49 | | | | | | | | 1.27 | | | | 0.64 | | | | 1.45 | | | | 1.10 | | | | 0.24 | |
| | | | | | | | | | | | | | | | | | | | | | | | | | | | | | | | |
| | | | | | | | |
Distributions from net investment income(c) | | | (0.49 | )(d) | | | (0.47 | ) | | | | | | | (0.95 | ) | | | (0.95 | ) | | | (1.27 | ) | | | (1.30 | ) | | | (1.29 | ) |
| | | | | | | | | | | | | | | | | | | | | | | | | | | | | | | | |
| | | | | | | | |
Net asset value, end of period | | $ | 15.65 | | | $ | 17.05 | | | | | | | $ | 17.03 | | | $ | 16.71 | | | $ | 17.02 | | | $ | 16.84 | | | $ | 17.04 | (e) |
| | | | | | | | | | | | | | | | | | | | | | | | | | | | | | | | |
| | | | | | | | |
Market price, end of period | | $ | 13.93 | | | $ | 16.39 | | | | | | | $ | 15.44 | | | $ | 15.06 | | | $ | 15.99 | | | $ | 15.74 | | | $ | 14.60 | |
| | | | | | | | | | | | | | | | | | | | | | | | | | | | | | | | |
| | | | | | | | |
Total Return(f) | | | | | | | | | | | | | | | | | | | | | | | | | | | | | | | | |
Based on net asset value | | | (4.90 | )%(g) | | | 3.11 | %(g) | | | | | | | 8.77 | % | | | 4.42 | % | | | 9.62 | % | | | 7.78 | % | | | 2.23 | %(e) |
| | | | | | | | | | | | | | | | | | | | | | | | | | | | | | | | |
Based on market price | | | (11.94 | )%(g) | | | 9.32 | %(g) | | | | | | | 9.41 | % | | | 0.18 | % | | | 10.18 | % | | | 17.59 | % | | | (5.74 | )% |
| | | | | | | | | | | | | | | | | | | | | | | | | | | | | | | | |
| | | | | | | | |
Ratios to Average Net Assets(h) | | | | | | | | | | | | | | | | | | | | | | | | | | | | | | | | |
Total expenses | | | 1.50 | %(i) | | | 1.64 | %(i)(j) | | | | | | | 1.81 | % | | | 1.73 | % | | | 1.45 | % | | | 1.21 | % | | | 1.15 | % |
| | | | | | | | | | | | | | | | | | | | | | | | | | | | | | | | |
Total expenses after fees waived and/or reimbursed | | | 1.50 | %(i) | | | 1.64 | %(i)(j) | | | | | | | 1.81 | % | | | 1.73 | % | | | 1.45 | % | | | 1.21 | % | | | 1.15 | % |
| | | | | | | | | | | | | | | | | | | | | | | | | | | | | | | | |
Total expenses after fees waived and/or reimbursed and excluding interest expense | | | 0.87 | %(i) | | | 0.89 | %(i) | | | | | | | 0.84 | % | | | 0.89 | % | | | 0.89 | % | | | 0.89 | % | | | 0.92 | % |
| | | | | | | | | | | | | | | | | | | | | �� | | | | | | | | | | | |
Net investment income | | | 6.14 | %(i) | | | 5.32 | %(i) | | | | | | | 5.69 | % | | | 5.60 | % | | | 6.00 | % | | | 8.04 | % | | | 6.65 | % |
| | | | | | | | | | | | | | | | | | | | | | | | | | | | | | | | |
| | | | | | | | |
Supplemental Data | | | | | | | | | | | | | | | | | | | | | | | | | | | | | | | | |
Net assets, end of period (000) | | $ | 559,147 | | | $ | 611,068 | | | | | | | $ | 610,251 | | | $ | 612,048 | | | $ | 629,728 | | | $ | 623,219 | | | $ | 630,388 | |
| | | | | | | | | | | | | | | | | | | | | | | | | | | | | | | | |
Borrowings outstanding, end of period (000) | | $ | 279,747 | | | $ | 213,399 | | | | | | | $ | 202,539 | | | $ | 234,622 | | | $ | 252,280 | | | $ | 263,445 | | | $ | 264,036 | |
| | | | | | | | | | | | | | | | | | | | | | | | | | | | | | | | |
Portfolio turnover rate(k) | | | 35 | % | | | 14 | % | | | | | | | 50 | % | | | 50 | % | | | 55 | % | | | 54 | % | | | 47 | % |
| | | | | | | | | | | | | | | | | | | | | | | | | | | | | | | | |
| (a) | Consolidated Financial Highlights. |
| (b) | Based on average shares outstanding. |
| (c) | Distributions for annual periods determined in accordance with U.S. federal income tax regulations. |
| (d) | A portion of the distributions from net investment income may be deemed a return of capital or net realized gain at fiscal year end. |
| (e) | For financial reporting purposes, the market value of certain investments were adjusted as of report date. Accordingly, the net asset value per share and total return performance presented herein are different than the information previously published on August 31, 2015. |
| (f) | Total returns based on market price, which can be significantly greater or less than the net asset value, may result in substantially different returns. Where applicable, excludes the effects of any sales charges and assumes the reinvestment of distributions at actual reinvestment prices. |
| (g) | Aggregate total return. |
| (h) | Excludes expenses incurred indirectly as a result of investments in underlying funds as follows: |
| | | | | | | | | | | | | | | | | | | | | | | | | | | | | | | | |
| | | Six Months Ended
06/30/20
(Unaudited) | | | Period from 09/01/19 to 12/31/19 | | | | | | Year Ended August 31, | |
| | | 2019 | | | 2018 | | | 2017 | | | 2016 | | | 2015 (a) | |
Investments in underlying funds | | | 0.01 | % | | | 0.02 | % | | | | | | | 0.02 | % | | | — | % | | | — | % | | | — | % | | | — | % |
| | | | | | | | | | | | | | | | | | | | | | | | | | | | | | | | |
| (j) | Audit costs were not annualized in the calculation of the expense ratios. If these expenses were annualized, the total expenses and total expenses after fees waived and/or reimbursed would have been 1.66%. |
| (k) | Includes mortgage dollar roll transactions (“MDRs”). Additional information regarding portfolio turnover rate is as follows: |
| | | | | | | | | | | | | | | | | | | | | | | | | | | | | | | | |
| | | Six Months Ended
06/30/20
(Unaudited) | | | Period from 09/01/19 to 12/31/19 | | | | | | Year Ended August 31, | |
| | | 2019 | | | 2018 | | | 2017 | | | 2016 | | | 2015 (a) | |
Portfolio turnover rate (excluding MDRs) | | | 29 | % | | | — | % | | | | | | | — | % | | | — | % | | | — | % | | | — | % | | | — | % |
| | | | | | | | | | | | | | | | | | | | | | | | | | | | | | | | |
See notes to financial statements.
| | |
| 92 | | 2020 BLACKROCK SEMI-ANNUAL REPORTTO SHAREHOLDERS |
Notes to Financial Statements (unaudited)
The following are registered under the Investment Company Act of 1940, as amended (the “1940 Act”), as closed-end management investment companies and are referred to herein collectively as the “Funds”, or individually as a “Fund”:
| | | | | | |
| Fund Name | | Herein Referred To As | | Organized | | Diversification
Classification |
BlackRock Debt Strategies Fund, Inc. | | DSU | | Maryland | | Diversified |
BlackRock Floating Rate Income Strategies Fund, Inc. | | FRA | | Maryland | | Diversified |
BlackRock Limited Duration Income Trust | | BLW | | Delaware | | Diversified |
The Boards of Directors and Boards of Trustees of the Funds are collectively referred to throughout this report as the “Board,” and the directors/trustees thereof are collectively referred to throughout this report as “Directors”. The Funds determine and make available for publication the net asset value (“NAV”) of their Common Shares on a daily basis.
The Funds, together with certain other registered investment companies advised by BlackRock Advisors, LLC (the “Manager”) or its affiliates, are included in a complex of non-index fixed-income mutual funds and all BlackRock-advised closed-end funds referred to as the BlackRock Fixed-Income Complex.
| 2. | SIGNIFICANT ACCOUNTING POLICIES |
The financial statements are prepared in conformity with accounting principles generally accepted in the United States of America (“U.S. GAAP”), which may require management to make estimates and assumptions that affect the reported amounts of assets and liabilities in the financial statements, disclosure of contingent assets and liabilities at the date of the financial statements and the reported amounts of increases and decreases in net assets from operations during the reporting period. Actual results could differ from those estimates. Each Fund is considered an investment company under U.S. GAAP and follows the accounting and reporting guidance applicable to investment companies. Below is a summary of significant accounting policies:
Investment Transactions and Income Recognition: For financial reporting purposes, investment transactions are recorded on the dates the transactions are executed. Realized gains and losses on investment transactions are determined on the identified cost basis. Dividend income and non-cash dividend income, if any, are recorded on the ex-dividend date. Dividends from foreign securities where the ex-dividend date may have passed are subsequently recorded when the Funds are informed of the ex-dividend date. Under the applicable foreign tax laws, a withholding tax at various rates may be imposed on capital gains, dividends and interest. Upon notification from issuers, a portion of the dividend income received from a real estate investment trust may be redesignated as a reduction of cost of the related investment and/or realized gain. Interest income, including amortization and accretion of premiums and discounts on debt securities, and payment-in-kind interest are recognized on an accrual basis.
Foreign Currency Translation: Each Fund’s books and records are maintained in U.S. dollars. Securities and other assets and liabilities denominated in foreign currencies are translated into U.S. dollars using exchange rates determined as of the close of trading on the New York Stock Exchange (“NYSE”). Purchases and sales of investments are recorded at the rates of exchange prevailing on the respective dates of such transactions. Generally, when the U.S. dollar rises in value against a foreign currency, the investments denominated in that currency will lose value; the opposite effect occurs if the U.S. dollar falls in relative value.
Each Fund does not isolate the portion of the results of operations arising as a result of changes in the exchange rates from the changes in the market prices of investments held or sold for financial reporting purposes. Accordingly, the effects of changes in exchange rates on investments are not segregated in the Statements of Operations from the effects of changes in market prices of those investments, but are included as a component of net realized and unrealized gain (loss) from investments. Each Fund reports realized currency gains (losses) on foreign currency related transactions as components of net realized gain (loss) for financial reporting purposes, whereas such components are generally treated as ordinary income for U.S. federal income tax purposes.
Segregation and Collateralization: In cases where a Fund enters into certain investments (e.g., dollar rolls, TBA sale commitments, futures contracts, forward foreign currency exchange contracts, options written and swaps) or certain borrowings (e.g., reverse repurchase transactions) that would be treated as “senior securities” for 1940 Act purposes, a Fund may segregate or designate on its books and records cash or liquid assets having a market value at least equal to the amount of its future obligations under such investments or borrowings. Doing so allows the investment or borrowings to be excluded from treatment as a “senior security.” Furthermore, if required by an exchange or counterparty agreement, the Funds may be required to deliver/deposit cash and/or securities to/with an exchange, or broker-dealer or custodian as collateral for certain investments or obligations.
Distributions: Distributions paid by the Funds are recorded on the ex-dividend date. Subject to the Funds’ managed distribution plan, the Funds intend to make monthly cash distributions to shareholders, which may consist of net investment income, and net realized and unrealized gains on investments and/or return of capital.
The character of distributions is determined in accordance with U.S. federal income tax regulations, which may differ from U.S. GAAP. The portion of distributions that exceeds a Fund’s current and accumulated earnings and profits, which are measured on a tax basis, will constitute a non-taxable return of capital. See Note 8, Income Tax Information, for the tax character of each Fund’s distributions paid during the period.
Deferred Compensation Plan: Under the Deferred Compensation Plan (the “Plan”) approved by the Board, the directors who are not “interested persons” of the Funds, as defined in the 1940 Act (“Independent Directors”), may defer a portion of their annual complex-wide compensation. Deferred amounts earn an approximate return as though equivalent dollar amounts had been invested in common shares of certain funds in the BlackRock Fixed-Income Complex selected by the Independent Directors. This has the same economic effect for the Independent Directors as if the Independent Directors had invested the deferred amounts directly in certain funds in the BlackRock Fixed-Income Complex.
| | |
NOTESTO FINANCIAL STATEMENTS | | 93 |
Notes to Financial Statements (unaudited) (continued)
The Plan is not funded and obligations thereunder represent general unsecured claims against the general assets of each Fund, as applicable. Deferred compensation liabilities are included in the Directors’ and Officer’s fees payable in the Statements of Assets and Liabilities and will remain as a liability of the Funds until such amounts are distributed in accordance with the Plan.
Indemnifications: In the normal course of business, a Fund enters into contracts that contain a variety of representations that provide general indemnification. A Fund’s maximum exposure under these arrangements is unknown because it involves future potential claims against a Fund, which cannot be predicted with any certainty.
Other: Expenses directly related to a Fund are charged to that Fund. Other operating expenses shared by several funds, including other funds managed by the Manager, are prorated among those funds on the basis of relative net assets or other appropriate methods.
| 3. | INVESTMENT VALUATION AND FAIR VALUE MEASUREMENTS |
Investment Valuation Policies: The Funds’ investments are valued at fair value (also referred to as “market value” within the financial statements) as of the close of trading on the NYSE (generally 4:00 p.m., Eastern time). U.S. GAAP defines fair value as the price the Funds would receive to sell an asset or pay to transfer a liability in an orderly transaction between market participants at the measurement date. The Funds determine the fair values of their financial instruments using various independent dealers or pricing services under policies approved by the Board. If a security’s market price is not readily available or does not otherwise accurately represent the fair value of the security, the security will be valued in accordance with a policy approved by the Board as reflecting fair value. The BlackRock Global Valuation Methodologies Committee (the “Global Valuation Committee”) is the committee formed by management to develop global pricing policies and procedures and to oversee the pricing function for all financial instruments.
Fair Value Inputs and Methodologies: The following methods and inputs are used to establish the fair value of each Fund’s assets and liabilities:
| | • | | Equity investments traded on a recognized securities exchange are valued at the official closing price each day, if available. For equity investments traded on more than one exchange, the official closing price on the exchange where the stock is primarily traded is used. Equity investments traded on a recognized exchange for which there were no sales on that day may be valued at the last available bid (long positions) or ask (short positions) price. |
| | • | | Fixed-income securities for which market quotations are readily available are generally valued using the last available bid prices or current market quotations provided by independent dealers or third party pricing services. Floating rate loan interests are valued at the mean of the bid prices from one or more independent brokers or dealers as obtained from a third party pricing service. Pricing services generally value fixed-income securities assuming orderly transactions of an institutional round lot size, but a fund may hold or transact in such securities in smaller, odd lot sizes. Odd lots may trade at lower prices than institutional round lots. The pricing services may use matrix pricing or valuation models that utilize certain inputs and assumptions to derive values, including transaction data (e.g., recent representative bids and offers), credit quality information, perceived market movements, news, and other relevant information. Certain fixed-income securities, including asset-backed and mortgage related securities may be valued based on valuation models that consider the estimated cash flows of each tranche of the entity, establish a benchmark yield and develop an estimated tranche specific spread to the benchmark yield based on the unique attributes of the tranche. The amortized cost method of valuation may be used with respect to debt obligations with sixty days or less remaining to maturity unless the Manager determines such method does not represent fair value. |
Generally, trading in foreign instruments is substantially completed each day at various times prior to the close of trading on the NYSE. Occasionally, events affecting the values of such instruments may occur between the foreign market close and the close of trading on the NYSE that may not be reflected in the computation of the Funds’ net assets. Each business day, the Funds use a pricing service to assist with the valuation of certain foreign exchange-traded equity securities and foreign exchange-traded and over-the-counter (“OTC”) options (the “Systematic Fair Value Price”). Using current market factors, the Systematic Fair Value Price is designed to value such foreign securities and foreign options at fair value as of the close of trading on the NYSE, which follows the close of the local markets.
| | • | | Exchange-traded funds (“ETFs”) traded on a recognized securities exchange are valued at the official closing price each day, if available. For ETFs traded on more than one exchange, the official closing price on the exchange where the ETF is primarily traded is used. ETFs traded on a recognized exchange for which there were no sales on that day may be valued at the last available bid (long positions) or ask (short positions) price. |
| | • | | Investments in open-end U.S. mutual funds are valued at NAV each business day. |
| | • | | Futures contract notional values are determined based on that day’s last reported settlement price on the exchange where the contract is traded. |
| | • | | Forward foreign currency exchange contracts are valued at the mean between the bid and ask prices and are determined as of the close of trading on the NYSE based on that day’s prevailing forward exchange rate for the underlying currencies. Interpolated values are derived when the settlement date of the contract is an interim date for which quotations are not available. |
| | • | | Exchange-traded equity options for which market quotations are readily available will be valued at the National Best Bid and Offer quotes (“NBBO”). NBBO represents the mean of the bid and ask prices as quoted on the exchange on which such options are traded. In the event that there is no mean price available, the last bid (long positions) or ask (short positions) price will be used. If no bid or ask price is available, the prior day’s price may be used. |
| | • | | Swap agreements are valued utilizing quotes received daily by the Funds’ pricing service or through brokers, which are derived using daily swap curves and models that incorporate a number of market data factors, such as discounted cash flows, trades and values of the underlying reference instruments. |
| | • | | To-be-announced (“TBA”) commitments are valued on the basis of last available bid prices or current market quotations provided by pricing services. |
| | |
| 94 | | 2020 BLACKROCK SEMI-ANNUAL REPORTTO SHAREHOLDERS |
Notes to Financial Statements (unaudited) (continued)
If events (e.g., a company announcement, market volatility or a natural disaster) occur that are expected to materially affect the value of such investments, or in the event that the application of these methods of valuation results in a price for an investment that is deemed not to be representative of the market value of such investment, or if a price is not available, the investment will be valued by the Global Valuation Committee, or its delegate, in accordance with a policy approved by the Board as reflecting fair value (“Fair Valued Investments”). The fair valuation approaches that may be used by the Global Valuation Committee will include market approach, income approach and cost approach. Valuation techniques such as discounted cash flow, use of market comparables and matrix pricing are types of valuation approaches and are typically used in determining fair value. When determining the price for Fair Valued Investments, the Global Valuation Committee, or its delegate, seeks to determine the price that each Fund might reasonably expect to receive or pay from the current sale or purchase of that asset or liability in an arm’s-length transaction. Fair value determinations shall be based upon all available factors that the Global Valuation Committee, or its delegate, deems relevant and consistent with the principles of fair value measurement. The pricing of all Fair Valued Investments is subsequently reported to the Board or a committee thereof on a quarterly basis.
For investments in equity or debt issued by privately held companies or funds (“Private Company” or collectively, the “Private Companies”) and other Fair Valued Investments, the fair valuation approaches that are used by the Global Valuation Committee and third party pricing services utilize one or a combination of, but not limited to, the following inputs.
| | |
| | | Standard Inputs Generally Considered By Third Party Pricing Services |
Market approach | | (i) recent market transactions, including subsequent rounds of financing, in the underlying investment or comparable issuers; (ii) recapitalizations and other transactions across the capital structure; and (iii) market multiples of comparable issuers. |
Income approach | | (i) future cash flows discounted to present and adjusted as appropriate for liquidity, credit, and/or market risks; (ii) quoted prices for similar investments or assets in active markets; and (iii) other risk factors, such as interest rates, yield curves, volatilities, prepayment speeds, loss severities, credit risks, recovery rates, liquidation amounts and/or default rates. |
Cost approach | | (i) audited or unaudited financial statements, investor communications and financial or operational metrics issued by the Private Company; (ii) changes in the valuation of relevant indices or publicly traded companies comparable to the Private Company; (iii) relevant news and other public sources; and (iv) known secondary market transactions in the Private Company’s interests and merger or acquisition activity in companies comparable to the Private Company. |
Investments in series of preferred stock issued by Private Companies are typically valued utilizing market approach in determining the enterprise value of the company. Such investments often contain rights and preferences that differ from other series of preferred and common stock of the same issuer. Valuation techniques such as an option pricing model (“OPM”), a probability weighted expected return model (“PWERM”) or a hybrid of those techniques are used in allocating enterprise value of the company, as deemed appropriate under the circumstances. The use of OPM and PWERM techniques involve a determination of the exit scenarios of the investment in order to appropriately allocate the enterprise value of the company among the various parts of its capital structure.
The Private Companies are not subject to the public company disclosure, timing, and reporting standards as other investments held by a Fund. Typically, the most recently available information by a Private Company is as of a date that is earlier than the date a Fund is calculating its NAV. This factor may result in a difference between the value of the investment and the price a Fund could receive upon the sale of the investment.
Fair Value Hierarchy: Various inputs are used in determining the fair value of investments and derivative financial instruments. These inputs to valuation techniques are categorized into a fair value hierarchy consisting of three broad levels for financial statement purposes as follows:
| | • | | Level 1 — Unadjusted price quotations in active markets/exchanges for identical assets or liabilities that each Fund has the ability to access |
| | • | | Level 2 — Other observable inputs (including, but not limited to, quoted prices for similar assets or liabilities in markets that are active, quoted prices for identical or similar assets or liabilities in markets that are not active, inputs other than quoted prices that are observable for the assets or liabilities (such as interest rates, yield curves, volatilities, prepayment speeds, loss severities, credit risks and default rates) or other market–corroborated inputs) |
| | • | | Level 3 — Unobservable inputs based on the best information available in the circumstances, to the extent observable inputs are not available (including the Global Valuation Committee’s assumptions used in determining the fair value of investments and derivative financial instruments) |
The hierarchy gives the highest priority to unadjusted quoted prices in active markets for identical assets or liabilities (Level 1 measurements) and the lowest priority to unobservable inputs (Level 3 measurements). Accordingly, the degree of judgment exercised in determining fair value is greatest for instruments categorized in Level 3. The inputs used to measure fair value may fall into different levels of the fair value hierarchy. In such cases, for disclosure purposes, the fair value hierarchy classification is determined based on the lowest level input that is significant to the fair value measurement in its entirety. Investments classified within Level 3 have significant unobservable inputs used by the Global Valuation Committee in determining the price for Fair Valued Investments. Level 3 investments include equity or debt issued by Private Companies. There may not be a secondary market, and/or there are a limited number of investors. The categorization of a value determined for investments and derivative financial instruments is based on the pricing transparency of the investments and derivative financial instruments and is not necessarily an indication of the risks associated with investing in those securities.
As of June 30, 2020, certain investments of BLW were valued using NAV per share as no quoted market value is available and therefore have been excluded from the fair value hierarchy.
| | |
NOTESTO FINANCIAL STATEMENTS | | 95 |
Notes to Financial Statements (unaudited) (continued)
| 4. | SECURITIES AND OTHER INVESTMENTS |
Asset-Backed and Mortgage-Backed Securities: Asset-backed securities are generally issued as pass-through certificates or as debt instruments. Asset-backed securities issued as pass-through certificates represent undivided fractional ownership interests in an underlying pool of assets. Asset-backed securities issued as debt instruments, which are also known as collateralized obligations, are typically issued as the debt of a special purpose entity organized solely for the purpose of owning such assets and issuing such debt. Asset-backed securities are often backed by a pool of assets representing the obligations of a number of different parties. The yield characteristics of certain asset-backed securities may differ from traditional debt securities. One such major difference is that all or a principal part of the obligations may be prepaid at any time because the underlying assets (i.e., loans) may be prepaid at any time. As a result, a decrease in interest rates in the market may result in increases in the level of prepayments as borrowers, particularly mortgagors, refinance and repay their loans. An increased prepayment rate with respect to an asset-backed security will have the effect of shortening the maturity of the security. In addition, a fund may subsequently have to reinvest the proceeds at lower interest rates. If a fund has purchased such an asset-backed security at a premium, a faster than anticipated prepayment rate could result in a loss of principal to the extent of the premium paid.
For mortgage pass-through securities (the “Mortgage Assets”) there are a number of important differences among the agencies and instrumentalities of the U.S. Government that issue mortgage-related securities and among the securities that they issue. For example, mortgage-related securities guaranteed by Ginnie Mae are guaranteed as to the timely payment of principal and interest by Ginnie Mae and such guarantee is backed by the full faith and credit of the United States. However, mortgage-related securities issued by Freddie Mac and Fannie Mae, including Freddie Mac and Fannie Mae guaranteed mortgage pass-through certificates, which are solely the obligations of Freddie Mac and Fannie Mae, are not backed by or entitled to the full faith and credit of the United States, but are supported by the right of the issuer to borrow from the U.S. Treasury.
Non-agency mortgage-backed securities are securities issued by non-governmental issuers and have no direct or indirect government guarantees of payment and are subject to various risks. Non-agency mortgage loans are obligations of the borrowers thereunder only and are not typically insured or guaranteed by any other person or entity. The ability of a borrower to repay a loan is dependent upon the income or assets of the borrower. A number of factors, including a general economic downturn, acts of God, terrorism, social unrest and civil disturbances, may impair a borrower’s ability to repay its loans.
Collateralized Debt Obligations: Collateralized debt obligations (“CDOs”), including collateralized bond obligations (“CBOs”) and collateralized loan obligations (“CLOs”), are types of asset-backed securities. A CDO is an entity that is backed by a diversified pool of debt securities (CBOs) or syndicated bank loans (CLOs). The cash flows of the CDO can be split into multiple segments, called “tranches,” which will vary in risk profile and yield. The riskiest segment is the subordinated or “equity” tranche. This tranche bears the greatest risk of defaults from the underlying assets in the CDO and serves to protect the other, more senior, tranches from default in all but the most severe circumstances. Since it is shielded from defaults by the more junior tranches, a “senior” tranche will typically have higher credit ratings and lower yields than their underlying securities, and often receive investment grade ratings from one or more of the nationally recognized rating agencies. Despite the protection from the more junior tranches, senior tranches can experience substantial losses due to actual defaults, increased sensitivity to future defaults and the disappearance of one or more protecting tranches as a result of changes in the credit profile of the underlying pool of assets.
Multiple Class Pass-Through Securities: Multiple class pass-through securities, including collateralized mortgage obligations (“CMOs”) and commercial mortgage-backed securities, may be issued by Ginnie Mae, U.S. Government agencies or instrumentalities or by trusts formed by private originators of, or investors in, mortgage loans. In general, CMOs are debt obligations of a legal entity that are collateralized by a pool of residential or commercial mortgage loans or mortgage pass-through securities Mortgage Assets. The payments on these are used to make payments on the CMOs or multiple pass-through securities. Multiple class pass-through securities represent direct ownership interests in the Mortgage Assets. Classes of CMOs include interest only (“IOs”), principal only (“POs”), planned amortization classes and targeted amortization classes. IOs and POs are stripped mortgage-backed securities representing interests in a pool of mortgages, the cash flow from which has been separated into interest and principal components. IOs receive the interest portion of the cash flow while POs receive the principal portion. IOs and POs can be extremely volatile in response to changes in interest rates. As interest rates rise and fall, the value of IOs tends to move in the same direction as interest rates. POs perform best when prepayments on the underlying mortgages rise since this increases the rate at which the principal is returned and the yield to maturity on the PO. When payments on mortgages underlying a PO are slower than anticipated, the life of the PO is lengthened and the yield to maturity is reduced. If the underlying Mortgage Assets experience greater than anticipated prepayments of principal, a fund’s initial investment in the IOs may not fully recoup.
Stripped Mortgage-Backed Securities: Stripped mortgage-backed securities are typically issued by the U.S. Government, its agencies and instrumentalities. Stripped mortgage-backed securities are usually structured with two classes that receive different proportions of the interest (IOs) and principal (POs) distributions on a pool of the Mortgage Assets. Stripped mortgage-backed securities may be privately issued.
Zero-Coupon Bonds: Zero-coupon bonds are normally issued at a significant discount from face value and do not provide for periodic interest payments. These bonds may experience greater volatility in market value than other debt obligations of similar maturity which provide for regular interest payments.
Capital Securities and Trust Preferred Securities: Capital securities, including trust preferred securities, are typically issued by corporations, generally in the form of interest-bearing notes with preferred securities characteristics. In the case of trust preferred securities, an affiliated business trust of a corporation issues these securities, generally in the form of beneficial interests in subordinated debentures or similarly structured securities. The securities can be structured with either a fixed or adjustable coupon that can have either a perpetual or stated maturity date. For trust preferred securities, the issuing bank or corporation pays interest to the trust, which is then distributed to holders of these securities as a dividend. Dividends can be deferred without creating an event of default or acceleration, although maturity cannot take place unless all cumulative payment obligations have been met. The deferral of payments does not affect the purchase or sale of these securities in the open market. These securities generally are rated below that of the issuing company’s senior debt securities and are freely callable at the issuer’s option.
Preferred Stocks: Preferred stock has a preference over common stock in liquidation (and generally in receiving dividends as well), but is subordinated to the liabilities of the issuer in all respects. As a general rule, the market value of preferred stock with a fixed dividend rate and no conversion element varies inversely with interest rates and perceived credit risk, while the market price of convertible preferred stock generally also reflects some element of conversion value. Because preferred stock is junior
| | |
| 96 | | 2020 BLACKROCK SEMI-ANNUAL REPORTTO SHAREHOLDERS |
Notes to Financial Statements (unaudited) (continued)
to debt securities and other obligations of the issuer, deterioration in the credit quality of the issuer will cause greater changes in the value of a preferred stock than in a more senior debt security with similar stated yield characteristics. Unlike interest payments on debt securities, preferred stock dividends are payable only if declared by the issuer’s board of directors. Preferred stock also may be subject to optional or mandatory redemption provisions.
Warrants: Warrants entitle a fund to purchase a specified number of shares of common stock and are non-income producing. The purchase price and number of shares are subject to adjustment under certain conditions until the expiration date of the warrants, if any. If the price of the underlying stock does not rise above the strike price before the warrant expires, the warrant generally expires without any value and a fund will lose any amount it paid for the warrant. Thus, investments in warrants may involve more risk than investments in common stock. Warrants may trade in the same markets as their underlying stock; however, the price of the warrant does not necessarily move with the price of the underlying stock.
Floating Rate Loan Interests: Floating rate loan interests are typically issued to companies (the “borrower”) by banks, other financial institutions, or privately and publicly offered corporations (the “lender”). Floating rate loan interests are generally non-investment grade, often involve borrowers whose financial condition is troubled or uncertain and companies that are highly leveraged or in bankruptcy proceedings. In addition, transactions in floating rate loan interests may settle on a delayed basis, which may result in proceeds from the sale not being readily available for a fund to make additional investments or meet its redemption obligations. Floating rate loan interests may include fully funded term loans or revolving lines of credit. Floating rate loan interests are typically senior in the corporate capital structure of the borrower. Floating rate loan interests generally pay interest at rates that are periodically determined by reference to a base lending rate plus a premium. Since the rates reset only periodically, changes in prevailing interest rates (and particularly sudden and significant changes) can be expected to cause some fluctuations in the NAV of a fund to the extent that it invests in floating rate loan interests. The base lending rates are generally the lending rate offered by one or more European banks, such as the London Interbank Offered Rate (“LIBOR”), the prime rate offered by one or more U.S. banks or the certificate of deposit rate. Floating rate loan interests may involve foreign borrowers, and investments may be denominated in foreign currencies. These investments are treated as investments in debt securities for purposes of a fund’s investment policies.
When a fund purchases a floating rate loan interest, it may receive a facility fee and when it sells a floating rate loan interest, it may pay a facility fee. On an ongoing basis, a fund may receive a commitment fee based on the undrawn portion of the underlying line of credit amount of a floating rate loan interest. Facility and commitment fees are typically amortized to income over the term of the loan or term of the commitment, respectively. Consent and amendment fees are recorded to income as earned. Prepayment penalty fees, which may be received by a fund upon the prepayment of a floating rate loan interest by a borrower, are recorded as realized gains. A fund may invest in multiple series or tranches of a loan. A different series or tranche may have varying terms and carry different associated risks.
Floating rate loan interests are usually freely callable at the borrower’s option. A fund may invest in such loans in the form of participations in loans (“Participations”) or assignments (“Assignments”) of all or a portion of loans from third parties. Participations typically will result in a fund having a contractual relationship only with the lender, not with the borrower. A fund has the right to receive payments of principal, interest and any fees to which it is entitled only from the lender selling the Participation and only upon receipt by the lender of the payments from the borrower. In connection with purchasing Participations, a fund generally will have no right to enforce compliance by the borrower with the terms of the loan agreement, nor any rights of offset against the borrower. A fund may not benefit directly from any collateral supporting the loan in which it has purchased the Participation. As a result, a fund assumes the credit risk of both the borrower and the lender that is selling the Participation. A fund’s investment in loan participation interests involves the risk of insolvency of the financial intermediaries who are parties to the transactions. In the event of the insolvency of the lender selling the Participation, a fund may be treated as a general creditor of the lender and may not benefit from any offset between the lender and the borrower. Assignments typically result in a fund having a direct contractual relationship with the borrower, and a fund may enforce compliance by the borrower with the terms of the loan agreement.
In connection with floating rate loan interests, certain funds may also enter into unfunded floating rate loan interests (“commitments”). In connection with these commitments, a fund earns a commitment fee, typically set as a percentage of the commitment amount. Such fee income, which is included in interest income in the Statements of Operations, is recognized ratably over the commitment period. Unfunded floating rate loan interests are marked-to-market daily, and any unrealized appreciation (depreciation) is included in the Statements of Assets and Liabilities and Statements of Operations. As of period end, the funds had the following unfunded floating rate loan interests:
| | | | | | | | | | | | | | | | | | |
| Fund Name | | Borrower | | Par | | | Commitment Amount | | | Value | | | Unrealized
Appreciation/
(Depreciation) | |
DSU | | EyeCare Partners LLC | | $ | 375,820 | | | $ | 375,820 | | | $ | 337,392 | | | $ | (38,428 | ) |
| | Intelsat Jackson Holdings SA | | | 77,512 | | | | 77,493 | | | | 78,530 | | | | 1,037 | |
| | MED ParentCo LP | | | 113,223 | | | | 112,091 | | | | 102,184 | | | | (9,907 | ) |
| | Neiman Marcus Group Ltd LLC | | | 22,508 | | | | 22,508 | | | | 22,958 | | | | 450 | |
FRA | | EyeCare Partners LLC | | | 324,109 | | | | 324,109 | | | | 290,969 | | | | (33,140 | ) |
| | Intelsat Jackson Holdings SA | | | 67,290 | | | | 67,274 | | | | 68,174 | | | | 900 | |
| | MED ParentCo LP | | | 104,833 | | | | 103,476 | | | | 94,611 | | | | (8,865 | ) |
| | Neiman Marcus Group Ltd LLC | | | 55,054 | | | | 55,054 | | | | 56,155 | | | | 1,101 | |
BLW | | EyeCare Partners LLC | | | 121,637 | | | | 121,637 | | | | 109,200 | | | | (12,437 | ) |
| | Intelsat Jackson Holdings SA | | | 24,702 | | | | 24,631 | | | | 25,026 | | | | 395 | |
| | MED ParentCo LP | | | 50,529 | | | | 49,201 | | | | 45,602 | | | | (3,599 | ) |
| | | Neiman Marcus Group Ltd LLC | | | 20,250 | | | | 20,250 | | | | 20,655 | | | | 405 | |
Forward Commitments, When-Issued and Delayed Delivery Securities: Certain funds may purchase securities on a when-issued basis and may purchase or sell securities on a forward commitment basis. Settlement of such transactions normally occurs within a month or more after the purchase or sale commitment is made. A fund may purchase securities under such conditions with the intention of actually acquiring them, but may enter into a separate agreement to sell the securities before the settlement date. Since the value of securities purchased may fluctuate prior to settlement, a fund may be required to pay more at settlement than the security is worth. In addition, a fund is not entitled to any of the interest earned prior to settlement. When purchasing a security on a delayed delivery basis, a fund assumes the rights and risks of ownership of the security, including the risk of price and yield fluctuations. In the event of default by the counterparty, a fund’s maximum amount of loss is the unrealized appreciation of unsettled when-issued transactions.
| | |
NOTESTO FINANCIAL STATEMENTS | | 97 |
Notes to Financial Statements (unaudited) (continued)
TBA Commitments: TBA commitments are forward agreements for the purchase or sale of mortgage-backed securities for a fixed price, with payment and delivery on an agreed upon future settlement date. The specific securities to be delivered are not identified at the trade date. However, delivered securities must meet specified terms, including issuer, rate and mortgage terms. When entering into TBA commitments, a fund may take possession of or deliver the underlying mortgage-backed securities but can extend the settlement or roll the transaction. TBA commitments involve a risk of loss if the value of the security to be purchased or sold declines or increases, respectively, prior to settlement date.
In order to better define contractual rights and to secure rights that will help a fund mitigate its counterparty risk, TBA commitments may be entered into by a fund under Master Securities Forward Transaction Agreements (each, an “MSFTA”). An MSFTA typically contains, among other things, collateral posting terms and netting provisions in the event of default and/or termination event. The collateral requirements are typically calculated by netting the mark-to-market amount for each transaction under such agreement and comparing that amount to the value of the collateral currently pledged by a fund and the counterparty. Cash collateral that has been pledged to cover the obligations of a fund and cash collateral received from the counterparty, if any, is reported separately in the Statements of Assets and Liabilities as cash pledged as collateral for TBA commitments or cash received as collateral for TBA commitments, respectively. Non-cash collateral pledged by a fund, if any, is noted in the Schedules of Investments. Typically, a fund is permitted to sell, re-pledge or use the collateral it receives; however, the counterparty is not permitted to do so. To the extent amounts due to a fund are not fully collateralized, contractually or otherwise, a fund bears the risk of loss from counterparty non-performance.
Mortgage Dollar Roll Transactions: Certain funds may sell TBA mortgage-backed securities and simultaneously contract to repurchase substantially similar (i.e., same type, coupon and maturity) securities on a specific future date at an agreed upon price. During the period between the sale and repurchase, a fund is not entitled to receive interest and principal payments on the securities sold. Mortgage dollar roll transactions are treated as purchases and sales and realize gains and losses on these transactions. Mortgage dollar rolls involve the risk that the market value of the securities that a fund is required to purchase may decline below the agreed upon repurchase price of those securities.
Reverse Repurchase Agreements: Reverse repurchase agreements are agreements with qualified third party broker dealers in which a fund sells securities to a bank or broker-dealer and agrees to repurchase the same securities at a mutually agreed upon date and price. A fund receives cash from the sale to use for other investment purposes. During the term of the reverse repurchase agreement, a fund continues to receive the principal and interest payments on the securities sold. Certain agreements have no stated maturity and can be terminated by either party at any time. Interest on the value of the reverse repurchase agreements issued and outstanding is based upon competitive market rates determined at the time of issuance. A fund may utilize reverse repurchase agreements when it is anticipated that the interest income to be earned from the investment of the proceeds of the transaction is greater than the interest expense of the transaction. Reverse repurchase agreements involve leverage risk. If a fund suffers a loss on its investment of the transaction proceeds from a reverse repurchase agreement, a fund would still be required to pay the full repurchase price. Further, a fund remains subject to the risk that the market value of the securities repurchased declines below the repurchase price. In such cases, a fund would be required to return a portion of the cash received from the transaction or provide additional securities to the counterparty.
Cash received in exchange for securities delivered plus accrued interest due to the counterparty is recorded as a liability in the Statements of Assets and Liabilities at face value including accrued interest. Due to the short-term nature of the reverse repurchase agreements, face value approximates fair value. Interest payments made by a fund to the counterparties are recorded as a component of interest expense in the Statements of Operations. In periods of increased demand for the security, a fund may receive a fee for the use of the security by the counterparty, which may result in interest income to a fund.
For the six months ended June 30, 2020, the average amount of reverse repurchase agreements outstanding and the daily weighted average interest rate for BLW was $233,773,903 and 1.51%, respectively.
Reverse repurchase transactions are entered into by a fund under Master Repurchase Agreements (each, an “MRA”), which permit a fund, under certain circumstances, including an event of default (such as bankruptcy or insolvency), to offset payables and/or receivables under the MRA with collateral held and/or posted to the counterparty and create one single net payment due to or from a fund. With reverse repurchase transactions, typically a fund and counterparty under an MRA are permitted to sell, re-pledge, or use the collateral associated with the transaction. Bankruptcy or insolvency laws of a particular jurisdiction may impose restrictions on or prohibitions against such a right of offset in the event of the MRA counterparty’s bankruptcy or insolvency. Pursuant to the terms of the MRA, a fund receives or posts securities and cash as collateral with a market value in excess of the repurchase price to be paid or received by a fund upon the maturity of the transaction. Upon a bankruptcy or insolvency of the MRA counterparty, a fund is considered an unsecured creditor with respect to excess collateral and, as such, the return of excess collateral may be delayed.
As of period end, the following table is a summary of BLW’s open reverse repurchase agreements by counterparty which are subject to offset under an MRA on a net basis:
| | | | | | | | | | | | | | | | |
| Counterparty | | Reverse
Repurchase
Agreements | | | Fair Value of Non-cash Collateral
Pledged Including
Accrued Interest (a) | | | Cash Collateral
Pledged/Received | | | Net
Amount | |
Barclays Capital, Inc. | | | $(90,868,540) | | | $ | 90,868,540 | | | $ | — | | | $ | — | |
BNP Paribas S.A. | | | (118,490,275 | ) | | | 118,490,275 | | | | — | | | | — | |
BofA Securities, Inc. | | | (101,116 | ) | | | 101,116 | | | | — | | | | — | |
Credit Agricole Corporate And Inves | | | (4,001,857 | ) | | | 4,001,857 | | | | — | | | | — | |
Credit Suisse Securities (USA) LLC | | | (449,171 | ) | | | 449,171 | | | | — | | | | — | |
Goldman Sachs & Co. | | | (4,095,176 | ) | | | 4,095,176 | | | | — | | | | — | |
HSBC Securities (USA), Inc. | | | (18,681,101 | ) | | | 18,681,101 | | | | — | | | | — | |
J.P. Morgan Securities LLC | | | (1,628,770 | ) | | | 1,628,770 | | | | — | | | | — | |
RBC Capital Markets LLC | | | (41,430,778 | ) | | | 41,430,778 | | | | — | | | | — | |
| | | | | | | | | | | | | | | | |
| | $ | (279,746,784 | ) | | $ | 279,746,784 | | | $ | — | | | $ | — | |
| | | | | | | | | | | | | | | | |
| | (a) | Collateral with a value of $ 310,969,565 has been pledged in connection with open reverse repurchase agreements. Excess of collateral pledged to the individual counterparty is not shown for financial reporting purposes. | |
| | |
| 98 | | 2020 BLACKROCK SEMI-ANNUAL REPORTTO SHAREHOLDERS |
Notes to Financial Statements (unaudited) (continued)
In the event the counterparty of securities under an MRA files for bankruptcy or becomes insolvent, a fund’s use of the proceeds from the agreement may be restricted while the counterparty, or its trustee or receiver, determines whether or not to enforce a fund’s obligation to repurchase the securities.
| 5. | DERIVATIVE FINANCIAL INSTRUMENTS |
The Funds engage in various portfolio investment strategies using derivative contracts both to increase the returns of the Funds and/or to manage their exposure to certain risks such as credit risk, equity risk, interest rate risk, foreign currency exchange rate risk, commodity price risk or other risks (e.g., inflation risk). Derivative financial instruments categorized by risk exposure are included in the Schedules of Investments. These contracts may be transacted on an exchange or OTC.
Futures Contracts: Futures contracts are purchased or sold to gain exposure to, or manage exposure to, changes in interest rates (interest rate risk) and changes in the value of equity securities (equity risk) or foreign currencies (foreign currency exchange rate risk).
Futures contracts are agreements between the Funds and a counterparty to buy or sell a specific quantity of an underlying instrument at a specified price and on a specified date. Depending on the terms of a contract, it is settled either through physical delivery of the underlying instrument on the settlement date or by payment of a cash amount on the settlement date. Upon entering into a futures contract, the Funds are required to deposit initial margin with the broker in the form of cash or securities in an amount that varies depending on a contract’s size and risk profile. The initial margin deposit must then be maintained at an established level over the life of the contract. Amounts pledged, which are considered restricted, are included in cash pledged for futures contracts in the Statements of Assets and Liabilities.
Securities deposited as initial margin are designated in the Schedules of Investments and cash deposited, if any, are shown as cash pledged for futures contracts in the Statements of Assets and Liabilities. Pursuant to the contract, the Funds agree to receive from or pay to the broker an amount of cash equal to the daily fluctuation in market value of the contract (“variation margin”). Variation margin is recorded as unrealized appreciation (depreciation) and, if any, shown as variation margin receivable (or payable) on futures contracts in the Statements of Assets and Liabilities. When the contract is closed, a realized gain or loss is recorded in the Statements of Operations equal to the difference between the notional amount of the contract at the time it was opened and the notional amount at the time it was closed. The use of futures contracts involves the risk of an imperfect correlation in the movements in the price of futures contracts and interest, foreign currency exchange rates or underlying assets.
Forward Foreign Currency Exchange Contracts: Forward foreign currency exchange contracts are entered into to gain or reduce exposure to foreign currencies (foreign currency exchange rate risk).
A forward foreign currency exchange contract is an agreement between two parties to buy and sell a currency at a set exchange rate on a specified date. These contracts help to manage the overall exposure to the currencies in which some of the investments held by the Funds are denominated and in some cases, may be used to obtain exposure to a particular market.
The contract is marked-to-market daily and the change in market value is recorded as unrealized appreciation (depreciation) in the Statements of Assets and Liabilities. When a contract is closed, a realized gain or loss is recorded in the Statements of Operations equal to the difference between the value at the time it was opened and the value at the time it was closed. Non-deliverable forward foreign currency exchange contracts are settled with the counterparty in cash without the delivery of foreign currency. The use of forward foreign currency exchange contracts involves the risk that the value of a forward foreign currency exchange contract changes unfavorably due to movements in the value of the referenced foreign currencies, and such value may exceed the amount(s) reflected in the Statements of Assets and Liabilities. Cash amounts pledged for forward foreign currency exchange contracts are considered restricted and are included in cash pledged as collateral for OTC derivatives in the Statements of Assets and Liabilities.
Options: Certain Funds purchase and write call and put options to increase or decrease their exposure to the risks of underlying instruments, including equity risk, interest rate risk and/or commodity price risk and/or, in the case of options written, to generate gains from options premiums.
A call option gives the purchaser (holder) of the option the right (but not the obligation) to buy, and obligates the seller (writer) to sell (when the option is exercised) the underlying instrument at the exercise or strike price at any time or at a specified time during the option period. A put option gives the holder the right to sell and obligates the writer to buy the underlying instrument at the exercise or strike price at any time or at a specified time during the option period.
Premiums paid on options purchased and premiums received on options written, as well as the daily fluctuation in market value, are included in investments at value – unaffiliated and options written at value, respectively, in the Statements of Assets and Liabilities. When an instrument is purchased or sold through the exercise of an option, the premium is offset against the cost or proceeds of the underlying instrument. When an option expires, a realized gain or loss is recorded in the Statements of Operations to the extent of the premiums received or paid. When an option is closed or sold, a gain or loss is recorded in the Statements of Operations to the extent the cost of the closing transaction exceeds the premiums received or paid. When the Funds write a call option, such option is typically “covered,” meaning that they hold the underlying instrument subject to being called by the option counterparty. When the Funds write a put option, cash is segregated in an amount sufficient to cover the obligation. These amounts, which are considered restricted, are included in cash pledged as collateral for options written in the Statements of Assets and Liabilities.
| | • | | Swaptions — Certain Funds purchase and write options on swaps (“swaptions”) primarily to preserve a return or spread on a particular investment or portion of the Funds’ holdings, as a duration management technique or to protect against an increase in the price of securities it anticipates purchasing at a later date. The purchaser and writer of a swaption is buying or granting the right to enter into a previously agreed upon interest rate or credit default swap agreement (interest rate risk and/or credit risk) at any time before the expiration of the option. |
In purchasing and writing options, the Funds bear the risk of an unfavorable change in the value of the underlying instrument or the risk that they may not be able to enter into a closing transaction due to an illiquid market. Exercise of a written option could result in the Funds purchasing or selling a security when they otherwise would not, or at a price different from the current market value.
| | |
NOTESTO FINANCIAL STATEMENTS | | 99 |
Notes to Financial Statements (unaudited) (continued)
Swaps: Swap contracts are entered into to manage exposure to issuers, markets and securities. Such contracts are agreements between the Funds and a counterparty to make periodic net payments on a specified notional amount or a net payment upon termination. Swap agreements are privately negotiated in the OTC market and may be entered into as a bilateral contract (“OTC swaps”) or centrally cleared (“centrally cleared swaps”).
For OTC swaps, any upfront premiums paid and any upfront fees received are shown as swap premiums paid and swap premiums received, respectively, in the Statements of Assets and Liabilities and amortized over the term of the contract. The daily fluctuation in market value is recorded as unrealized appreciation (depreciation) on OTC Swaps in the Statements of Assets and Liabilities. Payments received or paid are recorded in the Statements of Operations as realized gains or losses, respectively. When an OTC swap is terminated, a realized gain or loss is recorded in the Statements of Operations equal to the difference between the proceeds from (or cost of) the closing transaction and the Funds’ basis in the contract, if any. Generally, the basis of the contract is the premium received or paid.
In a centrally cleared swap, immediately following execution of the swap contract, the swap contract is novated to a central counterparty (the “CCP”) and the Funds’ counterparty on the swap agreement becomes the CCP. The Funds are required to interface with the CCP through the broker. Upon entering into a centrally cleared swap, the Funds are required to deposit initial margin with the broker in the form of cash or securities in an amount that varies depending on the size and risk profile of the particular swap. Securities deposited as initial margin are designated in the Schedules of Investments and cash deposited is shown as cash pledged for centrally cleared swaps in the Statements of Assets and Liabilities. Amounts pledged, which are considered restricted cash, are included in cash pledged for centrally cleared swaps in the Statements of Assets and Liabilities. Pursuant to the contract, the Funds agree to receive from or pay to the broker an amount of cash equal to the daily fluctuation in market value of the contract (“variation margin”). Variation margin is recorded as unrealized appreciation (depreciation) and shown as variation margin receivable (or payable) on centrally cleared swaps in the Statements of Assets and Liabilities. Payments received from (paid to) the counterparty, including at termination, are recorded as realized gains (losses) in the Statements of Operations.
| | • | | Credit default swaps — Credit default swaps are entered into to manage exposure to the market or certain sectors of the market, to reduce risk exposure to defaults of corporate and/or sovereign issuers or to create exposure to corporate and/or sovereign issuers to which a fund is not otherwise exposed (credit risk). |
The Funds may either buy or sell (write) credit default swaps on single-name issuers (corporate or sovereign), a combination or basket of single-name issuers or traded indexes. Credit default swaps are agreements in which the protection buyer pays fixed periodic payments to the seller in consideration for a promise from the protection seller to make a specific payment should a negative credit event take place with respect to the referenced entity (e.g., bankruptcy, failure to pay, obligation acceleration, repudiation, moratorium or restructuring). As a buyer, if an underlying credit event occurs, the Funds will either (i) receive from the seller an amount equal to the notional amount of the swap and deliver the referenced security or underlying securities comprising the index, or (ii) receive a net settlement of cash equal to the notional amount of the swap less the recovery value of the security or underlying securities comprising the index. As a seller (writer), if an underlying credit event occurs, the Funds will either pay the buyer an amount equal to the notional amount of the swap and take delivery of the referenced security or underlying securities comprising the index or pay a net settlement of cash equal to the notional amount of the swap less the recovery value of the security or underlying securities comprising the index.
| | • | | Interest rate swaps — Interest rate swaps are entered into to gain or reduce exposure to interest rates or to manage duration, the yield curve or interest rate (interest rate risk). |
Interest rate swaps are agreements in which one party pays a stream of interest payments, either fixed or floating, in exchange for another party’s stream of interest payments, either fixed or floating, on the same notional amount for a specified period of time. In more complex interest rate swaps, the notional principal amount may decline (or amortize) over time.
Swap transactions involve, to varying degrees, elements of interest rate, credit and market risk in excess of the amounts recognized in the Statements of Assets and Liabilities. Such risks involve the possibility that there will be no liquid market for these agreements, that the counterparty to the agreements may default on its obligation to perform or disagree as to the meaning of the contractual terms in the agreements, and that there may be unfavorable changes in interest rates and/or market values associated with these transactions.
Master Netting Arrangements: In order to define their contractual rights and to secure rights that will help them mitigate their counterparty risk, the Funds may enter into an International Swaps and Derivatives Association, Inc. Master Agreement (“ISDA Master Agreement”) or similar agreement with their counterparties. An ISDA Master Agreement is a bilateral agreement between each Fund and a counterparty that governs certain OTC derivatives and typically contains, among other things, collateral posting terms and netting provisions in the event of a default and/or termination event. Under an ISDA Master Agreement, each Fund may, under certain circumstances, offset with the counterparty certain derivative financial instruments’ payables and/or receivables with collateral held and/or posted and create one single net payment. The provisions of the ISDA Master Agreement typically permit a single net payment in the event of default including the bankruptcy or insolvency of the counterparty. Bankruptcy or insolvency laws of a particular jurisdiction may restrict or prohibit the right of offset in bankruptcy, insolvency or other events.
Collateral Requirements: For derivatives traded under an ISDA Master Agreement, the collateral requirements are typically calculated by netting the mark-to-market amount for each transaction under such agreement and comparing that amount to the value of any collateral currently pledged by the Fund and the counterparty.
Cash collateral that has been pledged to cover obligations of the Funds and cash collateral received from the counterparty, if any, is reported separately in the Statements of Assets and Liabilities as cash pledged as collateral and cash received as collateral, respectively. Non-cash collateral pledged by the Funds, if any, is noted in the Schedules of Investments. Generally, the amount of collateral due from or to a counterparty is subject to a certain minimum transfer amount threshold before a transfer is required, which is determined at the close of business of the Funds. Any additional required collateral is delivered to/pledged by the Funds on the next business day. Typically, the counterparty is not permitted to sell, re-pledge or use cash and non-cash collateral it receives. A Fund generally agrees not to use non-cash collateral that it receives but may, absent default or certain other circumstances defined in the underlying ISDA Master Agreement, be permitted to use cash collateral received. In such cases, interest may be paid pursuant to the collateral arrangement with the counterparty. To the extent amounts due to the Funds from their counterparties are not fully collateralized, they bear the risk of loss from counterparty non-performance. Likewise, to the extent the Funds have delivered collateral to a counterparty and stand ready to perform under the terms of their agreement with such counterparty, they bear the risk of loss from a counterparty in the amount of the value of the collateral in the event the counterparty fails to return such collateral. Based on the terms of agreements, collateral may not be required for all derivative contracts.
| | |
| 100 | | 2020 BLACKROCK SEMI-ANNUAL REPORTTO SHAREHOLDERS |
Notes to Financial Statements (unaudited) (continued)
For financial reporting purposes, the Funds do not offset derivative assets and derivative liabilities that are subject to netting arrangements, if any, in the Statements of Assets and Liabilities.
| 6. | INVESTMENT ADVISORY AGREEMENT AND OTHER TRANSACTIONS WITH AFFILIATES |
Investment Advisory: Each Fund entered into an Investment Advisory Agreement with the Manager, the Funds’ investment adviser and an indirect, wholly-owned subsidiary of BlackRock, Inc. (“BlackRock”), to provide investment advisory and administrative services. The Manager is responsible for the management of each Fund’s portfolio and provides the personnel, facilities, equipment and certain other services necessary to the operations of each Fund.
For such services, DSU and FRA pay the Manager a monthly fee at an annual rate equal to the following percentages of the average daily value of each Fund’s net assets, plus the proceeds of any debt securities or outstanding borrowings used for leverage:
| | | | |
| | | DSU | | FRA |
Investment advisory fees | | 0.55% | | 0.75% |
For purposes of calculating these fees, “net assets” means the total assets of each Fund minus the sum of its accrued liabilities.
For such services, BLW pays the Manager a monthly fee at an annual rate equal to 0.55% of the average weekly value of the Fund’s managed assets, plus the proceeds of any debt securities or outstanding borrowings used for leverage. For purposes of calculating this fee, “managed assets” are determined as total assets of the Fund (including any assets attributable to money borrowed for investment purposes) less the sum of its accrued liabilities (other than money borrowed for investment purposes).
With respect to each Fund, effective March 2, 2020 for FRA, the Manager entered into separate sub-advisory agreements with BlackRock International Limited (“BIL”), an affiliate of the Manager. With respect to BLW, the Manager also entered into a separate sub-advisory agreement with BlackRock (Singapore) Limited (“BRS”), an affiliate of the Manager. The Manager pays BIL and, with respect to BLW, BRS for services they provide for that portion of each Fund for which BIL, and, with respect to BLW, BRS acts as sub-adviser, a monthly fee that is equal to a percentage of the investment advisory fees paid by each Fund to the Manager.
Expense Waivers and Reimbursements: With respect to each Fund, the Manager contractually agreed to waive its investment advisory fees by the amount of investment advisory fees each Fund pays to the Manager indirectly through its investment in affiliated money market funds (the “affiliated money market fund waiver”) through June 30, 2021. The contractual agreement may be terminated upon 90 days’ notice by a majority of the Independent Directors, or by a vote of a majority of the outstanding voting securities of the Fund. These amounts are included in fees waived and/or reimbursed by the Manager in the Statements of Operations. For the six months ended June 30, 2020, the amounts waived were as follows:
| | | | | | | | | | | | |
| | | DSU | | | FRA | | | BLW | |
Amounts waived | | $ | 703 | | | $ | 452 | | | $ | 1,423 | |
The Manager contractually agreed to waive its investment advisory fee with respect to any portion of each Fund’s assets invested in affiliated equity and fixed-income mutual funds and affiliated exchange-traded funds that have a contractual management fee through June 30, 2021. The agreement can be renewed for annual periods thereafter, and may be terminated on 90 days’ notice, each subject to approval by a majority of the Funds’ Independent Directors. These amounts are included in fees waived and/or reimbursed by the Manager in the Statements of Operations. For the six months ended June 30, 2020, the amounts waived in investment advisory fees pursuant to these arrangements were as follows:
| | | | | | | | | | | | |
| | | DSU | | | FRA | | | BLW | |
Amounts waived | | $ | 15,852 | | | $ | 29,714 | | | $ | 1,977 | |
Directors and Officers: Certain directors and/or officers of the Funds are directors and/or officers of BlackRock or its affiliates. The Funds reimburse the Manager for a portion of the compensation paid to the Funds’ Chief Compliance Officer, which is included in Directors and Officer in the Statements of Operations.
Other Transactions: The Funds may purchase securities from, or sell securities to, an affiliated fund provided the affiliation is due solely to having a common investment adviser, common officers, or common directors. For the six months ended June 30, 2020, the purchase and sale transactions and any net realized gains (losses) with affiliated funds in compliance with Rule 17a-7 under the 1940 Act were as follows:
| | | | | | | | | | | | |
| | | Purchases | | | Sales | | | Net Realized Gain (Loss) | |
DSU | | $ | 83,969 | | | $ | 7,365,717 | | | $ | (183,602 | ) |
FRA | | | — | | | | 623,665 | | | | (93,730 | ) |
BLW | | | 1,769,374 | | | | 1,856,170 | | | | 74,614 | |
For the six months ended June 30, 2020, purchases and sales of investments, including paydowns/payups and excluding short-term securities, were as follows:
| | | | | | | | | | | | |
| | | DSU | | | FRA | | | BLW | |
Purchases | | $ | 309,536,208 | | | $ | 263,794,256 | | | $ | 375,320,999 | |
Sales | | | 390,088,440 | | | | 268,385,931 | | | | 283,315,587 | |
| | |
NOTESTO FINANCIAL STATEMENTS | | 101 |
Notes to Financial Statements (unaudited) (continued)
For the six months ended June 30, 2020, purchases and sales related to mortgage dollar rolls were as follows:
| | | | |
| | | BLW | |
Purchases | | $ | 53,749,990 | |
Sales | | | 53,858,441 | |
It is each Fund’s policy to comply with the requirements of the Internal Revenue Code of 1986, as amended, applicable to regulated investment companies, and to distribute substantially all of its taxable income to its shareholders. Therefore, no U.S. federal income tax provision is required.
Each Fund files U.S. federal and various state and local tax returns. No income tax returns are currently under examination. The statute of limitations on each Fund’s U.S. federal tax returns generally remains open, for FRA and BLW, each of the four years ended August 31, 2019 and period ended December 31, 2019 and for DSU, each of the four years ended February 28, 2019 and period ended December 31, 2019. The statutes of limitations on each Fund’s state and local tax returns may remain open for an additional year depending upon the jurisdiction.
Management has analyzed tax laws and regulations and their application to the Funds as of June 30, 2020, inclusive of the open tax return years, and does not believe that there are any uncertain tax positions that require recognition of a tax liability in the Funds’ financial statements.
As of December 31, 2019, the Funds had non-expiring capital loss carryforwards available to offset future realized capital gains as follows:
| | | | | | | | | | | | |
| | | DSU | | | FRA | | | BLW | |
| | | $ | 71,050,350 | | | $ | 29,632,724 | | | $ | 38,457,929 | |
As of June 30, 2020, gross unrealized appreciation and depreciation for investments and derivatives based on cost for U.S. federal income tax purposes were as follows:
| | | | | | | | | | | | |
| | | DSU | | | FRA | | | BLW | |
Tax cost | | $ | 793,298,869 | | | $ | 726,945,355 | | | $ | 910,709,674 | |
| | | | | | | | | | | | |
Gross unrealized appreciation | | $ | 3,391,742 | | | $ | 2,161,338 | | | $ | 20,159,884 | |
Gross unrealized depreciation | | | (64,672,490 | ) | | | (43,819,041 | ) | | | (43,167,209 | ) |
| | | | | | | | | | | | |
Net unrealized appreciation (depreciation) | | $ | (61,280,748 | ) | | $ | (41,657,703 | ) | | $ | (23,007,325 | ) |
| | | | | | | | | | | | |
DSU and FRA are party to a senior committed secured, 360-day rolling line of credit facility and a separate security agreement (the “SSB Agreement”) with State Street Bank and Trust Company (“SSB”). SSB may elect to terminate its commitment upon 360-days written notice to DSU and FRA. As of period end, DSU and FRA have not received any notice to terminate. DSU and FRA have granted a security interest in substantially all of their assets to SSB.
The SSB Agreement allows for the following maximum commitment amounts:
| | | | |
| | | Commitment Amounts | |
DSU | | $ | 340,000,000 | |
FRA | | | 274,000,000 | |
Advances will be made by SSB to DSU and FRA, at DSU’s and FRA’s option of (a) the higher of (i) 0.80% above the Fed Funds rate and (ii) 0.80% above Overnight LIBOR or (b) 0.80% above 7-day, 30-day, 60-day or 90-day LIBOR. Overnight LIBOR and LIBOR rates are subject to a 0% floor.
In addition, DSU and FRA paid a commitment fee (based on the daily unused portion of the commitments). The fees associated with each of the agreements are included in the Statements of Operations as borrowing costs, if any. Advances to DSU and FRA as of period end, if any, are shown in the Statements of Assets and Liabilities as bank borrowings payable. Based on the short-term nature of the borrowings under the line of credit and the variable interest rate, the carrying amount of the borrowings approximates fair value.
DSU and FRA may not declare dividends or make other distributions on shares or purchase any such shares if, at the time of the declaration, distribution or purchase, asset coverage with respect to the outstanding short-term borrowings is less than 300%.
For the six months ended June 30, 2020, the average amount of bank borrowings and the daily weighted average interest rates for DSU and FRA for loans under the revolving credit agreements were as follows:
| | | | | | | | |
| | | Average Amount
Outstanding | | | Daily Weighted
Average Interest Rate | |
DSU | | $ | 222,719,780 | | | | 1.71 | % |
FRA | | | 191,368,132 | | | | 1.65 | |
| | |
| 102 | | 2020 BLACKROCK SEMI-ANNUAL REPORTTO SHAREHOLDERS |
Notes to Financial Statements (unaudited) (continued)
In the normal course of business, certain Funds invest in securities or other instruments and may enter into certain transactions, and such activities subject each Fund to various risks, including among others, fluctuations in the market (market risk) or failure of an issuer to meet all of its obligations. The value of securities or other instruments may also be affected by various factors, including, without limitation: (i) the general economy; (ii) the overall market as well as local, regional or global political and/or social instability; (iii) regulation, taxation or international tax treaties between various countries; or (iv) currency, interest rate and price fluctuations. Local, regional or global events such as war, acts of terrorism, the spread of infectious illness or other public health issues, recessions, or other events could have a significant impact on the Funds and their investments.
Each Fund may be exposed to prepayment risk, which is the risk that borrowers may exercise their option to prepay principal earlier than scheduled during periods of declining interest rates, which would force each Fund to reinvest in lower yielding securities. Each Fund may also be exposed to reinvestment risk, which is the risk that income from each Fund’s portfolio will decline if each Fund invests the proceeds from matured, traded or called fixed-income securities at market interest rates that are below each Fund portfolio’s current earnings rate.
Each Fund may invest without limitation in illiquid or less liquid investments or investments in which no secondary market is readily available or which are otherwise illiquid, including private placement securities. A Fund may not be able to readily dispose of such investments at prices that approximate those at which a Fund could sell such investments if they were more widely traded and, as a result of such illiquidity, a Fund may have to sell other investments or engage in borrowing transactions if necessary to raise funds to meet its obligations. Limited liquidity can also affect the market price of investments, thereby adversely affecting a Fund’s net asset value and ability to make dividend distributions. Privately issued debt securities are often of below investment grade quality, frequently are unrated and present many of the same risks as investing in below investment grade public debt securities.
Valuation Risk: The market values of equities, such as common stocks and preferred securities or equity related investments, such as futures and options, may decline due to general market conditions which are not specifically related to a particular company. They may also decline due to factors which affect a particular industry or industries. A Fund may invest in illiquid investments. An illiquid investment is any investment that a Fund reasonably expects cannot be sold or disposed of in current market conditions in seven calendar days or less without the sale or disposition significantly changing the market value of the investment. A Fund may experience difficulty in selling illiquid investments in a timely manner at the price that it believes the investments are worth. Prices may fluctuate widely over short or extended periods in response to company, market or economic news. Markets also tend to move in cycles, with periods of rising and falling prices. This volatility may cause each Fund’s NAV to experience significant increases or decreases over short periods of time. If there is a general decline in the securities and other markets, the NAV of a Fund may lose value, regardless of the individual results of the securities and other instruments in which a Fund invests.
The price a Fund could receive upon the sale of any particular portfolio investment may differ from a Fund’s valuation of the investment, particularly for securities that trade in thin or volatile markets or that are valued using a fair valuation technique or a price provided by an independent pricing service. Changes to significant unobservable inputs and assumptions (i.e., publicly traded company multiples, growth rate, time to exit) due to the lack of observable inputs may significantly impact the resulting fair value and therefore a Fund’s results of operations. As a result, the price received upon the sale of an investment may be less than the value ascribed by a Fund, and a Fund could realize a greater than expected loss or lesser than expected gain upon the sale of the investment. A Fund’s ability to value its investments may also be impacted by technological issues and/or errors by pricing services or other third party service providers.
An outbreak of respiratory disease caused by a novel coronavirus has developed into a global pandemic and has resulted in closing borders, quarantines, disruptions to supply chains and customer activity, as well as general concern and uncertainty. The impact of this pandemic, and other global health crises that may arise in the future, could affect the economies of many nations, individual companies and the market in general in ways that cannot necessarily be foreseen at the present time. This pandemic may result in substantial market volatility and may adversely impact the prices and liquidity of a fund’s investments. The duration of this pandemic and its effects cannot be determined with certainty.
Counterparty Credit Risk: The Funds may be exposed to counterparty credit risk, or the risk that an entity may fail to or be unable to perform on its commitments related to unsettled or open transactions. The Funds manage counterparty credit risk by entering into transactions only with counterparties that the Manager believes have the financial resources to honor their obligations and by monitoring the financial stability of those counterparties. Financial assets, which potentially expose the Funds to market, issuer and counterparty credit risks, consist principally of financial instruments and receivables due from counterparties. The extent of the Funds’ exposure to market, issuer and counterparty credit risks with respect to these financial assets is approximately their value recorded in the Statements of Assets and Liabilities, less any collateral held by the Funds.
A derivative contract may suffer a mark-to-market loss if the value of the contract decreases due to an unfavorable change in the market rates or values of the underlying instrument. Losses can also occur if the counterparty does not perform under the contract.
A Fund’s risk of loss from counterparty credit risk on OTC derivatives is generally limited to the aggregate unrealized gain less the value of any collateral held by such Fund.
For OTC options purchased, each Fund bears the risk of loss in the amount of the premiums paid plus the positive change in market values net of any collateral held by the Funds should the counterparty fail to perform under the contracts. Options written by the Funds do not typically give rise to counterparty credit risk, as options written generally obligate the Funds, and not the counterparty, to perform. The Funds may be exposed to counterparty credit risk with respect to options written to the extent each Fund deposits collateral with its counterparty to a written option.
With exchange-traded options purchased and futures and centrally cleared swaps, there is less counterparty credit risk to the Funds since the exchange or clearinghouse, as counterparty to such instruments, guarantees against a possible default. The clearinghouse stands between the buyer and the seller of the contract; therefore, credit risk is limited to failure of the clearinghouse. While offset rights may exist under applicable law, a Fund does not have a contractual right of offset against a clearing broker or clearinghouse in the event of a default (including the bankruptcy or insolvency). Additionally, credit risk exists in exchange-traded futures and centrally cleared swaps
| | |
NOTESTO FINANCIAL STATEMENTS | | 103 |
Notes to Financial Statements (unaudited) (continued)
with respect to initial and variation margin that is held in a clearing broker’s customer accounts. While clearing brokers are required to segregate customer margin from their own assets, in the event that a clearing broker becomes insolvent or goes into bankruptcy and at that time there is a shortfall in the aggregate amount of margin held by the clearing broker for all its clients, typically the shortfall would be allocated on a pro rata basis across all the clearing broker’s customers, potentially resulting in losses to the Funds.
Concentration Risk: Certain Funds may invest in securities that are rated below investment grade quality (sometimes called “junk bonds”) or are unrated, which are predominantly speculative, have greater credit risk and generally are less liquid than, and have more volatile prices than, higher quality securities.
Certain Funds invest a significant portion of their assets in fixed-income securities and/or use derivatives tied to the fixed-income markets. Changes in market interest rates or economic conditions may affect the value and/or liquidity of such investments. Interest rate risk is the risk that prices of bonds and other fixed-income securities will increase as interest rates fall and decrease as interest rates rise. The Funds may be subject to a greater risk of rising interest rates due to the current period of historically low rates.
| 11. | CAPITAL SHARE TRANSACTIONS |
DSU is authorized to issue 400 million shares, all of which were initially classified as Common Shares. FRA is authorized to issue 200 million shares, all of which were initially classified as Common Shares. BLW is authorized to issue an unlimited number of shares, all of which were initially classified as Common Shares. The par value for DSU’s, FRA’s and BLW’s shares is $0.10, $0.10 and $0.001, respectively. Each Board is authorized, however, to reclassify any unissued Common Shares to Preferred Shares without the approval of Common Shareholders.
Open Market Share Repurchase Program: Each Fund participates in an open market share repurchase program (the “Repurchase Program”). From December 1, 2018 through November 30, 2019, each Fund was permitted to repurchase up to 5% of its outstanding common shares under the Repurchase Program, based on common shares outstanding as of the close of business on November 30, 2018, subject to certain conditions. From December 1, 2019 through November 30, 2020, each Fund may repurchase up to 5% of its outstanding common shares under the Repurchase Program, based on common shares outstanding as of the close of business on November 30, 2019, subject to certain conditions. There is no assurance that the Funds will purchase shares in any particular amounts.
The total cost of the shares repurchased is reflected in the Fund’s Statements of Changes in Net Assets. For the periods shown, shares repurchased and cost, including transaction costs were as follows:
| | | | | | | | | | | | | | | | | | | | | | | | |
| | | DSU | | | FRA | | | BLW | |
| | | Shares | | | Amount | | | Shares | | | Amount | | | Shares | | | Amount | |
Six Months Ended June 30, 2020 | | | 2,632,584 | | | $ | 26,716,257 | | | | 223,820 | | | $ | 2,485,930 | | | | 93,594 | | | $ | 1,263,289 | |
Period Ended December 31, 2019 | | | 686,397 | | | | 7,398,251 | | | | 420,202 | | | | 5,346,886 | | | | — | | | | — | |
Year Ended August 31, 2019 | | | — | | | | — | | | | 907,235 | | | | 11,500,788 | | | | 803,959 | | | | 11,648,172 | |
Year Ended February 28, 2019 | | | 173,552 | | | | 1,913,158 | | | | — | | | | — | | | | — | | | | — | |
Discount Management Program: DSU’s three-year discount management program (the “Program”) ended in 2020. Under the Program, the Fund offered to repurchase its common shares based on three 3-month measurement periods when the Fund’s common shares traded at an average daily discount to net asset value (“NAV”) of more than 7.5% during a measurement period (the “discount trigger”). There was no guarantee that shareholders would be able to sell all of the shares that they desired to sell in any particular repurchase that was executed.
The discount trigger was met for all three measurement periods. For the first measurement period, the Fund conducted a tender offer for 10% of its outstanding shares of common stock. For the second and third measurement periods, the Fund conducted a tender offer for 5% of its outstanding shares of common stock.
The results of each tender offer were as follows:
| | | | | | | | | | | | | | | | | | | | | | | | | | | | |
Commencement
Date (a) | | Valuation Date | | | Number of Shares
Tendered | | | Tendered Shares
as a Percentage of
Outstanding
Shares | | | Number of
Tendered Shares
Purchased | | | Tendered Shares
Purchased as a
Percentage of
Outstanding
Shares | | | Purchase Price | | | Total Amount of
Purchases | |
March 16, 2018 | | | April 17, 2018 | | | | 26,225,806 | | | | 45 | % | | | 5,879,192 | | | | 10 | % | | $ | 12.4068 | | | $ | 72,941,959 | |
March 15, 2019 | | | April 15, 2019 | | | | 21,792,955 | | | | 41 | % | | | 2,636,959 | | | | 5 | % | | | 11.9854 | | | | 31,605,008 | |
March 17, 2020 | | | April 16, 2020 | | | | 17,034,684 | | | | 34 | % | | | 2,470,791 | | | | 5 | % | | | 10.2018 | | | | 25,206,516 | |
| | (a) | Date the tender offer period began. | |
| | |
| 104 | | 2020 BLACKROCK SEMI-ANNUAL REPORTTO SHAREHOLDERS |
Notes to Financial Statements (unaudited) (continued)
Management’s evaluation of the impact of all subsequent events on the Funds’ financial statements was completed through the date the financial statements were issued and the following items were noted:
The Funds declared and paid distributions to Common Shareholders as follows:
| | | | | | | | |
| | | Common Dividend Per Share | |
| | | Paid (a) | | | Declared (b) | |
DSU | | $ | 0.071100 | | | $ | 0.071100 | |
FRA | | | 0.078800 | | | | 0.078800 | |
BLW | | | 0.098100 | | | | 0.098100 | |
| | (a) | Net investment income dividend paid on July 31, 2020 to Common Shareholders of record on July 15, 2020. | |
| | (b) | Net investment income dividend declared on August 3, 2020, payable to shareholders of record on August 14, 2020. | |
| | |
NOTESTO FINANCIAL STATEMENTS | | 105 |
Disclosure of Investment Advisory Agreements
The Boards of Directors/Trustees, as applicable (collectively, the “Board,” the members of which are referred to as “Board Members”) of BlackRock Debt Strategies Fund, Inc. (“DSU”), BlackRock Floating Rate Income Strategies Fund, Inc. (“FRA”) and BlackRock Limited Duration Income Trust (“BLW” together with DSU and FRA, the “Funds” and each, a “Fund”) met on April 16, 2020 (the “April Meeting”) and May 20-21, 2020 (the “May Meeting”) to consider the approval of the investment advisory agreements (the “Advisory Agreements” or the “Agreements”) between each Fund and BlackRock Advisors, LLC (the “Manager” or “BlackRock”), each Fund’s investment advisor.
Activities and Composition of the Board
On the date of the May Meeting, the Board consisted of ten individuals, eight of whom were not “interested persons” of each Fund as defined in the Investment Company Act of 1940, as amended (the “1940 Act”) (the “Independent Board Members”). The Board Members are responsible for the oversight of the operations of each Fund and perform the various duties imposed on the directors of investment companies by the 1940 Act. The Independent Board Members have retained independent legal counsel to assist them in connection with their duties. The Co-Chairs of the Board are Independent Board Members. The Board has established five standing committees: an Audit Committee, a Governance and Nominating Committee, a Compliance Committee, a Performance Oversight Committee and an Executive Committee, each of which is chaired by an Independent Board Member and composed of Independent Board Members (except for the Executive Committee, which also has one interested Board Member).
The Agreements
Consistent with the requirements of the 1940 Act, the Board considers the continuation of the Agreements on an annual basis. The Board has four quarterly meetings per year, each typically extending for two days, and additional in-person and telephonic meetings throughout the year, as needed. While the Board also has a fifth one-day meeting to consider specific information surrounding the renewal of the Agreements, the Board’s consideration entails a year-long deliberative process whereby the Board and its committees assess BlackRock’s services to each Fund. In particular, the Board assessed, among other things, the nature, extent and quality of the services provided to each Fund by BlackRock, BlackRock’s personnel and affiliates, including (as applicable): investment management services; accounting oversight; administrative and shareholder services; oversight of each Fund’s service providers; risk management and oversight; and legal, regulatory and compliance services. Throughout the year, including during the contract renewal process, the Independent Board Members were advised by independent legal counsel, and met with independent legal counsel in various executive sessions outside of the presence of BlackRock’s management.
During the year, the Board, acting directly and through its committees, considers information that is relevant to its annual consideration of the renewal of the Agreements, including the services and support provided by BlackRock to each Fund and its shareholders. BlackRock also furnished additional information to the Board in response to specific questions from the Board. This additional information is discussed further in the section titled “Board Considerations in Approving the Agreements.” Among the matters the Board considered were: (a) investment performance for one-year, three-year, five-year, and/or since inception periods, as applicable, against peer funds, applicable benchmarks, and other performance metrics, as applicable, as well as BlackRock senior management’s and portfolio managers’ analyses of the reasons for any outperformance or underperformance relative to its peers, benchmarks, and other performance metrics, as applicable; (b) leverage management, as applicable; (c) fees, including advisory, administration, if applicable, and other amounts paid to BlackRock and its affiliates by each Fund for services; (d) Fund operating expenses and how BlackRock allocates expenses to each Fund; (e) the resources devoted to risk oversight of, and compliance reports relating to, implementation of each Fund’s investment objective, policies and restrictions, and meeting regulatory requirements; (f) BlackRock’s and each Fund’s adherence to applicable compliance policies and procedures; (g) the nature, character and scope of non-investment management services provided by BlackRock and its affiliates and the estimated cost of such services; (h) BlackRock’s and other service providers’ internal controls and risk and compliance oversight mechanisms; (i) BlackRock’s implementation of the proxy voting policies approved by the Board; (j) execution quality of portfolio transactions; (k) BlackRock’s implementation of each Fund’s valuation and liquidity procedures; (l) an analysis of management fees for products with similar investment mandates across the open-end fund, closed-end fund, sub-advised mutual fund, collective investment trust and institutional separate account product channels, as applicable, and the similarities and differences between these products and the services provided as compared to each Fund; (m) BlackRock’s compensation methodology for its investment professionals and the incentives and accountability it creates, along with investment professionals’ investments in the fund(s) they manage; (n)��periodic updates on BlackRock’s business; and (o) each Fund’s market discount/premium compared to peer funds.
Board Considerations in Approving the Agreements
The Approval Process: Prior to the April Meeting, the Board requested and received materials specifically relating to the Agreements. The Independent Board Members are continuously engaged in a process with their independent legal counsel and BlackRock to review the nature and scope of the information provided to the Board to better assist its deliberations. The materials provided in connection with the April Meeting included, among other things: (a) information independently compiled and prepared by Broadridge Financial Solutions, Inc. (“Broadridge”), based on Lipper classifications, regarding each Fund’s fees and expenses as compared with a peer group of funds as determined by Broadridge (“Expense Peers”) and the investment performance of each Fund as compared with a peer group of funds (“Performance Peers”); (b) information on the composition of the Expense Peers and Performance Peers and a description of Broadridge’s methodology; (c) information on the estimated profits realized by BlackRock and its affiliates pursuant to the Agreements and a discussion of fall-out benefits to BlackRock and its affiliates; (d) a general analysis provided by BlackRock concerning investment management fees received in connection with other types of investment products, such as institutional accounts, sub-advised mutual funds, closed-end funds, and open-end funds, under similar investment mandates, as applicable; (e) a review of non-management fees; (f) the existence, impact and sharing of potential economies of scale, if any, with each Fund; (g) a summary of aggregate amounts paid by each Fund to BlackRock; and (h) various additional information requested by the Board as appropriate regarding BlackRock’s and each Fund’s operations.
At the April Meeting, the Board reviewed materials relating to its consideration of the Agreements. As a result of the discussions that occurred during the April Meeting, and as a culmination of the Board’s year-long deliberative process, the Board presented BlackRock with questions and requests for additional information. BlackRock responded to these questions and requests with additional written information in advance of the May Meeting. Topics covered included: (a) the methodology for measuring estimated fund profitability; (b) fund expenses and potential fee waivers; (c) differences in services provided and management fees between closed-end funds and other product channels; and (d) BlackRock’s option overwrite strategy.
| | |
| 106 | | 2020 BLACKROCK SEMI-ANNUAL REPORTTO SHAREHOLDERS |
Disclosure of Investment Advisory Agreements (continued)
At the May Meeting, the Board concluded its assessment of, among other things: (a) the nature, extent and quality of the services provided by BlackRock; (b) the investment performance of each Fund as compared to its Performance Peers and to other metrics, as applicable; (c) the advisory fee and the estimated cost of the services and estimated profits realized by BlackRock and its affiliates from their relationship with each Fund; (d) each Fund’s fees and expenses compared to its Expense Peers; (e) the existence and sharing of potential economies of scale; (f) any fall-out benefits to BlackRock and its affiliates as a result of BlackRock’s relationship with each Fund; and (g) other factors deemed relevant by the Board Members.
The Board also considered other matters it deemed important to the approval process, such as other payments made to BlackRock or its affiliates relating to securities lending and cash management, and BlackRock’s services related to the valuation and pricing of Fund portfolio holdings. The Board noted the willingness of BlackRock’s personnel to engage in open, candid discussions with the Board. The Board did not identify any particular information as determinative, and each Board Member may have attributed different weights to the various items considered.
A. Nature, Extent and Quality of the Services Provided by BlackRock: The Board, including the Independent Board Members, reviewed the nature, extent and quality of services provided by BlackRock, including the investment advisory services, and the resulting performance of each Fund. Throughout the year, the Board compared Fund performance to the performance of a comparable group of closed-end funds, relevant benchmarks, and performance metrics, as applicable. The Board met with BlackRock’s senior management personnel responsible for investment activities, including the senior investment officers. The Board also reviewed the materials provided by each Fund’s portfolio management team discussing each Fund’s performance, investment strategies and outlook.
The Board considered, among other factors, with respect to BlackRock: the number, education and experience of investment personnel generally and each Fund’s portfolio management team; research capabilities; investments by portfolio managers in the funds they manage; portfolio trading capabilities; use of technology; commitment to compliance; credit analysis capabilities; risk analysis and oversight capabilities; and the approach to training and retaining portfolio managers and other research, advisory and management personnel. The Board also considered BlackRock’s overall risk management program, including the continued efforts of BlackRock and its affiliates to address cybersecurity risks and the role of BlackRock’s Risk & Quantitative Analysis Group. The Board engaged in a review of BlackRock’s compensation structure with respect to each Fund’s portfolio management team and BlackRock’s ability to attract and retain high-quality talent and create performance incentives.
In addition to investment advisory services, the Board considered the nature and quality of the administrative and other non-investment advisory services provided to each Fund. BlackRock and its affiliates provide each Fund with certain administrative, shareholder and other services (in addition to any such services provided to each Fund by third-parties) and officers and other personnel as are necessary for the operations of each Fund. In particular, BlackRock and its affiliates provide each Fund with administrative services including, among others: (i) responsibility for disclosure documents, such as the prospectus and the statement of additional information in connection with the initial public offering and periodic shareholder reports; (ii) preparing communications with analysts to support secondary market trading of each Fund; (iii) oversight of daily accounting and pricing; (iv) responsibility for periodic filings with regulators and stock exchanges; (v) overseeing and coordinating the activities of third-party service providers including, among others, each Fund’s custodian, fund accountant, transfer agent, and auditor; (vi) organizing Board meetings and preparing the materials for such Board meetings; (vii) providing legal and compliance support; (viii) furnishing analytical and other support to assist the Board in its consideration of strategic issues such as the merger, consolidation or repurposing of certain closed-end funds; and (ix) performing or managing administrative functions necessary for the operation of each Fund, such as tax reporting, expense management, fulfilling regulatory filing requirements, and shareholder call center and other services. The Board reviewed the structure and duties of BlackRock’s fund administration, shareholder services, and legal & compliance departments and considered BlackRock’s policies and procedures for assuring compliance with applicable laws and regulations.
B. The Investment Performance of each Fund and BlackRock: The Board, including the Independent Board Members, also reviewed and considered the performance history of each Fund. In preparation for the April Meeting, the Board was provided with reports independently prepared by Broadridge, which included an analysis of each Fund’s performance as of December 31, 2019, as compared to its Performance Peers. The performance information is based on net asset value (NAV), and utilizes Lipper data. Lipper’s methodology calculates a fund’s total return assuming distributions are reinvested on the ex-date at a fund’s ex-date NAV. Broadridge ranks funds in quartiles, ranging from first to fourth, where first is the most desirable quartile position and fourth is the least desirable. In connection with its review, the Board received and reviewed information regarding the investment performance of each Fund as compared to its Performance Peers and, with respect to DSU and FRA, a custom peer group of funds as defined by BlackRock (“Customized Peer Group”) and the performance of BLW as compared with its custom benchmark. The Board and its Performance Oversight Committee regularly review and meet with Fund management to discuss the performance of each Fund throughout the year.
In evaluating performance, the Board focused particular attention on funds with less favorable performance records. The Board also noted that while it found the data provided by Broadridge generally useful, it recognized the limitations of such data, including in particular, that notable differences may exist between a fund and its Performance Peers (for example, the investment objectives and strategies). Further, the Board recognized that the performance data reflects a snapshot of a period as of a particular date and that selecting a different performance period could produce significantly different results. The Board also acknowledged that long-term performance could be impacted by even one period of significant outperformance or underperformance, and that a single investment theme could have the ability to disproportionately affect long-term performance.
The Board noted that for the one-, three- and five-year periods reported, DSU ranked in the second, second, and third quartiles, respectively, against its Customized Peer Group. The Board noted that BlackRock believes that the Customized Peer Group is an appropriate performance metric for DSU, and that BlackRock has explained its rationale for this belief to the Board. The Board and BlackRock reviewed DSU’s underperformance relative to its Customized Peer Group during the applicable period.
The Board noted that for the one-, three- and five-year periods reported, FRA ranked in the first, second and second quartiles, respectively, against its Customized Peer Group. The Board noted that BlackRock believes that the Customized Peer Group is an appropriate performance metric for FRA, and that BlackRock has explained its rationale for this belief to the Board.
The Board noted that for each of the one-, three- and five-year periods reported, BLW outperformed its customized benchmark. The Board noted that BlackRock believes that performance relative to the customized benchmark is an appropriate performance metric for BLW, and that BlackRock has explained its rationale for this belief to the Board.
| | |
DISCLOSURE OF INVESTMENT ADVISORY AGREEMENTS | | 107 |
Disclosure of Investment Advisory Agreements (continued)
C. Consideration of the Advisory/Management Fees and the Estimated Cost of the Services and Estimated Profits Realized by BlackRock and its Affiliates from their Relationship with each Fund: The Board, including the Independent Board Members, reviewed each Fund’s contractual management fee rate compared with those of its Expense Peers. The contractual management fee rate represents a combination of the advisory fee and any administrative fees, before taking into account any reimbursements or fee waivers. The Board also compared each Fund’s total expense ratio, as well as its actual management fee rate as a percentage of managed assets, which is the total assets of each Fund (including any assets attributable to money borrowed for investment purposes) minus the sum of each Fund’s accrued liabilities (other than money borrowed for investment purposes) to those of its Expense Peers. The total expense ratio represents a fund’s total net operating expenses, excluding any investment related expenses. The total expense ratio gives effect to any expense reimbursements or fee waivers, and the actual management fee rate gives effect to any management fee reimbursements or waivers. The Board considered the services provided and the fees charged by BlackRock and its affiliates to other types of clients with similar investment mandates, as applicable, including institutional accounts and sub-advised mutual funds (including mutual funds sponsored by third parties).
The Board received and reviewed statements relating to BlackRock’s financial condition. The Board reviewed BlackRock’s profitability methodology and was also provided with an estimated profitability analysis that detailed the revenues earned and the expenses incurred by BlackRock for services provided to each Fund. The Board reviewed BlackRock’s estimated profitability with respect to each Fund and other funds the Board currently oversees for the year ended December 31, 2019 compared to available aggregate estimated profitability data provided for the prior two years. The Board reviewed BlackRock’s estimated profitability with respect to certain other U.S. fund complexes managed by the Manager and/or its affiliates. The Board reviewed BlackRock’s assumptions and methodology of allocating expenses in the estimated profitability analysis, noting the inherent limitations in allocating costs among various advisory products. The Board recognized that profitability may be affected by numerous factors including, among other things, fee waivers and expense reimbursements by the Manager, the types of funds managed, precision of expense allocations and business mix. The Board thus recognized that calculating and comparing profitability at the individual fund level is difficult.
The Board noted that, in general, individual fund or product line profitability of other advisors is not publicly available. The Board reviewed BlackRock’s overall operating margin, in general, compared to that of certain other publicly traded asset management firms. The Board considered the differences between BlackRock and these other firms, including the contribution of technology at BlackRock, BlackRock’s expense management, and the relative product mix.
The Board considered whether BlackRock has the financial resources necessary to attract and retain high quality investment management personnel to perform its obligations under the Agreements and to continue to provide the high quality of services that is expected by the Board. The Board further considered factors including but not limited to BlackRock’s commitment of time, assumption of risk, and liability profile in servicing each Fund, including in contrast to what is required of BlackRock with respect to other products with similar investment mandates across the open-end fund, closed-end fund, sub-advised mutual fund, collective investment trust, and institutional separate account product channels, as applicable.
The Board noted that DSU’s contractual management fee rate ranked in the first quartile, and that the actual management fee rate and total expense ratio each ranked in first quartile, relative to the Expense Peers.
The Board noted that FRA’s contractual management fee rate ranked in the first quartile, and that the actual management fee rate and total expense ratio each ranked in the first quartile, relative to the Expense Peers.
The Board noted that BLW’s contractual management fee rate ranked in the first quartile, and that the actual management fee rate and total expense ratio each ranked in the first quartile, relative to the Expense Peers.
D. Economies of Scale: The Board, including the Independent Board Members, considered the extent to which economies of scale might be realized as the assets of each Fund increase. The Board also considered the extent to which each Fund benefits from such economies of scale in a variety of ways, and whether there should be changes in the advisory fee rate or breakpoint structure in order to enable each Fund to more fully participate in these economies of scale. The Board considered each Fund’s asset levels and whether the current fee was appropriate.
Based on the Board’s review and consideration of the issue, the Board concluded that most closed-end funds do not have fund level breakpoints because closed-end funds generally do not experience substantial growth after the initial public offering. Closed-end funds are typically priced at scale at a fund’s inception.
E. Other Factors Deemed Relevant by the Board Members: The Board, including the Independent Board Members, also took into account other ancillary or “fall-out” benefits that BlackRock or its affiliates may derive from BlackRock’s respective relationships with each Fund, both tangible and intangible, such as BlackRock’s ability to leverage its investment professionals who manage other portfolios and its risk management personnel, an increase in BlackRock’s profile in the investment advisory community, and the engagement of BlackRock’s affiliates as service providers to each Fund, including for administrative, securities lending and cash management services. The Board also considered BlackRock’s overall operations and its efforts to expand the scale of, and improve the quality of, its operations. The Board also noted that, subject to applicable law, BlackRock may use and benefit from third-party research obtained by soft dollars generated by certain registered fund transactions to assist in managing all or a number of its other client accounts.
In connection with its consideration of the Agreements, the Board also received information regarding BlackRock’s brokerage and soft dollar practices. The Board received reports from BlackRock which included information on brokerage commissions and trade execution practices throughout the year.
The Board noted the competitive nature of the closed-end fund marketplace, and that shareholders are able to sell their Fund shares in the secondary market if they believe that each Fund’s fees and expenses are too high or if they are dissatisfied with the performance of each Fund.
The Board also considered the various notable initiatives and projects BlackRock performed in connection with its closed-end fund product line. These initiatives included developing equity shelf programs; efforts to eliminate product overlap with fund mergers; ongoing services to manage leverage that has become increasingly complex; periodic evaluation of share repurchases and other support initiatives for certain BlackRock funds; and continued communication efforts with shareholders, fund analysts and financial advisers. With respect to the latter, the Independent Board Members noted BlackRock’s continued commitment to supporting the secondary market for the
| | |
| 108 | | 2020 BLACKROCK SEMI-ANNUAL REPORTTO SHAREHOLDERS |
Disclosure of Investment Advisory Agreements (continued)
common shares of its closed-end funds through a comprehensive secondary market communication program designed to raise investor and analyst awareness and understanding of closed-end funds. BlackRock’s support services included, among other things: sponsoring and participating in conferences; communicating with closed-end fund analysts covering the BlackRock funds throughout the year; providing marketing and product updates for the closed-end funds; and maintaining and enhancing its closed-end fund website.
Conclusion
The Board, including the Independent Board Members, unanimously approved the continuation of the Advisory Agreements between the Manager and each Fund for a one-year term ending June 30, 2021. Based upon its evaluation of all of the aforementioned factors in their totality, as well as other information, the Board, including the Independent Board Members, was satisfied that the terms of the Agreements were fair and reasonable and in the best interest of each Fund and its shareholders. In arriving at its decision to approve the Agreements, the Board did not identify any single factor or group of factors as all-important or controlling, but considered all factors together, and different Board Members may have attributed different weights to the various factors considered. The Independent Board Members were also assisted by the advice of independent legal counsel in making this determination.
| | |
DISCLOSURE OF INVESTMENT ADVISORY AGREEMENTS | | 109 |
Disclosure of Sub-Advisory Agreement
The Board of Directors (the “Board,” and the members of which are referred to as “Board Members”) of BlackRock Floating Rate Income Strategies Fund, Inc. (the “Fund”), met in person on February 19, 2020 (the “February Meeting”) to consider the initial approval of the sub-advisory agreement (the “Sub-Advisory Agreement”) among the Fund, BlackRock Advisors, LLC (the “Manager”), the Fund’s investment advisor, and BlackRock International Limited. The Sub-Advisory Agreement was substantially similar to the sub-advisory agreements previously approved with respect to certain other portfolios in the BlackRock Fixed-Income Complex.
On the date of the February Meeting, the Board consisted of ten individuals, eight of whom were not “interested persons” of the Fund as defined in the Investment Company Act of 1940, as amended (the “1940 Act”) (the “Independent Board Members”). Pursuant to the 1940 Act, the Board is required to consider the initial approval of the Sub-Advisory Agreement.
At the February Meeting, the Board reviewed materials relating to its consideration of the proposed Sub-Advisory Agreement. The Fund’s investment advisory agreement with the Manager was most recently approved by the Board at in-person meetings on May 1, 2019 (the “May Meeting”) and June 5-6, 2019 (the “June Meeting”). A discussion of the basis for the Board’s approval of this agreement at the May and June Meetings is included in the Fund’s annual shareholder report for the fiscal year ended August 31, 2019. The factors considered by the Board at the February Meeting in connection with approval of the proposed Sub-Advisory Agreement were substantially the same as the factors considered at the May and June Meetings.
Following discussion, all the Board Members present at the February Meeting, including all the Independent Board Members present, approved the Sub-Advisory Agreement among the Fund, the Manager and BlackRock International Limited for a two-year term beginning on the effective date of the Sub-Advisory Agreement. Based upon its evaluation of all of the aforementioned factors in their totality, the Board, including the Independent Board Members, was satisfied that the terms of the Sub-Advisory Agreement were fair and reasonable and in the best interest of the Fund and its shareholders. In arriving at its decision to approve the Sub-Advisory Agreement, the Board did not identify any single factor or group of factors as all-important or controlling, but considered all factors together, and different Board Members may have attributed different weights to the various factors considered. The Independent Board Members were also assisted by the advice of independent legal counsel in making this determination.
| | |
| 110 | | 2020 BLACKROCK SEMI-ANNUAL REPORTTO SHAREHOLDERS |
Director and Officer Information
Richard E. Cavanagh, Co-Chair of the Board and Director
Karen P. Robards, Co-Chair of the Board and Director
Michael J. Castellano, Director
Cynthia L. Egan, Director
Frank J. Fabozzi, Director
R. Glenn Hubbard, Director
W. Carl Kester, Director
Catherine A. Lynch, Director
Robert Fairbairn, Director
John M. Perlowski, Director, President and Chief Executive Officer
Jonathan Diorio, Vice President
Neal J. Andrews, Chief Financial Officer
Jay M. Fife, Treasurer
Charles Park, Chief Compliance Officer
Janey Ahn, Secretary
Investment Adviser
BlackRock Advisors, LLC
Wilmington, DE 19809
Sub-Advisers
BlackRock International Limited
Edinburgh EH3 8BL
United Kingdom
BlackRock (Singapore) Limited(a)
079912 Singapore
Accounting Agent and Custodian
State Street Bank and Trust Company
Boston, MA 02111
Transfer Agent
Computershare Trust Company, N.A.
Canton, MA 02021
Independent Registered Public Accounting Firm
Deloitte & Touche LLP
Boston, MA 02116
Legal Counsel
Willkie Farr & Gallagher LLP
New York, NY 10019
Address of the Funds
100 Bellevue Parkway
Wilmington, DE 19809
| | |
DIRECTORAND OFFICER INFORMATION | | 111 |
Additional Information
Fund Certification
The Funds are listed for trading on the NYSE and have filed with the NYSE their annual chief executive officer certification regarding compliance with the NYSE’s listing standards. The Funds filed with the SEC the certification of its chief executive officer and chief financial officer required by section 302 of the Sarbanes-Oxley Act.
Dividend Policy
Each Fund’s policy is to make monthly distributions to shareholders. In order to provide shareholders with a more stable level of dividend distributions, each Fund employs a managed distribution plan (the Plan”), the goal of which is to provide shareholders with consistent and predictable cash flows by setting distribution rates based on expected long-term returns of each Fund.
The distributions paid by each Fund for any particular month may be more or less than the amount of net investment income earned by each Fund during such month. Furthermore, the final tax characterization of distributions is determined after the year-end of each Fund and is reported in each Fund’s annual report to shareholders. Distributions can be characterized as ordinary income, capital gains and/or return of capital. The Fund’s taxable net investment income and net realized capital gains (“taxable income”) may not be sufficient to support the level of distributions paid. To the extent that distributions exceed the Fund’s current and accumulated earnings and profits, the excess may be treated as a non-taxable return of capital.
A return of capital is a return of a portion of an investor’s original investment. A return of capital is not expected to be taxable, but it reduces a shareholder’s tax basis in his or her shares, thus reducing any loss or increasing any gain on a subsequent disposition by the shareholder of his or her shares. It is possible that a substantial portion of the distributions paid during a calendar year may ultimately be classified as return of capital for U.S. federal income tax purposes when the final determination of the source and character of the distributions is made.
Such distributions, under certain circumstances, may exceed a Fund’s total return performance. When total distributions exceed total return performance for the period, the difference reduces the Fund’s total assets and net asset value per share (“NAV”) and, therefore, could have the effect of increasing the Fund’s expense ratio and reducing the amount of assets the Fund has available for long term investment.
General Information
The Funds do not make available copies of their Statements of Additional Information because the Funds’ shares are not continuously offered, which means that the Statement of Additional Information of each Fund has not been updated after completion of the respective Fund’s offerings and the information contained in its Statement of Additional Information may have become outdated.
During the period, there were no material changes in the Funds’ investment objectives or policies or to the Funds’ charters or by-laws that would delay or prevent a change of control of the Funds that were not approved by the shareholders or in the principal risk factors associated with investment in the Funds. There have been no changes in the persons who are primarily responsible for the day-to-day management of the Funds’ portfolios.
In accordance with Section 23(c) of the Investment Company Act of 1940, each Fund may from time to time purchase shares of its common stock in the open market or in private transactions.
Quarterly performance, semi-annual and annual reports, current net asset value and other information regarding the Funds may be found on BlackRock’s website, which can be accessed at blackrock.com. Any reference to BlackRock’s website in this report is intended to allow investors public access to information regarding the Funds and does not, and is not intended to, incorporate BlackRock’s website in this report.
Electronic Delivery
Shareholders can sign up for e-mail notifications of quarterly statements, annual and semi-annual shareholder reports by enrolling in the electronic delivery program. Electronic copies of shareholder reports are available on BlackRock’s website.
To enroll in electronic delivery:
Shareholders Who Hold Accounts with Investment Advisers, Banks or Brokerages:
Please contact your financial advisor. Please note that not all investment advisers, banks or brokerages may offer this service.
Householding
The Funds will mail only one copy of shareholder documents, annual and semi-annual reports and proxy statements, to shareholders with multiple accounts at the same address. This practice is commonly called “householding” and is intended to reduce expenses and eliminate duplicate mailings of shareholder documents. Mailings of your shareholder documents may be householded indefinitely unless you instruct us otherwise. If you do not want the mailing of these documents to be combined with those for other members of your household, please call the Funds at (800) 882-0052.
| | |
| 112 | | 2020 BLACKROCK SEMI-ANNUAL REPORTTO SHAREHOLDERS |
Additional Information (continued)
Availability of Quarterly Schedule of Investments
The Funds file their complete schedule of portfolio holdings with the SEC for the first and third quarters of each fiscal year as an exhibit to its reports on Form N-PORT. The Funds’ Forms N-PORT are available on the SEC’s website at sec.gov.
Availability of Proxy Voting Policies and Procedures
A description of the policies and procedures that the Funds use to determine how to vote proxies relating to portfolio securities is available upon request and without charge (1) by calling (800) 882-0052; (2) at blackrock.com; and (3) on the SEC’s website at sec.gov.
Availability of Proxy Voting Record
Information about how the Funds voted proxies relating to securities held in the Funds’ portfolios during the most recent 12-month period ended June 30 is available upon request and without charge (1) at blackrock.com or by calling (800) 882-0052 and (2) on the SEC’s website at sec.gov.
Availability of Fund Updates
BlackRock will update performance and certain other data for the Funds on a monthly basis on its website in the “Closed-end Funds” section of blackrock.com as well as certain other material information as necessary from time to time. Investors and others are advised to check the website for updated performance information and the release of other material information about the Funds. This reference to BlackRock’s website is intended to allow investors public access to information regarding the Funds and does not, and is not intended to, incorporate BlackRock’s website in this report.
BlackRock Privacy Principles
BlackRock is committed to maintaining the privacy of its current and former fund investors and individual clients (collectively, “Clients”) and to safeguarding their non-public personal information. The following information is provided to help you understand what personal information BlackRock collects, how we protect that information and why in certain cases we share such information with select parties.
If you are located in a jurisdiction where specific laws, rules or regulations require BlackRock to provide you with additional or different privacy-related rights beyond what is set forth below, then BlackRock will comply with those specific laws, rules or regulations.
BlackRock obtains or verifies personal non-public information from and about you from different sources, including the following: (i) information we receive from you or, if applicable, your financial intermediary, on applications, forms or other documents; (ii) information about your transactions with us, our affiliates, or others; (iii) information we receive from a consumer reporting agency; and (iv) from visits to our websites.
BlackRock does not sell or disclose to non-affiliated third parties any non-public personal information about its Clients, except as permitted by law or as is necessary to respond to regulatory requests or to service Client accounts. These non-affiliated third parties are required to protect the confidentiality and security of this information and to use it only for its intended purpose.
We may share information with our affiliates to service your account or to provide you with information about other BlackRock products or services that may be of interest to you. In addition, BlackRock restricts access to non-public personal information about its Clients to those BlackRock employees with a legitimate business need for the information. BlackRock maintains physical, electronic and procedural safeguards that are designed to protect the non-public personal information of its Clients, including procedures relating to the proper storage and disposal of such information.
| | |
ADDITIONAL INFORMATION | | 113 |
Glossary of Terms Used in this Report
| | |
| Currency |
| |
| AUD | | Australian Dollar |
| |
| BRL | | Brazilian Real |
| |
| CAD | | Canadian Dollar |
| |
| EUR | | Euro |
| |
| GBP | | British Pound |
| |
| NOK | | Norwegian Krono |
| |
| NZD | | New Zealand Dollar |
| |
| USD | | U.S. Dollar |
| | |
| Portfolio Abbreviations |
| |
| ABS | | Asset-Backed Security |
| |
| CLO | | Collateralized Loan Obligation |
| |
| ETF | | Exchange-Traded Fund |
| |
| EURIBOR | | Euro Interbank Offered Rate |
| |
| LIBOR | | London Interbank Offered Rate |
| |
| PIK | | Payment-In-Kind |
| |
| PRIME | | U.S. Prime Rate |
| |
| S&P | | Standard & Poor’s |
| | |
| 114 | | 2020 BLACKROCK SEMI-ANNUAL REPORTTO SHAREHOLDERS |
Want to know more?
blackrock.com | 800-882-0052
This report is intended for current holders. It is not a prospectus. Past performance results shown in this report should not be considered a representation of future performance. The Funds have leveraged their Common Shares, which creates risks for Common Shareholders, including the likelihood of greater volatility of net asset value and market price of the Common Shares, and the risk that fluctuations in short-term interest rates may reduce the Common Shares’ yield. Statements and other information herein are as dated and are subject to change.
CEFT-BK3-6/20-SAR
Item 2 – Code of Ethics – Not Applicable to this semi-annual report
Item 3 – Audit Committee Financial Expert – Not Applicable to this semi-annual report
Item 4 – Principal Accountant Fees and Services – Not Applicable to this semi-annual report
Item 5 – Audit Committee of Listed Registrants – Not Applicable to this semi-annual report
Item 6 – Investments
(a) The registrant’s Schedule of Investments is included as part of the Report to Stockholders filed under Item 1 of this Form.
(b) Not Applicable due to no such divestments during the semi-annual period covered since the previous Form N-CSR filing.
| Item 7 – | Disclosure of Proxy Voting Policies and Procedures for Closed-End Management Investment Companies – Not Applicable to this semi-annual report |
Item 8 – Portfolio Managers of Closed-End Management Investment Companies
| | (a) | Not Applicable to this semi-annual report |
| | (b) | As of the date of this filing, there have been no changes in any of the portfolio managers identified in the most recent annual report on Form N-CSR. |
Item 9 – Purchases of Equity Securities by Closed-End Management Investment Company and Affiliated Purchasers
| | | | | | | | |
| Period | | (a) Total
Number of
Shares
Purchased | | (b) Average
Price Paid per
Share | | (c) Total Number of
Shares Purchased as Part
of Publicly Announced
Plans or Programs | | (d) Maximum Number of
Shares that May Yet Be
Purchased Under the Plans
or Programs3 |
January 1-31, 2020 | | 01 | | $ --1 | | 01 | | 2,470,791 |
February 1-29, 2020 | | 01 | | $ --1 | | 01 | | 2,470,791 |
March 1-31, 2020 | | 01 | | $ --1 | | 01 | | 2,470,791 |
April 1-30, 2020 | | 2,470,7912 | | $10.20182 | | 2,470,7912 | | 2,470,791 |
May 1-31, 2020 | | 161,7931 | | $9.32131 | | 161,7931 | | 2,308,998 |
June 1-30, 2020 | | 01 | | $ -- | | 01 | | 2,308,998 |
Total: | | 2,632,584 | | $9.7616 | | 2,632,584 | | 2,308,998 |
1 On September 5, 2019, the Fund announced a continuation of its open market share repurchase program. Commencing on December 1, 2019, the Fund may repurchase through November 30, 2020, up to 5% of its common shares outstanding as of the close of business on November 30, 2019, subject to certain conditions.
2 On February 16, 2018, the Fund announced the adoption of a three-year discount management program, which has been completed. Under the program, the Fund intended to offer to repurchase its common shares based on three 3-month measurement periods if the Fund’s common shares trade at an average daily discount to net asset value (“NAV”) of more than 7.5% during a measurement period. The Board approved the Fund offering to repurchase 5% of its outstanding common shares for the third and final measurement period, which began on December 2, 2019 and ended on February 28, 2020, as the discount trigger was met. This repurchase was conducted via a tender offer that commenced on March 17, 2020 and expired on April 16, 2020. There were no shares purchased under the open market share repurchase program during that time.
3 Represents shares that may yet be purchased under the Fund’s open market share repurchase program.
2
Item 10 – Submission of Matters to a Vote of Security Holders – There have been no material changes to these procedures.
Item 11 – Controls and Procedures
(a) – The registrant’s principal executive and principal financial officers, or persons performing similar functions, have concluded that the registrant’s disclosure controls and procedures (as defined in Rule 30a-3(c) under the Investment Company Act of 1940, as amended (the “1940 Act”)) are effective as of a date within 90 days of the filing of this report based on the evaluation of these controls and procedures required by Rule 30a-3(b) under the 1940 Act and Rule 13a-15(b) under the Securities Exchange Act of 1934, as amended.
(b) – There were no changes in the registrant’s internal control over financial reporting (as defined in Rule 30a-3(d) under the 1940 Act) that occurred during the period covered by this report that have materially affected, or are reasonably likely to materially affect, the registrant’s internal control over financial reporting.
Item 12 – Disclosure of Securities Lending Activities for Closed-End Management Investment Companies – Not Applicable to this semi-annual report
Item 13 – Exhibits attached hereto
(a)(1) – Code of Ethics – See Item 2
(a)(2) – Section 302 Certifications are attached
(a)(3) – Not Applicable
(a)(4) – Not Applicable
(b) – Section 906 Certifications are attached
(c) – Notices to the registrant’s common shareholders in accordance with the order under Section 6(c) of the 1940 Act granting an exemption from Section 19(b) of the 1940 Act and Rule 19b-1 under the 1940 Act, dated May 9, 20091
1 The Fund has received exemptive relief from the Securities and Exchange Commission permitting it to make periodic distributions of long-term capital gains with respect to its outstanding common stock as frequently as twelve times each year, and as frequently as distributions are specified by or in accordance with the terms of its outstanding preferred stock. This relief is conditioned, in part, on an undertaking by the Fund to make the disclosures to theholders of the Fund’s common shares, in addition to the information required by Section 19(a) of the 1940 Act and Rule 19a-1 thereunder. The Fund is likewise obligated to file with the SEC the information contained in any such notice to shareholders and, in that regard, has attached hereto copies of each such notice made during the period.
3
Pursuant to the requirements of the Securities Exchange Act of 1934 and the Investment Company Act of 1940, the registrant has duly caused this report to be signed on its behalf by the undersigned, thereunto duly authorized.
| | |
| BlackRock Debt Strategies Fund, Inc. |
| |
| By: | | /s/ John M. Perlowski |
| | John M. Perlowski |
| | Chief Executive Officer (principal executive officer) of |
| | BlackRock Debt Strategies Fund, Inc. |
|
| Date: September 4, 2020 |
Pursuant to the requirements of the Securities Exchange Act of 1934 and the Investment Company Act of 1940, this report has been signed below by the following persons on behalf of the registrant and in the capacities and on the dates indicated.
| | |
| By: | | /s/ John M. Perlowski |
| | John M. Perlowski |
| | Chief Executive Officer (principal executive officer) of |
| | BlackRock Debt Strategies Fund, Inc. |
|
| Date: September 4, 2020 |
| |
| By: | | /s/ Neal J. Andrews |
| | Neal J. Andrews |
| | Chief Financial Officer (principal financial officer) of |
| | BlackRock Debt Strategies Fund, Inc. |
|
| Date: September 4, 2020 |
4