UNITED STATES
SECURITIES AND EXCHANGE COMMISSION
Washington, D.C. 20549
FORM N-CSR
CERTIFIED SHAREHOLDER REPORT OF REGISTERED MANAGEMENT INVESTMENT COMPANIES
Investment Company Act file number: 811-08573
| Name of Fund: | | BlackRock MuniHoldings California Quality Fund, Inc. (MUC) |
| Fund Address: | | 100 Bellevue Parkway, Wilmington, DE 19809 |
Name and address of agent for service: John M. Perlowski, Chief Executive Officer, BlackRock MuniHoldings California Quality Fund, Inc., 55 East 52nd Street, New York, NY 10055
Registrant’s telephone number, including area code: (800) 882-0052, Option 4
Date of fiscal year end: 07/31/2022
Date of reporting period: 01/31/2022
Item 1 – Report to Stockholders
(a) The Report to Shareholders is attached herewith.
| | |

| | JANUARY 31, 2022 |
| | |
| |
| | 2022 Semi-Annual Report (Unaudited) |
BlackRock MuniHoldings California Quality Fund, Inc. (MUC)
BlackRock MuniHoldings New Jersey Quality Fund, Inc. (MUJ)
BlackRock MuniYield Michigan Quality Fund, Inc. (MIY)
BlackRock MuniYield Pennsylvania Quality Fund (MPA)
|
| Not FDIC Insured • May Lose Value • No Bank Guarantee |
The Markets in Review
Dear Shareholder,
The 12-month reporting period as of January 31, 2022 saw a continuation of the resurgent growth that followed the initial coronavirus (or “COVID-19”) pandemic reopening, albeit at a slower pace. The global economy weathered the emergence of several variant strains and the resulting peaks and troughs in infections amid optimism that increasing vaccinations and economic adaptation could help contain the pandemic’s disruptions. Continued growth meant that the U.S. economy regained and then surpassed its pre-pandemic output. However, rapid changes in consumer spending led to supply constraints and elevated inflation.
Equity prices were mixed, as persistently high inflation drove investors’ expectations for higher interest rates, which particularly weighed on relatively high valuation growth stocks and economically sensitive small-capitalization stocks. Overall, small-capitalization U.S. stocks declined slightly, while large-capitalization U.S. stocks posted a strong advance. International equities from developed markets also gained, although emerging market stocks declined, pressured by rising interest rates and a strengthening U.S. dollar.
The 10-year U.S. Treasury yield (which is inversely related to bond prices) rose significantly during the reporting period as the economy expanded rapidly and inflation reached its highest annualized reading in decades. In the corporate bond market, the improving economy assuaged credit concerns and led to positive returns for high-yield corporate bonds, outpacing the modest negative return of investment-grade corporate bonds.
The U.S. Federal Reserve (the “Fed”) maintained accommodative monetary policy during the reporting period by keeping near-zero interest rates. However, the Fed’s tone shifted late in the period, as it reduced its bond-buying program and raised the prospect of higher rates in 2022. Continued high inflation and the Fed’s new tone led many analysts to anticipate that the Fed will raise interest rates multiple times throughout the year.
Looking ahead, however, the horrific war in Ukraine has significantly clouded the outlook for the global economy. Sanctions on Russia and general wartime disruption are likely to drive already-high commodity prices even further upwards, and we have already seen spikes in energy and metal markets. While this will exacerbate inflationary pressure, it could also constrain economic growth, making the Fed’s way forward less clear. Its challenge will be combating inflation without stifling a recovery that is now facing additional supply shocks.
In this environment, we favor an overweight to equities, as we believe low interest rates and continued economic growth will support further gains, albeit likely more modest than what we saw in 2021. Sectors that are better poised to manage the transition to a lower-carbon world, such as technology and health care, are particularly attractive in the long term. U.S. and other developed-market equities have room for further growth, while we believe Chinese equities stand to gain from a more accommodative monetary and fiscal environment. We are underweight long-term credit, but inflation-protected U.S. Treasuries, Asian fixed income, and emerging market local-currency bonds offer potential opportunities. We believe that international diversification and a focus on sustainability can help provide portfolio resilience, and the disruption created by the coronavirus appears to be accelerating the shift toward sustainable investments.
In this environment, our view is that investors need to think globally, extend their scope across a broad array of asset classes, and be nimble as market conditions change. We encourage you to talk with your financial advisor and visit blackrock.com for further insight about investing in today’s markets.
Sincerely,

Rob Kapito
President, BlackRock Advisors, LLC

Rob Kapito
President, BlackRock Advisors, LLC
| | | | |
| Total Returns as of January 31, 2022 |
| | | 6-Month | | 12-Month |
U.S. large cap equities
(S&P 500® Index) | | 3.44% | | 23.29% |
U.S. small cap equities
(Russell 2000® Index) | | (8.41) | | (1.21) |
International equities
(MSCI Europe, Australasia, Far East Index) | | (3.43) | | 7.03 |
Emerging market equities
(MSCI Emerging Markets Index) | | (4.59) | | (7.23) |
3-month Treasury bills
(ICE BofA 3-Month U.S. Treasury Bill Index) | | 0.01 | | 0.04 |
U.S. Treasury securities
(ICE BofA 10-Year U.S. Treasury Index) | | (3.87) | | (4.43) |
U.S. investment grade bonds
(Bloomberg U.S. Aggregate Bond Index) | | (3.17) | | (2.97) |
Tax-exempt municipal bonds
(S&P Municipal Bond Index) | | (2.56) | | (1.22) |
U.S. high yield bonds
(Bloomberg U.S. Corporate High Yield 2% Issuer Capped Index) | | (1.55) | | 2.05 |
Past performance is not an indication of future results. Index performance is shown for illustrative purposes only. You cannot invest directly in an index. |
| | |
| 2 | | T H I S P A G E I S N O T P A R T O F Y O U R F U N D R E P O R T |
Table of Contents
Municipal Market Overview For the Reporting Period Ended January 31, 2022
Municipal Market Conditions
Municipal bonds posted modestly negative total returns during the period amid rising interest rates spurred by strong economic growth and above trend inflation, waning COVID-19 variant fears, and hawkish Fed monetary policy expectations. The asset class benefited from favorable supply and demand dynamics and improved credit fundamentals amid considerable fiscal stimulus and a quicker-than-expected rebound in state and local government revenues. As a result, municipal bonds generated positive excess returns versus duration matched U.S. Treasuries. However, the market faced several bouts of volatility, including temporary valuation-based market corrections in February 2021 and January 2022. Shorter duration and lower credit quality strategies outperformed.
| | | | |
Technical support was helpful as robust demand outpaced supply. During the 12 months ended January 31, 2022, municipal bond funds experienced net inflows totaling $71 billion (based on data from the Investment Company Institute). However, the post-pandemic inflow cycle, which spanned 92-weeks and garnered $149 billion, came to an end late in the period with modest outflows. At the same time, the market absorbed $453 billion in issuance, a small increase from the $448 billion issued during the prior 12-month period. Taxable municipal issuance, which draws a unique buyer base, remained proportionally elevated, helping to make supply more easily digestible. | | | | S&P Municipal Bond Index Total Returns as of January 31, 2022 6 months: (2.56%) 12 months: (1.22%) |
| | |
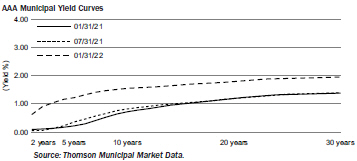
A Closer Look at Yields
From January 31, 2021 to January 31, 2022, yields on AAA-rated 30-year municipal bonds increased by 57 basis points (“bps”) from 1.38% to 1.95%, while ten-year rates increased by 83 bps from 0.72% to 1.55% and five-year rates increased by 100 bps from 0.22% to 1.22% (as measured by Thomson Municipal Market Data). As a result, the municipal yield curve flattened over the 12-month period with the spread between two- and 30-year maturities flattening by 22 bps, led by 26 bps of flattening between ten- and 30-year maturities.
After maintaining historically tight valuations for most of the reporting period, the most recent market correction has restored value to the asset class and reset municipal-to-Treasury ratios to levels on par with their 5-year averages.
Financial Conditions of Municipal Issuers
Buoyed by successive federal aid injections, vaccine distribution, and the subsequent re-opening of the economy, states and many local governments experienced revenue growth above forecasts in 2021. Increased immunity (natural or through vaccinations), the possible weakness of future variants, and new treatments could bring the end of the pandemic closer, leading to a longer-lasting return to more normal economic activity that bodes well for state and local fiscal conditions. Any prolonged inflation in a post-COVID recovery, especially from continued worker shortages, would adversely affect state and local entities. However, wage pressures, less consumer spending and higher interest rates could be offset by increased revenue collections, particularly sales and personal income tax receipts. Essential public services such as power, water, and sewer remain protected segments. State housing authority bonds, flagship universities, and strong national and regional health systems have absorbed the impact of the economic shock. Critical providers (safety net hospitals, mass transit systems, airports) with limited resources may still experience fiscal strain but the additional aid and the re-opening of the economy will continue to support operating results through 2022. Work-from-home policies will continue to be headwinds for mass transit farebox revenue and commercial real estate values. BlackRock anticipates that a small subset of the market, mainly non-rated stand-alone projects, will remain susceptible to credit deterioration. While credit fundamentals have improved noticeably across the municipal space, BlackRock advocates careful credit selection as the course of economic recovery remains unclear.
The opinions expressed are those of BlackRock as of January 31, 2022 and are subject to change at any time due to changes in market or economic conditions. The comments should not be construed as a recommendation of any individual holdings or market sectors. Investing involves risk including loss of principal. Bond values fluctuate in price so the value of your investment can go down depending on market conditions. Fixed income risks include interest-rate and credit risk. Typically, when interest rates rise, there is a corresponding decline in bond values. Credit risk refers to the possibility that the bond issuer will not be able to make principal and interest payments. There may be less information on the financial condition of municipal issuers than for public corporations. The market for municipal bonds may be less liquid than for taxable bonds. Some investors may be subject to Alternative Minimum Tax (“AMT”). Capital gains distributions, if any, are taxable.
The S&P Municipal Bond Index, a broad, market value-weighted index, seeks to measure the performance of the U.S. municipal bond market. All bonds in the index are exempt from U.S. federal income taxes or subject to the AMT. Past performance is not an indication of future results. Index performance is shown for illustrative purposes only. It is not possible to invest directly in an index.
| | |
| 4 | | 2 0 2 2 B L A C K R O C K S E M I - A N N U A L R E P O R T T O S H A R E H O L D E R S |
The Benefits and Risks of Leveraging
The Funds may utilize leverage to seek to enhance the distribution rate on, and net asset value (“NAV”) of, their common shares (“Common Shares”). However, there is no guarantee that these objectives can be achieved in all interest rate environments.
In general, the concept of leveraging is based on the premise that the financing cost of leverage, which is based on short-term interest rates, is normally lower than the income earned by a Fund on its longer-term portfolio investments purchased with the proceeds from leverage. To the extent that the total assets of each Fund (including the assets obtained from leverage) are invested in higher-yielding portfolio investments, each Fund’s shareholders benefit from the incremental net income. The interest earned on securities purchased with the proceeds from leverage (after paying the leverage costs) is paid to shareholders in the form of dividends, and the value of these portfolio holdings (less the leverage liability) is reflected in the per share NAV.
To illustrate these concepts, assume a Fund’s Common Shares capitalization is $100 million and it utilizes leverage for an additional $30 million, creating a total value of $130 million available for investment in longer-term income securities. If prevailing short-term interest rates are 3% and longer-term interest rates are 6%, the yield curve has a strongly positive slope. In this case, a Fund’s financing costs on the $30 million of proceeds obtained from leverage are based on the lower short-term interest rates. At the same time, the securities purchased by a Fund with the proceeds from leverage earn income based on longer-term interest rates. In this case, a Fund’s financing cost of leverage is significantly lower than the income earned on a Fund’s longer-term investments acquired from such leverage proceeds, and therefore the holders of Common Shares (“Common Shareholders”) are the beneficiaries of the incremental net income.
However, in order to benefit Common Shareholders, the return on assets purchased with leverage proceeds must exceed the ongoing costs associated with the leverage. If interest and other costs of leverage exceed a Fund’s return on assets purchased with leverage proceeds, income to shareholders is lower than if a Fund had not used leverage. Furthermore, the value of the Funds’ portfolio investments generally varies inversely with the direction of long-term interest rates, although other factors can influence the value of portfolio investments. In contrast, the amount of each Fund’s obligations under its respective leverage arrangement generally does not fluctuate in relation to interest rates. As a result, changes in interest rates can influence the Funds’ NAVs positively or negatively. Changes in the future direction of interest rates are very difficult to predict accurately, and there is no assurance that a Fund’s intended leveraging strategy will be successful.
The use of leverage also generally causes greater changes in each Fund’s NAV, market price and dividend rates than comparable portfolios without leverage. In a declining market, leverage is likely to cause a greater decline in the NAV and market price of a Fund’s Common Shares than if the Fund were not leveraged. In addition, each Fund may be required to sell portfolio securities at inopportune times or at distressed values in order to comply with regulatory requirements applicable to the use of leverage or as required by the terms of leverage instruments, which may cause the Fund to incur losses. The use of leverage may limit a Fund’s ability to invest in certain types of securities or use certain types of hedging strategies. Each Fund incurs expenses in connection with the use of leverage, all of which are borne by Common Shareholders and may reduce income to the Common Shares. Moreover, to the extent the calculation of each Fund’s investment advisory fees includes assets purchased with the proceeds of leverage, the investment advisory fees payable to the Funds’ investment adviser will be higher than if the Funds did not use leverage.
To obtain leverage, each Fund has issued Variable Rate Demand Preferred Shares (“VRDP Shares”) or Variable Rate Muni Term Preferred Shares (“VMTP Shares”) (collectively, “Preferred Shares”) and/or leveraged its assets through the use of tender option bond trusts (“TOB Trusts”) as described in the Notes to Financial Statements.
Under the Investment Company Act of 1940, as amended (the “1940 Act”), each Fund is permitted to issue debt up to 33 1/3% of its total managed assets or equity securities (e.g., Preferred Shares) up to 50% of its total managed assets. A Fund may voluntarily elect to limit its leverage to less than the maximum amount permitted under the 1940 Act. In addition, a Fund may also be subject to certain asset coverage, leverage or portfolio composition requirements imposed by the Preferred Shares’ governing instruments or by agencies rating the Preferred Shares, which may be more stringent than those imposed by the 1940 Act.
If a Fund segregates or designates on its books and records cash or liquid assets having a value not less than the value of a Fund’s obligations under the TOB Trust (including accrued interest), then the TOB Trust is not considered a senior security and is not subject to the foregoing limitations and requirements imposed by the 1940 Act.
Derivative Financial Instruments
The Funds may invest in various derivative financial instruments. These instruments are used to obtain exposure to a security, commodity, index, market, and/or other assets without owning or taking physical custody of securities, commodities and/or other referenced assets or to manage market, equity, credit, interest rate, foreign currency exchange rate, commodity and/or other risks. Derivative financial instruments may give rise to a form of economic leverage and involve risks, including the imperfect correlation between the value of a derivative financial instrument and the underlying asset, possible default of the counterparty to the transaction or illiquidity of the instrument. The Funds’ successful use of a derivative financial instrument depends on the investment adviser’s ability to predict pertinent market movements accurately, which cannot be assured. The use of these instruments may result in losses greater than if they had not been used, may limit the amount of appreciation a Fund can realize on an investment and/or may result in lower distributions paid to shareholders. The Funds’ investments in these instruments, if any, are discussed in detail in the Notes to Financial Statements.
| | |
T H E B E N E F I T S A N D R I S K S O F L E V E R A G I N G / D E R I V A T I V E F I N A N C I A L I N S T R U M E N T S | | 5 |
| | |
| Fund Summary as of January 31, 2022 | | BlackRock MuniHoldings California Quality Fund, Inc. (MUC) |
Investment Objective
BlackRock MuniHoldings California Quality Fund, Inc.’s (MUC) (the “Fund”) investment objective is to provide shareholders with current income exempt from U.S. federal income taxes and California personal income taxes. The Fund seeks to achieve its investment objective by investing primarily in municipal obligations exempt from U.S. federal income taxes (except that the interest may be subject to the U.S. federal alternative minimum tax) and California personal income taxes. Under normal market conditions, the Fund invests at least 80% of its assets in investment grade municipal obligations with remaining maturities of one year or more at the time of investment. The municipal obligations in which the Fund primarily invests are either rated investment grade quality, or are considered by the Fund’s investment adviser to be of comparable quality, at the time of investment. The Fund may invest up to 20% of its managed assets in securities that are rated below investment grade, or are considered by the Fund’s investment adviser to be of comparable quality, at the time of purchase. The Fund may invest directly in securities or synthetically through the use of derivatives.
On September 24, 2021, the Boards of Directors of BlackRock MuniYield California Fund, Inc. (MYC), BlackRock MuniYield California Quality Fund, Inc. (MCA) and the Fund each approved the reorganization of MYC and MCA into MUC. The reorganization was approved by each Fund’s shareholders and is expected to occur during the second quarter of 2022, subject to the satisfaction of customary closing conditions.
No assurance can be given that the Fund’s investment objective will be achieved.
Fund Information
| | |
Symbol on New York Stock Exchange | | MUC |
Initial Offering Date | | February 27, 1998 |
Yield on Closing Market Price as of January 31, 2022 ($14.34)(a) | | 4.60% |
Tax Equivalent Yield(b) | | 10.02% |
Current Monthly Distribution per Common Share(c) | | $0.0550 |
Current Annualized Distribution per Common Share(c) | | $0.6600 |
Leverage as of January 31, 2022(d) | | 39% |
| | (a) | Yield on closing market price is calculated by dividing the current annualized distribution per share by the closing market price. Past performance is not an indication of future results. | |
| | (b) | Tax equivalent yield assumes the maximum marginal U.S. federal and state tax rate of 54.1%, which includes the 3.8% Medicare tax. Actual tax rates will vary based on income, exemptions and deductions. Lower taxes will result in lower tax equivalent yields. | |
| | (c) | The distribution rate is not constant and is subject to change. In connection with the Reorganization, the Fund declared a special distribution, which is payable on May 2, 2022. See Note 11 in the Notes to Financial Statements for additional information on the special distribution. | |
| | (d) | Represents VMTP Shares and TOB Trusts as a percentage of total managed assets, which is the total assets of the Fund, including any assets attributable to VMTP Shares and TOB Trusts, minus the sum of its accrued liabilities. Does not reflect derivatives or other instruments that may give rise to economic leverage. For a discussion of leveraging techniques utilized by the Fund, please see The Benefits and Risks of Leveraging and Derivative Financial Instruments. | |
Market Price and Net Asset Value Per Share Summary
| | | | | | | | | | | | | | | | | | | | |
| | | 01/31/22 | | | 07/31/21 | | | Change | | | High | | | Low | |
Closing Market Price | | $ | 14.34 | | | $ | 16.09 | | | | (10.88 | )% | | $ | 16.33 | | | $ | 14.24 | |
Net Asset Value | | | 15.01 | | | | 16.16 | | | | (7.12 | ) | | | 16.19 | | | | 15.01 | |
Performance
Returns for the period ended January 31, 2022 were as follows:
| | | | | | | | | | | | | | | | | | | | |
| | | | | | | | | Average Annual Total Returns | |
| | | | | | 6-month | | | 1 Year | | | 5 Years | | | 10 Years | |
Fund at NAV(a)(b) | | | | | | | (5.10 | )% | | | (3.07 | )% | | | 4.15 | % | | | 4.58 | % |
Fund at Market Price(a)(b) | | | | | | | (8.95 | ) | | | (0.24 | ) | | | 4.43 | | | | 4.32 | |
California Customized Reference Benchmark(c) | | | | | | | (3.48 | ) | | | (2.19 | ) | | | 3.61 | | | | N/A | |
Bloomberg Municipal Bond Index(d) | | | | | | | (3.10 | ) | | | (1.89 | ) | | | 3.46 | | | | 3.20 | |
S&P® Municipal Bond Index(e) | | | | | | | (2.56 | ) | | | (1.22 | ) | | | 3.42 | | | | 3.29 | |
Lipper California Municipal Debt Funds at NAV(f) | | | | | | | (4.97 | ) | | | (2.90 | ) | | | 4.37 | | | | 5.04 | |
Lipper California Municipal Debt Funds at Market Price(f) | | | | | | | (8.40 | ) | | | (1.57 | ) | | | 3.62 | | | | 4.64 | |
| | (a) | All returns reflect reinvestment of dividends and/or distributions at actual reinvestment prices. Performance results reflect the Fund’s use of leverage. | |
| | (b) | The Fund’s discount to NAV widened during the period, which accounts for the difference between performance based on market price and performance based on NAV. | |
| | (c) | The California Customized Reference Benchmark is comprised of the Bloomberg Municipal Bond: California Exempt Total Return Index Unhedged (90%) and the California Bloomberg Municipal Bond: High Yield (non-Investment Grade) Total Return Index (10%). Effective October 1, 2021, the Fund changed its reporting benchmarks from S&P Municipal Bond Index and Lipper California Municipal Debt Funds to Bloomberg Municipal Bond Index and the California Customized Reference Benchmark. The investment adviser believes the new benchmarks are more appropriate reporting benchmarks for the Fund. The California Customized Reference Benchmark commenced on September 30, 2016. | |
| | (d) | An unmanaged index that tracks the U.S. long term tax-exempt bond market, including state and local general obligation bonds, revenue bonds, pre-refunded bonds, and insured bonds. | |
| | (e) | A broad, market value-weighted index that seeks to measure the performance of the U.S. municipal bond market. | |
| | (f) | Average return. Returns reflect reinvestment of dividends and/or distributions at NAV on the ex-dividend date as calculated by Lipper. | |
Performance results may include adjustments made for financial reporting purposes in accordance with U.S. generally accepted accounting principles. Past performance is not an indication of future results.
| | |
| 6 | | 2 0 2 2 B L A C K R O C K S E M I - A N N U A L R E P O R T T O S H A R E H O L D E R S |
| | |
| Fund Summary as of January 31, 2022 (continued) | | BlackRock MuniHoldings California Quality Fund, Inc. (MUC) |
The Fund is presenting the performance of one or more indices for informational purposes only. The Fund is actively managed and does not seek to track or replicate the performance of any index. The index performance shown is not intended to be indicative of the Fund’s investment strategies, portfolio components or past or future performance.
More information about the Fund’s historical performance can be found in the “Closed End Funds” section of blackrock.com.
The following discussion relates to the Fund’s absolute performance based on NAV:
Fixed-income assets experienced rising yields (and falling prices) during the six-month period. The Fed pivoted to a more hawkish tone on monetary policy as inflation accelerated well beyond its 2% target and labor markets improved toward its mandate of full employment. In this environment, the benefit of municipal bonds’ yield was insufficient to make up for the decline in prices.
Positions in long-dated securities were the largest detractors from performance due to their higher interest-rate sensitivity. AA rated bonds were the Fund’s largest allocation among the various credit tiers and thus were most significant detractors on an absolute basis. In terms of sectors, housing bonds—led by the high yield workforce housing sub-sector—were the largest detractors.
The Fund actively sought to manage interest rate risk using U.S. Treasury futures. Since U.S. Treasury yields rose, as prices fell, this strategy contributed to results. Positions in select longer-dated bonds that were pre-refunded also helped performance.
The views expressed reflect the opinions of BlackRock as of the date of this report and are subject to change based on changes in market, economic or other conditions. These views are not intended to be a forecast of future events and are no guarantee of future results.
Overview of the Fund’s Total Investments
SECTOR ALLOCATION
| | | | | | | | |
| Sector(a)(b) | | 01/31/22 | | | 07/31/21 | |
| | |
County/City/Special District/School District | | | 33 | % | | | 38 | % |
Health | | | 18 | | | | 19 | |
Transportation | | | 15 | | | | 13 | |
Education | | | 9 | | | | 9 | |
Utilities | | | 8 | | | | 8 | |
Housing | | | 7 | | | | 4 | |
State | | | 5 | | | | 4 | |
Tobacco | | | 5 | | | | 5 | |
Corporate | | | — | (c) | | | — | (c) |
CALL/MATURITY SCHEDULE
| | | | |
| Calendar Year Ended December 31,(a)(d) | | Percentage | |
| |
2022 | | | 7 | % |
2023 | | | 8 | |
2024 | | | 3 | |
2025 | | | 19 | |
2026 | | | 9 | |
CREDIT QUALITY ALLOCATION
| | | | | | | | |
| Credit Rating(a)(e) | | 01/31/22 | | | 07/31/21 | |
| | |
AAA/Aaa | | | 10 | % | | | 14 | % |
AA/Aa | | | 54 | | | | 54 | |
A | | | 18 | | | | 17 | |
BBB/Baa | | | 2 | | | | 3 | |
BB/Ba | | | — | (c) | | | 1 | |
B | | | — | (c) | | | — | (c) |
N/R(f) | | | 16 | | | | 11 | |
| (a) | | Excludes short-term securities. |
| (b) | | For Fund compliance purposes, the Fund’s sector classifications refer to one or more of the sector sub-classifications used by one or more widely recognized market indexes or rating group indexes, and/or as defined by the investment adviser. These definitions may not apply for purposes of this report, which may combine such sector sub-classifications for reporting ease. |
| (c) | | Rounds to less than 1% of total investments. |
| (d) | | Scheduled maturity dates and/or bonds that are subject to potential calls by issuers over the next five years. |
| (e) | | For financial reporting purposes, credit quality ratings shown above reflect the highest rating assigned by either S&P Global Ratings or Moody’s Investors Service, Inc. if ratings differ. These rating agencies are independent, nationally recognized statistical rating organizations and are widely used. Investment grade ratings are credit ratings of BBB/Baa or higher. Below investment grade ratings are credit ratings of BB/Ba or lower. Investments designated N/R are not rated by either rating agency. Unrated investments do not necessarily indicate low credit quality. Credit quality ratings are subject to change. |
| (f) | | The investment adviser evaluates the credit quality of unrated investments based upon certain factors including, but not limited to, credit ratings for similar investments and financial analysis of sectors and individual investments. Using this approach, the investment adviser has deemed certain of these unrated securities as investment grade quality. As of January 31, 2022 and July 31, 2021, the market value of unrated securities deemed by the investment adviser to be investment grade represents 2% and less than 1%, respectively, of the Fund’s total investments. |
| | |
| Fund Summary as of January 31, 2022 | | BlackRock MuniHoldings New Jersey Quality Fund, Inc. (MUJ) |
Investment Objective
BlackRock MuniHoldings New Jersey Quality Fund, Inc.’s (MUJ) (the “Fund”) investment objective is to provide shareholders with current income exempt from U.S. federal income tax and New Jersey personal income taxes. The Fund seeks to achieve its investment objective by investing primarily in long-term, investment grade municipal obligations exempt from U.S federal income taxes (except that the interest may be subject to the U.S. federal alternative minimum tax) and New Jersey personal income taxes. The municipal obligations in which the Fund primarily invests are either rated investment grade quality, or are considered by the Fund’s investment adviser to be of comparable quality, at the time of investment. Under normal market conditions, the Fund invests at least 80% of its assets in municipal obligations with remaining maturities of one year or more at the time of investment. The Fund may invest up to 20% of its managed assets in securities that are rated below investment grade, or are considered by the Fund’s investment adviser to be of comparable quality, at the time of purchase. The Fund may invest directly in securities or synthetically through the use of derivatives.
On September 24, 2021, the Boards of Directors of BlackRock MuniYield New Jersey Fund, Inc. (MYJ) and the Fund each approved the reorganization of MYJ into MUJ. The reorganization was approved by each Fund’s shareholders and is expected to occur during the second quarter of 2022, subject to the satisfaction of customary closing conditions.
No assurance can be given that the Fund’s investment objective will be achieved.
Fund Information
| | |
Symbol on New York Stock Exchange | | MUJ |
Initial Offering Date | | March 11, 1998 |
Yield on Closing Market Price as of January 31, 2022 ($14.42)(a) | | 5.24% |
Tax Equivalent Yield(b) | | 10.82% |
Current Monthly Distribution per Common Share(c) | | $0.0630 |
Current Annualized Distribution per Common Share(c) | | $0.7560 |
Leverage as of January 31, 2022(d) | | 40% |
| | (a) | Yield on closing market price is calculated by dividing the current annualized distribution per share by the closing market price. Past performance is not an indication of future results. | |
| | (b) | Tax equivalent yield assumes the maximum marginal U.S. federal and state tax rate of 51.55%, which includes the 3.8% Medicare tax. Actual tax rates will vary based on income, exemptions and deductions. Lower taxes will result in lower tax equivalent yields. | |
| | (c) | The distribution rate is not constant and is subject to change. In connection with the Reorganization, the Fund declared a special distribution, which is payable on May 2, 2022. See Note 11 in the Notes to Financial Statements for additional information on the special distribution. | |
| | (d) | Represents VRDP Shares and TOB Trusts as a percentage of total managed assets, which is the total assets of the Fund, including any assets attributable to VRDP Shares and TOB Trusts, minus the sum of its accrued liabilities. Does not reflect derivatives or other instruments that may give rise to economic leverage. For a discussion of leveraging techniques utilized by the Fund, please see The Benefits and Risks of Leveraging and Derivative Financial Instruments. | |
Market Price and Net Asset Value Per Share Summary
| | | | | | | | | | | | | | | | | | | | |
| | | 01/31/22 | | | 07/31/21 | | | Change | | | High | | | Low | |
Closing Market Price | | $ | 14.42 | | | $ | 15.63 | | | | (7.74 | )% | | $ | 16.06 | | | $ | 14.19 | |
Net Asset Value | | | 15.15 | | | | 16.29 | | | | (7.00 | ) | | | 16.30 | | | | 15.15 | |
Performance
Returns for the period ended January 31, 2022 were as follows:
| | | | | | | | | | | | | | | | | | | | |
| | | | | | | | | Average Annual Total Returns | |
| | | | | | | | 6-month | | | | 1 Year | | | | 5 Years | | | | 10 Years | |
Fund at NAV(a)(b) | | | | | | | (4.70 | )% | | | (2.28 | )% | | | 5.15 | % | | | 4.89 | % |
Fund at Market Price(a)(b) | | | | | | | (5.46 | ) | | | 4.72 | | | | 5.45 | | | | 4.69 | |
New Jersey Customized Reference Benchmark(c) | | | | | | | (3.26 | ) | | | (1.07 | ) | | | 4.97 | | | | N/A | |
Bloomberg Municipal Bond Index(d) | | | | | | | (3.10 | ) | | | (1.89 | ) | | | 3.46 | | | | 3.20 | |
S&P® Municipal Bond Index(e) | | | | | | | (2.56 | ) | | | (1.22 | ) | | | 3.42 | | | | 3.29 | |
Lipper New Jersey Municipal Debt Funds at NAV(f) | | | | | | | (4.71 | ) | | | (2.48 | ) | | | 4.95 | | | | 4.68 | |
Lipper New Jersey Municipal Debt Funds at Market Price(f) | | | | | | | (6.88 | ) | | | 3.16 | | | | 5.06 | | | | 4.66 | |
| | (a) | All returns reflect reinvestment of dividends and/or distributions at actual reinvestment prices. Performance results reflect the Fund’s use of leverage. | |
| | (b) | The Fund’s discount to NAV widened during the period, which accounts for the difference between performance based on market price and performance based on NAV. | |
| | (c) | The New Jersey Customized Reference Benchmark is comprised of the Bloomberg Municipal Bond: New Jersey Exempt Total Return Index Unhedged (90%) and the New Jersey Bloomberg Municipal Bond: High Yield (non-Investment Grade) Total Return Index (10%). Effective October 1, 2021, the Fund changed its reporting benchmarks from S&P Municipal Bond Index and Lipper New Jersey Municipal Debt Funds to Bloomberg Municipal Bond Index and the New Jersey Customized Reference Benchmark. The investment adviser believes the new benchmarks are more appropriate reporting benchmarks for the Fund. The New Jersey Customized Reference Benchmark commenced on September 30, 2016. | |
| | (d) | An unmanaged index that tracks the U.S. long term tax-exempt bond market, including state and local general obligation bonds, revenue bonds, pre-refunded bonds, and insured bonds. | |
| | (e) | A broad, market value-weighted index that seeks to measure the performance of the U.S. municipal bond market. | |
| | (f) | Average return. Returns reflect reinvestment of dividends and/or distributions at NAV on the ex-dividend date as calculated by Lipper. | |
Performance results may include adjustments made for financial reporting purposes in accordance with U.S. generally accepted accounting principles. Past performance is not an indication of future results.
| | |
| 8 | | 2 0 2 2 B L A C K R O C K S E M I - A N N U A L R E P O R T T O S H A R E H O L D E R S |
| | |
| Fund Summary as of January 31, 2022 (continued) | | BlackRock MuniHoldings New Jersey Quality Fund, Inc. (MUJ) |
The Fund is presenting the performance of one or more indices for informational purposes only. The Fund is actively managed and does not seek to track or replicate the performance of any index. The index performance shown is not intended to be indicative of the Fund’s investment strategies, portfolio components or past or future performance.
More information about the Fund’s historical performance can be found in the “Closed End Funds” section of blackrock.com.
The following discussion relates to the Fund’s absolute performance based on NAV:
Fixed-income assets experienced rising yields (and falling prices) during the six-month period. The Fed pivoted to a more hawkish tone on monetary policy as inflation accelerated well beyond its 2% target and labor markets improved toward its mandate of full employment.
The Fund was positioned longer on the yield curve, with a heavier weighting in bonds with maturities of 20 year and above. This positioning detracted from performance, since longer-dated bonds underperformed due to their higher degree of interest-rate sensitivity. Holdings in the state tax-backed sector detracted the most, since it is the largest sector weighting in the portfolio. Positions in transportation issues detracted, as well. Similarly, the A and BBB ratings categories were the Fund’s largest allocations and thus were most significant detractors on an absolute basis. Positions in lower-coupon bonds, which tend to be more sensitive to moves in interest rates, also hurt performance. The Fund’s use of leverage, which magnified the impact of falling prices, was an additional detractor.
The Fund actively sought to manage interest rate risk using U.S. Treasury futures. Since U.S. Treasury yields rose, as prices fell, this strategy contributed to results.
The views expressed reflect the opinions of BlackRock as of the date of this report and are subject to change based on changes in market, economic or other conditions. These views are not intended to be a forecast of future events and are no guarantee of future results.
Overview of the Fund’s Total Investments
SECTOR ALLOCATION
| | | | | | | | |
| | | |
| Sector(a)(b) | | 01/31/22 | | | 07/31/21 | |
| | |
State | | | 28 | % | | | 28 | % |
Transportation | | | 26 | | | | 27 | |
Education | | | 16 | | | | 15 | |
County/City/Special District/School District | | | 11 | | | | 10 | |
Health | | | 7 | | | | 6 | |
Utilities | | | 5 | | | | 5 | |
Tobacco | | | 3 | | | | 4 | |
Housing | | | 3 | | | | 4 | |
Corporate | | | 1 | | | | 1 | |
CALL/MATURITY SCHEDULE
| | | | |
| | |
| Calendar Year Ended December 31,(a)(c) | | Percentage | |
| |
2022 | | | 10 | % |
2023 | | | 9 | |
2024 | | | 14 | |
2025 | | | 9 | |
2026 | | | 7 | |
CREDIT QUALITY ALLOCATION
| | | | | | | | |
| | | |
| Credit Rating(a)(d) | | 01/31/22 | | | 07/31/21 | |
| | |
AAA/Aaa | | | 4 | % | | | 5 | % |
AA/Aa | | | 35 | | | | 36 | |
A | | | 23 | | | | 22 | |
BBB/Baa | | | 31 | | | | 31 | |
BB/Ba | | | 3 | | | | 3 | |
B | | | — | (e) | | | — | (e) |
N/R(f) | | | 4 | | | | 3 | |
| (a) | | Excludes short-term securities. |
| (b) | | For Fund compliance purposes, the Fund’s sector classifications refer to one or more of the sector sub-classifications used by one or more widely recognized market indexes or rating group indexes, and/or as defined by the investment adviser. These definitions may not apply for purposes of this report, which may combine such sector sub-classifications for reporting ease. |
| (c) | | Scheduled maturity dates and/or bonds that are subject to potential calls by issuers over the next five years. |
| (d) | | For financial reporting purposes, credit quality ratings shown above reflect the highest rating assigned by either S&P Global Ratings or Moody’s Investors Service, Inc. if ratings differ. These rating agencies are independent, nationally recognized statistical rating organizations and are widely used. Investment grade ratings are credit ratings of BBB/Baa or higher. Below investment grade ratings are credit ratings of BB/Ba or lower. Investments designated N/R are not rated by either rating agency. Unrated investments do not necessarily indicate low credit quality. Credit quality ratings are subject to change. |
| (e) | | Rounds to less than 1% of total investments. |
| (f) | | The investment adviser evaluates the credit quality of unrated investments based upon certain factors including, but not limited to, credit ratings for similar investments and financial analysis of sectors and individual investments. Using this approach, the investment adviser has deemed certain of these unrated securities as investment grade quality. As of January 31, 2022 and July 31, 2021, the market value of unrated securities deemed by the investment adviser to be investment grade each represents less than 1% of the Fund’s total investments. |
| | |
| Fund Summary as of January 31, 2022 | | BlackRock MuniYield Michigan Quality Fund, Inc. (MIY) |
Investment Objective
BlackRock MuniYield Michigan Quality Fund, Inc.’s (MIY) (the “Fund”) investment objective is to provide shareholders with as high a level of current income exempt from U.S. federal and Michigan income taxes as is consistent with its investment policies and prudent investment management. The Fund seeks to achieve its investment objective by investing at least 80% of its assets in municipal obligations exempt from U.S. federal income taxes (except that the interest may be subject to the U.S. federal alternative minimum tax) and Michigan income taxes. Under normal market conditions, the Fund invests primarily in long-term municipal obligations that are investment grade quality, or are considered by the Fund’s investment adviser to be of comparable quality, at the time of investment. The Fund may invest up to 20% of its managed assets in securities that are rated below investment grade, or are considered by the Fund’s investment adviser to be of comparable quality, at the time of purchase. The Fund may invest directly in securities or synthetically through the use of derivatives.
No assurance can be given that the Fund’s investment objective will be achieved.
Fund Information
| | |
Symbol on New York Stock Exchange | | MIY |
Initial Offering Date | | October 30, 1992 |
Yield on Closing Market Price as of January 31, 2022 ($14.33)(a) | | 4.69% |
Tax Equivalent Yield(b) | | 8.54% |
Current Monthly Distribution per Common Share(c) | | $0.0560 |
Current Annualized Distribution per Common Share(c) | | $0.6720 |
Leverage as of January 31, 2022(d) | | 38% |
| | (a) | Yield on closing market price is calculated by dividing the current annualized distribution per share by the closing market price. Past performance is not an indication of future results. | |
| | (b) | Tax equivalent yield assumes the maximum marginal U.S. federal and state tax rate of 45.05%, which includes the 3.8% Medicare tax. Actual tax rates will vary based on income, exemptions and deductions. Lower taxes will result in lower tax equivalent yields. | |
| | (c) | The distribution rate is not constant and is subject to change. | |
| | (d) | Represents VRDP Shares and TOB Trusts as a percentage of total managed assets, which is the total assets of the Fund, including any assets attributable to VRDP Shares and TOB Trusts, minus the sum of its accrued liabilities. Does not reflect derivatives or other instruments that may give rise to economic leverage. For a discussion of leveraging techniques utilized by the Fund, please see The Benefits and Risks of Leveraging. | |
Market Price and Net Asset Value Per Share Summary
| | | | | | | | | | | | | | | | | | | | |
| | | 01/31/22 | | | 07/31/21 | | | Change | | | High | | | Low | |
Closing Market Price | | $ | 14.33 | | | $ | 15.80 | | | | (9.30 | )% | | $ | 15.98 | | | $ | 14.15 | |
Net Asset Value | | | 15.02 | | | | 16.04 | | | | (6.36 | ) | | | 16.06 | | | | 15.02 | |
Performance
Returns for the period ended January 31, 2022 were as follows:
| | | | | | | | | | | | | | | | | | | | |
| | | | | | | | | Average Annual Total Returns | |
| | | | | | | | 6-month | | | | 1 Year | | | | 5 Years | | | | 10 Years | |
Fund at NAV(a)(b) | | | | | | | (4.27 | )% | | | (1.97 | )% | | | 4.67 | % | | | 4.95 | % |
Fund at Market Price(a)(b) | | | | | | | (7.28 | ) | | | 1.17 | | | | 5.77 | | | | 4.64 | |
Michigan Customized Reference Benchmark(c) | | | | | | | (2.99 | ) | | | (1.43 | ) | | | 4.22 | | | | N/A | |
Bloomberg Municipal Bond Index(d) | | | | | | | (3.10 | ) | | | (1.89 | ) | | | 3.46 | | | | 3.20 | |
S&P® Municipal Bond Index(e) | | | | | | | (2.56 | ) | | | (1.22 | ) | | | 3.42 | | | | 3.29 | |
Lipper Other States Municipal Debt Funds at NAV(f) | | | | | | | (3.83 | ) | | | (1.48 | ) | | | 4.21 | | | | 4.04 | |
Lipper Other States Municipal Debt Funds at Market Price(f) | | | | | | | (5.77 | ) | | | 0.74 | | | | 4.46 | | | | 4.12 | |
| | (a) | All returns reflect reinvestment of dividends and/or distributions at actual reinvestment prices. Performance results reflect the Fund’s use of leverage. | |
| | (b) | The Fund’s discount to NAV widened during the period, which accounts for the difference between performance based on market price and performance based on NAV. | |
| | (c) | The Michigan Customized Reference Benchmark is comprised of the Bloomberg Municipal Bond: Michigan Exempt Total Return Index Unhedged (90%) and the Michigan Bloomberg Municipal Bond: High Yield (non-Investment Grade) Total Return Index (10%). Effective October 1, 2021, the Fund changed its reporting benchmarks from S&P Municipal Bond Index and Lipper Other States Municipal Debt Funds to Bloomberg Municipal Bond Index and the Michigan Customized Reference Benchmark. The investment adviser believes the new benchmarks are more appropriate reporting benchmarks for the Fund. The Michigan Customized Reference Benchmark commenced on September 30, 2016. | |
| | (d) | An unmanaged index that tracks the U.S. long term tax-exempt bond market, including state and local general obligation bonds, revenue bonds, pre-refunded bonds, and insured bonds. | |
| | (e) | A broad, market value-weighted index that seeks to measure the performance of the U.S. municipal bond market. | |
| | (f) | Average return. Returns reflect reinvestment of dividends and/or distributions at NAV on the ex-dividend date as calculated by Lipper. | |
Performance results may include adjustments made for financial reporting purposes in accordance with U.S. generally accepted accounting principles.
Past performance is not an indication of future results.
The Fund is presenting the performance of one or more indices for informational purposes only. The Fund is actively managed and does not seek to track or replicate the performance of any index. The index performance shown is not intended to be indicative of the Fund’s investment strategies, portfolio components or past or future performance.
| | |
| 10 | | 2 0 2 2 B L A C K R O C K S E M I - A N N U A L R E P O R T T O S H A R E H O L D E R S |
| | |
| Fund Summary as of January 31, 2022 (continued) | | BlackRock MuniYield Michigan Quality Fund, Inc. (MIY) |
More information about the Fund’s historical performance can be found in the “Closed End Funds” section of blackrock.com.
The following discussion relates to the Fund’s absolute performance based on NAV:
Fixed-income assets experienced rising yields (and falling prices) during the six-month period. The Fed pivoted to a more hawkish tone on monetary policy as inflation accelerated well beyond its 2% target and labor markets improved toward its mandate of full employment. In this environment, the benefit of yield was insufficient to make up for the decline in municipal bond prices.
The Fund’s holdings in bonds with maturities of ten years and above detracted from performance. The Fund was also adversely impacted by the ongoing loss of income from higher-yielding securities being called or maturing. The Fund’s use of leverage, while augmenting income, further detracted by amplifying the effect of falling prices.
The views expressed reflect the opinions of BlackRock as of the date of this report and are subject to change based on changes in market, economic or other conditions. These views are not intended to be a forecast of future events and are no guarantee of future results.
Overview of the Fund’s Total Investments
SECTOR ALLOCATION
| | | | | | | | |
| | | |
| Sector(a)(b) | | 01/31/22 | | | 07/31/21 | |
| | |
Education | | | 27 | % | | | 28 | % |
Health | | | 19 | | | | 21 | |
State | | | 18 | | | | 16 | |
County/City/Special District/School District | | | 17 | | | | 16 | |
Utilities | | | 7 | | | | 7 | |
Transportation | | | 5 | | | | 4 | |
Housing | | | 4 | | | | 5 | |
Corporate | | | 2 | | | | 2 | |
Tobacco | | | 1 | | | | 1 | |
CALL/MATURITY SCHEDULE
| | | | |
| | |
| Calendar Year Ended December 31,(a)(c) | | Percentage | |
| |
2022 | | | 10 | % |
2023 | | | 15 | |
2024 | | | 9 | |
2025 | | | 12 | |
2026 | | | 11 | |
CREDIT QUALITY ALLOCATION
| | | | | | | | |
| | | |
| Credit Rating(a)(d) | | 01/31/22 | | | 07/31/21 | |
| | |
AAA/Aaa | | | 3 | % | | | 2 | % |
AA/Aa | | | 61 | | | | 61 | |
A | | | 27 | | | | 28 | |
BBB/Baa | | | 4 | | | | 4 | |
BB/Ba | | | — | (e) | | | — | (e) |
N/R(f) | | | 5 | | | | 5 | |
| (a) | | Excludes short-term securities. |
| (b) | | For Fund compliance purposes, the Fund’s sector classifications refer to one or more of the sector sub-classifications used by one or more widely recognized market indexes or rating group indexes, and/or as defined by the investment adviser. These definitions may not apply for purposes of this report, which may combine such sector sub-classifications for reporting ease. |
| (c) | | Scheduled maturity dates and/or bonds that are subject to potential calls by issuers over the next five years. |
| (d) | | For financial reporting purposes, credit quality ratings shown above reflect the highest rating assigned by either S&P Global Ratings or Moody’s Investors Service, Inc. if ratings differ. These rating agencies are independent, nationally recognized statistical rating organizations and are widely used. Investment grade ratings are credit ratings of BBB/Baa or higher. Below investment grade ratings are credit ratings of BB/Ba or lower. Investments designated N/R are not rated by either rating agency. Unrated investments do not necessarily indicate low credit quality. Credit quality ratings are subject to change. |
| (e) | | Rounds to less than 1% of total investments. |
| (f) | | The investment adviser evaluates the credit quality of unrated investments based upon certain factors including, but not limited to, credit ratings for similar investments and financial analysis of sectors and individual investments. Using this approach, the investment adviser has deemed certain of these unrated securities as investment grade quality. As of January 31, 2022 and July 31, 2021, the market value of unrated securities deemed by the investment adviser to be investment grade each represents less than 1% of the Fund’s total investments. |
| | |
| Fund Summary as of January 31, 2022 | | BlackRock MuniYield Pennsylvania Quality Fund (MPA) |
Investment Objective
BlackRock MuniYield Pennsylvania Quality Fund’s (MPA) (the “Fund”) investment objective is to provide shareholders with as high a level of current income exempt from U.S. federal and Pennsylvania income taxes as is consistent with its investment policies and prudent investment management. The Fund seeks to achieve its investment objective by investing at least 80% of its assets in municipal obligations exempt from U.S. federal income taxes (except that the interest may be subject to the U.S. federal alternative minimum tax) and Pennsylvania income taxes. Under normal market conditions, the Fund invests primarily in long-term municipal obligations that are investment grade quality, or are considered by the Fund’s investment adviser to be of comparable quality, at the time of investment. The Fund may invest up to 20% of its managed assets in securities that are rated below investment grade, or are considered by the Fund’s investment adviser to be of comparable quality, at the time of purchase. The Fund may invest directly in securities or synthetically through the use of derivatives.
No assurance can be given that the Fund’s investment objective will be achieved.
Fund Information
| | |
Symbol on New York Stock Exchange | | MPA |
Initial Offering Date | | October 30, 1992 |
Yield on Closing Market Price as of January 31, 2022 ($14.77)(a) | | 4.47% |
Tax Equivalent Yield(b) | | 7.96% |
Current Monthly Distribution per Common Share(c) | | $0.0550 |
Current Annualized Distribution per Common Share(c) | | $0.6600 |
Leverage as of January 31, 2022(d) | | 38% |
| | (a) | Yield on closing market price is calculated by dividing the current annualized distribution per share by the closing market price. Past performance is not an indication of future results. | |
| | (b) | Tax equivalent yield assumes the maximum marginal U.S. federal and state tax rate of 43.87%, which includes the 3.8% Medicare tax. Actual tax rates will vary based on income, exemptions and deductions. Lower taxes will result in lower tax equivalent yields. | |
| | (c) | The distribution rate is not constant and is subject to change. | |
| | (d) | Represents VRDP Shares and TOB Trusts as a percentage of total managed assets, which is the total assets of the Fund, including any assets attributable to VRDP Shares and TOB Trusts, minus the sum of its accrued liabilities. Does not reflect derivatives or other instruments that may give rise to economic leverage. For a discussion of leveraging techniques utilized by the Fund, please see The Benefits and Risks of Leveraging and Derivative Financial Instruments. | |
Market Price and Net Asset Value Per Share Summary
| | | | | | | | | | | | | | | | | | | | |
| | | 01/31/22 | | | 07/31/21 | | | Change | | | High | | | Low | |
Closing Market Price | | $ | 14.77 | | | $ | 16.23 | | | | (9.00 | )% | | $ | 17.27 | | | $ | 14.54 | |
Net Asset Value | | | 15.55 | | | | 16.64 | | | | (6.55 | ) | | | 16.66 | | | | 15.55 | |
Performance
Returns for the period ended January 31, 2022 were as follows:
| | | | | | | | | | | | | | | | | | | | |
| | | | | | | | | Average Annual Total Returns | |
| | | | | | 6-month | | | 1 Year | | | 5 Years | | | 10 Years | |
Fund at NAV(a)(b) | | | | | | | (4.59 | )% | | | (1.47 | )% | | | 5.05 | % | | | 4.85 | % |
Fund at Market Price(a)(b) | | | | | | | (7.09 | ) | | | 5.01 | | | | 5.17 | | | | 4.37 | |
Pennsylvania Customized Reference Benchmark(c) | | | | | | | (2.89 | ) | | | (1.24 | ) | | | 4.09 | | | | N/A | |
Bloomberg Municipal Bond Index(d) | | | | | | | (3.10 | ) | | | (1.89 | ) | | | 3.46 | | | | 3.20 | |
S&P® Municipal Bond Index(e) | | | | | | | (2.56 | ) | | | (1.22 | ) | | | 3.42 | | | | 3.29 | |
Lipper Pennsylvania Municipal Debt Funds at NAV(f) | | | | | | | (3.60 | ) | | | (0.50 | ) | | | 4.86 | | | | 4.50 | |
Lipper Pennsylvania Municipal Debt Funds at Market Price(f) | | | | | | | (5.04 | ) | | | 4.40 | | | | 5.72 | | | | 4.46 | |
| | (a) | All returns reflect reinvestment of dividends and/or distributions at actual reinvestment prices. Performance results reflect the Fund’s use of leverage. | |
| | (b) | The Fund’s discount to NAV widened during the period, which accounts for the difference between performance based on market price and performance based on NAV. | |
| | (c) | The Pennsylvania Customized Reference Benchmark is comprised of the Bloomberg Pennsylvania Total Return Index Unhedged (90%) and the Pennsylvania Bloomberg Municipal Bond: High Yield (non-Investment Grade) Total Return Index (10%). Effective October 1, 2021, the Fund changed its reporting benchmarks from S&P Municipal Bond Index and Lipper Pennsylvania Municipal Debt Funds to Bloomberg Municipal Bond Index and the Pennsylvania Customized Reference Benchmark. The investment adviser believes the new benchmarks are more appropriate reporting benchmarks for the Fund. The Pennsylvania Customized Reference Benchmark commenced on September 30, 2016. | |
| | (d) | An unmanaged index that tracks the U.S. long term tax-exempt bond market, including state and local general obligation bonds, revenue bonds, pre-refunded bonds, and insured bonds. | |
| | (e) | A broad, market value-weighted index that seeks to measure the performance of the U.S. municipal bond market. | |
| | (f) | Average return. Returns reflect reinvestment of dividends and/or distributions at NAV on the ex-dividend date as calculated by Lipper. | |
Performance results may include adjustments made for financial reporting purposes in accordance with U.S. generally accepted accounting principles.
Past performance is not an indication of future results.
The Fund is presenting the performance of one or more indices for informational purposes only. The Fund is actively managed and does not seek to track or replicate the performance of any index. The index performance shown is not intended to be indicative of the Fund’s investment strategies, portfolio components or past or future performance.
| | |
| 12 | | 2 0 2 2 B L A C K R O C K S E M I - A N N U A L R E P O R T T O S H A R E H O L D E R S |
| | |
| Fund Summary as of January 31, 2022 (continued) | | BlackRock MuniYield Pennsylvania Quality Fund (MPA) |
More information about the Fund’s historical performance can be found in the “Closed End Funds” section of blackrock.com.
The following discussion relates to the Fund’s absolute performance based on NAV:
Fixed-income assets experienced rising yields (and falling prices) during the six-month period. The Fed pivoted to a more hawkish tone on monetary policy as inflation accelerated well beyond its 2% target and labor markets improved toward its mandate of full employment.
The Fund was positioned longer on the yield curve, with a heavier weighting in bonds with maturities of 20 year and above. This positioning detracted from performance, since longer-dated bonds underperformed due to their higher degree of interest-rate sensitivity. Holdings in the health care sector detracted the most, since it is the largest sector weighting in the portfolio. Similarly, A rated bonds were the Fund’s largest allocation on a ratings basis and thus were most significant detractors from absolute performance. Positions in lower-coupon bonds, which tend to be more sensitive to moves in interest rates, also hurt performance. The Fund’s use of leverage, which magnified the impact of falling prices, was an additional detractor.
The Fund actively sought to manage interest rate risk using U.S. Treasury futures. Since U.S. Treasury yields rose, as prices fell, this strategy contributed to results.
The views expressed reflect the opinions of BlackRock as of the date of this report and are subject to change based on changes in market, economic or other conditions. These views are not intended to be a forecast of future events and are no guarantee of future results.
Overview of the Fund’s Total Investments
SECTOR ALLOCATION
| | | | | | | | |
| | | |
| Sector(a)(b) | | 01/31/22 | | | 07/31/21 | |
| | |
Health | | | 28 | % | | | 27 | % |
County/City/Special District/School District | | | 20 | | | | 18 | |
Education | | | 16 | | | | 18 | |
Transportation | | | 11 | | | | 11 | |
State | | | 11 | | | | 10 | |
Utilities | | | 9 | | | | 10 | |
Housing | | | 2 | | | | 2 | |
Corporate | | | 2 | | | | 1 | |
Tobacco | | | 1 | | | | 3 | |
CALL/MATURITY SCHEDULE
| | | | | | | | |
| | |
| Calendar Year Ended December 31,(a)(c) | | Percentage | |
| | |
2022 | | | | | | | 6 | % |
2023 | | | | | | | 3 | |
2024 | | | | | | | 7 | |
2025 | | | | | | | 13 | |
2026 | | | | | | | 6 | |
CREDIT QUALITY ALLOCATION
| | | | | | | | |
| Credit Rating(a)(d) | | 01/31/22 | | | 07/31/21 | |
| | |
AAA/Aaa | | | — | %(e) | | | — | % (e) |
AA/Aa | | | 50 | | | | 49 | |
A | | | 30 | | | | 29 | |
BBB/Baa | | | 5 | | | | 6 | |
BB/Ba | | | 3 | | | | 3 | |
B | | | 1 | | | | 1 | |
CCC/Caa | | | 1 | | | | 1 | |
N/R(f) | | | 10 | | | | 11 | |
| (a) | | Excludes short-term securities. |
| (b) | | For Fund compliance purposes, the Fund’s sector classifications refer to one or more of the sector sub-classifications used by one or more widely recognized market indexes or rating group indexes, and/or as defined by the investment adviser. These definitions may not apply for purposes of this report, which may combine such sector sub-classifications for reporting ease. |
| (c) | | Scheduled maturity dates and/or bonds that are subject to potential calls by issuers over the next five years. |
| (d) | | For financial reporting purposes, credit quality ratings shown above reflect the highest rating assigned by either S&P Global Ratings or Moody’s Investors Service, Inc. if ratings differ. These rating agencies are independent, nationally recognized statistical rating organizations and are widely used. Investment grade ratings are credit ratings of BBB/Baa or higher. Below investment grade ratings are credit ratings of BB/Ba or lower. Investments designated N/R are not rated by either rating agency. Unrated investments do not necessarily indicate low credit quality. Credit quality ratings are subject to change. |
| (e) | | Rounds to less than 1% of total investments. |
| (f) | | The investment adviser evaluates the credit quality of unrated investments based upon certain factors including, but not limited to, credit ratings for similar investments and financial analysis of sectors and individual investments. Using this approach, the investment adviser has deemed certain of these unrated securities as investment grade quality. As of January 31, 2022 and July 31, 2021, the market value of unrated securities deemed by the investment adviser to be investment grade represents 1% and 2%, respectively, of the Fund’s total investments. |
| | |
Schedule of Investments (unaudited) January 31, 2022 | | BlackRock MuniHoldings California Quality Fund, Inc. (MUC) (Percentages shown are based on Net Assets) |
| | | | | | | | |
| Security | | Par (000) | | | Value | |
|
Municipal Bonds | |
|
California — 110.1% | |
|
| Corporate — 0.3% | |
California Municipal Finance Authority, RB, Series A, AMT, 4.00%, 07/15/29 | | $ | 1,620 | | | $ | 1,802,845 | |
| | | | | | | | |
|
| County/City/Special District/School District — 37.0% | |
California Municipal Finance Authority, RB, 5.00%, 06/01/43 | | | 2,000 | | | | 2,363,026 | |
California Statewide Communities Development Authority, SAB | | | | | | | | |
Series B, 4.00%, 09/02/40 | | | 605 | | | | 663,537 | |
Series B, 4.00%, 09/02/50 | | | 735 | | | | 797,921 | |
Series C, 4.00%, 09/02/40 | | | 2,160 | | | | 2,368,991 | |
Series C, 4.00%, 09/02/50 | | | 1,550 | | | | 1,682,691 | |
California Statewide Communities Development Authority, SAB, S/F Housing | | | | | | | | |
5.00%, 09/02/39 | | | 535 | | | | 626,855 | |
5.00%, 09/02/40 | | | 400 | | | | 473,393 | |
5.00%, 09/02/44 | | | 615 | | | | 710,128 | |
5.00%, 09/02/49 | | | 900 | | | | 1,031,702 | |
4.00%, 09/02/50 | | | 320 | | | | 343,584 | |
5.00%, 09/02/50 | | | 320 | | | | 374,211 | |
Series C, 5.00%, 09/02/44 | | | 130 | | | | 150,108 | |
Series C, 5.00%, 09/02/49 | | | 640 | | | | 733,655 | |
California Statewide Communities Development Authority, ST | | | | | | | | |
4.00%, 09/01/41 | | | 295 | | | | 321,872 | |
4.00%, 09/01/51 | | | 565 | | | | 611,436 | |
Chabot-Las Positas Community College District, GO, Series A, 4.00%, 08/01/47 | | | 1,500 | | | | 1,663,263 | |
Chaffey Joint Union High School District, GO, CAB(a) | | | | | | | | |
Series C, 0.00%, 08/01/32 | | | 250 | | | | 182,836 | |
Series C, 0.00%, 08/01/33 | | | 500 | | | | 349,530 | |
Series C, 0.00%, 08/01/34 | | | 510 | | | | 341,130 | |
Series C, 0.00%, 08/01/35 | | | 545 | | | | 348,326 | |
Series C, 0.00%, 08/01/36 | | | 500 | | | | 305,360 | |
Series C, 0.00%, 08/01/37 | | | 650 | | | | 378,727 | |
Series C, 0.00%, 08/01/38 | | | 625 | | | | 347,658 | |
Series C, 0.00%, 08/01/39 | | | 750 | | | | 398,464 | |
Series C, 0.00%, 08/01/40 | | | 1,855 | | | | 940,776 | |
Series C, 0.00%, 08/01/41 | | | 305 | | | | 147,731 | |
Series C, 0.00%, 02/01/42 | | | 350 | | | | 165,646 | |
ChiNo.Valley Unified School District, GO, Series B, 5.00%, 08/01/55 | | | 1,285 | | | | 1,560,238 | |
City of Dixon California, ST, 4.00%, 09/01/45 | | | 535 | | | | 570,503 | |
City of Roseville California, ST, 4.00%, 09/01/50 | | | 365 | | | | 391,410 | |
City of Sacramento California Transient Occupancy Tax Revenue, RB, Series A, 5.00%, 06/01/43 | | | 1,230 | | | | 1,420,703 | |
Coronado Community Development Agency Successor Agency, Refunding TA, Series A, 5.00%, 09/01/33 | | | 1,785 | | | | 2,005,039 | |
County of Santa Clara California, GO, Series B, 4.00%, 08/01/43 | | | 10,225 | | | | 10,354,950 | |
El Dorado Irrigation District, Refunding RB, Series A, (AGM), 5.25%, 03/01/24(b) | | | 10,000 | | | | 10,870,910 | |
Elk Grove Unified School District, GO, 4.00%, 08/01/46 | | | 10,000 | | | | 10,823,980 | |
Fremont Union High School District, Refunding GO, 4.00%, 08/01/40 | | | 2,500 | | | | 2,656,808 | |
| | | | | | | | |
| Security | | Par (000) | | | Value | |
|
| County/City/Special District/School District (continued) | |
Garden Grove Unified School District, GO, Series C, 5.25%, 08/01/23(b) | | $ | 5,500 | | | $ | 5,857,665 | |
Glendale Community College District, GO, Series A, 4.00%, 08/01/46 | | | 8,000 | | | | 8,762,360 | |
Hayward Unified School District, GO, Series A, (BAM), 4.00%, 08/01/48 | | | 2,000 | | | | 2,211,798 | |
Kern Community College District, GO(b) | | | | | | | | |
Series C, 5.25%, 11/01/23 | | | 5,715 | | | | 6,146,477 | |
Series C, 5.75%, 11/01/23 | | | 12,085 | | | | 13,101,916 | |
Los Alamitos Unified School District, Refunding GO, 5.25%, 08/01/23(b) | | | 3,700 | | | | 3,940,611 | |
Los Angeles County Facilities Inc., RB | | | | | | | | |
5.00%, 12/01/28(b) | | | 7,130 | | | | 8,751,590 | |
5.00%, 12/01/51 | | | 11,140 | | | | 13,047,580 | |
Los Angeles County Metropolitan Transportation Authority, Refunding RB | | | | | | | | |
5.00%, 06/01/28 | | | 315 | | | | 383,559 | |
Series A, 5.00%, 07/01/44 | | | 2,000 | | | | 2,399,888 | |
Los Angeles County Public Works Financing Authority, Refunding RB, Series D, 5.00%, 12/01/45 | | | 1,430 | | | | 1,600,074 | |
Mount San Jacinto Community College District, GO | | | | | | | | |
Series A, 5.00%, 08/01/35 | | | 3,565 | | | | 4,010,654 | |
Series C, 2.38%, 08/01/51 | | | 6,115 | | | | 5,525,300 | |
Natomas Unified School District, GO, (BAM), 4.00%, 08/01/42 | | | 5,000 | | | | 5,441,725 | |
Orange County Community Facilities District, ST | | | | | | | | |
4.00%, 08/15/40 | | | 345 | | | | 369,822 | |
4.00%, 08/15/50 | | | 320 | | | | 339,827 | |
Rio Elementary School District, GO, Series A, (AGM), 5.25%, 08/15/25(b) | | | 5,865 | | | | 6,674,012 | |
Riverside County Public Financing Authority, Refunding TA, Series A, (BAM), 4.00%, 10/01/40 | | | 4,045 | | | | 4,414,381 | |
San Benito High School District, GO, 4.00%, 08/01/48 | | | 5,000 | | | | 5,480,045 | |
San Bernardino County Transportation Authority, RB, Series A, 5.25%, 03/01/40 | | | 4,545 | | | | 4,914,695 | |
San Diego Unified School District, GO, Series B, 3.25%, 07/01/48 | | | 6,000 | | | | 6,288,312 | |
San Diego Unified School District, GO, CAB(a) | | | | | | | | |
Series K-2, 0.00%, 07/01/38 | | | 2,755 | | | | 1,568,399 | |
Series K-2, 0.00%, 07/01/39 | | | 3,340 | | | | 1,819,218 | |
Series K-2, 0.00%, 07/01/40 | | | 4,285 | | | | 2,232,481 | |
San Jose Financing Authority, RB, 5.75%, 05/01/42 | | | 4,500 | | | | 4,517,554 | |
San Jose Financing Authority, Refunding RB, Series A, 5.00%, 06/01/23(b) | | | 5,800 | | | | 6,124,591 | |
San Luis Obispo County Community College District, Refunding GO, Series B, 4.00%, 08/01/43 | | | 3,555 | | | | 3,992,692 | |
San Marcos Redevelopment Agency Successor Agency, Refunding TA | | | | | | | | |
Series A, 5.00%, 10/01/32 | | | 1,700 | | | | 1,914,127 | |
Series A, 5.00%, 10/01/33 | | | 1,125 | | | | 1,266,002 | |
Santa Clara Unified School District, GO, 4.00%, 07/01/48 | | | 10,000 | | | | 10,923,970 | |
Santa Clarita Community College District, Refunding GO, 4.00%, 08/01/46 | | | 10,000 | | | | 10,924,240 | |
South San Francisco Public Facilities Financing Authority, RB, 4.00%, 06/01/46 | | | 4,890 | | | | 5,525,592 | |
Washington Township Health Care District, GO, Series B, 5.50%, 08/01/38 | | | 1,625 | | | | 1,788,239 | |
| | |
| 14 | | 2 0 2 2 B L A C K R O C K S E M I - A N N U A L R E P O R T T O S H A R E H O L D E R S |
| | |
Schedule of Investments (unaudited) (continued) January 31, 2022 | | BlackRock MuniHoldings California Quality Fund, Inc. (MUC) (Percentages shown are based on Net Assets) |
| | | | | | | | |
| Security | | Par (000) | | | Value | |
|
| County/City/Special District/School District (continued) | |
West Contra Costa Unified School District, GO(b) | | | | | | | | |
Series A, 5.50%, 08/01/23 | | $ | 2,500 | | | $ | 2,671,853 | |
Series B, 5.50%, 08/01/23 | | | 3,195 | | | | 3,414,628 | |
| | | | | | | | |
| | | | | | | 227,822,975 | |
| | |
| Education — 10.1% | | | | | | |
California Educational Facilities Authority, RB, Series V-1, 5.00%, 05/01/49 | | | 5,800 | | | | 8,423,038 | |
California Enterprise Development Authority, RB | | | | | | | | |
Series A, 5.00%, 08/01/50 | | | 650 | | | | 760,720 | |
Series A, 5.00%, 08/01/57 | | | 600 | | | | 699,544 | |
California Enterprise Development Authority, Refunding RB(c) | | | | | | | | |
4.00%, 06/01/51 | | | 625 | | | | 674,422 | |
4.00%, 06/01/61 | | | 345 | | | | 370,158 | |
California Municipal Finance Authority, RB(c) | | | | | | | | |
Series A, 5.50%, 08/01/34 | | | 250 | | | | 264,209 | |
Series A, 5.00%, 10/01/39 | | | 285 | | | | 310,360 | |
Series A, 5.00%, 10/01/49 | | | 480 | | | | 515,181 | |
Series A, 5.00%, 10/01/57 | | | 940 | | | | 1,004,342 | |
California Municipal Finance Authority, Refunding RB
5.00%, 08/01/39 | | | 1,105 | | | | 1,252,635 | |
Series B, 5.00%, 01/01/42 | | | 1,750 | | | | 2,001,571 | |
California School Finance Authority, RB(c) | | | | | | | | |
5.00%, 06/01/40 | | | 355 | | | | 382,933 | |
5.00%, 06/01/50 | | | 555 | | | | 591,179 | |
5.00%, 06/01/59 | | | 885 | | | | 938,543 | |
Series A, 5.00%, 07/01/49 | | | 850 | | | | 984,962 | |
Series A, 5.00%, 06/01/58 | | | 4,135 | | | | 4,417,806 | |
Series A, 5.00%, 07/01/59 | | | 1,380 | | | | 1,521,059 | |
Series A, 4.00%, 06/01/61 | | | 850 | | | | 861,155 | |
Series B, 4.00%, 07/01/45 | | | 560 | | | | 560,301 | |
Hastings Campus Housing Finance Authority, RB | | | | | | | | |
Series A, 5.00%, 07/01/45 | | | 785 | | | | 918,206 | |
Series A, 5.00%, 07/01/61 | | | 3,935 | | | | 4,505,473 | |
University of California, RB, Series M, 5.00%, 05/15/47 | | | 15,000 | | | | 17,425,620 | |
University of California, Refunding RB | | | | | | | | |
Series AO, 5.00%, 05/15/40 | | | 5,430 | | | | 6,058,637 | |
Series AZ, 4.00%, 05/15/48 | | | 6,000 | | | | 6,584,088 | |
| | | | | | | | |
| | | | | | | 62,026,142 | |
| | |
| Health — 12.4% | | | | | | |
California Health Facilities Financing Authority Refunding RB, 3.00%, 08/15/51(c) | | | 2,875 | | | | 2,868,666 | |
California Health Facilities Financing Authority, RB
4.00%, 11/15/47 | | | 825 | | | | 913,197 | |
Series A, 5.00%, 11/15/35 | | | 1,960 | | | | 2,337,733 | |
Series A, 4.00%, 11/15/42 | | | 450 | | | | 504,834 | |
California Health Facilities Financing Authority, Refunding RB | | | | | | | | |
Series A, 5.00%, 07/01/23(b) | | | 10,000 | | | | 10,582,360 | |
Series A, 5.00%, 10/01/24(b) | | | 4,745 | | | | 5,230,010 | |
Series A, 5.00%, 10/01/38 | | | 6,225 | | | | 6,814,396 | |
Series B, 5.00%, 11/15/26(b) | | | 3,385 | | | | 3,958,169 | |
Series B, 5.00%, 11/15/46 | | | 4,910 | | | | 5,691,736 | |
California Municipal Finance Authority, Refunding RB | | | | | | | | |
Series A, 5.00%, 02/01/37 | | | 3,110 | | | | 3,575,502 | |
Series A, 5.00%, 11/01/39(c) | | | 250 | | | | 279,718 | |
Series A, 5.00%, 02/01/42 | | | 5,250 | | | | 6,001,973 | |
| | | | | | | | |
| Security | | Par (000) | | | Value | |
| | |
| Health (continued) | | | | | | |
California Municipal Finance Authority, Refunding RB (continued) | | | | | | | | |
Series A, 5.00%, 11/01/49(c) | | $ | 280 | | | $ | 307,904 | |
California Statewide Communities Development Authority, RB | | | | | | | | |
4.00%, 08/01/45 | | | 2,500 | | | | 2,547,855 | |
4.00%, 07/01/48 | | | 2,220 | | | | 2,418,439 | |
California Statewide Communities Development Authority, Refunding RB | | | | | | | | |
4.00%, 04/01/42 | | | 3,005 | | | | 3,220,885 | |
4.00%, 04/01/47 | | | 2,655 | | | | 2,822,602 | |
5.00%, 04/01/47 | | | 2,995 | | | | 3,382,263 | |
Series A, 5.00%, 08/15/51 | | | 1,635 | | | | 1,875,917 | |
Series A, 5.00%, 12/01/53 | | | 1,000 | | | | 1,175,751 | |
Series A, 4.00%, 12/01/57 | | | 3,250 | | | | 3,334,331 | |
Series A, 5.00%, 12/01/57 | | | 1,750 | | | | 2,060,315 | |
Regents of the University of California Medical Center Pooled Revenue, Refunding RB, Series L, 5.00%, 05/15/47 | | | 4,000 | | | | 4,507,192 | |
| | | | | | | | |
| | | | | | | 76,411,748 | |
| | |
| Housing — 11.7% | | | | | | |
California Community Housing Agency, RB, M/F Housing(c) | | | | | | | | |
3.00%, 08/01/56 | | | 1,500 | | | | 1,254,456 | |
4.00%, 02/01/50 | | | 455 | | | | 427,294 | |
4.00%, 08/01/51 | | | 2,320 | | | | 2,074,839 | |
3.00%, 02/01/57 | | | 1,520 | | | | 1,196,982 | |
Series A, 5.00%, 04/01/49 | | | 3,840 | | | | 4,124,087 | |
Series A, 4.00%, 02/01/56 | | | 4,615 | | | | 4,524,263 | |
Series A-1, 4.00%, 08/01/50 | | | 480 | | | | 437,131 | |
Series A-1, 3.00%, 02/01/57 | | | 955 | | | | 802,801 | |
California Housing Finance Agency, RB, M/F Housing Class A, (FHLMC), 3.75%, 03/25/35 | | | 7,919 | | | | 8,862,950 | |
Series 2021-1, Class A, 3.50%, 11/20/35 | | | 2,327 | | | | 2,542,341 | |
Series A, 4.25%, 01/15/35 | | | 926 | | | | 1,061,077 | |
California Housing Finance, RB, M/F Housing, Series 2, Class A, 4.00%, 03/20/33 | | | 3,996 | | | | 4,429,933 | |
CMFA Special Finance Agency VII, RB, M/F Housing, 4.00%, 08/01/47(c) | | | 1,420 | | | | 1,291,182 | |
CMFA Special Finance Agency VIII, RB, M/F Housing, 3.00%, 08/01/56(c) | | | 1,860 | | | | 1,521,752 | |
CMFA Special Finance Agency XII, RB, M/F Housing, Series A, 3.25%, 02/01/57(c) | | | 1,400 | | | | 1,169,108 | |
CMFA Special Finance Agency, RB, M/F Housing(c) | | | | | | | | |
Series A, 4.00%, 12/01/45 | | | 1,155 | | | | 1,092,453 | |
Series A-2, 4.00%, 08/01/45 | | | 1,135 | | | | 1,131,588 | |
CSCDA Community Improvement Authority, RB, M/F Housing(c) | | | | | | | | |
4.00%, 10/01/46 | | | 2,180 | | | | 2,077,139 | |
2.65%, 12/01/46 | | | 1,825 | | | | 1,566,472 | |
4.00%, 07/01/56 | | | 1,490 | | | | 1,504,453 | |
3.13%, 08/01/56 | | | 605 | | | | 524,563 | |
4.00%, 08/01/56 | | | 1,905 | | | | 1,828,596 | |
3.25%, 04/01/57 | | | 755 | | | | 657,959 | |
4.00%, 04/01/57 | | | 2,025 | | | | 1,859,357 | |
4.00%, 05/01/57 | | | 2,335 | | | | 2,245,355 | |
3.13%, 06/01/57 | | | 1,455 | | | | 1,159,738 | |
4.00%, 06/01/58 | | | 3,195 | | | | 3,012,029 | |
4.00%, 12/01/58 | | | 2,025 | | | | 1,898,049 | |
| | |
S C H E D U L E O F I N V E S T M E N T S | | 15 |
| | |
Schedule of Investments (unaudited) (continued) January 31, 2022 | | BlackRock MuniHoldings California Quality Fund, Inc. (MUC) (Percentages shown are based on Net Assets) |
| | | | | | | | |
| Security | | Par (000) | | | Value | |
| | |
| Housing (continued) | | | | | | |
CSCDA Community Improvement Authority, RB, M/F Housing(c) (continued) | | | | | | | | |
Series A, 2.45%, 02/01/47 | | $ | 775 | | | $ | 654,458 | |
Series A, 5.00%, 07/01/51 | | | 1,325 | | | | 1,416,565 | |
Series A-2, 4.00%, 09/01/56 | | | 2,700 | | | | 2,748,568 | |
Series B, 4.00%, 02/01/57 | | | 605 | | | | 584,331 | |
Freddie Mac Multifamily ML Certificates, RB, M/F Housing, Series CA, Class A, 3.35%, 11/25/33 | | | 9,558 | | | | 10,300,600 | |
| | | | | | | | |
| | | | | | | 71,982,469 | |
| | |
| State — 3.3% | | | | | | |
California State Public Works Board, RB, Series I, 5.50%, 11/01/33 | | | 2,015 | | | | 2,166,758 | |
City of Roseville California, ST, 4.00%, 09/01/45 | | | 100 | | | | 107,314 | |
State of California, Refunding GO | | | | | | | | |
4.00%, 10/01/41 | | | 10,075 | | | | 11,560,519 | |
5.00%, 08/01/45 | | | 5,690 | | | | 6,325,334 | |
| | | | | | | | |
| | | | | | | 20,159,925 | |
| | |
| Tobacco — 7.6% | | | | | | |
California County Tobacco Securitization Agency, Refunding RB | | | | | | | | |
4.00%, 06/01/49 | | | 320 | | | | 356,618 | |
Series A, 4.00%, 06/01/49 | | | 465 | | | | 520,654 | |
California County Tobacco Securitization Agency, Refunding RB, CAB(a) | | | | | | | | |
0.00%, 06/01/55 | | | 3,185 | | | | 757,944 | |
Series B-2, Subordinate, 0.00%, 06/01/55 | | | 4,780 | | | | 911,575 | |
Golden State Tobacco Securitization Corp., Refunding RB | | | | | | | | |
0.00%, 06/01/66(a) | | | 3,660 | | | | 566,993 | |
Series A, (AGM-CR SAP), 5.00%, 06/01/25(b) | | | 9,765 | | | | 10,986,885 | |
Series A-1, 3.50%, 06/01/22(b) | | | 6,330 | | | | 6,393,692 | |
Series A-1, 5.00%, 06/01/22(b) | | | 11,350 | | | | 11,520,250 | |
Series A-1, 5.00%, 06/01/28(b) | | | 7,560 | | | | 9,172,896 | |
Series A-2, 5.00%, 06/01/22(b) | | | 1,645 | | | | 1,669,614 | |
Tobacco Securitization Authority of Southern California, Refunding RB, 5.00%, 06/01/48 | | | 1,130 | | | | 1,302,357 | |
Tobacco Securitization Authority of Southern California, Refunding RB, CAB, 0.00%, 06/01/54(a) | | | 13,750 | | | | 2,662,096 | |
| | | | | | | | |
| | | | | | | 46,821,574 | |
| | |
| Transportation — 18.5% | | | | | | |
Alameda Corridor Transportation Authority, Refunding RB, Series B, Sub Lien, 5.00%, 10/01/35 | | | 1,500 | | | | 1,712,895 | |
Bay Area Toll Authority, Refunding RB, 4.00%, 04/01/42 | | | 5,000 | | | | 5,427,660 | |
California Municipal Finance Authority, ARB, AMT, Senior Lien, 4.00%, 12/31/47 | | | 13,915 | | | | 14,978,412 | |
City of Los Angeles Department of Airports, ARB | | | | | | | | |
Series A, AMT, 5.00%, 05/15/40 | | | 3,830 | | | | 4,239,791 | |
Series C, AMT, 5.00%, 05/15/45 | | | 5,000 | | | | 6,037,890 | |
Series D, AMT, 5.00%, 05/15/35 | | | 2,000 | | | | 2,220,732 | |
Series D, AMT, 5.00%, 05/15/36 | | | 1,500 | | | | 1,664,479 | |
Sub-Series A, AMT, 5.00%, 05/15/47 | | | 6,725 | | | | 7,639,049 | |
City of Los Angeles Department of Airports, Refunding ARB, 5.00%, 05/15/43 | | | 7,000 | | | | 8,501,101 | |
| | | | | | | | |
| Security | | Par (000) | | | Value | |
| | |
| Transportation (continued) | | | | | | |
County of Sacramento California Airport System Revenue, Refunding RB | | | | | | | | |
Series A, 5.00%, 07/01/41 | | $ | 2,500 | | | $ | 2,841,360 | |
Sub-Series B, 5.00%, 07/01/41 | | | 1,250 | | | | 1,424,215 | |
Norman Y Mineta San Jose International Airport SJC, Refunding RB | | | | | | | | |
Series A, AMT, 5.00%, 03/01/41 | | | 3,075 | | | | 3,518,387 | |
Series A, AMT, 5.00%, 03/01/47 | | | 11,770 | | | | 13,466,222 | |
Port of Los Angeles, Refunding ARB, Series A, AMT, 5.00%, 08/01/44 | | | 500 | | | | 542,559 | |
Riverside County Transportation Commission, Refunding RB | | | | | | | | |
4.00%, 06/01/46 | | | 1,235 | | | | 1,396,048 | |
4.00%, 06/01/47 | | | 380 | | | | 419,679 | |
3.00%, 06/01/49 | | | 3,180 | | | | 3,196,103 | |
San Diego County Regional Airport Authority, Refunding ARB, Series A, 5.00%, 07/01/42 | | | 4,275 | | | | 4,973,535 | |
San Francisco City & County Airport Comm-San Francisco International Airport, Refunding ARB | | | | | | | | |
4.00%, 05/01/52(d) | | | 5,500 | | | | 6,194,980 | |
Series A, AMT, 5.00%, 05/01/29 | | | 6,435 | | | | 6,498,050 | |
Series A, AMT, 5.00%, 05/01/44 | | | 5,000 | | | | 5,880,420 | |
Series A, AMT, 5.00%, 05/01/47 | | | 5,000 | | | | 5,677,505 | |
Series B, AMT, 5.00%, 05/01/41 | | | 5,000 | | | | 5,608,955 | |
| | | | | | | | |
| | | | | | | 114,060,027 | |
| | |
| Utilities — 9.2% | | | | | | |
City of Riverside California Electric Revenue, Refunding RB, Series A, 5.00%, 10/01/43 | | | 3,500 | | | | 4,249,893 | |
City of San Francisco California Public Utilities Commission Water Revenue, RB, Series A, 5.00%, 11/01/39 | | | 5,245 | | | | 5,854,548 | |
East Bay Municipal Utility District Water System Revenue, RB | | | | | | | | |
Series A, 4.00%, 06/01/45 | | | 4,585 | | | | 5,076,342 | |
Series A, 5.00%, 06/01/49 | | | 11,190 | | | | 13,565,279 | |
Los Angeles Department of Water, RB, Series A, 5.00%, 07/01/42 | | | 8,825 | | | | 10,182,214 | |
San Diego Public Facilities Financing Authority, Refunding RB, Series A, Subordinate, 5.00%, 08/01/43 | | | 9,655 | | | | 11,500,215 | |
San Francisco City & County Public Utilities Commission Wastewater Revenue, Refunding RB, Series B, 4.00%, 10/01/42 | | | 3,000 | | | | 3,057,267 | |
San Juan Water District, Refunding RB, Series A, 5.25%, 02/01/33 | | | 1,095 | | | | 1,097,653 | |
San Mateo Foster City Public Financing Authority, RB, 4.00%, 08/01/44 | | | 2,000 | | | | 2,262,468 | |
| | | | | | | | |
| | | | | | | 56,845,879 | |
| | | | | | | | |
| | |
Total Municipal Bonds in California | | | | | | | 677,933,584 | |
| | |
Puerto Rico — 4.8% | | | | | | | | |
| | |
| State — 4.8% | | | | | | |
Puerto Rico Sales Tax Financing Corp. Sales Tax Revenue, RB | | | | | | | | |
Series A-1, Restructured, 4.75%, 07/01/53 | | | 8,317 | | | | 9,100,154 | |
| | |
| 16 | | 2 0 2 2 B L A C K R O C K S E M I - A N N U A L R E P O R T T O S H A R E H O L D E R S |
| | |
Schedule of Investments (unaudited) (continued) January 31, 2022 | | BlackRock MuniHoldings California Quality Fund, Inc. (MUC) (Percentages shown are based on Net Assets) |
| | | | | | | | |
| Security | | Par (000) | | | Value | |
| | |
| State (continued) | | | | | | |
Puerto Rico Sales Tax Financing Corp. Sales Tax Revenue, RB (continued) | | | | | | | | |
Series A-1, Restructured, 5.00%, 07/01/58 | | $ | 11,280 | | | $ | 12,550,354 | |
Series A-2, Restructured, 4.33%, 07/01/40 | | | 2,677 | | | | 2,905,883 | |
Series A-2, Restructured, 4.78%, 07/01/58 | | | 553 | | | | 607,216 | |
Series B-1, Restructured, 4.75%, 07/01/53 | | | 848 | | | | 929,879 | |
Series B-2, Restructured, 4.78%, 07/01/58 | | | 822 | | | | 903,204 | |
Puerto Rico Sales Tax Financing Corp. Sales Tax Revenue, RB, CAB, Series A-1, Restructured, 0.00%, 07/01/46(a) | | | 8,705 | | | | 2,815,380 | |
| | | | | | | | |
| | |
Total Municipal Bonds in Puerto Rico | | | | | | | 29,812,070 | |
| | | | | | | | |
| | |
Total Municipal Bonds — 114.9%
(Cost: $669,615,021) | | | | | | | 707,745,654 | |
| | | | | | | | |
|
| Municipal Bonds Transferred to Tender Option Bond Trusts(e) | |
| | |
| California — 44.1% | | | | | | |
|
| County/City/Special District/School District — 15.8% | |
Palomar Community College District, GO, Series C, 5.00%, 08/01/25(b) | | | 15,140 | | | | 17,101,750 | |
Riverside County Public Financing Authority, RB, 5.25%, 11/01/25(b) | | | 10,000 | | | | 11,459,260 | |
Sacramento Area Flood Control Agency, Refunding SAB, Series A, 5.00%, 10/01/43 | | | 9,990 | | | | 11,493,422 | |
San Luis Obispo County Community College District, Refunding GO, Series A, 4.00%, 08/01/40 | | | 6,585 | | | | 7,114,561 | |
San Mateo County Community College District, GO, Series A, 5.00%, 09/01/25(b) | | | 17,615 | | | | 19,943,695 | |
Southwestern Community College District, GO, Series D, 5.00%, 08/01/25(b) | | | 10,820 | | | | 12,225,702 | |
West Valley-Mission Community College District, GO, Series B, 4.00%, 08/01/40 | | | 17,000 | | | | 18,326,051 | |
| | | | | | | | |
| | | | | | | 97,664,441 | |
| | |
| Education — 3.8% | | | | | | |
California State University, Refunding RB, Series A, 5.00%, 11/01/43 | | | 6,001 | | | | 6,758,523 | |
University of California, RB, Series AM, 5.25%, 05/15/44 | | | 10,210 | | | | 11,122,896 | |
University of California, Refunding RB, Series AF, 5.00%, 05/15/39 | | | 5,000 | | | | 5,243,110 | |
| | | | | | | | |
| | | | | | | 23,124,529 | |
| | |
| Health — 16.2% | | | | | | |
California Health Facilities Financing Authority, RB | | | | | | | | |
5.00%, 11/15/49(f) | | | 5,000 | | | | 5,775,859 | |
5.00%, 11/15/56 | | | 6,000 | | | | 7,096,820 | |
Series A, 5.00%, 08/15/23(b) | | | 14,520 | | | | 15,430,869 | |
Series B, 5.00%, 08/15/55 | | | 4,500 | | | | 5,162,655 | |
California Health Facilities Financing Authority, Refunding RB | | | | | | | | |
Series A, 5.00%, 08/15/25(b) | | | 19,425 | | | | 21,966,739 | |
Series A, 4.00%, 10/01/47 | | | 4,997 | | | | 5,345,829 | |
Sub-Series A-2, 4.00%, 11/01/44 | | | 17,720 | | | | 19,676,447 | |
California Statewide Communities Development Authority, RB, Series A, 5.00%, 04/01/42 | | | 19,070 | | | | 19,187,280 | |
| | | | | | | | |
| | | | | | | 99,642,498 | |
| | | | | | | | |
| Security | | Par (000) | | | Value | |
| | |
| Transportation — 5.8% | | | | | | |
Bay Area Toll Authority, Refunding RB, 4.00%, 04/01/49(f) | | $ | 10,005 | | | $ | 11,066,437 | |
City of Los Angeles Department of Airports, ARB | | | | | | | | |
Series A, AMT, 5.00%, 05/15/40 | | | 5,500 | | | | 6,088,472 | |
Series B, AMT, 5.00%, 05/15/41 | | | 3,645 | | | | 4,080,080 | |
Series D, AMT, 5.00%, 05/15/41 | | | 13,332 | | | | 14,748,759 | |
| | | | | | | | |
| | | | | | | 35,983,748 | |
| | |
| Utilities — 2.5% | | | | | | |
City of Los Angeles California Wastewater System Revenue, RB, Series A, 5.00%, 06/01/44 | | | 13,790 | | | | 15,319,663 | |
| | | | | | | | |
| | |
Total Municipal Bonds in California | | | | | | | 271,734,879 | |
| | | | | | | | |
| | |
Total Municipal Bonds Transferred to Tender Option Bond Trusts — 44.1%
(Cost: $256,294,922) | | | | | | | 271,734,879 | |
| | | | | | | | |
| | |
Total Long-Term Investments — 159.0%
(Cost: $925,909,943) | | | | | | | 979,480,533 | |
| | | | | | | | |
| | |
| | | Shares | | | | |
| | |
Short-Term Securities | | | | | | | | |
| | |
| Money Market Funds — 2.8% | | | | | | |
BlackRock Liquidity Funds California Money Fund, Institutional Class, 0.01%(g)(h) | | | 17,118,189 | | | | 17,107,918 | |
| | | | | | | | |
| |
Total Short-Term Securities — 2.8%
(Cost: $17,114,999) | | | | 17,107,918 | |
| | | | | | | | |
| |
Total Investments — 161.8%
(Cost: $943,024,942) | | | | 996,588,451 | |
| |
Other Assets Less Liabilities — 0.9% | | | | 5,631,387 | |
| |
Liability for TOB Trust Certificates, Including Interest Expense and Fees Payable — (21.5)% | | | | (132,184,780 | ) |
| |
VMTP Shares at Liquidation Value — (41.2)% | | | | (254,000,000 | ) |
| | | | | | | | |
| |
Net Assets Applicable to Common Shares — 100.0% | | | $ | 616,035,058 | |
| | | | | | | | |
| (b) | U.S. Government securities held in escrow, are used to pay interest on this security as well as to retire the bond in full at the date indicated, typically at a premium to par. |
| (c) | Security exempt from registration pursuant to Rule 144A under the Securities Act of 1933, as amended. These securities may be resold in transactions exempt from registration to qualified institutional investors. |
| (d) | When-issued security. |
| (e) | Represent bonds transferred to a TOB Trust in exchange of cash and residual certificates received by the Fund. These bonds serve as collateral in a secured borrowing. See Note 4 of the Notes to Financial Statements for details. |
| (f) | All or a portion of the security is subject to a recourse agreement. The aggregate maximum potential amount the Fund could ultimately be required to pay under the agreements, which expire between April 1, 2025 to May 15, 2025, is $10,754,131. See Note 4 of the Notes to Financial Statements for details. |
| (g) | Affiliate of the Fund. |
| (h) | Annualized 7-day yield as of period end. |
For Fund compliance purposes, the Fund’s sector classifications refer to one or more of the sector sub-classifications used by one or more widely recognized market indexes or rating group indexes, and/or as defined by the investment adviser. These definitions may not apply for purposes of this report, which may combine such sector sub-classifications for reporting ease.
| | |
S C H E D U L E O F I N V E S T M E N T S | | 17 |
| | |
Schedule of Investments (unaudited) (continued) January 31, 2022 | | BlackRock MuniHoldings California Quality Fund, Inc. (MUC) |
Affiliates
Investments in issuers considered to be affiliate(s) of the Fund during the six months ended January 31, 2022 for purposes of Section 2(a)(3) of the Investment Company Act of 1940, as amended, were as follows:
| | | | | | | | | | | | | | | | | | | | | | | | | | | | | | | | | | | | |
| Affiliated Issuer | | Value at
07/31/21 | | | Purchases
at Cost | | | Proceeds
from Sales | | | Net
Realized
Gain (Loss) | | | Change in
Unrealized
Appreciation
(Depreciation) | | | Value at
01/31/22 | | | Shares
Held at
01/31/22 | | | Income | | | Capital Gain
Distributions
from
Underlying
Funds | |
BlackRock Liquidity Funds California Money Fund, Institutional Class | | $ | 19,391,202 | | | $ | — | | | $ | (2,260,431 | )(a) | | $ | (8,007 | ) | | $ | (14,846 | ) | | $ | 17,107,918 | | | | 17,118,189 | | | $ | 23,419 | | | $ | — | |
| | | | | | | | | | | | | | | | | | | | | | | | | | | | | | | | | | | | |
| | (a) | Represents net amount purchased (sold). | |
Derivative Financial Instruments Categorized by Risk Exposure
For the period ended January 31, 2022, the effect of derivative financial instruments in the Statements of Operations was as follows:
| | | | | | | | | | | | | | | | | | | | | | | | | | | | |
| | | Commodity
Contracts | | | Credit
Contracts | | | Equity
Contracts | | | Foreign
Currency
Exchange
Contracts | | | Interest
Rate
Contracts | | | Other
Contracts | | | Total | |
Net Realized Gain (Loss) from: | | | | | | | | | | | | | | | | | | | | | | | | | | | | |
Futures contracts | | $ | — | | | $ | — | | | $ | — | | | $ | — | | | $ | 1,060,539 | | | $ | — | | | $ | 1,060,539 | |
| | | | | | | | | | | | | | | | | | | | | | | | | | | | |
Average Quarterly Balances of Outstanding Derivative Financial Instruments
| | |
Futures contracts: | | |
Average notional value of contracts — short | | $25,855,176 |
For more information about the Fund’s investment risks regarding derivative financial instruments, refer to the Notes to Financial Statements.
Fair Value Hierarchy as of Period End
Various inputs are used in determining the fair value of financial instruments. For a description of the input levels and information about the Fund’s policy regarding valuation of financial instruments, refer to the Notes to Financial Statements.
The following table summarizes the Fund’s financial instruments categorized in the fair value hierarchy. The breakdown of the Fund’s financial instruments into major categories is disclosed in the Schedule of Investments above.
| | | | | | | | | | | | | | | | |
| | | | | |
| | | Level 1 | | | Level 2 | | | Level 3 | | | Total | |
Assets | | | | | | | | | | | | | | | | |
Investments | | | | | | | | | | | | | | | | |
Long-Term Investments | | | | | | | | | | | | | | | | |
Municipal Bonds | | $ | — | | | $ | 707,745,654 | | | $ | — | | | $ | 707,745,654 | |
Municipal Bonds Transferred to Tender Option Bond Trusts | | | — | | | | 271,734,879 | | | | — | | | | 271,734,879 | |
Short-Term Securities | | | | | | | | | | | | | | | | |
Money Market Funds | | | 17,107,918 | | | | — | | | | — | | | | 17,107,918 | |
| | | | | | | | | | | | | | | | |
| | $ | 17,107,918 | | | $ | 979,480,533 | | | $ | — | | | $ | 996,588,451 | |
| | | | | | | | | | | | | | | | |
The Fund may hold assets and/or liabilities in which the fair value approximates the carrying amount for financial statement purposes. As of period end, such assets and/or liabilities are categorized within the fair value hierarchy as follows:
| | | | | | | | | | | | | | | | |
| | | | | |
| | | Level 1 | | | Level 2 | | | Level 3 | | | Total | |
| Liabilities | | | | | | | | | | | | | | | | |
TOB Trust Certificates | | $ | — | | | $ | (132,144,550 | ) | | $ | — | | | $ | (132,144,550 | ) |
VMTP Shares at Liquidation Value | | | — | | | | (254,000,000 | ) | | | — | | | | (254,000,000 | ) |
| | | | | | | | | | | | | | | | |
| | $ | — | | | $ | (386,144,550 | ) | | $ | — | | | $ | (386,144,550 | ) |
| | | | | | | | | | | | | | | | |
See notes to financial statements.
| | |
| 18 | | 2 0 2 2 B L A C K R O C K S E M I - A N N U A L R E P O R T T O S H A R E H O L D E R S |
| | |
Schedule of Investments (unaudited) January 31, 2022 | | BlackRock MuniHoldings New Jersey Quality Fund, Inc. (MUJ) (Percentages shown are based on Net Assets) |
| | | | | | | | |
| Security | | Par (000) | | | Value | |
| | |
Municipal Bonds | | | | | | | | |
| | |
| Guam — 0.3% | | | | | | |
| | |
| Utilities — 0.3% | | | | | | |
Guam Government Waterworks Authority, RB, Series A, 5.00%, 01/01/50 | | $ | 1,015 | | | $ | 1,197,632 | |
| | | | | | | | |
| | |
| New Jersey — 124.0% | | | | | | |
| | |
| Corporate — 1.5% | | | | | | |
New Jersey Economic Development Authority, RB(a) | | | | | | | | |
Series A, (NPFGC), 5.25%, 07/01/25 | | | 535 | | | | 608,108 | |
Series A, (NPFGC), 5.25%, 07/01/26 | | | 1,415 | | | | 1,655,772 | |
New Jersey Economic Development Authority, Refunding RB | | | | | | | | |
3.38%, 04/01/38 | | | 2,230 | | | | 2,278,471 | |
3.50%, 04/01/42 | | | 1,675 | | | | 1,710,793 | |
Series A, AMT, 2.20%, 10/01/39(b) | | | 850 | | | | 857,018 | |
| | | | | | | | |
| | | | | | | 7,110,162 | |
| | |
| County/City/Special District/School District — 11.0% | | | | | | |
Casino Reinvestment Development Authority, Inc., Refunding RB | | | | | | | | |
5.25%, 11/01/39 | | | 11,130 | | | | 11,959,997 | |
5.25%, 11/01/44 | | | 3,755 | | | | 4,005,947 | |
City of Bayonne New Jersey, Refunding GO, (BAM, SAW), 5.00%, 07/01/26(c) | | | 3,720 | | | | 4,301,194 | |
County of Essex New Jersey, GO, Series B, (SCH BD RES FD), 3.00%, 09/01/46 | | | 1,700 | | | | 1,736,689 | |
County of Mercer New Jersey, Refunding GO, 2.38%, 02/15/30 | | | 1,640 | | | | 1,686,674 | |
Essex County Improvement Authority, RB, (GTD), 4.00%, 11/01/49 | | | 575 | | | | 637,538 | |
Essex County Improvement Authority, Refunding RB | | | | | | | | |
(NPFGC GTD), 5.50%, 10/01/27 | | | 250 | | | | 305,759 | |
(NPFGC GTD), 5.50%, 10/01/28 | | | 4,840 | | | | 6,078,188 | |
Ewing Township Board of Education, GO | | | | | | | | |
4.00%, 07/15/38 | | | 1,470 | | | | 1,661,338 | |
4.00%, 07/15/39 | | | 1,330 | | | | 1,500,908 | |
Gloucester County Improvement Authority, RB | | | | | | | | |
(BAM), 4.00%, 07/01/46 | | | 465 | | | | 521,543 | |
(BAM), 4.00%, 07/01/51 | | | 645 | | | | 722,579 | |
Hudson County Improvement Authority, RB, 4.00%, 10/01/51 | | | 2,800 | | | | 3,136,020 | |
Hudson County Improvement Authority, RB, CAB, Series A-1, (NPFGC GTD), 0.00%, 12/15/32(d) | | | 1,000 | | | | 773,870 | |
Jersey City Redevelopment Agency, 4.00%, 12/15/31 | | | 2,720 | | | | 3,227,005 | |
New Jersey Economic Development Authority, RB | | | | | | | | |
5.00%, 06/15/23(c) | | | 3,065 | | | | 3,237,796 | |
Series KK, 5.00%, 09/01/22(c) | | | 325 | | | | 333,058 | |
Series QQQ, 4.00%, 06/15/50 | | | 2,070 | | | | 2,257,484 | |
Township of Irvington New Jersey, Refunding GO, Series A, (AGM, SAW), 5.00%, 07/15/24(c) | | | 1,175 | | | | 1,283,535 | |
Union County Utilities Authority, Refunding RB, Series A, AMT, (GTD), 5.25%, 12/01/31 | | | 645 | | | | 647,287 | |
| | | | | | | | |
| | | | | | | 50,014,409 | |
| | |
| Education — 18.2% | | | | | | |
Atlantic County Improvement Authority, RB, Series A, (AGM), 4.00%, 07/01/46 | | | 1,300 | | | | 1,387,506 | |
Clifton Board of Education GO | | | | | | | | |
(AGM), 2.25%, 08/15/45 | | | 3,425 | | | | 3,068,666 | |
(AGM), 2.25%, 08/15/46 | | | 3,425 | | | | 3,050,165 | |
| | | | | | | | |
| Security | | Par (000) | | | Value | |
| | |
| Education (continued) | | | | | | |
Gloucester County Improvement Authority, RB | | | | | | | | |
5.00%, 07/01/44 | | $ | 1,985 | | | $ | 2,195,716 | |
Series A, 5.00%, 07/01/31 | | | 1,950 | | | | 2,182,358 | |
Series A, 5.00%, 07/01/32 | | | 1,775 | | | | 1,985,323 | |
Series A, 5.00%, 07/01/33 | | | 2,250 | | | | 2,515,183 | |
Series A, 5.00%, 07/01/34 | | | 1,200 | | | | 1,340,658 | |
New Jersey Economic Development Authority, RB | | | | | | | | |
Series A, 5.00%, 01/01/35 | | | 2,000 | | | | 2,079,328 | |
Series A, 5.00%, 07/01/38 | | | 190 | | | | 220,259 | |
Series A, 5.00%, 07/01/47 | | | 795 | | | | 832,502 | |
Series A, 5.00%, 07/01/50 | | | 495 | | | | 562,518 | |
Series A, 5.25%, 11/01/54(e) | | | 2,235 | | | | 2,319,890 | |
Series WW, 5.25%, 06/15/25(c) | | | 460 | | | | 520,503 | |
New Jersey Economic Development Authority, Refunding RB | | | | | | | | |
(AGM), 5.00%, 06/01/37 | | | 3,990 | | | | 4,632,550 | |
(AGM), 5.00%, 06/01/42 | | | 810 | | | | 939,319 | |
New Jersey Educational Facilities Authority, RB | | | | | | | | |
Series A, 5.00%, 07/01/45 | | | 1,345 | | | | 1,580,737 | |
Series C, (AGM), 3.25%, 07/01/49 | | | 585 | | | | 605,263 | |
Series C, (AGM), 4.00%, 07/01/50 | | | 495 | | | | 551,007 | |
New Jersey Educational Facilities Authority, Refunding RB | | | | | | | | |
Series A, (BAM), 5.00%, 07/01/28 | | | 1,135 | | | | 1,311,473 | |
Series A, 5.00%, 07/01/39 | | | 15,555 | | | | 16,846,361 | |
Series A, 5.00%, 07/01/44 | | | 3,540 | | | | 3,826,754 | |
Series A, 4.00%, 07/01/47 | | | 1,145 | | | | 1,213,188 | |
Series D, 5.00%, 07/01/38 | | | 500 | | | | 522,623 | |
Series D, 5.00%, 07/01/43 | | | 600 | | | | 626,212 | |
New Jersey Higher Education Student Assistance Authority, RB | | | | | | | | |
Series 1A, AMT, 4.00%, 12/01/28. | | | 280 | | | | 285,559 | |
Series 1A, AMT, 4.50%, 12/01/28 | | | 740 | | | | 757,731 | |
Series 1A, AMT, 4.00%, 12/01/29 | | | 190 | | | | 193,717 | |
Series 1A, AMT, 4.50%, 12/01/29 | | | 935 | | | | 957,131 | |
Series 1A, AMT, 4.63%, 12/01/30 | | | 920 | | | | 942,502 | |
Series 1A, AMT, 4.00%, 12/01/31 | | | 300 | | | | 305,744 | |
Series 1A, AMT, 4.13%, 12/01/35 | | | 180 | | | | 182,540 | |
Series 1A-1, AMT, 4.00%, 12/01/29 | | | 1,885 | | | | 1,961,371 | |
Series 1A-1, AMT, 4.25%, 12/01/32 | | | 680 | | | | 707,193 | |
Series 1A-1, AMT, 4.50%, 12/01/36 | | | 595 | | | | 618,532 | |
Sub-Series C, AMT, 4.00%, 12/01/48 | | | 1,760 | | | | 1,906,135 | |
New Jersey Higher Education Student Assistance Authority, Refunding RB | | | | | | | | |
1st Series, AMT, 5.50%, 12/01/26 | | | 585 | | | | 585,511 | |
Series 1, AMT, 5.38%, 12/01/24 | | | 485 | | | | 485,426 | |
Series B, AMT, 3.00%, 12/01/32 | | | 3,435 | | | | 3,539,555 | |
New Jersey Institute of Technology, RB, Series A, 5.00%, 07/01/45 | | | 7,500 | | | | 8,324,272 | |
Newark Board of Education, Refunding GO | | | | | | | | |
(BAM SCH BD RES FD), 3.00%, 07/15/38 | | | 700 | | | | 723,253 | |
(BAM SCH BD RES FD), 3.00%, 07/15/39 | | | 120 | | | | 123,940 | |
(BAM SCH BD RES FD), 3.00%, 07/15/41 | | | 1,500 | | | | 1,541,013 | |
Sustainability Bonds, (BAM), 3.00%, 07/15/42 | | | 485 | | | | 496,506 | |
Rutgers The State University of New Jersey, Refunding RB, Series L, 5.00%, 05/01/23(c) | | | 1,565 | | | | 1,643,048 | |
| | | | | | | | |
| | | | | | | 83,196,741 | |
| | |
| Health — 8.4% | | | | | | |
Camden County Improvement Authority, Refunding RB, 5.00%, 02/15/33 | | | 2,000 | | | | 2,132,470 | |
| | |
S C H E D U L E O F I N V E S T M E N T S | | 19 |
| | |
Schedule of Investments (unaudited) (continued) January 31, 2022 | | BlackRock MuniHoldings New Jersey Quality Fund, Inc. (MUJ) (Percentages shown are based on Net Assets) |
| | | | | | | | |
| Security | | Par (000) | | | Value | |
| | |
| Health (continued) | | | | | | |
Middlesex County Improvement Authority, RB, AMT, (AMBAC), 5.50%, 09/01/30 | | $ | 475 | | | $ | 476,884 | |
New Jersey Economic Development Authority, Refunding RB | | | | | | | | |
5.00%, 01/01/34 | | | 675 | | | | 754,499 | |
5.00%, 01/01/39 | | | 675 | | | | 750,279 | |
New Jersey Health Care Facilities Financing Authority, RB | | | | | | | | |
5.00%, 07/01/42 | | | 2,270 | | | | 2,623,739 | |
4.00%, 07/01/44 | | | 2,175 | | | | 2,402,703 | |
2.38%, 07/01/46 | | | 1,495 | | | | 1,290,465 | |
3.00%, 07/01/51 | | | 760 | | | | 749,498 | |
Series A, 5.50%, 07/01/43 | | | 7,105 | | | | 7,513,182 | |
New Jersey Health Care Facilities Financing Authority, Refunding RB | | | | | | | | |
5.00%, 07/01/25 | | | 1,000 | | | | 1,017,714 | |
5.00%, 07/01/26 | | | 3,720 | | | | 3,784,951 | |
5.00%, 07/01/28 | | | 3,000 | | | | 3,219,012 | |
5.00%, 07/01/29 | | | 715 | | | | 766,013 | |
5.00%, 07/01/34 | | | 1,330 | | | | 1,527,456 | |
5.00%, 07/01/39 | | | 1,825 | | | | 2,077,043 | |
4.00%, 07/01/41 | | | 1,600 | | | | 1,742,486 | |
Series A, 4.00%, 07/01/43 | | | 1,865 | | | | 2,014,685 | |
Series A, 5.00%, 07/01/43 | | | 3,080 | | | | 3,550,602 | |
| | | | | | | | |
| | | | | | | 38,393,681 | |
| | |
| Housing — 5.5% | | | | | | |
New Jersey Housing & Mortgage Finance Agency, RB, Series A, (AGM), 5.00%, 05/01/27 | | | 2,260 | | | | 2,266,809 | |
New Jersey Housing & Mortgage Finance Agency, RB, S/F Housing | | | | | | | | |
Series H, 2.15%, 10/01/41 | | | 1,710 | | | | 1,539,335 | |
Series H, 2.30%, 10/01/46 | | | 1,285 | | | | 1,135,083 | |
Series H, 2.40%, 04/01/52 | | | 1,285 | | | | 1,134,033 | |
New Jersey Housing & Mortgage Finance Agency, Refunding RB | | | | | | | | |
Series 2, AMT, 4.60%, 11/01/38 | | | 3,120 | | | | 3,156,988 | |
Series 2, AMT, 4.75%, 11/01/46 | | | 3,795 | | | | 3,829,356 | |
New Jersey Housing & Mortgage Finance Agency, Refunding RB, M/F Housing | | | | | | | | |
Series A, (HUD SECT 8), 2.25%, 11/01/36 | | | 640 | | | | 604,133 | |
Series A, (HUD SECT 8), 2.45%, 11/01/45 | | | 475 | | | | 432,247 | |
Series A, (HUD SECT 8), 2.65%, 11/01/46 | | | 640 | | | | 589,740 | |
Series A, 4.00%, 11/01/48 | | | 370 | | | | 385,029 | |
Series A, (HUD SECT 8), 2.55%, 11/01/50 | | | 430 | | | | 386,355 | |
Series A, (HUD SECT 8), 2.70%, 11/01/51 | | | 640 | | | | 578,439 | |
Series A, 4.10%, 11/01/53 | | | 220 | | | | 232,099 | |
Series A, (HUD SECT 8), 2.63%, 11/01/56 | | | 430 | | | | 377,828 | |
Series A, (HUD SECT 8), 2.75%, 11/01/56 | | | 640 | | | | 569,455 | |
Series D, AMT, 4.25%, 11/01/37 | | | 490 | | | | 513,206 | |
Series D, AMT, 4.35%, 11/01/42 | | | 1,000 | | | | 1,039,220 | |
New Jersey Housing & Mortgage Finance Agency, Refunding RB, S/F Housing | | | | | | | | |
Series A, 3.75%, 10/01/35 | | | 3,420 | | | | 3,704,298 | |
Series E, 2.25%, 10/01/40 | | | 1,500 | | | | 1,387,347 | |
Series E, 2.40%, 10/01/45 | | | 1,155 | | | | 1,051,298 | |
| | | | | | | | |
| | | | | | | 24,912,298 | |
| | |
| State — 35.3% | | | | | | |
Garden State Preservation Trust, RB, CAB(d) | | | | | | | | |
Series B, (AGM), 0.00%, 11/01/23 | | | 15,725 | | | | 15,393,124 | |
Series B, (AGM), 0.00%, 11/01/25 | | | 10,000 | | | | 9,388,840 | |
| | | | | | | | |
| Security | | Par (000) | | | Value | |
| | |
| State (continued) | | | | | | |
New Jersey Economic Development Authority, RB | | | | | | | | |
4.00%, 06/15/49 | | $ | 2,930 | | | $ | 3,192,944 | |
Series A, (NPFGC), 5.25%, 07/01/24 | | | 1,785 | | | | 1,948,347 | |
Series A, (NPFGC), 5.25%, 07/01/25 | | | 4,465 | | | | 5,028,800 | |
Series A, (NPFGC), 5.25%, 07/01/26 | | | 7,415 | | | | 8,561,418 | |
Series B, 5.00%, 06/15/43 | | | 1,235 | | | | 1,433,873 | |
Series EEE, 5.00%, 06/15/43 | | | 5,395 | | | | 6,276,349 | |
Series WW, 5.25%, 06/15/33 | | | 380 | | | | 424,942 | |
Series WW, 5.00%, 06/15/34 | | | 5,500 | | | | 6,100,320 | |
Series WW, 5.00%, 06/15/36 | | | 3,115 | | | | 3,449,202 | |
Series WW, 5.25%, 06/15/40 | | | 7,915 | | | | 8,733,601 | |
New Jersey Economic Development Authority, Refunding RB | | | | | | | | |
5.00%, 06/15/22(c) | | | 11,875 | | | | 12,029,292 | |
4.00%, 07/01/46 | | | 2,770 | | | | 3,032,078 | |
Series N-1, (AMBAC), 5.50%, 09/01/26 | | | 800 | | | | 936,695 | |
Series N-1, (NPFGC), 5.50%, 09/01/27 | | | 1,000 | | | | 1,197,137 | |
Series NN, 5.00%, 03/01/23(c) | | | 5,000 | | | | 5,218,210 | |
Sub-Series A, 4.00%, 07/01/32 | | | 5,000 | | | | 5,431,235 | |
Sub-Series A, 5.00%, 07/01/33 | | | 3,875 | | | | 4,431,396 | |
Sub-Series A, 4.00%, 07/01/34 | | | 7,300 | | | | 7,908,484 | |
New Jersey Educational Facilities Authority, RB | | | | | | | | |
Series A, 4.00%, 09/01/28 | | | 9,705 | | | | 10,347,918 | |
Series A, 5.00%, 09/01/33 | | | 5,370 | | | | 5,841,883 | |
New Jersey Sports & Exposition Authority, Refunding RB, (NPFGC), 5.50%, 03/01/22(a) | | | 4,200 | | | | 4,216,888 | |
South Jersey Port Corp., ARB | | | | | | | | |
Series B, AMT, 5.00%, 01/01/42 | | | 3,000 | | | | 3,402,057 | |
Series B, AMT, 5.00%, 01/01/48 | | | 1,500 | | | | 1,689,606 | |
State of New Jersey, GO
2.00%, 06/01/37 | | | 3,225 | | | | 3,017,030 | |
Series A, 5.00%, 06/01/28 | | | 3,500 | | | | 4,194,526 | |
Series A, 5.00%, 06/01/29 | | | 1,105 | | | | 1,340,926 | |
Series A, 4.00%, 06/01/30 | | | 3,410 | | | | 3,917,691 | |
Series A, 4.00%, 06/01/31 | | | 3,000 | | | | 3,483,291 | |
Series A, 4.00%, 06/01/32 | | | 7,755 | | | | 9,193,312 | |
| | | | | | | | |
| | | | | | | 160,761,415 | |
| | |
| Tobacco — 5.5% | | | | | | |
Tobacco Settlement Financing Corp., Refunding RB | | | | | | | | |
Series A, 5.00%, 06/01/46 | | | 3,000 | | | | 3,402,798 | |
Series A, 5.25%, 06/01/46 | | | 1,960 | | | | 2,257,755 | |
Sub-Series B, 5.00%, 06/01/46 | | | 17,315 | | | | 19,490,647 | |
| | | | | | | | |
| | | | | | | 25,151,200 | |
| | |
| Transportation — 31.6% | | | | | | |
New Brunswick Parking Authority, Refunding RB, Series B, (AGM MUN GOVT GTD), 3.00%, 09/01/39 | | | 2,500 | | | | 2,573,855 | |
New Jersey Economic Development Authority, RB | | | | | | | | |
AMT, 5.13%, 01/01/34 | | | 2,290 | | | | 2,443,247 | |
AMT, 5.38%, 01/01/43 | | | 7,730 | | | | 8,251,752 | |
New Jersey Transportation Trust Fund Authority, 4.00%, 06/15/50 | | | 2,130 | | | | 2,318,277 | |
New Jersey Transportation Trust Fund Authority, RB | | | | | | | | |
Series A, (NPFGC), 5.75%, 06/15/24 | | | 1,205 | | | | 1,331,503 | |
Series A, 5.00%, 06/15/30 | | | 2,250 | | | | 2,552,996 | |
Series AA, 5.25%, 06/15/33 | | | 5,690 | | | | 5,991,382 | |
Series AA, 5.25%, 06/15/34 | | | 1,305 | | | | 1,458,087 | |
Series AA, 5.00%, 06/15/38 | | | 2,340 | | | | 2,523,021 | |
Series AA, 4.00%, 06/15/50 | | | 6,300 | | | | 6,855,616 | |
Series B, 5.00%, 06/15/33 | | | 1,340 | | | | 1,574,031 | |
Series BB, 4.00%, 06/15/50 | | | 3,325 | | | | 3,602,175 | |
| | |
| 20 | | 2 0 2 2 B L A C K R O C K S E M I - A N N U A L R E P O R T T O S H A R E H O L D E R S |
| | |
Schedule of Investments (unaudited) (continued) January 31, 2022 | | BlackRock MuniHoldings New Jersey Quality Fund, Inc. (MUJ) (Percentages shown are based on Net Assets) |
| | | | | | | | |
| Security | | Par (000) | | | Value | |
| | |
| Transportation (continued) | | | | | | |
New Jersey Transportation Trust Fund Authority, RB (continued) | | | | | | | | |
Series D, 5.00%, 06/15/32 | | $ | 3,300 | | | $ | 3,620,229 | |
New Jersey Transportation Trust Fund Authority, RB, CAB(d) | | | | | | | | |
Series A, 0.00%, 12/15/35 | | | 6,000 | | | | 3,961,392 | |
Series C, (AGM), 0.00%, 12/15/32 | | | 8,800 | | | | 6,754,572 | |
Series C, (AMBAC), 0.00%, 12/15/35 | | | 4,160 | | | | 2,803,457 | |
Series C, (AMBAC), 0.00%, 12/15/36 | | | 7,210 | | | | 4,678,785 | |
New Jersey Transportation Trust Fund Authority, Refunding RB | | | | | | | | |
4.00%, 12/15/39 | | | 165 | | | | 181,923 | |
Series A, 5.00%, 06/15/26 | | | 400 | | | | 457,597 | |
Series A, 5.00%, 06/15/31 | | | 7,480 | | | | 8,554,809 | |
Series A, 5.00%, 06/15/32 | | | 750 | | | | 921,942 | |
Series A, 5.00%, 12/15/32 | | | 4,285 | | | | 5,043,381 | |
Series A, 5.00%, 06/15/33 | | | 3,315 | | | | 4,043,942 | |
Series A, 4.00%, 06/15/34 | | | 1,950 | | | | 2,195,679 | |
Series A, 4.00%, 06/15/35 | | | 2,950 | | | | 3,319,198 | |
Series A, 5.00%, 12/15/35 | | | 1,095 | | | | 1,280,577 | |
Series A, 4.00%, 06/15/36 | | | 2,655 | | | | 2,977,559 | |
Series A, 5.00%, 06/15/42 | | | 5,000 | | | | 5,064,885 | |
Series AA, 5.00%, 06/15/33 | | | 3,000 | | | | 3,046,515 | |
New Jersey Turnpike Authority, RB | | | | | | | | |
Series A1, 5.00%, 01/01/35 | | | 1,440 | | | | 1,672,468 | |
Series E, 5.00%, 01/01/45 | | | 8,000 | | | | 8,747,176 | |
New Jersey Turnpike Authority, Refunding RB | | | | | | | | |
Series A, (AGM), 5.25%, 01/01/29 | | | 4,000 | | | | 4,980,620 | |
Series A, (BHAC-CR AGM), 5.25%, 01/01/29 | | | 500 | | | | 618,174 | |
Series A, (AGM), 5.25%, 01/01/30 | | | 4,000 | | | | 5,081,828 | |
Series B, 5.00%, 01/01/34 | | | 2,300 | | | | 2,724,258 | |
Series B, 5.00%, 01/01/40 | | | 5,740 | | | | 6,778,670 | |
Series G, 5.00%, 01/01/36 | | | 5,000 | | | | 5,919,260 | |
Series G, 4.00%, 01/01/43 | | | 3,320 | | | | 3,659,135 | |
South Jersey Transportation Authority, RB, Series A, 5.00%, 11/01/45 | | | 2,865 | | | | 3,424,428 | |
| | | | | | | | |
| | | | | | | 143,988,401 | |
| | |
| Utilities — 7.0% | | | | | | |
Essex County Utilities Authority, Refunding RB, (AGC | | | | | | | | |
GTD), 4.13%, 04/01/22 | | | 2,000 | | | | 2,005,398 | |
New Jersey Infrastructure Bank, RB 2.00%, 09/01/43 | | | 915 | | | | 793,233 | |
2.25%, 09/01/50 | | | 2,245 | | | | 1,943,564 | |
Passaic Valley Sewerage Commission, Refunding RB | | | | | | | | |
Series J, (AGM), 3.00%, 12/01/40 | | | 1,140 | | | | 1,181,017 | |
Series J, (AGM), 3.00%, 12/01/41 | | | 1,170 | | | | 1,209,798 | |
Series J, (AGM), 3.00%, 12/01/42 | | | 1,190 | | | | 1,227,154 | |
Series J, (AGM), 3.00%, 12/01/43 | | | 1,220 | | | | 1,254,427 | |
Series J, (AGM), 3.00%, 12/01/44 | | | 1,250 | | | | 1,281,440 | |
Series J, (AGM), 3.00%, 12/01/45 | | | 1,275 | | | | 1,305,605 | |
Rahway Valley Sewerage Authority, RB, CAB(d) | | | | | | | | |
Series A, (NPFGC), 0.00%, 09/01/26 | | | 4,100 | | | | 3,803,197 | |
Series A, (NPFGC), 0.00%, 09/01/28 | | | 6,600 | | | | 5,823,847 | |
| | | | | | | | |
| Security | | Par (000) | | | Value | |
| | |
| Utilities (continued) | | | | | | |
Rahway Valley Sewerage Authority, RB, CAB(d) (continued) | | | | | | | | |
Series A, (NPFGC), 0.00%, 09/01/29 | | $ | 9,650 | | | $ | 8,283,434 | |
Series A, (NPFGC), 0.00%, 09/01/33 | | | 2,350 | | | | 1,791,670 | |
| | | | | | | | |
| | | | | | | 31,903,784 | |
| | | | | | | | |
| |
Total Municipal Bonds in New Jersey | | | | 565,432,091 | |
| | |
| New York — 6.5% | | | | | | |
| | |
| Transportation — 6.5% | | | | | | |
Port Authority of New York & New Jersey, ARB | | | | | | | | |
Consolidated, 93rd Series, 6.13%, 06/01/94 | | | 1,000 | | | | 1,109,644 | |
Consolidated, 218th Series, AMT, 4.00%, 11/01/34 | | | 1,640 | | | | 1,854,747 | |
Consolidated, 218th Series, AMT, 4.00%, 11/01/47 | | | 2,485 | | | | 2,695,604 | |
Consolidated, 221st Series, AMT, 4.00%, 07/15/45 | | | 2,165 | | | | 2,371,907 | |
Port Authority of New York & New Jersey, Refunding ARB | | | | | | | | |
Consolidated, 206th Series, AMT, 5.00%, 11/15/42 | | | 3,110 | | | | 3,590,644 | |
Consolidated, 206th Series, AMT, 5.00%, 11/15/47 | | | 3,475 | | | | 3,962,185 | |
Series 178th, AMT, 5.00%, 12/01/33 | | | 4,005 | | | | 4,268,537 | |
Series 223, AMT, 4.00%, 07/15/51 | | | 2,960 | | | | 3,250,740 | |
Port Authority of New York & New Jersey, Refunding RB | | | | | | | | |
Consolidated, 200th Series, 5.00%, 09/01/36 | | | 3,090 | | | | 3,762,980 | |
Consolidated, 212th Series, 4.00%, 09/01/37 | | | 2,460 | | | | 2,807,406 | |
| | | | | | | | |
| | |
Total Municipal Bonds in New York | | | | | | | 29,674,394 | |
| | |
| Pennsylvania — 2.7% | | | | | | |
| | |
| Transportation — 2.7% | | | | | | |
Delaware River Port Authority, RB 5.00%, 01/01/29 | | | 2,000 | | | | 2,148,566 | |
5.00%, 01/01/37 | | | 8,830 | | | | 9,436,771 | |
Delaware River Port Authority, Refunding RB, 5.00%, 01/01/27 | | | 785 | | | | 812,251 | |
| | | | | | | | |
| |
Total Municipal Bonds in Pennsylvania | | | | 12,397,588 | |
| | | | | | | | |
| | |
| Puerto Rico — 4.8% | | | | | | |
| | |
| State — 4.8% | | | | | | |
Puerto Rico Sales Tax Financing Corp. Sales Tax Revenue, RB | | | | | | | | |
Series A-1, Restructured, 4.75%, 07/01/53 | | | 583 | | | | 637,897 | |
Series A-1, Restructured, 5.00%, 07/01/58 | | | 3,462 | | | | 3,851,891 | |
Series A-2, Restructured, 4.33%, 07/01/40 | | | 11,732 | | | | 12,735,086 | |
Series A-2, Restructured, 4.78%, 07/01/58 | | | 878 | | | | 964,079 | |
Series B-1, Restructured, 4.75%, 07/01/53 | | | 638 | | | | 699,603 | |
Series B-2, Restructured, 4.78%, 07/01/58 | | | 618 | | | | 679,051 | |
Puerto Rico Sales Tax Financing Corp. Sales Tax Revenue, RB, CAB, Series A-1, Restructured, 0.00%, 07/01/46(d) | | | 7,564 | | | | 2,446,356 | |
| | | | | | | | |
| | |
Total Municipal Bonds in Puerto Rico | | | | | | | 22,013,963 | |
| | | | | | | | |
| | |
Total Municipal Bonds — 138.3%
(Cost: $594,001,503) | | | | | | | 630,715,668 | |
| | | | | | | | |
| | |
S C H E D U L E O F I N V E S T M E N T S | | 21 |
| | |
Schedule of Investments (unaudited) (continued) January 31, 2022 | | BlackRock MuniHoldings New Jersey Quality Fund, Inc. (MUJ) (Percentages shown are based on Net Assets) |
| | | | | | | | |
| Security | | Par (000) | | | Value | |
|
| Municipal Bonds Transferred to Tender Option Bond Trusts(f) | |
| | |
| New Jersey — 23.8% | | | | | | |
|
| County/City/Special District/School District — 6.2% | |
Hudson County Improvement Authority, RB, 5.25%, 05/01/51 | | $ | 3,120 | | | $ | 3,564,924 | |
Union County Utilities Authority, Refunding RB | | | | | | | | |
Series A, 5.00%, 06/15/41 | | | 7,574 | | | | 7,598,126 | |
Series A, AMT, 5.25%, 12/01/31 | | | 17,231 | | | | 17,292,149 | |
| | | | | | | | |
| | | | | | | 28,455,199 | |
| | |
| Education — 7.5% | | | | | | |
New Jersey Economic Development Authority, Refunding RB(g) | | | | | | | | |
AMT, 3.00%, 08/01/41 | | | 9,749 | | | | 9,777,478 | |
AMT, 3.00%, 08/01/43 | | | 14,021 | | | | 14,061,990 | |
Rutgers The State University of New Jersey, Refunding RB, Series L, 5.00%, 05/01/23(c) | | | 10,000 | | | | 10,498,745 | |
| | | | | | | | |
| | | | | | | 34,338,213 | |
| | |
| Health — 3.2% | | | | | | |
New Jersey Health Care Facilities Financing Authority, RB | | | | | | | | |
4.00%, 07/01/47 | | | 6,133 | | | | 6,571,560 | |
4.00%, 07/01/51 | | | 7,006 | | | | 7,899,816 | |
| | | | | | | | |
| | | | | | | 14,471,376 | |
| | |
| State — 4.8% | | | | | | |
Garden State Preservation Trust, RB, Series A, 5.75%, 11/01/28 | | | 12,460 | | | | 14,696,198 | |
New Jersey Economic Development Authority, Refunding RB, Series NN, 5.00%, 03/01/23(g) | | | 6,698 | | | | 6,990,490 | |
| | | | | | | | |
| | | | | | | 21,686,688 | |
| | |
| Transportation — 2.1% | | | | | | |
New Jersey Turnpike Authority, RB, Series A, 5.00%, 07/01/22(c)(g) | | | 9,300 | | | | 9,466,317 | |
| | | | | | | | |
| | |
Total Municipal Bonds in New Jersey | | | | | | | 108,417,793 | |
| | | | | | | | |
| | |
Total Municipal Bonds Transferred to Tender Option Bond Trusts — 23.8%
(Cost: $105,504,875) | | | | | | | 108,417,793 | |
| | | | | | | | |
| | |
Total Long-Term Investments — 162.1%
(Cost: $699,506,378) | | | | | | | 739,133,461 | |
| | | | | | | | |
| | | | | | | | |
| Security | | Par (000) | | | Value | |
|
Short-Term Securities | |
|
| Commercial Paper — 1.1% | |
Port Authority of New York & New Jersey, Refunding ARB, 0.13%, 03/03/22 | | $ | 5,100 | | | $ | 5,099,832 | |
| | | | | | | | |
| | | | | | | 5,099,832 | |
| | | | | | | | |
| | |
| | | Shares | | | | |
|
| Money Market Funds — 1.6% | |
BlackRock Liquidity Funds, MuniCash, Institutional Class, 0.01%(h)(i) | | | 6,938,365 | | | | 6,938,365 | |
| | | | | | | | |
| | |
Total Short-Term Securities — 2.7%
(Cost: $12,038,874) | | | | | | | 12,038,197 | |
| | | | | | | | |
| | |
Total Investments — 164.8%
(Cost: $711,545,252) | | | | | | | 751,171,658 | |
| | |
Other Assets Less Liabilities — 0.5% | | | | | | | 2,585,821 | |
| |
Liability for TOB Trust Certificates, Including Interest Expense and Fees Payable — (13.4)% | | | | (61,186,532 | ) |
| |
VRDP Shares at Liquidation Value, Net of Deferred Offering Costs — (51.9)% | | | | (236,696,654 | ) |
| | | | | | | | |
| | |
Net Assets Applicable to Common Shares — 100.0% | | | | | | $ | 455,874,293 | |
| | | | | | | | |
| (a) | Security is collateralized by municipal bonds or U.S. Treasury obligations. |
| (b) | Variable rate security. Interest rate resets periodically. The rate shown is the effective interest rate as of period end. Security description also includes the reference rate and spread if published and available. |
| (c) | U.S. Government securities held in escrow, are used to pay interest on this security as well as to retire the bond in full at the date indicated, typically at a premium to par. |
| (e) | Security exempt from registration pursuant to Rule 144A under the Securities Act of 1933, as amended. These securities may be resold in transactions exempt from registration to qualified institutional investors. |
| (f) | Represent bonds transferred to a TOB Trust in exchange of cash and residual certificates received by the Fund. These bonds serve as collateral in a secured borrowing. See Note 4 of the Notes to Financial Statements for details. |
| (g) | All or a portion of the security is subject to a recourse agreement. The aggregate maximum potential amount the Fund could ultimately be required to pay under the agreements, which expire between July 1, 2022 to February 1, 2037, is $24,100,690. See Note 4 of the Notes to Financial Statements for details. |
| (h) | Affiliate of the Fund. |
| (i) | Annualized 7-day yield as of period end. |
For Fund compliance purposes, the Fund’s sector classifications refer to one or more of the sector sub-classifications used by one or more widely recognized market indexes or rating group indexes, and/or as defined by the investment adviser. These definitions may not apply for purposes of this report, which may combine such sector sub-classifications for reporting ease.
Affiliates
Investments in issuers considered to be affiliate(s) of the Fund during the six months ended January 31, 2022 for purposes of Section 2(a)(3) of the Investment Company Act of 1940, as amended, were as follows:
| | | | | | | | | | | | | | | | | | | | | | | | | | | | | | | | | | | | |
| Affiliated Issuer | | Value at
07/31/21 | | | Purchases
at Cost | | | Proceeds
from Sales | | | Net
Realized
Gain (Loss) | | | Change in
Unrealized
Appreciation
(Depreciation) | | | Value at
01/31/22 | | | Shares
Held at
01/31/22 | | | Income | | | Capital Gain
Distributions
from
Underlying
Funds | |
BlackRock Liquidity Funds, MuniCash, Institutional Class | | $ | 22,337,405 | | | $ | — | | | $ | (15,397,763 | )(a) | | $ | (768 | ) | | $ | (509 | ) | | $ | 6,938,365 | | | | 6,938,365 | | | $ | 366 | | | $ | — | |
| | | | | | | | | | | | | | | | | | | | | | | | | | | | | | | | | | | | |
| | (a) | Represents net amount purchased (sold). | |
| | |
| 22 | | 2 0 2 2 B L A C K R O C K S E M I - A N N U A L R E P O R T T O S H A R E H O L D E R S |
| | |
Schedule of Investments (unaudited) (continued) January 31, 2022 | | BlackRock MuniHoldings New Jersey Quality Fund, Inc. (MUJ) |
Derivative Financial Instruments Outstanding as of Period End
Futures Contracts
| | | | | | | | | | | | | | | | |
| Description | | Number of
Contracts | | | Expiration
Date | | | Notional
Amount (000) | | | Value/
Unrealized
Appreciation
(Depreciation) | |
Short Contracts | | | | | | | | | | | | | | | | |
10-Year U.S. Treasury Note | | | 60 | | | | 03/22/22 | | | $ | 7,678 | | | $ | 181,781 | |
U.S. Long Bond | | | 24 | | | | 03/22/22 | | | | 3,733 | | | | 133,689 | |
5-Year U.S. Treasury Note | | | 55 | | | | 03/31/22 | | | | 6,557 | | | | 131,647 | |
| | | | | | | | | | | | | | | | |
| | | | |
| | | | | | | | | | | | | | $ | 447,117 | |
| | | | | | | | | | | | | | | | |
Derivative Financial Instruments Categorized by Risk Exposure
As of period end, the fair values of derivative financial instruments located in the Statements of Assets and Liabilities were as follows:
| | | | | | | | | | | | | | | | | | | | | | | | | | | | |
| | | Commodity
Contracts | | | Credit
Contracts | | | Equity
Contracts | | | Foreign
Currency
Exchange
Contracts | | | Interest
Rate
Contracts | | | Other
Contracts | | | Total | |
Assets — Derivative Financial Instruments | | | | | | | | | | | | | | | | | | | | | | | | | | | | |
Futures contracts | | | | | | | | | | | | | | | | | | | | | | | | | | | | |
Unrealized appreciation on futures contracts(a) | | $ | — | | | $ | — | | | $ | — | | | $ | — | | | $ | 447,117 | | | $ | — | | | $ | 447,117 | |
| | | | | | | | | | | | | | | | | | | | | | | | | | | | |
| | (a) | Net cumulative unrealized appreciation (depreciation) on futures contracts and centrally cleared swaps, if any, are reported in the Schedule of Investments. In the Statements of Assets and Liabilities, only current day’s variation margin is reported in receivables or payables and the net cumulative unrealized appreciation (depreciation) is included in accumulated earnings (loss). | |
For the period ended January 31, 2022, the effect of derivative financial instruments in the Statements of Operations was as follows:
| | | | | | | | | | | | | | | | | | | | | | | | | | | | |
| | | Commodity
Contracts | | | Credit
Contracts | | | Equity
Contracts | | | Foreign
Currency
Exchange
Contracts | | | Interest
Rate
Contracts | | | Other
Contracts | | | Total | |
Net Realized Gain (Loss) from: | | | | | | | | | | | | | | | | | | | | | | | | | | | | |
Futures contracts | | $ | — | | | $ | — | | | $ | — | | | $ | — | | | $ | 491,104 | | | $ | — | | | $ | 491,104 | |
| | | | | | | | | | | | | | | | | | | | | | | | | | | | |
| | | | | | | |
Net Change in Unrealized Appreciation (Depreciation) on: | | | | | | | | | | | | | | | | | | | | | | | | | | | | |
Futures contracts | | $ | — | | | $ | — | | | $ | — | | | $ | — | | | $ | 1,295,484 | | | $ | — | | | $ | 1,295,484 | |
| | | | | | | | | | | | | | | | | | | | | | | | | | | | |
Average Quarterly Balances of Outstanding Derivative Financial Instruments
| | |
Futures contracts: | | |
Average notional value of contracts — short | | $18,168,879 |
For more information about the Fund’s investment risks regarding derivative financial instruments, refer to the Notes to Financial Statements.
Fair Value Hierarchy as of Period End
Various inputs are used in determining the fair value of financial instruments. For a description of the input levels and information about the Fund’s policy regarding valuation of financial instruments, refer to the Notes to Financial Statements.
The following table summarizes the Fund’s financial instruments categorized in the fair value hierarchy. The breakdown of the Fund’s financial instruments into major categories is disclosed in the Schedule of Investments above.
| | | | | | | | | | | | | | | | |
| | | Level 1 | | | Level 2 | | | Level 3 | | | Total | |
Assets | | | | | | | | | | | | | | | | |
Investments | | | | | | | | | | | | | | | | |
Long-Term Investments | | | | | | | | | | | | | | | | |
Municipal Bonds | | $ | — | | | $ | 630,715,668 | | | $ | — | | | $ | 630,715,668 | |
Municipal Bonds Transferred to Tender Option Bond Trusts | | | — | | | | 108,417,793 | | | | — | | | | 108,417,793 | |
| | |
S C H E D U L E O F I N V E S T M E N T S | | 23 |
| | |
Schedule of Investments (unaudited) (continued) January 31, 2022 | | BlackRock MuniHoldings New Jersey Quality Fund, Inc. (MUJ) |
Fair Value Hierarchy as of Period End (continued)
| | | | | | | | | | | | | | | | |
| | | Level 1 | | | Level 2 | | | Level 3 | | | Total | |
Short-Term Securities | | | | | | | | | | | | | | | | |
Commercial Paper | | $ | — | | | $ | 5,099,832 | | | $ | — | | | $ | 5,099,832 | |
Money Market Funds | | | 6,938,365 | | | | — | | | | — | | | | 6,938,365 | |
| | | | | | | | | | | | | | | | |
| | $ | 6,938,365 | | | $ | 744,233,293 | | | $ | — | | | $ | 751,171,658 | |
| | | | | | | | | | | | | | | | |
Derivative Financial Instruments(a) | | | | | | | | | | | | | | | | |
Assets | | | | | | | | | | | | | | | | |
Interest Rate Contracts | | $ | 447,117 | | | $ | — | | | $ | — | | | $ | 447,117 | |
| | | | | | | | | | | | | | | | |
| | (a) | Derivative financial instruments are futures contracts. Futures contracts are valued at the unrealized appreciation (depreciation) on the instrument. | |
The Fund may hold assets and/or liabilities in which the fair value approximates the carrying amount for financial statement purposes. As of period end, such assets and/or liabilities are categorized within the fair value hierarchy as follows:
| | | | | | | | | | | | | | | | |
| | | Level 1 | | | Level 2 | | | Level 3 | | | Total | |
Liabilities | | | | | | | | | | | | | | | | |
TOB Trust Certificates | | $ | — | | | $ | (61,170,038 | ) | | $ | — | | | $ | (61,170,038 | ) |
VRDP Shares at Liquidation Value | | | — | | | | (237,100,000 | ) | | | — | | | | (237,100,000 | ) |
| | | | | | | | | | | | | | | | |
| | | | |
| | $ | — | | | $ | (298,270,038 | ) | | $ | — | | | $ | (298,270,038 | ) |
| | | | | | | | | | | | | | | | |
See notes to financial statements.
| | |
| 24 | | 2 0 2 2 B L A C K R O C K S E M I - A N N U A L R E P O R T T O S H A R E H O L D E R S |
| | |
Schedule of Investments (unaudited) January 31, 2022 | | BlackRock MuniYield Michigan Quality Fund, Inc. (MIY) (Percentages shown are based on Net Assets) |
| | | | | | | | |
Security | | Par (000) | | | Value | |
|
| Municipal Bonds | |
|
| Michigan — 137.7% | |
|
| Corporate — 3.4% | |
Monroe County Economic Development Corp., Refunding RB, Series AA, (NPFGC), 6.95%, 09/01/22 | | $ | 14,500 | | | $ | 15,035,326 | |
| | | | | | | | |
|
| County/City/Special District/School District — 27.0% | |
Battle Creek School District, Refunding GO, (Q-SBLF), 5.00%, 05/01/37 | | | 1,170 | | | | 1,337,650 | |
Berkley School District, GO, (Q-SBLF), 5.00%, 05/01/35 | | | 2,965 | | | | 3,301,545 | |
Byron Center Public Schools, GO | | | | | | | | |
Series I, (Q-SBLF), 5.00%, 05/01/43 | | | 4,475 | | | | 5,198,961 | |
Series I, (Q-SBLF), 5.00%, 05/01/47 | | | 740 | | | | 857,832 | |
Columbia School District, GO, (Q-SBLF), 5.00%, 11/01/23(a) | | | 5,185 | | | | 5,549,511 | |
County of Saginaw Michigan, GO, 4.00%, 11/01/42 | | | 2,000 | | | | 2,199,714 | |
Dearborn School District, GO | | | | | | | | |
Series A, (Q-SBLF), 5.00%, 11/01/23(a) | | | 1,500 | | | | 1,605,452 | |
Series A, (Q-SBLF), 5.00%, 05/01/33 | | | 1,600 | | | | 1,705,910 | |
Series A, (Q-SBLF), 5.00%, 05/01/34 | | | 1,200 | | | | 1,278,917 | |
Dowagiac Union School District, GO, (Q-SBLF), 5.00%, 05/01/41 | | | 1,140 | | | | 1,293,036 | |
East Lansing School District, GO, Series I, (Q-SBLF), 5.00%, 05/01/42 | | | 1,000 | | | | 1,155,548 | |
Farmington Public School District, Refunding GO | | | | | | | | |
(AGM), 5.00%, 05/01/33 | | | 1,500 | | | | 1,671,507 | |
(AGM), 5.00%, 05/01/34 | | | 1,500 | | | | 1,670,589 | |
(AGM), 5.00%, 05/01/35 | | | 1,000 | | | | 1,113,116 | |
Fraser Public School District, Refunding GO | | | | | | | | |
(Q-SBLF), 5.00%, 05/01/43 | | | 2,000 | | | | 2,309,284 | |
(Q-SBLF), 5.00%, 05/01/47 | | | 3,225 | | | | 3,714,819 | |
Gibraltar School District, GO, (Q-SBLF), 5.00%, 05/01/36 | | | 750 | | | | 890,617 | |
Grandville Public Schools, GO | | | | | | | | |
Series I, (AGM), 4.00%, 05/01/38 | | | 910 | | | | 1,035,095 | |
Series II, (AGM), 5.00%, 05/01/40 | | | 3,250 | | | | 3,603,106 | |
Gull Lake Community School District, GO, Series I, (Q-SBLF), 5.00%, 05/01/45 | | | 4,000 | | | | 4,703,048 | |
Hudsonville Public Schools, GO | | | | | | | | |
Series I, (Q-SBLF), 4.00%, 05/01/43 | | | 1,875 | | | | 2,109,420 | |
Series I, (Q-SBLF), 4.00%, 05/01/44 | | | 1,950 | | | | 2,189,546 | |
Series I, (Q-SBLF), 4.00%, 05/01/45 | | | 2,040 | | | | 2,287,203 | |
Jackson Public Schools, GO, (Q-SBLF), 5.00%, 05/01/42 | | | 4,000 | | | | 4,706,524 | |
Kentwood Public Schools, GO 5.00%, 05/01/41 | | | 1,120 | | | | 1,275,382 | |
5.00%, 05/01/44 | | | 1,815 | | | | 2,058,148 | |
Livonia Public Schools, GO, Series I, (AGM), 5.00%, 05/01/23(a) | | | 5,000 | | | | 5,259,985 | |
Mattawan Consolidated School District, GO, Series I, (Q-SBLF), 5.00%, 05/01/25(a) | | | 3,375 | | | | 3,783,685 | |
Michigan Finance Authority, RB
5.00%, 11/01/34 | | | 215 | | | | 259,562 | |
5.00%, 11/01/38 | | | 2,500 | | | | 3,008,147 | |
5.00%, 11/01/43 | | | 4,000 | | | | 4,784,756 | |
Series H-1, 5.00%, 10/01/24 | | | 5,400 | | | | 5,891,022 | |
Mona Shores Public Schools, GO | | | | | | | | |
Series I, (Q-SBLF), 5.00%, 05/01/42 | | | 1,000 | | | | 1,208,817 | |
Series I, (Q-SBLF), 5.00%, 05/01/43 | | | 1,025 | | | | 1,236,883 | |
| | | | | | | | |
Security | | Par (000) | | | Value | |
|
| County/City/Special District/School District (continued) | |
Mona Shores Public Schools, GO (continued) | | | | | | | | |
Series I, (Q-SBLF), 5.00%, 05/01/44 | | $ | 1,525 | | | $ | 1,837,166 | |
Portage Public Schools, GO, 4.00%, 11/01/44 | | | 3,940 | | | | 4,518,309 | |
Swartz Creek Community Schools, GO, (Q-SBLF), 5.00%, 05/01/44 | | | 4,270 | | | | 5,102,377 | |
Troy School District, GO, (Q-SBLF), 5.00%, 11/01/23(a) | | | 2,000 | | | | 2,140,602 | |
Walled Lake Consolidated School District, GO | | | | | | | | |
(Q-SBLF), 5.00%, 11/01/23(a) | | | 7,010 | | | | 7,502,811 | |
(Q-SBLF), 5.00%, 05/01/50 | | | 3,000 | | | | 3,638,001 | |
West Ottawa Public Schools, GO | | | | | | | | |
(AGM), 4.00%, 11/01/39 | | | 1,105 | | | | 1,272,547 | |
(AGM), 4.00%, 11/01/40 | | | 800 | | | | 920,162 | |
(AGM), 4.00%, 11/01/41 | | | 845 | | | | 970,850 | |
(AGM), 4.00%, 11/01/46 | | | 1,725 | | | | 1,965,481 | |
Zeeland Public Schools, GO | | | | | | | | |
Series A, (AGM), 5.00%, 05/01/25(a) | | | 2,000 | | | | 2,242,184 | |
Series A, (AGM), 5.00%, 05/01/33 | | | 1,000 | | | | 1,111,286 | |
| | | | | | | | |
| | | | | | | 119,476,113 | |
|
| Education — 30.1% | |
Grand Valley State University, RB, 5.00%, 12/01/43 | | | 1,600 | | | | 1,886,069 | |
Lake Superior State University, RB, (AGM), 5.00%, 01/15/48 | | | 3,750 | | | | 4,336,590 | |
Michigan Finance Authority, Refunding RB 4.00%, 02/01/29 | | | 700 | | | | 743,294 | |
5.00%, 02/01/33 | | | 830 | | | | 914,058 | |
4.00%, 12/01/33 | | | 1,720 | | | | 1,781,691 | |
5.00%, 12/01/36 | | | 1,550 | | | | 1,637,544 | |
5.00%, 09/01/40 | | | 1,000 | | | | 1,090,050 | |
5.00%, 12/01/40 | | | 2,900 | | | | 3,033,980 | |
5.00%, 12/01/45 | | | 4,400 | | | | 4,592,746 | |
4.00%, 09/01/46 | | | 1,750 | | | | 1,936,919 | |
Series 25-A, AMT, 4.00%, 11/01/29 | | | 5,900 | | | | 6,037,169 | |
Series 25-A, AMT, 4.00%, 11/01/30 | | | 2,850 | | | | 2,915,248 | |
Series 25-A, AMT, 4.00%, 11/01/31 | | | 3,150 | | | | 3,221,215 | |
Michigan State University, Refunding RB, Series A, 5.00%, 08/15/38 | | | 10,000 | | | | 10,566,580 | |
Michigan Technological University, RB, Series A, 5.00%, 10/01/45 | | | 1,800 | | | | 2,009,221 | |
Michigan Technological University, Refunding RB 5.00%, 10/01/31 | | | 1,080 | | | | 1,378,066 | |
5.00%, 10/01/32 | | | 1,250 | | | | 1,592,648 | |
5.00%, 10/01/33 | | | 1,325 | | | | 1,683,888 | |
5.00%, 10/01/34 | | | 1,400 | | | | 1,775,274 | |
Oakland University, RB
5.00%, 03/01/32 | | | 400 | | | | 401,348 | |
5.00%, 03/01/41 | | | 3,635 | | | | 4,092,999 | |
Series A, 5.00%, 03/01/38 | | | 5,490 | | | | 5,702,688 | |
Series A, 5.00%, 03/01/43 | | | 16,845 | | | | 17,476,469 | |
University of Michigan, RB, Series A, 5.00%, 04/01/39 | | | 3,425 | | | | 3,694,332 | |
Wayne State University, RB, Series A, 5.00%, 11/15/40 | | | 13,000 | | | | 13,821,028 | |
Western Michigan University, RB, Series A, (AGM), 5.00%, 11/15/51 | | | 5,000 | | | | 6,124,220 | |
Western Michigan University, Refunding RB | | | | | | | | |
(AGM), 5.00%, 11/15/23(a) | | | 1,750 | | | | 1,875,417 | |
5.25%, 11/15/23(a) | | | 8,475 | | | | 9,119,812 | |
(AGM), 5.25%, 11/15/23(a) | | | 1,000 | | | | 1,076,084 | |
5.00%, 11/15/44 | | | 5,650 | | | | 6,756,564 | |
5.00%, 11/15/49 | | | 8,680 | | | | 10,370,361 | |
| | | | | | | | |
| | | | | | | 133,643,572 | |
| | |
| |
S C H E D U L E O F I N V E S T M E N T S | | 25 |
| | |
Schedule of Investments (unaudited) (continued) January 31, 2022 | | BlackRock MuniYield Michigan Quality Fund, Inc. (MIY) (Percentages shown are based on Net Assets) |
| | | | | | | | |
Security | | Par (000) | | | Value | |
|
| Health — 29.6% | |
Grand Traverse County Hospital Finance Authority, RB | | | | | | | | |
Series A, 5.00%, 07/01/44 | | $ | 4,230 | | | $ | 4,577,803 | |
Series A, 5.00%, 07/01/47 | | | 2,200 | | | | 2,377,976 | |
Series A, 5.00%, 07/01/49 | | | 2,610 | | | | 3,042,534 | |
Series B, 4.00%, 07/01/49 | | | 2,000 | | | | 2,172,062 | |
Grand Traverse County Hospital Finance Authority, Refunding RB | | | | | | | | |
5.00%, 07/01/32 | | | 2,135 | | | | 2,706,877 | |
5.00%, 07/01/33 | | | 1,125 | | | | 1,420,466 | |
5.00%, 07/01/34 | | | 1,180 | | | | 1,485,258 | |
Kalamazoo Economic Development Corp., Refunding RB | | | | | | | | |
5.00%, 05/15/32 | | | 865 | | | | 943,532 | |
5.00%, 05/15/42 | | | 425 | | | | 458,525 | |
Kentwood Economic Development Corp., RB, 4.00%, 11/15/45 | | | 750 | | | | 811,328 | |
Kentwood Economic Development Corp., Refunding RB, 5.00%, 11/15/41 | | | 2,335 | | | | 2,661,606 | |
Michigan Finance Authority, RB 5.00%, 11/15/36 | | | 2,500 | | | | 2,576,292 | |
Series S, 4.00%, 11/01/46 | | | 1,025 | | | | 1,079,045 | |
Michigan Finance Authority, Refunding RB 5.00%, 06/01/24(a) | | | 1,500 | | | | 1,636,004 | |
5.00%, 06/01/26 | | | 290 | | | | 334,808 | |
5.00%, 11/01/32 | | | 4,000 | | | | 4,116,620 | |
5.00%, 11/15/37 | | | 3,000 | | | | 3,443,559 | |
5.00%, 11/15/41 | | | 1,000 | | | | 1,142,839 | |
5.00%, 11/15/45 | | | 3,750 | | | | 4,118,437 | |
5.00%, 12/01/45 | | | 19,445 | | | | 21,932,638 | |
4.00%, 11/15/46 | | | 8,500 | | | | 9,052,848 | |
4.00%, 12/01/47 | | | 4,000 | | | | 4,544,676 | |
Series S, 5.00%, 05/15/32 | | | 1,000 | | | | 1,115,091 | |
Series S, 5.00%, 05/15/33 | | | 2,000 | | | | 2,228,672 | |
Series S, 5.00%, 05/15/34 | | | 6,500 | | | | 7,238,277 | |
Series S, 5.00%, 05/15/35 | | | 4,945 | | | | 5,502,806 | |
Michigan State Hospital Finance Authority, Refunding RB | | | | | | | | |
Series A, 5.00%, 06/01/35 | | | 2,250 | | | | 2,278,912 | |
Series C, 4.00%, 06/01/22(a) | | | 5,300 | | | | 5,361,708 | |
Michigan Strategic Fund, Refunding RB, 5.00%, 11/15/43 | | | 1,220 | | | | 1,379,739 | |
Royal Oak Hospital Finance Authority, Refunding RB, Series D, 5.00%, 09/01/39 | | | 27,365 | | | | 29,364,205 | |
| | | | | | | | |
| | | | | | | 131,105,143 | |
|
| Housing — 6.7% | |
Michigan State Housing Development Authority, RB, M/F Housing | | | | | | | | |
Series A, 4.45%, 10/01/34 | | | 1,000 | | | | 1,025,102 | |
Series A, 4.63%, 10/01/39 | | | 3,490 | | | | 3,568,382 | |
Series A, 4.30%, 10/01/40 | | | 3,320 | | | | 3,481,422 | |
Series A, 4.00%, 10/01/43 | | | 7,420 | | | | 7,887,156 | |
Series A, 4.75%, 10/01/44 | | | 5,000 | | | | 5,106,580 | |
Series A, 2.45%, 10/01/46 | | | 5,000 | | | | 4,587,900 | |
AMT, (GNMA), 4.75%, 04/20/37 | | | 2,850 | | | | 2,851,906 | |
Michigan State Housing Development Authority, RB, S/F Housing, Series A, 4.00%, 12/01/44 | | | 1,220 | | | | 1,244,095 | |
| | | | | | | | |
| | | | | | | 29,752,543 | |
| | | | | | | | |
Security | | Par (000) | | | Value | |
|
| State — 23.3% | |
Flint Economic Development Corp., RB, 5.25%, 10/01/41 | | $ | 4,950 | | | $ | 4,966,523 | |
Michigan Finance Authority, RB | | | | | | | | |
Series F, 5.00%, 04/01/31 | | | 1,000 | | | | 1,003,509 | |
Series F, 5.25%, 10/01/41 | | | 8,595 | | | | 8,624,120 | |
Michigan State Building Authority, Refunding RB | | | | | | | | |
Series I, 5.00%, 04/15/41 | | | 4,750 | | | | 5,433,948 | |
Series I, 4.00%, 10/15/46 | | | 6,250 | | | | 7,205,937 | |
Michigan Strategic Fund, RB | | | | | | | | |
Series A, 5.25%, 10/15/40 | | | 3,000 | | | | 3,378,201 | |
AMT, (AGM), 4.25%, 12/31/38 | | | 14,000 | | | | 15,806,056 | |
AMT, 5.00%, 12/31/43 | | | 15,000 | | | | 17,231,235 | |
Michigan Strategic Fund, Refunding RB, 5.25%, 10/15/31 | | | 7,000 | | | | 7,026,362 | |
State of Michigan Trunk Line Revenue, RB 4.00%, 11/15/46 | | | 17,910 | | | | 20,530,412 | |
Series B, 4.00%, 11/15/45 | | | 8,000 | | | | 9,067,280 | |
State of Michigan, COP, (AMBAC), 0.00%, 06/01/22(b)(c) | | | 3,000 | | | | 2,995,329 | |
| | | | | | | | |
| | | | | | | 103,268,912 | |
|
| Tobacco — 1.8% | |
Michigan Finance Authority, Refunding RB, Series A, Class 1, 4.00%, 06/01/40 | | | 1,250 | | | | 1,407,608 | |
|
Michigan Finance Authority, Refunding RB, CAB, Series B-2, Class 2, 0.00%, 06/01/65(c) | | | 50,000 | | | | 6,471,050 | |
| | | | | | | | |
| | | | | | | 7,878,658 | |
|
| Transportation — 7.8% | |
Gerald R Ford International Airport Authority, ARB | | | | | | | | |
AMT, (GTD), 5.00%, 01/01/46 | | | 1,685 | | | | 2,102,846 | |
AMT, (GTD), 5.00%, 01/01/51 | | | 2,250 | | | | 2,811,996 | |
Wayne County Airport Authority, ARB | | | | | | | | |
Series A, 5.00%, 12/01/42 | | | 1,000 | | | | 1,164,149 | |
Series A, 5.00%, 12/01/46 | | | 2,000 | | | | 2,508,216 | |
Series D, 5.00%, 12/01/35 | | | 3,850 | | | | 4,333,583 | |
Series D, 5.00%, 12/01/45 | | | 7,500 | | | | 8,347,530 | |
Series B, AMT, 5.00%, 12/01/42 | | | 1,000 | | | | 1,149,807 | |
Series B, AMT, 5.00%, 12/01/47 | | | 1,250 | | | | 1,422,495 | |
Series C, AMT, 5.00%, 12/01/39 | | | 1,475 | | | | 1,608,498 | |
Wayne County Airport Authority, Refunding ARB, Series F, AMT, 5.00%, 12/01/34 | | | 8,000 | | | | 8,968,568 | |
| | | | | | | | |
| | | | | | | 34,417,688 | |
|
| Utilities — 8.0% | |
City of Detroit Michigan Sewage Disposal System Revenue, Refunding RB, Series A, Senior Lien, 5.25%, 07/01/22(a) | | | 2,655 | | | | 2,707,335 | |
City of Detroit Michigan Water Supply System Revenue, RB, Series A, Senior Lien, (NATL), 5.00%, 07/01/34 | | | 10 | | | | 10,035 | |
Downriver Utility Wastewater Authority, Refunding RB, (AGM), 5.00%, 04/01/43 | | | 1,000 | | | | 1,150,033 | |
Great Lakes Water Authority Water Supply System Revenue, RB, Series B, 2nd Lien, 5.00%, 07/01/46 | | | 10,000 | | | | 11,276,040 | |
Karegnondi Water Authority, Refunding RB 5.00%, 11/01/41 | | | 2,750 | | | | 3,189,249 | |
5.00%, 11/01/45 | | | 3,000 | | | | 3,476,103 | |
Michigan Finance Authority, Refunding RB | | | | | | | | |
Series D-1, 5.00%, 07/01/34 | | | 2,000 | | | | 2,243,102 | |
Series D-1, 5.00%, 07/01/35 | | | 750 | | | | 841,304 | |
Series C-3, Senior Lien, (AGM), 5.00%, 07/01/31 | | | 1,000 | | | | 1,085,779 | |
| | |
| 26 | | 2 0 2 2 B L A C K R O C K S E M I - A N N U A L R E P O R T T O S H A R E H O L D E R S |
| | |
Schedule of Investments (unaudited) (continued) January 31, 2022 | | BlackRock MuniYield Michigan Quality Fund, Inc. (MIY) (Percentages shown are based on Net Assets) |
| | | | | | | | |
Security | | Par (000) | | | Value | |
|
| Utilities (continued) | |
Michigan Finance Authority, Refunding RB (continued) | | | | | | | | |
Series C-3, Senior Lien, (AGM), 5.00%, 07/01/32 | | $ | 5,250 | | | $ | 5,696,764 | |
Series C-3, Senior Lien, (AGM), 5.00%, 07/01/33 | | | 3,000 | | | | 3,253,599 | |
Michigan Strategic Fund, RB, AMT, 4.00%, 10/01/61(d) | | | 445 | | | | 488,138 | |
| | | | | | | | |
| | | | | | | 35,417,481 | |
| | | | | | | | |
| |
| Total Municipal Bonds in Michigan | | | 609,995,436 | |
|
| Puerto Rico — 4.7% | |
|
| State — 4.7% | |
Puerto Rico Sales Tax Financing Corp. Sales Tax Revenue, RB | | | | | | | | |
Series A-1, Restructured, 4.75%, 07/01/53 | | | 534 | | | | 584,283 | |
Series A-1, Restructured, 5.00%, 07/01/58 | | | 825 | | | | 917,912 | |
Series A-2, Restructured, 4.33%, 07/01/40 | | | 1,109 | | | | 1,203,820 | |
Series A-2, Restructured, 4.78%, 07/01/58 | | | 103 | | | | 113,098 | |
Series B-1, Restructured, 4.75%, 07/01/53 | | | 616 | | | | 675,479 | |
Series B-1, Restructured, 5.00%, 07/01/58 | | | 7,451 | | | | 8,280,095 | |
Series B-2, Restructured, 4.33%, 07/01/40 | | | 5,880 | | | | 6,372,479 | |
Series B-2, Restructured, 4.78%, 07/01/58 | | | 597 | | | | 655,976 | |
Puerto Rico Sales Tax Financing Corp. Sales Tax Revenue, RB, CAB, Series A-1, Restructured, 0.00%, 07/01/46(c) | | | 6,295 | | | | 2,035,935 | |
| | | | | | | | |
| |
Total Municipal Bonds in Puerto Rico | | | | 20,839,077 | |
| | | | | | | | |
| |
Total Municipal Bonds — 142.4% | | | | | |
| |
(Cost: $603,451,774) | | | | 630,834,513 | |
| | | | | | | | |
|
| Municipal Bonds Transferred to Tender Option Bond Trusts(e) | |
|
| Michigan — 17.4% | |
|
| Education — 13.4% | |
Eastern Michigan University, RB, Series A, 4.00%, 03/01/44 | | | 10,000 | | | | 10,847,760 | |
Michigan Finance Authority, RB, Series A, 5.00%, 11/01/44 | | | 10,002 | | | | 11,120,665 | |
Michigan Finance Authority, Refunding RB, AMT, Series 25-A, 4.00%, 11/01/28 | | | 8,750 | | | | 8,956,495 | |
Michigan State University, Refunding RB, Series B, 5.00%, 02/15/44(f) | | | 5,750 | | | | 6,956,509 | |
University of Michigan, Refunding RB, 5.00%, 04/01/46 | | | 10,000 | | | | 11,394,314 | |
Wayne State University, RB, Series A, 5.00%, 11/15/43(f) | | | 8,530 | | | | 10,102,325 | |
| | | | | | | | |
| | | | | | | 59,378,068 | |
|
| State — 1.3% | |
Michigan State Building Authority, Refunding RB, Series I, 5.00%, 10/15/45 | | | 5,150 | | | | 5,774,631 | |
| | | | | | | | |
| | | | | | | | |
Security | | Par (000) | | | Value | |
| |
| Utilities — 2.7% | | | | |
Lansing Board of Water & Light, Refunding RB, Series A, 5.00%, 07/01/44 | | $ | 10,000 | | | $ | 12,054,249 | |
| | | | | | | | |
| |
Total Municipal Bonds in Michigan | | | | 77,206,948 | |
| | | | | | | | |
| |
Total Municipal Bonds Transferred to Tender Option Bond Trusts — 17.4% | | | | | |
| |
(Cost: $72,782,875) | | | | 77,206,948 | |
| | | | | | | | |
| |
Total Long-Term Investments — 159.8% | | | | | |
| |
(Cost: $676,234,649) | | | | 708,041,461 | |
| | | | | | | | |
| | |
| | | Shares | | | | |
|
| Short-Term Securities | |
| |
Money Market Funds — 0.5% | | | | | |
BlackRock Liquidity Funds, MuniCash, Institutional Class, 0.01%(g)(h) | | | 2,506,301 | | | | 2,506,301 | |
| | | | | | | | |
| |
Total Short-Term Securities — 0.5%
(Cost: $2,506,552) | | | | 2,506,301 | |
| | | | | | | | |
| |
Total Investments — 160.3%
(Cost: $678,741,201) | | | | 710,547,762 | |
Other Assets Less Liabilities — 1.2% | | | | 5,424,533 | |
Liability for TOB Trust Certificates, Including Interest Expense and Fees Payable — (9.3)% | | | | (41,283,021 | ) |
VRDP Shares at Liquidation Value, Net of Deferred Offering Costs — (52.2)% | | | | (231,536,377 | ) |
| | | | | | | | |
| |
Net Assets Applicable to Common Shares — 100.0% | | | $ | 443,152,897 | |
| | | | | | | | |
| (a) | U.S. Government securities held in escrow, are used to pay interest on this security as well as to retire the bond in full at the date indicated, typically at a premium to par. |
| (b) | Security is collateralized by municipal bonds or U.S. Treasury obligations. |
| (d) | Variable rate security. Interest rate resets periodically. The rate shown is the effective interest rate as of period end. Security description also includes the reference rate and spread if published and available. |
| (e) | Represent bonds transferred to a TOB Trust in exchange of cash and residual certificates received by the Fund. These bonds serve as collateral in a secured borrowing. See Note 4 of the Notes to Financial Statements for details. |
| (f) | All or a portion of the security is subject to a recourse agreement. The aggregate maximum potential amount the Fund could ultimately be required to pay under the agreements, which expire between November 15, 2026 to February 15, 2027, is $9,881,914. See Note 4 of the Notes to Financial Statements for details. |
| (g) | Affiliate of the Fund. |
| (h) | Annualized 7-day yield as of period end. |
For Fund compliance purposes, the Fund’s sector classifications refer to one or more of the sector sub-classifications used by one or more widely recognized market indexes or rating group indexes, and/or as defined by the investment adviser. These definitions may not apply for purposes of this report, which may combine such sector sub-classifications for reporting ease.
| | |
S C H E D U L E O F I N V E S T M E N T S | | 27 |
| | |
Schedule of Investments (unaudited) (continued) January 31, 2022 | | BlackRock MuniYield Michigan Quality Fund, Inc. (MIY) |
Affiliates
Investments in issuers considered to be affiliate(s) of the Fund during the six months ended January 31, 2022 for purposes of Section 2(a)(3) of the Investment Company Act of 1940, as amended, were as follows:
| | | | | | | | | | | | | | | | | | | | | | | | | | | | | | | | | | | | |
Affiliated Issuer | | Value at 07/31/21 | | | Purchases at Cost | | | Proceeds from Sales | | | Net Realized Gain (Loss) | | | Change in Unrealized Appreciation (Depreciation) | | | Value at 01/31/22 | | | Shares Held at 01/31/22 | | | Income | | | Capital Gain Distributions from Underlying Funds | |
|
|
|
|
BlackRock Liquidity Funds, MuniCash, Institutional Class | | $ | 2,854,776 | | | $ | — | | | $ | (347,455 | )(a) | | $ | 200 | | | $ | (1,220 | ) | | $ | 2,506,301 | | | | 2,506,301 | | | $ | 336 | | | $ | — | |
| | | | | | | | | | | | | | | | | | | | | | | | | | | | | | | | | | | | |
| | (a) | Represents net amount purchased (sold). | |
Fair Value Hierarchy as of Period End
Various inputs are used in determining the fair value of financial instruments. For a description of the input levels and information about the Fund’s policy regarding valuation of financial instruments, refer to the Notes to Financial Statements.
The following table summarizes the Fund’s financial instruments categorized in the fair value hierarchy. The breakdown of the Fund’s financial instruments into major categories is disclosed in the Schedule of Investments above.
| | | | | | | | | | | | | | | | |
| | | | | |
| | | Level 1 | | | Level 2 | | | Level 3 | | | Total | |
Assets | | | | | | | | | | | | | | | | |
Investments | | | | | | | | | | | | | | | | |
Long-Term Investments | | | | | | | | | | | | | | | | |
Municipal Bonds | | $ | — | | | $ | 630,834,513 | | | $ | — | | | $ | 630,834,513 | |
Municipal Bonds Transferred to Tender Option Bond Trusts | | | — | | | | 77,206,948 | | | | — | | | | 77,206,948 | |
Short-Term Securities | | | | | | | | | | | | | | | | |
Money Market Funds | | | 2,506,301 | | | | — | | | | — | | | | 2,506,301 | |
| | | | | | | | | | | | | | | | |
| | $ | 2,506,301 | | | $ | 708,041,461 | | | $ | — | | | $ | 710,547,762 | |
| | | | | | | | | | | | | | | | |
The Fund may hold assets and/or liabilities in which the fair value approximates the carrying amount for financial statement purposes. As of period end, such assets and/or liabilities are categorized within the fair value hierarchy as follows:
| | | | | | | | | | | | | | | | |
| | | Level 1 | | | Level 2 | | | Level 3 | | | Total | |
Liabilities | | | | | | | | | | | | | | | | |
TOB Trust Certificates | | $ | — | | | $ | (41,267,055 | ) | | $ | — | | | $ | (41,267,055 | ) |
VRDP Shares at Liquidation Value | | | — | | | | (231,900,000 | ) | | | — | | | | (231,900,000 | ) |
| | | | | | | | | | | | | | | | |
| | $ | — | | | $ | (273,167,055 | ) | | $ | — | | | $ | (273,167,055 | ) |
| | | | | | | | | | | | | | | | |
See notes to financial statements.
| | |
| 28 | | 2 0 2 2 B L A C K R O C K S E M I - A N N U A L R E P O R T T O S H A R E H O L D E R S |
| | |
Schedule of Investments (unaudited) January 31, 2022 | | BlackRock MuniYield Pennsylvania Quality Fund (MPA) (Percentages shown are based on Net Assets) |
| | | | | | | | |
| Security | | Par
(000) | | | Value | |
|
Municipal Bonds | |
|
Guam — 0.3% | |
|
| Utilities — 0.3% | |
Guam Government Waterworks Authority, RB, Series A, 5.00%, 01/01/50 | | $ | 460 | | | $ | 542,769 | |
| | | | | | | | |
| | |
| Pennsylvania — 116.7% | | | | | | |
| | |
| Corporate — 2.3% | | | | | | |
Pennsylvania Economic Development Financing Authority, RB | | | | | | | | |
Series A, AMT, 0.58%, 08/01/37(a) | | | 2,755 | | | | 2,697,619 | |
Series A, AMT, 3.25%, 08/01/39(b) | | | 1,950 | | | | 1,980,036 | |
Pennsylvania Economic Development Financing Authority, Refunding RB, AMT, 5.50%, 11/01/44 | | | 135 | | | | 141,323 | |
| | | | | | | | |
| | |
| | | | | | | 4,818,978 | |
|
| County/City/Special District/School District — 31.5% | |
Allentown Neighborhood Improvement Zone Development Authority, Refunding RB | | | | | | | | |
5.00%, 05/01/42(c) | | | 1,980 | | | | 2,371,840 | |
Series A, 5.00%, 05/01/35 | | | 190 | | | | 191,709 | |
Series A, 5.00%, 05/01/42 | | | 450 | | | | 453,895 | |
Altoona Area School District, GO | | | | | | | | |
(BAM, SAW), 5.00%, 12/01/25(d) | | | 725 | | | | 825,820 | |
Series A, (AGM, SAW), 5.00%, 12/01/36 | | | 1,180 | | | | 1,327,768 | |
Bethlehem Area School District, GO | | | | | | | | |
Series A, (BAM, SAW), 5.00%, 08/01/34 | | | 1,610 | | | | 1,796,882 | |
Series A, (BAM, SAW), 5.00%, 08/01/35 | | | 1,210 | | | | 1,351,115 | |
Borough of West Chester Pennsylvania, Refunding GO, 3.50%, 11/15/35 | | | 1,095 | | | | 1,163,993 | |
Boyertown Area School District, GO | | | | | | | | |
(SAW), 5.00%, 10/01/36 | | | 610 | | | | 656,866 | |
(SAW), 5.00%, 10/01/38 | | | 920 | | | | 990,013 | |
Bristol Township School District, GO | | | | | | | | |
(SAW), 5.00%, 06/01/40 | | | 775 | | | | 812,407 | |
(BAM, SAW), 5.00%, 06/01/42 | | | 1,685 | | | | 1,957,769 | |
Chester County Industrial Development Authority, SAB(b) | | | | | | | | |
4.25%, 03/01/35 | | | 715 | | | | 706,896 | |
4.75%, 03/01/50 | | | 1,525 | | | | 1,501,575 | |
City of Lancaster Pennsylvania, GO, (BAM), 4.00%, 11/01/42 | | | 1,705 | | | | 1,882,252 | |
City of Philadelphia Pennsylvania, Refunding GO, Series A, 5.00%, 08/01/37 | | | 1,360 | | | | 1,586,266 | |
City of Pittsburgh Pennsylvania, GO, Series B, 5.00%, 09/01/22(d) | | | 1,095 | | | | 1,123,227 | |
Coatesville School District, GO, CAB(e) | | | | | | | | |
Series A, (BAM, SAW), 0.00%, 10/01/34 | | | 160 | | | | 105,615 | |
Series A, (BAM, SAW), 0.00%, 10/01/35 | | | 1,435 | | | | 906,785 | |
Series A, (BAM, SAW), 0.00%, 10/01/37 | | | 1,395 | | | | 807,870 | |
Coatesville School District, Refunding GO, CAB(e) | | | | | | | | |
Series B, (BAM, SAW), 0.00%, 10/01/33 | | | 275 | | | | 189,390 | |
Series B, (BAM, SAW), 0.00%, 10/01/34 | | | 550 | | | | 363,052 | |
Series C, (BAM, SAW), 0.00%, 10/01/33 | | | 360 | | | | 254,694 | |
County of Monroe Pennsylvania, GO | | | | | | | | |
Series A, 4.00%, 07/15/30 | | | 455 | | | | 529,833 | |
Series A, 4.00%, 07/15/31 | | | 530 | | | | 615,616 | |
Series A, 4.00%, 07/15/32 | | | 695 | | | | 804,602 | |
Dallastown Area School District, Refunding GO, (SAW), 5.00%, 04/15/34 | | | 1,235 | | | | 1,371,369 | |
East Pennsboro Area School District, GO (BAM, SAW), 4.00%, 10/01/40 | | | 355 | | | | 395,018 | |
| | | | | | | | |
| Security | | Par
(000) | | | Value | |
|
| County/City/Special District/School District (continued) | |
East Pennsboro Area School District, GO (continued) | | | | | | | | |
(BAM, SAW), 4.00%, 10/01/44 | | $ | 840 | | | $ | 932,244 | |
Fox Chapel Area School District, GO | | | | | | | | |
(SAW), 5.00%, 02/01/39 | | | 1,345 | | | | 1,574,700 | |
(SAW), 5.00%, 02/01/42 | | | 1,250 | | | | 1,441,914 | |
Governor Mifflin School District, GO | | | | | | | | |
Series A, (SAW), 4.00%, 04/01/39 | | | 360 | | | | 405,564 | |
Series A, (SAW), 4.00%, 04/01/40 | | | 225 | | | | 252,510 | |
Series A, (SAW), 4.00%, 04/01/42 | | | 640 | | | | 715,092 | |
Series A, (SAW), 4.00%, 04/01/43 | | | 570 | | | | 635,419 | |
Series A, (SAW), 4.00%, 04/01/46 | | | 665 | | | | 738,194 | |
Manheim Township School District, GO | | | | | | | | |
Series A, (SAW), 4.00%, 02/01/34 | | | 260 | | | | 294,366 | |
Series A, (SAW), 4.00%, 02/01/35 | | | 510 | | | | 576,329 | |
Series A, (SAW), 4.00%, 02/01/36 | | | 345 | | | | 389,491 | |
Marple Newtown School District, GO, (SAW), 3.00%, 06/01/40 | | | 1,375 | | | | 1,454,241 | |
Northampton County Industrial Development Authority, TA, 7.00%, 07/01/32 | | | 140 | | | | 146,639 | |
School District of Philadelphia, GO, Series A, (SAW), 4.00%, 09/01/46 | | | 2,560 | | | | 2,857,265 | |
Shaler Area School District, GO, CAB, (XLCA SAW), 0.00%, 09/01/30(e) | | | 6,145 | | | | 5,109,340 | |
Springfield School District/Delaware County, GO | | | | | | | | |
(SAW), 5.00%, 03/01/36 | | | 870 | | | | 1,024,757 | |
(SAW), 5.00%, 03/01/37 | | | 890 | | | | 1,047,265 | |
(SAW), 5.00%, 03/01/40 | | | 1,025 | | | | 1,204,207 | |
(SAW), 5.00%, 03/01/43 | | | 775 | | | | 908,130 | |
State Public School Building Authority, RB, CAB(e) | | | | | | | | |
(AGM, SAW), 0.00%, 12/15/22 | | | 1,640 | | | | 1,626,263 | |
(AGM, SAW), 0.00%, 12/15/23 | | | 1,980 | | | | 1,933,221 | |
(AGM, SAW), 0.00%, 12/15/24 | | | 1,980 | | | | 1,895,826 | |
(AGM, SAW), 0.00%, 12/15/25 | | | 1,770 | | | | 1,655,814 | |
Township of Lower Paxton Pennsylvania, GO
5.00%, 04/01/24(d) | | | 1,870 | | | | 2,027,741 | |
Series A, 4.00%, 04/01/39 | | | 400 | | | | 446,797 | |
Series A, 4.00%, 04/01/40 | | | 150 | | | | 166,889 | |
Series A, 4.00%, 04/01/42 | | | 315 | | | | 348,571 | |
Series A, 4.00%, 04/01/50 | | | 395 | | | | 433,334 | |
Tredyffrin Easttown School District, GO, (SAW), 5.00%, 02/15/39 | | | 695 | | | | 812,798 | |
West Shore School District, GO | | | | | | | | |
(SAW), 5.00%, 11/15/43 | | | 2,095 | | | | 2,463,410 | |
(SAW), 4.00%, 11/15/45 | | | 715 | | | | 812,392 | |
(SAW), 4.00%, 11/15/48 | | | 360 | | | | 405,756 | |
(SAW), 5.00%, 11/15/48 | | | 1,200 | | | | 1,407,479 | |
| | | | | | | | |
| | | | | | | 65,188,095 | |
| | |
| Education — 16.0% | | | | | | |
Berks County Municipal Authority, Refunding RB 5.00%, 10/01/39 | | | 160 | | | | 173,182 | |
5.00%, 10/01/49 | | | 430 | | | | 457,903 | |
Bethlehem Redevelopment Authority, Refunding RB, 4.00%, 10/01/38 | | | 170 | | | | 189,327 | |
City of Erie Higher Education Building Authority, Refunding RB | | | 105 | | | | 117,618 | |
4.00%, 05/01/36 | | | | | | | | |
5.00%, 05/01/47 | | | 335 | | | | 396,187 | |
Commonwealth of Pennsylvania, GO, First Series, 5.00%, 06/01/22(d) | | | 2,460 | | | | 2,496,622 | |
| | |
S C H E D U L E O F I N V E S T M E N T S | | 29 |
| | |
Schedule of Investments (unaudited) (continued) January 31, 2022 | | BlackRock MuniYield Pennsylvania Quality Fund (MPA) (Percentages shown are based on Net Assets) |
| | | | | | | | |
| Security | | Par
(000) | | | Value | |
| | |
| Education (continued) | | | | | | |
Delaware County Authority, RB | | | | | | | | |
5.00%, 08/01/40 | | $ | 1,205 | | | $ | 1,345,937 | |
5.00%, 08/01/45 | | | 1,610 | | | | 1,782,318 | |
East Hempfield Township Industrial Development Authority, RB(d) | | | | | | | | |
5.00%, 07/01/23 | | | 785 | | | | 830,402 | |
5.00%, 07/01/25 | | | 1,255 | | | | 1,413,278 | |
Latrobe Industrial Development Authority, Refunding RB, 4.00%, 03/01/46 | | | 285 | | | | 298,948 | |
Lehigh County Industrial Development Authority, Refunding RB, 4.00%, 05/01/51 | | | 840 | | | | 865,973 | |
Northampton County General Purpose Authority, Refunding RB, 4.00%, 11/01/38 | | | 1,160 | | | | 1,320,402 | |
Pennsylvania Higher Education Assistance Agency, RB | | | | | | | | |
Series A, 5.00%, 06/01/26 | | | 165 | | | | 186,874 | |
Series A, 5.00%, 06/01/27 | | | 185 | | | | 213,266 | |
Series A, 5.00%, 06/01/28 | | | 195 | | | | 228,302 | |
Series A, 5.00%, 06/01/29 | | | 190 | | | | 225,799 | |
Series A, 5.00%, 06/01/30 | | | 140 | | | | 168,724 | |
Series A, 2.63%, 06/01/42 | | | 1,205 | | | | 1,161,058 | |
Series B, AMT, Subordinate, 3.13%, 06/01/48 | | | 350 | | | | 327,963 | |
Pennsylvania Higher Educational Facilities Authority, RB, Series AT-1, 4.00%, 06/15/34 | | | 2,000 | | | | 2,179,712 | |
Pennsylvania Higher Educational Facilities Authority, Refunding RB | | | | | | | | |
5.00%, 05/01/37 | | | 1,325 | | | | 1,338,410 | |
Series A, 5.25%, 07/15/23(d) | | | 1,580 | | | | 1,679,453 | |
Series A, 5.50%, 07/15/23(d) | | | 385 | | | | 410,620 | |
Philadelphia Authority for Industrial Development, RB | | | | | | | | |
4.00%, 06/15/29 | | | 280 | | | | 292,851 | |
5.00%, 06/15/39 | | | 335 | | | | 359,380 | |
4.00%, 06/01/41 | | | 260 | | | | 281,565 | |
5.00%, 06/15/49 | | | 935 | | | | 991,786 | |
5.00%, 06/15/50 | | | 575 | | | | 606,899 | |
4.00%, 06/01/51 | | | 205 | | | | 216,999 | |
4.00%, 06/01/56 | | | 290 | | | | 305,029 | |
Philadelphia Authority for Industrial Development, Refunding RB | | | | | | | | |
5.00%, 05/01/30 | | | 440 | | | | 490,648 | |
5.00%, 05/01/40 | | | 375 | | | | 411,272 | |
5.00%, 06/15/40(b) | | | 320 | | | | 364,033 | |
4.00%, 05/01/42 | | | 2,985 | | | | 3,006,710 | |
4.00%, 11/01/45 | | | 740 | | | | 820,244 | |
5.00%, 05/01/50 | | | 1,120 | | | | 1,204,915 | |
5.00%, 06/15/50(b) | | | 610 | | | | 685,056 | |
Series 2015, 5.00%, 04/01/45 | | | 2,170 | | | | 2,410,913 | |
Swarthmore Borough Authority, Refunding RB, 5.00%, 09/15/38 | | | 830 | | | | 880,293 | |
| | | | | | | | |
| | | | | | | 33,136,871 | |
| | |
| Health — 24.8% | | | | | | |
Allegheny County Hospital Development Authority, RB, Series B, (NPFGC), 6.00%, 07/01/26 | | | 2,000 | | | | 2,386,106 | |
Allegheny County Hospital Development Authority, Refunding RB | | | | | | | | |
Series A, 4.00%, 04/01/37 | | | 1,700 | | | | 1,868,003 | |
Series A, (AGM-CR), 4.00%, 04/01/44 | | | 3,440 | | | | 3,749,655 | |
Series A, 5.00%, 04/01/47 | | | 700 | | | | 804,260 | |
Bucks County Industrial Development Authority, RB, 4.00%, 07/01/51 | | | 1,000 | | | | 1,086,009 | |
| | | | | | | | |
| Security | | Par
(000) | | | Value | |
| | |
| Health (continued) | | | | | | |
Bucks County Industrial Development Authority, Refunding RB, 5.00%, 10/01/37 | | $ | 940 | | | $ | 1,033,603 | |
County of Lehigh Pennsylvania, Refunding RB, Series A, 4.00%, 07/01/49 | | | 600 | | | | 655,804 | |
Cumberland County Municipal Authority, Refunding RB | | | | | | | | |
5.00%, 01/01/25(d) | | | 1,310 | | | | 1,453,944 | |
5.00%, 01/01/29(d) | | | 70 | | | | 85,839 | |
4.00%, 01/01/36 | | | 395 | | | | 434,732 | |
4.13%, 01/01/38 | | | 160 | | | | 176,543 | |
5.00%, 01/01/38 | | | 1,290 | | | | 1,404,875 | |
5.00%, 01/01/39 | | | 690 | | | | 812,452 | |
Doylestown Hospital Authority, RB, Series A, 5.00%, 07/01/49 | | | 500 | | | | 568,547 | |
DuBois Hospital Authority, Refunding RB, 4.00%, 07/15/48 | | | 2,060 | | | | 2,189,143 | |
Franklin County Industrial Development Authority, RB | | | | | | | | |
5.00%, 12/01/29 | | | 70 | | | | 76,707 | |
5.00%, 12/01/39 | | | 135 | | | | 146,576 | |
5.00%, 12/01/49 | | | 100 | | | | 107,440 | |
5.00%, 12/01/54 | | | 365 | | | | 390,623 | |
Geisinger Authority, Refunding RB | | | | | | | | |
Series A, 4.00%, 04/01/50 | | | 900 | | | | 985,346 | |
Series A-2, 5.00%, 02/15/39 | | | 4,050 | | | | 4,664,952 | |
Lancaster County Hospital Authority, Refunding RB, 5.00%, 11/01/35 | | | 575 | | | | 633,537 | |
Lancaster Industrial Development Authority, RB 4.00%, 12/01/44 | | | 420 | | | | 453,554 | |
5.00%, 12/01/44 | | | 665 | | | | 749,870 | |
4.00%, 12/01/49 | | | 565 | | | | 606,781 | |
Lancaster Industrial Development Authority, Refunding RB(d) | | | | | | | | |
5.38%, 05/01/23 | | | 520 | | | | 549,284 | |
5.75%, 05/01/23 | | | 865 | | | | 917,729 | |
Montgomery County Higher Education and Health Authority, Refunding RB | | | | | | | | |
5.00%, 05/01/52 | | | 2,700 | | | | 3,230,104 | |
Series A, 5.00%, 09/01/37 | | | 840 | | | | 981,106 | |
Series A, 5.00%, 09/01/48 | | | 1,500 | | | | 1,708,868 | |
Montgomery County Industrial Development Authority, RB | | | | | | | | |
Series C, 4.00%, 11/15/43 | | | 200 | | | | 222,317 | |
Series C, 5.00%, 11/15/45 | | | 915 | | | | 1,082,139 | |
Montgomery County Industrial Development Authority, Refunding RB | | | | | | | | |
5.00%, 05/15/22(d) | | | 1,420 | | | | 1,438,366 | |
5.25%, 01/01/40 | | | 220 | | | | 232,368 | |
Mount Lebanon Hospital Authority, RB, 4.00%, 07/01/48 | | | 2,345 | | | | 2,518,626 | |
Northampton County General Purpose Authority, Refunding RB | | | | | | | | |
5.00%, 08/15/46 | | | 1,000 | | | | 1,124,194 | |
5.00%, 08/15/48 | | | 1,125 | | | | 1,302,577 | |
Pennsylvania Higher Educational Facilities Authority, Refunding RB, Series A, 5.00%, 09/01/45 | | | 2,000 | | | | 2,169,032 | |
Pottsville Hospital Authority, Refunding RB, Series B, 5.00%, 07/01/41 | | | 3,000 | | | | 3,442,077 | |
Wayne County Hospital & Health Facilities Authority, RB, Series A, (GTD), 4.00%, 07/01/46 | | | 1,595 | | | | 1,690,424 | |
West Cornwall Township Municipal Authority, Refunding RB | | | | | | | | |
Series A, 4.00%, 11/15/36 | | | 230 | | | | 253,403 | |
| | |
| 30 | | 2 0 2 2 B L A C K R O C K S E M I - A N N U A L R E P O R T T O S H A R E H O L D E R S |
| | |
Schedule of Investments (unaudited) (continued) January 31, 2022 | | BlackRock MuniYield Pennsylvania Quality Fund (MPA) (Percentages shown are based on Net Assets) |
| | | | | | | | |
| Security | | Par
(000) | | | Value | |
| | |
| Health (continued) | | | | | | |
West Cornwall Township Municipal Authority, Refunding RB (continued) | | | | | | | | |
Series A, 4.00%, 11/15/41 | | $ | 225 | | | $ | 245,586 | |
Series A, 4.00%, 11/15/46 | | | 335 | | | | 362,062 | |
Westmoreland County Industrial Development Authority, Refunding RB, Series A, 4.00%, 07/01/37 | | | 360 | | | | 406,025 | |
| | | | | | | | |
| | | | | | | 51,401,188 | |
| | |
| Housing — 3.3% | | | | | | |
Pennsylvania Housing Finance Agency, RB, S/F Housing | | | | | | | | |
Series 137, 2.45%, 10/01/41 | | | 685 | | | | 651,714 | |
Series 137, 2.60%, 04/01/46 | | | 2,730 | | | | 2,609,940 | |
Philadelphia Authority for Industrial Development, RB, M/F Housing | | | | | | | | |
Series A, 3.50%, 12/01/36 | | | 810 | | | | 650,434 | |
Series A, 4.00%, 12/01/46 | | | 2,970 | | | | 2,326,849 | |
Series A, 4.00%, 12/01/51 | | | 805 | | | | 614,033 | |
| | | | | | | | |
| | | | | | | 6,852,970 | |
| | |
| State — 8.8% | | | | | | |
Commonwealth Financing Authority, RB
5.00%, 06/01/34 | | | 4,175 | | | | 4,926,621 | |
5.00%, 06/01/35 | | | 1,295 | | | | 1,526,073 | |
Commonwealth of Pennsylvania, GO, First Series, 5.00%, 05/15/28 | | | 1,300 | | | | 1,563,448 | |
Pennsylvania Economic Development Financing Authority, RB, AMT, 5.00%, 06/30/42 | | | 7,000 | | | | 7,785,120 | |
Pennsylvania Turnpike Commission, RB, Sub-Series B, 5.25%, 12/01/48 | | | 1,930 | | | | 2,305,240 | |
| | | | | | | | |
| | | | | | | 18,106,502 | |
| | |
| Tobacco — 2.0% | | | | | | |
Commonwealth Financing Authority, RB, 5.00%, 06/01/33 | | | 3,575 | | | | 4,221,267 | |
| | | | | | | | |
| | |
| Transportation — 15.2% | | | | | | |
Allegheny County Airport Authority, ARB, Series A, AMT, 5.00%, 01/01/51 | | | 500 | | | | 593,699 | |
City of Philadelphia PA Airport Revenue, Refunding, ARB, AMT, (AGM), 4.00%, 07/01/46 | | | 610 | | | | 673,150 | |
City of Philadelphia Pennsylvania Airport Revenue, Refunding ARB | | | | | | | | |
Series B, AMT, 5.00%, 07/01/37 | | | 1,100 | | | | 1,262,799 | |
Series B, AMT, 5.00%, 07/01/47 | | | 2,105 | | | | 2,407,227 | |
Delaware River Joint Toll Bridge Commission, RB, 5.00%, 07/01/42 | | | 1,500 | | | | 1,761,242 | |
Delaware River Port Authority, RB
5.00%, 01/01/29 | | | 475 | | | | 510,284 | |
5.00%, 01/01/37 | | | 2,285 | | | | 2,442,018 | |
Pennsylvania Economic Development Financing Authority, Refunding RB, Series A, AMT, 5.00%, 11/01/41 | | | 6,025 | | | | 6,167,371 | |
Pennsylvania Turnpike Commission, RB
5.00%, 12/01/29 | | | 260 | | | | 320,909 | |
5.00%, 12/01/30 | | | 325 | | | | 407,873 | |
5.00%, 12/01/31 | | | 590 | | | | 751,921 | |
3.00%, 12/01/51 | | | 1,470 | | | | 1,418,775 | |
Sub-Series B-1, 5.00%, 06/01/42 | | | 2,345 | | | | 2,692,576 | |
Pennsylvania Turnpike Commission, RB, CAB(e) Sub-Series A-3, (AGM), 0.00%, 12/01/40 | | | 1,275 | | | | 770,128 | |
| | | | | | | | |
| Security | | Par
(000) | | | Value | |
| | |
| Transportation (continued) | | | | | | |
Pennsylvania Turnpike Commission, RB, CAB(e) (continued) | | | | | | | | |
Sub-Series A-3, 0.00%, 12/01/42 | | $ | 4,760 | | | $ | 2,480,726 | |
Pennsylvania Turnpike Commission, Refunding RB | | | | | | | | |
Series A-1, 5.25%, 12/01/45 | | | 3,270 | | | | 3,680,218 | |
Series C, 5.00%, 12/01/46 | | | 425 | | | | 523,109 | |
Series C, 3.00%, 12/01/51 | | | 920 | | | | 941,623 | |
Series C, 4.00%, 12/01/51 | | | 340 | | | | 380,367 | |
Southeastern Pennsylvania Transportation Authority, RB, 5.00%, 06/01/32 | | | 1,075 | | | | 1,322,791 | |
| | | | | | | | |
| | | | | | | 31,508,806 | |
| | |
| Utilities — 12.8% | | | | | | |
Aliquippa Municipal Water Authority Water & Sewer Revenue, RB | | | | | | | | |
(BAM), 4.00%, 11/15/46 | | | 205 | | | | 230,033 | |
(BAM), 4.00%, 11/15/51 | | | 595 | | | | 665,625 | |
(BAM), 4.00%, 11/15/55 | | | 750 | | | | 834,555 | |
Allegheny County Sanitary Authority, RB, (BAM), 5.25%, 12/01/41 | | | 1,410 | | | | 1,506,653 | |
Allegheny Valley Joint Sewage Authority RB, 4.00%, 08/01/52 | | | 755 | | | | 841,699 | |
Allegheny Valley Joint Sewage Authority, RB, 4.00%, 08/01/47 | | | 370 | | | | 412,982 | |
Bucks County Water and Sewer Authority, RB | | | | | | | | |
Series A, (AGM), 5.00%, 12/01/37 | | | 780 | | | | 856,417 | |
Series A, (AGM), 5.00%, 12/01/40 | | | 1,000 | | | | 1,091,324 | |
City of Philadelphia Pennsylvania Water & Wastewater Revenue, RB | | | | | | | | |
Series A, 5.00%, 10/01/43 | | | 3,040 | | | | 3,638,390 | |
Series A, 5.00%, 11/01/45 | | | 1,790 | | | | 2,186,186 | |
Series A, 5.25%, 10/01/52 | | | 810 | | | | 958,159 | |
Delaware County Regional Water Quality Control Authority, RB, 5.00%, 05/01/23(d) | | | 420 | | | | 441,703 | |
New Kensington Municipal Sanitary Authority, RB, (AGM), 3.25%, 12/01/47 | | | 1,195 | | | | 1,223,403 | |
Oxford Area Sewer Authority, Refunding RB | | | | | | | | |
(BAM), 4.00%, 07/01/22 | | | 100 | | | | 101,354 | |
(BAM), 4.00%, 07/01/23 | | | 135 | | | | 140,579 | |
(BAM), 3.00%, 07/01/25 | | | 100 | | | | 105,387 | |
(BAM), 4.00%, 07/01/28 | | | 160 | | | | 182,291 | |
(BAM), 4.00%, 07/01/29 | | | 165 | | | | 190,296 | |
(BAM), 4.00%, 07/01/30 | | | 120 | | | | 139,953 | |
(BAM), 4.00%, 07/01/31 | | | 100 | | | | 117,989 | |
(BAM), 4.00%, 07/01/33 | | | 100 | | | | 117,054 | |
(BAM), 4.00%, 07/01/34 | | | 200 | | | | 232,604 | |
(BAM), 3.00%, 07/01/35 | | | 100 | | | | 106,464 | |
(BAM), 4.00%, 07/01/37 | | | 220 | | | | 254,248 | |
(BAM), 4.00%, 07/01/39 | | | 240 | | | | 276,746 | |
(BAM), 4.00%, 07/01/41 | | | 260 | | | | 298,930 | |
(BAM), 3.00%, 07/01/46 | | | 1,255 | | | | 1,296,269 | |
(BAM), 2.38%, 07/01/55 | | | 400 | | | | 357,947 | |
Philadelphia Gas Works Co., Refunding RB | | | | | | | | |
5.00%, 08/01/30 | | | 800 | | | | 892,962 | |
5.00%, 08/01/31 | | | 600 | | | | 669,372 | |
5.00%, 08/01/32 | | | 800 | | | | 892,013 | |
5.00%, 08/01/33 | | | 400 | | | | 445,757 | |
5.00%, 08/01/34 | | | 700 | | | | 779,659 | |
| | |
S C H E D U L E O F I N V E S T M E N T S | | 31 |
| | |
Schedule of Investments (unaudited) (continued) January 31, 2022 | | BlackRock MuniYield Pennsylvania Quality Fund (MPA) (Percentages shown are based on Net Assets) |
| | | | | | | | |
| Security | | Par
(000) | | | Value | |
| | |
| Utilities (continued) | | | | | | |
Pittsburgh Water & Sewer Authority, RB, Series B, (AGM), 4.00%, 09/01/50 | | $ | 900 | | | $ | 1,028,817 | |
Westmoreland County Municipal Authority, Refunding RB, (BAM), 5.00%, 08/15/36 | | | 2,000 | | | | 2,320,552 | |
Williamsport Sanitary Authority, Refunding RB, (BAM), 4.00%, 01/01/40 | | | 580 | | | | 641,414 | |
| | | | | | | | |
| | |
| | | | | | | 26,475,786 | |
| | | | | | | | |
| | |
Total Municipal Bonds in Pennsylvania | | | | | | | 241,710,463 | |
| | |
| Puerto Rico — 4.8% | | | | | | |
| | |
| State — 4.8% | | | | | | |
Puerto Rico Sales Tax Financing Corp. Sales Tax Revenue, RB | | | | | | | | |
Series A-1, Restructured, 4.75%, 07/01/53 | | | 265 | | | | 289,953 | |
Series A-1, Restructured, 5.00%, 07/01/58 | | | 389 | | | | 432,809 | |
Series A-2, Restructured, 4.33%, 07/01/40 | | | 519 | | | | 563,375 | |
Series A-2, Restructured, 4.78%, 07/01/58 | | | 46 | | | | 50,510 | |
Series B-1, Restructured, 4.75%, 07/01/53 | | | 283 | | | | 310,325 | |
Series B-1, Restructured, 5.00%, 07/01/58 | | | 3,423 | | | | 3,803,888 | |
Series B-2, Restructured, 4.33%, 07/01/40 | | | 2,701 | | | | 2,927,222 | |
Series B-2, Restructured, 4.78%, 07/01/58 | | | 274 | | | | 301,068 | |
Puerto Rico Sales Tax Financing Corp. Sales Tax Revenue, RB, CAB, Series A-1, Restructured, 0.00%, 07/01/46(e) | | | 3,618 | | | | 1,170,137 | |
| | | | | | | | |
| | |
Total Municipal Bonds in Puerto Rico | | | | | | | 9,849,287 | |
| | | | | | | | |
| | |
Total Municipal Bonds — 121.8%
(Cost: $240,090,476) | | | | | | | 252,102,519 | |
| | | | | | | | |
|
| Municipal Bonds Transferred to Tender Option Bond Trusts(f) | |
| | |
| Pennsylvania — 36.5% | | | | | | |
| | |
| Education — 9.8% | | | | | | |
Northampton County General Purpose Authority, Refunding RB, 5.00%, 11/01/47 | | | 3,900 | | | | 4,568,964 | |
Pennsylvania Higher Educational Facilities Authority, RB, Series AR, 4.00%, 06/15/38 | | | 11,335 | | | | 12,074,447 | |
Philadelphia Authority for Industrial Development, RB, 4.00%, 12/01/48(g) | | | 3,300 | | | | 3,662,523 | |
| | | | | | | | |
| | |
| | | | | | | 20,305,934 | |
| | |
| Health — 19.6% | | | | | | |
County of Lehigh Pennsylvania, Refunding RB, Series A, 4.00%, 07/01/49(g) | | | 2,501 | | | | 2,734,077 | |
General Authority of Southcentral Pennsylvania, Refunding RB | | | | | | | | |
4.00%, 06/01/49 | | | 5,385 | | | | 5,924,807 | |
Series A, 5.00%, 06/01/24(d) | | | 7,000 | | | | 7,631,358 | |
Montgomery County Higher Education and Health Authority, Refunding RB, 4.00%, 09/01/44(g) | | | 3,100 | | | | 3,364,622 | |
Pennsylvania Economic Development Financing Authority, RB, Series B, 4.00%, 03/15/40 | | | 8,000 | | | | 8,533,260 | |
Pennsylvania Higher Educational Facilities Authority, RB, Series A, 4.00%, 08/15/39(g) | | | 7,815 | | | | 7,918,601 | |
St Mary Hospital Authority, Refunding RB, 5.00%, 12/01/48 | | | 3,754 | | | | 4,532,411 | |
| | | | | | | | |
| | |
| | | | | | | 40,639,136 | |
| | | | | | | | |
| Security | | Par
(000) | | | Value | |
| | |
| State — 3.2% | | | | | | |
Commonwealth of Pennsylvania, GO, 1st Series, 4.00%, 03/01/38(g) | | $ | 6,000 | | | $ | 6,726,879 | |
| | | | | | | | |
| | |
| Transportation — 2.0% | | | | | | |
Pennsylvania Turnpike Commission, RB, Sub-Series A, 5.50%, 12/01/42 | | | 1,680 | | | | 1,965,284 | |
Pennsylvania Turnpike Commission, Refunding RB, Sub- Series B-2, 5.00%, 06/01/35 | | | 1,850 | | | | 2,172,729 | |
| | | | | | | | |
| | |
| | | | | | | 4,138,013 | |
| | |
| Utilities — 1.9% | | | | | | |
Westmoreland County Municipal Authority, Refunding RB, 5.00%, 08/15/42 | | | 3,493 | | | | 3,863,817 | |
| | | | | | | | |
| | |
Total Municipal Bonds in Pennsylvania | | | | | | | 75,673,779 | |
| | | | | | | | |
| | |
Total Municipal Bonds Transferred to Tender Option Bond Trusts — 36.5%
(Cost: $70,907,750) | | | | | | | 75,673,779 | |
| | | | | | | | |
| | |
Total Long-Term Investments — 158.3%
(Cost: $310,998,226) | | | | | | | 327,776,298 | |
| | | | | | | | |
| | |
| | | Shares | | | | |
|
Short-Term Securities | |
|
| Money Market Funds — 3.6% | |
BlackRock Liquidity Funds, MuniCash, Institutional Class, 0.01%(h)(i) | | | 7,453,454 | | | | 7,453,454 | |
| | | | | | | | |
| |
Total Short-Term Securities — 3.6%
(Cost: $7,453,907) | | | | 7,453,454 | |
| | | | | | | | |
| |
Total Investments — 161.9%
(Cost: $318,452,133) | | | | 335,229,752 | |
| |
Liabilities in Excess of Other Assets — (1.7)% | | | | (3,650,657 | ) |
| |
Liability for TOB Trust Certificates, Including Interest Expense and Fees Payable — (20.4)% | | | | (42,195,124 | ) |
| |
VRDP Shares at Liquidation Value, Net of Deferred Offering Costs — (39.8)% | | | | (82,344,443 | ) |
| | | | | | | | |
| |
Net Assets Applicable to Common Shares — 100.0% | | | $ | 207,039,528 | |
| | | | | | | | |
| (a) | Variable rate security. Interest rate resets periodically. The rate shown is the effective interest rate as of period end. Security description also includes the reference rate and spread if published and available. |
| (b) | Security exempt from registration pursuant to Rule 144A under the Securities Act of 1933, as amended. These securities may be resold in transactions exempt from registration to qualified institutional investors. |
| (c) | When-issued security. |
| (d) | U.S. Government securities held in escrow, are used to pay interest on this security as well as to retire the bond in full at the date indicated, typically at a premium to par. |
| (f) | Represent bonds transferred to a TOB Trust in exchange of cash and residual certificates received by the Fund. These bonds serve as collateral in a secured borrowing. See Note 4 of the Notes to Financial Statements for details. |
| (g) | All or a portion of the security is subject to a recourse agreement. The aggregate maximum potential amount the Fund could ultimately be required to pay under the agreements, which expire between August 15, 2022 to June 1, 2039, is $14,130,711. See Note 4 of the Notes to Financial Statements for details. |
| (h) | Affiliate of the Fund. |
| (i) | Annualized 7-day yield as of period end. |
For Fund compliance purposes, the Fund’s sector classifications refer to one or more of the sector sub-classifications used by one or more widely recognized market indexes or rating group indexes, and/or as defined by the investment adviser. These definitions may not apply for purposes of this report, which may combine such sector sub-classifications for reporting ease.
| | |
| 32 | | 2 0 2 2 B L A C K R O C K S E M I - A N N U A L R E P O R T T O S H A R E H O L D E R S |
| | |
Schedule of Investments (unaudited) (continued) January 31, 2022 | | BlackRock MuniYield Pennsylvania Quality Fund (MPA) |
Affiliates
Investments in issuers considered to be affiliate(s) of the Fund during the six months ended January 31, 2022 for purposes of Section 2(a)(3) of the Investment Company Act of 1940, as amended, were as follows:
| | | | | | | | | | | | | | | | | | | | | | | | | | | | | | | | | | | | |
| Affiliated Issuer | | Value at
07/31/21 | | | Purchases
at Cost | | | Proceeds from Sales | | | Net
Realized
Gain (Loss) | | | Change in
Unrealized
Appreciation
(Depreciation) | | | Value at 01/31/22 | | | Shares
Held at
01/31/22 | | | Income | | | Capital Gain
Distributions
from
Underlying
Funds | |
BlackRock Liquidity Funds, MuniCash, Institutional Class | | $ | 25,907 | | | $ | 7,427,941 | (a) | | $ | — | | | $ | 59 | | | $ | (453 | ) | | $ | 7,453,454 | | | | 7,453,454 | | | $ | 476 | | | $ | — | |
| | | | | | | | | | | | | | | | | | | | | | | | | | | | | | | | | | | | |
| | (a) | Represents net amount purchased (sold). | |
Derivative Financial Instruments Outstanding as of Period End
Futures Contracts
| | | | | | | | | | | | | | | | |
| Description | | Number of
Contracts | | | Expiration
Date | | | Notional
Amount (000) | | | Value/
Unrealized
Appreciation (Depreciation) | |
Short Contracts | | | | | | | | | | | | | | | | |
10-Year U.S. Treasury Note | | | 29 | | | | 03/22/22 | | | $ | 3,711 | | | $ | 86,818 | |
U.S. Long Bond | | | 14 | | | | 03/22/22 | | | | 2,177 | | | | 77,985 | |
5-Year U.S. Treasury Note | | | 25 | | | | 03/31/22 | | | | 2,980 | | | | 58,405 | |
| | | | | | | | | | | | | | | | |
| | | | | | | | | | | | | | $ | 223,208 | |
| | | | | | | | | | | | | | | | |
Derivative Financial Instruments Categorized by Risk Exposure
As of period end, the fair values of derivative financial instruments located in the Statements of Assets and Liabilities were as follows:
| | | | | | | | | | | | | | | | | | | | | | | | | | | | |
| | | Commodity
Contracts | | | Credit
Contracts | | | Equity
Contracts | | | Foreign
Currency
Exchange
Contracts | | | Interest
Rate
Contracts | | | Other
Contracts | | | Total | |
Assets — Derivative Financial Instruments | | | | | | | | | | | | | | | | | | | | | | | | | | | | |
Futures contracts | | | | | | | | | | | | | | | | | | | | | | | | | | | | |
Unrealized appreciation on futures contracts(a) | | $ | — | | | $ | — | | | $ | — | | | $ | — | | | $ | 223,208 | | | $ | — | | | $ | 223,208 | |
| | | | | | | | | | | | | | | | | | | | | | | | | | | | |
| | (a) | Net cumulative unrealized appreciation (depreciation) on futures contracts and centrally cleared swaps, if any, are reported in the Schedule of Investments. In the Statements of Assets and Liabilities, only current day’s variation margin is reported in receivables or payables and the net cumulative unrealized appreciation (depreciation) is included in accumulated earnings (loss). | |
For the period ended January 31, 2022, the effect of derivative financial instruments in the Statements of Operations was as follows:
| | | | | | | | | | | | | | | | | | | | | | | | | | | | |
| | | Commodity
Contracts | | | Credit
Contracts | | | Equity
Contracts | | | Foreign
Currency
Exchange
Contracts | | | Interest
Rate
Contracts | | | Other
Contracts | | | Total | |
Net Realized Gain (Loss) from: | | | | | | | | | | | | | | | | | | | | | | | | | | | | |
Futures contracts | | $ | — | | | $ | — | | | $ | — | | | $ | — | | | $ | 223,393 | | | $ | — | | | $ | 223,393 | |
| | | | | | | | | | | | | | | | | | | | | | | | | | | | |
| | | | | | | |
Net Change in Unrealized Appreciation (Depreciation) on: | | | | | | | | | | | | | | | | | | | | | | | | | | | | |
Futures contracts | | $ | — | | | $ | — | | | $ | — | | | $ | — | | | $ | 688,673 | | | $ | — | | | $ | 688,673 | |
| | | | | | | | | | | | | | | | | | | | | | | | | | | | |
Average Quarterly Balances of Outstanding Derivative Financial Instruments
| | |
| | |
Futures contracts: | | |
Average notional value of contracts — short | | $8,788,871 |
For more information about the Fund’s investment risks regarding derivative financial instruments, refer to the Notes to Financial Statements.
| | |
S C H E D U L E O F I N V E S T M E N T S | | 33 |
| | |
Schedule of Investments (unaudited) (continued) January 31, 2022 | | BlackRock MuniYield Pennsylvania Quality Fund (MPA) |
Fair Value Hierarchy as of Period End
Various inputs are used in determining the fair value of financial instruments. For a description of the input levels and information about the Fund’s policy regarding valuation of financial instruments, refer to the Notes to Financial Statements.
The following table summarizes the Fund’s financial instruments categorized in the fair value hierarchy. The breakdown of the Fund’s financial instruments into major categories is disclosed in the Schedule of Investments above.
| | | | | | | | | | | | | | | | |
| | | | | |
| | | Level 1 | | | Level 2 | | | Level 3 | | | Total | |
Assets | | | | | | | | | | | | | | | | |
Investments | | | | | | | | | | | | | | | | |
Long-Term Investments | | | | | | | | | | | | | | | | |
Municipal Bonds | | $ | — | | | $ | 252,102,519 | | | $ | — | | | $ | 252,102,519 | |
Municipal Bonds Transferred to Tender Option Bond Trusts | | | — | | | | 75,673,779 | | | | — | | | | 75,673,779 | |
Short-Term Securities | | | | | | | | | | | | | | | | |
Money Market Funds | | | 7,453,454 | | | | — | | | | — | | | | 7,453,454 | |
| | | | | | | | | | | | | | | | |
| | $ | 7,453,454 | | | $ | 327,776,298 | | | $ | — | | | $ | 335,229,752 | |
| | | | | | | | | | | | | | | | |
Derivative Financial Instruments(a) | | | | | | | | | | | | | | | | |
Assets | | | | | | | | | | | | | | | | |
Interest Rate Contracts | | $ | 223,208 | | | $ | — | | | $ | — | | | $ | 223,208 | |
| | | | | | | | | | | | | | | | |
| | (a) | Derivative financial instruments are futures contracts. Futures contracts are valued at the unrealized appreciation (depreciation) on the instrument. | |
The Fund may hold assets and/or liabilities in which the fair value approximates the carrying amount for financial statement purposes. As of period end, such assets and/or liabilities are categorized within the fair value hierarchy as follows:
| | | | | | | | | | | | | | | | |
| | | | | |
| | | Level 1 | | | Level 2 | | | Level 3 | | | Total | |
Liabilities | | | | | | | | | | | | | | | | |
TOB Trust Certificates | | $ | — | | | | $ (42,183,181 | ) | | $ | — | | | $ | (42,183,181 | ) |
VRDP Shares at Liquidation Value | | | — | | | | (82,600,000 | ) | | | — | | | | (82,600,000 | ) |
| | | | | | | | | | | | | | | | |
| | $ | — | | | | $ (124,783,181 | ) | | $ | — | | | $ | (124,783,181 | ) |
| | | | | | | | | | | | | | | | |
See notes to financial statements.
| | |
| 34 | | 2 0 2 2 B L A C K R O C K S E M I - A N N U A L R E P O R T T O S H A R E H O L D E R S |
| | |
| | Statements of Assets and Liabilities (unaudited) January 31, 2022 |
| | | | | | | | | | | | | | | | |
| | | MUC | | | MUJ | | | MIY | | | MPA | |
| | | | |
ASSETS | | | | | | | | | | | | | | | | |
Investments, at value — unaffiliated(a) | | $ | 979,480,533 | | | $ | 744,233,293 | | | $ | 708,041,461 | | | $ | 327,776,298 | |
Investments, at value — affiliated(b) | | | 17,107,918 | | | | 6,938,365 | | | | 2,506,301 | | | | 7,453,454 | |
Cash pledged for futures contracts | | | — | | | | 228,000 | | | | — | | | | 117,000 | |
Receivables: | | | | | | | | | | | | | | | | |
Investments sold | | | 6,230,000 | | | | — | | | | 2,214,539 | | | | — | |
Dividends — affiliated | | | 77 | | | | 39 | | | | 25 | | | | 26 | |
Interest — unaffiliated | | | 11,635,744 | | | | 4,801,005 | | | | 7,361,707 | | | | 2,904,899 | |
Variation margin on futures contracts | | | — | | | | 5,250 | | | | — | | | | 3,062 | |
Prepaid expenses | | | 27,952 | | | | 11,676 | | | | 118,116 | | | | 88,772 | |
Other assets | | | 286,000 | | | | — | | | | — | | | | — | |
| | | | | | | | | | | | | | | | |
Total assets | | | 1,014,768,224 | | | | 756,217,628 | | | | 720,242,149 | | | | 338,343,511 | |
| | | | | | | | | | | | | | | | |
| | | | |
ACCRUED LIABILITIES | | | | | | | | | | | | | | | | |
Payables: | | | | | | | | | | | | | | | | |
Investments purchased | | | 9,172,734 | | | | — | | | | 2,209,229 | | | | 5,743,291 | |
Accounting services fees | | | 57,468 | | | | 46,861 | | | | 45,218 | | | | 25,931 | |
Custodian fees | | | 4,979 | | | | 2,263 | | | | 3,279 | | | | 1,900 | |
Income dividend distributions — Common Shares | | | 2,257,279 | | | | 1,896,102 | | | | 1,652,534 | | | | 732,345 | |
Interest expense and fees | | | 40,230 | | | | 16,494 | | | | 15,966 | | | | 11,943 | |
Investment advisory fees | | | 477,260 | | | | 327,952 | | | | 302,887 | | | | 141,271 | |
Directors’ and Officer’s fees | | | 339,441 | | | | 4,518 | | | | 4,384 | | | | 12,531 | |
Other accrued expenses | | | 5,776 | | | | 8,923 | | | | 6,909 | | | | 66,912 | |
Professional fees | | | 33,703 | | | | 35,083 | | | | 28,547 | | | | 26,226 | |
Reorganization costs | | | 180,691 | | | | 118,077 | | | | — | | | | — | |
Transfer agent fees | | | 19,055 | | | | 16,430 | | | | 16,867 | | | | 12,196 | |
Variation margin on futures contracts | | | — | | | | 3,940 | | | | — | | | | 1,813 | |
| | | | | | | | | | | | | | | | |
Total accrued liabilities | | | 12,588,616 | | | | 2,476,643 | | | | 4,285,820 | | | | 6,776,359 | |
| | | | | | | | | | | | | | | | |
| | | | |
OTHER LIABILITIES | | | | | | | | | | | | | | | | |
TOB Trust Certificates | | | 132,144,550 | | | | 61,170,038 | | | | 41,267,055 | | | | 42,183,181 | |
VRDP Shares, at liquidation value of $100,000 per share, net of deferred offering
costs(c)(d)(e) | | | — | | | | 236,696,654 | | | | 231,536,377 | | | | 82,344,443 | |
VMTP Shares, at liquidation value of $100,000 per share(c)(d)(e) | | | 254,000,000 | | | | — | | | | — | | | | — | |
| | | | | | | | | | | | | | | | |
Total other liabilities | | | 386,144,550 | | | | 297,866,692 | | | | 272,803,432 | | | | 124,527,624 | |
| | | | | | | | | | | | | | | | |
Total liabilities | | | 398,733,166 | | | | 300,343,335 | | | | 277,089,252 | | | | 131,303,983 | |
| | | | | | | | | | | | | | | | |
| | | | |
NET ASSETS APPLICABLE TO COMMON SHAREHOLDERS | | $ | 616,035,058 | | | $ | 455,874,293 | | | $ | 443,152,897 | | | $ | 207,039,528 | |
| | | | | | | | | | | | | | | | |
| | | | |
NET ASSETS APPLICABLE TO COMMON SHAREHOLDERS CONSIST OF | | | | | | | | | | | | | | | | |
Paid-in capital(f)(g)(h) | | $ | 581,916,175 | | | $ | 423,299,928 | | | $ | 418,118,813 | | | $ | 194,139,041 | |
Accumulated earnings | | | 34,118,883 | | | | 32,574,365 | | | | 25,034,084 | | | | 12,900,487 | |
| | | | | | | | | | | | | | | | |
NET ASSETS APPLICABLE TO COMMON SHAREHOLDERS | | $ | 616,035,058 | | | $ | 455,874,293 | | | $ | 443,152,897 | | | $ | 207,039,528 | |
| | | | | | | | | | | | | | | | |
| | | | |
Net asset value per Common Share | | $ | 15.01 | | | $ | 15.15 | | | $ | 15.02 | | | $ | 15.55 | |
| | | | | | | | | | | | | | | | |
| | | | |
(a) Investments, at cost — unaffiliated | | $ | 925,909,943 | | | $ | 704,606,378 | | | $ | 676,234,649 | | | $ | 310,998,226 | |
(b) Investments, at cost — affiliated | | $ | 17,114,999 | | | $ | 6,938,874 | | | $ | 2,506,552 | | | $ | 7,453,907 | |
(c) Preferred Shares outstanding | | | 2,540 | | | | 2,371 | | | | 2,319 | | | | 826 | |
(d) Preferred Shares authorized | | | 18,140 | | | | 10,491 | | | | 8,919 | | | | 1,000,000 | |
(e) Par value per Preferred Share | | $ | 0.10 | | | $ | 0.10 | | | $ | 0.10 | | | $ | 0.05 | |
(f) Common Shares outstanding | | | 41,041,435 | | | | 30,096,853 | | | | 29,509,535 | | | | 13,315,371 | |
(g) Common Shares authorized | | | 199,981,860 | | | | 199,989,509 | | | | 199,991,081 | | | | Unlimited | |
(h) Par value per Common Share | | $ | 0.10 | | | $ | 0.10 | | | $ | 0.10 | | | $ | 0.10 | |
See notes to financial statements.
| | |
F I N A N C I A L S T A T E M E N T S | | 35 |
Statements of Operations (unaudited)
Six Months Ended January 31, 2022
| | | | | | | | | | | | | | | | |
| | | | | | | | | | | | | | | | |
| | | | | | | | | | | | | | | | |
| | | MUC | | | MUJ | | | MIY | | | MPA | |
| | | | |
INVESTMENT INCOME | | | | | | | | | | | | | | | | |
Dividends — affiliated | | $ | 23,419 | | | $ | 366 | | | $ | 336 | | | $ | 476 | |
Interest — unaffiliated | | | 16,650,581 | | | | 13,513,747 | | | | 12,704,081 | | | | 5,562,725 | |
| | | | | | | | | | | | | | | | |
Total investment income | | | 16,674,000 | | | | 13,514,113 | | | | 12,704,417 | | | | 5,563,201 | |
| | | | | | | | | | | | | | | | |
| | | | |
EXPENSES | | | | | | | | | | | | | | | | |
Investment advisory | | | 2,869,697 | | | | 1,966,704 | | | | 1,818,256 | | | | 847,350 | |
Reorganization | | | 309,411 | | | | 294,594 | | | | — | | | | — | |
Accounting services | | | 68,845 | | | | 56,664 | | | | 54,323 | | | | 31,061 | |
Professional | | | 45,894 | | | | 42,427 | | | | 37,193 | | | | 33,897 | |
Directors and Officer | | | 17,740 | | | | 14,929 | | | | 14,429 | | | | 7,027 | |
Transfer agent | | | 16,225 | | | | 15,630 | | | | 16,512 | | | | 13,253 | |
Registration | | | 7,191 | | | | 5,279 | | | | 5,179 | | | | 4,273 | |
Custodian | | | 6,254 | | | | 5,729 | | | | 4,181 | | | | 5,095 | |
Liquidity fees | | | — | | | | 12,174 | | | | — | | | | 339,278 | |
Remarketing fees on Preferred Shares | | | — | | | | 11,952 | | | | — | | | | 21,205 | |
Miscellaneous | | | 39,026 | | | | 36,702 | | | | 37,904 | | | | 38,839 | |
| | | | | | | | | | | | | | | | |
Total expenses excluding interest expense, fees and amortization of offering costs | | | 3,380,283 | | | | 2,462,784 | | | | 1,987,977 | | | | 1,341,278 | |
Interest expense, fees and amortization of offering costs(a) | | | 1,461,593 | | | | 1,290,736 | | | | 1,401,752 | | | | 202,478 | |
| | | | | | | | | | | | | | | | |
Total expenses | | | 4,841,876 | | | | 3,753,520 | | | | 3,389,729 | | | | 1,543,756 | |
Less: | | | | | | | | | | | | | | | | |
Fees waived and/or reimbursed by the Manager | | | (197,031 | ) | | | (133,865 | ) | | | (393 | ) | | | (410 | ) |
| | | | | | | | | | | | | | | | |
Total expenses after fees waived and/or reimbursed | | | 4,644,845 | | | | 3,619,655 | | | | 3,389,336 | | | | 1,543,346 | |
| | | | | | | | | | | | | | | | |
Net investment income | | | 12,029,155 | | | | 9,894,458 | | | | 9,315,081 | | | | 4,019,855 | |
| | | | | | | | | | | | | | | | |
| | | | |
REALIZED AND UNREALIZED GAIN (LOSS) | | | | | | | | | | | | | | | | |
Net realized gain (loss) from: | | | | | | | | | | | | | | | | |
Investments — unaffiliated | | | (607,303 | ) | | | (28,794 | ) | | | 211,805 | | | | 252,518 | |
Investments — affiliated | | | (8,007 | ) | | | (768 | ) | | | 200 | | | | 59 | |
Futures contracts | | | 1,060,539 | | | | 491,104 | | | | — | | | | 223,393 | |
| | | | | | | | | | | | | | | | |
| | | 445,229 | | | 461,542 | | | 212,005 | | | 475,970 | |
| | | | | | | | | | | | | | | | |
Net change in unrealized appreciation (depreciation) on: | | | | | | | | | | | | | | | | |
Investments — unaffiliated | | | (46,248,696 | ) | | | (34,660,106 | ) | | | (29,921,272 | ) | | | (15,274,535 | ) |
Investments — affiliated | | | (14,846 | ) | | | (509 | ) | | | (1,220 | ) | | | (453 | ) |
Futures contracts | | | — | | | | 1,295,484 | | | | — | | | | 688,673 | |
| | | | | | | | | | | | | | | | |
| | | (46,263,542) | | | (33,365,131) | | | (29,922,492) | | | (14,586,315) | |
| | | | | | | | | | | | | | | | |
Net realized and unrealized loss | | | (45,818,313 | ) | | | (32,903,589 | ) | | | (29,710,487 | ) | | | (14,110,345 | ) |
| | | | | | | | | | | | | | | | |
| | | | |
NET DECREASE IN NET ASSETS APPLICABLE TO COMMON SHAREHOLDERS RESULTING FROM OPERATIONS | | $ | (33,789,158 | ) | | $ | (23,009,131 | ) | | $ | (20,395,406 | ) | | $ | (10,090,490 | ) |
| | | | | | | | | | | | | | | | |
| (a) | Related to TOB Trusts, VMTP Shares and/or VRDP Shares. |
See notes to financial statements.
| | |
| 36 | | 2 0 2 2 B L A C K R O C K S E M I - A N N U A L R E P O R T T O S H A R E H O L D E R S |
Statements of Changes in Net Assets
| | | | | | | | | | | | | | | | |
| | | MUC | | | MUJ | |
| | | Six Months Ended
01/31/22
(unaudited) | | | Year Ended
07/31/21 | | | Six Months Ended
01/31/22
(unaudited) | | | Year Ended
07/31/21 | |
| | | | |
INCREASE (DECREASE) IN NET ASSETS APPLICABLE TO COMMON SHAREHOLDERS | | | | | | | | | | | | | | | | |
| | | | |
OPERATIONS | | | | | | | | | | | | | | | | |
Net investment income | | $ | 12,029,155 | | | $ | 26,826,689 | | | $ | 9,894,458 | | | $ | 22,057,671 | |
Net realized gain | | | 445,229 | | | | 1,503,270 | | | | 461,542 | | | | 1,383,050 | |
Net change in unrealized appreciation (depreciation) | | | (46,263,542 | ) | | | 7,313,166 | | | | (33,365,131 | ) | | | 12,798,349 | |
| | | | | | | | | | | | | | | | |
Net increase (decrease) in net assets applicable to Common Shareholders resulting from operations | | | (33,789,158 | ) | | | 35,643,125 | | | | (23,009,131 | ) | | | 36,239,070 | |
| | | | | | | | | | | | | | | | |
| | | | |
DISTRIBUTIONS TO COMMON SHAREHOLDERS(a) | | | | | | | | | | | | | | | | |
Decrease in net assets resulting from distributions to Common Shareholders | | | (13,539,783 | ) | | | (26,734,123 | ) | | | (11,373,560 | ) | | | (22,445,028 | ) |
| | | | | | | | | | | | | | | | |
| | | | |
CAPITAL SHARE TRANSACTIONS | | | | | | | | | | | | | | | | |
Reinvestment of common distributions | | | 472,286 | | | | 146,828 | | | | 153,766 | | | | — | |
| | | | | | | | | | | | | | | | |
| | | | |
NET ASSETS APPLICABLE TO COMMON SHAREHOLDERS | | | | | | | | | | | | | | | | |
Total increase (decrease) in net assets applicable to Common Shareholders | | | (46,856,655 | ) | | | 9,055,830 | | | | (34,228,925 | ) | | | 13,794,042 | |
Beginning of period | | | 662,891,713 | | | | 653,835,883 | | | | 490,103,218 | | | | 476,309,176 | |
| | | | | | | | | | | | | | | | |
End of period | | $ | 616,035,058 | | | $ | 662,891,713 | | | $ | 455,874,293 | | | $ | 490,103,218 | |
| | | | | | | | | | | | | | | | |
| (a) | Distributions for annual periods determined in accordance with U.S. federal income tax regulations. |
See notes to financial statements.
| | |
| F I N A N C I A L S T A T E M E N T S | | 37 |
Statements of Changes in Net Assets (continued)
| | | | | | | | | | | | | | | | |
| | | MIY | | | MPA | |
| | | Six Months Ended 01/31/22
(unaudited) | | | Year Ended 07/31/21 | | | Six Months Ended
01/31/22 (unaudited) | | | Year Ended
07/31/21 | |
| | | | |
INCREASE (DECREASE) IN NET ASSETS APPLICABLE TO COMMON SHAREHOLDERS | | | | | | | | | | | | | | | | |
| | | | |
OPERATIONS | | | | | | | | | | | | | | | | |
Net investment income | | $ | 9,315,081 | | | $ | 20,189,799 | | | $ | 4,019,855 | | | $ | 9,126,228 | |
Net realized gain | | | 212,005 | | | | 325,842 | | | | 475,970 | | | | 777,507 | |
Net change in unrealized appreciation (depreciation) | | | (29,922,492 | ) | | | 3,731,074 | | | | (14,586,315 | ) | | | 6,126,035 | |
| | | | | | | | | | | | | | | | |
Net increase (decrease) in net assets applicable to Common Shareholders resulting from operations | | | (20,395,406 | ) | | | 24,246,715 | | | | (10,090,490 | ) | | | 16,029,770 | |
| | | | | | | | | | | | | | | | |
| | | | |
DISTRIBUTIONS TO COMMON SHAREHOLDERS(a) | | | | | | | | | | | | | | | | |
Decrease in net assets resulting from distributions to Common Shareholders | | | (9,915,204 | ) | | | (19,535,312 | ) | | | (4,392,369 | ) | | | (8,782,520 | ) |
| | | | | | | | | | | | | | | | |
| | | | |
CAPITAL SHARE TRANSACTIONS | | | | | | | | | | | | | | | | |
Reinvestment of common distributions | | | — | | | | — | | | | 138,459 | | | | — | |
Redemption of shares resulting from share repurchase program (including transaction costs) | | | — | | | | — | | | | — | | | | (18,678 | ) |
| | | | | | | | | | | | | | | | |
Net increase (decrease) in net assets derived from capital share transactions | | | — | | | | — | | | | 138,459 | | | | (18,678 | ) |
| | | | | | | | | | | | | | | | |
| | | | |
NET ASSETS APPLICABLE TO COMMON SHAREHOLDERS | | | | | | | | | | | | | | | | |
Total increase (decrease) in net assets applicable to Common Shareholders | | | (30,310,610 | ) | | | 4,711,403 | | | | (14,344,400 | ) | | | 7,228,572 | |
Beginning of period | | | 473,463,507 | | | | 468,752,104 | | | | 221,383,928 | | | | 214,155,356 | |
| | | | | | | | | | | | | | | | |
End of period | | $ | 443,152,897 | | | $ | 473,463,507 | | | $ | 207,039,528 | | | $ | 221,383,928 | |
| | | | | | | | | | | | | | | | |
| (a) | Distributions for annual periods determined in accordance with U.S. federal income tax regulations. |
See notes to financial statements.
| | |
| 38 | | 2 0 2 2 B L A C K R O C K S E M I - A N N U A L R E P O R T T O S H A R E H O L D E R S |
Statements of Cash Flows (unaudited)
Six Months Ended January 31, 2022
| | | | | | | | | | | | | | | | |
| | | MUC | | | MUJ | | | MIY | | | MPA | |
| |
CASH PROVIDED BY (USED FOR) OPERATING ACTIVITIES | |
Net decrease in net assets resulting from operations | | $ | (33,789,158 | ) | | $ | (23,009,131) | | | $ | (20,395,406) | | | $ | (10,090,490) | |
Adjustments to reconcile net increase in net assets resulting from operations to net cash provided by operating activities | | | | | | | | | | | | | | | | |
Proceeds from sales of long-term investments | | | 100,265,091 | | | | 35,369,411 | | | | 54,987,033 | | | | 30,615,889 | |
Purchases of long-term investments | | | (86,875,052 | ) | | | (51,840,440 | ) | | | (57,254,829 | ) | | | (22,911,155 | ) |
Net proceeds from sales (purchases) of short-term securities | | | 2,260,431 | | | | 15,397,763 | | | | 347,455 | | | | (7,427,941 | ) |
Amortization of premium and accretion of discount on investments and other fees | | | 3,454,813 | | | | 707,686 | | | | 2,556,678 | | | | 752,370 | |
Net realized (gain) loss on investments | | | 615,310 | | | | 29,562 | | | | (212,005 | ) | | | (252,577 | ) |
Net unrealized depreciation on investments | | | 46,263,542 | | | | 34,660,615 | | | | 29,922,492 | | | | 15,274,988 | |
(Increase) Decrease in Assets | | | | | | | | | | | | | | | | |
Receivables | | | | | | | | | | | | | | | | |
Dividends — affiliated | | | 18 | | | | 67 | | | | 21 | | | | (7 | ) |
Interest — unaffiliated | | | 1,202,800 | | | | 100,756 | | | | 438 | | | | 105,923 | |
Variation margin on futures contracts | | | — | | | | (5,250 | ) | | | — | | | | (3,062 | ) |
Prepaid expenses | | | (21,741 | ) | | | 23 | | | | 25,318 | | | | (4,266 | ) |
Other assets | | | (286,000 | ) | | | — | | | | — | | | | — | |
| | | | |
Increase (Decrease) in Liabilities | | | | | | | | | | | | | | | | |
Payables | | | | | | | | | | | | | | | | |
Accounting services fees | | | (70,331 | ) | | | (56,078 | ) | | | (54,434 | ) | | | (31,814 | ) |
Custodian fees | | | (3,681 | ) | | | (4,756 | ) | | | (3,306 | ) | | | (1,838 | ) |
Interest expense and fees | | | (3,445 | ) | | | (1,450 | ) | | | 1,435 | | | | 342 | |
Investment advisory fees | | | 1,308 | | | | (5,950 | ) | | | (7,312 | ) | | | (3,360 | ) |
Directors’ and Officer’s fees | | | (92,307 | ) | | | 1,231 | | | | 1,156 | | | | (178 | ) |
Other accrued expenses | | | (7,031 | ) | | | (1,589 | ) | | | (5,899 | ) | | | (5,838 | ) |
Professional fees | | | (25,678 | ) | | | (15,100 | ) | | | (20,952 | ) | | | (16,429 | ) |
Reorganization costs | | | 180,691 | | | | 118,077 | | | | — | | | | — | |
Transfer agent fees | | | (3,722 | ) | | | (2,583 | ) | | | (2,507 | ) | | | (2,476 | ) |
Variation margin on futures contracts | | | — | | | | (89,390 | ) | | | — | | | | (48,067 | ) |
| | | | | | | | | | | | | | | | |
Net cash provided by operating activities | | | 33,065,858 | | | | 11,353,474 | | | | 9,885,376 | | | | 5,950,014 | |
| | | | | | | | | | | | | | | | |
| | | | |
CASH PROVIDED BY (USED FOR) FINANCING ACTIVITIES | | | | | | | | | | | | | | | | |
Cash dividends paid to Common Shareholders | | | (13,065,858 | ) | | | (11,219,184 | ) | | | (9,915,204 | ) | | | (4,253,442 | ) |
Repayments of TOB Trust Certificates | | | (20,000,000 | ) | | | (5,035,462 | ) | | | — | | | | (1,828,403 | ) |
Proceeds from TOB Trust Certificates | | | — | | | | 4,671,366 | | | | — | | | | — | |
Amortization of deferred offering costs | | | — | | | | 10,695 | | | | 29,828 | | | | 9,674 | |
| | | | | | | | | | | | | | | | |
Net cash used for financing activities | | | (33,065,858 | ) | | | (11,572,585 | ) | | | (9,885,376 | ) | | | (6,072,171 | ) |
| | | | | | | | | | | | | | | | |
| | | | |
CASH | | | | | | | | | | | | | | | | |
Net decrease in restricted and unrestricted cash | | | — | | | | (219,111 | ) | | | — | | | | (122,157 | ) |
Restricted and unrestricted cash at beginning of period | | | — | | | | 447,111 | | | | — | | | | 239,157 | |
| | | | | | | | | | | | | | | | |
Restricted and unrestricted cash at end of period | | $ | — | | | $ | 228,000 | | | $ | — | | | $ | 117,000 | |
| | | | | | | | | | | | | | | | |
| | | | |
SUPPLEMENTAL DISCLOSURE OF CASH FLOW INFORMATION | | | | | | | | | | | | | | | | |
Cash paid during the period for interest expense | | $ | 1,465,038 | | | $ | 1,281,491 | | | $ | 1,370,489 | | | $ | 192,462 | |
| | | | | | | | | | | | | | | | |
| | | | |
NON-CASH FINANCING ACTIVITIES | | | | | | | | | | | | | | | | |
Reinvestment of common distributions | | $ | 472,286 | | | $ | 153,766 | | | $ | — | | | $ | 138,459 | |
| | | | | | | | | | | | | | | | |
| | | | |
RECONCILIATION OF RESTRICTED AND UNRESTRICTED CASH AT THE END OF PERIOD TO THE STATEMENTS OF ASSETS AND LIABILITIES | | | | | | | | | | | | | | | | |
Cash pledged | | | | | | | | | | | | | | | | |
Futures contracts | | | — | | | | 228,000 | | | | — | | | | 117,000 | |
| | | | | | | | | | | | | | | | |
| | $ | — | | | $ | 228,000 | | | $ | — | | | $ | 117,000 | |
| | | | | | | | | | | | | | | | |
| See notes to financial statements. | | | | | | | | | | | | | | | | |
| | |
F I N A N C I A L S T A T E M E N T S | | 39 |
Financial Highlights
(For a share outstanding throughout each period)
| | | | | | | | | | | | | | | | | | | | | | | | | | | | | | | | |
| | | | | | | | | MUC | | | | | | |
| | | Six Months Ended | | Year Ended July 31, |
| | | | | 01/31/22 |
| | | | | (unaudited) | | 2021 | | 2020 | | 2019 | | 2018 | | 2017 |
| | | | | | | |
Net asset value, beginning of period | | | | | $ | 16.16 | | | | $ | 15.95 | | | | $ | 15.56 | | | | $ | 15.03 | | | | $ | 15.53 | | | | $ | 16.51 | |
| | | | | | | | | | | | | | | | | | | | | | | | | | | | | | | | |
Net investment income(a) | | | | | | 0.29 | | | | | 0.65 | | | | | 0.58 | | | | | 0.57 | | | | | 0.64 | | | | | 0.69 | |
Net realized and unrealized gain (loss) | | | | | | (1.11 | ) | | | | 0.21 | | | | | 0.35 | | | | | 0.54 | | | | | (0.47 | ) | | | | (0.93 | ) |
| | | | | | | | | | | | | | | | | | | | | | | | | | | | | | | | |
Net increase (decrease) from investment operations | | | | | | (0.82 | ) | | | | 0.86 | | | | | 0.93 | | | | | 1.11 | | | | | 0.17 | | | | | (0.24 | ) |
| | | | | | | | | | | | | | | | | | | | | | | | | | | | | | | | |
| | | | | | | |
Distributions to Common Shareholders(b) | | | | | | | | | | | | | | | | | | | | | | | | | | | | | | | | |
From net investment income | | | | | | (0.33 | ) | | | | (0.65 | ) | | | | (0.54 | ) | | | | (0.57 | ) | | | | (0.67 | ) | | | | (0.74 | ) |
From net realized gain | | | | | | — | | | | | — | | | | | — | | | | | (0.01 | ) | | | | — | | | | | — | |
| | | | | | | | | | | | | | | | | | | | | | | | | | | | | | | | |
Total distributions to Common Shareholders | | | | | | (0.33 | ) | | | | (0.65 | ) | | | | (0.54 | ) | | | | (0.58 | ) | | | | (0.67 | ) | | | | (0.74 | ) |
| | | | | | | | | | | | | | | | | | | | | | | | | | | | | | | | |
| | | | | | | |
Net asset value, end of period | | | | | $ | 15.01 | | | | $ | 16.16 | | | | $ | 15.95 | | | | $ | 15.56 | | | | $ | 15.03 | | | | $ | 15.53 | |
| | | | | | | | | | | | | | | | | | | | | | | | | | | | | | | | |
| | | | | | | |
Market price, end of period | | | | | $ | 14.34 | | | | $ | 16.09 | | | | $ | 14.67 | | | | $ | 14.00 | | | | $ | 13.07 | | | | $ | 14.75 | |
| | | | | | | | | | | | | | | | | | | | | | | | | | | | | | | | |
| | | | | | | |
Total Return Applicable to Common Shareholders(c) | | | | | | | | | | | | | | | | | | | | | | | | | | | | | | | | |
Based on net asset value | | | | | | (5.10 | )%(d) | | | | 5.78 | % | | | | 6.55 | % | | | | 8.17 | % | | | | 1.54 | % | | | | (1.08 | )% |
| | | | | | | | | | | | | | | | | | | | | | | | | | | | | | | | |
Based on market price | | | | | | (8.95 | )%(d) | | | | 14.52 | % | | | | 8.92 | % | | | | 11.92 | % | | | | (7.03 | )% | | | | (4.73 | )% |
| | | | | | | | | | | | | | | | | | | | | | | | | | | | | | | | |
| | | | | | | |
Ratios to Average Net Assets Applicable to Common Shareholders(e) | | | | | | | | | | | | | | | | | | | | | | | | | | | | | | | | |
Total expenses | | | | | | 1.48 | %(f)(g) | | | | 1.46 | % | | | | 2.11 | % | | | | 2.58 | % | | | | 2.38 | % | | | | 2.04 | % |
| | | | | | | | | | | | | | | | | | | | | | | | | | | | | | | | |
Total expenses after fees waived and/or reimbursed | | | | | | 1.42 | %(f)(g) | | | | 1.41 | % | | | | 2.05 | % | | | | 2.50 | % | | | | 2.29 | % | | | | 1.96 | % |
| | | | | | | | | | | | | | | | | | | | | | | | | | | | | | | | |
Total expenses after fees waived and/or reimbursed and excluding interest expense, fees, and amortization of offering costs(h) | | | | | | 0.97 | %(f)(g) | | | | 0.92 | % | | | | 0.92 | % | | | | 0.92 | % | | | | 0.93 | % | | | | 0.93 | % |
| | | | | | | | | | | | | | | | | | | | | | | | | | | | | | | | |
Net investment income to Common Shareholders | | | | | | 3.68 | %(g) | | | | 4.11 | % | | | | 3.75 | % | | | | 3.82 | % | | | | 4.20 | % | | | | 4.44 | % |
| | | | | | | | | | | | | | | | | | | | | | | | | | | | | | | | |
| | | | | | | |
Supplemental Data | | | | | | | | | | | | | | | | | | | | | | | | | | | | | | | | |
Net assets applicable to Common Shareholders, end of period (000) | | | | | $ | 616,035 | | | | $ | 662,892 | | | | $ | 653,836 | | | | $ | 637,822 | | | | $ | 616,387 | | | | $ | 636,865 | |
| | | | | | | | | | | | | | | | | | | | | | | | | | | | | | | | |
VMTP Shares outstanding at $100,000 liquidation value, end of period (000) | | | | | $ | 254,000 | | | | $ | 254,000 | | | | $ | 254,000 | | | | $ | 254,000 | | | | $ | 254,000 | | | | $ | 254,000 | |
| | | | | | | | | | | | | | | | | | | | | | | | | | | | | | | | |
Asset coverage per VMTP Shares at $100,000 liquidation value, end of period | | | | | $ | 342,533 | | | | $ | 360,981 | | | | $ | 357,416 | | | | $ | 351,111 | | | | $ | 342,672 | | | | $ | 350,734 | |
| | | | | | | | | | | | | | | | | | | | | | | | | | | | | | | | |
Borrowings outstanding, end of period (000) | | | | | $ | 132,145 | | | | $ | 152,145 | | | | $ | 158,512 | | | | $ | 159,555 | | | | $ | 185,905 | | | | $ | 181,685 | |
| | | | | | | | | | | | | | | | | | | | | | | | | | | | | | | | |
Portfolio turnover rate | | | | | | 10 | % | | | | 4 | % | | | | 16 | % | | | | 24 | % | | | | 24 | % | | | | 19 | % |
| | | | | | | | | | | | | | | | | | | | | | | | | | | | | | | | |
| (a) | Based on average Common Shares outstanding. |
| (b) | Distributions for annual periods determined in accordance with U.S. federal income tax regulations. |
| (c) | Total returns based on market price, which can be significantly greater or less than the net asset value, may result in substantially different returns. Where applicable, excludes the effects of any sales charges and assumes the reinvestment of distributions at actual reinvestment prices. |
| (d) | Aggregate total return. |
| (e) | Excludes fees and expenses incurred indirectly as a result of investments in underlying funds. |
| (f) | Includes non-recurring expenses of reorganization costs. Without these costs, total expenses, total expenses after fees waived and/or reimbursed and total expenses after fees waived and/or reimbursed and excluding interest expense, fees, and amortization of offering cost would have been 1.39%, 1.36% and 0.91%, respectively. |
| (h) | Interest expense, fees and amortization of offering costs related to TOB Trusts and/or VMTP Shares. See Note 4 and Note 10 of the Notes to Financial Statements for details. |
See notes to financial statements.
| | |
| 40 | | 2 0 2 2 B L A C K R O C K S E M I - A N N U A L R E P O R T T O S H A R E H O L D E R S |
Financial Highlights (continued)
(For a share outstanding throughout each period)
| | | | | | | | | | | | | | | | | | | | | | | | | | |
| | | | | MUJ | |
| Six Months Ended | | | Year Ended July 31, | |
| | | | | 01/31/22 | |
| | | | | (unaudited) | | | 2021 | | | 2020 | | | 2019 | | | 2018 | | | 2017 | |
| | | | | | | | |
Net asset value, beginning of period | | | | $ | 16.29 | | | $ | 15.83 | | | $ | 15.95 | | | $ | 15.28 | | | $ | 15.57 | | | $ | 16.55 | |
| | | | | | | | | | | | | | | | | | | | | | | | | | |
Net investment income(a) | | | | | 0.33 | | | | 0.73 | | | | 0.69 | | | | 0.66 | | | | 0.71 | | | | 0.77 | |
Net realized and unrealized gain (loss) | | | | | (1.09 | ) | | | 0.48 | | | | (0.16 | ) | | | 0.64 | | | | (0.26 | ) | | | (0.94 | ) |
| | | | | | | | | | | | | | | | | | | | | | | | | | |
Net increase (decrease) from investment operations | | | | | (0.76 | ) | | | 1.21 | | | | 0.53 | | | | 1.30 | | | | 0.45 | | | | (0.17 | ) |
| | | | | | | | | | | | | | | | | | | | | | | | | | |
Distributions to Common Shareholders from net investment income(b) | | | | | (0.38 | ) | | | (0.75 | ) | | | (0.65 | ) | | | (0.63 | ) | | | (0.74 | ) | | | (0.81 | ) |
| | | | | | | | | | | | | | | | | | | | | | | | | | |
| | | | | | | |
Net asset value, end of period | | | | $ | 15.15 | | | $ | 16.29 | | | $ | 15.83 | | | $ | 15.95 | | | $ | 15.28 | | | $ | 15.57 | |
| | | | | | | | | | | | | | | | | | | | | | | | | | |
| | | | | | | |
Market price, end of period | | | | $ | 14.42 | | | $ | 15.63 | | | $ | 14.21 | | | $ | 14.43 | | | $ | 12.90 | | | $ | 14.88 | |
| | | | | | | | | | | | | | | | | | | | | | | | | | |
| | | | | | | |
Total Return Applicable to Common Shareholders(c) | | | | | | | | | | | | | | | | | | | | | | | | | | |
Based on net asset value | | | | | (4.70 | )%(d) | | | 8.22 | % | | | 3.98 | % | | | 9.44 | % | | | 3.52 | % | | | (0.57 | )% |
| | | | | | | | | | | | | | | | | | | | | | | | | | |
Based on market price | | | | | (5.46 | )%(d) | | | 15.67 | % | | | 3.17 | % | | | 17.28 | % | | | (8.55 | )% | | | (2.44 | )% |
| | | | | | | | | | | | | | | | | | | | | | | | | | |
| | | | | | | |
Ratios to Average Net Assets Applicable to Common Shareholders(e) | | | | | | | | | | | | | | | | | | | | | | | | | | |
Total expenses | | | | | 1.56 | %(f)(g) | | | 1.44 | % | | | 2.14 | % | | | 2.49 | % | | | 2.23 | % | | | 1.89 | % |
| | | | | | | | | | | | | | | | | | | | | | | | | | |
Total expenses after fees waived and/or reimbursed | | | | | 1.50 | %(f)(g) | | | 1.44 | % | | | 2.14 | % | | | 2.49 | % | | | 2.23 | % | | | 1.89 | % |
| | | | | | | | | | | | | | | | | | | | | | | | | | |
Total expenses after fees waived and/or reimbursed and excluding interest expense, fees, and amortization of offering costs(h)(i) | | | | | 0.97 | %(f)(g) | | | 0.89 | % | | | 0.92 | % | | | 0.92 | % | | | 0.93 | % | | | 0.91 | % |
| | | | | | | | | | | | | | | | | | | | | | | | | | |
Net investment income to Common Shareholders | | | | | 4.10 | %(g) | | | 4.59 | % | | | 4.39 | % | | | 4.28 | % | | | 4.60 | % | | | 4.95 | % |
| | | | | | | | | | | | | | | | | | | | | | | | | | |
| | | | | | | |
Supplemental Data | | | | | | | | | | | | | | | | | | | | | | | | | | |
Net assets, end of period (000) | | | | $ | 455,874 | | | $ | 490,103 | | | $ | 476,309 | | | $ | 481,024 | | | $ | 460,727 | | | $ | 469,417 | |
| | | | | | | | | | | | | | | | | | | | | | | | | | |
VRDP Shares outstanding at $100,000 liquidation value, end of period (000) | | | | $ | 237,100 | | | $ | 237,100 | | | $ | 237,100 | | | $ | 237,100 | | | $ | 237,100 | | | $ | 237,100 | |
| | | | | | | | | | | | | | | | | | | | | | | | | | |
Asset coverage per VRDP Shares at $100,000 liquidation value, end of period | | | | $ | 292,271 | | | $ | 306,707 | | | $ | 300,890 | | | $ | 302,878 | | | $ | 294,318 | | | $ | 297,983 | |
| | | | | | | | | | | | | | | | | | | | | | | | | | |
Borrowings outstanding, end of period (000) | | | | $ | 61,170 | | | $ | 61,534 | | | $ | 71,300 | | | $ | 59,415 | | | $ | 62,747 | | | $ | 63,877 | |
| | | | | | | | | | | | | | | | | | | | | | | | | | |
Portfolio turnover rate | | | | | 5 | % | | | 10 | % | | | 13 | % | | | 8 | % | | | 14 | % | | | 8 | % |
| | | | | | | | | | | | | | | | | | | | | | | | | | |
| (a) | Based on average Common Shares outstanding. |
| (b) | Distributions for annual periods determined in accordance with U.S. federal income tax regulations. |
| (c) | Total returns based on market price, which can be significantly greater or less than the net asset value, may result in substantially different returns. Where applicable, excludes the effects of any sales charges and assumes the reinvestment of distributions at actual reinvestment prices. |
| (d) | Aggregate total return. |
| (e) | Excludes fees and expenses incurred indirectly as a result of investments in underlying funds. |
| (f) | Includes non-recurring expenses of reorganization costs. Without these costs, total expenses, total expenses after fees waived and/or reimbursed and total expenses after fees waived and/or reimbursed and excluding interest expense, fees, and amortization of offering cost would have been 1.43%, 1.43% and 0.90%, respectively. |
| (h) | Interest expense, fees and amortization of offering costs related to TOB Trusts and/or VRDP Shares. See Note 4 and Note 10 of the Notes to Financial Statements for details. |
| (i) | The total expense ratio after fees waived and/or reimbursed and excluding interest expense, fees, amortization of offering costs, liquidity and remarketing fees as follows: |
| | | | | | | | | | | | | | | | | | | | | | | | | | |
| | | | | | |
| | | Six Months Ended | | | Year Ended July 31, | |
| | | | | 01/31/22 | |
| | | | | (unaudited) | | | 2021 | | | 2020 | | | 2019 | | | 2018 | | | 2017 | |
Expense ratios | | | | | 0.96 | % | | | 0.88 | % | | | 0.91 | % | | | 0.91 | % | | | 0.93 | % | | | 0.91 | % |
| | | | | | | | | | | | | | | | | | | | | | | | | | |
See notes to financial statements.
| | |
F I N A N C I A L S T A T E M E N T S | | 41 |
Financial Highlights (continued)
(For a share outstanding throughout each period)
| | | | | | | | | | | | | | | | | | | | | | | | | | |
| | | | | MIY | |
| | | Six Months Ended | | | Year Ended July 31, | |
| | | | | 01/31/22 | |
| | | | | (unaudited) | | | 2021 | | | 2020 | | | 2019 | | | 2018 | | | 2017 | |
| | | | | | | | |
Net asset value, beginning of period | | | | $ | 16.04 | | | $ | 15.88 | | | $ | 15.70 | | | $ | 15.04 | | | $ | 15.48 | | | $ | 16.36 | |
| | | | | | | | | | | | | | | | | | | | | | | | | | |
Net investment income(a) | | | | | 0.32 | | | | 0.68 | | | | 0.63 | | | | 0.62 | | | | 0.69 | | | | 0.75 | |
Net realized and unrealized gain (loss) | | | | | (1.00 | ) | | | 0.14 | | | | 0.14 | | | | 0.66 | | | | (0.42 | ) | | | (0.86 | ) |
| | | | | | | | | | | | | | | | | | | | | | | | | | |
Net increase (decrease) from investment operations | | | | | (0.68 | ) | | | 0.82 | | | | 0.77 | | | | 1.28 | | | | 0.27 | | | | (0.11 | ) |
| | | | | | | | | | | | | | | | | | | | | | | | | | |
Distributions to Common Shareholders from net investment income(b) | | | | | (0.34 | ) | | | (0.66 | ) | | | (0.59 | ) | | | (0.62 | ) | | | (0.71 | ) | | | (0.77 | ) |
| | | | | | | | | | | | | | | | | | | | | | | | | | |
| | | | | | | |
Net asset value, end of period | | | | $ | 15.02 | | | $ | 16.04 | | | $ | 15.88 | | | $ | 15.70 | | | $ | 15.04 | | | $ | 15.48 | |
| | | | | | | | | | | | | | | | | | | | | | | | | | |
| | | | | | | |
Market price, end of period | | | | | $14.33 | | | $ | 15.80 | | | $ | 14.24 | | | $ | 14.24 | | | $ | 12.89 | | | $ | 14.19 | |
| | | | | | | | | | | | | | | | | | | | | | | | | | |
| | | | | | | |
Total Return Applicable to Common Shareholders(c) | | | | | | | | | | | | | | | | | | | | | | | | | | |
Based on net asset value | | | | | (4.27 | )%(d) | | | 5.61 | % | | | 5.52 | % | | | 9.42 | % | | | 2.37 | % | | | (0.07 | )% |
| | | | | | | | | | | | | | | | | | | | | | | | | | |
Based on market price | | | | | (7.28 | )%(d) | | | 16.02 | % | | | 4.31 | % | | | 15.80 | % | | | (4.29 | )% | | | (2.56 | )% |
| | | | | | | | | | | | | | | | | | | | | | | | | | |
| | | | | | | |
Ratios to Average Net Assets Applicable to Common Shareholders(e) | | | | | | | | | | | | | | | | | | | | | | | | | | |
Total expenses | | | | | 1.45 | %(f) | | | 1.44 | % | | | 2.07 | % | | | 2.46 | % | | | 2.16 | % | | | 1.88 | % |
| | | | | | | | | | | | | | | | | | | | | | | | | | |
Total expenses after fees waived and/or reimbursed | | | | | 1.45 | %(f) | | | 1.44 | % | | | 2.07 | % | | | 2.46 | % | | | 2.16 | % | | | 1.88 | % |
| | | | | | | | | | | | | | | | | | | | | | | | | | |
Total expenses after fees waived and/or reimbursed and excluding interest expense, fees, and amortization of offering costs(g)(h) | | | | | 0.85 | %(f) | | | 0.85 | % | | | 1.20 | % | | | 1.09 | % | | | 0.89 | % | | | 0.89 | % |
| | | | | | | | | | | | | | | | | | | | | | | | | | |
Net investment income to Common Shareholders | | | | | 3.99 | %(f) | | | 4.32 | % | | | 4.06 | % | | | 4.11 | % | | | 4.49 | % | | | 4.81 | % |
| | | | | | | | | | | | | | | | | | | | | | | | | | |
| | | | | | | |
Supplemental Data | | | | | | | | | | | | | | | | | | | | | | | | | | |
Net assets applicable to Common Shareholders, end of period (000) | | | | $ | 443,153 | | | $ | 473,464 | | | $ | 468,752 | | | $ | 464,366 | | | $ | 444,947 | | | $ | 457,888 | |
| | | | | | | | | | | | | | | | | | | | | | | | | | |
VRDP Shares outstanding at $100,000 liquidation value, end of period (000) | | | | $ | 231,900 | | | $ | 231,900 | | | $ | 231,900 | | | $ | 231,900 | | | $ | 231,900 | | | $ | 231,900 | |
| | | | | | | | | | | | | | | | | | | | | | | | | | |
Asset coverage per VRDP Shares at $100,000 liquidation value, end of period | | | | $ | 291,097 | | | $ | 304,167 | | | $ | 302,135 | | | $ | 300,244 | | | $ | 291,870 | | | $ | 297,450 | |
| | | | | | | | | | | | | | | | | | | | | | | | | | |
Borrowings outstanding, end of period (000) | | | | $ | 41,267 | | | $ | 41,267 | | | $ | 41,362 | | | $ | 64,527 | | | $ | 60,002 | | | $ | 52,002 | |
| | | | | | | | | | | | | | | | | | | | | | | | | | |
Portfolio turnover rate | | | | | 8 | % | | | 7 | % | | | 9 | % | | | 15 | % | | | 8 | % | | | 13 | % |
| | | | | | | | | | | | | | | | | | | | | | | | | | |
| (a) | Based on average Common Shares outstanding. |
| (b) | Distributions for annual periods determined in accordance with U.S. federal income tax regulations. |
| (c) | Total returns based on market price, which can be significantly greater or less than the net asset value, may result in substantially different returns. Where applicable, excludes the effects of any sales charges and assumes the reinvestment of distributions at actual reinvestment prices. |
| (d) | Aggregate total return. |
| (e) | Excludes fees and expenses incurred indirectly as a result of investments in underlying funds. |
| (g) | Interest expense, fees and amortization of offering costs related to TOB Trusts and/or VRDP Shares. See Note 4 and Note 10 of the Notes to Financial Statements for details. |
| (h) | The total expense ratio after fees waived and/or reimbursed and excluding interest expense, fees, amortization of offering costs, liquidity and remarketing fees as follows: |
| | | | | | | | | | | | | | | | | | | | | | | | | | |
| | | Six Months Ended | | | | |
| | | | | 01/31/22 | | | Year Ended July 31, | |
| | | | | (unaudited) | | | 2021 | | | 2020 | | | 2019 | | | 2018 | | | 2017 | |
Expense ratios | | | | | 0.85 | % | | | 0.85 | % | | | 0.88 | % | | | 0.90 | % | | | 0.89 | % | | | 0.89 | % |
| | | | | | | | | | | | | | | | | | | | | | | | | | |
See notes to financial statements.
| | |
| 42 | | 2 0 2 2 B L A C K R O C K S E M I - A N N U A L R E P O R T T O S H A R E H O L D E R S |
Financial Highlights (continued)
(For a share outstanding throughout each period)
| | | | | | | | | | | | | | | | | | | | | | | | | | |
| | | | | MPA | |
| | | Six Months Ended | | | Year Ended July 31, | |
| | | | | 01/31/22 | |
| | | | | (unaudited) | | | 2021 | | | 2020 | | | 2019 | | | 2018 | | | 2017 | |
| | | | | | | | |
Net asset value, beginning of period | | | | $ | 16.64 | | | $ | 16.09 | | | $ | 16.06 | | | $ | 15.27 | | | $ | 15.74 | | | $ | 16.76 | |
| | | | | | | | | | | | | | | | | | | | | | | | | | |
Net investment income(a) | | | | | 0.30 | | | | 0.69 | | | | 0.65 | | | | 0.63 | | | | 0.71 | | | | 0.76 | |
Net realized and unrealized gain (loss) | | | | | (1.06 | ) | | | 0.52 | | | | (0.05 | ) | | | 0.80 | | | | (0.47 | ) | | | (1.03 | ) |
| | | | | | | | | | | | | | | | | | | | | | | | | | |
Net increase (decrease) from investment operations | | | | | (0.76 | ) | | | 1.21 | | | | 0.60 | | | | 1.43 | | | | 0.24 | | | | (0.27 | ) |
| | | | | | | | | | | | | | | | | | | | | | | | | | |
Distributions to Common Shareholders from net investment income(b) | | | | | (0.33 | ) | | | (0.66 | ) | | | (0.57 | ) | | | (0.64 | ) | | | (0.71 | ) | | | (0.75 | ) |
| | | | | | | | | | | | | | | | | | | | | | | | | | |
| | | | | | | |
Net asset value, end of period | | | | $ | 15.55 | | | $ | 16.64 | | | $ | 16.09 | | | $ | 16.06 | | | $ | 15.27 | | | $ | 15.74 | |
| | | | | | | | | | | | | | | | | | | | | | | | | | |
| | | | | | | |
Market price, end of period | | | | $ | 14.77 | | | $ | 16.23 | | | $ | 14.09 | | | $ | 14.18 | | | $ | 13.26 | | | $ | 14.69 | |
| | | | | | | | | | | | | | | | | | | | | | | | | | |
| | | | | | | |
Total Return Applicable to Common Shareholders(c) | | | | | | | | | | | | | | | | | | | | | | | | | | |
Based on net asset value | | | | | (4.59 | )%(d) | | | 8.09 | % | | | 4.33 | % | | | 10.32 | % | | | 2.09 | % | | | (1.20 | )% |
| | | | | | | | | | | | | | | | | | | | | | | | | | |
Based on market price | | | | | (7.09 | )%(d) | | | 20.40 | % | | | 3.47 | % | | | 12.18 | % | | | (5.01 | )% | | | (3.83 | )% |
| | | | | | | | | | | | | | | | | | | | | | | | | | |
| | | | | | | |
Ratios to Average Net Assets Applicable to Common Shareholders(e) | | | | | | | | | | | | | | | | | | | | | | | | | | |
Total expenses | | | | | 1.42 | %(f) | | | 1.48 | % | | | 2.13 | % | | | 2.55 | % | | | 2.26 | % | | | 1.91 | % |
| | | | | | | | | | | | | | | | | | | | | | | | | | |
Total expenses after fees waived and/or reimbursed | | | | | 1.41 | %(f) | | | 1.48 | % | | | 2.12 | % | | | 2.55 | % | | | 2.26 | % | | | 1.91 | % |
| | | | | | | | | | | | | | | | | | | | | | | | | | |
Total expenses after fees waived and/or reimbursed and excluding interest expense, fees, and amortization of offering costs(g)(h) | | | | | 1.23 | %(f) | | | 1.25 | % | | | 1.23 | % | | | 0.99 | % | | | 0.95 | % | | | 0.94 | % |
| | | | | | | | | | | | | | | | | | | | | | | | | | |
Net investment income to Common Shareholders | | | | | 3.68 | %(f) | | | 4.24 | % | | | 4.08 | % | | | 4.11 | % | | | 4.56 | % | | | 4.83 | % |
| | | | | | | | | | | | | | | | | | | | | | | | | | |
| | | | | | | |
Supplemental Data | | | | | | | | | | | | | | | | | | | | | | | | | | |
Net assets applicable to Common Shareholders, end of period (000) | | | | $ | 207,040 | | | $ | 221,384 | | | $ | 214,155 | | | $ | 214,359 | | | $ | 203,956 | | | $ | 210,170 | |
| | | | | | | | | | | | | | | | | | | | | | | | | | |
VRDP Shares outstanding at $100,000 liquidation value, end of period (000) | | | | $ | 82,600 | | | $ | 82,600 | | | $ | 82,600 | | | $ | 82,600 | | | $ | 82,600 | | | $ | 82,600 | |
| | | | | | | | | | | | | | | | | | | | | | | | | | |
Asset coverage per VRDP Shares at $100,000 liquidation value, end of period | | | | $ | 350,653 | | | $ | 368,019 | | | $ | 359,268 | | | $ | 359,514 | | | $ | 346,921 | | | $ | 354,444 | |
| | | | | | | | | | | | | | | | | | | | | | | | | | |
Borrowings outstanding, end of period (000) | | | | $ | 42,183 | | | $ | 44,012 | | | $ | 54,482 | | | $ | 52,814 | | | $ | 58,176 | | | $ | 55,826 | |
| | | | | | | | | | | | | | | | | | | | | | | | | | |
Portfolio turnover rate | | | | | 8 | % | | | 13 | % | | | 12 | % | | | 21 | % | | | 21 | % | | | 15 | % |
| | | | | | | | | | | | | | | | | | | | | | | | | | |
| (a) | Based on average Common Shares outstanding. |
| (b) | Distributions for annual periods determined in accordance with U.S. federal income tax regulations. |
| (c) | Total returns based on market price, which can be significantly greater or less than the net asset value, may result in substantially different returns. Where applicable, excludes the effects of any sales charges and assumes the reinvestment of distributions at actual reinvestment prices. |
| (d) | Aggregate total return. |
| (e) | Excludes fees and expenses incurred indirectly as a result of investments in underlying funds. |
| (g) | Interest expense, fees and amortization of offering costs related to TOB Trusts and/or VRDP Shares. See Note 4 and Note 10 of the Notes to Financial Statements for details. |
| (h) | The total expense ratio after fees waived and/or reimbursed and excluding interest expense, fees, amortization of offering costs, liquidity and remarketing fees as follows: |
| | | | | | | | | | | | | | | | | | | | | | | | | | |
| | | Six Months Ended | | | Year Ended July 31, | |
| | | | | 01/31/22 | |
| | | | | (unaudited) | | | 2021 | | | 2020 | | | 2019 | | | 2018 | | | 2017 | |
Expense ratios | | | | | 0.90 | % | | | 0.92 | % | | | 0.93 | % | | | 0.96 | % | | | 0.95 | % | | | 0.94 | % |
| | | | | | | | | | | | | | | | | | | | | | | | | | |
See notes to financial statements.
| | |
F I N A N C I A L H I G H L I G H T S | | 43 |
Notes to Financial Statements (unaudited)
The following are registered under the Investment Company Act of 1940, as amended (the “1940 Act”), as closed-end management investment companies and are referred to herein collectively as the “Funds”, or individually as a “Fund”:
| | | | | | |
| Fund Name | | Herein Referred To As | | Organized | | Diversification Classification |
BlackRock MuniHoldings California Quality Fund, Inc | | MUC | | Maryland | | Diversified |
BlackRock MuniHoldings New Jersey Quality Fund, Inc | | MUJ | | Maryland | | Non-diversified |
BlackRock MuniYield Michigan Quality Fund, Inc. | | MIY | | Maryland | | Non-diversified |
BlackRock MuniYield Pennsylvania Quality Fund. | | MPA | | Massachusetts | | Non-diversified |
The Boards of Directors and Boards of Trustees of the Funds are collectively referred to throughout this report as the “Board,” and the directors/trustees thereof are collectively referred to throughout this report as “Directors”. The Funds determine and make available for publication the net asset values (“NAVs”) of their Common Shares on a daily basis.
On September 24, 2021, the Boards of Directors of BlackRock MuniYield California Fund (MYC), BlackRock MuniYield California Quality Fund (MCA) and MUC each approved the reorganization of MYC and MCA into MUC. The reorganization was approved by each Fund’s shareholders and is expected to occur during the second quarter of 2022, subject to the satisfaction of customary closing conditions.
On September 24, 2021, the Boards of Directors of BlackRock MuniYield New Jersey Fund (MYJ) and MUJ each approved the reorganization of MYJ into MUJ. The reorganization was approved by each Fund’s shareholders and is expected to occur during the second quarter of 2022, subject to the satisfaction of customary closing conditions.
The Funds, together with certain other registered investment companies advised by BlackRock Advisors, LLC (the “Manager”) or its affiliates, are included in a complex of open-end non-index fixed-income funds and all BlackRock-advised closed-end funds referred to as the BlackRock Fixed-Income Complex.
| 2. | SIGNIFICANT ACCOUNTING POLICIES |
The financial statements are prepared in conformity with accounting principles generally accepted in the United States of America (“U.S. GAAP”), which may require management to make estimates and assumptions that affect the reported amounts of assets and liabilities in the financial statements, disclosure of contingent assets and liabilities at the date of the financial statements and the reported amounts of increases and decreases in net assets from operations during the reporting period. Actual results could differ from those estimates. Each Fund is considered an investment company under U.S. GAAP and follows the accounting and reporting guidance applicable to investment companies. Below is a summary of significant accounting policies:
Investment Transactions and Income Recognition: For financial reporting purposes, investment transactions are recorded on the dates the transactions are executed. Realized gains and losses on investment transactions are determined using the specific identification method. Dividend income and capital gain distributions, if any, are recorded on the ex-dividend dates. Non-cash dividends, if any, are recorded on the ex-dividend dates at fair value. Interest income, including amortization and accretion of premiums and discounts on debt securities, is recognized daily on an accrual basis.
Segregation and Collateralization: In cases where a Fund enters into certain investments (e.g., futures contracts) or certain borrowings (e.g.,TOB Trust transactions) that would be treated as “senior securities” for 1940 Act purposes, a Fund may segregate or designate on its books and records cash or liquid assets having a market value at least equal to the amount of its future obligations under such investments or borrowings. Doing so allows the investments or borrowings to be excluded from treatment as a “senior security.” Furthermore, if required by an exchange or counterparty agreement, the Funds may be required to deliver/deposit cash and/or securities to/with an exchange, or broker-dealer or custodian as collateral for certain investments or obligations.
Distributions: Distributions from net investment income are declared and paid monthly. Distributions of capital gains are recorded on the ex-dividend dates and made at least annually. The character and timing of distributions are determined in accordance with U.S. federal income tax regulations, which may differ from U.S. GAAP.
Distributions to Preferred Shareholders are accrued and determined as described in Note 10.
Deferred Compensation Plan: Under the Deferred Compensation Plan (the “Plan”) approved by each Fund’s Board, the directors who are not “interested persons” of the Funds, as defined in the 1940 Act (“Independent Directors”), may defer a portion of their annual complex-wide compensation. Deferred amounts earn an approximate return as though equivalent dollar amounts had been invested in common shares of certain funds in the BlackRock Fixed-Income Complex selected by the Independent Directors. This has the same economic effect for the Independent Directors as if the Independent Directors had invested the deferred amounts directly in certain funds in the BlackRock Fixed-Income Complex.
The Plan is not funded and obligations thereunder represent general unsecured claims against the general assets of each Fund, as applicable. Deferred compensation liabilities, if any, are included in the Directors’ and Officer’s fees payable in the Statements of Assets and Liabilities and will remain as a liability of the Funds until such amounts are distributed in accordance with the Plan.
| | |
| 44 | | 2 0 2 2 B L A C K R O C K S E M I - A N N U A L R E P O R T T O S H A R E H O L D E R S |
Notes to Financial Statements (unaudited) (continued)
Indemnifications: In the normal course of business, a Fund enters into contracts that contain a variety of representations that provide general indemnification. A Fund’s maximum exposure under these arrangements is unknown because it involves future potential claims against a Fund, which cannot be predicted with any certainty.
Other: Expenses directly related to a Fund are charged to that Fund. Other operating expenses shared by several funds, including other funds managed by the Manager, are prorated among those funds on the basis of relative net assets or other appropriate methods.
| 3. | INVESTMENT VALUATION AND FAIR VALUE MEASUREMENTS |
Investment Valuation Policies: Each Fund’s investments are valued at fair value (also referred to as “market value” within the financial statements) each day that the Fund is open for business and, for financial reporting purposes, as of the report date. U.S. GAAP defines fair value as the price a fund would receive to sell an asset or pay to transfer a liability in an orderly transaction between market participants at the measurement date. Each Fund determines the fair values of its financial instruments using various independent dealers or pricing services under policies approved by the Board. If a security’s market price is not readily available or does not otherwise accurately represent the fair value of the security, the security will be valued in accordance with a policy approved by the Board as reflecting fair value. The BlackRock Global Valuation Methodologies Committee (the “Global Valuation Committee”) is the committee formed by management to develop global pricing policies and procedures and to oversee the pricing function for all financial instruments.
Fair Value Inputs and Methodologies: The following methods and inputs are used to establish the fair value of each Fund’s assets and liabilities:
| | • | | Fixed-income investments for which market quotations are readily available are generally valued using the last available bid price or current market quotations provided by independent dealers or third-party pricing services. Pricing services generally value fixed-income securities assuming orderly transactions of an institutional round lot size, but a fund may hold or transact in such securities in smaller, odd lot sizes. Odd lots may trade at lower prices than institutional round lots. The pricing services may use matrix pricing or valuation models that utilize certain inputs and assumptions to derive values, including transaction data (e.g., recent representative bids and offers), market data, credit quality information, perceived market movements, news, and other relevant information. Certain fixed-income securities, including asset-backed and mortgage related securities may be valued based on valuation models that consider the estimated cash flows of each tranche of the entity, establish a benchmark yield and develop an estimated tranche specific spread to the benchmark yield based on the unique attributes of the tranche. The amortized cost method of valuation may be used with respect to debt obligations with sixty days or less remaining to maturity unless the Manager determines such method does not represent fair value. |
| | • | | Investments in open-end U.S. mutual funds (including money market funds) are valued at that day’s published NAV. |
| | • | | Futures contracts are valued based on that day’s last reported settlement or trade price on the exchange where the contract is traded. |
If events (e.g., market volatility, company announcement or a natural disaster) occur that are expected to materially affect the value of such investment, or in the event that application of these methods of valuation results in a price for an investment that is deemed not to be representative of the market value of such investment, or if a price is not available, the investment will be valued by the Global Valuation Committee, or its delegate, in accordance with a policy approved by the Board as reflecting fair value (“Fair Valued Investments”). The fair valuation approaches that may be used by the Global Valuation Committee include market approach, income approach and cost approach. Valuation techniques such as discounted cash flow, use of market comparables and matrix pricing are types of valuation approaches and are typically used in determining fair value. When determining the price for Fair Valued Investments, the Global Valuation Committee, or its delegate, seeks to determine the price that each Fund might reasonably expect to receive or pay from the current sale or purchase of that asset or liability in an arm’s-length transaction. Fair value determinations shall be based upon all available factors that the Global Valuation Committee, or its delegate, deems relevant and consistent with the principles of fair value measurement. The pricing of all Fair Valued Investments is subsequently reported to the Board or a committee thereof on a quarterly basis.
Fair Value Hierarchy: Various inputs are used in determining the fair value of financial instruments. These inputs to valuation techniques are categorized into a fair value hierarchy consisting of three broad levels for financial reporting purposes as follows:
| | • | | Level 1 – Unadjusted price quotations in active markets/exchanges for identical assets or liabilities that each Fund has the ability to access; |
| | • | | Level 2 – Other observable inputs (including, but not limited to, quoted prices for similar assets or liabilities in markets that are active, quoted prices for identical or similar assets or liabilities in markets that are not active, inputs other than quoted prices that are observable for the assets or liabilities (such as interest rates, yield curves, volatilities, prepayment speeds, loss severities, credit risks and default rates) or other market–corroborated inputs); and |
| | • | | Level 3 – Unobservable inputs based on the best information available in the circumstances, to the extent observable inputs are not available (including the Global Valuation Committee’s assumptions used in determining the fair value of financial instruments). |
The hierarchy gives the highest priority to unadjusted quoted prices in active markets for identical assets or liabilities (Level 1 measurements) and the lowest priority to unobservable inputs (Level 3 measurements). Accordingly, the degree of judgment exercised in determining fair value is greatest for instruments categorized in Level 3. The inputs used to measure fair value may fall into different levels of the fair value hierarchy. In such cases, for disclosure purposes, the fair value hierarchy classification is determined based on the lowest level input that is significant to the fair value measurement in its entirety. Investments classified within Level 3 have significant unobservable inputs used by the Global Valuation Committee in determining the price for Fair Valued Investments. Level 3 investments include equity or debt issued by privately held companies or funds that may not have a secondary market and/or may have a limited number of investors. The categorization of a value determined for financial instruments is based on the pricing transparency of the financial instruments and is not necessarily an indication of the risks associated with investing in those securities.
| | |
N O T E S T O F I N A N C I A L S T A T E M E N T S | | 45 |
Notes to Financial Statements (unaudited) (continued)
| 4. | SECURITIES AND OTHER INVESTMENTS |
Zero-Coupon Bonds: Zero-coupon bonds are normally issued at a significant discount from face value and do not provide for periodic interest payments. These bonds may experience greater volatility in market value than other debt obligations of similar maturity which provide for regular interest payments.
Forward Commitments, When-Issued and Delayed Delivery Securities: The Funds may purchase securities on a when-issued basis and may purchase or sell securities on a forward commitment basis. Settlement of such transactions normally occurs within a month or more after the purchase or sale commitment is made. The Funds may purchase securities under such conditions with the intention of actually acquiring them but may enter into a separate agreement to sell the securities before the settlement date. Since the value of securities purchased may fluctuate prior to settlement, the Funds may be required to pay more at settlement than the security is worth. In addition, a fund is not entitled to any of the interest earned prior to settlement. When purchasing a security on a delayed delivery basis, the Funds assume the rights and risks of ownership of the security, including the risk of price and yield fluctuations. In the event of default by the counterparty, the Funds’ maximum amount of loss is the unrealized appreciation of unsettled when-issued transactions.
Municipal Bonds Transferred to TOB Trusts: The Funds leverage their assets through the use of “TOB Trust” transactions. The funds transfer municipal bonds into a special purpose trust (a “TOB Trust”). A TOB Trust issues two classes of beneficial interests: short-term floating rate interests (“TOB Trust Certificates”), which are sold to third-party investors, and residual inverse floating rate interests (“TOB Residuals”), which are issued to the participating funds that contributed the municipal bonds to the TOB Trust. The TOB Trust Certificates have interest rates that reset weekly and their holders have the option to tender such certificates to the TOB Trust for redemption at par and any accrued interest at each reset date. The TOB Residuals held by a fund provide the fund with the right to cause the holders of a proportional share of the TOB Trust Certificates to tender their certificates to the TOB Trust at par plus accrued interest. The funds may withdraw a corresponding share of the municipal bonds from the TOB Trust. Other funds managed by the investment adviser may also contribute municipal bonds to a TOB Trust into which a fund has contributed bonds. If multiple BlackRock-advised funds participate in the same TOB Trust, the economic rights and obligations under the TOB Residuals will be shared among the funds ratably in proportion to their participation in the TOB Trust.
TOB Trusts are supported by a liquidity facility provided by a third-party bank or other financial institution (the “Liquidity Provider”) that allows the holders of the TOB Trust Certificates to tender their certificates in exchange for payment of par plus accrued interest on any business day. The tendered TOB Trust Certificates are remarketed by a Remarketing Agent. In the event of a failed remarketing, the TOB Trust may draw upon a loan from the Liquidity Provider to purchase the tendered TOB Trust Certificates. Any loans made by the Liquidity Provider will be secured by the purchased TOB Trust Certificates held by the TOB Trust and will be subject to an increased interest rate based on number of days the loan is outstanding.
The TOB Trust may be collapsed without the consent of a fund, upon the occurrence of a termination event as defined in the TOB Trust agreement. Upon the occurrence of a termination event, a TOB Trust would be liquidated with the proceeds applied first to any accrued fees owed to the trustee of the TOB Trust, the Remarketing Agent and the Liquidity Provider. Upon certain termination events, TOB Trust Certificates holders will be paid before the TOB Residuals holders (i.e., the Funds) whereas in other termination events, TOB Trust Certificates holders and TOB Residuals holders will be paid pro rata.
While a fund’s investment policies and restrictions expressly permit investments in inverse floating rate securities, such as TOB Residuals, they restrict the ability of a fund to borrow money for purposes of making investments. MIY’s and MPA’s management believes that a fund’s restrictions on borrowings do not apply to the Funds’ TOB Trust transactions. Each Fund’s transfer of the municipal bonds to a TOB Trust is considered a secured borrowing for financial reporting purposes. The cash received by the TOB Trust from the sale of the TOB Trust Certificates, less certain transaction expenses, is paid to a Fund. A Fund typically invests the cash received in additional municipal bonds.
Accounting for TOB Trusts: The municipal bonds deposited into a TOB Trust are presented in a Fund’s Schedule of Investments and the TOB Trust Certificates are shown in Other Liabilities in the Statements of Assets and Liabilities. Any loans drawn by the TOB Trust pursuant to the liquidity facility to purchase tendered TOB Trust Certificates are shown as Loan for TOB Trust Certificates. The carrying amount of a Fund’s payable to the holder of the TOB Trust Certificates, as reported in the Statements of Assets and Liabilities as TOB Trust Certificates, approximates its fair value.
Interest income, including amortization and accretion of premiums and discounts, from the underlying municipal bonds is recorded by a Fund on an accrual basis. Interest expense incurred on the TOB Trust transaction and other expenses related to remarketing, administration, trustee, liquidity and other services to a TOB Trust are shown as interest expense, fees and amortization of offering costs in the Statements of Operations. Fees paid upon creation of the TOB Trust are recorded as debt issuance costs and are amortized to interest expense, fees and amortization of offering costs in the Statements of Operations to the expected maturity of the TOB Trust. In connection with the restructurings of the TOB Trusts to non-bank sponsored TOB Trusts, a Fund incurred non-recurring, legal and restructuring fees, which are recorded as interest expense, fees and amortization of offering costs in the Statements of Operations. Amounts recorded within interest expense, fees and amortization of offering costs in the Statements of Operations are:
| | | | | | | | | | | | | | | | |
| Fund Name | | Interest Expense | | | Liquidity Fees | | | Other Expenses | | | Total | |
MUC | | $ | 54,279 | | | $ | 299,403 | | | $ | 89,893 | | | $ | 443,575 | |
MUJ | | | 30,850 | | | | 114,746 | | | | 64,637 | | | | 210,233 | |
MIY | | | 27,211 | | | | 87,636 | | | | 23,554 | | | | 138,401 | |
MPA | | | 19,574 | | | | 90,673 | | | | 28,675 | | | | 138,922 | |
| | |
| 46 | | 2 0 2 2 B L A C K R O C K S E M I - A N N U A L R E P O R T T O S H A R E H O L D E R S |
Notes to Financial Statements (unaudited) (continued)
For the six months ended January 31, 2022, the following table is a summary of each Fund’s TOB Trusts:
| | | | | | | | | | | | | | | | | | | | |
Fund Name | |
| Underlying
Municipal Bonds Transferred to TOB Trusts |
(a) | | | Liability for TOB Trust Certificates | (b) | |
| Range of
Interest Rates on TOB Trust Certificates at Period End |
| | | Average TOB Trust Certificates Outstanding | | |
| Daily Weighted
Average Rate of Interest and Other Expenses on TOB Trusts |
|
MUC | | $ | 271,734,879 | | | $ | 132,144,550 | | | | 0.06% — 0.16% | | | $ | 132,307,593 | | | | 0.66 | % |
MUJ | | | 108,417,793 | | | | 61,170,038 | | | | 0.06 — 0.14 | | | | 61,886,770 | | | | 0.67 | |
MIY | | | 77,206,948 | | | | 41,267,055 | | | | 0.09 — 0.22 | | | | 41,267,055 | | | | 0.66 | |
MPA | | | 75,673,779 | | | | 42,183,181 | | | | 0.09 — 0.20 | | | | 42,789,336 | | | | 0.65 | |
| | (a) | The municipal bonds transferred to a TOB Trust are generally high grade municipal bonds. In certain cases, when municipal bonds transferred are lower grade municipal bonds, the TOB Trust transaction may include a credit enhancement feature that provides for the timely payment of principal and interest on the bonds to the TOB Trust by a credit enhancement provider in the event of default of the municipal bond. The TOB Trust would be responsible for the payment of the credit enhancement fee and the Funds, as TOB Residuals holders, would be responsible for reimbursement of any payments of principal and interest made by the credit enhancement provider. The maximum potential amounts owed by the Funds, for such reimbursements, as applicable, are included in the maximum potential amounts disclosed for recourse TOB Trusts in the Schedules of Investments. | |
| | (b) | TOB Trusts may be structured on a non-recourse or recourse basis. When a Fund invests in TOB Trusts on a non-recourse basis, the Liquidity Provider may be required to make a payment under the liquidity facility to allow the TOB Trust to repurchase TOB Trust Certificates. The Liquidity Provider will be reimbursed from the liquidation of bonds held in the TOB Trust. If a Fund invests in a TOB Trust on a recourse basis, a Fund enters into a reimbursement agreement with the Liquidity Provider where a Fund is required to reimburse the Liquidity Provider for any shortfall between the amount paid by the Liquidity Provider and proceeds received from liquidation of municipal bonds held in the TOB Trust (the “Liquidation Shortfall”). As a result, if a Fund invests in a recourse TOB Trust, a Fund will bear the risk of loss with respect to any Liquidation Shortfall. If multiple funds participate in any such TOB Trust, these losses will be shared ratably, including the maximum potential amounts owed by a Fund at January 31, 2022, in proportion to their participation in the TOB Trust. The recourse TOB Trusts are identified in the Schedules of Investments including the maximum potential amounts owed by a fund at January 31, 2022. | |
| 5. | DERIVATIVE FINANCIAL INSTRUMENTS |
The Funds engage in various portfolio investment strategies using derivative contracts both to increase the returns of the Funds and/or to manage their exposure to certain risks such as credit risk, equity risk, interest rate risk, foreign currency exchange rate risk, commodity price risk or other risks (e.g., inflation risk). Derivative financial instruments categorized by risk exposure are included in the Schedules of Investments. These contracts may be transacted on an exchange or over-the-counter (“OTC”).
Futures Contracts: Futures contracts are purchased or sold to gain exposure to, or manage exposure to, changes in interest rates (interest rate risk) and changes in the value of equity securities (equity risk) or foreign currencies (foreign currency exchange rate risk).
Futures contracts are exchange-traded agreements between the Funds and a counterparty to buy or sell a specific quantity of an underlying instrument at a specified price and on a specified date. Depending on the terms of a contract, it is settled either through physical delivery of the underlying instrument on the settlement date or by payment of a cash amount on the settlement date. Upon entering into a futures contract, the Funds are required to deposit initial margin with the broker in the form of cash or securities in an amount that varies depending on a contract’s size and risk profile. The initial margin deposit must then be maintained at an established level over the life of the contract. Amounts pledged, which are considered restricted, are included in cash pledged for futures contracts in the Statements of Assets and Liabilities.
Securities deposited as initial margin are designated in the Schedules of Investments and cash deposited, if any, are shown as cash pledged for futures contracts in the Statements of Assets and Liabilities. Pursuant to the contract, the Funds agree to receive from or pay to the broker an amount of cash equal to the daily fluctuation in market value of the contract (“variation margin”). Variation margin is recorded as unrealized appreciation (depreciation) and, if any, shown as variation margin receivable (or payable) on futures contracts in the Statements of Assets and Liabilities. When the contract is closed, a realized gain or loss is recorded in the Statements of Operations equal to the difference between the notional amount of the contract at the time it was opened and the notional amount at the time it was closed. The use of futures contracts involves the risk of an imperfect correlation in the movements in the price of futures contracts and interest rates, foreign currency exchange rates or underlying assets.
| 6. | INVESTMENT ADVISORY AGREEMENT AND OTHER TRANSACTIONS WITH AFFILIATES |
Investment Advisory: Each Fund entered into an Investment Advisory Agreement with the Manager, the Funds’ investment adviser and an indirect, wholly-owned subsidiary of BlackRock, Inc. (“BlackRock”), to provide investment advisory and administrative services. The Manager is responsible for the management of each Fund’s portfolio and provides the personnel, facilities, equipment and certain other services necessary to the operations of each Fund.
For such services, each Fund pays the Manager a monthly fee at an annual rate equal to the following percentages of the average daily value of each Fund’s net assets:
| | | | | | | | | | | | | | | | |
| | | MUC | | | MUJ | | | MIY | | | MPA | |
Investment advisory fees | | | 0.55 | % | | | 0.50 | % | | | 0.49 | % | | | 0.49 | % |
| | |
N O T E S T O F I N A N C I A L S T A T E M E N T S | | 47 |
Notes to Financial Statements (unaudited) (continued)
For purposes of calculating these fees, “net assets” mean the total assets of the Fund minus the sum of its accrued liabilities (which does not include liabilities represented by TOB Trusts and the liquidation preference of any outstanding preferred shares). It is understood that the liquidation preference of any outstanding preferred stock (other than accumulated dividends) and TOB Trusts is not considered a liability in determining a Fund’s NAV.
Expense Waivers and Reimbursements: With respect to each Fund, the Manager contractually agreed to waive its investment advisory fees by the amount of investment advisory fees each Fund pays to the Manager indirectly through its investment in affiliated money market funds (the “affiliated money market fund waiver”) through June 30, 2023. The contractual agreement may be terminated upon 90 days’ notice by a majority of the Independent Directors, or by a vote of a majority of the outstanding voting securities of a Fund. These amounts are included in fees waived and/or reimbursed by the Manager in the Statements of Operations. For the six months ended January 31, 2022, the amounts waived were as follows:
| | | | |
| Fund Name | | Fees Waived and/or Reimbursed by the Manager | |
MUC | | $ | 42 | |
MUJ | | | 810 | |
MIY | | | 393 | |
MPA | | | 410 | |
The Manager contractually agreed to waive its investment advisory fee with respect to any portion of each Fund’s assets invested in affiliated equity and fixed-income mutual funds and affiliated exchange-traded funds that have a contractual management fee through June 30, 2023. The agreement can be renewed for annual periods thereafter, and may be terminated on 90 days’ notice, each subject to approval by a majority of the Funds’ Independent Directors. For the six months ended January 31, 2022, there were no fees waived by the Manager pursuant to this arrangement.
The Manager, for MUC, voluntarily agreed to waive its investment advisory fee on the proceeds of the Preferred Shares and TOB Trusts that exceed 35% of total assets minus the sum of its accrued liabilities (which does not include liabilities represented by TOB Trusts and the liquidation preference of any outstanding preferred shares). The voluntary waiver may be reduced or discontinued at any time without notice. This amount is included in fees waived and/or reimbursed by the Manager in the Statements of Operations. For the six months ended January 31, 2022 the waiver was $106,068.
The Manager reimbursed MUC and MUJ $90,921 and $133,055 respectively, for reorganization costs.
Directors and Officers: Certain directors and/or officers of the Fund are directors and/or officers of BlackRock or its affiliates. The Funds reimburse the Manager for a portion of the compensation paid to the Funds’ Chief Compliance Officer, which is included in Directors and Officer in the Statements of Operations.
For the six months ended January 31, 2022, purchases and sales of investments, excluding short-term investments, were as follows:
| | | | | | | | |
| Fund Name | | Purchases | | | Sales | |
MUC | | $ | 96,047,786 | | | $ | 106,335,091 | |
MUJ | | | 47,560,440 | | | | 35,369,411 | |
MIY | | | 59,464,058 | | | | 57,201,572 | |
MPA | | | 25,899,446 | | | | 30,615,889 | |
It is each Fund’s policy to comply with the requirements of the Internal Revenue Code of 1986, as amended, applicable to regulated investment companies, and to distribute substantially all of its taxable income to its shareholders. Therefore, no U.S. federal income tax provision is required.
Each Fund files U.S. federal and various state and local tax returns. No income tax returns are currently under examination. The statute of limitations on each Fund’s U.S. federal tax returns generally remains open for a period of three fiscal years after they are filed. The statutes of limitations on each Fund’s state and local tax returns may remain open for an additional year depending upon the jurisdiction.
Management has analyzed tax laws and regulations and their application to the Funds as of January 31, 2022, inclusive of the open tax return years, and does not believe that there are any uncertain tax positions that require recognition of a tax liability in the Funds’ financial statements.
As of July 31, 2021, the Funds had non-expiring capital loss carryforwards available to offset future realized capital gains as follows:
| | | | |
| Fund Name | | Non-Expiring | |
MUC | | $ | 19,765,284 | |
MUJ | | | 8,621,838 | |
MIY | | | 8,035,624 | |
MPA | | | 5,479,103 | |
| | |
| 48 | | 2 0 2 2 B L A C K R O C K S E M I - A N N U A L R E P O R T T O S H A R E H O L D E R S |
Notes to Financial Statements (unaudited) (continued)
As of January 31, 2022, gross unrealized appreciation and depreciation based on cost of investments (including short positions and derivatives, if any) for U.S. federal income tax purposes were as follows:
| | | | | | | | | | | | | | | | |
| Fund Name | | Tax Cost | | | Gross Unrealized Appreciation | | | Gross Unrealized Depreciation | | | Net Unrealized Appreciation (Depreciation) | |
MUC | | $ | 811,833,267 | | | $ | 60,167,836 | | | $ | (7,557,202 | ) | | $ | 52,610,634 | |
MUJ | | | 650,946,780 | | | | 45,218,532 | | | | (5,716,575 | ) | | | 39,501,957 | |
MIY | | | 637,612,900 | | | | 34,633,869 | | | | (2,966,062 | ) | | | 31,667,807 | |
MPA | | | 276,233,925 | | | | 19,625,905 | | | | (2,590,051 | ) | | | 17,035,854 | |
In the normal course of business, the Funds invest in securities or other instruments and may enter into certain transactions, and such activities subject each Fund to various risks, including among others, fluctuations in the market (market risk) or failure of an issuer to meet all of its obligations. The value of securities or other instruments may also be affected by various factors, including, without limitation: (i) the general economy; (ii) the overall market as well as local, regional or global political and/or social instability; (iii) regulation, taxation or international tax treaties between various countries; or (iv) currency, interest rate and price fluctuations. Local, regional or global events such as war, acts of terrorism, the spread of infectious illness or other public health issues, recessions, or other events could have a significant impact on the Funds and their investments.
A Fund structures and “sponsors” the TOB Trusts in which it holds TOB Residuals and has certain duties and responsibilities, which may give rise to certain additional risks including, but not limited to, compliance, securities law and operational risks.
Should short-term interest rates rise, the Funds’ investments in the TOB Trusts may adversely affect the Funds’ net investment income and dividends to Common Shareholders. Also, fluctuations in the market value of municipal bonds deposited into the TOB Trust may adversely affect the Funds’ NAVs per share.
The U.S. Securities and Exchange Commission (“SEC”) and various federal banking and housing agencies have adopted credit risk retention rules for securitizations (the “Risk Retention Rules”). The Risk Retention Rules would require the sponsor of a TOB Trust to retain at least 5% of the credit risk of the underlying assets supporting the TOB Trust’s municipal bonds. The Risk Retention Rules may adversely affect the Funds’ ability to engage in TOB Trust transactions or increase the costs of such transactions in certain circumstances.
TOB Trusts constitute an important component of the municipal bond market. Any modifications or changes to rules governing TOB Trusts may adversely impact the municipal market and the Funds, including through reduced demand for and liquidity of municipal bonds and increased financing costs for municipal issuers. The ultimate impact of any potential modifications on the TOB Trust market and the overall municipal market is not yet certain.
Each Fund may invest without limitation in illiquid or less liquid investments or investments in which no secondary market is readily available or which are otherwise illiquid, including private placement securities. A Fund may not be able to readily dispose of such investments at prices that approximate those at which a Fund could sell such investments if they were more widely traded and, as a result of such illiquidity, a Fund may have to sell other investments or engage in borrowing transactions if necessary to raise funds to meet its obligations. Limited liquidity can also affect the market price of investments, thereby adversely affecting a Fund’s NAV and ability to make dividend distributions. Privately issued debt securities are often of below investment grade quality, frequently are unrated and present many of the same risks as investing in below investment grade public debt securities.
Market Risk: Each Fund may be exposed to prepayment risk, which is the risk that borrowers may exercise their option to prepay principal earlier than scheduled during periods of declining interest rates, which would force each Fund to reinvest in lower yielding securities. Each Fund may also be exposed to reinvestment risk, which is the risk that income from each Fund’s portfolio will decline if each Fund invests the proceeds from matured, traded or called fixed-income securities at market interest rates that are below each Fund portfolio’s current earnings rate.
Municipal securities are subject to the risk that litigation, legislation or other political events, local business or economic conditions, credit rating downgrades, or the bankruptcy of the issuer could have a significant effect on an issuer’s ability to make payments of principal and/or interest or otherwise affect the value of such securities. Municipal securities can be significantly affected by political or economic changes, including changes made in the law after issuance of the securities, as well as uncertainties in the municipal market related to, taxation, legislative changes or the rights of municipal security holders, including in connection with an issuer insolvency. Municipal securities backed by current or anticipated revenues from a specific project or specific assets can be negatively affected by the discontinuance of the tax benefits supporting the project or assets or the inability to collect revenues for the project or from the assets. Municipal securities may be less liquid than taxable bonds, and there may be less publicly available information on the financial condition of municipal security issuers than for issuers of other securities.
An outbreak of respiratory disease caused by a novel coronavirus has developed into a global pandemic and has resulted in closing borders, quarantines, disruptions to supply chains and customer activity, as well as general concern and uncertainty. The impact of this pandemic, and other global health crises that may arise in the future, could affect the economies of many nations, individual companies and the market in general in ways that cannot necessarily be foreseen at the present time. This pandemic may result in substantial market volatility and may adversely impact the prices and liquidity of a fund’s investments. The duration of this pandemic and its effects cannot be determined with certainty.
Counterparty Credit Risk: The Funds may be exposed to counterparty credit risk, or the risk that an entity may fail to or be unable to perform on its commitments related to unsettled or open transactions, including making timely interest and/or principal payments or otherwise honoring its obligations. The Funds manage counterparty credit risk by entering into transactions only with counterparties that the Manager believes have the financial resources to honor their obligations and by monitoring the financial stability of those counterparties. Financial assets, which potentially expose the Funds to market, issuer and counterparty credit risks, consist principally of financial instruments and
| | |
N O T E S T O F I N A N C I A L S T A T E M E N T S | | 49 |
Notes to Financial Statements (unaudited) (continued)
receivables due from counterparties. The extent of the Funds’ exposure to market, issuer and counterparty credit risks with respect to these financial assets is approximately their value recorded in the Statements of Assets and Liabilities, less any collateral held by the Funds.
A derivative contract may suffer a mark-to-market loss if the value of the contract decreases due to an unfavorable change in the market rates or values of the underlying instrument. Losses can also occur if the counterparty does not perform under the contract.
With exchange-traded futures, there is less counterparty credit risk to the Funds since the exchange or clearinghouse, as counterparty to such instruments, guarantees against a possible default. The clearinghouse stands between the buyer and the seller of the contract; therefore, credit risk is limited to failure of the clearinghouse. While offset rights may exist under applicable law, a Fund does not have a contractual right of offset against a clearing broker or clearinghouse in the event of a default (including the bankruptcy or insolvency). Additionally, credit risk exists in exchange-traded futures with respect to initial and variation margin that is held in a clearing broker’s customer accounts. While clearing brokers are required to segregate customer margin from their own assets, in the event that a clearing broker becomes insolvent or goes into bankruptcy and at that time there is a shortfall in the aggregate amount of margin held by the clearing broker for all its clients, typically the shortfall would be allocated on a pro rata basis across all the clearing broker’s customers, potentially resulting in losses to the Funds.
Concentration Risk: A diversified portfolio, where this is appropriate and consistent with a fund’s objectives, minimizes the risk that a price change of a particular investment will have a material impact on the NAV of a fund. The investment concentrations within each Fund’s portfolio are disclosed in its Schedule of Investments.
Certain Funds invest a substantial amount of their assets in issuers located in a single state or limited number of states. When a Fund concentrates its investments in this manner, it assumes the risk that economic, regulatory, political or social conditions affecting that state or group of states could have a significant impact on the fund and could affect the income from, or the value or liquidity of, the fund’s portfolio. Investment percentages in specific states or U.S. territories are presented in the Schedules of Investments.
Certain Funds invest a significant portion of their assets in securities within a single or limited number of market sectors. When a Fund concentrates its investments in this manner, it assumes the risk that economic, regulatory, political and social conditions affecting such sectors may have a significant impact on the Fund and could affect the income from, or the value or liquidity of, the Fund’s portfolio. Investment percentages in specific sectors are presented in the Schedules of Investments.
Certain Funds invest a significant portion of their assets in fixed-income securities and/or use derivatives tied to the fixed-income markets. Changes in market interest rates or economic conditions may affect the value and/or liquidity of such investments. Interest rate risk is the risk that prices of bonds and other fixed-income securities will increase as interest rates fall and decrease as interest rates rise. The Funds may be subject to a greater risk of rising interest rates due to the current period of historically low rates.
LIBOR Transition Risk: The United Kingdom’s Financial Conduct Authority announced a phase out of the London Interbank Offered Rate (“LIBOR”). Although many LIBOR rates ceased to be published or no longer are representative of the underlying market they seek to measure after December 31, 2021, a selection of widely used USD LIBOR rates will continue to be published through June 2023 in order to assist with the transition. The Funds may be exposed to financial instruments tied to LIBOR to determine payment obligations, financing terms, hedging strategies or investment value. The transition process away from LIBOR might lead to increased volatility and illiquidity in markets for, and reduce the effectiveness of new hedges placed against instruments whose terms currently include LIBOR. The ultimate effect of the LIBOR transition process on the Funds is uncertain.
| 10. | CAPITAL SHARE TRANSACTIONS |
MPA is authorized to issue an unlimited number of Common Shares, all of which were initially classified as Common Shares. MUC, MUJ and MIY each is authorized to issue 200 million shares, all of which were initially classified as Common Shares. The par value for each Fund’s Common Shares is $0.10. The par value for each Fund’s Preferred Shares outstanding is $0.10, except for MPA, which is $0.05. The Board is authorized, however, to reclassify any unissued Common Shares to Preferred Shares without the approval of Common Shareholders. MPA is authorized to issue 1 million Preferred Shares.
Common Shares
For the periods shown, shares issued and outstanding increased by the following amounts as a result of dividend reinvestment:
| | | | | | | | |
| Fund Name | | Six Months Ended
01/31/22 | | | Year Ended
07/31/21 | |
MUC | | | 29,799 | | | | 9,153 | |
MUJ | | | 9,684 | | | | — | |
MPA | | | 8,523 | | | | — | |
For the six months ended January 31, 2022 and the year ended July 31, 2021, shares issued and outstanding remained constant for MIY.
The Funds participate in an open market share repurchase program (the “Repurchase Program”). From December 1, 2020 through November 30, 2021, each Fund may repurchase up to 5% of its outstanding common shares under the Repurchase Program, based on common shares outstanding as of the close of business on November 30, 2020, subject to certain conditions. From December 1, 2021 through November 30, 2022, each Fund may repurchase up to 5% of its outstanding common shares under the Repurchase Program, based on common shares outstanding as of the close of business on November 30, 2021, subject to certain conditions. There is no assurance that the Funds will purchase shares in any particular amounts.
| | |
| 50 | | 2 0 2 2 B L A C K R O C K S E M I - A N N U A L R E P O R T T O S H A R E H O L D E R S |
Notes to Financial Statements (unaudited) (continued)
The total cost of the shares repurchased is reflected in MPA’s Statements of Changes in Net Assets. For the periods shown, shares repurchased and cost, including transaction costs were as follows:
| | | | | | | | |
| | | MPA | |
| | | Shares | | | Amounts | |
Six Months Ended January 31, 2022 | | | — | | | $ | — | |
Year Ended July 31, 2021 | | | 1,307 | | | | 18,678 | |
Preferred Shares
A Fund’s Preferred Shares rank prior to its Common Shares as to the payment of dividends by the Fund and distribution of assets upon dissolution or liquidation of the Fund. The 1940 Act prohibits the declaration of any dividend on Common Shares or the repurchase of Common Shares if the Fund fails to maintain asset coverage of at least 200% of the liquidation preference of the Fund’s outstanding Preferred Shares. In addition, pursuant to the Preferred Shares’ governing instruments, a Fund is restricted from declaring and paying dividends on classes of shares ranking junior to or on parity with its Preferred Shares or repurchasing such shares if the Fund fails to declare and pay dividends on the Preferred Shares, redeem any Preferred Shares required to be redeemed under the Preferred Shares’ governing instruments or comply with the basic maintenance amount requirement of the ratings agencies rating the Preferred Shares.
Holders of Preferred Shares have voting rights equal to the voting rights of holders of Common Shares (one vote per share) and vote together with holders of Common Shares (one vote per share) as a single class on certain matters. Holders of Preferred Shares, voting as a separate class, are also entitled to (i) elect two members of the Board, (ii) elect the full Board if dividends on the Preferred Shares are not paid for a period of two years and (iii) a separate class vote to amend the Preferred Share governing documents. In addition, the 1940 Act requires the approval of the holders of a majority of any outstanding Preferred Shares, voting as a separate class, to (a) adopt any plan of reorganization that would adversely affect the Preferred Shares, (b) change a Fund’s sub-classification as a closed-end investment company or change its fundamental investment restrictions or (c) change its business so as to cease to be an investment company.
VRDP Shares
MUJ, MIY and MPA (for purposes of this section, each a “VRDP Fund”) have issued Series W-7 VRDP Shares, $100,000 liquidation preference per share, in one or more privately negotiated offerings to qualified institutional buyers as defined pursuant to Rule 144A under the Securities Act of 1933, as amended (the “Securities Act”). The VRDP Shares include a liquidity feature and may be subject to a special rate period. As of period end, the VRDP Shares outstanding were as follows:
| | | | | | | | | | | | | | | | |
Fund Name | | Issue Date | | | Shares Issued | | | Aggregate Principal | | | Maturity
Date | |
MUJ | | | 06/30/11 | | | | 1,727 | | | $ | 172,700,000 | | | | 07/01/41 | |
| | | 04/13/15 | | | | 644 | | | | 64,400,000 | | | | 07/01/41 | |
MIY | | | 04/21/11 | | | | 1,446 | | | | 144,600,000 | | | | 05/01/41 | |
| | | 09/14/15 | | | | 873 | | | | 87,300,000 | | | | 05/01/41 | |
MPA | | | 05/19/11 | | | | 663 | | | | 66,300,000 | | | | 06/01/41 | |
| | | | 04/13/15 | | | | 163 | | | | 16,300,000 | | | | 06/01/41 | |
Redemption Terms: A VRDP Fund is required to redeem its VRDP Shares on the maturity date, unless earlier redeemed or repurchased. Six months prior to the maturity date, a VRDP Fund is required to begin to segregate liquid assets with the Fund’s custodian to fund the redemption. In addition, a VRDP Fund is required to redeem certain of its outstanding VRDP Shares if it fails to comply with certain asset coverage, basic maintenance amount or leverage requirements.
Subject to certain conditions, the VRDP Shares may also be redeemed, in whole or in part, at any time at the option of a VRDP Fund. The redemption price per VRDP Share is equal to the liquidation preference per share plus any outstanding unpaid dividends.
Liquidity Feature: VRDP Shares are subject to a fee agreement between the VRDP Fund and the liquidity provider that requires a per annum liquidity fee and, in some cases, an upfront or initial commitment fee, payable to the liquidity provider. These fees, if applicable, are shown as liquidity fees in the Statements of Operations. As of period end, the fee agreement is set to expire, unless renewed or terminated in advance, as follows:
| | | | | | |
| | | MUJ | | MIY | | MPA |
Expiration date | | 04/30/23 | | 07/09/22 | | 07/02/22 |
The VRDP Shares are also subject to a purchase agreement in connection with the liquidity feature. In the event a purchase agreement is not renewed or is terminated in advance, and the VRDP Shares do not become subject to a purchase agreement with an alternate liquidity provider, the VRDP Shares will be subject to mandatory purchase by the liquidity provider prior to the termination of the purchase agreement. In the event of such mandatory purchase, a VRDP Fund is required to redeem the VRDP Shares six months after the purchase date. Immediately after such mandatory purchase, the VRDP Fund is required to begin to segregate liquid assets with its custodian to fund the redemption. There is no assurance that a VRDP Fund will replace such redeemed VRDP Shares with any other preferred shares or other form of leverage.
Remarketing: A VRDP Fund may incur remarketing fees on the aggregate principal amount of all its VRDP Shares, which, if any, are included in remarketing fees on Preferred Shares in the Statements of Operations. During any special rate period (as described below), a VRDP Fund may incur nominal or no remarketing fees.
| | |
N O T E S T O F I N A N C I A L S T A T E M E N T S | | 51 |
Notes to Financial Statements (unaudited) (continued)
Ratings: As of period end, the VRDP Shares were assigned the following ratings:
| | | | | | | | | | | | | | | | |
Fund Name | |
| Moody’s Investors
Service, Inc. Long-Term Ratings |
| | | Fitch Ratings, Inc. Long-Term Ratings | | |
| Fitch Ratings, Inc.
Short-Term Ratings |
| | | S&P Global Short-Term Ratings | |
MUJ | | | Aa2 | | | | AA | | | | N/A | | | | N/A | |
MIY | | | Aa2 | | | | AA | | | | N/A | | | | N/A | |
MPA | | | Aa2 | | | | AA | | | | F1+ | | | | A-1+ | |
Any short-term ratings on VRDP Shares are directly related to the short-term ratings of the liquidity provider for such VRDP Shares. Changes in the credit quality of the liquidity provider could cause a change in the short-term credit ratings of the VRDP Shares as rated by Moody’s Investors Service, Inc., Fitch Ratings, Inc. and S&P Global Ratings. The liquidity provider may be terminated prior to the scheduled termination date if the liquidity provider fails to maintain short-term debt ratings in one of the two highest rating categories.
Special Rate Period: A VRDP Fund has commenced a “special rate period” with respect to its VRDP Shares, during which the VRDP Shares will not be subject to any remarketing and the dividend rate will be based on a predetermined methodology. During a special rate period, short-term ratings on VRDP Shares are withdrawn. As of period end, the following VRDP Funds have commenced/are set to commence a special rate period:
| | | | |
Fund Name | | Commencement Date | | Expiration Date as of Period Ended 01/31/22 |
MUJ | | 04/17/14 | | 04/15/23 |
MIY | | 06/25/20 | | 06/25/22 |
Prior to the expiration date, the VRDP Fund and the VRDP Shares holder may mutually agree to extend the special rate period. If a special rate period is not extended, the VRDP Shares will revert to remarketable securities upon the termination of the special rate period and will be remarketed and available for purchase by qualified institutional investors.
During the special rate period: (i) the liquidity and fee agreements remain in effect, (ii) VRDP Shares remain subject to mandatory redemption by the VRDP Fund on the maturity date, (iii) VRDP Shares will not be remarketed or subject to optional or mandatory tender events, (iv) the VRDP Fund is required to comply with the same asset coverage, basic maintenance amount and leverage requirements for the VRDP Shares as is required when the VRDP Shares are not in a special rate period, (v) the VRDP Fund will pay dividends monthly based on the sum of an agreed upon reference rate and a percentage per annum based on the long-term ratings assigned to the VRDP Shares and (vi) the VRDP Fund will pay nominal or no fees to the liquidity provider and remarketing agent.
Dividends: Except during the Special Rate Period as described above, dividends on the VRDP Shares are payable monthly at a variable rate set weekly by the remarketing agent. Such dividend rates are generally based upon a spread over a base rate and cannot exceed a maximum rate. A change in the short-term credit rating of the liquidity provider or the VRDP Shares may adversely affect the dividend rate paid on such shares, although the dividend rate paid on the VRDP Shares is not directly based upon either short-term rating. In the event of a failed remarketing, the dividend rate of the VRDP Shares will be reset to a maximum rate. The maximum rate is determined based on, among other things, the long-term preferred share rating assigned to the VRDP Shares and the length of time that the VRDP Shares fail to be remarketed.
For the six months ended January 31, 2022, the annualized dividend rate for the VRDP Shares were as follows:
| | | | | | | | |
| | | | | MUJ | | MIY | | MPA |
Dividend rates | | | | 0.90% | | 1.06% | | 0.13% |
For the six months ended January 31, 2022, VRDP Shares issued and outstanding of each VRDP Fund remained constant.
VMTP Shares
MUC (for purposes of this section, a “VMTP Fund”) have issued Series W-7 VMTP Shares, $100,000 liquidation preference per share, in one or more privately negotiated offerings to qualified institutional buyers as defined pursuant to Rule 144A under the Securities Act. The VMTP Shares are subject to certain restrictions on transfer, and a VMTP Fund may also be required to register its VMTP Shares for sale under the Securities Act under certain circumstances. As of period end, the VMTP Shares outstanding and assigned long-term ratings were as follows:
| | | | | | | | | | | | | | | | | | | | | | | | |
Fund Name | |
| Issue
Date |
| |
| Shares
Issued |
| |
| Aggregate
Principal |
| |
| Term
Redemption Date |
| |
| Moody’s
Rating |
| |
| Fitch
Rating |
|
MUC | | | 03/22/12 | | | | 2,540 | | | $ | 254,000,000 | | | | 03/30/23 | | | | Aa2 | | | | AA | |
Redemption Terms: A VMTP Fund is required to redeem its VMTP Shares on the term redemption date, unless earlier redeemed or repurchased or unless extended. There is no assurance that a term will be extended further or that any VMTP Shares will be replaced with any other preferred shares or other form of leverage upon the redemption or repurchase of the VMTP Shares. Six months prior to the term redemption date, a VMTP Fund is required to begin to segregate liquid assets with its custodian to fund the redemption. In addition, a VMTP Fund is required to redeem certain of its outstanding VMTP Shares if it fails to comply with certain asset coverage, basic maintenance amount or leverage requirements.
| | |
| 52 | | 2 0 2 2 B L A C K R O C K S E M I - A N N U A L R E P O R T T O S H A R E H O L D E R S |
Notes to Financial Statements (unaudited) (continued)
Subject to certain conditions, VMTP Shares may be redeemed, in whole or in part, at any time at the option of the VMTP Fund. The redemption price per VMTP Share is equal to the liquidation preference per share plus any outstanding unpaid dividends.
Dividends: Dividends on the VMTP Shares are declared daily and payable monthly at a variable rate set weekly at a fixed rate spread to the Securities Industry and Financial Markets Association (“SIFMA”) Municipal Swap Index or to a percentage of the one-month LIBOR rate, as set forth in the VMTP Shares governing instrument. The fixed spread is determined based on the long-term preferred share rating assigned to the VMTP Shares by the ratings agencies then rating the VMTP Shares.
The dividend rate on VMTP Shares is subject to a step-up spread if the VMTP Fund fails to comply with certain provisions, including, among other things, the timely payment of dividends, redemptions or gross-up payments, and complying with certain asset coverage and leverage requirements.
For the six months ended January 31, 2022, the average annualized dividend rates for the VMTP Shares were as follows:
For the six months ended January 31, 2022, VMTP Shares issued and outstanding of each VMTP Fund remained constant.
Offering Costs: The Funds incurred costs in connection with the issuance of VRDP and VMTP Shares, which were recorded as a direct deduction from the carrying value of the related debt liability and will be amortized over the life of the VRDP and VMTP Shares with the exception of any upfront fees paid by a VRDP Fund to the liquidity provider which, if any, were amortized over the life of the liquidity agreement. Amortization of these costs is included in interest expense, fees and amortization of offering costs in the Statements of Operations.
Financial Reporting: The VRDP and VMTP Shares are considered debt of the issuer; therefore, the liquidation preference, which approximates fair value of the VRDP and VMTP Shares, is recorded as a liability in the Statements of Assets and Liabilities net of deferred offering costs. Unpaid dividends are included in interest expense and fees payable in the Statements of Assets and Liabilities, and the dividends accrued and paid on the VRDP and VMTP Shares are included as a component of interest expense, fees and amortization of offering costs in the Statements of Operations. The VRDP and VMTP Shares are treated as equity for tax purposes. Dividends paid to holders of the VRDP and VMTP Shares are generally classified as tax-exempt income for tax-reporting purposes. Dividends and amortization of deferred offering costs on VRDP and VMTP Shares are included in interest expense, fees and amortization of offering costs in the Statements of Operations:
| | | | | | | | |
Fund Name | | | Dividends Accrued | | |
| Deferred Offering
Costs Amortization |
|
MUC | | $ | 1,018,018 | | | $ | — | |
MUJ | | | 1,069,808 | | | | 10,695 | |
MIY | | | 1,233,523 | | | | 29,828 | |
MPA | | | 53,882 | | | | 9,674 | |
Management’s evaluation of the impact of all subsequent events on the Funds’ financial statements was completed through the date the financial statements were issued and the following items were noted:
The Funds declared and paid or will pay distributions to Common Shareholders as follows:
| | | | | | | | | | | | | | | | |
Fund Name | |
| Declaration
Date |
| |
| Record
Date |
| |
| Payable/
Paid Date |
| |
| Dividend Per
Common Share |
|
MUC | | | 02/01/22 | | | | 02/15/22 | | | | 03/01/22 | | | $ | 0.055000 | |
| | | 03/01/22 | | | | 03/15/22 | | | | 04/01/22 | | | | 0.055000 | |
| | | 03/18/22 | | | | 04/07/22 | | | | 05/02/22 | | | | 0.055000 | (a) |
MUJ | | | 02/01/22 | | | | 02/15/22 | | | | 03/01/22 | | | | 0.063000 | |
| | | 03/01/22 | | | | 03/15/22 | | | | 04/01/22 | | | | 0.063000 | |
| | | 03/18/22 | | | | 04/07/22 | | | | 05/02/22 | | | | 0.063000 | (a) |
MIY | | | 02/01/22 | | | | 02/15/22 | | | | 03/01/22 | | | | 0.056000 | |
| | | 03/01/22 | | | | 03/15/22 | | | | 04/01/22 | | | | 0.056000 | |
MPA | | | 02/01/22 | | | | 02/15/22 | | | | 03/01/22 | | | | 0.055000 | |
| | | | 03/01/22 | | | | 03/15/22 | | | | 04/01/22 | | | | 0.055000 | |
| | (a) | Net investment income special dividend. | |
| | | | | | |
| | | Preferred Shares(a) |
| Fund Name | | Shares | | Series | | Declared |
MUC | | VMTP | | W-7 | | $ 176,826 |
MUJ | | VRDP | | W-7 | | 183,249 |
MIY | | VRDP | | W-7 | | 201,658 |
MPA | | VRDP | | W-7 | | 16,316 |
| | (a) | Dividends declared for period February 1, 2022 to February 28, 2022. | |
| | |
N O T E S T O F I N A N C I A L S T A T E M E N T S | | 53 |
Additional Information
Fund Certification
The Funds are listed for trading on the NYSE and have filed with the NYSE their annual chief executive officer certification regarding compliance with the NYSE’s listing standards. The Funds filed with the SEC the certification of its chief executive officer and chief financial officer required by Section 302 of the Sarbanes-Oxley Act.
Regulation Regarding Derivatives
On October 28, 2020, the Securities and Exchange Commission (the “SEC”) adopted regulations governing the use of derivatives by registered investment companies (“Rule 18f-4”). The Funds will be required to implement and comply with Rule 18f-4 by August 19, 2022. Once implemented, Rule 18f-4 will impose limits on the amount of derivatives a fund can enter into, eliminate the asset segregation framework currently used by funds to comply with Section 18 of the 1940 Act, treat derivatives as senior securities and require funds whose use of derivatives is more than a limited specified exposure amount to establish and maintain a comprehensive derivatives risk management program and appoint a derivatives risk manager.
Environmental, Social and Governance (“ESG”) Integration
Although a Fund does not seek to implement a specific ESG, impact or sustainability strategy unless otherwise disclosed, Fund management will consider ESG characteristics as part of the investment process for actively managed Funds. These considerations will vary depending on a Fund’s particular investment strategies and may include consideration of third-party research as well as consideration of proprietary BlackRock research across the ESG risks and opportunities regarding an issuer. Fund management will consider those ESG characteristics it deems relevant or additive when making investment decisions for a Fund. The ESG characteristics utilized in a Fund’s investment process are anticipated to evolve over time and one or more characteristics may not be relevant with respect to all issuers that are eligible for investment. ESG characteristics are not the sole considerations when making investment decisions for a Fund. Further, investors can differ in their views of what constitutes positive or negative ESG characteristics. As a result, a Fund may invest in issuers that do not reflect the beliefs and values with respect to ESG of any particular investor. ESG considerations may affect a Fund’s exposure to certain companies or industries and a Fund may forego certain investment opportunities. While Fund management views ESG considerations as having the potential to contribute to a Fund’s long-term performance, there is no guarantee that such results will be achieved.
Dividend Policy
Each Fund’s dividend policy is to distribute all or a portion of its net investment income to its shareholders on a monthly basis. In order to provide shareholders with a more stable level of distributions, the Funds may at times pay out less than the entire amount of net investment income earned in any particular month and may at times in any particular month pay out such accumulated but undistributed income in addition to net investment income earned in that month. As a result, the distributions paid by the Funds for any particular month may be more or less than the amount of net investment income earned by the Funds during such month. The Funds’ current accumulated but undistributed net investment income, if any, is disclosed as accumulated earnings (loss) in the Statements of Assets and Liabilities, which comprises part of the financial information included in this report.
General Information
The Funds do not make available copies of their Statements of Additional Information because the Funds’ shares are not continuously offered, which means that the Statement of Additional Information of each Fund has not been updated after completion of the respective Fund’s offerings and the information contained in each Fund’s Statement of Additional Information may have become outdated.
The following information is a summary of certain changes since July 31, 2021. This information may not reflect all of the changes that have occurred since you purchased the relevant Fund.
On November 2, 2021, each of MUC, MUJ and MIY divided its Board of Directors into three classes, with one class standing for election each year, effective November 18, 2021. In addition, on November 2, 2021, each of MUC, MUJ and MIY amended and restated its Bylaws to classify its Board of Directors and adopt a voting standard of a majority of the outstanding shares for the election of directors in a contested election.
Except if noted otherwise herein, there were no changes to the Funds’ charters or by-laws that would delay or prevent a change of control of the Funds that were not approved by the shareholders.
In accordance with Section 23(c) of the Investment Company Act of 1940, each Fund may from time to time purchase shares of its common stock in the open market or in private transactions.
Quarterly performance, semi-annual and annual reports, current net asset value and other information regarding the Funds may be found on BlackRock’s website, which can be accessed at blackrock.com. Any reference to BlackRock’s website in this report is intended to allow investors public access to information regarding the Funds and does not, and is not intended to, incorporate BlackRock’s website in this report.
Electronic Delivery
Shareholders can sign up for e-mail notifications of quarterly statements, annual and semi-annual shareholder reports by enrolling in the electronic delivery program. Electronic copies of shareholder reports are available on BlackRock’s website.
To enroll in electronic delivery:
| | |
| 54 | | 2 0 2 2 B L A C K R O C K S E M I - A N N U A L R E P O R T T O S H A R E H O L D E R S |
Additional Information (continued)
Shareholders Who Hold Accounts with Investment Advisers, Banks or Brokerages:
Please contact your financial adviser. Please note that not all investment advisers, banks or brokerages may offer this service.
Householding
The Funds will mail only one copy of shareholder documents, annual and semi-annual reports, Rule 30e-3 notices and proxy statements, to shareholders with multiple accounts at the same address. This practice is commonly called “householding” and is intended to reduce expenses and eliminate duplicate mailings of shareholder documents. Mailings of your shareholder documents may be householded indefinitely unless you instruct us otherwise. If you do not want the mailing of these documents to be combined with those for other members of your household, please call the Funds at (800) 882-0052.
Availability of Quarterly Schedule of Investments
The Funds file their complete schedules of portfolio holdings with the SEC for the first and third quarters of each fiscal year as an exhibit to their reports on Form N-PORT. The Funds’ Forms N-PORT are available on the SEC’s website at sec.gov. Additionally, each Fund makes its portfolio holdings for the first and third quarters of each fiscal year available at blackrock.com/fundreports.
Availability of Proxy Voting Policies, Procedures and Voting Records
A description of the policies and procedures that the Funds use to determine how to vote proxies relating to portfolio securities and information about how the Funds voted proxies relating to securities held in the Funds’ portfolios during the most recent 12-month period ended June 30 is available without charge, upon request (1) by calling (800) 882-0052; (2) on the BlackRock website at blackrock.com; and (3) on the SEC’s website at sec.gov.
Availability of Fund Updates
BlackRock will update performance and certain other data for the Funds on a monthly basis on its website in the “Closed-end Funds” section of blackrock.com as well as certain other material information as necessary from time to time. Investors and others are advised to check the website for updated performance information and the release of other material information about the Funds. This reference to BlackRock’s website is intended to allow investors public access to information regarding the Funds and does not, and is not intended to, incorporate BlackRock’s website in this report.
BlackRock Privacy Principles
BlackRock is committed to maintaining the privacy of its current and former fund investors and individual clients (collectively, “Clients”) and to safeguarding their non-public personal information. The following information is provided to help you understand what personal information BlackRock collects, how we protect that information and why in certain cases we share such information with select parties.
If you are located in a jurisdiction where specific laws, rules or regulations require BlackRock to provide you with additional or different privacy-related rights beyond what is set forth below, then BlackRock will comply with those specific laws, rules or regulations.
BlackRock obtains or verifies personal non-public information from and about you from different sources, including the following: (i) information we receive from you or, if applicable, your financial intermediary, on applications, forms or other documents; (ii) information about your transactions with us, our affiliates, or others; (iii) information we receive from a consumer reporting agency; and (iv) from visits to our websites.
BlackRock does not sell or disclose to non-affiliated third parties any non-public personal information about its Clients, except as permitted by law or as is necessary to respond to regulatory requests or to service Client accounts. These non-affiliated third parties are required to protect the confidentiality and security of this information and to use it only for its intended purpose.
We may share information with our affiliates to service your account or to provide you with information about other BlackRock products or services that may be of interest to you. In addition, BlackRock restricts access to non-public personal information about its Clients to those BlackRock employees with a legitimate business need for the information. BlackRock maintains physical, electronic and procedural safeguards that are designed to protect the non-public personal information of its Clients, including procedures relating to the proper storage and disposal of such information.
Fund and Service Providers
| | |
| Investment Adviser | | Transfer Agent |
| BlackRock Advisors, LLC | | Computershare Trust Company, N.A. |
| Wilmington, DE 19809 | | Canton, MA 02021 |
| |
| Accounting Agent and Custodian | | VRDP Liquidity Provider |
| State Street Bank and Trust Company | | Bank of America, N.A.(a) |
| Boston, MA 02111 | | New York, NY 10036 |
| |
| | The Toronto-Dominion Bank(b) |
| | New York, NY 10019 |
| | |
A D D I T I O N A L I N F O R M A T I O N | | 55 |
Additional Information (continued)
Fund and Service Providers (continued)
| | |
(a) For MUJ. | | VRDP Remarketing Agent |
(b) For MPA and MIY. | | BofA Securities, Inc.(a) |
| | New York, NY 10036 |
| |
| | TD Securities (USA) LLC(b) |
| | New York, NY 10019 |
| |
| | VRDP Tender and Paying Agent and VMTP Redemption and Paying Agent |
| | The Bank of New York Mellon |
| | New York, NY 10286 |
| |
| | Independent Registered Public Accounting Firm |
| | Deloitte & Touche LLP |
| | Boston, MA 02116 |
| |
| | Legal Counsel |
| | Willkie Farr & Gallagher LLP |
| | New York, NY 10019 |
| |
| | Address of the Funds |
| | 100 Bellevue Parkway |
| | Wilmington, DE 19809 |
| | |
| 56 | | 2 0 2 2 B L A C K R O C K S E M I - A N N U A L R E P O R T T O S H A R E H O L D E R S |
Glossary of Terms Used in this Report
Portfolio Abbreviation
| | |
| AGC | | Assured Guaranty Corp. |
| |
| AGM | | Assured Guaranty Municipal Corp. |
| |
| AGM-CR | | AGM Insured Custodial Receipt |
| |
| AMBAC | | AMBAC Assurance Corp. |
| |
| AMT | | Alternative Minimum Tax |
| |
| ARB | | Airport Revenue Bonds |
| |
| BAM | | Build America Mutual Assurance Co. |
| |
| BHAC-CR | | Berkshire Hathaway Assurance Corp. - Custodian Receipt |
| |
| CAB | | Capital Appreciation Bonds |
| |
| COP | | Certificates of Participation |
| |
| CR | | Custodian Receipt |
| |
| FHLMC | | Federal Home Loan Mortgage Corp. |
| |
| GNMA | | Government National Mortgage Association |
| |
| GO | | General Obligation Bonds |
| |
| GTD | | GTD Guaranteed |
| |
| HUD SECT 8 | | U.S. Department of Housing and Urban Development |
| |
| | Section 8 |
| |
| M/F | | Multi-Family |
| |
| NPFGC | | National Public Finance Guarantee Corp. |
| |
| Q-SBLF | | Qualified School Bond Loan Fund |
| |
| RB | | Revenue Bond |
| |
| S/F | | Single-Family |
| |
| SAB | | Special Assessment Bonds |
| |
| SAN | | State Aid Notes |
| |
| SAP | | Subject to Appropriations |
| |
| SAW | | State Aid Withholding |
| |
| SCH BD RES FD | | School Board Resolution Fund |
| |
| ST | | Special Tax |
| |
| TA | | Tax Allocation |
| | |
G L O S S A R Y O F T E R M S U S E D I N T H I S R E P O R T | | 57 |
Want to know more?
blackrock.com | 800-882-0052
This report is intended for current holders. It is not a prospectus. Past performance results shown in this report should not be considered a representation of future performance. The Funds have leveraged their Common Shares, which creates risks for Common Shareholders, including the likelihood of greater volatility of NAV and market price of the Common Shares, and the risk that fluctuations in short-term interest rates may reduce the Common Shares’ yield. Statements and other information herein are as dated and are subject to change.
MQUAL5-01/22-SAR
(b) Not Applicable
| Item 2 – | Code of Ethics – Not Applicable to this semi-annual report |
| Item 3 – | Audit Committee Financial Expert – Not Applicable to this semi-annual report |
| Item 4 – | Principal Accountant Fees and Services – Not Applicable to this semi-annual report |
| Item 5 – | Audit Committee of Listed Registrant – Not Applicable to this semi-annual report |
(a) The registrant’s Schedule of Investments is included as part of the Report to Stockholders filed under Item 1(a) of this Form.
(b) Not Applicable due to no such divestments during the semi-annual period covered since the previous Form N-CSR filing.
| Item 7 – | Disclosure of Proxy Voting Policies and Procedures for Closed-End Management Investment Companies – Not Applicable to this semi-annual report |
| Item 8 – | Portfolio Managers of Closed-End Management Investment Companies |
(a) Not Applicable to this semi-annual report.
(b) As of the date of this filing, there have been no changes in any of the portfolio managers identified in the most recent annual report on Form N-CSR.
| Item 9 – | Purchases of Equity Securities by Closed-End Management Investment Company and Affiliated Purchasers – Not Applicable due to no such purchases during the period covered by this report. |
| Item 10 – | Submission of Matters to a Vote of Security Holders – There have been no material changes to these procedures. |
| Item 11 – | Controls and Procedures |
(a) The registrant’s principal executive and principal financial officers, or persons performing similar functions, have concluded that the registrant’s disclosure controls and procedures (as defined in Rule 30a-3(c) under the Investment Company Act of 1940, as amended (the “1940 Act”)) are effective as of a date within 90 days of the filing of this report based on the evaluation of these controls and procedures required by Rule 30a-3(b) under the 1940 Act and Rule 13a-15(b) under the Securities Exchange Act of 1934, as amended.
(b) There were no changes in the registrant’s internal control over financial reporting (as defined in Rule 30a-3(d) under the 1940 Act) that occurred during the period covered by this report that have materially affected, or are reasonably likely to materially affect, the registrant’s internal control over financial reporting.
| Item 12 – | Disclosure of Securities Lending Activities for Closed-End Management Investment Companies – Not Applicable |
| Item 13 – | Exhibits attached hereto |
2
(a)(1) Code of Ethics – Not Applicable to this semi-annual report
(a)(2) Section 302 Certifications are attached
(a)(3) Any written solicitation to purchase securities under Rule 23c-1 – Not Applicable
(a)(4) Change in Registrant’s independent public accountant – Not Applicable
(b) Section 906 Certifications are attached
3
Pursuant to the requirements of the Securities Exchange Act of 1934 and the Investment Company Act of 1940, the registrant has duly caused this report to be signed on its behalf by the undersigned, thereunto duly authorized.
BlackRock MuniHoldings California Quality Fund, Inc.
| | | | |
| | By: | | /s/ John M. Perlowski |
| | | | John M. Perlowski |
| | | | Chief Executive Officer (principal executive officer) of |
| | | | BlackRock MuniHoldings California Quality Fund, Inc. |
Date: March 23, 2022
Pursuant to the requirements of the Securities Exchange Act of 1934 and the Investment Company Act of 1940, this report has been signed below by the following persons on behalf of the registrant and in the capacities and on the dates indicated.
| | | | |
| | By: | | /s/ John M. Perlowski |
| | | | John M. Perlowski |
| | | | Chief Executive Officer (principal executive officer) of |
| | | | BlackRock MuniHoldings California Quality Fund, Inc. |
Date: March 23, 2022
| | | | |
| | By: | | /s/ Trent Walker |
| | | | Trent Walker |
| | | | Chief Financial Officer (principal financial officer) of |
| | | | BlackRock MuniHoldings California Quality Fund, Inc. |
Date: March 23, 2022
4