UNITED STATES
SECURITIES AND EXCHANGE COMMISSION
Washington, D.C. 20549
FORM N-CSR
CERTIFIED SHAREHOLDER REPORT OF REGISTERED MANAGEMENT INVESTMENT COMPANIES
Investment Company Act file number: 811-08573
| Name of Fund: | | BlackRock MuniHoldings California Quality Fund, Inc. (MUC) |
| Fund Address: | | 100 Bellevue Parkway, Wilmington, DE 19809 |
Name and address of agent for service: John M. Perlowski, Chief Executive Officer, BlackRock MuniHoldings California Quality Fund, Inc., 50 Hudson Yards, New York, NY 10001
Registrant’s telephone number, including area code: (800) 882-0052, Option 4
Date of fiscal year end: 07/31/2023
Date of reporting period: 01/31/2023
Item 1 – Report to Stockholders
(a) The Report to Shareholders is attached herewith.
| | |

| | JANUARY 31, 2023 |
| | |
| |
| | 2023 Semi-Annual Report (Unaudited) |
BlackRock California Municipal Income Trust (BFZ)
BlackRock Municipal 2030 Target Term Trust (BTT)
BlackRock MuniHoldings California Quality Fund, Inc. (MUC)
BlackRock MuniHoldings Quality Fund II, Inc. (MUE)
|
| |
| Not FDIC Insured • May Lose Value • No Bank Guarantee |
The Markets in Review
Dear Shareholder,
Significant economic headwinds emerged during the 12-month reporting period ended January 31, 2023, as investors navigated changing economic conditions and volatile markets. The U.S. economy shrank in the first half of 2022 before returning to modest growth in the second half of the year, marking a shift to a more challenging post-reopening economic environment. Changes in consumer spending patterns and a tight labor market led to elevated inflation, which reached a 40-year high before beginning to moderate. Moreover, while the foremost effect of Russia’s invasion of Ukraine has been a severe humanitarian crisis, the ongoing war continued to present challenges for both investors and policymakers.
Equity prices fell as interest rates rose, particularly during the first half of the reporting period. Both large- and small-capitalization U.S. stocks fell, although equities began to recover in the second half of the period as inflation eased and economic growth resumed. Emerging market stocks and international equities from developed markets declined overall, pressured by rising interest rates and a strong U.S. dollar.
The 10-year U.S. Treasury yield rose notably during the reporting period, driving its price down, as investors reacted to fluctuating inflation data and attempted to anticipate its impact on future interest rate changes. The corporate bond market also faced inflationary headwinds, and higher interest rates led to rising borrowing costs for corporate issuers.
The U.S. Federal Reserve (the “Fed”), acknowledging that inflation has been more persistent than expected, raised interest rates seven times. Furthermore, the Fed wound down its bond-buying programs and is accelerating the reduction of its balance sheet. While the Fed suggested that additional rate hikes were likely, it also gave indications that the pace of increases would slow if inflation continued to subside.
Restricted labor supply kept inflation elevated even as other inflation drivers, such as goods prices and energy costs, moderated. While economic growth slowed in the last year, we believe that taming inflation requires a more substantial decline that lowers demand to a level more in line with the economy’s productive capacity. Although the Fed has decelerated the pace of interest rate hikes, it still seems determined to get inflation back to target. With this in mind, we believe the possibility of a U.S. recession in the near-term is high, but the dimming economic outlook has not yet been fully reflected in current market prices. Investors should expect a period of higher volatility as markets adjust to the new economic reality and policymakers attempt to adapt to rapidly changing conditions.
While we favor an overweight to equities in the long-term, several factors lead us to take an underweight stance on equities overall in the near term. We believe that higher input costs and a deteriorating economic backdrop are likely to challenge corporate earnings, while the market’s concerns over excessive rate hikes could remain until the Fed indicates that its tightening cycle has ended. Nevertheless, we see opportunities in credit, where valuations are attractive and higher yields provide income opportunities. We believe that global investment-grade corporates, global inflation-linked bonds, and U.S. mortgage-backed securities offer strong opportunities for a six- to twelve-month horizon.
Overall, our view is that investors need to think globally, position themselves to be prepared for a decarbonizing economy, and be nimble as market conditions change. We encourage you to talk with your financial advisor and visit blackrock.com for further insight about investing in today’s markets.
Sincerely,

Rob Kapito
President, BlackRock Advisors, LLC

Rob Kapito
President, BlackRock Advisors, LLC
| | | | |
| Total Returns as of January 31, 2023 |
| | | |
| | | 6-Month | | 12-Month |
| | | |
U.S. large cap equities
(S&P 500® Index) | | (0.44)% | | (8.22)% |
| | | |
U.S. small cap equities
(Russell 2000® Index) | | 3.25 | | (3.38) |
| | | |
International equities
(MSCI Europe, Australasia,
Far East Index) | | 9.52 | | (2.83) |
| | | |
Emerging market equities
(MSCI Emerging Markets Index) | | 4.92 | | (12.12) |
| | | |
3-month Treasury bills
(ICE BofA 3-Month U.S. Treasury Bill Index) | | 1.58 | | 1.79 |
| | | |
U.S. Treasury securities
(ICE BofA 10-Year U.S. Treasury Index) | | (5.60) | | (11.62) |
| | | |
U.S. investment grade bonds (Bloomberg U.S. Aggregate Bond Index) | | (2.37) | | (8.36) |
| | | |
Tax-exempt municipal bonds (Bloomberg Municipal Bond Index) | | 0.73 | | (3.25) |
| | | |
U.S. high yield bonds
(Bloomberg U.S. Corporate High Yield 2% Issuer Capped Index) | | 1.46 | | (5.22) |
|
| Past performance is not an indication of future results. Index performance is shown for illustrative purposes only. You cannot invest directly in an index. |
| | |
| 2 | | THIS PAGE IS NOT PART OF YOUR FUND REPORT |
Table of Contents
Municipal Market Overview For the Reporting Period Ended January 31, 2023
Municipal Market Conditions
Municipal bonds posted negative total returns during the period alongside rising interest rates spurred by surging inflation and aggressive Fed policy tightening. The market experienced a drawdown on par with some of the worst on record as the U.S. central bank delivered 425bps of rate hikes at the fastest pace in history. However, growing expectations for a pause in policy tightening later in the period offered a reprieve. Strong credit fundamentals, bolstered by robust revenue growth and elevated fund balances, drove positive excess returns versus comparable U.S. Treasuries. Shorter-duration (i.e., less sensitive to interest rates) and higher-rated bonds outperformed.
| | | | |
During the 12 months ended January 31, 2023, municipal bond funds experienced net outflows totaling $141 billion (based on data from the Investment Company Institute), marking the largest outflow cycle on record. As a result, elevated bid-wanted activity weighed on the market as investors raised cash to meet redemptions. At the same time, the market absorbed $347 billion in issuance, below the $453 billion issued during the prior 12-months. New issue oversubscriptions waned as sentiment turned less constructive. | | | | Bloomberg Municipal Bond Index Total Returns as of January 31, 2023 6 months: 0.73% 12 months: (3.25)% |
A Closer Look at Yields
AAA Municipal Yield Curves
| | |
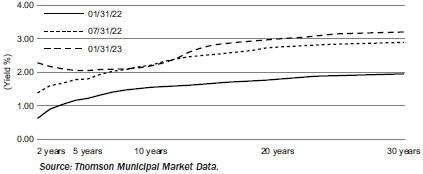
| | From January 31, 2022, to January 31, 2023, yields on AAA-rated 30-year municipal bonds increased by 125 basis points (“bps”) from 1.95% to 3.20%, while ten-year rates increased by 64 bps from 1.55% to 2.19% and five-year rates increased by 83 bps from 1.22% to 2.05% (as measured by Thomson Municipal Market Data). As a result, the municipal yield curve flattened over the 12-month period with the spread between two- and 30-year maturities flattening by 2 bps. However, the curve remained relatively steep compared to the deeply inverted U.S. Treasury curve, which flattened by 150 bps. The selloff experienced in early 2022 helped restore value to the asset class before outperformance in the latter half of the year stretched valuations across the curve. Municipal-to-Treasury ratios now sit below their 5-year averages, most notably in the front end of the curve. |
Financial Conditions of Municipal Issuers
Buoyed by successive federal aid injections, vaccine distribution, and the re-opening of the economy, states and many local governments experienced revenue growth above forecasts in 2021 and 2022. While revenue collections, particularly sales and personal income tax receipts, continue to be robust in an environment of higher inflation, growth may subside as inflation declines or the economy slows. In the meantime, prevailing higher wages, energy costs, and interest rates in the post-Covid recovery will pressure state and local government costs. However, overall credit fundamentals are expected to remain sturdy. At this point, tax receipts could come under pressure although states with significant oil and gas production would benefit should prices remain elevated or rise. While municipal utilities typically benefit from autonomous rate-setting that allows them to adjust for rising fuel costs, rising commodity prices over a prolonged period could test affordability and the political will to raise rates to balance operations. State housing authority bonds, flagship universities, and strong national and regional health systems may also be pressured but are better poised to absorb the impact of the economic shock. Critical providers (safety net hospitals, mass transit systems, airports) with limited resources may still experience fiscal strain from the economic fallout from rising inflation, but aid and the re-opening of the economy will continue to support operating results through 2023. Work-from-home policies remain headwinds for mass transit farebox revenue and commercial real estate values. BlackRock anticipates that a small subset of the market, mainly non-rated stand-alone projects, will remain susceptible to credit deterioration.
The opinions expressed are those of BlackRock as of January 31, 2023 and are subject to change at any time due to changes in market or economic conditions. The comments should not be construed as a recommendation of any individual holdings or market sectors. Investing involves risk including loss of principal. Bond values fluctuate in price so the value of your investment can go down depending on market conditions. Fixed income risks include interest-rate and credit risk. Typically, when interest rates rise, there is a corresponding decline in bond values. Credit risk refers to the possibility that the bond issuer will not be able to make principal and interest payments. There may be less information on the financial condition of municipal issuers than for public corporations. The market for municipal bonds may be less liquid than for taxable bonds. Some investors may be subject to Alternative Minimum Tax (“AMT”). Capital gains distributions, if any, are taxable.
The Bloomberg Municipal Bond Index, a broad, market value-weighted index, seeks to measure the performance of the U.S. municipal bond market. All bonds in the index are exempt from U.S. federal income taxes or subject to the AMT. Past performance is not an indication of future results. Index performance is shown for illustrative purposes only. It is not possible to invest directly in an index.
| | |
| 4 | | 2 0 2 3 BLACK ROCK SEMI - ANNUAL REPORT TO SHAREHOLDERS |
The Benefits and Risks of Leveraging
The Trusts may utilize leverage to seek to enhance the distribution rate on, and net asset value (“NAV”) of, their common shares (“Common Shares”). However, there is no guarantee that these objectives can be achieved in all interest rate environments.
In general, the concept of leveraging is based on the premise that the financing cost of leverage, which is based on short-term interest rates, is normally lower than the income earned by a Trust on its longer-term portfolio investments purchased with the proceeds from leverage. To the extent that the total assets of each Trust (including the assets obtained from leverage) are invested in higher-yielding portfolio investments, each Trust’s shareholders benefit from the incremental net income. The interest earned on securities purchased with the proceeds from leverage (after paying the leverage costs) is paid to shareholders in the form of dividends, and the value of these portfolio holdings (less the leverage liability) is reflected in the per share NAV.
To illustrate these concepts, assume a Trust’s Common Shares capitalization is $100 million and it utilizes leverage for an additional $30 million, creating a total value of $130 million available for investment in longer-term income securities. If prevailing short-term interest rates are 3% and longer-term interest rates are 6%, the yield curve has a strongly positive slope. In this case, a Trust’s financing costs on the $30 million of proceeds obtained from leverage are based on the lower short-term interest rates. At the same time, the securities purchased by a Trust with the proceeds from leverage earn income based on longer-term interest rates. In this case, a Trust’s financing cost of leverage is significantly lower than the income earned on a Trust’s longer-term investments acquired from such leverage proceeds, and therefore the holders of Common Shares (“Common Shareholders”) are the beneficiaries of the incremental net income.
However, in order to benefit Common Shareholders, the return on assets purchased with leverage proceeds must exceed the ongoing costs associated with the leverage. If interest and other costs of leverage exceed a Trust’s return on assets purchased with leverage proceeds, income to shareholders is lower than if a Trust had not used leverage. In such circumstance, the investment adviser may nevertheless determine to maintain a Trust’s leverage if it deems such action to be appropriate. Furthermore, the value of the Trusts’ portfolio investments generally varies inversely with the direction of long-term interest rates, although other factors can influence the value of portfolio investments. In contrast, the amount of each Trust’s obligations under its respective leverage arrangement generally does not fluctuate in relation to interest rates. As a result, changes in interest rates can influence the Trusts’ NAVs positively or negatively. Changes in the future direction of interest rates are very difficult to predict accurately, and there is no assurance that a Trust’s intended leveraging strategy will be successful.
The use of leverage also generally causes greater changes in each Trust’s NAV, market price and dividend rates than comparable portfolios without leverage. In a declining market, leverage is likely to cause a greater decline in the NAV and market price of a Trust’s Common Shares than if the Trust were not leveraged. In addition, each Trust may be required to sell portfolio securities at inopportune times or at distressed values in order to comply with regulatory requirements applicable to the use of leverage or as required by the terms of leverage instruments, which may cause the Trust to incur losses. The use of leverage may limit a Trust’s ability to invest in certain types of securities or use certain types of hedging strategies. Each Trust incurs expenses in connection with the use of leverage, all of which are borne by Common Shareholders and may reduce income to the Common Shares. Moreover, to the extent the calculation of each Trust’s investment advisory fees includes assets purchased with the proceeds of leverage, the investment advisory fees payable to the Trusts’ investment adviser will be higher than if the Trusts did not use leverage.
To obtain leverage, each Trust has issued Variable Rate Muni Term Preferred Shares (“VMTP Shares”) or Remarketable Variable Rate Muni Term Preferred Shares (“RVMTP Shares”) (collectively, “Preferred Shares”) and/or leveraged its assets through the use of tender option bond trusts (“TOB Trusts”) as described in the Notes to Financial Statements.
Under the Investment Company Act of 1940, as amended (the “1940 Act”), each Trust is permitted to borrow money (including through the use of TOB Trusts) or issue debt securities up to 33 1/3% of its total managed assets or equity securities (e.g., Preferred Shares) up to 50% of its total managed assets. A Trust may voluntarily elect to limit its leverage to less than the maximum amount permitted under the 1940 Act. In addition, a Trust may also be subject to certain asset coverage, leverage or portfolio composition requirements imposed by the Preferred Shares’ governing instruments or by agencies rating the Preferred Shares, which may be more stringent than those imposed by the 1940 Act.
Derivative Financial Instruments
The Trusts may invest in various derivative financial instruments. These instruments are used to obtain exposure to a security, commodity, index, market, and/or other assets without owning or taking physical custody of securities, commodities and/or other referenced assets or to manage market, equity, credit, interest rate, foreign currency exchange rate, commodity and/or other risks. Derivative financial instruments may give rise to a form of economic leverage and involve risks, including the imperfect correlation between the value of a derivative financial instrument and the underlying asset, possible default of the counterparty to the transaction or illiquidity of the instrument. Pursuant to Rule 18f-4 under the 1940 Act, among other things, the Trusts must either use derivative financial instruments with embedded leverage in a limited manner or comply with an outer limit on fund leverage risk based on value-at-risk. The Trusts’ successful use of a derivative financial instrument depends on the investment adviser’s ability to predict pertinent market movements accurately, which cannot be assured. The use of these instruments may result in losses greater than if they had not been used, may limit the amount of appreciation a Trust can realize on an investment and/or may result in lower distributions paid to shareholders. The Trusts’ investments in these instruments, if any, are discussed in detail in the Notes to Financial Statements.
| | |
THE BENEFITS AND RISKS OF LEVERAGING / DERIVATIVE FINANCIAL INSTRUMENTS | | 5 |
| | |
| Trust Summary as of January 31, 2023 | | BlackRock California Municipal Income Trust (BFZ) |
Investment Objective
BlackRock California Municipal Income Trust’s (BFZ) (the “Trust”) investment objective is to provide current income exempt from regular U.S. federal income and California income taxes. The Trust seeks to achieve its investment objective by investing primarily in municipal obligations exempt from U.S. federal income taxes (except that the interest may be subject to the federal alternative minimum tax) and California income taxes. The Trust invests, under normal market conditions, at least 80% of its assets in municipal obligations that are investment grade quality, or are considered by the Trust’s investment adviser to be of comparable quality, at the time of investment. The Trust may invest directly in securities or synthetically through the use of derivatives.
No assurance can be given that the Trust’s investment objective will be achieved.
Trust Information
| | |
| | |
Symbol on New York Stock Exchange | | BFZ |
Initial Offering Date | | July 27, 2001 |
Yield on Closing Market Price as of January 31, 2023 ($11.47)(a) | | 3.56% |
Tax Equivalent Yield(b) | | 7.76% |
Current Monthly Distribution per Common Share(c) | | $0.0340 |
Current Annualized Distribution per Common Share(c) | | $0.4080 |
Leverage as of January 31, 2023(d) | | 34% |
| | (a) | Yield on closing market price is calculated by dividing the current annualized distribution per share by the closing market price. Past performance is not an indication of future results. | |
| | (b) | Tax equivalent yield assumes the maximum marginal U.S. federal and state tax rate of 54.1%, which includes the 3.8% Medicare tax. Actual tax rates will vary based on income, exemptions and deductions. Lower taxes will result in lower tax equivalent yields. | |
| | (c) | The monthly distribution per Common Share, declared on February 1, 2023, was increased to $0.0390 per share. The yield on closing market price, tax equivalent yield, current monthly distribution per Common Share, and current annualized distribution per Common Share do not reflect the new distribution rate. The new distribution rate is not constant and is subject to change in the future. | |
| | (d) | Represents VMTP Shares and TOB Trusts as a percentage of total managed assets, which is the total assets of the Trust, including any assets attributable to VMTP Shares and TOB Trusts, minus the sum of its accrued liabilities. Does not reflect derivatives or other instruments that may give rise to economic leverage. For a discussion of leveraging techniques utilized by the Trust, please see The Benefits and Risks of Leveraging and Derivative Financial Instruments. | |
Market Price and Net Asset Value Per Share Summary
| | | | | | | | | | | | | | | | | | | | |
| | | 01/31/23 | | | 07/31/22 | | | Change | | | High | | | Low | |
| | | | | |
Closing Market Price | | | $ 11.47 | | | | $ 11.65 | | | | (1.55 | )% | | | $ 11.80 | | | | $ 10.07 | |
Net Asset Value | | | 13.25 | | | | 13.41 | | | | (1.19 | ) | | | 13.54 | | | | 11.54 | |
Performance
Returns for the period ended January 31, 2023 were as follows:
| | | | | | | | | | | | | | | | |
| | | | | | Average Annual Total Returns | |
| | | | |
| | | 6-month | | | 1 Year | | | 5 Years | | | 10 Years | |
| | | | |
Trust at NAV(a)(b) | | | 0.87 | % | | | (8.03 | )% | | | 1.86 | % | | | 2.76 | % |
Trust at Market Price(a)(b) | | | 0.51 | | | | (10.83 | ) | | | 1.27 | | | | 1.05 | |
California Customized Reference Benchmark(c) | | | 0.80 | | | | (3.19 | ) | | | 2.07 | | | | N/A | |
Bloomberg Municipal Bond Index(d) | | | 0.73 | | | | (3.25 | ) | | | 2.07 | | | | 2.38 | |
| | (a) | All returns reflect reinvestment of dividends and/or distributions at actual reinvestment prices. Performance results reflect the Trust’s use of leverage. | |
| | (b) | The Trust’s discount to NAV widened during the period, which accounts for the difference between performance based on market price and performance based on NAV. | |
| | (c) | The California Customized Reference Benchmark is comprised of the Bloomberg Municipal Bond: California Exempt Total Return Index Unhedged (90%) and the California Bloomberg Municipal Bond: High Yield (non-Investment Grade) Total Return Index (10%). The California Customized Reference Benchmark commenced on September 30, 2016. | |
| | (d) | An unmanaged index that tracks the U.S. long term tax-exempt bond market, including state and local general obligation bonds, revenue bonds, pre-refunded bonds, and insured bonds. | |
Performance results may include adjustments made for financial reporting purposes in accordance with U.S. generally accepted accounting principles.
Past performance is not an indication of future results.
The Trust is presenting the performance of one or more indices for informational purposes only. The Trust is actively managed and does not seek to track or replicate the performance of any index. The index performance shown is not intended to be indicative of the Trust’s investment strategies, portfolio components or past or future performance.
More information about the Trust’s historical performance can be found in the “Closed End Funds” section of blackrock.com.
The following discussion relates to the Trust’s absolute performance based on NAV:
Municipal bonds posted slightly positive returns during the six-month period, with the benefit of income offsetting the effect of falling prices. Bond market returns, in general, were dampened by the combination of high inflation and continued interest rate increases by the Fed. California municipals performed in line with the national market.
| | |
| 6 | | 2 0 2 3 BLACK ROCK SEMI - ANNUAL REPORT TO SHAREHOLDERS |
| | |
| Trust Summary as of January 31, 2023 (continued) | | BlackRock California Municipal Income Trust (BFZ) |
The Trust’s holdings in higher-quality investment-grade securities with longer duration characteristics contributed to performance. (Duration is a measure of interest rate sensitivity.) The investment adviser purchased these securities later in the period after yields had risen and the market had reached more attractive valuation levels. The investment adviser also swapped out of lower-yielding holdings into bonds trading near or below par. These issues, which had a higher potential for appreciation, performed well in the rally that occurred in the latter half of the period.
The Trust continued to use U.S. Treasury futures in an effort to mitigate interest rate risk. This aspect of its strategy had a marginally positive effect on its performance.
On the negative side, positions in deeply discounted high yield bonds—which remained out of favor and did not participate in the late rally—detracted. This trend was especially notable among the Trust’s holdings in workforce housing bonds. The Trust’s use of leverage also detracted from performance due in part to the effect of rising borrowing costs.
The views expressed reflect the opinions of BlackRock as of the date of this report and are subject to change based on changes in market, economic or other conditions. These views are not intended to be a forecast of future events and are no guarantee of future results.
Overview of the Trust’s Total Investments
SECTOR ALLOCATION
| | | | |
| |
| |
| Sector(a)(b) | | 01/31/23 | |
| |
| |
County/City/Special District/School District | | | 30.1% | |
Transportation | | | 18.5 | |
Utilities | | | 14.5 | |
Health | | | 14.1 | |
State | | | 8.3 | |
Corporate | | | 5.4 | |
Education | | | 4.2 | |
Housing | | | 2.5 | |
Tobacco | | | 2.4 | |
| |
CALL/MATURITY SCHEDULE
| | | | |
| |
| |
| Calendar Year Ended December 31,(a)(c) | | Percentage | |
| |
| |
2023 | | | —% | (d) |
2024 | | | 1.9 | |
2025 | | | 0.7 | |
2026 | | | 9.1 | |
2027 | | | 15.0 | |
| |
CREDIT QUALITY ALLOCATION
| | | | |
| |
| |
| Credit Rating(a)(e) | | 01/31/23 | |
| |
| |
AAA/Aaa | | | 6.1% | |
AA/Aa | | | 66.1 | |
A | | | 17.6 | |
BBB/Baa | | | 2.2 | |
BB/Ba | | | 0.1 | |
N/R(f) | | | 7.9 | |
| |
| (a) | Excludes short-term securities. |
| (b) | For Trust compliance purposes, the Trust’s sector classifications refer to one or more of the sector sub-classifications used by one or more widely recognized market indexes or rating group indexes, and/or as defined by the investment adviser. These definitions may not apply for purposes of this report, which may combine such sector sub-classifications for reporting ease. |
| (c) | Scheduled maturity dates and/or bonds that are subject to potential calls by issuers over the next five years. |
| (d) | Rounds to less than 0.1%. |
| (e) | For financial reporting purposes, credit quality ratings shown above reflect the highest rating assigned by either S&P Global Ratings or Moody’s Investors Service, Inc. if ratings differ. These rating agencies are independent, nationally recognized statistical rating organizations and are widely used. Investment grade ratings are credit ratings of BBB/Baa or higher. Below investment grade ratings are credit ratings of BB/Ba or lower. Investments designated N/R are not rated by either rating agency. Unrated investments do not necessarily indicate low credit quality. Credit quality ratings are subject to change. |
| (f) | The investment adviser evaluates the credit quality of unrated investments based upon certain factors including, but not limited to, credit ratings for similar investments and financial analysis of sectors and individual investments. Using this approach, the investment adviser has deemed certain of these unrated securities as investment grade quality. As of January 31, 2023, the market value of unrated securities deemed by the investment adviser to be investment grade represents less than 1.0% of the Trust’s total investments. |
| | |
| Trust Summary as of January 31, 2023 | | BlackRock Municipal 2030 Target Term Trust (BTT) |
Investment Objective
BlackRock Municipal 2030 Target Term Trust’s (BTT) (the “Trust”) investment objectives are to provide current income exempt from regular U.S. federal income tax (but which may be subject to the federal alternative minimum tax in certain circumstances) and to return $25.00 per common share (the initial offering price per share) to holders of common shares on or about December 31, 2030. The Trust seeks to achieve its investment objectives by investing at least 80% of its assets in municipal bonds exempt from U.S. federal income taxes (except that the interest may be subject to the federal alternative minimum tax). The Trust invests at least 80% of its assets in municipal bonds that are investment grade quality, or are considered by the Trust’s investment adviser to be of comparable quality, at the time of investment. The Trust actively manages the maturity of its bonds to seek to have a dollar weighted average effective maturity approximately equal to the Trust’s maturity date. The Trust may invest directly in securities or synthetically through the use of derivatives.
There is no assurance that the Trust will achieve its investment objectives, including its investment objective of returning $25.00 per share.
Trust Information
| | |
| | |
Symbol on New York Stock Exchange | | BTT |
Initial Offering Date | | August 30, 2012 |
Termination Date (on or about) | | December 31, 2030 |
Yield on Closing Market Price as of January 31, 2023 ($22.22)(a) | | 3.05% |
Tax Equivalent Yield(b) | | 5.15% |
Current Monthly Distribution per Common Share(c) | | $0.0564 |
Current Annualized Distribution per Common Share(c) | | $0.6768 |
Leverage as of January 31, 2023(d) | | 33% |
| | (a) | Yield on closing market price is calculated by dividing the current annualized distribution per share by the closing market price. Past performance is not an indication of future results. | |
| | (b) | Tax equivalent yield assumes the maximum marginal U.S. federal tax rate of 40.8%, which includes the 3.8% Medicare tax. Actual tax rates will vary based on income, exemptions and deductions. Lower taxes will result in lower tax equivalent yields. | |
| | (c) | The distribution rate is not constant and is subject to change. | |
| | (d) | Represents RVMTP Shares and TOB Trusts as a percentage of total managed assets, which is the total assets of the Trust, including any assets attributable to RVMTP Shares and TOB Trusts, minus the sum of accrued liabilities. Does not reflect derivatives or other instruments that may give rise to economic leverage. For a discussion of leveraging techniques utilized by the Trust, please see The Benefits and Risks of Leveraging. | |
Market Price and Net Asset Value Per Share Summary
| | | | | | | | | | | | | | | | | | | | |
| | | 01/31/23 | | | 07/31/22 | | | Change | | | High | | | Low | |
| | | | | |
Closing Market Price | | | $ 22.22 | | | | $ 23.65 | | | | (6.05 | )% | | | $ 23.65 | | | | $ 20.30 | |
Net Asset Value | | | 24.00 | | | | 24.27 | | | | (1.11 | ) | | | 24.38 | | | | 22.15 | |
Performance
Returns for the period ended January 31, 2023 were as follows:
| | | | | | | | | | | | | | | | |
| | | | | | Average Annual Total Returns | |
| | | | | | | | |
| | | | |
| | | 6-month | | | 1 Year | | | 5 Years | | | 10 Years | |
| | | | |
Trust at NAV(a)(b) | | | 0.58 | % | | | (3.74 | )% | | | 3.52 | % | | | 4.14 | % |
Trust at Market Price(a)(b) | | | (4.44 | ) | | | (8.32 | ) | | | 4.09 | | | | 3.30 | |
| | | | |
Customized Reference Benchmark(c) | | | 0.95 | | | | (1.34 | ) | | | 2.64 | | | | N/A | |
Bloomberg Municipal Bond Index(d) | | | 0.73 | | | | (3.25 | ) | | | 2.07 | | | | 2.38 | |
| | (a) | All returns reflect reinvestment of dividends and/or distributions at actual reinvestment prices. Performance results reflect the Trust’s use of leverage. | |
| | (b) | The Trust’s discount to NAV widened during the period, which accounts for the difference between performance based on market price and performance based on NAV. | |
| | (c) | The Customized Reference Benchmark is comprised of the Bloomberg Municipal Bond 2030 Index (90%) and the Bloomberg Municipal Bond: High Yield (non-Investment Grade) 2030 Total Return Index (10%). The Customized Reference Benchmark commenced on September 30, 2016. | |
| | (d) | An unmanaged index that tracks the U.S. long term tax-exempt bond market, including state and local general obligation bonds, revenue bonds, pre-refunded bonds, and insured bonds. | |
Performance results may include adjustments made for financial reporting purposes in accordance with U.S. generally accepted accounting principles.
Past performance is not an indication of future results.
The Trust is presenting the performance of one or more indices for informational purposes only. The Trust is actively managed and does not seek to track or replicate the performance of any index. The index performance shown is not intended to be indicative of the Trust’s investment strategies, portfolio components or past or future performance.
More information about the Trust’s historical performance can be found in the “Closed End Funds” section of blackrock.com.
The following discussion relates to the Trust’s absolute performance based on NAV:
Municipal bonds posted slightly positive returns during the six-month period, with the benefit of income offsetting the effect of falling prices. Bond market returns, in general, were dampened by the combination of high inflation and continued interest rate increases by the Fed.
| | |
| 8 | | 2 0 2 3 BLACK ROCK SEMI - ANNUAL REPORT TO SHAREHOLDERS |
| | |
| Trust Summary as of January 31, 2023 (continued) | | BlackRock Municipal 2030 Target Term Trust (BTT) |
Holdings in higher-quality A and AA rated bonds in the transportation, school districts and healthcare sectors with maturities in the 5- to 10-year maturity range generated the highest absolute returns. Conversely, positions in bonds rated BBB or below in the 12- to 15-year part of the yield curve were a modest drag on performance. Holdings in Puerto Rico Sales Tax zero-coupon bonds slightly underperformed the market and detracted from results.
At the close of the period, the Fund was underweight duration, had a cash weighting of 3.75%, and held a position in floating rate notes to help buffer the impact of rising interest rates. (Duration is a measure of interest rate sensitivity.)
The views expressed reflect the opinions of BlackRock as of the date of this report and are subject to change based on changes in market, economic or other conditions. These views are not intended to be a forecast of future events and are no guarantee of future results.
Overview of the Trust’s Total Investments
SECTOR ALLOCATION
| | |
| | |
| Sector(a)(b) | | 01/31/23 |
| |
Transportation | | 23.5% |
Health | | 17.0 |
Corporate | | 16.3 |
County/City/Special District/School District | | 13.7 |
State | | 11.3 |
Utilities | | 7.6 |
Education | | 6.8 |
Tobacco | | 1.9 |
Housing | | 1.7 |
Other* | | 0.2 |
CREDIT QUALITY ALLOCATION
| | |
| | |
| Credit Rating(a)(d) | | 01/31/23 |
| |
AAA/Aaa | | 3.3% |
AA/Aa | | 36.9 |
A | | 38.6 |
BBB/Baa | | 9.3 |
BB/Ba | | 2.3 |
B | | 0.2 |
CCC/Caa | | —(e) |
N/R(f) | | 9.4 |
CALL/MATURITY SCHEDULE
| | |
| | |
| Calendar Year Ended December 31,(a)(c) | | Percentage |
| |
2023 | | 11.7% |
2024 | | 6.1 |
2025 | | 5.7 |
2026 | | 16.2 |
2027 | | 13.6 |
| (a) | Excludes short-term securities. |
| (b) | For Trust compliance purposes, the Trust’s sector classifications refer to one or more of the sector sub-classifications used by one or more widely recognized market indexes or rating group indexes, and/or as defined by the investment adviser. These definitions may not apply for purposes of this report, which may combine such sector sub-classifications for reporting ease. |
| (c) | Scheduled maturity dates and/or bonds that are subject to potential calls by issuers over the next five years. |
| (d) | For financial reporting purposes, credit quality ratings shown above reflect the highest rating assigned by either S&P Global Ratings or Moody’s Investors Service, Inc. if ratings differ. These rating agencies are independent, nationally recognized statistical rating organizations and are widely used. Investment grade ratings are credit ratings of BBB/Baa or higher. Below investment grade ratings are credit ratings of BB/Ba or lower. Investments designated N/R are not rated by either rating agency. Unrated investments do not necessarily indicate low credit quality. Credit quality ratings are subject to change. |
| (e) | Rounds to less than 0.1% of total investments. |
| (f) | The investment adviser evaluates the credit quality of unrated investments based upon certain factors including, but not limited to, credit ratings for similar investments and financial analysis of sectors and individual investments. Using this approach, the investment adviser has deemed certain of these unrated securities as investment grade quality. As of January 31, 2023, the market value of unrated securities deemed by the investment adviser to be investment grade represents less than 1.0% of the Trust’s total investments. |
| * | Includes one or more investment categories that individually represents less than 1.0% of the Trust’s total investments. Please refer to the Schedule of Investments for details. |
| | |
| Trust Summary as of January 31, 2023 | | BlackRock MuniHoldings California Quality Fund, Inc. (MUC) |
Investment Objective
BlackRock MuniHoldings California Quality Fund, Inc.’s (MUC) (the “Trust”) investment objective is to provide shareholders with current income exempt from U.S. federal income taxes and California personal income taxes. The Trust seeks to achieve its investment objective by investing primarily in municipal obligations exempt from U.S. federal income taxes (except that the interest may be subject to the U.S. federal alternative minimum tax) and California personal income taxes. Under normal market conditions, the Trust invests at least 80% of its assets in investment grade municipal obligations with remaining maturities of one year or more at the time of investment. The municipal obligations in which the Trust primarily invests are either rated investment grade quality, or are considered by the Trust’s investment adviser to be of comparable quality, at the time of investment. The Trust may invest up to 20% of its managed assets in securities that are rated below investment grade, or are considered by the Trust’s investment adviser to be of comparable quality, at the time of purchase. The Trust may invest directly in securities or synthetically through the use of derivatives.
No assurance can be given that the Trust’s investment objective will be achieved.
Trust Information
| | |
| | |
Symbol on New York Stock Exchange | | MUC |
Initial Offering Date | | February 27, 1998 |
Yield on Closing Market Price as of January 31, 2023 ($11.52)(a) | | 4.01% |
Tax Equivalent Yield(b) | | 8.74% |
Current Monthly Distribution per Common Share(c) | | $0.0385 |
Current Annualized Distribution per Common Share(c) | | $0.4620 |
Leverage as of January 31, 2023(d) | | 37% |
| | (a) | Yield on closing market price is calculated by dividing the current annualized distribution per share by the closing market price. Past performance is not an indication of future results. | |
| | (b) | Tax equivalent yield assumes the maximum marginal U.S. federal and state tax rate of 54.1%, which includes the 3.8% Medicare tax. Actual tax rates will vary based on income, exemptions and deductions. Lower taxes will result in lower tax equivalent yields. | |
| | (c) | The monthly distribution per Common Share, declared on March 1, 2023, was decreased to $0.0335 per share. The yield on closing market price, tax equivalent yield, current monthly distribution per Common Share, and current annualized distribution per Common Share do not reflect the new distribution rate. The new distribution rate is not constant and is subject to change in the future. | |
| | (d) | Represents VMTP Shares and TOB Trusts as a percentage of total managed assets, which is the total assets of the Trust, including any assets attributable to VMTP Shares and TOB Trusts, minus the sum of its accrued liabilities. Does not reflect derivatives or other instruments that may give rise to economic leverage. For a discussion of leveraging techniques utilized by the Trust, please see The Benefits and Risks of Leveraging and Derivative Financial Instruments. | |
Market Price and Net Asset Value Per Share Summary
| | | | | | | | | | | | | | | | | | | | |
| | | 01/31/23 | | | 07/31/22 | | | Change | | | High | | | Low | |
| | | | | |
Closing Market Price | | $ | 11.52 | | | $ | 12.58 | | | | (8.43 | )% | | $ | 12.94 | | | $ | 9.95 | |
Net Asset Value | | | 12.97 | | | | 13.42 | | | | (3.35 | ) | | | 13.52 | | | | 11.39 | |
Performance
Returns for the period ended January 31, 2023 were as follows:
| | | | | | | | | | | | | | | | |
| | | | | | Average Annual Total Returns | |
| | | | |
| | | 6-month | | | 1 Year | | | 5 Years | | | 10 Years | |
| | | | |
Trust at NAV(a)(b) | | | (0.92 | )% | | | (9.08 | )% | | | 1.25 | % | | | 2.57 | % |
Trust at Market Price(a)(b) | | | (6.12 | ) | | | (15.47 | ) | | | 1.17 | | | | 1.30 | |
| | | | |
California Customized Reference Benchmark(c) | | | 0.80 | | | | (3.19 | ) | | | 2.07 | | | | N/A | |
Bloomberg Municipal Bond Index(d) | | | 0.73 | | | | (3.25 | ) | | | 2.07 | | | | 2.38 | |
| | (a) | All returns reflect reinvestment of dividends and/or distributions at actual reinvestment prices. Performance results reflect the Trust’s use of leverage. | |
| | (b) | The Trust’s discount to NAV widened during the period, which accounts for the difference between performance based on market price and performance based on NAV. | |
| | (c) | The California Customized Reference Benchmark is comprised of the Bloomberg Municipal Bond: California Exempt Total Return Index Unhedged (90%) and the California Bloomberg Municipal Bond: High Yield (non-Investment Grade) Total Return Index (10%). The California Customized Reference Benchmark commenced on September 30, 2016. | |
| | (d) | An unmanaged index that tracks the U.S. long term tax-exempt bond market, including state and local general obligation bonds, revenue bonds, pre-refunded bonds, and insured bonds. | |
Performance results may include adjustments made for financial reporting purposes in accordance with U.S. generally accepted accounting principles.
Past performance is not an indication of future results.
The Trust is presenting the performance of one or more indices for informational purposes only. The Trust is actively managed and does not seek to track or replicate the performance of any index. The index performance shown is not intended to be indicative of the Trust’s investment strategies, portfolio components or past or future performance.
More information about the Trust’s historical performance can be found in the “Closed End Funds” section of blackrock.com.
| | |
| 10 | | 2 0 2 3 BLACK ROCK SEMI - ANNUAL REPORT TO SHAREHOLDERS |
| | |
| Trust Summary as of January 31, 2023 (continued) | | BlackRock MuniHoldings California Quality Fund, Inc. (MUC) |
The following discussion relates to the Trust’s absolute performance based on NAV:
Municipal bonds posted slightly positive returns during the six-month period, with the benefit of income offsetting the effect of falling prices. Bond market returns, in general, were dampened by the combination of high inflation and continued interest rate increases by the Fed. California municipals performed in line with the national market.
The Fund’s use of U.S. Treasury futures to manage interest rate risk added value in the rising-rate environment. (Prices and yields move in opposite directions.) Holdings in high-quality bonds, especially those in the state tax-backed, local tax-backed and utilities sectors, also helped results.
Positions in longer-dated securities detracted due to their longer duration (interest rate sensitivity). Holdings in high yield and non-rated securities, particularly in the workforce housing sector, detracted at a time in which investors preferred higher-quality bonds. Positions in short-dated issues, including pre-refunded debt, underperformed due to weakness in bonds with maturities of ten years and below. This segment, which was richly priced relative to the overall market at the beginning of the period, underperformed despite a late rally. Positions in the education and healthcare sectors, particularly A rated and longer-duration issues, also detracted.
The views expressed reflect the opinions of BlackRock as of the date of this report and are subject to change based on changes in market, economic or other conditions. These views are not intended to be a forecast of future events and are no guarantee of future results.
Overview of the Trust’s Total Investments
| | | | |
| SECTOR ALLOCATION | |
| | |
| Sector(a)(b) | | 01/31/23 | |
| |
County/City/Special District/School District | | | 34.4% | |
Transportation | | | 17.3 | |
Health | | | 14.0 | |
Utilities | | | 10.0 | |
Education | | | 9.9 | |
State | | | 7.0 | |
Housing | | | 5.2 | |
Tobacco | | | 1.1 | |
Corporate | | | 1.1 | |
| | | | |
| CALL/MATURITY SCHEDULE | |
| | |
| Calendar Year Ended December 31,(a)(c) | | Percentage | |
| |
2023 | | | 5.3% | |
2024 | | | 2.0 | |
2025 | | | 8.8 | |
2026 | | | 9.8 | |
2027 | | | 16.5 | |
| | | | |
| CREDIT QUALITY ALLOCATION | |
| | |
| Credit Rating(a)(d) | | 01/31/23 | |
| |
AAA/Aaa | | | 9.6% | |
AA/Aa | | | 56.3 | |
A | | | 18.7 | |
BBB/Baa | | | 3.4 | |
BB/Ba | | | 0.1 | |
N/R(e) | | | 11.9 | |
| (a) | Excludes short-term securities. |
| (b) | For Trust compliance purposes, the Trust’s sector classifications refer to one or more of the sector sub-classifications used by one or more widely recognized market indexes or rating group indexes, and/or as defined by the investment adviser. These definitions may not apply for purposes of this report, which may combine such sector sub-classifications for reporting ease. |
| (c) | Scheduled maturity dates and/or bonds that are subject to potential calls by issuers over the next five years. |
| (d) | For financial reporting purposes, credit quality ratings shown above reflect the highest rating assigned by either S&P Global Ratings or Moody’s Investors Service, Inc. if ratings differ. These rating agencies are independent, nationally recognized statistical rating organizations and are widely used. Investment grade ratings are credit ratings of BBB/Baa or higher. Below investment grade ratings are credit ratings of BB/Ba or lower. Investments designated N/R are not rated by either rating agency. Unrated investments do not necessarily indicate low credit quality. Credit quality ratings are subject to change. |
| (e) | The investment adviser evaluates the credit quality of unrated investments based upon certain factors including, but not limited to, credit ratings for similar investments and financial analysis of sectors and individual investments. Using this approach, the investment adviser has deemed certain of these unrated securities as investment grade quality. As of January 31, 2023, the market value of unrated securities deemed by the investment adviser to be investment grade represents less than 1.0% of the Trust’s total investments. |
| | |
| Trust Summary as of January 31, 2023 | | BlackRock MuniHoldings Quality Fund II, Inc. (MUE) |
Investment Objective
BlackRock MuniHoldings Quality Fund II, Inc.’s (MUE) (the “Trust”) investment objective is to provide shareholders with current income exempt from U.S. federal income taxes. The Trust seeks to achieve its investment objective by investing primarily in long-term, investment grade municipal obligations exempt from U.S. federal income taxes (except that the interest may be subject to the U.S. federal alternative minimum tax). The municipal obligations in which the Trust primarily invests are either rated investment grade quality, or are considered by the Trust’s investment adviser to be of comparable quality, at the time of investment. Under normal market conditions, the Trust invests at least 80% of its assets in municipal obligations with remaining maturities of one year or more at the time of investment. The Trust may invest up to 20% of its managed assets in securities that are rated below investment grade, or are considered by the Trust’s investment adviser to be of comparable quality, at the time of purchase. The Trust may invest directly in securities or synthetically through the use of derivatives.
No assurance can be given that the Trust’s investment objective will be achieved.
Trust Information
| | |
| | |
Symbol on New York Stock Exchange | | MUE |
Initial Offering Date | | February 26, 1999 |
Yield on Closing Market Price as of January 31, 2023 ($10.43)(a) | | 3.85% |
Tax Equivalent Yield(b) | | 6.50% |
Current Monthly Distribution per Common Share(c) | | $0.0335 |
Current Annualized Distribution per Common Share(c) | | $0.4020 |
Leverage as of January 31, 2023(d) | | 37% |
| | (a) | Yield on closing market price is calculated by dividing the current annualized distribution per share by the closing market price. Past performance is not an indication of future results. | |
| | (b) | Tax equivalent yield assumes the maximum marginal U.S. federal tax rate of 40.8%, which includes the 3.8% Medicare tax. Actual tax rates will vary based on income, exemptions and deductions. Lower taxes will result in lower tax equivalent yields. | |
| | (c) | The monthly distribution per Common Share, declared on March 1, 2023, was decreased to $0.0290 per share. The yield on closing market price, tax equivalent yield, current monthly distribution per Common Share, and current annualized distribution per Common Share do not reflect the new distribution rate. The new distribution rate is not constant and is subject to change in the future. | |
| | (d) | Represents VMTP Shares and TOB Trusts as a percentage of total managed assets, which is the total assets of the Trust, including any assets attributable to VMTP Shares and TOB Trusts, minus the sum of its accrued liabilities. Does not reflect derivatives or other instruments that may give rise to economic leverage. For a discussion of leveraging techniques utilized by the Trust, please see The Benefits and Risks of Leveraging and Derivative Financial Instruments. | |
Market Price and Net Asset Value Per Share Summary
| | | | | | | | | | | | | | | | | | | | |
| | | 01/31/23 | | | 07/31/22 | | | Change | | | High | | | Low | |
| | | | | |
Closing Market Price | | $ | 10.43 | | | $ | 11.45 | | | | (8.91 | )% | | $ | 11.90 | | | $ | 9.37 | |
Net Asset Value | | | 11.64 | | | | 12.10 | | | | (3.80 | ) | | | 12.18 | | | | 10.56 | |
Performance
Returns for the period ended January 31, 2023 were as follows:
| | | | | | | | | | | | | | | | |
| | | | | | Average Annual Total Returns | |
| | | | | | | | |
| | | 6-month | | | 1 Year | | | 5 Years | | | 10 Years | |
| | | | |
Trust at NAV(a)(b) | | | (1.39 | )% | | | (9.39 | )% | | | 1.36 | % | | | 2.65 | % |
Trust at Market Price(a)(b) | | | (6.62 | ) | | | (13.37 | ) | | | 0.52 | | | | 1.49 | |
| | | | |
National Customized Reference Benchmark(c) | | | 0.57 | | | | (3.59 | ) | | | 2.24 | | | | N/A | |
Bloomberg Municipal Bond Index(d) | | | 0.73 | | | | (3.25 | ) | | | 2.07 | | | | 2.38 | |
| | (a) | All returns reflect reinvestment of dividends and/or distributions at actual reinvestment prices. Performance results reflect the Trust’s use of leverage. | |
| | (b) | The Trust’s discount to NAV widened during the period, which accounts for the difference between performance based on market price and performance based on NAV. | |
| | (c) | The National Customized Reference Benchmark is comprised of the Bloomberg Municipal Bond Index Total Return Index Value Unhedged (90%) and the Bloomberg Municipal Bond: High Yield (non-Investment Grade) Total Return Index (10%). The National Customized Reference Benchmark commenced on September 30, 2016. | |
| | (d) | An unmanaged index that tracks the U.S. long term tax-exempt bond market, including state and local general obligation bonds, revenue bonds, pre-refunded bonds, and insured bonds. | |
Performance results may include adjustments made for financial reporting purposes in accordance with U.S. generally accepted accounting principles.
Past performance is not an indication of future results.
The Trust is presenting the performance of one or more indices for informational purposes only. The Trust is actively managed and does not seek to track or replicate the performance of any index. The index performance shown is not intended to be indicative of the Trust’s investment strategies, portfolio components or past or future performance.
More information about the Trust’s historical performance can be found in the “Closed End Funds” section of blackrock.com.
| | |
| 12 | | 2 0 2 3 BLACK ROCK SEMI - ANNUAL REPORT TO SHAREHOLDERS |
| | |
| Trust Summary as of January 31, 2023 (continued) | | BlackRock MuniHoldings Quality Fund II, Inc. (MUE) |
The following discussion relates to the Trust’s absolute performance based on NAV:
Municipal bonds posted slightly positive returns during the six-month period, with the benefit of income offsetting the effect of falling prices. Bond-market returns, in general, were dampened by the combination of high inflation and continued interest rate increases by the Fed.
The Fund’s use of U.S. Treasury futures to manage interest rate risk added value in the rising-rate environment. (Prices and yields move in opposite directions.) Allocations to the transportation and state tax-backed sectors contributed to performance, as did holdings in pre-refunded bonds. Positions in AAA and AA rated issues generated positive returns, as well. On the other hand, holdings in the healthcare sector and securities rated A and below detracted from results. Long-duration and low-coupon bonds (those with coupons below 5%) detracted from performance due to their higher interest rate sensitivity.
The views expressed reflect the opinions of BlackRock as of the date of this report and are subject to change based on changes in market, economic or other conditions. These views are not intended to be a forecast of future events and are no guarantee of future results.
Overview of the Trust’s Total Investments
| | | | |
| SECTOR ALLOCATION | | | | |
| | |
| Sector(a)(b) | | 01/31/23 | |
| |
Transportation | | | 31.9% | |
State | | | 14.4 | |
County/City/Special District/School District | | | 12.6 | |
Health | | | 12.1 | |
Education | | | 11.3 | |
Utilities | | | 5.8 | |
Corporate | | | 5.8 | |
Housing | | | 4.2 | |
Tobacco | | | 1.8 | |
Other* | | | 0.1 | |
| | | | |
| CALL/MATURITY SCHEDULE | | | | |
| | |
| Calendar Year Ended December 31,(a)(c) | | Percentage | |
| |
2023 | | | 24.7% | |
2024 | | | 5.7 | |
2025 | | | 4.8 | |
2026 | | | 6.2 | |
2027 | | | 13.0 | |
| | | | |
| CREDIT QUALITY ALLOCATION | | | | |
| | |
| Credit Rating(a)(d) | | 01/31/23 | |
| |
AAA/Aaa | | | 3.6% | |
AA/Aa | | | 40.4 | |
A | | | 32.6 | |
BBB/Baa | | | 8.1 | |
BB/Ba | | | 2.4 | |
B | | | 0.4 | |
N/R(e) | | | 12.5 | |
| (a) | Excludes short-term securities. |
| (b) | For Trust compliance purposes, the Trust’s sector classifications refer to one or more of the sector sub-classifications used by one or more widely recognized market indexes or rating group indexes, and/or as defined by the investment adviser. These definitions may not apply for purposes of this report, which may combine such sector sub-classifications for reporting ease. |
| (c) | Scheduled maturity dates and/or bonds that are subject to potential calls by issuers over the next five years. |
| (d) | For financial reporting purposes, credit quality ratings shown above reflect the highest rating assigned by either S&P Global Ratings or Moody’s Investors Service, Inc. if ratings differ. These rating agencies are independent, nationally recognized statistical rating organizations and are widely used. Investment grade ratings are credit ratings of BBB/Baa or higher. Below investment grade ratings are credit ratings of BB/Ba or lower. Investments designated N/R are not rated by either rating agency. Unrated investments do not necessarily indicate low credit quality. Credit quality ratings are subject to change. |
| (e) | The investment adviser evaluates the credit quality of unrated investments based upon certain factors including, but not limited to, credit ratings for similar investments and financial analysis of sectors and individual investments. Using this approach, the investment adviser has deemed certain of these unrated securities as investment grade quality. As of January 31, 2023, the market value of unrated securities deemed by the investment adviser to be investment grade represents 2.1% of the Trust’s total investments. |
| * | Includes one or more investment categories that individually represents less than 1.0% of the Trust’s total investments. Please refer to the Schedule of Investments for details. |
| | |
Schedule of Investments (unaudited) January 31, 2023 | | BlackRock California Municipal Income Trust (BFZ) (Percentages shown are based on Net Assets) |
| | | | | | | | |
| Security | | Par (000) | | | Value | |
| | |
Municipal Bonds | | | | | | | | |
| | |
California — 126.1% | | | | | | | | |
| | |
| Corporate(a) — 8.1% | | | | | | |
California Community Choice Financing Authority, RB | | | | | | | | |
5.00%, 07/01/53 | | $ | 18,500 | | | $ | 19,807,284 | |
5.00%, 12/01/53 | | | 9,690 | | | | 10,346,633 | |
Series B-1, 4.00%, 02/01/52 | | | 2,500 | | | | 2,536,245 | |
| | | | | | | | |
| | |
| | | | | | | 32,690,162 | |
|
| County/City/Special District/School District — 36.5% | |
Butte-Glenn Community College District, GO | | | | | | | | |
Series C, 4.00%, 08/01/47 | | | 5,000 | | | | 5,035,085 | |
Series A, Election 2016, 5.25%, 08/01/46 | | | 1,420 | | | | 1,536,633 | |
California Statewide Communities Development Authority, SAB, S/F Housing | | | | | | | | |
5.00%, 09/02/40 | | | 300 | | | | 317,213 | |
4.00%, 09/02/50 | | | 240 | | | | 215,457 | |
5.00%, 09/02/50 | | | 240 | | | | 249,186 | |
Series C, 5.00%, 09/02/44 | | | 595 | | | | 621,738 | |
Chino Valley Unified School District, GO, Series B, 4.00%, 08/01/45 | | | 9,210 | | | | 9,316,854 | |
City & County of San Francisco California, GO | | | | | | | | |
Series 2020, Class D-1, 4.00%, 06/15/46 | | | 2,500 | | | | 2,552,270 | |
Series 2020 D-1, 4.00%, 06/15/44 | | | 7,895 | | | | 8,066,187 | |
Series D-1, 4.00%, 06/15/41 | | | 1,215 | | | | 1,243,509 | |
Series D-1, 4.00%, 06/15/42 | | | 2,470 | | | | 2,563,667 | |
City & County of San Francisco California, Refunding COP, Class A, 4.00%, 04/01/40 | | | 9,635 | | | | 9,774,823 | |
Coast Community College District, GO, Series F, Election 2012, 0.00%, 08/01/40(b) | | | 4,500 | | | | 2,254,995 | |
Corona-Norco Unified School District, GO | | | | | | | | |
Series C, 4.00%, 08/01/49 | | | 6,315 | | | | 6,332,802 | |
Series B, Election 2014, 5.00%, 08/01/47 | | | 5,000 | | | | 5,371,615 | |
Escondido Union School District, GO, Series B, Election 2014, 4.00%, 08/01/47 | | | 2,500 | | | | 2,493,158 | |
Etiwanda School District, GO, Series A, Election 2016, 4.00%, 08/01/49 | | | 3,225 | | | | 3,228,167 | |
Folsom Cordova Unified School District, GO, Series D, (AGM), 4.00%, 10/01/44 | | | 3,040 | | | | 3,052,230 | |
Garden Grove Unified School District, GO, Election 2016, 4.00%, 08/01/45 | | | 1,320 | | | | 1,333,127 | |
Grossmont Union High School District, GO, Series I-2, 4.00%, 08/01/44 | | | 5,115 | | | | 5,144,058 | |
Grossmont-Cuyamaca Community College District, GO, Series B, Election 2012, 4.00%, 08/01/47 | | | 2,035 | | | | 2,043,598 | |
Hartnell Community College District, GO | | | | | | | | |
Series B, 3.00%, 08/01/45 | | | 1,215 | | | | 1,016,569 | |
Series A, Election 2016, 4.00%, 08/01/47 | | | 4,560 | | | | 4,586,977 | |
Long Beach Community College District, GO, Series C, 4.00%, 08/01/49 | | | 4,175 | | | | 4,193,683 | |
Los Angeles County Metropolitan Transportation Authority Sales Tax Revenue, RB, Series A, 4.00%, 06/01/37 | | | 3,075 | | | | 3,267,892 | |
Marin Healthcare District, GO, Series A, Election 2013, 4.00%, 08/01/40 | | | 2,030 | | | | 2,057,371 | |
Mount San Antonio Community College District, Refunding GO, Series 2018-A, Election 2018, 4.00%, 08/01/49 | | | 3,000 | | | | 3,019,689 | |
Mount San Jacinto Community College District, GO, Series B, Election 2014, 4.00%, 08/01/43 | | | 2,000 | | | | 2,011,362 | |
| | | | | | | | |
| Security | | Par (000) | | | Value | |
|
| County/City/Special District/School District (continued) | |
Municipal Improvement Corp. of Los Angeles, Refunding RB, Series B, 4.00%, 11/01/34 | | $ | 3,530 | | | $ | 3,673,477 | |
Napa Valley Unified School District, GO, Series A, Election 2016, 4.00%, 08/01/38 | | | 2,925 | | | | 2,996,475 | |
Ohlone Community College District, Refunding GO, 4.00%, 08/01/35 | | | 3,790 | | | | 3,942,468 | |
Peralta Community College District, GO, 5.25%, 08/01/37 | | | 1,000 | | | | 1,176,807 | |
Pomona Unified School District, GO | | | | | | | | |
Series F, (BAM), 4.00%, 08/01/48 | | | 1,550 | | | | 1,554,748 | |
Series H, (BAM), 4.00%, 08/01/40 | | | 3,750 | | | | 3,797,760 | |
San Bernardino City Unified School District, GO, Series D, Election 2012, (AGM), 4.00%, 08/01/42 | | | 1,210 | | | | 1,228,871 | |
San Diego Unified School District, GO | | | | | | | | |
Series D2, 4.00%, 07/01/50 | | | 7,720 | | | | 7,737,347 | |
Series L, 4.00%, 07/01/44 | | | 4,035 | | | | 4,078,965 | |
San Lorenzo Unified School District, GO, 4.00%, 08/01/41 | | | 345 | | | | 352,893 | |
San Lorenzo Valley Unified School District, GO, Series B, Election 2020, 4.00%, 08/01/49 | | | 1,000 | | | | 982,275 | |
San Mateo Foster City Public Financing Authority, RB, 4.00%, 05/01/48 | | | 3,250 | | | | 3,222,859 | |
Santa Clara Unified School District, GO, Election 2014, 4.00%, 07/01/41 | | | 5,000 | | | | 5,081,870 | |
Santa Monica Community College District, GO, Series A, Election 2016, 4.00%, 08/01/47 | | | 5,000 | | | | 5,034,770 | |
Vacaville Unified School District, GO, Series D, 4.00%, 08/01/45 | | | 5,405 | | | | 5,418,631 | |
West Valley-Mission Community College District, GO, Series A, AMT, 4.00%, 08/01/44 | | | 4,000 | | | | 4,108,176 | |
| | | | | | | | |
| | |
| | | | | | | 147,288,307 | |
| | |
| Education — 6.3% | | | | | | |
California Enterprise Development Authority, Refunding RB(c) | | | | | | | | |
Series A, 4.00%, 06/01/36 | | | 500 | | | | 450,033 | |
Series A, 4.00%, 06/01/51 | | | 375 | | | | 293,761 | |
California Municipal Finance Authority, RB(c) | | | | | | | | |
Series A, 5.00%, 10/01/39 | | | 220 | | | | 212,786 | |
Series A, 5.00%, 10/01/49 | | | 370 | | | | 338,595 | |
Series A, 5.00%, 10/01/57 | | | 725 | | | | 646,568 | |
California Municipal Finance Authority, Refunding RB(c) | | | | | | | | |
5.00%, 08/01/39 | | | 425 | | | | 417,792 | |
5.00%, 08/01/48 | | | 510 | | | | 469,660 | |
California School Finance Authority, RB(c) | | | | | | | | |
5.00%, 06/01/40 | | | 270 | | | | 271,718 | |
5.00%, 06/01/50 | | | 430 | | | | 420,730 | |
Series A, 4.00%, 06/01/41 | | | 600 | | | | 520,262 | |
Series A, 5.00%, 06/01/49 | | | 1,000 | | | | 905,621 | |
Series A, 5.00%, 06/01/58 | | | 2,120 | | | | 1,984,988 | |
Fremont Unified School District Alameda County California, GO, Series E, Election 2014, 4.00%, 08/01/43 | | | 7,790 | | | | 7,927,244 | |
Hastings Campus Housing Finance Authority, RB(c) | | | | | | | | |
Series A, 5.00%, 07/01/45 | | | 355 | | | | 310,190 | |
Series A, 5.00%, 07/01/61 | | | 3,000 | | | | 2,460,276 | |
University of California, Refunding RB | | | | | | | | |
Series BE, 4.00%, 05/15/47 | | | 4,500 | | | | 4,578,858 | |
Series BH, 4.00%, 05/15/46 | | | 3,215 | | | | 3,266,466 | |
| | | | | | | | |
| | |
| | | | | | | 25,475,548 | |
| | |
| 14 | | 2 0 2 3 BLACK ROCK SEMI - ANNUAL REPORT TO SHAREHOLDERS |
| | |
Schedule of Investments (unaudited) (continued) January 31, 2023 | | BlackRock California Municipal Income Trust (BFZ) (Percentages shown are based on Net Assets) |
| | | | | | | | |
| Security | | Par (000) | | | Value | |
| | |
Health — 16.7% | | | | | | | | |
California Health Facilities Financing Authority, RB | | | | | | | | |
5.00%, 11/15/42 | | $ | 1,000 | | | $ | 1,059,864 | |
Series A, 5.00%, 11/15/48 | | | 6,190 | | | | 6,446,774 | |
California Health Facilities Financing Authority, Refunding RB | | | | | | | | |
Series A, 4.00%, 04/01/38 | | | 3,000 | | | | 3,012,948 | |
Series A, 4.00%, 03/01/39 | | | 2,405 | | | | 2,408,307 | |
Series A, 4.00%, 08/15/40 | | | 1,350 | | | | 1,425,118 | |
Series A, 4.00%, 11/15/40 | | | 2,425 | | | | 2,465,531 | |
Series A, 4.00%, 04/01/44 | | | 4,810 | | | | 4,602,655 | |
Series A, 4.00%, 04/01/45 | | | 7,110 | | | | 6,803,659 | |
Series A, 4.00%, 08/15/48 | | | 13,935 | | | | 13,881,016 | |
Series A, 5.00%, 11/15/48 | | | 5,000 | | | | 5,207,545 | |
Series A, 4.00%, 04/01/49 | | | 940 | | | | 890,716 | |
Series A-2, 4.00%, 11/01/44 | | | 1,250 | | | | 1,257,364 | |
California Municipal Finance Authority, Refunding RB, Series A, 5.00%, 11/01/39(c) | | | 195 | | | | 199,074 | |
California Public Finance Authority, RB | | | | | | | | |
Series A, 4.00%, 07/15/42 | | | 1,785 | | | | 1,812,271 | |
Series A, 4.00%, 07/15/51 | | | 7,500 | | | | 7,501,890 | |
California Statewide Communities Development Authority, Refunding RB, 5.00%, 10/01/45 | | | 1,860 | | | | 1,907,123 | |
Regents of the University of California Medical Center Pooled Revenue, RB | | | | | | | | |
Series P, 4.00%, 05/15/43 | | | 4,445 | | | | 4,561,610 | |
Series P, 5.00%, 05/15/47 | | | 2,000 | | | | 2,225,388 | |
| | | | | | | | |
| | |
| | | | | | | 67,668,853 | |
| | |
| Housing — 3.7% | | | | | | |
California Community Housing Agency, RB, M/F Housing(c)
4.00%, 08/01/46 | | | 805 | | | | 680,619 | |
Series A, 5.00%, 04/01/49 | | | 2,770 | | | | 2,486,873 | |
Series A-2, 4.00%, 02/01/50 | | | 375 | | | | 303,200 | |
California Housing Finance Agency, RB, M/F Housing, Series A, AMT, 4.25%, 01/15/35 | | | 1 | | | | 684 | |
CMFA Special Finance Agency VII, RB, M/F Housing, Series A1, 3.00%, 08/01/56(c) | | | 340 | | | | 244,808 | |
CMFA Special Finance Agency VIII, RB, M/F Housing, Series A-1, 3.00%, 08/01/56(c) | | | 1,400 | | | | 986,011 | |
CMFA Special Finance Agency XII, RB, M/F Housing, Series A, 3.25%, 02/01/57(c) | | | 975 | | | | 717,098 | |
CMFA Special Finance Agency, RB, M/F Housing, Series A-1, 3.00%, 12/01/56(c) | | | 750 | | | | 520,432 | |
CSCDA Community Improvement Authority, RB, M/F Housing(c) | | | | | | | | |
2.80%, 03/01/47 | | | 825 | | | | 634,874 | |
4.00%, 07/01/56 | | | 1,260 | | | | 983,424 | |
4.00%, 08/01/56 | | | 2,895 | | | | 2,406,825 | |
4.00%, 10/01/56 | | | 345 | | | | 296,577 | |
4.00%, 12/01/56 | | | 265 | | | | 196,476 | |
4.00%, 05/01/57 | | | 1,840 | | | | 1,346,562 | |
Series A, 3.00%, 09/01/56 | | | 480 | | | | 331,110 | |
Series A, 4.00%, 06/01/58 | | | 2,085 | | | | 1,748,028 | |
Series A-2, 3.00%, 02/01/57 | | | 525 | | | | 371,256 | |
Series B, Sub Lien, 4.00%, 12/01/59 | | | 1,095 | | | | 768,265 | |
| | | | | | | | |
| | |
| | | | | | | 15,023,122 | |
| | |
| State — 7.9% | | | | | | |
California State Public Works Board, RB 4.00%, 11/01/46 | | | 2,000 | | | | 2,024,590 | |
Series B, 4.00%, 05/01/39 | | | 1,560 | | | | 1,644,391 | |
| | | | | | | | |
| Security | | Par (000) | | | Value | |
| | |
| State (continued) | | | | | | |
California State Public Works Board, RB (continued) | | | | | | | | |
Series D, 4.00%, 05/01/40 | | $ | 5,725 | | | $ | 5,864,678 | |
Series D, 4.00%, 05/01/42 | | | 5,000 | | | | 5,072,435 | |
Series D, 4.00%, 05/01/45 | | | 3,740 | | | | 3,735,460 | |
Series D, 4.00%, 05/01/46 | | | 1,450 | | | | 1,438,696 | |
California Statewide Communities Development Authority, SAB | | | | | | | | |
Series A, 5.00%, 09/02/39 | | | 275 | | | | 290,931 | |
Series A, 5.00%, 09/02/44 | | | 160 | | | | 167,190 | |
Series A, 5.00%, 09/02/48 | | | 160 | | | | 165,996 | |
Series B, 5.00%, 09/02/52 | | | 565 | | | | 543,532 | |
State of California, Refunding GO | | | | | | | | |
4.00%, 11/01/40 | | | 1,945 | | | | 2,007,851 | |
5.00%, 04/01/42 | | | 3,185 | | | | 3,690,479 | |
4.00%, 10/01/44 | | | 5,050 | | | | 5,181,355 | |
| | | | | | | | |
| | |
| | | | | | | 31,827,584 | |
| | |
| Tobacco — 3.5% | | | | | | |
California County Tobacco Securitization Agency, Refunding RB | | | | | | | | |
5.00%, 06/01/50 | | | 265 | | | | 267,654 | |
Series A, 4.00%, 06/01/49 | | | 1,745 | | | | 1,598,959 | |
California County Tobacco Securitization Agency, Refunding RB, CAB(b) 0.00%, 06/01/55 | | | 2,425 | | | | 443,327 | |
Series B-2, Subordinate, 0.00%, 06/01/55 | | | 1,755 | | | | 317,130 | |
Golden State Tobacco Securitization Corp., Refunding RB, Series B, 5.00%, 06/01/51 | | | 7,000 | | | | 7,420,490 | |
Tobacco Securitization Authority of Southern California, Refunding RB, 5.00%, 06/01/48 | | | 4,000 | | | | 4,173,516 | |
| | | | | | | | |
| | |
| | | | | | | 14,221,076 | |
| | |
| Transportation — 27.7% | | | | | | |
Bay Area Toll Authority, Refunding RB | | | | | | | | |
4.00%, 04/01/37 | | | 7,600 | | | | 7,837,774 | |
4.00%, 04/01/49 | | | 4,835 | | | | 4,852,764 | |
City of Long Beach California Harbor Revenue, RB, Series A, AMT, 5.00%, 05/15/44 | | | 2,500 | | | | 2,727,722 | |
City of Los Angeles Department of Airports, RB | | | | | | | | |
AMT, 4.00%, 05/15/44 | | | 940 | | | | 921,621 | |
AMT, 5.25%, 05/15/47 | | | 3,000 | | | | 3,262,236 | |
Series A, AMT, 5.25%, 05/15/48 | | | 1,990 | | | | 2,096,714 | |
Series B, AMT, 5.00%, 05/15/41 | | | 6,000 | | | | 6,216,618 | |
Series B, AMT, 5.00%, 05/15/46 | | | 7,860 | | | | 8,078,131 | |
Series C, AMT, Subordinate, 5.00%, 05/15/44 | | | 2,875 | | | | 3,000,258 | |
City of Los Angeles Department of Airports, Refunding RB | | | | | | | | |
AMT, 5.25%, 05/15/47 | | | 2,250 | | | | 2,446,677 | |
Series A, AMT, 5.00%, 05/15/40 | | | 4,450 | | | | 4,840,198 | |
Series A, AMT, Subordinate, 5.00%, 05/15/37 | | | 4,800 | | | | 5,177,102 | |
County of Sacramento California Airport System Revenue, Refunding RB, Series C, AMT, 5.00%, 07/01/39 | | | 1,000 | | | | 1,049,820 | |
Norman Y Mineta San Jose International Airport SJC, Refunding RB | | | | | | | | |
Series A, AMT, 5.00%, 03/01/37 | | | 1,280 | | | | 1,342,371 | |
Series A, AMT, 5.00%, 03/01/47 | | | 2,500 | | | | 2,570,213 | |
Port of Los Angeles, Refunding ARB, Series A, AMT, 5.00%, 08/01/44 | | | 11,190 | | | | 11,334,228 | |
Port of Los Angeles, Refunding RB | | | | | | | | |
Series B, 4.00%, 08/01/35 | | | 2,685 | | | | 2,777,318 | |
Series C, 4.00%, 08/01/39 | | | 3,295 | | | | 3,343,667 | |
| | |
SCHEDULE OF INVESTMENTS | | 15 |
| | |
Schedule of Investments (unaudited) (continued) January 31, 2023 | | BlackRock California Municipal Income Trust (BFZ) (Percentages shown are based on Net Assets) |
| | | | | | | | |
| Security | | Par (000) | | | Value | |
| |
| | |
| Transportation (continued) | | | | | | |
San Diego County Regional Airport Authority, ARB, Series B, AMT, Subordinate, 5.00%, 07/01/51 | | $ | 1,500 | | | $ | 1,584,204 | |
San Diego County Regional Airport Authority, RB, Series A, Subordinate, 4.00%, 07/01/41 | | | 1,090 | | | | 1,107,075 | |
San Diego County Regional Airport Authority, Refunding ARB, Series A, Subordinate, 4.00%, 07/01/38 | | | 3,400 | | | | 3,443,095 | |
San Diego County Regional Airport Authority, Refunding RB, Series B, AMT, Subordinate, 5.00%, 07/01/34 | | | 2,000 | | | | 2,173,466 | |
San Francisco City & County Airport Comm-San | | | | | | | | |
Francisco International Airport, Refunding RB | | | | | | | | |
Series A, AMT, 5.00%, 05/01/47 | | | 16,735 | | | | 17,267,608 | |
Series B, AMT, 5.00%, 05/01/41 | | | 12,085 | | | | 12,437,918 | |
| | | | | | | | |
| | |
| | | | | | | 111,888,798 | |
| | |
| Utilities — 15.7% | | | | | | |
City of Los Angeles California Wastewater System Revenue, Refunding RB, Series A, Subordinate, 4.00%, 06/01/52 | | | 5,400 | | | | 5,441,904 | |
City of San Francisco California Public Utilities Commission Water Revenue, RB | | | | | | | | |
Series C, 4.00%, 11/01/45 | | | 1,085 | | | | 1,092,523 | |
Series C, 4.00%, 11/01/50 | | | 2,000 | | | | 2,013,594 | |
Contra Costa Water District, Refunding RB, Series V, 5.00%, 10/01/44 | | | 2,310 | | | | 2,574,292 | |
Los Angeles Department of Water & Power Water System Revenue, RB, Series A, 5.00%, 07/01/43 | | | 8,380 | | | | 9,103,395 | |
Los Angeles Department of Water & Power Water System Revenue, Refunding RB | | | | | | | | |
Series C, 5.00%, 07/01/41 | | | 985 | | | | 1,144,664 | |
Series C, 5.00%, 07/01/42 | | | 845 | | | | 972,738 | |
Los Angeles Department of Water & Power, Refunding RB | | | | | | | | |
Series B, 5.00%, 07/01/46 | | | 215 | | | | 240,003 | |
Series C, 5.00%, 07/01/43 | | | 4,750 | | | | 5,426,676 | |
Orange County Water District, Refunding RB, Series A, 4.00%, 08/15/41 | | | 1,100 | | | | 1,119,363 | |
Poway Public Financing Authority, RB, Series A, (BAM), 4.00%, 06/01/46 | | | 2,000 | | | | 2,018,094 | |
Sacramento Municipal Utility District, Refunding RB, Series H, 4.00%, 08/15/45 | | | 26,935 | | | | 27,238,611 | |
San Mateo Foster City Public Financing Authority, RB, 4.00%, 08/01/44 | | | 4,800 | | | | 4,867,646 | |
| | | | | | | | |
| | |
| | | | | | | 63,253,503 | |
| | | | | | | | |
| | |
Total Municipal Bonds in California | | | | | | | 509,336,953 | |
| | |
| Puerto Rico — 4.5% | | | | | | |
| | |
| State — 4.5% | | | | | | |
Puerto Rico Sales Tax Financing Corp. Sales Tax Revenue, RB | | | | | | | | |
Series A-1, Restructured, 4.75%, 07/01/53 | | | 2,845 | | | | 2,709,862 | |
Series A-1, Restructured, 5.00%, 07/01/58 | | | 8,279 | | | | 8,156,885 | |
Series A-2, Restructured, 4.78%, 07/01/58 | | | 2,530 | | | | 2,408,267 | |
Series A-2, Restructured, 4.33%, 07/01/40 | | | 2,588 | | | | 2,474,858 | |
Puerto Rico Sales Tax Financing Corp. Sales Tax Revenue, RB, CAB, Series A-1, Restructured, 0.00%, 07/01/46(b) | | | 8,577 | | | | 2,381,730 | |
| | | | | | | | |
| | |
Total Municipal Bonds in Puerto Rico | | | | | | | 18,131,602 | |
| | | | | | | | |
| | |
Total Municipal Bonds — 130.6%
(Cost: $517,207,543) | | | | | | | 527,468,555 | |
| | | | | | | | |
| | | | | | | | |
| Security | | Par (000) | | | Value | |
| |
|
Municipal Bonds Transferred to Tender Option Bond Trusts(d) | |
| | |
California — 19.0% | | | | | | | | |
|
| County/City/Special District/School District — 8.6% | |
Clovis Unified School District, GO, Election 2020, Series B, 5.00%, 08/01/47 | | $ | 10,000 | | | $ | 10,999,990 | |
Los Angeles County Metropolitan Transportation Authority Sales Tax Revenue, Refunding RB, Series A, 5.00%, 07/01/44 | | | 11,200 | | | | 12,292,554 | |
Los Angeles Unified School District, GO, 5.25%, 07/01/47 | | | 10,000 | | | | 11,527,990 | |
| | | | | | | | |
| | |
| | | | | | | 34,820,534 | |
| | |
| Health — 4.3% | | | | | | |
Regents of the University of California Medical Center Pooled Revenue, RB, Series P, 5.00%, 05/15/47 | | | 15,620 | | | | 17,380,280 | |
| | | | | | | | |
| | |
Utilities — 6.1% | | | | | | | | |
Los Angeles Department of Water & Power, RB, Series A, 5.00%, 07/01/42 | | | 10,670 | | | | 11,466,644 | |
San Francisco City & County Public Utilities Commission Wastewater Revenue, Refunding RB, Series A, 4.00%, 10/01/49 | | | 12,790 | | | | 12,923,700 | |
| | | | | | | | |
| | |
| | | | | | | 24,390,344 | |
| | | | | | | | |
| | |
Total Municipal Bonds in California | | | | | | | 76,591,158 | |
| | | | | | | | |
| | |
Total Municipal Bonds Transferred to Tender Option Bond Trusts — 19.0%
(Cost: $74,770,483) | | | | | | | 76,591,158 | |
| | | | | | | | |
| | |
Total Long-Term Investments — 149.6%
(Cost: $591,978,026) | | | | | | | 604,059,713 | |
| | | | | | | | |
| | |
| | | Shares | | | | |
| |
| | |
Short-Term Securities | | | | | | | | |
| | |
Money Market Funds — 1.0% | | | | | | | | |
BlackRock Liquidity Funds California Money Fund, Institutional Class, 1.00%(e)(f) | | | 4,188,121 | | | | 4,186,027 | |
| | | | | | | | |
| | |
Total Short-Term Securities — 1.0%
(Cost: $4,185,288) | | | | | | | 4,186,027 | |
| | | | | | | | |
| | |
Total Investments — 150.6%
(Cost: $596,163,314) | | | | | | | 608,245,740 | |
| | |
Other Assets Less Liabilities — 0.5% | | | | | | | 2,183,096 | |
| | |
Liability for TOB Trust Certificates, Including Interest Expense and Fees Payable — (8.7)% | | | | | | | (35,261,458 | ) |
| | |
VMTP Shares at Liquidation Value, Net of Deferred Offering Costs — (42.4)% | | | | | | | (171,300,000 | ) |
| | | | | | | | |
| | |
Net Assets Applicable to Common
Shares — 100.0% | | | | | | $ | 403,867,378 | |
| | | | | | | | |
| (a) | Variable rate security. Interest rate resets periodically. The rate shown is the effective interest rate as of period end. Security description also includes the reference rate and spread if published and available. |
| (c) | Security exempt from registration pursuant to Rule 144A under the Securities Act of 1933, as amended. These securities may be resold in transactions exempt from registration to qualified institutional investors. |
| (d) | Represent bonds transferred to a TOB Trust in exchange of cash and residual certificates received by the Trust. These bonds serve as collateral in a secured borrowing. See Note 4 of the Notes to Financial Statements for details. |
| (e) | Affiliate of the Trust. |
| (f) | Annualized 7-day yield as of period end. |
| | |
| 16 | | 2 0 2 3 BLACK ROCK SEMI - ANNUAL REPORT TO SHAREHOLDERS |
| | |
Schedule of Investments (unaudited) (continued) January 31, 2023 | | BlackRock California Municipal Income Trust (BFZ) |
For Trust compliance purposes, the Trust’s sector classifications refer to one or more of the sector sub-classifications used by one or more widely recognized market indexes or rating group indexes, and/or as defined by the investment adviser. These definitions may not apply for purposes of this report, which may combine such sector sub-classifications for reporting ease.
Affiliates
Investments in issuers considered to be affiliate(s) of the Trust during the six months ended January 31, 2023 for purposes of Section 2(a)(3) of the Investment Company Act of 1940, as amended, were as follows:
| | | | | | | | | | | | | | | | | | | | | | | | | | | | | | | | | | | | |
| | | | | | | | | | |
| Affiliated Issuer | | Value at
07/31/22 | | | Purchases
at Cost | | | Proceeds
from Sales | | | Net
Realized
Gain (Loss) | | | Change in
Unrealized
Appreciation
(Depreciation) | | | Value at
01/31/23 | | | Shares
Held at
01/31/23 | | | Income | | | Capital Gain
Distributions
from
Underlying
Funds | |
| | | | | | | | | |
BlackRock Liquidity Funds California Money Fund, Institutional Class | | $ | 2,559,236 | | | $ | 1,628,431 | (a) | | $ | — | | | $ | (2,377 | ) | | $ | 737 | | | $ | 4,186,027 | | | | 4,188,121 | | | $ | 61,270 | | | $ | — | |
| | | | | | | | | | | | | | | | | | | | | | | | | | | | | | | | |
| | (a) | Represents net amount purchased (sold). | |
Derivative Financial Instruments Outstanding as of Period End
Futures Contracts
| | | | | | | | | | | | | | | | |
| | | | | |
| Description | | Number of
Contracts | | | Expiration
Date | | | Notional
Amount (000) | | | Value/
Unrealized
Appreciation
(Depreciation) | |
| | | | |
Short Contracts | | | | | | | | | | | | | | | | |
10-Year U.S. Treasury Note | | | 186 | | | | 03/22/23 | | | $ | 21,355 | | | $ | (144,873 | ) |
U.S. Long Bond | | | 332 | | | | 03/22/23 | | | | 43,357 | | | | (775,810 | ) |
5-Year U.S. Treasury Note | | | 164 | | | | 03/31/23 | | | | 17,950 | | | | (116,446 | ) |
| | | | | | | | | | | | | | | | |
| | | | |
| | | | | | | | | | | | | | $ | (1,037,129 | ) |
| | | | | | | | | | | | | | | | |
Derivative Financial Instruments Categorized by Risk Exposure
As of period end, the fair values of derivative financial instruments located in the Statements of Assets and Liabilities were as follows:
| | | | | | | | | | | | | | | | | | | | | | | | | | | | |
| | | | | | | | |
| | | Commodity
Contracts | | | Credit
Contracts | | | Equity
Contracts | | | Foreign
Currency
Exchange
Contracts | | | Interest
Rate
Contracts | | | Other
Contracts | | | Total | |
| | | | | | | |
Liabilities — Derivative Financial Instruments | | | | | | | | | | | | | | | | | | | | | | | | | | | | |
Futures contracts | | | | | | | | | | | | | | | | | | | | | | | | | | | | |
Unrealized depreciation on futures contracts(a) | | $ | — | | | $ | — | | | $ | — | | | $ | — | | | $ | 1,037,129 | | | $ | — | | | $ | 1,037,129 | |
| | | | | | | | | | | | | | | | | | | | | | | | | | | | |
| | (a) | Net cumulative unrealized appreciation (depreciation) on futures contracts and centrally cleared swaps, if any, are reported in the Schedule of Investments. In the Statements of Assets and Liabilities, only current day’s variation margin is reported in receivables or payables and the net cumulative unrealized appreciation (depreciation) is included in accumulated earnings (loss). | |
For the period ended January 31, 2023, the effect of derivative financial instruments in the Statements of Operations was as follows:
| | | | | | | | | | | | | | | | | | | | | | | | | | | | |
| | | | | | | | |
| | | Commodity
Contracts | | | Credit
Contracts | | | Equity
Contracts | | | Foreign
Currency
Exchange
Contracts | | | Interest
Rate
Contracts | | | Other
Contracts | | | Total | |
| | | | | | | |
Net Realized Gain (Loss) from: | | | | | | | | | | | | | | | | | | | | | | | | | | | | |
Futures contracts | | $ | — | | | $ | — | | | $ | — | | | $ | — | | | $ | 5,704,843 | | | $ | — | | | $ | 5,704,843 | |
| | | | | | | | | | | | | | | | | | | | | | | | | | | | |
| | | | | |
Net Change in Unrealized Appreciation
(Depreciation) on: | | | | | | | | | | | | | | | | | | | | | |
Futures contracts | | $ | — | | | $ | — | | | $ | — | | | $ | — | | | $ | 1,533,732 | | | $ | — | | | $ | 1,533,732 | |
| | | | | | | | | | | | | | | | | | | | | | | | | | | | |
| | |
SCHEDULE OF INVESTMENTS | | 17 |
| | |
Schedule of Investments (unaudited) (continued) January 31, 2023 | | BlackRock California Municipal Income Trust (BFZ) |
Average Quarterly Balances of Outstanding Derivative Financial Instruments
| | | | |
| | |
Futures contracts: | | | | |
Average notional value of contracts — short | | $ | 96,908,797 | |
For more information about the Trust’s investment risks regarding derivative financial instruments, refer to the Notes to Financial Statements.
Fair Value Hierarchy as of Period End
Various inputs are used in determining the fair value of financial instruments. For a description of the input levels and information about the Trust’s policy regarding valuation of financial instruments, refer to the Notes to Financial Statements.
The following table summarizes the Trust’s financial instruments categorized in the fair value hierarchy. The breakdown of the Trust’s financial instruments into major categories is disclosed in the Schedule of Investments above.
| | | | | | | | | | | | | | | | |
| | | | | |
| | | Level 1 | | | Level 2 | | | Level 3 | | | Total | |
| | | | |
Assets | | | | | | | | | | | | | | | | |
Investments | | | | | | | | | | | | | | | | |
Long-Term Investments | | | | | | | | | | | | | | | | |
Municipal Bonds | | $ | — | | | $ | 527,468,555 | | | $ | — | | | $ | 527,468,555 | |
Municipal Bonds Transferred to Tender Option Bond Trusts | | | — | | | | 76,591,158 | | | | — | | | | 76,591,158 | |
Short-Term Securities | | | | | | | | | | | | | | | | |
Money Market Funds | | | 4,186,027 | | | | — | | | | — | | | | 4,186,027 | |
| | | | | | | | | | | | | | | | |
| | | | |
| | $ | 4,186,027 | | | $ | 604,059,713 | | | $ | — | | | $ | 608,245,740 | |
| | | | | | | | | | | | | | | | |
Derivative Financial Instruments(a) | | | | | | | | | | | | | | | | |
Liabilities | | | | | | | | | | | | | | | | |
Interest Rate Contracts | | $ | (1,037,129 | ) | | $ | — | | | $ | — | | | $ | (1,037,129 | ) |
| | | | | | | | | | | | | | | | |
| | (a) | Derivative financial instruments are futures contracts. Futures contracts are valued at the unrealized appreciation (depreciation) on the instrument. | |
The Trust may hold assets and/or liabilities in which the fair value approximates the carrying amount for financial statement purposes. As of period end, such assets and/or liabilities are categorized within the fair value hierarchy as follows:
| | | | | | | | | | | | | | | | |
| | | | | |
| | | Level 1 | | | Level 2 | | | Level 3 | | | Total | |
| | | | |
Liabilities | | | | | | | | | | | | | | | | |
TOB Trust Certificates | | $ | — | | | $ | (35,140,000 | ) | | $ | — | | | $ | (35,140,000 | ) |
VMTP Shares at Liquidation Value | | | — | | | | (171,300,000 | ) | | | — | | | | (171,300,000 | ) |
| | | | | | | | | | | | | | | | |
| | | | |
| | $ | — | | | $ | (206,440,000 | ) | | $ | — | | | $ | (206,440,000 | ) |
| | | | | | | | | | | | | | | | |
See notes to financial statements.
| | |
| 18 | | 2 0 2 3 BLACK ROCK SEMI - ANNUAL REPORT TO SHAREHOLDERS |
| | |
Schedule of Investments (unaudited) January 31, 2023 | | BlackRock Municipal 2030 Target Term Trust (BTT) (Percentages shown are based on Net Assets) |
| | | | | | | | |
| Security | | Par (000) | | | Value | |
| | |
Municipal Bonds | | | | | | | | |
| | |
Alabama — 6.9% | | | | | | | | |
Alabama Economic Settlement Authority, RB, Series A, 4.00%, 09/15/33 | | $ | 5,000 | | | $ | 5,165,930 | |
Alabama Public School and College Authority, Refunding RB, Series A, 5.00%, 11/01/30 | | | 11,900 | | | | 14,276,037 | |
Alabama Special Care Facilities Financing Authority- Birmingham Alabama, Refunding RB, 5.00%, 06/01/30 | | | 10,000 | | | | 10,534,850 | |
Birmingham-Jefferson Civic Center Authority, ST | | | | | | | | |
Series A, 5.00%, 07/01/31 | | | 1,100 | | | | 1,225,764 | |
Series A, 5.00%, 07/01/32 | | | 1,150 | | | | 1,277,913 | |
Series A, 5.00%, 07/01/33 | | | 1,600 | | | | 1,773,087 | |
Black Belt Energy Gas District, RB(a) | | | | | | | | |
4.00%, 10/01/52 | | | 12,025 | | | | 12,010,678 | |
Series B-2, 4.36%, 12/01/48 | | | 5,000 | | | | 4,995,545 | |
Black Belt Energy Gas District, Refunding RB, 4.00%, 06/01/51(a) | | | 8,930 | | | | 9,082,944 | |
County of Jefferson Alabama Sewer Revenue, Refunding RB, CAB(b) | | | | | | | | |
Series B, Senior Lien, (AGM), 0.00%, 10/01/31 | | | 7,375 | | | | 4,601,071 | |
Series B, Senior Lien, (AGM), 0.00%, 10/01/32 | | | 6,295 | | | | 3,648,733 | |
Series B, Senior Lien, (AGM), 0.00%, 10/01/33 | | | 1,275 | | | | 692,518 | |
Homewood Educational Building Authority, Refunding RB | | | | | | | | |
Series A, 5.00%, 12/01/33 | | | 1,010 | | | | 1,095,274 | |
Series A, 5.00%, 12/01/34 | | | 1,380 | | | | 1,491,151 | |
Orange Beach Water Sewer & Fire Protection Authority, RB, 4.00%, 05/15/30 | | | 510 | | | | 553,156 | |
Southeast Energy Authority A Cooperative District, RB(a) | | | | | | | | |
Series A-2, 5.47%, 01/01/53 | | | 30,265 | | | | 30,948,323 | |
Series B-1, 5.00%, 05/01/53 | | | 9,375 | | | | 9,878,822 | |
University of South Alabama, Refunding RB | | | | | | | | |
(AGM), 5.00%, 11/01/29 | | | 1,105 | | | | 1,189,296 | |
(AGM), 5.00%, 11/01/30 | | | 2,000 | | | | 2,151,832 | |
| | | | | | | | |
| | |
| | | | | | | 116,592,924 | |
| | |
| Arizona — 2.4% | | | | | | |
Arizona Health Facilities Authority, Refunding RB, Series B, 5.00%, 02/01/33 | | | 1,810 | | | | 1,812,369 | |
Arizona Industrial Development Authority, RB(c) | | | | | | | | |
4.00%, 07/01/29 | | | 650 | | | | 642,912 | |
4.50%, 07/01/29 | | | 765 | | | | 754,216 | |
4.00%, 07/01/30 | | | 620 | | | | 596,617 | |
Series A, 4.00%, 07/01/29 | | | 4,135 | | | | 3,963,583 | |
Arizona Sports & Tourism Authority, Refunding RB, Senior Lien, (BAM), 5.00%, 07/01/30 | | | 12,000 | | | | 13,791,444 | |
Industrial Development Authority of the City of Phoenix Arizona, RB
6.00%, 07/01/23(d) | | | 100 | | | | 101,400 | |
Series A, 5.75%, 07/01/24(c) | | | 325 | | | | 327,915 | |
Series A, 5.00%, 07/01/33 | | | 1,000 | | | | 1,000,243 | |
Industrial Development Authority of the County of Pima, Refunding RB, Series A, 4.00%, 09/01/29 | | | 6,000 | | | | 6,002,208 | |
| | | | | | | | |
| Security | | Par (000) | | | Value | |
| | |
Arizona (continued) | | | | | | | | |
Maricopa County Industrial Development Authority, Refunding RB | | | | | | | | |
4.00%, 07/01/29(c) | | $ | 855 | | | $ | 837,837 | |
Series A, 5.00%, 01/01/31 | | | 10,000 | | | | 10,959,610 | |
| | | | | | | | |
| | |
| | | | | | | 40,790,354 | |
| | |
| California — 10.5% | | | | | | |
Alameda Corridor Transportation Authority, Refunding RB, Series A, Sub Lien, (AMBAC), 0.00%, 10/01/30(b) | | | 10,530 | | | | 8,263,281 | |
Bay Area Toll Authority, RB, Class A, 4.99%, 04/01/36(a) | | | 3,000 | | | | 3,162,714 | |
Bay Area Toll Authority, Refunding RB(a) | | | | | | | | |
Series C, 4.19%, 04/01/56 | | | 4,500 | | | | 4,435,308 | |
Series E, 4.15%, 04/01/56 | | | 3,250 | | | | 3,261,391 | |
California Community Choice Financing Authority, RB(a) | | | | | | | | |
5.00%, 12/01/53 | | | 6,500 | | | | 6,109,343 | |
Series A, 4.00%, 10/01/52 | | | 8,650 | | | | 8,755,980 | |
California Health Facilities Financing Authority, RB | | | | | | | | |
Series A, 5.00%, 11/15/32 | | | 1,600 | | | | 1,770,990 | |
Series A, 5.00%, 11/15/33 | | | 1,855 | | | | 2,040,517 | |
California Housing Finance Agency, RB, M/F Housing, Series 2021-1, Class A, 3.50%, 11/20/35 | | | 3,654 | | | | 3,515,400 | |
California Municipal Finance Authority, RB | | | | | | | | |
4.00%, 10/01/23(e) | | | 2,500 | | | | 2,523,662 | |
AMT, Senior Lien, 5.00%, 12/31/33 | | | 4,000 | | | | 4,304,336 | |
California Municipal Finance Authority, RB, S/F Housing, Series A, 5.00%, 08/15/30 | | | 1,000 | | | | 1,020,265 | |
California Municipal Finance Authority, Refunding RB | | | | | | | | |
Series A, 5.00%, 07/01/30 | | | 1,200 | | | | 1,291,955 | |
Series A, 5.00%, 07/01/31 | | | 1,050 | | | | 1,127,435 | |
California School Finance Authority, RB(c) 5.00%, 06/01/30 | | | 565 | | | | 581,890 | |
Series A, 5.00%, 06/01/29 | | | 280 | | | | 281,775 | |
Series A, 4.00%, 06/01/31 | | | 265 | | | | 257,478 | |
Series A, 5.00%, 06/01/32 | | | 1,100 | | | | 1,117,718 | |
City of Long Beach California Harbor Revenue, RB | | | | | | | | |
Series A, AMT, 5.00%, 05/15/31 | | | 1,200 | | | | 1,301,027 | |
Series A, AMT, 5.00%, 05/15/32 | | | 1,800 | | | | 1,950,626 | |
Series A, AMT, 5.00%, 05/15/33 | | | 675 | | | | 729,884 | |
Series A, AMT, 5.00%, 05/15/34 | | | 1,650 | | | | 1,778,327 | |
City of Los Angeles Department of Airports, RB, AMT, 5.00%, 05/15/30 | | | 18,250 | | | | 20,820,750 | |
Compton Unified School District, GO, CAB(b) | | | | | | | | |
Series B, (BAM), 0.00%, 06/01/33 | | | 1,000 | | | | 702,114 | |
Series B, (BAM), 0.00%, 06/01/34 | | | 1,125 | | | | 774,512 | |
Series B, (BAM), 0.00%, 06/01/35 | | | 1,000 | | | | 634,782 | |
Series B, (BAM), 0.00%, 06/01/36 | | | 1,000 | | | | 599,414 | |
El Camino Community College District Foundation, GO, CAB(b) | | | | | | | | |
Series C, Election 2002, 0.00%, 08/01/30 | | | 9,090 | | | | 7,481,834 | |
Series C, Election 2002, 0.00%, 08/01/31 | | | 12,465 | | | | 9,941,000 | |
Series C, Election 2002, 0.00%, 08/01/32 | | | 17,435 | | | | 13,425,909 | |
Los Angeles Unified School District, GO, Series A, Election 2008, 4.00%, 07/01/33 | | | 3,000 | | | | 3,136,173 | |
Monterey Peninsula Community College District, Refunding GO, CAB(b) 0.00%, 08/01/30 | | | 3,500 | | | | 2,755,693 | |
| | |
SCHEDULE OF INVESTMENTS | | 19 |
| | |
Schedule of Investments (unaudited) (continued) January 31, 2023 | | BlackRock Municipal 2030 Target Term Trust (BTT) (Percentages shown are based on Net Assets) |
| | | | | | | | |
| Security | | Par (000) | | | Value | |
| | |
California (continued) | | | | | | | | |
Monterey Peninsula Community College District, Refunding GO, CAB(b) (continued) 0.00%, 08/01/31 | | $ | 5,940 | | | $ | 4,512,737 | |
M-S-R Energy Authority, RB, Series C, 6.13%, 11/01/29 | | | 2,210 | | | | 2,446,443 | |
Norman Y Mineta San Jose International Airport SJC, Refunding RB | | | | | | | | |
Series A, AMT, 5.00%, 03/01/30 | | | 500 | | | | 540,648 | |
Series A, AMT, 5.00%, 03/01/31 | | | 1,500 | | | | 1,617,739 | |
Series A, AMT, 5.00%, 03/01/32 | | | 1,000 | | | | 1,077,582 | |
Series A, AMT, 5.00%, 03/01/33 | | | 975 | | | | 1,046,670 | |
Series A, AMT, 5.00%, 03/01/34 | | | 1,250 | | | | 1,334,790 | |
Series A, AMT, 5.00%, 03/01/35 | | | 2,000 | | | | 2,126,000 | |
Poway Unified School District, GO(b) | | | | | | | | |
Series A, Election 2008, 0.00%, 08/01/30 | | | 10,000 | | | | 8,333,240 | |
Series A, Election 2008, 0.00%, 08/01/32 | | | 12,500 | | | | 9,747,512 | |
San Diego County Regional Airport Authority, RB, Sub-Series B, AMT, 5.00%, 07/01/33 | | | 1,000 | | | | 1,070,762 | |
San Rafael City Elementary School District, GO, Series C, Election 2002, (NPFGC), 0.00%, 08/01/30(b) | | | 6,350 | | | | 5,232,470 | |
State of California, Refunding GO, 5.00%, 08/01/30 | | | 10,000 | | | | 11,251,750 | |
Washington Township Health Care District, Refunding RB, Series B, 3.00%, 07/01/28 | | | 750 | | | | 735,397 | |
Wiseburn School District, GO, Series A, Election 2007, (NPFGC), 0.00%, 08/01/30(b) | | | 7,505 | | | | 6,160,622 | |
| | | | | | | | |
| | |
| | | | | | | 177,087,845 | |
| | |
| Colorado — 5.6% | | | | | | |
Aspen Valley Hospital District, Refunding GO, 5.00%, 12/01/30 | | | 620 | | | | 730,353 | |
Central Platte Valley Metropolitan District, GO(e) | | | | | | | | |
Series A, 5.13%, 12/01/23 | | | 700 | | | | 713,193 | |
Series A, 5.50%, 12/01/23 | | | 750 | | | | 766,427 | |
City & County of Denver Colorado Airport System Revenue, Refunding RB | | | | | | | | |
Series A, AMT, 5.00%, 12/01/30 | | | 12,780 | | | | 14,448,122 | |
Series A, AMT, 5.00%, 12/01/33 | | | 25,000 | | | | 27,232,100 | |
Series D, AMT, 5.50%, 11/15/30 | | | 14,000 | | | | 16,415,602 | |
City & County of Denver Colorado Pledged Excise Tax Revenue, RB, CAB, Series A-2, 0.00%, 08/01/30(b). | | | 1,000 | | | | 767,592 | |
Colorado Educational & Cultural Facilities Authority, Refunding RB, 4.00%, 12/01/30(c) | | | 1,185 | | | | 1,155,366 | |
Colorado Health Facilities Authority, RB | | | | | | | | |
5.00%, 11/01/30 | | | 1,000 | | | | 1,124,254 | |
Series B, 2.63%, 05/15/29 | | | 2,100 | | | | 1,901,218 | |
Series D, 4.29%, 05/15/61(a) | | | 7,695 | | | | 7,816,797 | |
Colorado Health Facilities Authority, Refunding RB, Series A, 4.00%, 08/01/37 | | | 3,000 | | | | 2,953,794 | |
E-470 Public Highway Authority, Refunding RB, Series B, 3.40%, 09/01/39(a) | | | 1,475 | | | | 1,467,722 | |
Park Creek Metropolitan District, Refunding RB | | | | | | | | |
Series A, Senior Lien, 5.00%, 12/01/27 | | | 1,500 | | | | 1,588,950 | |
Series A, Senior Lien, 5.00%, 12/01/28 | | | 1,500 | | | | 1,588,956 | |
Series A, Senior Lien, 5.00%, 12/01/30 | | | 1,350 | | | | 1,430,075 | |
Series A, Senior Lien, 5.00%, 12/01/31 | | | 1,500 | | | | 1,588,931 | |
Plaza Metropolitan District No. 1, Refunding TA(c) 4.00%, 12/01/23 | | | 1,000 | | | | 993,590 | |
| | | | | | | | |
| Security | | Par (000) | | | Value | |
| | |
Colorado (continued) | | | | | | | | |
Plaza Metropolitan District No. 1, Refunding TA(c) (continued) | | | | | | | | |
4.10%, 12/01/24 | | $ | 5,080 | | | $ | 5,029,149 | |
4.20%, 12/01/25 | | | 5,280 | | | | 5,223,451 | |
Tallyn’s Reach Metropolitan District No. 3, GO, 5.00%, 12/01/23(c)(e) | | | 467 | | | | 475,326 | |
| | | | | | | | |
| | |
| | | | | | | 95,410,968 | |
| | |
| Connecticut — 1.0% | | | | | | |
Capital Region Development Authority, Refunding RB | | | | | | | | |
(SAP), 5.00%, 06/15/30 | | | 1,095 | | | | 1,235,476 | |
(SAP), 5.00%, 06/15/31 | | | 1,125 | | | | 1,267,970 | |
Connecticut State Health & Educational Facilities Authority, RB, Series A, 5.00%, 01/01/30(c) | | | 370 | | | | 376,665 | |
Connecticut State Health & Educational Facilities Authority, Refunding RB | | | | | | | | |
Series G-1, 5.00%, 07/01/27(c) | | | 225 | | | | 228,633 | |
Series G-1, 5.00%, 07/01/28(c) | | | 300 | | | | 304,658 | |
Series G-1, 5.00%, 07/01/29(c) | | | 300 | | | | 304,226 | |
Series G-1, 5.00%, 07/01/30(c) | | | 300 | | | | 303,348 | |
Series G-1, 5.00%, 07/01/32(c) | | | 425 | | | | 428,357 | |
Series G-1, 5.00%, 07/01/34(c) | | | 355 | | | | 356,739 | |
Series I-1, 5.00%, 07/01/35 | | | 400 | | | | 430,271 | |
State of Connecticut Special Tax Revenue, RB, Series A, 5.00%, 07/01/30 | | | 3,500 | | | | 4,154,416 | |
State of Connecticut, GO, Series A, 5.00%, 04/15/33 | | | 7,000 | | | | 7,875,567 | |
| | | | | | | | |
| | |
| | | | | | | 17,266,326 | |
| | |
| Delaware — 0.8% | | | | | | |
County of Kent Delaware, RB | | | | | | | | |
Series A, 5.00%, 07/01/24 | | | 705 | | | | 709,842 | |
Series A, 5.00%, 07/01/25 | | | 805 | | | | 812,902 | |
Series A, 5.00%, 07/01/26 | | | 850 | | | | 859,360 | |
Series A, 5.00%, 07/01/27 | | | 890 | | | | 899,317 | |
Series A, 5.00%, 07/01/28 | | | 935 | | | | 942,509 | |
Delaware State Economic Development Authority, Refunding RB(a) | | | | | | | | |
Series A, 1.25%, 10/01/45 | | | 6,035 | | | | 5,700,257 | |
Series B, 1.25%, 10/01/40 | | | 500 | | | | 472,288 | |
Delaware State Health Facilities Authority, RB, 4.00%, 06/01/35 | | | 1,250 | | | | 1,229,272 | |
Delaware Transportation Authority, Refunding RB, 5.00%, 09/01/30 | | | 2,000 | | | | 2,385,594 | |
| | | | | | | | |
| | |
| | | | | | | 14,011,341 | |
| | |
| District of Columbia — 0.9% | | | | | | |
District of Columbia, Refunding RB, Series A, 6.00%, 07/01/23(e) | | | 1,700 | | | | 1,722,772 | |
Metropolitan Washington Airports Authority Aviation Revenue, Refunding RB, Series A, AMT, 5.00%, 10/01/30 | | | 12,325 | | | | 14,015,435 | |
| | | | | | | | |
| | |
| | | | | | | 15,738,207 | |
| | |
| Florida — 6.1% | | | | | | |
Capital Projects Finance Authority, RB, Series A-1, 5.00%, 10/01/30 | | | 1,000 | | | | 1,059,360 | |
Capital Trust Agency, Inc., RB(c) | | | | | | | | |
Series A, 4.00%, 06/15/29 | | | 1,595 | | | | 1,488,243 | |
Series A-1, 3.38%, 07/01/31 | | | 1,810 | | | | 1,666,167 | |
| | |
| 20 | | 2 0 2 3 BLACK ROCK SEMI - ANNUAL REPORT TO SHAREHOLDERS |
| | |
Schedule of Investments (unaudited) (continued) January 31, 2023 | | BlackRock Municipal 2030 Target Term Trust (BTT) (Percentages shown are based on Net Assets) |
| | | | | | | | |
| Security | | Par (000) | | | Value | |
| | |
| Florida (continued) | | | | | | |
Central Florida Expressway Authority, Refunding RB | | | | | | | | |
Senior Lien, 5.00%, 07/01/32 | | $ | 1,610 | | | $ | 1,827,268 | |
Senior Lien, 5.00%, 07/01/33 | | | 2,750 | | | | 3,114,028 | |
City of Lakeland Florida, Refunding RB, 5.00%, 11/15/30 | | | 3,750 | | | | 4,030,714 | |
County of Broward Florida, RB, Series A, AMT, (AGM), 5.00%, 04/01/23(e) | | | 600 | | | | 601,706 | |
County of Miami-Dade Florida Water & Sewer System Revenue, RB, 5.00%, 10/01/27 | | | 5,000 | | | | 5,606,660 | |
County of Miami-Dade Florida, Refunding RB, Series B, 4.00%, 04/01/32 | | | 6,690 | | | | 7,020,412 | |
County of Palm Beach Florida, RB, 5.00%, 04/01/29(c) | | | 1,000 | | | | 1,022,109 | |
County of St. Johns Florida Water & Sewer Revenue, Refunding RB, CAB(b) | | | | | | | | |
Series B, 0.00%, 06/01/30 | | | 2,000 | | | | 1,650,998 | |
Series B, 0.00%, 06/01/31 | | | 1,295 | | | | 1,035,255 | |
Series B, 0.00%, 06/01/32 | | | 2,495 | | | | 1,925,120 | |
Double Branch Community Development District, Refunding SAB, Series A-1, Senior Lien, 4.13%, 05/01/31 | | | 1,200 | | | | 1,204,516 | |
Florida Development Finance Corp., RB | | | | | | | | |
AMT, 5.00%, 05/01/29(c) | | | 7,430 | | | | 6,989,089 | |
AMT, 3.00%, 06/01/32 | | | 3,000 | | | | 2,306,451 | |
Florida Development Finance Corp., Refunding RB | | | | | | | | |
4.00%, 06/01/24 | | | 105 | | | | 103,565 | |
4.00%, 06/01/25 | | | 100 | | | | 97,408 | |
4.00%, 06/01/26 | | | 110 | | | | 105,534 | |
4.00%, 09/15/30(c) | | | 470 | | | | 432,837 | |
Greater Orlando Aviation Authority, Refunding RB, AMT, 5.00%, 11/15/36 | | | 250 | | | | 250,366 | |
Hillsborough County Aviation Authority, RB, AMT, 5.00%, 10/01/30 | | | 2,325 | | | | 2,636,999 | |
Lakewood Ranch Stewardship District, Refunding SAB, 3.20%, 05/01/30(c) | | | 540 | | | | 504,036 | |
Lakewood Ranch Stewardship District, SAB, S/F Housing, 3.40%, 05/01/30 | | | 375 | | | | 353,317 | |
LT Ranch Community Development District, SAB, 3.40%, 05/01/30 | | | 985 | | | | 933,188 | |
Miami Beach Health Facilities Authority, Refunding RB, 5.00%, 11/15/30 | | | 1,000 | | | | 1,033,433 | |
Orange County Convention Center/Orlando, Refunding RB, 5.00%, 10/01/30 | | | 11,470 | | | | 13,316,085 | |
Palm Beach County Health Facilities Authority, RB | | | | | | | | |
Series A, 5.00%, 11/01/30 | | | 200 | | | | 217,380 | |
Series B, 5.00%, 05/15/31 | | | 410 | | | | 400,424 | |
Palm Beach County Health Facilities Authority, Refunding RB, 5.00%, 11/15/32 | | | 16,805 | | | | 17,330,223 | |
Reedy Creek Improvement District, GO, Series A, 5.25%, 06/01/23(e) | | | 3,825 | | | | 3,856,090 | |
Sarasota National Community Development District, Refunding SAB, 3.50%, 05/01/31 | | | 1,000 | | | | 934,795 | |
School Board of Miami-Dade County, Refunding COP, Series A, 5.00%, 05/01/32 | | | 9,000 | | | | 9,714,303 | |
St. Johns County Industrial Development Authority, Refunding RB | | | | | | | | |
4.00%, 12/15/25 | | | 180 | | | | 176,990 | |
4.00%, 12/15/28 | | | 200 | | | | 191,346 | |
4.00%, 12/15/29 | | | 215 | | | | 203,538 | |
4.00%, 12/15/30 | | | 195 | | | | 182,960 | |
| | | | | | | | |
| Security | | Par (000) | | | Value | |
| | |
| Florida (continued) | | | | | | |
St. Johns County Industrial Development Authority, Refunding RB (continued) 4.00%, 12/15/31 | | $ | 205 | | | $ | 190,398 | |
Tolomato Community Development District, Refunding SAB, Sub-Series A-2, 3.85%, 05/01/29 | | | 520 | | | | 511,118 | |
Village Community Development District No. 5, Refunding SAB | | | | | | | | |
3.50%, 05/01/28 | | | 4,790 | | | | 4,799,939 | |
4.00%, 05/01/33 | | | 925 | | | | 927,513 | |
4.00%, 05/01/34 | | | 2,030 | | | | 2,034,622 | |
| | | | | | | | |
| | |
| | | | | | | 103,986,503 | |
| | |
| Georgia — 5.2% | | | | | | |
City of Atlanta Georgia Department of Aviation, Refunding ARB, Series B, AMT, 5.00%, 07/01/29 | | | 4,150 | | | | 4,636,019 | |
Georgia Ports Authority, RB, 5.00%, 07/01/30 | | | 1,175 | | | | 1,403,961 | |
Main Street Natural Gas, Inc., RB | | | | | | | | |
Series A, 5.00%, 05/15/29 | | | 1,250 | | | | 1,323,188 | |
Series A, 5.00%, 05/15/30 | | | 8,000 | | | | 8,460,392 | |
Series A, 4.00%, 07/01/52(a) | | | 3,500 | | | | 3,564,361 | |
Series A, 4.00%, 09/01/52(a) | | | 15,000 | | | | 14,998,785 | |
Series A, 5.00%, 06/01/53(a)(f) | | | 11,185 | | | | 11,878,750 | |
Series B, 5.00%, 12/01/52(a) | | | 20,190 | | | | 21,371,236 | |
Series C, 4.00%, 05/01/52(a) | | | 5,360 | | | | 5,373,625 | |
Municipal Electric Authority of Georgia, RB, Series A, 5.00%, 01/01/34 | | | 8,000 | | | | 8,730,256 | |
Municipal Electric Authority of Georgia, Refunding RB | | | | | | | | |
Series A, 5.00%, 01/01/29 | | | 2,000 | | | | 2,233,434 | |
Series A, 5.00%, 01/01/30 | | | 1,905 | | | | 2,159,449 | |
Series A, Subordinate, 5.00%, 01/01/29 | | | 1,200 | | | | 1,340,060 | |
Series A, Subordinate, 5.00%, 01/01/30 | | | 1,250 | | | | 1,416,961 | |
| | | | | | | | |
| | |
| | | | | | | 88,890,477 | |
| | |
| Guam — 0.2% | | | | | | |
Territory of Guam, Refunding RB | | | | | | | | |
Series A, 5.00%, 11/01/30 | | | 500 | | | | 548,182 | |
Series F, 5.00%, 01/01/30 | | | 1,160 | | | | 1,266,472 | |
Series F, 5.00%, 01/01/31 | | | 1,250 | | | | 1,370,297 | |
| | | | | | | | |
| | |
| | | | | | | 3,184,951 | |
| | |
| Idaho — 0.0% | | | | | | |
Idaho Housing & Finance Association, RB, Series A, 4.63%, 07/01/29(c) | | | 175 | | | | 177,140 | |
| | | | | | | | |
| | |
| Illinois — 13.4% | | | | | | |
Chicago Board of Education, Refunding GO, Series C, 5.00%, 12/01/30 | | | 7,025 | | | | 7,331,585 | |
Chicago Housing Authority, RB, M/F Housing
Series A, (HUD SEC 8), 5.00%, 01/01/33 | | | 3,000 | | | | 3,323,205 | |
Series A, (HUD SEC 8), 5.00%, 01/01/35 | | | 1,500 | | | | 1,655,022 | |
Chicago Midway International Airport, Refunding ARB, Series A, AMT, 2nd Lien, 5.00%, 01/01/33 | | | 5,000 | | | | 5,081,060 | |
Chicago O’Hare International Airport, Refunding RB | | | | | | | | |
Series B, AMT, 4.00%, 01/01/27 | | | 5,000 | | | | 5,003,865 | |
Series B, Senior Lien, 5.00%, 01/01/33 | | | 6,000 | | | | 6,582,630 | |
Chicago Transit Authority Capital Grant Receipts Revenue, Refunding RB, 5.00%, 06/01/26 | | | 3,000 | | | | 3,204,940 | |
City of Chicago Illinois Wastewater Transmission Revenue, RB | | | | | | | | |
2nd Lien, 4.00%, 01/01/31 | | | 10,375 | | | | 10,380,561 | |
2nd Lien, 4.00%, 01/01/32 | | | 10,790 | | | | 10,796,032 | |
2nd Lien, 4.00%, 01/01/33 | | | 11,220 | | | | 11,223,265 | |
2nd Lien, 4.00%, 01/01/35 | | | 9,135 | | | | 9,135,493 | |
| | |
SCHEDULE OF INVESTMENTS | | 21 |
| | |
Schedule of Investments (unaudited) (continued) January 31, 2023 | | BlackRock Municipal 2030 Target Term Trust (BTT) (Percentages shown are based on Net Assets) |
| | | | | | | | |
| Security | | Par (000) | | | Value | |
| | |
| Illinois (continued) | | | | | | |
City of Chicago Illinois, Refunding GO, Series B, 4.00%, 01/01/30 | | $ | 1,053 | | | $ | 1,077,253 | |
Illinois Finance Authority, RB, 5.00%, 07/01/30 | | | 1,500 | | | | 1,787,470 | |
Illinois Finance Authority, Refunding RB | | | | | | | | |
5.00%, 08/15/30 | | | 4,515 | | | | 5,312,823 | |
Series A, 4.00%, 11/01/24 | | | 425 | | | | 416,936 | |
Series A, 5.00%, 11/01/26 | | | 460 | | | | 455,824 | |
Series A, 5.00%, 11/01/28 | | | 1,745 | | | | 1,710,842 | |
Series A, 5.00%, 11/01/29 | | | 1,840 | | | | 1,793,347 | |
Series A, 5.00%, 10/01/30 | | | 1,000 | | | | 1,087,744 | |
Series A, 5.00%, 11/01/30 | | | 1,935 | | | | 1,877,912 | |
Series A, 5.00%, 11/15/31 | | | 8,415 | | | | 8,827,579 | |
Series A, 4.00%, 10/01/32 | | | 1,000 | | | | 1,041,828 | |
Series A, 5.00%, 11/15/32 | | | 2,075 | | | | 2,176,528 | |
Series A, 4.00%, 02/01/33 | | | 11,000 | | | | 11,023,936 | |
Series A, 5.00%, 11/15/33 | | | 2,125 | | | | 2,228,757 | |
Series B, 5.00%, 08/15/30 | | | 3,205 | | | | 3,493,822 | |
Series B, 4.44%, 05/01/42(a) | | | 1,750 | | | | 1,721,503 | |
Series C, 5.00%, 02/15/30 | | | 12,000 | | | | 13,101,852 | |
Illinois State Toll Highway Authority, Refunding RB, Series A, 4.00%, 12/01/31 | | | 20,000 | | | | 20,689,020 | |
Kane McHenry Cook & De Kalb Counties Unit School District No. 300, Refunding GO, Series A, 5.00%, 01/01/30 | | | 6,350 | | | | 6,954,812 | |
Metropolitan Pier & Exposition Authority, Refunding RB | | | | | | | | |
5.00%, 12/15/28 | | | 1,200 | | | | 1,280,840 | |
5.00%, 12/15/30 | | | 1,385 | | | | 1,475,229 | |
Sales Tax Securitization Corp., Refunding RB, Series A, 2nd Lien, 5.00%, 01/01/30 | | | 11,000 | | | | 12,499,117 | |
State of Illinois, GO | | | | | | | | |
Series A, 5.00%, 12/01/26 | | | 10,805 | | | | 11,529,129 | |
Series A, 5.00%, 12/01/28 | | | 9,950 | | | | 10,727,344 | |
Series A, 5.00%, 03/01/32 | | | 1,500 | | | | 1,658,700 | |
State of Illinois, Refunding GO, Series B, 5.00%, 10/01/30 | | | 7,000 | | | | 7,574,133 | |
Upper Illinois River Valley Development Authority, Refunding RB, 4.00%, 01/01/31(c) | | | 265 | | | | 248,922 | |
Winnebago & Boone Counties School District No.205 Rockford, Refunding GO | | | | | | | | |
4.00%, 02/01/29 | | | 9,080 | | | | 9,080,000 | |
4.00%, 02/01/30 | | | 9,835 | | | | 9,835,000 | |
| | | | | | | | |
| | |
| | | | | | | 226,405,860 | |
| | |
| Indiana — 2.8% | | | | | | |
City of Indianapolis Department of Public Utilities Water System Revenue, Refunding RB, Series A, 1st Lien, 5.00%, 10/01/35 | | | 10,000 | | | | 11,189,360 | |
City of Valparaiso Indiana, RB, AMT, 5.88%, 01/01/24 | | | 335 | | | | 339,221 | |
City of Whiting Indiana, RB, Series A, AMT, 5.00%, 03/01/46(a) | | | 5,500 | | | | 5,502,739 | |
Indiana Finance Authority, Refunding RB | | | | | | | | |
Class B, 1.96%, 03/01/39(a) | | | 1,010 | | | | 1,025,128 | |
Series A, 4.00%, 05/01/23(e) | | | 22,565 | | | | 22,635,877 | |
Series A, 4.13%, 12/01/26 | | | 3,665 | | | | 3,636,959 | |
| | | | | | | | |
| Security | | Par (000) | | | Value | |
| | |
| Indiana (continued) | | | | | | |
Northern Indiana Commuter Transportation District, RB | | | | | | | | |
5.00%, 07/01/32 | | $ | 1,000 | | | $ | 1,080,323 | |
5.00%, 07/01/33 | | | 1,400 | | | | 1,511,784 | |
| | | | | | | | |
| | |
| | | | | | | 46,921,391 | |
| | |
| Iowa(a) — 1.5% | | | | | | |
Iowa Finance Authority, RB, AMT, 1.50%, 01/01/42 | | | 2,750 | | | | 2,708,615 | |
PEFA, Inc., RB, 5.00%, 09/01/49 | | | 21,415 | | | | 22,243,525 | |
| | | | | | | | |
| | |
| | | | | | | 24,952,140 | |
| | |
| Kansas — 0.3% | | | | | | |
City of Lenexa Kansas, Refunding RB, Series A, 5.00%, 05/15/24 | | | 1,550 | | | | 1,565,050 | |
City of Manhattan Kansas, RB | | | | | | | | |
Class B-1, 2.88%, 06/01/28 | | | 375 | | | | 335,124 | |
Class B2, 2.38%, 06/01/27 | | | 425 | | | | 380,471 | |
City of Manhattan Kansas, Refunding RB, Series A, 4.00%, 06/01/26 | | | 315 | | | | 305,164 | |
City of Shawnee Kansas, RB, 4.00%, 08/01/31(c) | | | 500 | | | | 488,209 | |
Wyandotte County-Kansas City Unified Government Utility System Revenue, RB, Series A, 5.00%, 09/01/33 | | | 1,370 | | | | 1,463,913 | |
| | | | | | | | |
| | |
| | | | | | | 4,537,931 | |
| | |
| Kentucky — 0.9% | | | | | | |
Kentucky Public Energy Authority, RB, Series A-1, 4.00%, 08/01/52(a) | | | 4,225 | | | | 4,220,416 | |
Kentucky Public Transportation Infrastructure Authority, RB, CAB | | | | | | | | |
Series B, 0.00%, 07/01/30(b) | | | 1,230 | | | | 874,298 | |
Series C, Convertible, 6.40%, 07/01/33(g) | | | 1,500 | | | | 1,789,675 | |
Louisville/Jefferson County Metropolitan Government, Refunding RB, Series A, 5.00%, 10/01/32 | | | 7,300 | | | | 7,760,681 | |
| | | | | | | | |
| | |
| | | | | | | 14,645,070 | |
| | |
| Louisiana — 1.8% | | | | | | |
City of Ruston Lauisiana Sales Tax Revenue, RB | | | | | | | | |
(AGM), 5.00%, 06/01/29 | | | 1,060 | | | | 1,137,785 | |
(AGM), 5.00%, 06/01/30 | | | 1,000 | | | | 1,073,338 | |
(AGM), 5.00%, 06/01/31 | | | 1,020 | | | | 1,094,710 | |
(AGM), 5.00%, 06/01/32 | | | 1,225 | | | | 1,313,547 | |
Louisiana Local Government Environmental Facilities & Community Development Authority, RB, 5.00%, 08/15/30 | | | 4,700 | | | | 5,153,705 | |
Louisiana Local Government Environmental Facilities & Community Development Authority, Refunding RB, Series A, 2.00%, 06/01/30 | | | 1,250 | | | | 1,152,227 | |
Louisiana Public Facilities Authority, RB(c) | | | | | | | | |
Series A, 5.00%, 06/01/29 | | | 710 | | | | 728,848 | |
Series A, 5.00%, 04/01/30 | | | 525 | | | | 533,653 | |
Series A, 5.00%, 06/01/31 | | | 500 | | | | 506,440 | |
Louisiana Public Facilities Authority, Refunding RB | | | | | | | | |
5.00%, 05/15/29 | | | 1,235 | | | | 1,316,997 | |
5.00%, 05/15/30 | | | 990 | | | | 1,055,667 | |
3.00%, 05/15/31 | | | 2,225 | | | | 2,174,283 | |
5.00%, 05/15/32 | | | 1,485 | | | | 1,582,640 | |
5.00%, 05/15/33 | | | 2,175 | | | | 2,315,779 | |
Louisiana Stadium & Exposition District, RB, 4.00%, 07/03/23 | | | 1,000 | | | | 1,001,185 | |
| | |
| 22 | | 2 0 2 3 BLACK ROCK SEMI - ANNUAL REPORT TO SHAREHOLDERS |
| | |
Schedule of Investments (unaudited) (continued) January 31, 2023 | | BlackRock Municipal 2030 Target Term Trust (BTT) (Percentages shown are based on Net Assets) |
| | | | | | | | |
| Security | | Par (000) | | | Value | |
| | |
| Louisiana (continued) | | | | | | |
Louisiana Stadium & Exposition District, Refunding RB, Series A, 5.00%, 07/01/30 | | $ | 3,000 | | | $ | 3,028,212 | |
Port New Orleans Board of Commissioners, Refunding RB, Series B, AMT, 5.00%, 04/01/23(e) | | | 2,875 | | | | 2,882,585 | |
Terrebonne Levee & Conservation District Sales Tax Revenue, RB, 5.00%, 07/01/23(e) | | | 1,925 | | | | 1,941,919 | |
| | | | | | | | |
| | |
| | | | | | | 29,993,520 | |
| | |
| Maine — 0.2% | | | | | | |
City of Portland Maine General Airport Revenue, Refunding RB | | | | | | | | |
5.00%, 01/01/33 | | | 695 | | | | 777,151 | |
5.00%, 01/01/34 | | | 305 | | | | 338,555 | |
4.00%, 01/01/35 | | | 1,000 | | | | 1,018,855 | |
Maine Turnpike Authority, RB | | | | | | | | |
5.00%, 07/01/29 | | | 300 | | | | 348,283 | |
5.00%, 07/01/30 | | | 275 | | | | 325,150 | |
| | | | | | | | |
| | |
| | | | | | | 2,807,994 | |
| | |
| Maryland — 1.7% | | | | | | |
Anne Arundel County Consolidated Special Taxing District, ST | | | | | | | | |
4.20%, 07/01/24 | | | 310 | | | | 312,832 | |
4.90%, 07/01/30 | | | 1,315 | | | | 1,335,774 | |
City of Baltimore Maryland, Refunding RB, 5.00%, 09/01/31 | | | 1,250 | | | | 1,234,078 | |
County of Prince George’s Maryland, TA, 5.00%, 07/01/30(c) | | | 585 | | | | 590,887 | |
Howard County Housing Commission, RB, M/F Housing, 5.00%, 12/01/33 | | | 1,765 | | | | 1,921,165 | |
Maryland Health & Higher Educational Facilities Authority, Refunding RB | | | | | | | | |
5.00%, 07/01/29 | | | 2,200 | | | | 2,307,686 | |
5.00%, 07/01/31 | | | 2,400 | | | | 2,565,432 | |
5.00%, 07/01/32 | | | 500 | | | | 548,713 | |
5.00%, 07/01/33 | | | 2,585 | | | | 2,765,185 | |
5.00%, 07/01/34 | | | 775 | | | | 847,447 | |
Series A, 5.00%, 01/01/31 | | | 2,865 | | | | 2,978,692 | |
Series A, 5.00%, 01/01/32 | | | 3,010 | | | | 3,128,579 | |
Series A, 5.00%, 01/01/33 | | | 3,165 | | | | 3,287,846 | |
State of Maryland, GO, 1st Series, 3.00%, 03/15/34 | | | 5,000 | | | | 5,073,855 | |
| | | | | | | | |
| | |
| | | | | | | 28,898,171 | |
| | |
| Massachusetts — 2.3% | | | | | | |
Commonwealth of Massachusetts, GO, Series I, 5.00%, 12/01/33 | | | 5,000 | | | | 5,535,005 | |
Commonwealth of Massachusetts, Refunding GO, Series A, (AMBAC), 5.50%, 08/01/30 | | | 18,070 | | | | 22,059,314 | |
Massachusetts Bay Transportation Authority Sales Tax Revenue, Refunding RB, CAB, Series A, 0.00%, 07/01/32(b) | | | 4,000 | | | | 2,915,012 | |
Massachusetts Development Finance Agency, RB, Series A, 5.00%, 01/01/33 | | | 1,070 | | | | 1,142,278 | |
Massachusetts Development Finance Agency, Refunding RB | | | | | | | | |
Series A, 5.00%, 01/01/32 | | | 2,020 | | | | 2,186,521 | |
Series A, 5.00%, 01/01/33 | | | 1,500 | | | | 1,617,528 | |
Series A, 5.00%, 01/01/34 | | | 2,085 | | | | 2,233,429 | |
Series A, 5.00%, 01/01/35 | | | 2,000 | | | | 2,122,560 | |
| | | | | | | | |
| | |
| | | | | | | 39,811,647 | |
| | | | | | | | |
| Security | | Par (000) | | | Value | |
| | |
| Michigan — 2.5% | | | | | | |
City of Detroit Michigan, GO | | | | | | | | |
5.00%, 04/01/26 | | $ | 735 | | | $ | 760,816 | |
5.00%, 04/01/27 | | | 580 | | | | 604,213 | |
5.00%, 04/01/28 | | | 665 | | | | 695,877 | |
5.00%, 04/01/29 | | | 665 | | | | 693,315 | |
5.00%, 04/01/30 | | | 510 | | | | 529,883 | |
5.00%, 04/01/31 | | | 735 | | | | 762,047 | |
5.00%, 04/01/32 | | | 625 | | | | 646,526 | |
5.00%, 04/01/33 | | | 830 | | | | 857,449 | |
Michigan Finance Authority, Refunding RB | | | | | | | | |
5.00%, 08/15/23(e) | | | 2,105 | | | | 2,131,647 | |
5.00%, 04/15/30 | | | 4,000 | | | | 4,633,828 | |
4.49%, 04/15/47(a) | | | 16,595 | | | | 17,306,527 | |
Michigan State Housing Development Authority, RB, M/F Housing, Series A, 0.55%, 04/01/25 | | | 985 | | | | 932,578 | |
Michigan Strategic Fund, RB | | | | | | | | |
AMT, 5.00%, 12/31/32 | | | 2,000 | | | | 2,096,172 | |
AMT, 4.00%, 10/01/61(a) | | | 1,730 | | | | 1,712,724 | |
Michigan Strategic Fund, Refunding RB | | | | | | | | |
5.00%, 11/15/29 | | | 1,260 | | | | 1,287,447 | |
5.00%, 11/15/34 | | | 1,410 | | | | 1,424,278 | |
Saginaw Valley State University, Refunding RB | | | | | | | | |
Series A, 5.00%, 07/01/31 | | | 2,070 | | | | 2,242,224 | |
Series A, 5.00%, 07/01/32 | | | 1,430 | | | | 1,548,850 | |
State of Michigan Trunk Line Revenue, RB, 5.00%, 11/15/30 | | | 800 | | | | 964,159 | |
| | | | | | | | |
| | |
| | | | | | | 41,830,560 | |
| | |
| Minnesota — 0.5% | | | | | | |
City of Spring Lake Park Minnesota, RB, 4.00%, 06/15/29 | | | 1,185 | | | | 1,146,700 | |
Minnesota Housing Finance Agency, RB, S/F Housing | | | | | | | | |
Series L, AMT, (FHLMC, FNMA, GNMA), 4.90%, 01/01/30 | | | 465 | | | | 499,399 | |
Series L, AMT, (FHLMC, FNMA, GNMA), 4.95%, 07/01/30 | | | 490 | | | | 528,112 | |
Sartell-St. Stephen Independent School District No. 748, GO, CAB(b) | | | | | | | | |
Series B, (SD CRED PROG), 0.00%, 02/01/30 | | | 3,915 | | | | 3,160,885 | |
Series B, (SD CRED PROG), 0.00%, 02/01/31 | | | 2,190 | | | | 1,711,770 | |
Series B, (SD CRED PROG), 0.00%, 02/01/32 | | | 1,450 | | | | 1,094,242 | |
| | | | | | | | |
| | |
| | | | | | | 8,141,108 | |
| | |
| Mississippi — 1.2% | | | | | | |
Mississippi Development Bank, Refunding RB | | | | | | | | |
Series A, (AGM), 5.00%, 03/01/30 | | | 2,280 | | | | 2,435,195 | |
Series A, (AGM), 5.00%, 03/01/31 | | | 1,595 | | | | 1,703,593 | |
Series A, (AGM), 5.00%, 03/01/32 | | | 2,000 | | | | 2,136,090 | |
Series A, (AGM), 5.00%, 03/01/33 | | | 1,275 | | | | 1,361,808 | |
State of Mississippi Gaming Tax Revenue, RB, Series E, 5.00%, 10/15/33 | | | 12,225 | | | | 12,942,999 | |
| | | | | | | | |
| | |
| | | | | | | 20,579,685 | |
| | |
| Missouri — 0.6% | | | | | | |
Health & Educational Facilities Authority of the State of Missouri, Refunding RB | | | | | | | | |
5.00%, 05/01/30 | | | 3,000 | | | | 3,016,311 | |
5.00%, 05/15/31 | | | 1,175 | | | | 1,270,727 | |
4.00%, 05/15/32 | | | 1,680 | | | | 1,740,079 | |
4.00%, 05/15/33 | | | 2,000 | | | | 2,064,674 | |
| | |
SCHEDULE OF INVESTMENTS | | 23 |
| | |
Schedule of Investments (unaudited) (continued) January 31, 2023 | | BlackRock Municipal 2030 Target Term Trust (BTT) (Percentages shown are based on Net Assets) |
| | | | | | | | |
| Security | | Par (000) | | | Value | |
| | |
| Missouri (continued) | | | | | | |
Health & Educational Facilities Authority of the State of Missouri, Refunding RB (continued) Series A, 4.00%, 11/15/33 | | $ | 2,010 | | | $ | 2,027,955 | |
Industrial Development Authority of the City of St. Louis Missouri, Refunding RB, Series A, 3.88%, 11/15/29 | | | 970 | | | | 836,698 | |
| | | | | | | | |
| | |
| | | | | | | 10,956,444 | |
| | |
| Montana — 0.6% | | | | | | |
City of Forsyth Montana, Refunding RB, Series A, 3.90%, 03/01/31(a) | | | 10,050 | | | | 10,050,955 | |
| | | | | | | | |
| | |
| Nebraska — 0.0% | | | | | | |
Elkhorn School District, GO | | | | | | | | |
4.00%, 12/15/32 | | | 325 | | | | 350,024 | |
4.00%, 12/15/33 | | | 375 | | | | 400,292 | |
| | | | | | | | |
| | |
| | | | | | | 750,316 | |
| | |
| Nevada — 0.3% | | | | | | |
County of Clark Nevada, Refunding GO, Series B, 4.00%, 11/01/34 | | | 5,000 | | | | 5,148,805 | |
State of Nevada Department of Business & Industry, RB(c) | | | | | | | | |
Series A, 5.00%, 07/15/27 | | | 335 | | | | 337,960 | |
Series A, 4.50%, 12/15/29 | | | 485 | | | | 489,607 | |
| | | | | | | | |
| | |
| | | | | | | 5,976,372 | |
| | |
| New Hampshire — 0.6% | | | | | | |
New Hampshire Business Finance Authority, Refunding RB | | | | | | | | |
4.00%, 01/01/28 | | | 285 | | | | 282,837 | |
4.00%, 01/01/29 | | | 300 | | | | 295,802 | |
4.00%, 01/01/30 | | | 280 | | | | 272,500 | |
Class A, AMT, 2.04%, 10/01/33(a) | | | 7,180 | | | | 6,963,423 | |
Series A, AMT, 4.00%, 11/01/27(c) | | | 2,205 | | | | 2,129,801 | |
| | | | | | | | |
| | |
| | | | | | | 9,944,363 | |
| | |
| New Jersey — 13.8% | | | | | | |
Atlantic City Board of Education, Refunding GO | | | | | | | | |
(AGM), 4.00%, 04/01/30 | | | 170 | | | | 180,010 | |
(AGM), 4.00%, 04/01/31 | | | 175 | | | | 184,207 | |
Industrial Pollution Control Financing Authority of Gloucester County, Refunding RB, Series A, AMT, 5.00%, 12/01/24(d) | | | 620 | | | | 631,690 | |
New Jersey Economic Development Authority, RB | | | | | | | | |
Series A, 4.00%, 06/15/29(c) | | | 595 | | | | 574,148 | |
Series A, 4.00%, 07/01/29 | | | 350 | | | | 352,872 | |
Series A, 5.00%, 06/15/32 | | | 4,500 | | | | 4,943,200 | |
Series C, 5.00%, 06/15/32 | | | 3,600 | | | | 3,954,560 | |
Series DDD, 5.00%, 06/15/35 | | | 2,000 | | | | 2,144,536 | |
Series QQQ, 5.00%, 06/15/30 | | | 600 | | | | 688,628 | |
AMT, 5.00%, 01/01/28 | | | 4,705 | | | | 4,744,000 | |
AMT, 5.25%, 09/15/29 | | | 6,500 | | | | 6,538,623 | |
Series A, AMT, 5.63%, 11/15/30 | | | 1,740 | | | | 1,771,892 | |
Series B, AMT, 5.63%, 11/15/30 | | | 1,315 | | | | 1,331,558 | |
New Jersey Economic Development Authority, Refunding RB | | | | | | | | |
(AGM), 5.00%, 06/01/28 | | | 1,000 | | | | 1,066,589 | |
5.00%, 01/01/29 | | | 2,280 | | | | 2,306,152 | |
(AGM), 5.00%, 06/01/30 | | | 1,500 | | | | 1,600,009 | |
(AGM), 5.00%, 06/01/31 | | | 1,750 | | | | 1,865,887 | |
| | | | | | | | |
| Security | | Par (000) | | | Value | |
| | |
| New Jersey (continued) | | | | | | |
New Jersey Economic Development Authority, Refunding RB (continued)
(AGM), 4.00%, 06/01/32 | | $ | 2,125 | | | $ | 2,154,064 | |
Series MMM, 4.00%, 06/15/35 | | | 5,000 | | | | 5,146,935 | |
Sub-Series A, 4.00%, 07/01/32 | | | 9,855 | | | | 10,035,958 | |
Series A, AMT, 2.20%, 10/01/39(a) | | | 4,000 | | | | 3,573,764 | |
New Jersey Economic Development Authority, Refunding SAB, 5.75%, 04/01/31 | | | 5,000 | | | | 4,733,320 | |
New Jersey Educational Facilities Authority, RB, Series A, 4.00%, 09/01/30 | | | 5,860 | | | | 5,972,975 | |
New Jersey Health Care Facilities Financing Authority, Refunding RB | | | | | | | | |
5.00%, 07/01/28 | | | 1,500 | | | | 1,553,747 | |
5.00%, 07/01/29 | | | 4,150 | | | | 4,444,911 | |
5.00%, 07/01/30 | | | 3,500 | | | | 3,741,984 | |
Series A, 5.00%, 07/01/30 | | | 11,245 | | | | 12,213,779 | |
New Jersey Higher Education Student Assistance Authority, RB | | | | | | | | |
Series 1A, AMT, 5.00%, 12/01/25 | | | 5,500 | | | | 5,772,844 | |
Series 1A, AMT, 5.00%, 12/01/26 | | | 2,250 | | | | 2,360,668 | |
Series A, AMT, 4.00%, 12/01/32 | | | 1,190 | | | | 1,236,611 | |
Series A, AMT, 4.00%, 12/01/33 | | | 960 | | | | 990,372 | |
Series A, AMT, 4.00%, 12/01/34 | | | 475 | | | | 488,449 | |
Series A, AMT, 4.00%, 12/01/35 | | | 475 | | | | 487,382 | |
Series B, AMT, 5.00%, 12/01/23 | | | 50 | | | | 50,814 | |
New Jersey Higher Education Student Assistance Authority, Refunding RB, Series A, AMT, 5.00%, 12/01/23 | | | 215 | | | | 218,498 | |
New Jersey Housing & Mortgage Finance Agency, RB, S/F Housing, Series A, AMT, 3.80%, 10/01/32 | | | 10,165 | | | | 10,082,531 | |
New Jersey Transportation Trust Fund Authority, RB | | | | | | | | |
Series AA, 5.25%, 06/15/27 | | | 4,225 | | | | 4,472,902 | |
Series AA, 5.25%, 06/15/28 | | | 4,500 | | | | 4,764,150 | |
Series BB, 5.00%, 06/15/30 | | | 1,500 | | | | 1,682,259 | |
Series C, 5.25%, 06/15/32 | | | 10,000 | | | | 10,443,100 | |
Series D, 5.00%, 06/15/32 | | | 5,000 | | | | 5,203,335 | |
New Jersey Transportation Trust Fund Authority, Refunding RB | | | | | | | | |
Series A, 5.00%, 06/15/30 | | | 6,600 | | | | 7,092,584 | |
Series A, 5.00%, 12/15/30 | | | 21,325 | | | | 23,915,625 | |
Newark Housing Authority, Refunding RB, (NPFGC), 5.25%, 01/01/27 | | | 5,000 | | | | 5,423,235 | |
South Jersey Transportation Authority, Refunding RB, Series A, 5.00%, 11/01/33 | | | 500 | | | | 519,565 | |
State of New Jersey, GO, Series A, 4.00%, 06/01/30 | | | 26,000 | | | | 28,869,152 | |
Tobacco Settlement Financing Corp., Refunding RB | | | | | | | | |
Series A, 5.00%, 06/01/30 | | | 16,740 | | | | 17,957,550 | |
Series A, 5.00%, 06/01/32 | | | 8,270 | | | | 8,846,775 | |
Township of Irvington New Jersey, Refunding GO, Series A, (AGM, SAW), 5.00%, 07/15/24(e) | | | 3,450 | | | | 3,578,361 | |
| | | | | | | | |
| | |
| | | | | | | 232,906,760 | |
| | |
| New Mexico — 0.1% | | | | | | |
City of Santa Fe New Mexico, RB, Series A, 5.00%, 05/15/34 | | | 480 | | | | 471,483 | |
New Mexico Educational Assistance Foundation, RB
Series A-1, AMT, (GTD STD LNS), 3.75%, 09/01/31 | | | 255 | | | | 258,630 | |
| | |
| 24 | | 2 0 2 3 BLACK ROCK SEMI - ANNUAL REPORT TO SHAREHOLDERS |
| | |
Schedule of Investments (unaudited) (continued) January 31, 2023 | | BlackRock Municipal 2030 Target Term Trust (BTT) (Percentages shown are based on Net Assets) |
| | | | | | | | |
| Security | | Par (000) | | | Value | |
| | |
| New Mexico (continued) | | | | | | |
New Mexico Educational Assistance Foundation, RB (continued) | | | | | | | | |
Series A-1, AMT, (GTD STD LNS), 3.88%, 04/01/34 | | $ | 80 | | | $ | 81,006 | |
Series A-2, AMT, (GTD STD LNS), 3.80%, 11/01/32 | | | 240 | | | | 243,293 | |
Series A-2, AMT, (GTD STD LNS), 3.80%, 09/01/33 | | | 405 | | | | 409,779 | |
| | | | | | | | |
| | |
| | | | | | | 1,464,191 | |
| | |
| New York — 4.4% | | | | | | |
Build NYC Resource Corp., Refunding RB, AMT, 4.50%, 01/01/25(c) | | | 375 | | | | 382,289 | |
County of Nassau New York, GO | | | | | | | | |
Series A, (AGM), 5.00%, 04/01/34 | | | 4,165 | | | | 4,647,819 | |
Series A, (AGM), 5.00%, 04/01/35 | | | 4,385 | | | | 4,867,175 | |
Genesee County Funding Corp., Refunding RB, Class A, 5.00%, 12/01/30 | | | 500 | | | | 554,579 | |
Hempstead Town Local Development Corp., Refunding RB | | | | | | | | |
5.00%, 06/01/30 | | | 200 | | | | 229,427 | |
5.00%, 06/01/31 | | | 300 | | | | 348,657 | |
5.00%, 06/01/32 | | | 100 | | | | 115,649 | |
Metropolitan Transportation Authority, Refunding RB
2nd Sub Series, (AGM), 3.85%, 11/01/32(a) | | | 2,875 | | | | 2,837,884 | |
Sub-Series C-1, 5.00%, 11/15/34 | | | 10,000 | | | | 10,541,600 | |
Metropolitan Transportation Authority, Refunding RB, CAB, Series A, 0.00%, 11/15/30(b) | | | 13,000 | | | | 9,918,259 | |
New York City Transitional Finance Authority Future Tax Secured Revenue, RB, Sub-Series B-1, 5.00%, 08/01/30 | | | 4,980 | | | | 5,560,294 | |
New York State Energy Research & Development Authority, Refunding RB, Series D, 3.50%, 10/01/29 | | | 9,000 | | | | 9,006,039 | |
New York Transportation Development Corp., RB | | | | | | | | |
AMT, 4.00%, 10/01/30 | | | 8,140 | | | | 8,089,451 | |
AMT, 4.00%, 10/31/34 | | | 350 | | | | 323,639 | |
Series A, AMT, 4.00%, 07/01/32 | | | 5,500 | | | | 5,452,100 | |
Series A, AMT, 4.00%, 07/01/33 | | | 6,000 | | | | 5,912,676 | |
New York Transportation Development Corp., Refunding RB | | | | | | | | |
Series A, AMT, 5.00%, 12/01/28 | | | 350 | | | | 374,143 | |
Series A, AMT, 5.00%, 12/01/29 | | | 235 | | | | 252,759 | |
Series A, AMT, 5.00%, 12/01/30 | | | 250 | | | | 270,214 | |
Port Authority of New York & New Jersey, Refunding ARB, Series 223, AMT, 5.00%, 07/15/30 | | | 3,730 | | | | 4,238,682 | |
| | | | | | | | |
| | |
| | | | | | | 73,923,335 | |
| | |
| North Carolina — 1.7% | | | | | | |
City of Charlotte North Carolina, Refunding GO | | | | | | | | |
Series A, 5.00%, 06/01/28 | | | 330 | | | | 376,648 | |
Series A, 5.00%, 06/01/29 | | | 350 | | | | 408,147 | |
Series A, 5.00%, 06/01/30 | | | 485 | | | | 577,116 | |
North Carolina Medical Care Commission, RB | | | | | | | | |
4.00%, 09/01/33 | | | 175 | | | | 164,310 | |
4.00%, 09/01/34 | | | 185 | | | | 171,464 | |
Series A, 4.00%, 10/01/27 | | | 600 | | | | 603,453 | |
| | | | | | | | |
| Security | | Par (000) | | | Value | |
| | |
| North Carolina (continued) | | | | | | |
North Carolina Medical Care Commission, Refunding RB, 5.00%, 10/01/30 | | $ | 1,500 | | | $ | 1,506,985 | |
University of North Carolina at Chapel Hill, Refunding RB(a) | | | | | | | | |
Series A, 3.70%, 12/01/34 | | | 7,000 | | | | 6,778,716 | |
Series A, 3.70%, 12/01/41 | | | 17,845 | | | | 17,830,456 | |
| | | | | | | | |
| | |
| | | | | | | 28,417,295 | |
| | |
| Ohio — 1.4% | | | | | | |
Akron Bath Copley Joint Township Hospital District, Refunding RB, Class A, 5.00%, 11/15/30 | | | 1,010 | | | | 1,171,890 | |
Allen County Port Authority, Refunding RB, Series A, 4.00%, 12/01/31 | | | 460 | | | | 466,137 | |
American Municipal Power, Inc., Refunding RB, Series A-2, 1.00%, 02/15/48(a) | | | 6,000 | | | | 5,860,254 | |
Ohio Air Quality Development Authority, Refunding RB | | | | | | | | |
3.25%, 09/01/29 | | | 4,450 | | | | 4,139,395 | |
4.00%, 09/01/30(a) | | | 1,650 | | | | 1,687,442 | |
Series A, AMT, 4.25%, 11/01/39(a) | | | 1,525 | | | | 1,560,738 | |
Ohio State University, RB, Class A, 5.00%, 12/01/30 | | | 3,320 | | | | 3,978,432 | |
State of Ohio, RB | | | | | | | | |
AMT, (AGM), 5.00%, 12/31/29 | | | 1,625 | | | | 1,706,435 | |
AMT, (AGM), 5.00%, 12/31/30 | | | 2,400 | | | | 2,519,535 | |
| | | | | | | | |
| | |
| | | | | | | 23,090,258 | |
| | |
| Oklahoma — 0.9% | | | | | | |
Norman Regional Hospital Authority, Refunding RB | | | | | | | | |
5.00%, 09/01/27 | | | 2,100 | | | | 2,231,924 | |
5.00%, 09/01/28 | | | 2,000 | | | | 2,122,714 | |
5.00%, 09/01/29 | | | 2,150 | | | | 2,278,488 | |
5.00%, 09/01/30 | | | 5,130 | | | | 5,424,514 | |
Oklahoma Capitol Improvement Authority, RB, Series B, 5.00%, 07/01/30 | | | 2,150 | | | | 2,522,638 | |
| | | | | | | | |
| | |
| | | | | | | 14,580,278 | |
| | |
| Oregon — 0.9% | | | | | | |
Oregon Health & Science University, Refunding RB, Series B, 5.00%, 07/01/35 | | | 7,390 | | | | 7,980,217 | |
Oregon State Facilities Authority, Refunding RB, Class B, 5.00%, 06/01/30 | | | 4,750 | | | | 5,384,757 | |
Port of Morrow Oregon, Refunding GO | | | | | | | | |
Series A, 4.00%, 06/01/30 | | | 1,205 | | | | 1,287,307 | |
Series D, 4.00%, 12/01/30 | | | 880 | | | | 942,730 | |
| | | | | | | | |
| | |
| | | | | | | 15,595,011 | |
| | |
| Pennsylvania — 16.2% | | | | | | |
Allegheny County Hospital Development Authority, RB, Series D2, 4.44%, 11/15/47(a) | | | 5,205 | | | | 5,377,291 | |
Allegheny County Hospital Development Authority, Refunding RB | | | | | | | | |
Series A, 5.00%, 04/01/31 | | | 3,075 | | | | 3,370,498 | |
Series A, 5.00%, 04/01/34 | | | 3,345 | | | | 3,625,947 | |
Series A, 5.00%, 04/01/35 | | | 1,000 | | | | 1,075,246 | |
Allentown City School District, Refunding GO, Series B, (BAM, SAW), 5.00%, 02/01/31 | | | 4,000 | | | | 4,515,952 | |
Allentown Neighborhood Improvement Zone Development Authority, RB(c) | | | | | | | | |
5.00%, 05/01/23 | | | 160 | | | | 160,473 | |
5.00%, 05/01/28 | | | 835 | | | | 861,566 | |
| | |
SCHEDULE OF INVESTMENTS | | 25 |
| | |
Schedule of Investments (unaudited) (continued) January 31, 2023 | | BlackRock Municipal 2030 Target Term Trust (BTT) (Percentages shown are based on Net Assets) |
| | | | | | | | |
| Security | | Par (000) | | | Value | |
| | |
| Pennsylvania (continued) | | | | | | |
Allentown Neighborhood Improvement Zone Development Authority, Refunding RB | | | | | | | | |
5.00%, 05/01/29 | | $ | 450 | | | $ | 478,789 | |
5.00%, 05/01/30 | | | 450 | | | | 481,950 | |
Bucks County Industrial Development Authority, RB | | | | | | | | |
5.00%, 07/01/29 | | | 555 | | | | 557,995 | |
5.00%, 07/01/30 | | | 700 | | | | 701,899 | |
Chester County Health and Education Facilities Authority, Refunding RB | | | | | | | | |
Series A, 5.00%, 12/01/30 | | | 2,180 | | | | 2,133,198 | |
Series A, 5.00%, 10/01/32 | | | 1,450 | | | | 1,585,517 | |
Chester County Industrial Development Authority, SAB, 4.38%, 03/01/28(c) | | | 197 | | | | 196,852 | |
City of Philadelphia Pennsylvania Airport Revenue, Refunding RB, Series A, 5.00%, 07/01/30 | | | 5,000 | | | | 5,849,840 | |
City of Philadelphia Pennsylvania, Refunding GO | | | | | | | | |
(AGM), 5.00%, 08/01/30 | | | 9,235 | | | | 10,104,919 | |
(AGM), 4.00%, 08/01/32 | | | 6,000 | | | | 6,234,210 | |
Series A, 5.00%, 08/01/30 | | | 4,500 | | | | 5,000,314 | |
Clarion County Industrial Development Authority, Refunding RB, AMT, 2.45%, 12/01/39(a) | | | 4,200 | | | | 4,045,784 | |
Commonwealth Financing Authority, RB, 5.00%, 06/01/32 | | | 6,000 | | | | 6,609,762 | |
Commonwealth of Pennsylvania, Refunding GO, 1st Series, 4.00%, 01/01/30 | | | 7,000 | | | | 7,424,235 | |
Cumberland County Municipal Authority, Refunding RB | | | | | | | | |
5.00%, 01/01/29 | | | 570 | | | | 583,667 | |
5.00%, 01/01/30 | | | 1,285 | | | | 1,313,081 | |
5.00%, 01/01/32 | | | 1,510 | | | | 1,543,575 | |
Dauphin County General Authority, Refunding RB, Series A, 4.00%, 06/01/31 | | | 2,275 | | | | 2,364,403 | |
East Hempfield Township Industrial Development Authority, RB(e) | | | | | | | | |
5.00%, 07/01/23 | | | 1,280 | | | | 1,291,681 | |
5.00%, 07/01/25 | | | 825 | | | | 874,516 | |
Geisinger Authority, Refunding RB | | | | | | | | |
Series A-2, 5.00%, 02/15/32 | | | 4,000 | | | | 4,309,340 | |
Series A-2, 5.00%, 02/15/34 | | | 1,750 | | | | 1,875,039 | |
Lancaster County Hospital Authority, Refunding RB, Series A, 3.00%, 08/15/30 | | | 2,535 | | | | 2,564,300 | |
Latrobe Industrial Development Authority, Refunding RB, 5.00%, 03/01/30 | | | 150 | | | | 163,143 | |
Lehigh County Industrial Development Authority, Refunding RB, Series A, 3.00%, 09/01/29 | | | 15,000 | | | | 14,784,285 | |
Montgomery County Higher Education and Health Authority, Refunding RB | | | | | | | | |
4.00%, 09/01/35 | | | 1,735 | | | | 1,761,955 | |
4.00%, 09/01/36 | | | 1,500 | | | | 1,509,807 | |
Series A, 5.00%, 09/01/31 | | | 1,750 | | | | 1,919,531 | |
Series A, 5.00%, 09/01/32 | | | 1,315 | | | | 1,437,891 | |
Montgomery County Industrial Development Authority, Refunding RB | | | | | | | | |
5.00%, 01/01/30 | | | 2,000 | | | | 1,980,440 | |
Series A, 5.25%, 01/15/25(e) | | | 3,250 | | | | 3,421,077 | |
Northampton County General Purpose Authority, RB, Series A, 5.00%, 08/15/23(e) | | | 10,000 | | | | 10,119,260 | |
Northampton County General Purpose Authority, Refunding RB, 5.00%, 11/01/34 | | | 5,400 | | | | 5,953,100 | |
| | | | | | | | |
| Security | | Par (000) | | | Value | |
| | |
| Pennsylvania (continued) | | | | | | |
Pennsylvania Economic Development Financing Authority, RB | | | | | | | | |
Series A-1, 5.00%, 04/15/30 | | $ | 2,500 | | | $ | 2,872,008 | |
AMT, 5.00%, 12/31/29 | | | 8,750 | | | | 9,299,530 | |
AMT, 5.00%, 06/30/30 | | | 3,500 | | | | 3,847,686 | |
AMT, 5.00%, 12/31/30 | | | 13,100 | | | | 13,606,184 | |
AMT, 5.00%, 12/31/34 | | | 16,500 | | | | 16,875,441 | |
Pennsylvania Economic Development Financing Authority, Refunding RB, 5.00%, 03/15/31 | | | 4,500 | | | | 4,870,777 | |
Pennsylvania Higher Educational Facilities Authority, RB, Series AT-1, 5.00%, 06/15/30 | | | 7,910 | | | | 8,569,947 | |
Pennsylvania Higher Educational Facilities Authority, Refunding RB | | | | | | | | |
5.00%, 05/01/30 | | | 425 | | | | 455,000 | |
5.00%, 05/01/31 | | | 1,275 | | | | 1,364,747 | |
4.00%, 05/01/32 | | | 3,000 | | | | 2,677,332 | |
5.00%, 05/01/32 | | | 1,750 | | | | 1,873,065 | |
5.00%, 05/01/33 | | | 3,320 | | | | 3,546,520 | |
5.00%, 05/01/35 | | | 1,000 | | | | 1,065,571 | |
Pennsylvania Housing Finance Agency, RB, S/F Housing | | | | | | | | |
Series 137, 1.90%, 04/01/30 | | | 1,625 | | | | 1,484,000 | |
Series 137, 1.95%, 10/01/30 | | | 875 | | | | 794,567 | |
Pennsylvania Housing Finance Agency, Refunding RB, Series 125A, AMT, 3.40%, 10/01/32 | | | 9,000 | | | | 8,714,475 | |
Pennsylvania Turnpike Commission, RB
Series B, 5.00%, 12/01/29 | | | 800 | | | | 930,896 | |
Series B, 5.00%, 12/01/30 | | | 620 | | | | 733,862 | |
Sub-Series B-1, 5.00%, 06/01/31 | | | 3,000 | | | | 3,301,590 | |
Sub-Series B-1, 5.00%, 06/01/32 | | | 4,075 | | | | 4,480,373 | |
Sub-Series B-1, 5.00%, 06/01/33 | | | 4,000 | | | | 4,389,504 | |
Pennsylvania Turnpike Commission, Refunding RB | | | | | | | | |
2nd Series, 5.00%, 12/01/32 | | | 1,000 | | | | 1,106,538 | |
2nd Series, 5.00%, 12/01/35 | | | 2,005 | | | | 2,170,330 | |
2nd Sub Series, 5.00%, 12/01/33 | | | 1,815 | | | | 1,998,865 | |
2nd Sub Series, 5.00%, 12/01/34 | | | 1,500 | | | | 1,639,560 | |
Series B, 5.00%, 12/01/30 | | | 330 | | | | 390,604 | |
Sub-Series B-2, (AGM), 5.00%, 06/01/34 | | | 4,000 | | | | 4,373,128 | |
Philadelphia Authority for Industrial Development, RB, 4.00%, 06/15/29 | | | 350 | | | | 342,304 | |
Philadelphia Gas Works Co., RB, Series A, (AGM), 5.00%, 08/01/30 | | | 800 | | | | 931,258 | |
Philadelphia Gas Works Co., Refunding RB, Series 14-T, 5.00%, 10/01/30 | | | 425 | | | | 458,673 | |
Pittsburgh Water & Sewer Authority, RB, Series B, (AGM), 5.00%, 09/01/30 | | | 205 | | | | 241,686 | |
Southeastern Pennsylvania Transportation Authority, RB, 5.00%, 06/01/30 | | | 5,000 | | | | 5,860,260 | |
Wayne County Hospital & Health Facilities Authority, RB | | | | | | | | |
Series A, (GTD), 5.00%, 07/01/31 | | | 460 | | | | 501,846 | |
Series A, (GTD), 4.00%, 07/01/33 | | | 440 | | | | 452,379 | |
West Cornwall Township Municipal Authority, Refunding RB | | | | | | | | |
Series A, 4.00%, 11/15/27 | | | 130 | | | | 128,535 | |
Series A, 4.00%, 11/15/28 | | | 105 | | | | 103,342 | |
Series A, 4.00%, 11/15/29 | | | 140 | | | | 137,188 | |
Series A, 4.00%, 11/15/30 | | | 190 | | | | 184,274 | |
Series A, 4.00%, 11/15/31 | | | 200 | | | | 191,293 | |
| | |
| 26 | | 2 0 2 3 BLACK ROCK SEMI - ANNUAL REPORT TO SHAREHOLDERS |
| | |
Schedule of Investments (unaudited) (continued) January 31, 2023 | | BlackRock Municipal 2030 Target Term Trust (BTT) (Percentages shown are based on Net Assets) |
| | | | | | | | |
| Security | | Par (000) | | | Value | |
| | |
| Pennsylvania (continued) | | | | | | |
Westmoreland County Municipal Authority, Refunding RB | | | | | | | | |
(BAM), 5.00%, 08/15/27 | | $ | 1,500 | | | $ | 1,602,026 | |
(BAM), 5.00%, 08/15/31 | | | 5,000 | | | | 5,565,335 | |
(BAM), 5.00%, 08/15/32 | | | 17,945 | | | | 19,962,951 | |
| | | | | | | | |
| | |
| | | | | | | 274,257,778 | |
| | |
| Puerto Rico — 4.3% | | | | | | |
Commonwealth of Puerto Rico, GO, Series A1, Restructured, 5.63%, 07/01/29 | | | 1,534 | | | | 1,633,368 | |
Puerto Rico Sales Tax Financing Corp. Sales Tax Revenue, RB, CAB(b) | | | | | | | | |
Series A-1, Restructured, 0.00%, 07/01/29 | | | 14,055 | | | | 10,532,395 | |
Series A-1, Restructured, 0.00%, 07/01/31 | | | 38,523 | | | | 26,236,128 | |
Series A-1, Restructured, 0.00%, 07/01/33 | | | 43,149 | | | | 26,557,778 | |
Series B-1, Restructured, 0.00%, 07/01/31 | | | 5,755 | | | | 3,911,863 | |
Series B-1, Restructured, 0.00%, 07/01/33 | | | 6,477 | | | | 3,982,507 | |
| | | | | | | | |
| | |
| | | | | | | 72,854,039 | |
| | |
| Rhode Island — 1.0% | | | | | | |
Rhode Island Health and Educational Building Corp., Refunding RB, 5.00%, 05/15/30 | | | 1,500 | | | | 1,558,848 | |
Rhode Island Student Loan Authority, RB | | | | | | | | |
Series A, AMT, 5.00%, 12/01/29 | | | 1,950 | | | | 2,172,637 | |
Series A, AMT, 5.00%, 12/01/30 | | | 1,300 | | | | 1,463,987 | |
Tobacco Settlement Financing Corp., Refunding RB | | | | | | | | |
Series A, 5.00%, 06/01/28 | | | 2,750 | | | | 2,828,372 | |
Series A, 5.00%, 06/01/29 | | | 4,500 | | | | 4,625,942 | |
Series A, 5.00%, 06/01/30 | | | 4,215 | | | | 4,326,913 | |
| | | | | | | | |
| | |
| | | | | | | 16,976,699 | |
| | |
| South Carolina — 0.8% | | | | | | |
South Carolina Jobs-Economic Development Authority, Refunding RB, Series A, 5.00%, 05/01/35 | | | 10,000 | | | | 10,600,610 | |
South Carolina Public Service Authority, Refunding RB, Series A, 5.00%, 12/01/31 | | | 2,800 | | | | 3,200,890 | |
| | | | | | | | |
| | |
| | | | | | | 13,801,500 | |
| | |
| Tennessee — 1.2% | | | | | | |
Chattanooga Health Educational & Housing Facility Board, Refunding RB, Series A, 4.00%, 08/01/36 | | | 2,000 | | | | 1,991,140 | |
Chattanooga-Hamilton County Hospital Authority, Refunding RB, Series A, 5.00%, 10/01/31 | | | 6,210 | | | | 6,396,611 | |
Metropolitan Government Nashville & Davidson County Health & Educational Facilities Board, RB, Series A, 5.00%, 07/01/31 | | | 1,300 | | | | 1,384,106 | |
Tennergy Corp., RB, Series A, 4.00%, 12/01/51(a) | | | 6,000 | | | | 6,015,972 | |
Tennessee Energy Acquisition Corp., RB, Series A, 5.00%, 05/01/52(a) | | | 5,000 | | | | 5,368,250 | |
| | | | | | | | |
| | |
| | | | | | | 21,156,079 | |
| | |
| Texas — 13.1% | | | | | | |
Arlington Higher Education Finance Corp., RB, 4.00%, 06/15/31 | | | 3,260 | | | | 2,960,888 | |
Central Texas Regional Mobility Authority, RB, Series A, Senior Lien, 5.00%, 07/01/25(e) | | | 4,275 | | | | 4,533,928 | |
Central Texas Turnpike System, RB | | | | | | | | |
Series C, 5.00%, 08/15/32 | | | 12,500 | | | | 12,931,250 | |
Series C, 5.00%, 08/15/33 | | | 14,000 | | | | 14,484,260 | |
| | | | | | | | |
| Security | | Par (000) | | | Value | |
| | |
| Texas (continued) | | | | | | |
City of Austin Texas Airport System Revenue, RB, AMT, 5.00%, 11/15/30 | | $ | 2,000 | | | $ | 2,260,072 | |
City of Austin Texas Water & Wastewater System Revenue, Refunding RB, Series C, 5.00%, 11/15/30 | | | 900 | | | | 1,075,095 | |
City of Houston Texas Airport System Revenue, RB, Series B-1, AMT, 5.00%, 07/15/30 | | | 1,900 | | | | 1,928,420 | |
City of Houston Texas Airport System Revenue, Refunding RB | | | | | | | | |
Sub-Series D, 5.00%, 07/01/33 | | | 7,000 | | | | 7,913,591 | |
Sub-Series A, AMT, 5.00%, 07/01/30 | | | 1,200 | | | | 1,356,588 | |
City of Houston Texas Combined Utility System Revenue, Refunding RB, Series B, 1st Lien, Subordinate, 5.00%, 11/15/34 | | | 7,315 | | | | 7,978,646 | |
Clifton Higher Education Finance Corp., RB, 6.00%, 08/15/33 | | | 1,650 | | | | 1,675,072 | |
Clifton Higher Education Finance Corp., Refunding RB | | | | | | | | |
Series A, (PSF), 4.00%, 08/15/31 | | | 1,250 | | | | 1,304,002 | |
Series A, 3.95%, 12/01/32 | | | 1,800 | | | | 1,747,946 | |
County of Nueces Texas, Refunding GO | | | | | | | | |
4.00%, 02/15/33 | | | 1,165 | | | | 1,234,477 | |
4.00%, 02/15/35 | | | 725 | | | | 756,719 | |
Dallas Fort Worth International Airport, Refunding RB, 5.00%, 11/01/32 | | | 5,000 | | | | 5,904,595 | |
DeSoto Independent School District, Refunding GO, (PSF), 5.00%, 08/15/30 | | | 3,980 | | | | 4,585,947 | |
Harris County Cultural Education Facilities Finance Corp., RB | | | | | | | | |
Series B, 5.75%, 01/01/28 | | | 500 | | | | 500,089 | |
Series B, 6.38%, 01/01/33 | | | 460 | | | | 460,237 | |
Harris County Cultural Education Facilities Finance Corp., Refunding RB | | | | | | | | |
Series A, 5.00%, 06/01/28 | | | 1,150 | | | | 1,142,770 | |
Series A, 5.00%, 01/01/33 | | | 1,090 | | | | 1,038,648 | |
Series A, 5.00%, 06/01/33 | | | 3,000 | | | | 2,919,300 | |
Leander Independent School District, Refunding GO, CAB(b) | | | | | | | | |
Series D, (PSF), 0.00%, 08/15/24(e) | | | 4,610 | | | | 2,947,956 | |
Series D, (PSF), 0.00%, 08/15/31 | | | 1,200 | | | | 842,530 | |
Series D, (PSF), 0.00%, 08/15/32 | | | 1,875 | | | | 1,263,956 | |
Matagorda County Navigation District No. 1, Refunding RB | | | | | | | | |
Series A, (AMBAC), 4.40%, 05/01/30 | | | 26,120 | | | | 27,588,545 | |
Series B-2, 4.00%, 06/01/30 | | | 12,995 | | | | 13,008,918 | |
Series B, AMT, (AMBAC), 4.55%, 05/01/30 | | | 10,000 | | | | 10,207,490 | |
Midland County Fresh Water Supply District No. 1, RB, CAB, Series A, 0.00%, 09/15/27(b)(e) | | | 21,370 | | | | 15,261,176 | |
Mission Economic Development Corp., Refunding RB, AMT, Senior Lien, 4.63%, 10/01/31(c) | | | 3,805 | | | | 3,773,951 | |
New Hope Cultural Education Facilities Finance Corp., RB, Series A, 4.00%, 08/15/29(c) | | | 335 | | | | 330,649 | |
Socorro Independent School District, Refunding GO, Series B, (PSF), 4.00%, 08/15/34 | | | 3,000 | | | | 3,138,243 | |
Spring Branch Independent School District, GO, (PSF), 3.00%, 02/01/33 | | | 5,000 | | | | 5,085,635 | |
Tarrant County Cultural Education Facilities Finance Corp., RB
Class F, 5.00%, 11/15/52(a) | | | 3,585 | | | | 4,090,998 | |
| | |
SCHEDULE OF INVESTMENTS | | 27 |
| | |
Schedule of Investments (unaudited) (continued) January 31, 2023 | | BlackRock Municipal 2030 Target Term Trust (BTT) (Percentages shown are based on Net Assets) |
| | | | | | | | |
| Security | | Par (000) | | | Value | |
| | |
| Texas (continued) | | | | | | |
Tarrant County Cultural Education Facilities Finance Corp., RB (continued) | | | | | | | | |
Series A, 4.00%, 05/15/23(e) | | $ | 15,920 | | | $ | 15,977,837 | |
Series B, 5.00%, 07/01/35 | | | 6,000 | | | | 6,473,388 | |
Tarrant County Cultural Education Facilities Finance Corp., Refunding RB, Series A-1, 5.00%, 10/01/29 | | | 1,000 | | | | 1,019,486 | |
Texas Municipal Gas Acquisition & Supply Corp. III, Refunding RB | | | | | | | | |
5.00%, 12/15/30 | | | 16,435 | | | | 17,547,502 | |
5.00%, 12/15/32 | | | 5,000 | | | | 5,364,810 | |
Texas Public Finance Authority, Refunding RB, 4.00%, 12/01/31 | | | 1,650 | | | | 1,730,500 | |
Texas Water Development Board, RB, 5.00%, 10/15/30 | | | 3,850 | | | | 4,605,043 | |
| | | | | | | | |
| | |
| | | | | | | 220,951,153 | |
| | |
| Utah — 0.3% | | | | | | |
Utah Transit Authority, Refunding RB, Subordinate, 4.00%, 12/15/31 | | | 5,000 | | | | 5,221,470 | |
| | | | | | | | |
| | |
| Virginia — 0.3% | | | | | | |
Dulles Town Center Community Development Authority, Refunding SAB, 4.25%, 03/01/26 | | | 500 | | | | 498,653 | |
Fairfax County Economic Development Authority, RB, Series A, 5.00%, 12/01/23(e) | | | 2,000 | | | | 2,038,450 | |
Hanover County Economic Development Authority, Refunding RB, 4.00%, 07/01/30(c) | | | 1,000 | | | | 951,929 | |
Norfolk Redevelopment and Housing Authority, RB, Series B, 4.00%, 01/01/25 | | | 1,650 | | | | 1,613,791 | |
| | | | | | | | |
| | |
| | | | | | | 5,102,823 | |
| | |
| Washington — 2.2% | | | | | | |
County of King Washington Sewer Revenue, Refunding RB, Series A, Junior Lien, 3.97%, 01/01/40(a) | | | 5,750 | | | | 5,783,350 | |
Port of Seattle Washington, RB | | | | | | | | |
Series C, AMT, Intermediate Lien, 5.00%, 05/01/33 | | | 6,695 | | | | 7,176,645 | |
Series C, AMT, Intermediate Lien, 5.00%, 05/01/34 | | | 6,000 | | | | 6,403,866 | |
Washington Health Care Facilities Authority, Refunding RB, Series B, 5.00%, 08/15/35 | | | 9,485 | | | | 10,161,916 | |
Washington State Convention Center Public Facilities District, RB, 4.00%, 07/01/31 | | | 4,240 | | | | 3,985,252 | |
Washington State Housing Finance Commission, Refunding RB | | | | | | | | |
5.00%, 07/01/28 | | | 1,000 | | | | 1,004,537 | |
5.00%, 07/01/33 | | | 1,320 | | | | 1,326,000 | |
WBRP 3.2, RB | | | | | | | | |
Series A, 5.00%, 01/01/31 | | | 1,000 | | | | 1,066,708 | |
Series A, 5.00%, 01/01/32 | | | 1,140 | | | | 1,216,078 | |
| | | | | | | | |
| | |
| | | | | | | 38,124,352 | |
| | | | | | | | |
| Security | | Par (000) | | | Value | |
| | |
| West Virginia — 0.2% | | | | | | |
West Virginia Hospital Finance Authority, RB | | | | | | | | |
Series A, 5.00%, 06/01/31 | | $ | 1,950 | | | $ | 2,091,274 | |
Series A, 5.00%, 06/01/33 | | | 1,100 | | | | 1,175,023 | |
| | | | | | | | |
| | |
| | | | | | | 3,266,297 | |
| | |
| Wisconsin — 2.8% | | | | | | |
Public Finance Authority, RB(c) | | | | | | | | |
4.00%, 06/15/30 | | | 1,520 | | | | 1,384,994 | |
5.00%, 01/01/31 | | | 650 | | | | 662,160 | |
Class A, 5.00%, 06/15/31 | | | 720 | | | | 722,336 | |
Series A, 4.00%, 07/15/29 | | | 645 | | | | 629,016 | |
Series A, 4.00%, 03/01/30 | | | 1,305 | | | | 1,233,739 | |
Series A, 3.75%, 06/01/30 | | | 345 | | | | 325,986 | |
Public Finance Authority, Refunding RB | | | | | | | | |
4.00%, 09/01/29(c) | | | 375 | | | | 342,364 | |
Class A, 3.00%, 12/01/26 | | | 250 | | | | 239,101 | |
Class C, 4.00%, 10/01/41(a) | | | 7,000 | | | | 7,283,689 | |
AMT, 2.63%, 11/01/25 | | | 3,000 | | | | 2,900,559 | |
Class B, AMT, 4.00%, 10/01/46(a) | | | 1,750 | | | | 1,877,433 | |
Series B, AMT, 5.25%, 07/01/28 | | | 2,250 | | | | 2,252,011 | |
State of Wisconsin, GO, Series A, 4.16%, 05/01/25(a) | | | 8,960 | | | | 8,957,276 | |
Wisconsin Health & Educational Facilities Authority, Refunding RB
5.00%, 04/01/35 | | | 2,500 | | | | 2,773,830 | |
Series C-4, 4.39%, 08/15/54(a) | | | 8,200 | | | | 8,304,411 | |
Wisconsin Housing & Economic Development Authority Home Ownership Revenue, RB, S/F Housing, Series D, (FNMA), 3.00%, 09/01/32 | | | 7,265 | | | | 6,842,577 | |
| | | | | | | | |
| | |
| | | | | | | 46,731,482 | |
| | | | | | | | |
| |
Total Municipal Bonds — 136.4%
(Cost: $2,317,168,879) | | | | 2,308,761,363 | |
| | | | | | | | |
|
Municipal Bonds Transferred to Tender Option Bond Trusts(h)(i) | |
| | |
| Colorado — 0.6% | | | | | | |
City & County of Denver Colorado Airport System Revenue, Refunding ARB | | | | | | | | |
Series A, AMT, 4.25%, 11/15/31 | | | 8,085 | | | | 8,094,236 | |
Series A, AMT, 4.25%, 11/15/32 | | | 2,230 | | | | 2,232,679 | |
| | | | | | | | |
| | |
| | | | | | | 10,326,915 | |
| | |
| Florida — 5.6% | | | | | | |
County of Broward Florida Airport System Revenue, ARB | | | | | | | | |
Series Q-1, 4.00%, 10/01/29 | | | 17,200 | | | | 17,221,580 | |
Series Q-1, 4.00%, 10/01/30 | | | 18,095 | | | | 18,117,730 | |
Series Q-1, 4.00%, 10/01/31 | | | 18,820 | | | | 18,843,633 | |
| | |
| 28 | | 2 0 2 3 BLACK ROCK SEMI - ANNUAL REPORT TO SHAREHOLDERS |
| | |
Schedule of Investments (unaudited) (continued) January 31, 2023 | | BlackRock Municipal 2030 Target Term Trust (BTT) (Percentages shown are based on Net Assets) |
| | | | | | | | |
| Security | | Par (000) | | | Value | |
| |
| | |
| Florida (continued) | | | | | | |
County of Broward Florida Airport System Revenue, ARB (continued) | | | | | | | | |
Series Q-1, 4.00%, 10/01/32 | | $ | 19,575 | | | $ | 19,599,573 | |
Series Q-1, 4.00%, 10/01/33 | | | 20,355 | | | | 20,380,563 | |
| | | | | | | | |
| | |
| | | | | | | 94,163,079 | |
| | | | | | | | |
| |
Total Municipal Bonds Transferred to Tender Option Bond Trusts — 6.2%
(Cost: $104,359,983) | | | | 104,489,994 | |
| | | | | | | | |
| |
Total Long-Term Investments — 142.6%
(Cost: $2,421,528,862) | | | | 2,413,251,357 | |
| | | | | | | | |
| | |
| | | Shares | | | | |
| |
| | |
Short-Term Securities | | | | | | | | |
| | |
| Money Market Funds — 5.6% | | | | | | |
BlackRock Liquidity Funds, MuniCash, Institutional Class, 1.39%(j)(k) | | | 93,840,444 | | | | 93,859,212 | |
| | | | | | | | |
| |
Total Short-Term Securities — 5.6%
(Cost: $93,842,274) | | | | 93,859,212 | |
| | | | | | | | |
| |
Total Investments — 148.2%
(Cost: $2,515,371,136) | | | | 2,507,110,569 | |
| |
Other Assets Less Liabilities — 0.2% | | | | 4,706,562 | |
| |
Liability for TOB Trust Certificates, Including Interest Expense and Fees Payable — (4.1)% | | | | (70,145,702 | ) |
| |
RVMTP Shares at Liquidation Value, Net of Deferred Offering Costs — (44.3)% | | | | (749,752,309 | ) |
| | | | | | | | |
| |
Net Assets Applicable to Common Shares — 100.0% | | | $ | 1,691,919,120 | |
| | | | | | | | |
| (a) | Variable rate security. Interest rate resets periodically. The rate shown is the effective interest rate as of period end. Security description also includes the reference rate and spread if published and available. |
| (c) | Security exempt from registration pursuant to Rule 144A under the Securities Act of 1933, as amended. These securities may be resold in transactions exempt from registration to qualified institutional investors. |
| (d) | Security is collateralized by municipal bonds or U.S. Treasury obligations. |
| (e) | U.S. Government securities held in escrow, are used to pay interest on this security as well as to retire the bond in full at the date indicated, typically at a premium to par. |
| (f) | When-issued security. |
| (g) | Step coupon security. Coupon rate will either increase (step-up bond) or decrease (step- down bond) at regular intervals until maturity. Interest rate shown reflects the rate currently in effect. |
| (h) | Represent bonds transferred to a TOB Trust in exchange of cash and residual certificates received by the Trust. These bonds serve as collateral in a secured borrowing. See Note 4 of the Notes to Financial Statements for details. |
| (i) | All or a portion of the security is subject to a recourse agreement. The aggregate maximum potential amount the Trust could ultimately be required to pay under the agreements, which expire between October 1, 2029 to November 15, 2032, is $71,728,412. See Note 4 of the Notes to Financial Statements for details. |
| (j) | Affiliate of the Trust. |
| (k) | Annualized 7-day yield as of period end. |
Affiliates
Investments in issuers considered to be affiliate(s) of the Trust during the six months ended January 31, 2023 for purposes of Section 2(a)(3) of the Investment Company Act of 1940, as amended, were as follows:
| | | | | | | | | | | | | | | | | | | | | | | | | | | | | | | | | | | | |
| | | | | | | | | | |
| Affiliated Issuer | | Value at
07/31/22 | | | Purchases
at Cost | | | Proceeds
from Sales | | | Net
Realized
Gain (Loss) | | | Change in
Unrealized
Appreciation
(Depreciation) | | | Value at
01/31/23 | | | Shares
Held at
01/31/23 | | | Income | | | Capital Gain
Distributions
from
Underlying
Funds | |
| | | | | | | | | |
BlackRock Liquidity Funds, MuniCash, Institutional Class | | $ | 53,019,664 | | | $ | 40,853,106 | (a) | | $ | — | | | $ | (29,387 | ) | | $ | 15,829 | | | $ | 93,859,212 | | | | 93,840,444 | | | $ | 588,220 | | | $ | — | |
| | | | | | | | | | | | | | | | | | | | | | | | | | | | | | | | | | | | |
| | (a) | Represents net amount purchased (sold). | |
| | |
SCHEDULE OF INVESTMENTS | | 29 |
| | |
Schedule of Investments (unaudited) (continued) January 31, 2023 | | BlackRock Municipal 2030 Target Term Trust (BTT) |
Fair Value Hierarchy as of Period End
Various inputs are used in determining the fair value of financial instruments. For a description of the input levels and information about the Trust’s policy regarding valuation of financial instruments, refer to the Notes to Financial Statements.
The following table summarizes the Trust’s financial instruments categorized in the fair value hierarchy. The breakdown of the Trust’s financial instruments into major categories is disclosed in the Schedule of Investments above.
| | | | | | | | | | | | | | | | |
| |
| | | | |
| | | Level 1 | | | Level 2 | | | Level 3 | | | Total | |
| |
| | | | |
Assets | | | | | | | | | | | | | | | | |
Investments | | | | | | | | | | | | | | | | |
Long-Term Investments | | | | | | | | | | | | | | | | |
Municipal Bonds | | $ | — | | | $ | 2,308,761,363 | | | $ | — | | | $ | 2,308,761,363 | |
Municipal Bonds Transferred to Tender Option Bond Trusts | | | — | | | | 104,489,994 | | | | — | | | | 104,489,994 | |
Short-Term Securities | | | | | | | | | | | | | | | | |
Money Market Funds | | | 93,859,212 | | | | — | | | | — | | | | 93,859,212 | |
| | | | | | | | | | | | | | | | |
| | | | |
| | $ | 93,859,212 | | | $ | 2,413,251,357 | | | $ | — | | | $ | 2,507,110,569 | |
| | | | | | | | | | | | | | | | |
The Trust may hold assets and/or liabilities in which the fair value approximates the carrying amount for financial statement purposes. As of period end, such assets and/or liabilities are categorized within the fair value hierarchy as follows:
| | | | | | | | | | | | | | | | |
| |
| | | | |
| | | Level 1 | | | Level 2 | | | Level 3 | | | Total | |
| |
| | | | |
Liabilities | | | | | | | | | | | | | | | | |
TOB Trust Certificates | | $ | — | | | $ | (69,569,982 | ) | | $ | — | | | $ | (69,569,982 | ) |
RVMTP Shares at Liquidation Value | | | — | | | | (750,000,000 | ) | | | — | | | | (750,000,000 | ) |
| | | | | | | | | | | | | | | | |
| | | | |
| | $ | — | | | $ | (819,569,982 | ) | | $ | — | | | $ | (819,569,982 | ) |
| | | | | | | | | | | | | | | | |
See notes to financial statements.
| | |
| 30 | | 2 0 2 3 BLACK ROCK SEMI - ANNUAL REPORT TO SHAREHOLDERS |
| | |
Schedule of Investments (unaudited) January 31, 2023 | | BlackRock MuniHoldings California Quality Fund, Inc. (MUC) (Percentages shown are based on Net Assets) |
| | | | | | | | |
| Security | | Par (000) | | | Value | |
| | |
Municipal Bonds | | | | | | | | |
| | |
California — 117.9% | | | | | | | | |
| | |
Corporate — 1.7% | | | | | | | | |
California Community Choice Financing Authority, RB(a) | | | | | | | | |
5.00%, 12/01/53 | | $ | 6,670 | | | $ | 7,121,986 | |
Series B-1, 4.00%, 02/01/52 | | | 9,665 | | | | 9,805,123 | |
California Pollution Control Financing Authority, RB, AMT, 4.75%, 11/01/46 | | | 4,000 | | | | 4,053,068 | |
| | | | | | | | |
| | |
| | | | | | | 20,980,177 | |
|
| County/City/Special District/School District — 43.6% | |
Beverly Hills Unified School District California, GO, Series A, 3.00%, 08/01/41 | | | 2,000 | | | | 1,851,042 | |
California Municipal Finance Authority, RB | | | | | | | | |
5.00%, 06/01/43 | | | 2,000 | | | | 2,165,276 | |
5.00%, 06/01/48 | | | 15,000 | | | | 16,068,255 | |
California Statewide Communities Development Authority, SAB | | | | | | | | |
Series B, 4.00%, 09/02/40 | | | 570 | | | | 532,683 | |
Series B, 4.00%, 09/02/50 | | | 690 | | | | 608,848 | |
Series C, 4.00%, 09/02/40 | | | 4,015 | | | | 3,752,146 | |
Series C, 4.00%, 09/02/50 | | | 2,885 | | | | 2,528,342 | |
California Statewide Communities Development Authority, SAB, S/F Housing | | | | | | | | |
5.00%, 09/02/39 | | | 1,000 | | | | 1,057,932 | |
5.00%, 09/02/40 | | | 950 | | | | 1,004,506 | |
5.00%, 09/02/44 | | | 1,150 | | | | 1,201,678 | |
5.00%, 09/02/49 | | | 1,675 | | | | 1,757,248 | |
4.00%, 09/02/50 | | | 760 | | | | 682,281 | |
5.00%, 09/02/50 | | | 760 | | | | 789,090 | |
Series C, 5.00%, 09/02/39 | | | 850 | | | | 899,242 | |
Series C, 5.00%, 09/02/44 | | | 130 | | | | 135,842 | |
Series C, 5.00%, 09/02/49 | | | 865 | | | | 894,449 | |
California Statewide Communities Development Authority, ST | | | | | | | | |
4.00%, 09/01/41 | | | 700 | | | | 662,109 | |
4.00%, 09/01/51 | | | 1,350 | | | | 1,196,398 | |
Chabot-Las Positas Community College District, GO, Series A, Election 2016, 4.00%, 08/01/47 | | | 1,500 | | | | 1,507,749 | |
Chaffey Joint Union High School District, GO, CAB(b) | | | | | | | | |
Series C, Election 2012, 0.00%, 08/01/32 | | | 500 | | | | 359,797 | |
Series C, Election 2012, 0.00%, 08/01/33 | | | 1,000 | | | | 684,998 | |
Series C, Election 2012, 0.00%, 08/01/34 | | | 1,015 | | | | 662,252 | |
Series C, Election 2012, 0.00%, 08/01/35 | | | 1,090 | | | | 676,524 | |
Series C, Election 2012, 0.00%, 08/01/36 | | | 1,000 | | | | 590,292 | |
Series C, Election 2012, 0.00%, 08/01/37 | | | 1,300 | | | | 730,012 | |
Series C, Election 2012, 0.00%, 08/01/38 | | | 1,255 | | | | 671,977 | |
Series C, Election 2012, 0.00%, 08/01/39 | | | 1,500 | | | | 767,435 | |
Series C, Election 2012, 0.00%, 08/01/40 | | | 3,705 | | | | 1,812,964 | |
Series C, Election 2012, 0.00%, 08/01/41 | | | 610 | | | | 285,346 | |
Series C, Election 2012, 0.00%, 02/01/42 | | | 700 | | | | 318,707 | |
Chino Valley Unified School District, GO | | | | | | | | |
Series B, 4.00%, 08/01/45 | | | 640 | | | | 647,425 | |
Series B, 5.00%, 08/01/55 | | | 1,285 | | | | 1,392,400 | |
City of Dixon California, ST, 4.00%, 09/01/45 | | | 1,000 | | | | 904,409 | |
City of Los Angeles California, COP, (AMBAC), 6.20%, 11/01/31 | | | 1,600 | | | | 1,605,464 | |
City of Roseville California, ST, 4.00%, 09/01/50 | | | 1,000 | | | | 878,049 | |
| | | | | | | | |
| Security | | Par (000) | | | Value | |
|
| County/City/Special District/School District (continued) | |
City of Sacramento California Transient Occupancy Tax Revenue, RB | | | | | | | | |
Series A, 5.00%, 06/01/43 | | $ | 1,230 | | | $ | 1,314,098 | |
Series A, 5.00%, 06/01/48 | | | 3,750 | | | | 3,965,824 | |
Clovis Unified School District, GO, Series B, Election 2020, 5.00%, 08/01/47 | | | 8,050 | | | | 8,854,992 | |
El Dorado Irrigation District, Refunding RB, Series A, (AGM), 5.25%, 03/01/24(c) | | | 15,000 | | | | 15,444,915 | |
El Monte City School District, GO, Series B, Election 2014, 5.50%, 08/01/46 | | | 4,265 | | | | 4,566,945 | |
Elk Grove Unified School District, GO, Election 2016, 4.00%, 08/01/46 | | | 10,000 | | | | 10,014,310 | |
Escondido Union School District, GO, Series B, Election 2014, 4.00%, 08/01/47 | | | 4,320 | | | | 4,308,176 | |
Folsom Cordova Unified School District, GO, Series D, (AGM), 4.00%, 10/01/44 | | | 21,300 | | | | 21,385,690 | |
Fowler Unified School District, GO, Series A, Election 2016, (BAM), 5.25%, 08/01/46 | | | 3,700 | | | | 4,006,926 | |
Fremont Union High School District, Refunding GO 4.00%, 08/01/40 | | | 2,500 | | | | 2,520,833 | |
Series A, 4.00%, 08/01/46 | | | 4,635 | | | | 4,665,345 | |
Garden Grove Unified School District, GO, Series C, Election 2010, 5.25%, 08/01/23(c) | | | 2,725 | | | | 2,760,586 | |
Gilroy Unified School District, GO, Election 2016, 4.00%, 08/01/48 | | | 9,500 | | | | 9,504,940 | |
Glendale Community College District, GO, Series A, Election 2016, 4.00%, 08/01/46 | | | 8,000 | | | | 8,059,224 | |
Glendale Community College District, GO, CAB(b) | | | | | | | | |
Series B, 0.00%, 08/01/41 | | | 2,465 | | | | 1,134,876 | |
Series B, 0.00%, 08/01/42 | | | 2,650 | | | | 1,160,149 | |
Series B, 0.00%, 08/01/43 | | | 3,580 | | | | 1,487,751 | |
Hayward Unified School District, GO, Series A, (BAM), 4.00%, 08/01/48 | | | 4,000 | | | | 3,982,344 | |
Indio Finance Authority, Refunding RB | | | | | | | | |
Series A, (BAM), 5.25%, 11/01/47 | | | 2,225 | | | | 2,480,399 | |
Series A, (BAM), 5.25%, 11/01/52 | | | 7,000 | | | | 7,728,854 | |
Kern Community College District, GO(c) | | | | | | | | |
Series C, 5.25%, 11/01/23 | | | 11,430 | | | | 11,661,435 | |
Series C, 5.75%, 11/01/23 | | | 12,085 | | | | 12,374,109 | |
Los Alamitos Unified School District, Refunding GO, 5.25%, 08/01/23(c) | | | 3,700 | | | | 3,748,318 | |
Los Angeles County Facilities, Inc., RB | | | | | | | | |
Class A, 5.00%, 12/01/28(c) | | | 4,455 | | | | 5,166,410 | |
Class A, 5.00%, 12/01/51 | | | 4,760 | | | | 5,064,516 | |
Series A, 5.00%, 12/01/43 | | | 13,345 | | | | 14,496,313 | |
Series A, 4.00%, 12/01/48 | | | 11,000 | | | | 11,009,933 | |
Los Angeles County Metropolitan Transportation Authority Sales Tax Revenue, RB, Series A, 5.00%, 07/01/45 | | | 6,585 | | | | 7,433,365 | |
Los Angeles County Metropolitan Transportation Authority Sales Tax Revenue, Refunding RB, Series A, 5.00%, 07/01/39 | | | 2,135 | | | | 2,343,297 | |
Los Angeles County Public Works Financing Authority, Refunding RB | | | | | | | | |
Series D, 5.00%, 12/01/45 | | | 1,430 | | | | 1,510,613 | |
Series F, 4.00%, 12/01/46 | | | 4,190 | | | | 4,279,046 | |
Los Angeles Unified School District, GO | | | | | | | | |
Series C, 4.00%, 07/01/39 | | | 5,875 | | | | 6,063,024 | |
Series RYQ, 4.00%, 07/01/44 | | | 23,975 | | | | 24,320,767 | |
| | |
SCHEDULE OF INVESTMENTS | | 31 |
| | |
Schedule of Investments (unaudited) (continued) January 31, 2023 | | BlackRock MuniHoldings California Quality Fund, Inc. (MUC) (Percentages shown are based on Net Assets) |
| | | | | | | | |
| Security | | Par (000) | | | Value | |
|
| County/City/Special District/School District (continued) | |
Menifee Union School District, GO, Series B, (BAM), 4.00%, 08/01/43 | | $ | 5,370 | | | $ | 5,434,392 | |
Mount San Antonio Community College District, Refunding GO, Series A, Election 2008, 5.00%, 08/01/23(c) | | | 4,500 | | | | 4,553,244 | |
Mount San Jacinto Community College District, GO, Series A, Election 2014, 5.00%, 08/01/35 | | | 3,565 | | | | 3,777,609 | |
Napa Valley Unified School District, GO, Series C, (AGM), 4.00%, 08/01/44 | | | 5,250 | | | | 5,295,528 | |
Natomas Unified School District, GO, Election 2014, (BAM), 4.00%, 08/01/42 | | | 5,000 | | | | 5,065,485 | |
Newport Mesa Unified School District, Refunding GO, CAB, 0.00%, 08/01/45(b) | | | 8,485 | | | | 3,196,172 | |
Oceanside Unified School District, GO, Series E, Election 2008, 4.00%, 08/01/48 | | | 3,275 | | | | 3,284,832 | |
Orange County Local Transportation Authority Sales Tax Revenue, RB, 5.00%, 02/15/41 | | | 8,000 | | | | 8,848,824 | |
Oxnard Union High School District, GO, Series C, Election 2018, 4.00%, 08/01/47 | | | 6,750 | | | | 6,738,943 | |
Peralta Community College District, GO, Series B, 5.50%, 08/01/52 | | | 2,500 | | | | 2,864,575 | |
Perris Union High School District, GO, Series B, Election 2012, (BAM), 5.25%, 09/01/39 | | | 2,715 | | | | 2,906,861 | |
Redwood City School District, GO, Series C, 4.00%, 08/01/44 | | | 3,000 | | | | 3,017,043 | |
Rio Elementary School District, GO, Series A, Election 2014, (AGM), 5.25%, 08/01/25(c) | | | 5,865 | | | | 6,298,511 | |
Riverside County Public Financing Authority, Refunding TA, Series A, (BAM), 4.00%, 10/01/40 | | | 9,500 | | | | 9,635,071 | |
Riverside County Redevelopment Successor Agency, Refunding TA, Series A, (AGM), 4.00%, 10/01/37 | | | 6,000 | | | | 6,044,460 | |
RNR School Financing Authority, ST | | | | | | | | |
Series A, (BAM), 5.00%, 09/01/37 | | | 1,500 | | | | 1,608,804 | |
Series A, (BAM), 5.00%, 09/01/41 | | | 3,000 | | | | 3,150,495 | |
San Benito High School District, GO, Election 2016, 4.00%, 08/01/48 | | | 5,000 | | | | 5,015,135 | |
San Diego County Regional Transportation Commission, Refunding RB, Series A, 4.00%, 04/01/48 | | | 1,085 | | | | 1,096,393 | |
San Diego Unified School District, GO | | | | | | | | |
Series B, 3.25%, 07/01/48 | | | 6,000 | | | | 5,049,618 | |
Series I, Election 2012, 4.00%, 07/01/47 | | | 5,000 | | | | 5,008,935 | |
San Diego Unified School District, GO, CAB(b) | | | | | | | | |
Series K-2, 0.00%, 07/01/38 | | | 2,755 | | | | 1,504,891 | |
Series K-2, 0.00%, 07/01/39 | | | 3,340 | | | | 1,732,692 | |
Series K-2, 0.00%, 07/01/40 | | | 4,285 | | | | 2,120,008 | |
San Francisco Bay Area Rapid Transit District, GO | | | | | | | | |
Series C-1, 3.00%, 08/01/50 | | | 2,500 | | | | 2,042,060 | |
Class D1, Election 2016, 4.25%, 08/01/52 | | | 16,500 | | | | 17,045,919 | |
Series A, Election 2016, 4.00%, 08/01/42 | | | 6,000 | | | | 6,133,518 | |
San Jacinto Unified School District, GO | | | | | | | | |
Election 2016, 4.00%, 08/01/42 | | | 3,960 | | | | 4,047,880 | |
Election 2016, 4.00%, 08/01/43 | | | 1,095 | | | | 1,116,417 | |
San Jose Financing Authority, Refunding RB, Series A, 5.00%, 06/01/23(c) | | | 14,175 | | | | 14,287,531 | |
San Leandro Unified School District, GO, Series B, 5.25%, 08/01/48 | | | 3,000 | | | | 3,343,773 | |
San Marcos Redevelopment Agency Successor Agency, Refunding TA Series A, 5.00%, 10/01/32 | | | 1,700 | | | | 1,822,179 | |
| | | | | | | | |
| Security | | Par (000) | | | Value | |
|
| County/City/Special District/School District (continued) | |
San Marcos Redevelopment Agency Successor Agency, Refunding TA (continued) | | | | | | | | |
Series A, 5.00%, 10/01/33 | | $ | 1,125 | | | $ | 1,205,883 | |
San Mateo Joint Powers Financing Authority, RB, Series A, 4.00%, 07/15/52 | | | 14,270 | | | | 13,913,279 | |
Santa Clara County Financing Authority, RB, Series A, 4.00%, 04/01/43 | | | 6,355 | | | | 6,411,915 | |
Santa Clara Unified School District, GO, Election 2018, 4.00%, 07/01/48 | | | 15,000 | | | | 15,022,800 | |
Santa Clarita Community College District, GO, Election 2016, 5.25%, 08/01/45 | | | 4,000 | | | | 4,621,908 | |
Santa Monica Community College District, GO, Series A, Election 2016, 5.00%, 08/01/43 | | | 10,000 | | | | 10,959,680 | |
South San Francisco Public Facilities Financing Authority, RB | | | | | | | | |
Class A, 4.00%, 06/01/42 | | | 500 | | | | 506,145 | |
Class A, 5.25%, 06/01/46 | | | 750 | | | | 830,027 | |
Southwestern Community College District, GO, Series D, 3.00%, 08/01/41 | | | 7,370 | | | | 6,614,280 | |
Transbay Joint Powers Authority, TA, Series B, Subordinate, 5.00%, 10/01/38 | | | 600 | | | | 660,248 | |
Washington Township Health Care District, GO, Series B, Election 2004, 5.50%, 08/01/38 | | | 3,250 | | | | 3,384,631 | |
West Contra Costa Unified School District, GO(c) | | | | | | | | |
Series B, Election 2010, 5.50%, 08/01/23 | | | 6,195 | | | | 6,283,502 | |
Series A, Election 2012, 5.50%, 08/01/23 | | | 7,500 | | | | 7,607,145 | |
West Valley-Mission Community College District, GO, Series B, Election 2012, 4.00%, 08/01/40 | | | 34,000 | | | | 34,593,980 | |
| | | | | | | | |
| | |
| | | | | | | 546,804,711 | |
| | |
| Education — 11.9% | | | | | | |
California Educational Facilities Authority, RB | | | | | | | | |
Series A, 5.00%, 10/01/48 | | | 10,000 | | | | 10,515,387 | |
Series U-7, 5.00%, 06/01/46 | | | 7,525 | | | | 9,175,466 | |
California Enterprise Development Authority, Refunding RB, Series A, 4.00%, 06/01/51(d) | | | 875 | | | | 685,443 | |
California Municipal Finance Authority, RB | | | | | | | | |
4.00%, 10/01/51 | | | 1,150 | | | | 989,007 | |
Series A, 5.50%, 08/01/34(d) | | | 465 | | | | 468,648 | |
Series A, 5.00%, 10/01/39(d) | | | 680 | | | | 657,703 | |
Series A, 5.00%, 10/01/49(d) | | | 1,145 | | | | 1,047,814 | |
Series A, 5.00%, 10/01/57(d) | | | 2,255 | | | | 2,011,050 | |
California Municipal Finance Authority, Refunding RB(d) | | | | | | | | |
5.00%, 08/01/39 | | | 2,040 | | | | 2,088,156 | |
5.00%, 08/01/48 | | | 1,245 | | | | 1,220,074 | |
California School Finance Authority, RB | | | | | | | | |
6.65%, 07/01/33 | | | 595 | | | | 602,192 | |
5.00%, 06/01/40(d) | | | 660 | | | | 664,199 | |
6.90%, 07/01/43 | | | 1,330 | | | | 1,347,669 | |
5.00%, 06/01/50(d) | | | 1,030 | | | | 1,007,795 | |
5.00%, 08/01/52(d) | | | 1,875 | | | | 1,898,250 | |
5.00%, 08/01/61(d) | | | 5,315 | | | | 5,359,364 | |
Class A, (NPFGC), 5.00%, 06/01/61(d) | | | 820 | | | | 781,822 | |
Series A, 6.00%, 07/01/33 | | | 1,500 | | | | 1,514,168 | |
Series A, 5.00%, 06/01/39(d) | | | 740 | | | | 710,105 | |
Series A, (NPFGC), 5.00%, 06/01/41(d) | | | 440 | | | | 440,990 | |
Series A, 6.30%, 07/01/43 | | | 3,000 | | | | 3,032,538 | |
Series A, 5.00%, 07/01/49(d) | | | 1,850 | | | | 1,888,108 | |
Series A, 4.00%, 06/01/51(d) | | | 800 | | | | 640,672 | |
Series A, (NPFGC), 5.00%, 06/01/51(d) | | | 600 | | | | 581,411 | |
| | |
| 32 | | 2 0 2 3 BLACK ROCK SEMI - ANNUAL REPORT TO SHAREHOLDERS |
| | |
Schedule of Investments (unaudited) (continued) January 31, 2023 | | BlackRock MuniHoldings California Quality Fund, Inc. (MUC) (Percentages shown are based on Net Assets) |
| | | | | | | | |
| Security | | Par (000) | | | Value | |
| | |
| Education (continued) | | | | | | |
California School Finance Authority, RB (continued) | | | | | | | | |
Series A, 5.00%, 06/01/58(d) | | $ | 9,215 | | | $ | 8,478,188 | |
Series A, 5.00%, 07/01/59(d) | | | 2,565 | | | | 2,585,584 | |
Series A, 4.00%, 06/01/61(d) | | | 1,300 | | | | 998,691 | |
Series B, 4.00%, 07/01/45(d) | | | 1,035 | | | | 908,800 | |
California School Finance Authority, Refunding RB(d) | | | | | | | | |
5.00%, 08/01/46 | | | 1,145 | | | | 1,155,347 | |
Series A, 5.00%, 07/01/36 | | | 755 | | | | 771,159 | |
California State University, Refunding RB | | | | | | | | |
Series A, 5.00%, 11/01/41 | | | 9,775 | | | | 10,444,001 | |
Series A, 5.00%, 11/01/47 | | | 13,430 | | | | 14,370,664 | |
California Statewide Communities Development Authority, RB, Series A, 5.00%, 05/15/37 | | | 4,000 | | | | 4,125,740 | |
California Statewide Communities Development Authority, Refunding RB, 5.00%, 05/15/40 | | | 2,250 | | | | 2,296,127 | |
Hastings Campus Housing Finance Authority, RB(d) | | | | | | | | |
Series A, 5.00%, 07/01/45 | | | 1,115 | | | | 974,258 | |
Series A, 5.00%, 07/01/61 | | | 9,360 | | | | 7,676,061 | |
University of California, RB, Series AM, 5.25%, 05/15/36 | | | 2,970 | | | | 3,089,112 | |
University of California, Refunding RB | | | | | | | | |
Series AO, 5.00%, 05/15/40 | | | 5,430 | | | | 5,788,890 | |
Series AZ, 4.00%, 05/15/48 | | | 6,000 | | | | 6,071,508 | |
Series BH, 4.00%, 05/15/51 | | | 15,000 | | | | 15,188,535 | |
Series D, 5.50%, 05/15/58 | | | 4,000 | | | | 4,367,440 | |
Series Q, 3.00%, 05/15/51 | | | 13,000 | | | | 10,383,373 | |
| | | | | | | | |
| | |
| | | | | | | 149,001,509 | |
| | |
| Health — 8.9% | | | | | | |
California Health Facilities Financing Authority, RB | | | | | | | | |
4.00%, 11/15/47 | | | 825 | | | | 826,720 | |
5.00%, 11/15/56 | | | 9,000 | | | | 9,359,982 | |
Series A, 5.00%, 11/15/35 | | | 1,960 | | | | 2,120,316 | |
Series A, 4.00%, 11/15/42 | | | 450 | | | | 452,645 | |
California Health Facilities Financing Authority, Refunding RB | | | | | | | | |
5.00%, 08/01/40 | | | 700 | | | | 749,861 | |
(AGM), 3.00%, 08/15/51 | | | 13,975 | | | | 11,351,026 | |
Series A, 5.00%, 07/01/23(c) | | | 10,000 | | | | 10,098,220 | |
Series A, 4.00%, 03/01/39 | | | 895 | | | | 896,231 | |
Series A, 4.00%, 03/01/43 | | | 1,315 | | | | 1,266,021 | |
Series A, 4.00%, 04/01/45 | | | 3,570 | | | | 3,416,183 | |
Series A, 5.00%, 11/15/48 | | | 7,280 | | | | 7,582,186 | |
Series B, 5.00%, 11/15/26(c) | | | 3,385 | | | | 3,742,483 | |
California Municipal Finance Authority, RB | | | | | | | | |
Series A, 4.00%, 11/15/52 | | | 1,000 | | | | 755,236 | |
Series A, 4.00%, 11/15/56 | | | 1,100 | | | | 816,281 | |
California Municipal Finance Authority, Refunding RB | | | | | | | | |
Series A, 5.00%, 02/01/37 | | | 3,110 | | | | 3,246,964 | |
Series A, 5.00%, 11/01/39(d) | | | 600 | | | | 612,535 | |
Series A, 5.00%, 02/01/47 | | | 9,250 | | | | 9,534,715 | |
California Statewide Communities Development Authority, RB | | | | | | | | |
4.25%, 01/01/43 | | | 3,450 | | | | 3,433,685 | |
4.00%, 08/01/45 | | | 5,000 | | | | 4,369,425 | |
4.00%, 07/01/48 | | | 4,000 | | | | 3,985,496 | |
California Statewide Communities Development Authority, Refunding RB | | | | | | | | |
4.00%, 04/01/42 | | | 5,600 | | | | 5,562,239 | |
4.00%, 04/01/47 | | | 3,975 | | | | 3,907,874 | |
5.00%, 04/01/47 | | | 2,995 | | | | 3,119,098 | |
| | | | | | | | |
| Security | | Par (000) | | | Value | |
| | |
Health (continued) | | | | | | | | |
California Statewide Communities Development Authority, Refunding RB (continued) | | | | | | | | |
5.00%, 03/01/48 | | $ | 5,000 | | | $ | 5,179,585 | |
Series A, 5.00%, 08/15/51 | | | 1,635 | | | | 1,685,651 | |
Series A, 5.00%, 12/01/53 | | | 1,000 | | | | 1,040,562 | |
Series A, 4.00%, 12/01/57 | | | 6,500 | | | | 6,439,134 | |
Series A, 5.00%, 12/01/57 | | | 1,750 | | | | 1,819,279 | |
Regents of the University of California Medical Center Pooled Revenue, Refunding RB, Series L, 5.00%, 05/15/47 | | | 4,000 | | | | 4,176,524 | |
| | | | | | | | |
| | |
| | | | | | | 111,546,157 | |
| | |
| Housing — 8.1% | | | | | | |
California Community Housing Agency, RB, M/F Housing(d) | | | | | | | | |
4.00%, 08/01/46 | | | 2,495 | | | | 2,109,498 | |
Series A, 5.00%, 04/01/49 | | | 9,400 | | | | 8,439,207 | |
Series A-2, 4.00%, 08/01/47 | | | 2,100 | | | | 1,739,373 | |
Series A-2, 4.00%, 02/01/50 | | | 1,160 | | | | 937,899 | |
Series A-2, 4.00%, 08/01/51 | | | 6,380 | | | | 4,651,090 | |
California Housing Finance Agency, RB, M/F Housing | | | | | | | | |
Series 2021-1, Class A, 3.50%, 11/20/35 | | | 17,847 | | | | 17,187,792 | |
Series 2021-2, Class A, (FHLMC), 3.75%, 03/25/35 | | | 18,201 | | | | 18,052,833 | |
City & County of San Francisco California, RB, M/F Housing, Series J, (FNMA), 2.55%, 07/01/39 | | | 5,000 | | | | 4,236,970 | |
CMFA Special Finance Agency VII, RB, M/F Housing, Series A1, 3.00%, 08/01/56(d) | | | 1,035 | | | | 745,224 | |
CMFA Special Finance Agency VIII, RB, M/F Housing, Series A-1, 3.00%, 08/01/56(d) | | | 4,350 | | | | 3,063,679 | |
CMFA Special Finance Agency XII, RB, M/F Housing, Series A, 3.25%, 02/01/57(d) | | | 2,605 | | | | 1,915,938 | |
CMFA Special Finance Agency, RB, M/F Housing(d) | | | | | | | | |
Series A-1, 3.00%, 12/01/56 | | | 2,315 | | | | 1,606,399 | |
Series A-2, 4.00%, 08/01/45 | | | 660 | | | | 561,340 | |
CSCDA Community Improvement Authority, RB, M/F Housing(d) | | | | | | | | |
4.00%, 10/01/46 | | | 695 | | | | 576,449 | |
2.80%, 03/01/47 | | | 2,555 | | | | 1,966,188 | |
4.00%, 07/01/56 | | | 3,945 | | | | 3,079,053 | |
4.00%, 08/01/56 | | | 9,055 | | | | 7,528,083 | |
4.00%, 10/01/56 | | | 1,000 | | | | 859,643 | |
4.00%, 12/01/56 | | | 765 | | | | 567,186 | |
3.25%, 04/01/57 | | | 3,675 | | | | 2,723,811 | |
4.00%, 05/01/57 | | | 5,660 | | | | 4,142,141 | |
Series A, 3.00%, 09/01/56 | | | 1,475 | | | | 1,017,473 | |
Series A, 4.00%, 06/01/58 | | | 6,480 | | | | 5,432,722 | |
Series A-2, 3.00%, 02/01/57 | | | 1,625 | | | | 1,149,125 | |
Senior Lien, 3.13%, 06/01/57 | | | 2,705 | | | | 1,897,909 | |
Series A, Senior Lien, 4.00%, 12/01/58 | | | 1,625 | | | | 1,262,339 | |
Series B, Sub Lien, 4.00%, 12/01/59 | | | 575 | | | | 403,426 | |
Santa Clara County Housing Authority, RB, M/F Housing, Series A, AMT, 6.00%, 08/01/41 | | | 3,500 | | | | 3,504,883 | |
| | | | | | | | |
| | |
| | | | | | | 101,357,673 | |
| | |
| State — 5.7% | | | | | | |
California State Public Works Board, RB | | | | | | | | |
Series B, 4.00%, 05/01/46 | | | 6,075 | | | | 6,255,209 | |
Series D, 4.00%, 05/01/47 | | | 9,000 | | | | 8,874,360 | |
Series I, 5.50%, 11/01/33 | | | 4,590 | | | | 4,704,525 | |
| | |
SCHEDULE OF INVESTMENTS | | 33 |
| | |
Schedule of Investments (unaudited) (continued) January 31, 2023 | | BlackRock MuniHoldings California Quality Fund, Inc. (MUC) (Percentages shown are based on Net Assets) |
| | | | | | | | |
| Security | | Par (000) | | | Value | |
| | |
| State (continued) | | | | | | |
California Statewide Communities Development Authority, SAB | | | | | | | | |
Series A, 5.00%, 09/02/39 | | $ | 190 | | | $ | 201,007 | |
Series A, 5.00%, 09/02/44 | | | 110 | | | | 114,943 | |
Series A, 5.00%, 09/02/48 | | | 110 | | | | 114,122 | |
Series B, 5.00%, 09/02/52 | | | 1,785 | | | | 1,717,177 | |
State of California, GO, 4.00%, 03/01/50 | | | 5,000 | | | | 5,067,115 | |
State of California, Refunding GO | | | | | | | | |
5.00%, 03/01/35 | | | 9,000 | | | | 10,468,557 | |
4.00%, 10/01/37 | | | 9,385 | | | | 9,968,099 | |
4.00%, 10/01/39 | | | 10,000 | | | | 10,402,240 | |
5.25%, 10/01/39 | | | 3,000 | | | | 3,281,835 | |
5.00%, 09/01/41 | | | 530 | | | | 609,294 | |
3.00%, 04/01/52 | | | 5,590 | | | | 4,590,536 | |
5.00%, 09/01/52 | | | 5,000 | | | | 5,686,995 | |
| | | | | | | | |
| | |
| | | | | | | 72,056,014 | |
| | |
| Tobacco — 1.7% | | | | | | |
California County Tobacco Securitization Agency, Refunding RB 5.00%, 06/01/50 | | | 540 | | | | 545,409 | |
Series A, 4.00%, 06/01/49 | | | 1,860 | | | | 1,704,335 | |
Series B-1, Subordinate, 4.00%, 06/01/49 | | | 185 | | | | 184,564 | |
California County Tobacco Securitization Agency, Refunding RB, CAB(b) | | | | | | | | |
0.00%, 06/01/55 | | | 7,575 | | | | 1,384,824 | |
Series B-2, Subordinate, 0.00%, 06/01/55 | | | 8,895 | | | | 1,607,335 | |
Golden State Tobacco Securitization Corp., Refunding RB | | | | | | | | |
Series A-1, 5.00%, 06/01/28(c) | | | 5,390 | | | | 6,188,652 | |
Series B, 5.00%, 06/01/51 | | | 5,000 | | | | 5,300,350 | |
Tobacco Securitization Authority of Southern California, Refunding RB, CAB, 0.00%, 06/01/54(b) | | | 25,600 | | | | 4,631,347 | |
| | | | | | | | |
| | |
| | | | | | | 21,546,816 | |
| | |
| Transportation — 24.2% | | | | | | |
Alameda Corridor Transportation Authority, Refunding RB, Series B, Sub Lien, 5.00%, 10/01/35 | | | 3,000 | | | | 3,178,692 | |
Bay Area Toll Authority, Refunding RB | | | | | | | | |
4.00%, 04/01/42 | | | 11,250 | | | | 11,418,919 | |
4.00%, 04/01/47 | | | 5,000 | | | | 5,022,375 | |
California Municipal Finance Authority, RB | | | | | | | | |
AMT, Senior Lien, 5.00%, 12/31/43 | | | 6,500 | | | | 6,628,342 | |
AMT, Senior Lien, 4.00%, 12/31/47 | | | 21,415 | | | | 18,505,451 | |
City of Los Angeles Department of Airports, RB | | | | | | | | |
Series A, AMT, 5.25%, 05/15/38 | | | 1,735 | | | | 1,869,808 | |
Series A, AMT, 5.00%, 05/15/40 | | | 14,830 | | | | 15,300,274 | |
Series A, AMT, 5.00%, 05/15/45 | | | 10,045 | | | | 10,242,826 | |
Series A, AMT, 4.00%, 05/15/49 | | | 5,000 | | | | 4,791,740 | |
Series B, AMT, 5.00%, 05/15/36 | | | 2,865 | | | | 3,024,068 | |
Series B, AMT, 5.00%, 05/15/41 | | | 8,500 | | | | 8,806,875 | |
Series B, AMT, 5.00%, 05/15/46 | | | 11,280 | | | | 11,593,043 | |
Series D, AMT, 5.00%, 05/15/35 | | | 4,000 | | | | 4,198,664 | |
Series D, AMT, 5.00%, 05/15/36 | | | 3,000 | | | | 3,143,391 | |
Series D, AMT, 5.00%, 05/15/41 | | | 6,855 | | | | 7,020,185 | |
Series E, AMT, 5.00%, 05/15/44 | | | 7,000 | | | | 7,530,264 | |
Series C, AMT, Subordinate, 5.00%, 05/15/38 | | | 3,215 | | | | 3,403,023 | |
Series C, AMT, Subordinate, 5.00%, 05/15/44 | | | 6,725 | | | | 7,017,995 | |
City of Los Angeles Department of Airports, Refunding RB | | | | | | | | |
AMT, 5.00%, 05/15/43 | | | 2,175 | | | | 2,303,877 | |
| | | | | | | | |
| Security | | Par (000) | | | Value | |
| | |
| Transportation (continued) | | | | | | |
City of Los Angeles Department of Airports, Refunding RB (continued) | | | | | | | | |
AMT, 5.00%, 05/15/45 | | $ | 1,940 | | | $ | 2,081,831 | |
AMT, 5.25%, 05/15/47 | | | 2,250 | | | | 2,446,677 | |
AMT, 3.25%, 05/15/49 | | | 1,500 | | | | 1,150,100 | |
AMT, Subordinate, 4.00%, 11/15/31(c) | | | 115 | | | | 125,010 | |
AMT, Subordinate, 5.00%, 11/15/31(c) | | | 20 | | | | 23,284 | |
AMT, Subordinate, 4.00%, 05/15/41 | | | 4,190 | | | | 4,069,977 | |
AMT, Subordinate, 5.00%, 05/15/46 | | | 5,980 | | | | 6,379,314 | |
County of Sacramento California Airport System Revenue, Refunding RB | | | | | | | | |
Series A, 5.00%, 07/01/41 | | | 13,290 | | | | 13,884,422 | |
Sub-Series B, 5.00%, 07/01/41 | | | 3,000 | | | | 3,123,693 | |
Series C, AMT, 5.00%, 07/01/38 | | | 3,000 | | | | 3,156,873 | |
Foothill-Eastern Transportation Corridor Agency, Refunding RB, Series B-2, 3.50%, 01/15/53 | | | 10,000 | | | | 8,527,910 | |
Los Angeles County Metropolitan Transportation Authority Sales Tax Revenue, Refunding RB, Series A, 5.00%, 07/01/41 | | | 1,300 | | | | 1,417,735 | |
Norman Y Mineta San Jose International Airport SJC, Refunding RB | | | | | | | | |
Series A, AMT, 5.00%, 03/01/33 | | | 2,000 | | | | 2,236,996 | |
Series A, AMT, 5.00%, 03/01/41 | | | 17,400 | | | | 18,051,560 | |
Series A, AMT, 5.00%, 03/01/47 | | | 7,290 | | | | 7,494,740 | |
Port of Los Angeles, Refunding ARB, Series A, AMT, 5.00%, 08/01/44 | | | 700 | | | | 709,022 | |
San Diego County Regional Airport Authority, RB | | | | | | | | |
Series B, AMT, 5.00%, 07/01/42 | | | 6,485 | | | | 6,740,911 | |
Series B, AMT, Subordinate, 4.00%, 07/01/56 | | | 5,000 | | | | 4,618,315 | |
San Diego County Regional Airport Authority, Refunding RB, Series A, 5.00%, 07/01/42 | | | 4,275 | | | | 4,523,442 | |
San Francisco City & County Airport Comm-San Francisco International Airport, Refunding ARB | | | | | | | | |
Series A, AMT, 5.00%, 05/01/40 | | | 3,785 | | | | 3,879,636 | |
Series A, AMT, 5.00%, 05/01/44 | | | 2,660 | | | | 2,690,215 | |
San Francisco City & County Airport Comm-San Francisco International Airport, Refunding RB | | | | | | | | |
Series B, 4.00%, 05/01/52 | | | 5,500 | | | | 5,506,595 | |
2nd Series, AMT, 5.00%, 05/01/48 | | | 30,660 | | | | 31,770,781 | |
Series 2020, AMT, 4.00%, 05/01/39 | | | 6,800 | | | | 6,722,657 | |
Series A, AMT, 5.00%, 05/01/47 | | | 14,220 | | | | 14,672,566 | |
Series E, AMT, 5.00%, 05/01/45 | | | 2,515 | | | | 2,644,507 | |
Series E, AMT, 5.00%, 05/01/50 | | | 10,305 | | | | 10,689,294 | |
| | | | | | | | |
| | |
| | | | | | | 304,337,875 | |
| | |
| Utilities — 12.1% | | | | | | |
City of Los Angeles California Wastewater System Revenue, Refunding RB, Series A, Subordinate, 4.00%, 06/01/52 | | | 10,000 | | | | 10,077,600 | |
City of Richmond California Wastewater Revenue, Refunding RB, Series A, 5.00%, 08/01/42 | | | 5,185 | | | | 5,610,870 | |
City of Riverside California Electric Revenue, Refunding RB, Series A, 5.00%, 10/01/43 | | | 3,500 | | | | 3,839,868 | |
City of Riverside California Water Revenue, RB | | | | | | | | |
Series A, 5.00%, 10/01/47 | | | 1,500 | | | | 1,704,945 | |
Series A, 5.00%, 10/01/52 | | | 2,250 | | | | 2,533,822 | |
City of San Francisco California Public Utilities Commission Water Revenue, RB, Series C, 4.00%, 11/01/50 | | | 16,935 | | | | 17,050,107 | |
| | |
| 34 | | 2 0 2 3 BLACK ROCK SEMI - ANNUAL REPORT TO SHAREHOLDERS |
| | |
Schedule of Investments (unaudited) (continued) January 31, 2023 | | BlackRock MuniHoldings California Quality Fund, Inc. (MUC) (Percentages shown are based on Net Assets) |
| | | | | | | | |
| Security | | Par (000) | | | Value | |
| | |
| Utilities (continued) | | | | | | |
City of San Francisco California Public Utilities Commission Water Revenue, Refunding RB, 5.00%, 11/01/36 | | $ | 2,335 | | | $ | 2,486,350 | |
East Bay Municipal Utility District Water System Revenue, RB | | | | | | | | |
Series A, 4.00%, 06/01/45 | | | 4,585 | | | | 4,627,980 | |
Series A, 5.00%, 06/01/49 | | | 11,190 | | | | 12,134,951 | |
Series B, 4.00%, 06/01/45 | | | 6,500 | | | | 6,530,894 | |
Eastern Municipal Water District, Refunding RB, Series A, 5.00%, 07/01/42 | | | 3,000 | | | | 3,255,972 | �� |
Los Angeles Department of Water & Power Water System Revenue, Refunding RB | | | | | | | | |
Series A, 5.00%, 07/01/46 | | | 8,410 | | | | 8,895,324 | |
Series C, 5.00%, 07/01/40 | | | 2,380 | | | | 2,705,641 | |
Los Angeles Department of Water & Power, RB, Series A, 5.00%, 07/01/42 | | | 12,265 | | | | 13,180,729 | |
Los Angeles Department of Water & Power, Refunding RB, Series C, 5.00%, 07/01/43 | | | 2,350 | | | | 2,684,776 | |
Mountain House Public Financing Authority, RB, Series A, (BAM), 4.00%, 12/01/55 | | | 4,500 | | | | 4,447,899 | |
Sacramento Municipal Utility District, RB, Series G, 5.00%, 08/15/39 | | | 3,135 | | | | 3,510,683 | |
Sacramento Municipal Utility District, Refunding RB, Series H, 4.00%, 08/15/45 | | | 3,065 | | | | 3,099,549 | |
San Diego Public Facilities Financing Authority, Refunding RB | | | | | | | | |
Series A, Subordinate, 5.00%, 08/01/43 | | | 9,655 | | | | 10,684,657 | |
Series A, Subordinate, 5.25%, 08/01/47 | | | 5,000 | | | | 5,541,445 | |
San Francisco City & County Public Utilities Commission Power Revenue, RB, Series A, 5.00%, 11/01/39 | | | 5,245 | | | | 5,554,833 | |
San Francisco City & County Public Utilities Commission Power Revenue, Refunding RB, Series B, 4.00%, 11/01/51 | | | 3,500 | | | | 3,516,219 | |
San Jose Financing Authority, Refunding RB, 5.00%, 11/01/52 | | | 16,000 | | | | 18,216,080 | |
| | | | | | | | |
| | |
| | | | | | | 151,891,194 | |
| | | | | | | | |
| | |
Total Municipal Bonds in California | | | | | | | 1,479,522,126 | |
| | |
| Puerto Rico — 5.0% | | | | | | |
| | |
| State — 5.0% | | | | | | |
Puerto Rico Sales Tax Financing Corp. Sales Tax Revenue, RB | | | | | | | | |
Series A-1, Restructured, 4.75%, 07/01/53 | | | 10,719 | | | | 10,209,848 | |
Series A-1, Restructured, 5.00%, 07/01/58 | | | 19,006 | | | | 18,725,661 | |
Series A-2, Restructured, 4.78%, 07/01/58 | | | 2,416 | | | | 2,299,752 | |
Series A-2, Restructured, 4.33%, 07/01/40 | | | 5,766 | | | | 5,513,922 | |
Series B-1, Restructured, 4.75%, 07/01/53 | | | 1,583 | | | | 1,509,202 | |
Series B-1, Restructured, 5.00%, 07/01/58 | | | 8,899 | | | | 8,773,480 | |
Series B-2, Restructured, 4.33%, 07/01/40 | | | 7,022 | | | | 6,710,666 | |
| | | | | | | | |
| Security | | Par (000) | | | Value | |
| | |
| State (continued) | | | | | | |
Puerto Rico Sales Tax Financing Corp. Sales Tax Revenue, RB (continued) | | | | | | | | |
Series B-2, Restructured, 4.78%, 07/01/58 | | $ | 1,535 | | | $ | 1,459,169 | |
Puerto Rico Sales Tax Financing Corp. Sales Tax Revenue, RB, CAB, Series A-1, Restructured, 0.00%, 07/01/46(b) | | | 26,291 | | | | 7,300,695 | |
| | | | | | | | |
| | |
Total Municipal Bonds in Puerto Rico | | | | | | | 62,502,395 | |
| | | | | | | | |
| | |
Total Municipal Bonds — 122.9%
(Cost: $1,541,149,728) | | | | | | | 1,542,024,521 | |
| | | | | | | | |
|
Municipal Bonds Transferred to Tender Option Bond Trusts(e) | |
| | |
| California — 31.3% | | | | | | |
|
| County/City/Special District/School District — 9.5% | |
California Municipal Finance Authority, RB, 5.00%, 06/01/48 | | | 9,500 | | | | 10,176,557 | |
Livermore Valley Joint Unified School District, GO, 4.00%, 08/01/46 | | | 15,000 | | | | 15,084,845 | |
Marin Healthcare District, GO, Election 2013, 4.00%, 08/01/45 | | | 10,000 | | | | 10,059,035 | |
Sacramento Area Flood Control Agency, Refunding SAB, Series A, 5.00%, 10/01/43 | | | 19,995 | | | | 21,247,447 | |
San Luis Obispo County Community College District, GO, Election 2014, Series A, 4.00%, 08/01/40 | | | 13,170 | | | | 13,336,222 | |
San Mateo County Community College District, GO, Series A, 5.00%, 09/01/25(c) | | | 35,230 | | | | 37,703,328 | |
Southwestern Community College District, GO, Election 2008, Series D, 5.00%, 08/01/25(c) | | | 10,820 | | | | 11,553,104 | |
| | | | | | | | |
| | |
| | | | | | | 119,160,538 | |
| | |
| Education — 3.3% | �� | | | | | |
California State University, Refunding RB, Series A, 4.00%, 11/01/45 | | | 7,980 | | | | 8,093,074 | |
Oakland Unified School District, GO, Series A, 4.00%, 08/01/46 | | | 14,530 | | | | 14,636,810 | |
University of California, Refunding RB | | | | | | | | |
Series AZ, 5.00%, 05/15/48 | | | 12,000 | | | | 12,949,540 | |
Series Q, 4.00%, 05/15/51 | | | 6,000 | | | | 6,033,578 | |
| | | | | | | | |
| | |
| | | | | | | 41,713,002 | |
| | |
| Health — 12.8% | | | | | | |
California Health Facilities Financing Authority, RB, Series A, 4.00%, 11/15/42 | | | 7,500 | | | | 7,544,080 | |
California Health Facilities Financing Authority, Refunding RB | | | | | | | | |
Series A, 5.00%, 08/15/43 | | | 44,365 | | | | 47,425,115 | |
Series A, 4.00%, 10/01/47 | | | 11,015 | | | | 10,895,744 | |
Sub-Series A-2, 4.00%, 11/01/44 | | | 31,000 | | | | 31,182,621 | |
Regents of the University of California Medical Center Pooled Revenue, RB, Series P, 5.00%, 05/15/47 | | | 56,410 | | | | 62,767,085 | |
| | | | | | | | |
| | |
| | | | | | | 159,814,645 | |
| | |
SCHEDULE OF INVESTMENTS | | 35 |
| | |
Schedule of Investments (unaudited) (continued) January 31, 2023 | | BlackRock MuniHoldings California Quality Fund, Inc. (MUC) (Percentages shown are based on Net Assets) |
| | | | | | | | |
| Security | | Par (000) | | | Value | |
| |
| | |
| Transportation — 2.3% | | | | | | |
Bay Area Toll Authority, Refunding RB, 4.00%, 04/01/49(f) | | $ | 16,560 | | | $ | 16,620,841 | |
City of Los Angeles Department of Airports, ARB | | | | | | | | |
Series B, AMT, 5.00%, 05/15/41 | | | 7,290 | | | | 7,552,931 | |
Series B, AMT, 5.00%, 05/15/46 | | | 5,000 | | | | 5,138,760 | |
| | | | | | | | |
| | |
| | | | | | | 29,312,532 | |
| | |
| Utilities — 3.4% | | | | | | |
Beaumont Public Improvement Authority, RB, Series A, 5.00%, 09/01/49 | | | 6,000 | | | | 6,350,198 | |
City of Los Angeles California Wastewater System Revenue, RB, Series A, 5.00%, 06/01/44 | | | 20,080 | | | | 21,046,240 | |
San Francisco City & County Public Utilities Commission Wastewater Revenue, Refunding RB, Series A, 4.00%, 10/01/51 | | | 14,595 | | | | 14,731,093 | |
| | | | | | | | |
| | |
| | | | | | | 42,127,531 | |
| | | | | | | | |
| |
Total Municipal Bonds in California | | | | 392,128,248 | |
| | | | | | | | |
| |
Total Municipal Bonds Transferred to Tender Option Bond Trusts — 31.3%
(Cost: $386,288,376) | | | | 392,128,248 | |
| | | | | | | | |
| |
Total Long-Term Investments — 154.2%
(Cost: $1,927,438,104) | | | | 1,934,152,769 | |
| | | | | | | | |
| | |
| | | Shares | | | | |
| |
| | |
Short-Term Securities | | | | | | | | |
| | |
| Money Market Funds — 2.9% | | | | | | |
| | |
BlackRock Liquidity Funds California Money Fund, Institutional Class,
1.00%(g)(h) | | | 36,543,921 | | | | 36,525,649 | |
| | | | | | | | |
| | |
Total Short-Term Securities — 2.9%
(Cost: $36,514,992) | | | | | | | 36,525,649 | |
| | | | | | | | |
| |
Total Investments — 157.1%
(Cost: $1,963,953,096) | | | | 1,970,678,418 | |
Other Assets Less Liabilities — 1.9% | | | | 23,044,515 | |
Liability for TOB Trust Certificates, Including Interest Expense and Fees Payable — (17.0)% | | | | (213,287,831 | ) |
VMTP Shares at Liquidation Value, Net of Deferred Offering Costs — (42.0)% | | | | (526,400,000 | ) |
| | | | | | | | |
| |
Net Assets Applicable to Common Shares — 100.0% | | | $ | 1,254,035,102 | |
| | | | | | | | |
| (a) | Variable rate security. Interest rate resets periodically. The rate shown is the effective interest rate as of period end. Security description also includes the reference rate and spread if published and available. |
| (c) | U.S. Government securities held in escrow, are used to pay interest on this security as well as to retire the bond in full at the date indicated, typically at a premium to par. |
| (d) | Security exempt from registration pursuant to Rule 144A under the Securities Act of 1933, as amended. These securities may be resold in transactions exempt from registration to qualified institutional investors. |
| (e) | Represent bonds transferred to a TOB Trust in exchange of cash and residual certificates received by the Trust. These bonds serve as collateral in a secured borrowing. See Note 4 of the Notes to Financial Statements for details. |
| (f) | All or a portion of the security is subject to a recourse agreement. The aggregate maximum potential amount the Trust could ultimately be required to pay under the agreement, which expires on April 1, 2025, is $11,380,400. See Note 4 of the Notes to Financial Statements for details. |
| (g) | Affiliate of the Trust. |
| (h) | Annualized 7-day yield as of period end. |
For Trust compliance purposes, the Trust’s sector classifications refer to one or more of the sector sub-classifications used by one or more widely recognized market indexes or rating group indexes, and/or as defined by the investment adviser. These definitions may not apply for purposes of this report, which may combine such sector sub-classifications for reporting ease.
Affiliates
Investments in issuers considered to be affiliate(s) of the Trust during the six months ended January 31, 2023 for purposes of Section 2(a)(3) of the Investment Company Act of 1940, as amended, were as follows:
| | | | | | | | | | | | | | | | | | | | | | | | | | | | | | | | | | | | |
| | | | | | | | | | |
| Affiliated Issuer | | Value at 07/31/22 | | | Purchases at Cost | | | Proceeds from Sales | | | Net Realized Gain (Loss) | | | Change in Unrealized Appreciation (Depreciation) | | | Value at 01/31/23 | | | Shares Held at 01/31/23 | | | Income | | | Capital Gain Distributions from Underlying Funds | |
| | | | | | | | | |
BlackRock Liquidity Funds California Money Fund, Institutional Class | | $ | 23,054,296 | | | $ | 13,461,130 | (a) | | $ | — | | | $ | 5,431 | | | $ | 4,792 | | | $ | 36,525,649 | | | | 36,543,921 | | | $ | 467,385 | | | $ | — | |
| | | | | | | | | | | | | | | | | | | | | | | | | | | | | | | | | | | | |
| | (a) | Represents net amount purchased (sold). | |
| | |
| 36 | | 2 0 2 3 BLACK ROCK SEMI - ANNUAL REPORT TO SHAREHOLDERS |
| | |
Schedule of Investments (unaudited) (continued) January 31, 2023 | | BlackRock MuniHoldings California Quality Fund, Inc. (MUC) |
Derivative Financial Instruments Outstanding as of Period End
Futures Contracts
| | | | | | | | | | | | | | | | |
| | | | | |
| Description | | Number of Contracts | | | Expiration Date | | | Notional Amount (000) | | | Value/ Unrealized Appreciation (Depreciation) | |
| | | | |
Short Contracts | | | | | | | | | | | | | | | | |
10-Year U.S. Treasury Note | | | 348 | | | | 03/22/23 | | | $ | 39,955 | | | $ | (505,221 | ) |
U.S. Long Bond | | | 685 | | | | 03/22/23 | | | | 89,457 | | | | (1,885,988 | ) |
5-Year U.S. Treasury Note | | | 387 | | | | 03/31/23 | | | | 42,358 | | | | (436,136 | ) |
| | | | | | | | | | | | | | | | |
| | | | |
| | | | | | | | | | | | | | $ | (2,827,345 | ) |
| | | | | | | | | | | | | | | | |
Derivative Financial Instruments Categorized by Risk Exposure
As of period end, the fair values of derivative financial instruments located in the Statements of Assets and Liabilities were as follows:
| | | | | | | | | | | | | | | | | | | | | | | | | | | | |
| | | | | | | | |
| | | Commodity Contracts | | | Credit Contracts | | | Equity Contracts | | | Foreign Currency Exchange Contracts | | | Interest Rate Contracts | | | Other Contracts | | | Total | |
| | | | | | | |
Liabilities — Derivative Financial Instruments | | | | | | | | | | | | | | | | | | | | | | | | | | | | |
Futures contracts | | | | | | | | | | | | | | | | | | | | | | | | | | | | |
Unrealized depreciation on futures contracts(a) | | $ | — | | | $ | — | | | $ | — | | | $ | — | | | $ | 2,827,345 | | | $ | — | | | $ | 2,827,345 | |
| | | | | | | | | | | | | | | | | | | | | | | | | | | | |
| | (a) | Net cumulative unrealized appreciation (depreciation) on futures contracts and centrally cleared swaps, if any, are reported in the Schedule of Investments. In the Statements of Assets and Liabilities, only current day’s variation margin is reported in receivables or payables and the net cumulative unrealized appreciation (depreciation) is included in accumulated earnings (loss). | |
For the period ended January 31, 2023, the effect of derivative financial instruments in the Statements of Operations was as follows:
| | | | | | | | | | | | | | | | | | | | | | | | | | | | |
| | | | | | | | |
| | | Commodity Contracts | | | Credit Contracts | | | Equity Contracts | | | Foreign Currency Exchange Contracts | | | Interest Rate Contracts | | | Other Contracts | | | Total | |
| | | | | | | |
Net Realized Gain (Loss) from: | | | | | | | | | | | | | | | | | | | | | | | | | | | | |
Futures contracts | | $ | — | | | $ | — | | | $ | — | | | $ | — | | | $ | 6,871,567 | | | $ | — | | | $ | 6,871,567 | |
| | | | | | | | | | | | | | | | | | | | | | | | | | | | |
| | | | | | | |
Net Change in Unrealized Appreciation (Depreciation) on: | | | | | | | | | | | | | | | | | | | | | | | | | | | | |
Futures contracts | | $ | — | | | $ | — | | | $ | — | | | $ | — | | | $ | (1,542,005 | ) | | $ | — | | | $ | (1,542,005 | ) |
| | | | | | | | | | | | | | | | | | | | | | | | | | | | |
Average Quarterly Balances of Outstanding Derivative Financial Instruments
| | | | |
| | |
Futures contracts: | | | | |
Average notional value of contracts — short | | $ | 200,580,039 | |
For more information about the Trust’s investment risks regarding derivative financial instruments, refer to the Notes to Financial Statements.
Fair Value Hierarchy as of Period End
Various inputs are used in determining the fair value of financial instruments. For a description of the input levels and information about the Trust’s policy regarding valuation of financial instruments, refer to the Notes to Financial Statements.
The following table summarizes the Trust’s financial instruments categorized in the fair value hierarchy. The breakdown of the Trust’s financial instruments into major categories is disclosed in the Schedule of Investments above.
| | | | | | | | | | | | | | | | |
| | | | | |
| | | Level 1 | | | Level 2 | | | Level 3 | | | Total | |
| | | | |
Assets | | | | | | | | | | | | | | | | |
Investments | | | | | | | | | | | | | | | | |
Long-Term Investments | | | | | | | | | | | | | | | | |
Municipal Bonds | | $ | — | | | $ | 1,542,024,521 | | | $ | — | | | $ | 1,542,024,521 | |
Municipal Bonds Transferred to Tender Option Bond Trusts | | | — | | | | 392,128,248 | | | | — | | | | 392,128,248 | |
| | |
SCHEDULE OF INVESTMENTS | | 37 |
| | |
Schedule of Investments (unaudited) (continued) January 31, 2023 | | BlackRock MuniHoldings California Quality Fund, Inc. (MUC) |
Fair Value Hierarchy as of Period End (continued)
| | | | | | | | | | | | | | | | |
| | | | | |
| | | Level 1 | | | Level 2 | | | Level 3 | | | Total | |
| | | | |
Short-Term Securities | | | | | | | | | | | | | | | | |
Money Market Funds | | $ | 36,525,649 | | | $ | — | | | $ | — | | | $ | 36,525,649 | |
| | | | | | | | | | | | | | | | |
| | | | |
| | $ | 36,525,649 | | | $ | 1,934,152,769 | | | $ | — | | | $ | 1,970,678,418 | |
| | | | | | | | | | | | | | | | |
Derivative Financial Instruments(a) | | | | | | | | | | | | | | | | |
Liabilities | | | | | | | | | | | | | | | | |
Interest Rate Contracts | | $ | (2,827,345 | ) | | $ | — | | | $ | — | | | $ | (2,827,345 | ) |
| | | | | | | | | | | | | | | | |
| | (a) | Derivative financial instruments are futures contracts. Futures contracts are valued at the unrealized appreciation (depreciation) on the instrument. | |
The Trust may hold assets and/or liabilities in which the fair value approximates the carrying amount for financial statement purposes. As of period end, such assets and/or liabilities are categorized within the fair value hierarchy as follows:
| | | | | | | | | | | | | | | | |
| | | | | |
| | | Level 1 | | | Level 2 | | | Level 3 | | | Total | |
| | | | |
Liabilities | | | | | | | | | | | | | | | | |
TOB Trust Certificates | | $ | — | | | $ | (211,599,963 | ) | | $ | — | | | $ | (211,599,963 | ) |
VMTP Shares at Liquidation Value | | | — | | | | (526,400,000 | ) | | | — | | | | (526,400,000 | ) |
| | | | | | | | | | | | | | | | |
| | | | |
| | $ | — | | | $ | (737,999,963 | ) | | $ | — | | | $ | (737,999,963 | ) |
| | | | | | | | | | | | | | | | |
See notes to financial statements.
| | |
| 38 | | 2 0 2 3 BLACK ROCK SEMI - ANNUAL REPORT TO SHAREHOLDERS |
| | |
Schedule of Investments (unaudited) January 31, 2023 | | BlackRock MuniHoldings Quality Fund II, Inc. (MUE) (Percentages shown are based on Net Assets) |
| | | | | | | | |
| Security | | Par (000) | | | Value | |
| | |
Municipal Bonds | | | | | | | | |
| | |
| Alabama(a) — 3.3% | | | | | | |
Black Belt Energy Gas District, RB | | | | | | | | |
Series B-2, 4.36%, 12/01/48 | | $ | 2,500 | | | $ | 2,497,773 | |
Series F, 5.50%, 11/01/53 | | | 840 | | | | 900,572 | |
Southeast Energy Authority A Cooperative District, RB, Series A-2, 5.47%, 01/01/53 | | | 5,090 | | | | 5,204,922 | |
| | | | | | | | |
| | |
| | | | | | | 8,603,267 | |
| | |
| Arizona — 1.6% | | | | | | |
Arizona Industrial Development Authority, RB | | | | | | | | |
4.38%, 07/01/39(b) | | | 550 | | | | 521,481 | |
Series A, 5.00%, 07/01/39(b) | | | 465 | | | | 448,204 | |
Series A, (BAM), 4.00%, 06/01/44 | | | 730 | | | | 724,804 | |
Series A, 5.00%, 07/01/49(b) | | | 525 | | | | 478,868 | |
Series A, 5.00%, 07/01/54(b) | | | 405 | | | | 361,991 | |
Glendale Industrial Development Authority, RB, 5.00%, 05/15/56 | | | 535 | | | | 491,400 | |
Maricopa County Industrial Development Authority, Refunding RB(b) | | | | | | | | |
5.00%, 07/01/39 | | | 195 | | | | 193,069 | |
5.00%, 07/01/54 | | | 450 | | | | 417,807 | |
Salt Verde Financial Corp., RB, 5.00%, 12/01/37 | | | 450 | | | | 477,717 | |
| | | | | | | | |
| | |
| | | | | | | 4,115,341 | |
| | |
| Arkansas — 0.4% | | | | | | |
Arkansas Development Finance Authority, RB, Series A, AMT, 4.50%, 09/01/49(b) | | | 1,270 | | | | 1,144,346 | |
| | | | | | | | |
| | |
| California — 14.1% | | | | | | |
Bay Area Toll Authority, Refunding RB, Series C, 4.19%, 04/01/56(a) | | | 1,000 | | | | 985,624 | |
California Community Housing Agency, RB, M/F Housing(b) | | | | | | | | |
3.00%, 08/01/56 | | | 120 | | | | 85,339 | |
Series A, 5.00%, 04/01/49 | | | 200 | | | | 179,558 | |
Series A-2, 4.00%, 08/01/47 | | | 1,300 | | | | 1,076,755 | |
California Health Facilities Financing Authority, Refunding RB, Series A, 3.00%, 08/15/51 | | | 1,100 | | | | 887,776 | |
California Housing Finance Agency, RB, M/F Housing | | | | | | | | |
Class A, 3.25%, 08/20/36 | | | 585 | | | | 541,703 | |
Series 2021-1, Class A, 3.50%, 11/20/35 | | | 652 | | | | 627,248 | |
California Municipal Finance Authority, RB, AMT, Senior Lien, 5.00%, 12/31/43 | | | 1,400 | | | | 1,427,643 | |
California State Public Works Board, RB | | | | | | | | |
Series F, 5.25%, 09/01/33 | | | 1,260 | | | | 1,282,321 | |
Series I, 5.50%, 11/01/30 | | | 5,000 | | | | 5,122,795 | |
Series I, 5.50%, 11/01/31 | | | 3,130 | | | | 3,207,414 | |
Series I, 5.50%, 11/01/33 | | | 3,000 | | | | 3,074,853 | |
CMFA Special Finance Agency XII, RB, M/F Housing, Series A, 3.25%, 02/01/57(b) | | | 130 | | | | 95,613 | |
CSCDA Community Improvement Authority, RB, M/F Housing(b) | | | | | | | | |
5.00%, 09/01/37 | | | 105 | | | | 102,840 | |
4.00%, 10/01/56 | | | 160 | | | | 137,543 | |
4.00%, 12/01/56 | | | 200 | | | | 148,284 | |
Series A, 4.00%, 06/01/58 | | | 910 | | | | 762,929 | |
Senior Lien, 3.13%, 06/01/57 | | | 515 | | | | 361,339 | |
Series A, Senior Lien, 4.00%, 12/01/58 | | | 845 | | | | 656,416 | |
| | | | | | | | |
| Security | | Par (000) | | | Value | |
| | |
| California (continued) | | | | | | |
Kern Community College District, GO, Series C, 5.50%, 11/01/23(c) | | $ | 2,445 | | | $ | 2,498,998 | |
Regents of the University of California Medical Center Pooled Revenue, Refunding RB | | | | | | | | |
Series J, 5.25%, 05/15/23(c) | | | 5,905 | | | | 5,949,713 | |
Series J, 5.25%, 05/15/38 | | | 1,675 | | | | 1,688,661 | |
San Francisco City & County Airport Comm-San Francisco International Airport, Refunding ARB | | | | | | | | |
Series A, AMT, 5.50%, 05/01/28 | | | 1,800 | | | | 1,809,846 | |
Series A, AMT, 5.25%, 05/01/33 | | | 1,410 | | | | 1,418,639 | |
Series A, AMT, 5.00%, 05/01/44 | | | 1,860 | | | | 1,881,128 | |
Washington Township Health Care District, GO, Series B, Election 2004, 5.50%, 08/01/40 | | | 940 | | | | 978,997 | |
| | | | | | | | |
| | |
| | | | | | | 36,989,975 | |
| | |
| Colorado — 3.7% | | | | | | |
City & County of Denver Colorado Airport System Revenue, RB | | | | | | | | |
Series A, AMT, 5.50%, 11/15/28 | | | 1,500 | | | | 1,529,552 | |
Series A, AMT, 5.50%, 11/15/30 | | | 565 | | | | 576,258 | |
Series A, AMT, 5.50%, 11/15/31 | | | 675 | | | | 688,505 | |
City & County of Denver Colorado Airport System Revenue, Refunding RB, Series A, AMT, 5.00%, 12/01/48 | | | 1,700 | | | | 1,770,650 | |
Colorado Educational & Cultural Facilities Authority, RB, 5.00%, 03/01/50(b) | | | 790 | | | | 774,574 | |
Colorado Educational & Cultural Facilities Authority, Refunding RB, Class A, 5.00%, 10/01/59(b) | | | 1,050 | | | | 958,340 | |
Colorado Health Facilities Authority, RB 5.50%, 11/01/47 | | | 205 | | | | 223,849 | |
Series D, 4.29%, 05/15/61(a) | | | 1,290 | | | | 1,310,418 | |
Denver Convention Center Hotel Authority, Refunding RB, 5.00%, 12/01/40 | | | 830 | | | | 835,987 | |
E-470 Public Highway Authority, Refunding RB, Series B, 3.40%, 09/01/39(a) | | | 260 | | | | 258,717 | |
STC Metropolitan District No. 2, Refunding GO, Series A, 5.00%, 12/01/38 | | | 715 | | | | 710,385 | |
| | | | | | | | |
| | |
| | | | | | | 9,637,235 | |
| | |
| Connecticut — 1.9% | | | | | | |
Connecticut State Health & Educational Facilities Authority, Refunding RB, Series I-1, 5.00%, 07/01/42. | | | 1,015 | | | | 1,059,754 | |
State of Connecticut Special Tax Revenue, RB, Series A, 5.25%, 07/01/42 | | | 1,725 | | | | 1,996,372 | |
State of Connecticut, GO, Series A, 5.00%, 04/15/38 | | | 1,690 | | | | 1,836,792 | |
| | | | | | | | |
| | |
| | | | | | | 4,892,918 | |
| | |
| Delaware — 0.6% | | | | | | |
Delaware State Health Facilities Authority, RB, 5.00%, 06/01/43 | | | 1,400 | | | | 1,449,843 | |
| | | | | | | | |
| | |
| Florida — 15.0% | | | | | | |
Capital Trust Agency, Inc., RB(b) | | | | | | | | |
Series A, 5.00%, 06/01/45 | | | 465 | | | | 414,839 | |
Series A, 5.50%, 06/01/57 | | | 165 | | | | 150,732 | |
Central Florida Expressway Authority, Refunding RB, Senior Lien, 5.00%, 07/01/48 | | | 3,000 | | | | 3,154,434 | |
County of Broward Florida Airport System Revenue, RB | | | | | | | | |
Series A, AMT, 5.13%, 10/01/23(c) | | | 5,665 | | | | 5,740,362 | |
Series A, AMT, 5.00%, 10/01/45 | | | 1,440 | | | | 1,472,233 | |
| | |
SCHEDULE OF INVESTMENTS | | 39 |
| | |
Schedule of Investments (unaudited) (continued) January 31, 2023 | | BlackRock MuniHoldings Quality Fund II, Inc. (MUE) (Percentages shown are based on Net Assets) |
| | | | | | | | |
| Security | | Par (000) | | | Value | |
| | |
| Florida (continued) | | | | | | |
County of Miami-Dade Seaport Department, RB(c) | | | | | | | | |
Series A, 5.38%, 10/01/23 | | $ | 1,765 | | | $ | 1,795,699 | |
Series A, 5.50%, 10/01/23 | | | 3,000 | | | | 3,054,630 | |
Series B, AMT, 6.00%, 10/01/23 | | | 1,060 | | | | 1,078,951 | |
Series B, AMT, 6.25%, 10/01/23 | | | 800 | | | | 817,304 | |
County of Miami-Dade Seaport Department, Refunding RB | | | | | | | | |
Series A-2, (AGM), 4.00%, 10/01/49 | | | 4,020 | | | | 3,910,330 | |
Series A, AMT, 5.00%, 10/01/39(d) | | | 1,025 | | | | 1,095,685 | |
Series A-1, AMT, (AGM), 4.00%, 10/01/45 | | | 3,230 | | | | 3,118,504 | |
Cypress Bluff Community Development District, SAB, Series A, 3.80%, 05/01/50(b) | | | 730 | | | | 544,692 | |
Finley Woods Community Development District, SAB | | | | | | | | |
4.00%, 05/01/40 | | | 265 | | | | 227,781 | |
4.20%, 05/01/50 | | | 450 | | | | 365,353 | |
Florida Development Finance Corp., RB(b) | | | | | | | | |
6.50%, 06/30/57 | | | 335 | | | | 337,402 | |
AMT, 5.00%, 05/01/29 | | | 470 | | | | 442,109 | |
Florida Development Finance Corp., Refunding RB, Series C, 5.00%, 09/15/50(b) | | | 260 | | | | 221,971 | |
Highlands County Health Facilities Authority, Refunding RB, 1.58%, 11/15/56(a) | | | 2,700 | | | | 2,700,000 | |
Hillsborough County Aviation Authority, Refunding RB, Sub-Series A, AMT, 5.50%, 10/01/23(c) | | | 2,995 | | | | 3,040,590 | |
Lee County Housing Finance Authority, RB, S/F Housing, Series A-2, AMT, (FHLMC, FNMA, GNMA), 6.00%, 09/01/40 | | | 40 | | | | 40,070 | |
Osceola Chain Lakes Community Development District, SAB | | | | | | | | |
4.00%, 05/01/40 | | | 670 | | | | 593,149 | |
4.00%, 05/01/50 | | | 640 | | | | 519,334 | |
Palm Beach County Health Facilities Authority, RB | | | | | | | | |
Series A, 5.00%, 11/01/47 | | | 200 | | | | 203,888 | |
Series A, 5.00%, 11/01/52 | | | 285 | | | | 289,483 | |
Palm Beach County Health Facilities Authority, Refunding RB, 4.00%, 08/15/49 | | | 2,065 | | | | 1,961,876 | |
Reedy Creek Improvement District, GO, Series A, 5.25%, 06/01/23(c) | | | 1,805 | | | | 1,819,630 | |
Southern Groves Community Development District No. 5, Refunding SAB, 4.00%, 05/01/43 | | | 380 | | | | 316,421 | |
| | | | | | | | |
| | |
| | | | | | | 39,427,452 | |
| | |
| Georgia — 2.1% | | | | | | |
Development Authority for Fulton County, RB, 4.00%, 06/15/49 | | | 815 | | | | 802,859 | |
East Point Business & Industrial Development Authority, RB, Series A, 5.25%, 06/15/62(b) | | | 195 | | | | 181,800 | |
Main Street Natural Gas, Inc., RB | | | | | | | | |
Series A, 5.00%, 05/15/49 | | | 950 | | | | 974,282 | |
Series B, 5.00%, 12/01/52(a) | | | 2,015 | | | | 2,132,889 | |
Municipal Electric Authority of Georgia, RB, 5.00%, 01/01/48 | | | 1,420 | | | | 1,433,141 | |
| | | | | | | | |
| | |
| | | | | | | 5,524,971 | |
| | |
| Hawaii — 1.8% | | | | | | |
State of Hawaii Airports System Revenue, COP AMT, 5.25%, 08/01/25 | | | 740 | | | | 747,005 | |
| | | | | | | | |
| Security | | Par (000) | | | Value | |
| | |
| Hawaii (continued) | | | | | | |
State of Hawaii Airports System Revenue, COP (continued) | | | | | | | | |
AMT, 5.25%, 08/01/26 | | $ | 1,205 | | | $ | 1,216,814 | |
State of Hawaii Airports System Revenue, RB, Series A, AMT, 5.00%, 07/01/45 | | | 2,805 | | | | 2,864,306 | |
| | | | | | | | |
| | |
| | | | | | | 4,828,125 | |
| | |
| Illinois — 12.9% | | | | | | |
Chicago Board of Education, GO | | | | | | | | |
Series A, 5.00%, 12/01/34 | | | 1,225 | | | | 1,279,731 | |
Series A, 5.00%, 12/01/40 | | | 1,165 | | | | 1,182,195 | |
Series A, 5.00%, 12/01/47 | | | 795 | | | | 797,787 | |
Chicago Midway International Airport, Refunding ARB, Series A, AMT, 2nd Lien, 5.00%, 01/01/41 | | | 1,140 | | | | 1,146,364 | |
Chicago Midway International Airport, Refunding RB | | | | | | | | |
Series A, AMT, 2nd Lien, 5.50%, 01/01/28 | | | 1,000 | | | | 1,001,843 | |
Series A, AMT, 2nd Lien, 5.50%, 01/01/29 | | | 1,500 | | | | 1,502,808 | |
Series A, AMT, 2nd Lien, 5.38%, 01/01/33 | | | 2,000 | | | | 2,002,610 | |
Chicago O’Hare International Airport, RB, Series D, AMT, Senior Lien, 5.00%, 01/01/42 | | | 735 | | | | 759,507 | |
City of Chicago Illinois Wastewater Transmission Revenue, RB, 2nd Lien, 5.00%, 01/01/42 | | | 2,985 | | | | 2,986,809 | |
Cook County Community College District No. 508, GO | | | | | | | | |
5.25%, 12/01/30 | | | 1,270 | | | | 1,293,200 | |
5.50%, 12/01/38 | | | 1,205 | | | | 1,229,499 | |
5.25%, 12/01/43 | | | 2,960 | | | | 3,014,201 | |
Illinois Finance Authority, Refunding RB | | | | | | | | |
Series A, 4.00%, 05/01/45 | | | 1,305 | | | | 1,162,750 | |
Series C, 5.00%, 02/15/41 | | | 975 | | | | 1,016,595 | |
Illinois Housing Development Authority, RB, S/F Housing, Series G, (FHLMC, FNMA, GNMA), 4.85%, 10/01/42 | | | 515 | | | | 537,638 | |
Illinois State Toll Highway Authority, RB, Series B, 5.00%, 01/01/40 | | | 6,155 | | | | 6,523,685 | |
State of Illinois, GO | | | | | | | | |
5.25%, 02/01/31 | | | 1,495 | | | | 1,528,678 | |
5.25%, 02/01/32 | | | 2,320 | | | | 2,371,794 | |
5.50%, 07/01/33 | | | 1,000 | | | | 1,010,955 | |
5.50%, 07/01/38 | | | 700 | | | | 707,360 | |
Upper Illinois River Valley Development Authority, Refunding RB, 5.00%, 01/01/45(b) | | | 715 | | | | 654,946 | |
| | | | | | | | |
| | |
| | | | | | | 33,710,955 | |
| | |
| Indiana — 0.4% | | | | | | |
Indiana Finance Authority, RB | | | | | | | | |
Series A, 5.00%, 06/01/41 | | | 300 | | | | 282,520 | |
Series A, 5.00%, 06/01/51 | | | 220 | | | | 195,648 | |
Series A, 5.00%, 06/01/56 | | | 190 | | | | 166,195 | |
Series A, AMT, 5.00%, 07/01/23(c) | | | 460 | | | | 463,456 | |
| | | | | | | | |
| | |
| | | | | | | 1,107,819 | |
| | |
| Iowa — 1.2% | | | | | | |
Iowa Finance Authority, RB, Series A, 5.00%, 05/15/48 | | | 3,350 | | | | 2,865,014 | |
Iowa Tobacco Settlement Authority, Refunding RB, CAB, Series B2, Subordinate, 0.00%, 06/01/65(e) | | | 2,930 | | | | 366,847 | |
| | | | | | | | |
| | |
| | | | | | | 3,231,861 | |
| | |
| Kentucky — 0.1% | | | | | | |
City of Henderson Kentucky, RB, Series SE, Class A, AMT, 4.70%, 01/01/52(b) | | | 150 | | | | 143,295 | |
| | | | | | | | |
| | |
| 40 | | 2 0 2 3 BLACK ROCK SEMI - ANNUAL REPORT TO SHAREHOLDERS |
| | |
Schedule of Investments (unaudited) (continued) January 31, 2023 | | BlackRock MuniHoldings Quality Fund II, Inc. (MUE) (Percentages shown are based on Net Assets) |
| | | | | | | | |
| Security | | Par (000) | | | Value | |
| | |
| Louisiana — 3.1% | | | | | | |
City of Shreveport Louisiana Water & Sewer Revenue, RB, Series B, Junior Lien, (AGM), 4.00%, 12/01/49 | | $ | 6,100 | | | $ | 5,775,151 | |
Lake Charles Harbor & Terminal District, RB, Series B, AMT, (AGM), 5.50%, 01/01/29 | | | 2,225 | | | | 2,275,879 | |
| | | | | | | | |
| | |
| | | | | | | 8,051,030 | |
| | |
| Maryland — 6.3% | | | | | | |
Howard County Housing Commission, RB, M/F Housing, 5.00%, 12/01/42 | | | 2,450 | | | | 2,568,617 | |
Maryland Economic Development Corp., RB, Class B, AMT, 5.00%, 12/31/40 | | | 525 | | | | 550,062 | |
Maryland Health & Higher Educational Facilities Authority, RB, Series B, 4.00%, 04/15/45 | | | 1,360 | | | | 1,322,598 | |
Maryland Stadium Authority, RB (NPFGC), 5.00%, 05/01/34 | | | 4,780 | | | | 5,313,797 | |
Series A, (NPFGC), 5.00%, 05/01/47 | | | 6,460 | | | | 6,856,612 | |
| | | | | | | | |
| | |
| | | | | | | 16,611,686 | |
| | |
| Massachusetts — 1.2% | | | | | | |
Commonwealth of Massachusetts, GO, Series B, 3.00%, 04/01/49 | | | 1,300 | | | | 1,056,079 | |
Massachusetts Development Finance Agency, RB | | | | | | | | |
Series A, 5.25%, 01/01/42 | | | 940 | | | | 971,562 | |
Series A, 5.00%, 01/01/47 | | | 420 | | | | 426,096 | |
Massachusetts Development Finance Agency, Refunding RB, Series A, 5.00%, 01/01/40 | | | 745 | | | | 770,199 | |
| | | | | | | | |
| | |
| | | | | | | 3,223,936 | |
| | |
| Michigan — 2.7% | | | | | | |
Michigan Finance Authority, Refunding RB | | | | | | | | |
4.00%, 09/01/46 | | | 550 | | | | 523,154 | |
4.49%, 04/15/47(a) | | | 2,910 | | | | 3,034,769 | |
Michigan State Housing Development Authority, RB, M/F Housing | | | | | | | | |
Series A, 0.55%, 04/01/25 | | | 175 | | | | 165,687 | |
Series A, AMT, 2.55%, 10/01/51 | | | 3,540 | | | | 2,352,677 | |
Michigan Strategic Fund, RB, AMT, 5.00%, 12/31/43 | | | 895 | | | | 907,353 | |
| | | | | | | | |
| | |
| | | | | | | 6,983,640 | |
| | |
| Minnesota — 1.0% | | | | | | |
Housing & Redevelopment Authority of The City of St. Paul Minnesota, Refunding RB, Series A, 4.00%, 11/15/43 | | | 985 | | | | 941,374 | |
Minnesota Housing Finance Agency, RB, S/F Housing, Series N, (FHLMC, FNMA, GNMA), 5.10%, 07/01/42 | | | 1,555 | | | | 1,655,156 | |
| | | | | | | | |
| | |
| | | | | | | 2,596,530 | |
| | |
| Mississippi — 2.5% | | | | | | |
Mississippi Development Bank, RB, (AGM), 6.88%, 12/01/40 | | | 2,225 | | | | 2,289,383 | |
Mississippi State University Educational Building Corp., Refunding RB, 5.25%, 08/01/23(c) | | | 1,000 | | | | 1,012,706 | |
State of Mississippi Gaming Tax Revenue, RB | | | | | | | | |
Series A, 5.00%, 10/15/37 | | | 565 | | | | 602,989 | |
Series A, 4.00%, 10/15/38 | | | 2,815 | | | | 2,772,845 | |
| | | | | | | | |
| | |
| | | | | | | 6,677,923 | |
| | | | | | | | |
| Security | | Par (000) | | | Value | |
| | |
| Montana — 0.1% | | | | | | |
Montana Board of Housing, RB, S/F Housing | | | | | | | | |
Series B-2, 3.50%, 12/01/42 | | $ | 110 | | | $ | 109,649 | |
Series B-2, 3.60%, 12/01/47 | | | 165 | | | | 165,317 | |
| | | | | | | | |
| | |
| | | | | | | 274,966 | |
| | |
| Nebraska — 1.0% | | | | | | |
Central Plains Energy Project, RB, Series 1, 5.00%, 05/01/53(a) | | | 2,380 | | | | 2,512,842 | |
| | | | | | | | |
| | |
| Nevada — 2.2% | | | | | | |
Carson City Nevada, Refunding RB, 5.00%, 09/01/42 | | | 1,130 | | | | 1,160,716 | |
City of Las Vegas Nevada Special Improvement District No. 814, SAB | | | | | | | | |
4.00%, 06/01/39 | | | 120 | | | | 109,628 | |
4.00%, 06/01/44 | | | 320 | | | | 282,223 | |
City of Reno Nevada, Refunding RB, Series A-1, (AGM), 4.00%, 06/01/43 | | | 2,690 | | | | 2,682,847 | |
County of Clark Nevada, GO, Series A, 5.00%, 06/01/37 | | | 500 | | | | 546,049 | |
Tahoe-Douglas Visitors Authority, RB | | | | | | | | |
5.00%, 07/01/40 | | | 580 | | | | 592,370 | |
5.00%, 07/01/45 | | | 400 | | | | 402,726 | |
| | | | | | | | |
| | |
| | | | | | | 5,776,559 | |
| | |
| New Hampshire(a)(b) — 0.3% | | | | | | |
New Hampshire Business Finance Authority, Refunding RB | | | | | | | | |
Series A, 3.63%, 07/01/43 | | | 315 | | | | 262,646 | |
Series B, AMT, 3.75%, 07/01/45 | | | 670 | | | | 538,669 | |
| | | | | | | | |
| | |
| | | | | | | 801,315 | |
| | |
| New Jersey — 10.9% | | | | | | |
New Jersey Economic Development Authority, RB | | | | | | | | |
5.00%, 06/15/36 | | | 810 | | | | 879,988 | |
Series A, 5.00%, 06/15/47 | | | 2,500 | | | | 2,589,790 | |
Series LLL, 5.00%, 06/15/34 | | | 635 | | | | 702,302 | |
AMT, (AGM), 5.00%, 01/01/31 | | | 1,355 | | | | 1,370,753 | |
AMT, 5.38%, 01/01/43 | | | 1,940 | | | | 1,957,751 | |
New Jersey Economic Development Authority, Refunding RB, Series A, AMT, 2.20%, 10/01/39(a) | | | 1,500 | | | | 1,340,162 | |
New Jersey Higher Education Student Assistance Authority, Refunding RB | | | | | | | | |
Series B, Class B, AMT, 4.00%, 12/01/41 | | | 1,195 | | | | 1,204,960 | |
Series C, Class C, AMT, Subordinate, 5.00%, 12/01/52 | | | 1,355 | | | | 1,400,936 | |
New Jersey Housing & Mortgage Finance Agency, RB, S/F Housing, Series A, AMT, 3.80%, 10/01/32 | | | 1,880 | | | | 1,864,748 | |
New Jersey Transportation Trust Fund Authority, RB Class BB, 4.00%, 06/15/50 | | | 1,500 | | | | 1,416,309 | |
Series AA, 5.50%, 06/15/39 | | | 3,040 | | | | 3,071,206 | |
Series BB, 4.00%, 06/15/50 | | | 2,775 | | | | 2,630,225 | |
Series S, 5.25%, 06/15/43 | | | 2,980 | | | | 3,165,955 | |
New Jersey Transportation Trust Fund Authority, Refunding RB, Series A, 5.00%, 12/15/32 | | | 2,735 | | | | 3,030,990 | |
Tobacco Settlement Financing Corp., Refunding RB
Series A, 5.00%, 06/01/46 | | | 1,000 | | | | 1,030,316 | |
Sub-Series B, 5.00%, 06/01/46 | | | 870 | | | | 880,067 | |
| | | | | | | | |
| | |
| | | | | | | 28,536,458 | |
| | |
SCHEDULE OF INVESTMENTS | | 41 |
| | |
Schedule of Investments (unaudited) (continued) January 31, 2023 | | BlackRock MuniHoldings Quality Fund II, Inc. (MUE) (Percentages shown are based on Net Assets) |
| | | | | | | | |
| Security | | Par (000) | | | Value | |
| | |
| New Mexico — 0.1% | | | | | | |
City of Santa Fe New Mexico, RB, Series A, 5.00%, 05/15/49 | | $ | 170 | | | $ | 147,175 | |
| | | | | | | | |
| | |
| New York — 4.3% | | | | | | |
Metropolitan Transportation Authority, RB, Series A-1, 5.25%, 11/15/39 | | | 1,550 | | | | 1,557,970 | |
New York City Transitional Finance Authority Future Tax Secured Revenue, RB | | | | | | | | |
Series C-4, 1.25%, 11/01/36(a) | | | 2,175 | | | | 2,175,000 | |
Series F-1, Subordinate, 5.00%, 02/01/47 | | | 510 | | | | 565,537 | |
New York Liberty Development Corp., Refunding RB Series 1, 4.00%, 02/15/43 | | | 1,750 | | | | 1,724,436 | |
Series 1, 5.00%, 11/15/44(b) | | | 960 | | | | 957,592 | |
Series A, 3.00%, 11/15/51 | | | 210 | | | | 156,114 | |
New York State Thruway Authority, RB, Second Series, 4.13%, 03/15/56 | | | 1,675 | | | | 1,655,143 | |
New York Transportation Development Corp., RB | | | | | | | | |
AMT, 5.00%, 10/01/35 | | | 1,025 | | | | 1,068,640 | |
AMT, 4.00%, 04/30/53 | | | 605 | | | | 518,372 | |
TSASC, Inc., Refunding RB, Series A, 5.00%, 06/01/41 | | | 895 | | | | 919,582 | |
| | | | | | | | |
| | |
| | | | | | | 11,298,386 | |
| | |
| North Carolina — 2.2% | | | | | | |
North Carolina Medical Care Commission, RB | | | | | | | | |
Series A, 4.00%, 10/01/50 | | | 195 | | | | 161,332 | |
Series A, 5.00%, 10/01/50 | | | 515 | | | | 515,575 | |
University of North Carolina at Chapel Hill, Refunding RB, Series A, 3.70%, 12/01/41(a) | | | 4,970 | | | | 4,965,949 | |
| | | | | | | | |
| | |
| | | | | | | 5,642,856 | |
| | |
| North Dakota — 0.2% | | | | | | |
University of North Dakota, COP, Series A, (AGM), 4.00%, 06/01/46 | | | 510 | | | | 486,274 | |
| | | | | | | | |
| | |
| Ohio — 3.2% | | | | | | |
Allen County Port Authority, Refunding RB, Series A, 4.00%, 12/01/40 | | | 490 | | | | 451,611 | |
Buckeye Tobacco Settlement Financing Authority, Refunding RB, Series B-2, 5.00%, 06/01/55 | | | 3,320 | | | | 3,167,014 | |
County of Franklin Ohio, RB, Series CC, 5.00%, 11/15/49 | | | 270 | | | | 301,299 | |
Ohio Turnpike & Infrastructure Commission, RB, Series A-1, Junior Lien, 5.25%, 02/15/31 | | | 2,500 | | | | 2,502,433 | |
State of Ohio, Refunding RB, Series A, 4.00%, 01/15/50 | | | 2,275 | | | | 2,098,749 | |
| | | | | | | | |
| | |
| | | | | | | 8,521,106 | |
| | |
| Oklahoma — 1.4% | | | | | | |
Oklahoma Turnpike Authority, RB, Series A, 4.00%, 01/01/48 | | | 3,600 | | | | 3,629,434 | |
| | | | | | | | |
| | |
| Oregon — 0.4% | | | | | | |
Oregon Health & Science University, RB, Series A, 5.00%, 07/01/42 | | | 1,100 | | | | 1,157,607 | |
| | | | | | | | |
| | |
| Pennsylvania — 8.2% | | | | | | |
Allegheny County Hospital Development Authority, RB, Series D2, 4.44%, 11/15/47(a) | | | 1,040 | | | | 1,074,425 | |
Bristol Township School District, GO, (SAW), 5.25%, 06/01/23(c) | | | 2,500 | | | | 2,520,275 | |
Bucks County Industrial Development Authority, RB 4.00%, 07/01/46 | | | 100 | | | | 80,975 | |
| | | | | | | | |
| Security | | Par (000) | | | Value | |
| | |
| Pennsylvania (continued) | | | | | | |
Bucks County Industrial Development Authority, RB (continued)
4.00%, 07/01/51 | | $ | 100 | | | $ | 78,340 | |
Hospitals & Higher Education Facilities Authority of Philadelphia, Refunding RB, (AGM), 4.00%, 07/01/40 | | | 1,215 | | | | 1,199,936 | |
Montgomery County Higher Education and Health Authority, Refunding RB, Series A, 5.00%, 09/01/48 | | | 1,240 | | | | 1,280,464 | |
Pennsylvania Economic Development Financing Authority, RB, AMT, 5.50%, 06/30/43 | | | 515 | | | | 561,456 | |
Pennsylvania Housing Finance Agency, RB, S/F Housing | | | | | | | | |
Series 137, 2.45%, 10/01/41 | | | 210 | | | | 158,789 | |
Series 125B, AMT, 3.65%, 10/01/42 | | | 3,000 | | | | 2,781,447 | |
Pennsylvania Turnpike Commission, RB | | | | | | | | |
Sub-Series B-1, 5.25%, 06/01/47 | | | 2,300 | | | | 2,415,278 | |
Series A, Subordinate, 5.00%, 12/01/37 | | | 750 | | | | 809,099 | |
Series A, Subordinate, 5.00%, 12/01/39 | | | 580 | | | | 621,692 | |
Pennsylvania Turnpike Commission, Refunding RB, 2nd Series, 5.00%, 12/01/41 | | | 2,490 | | | | 2,635,426 | |
Philadelphia Authority for Industrial Development, RB, 5.25%, 11/01/52 | | | 1,285 | | | | 1,383,764 | |
Pittsburgh School District, GO, (SAW), 3.00%, 09/01/41 | | | 1,165 | | | | 1,014,750 | |
Springfield School District/Delaware County, GO | | | | | | | | |
(SAW), 5.00%, 03/01/40 | | | 1,485 | | | | 1,607,902 | |
(SAW), 5.00%, 03/01/43 | | | 1,100 | | | | 1,181,380 | |
| | | | | | | | |
| | |
| | | | | | | 21,405,398 | |
| | |
| Puerto Rico — 4.7% | | | | | | |
Puerto Rico Sales Tax Financing Corp. Sales Tax Revenue, RB | | | | | | | | |
Series A-1, Restructured, 4.75%, 07/01/53 | | | 3,882 | | | | 3,697,605 | |
Series A-1, Restructured, 5.00%, 07/01/58 | | | 5,266 | | | | 5,188,326 | |
Series A-2, Restructured, 4.78%, 07/01/58 | | | 264 | | | | 251,297 | |
Series A-2, Restructured, 4.33%, 07/01/40 | | | 1,279 | | | | 1,223,085 | |
Series B-1, Restructured, 4.75%, 07/01/53 | | | 407 | | | | 388,026 | |
Series B-2, Restructured, 4.78%, 07/01/58 | | | 394 | | | | 374,536 | |
Puerto Rico Sales Tax Financing Corp. Sales Tax Revenue, RB, CAB, Series A-1, Restructured, 0.00%, 07/01/46(e) | | | 4,757 | | | | 1,320,962 | |
| | | | | | | | |
| | |
| | | | | | | 12,443,837 | |
| | |
| South Carolina — 4.5% | | | | | | |
Charleston County Airport District, RB(c) | | | | | | | | |
Series A, AMT, 5.50%, 07/01/23 | | | 2,500 | | | | 2,523,457 | |
Series A, AMT, 6.00%, 07/01/23 | | | 2,940 | | | | 2,972,452 | |
County of Charleston South Carolina, RB, 5.25%, 12/01/23(c) | | | 3,760 | | | | 3,836,531 | |
South Carolina Jobs-Economic Development Authority, RB(b) | | | | | | | | |
5.00%, 01/01/55 | | | 825 | | | | 725,833 | |
7.50%, 08/15/62 | | | 390 | | | | 388,216 | |
South Carolina Jobs-Economic Development Authority, Refunding RB, Series A, 5.00%, 05/01/43 | | | 1,360 | | | | 1,403,180 | |
| | | | | | | | |
| | |
| | | | | | | 11,849,669 | |
| | |
| Tennessee — 1.2% | | | | | | |
Mercer County Improvement Authority, RB, Series B, AMT, 5.00%, 07/01/40 | | | 3,000 | | | | 3,067,569 | |
| | | | | | | | |
| | |
| 42 | | 2 0 2 3 BLACK ROCK SEMI - ANNUAL REPORT TO SHAREHOLDERS |
| | |
Schedule of Investments (unaudited) (continued) January 31, 2023 | | BlackRock MuniHoldings Quality Fund II, Inc. (MUE) (Percentages shown are based on Net Assets) |
| | | | | | | | |
| Security | | Par (000) | | | Value | |
| | |
| Texas — 8.5% | | | | | | |
Arlington Higher Education Finance Corp., RB | | | | | | | | |
7.50%, 04/01/62 | | $ | 410 | | | $ | 438,434 | |
7.88%, 11/01/62(b) | | | 360 | | | | 374,798 | |
City of Beaumont Texas, GO, 5.25%, 03/01/23(c) | | | 2,345 | | | | 2,349,741 | |
City of Houston Texas Airport System Revenue, RB, Series A, AMT, 6.63%, 07/15/38 | | | 395 | | | | 395,347 | |
City of Houston Texas Airport System Revenue, Refunding ARB, AMT, 5.00%, 07/15/27 | | | 225 | | | | 231,463 | |
City of Houston Texas Airport System Revenue, Refunding RB | | | | | | | | |
Sub-Series D, 5.00%, 07/01/37 | | | 2,010 | | | | 2,191,224 | |
Series A, AMT, 5.00%, 07/01/27 | | | 220 | | | | 224,855 | |
Lower Colorado River Authority, Refunding RB, 5.50%, 05/15/33 | | | 2,155 | | | | 2,172,705 | |
New Hope Cultural Education Facilities Finance Corp., RB, Series A, 5.00%, 08/15/50(b) | | | 440 | | | | 402,661 | |
North Texas Tollway Authority, Refunding RB, Series A, 5.00%, 01/01/48 | | | 1,775 | | | | 1,866,922 | |
Red River Education Finance Corp., RB, 5.25%, 03/15/23(c) | | | 1,070 | | | | 1,073,183 | |
Tarrant County Cultural Education Facilities Finance Corp., RB | | | | | | | | |
5.00%, 11/15/51 | | | 1,620 | | | | 1,753,289 | |
Series B, 5.00%, 07/01/36 | | | 2,500 | | | | 2,673,345 | |
Tarrant County Cultural Education Facilities Finance Corp., Refunding RB, 5.00%, 11/15/40 | | | 2,500 | | | | 2,468,220 | |
Texas City Industrial Development Corp., RB, Series 2012, 4.13%, 12/01/45 | | | 255 | | | | 242,726 | |
Texas Municipal Gas Acquisition & Supply Corp. III, Refunding RB | | | | | | | | |
5.00%, 12/15/29 | | | 1,165 | | | | 1,239,685 | |
5.00%, 12/15/32 | | | 1,770 | | | | 1,899,143 | |
Texas Private Activity Bond Surface Transportation Corp., RB, AMT, 5.00%, 06/30/58 | | | 360 | | | | 364,042 | |
| | | | | | | | |
| | |
| | | | | | | 22,361,783 | |
| | |
| Utah(b) — 0.2% | | | | | | |
Utah Charter School Finance Authority, RB, Series A, 5.00%, 06/15/49 | | | 170 | | | | 162,007 | |
Utah Charter School Finance Authority, Refunding RB, 5.00%, 06/15/40 | | | 325 | | | | 315,500 | |
| | | | | | | | |
| | |
| | | | | | | 477,507 | |
| | |
| Vermont — 1.0% | | | | | | |
University of Vermont and State Agricultural College, Refunding RB, 5.00%, 10/01/43 | | | 2,535 | | | | 2,698,982 | |
| | | | | | | | |
| | |
| Virginia — 3.4% | | | | | | |
Fairfax County Economic Development Authority, RB, 5.00%, 04/01/47 | | | 3,715 | | | | 3,896,452 | |
Tobacco Settlement Financing Corp., Refunding RB, Series B-1, 5.00%, 06/01/47 | | | 955 | | | | 928,193 | |
Virginia Small Business Financing Authority, RB, AMT, 5.00%, 12/31/52 | | | 4,000 | | | | 4,018,660 | |
| | | | | | | | |
| | |
| | | | | | | 8,843,305 | |
| | |
| Washington — 3.5% | | | | | | |
Central Puget Sound Regional Transit Authority, RB, Series 2015, Class 2A, 1.86%, 11/01/45(a) | | | 3,000 | | | | 3,003,024 | |
| | | | | | | | |
| Security | | Par (000) | | | Value | |
| | |
| Washington (continued) | | | | | | |
County of King Washington Sewer Revenue, Refunding RB, Series A, Junior Lien, 3.97%, 01/01/40(a) | | $ | 915 | | | $ | 920,307 | |
Port of Seattle Washington, RB, Series A, AMT, 5.00%, 05/01/43 | | | 660 | | | | 685,932 | |
State of Washington, COP, Series B, 5.00%, 07/01/38 | | | 1,155 | | | | 1,224,847 | |
State of Washington, GO, Series C, 5.00%, 02/01/36 | | | 3,000 | | | | 3,361,914 | |
| | | | | | | | |
| | |
| | | | | | | 9,196,024 | |
| | |
| Wisconsin — 3.0% | | | | | | |
Public Finance Authority, RB | | | | | | | | |
5.00%, 10/15/51(b) | | | 210 | | | | 190,628 | |
Class A, 5.00%, 06/15/51(b) | | | 550 | | | | 469,447 | |
Series A, 4.00%, 11/15/37 | | | 175 | | | | 160,279 | |
Series A, 5.00%, 07/01/55(b) | | | 305 | | | | 273,875 | |
Series A, 5.00%, 10/15/55(b) | | | 955 | | | | 871,391 | |
Series A-1, 4.50%, 01/01/35(b) | | | 520 | | | | 467,472 | |
Public Finance Authority, Refunding RB | | | | | | | | |
5.00%, 09/01/49(b) | | | 285 | | | | 234,822 | |
Series A, 5.00%, 11/15/49 | | | 570 | | | | 549,295 | |
Series B, AMT, 5.00%, 07/01/42 | | | 990 | | | | 991,292 | |
State of Wisconsin, GO, Series A, 4.16%, 05/01/25(a) | | | 1,560 | | | | 1,559,526 | |
Wisconsin Health & Educational Facilities Authority, Refunding RB, 5.00%, 04/01/44 | | | 2,065 | | | | 2,195,132 | |
| | | | | | | | |
| | |
| | | | | | | 7,963,159 | |
| | | | | | | | |
| |
Total Municipal Bonds — 140.4%
(Cost: $371,912,828) | | | | 368,044,359 | |
| | | | | | | | |
|
Municipal Bonds Transferred to Tender Option Bond Trusts(f) | |
| | |
| California — 3.0% | | | | | | |
Sacramento Area Flood Control Agency, Refunding SAB, 5.00%, 10/01/47 | | | 7,499 | | | | 7,890,886 | |
| | | | | | | | |
| | |
| Colorado — 1.3% | | | | | | |
City & County of Denver Colorado Airport System Revenue, Refunding ARB, Series A, AMT, 5.25%, 12/01/43(g) | | | 3,262 | | | | 3,480,316 | |
| | | | | | | | |
| | |
| Illinois — 1.1% | | | | | | |
City of Chicago Illinois Waterworks Revenue, Refunding RB, 2nd Lien, (AGM), 5.25%, 11/01/33 | | | 760 | | | | 761,347 | |
Illinois State Toll Highway Authority, RB, Series A, 5.00%, 01/01/40 | | | 1,980 | | | | 2,055,355 | |
| | | | | | | | |
| | |
| | | | | | | 2,816,702 | |
| | |
| Maryland — 1.0% | | | | | | |
City of Baltimore Maryland, RB, Series A, 5.00%, 07/01/46 | | | 2,499 | | | | 2,624,433 | |
| | | | | | | | |
| | |
| New York — 1.9% | | | | | | |
New York State Dormitory Authority, Refunding RB, Series D, 4.00%, 02/15/47 | | | 5,000 | | | | 4,906,925 | |
| | | | | | | | |
| | |
| Pennsylvania — 4.5% | | | | | | |
Commonwealth of Pennsylvania, GO, 1st Series, 4.00%, 03/01/38(g) | | | 3,600 | | | | 3,708,634 | |
| | |
SCHEDULE OF INVESTMENTS | | 43 |
| | |
Schedule of Investments (unaudited) (continued) January 31, 2023 | | BlackRock MuniHoldings Quality Fund II, Inc. (MUE) (Percentages shown are based on Net Assets) |
| | | | | | | | |
| Security | | Par (000) | | | Value | |
| |
| | |
| Pennsylvania (continued) | | | | | | |
Northampton County General Purpose Authority, Refunding RB, 4.00%, 11/01/38(g) | | $ | 5,929 | | | $ | 5,979,630 | |
Westmoreland County Municipal Authority, Refunding RB, (BAM), 5.00%, 08/15/38 | | | 1,963 | | | | 2,053,099 | |
| | | | | | | | |
| | | | | | | 11,741,363 | |
| | |
| Texas — 1.6% | | | | | | |
Tarrant County Cultural Education Facilities Finance Corp., RB, Series A, 5.00%, 11/15/38 | | | 4,295 | | | | 4,330,524 | |
| | | | | | | | |
| |
Total Municipal Bonds Transferred to Tender Option Bond Trusts — 14.4%
(Cost: $37,810,386) | | | | 37,791,149 | |
| | | | | | | | |
| |
Total Long-Term Investments — 154.8%
(Cost: $409,723,214) | | | | 405,835,508 | |
| | | | | | | | |
| | |
| | | Shares | | | | |
| | |
Short-Term Securities | | | | | | | | |
| | |
| Money Market Funds — 2.5% | | | | | | |
BlackRock Liquidity Funds, MuniCash, Institutional Class, 1.39%(h)(i) | | | 6,583,308 | | | | 6,584,625 | |
| | | | | | | | |
| |
Total Short-Term Securities — 2.5%
(Cost: $6,584,089) | | | | 6,584,625 | |
| | | | | | | | |
| |
Total Investments — 157.3%
(Cost: $416,307,303) | | | | 412,420,133 | |
| |
Other Assets Less Liabilities — 1.3% | | | | 3,288,811 | |
| |
Liability for TOB Trust Certificates, Including Interest Expense and Fees Payable — (8.6)% | | | | (22,497,377 | ) |
| |
VMTP Shares at Liquidation Value, Net of Deferred Offering Costs — (50.0)% | | | | (131,000,000 | ) |
| | | | | | | | |
| |
Net Assets Applicable to Common Shares — 100.0% | | | $ | 262,211,567 | |
| | | | | | | | |
| (a) | Variable rate security. Interest rate resets periodically. The rate shown is the effective interest rate as of period end. Security description also includes the reference rate and spread if published and available. |
| (b) | Security exempt from registration pursuant to Rule 144A under the Securities Act of 1933, as amended. These securities may be resold in transactions exempt from registration to qualified institutional investors. |
| (c) | U.S. Government securities held in escrow, are used to pay interest on this security as well as to retire the bond in full at the date indicated, typically at a premium to par. |
| (d) | When-issued security. |
| (f) | Represent bonds transferred to a TOB Trust in exchange of cash and residual certificates received by the Trust. These bonds serve as collateral in a secured borrowing. See Note 4 of the Notes to Financial Statements for details. |
| (g) | All or a portion of the security is subject to a recourse agreement. The aggregate maximum potential amount the Trust could ultimately be required to pay under the agreements, which expire between March 1, 2026 to November 1, 2026, is $7,669,205. |
| | See Note 4 of the Notes to Financial Statements for details. |
| (h) | Affiliate of the Trust. |
| (i) | Annualized 7-day yield as of period end. |
Affiliates
Investments in issuers considered to be affiliate(s) of the Trust during the six months ended January 31, 2023 for purposes of Section 2(a)(3) of the Investment Company Act of 1940, as amended, were as follows:
| | | | | | | | | | | | | | | | | | | | | | | | | | | | | | | | | | | | |
| | | | | | | | | | |
| Affiliated Issuer | | Value at 07/31/22 | | | Purchases
at Cost | | | Proceeds
from Sales | | | Net
Realized
Gain (Loss) | | | Change in
Unrealized
Appreciation
(Depreciation) | | | Value at 01/31/23 | | | Shares
Held at 01/31/23 | | | Income | | | Capital Gain
Distributions
from
Underlying
Funds | |
| | | | | | | | | |
BlackRock Liquidity Funds, MuniCash, Institutional Class | | $ | 4,488,570 | | | $ | 2,098,897 | (a) | | $ | — | | | $ | (2,989 | ) | | $ | 147 | | | $ | 6,584,625 | | | | 6,583,308 | | | $ | 70,649 | | | $ | — | |
| | | | | | | | | | | | | | | | | | | | | | | | | | | | | | | | | | | | |
| | (a) | Represents net amount purchased (sold). | |
| | |
| 44 | | 2 0 2 3 BLACK ROCK SEMI - ANNUAL REPORT TO SHAREHOLDERS |
| | |
Schedule of Investments (unaudited) (continued) January 31, 2023 | | BlackRock MuniHoldings Quality Fund II, Inc. (MUE) |
Derivative Financial Instruments Outstanding as of Period End
Futures Contracts
| | | | | | | | | | | | | | | | |
| | | | | |
| Description | | Number of
Contracts | | | Expiration
Date | | | Notional
Amount (000) | | | Value/
Unrealized
Appreciation
(Depreciation) | |
| | | | |
Short Contracts | | | | | | | | | | | | | | | | |
10-Year U.S. Treasury Note | | | 63 | | | | 03/22/23 | | | $ | 7,233 | | | $ | (72,633 | ) |
U.S. Long Bond | | | 97 | | | | 03/22/23 | | | | 12,668 | | | | (247,692 | ) |
5-Year U.S. Treasury Note | | | 73 | | | | 03/31/23 | | | | 7,990 | | | | (60,811 | ) |
| | | | | | | | | | | | | | | | |
| | | | |
| | | | | | | | | | | | | | $ | (381,136 | ) |
| | | | | | | | | | | | | | | | |
Derivative Financial Instruments Categorized by Risk Exposure
As of period end, the fair values of derivative financial instruments located in the Statements of Assets and Liabilities were as follows:
| | | | | | | | | | | | | | | | | | | | | | | | | | | | |
| | | | | | | | |
| | | Commodity
Contracts | | | Credit
Contracts | | | Equity
Contracts | | | Foreign
Currency
Exchange
Contracts | | | Interest
Rate
Contracts | | | Other
Contracts | | | Total | |
| | | | | | | |
Liabilities — Derivative Financial Instruments | | | | | | | | | | | | | | | | | | | | | | | | | | | | |
Futures contracts | | | | | | | | | | | | | | | | | | | | | | | | | | | | |
Unrealized depreciation on futures contracts(a) | | $ | — | | | $ | — | | | $ | — | | | $ | — | | | $ | 381,136 | | | $ | — | | | $ | 381,136 | |
| | | | | | | | | | | | | | | | | | | | | | | | | | | | |
| | (a) | Net cumulative unrealized appreciation (depreciation) on futures contracts and centrally cleared swaps, if any, are reported in the Schedule of Investments. In the Statements of Assets and Liabilities, only current day’s variation margin is reported in receivables or payables and the net cumulative unrealized appreciation (depreciation) is included in accumulated earnings (loss). | |
For the period ended January 31, 2023, the effect of derivative financial instruments in the Statements of Operations was as follows:
| | | | | | | | | | | | | | | | | | | | | | | | | | | | |
| | | | | | | | |
| | | Commodity
Contracts | | | Credit
Contracts | | | Equity
Contracts | | | Foreign
Currency
Exchange
Contracts | | | Interest
Rate
Contracts | | | Other
Contracts | | | Total | |
| | | | | | | |
Net Realized Gain (Loss) from: | | | | | | | | | | | | | | | | | | | | | | | | | | | | |
Futures contracts | | $ | — | | | $ | — | | | $ | — | | | $ | — | | | $ | 2,173,694 | | | $ | — | | | $ | 2,173,694 | |
| | | | | | | | | | | | | | | | | | | | | | | | | | | | |
| | | | | | | |
Net Change in Unrealized Appreciation (Depreciation) on: | | | | | | | | | | | | | | | | | | | | | | | | | | | | |
Futures contracts | | $ | — | | | $ | — | | | $ | — | | | $ | — | | | $ | 158,880 | | | $ | — | | | $ | 158,880 | |
| | | | | | | | | | | | | | | | | | | | | | | | | | | | |
Average Quarterly Balances of Outstanding Derivative Financial Instruments
| | | | |
Futures contracts: | | | | |
Average notional value of contracts — short | | $ | 28,296,492 | |
For more information about the Trust’s investment risks regarding derivative financial instruments, refer to the Notes to Financial Statements.
Fair Value Hierarchy as of Period End
Various inputs are used in determining the fair value of financial instruments. For a description of the input levels and information about the Trust’s policy regarding valuation of financial instruments, refer to the Notes to Financial Statements.
The following table summarizes the Trust’s financial instruments categorized in the fair value hierarchy. The breakdown of the Trust’s financial instruments into major categories is disclosed in the Schedule of Investments above.
| | | | | | | | | | | | | | | | |
| |
| | | | |
| | | Level 1 | | | Level 2 | | | Level 3 | | | Total | |
| |
| | | | |
Assets | | | | | | | | | | | | | | | | |
Investments | | | | | | | | | | | | | | | | |
Long-Term Investments | | | | | | | | | | | | | | | | |
Municipal Bonds | | $ | — | | | $ | 368,044,359 | | | $ | — | | | $ | 368,044,359 | |
Municipal Bonds Transferred to Tender Option Bond Trusts | | | — | | | | 37,791,149 | | | | — | | | | 37,791,149 | |
| | |
SCHEDULE OF INVESTMENTS | | 45 |
| | |
Schedule of Investments (unaudited) (continued) January 31, 2023 | | BlackRock MuniHoldings Quality Fund II, Inc. (MUE) |
Fair Value Hierarchy as of Period End (continued)
| | | | | | | | | | | | | | | | |
| |
| | | | |
| | | Level 1 | | | Level 2 | | | Level 3 | | | Total | |
| |
| | | | |
Short-Term Securities | | | | | | | | | | | | | | | | |
Money Market Funds | | $ | 6,584,625 | | | $ | — | | | $ | — | | | $ | 6,584,625 | |
| | | | | | | | | | | | | | | | |
| | | | |
| | $ | 6,584,625 | | | $ | 405,835,508 | | | $ | — | | | $ | 412,420,133 | |
| | | | | | | | | | | | | | | | |
Derivative Financial Instruments(a) | | | | | | | | | | | | | | | | |
Liabilities | | | | | | | | | | | | | | | | |
Interest Rate Contracts | | $ | (381,136 | ) | | $ | — | | | $ | — | | | $ | (381,136 | ) |
| | | | | | | | | | | | | | | | |
| | (a) | Derivative financial instruments are futures contracts. Futures contracts are valued at the unrealized appreciation (depreciation) on the instrument. | |
The Trust may hold assets and/or liabilities in which the fair value approximates the carrying amount for financial statement purposes. As of period end, such assets and/or liabilities are categorized within the fair value hierarchy as follows:
| | | | | | | | | | | | | | | | |
| |
| | | | |
| | | Level 1 | | | Level 2 | | | Level 3 | | | Total | |
| |
| | | | |
Liabilities | | | | | | | | | | | | | | | | |
TOB Trust Certificates | | $ | — | | | $ | (22,362,382 | ) | | $ | — | | | $ | (22,362,382 | ) |
VMTP Shares at Liquidation Value | | | — | | | | (131,000,000 | ) | | | — | | | | (131,000,000 | ) |
| | | | | | | | | | | | | | | | |
| | | | |
| | $ | — | | | $ | (153,362,382 | ) | | $ | — | | | $ | (153,362,382 | ) |
| | | | | | | | | | | | | | | | |
See notes to financial statements.
| | |
| 46 | | 2 0 2 3 BLACK ROCK SEMI - ANNUAL REPORT TO SHAREHOLDERS |
Statements of Assets and Liabilities (unaudited)
January 31, 2023
| | | | | | | | | | | | | | | | |
| | | BFZ | | | BTT | | | MUC | | | MUE | |
| |
| | | | |
ASSETS | | | | | | | | | | | | | | | | |
Investments, at value — unaffiliated(a) | | $ | 604,059,713 | | | $ | 2,413,251,357 | | | $ | 1,934,152,769 | | | $ | 405,835,508 | |
Investments, at value — affiliated(b) | | | 4,186,027 | | | | 93,859,212 | | | | 36,525,649 | | | | 6,584,625 | |
Cash | | | — | | | | — | | | | 6,378,221 | | | | 76,820 | |
Cash pledged for futures contracts | | | 1,991,000 | | | | — | | | | 4,100,000 | | | | 632,000 | |
Receivables: | | | | | | | | | | | | | | | | |
Investments sold | | | — | | | | 62,000 | | | | 45,529 | | | | 709 | |
TOB Trust | | | — | | | | — | | | | — | | | | 2,499,675 | |
Dividends — affiliated | | | 9,192 | | | | 127,567 | | | | 67,683 | | | | 7,611 | |
Interest — unaffiliated | | | 6,956,155 | | | | 21,320,401 | | | | 23,628,127 | | | | 4,010,267 | |
Prepaid expenses | | | — | | | | 15,306 | | | | 37,529 | | | | 6,924 | |
| | | | | | | | | | | | | | | | |
| | | | |
Total assets | | | 617,202,087 | | | | 2,528,635,843 | | | | 2,004,935,507 | | | | 419,654,139 | |
| | | | | | | | | | | | | | | | |
| | | | |
ACCRUED LIABILITIES | | | | | | | | | | | | | | | | |
Bank overdraft | | | 4,432,012 | | | | — | | | | — | | | | — | |
Payables: | | | | | | | | | | | | | | | | |
Investments purchased | | | 238,884 | | | | 11,779,371 | | | | 4,313,741 | | | | 2,765,578 | |
Accounting services fees | | | 22,179 | | | | 112,154 | | | | 100,881 | | | | 33,302 | |
Capital shares redeemed | | | 156,831 | | | | — | | | | 596,064 | | | | — | |
Custodian fees | | | — | | | | 10,694 | | | | — | | | | 2,738 | |
Income dividend distributions — Common Shares | | | 1,039,401 | | | | 3,976,514 | | | | 3,739,250 | | | | 754,772 | |
Interest expense and fees | | | 121,458 | | | | 575,720 | | | | 1,687,868 | | | | 134,995 | |
Investment advisory fees | | | 280,138 | | | | 837,721 | | | | 854,259 | | | | 185,628 | |
Trustees’ and Officer’s fees | | | 81,179 | | | | 11,660 | | | | 608,019 | | | | 2,111 | |
Other accrued expenses | | | 23,022 | | | | 23,439 | | | | 13,893 | | | | 8,863 | |
Professional fees | | | 50,457 | | | | 34,183 | | | | 21,138 | | | | 36,520 | |
Reorganization costs | | | — | | | | — | | | | 44,833 | | | | — | |
Transfer agent fees | | | 11,430 | | | | 32,976 | | | | 15,781 | | | | 12,602 | |
Variation margin on futures contracts | | | 437,718 | | | | — | | | | 904,715 | | | | 143,081 | |
| | | | | | | | | | | | | | | | |
| | | | |
Total accrued liabilities | | | 6,894,709 | | | | 17,394,432 | | | | 12,900,442 | | | | 4,080,190 | |
| | | | | | | | | | | | | | | | |
| | | | |
OTHER LIABILITIES | | | | | | | | | | | | | | | | |
TOB Trust Certificates | | | 35,140,000 | | | | 69,569,982 | | | | 211,599,963 | | | | 22,362,382 | |
RVMTP Shares, at liquidation value of $5,000,000 per share, net of deferred offering costs(c)(d)(e) | | | — | | | | 749,752,309 | | | | — | | | | — | |
VMTP Shares, at liquidation value of $100,000 per share, net of deferred offering costs(c)(d)(e) | | | 171,300,000 | | | | — | | | | 526,400,000 | | | | 131,000,000 | |
| | | | | | | | | | | | | | | | |
| | | | |
Total other liabilities | | | 206,440,000 | | | | 819,322,291 | | | | 737,999,963 | | | | 153,362,382 | |
| | | | | | | | | | | | | | | | |
| | | | |
Total liabilities | | | 213,334,709 | | | | 836,716,723 | | | | 750,900,405 | | | | 157,442,572 | |
| | | | | | | | | | | | | | | | |
| | | | |
NET ASSETS APPLICABLE TO COMMON SHAREHOLDERS | | $ | 403,867,378 | | | $ | 1,691,919,120 | | | $ | 1,254,035,102 | | | $ | 262,211,567 | |
| | | | | | | | | | | | | | | | |
| | | | |
NET ASSETS APPLICABLE TO COMMON SHAREHOLDERS CONSIST OF | | | | | | | | | | | | | | | | |
Paid-in capital(f)(g)(h) | | $ | 430,110,516 | | | $ | 1,685,128,039 | | | $ | 1,367,172,071 | | | $ | 290,790,013 | |
Accumulated earnings (loss) | | | (26,243,138 | ) | | | 6,791,081 | | | | (113,136,969 | ) | | | (28,578,446 | ) |
| | | | | | | | | | | | | | | | |
| | | | |
NET ASSETS APPLICABLE TO COMMON SHAREHOLDERS | | $ | 403,867,378 | | | $ | 1,691,919,120 | | | $ | 1,254,035,102 | | | $ | 262,211,567 | |
| | | | | | | | | | | | | | | | |
| | | | |
Net asset value per Common Share | | $ | 13.25 | | | $ | 24.00 | | | $ | 12.97 | | | $ | 11.64 | |
| | | | | | | | | | | | | | | | |
| | | | |
(a) Investments, at cost — unaffiliated | | $ | 591,978,026 | | | $ | 2,421,528,862 | | | $ | 1,927,438,104 | | | $ | 409,723,214 | |
(b) Investments, at cost — affiliated | | $ | 4,185,288 | | | $ | 93,842,274 | | | $ | 36,514,992 | | | $ | 6,584,089 | |
(c) Preferred Shares outstanding | | | 1,713 | | | | 150 | | | | 5,264 | | | | 1,310 | |
(d) Preferred Shares authorized | | | 1,713 | | | | 150 | | | | 20,864 | | | | 9,490 | |
(e) Par value per Preferred Share | | $ | 0.001 | | | $ | 0.001 | | | $ | 0.10 | | | $ | 0.10 | |
(f) Common Shares outstanding | | | 30,471,902 | | | | 70,505,571 | | | | 96,679,518 | | | | 22,525,806 | |
(g) Common Shares authorized | | | Unlimited | | | | Unlimited | | | | 199,979,136 | | | | 199,990,510 | |
(h) Par value per Common Share | | $ | 0.001 | | | $ | 0.001 | | | $ | 0.10 | | | $ | 0.10 | |
See notes to financial statements.
Statements of Operations (unaudited)
Six Months Ended January 31, 2023
| | | | | | | | | | | | | | | | |
| | | BFZ | | | BTT | | | MUC | | | MUE | |
| |
| | | | |
INVESTMENT INCOME | | | | | | | | | | | | | | | | |
Dividends — affiliated | | $ | 61,270 | | | $ | 588,220 | | | $ | 467,385 | | | $ | 70,649 | |
Interest — unaffiliated | | | 11,537,428 | | | | 40,889,282 | | | | 37,925,297 | | | | 8,680,097 | |
| | | | | | | | | | | | | | | | |
| | | | |
Total investment income | | | 11,598,698 | | | | 41,477,502 | | | | 38,392,682 | | | | 8,750,746 | |
| | | | | | | | | | | | | | | | |
| | | | |
EXPENSES | | | | | | | | | | | | | | | | |
Investment advisory | | | 1,816,696 | | | | 5,080,062 | | | | 5,563,816 | | | | 1,159,625 | |
Professional | | | 38,473 | | | | 40,811 | | | | 76,268 | | | | 36,665 | |
Accounting services | | | 26,054 | | | | 127,921 | | | | 103,400 | | | | 35,766 | |
Transfer agent | | | 15,008 | | | | 35,434 | | | | 25,356 | | | | 16,467 | |
Trustees and Officer | | | 14,016 | | | | 43,209 | | | | 85,227 | | | | 7,327 | |
Custodian | | | 11,594 | | | | 14,143 | | | | 19,107 | | | | 3,630 | |
Registration | | | 5,198 | | | | 11,889 | | | | 28,249 | | | | 4,134 | |
Printing and postage | | | 4,454 | | | | 5,088 | | | | 6,191 | | | | 6,477 | |
Miscellaneous | | | 34,306 | | | | 46,474 | | | | 180,425 | | | | 35,282 | |
| | | | | | | | | | | | | | | | |
| | | | |
Total expenses excluding interest expense, fees and amortization of offering costs | | | 1,965,799 | | | | 5,405,031 | | | | 6,088,039 | | | | 1,305,373 | |
Interest expense, fees and amortization of offering costs(a) | | | 3,424,930 | | | | 14,000,940 | | | | 11,568,214 | | | | 2,766,004 | |
| | | | | | | | | | | | | | | | |
| | | | |
Total expenses | | | 5,390,729 | | | | 19,405,971 | | | | 17,656,253 | | | | 4,071,377 | |
Less: | | | | | | | | | | | | | | | | |
Fees waived and/or reimbursed by the Manager | | | (2,490 | ) | | | (29,743 | ) | | | (422,080 | ) | | | (76,240 | ) |
| | | | | | | | | | | | | | | | |
| | | | |
Total expenses after fees waived and/or reimbursed | | | 5,388,239 | | | | 19,376,228 | | | | 17,234,173 | | | | 3,995,137 | |
| | | | | | | | | | | | | | | | |
| | | | |
Net investment income | | | 6,210,459 | | | | 22,101,274 | | | | 21,158,509 | | | | 4,755,609 | |
| | | | | | | | | | | | | | | | |
| | | | |
REALIZED AND UNREALIZED GAIN (LOSS) | | | | | | | | | | | | | | | | |
Net realized gain (loss) from: | | | | | | | | | | | | | | | | |
Investments — unaffiliated | | | (34,715,206 | ) | | | 36,622 | | | | (69,176,818 | ) | | | (7,373,663 | ) |
Investments — affiliated | | | (2,377 | ) | | | (29,387 | ) | | | 5,431 | | | | (2,989 | ) |
Futures contracts | | | 5,704,843 | | | | — | | | | 6,871,567 | | | | 2,173,694 | |
| | | | | | | | | | | | | | | | |
| | | | |
| | | (29,012,740 | ) | | | 7,235 | | | | (62,299,820 | ) | | | (5,202,958 | ) |
| | | | | | | | | | | | | | | | |
Net change in unrealized appreciation (depreciation) on: | | | | | | | | | | | | | | | | |
Investments — unaffiliated | | | 21,948,887 | | | | (15,504,448 | ) | | | 23,724,513 | | | | (4,319,643 | ) |
Investments — affiliated | | | 737 | | | | 15,829 | | | | 4,792 | | | | 147 | |
Futures contracts | | | 1,533,732 | | | | — | | | | (1,542,005 | ) | | | 158,880 | |
| | | | | | | | | | | | | | | | |
| | | | |
| | | 23,483,356 | | | | (15,488,619 | ) | | | 22,187,300 | | | | (4,160,616 | ) |
| | | | | | | | | | | | | | | | |
| | | | |
Net realized and unrealized loss | | | (5,529,384 | ) | | | (15,481,384 | ) | | | (40,112,520 | ) | | | (9,363,574 | ) |
| | | | | | | | | | | | | | | | |
| | | | |
NET INCREASE (DECREASE) IN NET ASSETS APPLICABLE TO COMMON SHAREHOLDERS RESULTING FROM OPERATIONS | | $ | 681,075 | | | $ | 6,619,890 | | | $ | (18,954,011 | ) | | $ | (4,607,965 | ) |
| | | | | | | | | | | | | | | | |
| (a) | Related to TOB Trusts, VMTP and/or RVMTP Shares. |
See notes to financial statements.
| | |
| 48 | | 2 0 2 3 BLACK ROCK SEMI - ANNUAL REPORT TO SHAREHOLDERS |
Statements of Changes in Net Assets
| | | | | | | | | | | | | | | | |
| | | BFZ | | | BTT | |
| | | | | | | | |
| | | | |
| | | Six Months Ended
01/31/23
(unaudited) | | | Year Ended
07/31/22 | | | Six Months Ended 01/31/23
(unaudited) | | | Year Ended
07/31/22 | |
| |
| | | | |
INCREASE (DECREASE) IN NET ASSETS APPLICABLE TO COMMON SHAREHOLDERS | | | | | | | | | | | | | | | | |
| | | | |
OPERATIONS | | | | | | | | | | | | | | | | |
Net investment income | | $ | 6,210,459 | | | $ | 16,474,495 | | | $ | 22,101,274 | | | $ | 65,668,609 | |
Net realized gain (loss) | | | (29,012,740 | ) | | | (5,711,331 | ) | | | 7,235 | | | | 10,127,147 | |
Net change in unrealized appreciation (depreciation) | | | 23,483,356 | | | | (83,282,513 | ) | | | (15,488,619 | ) | | | (237,941,606 | ) |
| | | | | | | | | | | | | | | | |
| | | | |
Net increase (decrease) in net assets applicable to Common Shareholders resulting from operations | | | 681,075 | | | | (72,519,349 | ) | | | 6,619,890 | | | | (162,145,850 | ) |
| | | | | | | | | | | | | | | | |
| | | | |
DISTRIBUTIONS TO COMMON SHAREHOLDERS(a) | | | | | | | | | | | | | | | | |
Decrease in net assets resulting from distributions to Common Shareholders | | | (6,925,760 | ) | | | (18,455,413 | ) | | | (25,788,611 | ) | | | (52,794,571 | ) |
| | | | | | | | | | | | | | | | |
| | | | |
CAPITAL SHARE TRANSACTIONS | | | | | | | | | | | | | | | | |
Redemption of shares resulting from share repurchase program (including transaction costs) | | | (7,138,313 | ) | | | (2,430,492 | ) | | | — | | | | — | |
| | | | | | | | | | | | | | | | |
| | | | |
NET ASSETS APPLICABLE TO COMMON SHAREHOLDERS | | | | | | | | | | | | | | | | |
Total decrease in net assets applicable to Common Shareholders | | | (13,382,998 | ) | | | (93,405,254 | ) | | | (19,168,721 | ) | | | (214,940,421 | ) |
Beginning of period | | | 417,250,376 | | | | 510,655,630 | | | | 1,711,087,841 | | | | 1,926,028,262 | |
| | | | | | | | | | | | | | | | |
| | | | |
End of period | | $ | 403,867,378 | | | $ | 417,250,376 | | | $ | 1,691,919,120 | | | $ | 1,711,087,841 | |
| | | | | | | | | | | | | | | | |
| (a) | Distributions for annual periods determined in accordance with U.S. federal income tax regulations. |
See notes to financial statements.
Statements of Changes in Net Assets (continued)
| | | | | | | | | | | | | | | | |
| | | MUC | | | MUE | |
| | | | | | | | |
| | | | |
| | | Six Months Ended 01/31/23
(unaudited) | | | Year Ended
07/31/22 | | | Six Months Ended 01/31/23
(unaudited) | | | Year Ended
07/31/22 | |
| |
| | | | |
INCREASE (DECREASE) IN NET ASSETS APPLICABLE TO COMMON SHAREHOLDERS | | | | | | | | | | | | | | | | |
| | | | |
OPERATIONS | | | | | | | | | | | | | | | | |
Net investment income | | $ | 21,158,509 | | | $ | 33,920,046 | | | $ | 4,755,609 | | | $ | 12,705,457 | |
Net realized loss | | | (62,299,820 | ) | | | (18,511,144 | ) | | | (5,202,958 | ) | | | (4,536,782 | ) |
Net change in unrealized appreciation (depreciation) | | | 22,187,300 | | | | (110,334,687 | ) | | | (4,160,616 | ) | | | (47,875,963 | ) |
| | | | | | | | | | | | | | | | |
| | | | |
Net decrease in net assets applicable to Common Shareholders resulting from operations | | | (18,954,011 | ) | | | (94,925,785 | ) | | | (4,607,965 | ) | | | (39,707,288 | ) |
| | | | | | | | | | | | | | | | |
| | | | |
DISTRIBUTIONS TO COMMON SHAREHOLDERS(a) | | | | | | | | | | | | | | | | |
Decrease in net assets resulting from distributions to Common Shareholders | | | (26,874,730 | ) | | | (36,403,800 | ) | | | (5,744,080 | ) | | | (14,191,214 | ) |
| | | | | | | | | | | | | | | | |
| | | | |
CAPITAL SHARE TRANSACTIONS | | | | | | | | | | | | | | | | |
Net proceeds from the issuance of common shares due to reorganization | | | — | | | | 777,266,364 | | | | — | | | | — | |
Reinvestment of common distributions | | | — | | | | 472,286 | | | | — | | | | 72,596 | |
Redemption of shares resulting from share repurchase program (including transaction costs) | | | (9,436,475 | ) | | | — | | | | — | | | | — | |
Redemption of common shares due to reorgnization | | | — | | | | (460 | ) | | | — | | | | — | |
| | | | | | | | | | | | | | | | |
| | | | |
Net increase (decrease) in net assets derived from capital share transactions | | | (9,436,475 | ) | | | 777,738,190 | | | | — | | | | 72,596 | |
| | | | | | | | | | | | | | | | |
| | | | |
NET ASSETS APPLICABLE TO COMMON SHAREHOLDERS | | | | | | | | | | | | | | | | |
Total increase (decrease) in net assets applicable to Common Shareholders | | | (55,265,216 | ) | | | 646,408,605 | | | | (10,352,045 | ) | | | (53,825,906 | ) |
Beginning of period | | | 1,309,300,318 | | | | 662,891,713 | | | | 272,563,612 | | | | 326,389,518 | |
| | | | | | | | | | | | | | | | |
| | | | |
End of period | | $ | 1,254,035,102 | | | $ | 1,309,300,318 | | | $ | 262,211,567 | | | $ | 272,563,612 | |
| | | | | | | | | | | | | | | | |
| (a) | Distributions for annual periods determined in accordance with U.S. federal income tax regulations. |
See notes to financial statements.
| | |
| 50 | | 2 0 2 3 BLACK ROCK SEMI - ANNUAL REPORT TO SHAREHOLDERS |
Statements of Cash Flows (unaudited)
Six Months Ended January 31, 2023
| | | | | | | | | | | | | | | | |
| | | BFZ | | | BTT | | | MUC | | | MUE | |
| |
| | | | |
CASH PROVIDED BY (USED FOR) OPERATING ACTIVITIES | | | | | | | | | | | | | | | | |
Net increase (decrease) in net assets resulting from operations | | $ | 681,075 | | | $ | 6,619,890 | | | $ | (18,954,011 | ) | | $ | (4,607,965 | ) |
Adjustments to reconcile net increase (decrease) in net assets resulting from operations to net cash provided by operating activities: | | | | | | | | | | | | | | | | |
Proceeds from sales of long-term investments | | | 520,430,383 | | | | 413,170,114 | | | | 639,921,088 | | | | 82,491,638 | |
Purchases of long-term investments | | | (460,005,429 | ) | | | (219,937,002 | ) | | | (480,636,752 | ) | | | (55,394,732 | ) |
Net purchases of short-term securities | | | (1,628,431 | ) | | | (40,853,105 | ) | | | (13,461,130 | ) | | | (2,098,897 | ) |
Amortization of premium and accretion of discount on investments and other fees | | | 2,222,561 | | | | 7,938,439 | | | | 5,476,776 | | | | 2,320,883 | |
Net realized (gain) loss on investments | | | 34,717,583 | | | | (7,235 | ) | | | 69,171,387 | | | | 7,376,652 | |
Net unrealized (appreciation) depreciation on investments | | | (21,949,624 | ) | | | 15,488,619 | | | | (23,729,305 | ) | | | 4,319,496 | |
(Increase) Decrease in Assets | | | | | | | | | | | | | | | | |
Receivables | | | | | | | | | | | | | | | | |
Dividends — affiliated | | | (8,426 | ) | | | (100,138 | ) | | | (51,878 | ) | | | (5,012 | ) |
Interest — unaffiliated | | | 512,451 | | | | 2,692,403 | | | | 3,174,142 | | | | 257,007 | |
Prepaid expenses | | | 7,736 | | | | 6,380 | | | | 155,241 | | | | 21,375 | |
Increase (Decrease) in Liabilities
Payables | | | | | | | | | | | | | | | | |
Accounting services fees | | | (8,839 | ) | | | (70,199 | ) | | | (106,256 | ) | | | (23,038 | ) |
Custodian fees | | | (6,932 | ) | | | (9,081 | ) | | | (18,592 | ) | | | (1,115 | ) |
Interest expense and fees | | | (82,037 | ) | | | 70,503 | | | | 933,871 | | | | 44,873 | |
Investment advisory fees | | | (380,888 | ) | | | (930,578 | ) | | | (968,171 | ) | | | (190,403 | ) |
Trustees’ and Officer’s fees | | | 2,723 | | | | (1,632 | ) | | | 5,296 | | | | (305 | ) |
Other accrued expenses | | | (30,430 | ) | | | 5,154 | | | | (78,116 | ) | | | 1,530 | |
Professional fees | | | (27,239 | ) | | | (40,946 | ) | | | (64,082 | ) | | | (26,018 | ) |
Reorganization costs | | | — | | | | — | | | | (5,149 | ) | | | — | |
Transfer agent fees | | | (4,710 | ) | | | (15,708 | ) | | | (14,111 | ) | | | (5,185 | ) |
Variation margin on futures contracts | | | 378,759 | | | | — | | | | 820,121 | | | | 121,563 | |
| | | | | | | | | | | | | | | | |
| | | | |
Net cash provided by operating activities | | | 74,820,286 | | | | 184,025,878 | | | | 181,570,369 | | | | 34,602,347 | |
| | | | | | | | | | | | | | | | |
| | | | |
CASH PROVIDED BY (USED FOR) FINANCING ACTIVITIES | | | | | | | | | | | | | | | | |
Cash dividends paid to Common Shareholders | | | (7,227,253 | ) | | | (26,211,644 | ) | | | (28,499,539 | ) | | | (6,172,070 | ) |
Repayments of TOB Trust Certificates | | | (91,805,847 | ) | | | (157,829,997 | ) | | | (151,300,434 | ) | | | (28,309,767 | ) |
Net payments on Common Shares redeemed including change in redemptions payable | | | (7,122,198 | ) | | | — | | | | (8,840,411 | ) | | | — | |
Proceeds from TOB Trust Certificates | | | 27,330,000 | | | | — | | | | 15,299,997 | | | | 325 | |
Increase (decrease) in bank overdraft | | | 4,432,012 | | | | — | | | | (90,761 | ) | | | (8,015 | ) |
Amortization of deferred offering costs | | | — | | | | 15,763 | | | | — | | | | — | |
| | | | | | | | | | | | | | | | |
| | | | |
Net cash used for financing activities | | | (74,393,286 | ) | | | (184,025,878 | ) | | | (173,431,148 | ) | | | (34,489,527 | ) |
| | | | | | | | | | | | | | | | |
| | | | |
CASH | | | | | | | | | | | | | | | | |
Net increase in restricted and unrestricted cash | | | 427,000 | | | | — | | | | 8,139,221 | | | | 112,820 | |
Restricted and unrestricted cash at beginning of period | | | 1,564,000 | | | | — | | | | 2,339,000 | | | | 596,000 | |
| | | | | | | | | | | | | | | | |
| | | | |
Restricted and unrestricted cash at end of period | | $ | 1,991,000 | | | $ | — | | | $ | 10,478,221 | | | $ | 708,820 | |
| | | | | | | | | | | | | | | | |
| | | | |
SUPPLEMENTAL DISCLOSURE OFCASH FLOW INFORMATION | | | | | | | | | | | | | | | | |
Cash paid during the period for interest expense | | $ | 3,506,967 | | | $ | 13,914,674 | | | $ | 10,634,343 | | | $ | 2,721,131 | |
| | | | | | | | | | | | | | | | |
| | | | |
RECONCILIATION OF RESTRICTED AND UNRESTRICTED CASH AT THE END OF PERIOD TO THE STATEMENTS OF ASSETS AND LIABILITIES | | | | | | | | | | | | | | | | |
Cash | | $ | — | | | $ | — | | | $ | 6,378,221 | | | $ | 76,820 | |
Cash pledged | | | | | | | | | | | | | | | | |
Futures contracts | | | 1,991,000 | | | | — | | | | 4,100,000 | | | | 632,000 | |
| | | | | | | | | | | | | | | | |
| | | | |
| | $ | 1,991,000 | | | $ | — | | | $ | 10,478,221 | | | $ | 708,820 | |
| | | | | | | | | | | | | | | | |
See notes to financial statements.
Financial Highlights
(For a share outstanding throughout each period)
| | | | | | | | | | | | | | | | | | | | | | | | | | | | |
| | | BFZ | |
| | | | | | |
| | | Six Months Ended
01/31/23
(unaudited) | | | Year Ended
07/31/22 | | | Year Ended
07/31/21 | | | Year Ended
07/31/20 | | | Year Ended
07/31/19 | | | Year Ended
07/31/18 | |
| | | | | | | | |
Net asset value, beginning of period | | | | | | $ | 13.41 | | | $ | 16.29 | | | $ | 15.86 | | | $ | 15.25 | | | $ | 14.81 | | | $ | 15.34 | |
| | | | | | | | | | | | | | | | | | | | | | | | | | | | |
| | | | | | | |
Net investment income(a) | | | | | | | 0.20 | | | | 0.53 | | | | 0.54 | | | | 0.48 | | | | 0.52 | | | | 0.65 | |
Net realized and unrealized gain (loss) | | | | | | | (0.14 | ) | | | (2.82 | ) | | | 0.37 | | | | 0.60 | | | | 0.63 | | | | (0.51 | ) |
| | | | | | | | | | | | | | | | | | | | | | | | | | | | |
| | | | | | | |
Net increase (decrease) from investment operations | | | | | | | 0.06 | | | | (2.29 | ) | | | 0.91 | | | | 1.08 | | | | 1.15 | | | | 0.14 | |
| | | | | | | | | | | | | | | | | | | | | | | | | | | | |
| | | | | | | |
Distributions to Common Shareholders(b) | | | | | | | | | | | | | | | | | | | | | | | | | | | | |
From net investment income | | | | | | | (0.22 | ) | | | (0.51 | ) | | | (0.48 | ) | | | (0.47 | ) | | | (0.55 | ) | | | (0.67 | ) |
From net realized gain | | | | | | | — | | | | (0.08 | ) | | | — | | | | — | | | | (0.16 | ) | | | — | |
| | | | | | | | | | | | | | | | | | | | | | | | | | | | |
| | | | | | | |
Total distributions to Common Shareholders | | | | | | | (0.22 | ) | | | (0.59 | ) | | | (0.48 | ) | | | (0.47 | ) | | | (0.71 | ) | | | (0.67 | ) |
| | | | | | | | | | | | | | | | | | | | | | | | | | | | |
| | | | | | | |
Net asset value, end of period | | | | | | $ | 13.25 | | | $ | 13.41 | | | $ | 16.29 | | | $ | 15.86 | | | $ | 15.25 | | | $ | 14.81 | |
| | | | | | | | | | | | | | | | | | | | | | | | | | | | |
| | | | | | | |
Market price, end of period | | | | | | $ | 11.47 | | | $ | 11.65 | | | $ | 15.01 | | | $ | 13.79 | | | $ | 13.50 | | | $ | 12.75 | |
| | | | | | | | | | | | | | | | | | | | | | | | | | | | |
| | | | | | | |
Total Return Applicable to Common Shareholders(c) | | | | | | | | | | | | | | | | | | | | | | | | | | | | |
Based on net asset value | | | | | | | 0.87 | %(d) | | | (13.93 | )% | | | 6.24 | % | | | 7.69 | % | | | 8.89 | % | | | 1.41 | % |
| | | | | | | | | | | | | | | | | | | | | | | | | | | | |
| | | | | | | |
Based on market price | | | | | | | 0.51 | %(d) | | | (18.85 | )% | | | 12.59 | % | | | 5.77 | % | | | 11.96 | % | | | (8.95 | )% |
| | | | | | | | | | | | | | | | | | | | | | | | | | | | |
| | | | | | | |
Ratios to Average Net Assets Applicable to Common Shareholders(e) | | | | | | | | | | | | | | | | | | | | | | | | | | | | |
Total expenses | | | | | | | 2.74 | %(f) | | | 1.67 | % | | | 1.49 | % | | | 2.17 | % | | | 2.76 | % | | | 2.41 | % |
| | | | | | | | | | | | | | | | | | | | | | | | | | | | |
| | | | | | | |
Total expenses after fees waived and/or reimbursed | | | | | | | 2.74 | %(f) | | | 1.67 | % | | | 1.49 | % | | | 2.17 | % | | | 2.76 | % | | | 2.41 | % |
| | | | | | | | | | | | | | | | | | | | | | | | | | | | |
Total expenses after fees waived and/or reimbursed and excluding interest expense, fees and amortization of offering costs(g) | | | | | | | 1.00 | %(f) | | | 1.02 | % | | | 1.01 | % | | | 1.02 | % | | | 1.06 | % | | | 1.05 | % |
| | | | | | | | | | | | | | | | | | | | | | | | | | | | |
| | | | | | | |
Net investment income to Common Shareholders | | | | | | | 3.16 | %(f) | | | 3.56 | % | | | 3.37 | % | | | 3.14 | % | | | 3.56 | % | | | 4.33 | % |
| | | | | | | | | | | | | | | | | | | | | | | | | | | | |
| | | | | | | |
Supplemental Data | | | | | | | | | | | | | | | | | | | | | | | | | | | | |
Net assets applicable to Common Shareholders, end of period (000) | | | | | | $ | 403,867 | | | $ | 417,250 | | | $ | 510,656 | | | $ | 500,353 | | | $ | 486,586 | | | $ | 472,407 | |
| | | | | | | | | | | | | | | | | | | | | | | | | | | | |
| | | | | | | |
VMTP Shares outstanding at $100,000 liquidation value, end of period (000) | | | | | | $ | 171,300 | | | $ | 171,300 | | | $ | 171,300 | | | $ | 171,300 | | | $ | 171,300 | | | $ | 171,300 | |
| | | | | | | | | | | | | | | | | | | | | | | | | | | | |
| | | | | | | |
Asset coverage per VMTP Shares at $100,000 liquidation value, end of period | | | | | | $ | 295,634 | (h) | | $ | 254,015 | (h) | | $ | 398,106 | (i) | | $ | 392,092 | (i) | | $ | 384,055 | (i) | | $ | 375,778 | (i) |
| | | | | | | | | | | | | | | | | | | | | | | | | | | | |
| | | | | | | |
TOB Trust Certificates, end of period (000) | | | | | | $ | 35,140 | | | $ | 99,616 | | | $ | 143,276 | | | $ | 143,276 | | | $ | 156,312 | | | $ | 157,126 | |
| | | | | | | | | | | | | | | | | | | | | | | | | | | | |
| | | | | | | |
Asset coverage per $1,000 of TOB Trust Certificates, end of period(j) | | | | | | $ | 17,368 | | | $ | 6,908 | | | | N/A | | | | N/A | | | | N/A | | | | N/A | |
| | | | | | | | | | | | | | | | | | | | | | | | | | | | |
| | | | | | | |
Portfolio turnover rate | | | | | | | 75 | % | | | 59 | % | | | 19 | % | | | 38 | % | | | 51 | % | | | 45 | % |
| | | | | | | | | | | | | | | | | | | | | | | | | | | | |
| (a) | Based on average Common Shares outstanding. |
| (b) | Distributions for annual periods determined in accordance with U.S. federal income tax regulations. |
| (c) | Total returns based on market price, which can be significantly greater or less than the net asset value, may result in substantially different returns. Where applicable, excludes the effects of any sales charges and assumes the reinvestment of distributions at actual reinvestment prices. |
| (e) | Excludes fees and expenses incurred indirectly as a result of investments in underlying funds. |
| (g) | Interest expense, fees and amortization of offering costs related to TOB Trusts and/or VMTP Shares. See Note 4 and Note 10 of the Notes to Financial Statements for details. |
| (h) | Calculated by subtracting the Trust’s total liabilities (not including VMTP Shares and TOBs) from the Trust’s total assets and dividing this by the sum of the amount of TOBs and liquidation value of the VMTP Shares, and by multiplying the results by 100,000. |
| (i) | Calculated by subtracting the Trust’s total liabilities (not including VMTP Shares) from the Trust’s total assets and dividing this by the liquidation value of the VMTP Shares, and by multiplying the results by 100,000. |
| (j) | Effective July 18, 2022, TOB Trust Certificates are treated as senior securities pursuant to Rule 18f-4 of the 1940 Act. Calculated by subtracting the Trust’s total liabilities (not including VMTP Shares and TOBs) from the Trust’s total assets and dividing this by the amount of TOBs, and by multiplying the results by 1,000. |
See notes to financial statements.
| | |
| 52 | | 2 0 2 3 BLACK ROCK SEMI - ANNUAL REPORT TO SHAREHOLDERS |
Financial Highlights (continued)
(For a share outstanding throughout each period)
| | | | | | | | | | | | | | | | | | | | | | | | | | | | |
| | | BTT | |
| | | | | | |
| | | Six Months Ended 01/31/23
(unaudited) | | | Year Ended
07/31/22 | | | Year Ended
07/31/21 | | | Year Ended
07/31/20 | | | Year Ended
07/31/19 | | | Year Ended
07/31/18 | |
| | | | | | | | |
Net asset value, beginning of period | | | | | | $ | 24.27 | | | $ | 27.32 | | | $ | 26.31 | | | $ | 25.60 | | | $ | 23.62 | | | $ | 23.83 | |
| | | | | | | | | | | | | | | | | | | | | | | | | | | | |
| | | | | | | |
Net investment income(a) | | | | | | | 0.31 | | | | 0.93 | | | | 1.00 | | | | 0.92 | | | | 0.80 | | | | 0.85 | |
Net realized and unrealized gain (loss) | | | | | | | (0.21 | ) | | | (3.23 | ) | | | 0.76 | | | | 0.54 | | | | 1.93 | | | | (0.21 | ) |
| | | | | | | | | | | | | | | | | | | | | | | | | | | | |
| | | | | | | |
Net increase (decrease) from investment operations | | | | | | | 0.10 | | | | (2.30 | ) | | | 1.76 | | | | 1.46 | | | | 2.73 | | | | 0.64 | |
| | | | | | | | | | | | | | | | | | | | | | | | | | | | |
| | | | | | | |
Distributions to Common Shareholders from net investment income(b) | | | | | | | (0.37 | ) | | | (0.75 | ) | | | (0.75 | ) | | | (0.75 | ) | | | (0.75 | ) | | | (0.85 | ) |
| | | | | | | | | | | | | | | | | | | | | | | | | | | | |
| | | | | | | |
Net asset value, end of period | | | | | | $ | 24.00 | | | $ | 24.27 | | | $ | 27.32 | | | $ | 26.31 | | | $ | 25.60 | | | $ | 23.62 | |
| | | | | | | | | | | | | | | | | | | | | | | | | | | | |
| | | | | | | |
Market price, end of period | | | | | | $ | 22.22 | | | $ | 23.65 | | | $ | 26.27 | | | $ | 24.78 | | | $ | 23.49 | | | $ | 21.43 | |
| | | | | | | | | | | | | | | | | | | | | | | | | | | | |
| | | | | | | |
Total Return Applicable to Common Shareholders(c) | | | | | | | | | | | | | | | | | | | | | | | | | | | | |
Based on net asset value | | | | | | | 0.58 | %(d) | | | (8.41 | )% | | | 6.92 | % | | | 6.04 | % | | | 12.17 | % | | | 3.04 | % |
| | | | | | | | | | | | | | | | | | | | | | | | | | | | |
| | | | | | | |
Based on market price | | | | | | | (4.44 | )%(d) | | | (7.17 | )% | | | 9.16 | % | | | 8.84 | % | | | 13.45 | % | | | (3.73 | )% |
| | | | | | | | | | | | | | | | | | | | | | | | | | | | |
| | | | | | | |
| Ratios to Average Net Assets Applicable to Common Shareholders(e) | | | | | | | | | | | | | | | | | | | | | | | | | | | | |
| | | | | | | |
Total expenses | | | | | | | 2.35 | %(f) | | | 1.17 | % | | | 1.01 | % | | | 1.56 | % | | | 2.07 | % | | | 1.76 | % |
| | | | | | | | | | | | | | | | | | | | | | | | | | | | |
| | | | | | | |
Total expenses after fees waived and/or reimbursed | | | | | | | 2.34 | %(f) | | | 1.17 | % | | | 1.01 | % | | | 1.56 | % | | | 2.07 | % | | | 1.76 | % |
| | | | | | | | | | | | | | | | | | | | | | | | | | | | |
| | | | | | | |
Total expenses after fees waived and/or reimbursed and excluding interest expense, fees and amortization of offering costs(g) | | | | | | | 0.65 | %(f) | | | 0.65 | % | | | 0.65 | % | | | 0.67 | % | | | 0.69 | % | | | 0.69 | % |
| | | | | | | | | | | | | | | | | | | | | | | | | | | | |
| | | | | | | |
Net investment income to Common Shareholders | | | | | | | 2.67 | %(f) | | | 3.64 | % | | | 3.74 | % | | | 3.60 | % | | | 3.31 | % | | | 3.55 | % |
| | | | | | | | | | | | | | | | | | | | | | | | | | | | |
| | | | | | | |
Supplemental Data | | | | | | | | | | | | | | | | | | | | | | | | | | | | |
| | | | | | | |
Net assets applicable to Common Shareholders, end of period (000) | | | | | | $ | 1,691,919 | | | $ | 1,711,088 | | | $ | 1,926,028 | | | $ | 1,854,873 | | | $ | 1,804,738 | | | $ | 1,665,198 | |
| | | | | | | | | | | | | | | | | | | | | | | | | | | | |
| | | | | | | |
RVMTP Shares outstanding at $5,000,000 liquidation value, end of period (000) | | | | | | $ | 750,000 | | | $ | 750,000 | | | $ | 750,000 | | | $ | 750,000 | | | $ | 750,000 | | | $ | 750,000 | |
| | | | | | | | | | | | | | | | | | | | | | | | | | | | |
| | | | | | | |
Asset coverage per RVMTP Shares at $5,000,000 liquidation value, end of period | | | | | | $ | 15,321,993 | (h) | | $ | 13,753,263 | (h)(i) | | $ | 17,840,188 | (i)(j) | | $ | 17,365,817 | (i)(j) | | $ | 17,031,589 | (i)(j) | | $ | 16,101,317 | (j) |
| | | | | | | | | | | | | | | | | | | | | | | | | | | | |
| | | | | | | |
TOB Trust Certificates, end of period (000) | | | | | | $ | 69,570 | | | $ | 227,400 | | | $ | 233,220 | | | $ | 261,820 | | | $ | 261,820 | | | $ | 261,820 | |
| | | | | | | | | | | | | | | | | | | | | | | | | | | | |
| | | | | | | |
Asset coverage per $1,000 of TOB Trust Certificates, end of period(k) | | | | | | $ | 36,097 | | | $ | 11,822 | | | | N/A | | | | N/A | | | | N/A | | | | N/A | |
| | | | | | | | | | | | | | | | | | | | | | | | | | | | |
| | | | | | | |
Portfolio turnover rate | | | | | | | 7 | % | | | 17 | % | | | 9 | % | | | 5 | % | | | 21 | % | | | 23 | % |
| | | | | | | | | | | | | | | | | | | | | | | | | | | | |
| (a) | Based on average Common Shares outstanding. |
| (b) | Distributions for annual periods determined in accordance with U.S. federal income tax regulations. |
| (c) | Total returns based on market price, which can be significantly greater or less than the net asset value, may result in substantially different returns. Where applicable, excludes the effects of any sales charges and assumes the reinvestment of distributions at actual reinvestment prices. |
| (e) | Excludes fees and expenses incurred indirectly as a result of investments in underlying funds. |
| (g) | Interest expense, fees and amortization of offering costs related to TOB Trusts and/or RVMTP Shares. See Note 4 and Note 10 of the Notes to Financial Statements for details. |
| (h) | Calculated by subtracting the Trust’s total liabilities (not including RVMTP Shares and TOBs) from the Trust’s total assets and dividing this by the sum of the amount of TOBs and liquidation value of the RVMTP Shares, and by multiplying the results by 5,000,000. |
| (i) | Amount presented in prior shareholder reports was based on Asset Coverage per RVMTP Shares at $100,000 liquidation value and has been updated to reflect Asset Coverage per RVMTP Shares at $5,000,000 liquidation value. |
| (j) | Calculated by subtracting the Trust’s total liabilities (not including RVMTP Shares) from the Trust’s total assets and dividing this by the liquidation value of the RVMTP Shares, and by multiplying the results by 5,000,000. |
| (k) | Effective July 18, 2022, TOB Trust Certificates are treated as senior securities pursuant to Rule 18f-4 of the 1940 Act. Calculated by subtracting the Trust’s total liabilities (not including RVMTP Shares and TOBs) from the Trust’s total assets and dividing this by the amount of TOBs, and by multiplying the results by 1,000. |
See notes to financial statements.
Financial Highlights (continued)
(For a share outstanding throughout each period)
| | | | | | | | | | | | | | | | | | | | | | | | | | | | |
| | | MUC | |
| | | | | | |
| | | Six Months Ended
01/31/23
(unaudited) | | | Year Ended
07/31/22 | | | Year Ended
07/31/21 | | | Year Ended
07/31/20 | | | Year Ended
07/31/19 | | | Year Ended
07/31/18 | |
| | | | | | | | |
Net asset value, beginning of period | | | | | | $ | 13.42 | | | $ | 16.16 | | | $ | 15.95 | | | $ | 15.56 | | | $ | 15.03 | | | $ | 15.53 | |
| | | | | | | | | | | | | | | | | | | | | | | | | | | | |
| | | | | | | |
Net investment income(a) | | | | | | | 0.22 | | | | 0.58 | | | | 0.65 | | | | 0.58 | | | | 0.57 | | | | 0.64 | |
Net realized and unrealized gain (loss) | | | | | | | (0.39 | ) | | | (2.66 | ) | | | 0.21 | | | | 0.35 | | | | 0.54 | | | | (0.47 | ) |
| | | | | | | | | | | | | | | | | | | | | | | | | | | | |
| | | | | | | |
Net increase (decrease) from investment operations | | | | | | | (0.17 | ) | | | (2.08 | ) | | | 0.86 | | | | 0.93 | | | | 1.11 | | | | 0.17 | |
| | | | | | | | | | | | | | | | | | | | | | | | | | | | |
| | | | | | | |
Distributions to Common Shareholders(b) | | | | | | | | | | | | | | | | | | | | | | | | | | | | |
From net investment income | | | | | | | (0.28 | ) | | | (0.66 | ) | | | (0.65 | ) | | | (0.54 | ) | | | (0.57 | ) | | | (0.67 | ) |
From net realized gain | | | | | | | — | | | | — | | | | — | | | | — | | | | (0.01 | ) | | | — | |
| | | | | | | | | | | | | | | | | | | | | | | | | | | | |
| | | | | | | |
Total distributions to Common Shareholders | | | | | | | (0.28 | ) | | | (0.66 | ) | | | (0.65 | ) | | | (0.54 | ) | | | (0.58 | ) | | | (0.67 | ) |
| | | | | | | | | | | | | | | | | | | | | | | | | | | | |
| | | | | | | |
Net asset value, end of period | | | | | | $ | 12.97 | | | $ | 13.42 | | | $ | 16.16 | | | $ | 15.95 | | | $ | 15.56 | | | $ | 15.03 | |
| | | | | | | | | | | | | | | | | | | | | | | | | | | | |
| | | | | | | |
Market price, end of period | | | | | | $ | 11.52 | | | $ | 12.58 | | | $ | 16.09 | | | $ | 14.67 | | | $ | 14.00 | | | $ | 13.07 | |
| | | | | | | | | | | | | | | | | | | | | | | | | | | | |
| | | | | | | |
Total Return Applicable to Common Shareholders(c) | | | | | | | | | | | | | | | | | | | | | | | | | | | | |
Based on net asset value | | | | | | | (0.92 | )%(d) | | | (12.92 | )% | | | 5.78 | % | | | 6.55 | % | | | 8.17 | % | | | 1.54 | % |
| | | | | | | | | | | | | | | | | | | | | | | | | | | | |
| | | | | | | |
Based on market price | | | | | | | (6.12 | )%(d) | | | (18.01 | )% | | | 14.52 | % | | | 8.92 | % | | | 11.92 | % | | | (7.03 | )% |
| | | | | | | | | | | | | | | | | | | | | | | | | | | | |
| | | | | | | |
Ratios to Average Net Assets Applicable to Common Shareholders(e) | | | | | | | | | | | | | | | | | | | | | | | | | | | | |
Total expenses | | | | | | | 2.89 | %(f) | | | 1.75 | %(g) | | | 1.46 | % | | | 2.11 | % | | | 2.58 | % | | | 2.38 | % |
| | | | | | | | | | | | | | | | | | | | | | | | | | | | |
| | | | | | | |
Total expenses after fees waived and/or reimbursed | | | | | | | 2.82 | %(f) | | | 1.69 | %(g) | | | 1.41 | % | | | 2.05 | % | | | 2.50 | % | | | 2.29 | % |
| | | | | | | | | | | | | | | | | | | | | | | | | | | | |
Total expenses after fees waived and/or reimbursed and excluding interest expense, fees and amortization of offering costs(h) | | | | | | | 0.93 | %(f) | | | 0.96 | %(g) | | | 0.92 | % | | | 0.92 | % | | | 0.92 | % | | | 0.93 | % |
| | | | | | | | | | | | | | | | | | | | | | | | | | | | |
| | | | | | | |
Net investment income to Common Shareholders | | | | | | | 3.46 | %(f) | | | 4.08 | % | | | 4.11 | % | | | 3.75 | % | | | 3.82 | % | | | 4.20 | % |
| | | | | | | | | | | | | | | | | | | | | | | | | | | | |
| | | | | | | |
Supplemental Data | | | | | | | | | | | | | | | | | | | | | | | | | | | | |
Net assets applicable to Common Shareholders, end of period (000) | | | | | | $ | 1,254,035 | | | $ | 1,309,300 | | | $ | 662,892 | | | $ | 653,836 | | | $ | 637,822 | | | $ | 616,387 | |
| | | | | | | | | | | | | | | | | | | | | | | | | | | | |
| | | | | | | |
VMTP Shares outstanding at $100,000 liquidation value, end of period (000) | | | | | | $ | 526,400 | | | $ | 526,400 | | | $ | 254,000 | | | $ | 254,000 | | | $ | 254,000 | | | $ | 254,000 | |
| | | | | | | | | | | | | | | | | | | | | | | | | | | | |
| | | | | | | |
Asset coverage per VMTP Shares at $100,000 liquidation value, end of period | | | | | | $ | 269,923 | (i) | | $ | 249,806 | (i) | | $ | 360,981 | (j) | | $ | 357,416 | (j) | | $ | 351,111 | (j) | | $ | 342,672 | (j) |
| | | | | | | | | | | | | | | | | | | | | | | | | | | | |
| | | | | | | |
TOB Trust Certificates, end of period (000) | | | | | | $ | 211,600 | | | $ | 347,600 | | | $ | 152,145 | | | $ | 158,512 | | | $ | 159,555 | | | $ | 185,905 | |
| | | | | | | | | | | | | | | | | | | | | | | | | | | | |
| | | | | | | |
Asset coverage per $1,000 of TOB Trust Certificates, end of period(k) | | | | | | $ | 9,414 | | | $ | 6,281 | | | | N/A | | | | N/A | | | | N/A | | | | N/A | |
| | | | | | | | | | | | | | | | | | | | | | | | | | | | |
| | | | | | | |
Portfolio turnover rate | | | | | | | 24 | % | | | 41 | % | | | 4 | % | | | 16 | % | | | 24 | % | | | 24 | % |
| | | | | | | | | | | | | | | | | | | | | | | | | | | | |
| (a) | Based on average Common Shares outstanding. |
| (b) | Distributions for annual periods determined in accordance with U.S. federal income tax regulations. |
| (c) | Total returns based on market price, which can be significantly greater or less than the net asset value, may result in substantially different returns. Where applicable, excludes the effects of any sales charges and assumes the reinvestment of distributions at actual reinvestment prices. |
| (e) | Excludes fees and expenses incurred indirectly as a result of investments in underlying funds. |
| (g) | Includes non-recurring expenses of reorganization costs. Without these costs, total expenses, total expenses after fees waived and/or reimbursed and total expenses after fees waived and/or reimbursed and excluding interest expense, fees, and amortization of offering costs, would have been 1.71%, 1.65% and 0.92%, respectively. |
| (h) | Interest expense, fees and amortization of offering costs related to TOB Trusts and/or VMTP Shares. See Note 4 and Note 10 of the Notes to Financial Statements for details. |
| (i) | Calculated by subtracting the Trust’s total liabilities (not including VMTP Shares and TOBs) from the Trust’s total assets and dividing this by the sum of the amount of TOBs and liquidation value of the VMTP Shares, and by multiplying the results by 100,000. |
| (j) | Calculated by subtracting the Trust’s total liabilities (not including VMTP Shares) from the Trust’s total assets and dividing this by the liquidation value of the VMTP Shares, and by multiplying the results by 100,000. |
| (k) | Effective July 18, 2022, TOB Trust Certificates are treated as senior securities pursuant to Rule 18f-4 of the 1940 Act. Calculated by subtracting the Trust’s total liabilities (not including VMTP Shares and TOBs) from the Trust’s total assets and dividing this by the amount of TOBs, and by multiplying the results by 1,000. |
See notes to financial statements.
| | |
| 54 | | 2 0 2 3 BLACK ROCK SEMI - ANNUAL REPORT TO SHAREHOLDERS |
Financial Highlights (continued)
(For a share outstanding throughout each period)
| | | | | | | | | | | | | | | | | | | | | | | | | | | | |
| | | MUE | |
| | | | | | |
| | | Six Months Ended
01/31/23
(unaudited) | | | Year Ended
07/31/22 | | | Year Ended
07/31/21 | | | Year Ended
07/31/20 | | | Year Ended
07/31/19 | | | Year Ended
07/31/18 | |
| | | | | | | | |
Net asset value, beginning of period | | | | | | $ | 12.10 | | | $ | 14.49 | | | $ | 14.17 | | | $ | 13.92 | | | $ | 13.55 | | | $ | 14.19 | |
| | | | | | | | | | | | | | | | | | | | | | | | | | | | |
| | | | | | | |
Net investment income(a) | | | | | | | 0.21 | | | | 0.56 | | | | 0.65 | | | | 0.59 | | | | 0.57 | | | | 0.69 | |
Net realized and unrealized gain (loss) | | | | | | | (0.41 | ) | | | (2.32 | ) | | | 0.28 | | | | 0.20 | | | | 0.40 | | | | (0.61 | ) |
| | | | | | | | | | | | | | | | | | | | | | | | | | | | |
| | | | | | | |
Net increase (decrease) from investment operations | | | | | | | (0.20 | ) | | | (1.76 | ) | | | 0.93 | | | | 0.79 | | | | 0.97 | | | | 0.08 | |
| | | | | | | | | | | | | | | | | | | | | | | | | | | | |
| | | | | | | |
Distributions to Common Shareholders from net investment income(b) | | | | | | | (0.26 | ) | | | (0.63 | ) | | | (0.61 | ) | | | (0.54 | ) | | | (0.60 | ) | | | (0.72 | ) |
| | | | | | | | | | | | | | | | | | | | | | | | | | | | |
| | | | | | | |
Net asset value, end of period | | | | | | $ | 11.64 | | | $ | 12.10 | | | $ | 14.49 | | | $ | 14.17 | | | $ | 13.92 | | | $ | 13.55 | |
| | | | | | | | | | | | | | | | | | | | | | | | | | | | |
| | | | | | | |
Market price, end of period | | | | | | $ | 10.43 | | | $ | 11.45 | | | $ | 14.41 | | | $ | 13.12 | | | $ | 12.67 | | | $ | 12.36 | |
| | | | | | | | | | | | | | | | | | | | | | | | | | | | |
| | | | | | | |
Total Return Applicable to Common Shareholders(c) | | | | | | | | | | | | | | | | | | | | | | | | | | | | |
Based on net asset value | | | | | | | (1.39 | )%(d) | | | (12.21 | )% | | | 6.97 | % | | | 6.25 | % | | | 7.96 | % | | | 0.87 | % |
| | | | | | | | | | | | | | | | | | | | | | | | | | | | |
| | | | | | | |
Based on market price | | | | | | | (6.62 | )%(d) | | | (16.47 | )% | | | 14.89 | % | | | 8.08 | % | | | 7.72 | % | | | (7.85 | )% |
| | | | | | | | | | | | | | | | | | | | | | | | | | | | |
| | | | | | | |
Ratios to Average Net Assets Applicable to Common Shareholders(e) | | | | | | | | | | | | | | | | | | | | | | | | | | | | |
| | | | | | | |
Total expenses | | | | | | | 3.17 | %(f) | | | 1.75 | % | | | 1.51 | % | | | 2.07 | % | | | 2.48 | % | | | 2.24 | % |
| | | | | | | | | | | | | | | | | | | | | | | | | | | | |
| | | | | | | |
Total expenses after fees waived and/or reimbursed | | | | | | | 3.11 | %(f) | | | 1.69 | % | | | 1.48 | % | | | 2.03 | % | | | 2.45 | % | | | 2.20 | % |
| | | | | | | | | | | | | | | | | | | | | | | | | | | | |
| | | | | | | |
Total expenses after fees waived and/or reimbursed and excluding interest expense and fees(g) | | | | | | | 0.96 | %(f) | | | 0.95 | % | | | 0.93 | % | | | 0.95 | % | | | 0.95 | % | | | 0.95 | % |
| | | | | | | | | | | | | | | | | | | | | | | | | | | | |
| | | | | | | |
Net investment income to Common Shareholders | | | | | | | 3.70 | %(f) | | | 4.25 | % | | | 4.55 | % | | | 4.29 | % | | | 4.23 | % | | | 4.96 | % |
| | | | | | | | | | | | | | | | | | | | | | | | | | | | |
| | | | | | | |
Supplemental Data | | | | | | | | | | | | | | | | | | | | | | | | | | | | |
| | | | | | | |
Net assets applicable to Common Shareholders, end of period (000) | | | | | | $ | 262,212 | | | $ | 272,564 | | | $ | 326,390 | | | $ | 319,085 | | | $ | 313,406 | | | $ | 305,267 | |
| | | | | | | | | | | | | | | | | | | | | | | | | | | | |
| | | | | | | |
VMTP Shares outstanding at $100,000 liquidation value, end of period (000) | | | | | | $ | 131,000 | | | $ | 131,000 | | | $ | 131,000 | | | $ | 131,000 | | | $ | 131,000 | | | $ | 131,000 | |
| | | | | | | | | | | | | | | | | | | | | | | | | | | | |
| | | | | | | |
Asset coverage per VMTP Shares at $100,000 liquidation value, end of period | | | | | | $ | 270,976 | (h) | | $ | 252,124 | (h) | | $ | 349,152 | (i) | | $ | 343,577 | (i) | | $ | 339,241 | (i) | | $ | 333,028 | (i) |
| | | | | | | | | | | | | | | | | | | | | | | | | | | | |
| | | | | | | |
TOB Trust Certificates, end of period (000) | | | | | | $ | 22,362 | | | $ | 48,172 | | | $ | 59,850 | | | $ | 60,976 | | | $ | 58,458 | | | $ | 48,546 | |
| | | | | | | | | | | | | | | | | | | | | | | | | | | | |
| | | | | | | |
Asset coverage per $1,000 of TOB Trust Certificates, end of period(j) | | | | | | $ | 18,584 | | | $ | 9,378 | | | | N/A | | | | N/A | | | | N/A | | | | N/A | |
| | | | | | | | | | | | | | | | | | | | | | | | | | | | |
| | | | | | | |
Portfolio turnover rate | | | | | | | 13 | % | | | 28 | % | | | 7 | % | | | 18 | % | | | 26 | % | | | 21 | % |
| | | | | | | | | | | | | | | | | | | | | | | | | | | | |
| (a) | Based on average Common Shares outstanding. |
| (b) | Distributions for annual periods determined in accordance with U.S. federal income tax regulations. |
| (c) | Total returns based on market price, which can be significantly greater or less than the net asset value, may result in substantially different returns. Where applicable, excludes the effects of any sales charges and assumes the reinvestment of distributions at actual reinvestment prices. |
| (e) | Excludes fees and expenses incurred indirectly as a result of investments in underlying funds. |
| (g) | Interest expense, fees and amortization of offering costs related to TOB Trusts and/or VMTP Shares. See Note 4 and Note 10 of the Notes to Financial Statements for details. |
| (h) | Calculated by subtracting the Trust’s total liabilities (not including VMTP Shares and TOBs) from the Trust’s total assets and dividing this by the sum of the amount of TOBs and liquidation value of the VMTP Shares, and by multiplying the results by 100,000. |
| (i) | Calculated by subtracting the Trust’s total liabilities (not including VMTP Shares) from the Trust’s total assets and dividing this by the liquidation value of the VMTP Shares, and by multiplying the results by 100,000. |
| (j) | Effective July 18, 2022, TOB Trust Certificates are treated as senior securities pursuant to Rule 18f-4 of the 1940 Act. Calculated by subtracting the Trust’s total liabilities (not including VMTP Shares and TOBs) from the Trust’s total assets and dividing this by the amount of TOBs, and by multiplying the results by 1,000. |
See notes to financial statements.
Notes to Financial Statements (unaudited)
The following are registered under the Investment Company Act of 1940, as amended (the “1940 Act”), as closed-end management investment companies and are referred to herein collectively as the “Trusts”, or individually as a “Trust”:
| | | | | | | | | | |
| | | | |
| Trust Name | | Herein Referred To As | | | Organized | | | Diversification Classification |
| | | |
BlackRock California Municipal Income Trust | | | BFZ | | | | Delaware | | | Diversified |
BlackRock Municipal 2030 Target Term Trust | | | BTT | | | | Delaware | | | Diversified |
BlackRock MuniHoldings California Quality Fund, Inc. | | | MUC | | | | Maryland | | | Diversified |
BlackRock MuniHoldings Quality Fund II, Inc. | | | MUE | | | | Maryland | | | Diversified |
The Boards of Trustees of the Trusts are collectively referred to throughout this report as the “Board,” and the trustees thereof are collectively referred to throughout this report as “Trustees”. The Trusts determine and make available for publication the net asset values (“NAVs”) of their Common Shares on a daily basis.
The Trusts, together with certain other registered investment companies advised by BlackRock Advisors, LLC (the “Manager”) or its affiliates, are included in a complex of funds referred to as the BlackRock Fixed-Income Complex.
PriorYear Reorganization: The Board and shareholders of MUC (the “Acquiring Trust”) and the Board and shareholders of each of BlackRock MuniYield California Fund, Inc. (“MYC”) and BlackRock MuniYield California Quality Fund, Inc. (“MCA”) (individually, a “Target Fund” and collectively the “Target Funds”) approved the reorganizations of each Target Fund into the Acquiring Trust. As a result, the Acquiring Trust acquired substantially all of the assets and assumed substantially all of the liabilities of each Target Fund in exchange for an equal aggregate value of newly-issued Common Shares and Preferred Shares of the Acquiring Trust.
Each Common Shareholder of a Target Fund received Common Shares of the Acquiring Trust in an amount equal to the aggregate NAV of such Common Shareholder’s Target Fund Common Shares, as determined at the close of business on April 8, 2022, less the costs of the Target Fund’s reorganizations. Cash was distributed for any fractional shares.
Each Preferred Shareholder of a Target Fund received Preferred Shares of the Acquiring Trust in an amount equal to the aggregate liquidation preference of the Target Fund’s Preferred Shares held by such Preferred Shareholder prior to the Target Fund’s reorganization.
The reorganizations were accomplished by a tax-free exchange of Common Shares and Preferred Shares of the Acquiring Trust in the following amounts and at the following conversion ratios:
| | | | | | | | | | | | | | | | | | | | |
| | | | | | |
| Target Funds | | Target
Fund’s
Share
Class | | | Shares Prior to
Reorganization | | | Conversion
Ratio | | | MUC’s
Share
Class | | | Shares of
MUC | |
| | | | | |
MYC | | | Common | | | | 21,419,494 | | | | 1.01385164 | | | | Common | | | | 21,716,172 | (a) |
MCA | | | Common | | | | 34,405,717 | | | | 1.01061039 | | | | Common | | | | 34,770,757 | (a) |
MYC | | | VMTP | | | | 1,059 | | | | 1 | | | | VMTP | | | | 1,059 | |
MCA | | | VMTP | | | | 1,665 | | | | 1 | | | | VMTP | | | | 1,665 | |
| | (a) | Net of fractional shares redeemed. | |
Each Target Fund’s net assets and composition of net assets on April 8, 2022, the valuation date of the reorganizations were as follows:
| | | | | | | | |
| |
| | |
| | | MYC | | | MCA | |
| |
| | |
Net assets applicable to Common Shareholders | | $ | 298,816,683 | | | $ | 478,449,681 | |
Paid-in-capital | | | 302,810,070 | | | | 492,079,121 | |
Accumulated loss | | | (3,993,387 | ) | | | (13,629,440 | ) |
| |
For financial reporting purposes, assets received and shares issued by the Acquiring Trust were recorded at fair value. However, the cost basis of the investments received from the Target Funds was carried forward to align ongoing reporting of the Acquiring Trust’s realized and unrealized gains and losses with amounts distributable to shareholders for tax purposes.
The net assets applicable to Common Shareholders of the Acquiring Trust before the reorganizations were $564,734,876. The aggregate net assets applicable to Common Shareholders of the Acquiring Trust immediately after the reorganizations amounted to $1,342,001,240. Each Target Fund’s fair value and cost of financial instruments prior to the reorganizations were as follows:
| | | | | | | | | | | | | | |
| | | | | |
| Target Funds | | Fair Value of
Investments | | | Cost of
Investments | | | TOB Trust
Certificates | | | Preferred Shares Value |
| | | | |
MYC | | $ | 503,360,614 | | | $ | 507,100,686 | | | $ | 104,690,676 | | | $105,900,000 |
MCA | | | 819,871,446 | | | | 823,913,061 | | | | 191,958,461 | | | 166,500,000 |
The purpose of these transactions was to combine three funds managed by the Manager with similar or substantially similar (but not identical) investment objectives and similar investment strategies, policies and restrictions and portfolio compositions. Each reorganization was a tax-free event and was effective on April 11, 2022.
| | |
| 56 | | 2 0 2 3 BLACK ROCK SEMI - ANNUAL REPORT TO SHAREHOLDERS |
Notes to Financial Statements (unaudited) (continued)
Assuming the reorganization had been completed on August 1, 2021, the beginning of the fiscal reporting period of the Acquiring Trust, the pro forma results of operations for the year ended July 31, 2022, are as follows:
• Net investment income/loss: $55,719,848
• Net realized and change in unrealized gain/loss on investments: $(268,549,785)
• Net decrease in net assets resulting from operations: $(212,829,937)
Because the combined investment portfolios have been managed as a single integrated portfolio since the reorganization was completed, it is not practicable to separate the amounts of revenue and earnings of the Target Funds that have been included in the Acquiring Trust’s Statements of Operations since April 11, 2022.
Reorganization costs incurred by MUC in connection with the reorganization were expensed by MUC. The Manager reimbursed MUC $110,355.
| 2. | SIGNIFICANT ACCOUNTING POLICIES |
The financial statements are prepared in conformity with accounting principles generally accepted in the United States of America (“U.S. GAAP”), which may require management to make estimates and assumptions that affect the reported amounts of assets and liabilities in the financial statements, disclosure of contingent assets and liabilities at the date of the financial statements and the reported amounts of increases and decreases in net assets from operations during the reporting period. Actual results could differ from those estimates. Each Trust is considered an investment company under U.S. GAAP and follows the accounting and reporting guidance applicable to investment companies. Below is a summary of significant accounting policies:
Investment Transactions and Income Recognition: For financial reporting purposes, investment transactions are recorded on the dates the transactions are executed. Realized gains and losses on investment transactions are determined using the specific identification method. Dividend income and capital gain distributions, if any, are recorded on the ex-dividend dates. Non-cash dividends, if any, are recorded on the ex-dividend dates at fair value. Interest income, including amortization and accretion of premiums and discounts on debt securities, is recognized daily on an accrual basis.
Collateralization: If required by an exchange or counterparty agreement, the Trusts may be required to deliver/deposit cash and/or securities to/with an exchange, or broker-dealer or custodian as collateral for certain investments.
Distributions: Distributions from net investment income are declared monthly and paid monthly. Distributions of capital gains are recorded on the ex-dividend dates and made at least annually. The character and timing of distributions are determined in accordance with U.S. federal income tax regulations, which may differ from U.S. GAAP.
Distributions to Preferred Shareholders are accrued and determined as described in Note 10.
Deferred Compensation Plan: Under the Deferred Compensation Plan (the “Plan”) approved by each Board, the trustees who are not “interested persons” of the Trusts, as defined in the 1940 Act (“Independent Trustees”), may defer a portion of their annual complex-wide compensation. Deferred amounts earn an approximate return as though equivalent dollar amounts had been invested in common shares of certain funds in the BlackRock Fixed-Income Complex selected by the Independent Trustees. This has the same economic effect for the Independent Trustees as if the Independent Trustees had invested the deferred amounts directly in certain funds in the BlackRock Fixed-Income Complex.
The Plan is not funded and obligations thereunder represent general unsecured claims against the general assets of each Trust, as applicable. Deferred compensation liabilities, if any, are included in the Trustees’ and Officer’s fees payable in the Statements of Assets and Liabilities and will remain as a liability of the Trusts until such amounts are distributed in accordance with the Plan. Net appreciation (depreciation) in the value of participants’ deferral accounts is allocated among the participating funds in the BlackRock Fixed-Income Complex and reflected as Trustees and Officer expense on the Statements of Operations. The Trustees and Officer expense may be negative as a result of a decrease in value of the deferred accounts.
Indemnifications: In the normal course of business, a Trust enters into contracts that contain a variety of representations that provide general indemnification. A Trust’s maximum exposure under these arrangements is unknown because it involves future potential claims against a Trust, which cannot be predicted with any certainty.
Other: Expenses directly related to a Trust are charged to that Trust. Other operating expenses shared by several funds, including other funds managed by the Manager, are prorated among those funds on the basis of relative net assets or other appropriate methods.
| 3. | INVESTMENT VALUATION AND FAIR VALUE MEASUREMENTS |
Investment Valuation Policies: Each Trust’s investments are valued at fair value (also referred to as “market value” within the financial statements) each day that the Trust is open for business and, for financial reporting purposes, as of the report date. U.S. GAAP defines fair value as the price a fund would receive to sell an asset or pay to transfer a liability in an orderly transaction between market participants at the measurement date. The Board has approved the designation of each Trust’s Manager as the valuation designee for each Trust. Each Trust determines the fair values of its financial instruments using various independent dealers or pricing services under the Manager’s policies. If a security’s market price is not readily available or does not otherwise accurately represent the fair value of the security, the security will be valued in accordance with the Manager’s policies and procedures as reflecting fair value. The Manager has formed a committee (the “Valuation Committee”) to develop pricing policies and procedures and to oversee the pricing function for all financial instruments, with assistance from other BlackRock pricing committees.
| | |
NOTES TO FINANCIAL STATEMENTS | | 57 |
Notes to Financial Statements (unaudited) (continued)
Fair Value Inputs and Methodologies: The following methods and inputs are used to establish the fair value of each Trust’s assets and liabilities:
| | • | | Fixed-income investments for which market quotations are readily available are generally valued using the last available bid price or current market quotations provided by independent dealers or third-party pricing services. Pricing services generally value fixed-income securities assuming orderly transactions of an institutional round lot size, but a fund may hold or transact in such securities in smaller, odd lot sizes. Odd lots may trade at lower prices than institutional round lots. The pricing services may use matrix pricing or valuation models that utilize certain inputs and assumptions to derive values, including transaction data (e.g., recent representative bids and offers), market data, credit quality information, perceived market movements, news, and other relevant information. Certain fixed-income securities, including asset-backed and mortgage related securities may be valued based on valuation models that consider the estimated cash flows of each tranche of the entity, establish a benchmark yield and develop an estimated tranche specific spread to the benchmark yield based on the unique attributes of the tranche. The amortized cost method of valuation may be used with respect to debt obligations with sixty days or less remaining to maturity unless the Manager determines such method does not represent fair value. |
| | • | | Investments in open-end U.S. mutual funds (including money market funds) are valued at that day’s published NAV. |
| | • | | Futures contracts are valued based on that day’s last reported settlement or trade price on the exchange where the contract is traded. |
If events (e.g., market volatility, company announcement or a natural disaster) occur that are expected to materially affect the value of such investment, or in the event that application of these methods of valuation results in a price for an investment that is deemed not to be representative of the market value of such investment, or if a price is not available, the investment will be valued by the Valuation Committee in accordance with the Manager’s policies and procedures as reflecting fair value (“Fair Valued Investments”). The fair valuation approaches that may be used by the Valuation Committee include market approach, income approach and cost approach. Valuation techniques such as discounted cash flow, use of market comparables and matrix pricing are types of valuation approaches and are typically used in determining fair value. When determining the price for Fair Valued Investments, the Valuation Committee seeks to determine the price that each Trust might reasonably expect to receive or pay from the current sale or purchase of that asset or liability in an arm’s-length transaction. Fair value determinations shall be based upon all available factors that the Valuation Committee deems relevant and consistent with the principles of fair value measurement.
Fair Value Hierarchy: Various inputs are used in determining the fair value of financial instruments. These inputs to valuation techniques are categorized into a fair value hierarchy consisting of three broad levels for financial reporting purposes as follows:
| | • | | Level 1 – Unadjusted price quotations in active markets/exchanges for identical assets or liabilities that each Trust has the ability to access; |
| | • | | Level 2 – Other observable inputs (including, but not limited to, quoted prices for similar assets or liabilities in markets that are active, quoted prices for identical or similar assets or liabilities in markets that are not active, inputs other than quoted prices that are observable for the assets or liabilities (such as interest rates, yield curves, volatilities, prepayment speeds, loss severities, credit risks and default rates) or other market–corroborated inputs); and |
| | • | | Level 3 – Unobservable inputs based on the best information available in the circumstances, to the extent observable inputs are not available (including the Valuation Committee’s assumptions used in determining the fair value of financial instruments). |
The hierarchy gives the highest priority to unadjusted quoted prices in active markets for identical assets or liabilities (Level 1 measurements) and the lowest priority to unobservable inputs (Level 3 measurements). Accordingly, the degree of judgment exercised in determining fair value is greatest for instruments categorized in Level 3. The inputs used to measure fair value may fall into different levels of the fair value hierarchy. In such cases, for disclosure purposes, the fair value hierarchy classification is determined based on the lowest level input that is significant to the fair value measurement in its entirety. Investments classified within Level 3 have significant unobservable inputs used by the Valuation Committee in determining the price for Fair Valued Investments. Level 3 investments include equity or debt issued by privately held companies or funds that may not have a secondary market and/or may have a limited number of investors. The categorization of a value determined for financial instruments is based on the pricing transparency of the financial instruments and is not necessarily an indication of the risks associated with investing in those securities.
| 4. | SECURITIES AND OTHER INVESTMENTS |
Zero-Coupon Bonds: Zero-coupon bonds are normally issued at a significant discount from face value and do not provide for periodic interest payments. These bonds may experience greater volatility in market value than other debt obligations of similar maturity which provide for regular interest payments.
Forward Commitments, When-Issued and Delayed Delivery Securities: The Trusts may purchase securities on a when-issued basis and may purchase or sell securities on a forward commitment basis. Settlement of such transactions normally occurs within a month or more after the purchase or sale commitment is made. The Trusts may purchase securities under such conditions with the intention of actually acquiring them but may enter into a separate agreement to sell the securities before the settlement date. Since the value of securities purchased may fluctuate prior to settlement, the Trusts may be required to pay more at settlement than the security is worth. In addition, a fund is not entitled to any of the interest earned prior to settlement. When purchasing a security on a delayed delivery basis, the Trusts assume the rights and risks of ownership of the security, including the risk of price and yield fluctuations. In the event of default by the counterparty, the Trusts’ maximum amount of loss is the unrealized appreciation of unsettled when-issued transactions.
Municipal Bonds Transferred to TOB Trusts: Certain Trusts leverage their assets through the use of “TOB Trust” transactions. The funds transfer municipal bonds into a special purpose trust (a “TOB Trust”). A TOB Trust issues two classes of beneficial interests: short-term floating rate interests (“TOB Trust Certificates”), which are sold to third-party investors, and residual inverse floating rate interests (“TOB Residuals”), which are issued to the participating funds that contributed the municipal bonds to the TOB Trust. The TOB Trust Certificates have interest rates that reset weekly and their holders have the option to tender such certificates to the TOB Trust for redemption at par and any accrued interest at each reset date. The TOB Residuals held by a fund provide the fund with the right to cause the holders of a proportional share of the TOB Trust Certificates to tender their certificates to the TOB Trust at par plus accrued interest. The funds may withdraw a corresponding share of the municipal bonds from the TOB Trust.
| | |
| 58 | | 2 0 2 3 BLACK ROCK SEMI - ANNUAL REPORT TO SHAREHOLDERS |
Notes to Financial Statements (unaudited) (continued)
Other funds managed by the investment adviser may also contribute municipal bonds to a TOB Trust into which a fund has contributed bonds. If multiple BlackRock-advised funds participate in the same TOB Trust, the economic rights and obligations under the TOB Residuals will be shared among the funds ratably in proportion to their participation in the TOB Trust.
TOB Trusts are supported by a liquidity facility provided by a third-party bank or other financial institution (the “Liquidity Provider”) that allows the holders of the TOB Trust Certificates to tender their certificates in exchange for payment of par plus accrued interest on any business day. The tendered TOB Trust Certificates are remarketed by a Remarketing Agent. In the event of a failed remarketing, the TOB Trust may draw upon a loan from the Liquidity Provider to purchase the tendered TOB Trust Certificates. Any loans made by the Liquidity Provider will be secured by the purchased TOB Trust Certificates held by the TOB Trust and will be subject to an increased interest rate based on number of days the loan is outstanding.
The TOB Trust may be collapsed without the consent of a fund, upon the occurrence of a termination event as defined in the TOB Trust agreement. Upon the occurrence of a termination event, a TOB Trust would be liquidated with the proceeds applied first to any accrued fees owed to the trustee of the TOB Trust, the Remarketing Agent and the Liquidity Provider. Upon certain termination events, TOB Trust Certificates holders will be paid before the TOB Residuals holders (i.e., the Trusts) whereas in other termination events, TOB Trust Certificates holders and TOB Residuals holders will be paid pro rata.
While a fund’s investment policies and restrictions expressly permit investments in inverse floating rate securities, such as TOB Residuals, they restrict the ability of a fund to borrow money for purposes of making investments. Each Trust’s transfer of the municipal bonds to a TOB Trust is considered a secured borrowing for financial reporting purposes. The cash received by the TOB Trust from the sale of the TOB Trust Certificates, less certain transaction expenses, is paid to a Trust. A Trust typically invests the cash received in additional municipal bonds.
Accounting for TOB Trusts: The municipal bonds deposited into a TOB Trust are presented in a Trust’s Schedule of Investments and the TOB Trust Certificates are shown in Other Liabilities in the Statements of Assets and Liabilities. Any loans drawn by the TOB Trust pursuant to the liquidity facility to purchase tendered TOB Trust Certificates are shown as Loan for TOB Trust Certificates. The carrying amount of a Trust’s payable to the holder of the TOB Trust Certificates, as reported in the Statements of Assets and Liabilities as TOB Trust Certificates, approximates its fair value.
Interest income, including amortization and accretion of premiums and discounts, from the underlying municipal bonds is recorded by a Trust on an accrual basis. Interest expense incurred on the TOB Trust transaction and other expenses related to remarketing, administration, trustee, liquidity and other services to a TOB Trust are shown as interest expense, fees and amortization of offering costs in the Statements of Operations. Fees paid upon creation of the TOB Trust are recorded as debt issuance costs and are amortized to interest expense, fees and amortization of offering costs in the Statements of Operations to the expected maturity of the TOB Trust. In connection with the restructurings of the TOB Trusts to non-bank sponsored TOB Trusts, a Trust incurred non-recurring, legal and restructuring fees, which are recorded as interest expense, fees and amortization of offering costs in the Statements of Operations. Amounts recorded within interest expense, fees and amortization of offering costs in the Statements of Operations are:
| | | | | | | | | | | | | | |
| | | | | |
| Trust Name | | Interest Expense | | | Liquidity Fees | | | Other Expenses | | | Total |
| | | | |
BFZ | | $ | 673,347 | | | $ | 137,549 | | | $ | 41,797 | | | $ 852,693 |
BTT | | | 1,398,174 | | | | 203,981 | | | | 197,526 | | | 1,799,681 |
MUC | | | 2,920,651 | | | | 565,490 | | | | 184,025 | | | 3,670,166 |
MUE | | | 344,817 | | | | 62,293 | | | | 23,391 | | | 430,501 |
For the six months ended January 31, 2023, the following table is a summary of each Trust’s TOB Trusts:
| | | | | | | | | | | | | | | | | | |
| | | | | | |
| Trust Name | |
| Underlying
Municipal Bonds Transferred to TOB Trusts |
(a) | |
| Liability for
TOB Trust Certificates |
(b) | | Range of Interest Rates on TOB Trust Certificates at Period End | |
| Average
TOB Trust Certificates Outstanding |
| |
| Daily Weighted
Average Rate of Interest and Other Expenses
on TOB Trusts |
|
| | | | | |
BFZ | | $ | 76,591,158 | | | $ | 35,140,000 | | | 1.66% — 1.69% | | $ | 64,475,794 | | | | 2.62 | % |
BTT | | | 104,489,994 | | | | 69,569,982 | | | 1.70 — 1.73 | | | 128,822,448 | | | | 2.77 | |
MUC | | | 392,128,248 | | | | 211,599,963 | | | 1.68 — 1.78 | | | 265,569,866 | | | | 2.74 | |
MUE | | | 37,791,149 | | | | 22,362,382 | | | 1.69 — 1.96 | | | 31,920,446 | | | | 2.67 | |
| | (a) | The municipal bonds transferred to a TOB Trust are generally high grade municipal bonds. In certain cases, when municipal bonds transferred are lower grade municipal bonds, the TOB Trust transaction may include a credit enhancement feature that provides for the timely payment of principal and interest on the bonds to the TOB Trust by a credit enhancement provider in the event of default of the municipal bond. The TOB Trust would be responsible for the payment of the credit enhancement fee and the Trusts, as TOB Residuals holders, would be responsible for reimbursement of any payments of principal and interest made by the credit enhancement provider. The maximum potential amounts owed by the Trusts, for such reimbursements, as applicable, are included in the maximum potential amounts disclosed for recourse TOB Trusts in the Schedules of Investments. | |
| | (b) | TOB Trusts may be structured on a non-recourse or recourse basis. When a Trust invests in TOB Trusts on a non-recourse basis, the Liquidity Provider may be required to make a payment under the liquidity facility to allow the TOB Trust to repurchase TOB Trust Certificates. The Liquidity Provider will be reimbursed from the liquidation of bonds held in the TOB Trust. If a Trust invests in a TOB Trust on a recourse basis, a Trust enters into a reimbursement agreement with the Liquidity Provider where a Trust is required to reimburse the Liquidity Provider for any shortfall between the amount paid by the Liquidity Provider and proceeds received from liquidation of municipal bonds held in the TOB Trust (the “Liquidation Shortfall”). As a result, if a Trust invests in a recourse TOB Trust, a Trust will bear the risk of loss with respect to any Liquidation Shortfall. If multiple funds participate in any such TOB Trust, these losses will be shared ratably, including the maximum potential amounts owed by a Trust at January 31, 2023, in proportion to their participation in the TOB Trust. The recourse TOB Trusts are identified in the Schedules of Investments including the maximum potential amounts owed by a Trust at January 31, 2023. | |
| | |
NOTES TO FINANCIAL STATEMENTS | | 59 |
Notes to Financial Statements (unaudited) (continued)
| 5. | DERIVATIVE FINANCIAL INSTRUMENTS |
The Trusts engage in various portfolio investment strategies using derivative contracts both to increase the returns of the Trusts and/or to manage their exposure to certain risks such as credit risk, equity risk, interest rate risk, foreign currency exchange rate risk, commodity price risk or other risks (e.g., inflation risk). Derivative financial instruments categorized by risk exposure are included in the Schedules of Investments. These contracts may be transacted on an exchange or over-the-counter (“OTC”).
Futures Contracts: Futures contracts are purchased or sold to gain exposure to, or manage exposure to, changes in interest rates (interest rate risk) and changes in the value of equity securities (equity risk) or foreign currencies (foreign currency exchange rate risk).
Futures contracts are exchange-traded agreements between the Trusts and a counterparty to buy or sell a specific quantity of an underlying instrument at a specified price and on a specified date. Depending on the terms of a contract, it is settled either through physical delivery of the underlying instrument on the settlement date or by payment of a cash amount on the settlement date. Upon entering into a futures contract, the Trusts are required to deposit initial margin with the broker in the form of cash or securities in an amount that varies depending on a contract’s size and risk profile. The initial margin deposit must then be maintained at an established level over the life of the contract. Amounts pledged, which are considered restricted, are included in cash pledged for futures contracts in the Statements of Assets and Liabilities.
Securities deposited as initial margin are designated in the Schedules of Investments and cash deposited, if any, are shown as cash pledged for futures contracts in the Statements of Assets and Liabilities. Pursuant to the contract, the Trusts agree to receive from or pay to the broker an amount of cash equal to the daily fluctuation in market value of the contract (“variation margin”). Variation margin is recorded as unrealized appreciation (depreciation) and, if any, shown as variation margin receivable (or payable) on futures contracts in the Statements of Assets and Liabilities. When the contract is closed, a realized gain or loss is recorded in the Statements of Operations equal to the difference between the notional amount of the contract at the time it was opened and the notional amount at the time it was closed. The use of futures contracts involves the risk of an imperfect correlation in the movements in the price of futures contracts and interest rates, foreign currency exchange rates or underlying assets.
| 6. | INVESTMENT ADVISORY AGREEMENT AND OTHER TRANSACTIONS WITH AFFILIATES |
Investment Advisory: Each Trust entered into an Investment Advisory Agreement with the Manager, the Trusts’ investment adviser and an indirect, wholly-owned subsidiary of BlackRock, Inc. (“BlackRock”), to provide investment advisory and administrative services. The Manager is responsible for the management of each Trust’s portfolio and provides the personnel, facilities, equipment and certain other services necessary to the operations of each Trust.
For such services, MUC and MUE pays the Manager a monthly fee at an annual rate equal to the following percentages of the average daily value of each Trust’s net assets:
| | | | | | | | |
| | | |
| | | MUC | | | MUE | |
| | |
Investment advisory fees | | | 0.55 | % | | | 0.55 | % |
For purposes of calculating these fees, “net assets” mean the total assets of the Trust minus the sum of its accrued liabilities (which does not include liabilities represented by TOB Trusts and the liquidation preference of any outstanding preferred shares). It is understood that the liquidation preference of any outstanding preferred stock (other than accumulated dividends) and TOB Trusts is not considered a liability in determining a Trust’s NAV.
Effective January 1, 2023, for such services, BFZ pays the Manager a monthly fee at an annual rate equal to 0.55% of the average daily value of the Trust’s managed assets. Prior to January 1, 2023, for such services, BFZ paid the Manager a monthly fee at an annual rate equal to 0.58% of the average daily value of the Trust’s managed assets.
For such services, BTT pays the Manager a monthly fee at an annual rate equal to 0.40% of the average daily value of the Trust’s managed assets.
For purposes of calculating these fees, “managed assets” are determined as total assets of the Trust (including any assets attributable to money borrowed for investment purposes) less the sum of its accrued liabilities (other than money borrowed for investment purposes).
Expense Waivers and Reimbursements: With respect to each Trust, the Manager contractually agreed to waive its investment advisory fees by the amount of investment advisory fees each Trust pays to the Manager indirectly through its investment in affiliated money market funds (the “affiliated money market fund waiver”) through June 30, 2024. The contractual agreement may be terminated upon 90 days’ notice by a majority of the Independent Trustees, or by a vote of a majority of the outstanding voting securities of a Trust. These amounts are included in fees waived and/or reimbursed by the Manager in the Statements of Operations. For the six months ended January 31, 2023, the amounts waived were as follows:
| | |
| | |
| Trust Name | | Fees Waived and/or Reimbursed by the Manager |
| |
BFZ | | $ 2,490 |
BTT | | 29,743 |
MUC | | 17,439 |
MUE | | 4,072 |
The Manager has contractually agreed to waive its investment advisory fee with respect to any portion of each Trust’s assets invested in affiliated equity and fixed-income mutual funds and affiliated exchange-traded funds that have a contractual management fee through June 30, 2024. The agreement can be renewed for annual periods thereafter, and may be terminated on 90 days’ notice, each subject to approval by a majority of the Trusts’ Independent Trustees. For the six months ended January 31, 2023, there were no fees waived by the Manager pursuant to this arrangement.
With respect to MUC, the Manager contractually agreed to waive a portion of its investment advisory fees equal to the annual rate of 0.04% of the average daily value of net assets through June 30, 2023. The contractual agreement may be terminated upon 90 days’ notice by a majority of the Independent Trustees or by a vote of a majority of the
| | |
| 60 | | 2 0 2 3 BLACK ROCK SEMI - ANNUAL REPORT TO SHAREHOLDERS |
Notes to Financial Statements (unaudited) (continued)
outstanding voting securities of the Trust. This amount is included in fees waived and/or reimbursed by the Manager in the Statements of Operations. For the six months ended January 31, 2023, the amount waived was $404,641.
The Manager, for MUC and MUE, voluntarily agreed to waive its investment advisory fee on the proceeds of the Preferred Shares and TOB Trusts that exceed 35% of total assets minus the sum of its accrued liabilities (which does not include liabilities represented by TOB Trusts and the liquidation preference of any outstanding preferred shares). The voluntary waiver may be reduced or discontinued at any time without notice. This amount is included in fees waived and/or reimbursed by the Manager in the Statements of Operations. For the six months ended January 31, 2023, the waivers were as follows:
| | | | |
| |
| |
| Trust Name | | Fees Waived and/or Reimbursed by the Manager | |
| |
| |
MUC | | $ | — | |
MUE | | | 72,168 | |
| |
Trustees and Officers: Certain trustees and/or officers of the Trusts are directors and/or officers of BlackRock or its affiliates. The Trusts reimburse the Manager for a portion of the compensation paid to the Trusts’ Chief Compliance Officer, which is included in Trustees and Officer in the Statements of Operations.
Other Transactions: The Trusts may purchase securities from, or sell securities to, an affiliated fund provided the affiliation is due solely to having a common investment adviser, common officers, or common trustees. For the six months ended January 31, 2023, the purchase and sale transactions and any net realized gains (losses) with affiliated funds in compliance with Rule 17a-7 under the 1940 Act were as follows:
| | | | | | | | | | | | |
| |
| | | |
| Trust Name | | Purchases | | | Sales | | | Net Realized Gain (Loss) | |
| |
| | | |
MUE | | $ | 5,502,637 | | | $ | — | | | $ | — | |
| |
For the six months ended January 31, 2023, purchases and sales of investments, excluding short-term securities, were as follows:
| | | | | | | | |
| |
| | |
| Trust Name | | Purchases | | | Sales | |
| |
| | |
BFZ | | $ | 460,244,313 | | | $ | 520,430,383 | |
BTT | | | 182,877,432 | | | | 390,550,784 | |
MUC | | | 474,967,092 | | | | 639,931,617 | |
MUE | | | 54,736,203 | | | | 76,069,623 | |
| |
It is each Trust’s policy to comply with the requirements of the Internal Revenue Code of 1986, as amended, applicable to regulated investment companies, and to distribute substantially all of its taxable income to its shareholders. Therefore, no U.S. federal income tax provision is required.
Each Trust files U.S. federal and various state and local tax returns. No income tax returns are currently under examination. The statute of limitations on each Trust’s U.S. federal tax returns generally remains open for a period of three years after they are filed. The statutes of limitations on each Trust’s state and local tax returns may remain open for an additional year depending upon the jurisdiction.
Management has analyzed tax laws and regulations and their application to the Trusts as of January 31, 2023, inclusive of the open tax return years, and does not believe that there are any uncertain tax positions that require recognition of a tax liability in the Trusts’ financial statements.
As of July 31, 2022, the Trusts had non-expiring capital loss carryforwards available to offset future realized capital gains as follows:
| | | | |
| |
| |
| Trust Name | | Non-Expiring | |
| |
| |
BTT | | $ | 7,680,557 | |
MUC | | | 49,043,766 | |
MUE | | | 18,093,291 | |
| |
As of January 31, 2023, gross unrealized appreciation and depreciation based on cost of investments (including short positions and derivatives, if any) for U.S. federal income tax purposes were as follows:
| | | | | | | | | | | | | | | | |
| |
| | | | |
| Trust Name | | Tax Cost | | | Gross Unrealized Appreciation | | | Gross Unrealized Depreciation | | | Net Unrealized Appreciation (Depreciation) | |
| |
| | | | |
BFZ | | $ | 562,388,865 | | | $ | 16,591,695 | | | $ | (6,911,950 | ) | | $ | 9,679,745 | |
BTT | | | 2,446,402,210 | | | | 37,647,488 | | | | (46,509,112 | ) | | | (8,861,624 | ) |
MUC | | | 1,753,097,913 | | | | 39,639,832 | | | | (36,486,635 | ) | | | 3,153,197 | |
MUE | | | 394,466,533 | | | | 5,047,074 | | | | (9,836,993 | ) | | | (4,789,919 | ) |
| |
| | |
NOTES TO FINANCIAL STATEMENTS | | 61 |
Notes to Financial Statements (unaudited) (continued)
In the normal course of business, the Trusts invest in securities or other instruments and may enter into certain transactions, and such activities subject each Trust to various risks, including among others, fluctuations in the market (market risk) or failure of an issuer to meet all of its obligations. The value of securities or other instruments may also be affected by various factors, including, without limitation: (i) the general economy; (ii) the overall market as well as local, regional or global political and/or social instability; (iii) regulation, taxation or international tax treaties between various countries; or (iv) currency, interest rate and price fluctuations. Local, regional or global events such as war, acts of terrorism, the spread of infectious illness or other public health issues, recessions, or other events could have a significant impact on the Trusts and their investments.
The Trusts may hold a significant amount of bonds subject to calls by the issuers at defined dates and prices. When bonds are called by issuers and the Trusts reinvest the proceeds received, such investments may be in securities with lower yields than the bonds originally held, and correspondingly, could adversely impact the yield and total return performance of a Trust.
A Trust structures and “sponsors” the TOB Trusts in which it holds TOB Residuals and has certain duties and responsibilities, which may give rise to certain additional risks including, but not limited to, compliance, securities law and operational risks.
As short-term interest rates rise, the Trusts’ investments in the TOB Trusts may adversely affect the Trusts’ net investment income and dividends to Common Shareholders. Also, fluctuations in the market value of municipal bonds deposited into the TOB Trust may adversely affect the Trusts’ NAVs per share.
The U.S. Securities and Exchange Commission (“SEC”) and various federal banking and housing agencies have adopted credit risk retention rules for securitizations (the “Risk Retention Rules”). The Risk Retention Rules would require the sponsor of a TOB Trust to retain at least 5% of the credit risk of the underlying assets supporting the TOB Trust’s municipal bonds. The Risk Retention Rules may adversely affect the Trusts’ ability to engage in TOB Trust transactions or increase the costs of such transactions in certain circumstances.
TOB Trusts constitute an important component of the municipal bond market. Any modifications or changes to rules governing TOB Trusts may adversely impact the municipal market and the Trusts, including through reduced demand for and liquidity of municipal bonds and increased financing costs for municipal issuers. The ultimate impact of any potential modifications on the TOB Trust market and the overall municipal market is not yet certain.
Each Trust may invest without limitation in illiquid or less liquid investments or investments in which no secondary market is readily available or which are otherwise illiquid, including private placement securities. A Trust may not be able to readily dispose of such investments at prices that approximate those at which a Trust could sell such investments if they were more widely traded and, as a result of such illiquidity, a Trust may have to sell other investments or engage in borrowing transactions if necessary to raise funds to meet its obligations. Limited liquidity can also affect the market price of investments, thereby adversely affecting a Trust’s NAV and ability to make dividend distributions. Privately issued debt securities are often of below investment grade quality, frequently are unrated and present many of the same risks as investing in below investment grade public debt securities.
Market Risk: Each Trust may be exposed to prepayment risk, which is the risk that borrowers may exercise their option to prepay principal earlier than scheduled during periods of declining interest rates, which would force each Trust to reinvest in lower yielding securities. Each Trust may also be exposed to reinvestment risk, which is the risk that income from each Trust’s portfolio will decline if each Trust invests the proceeds from matured, traded or called fixed-income securities at market interest rates that are below each Trust portfolio’s current earnings rate.
Municipal securities are subject to the risk that litigation, legislation or other political events, local business or economic conditions, credit rating downgrades, or the bankruptcy of the issuer could have a significant effect on an issuer’s ability to make payments of principal and/or interest or otherwise affect the value of such securities. Municipal securities can be significantly affected by political or economic changes, including changes made in the law after issuance of the securities, as well as uncertainties in the municipal market related to, taxation, legislative changes or the rights of municipal security holders, including in connection with an issuer insolvency. Municipal securities backed by current or anticipated revenues from a specific project or specific assets can be negatively affected by the discontinuance of the tax benefits supporting the project or assets or the inability to collect revenues for the project or from the assets. Municipal securities may be less liquid than taxable bonds, and there may be less publicly available information on the financial condition of municipal security issuers than for issuers of other securities.
Infectious Illness Risk: An outbreak of an infectious illness, such as the COVID-19 pandemic, may adversely impact the economies of many nations and the global economy, and may impact individual issuers and capital markets in ways that cannot be foreseen. An infectious illness outbreak may result in, among other things, closed international borders, prolonged quarantines, supply chain disruptions, market volatility or disruptions and other significant economic, social and political impacts.
Investment Objective Risk: There is no assurance that BTT will achieve its investment objectives, including its investment objective of returning $25.00 per share. As BTT approaches its scheduled termination date, it is expected that the maturity of BTT’s portfolio securities will shorten, which is likely to reduce BTT’s income and distributions to shareholders.
Counterparty Credit Risk: The Trusts may be exposed to counterparty credit risk, or the risk that an entity may fail to or be unable to perform on its commitments related to unsettled or open transactions, including making timely interest and/or principal payments or otherwise honoring its obligations. The Trusts manage counterparty credit risk by entering into transactions only with counterparties that the Manager believes have the financial resources to honor their obligations and by monitoring the financial stability of those counterparties. Financial assets, which potentially expose the Trusts to market, issuer and counterparty credit risks, consist principally of financial instruments and receivables due from counterparties. The extent of the Trusts’ exposure to market, issuer and counterparty credit risks with respect to these financial assets is approximately their value recorded in the Statements of Assets and Liabilities, less any collateral held by the Trusts.
A derivative contract may suffer a mark-to-market loss if the value of the contract decreases due to an unfavorable change in the market rates or values of the underlying instrument. Losses can also occur if the counterparty does not perform under the contract.
| | |
| 62 | | 2 0 2 3 BLACK ROCK SEMI - ANNUAL REPORT TO SHAREHOLDERS |
Notes to Financial Statements (unaudited) (continued)
With exchange-traded futures, there is less counterparty credit risk to the Trusts since the exchange or clearinghouse, as counterparty to such instruments, guarantees against a possible default. The clearinghouse stands between the buyer and the seller of the contract; therefore, credit risk is limited to failure of the clearinghouse. While offset rights may exist under applicable law, a Trust does not have a contractual right of offset against a clearing broker or clearinghouse in the event of a default (including the bankruptcy or insolvency). Additionally, credit risk exists in exchange-traded futures with respect to initial and variation margin that is held in a clearing broker’s customer accounts. While clearing brokers are required to segregate customer margin from their own assets, in the event that a clearing broker becomes insolvent or goes into bankruptcy and at that time there is a shortfall in the aggregate amount of margin held by the clearing broker for all its clients, typically the shortfall would be allocated on a pro rata basis across all the clearing broker’s customers, potentially resulting in losses to the Trusts.
Concentration Risk: A diversified portfolio, where this is appropriate and consistent with a fund’s objectives, minimizes the risk that a price change of a particular investment will have a material impact on the NAV of a fund. The investment concentrations within each Trust’s portfolio are disclosed in its Schedule of Investments.
Certain Trusts invest a substantial amount of their assets in issuers located in a single state or limited number of states. When a fund concentrates its investments in this manner, it assumes the risk that economic, regulatory, political or social conditions affecting that state or group of states could have a significant impact on the fund and could affect the income from, or the value or liquidity of, the fund’s portfolio. Investment percentages in specific states or U.S. territories are presented in the Schedules of Investments.
Certain Trusts invest a significant portion of their assets in securities within a single or limited number of market sectors. When a fund concentrates its investments in this manner, it assumes the risk that economic, regulatory, political and social conditions affecting such sectors may have a significant impact on the Trust and could affect the income from, or the value or liquidity of, the Trust’s portfolio. Investment percentages in specific sectors are presented in the Schedules of Investments.
The Trusts invest a significant portion of their assets in fixed-income securities and/or use derivatives tied to the fixed-income markets. Changes in market interest rates or economic conditions may affect the value and/or liquidity of such investments. Interest rate risk is the risk that prices of bonds and other fixed-income securities will decrease as interest rates rise and increase as interest rates fall. The Trusts may be subject to a greater risk of rising interest rates due to the recent period of historically low interest rates. The Federal Reserve has recently begun to raise the federal funds rate as part of its efforts to address inflation. There is a risk that interest rates will continue to rise, which will likely drive down the prices of bonds and other fixed-income securities, and could negatively impact the Trusts’ performance.
LIBOR Transition Risk: The United Kingdom’s Financial Conduct Authority announced a phase out of the London Interbank Offered Rate (“LIBOR”). Although many LIBOR rates ceased to be published or no longer are representative of the underlying market they seek to measure after December 31, 2021, a selection of widely used USD LIBOR rates will continue to be published through June 2023 in order to assist with the transition. The Trusts may be exposed to financial instruments tied to LIBOR to determine payment obligations, financing terms, hedging strategies or investment value. The transition process away from LIBOR might lead to increased volatility and illiquidity in markets for, and reduce the effectiveness of new hedges placed against instruments whose terms currently include LIBOR. The ultimate effect of the LIBOR transition process on the Trusts is uncertain.
| 10. | CAPITAL SHARE TRANSACTIONS |
BFZ and BTT are authorized to issue an unlimited number of shares, MUC and MUE are authorized to issue 200 million shares, all of which were initially classified as Common Shares. The par value of Common Shares for BFZ and BTT is $0.001 and for MUC and MUE is $0.10. The par value of Preferred Shares outstanding for BFZ and BTT is $0.001 and for MUC and MUE is $0.10. Each Board is authorized, however, to reclassify any unissued Common Shares to Preferred Shares without the approval of Common Shareholders.
Common Shares
For the periods shown, shares issued and outstanding increased by the following amounts as a result of dividend reinvestment:
| | | | | | | | |
| |
| | |
| Trust Name | | Six Months Ended 01/31/23 | | | Year Ended 07/31/22 | |
| |
| | |
MUC | | | — | | | | 29,799 | |
MUE | | | — | | | | 5,047 | |
| |
For the six months ended January 31, 2023 and the year ended July 31, 2022, shares issued and outstanding remained constant for BTT.
The Trusts participate in an open market share repurchase program (the “Repurchase Program”). From December 1, 2021 through November 30, 2022, each Trust may repurchase up to 5% of its outstanding common shares under the Repurchase Program, based on common shares outstanding as of the close of business on November 30, 2021 for each trust (other than BTT) or November 18, 2021 (for BTT) subject to certain conditions. From December 1, 2022 through November 30, 2023, each Trust may repurchase up to 5% of its outstanding common shares under the Repurchase Program, based on common shares outstanding as of the close of business on November 30, 2022 for each Trust, subject to certain conditions. The Repurchase Program has an accretive effect as shares are purchased at a discount to the Trust’s NAV. There is no assurance that the Trusts will purchase shares in any particular amounts. For the six months ended January 31, 2023, BTT and MUE did not repurchase any shares.
| | |
NOTES TO FINANCIAL STATEMENTS | | 63 |
Notes to Financial Statements (unaudited) (continued)
The total cost of the shares repurchased is reflected in BFZ’s and MUC’s Statements of Changes in Net Assets. For the periods shown, shares repurchased and cost, including transaction costs were as follows:
| | | | | | | | | | | | | | | | |
| |
| | | BFZ | | | MUC | |
| | | | | | | | |
| | | | |
| | | Shares | | | Amounts | | | Shares | | | Amounts | |
| |
| | | | |
Six Months Ended January 31, 2023 | | | 653,038 | | | $ | 7,138,313 | | | | 848,846 | | | $ | 9,436,475 | |
Year Ended July 31, 2022 | | | 216,743 | | | | 2,430,492 | | | | 35 | | | | 460 | |
| |
Preferred Shares
A Trust’s Preferred Shares rank prior to its Common Shares as to the payment of dividends by the Trust and distribution of assets upon dissolution or liquidation of the Trust. The 1940 Act prohibits the declaration of any dividend on Common Shares or the repurchase of Common Shares if the Trust fails to maintain asset coverage of at least 200% of the liquidation preference of the Trust’s outstanding Preferred Shares. In addition, pursuant to the Preferred Shares’ governing instruments, a Trust is restricted from declaring and paying dividends on classes of shares ranking junior to or on parity with its Preferred Shares or repurchasing such shares if the Trust fails to declare and pay dividends on the Preferred Shares, redeem any Preferred Shares required to be redeemed under the Preferred Shares’ governing instruments or comply with the basic maintenance amount requirement of the ratings agencies rating the Preferred Shares.
Holders of Preferred Shares have voting rights equal to the voting rights of holders of Common Shares (one vote per share) and vote together with holders of Common Shares (one vote per share) as a single class on certain matters. Holders of Preferred Shares, voting as a separate class, are also entitled to (i) elect two members of the Board, (ii) elect the full Board if dividends on the Preferred Shares are not paid for a period of two years and (iii) a separate class vote to amend the Preferred Share governing documents. In addition, the 1940 Act requires the approval of the holders of a majority of any outstanding Preferred Shares, voting as a separate class, to (a) adopt any plan of reorganization that would adversely affect the Preferred Shares, (b) change a Trust’s sub-classification as a closed-end investment company or change its fundamental investment restrictions or (c) change its business so as to cease to be an investment company.
VMTP Shares
BFZ, MUC and MUE (for purposes of this section, each “VMTP Trust”) have issued Series W-7 VMTP Shares, $100,000 liquidation preference per share, in one or more privately negotiated offerings to qualified institutional buyers as defined pursuant to Rule 144A under the Securities Act. The VMTP Shares are subject to certain restrictions on transfer, and a VMTP Trust may also be required to register its VMTP Shares for sale under the Securities Act under certain circumstances. As of period end, the VMTP Shares outstanding and assigned long-term ratings were as follows:
| | | | | | | | | | | | | | | | | | | | | | | | |
| |
| | | | | | |
| Trust Name | | Issue Date | | | Shares Issued | | | Aggregate Principal | | | Term Redemption Date | | | Moody’s Rating | | | Fitch Rating | |
| |
| | | | | | |
BFZ | | | 03/22/12 | | | | 1,713 | | | $ | 171,300,000 | | | | 03/30/24 | | | | Aa2 | | | | AA | |
MUC | | | 03/22/12 | | | | 2,540 | | | | 254,000,000 | | | | 03/30/24 | | | | Aa2 | | | | AA | |
| | | 04/11/22 | | | | 2,724 | | | | 272,400,000 | | | | 03/30/24 | | | | Aa2 | | | | AA | |
MUE | | | 12/16/11 | | | | 1,310 | | | | 131,000,000 | | | | 07/02/24 | | | | Aa1 | | | | AA | |
| |
Redemption Terms: A VMTP Trust is required to redeem its VMTP Shares on the term redemption date, unless earlier redeemed or repurchased or unless extended. There is no assurance that a term will be extended further or that any VMTP Shares will be replaced with any other preferred shares or other form of leverage upon the redemption or repurchase of the VMTP Shares. Six months prior to the term redemption date, a VMTP Trust is required to begin to segregate liquid assets with its custodian to fund the redemption. In addition, a VMTP Trust is required to redeem certain of its outstanding VMTP Shares if it fails to comply with certain asset coverage, basic maintenance amount or leverage requirements.
Subject to certain conditions, VMTP Shares may be redeemed, in whole or in part, at any time at the option of the VMTP Trust. With respect to BFZ and MUC, the redemption price per VMTP Share is equal to the liquidation preference per share plus any outstanding unpaid dividends. With respect to MUE, the redemption price per VMTP Share is equal to the liquidation preference per share plus any outstanding unpaid dividends and applicable redemption premium. If MUE redeems the VMTP Shares prior to the term redemption date and the VMTP Shares have long-term ratings above A1/A+ or its equivalent by the ratings agencies then rating the VMTP Shares, then such redemption may be subject to a prescribed redemption premium (up to 1% of the liquidation preference) payable to the holder of the VMTP Shares based on the time remaining until the term redemption date, subject to certain exceptions for redemptions that are required to comply with minimum asset coverage requirements.
Dividends: Dividends on the VMTP Shares are declared daily and payable monthly at a variable rate set weekly at a fixed rate spread to the Securities Industry and Financial Markets Association (“SIFMA”) Municipal Swap Index or to a percentage of the daily Secured Overnight Financing Rate, as set forth in the VMTP Shares governing instrument. The fixed spread is determined based on the long-term preferred share rating assigned to the VMTP Shares by the ratings agencies then rating the VMTP Shares.
The dividend rate on VMTP Shares is subject to a step-up spread if the VMTP Trust fails to comply with certain provisions, including, among other things, the timely payment of dividends, redemptions or gross-up payments, and complying with certain asset coverage and leverage requirements.
For the six months ended January 31, 2023, the average annualized dividend rates for the VMTP Shares were as follows:
| | | | | | | | | | | | |
| |
| | | |
| | | BFZ | | | MUC | | | MUE | |
| |
| | | |
Dividend rates | | | 3.00% | | | | 3.00% | | | | 3.57% | |
| |
For the six months ended January 31, 2023, VMTP Shares issued and outstanding of BFZ, MUC and MUE remained constant.
| | |
| 64 | | 2 0 2 3 BLACK ROCK SEMI - ANNUAL REPORT TO SHAREHOLDERS |
Notes to Financial Statements (unaudited) (continued)
RVMTP Shares
BTT has issued Series W-7 RVMTP Shares, $5,000,000 liquidation preference per share, in privately negotiated offerings to qualified institutional buyers as defined pursuant to Rule 144A under the Securities Act. The RVMTP Shares are subject to certain restrictions on transfer outside of a remarketing. As of period end, the RVMTP Shares outstanding of BTT were as follows:
| | | | | | | | | | | | | | | | | | | | |
| |
| | | | | |
| Trust Name | | Issue Date | | | Shares Issued | | | Shares Outstanding | | | Aggregate Principal | | | Term Redemption Date | |
| |
| | | | | |
BTT | | | 01/10/13 | | | | 50 | | | | 50 | | | $ | 250,000,000 | | | | 12/31/30 | |
| | | 01/30/13 | | | | 50 | | | | 50 | | | | 250,000,000 | | | | 12/31/30 | |
| | | 02/20/13 | | | | 50 | | | | 50 | | | | 250,000,000 | | | | 12/31/30 | |
| |
Redemption Terms: BTT is required to redeem its RVMTP Shares on the term redemption date or within six months of an unsuccessful remarketing, unless earlier redeemed or repurchased. There is no assurance that RVMTP Shares will be replaced with any other preferred shares or other form of leverage upon the redemption or repurchase of the RVMTP Shares. In addition, BTT is required to redeem certain of its outstanding RVMTP Shares if it fails to comply with certain asset coverage, basic maintenance amount or leverage requirements.
Subject to certain conditions, RVMTP Shares may be redeemed, in whole or in part, at any time at the option of BTT. The redemption price per RVMTP Share is equal to the liquidation preference per share plus any outstanding unpaid dividends. The RVMTP Shares are subject to certain restrictions on transfer outside of a remarketing. The RVMTP Shares are subject to remarketing upon 90 days’ notice by holders of the RVMTP Shares and 30 days’ notice by BTT. Each remarketing must be at least six months apart from the last remarketing. A holder of RVMTP Shares may submit notice of remarketing only if such holder requests a remarketing of at least the lesser of (i) $100,000,000 of RVMTP Shares or (ii) all of the RVMTP Shares held by such holder.
Dividends: Dividends on the RVMTP Shares are declared daily and payable monthly at a variable rate set weekly at a fixed rate spread to a percentage of the one-month LIBOR rate. The fixed rate spread may be adjusted at each remarketing or upon the agreement of BTT and the then-holder(s) of the RVMTP Shares. In the event that all of the RVMTP Shares submitted for remarketing are not successfully remarketed, a failed remarketing would occur, and all holders would retain their RVMTP Shares. In the event of a failed remarketing, the fixed rate spread would be set at the fixed rate spread applicable to such failed remarketing. BTT has the right to reject any fixed spread determined at a remarketing, and such rejection would result in a failed remarketing and the fixed rate spread would be set at the fixed rate spread applicable to such failed remarketing. The fixed rate spread applicable due to a failed remarketing depends on whether the remarketing was pursuant to a mandatory or non-mandatory tender. In the case of a failed remarketing following a mandatory tender, the failed remarketing spread would be the sum of the last applicable spread in effect immediately prior to the failed remarketing date for such failed remarketing plus 0.75%. In the case of a failed remarketing not associated with a mandatory tender, the failed remarketing spread would be the sum of the last applicable spread in effect immediately prior to the failed remarketing date for such failed remarketing plus 0.25%.
For the six months ended January 31, 2023, the average annualized dividend rate for the RVMTP Shares was 3.25%.
Remarketing: In the event of a failed remarketing that is not subsequently cured, BTT will be required to redeem the RVMTP Shares subject to such failed remarketing on a date that is approximately six months from the remarketing date for such failed remarketing, provided that no redemption of any RVMTP Share may occur within one year of the date of issuance of such RVMTP Share. At the date of issuance and as of period end, the RVMTP Shares were assigned long-term ratings of Aa2 from Moody’s and AA from Fitch. The dividend rate on the RVMTP Shares is subject to a step-up spread if BTT fails to comply with certain provisions, including, among other things, the timely payment of dividends, redemptions or gross-up payments, and complying with certain asset coverage and leverage requirements.
During the six months ended January 31, 2023, no RVMTP Shares were tendered for remarketing.
For the six months ended January 31, 2023, RVMTP Shares issued and outstanding of BTT remained constant.
Offering Costs: The Trusts incurred costs in connection with the issuance of VMTP and RVMTP Shares, which were recorded as a direct deduction from the carrying value of the related debt liability and will be amortized over the life of the VMTP and RVMTP Shares. Amortization of these costs is included in interest expense, fees and amortization of offering costs in the Statements of Operations.
Financial Reporting: The VMTP and RVMTP Shares are considered debt of the issuer; therefore, the liquidation preference, which approximates fair value of the VMTP and RVMTP Shares, is recorded as a liability in the Statements of Assets and Liabilities net of deferred offering costs. Unpaid dividends are included in interest expense and fees payable in the Statements of Assets and Liabilities, and the dividends accrued and paid on the VMTP and RVMTP Shares are included as a component of interest expense, fees and amortization of offering costs in the Statements of Operations. The VMTP and RVMTP Shares are treated as equity for tax purposes. Dividends paid to holders of the VMTP and RVMTP Shares are generally classified as tax-exempt income for tax-reporting purposes. Dividends and amortization of deferred offering costs on VMTP and RVMTP Shares are included in interest expense, fees and amortization of offering costs in the Statements of Operations:
| | | | | | | | |
| |
| | |
| Trust Name | | Dividends Accrued | | | Deferred Offering Costs Amortization | |
| |
BFZ | | $ | 2,572,237 | | | $ | — | |
BTT | | | 12,185,496 | | | | 15,763 | |
MUC | | | 7,898,048 | | | | — | |
MUE | | | 2,335,503 | | | | — | |
| |
| | |
NOTES TO FINANCIAL STATEMENTS | | 65 |
Notes to Financial Statements (unaudited) (continued)
Management’s evaluation of the impact of all subsequent events on the Trusts’ financial statements was completed through the date the financial statements were issued and the following items were noted:
The Trusts declared and paid or will pay distributions to Common Shareholders as follows:
| | | | | | | | | | | | | | | | |
| |
| | | | |
| Trust Name | | Declaration Date | | | Record Date | | | Payable/ Paid Date | | | Dividend Per Common Share | |
| |
| | | | |
BFZ | | | 02/01/23 | | | | 02/15/23 | | | | 03/01/23 | | | $ | 0.039000 | |
| | | 03/01/23 | | | | 03/15/23 | | | | 04/03/23 | | | | 0.039000 | |
BTT | | | 02/01/23 | | | | 02/15/23 | | | | 03/01/23 | | | | 0.056400 | |
| | | 03/01/23 | | | | 03/15/23 | | | | 04/03/23 | | | | 0.056400 | |
MUC | | | 02/01/23 | | | | 02/15/23 | | | | 03/01/23 | | | | 0.038500 | |
| | | 03/01/23 | | | | 03/15/23 | | | | 04/03/23 | | | | 0.033500 | |
MUE | | | 02/01/23 | | | | 02/15/23 | | | | 03/01/23 | | | | 0.033500 | |
| | | 03/01/23 | | | | 03/15/23 | | | | 04/03/23 | | | | 0.029000 | |
| |
The Trusts declared and paid or will pay distributions to Preferred Shareholders as follows:
| | | | | | | | | | | | |
| |
| |
| | | Preferred Shares(a) | |
| | | | |
| | | |
| Trust Name | | Shares | | | Series | | | Declared | |
| |
| | | |
BFZ | | | VMTP | | | | W-7 | | | $ | 517,701 | |
BTT | | | RVMTP | | | | W-7 | | | | 2,307,786 | |
MUC | | | VMTP | | | | W-7 | | | | 1,590,882 | |
MUE | | | VMTP | | | | W-7 | | | | 433,233 | |
| |
| | (a) | Dividends declared for period February 1, 2023 to February 28, 2023. | |
| | |
| 66 | | 2 0 2 3 BLACK ROCK SEMI - ANNUAL REPORT TO SHAREHOLDERS |
Additional Information
Trust Certification
The Trusts are listed for trading on the NYSE and have filed with the NYSE their annual chief executive officer certification regarding compliance with the NYSE’s listing standards. The Trusts filed with the SEC the certification of its chief executive officer and chief financial officer required by Section 302 of the Sarbanes-Oxley Act.
Environmental, Social and Governance (“ESG”) Integration
Although a Trust does not seek to implement a specific sustainability strategy unless otherwise disclosed, Trust management will consider ESG characteristics as part of the investment process for actively managed Trusts. These considerations will vary depending on a Trust’s particular investment strategies and may include consideration of third-party research as well as consideration of proprietary BlackRock research across the ESG risks and opportunities regarding an issuer. Trust management will consider such ESG characteristics it deems relevant or additive, if any, when making investment decisions for a Trust. The ESG characteristics utilized in a Trust’s investment process are anticipated to evolve over time and one or more characteristics may not be relevant with respect to all issuers that are eligible for investment. ESG characteristics are not the sole considerations when making investment decisions for a Trust. Further, investors can differ in their views of what constitutes positive or negative ESG characteristics. As a result, a Trust may invest in issuers that do not reflect the beliefs and values with respect to ESG of any particular investor. ESG considerations may affect a Trust’s exposure to certain companies or industries and a Trust may forego certain investment opportunities. While Trust management views ESG considerations as having the potential to contribute to a Trust’s long-term performance, there is no guarantee that such results will be achieved.
Dividend Policy
Each Trust’s dividend policy is to distribute all or a portion of its net investment income to its shareholders on a monthly basis. In order to provide shareholders with a more stable level of distributions, the Trusts may at times pay out less than the entire amount of net investment income earned in any particular month and may at times in any particular month pay out such accumulated but undistributed income in addition to net investment income earned in that month. As a result, the distributions paid by the Trusts for any particular month may be more or less than the amount of net investment income earned by the Trusts during such month. The Trusts’ current accumulated but undistributed net investment income, if any, is disclosed as accumulated earnings (loss) in the Statements of Assets and Liabilities, which comprises part of the financial information included in this report.
General Information
The Trusts do not make available copies of their Statements of Additional Information because the Trusts’ shares are not continuously offered, which means that the Statement of Additional Information of each Trust has not been updated after completion of the respective Trust’s offerings and the information contained in each Trust’s Statement of Additional Information may have become outdated.
The following information is a summary of certain changes since July 31, 2022. This information may not reflect all of the changes that have occurred since you purchased the relevant Trust.
Except if noted otherwise herein, there were no changes to the Trusts’ charters or by-laws that would delay or prevent a change of control of the Trusts that were not approved by the shareholders.
Effective August 1, 2022, the State of Delaware enacted new control beneficial interest acquisition provisions of the Delaware Statutory Trust Act (the “Delaware CBIA Statute”) that automatically applies to Delaware statutory trusts that are registered as closed-end management investment companies under the Investment Company Act of 1940, such as BFZ and BTT. In general, the Delaware CBIA Statute limits the right of holders who acquire “control beneficial interests” of a statutory trust to vote those beneficial interests on matters under the Delaware Statutory Trust Act or the governing instrument of BFZ and BTT unless approved by disinterested shareholders holding two-thirds of the votes entitled to be cast. The Delaware CBIA Statute generally defines “control beneficial interests” to include beneficial interests that, in the absence of the Delaware CBIA Statute, if aggregated with all other beneficial interests of the statutory trust that are either (i) owned by the acquiring person (or an associate) or (ii) in respect of which the acquiring person (or an associate) is entitled to exercise or direct the exercise of voting power, would entitle that person to exercise or direct the exercise of voting power of beneficial interests in the election of trustees, within any of certain specified ranges of voting power starting at 10%. The Delaware CBIA Statute requires acquiring persons to disclose to the statutory trust any control beneficial interest acquisition within 10 days of such acquisition. The Delaware CBIA Statute allows a statutory trust’s governing instrument or board of trustees to provide exemptions from the statute’s limitations to acquisitions of beneficial interests, including as to any series or classes of beneficial interests. After careful consideration of a number of factors including, among other factors, the potential impact to each of BFZ’s and BTT’s use of leverage through preferred shares, each Trust’s Board of Trustees approved the adoption of an amendment to each Trust’s Statement of Preferences governing the preferred shares which provides for acquisitions of each Trust’s outstanding preferred shares to be exempt from the limitations of the Delaware CBIA Statute. The foregoing is only a summary of certain aspects of the Delaware CBIA Statute. Shareholders should consult their own legal counsel to determine the application of the Delaware CBIA Statute with respect to their beneficial interests of BFZ and BTT and any subsequent acquisitions of beneficial interests.
In accordance with Section 23(c) of the Investment Company Act of 1940, each Trust may from time to time purchase shares of its common stock in the open market or in private transactions.
Quarterly performance, semi-annual and annual reports, current net asset value and other information regarding the Trusts may be found on BlackRock’s website, which can be accessed at blackrock.com. Any reference to BlackRock’s website in this report is intended to allow investors public access to information regarding the Trusts and does not, and is not intended to, incorporate BlackRock’s website in this report.
| | |
ADDITIONAL INFORMATION | | 67 |
Additional Information (continued)
Electronic Delivery
Shareholders can sign up for e-mail notifications of quarterly statements, annual and semi-annual shareholder reports by enrolling in the electronic delivery program. Electronic copies of shareholder reports are available on BlackRock’s website.
To enroll in electronic delivery:
Shareholders Who Hold Accounts with Investment Advisers, Banks or Brokerages:
Please contact your financial adviser. Please note that not all investment advisers, banks or brokerages may offer this service.
Householding
The Trusts will mail only one copy of shareholder documents, annual and semi-annual reports, Rule 30e-3 notices and proxy statements, to shareholders with multiple accounts at the same address. This practice is commonly called “householding” and is intended to reduce expenses and eliminate duplicate mailings of shareholder documents. Mailings of your shareholder documents may be householded indefinitely unless you instruct us otherwise. If you do not want the mailing of these documents to be combined with those for other members of your household, please call the Trusts at (800) 882-0052.
Availability of Quarterly Schedule of Investments
The Trusts file their complete schedules of portfolio holdings with the SEC for the first and third quarters of each fiscal year as an exhibit to their reports on Form N-PORT. The Trusts’ Forms N-PORT are available on the SEC’s website at sec.gov. Additionally, each Trust makes its portfolio holdings for the first and third quarters of each fiscal year available at blackrock.com/fundreports.
Availability of Proxy Voting Policies, Procedures and Voting Records
A description of the policies and procedures that the Trusts use to determine how to vote proxies relating to portfolio securities and information about how the Trusts voted proxies relating to securities held in the Trusts’ portfolios during the most recent 12-month period ended June 30 is available without charge, upon request (1) by calling (800) 882-0052; (2) on the BlackRock website at blackrock.com; and (3) on the SEC’s website at sec.gov.
Availability of Trust Updates
BlackRock will update performance and certain other data for the Trusts on a monthly basis on its website in the “Closed-end Funds” section of blackrock.com as well as certain other material information as necessary from time to time. Investors and others are advised to check the website for updated performance information and the release of other material information about the Trusts. This reference to BlackRock’s website is intended to allow investors public access to information regarding the Trusts and does not, and is not intended to, incorporate BlackRock’s website in this report.
BlackRock Privacy Principles
BlackRock is committed to maintaining the privacy of its current and former fund investors and individual clients (collectively, “Clients”) and to safeguarding their non-public personal information. The following information is provided to help you understand what personal information BlackRock collects, how we protect that information and why in certain cases we share such information with select parties.
If you are located in a jurisdiction where specific laws, rules or regulations require BlackRock to provide you with additional or different privacy-related rights beyond what is set forth below, then BlackRock will comply with those specific laws, rules or regulations.
BlackRock obtains or verifies personal non-public information from and about you from different sources, including the following: (i) information we receive from you or, if applicable, your financial intermediary, on applications, forms or other documents; (ii) information about your transactions with us, our affiliates, or others; (iii) information we receive from a consumer reporting agency; and (iv) from visits to our websites.
BlackRock does not sell or disclose to non-affiliated third parties any non-public personal information about its Clients, except as permitted by law or as is necessary to respond to regulatory requests or to service Client accounts. These non-affiliated third parties are required to protect the confidentiality and security of this information and to use it only for its intended purpose.
We may share information with our affiliates to service your account or to provide you with information about other BlackRock products or services that may be of interest to you. In addition, BlackRock restricts access to non-public personal information about its Clients to those BlackRock employees with a legitimate business need for the information. BlackRock maintains physical, electronic and procedural safeguards that are designed to protect the non-public personal information of its Clients, including procedures relating to the proper storage and disposal of such information.
| | |
| 68 | | 2 0 2 3 BLACK ROCK SEMI - ANNUAL REPORT TO SHAREHOLDERS |
Additional Information (continued)
Trust and Service Providers
| | |
Investment Adviser BlackRock Advisors, LLC Wilmington, DE 19809 Accounting Agent and Custodian State Street Bank and Trust Company Boston, MA 02111 Transfer Agent Computershare Trust Company, N.A. Canton, MA 02021 VMTP Redemption and Paying Agent and RVMTP Tender and Paying Agent The Bank of New York Mellon New York, NY 10286 | | Independent Registered Public Accounting Firm Deloitte & Touche LLP Boston, MA 02116 Legal Counsel Willkie Farr & Gallagher LLP New York, NY 10019 Address of the Trusts 100 Bellevue Parkway Wilmington, DE 19809 |
| | |
ADDITIONAL INFORMATION | | 69 |
Glossary of Terms Used in this Report
Portfolio Abbreviation
| | |
AGM | | Assured Guaranty Municipal Corp. |
| |
AMBAC | | AMBAC Assurance Corp. |
| |
AMT | | Alternative Minimum Tax |
| |
ARB | | Airport Revenue Bonds |
| |
BAM | | Build America Mutual Assurance Co. |
| |
CAB | | Capital Appreciation Bonds |
| |
COP | | Certificates of Participation |
| |
FHLMC | | Federal Home Loan Mortgage Corp. |
| |
FNMA | | Federal National Mortgage Association |
| |
GNMA | | Government National Mortgage Association |
| |
GO | | General Obligation Bonds |
| |
GTD | | GTD Guaranteed |
| |
M/F | | Multi-Family |
| |
NPFGC | | National Public Finance Guarantee Corp. |
| |
PSF | | Permanent School Fund |
| |
RB | | Revenue Bond |
| |
S/F | | Single-Family |
| |
SAB | | Special Assessment Bonds |
| |
SAP | | Subject to Appropriations |
| |
SAW | | State Aid Withholding |
| |
ST | | Special Tax |
| |
TA | | Tax Allocation |
| | |
| 70 | | 2 0 2 3 BLACK ROCK SEMI - ANNUAL REPORT TO SHAREHOLDERS |
THIS PAGE INTENTIONALLY LEFT BLANK.
Want to know more?
blackrock.com | 800-882-0052
This report is intended for current holders. It is not a prospectus. Past performance results shown in this report should not be considered a representation of future performance. The Trusts have leveraged their Common Shares, which creates risks for Common Shareholders, including the likelihood of greater volatility of NAV and market price of the Common Shares, and the risk that fluctuations in short-term interest rates may reduce the Common Shares’ yield. Statements and other information herein are as dated and are subject to change.
CEMUNI4-01/23-SAR
(b) Not Applicable
| Item 2 – | Code of Ethics – Not Applicable to this semi-annual report |
| Item 3 – | Audit Committee Financial Expert – Not Applicable to this semi-annual report |
| Item 4 – | Principal Accountant Fees and Services – Not Applicable to this semi-annual report |
| Item 5 – | Audit Committee of Listed Registrant – Not Applicable to this semi-annual report |
(a) The registrant’s Schedule of Investments is included as part of the Report to Stockholders filed under Item 1(a) of this Form.
(b) Not Applicable due to no such divestments during the semi-annual period covered since the previous Form N-CSR filing.
| Item 7 – | Disclosure of Proxy Voting Policies and Procedures for Closed-End Management Investment Companies – Not Applicable to this semi-annual report |
| Item 8 – | Portfolio Managers of Closed-End Management Investment Companies |
(a) Not Applicable to this semi-annual report.
(b) As of the date of this filing, there have been no changes in any of the portfolio managers identified in the most recent annual report on Form N-CSR.
| Item 9 – | Purchases of Equity Securities by Closed-End Management Investment Company and Affiliated Purchasers |
| | | | | | | | |
| Period | | (a) Total
Number of Shares
Purchased1 | | (b) Average
Price Paid per
Share | | (c) Total Number of Shares Purchased as Part of Publicly Announced
Plans or Programs1 | | (d) Maximum Number of Shares that May Yet Be Purchased Under the Plans or Programs1 |
August 1-31, 2022 | | 0 | | $- | | 0 | | 2,051,623 |
September 1-30, 2022 | | 0 | | $- | | 0 | | 2,051,623 |
October 1-31, 2022 | | 0 | | $- | | 0 | | 2,051,623 |
November 1-30, 2022 | | 183,797 | | $ 10.8615 | | 183,797 | | 1,867,826 |
December 1-31, 2022 | | 221,199 | | $10.7393 | | 221,199 | | 4,646,029 |
January 1-31, 2023 | | 443,850 | | $11.3820 | | 443,850 | | 4,202,179 |
Total: | | 848,846 | | 11.1018 | | 848,846 | | 4,202,179 |
1 On September 27, 2021, the Fund announced a continuation of its open market share repurchase program. Commencing on December 1, 2021, the Fund may repurchase through November 30, 2022, up to 5% of its common shares outstanding as of the close of business on November 30, 2021, subject to certain conditions. On September 8, 2022, the Fund announced a further continuation of its open market share repurchase program. Commencing on December 1, 2022, the Fund may repurchase through November 30, 2023, up to 5% of its common shares outstanding as of the close of business on November 30, 2022, subject to certain conditions. |
| Item 10 – | Submission of Matters to a Vote of Security Holders – There have been no material changes to these procedures. |
| Item 11 – | Controls and Procedures |
2
(a) The registrant’s principal executive and principal financial officers, or persons performing similar functions, have concluded that the registrant’s disclosure controls and procedures (as defined in Rule 30a-3(c) under the Investment Company Act of 1940, as amended (the “1940 Act”)) are effective as of a date within 90 days of the filing of this report based on the evaluation of these controls and procedures required by Rule 30a-3(b) under the 1940 Act and Rule 13a-15(b) under the Securities Exchange Act of 1934, as amended.
(b) There were no changes in the registrant’s internal control over financial reporting (as defined in Rule 30a-3(d) under the 1940 Act) that occurred during the period covered by this report that have materially affected, or are reasonably likely to materially affect, the registrant’s internal control over financial reporting.
| Item 12 – | Disclosure of Securities Lending Activities for Closed-End Management Investment |
Companies – Not Applicable to this semi-annual report
| Item 13 – | Exhibits attached hereto |
(a)(1) Code of Ethics – Not Applicable to this semi-annual report
(a)(2) Section 302 Certifications are attached
(a)(3) Any written solicitation to purchase securities under Rule 23c-1 – Not Applicable
(a)(4) Change in Registrant’s independent public accountant – Not Applicable
(b) Section 906 Certifications are attached
2
Pursuant to the requirements of the Securities Exchange Act of 1934 and the Investment Company Act of 1940, the registrant has duly caused this report to be signed on its behalf by the undersigned, thereunto duly authorized.
| | | | |
| | BlackRock MuniHoldings California Quality Fund, Inc. |
| | |
| | By: | | /s/ John M. Perlowski |
| | | | John M. Perlowski |
| | | | Chief Executive Officer (principal executive officer) of |
| | | | BlackRock MuniHoldings California Quality Fund, Inc. |
| |
| | Date: March 23, 2023 |
Pursuant to the requirements of the Securities Exchange Act of 1934 and the Investment Company Act of 1940, this report has been signed below by the following persons on behalf of the registrant and in the capacities and on the dates indicated.
| | | | |
| | By: | | /s/ John M. Perlowski |
| | | | John M. Perlowski |
| | | | Chief Executive Officer (principal executive officer) of |
| | | | BlackRock MuniHoldings California Quality Fund, Inc. |
| |
| | Date: March 23, 2023 |
| | |
| | By: | | /s/ Trent Walker |
| | | | Trent Walker |
| | | | Chief Financial Officer (principal financial officer) of |
| | | | BlackRock MuniHoldings California Quality Fund, Inc. |
| |
| | Date: March 23, 2023 |
4