UNITED STATES
SECURITIES AND EXCHANGE COMMISSION
Washington, D.C. 20549
FORM N-CSR
CERTIFIED SHAREHOLDER REPORT OF REGISTERED
MANAGEMENT INVESTMENT COMPANIES
Investment Company Act file number: 811-08565
Strategic Partners Real
Estate Securities Fund
Exact name of registrant as specified in charter
Gateway Center 3,
100 Mulberry Street,
Newark, New Jersey 07102
Address of principal executive offices
Jonathan D. Shain
Gateway Center 3,
100 Mulberry Street,
Newark, New Jersey 07102
Name and address of agent for service
Registrant’s telephone number, including area code: 973-802-6469
Date of fiscal year end: 3/31/2004
Date of reporting period: 3/31/2004
Item 1 – Reports to Stockholders – [ INSERT REPORT ]
ANNUAL REPORT
MARCH 31, 2004

STRATEGIC PARTNERS
REAL ESTATE SECURITIES FUND
OBJECTIVE
High current income and long-term growth of capital
This report is not authorized for distribution to prospective investors unless preceded or accompanied by a current prospectus.
The views expressed in this report and information about the Fund’s portfolio holdings are for the period covered by this report and are subject to change thereafter.
Dear Shareholder,
May 18, 2004
As the U.S. stock market slowed in 2004 following its particularly strong performance in 2003, some investors still seemed to be watching developments from the sidelines. Though the economy appears sound, given the unsettled global political climate and the potential for rising interest rates in the United States, we can understand why some investors may want to remain cautious. For those with long-term goals, a broadly diversified asset allocation can increase your chances of participating in economic growth.
We recommend that you develop a diversified asset allocation strategy in consultation with a financial professional who knows you and who understands your reasons for investing, the time you have to reach your goals, and the amount of risk you are comfortable assuming. Strategic Partners mutual funds offer a wide range of investment choices, and your financial professional can help you choose the appropriate funds to implement your strategy.
Whether you are investing for your retirement, your children’s education, or some other purpose, Strategic Partners mutual funds offer the resources and professional discipline of leading asset management firms. Our team of experienced analysts selects firms that are widely respected by institutional and individual investors. These firms have established track records in the specific asset classes and management styles they offer in Strategic Partners funds. Our analysts continue to monitor their performance and their adherence to the investment processes that earned them their reputations.
Thank you for your confidence in Strategic Partners mutual funds.
Sincerely,

Judy A. Rice, President
Strategic Partners Real Estate Securities Fund
| | |
| Strategic Partners Real Estate Securities Fund | | 1 |
Your Fund’s Performance
Fund objective
The investment objective of the Strategic Partners Real Estate Securities Fund (the Fund) is high current income and long-term growth of capital. There can be no assurance that the Fund will achieve its investment objective.
Performance data quoted represents past performance and is not indicative of future results. The investment return and principal value of an investment will fluctuate so that an investor’s shares, when redeemed, may be worth more or less than their original cost. Current performance may be lower or higher than the past performance data quoted. An investor may obtain current performance data to the most recent month-end by visiting our website at www.strategicpartners.com or by calling (800) 225-1852.
| | | | | | | | | |
|
| Cumulative Total Returns1 as of 3/31/04 | |
| | | One Year | | | Five Years | | | Since Inception2 | |
Class A | | 62.79 | % | | 143.94 | % | | 87.13 | % |
| |
Class B | | 61.62 | | | 134.89 | | | 79.04 | |
| |
Class C | | 61.62 | | | 134.89 | | | 79.04 | |
| |
Class Z | | 63.21 | | | 146.95 | | | 90.02 | |
| |
S&P 500 Index3 | | 35.10 | | | –5.86 | | | 10.42 | |
| |
Wilshire REIT Index4 | | 50.72 | | | 136.09 | | | 96.55 | |
| |
Lipper Real Estate Funds Avg.5 | | 51.23 | | | 125.12 | | | 84.86 | |
| |
| | | | | | | | | | |
| | | |
| Average Annual Total Returns1 as of 3/31/04 | | | | | | | | | |
| | | One Year | | | Five Years | | | Since Inception2 | |
Class A | | 53.84 | % | | 18.18 | % | | 10.13 | % |
| |
Class B | | 56.62 | | | 18.52 | | | 10.26 | |
| |
Class C | | 60.62 | | | 18.62 | | | 10.36 | |
| |
Class Z | | 63.21 | | | 19.82 | | | 11.48 | |
| |
S&P 500 Index3 | | 35.10 | | | –1.20 | | | 1.69 | |
| |
Wilshire REIT Index4 | | 50.72 | | | 18.75 | | | 12.10 | |
| |
Lipper Real Estate Funds Avg.5 | | 51.23 | | | 17.52 | | | 10.89 | |
| |
1Source: Prudential Investments LLC and Lipper Inc. The cumulative total returns do not take into account applicable sales charges. If reflected, the applicable sales charges would reduce the cumulative total returns performance quoted. The average annual total returns do take into account applicable sales charges. Without a distribution and service (12b-1) fee waiver of 0.05% for Class A shares, the returns would have been lower. Through March 14, 2004, the Fund charged a maximum front-end sales charge of 5% for Class A shares and a 12b-1 fee of up to 0.30% annually. Effective March 15, 2004, Class A shares are subject to a maximum front-end sales charge of 5.50% and a 12b-1 fee of up to 0.30% annually. Investors who purchase Class A shares in an amount of $1 million or more do not pay a front-end sales charge, but are subject to a contingent deferred sales charge (CDSC) of 1% for shares sold within 12 months of purchase. Class B shares are subject to a
| | |
| 2 | | Visit our website at www.strategicpartners.com |
declining CDSC of 5%, 4%, 3%, 2%, 1%, and 1% respectively for the first six years after purchase and a 12b-1 fee of 1% annually. Approximately seven years after purchase, Class B shares will automatically convert to Class A shares on a quarterly basis. Through February 1, 2004, Class C shares were subject to a front-end sales charge of 1%, a CDSC of 1% for shares redeemed within 18 months of purchase, and a 12b-1 fee of 1% annually. Class C shares purchased on or after February 2, 2004 are not subject to a front-end sales charge, the CDSC of 1% for Class C shares purchased on or after that date will apply for 12 months from the date of purchase, and the annual 12b-1 fee will remain 1%. Class Z shares are not subject to a 12b-1 fee. The returns in the tables do not reflect the deduction of taxes that a shareholder would pay on Fund distributions or following the redemption of Fund shares. 2Inception date: 5/5/98. 3The Standard & Poor’s 500 Composite Stock Price Index (S&P 500 Index) is an unmanaged index of 500 stocks of large U.S. companies. It gives a broad look at how U.S. stock prices have performed. 4The Wilshire REIT Index is an unmanaged, market capitalization-weighted index comprising publicly traded REITs. This Index does not include real estate operating companies like the Wilshire Real Estate Securities Index does. 5The Lipper Real Estate Funds Average (Lipper Average) represents returns based on the average return for all funds in the Lipper Real Estate Funds category for the periods noted. Funds in the Lipper Real Estate Funds category invest primarily in equity securities of domestic and foreign companies engaged in the real estate industry. Investors cannot invest directly in an index. The returns for the S&P 500 Index and the Wilshire REIT Index would be lower if they included the effects of sales charges, operating expenses of a mutual fund, or taxes. Returns for the Lipper Average reflect the deduction of operating expenses, but not sales charges or taxes.
| | | |
|
| Five Largest Holdings expressed as a percentage of net assets as of 3/31/04 | |
General Growth Properties, Inc./Retail—Malls | | 7.5 | % |
| |
Rouse Co./Diversified | | 6.4 | |
| |
Simon Property Group, Inc./Retail—Malls | | 6.0 | |
| |
ProLogis/Warehouses | | 5.9 | |
| |
Kimco Realty Corp./Retail—Shopping Centers | | 5.9 | |
| |
| Holdings are subject to change. | | | |
| | | |
|
| Five Largest Industries expressed as a percentage of net assets as of 3/31/04 | |
Diversified | | 16.5 | % |
| |
Retail—Shopping Centers | | 15.3 | |
| |
Retail—Malls | | 13.5 | |
| |
Specialty Finance | | 12.8 | |
| |
Warehouse | | 10.3 | |
| |
Industry weightings are subject to change.
| | |
| Strategic Partners Real Estate Securities Fund | | 3 |
Investment Adviser’s Report
Wellington Management Company, LLP
During the 12 months ended March 31, 2004, real estate investment trusts (REITs) continued to benefit from a heavy inflow of capital. We think that investors were attracted by REITs’ past strong performance and high dividend yields, and by expectations that they would be less volatile than other stocks. The robust growth of the U.S. economy and improving employment data helped the performance of REITs by mitigating concerns that operating fundamentals were weak in real estate. Performance was strong across the REIT subsectors, with specialty finance and home builders generating the strongest returns. Low interest rates fueled continued growth for housing and refinancing while strong consumer spending helped owners of retail malls.
The Fund’s real estate benchmark, the Wilshire REIT Index (the Wilshire), had an impressive return over this reporting period. Even so, the Fund’s performance was substantially better. The Fund beat the Wilshire in each of its subsectors. It also profited from an overweight in specialty finance compared with the Wilshire, and underweights in the office space and multifamily subsectors. In addition, the Fund had positions in home-building companies such as Pulte Homes, which have been benefiting because low interest rates encouraged demand for homeownership. These companies are not represented in the Wilshire, and their sizable gains contributed to the Fund’s strong performance.
Specialty finance
Specialty finance—including all healthcare, mortgage, and net lease REITS—made the largest contribution to the Fund’s performance relative to the Wilshire. Specialty finance firms provide debt and equity financing to real estate entities. Specialty finance is less vulnerable to occupancy issues and high capital expenditure requirements than traditional real estate sectors. The Fund had a significant overweight in this high-performing area, as well as strong security selection.
Retail space
Consumer spending continued to be the primary factor in mall property performance, with foot traffic on the rise. Simon Property Group, General Growth Properties, and Rouse (see Comments on Largest Holdings for General Growth and Rouse) continued to contribute substantially to the Fund’s return. Retail space as a whole outperformed the overall real estate sector during this reporting period, and our slight overweight added to the Fund’s performance. Kimco Realty (see Comments on Largest Holdings) made the largest contribution to the Fund’s return in this group.
Lodging
Lodging is the most economically sensitive subsector in real estate. As most lodging companies tend to bear heavy debt burdens, their profitability is particularly
| | |
| 4 | | Visit our website at www.strategicpartners.com |
dependent on economic recovery. In addition to the strengthening economy, the weak dollar encouraged foreigners to visit the United States. Share prices improved as bookings increased, and our overweight helped the Fund.
Office
High vacancy rates from job outsourcing and the slow recovery of employment continued to affect this subsector. The Fund’s comparative performance benefited from a considerable underweight in offices. Its largest position in the subsector, however, was Boston Properties, which had strong returns over the reporting period. Boston Properties owns primarily Class A office buildings in markets with greater development constraints, such as midtown Manhattan, Washington D.C., and San Francisco. All of our office holdings contributed positively to Fund performance.
Multifamily
The Fund benefited from a substantial underweight in multifamily apartments. This sector competes with homeownership, which was favored by the low interest rates prevalent during the Fund’s reporting period. However, the rental environment is stabilizing, and could improve if employment prospects become more positive and interest rates look likely to tighten. While the multifamily subsector overall contributed positively to performance, the Fund’s holdings in Apartment and Investment Management Corporation negatively affected portfolio gains.
Warehouse
Although the warehouse subsector performed well helped by improving occupancy, it lagged all but the multifamily subsector. The Fund’s largest position was ProLogis (see Comments on Largest Holdings), which delivered strong returns and was among the largest contributors to the Fund’s overall performance.
Looking ahead
REIT shares made substantial advances despite weak real estate fundamentals. As a result, by the end of 2003 shares were expensive compared to the net asset value of REITs, and the margin that REIT dividends usually offer over the yield on corporate bonds was at historic lows. The sector’s stellar performance early in 2004 may well represent a peak in near-term valuations. REITs sold off sharply in the first half of April, which may lead to capital scarcity. We welcome the increased capital market discipline that this implies. As other investors pull back, the range of attractive investment opportunities for us has greatly increased.
The Portfolio of Investments following this report shows the size of the Fund’s positions at period-end.
| | |
| Strategic Partners Real Estate Securities Fund | | 5 |
Comments on Largest Holdings
Holdings expressed as a percentage of the Fund’s net assets as of 3/31/04.
| 7.5% | General Growth Properties, Inc./Retail—Malls |
General Growth is a real estate investment trust that is primarily engaged in the ownership, operation, management, leasing, acquisition, development, expansion, and financing of regional mall shopping centers in the United States. It has achieved strong operating margins, and has been one of the most successful REITs in deploying capital.
| 6.4% | Rouse Co./Diversified |
Rouse is a REIT engaged in the ownership, management, acquisition, and development of regional malls. It also has a significant community development portfolio. In addition to liking the regional mall business, we believe Rouse’s land development program in Las Vegas is significantly undervalued.
| 6.0% | Simon Property Group, Inc./Retail—Malls |
The largest shopping mall owner in the United States, Simon Property owns, develops, and manages more than 250 properties, primarily regional shopping malls and community shopping centers. It should continue to benefit from the stability of the mall sector and from its dominance in this area.
ProLogis operates a global network of warehouse and distribution properties, and is the largest owner of warehouse and distribution properties in Europe. We have a positive outlook on the warehouse and distribution market, and we are attracted to ProLogis’s development expertise and its unique business model, which enables the company to fund the expansion of its warehouse network through pension fund co-investment vehicles.
| 5.9% | Kimco Realty Corp./Retail—Shopping Centers |
Kimco Realty owns a portfolio of 400 neighborhood and community shopping centers. We are attracted to the stable cash flows characteristic of the sector, as well as to the company’s unique development and finance capabilities, which have historically led to investments producing high investment returns.
Holdings are subject to change.
| | |
| 6 | | Visit our website at www.strategicpartners.com |
ANNUAL REPORT
MARCH 31, 2004
STRATEGIC PARTNERS
REAL ESTATE SECURITIES FUND
PORTFOLIO OF INVESTMENTS
Portfolio of Investments
as of March 31, 2004
| | | | | |
| Shares | | Description | | Value (Note 1) |
| | | | | | |
LONG-TERM INVESTMENTS 97.4% | | | |
| |
COMMON STOCKS | | | |
| |
Diversified 16.5% | | | |
|
| 125,000 | | Hammerson PLC (United Kingdom) | | $ | 1,562,173 |
| 53,000 | | Newcastle Investment Holdings Corp.(a)(b) | | | 265,000 |
| 91,000 | | Rouse Co. (The) | | | 4,877,600 |
| 26,000 | | St. Joe Co. (The) | | | 1,057,940 |
| 20,972 | | Unibail | | | 2,191,950 |
| 43,200 | | Vornado Realty Trust | | | 2,612,736 |
| | | | |
|
|
| | | | | | 12,567,399 |
| |
Home Builder 1.5% | | | |
|
| 19,400 | | Standard Pacific Corp. | | | 1,164,000 |
| |
Lodging 9.0% | | | |
|
| 288,600 | | Host Marriott Corp.(b) | | | 3,688,308 |
| 60,052 | | Interstate Hotels & Resorts, Inc.(b) | | | 354,307 |
| 70,000 | | Starwood Hotels & Resorts Worldwide, Inc. | | | 2,835,000 |
| | | | |
|
|
| | | | | | 6,877,615 |
| |
Multi-Family 5.6% | | | |
|
| 56,400 | | Apartment Investment & Management Co. (Class A) | | | 1,753,476 |
| 47,100 | | Avalonbay Communities, Inc. | | | 2,523,618 |
| | | | |
|
|
| | | | | | 4,277,094 |
| |
Office 8.8% | | | |
|
| 62,200 | | Boston Properties, Inc. | | | 3,378,082 |
| 15,000 | | Dundee Real Estate Investment Trust | | | 285,904 |
| 41,100 | | Liberty Property Trust | | | 1,849,500 |
| 25,000 | | PS Business Parks, Inc. | | | 1,158,750 |
| | | | |
|
|
| | | | | | 6,672,236 |
| |
Retail-Malls 13.5% | | | |
|
| 163,200 | | General Growth Properties, Inc. | | | 5,736,480 |
| 77,700 | | Simon Property Group, Inc. | | | 4,540,788 |
| | | | |
|
|
| | | | | | 10,277,268 |
| |
Retail-Shopping Centers 15.3% | | | |
|
| 18,900 | | Acadia Realty Trust | | | 266,679 |
| 44,900 | | Chelsea Property Group, Inc. | | | 2,826,006 |
| 88,600 | | Kimco Realty Corp. | | | 4,516,828 |
See Notes to Financial Statements.
| | |
| 8 | | Visit our website at www.strategicpartners.com |
| | | | | | |
| Shares | | Description | | Value (Note 1) | |
| 78,600 | | Regency Centers Corp. | | $ | 3,672,978 | |
| 12,700 | | Saul Centers, Inc. | | | 387,985 | |
| | | | |
|
|
|
| | | | | | 11,670,476 | |
| |
Self-Storage Facilities 4.1% | | | | |
| |
| 64,900 | | Public Storage, Inc. | | | 3,158,034 | |
| |
Specialty Finance 12.8% | | | | |
| |
| 85,540 | | iStar Financial, Inc. | | | 3,618,342 | |
| 22,700 | | RAIT Investment Trust | | | 670,785 | |
| 36,100 | | Medical Properties of America(b) | | | 361,000 | |
| 106,800 | | Ventas, Inc. | | | 2,934,864 | |
| 8,500 | | Realty Income Corp. | | | 379,525 | |
| 33,100 | | LNR Property Corp. | | | 1,771,843 | |
| | | | |
|
|
|
| | | | | | 9,736,359 | |
| | | | |
|
|
|
| |
Warehouse 10.3% | | | | |
| |
| 89,500 | | AMB Property Corp. | | | 3,326,715 | |
| 126,500 | | ProLogis | | | 4,537,555 | |
| | | | |
|
|
|
| | | | | | 7,864,270 | |
| | | | |
|
|
|
| | | Total long-term investments
(cost $52,333,898) | | | 74,264,751 | |
| | | | |
|
|
|
SHORT-TERM INVESTMENTS 3.7% | | | | |
| | |
Principal
Amount
(000)
| | | | | |
| |
Repurchase Agreement | | | | |
| |
| 2,855 | | State Street Bank & Trust Co. Repurchase Agreement,
dated 3/31/04, 0.10%, due 4/01/04(c)
(cost $2,855,000) | | | 2,855,000 | |
| | | | |
|
|
|
| | | Total Investments 101.1% (cost $55,188,898) | | | 77,119,751 | |
| | | Liabilities in excess of other assets (1.1%) | | | (846,576 | ) |
| | | | |
|
|
|
| | | Net Assets 100% | | $ | 76,273,175 | |
| | | | |
|
|
|
| (a) | Fair-valued security (Note 1). |
| (b) | Non-income producing security. |
| (c) | Repurchase price of $2,855,008. Collateralized by $2,660,000 U.S. Treasury Bonds with a rate of 10.375%, maturity date of 11/15/09, and aggregate market value, including accrued interest, of $2,916,518. |
See Notes to Financial Statements.
| | |
| Strategic Partners Real Estate Securities Fund | | 9 |
Statement of Assets and Liabilities
as of March 31, 2004
| | | | |
Assets | | | | |
| |
Investments, at value (cost $55,188,898) | | $ | 77,119,751 | |
Receivable for investments sold | | | 1,599,903 | |
Receivable for Fund shares sold | | | 219,570 | |
Dividends and interest receivable | | | 130,133 | |
Tax reclaim receivable | | | 2,652 | |
Other assets | | | 326 | |
| | |
|
|
|
Total assets | | | 79,072,335 | |
| | |
|
|
|
| |
Liabilities | | | | |
| |
Payable for investments purchased | | | 2,365,886 | |
Payable for Fund shares reacquired | | | 157,111 | |
Accrued expenses | | | 112,148 | |
Payable to custodian | | | 77,135 | |
Management fee payable | | | 46,268 | |
Distribution fee payable | | | 40,298 | |
Foreign withholding tax payable | | | 314 | |
| | |
|
|
|
Total liabilities | | | 2,799,160 | |
| | |
|
|
|
| |
Net Assets | | $ | 76,273,175 | |
| | |
|
|
|
| | | | | |
| |
Net assets were comprised of: | | | | |
Shares of beneficial interest, at par | | $ | 4,863 | |
Paid-in capital in excess of par | | | 75,186,860 | |
| | |
|
|
|
| | | | 75,191,723 | |
Undistributed net investment income | | | 41,744 | |
Accumulated net realized loss on investments | | | (20,892,043 | ) |
Net unrealized appreciation on investments | | | 21,931,751 | |
| | |
|
|
|
Net assets, March 31, 2004 | | $ | 76,273,175 | |
| | |
|
|
|
See Notes to Financial Statements.
| | |
| 10 | | Visit our website at www.strategicpartners.com |
| | | |
Class A | | | |
|
Net asset value and redemption price per share ($25,954,264 ÷ 1,651,606 shares of beneficial interest issued and outstanding) | | $ | 15.71 |
Maximum sales charge (5.5% of offering price) | | | .91 |
| | |
|
|
Maximum offering price to public | | $ | 16.62 |
| | |
|
|
| |
Class B | | | |
|
Net asset value, offering price and redemption price per share ($35,961,067 ÷ 2,297,167 shares of beneficial interest issued and outstanding) | | $ | 15.65 |
| | |
|
|
| |
Class C | | | |
|
Net asset value, offering price and redemption price per share ($6,851,675 ÷ 437,679 shares of beneficial interest issued and outstanding) | | $ | 15.65 |
| | |
|
|
| |
Class Z | | | |
|
Net asset value, offering price and redemption price per share
($7,506,169 ÷ 476,685 shares of beneficial interest issued and outstanding) | | $ | 15.75 |
| | |
|
|
See Notes to Financial Statements.
| | |
| Strategic Partners Real Estate Securities Fund | | 11 |
Statement of Operations
Year Ended March 31, 2004
| | | | |
Net Investment Income | | | | |
| |
Income | | | | |
Dividends (net of foreign withholding taxes of $7,338) | | $ | 1,744,593 | |
Interest | | | 3,630 | |
| | |
|
|
|
Total income | | | 1,748,223 | |
| | |
|
|
|
| |
Expenses | | | | |
Management fee | | | 408,473 | |
Distribution fee—Class A | | | 39,714 | |
Distribution fee—Class B | | | 301,955 | |
Distribution fee—Class C | | | 47,341 | |
Custodian’s fees and expenses | | | 133,000 | |
Transfer agent’s fees and expenses | | | 85,000 | |
Legal fees and expenses | | | 37,000 | |
Reports to shareholders | | | 18,000 | |
Audit fee | | | 17,000 | |
Registration fees | | | 11,000 | |
Trustees’ fees | | | 11,000 | |
Amortization of organizational expense | | | 2,461 | |
Miscellaneous | | | 3,214 | |
| | |
|
|
|
Total expenses | | | 1,115,158 | |
| | |
|
|
|
Net investment income | | | 633,065 | |
| | |
|
|
|
| |
Realized and Unrealized Gain (Loss) on Investments and Foreign Currency Transactions | | | | |
| |
Net realized gain (loss) on: | | | | |
Investment transactions | | | 4,537,908 | |
Foreign currency transactions | | | (4,240 | ) |
| | |
|
|
|
| | | | 4,533,668 | |
| | |
|
|
|
Net change in unrealized appreciation on: | | | | |
Investments | | | 21,047,029 | |
Foreign currencies | | | 898 | |
| | |
|
|
|
| | | | 21,047,927 | |
| | |
|
|
|
Net gain on investments | | | 25,581,595 | |
| | |
|
|
|
Net Increase in Net Assets Resulting From Operations | | $ | 26,214,660 | |
| | |
|
|
|
See Notes to Financial Statements.
| | |
| 12 | | Visit our website at www.strategicpartners.com |
Statement of Changes in Net Assets
| | | | | | | | |
| |
| | | Year Ended March 31,
| |
| | | 2004 | | | 2003 | |
Increase (Decrease) in Net Assets | | | | | | | | |
| |
Operations | | | | | | | | |
Net investment income | | $ | 633,065 | | | $ | 1,069,162 | |
Net realized gain on investments and foreign currency transactions | | | 4,533,668 | | | | 3,067,176 | |
Net change in unrealized appreciation (depreciation) on investments and foreign currencies | | | 21,047,927 | | | | (3,681,292 | ) |
| | |
|
|
| |
|
|
|
Net increase in net assets resulting from operations | | | 26,214,660 | | | | 455,046 | |
| | |
|
|
| |
|
|
|
Dividends and distributions (Note 1) | | | | | | | | |
Dividends from net investment income | | | | | | | | |
Class A | | | (258,161 | ) | | | (398,589 | ) |
Class B | | | (376,840 | ) | | | (751,391 | ) |
Class C | | | (56,241 | ) | | | (106,366 | ) |
Class Z | | | (52,132 | ) | | | (61,045 | ) |
| | |
|
|
| |
|
|
|
| | | | (743,374 | ) | | | (1,317,391 | ) |
| | |
|
|
| |
|
|
|
| | |
Fund share transactions (Net of share conversions) (Note 6) | | | | | | | | |
Net proceeds from shares sold | | | 26,824,919 | | | | 18,911,306 | |
Net asset value of shares issued in reinvestment of dividends and distributions | | | 635,174 | | | | 1,117,048 | |
Cost of shares reacquired | | | (18,329,511 | ) | | | (22,372,903 | ) |
| | |
|
|
| |
|
|
|
Net increase (decrease) in net assets from Fund share transactions | | | 9,130,582 | | | | (2,344,549 | ) |
| | |
|
|
| |
|
|
|
Total increase (decrease) | | | 34,601,868 | | | | (3,206,894 | ) |
| | |
Net Assets | | | | | | | | |
| |
Beginning of year | | | 41,671,307 | | | | 44,878,201 | |
| | |
|
|
| |
|
|
|
End of year(a) | | $ | 76,273,175 | | | $ | 41,671,307 | |
| | |
|
|
| |
|
|
|
(a) Includes undistributed net investment income of: | | $ | 41,744 | | | $ | 159,575 | |
| | |
|
|
| |
|
|
|
See Notes to Financial Statements.
| | |
| Strategic Partners Real Estate Securities Fund | | 13 |
Notes to Financial Statements
Strategic Partners Real Estate Securities Fund, Inc. (the “Fund”), is registered under the Investment Company Act of 1940 as a nondiversified, open-end, management investment company. The Fund was established as a Delaware business trust on October 24, 1997. The Fund commenced investment operations on May 5, 1998. The investment objective of the Fund is high current income and long-term growth of capital. It seeks to achieve this objective by investing primarily in equity securities of real estate companies.
Note 1. Accounting Policies
The following is a summary of significant accounting policies followed by the Fund in the preparation of its financial statements.
Securities Valuation: Securities listed on a securities exchange are valued at the last sale price on such exchange on the day of valuation or, if there was no sale on such day, at the mean between the last reported bid and asked prices, or at the last bid price on such day in the absence of an asked price. Securities that are actively traded via Nasdaq, are valued at the official closing price provided by Nasdaq. Securities that are actively traded in the over-the-counter market, including listed securities for which the primary market is believed by Prudential Investments LLC (“PI” or “Manager”), in consultation with the subadviser, to be over-the-counter, are valued at market value using prices provided by an independent pricing agent or principal market maker. Options on securities and indices traded on an exchange are valued at the mean between the most recently quoted bid and asked prices on such exchange. Future contracts and options thereon traded on a commodities exchange or board of trade are valued at the last sale price at the close of trading on such exchange or board of trade or, if there was no sale on the applicable commodities exchange or board of trade on such day, at the mean between the most recently quoted bid and asked prices on such exchange or board of trade or at the last bid price in the absence of an asked price. Securities for which market quotations are not readily available, or for which pricing services does not provide a valuation methodology, or does not present fair value, or whose values have been affected by events occurring after the close of the security’s foreign market and before the Fund’s normal pricing time, are valued at fair value in accordance with Board of Trustees’ approved fair valuation procedures.
Short-term securities which mature in sixty days or less are valued at amortized cost, which approximates market value. The amortized cost method involves valuing a
| | |
| 14 | | Visit our website at www.strategicpartners.com |
security at its cost on the date of purchases and thereafter assuming a constant amortization to maturity of the difference between the principal amount due at maturity and cost. Short-term securities which mature in more than sixty days are valued at current market quotations.
Foreign Currency Translation: The books and records of the Series are maintained in U.S. dollars. Foreign currency amounts are translated into U.S. dollars on the following basis:
(i) market value of investment securities, other assets and liabilities—at the current rates of exchange;
(ii) purchases and sales of investment securities, income and expenses—at the rates of exchange prevailing on the respective dates of such transactions.
Although the net assets of the Fund are presented at the foreign exchange rates and market values at the close of the fiscal period, the Fund does not isolate that portion of the results of operations arising as a result of changes in the foreign exchange rates from the fluctuations arising from changes in the market prices of securities held at the end of the fiscal period. Similarly, the Fund does not isolate the effect of changes in foreign exchange rates from the fluctuations arising from changes in the market prices of portfolio securities sold during the fiscal period. Accordingly, realized foreign currency gains or losses are included in the reported net realized gains or losses on investment transactions.
Net realized gains or losses on foreign currency transactions represent net foreign exchange gains or losses from the holding of foreign currencies, currency gains or losses realized between the trade date and settlement date on securities transactions, and the difference between the amounts of dividends, interest and foreign withholding taxes recorded on the Fund’s books and the U.S. dollar equivalent amounts actually received or paid. Net unrealized currency gains or losses from valuing foreign currency denominated assets and liabilities (other than investments) at period end exchange rates are reflected as a component of net unrealized appreciation (depreciation) on foreign currencies.
Foreign security and currency transactions may involve certain considerations and risks not typically associated with those of domestic origin as a result of, among other factors, the possibility of political and economic instability or the level of governmental supervision and regulation of foreign securities markets.
Repurchase Agreements: In connection with transactions in repurchase agreements with United States financial institutions, it is the Fund’s policy that its custodian or
| | |
| Strategic Partners Real Estate Securities Fund | | 15 |
Notes to Financial Statements
Cont’d
designated subcustodians, as the case may be under triparty repurchase agreements, take possession of the underlying collateral securities, the value of which exceeds the principal amount of the repurchase transaction, including accrued interest. To the extent that any repurchase transaction exceeds one business day, the value of collateral is marked to market on a daily basis to ensure adequacy of the collateral. If the seller defaults and the value of the collateral declines, or if bankruptcy proceedings are commenced with respect to the seller of the security, realization of the collateral by the Fund may be delayed or limited.
Securities Transactions and Net Investment Income: Securities transactions are recorded on the trade date. Realized and unrealized gains or loss from investments on sales of investments are calculated on the identified cost basis. Dividend income is recorded on the ex-dividend date. Interest income, including amortization of premium and accretion of discount on debt securities, as required, is recorded on the accrual basis. The Fund invests in real estate investment trusts (“REITS”), which report information on the source of their distributions annually. A portion of distributions received from REITS during the period is estimated to be capital gain and a portion is estimated to be return of capital and is recorded as a reduction of their costs. These estimates are adjusted when the actual source of distributions is disclosed by the REITS.
Net investment income or loss (other than distribution fees which are charged directly to the respective class) and unrealized and realized gains or losses are allocated daily to each class of shares based upon the relative proportion of net assets of each class at the beginning of the day.
Dividends and Distributions: The Fund expects to pay dividends of net investment income quarterly and distributions of net realized capital gains, if any, annually. Dividends and distributions to shareholders, which are determined in accordance with federal income tax regulations which may differ from generally accepted accounting principles, are recorded on the ex-dividend date. Permanent book/tax differences relating to income and gains are reclassified amongst undistributed net investment income, accumulated net realized gain or loss and paid-in capital in excess of par, as appropriate.
Taxes: It is the Fund’s policy to continue to meet the requirements of the Internal Revenue Code applicable to regulated investment companies and to distribute all of
| | |
| 16 | | Visit our website at www.strategicpartners.com |
its taxable net income and capital gains, if any, to shareholders. Therefore, no federal income tax provision is required.
Withholding taxes on foreign dividends are recorded, net of reclaimable amounts, at the time the related income is earned.
Organization Expenses: Organization costs of approximately $108,700 are being amortized ratably over a period of sixty months from the date the Fund commenced investment operations.
Estimates: The preparation of the financial statements requires management to make estimates and assumptions that affect the reported amounts and disclosures in the financial statements. Actual results could differ from those estimates.
Note 2. Agreements
The Fund has a management agreement with PI. Pursuant to this agreement, PI has responsibility for all investment advisory services and supervises the subadviser’s performance of such services. PI has a subadvisory agreement with Wellington Management Company, LLP (“Wellington” or “subadviser”). The subadvisory agreement provides that Wellington furnishes investment advisory services in connection with the management of the Fund. In connection therewith, Wellington is obligated to keep certain books and records of the Fund. PI continues to have responsibility for all investment advisory services pursuant to the management agreement and supervises Wellington’s performance of such services. PI pays for the services of Wellington, the cost of compensation of officers of the Fund, occupancy and certain clerical and bookkeeping costs of the Fund. The Fund bears all other costs and expenses.
The management fee paid to PI is computed daily and payable monthly at an annual rate of .75 of 1% of the Fund’s average daily net assets.
The Fund has a distribution agreement with Prudential Investment Management Services LLC (“PIMS”), which acts as the distributor of the Class A, Class B, Class C and Class Z shares of the Fund. The Fund compensates PIMS for distributing and servicing the Fund’s Class A, Class B and Class C shares, pursuant to a plan of distribution (the “Class A, B and C Plans”), regardless of expenses actually incurred by PIMS. The distribution fees are accrued daily and payable monthly. No distribution or service fees are paid to PIMS as distributor of the Class Z shares of the Fund.
Pursuant to the Class A, B and C Plans, the Fund compensates PIMS for distribution-related activities at an annual rate of up to .30 of 1%, 1% and 1%, of the average
| | |
| Strategic Partners Real Estate Securities Fund | | 17 |
Notes to Financial Statements
Cont’d
daily net assets of the Class A, B and C shares, respectively. For the year ended March 31, 2004, PIMS has contractually agreed to limit such fees to .25% of 1% of the average daily net assets of the Class A shares.
PIMS has advised the Fund that it received approximately $74,800 and $4,600 in front-end sales charges resulting from sales of Class A and Class C shares, respectively, during the year ended March 31, 2004. From these fees, PIMS paid such sales charges to dealers, which in turn paid commissions to salespersons and incurred other distribution costs.
PIMS has advised the Fund that for the year ended March 31, 2004, it received approximately $53,300 and $1,900 in contingent deferred sales charges imposed upon certain redemptions by Class B and Class C shareholders, respectively.
PI and PIMS are indirect, wholly-owned subsidiaries of Prudential Financial, Inc. (“Prudential”).
The Fund, along with other affiliated registered investment companies (the “Funds”), is a party to a syndicated credit agreement (“SCA”) with a group of banks. For the year ended March 31, 2004, the SCA provides for a commitment of $800 million and allows the Funds to increase the commitment to $1 billion, if necessary. Interest on any borrowings under the SCA will be incurred at market rates. The Funds pay a commitment fee of .08 of 1% of the unused portion of the SCA. The commitment fee is accrued daily and paid quarterly and is allocated to the Funds pro rata, based on net assets. The purpose of the SCA is to serve as an alternative source of funding for capital share redemptions. The expiration date of the SCA was April 30, 2004. Effective May 1, 2004, the commitment will be reduced to $500 million. All other terms and conditions will remain the same. The expiration of the renewed SCA will be October 29, 2004. The fund did not borrow any amounts pursuant to the SCA during the year ended March 31, 2004.
Note 3. Other Transactions with Affiliates
Prudential Mutual Fund Services LLC (“PMFS”), an affiliate of PI and an indirect, wholly-owned subsidiary of Prudential, serves as the Fund’s transfer agent. During the year ended March 31, 2004, the Fund incurred fees of approximately $66,400 for the services of PMFS. As of March 31, 2004, approximately $6,400 of such fees were due
| | |
| 18 | | Visit our website at www.strategicpartners.com |
to PMFS. Transfer agent fees and expenses in the Statement of Operations include certain out-of-pocket expenses paid to non-affiliates, where applicable.
The Fund pays networking fees to affiliated and unaffiliated broker/dealers. These networking fees are payments made to broker/dealers that clear mutual fund transactions through a national clearing system. The Fund incurred approximately $10,200 in total networking fees, of which the amount relating to the services of Wachovia Securities, LLC (“Wachovia”) and Prudential Securities, Inc. (“PSI”), affiliates of PI, was approximately $9,500 for the year ended March 31, 2004. Effective July 1, 2003 Prudential and Wachovia Corp. formed a joint venture (“Wachovia Securities, LLC”) whereby Prudential and Wachovia Corp. combined their brokerage business with Prudential holding a minority interest. Prior to July 1, 2003, PSI was an indirect, wholly-owned subsidiary of Prudential. As of March 31, 2004, approximately $1,000 of such fees were due to Wachovia. These amounts are included in the transfer agent’s fees and expenses in the Statement of Operations.
For the period of July 1, 2003 to March 31, 2004, Wachovia earned $470 in brokerage commissions from portfolio transactions executed on behalf of the Fund.
Note 4. Portfolio Securities
Purchases and sales of investment securities, other than short-term investments, for the year ended March 31, 2004 aggregated $42,789,492 and $34,538,928, respectively.
Note 5. Distributions and Tax Information
In order to present undistributed net investment income (loss) and accumulated net realized gains (losses) on the Statement of Assets and Liabilities that more closely represent their tax character, certain adjustments have been made to paid-in-capital in excess of par, undistributed net investment income (loss) and accumulated net realized gain (loss) on investments. For the year ended March 31, 2004, the adjustments were to decrease accumulated net realized loss by $4,240, decrease undistributed net investment income by $7,522, and decrease paid-in-capital in excess of par by $3,282 for foreign currencies, certain expenses not deductible for tax purposes and redemptions utilized as distributions. Net investment income, net realized gains and net assets were not affected by this change date.
For the years ended March 31, 2004 and March 31, 2003, the tax character of dividends paid by the Fund was $749,117 and $1,317,391, respectively, from ordinary income.
| | |
| Strategic Partners Real Estate Securities Fund | | 19 |
Notes to Financial Statements
Cont’d
For the years ended March 31, 2004 and March 31, 2003, the Fund had undistributed ordinary income on a tax basis of $41,744 and $159,575, respectively.
For federal income tax purposes, the Fund had a capital loss carryforward as of March 31, 2004, of approximately $20,544,000 of which $18,400,000 expires in 2008 and $2,144,000 expires in 2009. Accordingly, no capital gains distributions are expected to be paid to shareholders until future net gains have been realized in excess of such carryforward.
The United States federal income tax basis of the Fund’s investments and the net unrealized appreciation as of March 31, 2004 were as follows:
| | | | | | | | |
Tax Basis
| | Appreciation
| | Depreciation
| | Other Cost Basis
Adjustments
| | Total
Net Unrealized Appreciation
|
| $55,536,766 | | $22,053,525 | | $470,540 | | $898 | | $21,583,883 |
The difference between book basis and tax basis was attributable to deferred losses on wash sales.
Note 6. Capital
The Fund offers Class A, Class B, Class C and Class Z shares. Class A shares are sold with a front-end sales charge of up to 5.5%. Prior to March 15, 2004, Class A shares were sold with a front-end sales charge of 5%. Effective March 15, 2004, all investors who purchase Class A shares in an amount of $1 million or more and sell these shares within 12 months of purchase are subject to a contingent deferred sales charge (CDSC) of 1%, including investors who purchase their shares through broker-dealers affiliated with Prudential. Class B shares are sold with a contingent deferred sales charge which declines from 5% to zero depending on the period of time the shares are held. Prior to February 2, 2004, Class C shares were sold with a front-end sales charge of 1% and a contingent deferred sales charge of 1% during the first 18 months. Class C shares purchased on or after February 2, 2004 are not subject to an initial sales charge and the contingent deferred sales charge (CDSC) for Class C shares will be 12 months from the date of purchase. Class B shares automatically convert to Class A shares on a quarterly basis approximately seven years after purchase. A special exchange privilege is also available for shareholders who qualified to purchase Class A shares at net asset value. Class Z shares are not subject to any sales or redemption charge and are offered exclusively for sale to a limited group of investors.
| | |
| 20 | | Visit our website at www.strategicpartners.com |
There is an unlimited number of shares of beneficial interest, $.001 par value per share, divided into four classes, designated Class A, Class B, Class C and Class Z.
At March 31, 2004, Prudential owns 1 share of each Class A, Class B, Class C and Class Z.
| | | | | | | |
Class A
| | Shares
| | | Amount
| |
Year ended March 31, 2004: | | | | | | | |
Shares sold | | 1,001,362 | | | $ | 13,259,775 | |
Shares issued in reinvestment of dividends | | 19,338 | | | | 221,931 | |
Shares reacquired | | (530,737 | ) | | | (6,563,602 | ) |
| | |
|
| |
|
|
|
Net increase (decrease) in shares outstanding before conversion | | 489,963 | | | | 6,918,104 | |
Shares issued upon conversion from Class B | | 36,097 | | | | 479,841 | |
| | |
|
| |
|
|
|
Net increase (decrease) in shares outstanding | | 526,060 | | | $ | 7,397,945 | |
| | |
|
| |
|
|
|
Year ended March 31, 2003: | | | | | | | |
Shares sold | | 720,377 | | | $ | 7,051,194 | |
Shares issued in reinvestment of dividends | | 35,963 | | | | 346,610 | |
Shares reacquired | | (784,287 | ) | | | (7,543,928 | ) |
| | |
|
| |
|
|
|
Net increase (decrease) in shares outstanding before conversion | | (27,947 | ) | | | (146,124 | ) |
Shares issued upon conversion from Class B | | 27,626 | | | | 274,022 | |
| | |
|
| |
|
|
|
Net increase (decrease) in shares outstanding | | (321 | ) | | $ | 127,898 | |
| | |
|
| |
|
|
|
Class B
| | | | | | |
Year ended March 31, 2004: | | | | | | | |
Shares sold | | 397,793 | | | $ | 5,007,352 | |
Shares issued in reinvestment of dividends | | 27,360 | | | | 311,318 | |
Shares reacquired | | (645,096 | ) | | | (7,992,963 | ) |
| | |
|
| |
|
|
|
Net increase (decrease) in shares outstanding before conversion | | (219,943 | ) | | | (2,674,293 | ) |
Shares reacquired upon conversion from Class A | | (36,185 | ) | | | (479,841 | ) |
| | |
|
| |
|
|
|
Net increase (decrease) in shares outstanding | | (256,128 | ) | | $ | (3,154,134 | ) |
| | |
|
| |
|
|
|
Year ended March 31, 2003: | | | | | | | |
Shares sold | | 728,086 | | | $ | 7,188,231 | |
Shares issued in reinvestment of dividends | | 63,891 | | | | 616,151 | |
Shares reacquired | | (1,061,355 | ) | | | (10,341,123 | ) |
| | |
|
| |
|
|
|
Net increase (decrease) in shares outstanding before conversion | | (269,378 | ) | | | (2,536,741 | ) |
Shares reacquired upon conversion from Class A | | (27,665 | ) | | | (274,022 | ) |
| | |
|
| |
|
|
|
Net increase (decrease) in shares outstanding | | (297,043 | ) | | $ | (2,810,763 | ) |
| | |
|
| |
|
|
|
Class C
| | | | | | |
Year ended March 31, 2004: | | | | | | | |
Shares sold | | 208,265 | | | $ | 2,751,417 | |
Shares issued in reinvestment of dividends | | 4,506 | | | | 51,369 | |
Shares reacquired | | (146,029 | ) | | | (1,801,285 | ) |
| | |
|
| |
|
|
|
Net increase (decrease) in shares outstanding | | 66,742 | | | $ | 1,001,501 | |
| | |
|
| |
|
|
|
Year ended March 31, 2003: | | | | | | | |
Shares sold | | 135,638 | | | $ | 1,326,702 | |
Shares issued in reinvestment of dividends | | 10,007 | | | | 96,488 | |
Shares reacquired | | (188,554 | ) | | | (1,823,267 | ) |
| | |
|
| |
|
|
|
Net increase (decrease) in shares outstanding | | (42,909 | ) | | $ | (400,077 | ) |
| | |
|
| |
|
|
|
| | |
| Strategic Partners Real Estate Securities Fund | | 21 |
Notes to Financial Statements
Cont’d
| | | | | | | |
Class Z
| | Shares
| | | Amount
| |
Year ended March 31, 2004: | | | | | | | |
Shares sold | | 442,671 | | | $ | 5,806,375 | |
Shares issued in reinvestment of dividends | | 4,358 | | | | 50,556 | |
Shares reacquired | | (161,624 | ) | | | (1,971,661 | ) |
| | |
|
| |
|
|
|
Net increase (decrease) in shares outstanding | | 285,405 | | | $ | 3,885,270 | |
| | |
|
| |
|
|
|
Year ended March 31, 2003: | | | | | | | |
Shares sold | | 343,421 | | | $ | 3,345,179 | |
Shares issued in reinvestment of dividends | | 6,049 | | | | 57,799 | |
Shares reacquired | | (276,329 | ) | | | (2,664,585 | ) |
| | |
|
| |
|
|
|
Net increase (decrease) in shares outstanding | | 73,141 | | | $ | 738,393 | |
| | |
|
| |
|
|
|
Note 7. Change in Independent Auditors
PricewaterhouseCoopers LLP was previously the independent auditors for the Fund. The decision to change the independent auditors was approved by the Audit Committee and by the Board of Trustees in a meeting held on November 18, 2003, resulting in KPMG LLP’s appointment as independent auditors of the Fund.
The reports on the financial statements of the Fund audited by PricewaterhouseCoopers LLP through the year ended March 31, 2003 did not contain an adverse opinion or disclaimer of opinion, and were not qualified or modified as to uncertainty, audit scope or accounting principles. There were no disagreements between the Fund and PricewaterhouseCoopers LLP on any matter of accounting principles or practices, financial statement disclosure, or auditing scope or procedures.
Note 8. Subsequent Events
On April 8, 2004 the Board of Trustees of the Fund declared the following dividends per share, payable on April 13, 2004 to shareholders of record on April 12, 2004.
| | | | | | | | | |
| | | |
| | | Class A
| | Class B
and C
| | Class Z
|
Ordinary Income | | $ | 0.03 | | $ | 0.01 | | $ | 0.04 |
| | |
| 22 | | Visit our website at www.strategicpartners.com |
Financial Highlights
| | |
|
| MARCH 31, 2004 | | ANNUAL REPORT |
Real Estate Securities Fund
Financial Highlights
| | | | |
| |
| | | Class A
| |
| | | Year Ended
March 31, 2004 | |
| |
Per Share Operating Performance: | | | | |
Net Asset Value, Beginning Of Year | | $ | 9.84 | |
| | |
|
|
|
Income from investment operations | | | | |
Net investment income | | | .16 | |
Net realized and unrealized gain (loss) on investment and foreign currency transactions | | | 5.93 | |
| | |
|
|
|
Total from investment operations | | | 6.09 | |
| | |
|
|
|
Less Distributions: | | | | |
Dividends from net investment income | | | (.22 | ) |
Distributions in excess of net investment income | | | — | |
Tax return of capital distributions | | | — | |
| | |
|
|
|
Total distributions | | | (.22 | ) |
| | |
|
|
|
Net asset value, end of year | | $ | 15.71 | |
| | |
|
|
|
Total Return(a): | | | 62.79 | % |
Ratios/Supplemental Data: | | | | |
Net assets, end of year (000) | | $ | 25,954 | |
Average net assets (000) | | $ | 15,886 | |
Ratios to average net assets: | | | | |
Expenses, including distribution and service (12b-1) fees(d) | | | 1.58 | % |
Expenses, excluding distribution and service (12b-1) fees | | | 1.33 | % |
Net investment income | | | 1.53 | % |
For Class A, B, C and Z shares: | | | | |
Portfolio turnover | | | 65 | % |
| (a) | Total return does not consider the effects of sales loads. Total return is calculated assuming a purchase of shares on the first day and a sale on the last day of each year reported and includes reinvestment of dividends and distributions. |
| (b) | Less than $.005 per share. |
| (c) | Based on average shares outstanding during the year. |
| (d) | The Distributor of the Fund contractually agreed to limit its distribution and service (12b-1) fees to .25 of 1% of the average net assets for the Class A shares. |
See Notes to Financial Statements.
| | |
| 24 | | Visit our website at www.strategicpartners.com |
| | | | | | | | | | | | | | |
|
| Class A | |
|
| Year Ended March 31, | |
|
| 2003 | | | 2002 | | | 2001 | | | 2000 | |
| |
| | | | | | | | | | | | | | | |
| $ | 9.97 | | | $ | 8.71 | | | $ | 7.79 | | | $ | 7.46 | |
|
|
| |
|
|
| |
|
|
| |
|
|
|
| | | | | | | | | | | | | | | |
| | .29 | (c) | | | .31 | (c) | | | .28 | (c) | | | .15 | (c) |
| | (.08 | ) | | | 1.30 | | | | .82 | | | | .42 | |
|
|
| |
|
|
| |
|
|
| |
|
|
|
| | .21 | | | | 1.61 | | | | 1.10 | | | | .57 | |
|
|
| |
|
|
| |
|
|
| |
|
|
|
| | | | | | | | | | | | | | | |
| | (.34 | ) | | | (.35 | ) | | | (.18 | ) | | | (.21 | ) |
| | — | | | | — | | | | — | | | | — | (b) |
| | — | | | | — | | | | — | | | | (.03 | ) |
|
|
| |
|
|
| |
|
|
| |
|
|
|
| | (.34 | ) | | | (.35 | ) | | | (.18 | ) | | | (.24 | ) |
|
|
| |
|
|
| |
|
|
| |
|
|
|
| $ | 9.84 | | | $ | 9.97 | | | $ | 8.71 | | | $ | 7.79 | |
|
|
| |
|
|
| |
|
|
| |
|
|
|
| | 2.27 | % | | | 19.00 | % | | | 14.28 | % | | | 7.74 | % |
| | | | | | | | | | | | | | | |
| $ | 11,073 | | | $ | 11,225 | | | $ | 15,103 | | | $ | 16,545 | |
| $ | 11,248 | | | $ | 12,433 | | | $ | 16,271 | | | $ | 19,631 | |
| | | | | | | | | | | | | | | |
| | 1.79 | % | | | 1.93 | % | | | 1.87 | % | | | 1.70 | % |
| | 1.54 | % | | | 1.68 | % | | | 1.62 | % | | | 1.45 | % |
| | 2.97 | % | | | 3.43 | % | | | 3.27 | % | | | 1.93 | % |
| | | | | | | | | | | | | | | |
| | 92 | % | | | 110 | % | | | 62 | % | | | 54 | % |
See Notes to Financial Statements.
| | |
| Strategic Partners Real Estate Securities Fund | | 25 |
Financial Highlights
Cont’d
| | | | |
| |
| | | Class B
| |
| | | Year Ended
March 31, 2004 | |
| |
Per Share Operating Performance: | | | | |
Net Asset Value, Beginning Of Year | | $ | 9.82 | |
| | |
|
|
|
Income from investment operations | | | | |
Net investment income | | | .12 | |
Net realized and unrealized gain (loss) on investment and foreign currency transactions | | | 5.86 | |
| | |
|
|
|
Total from investment operations | | | 5.98 | |
| | |
|
|
|
Less Distributions: | | | | |
Dividends from net investment income | | | (.15 | ) |
Distributions in excess of net investment income | | | — | |
Tax return of capital distributions | | | — | |
| | |
|
|
|
Total distributions | | | (.15 | ) |
| | |
|
|
|
Net asset value, end of year | | $ | 15.65 | |
| | |
|
|
|
Total Return(a): | | | 61.62 | % |
Ratios/Supplemental Data: | | | | |
Net assets, end of year (000) | | $ | 35,961 | |
Average net assets (000) | | $ | 30,195 | |
Ratios to average net assets: | | | | |
Expenses, including distribution and service (12b-1) fees | | | 2.33 | % |
Expenses, excluding distribution and service (12b-1) fees | | | 1.33 | % |
Net investment income | | | .97 | % |
| (a) | Total return does not consider the effects of sales loads. Total return is calculated assuming a purchase of shares on the first day and a sale on the last day of each year reported and includes reinvestment of dividends and distributions. |
| (b) | Less than $.005 per share. |
| (c) | Based on average shares outstanding during the year. |
See Notes to Financial Statements
| | |
| 26 | | Visit our website at www.strategicpartners.com |
| | | | | | | | | | | | | | |
|
| Class B | |
|
| Year Ended March 31, | |
|
| 2003 | | | 2002 | | | 2001 | | | 2000 | |
| |
| | | | | | | | | | | | | | | |
| $ | 9.95 | | | $ | 8.69 | | | $ | 7.78 | | | $ | 7.45 | |
|
|
| |
|
|
| |
|
|
| |
|
|
|
| | | | | | | | | | | | | | | |
| | .22 | (c) | | | .24 | (c) | | | .21 | (c) | | | .09 | (c) |
| | (.08 | ) | | | 1.30 | | | | .82 | | | | .42 | |
|
|
| |
|
|
| |
|
|
| |
|
|
|
| | .14 | | | | 1.54 | | | | 1.03 | | | | .51 | |
|
|
| |
|
|
| |
|
|
| |
|
|
|
| | | | | | | | | | | | | | | |
| | (.27 | ) | | | (.28 | ) | | | (.12 | ) | | | (.15 | ) |
| | — | | | | — | | | | — | | | | — | (b) |
| | — | | | | — | | | | — | | | | (.03 | ) |
|
|
| |
|
|
| |
|
|
| |
|
|
|
| | (.27 | ) | | | (.28 | ) | | | (.12 | ) | | | (.18 | ) |
|
|
| |
|
|
| |
|
|
| |
|
|
|
| $ | 9.82 | | | $ | 9.95 | | | $ | 8.69 | | | $ | 7.78 | |
|
|
| |
|
|
| |
|
|
| |
|
|
|
| | 1.47 | % | | | 18.14 | % | | | 13.35 | % | | | 6.96 | % |
| | | | | | | | | | | | | | | |
| $ | 25,072 | | | $ | 28,357 | | | $ | 28,118 | | | $ | 33,616 | |
| $ | 26,955 | | | $ | 27,939 | | | $ | 30,747 | | | $ | 47,271 | |
| | | | | | | | | | | | | | | |
| | 2.54 | % | | | 2.68 | % | | | 2.62 | % | | | 2.45 | % |
| | 1.54 | % | | | 1.68 | % | | | 1.62 | % | | | 1.45 | % |
| | 2.20 | % | | | 2.67 | % | | | 2.49 | % | | | 1.16 | % |
See Notes to Financial Statements.
| | |
| Strategic Partners Real Estate Securities Fund | | 27 |
Financial Highlights
Cont’d
| | | | |
| |
| | | Class C
| |
| | | Year Ended
March 31, 2004 | |
| |
Per Share Operating Performance: | | | | |
Net Asset Value, Beginning Of Year | | $ | 9.82 | |
| | |
|
|
|
Income from investment operations | | | | |
Net investment income | | | .12 | |
Net realized and unrealized gain (loss) on investment and foreign currency transactions | | | 5.86 | |
| | |
|
|
|
Total from investment operations | | | 5.98 | |
| | |
|
|
|
Less Distributions: | | | | |
Dividends from net investment income | | | (.15 | ) |
Distributions in excess of net investment income | | | — | |
Tax return of capital distributions | | | — | |
| | |
|
|
|
Total distributions | | | (.15 | ) |
| | |
|
|
|
Net asset value, end of year | | $ | 15.65 | |
| | |
|
|
|
Total Return(a): | | | 61.62 | % |
Ratios/Supplemental Data: | | | | |
Net assets, end of year (000) | | $ | 6,852 | |
Average net assets (000) | | $ | 4,734 | |
Ratios to average net assets: | | | | |
Expenses, including distribution and service (12b-1) fees | | | 2.33 | % |
Expenses, excluding distribution and service (12b-1) fees | | | 1.33 | % |
Net investment income | | | .87 | % |
| (a) | Total return does not consider the effects of sales loads. Total return is calculated assuming a purchase of shares on the first day and a sale on the last day of each year reported and includes reinvestment of dividends and distributions. |
| (b) | Less than $.005 per share. |
| (c) | Based on average shares outstanding during the year. |
See Notes to Financial Statements
| | |
| 28 | | Visit our website at www.strategicpartners.com |
| | | | | | | | | | | | | | |
|
| Class C | |
|
| Year Ended March 31, | |
|
| 2003 | | | 2002 | | | 2001 | | | 2000 | |
| |
| | | | | | | | | | | | | | | |
| $ | 9.95 | | | $ | 8.69 | | | $ | 7.78 | | | $ | 7.45 | |
|
|
| |
|
|
| |
|
|
| |
|
|
|
| | | | | | | | | | | | | | | |
| | .22 | (c) | | | .25 | (c) | | | .21 | (c) | | | .09 | (c) |
| | (.08 | ) | | | 1.29 | | | | .82 | | | | .42 | |
|
|
| |
|
|
| |
|
|
| |
|
|
|
| | .14 | | | | 1.54 | | | | 1.03 | | | | .51 | |
|
|
| |
|
|
| |
|
|
| |
|
|
|
| | | | | | | | | | | | | | | |
| | (.27 | ) | | | (.28 | ) | | | (.12 | ) | | | (.15 | ) |
| | — | | | | — | | | | — | | | | — | (b) |
| | — | | | | — | | | | — | | | | (.03 | ) |
|
|
| |
|
|
| |
|
|
| |
|
|
|
| | (.27 | ) | | | (.28 | ) | | | (.12 | ) | | | (.18 | ) |
|
|
| |
|
|
| |
|
|
| |
|
|
|
| $ | 9.82 | | | $ | 9.95 | | | $ | 8.69 | | | $ | 7.78 | |
|
|
| |
|
|
| |
|
|
| |
|
|
|
| | 1.47 | % | | | 18.14 | % | | | 13.35 | % | | | 6.96 | % |
| | | | | | | | | | | | | | | |
| $ | 3,642 | | | $ | 4,117 | | | $ | 4,750 | | | $ | 5,162 | |
| $ | 3,891 | | | $ | 4,390 | | | $ | 5,096 | | | $ | 8,215 | |
| | | | | | | | | | | | | | | |
| | 2.54 | % | | | 2.68 | % | | | 2.62 | % | | | 2.45 | % |
| | 1.54 | % | | | 1.68 | % | | | 1.62 | % | | | 1.45 | % |
| | 2.24 | % | | | 2.72 | % | | | 2.52 | % | | | 1.12 | % |
See Notes to Financial Statements.
| | |
| Strategic Partners Real Estate Securities Fund | | 29 |
Financial Highlights
Cont’d
| | | | |
| |
| | | Class Z
| |
| | | Year Ended
March 31, 2004 | |
| |
Per Share Operating Performance: | | | | |
Net Asset Value, Beginning Of Year | | $ | 9.85 | |
| | |
|
|
|
Income from investment operations | | | | |
Net investment income | | | .18 | |
Net realized and unrealized gain (loss) on investment and foreign currency transactions | | | 5.96 | |
| | |
|
|
|
Total from investment operations | | | 6.14 | |
| | |
|
|
|
Less Distributions: | | | | |
Dividends from net investment income | | | (.24 | ) |
Distributions in excess of net investment income | | | — | |
Tax return of capital distributions | | | — | |
| | |
|
|
|
Total distributions | | | (.24 | ) |
| | |
|
|
|
Net asset value, end of year | | $ | 15.75 | |
| | |
|
|
|
Total Return(a): | | | 63.21 | % |
Ratios/Supplemental Data: | | | | |
Net assets, end of year (000) | | $ | 7,506 | |
Average net assets (000) | | $ | 3,648 | |
Ratios to average net assets: | | | | |
Expenses, including distribution and service (12b-1) fees | | | 1.33 | % |
Expenses, excluding distribution and service (12b-1) fees | | | 1.33 | % |
Net investment income | | | 1.52 | % |
| (a) | Total return does not consider the effects of sales loads. Total return is calculated assuming a purchase of shares on the first day and a sale on the last day of each year reported and includes reinvestment of dividends and distributions. |
| (b) | Less than $.005 per share. |
| (c) | Based on average shares outstanding during the year. |
See Notes to Financial Statements
| | |
| 30 | | Visit our website at www.strategicpartners.com |
| | | | | | | | | | | | | | |
|
| Class Z | |
|
| Year Ended March 31, | |
|
| 2003 | | | 2002 | | | 2001 | | | 2000 | |
| |
| | | | | | | | | | | | | | | |
| $ | 9.98 | | | $ | 8.72 | | | $ | 7.80 | | | $ | 7.47 | |
|
|
| |
|
|
| |
|
|
| |
|
|
|
| | | | | | | | | | | | | | | |
| | .31 | (c) | | | .33 | (c) | | | .29 | (c) | | | .18 | (c) |
| | (.07 | ) | | | 1.30 | | | | .83 | | | | .41 | |
|
|
| |
|
|
| |
|
|
| |
|
|
|
| | .24 | | | | 1.63 | | | | 1.12 | | | | .59 | |
|
|
| |
|
|
| |
|
|
| |
|
|
|
| | | | | | | | | | | | | | | |
| | (.37 | ) | | | (.37 | ) | | | (.20 | ) | | | (.23 | ) |
| | — | | | | — | | | | — | | | | — | (b) |
| | — | | | | — | | | | — | | | | (.03 | ) |
|
|
| |
|
|
| |
|
|
| |
|
|
|
| | (.37 | ) | | | (.37 | ) | | | (.20 | ) | | | (.26 | ) |
|
|
| |
|
|
| |
|
|
| |
|
|
|
| $ | 9.85 | | | $ | 9.98 | | | $ | 8.72 | | | $ | 7.80 | |
|
|
| |
|
|
| |
|
|
| |
|
|
|
| | 2.52 | % | | | 19.29 | % | | | 14.54 | % | | | 8.02 | % |
| | | | | | | | | | | | | | | |
| $ | 1,884 | | | $ | 1,179 | | | $ | 1,045 | | | $ | 1,746 | |
| $ | 1,722 | | | $ | 988 | | | $ | 1,376 | | | $ | 1,482 | |
| | | | | | | | | | | | | | | |
| | 1.54 | % | | | 1.68 | % | | | 1.62 | % | | | 1.45 | % |
| | 1.54 | % | | | 1.68 | % | | | 1.62 | % | | | 1.45 | % |
| | 3.17 | % | | | 3.70 | % | | | 3.43 | % | | | 2.32 | % |
See Notes to Financial Statements.
| | |
| Strategic Partners Real Estate Securities Fund | | 31 |
Report of Independent Registered Public Accounting Firm
The Board of Trustees and Shareholders of
Strategic Partners Real Estate Securities Fund
We have audited the accompanying statement of assets and liabilities of the Strategic Partners Real Estate Securities Fund, (the “Fund”) formerly known as the Prudential Real Estate Securities Fund, including the portfolio of investments, as of March 31, 2004, and the related statement of operations, the statement of changes in net assets, and the financial highlights for the year then ended. These financial statements and financial highlights are the responsibility of the Fund’s management. Our responsibility is to express an opinion on these financial statements and financial highlights based on our audit. The statement of changes in net assets and the financial highlights for the years presented through March 31, 2003, were audited by other auditors, whose report dated, May 15, 2003, expressed an unqualified opinion thereon.
We conducted our audit in accordance with the standards of the Public Company Accounting Oversight Board (United States). Those standards require that we plan and perform the audit to obtain reasonable assurance about whether the financial statements and financial highlights are free of material misstatement. An audit includes examining, on a test basis, evidence supporting the amounts and disclosures in the financial statements. Our procedures included confirmation of securities owned as of March 31, 2004 by correspondence with the custodian and brokers. As to securities purchased or sold but not yet received or delivered, we performed other appropriate auditing procedures. An audit also includes assessing the accounting principles used and significant estimates made by management, as well as evaluating the overall financial statement presentation. We believe that our audit provides a reasonable basis for our opinion.
In our opinion, the financial statements and financial highlights referred to above present fairly, in all material respects, the financial position of the Strategic Partners Real Estate Securities Fund as of March 31, 2004 and the results of its operations, the changes in its net assets, and the financial highlights for the year then ended, in conformity with accounting principles generally accepted in the United States of America.

New York, New York
May 18, 2004
| | |
| 32 | | Visit our website at www.strategicpartners.com |
Strategic Partners Real Estate Securities Fund
Federal Income Tax Information (Unaudited)
We are required by the Internal Revenue Code to advise you within 60 days of the Fund’s fiscal year end (March 31, 2004) as to the federal tax status of dividends paid by the Fund during such fiscal year. Accordingly, we are advising you that in the fiscal year ended March 31, 2004, dividends were paid of $.216, $.153, $.153 and $.236 per share (representing net investment income for Class A, B, C and Z shares respectively), which are taxable as ordinary income. The Fund utilized redemptions as distributions in the amount of $.0012 of ordinary income for each class of shares.
We wish to advise you that the corporate dividends received deduction for the Fund is 24%. Only funds that invest in U.S. equity securities are entitled to pass-through a corporate dividends received deduction.
In January 2004, you were advised on IRS Form 1099 DIV or substitute 1099 DIV as to the federal tax status of the dividends received by you in calendar year 2003.
| | |
| Strategic Partners Real Estate Securities Fund | | 33 |
Management of the Fund
(Unaudited)
Information pertaining to the Trustees of the Fund is set forth below. Trustees who are not deemed to be “interested persons” of the Fund, as defined in the 1940 Act are referred to as “Independent Trustees.” Trustees who are deemed to be “interested persons” of the Fund are referred to as “Interested Trustees.” “Fund Complex”† consists of the Fund and any other investment companies managed by Prudential Investments LLC (the Manager or PI).
Independent Trustees(2)
David E.A. Carson (69), Trustee since 2003(3) Oversees 89 portfolios in Fund complex
Principal occupations (last 5 years): Director (January 2000 to May 2000), Chairman (January 1999 to December 1999), Chairman and Chief Executive Officer (January 1998 to December 1998) and President, Chairman and Chief Executive Officer (1983-1997) of People’s Bank.
Other Directorships held:(4) Director of United Illuminating and UIL Holdings (utility company), since 1993.
Robert E. La Blanc (70), Trustee since 2001(3) Oversees 97 portfolios in Fund complex
Principal occupations (last 5 years): President (since 1981) of Robert E. La Blanc Associates, Inc. (telecommunications); formerly General Partner at Salomon Brothers and Vice-Chairman of Continental Telecom; Trustee of Manhattan College.
Other Directorships held:(4) Director of Storage Technology Corporation (technology) (since 1979), Chartered Semiconductor Manufacturing, Ltd. (since 1998); Titan Corporation (electronics) (since 1995), Computer Associates International, Inc. (software company) (since 2002); FiberNet Telecom Group, Inc. (telecom company) (since 2003); Director (since April 1999) of the High Yield Plus Fund, Inc.
Douglas H. McCorkindale (64), Trustee since 2003(3) Oversees 90 portfolios in Fund complex
Principal occupations (last 5 years): Chairman (since February 2001), Chief Executive Officer (since June 2000) and President (since September 1997) of Gannett Co. Inc. (publishing and media); formerly Vice Chairman (March 1984-May 2000) of Gannett Co., Inc.
Other Directorships held:(4) Director of Gannett Co. Inc., Director of Continental Airlines, Inc. (since May 1993); Director of Lockheed Martin Corp. (aerospace and defense) (since May 2001); Director of The High Yield Plus Fund, Inc. (since 1996).
Richard A. Redeker (60), Trustee since 2003(3) Oversees 91 portfolios in Fund complex
Principal occupations (last 5 years): Management Consultant; Director of Invesmart, Inc. (since 2001) and Director of Penn Tank Lines, Inc. (since 1999).
Other Directorships held:(4) None.
| | |
| 34 | | Visit our website at www.strategicpartners.com |
Robin B. Smith (64), Trustee since 1997(3) Oversees 96 portfolios in Fund complex
Principal occupations (last 5 years): Chairman of the Board (since January 2003) of Publishers Clearing House (direct marketing); formerly Chairman and Chief Executive Officer (August 1996-January 2003) of Publishers Clearing House.
Other Directorships held:(4) Director of BellSouth Corporation (since 1992).
Stephen D. Stoneburn (60), Trustee since 2001(3) Oversees 94 portfolios in Fund complex
Principal occupations (last 5 years): President and Chief Executive Officer (since June 1996) of Quadrant Media Corp. (a publishing company); formerly President (June 1995-June 1996) of Argus Integrated Media, Inc.; Senior Vice President and Managing Director (January 1993-1995) of Cowles Business Media and Senior Vice President of Fairchild Publications, Inc. (1975-1989).
Other Directorships held:(4) None
Clay T. Whitehead (65), Trustee since 1997(3) Oversees 95 portfolios in Fund complex
Principal occupations (last 5 years): President (since 1983) of National Exchange Inc. (new business development firm).
Other Directorships held:(4) Director (since 2000) of the High Yield Plus Fund, Inc.
Interested Trustees(1)
Judy A. Rice (56), President since 2003 and Trustee since 2000(3) Oversees 94 portfolios in Fund complex
Principal occupations (last 5 years): President, Chief Executive Officer, Chief Operating Officer and Officer-in-Charge (since 2003) of PI; Director, Officer-in-Charge, President, Chief Executive Officer and Chief Operating Officer (since May 2003) of American Skandia Advisory Services, Inc. and American Skandia Investment Services, Inc.; Director, Officer-in-Charge, President, Chief Executive Officer (since May 2003) of American Skandia Fund Services, Inc.; Vice President (since February 1999) of Prudential Investment Management Services LLC; President, Chief Executive Officer and Officer-in-Charge (since April 2003) of Prudential Mutual Fund Services LLC; formerly various positions to Senior Vice President (1992-1999) of Prudential Securities; and various positions to Managing Director (1975-1992) of Salomon Smith Barney; Member of Board of Governors of the Money Management Institute.
Other Directorships held:(4) None
Robert F. Gunia (57), Vice President and Trustee since 1997(3) Oversees 178 portfolios in Fund complex
Principal occupations (last 5 years): Chief Administrative Officer (since June 1999) of PI; Executive Vice President and Treasurer (since January 1996) of PI; President (since April 1999) of Prudential Investment Management Services LLC (PIMS); Corporate Vice President (since September 1997) of The Prudential Insurance Company of America (Prudential); Director, Executive Vice President and Chief Administrative Officer (since May 2003) of American Skandia Investment Services, Inc., American Skandia Advisory Services, Inc. and American Skandia Fund Services, Inc.; Executive Vice President (since March 1999) and Treasurer (since May 2000) of Prudential Mutual Fund Services LLC; formerly Senior Vice President (March 1987-May 1999) of Prudential Securities.
Other Directorships held:(4) Vice President and Director (since May 1989) and Treasurer (since 1999) of The Asia Pacific Fund, Inc.
| | |
| Strategic Partners Real Estate Securities Fund | | 35 |
Management of the Fund
Cont’d
Information pertaining to the Officers of the Fund who are not also Trustees is set forth below.
Officers(2)
Marguerite E.H. Morrison (48), Chief Legal Officer since 2003 and Assistant Secretary since 2002(3)
Principal occupations (last 5 years): Vice President and Chief Legal Officer—Mutual Funds and Unit Investment Trust (since August 2000) of Prudential; Senior Vice President and Secretary (since April 2003) of PI; Senior Vice President and Secretary (since May 2003) of American Skandia Investment Services, Inc., American Skandia Advisory Services, Inc. and American Skandia Fund Services, Inc.; Vice President and Assistant Secretary of PIMS (since October 2001), previously Senior Vice President and Assistant Secretary (February 2001-April 2003) of PI, Vice President and Associate General Counsel (December 1996-February 2001) of PI.
Grace C. Torres (44), Treasurer and Principal Financial and Accounting Officer since 1997(3)
Principal occupations (last 5 years): Senior Vice President (since January 2000) of PI; Senior Vice President and Assistant Treasurer (since May 2003) of American Skandia Investment Services, Inc. and American Skandia Advisory Services, Inc.; formerly First Vice President (December 1996-January 2000) of PI and First Vice President (March 1993-1999) of Prudential Securities.
Jonathan D. Shain (45), Secretary since 2001
Vice President and Corporate Counsel (since August 1998) of Prudential; Vice President and Assistant Secretary (since May 2003) of American Skandia Investment Services, Inc. and American Skandia Fund Services, Inc., formerly Attorney with Fleet Bank, N.A. (January 1997-July 1998).
Maryanne Ryan (39), Anti-Money Laundering Compliance Officer since 2002(3)
Principal occupations (last 5 years): Vice President, Prudential (since November 1998); First Vice President, Prudential Securities (March 1997-May 1998); Anti-Money Laundering Compliance Officer (since 2003) of American Skandia Investment Services, Inc., American Skandia Advisory Services, Inc. and American Skandia Marketing, Inc.
Lee D. Augsburger (44), Chief Compliance Officer since 2004(3)
Principal occupations (last 5 years): Vice President and Chief Compliance Officer (since May 2003) of PI; Vice President and Chief Compliance Officer (since October 2000) of Prudential Investment Management, Inc.; formerly Vice President and Chief Legal Officer—Annuities (August 1999-October 2000) of Prudential Insurance Company of America; Vice President and Corporate Counsel (November 1997-August 1999) of Prudential Insurance Company of America.
| † | The Fund Complex consists of all investment companies managed by PI. The Funds for which PI serves as manager include JennisonDryden Mutual Funds, Strategic Partners Funds, The Prudential Variable Contract Accounts 2, 10, 11, The Target Portfolio Trust, The Prudential Series Fund, Inc., American Skandia Trust, and Prudential’s Gibraltar Fund. |
| (1) | “Interested” Trustee, as defined in the 1940 Act, by reason of employment with the Manager (Prudential Investments LLC or PI), the Subadviser (Wellington Management Company, LLP or Wellington Management, Inc.) or the Distributor (Prudential Investment Management Services LLC or PIMS). |
| | |
| 36 | | Visit our website at www.strategicpartners.com |
| (2) | Unless otherwise noted, the address of the Trustees and Officers is c/o: Prudential Investments LLC, Gateway Center Three, 100 Mulberry Street, Newark, NJ 07102. |
| (3) | There is no set term of office for Trustees and Officers. The Independent Trustees have adopted a retirement policy, which calls for the retirement of Trustees on December 31 of the year in which they reach the age of 75. The table shows the individuals’ length of service as Trustees and/or Officer. |
| (4) | This includes only directorships of companies required to register, or file reports with, the SEC under the Securities and Exchange Act of 1934 (that is, “public companies”) or other investment companies registered under the 1940 Act. |
Additional information about the Fund’s Trustees is included in the Fund’s Statement of Additional Information which is available without charge, upon request, by calling (800) 521-7466 or (732) 482-7555 (Calling from outside the U.S.)
| | |
| Strategic Partners Real Estate Securities Fund | | 37 |
Growth of a $10,000 Investment
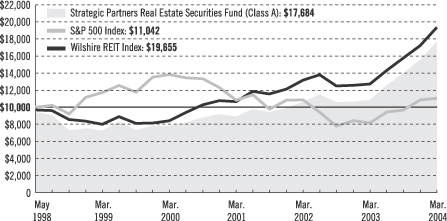
| | | | | | | | | |
|
| Average Annual Total Returns (With Sales Charges) as of 3/31/04 | |
| | | One Year | | | Five Years | | | Since Inception | |
Class A | | 53.84 | % | | 18.18 | % | | 10.13 | % |
| |
Class B | | 56.62 | | | 18.52 | | | 10.26 | |
| |
Class C | | 60.62 | | | 18.62 | | | 10.36 | |
| |
Class Z | | 63.21 | | | 19.82 | | | 11.48 | |
| |
| | | | | | | | | | |
|
| Average Annual Total Returns (Without Sales Charges) as of 3/31/04 | |
| | | One Year | | | Five Years | | | Since Inception | |
Class A | | 62.79 | % | | 19.52 | % | | 11.19 | % |
| |
Class B | | 61.62 | | | 18.62 | | | 10.36 | |
| |
Class C | | 61.62 | | | 18.62 | | | 10.36 | |
| |
Class Z | | 63.21 | | | 19.82 | | | 11.48 | |
| |
Performance data quoted represents past performance and is not indicative of future results. The investment return and principal value of an investment will fluctuate so that an investor’s shares, when redeemed, may be worth more or less than their original cost. Current performance may be lower or higher than the past performance data quoted. An investor may obtain current performance data to the most recent month-end by visiting our website at www.strategicpartners.com or by calling (800) 225-1852.
Source: Prudential Investments LLC and Lipper Inc. Inception date: 5/5/98.
| | |
| | | Visit our website www.strategicpartners.com |
The graph compares a $10,000 investment in the Strategic Partners Real Estate Securities Fund (Class A shares) with a similar investment in the S&P 500 Index and the Wilshire REIT Index by portraying the initial account values at the commencement of operations of Class A shares (May 5, 1998) and the account values at the end of the current fiscal year (March 31, 2004) as measured on a quarterly basis. For purposes of the graph, and unless otherwise indicated, it has been assumed that (a) the maximum applicable front-end sales charge was deducted from the initial $10,000 investment in Class A shares; (b) all recurring fees (including management fees) were deducted; and (c) all dividends and distributions were reinvested. The line graph provides information for Class A shares only. As indicated in the tables provided earlier, performance for Class B, C, and Z shares will vary due to the differing charges and expenses applicable to each share class (as indicated in the following paragraphs). Without a distribution and service (12b-1) fee waiver of 0.05% for Class A shares annually through March 31, 2004, the returns shown in the graph and for Class A shares in the tables would have been lower.
The S&P 500 Index is an unmanaged index of 500 stocks of large U.S. public companies. It gives a broad look at how stock prices in the United States have performed. The Wilshire REIT Index is an unmanaged, market capitalization-weighted index comprising publicly traded REITs. The Wilshire REIT Index does not include real estate operating companies like the Wilshire Real Estate Securities Index does. The Indexes’ total returns include the reinvestment of all dividends, but do not include the effects of sales charges, operating expenses of a mutual fund, or taxes. The returns for the Indexes would be lower if they included the effects of sales charges, operating expenses, or taxes. The securities that comprise these indexes may differ substantially from the securities in the Fund. These are not the only indexes that may be used to characterize performance of real estate securities funds. Other indexes may portray different comparative performance. Investors cannot invest directly in an index.
Through March 14, 2004, the Fund charged a maximum front-end sales charge of 5% for Class A shares and a 12b-1 fee of up to 0.30% annually. Effective March 15, 2004, Class A shares are subject to a maximum front-end sales charge of 5.50% and a 12b-1 fee of up to 0.30% annually. Investors who purchase Class A shares in an amount of $1 million or more do not pay a front-end sales charge, but are subject to a contingent deferred sales charge (CDSC) of 1% for shares sold within 12 months of purchase. Class B shares are subject to a declining CDSC of 5%, 4%, 3%, 2%, 1%, and 1% respectively for the first six years after purchase and a 12b-1 fee of 1% annually. Approximately seven years after purchase, Class B shares will automatically convert to Class A shares on a quarterly basis. Through February 1, 2004, Class C shares were subject to a front-end sales charge of 1%, a CDSC of 1% for shares redeemed within 18 months of purchase, and a 12b-1 fee of 1% annually. Class C shares purchased on or after February 2, 2004 are not subject to a front-end sales charge, the CDSC of 1% for Class C shares purchased on or after that date will apply for 12 months from the date of purchase, and the annual 12b-1 fee will remain 1%. The returns in the graph and the tables do not reflect the deduction of taxes that a shareholder would pay on Fund distributions or following the redemption of Fund shares.
| | |
| Strategic Partners Real Estate Securities Fund | | |
| | | | |
| | |
| n MAIL | | n TELEPHONE | | n WEBSITE |
Gateway Center Three 100 Mulberry Street Newark, NJ 07102 | | (800) 225-1852 | | www.strategicpartners.com |
|
| PROXY VOTING |
| The Board of Trustees of the Fund has delegated to the Fund’s investment adviser the responsibility for voting any proxies and maintaining proxy recordkeeping with respect to the Fund. A description of these proxy voting policies and procedures is available without charge, upon request, by calling (800) 225-1852 or by visiting the SEC’s website at http://www.sec.gov. |
|
| TRUSTEES |
| David E.A. Carson • Robert F. Gunia • Robert E. La Blanc • Douglas H. McCorkindale • Richard A. Redeker • Judy A. Rice • Robin B. Smith • Stephen D. Stoneburn • Clay T. Whitehead |
|
| OFFICERS |
| Judy A. Rice, President • Robert F. Gunia, Vice President • Grace C. Torres, Treasurer and Principal Financial and Accounting Officer • Marguerite E.H. Morrison, Chief Legal Officer and Assistant Secretary• Jonathan D. Shain, Secretary •Maryanne Ryan, Anti-Money Laundering Compliance Officer •Lee D. Augsberger, Chief Compliance Officer |
| | | | |
| MANAGER | | Prudential Investments LLC | | Gateway Center Three
100 Mulberry Street
Newark, NJ 07102 |
|
| INVESTMENT ADVISER | | Wellington Management
Company, LLP | | 75 State Street
Boston, MA 02109 |
|
| DISTRIBUTOR | | Prudential Investment
Management Services LLC | | Gateway Center Three
14th Floor
100 Mulberry Street
Newark, NJ 07102 |
|
| CUSTODIAN | | State Street Bank
and Trust Company | | One Heritage Drive
North Quincy, MA 02171 |
|
| TRANSFER AGENT | | Prudential Mutual Fund
Services LLC | | PO Box 8098
Philadelphia, PA 19101 |
|
| INDEPENDENT AUDITORS | | KPMG LLP | | 757 Third Avenue
New York, NY 10017 |
|
| FUND COUNSEL | | Sullivan & Cromwell LLP | | 125 Broad Street
New York, NY 10004 |
| | | | | | | | | | | | |
| | |
| Strategic Partners Real Estate Securities Fund | | | | |
| | | Share Class | | A | | B | | C | | Z | | |
| | | | | | |
| | | NASDAQ | | PURAX | | PURBX | | — | | — | | |
| | | CUSIP | | 86276L109 | | 86276L208 | | 86276L307 | | 86276L406 | | |
| | | | | | | | | | | | | |
|
| |
An investor should consider the investment objectives, risks, and charges and expenses of the Fund carefully before investing. The prospectus for the Fund contains this and other information about the Fund. An investor may obtain a prospectus by visiting our website at www.strategicpartners.com or by calling (800) 225-1852. The prospectus should be read carefully before investing. |
|
| |
E-DELIVERY To receive your mutual fund documents online, go to www.icsdelivery.com/prudential/funds and enroll. Instead of receiving printed documents by mail, you will receive notification via e-mail when new materials are available. You can cancel your enrollment or change your e-mail address at any time by clicking on the change/cancel enrollment option at the icsdelivery website address. |
Mutual Funds:
| | | | |
| ARE NOT INSURED BY THE FDIC OR ANY FEDERAL GOVERNMENT AGENCY | | MAY LOSE VALUE | | ARE NOT A DEPOSIT OF OR GUARANTEED BY ANY BANK OR ANY BANK AFFILIATE |

| | | | | | | | | | | | |
| | |
| Strategic Partners Real Estate Securities Fund | | | | |
| | | Share Class | | A | | B | | C | | Z | | |
| | | | | | |
| | | NASDAQ | | PURAX | | PURBX | | — | | — | | |
| | | CUSIP | | 86276L109 | | 86276L208 | | 86276L307 | | 86276L406 | | |
| | | | | | | | | | | | | |
MFSP182E IFS-A091937 Ed. 05/2004
Item 2 – Code of Ethics – – See Exhibit (a)
As of the end of the period covered by this report, the registrant has adopted a code of ethics (the “Section 406 Standards for Investment Companies – Ethical Standards for Principal Executive and Financial Officers”) that applies to the registrant’s Principal Executive Officer and Principal Financial Officer; the registrant’s Principal Financial Officer also serves as the Principal Accounting Officer.
The registrant hereby undertakes to provide any person, without charge, upon request, a copy of the code of ethics. To request a copy of the code of ethics, contact the registrant 973-802-6469, and ask for a copy of the Section 406 Standards for Investment Companies – Ethical Standards for Principal Executive and Financial Officers.
Item 3 – Audit Committee Financial Expert –
The registrant’s Board has determined that Mr. David Carson, member of the Board’s Audit Committee is an “audit committee financial expert,” and that he is “independent,” for purposes of this Item.
Item 4 – Principal Accountant Fees and Services –
(a) Audit Fees
For the fiscal year ended March 31, 2004, KPMG LLP, the Registrant’s principal accountant, billed the Registrant $16,700 for professional services rendered for the audit of the Registrant’s annual financial statements or services that are normally provided in connection with statutory and regulatory filings. KPMG did not serve as the Registrant’s principal accountant during fiscal year ended March 31, 2003, so no information for that fiscal year is provided.
(b) Audit-Related Fees
None.
( c) Tax Fees
None.
(d) All Other Fees
None.
(e) (1) Audit Committee Pre-Approval Policies and Procedures
THE PRUDENTIAL MUTUAL FUNDS
AUDIT COMMITTEE POLICY
on
Pre-Approval of Services Provided by the Independent Accountants
The Audit Committee of each Prudential Mutual Fund is charged with the responsibility to monitor the independence of the Fund’s independent accountants. As part of this responsibility, the Audit Committee must pre-approve any independent accounting firm’s engagement to render audit and/or permissible non-audit services, as required by law. In evaluating a proposed engagement of the independent accountants, the Audit Committee will assess the effect that the engagement might reasonably be expected to have on the accountant’s independence. The Committee’s evaluation will be based on:
| | • | a review of the nature of the professional services expected to be provided, |
| | • | a review of the safeguards put into place by the accounting firm to safeguard independence, and |
| | • | periodic meetings with the accounting firm. |
Policy for Audit and Non-Audit Services Provided to the Funds
On an annual basis, the scope of audits for each Fund, audit fees and expenses, and audit-related and non-audit services (and fees proposed in respect thereof) proposed to be performed by the Fund’s independent accountants will be presented by the Treasurer and the independent accountants to the Audit Committee for review and, as appropriate, approval prior to the initiation of such services. Such presentation shall be accompanied by confirmation by both the Treasurer and the independent accountants that the proposed services will not adversely affect the independence of the independent accountants. Proposed services shall be described in sufficient detail to enable the Audit Committee to assess the appropriateness of such services and fees, and the compatibility of the provision of such services with the auditor’s independence. The Committee shall receive periodic reports on the progress of the audit and other services which are approved by the Committee or by the Committee Chair pursuant to authority delegated in this Policy.
The categories of services enumerated under “Audit Services”, “Audit-related Services”, and “Tax Services” are intended to provide guidance to the Treasurer and the independent accountants as to those categories of services which the Committee believes are generally consistent with the independence of the independent accountants and which the Committee (or the Committee Chair) would expect upon the presentation of specific proposals to pre-approve. The enumerated categories are not intended as an exclusive list of audit, audit-related or tax services which the Committee (or the Committee Chair) would consider for pre-approval.
Audit Services
The following categories of audit services are considered to be consistent with the role of the Fund’s independent accountants:
| | Ø | Annual Fund financial statement audits |
| | Ø | Seed audits (related to new product filings, as required) |
| | Ø | SEC and regulatory filings and consents |
Audit-related Services
The following categories of audit-related services are considered to be consistent with the role of the Fund’s independent accountants:
| | Ø | Accounting consultations |
| | Ø | Fund merger support services |
| | Ø | Agreed Upon Procedure Reports |
| | Ø | Other Internal Control Reports |
Individual audit-related services that fall within one of these categories and are not presented to the Audit Committee as part of the annual pre-approval process will be subject to pre-approval by the Committee Chair (or any other Committee member on whom this responsibility has been delegated) so long as the estimated fee for those services does not exceed $50,000.
Tax Services
The following categories of tax services are considered to be consistent with the role of the Fund’s independent accountants:
| | Ø | Tax compliance services related to the filing or amendment of the following: |
| | • | Federal, state and local income tax compliance; and, |
| | • | Sales and use tax compliance |
| | Ø | Timely RIC qualification reviews |
| | Ø | Tax distribution analysis and planning |
| | Ø | Tax authority examination services |
| | Ø | Tax appeals support services |
| | Ø | Accounting methods studies |
| | Ø | Fund merger support services |
| | Ø | Tax consulting services and related projects |
Individual tax services that fall within one of these categories and are not presented to the Audit Committee as part of the annual pre-approval process will be subject to pre-approval by the Committee Chair (or any other Committee member on whom this responsibility has been delegated) so long as the estimated fee for those services does not exceed $50,000.
Other Non-audit Services
Certain non-audit services that the independent accountants are legally permitted to render will be subject to pre-approval by the Committee or by one or more Committee members to whom the Committee has delegated this authority and who will report to the full Committee any pre-approval decisions made pursuant to this Policy. Non-audit services presented for pre-approval
pursuant to this paragraph will be accompanied by a confirmation from both the Treasurer and the independent accountants that the proposed services will not adversely affect the independence of the independent accountants.
Proscribed Services
The Fund’s independent accountants will not render services in the following categories of non-audit services:
| | Ø | Bookkeeping or other services related to the accounting records or financial statements of the Fund |
| | Ø | Financial information systems design and implementation |
| | Ø | Appraisal or valuation services, fairness opinions, or contribution-in-kind reports |
| | Ø | Internal audit outsourcing services |
| | Ø | Management functions or human resources |
| | Ø | Broker or dealer, investment adviser, or investment banking services |
| | Ø | Legal services and expert services unrelated to the audit |
| | Ø | Any other service that the Public Company Accounting Oversight Board determines, by regulation, is impermissible. |
Pre-approval of Non-Audit Services Provided to Other Entities Within the Prudential Fund Complex
Certain non-audit services provided to Prudential Investments LLC or any of its affiliates that also provide ongoing services to the Prudential Mutual Funds will be subject to pre-approval by the Audit Committee. The only non-audit services provided to these entities that will require pre-approval are those related directly to the operations and financial reporting of the Funds. Individual projects that are not presented to the Audit Committee as part of the annual pre-approval process, will be subject to pre-approval by the Committee Chair (or any other Committee member on whom this responsibility has been delegated) so long as the estimated fee for those services does not exceed $50,000. Services presented for pre-approval pursuant to this paragraph will be accompanied by a confirmation from both the Treasurer and the independent accountants that the proposed services will not adversely affect the independence of the independent accountants.
Although the Audit Committee will not pre-approve all services provided to Prudential Investments LLC and its affiliates, the Committee will receive an annual report from the Fund’s independent accounting firm showing the aggregate fees for all services provided to Prudential Investments and its affiliates.
(e)-(2) Percentage of services referred to in 4(b)- (4)(d) that were approved by the audit committee –Not applicable.
| (f) | Percentage of hours expended attributable to work performed by other than full time employees of principal accountant if greater than 50%. |
Not applicable.
(g) Non-Audit Fees
Not applicable to Registrant and to the registrant’s investment adviser and any entity controlling, controlled by, or under common control with the investment adviser that provides ongoing services to the registrant.
(h) Principal Accountants Independence
Not applicable as KPMG has not provided non-audit services to the registrant’s investment adviser and any entity controlling, controlled by, or under common control with the investment adviser that provides ongoing services to the registrant that were not pre-approved pursuant to Rule 2-01(c)(7)(ii) of Regulation S-X.
Item 5 – Audit Committee of Listed Registrants – Not applicable.
Item 6 – Schedule of Investments – The schedule is included as part of the report to shareholders filed under Item 1 of this Form.
Item 7 – Disclosure of Proxy Voting Policies and Procedures for Closed-End Management Investment Companies – Not applicable.
Item 8 – Purchases of Equity Securities by Closed-End Management Investment Company and Affiliated Purchasers – Not applicable.
Item 9 – Submission of Matters to a Vote of Security Holders: None.
Item 10 – Controls and Procedures
| | (a) | It is the conclusion of the registrant’s principal executive officer and principal financial officer that the effectiveness of the registrant’s current disclosure controls and procedures (such disclosure controls and procedures having been evaluated within 90 days of the date of this filing) provide reasonable assurance that the information required to be disclosed by the registrant has been recorded, processed, summarized and reported within the time period specified in the Commission’s rules and forms and that the information required to be disclosed by the registrant has been accumulated and communicated to the registrant’s principal executive officer and principal financial officer in order to allow timely decisions regarding required disclosure. |
| | (b) | There have been no significant changes in the registrant’s internal controls or in other factors that could significantly affect these controls subsequent to the date of their evaluation, including any corrective actions with regard to significant deficiencies and material weaknesses. |
Item 11 – Exhibits
| | (a) | Code of Ethics – Attached hereto |
| | (b) | Certifications pursuant to Section 302 and 906 of the Sarbanes-Oxley Act – Attached hereto |
SIGNATURES
Pursuant to the requirements of the Securities Exchange Act of 1934 and the Investment Company Act of 1940, the registrant has duly caused this report to be signed on its behalf by the undersigned, thereunto duly authorized.
| | |
| (Registrant) | | Strategic Partners Real Estate Securities Fund |
| | |
|
| | |
| By (Signature and Title)* | | /s/ Jonathan D. Shain |
| | |
|
| | | Jonathan D. Shain Secretary |
Pursuant to the requirements of the Securities Exchange Act of 1934 and the Investment Company Act of 1940, this report has been signed below by the following persons on behalf of the registrant and in the capacities and on the dates indicated.
| | |
| By (Signature and Title)* | | /s/ Judy A. Rice |
| | |
|
| | | Judy A. Rice President and Principal Executive Officer |
| | |
| By (Signature and Title)* | | /s/ Grace C. Torres |
| | |
|
| | | Grace C. Torres Treasurer and Principal Financial Officer |
| * | Print the name and title of each signing officer under his or her signature. |