UNITED STATES
SECURITIES AND EXCHANGE COMMISSION
Washington, D.C. 20549
FORM N-CSR
CERTIFIED SHAREHOLDER REPORT OF REGISTERED MANAGEMENT
INVESTMENT COMPANIES
| | |
| Investment Company Act file number: | | 811-08565 |
| |
| Exact name of registrant as specified in charter: | | Strategic Partners Real Estate |
| | | Fund (fka Strategic Partners |
| | | Real Estate Securities Fund) |
| |
| Address of principal executive offices: | | Gateway Center 3, |
| | | 100 Mulberry Street, |
| | | Newark, New Jersey 07102 |
| |
| Name and address of agent for service: | | Deborah A. Docs |
| | | Gateway Center 3, |
| | | 100 Mulberry Street, |
| | | Newark, New Jersey 07102 |
| |
| Registrant’s telephone number, including area code: | | 973-367-7521 |
| |
| Date of fiscal year end: | | 3/31/2005 |
| |
| Date of reporting period: | | 3/31/2005 |
Item 1 – Reports to Stockholders – [ INSERT REPORT ]
ANNUAL REPORT
MARCH 31, 2005
STRATEGIC PARTNERS
REAL ESTATE FUND
Formerly known as Strategic Partners Real Estate Securities Fund

OBJECTIVE
High current income and long-term growth of capital
This report is not authorized for distribution to prospective investors unless preceded or accompanied by a current prospectus.
The views expressed in this report and information about the Fund’s portfolio holdings are for the period covered by this report and are subject to change thereafter.

Dear Shareholder,
May 16, 2005
We hope that you find the annual report for the Strategic Partners Real Estate Fund informative and useful. As a Strategic Partners Mutual Fund shareholder, you may be thinking about where you can find additional growth opportunities. You could invest in last year’s top-performing asset class and hope that history repeats itself or you could stay in cash while waiting for the “right moment” to invest.
We believe it is wise to take advantage of developing domestic and global investment opportunities through a diversified portfolio of stock and bond mutual funds. A diversified asset allocation offers two advantages. It helps you manage downside risk by not being overly exposed to any particular asset class, plus it gives you a better opportunity to have at least some of your assets in the right place at the right time. Your financial professional can help you create a diversified investment plan that may include mutual funds that cover all the basic asset classes and reflects your personal investment profile and tolerance for risk.
Strategic Partners Mutual Funds give you a wide range of choices that can help you make progress toward your financial goals. Our funds feature leading asset managers not just from a single company but from the entire investment industry.
Thank you for choosing Strategic Partners Mutual Funds.
Sincerely,

Judy A. Rice, President
Strategic Partners Real Estate Fund
| | |
| Strategic Partners Real Estate Fund | | 1 |
Your Fund’s Performance
Fund objective
The investment objective of the Strategic Partners Real Estate Fund (the Fund) is high current income and long-term growth of capital. There can be no assurance that the Fund will achieve its investment objective.
Performance data quoted represent past performance. Past performance does not guarantee future results. The investment return and principal value of an investment will fluctuate so that an investor’s shares, when redeemed, may be worth more or less than their original cost. Current performance may be lower or higher than the past performance data quoted. An investor may obtain performance data current to the most recent month-end by visiting our website at www.strategicpartners.com or by calling (800) 225-1852. The maximum initial sales charge is 5.50% (Class A shares).
| | | | | | | | | |
| Cumulative Total Returns1 as of 3/31/05 | | | | | | | | | |
| | | One Year | | | Five Years | | | Since Inception2 | |
Class A | | 15.37 | % | | 161.20 | % | | 115.88 | % |
Class B | | 14.51 | | | 151.47 | | | 105.02 | |
Class C | | 14.51 | | | 151.47 | | | 105.02 | |
Class Z | | 15.69 | | | 164.47 | | | 119.83 | |
S&P 500 Index3 | | 6.69 | | | –14.83 | | | 17.80 | |
Wilshire REIT Index4 | | 10.24 | | | 148.75 | | | 116.69 | |
Lipper Real Estate Funds Avg.5 | | 10.10 | | | 142.61 | | | 106.13 | |
| | | | | | | | | | |
| Average Annual Total Returns1 as of 3/31/05 | | | | | | | | | |
| | | One Year | | | Five Years | | | Since Inception2 | |
Class A | | 9.02 | % | | 19.81 | % | | 10.87 | % |
Class B | | 9.51 | | | 20.16 | | | 10.95 | |
Class C | | 13.51 | | | 20.25 | | | 10.95 | |
Class Z | | 15.69 | | | 21.47 | | | 12.08 | |
S&P 500 Index3 | | 6.69 | | | –3.16 | | | 2.40 | |
Wilshire REIT Index4 | | 10.24 | | | 19.99 | | | 11.83 | |
Lipper Real Estate Funds Avg.5 | | 10.10 | | | 19.30 | | | 10.96 | |
The cumulative total returns do not reflect the deduction of applicable sales charges. If reflected, the applicable sales charges would reduce the cumulative total returns performance quoted. Class A shares are subject to a maximum front-end sales charge of 5.50%. Under certain circumstances, Class A shares may be subject to a contingent deferred sales charge (CDSC) of 1%. Class B and Class C shares are subject to a maximum CDSC of 5% and 1% respectively. Class Z shares are not subject to a sales charge.
| | |
| 2 | | Visit our website at www.strategicpartners.com |
1Source: Prudential Investments LLC and Lipper Inc. The average annual total returns take into account applicable sales charges. During certain periods shown, fee waivers and/or expense reimbursements were in effect. Without such fee waivers and expense reimbursements, the returns for the share classes would have been lower. Class A, Class B, and Class C shares are subject to an annual distribution and service (12b-1) fee of up to 0.30%, 1.00%, and 1.00% respectively. Approximately seven years after purchase, Class B shares will automatically convert to Class A shares on a quarterly basis. Class Z shares are not subject to a 12b-1 fee. The returns in the tables do not reflect the deduction of taxes that a shareholder would pay on Fund distributions or following the redemption of Fund shares.
2Inception date: 5/5/98.
3The Standard & Poor’s 500 Composite Stock Price Index (S&P 500 Index) is an unmanaged index of 500 stocks of large U.S. companies. It gives a broad look at how U.S. stock prices have performed.
4The Wilshire REIT Index is an unmanaged, market capitalization-weighted index comprising publicly traded REITs. This Index does not include real estate operating companies as the Wilshire Real Estate Securities Index does.
5The Lipper Real Estate Funds Average (Lipper Average) represents returns based on the average return for all funds in the Lipper Real Estate Funds category for the periods noted. Funds in the Lipper Real Estate Funds category invest primarily in equity securities of domestic and foreign companies engaged in the real estate industry.
Investors cannot invest directly in an index. The returns for the S&P 500 Index and the Wilshire REIT Index would be lower if they included the effects of sales charges, operating expenses of a mutual fund, or taxes.
Returns for the Lipper Average reflect the deduction of operating expenses, but not sales charges or taxes. The Since Inception returns for the S&P 500 Index, the Wilshire REIT Index, and the Lipper Average are measured from the closest month-end to inception date, and not from the Fund’s actual inception date.
| | | |
| Five Largest Holdings expressed as a percentage of net assets as of 3/31/05 | |
Simon Property Group, Inc., Retail—Malls | | 7.6 | % |
Kimco Realty Corp., Retail—Shopping Centers | | 7.6 | |
General Growth Properties, Inc., Retail—Malls | | 7.4 | |
Starwood Hotels & Resorts Worldwide, Inc., Lodging | | 6.5 | |
ProLogis, Warehouse | | 5.4 | |
| Holdings are subject to change. | | | |
| | | |
| Five Largest Industries expressed as a percentage of net assets as of 3/31/05 | |
Retail—Shopping Centers | | 15.6 | % |
Retail—Malls | | 15.0 | |
Lodging | | 13.8 | |
Diversified | | 13.1 | |
Warehouse | | 11.3 | |
Industry weightings are subject to change.
| | |
| Strategic Partners Real Estate Fund | | 3 |
Investment Adviser’s Report
Wellington Management Company, LLP
The REIT sector and the Fund both performed well over the one-year period ended March 31, 2005, despite rising short-term interest rates and higher REIT volatility than in the overall market. The Fund’s benchmark, the Wilshire REIT Index, returned 10.24%, outperforming both the S&P 500 and the Russell 2000 Indexes. The Fund substantially outperformed its benchmark.
We believe REIT outperformance was driven by improved real estate operating fundamentals coupled with investors’ continued attraction to the sector’s relatively stable high dividends. An increase in merger and acquisition activity also contributed to the sector’s performance.
Our investment style is bottom-up stock selection. The Fund outperformed primarily because several significant positions had returns between 20% and over 50% during the reporting period. One of its largest holdings also was among the largest contributors to its return: Starwood Hotels & Resorts (see Comments on Largest Holdings) returned 44%. Starwood’s hotel business emphasizes the global operation of hotels and resorts, primarily in the luxury and upscale segment of the industry. The French property market has performed well in the last several years. Unibail, the largest commercial property firm in France, was a strong performer, rising 51%. CB Richard Ellis Group was another significant contributor to Fund performance. It is one of the largest firms in the fragmented U.S. commercial real estate services business, and it has increasingly become an industry consolidator. We view the company as an attractive way to invest in the recovering market for office properties.
The Fund benefited when three firms in which it had positions—The Rouse Company, Chelsea Property Group, and LNR Property—were acquired or merged. Rouse was acquired by another Fund holding, General Growth Properties (see Comments on Largest Holdings). The Fund also had substantial holdings in the high-performing lodging sector, which is enjoying a cyclical rebound in corporate travel and improving trends in room rates and occupancy. In addition to Starwood, Host Marriott was among the largest contributors to the period’s return.
Looking ahead
We expect the U.S. economy to continue growing, but at a slower pace than in 2004. Rising interest rates and higher energy costs have been dampening the rate of growth since last summer, but recent strength in the U.S. dollar and subdued employment growth support our baseline scenario of continued growth.
| | |
| 4 | | Visit our website at www.strategicpartners.com |
We view the real estate securities sector, in general, as being fairly valued in terms of both cash flow and net asset values. Private-market real estate valuations have increased dramatically over the last 18 months, causing the perceived public market premium to private market valuations to all but disappear.
We remain wary that the Federal Reserve may be forced to raise interest rates to defend the U.S. dollar and that higher interest rates may dampen investor demand and pressure asset values. We are concerned that the negative impact of higher interest rates on the demand for space will be felt before the positive impact of a stronger economy. Nevertheless, our outlook for the real estate sector has improved slightly due to the recent pullback in REIT share prices, improved operating fundamentals in most property sectors, and the fact that we are closer to the end of the series of interest-rate hikes than we were six months ago.
We are seeing evidence that higher commodity and land prices, the latter due in part to the exuberant residential real estate market, are translating into significantly higher construction costs for commercial property. Rising construction costs typically slow the introduction of new supply until rents are high enough to justify further investment. These considerations underlie our increasing confidence that rent and occupancy rates will begin to rise.
The Portfolio of Investments following this report shows the size of the Fund’s positions at period-end.
| | |
| Strategic Partners Real Estate Fund | | 5 |
Comments on Largest Holdings
Holdings expressed as a percentage of the Fund’s net assets as of 3/31/05.
7.6% Simon Property Group, Inc.
Simon Property Group is the largest publicly traded retail REIT in North America and the country’s largest owner, developer, and manager of high-quality retail real estate, primarily regional malls, Premium Outlet® centers, and community shopping centers. We believe it has strong growth potential from the repricing of its below-market leases at market rates and significant redevelopment opportunities.
7.6% Kimco Realty Corp.
Kimco Realty is the largest publicly traded owner and operator of neighborhood and community shopping centers in North America. It also develops retail properties for sale, invests in real estate-related securities and mortgages secured by retail real estate, and provides capital and expertise to retailers with surplus real estate. We are attracted to Kimco’s strong management team and its ability to find very attractive, high return-on-equity investment opportunities.
7.4% General Growth Properties, Inc.
General Growth Properties owns and operates regional malls. It has been an aggressive consolidator of retail real estate, successfully integrating several large acquisitions and mergers, including last year’s acquisition of the Rouse Company. We believe the synergism and growth potential of the Rouse acquisition, together with General Growth Properties’ use of leverage, will allow it to declare significantly higher dividends over the next several years.
6.5% Starwood Hotels & Resorts WorldWide, Inc.
Starwood’s brand names include St. Regis, The Luxury Collection, Sheraton, Westin, W, and Four Points by Sheraton, which are well represented in most major markets around the world. Its hotel business emphasizes the global operation of hotels and resorts primarily in the luxury segment of the industry. We expect strong room rate and occupancy trends to drive double-digit earnings growth over the next several years. We also expect its new senior management team to bring a sharper focus to both operations and owned assets.
5.4% ProLogis
ProLogis is a leading provider of distribution facilities and services, with more than 1,990 facilities owned, managed, and under development in 72 markets in North America, Europe, and Asia. ProLogis built the first and largest global network of distribution facilities that enable companies to streamline their supply chain operations. It is increasingly diversifying its capital sources and revenue streams, which should boost return on equity while reducing the need for additional equity.
Holdings are subject to change.
| | |
| 6 | | Visit our website at www.strategicpartners.com |
Fees and Expenses (Unaudited)
As a shareholder of the Fund, you incur two types of costs: (1) transaction costs, including sales charges (loads) on purchase payments and redemptions, as applicable, and (2) ongoing costs, including management fees, distribution and/or service (12b-1) fees, and other Fund expenses, as applicable. This example is intended to help you understand your ongoing costs (in dollars) of investing in the Fund and to compare these costs with the ongoing costs of investing in other mutual funds.
The example is based on an investment of $1,000 invested on October 1, 2004, at the beginning of the period, and held through the six-month period ended March 31, 2005.
The Fund may charge additional fees to holders of certain accounts that are not included in the expenses shown in the table on the following page. These fees apply to Individual Retirement Accounts (IRAs), Section 403(b) accounts, and Section 529 plan accounts. As of the close of the six-month period covered by the table, IRA fees included a setup fee of $5, a maintenance fee of up to $36 annually ($18 for the six-month period), and a termination fee of $10. Section 403(b) accounts and Section 529 plan accounts are each charged an annual $25 fiduciary maintenance fee ($12.50 for the six-month period). Some of the fees vary in amount, or are waived, based on your total account balance or the number of JennisonDryden or Strategic Partners funds, including the Fund, that you own. You should consider the additional fees that were charged to your Fund account over the six-month period when you estimate the total ongoing expenses paid over the period and the impact of these fees on your ending account value, as these additional expenses are not reflected in the information provided in the expense table. Additional fees have the effect of reducing investment returns.
Actual Expenses
The first line for each share class in the table on the following page provides information about actual account values and actual expenses. You may use the information on this line, together with the amount you invested, to estimate the expenses that you paid over the period. Simply divide your account value by $1,000 (for example, an $8,600 account value ÷ $1,000 = 8.6), then multiply the result by the number on the first line under the heading “Expenses Paid During the Six-Month Period” to estimate the expenses you paid on your account during this period.
Hypothetical Example for Comparison Purposes
The second line for each share class in the table on the following page provides information about hypothetical account values and hypothetical expenses based on the Fund’s actual expense ratio and an assumed rate of return of 5% per year before
| | |
| Strategic Partners Real Estate Fund | | 7 |
Fees and Expenses (continued)
expenses, which is not the Fund’s actual return. The hypothetical account values and expenses may not be used to estimate the actual ending account balance or expenses you paid for the period. You may use this information to compare the ongoing costs of investing in the Fund and other funds. To do so, compare this 5% hypothetical example with the 5% hypothetical examples that appear in the shareholder reports of the other funds.
Please note that the expenses shown in the table are meant to highlight your ongoing costs only, and do not reflect any transactional costs such as sales charges (loads). Therefore the second line for each share class in the table is useful in comparing ongoing costs only, and will not help you determine the relative total costs of owning different funds. In addition, if these transactional costs were included, your costs would have been higher.
| | | | | | | | | | | | | | |
Strategic Partners
Real Estate Fund | | Beginning Account
Value
October 1, 2004 | | Ending Account
Value March 31, 2005 | | Annualized
Expense Ratio
Based on the
Six-Month Period | | | Expenses Paid
During the Six-
Month Period* |
| | | | | | | | | | | | | | | |
| Class A | | Actual | | $ | 1,000 | | $ | 1,106 | | 1.49 | % | | $ | 7.82 |
| | | Hypothetical | | $ | 1,000 | | $ | 1,018 | | 1.49 | % | | $ | 7.50 |
| | | | | | | | | | | | | | | |
| Class B | | Actual | | $ | 1,000 | | $ | 1,102 | | 2.24 | % | | $ | 11.74 |
| | | Hypothetical | | $ | 1,000 | | $ | 1,014 | | 2.24 | % | | $ | 11.25 |
| | | | | | | | | | | | | | | |
| Class C | | Actual | | $ | 1,000 | | $ | 1,102 | | 2.24 | % | | $ | 11.74 |
| | | Hypothetical | | $ | 1,000 | | $ | 1,014 | | 2.24 | % | | $ | 11.25 |
| | | | | | | | | | | | | | | |
| Class Z | | Actual | | $ | 1,000 | | $ | 1,107 | | 1.24 | % | | $ | 6.51 |
| | | Hypothetical | | $ | 1,000 | | $ | 1,019 | | 1.24 | % | | $ | 6.24 |
* Fund expenses for each share class are equal to the annualized expense ratio for each share class (provided in the table), multiplied by the average account value over the period, multiplied by the 182 days in the six-month period ended March 31, 2005, and divided by the 365 days in the Fund’s fiscal year ended March 31, 2005 (to reflect the six-month period).
| | |
| 8 | | Visit our website at www.strategicpartners.com |
Portfolio of Investments
as of March 31, 2005
| | | | | |
| Shares | | Description | | Value (Note 1) |
| | | | | | |
LONG-TERM INVESTMENTS 97.3% | | | |
COMMON STOCKS | | | |
| |
Diversified 13.1% | | | |
| 75,100 | | Archstone-Smith Trust | | $ | 2,561,661 |
| 35,500 | | Health Care Property Investors, Inc. | | | 833,185 |
| 53,000 | | Newcastle Investment Holdings Corp.(a)(b) | | | 437,250 |
| 36,800 | | Sunrise Senior Living Real Estate Investment Trust (Canada) | | | 325,502 |
| 75,300 | | Thomas Properties Group, Inc. | | | 932,214 |
| 29,112 | | Unibail | | | 3,451,132 |
| 52,700 | | Vornado Realty Trust | | | 3,650,529 |
| | | | |
|
|
| | | | | | 12,191,473 |
| |
Lodging 13.8% | | | |
| 59,400 | | DiamondRock Hospitality Co.(a)(b) | | | 632,610 |
| 297,900 | | Host Marriott Corp. | | | 4,933,224 |
| 52,600 | | La Quinta Corp.(b) | | | 447,100 |
| 100,300 | | Starwood Hotels & Resorts Worldwide, Inc. | | | 6,021,009 |
| 56,000 | | Strategic Hotel Capital, Inc. | | | 823,200 |
| | | | |
|
|
| | | | | | 12,857,143 |
| |
Multi-Family 4.0% | | | |
| 34,700 | | Avalonbay Communities, Inc. | | | 2,321,083 |
| 30,000 | | Camden Property Trust | | | 1,410,900 |
| | | | |
|
|
| | | | | | 3,731,983 |
| |
Office 10.1% | | | |
| 75,100 | | Boston Properties, Inc. | | | 4,523,273 |
| 50,400 | | CB Richard Ellis Group, Inc. (Class A)(b) | | | 1,763,496 |
| 40,400 | | Liberty Property Trust | | | 1,577,620 |
| 37,400 | | PS Business Parks, Inc. | | | 1,507,220 |
| | | | |
|
|
| | | | | | 9,371,609 |
| |
Retail-Malls 15.0% | | | |
| 202,510 | | General Growth Properties, Inc. | | | 6,905,591 |
| 117,000 | | Simon Property Group, Inc. | | | 7,087,860 |
| | | | |
|
|
| | | | | | 13,993,451 |
| |
Retail-Shopping Centers 15.6% | | | |
| 57,700 | | Acadia Realty Trust | | | 927,816 |
| 130,700 | | Kimco Realty Corp. | | | 7,044,730 |
| 90,700 | | Regency Centers Corp. | | | 4,320,041 |
See Notes to Financial Statements.
| | |
| Strategic Partners Real Estate Fund | | 9 |
Portfolio of Investments
as of March 31, 2005 Cont’d.
| | | | | |
| Shares | | Description | | Value (Note 1) |
| | | | | | |
| 28,200 | | Saul Centers, Inc. | | $ | 902,400 |
| 40,200 | | Weingarten Realty Investors | | | 1,387,302 |
| | | | |
|
|
| | | | | | 14,582,289 |
| |
Self-Storage Facilities 5.5% | | | |
| 81,900 | | Public Storage, Inc. | | | 4,663,386 |
| 27,600 | | U-Store-It Trust | | | 480,240 |
| | | | |
|
|
| | | | | | 5,143,626 |
| |
Specialty Financials 8.9% | | | |
| 21,400 | | Arbor Realty Trust, Inc. | | | 529,650 |
| 102,940 | | iStar Financial, Inc. | | | 4,239,069 |
| 36,100 | | Medical Properties of America(a) | | | 370,025 |
| 128,300 | | Ventas, Inc. | | | 3,202,368 |
| | | | |
|
|
| | | | | | 8,341,112 |
| |
Warehouse 11.3% | | | |
| 96,900 | | AMB Property Corp. | | | 3,662,820 |
| 66,700 | | Catellus Development Corp. | | | 1,777,555 |
| 136,700 | | ProLogis | | | 5,071,570 |
| | | | |
|
|
| | | | | | 10,511,945 |
| | | | |
|
|
| | | Total long-term investments
(cost $67,997,441) | | | 90,724,631 |
| | | | |
|
|
| | |
Principal
Amount (000)
| | | | |
SHORT-TERM INVESTMENTS 2.5% | �� | | |
| |
Repurchase Agreement | | | |
| 2,327 | | State Street Bank & Trust Co. 1.05%, dated 3/31/05, due 4/1/05 in the amount of $2,327,068 (collateralized by U.S. Treasury Bond,
2.25%, 4/30/06; value of collateral including accrued interest
was $2,398,440)
(cost $2,327,000) | | | 2,327,000 |
| | | | |
|
|
| | | Total Investments 99.8%
(cost $70,324,441) | | | 93,051,631 |
| | | Other assets in excess of liabilities 0.2% | | | 185,520 |
| | | | |
|
|
| | | Net Assets 100% | | $ | 93,237,151 |
| | | | |
|
|
| (a) | Fair-valued security (Note 1). |
| (b) | Non-income producing security. |
See Notes to Financial Statements.
| | |
| 10 | | Visit our website at www.strategicpartners.com |
Outstanding forward foreign currency contracts to sell foreign currencies at March 31, 2005 were as follows:
| | | | | | | | | |
Foreign Currency Sale Contract
| | Value at Settlement
Date Receivable
| | Current
Value
| | Unrealized
Appreciation
|
Euros, 2,471,000
Expiring 6/15/05 | | $ | 3,259,645 | | $ | 3,209,456 | | $ | 50,189 |
| | |
|
| |
|
| |
|
|
The industry classification of portfolio holdings and other assets in excess of liabilities shown as a percentage of net assets as of March 31, 2005 was as follows:
| | | |
Retail—Shopping Centers | | 15.6 | % |
Retail—Malls | | 15.0 | |
Lodging | | 13.8 | |
Diversified | | 13.1 | |
Warehouse | | 11.3 | |
Office | | 10.1 | |
Specialty Financials | | 8.9 | |
Self-Storage Facilities | | 5.5 | |
Multi-Family | | 4.0 | |
Repurchase Agreement | | 2.5 | |
| | |
|
|
| | | 99.8 | |
Other assets in excess of liabilities | | 0.2 | |
| | |
|
|
| | | 100.0 | % |
| | |
|
|
See Notes to Financial Statements.
| | |
| Strategic Partners Real Estate Fund | | 11 |
Statement of Assets and Liabilities
as of March 31, 2005
| | | | |
ASSETS | | | | |
Investments, at value (cost $70,324,441) | | $ | 93,051,631 | |
Receivable for Fund shares sold | | | 354,526 | |
Dividends and interest receivable | | | 221,763 | |
Unrealized appreciation on forward foreign currency contracts | | | 50,189 | |
Tax reclaim receivable | | | 30,999 | |
Other assets | | | 817 | |
| | |
|
|
|
Total assets | | | 93,709,925 | |
| | |
|
|
|
| |
Liabilities | | | | |
Payable for Fund shares reacquired | | | 205,145 | |
Accrued expenses | | | 141,855 | |
Management fee payable | | | 60,070 | |
Distribution fee payable | | | 47,586 | |
Payable to custodian | | | 16,394 | |
Deferred Trustees’ fees | | | 1,393 | |
Foreign withholding tax payable | | | 331 | |
| | |
|
|
|
Total liabilities | | | 472,774 | |
| | |
|
|
|
| |
Net Assets | | $ | 93,237,151 | |
| | |
|
|
|
| | | | | |
Net assets were comprised of: | | | | |
Shares of beneficial interest, at par | | $ | 5,222 | |
Paid-in capital in excess of par | | | 82,926,940 | |
| | |
|
|
|
| | | | 82,932,162 | |
Undistributed net investment income | | | 331,058 | |
Accumulated net realized loss on investments and foreign currency transactions | | | (12,803,345 | ) |
Net unrealized appreciation on investments and foreign currency transactions | | | 22,777,276 | |
| | |
|
|
|
Net assets, March 31, 2005 | | $ | 93,237,151 | |
| | |
|
|
|
See Notes to Financial Statements.
| | |
| 12 | | Visit our website at www.strategicpartners.com |
| | | |
Class A: | | | |
Net asset value and redemption price per share
($37,686,155 ÷ 2,106,237 shares of beneficial interest issued and outstanding) | | $ | 17.89 |
Maximum sales charge (5.5% of offering price) | | | 1.04 |
| | |
|
|
Maximum offering price to public | | $ | 18.93 |
| | |
|
|
| |
Class B: | | | |
Net asset value, offering price and redemption price per share
($35,250,833 ÷ 1,979,445 shares of beneficial interest issued and outstanding) | | $ | 17.81 |
| | |
|
|
| |
Class C: | | | |
Net asset value, offering price and redemption price per share
($10,524,387 ÷ 590,983 shares of beneficial interest issued and outstanding) | | $ | 17.81 |
| | |
|
|
| |
Class Z: | | | |
Net asset value, offering price and redemption price per share
($9,775,776 ÷ 545,332 shares of beneficial interest issued and outstanding) | | $ | 17.93 |
| | |
|
|
See Notes to Financial Statements.
| | |
| Strategic Partners Real Estate Fund | | 13 |
Statement of Operations
Year Ended March 31, 2005
| | | |
Net Investment Income | | | |
Income | | | |
Dividends (net of foreign withholding taxes of $58,012) | | $ | 2,549,451 |
Interest | | | 14,518 |
| | |
|
|
Total income | | | 2,563,969 |
| | |
|
|
| |
Expenses | | | |
Management fee | | | 590,155 |
Distribution fee—Class A | | | 72,404 |
Distribution fee—Class B | | | 339,681 |
Distribution fee—Class C | | | 79,735 |
Custodian’s fees and expenses | | | 139,000 |
Transfer agent’s fees and expenses | | | 112,000 |
Registration fees | | | 55,000 |
Reports to shareholders | | | 40,000 |
Legal fees and expenses | | | 35,000 |
Audit fee | | | 17,000 |
Trustees’ fees | | | 11,000 |
Miscellaneous | | | 10,277 |
| | |
|
|
Total expenses | | | 1,501,252 |
| | |
|
|
Net investment income | | | 1,062,717 |
| | |
|
|
| |
Realized And Unrealized Gain (Loss) On Investments And Foreign Currency Transactions | | | |
Net realized gain on: | | | |
Investment transactions | | | 8,088,698 |
Foreign currency transactions | | | 6,521 |
| | |
|
|
| | | | 8,095,219 |
| | |
|
|
Net change in unrealized appreciation on: | | | |
Investments | | | 796,337 |
Foreign currencies | | | 49,188 |
| | |
|
|
| | | | 845,525 |
| | |
|
|
Net gain on investments | | | 8,940,744 |
| | |
|
|
Net Increase In Net Assets Resulting From Operations | | $ | 10,003,461 |
| | |
|
|
See Notes to Financial Statements.
| | |
| 14 | | Visit our website at www.strategicpartners.com |
Statement of Changes in Net Assets
| | | | | | | | |
| | | Year Ended March 31,
| |
| | | 2005 | | | 2004 | |
Increase (Decrease) In Net Assets | | | | | | | | |
Operations | | | | | | | | |
Net investment income | | $ | 1,062,717 | | | $ | 633,065 | |
Net realized gain on investments and foreign currency transactions | | | 8,095,219 | | | | 4,533,668 | |
Net change in unrealized appreciation on investments and foreign currencies | | | 845,525 | | | | 21,047,927 | |
| | |
|
|
| |
|
|
|
Net increase in net assets resulting from operations | | | 10,003,461 | | | | 26,214,660 | |
| | |
|
|
| |
|
|
|
Dividends and distributions (Note 1) | | | | | | | | |
Dividends from net investment income | | | | | | | | |
Class A | | | (378,394 | ) | | | (258,161 | ) |
Class B | | | (230,468 | ) | | | (376,840 | ) |
Class C | | | (50,443 | ) | | | (56,241 | ) |
Class Z | | | (120,619 | ) | | | (52,132 | ) |
| | |
|
|
| |
|
|
|
| | | | (779,924 | ) | | | (743,374 | ) |
| | |
|
|
| |
|
|
|
| | |
Fund share transactions (net of share conversions) (Note 6) | | | | | | | | |
Net proceeds from shares sold | | | 39,258,304 | | | | 26,824,919 | |
Net asset value of shares issued in reinvestment of dividends and distributions | | | 685,565 | | | | 635,174 | |
Cost of shares reacquired | | | (32,203,430 | ) | | | (18,329,511 | ) |
| | |
|
|
| |
|
|
|
Net increase in net assets from Fund share transactions | | | 7,740,439 | | | | 9,130,582 | |
| | |
|
|
| |
|
|
|
Total increase | | | 16,963,976 | | | | 34,601,868 | |
| | |
Net Assets | | | | | | | | |
Beginning of year | | | 76,273,175 | | | | 41,671,307 | |
| | |
|
|
| |
|
|
|
End of year(a) | | $ | 93,237,151 | | | $ | 76,273,175 | |
| | |
|
|
| |
|
|
|
(a) Includes undistributed net investment income of: | | $ | 331,058 | | | $ | 41,744 | |
| | |
|
|
| |
|
|
|
See Notes to Financial Statements.
| | |
| Strategic Partners Real Estate Fund | | 15 |
Notes to Financial Statements
Strategic Partners Real Estate Fund, formerly know as Strategic Partners Real Estate Securities Fund, Inc., (the “Fund”), is registered under the Investment Company Act of 1940 as a nondiversified, open-end, management investment company. The Fund was established as a Delaware business trust on October 24, 1997. The Fund commenced investment operations on May 5, 1998. The investment objective of the Fund is high current income and long-term growth of capital. It seeks to achieve this objective by investing primarily in equity securities of real estate companies.
Note 1. Accounting Policies
The following is a summary of significant accounting policies followed by the Fund in the preparation of its financial statements.
Securities Valuation: Securities listed on a securities exchange (other than options on securities and indices) are valued at the last sale price on such exchange on the day of valuation or, if there was no sale on such day, at the mean between the last reported bid and asked prices, or at the last bid price on such day in the absence of an asked price. Securities traded via Nasdaq, are valued at the official closing price provided by Nasdaq. Securities that are actively traded in the over-the-counter market, including listed securities for which the primary market is believed by Prudential Investments LLC (“PI” or “Manager”), in consultation with the subadviser, to be over-the-counter, are valued at market value using prices provided by an independent pricing agent or principal market maker. Future contracts and options thereon traded on a commodities exchange or board of trade are valued at the last sale price at the close of trading on such exchange or board of trade or, if there was no sale on the applicable commodities exchange or board of trade on such day, at the mean between the most recently quoted prices on such exchange or board of trade or at the last bid price in the absence of an asked price. Securities for which reliable market quotations are not readily available, or whose values have been affected by events occurring after the close of the security’s foreign market and before the Fund’s normal pricing time, are valued at fair value in accordance with Board of Trustees’ approved fair valuation procedures. Using fair value to price securities may result in a value that is different from a security’s most recent closing price and from the price used by other mutual funds to calculate their net asset values.
Short-term securities which mature in sixty days or less are valued at amortized cost, which approximates market value. The amortized cost method involves valuing a security at its cost on the date of purchase and thereafter assuming a constant amortization to maturity of the difference between the principal amount due at
| | |
| 16 | | Visit our website at www.strategicpartners.com |
maturity and cost. Short-term securities which mature in more than sixty days are valued at current market quotations.
Foreign Currency Translation: The books and records of the Fund are maintained in U.S. dollars. Foreign currency amounts are translated into U.S. dollars on the following basis:
(i) market value of investment securities, other assets and liabilities—at the current daily rates of exchange;
(ii) purchases and sales of investment securities, income and expenses—at the rates of exchange prevailing on the respective dates of such transactions.
Although the net assets of the Fund are presented at the foreign exchange rates and market values at the close of the fiscal period, the Fund does not isolate that portion of the results of operations arising as a result of changes in the foreign exchange rates from the fluctuations arising from changes in the market prices of securities held at the end of the fiscal period. Similarly, the Fund does not isolate the effect of changes in foreign exchange rates from the fluctuations arising from changes in the market prices of portfolio securities sold during the fiscal period. Accordingly, realized foreign currency gains or losses are included in the reported net realized gains or losses on investment transactions.
Net realized gains or losses on foreign currency transactions represent net foreign exchange gains or losses from the holding of foreign currencies, currency gains or losses realized between the trade date and settlement date on securities transactions, and the difference between the amounts of dividends, interest and foreign withholding taxes recorded on the Fund’s books and the U.S. dollar equivalent amounts actually received or paid. Net unrealized currency gains or losses from valuing foreign currency denominated assets and liabilities (other than investments) at period end exchange rates are reflected as a component of net unrealized appreciation (depreciation) on foreign currencies.
Foreign security and currency transactions may involve certain considerations and risks not typically associated with those of domestic origin as a result of, among other factors, the possibility of political and economic instability or the level of governmental supervision and regulation of foreign securities markets.
Repurchase Agreements: In connection with transactions in repurchase agreements with United States financial institutions, it is the Fund’s policy that its custodian or designated subcustodians, as the case may be under triparty repurchase agreements, take possession of the underlying collateral securities, the value of which exceeds the
| | |
| Strategic Partners Real Estate Fund | | 17 |
Notes to Financial Statements
Cont’d
principal amount of the repurchase transaction, including accrued interest. To the extent that any repurchase transaction exceeds one business day, the value of collateral is marked to market on a daily basis to ensure adequacy of the collateral. If the seller defaults and the value of the collateral declines, or if bankruptcy proceedings are commenced with respect to the seller of the security, realization of the collateral by the Fund may be delayed or limited.
Securities Transactions and Net Investment Income: Securities transactions are recorded on the trade date. Realized and unrealized gains or losses from investments and currency transactions on sales of portfolio securities are calculated on the identified cost basis. Dividend income is recorded on the ex-dividend date. Interest income, including amortization of premium and accretion of discount on debt securities, as required, is recorded on the accrual basis. The Fund invests in real estate investment trusts (“REITS”), which report information on the source of their distributions annually. A portion of distributions received from REITS during the period is estimated to be capital gain and a portion is estimated to be return of capital and is recorded as a reduction of their cost. These estimates are adjusted when the actual source of distributions is disclosed by the REITS.
Net investment income or loss (other than distribution fees which are charged directly to the respective class) and unrealized and realized gains or losses are allocated daily to each class of shares based upon the relative proportion of net assets of each class at the beginning of the day.
Dividends and Distributions: The Fund expects to pay dividends of net investment income quarterly and distributions of net realized capital gains, if any, annually. Dividends and distributions to shareholders, which are determined in accordance with federal income tax regulations which may differ from generally accepted accounting principles, are recorded on the ex-dividend date. Permanent book/tax differences relating to income and gains are reclassified amongst undistributed net investment income, accumulated net realized gain or loss and paid-in capital in excess of par, as appropriate.
Taxes: It is the Fund’s policy to continue to meet the requirements of the Internal Revenue Code applicable to regulated investment companies and to distribute all of its taxable net income and capital gains, if any, to shareholders. Therefore, no federal income tax provision is required.
| | |
| 18 | | Visit our website at www.strategicpartners.com |
Withholding taxes on foreign dividends are recorded, net of reclaimable amounts, at the time the related income is earned.
Estimates: The preparation of the financial statements requires management to make estimates and assumptions that affect the reported amounts and disclosures in the financial statements. Actual results could differ from those estimates.
Note 2. Agreements
The Fund has a management agreement with PI. Pursuant to this agreement, PI has responsibility for all investment advisory services and supervises the subadviser’s performance of such services. PI has a subadvisory agreement with Wellington Management Company, LLP (“Wellington” or “subadviser”). The subadvisory agreement provides that Wellington furnishes investment advisory services in connection with the management of the Fund. In connection therewith, Wellington is obligated to keep certain books and records of the Fund. PI continues to have responsibility for all investment advisory services pursuant to the management agreement and supervises Wellington’s performance of such services. PI pays for the services of Wellington, the cost of compensation of officers of the Fund, occupancy and certain clerical and bookkeeping costs of the Fund. The Fund bears all other costs and expenses.
The management fee paid to PI is computed daily and payable monthly at an annual rate of .75 of 1% of the Fund’s average daily net assets. The effective management fee rate was .75 of 1% for the fiscal year ended March 31, 2005.
The Fund has a distribution agreement with Prudential Investment Management Services LLC (“PIMS”), which acts as the distributor of the Class A, Class B, Class C and Class Z shares of the Fund. The Fund compensates PIMS for distributing and servicing the Fund’s Class A, Class B and Class C shares, pursuant to a plan of distribution (the “Class A, B and C Plans”), regardless of expenses actually incurred by PIMS. The distribution fees are accrued daily and payable monthly. No distribution or service fees are paid to PIMS as distributor of the Class Z shares of the Fund.
Pursuant to the Class A, B and C Plans, the Fund compensates PIMS for distribution-related activities at an annual rate of up to .30 of 1%, 1% and 1%, of the average daily net assets of the Class A, B and C shares, respectively. For the year ended March 31, 2005, PIMS has contractually agreed to limit such fees to .25% of 1% of the average daily net assets of the Class A shares.
| | |
| Strategic Partners Real Estate Fund | | 19 |
Notes to Financial Statements
Cont’d
PIMS has advised the Fund that it received approximately $239,200 in front-end sales charges resulting from sales of Class A shares, during the year ended March 31, 2005. From these fees, PIMS paid such sales charges to dealers, which in turn paid commissions to salespersons and incurred other distribution costs.
PIMS has advised the Fund that for the year ended March 31, 2005, it received approximately $42,200 and $2,800 in contingent deferred sales charges imposed upon certain redemptions by Class B and Class C shareholders, respectively.
PI and PIMS are indirect, wholly-owned subsidiaries of Prudential Financial, Inc. (“Prudential”).
The Fund, along with other affiliated registered investment companies (the “Funds”), is a party to a syndicated credit agreement (“SCA”) with a group of banks. For the period from April 1, 2004 to April 30, 2004, the SCA provided for a commitment of $800 million and allowed the Funds to increase the commitment to $1 billion, if necessary. Effective May 1, 2004, the commitment was reduced to $500 million. Interest on any borrowings under the SCA will be incurred at market rates. The Funds pay a commitment fee of .08 of 1% of the unused portion of the SCA. The commitment fee is accrued daily and paid quarterly and is allocated to the Funds pro rata, based on net assets. The purpose of the SCA is to serve as an alternative source of funding for capital share redemptions. The expiration date of the SCA was October 29, 2004. Effective October 29, 2004, the Funds entered into a revised credit agreement with two banks. The commitment under the revised credit agreement continues to be $500 million. The funds pay a commitment fee of .075 of 1% of the unused portion of the revised agreement. The expiration of the revised SCA is October 28, 2005. The fund did not borrow any amounts pursuant to the SCA during the year ended March 31, 2005.
Note 3. Other Transactions with Affiliates
Prudential Mutual Fund Services LLC (“PMFS”), an affiliate of PI and an indirect, wholly-owned subsidiary of Prudential, serves as the Fund’s transfer agent. During the year ended March 31, 2005, the Fund incurred fees of approximately $86,800 for the services of PMFS. As of March 31, 2005, approximately $16,400 of such fees were due to PMFS. Transfer agent fees and expenses in the Statement of Operations include certain out-of-pocket expenses paid to non-affiliates, where applicable.
| | |
| 20 | | Visit our website at www.strategicpartners.com |
The Fund pays networking fees to affiliated and unaffiliated broker/dealers. These networking fees are payments made to broker/dealers that clear mutual fund transactions through a national clearing system. The Fund incurred approximately $23,200 in total networking fees, of which the amount relating to the services of Wachovia Securities, LLC (“Wachovia”) and First Clearing, LLC (“First Clearing”), affiliates of PI, was approximately $4,900 and $12,700, respectively, for the year ended March 31, 2005. As of March 31, 2005, approximately $4,600 of such fees were due to First Clearing. These amounts are included in the transfer agent’s fees and expenses in the Statement of Operations.
For the year ended March 31, 2005, Wachovia and First Clearing earned $2,877 and $170, respectively, in brokerage commissions from portfolio transactions executed on behalf of the Fund.
Note 4. Portfolio Securities
Purchases and sales of investment securities, other than short-term investments, for the year ended March 31, 2005, aggregated $45,689,101 and $36,971,455, respectively.
Note 5. Distributions and Tax Information
In order to present undistributed net investment income (loss) and accumulated net realized gains (losses) on the Statement of Assets and Liabilities that more closely represent their tax character, certain adjustments have been made to paid-in-capital in excess of par, undistributed net investment income (loss) and accumulated net realized gain (loss) on investments. For the year ended March 31, 2005, the adjustments were to increase accumulated net realized loss on investments and foreign currency transactions by $6,521 and increase undistributed net investment income by $6,521, due to differences in the treatment for book and tax purposes of certain transactions involving foreign securities and currencies. Net investment income, net realized gains and net assets were not affected by this change.
For the years ended March 31, 2005 and March 31, 2004, the tax character of dividends paid by the Fund was $779,924 and $743,374, respectively, from ordinary income.
For the year ended March 31, 2005, the Fund had undistributed ordinary income on a tax basis of $382,640.
For federal income tax purposes, the Fund had a capital loss carryforward as of March 31, 2005, of approximately $12,717,000 of which $10,573,000 expires in 2008
| | |
| Strategic Partners Real Estate Fund | | 21 |
Notes to Financial Statements
Cont’d
and $2,144,000 expires in 2009. In addition, the fund utilized $7,827,000 of its prior year‘s capital loss carryforward to offset net taxable gains realized in the fiscal year ended March 31, 2005. Accordingly, no capital gains distributions are expected to be paid to shareholders until future net gains have been realized in excess of such carryforward.
The United States federal income tax basis of the Fund’s investments and the net unrealized appreciation as of March 31, 2005 were as follows:
| | | | | | | | |
Tax Basis
| | Appreciation
| | Depreciation
| | Other Cost Basis
Adjustments
| | Total Net Unrealized Appreciation
|
| $70,410,777 | | $22,913,126 | | $272,272 | | $(103) | | $22,640,751 |
The difference between book basis and tax basis was attributable to deferred losses on wash sales. The other cost basis adjustment of $103 was primarily attributable to mark to market of receivables and payables.
Note 6. Capital
The Fund offers Class A, Class B, Class C and Class Z shares. Class A shares are sold with a front-end sales charge of up to 5.5%. Prior to March 15, 2004, Class A shares were sold with a front-end sales charge of 5%. Effective March 15, 2004, all investors who purchase Class A shares in an amount of $1 million or more and sell these shares within 12 months of purchase are subject to a contingent deferred sales charge (CDSC) of 1%, including investors who purchase their shares through broker-dealers affiliated with Prudential. Class B shares are sold with a contingent deferred sales charge which declines from 5% to zero depending on the period of time the shares are held. Prior to February 2, 2004, Class C shares were sold with a front-end sales charge of 1% and a contingent deferred sales charge of 1% during the first 18 months. Class C shares purchased on or after February 2, 2004 are not subject to an initial sales charge and the contingent deferred sales charge (CDSC) for Class C shares will be 12 months from the date of purchase. Class B shares automatically convert to Class A shares on a quarterly basis approximately seven years after purchase. A special exchange privilege is also available for shareholders who qualified to purchase Class A shares at net asset value. Class Z shares are not subject to any sales or redemption charge and are offered exclusively for sale to a limited group of investors.
There is an unlimited number of shares of beneficial interest, $.001 par value per share, divided into four classes, designated Class A, Class B, Class C and Class Z.
| | |
| 22 | | Visit our website at www.strategicpartners.com |
| | | | | | | |
Class A
| | Shares
| | | Amount
| |
Year ended March 31, 2005: | | | | | | | |
Shares sold | | 1,426,870 | | | $ | 23,696,390 | |
Shares issued in reinvestment of dividends | | 21,350 | | | | 345,324 | |
Shares reacquired | | (1,030,979 | ) | | | (16,208,584 | ) |
| | |
|
| |
|
|
|
Net increase (decrease) in shares outstanding before conversion | | 417,241 | | | | 7,833,130 | |
Shares issued upon conversion from Class B | | 37,390 | | | | 639,988 | |
| | |
|
| |
|
|
|
Net increase (decrease) in shares outstanding | | 454,631 | | | $ | 8,473,118 | |
| | |
|
| |
|
|
|
Year ended March 31, 2004: | | | | | | | |
Shares sold | | 1,001,362 | | | $ | 13,259,775 | |
Shares issued in reinvestment of dividends | | 19,338 | | | | 221,931 | |
Shares reacquired | | (530,737 | ) | | | (6,563,602 | ) |
| | |
|
| |
|
|
|
Net increase (decrease) in shares outstanding before conversion | | 489,963 | | | | 6,918,104 | |
Shares issued upon conversion from Class B | | 36,097 | | | | 479,841 | |
| | |
|
| |
|
|
|
Net increase (decrease) in shares outstanding | | 526,060 | | | $ | 7,397,945 | |
| | |
|
| |
|
|
|
Class B
| | | | | | |
Year ended March 31, 2005: | | | | | | | |
Shares sold | | 291,585 | | | $ | 4,922,341 | |
Shares issued in reinvestment of dividends | | 12,027 | | | | 193,020 | |
Shares reacquired | | (583,796 | ) | | | (9,313,448 | ) |
| | |
|
| |
|
|
|
Net increase (decrease) in shares outstanding before conversion | | (280,184 | ) | | | (4,198,087 | ) |
Shares reacquired upon conversion into Class A | | (37,538 | ) | | | (639,988 | ) |
| | |
|
| |
|
|
|
Net increase (decrease) in shares outstanding | | (317,722 | ) | | $ | (4,838,075 | ) |
| | |
|
| |
|
|
|
Year ended March 31, 2004: | | | | | | | |
Shares sold | | 397,793 | | | $ | 5,007,352 | |
Shares issued in reinvestment of dividends | | 27,360 | | | | 311,318 | |
Shares reacquired | | (645,096 | ) | | | (7,992,963 | ) |
| | |
|
| |
|
|
|
Net increase (decrease) in shares outstanding before conversion | | (219,943 | ) | | | (2,674,293 | ) |
Shares reacquired upon conversion into Class A | | (36,185 | ) | | | (479,841 | ) |
| | |
|
| |
|
|
|
Net increase (decrease) in shares outstanding | | (256,128 | ) | | $ | (3,154,134 | ) |
| | |
|
| |
|
|
|
Class C
| | | | | | |
Year ended March 31, 2005: | | | | | | | |
Shares sold | | 286,966 | | | $ | 4,856,541 | |
Shares issued in reinvestment of dividends | | 2,153 | | | | 34,719 | |
Shares reacquired | | (135,815 | ) | | | (2,156,602 | ) |
| | |
|
| |
|
|
|
Net increase (decrease) in shares outstanding | | 153,304 | | | $ | 2,734,658 | |
| | |
|
| |
|
|
|
Year ended March 31, 2004: | | | | | | | |
Shares sold | | 208,265 | | | $ | 2,751,417 | |
Shares issued in reinvestment of dividends | | 4,506 | | | | 51,369 | |
Shares reacquired | | (146,029 | ) | | | (1,801,285 | ) |
| | |
|
| |
|
|
|
Net increase (decrease) in shares outstanding | | 66,742 | | | $ | 1,001,501 | |
| | |
|
| |
|
|
|
| | |
| Strategic Partners Real Estate Fund | | 23 |
Notes to Financial Statements
Cont’d
| | | | | | | |
Class Z
| | Shares
| | | Amount
| |
Year ended March 31, 2005: | | | | | | | |
Shares sold | | 352,912 | | | $ | 5,783,032 | |
Shares issued in reinvestment of dividends | | 6,970 | | | | 112,502 | |
Shares reacquired | | (291,235 | ) | | | (4,524,796 | ) |
| | |
|
| |
|
|
|
Net increase (decrease) in shares outstanding | | 68,647 | | | $ | 1,370,738 | |
| | |
|
| |
|
|
|
Year ended March 31, 2004: | | | | | | | |
Shares sold | | 442,671 | | | $ | 5,806,375 | |
Shares issued in reinvestment of dividends | | 4,358 | | | | 50,556 | |
Shares reacquired | | (161,624 | ) | | | (1,971,661 | ) |
| | |
|
| |
|
|
|
Net increase (decrease) in shares outstanding | | 285,405 | | | $ | 3,885,270 | |
| | |
|
| |
|
|
|
Note 7. Subsequent Events
On April 15, 2005 the Board of Trustees of the Fund declared the following dividends per share, payable on April 15, 2005 to shareholders of record on April 15, 2005.
| | | | | | | | | |
| | | Class A
| | Class B
and C
| | Class Z
|
Ordinary Income | | $ | 0.066 | | $ | 0.033 | | $ | 0.077 |
| | |
| 24 | | Visit our website at www.strategicpartners.com |
ANNUAL REPORT
MARCH 31, 2005
STRATEGIC PARTNERS
REAL ESTATE FUND
FINANCIAL HIGHLIGHTS
Financial Highlights
| | | | |
| | | Class A
| |
| | | Year Ended
March 31, 2005 | |
Per Share Operating Performance: | | | | |
Net Asset Value, Beginning Of Year | | $ | 15.71 | |
| | |
|
|
|
Income from investment operations | | | | |
Net investment income | | | .26 | |
Net realized and unrealized gain (loss) on investment and foreign currency transactions | | | 2.14 | |
| | |
|
|
|
Total from investment operations | | | 2.40 | |
| | |
|
|
|
Less Distributions: | | | | |
Dividends from net investment income | | | (.22 | ) |
| | |
|
|
|
Total distributions | | | (.22 | ) |
| | |
|
|
|
Net asset value, end of year | | $ | 17.89 | |
| | |
|
|
|
Total Return(a): | | | 15.37 | % |
Ratios/Supplemental Data: | | | | |
Net assets, end of year (000) | | $ | 37,686 | |
Average net assets (000) | | $ | 28,961 | |
Ratios to average net assets: | | | | |
Expenses, including distribution and service (12b-1) fees(c) | | | 1.53 | % |
Expenses, excluding distribution and service (12b-1) fees | | | 1.28 | % |
Net investment income | | | 1.71 | % |
For Class A, B, C and Z shares: | | | | |
Portfolio turnover | | | 48 | % |
| (a) | Total return does not consider the effects of sales loads. Total return is calculated assuming a purchase of shares on the first day and a sale on the last day of each year reported and includes reinvestment of dividends and distributions. |
| (b) | Based on average shares outstanding during the year. |
| (c) | The Distributor of the Fund contractually agreed to limit its distribution and service (12b-1) fees to .25 of 1% of the average net assets for the Class A shares. |
See Notes to Financial Statements.
| | |
| 26 | | Visit our website at www.strategicpartners.com |
| | | | | | | | | | | | | | |
| Class A | |
| Year Ended March 31, | |
| 2004 | | | 2003 | | | 2002 | | | 2001 | |
| | | | | | | | | | | | | | | |
| $ | 9.84 | | | $ | 9.97 | | | $ | 8.71 | | | $ | 7.79 | |
|
|
| |
|
|
| |
|
|
| |
|
|
|
| | | | | | | | | | | | | | | |
| | .16 | | | | .29 | (b) | | | .31 | (b) | | | .28 | (b) |
| | 5.93 | | | | (.08 | ) | | | 1.30 | | | | .82 | |
|
|
| |
|
|
| |
|
|
| |
|
|
|
| | 6.09 | | | | .21 | | | | 1.61 | | | | 1.10 | |
|
|
| |
|
|
| |
|
|
| |
|
|
|
| | | | | | | | | | | | | | | |
| | (.22 | ) | | | (.34 | ) | | | (.35 | ) | | | (.18 | ) |
|
|
| |
|
|
| |
|
|
| |
|
|
|
| | (.22 | ) | | | (.34 | ) | | | (.35 | ) | | | (.18 | ) |
|
|
| |
|
|
| |
|
|
| |
|
|
|
| $ | 15.71 | | | $ | 9.84 | | | $ | 9.97 | | | $ | 8.71 | |
|
|
| |
|
|
| |
|
|
| |
|
|
|
| | 62.79 | % | | | 2.27 | % | | | 19.00 | % | | | 14.28 | % |
| | | | | | | | | | | | | | | |
| $ | 25,954 | | | $ | 11,073 | | | $ | 11,225 | | | $ | 15,103 | |
| $ | 15,886 | | | $ | 11,248 | | | $ | 12,433 | | | $ | 16,271 | |
| | | | | | | | | | | | | | | |
| | 1.58 | % | | | 1.79 | % | | | 1.93 | % | | | 1.87 | % |
| | 1.33 | % | | | 1.54 | % | | | 1.68 | % | | | 1.62 | % |
| | 1.53 | % | | | 2.97 | % | | | 3.43 | % | | | 3.27 | % |
| | | | | | | | | | | | | | | |
| | 65 | % | | | 92 | % | | | 110 | % | | | 62 | % |
See Notes to Financial Statements.
| | |
| Strategic Partners Real Estate Fund | | 27 |
Financial Highlights
Cont’d
| | | | |
| | | Class B
| |
| | | Year Ended
March 31, 2005 | |
Per Share Operating Performance: | | | | |
Net Asset Value, Beginning Of Year | | $ | 15.65 | |
| | |
|
|
|
Income from investment operations | | | | |
Net investment income | | | .16 | |
Net realized and unrealized gain (loss) on investment and foreign currency transactions | | | 2.11 | |
| | |
|
|
|
Total from investment operations | | | 2.27 | |
| | |
|
|
|
Less Distributions: | | | | |
Dividends from net investment income | | | (.11 | ) |
| | |
|
|
|
Total distributions | | | (.11 | ) |
| | |
|
|
|
Net asset value, end of year | | $ | 17.81 | |
| | |
|
|
|
Total Return(a): | | | 14.51 | % |
Ratios/Supplemental Data: | | | | |
Net assets, end of year (000) | | $ | 35,251 | |
Average net assets (000) | | $ | 33,968 | |
Ratios to average net assets: | | | | |
Expenses, including distribution and service (12b-1) fees | | | 2.28 | % |
Expenses, excluding distribution and service (12b-1) fees | | | 1.28 | % |
Net investment income | | | .99 | % |
| (a) | Total return does not consider the effects of sales loads. Total return is calculated assuming a purchase of shares on the first day and a sale on the last day of each year reported and includes reinvestment of dividends and distributions. |
| (b) | Based on average shares outstanding during the year. |
See Notes to Financial Statements.
| | |
| 28 | | Visit our website at www.strategicpartners.com |
| | | | | | | | | | | | | | |
| Class B | |
| Year Ended March 31, | |
| 2004 | | | 2003 | | | 2002 | | | 2001 | |
| | | | | | | | | | | | | | | |
| $ | 9.82 | | | $ | 9.95 | | | $ | 8.69 | | | $ | 7.78 | |
|
|
| |
|
|
| |
|
|
| |
|
|
|
| | | | | | | | | | | | | | | |
| | .12 | | | | .22 | (b) | | | .24 | (b) | | | .21 | (b) |
| | 5.86 | | | | (.08 | ) | | | 1.30 | | | | .82 | |
|
|
| |
|
|
| |
|
|
| |
|
|
|
| | 5.98 | | | | .14 | | | | 1.54 | | | | 1.03 | |
|
|
| |
|
|
| |
|
|
| |
|
|
|
| | | | | | | | | | | | | | | |
| | (.15 | ) | | | (.27 | ) | | | (.28 | ) | | | (.12 | ) |
|
|
| |
|
|
| |
|
|
| |
|
|
|
| | (.15 | ) | | | (.27 | ) | | | (.28 | ) | | | (.12 | ) |
|
|
| |
|
|
| |
|
|
| |
|
|
|
| $ | 15.65 | | | $ | 9.82 | | | $ | 9.95 | | | $ | 8.69 | |
|
|
| |
|
|
| |
|
|
| |
|
|
|
| | 61.62 | % | | | 1.47 | % | | | 18.14 | % | | | 13.35 | % |
| | | | | | | | | | | | | | | |
| $ | 35,961 | | | $ | 25,072 | | | $ | 28,357 | | | $ | 28,118 | |
| $ | 30,195 | | | $ | 26,955 | | | $ | 27,939 | | | $ | 30,747 | |
| | | | | | | | | | | | | | | |
| | 2.33 | % | | | 2.54 | % | | | 2.68 | % | | | 2.62 | % |
| | 1.33 | % | | | 1.54 | % | | | 1.68 | % | | | 1.62 | % |
| | .97 | % | | | 2.20 | % | | | 2.67 | % | | | 2.49 | % |
See Notes to Financial Statements.
| | |
| Strategic Partners Real Estate Fund | | 29 |
Financial Highlights
Cont’d
| | | | |
| | | Class C
| |
| | | Year Ended
March 31, 2005 | |
Per Share Operating Performance: | | | | |
Net Asset Value, Beginning Of Year | | $ | 15.65 | |
| | |
|
|
|
Income from investment operations | | | | |
Net investment income | | | .16 | |
Net realized and unrealized gain (loss) on investment and foreign currency transactions | | | 2.11 | |
| | |
|
|
|
Total from investment operations | | | 2.27 | |
| | |
|
|
|
Less Distributions: | | | | |
Dividends from net investment income | | | (.11 | ) |
| | |
|
|
|
Total distributions | | | (.11 | ) |
| | |
|
|
|
Net asset value, end of year | | $ | 17.81 | |
| | |
|
|
|
Total Return(a): | | | 14.51 | % |
Ratios/Supplemental Data: | | | | |
Net assets, end of year (000) | | $ | 10,524 | |
Average net assets (000) | | $ | 7,973 | |
Ratios to average net assets: | | | | |
Expenses, including distribution and service (12b-1) fees | | | 2.28 | % |
Expenses, excluding distribution and service (12b-1) fees | | | 1.28 | % |
Net investment income | | | .95 | % |
| (a) | Total return does not consider the effects of sales loads. Total return is calculated assuming a purchase of shares on the first day and a sale on the last day of each year reported and includes reinvestment of dividends and distributions. |
| (b) | Based on average shares outstanding during the year. |
See Notes to Financial Statements.
| | |
| 30 | | Visit our website at www.strategicpartners.com |
| | | | | | | | | | | | | | |
| Class C | |
| Year Ended March 31, | |
| 2004 | | | 2003 | | | 2002 | | | 2001 | |
| | | | | | | | | | | | | | | |
| $ | 9.82 | | | $ | 9.95 | | | $ | 8.69 | | | $ | 7.78 | |
|
|
| |
|
|
| |
|
|
| |
|
|
|
| | | | | | | | | | | | | | | |
| | .12 | | | | .22 | (b) | | | .25 | (b) | | | .21 | (b) |
| | 5.86 | | | | (.08 | ) | | | 1.29 | | | | .82 | |
|
|
| |
|
|
| |
|
|
| |
|
|
|
| | 5.98 | | | | .14 | | | | 1.54 | | | | 1.03 | |
|
|
| |
|
|
| |
|
|
| |
|
|
|
| | | | | | | | | | | | | | | |
| | (.15 | ) | | | (.27 | ) | | | (.28 | ) | | | (.12 | ) |
|
|
| |
|
|
| |
|
|
| |
|
|
|
| | (.15 | ) | | | (.27 | ) | | | (.28 | ) | | | (.12 | ) |
|
|
| |
|
|
| |
|
|
| |
|
|
|
| $ | 15.65 | | | $ | 9.82 | | | $ | 9.95 | | | $ | 8.69 | |
|
|
| |
|
|
| |
|
|
| |
|
|
|
| | 61.62 | % | | | 1.47 | % | | | 18.14 | % | | | 13.35 | % |
| | | | | | | | | | | | | | | |
| $ | 6,852 | | | $ | 3,642 | | | $ | 4,117 | | | $ | 4,750 | |
| $ | 4,734 | | | $ | 3,891 | | | $ | 4,390 | | | $ | 5,096 | |
| | | | | | | | | | | | | | | |
| | 2.33 | % | | | 2.54 | % | | | 2.68 | % | | | 2.62 | % |
| | 1.33 | % | | | 1.54 | % | | | 1.68 | % | | | 1.62 | % |
| | .87 | % | | | 2.24 | % | | | 2.72 | % | | | 2.52 | % |
See Notes to Financial Statements.
| | |
| Strategic Partners Real Estate Fund | | 31 |
Financial Highlights
Cont’d
| | | | |
| | | Class Z
| |
| | | Year Ended
March 31, 2005 | |
Per Share Operating Performance: | | | | |
Net Asset Value, Beginning Of Year | | $ | 15.75 | |
| | |
|
|
|
Income from investment operations | | | | |
Net investment income | | | .31 | |
Net realized and unrealized gain (loss) on investment and foreign currency transactions | | | 2.13 | |
| | |
|
|
|
Total from investment operations | | | 2.44 | |
| | |
|
|
|
Less Distributions: | | | | |
Dividends from net investment income | | | (.26 | ) |
| | |
|
|
|
Total distributions | | | (.26 | ) |
| | |
|
|
|
Net asset value, end of year | | $ | 17.93 | |
| | |
|
|
|
Total Return(a): | | | 15.69 | % |
Ratios/Supplemental Data: | | | | |
Net assets, end of year (000) | | $ | 9,776 | |
Average net assets (000) | | $ | 7,784 | |
Ratios to average net assets: | | | | |
Expenses, including distribution and service (12b-1) fees | | | 1.28 | % |
Expenses, excluding distribution and service (12b-1) fees | | | 1.28 | % |
Net investment income | | | 1.98 | % |
| (a) | Total return does not consider the effects of sales loads. Total return is calculated assuming a purchase of shares on the first day and a sale on the last day of each year reported and includes reinvestment of dividends and distributions. |
| (b) | Based on average shares outstanding during the year. |
See Notes to Financial Statements.
| | |
| 32 | | Visit our website at www.strategicpartners.com |
| | | | | | | | | | | | | | |
| Class Z | |
| Year Ended March 31, | |
| 2004 | | | 2003 | | | 2002 | | | 2001 | |
| | | | | | | | | | | | | | | |
| $ | 9.85 | | | $ | 9.98 | | | $ | 8.72 | | | $ | 7.80 | |
|
|
| |
|
|
| |
|
|
| |
|
|
|
| | | | | | | | | | | | | | | |
| | .18 | | | | .31 | (b) | | | .33 | (b) | | | .29 | (b) |
| | 5.96 | | | | (.07 | ) | | | 1.30 | | | | .83 | |
|
|
| |
|
|
| |
|
|
| |
|
|
|
| | 6.14 | | | | .24 | | | | 1.63 | | | | 1.12 | |
|
|
| |
|
|
| |
|
|
| |
|
|
|
| | | | | | | | | | | | | | | |
| | (.24 | ) | | | (.37 | ) | | | (.37 | ) | | | (.20 | ) |
|
|
| |
|
|
| |
|
|
| |
|
|
|
| | (.24 | ) | | | (.37 | ) | | | (.37 | ) | | | (.20 | ) |
|
|
| |
|
|
| |
|
|
| |
|
|
|
| $ | 15.75 | | | $ | 9.85 | | | $ | 9.98 | | | $ | 8.72 | |
|
|
| |
|
|
| |
|
|
| |
|
|
|
| | 63.21 | % | | | 2.52 | % | | | 19.29 | % | | | 14.54 | % |
| | | | | | | | | | | | | | | |
| $ | 7,506 | | | $ | 1,884 | | | $ | 1,179 | | | $ | 1,045 | |
| $ | 3,648 | | | $ | 1,722 | | | $ | 988 | | | $ | 1,376 | |
| | | | | | | | | | | | | | | |
| | 1.33 | % | | | 1.54 | % | | | 1.68 | % | | | 1.62 | % |
| | 1.33 | % | | | 1.54 | % | | | 1.68 | % | | | 1.62 | % |
| | 1.52 | % | | | 3.17 | % | | | 3.70 | % | | | 3.43 | % |
See Notes to Financial Statements.
| | |
| Strategic Partners Real Estate Fund | | 33 |
Report of Independent Registered Public Accounting Firm
The Board of Trustees and Shareholders of Strategic Partners Real Estate Fund:
We have audited the accompanying statement of assets and liabilities of the Strategic Partners Real Estate Fund (the “Fund”) (formerly known as Strategic Partners Real Estate Securities Fund), including the portfolio of investments, as of March 31, 2005, and the related statement of operations for the year then ended, and the statements of changes in net assets and the financial highlights for each of the years in the two-year period then ended. These financial statements and financial highlights are the responsibility of the Fund’s management. Our responsibility is to express an opinion on these financial statements and financial highlights based on our audits. The financial highlights for the years presented through March 31, 2003 were audited by another independent registered public accounting firm, whose report dated May 15, 2003, expressed an unqualified opinion thereon.
We conducted our audits in accordance with the standards of the Public Company Accounting Oversight Board (United States). Those standards require that we plan and perform the audit to obtain reasonable assurance about whether the financial statements and financial highlights are free of material misstatement. An audit includes examining, on a test basis, evidence supporting the amounts and disclosures in the financial statements. Our procedures included confirmation of securities owned as of March 31, 2005, by correspondence with the custodian and brokers or by other appropriate auditing procedures where replies from brokers were not received. An audit also includes assessing the accounting principles used and significant estimates made by management, as well as evaluating the overall financial statement presentation. We believe that our audits provide a reasonable basis for our opinion.
In our opinion, the financial statements and financial highlights referred to above present fairly, in all material respects, the financial position of the Strategic Partners Real Estate Fund as of March 31, 2005, and the results of its operations for the year then ended, and the changes in its net assets and the financial highlights for each of the years in the two-year period then ended, in conformity with U.S. generally accepted accounting principles.

New York, New York
May 26, 2005
| | |
| 34 | | Visit our website at www.strategicpartners.com |
Strategic Partners Real Estate Securities Fund
Federal Income Tax Information (Unaudited)
We are required by the Internal Revenue Code to advise you within 60 days of the Fund’s fiscal year end (March 31, 2005) as to the federal tax status of dividends paid by the Fund during such fiscal year. Accordingly, we are advising you that in the fiscal year ended March 31, 2005, dividends were paid of $.220, $.110, $.110 and $.259 per share (representing net investment income for Class A, B, C and Z shares respectively), which are taxable as ordinary income.
We wish to advise you that the corporate dividends received deduction for the Fund is 4.75%. Only funds that invest in U.S. equity securities are entitled to pass-through a corporate dividends received deduction.
The Fund intends to designate 53.86% of ordinary income dividends, as qualified for the reduced tax rate under The Jobs & Growth Tax Relief Reconciliation Act of 2003.
In January 2006, you were advised on IRS Form 1099 DIV or substitute 1099 DIV as to the federal tax status of the dividends received by you in calendar year 2005.
| | |
| Strategic Partners Real Estate Fund | | 35 |
Management of the Fund
(Unaudited)
Information pertaining to the Trustees of the Fund is set forth below. Trustees who are not deemed to be “interested persons” of the Fund, as defined in the Investment Company Act of 1940 (the 1940 Act), are referred to as “Independent Trustees.” Trustees who are deemed to be “interested persons” of the Fund are referred to as “Interested Trustees.” “Fund Complex”† consists of the Fund and any other investment companies managed by PI.
Independent Trustees(2)
Linda W. Bynoe (52), Trustee since 2005(3) Oversees 91 portfolios in Fund complex
Principal occupations (last 5 years): President and Chief Executive Officer (since March 1995) of Telemat Ltd., formerly Vice President at Morgan Stanley & Co.
Other Directorships held:(4) Director of Dynegy Inc. (since September 2002) and Simon Property Group, Inc. (since May 2003).
David E.A. Carson (70), Trustee since 2003(3) Oversees 91 portfolios in Fund complex
Principal occupations (last 5 years): Director (January 2000 to May 2000), Chairman (January 1999 to December 1999), Chairman and Chief Executive Officer (January 1998 to December 1998) and President, Chairman and Chief Executive Officer (1983-1997) of People’s Bank.
Other Directorships held.(4) Director of United Illuminating and UIL Holdings (utility company), since 1993.
Robert E. La Blanc (71), Trustee since 2001(3) Oversees 91 portfolios in Fund complex
Principal occupations (last 5 years): President (since 1981) of Robert E. La Blanc Associates, Inc. (telecommunications); formerly General Partner at Salomon Brothers and Vice-Chairman of Continental Telecom; Trustee of Manhattan College.
Other Directorships held:(4) Director of Chartered Semiconductor Manufacturing, Ltd. (since 1998); Titan Corporation (electronics) (since 1995); Computer Associates International, Inc. (software company) (since 2002); FiberNet Telecom Group, Inc. (telecom company) (since 2003); Director (since April 1999) of the High Yield Plus Fund, Inc.
Douglas H. McCorkindale (65), Trustee since 2003(3) Oversees 91 portfolios in Fund complex
Principal occupations (last 5 years): Chairman (since February 2001), Chief Executive Officer (since June 2000) and President (since September 1997) of Gannett Co. Inc. (publishing and media); formerly Vice Chairman (March 1984-May 2000) of Gannett Co., Inc.
Other Directorships held:(4) Director of Gannett Co. Inc., Director of Continental Airlines, Inc. (since May 1993); Director of Lockheed Martin Corp. (aerospace and defense) (since May 2001); Director of The High Yield Plus Fund, Inc. (since 1996).
Richard A. Redeker (61), Trustee since 2003(3) Oversees 90 portfolios in Fund complex
Principal occupations (last 5 years): Management Consultant; Director of Investmart, Inc. (since 2001) and Director of Penn Tank Lines, Inc. (since 1999).
Other Directorships held:(4) None.
| | |
| 36 | | Visit our website at www.strategicpartners.com |
Robin B. Smith (65), Trustee since 1997(3) Oversees 90 portfolios in Fund complex
Principal occupations (last 5 years): Chairman of the Board (since January 2003) of Publishers Clearing House (direct marketing); formerly Chairman and Chief Executive Officer (August 1996-January 2003) of Publishers Clearing House.
Other Directorships held:(4) Director of BellSouth Corporation (since 1992).
Stephen G. Stoneburn (61), Trustee since 2001(3) Oversees 90 portfolios in Fund complex
Principal occupations (last 5 years): President and Chief Executive Officer (since June 1996) of Quadrant Media Corp. (a publishing company); formerly President (June 1995-June 1996) of Argus Integrated Media, Inc.; Senior Vice President and Managing Director (January 1993-1995) of Cowles Business Media and Senior Vice President of Fairchild Publications, Inc. (1975-1989).
Other Directorships held:(4) None
Clay T. Whitehead (66), Trustee since 1997(3) Oversees 91 portfolios in Fund complex
Principal occupations (last 5 years): President (since 1983) of National Exchange Inc. (new business development firm).
Other Directorships held:(4) Director (since 2000) of the High Yield Plus Fund, Inc.
Interested Trustees(1)
Judy A. Rice (57), President since 2003 and Trustee since 2000(3) Oversees 91 portfolios in Fund complex
Principal occupations (last 5 years): President, Chief Executive Officer, Chief Operating Officer and Officer-in-Charge (since 2003) of PI; Director, Officer-in-Charge, President, Chief Executive Officer and Chief Operating Officer (since May 2003) of American Skandia Advisory Services, Inc., and American Skandia Investment Services, Inc.; Director, Officer-in-Charge, President, Chief Executive Officer (since May 2003) of American Skandia Fund Services, Inc.; Vice President (since February 1999) of Prudential Investment Management Services LLC; President, Chief Executive Officer and Officer-in-Charge (since April 2003) of Prudential Mutual Fund Services LLC; formerly various positions to Senior Vice President (1992-1999) of Prudential Securities Incorporated (Prudential Securities); and various positions to Managing Director (1975-1992) of Salomon Smith Barney; Member of Board of Governors of the Money Management Institute.
Other Directorships held:(4) None
Robert F. Gunia (58), Vice President and Trustee since 1997(3) Oversees 166 portfolios in Fund complex
Principal occupations (last 5 years): Chief Administrative Officer (since June 1999) of PI; Executive Vice President (since January 1996) of PI; President (since April 1999) of Prudential Investment Management Services LLC (PIMS); Director, Executive Vice President and Chief Administrative Officer (since May 2003) of American Skandia Investment Services, Inc, American Skandia Advisory Services, Inc., and American Skandia Fund Services, Inc.; Executive Vice President (since March 1999) of Prudential Mutual Fund Services LLC; formerly Senior Vice President (March 1987-May 1999) of Prudential Securities.
Other Directorships held:(4) Vice President and Director (since May 1989) and Treasurer (since 1999) of The Asia Pacific Fund, Inc.
| | |
| Strategic Partners Real Estate Fund | | 37 |
Information pertaining to the Officers of the Fund who are not also Trustees is set forth below.
Officers(2)
William V. Healey (51), Chief Legal Officer and Secretary since 2004(3)
Principal occupations (last 5 years): Vice President and Associate General Counsel (since 1998) of Prudential; Executive Vice President and Chief Legal Officer (since February 1999) of Prudential Investments LLC; Senior Vice President, Chief Legal Officer and Secretary (since December 1998) of Prudential Investment Management Services LLC; Executive Vice President and Chief Legal Officer (since February 1999) of Prudential Mutual Fund Services LLC; Vice President and Secretary (since October 1998) of Prudential Investment Management, Inc., Executive Vice President and Chief Legal Officer (since May 2003) of American Skandia Investment Services, Inc., American Skandia Fund Services, Inc. and American Skandia Advisory Services, Inc.; Director (June 1999-June 2002 and June 2003-present) of ICI Mutual Insurance Company; prior to August 1998, Associate General Counsel of the Dreyfus Corporation (Dreyfus), a subsidiary of Mellon Bank, N.A. (Mellon Bank), and an officer and/or director of various affiliates of Mellon Bank and Dreyfus.
Grace C. Torres (45), Treasurer and Principal Financial and Accounting Officer since 1997(3)
Principal occupations (last 5 years): Senior Vice President (since January 2000) of PI; Senior Vice President and Assistant Treasurer (since May 2003) of American Skandia Investment Services, Inc. and American Skandia Advisory Services, Inc.; formerly First Vice President (December 1996-January 2000) of PI and First Vice President (March 1993-1999) of Prudential Securities.
Jonathan D. Shain (46), Secretary since 2001(3)
Principal occupations (last 5 years): Vice President and Corporate Counsel (since August 1998) of Prudential; Vice President and Assistant Secretary (since May 2003) of American Skandia Investment Services, Inc. and American Skandia Fund Services, Inc.
Lee D. Augsburger (45), Chief Compliance Officer since 2004(3)
Principal occupations (last 5 years): Vice President and Chief Compliance Officer (since May 2003) of PI; Vice President and Chief Compliance Officer (since October 2000) of Prudential Investment Management, Inc.: formerly Vice President and Chief Legal Officer—Annuities (August 1999-October 2000) of Prudential Insurance Company of America; Vice President and Corporate Counsel (November 1997-August 1999) of Prudential Insurance Company of America.
Maryanne Ryan (40), Anti-Money Laundering Compliance Officer since 2002(3)
Principal occupations (last 5 years): Vice President, Prudential (since November 1998); First Vice President, Prudential Securities (March 1997-May 1998); Anti-Money Laundering Compliance Officer (since 2003) of American Skandia Investment Services, Inc., American Skandia Advisory Services, Inc. and American Skandia Marketing, Inc.
Helene Gurian (51), Acting Anti-Money Laundering Compliance Officer since 2004(3)
Vice President, Prudential (since July 1997): Vice President, Compliance (July 1997-January 2001); Vice President, Compliance and Risk Officer, Retail Distribution (January 2001-May 2002); Vice President, Corporate Investigations (May 2002-present) responsible for supervision of Prudential’s fraud investigations, anti-money laundering program and high technology investigation unit.
| † | The Fund Complex consists of all investment companies managed by PI. The Funds for which PI serves as manager include Jennison Dryden Mutual Funds, Strategic Partners Funds, The Prudential Variable Contract Accounts 2, 10, 11. The Target Portfolio Trust, The Prudential Series Fund, Inc., American Skandia Trust, and Prudential’s Gibraltar Fund. |
| | |
| 38 | | Visit our website at www.strategicpartners.com |
| (1) | “Interested” Trustee, as defined in the 1940 Act, by reason of employment with the Manager (Prudential Investments LLC or PI), the Subadviser (Wellington Management Company, LLP or Wellington Management) or the Distributor (Prudential Investment Management Services LLC or PIMS). |
| (2) | Unless otherwise noted, the address of the Trustees and Officers is c/o: Prudential Investments LLC, Gateway Center Three, 100 Mulberry Street, Newark, NJ 07102. |
| (3) | There is no set term of office for Trustees and Officers. The independent Trustees have adopted a retirement policy, which calls for the retirement of Trustees on December 31 of the year in which they reach the age of 75. |
| (4) | This includes only directorships of companies required to register, or file reports with the SEC under the Securities and Exchange Act of 1934 (that is, “public companies”) or other investment companies registered under the 1940 Act. |
Additional information about the Company’s Trustees is included in the Company’s Statement of Additional Information which is available without charge, upon request, by calling (800) 225-1852 or (973) 367-3529 (Calling from outside the U.S.)
| | |
| Strategic Partners Real Estate Fund | | 39 |
Growth of a $10,000 Investment
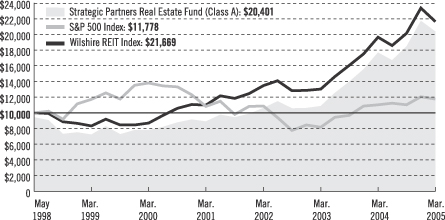
| | | | | | | | | |
| Average Annual Total Returns (With Sales Charges) as of 3/31/05 | |
| | | One Year | | | Five Years | | | Since Inception | |
Class A | | 9.02 | % | | 19.81 | % | | 10.87 | % |
Class B | | 9.51 | | | 20.16 | | | 10.95 | |
Class C | | 13.51 | | | 20.25 | | | 10.95 | |
Class Z | | 15.69 | | | 21.47 | | | 12.08 | |
| | | | | | | | | | |
| Average Annual Total Returns (Without Sales Charges) as of 3/31/05 | |
| | | One Year | | | Five Years | | | Since Inception | |
Class A | | 15.37 | % | | 21.17 | % | | 11.79 | % |
Class B | | 14.51 | | | 20.25 | | | 10.95 | |
Class C | | 14.51 | | | 20.25 | | | 10.95 | |
Class Z | | 15.69 | | | 21.47 | | | 12.08 | |
Performance data quoted represent past performance. Past performance does not guarantee future results. The investment return and principal value of an investment will fluctuate so that an investor’s shares, when redeemed, may be worth more or less than their original cost. Current performance may be lower or higher than the past performance data quoted. The returns in the graph and the tables do not reflect the deduction of taxes that a shareholder would pay on Fund distributions or following the redemption of Fund shares. An investor may obtain performance data current to the most recent month-end by visiting our website at www.strategicpartners.com or by calling (800) 225-1852. The maximum initial sales charge is 5.50%.
| | |
| | | Visit our website at www.strategicpartners.com |
Source: Prudential Investments LLC and Lipper Inc. Inception date: 5/5/98.
The graph compares a $10,000 investment in the Strategic Partners Real Estate Fund (Class A shares) with a similar investment in the S&P 500 Index and the Wilshire REIT Index by portraying the initial account values at the commencement of operations of Class A shares (May 5, 1998) and the account values at the end of the current fiscal year (March 31, 2005) as measured on a quarterly basis. For purposes of the graph, and unless otherwise indicated, it has been assumed that (a) the maximum applicable front-end sales charge was deducted from the initial $10,000 investment in Class A shares; (b) all recurring fees (including management fees) were deducted; and (c) all dividends and distributions were reinvested. The line graph provides information for Class A shares only. As indicated in the tables provided earlier, performance for Class B, C, and Z shares will vary due to the differing charges and expenses applicable to each share class (as indicated in the following paragraphs). Without a distribution and service (12b-1) fee waiver of 0.05% for Class A shares annually through March 31, 2005, the returns shown in the graph and for Class A shares in the tables would have been lower.
The S&P 500 Index is an unmanaged index of 500 stocks of large U.S. public companies. It gives a broad look at how stock prices in the United States have performed. The Wilshire REIT Index is an unmanaged, market capitalization-weighted index comprising publicly traded REITs. The Wilshire REIT Index does not include real estate operating companies as the Wilshire Real Estate Securities Index does. The Indexes’ total returns include the reinvestment of all dividends, but do not include the effects of sales charges, operating expenses of a mutual fund, or taxes. The returns for the Indexes would be lower if they included the effects of sales charges, operating expenses, or taxes. The securities that comprise these indexes may differ substantially from the securities in the Fund. These are not the only indexes that may be used to characterize performance of real estate securities funds. Other indexes may portray different comparative performance. Investors cannot invest directly in an index.
Through March 14, 2004, the Fund charged a maximum front-end sales charge of 0.50% for Class A shares and a 12b-1 fee of up to 0.30% annually. Effective March 15, 2004, Class A shares are subject to a maximum front-end sales charge of 5.50% and a 12b-1 fee of up to 0.30% annually. Investors who purchase Class A shares in an amount of $1 million or more do not pay a front-end sales charge, but are subject to a contingent deferred sales charge (CDSC) of 1% for shares sold within 12 months of purchase. Class B shares are subject to a declining CDSC of 5%, 4%, 3%, 2%, 1%, and 1% respectively for the first six years after purchase and a 12b-1 fee of 1% annually. Approximately seven years after purchase, Class B shares will automatically convert to Class A shares on a quarterly basis. Through February 1, 2004, Class C shares were subject to a front-end sales charge of 1%, a CDSC of 1% for shares redeemed within 18 months of purchase, and a 12b-1 fee of 1% annually. Class C shares purchased on or after February 2, 2004, are not subject to a front-end sales charge, the CDSC of 1% for Class C shares purchased on or after that date will apply for 12 months from the date of purchase, and the annual 12b-1 fee will remain 1%. The returns in the graph and the tables do not reflect the deduction of taxes that a shareholder would pay on Fund distributions or following the redemption of Fund shares.
| | |
| Strategic Partners Real Estate Fund | | |
| | | | |
| n MAIL | | n TELEPHONE | | n WEBSITE |
Gateway Center Three 100 Mulberry Street Newark, NJ 07102 | | (800) 225-1852 | | www.strategicpartners.com |
|
| PROXY VOTING |
The Board of Trustees for the Fund has delegated to the Fund’s investment advisers the responsibility for voting any proxies and maintaining proxy recordkeeping with respect to the Fund. A description of these proxy voting policies and procedures is available without charge, upon request, by calling (800) 225-1852 or by visiting the Securities and Exchange
Commission’s (the Commission) website at http://www.sec.gov. Information regarding how the Fund voted proxies relating to portfolio securities during the most recent 12-month period
ended June 30, 2004, is available on the Fund’s website at http://www.prudential.com and on the Commission’s website at http://www.sec.gov. |
|
| TRUSTEES |
| Linda W. Bynoe • David E.A. Carson • Robert F. Gunia • Robert E. La Blanc • Douglas H. McCorkindale • Richard A. Redeker • Judy A. Rice • Robin B. Smith • Stephen G. Stoneburn • Clay T. Whitehead |
|
| OFFICERS |
Judy A. Rice, President • Robert F. Gunia, Vice President • Grace C. Torres, Treasurer and Principal Financial and Accounting Officer • William V. Healey, Chief Legal Officer • Jonathan D. Shain, Secretary • Maryanne Ryan, Anti-Money Laundering Officer •
Helene Gurian, Acting Anti-Money Laundering Compliance Officer • Lee D. Augsberger, Chief Compliance Officer |
| | | | |
| MANAGER | | Prudential Investments LLC | | Gateway Center Three
100 Mulberry Street
Newark, NJ 07102 |
|
| INVESTMENT ADVISER | | Wellington Management
Company, LLP | | 75 State Street
Boston, MA 02109 |
|
| DISTRIBUTOR | | Prudential Investment
Management Services LLC | | Gateway Center Three
100 Mulberry Street
Newark, NJ 07102 |
|
| CUSTODIAN | | State Street Bank
and Trust Company | | One Heritage Drive
North Quincy, MA 02171 |
|
| TRANSFER AGENT | | Prudential Mutual Fund
Services LLC | | PO Box 8098
Philadelphia, PA 19176 |
|
| INDEPENDENT REGISTERED PUBLIC ACCOUNTING FIRM | | KPMG LLP | | 345 Park Avenue
New York, NY 10154 |
|
| FUND COUNSEL | | Sullivan & Cromwell LLP | | 125 Broad Street
New York, NY 10004 |
| | | | | | | | | | | | |
| Strategic Partners Real Estate Fund | | | | |
| | | Share Class | | A | | B | | C | | Z | | |
| | | NASDAQ | | PURAX | | PURBX | | — | | — | | |
| | | CUSIP | | 86276L109 | | 86276L208 | | 86276L307 | | 86276L406 | | |
| | | | | | | | | | | | | |
|
| An investor should consider the investment objectives, risks, and charges and expenses of the Fund carefully before investing. The prospectus for the Fund contains this and other information about the Fund. An investor may obtain a prospectus by visiting our website at www.strategicpartners.com or by calling (800) 225-1852. The prospectus should be read carefully before investing. |
|
| E-DELIVERY |
To receive your mutual fund documents on-line, go to www.icsdelivery.com/prudential/funds
and enroll. Instead of receiving printed documents by mail, you will receive notification via e-mail when new materials are available. You can cancel your enrollment or change your e-mail
address at any time by clicking on the change/cancel enrollment option at the icsdelivery
website address. |
|
| SHAREHOLDER COMMUNICATIONS WITH TRUSTEES |
| Shareholders of the Fund can communicate directly with the Board of Trustees by writing to the Chair of the Board, Strategic Partners Real Estate Fund, PO Box 13964, Philadelphia, PA 19176. Shareholders can communicate directly with an individual Trustee by writing to that Trustee at Strategic Partners Real Estate Fund, PO Box 13964, Philadelphia, PA 19176. Such communications to the Board or individual Trustees are not screened before being delivered to the addressee. |
|
| AVAILABILITY OF QUARTERLY PORTFOLIO SCHEDULE |
| The Fund files its complete schedule of portfolio holdings with the Securities and Exchange Commission (the Commission) for the first and third quarters of each fiscal year on Form N-Q. The Fund’s Forms N-Q are available on the Commission’s website at http://www.sec.gov. The Fund’s Forms N-Q may also be reviewed and copied at the Commission’s Public Reference Room in Washington, D.C. Information on the operation and location of the Public Reference Room may be obtained by calling (800) SEC-0330 (732-0330). The Fund will provide a full list of its portfolio holdings as of the end of each fiscal quarter on its website at www.strategicpartners.com approximately 60 days after the end of the fiscal quarter. |
Mutual Funds:
| | | | |
| ARE NOT INSURED BY THE FDIC OR ANY FEDERAL GOVERNMENT AGENCY | | MAY LOSE VALUE | | ARE NOT A DEPOSIT OF OR GUARANTEED BY ANY BANK OR ANY BANK AFFILIATE |

| | | | | | | | | | | | |
| Strategic Partners Real Estate Fund |
| | | Share Class | | A | | B | | C | | Z | | |
| | | NASDAQ | | PURAX | | PURBX | | — | | — | | |
| | | CUSIP | | 86276L109 | | 86276L208 | | 86276L307 | | 86276L406 | | |
| | | | | | | | | | | | | |
MFSP182E IFS-A104167 Ed. 05/2005
Item 2 – Code of Ethics – – See Exhibit (a)
As of the end of the period covered by this report, the registrant has adopted a code of ethics (the “Section 406 Standards for Investment Companies – Ethical Standards for Principal Executive and Financial Officers”) that applies to the registrant’s Principal Executive Officer and Principal Financial Officer; the registrant’s Principal Financial Officer also serves as the Principal Accounting Officer.
The registrant hereby undertakes to provide any person, without charge, upon request, a copy of the code of ethics. To request a copy of the code of ethics, contact the registrant 973-367-7521, and ask for a copy of the Section 406 Standards for Investment Companies - Ethical Standards for Principal Executive and Financial Officers.
Item 3 – Audit Committee Financial Expert –
The registrant’s Board has determined that Mr. David Carson, member of the Board’s Audit Committee is an “audit committee financial expert,” and that he is “independent,” for purposes of this Item.
Item 4 – Principal Accountant Fees and Services –
For the fiscal years ended March 31, 2005 and March 31, 2004, KPMG LLP (“KPMG”), the Registrant’s principal accountant, billed the Registrant $16,700 and $16,700, respectively, for professional services rendered for the audit of the Registrant’s annual financial statements or services that are normally provided in connection with statutory and regulatory filings.
None.
None.
None.
(e) (1) Audit Committee Pre-Approval Policies and Procedures
THE PRUDENTIAL MUTUAL FUNDS
AUDIT COMMITTEE POLICY
on
Pre-Approval of Services Provided by the Independent Accountants
The Audit Committee of each Prudential Mutual Fund is charged with the responsibility to monitor the independence of the Fund’s independent accountants. As part of this responsibility, the Audit Committee must pre-approve any independent accounting firm’s engagement to render audit and/or permissible non-audit services, as required by law. In evaluating a proposed engagement of the independent accountants, the Audit Committee will assess the effect that the engagement might reasonably be expected to have on the accountant’s independence. The Committee’s evaluation will be based on:
| | • | | a review of the nature of the professional services expected to be provided, |
| | • | | a review of the safeguards put into place by the accounting firm to safeguard independence, and |
| | • | | periodic meetings with the accounting firm. |
Policy for Audit and Non-Audit Services Provided to the Funds
On an annual basis, the scope of audits for each Fund, audit fees and expenses, and audit-related and non-audit services (and fees proposed in respect thereof) proposed to be performed by the Fund’s independent accountants will be presented by the Treasurer and the independent accountants to the Audit Committee for review and, as appropriate, approval prior to the initiation of such services. Such presentation shall be accompanied by confirmation by both the Treasurer and the independent accountants that the proposed services will not adversely affect the independence of the independent accountants. Proposed services shall be described in sufficient detail to enable the Audit Committee to assess the appropriateness of such services and fees, and the compatibility of the provision of such services with the auditor’s independence. The Committee shall receive periodic reports on the progress of the audit and other services which are approved by the Committee or by the Committee Chair pursuant to authority delegated in this Policy.
The categories of services enumerated under “Audit Services”, “Audit-related Services”, and “Tax Services” are intended to provide guidance to the Treasurer and the independent accountants as to those categories of services which the Committee believes are generally consistent with the independence of the independent accountants and which the Committee (or the Committee Chair) would expect upon the presentation of specific proposals to pre-approve. The enumerated categories are not intended as an exclusive list of audit, audit-related or tax services which the Committee (or the Committee Chair) would consider for pre-approval.
Audit Services
The following categories of audit services are considered to be consistent with the role of the Fund’s independent accountants:
| | • | | Annual Fund financial statement audits |
| | • | | Seed audits (related to new product filings, as required) |
| | • | | SEC and regulatory filings and consents |
Audit-related Services
The following categories of audit-related services are considered to be consistent with the role of the Fund’s independent accountants:
| | • | | Accounting consultations |
| | • | | Fund merger support services |
| | • | | Agreed Upon Procedure Reports |
| | • | | Other Internal Control Reports |
Individual audit-related services that fall within one of these categories and are not presented to the Audit Committee as part of the annual pre-approval process will be subject to pre-approval by the Committee Chair (or any other Committee member on whom this responsibility has been delegated) so long as the estimated fee for those services does not exceed $50,000.
Tax Services
The following categories of tax services are considered to be consistent with the role of the Fund’s independent accountants:
| | • | | Tax compliance services related to the filing or amendment of the following: |
| | • | | Federal, state and local income tax compliance; and, |
| | • | | Sales and use tax compliance |
| | • | | Timely RIC qualification reviews |
| | • | | Tax distribution analysis and planning |
| | • | | Tax authority examination services |
| | • | | Tax appeals support services |
| | • | | Accounting methods studies |
| | • | | Fund merger support services |
| | • | | Tax consulting services and related projects |
Individual tax services that fall within one of these categories and are not presented to the Audit Committee as part of the annual pre-approval process will be subject to pre-approval by the Committee Chair (or any other Committee member on whom this responsibility has been delegated) so long as the estimated fee for those services does not exceed $50,000.
Other Non-audit Services
Certain non-audit services that the independent accountants are legally permitted to render will be subject to pre-approval by the Committee or by one or more Committee members to whom the Committee has delegated this authority and who will report to the full Committee any pre-approval decisions made pursuant to this Policy. Non-audit services presented for pre-approval pursuant to this paragraph will be accompanied by a confirmation from both the Treasurer and the independent accountants that the proposed services will not adversely affect the independence of the independent accountants.
Proscribed Services
The Fund’s independent accountants will not render services in the following categories of non-audit services:
| | • | | Bookkeeping or other services related to the accounting records or financial statements of the Fund |
| | • | | Financial information systems design and implementation |
| | • | | Appraisal or valuation services, fairness opinions, or contribution-in-kind reports |
| | • | | Internal audit outsourcing services |
| | • | | Management functions or human resources |
| | • | | Broker or dealer, investment adviser, or investment banking services |
| | • | | Legal services and expert services unrelated to the audit |
| | • | | Any other service that the Public Company Accounting Oversight Board determines, by regulation, is impermissible. |
Pre-approval of Non-Audit Services Provided to Other Entities Within the Prudential Fund Complex
Certain non-audit services provided to Prudential Investments LLC or any of its affiliates that also provide ongoing services to the Prudential Mutual Funds will be subject to pre-approval by the Audit Committee. The only non-audit services provided to these entities that will require pre-approval are those related directly to the operations and financial reporting of the Funds. Individual projects that are not presented to the Audit Committee as part of the annual pre-approval process, will be subject to pre-approval by the Committee Chair (or any other Committee member on whom this responsibility has been delegated) so long as the estimated fee for those services does not exceed $50,000. Services presented for pre-approval pursuant to this paragraph will be accompanied by a confirmation from both the Treasurer and the independent accountants that the proposed services will not adversely affect the independence of the independent accountants.
Although the Audit Committee will not pre-approve all services provided to Prudential Investments LLC and its affiliates, the Committee will receive an annual report from the Fund’s independent accounting firm showing the aggregate fees for all services provided to Prudential Investments and its affiliates.
(e) (2) Percentage of services referred to in 4(b)- (4)(d) that were approved by the audit committee –
Not applicable.
| (f) | Percentage of hours expended attributable to work performed by other than full time employees of principal accountant if greater than 50%. |
Not applicable.
Not applicable to Registrant for the fiscal years 2005 and 2004. The aggregate non-audit fees billed by KPMG for services rendered to the registrant’s investment adviser and any entity controlling, controlled by, or under common control with the investment adviser that provides ongoing services to the registrant for the fiscal year 2005 was $33,500. There were no non-audit fees billed by KPMG for services rendered to the registrant’s investment adviser and any entity controlling, controlled by, or under common control with the investment adviser that provides ongoing services to the registrant for the fiscal year 2004.
| (h) | Principal Accountants Independence |
Not applicable as KPMG has not provided non-audit services to the registrant’s investment adviser and any entity controlling, controlled by, or under common control with the investment adviser that provides ongoing services to the registrant that were not pre-approved pursuant to Rule 2-01(c)(7)(ii) of Regulation S-X.
Item 5 – Audit Committee of Listed Registrants – Not applicable.
Item 6 – Schedule of Investments – The schedule is included as part of the report to shareholders filed under Item 1 of this Form.
Item 7 – Disclosure of Proxy Voting Policies and Procedures for Closed-End Management Investment Companies – Not applicable.
Item 8 – Portfolio Managers of Closed-End Management Investment Companies – Not applicable.
Item 9 – Purchases of Equity Securities by Closed-End Management Investment Company and Affiliated Purchasers – Not applicable.
Item 10 – Submission of Matters to a Vote of Security Holders – Not applicable.
Item 11 – Controls and Procedures
| | (a) | It is the conclusion of the registrant’s principal executive officer and principal financial officer that the effectiveness of the registrant’s current disclosure controls and procedures (such disclosure controls and procedures having been evaluated within 90 days of the date of this filing) provide reasonable assurance that the information required to be disclosed by the registrant has been recorded, processed, summarized and reported within the time period specified in the Commission’s rules and forms and that the information required to be disclosed by the registrant has been accumulated and communicated to the registrant’s principal executive officer and principal financial officer in order to allow timely decisions regarding required disclosure. |
| | (b) | There have been no significant changes in the registrant’s internal controls or in other factors that could significantly affect these controls subsequent to the date of their evaluation, including any corrective actions with regard to significant deficiencies and material weaknesses. |
Item 12 – Exhibits
| | (a) | Code of Ethics – Attached hereto |
| | (b) | Certifications pursuant to Section 302 and 906 of the Sarbanes-Oxley Act – Attached hereto |
SIGNATURES
Pursuant to the requirements of the Securities Exchange Act of 1934 and the Investment Company Act of 1940, the registrant has duly caused this report to be signed on its behalf by the undersigned, thereunto duly authorized.
| | |
| (Registrant) Strategic Partners Real Estate Fund |
| |
| By (Signature and Title)* | | /s/ DEBORAH A. DOCS |
| | | Deborah A. Docs |
| | | Secretary |
Date May 26, 2005
Pursuant to the requirements of the Securities Exchange Act of 1934 and the Investment Company Act of 1940, this report has been signed below by the following persons on behalf of the registrant and in the capacities and on the dates indicated.
| | |
| |
| By (Signature and Title)* | | /s/ JUDY A. RICE |
| | | Judy A. Rice |
| | | President and Principal Executive Officer |
Date May 26, 2005
| | |
| |
| By (Signature and Title)* | | /s/ GRACE C. TORRES |
| | | Grace C. Torres |
| | | Treasurer and Principal Financial Officer |
Date May 26, 2005
| * | Print the name and title of each signing officer under his or her signature. |