UNITED STATES
SECURITIES AND EXCHANGE COMMISSION
Washington, D.C. 20549
FORM N-CSR
CERTIFIED SHAREHOLDER REPORT OF REGISTERED MANAGEMENT
INVESTMENT COMPANIES
| | |
| Investment Company Act file number: | | 811-08565 |
| |
| Exact name of registrant as specified in charter: | | Dryden Global Real |
| | Estate Fund (f/k/a Strategic |
| | Partners Real Estate Fund) |
| |
| Address of principal executive offices: | | Gateway Center 3, |
| | 100 Mulberry Street, |
| | Newark, New Jersey 07102 |
| |
| Name and address of agent for service: | | Deborah A. Docs |
| | Gateway Center 3, |
| | 100 Mulberry Street, |
| | Newark, New Jersey 07102 |
| |
| Registrant’s telephone number, including area code: | | 800-225-1852 |
| |
| Date of fiscal year end: | | 3/31/2007 |
| |
| Date of reporting period: | | 3/31/2007 |
Item 1 – Reports to Stockholders

Dryden Global Real Estate Fund
(Formerly known as Strategic Partners Real Estate Fund)
| | |
| MARCH 31, 2007 | | ANNUAL REPORT |

FUND TYPE
Stock
OBJECTIVE
Capital appreciation and income
This report is not authorized for distribution to prospective investors unless preceded or accompanied by a current prospectus.
The views expressed in this report and information about the Fund’s portfolio holdings are for the period covered by this report and are subject to change thereafter.

May 16, 2007
Dear Shareholder:
It’s been an eventful fiscal year for the Fund. It began the period as the Strategic Partners Real Estate Fund, focused on domestic real estate securities. Following shareholder approval, earlier this year we broadened the Fund’s focus from domestic to global securities, and accordingly changed its name to Dryden Global Real Estate Fund. The Fund changed its subadviser to Prudential Real Estate Investors (PREI). These changes took effect just as the domestic real estate indexes declined. In their “Looking Ahead” comments in the following annual report, PREI will give its view of what this means for the market’s fundamentals.
We are pleased to welcome you into our JennisonDryden fund family. The Dryden Global Real Estate Fund fits well with the JennisonDryden investment philosophy of targeting consistently strong performance. Like the other Prudential-affiliated asset managers subadvising JennisonDryden funds, PREI’s investment process combines a strong team of research analysts, a culture that leverages their findings, and a security selection discipline that focuses on risk controls as well as returns.
At Prudential, we have appreciated your confidence in our Strategic Partners funds and look forward to continuing to serve you with our JennisonDryden family of mutual funds.
Sincerely,

Judy A. Rice, President
Dryden Global Real Estate Fund
| | |
| Dryden Global Real Estate Fund | | 1 |
Your Fund’s Performance
Fund objective
The investment objective of the Dryden Global Real Estate Fund is capital appreciation and income. There can be no assurance that the Fund will achieve its investment objective.
Performance data quoted represent past performance. Past performance does not guarantee future results. The investment return and principal value of an investment will fluctuate, so that an investor’s shares, when redeemed, may be worth more or less than their original cost. Current performance may be lower or higher than the past performance data quoted. An investor may obtain performance data as of the most recent month-end by visiting our website at www.jennisondryden.com or by calling (800) 225-1852. The maximum initial sales charge is 5.50% (Class A shares). As of March 31, 2007, the gross annualized operating expenses are 1.27%, 1.97%, 1.97%, 0.97% for Class A, B, C and Z shares, respectively. As of March 31, 2007, the annualized operating expenses net of a contractual reduction through July 31, 2008 are 1.22%, 1.97%, 1.97%, and 0.97% for Class A, B, C and Z shares, respectively. These figures include the net operating expenses of the underlying portfolios in which the Fund invests. Such expenses were calculated using a weighted average of the net operating expenses of each underlying fund and when annualized amounted to less than 0.005% for each share class.
| | | | | | | | | |
| Cumulative Total Returns as of 3/31/07 | | | | | | | | | |
| | | One Year | | | Five Years | | | Since Inception1 | |
Class A | | 27.09 | % | | 245.38 | % | | 288.22 | % |
Class B | | 26.12 | | | 232.47 | | | 262.98 | |
Class C | | 26.12 | | | 232.47 | | | 262.98 | |
Class Z | | 27.38 | | | 249.62 | | | 297.06 | |
S&P 500 Index2 | | 11.82 | | | 35.49 | | | 47.16 | |
S&P Citigroup/BMI World Property Net Index3 | | 31.07 | | | 209.17 | | | — | |
Dow Jones Wilshire REIT (Full-Cap) Index4 | | 21.83 | | | 178.81 | | | 276.27 | |
Lipper Real Estate Funds Avg.5 | | 21.51 | | | 174.21 | | | 241.39 | |
| | | | | | | | | |
| Average Annual Total Returns6 as of 3/31/07 | | | | | | | | | |
| | | One
Year | | | Five
Years | | | Since Inception1 | |
Class A | | 20.10 | % | | 26.69 | % | | 15.71 | % |
Class B | | 21.12 | | | 27.08 | | | 15.58 | |
Class C | | 25.12 | | | 27.16 | | | 15.58 | |
Class Z | | 27.38 | | | 28.45 | | | 16.75 | |
S&P 500 Index2 | | 11.82 | | | 6.26 | | | 4.43 | |
S&P Citigroup/BMI World Property Net Index3 | | 31.07 | | | 25.33 | | | — | |
Dow Jones Wilshire REIT (Full-Cap) Index4 | | 21.83 | | | 22.76 | | | 16.02 | |
Lipper Real Estate Funds Avg.5 | | 21.51 | | | 22.16 | | | 14.67 | |
| | |
| 2 | | Visit our website at www.jennisondryden.com |
The cumulative total returns do not reflect the deduction of applicable sales charges. If reflected, the applicable sales charges would reduce the cumulative total returns performance quoted. Class A shares are subject to a maximum front-end sales charge of 5.50%. All investors who purchase Class A shares in the amount of $1 million or more and sell these shares within 12 months of purchase are not subject to a front-end sales charge but are subject to a contingent deferred sales charge (CDSC) of 1%, including investors who purchase their shares through broker-dealers affiliated with Prudential. Class B and Class C shares are subject to a maximum CDSC of 5% and 1%, respectively. Class Z shares are not subject to a sales charge.
Source: Prudential Investments LLC, Lipper Inc., and Bloomberg. Performance figures may reflect fee waivers and/or expense reimbursements. In the absence of such fee waivers and/or expense reimbursements, total returns would be lower.
1Inception date: 5/5/98.
2The S&P 500 Index is an unmanaged index of 500 stocks of large U.S. public companies. It gives a broad look at how U.S. stock prices have performed.
3The S&P Citigroup/BMl World Property Net Index is a broad market index of more than 400 companies from 21 countries. Its inception date is 12/29/2000, later than the inception of the fund.
4The Dow Jones Wilshire REIT (Full-Cap) Index is an unmanaged, market capitalization weighted index comprised of publicly-traded REITs. Note: The Fund no longer utilizes the Dow Jones Wilshire REIT (Full-Cap) Index as the benchmark index utilized to measure the performance of the Fund. The Fund now utilizes the S&P Citigroup/BMI World Property Net Index as the benchmark index for purposes of measuring Fund performance.
5The Lipper Real Estate Funds Average (Lipper Average) is based on the average return for all funds in the Lipper Real Estate Funds category for the periods noted. Funds in the Lipper Average invest primarily in equity securities of domestic and foreign companies engaged in the real estate industry.
6The average annual total returns take into account applicable sales charges. Class A, Class B, and Class C shares are subject to an annual distribution and service (12b-1) fee of up to 0.30%, 1.00%, and 1.00%, respectively. Approximately seven years after purchase, Class B shares will automatically convert to Class A shares on a quarterly basis. Class Z shares are not subject to a 12b-1 fee. The returns in the tables do not reflect the deduction of taxes that a shareholder would pay on Fund distributions or following the redemption of Fund shares.
Investors cannot invest directly in an index. The securities in the S&P 500 Index, S&P Citigroup/BMI World Property Net Index, and Dow Jones Wilshire REIT (Full-Cap) Index may be very different from those in the Fund. Their returns do not include the effect of the sales charges and operating expenses of a mutual fund and would be lower if they did.
Returns for the Lipper Average reflect the deduction of operating expenses, but not sales charges or taxes. The Since Inception returns for the S&P 500 Index, the Dow Jones Wilshire REIT (Full-Cap) Index, and the Lipper Average are measured from the closest month-end to inception date, and not from the Fund’s actual inception date.
| | |
| Dryden Global Real Estate Fund | | 3 |
Your Fund’s Performance (continued)
| | | |
| Five Largest Holdings expressed as a percentage of net assets as of 3/31/07 | |
Mitsubishi Estate Co. Ltd., Real Estate Management/Service | | 4.2 | % |
Westfield Group, Property Trust | | 3.4 | |
Simon Property Group, Inc., Retail | | 3.3 | |
Land Securities Group PLC, Diversified | | 2.7 | |
Mitsui Fudosan Co. Ltd., Real Estate Operation & Development | | 2.7 | |
| Holdings are subject to change. | | | |
| | | |
| Five Largest Industries expressed as a percentage of net assets as of 3/31/07 | |
Diversified | | 21.5 | % |
Real Estate Operation & Development | | 18.1 | |
Real Estate Management/Service | | 10.3 | |
Property Trust | | 9.8 | |
Retail | | 6.6 | |
Industry weightings are subject to change.
| | |
| 4 | | Visit our website at www.jennisondryden.com |
Over the 12 months ended March 31, 2007, the Dryden Global Real Estate Fund Class A shares returned 27.09%, substantially above domestic real estate benchmarks and the Lipper Real Estate Funds Average, but trailing the S&P/Citigroup BMI World Property Index. Through the close of business on January 19, 2007, the Fund was named Strategic Partners Real Estate Fund and was managed as a domestic fund. Wellington Capital Management managed approximately 90% of the Fund’s assets while Principal Global Investors managed the remaining 10%. For the remaining portion of the reporting period, the Fund was managed by Prudential Real Estate Investors (PREI) on a global basis. PREI is a business unit of Prudential Investment Management, Inc., which is a Prudential Financial company.
The market environment was strong
In 2006, real estate occupancy and rental rate fundamentals in most market sectors strengthened as the U.S. economy continued its extended period of moderate growth. These factors helped to support continued earnings growth for real estate securities. By year-end 2006, real estate investment trust (REIT) indexes had outperformed the S&P 500 Index for the fourth consecutive calendar year, with impressive double-digit gains. The strength continued into January 2007, but then domestic markets peaked and fell during February and March. The global market, which includes both domestic and international REITs, was slowed by the falling domestic securities in those months but continued to rise overall.
The domestic Strategic Partners Fund’s performance was good
The primary driver of the Fund’s outperformance during the period as a Strategic Partners Fund was solid security selection in all REIT sectors except warehouses. Of 11 domestic REIT market sectors, the Fund beat the Dow Jones Wilshire REIT Index in 10. Selection was particularly strong in the lodging, retail, specialty finance, and diversified segments.
However, the Fund’s distribution among REIT sectors weakened its performance. Large overweights compared with the Dow Jones Wilshire REIT Index in lodging REITs and smaller overweights in homebuilder REITs hurt its relative performance. Although the lodging segment posted a gain of more than 30%, it nonetheless was not as strong as other segments of the market. The office, diversified, and specialty finance segments each returned more than 40%. Homebuilders was the only REIT sector that posted significant losses over the period, falling more than 30% as home prices began an overdue correction. The negative impact of these sector weightings was mitigated by the advantages of underweights in warehouse REITs and overweights in real estate service company REITs.
The global JennisonDryden Fund continued to gain
During the period the Fund was managed by PREI, performance continued to be good despite the sharp downturn in domestic markets. Confidence in the broader real
| | |
| Dryden Global Real Estate Fund | | 5 |
Your Fund’s Performance (continued)
estate market was affected by increasing defaults on subprime home loans. However, commercial real estate fundamentals remained quite strong while many residential markets were fundamentally weak. The Fund’s return in North America was driven by its selection among regional malls, with General Growth Properties, Taubman Centers, and Simon Property Group all providing above-average returns. The Fund also benefited from PREI’s decision to be less exposed than its benchmarks to multi-family housing because of high valuations in the sector. Companies in this sector generally reported fourth-quarter earnings and 2007 outlooks that were below expectations. In Japan, an emphasis on the major property developers rather than Japanese real estate investment trusts (JREITs) added to performance. The Fund’s European holdings were helped by expectations of a recovering prime office market in Stockholm and continued strength in the residential market. The Fund benefited from PREI’s decision to not hold any Spanish securities because of their high valuations. In Australia, the Fund’s performance was hurt by its emphasis on blue chip limited partnership trusts as these large, more liquid companies saw a heavier sell–off during the late February market turmoil than stocks of smaller firms.
Looking ahead
PREI has 35 years of private real estate investing experience and provides global real estate investing management services in the United States, Europe, Latin America, and Asia. With this background, it attempts to add value primarily by individual security selection within the various geographic and industry market sectors. The portfolio managers utilize the vast professional and local market resources of PREI to identify companies trading at discounts to net asset value and to identify top real estate management teams globally. Portfolio managers evaluate dividend and cash flow growth rates, net asset value, relative valuation, quality of the real estate portfolio, balance sheet quality, and consistency of earnings. The portfolio management team also analyzes companies’ qualitative characteristics, including company management’s ability to create shareholder value, company management’s alignment of interest with shareholders, business plans, visions for future growth, and ability to execute business plans and sustain growth. The portfolio is then constructed with constraints on strategic overweights and underweights of particular real estate sectors relative to the Fund’s global benchmark. In addition, PREI emphasizes geographic regions that offer higher risk-adjusted return potential, based upon economic research, real estate trends, government policies, liquidity issues, and the prospects for local real estate sectors.
Real estate securities in the United States still have attractive dividend yields and earnings growth relative to bonds and other equities. Fourth quarter earnings reports and 2007 outlooks for commercial real estate companies were generally in line with or better than Wall Street analysts’ expectations. Regional mall, hotel, and coastal office
| | |
| 6 | | Visit our website at www.jennisondryden.com |
companies generated the largest earnings surprises while the outlooks for apartment companies generally fell short of high expectations. We continue to overweight malls as consumer spending remains solid and supply and demand conditions remain favorable. We think that landlords in the office sector still have pricing power, particularly in the coastal markets, while inland markets are showing signs of strength. In addition, many companies still trade at discounts to the value of their underlying real estate assets. As the domestic economy slows, we are shifting our hotel exposure away from companies with U.S. holdings in favor of those that have significant international exposure. We are becoming selectively optimistic on apartment companies on the basis of their relative valuations and earnings expectations.
In Asia, we are becoming more cautious about JREITs as acquisitions become more difficult in the competitive Japanese market. This is most apparent in office space because foreign investors have been buying Japanese commercial real estate. We continue to favor Hong Kong residential developers as signs of an improving secondhand market are emerging. We continue to find the United Kingdom favorably valued, but we try to find companies that can offer higher returns than are available on stable property portfolios by financing developments and/or deriving fees from managing investment funds. We also favor Swedish real estate companies exposed to the residential and prime office sectors.
We believe that increasing concerns about subprime (low credit quality) residential mortgages may affect the way investors perceive commercial real estate securities, but there is no genuine problem with the industry’s fundamentals. There is a very low correlation between U.S. house prices and U.S. REITs. The widespread misconception that they are linked may lead to attractive investment opportunities.
We think strong earnings and dividend growth, combined with attractive valuations, will drive the sector higher in 2007.
The Portfolio of Investments following this report shows the size of the Fund’s positions at period-end.
| | |
| Dryden Global Real Estate Fund | | 7 |
Comments on Largest Holdings
| 4.2% | Mitsubishi Estate Co. Ltd., Real Estate Management/Service |
Mitsubishi Estate is a leading developer in Japan. It owns some of the most attractive assets in Tokyo. The company is also a developer, benefiting from delivering vacant space into a high-growth rental market.
| 3.4% | Westfield Group, Property Trust |
Westfield Group is the largest global regional mall owner and developer. It has a strong pipeline and has been able to consistently earn three percentage points more on its properties than the cost of its investment in them.
| 3.3% | Simon Property Group, Inc., Retail |
Simon Property Group is the largest publicly traded retail real estate investment trust in North America and the country’s largest owner, developer, and manager of high quality retail real estate. It has a proven management team with a history of value creation. Its shares currently trade at a discount to the value of its properties. Demand fundamentals in its major markets are strong and the firm is currently rolling out a global strategy.
| 2.7% | Land Securities Group PLC, Diversified |
Land Securities is one of the largest owners of downtown London office properties. The London office market has seen rapid growth in rents. We believe this trend will continue with the current supply and demand characteristics in that market.
| 2.7% | Mitsui Fudosan Co. Ltd., Real Estate Operation & Development |
Mitsui Fudosan is one of Japan’s leading integrated real estate developers. Unlike JREITs, developers such as Mitsui Fudosan are able to capitalize on the growing demand in Tokyo for office space. It can deliver new, vacant product into the market so its average rental rate rises to current market levels more rapidly. In addition, Mitsui Fudosan’s assets are of the highest quality in Tokyo.
| | |
| 8 | | Visit our website at www.jennisondryden.com |
Fees and Expenses (Unaudited)
As a shareholder of the Fund, you incur two types of costs: (1) transaction costs, including sales charges (loads) on purchase payments and redemptions, as applicable, and (2) ongoing costs, including management fees, distribution and/or service (12b-1) fees, and other Fund expenses, as applicable. This example is intended to help you understand your ongoing costs (in dollars) of investing in the Fund and to compare these costs with the ongoing costs of investing in other mutual funds.
The example is based on an investment of $1,000 invested on October 1, 2006, at the beginning of the period, and held through the six-month period ended March 31, 2007.
The Fund’s transfer agent may charge additional fees to holders of certain accounts that are not included in the expenses shown in the table on the following page. These fees apply to Individual Retirement Accounts (IRAs) and Section 403(b) accounts. As of the close of the six-month period covered by the table, IRA fees included an annual maintenance fee of $15 per account (subject to a maximum annual maintenance fee of $25 for all accounts held by the same shareholder). Section 403(b) accounts are charged an annual $25 fiduciary maintenance fee. Some of the fees may vary in amount, or may be waived, based on your total account balance or the number of JennisonDryden or Strategic Partners Funds, including the Fund, that you own. You should consider the additional fees that were charged to your Fund account over the six-month period when you estimate the total ongoing expenses paid over the period and the impact of these fees on your ending account value, as these additional expenses are not reflected in the information provided in the expense table. Additional fees have the effect of reducing investment returns.
Actual Expenses
The first line for each share class in the table on the following page provides information about actual account values and actual expenses. You may use the information on this line, together with the amount you invested, to estimate the expenses that you paid over the period. Simply divide your account value by $1,000 (for example, an $8,600 account value ÷ $1,000 = 8.6), then multiply the result by the number on the first line under the heading “Expenses Paid During the Six-Month Period” to estimate the expenses you paid on your account during this period.
Hypothetical Example for Comparison Purposes
The second line for each share class in the table on the following page provides information about hypothetical account values and hypothetical expenses based on the Fund’s actual expense ratio and an assumed rate of return of 5% per year before expenses, which is not the Fund’s actual return. The hypothetical account values and
| | |
| Dryden Global Real Estate Fund | | 9 |
expenses may not be used to estimate the actual ending account balance or expenses you paid for the period. You may use this information to compare the ongoing costs of investing in the Fund and other funds. To do so, compare this 5% hypothetical example with the 5% hypothetical examples that appear in the shareholder reports of the other funds.
Please note that the expenses shown in the table are meant to highlight your ongoing costs only, and do not reflect any transactional costs such as sales charges (loads). Therefore the second line for each share class in the table is useful in comparing ongoing costs only, and will not help you determine the relative total costs of owning different funds. In addition, if these transactional costs were included, your costs would have been higher.
| | | | | | | | | | | | | | |
Dryden Global
Real Estate Fund | | Beginning Account
Value
October 1, 2006 | | Ending Account
Value March 31, 2007 | | Annualized
Expense Ratio
Based on the
Six-Month Period | | | Expenses Paid
During the Six-
Month Period* |
| | | | | | | | | | | | | | | |
| Class A | | Actual | | $ | 1,000.00 | | $ | 1,183.60 | | 1.21 | % | | $ | 6.59 |
| | | Hypothetical | | $ | 1,000.00 | | $ | 1,018.90 | | 1.21 | % | | $ | 6.09 |
| | | | | | | | | | | | | | | |
| Class B | | Actual | | $ | 1,000.00 | | $ | 1,179.40 | | 1.96 | % | | $ | 10.65 |
| | | Hypothetical | | $ | 1,000.00 | | $ | 1,015.16 | | 1.96 | % | | $ | 9.85 |
| | | | | | | | | | | | | | | |
| Class C | | Actual | | $ | 1,000.00 | | $ | 1,179.40 | | 1.96 | % | | $ | 10.65 |
| | | Hypothetical | | $ | 1,000.00 | | $ | 1,015.16 | | 1.96 | % | | $ | 9.85 |
| | | | | | | | | | | | | | | |
| Class Z | | Actual | | $ | 1,000.00 | | $ | 1,185.10 | | 0.96 | % | | $ | 5.23 |
| | | Hypothetical | | $ | 1,000.00 | | $ | 1,020.14 | | 0.96 | % | | $ | 4.84 |
* Fund expenses (net of fee waivers or subsides, if any) for each share class are equal to the annualized expense ratio for each share class (provided in the table), multiplied by the average account value over the period, multiplied by the 182 days in the six-month period ended March 31, 2007, and divided by the 365 days in the Fund’s fiscal year ended March 31, 2007 (to reflect the six-month period).
| | |
| 10 | | Visit our website at www.jennisondryden.com |
Portfolio of Investments
as of March 31, 2007
| | | | | |
| Shares | | Description | | Value (Note 1) |
| | | | | |
LONG-TERM INVESTMENTS 99.4% | | | |
COMMON STOCKS | | | |
| |
Australia 10.7% | | | |
| 437,394 | | Centro Properties Group | | $ | 3,082,433 |
| 1,882,854 | | Challenger Diversified Property Group | | | 1,630,058 |
| 1,524,727 | | Galileo Shopping America Trust | | | 1,437,211 |
| 1,006,039 | | GPT Group | | | 4,021,095 |
| 219,075 | | Lend Lease Corp. Ltd. | | | 3,543,303 |
| 1,273,173 | | Macquarie DDR Trust | | | 1,225,849 |
| 759,575 | | Macquarie Goodman Group | | | 4,295,863 |
| 1,542,705 | | Macquarie Office Trust | | | 1,891,029 |
| 598,695 | | Mirvac Group | | | 2,538,280 |
| 774,677 | | Stockland | | | 5,108,353 |
| 789,669 | | Westfield Group | | | 13,142,621 |
| | | | | |
| | | | | 41,916,095 |
| |
Austria 1.1% | | | |
| 274,189 | | Immofinanz Immobilien Anlagen AG(a) | | | 4,395,287 |
| |
Belgium 0.3% | | | |
| 4,625 | | Cofinimmo | | | 963,194 |
| |
Bermuda 0.5% | | | |
| 31,400 | | Orient-Express Hotels Ltd.(Class A Stock)(a) | | | 1,878,348 |
| |
Canada 0.6% | | | |
| 34,200 | | Boardwalk Real Estate Investment Trust | | | 1,314,382 |
| 51,300 | | H&R Real Estate Investment(a) | | | 1,093,985 |
| | | | | |
| | | | | 2,408,367 |
| |
Finland 0.2% | | | |
| 43,586 | | Sponda OYJ(a) | | | 754,002 |
| |
France 2.7% | | | |
| 7,990 | | Fonciere Des Regions(a) | | | 1,492,781 |
| 14,815 | �� | Fonciere Developpement Logements(a) | | | 2,157,367 |
| 8,306 | | Klepierre(a) | | | 1,607,076 |
| 17,373 | | Unibail Holding(a) | | | 5,265,347 |
| | | | | |
| | | | | 10,522,571 |
See Notes to Financial Statements.
| | |
| Dryden Global Real Estate Fund | | 11 |
Portfolio of Investments
as of March 31, 2007 Cont’d.
| | | | | |
| Shares | | Description | | Value (Note 1) |
| | | | | |
Germany 1.5% | | | |
| 35,742 | | Colonia Real Estate AG(a) | | $ | 1,948,504 |
| 77,799 | | IVG Immobilien AG(a) | | | 3,725,797 |
| | | | | |
| | | | | 5,674,301 |
| |
Hong Kong 8.4% | | | |
| 670,000 | | Cheung Kong Holdings Ltd.(a) | | | 8,480,578 |
| 1,423,000 | | Hang Lung Properties Ltd. | | | 3,979,337 |
| 394,000 | | Henderson Land Development Co. Ltd.(a) | | | 2,301,926 |
| 897,000 | | Hongkong Land Holdings Ltd. | | | 4,180,020 |
| 512,000 | | Hysan Development Co. Ltd.(a) | | | 1,392,462 |
| 1,102,500 | | Link (The), REIT | | | 2,652,716 |
| 892,000 | | Sino Land Co.(a) | | | 1,920,195 |
| 667,000 | | Sun Hung Kai Properties Ltd. | | | 7,717,003 |
| | | | | |
| | | | | 32,624,237 |
| |
Italy 0.5% | | | |
| 1,200,101 | | Beni Stabili SpA(a) | | | 2,003,936 |
| |
Japan 15.1% | | | |
| 252 | | Japan Real Estate Investment Corp.(a) | | | 3,336,049 |
| 283 | | Japan Retail Fund Investment Corp.(a) | | | 2,785,811 |
| 44,300 | | Leopalace21 Corp. | | | 1,466,141 |
| 496,000 | | Mitsubishi Estate Co. Ltd. | | | 16,289,206 |
| 356,000 | | Mitsui Fudosan Co. Ltd. | | | 10,452,817 |
| 210 | | Mori Hills REIT Investment Corp.(a) | | | 2,156,314 |
| 275 | | Nippon Building Fund, Inc.(a) | | | 4,550,662 |
| 210 | | Nomura Real Estate Office Fund, Inc.(a) | | | 2,690,937 |
| 1,262 | | NTT Urban Development Corp. | | | 2,955,804 |
| 210 | | Orix Jreit, Inc. | | | 1,960,285 |
| 204,000 | | Sumitomo Realty & Development Co. Ltd. | | | 7,738,289 |
| 167,000 | | Tokyo Tatemono Co. Ltd.(a) | | | 2,519,739 |
| | | | | |
| | | | | 58,902,054 |
| |
Netherlands 2.2% | | | |
| 13,877 | | Corio NV(a) | | | 1,260,737 |
| 16,821 | | Eurocommercial Properties NV | | | 988,915 |
| 30,093 | | Rodamco Europe NV(a) | | | 4,182,766 |
| 30,594 | | Vastned Offices/Industrial(a) | | | 1,268,569 |
| 6,074 | | Wereldhave NV(a) | | | 935,129 |
| | | | | |
| | | | | 8,636,116 |
See Notes to Financial Statements.
| | |
| 12 | | Visit our website at www.jennisondryden.com |
| | | | | |
| Shares | | Description | | Value (Note 1) |
| | | | | |
Singapore 3.8% | | | |
| 701,000 | | CapitaLand Ltd.(a) | | $ | 3,696,404 |
| 598,000 | | CapitaMall Trust | | | 1,482,042 |
| 264,000 | | City Developments Ltd.(a) | | | 2,540,553 |
| 1,704,000 | | Frasers Centrepoint Trust | | | 2,010,454 |
| 211,000 | | Keppel Land Ltd.(a) | | | 1,321,227 |
| 2,173,000 | | Mapletree Logistics Trust | | | 1,847,655 |
| 1,584,000 | | Suntec Real Estate Investment Trust | | | 2,067,245 |
| | | | | |
| | | | | 14,965,580 |
| |
Sweden 1.8% | | | |
| 58,875 | | Hufvudstaden AB (Class A Stock) | | | 674,515 |
| 84,362 | | JM AB(a) | | | 2,905,577 |
| 155,748 | | Wallenstam Byggnads AB (Class B Stock)(a) | | | 3,323,373 |
| | | | | |
| | | | | 6,903,465 |
| |
Switzerland 0.5% | | | |
| 32,688 | | PSP Swiss Property AG(a) | | | 1,990,628 |
| |
United Kingdom 10.2% | | | |
| 294,800 | | British Land Co.(a) | | | 8,864,246 |
| 156,334 | | Brixton PLC(a) | | | 1,564,355 |
| 96,035 | | Capital & Regional PLC(a) | | | 2,910,323 |
| 44,549 | | Derwent London PLC | | | 1,903,219 |
| 144,138 | | Great Portland Estates PLC | | | 2,201,057 |
| 168,319 | | Hammerson PLC(a) | | | 5,740,143 |
| 253,300 | | Land Securities Group PLC | | | 10,666,942 |
| 68,337 | | Liberty International PLC(a) | | | 1,676,924 |
| 268,091 | | Slough Estates PLC(a) | | | 4,136,083 |
| | | | | |
| | | | | 39,663,292 |
| |
United States 39.3% | | | |
| 17,000 | | Alexandria Real Estate Equities, Inc. | | | 1,706,290 |
| 34,200 | | AMB Property Corp.(a) | | | 2,010,618 |
| 96,400 | | American Financial Realty Trust | | | 971,712 |
| 29,100 | | Archstone-Smith Trust | | | 1,579,548 |
| 39,300 | | Avalonbay Communities, Inc. | | | 5,109,000 |
| 50,100 | | BioMed Realty Trust, Inc. | | | 1,317,630 |
| 61,400 | | Boston Properties, Inc. | | | 7,208,360 |
| 69,775 | | Brandywine Realty Trust(a) | | | 2,331,183 |
| 79,800 | | Brookfield Properties Corp. | | | 3,245,223 |
| 27,900 | | Camden Property Trust | | | 1,961,649 |
| 85,300 | | CBL & Associates Properties, Inc. | | | 3,824,852 |
See Notes to Financial Statements.
| | |
| Dryden Global Real Estate Fund | | 13 |
Portfolio of Investments
as of March 31, 2007 Cont’d.
| | | | | |
| Shares | | Description | | Value (Note 1) |
| | | | | |
| 7,300 | | Colonial Properties Trust | | $ | 333,391 |
| 68,000 | | Corporate Office Properties Trust | | | 3,106,240 |
| 70,429 | | Cresent Real Estate Equities Co. | | | 1,412,806 |
| 195,000 | | DCT Industrial Trust, Inc.(a) | | | 2,306,850 |
| 33,600 | | Developers Diversified Realty Corp. | | | 2,113,440 |
| 93,900 | | DiamondRock Hospitality Co. | | | 1,784,100 |
| 75,400 | | Digital Realty Trust, Inc. | | | 3,008,460 |
| 150,100 | | Douglas Emmett, Inc. | | | 3,832,053 |
| 63,800 | | Equity One, Inc. | | | 1,690,700 |
| 110,900 | | Equity Residential | | | 5,348,707 |
| 81,650 | | Extra Space Storage, Inc. | | | 1,546,451 |
| 133,100 | | General Growth Properties, Inc.(a) | | | 8,594,267 |
| 46,400 | | Health Care Property Investors, Inc. | | | 1,671,792 |
| 49,000 | | Highwoods Properties, Inc. | | | 1,935,010 |
| 53,000 | | Hilton Hotels Corp. | | | 1,905,880 |
| 54,710 | | Home Properties, Inc. | | | 2,889,235 |
| 177,200 | | Host Marriott Corp. | | | 4,662,132 |
| 9,900 | | Jones Lang LaSalle, Inc. | | | 1,032,372 |
| 129,200 | | Kimco Realty Corp.(a) | | | 6,297,208 |
| 39,900 | | Kite Realty Group Trust(a) | | | 796,005 |
| 22,600 | | LaSalle Hotel Properties | | | 1,047,736 |
| 35,100 | | Maguire Properties, Inc. | | | 1,248,156 |
| 44,300 | | Nationwide Health Properties, Inc. | | | 1,384,818 |
| 142,100 | | ProLogis | | | 9,226,553 |
| 54,800 | | Public Storage, Inc. | | | 5,187,916 |
| 57,800 | | Regency Centers Corp. | | | 4,829,190 |
| 114,700 | | Simon Property Group, Inc. | | | 12,760,375 |
| 45,800 | | SL Green Realty Corp. | | | 6,282,844 |
| 96,900 | | Sunstone Hotel Investors, Inc. | | | 2,641,494 |
| 45,800 | | Taubman Centers, Inc. | | | 2,655,942 |
| 92,600 | | UDR, Inc.(a) | | | 2,835,412 |
| 108,200 | | Ventas, Inc. | | | 4,558,466 |
| 71,000 | | Vornado Realty Trust(a) | | | 8,473,140 |
| 61,550 | | Weingarten Realty Investors | | | 2,927,318 |
| | | | | |
| | | | | 153,592,524 |
| | | | | |
| | Total long-term investments
(cost $329,915,390) | | | 387,793,997 |
| | | | | |
See Notes to Financial Statements.
| | |
| 14 | | Visit our website at www.jennisondryden.com |
| | | | | | |
| Shares | | Description | | Value (Note 1) | |
| | | | | | |
SHORT-TERM INVESTMENT 1.0% | |
| |
Affiliated Money Market Mutual Fund | | | | |
| | Dryden Core Investment Fund - Taxable Money Market Series(b) | | | | |
| 3,972,966 | | (cost $3,972,966) | | $ | 3,972,966 | |
| | | | | | |
| | Total Investments 100.4%
(cost $333,888,356; Note 5) | | | 391,766,963 | |
| | Liabilities in excess of other assets (0.4%) | | | (1,397,301 | ) |
| | | | | | |
| | Net Assets 100% | | $ | 390,369,662 | |
| | | | | | |
The following abbreviations are used in portfolio descriptions:
REIT—Real Estate Investment Trust
| (a) | Non-income producing security. |
| (b) | Prudential Investments LLC, the manager of the Fund, also serves as manager of the Dryden Core Investment Fund - Taxable Money Market Series. |
The industry classification of long-term portfolio holdings, and liabilities in excess of other assets shown as a percentage of net assets as of March 31, 2007 was as follows:
| | | |
Diversified | | 37.3 | % |
Retail Property | | 26.3 | |
Office Space | | 15.2 | |
Residential | | 6.6 | |
Industrial Property | | 6.5 | |
Hotel/Resort & Entertainment Property | | 3.8 | |
Healthcare Property | | 2.0 | |
Storage Property | | 1.7 | |
Affiliated Money Market Mutual Fund | | 1.0 | |
| | | |
| | 100.4 | |
Liabilities in excess of other assets | | (0.4 | ) |
| | | |
| | 100.0 | % |
| | | |
See Notes to Financial Statements.
| | |
| Dryden Global Real Estate Fund | | 15 |
Statement of Assets and Liabilities
as of March 31, 2007
| | | | |
Assets | | | | |
Investments, at value: | | | | |
Unaffiliated investments (cost $329,915,390) | | $ | 387,793,997 | |
Affiliated investments (cost $3,972,966) | | | 3,972,966 | |
Receivable for Fund shares sold | | | 3,255,128 | |
Receivable for investments sold | | | 3,230,275 | |
Dividends receivable | | | 1,030,450 | |
Tax reclaim receivable | | | 46,407 | |
Prepaid expenses | | | 2,073 | |
| | | | |
Total assets | | | 399,331,296 | |
| | | | |
| |
Liabilities | | | | |
Payable for investments purchased | | | 5,122,495 | |
Payable for Fund shares reacquired | | | 2,316,092 | |
Payable to custodian | | | 1,091,025 | |
Management fee payable | | | 240,470 | |
Distribution fee payable | | | 121,189 | |
Accrued expenses | | | 43,371 | |
Transfer agent fee payable | | | 26,286 | |
Deferred Trustees’ fees | | | 706 | |
| | | | |
Total liabilities | | | 8,961,634 | |
| | | | |
| |
Net Assets | | $ | 390,369,662 | |
| | | | |
| | | | | |
Net assets were comprised of: | | | | |
Shares of beneficial interest, at par | | $ | 12,527 | |
Paid-in capital in excess of par | | | 271,719,936 | |
| | | | |
| | | 271,732,463 | |
Overdistribution of net investment income | | | (98,765 | ) |
Accumulated net realized gain on investments and foreign currency transactions | | | 60,851,997 | |
Net unrealized appreciation on investments and foreign currencies | | | 57,883,967 | |
| | | | |
Net assets, March 31, 2007 | | $ | 390,369,662 | |
| | | | |
See Notes to Financial Statements.
| | |
| 16 | | Visit our website at www.jennisondryden.com |
| | | |
Class A | | | |
Net asset value and redemption price per share
($264,980,149 ÷ 8,495,293 shares of beneficial interest issued and outstanding) | | $ | 31.19 |
Maximum sales charge (5.5% of offering price) | | | 1.82 |
| | | |
Maximum offering price to public | | $ | 33.01 |
| | | |
| |
Class B | | | |
Net asset value, offering price and redemption price per share
($32,867,399 ÷ 1,059,478 shares of beneficial interest issued and outstanding) | | $ | 31.02 |
| | | |
| |
Class C | | | |
Net asset value, offering price and redemption price per share
($49,920,765 ÷ 1,609,167 shares of beneficial interest issued and outstanding) | | $ | 31.02 |
| | | |
| |
Class Z | | | |
Net asset value, offering price and redemption price per share
($42,601,349 ÷ 1,362,968 shares of beneficial interest issued and outstanding) | | $ | 31.26 |
| | | |
See Notes to Financial Statements.
| | |
| Dryden Global Real Estate Fund | | 17 |
Statement of Operations
Year Ended March 31, 2007
| | | | |
Net Investment Income | | | | |
Dividends (net of $124,051 foreign withholding tax) | | $ | 6,447,697 | |
Affiliated dividends | | | 467,374 | |
| | | | |
Total income | | | 6,915,071 | |
| | | | |
| |
Expenses | | | | |
Management fee | | | 2,014,715 | |
Distribution fee—Class A | | | 441,016 | |
Distribution fee—Class B | | | 259,247 | |
Distribution fee—Class C | | | 328,398 | |
Transfer agent’s fees and expenses (including affiliated expenses of $242,000) | | | 310,000 | |
Custodian’s fees and expenses | | | 68,000 | |
Registration fees | | | 61,000 | |
Reports to shareholders | | | 60,000 | |
Legal fees and expenses | | | 40,000 | |
Audit fee | | | 17,000 | |
Trustees’ fees | | | 12,000 | |
Loan interest expense (Note 8) | | | 1,238 | |
Miscellaneous | | | 25,958 | |
| | | | |
Total expenses | | | 3,638,572 | |
| | | | |
Net investment income | | | 3,276,499 | |
| | | | |
| |
Net Realized And Unrealized Gain (Loss) On Investments And Foreign Currencies | | | | |
Net realized gain (loss) on: | | | | |
Investment transactions | | | 67,969,907 | |
Foreign currency transactions | | | (121,465 | ) |
| | | | |
| | | 67,848,442 | |
| | | | |
Net change in unrealized appreciation (depreciation) on: | | | | |
Investments | | | (1,508,978 | ) |
Foreign currencies | | | 7,588 | |
| | | | |
| | | (1,501,390 | ) |
| | | | |
Net gain on investments and foreign currencies | | | 66,347,052 | |
| | | | |
Net Increase In Net Assets Resulting From Operations | | $ | 69,623,551 | |
| | | | |
See Notes to Financial Statements.
| | |
| 18 | | Visit our website at www.jennisondryden.com |
Statement of Changes in Net Assets
| | | | | | | | |
| | | Year Ended March 31, | |
| | | 2007 | | | 2006 | |
Increase (Decrease) In Net Assets | | | | | | | | |
Operations | | | | | | | | |
Net investment income | | $ | 3,276,499 | | | $ | 1,779,873 | |
Net realized gain on investments and foreign currency transactions | | | 67,848,442 | | | | 5,933,936 | |
Net change in unrealized appreciation (depreciation) on investments and foreign currencies | | | (1,501,390 | ) | | | 36,608,081 | |
| | | | | | | | |
Net increase in net assets resulting from operations | | | 69,623,551 | | | | 44,321,890 | |
| | | | | | | | |
Dividends and distributions (Note 1) | | | | | | | | |
Dividends from net investment income | | | | | | | | |
Class A | | | (2,694,807 | ) | | | (912,702 | ) |
Class B | | | (228,029 | ) | | | (167,582 | ) |
Class C | | | (284,235 | ) | | | (92,673 | ) |
Class Z | | | (605,200 | ) | | | (208,220 | ) |
| | | | | | | | |
| | | (3,812,271 | ) | | | (1,381,177 | ) |
| | | | | | | | |
Distributions from net realized gains | | | | | | | | |
Class A | | | (61,137 | ) | | | — | |
Class B | | | (8,183 | ) | | | — | |
Class C | | | (11,392 | ) | | | — | |
Class Z | | | (11,458 | ) | | | — | |
| | | | | | | | |
| | | (92,170 | ) | | | — | |
| | | | | | | | |
| | |
Fund share transactions (Net of share conversions) (Note 6) | | | | | | | | |
Net proceeds from shares sold | | | 219,488,440 | | | | 85,308,083 | |
Net asset value of shares issued in reinvestment of dividends and distributions | | | 3,336,408 | | | | 1,195,796 | |
Cost of shares reacquired | | | (83,071,053 | ) | | | (37,784,986 | ) |
| | | | | | | | |
Net increase in net assets from Fund share transactions | | | 139,753,795 | | | | 48,718,893 | |
| | | | | | | | |
Total increase in net assets | | | 205,472,905 | | | | 91,659,606 | |
| | |
Net Assets | | | | | | | | |
Beginning of year | | | 184,896,757 | | | | 93,237,151 | |
| | | | | | | | |
End of year(a) | | $ | 390,369,662 | | | $ | 184,896,757 | |
| | | | | | | | |
(a) Includes undistributed net investment income of | | $ | — | | | $ | 393,803 | |
| | | | | | | | |
See Notes to Financial Statements.
| | |
| Dryden Global Real Estate Fund | | 19 |
Notes to Financial Statements
Dryden Global Real Estate Fund (formerly known as “Strategic Partners Real Estate Fund”) (the “Fund”), is registered under the Investment Company Act of 1940 as a non-diversified, open-end, management investment company. The Fund was established as a Delaware business trust on October 24, 1997. The Fund commenced investment operations on May 5, 1998. The investment objective of the Fund is capital appreciation and income. It seeks to achieve this objective by investing primarily in equity securities of real estate companies.
Note 1. Accounting Policies
The following is a summary of significant accounting policies followed by the Fund in the preparation of its financial statements.
Securities Valuation: Securities listed on a securities exchange (other than options on securities and indices) are valued at the last sale price on such exchange on the day of valuation or, if there was no sale on such day, at the mean between the last reported bid and asked prices, or at the last bid price on such day in the absence of an asked price. Securities traded via Nasdaq are valued at the Nasdaq official closing price (“NOCP”) on the day of valuation, or if there was no NOCP, at the last sale price. Securities that are actively traded in the over-the-counter market, including listed securities for which the primary market is believed by Prudential Investments LLC (“PI” or “Manager”), in consultation with the subadviser, to be over-the-counter, are valued at market value using prices provided by an independent pricing agent or principal market maker. Options on securities and indices traded on an exchange are valued at the last sale price as of the close of trading on the applicable exchange or, if there was no sale, at the mean between the most recently quoted bid and asked prices on such exchange. Futures contracts and options thereon traded on a commodities exchange or board of trade are valued at the last sale price at the close of trading on such exchange or board of trade or, if there was no sale on the applicable commodities exchange or board of trade on such day, at the mean between the most recently quoted prices on such exchange or board of trade or at the last bid price in the absence of an asked price. Prices may be obtained from independent pricing services which use information provided by market makers or estimates of market values obtained from yield data relating to investments or securities with similar characteristics. Securities for which reliable market quotations are not readily available, or whose values have been affected by events occurring after the close of the security’s foreign market and before the Fund’s normal pricing time, are valued at fair value in accordance with the Board of Trustees’ approved fair valuation procedures. When determining the fair valuation of securities some of the
| | |
| 20 | | Visit our website at www.jennisondryden.com |
factors influencing the valuation include, the nature of any restrictions on disposition of the securities; assessment of the general liquidity of the securities; the issuer’s financial condition and the markets in which it does business; the cost of the investment; the size of the holding and the capitalization of issuer; the prices of any recent transactions or bids/offers for such securities or any comparable securities; any available analyst media or other reports or information deemed reliable by the investment adviser regarding the issuer or the markets or industry in which it operates. Using fair value to price securities may result in a value that is different from a security’s most recent closing price and from the price used by other mutual funds to calculate their net asset values. As of March 31, 2007, there were no securities valued in accordance with such procedures.
Investments in mutual funds are valued at their net asset value as of the close of the New York Stock Exchange on the date of valuation.
Short-term securities, which mature in sixty days or less, are valued at amortized cost, which approximates market value. The amortized cost method involves valuing a security at its cost on the date of purchase and thereafter assuming a constant amortization to maturity of the difference between the principal amount due at maturity and cost. Short-term securities, which mature in more than sixty days, are valued at current market quotations.
Foreign Currency Translation: The books and records of the Fund are maintained in U.S. dollars. Foreign currency amounts are translated into U.S. dollars on the following basis:
(i) market value of investment securities, other assets and liabilities—at the current daily rates of exchange;
(ii) purchases and sales of investment securities, income and expenses—at the rates of exchange prevailing on the respective dates of such transactions.
Although the net assets of the Fund are presented at the foreign exchange rates and market values at the close of the fiscal period, the Fund does not isolate that portion of the results of operations arising as a result of changes in the foreign exchange rates from the fluctuations arising from changes in the market prices of portfolio securities held at the end of the fiscal period. Similarly, the Fund does not isolate the effect of changes in foreign exchange rates from the fluctuations arising from changes in the market prices of portfolio securities sold during the fiscal year. Accordingly, realized foreign currency gains or losses are included in the reported net realized gains or losses on investment transactions.
| | |
| Dryden Global Real Estate Fund | | 21 |
Notes to Financial Statements
Cont’d
Net realized gains or losses on foreign currency transactions represent net foreign exchange gains or losses from holdings of foreign currencies, currency gains or losses realized between the trade and settlement dates on security transactions, and the difference between the amounts of dividends, interest and foreign withholding taxes recorded on the Fund’s books and the U.S. dollar equivalent amounts actually received or paid. Net unrealized currency gains or losses from valuing foreign currency denominated assets and liabilities (other than investments) at period-end exchange rates are reflected as a component of net unrealized appreciation (depreciation) on foreign currencies.
Foreign security and currency transactions may involve certain considerations and risks not typically associated with those of domestic origin as a result of, among other factors, the possibility of political or economic instability, or the level of governmental supervision and regulation of foreign securities markets.
Securities Transactions and Net Investment Income: Security transactions are recorded on the trade date. Realized and unrealized gains or losses from investments and currency transactions on sales of portfolio securities are calculated on the identified cost basis. Dividend income is recorded on the ex-dividend date. Interest income, including amortization of premium and accretion of discount on debt securities, as required, is recorded on the accrual basis. Expenses are recorded on an accrual basis. The Fund invests in real estate investment trusts (“REITS”), which report information on the source of their distributions annually. A portion of distributions received from REITs during the period is estimated to be capital gain and a portion is estimated to be return of capital and is recorded as a reduction of their cost. These estimates are adjusted when the actual source of distributions is disclosed by the REITs.
Net investment income or loss (other than distribution fees which are charged directly to the respective class) and unrealized and realized gains and losses are allocated daily to each class of shares based upon the relative proportion of net assets of each class at the beginning of the day.
Dividends and Distributions: The Fund typically paid dividends of net investment income quarterly and distributions of net realized capital gains, if any, annually. Effective the close of business on January 19, 2007, the Fund expects to pay dividends of net investment income and distributions of net realized capital and currency gains, if any, annually. Dividends and distributions to shareholders, which are determined in
| | |
| 22 | | Visit our website at www.jennisondryden.com |
accordance with federal income tax regulations, which may differ from U.S. generally accepted accounting principles, are recorded on the ex-dividend date. Permanent book/tax differences relating to income and gains are reclassified amongst undistributed net investment income, accumulated net realized gain or loss and paid-in capital in excess of par, as appropriate.
Taxes: It is the Fund’s policy to continue to meet the requirements of the Internal Revenue Code applicable to regulated investment companies and to distribute all of its taxable net investment income and capital gains, if any, to its shareholders. Therefore, no federal income tax provision is required.
Withholding taxes on foreign dividends are recorded, net of reclaimable amounts, at the time the related income is earned.
Estimates: The preparation of the financial statements requires management to make estimates and assumptions that affect the reported amounts and disclosures in the financial statements. Actual results could differ from those estimates.
Note 2. Agreements
The Fund has a management agreement with PI. Pursuant to this agreement, PI has responsibility for all investment advisory services and supervises the subadviser’s performance of such services. Through the close of business on January 19, 2007, PI had entered into subadvisory agreements with Wellington Management Company, LLP (“Wellington”) and Principal Global Investors, LLC (“Principal”). The subadvisory agreement provided that each subadviser furnishes investment advisory services in connection with the management of the Fund. In connection therewith, each subadviser is obligated to keep certain books and records of the Fund. PI pays for the services of the subadvisers, the cost of compensation of officers of the Fund, occupancy and certain clerical and bookkeeping costs of the Fund. The Fund bears all other costs and expenses.
Effective after the close of business on January 19, 2007, PI entered into a subadvisory agreement with Prudential Real Estate Investors (“PREI”) which is a business unit of Prudential Investment Management (“PIM”).
The management fee paid to PI is computed daily and payable monthly at an annual rate of .75 of 1% of the Fund’s average daily net assets. The effective management fee rate was .75 of 1% for the year ended March 31, 2007.
| | |
| Dryden Global Real Estate Fund | | 23 |
Notes to Financial Statements
Cont’d
The Fund has a distribution agreement with Prudential Investment Management Services LLC (“PIMS”), which acts as the distributor of the Class A, Class B, Class C and Class Z shares of the Fund. The Fund compensates PIMS for distributing and servicing the Fund’s Class A, Class B and Class C shares, pursuant to plans of distribution (the “Class A, B and C Plans”), regardless of expenses actually incurred by PIMS. The distribution fees are accrued daily and payable monthly. No distribution or service fees are paid to PIMS as distributor of the Class Z shares of the Fund.
Pursuant to the Class A, B and C Plans, the Fund compensates PIMS for distribution related activities at an annual rate of up to .30 of 1%, 1% and 1% of the average daily net assets of the Class A, B and C shares, respectively. For the year ended March 31, 2007, PIMS has contractually agreed to limit such fees to .25 of 1% of the average daily net assets of the Class A shares.
PIMS has advised the Fund that it has received approximately $1,166,000 in front-end sales charges resulting from sales of Class A during the year ended March 31, 2007. From these fees, PIMS paid such sales charges to broker-dealers, which in turn paid commissions to salespersons and incurred other distribution costs.
PIMS has advised the Fund that it has received approximately $54,600 and $5,600 in contingent deferred sales charges imposed upon certain redemptions by Class B and Class C shareholders, respectively, during the year ended March 31, 2007.
PI and PIMS are indirect, wholly-owned subsidiaries of Prudential Financial, Inc. (“Prudential”).
Note 3. Other Transactions with Affiliates
Prudential Mutual Fund Services LLC (“PMFS”), an affiliate of PI and an indirect, wholly-owned subsidiary of Prudential, serves as the Fund’s transfer agent. The transfer agent fees and expenses in the Statement of Operations also include certain out-of-pocket expenses paid to non-affiliates, where applicable.
The Fund pays networking fees to affiliated and unaffiliated broker/dealers. These networking fees are payments made to broker/dealers that clear mutual fund transactions through a national clearing system. For the year ended March 31, 2007,
| | |
| 24 | | Visit our website at www.jennisondryden.com |
the Fund incurred approximately $87,000 in total networking fees. These amounts are included in transfer agent’s fees and expenses in the Statement of Operations.
The Fund invests in the Taxable Money Market Series (the “Series”), a portion of Dryden Core Investment Fund, pursuant to an exemptive order received from the Securities and Exchange Commission. The Series is a money market mutual fund registered under the Investment Company Act of 1940, as amended, and managed by PI.
Note 4. Portfolio Securities
Purchases and sales of portfolio securities, other than short-term investments, for the year ended March 31, 2007 were $449,114,518 and $292,791,029, respectively.
Note 5. Distributions and Tax Information
In order to present overdistribution of net investment income and accumulated net realized gain on investments and foreign currency transactions on the Statement of Assets and Liabilities that more closely represent their tax character, certain adjustments have been made to overdistribution of net investment income and accumulated net realized gain on investments and foreign currency transactions. For the year ended March 31, 2007, the adjustments were to decrease accumulated net realized gain on investments and foreign currency transactions and decrease overdistribution of net investment income by $43,204 due to differences in the treatment for book and tax purposes of certain transactions involving foreign securities and currencies. Net investment income, net realized gains and net assets were not affected by this change.
For the year ended March 31, 2007, the tax character of dividends and distributions paid by the Fund were $3,812,271 from ordinary income and $92,170 from long-term capital gains. For the year ended March 31, 2006, the tax character of dividends paid by the Fund was $1,381,177 from ordinary income.
As of March 31, 2007, accumulated undistributed earnings on a tax basis were $28,717,280 from ordinary income and $36,443,693 from long-term capital gains.
| | |
| Dryden Global Real Estate Fund | | 25 |
Notes to Financial Statements
Cont’d
The United States federal income tax basis of the Fund’s investments and the net unrealized appreciation as of March 31, 2007 were as follows:
| | | | | | | | | | |
Tax Basis
of Investments | | Appreciation | | Depreciation | | Net Unrealized
Appreciation | | Other Cost
Basis
Adjustments | | Adjusted Net
Unrealized
Appreciation |
$338,178,511 | | $58,390,093 | | $(4,801,641) | | $53,588,452 | | $5,360 | | $53,593,812 |
The difference between book basis and tax basis were primarily attributable to deferred losses on wash sales and mark to market on open investments in Passive Foreign Investment Companies.
The Fund utilized $6,698,310 of its prior year’s capital loss carryforward to offset net taxable gains realized in the fiscal year ended March 31, 2007. In addition, the Fund elects to treat foreign currency losses of $116,880 incurred during the period November 1, 2006 through March 31, 2007 as having been incurred in the following year.
Note 6. Capital
The Fund offers Class A, Class B, Class C and Class Z shares. Class A shares are sold with a front-end sales charge of up to 5.5%. All investors who purchase Class A shares in an amount of $1 million or more and sell these shares within 12 months of purchase are subject to a contingent deferred sales charge (“CDSC”) of 1%, including investors who purchase their shares through broker-dealers affiliated with Prudential. Class B shares are sold with a CDSC which declines from 5% to zero depending on the period of time the shares are held. Class C shares are not subject to an initial sales charge and the CDSC for Class C shares will be 12 months from the date of purchase. Class B shares automatically convert to Class A shares on a quarterly basis approximately seven years after purchase. A special exchange privilege is also available for shareholders who qualified to purchase Class A shares at net asset value. Class Z shares are not subject to any sales or redemption charge and are offered exclusively for sale to a limited group of investors.
There is an unlimited number of shares of beneficial interest, $.001 par value per share, divided into four classes, designated Class A, Class B, Class C and Class Z.
| | |
| 26 | | Visit our website at www.jennisondryden.com |
Transactions in shares of beneficial interest were as follows:
| | | | | | | |
Class A | | Shares | | | Amount | |
Year ended March 31, 2007: | | | | | | | |
Shares sold | | 5,599,356 | | | $ | 155,010,533 | |
Shares issued in reinvestment of dividends and distributions | | 91,582 | | | | 2,441,210 | |
Shares reacquired | | (2,119,145 | ) | | | (58,529,197 | ) |
| | | | | | | |
Net increase in shares outstanding before conversion | | 3,571,793 | | | | 98,922,546 | |
Shares issued upon conversion from Class B | | 81,312 | | | | 2,211,970 | |
| | | | | | | |
Net increase in shares outstanding | | 3,653,105 | | | $ | 101,134,516 | |
| | | | | | | |
Year ended March 31, 2006: | | | | | | | |
Shares sold | | 2,714,859 | | | $ | 59,050,672 | |
Shares issued in reinvestment of dividends | | 40,355 | | | | 813,731 | |
Shares reacquired | | (1,105,714 | ) | | | (23,325,512 | ) |
| | | | | | | |
Net increase in shares outstanding before conversion | | 1,649,500 | | | | 36,538,891 | |
Shares issued upon conversion from Class B | | 1,086,451 | | | | 21,939,255 | |
| | | | | | | |
Net increase in shares outstanding | | 2,735,951 | | | $ | 58,478,146 | |
| | | | | | | |
Class B | | | | | | |
Year ended March 31, 2007: | | | | | | | |
Shares sold | | 453,442 | | | $ | 12,564,854 | |
Shares issued in reinvestment of dividends and distributions | | 7,419 | | | | 196,420 | |
Shares reacquired | | (210,179 | ) | | | (5,719,732 | ) |
| | | | | | | |
Net increase in shares outstanding before conversion | | 250,682 | | | | 7,041,542 | |
Shares issued upon conversion into Class A | | (81,721 | ) | | | (2,211,970 | ) |
| | | | | | | |
Net increase in shares outstanding | | 168,961 | | | $ | 4,829,572 | |
| | | | | | | |
Year ended March 31, 2006: | | | | | | | |
Shares sold | | 300,398 | | | $ | 6,367,641 | |
Shares issued in reinvestment of dividends | | 7,120 | | | | 138,404 | |
Shares reacquired | | (305,593 | ) | | | (6,222,127 | ) |
| | | | | | | |
Net decrease in shares outstanding before conversion | | 1,925 | | | | 283,918 | |
Shares issued upon conversion into Class A | | (1,090,853 | ) | | | (21,939,255 | ) |
| | | | | | | |
Net decrease in shares outstanding | | (1,088,928 | ) | | $ | (21,655,337 | ) |
| | | | | | | |
| | |
| Dryden Global Real Estate Fund | | 27 |
Notes to Financial Statements
Cont’d
| | | | | | | |
Class C | | Shares | | | Amount | |
Year ended March 31, 2007: | | | | | | | |
Shares sold | | 920,622 | | | $ | 25,528,210 | |
Shares issued in reinvestment of dividends and distributions | | 6,315 | | | | 167,887 | |
Shares reacquired | | (220,295 | ) | | | (6,118,217 | ) |
| | | | | | | |
Net increase in shares outstanding | | 706,642 | | | $ | 19,577,880 | |
| | | | | | | |
Year ended March 31, 2006: | | | | | | | |
Shares sold | | 491,018 | | | $ | 10,604,314 | |
Shares issued in reinvestment of dividends | | 2,722 | | | | 54,203 | |
Shares reacquired | | (182,198 | ) | | | (3,807,646 | ) |
| | | | | | | |
Net increase in shares outstanding | | 311,542 | | | $ | 6,850,871 | |
| | | | | | | |
Class Z | | | | | | |
Year ended March 31, 2007: | | | | | | | |
Shares sold | | 1,000,979 | | | $ | 26,384,843 | |
Shares issued in reinvestment of dividends and distributions | | 19,923 | | | | 530,891 | |
Shares reacquired | | (436,835 | ) | | | (12,703,907 | ) |
| | | | | | | |
Net increase in shares outstanding | | 584,067 | | | $ | 14,211,827 | |
| | | | | | | |
Year ended March 31, 2006: | | | | | | | |
Shares sold | | 434,081 | | | $ | 9,285,456 | |
Shares issued in reinvestment of dividends | | 9,457 | | | | 189,458 | |
Shares reacquired | | (209,969 | ) | | | (4,429,701 | ) |
| | | | | | | |
Net increase in shares outstanding | | 233,569 | | | $ | 5,045,213 | |
| | | | | | | |
Note 7. Borrowings
The Fund, along with other affiliated registered investment companies (the “Funds”), is a party to a syndicated credit agreement (“SCA”) with two banks. The SCA provided for a commitment of $500 million. Interest on any borrowings under the SCA would be incurred at market rates and a commitment fee for the unused amount is accrued daily and paid quarterly. Effective October 27, 2006, the Funds renewed the SCA with the banks. The commitment under the renewed SCA continues to be $500 million. The Funds pay a commitment fee of .07 of 1% of the unused portion of the renewed SCA. The expiration date of the renewed SCA is October 26, 2007. For the period from October 29, 2005 through October 26, 2006, the Funds paid a commitment fee of .0725 of 1% of the unused portion of the agreement. The purpose of the SCA is to provide an alternative source of temporary funding for capital share redemptions.
| | |
| 28 | | Visit our website at www.jennisondryden.com |
The following table summarizes the borrowing that occurred during the year ended March 31, 2007:
| | | | | | | | |
Fund | | Average Advances
Outstanding
During the Period | | Average
Interest
Rate | | Number of Days
Advances
Outstanding During
the Period | | Outstanding
Borrowings at
March 31, 2007 |
| Dryden Global Real Estate | | $1,560,000 | | 5.71% | | 5 | | — |
Note 8. New Accounting Pronouncements
On July 13, 2006, the Financial Accounting Standards Board (FASB) released FASB Interpretation No. 48 “Accounting for Uncertainty in Income Taxes” (FIN 48). FIN 48 provides guidance for how uncertain tax positions should be recognized, measured, presented and disclosed in the financial statements. FIN 48 requires the evaluation of tax positions taken or expected to be taken in the course of preparing the Fund’s tax returns to determine whether the tax positions are “more-likely-than-not” of being sustained by the applicable tax authority. The impact of the tax positions not deemed to meet the more-likely-than-not threshold would be recorded in the year in which they arise. On December 22, 2006 the Securities and Exchange Commission delayed the effective date until the last net asset value calculation in the first required financial reporting period for its fiscal year beginning after December 15, 2006. At this time, management is evaluating the implications of FIN 48 and its impact, if any, in the financial statements has not yet been determined.
On September 20, 2006, the FASB released Statement of Financial Accounting Standards No. 157 “Fair Value Measurements” (FAS 157). FAS 157 establishes an authoritative definition of fair value, sets out a framework for measuring fair value, and requires additional disclosures about fair-value measurements. The application of FAS 157 is required for fiscal years beginning after November 15, 2007 and interim periods within those fiscal years. At this time, management is evaluating the implications of FAS 157 and its impact, if any, in the financial statements has not yet been determined.
Note 9. Subsequent Event
On May 22, 2007 the Board of Trustees of the Fund declared the following distributions per share, payable on May 24, 2007 to shareholders of record on May 23, 2007.
| | | |
| | | Class A, B, C, Z |
Short-Term Capital Gains | | $ | 1.781 |
Long-Term Capital Gains | | | 2.633 |
| | |
| Dryden Global Real Estate Fund | | 29 |
Financial Highlights
| | | | |
| | | Class A | |
| | | Year Ended
March 31, 2007(b) | |
Per Share Operating Performance: | | | | |
Net Asset Value, Beginning Of Year | | $ | 24.96 | |
| | | | |
Income from investment operations: | | | | |
Net investment income | | | 0.38 | |
Net realized and unrealized gains (losses) on investments transactions | | | 6.30 | |
| | | | |
Total from investment operations | | | 6.68 | |
| | | | |
Less Dividends and Distributions: | | | | |
Dividends from net investment income | | | (0.44 | ) |
Distributions from net realized gains from investments | | | (0.01 | ) |
| | | | |
Total Dividends and Distributions: | | | (0.45 | ) |
| | | | |
Net asset value, end of year | | $ | 31.19 | |
| | | | |
Total Return(a): | | | 27.09 | % |
Ratios/Supplemental Data: | | | | |
Net assets, end of year (000) | | $ | 264,980 | |
Average net assets (000) | | $ | 176,407 | |
Ratios to average net assets: | | | | |
Expenses, including distribution and service (12b-1) fees(c) | | | 1.22 | % |
Expenses, excluding distribution and service (12b-1) fees | | | 0.97 | % |
Net investment income | | | 1.58 | % |
For Class A, B, C, and Z shares: | | | | |
Portfolio turnover | | | 121 | % |
| (a) | Total return does not consider the effects of sales loads. Total return is calculated assuming a purchase of shares on the first day and a sale on the last day of each year reported and includes reinvestment of dividends and distributions. |
| (b) | Based on average shares outstanding during the year. |
| (c) | The Distributor of the Fund has contractually agreed to limit its distribution and service (12b-1) fees to .25 of 1% of the average net assets for the Class A shares. |
See Notes to Financial Statements.
| | |
| 30 | | Visit our website at www.jennisondryden.com |
| | | | | | | | | | | | | | |
| Class A | |
| Year Ended March 31, | |
| 2006(b) | | | 2005 | | | 2004 | | | 2003(b) | |
| | | | | | | | | | | | | | |
| $ | 17.89 | | | $ | 15.71 | | | $ | 9.84 | | | $ | 9.97 | |
| | | | | | | | | | | | | | | |
| | | | | | | | | | | | | | |
| | 0.35 | | | | 0.26 | | | | 0.16 | | | | 0.29 | |
| | 7.00 | | | | 2.14 | | | | 5.93 | | | | (0.08 | ) |
| | | | | | | | | | | | | | | |
| | 7.35 | | | | 2.40 | | | | 6.09 | | | | 0.21 | |
| | | | | | | | | | | | | | | |
| | | | | | | | | | | | | | |
| | (0.28 | ) | | | (0.22 | ) | | | (0.22 | ) | | | (0.34 | ) |
| | — | | | | — | | | | — | | | | — | |
| | | | | | | | | | | | | | | |
| | (0.28 | ) | | | (0.22 | ) | | | (0.22 | ) | | | (0.34 | ) |
| | | | | | | | | | | | | | | |
| $ | 24.96 | | | $ | 17.89 | | | $ | 15.71 | | | $ | 9.84 | |
| | | | | | | | | | | | | | | |
| | 41.50 | % | | | 15.37 | % | | | 62.79 | % | | | 2.27 | % |
| | | | | | | | | | | | | | |
| $ | 120,881 | | | $ | 37,686 | | | $ | 25,954 | | | $ | 11,073 | |
| $ | 74,239 | | | $ | 28,961 | | | $ | 15,886 | | | $ | 11,248 | |
| | | | | | | | | | | | | | |
| | 1.40 | % | | | 1.53 | % | | | 1.58 | % | | | 1.79 | % |
| | 1.15 | % | | | 1.28 | % | | | 1.33 | % | | | 1.54 | % |
| | 1.58 | % | | | 1.71 | % | | | 1.53 | % | | | 2.97 | % |
| | | | | | | | | | | | | | |
| | 35 | % | | | 48 | % | | | 65 | % | | | 92 | % |
See Notes to Financial Statements.
| | |
| Dryden Global Real Estate Fund | | 31 |
Financial Highlights
Cont’d
| | | | |
| | | Class B | |
| | | Year Ended
March 31, 2007(b) | |
Per Share Operating Performance: | | | | |
Net Asset Value, Beginning Of Year | | $ | 24.84 | |
| | | | |
Income from investment operations: | | | | |
Net investment income | | | 0.18 | |
Net realized and unrealized gains (losses) on investments transactions | | | 6.25 | |
| | | | |
Total from investment operations | | | 6.43 | |
| | | | |
Less Dividends and Distributions: | | | | |
Dividends from net investment income | | | (0.24 | ) |
Distributions from net realized gains from investments | | | (0.01 | ) |
| | | | |
Total Dividends and Distributions: | | | (0.25 | ) |
| | | | |
Net asset value, end of year | | $ | 31.02 | |
| | | | |
Total Return(a): | | | 26.12 | % |
Ratios/Supplemental Data: | | | | |
Net assets, end of year (000) | | $ | 32,867 | |
Average net assets (000) | | $ | 25,925 | |
Ratios to average net assets: | | | | |
Expenses, including distribution and service (12b-1) fees | | | 1.97 | % |
Expenses, excluding distribution and service (12b-1) fees | | | 0.97 | % |
Net investment income | | | 1.66 | % |
| (a) | Total return does not consider the effects of sales loads. Total return is calculated assuming a purchase of shares on the first day and a sale on the last day of each year reported and includes reinvestment of dividends and distributions. |
| (b) | Based on average shares outstanding during the year. |
See Notes to Financial Statements.
| | |
| 32 | | Visit our website at www.jennisondryden.com |
| | | | | | | | | | | | | | |
| Class B | |
| Year Ended March 31, | |
| 2006(b) | | | 2005 | | | 2004 | | | 2003(b) | |
| | | | | | | | | | | | | | |
| $ | 17.81 | | | $ | 15.65 | | | $ | 9.82 | | | $ | 9.95 | |
| | | | | | | | | | | | | | | |
| | | | | | | | | | | | | | |
| | 0.18 | | | | 0.16 | | | | 0.12 | | | | 0.22 | |
| | 6.99 | | | | 2.11 | | | | 5.86 | | | | (0.08 | ) |
| | | | | | | | | | | | | | | |
| | 7.17 | | | | 2.27 | | | | 5.98 | | | | 0.14 | |
| | | | | | | | | | | | | | | |
| | | | | | | | | | | | | | |
| | (0.14 | ) | | | (0.11 | ) | | | (0.15 | ) | | | (0.27 | ) |
| | — | | | | — | | | | — | | | | — | |
| | | | | | | | | | | | | | | |
| | (0.14 | ) | | | (0.11 | ) | | | (0.15 | ) | | | (0.27 | ) |
| | | | | | | | | | | | | | | |
| $ | 24.84 | | | $ | 17.81 | | | $ | 15.65 | | | $ | 9.82 | |
| | | | | | | | | | | | | | | |
| | 40.38 | % | | | 14.51 | % | | | 61.62 | % | | | 1.47 | % |
| | | | | | | | | | | | | | |
| $ | 22,117 | | | $ | 35,251 | | | $ | 35,961 | | | $ | 25,072 | |
| $ | 23,855 | | | $ | 33,968 | | | $ | 30,195 | | | $ | 26,955 | |
| | | | | | | | | | | | | | |
| | 2.15 | % | | | 2.28 | % | | | 2.33 | % | | | 2.54 | % |
| | 1.15 | % | | | 1.28 | % | | | 1.33 | % | | | 1.54 | % |
| | 0.91 | % | | | 0.99 | % | | | 0.97 | % | | | 2.20 | % |
See Notes to Financial Statements.
| | |
| Dryden Global Real Estate Fund | | 33 |
Financial Highlights
Cont’d
| | | | |
| | | Class C | |
| | | Year Ended
March 31, 2007(b) | |
Per Share Operating Performance: | | | | |
Net Asset Value, Beginning Of Year | | $ | 24.84 | |
| | | | |
Income from investment operations: | | | | |
Net investment income | | | 0.16 | |
Net realized and unrealized gains (losses) on investments transactions | | | 6.27 | |
| | | | |
Total from investment operations | | | 6.43 | |
| | | | |
Less Dividends and Distributions: | | | | |
Dividends from net investment income | | | (0.24 | ) |
Distributions from net realized gains from investments | | | (0.01 | ) |
| | | | |
Total Dividends and Distributions: | | | (0.25 | ) |
| | | | |
Net asset value, end of year | | $ | 31.02 | |
| | | | |
Total Return(a): | | | 26.12 | % |
Ratios/Supplemental Data: | | | | |
Net assets, end of year (000) | | $ | 49,921 | |
Average net assets (000) | | $ | 32,840 | |
Ratios to average net assets: | | | | |
Expenses, including distribution and service (12b-1) fees | | | 1.97 | % |
Expenses, excluding distribution and service (12b-1) fees | | | 0.97 | % |
Net investment income | | | 1.58 | % |
| (a) | Total return does not consider the effects of sales loads. Total return is calculated assuming a purchase of shares on the first day and a sale on the last day of each year reported and includes reinvestment of dividends and distributions. |
| (b) | Based on average shares outstanding during the year. |
See Notes to Financial Statements.
| | |
| 34 | | Visit our website at www.jennisondryden.com |
| | | | | | | | | | | | | | |
| Class C | |
| Year Ended March 31, | |
| 2006(b) | | | 2005 | | | 2004 | | | 2003(b) | |
| | | | | | | | | | | | | | |
| $ | 17.81 | | | $ | 15.65 | | | $ | 9.82 | | | $ | 9.95 | |
| | | | | | | | | | | | | | | |
| | | | | | | | | | | | | | |
| | 0.18 | | | | 0.16 | | | | 0.12 | | | | 0.22 | |
| | 6.99 | | | | 2.11 | | | | 5.86 | | | | (0.08 | ) |
| | | | | | | | | | | | | | | |
| | 7.17 | | | | 2.27 | | | | 5.98 | | | | 0.14 | |
| | | | | | | | | | | | | | | |
| | | | | | | | | | | | | | |
| | (0.14 | ) | | | (0.11 | ) | | | (0.15 | ) | | | (0.27 | ) |
| | — | | | | — | | | | — | | | | — | |
| | | | | | | | | | | | | | | |
| | (0.14 | ) | | | (0.11 | ) | | | (0.15 | ) | | | (0.27 | ) |
| | | | | | | | | | | | | | | |
| $ | 24.84 | | | $ | 17.81 | | | $ | 15.65 | | | $ | 9.82 | |
| | | | | | | | | | | | | | | |
| | 40.38 | % | | | 14.51 | % | | | 61.62 | % | | | 1.47 | % |
| | | | | | | | | | | | | | |
| $ | 22,415 | | | $ | 10,524 | | | $ | 6,852 | | | $ | 3,642 | |
| $ | 14,963 | | | $ | 7,973 | | | $ | 4,734 | | | $ | 3,891 | |
| | | | | | | | | | | | | | |
| | 2.15 | % | | | 2.28 | % | | | 2.33 | % | | | 2.54 | % |
| | 1.15 | % | | | 1.28 | % | | | 1.33 | % | | | 1.54 | % |
| | 0.84 | % | | | 0.95 | % | | | 0.87 | % | | | 2.24 | % |
See Notes to Financial Statements.
| | |
| Dryden Global Real Estate Fund | | 35 |
Financial Highlights
Cont’d
| | | | |
| | | Class Z | |
| | | Year Ended
March 31, 2007(b) | |
Per Share Operating Performance: | | | | |
Net Asset Value, Beginning Of Year | | $ | 25.01 | |
| | | | |
Income from investment operations: | | | | |
Net investment income | | | 0.47 | |
Net realized and unrealized gains (losses) on investments transactions | | | 6.29 | |
| | | | |
Total from investment operations | | | 6.76 | |
| | | | |
Less Dividends and Distributions: | | | | |
Dividends from net investment income | | | (0.50 | ) |
Distributions from net realized gains from investments | | | (0.01 | ) |
| | | | |
Total Dividends and Distributions: | | | (0.51 | ) |
| | | | |
Net asset value, end of year | | $ | 31.26 | |
| | | | |
Total Return(a): | | | 27.38 | % |
Ratios/Supplemental Data: | | | | |
Net assets, end of year (000) | | $ | 42,601 | |
Average net assets (000) | | $ | 33,458 | |
Ratios to average net assets: | | | | |
Expenses, including distribution and service (12b-1) fees | | | 0.97 | % |
Expenses, excluding distribution and service (12b-1) fees | | | 0.97 | % |
Net investment income | | | 1.68 | % |
| (a) | Total return is calculated assuming a purchase of shares on the first day and a sale on the last day of each year reported and includes reinvestment of dividends and distributions. |
| (b) | Based on average shares outstanding during the year. |
See Notes to Financial Statements.
| | |
| 36 | | Visit our website at www.jennisondryden.com |
| | | | | | | | | | | | | | |
| Class Z | |
| Year Ended March 31, | |
| 2006(b) | | | 2005 | | | 2004 | | | 2003(b) | |
| | | | | | | | | | | | | | |
| $ | 17.93 | | | $ | 15.75 | | | $ | 9.85 | | | $ | 9.98 | |
| | | | | | | | | | | | | | | |
| | | | | | | | | | | | | | |
| | 0.41 | | | | 0.31 | | | | 0.18 | | | | 0.31 | |
| | 7.00 | | | | 2.13 | | | | 5.96 | | | | (0.07 | ) |
| | | | | | | | | | | | | | | |
| | 7.41 | | | | 2.44 | | | | 6.14 | | | | 0.24 | |
| | | | | | | | | | | | | | | |
| | | | | | | | | | | | | | |
| | (0.33 | ) | | | (0.26 | ) | | | (0.24 | ) | | | (0.37 | ) |
| | — | | | | — | | | | — | | | | — | |
| | | | | | | | | | | | | | | |
| | (0.33 | ) | | | (0.26 | ) | | | (0.24 | ) | | | (0.37 | ) |
| | | | | | | | | | | | | | | |
| $ | 25.01 | | | $ | 17.93 | | | $ | 15.75 | | | $ | 9.85 | |
| | | | | | | | | | | | | | | |
| | 41.80 | % | | | 15.69 | % | | | 63.21 | % | | | 2.52 | % |
| | | | | | | | | | | | | | |
| $ | 19,484 | | | $ | 9,776 | | | $ | 7,506 | | | $ | 1,884 | |
| $ | 13,939 | | | $ | 7,784 | | | $ | 3,648 | | | $ | 1,722 | |
| | | | | | | | | | | | | | |
| | 1.15 | % | | | 1.28 | % | | | 1.33 | % | | | 1.54 | % |
| | 1.15 | % | | | 1.28 | % | | | 1.33 | % | | | 1.54 | % |
| | 1.88 | % | | | 1.98 | % | | | 1.52 | % | | | 3.17 | % |
See Notes to Financial Statements.
| | |
| Dryden Global Real Estate Fund | | 37 |
Report of Independent Registered Public Accounting Firm
To the Board of Trustees and Shareholders of
Dryden Global Real Estate Fund:
We have audited the accompanying statement of assets and liabilities of Dryden Global Real Estate Fund (the “Fund”), including the portfolio of investments, as of March 31, 2007, and the related statement of operations for the year then ended, the statement of changes in net assets for each of the years in the two-year period then ended and the financial highlights for each of the years in the four-year period then ended. These financial statements and financial highlights are the responsibility of the Fund’s management. Our responsibility is to express an opinion on these financial statements and the financial highlights based on our audits. The financial highlights for the year ended March 31, 2003 were audited by another independent registered public accounting firm, whose report dated May 15, 2003, expressed an unqualified opinion thereon.
We conducted our audits in accordance with the Public Company Accounting Oversight Board (United States). Those standards require that we plan and perform the audit to obtain reasonable assurance about whether the financial statements and financial highlights are free of material misstatement. An audit includes examining, on a test basis, evidence supporting the amounts and disclosures in the financial statements. Our procedures included confirmation of securities owned as of March 31, 2007, by correspondence with the custodian and brokers or by other appropriate audit procedures where replies from brokers were not received. An audit also includes assessing the accounting principles used and significant estimates made by management, as well as evaluating the overall financial statement presentation. We believe that our audits provide a reasonable basis for our opinion.
In our opinion, the financial statements and financial highlights referred to above present fairly, in all material respects, the financial position of the Dryden Global Real Estate Fund as of March 31, 2007, and the results of its operations for the year then ended, the changes in its net assets for each of the years in the two-year period then ended and the financial highlights for each of the years in the four-year period then ended, in conformity with U.S. generally accepted accounting principles.

New York, New York
May 25, 2007
| | |
| 38 | | Visit our website at www.jennisondryden.com |
Supplemental Proxy Information
(Unaudited)
A Special Meeting of Shareholders of Dryden Global Real Estate Fund was held on October 30, 2006, which was adjourned until November 28, 2006 and re-adjourned to December 29, 2006. At the Meeting held on December 29, 2006, Shareholders approved the following proposals:
| 1. | To approve a new subadvisory agreement between Prudential Investments LLC and Prudential Investment Management, Inc. |
The result of the proxy solicitation on the preceding matter was as follows:
| | |
For: | | 3,690,955.63 |
Against: | | 561,239.87 |
Abstain: | | 228,832.03 |
Uninstructed: | | 406,487.00 |
| 2. | To approve a change in the Fund’s investment objective: |
The results of the proxy solicitation on the preceding matter was as follows:
| | |
For: | | 3,656,899.35 |
Against: | | 585,329.68 |
Abstain: | | 238,798.50 |
Uninstructed: | | 406,487.00 |
At the Meeting held on December 29, 2006, Shareholders did not approve the following proposal:
| 3. | To approve an increase in the management fee paid by the Fund to Prudential Investments LLC. |
The results of the proxy solicitation on the preceding matter was as follows:
| | |
For: | | 2,839,361.54 |
Against: | | 1,423,191.75 |
Abstain: | | 218,474.24 |
Uninstructed: | | 406,487.00 |
| | |
| Dryden Global Real Estate Fund | | 39 |
Federal Income Tax Information
(Unaudited)
We are required by the Internal Revenue Code to advise you within 60 days of the Fund’s fiscal year end (March 31, 2007) as to the federal tax status of dividends paid by the Fund during such fiscal year. Accordingly, we are advising you that in the fiscal year ended March 31, 2007, dividends were paid of $.4382, $.2425, $.2425 and $.5011 per share (representing net investment income for Class A, B, C and Z shares respectively), which are taxable as ordinary income. Additionally, the Fund paid long-term capital gain distributions for Class A, B, C and Z shares of .0084, respectively.
The Fund intends to designate 10.85% of the ordinary income dividends paid as qualified interest related dividends under The American Jobs Creation Act of 2004.
The Fund intends to designate 2.13% of the ordinary income dividends paid as qualified for the reduced tax rate under The Jobs and Growth Tax Relief Reconciliation Act of 2003.
For the fiscal year ended March 31, 2007, the Fund intends on passing through $121,247 of ordinary income distributions as a foreign tax credit from recognized foreign source income of $1,358,353.
In January 2008, you will be advised on IRS Form 1099 DIV or substitute 1099 DIV as to the federal tax status of the dividends received by you in calendar year 2007.
| | |
| 40 | | Visit our website at www.jennisondryden.com |
Management of the Trust
(Unaudited)
Information pertaining to the Trustees of the Fund (the “Trust”) is set forth below. Trustees who are not deemed to be “interested persons” of the Trust, as defined in the Investment Company Act of 1940 (the 1940 Act), are referred to as “Independent Trustees.” Trustees who are deemed to be “interested persons” of the Trust are referred to as “Interested Trustees.” “Fund Complex”† consists of the Trust and any other investment companies managed by PI.
Independent Trustees(2)
Linda W. Bynoe (54), Trustee since 2005(3) Oversees 62 portfolios in Fund complex
Principal occupations (last 5 years): President and Chief Executive Officer (since March 1995) of Telemat, Ltd. (management consulting); formerly Vice President at Morgan Stanley & Co.
Other Directorships held: Director of Simon Property Group, Inc. (real estate investment trust) (since May 2003); Anixter International (communication products distributor) (since January 2006), Director of Northern Trust Corporation (since April 2006).
David E.A. Carson (72), Trustee since 2003(3) Oversees 66 portfolios in Fund complex
Principal occupations (last 5 years): Formerly Director (January 2000-May 2000), Chairman (January 1999-December 1999), Chairman and Chief Executive Officer (January 1998 to December 1998) and President, Chairman and Chief Executive Officer of People’s Bank (1983-1997).
Robert E. La Blanc (73), Trustee since 2001(3) Oversees 64 portfolios in Fund complex
Principal occupations (last 5 years): President (since 1981) of Robert E. La Blanc Associates, Inc. (telecommunications).
Other Directorships held:(4) Director of CA, Inc. (since 2002) (software company); FiberNet Telecom Group, Inc. (since 2003) (telecom company).
Douglas H. McCorkindale (67), Trustee since 2000(3) Oversees 62 portfolios in Fund complex
Principal occupations (last 5 years): Formerly Chairman (February 2001-June 2006), Chief Executive Officer (June 2000-July 2005), President (September 1997-July 2005) and Vice Chairman (March 1984-May 2000) of Gannett Co. Inc. (publishing and media).
Other Directorships held:(4) Director of Continental Airlines, Inc. (since May 1993); Director of Lockheed Martin Corp. (aerospace and defense) (since May 2001).
Richard A. Redeker (63), Trustee since 2003(3) Oversees 63 portfolios in Fund complex
Principal occupations (last 5 years): Management Consultant; Director (since 2001) and Chairman of the Board (since 2006) of Invesmart, Inc.; Director of Penn Tank Lines, Inc. (since 1999).
Robin B. Smith (67), Trustee since 1997(3) Oversees 64 portfolios in Fund complex
Principal occupations (last 5 years): Chairman of the Board (since January 2003) of Publishers Clearing House (direct marketing); formerly Chairman and Chief Executive Officer (August 1996-January 2003) of Publishers Clearing House.
| | |
| Dryden Global Real Estate Fund | | 41 |
Other Directorships held:(4) Formerly Director of BellSouth Corporation (1992-2006).
Stephen G. Stoneburn (63), Trustee since 2000(3) Oversees 64 portfolios in Fund complex
Principal occupations (last 5 years): President and Chief Executive Officer (since June 1996) of Quadrant Media Corp. (a publishing company); formerly President (June 1995-June 1996) of Argus Integrated Media, Inc.; Senior Vice President and Managing Director (January 1993-1995) of Cowles Business Media; Senior Vice President of Fairchild Publications, Inc. (1975-1989).
Clay T. Whitehead (68), Trustee since 2000(3) Oversees 64 portfolios in Fund complex
Principal occupations (last 5 years): President (since 1983) of YCO (new business development firm).
Interested Trustees(1)
Judy A. Rice (59), President since 2003 and Trustee since 2000(3) Oversees 63 portfolios in Fund complex
Principal occupations (last 5 years): President, Chief Executive Officer, Chief Operating Officer and Officer-In-Charge (since February 2003) of Prudential Investments LLC; Vice President (since February 1999) of Prudential Investment Management Services LLC; President, Chief Executive Officer and Officer-In-Charge (since April 2003) of Prudential Mutual Fund Services LLC; formerly Director (May 2003-March 2006) and Executive Vice President (June 2005-March 2006) of AST Investment Services, Inc.; formerly Executive Vice President (September 1999-February 2003) of Prudential Investments LLC; Member of Board of Governors of the Investment Company Institute.
Robert F. Gunia (60), Vice President and Trustee since 1997(3) Oversees 143 portfolios in Fund complex
Principal occupations (last 5 years): Chief Administrative Officer (since September 1999) and Executive Vice President (since December 1996) of Prudential Investments LLC; President (since April 1999) of Prudential Investment Management Services LLC; Executive Vice President (since March 1999) and Treasurer (since May 2000) of Prudential Mutual Fund Services LLC; Chief Administrative Officer, Executive Vice President and Director (since May 2003) of AST Investment Services, Inc.
Other Directorships held:(4) Vice President and Director (since May 1989) and Treasurer (since 1999) of The Asia Pacific Fund, Inc.
Information pertaining to the Officers of the Fund who are not also Trustees is set forth below.
Officers(2)
Kathryn L. Quirk (54), Chief Legal Officer since 2005(3)
Principal occupations (last 5 years): Vice President and Corporate Counsel (since September 2004) of Prudential; Executive Vice President, Chief Legal Officer and Secretary (since July 2005) of Prudential Investments LLC and Prudential Mutual Fund Services LLC; formerly Managing Director, General Counsel, Chief Compliance Officer, Chief Risk Officer and Corporate Secretary (1997-2002) of Zurich Scudder Investments, Inc.
Deborah A. Docs (49), Secretary since 2005(3)
Principal occupations (last 5 years): Vice President and Corporate Counsel (since January 2001) of Prudential; Vice President (since December 1996) and Assistant Secretary (since March 1999) of PI; formerly Vice President and Assistant Secretary (May 2003-June 2005) of AST Investment Services, Inc.
| | |
| 42 | | Visit our website at www.jennisondryden.com |
Jonathan D. Shain (48), Assistant Secretary since 2005(3)
Principal occupations (last 5 years): Vice President and Corporate Counsel (since August 1998) of Prudential; Vice President and Assistant Secretary (since May 2001) of PI; Vice President and Assistant Secretary (since February 2001) of PMFS; formerly Vice President and Assistant Secretary (May 2003-June 2005) of AST Investment Services, Inc.
Claudia DiGiacomo (32), Assistant Secretary since 2005(3)
Principal occupations (last 5 years): Vice President and Corporate Counsel (since January 2005) of Prudential; Vice President and Assistant Secretary of PI (since December 2005); Associate at Sidley Austin Brown & Wood LLP (1999-2004).
Lee D. Augsburger (47), Chief Compliance Officer since 1994(3)
Principal occupations (last 5 years): Senior Vice President and Chief Compliance Officer (since April 2003) of PI; Vice President (since November 2000) and Chief Compliance Officer (since October 2000) of Prudential Investment Management, Inc.; Chief Compliance Officer and Senior Vice President (since May 2003) of AST Investment Services, Inc.
Valerie M. Simpson (48), Deputy Chief Compliance Officer since 2007.(3)
Principal Occupations (last 5 years): Vice President and Senior Compliance Officer (since March 2006) of PI; Vice President-Financial Reporting (since March 2006) for Prudential Life and Annuities Finance.
Grace C. Torres (47), Treasurer and Principal Financial and Accounting Officer since 1997(3)
Principal occupations (last 5 years): Assistant Treasurer (since March 1999) and Senior Vice President (since September 1999) of PI; Assistant Treasurer (since May 2003) and Vice President (since June 2005) of AST Investment Services, Inc.; Senior Vice President and Assistant Treasurer (since May 2003) of Prudential Annuities Advisory Services, Inc.; formerly Senior Vice President (May 2003-June 2005) of AST Investment Services, Inc.
John P. Schwartz (35), Assistant Secretary since 2006(3)
Principal occupations (last 5 years): Vice President and Corporate Counsel (since April 2005) of Prudential; Vice President and Assistant Secretary of PI (since December 2005); Associate at Sidley, Austin Brown & Wood LLP (1997-2005).
M. Sadiq Peshimam (43), Assistant Treasurer since 2006(3)
Principal occupations (last 5 years): Vice President (since 2005) and Director (2000-2005) within Prudential Mutual Fund Administration.
Andrew R. French (44), Assistant Secretary since 2006(3)
Principal occupations (last 5 years): Director and Corporate Counsel (since May 2006) of Prudential; Vice President and Assistant Secretary (since January 2007) of PI; Vice President and Assistant Secretary (since January 2007) of PMFS; formerly Senior Legal Analyst of Prudential Mutual Fund Law Department.
Noreen M. Fierro (42), Anti-Money Laundering Compliance Officer since 2006(3)
Principal occupations (last 5 years): Vice President, Corporate Compliance (since May 2006) of Prudential; formerly Corporate Vice President, Associate General Counsel (April 2002-May 2005) of UBS Financial Services, Inc., in their Money Laundering Prevention Group; Senior Manager (May 2005-May 2006) of Deloitte Financial Advisory Services, LLP, in their Forensic and Dispute Services, Anti-Money Laundering Group.
| | |
| Dryden Global Real Estate Fund | | 43 |
† | The Fund Complex consists of all investment companies managed by PI. The Funds for which PI serves as manager include Jennison Dryden Mutual Funds, Strategic Partners Funds, The Prudential Variable Contract Accounts 2, 10, 11. The Target Portfolio Trust, The Prudential Series Fund, American Skandia Trust, and Prudential’s Gibraltar Fund, Inc. |
(1) | “Interested” Trustee, as defined in the 1940 Act, by reason of employment with the Manager (Prudential Investments LLC or PI), the Subadviser or the Distributor (Prudential Investment Management Services LLC or PIMS). |
(2) | Unless otherwise noted, the address of the Trustees and Officers is c/o: Prudential Investments LLC, Gateway Center Three, 100 Mulberry Street, Newark, NJ 07102. |
(3) | There is no set term of office for Trustees and Officers. The Independent Trustees have adopted a retirement policy, which calls for the retirement of Trustees on December 31 of the year in which they reach the age of 75. The table shows the individuals length of service as Trustee and/or Officer. |
(4) | This includes only directorships of companies required to register, or file reports with the SEC under the Securities and Exchange Act of 1934 (that is, “public companies”) or other investment companies registered under the 1940 Act. |
Additional Information about the Fund’s Trustees is included in the Fund’s Statement of Additional Information which is available without charge, upon request, by calling (800) 521-7466 or (732) 482-7555 (Calling from outside the U.S.)
| | |
| 44 | | Visit our website at www.jennisondryden.com |
Growth of a $10,000 Investment
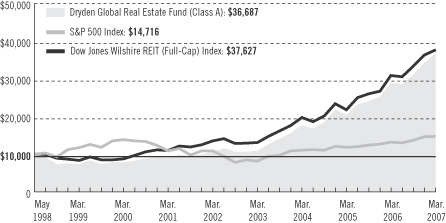
| | | | | | | | | |
| Average Annual Total Returns (With Sales Charges) as of 3/31/07 | |
| | | One Year | | | Five Years | | | Since Inception | |
Class A | | 20.10 | % | | 26.69 | % | | 15.71 | % |
Class B | | 21.12 | | | 27.08 | | | 15.58 | |
Class C | | 25.12 | | | 27.16 | | | 15.58 | |
Class Z | | 27.38 | | | 28.45 | | | 16.75 | |
| | | | | | | | | |
| Average Annual Total Returns (Without Sales Charges) as of 3/31/07 | |
| | | One Year | | | Five Years | | | Since Inception | |
Class A | | 27.09 | % | | 28.13 | % | | 16.45 | % |
Class B | | 26.12 | | | 27.16 | | | 15.58 | |
Class C | | 26.12 | | | 27.16 | | | 15.58 | |
Class Z | | 27.38 | | | 28.45 | | | 16.75 | |
Performance data quoted represent past performance. Past performance does not guarantee future results. The investment return and principal value of an investment will fluctuate, so that an investor’s shares, when redeemed, may be worth more or less than their original cost. Current performance may be lower or higher than the past performance data quoted. An investor may obtain performance data current to the most recent month-end by visiting our website at www.jennisondryden.com or by calling (800) 225-1852. The maximum initial sales charge is 5.50% (Class A shares). As of March 31, 2007, the gross annualized operating expenses are 1.27%, 1.97%, 1.97%, 0.97% for Class A, B, C and Z shares, respectively. As of March 31, 2007, the annualized operating expenses net of a contractual reduction through July 31, 2008 are 1.22%, 1.97%, 1.97%, and 0.97% for Class A, B, C and Z shares,
| | |
| | Visit our website at www.jennisondryden.com |
respectively. These figures include the net operating expenses of the underlying portfolios in which the Fund invests. Such expenses were calculated using a weighted average of the net operating expenses of each underlying fund and when annualized amounted to less than 0.005% for each share class.
The returns in the graph and the tables do not reflect the deduction of taxes that a shareholder would pay on Fund distributions or following the redemption of Fund shares.
Source: Prudential Investments LLC, Lipper Inc., and Bloomberg
Inception date: 5/5/98.
The graph compares a $10,000 investment in the Dryden Global Real Estate Fund (Class A shares) with a similar investment in the S&P 500 Index, and the Dow Jones Wilshire REIT (Full-Cap) Index by portraying the initial account values at the commencement of operations of Class A shares (May 5, 1998) and the account values at the end of the current fiscal year (March 31, 2007) as measured on a quarterly basis. For purposes of the graph, and unless otherwise indicated, it has been assumed that (a) the maximum applicable front-end sales charge was deducted from the initial $10,000 investment in Class A shares; (b) all recurring fees (including management fees) were deducted; and (c) all dividends and distributions were reinvested. The line graph provides information for Class A shares only. As indicated in the tables provided earlier, performance for Class B, C, and Z shares will vary due to the differing charges and expenses applicable to each share class (as indicated in the following paragraphs). Without a distribution and service (12b-1) fee waiver of 0.05% for Class A shares annually through March 31, 2007, the returns shown in the graph and for Class A shares in the tables would have been lower.
The S&P 500 Index is an unmanaged index of 500 stocks of large U.S. public companies. It gives a broad look at how stock prices in the United States have performed. The Dow Jones Wilshire REIT (Full-Cap) Index is an unmanaged, market capitalization-weighted index comprising U.S. publicly traded Real Estate Investment Trusts. The Fund no longer utilizes the Dow Jones Wilshire REIT (Full-Cap) Index as the benchmark index utilized to measure the performance of the Fund. The Fund now utilizes the S&P Citigroup/BMI World Property Net Index as the benchmark index for purposes of measuring Fund performance. The S&P Citigroup/BMI World Property Net Index is a broad market index of more than 400 companies from 21 countries, and is available for a wide range of regions (including ex-U.S.) as well as by country. The Indexes’ total returns include the reinvestment of all dividends, but do not include the effects of sales charges, operating expenses of a mutual fund, or taxes. The returns for the Indexes would be lower if they included the effects of sales charges, operating expenses, or taxes. The securities that comprise these indexes may differ substantially from the securities in the Fund. These are not the only indexes that may be used to characterize performance of real estate securities funds. Other indexes may portray different comparative performance. Investors cannot invest directly in an index.
Class A shares are subject to a maximum front-end sales charge of 5.50% and a 12b-1 fee of up to 0.30% annually. Investors who purchase Class A shares in an amount of $1 million or more do not pay a front-end sales charge, but are subject to a contingent deferred sales charge (CDSC) of 1% for shares sold within 12 months of purchase. Class B shares are subject to a declining CDSC of 5%, 4%, 3%, 2%, 1%, and 1%, respectively, for the first six years after purchase and a 12b-1 fee of 1% annually. Approximately seven years after purchase, Class B shares will automatically convert to Class A shares on a quarterly basis. Class C shares are not subject to a front-end sales charge, but have a CDSC of 1% for Class C shares redeemed within 12 months from the date of purchase and an annual 12b-1 fee of 1%. The returns in the graph and the tables do not reflect the deduction of taxes that a shareholder would pay on Fund distributions or following the redemption of Fund shares.
| | |
| Dryden Global Real Estate Fund | | |
| | | | |
| n MAIL | | n TELEPHONE | | n WEBSITE |
Gateway Center Three 100 Mulberry Street Newark, NJ 07102 | | (800) 225-1852 | | www.jennisondryden.com |
|
| PROXY VOTING |
| The Board of Trustees of the Fund has delegated to the Fund’s investment subadvisers the responsibility for voting any proxies and maintaining proxy recordkeeping with respect to the Fund. A description of these proxy voting policies and procedures is available without charge, upon request, by calling (800) 225-1852 or by visiting the Securities and Exchange Commission’s website at www.sec.gov. Information regarding how the Fund voted proxies relating to portfolio securities during the most recent 12-month period ended June 30 is available on the Fund’s website and on the Commission’s website. |
|
| TRUSTEES |
| Linda W. Bynoe • David E.A. Carson • Robert F. Gunia • Robert E. La Blanc • Douglas H. McCorkindale • Richard A. Redeker • Judy A. Rice • Robin B. Smith • Stephen G. Stoneburn • Clay T. Whitehead |
|
| OFFICERS |
Judy A. Rice, President • Robert F. Gunia, Vice President • Grace C. Torres, Treasurer and Principal Financial and Accounting Officer • Kathryn L. Quirk, Chief Legal Officer • Deborah A. Docs, Secretary • Lee D. Augsberger, Chief Compliance Officer • Valerie Simpson, Deputy Chief Compliance Officer • Noreen M. Fierro, Anti-Money Laundering Compliance
Officer • Jonathan D. Shain, Assistant Secretary • Claudia DiGiacomo, Assistant Secretary • John P. Schwartz, Assistant Secretary • Andrew R. French, Assistant Secretary • M. Sadiq Peshimam, Assistant Treasurer |
| | | | |
| MANAGER | | Prudential Investments LLC | | Gateway Center Three
100 Mulberry Street
Newark, NJ 07102 |
|
| INVESTMENT SUBADVISERS | | Through the close of business on January 19, 2007: |
| | Wellington Management
Company, LLP | | 75 State Street
Boston, MA 02109 |
| | Principal Global
Investors, LLC | | 801 Grand Avenue
Des Moines, IA 50392 |
| | Effective after the close of business on January 19, 2007: |
| | Prudential Real Estate Investors | | 8 Campus Drive
Parsippany, NJ 07054 |
|
| DISTRIBUTOR | | Prudential Investment
Management Services LLC | | Gateway Center Three
100 Mulberry Street
Newark, NJ 07102 |
|
| CUSTODIAN | | PFPC Trust Company | | 400 Bellevue Parkway
Wilmington, DE 19809 |
|
| TRANSFER AGENT | | Prudential Mutual Fund
Services LLC | | PO Box 8098
Philadelphia, PA 19176 |
|
| INDEPENDENT REGISTERED PUBLIC ACCOUNTING FIRM | | KPMG LLP | | 345 Park Avenue
New York, NY 10154 |
|
| FUND COUNSEL | | Willkie, Farr & Gallagher LLP | | 787 Seventh Avenue
New York, NY 10019 |
|
| An investor should consider the investment objectives, risks, charges, and expenses of the Fund carefully before investing. The prospectus for the Fund contains this and other information about the Fund. An investor may obtain a prospectus by visiting our website at www.jennisondryden.com or by calling (800) 225-1852. The prospectus should be read carefully before investing. |
|
| E-DELIVERY |
| To receive your mutual fund documents on-line, go to www.icsdelivery.com/prudential/funds and enroll. Instead of receiving printed documents by mail, you will receive notification via e-mail when new materials are available. You can cancel your enrollment or change your e-mail address at any time by clicking on the change/cancel enrollment option at the icsdelivery website address. |
|
| SHAREHOLDER COMMUNICATIONS WITH TRUSTEES |
| Shareholders can communicate directly with the Board of Trustees by writing to the Chair of the Board, Dryden Global Real Estate Fund, Prudential Investments, Attn: Board of Trustees, 100 Mulberry Street, Gateway Center Three, Newark, NJ 07102. Shareholders can communicate directly with an individual Trustee by writing to the same address. Communications are not screened before being delivered to the addressee. |
|
| AVAILABILITY OF PORTFOLIO SCHEDULE |
| The Fund files its complete schedule of portfolio holdings with the Securities and Exchange Commission for the first and third quarters of each fiscal year on Form N-Q. The Fund’s Forms N-Q are available on the Commission’s website at www.sec.gov. The Fund’s Forms N-Q may also be reviewed and copied at the Commission’s Public Reference Room in Washington, D.C. Information on the operation and location of the Public Reference Room may be obtained by calling (800) SEC-0330 (732-0330). The Fund’s schedule of portfolio holdings is also available on the Fund’s website as of the end of each fiscal quarter. |
|
| The Fund’s Statement of Additional Information contains additional information about the Fund’s Trustees and is available without charge, upon request, by calling (800) 225-1852. |
Mutual Funds:
| | | | |
| ARE NOT INSURED BY THE FDIC OR ANY FEDERAL GOVERNMENT AGENCY | | MAY LOSE VALUE | | ARE NOT A DEPOSIT OF OR GUARANTEED BY ANY BANK OR ANY BANK AFFILIATE |

| | | | | | | | | | | | |
| Dryden Global Real Estate Fund |
| | | Share Class | | A | | B | | C | | Z | | |
| | NASDAQ | | PURAX | | PURBX | | PURCX | | PURZX | | |
| | CUSIP | | 26244A108 | | 26244A207 | | 26244A306 | | 26244A405 | | |
| | | | | | | | | | | | |
MF182E IFS-A133570 Ed. 05/2007
Item 2 – Code of Ethics – – See Exhibit (a)
As of the end of the period covered by this report, the registrant has adopted a code of ethics (the “Section 406 Standards for Investment Companies – Ethical Standards for Principal Executive and Financial Officers”) that applies to the registrant’s Principal Executive Officer and Principal Financial Officer; the registrant’s Principal Financial Officer also serves as the Principal Accounting Officer.
The registrant hereby undertakes to provide any person, without charge, upon request, a copy of the code of ethics. To request a copy of the code of ethics, contact the registrant 800-225-1852, and ask for a copy of the Section 406 Standards for Investment Companies - Ethical Standards for Principal Executive and Financial Officers.
Item 3 – Audit Committee Financial Expert –
The registrant’s Board has determined that Mr. David E. A. Carson, member of the Board’s Audit Committee is an “audit committee financial expert,” and that he is “independent,” for purposes of this Item.
Item 4 – Principal Accountant Fees and Services –
(a) Audit Fees
For the fiscal years ended March 31, 2007 and March 31, 2006 KPMG LLP (“KPMG”), the Registrant’s principal accountant, billed the Registrant $22,359 and $16,700, respectively, for professional services rendered for the audit of the Registrant’s annual financial statements or services that are normally provided in connection with statutory and regulatory filings.
(b) Audit-Related Fees
None.
(c) Tax Fees
None.
(d) All Other Fees
None.
(e) (1) Audit Committee Pre-Approval Policies and Procedures
THE PRUDENTIAL MUTUAL FUNDS
AUDIT COMMITTEE POLICY
on
Pre-Approval of Services Provided by the Independent Accountants
The Audit Committee of each Prudential Mutual Fund is charged with the responsibility to monitor the independence of the Fund’s independent accountants. As part of this responsibility, the Audit Committee must pre-approve any independent accounting firm’s engagement to render audit and/or permissible non-audit services, as required by law. In evaluating a proposed engagement of the independent accountants, the Audit Committee will assess the effect that the engagement might reasonably be expected to have on the accountant’s independence. The Committee’s evaluation will be based on:
| | • | | a review of the nature of the professional services expected to be provided, |
| | • | | a review of the safeguards put into place by the accounting firm to safeguard independence, and |
| | • | | periodic meetings with the accounting firm. |
Policy for Audit and Non-Audit Services Provided to the Funds
On an annual basis, the scope of audits for each Fund, audit fees and expenses, and audit-related and non-audit services (and fees proposed in respect thereof) proposed to be performed by the Fund’s independent accountants will be presented by the Treasurer and the independent accountants to the Audit Committee for review and, as appropriate, approval prior to the initiation of such services. Such presentation shall be accompanied by confirmation by both the Treasurer and the independent accountants that the proposed services will not adversely affect the independence of the independent accountants. Proposed services shall be described in sufficient detail to enable the Audit Committee to assess the appropriateness of such services and fees, and the compatibility of the provision of such services with the auditor’s independence. The Committee shall receive periodic reports on the progress of the audit and other services which are approved by the Committee or by the Committee Chair pursuant to authority delegated in this Policy.
The categories of services enumerated under “Audit Services”, “Audit-related Services”, and “Tax Services” are intended to provide guidance to the Treasurer and the independent accountants as to those categories of services which the Committee believes are generally consistent with the independence of the independent accountants and which the Committee (or the Committee Chair) would expect upon the presentation of specific proposals to pre-approve. The enumerated categories are not intended as an exclusive list of audit, audit-related or tax services, which the Committee (or the Committee Chair) would consider for pre-approval.
Audit Services
The following categories of audit services are considered to be consistent with the role of the Fund’s independent accountants:
| | • | | Annual Fund financial statement audits |
| | • | | Seed audits (related to new product filings, as required) |
| | • | | SEC and regulatory filings and consents |
Audit-related Services
The following categories of audit-related services are considered to be consistent with the role of the Fund’s independent accountants:
| | • | | Accounting consultations |
| | • | | Fund merger support services |
| | • | | Agreed Upon Procedure Reports |
| | • | | Other Internal Control Reports |
Individual audit-related services that fall within one of these categories and are not presented to the Audit Committee as part of the annual pre-approval process will be subject to pre-approval by the Committee Chair (or any other Committee member on whom this responsibility has been delegated) so long as the estimated fee for those services does not exceed $50,000.
Tax Services
The following categories of tax services are considered to be consistent with the role of the Fund’s independent accountants:
| | • | | Tax compliance services related to the filing or amendment of the following: |
| | • | | Federal, state and local income tax compliance; and, |
| | • | | Sales and use tax compliance |
| | • | | Timely RIC qualification reviews |
| | • | | Tax distribution analysis and planning |
| | • | | Tax authority examination services |
| | • | | Tax appeals support services |
| | • | | Accounting methods studies |
| | • | | Fund merger support services |
| | • | | Tax consulting services and related projects |
Individual tax services that fall within one of these categories and are not presented to the Audit Committee as part of the annual pre-approval process will be subject to pre-approval by the Committee Chair (or any other Committee member on whom this responsibility has been delegated) so long as the estimated fee for those services does not exceed $50,000.
Other Non-audit Services
Certain non-audit services that the independent accountants are legally permitted to render will be subject to pre-approval by the Committee or by one or more Committee members to whom the Committee has delegated this authority and who will report to the full Committee any pre-approval decisions made pursuant to this Policy. Non-audit services presented for pre-approval pursuant to this paragraph will be accompanied by a confirmation from both the Treasurer and the independent accountants that the proposed services will not adversely affect the independence of the independent accountants.
Proscribed Services
The Fund’s independent accountants will not render services in the following categories of non-audit services:
| | • | | Bookkeeping or other services related to the accounting records or financial statements of the Fund |
| | • | | Financial information systems design and implementation |
| | • | | Appraisal or valuation services, fairness opinions, or contribution-in-kind reports |
| | • | | Internal audit outsourcing services |
| | • | | Management functions or human resources |
| | • | | Broker or dealer, investment adviser, or investment banking services |
| | • | | Legal services and expert services unrelated to the audit |
| | • | | Any other service that the Public Company Accounting Oversight Board determines, by regulation, is impermissible. |
Pre-approval of Non-Audit Services Provided to Other Entities Within the Prudential Fund Complex
Certain non-audit services provided to Prudential Investments LLC or any of its affiliates that also provide ongoing services to the Prudential Mutual Funds will be subject to pre-approval by the Audit Committee. The only non-audit services provided to these entities that will require pre-approval are those related directly to the operations and financial reporting of the Funds. Individual projects that are not presented to the Audit Committee as part of the annual pre-approval process will be subject to pre-approval by the Committee Chair (or any other Committee member on whom this responsibility has been delegated) so long as the estimated fee for those services does not exceed $50,000. Services presented for pre-approval pursuant to this paragraph will be accompanied by a confirmation from both the Treasurer and the independent accountants that the proposed services will not adversely affect the independence of the independent accountants.
Although the Audit Committee will not pre-approve all services provided to Prudential Investments LLC and its affiliates, the Committee will receive an annual report from the Fund’s independent accounting firm showing the aggregate fees for all services provided to Prudential Investments and its affiliates.
| (e) | (2) Percentage of services referred to in 4(b)- (4)(d) that were approved by the audit committee – |
Not applicable.
| (f) | Percentage of hours expended attributable to work performed by other than full time employees of principal accountant if greater than 50%. |
Not applicable.
(g) Non-Audit Fees
Not applicable to Registrant for the fiscal years 2007 and 2006. The aggregate non-audit fees billed by KPMG for services rendered to the registrant’s investment adviser and any entity controlling, controlled by, or under common control with the investment adviser that provides ongoing services to the registrant for the fiscal years 2007 and 2006 was $317,300 and $51,000, respectively.
(h) Principal Accountant’s Independence
Not applicable as KPMG has not provided non-audit services to the registrant’s investment adviser and any entity controlling, controlled by, or under common control with the investment adviser that provides ongoing services to the registrant that were not pre-approved pursuant to Rule 2-01(c)(7)(ii) of Regulation S-X.
Item 5 – Audit Committee of Listed Registrants – Not applicable.
Item 6 – Schedule of Investments – The schedule is included as part of the report to shareholders filed under Item 1 of this Form.
Item 7 – Disclosure of Proxy Voting Policies and Procedures for Closed-End Management Investment Companies – Not applicable.
Item 8 – Portfolio Managers of Closed-End Management Investment Companies – Not applicable.
Item 9 – Purchases of Equity Securities by Closed-End Management Investment Company and Affiliated Purchasers – Not applicable.
Item 10 – Submission of Matters to a Vote of Security Holders – Not applicable.
Item 11 – Controls and Procedures
| | (a) | It is the conclusion of the registrant’s principal executive officer and principal financial officer that the effectiveness of the registrant’s current disclosure controls and procedures (such disclosure controls and procedures having been evaluated within 90 days of the date of this filing) provide reasonable assurance that the information required to be disclosed by the registrant has been recorded, processed, summarized and reported within the time period specified in the Commission’s rules and forms and that the information required to be disclosed by the registrant has been accumulated and communicated to the registrant’s principal executive officer and principal financial officer in order to allow timely decisions regarding required disclosure. |
| | (b) | There has been no significant change in the registrant’s internal control over financial reporting that occurred during the registrant’s most recent fiscal quarter of the period covered by this report that has materially affected, or is likely to materially affect, the registrant’s internal control over financial reporting. |
Item 12 – Exhibits
| | (a)(1) | Code of Ethics – Attached hereto as Exhibit EX-99.CODE-ETH |
| | (2) | Certifications pursuant to Section 302 of the Sarbanes-Oxley Act – Attached hereto as Exhibit EX-99.CERT. |
| | (3) | Any written solicitation to purchase securities under Rule 23c-1. – Not applicable. |
| | (b) | Certifications pursuant to Section 906 of the Sarbanes-Oxley Act – Attached hereto as Exhibit EX-99.906CERT. |
SIGNATURES
Pursuant to the requirements of the Securities Exchange Act of 1934 and the Investment Company Act of 1940, the registrant has duly caused this report to be signed on its behalf by the undersigned, thereunto duly authorized.
| | |
| (Registrant) Dryden Global Real Estate Fund |
| |
| By (Signature and Title)* | | /s/ Deborah A. Docs |
| | Deborah A. Docs |
| | Secretary |
|
| Date May 23, 2007 |
Pursuant to the requirements of the Securities Exchange Act of 1934 and the Investment Company Act of 1940, this report has been signed below by the following persons on behalf of the registrant and in the capacities and on the dates indicated.
| | |
| By (Signature and Title)* | | /s/ Judy A. Rice |
| | Judy A. Rice |
| | President and Principal Executive Officer |
|
| Date May 23, 2007 |
| |
| By (Signature and Title)* | | /s/ Grace C. Torres |
| | Grace C. Torres |
| | Treasurer and Principal Financial Officer |
|
| Date May 23, 2007 |
| * | Print the name and title of each signing officer under his or her signature. |