UNITED STATES
SECURITIES AND EXCHANGE COMMISSION
Washington, D.C. 20549
FORM N-CSR
CERTIFIED SHAREHOLDER REPORT OF REGISTERED
MANAGEMENT INVESTMENT COMPANIES
Investment Company Act file number: 811-08565
Prudential Global Real Estate Fund
f/k/a Dryden Global Real Estate Fund
Exact name of registrant as specified in charter:
Gateway Center 3,
100 Mulberry Street,
Newark, New Jersey 07102
Address of principal executive offices:
Deborah A. Docs
Gateway Center 3,
100 Mulberry Street,
Newark, New Jersey 07102
Name and address of agent for service:
Registrant’s telephone number, including area code: 800-225-1852
Date of fiscal year end: 3/31/2010
Date of reporting period: 3/31/2010
Item 1 – Reports to Stockholders

| ANNUAL REPORT | MARCH 31, 2010 |
Prudential Global Real Estate Fund
(Formerly known as Dryden Global Real Estate Fund)
Fund Type Sector stock
Objective Capital appreciation and income | This report is not authorized for distribution to prospective investors unless preceded or accompanied by a current prospectus. The views expressed in this report and information about the Fund’s portfolio holdings are for the period covered by this report and are subject to change thereafter.
Prudential Investments, Prudential Financial, and the Rock Prudential logo are registered service marks of The Prudential Insurance Company of America, Newark, NJ, and |
| To enroll in e-delivery, go to www.prudentialfunds.com/edelivery |

May 14, 2010
Dear Shareholder:
Recently we announced the renaming of JennisonDryden, Prudential Financial’s mutual fund family, to Prudential Investments. As a result of this change, each of our funds has been renamed to feature “Prudential” as part of its new name. The name of your fund has changed from the Dryden Global Real Estate Fund to the Prudential Global Real Estate Fund.
While the name of your fund has changed, its investment objectives and portfolio management team remain the same. No action is required on your part. If you participate in an automatic investment plan, your account continues to be invested in the Fund under its new name.
Featuring the Prudential name in our funds creates an immediate connection to the experience and heritage of Prudential, a name recognized by millions for helping people grow and protect their wealth.
On the following pages, you will find your fund’s annual report, including an analysis of its performance over its fiscal year in addition to other data. If you have questions about your fund or the renaming of our mutual fund family, please contact your financial professional or visit our website at www.prudentialfunds.com.
Sincerely,

Judy A. Rice, President
Prudential Global Real Estate Fund
| Prudential Global Real Estate Fund | 1 |
Your Fund’s Performance
Performance data quoted represent past performance. Past performance does not guarantee future results. The investment return and principal value of an investment will fluctuate, so that an investor’s shares, when redeemed, may be worth more or less than their original cost. Current performance may be lower or higher than the past performance data quoted. An investor may obtain performance data as of the most recent month-end by visiting our website at www.prudentialfunds.com or by calling (800) 225-1852. The maximum initial sales charge is 5.50% (Class A shares). Gross operating expenses: Class A, 1.37%; Class B, 2.07%; Class C, 2.07%; Class R, 1.82%; Class Z, 1.07%. Net operating expenses apply to: Class A, 1.37%; Class B, 2.07%; Class C, 2.07%; Class R, 1.57%; Class Z, 1.07%, after contractual reduction through 7/31/2011 for Class R.
| Cumulative Total Returns (Without Sales Charges) as of 3/31/10 | |||||||||||
| One Year | Five Years | Ten Years | Since Inception | ||||||||
Class A | 83.79 | % | 23.95 | % | 223.76 | % | — | ||||
Class B | 82.44 | 19.41 | 200.28 | — | |||||||
Class C | 82.44 | 19.41 | 200.29 | — | |||||||
Class R | 83.44 | N/A | N/A | –15.66% (6/13/08) | |||||||
Class Z | 84.30 | 25.57 | 232.11 | — | |||||||
S&P Developed BMI Property Net Index | 82.43 | 13.58 | — | — | |||||||
S&P 500 Index | 49.73 | 9.97 | –6.35 | — | |||||||
Lipper Average | 78.59 | 10.54 | 178.46 | — | |||||||
| Average Annual Total Returns (With Sales Charges) as of 3/31/10 | ||||||||||||
| One Year | Five Years | Ten Years | Since Inception | |||||||||
Class A | 73.69% | 3.21 | % | 11.83 | % | — | ||||||
Class B | 77.44 | 3.45 | 11.62 | — | ||||||||
Class C | 81.44 | 3.61 | 11.62 | — | ||||||||
Class R | 83.44 | N/A | N/A | –9.07% (6/13/08) | ||||||||
Class Z | 84.30 | 4.66 | 12.75 | — | ||||||||
S&P Developed BMI Property Net Index | 82.43 | 2.58 | — | — | ||||||||
S&P 500 Index | 49.73 | 1.92 | –0.65 | — | ||||||||
Lipper Average | 78.59 | 1.85 | 10.73 | — | ||||||||
| 2 | Visit our website at www.prudentialfunds.com |
| Average Annual Total Returns (Without Sales Charges) as of 3/31/10 | |||||||||||
| One Year | Five Years | Ten Years | Since Inception | ||||||||
Class A | 83.79 | % | 4.39 | % | 12.47 | % | — | ||||
Class B | 82.44 | 3.61 | 11.62 | — | |||||||
Class C | 82.44 | 3.61 | 11.62 | — | |||||||
Class R | 83.44 | N/A | N/A | –9.07% (6/13/08) | |||||||
Class Z | 84.30 | 4.66 | 12.75 | — | |||||||
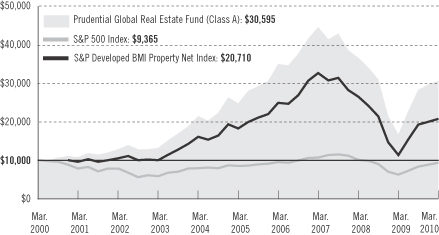
Growth of a $10,000 Investment
The returns in the graph and the tables do not reflect the deduction of taxes that a shareholder would pay on Fund distributions or following the redemption of Fund shares. Past performance does not guarantee future results.
The graph compares a $10,000 investment in the Prudential Global Real Estate Fund (Class A shares) with a similar investment in the S&P Developed BMI Property Net Index and S&P 500 Index by portraying the initial account values at the beginning of the 10-year period for Class A shares (March 31, 2000) and the account values at the end of the current fiscal year (March 31, 2010) as measured on a quarterly basis. For purposes of the graph, and unless otherwise indicated, it has been assumed that (a) the maximum applicable front-end sales charge was deducted from the initial $10,000 investment in Class A shares; (b) all recurring fees (including management fees) were deducted; and (c) all dividends and distributions were reinvested. The line graph provides information for Class A shares only. As indicated in the tables provided earlier, performance for Class B, C, R, and Z shares will vary due to the differing charges and expenses applicable to each share class (as indicated in the following paragraphs). Without a distribution and service (12b-1) fee waiver of 0.05% for Class A shares annually through July 31, 2008, the returns shown in the graph and for Class A shares in the tables would have been lower.
| Prudential Global Real Estate Fund | 3 |
Your Fund’s Performance (continued)
Source: Prudential Investments LLC and Lipper Inc. Performance figures may reflect fee waivers and/or expense reimbursements. In the absence of such fee waivers and/or expense reimbursements, total returns would be lower.
Inception returns are provided for any share class with less than 10 calendar years of returns.
The average annual total returns take into account applicable sales charges. Class A, Class B, Class C, and Class R shares are subject to an annual distribution and service (12b-1) fee of up to 0.30%, 1.00%, 1.00%, and 0.75%, respectively. Approximately seven years after purchase, Class B shares will automatically convert to Class A shares on a quarterly basis. Class Z shares are not subject to a 12b-1 fee. All investors who purchase Class A shares in the amount of $1 million or more and sell these shares within 12 months of purchase are not subject to a front-end sales charge but are subject to a contingent deferred sales charge (CDSC) of 1%, including investors who purchase their shares through broker-dealers affiliated with Prudential. Class B and Class C shares are subject to a maximum CDSC of 5% and 1%, respectively. Class R and Class Z shares are not subject to a sales charge. The returns in the tables do not reflect the deduction of taxes that a shareholder would pay on Fund distributions or following the redemption of Fund shares.
Benchmark Definitions
S&P Developed BMI Property Net Index
The S&P Developed BMl Property Net Index is an unmanaged broad market index of more than 400 companies from 21 countries. Its inception date is 12/29/2000, later than the inception of the Fund. S&P Developed BMI Property Net Index Closest Month-End to Inception cumulative total return is –24.08% for Class R. S&P Developed BMI Property Net Index Closest Month-End to Inception average annual total return is –13.95% for Class R.
S&P 500 Index
The S&P 500 Index is an unmanaged index of 500 stocks of large U.S. public companies. It gives a broad look at how U.S. stock prices have performed. S&P 500 Index Closest Month-End to Inception cumulative total return is –12.70% for Class R. S&P 500 Index Closest Month-End to Inception average annual total return is –7.14% for Class R.
Lipper Global Real Estate Funds Average
The Lipper Global Real Estate Funds Average (Lipper Average) is based on the average return for all funds in the Lipper Global Real Estate Funds category for the periods noted. Funds in the Lipper Average invest at least 25% but less than 75% of their equity portfolio in shares of companies engaged in the real estate industry that are strictly outside of the U.S. or whose securities are principally traded outside of the U.S. Lipper Average Closest Month-End to Inception cumulative total return is –22.15% for Class R. Lipper Average Closest Month-End to Inception average annual total return is –12.82% for Class R.
Investors cannot invest directly in an index. The securities in the S&P Developed BMl Property Net Index and S&P 500 Index may be very different from those in the Fund. Their returns do not include the effect of the sales charges and operating expenses of a mutual fund and would be lower if they did. Returns for the Lipper Average reflect the deduction of operating expenses, but not sales charges or taxes. The Since Inception returns for the S&P Developed BMl Property Net Index, S&P 500 Index, and the Lipper Average are measured from the closest month-end to inception date, and not from the Fund’s actual inception date.
| 4 | Visit our website at www.prudentialfunds.com |
| Five Largest Holdings expressed as a percentage of net assets as of 3/31/10 | |||
Simon Property Group, Inc., Retail Property | 4.5 | % | |
Westfield Group, Retail Property | 3.9 | ||
Sun Hung Kai Properties Ltd., Diversified | 3.1 | ||
Unibail-Rodamco, Diversified | 3.0 | ||
Mitsubishi Estate Co. Ltd., Diversified | 2.7 | ||
Holdings reflect only long-term investments and are subject to change.
| Five Largest Industries expressed as a percentage of net assets as of 3/31/10 | |||
Diversified | 34.4 | % | |
Retail Property | 20.2 | ||
Office Space | 13.9 | ||
Storage Property | 4.2 | ||
Shopping Centers | 4.0 | ||
Industry weightings reflect only long-term investments and are subject to change.
| Prudential Global Real Estate Fund | 5 |
Strategy and Performance Overview
How did the Fund perform?
For the 12-month reporting period ended March 31, 2010, the Prudential Global Real Estate Fund (the Fund) Class A shares gained 83.79%. This gain outperformed the 82.43% rise in the S&P Developed BMI Property Net Index (the Index) and the 78.59% rise in the Lipper Global Real Estate Funds Average.
How is the Fund managed?
Prudential Real Estate Investors, also known as PREI®, is one of the largest, most experienced global real estate managers with more than 220 investment professionals in 14 countries. PREI combines a “top-down” approach that defines broad economic and market trends with “bottom-up,” company-by-company analysis. A core understanding of real estate values is essential to PREI’s investment process.
PREI evaluates each security held by the Fund daily to assess its risk-adjusted return potential. It also regularly analyzes and updates allocation of the Fund’s holdings based on geographic location and property type. This results in a diversified portfolio that seeks the best of established markets as well as new opportunities in regions with growing public real estate securities markets.
PREI’s specialists in private direct property investment are integrated with the team that invests in publicly traded real estate stocks. PREI believes the information and ideas shared between the teams enables it to maintain a forward view on the markets. Though other firms offer both direct and indirect methods of investing in real estate, PREI believes the extent to which it has utilized both capabilities is uncommon, particularly on a global basis.
What were conditions like in the global real estate stock market?
As 2009 began, sentiment toward commercial real estate and publicly traded real estate companies was uniformly negative, and the near-term outlook for the capital and space markets was grim. But real estate securities across all regions bounced back from the extremely challenging first quarter and delivered exceptional returns for the year. The healthy rebound and recovery was not unwarranted. After the precipitous decline in share prices in 2008, it seemed only a matter of time before investors recognized that the extreme pessimism reflected in share prices failed to account for the inevitable recovery in the capital and space markets. Real estate securities gained sharply when the capital markets began to mend and the global economy, led by China and a handful of other emerging markets, began to expand again. Today, many systemic risks have receded. Equity investors are shedding riskier assets from their portfolios, increasingly moving to dividend-producing companies
| 6 | Visit our website at www.prudentialfunds.com |
with high-quality assets. Among the beneficiaries of this shift are publicly traded real estate companies, which at year-end were still an average of 45% below their 2007 peaks. Real Estate Investment Trusts (REITs) would have to rise about 90% on average globally to return to those levels. While this does not suggest that the sector will return to peak pricing anytime soon, current valuations provide room for normalized returns without coming close to their peak 2007 levels.
Which holdings or related groups of holdings made the largest positive and negative contribution to the Fund’s return?
The Fund posted significant gains by focusing on firms appropriately positioned to benefit from improvement in the overall market environment. Markets in all three major regions posted gains during the period, particularly North America. Positions in mall owners Simon Property Group, Macerich, and CBL & Associates most benefited the Fund. While Nippon Building Fund, Link Real Estate Investment Trust, and Mitsubishi Estate each posted gains for the period, their lower gains detracted from relative performance.
Did any tactical shifts in portfolio risk characteristics, including significant sales and purchases, affect the Fund?
The Fund benefited from several tactical and strategic shifts. For example, an allocation to several companies most affected during the credit crisis proved beneficial as conditions in the financial markets began to improve. The manager’s ability to recognize the underlying real estate value in many of these names delivered handsome returns.
Additionally, as publicly listed companies began adding equity to their balance sheets, the Fund selectively participated in follow-on offerings, in which companies issued additional shares. The real turning point for REITs, though, came in March 2009, after some of the leading REITs demonstrated they could still access the capital markets, even under the most severe conditions. However, these initial recapitalizations were very expensive since more shares were issued, which diluted their value. But these developments provided an opportunity for real price discovery, in addition to measuring the downside risk in a market where values were highly uncertain. These successful capital offerings opened the door for more REITs to follow, which PREI believes is the first phase of a massive deleveraging process—a wide scale unloading of debt—which eventually should spread across the entire commercial real estate industry.
REITs’ access to capital improved significantly in the third quarter due in part to the rally in the corporate bond market, which caused yield spreads to narrow sharply. Amid strong demand from yield-oriented investors, REITs turned to the unsecured
| Prudential Global Real Estate Fund | 7 |
Strategy and Performance Overview (continued)
bond market. Most of the capital raised to date by REITs has been used to shore up balance sheets, for purposes such as refinancing maturing debt or paying down credit lines. In all, U.S. REITs raised about $37 billion in 2009, mostly through follow-on equity offerings and a few Initial Public Offerings (IPOs).
What is PREI’s outlook for the global real estate securities markets?
With many of last year’s most worrisome risks no longer an immediate threat, the returns produced by real estate securities in 2010 are anticipated to be relatively normal, and potentially less volatile than in the past two years. The threat of widespread insolvency no longer looms over the sector. And while property values in many markets have declined by 30% or more from their peak, as they did in the 1990s, the write-downs during this cycle should be completed much more quickly than any prior cycle as a result of the increasing presence of capital markets in commercial real estate. It may take several years for asset values to recover to peak levels in some markets and sectors, but considering the speed and magnitude of the correction to date, the downside risk in capital values should be limited. To be sure, the road ahead may not be smooth. Investors already appear to be pricing in further deterioration in market fundamentals. Valuations are not nearly as compelling as they were before last year’s impressive rally, and many uncertainties abound related to the availability of debt and the impact of potential distressed asset sales. Debt that is maturing over the next 12 to 24 months still faces a substantial refinancing risk. All of these qualms will hinder a full recovery, at least until the picture becomes clearer. Still, with publicly traded property companies trading at levels 45% below their peak, it is evident that the sector offers significant value opportunities for the long-term investor.
While PREI does not anticipate reaching peak pricing in the near future, real estate securities historically have delivered positive returns over a multi-year period once the economy returns to growth after a recession. Looking ahead, it appears that the stage is set for attractive performance by shares in publicly traded property companies. PREI recommends that investors maintain a long-term view on the benefits of including real estate securities in diversified portfolios.
| 8 | Visit our website at www.prudentialfunds.com |
Comments on Largest Holdings
| 4.5% | Simon Property Group, Inc., Retail Property |
Simon Property Group is the largest publicly traded retail real estate investment trust in North America and the largest owner, developer, and manager of high quality retail real estate in the United States.
| 3.9% | Westfield Group, Retail Property |
Westfield Group, based in Australia, is the largest global regional mall owner and developer.
| 3.1% | Sun Hung Kai Properties Ltd., Diversified |
Sun Hung Kai is one of the largest property companies in Hong Kong. It specializes in premium-quality residential and commercial projects for sale and investment.
| 3.0% | Unibail-Rodamco, Diversified |
Based in France, Unibail-Rodamco is the leading listed European commercial property operator, investor, and developer. It is active in three major lines of business: shopping centers, offices, and convention centers.
| 2.7% | Mitsubishi Estate Co. Ltd., Diversified |
Mitsubishi Estate is a leading developer in Japan. It owns some of the most attractive assets in Tokyo.
| Prudential Global Real Estate Fund | 9 |
Fees and Expenses (Unaudited)
As a shareholder of the Fund, you incur two types of costs: (1) transaction costs, including sales charges (loads) on purchase payments and redemptions, as applicable, and (2) ongoing costs, including management fees, distribution and/or service (12b-1) fees, and other Fund expenses, as applicable. This example is intended to help you understand your ongoing costs (in dollars) of investing in the Fund and to compare these costs with the ongoing costs of investing in other mutual funds.
The example is based on an investment of $1,000 invested on October 1, 2009, at the beginning of the period, and held through the six-month period ended March 31, 2010. The example is for illustrative purposes only; you should consult the Prospectus for information on initial and subsequent minimum investment requirements.
The Fund’s transfer agent may charge additional fees to holders of certain accounts that are not included in the expenses shown in the table on the following page. These fees apply to individual retirement accounts (IRAs) and Section 403(b) accounts. As of the close of the six-month period covered by the table, IRA fees included an annual maintenance fee of $15 per account (subject to a maximum annual maintenance fee of $25 for all accounts held by the same shareholder). Section 403(b) accounts are charged an annual $25 fiduciary maintenance fee. Some of the fees may vary in amount, or may be waived, based on your total account balance or the number of Prudential Investments funds, including the Fund, that you own. You should consider the additional fees that were charged to your Fund account over the six-month period when you estimate the total ongoing expenses paid over the period and the impact of these fees on your ending account value, as these additional expenses are not reflected in the information provided in the expense table. Additional fees have the effect of reducing investment returns.
Actual Expenses
The first line for each share class in the table on the following page provides information about actual account values and actual expenses. You may use the information on this line, together with the amount you invested, to estimate the expenses that you paid over the period. Simply divide your account value by $1,000 (for example, an $8,600 account value ÷ $1,000 = 8.6), then multiply the result by the number on the first line under the heading “Expenses Paid During the Six-Month Period” to estimate the expenses you paid on your account during this period.
Hypothetical Example for Comparison Purposes
The second line for each share class in the table on the following page provides information about hypothetical account values and hypothetical expenses based on the Fund’s actual expense ratio and an assumed rate of return of 5% per year before
| 10 | Visit our website at www.prudentialfunds.com |
expenses, which is not the Fund’s actual return. The hypothetical account values and expenses may not be used to estimate the actual ending account balance or expenses you paid for the period. You may use this information to compare the ongoing costs of investing in the Fund and other funds. To do so, compare this 5% hypothetical example with the 5% hypothetical examples that appear in the shareholder reports of the other funds.
Please note that the expenses shown in the table are meant to highlight your ongoing costs only and do not reflect any transactional costs such as sales charges (loads). Therefore, the second line for each share class in the table is useful in comparing ongoing costs only and will not help you determine the relative total costs of owning different funds. In addition, if these transactional costs were included, your costs would have been higher.
| Prudential Global Real Estate Fund | Beginning Account Value October 1, 2009 | Ending Account Value March 31, 2010 | Annualized Expense Ratio Based on the Six-Month Period | Expenses Paid During the Six-Month Period* | ||||||||||
| Class A | Actual | $ | 1,000.00 | $ | 1,085.20 | 1.33 | % | $ | 6.91 | |||||
| Hypothetical | $ | 1,000.00 | $ | 1,018.30 | 1.33 | % | $ | 6.69 | ||||||
| Class B | Actual | $ | 1,000.00 | $ | 1,081.20 | 2.03 | % | $ | 10.53 | |||||
| Hypothetical | $ | 1,000.00 | $ | 1,014.81 | 2.03 | % | $ | 10.20 | ||||||
| Class C | Actual | $ | 1,000.00 | $ | 1,081.90 | 2.03 | % | $ | 10.54 | |||||
| Hypothetical | $ | 1,000.00 | $ | 1,014.81 | 2.03 | % | $ | 10.20 | ||||||
| Class R | Actual | $ | 1,000.00 | $ | 1,084.70 | 1.53 | % | $ | 7.95 | |||||
| Hypothetical | $ | 1,000.00 | $ | 1,017.30 | 1.53 | % | $ | 7.70 | ||||||
| Class Z | Actual | $ | 1,000.00 | $ | 1,087.60 | 1.03 | % | $ | 5.36 | |||||
| Hypothetical | $ | 1,000.00 | $ | 1,019.80 | 1.03 | % | $ | 5.19 | ||||||
* Fund expenses (net of fee waivers or subsidies, if any) for each share class are equal to the annualized expense ratio for each share class (provided in the table), multiplied by the average account value over the period, multiplied by the 182 days in the six-month period ended March 31, 2010, and divided by the 365 days in the Fund’s fiscal year ended March 31, 2010 (to reflect the six-month period). Expenses presented in the table include the expenses of any underlying portfolios in which the Fund may invest.
| Prudential Global Real Estate Fund | 11 |
Portfolio of Investments
as of March 31, 2010
| Shares | Description | Value (Note 1) | |||
LONG-TERM INVESTMENTS 93.6% | |||||
COMMON STOCKS 93.4% | |||||
Australia 10.0% | |||||
| 1,244,300 | CFS Retail Property Trust, REIT | $ | 2,140,935 | ||
| 1,761,500 | Commonwealth Property Office Fund, REIT | 1,462,879 | |||
| 3,630,826 | Dexus Property Group, REIT | 2,698,780 | |||
| 4,414,400 | Goodman Group, REIT | 2,653,323 | |||
| 561,600 | GPT Group, REIT | 296,328 | |||
| 3,209,020 | ING Office Fund, REIT | 1,722,683 | |||
| 363,355 | Lend Lease Corp. Ltd. | 2,887,528 | |||
| 1,097,200 | Macquarie CountryWide Trust, REIT | 563,834 | |||
| 1,829,356 | Mirvac Group, REIT | 2,476,095 | |||
| 956,425 | Mirvac Industrial Trust, REIT(a) | 41,250 | |||
| 1,538,825 | Stockland, REIT | 5,634,290 | |||
| 1,305,279 | Westfield Group, REIT | 14,445,340 | |||
| 37,023,265 | |||||
Belgium 0.4% | |||||
| 9,907 | Cofinimmo, REIT | 1,396,304 | |||
Bermuda 0.4% | |||||
| 98,085 | Orient-Express Hotels Ltd. (Class A Stock)(a) | 1,390,845 | |||
Brazil 2.5% | |||||
| 31,600 | BR Malls Participacoes SA(a) | 373,155 | |||
| 193,600 | Cyrela Brazil Realty SA | 2,267,657 | |||
| 288,502 | Gafisa SA | 1,962,985 | |||
| 150,000 | Multiplan Empreendimentos Imobiliarios SA | 2,511,879 | |||
| 233,066 | PDG Realty SA Empreendimentos e Participacoes | 1,950,135 | |||
| 9,065,811 | |||||
Canada 1.3% | |||||
| 154,900 | Brookfield Properties Corp. | 2,386,831 | |||
| 109,100 | Chartwell Seniors Housing Real Estate Investment Trust, REIT | 778,787 | |||
| 67,865 | InnVest Real Estate Investment Trust, REIT | 396,907 | |||
| 79,435 | RioCan Real Estate Investment Trust, REIT | 1,445,339 | |||
| 5,007,864 | |||||
Cayman Islands 0.1% | |||||
| 584,000 | Shui On Land Ltd. | 298,610 | |||
See Notes to Financial Statements.
| Prudential Global Real Estate Fund | 13 |
Portfolio of Investments
as of March 31, 2010 continued
| Shares | Description | Value (Note 1) | |||
COMMON STOCKS (Continued) | |||||
Finland 0.3% | |||||
| 87,255 | Citycon Oyj | $ | 347,662 | ||
| 170,624 | Sponda Oyj | 712,105 | |||
| 1,059,767 | |||||
France 4.6% | |||||
| 9,518 | Fonciere des Regions, REIT | 1,048,371 | |||
| 6,584 | GECINA SA, REIT | 728,671 | |||
| 13,694 | ICADE, REIT | 1,524,248 | |||
| 63,982 | Klepierre, REIT | 2,513,029 | |||
| 54,348 | Unibail-Rodamco, REIT | 11,010,832 | |||
| 16,825,151 | |||||
Hong Kong 13.7% | |||||
| 1,927,000 | Champion, REIT | 920,780 | |||
| 688,776 | Cheung Kong Holdings Ltd. | 8,871,121 | |||
| 1,635,469 | Hang Lung Properties Ltd. | 6,593,062 | |||
| 669,794 | Henderson Land Development Co. Ltd. | 4,718,773 | |||
| 1,018,000 | Hongkong Land Holdings Ltd. | 5,161,260 | |||
| 720,999 | Hysan Development Co. Ltd. | 2,084,738 | |||
| 378,392 | Kerry Properties Ltd. | 2,029,820 | |||
| 845,219 | Link (The), REIT | 2,083,587 | |||
| 1,326,000 | Sino Land Co. Ltd. | 2,599,313 | |||
| 767,935 | Sun Hung Kai Properties Ltd. | 11,552,282 | |||
| 201,000 | Wharf Holdings Ltd. (The) | 1,132,595 | |||
| 880,000 | Wheelock & Co. Ltd. | 2,595,486 | |||
| 50,342,817 | |||||
Italy 0.1% | |||||
| 307,192 | Beni Stabili SpA | 297,491 | |||
Japan 9.8% | |||||
| 119,100 | Aeon Mall Co. Ltd. | 2,510,922 | |||
| 171 | Frontier Real Estate Investment Corp., REIT | 1,327,907 | |||
| 225 | Japan Logistics Fund, Inc., REIT | 1,802,599 | |||
| 788 | Japan Retail Fund Investment Corp., REIT | 927,158 | |||
| 605,780 | Mitsubishi Estate Co. Ltd. | 9,913,824 | |||
| 476,339 | Mitsui Fudosan Co. Ltd. | 8,085,892 | |||
| 187 | Nippon Accommodations Fund, Inc., REIT | 962,103 | |||
| 281 | Nippon Building Fund, Inc., REIT | 2,419,564 | |||
| 78,700 | Nomura Real Estate Holdings, Inc. | 1,213,877 | |||
See Notes to Financial Statements.
| 14 | Visit our website at www.prudentialfunds.com |
| Shares | Description | Value (Note 1) | |||
COMMON STOCKS (Continued) | |||||
Japan (cont’d.) | |||||
| 1,192 | NTT Urban Development Corp. | $ | 1,007,252 | ||
| 304,952 | Sumitomo Realty & Development Co. Ltd. | 5,802,862 | |||
| 35,973,960 | |||||
Netherlands 3.0% | |||||
| 43,143 | Corio NV, REIT | 2,880,648 | |||
| 52,502 | Eurocommercial Properties NV, REIT | 2,109,639 | |||
| 58,700 | Nieuwe Steen Investments Funds NV, REIT | 1,246,735 | |||
| 23,993 | Vastned Retail NV, REIT | 1,602,493 | |||
| 32,613 | Wereldhave NV, REIT | 3,125,717 | |||
| 10,965,232 | |||||
New Zealand | |||||
| 252,300 | AMP NZ Office Trust, REIT | 134,416 | |||
Norway 0.1% | |||||
| 174,788 | Norwegian Property ASA(a) | 364,681 | |||
Singapore 6.8% | |||||
| 965,000 | Ascendas Real Estate Investment Trust, REIT | 1,324,422 | |||
| 3,013,000 | CapitaCommercial Trust, REIT | 2,326,059 | |||
| 1,564,000 | CapitaLand Ltd. | 4,438,386 | |||
| 1,846,673 | CapitaMall Trust, REIT | 2,336,475 | |||
| 601,058 | City Developments Ltd. | 4,554,283 | |||
| 2,449,000 | Fortune Real Estate Investment Trust, REIT | 1,126,049 | |||
| 1,952,651 | Frasers Centrepoint Trust, REIT | 1,870,369 | |||
| 2,530,000 | K-REIT Asia, REIT | 1,989,349 | |||
| 590,600 | Keppel Land Ltd. | 1,549,378 | |||
| 146,000 | Singapore Land Ltd. | 709,675 | |||
| 2,505,000 | Starhill Global, REIT | 1,002,752 | |||
| 1,139,000 | Suntec Real Estate Investment Trust, REIT | 1,091,004 | |||
| 438,000 | Yanlord Land Group Ltd. | 585,482 | |||
| 24,903,683 | |||||
Sweden 1.3% | |||||
| 41,134 | Castellum AB | 414,439 | |||
| 212,179 | Hufvudstaden AB (Class A Stock) | 1,814,538 | |||
| 312,000 | Klovern AB | 1,132,094 | |||
| 41,073 | Kungsleden AB | 322,811 | |||
| 52,698 | Wihlborgs Fastigheter AB | 1,112,989 | |||
| 4,796,871 | |||||
See Notes to Financial Statements.
| Prudential Global Real Estate Fund | 15 |
Portfolio of Investments
as of March 31, 2010 continued
| Shares | Description | Value (Note 1) | |||
COMMON STOCKS (Continued) | |||||
Switzerland 0.8% | |||||
| 48,445 | PSP Swiss Property AG(a) | $ | 3,110,514 | ||
United Kingdom 4.8% | |||||
| 169,062 | Atrium European Real Estate Ltd. | 1,082,355 | |||
| 220,452 | Big Yellow Group PLC, REIT(a) | 1,137,420 | |||
| 478,330 | British Land Co. PLC, REIT | 3,492,133 | |||
| 25,826 | Derwent London PLC, REIT | 535,347 | |||
| 254,001 | Great Portland Estates PLC, REIT | 1,211,841 | |||
| 396,513 | Hammerson PLC, REIT | 2,367,116 | |||
| 442,187 | Land Securities Group PLC, REIT | 4,549,497 | |||
| 522,721 | Segro PLC, REIT | 2,535,155 | |||
| 160,261 | Shaftesbury PLC, REIT | 935,330 | |||
| 17,846,194 | |||||
United States 33.4% | |||||
| 253,211 | BioMed Realty Trust, Inc., REIT | 4,188,110 | |||
| 84,759 | Boston Properties, Inc., REIT | 6,394,219 | |||
| 237,888 | Brandywine Realty Trust, REIT | 2,904,612 | |||
| 35,025 | BRE Properties, Inc., REIT | 1,252,144 | |||
| 303,347 | CBL & Associates Properties, Inc., REIT | 4,155,854 | |||
| 223,170 | DiamondRock Hospitality Co., REIT(a) | 2,256,249 | |||
| 68,761 | Digital Realty Trust, Inc., REIT | 3,726,846 | |||
| 102,596 | Douglas Emmett, Inc., REIT | 1,576,901 | |||
| 61,806 | Equity One, Inc., REIT | 1,167,515 | |||
| 88,950 | Extra Space Storage, Inc., REIT | 1,127,886 | |||
| 148,124 | First Potomac Realty Trust, REIT | 2,226,304 | |||
| 171,988 | Glimcher Realty Trust, REIT | 871,979 | |||
| 29,400 | Hersha Hospitality Trust, REIT | 152,292 | |||
| 397,287 | Host Hotels & Resorts, Inc., REIT | 5,820,255 | |||
| 26,800 | Hyatt Hotels Corp. (Class A Stock)(a) | 1,044,128 | |||
| 183,810 | Kilroy Realty Corp., REIT | 5,668,700 | |||
| 119,941 | Kimco Realty Corp., REIT | 1,875,877 | |||
| 94,403 | Liberty Property Trust, REIT | 3,204,038 | |||
| 176,819 | Macerich Co. (The), REIT | 6,773,936 | |||
| 168,934 | Mack-Cali Realty Corp., REIT | 5,954,924 | |||
| 89,175 | Morgans Hotel Group Co.(a) | 571,612 | |||
| 139,730 | Pebblebrook Hotel Trust(a) | 2,938,522 | |||
| 180,866 | Post Properties, Inc., REIT | 3,982,669 | |||
| 310,523 | ProLogis, REIT | 4,098,904 | |||
| 81,882 | Public Storage, Inc., REIT | 7,532,325 | |||
| 198,056 | Simon Property Group, Inc., REIT | 16,616,898 | |||
See Notes to Financial Statements.
| 16 | Visit our website at www.prudentialfunds.com |
| Shares | Description | Value (Note 1) | |||
COMMON STOCKS (Continued) | |||||
United States (cont’d.) | |||||
| 55,184 | SL Green Realty Corp., REIT | $ | 3,160,388 | ||
| 66,861 | Sovran Self Storage, Inc., REIT | 2,330,774 | |||
| 13,807 | Starwood Hotels & Resorts Worldwide, Inc. | 643,958 | |||
| 42,412 | Tanger Factory Outlet Centers, REIT | 1,830,502 | |||
| 469,751 | U-Store-It Trust, REIT | 3,382,207 | |||
| 127,100 | Ventas, Inc., REIT | 6,034,708 | |||
| 100,592 | Vornado Realty Trust, REIT | 7,614,814 | |||
| 123,081,050 | |||||
Total common stocks | 343,884,526 | ||||
PREFERRED STOCK 0.2% | |||||
United States | |||||
| 25,200 | Taubman Centers, Inc., REIT, 8.00% | 630,756 | |||
| Units | |||||
WARRANT(a) | |||||
France | |||||
| 14,828 | Fonciere des Regions, REIT, expiring 12/31/10 | 16,623 | |||
Total long-term investments | 344,531,905 | ||||
| Shares | |||||
SHORT-TERM INVESTMENT 4.9% | |||||
Affiliated Money Market Mutual Fund | |||||
| 17,921,186 | Prudential Investment Portfolios 2 - Prudential Core Taxable Money Market Fund | 17,921,186 | |||
Total Investments 98.5% | 362,453,091 | ||||
Other assets in excess of liabilities 1.5% | 5,561,850 | ||||
Net Assets 100% | $ | 368,014,941 | |||
See Notes to Financial Statements.
| Prudential Global Real Estate Fund | 17 |
Portfolio of Investments
as of March 31, 2010 continued
The following abbreviation is used in the Portfolio of Investments:
REIT—Real Estate Investment Trust
| (a) | Non-income producing security. |
| (b) | Prudential Investments LLC, the manager of the Fund, also serves as manager of the Prudential Investment Portfolios 2 - Prudential Core Taxable Money Market Fund. |
Various inputs are used in determining the value of the Fund’s investments. These inputs are summarized in the three broad levels listed below.
Level 1—quoted prices in active markets for identical securities
Level 2—other significant observable inputs (including quoted prices for similar securities, interest rates, prepayment speeds, credit risk, etc.)
Level 3—significant unobservable inputs (including the Portfolio’s own assumptions in determining the fair value of investments)
The following is a summary of the inputs used as of March 31, 2010 in valuing the Fund’s assets carried at fair value:
Investments in Securities | Level 1 | Level 2 | Level 3 | ||||||
Common Stocks: | |||||||||
Australia | $ | 37,023,265 | $ | — | $ | — | |||
Belgium | 1,396,304 | — | — | ||||||
Bermuda | 1,390,845 | — | — | ||||||
Brazil | 9,065,811 | — | — | ||||||
Canada | 5,007,864 | — | — | ||||||
Cayman Islands | 298,610 | — | — | ||||||
Finland | 1,059,767 | — | — | ||||||
France | 16,825,151 | — | — | ||||||
Hong Kong | 50,342,817 | — | — | ||||||
Italy | 297,491 | — | — | ||||||
Japan | 35,973,960 | — | — | ||||||
Netherlands | 10,965,232 | — | — | ||||||
New Zealand | 134,416 | — | — | ||||||
Norway | 364,681 | — | — | ||||||
Singapore | 24,903,683 | — | — | ||||||
Sweden | 4,796,871 | — | — | ||||||
Switzerland | 3,110,514 | — | — | ||||||
United Kingdom | 17,846,194 | — | — | ||||||
United States | 123,081,050 | — | — | ||||||
Preferred Stock—United States | 630,756 | — | — | ||||||
Warrant—France | 16,623 | — | — | ||||||
Affiliated Money Market Mutual Fund | 17,921,186 | — | — | ||||||
Total | $ | 362,453,091 | $ | — | $ | — | |||
See Notes to Financial Statements.
| 18 | Visit our website at www.prudentialfunds.com |
As of March 31, 2010 and 2009, the Fund did not use any significant unobservable inputs (Level 3) in determining the value of investments.
The industry classification of investments and other assets in excess of liabilities shown as a percentage of net assets as of March 31, 2010 were as follows:
Diversified | 34.4 | % | |
Retail Property | 20.2 | ||
Office Space | 13.9 | ||
Affiliated Money Market Mutual Fund | 4.9 | ||
Storage Property | 4.2 | ||
Shopping Centers | 4.0 | ||
Real Estate Operation & Development | 3.5 | ||
Hotel/Resort & Entertainment Property | 3.5 | ||
Real Estate Management/Service | 1.9 | ||
Healthcare Property | 1.8 | ||
Industrial Property | 1.7 | ||
Apartments | 1.4 | ||
Development Companies | 1.2 | ||
Financial Services | 0.7 | ||
Warehouse/Industrial | 0.5 | ||
Regional Malls | 0.4 | ||
Residential | 0.3 | ||
| 98.5 | |||
Other assets in excess of liabilities | 1.5 | ||
| 100.0 | % | ||
See Notes to Financial Statements.
| Prudential Global Real Estate Fund | 19 |
Statement of Assets and Liabilities
March 31, 2010
Assets | ||||
Investments at value: | ||||
Unaffiliated investments (cost $306,228,951) | $ | 344,531,905 | ||
Affiliated investments (cost $17,921,186) | 17,921,186 | |||
Cash | 1,448,697 | |||
Foreign currency, at value (cost $69,063) | 69,933 | |||
Receivable for Fund shares sold | 5,864,001 | |||
Dividends receivable | 1,159,612 | |||
Tax reclaim receivable | 180,774 | |||
Receivable for investments sold | 169,067 | |||
Prepaid expenses | 1,906 | |||
Total assets | 371,347,081 | |||
Liabilities | ||||
Payable for Fund shares reacquired | 2,013,054 | |||
Payable for investments purchased | 716,609 | |||
Accrued expenses | 261,020 | |||
Management fee payable | 224,384 | |||
Distribution fee payable | 89,297 | |||
Affiliated transfer agent fee payable | 26,201 | |||
Deferred trustees’ fees | 1,575 | |||
Total liabilities | 3,332,140 | |||
Net Assets | $ | 368,014,941 | ||
Net assets were comprised of: | ||||
Shares of beneficial interest, at par | $ | 21,867 | ||
Paid-in capital in excess of par | 499,288,327 | |||
| 499,310,194 | ||||
Distributions in excess of net investment income | (5,032,608 | ) | ||
Accumulated net realized loss on investment and foreign currency transactions | (164,542,562 | ) | ||
Net unrealized appreciation on investments and foreign currencies | 38,279,917 | |||
Net assets, March 31, 2010 | $ | 368,014,941 | ||
See Notes to Financial Statements.
| 20 | Visit our website at www.prudentialfunds.com |
Class A: | |||
Net asset value and redemption price per share | $ | 16.83 | |
Maximum sales charge (5.5% of offering price) | 0.98 | ||
Maximum offering price to public | $ | 17.81 | |
Class B: | |||
Net asset value, offering price and redemption price per share | $ | 16.70 | |
Class C: | |||
Net asset value, offering price and redemption price per share | $ | 16.69 | |
Class R: | |||
Net asset value, offering price and redemption price per share | $ | 16.81 | |
Class Z: | |||
Net asset value, offering price and redemption price per share | $ | 16.89 | |
See Notes to Financial Statements.
| Prudential Global Real Estate Fund | 21 |
Statement of Operations
Year Ended March 31, 2010
Investment Income | ||||
Dividends (net of $550,782 foreign withholding tax) | $ | 9,530,515 | ||
Affiliated dividends | 28,803 | |||
Total income | 9,559,318 | |||
Expenses | ||||
Management fee | 2,113,752 | |||
Distribution fee—Class A | 444,742 | |||
Distribution fee—Class B | 111,779 | |||
Distribution fee—Class C | 329,860 | |||
Distribution fee—Class R | 1,480 | |||
Transfer agent’s fees and expenses (including affiliated expenses of $150,000) | 506,000 | |||
Custodian’s fees and expenses | 113,000 | |||
Registration fees | 85,000 | |||
Reports to shareholders | 80,000 | |||
Legal fees and expenses | 42,000 | |||
Audit fee | 25,000 | |||
Trustees’ fees | 22,000 | |||
Commitment fee on syndicated credit agreement | 3,000 | |||
Loan interest expense (Note 7) | 1,048 | |||
Miscellaneous | 32,117 | |||
Total expenses | 3,910,778 | |||
Net investment income | 5,648,540 | |||
Net Realized And Unrealized Gain (Loss) On Investments And Foreign Currencies | ||||
Net realized loss on: | ||||
Investment transactions | (40,361,595 | ) | ||
Foreign currency transactions | (42,675 | ) | ||
| (40,404,270 | ) | |||
Net change in unrealized appreciation (depreciation) on: | ||||
Investments | 181,972,244 | |||
Foreign currencies | (2,445 | ) | ||
| 181,969,799 | ||||
Net gain on investments and foreign currencies | 141,565,529 | |||
Net Increase In Net Assets Resulting From Operations | $ | 147,214,069 | ||
See Notes to Financial Statements.
| 22 | Visit our website at www.prudentialfunds.com |
Statement of Changes in Net Assets
| Year Ended March 31, | ||||||||
| 2010 | 2009 | |||||||
Increase (Decrease) in Net Assets | ||||||||
Operations | ||||||||
Net investment income | $ | 5,648,540 | $ | 7,750,497 | ||||
Net realized loss on investment and foreign currency transactions | (40,404,270 | ) | (99,737,834 | ) | ||||
Net change in unrealized appreciation (depreciation) on investments and foreign currencies | 181,969,799 | (139,477,982 | ) | |||||
Net increase (decrease) in net assets resulting from operations | 147,214,069 | (231,465,319 | ) | |||||
Dividends and Distributions (Note 1) | ||||||||
Dividends from net investment income | ||||||||
Class A | (6,359,339 | ) | (2,214,064 | ) | ||||
Class B | (403,414 | ) | (125,759 | ) | ||||
Class C | (1,254,267 | ) | (348,255 | ) | ||||
Class R | (14,136 | ) | (10 | ) | ||||
Class Z | (4,370,000 | ) | (1,330,331 | ) | ||||
| (12,401,156 | ) | (4,018,419 | ) | |||||
Fund share transactions (Net of share conversions) (Note 6): | ||||||||
Net proceeds from shares sold | 137,390,350 | 172,148,895 | ||||||
Net asset value of shares issued in reinvestment of dividends | 10,181,977 | 3,309,980 | ||||||
Cost of shares reacquired | (87,586,408 | ) | (139,691,707 | ) | ||||
Net increase in net assets from fund share transactions | 59,985,919 | 35,767,168 | ||||||
Total increase (decrease) in net assets | 194,798,832 | (199,716,570 | ) | |||||
Net Assets | ||||||||
Beginning of year | 173,216,109 | 372,932,679 | ||||||
End of year(a) | $ | 368,014,941 | $ | 173,216,109 | ||||
(a) Includes undistributed net investment income of | $ | — | $ | 805,825 | ||||
See Notes to Financial Statements.
| Prudential Global Real Estate Fund | 23 |
Notes to Financial Statements
Prudential Global Real Estate Fund (the “Fund”) (formerly known as the Dryden Global Real Estate Fund), is registered under the Investment Company Act of 1940 as a non-diversified, open-end, management investment company. The Fund was established as a Delaware business trust on October 24, 1997. The Fund commenced investment operations on May 5, 1998. The investment objective of the Fund is capital appreciation and income. It seeks to achieve this objective by investing primarily in equity securities of real estate companies.
Note 1. Accounting Policies
The following is a summary of significant accounting policies followed by the Fund in the preparation of its financial statements.
Securities Valuation: Securities listed on a securities exchange (other than options on securities and indices) are valued at the last sale price on such exchange on the day of valuation or, if there was no sale on such day, at the mean between the last reported bid and asked prices, or at the last bid price on such day in the absence of an asked price. Securities traded via NASDAQ are valued at the NASDAQ official closing price (“NOCP”) on the day of valuation, or if there was no NOCP, at the last sale price. Securities that are actively traded in the over-the-counter market, including listed securities for which the primary market is believed by Prudential Investments LLC (“PI” or “Manager”), in consultation with the subadviser, to be over-the-counter, are valued at market value using prices provided by an independent pricing agent or principal market maker. Options on securities and indices traded on an exchange are valued at the last sale price as of the close of trading on the applicable exchange or, if there was no sale, at the mean between the most recently quoted bid and asked prices on such exchange. Futures contracts and options thereon traded on a commodities exchange or board of trade are valued at the last sale price at the close of trading on such exchange or board of trade or, if there was no sale on the applicable commodities exchange or board of trade on such day, at the mean between the most recently quoted prices on such exchange or board of trade or at the last bid price in the absence of an asked price. Prices may be obtained from independent pricing services which use information provided by market makers or estimates of market values obtained from yield data relating to investments or securities with similar characteristics. Securities for which reliable market quotations are not readily available, or whose values have been affected by events occurring after the close of the security’s foreign market and before the Fund’s normal pricing
| 24 | Visit our website at www.prudentialfunds.com |
time, are valued at fair value in accordance with the Board of Trustees’ approved fair valuation procedures. When determining the fair valuation of securities some of the factors influencing the valuation include, the nature of any restrictions on disposition of the securities; assessment of the general liquidity of the securities; the issuer’s financial condition and the markets in which it does business; the cost of the investment; the size of the holding and the capitalization of issuer; the prices of any recent transactions or bids/offers for such securities or any comparable securities; any available analyst media or other reports or information deemed reliable by the investment adviser regarding the issuer or the markets or industry in which it operates. Using fair value to price securities may result in a value that is different from a security’s most recent closing price and from the price used by other mutual funds to calculate their net asset values.
Investments in mutual funds are valued at their net asset value as of the close of the New York Stock Exchange on the date of valuation.
Short-term debt securities, which mature in sixty days or less, are valued at amortized cost, which approximates market value. The amortized cost method involves valuing a security at its cost on the date of purchase and thereafter assuming a constant amortization to maturity of the difference between the principal amount due at maturity and cost. Short-term debt securities, which mature in more than sixty days, are valued at current market quotations.
Foreign Currency Translation: The books and records of the Fund are maintained in U.S. dollars. Foreign currency amounts are translated into U.S. dollars on the following basis:
(i) market value of investment securities, other assets and liabilities—at the current daily rates of exchange;
(ii) purchases and sales of investment securities, income and expenses—at the rates of exchange prevailing on the respective dates of such transactions.
Although the net assets of the Fund are presented at the foreign exchange rates and market values at the close of the fiscal period, the Fund does not isolate that portion of the results of operations arising as a result of changes in the foreign exchange rates from the fluctuations arising from changes in the market prices of portfolio securities held at the end of the fiscal period. Similarly, the Fund does not isolate the effect of changes in foreign exchange rates from the fluctuations arising from changes in the market prices of portfolio securities sold during the fiscal period. Accordingly, realized foreign currency gains or losses are included in the reported net realized gains or losses on investment transactions.
| Prudential Global Real Estate Fund | 25 |
Notes to Financial Statements
continued
Net realized gains or losses on foreign currency transactions represent net foreign exchange gains or losses from holdings of foreign currencies, currency gains or losses realized between the trade and settlement dates on security transactions, and the difference between the amounts of dividends, interest and foreign withholding taxes recorded on the Fund’s books and the U.S. dollar equivalent amounts actually received or paid. Net unrealized currency gains or losses from valuing foreign currency denominated assets and liabilities (other than investments) at period-end exchange rates are reflected as a component of net unrealized appreciation (depreciation) on foreign currencies. Foreign security and currency transactions may involve certain considerations and risks not typically associated with those of domestic origin as a result of, among other factors, the possibility of political or economic instability, or the level of governmental supervision and regulation of foreign securities markets.
Securities Transactions and Net Investment Income: Security transactions are recorded on the trade date. Realized and unrealized gains or losses from investments and currency transactions on sales of portfolio securities are calculated on the identified cost basis. Dividend income is recorded on the ex-dividend date. Interest income, including amortization of premium and accretion of discount on debt securities, as required, is recorded on the accrual basis. Expenses are recorded on the accrual basis. The Fund invests in real estate investment trusts (“REITs”), which report information on the source of their distributions annually. A portion of distributions received from REITs during the period is estimated to be capital gain and a portion is estimated to be return of capital and is recorded as a reduction of their cost. These estimates are adjusted when the actual source of distributions is disclosed by the REITs.
Net investment income or loss (other than distribution fees which are charged directly to the respective class) and unrealized and realized gains and losses are allocated daily to each class of shares based upon the relative proportion of net assets of each class at the beginning of the day.
Dividends and Distributions: The Fund expects to pay dividends of net investment income and distributions of net realized capital and currency gains, if any, annually. Dividends and distributions to shareholders, which are determined in accordance with federal income tax regulations, which may differ from generally accepted accounting principles, are recorded on the ex-dividend date. Permanent book/tax
| 26 | Visit our website at www.prudentialfunds.com |
differences relating to income and gains are reclassified amongst undistributed net investment income; accumulated net realized gain or loss and paid-in capital in excess of par, as appropriate.
Taxes: It is the Fund’s policy to continue to meet the requirements of the Internal Revenue Code applicable to regulated investment companies and to distribute all of its taxable net investment income and capital gains, if any, to its shareholders. Therefore, no federal income tax provision is required.
Withholding taxes on foreign dividends are recorded, net of reclaimable amounts, at the time the related income is earned.
Estimates: The preparation of the financial statements requires management to make estimates and assumptions that affect the reported amounts and disclosures in the financial statements. Actual results could differ from those estimates.
Note 2. Agreements
The Fund has a management agreement with PI. Pursuant to this agreement, PI has responsibility for all investment advisory services and supervises the subadviser’s performance of such services. PI has entered into a subadvisory agreement with Prudential Real Estate Investors (“PREI”), which is a business unit of Prudential Investment Management (“PIM”). The subadvisory agreement provides that each subadviser furnishes investment advisory services in connection with the management of the Fund. In connection therewith, each subadviser is obligated to keep certain books and records of the Fund. PI pays for the services of the subadvisers, the cost of compensation of officers of the Fund, occupancy and certain clerical and bookkeeping costs of the Fund. The Fund bears all other costs and expenses.
The management fee paid to PI is computed daily and payable monthly at an annual rate of .75% of the Fund’s average daily net assets. The effective management fee rate was .75% for the year ended March 31, 2010.
The Fund has a distribution agreement with Prudential Investment Management Services LLC (“PIMS”), which acts as the distributor of the Class A, Class B, Class C, Class R and Class Z shares of the Fund. The Fund compensates PIMS for distributing and servicing the Fund’s Class A, Class B, Class C and Class R shares, pursuant to plans of distribution (the “Class A, B, C and R Plans”), regardless of expenses actually incurred by PIMS. The distribution fees are accrued daily and payable monthly. No distribution or service fees are paid to PIMS as distributor of the Class Z shares of the Fund.
| Prudential Global Real Estate Fund | 27 |
Notes to Financial Statements
continued
Pursuant to the Class A, B, C and R Plans, the Fund compensates PIMS for distribution related activities at an annual rate of up to .30%, 1%, 1% and .75% of the average daily net assets of the Class A, B, C and R shares, respectively. For the year ended March 31, 2010, PIMS has contractually agreed to limit such fees to .50 of 1% of the average daily net assets of the Class R shares.
PIMS has advised the Fund that it has received $152,530 in front-end sales charges resulting from sales of Class A during the year ended March 31, 2010. From these fees, PIMS paid such sales charges to broker-dealers, which in turn paid commissions to salespersons and incurred other distribution costs.
PIMS has advised the Fund that it has received $34,528 and $5,672 in contingent deferred sales charges imposed upon certain redemptions by Class B and Class C shareholders, respectively, during the year ended March 31, 2010.
PI and PIMS are indirect, wholly-owned subsidiaries of Prudential Financial, Inc. (“Prudential”).
Note 3. Other Transactions with Affiliates
Prudential Mutual Fund Services LLC (“PMFS”), an affiliate of PI and an indirect, wholly-owned subsidiary of Prudential, serves as the Fund’s transfer agent. The transfer agent fees and expenses in the Statement of Operations also include certain out-of-pocket expenses paid to non-affiliates, where applicable.
The Fund pays networking fees to affiliated and unaffiliated broker/dealers, including fees relating to the services of Wells Fargo Advisors, LLC (“Wells Fargo”) and First Clearing, LLC (“First Clearing”), affiliates of PI through December 31, 2009. These networking fees are payments made to broker/dealers that clear mutual fund transactions through a national clearing system. For the year ended March 31, 2010, the Fund incurred approximately $306,400 in total networking fees, of which approximately $12,700 and $8,200 were paid to First Clearing and Wells Fargo, respectively, through December 31, 2009. These amounts are included in transfer agent’s fees and expenses in the Statement of Operations.
The Fund invests in the Prudential Core Taxable Money Market Fund (formerly Taxable Money Market Series) (the “Portfolio”), a portfolio of Prudential Investment
| 28 | Visit our website at www.prudentialfunds.com |
Portfolios 2 (formerly Dryden Core Investment Fund), pursuant to an exemptive order received from the Securities and Exchange Commission. The Portfolio is a money market mutual fund registered under the Investment Company Act of 1940, as amended, and managed by PI.
Note 4. Portfolio Securities
Purchases and sales of portfolio securities, other than short-term investments, for the year ended March 31, 2010 were $191,093,588 and $144,946,451, respectively.
Note 5. Distributions and Tax Information
Distributions to shareholders, which are determined in accordance with federal income tax regulations and which may differ from generally accepted accounting principles are recorded on the ex-dividend date. In order to present distribution in excess of net investment income and accumulated net realized loss on investments and foreign currency transactions on the Statement of Assets and Liabilities that more closely represent their tax character, certain adjustments have been made to distributions in excess of net investment income and accumulated net realized loss on investments and foreign currency transactions. For the year ended March 31, 2010, the adjustments were to decrease distributions in excess of net investment income and increase accumulated net realized loss on investments and foreign currency transactions by $914,183 due to difference in the treatment for book and tax purposes of certain transactions involving foreign securities and currencies and investments in passive foreign investment companies. Net investment income, net realized loss and net assets were not affected by this change.
For the year ended March 31, 2009 and March 31, 2010, the tax character of dividends paid by the Fund were $4,018,419 and $12,401,156 from ordinary income, respectively.
As of March 31, 2010, the accumulated undistributed earnings on a tax basis was $3,079,718 from ordinary income. This differs from the amount on the Statement of Assets and Liabilities primarily due to cumulative timing differences.
| Prudential Global Real Estate Fund | 29 |
Notes to Financial Statements
continued
The United States federal income tax basis of the Fund’s investments and the net unrealized appreciation of March 31, 2010 were as follows:
Tax Basis of | Appreciation | Depreciation | Net | Other | Total Net | |||||
| $359,454,043 | $54,705,243 | $(51,706,195) | $2,999,048 | $(23,037) | $2,976,011 |
The difference between book basis and tax basis are primarily attributable to deferred losses on wash sales and investments in passive foreign investment companies. Other cost basis adjustments are attributable to net depreciation on foreign currencies and mark-to-market of receivables and payables.
As of March 31, 2010, the Fund had a capital loss carryforward for tax purposes of approximately $134,541,000 of which $3,918,000 expires in 2016, $48,041,000 expires in 2017 and $82,582,000 expires in 2018. Accordingly no capital gains distribution is expected to be paid to shareholders until net gains have been realized in excess of such carryforward. It is uncertain whether the Fund will be able to realize the full benefit prior to the expiration date.
The Fund elects to treat post-October capital and foreign currency losses of approximately $2,789,000 and $18,600, respectively, as having been incurred in the following fiscal year (March 31, 2011).
Management has analyzed the Fund’s tax positions taken on federal income tax returns for all open tax years and has concluded that as of March 31, 2010, no provision for income tax would be required in the Fund’s financial statements. The Fund’s federal and state income and federal excise tax returns for tax years for which the applicable statutes of limitations have not expired are subject to examination by the Internal Revenue Service and state departments of revenue.
Note 6. Capital
The Fund offers Class A, Class B, Class C, Class R and Class Z shares. Class A shares are sold with a front-end sales charge of up to 5.5%. All investors who purchase Class A shares in an amount of $1 million or more and sell these shares within 12 months of purchase are subject to a contingent deferred sales charge (“CDSC”) of 1%, including investors who purchase their shares through broker-dealers affiliated with Prudential. Class B shares are sold with a CDSC which declines from 5% to zero depending on the period of time the shares are held. Class C shares are sold with a
| 30 | Visit our website at www.prudentialfunds.com |
CDSC of 1% during the first 12 months. Class B shares automatically convert to Class A shares on a quarterly basis approximately seven years after purchase. A special exchange privilege is also available for shareholders who qualified to purchase Class A shares at net asset value. Class R and Class Z shares are not subject to any sales or redemption charge and are offered exclusively for sale to a limited group of investors.
There is an unlimited number of shares of beneficial interest, $.001 par value per share, divided into five classes, designated Class A, Class B, Class C, Class R and Class Z.
Transactions in shares of beneficial interest were as follows:
Class A | Shares | Amount | |||||
Year ended March 31, 2010: | |||||||
Shares sold | 4,226,408 | $ | 63,830,088 | ||||
Shares issued in reinvestment of dividends | 351,775 | 5,561,564 | |||||
Shares reacquired | (3,208,710 | ) | (47,802,894 | ) | |||
Net increase in shares outstanding before conversion | 1,369,473 | 21,588,758 | |||||
Shares issued upon conversion from Class B | 44,644 | 683,259 | |||||
Net increase (decrease) in shares outstanding | 1,414,117 | $ | 22,272,017 | ||||
Year ended March 31, 2009: | |||||||
Shares sold | 4,692,786 | $ | 79,503,664 | ||||
Shares issued in reinvestment of dividends | 183,456 | 1,889,595 | |||||
Shares reacquired | (4,863,315 | ) | (69,714,161 | ) | |||
Net increase in shares outstanding before conversion | 12,927 | 11,679,098 | |||||
Shares issued upon conversion from Class B | 69,192 | 1,077,059 | |||||
Net increase (decrease) in shares outstanding | 82,119 | $ | 12,756,157 | ||||
Class B | |||||||
Year ended March 31, 2010: | |||||||
Shares sold | 88,024 | $ | 1,305,420 | ||||
Shares issued in reinvestment of dividends | 22,592 | 355,149 | |||||
Shares reacquired | (127,797 | ) | (1,877,288 | ) | |||
Net decrease in shares outstanding before conversion | (17,181 | ) | (216,719 | ) | |||
Shares issued upon conversion into Class A | (45,052 | ) | (683,259 | ) | |||
Net increase (decrease) in shares outstanding | (62,233 | ) | $ | (899,978 | ) | ||
Year ended March 31, 2009: | |||||||
Shares sold | 110,199 | $ | 1,984,028 | ||||
Shares issued in reinvestment of dividends | 10,564 | 108,415 | |||||
Shares reacquired | (271,861 | ) | (3,958,871 | ) | |||
Net decrease in shares outstanding before conversion | (151,098 | ) | (1,866,428 | ) | |||
Shares reacquired upon conversion into Class A | (69,676 | ) | (1,077,059 | ) | |||
Net increase (decrease) in shares outstanding | (220,774 | ) | $ | (2,943,487 | ) | ||
| Prudential Global Real Estate Fund | 31 |
Notes to Financial Statements
continued
Class C | Shares | Amount | |||||
Year ended March 31, 2010: | |||||||
Shares sold | 675,584 | $ | 10,182,533 | ||||
Shares issued in reinvestment of dividends | 61,229 | 961,909 | |||||
Shares reacquired | (585,633 | ) | (8,544,682 | ) | |||
Net increase (decrease) in shares outstanding | 151,180 | $ | 2,599,760 | ||||
Year ended March 31, 2009: | |||||||
Shares sold | 838,043 | $ | 15,639,473 | ||||
Shares issued in reinvestment of dividends | 22,405 | 229,871 | |||||
Shares reacquired | (1,078,084 | ) | (15,363,678 | ) | |||
Net increase (decrease) in shares outstanding | (217,636 | ) | $ | 505,666 | |||
Class R | |||||||
Year ended March 31, 2010: | |||||||
Shares sold | 46,547 | $ | 745,032 | ||||
Shares issued in reinvestment of dividends | 501 | 7,914 | |||||
Shares reacquired | (7,381 | ) | (109,962 | ) | |||
Net increase (decrease) in shares outstanding | 39,667 | $ | 642,984 | ||||
June 16, 2008 through March 31, 2009: | |||||||
Shares sold | 19,846 | $ | 207,408 | ||||
Shares issued in reinvestment of dividends | 1 | 10 | |||||
Shares reacquired | (9,360 | ) | (105,313 | ) | |||
Net increase (decrease) in shares outstanding | 10,487 | $ | 102,105 | ||||
Class Z | |||||||
Year ended March 31, 2010: | |||||||
Shares sold | 3,991,433 | $ | 61,327,277 | ||||
Shares issued in reinvestment of dividends | 207,914 | 3,295,441 | |||||
Shares reacquired | (2,050,940 | ) | (29,251,582 | ) | |||
Net increase (decrease) in shares outstanding | 2,148,407 | $ | 35,371,136 | ||||
Year ended March 31, 2009: | |||||||
Shares sold | 4,415,272 | $ | 74,814,322 | ||||
Shares issued in reinvestment of dividends | 104,854 | 1,082,089 | |||||
Shares reacquired | (3,494,810 | ) | (50,549,684 | ) | |||
Net increase (decrease) in shares outstanding | 1,025,316 | $ | 25,346,727 | ||||
Note 7. Borrowings
The Fund, along with other affiliated registered investment companies (the “Funds”), are a party to a syndicated credit agreement (“SCA”) with two banks. The SCA
| 32 | Visit our website at www.prudentialfunds.com |
provides for a commitment of $500 million. Interest on any borrowings under the SCA is incurred at contracted market rates and a commitment fee for the unused amount is accrued daily and paid quarterly. Effective October 22, 2009, the Funds renewed the SCA with the two banks. The commitment under the renewed SCA continues to be $500 million. The Funds pay a commitment fee of .15% of the unused portion of the renewed SCA. The expiration date of the SCA is October 20, 2010. For the period from October 24, 2008 through October 21, 2009, the Funds paid a commitment fee of .13% of the unused portion of the agreement. The purpose of the SCA is to provide an alternative source of funding for capital share redemptions. During the year ended March 31, 2010, the Fund utilized the line of credit. The Fund had an average outstanding balance of $895,825 for thirty-six days at a weighted average interest rate of 1.17%.
Note 8. Subsequent Events
Management has evaluated the impact of all subsequent events on the Fund through the date the financial statements were issued, and has determined that there were no subsequent events requiring recognition or disclosure in the financial statements.
Note 9. New Accounting Pronouncements
In January 2010, the Financial Accounting Standards Board (“FASB”) issued Accounting Standards Update (“ASU”) No. 2010-06 “Improving Disclosures about Fair Value Measurements”. ASU 2010-06 will require reporting entities to make new disclosures about amounts and reasons for significant transfers in and out of Level 1 and Level 2 fair value measurements and input and valuation techniques used to measure fair value for both recurring and nonrecurring fair value measurements that fall in either Level 2 or Level 3, and information on purchases, sales, issuances, and settlements in the roll forward of activity in Level 3 fair value measurements. The new and revised disclosures are effective for interim and annual reporting periods beginning after December 15, 2009 except for the disclosures about purchases, sales, issuances, and settlements in the roll forward of activity in Level 3 fair value measurements, which are effective for interim and annual reporting periods beginning after December 15, 2010. At this time, management is evaluating the implications of ASU No. 2010-06 and its impact on the financial statements has not been determined.
| Prudential Global Real Estate Fund | 33 |
Financial Highlights
| Class A | ||||
| Year Ended March 31, 2010(b) | ||||
Per Share Operating Performance: | ||||
Net Asset Value, Beginning Of Year | $ | 9.53 | ||
Income (loss) from investment operations | ||||
Net investment income | 0.30 | |||
Net realized and unrealized gain (loss) on investment transactions | 7.64 | |||
Total from investment operations | 7.94 | |||
Less Dividends and Distributions: | ||||
Dividends from net investment income | (0.64 | ) | ||
Distributions from net realized gains on investments | — | |||
Total dividends and distributions | (0.64 | ) | ||
Net asset value, end of year | $ | 16.83 | ||
Total Return(a) | 83.79 | % | ||
Ratios/Supplemental Data: | ||||
Net assets, end of year (000) | $ | 186,200 | ||
Average net assets (000) | $ | 148,247 | ||
Ratios to average net assets(d): | ||||
Expenses, including distribution and service (12b-1) fees(c) | 1.37 | % | ||
Expenses, excluding distribution and service (12b-1) fees | 1.07 | % | ||
Net investment income | 2.03 | % | ||
For Class A, B, C, R and Z shares: | ||||
Portfolio turnover | 53 | % | ||
| (a) | Total return does not consider the effects of sales loads. Total return is calculated assuming a purchase of a share on the first day and a sale on the last day of each year reported and includes reinvestment of dividends and distributions. Total investment returns may reflect adjustments to conform to generally accepted accounting principles. |
| (b) | Based on average shares outstanding during the year. |
| (c) | Prior to July 31, 2008, the Distributor of the Fund had contractually agreed to limit its distribution and service (12b-1) fees to .25 of 1% of the average daily net assets for the Class A shares. |
| (d) | Does not include expenses of the underlying funds in which the Fund invests. |
See Notes to Financial Statements.
| 34 | Visit our website at www.prudentialfunds.com |
| Class A | ||||||||||||||
| Year Ended March 31, | ||||||||||||||
| 2009(b) | 2008(b) | 2007(b) | 2006(b) | |||||||||||
| $ | 21.33 | $ | 31.19 | $ | 24.96 | $ | 17.89 | |||||||
| 0.41 | 0.38 | 0.38 | 0.35 | |||||||||||
| (11.99 | ) | (5.12 | ) | 6.30 | 7.00 | |||||||||
| (11.58 | ) | (4.74 | ) | 6.68 | 7.35 | |||||||||
| (0.22 | ) | (0.63 | ) | (0.44 | ) | (0.28 | ) | |||||||
| — | (4.49 | ) | (0.01 | ) | — | |||||||||
| (0.22 | ) | (5.12 | ) | (0.45 | ) | (0.28 | ) | |||||||
| $ | 9.53 | $ | 21.33 | $ | 31.19 | $ | 24.96 | |||||||
| (54.38 | )% | (17.79 | )% | 27.09 | % | 41.50 | % | |||||||
| $ | 91,991 | $ | 204,098 | $ | 264,980 | $ | 120,881 | |||||||
| $ | 163,953 | $ | 233,525 | $ | 176,407 | $ | 74,239 | |||||||
| 1.35 | % | 1.31 | % | 1.22 | % | 1.40 | % | |||||||
| 1.07 | % | 1.06 | % | 0.97 | % | 1.15 | % | |||||||
| 2.58 | % | 1.55 | % | 1.58 | % | 1.58 | % | |||||||
| 67 | % | 78 | % | 121 | % | 35 | % | |||||||
See Notes to Financial Statements.
| Prudential Global Real Estate Fund | 35 |
Financial Highlights
continued
| Class B | ||||
| Year Ended March 31, 2010(b) | ||||
Per Share Operating Performance: | ||||
Net Asset Value, Beginning Of Year | $ | 9.47 | ||
Income (loss) from investment operations | ||||
Net investment income | 0.20 | |||
Net realized and unrealized gain (loss) on investment transactions | 7.58 | |||
Total from investment operations | 7.78 | |||
Less Dividends and Distributions: | ||||
Dividends from net investment income | (0.55 | ) | ||
Distributions from net realized gains on investments | — | |||
Total dividends and distributions | (0.55 | ) | ||
Net asset value, end of year | $ | 16.70 | ||
Total Return(a) | 82.55 | % | ||
Ratios/Supplemental Data: | ||||
Net assets, end of year (000) | $ | 12,382 | ||
Average net assets (000) | $ | 11,178 | ||
Ratios to average net assets(c): | ||||
Expenses, including distribution and service (12b-1) fees | 2.07 | % | ||
Expenses, excluding distribution and service (12b-1) fees | 1.07 | % | ||
Net investment income | 1.37 | % | ||
| (a) | Total return does not consider the effects of sales loads. Total return is calculated assuming a purchase of a share on the first day and a sale on the last day of each year reported and includes reinvestment of dividends and distributions. Total investment returns may reflect adjustments to conform to generally accepted accounting principles. |
| (b) | Based on average shares outstanding during the year. |
| (c) | Does not include the expenses of the underlying fund in which the Fund invests. |
See Notes to Financial Statements.
| 36 | Visit our website at www.prudentialfunds.com |
| Class B | ||||||||||||||
| Year Ended March 31, | ||||||||||||||
| 2009(b) | 2008(b) | 2007(b) | 2006(b) | |||||||||||
| $ | 21.18 | $ | 31.02 | $ | 24.84 | $ | 17.81 | |||||||
| 0.30 | 0.21 | 0.18 | 0.18 | |||||||||||
| (11.87 | ) | (5.11 | ) | 6.25 | 6.99 | |||||||||
| (11.57 | ) | (4.90 | ) | 6.43 | 7.17 | |||||||||
| (0.14 | ) | (0.45 | ) | (0.24 | ) | (0.14 | ) | |||||||
| — | (4.49 | ) | (0.01 | ) | — | |||||||||
| (0.14 | ) | (4.94 | ) | (0.25 | ) | (0.14 | ) | |||||||
| $ | 9.47 | $ | 21.18 | $ | 31.02 | $ | 24.84 | |||||||
| (54.68 | )% | (18.42 | )% | 26.12 | % | 40.38 | % | |||||||
| $ | 7,612 | $ | 21,706 | $ | 32,867 | $ | 22,117 | |||||||
| $ | 15,393 | $ | 28,993 | $ | 25,925 | $ | 23,855 | |||||||
| 2.07 | % | 2.06 | % | 1.97 | % | 2.15 | % | |||||||
| 1.07 | % | 1.06 | % | 0.97 | % | 1.15 | % | |||||||
| 1.87 | % | 0.85 | % | 1.66 | % | 0.91 | % | |||||||
See Notes to Financial Statements.
| Prudential Global Real Estate Fund | 37 |
Financial Highlights
continued
| Class C | ||||
| Year Ended March 31, 2010(b) | ||||
Per Share Operating Performance: | ||||
Net Asset Value, Beginning Of Year | $ | 9.47 | ||
Income (loss) from investment operations | ||||
Net investment income | 0.20 | |||
Net realized and unrealized gain (loss) on investment transactions | 7.57 | |||
Total from investment operations | 7.77 | |||
Less Dividends and Distributions: | ||||
Dividends from net investment income | (0.55 | ) | ||
Distributions from net realized gains on investments | — | |||
Total dividends and distributions | (0.55 | ) | ||
Net asset value, end of year | $ | 16.69 | ||
Total Return(a) | 82.44 | % | ||
Ratios/Supplemental Data: | ||||
Net assets, end of year (000) | $ | 39,758 | ||
Average net assets (000) | $ | 32,986 | ||
Ratios to average net assets(c): | ||||
Expenses, including distribution and service (12b-1) fees | 2.07 | % | ||
Expenses, excluding distribution and service (12b-1) fees | 1.07 | % | ||
Net investment income | 1.33 | % | ||
| (a) | Total return does not consider the effects of sales loads. Total return is calculated assuming a purchase of a share on the first day and a sale on the last day of each year reported and includes reinvestment of dividends and distributions. Total investment returns may reflect adjustments to conform to generally accepted accounting principles. |
| (b) | Based on average shares outstanding during the year. |
| (c) | Does not include the expenses of the underlying fund in which the Fund invests. |
See Notes to Financial Statements.
| 38 | Visit our website at www.prudentialfunds.com |
| Class C | ||||||||||||||
| Year Ended March 31, | ||||||||||||||
| 2009(b) | 2008(b) | 2007(b) | 2006(b) | |||||||||||
| $ | 21.18 | $ | 31.02 | $ | 24.84 | $ | 17.81 | |||||||
| 0.30 | 0.19 | 0.16 | 0.18 | |||||||||||
| (11.87 | ) | (5.09 | ) | 6.27 | 6.99 | |||||||||
| (11.57 | ) | (4.90 | ) | 6.43 | 7.17 | |||||||||
| (0.14 | ) | (0.45 | ) | (0.24 | ) | (0.14 | ) | |||||||
| — | (4.49 | ) | (0.01 | ) | — | |||||||||
| (0.14 | ) | (4.94 | ) | (0.25 | ) | (0.14 | ) | |||||||
| $ | 9.47 | $ | 21.18 | $ | 31.02 | $ | 24.84 | |||||||
| (54.68 | )% | (18.42 | )% | 26.12 | % | 40.38 | % | |||||||
| $ | 21,122 | $ | 51,856 | $ | 49,921 | $ | 22,415 | |||||||
| $ | 41,377 | $ | 54,791 | $ | 32,840 | $ | 14,963 | |||||||
| 2.07 | % | 2.06 | % | 1.97 | % | 2.15 | % | |||||||
| 1.07 | % | 1.06 | % | 0.97 | % | 1.15 | % | |||||||
| 1.87 | % | 0.79 | % | 1.58 | % | 0.84 | % | |||||||
See Notes to Financial Statements.
| Prudential Global Real Estate Fund | 39 |
Financial Highlights
continued
| Class R | ||||||||
| Year Ended March 31, 2010(b) | June 16, 2008(d) through March 31, 2009(b) | |||||||
Per Share Operating Performance: | ||||||||
Net Asset Value, Beginning Of Period | $ | 9.63 | $ | 21.14 | ||||
Income (loss) from investment operations | ||||||||
Net investment income | 0.23 | 0.14 | ||||||
Net realized and unrealized gain (loss) on investment transactions | 7.56 | (11.43 | ) | |||||
Total from investment operations | 7.79 | (11.29 | ) | |||||
Less Dividends and Distributions: | ||||||||
Dividends from net investment income | (0.61 | ) | (0.22 | ) | ||||
Distributions from net realized gains on investments | — | — | ||||||
Total dividends and distributions | (0.61 | ) | (0.22 | ) | ||||
Net asset value, end of period | $ | 16.81 | $ | 9.63 | ||||
Total Return(a) | 81.34 | % | (53.49 | )% | ||||
Ratios/Supplemental Data: | ||||||||
Net assets, end of period (000) | $ | 843 | $ | 101 | ||||
Average net assets (000) | $ | 296 | $ | 34 | ||||
Ratios to average net assets(f): | ||||||||
Expenses, including distribution and service (12b-1) fees(e) | 1.57 | % | 1.57 | %(c) | ||||
Expenses, excluding distribution and service (12b-1) fees | 1.07 | % | 1.07 | %(c) | ||||
Net investment income | 1.47 | % | 1.63 | %(c) | ||||
| (a) | Total return is calculated assuming a purchase of a share on the first day and a sale on the last day of each period reported and includes reinvestment of dividends and distributions. Total returns for periods of less than one full year are not annualized. Total investment returns may reflect adjustments to conform to generally accepted accounting principles. |
| (b) | Based on average shares outstanding during the period. |
| (c) | Annualized. |
| (d) | Commencement of operations. |
| (e) | The Distributor of the Fund contractually agreed to limit its distribution and service (12b-1) fees to .50 of 1% of the average daily net assets for the Class R shares. |
| (f) | Does not include the expenses of the underlying fund in which the Fund invests. |
See Notes to Financial Statements.
| 40 | Visit our website at www.prudentialfunds.com |
This Page Intentionally Left Blank
Financial Highlights
continued
| Class Z | ||||
| Year Ended March 31, 2010(b) | ||||
Per Share Operating Performance: | ||||
Net Asset Value, Beginning Of Year | $ | 9.56 | ||
Income (loss) from investment operations | ||||
Net investment income | 0.34 | |||
Net realized and unrealized gain (loss) on investment transactions | 7.67 | |||
Total from investment operations | 8.01 | |||
Less Dividends and Distributions: | ||||
Dividends from net investment income | (0.68 | ) | ||
Distributions from net realized gains on investments | — | |||
Total dividends and distributions | (0.68 | ) | ||
Net asset value, end of year | $ | 16.89 | ||
Total Return(a) | 84.30 | % | ||
Ratios/Supplemental Data: | ||||
Net assets, end of year (000) | $ | 128,831 | ||
Average net assets (000) | $ | 89,126 | ||
Ratios to average net assets(c): | ||||
Expenses, including distribution and service (12b-1) fees | 1.07 | % | ||
Expenses, excluding distribution and service (12b-1) fees | 1.07 | % | ||
Net investment income | 2.29 | % | ||
| (a) | Total return is calculated assuming a purchase of a share on the first day and a sale on the last day of each year reported and includes reinvestment of dividends and distributions. Total investment returns may reflect adjustments to conform to generally accepted accounting principles. |
| (b) | Based on average shares outstanding during the year. |
| (c) | Does not include the expenses of the underlying fund in which the Fund invests. |
See Notes to Financial Statements.
| 42 | Visit our website at www.prudentialfunds.com |
| Class Z | ||||||||||||||
| Year Ended March 31, | ||||||||||||||
| 2009(b) | 2008(b) | 2007(b) | 2006(b) | |||||||||||
| $ | 21.38 | $ | 31.26 | $ | 25.01 | $ | 17.93 | |||||||
| 0.44 | 0.39 | 0.47 | 0.41 | |||||||||||
| (12.01 | ) | (5.09 | ) | 6.29 | 7.00 | |||||||||
| (11.57 | ) | (4.70 | ) | 6.76 | 7.41 | |||||||||
| (0.25 | ) | (0.69 | ) | (0.50 | ) | (0.33 | ) | |||||||
| — | (4.49 | ) | (0.01 | ) | — | |||||||||
| (0.25 | ) | (5.18 | ) | (0.51 | ) | (0.33 | ) | |||||||
| $ | 9.56 | $ | 21.38 | $ | 31.26 | $ | 25.01 | |||||||
| (54.22 | )% | (17.60 | )% | 27.38 | % | 41.80 | % | |||||||
| $ | 52,390 | $ | 95,273 | $ | 42,601 | $ | 19,484 | |||||||
| $ | 87,029 | $ | 70,158 | $ | 33,458 | $ | 13,939 | |||||||
| 1.07 | % | 1.06 | % | 0.97 | % | 1.15 | % | |||||||
| 1.07 | % | 1.06 | % | 0.97 | % | 1.15 | % | |||||||
| 2.81 | % | 1.65 | % | 1.68 | % | 1.88 | % | |||||||
See Notes to Financial Statements.
| Prudential Global Real Estate Fund | 43 |
Report of Independent Registered Public Accounting Firm
The Board of Trustees and Shareholders
Prudential Global Real Estate Fund:
We have audited the accompanying statement of assets and liabilities of Prudential Global Real Estate Fund (hereafter referred to as the “Fund”), including the portfolio of investments, as of March 31, 2010, and the related statement of operations for the year then ended, the statement of changes in net assets for each of the years in the two-year period then ended and the financial highlights for each of the years in the five-year period then ended. These financial statements and financial highlights are the responsibility of the Fund’s management. Our responsibility is to express an opinion on these financial statements and financial highlights and based on our audit.
We conducted our audit in accordance with the standards of the Public Company Accounting Oversight Board (United States). Those standards require that we plan and perform the audit to obtain reasonable assurance about whether the financial statements and financial highlights are free of material misstatement. An audit includes examining on a test basis, evidence supporting the amounts and disclosures in the financial statements. Our procedures included confirmation of securities owned as of March 31, 2010, by correspondence with the custodian, transfer agent and brokers or by other appropriate auditing procedures where replies from brokers were not received. An audit also includes assessing the accounting principles used and significant estimates made by management, as well as evaluating the overall financial statement presentation. We believe that our audits provide a reasonable basis for our opinion.
In our opinion, the financial statements and financial highlights referred to above present fairly, in all material respects, the financial position of the Fund as of March 31, 2010 and the results of its operations for the year then ended, the changes in its net assets for each of the years in the two-year period then ended and the financial highlights for each of the years in the five-year period then ended, in conformity with U.S. generally accepted accounting principles.

New York, New York
May 26, 2010
| 44 | Visit our website at www.prudentialfunds.com |
Federal Income Tax Information
(Unaudited)
We are required by the Internal Revenue Code of 1986, as amended (“the Code”), to advise you within 60 days of the Fund’s fiscal year end (March 31, 2010) as to the federal tax status of dividends paid by the Fund during such fiscal year. We are advising you that in the fiscal year ended March 31, 2010, the Fund paid ordinary income dividends of $0.64, $0.55, $0.55, $0.61 and $0.68 per share for Class A, Class B, Class C, Class R and Class Z shares, respectively.
For the fiscal year ended March 31, 2010, the Fund designates the maximum amount allowable, but not less than 19.10% of the ordinary income dividends paid during the fiscal year as qualified dividend income in accordance with Section 854 of the Internal Revenue Code.
For the fiscal year ended March 31, 2010, the Fund made an election to pass through the maximum amount allowable of the portion of the ordinary income dividends paid derived from foreign source income as well as any foreign taxes paid by the Fund in accordance with Section 853 of the Internal Revenue Code of the following amounts: $412,255 foreign tax credit from recognized foreign source income of $7,046,938.
In January 2011, you will be advised on IRS 1099 DIV or substitute 1099 DIV as to the federal tax status of the dividends received by you in calendar year 2010.
| Prudential Global Real Estate Fund | 45 |
Results of Proxy Voting
(Unaudited)
At a special meeting of shareholders held on March 9, 2010, Fund shareholders approved a proposal to elect Trustees.
The individuals listed in the table below were elected as trustees of the Fund. All trustees, with the exception of Mr. Benjamin, served as trustees to the Fund prior to the shareholder meeting.
Trustee | For | Withheld | ||
Kevin J. Bannon | 15,117,729.869 | 327,170.287 | ||
Linda W. Bynoe | 15,090,785.260 | 354,114.896 | ||
Michael S. Hyland | 15,126,328.187 | 318,571.969 | ||
Douglas H. McCorkindale | 15,104,867.193 | 340,032.963 | ||
Stephen P. Munn | 15,131,076.295 | 313,823.861 | ||
Richard A. Redeker | 15,127,451.092 | 317,449.064 | ||
Robin B. Smith | 15,113,402.924 | 331,497.232 | ||
Stephen G. Stoneburn | 15,130,038.157 | 314,861.999 | ||
Judy A. Rice | 15,130,236.017 | 314,664.139 | ||
Scott E. Benjamin | 15,114,615.424 | 330,284.732 | ||
| 46 | Visit our website at www.prudentialfunds.com |
MANAGEMENT OF THE FUND
(Unaudited)
Information about Fund Directors/Trustees (referred to herein as “Board Members”) and Fund Officers is set forth below. Board Members who are not deemed to be “interested persons,” as defined in the 1940 Act, are referred to as “Independent Board Members.” Board Members who are deemed to be “interested persons” are referred to as “Interested Board Members.” The Board Members are responsible for the overall supervision of the operations of the Fund and perform the various duties imposed on the directors or trustees of investment companies by the 1940 Act.
| Independent Board Members (1) | ||||
Name, Address, Age Position(s) Portfolios Overseen | Principal Occupation(s) During Past Five Years | Other Directorships Held | ||
Kevin J. Bannon (57) Board Member Portfolios Overseen: 56 |
Managing Director (since April 2008) and Chief Investment Officer (since October 2008) of Highmount Capital LLC (registered investment adviser); formerly Executive Vice President and Chief Investment Officer (April 1993-August 2007) of Bank of New York Company; President (May 2003-May 2007) of BNY Hamilton Family of Mutual Funds. |
Director of Urstadt Biddle Properties (since September 2008). | ||
Linda W. Bynoe (57) Board Member Portfolios Overseen: 56 |
President and Chief Executive Officer (since March 1995) and formerly Chief Operating Officer (December 1989- February 1995) of Telemat Ltd. (management consulting); formerly Vice President (January 1985-June 1989) at Morgan Stanley & Co (broker-dealer). |
Director of Simon Property Group, Inc. (retail real estate) (since May 2003); Anixter International, Inc. (communication products distributor) (since January 2006); Director of Northern Trust Corporation (financial services) (since April 2006); Trustee of Equity Residential (residential real estate) (since December 2009); formerly Director of Dynegy Inc. (power generation) (September 2002-May 2006), CitiStreet Funds, Inc. (mutual funds) (May 1993-February 2005), AM- CH, Inc. (restaurant holding company) (November 2004-February 2005). | ||
Michael S. Hyland, CFA (64) Board Member Portfolios Overseen: 56 |
Independent Consultant (since February 2005); formerly Senior Managing Director (July 2001-February 2005) of Bear Stearns & Co, Inc.; Global Partner, INVESCO (1999-2001); Managing Director and President of Salomon Brothers Asset Management (1989-1999). |
None. | ||
Prudential Global Real Estate Fund
Douglas H. McCorkindale (70) Board Member Portfolios Overseen: 56 |
Formerly Chairman (February 2001-June 2006), Chief Executive Officer (June 2000-July 2005), President (September 1997-July 2005) and Vice Chairman (March 1984-May 2000) of Gannett Co. Inc. (publishing and media). |
Director of Continental Airlines, Inc. (since May 1993); Director of Lockheed Martin Corp. (aerospace and defense) (since May 2001). | ||
Stephen P. Munn (67) Board Member Portfolios Overseen: 56 |
Lead Director (since 2007) and formerly Chairman (1993-2007) of Carlisle Companies Incorporated (manufacturer of industrial products). |
Lead Director (since 2007) of Carlisle Companies Incorporated (manufacturer of industrial products). | ||
Richard A. Redeker (66) Board Member Portfolios Overseen: 56 |
Retired Mutual Fund Senior Executive (42 years); Management Consultant; Independent Directors Council (organization of 2,800 Independent Mutual Fund Directors)-Executive Committee, Chair of Policy Steering Committee, Governing Council. |
None. | ||
Robin B. Smith (70) Board Member & Independent Chair Portfolios Overseen: 56 |
Chairman of the Board (since January 2003) of Publishers Clearing House (direct marketing); formerly Chairman and Chief Executive Officer (August 1996-January 2003) of Publishers Clearing House. |
Formerly Director of BellSouth Corporation (telecommunications) (1992-2006). | ||
Stephen G. Stoneburn (66) Board Member Portfolios Overseen: 56 |
President and Chief Executive Officer (since June 1996) of Quadrant Media Corp. (publishing company); formerly President (June 1995-June 1996) of Argus Integrated Media, Inc.; Senior Vice President and Managing Director (January 1993-1995) of Cowles Business Media; Senior Vice President of Fairchild Publications, Inc (1975-1989). |
None. |
Visit our website at www.prudentialfunds.com
| Interested Board Members (1) | ||||
Judy A. Rice (62) Board Member & President Portfolios Overseen: 56 |
President, Chief Executive Officer, Chief Operating Officer and Officer-In-Charge (since February 2003) of Prudential Investments LLC; President, Chief Executive Officer and Officer-In-Charge (since April 2003) of Prudential Mutual Fund Services LLC; Executive Vice President (since December 2008) of Prudential Investment Management Services LLC; formerly Vice President (February 1999-April 2006) of Prudential Investment Management Services LLC; formerly President, Chief Executive Officer, Chief Operating Officer and Officer- In-Charge (May 2003-June 2005) and Director (May 2003-March 2006) and Executive Vice President (June 2005-March 2006) of AST Investment Services, Inc.; Member of Board of Governors of the Investment Company Institute. |
None. | ||
Scott E. Benjamin (37) Board Member & Vice President Portfolios Overseen: 55 |
Executive Vice President (since June 2009) of Prudential Investments LLC and Prudential Investment Management Services LLC; Senior Vice President of Product Development and Marketing, Prudential Investments (since February 2006); Vice President of Product Development and Product Management, Prudential Investments (2003-2006). |
None. | ||
| (1) | The year that each Board Member joined the Fund’s Board is as follows: |
Kevin J. Bannon, 2008; Linda W. Bynoe, 2005; Michael S. Hyland, 2008; Douglas H. McCorkindale, 2003; Stephen P. Munn, 2008; Richard A. Redeker, 2003; Robin B. Smith, 1997; Stephen G. Stoneburn, 2001; Judy A. Rice, Board Member since 2001 and President since 2003; Scott E. Benjamin, Board Member since 2010 and Vice President since 2009.
Prudential Global Real Estate Fund
| Fund Officers (a)(1) | ||
Name, Address and Age Position with Fund | Principal Occupation(s) During Past Five Years | |
Kathryn L. Quirk (57) Chief Legal Officer |
Vice President and Corporate Counsel (since September 2004) of Prudential; Executive Vice President, Chief Legal Officer and Secretary (since July 2005) of PI and Prudential Mutual Fund Services LLC; Vice President and Corporate Counsel (since June 2005) and Secretary (since February 2006) of AST Investment Services, Inc.; formerly Senior Vice President and Assistant Secretary (November 2004-August 2005) of PI; formerly Assistant Secretary (June 2005-February 2006) of AST Investment Services, Inc.; formerly Managing Director, General Counsel, Chief Compliance Officer, Chief Risk Officer and Corporate Secretary (1997-2002) of Zurich Scudder Investments, Inc. | |
Deborah A. Docs (52) Secretary |
Vice President and Corporate Counsel (since January 2001) of Prudential; Vice President (since December 1996) and Assistant Secretary (since March 1999) of PI; formerly Vice President and Assistant Secretary (May 2003-June 2005) of AST Investment Services, Inc. | |
Jonathan D. Shain (51) Assistant Secretary |
Vice President and Corporate Counsel (since August 1998) of Prudential; Vice President and Assistant Secretary (since May 2001) of PI; Vice President and Assistant Secretary (since February 2001) of PMFS; formerly Vice President and Assistant Secretary (May 2003-June 2005) of AST Investment Services, Inc. | |
Claudia DiGiacomo (35) Assistant Secretary |
Vice President and Corporate Counsel (since January 2005) of Prudential; Vice President and Assistant Secretary of PI (since December 2005); Associate at Sidley Austin Brown & Wood LLP (1999-2004). | |
John P. Schwartz (39) Assistant Secretary |
Vice President and Corporate Counsel (since April 2005) of Prudential; Vice President and Assistant Secretary of PI (since December 2005); Associate at Sidley Austin Brown & Wood LLP (1997-2005). | |
Andrew R. French (47) Assistant Secretary |
Vice President and Corporate Counsel (since February 2010) of Prudential; formerly Director and Corporate Counsel (2006-2010) of Prudential; Vice President and Assistant Secretary (since January 2007) of PI; Vice President and Assistant Secretary (since January 2007) of PMFS; formerly Senior Legal Analyst of Prudential Mutual Fund Law Department (1997-2006). | |
Timothy J. Knierim (51) Chief Compliance Officer |
Chief Compliance Officer of Prudential Investment Management, Inc. (since July 2007); formerly Chief Risk Officer of PIM and PI (2002-2007) and formerly Chief Ethics Officer of PIM and PI (2006-2007). | |
Valerie M. Simpson (51) Deputy Chief Compliance Officer |
Chief Compliance Officer (since April 2007) of PI and AST Investment Services, Inc.; formerly Vice President-Financial Reporting (June 1999-March 2006) for Prudential Life and Annuities Finance. | |
Theresa C. Thompson (47) Deputy Chief Compliance Officer |
Vice President, Compliance, PI (since April 2004); and Director, Compliance, PI (2001-2004). | |
Visit our website at www.prudentialfunds.com
Noreen M. Fierro (45) Anti-Money Laundering Compliance Officer |
Vice President, Corporate Compliance (since May 2006) of Prudential; formerly Corporate Vice President, Associate General Counsel (April 2002-May 2005) of UBS Financial Services, Inc., in their Money Laundering Prevention Group; Senior Manager (May 2005-May 2006) of Deloitte Financial Advisory Services, LLP, in their Forensic and Dispute Services, Anti-Money Laundering Group. | |
Grace C. Torres (50) Treasurer and Principal Financial and Accounting Officer |
Assistant Treasurer (since March 1999) and Senior Vice President (since September 1999) of PI; Assistant Treasurer (since May 2003) and Vice President (since June 2005) of AST Investment Services, Inc.; Senior Vice President and Assistant Treasurer (since May 2003) of Prudential Annuities Advisory Services, Inc.; formerly Senior Vice President (May 2003-June 2005) of AST Investment Services, Inc. | |
M. Sadiq Peshimam (46) Assistant Treasurer |
Vice President (since 2005) of Prudential Investments LLC. | |
Peter Parrella (51) Assistant Treasurer |
Vice President (since 2007) and Director (2004-2007) within Prudential Mutual Fund Administration; formerly Tax Manager at SSB Citi Fund Management LLC (1997-2004). |
| (a) | Excludes Ms. Rice and Mr. Benjamin, interested Board Members who also serve as President and Vice President, respectively. |
| (1) | The year that each individual became an officer of the Fund is as follows: Kathryn L. Quirk, 2005; Deborah A. Docs, 2005; Jonathan D. Shain, 2005; Claudia DiGiacomo, 2005; John P. Schwartz, 2006; Andrew R. French, 2006; Timothy J. Knierim, 2007; Valerie M. Simpson, 2007; Grace C. Torres, 1997; M. Sadiq Peshimam, 2006; Noreen M. Fierro, 2006; Peter Parrella, 2007, Theresa C. Thompson, 2008. |
Explanatory Notes
| • | Board Members are deemed to be “Interested,” as defined in the 1940 Act, by reason of their affiliation with Prudential Investments LLC and/or an affiliate of Prudential Investments LLC. |
| • | Unless otherwise noted, the address of all Board Members and Officers is c/o Prudential Investments LLC, Gateway Center Three, 100 Mulberry Street, Newark, New Jersey 07102. |
| • | There is no set term of office for Board Members or Officers. The Board Members have adopted a retirement policy, which calls for the retirement of Board Members on December 31st of the year in which they reach the age of 75. |
| • | “Other Directorships Held” includes only directorships of companies required to register or file reports with the SEC under the Securities Exchange Act of 1934 (that is, “public companies”) or other investment companies registered under the 1940 Act. |
| • | “Portfolios Overseen” includes all investment companies managed by Prudential Investments LLC. The investment companies for which PI serves as manager include the Prudential Investments Mutual Funds, The Prudential Variable Contract Accounts, Target Mutual Funds, The Prudential Series Fund, Prudential’s Gibraltar Fund, Inc. and the Advanced Series Trust. |
Prudential Global Real Estate Fund
| n MAIL | n TELEPHONE | n WEBSITE | ||
Gateway Center Three 100 Mulberry Street Newark, NJ 07102 | (800) 225-1852 | www.prudentialfunds.com |
| PROXY VOTING |
| The Board of Trustees of the Fund has delegated to the Fund’s investment subadviser the responsibility for voting any proxies and maintaining proxy recordkeeping with respect to the Fund. A description of these proxy voting policies and procedures is available without charge, upon request, by calling (800) 225-1852 or by visiting the Securities and Exchange Commission’s website at www.sec.gov. Information regarding how the Fund voted proxies relating to portfolio securities during the most recent 12-month period ended June 30 is available on the Fund’s website and on the Commission’s website. |
| TRUSTEES |
| Kevin J. Bannon • Scott E. Benjamin • Linda W. Bynoe • Michael S. Hyland • Douglas H. McCorkindale • Stephen P. Munn • Richard A. Redeker • Judy A. Rice • Robin B. Smith • Stephen G. Stoneburn |
| OFFICERS |
| Judy A. Rice, President • Scott E. Benjamin, Vice President • Grace C. Torres, Treasurer and Principal Financial and Accounting Officer • Kathryn L. Quirk, Chief Legal Officer • Deborah A. Docs, Secretary • Timothy J. Knierim, Chief Compliance Officer • Valerie M. Simpson, Deputy Chief Compliance Officer • Theresa C. Thompson, Deputy Chief Compliance Officer • Noreen M. Fierro, Anti-Money Laundering Compliance Officer • Jonathan D. Shain, Assistant Secretary • Claudia DiGiacomo, Assistant Secretary • John P. Schwartz, Assistant Secretary • Andrew R. French, Assistant Secretary • M. Sadiq Peshimam, Assistant Treasurer • Peter Parrella, Assistant Treasurer |
| MANAGER | Prudential Investments LLC | Gateway Center Three 100 Mulberry Street | ||
| ||||
| INVESTMENT SUBADVISER | Prudential Real Estate Investors | 8 Campus Drive Parsippany, NJ 07054 | ||
| ||||
| DISTRIBUTOR | Prudential Investment Management Services LLC | Gateway Center Three 100 Mulberry Street Newark, NJ 07102 | ||
| ||||
| CUSTODIAN | PFPC Trust Company | 400 Bellevue Parkway Wilmington, DE 19809 | ||
| ||||
| TRANSFER AGENT | Prudential Mutual Fund Services LLC | PO Box 9658 Providence, RI 02940 | ||
| ||||
| INDEPENDENT REGISTERED PUBLIC ACCOUNTING FIRM | KPMG LLP | 345 Park Avenue New York, NY 10154 | ||
| ||||
| FUND COUNSEL | Willkie Farr & Gallagher LLP | 787 Seventh Avenue New York, NY 10019 | ||
| An investor should consider the investment objectives, risks, charges, and expenses of the Fund carefully before investing. The prospectus for the Fund contains this and other information about the Fund. An investor may obtain a prospectus by visiting our website at www.prudentialfunds.com or by calling (800) 225-1852. The prospectus should be read carefully before investing. |
| E-DELIVERY |
| To receive your mutual fund documents online, go to www.prudentialfunds.com/edelivery and enroll. Instead of receiving printed documents by mail, you will receive notification via e-mail when new materials are available. You can cancel your enrollment or change your e-mail address at any time by visiting the website address above. |
| SHAREHOLDER COMMUNICATIONS WITH TRUSTEES |
| Shareholders can communicate directly with the Board of Trustees by writing to the Chair of the Board, Prudential Global Real Estate Fund, Prudential Investments, Attn: Board of Trustees, 100 Mulberry Street, Gateway Center Three, Newark, NJ 07102. Shareholders can communicate directly with an individual Trustee by writing to the same address. Communications are not screened before being delivered to the addressee. |
| AVAILABILITY OF PORTFOLIO SCHEDULE |
| The Fund files its complete schedule of portfolio holdings with the Securities and Exchange Commission for the first and third quarters of each fiscal year on Form N-Q. The Fund’s Forms N-Q are available on the Commission’s website at www.sec.gov. The Fund’s Forms N-Q may also be reviewed and copied at the Commission’s Public Reference Room in Washington, D.C. Information on the operation and location of the Public Reference Room may be obtained by calling (202) 551-8090. The Fund’s schedule of portfolio holdings is also available on the Fund’s website as of the end of each fiscal quarter. |
| The Fund’s Statement of Additional Information contains additional information about the Fund’s Trustees and is available without charges, upon request, by calling (800) 225-1852. |
Mutual Funds:
| ARE NOT INSURED BY THE FDIC OR ANY FEDERAL GOVERNMENT AGENCY | MAY LOSE VALUE | ARE NOT A DEPOSIT OF OR GUARANTEED BY ANY BANK OR ANY BANK AFFILIATE |

| Prudential Global Real Estate Fund | ||||||||||||||
| Share Class | A | B | C | R | Z | |||||||||
NASDAQ | PURAX | PURBX | PURCX | PURRX | PURZX | |||||||||
CUSIP | 744336108 | 744336207 | 744336306 | 744336405 | 744336504 | |||||||||
MF182E 0179431-00001-00
Item 2 – Code of Ethics — See Exhibit (a)
As of the end of the period covered by this report, the registrant has adopted a code of ethics (the “Section 406 Standards for Investment Companies – Ethical Standards for Principal Executive and Financial Officers”) that applies to the registrant’s Principal Executive Officer and Principal Financial Officer; the registrant’s Principal Financial Officer also serves as the Principal Accounting Officer.
The registrant hereby undertakes to provide any person, without charge, upon request, a copy of the code of ethics. To request a copy of the code of ethics, contact the registrant 800-225-1852, and ask for a copy of the Section 406 Standards for Investment Companies - Ethical Standards for Principal Executive and Financial Officers.
Item 3 – Audit Committee Financial Expert –
The registrant’s Board has determined that Mr. Stephen P. Munn, member of the Board’s Audit Committee is an “audit committee financial expert,” and that he is “independent,” for purposes of this Item.
Item 4 – Principal Accountant Fees and Services –
(a) Audit Fees
For the fiscal years ended March 31, 2010 and March 31, 2009, KPMG LLP (“KPMG”), the Registrant’s principal accountant, billed the Registrant $24,500 and $23,496, respectively, for professional services rendered for the audit of the Registrant’s annual financial statements or services that are normally provided in connection with statutory and regulatory filings.
(b) Audit-Related Fees
During the fiscal year ended March 31, 2010, KPMG, the Registrant’s principal accountant, billed the Registrant $1,558 for professional services rendered in connection with agreed upon procedures performed related to a custody conversion. Not applicable for the fiscal year ended March 31, 2009.
(c) Tax Fees
None.
(d) All Other Fees
None.
(e) (1) Audit Committee Pre-Approval Policies and Procedures
THE PRUDENTIAL MUTUAL FUNDS
AUDIT COMMITTEE POLICY
on
Pre-Approval of Services Provided by the Independent Accountants
The Audit Committee of each Prudential Mutual Fund is charged with the responsibility to monitor the independence of the Fund’s independent accountants. As part of this responsibility, the Audit Committee must pre-approve any independent accounting firm’s engagement to render audit and/or permissible non-audit services, as required by law. In evaluating a proposed engagement of the independent accountants, the Audit Committee will assess the effect that the engagement might reasonably be expected to have on the accountant’s independence. The Committee’s evaluation will be based on:
| • | a review of the nature of the professional services expected to be provided, |
| • | a review of the safeguards put into place by the accounting firm to safeguard independence, and |
| • | periodic meetings with the accounting firm. |
Policy for Audit and Non-Audit Services Provided to the Funds
On an annual basis, the scope of audits for each Fund, audit fees and expenses, and audit-related and non-audit services (and fees proposed in respect thereof) proposed to be performed by the Fund’s independent accountants will be presented by the Treasurer and the independent accountants to the Audit Committee for review and, as appropriate, approval prior to the initiation of such services. Such presentation shall be accompanied by confirmation by both the Treasurer and the independent accountants that the proposed services will not adversely affect the independence of the independent accountants. Proposed services shall be described in sufficient detail to enable the Audit Committee to assess the appropriateness of such services and fees, and the compatibility of the provision of such services with the auditor’s independence. The Committee shall receive periodic reports on the progress of the audit and other services which are approved by the Committee or by the Committee Chair pursuant to authority delegated in this Policy.
The categories of services enumerated under “Audit Services”, “Audit-related Services”, and “Tax Services” are intended to provide guidance to the Treasurer and the independent accountants as to those categories of services which the Committee believes are generally consistent with the independence of the independent accountants and which the Committee (or the Committee Chair) would expect upon the presentation of specific proposals to pre-approve. The enumerated categories are not intended as an exclusive list of audit, audit-related or tax services, which the Committee (or the Committee Chair) would consider for pre-approval.
Audit Services
The following categories of audit services are considered to be consistent with the role of the Fund’s independent accountants:
| • | Annual Fund financial statement audits |
| • | Seed audits (related to new product filings, as required) |
| • | SEC and regulatory filings and consents |
Audit-related Services
The following categories of audit-related services are considered to be consistent with the role of the Fund’s independent accountants:
| • | Accounting consultations |
| • | Fund merger support services |
| • | Agreed Upon Procedure Reports |
| • | Attestation Reports |
| • | Other Internal Control Reports |
Individual audit-related services that fall within one of these categories and are not presented to the Audit Committee as part of the annual pre-approval process will be subject to pre-approval by the Committee Chair (or any other Committee member on whom this responsibility has been delegated) so long as the estimated fee for those services does not exceed $50,000.
Tax Services
The following categories of tax services are considered to be consistent with the role of the Fund’s independent accountants:
| • | Tax compliance services related to the filing or amendment of the following: |
| • | Federal, state and local income tax compliance; and, |
| • | Sales and use tax compliance |
| • | Timely RIC qualification reviews |
| • | Tax distribution analysis and planning |
| • | Tax authority examination services |
| • | Tax appeals support services |
| • | Accounting methods studies |
| • | Fund merger support services |
| • | Tax consulting services and related projects |
Individual tax services that fall within one of these categories and are not presented to the Audit Committee as part of the annual pre-approval process will be subject to pre-approval by the Committee Chair (or any other Committee member on whom this responsibility has been delegated) so long as the estimated fee for those services does not exceed $50,000.
Other Non-audit Services
Certain non-audit services that the independent accountants are legally permitted to render will be subject to pre-approval by the Committee or by one or more Committee members to whom the Committee has delegated this authority and who will report to the full Committee any pre-approval decisions made pursuant to this Policy. Non-audit services presented for pre-approval pursuant to this paragraph will be accompanied by a confirmation from both the Treasurer and the independent accountants that the proposed services will not adversely affect the independence of the independent accountants.
Proscribed Services
The Fund’s independent accountants will not render services in the following categories of non-audit services:
| • | Bookkeeping or other services related to the accounting records or financial statements of the Fund |
| • | Financial information systems design and implementation |
| • | Appraisal or valuation services, fairness opinions, or contribution-in-kind reports |
| • | Actuarial services |
| • | Internal audit outsourcing services |
| • | Management functions or human resources |
| • | Broker or dealer, investment adviser, or investment banking services |
| • | Legal services and expert services unrelated to the audit |
| • | Any other service that the Public Company Accounting Oversight Board determines, by regulation, is impermissible. |
Pre-approval of Non-Audit Services Provided to Other Entities Within the Prudential Fund Complex
Certain non-audit services provided to Prudential Investments LLC or any of its affiliates that also provide ongoing services to the Prudential Mutual Funds will be subject to pre-approval by the Audit Committee. The only non-audit services provided to these entities that will require pre-approval are those related directly to the operations and financial reporting of the Funds. Individual projects that are not presented to the Audit Committee as part of the annual pre-approval process will be subject to pre-approval by the Committee Chair (or any other Committee member on whom this responsibility has been delegated) so long as the estimated fee for those services does not exceed $50,000. Services presented for pre-approval pursuant to this paragraph will be accompanied by a confirmation from both the Treasurer and the independent accountants that the proposed services will not adversely affect the independence of the independent accountants.
Although the Audit Committee will not pre-approve all services provided to Prudential Investments LLC and its affiliates, the Committee will receive an annual report from the Fund’s independent accounting firm showing the aggregate fees for all services provided to Prudential Investments and its affiliates.
(e) (2) Percentage of services referred to in 4(b) – 4(d) that were approved by the audit committee –
One hundred percent of the services described in Item 4(b) was approved by the audit committee.
(f) Percentage of hours expended attributable to work performed by other than full time employees of principal accountant if greater than 50%.
The percentage of hours expended on the principal accountant’s engagement to audit the registrant’s financial statements for the most recent fiscal year that were attributed to work performed by persons other than the principal accountant’s full-time, permanent employees was 0%.
(g) Non-Audit Fees
Not applicable to Registrant for the fiscal years 2010 and 2009. The aggregate non-audit fees billed by KPMG for services rendered to the registrant’s investment adviser and any entity controlling, controlled by, or under common control with the investment adviser that provides ongoing services to the registrant for the fiscal years 2010 and 2009 was $0 and $0, respectively.
(h) Principal Accountant’s Independence
Not applicable as KPMG has not provided non-audit services to the registrant’s investment adviser and any entity controlling, controlled by, or under common control with the investment adviser that provides ongoing services to the registrant that were not pre-approved pursuant to Rule 2-01(c)(7)(ii) of Regulation S-X.
Item 5 – Audit Committee of Listed Registrants – Not applicable.
Item 6 – Schedule of Investments – The schedule is included as part of the report to shareholders filed under Item 1 of this Form.
Item 7 – Disclosure of Proxy Voting Policies and Procedures for Closed-End Management Investment Companies – Not applicable.
Item 8 – Portfolio Managers of Closed-End Management Investment Companies – Not applicable.
Item 9 – Purchases of Equity Securities by Closed-End Management Investment Company and Affiliated Purchasers – Not applicable.
Item 10 – Submission of Matters to a Vote of Security Holders – Not applicable.
Item 11 – Controls and Procedures
| (a) | It is the conclusion of the registrant’s principal executive officer and principal financial officer that the effectiveness of the registrant’s current disclosure controls and procedures (such disclosure controls and procedures having been evaluated within 90 days of the date of this filing) provide reasonable assurance that the information required to be disclosed by the registrant has been recorded, processed, summarized and reported within the time period specified in the Commission’s rules and forms and that the information required to be disclosed by the registrant has been accumulated and communicated to the registrant’s principal executive officer and principal financial officer in order to allow timely decisions regarding required disclosure. |
| (b) | There has been no significant change in the registrant’s internal control over financial reporting that occurred during the registrant’s most recent fiscal quarter of the period covered by this report that has materially affected, or is likely to materially affect, the registrant’s internal control over financial reporting. |
Item 12 – Exhibits
(a) (1) Code of Ethics – Attached hereto as Exhibit EX-99.CODE-ETH
| (2) | Certifications pursuant to Section 302 of the Sarbanes-Oxley Act – Attached hereto as Exhibit EX-99.CERT. |
| (3) | Any written solicitation to purchase securities under Rule 23c-1. – Not applicable. |
| (b) | Certifications pursuant to Section 906 of the Sarbanes-Oxley Act – Attached hereto as Exhibit EX-99.906CERT. |
SIGNATURES
Pursuant to the requirements of the Securities Exchange Act of 1934 and the Investment Company Act of 1940, the registrant has duly caused this report to be signed on its behalf by the undersigned, thereunto duly authorized.
(Registrant): Prudential Global Real Estate Fund
| By: | /S/ DEBORAH A. DOCS | |
| Deborah A. Docs | ||
| Secretary | ||
| Date: May 25, 2010 | ||
Pursuant to the requirements of the Securities Exchange Act of 1934 and the Investment Company Act of 1940, this report has been signed below by the following persons on behalf of the registrant and in the capacities and on the dates indicated.
| By: | /S/ JUDY A. RICE | |
| Judy A. Rice | ||
| President and Principal Executive Officer | ||
| Date: May 25, 2010 | ||
| By: | /S/ GRACE C. TORRES | |
| Grace C. Torres | ||
| Treasurer and Principal Financial Officer | ||
| Date: May 25, 2010 | ||