UNITED STATES
SECURITIES AND EXCHANGE COMMISSION
Washington, D.C. 20549
FORM N-CSR
CERTIFIED SHAREHOLDER REPORT OF REGISTERED
MANAGEMENT INVESTMENT COMPANIES
| Investment Company Act file number: | 811-08565 | |
| Exact name of registrant as specified in charter: | Prudential Investment Portfolios 12 | |
| Address of principal executive offices: | Gateway Center 3, | |
| 100 Mulberry Street, | ||
| Newark, New Jersey 07102 | ||
| Name and address of agent for service: | Deborah A. Docs | |
| Gateway Center 3, | ||
| 100 Mulberry Street, | ||
| Newark, New Jersey 07102 | ||
| Registrant’s telephone number, including area code: | 800-225-1852 | |
| Date of fiscal year end: | 3/31/2012 | |
| Date of reporting period: | 3/31/2012 | |
Item 1 – Reports to Stockholders

PRUDENTIAL INVESTMENTS»MUTUAL FUNDS
PRUDENTIAL GLOBAL REAL ESTATE FUND
ANNUAL REPORT · MARCH 31, 2012
Fund Type
Sector Stock
Objective
Capital appreciation and income
This report is not authorized for distribution to prospective investors unless preceded or accompanied by a current prospectus.
The views expressed in this report and information about the Fund’s portfolio holdings are for the period covered by this report and are subject to change thereafter.
Prudential Investments, Prudential, the Prudential logo, the Rock symbol, and Bring Your Challenges are service marks of Prudential Financial, Inc. and its related entities, registered in many jurisdictions worldwide.

|  |

May 15, 2012
Dear Shareholder:
After an extraordinary career at Prudential, Judy Rice retired at the end of 2011 as President of Prudential Investments and President and Trustee of the Prudential Global Real Estate Fund (the Fund). While she will remain as Chairman of Prudential Investments until the end of 2012, I was named to succeed her as President of Prudential Investments and President and Trustee of the Fund effective January 1, 2012. I previously served as Executive Vice President of Retail Mutual Fund Distribution for Prudential Investments for the past six years.
Since this is my first letter to shareholders, I would like to recognize Judy for the significant contributions she made in building the Prudential Investments fund family and her unflagging commitment to helping investors like you meet the challenges of a rapidly changing investment environment. My goal is to build on Judy’s accomplishments, with a particular focus on delivering the solutions you need to address your financial goals.
I hope you find the annual report for the Fund informative. We recognize that ongoing market volatility may make it a difficult time to be an investor. We continue to believe a prudent response to uncertainty is to maintain a diversified portfolio, including stock and bond mutual funds consistent with your tolerance for risk, time horizon, and financial goals.
Your financial professional can help you create a diversified investment plan that reflects your personal investor profile and risk tolerance. Keep in mind that diversification and asset allocation strategies do not assure a profit or protect against loss in declining markets. We encourage you to call your financial professional before making any investment decision.
Prudential Investments provides a wide range of mutual funds to choose from that can help you make progress toward your financial goals. Our funds offer the experience, resources, and professional discipline of Prudential Financial’s affiliated asset managers. Thank you for choosing the Prudential Investments family of mutual funds.
Sincerely,

Stuart S. Parker, President
Prudential Global Real Estate Fund
| Prudential Global Real Estate Fund | 1 |
Your Fund’s Performance
Performance data quoted represent past performance. Past performance does not guarantee future results. The investment return and principal value of an investment will fluctuate, so that an investor’s shares, when redeemed, may be worth more or less than their original cost. Current performance may be lower or higher than the past performance data quoted. An investor may obtain performance data as of the most recent month-end by visiting our website at www.prudentialfunds.com or by calling (800) 225-1852. The maximum initial sales charge is 5.50% (Class A shares). Gross operating expenses: Class A, 1.27%; Class B, 1.97%; Class C, 1.97%; Class R, 1.72%; Class Z, 0.97%. Net operating expenses: Class A, 1.27%; Class B, 1.97%; Class C, 1.97%; Class R, 1.47%; Class Z, 0.97%, after contractual reduction through 7/31/2013 for Class R.
Cumulative Total Returns (Without Sales Charges) as of 3/31/12 | ||||||||||||||
| One Year | Five Years | Ten Years | Since Inception | |||||||||||
Class A | 3.75 | % | –15.20 | % | 192.87 | % | — | |||||||
Class B | 2.97 | –18.18 | 172.01 | — | ||||||||||
Class C | 3.03 | –18.18 | 172.02 | — | ||||||||||
Class R | 3.50 | N/A | N/A | 3.33% (6/16/08) | ||||||||||
Class Z | 4.05 | –13.99 | 200.71 | — | ||||||||||
S&P Developed BMI Property Net Index | 2.54 | –22.12 | 140.54 | — | ||||||||||
S&P 500 Index | 8.51 | 10.48 | 49.69 | — | ||||||||||
Lipper Global Real Estate Funds Average | 2.09 | –20.10 | 137.92 | — | ||||||||||
Average Annual Total Returns (With Sales Charges) as of 3/31/12 | ||||||||||||||
| One Year | Five Years | Ten Years | Since Inception | |||||||||||
Class A | –1.96 | % | –4.33 | % | 10.72 | % | — | |||||||
Class B | –2.03 | –4.08 | 10.52 | — | ||||||||||
Class C | 2.03 | –3.93 | 10.52 | — | ||||||||||
Class R | 3.50 | N/A | N/A | 0.87% (6/16/08) | ||||||||||
Class Z | 4.05 | –2.97 | 11.64 | — | ||||||||||
S&P Developed BMI Property Net Index | 2.54 | –4.88 | 9.17 | — | ||||||||||
S&P 500 Index | 8.51 | 2.01 | 4.12 | — | ||||||||||
Lipper Global Real Estate Funds Average | 2.09 | –4.47 | 8.93 | — | ||||||||||
| 2 | Visit our website at www.prudentialfunds.com |
Average Annual Total Returns (Without Sales Charges) as of 3/31/12 |
| |||||||||||||
| One Year | Five Years | Ten Years | Since Inception | |||||||||||
Class A | 3.75 | % | –3.24 | % | 11.34 | % | — | |||||||
Class B | 2.97 | –3.93 | 10.52 | — | ||||||||||
Class C | 3.03 | –3.93 | 10.52 | — | ||||||||||
Class R | 3.50 | N/A | N/A | 0.87% (6/16/08) | ||||||||||
Class Z | 4.05 | –2.97 | 11.64 | — | ||||||||||
Growth of a $10,000 Investment
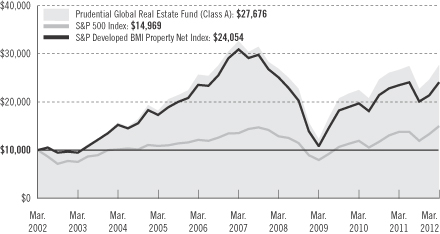
The graph compares a $10,000 investment in the Prudential Global Real Estate Fund (Class A shares) with a similar investment in the S&P Developed BMI Property Net Index and S&P 500 Index by portraying the initial account values at the beginning of the 10-year period for Class A shares (March 31, 2002) and the account values at the end of the current fiscal year (March 31, 2012) as measured on a quarterly basis. For purposes of the graph, and unless otherwise indicated, it has been assumed that (a) the maximum applicable front-end sales charge was deducted from the initial $10,000 investment in Class A shares; (b) all recurring fees (including management fees) were deducted; and (c) all dividends and distributions were reinvested. The line graph provides information for Class A shares only. As indicated in the tables provided earlier, performance for Class B, C, R, and Z shares will vary due to the differing charges and expenses applicable to each share class (as explained in the following paragraphs). Without waiver of fees and/or expense reimbursement, if any, the returns would have been lower.
Past performance does not predict future performance. Total returns and the ending account values in the graph include changes in share price and reinvestment of dividends and capital gains distributions in a hypothetical investment for the periods shown. The Fund’s total returns do not reflect the deduction of income taxes on an
| Prudential Global Real Estate Fund | 3 |
Your Fund’s Performance (continued)
individual’s investment. Taxes may reduce your actual investment returns on income or gains paid by the Fund or any gains you may realize if you sell your shares.
Source: Prudential Investments LLC and Lipper Inc. Performance figures may reflect fee waivers and/or expense reimbursements. In the absence of such fee waivers and/or expense reimbursements, total returns would be lower.
Inception returns are provided for any share class with less than 10 calendar years of returns.
The average annual total returns take into account applicable sales charges. Class A, Class B, Class C, and Class R shares are subject to an annual distribution and service (12b-1) fee of 0.30%, 1.00%, 1.00%, and 0.75%, respectively. Under certain circumstances, an exchange may be made from specified share classes of the Fund to one or more other share classes of the Fund. Investors who purchase Class A shares in the amount of $1 million or more and sell these shares within 12 months of purchase are not subject to a front-end sales charge but are subject to a contingent deferred sales charge (CDSC) of 1%. The Class A shares CDSC is waived for purchases by certain retirement or benefit plans. Class B shares are not subject to a front-end sales charge but are subject to a declining CDSC of 5%, 4%, 3%, 2%, 1%, and 1%, respectively, for the first six years after purchase and a 12b-1 fee of 1% annually. Approximately seven years after purchase, Class B shares will automatically convert to Class A shares on a quarterly basis. Class C shares are not subject to a front-end sales charge, but are subject to a CDSC of 1% for Class C shares sold within 12 months from the date of purchase and an annual 12b-1 fee of 1%. Class R shares are not subject to a sales charge but are subject to a 12b-1 fee of 0.75% annually. Class Z shares are not subject to a sales charge or a 12b-1 fee. The returns in the tables and graph do not reflect the deduction of taxes that a shareholder would pay on Fund distributions or following the redemption of Fund shares.
Benchmark Definitions
S&P Developed BMI Property Net Index
The S&P Developed BMl Property Net Index is an unmanaged broad market index of more than 400 companies from 21 countries. S&P Developed BMI Property Net Index Closest Month-End to Inception cumulative total return is –7.11% for Class R. S&P Developed BMI Property Net Index Closest Month-End to Inception average annual total return is –1.91% for Class R.
S&P 500 Index
The S&P 500 Index is an unmanaged index of 500 stocks of large U.S. public companies. It gives a broad look at how U.S. stock prices have performed. S&P 500 Index Closest Month-End to Inception cumulative total return is 9.57% for Class R. S&P 500 Index Closest Month-End to Inception average annual total return is 2.41% for Class R.
Lipper Global Real Estate Funds Average
The Lipper Global Real Estate Funds Average (Lipper Average) is based on the average return for all funds in the Lipper Global Real Estate Funds category for the periods noted. Funds in the Lipper Average invest at least 25% but less than 75% of their equity portfolio in shares of companies engaged in the real estate industry that are strictly outside of the U.S. or whose securities are principally traded outside of the U.S. Lipper Average Closest Month-End to Inception cumulative total return is –5.65% for Class R. Lipper Average Closest Month-End to Inception average annual total return is –1.55% for Class R.
| 4 | Visit our website at www.prudentialfunds.com |
Investors cannot invest directly in an index. The securities in the Indexes may be very different from those in the Fund. Returns for the Lipper Average reflect the deduction of operating expenses, but not sales charges or taxes.
Five Largest Holdings expressed as a percentage of net assets as of 3/31/12 |
| |||
Simon Property Group, Inc., Retail REITs | 5.5 | % | ||
Ventas, Inc., REIT, Specialized REITs | 2.6 | |||
Westfield Group, Retail REITs | 2.5 | |||
Host Hotels & Resorts, Inc., Specialized REITs | 2.4 | |||
Mitsubishi Estate Co. Ltd., Diversified Real Estate Activities | 2.4 | |||
Holdings reflect only long-term investments and are subject to change.
Five Largest Industries expressed as a percentage of net assets as of 3/31/12 |
| |||
Retail REITs | 21.8 | % | ||
Diversified Real Estate Activities | 14.7 | |||
Specialized REITs | 13.9 | |||
Residential REITs | 10.9 | |||
Diversified REITs | 10.1 | |||
Industry weightings reflect only long-term investments and are subject to change.
| Prudential Global Real Estate Fund | 5 |
Strategy and Performance Overview
How did the fund perform?
For the 12-month reporting period that ended March 31, 2012, the Prudential Global Real Estate Fund (the Fund) Class A shares gained 3.75%, outperforming the 2.54% return of the S&P Developed BMI Property Net Index (the Index) and the 2.09% return of the Lipper Global Real Estate Funds Average.
What were the conditions like in the global real estate stock market?
In the last 12 months, major property regions throughout the world produced mixed returns.
| • | The United States property market advanced based on resilient economic data, jobs growth, reduced vacancies, and rent increases in certain areas. The European property market declined on sovereign debt concerns. The Asian markets were flat with concerns about decelerating growth in China. |
| • | Real estate investment trusts (REITs) in the U.S. continued to strengthen their balance sheets, raise large sums of capital at attractive prices, and began deploying capital by acquiring properties to add to underlying value and cash flow growth. Generally, property types with clear revenue growth—i.e., apartments, self-storage—performed better than property types with less clarity on revenue growth, such as offices and hotels. |
| • | Fundamentals for the self-storage sector in the U.S. were clearly improving at an attractive rate. Self-storage companies had the best opportunity to increase occupancy and rates in the past year, yet still traded at attractive valuations. Moreover, as the employment picture continued to dominate attention in the U.S., certain West Coast markets, such as San Francisco and other parts of California, continued to recover and experienced sharp rental increases. |
| • | In Europe, economic growth deteriorated in the latter half of 2011, as governments struggled to resolve the sovereign debt crisis. Policymakers took initial measures, such as writing down Greek debt, recapitalizing some European banks, and increasing funds available to the European Financing Stability Facility (EFSC). Fears continued to loom in the fourth quarter of 2011 regarding implementation and scale of these reforms. |
| • | Systemic fears on the continent began to re-emerge after a European rally occurred as a result of central bank policy measures, a strengthening euro, and a slightly less risk-sensitive climate. Nevertheless, consumer sentiment declined in March, and unemployment was at historically high levels in the euro zone. |
| • | Asian markets ended 2011 on a disappointing note, with key markets Japan, Hong Kong, and Singapore recording double-digit declines. For Japan, the devastating March earthquake/tsunami was the defining event of the year in an |
| 6 | Visit our website at www.prudentialfunds.com |
economy that had already been contracting. Hong Kong property stocks peaked in early 2011, then declined sharply until December, before rising again in the first quarter of 2012. |
Which holdings or related groups of holdings made the largest positive and negative contribution to the Fund’s return?
| • | The Fund benefited from its overweight in the self-storage sector in the U.S., as the companies delivered significant net operating income growth. Additionally, as the employment picture continued to be a main focus, the Fund’s overweight in West Coast office companies helped performance. The West Coast, particularly parts of northern California, appeared to recover early due to jobs growth in the technology sector. |
| • | Markets such as San Francisco witnessed sharp increases in rents throughout 2011, and into 2012, as supply and demand imbalances persisted. As a result, the Fund’s exposure to California-based Kilroy Realty Corporation proved beneficial. The Fund’s strategic allocation and slight increase in Europe also assisted its performance. |
| • | Latin America, specifically Brazil, was a major detractor from performance for the period, as investors focused on reducing risk by decreasing allocations in emerging markets and areas of increased potential volatility. Additionally, the decline in the Brazilian real contributed to underperformance in securities held in this region. An underweight position in the defensive healthcare sector also detracted from performance as healthcare outperformed. |
What is the outlook for the global securities markets?
While large economic questions continue to loom, property market fundamentals have remained resilient.
| • | Prudential Real Estate Investments, also known as PREI, expects the next 12 months to show further gradual improvement in occupancies and, in many cases, rent growth. There will be certain markets and property types across the world where supply and demand imbalances will result in rent spikes. However, gradual global economic growth, low interest rates, and historically low supply additions should provide a good backdrop for gradual growth. |
| • | It is expected that transaction volume should increase in the next 12 months as capital markets in the U.S. and Asia remain open and REITs have the opportunity to provide additional cash flow growth through property acquisitions. Property development will most likely remain muted with the exception of U.S. apartments and select arrangements in the office and industrial markets. |
| Prudential Global Real Estate Fund | 7 |
Strategy and Performance Overview (continued)
| • | PREI sees large discounts to underlying values in European property companies and many Asian property companies. In many cases these discounts seem to be justified by lack of certainty on cash flow growth. However, PREI is finding select property companies with strong inherent value. In the U.S., property companies trade in line or at a slight premium to their intrinsic value as investors feel more conviction about cash flow growth. |
| 8 | Visit our website at www.prudentialfunds.com |
Comments on Largest Holdings
| 5.5% | Simon Property Group, Inc., Retail REITs |
Simon Property Group, Inc., is a self-administered and self-managed real estate investment trust. The company owns, develops, and manages retail real estate properties including regional malls, outlet centers, community/lifestyle centers, and international properties.
| 2.6% | Ventas, Inc., Specialized REITs |
Ventas, Inc., owns seniors housing communities, skilled nursing facilities, hospitals, and medical office buildings in the U.S. and Canada.
| 2.5% | Westfield Group, Retail REITs |
Westfield Group is a property trust that invests in leases and manages retail shopping centers in Australia, New Zealand, the U.S., and the United Kingdom. Westfield’s operations also include funds, asset management, property development, and construction.
| 2.4% | Host Hotels & Resorts, Inc., Specialized REITs |
Host Hotels & Resorts, Inc., owns or holds controlling interests in upscale and luxury full-service hotel lodging properties in areas that include Washington, D.C., Toronto and Calgary, Canada; Mexico City, Mexico; and Santiago, Chile, as well as Italy, Spain, Poland, Belgium, the Netherlands, and the United Kingdom.
| 2.4% | Mitsubishi Estate Co. Ltd., Diversified Real Estate Activities |
Mitsubishi Estate Co. Ltd. invests in real estate properties in Japan. The company leases, manages, and develops commercial buildings in central Tokyo. Mitsubishi Estate also develops and sells residential properties and parking lots and manages recreational facilities including golf courses and tennis clubs.
| Prudential Global Real Estate Fund | 9 |
Fees and Expenses (Unaudited)
As a shareholder of the Fund, you incur two types of costs: (1) transaction costs, including sales charges (loads) on purchase payments and redemptions, as applicable, and (2) ongoing costs, including management fees, distribution and/or service (12b-1) fees, and other Fund expenses, as applicable. This example is intended to help you understand your ongoing costs (in dollars) of investing in the Fund and to compare these costs with the ongoing costs of investing in other mutual funds.
The example is based on an investment of $1,000 invested on October 1, 2011, at the beginning of the period, and held through the six-month period ended March 31, 2012. The example is for illustrative purposes only; you should consult the Prospectus for information on initial and subsequent minimum investment requirements.
The Fund’s transfer agent may charge additional fees to holders of certain accounts that are not included in the expenses shown in the table on the following page. These fees apply to individual retirement accounts (IRAs) and Section 403(b) accounts. As of the close of the six-month period covered by the table, IRA fees included an annual maintenance fee of $15 per account (subject to a maximum annual maintenance fee of $25 for all accounts held by the same shareholder). Section 403(b) accounts are charged an annual $25 fiduciary maintenance fee. Some of the fees may vary in amount, or may be waived, based on your total account balance or the number of Prudential Investments funds, including the Fund, that you own. You should consider the additional fees that were charged to your Fund account over the six-month period when you estimate the total ongoing expenses paid over the period and the impact of these fees on your ending account value, as these additional expenses are not reflected in the information provided in the expense table. Additional fees have the effect of reducing investment returns.
Actual Expenses
The first line for each share class in the table on the following page provides information about actual account values and actual expenses. You may use the information on this line, together with the amount you invested, to estimate the expenses that you paid over the period. Simply divide your account value by $1,000 (for example, an $8,600 account value ÷ $1,000 = 8.6), then multiply the result by the number on the first line under the heading “Expenses Paid During the Six-Month Period” to estimate the expenses you paid on your account during this period.
Hypothetical Example for Comparison Purposes
The second line for each share class in the table on the following page provides information about hypothetical account values and hypothetical expenses based on the Fund’s actual expense ratio and an assumed rate of return of 5% per year before
| 10 | Visit our website at www.prudentialfunds.com |
expenses, which is not the Fund’s actual return. The hypothetical account values and expenses may not be used to estimate the actual ending account balance or expenses you paid for the period. You may use this information to compare the ongoing costs of investing in the Fund and other funds. To do so, compare this 5% hypothetical example with the 5% hypothetical examples that appear in the shareholder reports of the other funds.
Please note that the expenses shown in the table are meant to highlight your ongoing costs only and do not reflect any transactional costs such as sales charges (loads). Therefore, the second line for each share class in the table is useful in comparing ongoing costs only and will not help you determine the relative total costs of owning different funds. In addition, if these transactional costs were included, your costs would have been higher.
| Prudential Global Real Estate Fund | Beginning Account Value October 1, 2011 | Ending Account Value March 31, 2012 | Annualized Expense Ratio Based on the Six-Month Period | Expenses Paid During the Six-Month Period* | ||||||||||||||
| Class A | Actual | $ | 1,000.00 | $ | 1,221.10 | 1.32 | % | $ | 7.33 | |||||||||
| Hypothetical | $ | 1,000.00 | $ | 1,018.40 | 1.32 | % | $ | 6.66 | ||||||||||
| Class B | Actual | $ | 1,000.00 | $ | 1,216.20 | 2.02 | % | $ | 11.19 | |||||||||
| Hypothetical | $ | 1,000.00 | $ | 1,014.90 | 2.02 | % | $ | 10.18 | ||||||||||
| Class C | Actual | $ | 1,000.00 | $ | 1,216.20 | 2.02 | % | $ | 11.19 | |||||||||
| Hypothetical | $ | 1,000.00 | $ | 1,014.90 | 2.02 | % | $ | 10.18 | ||||||||||
| Class R | Actual | $ | 1,000.00 | $ | 1,219.40 | 1.52 | % | $ | 8.43 | |||||||||
| Hypothetical | $ | 1,000.00 | $ | 1,017.40 | 1.52 | % | $ | 7.67 | ||||||||||
| Class Z | Actual | $ | 1,000.00 | $ | 1,222.90 | 1.02 | % | $ | 5.67 | |||||||||
| Hypothetical | $ | 1,000.00 | $ | 1,019.90 | 1.02 | % | $ | 5.15 | ||||||||||
* Fund expenses (net of fee waivers or subsidies, if any) for each share class are equal to the annualized expense ratio for each share class (provided in the table), multiplied by the average account value over the period, multiplied by the 183 days in the six-month period ended March 31, 2012, and divided by the 366 days in the Fund’s fiscal year ended March 31, 2012 (to reflect the six-month period). Expenses presented in the table include the expenses of any underlying portfolios in which the Fund may invest.
| Prudential Global Real Estate Fund | 11 |
Portfolio of Investments
as of March 31, 2012
| Shares | Description | Value (Note 1) | ||||
LONG-TERM INVESTMENTS 94.9% | ||||||
COMMON STOCKS | ||||||
Australia 7.8% | ||||||
| 2,773,000 | CFS Retail Property Trust, REIT | $ | 5,141,622 | |||
| 590,800 | Charter Hall Office, REIT | 1,884,900 | ||||
| 711,223 | Charter Hall Retail, REIT | 2,328,038 | ||||
| 4,172,733 | Commonwealth Property Office Fund, REIT | 4,257,494 | ||||
| 8,050,326 | Dexus Property Group, REIT | 7,254,875 | ||||
| 1,520,400 | FKP Property Group | 779,579 | ||||
| 11,143,300 | Goodman Group, REIT | 7,964,529 | ||||
| 3,035,620 | GPT Group, REIT | 9,810,682 | ||||
| 6,382,320 | Investa Office Fund, REIT | 4,198,068 | ||||
| 787,556 | Mirvac Group, REIT | 954,475 | ||||
| 2,862,525 | Stockland, REIT | 8,717,538 | ||||
| 2,652,389 | Westfield Group, REIT | 24,260,242 | ||||
|
| |||||
| 77,552,042 | ||||||
Belgium 0.2% | ||||||
| 17,627 | Cofinimmo, REIT | 2,167,553 | ||||
Brazil 1.3% | ||||||
| 224,256 | BR Malls Participacoes SA | 2,899,253 | ||||
| 193,600 | Cyrela Brazil Realty SA Empreendimentos e Participacoes | 1,723,411 | ||||
| 288,502 | Gafisa SA | 682,752 | ||||
| 169,961 | Multiplan Empreendimentos Imobiliarios SA | 3,902,087 | ||||
| 963,196 | PDG Realty SA Empreendimentos e Participacoes | 3,318,909 | ||||
|
| |||||
| 12,526,412 | ||||||
Canada 1.2% | ||||||
| 3,700 | Boardwalk Real Estate Investment Trust, REIT | 211,810 | ||||
| 182,216 | Brookfield Properties Corp. | 3,169,530 | ||||
| 54,605 | Canadian Apartment Properties, REIT | 1,232,301 | ||||
| 318,858 | Chartwell Seniors Housing Real Estate Investment Trust, REIT | 2,918,616 | ||||
| 155,335 | RioCan Real Estate Investment Trust, REIT | 4,209,439 | ||||
|
| |||||
| 11,741,696 | ||||||
Finland 0.5% | ||||||
| 531,563 | Citycon Oyj | 1,779,462 | ||||
| 792,509 | Sponda Oyj | 3,266,052 | ||||
|
| |||||
| 5,045,514 | ||||||
See Notes to Financial Statements.
| Prudential Global Real Estate Fund | 13 |
Portfolio of Investments
as of March 31, 2012 continued
| Shares | Description | Value (Note 1) | ||||
COMMON STOCKS (Continued) | ||||||
France 2.8% | ||||||
| 32,122 | Fonciere des Regions, REIT | $ | 2,580,333 | |||
| 21,927 | ICADE, REIT | 1,956,144 | ||||
| 226,689 | Klepierre, REIT | 7,860,753 | ||||
| 5,123 | Societe de la Tour Eiffel, REIT | 297,217 | ||||
| 73,800 | Unibail-Rodamco SE, REIT | 14,759,213 | ||||
|
| |||||
| 27,453,660 | ||||||
Germany 0.4% | ||||||
| 61,039 | DIC Asset AG | 597,943 | ||||
| 71,269 | GSW Immobilien AG | 2,463,271 | ||||
| 89,221 | Prime Office REIT AG | 532,858 | ||||
|
| |||||
| 3,594,072 | ||||||
Hong Kong 10.1% | ||||||
| 6,062,000 | Champion, REIT | 2,568,264 | ||||
| 1,325,776 | Cheung Kong Holdings Ltd. | 17,123,750 | ||||
| 2,437,000 | China Overseas Land & Investment Ltd. | 4,632,012 | ||||
| 3,433,469 | Hang Lung Properties Ltd. | 12,578,915 | ||||
| 797,794 | Henderson Land Development Co. Ltd. | 4,402,196 | ||||
| 2,060,000 | Hongkong Land Holdings Ltd. | 11,968,600 | ||||
| 397,999 | Hysan Development Co. Ltd. | 1,593,933 | ||||
| 2,379,219 | Link (The), REIT | 8,854,418 | ||||
| 765,000 | New World Development Ltd. | 919,117 | ||||
| 3,253,800 | Sino Land Co. Ltd. | 5,195,655 | ||||
| 1,722,935 | Sun Hung Kai Properties Ltd. | 21,410,361 | ||||
| 1,076,000 | Wharf Holdings Ltd. (The) | 5,847,261 | ||||
| 1,077,000 | Wheelock & Co. Ltd. | 3,245,334 | ||||
|
| |||||
| 100,339,816 | ||||||
Italy 0.3% | ||||||
| 4,169,822 | Beni Stabili SpA, REIT | 2,591,019 | ||||
Japan 10.9% | ||||||
| 357,900 | Aeon Mall Co. Ltd. | 8,315,111 | ||||
| 115,600 | Daito Trust Construction Co. Ltd. | 10,377,045 | ||||
| 664,000 | Daiwa House Industry Co. Ltd. | 8,776,320 | ||||
| 476 | Frontier Real Estate Investment Corp., REIT | 3,899,094 | ||||
| 1,318,780 | Mitsubishi Estate Co. Ltd. | 23,517,208 | ||||
| 1,107,339 | Mitsui Fudosan Co. Ltd. | 21,178,176 | ||||
| 243 | Nippon Accommodations Fund, Inc., REIT | 1,567,742 | ||||
See Notes to Financial Statements.
| 14 | Visit our website at www.prudentialfunds.com |
| Shares | Description | Value (Note 1) | ||||
COMMON STOCKS (Continued) | ||||||
Japan (cont’d.) | ||||||
| 707 | Nippon Building Fund, Inc., REIT | $ | 6,713,809 | |||
| 481,000 | Nomura Real Estate Holdings, Inc. | 8,478,664 | ||||
| 3,617 | NTT Urban Development Corp. | 2,945,340 | ||||
| 506,952 | Sumitomo Realty & Development Co. Ltd. | 12,219,031 | ||||
|
| |||||
| 107,987,540 | ||||||
Netherlands 1.8% | ||||||
| 88,750 | Corio NV, REIT | 4,681,394 | ||||
| 126,208 | Eurocommercial Properties NV, REIT | 4,782,098 | ||||
| 58,711 | Vastned Retail NV, REIT | 3,083,191 | ||||
| 66,983 | Wereldhave NV, REIT | 5,316,366 | ||||
|
| |||||
| 17,863,049 | ||||||
Norway 0.2% | ||||||
| 1,347,926 | Norwegian Property ASA | 2,101,863 | ||||
Singapore 4.5% | ||||||
| 2,923,000 | Ascendas Real Estate Investment Trust, REIT | 4,697,076 | ||||
| 3,287,000 | Cache Logistics Trust, REIT | 2,614,852 | ||||
| 2,233,000 | CapitaLand Ltd. | 5,542,309 | ||||
| 2,716,673 | CapitaMall Trust, REIT | 3,900,875 | ||||
| 2,456,000 | CDL Hospitality Trusts, REIT | 3,389,809 | ||||
| 735,058 | City Developments Ltd. | 6,636,895 | ||||
| 995,000 | Fortune Real Estate Investment Trust, REIT | 494,582 | ||||
| 2,084,000 | Global Logistic Properties Ltd.(a) | 3,647,269 | ||||
| 4,791,800 | K-REIT Asia, REIT | 3,678,523 | ||||
| 2,125,600 | Keppel Land Ltd. | 5,867,573 | ||||
| 3,561,000 | Mapletree Commercial Trust, REIT | 2,478,720 | ||||
| 1,873,800 | Mapletree Industrial Trust, REIT | 1,639,696 | ||||
|
| |||||
| 44,588,179 | ||||||
Sweden 0.6% | ||||||
| 285,051 | Hufvudstaden AB (Class A Stock) | 3,013,894 | ||||
| 581,176 | Klovern AB | 2,204,951 | ||||
| 49,736 | Kungsleden AB | 345,817 | ||||
|
| |||||
| 5,564,662 | ||||||
United Kingdom 4.4% | ||||||
| 575,972 | Atrium European Real Estate Ltd. | 2,829,199 | ||||
| 551,223 | Big Yellow Group PLC, REIT | 2,503,956 | ||||
See Notes to Financial Statements.
| Prudential Global Real Estate Fund | 15 |
Portfolio of Investments
as of March 31, 2012 continued
| Shares | Description | Value (Note 1) | ||||
COMMON STOCKS (Continued) |
| |||||
United Kingdom (cont’d.) |
| |||||
| 1,206,657 | British Land Co. PLC, REIT | $ | 9,262,231 | |||
| 39,010 | Derwent London PLC, REIT | 1,088,811 | ||||
| 513,602 | Great Portland Estates PLC, REIT | 2,956,579 | ||||
| 1,046,802 | Hammerson PLC, REIT | 6,958,588 | ||||
| 1,145,887 | Land Securities Group PLC, REIT | 13,242,216 | ||||
| 1,389,946 | Segro PLC, REIT | 5,220,079 | ||||
|
| |||||
| 44,061,659 | ||||||
United States 47.9% | ||||||
| 109,678 | Alexandria Real Estate Equities, Inc., REIT | 8,020,752 | ||||
| 115,894 | American Assets Trust, Inc., REIT | 2,642,383 | ||||
| 211,653 | American Campus Communities, Inc., REIT | 9,465,122 | ||||
| 297,697 | Associated Estates Realty Corp., REIT | 4,864,369 | ||||
| 137,499 | AvalonBay Communities, Inc., REIT | 19,435,484 | ||||
| 91,600 | Boston Properties, Inc., REIT | 9,617,084 | ||||
| 376,435 | Brandywine Realty Trust, REIT | 4,321,474 | ||||
| 207,892 | BRE Properties, Inc., REIT | 10,508,941 | ||||
| 215,733 | Camden Property Trust, REIT | 14,184,445 | ||||
| 968,308 | Cogdell Spencer, Inc., REIT | 4,105,626 | ||||
| 477,010 | Colonial Properties Trust, REIT | 10,365,427 | ||||
| 759,618 | Cousins Properties, Inc., REIT | 5,757,904 | ||||
| 1,271,194 | CubeSmart, REIT | 15,127,209 | ||||
| 959,910 | DDR Corp., REIT | 14,014,686 | ||||
| 323,120 | DiamondRock Hospitality Co., REIT | 3,324,905 | ||||
| 192,894 | Douglas Emmett, Inc., REIT | 4,399,912 | ||||
| 280,691 | Duke Realty Corp., REIT | 4,025,109 | ||||
| 41,860 | Dupont Fabros Technology, Inc., REIT | 1,023,477 | ||||
| 167,820 | Education Realty Trust, Inc., REIT | 1,819,169 | ||||
| 226,271 | Equity Residential, REIT | 14,169,090 | ||||
| 50,262 | Essex Property Trust, Inc., REIT | 7,615,196 | ||||
| 156,950 | Extra Space Storage, Inc., REIT | 4,518,590 | ||||
| 66,581 | Federal Realty Investment Trust, REIT | 6,444,375 | ||||
| 463,431 | FelCor Lodging Trust, Inc., REIT(a) | 1,668,352 | ||||
| 163,834 | General Growth Properties, Inc., REIT | 2,783,540 | ||||
| 608,308 | Glimcher Realty Trust, REIT | 6,216,908 | ||||
| 142,497 | Health Care REIT, Inc., REIT | 7,831,635 | ||||
| 204,950 | Healthcare Realty Trust, Inc., REIT | 4,508,900 | ||||
| 1,435,814 | Host Hotels & Resorts, Inc., REIT | 23,576,066 | ||||
| 133,573 | Hudson Pacific Properties, Inc., REIT | 2,020,959 | ||||
| 167,003 | Hyatt Hotels Corp. (Class A Stock)(a) | 7,134,368 | ||||
See Notes to Financial Statements.
| 16 | Visit our website at www.prudentialfunds.com |
| Shares | Description | Value (Note 1) | ||||
COMMON STOCKS (Continued) |
| |||||
United States (cont’d.) |
| |||||
| 258,856 | Kilroy Realty Corp., REIT | $ | 12,065,278 | |||
| 138,710 | Kimco Realty Corp., REIT | 2,671,555 | ||||
| 351,300 | Liberty Property Trust, REIT | 12,548,436 | ||||
| 94,992 | LTC Properties, Inc., REIT | 3,039,744 | ||||
| 257,835 | Macerich Co. (The), REIT | 14,889,971 | ||||
| 233,515 | Mack-Cali Realty Corp., REIT | 6,729,902 | ||||
| 263,739 | Post Properties, Inc., REIT | 12,358,809 | ||||
| 536,119 | ProLogis, Inc., REIT | 19,311,006 | ||||
| 166,282 | Public Storage, REIT | 22,975,184 | ||||
| 199,838 | Regency Centers Corp., REIT | 8,888,794 | ||||
| 374,360 | Simon Property Group, Inc., REIT | 54,536,765 | ||||
| 52,504 | SL Green Realty Corp., REIT | 4,071,685 | ||||
| 98,661 | Sovran Self Storage, Inc., REIT | 4,916,278 | ||||
| 1,110,049 | Strategic Hotels & Resorts, Inc., REIT(a) | 7,304,122 | ||||
| 329,731 | Sunrise Senior Living, Inc.(a) | 2,083,900 | ||||
| 166,164 | Tanger Factory Outlet Centers, REIT | 4,940,056 | ||||
| 63,974 | Taubman Centers, Inc., REIT | 4,666,903 | ||||
| 74,470 | Terreno Realty Corp., REIT | 1,065,666 | ||||
| 447,626 | Ventas, Inc., REIT | 25,559,444 | ||||
| 179,188 | Vornado Realty Trust, REIT | 15,087,630 | ||||
|
| |||||
| 475,222,585 | ||||||
|
| |||||
Total common stocks | 940,401,321 | |||||
|
| |||||
PREFERRED STOCK |
| |||||
Sweden | ||||||
| 14,529 | Klovern AB (PRFC) | 297,572 | ||||
|
| |||||
Total long-term investments | 940,698,893 | |||||
|
| |||||
SHORT-TERM INVESTMENT 5.6% |
| |||||
AFFILIATED MONEY MARKET MUTUAL FUND |
| |||||
| 54,906,534 | Prudential Investment Portfolios 2 - Prudential Core | 54,906,534 | ||||
|
| |||||
Total Investments 100.5% | 995,605,427 | |||||
Liabilities in excess of other assets (0.5)% | (4,747,282 | ) | ||||
|
| |||||
Net Assets 100% | $ | 990,858,145 | ||||
|
| |||||
See Notes to Financial Statements.
| Prudential Global Real Estate Fund | 17 |
Portfolio of Investments
as of March 31, 2012 continued
The following abbreviations are used in the Portfolio descriptions:
PRFC—Preference Shares
REIT—Real Estate Investment Trust
| (a) | Non-income producing security. |
| (b) | Prudential Investments LLC, the manager of the Fund, also serves as manager of the Prudential Investment Portfolios 2 - Prudential Core Taxable Money Market Fund. |
Various inputs are used in determining the value of the Portfolio’s investments. These inputs are summarized in the three broad levels listed below.
Level 1—quoted prices generally for securities actively traded on a regulated securities exchange and for open-end mutual funds which trade at daily net asset value.
Level 2—other significant observable inputs (including, but not limited to, quoted prices for similar securities, interest rates, prepayment speeds, foreign currency exchange rates, and amortized cost) generally for debt securities, swaps, forward foreign currency contracts and for foreign stocks priced using vendor modeling tools.
Level 3—significant unobservable inputs for securities valued in accordance with Board approved fair valuation procedures.
The following is a summary of the inputs used as of March 31, 2012 in valuing such portfolio securities:
| Level 1 | Level 2 | Level 3 | ||||||||||
Investments in Securities | ||||||||||||
Common Stocks: | ||||||||||||
Australia | $ | 77,552,042 | $ | — | $ | — | ||||||
Belgium | 2,167,553 | — | — | |||||||||
Brazil | 12,526,412 | — | — | |||||||||
Canada | 11,741,696 | — | — | |||||||||
Finland | 5,045,514 | — | — | |||||||||
France | 27,453,660 | — | — | |||||||||
Germany | 3,594,072 | — | — | |||||||||
Hong Kong | 100,339,816 | — | — | |||||||||
Italy | 2,591,019 | — | — | |||||||||
Japan | 107,987,540 | — | — | |||||||||
Netherlands | 17,863,049 | — | — | |||||||||
Norway | 2,101,863 | — | — | |||||||||
See Notes to Financial Statements.
| 18 | Visit our website at www.prudentialfunds.com |
| Level 1 | Level 2 | Level 3 | ||||||||||
Common Stocks (continued): | ||||||||||||
Singapore | $ | 44,588,179 | $ | — | $ | — | ||||||
Sweden | 5,564,662 | — | — | |||||||||
United Kingdom | 44,061,659 | — | — | |||||||||
United States | 475,222,585 | — | — | |||||||||
Preferred Stock—Sweden | 297,572 | — | — | |||||||||
Affiliated Money Market Mutual Fund | 54,906,534 | �� | — | — | ||||||||
|
|
|
|
|
| |||||||
Total | $ | 995,605,427 | $ | — | $ | — | ||||||
|
|
|
|
|
| |||||||
The industry classification of investments and liabilities in excess of other assets shown as a percentage of net assets as of March 31, 2012 were as follows:
Retail REIT’s | 21.8 | % | ||
Diversified Real Estate Activities | 14.7 | |||
Specialized REIT’s | 13.9 | |||
Residential REIT’s | 10.9 | |||
Diversified REIT’s | 10.1 | |||
Office REIT’s | 8.6 | |||
Real Estate Operating Companies | 5.7 | |||
Affiliated Money Market Mutual Fund | 5.6 | |||
Industrial REIT’s | 4.3 | |||
Real Estate Development | 3.4 | % | ||
Hotels, Resorts & Cruise Lines | 0.7 | |||
Homebuilding | 0.6 | |||
Healthcare Facilities | 0.2 | |||
|
| |||
| 100.5 | ||||
Liabilities in excess of other assets | (0.5 | ) | ||
|
| |||
| 100.0 | % | |||
|
|
The Portfolio invested in derivative instruments during the reporting period. The primary type of risk associated with these derivative instruments is foreign exchange risk.
The effect of such derivative instruments on the Portfolio’s financial position and financial performance as reflected in the Statement of Assets and Liabilities and Statement of Operations is presented in the summary below.
The Portfolio did not hold any derivative instruments as of March 31, 2012, accordingly, no derivative positions were presented in the Statements of Assets and Liabilities.
See Notes to Financial Statements.
| Prudential Global Real Estate Fund | 19 |
Portfolio of Investments
as of March 31, 2012 continued
The effects of derivative instruments on the Statement of Operations for the year ended March 31, 2012 are as follows:
Amount of Realized Gain or (Loss) on Derivatives Recognized in Income | ||||
Derivatives not accounted for as hedging | Forward Currency Contracts | |||
Foreign exchange contracts | $ | 60,084 | ||
|
| |||
For the year ended March 31, 2012, the Portfolio’s average value at settlement date receivable for foreign currency exchange sale contracts was $5,225.
See Notes to Financial Statements.
| 20 | Visit our website at www.prudentialfunds.com |
Financial Statements
| MARCH 31, 2012 | ANNUAL REPORT |
Prudential Global Real Estate Fund
Statement of Assets and Liabilities
as of March 31, 2012
Assets | ||||
Investments at value: | ||||
Unaffiliated Investments (cost $821,173,069) | $ | 940,698,893 | ||
Affiliated Investments (cost $54,906,534) | 54,906,534 | |||
Foreign currency, at value (cost $249,878) | 251,035 | |||
Receivable for investments sold | 9,904,558 | |||
Receivable for Fund shares sold | 9,461,254 | |||
Dividends receivable | 3,311,866 | |||
Tax reclaim receivable | 58,510 | |||
Prepaid expenses | 5,813 | |||
|
| |||
Total assets | 1,018,598,463 | |||
|
| |||
Liabilities | ||||
Payable for investments purchased | 21,795,226 | |||
Payable for Fund shares reacquired | 4,780,330 | |||
Management fee payable | 605,792 | |||
Accrued expenses | 338,097 | |||
Distribution fee payable | 176,098 | |||
Affiliated transfer agent fee payable | 44,775 | |||
|
| |||
Total liabilities | 27,740,318 | |||
|
| |||
Net Assets | $ | 990,858,145 | ||
|
| |||
Net assets were comprised of: | ||||
Shares of beneficial interest, at par | $ | 50,036 | ||
Paid-in capital in excess of par | 1,038,283,355 | |||
|
| |||
| 1,038,333,391 | ||||
Distributions in excess of net investment income | (5,675,134 | ) | ||
Accumulated net realized loss on investment and foreign currency transactions | (161,294,390 | ) | ||
Net unrealized appreciation on investments and foreign currencies | 119,494,278 | |||
|
| |||
Net assets, March 31, 2012 | $ | 990,858,145 | ||
|
| |||
See Notes to Financial Statements.
| 22 | Visit our website at www.prudentialfunds.com |
Class A: | ||||
Net asset value and redemption price per share ($368,182,674 ÷ 18,608,566 shares of beneficial interest issued and outstanding) | $ | 19.79 | ||
Maximum sales charge (5.5% of offering price) | 1.15 | |||
|
| |||
Maximum offering price to public | $ | 20.94 | ||
|
| |||
Class B: | ||||
Net asset value, offering price and redemption price per share ($12,671,224 ÷ 645,791 shares of beneficial interest issued and outstanding) | $ | 19.62 | ||
|
| |||
Class C: | ||||
Net asset value, offering price and redemption price per share ($86,546,443 ÷ 4,411,182 shares of beneficial interest issued and outstanding) | $ | 19.62 | ||
|
| |||
Class R: | ||||
Net asset value, offering price and redemption price per share ($5,522,997 ÷ 279,338 shares of beneficial interest issued and outstanding) | $ | 19.77 | ||
|
| |||
Class Z: | ||||
Net asset value, offering price and redemption price per share ($517,934,807 ÷ 26,091,066 shares of beneficial interest issued and outstanding) | $ | 19.85 | ||
|
| |||
See Notes to Financial Statements.
| Prudential Global Real Estate Fund | 23 |
Statement of Operations
Year Ended March 31, 2012
Investment Income | ||||
Unaffiliated dividend income (net of $1,118,527 foreign withholding tax) | $ | 24,268,036 | ||
Affiliated dividend income | 46,801 | |||
|
| |||
Total income | 24,314,837 | |||
|
| |||
Expenses | ||||
Management fee | 6,039,719 | |||
Distribution fee—Class A | 908,304 | |||
Distribution fee—Class B | 133,196 | |||
Distribution fee—Class C | 782,125 | |||
Distribution fee—Class R | 21,016 | |||
Transfer agent’s fees and expenses (including affiliated expenses of $196,000) | 1,085,000 | |||
Custodian’s fees and expenses | 278,000 | |||
Reports to shareholders | 151,000 | |||
Registration fees | 128,000 | |||
Trustees’ fees | 27,000 | |||
Audit fee | 25,000 | |||
Legal fees and expenses | 25,000 | |||
Commitment fee on syndicated credit agreement | 5,000 | |||
Miscellaneous | 58,150 | |||
|
| |||
Total expenses | 9,666,510 | |||
|
| |||
Net investment income | 14,648,327 | |||
|
| |||
Net Realized And Unrealized Gain (Loss) On Investments And Foreign Currencies | ||||
Net realized gain (loss) on: | ||||
Investment transactions | 1,746,246 | |||
Foreign currency transactions | (463,819 | ) | ||
|
| |||
| 1,282,427 | ||||
|
| |||
Net change in unrealized appreciation on: | ||||
Investments | 18,502,735 | |||
Foreign currencies | 365 | |||
|
| |||
| 18,503,100 | ||||
|
| |||
Net gain on investments and foreign currencies | 19,785,527 | |||
|
| |||
Net Increase In Net Assets Resulting From Operations | $ | 34,433,854 | ||
|
| |||
See Notes to Financial Statements.
| 24 | Visit our website at www.prudentialfunds.com |
Statement of Changes in Net Assets
| Year Ended March 31, | ||||||||
| 2012 | 2011 | |||||||
Increase (Decrease) in Net Assets | ||||||||
Operations | ||||||||
Net investment income | $ | 14,648,327 | $ | 8,718,641 | ||||
Net realized gain on investment and foreign currency transactions | 1,282,427 | 4,238,812 | ||||||
Net change in unrealized appreciation on investments and | 18,503,100 | 65,449,259 | ||||||
|
|
|
| |||||
Net increase in net assets resulting from operations | 34,433,854 | 78,406,712 | ||||||
|
|
|
| |||||
Dividends and Distributions (Note 1) | ||||||||
Dividends from net investment income | ||||||||
Class A | (5,388,505 | ) | (6,028,465 | ) | ||||
Class B | (160,706 | ) | (254,037 | ) | ||||
Class C | (948,516 | ) | (946,017 | ) | ||||
Class R | (69,145 | ) | (60,408 | ) | ||||
Class Z | (8,549,530 | ) | (6,623,176 | ) | ||||
|
|
|
| |||||
| (15,116,402 | ) | (13,912,103 | ) | |||||
|
|
|
| |||||
Fund share transactions (Net of share conversions) (Note 6): | ||||||||
Net proceeds from shares sold | 533,136,320 | 386,696,144 | ||||||
Net asset value of shares issued in reinvestment of dividends and distributions | 11,268,864 | 10,702,328 | ||||||
Cost of shares reacquired | (265,364,297 | ) | (137,408,216 | ) | ||||
|
|
|
| |||||
Net increase in net assets from Fund share transactions | 279,040,887 | 259,990,256 | ||||||
|
|
|
| |||||
Total increase in net assets | 298,358,339 | 324,484,865 | ||||||
Net Assets | ||||||||
Beginning of year | 692,499,806 | 368,014,941 | ||||||
|
|
|
| |||||
End of year | $ | 990,858,145 | $ | 692,499,806 | ||||
|
|
|
| |||||
See Notes to Financial Statements.
| Prudential Global Real Estate Fund | 25 |
Notes to Financial Statements
Prudential Investment Portfolios 12 (the “Trust”) is an open-end management investment company, registered under the Investment Company Act of 1940, as amended, (the “1940 Act”). The Trust currently consists of two funds: Prudential Global Real Estate Fund (the “Fund”) and Prudential US Real Estate Fund. These financial statements relate only to Prudential Global Real Estate Fund. The financial statements of the other portfolio are not presented herein. The Trust was established as a Delaware business trust on October 24, 1997. The investment objective of the Fund is capital appreciation and income. It seeks to achieve this objective by investing primarily in equity securities of real estate companies.
Note 1. Accounting Policies
The following is a summary of significant accounting policies followed by the Fund in the preparation of its financial statements.
Securities Valuation: Securities listed on a securities exchange (other than options on securities and indices) are valued at the last sale price on such exchange on the day of valuation or, if there was no sale on such day, at the mean between the last reported bid and asked prices, or at the last bid price on such day in the absence of an asked price. Securities traded via NASDAQ are valued at the NASDAQ official closing price (“NOCP”) on the day of valuation, or if there was no NOCP, at the last sale price. Securities that are actively traded in the over-the-counter market, including listed securities for which the primary market is believed by Prudential Investments LLC (“PI” or “Manager”), in consultation with the subadviser, to be over-the-counter, are valued at market value using prices provided by an independent pricing agent or principal market maker. Options on securities and indices traded on an exchange are valued at the last sale price as of the close of trading on the applicable exchange or, if there was no sale, at the mean between the most recently quoted bid and asked prices on such exchange. Futures contracts and options thereon traded on a commodities exchange or board of trade are valued at the last sale price at the close of trading on such exchange or board of trade or, if there was no sale on the applicable commodities exchange or board of trade on such day, at the mean between the most recently quoted prices on such exchange or board of trade or at the last bid price in the absence of an asked price. Prices may be obtained from independent pricing services which use information provided by market makers or estimates of market values obtained from yield data relating to investments or securities with similar characteristics.
| 26 | Visit our website at www.prudentialfunds.com |
Securities for which reliable market quotations are not readily available, or whose values have been affected by events occurring after the close of the security’s foreign market and before the Fund’s normal pricing time, are valued at fair value in accordance with the Board of Trustees’ approved fair valuation procedures. When determining the fair valuation of securities some of the factors influencing the valuation include, the nature of any restrictions on disposition of the securities; assessment of the general liquidity of the securities; the issuer’s financial condition and the markets in which it does business; the cost of the investment; the size of the holding and the capitalization of issuer; the prices of any recent transactions or bids/offers for such securities or any comparable securities; any available analyst media or other reports or information deemed reliable by the investment adviser regarding the issuer or the markets or industry in which it operates. Using fair value to price securities may result in a value that is different from a security’s most recent closing price and from the price used by other mutual funds to calculate their net asset values.
Investments in open-end, non-exchange-traded mutual funds are valued at their net asset value as of the close of the New York Stock Exchange on the date of valuation.
Foreign Currency Translation: The books and records of the Fund are maintained in U.S. dollars. Foreign currency amounts are translated into U.S. dollars on the following basis:
(i) market value of investment securities, other assets and liabilities—at the current daily rates of exchange;
(ii) purchases and sales of investment securities, income and expenses—at the rates of exchange prevailing on the respective dates of such transactions.
Although the net assets of the Fund are presented at the foreign exchange rates and market values at the close of the fiscal period, the Fund does not isolate that portion of the results of operations arising as a result of changes in the foreign exchange rates from the fluctuations arising from changes in the market prices of portfolio securities held at the end of the fiscal period. Similarly, the Fund does not isolate the effect of changes in foreign exchange rates from the fluctuations arising from changes in the market prices of portfolio securities sold during the fiscal period. Accordingly, realized foreign currency gains or losses are included in the reported net realized gains or losses on investment transactions.
Net realized gains or losses on foreign currency transactions represent net foreign exchange gains or losses from holdings of foreign currencies, currency gains or losses realized between the trade and settlement dates on security transactions, and the
| Prudential Global Real Estate Fund | 27 |
Notes to Financial Statements
continued
difference between the amounts of dividends, interest and foreign withholding taxes recorded on the Fund’s books and the U.S. dollar equivalent amounts actually received or paid. Net unrealized currency gains or losses from valuing foreign currency denominated assets and liabilities (other than investments) at period-end exchange rates are reflected as a component of net unrealized appreciation (depreciation) on foreign currencies. Foreign security and currency transactions may involve certain considerations and risks not typically associated with those of domestic origin as a result of, among other factors, the possibility of political or economic instability, or the level of governmental supervision and regulation of foreign securities markets.
Securities Transactions and Net Investment Income: Security transactions are recorded on the trade date. Realized and unrealized gains or losses from investments and currency transactions on sales of portfolio securities are calculated on the identified cost basis. Dividend income is recorded on the ex-dividend date. Interest income, including amortization of premium and accretion of discount on debt securities, as required, is recorded on the accrual basis. Expenses are recorded on the accrual basis which may require the use of certain estimates by management. The Fund invests in real estate investment trusts (“REITs”), which report information on the source of their distributions annually. Based on current and historical information, a portion of distributions received from REITs during the period is estimated to be dividend income, capital gain or a return of capital and recorded accordingly. These estimates are adjusted periodically when the actual source of distributions is disclosed by the REITs.
Net investment income or loss (other than distribution fees which are charged directly to the respective class) and unrealized and realized gains and losses are allocated daily to each class of shares based upon the relative proportion of adjusted net assets of each class at the beginning of the day.
Dividends and Distributions: The Fund expects to pay dividends of net investment income quarterly and distributions of net realized capital and currency gains, if any, annually. Dividends and distributions to shareholders, which are determined in accordance with federal income tax regulations, which may differ from generally accepted accounting principles, are recorded on the ex-dividend date. Permanent book/tax differences relating to income and gains are reclassified amongst undistributed net investment income; accumulated net realized gain or loss and paid-in capital in excess of par, as appropriate.
| 28 | Visit our website at www.prudentialfunds.com |
Taxes: It is the Fund’s policy to continue to meet the requirements of the Internal Revenue Code applicable to regulated investment companies and to distribute all of its taxable net investment income and capital gains, if any, to its shareholders. Therefore, no federal income tax provision is required.
Withholding taxes on foreign dividends are recorded, net of reclaimable amounts, at the time the related income is earned.
Estimates: The preparation of the financial statements requires management to make estimates and assumptions that affect the reported amounts and disclosures in the financial statements. Actual results could differ from those estimates.
Note 2. Agreements
The Fund has a management agreement with PI. Pursuant to this agreement, PI has responsibility for all investment advisory services and supervises the subadviser’s performance of such services. PI has entered into a subadvisory agreement with Prudential Real Estate Investors (“PREI”), which is a business unit of Prudential Investment Management (“PIM”). The subadvisory agreement provides that each subadviser furnishes investment advisory services in connection with the management of the Fund. In connection therewith, each subadviser is obligated to keep certain books and records of the Fund. PI pays for the services of the subadvisers, the cost of compensation of officers of the Fund, occupancy and certain clerical and bookkeeping costs of the Fund. The Fund bears all other costs and expenses.
The management fee paid to PI is computed daily and payable monthly at an annual rate of 0.75% of the Fund’s average daily net assets. The effective management fee rate was 0.75% for the year ended March 31, 2012.
The Fund has a distribution agreement with Prudential Investment Management Services LLC (“PIMS”), which acts as the distributor of the Class A, Class B, Class C, Class R and Class Z shares of the Fund. The Fund compensates PIMS for distributing and servicing the Fund’s Class A, Class B, Class C and Class R shares, pursuant to plans of distribution (the “Class A, B, C and R Plans”), regardless of expenses actually incurred by PIMS. The distribution fees are accrued daily and payable monthly. No distribution or service fees are paid to PIMS as distributor of the Class Z shares of the Fund.
Pursuant to the Class A, B, C and R Plans, the Fund compensates PIMS for distribution related activities at an annual rate of up to 0.30%, 1%, 1% and 0.75% of the average daily net assets of the Class A, B, C and R shares, respectively. For the year ended
| Prudential Global Real Estate Fund | 29 |
Notes to Financial Statements
continued
March 31, 2012, PIMS has contractually agreed to limit such fees to 0.50% of the average daily net assets of the Class R shares.
PIMS has advised the Fund that it has received $516,045 in front-end sales charges resulting from sales of Class A during the year ended March 31, 2012. From these fees, PIMS paid such sales charges to broker-dealers, which in turn paid commissions to salespersons and incurred other distribution costs.
PIMS has advised the Fund that it has received $33, $24,476 and $20,442 in contingent deferred sales charges imposed upon certain redemptions by Class A, Class B and Class C shareholders, respectively, during the year ended March 31, 2012.
PI and PIMS are indirect, wholly-owned subsidiaries of Prudential Financial, Inc. (“Prudential”).
Note 3. Other Transactions with Affiliates
Prudential Mutual Fund Services LLC (“PMFS”), an affiliate of PI and an indirect, wholly-owned subsidiary of Prudential, serves as the Fund’s transfer agent. The transfer agent fees and expenses in the Statement of Operations also include certain out-of-pocket expenses paid to non-affiliates, where applicable.
The Fund invests in the Prudential Core Taxable Money Market Fund (the “Core Fund”), a portfolio of Prudential Investment Portfolios 2, registered under the 1940 Act, as amended, and managed by PI. Earnings from the Core Fund are disclosed on the Statement of Operations as affiliated dividend income.
Note 4. Portfolio Securities
Purchases and sales of portfolio securities, other than short-term investments, for the year ended March 31, 2012, were $432,445,721 and $155,725,916, respectively.
Note 5. Distributions and Tax Information
Distributions to shareholders, which are determined in accordance with federal income tax regulations and which may differ from generally accepted accounting
| 30 | Visit our website at www.prudentialfunds.com |
principles are recorded on the ex-dividend date. In order to present distributions in excess of net investment income, accumulated net realized loss on investment and foreign currency transactions and paid-in capital in excess of par on the Statement of Assets and Liabilities that more closely represent their tax character, certain adjustments have been made to distributions in excess of net investment income, accumulated net realized loss on investment and foreign currency transactions and paid-in capital in excess of par. For the year ended March 31, 2012, the adjustments were to decrease distributions in excess of net investment income by $2,477,851 and increase accumulated net realized loss on investment and foreign currency transactions by $2,477,851 due to difference in the treatment for book and tax purposes of certain transactions involving foreign securities and currencies, investments in passive foreign investment companies, and other book to tax differences. Net investment income, net realized gain and net assets were not affected by this change.
For the year ended March 31, 2011 and March 31, 2012, the tax character of dividends paid by the Fund were $13,912,103 and $15,116,402 from ordinary income, respectively.
As of March 31, 2012, the accumulated undistributed earnings on a tax basis was $4,045,881 from ordinary income. This differs from the amount on the Statement of Assets and Liabilities primarily due to cumulative timing differences.
The United States federal income tax basis of the Fund’s investments and the net unrealized appreciation as of March 31, 2012 were as follows:
Tax Basis of | Appreciation | Depreciation | Net | Other cost | Total Net | |||||
| $911,682,558 | $144,931,762 | $(61,008,893) | $83,922,869 | $(31,546) | $83,891,323 |
The difference between book basis and tax basis is primarily attributable to deferred losses on wash sales and investments in passive foreign investment companies. Other cost basis adjustments are attributable to net depreciation on foreign currency transactions.
Under the Regulated Investment Company Modernization Act of 2010 (“the Act”), the Fund is permitted to carryforward capital losses incurred in the fiscal year ended March 31, 2012 (“post-enactment losses”) for an unlimited period. Post enactment losses are required to be utilized before the utilization of losses incurred prior to the effective date of the Act. As a result of this ordering rule, capital loss carryforwards related to taxable years beginning before March 31, 2012 (“pre-enactment losses”)
| Prudential Global Real Estate Fund | 31 |
Notes to Financial Statements
continued
may have an increased likelihood to expire unused. The Fund utilized approximately $3,573,000 of its pre-enactment losses to offset net taxable gains realized in the fiscal year ended March 31, 2012. No capital gains distributions are expected to be paid to shareholders until net gains have been realized in excess of such losses. As of March 31, 2012, the pre and post-enactment losses were approximately:
Post-Enactment Losses: | $ | 0 | ||
|
| |||
Pre-Enactment Losses: | ||||
Expiring 2016 | 345,000 | |||
Expiring 2017 | 48,041,000 | |||
Expiring 2018 | 82,582,000 | |||
Expiring 2019 | 1,800,000 | |||
|
| |||
| $ | 132,768,000 | |||
|
|
The Fund elects to treat post-October capital losses of approximately $2,644,000, as having been incurred in the following year (March 31, 2013).
Management has analyzed the Fund’s tax positions taken on federal income tax returns for all open tax years and has concluded that no provision for income tax would be required in the Fund’s financial statements for the current reporting period. The Fund’s federal and state income and federal excise tax returns for tax years for which the applicable statutes of limitations have not expired are subject to examination by the Internal Revenue Service and state departments of revenue.
Note 6. Capital
The Fund offers Class A, Class B, Class C, Class R and Class Z shares. Class A shares are sold with a front-end sales charge of up to 5.5%. All investors who purchase Class A shares in an amount of $1 million or more and sell these shares within 12 months of purchase are subject to a contingent deferred sales charge (“CDSC”) of 1%, including investors who purchase their shares through broker-dealers affiliated with Prudential. The Class A shares CDSC is waived for purchases by certain retirement and/or benefit plans. Class B shares are sold with a CDSC which declines from 5% to zero depending on the period of time the shares are held. Class C shares are sold with a CDSC of 1% during the first 12 months of purchase. Class B shares automatically convert to Class A shares on a quarterly basis approximately seven years after purchase. A special exchange privilege is also available for shareholders who
| 32 | Visit our website at www.prudentialfunds.com |
qualified to purchase Class A shares at net asset value. Class R and Class Z shares are not subject to any sales or redemption charge and are offered exclusively for sale to a limited group of investors.
Under certain circumstances, an exchange may be made from specified share classes of the Fund to one or more other share classes of the Fund as presented in the table of transactions in shares of beneficial interest.
The Fund has authorized an unlimited number of shares of beneficial interest, $.001 par value per share, divided into five classes, designated Class A, Class B, Class C, Class R and Class Z.
Transactions in shares of beneficial interest were as follows:
Class A | Shares | Amount | ||||||
Year ended March 31, 2012: | ||||||||
Shares sold | 10,331,583 | $ | 195,868,445 | |||||
Shares issued in reinvestment of dividends | 255,260 | 4,658,551 | ||||||
Shares reacquired | (4,908,575 | ) | (91,212,508 | ) | ||||
|
|
|
| |||||
Net increase (decrease) in shares outstanding before conversion | 5,678,268 | 109,314,488 | ||||||
Shares issued upon conversion from Class B and Class Z | 165,110 | 3,027,251 | ||||||
Shares reacquired upon conversion into Class Z | (1,716,904 | ) | (32,971,840 | ) | ||||
|
|
|
| |||||
Net increase (decrease) in shares outstanding | 4,126,474 | $ | 79,369,899 | |||||
|
|
|
| |||||
Year ended March 31, 2011: | ||||||||
Shares sold | 7,107,852 | $ | 131,644,912 | |||||
Shares issued in reinvestment of dividends | 287,132 | 5,285,184 | ||||||
Shares reacquired | (4,019,399 | ) | (72,286,181 | ) | ||||
|
|
|
| |||||
Net increase (decrease) in shares outstanding before conversion | 3,375,585 | 64,643,915 | ||||||
Shares issued upon conversion from Class B | 62,167 | 1,146,400 | ||||||
Shares reacquired upon conversion into Class Z | (19,261 | ) | (361,102 | ) | ||||
|
|
|
| |||||
Net increase (decrease) in shares outstanding | 3,418,491 | $ | 65,429,213 | |||||
|
|
|
| |||||
Class B | ||||||||
Year ended March 31, 2012: | ||||||||
Shares sold | 122,484 | $ | 2,320,100 | |||||
Shares issued in reinvestment of dividends | 7,622 | 138,377 | ||||||
Shares reacquired | (149,143 | ) | (2,756,088 | ) | ||||
|
|
|
| |||||
Net increase (decrease) in shares outstanding before conversion | (19,037 | ) | (297,611 | ) | ||||
Shares issued upon conversion into Class A | (84,354 | ) | (1,562,708 | ) | ||||
|
|
|
| |||||
Net increase (decrease) in shares outstanding | (103,391 | ) | $ | (1,860,319 | ) | |||
|
|
|
| |||||
Year ended March 31, 2011: | ||||||||
Shares sold | 161,233 | $ | 2,943,719 | |||||
Shares issued in reinvestment of dividends | 12,087 | 220,305 | ||||||
Shares reacquired | (103,020 | ) | (1,808,496 | ) | ||||
|
|
|
| |||||
Net increase (decrease) in shares outstanding before conversion | 70,300 | 1,355,528 | ||||||
Shares issued upon conversion into Class A | (62,787 | ) | (1,146,400 | ) | ||||
|
|
|
| |||||
Net increase (decrease) in shares outstanding | 7,513 | $ | 209,128 | |||||
|
|
|
| |||||
| Prudential Global Real Estate Fund | 33 |
Notes to Financial Statements
continued
Class C | Shares | Amount | ||||||
Year ended March 31, 2012: | ||||||||
Shares sold | 1,646,736 | $ | 31,308,713 | |||||
Shares issued in reinvestment of dividends | 40,224 | 727,755 | ||||||
Shares reacquired | (815,467 | ) | (14,930,268 | ) | ||||
|
|
|
| |||||
Net increase (decrease) in shares outstanding before conversion | 871,493 | 17,106,200 | ||||||
Shares reacquired upon conversion into Class Z | (22,545 | ) | (436,083 | ) | ||||
|
|
|
| |||||
Net increase (decrease) in shares outstanding | 848,948 | $ | 16,670,117 | |||||
|
|
|
| |||||
Year ended March 31, 2011: | ||||||||
Shares sold | 1,703,835 | $ | 31,640,444 | |||||
Shares issued in reinvestment of dividends | 39,776 | 725,094 | ||||||
Shares reacquired | (545,618 | ) | (9,761,660 | ) | ||||
|
|
|
| |||||
Net increase (decrease) in shares outstanding before conversion | 1,197,993 | 22,603,878 | ||||||
Shares reacquired upon conversion into Class Z | (17,548 | ) | (325,510 | ) | ||||
|
|
|
| |||||
Net increase (decrease) in shares outstanding | 1,180,445 | $ | 22,278,368 | |||||
|
|
|
| |||||
Class R | ||||||||
Year ended March 31, 2012: | ||||||||
Shares sold | 253,763 | $ | 4,800,438 | |||||
Shares issued in reinvestment of dividends | 2,809 | 50,992 | ||||||
Shares reacquired | (133,378 | ) | (2,464,160 | ) | ||||
|
|
|
| |||||
Net increase (decrease) in shares outstanding | 123,194 | $ | 2,387,270 | |||||
|
|
|
| |||||
Year ended March 31, 2011: | ||||||||
Shares sold | 144,009 | $ | 2,596,766 | |||||
Shares issued in reinvestment of dividends | 2,010 | 36,944 | ||||||
Shares reacquired | (40,029 | ) | (726,679 | ) | ||||
|
|
|
| |||||
Net increase (decrease) in shares outstanding | 105,990 | $ | 1,907,031 | |||||
|
|
|
| |||||
| 34 | Visit our website at www.prudentialfunds.com |
Class Z | Shares | Amount | ||||||
Year ended March 31, 2012: | ||||||||
Shares sold | 15,836,752 | $ | 298,838,624 | |||||
Shares issued in reinvestment of dividends | 311,999 | 5,693,189 | ||||||
Shares reacquired | (8,374,076 | ) | (154,001,273 | ) | ||||
|
|
|
| |||||
Net increase (decrease) in shares outstanding before conversion | 7,774,675 | 150,530,540 | ||||||
Shares issued upon conversion from Class A and Class C | 1,732,995 | 33,407,955 | ||||||
Shares reacquired upon conversion into Class A | (81,209 | ) | (1,464,575 | ) | ||||
|
|
|
| |||||
Net increase (decrease) in shares outstanding | 9,426,461 | $ | 182,473,920 | |||||
|
|
|
| |||||
Year ended March 31, 2011: | ||||||||
Shares sold | 11,661,095 | $ | 217,870,303 | |||||
Shares issued in reinvestment of dividends | 239,972 | 4,434,801 | ||||||
Shares reacquired | (2,902,451 | ) | (52,825,200 | ) | ||||
|
|
|
| |||||
Net increase (decrease) in shares outstanding before conversion | 8,998,616 | 169,479,904 | ||||||
Shares issued upon conversion from Class A and Class C | 36,387 | 686,612 | ||||||
|
|
|
| |||||
Net increase (decrease) in shares outstanding | 9,035,003 | $ | 170,166,516 | |||||
|
|
|
| |||||
Note 7. Borrowings
The Fund, along with other affiliated registered investment companies (the “Funds”), is a party to a Syndicated Credit Agreement (“SCA”) with a group of banks. The purpose of the SCA is to provide an alternative source of temporary funding for capital share redemptions. The SCA provides for a commitment of $900 million for the period December 16, 2011 through December 14, 2012. The Funds pay an annualized commitment fee of 0.08% of the unused portion of the SCA. Prior to December 16, 2011, the Funds had another Syndicated Credit Agreement of a $750 million commitment with an annualized commitment fee of 0.10% of the unused portion. Interest on any borrowings under the SCA is paid at contracted market rates. The commitment fee for the unused amount is accrued daily and paid quarterly.
The Fund did not utilize the line of credit during the year ended March 31, 2012.
Note 8. New Accounting Pronouncements
In April 2011, the Financial Accounting Standards Board (“FASB”) issued Accounting Standards Update (“ASU”) No. 2011-03 “Reconsideration of Effective Control for Repurchase Agreements.” The objective of ASU 2011-03 is to improve the accounting for repurchase agreements and other agreements that both entitle and obligate a transferor to repurchase or redeem financial assets before their maturity. Under previous guidance, whether or not to account for a transaction as a sale was based on, in part, if the entity maintained effective control over the transferred financial
| Prudential Global Real Estate Fund | 35 |
Notes to Financial Statements
continued
assets. ASU 2011-03 removes the transferor’s ability criterion from the effective control assessment. This guidance is effective prospectively for interim and annual reporting periods beginning on or after December 15, 2011. At this time, management is evaluating the implications of ASU 2011-03 and its impact on the financial statements has not been determined.
In May 2011, the FASB issued ASU No. 2011-04 “Amendments to Achieve Common Fair Value Measurement and Disclosure Requirements in U.S. GAAP and IFRSs.” ASU 2011-04 includes common requirements for measurement of and disclosure about fair value between U.S. GAAP and IFRS. ASU 2011-04 will require reporting entities to disclose quantitative information about the unobservable inputs used in the fair value measurements categorized within Level 3 of the fair value hierarchy. In addition, ASU 2011-04 will require reporting entities to make disclosures about amounts and reasons for all transfers in and out of Level 1 and Level 2 fair value measurements. The new and revised disclosures are effective for interim and annual reporting periods beginning after December 15, 2011. At this time, management is evaluating the implications of ASU 2011-04 and its impact on the financial statements has not been determined.
| 36 | Visit our website at www.prudentialfunds.com |
Financial Highlights
| Class A Shares | ||||||||||||||||||||
| Year Ended March 31, | ||||||||||||||||||||
| 2012(b) | 2011(b) | 2010(b) | 2009(b) | 2008(b) | ||||||||||||||||
| Per Share Operating Performance: | ||||||||||||||||||||
| Net Asset Value, Beginning Of Year | $19.43 | $16.83 | $9.53 | $21.33 | $31.19 | |||||||||||||||
| Income (loss) from investment operations | ||||||||||||||||||||
| Net investment income | .33 | .35 | .30 | .41 | .38 | |||||||||||||||
| Net realized and unrealized gain (loss) on investment transactions | .37 | 2.75 | 7.64 | (11.99 | ) | (5.12 | ) | |||||||||||||
| Total from investment operations | .70 | 3.10 | 7.94 | (11.58 | ) | (4.74 | ) | |||||||||||||
| Less Dividends and Distributions: | ||||||||||||||||||||
| Dividends from net investment income | (.34 | ) | (.50 | ) | (.64 | ) | (.22 | ) | (.63 | ) | ||||||||||
| Distributions from net realized gains on investments | - | - | - | - | (4.49 | ) | ||||||||||||||
| Total dividends and distributions | (.34 | ) | (.50 | ) | (.64 | ) | (.22 | ) | (5.12 | ) | ||||||||||
| Net asset value, end of year | $19.79 | $19.43 | $16.83 | $9.53 | $21.33 | |||||||||||||||
| Total Return(a) | 3.75% | 18.57% | 83.79% | (54.38)% | (17.79)% | |||||||||||||||
| Ratios/Supplemental Data: | ||||||||||||||||||||
| Net assets, end of year (000) | $368,183 | $281,427 | $186,200 | $91,991 | $204,098 | |||||||||||||||
| Average net assets (000) | $302,768 | $214,086 | $148,247 | $163,953 | $233,525 | |||||||||||||||
| Ratios to average net assets(d): | ||||||||||||||||||||
| Expenses, including distribution and service (12b-1) fees(c) | 1.27% | 1.30% | 1.37% | 1.35% | 1.31% | |||||||||||||||
| Expenses, excluding distribution and service (12b-1) fees | .97% | 1.00% | 1.07% | 1.07% | 1.06% | |||||||||||||||
| Net investment income | 1.77% | 1.92% | 2.03% | 2.58% | 1.55% | |||||||||||||||
| Portfolio turnover | 20% | 29% | 53% | 67% | 78% | |||||||||||||||
(a) Total return does not consider the effects of sales loads. Total return is calculated assuming a purchase of a share on the first day and a sale on the last day of each year reported and includes reinvestment of dividends and distributions. Total investment returns may reflect adjustments to conform to generally accepted accounting principles.
(b) Based on average shares outstanding during the year.
(c) Prior to July 31, 2008, the Distributor of the Fund had contractually agreed to limit its distribution and service (12b-1) fees to .25% of the average daily net assets for the Class A shares.
(d) Does not include expenses of the underlying funds in which the Fund invests.
See Notes to Financial Statements.
| Prudential Global Real Estate Fund | 37 |
Financial Highlights
continued
| Class B Shares | ||||||||||||||||||||
| Year Ended March 31, | ||||||||||||||||||||
| 2012(b) | 2011(b) | 2010(b) | 2009(b) | 2008(b) | ||||||||||||||||
| Per Share Operating Performance: | ||||||||||||||||||||
| Net Asset Value, Beginning Of Year | $19.29 | $16.70 | $9.47 | $21.18 | $31.02 | |||||||||||||||
| Income (loss) from investment operations | ||||||||||||||||||||
| Net Investment income | .21 | .24 | .20 | .30 | .21 | |||||||||||||||
| Net realized and unrealized gain (loss) on investment transactions | .34 | 2.70 | 7.58 | (11.87 | ) | (5.11 | ) | |||||||||||||
| Total from investment operations | .55 | 2.94 | 7.78 | (11.57 | ) | (4.90 | ) | |||||||||||||
| Less Dividends and Distributions: | ||||||||||||||||||||
| Dividends from net investment income | (.22 | ) | (.35 | ) | (.55 | ) | (.14 | ) | (.45 | ) | ||||||||||
| Distributions from net realized gains on investments | - | - | - | - | (4.49 | ) | ||||||||||||||
| Total dividends and distributions | (.22 | ) | (.35 | ) | (.55 | ) | (.14 | ) | (4.94 | ) | ||||||||||
| Net asset value, end of year | $19.62 | $19.29 | $16.70 | $9.47 | $21.18 | |||||||||||||||
| Total Return(a) | 2.97% | 17.74% | 82.55% | (54.68)% | (18.42)% | |||||||||||||||
| Ratios/Supplemental Data: | ||||||||||||||||||||
| Net assets, end of year (000) | $12,671 | $14,451 | $12,382 | $7,612 | $21,706 | |||||||||||||||
| Average net assets (000) | $13,320 | $13,028 | $11,178 | $15,393 | $28,993 | |||||||||||||||
| Ratios to average net assets(c): | ||||||||||||||||||||
| Expenses, including distribution and service (12b-1) fees | 1.97% | 2.00% | 2.07% | 2.07% | 2.06% | |||||||||||||||
| Expenses, excluding distribution and service (12b-1) fees | .97% | 1.00% | 1.07% | 1.07% | 1.06% | |||||||||||||||
| Net investment income | 1.11% | 1.33% | 1.37% | 1.87% | .85% | |||||||||||||||
| Portfolio turnover | 20% | 29% | 53% | 67% | 78% | |||||||||||||||
(a) Total return does not consider the effects of sales loads. Total return is calculated assuming a purchase of a share on the first day and a sale on the last day of each year reported and includes reinvestment of dividends and distributions. Total investment returns may reflect adjustments to conform to generally accepted accounting principles.
(b) Based on average shares outstanding during the year.
(c) Does not include the expenses of the underlying fund in which the Fund invests.
See Notes to Financial Statements.
| 38 | Visit our website at www.prudentialfunds.com |
| Class C Shares | ||||||||||||||||||||
| Year Ended March 31, | ||||||||||||||||||||
| 2012(b) | 2011(b) | 2010(b) | 2009(b) | 2008(b) | ||||||||||||||||
| Per Share Operating Performance: | ||||||||||||||||||||
| Net Asset Value, Beginning Of year | $19.29 | $16.69 | $9.47 | $21.18 | $31.02 | |||||||||||||||
| Income (loss) from investment operations | ||||||||||||||||||||
| Net Investment income | .20 | .20 | .20 | .30 | .19 | |||||||||||||||
| Net realized and unrealized gain (loss) on investment transactions | .35 | 2.75 | 7.57 | (11.87 | ) | (5.09 | ) | |||||||||||||
| Total from investment operations | .55 | 2.95 | 7.77 | (11.57 | ) | (4.90 | ) | |||||||||||||
| Less Dividends and Distributions: | ||||||||||||||||||||
| Dividends from net investment income | (.22 | ) | (.35 | ) | (.55 | ) | (.14 | ) | (.45 | ) | ||||||||||
| Distributions from net realized gains on investments | - | - | - | - | (4.49 | ) | ||||||||||||||
| Total dividends and distributions | (.22 | ) | (.35 | ) | (.55 | ) | (.14 | ) | (4.94 | ) | ||||||||||
| Net asset value, end of year | $19.62 | $19.29 | $16.69 | $9.47 | $21.18 | |||||||||||||||
| Total Return(a) | 2.97% | 17.81% | 82.44% | (54.68)% | (18.42)% | |||||||||||||||
| Ratios/Supplemental Data: | ||||||||||||||||||||
| Net assets, end of year (000) | $86,546 | $68,703 | $39,758 | $21,122 | $51,856 | |||||||||||||||
| Average net assets (000) | $78,213 | $47,954 | $32,986 | $41,377 | $54,791 | |||||||||||||||
| Ratios to average net assets(c): | ||||||||||||||||||||
| Expenses, including distribution and service (12b-1) fees | 1.97% | 2.00% | 2.07% | 2.07% | 2.06% | |||||||||||||||
| Expenses, excluding distribution and service (12b-1) fees | .97% | 1.00% | 1.07% | 1.07% | 1.06% | |||||||||||||||
| Net investment income | 1.06% | 1.14% | 1.33% | 1.87% | .79% | |||||||||||||||
| Portfolio turnover | 20% | 29% | 53% | 67% | 78% | |||||||||||||||
(a) Total return does not consider the effects of sales loads. Total return is calculated assuming a purchase of a share on the first day and a sale on the last day of each year reported and includes reinvestment of dividends and distributions. Total investment returns may reflect adjustments to conform to generally accepted accounting principles.
(b) Based on average shares outstanding during the year.
(c) Does not include the expenses of the underlying fund in which the Fund invests.
See Notes to Financial Statements.
| Prudential Global Real Estate Fund | 39 |
Financial Highlights
continued
| Class R Shares | ||||||||||||||||||
| Year Ended March 31, | June 16, 2008(d) through March 31, | |||||||||||||||||
| 2012(b) | 2011(b) | 2010(b) | 2009(b) | |||||||||||||||
| Per Share Operating Performance: | ||||||||||||||||||
| Net Asset Value, Beginning Of Period | $19.42 | $16.81 | $9.63 | $21.14 | ||||||||||||||
| Income (loss) from investment operations | ||||||||||||||||||
| Net Investment income | .28 | .30 | .23 | .14 | ||||||||||||||
| Net realized and unrealized gain (loss) on investment transactions | .37 | 2.76 | 7.56 | (11.43 | ) | |||||||||||||
| Total from investment operations | .65 | 3.06 | 7.79 | (11.29 | ) | |||||||||||||
| Less Dividends and Distributions: | ||||||||||||||||||
| Dividends from net investment income | (.30 | ) | (.45 | ) | (.61 | ) | (.22 | ) | ||||||||||
| Distributions from net realized gains on investments | - | - | - | - | ||||||||||||||
| Total dividends and distributions | (.30 | ) | (.45 | ) | (.61 | ) | (.22 | ) | ||||||||||
| Net asset value, end of period | $19.77 | $19.42 | $16.81 | $9.63 | ||||||||||||||
| Total Return(a) | 3.50% | 18.37% | 81.34% | (53.49)% | ||||||||||||||
| Ratios/Supplemental Data: | ||||||||||||||||||
| Net assets, end of period (000) | $5,523 | $3,032 | $843 | $101 | ||||||||||||||
| Average net assets (000) | $4,203 | $1,823 | $296 | $34 | ||||||||||||||
| Ratios to average net assets(f): | ||||||||||||||||||
| Expenses, including distribution and service (12b-1) fees(e) | 1.47% | 1.50% | 1.57% | 1.57% | (c) | |||||||||||||
| Expenses, excluding distribution and service (12b-1) fees | .97% | 1.00% | 1.07% | 1.07% | (c) | |||||||||||||
| Net investment income | 1.52% | 1.64% | 1.47% | 1.63% | (c) | |||||||||||||
| Portfolio turnover | 20% | 29% | 53% | 67% | (g) | |||||||||||||
(a) Total return is calculated assuming a purchase of a share on the first day and a sale on the last day of each period reported and includes reinvestment of dividends and distributions. Total returns for periods of less than one full year are not annualized. Total investment returns may reflect adjustments to conform to generally accepted accounting principles.
(b) Based on average shares outstanding during the period.
(c) Annualized.
(d) Commencement of operations.
(e) The Distributor of the Fund contractually agreed to limit its distribution and service (12b-1) fees to .50% of the average daily net assets for the Class R shares.
(f) Does not include the expenses of the underlying fund in which the Fund invests.
(g) Not annualized.
See Notes to Financial Statements.
| 40 | Visit our website at www.prudentialfunds.com |
| Class Z Shares | ||||||||||||||||||||
| Year Ended March 31, | ||||||||||||||||||||
| 2012(b) | 2011(b) | 2010(b) | 2009(b) | 2008(b) | ||||||||||||||||
| Per Share Operating Performance: | ||||||||||||||||||||
| Net Asset Value, Beginning Of Year | $19.50 | $16.89 | $9.56 | $21.38 | $31.26 | |||||||||||||||
| Income (loss) from investment operations | ||||||||||||||||||||
| Net Investment income | .38 | .37 | .34 | .44 | .39 | |||||||||||||||
| Net realized and unrealized gain (loss) on investment transactions | .36 | 2.80 | 7.67 | (12.01 | ) | (5.09 | ) | |||||||||||||
| Total from investment operations | .74 | 3.17 | 8.01 | (11.57 | ) | (4.70 | ) | |||||||||||||
| Less Dividends and Distributions: | ||||||||||||||||||||
| Dividends from net investment income | (.39 | ) | (.56 | ) | (.68 | ) | (.25 | ) | (.69 | ) | ||||||||||
| Distributions from net realized gains on investments | - | - | - | - | (4.49 | ) | ||||||||||||||
| Total dividends and distributions | (.39 | ) | (.56 | ) | (.68 | ) | (.25 | ) | (5.18 | ) | ||||||||||
| Net asset value, end of year | $19.85 | $19.50 | $16.89 | $9.56 | $21.38 | |||||||||||||||
| Total Return(a) | 3.99% | 18.97% | 84.30% | (54.22)% | (17.60)% | |||||||||||||||
| Ratios/Supplemental Data: | ||||||||||||||||||||
| Net assets, end of year (000) | $517,935 | $324,886 | $128,831 | $52,390 | $95,273 | |||||||||||||||
| Average net assets (000) | $406,631 | $191,320 | $89,126 | $87,029 | $70,158 | |||||||||||||||
| Ratios to average net assets(c): | ||||||||||||||||||||
| Expenses, including distribution and service (12b-1) fees | .97% | 1.00% | 1.07% | 1.07% | 1.06% | |||||||||||||||
| Expenses, excluding distribution and service (12b-1) fees | .97% | 1.00% | 1.07% | 1.07% | 1.06% | |||||||||||||||
| Net investment income | 2.03% | 2.01% | 2.29% | 2.81% | 1.65% | |||||||||||||||
| Portfolio turnover | 20% | 29% | 53% | 67% | 78% | |||||||||||||||
(a) Total return is calculated assuming a purchase of a share on the first day and a sale on the last day of each year reported and includes reinvestment of dividends and distributions. Total investment returns may reflect adjustments to conform to generally accepted accounting principles.
(b) Based on average shares outstanding during the year.
(c) Does not include the expenses of the underlying fund in which the Fund invests.
See Notes to Financial Statements.
| Prudential Global Real Estate Fund | 41 |
Report of Independent Registered Public
Accounting Firm
The Board of Trustees and Shareholders
Prudential Investment Portfolios 12:
We have audited the accompanying statement of assets and liabilities of Prudential Global Real Estate Fund (hereafter referred to as the “Fund”), a series of Prudential Investment Portfolios 12, including the portfolio of investments, as of March 31, 2012, and the related statement of operations for the year then ended, the statement of changes in net assets for each of the years in the two-year period then ended, and the financial highlights for each of the years in the five-year period then ended. These financial statements and financial highlights are the responsibility of the Fund’s management. Our responsibility is to express an opinion on these financial statements and financial highlights based on our audits.
We conducted our audit in accordance with the standards of the Public Company Accounting Oversight Board (United States). Those standards require that we plan and perform the audit to obtain reasonable assurance about whether the financial statements and financial highlights are free of material misstatement. An audit includes examining, on a test basis, evidence supporting the amounts and disclosures in the financial statements. Our procedures included confirmation of securities owned as of March 31, 2012, by correspondence with the custodian, transfer agent and brokers or by other appropriate auditing procedures where replies from brokers were not received. An audit also includes assessing the accounting principles used and significant estimates made by management, as well as evaluating the overall financial statement presentation. We believe that our audits provide a reasonable basis for our opinion.
In our opinion, the financial statements and financial highlights referred to above present fairly, in all material respects, the financial position of the Fund as of March 31, 2012, and the results of its operations, the changes in its net assets and the financial highlights for the periods described in the first paragraph above, in conformity with U.S. generally accepted accounting principles.

New York, New York
May 21, 2012
| 42 | Visit our website at www.prudentialfunds.com |
Federal Income Tax Information
(Unaudited)
For the year ended March 31, 2012, the Fund reports the maximum amount allowable, but not less than 44.90% of the ordinary income dividends paid during the year as qualified dividend income in accordance with Section 854 of the Internal Revenue Code.
In January 2013, you will be advised on IRS Form 1099 DIV or substitute 1099 DIV as to the federal tax status of the dividends received by you in calendar year 2012.
| Prudential Global Real Estate Fund | 43 |
INFORMATION ABOUT BOARD MEMBERS AND OFFICERS
(Unaudited)
Information about Board Members and Officers is set forth below. Board Members who are not deemed to be “interested persons” of the Fund, as defined in the 1940 Act, are referred to as “Independent Board Members.” Board Members who are deemed to be “interested persons” of the Fund are referred to as “Interested Board Members.” The Board Members are responsible for the overall supervision of the operations of the Fund and perform the various duties imposed on the directors of investment companies by the 1940 Act.
Independent Board Members(1) | ||||
Name, Address, Age Position(s) Portfolios Overseen |
Principal Occupation(s) During Past Five Years |
Other Directorships Held | ||
Kevin J. Bannon (59) Board Member Portfolios Overseen: 61 |
Managing Director (since April 2008) and Chief Investment Officer (since October 2008) of Highmount Capital LLC (registered investment adviser); formerly Executive Vice President and Chief Investment Officer (April 1993-August 2007) of Bank of New York Company; President (May 2003-May 2007) of BNY Hamilton Family of Mutual Funds. |
Director of Urstadt Biddle Properties (since September 2008). | ||
Linda W. Bynoe (59) Board Member Portfolios Overseen: 61 |
President and Chief Executive Officer (since March 1995) and formerly Chief Operating Officer (December 1989-February 1995) of Telemat Ltd. (management consulting); formerly Vice President (January 1985-June 1989) at Morgan Stanley & Co (broker-dealer). |
Director of Simon Property Group, Inc. (retail real estate) (May 2003-May 2012); Director of Anixter International, Inc. (communication products distributor) (since January 2006); Director of Northern Trust Corporation (financial services) (since April 2006); Trustee of Equity Residential (residential real estate) (since December 2009). | ||
Michael S. Hyland, CFA (66) Board Member Portfolios Overseen: 61 |
Independent Consultant (since February 2005); formerly Senior Managing Director (July 2001-February 2005) of Bear Stearns & Co, Inc.; Global Partner, INVESCO (1999-2001); Managing Director and President of Salomon Brothers Asset Management (1989-1999). |
None. | ||
Douglas H. McCorkindale (72) Board Member Portfolios Overseen: 61 |
Formerly Chairman (February 2001-June 2006), Chief Executive Officer (June 2000-July 2005), President (September 1997-July 2005) and Vice Chairman (March 1984-May 2000) of Gannett Co. Inc. (publishing and media). |
Director of Lockheed Martin Corp. (aerospace and defense) (since May 2001). | ||
Prudential Global Real Estate Fund
Independent Board Members(1) | ||||
Name, Address, Age Position(s) Portfolios Overseen |
Principal Occupation(s) During Past Five Years |
Other Directorships Held | ||
Stephen P. Munn (69) Board Member Portfolios Overseen: 61 |
Lead Director (since 2007) and formerly Chairman (1993-2007) of Carlisle Companies Incorporated (manufacturer of industrial products). |
Lead Director (since 2007) of Carlisle Companies Incorporated (manufacturer of industrial products). | ||
Richard A. Redeker (68) Board Member & Independent Chair Portfolios Overseen: 61 |
Retired Mutual Fund Senior Executive (44 years); Management Consultant; Independent Directors Council (organization of 2,800 Independent Mutual Fund Directors)-Executive Committee, Chair of Policy Steering Committee, Governing Council. |
None. | ||
Robin B. Smith (72) Board Member Portfolios Overseen: 61 |
Chairman of the Board (since January 2003) of Publishers Clearing House (direct marketing); Member of the Board of Directors of ADLPartner (marketing) (since December 2010); formerly Chairman and Chief Executive Officer (August 1996-January 2003) of Publishers Clearing House. |
Formerly Director of BellSouth Corporation (telecommunications) (1992-2006). | ||
Stephen G. Stoneburn (68) Board Member Portfolios Overseen: 61 |
Chairman, (since July 2011), President and Chief Executive Officer (since June 1996) of Quadrant Media Corp. (publishing company); formerly President (June 1995-June 1996) of Argus Integrated Media, Inc.; Senior Vice President and Managing Director (January 1993-1995) of Cowles Business Media; Senior Vice President of Fairchild Publications, Inc. (1975-1989). |
None. | ||
| ||||
Interested Board Members(1)
| ||||
Name, Address, Age Position(s) Portfolios Overseen |
Principal Occupation(s) During Past Five Years |
Other Directorships Held | ||
Stuart S. Parker (49) Board Member & President Portfolios Overseen: 61 |
President of Prudential Investments LLC (since January 2012); Executive Vice President of Jennison Associates LLC and Head of Retail Distribution of Prudential Investments LLC (June 2005 - December 2011). |
None. | ||
Visit our website at www.prudentialfunds.com
Interested Board Members(1)
| ||||
Name, Address, Age Position(s) Portfolios Overseen |
Principal Occupation(s) During Past Five Years |
Other Directorships Held | ||
Scott E. Benjamin (39) Board Member & Vice President Portfolios Overseen: 61 |
Executive Vice President (since June 2009) of Prudential Investments LLC and Prudential Investment Management Services LLC; Executive Vice President (since September 2009) of AST Investment Services, Inc.; Senior Vice President of Product Development and Marketing, Prudential Investments (since February 2006); Vice President of Product Development and Product Management, Prudential Investments (2003-2006). |
None. | ||
(1) The year that each Board Member joined the Board is as follows:
Kevin J. Bannon, 2008; Linda W. Bynoe, 2005; Michael S. Hyland, 2008; Douglas H. McCorkindale, 2003; Stephen P. Munn, 2008; Richard A. Redeker, 2003; Robin B. Smith, 1997; Stephen G. Stoneburn, 2001; Stuart S. Parker, Board Member and President since 2012; Scott E. Benjamin, Board Member since 2010 and Vice President since 2009.
Fund Officers(a)(1)
| ||
Name, Address and Age Position with Fund |
Principal Occupation(s) During Past Five Years | |
Judy A. Rice (64) Vice President |
President, Chief Executive Officer (May 2011-Present) and Executive Vice President (December 2008-May 2011) of Prudential Investment Management Services LLC; Formerly President, Chief Executive Officer, Chief Operating Officer and Officer-In-Charge (February 2003-December 2011) of Prudential Investments LLC; formerly President, Chief Executive Officer and Officer-In-Charge (April 2003-December 2011) of Prudential Mutual Fund Services LLC; formerly Member of the Board of Directors of Jennison Associates LLC (November 2010-December 2011); formerly Vice President (February 1999-April 2006) of Prudential Investment Management Services LLC; formerly President, COO, CEO and Manager of PIFM Holdco, LLC (April 2006-December 2011); formerly President, Chief Executive Officer, Chief Operating Officer and Officer-In-Charge (May 2003-June 2005) and Director (May 2003-March 2006) and Executive Vice President (June 2005-March 2006) of AST Investment Services, Inc.; Member of Board of Governors of the Investment Company Institute. |
Prudential Global Real Estate Fund
Fund Officers(a)(1)
| ||
Name, Address and Age Position with Fund |
Principal Occupation(s) During Past Five Years | |
Kathryn L. Quirk (59) Chief Legal Officer |
Vice President and Corporate Counsel (since September 2004) of Prudential; Executive Vice President, Chief Legal Officer and Secretary (since July 2005) of PI and Prudential Mutual Fund Services LLC; Vice President and Corporate Counsel (since June 2005) and Secretary (since February 2006) of AST Investment Services, Inc.; formerly Senior Vice President and Assistant Secretary (November 2004-August 2005) of PI; formerly Assistant Secretary (June 2005-February 2006) of AST Investment Services, Inc.; formerly Managing Director, General Counsel, Chief Compliance Officer, Chief Risk Officer and Corporate Secretary (1997-2002) of Zurich Scudder Investments, Inc. | |
Deborah A. Docs (54) Secretary |
Vice President and Corporate Counsel (since January 2001) of Prudential; Vice President (since December 1996) and Assistant Secretary (since March 1999) of PI; formerly Vice President and Assistant Secretary (May 2003-June 2005) of AST Investment Services, Inc. | |
Jonathan D. Shain (53) Assistant Secretary |
Vice President and Corporate Counsel (since August 1998) of Prudential; Vice President and Assistant Secretary (since May 2001) of PI; Vice President and Assistant Secretary (since February 2001) of PMFS; formerly Vice President and Assistant Secretary (May 2003-June 2005) of AST Investment Services, Inc. | |
Claudia DiGiacomo (37) Assistant Secretary |
Vice President and Corporate Counsel (since January 2005) of Prudential; Vice President and Assistant Secretary of PI (since December 2005); Associate at Sidley Austin Brown & Wood LLP (1999-2004). | |
John P. Schwartz (41) Assistant Secretary |
Vice President and Corporate Counsel (since April 2005) of Prudential; Vice President and Assistant Secretary of PI (since December 2005); Associate at Sidley Austin Brown & Wood LLP (1997-2005). | |
Andrew R. French (49) Assistant Secretary |
Vice President and Corporate Counsel (since February 2010) of Prudential; formerly Director and Corporate Counsel (2006-2010) of Prudential; Vice President and Assistant Secretary (since January 2007) of PI; Vice President and Assistant Secretary (since January 2007) of PMFS. | |
Timothy J. Knierim (53) Chief Compliance Officer |
Chief Compliance Officer of Prudential Investment Management, Inc. (since July 2007); formerly Chief Risk Officer of PIM and PI (2002-2007) and formerly Chief Ethics Officer of PIM and PI (2006-2007). | |
Valerie M. Simpson (53) Deputy Chief Compliance Officer |
Chief Compliance Officer (since April 2007) of PI and AST Investment Services, Inc.; formerly Vice President-Financial Reporting (June 1999-March 2006) for Prudential Life and Annuities Finance. | |
Theresa C. Thompson (49) Deputy Chief Compliance Officer |
Vice President, Compliance, PI (since April 2004); and Director, Compliance, PI (2001-2004). | |
Visit our website at www.prudentialfunds.com
Fund Officers(a)(1)
| ||
Name, Address and Age Position with Fund |
Principal Occupation(s) During Past Five Years | |
Richard W. Kinville (43) Anti-Money Laundering Compliance Officer |
Vice President, Corporate Compliance, Anti-Money Laundering Unit (since January 2005) of Prudential; committee member of the American Council of Life Insurers Anti-Money Laundering and Critical Infrastructure Committee (since January 2007); formerly Investigator and Supervisor in the Special Investigations Unit for the New York Central Mutual Fire Insurance Company (August 1994-January 1999); Investigator in AXA Financial’s Internal Audit Department and Manager in AXA’s Anti-Money Laundering Office (January 1999-January 2005); first chair of the American Council of Life Insurers Anti-Money Laundering and Critical Infrastructure Committee (June 2007-December 2009). | |
Grace C. Torres (52) Treasurer and Principal Financial and Accounting Officer |
Assistant Treasurer (since March 1999) and Senior Vice President (since September 1999) of PI; Assistant Treasurer (since May 2003) and Vice President (since June 2005) of AST Investment Services, Inc.; Senior Vice President and Assistant Treasurer (since May 2003) of Prudential Annuities Advisory Services, Inc.; formerly Senior Vice President (May 2003-June 2005) of AST Investment Services, Inc. | |
M. Sadiq Peshimam (48) Assistant Treasurer |
Vice President (since 2005) of Prudential Investments LLC. | |
Peter Parrella (53) Assistant Treasurer |
Vice President (since 2007) and Director (2004-2007) within Prudential Mutual Fund Administration; formerly Tax Manager at SSB Citi Fund Management LLC (1997-2004). | |
(a) Excludes Mr. Parker and Mr. Benjamin, interested Board Members who also serve as President and Vice President, respectively.
(1) The year that each individual became an officer of the Fund is as follows:
Judy A. Rice, 2012; Kathryn L. Quirk, 2005; Deborah A. Docs, 2005; Jonathan D. Shain, 2005; Claudia DiGiacomo, 2005; John P. Schwartz, 2006; Andrew R. French, 2006; Timothy J. Knierim, 2007; Valerie M. Simpson, 2007; Grace C. Torres, 1997; M. Sadiq Peshimam, 2006; 2006; Peter Parrella, 2007, Theresa C. Thompson, 2008; Richard W. Kinville, 2011.
Explanatory Notes to Tables:
| n | Board Members are deemed to be “Interested,” as defined in the 1940 Act, by reason of their affiliation with Prudential Investments LLC and/or an affiliate of Prudential Investments LLC. |
| n | Unless otherwise noted, the address of all Board Members and Officers is c/o Prudential Investments LLC, Gateway Center Three, 100 Mulberry Street, Newark, New Jersey 07102-4077. |
| n | There is no set term of office for Board Members or Officers. The Board Members have adopted a retirement policy, which calls for the retirement of Board Members on December 31 of the year in which they reach the age of 75. |
| n | “Other Directorships Held” includes only directorships of companies required to register or file reports with the SEC under the 1934 Act (that is, “public companies”) or other investment companies registered under the 1940 Act. |
| n | “Portfolios Overseen” includes all investment companies managed by Prudential Investments LLC. The investment companies for which PI serves as manager include the Prudential Investments Mutual Funds, The Prudential Variable Contract Accounts, Target Mutual Funds, The Prudential Series Fund, Prudential’s Gibraltar Fund, Inc. and the Advanced Series Trust. |
Prudential Global Real Estate Fund
| n MAIL | n TELEPHONE | n WEBSITE | ||
Gateway Center Three 100 Mulberry Street Newark, NJ 07102 | (800) 225-1852 | www.prudentialfunds.com |
| PROXY VOTING |
| The Board of Trustees of the Fund has delegated to the Fund’s investment subadviser the responsibility for voting any proxies and maintaining proxy recordkeeping with respect to the Fund. A description of these proxy voting policies and procedures is available without charge, upon request, by calling (800) 225-1852 or by visiting the Securities and Exchange Commission’s website at www.sec.gov. Information regarding how the Fund voted proxies relating to portfolio securities during the most recent 12-month period ended June 30 is available on the Fund’s website and on the Commission’s website. |
| TRUSTEES |
| Kevin J. Bannon • Scott E. Benjamin • Linda W. Bynoe • Michael S. Hyland • Douglas H. McCorkindale • Stephen P. Munn • Stuart S. Parker • Richard A. Redeker • Robin B. Smith • Stephen G. Stoneburn |
| OFFICERS |
| Stuart S. Parker, President • Judy A. Rice, Vice President • Scott E. Benjamin, Vice President • Grace C. Torres, Treasurer and Principal Financial and Accounting Officer • Kathryn L. Quirk, Chief Legal Officer • Deborah A. Docs, Secretary • Timothy J. Knierim, Chief Compliance Officer • Valerie M. Simpson, Deputy Chief Compliance Officer • Theresa C. Thompson, Deputy Chief Compliance Officer • Richard W. Kinville, Anti-Money Laundering Compliance Officer • Jonathan D. Shain, Assistant Secretary • Claudia DiGiacomo, Assistant Secretary • John P. Schwartz, Assistant Secretary • Andrew R. French, Assistant Secretary • M. Sadiq Peshimam, Assistant Treasurer • Peter Parrella, Assistant Treasurer |
| MANAGER | Prudential Investments LLC | Gateway Center Three 100 Mulberry Street | ||
| ||||
| INVESTMENT SUBADVISER | Prudential Real Estate Investors | 7 Giralda Farms Madison, NJ 07940 | ||
| ||||
| DISTRIBUTOR | Prudential Investment Management Services LLC | Gateway Center Three 100 Mulberry Street Newark, NJ 07102 | ||
| ||||
| CUSTODIAN | The Bank of New York Mellon | One Wall Street New York, NY 10286 | ||
| ||||
| TRANSFER AGENT | Prudential Mutual Fund Services LLC | PO Box 9658 Providence, RI 02940 | ||
| ||||
| INDEPENDENT REGISTERED PUBLIC ACCOUNTING FIRM | KPMG LLP | 345 Park Avenue New York, NY 10154 | ||
| ||||
| FUND COUNSEL | Willkie Farr & Gallagher LLP | 787 Seventh Avenue New York, NY 10019 | ||
| An investor should consider the investment objectives, risks, charges, and expenses of the Fund carefully before investing. The prospectus and summary prospectus contain this and other information about the Fund. An investor may obtain a prospectus and summary prospectus by visiting our website at www.prudentialfunds.com or by calling (800) 225-1852. The prospectus and summary prospectus should be read carefully before investing. |
| E-DELIVERY |
| To receive your mutual fund documents online, go to www.prudentialfunds.com/edelivery and enroll. Instead of receiving printed documents by mail, you will receive notification via email when new materials are available. You can cancel your enrollment or change your email address at any time by visiting the website address above. |
| SHAREHOLDER COMMUNICATIONS WITH TRUSTEES |
| Shareholders can communicate directly with the Board of Trustees by writing to the Chair of the Board, Prudential Global Real Estate Fund, Prudential Investments, Attn: Board of Trustees, 100 Mulberry Street, Gateway Center Three, Newark, NJ 07102. Shareholders can communicate directly with an individual Trustee by writing to the same address. Communications are not screened before being delivered to the addressee. |
| AVAILABILITY OF PORTFOLIO SCHEDULE |
| The Fund files its complete schedule of portfolio holdings with the Securities and Exchange Commission for the first and third quarters of each fiscal year on Form N-Q. The Fund’s Forms N-Q are available on the Commission’s website at www.sec.gov. The Fund’s Forms N-Q may also be reviewed and copied at the Commission’s Public Reference Room in Washington, D.C. Information on the operation and location of the Public Reference Room may be obtained by calling (202) 551-8090. The Fund’s schedule of portfolio holdings is also available on the Fund’s website as of the end of each month. |
| The Fund’s Statement of Additional Information contains additional information about the Fund’s Trustees and is available without charge, upon request, by calling (800) 225-1852. |
Mutual Funds:
| ARE NOT INSURED BY THE FDIC OR ANY FEDERAL GOVERNMENT AGENCY | MAY LOSE VALUE | ARE NOT A DEPOSIT OF OR GUARANTEED BY ANY BANK OR ANY BANK AFFILIATE |
PRUDENTIAL GLOBAL REAL ESTATE FUND
| SHARE CLASS | A | B | C | R | Z | |||||
| NASDAQ | PURAX | PURBX | PURCX | PURRX | PURZX | |||||
| CUSIP | 744336108 | 744336207 | 744336306 | 744336405 | 744336504 |
MF182E 0224700-00001-00

PRUDENTIAL INVESTMENTS»MUTUAL FUNDS
PRUDENTIAL US REAL ESTATE FUND
ANNUAL REPORT · MARCH 31, 2012
Fund Type
Sector Stock
Objective
Capital appreciation and income
This report is not authorized for distribution to prospective investors unless preceded or accompanied by a current prospectus.
The views expressed in this report and information about the Fund’s portfolio holdings are for the period covered by this report and are subject to change thereafter.
Prudential Investments, Prudential, the Prudential logo, the Rock symbol, and Bring Your Challenges are service marks of Prudential Financial, Inc. and its related entities, registered in many jurisdictions worldwide.

|  |

May 15, 2012
Dear Shareholder:
After an extraordinary career at Prudential, Judy Rice retired at the end of 2011 as President of Prudential Investments and President and Trustee of the Prudential US Real Estate Fund (the Fund). While she will remain as Chairman of Prudential Investments until the end of 2012, I was named to succeed her as President of Prudential Investments and President and Trustee of the Fund effective January 1, 2012. I previously served as Executive Vice President of Retail Mutual Fund Distribution for Prudential Investments for the past six years.
Since this is my first letter to shareholders, I would like to recognize Judy for the significant contributions she made in building the Prudential Investments fund family and her unflagging commitment to helping investors like you meet the challenges of a rapidly changing investment environment. My goal is to build on Judy’s accomplishments, with a particular focus on delivering the solutions you need to address your financial goals.
I hope you find the annual report for the Fund informative. We recognize that ongoing market volatility may make it a difficult time to be an investor. We continue to believe a prudent response to uncertainty is to maintain a diversified portfolio, including stock and bond mutual funds consistent with your tolerance for risk, time horizon, and financial goals.
Your financial professional can help you create a diversified investment plan that reflects your personal investor profile and risk tolerance. Keep in mind that diversification and asset allocation strategies do not assure a profit or protect against loss in declining markets. We encourage you to call your financial professional before making any investment decision.
Prudential Investments provides a wide range of mutual funds to choose from that can help you make progress toward your financial goals. Our funds offer the experience, resources, and professional discipline of Prudential Financial’s affiliated asset managers. Thank you for choosing the Prudential Investments family of mutual funds.
Sincerely,

Stuart S. Parker, President
Prudential US Real Estate Fund
| Prudential US Real Estate Fund | 1 |
Your Fund’s Performance
Performance data quoted represent past performance. Past performance does not guarantee future results. The investment return and principal value of an investment will fluctuate, so that an investor’s shares, when redeemed, may be worth more or less than their original cost. Current performance may be lower or higher than the past performance data quoted. An investor may obtain performance data as of the most recent month-end by visiting our website at www.prudentialfunds.com or by calling (800) 225-1852. The maximum initial sales charge is 5.50% (Class A shares). Gross operating expenses: Class A, 2.30%; Class B, 2.77%; Class C, 3.02%; Class Z, 2.08%. Net operating expenses: Class A, 1.60%; Class B, 2.35%; Class C, 2.35%; Class Z, 1.35%, after contractual reduction through 12/31/2013.
Cumulative Total Returns (Without Sales Charges) as of 3/31/12 |
| |||||||
| One Year | Since Inception | |||||||
Class A | 10.09 | % | 18.83 | % | ||||
Class B | 9.46 | 17.89 | ||||||
Class C | 9.28 | 17.69 | ||||||
Class Z | 10.36 | 19.19 | ||||||
FTSE NAREIT Equity REITs Index | 12.83 | 19.98 | ||||||
Lipper Average | 11.97 | 19.04 | ||||||
Average Annual Total Returns (With Sales Charges) as of 3/31/12 |
| |||||||
| One Year | Since Inception | |||||||
Class A | 4.04 | % | 9.50 | % | ||||
Class B | 4.46 | 10.71 | ||||||
Class C | 8.28 | 13.59 | ||||||
Class Z | 10.36 | 14.72 | ||||||
FTSE NAREIT Equity REITs Index | 12.83 | 15.69 | ||||||
Lipper Average | 11.97 | 14.95 | ||||||
Average Annual Total Returns (Without Sales Charges) as of 3/31/12 |
| |||||||
| One Year | Since Inception | |||||||
Class A | 10.09 | % | 14.45 | % | ||||
Class B | 9.46 | 13.74 | ||||||
Class C | 9.28 | 13.59 | ||||||
Class Z | 10.36 | 14.72 | ||||||
| 2 | Visit our website at www.prudentialfunds.com |
Growth of a $10,000 Investment
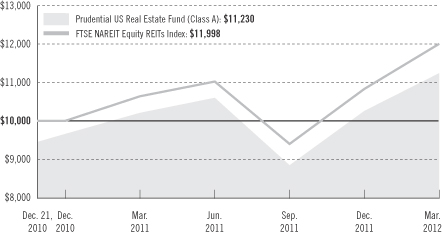
The graph compares a $10,000 investment in the Prudential US Real Estate Fund (Class A shares) with a similar investment in the FTSE NAREIT Equity REITs Index, by portraying the initial account values at the commencement of operations for Class A shares (December 21, 2010) and the account values at the end of the current fiscal period (March 31, 2012) as measured on a quarterly basis. For purposes of the graph, and unless otherwise indicated, it has been assumed that (a) the maximum applicable front-end sales charge was deducted from the initial $10,000 investment in Class A shares; (b) all recurring fees (including management fees) were deducted; and (c) all dividends and distributions were reinvested. The line graph provides information for Class A shares only. As indicated in the tables provided earlier, performance for Class B, Class C, and Class Z shares will vary due to the differing charges and expenses applicable to each share class (as explained in the following paragraphs). Without waiver of fees and/or expense reimbursement, if any, the returns would have been lower.
Past performance does not predict future performance. Total returns and the ending account values in the graph include changes in share price and reinvestment of dividends and capital gains distributions in a hypothetical investment for the periods shown. The Fund’s total returns do not reflect the deduction of income taxes on an individual’s investment. Taxes may reduce your actual investment returns on income or gains paid by the Fund or any gains you may realize if you sell your shares.
Source: Prudential Investments LLC and Lipper Inc. Performance figures may reflect fee waivers and/or expense reimbursements. In the absence of such fee waivers and/or expense reimbursements, total returns would be lower.
Inception date: 12/21/10
The average annual total returns take into account applicable sales charges. Class A, Class B, and Class C shares are subject to an annual distribution and service (12b-1) fee of 0.30%, 1.00%, and 1.00%, respectively. Under certain limited circumstances, an exchange may be made from Class A shares to Class Z shares of the fund.
| Prudential US Real Estate Fund | 3 |
Your Fund’s Performance (continued)
Investors who purchase Class A shares in the amount of $1 million or more and sell these shares within 12 months of purchase are not subject to a front-end sales charge but are subject to a contingent deferred sales charge (CDSC) of 1%. The Class A shares CDSC is waived for purchases by certain retirement or benefit plans. Under certain circumstances, an exchange may be made from specified share classes of the Fund to one or more other share classes of the Fund. Class B shares are not subject to a front-end sales charge but are subject to a declining CDSC of 5%, 4%, 3%, 2%, 1%, and 1%, respectively, for the first six years after purchase and a 12b-1 fee of 1% annually. Approximately seven years after purchase, Class B shares will automatically convert to Class A shares on a quarterly basis. Class C shares are not subject to a front-end sales charge but are subject to a CDSC of 1% for shares sold within 12 months from the date of purchase and an annual 12b-1 fee of 1%. Class Z shares are not subject to a sales charge or a 12b-1 fee. The returns in the tables and graph do not reflect the deduction of taxes that a shareholder would pay on Fund distributions or following the redemption of Fund shares.
Benchmark Definitions
FTSE NAREIT Equity REITs Index
The Financial Times Stock Exchange National Association of Real Estate Investment Trusts (FTSE NAREIT) Equity REITs Index is an unmanaged index which measures the performance of all real estate investment trusts listed on the New York Stock Exchange, the NASDAQ National Market, and the NYSE Amex Equities.
Lipper Equity Real Estate Funds Average
Funds in the Lipper Equity Real Estate Funds Average (Lipper Average) invest their portfolios primarily in shares of domestic companies engaged in the real estate industry.
Investors cannot invest directly in an index. The securities in the Index may be very different from those in the Fund. Their returns do not include the effect of the sales charges and operating expenses of a mutual fund and would be lower if they did. Returns for the Lipper Average reflect the deduction of operating expenses, but not sales charges or taxes. The Since Inception returns for the Index and the Lipper Average are measured from the closest month-end to inception date and not from the Fund’s actual inception date.
Five Largest Holdings expressed as a percentage of net assets as of 3/31/12 |
| |||
Simon Property Group, Inc., Retail REITs | 11.3 | % | ||
Ventas, Inc., Specialized REITs | 5.4 | |||
Host Hotels & Resorts, Inc., Specialized REITs | 4.7 | |||
Public Storage, Specialized REITs | 4.4 | |||
AvalonBay Communities, Inc., Residential REITs | 4.1 | |||
Holdings reflect only long-term investments and are subject to change.
Five Largest Industries expressed as a percentage of net assets as of 3/31/12 |
| |||
Retail REITs | 27.3 | % | ||
Specialized REITs | 23.9 | |||
Residential REITs | 19.9 | |||
Office REITs | 13.2 | |||
Diversified REITs | 6.5 | |||
Industry weightings reflect only long-term investments and are subject to change.
| 4 | Visit our website at www.prudentialfunds.com |
Strategy and Performance Overview
How did the Fund perform?
The Prudential US Real Estate Fund’s Class A shares returned 10.09% for the 12-month reporting period that ended March 31, 2012. The Class A shares underperformed the 12.83% gain of the Fund’s benchmark, the Financial Times Stock Exchange National Association of Real Estate Investment Trusts (FTSE NAREIT) Equity REITs Index. The Class A shares also lagged the 11.97% gain of the Lipper Equity Real Estate Funds Average.
How did the market for commercial real estate securities in the United States perform?
Conditions in the market improved significantly during the reporting period that began April 1, 2011. The period from June 30, 2011 through September 30, 2011, was challenging due to increasing investor risk aversion caused by a worsening sovereign debt crisis in the euro zone and fears that the global economy might slide into a double-dip recession.
The second half of the reporting period saw prices of commercial real estate securities in the United States rally so strongly that the FTSE NAREIT Equity REITs Index finished the entire period with a double-digit gain. Strong economic data (particularly private-sector-jobs growth), reduced vacancies, and, in certain cases, rent increases drove advances in the U.S. property market. REITs in the United States continued to strengthen their balance sheets, raise huge sums of capital at attractive prices, and began to deploy capital by acquiring properties that added to net asset value (NAV) and cash flow growth.
Generally properties with clearly identifiable revenue growth (e.g., apartments and self storage) performed better during the period than properties with less reliable sources of revenue growth (e.g., office and hotels). However, increasing risk appetite in the second half meant that investors were more willing to purchase securities of companies with volatile revenue streams.
Which holdings or group of holdings added most to the Fund’s return?
The Fund benefited from several tactical and strategic shifts during the period. Fundamentals for the self-storage sector were clearly improving at an attractive rate. These companies had the best opportunity to increase occupancies and rates over the past year, yet still traded at attractive relative valuations. The Fund benefited from having an overweight exposure to the sector versus the FTSE NAREIT Equity REITs Index over the past 12 months, as the companies delivered significant growth in net operating income.
Moreover, the Fund benefited from favorable selection in its office REIT holdings, which focused on areas with identifiable job growth. It had, and continues to have,
| Prudential US Real Estate Fund | 5 |
Strategy and Performance Overview (continued)
an overweight exposure to West Coast office companies versus the FTSE NAREIT Equity REITs Index. As the period progressed, certain West Coast markets, such as San Francisco, witnessed sharp rent spikes. Therefore, the Fund’s exposure to California-based Kilroy Realty Corporation and Douglas Emmett, Inc. proved beneficial.
PREI has recently increased the Fund’s exposure to retail shopping center companies, as small shop space fundamentals show improvement, and to warehouse companies, as growth in U.S. gross domestic product and consumer spending and sentiment increase.
Which holdings or group of holdings detracted most from the Fund’s return?
The Fund had an underweight exposure to apartments, particularly in the first half of the reporting period, due to concerns about valuation and decelerating growth. This strategy detracted from its performance versus the FTSE NAREIT Equity REITs Index.
The Fund’s relative performance was also weakened by its overweight exposure to the hotel sector and poor security selection within that sector. Risk aversion caused by concerns about the potential for a global double-dip recession and the European sovereign debt crisis negatively affected the hotel sector. However, hotel fundamentals continued to improve during the period, with revenue-per-available-room increasing in the mid to high single-digit range.
What is PREI’s outlook for the U.S. real estate securities market?
While large economic questions continue to loom, fundamentals of property markets have remained rather resilient. PREI expects the next 12 months to show further gradual improvement in occupancies, and, in many cases, growth in rents. There will be certain markets and types of properties across the world where supply/demand imbalances will result in rent spikes. However, moderate global economic growth, low interest rates, and historically low increases in the supply of new properties should provide a good backdrop for gradual absorption of vacant space and rent growth.
PREI expects transaction volume to increase in the next 12 months, as capital markets in the United States and Asia remain open and REITs have the opportunity to provide cash flow and NAV growth through property acquisitions. It expects property development to remain muted, with the exception of U.S. apartments and select build-to-suit office and industrial space. Property companies in the United States trade in line, or at a slight premium, to their NAVs as investors have more conviction about prospects for cash flow growth relative to property companies throughout the world that trade at discounts to their NAV.
| 6 | Visit our website at www.prudentialfunds.com |
Comments on Largest Holdings
| 11.3% | Simon Property Group, Inc., Retail REITs |
Simon Property Group, Inc. is a self-administered and self-managed real estate investment trust. The Company owns, develops, and manages retail real estate properties including regional malls, outlet centers, community/lifestyle centers, and international properties.
| 5.4% | Ventas, Inc., Specialized REITs |
Ventas, Inc. is a real estate investment trust that owns senior housing communities, skilled nursing facilities, hospitals, and medical office buildings in the United States and Canada.
| 4.7% | Host Hotels & Resorts, Inc., Specialized REITs |
Host Hotels & Resorts Inc. is a real estate investment trust that owns or holds controlling interests in upscale and luxury full-service hotel lodging properties in areas that include Washington, D.C., Toronto and Calgary, Canada, Mexico City, Mexico, and Santiago, Chile, as well as Italy, Spain, Poland, Belgium, The Netherlands, and the United Kingdom.
| 4.4% | Public Storage, Specialized REITs |
Public Storage is a real estate investment trust. The trust’s principal business activities include the acquisition, development, ownership, and operation of self-storage facilities in the United States. Public Storage also owns an equity interest in an owner and operator of self-storage facilities in Europe.
| 4.1% | AvalonBay Communities, Inc., Residential REITs |
AvalonBay Communities, Inc. develops, redevelops, acquires, owns, and operates multifamily communities in the United States.
| Prudential US Real Estate Fund | 7 |
Fees and Expenses (Unaudited)
As a shareholder of the Fund, you incur two types of costs: (1) transaction costs, including sales charges (loads) on purchase payments and redemptions, as applicable, and (2) ongoing costs, including management fees, distribution and/or service (12b-1) fees, and other Fund expenses, as applicable. This example is intended to help you understand your ongoing costs (in dollars) of investing in the Fund and to compare these costs with the ongoing costs of investing in other mutual funds.
The example is based on an investment of $1,000 invested on October 1, 2011, at the beginning of the period, and held through the six-month period ended March 31, 2012. The example is for illustrative purposes only; you should consult the Prospectus for information on initial and subsequent minimum investment requirements.
The Fund’s transfer agent may charge additional fees to holders of certain accounts that are not included in the expenses shown in the table on the following page. These fees apply to individual retirement accounts (IRAs) and Section 403(b) accounts. As of the close of the six-month period covered by the table, IRA fees included an annual maintenance fee of $15 per account (subject to a maximum annual maintenance fee of $25 for all accounts held by the same shareholder). Section 403(b) accounts are charged an annual $25 fiduciary maintenance fee. Some of the fees may vary in amount, or may be waived, based on your total account balance or the number of Prudential Investments funds, including the Fund, that you own. You should consider the additional fees that were charged to your Fund account over the six-month period when you estimate the total ongoing expenses paid over the period and the impact of these fees on your ending account value, as these additional expenses are not reflected in the information provided in the expense table. Additional fees have the effect of reducing investment returns.
Actual Expenses
The first line for each share class in the table on the following page provides information about actual account values and actual expenses. You may use the information on this line, together with the amount you invested, to estimate the expenses that you paid over the period. Simply divide your account value by $1,000 (for example, an $8,600 account value ÷ $1,000 = 8.6), then multiply the result by the number on the first line under the heading “Expenses Paid During the Six-Month Period” to estimate the expenses you paid on your account during this period.
Hypothetical Example for Comparison Purposes
The second line for each share class in the table on the following page provides information about hypothetical account values and hypothetical expenses based on the Fund’s actual expense ratio and an assumed rate of return of 5% per year before
| 8 | Visit our website at www.prudentialfunds.com |
expenses, which is not the Fund’s actual return. The hypothetical account values and expenses may not be used to estimate the actual ending account balance or expenses you paid for the period. You may use this information to compare the ongoing costs of investing in the Fund and other funds. To do so, compare this 5% hypothetical example with the 5% hypothetical examples that appear in the shareholder reports of the other funds.
Please note that the expenses shown in the table are meant to highlight your ongoing costs only and do not reflect any transactional costs such as sales charges (loads). Therefore, the second line for each share class in the table is useful in comparing ongoing costs only and will not help you determine the relative total costs of owning different funds. In addition, if these transactional costs were included, your costs would have been higher.
| Prudential US Real Estate Fund | Beginning Account Value October 1, 2011 | Ending Account Value March 31, 2012 | Annualized Expense Ratio Based on the Six-Month Period | Expenses Paid During the Six-Month Period* | ||||||||||||||
| Class A | Actual | $ | 1,000.00 | $ | 1,270.10 | 1.60 | % | $ | 9.08 | |||||||||
| Hypothetical | $ | 1,000.00 | $ | 1,017.00 | 1.60 | % | $ | 8.07 | ||||||||||
| Class B | Actual | $ | 1,000.00 | $ | 1,264.90 | 2.35 | % | $ | 13.31 | |||||||||
| Hypothetical | $ | 1,000.00 | $ | 1,013.25 | 2.35 | % | $ | 11.83 | ||||||||||
| Class C | Actual | $ | 1,000.00 | $ | 1,265.50 | 2.35 | % | $ | 13.31 | |||||||||
| Hypothetical | $ | 1,000.00 | $ | 1,013.25 | 2.35 | % | $ | 11.83 | ||||||||||
| Class Z | Actual | $ | 1,000.00 | $ | 1,271.60 | 1.35 | % | $ | 7.67 | |||||||||
| Hypothetical | $ | 1,000.00 | $ | 1,018.25 | 1.35 | % | $ | 6.81 | ||||||||||
* Fund expenses (net of fee waivers or subsidies, if any) for each share class are equal to the annualized expense ratio for each share class (provided in the table), multiplied by the average account value over the period, multiplied by the 183 days in the six-month period ended March 31, 2012, and divided by the 366 days in the Fund’s fiscal year ended March 31, 2012 (to reflect the six-month period). Expenses presented in the table include the expenses of any underlying portfolios in which the Fund may invest.
| Prudential US Real Estate Fund | 9 |
Portfolio of Investments
as of March 31, 2012
| Shares | Description | Value (Note 1) | ||||
LONG-TERM INVESTMENTS 96.6% | ||||||
COMMON STOCKS | ||||||
Diversified REIT’s 6.5% | ||||||
| 6,894 | American Assets Trust, Inc. | $ | 157,183 | |||
| 29,738 | Cousins Properties, Inc. | 225,414 | ||||
| 13,907 | Liberty Property Trust | 496,758 | ||||
| 5,100 | Vornado Realty Trust | 429,420 | ||||
|
| |||||
| 1,308,775 | ||||||
Healthcare Facilities 0.2% | ||||||
| 6,023 | Sunrise Senior Living, Inc.(a) | 38,065 | ||||
Hotels, Resorts & Cruise Lines 1.3% | ||||||
| 6,240 | Hyatt Hotels Corp. (Class A Stock)(a) | 266,573 | ||||
Industrial REIT’s 4.3% | ||||||
| 22,522 | ProLogis, Inc. | 811,242 | ||||
| 2,776 | Terreno Realty Corp. | 39,725 | ||||
|
| |||||
| 850,967 | ||||||
Office REIT’s 13.2% | ||||||
| 4,403 | Alexandria Real Estate Equities, Inc. | 321,991 | ||||
| 7,000 | Boston Properties, Inc. | 734,930 | ||||
| 14,328 | Brandywine Realty Trust | 164,486 | ||||
| 6,181 | Douglas Emmett, Inc. | 140,989 | ||||
| 11,591 | Duke Realty Corp. | 166,215 | ||||
| 1,525 | DuPont Fabros Technology, Inc. | 37,286 | ||||
| 9,288 | Hudson Pacific Properties, Inc. | 140,528 | ||||
| 9,322 | Kilroy Realty Corp. | 434,498 | ||||
| 7,810 | Mack-Cali Realty Corp. | 225,084 | ||||
| 3,793 | SL Green Realty Corp. | 294,147 | ||||
|
| |||||
| 2,660,154 | ||||||
Residential REIT’s 19.9% | ||||||
| 7,017 | American Campus Communities, Inc. | 313,800 | ||||
| 8,500 | Associated Estates Realty Corp. | 138,890 | ||||
| 5,834 | AvalonBay Communities, Inc. | 824,636 | ||||
| 8,554 | BRE Properties, Inc. | 432,405 | ||||
| 8,548 | Camden Property Trust | 562,031 | ||||
| 13,599 | Colonial Properties Trust | 295,506 | ||||
| 6,616 | Education Realty Trust, Inc. | 71,717 | ||||
| 9,937 | Equity Residential | 622,255 | ||||
See Notes to Financial Statements.
| Prudential US Real Estate Fund | 11 |
Portfolio of Investments
as of March 31, 2012 continued
| Shares | Description | Value (Note 1) | ||||
COMMON STOCKS (Continued) | ||||||
Residential REIT’s (cont’d.) | ||||||
| 1,986 | Essex Property Trust, Inc. | $ | 300,899 | |||
| 9,400 | Post Properties, Inc. | 440,484 | ||||
|
| |||||
| 4,002,623 | ||||||
Retail REIT’s 27.3% | ||||||
| 37,436 | DDR Corp. | 546,566 | ||||
| 3,732 | Federal Realty Investment Trust | 361,220 | ||||
| 28,997 | General Growth Properties, Inc. | 492,659 | ||||
| 23,364 | Glimcher Realty Trust | 238,780 | ||||
| 9,362 | Kimco Realty Corp. | 180,312 | ||||
| 10,050 | Macerich Co. (The) | 580,388 | ||||
| 7,785 | Regency Centers Corp. | 346,277 | ||||
| 15,571 | Simon Property Group, Inc. | 2,268,383 | ||||
| 9,270 | Tanger Factory Outlet Centers | 275,597 | ||||
| 2,775 | Taubman Centers, Inc. | 202,436 | ||||
|
| |||||
| 5,492,618 | ||||||
Specialized REIT’s 23.9% | ||||||
| 35,013 | Cogdell Spencer, Inc. | 148,455 | ||||
| 33,000 | CubeSmart | 392,700 | ||||
| 14,336 | DiamondRock Hospitality Co. | 147,518 | ||||
| 22,477 | FelCor Lodging Trust, Inc.(a) | 80,917 | ||||
| 5,609 | Health Care REIT, Inc. | 308,271 | ||||
| 7,841 | Healthcare Realty Trust, Inc. | 172,502 | ||||
| 57,568 | Host Hotels & Resorts, Inc. | 945,267 | ||||
| 3,626 | LTC Properties, Inc. | 116,032 | ||||
| 6,360 | Public Storage | 878,761 | ||||
| 4,500 | Sovran Self Storage, Inc. | 224,235 | ||||
| 46,354 | Strategic Hotels & Resorts, Inc.(a) | 305,009 | ||||
| 19,150 | Ventas, Inc. | 1,093,465 | ||||
|
| |||||
| 4,813,132 | ||||||
|
| |||||
Total long-term investments | 19,432,907 | |||||
|
| |||||
See Notes to Financial Statements.
| 12 | Visit our website at www.prudentialfunds.com |
| Shares | Description | Value (Note 1) | ||||
SHORT-TERM INVESTMENT 3.6% | ||||||
AFFILIATED MONEY MARKET MUTUAL FUND | ||||||
| 727,581 | Prudential Investment Portfolios 2 - Prudential Core Taxable Money Market Fund | $ | 727,581 | |||
|
| |||||
Total Investments 100.2% | 20,160,488 | |||||
Liabilities in excess of other assets (0.2)% | (33,883 | ) | ||||
|
| |||||
Net Assets 100% | $ | 20,126,605 | ||||
|
| |||||
The following abbreviation is used in the Portfolio descriptions:
REIT—Real Estate Investment Trust
| (a) | Non-income producing security. |
| (b) | Prudential Investments LLC, the manager of the Fund, also serves as manager of the Prudential Investment Portfolios 2 - Prudential Core Taxable Money Market Fund |
Various inputs are used in determining the value of the Portfolio’s investments. These inputs are summarized in the three broad levels listed below.
Level 1—quoted prices generally for securities actively traded on a regulated securities exchange and for open-end mutual funds which trade at daily net asset value.
Level 2—other significant observable inputs (including, but not limited to, quoted prices for similar securities, interest rates, prepayment speeds, foreign currency exchange rates, and amortized cost) generally for debt securities, swaps, forward foreign currency contracts and for foreign stocks priced using vendor modeling tools.
Level 3—significant unobservable inputs for securities valued in accordance with Board approved fair valuation procedures.
The following is a summary of the inputs used as of March 31, 2012 in valuing such portfolio securities:
| Level 1 | Level 2 | Level 3 | ||||||||||
Investments in Securities | ||||||||||||
Common Stocks | $ | 19,432,907 | $ | — | $ | — | ||||||
Affiliated Money Market Mutual Fund | 727,581 | — | — | |||||||||
|
|
|
|
|
| |||||||
Total | $ | 20,160,488 | $ | — | $ | — | ||||||
|
|
|
|
|
| |||||||
See Notes to Financial Statements.
| Prudential US Real Estate Fund | 13 |
Portfolio of Investments
as of March 31, 2012 continued
The industry classification of investments and liabilities in excess of other assets shown as a percentage of net assets as of March 31, 2012 were as follows:
Retail REIT’s | 27.3 | % | ||
Specialized REIT’s | 23.9 | |||
Residential REIT’s | 19.9 | |||
Office REIT’s | 13.2 | |||
Diversified REIT’s | 6.5 | |||
Industrial REIT’s | 4.3 | |||
Affiliated Money Market Mutual Fund | 3.6 | |||
Hotels, Resorts & Cruise Lines | 1.3 | |||
Healthcare Facilities | 0.2 | |||
|
| |||
| 100.2 | ||||
Liabilities in excess of other assets | (0.2 | ) | ||
|
| |||
| 100.0 | % | |||
|
|
See Notes to Financial Statements.
| 14 | Visit our website at www.prudentialfunds.com |
Financial Statements
| MARCH 31, 2012 | ANNUAL REPORT |
Prudential US Real Estate Fund
Statement of Assets and Liabilities
as of March 31, 2012
Assets | ||||
Investments at value: | ||||
Unaffiliated Investments (cost $16,735,472) | $ | 19,432,907 | ||
Affiliated Investments (cost $727,581) | 727,581 | |||
Dividends receivable | 51,065 | |||
Receivable for Fund shares sold | 36,200 | |||
Receivable for investments sold | 17,139 | |||
Prepaid expenses | 198 | |||
|
| |||
Total assets | 20,265,090 | |||
|
| |||
Liabilities | ||||
Accrued expenses | 104,484 | |||
Payable for investments purchased | 16,680 | |||
Management fee payable | 14,223 | |||
Payable for Fund shares reacquired | 2,400 | |||
Distribution fee payable | 478 | |||
Affiliated transfer agent fee payable | 220 | |||
|
| |||
Total liabilities | 138,485 | |||
|
| |||
Net Assets | $ | 20,126,605 | ||
|
| |||
Net assets were comprised of: | ||||
Shares of beneficial interest, at par | $ | 1,713 | ||
Paid-in capital in excess of par | 17,561,958 | |||
|
| |||
| 17,563,671 | ||||
Accumulated net realized loss on investment transactions | (134,501 | ) | ||
Net unrealized appreciation on investments | 2,697,435 | |||
|
| |||
Net assets, March 31, 2012 | $ | 20,126,605 | ||
|
| |||
See Notes to Financial Statements.
| 16 | Visit our website at www.prudentialfunds.com |
Class A | ||||
Net asset value and redemption price per share | $ | 11.75 | ||
Maximum sales charge (5.5% of offering price) | 0.68 | |||
|
| |||
Maximum offering price to public | $ | 12.43 | ||
|
| |||
Class B | ||||
Net asset value, offering price and redemption price per share | $ | 11.72 | ||
|
| |||
Class C | ||||
Net asset value, offering price and redemption price per share | $ | 11.70 | ||
|
| |||
Class Z | ||||
Net asset value, offering price and redemption price per share | $ | 11.75 | ||
|
| |||
See Notes to Financial Statements.
| Prudential US Real Estate Fund | 17 |
Statement of Operations
Year Ended March 31, 2012
Investment Income | ||||
Unaffiliated dividend income | $ | 349,781 | ||
Affiliated dividend income | 1,049 | |||
|
| |||
Total income | 350,830 | |||
|
| |||
Expenses | ||||
Management fee | 141,090 | |||
Distribution fee—Class A | 1,112 | |||
Distribution fee—Class B | 1,248 | |||
Distribution fee—Class C | 724 | |||
Registration fees | 57,000 | |||
Custodian’s fees and expenses | 44,000 | |||
Audit fee | 24,000 | |||
Reports to shareholders | 20,000 | |||
Legal fees and expenses | 10,000 | |||
Trustees’ fees | 10,000 | |||
Transfer agent’s fees and expenses (including affiliated expenses of $800) | 3,000 | |||
Commitment fee on syndicated credit agreement | 2,000 | |||
Loan interest expense (Note 7) | 228 | |||
Miscellaneous | 13,692 | |||
|
| |||
Total expenses | 328,094 | |||
Less: advisory fee waivers and expense reimbursements | (113,147 | ) | ||
|
| |||
Net expenses | 214,947 | |||
|
| |||
Net investment income | 135,883 | |||
|
| |||
Net Realized And Unrealized Gain (loss) On Investments And Foreign Currencies | ||||
Net realized gain (loss) on: | ||||
Investment transactions | (124,751 | ) | ||
Foreign currency transactions | 126 | |||
|
| |||
| (124,625 | ) | |||
|
| |||
Net change in unrealized appreciation on investments | 1,804,753 | |||
|
| |||
Net gain on investments and foreign currencies | 1,680,128 | |||
|
| |||
Net Increase In Net Assets Resulting From Operations | $ | 1,816,011 | ||
|
| |||
See Notes to Financial Statements.
| 18 | Visit our website at www.prudentialfunds.com |
Statement of Changes in Net Assets
| Year Ended March 31, 2012 | December 21, 2010* through March 31, 2011 | |||||||
Increase (Decrease) in Net Assets | ||||||||
Operations | ||||||||
Net investment income | $ | 135,883 | $ | 27,772 | ||||
Net realized gain (loss) on investment and foreign currency transactions | (124,625 | ) | 27,204 | |||||
Net change in unrealized appreciation on investments | 1,804,753 | 892,682 | ||||||
|
|
|
| |||||
Net increase in net assets resulting from operations | 1,816,011 | 947,658 | ||||||
|
|
|
| |||||
Dividends and Distributions (Note 1) | ||||||||
Dividends from net investment income | ||||||||
Class A | (4,043 | ) | (75 | ) | ||||
Class B | (556 | ) | — | |||||
Class C | (242 | ) | — | |||||
Class Z | (159,800 | ) | (12,299 | ) | ||||
|
|
|
| |||||
| (164,641 | ) | (12,374 | ) | |||||
|
|
|
| |||||
Distributions from net realized gains | ||||||||
Class A | (1,122 | ) | — | |||||
Class B | (371 | ) | — | |||||
Class C | (190 | ) | — | |||||
Class Z | (37,830 | ) | — | |||||
|
|
|
| |||||
| (39,513 | ) | — | ||||||
|
|
|
| |||||
Fund share transactions (Net of share conversions) (Note 6): | ||||||||
Net proceeds from shares sold | 7,399,808 | 13,746,757 | ||||||
Net asset value of shares issued in reinvestment of dividends and distributions | 203,606 | 12,361 | ||||||
Cost of shares reacquired | (3,780,134 | ) | (2,934 | ) | ||||
|
|
|
| |||||
Net increase in net assets from fund share transactions | 3,823,280 | 13,756,184 | ||||||
|
|
|
| |||||
Total increase in net assets | 5,435,137 | 14,691,468 | ||||||
Net Assets | ||||||||
Beginning of period | 14,691,468 | — | ||||||
|
|
|
| |||||
End of period(a) | $ | 20,126,605 | $ | 14,691,468 | ||||
|
|
|
| |||||
(a) Includes undistributed net investment income of | $ | — | $ | 30,265 | ||||
|
|
|
| |||||
| * | Commencement of operations. |
See Notes to Financial Statements.
| Prudential US Real Estate Fund | 19 |
Notes to Financial Statements
Prudential Investment Portfolios 12 (the “Trust”) is an open-end management investment company, registered under the Investment Company Act of 1940, as amended, (“1940 Act”). The Trust currently consists of two funds: Prudential Global Real Estate Fund and Prudential US Real Estate Fund (the “Fund”). These financial statements relate only to Prudential US Real Estate Fund. The Fund commenced investment operations on December 21, 2010. The financial statements of the other portfolio are not presented herein. The Trust was established as a Delaware business trust on October 24, 1997. The investment objective of the Fund is capital appreciation and income. It seeks to achieve this objective by investing primarily in equity securities of real estate companies operating in the United States.
Note 1. Accounting Policies
The following is a summary of significant accounting policies followed by the Trust in the preparation of its financial statements.
Securities Valuation: Securities listed on a securities exchange (other than options on securities and indices) are valued at the last sale price on such exchange on the day of valuation or, if there was no sale on such day, at the mean between the last reported bid and asked prices, or at the last bid price on such day in the absence of an asked price. Securities traded via NASDAQ are valued at the NASDAQ official closing price (“NOCP”) on the day of valuation, or if there was no NOCP, at the last sale price. Securities that are actively traded in the over-the-counter market, including listed securities for which the primary market is believed by Prudential Investments LLC (“PI” or “Manager”) in consultation with the subadviser, to be over-the-counter, are valued at market value using prices provided by an independent pricing agent or principal market maker. Futures contracts and options thereon traded on a commodities exchange or board of trade are valued at the last sale price at the close of trading on such exchange or board of trade or, if there was no sale on the applicable commodities exchange or board of trade on such day, at the mean between the most recently quoted prices on such exchange or board of trade or at the last bid price in the absence of an asked price. Prices may be obtained from independent pricing services which use information provided by market makers or estimates of market values obtained from yield data relating to investments or securities with similar characteristics.
| 20 | Visit our website at www.prudentialfunds.com |
Securities for which reliable market quotations are not readily available, or whose values have been affected by events occurring after the close of the security’s foreign market and before the Fund’s normal pricing time, are valued at fair value in accordance with the Board of Trustees’ approved fair valuation procedures. When determining the fair value of securities, some of the factors influencing the valuation include the nature of any restrictions on disposition of the securities; assessment of the general liquidity of the securities; the issuer’s financial condition and the markets in which it does business; the cost of the investments; the size of the holding and the capitalization of issuer; the prices of any recent transactions or bids/offers for such securities or any comparable securities; any available analyst media or other reports or information deemed reliable by the investment adviser regarding the issuer or the markets or industry in which it operates. Using fair value to price securities may result in a value that is different from a security’s most recent closing price and from the price used by other mutual funds to calculate their net asset values.
Investments in open end, non exchange-traded mutual funds are valued at their net asset value as of the close of the New York Stock Exchange on the date of valuation.
Foreign Currency Translation: The books and records of the Fund are maintained in U.S. dollars. Foreign currency amounts are translated into U.S. dollars on the following basis:
(i) market value of investment securities, other assets and liabilities-at the current daily rates of exchange.
(ii) purchases and sales of investment securities, income and expenses-at the rates of exchange prevailing on the respective dates of such transactions.
Although the net assets of the Fund are presented at the foreign exchange rates and market values at the close of the fiscal period, the Fund does not isolate that portion of the results of operations arising as a result of changes in the foreign exchange rates from the fluctuations arising from changes in the market prices of securities held at the end of the period. Similarly, the Fund does not isolate the effect of changes in foreign exchange rates from the fluctuations arising from changes in the market prices of portfolio securities sold during the period. Accordingly, realized foreign currency gains or losses are included in the reported net realized gains or losses on investment transactions.
Net realized gains or losses on foreign currency transactions represent net foreign exchange gains or losses from the holdings of foreign currencies, currency gains or losses realized between the trade date and settlement date on securities transactions, and the difference between the amounts of dividends, interest and foreign
| Prudential US Real Estate Fund | 21 |
Notes to Financial Statements
continued
withholding taxes recorded on the Fund’s books and the U.S. dollar equivalent amounts actually received or paid. Net unrealized currency gains or losses from valuing foreign currency denominated assets and liabilities (other than investments) at year-end exchange rates are reflected as a component of net unrealized appreciation (depreciation) on investments and foreign currencies.
Foreign security and currency transactions may involve certain considerations and risks not typically associated with those of domestic origin as a result of, among other factors, the possibility of political and economic instability and the level of governmental supervision and regulation of foreign securities markets.
Securities Transactions and Net Investment Income: Security transactions are recorded on the trade date. Realized and unrealized gains or losses from investments and currency transactions on sales of portfolio securities are calculated on the identified cost basis. Dividend income is recorded on the ex-dividend date. Interest income, including amortization of premium and accretion of discount on debt securities, as required, is recorded on the accrual basis. Expenses are recorded on the accrual basis which may require the use of certain estimates by management. The Fund invests in real estate investment trusts (“REITs”), which report information on the source of their distributions annually. Based on current and historical information, a portion of distributions received from REITs during the period is estimated to be dividend income, capital gain or a return of capital and recorded accordingly. These estimates are adjusted periodically when the actual source of distributions is disclosed by the REITs.
Net investment income or loss (other than distribution fees, which are charged directly to respective class) and unrealized and realized gains or losses are allocated daily to each class of shares based upon the relative proportion of adjusted net assets of each class at the beginning of the day.
Dividends and Distributions: The Fund expects to pay dividends of net investment income quarterly and distributions of net realized capital and currency gains, if any, annually.
Dividends and distributions to shareholders, which are determined in accordance with federal income tax regulations and which may differ from generally accepted accounting principles, are recorded on the ex-dividend date. Permanent book/tax
| 22 | Visit our website at www.prudentialfunds.com |
differences relating to income and gains are reclassified amongst undistributed net investment income, accumulated net realized gain or loss and paid-in capital in excess of par as appropriate.
Taxes: It is the Fund’s policy to continue to meet the requirements of the Internal Revenue Code applicable to regulated investment companies and to distribute all of its taxable net investment income and capital gains, if any, to its shareholders. Therefore, no federal income tax provision is required.
Withholding taxes on foreign dividends are recorded net of reclaimable amounts, at the time the related income is earned.
Estimates: The preparation of the financial statements requires management to make estimates and assumptions that affect the reported amounts and disclosures in the financial statements. Actual results could differ from those estimates.
Note 2. Agreements
The Fund has a management agreement with PI. Pursuant to this agreement, PI manages the investment operations of the Fund, administers the Fund’s affairs and supervises the subadviser’s performance of all investment advisory services. PI has entered into a subadvisory agreement with Prudential Real Estate Investors (“PREI”), which is a business unit of Prudential Investment Management (“PIM”). The subadvisory agreement provides that the subadviser furnish investment advisory services in connection with the management of the Fund. In connection therewith, the subadviser is obligated to keep certain books and records of the Fund. Pursuant to the advisory agreement, PI pays the cost of compensation of officers of the Fund, occupancy and certain clerical and accounting costs of the Fund. The Fund bears all other costs and expenses.
The management fee paid to PI is computed daily and payable monthly at an annual rate of .90% of the average daily net assets of the Fund.
For the year ended March 31, 2012, PI has contractually agreed to limit net annual Fund operating expenses (exclusive of distribution and service (12b-1) fees, interest, dividend and interest expense on short sales, brokerage, taxes, extraordinary and certain other expenses) of each class of shares to 1.35% of the Fund’s average daily net assets.
The Fund has a distribution agreement with Prudential Investment Management Services LLC (“PIMS”) which acts as the distributor of the Class A, B, C, and Z shares
| Prudential US Real Estate Fund | 23 |
Notes to Financial Statements
continued
of the Fund. The Fund compensates PIMS for distributing and servicing the Fund’s Class A, B, C, and Z shares, pursuant to plans of distribution (the “Distribution Plans”) regardless of expenses actually incurred by PIMS. The distribution fees are accrued daily and payable monthly. No distribution or service fees are paid to PIMS as distributor for Class Z shares of the Fund.
Pursuant to the Distribution Plans, the Fund compensates PIMS for distribution related activities at an annual rate of up to .30%, 1% and 1% of the average daily net assets of the Class A, B and C shares, respectively. For the year ended March 31, 2012, PIMS contractually agreed to limit such fees to .25% of the average daily net assets of the Class A shares.
PIMS has advised the Fund that it has received $8,927 in front-end sales charges resulting from sales of Class A during the year ended March 31, 2012. From these fees, PIMS paid such sales charges to broker-dealers which in turn paid commissions to salespersons and incurred other distribution costs.
PIMS has advised the Fund that for the year ended March 31, 2012, it has received $0, $0 and $28 in contingent deferred sales charges imposed upon certain redemptions by Class A, Class B, and Class C shareholders, respectively.
PI, PIMS, and PIM are indirect, wholly-owned subsidiaries of Prudential Financial, Inc. (“Prudential”).
Note 3. Other Transactions with Affiliates
Prudential Mutual Fund Services LLC (“PMFS”), an affiliate of PI and an indirect, wholly-owned subsidiary of Prudential, serves as the Fund’s transfer agent. Transfer agent fees and expenses in the Statement of Operations include certain out-of-pocket expenses paid to non-affiliates, where applicable.
The Fund invests in the Prudential Core Taxable Money Market Fund (the “Core Fund”), a portfolio of Prudential Investment Portfolios 2, registered under the 1940 Act, as amended, and managed by PI. Earnings from the Core Fund are disclosed on the Statement of Operations as affiliated dividend income.
| 24 | Visit our website at www.prudentialfunds.com |
Note 4. Portfolio Securities
Purchases and sales of portfolio securities, excluding short-term investments, for the year ended March 31, 2012, aggregated $11,802,139 and $7,901,200, respectively.
Note 5. Distributions and Tax Information
Distributions to shareholders, which are determined in accordance with federal income tax regulations and which may differ from generally accepted accounting principles, are recorded on the ex-dividend date. In order to present undistributed net investment income, accumulated net realized loss on investment transactions and paid-in capital in excess of par on the Statement of Assets and Liabilities that more closely represent their tax character, certain adjustments have been made to undistributed net investment income, accumulated net realized loss on investment transactions and paid-in capital in excess of par. For the year ended March 31, 2012, the adjustments were to decrease undistributed net investment income by $1,507, decrease accumulated net realized loss on investment transactions by $2,433 and decrease paid-in capital in excess of par by $926 due to differences in the treatment for book and tax purposes related to foreign securities and currencies and the redesignation of dividends paid. Net investment income, net realized loss on investment transactions and net assets were not affected by this change.
For the year ended March 31, 2012, the tax character of dividends paid as reflected in the Statement of Changes in Net Assets were $180,763 from ordinary income and $23,391 from long term capital gains. For the period ended March 31, 2011, the tax character of dividends paid as reflected in the Statement of Changes in Net Assets was $12,374 from ordinary income.
As of March 31, 2012, there were no undistributed earnings on a tax basis.
The United States federal income tax basis of the Fund’s investments and the net unrealized appreciation as of March 31, 2012 were as follows:
Tax Basis of | Appreciation | Depreciation | Net | |||
| $17,528,085 | $2,834,742 | $(202,339) | $2,632,403 |
The difference between book basis and tax basis is primarily attributable to deferred losses on wash sales.
The Fund elected to treat post-October capital losses of approximately $69,000 as having been incurred in the fiscal year ending March 31, 2013.
| Prudential US Real Estate Fund | 25 |
Notes to Financial Statements
continued
Management has analyzed the Fund’s tax positions taken on federal income tax returns for all open tax years and has concluded that no provision for income tax is required in the Fund’s financial statements for the current reporting period. The Fund’s federal and state income and federal excise tax returns for tax years for which the applicable statutes of limitations have not expired are subject to examination by the Internal Revenue Service and state departments of revenue.
Note 6. Capital
The Fund offers Class A, Class B, Class C, and Class Z shares. Class A shares are subject to a maximum front-end sales charge of 5.50%. Investors who purchase $1 million or more of Class A shares and sell these shares within 12 months of purchase are not subject to an initial sales charge but are subject to a contingent deferred sales charge (CDSC) of 1%, including investors who purchase their shares through broker-dealers affiliated with Prudential. Class B shares are subject to a CDSC of 5%, which decreases by 1% annually to 1% in the fifth and sixth years and 0% in the seventh year. Class B shares automatically convert to Class A shares on a quarterly basis approximately seven years after purchase. The CDSC for Class C shares is 1% for shares redeemed within 12 months of purchase. Class Z shares are not subject to any sales or redemption charge and are offered exclusively for sale to a limited group of investors.
Under certain circumstances, an exchange may be made from specified share classes of the Fund to one or more other share classes of the Fund as presented in the table of transactions in shares of beneficial interest.
The Trust has authorized an unlimited number of shares of beneficial interest at $.001 par value per share.
As of March 31, 2012, Prudential owned 201 of Class A shares, 101 Class C shares and 1,014,464 Class Z shares of the Fund.
Class A | Shares | Amount | ||||||
Year ended March 31, 2012 | ||||||||
Shares sold | 65,140 | $ | 717,601 | |||||
Shares issued in reinvestment of dividends and distributions | 456 | 4,800 | ||||||
Shares reacquired | (28,311 | ) | (302,237 | ) | ||||
|
|
|
| |||||
Net increase (decrease) in shares outstanding before conversion | 37,285 | 420,164 | ||||||
Shares issued, upon conversion from Class B | 232 | 2,614 | ||||||
|
|
|
| |||||
Net increase (decrease) in shares outstanding | 37,517 | $ | 422,778 | |||||
|
|
|
| |||||
Period December 21, 2010* through March 31, 2011: | ||||||||
Shares sold | 24,593 | $ | 263,403 | |||||
Shares issued in reinvestment of dividends and distributions | 6 | 63 | ||||||
Shares reacquired | (279 | ) | (2,934 | ) | ||||
|
|
|
| |||||
Net increase (decrease) in shares outstanding | 24,320 | $ | 260,532 | |||||
|
|
|
| |||||
| 26 | Visit our website at www.prudentialfunds.com |
Class B | Shares | Amount | ||||||
Year ended March 31, 2012 | ||||||||
Shares sold | 37,558 | $ | 422,545 | |||||
Shares issued in reinvestment of dividends and distributions | 76 | 772 | ||||||
Shares reacquired | (2,783 | ) | (29,977 | ) | ||||
|
|
|
| |||||
Net increase (decrease) in shares outstanding before conversion | 34,851 | 393,340 | ||||||
Shares reaquired upon conversion into Class A | (232 | ) | (2,614 | ) | ||||
|
|
|
| |||||
Net increase (decrease) in shares outstanding | 34,619 | $ | 390,726 | |||||
|
|
|
| |||||
Period December 21, 2010* through March 31, 2011: | ||||||||
Shares sold | 3,792 | $ | 39,619 | |||||
Shares issued in reinvestment of dividends and distributions | — | — | ||||||
Shares reacquired | — | — | ||||||
|
|
|
| |||||
Net increase (decrease) in shares outstanding | 3,792 | $ | 39,619 | |||||
|
|
|
| |||||
Class C | ||||||||
Year ended March 31, 2012 | ||||||||
Shares sold | 14,288 | $ | 158,235 | |||||
Shares issued in reinvestment of dividends and distributions | 40 | 403 | ||||||
Shares reacquired | (7,848 | ) | (81,891 | ) | ||||
|
|
|
| |||||
Net increase (decrease) in shares outstanding | 6,480 | $ | 76,747 | |||||
|
|
|
| |||||
Period December 21, 2010* through March 31, 2011: | ||||||||
Shares sold | 2,680 | $ | 28,235 | |||||
Shares issued in reinvestment of dividends and distributions | — | — | ||||||
Shares reacquired | — | — | ||||||
|
|
|
| |||||
Net increase (decrease) in shares outstanding | 2,680 | $ | 28,235 | |||||
|
|
|
| |||||
Class Z | ||||||||
Year ended March 31, 2012 | ||||||||
Shares sold | 565,761 | $ | 6,101,427 | |||||
Shares issued in reinvestment of dividends and distributions | 18,856 | 197,631 | ||||||
Shares reacquired | (312,193 | ) | (3,366,029 | ) | ||||
|
|
|
| |||||
Net increase (decrease) in shares outstanding | 272,424 | $ | 2,933,029 | |||||
|
|
|
| |||||
Period December 21, 2010* through March 31, 2011: | ||||||||
Shares sold | 1,330,084 | $ | 13,415,500 | |||||
Shares issued in reinvestment of dividends and distributions | 1,200 | 12,298 | ||||||
Shares reacquired | — | — | ||||||
|
|
|
| |||||
Net increase (decrease) in shares outstanding | 1,331,284 | $ | 13,427,798 | |||||
|
|
|
| |||||
| * | Commencement of operations. |
Note 7. Borrowings
The Fund, along with other affiliated registered investment companies (the “Funds”), is a party to a Syndicated Credit Agreement (“SCA”) with a group of banks. The
| Prudential US Real Estate Fund | 27 |
Notes to Financial Statements
continued
purpose of the SCA is to provide an alternative source of temporary funding for capital share redemptions. The SCA provides for a commitment of $900 million for the period December 16, 2011 through December 14, 2012. The Funds pay an annualized commitment fee of 0.08% of the unused portion of the SCA. Prior to December 16, 2011, the Funds had another Syndicated Credit Agreement of a $750 million commitment with an annualized commitment fee of 0.10% of the unused portion. Interest on any borrowings under the SCA is paid at contracted market rates. The commitment fee for the unused amount is accrued daily and paid quarterly.
The Fund utilized the line of credit during the year ended March 31, 2012. The Fund had an average outstanding balance of $508,000 for 11 days at an average interest rate of 1.47%.
Note 8. New Accounting Pronouncements
In April 2011, the Financial Accounting Standards Board (“FASB”) issued Accounting Standards Update (“ASU”) No. 2011-03 “Reconsideration of Effective Control for Repurchase Agreements.” The objective of ASU 2011-03 is to improve the accounting for repurchase agreements and other agreements that both entitle and obligate a transferor to repurchase or redeem financial assets before their maturity. Under previous guidance, whether or not to account for a transaction as a sale was based on, in part, if the entity maintained effective control over the transferred financial assets. ASU 2011-03 removes the transferor’s ability criterion from the effective control assessment. This guidance is effective prospectively for interim and annual reporting periods beginning on or after December 15, 2011. At this time, management is evaluating the implications of ASU 2011-03 and its impact on the financial statements has not been determined.
In May 2011, the FASB issued ASU No. 2011-04 “Amendments to Achieve Common Fair Value Measurement and Disclosure Requirements in U.S. GAAP and IFRSs.” ASU 2011-04 includes common requirements for measurement of and disclosure about fair value between U.S. GAAP and IFRS. ASU 2011-04 will require reporting entities to disclose quantitative information about the unobservable inputs used in the fair value measurements categorized within Level 3 of the fair value hierarchy. In addition, ASU 2011-04 will require reporting entities to make disclosures about amounts and reasons for all transfers in and out of Level 1 and Level 2 fair value measurements. The new and revised disclosures are effective for interim and annual reporting periods beginning after December 15, 2011. At this time, management is evaluating the implications of ASU 2011-04 and its impact on the financial statements has not been determined.
| 28 | Visit our website at www.prudentialfunds.com |
Financial Highlights
| Class A Shares | ||||||||||
| Year Ended March 31, 2012(b) | December 21, 2010(e) through March 31, 2011(b) | |||||||||
| Per Share Operating Performance: | ||||||||||
| Net Asset Value, Beginning Of Period | $10.79 | $10.00 | ||||||||
| Income (loss) from investment operations: | ||||||||||
| Net investment income (loss) | .06 | (.02 | ) | |||||||
| Net realized and unrealized gain on investments | 1.02 | .81 | ||||||||
| Total from investment operations | 1.08 | .79 | ||||||||
| Less Dividends and Distributions: | ||||||||||
| Dividends from net investment income | (.09 | ) | - | (i) | ||||||
| Distributions from net realized gains | (.03 | ) | - | |||||||
| Total dividends and distributions | (.12 | ) | - | (i) | ||||||
| Net asset value, end of period | $11.75 | $10.79 | ||||||||
| Total Return(a): | 10.09% | 7.94% | ||||||||
| Ratios/Supplemental Data: | ||||||||||
| Net assets, end of period (000) | $727 | $262 | ||||||||
| Average net assets (000) | $445 | $104 | ||||||||
| Ratios to average net assets(d): | ||||||||||
| Expenses, including distribution and service (12b-1) fees(c) | 1.60% | (h) | 1.60% | (f)(h) | ||||||
| Expenses, excluding distribution and service (12b-1) fees | 1.35% | (h) | 1.35% | (f)(h) | ||||||
| Net investment income (loss) | .60% | (h) | (.66)% | (f)(h) | ||||||
| Portfolio turnover rate | 51% | 4% | (g) | |||||||
(a) Total return does not consider the effects of sales loads. Total return is calculated assuming a purchase of a share on the first day and a sale on the last day of each period reported and includes reinvestment of dividends and distributions. Total returns may reflect adjustments to conform to generally accepted accounting principles. Total returns for periods less than one full year are not annualized.
(b) Calculations are based on the average daily number of shares outstanding.
(c) The distributor of the Fund has contractually agreed to limit its distribution and service (12b-1) fees to .25% of the average daily net assets of the Class A shares.
(d) Does not include expenses of the underlying portfolio in which the Fund invests.
(e) Commencement of operations.
(f) Annualized.
(g) Not annualized.
(h) Net of advisory fee waiver and expense reimbursement. If the investment manager had not waived/reimbursed expenses, the expense ratios both including and excluding distribution and service (12b-1) fees and the net investment income (loss) ratio would have been 2.25%, 2.00%, (.05)%, respectively, for the year ended March 31, 2012 and 7.01%, 6.76% and (6.07)%, respectively for the period ended March 31, 2011.
| (i) | Less than $0.005. |
See Notes to Financial Statements.
| Prudential US Real Estate Fund | 29 |
Financial Highlights
continued
| Class B Shares | ||||||||||
| Year Ended March 31, 2012(b) | December 21, 2010(d) through March 31, 2011(b) | |||||||||
| Per Share Operating Performance: | ||||||||||
| Net Asset Value, Beginning Of Period | $10.77 | $10.00 | ||||||||
| Income (loss) from investment operations: | ||||||||||
| Net investment loss | (.05 | ) | (.06 | ) | ||||||
| Net realized and unrealized gain on investments | 1.06 | .83 | ||||||||
| Total from investment operations | 1.01 | .77 | ||||||||
| Less Dividends and Distributions: | ||||||||||
| Dividends from net investment income | (.03 | ) | - | |||||||
| Distributions from net realized gains | (.03 | ) | - | |||||||
| Total dividends and distributions | (.06 | ) | - | |||||||
| Net asset value, end of period | $11.72 | $10.77 | ||||||||
| Total Return(a): | 9.46% | 7.70% | ||||||||
| Ratios/Supplemental Data: | ||||||||||
| Net assets, end of period (000) | $450 | $41 | ||||||||
| Average net assets (000) | $125 | $10 | ||||||||
| Ratios to average net assets(c): | ||||||||||
| Expenses, including distribution and service (12b-1) fees | 2.35% | (f) | 2.35% | (e)(f) | ||||||
| Expenses, excluding distribution and service (12b-1) fees | 1.35% | (f) | 1.35% | (e)(f) | ||||||
| Net investment loss | (.46)% | (f) | (2.13)% | (e)(f) | ||||||
| Portfolio turnover rate | 51% | 4% | (g) | |||||||
(a) Total return does not consider the effects of sales loads. Total return is calculated assuming a purchase of a share on the first day and a sale on the last day of each period reported and includes reinvestment of dividends and distributions. Total returns may reflect adjustments to conform to generally accepted accounting principles. Total returns for periods less than one full year are not annualized.
(b) Calculations are based on the average daily number of shares outstanding.
(c) Does not include expenses of the underlying portfolio in which the Fund invests.
(d) Commencement of operations.
(e) Annualized.
(f) Net of advisory fee waiver and expense reimbursement. If the investment manager had not waived/reimbursed expenses, the expense ratios both including and excluding distribution and service (12b-1) fees and the net investment loss ratio would have been 2.77%, 1.77%, (.88)%, respectively, for the year ended March 31, 2012 and 7.76%, 6.76% and (7.54)%, respectively for the period ended March 31, 2011.
(g) Not annualized.
See Notes to Financial Statements.
| 30 | Visit our website at www.prudentialfunds.com |
| Class C Shares | ||||||||||
| Year Ended March 31, 2012(b) | December 21, 2010(d) through March 31, 2011(b) | |||||||||
| Per Share Operating Performance: | ||||||||||
| Net Asset Value, Beginning Of Period | $10.77 | $10.00 | ||||||||
| Income (loss) from investment operations: | ||||||||||
| Net investment loss | (.04 | ) | (.05 | ) | ||||||
| Net realized and unrealized gain on investments | 1.03 | .82 | ||||||||
| Total from investment operations | .99 | .77 | ||||||||
| Less Dividends and Distributions: | ||||||||||
| Dividends from net investment income | (.03 | ) | - | |||||||
| Distributions from net realized gains | (.03 | ) | - | |||||||
| Total dividends and distributions | (.06 | ) | - | |||||||
| Net asset value, end of period | $11.70 | $10.77 | ||||||||
| Total Return(a): | 9.28% | 7.70% | ||||||||
| Ratios/Supplemental Data: | ||||||||||
| Net assets, end of period (000) | $107 | $29 | ||||||||
| Average net assets (000) | $72 | $7 | ||||||||
| Ratios to average net assets(c): | ||||||||||
| Expenses, including distribution and service (12b-1) fees | 2.35% | (f) | 2.35% | (e)(f) | ||||||
| Expenses, excluding distribution and service (12b-1) fees | 1.35% | (f) | 1.35% | (e)(f) | ||||||
| Net investment loss | (.33)% | (f) | (1.83)% | (e)(f) | ||||||
| Portfolio turnover rate | 51% | 4% | (g) | |||||||
(a) Total return does not consider the effects of sales loads. Total return is calculated assuming a purchase of a share on the first day and a sale on the last day of each period reported and includes reinvestment of dividends and distributions. Total returns may reflect adjustments to conform to generally accepted accounting principles. Total returns for periods less than one full year are not annualized.
(b) Calculations are based on the average daily number of shares outstanding.
(c) Does not include expenses of the underlying portfolio in which the Fund invests.
(d) Commencement of operations.
(e) Annualized.
(f) Net of advisory fee waiver and expense reimbursement. If the investment manager had not waived/reimbursed expenses, the expense ratios both including and excluding distribution and service (12b-1) fees and the net investment loss ratio would have been 3.02%, 2.02%, (1.00)%, respectively, for the year ended March 31, 2012 and 7.76%, 6.76% and (7.24)%, respectively for the period ended March 31, 2011.
(g) Not annualized.
See Notes to Financial Statements.
| Prudential US Real Estate Fund | 31 |
Financial Highlights
continued
| Class Z Shares | ||||||||||
| Year Ended March 31, 2012(b) | December 21, 2010(d) through March 31, 2011(b) | |||||||||
| Per Share Operating Performance: | ||||||||||
| Net Asset Value, Beginning Of Period | $10.79 | $10.00 | ||||||||
| Income (loss) from investment operations: | ||||||||||
| Net investment income | .10 | .02 | ||||||||
| Net realized and unrealized gain on investments | 1.00 | .78 | ||||||||
| Total from investment operations | 1.10 | .80 | ||||||||
| Less Dividends and Distributions: | ||||||||||
| Dividends from net investment income | (.11 | ) | (.01 | ) | ||||||
| Distributions from net realized gains | (.03 | ) | - | |||||||
| Total dividends and distributions | (.14 | ) | (.01 | ) | ||||||
| Net asset value, end of period | $11.75 | $10.79 | ||||||||
| Total Return(a): | 10.36% | 8.00% | ||||||||
| Ratios/Supplemental Data: | ||||||||||
| Net assets, end of period (000) | $18,843 | $14,359 | ||||||||
| Average net assets (000) | $15,035 | $13,065 | ||||||||
| Ratios to average net assets(c): | ||||||||||
| Expenses, including distribution and service (12b-1) fees | 1.35% | (f) | 1.35% | (e)(f) | ||||||
| Expenses, excluding distribution and service (12b-1) fees | 1.35% | (f) | 1.35% | (e)(f) | ||||||
| Net investment income | .89% | (f) | .78% | (e)(f) | ||||||
| Portfolio turnover rate | 51% | 4% | (g) | |||||||
(a) Total return is calculated assuming a purchase of a share on the first day and a sale on the last day of each period reported and includes reinvestment of dividends and distributions. Total returns may reflect adjustments to conform to generally accepted accounting principles. Total returns for periods less than one full year are not annualized.
(b) Calculations are based on the average daily number of shares outstanding.
(c) Does not include expenses of the underlying portfolio in which the Fund invests.
(d) Commencement of operations.
(e) Annualized.
(f) Net of advisory fee waiver and expense reimbursement. If the investment manager had not waived/reimbursed expenses, the expense ratios both including and excluding distribution and service (12b-1) fees and the net investment income (loss) ratio would have been 2.08%, 2.08%, .16%, respectively, for the year ended March 31, 2012 and 6.76%, 6.76% and (4.63)%, respectively for the period ended March 31, 2011.
(g) Not annualized.
See Notes to Financial Statements.
| 32 | Visit our website at www.prudentialfunds.com |
Report of Independent Registered Public
Accounting Firm
The Board of Trustees and Shareholders
Prudential Investment Portfolios 12:
We have audited the accompanying statement of assets and liabilities of Prudential US Real Estate Fund (hereafter referred to as the “Fund”), a series of Prudential Investment Portfolios 12, including the portfolio of investments, as of March 31, 2012, and the related statement of operations for the year then ended, the statement of changes in net assets and the financial highlights for the year then ended and for the period from December 21, 2010 (commencement of operations) to March 31, 2011. These financial statements and financial highlights are the responsibility of the Fund’s management. Our responsibility is to express an opinion on these financial statements and financial highlights based on our audits.
We conducted our audit in accordance with the standards of the Public Company Accounting Oversight Board (United States). Those standards require that we plan and perform the audit to obtain reasonable assurance about whether the financial statements and financial highlights are free of material misstatement. An audit includes examining, on a test basis, evidence supporting the amounts and disclosures in the financial statements. Our procedures included confirmation of securities owned as of March 31, 2012, by correspondence with the custodian, transfer agent and brokers or by other appropriate auditing procedures when replies from brokers were not received. An audit also includes assessing the accounting principles used and significant estimates made by management, as well as evaluating the overall financial statement presentation. We believe that our audits provide a reasonable basis for our opinion.
In our opinion, the financial statements and financial highlights referred to above present fairly, in all material respects, the financial position of the Fund as of March 31, 2012, and the results of its operations, the changes in its net assets and the financial highlights for the periods described in the first paragraph above, in conformity with U.S. generally accepted accounting principles.

New York, New York
May 21, 2012
| Prudential US Real Estate Fund | 33 |
Federal Income Tax Information
(Unaudited)
We are advising you that during the fiscal year ended March 31, 2012, the Fund reported the maximum amount allowed per share but not less than $0.02 for Class A, B, C and Z shares as capital gain distribution in accordance with Section 852(b)(3)(C) of the Internal Revenue Code.
In January 2013, you will be advised on IRS 1099-DIV or substitute 1099-DIV as to the federal tax status of the dividends and distributions received by you in calendar year 2012.
| 34 | Visit our website at www.prudentialfunds.com |
INFORMATION ABOUT BOARD MEMBERS AND OFFICERS
(Unaudited)
Information about Board Members and Officers is set forth below. Board Members who are not deemed to be “interested persons” of the Fund, as defined in the 1940 Act, are referred to as “Independent Board Members.” Board Members who are deemed to be “interested persons” of the Fund are referred to as “Interested Board Members.” The Board Members are responsible for the overall supervision of the operations of the Fund and perform the various duties imposed on the directors of investment companies by the 1940 Act.
Independent Board Members(1) | ||||
Name, Address, Age Position(s) Portfolios Overseen |
Principal Occupation(s) During Past Five Years |
Other Directorships Held | ||
Kevin J. Bannon (59) Board Member Portfolios Overseen: 61 |
Managing Director (since April 2008) and Chief Investment Officer (since October 2008) of Highmount Capital LLC (registered investment adviser); formerly Executive Vice President and Chief Investment Officer (April 1993-August 2007) of Bank of New York Company; President (May 2003-May 2007) of BNY Hamilton Family of Mutual Funds. |
Director of Urstadt Biddle Properties (since September 2008). | ||
Linda W. Bynoe (59) Board Member Portfolios Overseen: 61 |
President and Chief Executive Officer (since March 1995) and formerly Chief Operating Officer (December 1989-February 1995) of Telemat Ltd. (management consulting); formerly Vice President (January 1985-June 1989) at Morgan Stanley & Co (broker-dealer). |
Director of Simon Property Group, Inc. (retail real estate) (May 2003-May 2012); Director of Anixter International, Inc. (communication products distributor) (since January 2006); Director of Northern Trust Corporation (financial services) (since April 2006); Trustee of Equity Residential (residential real estate) (since December 2009). | ||
Michael S. Hyland, CFA (66) Board Member Portfolios Overseen: 61 |
Independent Consultant (since February 2005); formerly Senior Managing Director (July 2001-February 2005) of Bear Stearns & Co, Inc.; Global Partner, INVESCO (1999-2001); Managing Director and President of Salomon Brothers Asset Management (1989-1999). |
None. | ||
Douglas H. McCorkindale (72) Board Member Portfolios Overseen: 61 | �� |
Formerly Chairman (February 2001-June 2006), Chief Executive Officer (June 2000-July 2005), President (September 1997-July 2005) and Vice Chairman (March 1984-May 2000) of Gannett Co. Inc. (publishing and media). |
Director of Lockheed Martin Corp. (aerospace and defense) (since May 2001). | |
Prudential US Real Estate Fund
Independent Board Members(1) | ||||
Name, Address, Age Position(s) Portfolios Overseen |
Principal Occupation(s) During Past Five Years |
Other Directorships Held | ||
Stephen P. Munn (69) Board Member Portfolios Overseen: 61 |
Lead Director (since 2007) and formerly Chairman (1993-2007) of Carlisle Companies Incorporated (manufacturer of industrial products). |
Lead Director (since 2007) of Carlisle Companies Incorporated (manufacturer of industrial products). | ||
Richard A. Redeker (68) Board Member & Independent Chair Portfolios Overseen: 61 |
Retired Mutual Fund Senior Executive (44 years); Management Consultant; Independent Directors Council (organization of 2,800 Independent Mutual Fund Directors)-Executive Committee, Chair of Policy Steering Committee, Governing Council. |
None. | ||
Robin B. Smith (72) Board Member Portfolios Overseen: 61 |
Chairman of the Board (since January 2003) of Publishers Clearing House (direct marketing); Member of the Board of Directors of ADLPartner (marketing) (since December 2010); formerly Chairman and Chief Executive Officer (August 1996-January 2003) of Publishers Clearing House. |
Formerly Director of BellSouth Corporation (telecommunications) (1992-2006). | ||
Stephen G. Stoneburn (68) Board Member Portfolios Overseen: 61 |
Chairman, (since July 2011), President and Chief Executive Officer (since June 1996) of Quadrant Media Corp. (publishing company); formerly President (June 1995-June 1996) of Argus Integrated Media, Inc.; Senior Vice President and Managing Director (January 1993-1995) of Cowles Business Media; Senior Vice President of Fairchild Publications, Inc. (1975-1989). |
None. | ||
Interested Board Members(1) | ||||
Name, Address, Age Position(s) Portfolios Overseen |
Principal Occupation(s) During Past Five Years |
Other Directorships Held | ||
Stuart S. Parker (49) Board Member & President Portfolios Overseen: 61 |
President of Prudential Investments LLC (since January 2012); Executive Vice President of Jennison Associates LLC and Head of Retail Distribution of Prudential Investments LLC (June 2005 - December 2011). |
None. | ||
Visit our website at www.prudentialfunds.com
Interested Board Members(1) | ||||
Name, Address, Age Position(s) Portfolios Overseen |
Principal Occupation(s) During Past Five Years |
Other Directorships Held | ||
Scott E. Benjamin (39) Board Member & Vice President Portfolios Overseen: 61 |
Executive Vice President (since June 2009) of Prudential Investments LLC and Prudential Investment Management Services LLC; Executive Vice President (since September 2009) of AST Investment Services, Inc.; Senior Vice President of Product Development and Marketing, Prudential Investments (since February 2006); Vice President of Product Development and Product Management, Prudential Investments (2003-2006). |
None. | ||
(1) The year that each Board Member joined the Board is as follows:
Kevin J. Bannon, 2008; Linda W. Bynoe, 2005; Michael S. Hyland, 2008; Douglas H. McCorkindale, 2003; Stephen P. Munn, 2008; Richard A. Redeker, 2003; Robin B. Smith, 1997; Stephen G. Stoneburn, 2001; Stuart S. Parker, Board Member and President since 2012; Scott E. Benjamin, Board Member since 2010 and Vice President since 2009.
Fund Officers(a)(1) | ||
Name, Address and Age Position with Fund |
Principal Occupation(s) During Past Five Years | |
Judy A. Rice (64) Vice President |
President, Chief Executive Officer (May 2011-Present) and Executive Vice President (December 2008-May 2011) of Prudential Investment Management Services LLC; Formerly President, Chief Executive Officer, Chief Operating Officer and Officer-In-Charge (February 2003-December 2011) of Prudential Investments LLC; formerly President, Chief Executive Officer and Officer-In-Charge (April 2003-December 2011) of Prudential Mutual Fund Services LLC; formerly Member of the Board of Directors of Jennison Associates LLC (November 2010-December 2011); formerly Vice President (February 1999-April 2006) of Prudential Investment Management Services LLC; formerly President, COO, CEO and Manager of PIFM Holdco, LLC (April 2006-December 2011); formerly President, Chief Executive Officer, Chief Operating Officer and Officer-In-Charge (May 2003-June 2005) and Director (May 2003-March 2006) and Executive Vice President (June 2005-March 2006) of AST Investment Services, Inc.; Member of Board of Governors of the Investment Company Institute. | |
Prudential US Real Estate Fund
Fund Officers(a)(1) | ||
Name, Address and Age Position with Fund |
Principal Occupation(s) During Past Five Years | |
Kathryn L. Quirk (59) Chief Legal Officer |
Vice President and Corporate Counsel (since September 2004) of Prudential; Executive Vice President, Chief Legal Officer and Secretary (since July 2005) of PI and Prudential Mutual Fund Services LLC; Vice President and Corporate Counsel (since June 2005) and Secretary (since February 2006) of AST Investment Services, Inc.; formerly Senior Vice President and Assistant Secretary (November 2004-August 2005) of PI; formerly Assistant Secretary (June 2005-February 2006) of AST Investment Services, Inc.; formerly Managing Director, General Counsel, Chief Compliance Officer, Chief Risk Officer and Corporate Secretary (1997-2002) of Zurich Scudder Investments, Inc. | |
Deborah A. Docs (54) Secretary |
Vice President and Corporate Counsel (since January 2001) of Prudential; Vice President (since December 1996) and Assistant Secretary (since March 1999) of PI; formerly Vice President and Assistant Secretary (May 2003-June 2005) of AST Investment Services, Inc. | |
Jonathan D. Shain (53) Assistant Secretary |
Vice President and Corporate Counsel (since August 1998) of Prudential; Vice President and Assistant Secretary (since May 2001) of PI; Vice President and Assistant Secretary (since February 2001) of PMFS; formerly Vice President and Assistant Secretary (May 2003-June 2005) of AST Investment Services, Inc. | |
Claudia DiGiacomo (37) Assistant Secretary |
Vice President and Corporate Counsel (since January 2005) of Prudential; Vice President and Assistant Secretary of PI (since December 2005); Associate at Sidley Austin Brown & Wood LLP (1999-2004). | |
John P. Schwartz (41) Assistant Secretary |
Vice President and Corporate Counsel (since April 2005) of Prudential; Vice President and Assistant Secretary of PI (since December 2005); Associate at Sidley Austin Brown & Wood LLP (1997-2005). | |
Andrew R. French (49) Assistant Secretary |
Vice President and Corporate Counsel (since February 2010) of Prudential; formerly Director and Corporate Counsel (2006-2010) of Prudential; Vice President and Assistant Secretary (since January 2007) of PI; Vice President and Assistant Secretary (since January 2007) of PMFS. | |
Timothy J. Knierim (53) Chief Compliance Officer |
Chief Compliance Officer of Prudential Investment Management, Inc. (since July 2007); formerly Chief Risk Officer of PIM and PI (2002-2007) and formerly Chief Ethics Officer of PIM and PI (2006-2007). | |
Valerie M. Simpson (53) Deputy Chief Compliance Officer |
Chief Compliance Officer (since April 2007) of PI and AST Investment Services, Inc.; formerly Vice President-Financial Reporting (June 1999-March 2006) for Prudential Life and Annuities Finance. | |
Theresa C. Thompson (49) Deputy Chief Compliance Officer |
Vice President, Compliance, PI (since April 2004); and Director, Compliance, PI (2001-2004). | |
Visit our website at www.prudentialfunds.com
Fund Officers(a)(1) | ||
Name, Address and Age Position with Fund |
Principal Occupation(s) During Past Five Years | |
Richard W. Kinville (43) Anti-Money Laundering Compliance Officer |
Vice President, Corporate Compliance, Anti-Money Laundering Unit (since January 2005) of Prudential; committee member of the American Council of Life Insurers Anti-Money Laundering and Critical Infrastructure Committee (since January 2007); formerly Investigator and Supervisor in the Special Investigations Unit for the New York Central Mutual Fire Insurance Company (August 1994-January 1999); Investigator in AXA Financial’s Internal Audit Department and Manager in AXA’s Anti-Money Laundering Office (January 1999-January 2005); first chair of the American Council of Life Insurers Anti-Money Laundering and Critical Infrastructure Committee (June 2007-December 2009). | |
Grace C. Torres (52) Treasurer and Principal Financial and Accounting Officer |
Assistant Treasurer (since March 1999) and Senior Vice President (since September 1999) of PI; Assistant Treasurer (since May 2003) and Vice President (since June 2005) of AST Investment Services, Inc.; Senior Vice President and Assistant Treasurer (since May 2003) of Prudential Annuities Advisory Services, Inc.; formerly Senior Vice President (May 2003-June 2005) of AST Investment Services, Inc. | |
M. Sadiq Peshimam (48) Assistant Treasurer |
Vice President (since 2005) of Prudential Investments LLC. | |
Peter Parrella (53) Assistant Treasurer |
Vice President (since 2007) and Director (2004-2007) within Prudential Mutual Fund Administration; formerly Tax Manager at SSB Citi Fund Management LLC (1997-2004). | |
(a) Excludes Mr. Parker and Mr. Benjamin, interested Board Members who also serve as President and Vice President, respectively.
(1) The year that each individual became an officer of the Fund is as follows:
Judy A. Rice, 2012; Kathryn L. Quirk, 2005; Deborah A. Docs, 2005; Jonathan D. Shain, 2005; Claudia DiGiacomo, 2005; John P. Schwartz, 2006; Andrew R. French, 2006; Timothy J. Knierim, 2007; Valerie M. Simpson, 2007; Grace C. Torres, 1997; M. Sadiq Peshimam, 2006; 2006; Peter Parrella, 2007, Theresa C. Thompson, 2008; Richard W. Kinville, 2011.
Explanatory Notes to Tables:
| n | Board Members are deemed to be “Interested,” as defined in the 1940 Act, by reason of their affiliation with Prudential Investments LLC and/or an affiliate of Prudential Investments LLC. |
| n | Unless otherwise noted, the address of all Board Members and Officers is c/o Prudential Investments LLC, Gateway Center Three, 100 Mulberry Street, Newark, New Jersey 07102-4077. |
| n | There is no set term of office for Board Members or Officers. The Board Members have adopted a retirement policy, which calls for the retirement of Board Members on December 31 of the year in which they reach the age of 75. |
| n | “Other Directorships Held” includes only directorships of companies required to register or file reports with the SEC under the 1934 Act (that is, “public companies”) or other investment companies registered under the 1940 Act. |
| n | “Portfolios Overseen” includes all investment companies managed by Prudential Investments LLC. The investment companies for which PI serves as manager include the Prudential Investments Mutual Funds, The Prudential Variable Contract Accounts, Target Mutual Funds, The Prudential Series Fund, Prudential’s Gibraltar Fund, Inc. and the Advanced Series Trust. |
Prudential US Real Estate Fund
| n MAIL | n TELEPHONE | n WEBSITE | ||
Gateway Center Three 100 Mulberry Street Newark, NJ 07102 | (800) 225-1852 | www.prudentialfunds.com |
| PROXY VOTING |
| The Board of Trustees of the Fund has delegated to the Fund’s investment subadviser the responsibility for voting any proxies and maintaining proxy recordkeeping with respect to the Fund. A description of these proxy voting policies and procedures is available without charge, upon request, by calling (800) 225-1852 or by visiting the Securities and Exchange Commission’s website at www.sec.gov. Information regarding how the Fund voted proxies relating to portfolio securities during the most recent 12-month period ended June 30 is available on the Fund’s website and on the Commission’s website. |
| TRUSTEES |
| Kevin J. Bannon • Scott E. Benjamin • Linda W. Bynoe • Michael S. Hyland • Douglas H. McCorkindale • Stephen P. Munn • Stuart S. Parker • Richard A. Redeker • Robin B. Smith • Stephen G. Stoneburn |
| OFFICERS |
| Stuart S. Parker, President • Judy A. Rice, Vice President • Scott E. Benjamin, Vice President • Grace C. Torres, Treasurer and Principal Financial and Accounting Officer • Kathryn L. Quirk, Chief Legal Officer • Deborah A. Docs, Secretary • Timothy J. Knierim, Chief Compliance Officer • Valerie M. Simpson, Deputy Chief Compliance Officer • Theresa C. Thompson, Deputy Chief Compliance Officer • Richard W. Kinville, Anti-Money Laundering Compliance Officer • Jonathan D. Shain, Assistant Secretary • Claudia DiGiacomo, Assistant Secretary • John P. Schwartz, Assistant Secretary • Andrew R. French, Assistant Secretary • M. Sadiq Peshimam, Assistant Treasurer • Peter Parrella, Assistant Treasurer |
| MANAGER | Prudential Investments LLC | Gateway Center Three 100 Mulberry Street | ||
| ||||
| INVESTMENT SUBADVISER | Prudential Real Estate Investors | 7 Giralda Farms Madison, NJ 07940 | ||
| ||||
| DISTRIBUTOR | Prudential Investment Management Services LLC | Gateway Center Three 100 Mulberry Street Newark, NJ 07102 | ||
| ||||
| CUSTODIAN | The Bank of New York Mellon | One Wall Street New York, NY 10286 | ||
| ||||
| TRANSFER AGENT | Prudential Mutual Fund Services LLC | PO Box 9658 Providence, RI 02940 | ||
| ||||
| INDEPENDENT REGISTERED PUBLIC ACCOUNTING FIRM | KPMG LLP | 345 Park Avenue New York, NY 10154 | ||
| ||||
| FUND COUNSEL | Willkie Farr & Gallagher LLP | 787 Seventh Avenue New York, NY 10019 | ||
| An investor should consider the investment objectives, risks, charges, and expenses of the Fund carefully before investing. The prospectus and summary prospectus contain this and other information about the Fund. An investor may obtain a prospectus and summary prospectus by visiting our website at www.prudentialfunds.com or by calling (800) 225-1852. The prospectus and summary prospectus should be read carefully before investing. |
| E-DELIVERY |
| To receive your mutual fund documents online, go to www.prudentialfunds.com/edelivery and enroll. Instead of receiving printed documents by mail, you will receive notification via email when new materials are available. You can cancel your enrollment or change your email address at any time by visiting the website address above. |
| SHAREHOLDER COMMUNICATIONS WITH TRUSTEES |
| Shareholders can communicate directly with the Board of Trustees by writing to the Chair of the Board, Prudential US Real Estate Fund, Prudential Investments, Attn: Board of Trustees, 100 Mulberry Street, Gateway Center Three, Newark, NJ 07102. Shareholders can communicate directly with an individual Trustee by writing to the same address. Communications are not screened before being delivered to the addressee. |
| AVAILABILITY OF PORTFOLIO SCHEDULE |
| The Fund files its complete schedule of portfolio holdings with the Securities and Exchange Commission for the first and third quarters of each fiscal year on Form N-Q. The Fund’s Forms N-Q are available on the Commission’s website at www.sec.gov. The Fund’s Forms N-Q may also be reviewed and copied at the Commission’s Public Reference Room in Washington, D.C. Information on the operation and location of the Public Reference Room may be obtained by calling (202) 551-8090. The Fund’s schedule of portfolio holdings is also available on the Fund’s website as of the end of each month. |
| The Fund’s Statement of Additional Information contains additional information about the Fund’s Trustees and is available without charge, upon request, by calling (800) 225-1852. |
Mutual Funds:
| ARE NOT INSURED BY THE FDIC OR ANY FEDERAL GOVERNMENT AGENCY | MAY LOSE VALUE | ARE NOT A DEPOSIT OF OR GUARANTEED BY ANY BANK OR ANY BANK AFFILIATE |
PRUDENTIAL US REAL ESTATE FUND
| SHARE CLASS | A | B | C | Z | ||||
| NASDAQ | PJEAX | PJEBX | PJECX | PJEZX | ||||
| CUSIP | 744336603 | 744336702 | 744336801 | 744336884 |
MF209E 0224668-00001-00
Item 2 – Code of Ethics – – See Exhibit (a)
As of the end of the period covered by this report, the registrant has adopted a code of ethics (the “Section 406 Standards for Investment Companies – Ethical Standards for Principal Executive and Financial Officers”) that applies to the registrant’s Principal Executive Officer and Principal Financial Officer; the registrant’s Principal Financial Officer also serves as the Principal Accounting Officer.
The registrant hereby undertakes to provide any person, without charge, upon request, a copy of the code of ethics. To request a copy of the code of ethics, contact the registrant 800-225-1852, and ask for a copy of the Section 406 Standards for Investment Companies - Ethical Standards for Principal Executive and Financial Officers.
Item 3 – Audit Committee Financial Expert –
The registrant’s Board has determined that Mr. Stephen P. Munn, member of the Board’s Audit Committee is an “audit committee financial expert,” and that he is “independent,” for purposes of this Item.
Item 4 – Principal Accountant Fees and Services –
(a) Audit Fees
For the fiscal years ended March 31, 2012 and March 31, 2011, KPMG LLP (“KPMG”), the Registrant’s principal accountant, billed the Registrant $48,500 and $53,000, respectively, for professional services rendered for the audit of the Registrant’s annual financial statements or services that are normally provided in connection with statutory and regulatory filings.
(b) Audit-Related Fees
None.
(c) Tax Fees
During the fiscal year ended March 31, 2012, KPMG billed the Registrant $4,042 for professional services rendered in connection with agreed upon procedures performed related to an in-kind distribution of equity securities and a preliminary analysis of certain United States federal tax matters affecting a potential investment in real estate mezzanine debt. Not applicable for the fiscal year ended March 31, 2011.
(d) All Other Fees
None.
(e) (1) Audit Committee Pre-Approval Policies and Procedures
THE PRUDENTIAL MUTUAL FUNDS
AUDIT COMMITTEE POLICY
on
Pre-Approval of Services Provided by the Independent Accountants
The Audit Committee of each Prudential Mutual Fund is charged with the responsibility to monitor the independence of the Fund’s independent accountants. As part of this responsibility, the Audit Committee must pre-approve any independent accounting firm’s engagement to render audit and/or permissible non-audit services, as required by law. In evaluating a proposed engagement of the independent accountants, the Audit Committee will assess the effect that the engagement might reasonably be expected to have on the accountant’s independence. The Committee’s evaluation will be based on:
| • | a review of the nature of the professional services expected to be provided, |
| • | a review of the safeguards put into place by the accounting firm to safeguard independence, and |
| • | periodic meetings with the accounting firm. |
Policy for Audit and Non-Audit Services Provided to the Funds
On an annual basis, the scope of audits for each Fund, audit fees and expenses, and audit-related and non-audit services (and fees proposed in respect thereof) proposed to be performed by the Fund’s independent accountants will be presented by the Treasurer and the independent accountants to the Audit Committee for review and, as appropriate, approval prior to the initiation of such services. Such presentation shall be accompanied by confirmation by both the Treasurer and the independent accountants that the proposed services will not adversely affect the independence of the independent accountants. Proposed services shall be described in sufficient detail to enable the Audit Committee to assess the appropriateness of such services and fees, and the compatibility of the provision of such services with the auditor’s independence. The Committee shall receive periodic reports on the progress of the audit and other services which are approved by the Committee or by the Committee Chair pursuant to authority delegated in this Policy.
The categories of services enumerated under “Audit Services”, “Audit-related Services”, and “Tax Services” are intended to provide guidance to the Treasurer and the independent accountants as to those categories of services which the Committee believes are generally consistent with the independence of the independent accountants and which the Committee (or the Committee Chair) would expect upon the presentation of specific proposals to pre-approve. The enumerated categories are not intended as an exclusive list of audit, audit-related or tax services, which the Committee (or the Committee Chair) would consider for pre-approval.
Audit Services
The following categories of audit services are considered to be consistent with the role of the Fund’s independent accountants:
| • | Annual Fund financial statement audits |
| • | Seed audits (related to new product filings, as required) |
| • | SEC and regulatory filings and consents |
Audit-related Services
The following categories of audit-related services are considered to be consistent with the role of the Fund’s independent accountants:
| • | Accounting consultations |
| • | Fund merger support services |
| • | Agreed Upon Procedure Reports |
| • | Attestation Reports |
| • | Other Internal Control Reports |
Individual audit-related services that fall within one of these categories and are not presented to the Audit Committee as part of the annual pre-approval process will be subject to pre-approval by the Committee Chair (or any other Committee member on whom this responsibility has been delegated) so long as the estimated fee for those services does not exceed $50,000.
Tax Services
The following categories of tax services are considered to be consistent with the role of the Fund’s independent accountants:
| • | Tax compliance services related to the filing or amendment of the following: |
| • | Federal, state and local income tax compliance; and, |
| • | Sales and use tax compliance |
| • | Timely RIC qualification reviews |
| • | Tax distribution analysis and planning |
| • | Tax authority examination services |
| • | Tax appeals support services |
| • | Accounting methods studies |
| • | Fund merger support services |
| • | Tax consulting services and related projects |
Individual tax services that fall within one of these categories and are not presented to the Audit Committee as part of the annual pre-approval process will be subject to pre-approval by the Committee Chair (or any other Committee member on whom this responsibility has been delegated) so long as the estimated fee for those services does not exceed $50,000.
Other Non-audit Services
Certain non-audit services that the independent accountants are legally permitted to render will be subject to pre-approval by the Committee or by one or more Committee members to whom the Committee has delegated this authority and who will report to the full Committee any pre-approval decisions made pursuant to this Policy. Non-audit services presented for pre-approval pursuant to this paragraph will be accompanied by a confirmation from both the Treasurer and the independent accountants that the proposed services will not adversely affect the independence of the independent accountants.
Proscribed Services
The Fund’s independent accountants will not render services in the following categories of non-audit services:
| • | Bookkeeping or other services related to the accounting records or financial statements of the Fund |
| • | Financial information systems design and implementation |
| • | Appraisal or valuation services, fairness opinions, or contribution-in-kind reports |
| • | Actuarial services |
| • | Internal audit outsourcing services |
| • | Management functions or human resources |
| • | Broker or dealer, investment adviser, or investment banking services |
| • | Legal services and expert services unrelated to the audit |
| • | Any other service that the Public Company Accounting Oversight Board determines, by regulation, is impermissible. |
Pre-approval of Non-Audit Services Provided to Other Entities Within the Prudential Fund Complex
Certain non-audit services provided to Prudential Investments LLC or any of its affiliates that also provide ongoing services to the Prudential Mutual Funds will be subject to pre-approval by the Audit Committee. The only non-audit services provided to these entities that will require pre-approval are those related directly to the operations and financial reporting of the Funds. Individual projects that are not presented to the Audit Committee as part of the annual pre-approval process will be subject to pre-approval by the Committee Chair (or any other Committee member on whom this responsibility has been delegated) so long as the estimated fee for those services does not exceed $50,000. Services presented for pre-approval pursuant to this paragraph will be accompanied by a confirmation from both the Treasurer and the independent accountants that the proposed services will not adversely affect the independence of the independent accountants.
Although the Audit Committee will not pre-approve all services provided to Prudential Investments LLC and its affiliates, the Committee will receive an annual report from the Fund’s independent accounting firm showing the aggregate fees for all services provided to Prudential Investments and its affiliates.
(e) (2) Percentage of services referred to in 4(b) – 4(d) that were approved by the audit committee –
One hundred percent of the services described in Item 4(c) was approved by the audit committee.
| (f) | Percentage of hours expended attributable to work performed by other than full time employees of principal accountant if greater than 50%. |
The percentage of hours expended on the principal accountant’s engagement to audit the registrant’s financial statements for the most recent fiscal year that were attributed to work performed by persons other than the principal accountant’s full-time, permanent employees was 0%.
| (g) | Non-Audit Fees |
Not applicable to Registrant for the fiscal years 2012 and 2011. The aggregate non-audit fees billed by KPMG for services rendered to the registrant’s investment adviser and any entity controlling, controlled by, or under common control with the investment adviser that provides ongoing services to the registrant for the fiscal years 2012 and 2011 was $0 and $0, respectively.
| (h) | Principal Accountant’s Independence |
Not applicable as KPMG has not provided non-audit services to the registrant’s investment adviser and any entity controlling, controlled by, or under common control with the investment adviser that provides ongoing services to the registrant that were not pre-approved pursuant to Rule 2-01(c)(7)(ii) of Regulation S-X.
Item 5 – Audit Committee of Listed Registrants – Not applicable.
Item 6 – Schedule of Investments – The schedule is included as part of the report to shareholders filed under Item 1 of this Form.
Item 7 – Disclosure of Proxy Voting Policies and Procedures for Closed-End Management Investment Companies – Not applicable.
Item 8 – Portfolio Managers of Closed-End Management Investment Companies – Not applicable.
Item 9 – Purchases of Equity Securities by Closed-End Management Investment Company and Affiliated Purchasers – Not
applicable.
Item 10 – Submission of Matters to a Vote of Security Holders – Not applicable.
Item 11 – Controls and Procedures
| (a) | It is the conclusion of the registrant’s principal executive officer and principal financial officer that the effectiveness of the registrant’s current disclosure controls and procedures (such disclosure controls and procedures having been evaluated within 90 days of the date of this filing) provide reasonable assurance that the information required to be disclosed by the registrant has been recorded, processed, summarized and reported within the time period specified in the Commission’s rules and forms and that the information required to be disclosed by the registrant has been accumulated and communicated to the registrant’s principal executive officer and principal financial officer in order to allow timely decisions regarding required disclosure. |
| (b) | There has been no significant change in the registrant’s internal control over financial reporting that occurred during the registrant’s most recent fiscal quarter of the period covered by this report that has materially affected, or is likely to materially affect, the registrant’s internal control over financial reporting. |
Item 12 – Exhibits
| (a) (1) | Code of Ethics – Attached hereto as Exhibit EX-99.CODE-ETH. | |
| (2) | Certifications pursuant to Section 302 of the Sarbanes-Oxley Act – Attached hereto as Exhibit EX-99.CERT. | |
| (3) | Any written solicitation to purchase securities under Rule 23c-1. – Not applicable. | |
| (b) Certifications pursuant to Section 906 of the Sarbanes-Oxley Act – Attached hereto as Exhibit EX-99.906CERT. | ||
SIGNATURES
Pursuant to the requirements of the Securities Exchange Act of 1934 and the Investment Company Act of 1940, the registrant has duly caused this report to be signed on its behalf by the undersigned, thereunto duly authorized.
| Registrant: | Prudential Investment Portfolios 12 | |
| By: | /s/ Deborah A. Docs | |
| Deborah A. Docs | ||
| Secretary | ||
| Date: | May 23, 2012 | |
Pursuant to the requirements of the Securities Exchange Act of 1934 and the Investment Company Act of 1940, this report has been signed below by the following persons on behalf of the registrant and in the capacities and on the dates indicated.
| By: | /s/ Stuart S. Parker | |
| Stuart S. Parker | ||
| President and Principal Executive Officer | ||
| Date: | May 23, 2012 | |
| By: | /s/ Grace C. Torres | |
| Grace C. Torres | ||
| Treasurer and Principal Financial Officer | ||
| Date: | May 23, 2012 | |